UNITED STATES
SECURITIES AND EXCHANGE COMMISSION
Washington, D.C. 20549
FORM N-CSR
CERTIFIED SHAREHOLDER REPORT OF REGISTERED MANAGEMENT
INVESTMENT COMPANIES
Investment Company Act file number: 811-02857 and 811-21434
| Name of Fund: | BlackRock Bond Fund, Inc. |
| BlackRock Total Return Fund |
| Master Bond LLC |
| Master Total Return Portfolio |
| Fund Address:100 | Bellevue Parkway, Wilmington, DE 19809 |
Name and address of agent for service: John M. Perlowski, Chief Executive Officer, BlackRock Bond Fund, Inc.
and Master Bond LLC, 50 Hudson Yards, New York, NY 10001
Registrants’ telephone number, including area code: (800) 441-7762
Date of fiscal year end: 09/30/2023
Date of reporting period: 09/30/2023
Item 1 – Report to Stockholders
(a) The Report to Shareholders is attached herewith.
|
|
SEPTEMBER 30, 2023 |

|
|
2023 Annual Report
| |
BlackRock Bond Fund, Inc.
· BlackRock Total Return Fund
|
Not FDIC Insured • May Lose Value • No Bank Guarantee
|
Dear Shareholder,
The combination of continued economic growth and moderating inflation provided a supportive backdrop for investors during the 12-month reporting period ended September 30, 2023. Significantly tighter monetary policy helped to rein in inflation while the economy proved more resilient than many investors anticipated. A moderating labor market also helped ease inflationary pressure, although wages continued to grow and unemployment rates touched the lowest levels in decades. This robust labor market powered further growth in consumer spending, backstopping the economy. On October 7, 2023, Hamas launched a horrific attack on Israel. The ensuing war will have a significant humanitarian impact and could lead to heightened economic and market volatility. We see geopolitics as a structural market risk going forward. See our geopolitical risk dashboard at blackrock.com for more details.
Equity returns were substantial, as the durability of consumer sentiment and spending mitigated investors’ concerns about the economy’s trajectory. The U.S. economy resumed growth in the third quarter of 2022 and continued to expand thereafter. All major classes of equities rose, although large-capitalization U.S. stocks posted significantly higher returns than small-capitalization U.S. stocks due primarily to the performance of large technology companies. International developed market equities also advanced strongly, and emerging market equities posted solid gains.
The 10-year U.S. Treasury yield rose during the reporting period, driving its price down, as investors reacted to elevated inflation and attempted to anticipate future interest rate changes. The corporate bond market benefited from improving economic sentiment, although high-yield corporate bond prices fared significantly better than investment-grade bonds as demand from yield-seeking investors remained strong.
The U.S. Federal Reserve (the “Fed”), attempting to manage persistent inflation, raised interest rates six times during the 12-month period. Furthermore, the Fed wound down its bond-buying programs and incrementally reduced its balance sheet by not replacing securities that reach maturity. However, the Fed declined to raise interest rates at two of its meetings late in the period.
Supply constraints appear to have become an embedded feature of the new macroeconomic environment, making it difficult for developed economies to increase production without sparking higher inflation. Geopolitical fragmentation and an aging population risk further exacerbating these constraints, keeping the labor market tight and wage growth high. Although the Fed has decelerated the pace of interest rate hikes and recently opted for two pauses, we believe that the new economic regime means that the Fed will need to maintain high rates for an extended period to keep inflation under control. Furthermore, ongoing structural changes may mean that the Fed will be hesitant to cut interest rates in the event of faltering economic activity lest inflation accelerate again. We believe investors should expect a period of higher volatility as markets adjust to the new economic reality and policymakers attempt to adapt.
While we favor an overweight position in developed market equities in the long term, we prefer an underweight stance in the near term. Expectations for corporate earnings remain elevated, which seems inconsistent with macroeconomic constraints. Nevertheless, we are overweight on Japanese stocks in the near term as shareholder-friendly policies generate increased investor interest. We also believe that stocks with an AI tilt should benefit from an investment cycle that is set to support revenues and margins. In credit, there are selective opportunities in the near term despite tightening credit and financial conditions. For fixed income investing with a six- to twelve-month horizon, we see the most attractive investments in short-term U.S. Treasuries, U.S. inflation-linked bonds, euro area government bonds and gilts, U.S. mortgage-backed securities, and hard-currency emerging market bonds.
Overall, our view is that investors need to think globally, position themselves to be prepared for a decarbonizing economy, and be nimble as market conditions change. We encourage you to talk with your financial advisor and visit blackrock.com for further insight about investing in today’s markets.
Sincerely,

Rob Kapito
President, BlackRock Advisors, LLC

Rob Kapito
President, BlackRock Advisors, LLC
| Total Returns as of September 30, 2023 | ||||
| 6-Month | 12-Month | |||
| U.S. large cap equities (S&P 500® Index) |
5.18% | 21.62% | ||
| U.S. small cap equities (Russell 2000® Index) |
(0.19) | 8.93 | ||
| International equities (MSCI Europe, Australasia, Far East Index) |
(1.28) | 25.65 | ||
| Emerging market equities (MSCI Emerging Markets Index) |
(2.05) | 11.70 | ||
| 3-month Treasury bills (ICE BofA 3-Month U.S. Treasury Bill Index) |
2.50 | 4.47 | ||
| U.S. Treasury securities (ICE BofA 10-Year U.S. Treasury Index) |
(6.98) | (2.90) | ||
| U.S. investment grade bonds (Bloomberg U.S. Aggregate Bond Index) |
(4.05) | 0.64 | ||
| Tax-exempt municipal bonds (Bloomberg Municipal Bond Index) |
(4.05) | 2.66 | ||
| U.S. high yield bonds (Bloomberg U.S. Corporate High Yield 2% Issuer Capped Index) |
2.22 | 10.28 | ||
| Past performance is not an indication of future results. Index performance is shown for illustrative purposes only. You cannot invest directly in an index. | ||||
| 2 | T H I S P A G E I S N O T P A R T O F Y O U R F U N D R E P O R T |
| Page | ||||
| 2 | ||||
| Annual Report: |
||||
| 4 | ||||
| 7 | ||||
| 7 | ||||
| 8 | ||||
| Fund Financial Statements: |
||||
| 9 | ||||
| 11 | ||||
| 12 | ||||
| 13 | ||||
| 20 | ||||
| Fund Report of Independent Registered Public Accounting Firm |
25 | |||
| 26 | ||||
| 27 | ||||
| Master Portfolio Financial Statements: |
||||
| 28 | ||||
| 99 | ||||
| 101 | ||||
| 102 | ||||
| 103 | ||||
| 104 | ||||
| 118 | ||||
| 119 | ||||
| Disclosure of Investment Advisory Agreements and Sub-Advisory Agreements |
123 | |||
| 127 | ||||
| 129 | ||||

| 3 |
| Fund Summary as of September 30, 2023 | BlackRock Total Return Fund |
Investment Objective
BlackRock Total Return Fund’s (the “Fund”) investment objective is to realize a total return that exceeds that of the Bloomberg U.S. Aggregate Bond Index.
On June 1, 2023, the Board of Directors of the Fund approved a proposal pursuant to which the Fund will cease to invest in Master Total Return Portfolio (the “Master Portfolio”), a series of Master Bond LLC, as part of a “master/feeder” structure and will instead operate as a stand-alone fund. The change is expected to be completed in the first quarter of 2024.
Portfolio Management Commentary
How did the Fund perform?
For the 12-month period ended September 30, 2023, the Fund’s Institutional, Service, Investor A, Investor A1, Class K share classes outperformed the benchmark, the Bloomberg U.S. Aggregate Bond Index, while the Fund’s Investor C shares underperformed, and Class R shares outperformed. The Fund invests all of its assets in Master Total Return Portfolio (the “Master Portfolio”).
What factors influenced performance?
Holdings of structured products, agency mortgage-backed securities (“MBS”) and investment grade corporate bonds contributed positively to the Fund’s performance relative to the benchmark for the period.
The Fund’s macro strategies and currency exposures detracted from relative performance over the reporting period. The Fund held derivatives during the reporting period, namely futures and forwards. The Fund’s use of derivatives detracted from performance.
Describe recent portfolio activity.
During the fourth quarter of 2022, the Fund increased risk within high quality fixed income sectors as the opportunity set shifted on the back of the Fed’s fastest rate hiking cycle in decades. In this vein, the Fund strategically tilted further into high quality shorter maturity assets while maintaining its high yield corporate bond exposure near historically low levels. The Fund increased its active tilts within U.S. investment grade corporate credit given the increased dispersion of risk/reward within the sector, while reducing its overweight in agency MBS. Within securitized assets, exposure was rotated toward higher quality commercial mortgage-backed securities and structurally protected collateralized loan obligations. The Fund was defensively positioned in emerging market debt given concerns around tighter central bank policies, weakening growth and reduced liquidity.
During the first quarter of 2023, the Fund shifted to an underweight stance with respect to duration and corresponding interest rate sensitivity (Duration is a measure of interest rate sensitivity). The Fund continued to tactically rotate across select spread sectors given more attractive opportunities. Exposure to U.S. investment grade corporate bonds was slightly trimmed as spreads became less attractive, while exposure to agency MBS was tactically increased given the sectors favorable risk/reward profile in a shifting rate environment. Finally, the Fund became somewhat less defensive with respect to emerging markets.
Over the second quarter of 2023 the Fund continued to tactically rotate across select spread sectors given more attractive opportunities. The Fund slightly trimmed its U.S. investment grade corporate bond allocation as spreads became less attractive, while tactically adding to agency MBS given a favorable risk/reward profile. The Fund maintained its exposure to high yield corporate bonds near historically low levels, while preferring U.S. high yield corporate bonds over bank loans due to greater fundamental concerns in the latter sector.
Entering the third quarter of 2023, the Fund continued to manage its interest rate exposure as the end of the Fed’s hiking cycle approached, moving to an overweight U.S. duration stance on the view that inflation would ease more dramatically than expected in the second half of 2023. The Fund also added to its overweight position in agency MBS given attractive valuations. The Fund remained focused on seniority in structured products and continued to take a less defensive posture with respect to emerging markets. The Fund’s duration exposure was reduced late in the quarter as interest rates became more volatile.
Describe portfolio positioning at period end.
At the end of the reporting period, the Fund maintained an above-benchmark duration stance after having reduced the overweight by trimming in the front-end of the curve while tactically adding to the back end of the curve following September 2023 sharp increase in long rates. The Fund was overweight agency MBS and slightly underweight investment grade corporate bonds given less attractive spreads. The Fund was positioned opportunistically within high yield corporate bonds while remaining cautious down the capital stack. The Fund continued to prefer high yield corporate bonds relative to bank loans due to greater fundamental concerns in the latter sector. Within structured products, the Fund remained focused on the top of the capital structure.
Outside of the United States, the Fund had tactically trimmed its long European sovereign allocation, particularly within U.K. rates, while remaining modestly constructive there given attractive currency-hedged yields coupled with fairly hawkish Bank of England policy priced in the market. The Fund continued to hold a short position in long-term Japanese government bonds given the Bank of Japan’s decision to readjust its yield curve control policy to allow for higher rates.
Additionally, the Fund had tactically increased its emerging market debt allocation given a more constructive view toward local rates, particularly in Mexico and Brazil, as well as toward select hard currency bonds in the near-term.
The views expressed reflect the opinions of BlackRock as of the date of this report and are subject to change based on changes in market, economic or other conditions. These views are not intended to be a forecast of future events and are no guarantee of future results.
| 4 | 2 0 2 3 B L A C K R O C K A N N U A L R E P O R T T O S H A R E H O L D E R S |
| Fund Summary as of September 30, 2023 (continued) | BlackRock Total Return Fund |
GROWTH OF $10,000 INVESTMENT
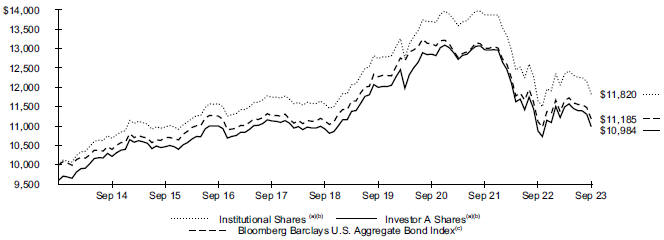
| (a) | Assuming maximum sales charges, if any, transaction costs and other operating expenses, including investment advisory fees and administration fees, if any. Institutional Shares do not have a sales charge. |
| (b) | The Fund invests all of its assets in the Master Portfolio. The Master Portfolio typically invests more than 90% of its assets in a diversified portfolio of fixed-income securities such as corporate bonds and notes, mortgage-backed securities, asset-backed securities, convertible securities, preferred securities and government obligations. Under normal circumstances, the Master Portfolio invests at least 80% of its assets in bonds and invests primarily in investment grade fixed income securities. |
| (c) | A widely recognized unmanaged market-weighted index, comprised of investment grade corporate bonds rated BBB or better, mortgages and U.S. Treasury and U.S. Government agency issues with at least one year to maturity. |
Performance
| Average Annual Total Returns(a) | ||||||||||||||||||||||||||||||||
| 1 Year | 5 Years | 10 Years | ||||||||||||||||||||||||||||||
| Standardized 30 Day Yields |
Unsubsidized 30 Day Yields |
Without Sales Charge |
With Sales Charge |
Without Sales Charge |
With Sales Charge |
Without Sales Charge |
With Sales Charge |
|||||||||||||||||||||||||
| Institutional |
4.09 | % | 4.07 | % | 1.41 | % | N/A | 0.44 | % | N/A | 1.69 | % | N/A | |||||||||||||||||||
| Service |
3.76 | 3.73 | 1.00 | N/A | 0.12 | N/A | 1.39 | N/A | ||||||||||||||||||||||||
| Investor A |
3.63 | 3.62 | 1.01 | (3.03 | )% | 0.11 | (0.70 | )% | 1.36 | 0.94 | % | |||||||||||||||||||||
| Investor A1 |
3.93 | 3.79 | 1.15 | N/A | 0.27 | N/A | 1.53 | N/A | ||||||||||||||||||||||||
| Investor C |
3.04 | 3.00 | 0.30 | (0.67 | ) | (0.57 | ) | (0.57 | ) | 0.82 | 0.82 | |||||||||||||||||||||
| Class K |
4.17 | 4.17 | 1.38 | N/A | 0.49 | N/A | 1.75 | N/A | ||||||||||||||||||||||||
| Class R |
3.47 | 3.45 | 0.72 | N/A | (0.17 | ) | N/A | 1.09 | N/A | |||||||||||||||||||||||
| Bloomberg U.S. Aggregate Bond Index |
— | — | 0.64 | N/A | 0.10 | N/A | 1.13 | N/A | ||||||||||||||||||||||||
| (a) | Assuming maximum sales charges, if any. Average annual total returns with and without sales charges reflect reductions for distribution and service fees. See “About Fund Performance” for a detailed description of share classes, including any related sales charges and fees. |
N/A - Not applicable as share class and index do not have a sales charge.
Past performance is not an indication of future results.
Performance results may include adjustments made for financial reporting purposes in accordance with U.S. generally accepted accounting principles.
| F U N D S U M M A R Y |
5 |
| Fund Summary as of September 30, 2023 (continued) | BlackRock Total Return Fund |
Expense Example
| Actual | Hypothetical 5% Return | |||||||||||||||||||||||||||||||
|
|
|
|
|
|||||||||||||||||||||||||||||
|
|
Beginning Account Value (04/01/23) |
|
|
Ending Account Value (09/30/23) |
|
|
Expenses Paid During the Period |
|
|
Beginning Account Value (04/01/23) |
|
|
Ending Account Value (09/30/23) |
|
|
Expenses Paid During the Period |
(a) |
|
Annualized Expense Ratio |
| ||||||||||||
| Institutional |
$ 1,000.00 | $ 1,014.10 | $ 2.22 | $ 1,000.00 | $ 1,022.86 | $ 2.23 | 0.44 | % | ||||||||||||||||||||||||
| Service |
1,000.00 | 1,010.00 | 3.78 | 1,000.00 | 1,021.31 | 3.80 | 0.75 | |||||||||||||||||||||||||
| Investor A |
1,000.00 | 1,010.10 | 3.73 | 1,000.00 | 1,021.36 | 3.75 | 0.74 | |||||||||||||||||||||||||
| Investor A1 |
1,000.00 | 1,011.50 | 2.98 | 1,000.00 | 1,022.11 | 2.99 | 0.59 | |||||||||||||||||||||||||
| Investor C |
1,000.00 | 1,003.00 | 7.23 | 1,000.00 | 1,017.85 | 7.28 | 1.44 | |||||||||||||||||||||||||
| Class K |
1,000.00 | 1,013.80 | 1.77 | 1,000.00 | 1,023.31 | 1.78 | 0.36 | |||||||||||||||||||||||||
| Class R |
1,000.00 | 1,007.20 | 5.18 | 1,000.00 | 1,019.90 | 5.22 | 1.03 | |||||||||||||||||||||||||
| (a) | For each class of the Fund, expenses are equal to the annualized expense ratio for the class, multiplied by the average account value over the period, multiplied by 183/365 (to reflect the one-half year period shown). Because the Fund invests all of its assets in the Master Portfolio, the expense example reflects the net expenses of both the Fund and the Master Portfolio in which it invests. |
See “Disclosure of Expenses” for further information on how expenses were calculated.
| 6 | 2 0 2 3 B L A C K R O C K A N N U A L R E P O R T T O S H A R E H O L D E R S |
Institutional and Class K Shares are not subject to any sales charge. These shares bear no ongoing distribution or service fees and are available only to certain eligible investors.
Service Shares are not subject to any sales charge. These shares are subject to a service fee of 0.25% per year (but no distribution fee) and are only available to certain eligible investors.
Investor A Shares are subject to a maximum initial sales charge (front-end load) of 4.00% and a service fee of 0.25% per year (but no distribution fee). Certain redemptions of these shares may be subject to a contingent deferred sales charge (“CDSC”) where no initial sales charge was paid at the time of purchase. These shares are generally available through financial intermediaries.
Investor A1 Shares are subject to a maximum initial sales charge (front-end load) of 1.00% and a service fee of 0.10% per year (but no distribution fee). The maximum initial sales charge does not apply to current eligible shareholders of Investor A1 Shares of the Fund. These shares are only available for dividend and capital gain reinvestment by existing shareholders and for purchase by certain eligible employer-sponsored retirement plans. Certain redemptions of these shares may be subject to a CDSC where no initial sales charge was paid at the time of purchase. However, the CDSC does not apply to redemptions by certain employer-sponsored retirement plans or to redemptions of shares acquired through the reinvestment of dividends and capital gains by existing shareholders.
Investor C Shares are subject to a 1.00% CDSC if redeemed within one year of purchase. In addition, these shares are subject to a distribution fee of 0.75% per year and a service fee of 0.25% per year. These shares are generally available through financial intermediaries. These shares automatically convert to Investor A Shares after approximately eight years.
Class R Shares are not subject to any sales charge. These shares are subject to a distribution fee of 0.25% per year and a service fee of 0.25% per year. These shares are available only to certain employer-sponsored retirement plans.
Past performance is not an indication of future results. Financial markets have experienced extreme volatility and trading in many instruments has been disrupted. These circumstances may continue for an extended period of time and may continue to affect adversely the value and liquidity of the Fund’s investments. As a result, current performance may be lower or higher than the performance data quoted. Refer to blackrock.com to obtain performance data current to the most recent month-end. Performance results do not reflect the deduction of taxes that a shareholder would pay on Fund distributions or the redemption of Fund shares. Figures shown in the performance table(s) assume reinvestment of all distributions, if any, at net asset value (“NAV”) on the ex-dividend date or payable date, as applicable. Investment return and principal value of shares will fluctuate so that shares, when redeemed, may be worth more or less than their original cost. Distributions paid to each class of shares will vary because of the different levels of service, distribution and transfer agency fees applicable to each class, which are deducted from the income available to be paid to shareholders.
BlackRock Advisors, LLC (the “Manager”), the Fund’s investment adviser, has contractually and/or voluntarily agreed to waive and/or reimburse a portion of the Fund’s expenses. Without such waiver(s) and/or reimbursement(s), the Fund’s performance would have been lower. With respect to the Fund’s voluntary waiver(s), if any, the Manager is under no obligation to waive and/or reimburse or to continue waiving and/or reimbursing its fees and such voluntary waiver(s) may be reduced or discontinued at any time. With respect to the Fund’s contractual waiver(s), if any, the Manager is under no obligation to continue waiving and/or reimbursing its fees after the applicable termination date of such agreement. See the Notes to Financial Statements for additional information on waivers and/or reimbursements. The standardized 30-day yield includes the effects of any waivers and/or reimbursements. The unsubsidized 30-day yield excludes the effects of any waivers and/or reimbursements.
Shareholders of the Fund may incur the following charges: (a) transactional expenses, such as sales charges; and (b) operating expenses, including investment advisory fees, administration fees, service and distribution fees, including 12b-1 fees, acquired fund fees and expenses, and other fund expenses. The expense example shown (which is based on a hypothetical investment of $1,000 invested at the beginning of the period and held through the end of the period) is intended to assist shareholders both in calculating expenses based on an investment in the Fund and in comparing these expenses with similar costs of investing in other mutual funds.
The expense example provides information about actual account values and actual expenses. Annualized expense ratios reflect contractual and voluntary fee waivers, if any. In order to estimate the expenses a shareholder paid during the period covered by this report, shareholders can divide their account value by $1,000 and then multiply the result by the number corresponding to their share class under the heading entitled “Expenses Paid During the Period.”
The expense example also provides information about hypothetical account values and hypothetical expenses based on the Fund’s actual expense ratio and an assumed rate of return of 5% per year before expenses. In order to assist shareholders in comparing the ongoing expenses of investing in the Fund and other funds, compare the 5% hypothetical example with the 5% hypothetical examples that appear in shareholder reports of other funds.
The expenses shown in the expense example are intended to highlight shareholders’ ongoing costs only and do not reflect transactional expenses, such as sales charges, if any. Therefore, the hypothetical example is useful in comparing ongoing expenses only and will not help shareholders determine the relative total expenses of owning different funds. If these transactional expenses were included, shareholder expenses would have been higher.
| A B O U T F U N D P E R F O R M A N C E / D I S C L O S U R E O F E X P E N S E S |
7 |
Derivative Financial Instruments
The Master Portfolio may invest in various derivative financial instruments. These instruments are used to obtain exposure to a security, commodity, index, market, and/or other assets without owning or taking physical custody of securities, commodities and/or other referenced assets or to manage market, equity, credit, interest rate, foreign currency exchange rate, commodity and/or other risks. Derivative financial instruments may give rise to a form of economic leverage and involve risks, including the imperfect correlation between the value of a derivative financial instrument and the underlying asset, possible default of the counterparty to the transaction or illiquidity of the instrument. Pursuant to Rule 18f-4 under the 1940 Act, among other things, the Master Portfolio must either use derivative financial instruments with embedded leverage in a limited manner or comply with an outer limit on fund leverage risk based on value-at-risk. The Master Portfolio’s successful use of a derivative financial instrument depends on the investment adviser’s ability to predict pertinent market movements accurately, which cannot be assured. The use of these instruments may result in losses greater than if they had not been used, may limit the amount of appreciation the Master Portfolio can realize on an investment and/or may result in lower distributions paid to shareholders. The Master Portfolio’s investments in these instruments, if any, are discussed in detail in the Master Portfolio’s Consolidated Notes to Financial Statements.
| 8 | 2 0 2 3 B L A C K R O C K A N N U A L R E P O R T T O S H A R E H O L D E R S |
Statement of Assets and Liabilities
September 30, 2023
| BlackRock Total Return Fund |
||||
| ASSETS |
||||
| Investments at value — Master Portfolio |
$ | 17,540,345,639 | ||
| Receivables: |
||||
| Capital shares sold |
33,389,818 | |||
| From the Manager |
251,645 | |||
| Withdrawals from the Master Portfolio |
39,756,969 | |||
| Prepaid expenses |
229,773 | |||
|
|
|
|||
| Total assets |
17,613,973,844 | |||
|
|
|
|||
| LIABILITIES |
||||
| Payables: |
||||
| Capital shares redeemed |
73,146,550 | |||
| Income dividend distributions |
8,024,983 | |||
| Investment advisory fees |
8,667,762 | |||
| Officer’s fees |
27,211 | |||
| Other accrued expenses |
2,236,125 | |||
| Other affiliate fees |
28,835 | |||
| Professional fees |
139,563 | |||
| Registration fees |
1,230,462 | |||
| Service and distribution fees |
332,272 | |||
|
|
|
|||
| Total liabilities |
93,833,763 | |||
|
|
|
|||
| Commitments and contingent liabilities |
||||
| NET ASSETS |
$ | 17,520,140,081 | ||
|
|
|
|||
| NET ASSETS CONSIST OF: |
||||
| Paid-in capital |
$ | 21,731,803,284 | ||
| Accumulated loss |
(4,211,663,203 | ) | ||
|
|
|
|||
| NET ASSETS |
$ | 17,520,140,081 | ||
|
|
|
|||
| F I N A N C I A L S T A T E M E N T S |
9 |
Statement of Assets and Liabilities (continued)
September 30, 2023
| BlackRock Total Return Fund |
||||||||
| NET ASSET VALUE |
||||||||
| Institutional |
||||||||
| Net assets |
$ | 9,557,512,389 | ||||||
|
|
|
|||||||
| Shares outstanding |
1,005,466,551 | |||||||
|
|
|
|||||||
| Net asset value |
$ | 9.51 | ||||||
|
|
|
|||||||
| Shares authorized |
1.6 billion | |||||||
|
|
|
|||||||
| Par value |
$ | 0.10 | ||||||
|
|
|
|||||||
| Service |
||||||||
| Net assets |
$ | 36,341,487 | ||||||
|
|
|
|||||||
| Shares outstanding |
3,822,474 | |||||||
|
|
|
|||||||
| Net asset value |
$ | 9.51 | ||||||
|
|
|
|||||||
| Shares authorized |
50 million | |||||||
|
|
|
|||||||
| Par value |
$ | 0.10 | ||||||
|
|
|
|||||||
| Investor A |
||||||||
| Net assets |
$ | 1,237,078,462 | ||||||
|
|
|
|||||||
| Shares outstanding |
130,092,544 | |||||||
|
|
|
|||||||
| Net asset value |
$ | 9.51 | ||||||
|
|
|
|||||||
| Shares authorized |
450 million | |||||||
|
|
|
|||||||
| Par value |
$ | 0.10 | ||||||
|
|
|
|||||||
| Investor A1 |
||||||||
| Net assets |
$ | 16,618,898 | ||||||
|
|
|
|||||||
| Shares outstanding |
1,749,118 | |||||||
|
|
|
|||||||
| Net asset value |
$ | 9.50 | ||||||
|
|
|
|||||||
| Shares authorized |
50 million | |||||||
|
|
|
|||||||
| Par value |
$ | 0.10 | ||||||
|
|
|
|||||||
| Investor C |
||||||||
| Net assets |
$ | 42,500,918 | ||||||
|
|
|
|||||||
| Shares outstanding |
4,472,949 | |||||||
|
|
|
|||||||
| Net asset value |
$ | 9.50 | ||||||
|
|
|
|||||||
| Shares authorized |
100 million | |||||||
|
|
|
|||||||
| Par value |
$ | 0.10 | ||||||
|
|
|
|||||||
| Class K |
||||||||
| Net assets |
$ | 6,563,237,433 | ||||||
|
|
|
|||||||
| Shares outstanding |
690,561,192 | |||||||
|
|
|
|||||||
| Net asset value |
$ | 9.50 | ||||||
|
|
|
|||||||
| Shares authorized |
1 billion | |||||||
|
|
|
|||||||
| Par value |
$ | 0.10 | ||||||
|
|
|
|||||||
| Class R |
||||||||
| Net assets |
$ | 66,850,494 | ||||||
|
|
|
|||||||
| Shares outstanding |
7,028,880 | |||||||
|
|
|
|||||||
| Net asset value |
$ | 9.51 | ||||||
|
|
|
|||||||
| Shares authorized |
250 million | |||||||
|
|
|
|||||||
| Par value |
$ | 0.10 | ||||||
|
|
|
|||||||
See notes to financial statements.
| 10 | 2 0 2 3 B L A C K R O C K A N N U A L R E P O R T T O S H A R E H O L D E R S |
Year Ended September 30, 2023
| BlackRock Total Return Fund |
||||
| INVESTMENT INCOME |
||||
| Net investment income allocated from the Master Portfolio: |
||||
| Dividends — unaffiliated |
$ | 3,136,996 | ||
| Dividends — affiliated |
41,707,369 | |||
| Interest — unaffiliated |
740,748,340 | |||
| Securities lending income — affiliated — net |
237,964 | |||
| Expenses |
(11,076,871 | ) | ||
| Fees waived |
679,428 | |||
|
|
|
|||
| Total investment income |
775,433,226 | |||
|
|
|
|||
| FUND EXPENSES |
||||
| Investment advisory |
50,529,354 | |||
| Transfer agent — class specific |
11,331,331 | |||
| Service and distribution — class specific |
4,227,707 | |||
| Registration |
919,271 | |||
| Printing and postage |
99,610 | |||
| Professional |
29,890 | |||
| Accounting services |
7,001 | |||
| Officer |
2,546 | |||
| Miscellaneous |
294,105 | |||
|
|
|
|||
| Total expenses |
67,440,815 | |||
| Less: |
||||
| Transfer agent fees waived and/or reimbursed — class specific |
(1,215,715 | ) | ||
|
|
|
|||
| Total expenses after fees waived and/or reimbursed |
66,225,100 | |||
|
|
|
|||
| Net investment income |
709,208,126 | |||
|
|
|
|||
| REALIZED AND UNREALIZED GAIN (LOSS) |
||||
| Net realized gain (loss) allocated from the Master Portfolio: |
||||
| Investments — unaffiliated |
(873,955,348 | ) | ||
| Investments — affiliated |
(540,524 | ) | ||
| Options written |
(56,181,554 | ) | ||
| Futures contracts |
(146,083,246 | ) | ||
| Forward foreign currency exchange contracts |
(12,823,457 | ) | ||
| Foreign currency transactions |
14,916,597 | |||
| Swaps |
(31,616,020 | ) | ||
|
|
|
|||
| (1,106,283,552 | ) | |||
|
|
|
|||
| Net change in unrealized appreciation (depreciation) allocated from the Master Portfolio: |
||||
| Investments — unaffiliated |
447,679,452 | |||
| Investments — affiliated |
(1,216,875 | ) | ||
| Options written |
29,292,381 | |||
| Futures contracts |
90,572,736 | |||
| Forward foreign currency exchange contracts |
(8,242,756 | ) | ||
| Foreign currency translations |
(3,233,300 | ) | ||
| Swaps |
15,362,795 | |||
| Unfunded floating rate loan interests |
(35,592 | ) | ||
|
|
|
|||
| 570,178,841 | ||||
|
|
|
|||
| Total net realized and unrealized loss |
(536,104,711 | ) | ||
|
|
|
|||
| NET INCREASE IN NET ASSETS RESULTING FROM OPERATIONS |
$ | 173,103,415 | ||
|
|
|
|||
See notes to financial statements.
| F I N A N C I A L S T A T E M E N T S |
11 |
Statements of Changes in Net Assets
| BlackRock Total Return Fund | ||||||||||||
|
|
|
|||||||||||
| Year Ended 09/30/23 |
Year Ended 09/30/22 |
|||||||||||
|
|
||||||||||||
| INCREASE (DECREASE) IN NET ASSETS |
||||||||||||
| OPERATIONS |
||||||||||||
| Net investment income |
$ | 709,208,126 | $ | 449,100,503 | ||||||||
| Net realized loss |
(1,106,283,552 | ) | (1,311,374,975 | ) | ||||||||
| Net change in unrealized appreciation (depreciation) |
570,178,841 | (2,474,670,916 | ) | |||||||||
|
|
|
|
|
|||||||||
| Net increase (decrease) in net assets resulting from operations |
173,103,415 | (3,336,945,388 | ) | |||||||||
|
|
|
|
|
|||||||||
| DISTRIBUTIONS TO SHAREHOLDERS |
||||||||||||
| From net investment income and net realized gain: |
||||||||||||
| Institutional |
(349,245,498 | ) | (299,087,560 | ) | ||||||||
| Service |
(1,408,690 | ) | (1,318,341 | ) | ||||||||
| Investor A |
(45,920,335 | ) | (41,803,454 | ) | ||||||||
| Investor A1 |
(703,801 | ) | (613,205 | ) | ||||||||
| Investor C |
(1,382,997 | ) | (1,485,206 | ) | ||||||||
| Class K |
(255,446,599 | ) | (219,556,363 | ) | ||||||||
| Class R |
(2,103,389 | ) | (1,810,350 | ) | ||||||||
| Return of capital: |
||||||||||||
| Institutional |
(22,267,190 | ) | — | |||||||||
| Service |
(89,815 | ) | — | |||||||||
| Investor A |
(2,927,788 | ) | — | |||||||||
| Investor A1 |
(44,873 | ) | — | |||||||||
| Investor C |
(88,177 | ) | — | |||||||||
| Class K |
(16,286,761 | ) | — | |||||||||
| Class R |
(134,108 | ) | — | |||||||||
|
|
|
|
|
|||||||||
| Decrease in net assets resulting from distributions to shareholders |
(698,050,021 | ) | (565,674,479 | ) | ||||||||
|
|
|
|
|
|||||||||
| CAPITAL SHARE TRANSACTIONS |
||||||||||||
| Net increase in net assets derived from capital share transactions |
1,381,778,602 | 91,715,235 | ||||||||||
|
|
|
|
|
|||||||||
| NET ASSETS |
||||||||||||
| Total increase (decrease) in net assets |
856,831,996 | (3,810,904,632 | ) | |||||||||
| Beginning of year |
16,663,308,085 | 20,474,212,717 | ||||||||||
|
|
|
|
|
|||||||||
| End of year |
$ | 17,520,140,081 | $ | 16,663,308,085 | ||||||||
|
|
|
|
|
|||||||||
See notes to financial statements.
| 12 | 2 0 2 3 B L A C K R O C K A N N U A L R E P O R T T O S H A R E H O L D E R S |
(For a share outstanding throughout each period)
| BlackRock Total Return Fund | ||||||||||||||||||||||
| Institutional | ||||||||||||||||||||||
| Year Ended 09/30/23 |
Year Ended 09/30/22 |
Year Ended 09/30/21 |
Year Ended 09/30/20 |
Year Ended 09/30/19 |
||||||||||||||||||
| Net asset value, beginning of year |
$ | 9.76 | $ | 11.96 | $ | 12.53 | $ | 11.95 | $ | 11.21 | ||||||||||||
|
|
|
|
|
|
|
|
|
|
|
|||||||||||||
| Net investment income(a) |
0.41 | 0.25 | 0.23 | 0.28 | 0.38 | |||||||||||||||||
| Net realized and unrealized gain (loss) |
(0.26 | ) | (2.13 | ) | (0.07 | ) | 0.60 | 0.75 | ||||||||||||||
|
|
|
|
|
|
|
|
|
|
|
|||||||||||||
| Net increase (decrease) from investment operations |
0.15 | (1.88 | ) | 0.16 | 0.88 | 1.13 | ||||||||||||||||
|
|
|
|
|
|
|
|
|
|
|
|||||||||||||
| Distributions(b) |
||||||||||||||||||||||
| From net investment income |
(0.38 | ) | (0.25 | ) | (0.24 | ) | (0.30 | ) | (0.39 | ) | ||||||||||||
| From net realized gain |
— | (0.07 | ) | (0.49 | ) | — | — | |||||||||||||||
| Return of capital |
(0.02 | ) | — | — | — | — | ||||||||||||||||
|
|
|
|
|
|
|
|
|
|
|
|||||||||||||
| Total distributions |
(0.40 | ) | (0.32 | ) | (0.73 | ) | (0.30 | ) | (0.39 | ) | ||||||||||||
|
|
|
|
|
|
|
|
|
|
|
|||||||||||||
| Net asset value, end of year |
$ | 9.51 | $ | 9.76 | $ | 11.96 | $ | 12.53 | $ | 11.95 | ||||||||||||
|
|
|
|
|
|
|
|
|
|
|
|||||||||||||
| Total Return(c) |
||||||||||||||||||||||
| Based on net asset value |
1.41 | % | (15.99 | )% | 1.25 | % | 7.51 | %(d) | 10.23 | % | ||||||||||||
|
|
|
|
|
|
|
|
|
|
|
|||||||||||||
| Ratios to Average Net Assets(e)(f) |
||||||||||||||||||||||
| Total expenses |
0.45 | %(g) | 0.47 | %(g) | 0.47 | %(g) | 0.47 | %(h) | 0.47 | %(h) | ||||||||||||
|
|
|
|
|
|
|
|
|
|
|
|||||||||||||
| Total expenses after fees waived and/or reimbursed |
0.44 | %(g) | 0.45 | %(g) | 0.45 | %(g) | 0.44 | %(h) | 0.44 | %(h) | ||||||||||||
|
|
|
|
|
|
|
|
|
|
|
|||||||||||||
| Net investment income |
4.08 | %(g) | 2.30 | %(g) | 1.88 | %(g) | 2.32 | %(h) | 3.33 | %(h) | ||||||||||||
|
|
|
|
|
|
|
|
|
|
|
|||||||||||||
| Supplemental Data |
||||||||||||||||||||||
| Net assets, end of year (000) |
$ | 9,557,512 | $ | 8,809,121 | $ | 9,915,659 | $ | 9,067,527 | $ | 6,535,538 | ||||||||||||
|
|
|
|
|
|
|
|
|
|
|
|||||||||||||
| Portfolio turnover rate of the Master Portfolio(i) |
380 | % | 289 | % | 459 | % | 556 | % | 574 | % | ||||||||||||
|
|
|
|
|
|
|
|
|
|
|
|||||||||||||
| (a) Based on average shares outstanding. (b) Distributions for annual periods determined in accordance with U.S. federal income tax regulations. (c) Where applicable, assumes the reinvestment of distributions. (d) Includes a payment received from an affiliate, which had no impact on the Fund’s total return. (e) Includes the Fund’s share of the Master Portfolios’ allocated expenses and/or net investment income. (f) Excludes fees and expenses incurred indirectly as a result of investments in underlying funds. (g) Includes the Fund’s share of the Master Portfolio’s allocated fees waived of less than 0.01%. (h) Includes the Fund’s share of the Master Portfolio’s allocated fees waived of 0.01%. (i) Includes mortgage dollar roll transactions (“MDRs”). Additional information regarding portfolio turnover rate is as follows:
|
|
|||||||||||||||||||||
| Year Ended 09/30/23 |
Year Ended 09/30/22 |
Year Ended 09/30/21 |
Year Ended 09/30/20 |
Year Ended 09/30/19 |
||||||||||||||||||
| Portfolio turnover rate (excluding MDRs) | 171 | % | 42 | % | 161 | % | 274 | % | 241 | % | ||||||||||||
See notes to financial statements.
| F I N A N C I A L H I G H L I G H T S |
13 |
Financial Highlights (continued)
(For a share outstanding throughout each period)
| BlackRock Total Return Fund (continued) | ||||||||||||||||||||||
| Service | ||||||||||||||||||||||
| Year Ended 09/30/23 |
Year Ended 09/30/22 |
Year Ended 09/30/21 |
Year Ended 09/30/20 |
Year Ended 09/30/19 |
||||||||||||||||||
| Net asset value, beginning of year |
$ | 9.77 | $ | 11.96 | $ | 12.54 | $ | 11.95 | $ | 11.22 | ||||||||||||
|
|
|
|
|
|
|
|
|
|
|
|||||||||||||
| Net investment income(a) |
0.37 | 0.22 | 0.19 | 0.26 | 0.35 | |||||||||||||||||
| Net realized and unrealized gain (loss) |
(0.26 | ) | (2.12 | ) | (0.08 | ) | 0.60 | 0.73 | ||||||||||||||
|
|
|
|
|
|
|
|
|
|
|
|||||||||||||
| Net increase (decrease) from investment operations |
0.11 | (1.90 | ) | 0.11 | 0.86 | 1.08 | ||||||||||||||||
|
|
|
|
|
|
|
|
|
|
|
|||||||||||||
| Distributions(b) |
||||||||||||||||||||||
| From net investment income |
(0.35 | ) | (0.22 | ) | (0.20 | ) | (0.27 | ) | (0.35 | ) | ||||||||||||
| From net realized gain |
— | (0.07 | ) | (0.49 | ) | — | — | |||||||||||||||
| Return of capital |
(0.02 | ) | — | — | — | — | ||||||||||||||||
|
|
|
|
|
|
|
|
|
|
|
|||||||||||||
| Total distributions |
(0.37 | ) | (0.29 | ) | (0.69 | ) | (0.27 | ) | (0.35 | ) | ||||||||||||
|
|
|
|
|
|
|
|
|
|
|
|||||||||||||
| Net asset value, end of year |
$ | 9.51 | $ | 9.77 | $ | 11.96 | $ | 12.54 | $ | 11.95 | ||||||||||||
|
|
|
|
|
|
|
|
|
|
|
|||||||||||||
| Total Return(c) |
||||||||||||||||||||||
| Based on net asset value |
1.00 | % | (16.17 | )% | 0.86 | % | 7.28 | %(d) | 9.80 | % | ||||||||||||
|
|
|
|
|
|
|
|
|
|
|
|||||||||||||
| Ratios to Average Net Assets(e)(f) |
||||||||||||||||||||||
| Total expenses |
0.79 | %(g) | 0.80 | %(g) | 0.80 | %(g) | 0.74 | %(h) | 0.74 | %(h) | ||||||||||||
|
|
|
|
|
|
|
|
|
|
|
|||||||||||||
| Total expenses after fees waived and/or reimbursed |
0.75 | %(g) | 0.76 | %(g) | 0.76 | %(g) | 0.74 | %(h) | 0.74 | %(h) | ||||||||||||
|
|
|
|
|
|
|
|
|
|
|
|||||||||||||
| Net investment income |
3.75 | %(g) | 1.98 | %(g) | 1.57 | %(g) | 2.15 | %(h) | 3.04 | %(h) | ||||||||||||
|
|
|
|
|
|
|
|
|
|
|
|||||||||||||
| Supplemental Data |
||||||||||||||||||||||
| Net assets, end of year (000) |
$ | 36,341 | $ | 42,155 | $ | 55,378 | $ | 57,849 | $ | 120,243 | ||||||||||||
|
|
|
|
|
|
|
|
|
|
|
|||||||||||||
| Portfolio turnover rate of the Master Portfolio(i) |
380 | % | 289 | % | 459 | % | 556 | % | 574 | % | ||||||||||||
|
|
|
|
|
|
|
|
|
|
|
|||||||||||||
| (a) Based on average shares outstanding. (b) Distributions for annual periods determined in accordance with U.S. federal income tax regulations. (c) Where applicable, assumes the reinvestment of distributions. (d) Includes a payment received from an affiliate, which had no impact on the Fund’s total return. (e) Includes the Fund’s share of the Master Portfolios’ allocated expenses and/or net investment income. (f) Excludes fees and expenses incurred indirectly as a result of investments in underlying funds. (g) Includes the Fund’s share of the Master Portfolio’s allocated fees waived of less than 0.01%. (h) Includes the Fund’s share of the Master Portfolio’s allocated fees waived of 0.01%. (i) Includes mortgage dollar roll transactions (“MDRs”). Additional information regarding portfolio turnover rate is as follows:
|
|
|||||||||||||||||||||
| Year Ended 09/30/23 |
Year Ended 09/30/22 |
Year Ended 09/30/21 |
Year Ended 09/30/20 |
Year Ended 09/30/19 |
||||||||||||||||||
| Portfolio turnover rate (excluding MDRs) | 171 | % | 42 | % | 161 | % | 274 | % | 241 | % | ||||||||||||
See notes to financial statements.
| 14 | 2 0 2 3 B L A C K R O C K A N N U A L R E P O R T T O S H A R E H O L D E R S |
Financial Highlights (continued)
(For a share outstanding throughout each period)
| BlackRock Total Return Fund (continued) | ||||||||||||||||||||||
| Investor A | ||||||||||||||||||||||
| Year Ended 09/30/23 |
Year Ended 09/30/22 |
Year Ended 09/30/21 |
Year Ended 09/30/20 |
Year Ended 09/30/19 |
||||||||||||||||||
| Net asset value, beginning of year |
$ | 9.77 | $ | 11.96 | $ | 12.54 | $ | 11.96 | $ | 11.22 | ||||||||||||
|
|
|
|
|
|
|
|
|
|
|
|||||||||||||
| Net investment income(a) |
0.38 | 0.22 | 0.19 | 0.25 | 0.34 | |||||||||||||||||
| Net realized and unrealized gain (loss) |
(0.27 | ) | (2.12 | ) | (0.08 | ) | 0.60 | 0.75 | ||||||||||||||
|
|
|
|
|
|
|
|
|
|
|
|||||||||||||
| Net increase (decrease) from investment operations |
0.11 | (1.90 | ) | 0.11 | 0.85 | 1.09 | ||||||||||||||||
|
|
|
|
|
|
|
|
|
|
|
|||||||||||||
| Distributions(b) |
||||||||||||||||||||||
| From net investment income |
(0.35 | ) | (0.22 | ) | (0.20 | ) | (0.27 | ) | (0.35 | ) | ||||||||||||
| From net realized gain |
— | (0.07 | ) | (0.49 | ) | — | — | |||||||||||||||
| Return of capital |
(0.02 | ) | — | — | — | — | ||||||||||||||||
|
|
|
|
|
|
|
|
|
|
|
|||||||||||||
| Total distributions |
(0.37 | ) | (0.29 | ) | (0.69 | ) | (0.27 | ) | (0.35 | ) | ||||||||||||
|
|
|
|
|
|
|
|
|
|
|
|||||||||||||
| Net asset value, end of year |
$ | 9.51 | $ | 9.77 | $ | 11.96 | $ | 12.54 | $ | 11.96 | ||||||||||||
|
|
|
|
|
|
|
|
|
|
|
|||||||||||||
| Total Return(c) |
||||||||||||||||||||||
| Based on net asset value |
1.01 | % | (16.16 | )% | 0.87 | % | 7.16 | %(d) | 9.85 | % | ||||||||||||
|
|
|
|
|
|
|
|
|
|
|
|||||||||||||
| Ratios to Average Net Assets(e)(f) |
||||||||||||||||||||||
| Total expenses |
0.74 | %(g) | 0.76 | %(g) | 0.74 | %(g) | 0.76 | %(h) | 0.79 | %(h) | ||||||||||||
|
|
|
|
|
|
|
|
|
|
|
|||||||||||||
| Total expenses after fees waived and/or reimbursed |
0.74 | %(g) | 0.76 | %(g) | 0.74 | %(g) | 0.76 | %(h) | 0.78 | %(h) | ||||||||||||
|
|
|
|
|
|
|
|
|
|
|
|||||||||||||
| Net investment income |
3.78 | %(g) | 1.98 | %(g) | 1.58 | %(g) | 2.02 | %(h) | 3.00 | %(h) | ||||||||||||
|
|
|
|
|
|
|
|
|
|
|
|||||||||||||
| Supplemental Data |
||||||||||||||||||||||
| Net assets, end of year (000) |
$ | 1,237,078 | $ | 1,330,459 | $ | 1,822,670 | $ | 2,147,025 | $ | 1,840,587 | ||||||||||||
|
|
|
|
|
|
|
|
|
|
|
|||||||||||||
| Portfolio turnover rate of the Master Portfolio(i) |
380 | % | 289 | % | 459 | % | 556 | % | 574 | % | ||||||||||||
|
|
|
|
|
|
|
|
|
|
|
|||||||||||||
| (a) Based on average shares outstanding. (b) Distributions for annual periods determined in accordance with U.S. federal income tax regulations. (c) Where applicable, excludes the effects of any sales charges and assumes the reinvestment of distributions. (d) Includes a payment received from an affiliate, which had no impact on the Fund’s total return. (e) Includes the Fund’s share of the Master Portfolios’ allocated expenses and/or net investment income. (f) Excludes fees and expenses incurred indirectly as a result of investments in underlying funds. (g) Includes the Fund’s share of the Master Portfolio’s allocated fees waived of less than 0.01%. (h) Includes the Fund’s share of the Master Portfolio’s allocated fees waived of 0.01%. (i) Includes mortgage dollar roll transactions (“MDRs”). Additional information regarding portfolio turnover rate is as follows:
|
|
|||||||||||||||||||||
| Year Ended 09/30/23 |
Year Ended 09/30/22 |
Year Ended 09/30/21 |
Year Ended 09/30/20 |
Year Ended 09/30/19 |
||||||||||||||||||
| Portfolio turnover rate (excluding MDRs) | 171 | % | 42 | % | 161 | % | 274 | % | 241 | % | ||||||||||||
See notes to financial statements.
| F I N A N C I A L H I G H L I G H T S |
15 |
Financial Highlights (continued)
(For a share outstanding throughout each period)
| BlackRock Total Return Fund (continued) | ||||||||||||||||||||||
| Investor A1 | ||||||||||||||||||||||
| Year Ended 09/30/23 |
Year Ended 09/30/22 |
Year Ended 09/30/21 |
Year Ended 09/30/20 |
Year Ended 09/30/19 |
||||||||||||||||||
| Net asset value, beginning of year |
$ | 9.76 | $ | 11.95 | $ | 12.53 | $ | 11.95 | $ | 11.21 | ||||||||||||
|
|
|
|
|
|
|
|
|
|
|
|||||||||||||
| Net investment income(a) |
0.39 | 0.24 | 0.21 | 0.27 | 0.37 | |||||||||||||||||
| Net realized and unrealized gain (loss) |
(0.27 | ) | (2.13 | ) | (0.08 | ) | 0.60 | 0.74 | ||||||||||||||
|
|
|
|
|
|
|
|
|
|
|
|||||||||||||
| Net increase (decrease) from investment operations |
0.12 | (1.89 | ) | 0.13 | 0.87 | 1.11 | ||||||||||||||||
|
|
|
|
|
|
|
|
|
|
|
|||||||||||||
| Distributions(b) |
||||||||||||||||||||||
| From net investment income |
(0.36 | ) | (0.23 | ) | (0.22 | ) | (0.29 | ) | (0.37 | ) | ||||||||||||
| From net realized gain |
— | (0.07 | ) | (0.49 | ) | — | — | |||||||||||||||
| Return of capital |
(0.02 | ) | — | — | — | — | ||||||||||||||||
|
|
|
|
|
|
|
|
|
|
|
|||||||||||||
| Total distributions |
(0.38 | ) | (0.30 | ) | (0.71 | ) | (0.29 | ) | (0.37 | ) | ||||||||||||
|
|
|
|
|
|
|
|
|
|
|
|||||||||||||
| Net asset value, end of year |
$ | 9.50 | $ | 9.76 | $ | 11.95 | $ | 12.53 | $ | 11.95 | ||||||||||||
|
|
|
|
|
|
|
|
|
|
|
|||||||||||||
| Total Return(c) |
||||||||||||||||||||||
| Based on net asset value |
1.15 | % | (16.04 | )% | 1.02 | % | 7.35 | %(d) | 10.06 | % | ||||||||||||
|
|
|
|
|
|
|
|
|
|
|
|||||||||||||
| Ratios to Average Net Assets(e)(f) |
||||||||||||||||||||||
| Total expenses |
0.71 | %(g) | 0.70 | %(g) | 0.68 | %(g) | 0.61 | %(h) | 0.63 | %(g) | ||||||||||||
|
|
|
|
|
|
|
|
|
|
|
|||||||||||||
| Total expenses after fees waived and/or reimbursed |
0.59 | %(g) | 0.60 | %(g) | 0.60 | %(g) | 0.59 | %(h) | 0.59 | %(g) | ||||||||||||
|
|
|
|
|
|
|
|
|
|
|
|||||||||||||
| Net investment income |
3.90 | %(g) | 2.19 | %(g) | 1.73 | %(g) | 2.22 | %(h) | 3.20 | %(g) | ||||||||||||
|
|
|
|
|
|
|
|
|
|
|
|||||||||||||
| Supplemental Data |
||||||||||||||||||||||
| Net assets, end of year (000) |
$ | 16,619 | $ | 20,124 | $ | 21,957 | $ | 24,443 | $ | 28,769 | ||||||||||||
|
|
|
|
|
|
|
|
|
|
|
|||||||||||||
| Portfolio turnover rate of the Master Portfolio(i) |
380 | % | 289 | % | 459 | % | 556 | % | 574 | % | ||||||||||||
|
|
|
|
|
|
|
|
|
|
|
|||||||||||||
| (a) Based on average shares outstanding. (b) Distributions for annual periods determined in accordance with U.S. federal income tax regulations. (c) Where applicable, excludes the effects of any sales charges and assumes the reinvestment of distributions. (d) Includes a payment received from an affiliate, which had no impact on the Fund’s total return. (e) Includes the Fund’s share of the Master Portfolios’ allocated expenses and/or net investment income. (f) Excludes fees and expenses incurred indirectly as a result of investments in underlying funds. (g) Includes the Fund’s share of the Master Portfolio’s allocated fees waived of less than 0.01%. (h) Includes the Fund’s share of the Master Portfolio’s allocated fees waived of 0.01%. (i) Includes mortgage dollar roll transactions (“MDRs”). Additional information regarding portfolio turnover rate is as follows:
|
|
|||||||||||||||||||||
| Year Ended 09/30/23 |
Year Ended 09/30/22 |
Year Ended 09/30/21 |
Year Ended 09/30/20 |
Year Ended 09/30/19 |
||||||||||||||||||
| Portfolio turnover rate (excluding MDRs) | 171 | % | 42 | % | 161 | % | 274 | % | 241 | % | ||||||||||||
See notes to financial statements.
| 16 | 2 0 2 3 B L A C K R O C K A N N U A L R E P O R T T O S H A R E H O L D E R S |
Financial Highlights (continued)
(For a share outstanding throughout each period)
| BlackRock Total Return Fund (continued) | ||||||||||||||||||||||
| Investor C | ||||||||||||||||||||||
| Year Ended 09/30/23 |
Year Ended 09/30/22 |
Year Ended 09/30/21 |
Year Ended 09/30/20 |
Year Ended 09/30/19 |
||||||||||||||||||
| Net asset value, beginning of year |
$ | 9.76 | $ | 11.95 | $ | 12.53 | $ | 11.95 | $ | 11.21 | ||||||||||||
|
|
|
|
|
|
|
|
|
|
|
|||||||||||||
| Net investment income(a) |
0.30 | 0.14 | 0.11 | 0.16 | 0.27 | |||||||||||||||||
| Net realized and unrealized gain (loss) |
(0.26 | ) | (2.12 | ) | (0.08 | ) | 0.60 | 0.74 | ||||||||||||||
|
|
|
|
|
|
|
|
|
|
|
|||||||||||||
| Net increase (decrease) from investment operations |
0.04 | (1.98 | ) | 0.03 | 0.76 | 1.01 | ||||||||||||||||
|
|
|
|
|
|
|
|
|
|
|
|||||||||||||
| Distributions(b) |
||||||||||||||||||||||
| From net investment income |
(0.28 | ) | (0.14 | ) | (0.12 | ) | (0.18 | ) | (0.27 | ) | ||||||||||||
| From net realized gain |
— | (0.07 | ) | (0.49 | ) | — | — | |||||||||||||||
| Return of capital |
(0.02 | ) | — | — | — | — | ||||||||||||||||
|
|
|
|
|
|
|
|
|
|
|
|||||||||||||
| Total distributions |
(0.30 | ) | (0.21 | ) | (0.61 | ) | (0.18 | ) | (0.27 | ) | ||||||||||||
|
|
|
|
|
|
|
|
|
|
|
|||||||||||||
| Net asset value, end of year |
$ | 9.50 | $ | 9.76 | $ | 11.95 | $ | 12.53 | $ | 11.95 | ||||||||||||
|
|
|
|
|
|
|
|
|
|
|
|||||||||||||
| Total Return(c) |
||||||||||||||||||||||
| Based on net asset value |
0.30 | % | (16.76 | )% | 0.16 | % | 6.44 | %(d) | 9.14 | % | ||||||||||||
|
|
|
|
|
|
|
|
|
|
|
|||||||||||||
| Ratios to Average Net Assets(e)(f) |
||||||||||||||||||||||
| Total expenses |
1.49 | %(g) | 1.48 | %(g)(h) | 1.47 | %(g) | 1.49 | %(i) | 1.51 | %(i) | ||||||||||||
|
|
|
|
|
|
|
|
|
|
|
|||||||||||||
| Total expenses after fees waived and/or reimbursed |
1.44 | %(g) | 1.46 | %(g)(h) | 1.45 | %(g) | 1.44 | %(i) | 1.44 | %(i) | ||||||||||||
|
|
|
|
|
|
|
|
|
|
|
|||||||||||||
| Net investment income |
3.06 | %(g) | 1.23 | %(g) | 0.89 | %(g) | 1.36 | %(i) | 2.35 | %(i) | ||||||||||||
|
|
|
|
|
|
|
|
|
|
|
|||||||||||||
| Supplemental Data |
||||||||||||||||||||||
| Net assets, end of year (000) |
$ | 42,501 | $ | 56,468 | $ | 100,462 | $ | 140,034 | $ | 209,532 | ||||||||||||
|
|
|
|
|
|
|
|
|
|
|
|||||||||||||
| Portfolio turnover rate of the Master Portfolio(j) |
380 | % | 289 | % | 459 | % | 556 | % | 574 | % | ||||||||||||
|
|
|
|
|
|
|
|
|
|
|
|||||||||||||
| (a) Based on average shares outstanding. (b) Distributions for annual periods determined in accordance with U.S. federal income tax regulations. (c) Where applicable, excludes the effects of any sales charges and assumes the reinvestment of distributions. (d) Includes a payment received from an affiliate, which had no impact on the Fund’s total return. (e) Includes the Fund’s share of the Master Portfolios’ allocated expenses and/or net investment income. (f) Excludes fees and expenses incurred indirectly as a result of investments in underlying funds. (g) Includes the Fund’s share of the Master Portfolio’s allocated fees waived of less than 0.01%. (h) Includes non-recurring expenses of proxy costs. Without these costs, total expenses, total expenses after fees waived and/or reimbursed, and total expenses after fees waived and/or reimbursed and excluding interest expense would have been 1.46%, 1.44% and 1.44%, respectively. (i) Includes the Fund’s share of the Master Portfolio’s allocated fees waived of 0.01%. (j) Includes mortgage dollar roll transactions (“MDRs”). Additional information regarding portfolio turnover rate is as follows:
|
| |||||||||||||||||||||
| Year Ended 09/30/23 |
Year Ended 09/30/22 |
Year Ended 09/30/21 |
Year Ended 09/30/20 |
Year Ended 09/30/19 |
||||||||||||||||||
| Portfolio turnover rate (excluding MDRs) | 171 | % | 42 | % | 161 | % | 274 | % | 241 | % | ||||||||||||
See notes to financial statements.
| F I N A N C I A L H I G H L I G H T S |
17 |
Financial Highlights (continued)
(For a share outstanding throughout each period)
| BlackRock Total Return Fund (continued) | ||||||||||||||||||||||
| Class K | ||||||||||||||||||||||
| Year Ended 09/30/23 |
Year Ended 09/30/22 |
Year Ended 09/30/21 |
Year Ended 09/30/20 |
Year Ended 09/30/19 |
||||||||||||||||||
| Net asset value, beginning of year |
$ | 9.76 | $ | 11.96 | $ | 12.53 | $ | 11.95 | $ | 11.21 | ||||||||||||
|
|
|
|
|
|
|
|
|
|
|
|||||||||||||
| Net investment income(a) |
0.41 | 0.26 | 0.24 | 0.29 | 0.39 | |||||||||||||||||
| Net realized and unrealized gain (loss) |
(0.26 | ) | (2.13 | ) | (0.07 | ) | 0.60 | 0.74 | ||||||||||||||
|
|
|
|
|
|
|
|
|
|
|
|||||||||||||
| Net increase (decrease) from investment operations |
0.15 | (1.87 | ) | 0.17 | 0.89 | 1.13 | ||||||||||||||||
|
|
|
|
|
|
|
|
|
|
|
|||||||||||||
| Distributions(b) |
||||||||||||||||||||||
| From net investment income |
(0.39 | ) | (0.26 | ) | (0.25 | ) | (0.31 | ) | (0.39 | ) | ||||||||||||
| From net realized gain |
— | (0.07 | ) | (0.49 | ) | — | — | |||||||||||||||
| Return of capital |
(0.02 | ) | — | — | — | — | ||||||||||||||||
|
|
|
|
|
|
|
|
|
|
|
|||||||||||||
| Total distributions |
(0.41 | ) | (0.33 | ) | (0.74 | ) | (0.31 | ) | (0.39 | ) | ||||||||||||
|
|
|
|
|
|
|
|
|
|
|
|||||||||||||
| Net asset value, end of year |
$ | 9.50 | $ | 9.76 | $ | 11.96 | $ | 12.53 | $ | 11.95 | ||||||||||||
|
|
|
|
|
|
|
|
|
|
|
|||||||||||||
| Total Return(c) |
||||||||||||||||||||||
| Based on net asset value |
1.38 | % | (15.93 | )% | 1.32 | % | 7.59 | %(d) | 10.30 | % | ||||||||||||
|
|
|
|
|
|
|
|
|
|
|
|||||||||||||
| Ratios to Average Net Assets(e)(f) |
||||||||||||||||||||||
| Total expenses |
0.37 | %(g) | 0.38 | %(g) | 0.38 | %(g) | 0.37 | %(h) | 0.37 | %(h) | ||||||||||||
|
|
|
|
|
|
|
|
|
|
|
|||||||||||||
| Total expenses after fees waived and/or reimbursed |
0.37 | %(g) | 0.38 | %(g) | 0.38 | %(g) | 0.37 | %(h) | 0.37 | %(h) | ||||||||||||
|
|
|
|
|
|
|
|
|
|
|
|||||||||||||
| Net investment income |
4.16 | %(g) | 2.37 | %(g) | 1.94 | %(g) | 2.41 | %(h) | 3.40 | %(h) | ||||||||||||
|
|
|
|
|
|
|
|
|
|
|
|||||||||||||
| Supplemental Data |
||||||||||||||||||||||
| Net assets, end of year (000) |
$ | 6,563,237 | $ | 6,340,122 | $ | 8,472,180 | $ | 7,491,107 | $ | 6,015,062 | ||||||||||||
|
|
|
|
|
|
|
|
|
|
|
|||||||||||||
| Portfolio turnover rate of the Master Portfolio(i) |
380 | % | 289 | % | 459 | % | 556 | % | 574 | % | ||||||||||||
|
|
|
|
|
|
|
|
|
|
|
|||||||||||||
| (a) Based on average shares outstanding. (b) Distributions for annual periods determined in accordance with U.S. federal income tax regulations. (c) Where applicable, assumes the reinvestment of distributions. (d) Includes a payment received from an affiliate, which had no impact on the Fund’s total return. (e) Includes the Fund’s share of the Master Portfolios’ allocated expenses and/or net investment income. (f) Excludes fees and expenses incurred indirectly as a result of investments in underlying funds. (g) Includes the Fund’s share of the Master Portfolio’s allocated fees waived of less than 0.01%. (h) Includes the Fund’s share of the Master Portfolio’s allocated fees waived of 0.01%. (i) Includes mortgage dollar roll transactions (“MDRs”). Additional information regarding portfolio turnover rate is as follows:
|
|
|||||||||||||||||||||
| Year Ended 09/30/23 |
Year Ended 09/30/22 |
Year Ended 09/30/21 |
Year Ended 09/30/20 |
Year Ended 09/30/19 |
||||||||||||||||||
| Portfolio turnover rate (excluding MDRs) |
171 | % | 42 | % | 161 | % | 274 | % | 241 | % | ||||||||||||
See notes to financial statements.
| 18 | 2 0 2 3 B L A C K R O C K A N N U A L R E P O R T T O S H A R E H O L D E R S |
Financial Highlights (continued)
(For a share outstanding throughout each period)
| BlackRock Total Return Fund (continued) | ||||||||||||||||||||||
| Class R | ||||||||||||||||||||||
| Year Ended 09/30/23 |
Year Ended 09/30/22 |
Year Ended 09/30/21 |
Year Ended 09/30/20 |
Year Ended 09/30/19 |
||||||||||||||||||
| Net asset value, beginning of year |
$ | 9.77 | $ | 11.96 | $ | 12.54 | $ | 11.96 | $ | 11.22 | ||||||||||||
|
|
|
|
|
|
|
|
|
|
|
|||||||||||||
| Net investment income(a) |
0.35 | 0.19 | 0.16 | 0.22 | 0.32 | |||||||||||||||||
| Net realized and unrealized gain (loss) |
(0.27 | ) | (2.13 | ) | (0.08 | ) | 0.59 | 0.74 | ||||||||||||||
|
|
|
|
|
|
|
|
|
|
|
|||||||||||||
| Net increase (decrease) from investment operations |
0.08 | (1.94 | ) | 0.08 | 0.81 | 1.06 | ||||||||||||||||
|
|
|
|
|
|
|
|
|
|
|
|||||||||||||
| Distributions(b) |
||||||||||||||||||||||
| From net investment income |
(0.32 | ) | (0.18 | ) | (0.17 | ) | (0.23 | ) | (0.32 | ) | ||||||||||||
| From net realized gain |
— | (0.07 | ) | (0.49 | ) | — | — | |||||||||||||||
| Return of capital |
(0.02 | ) | — | — | — | — | ||||||||||||||||
|
|
|
|
|
|
|
|
|
|
|
|||||||||||||
| Total distributions |
(0.34 | ) | (0.25 | ) | (0.66 | ) | (0.23 | ) | (0.32 | ) | ||||||||||||
|
|
|
|
|
|
|
|
|
|
|
|||||||||||||
| Net asset value, end of year |
$ | 9.51 | $ | 9.77 | $ | 11.96 | $ | 12.54 | $ | 11.96 | ||||||||||||
|
|
|
|
|
|
|
|
|
|
|
|||||||||||||
| Total Return(c) |
||||||||||||||||||||||
| Based on net asset value |
0.72 | % | (16.40 | )% | 0.57 | % | 6.88 | %(d) | 9.58 | % | ||||||||||||
|
|
|
|
|
|
|
|
|
|
|
|||||||||||||
| Ratios to Average Net Assets(e)(f) |
||||||||||||||||||||||
| Total expenses |
1.05 | %(g) | 1.06 | %(g) | 1.05 | %(g) | 1.04 | %(h) | 1.07 | %(g) | ||||||||||||
|
|
|
|
|
|
|
|
|
|
|
|||||||||||||
| Total expenses after fees waived and/or reimbursed |
1.03 | %(g) | 1.04 | %(g) | 1.04 | %(g) | 1.03 | %(h) | 1.03 | %(g) | ||||||||||||
|
|
|
|
|
|
|
|
|
|
|
|||||||||||||
| Net investment income |
3.48 | %(g) | 1.71 | %(g) | 1.29 | %(g) | 1.80 | %(h) | 2.76 | %(g) | ||||||||||||
|
|
|
|
|
|
|
|
|
|
|
|||||||||||||
| Supplemental Data |
||||||||||||||||||||||
| Net assets, end of year (000) |
$ | 66,850 | $ | 64,860 | $ | 85,906 | $ | 85,550 | $ | 142,718 | ||||||||||||
|
|
|
|
|
|
|
|
|
|
|
|||||||||||||
| Portfolio turnover rate of the Master Portfolio(i) |
380 | % | 289 | % | 459 | % | 556 | % | 574 | % | ||||||||||||
|
|
|
|
|
|
|
|
|
|
|
|||||||||||||
| (a) Based on average shares outstanding. (b) Distributions for annual periods determined in accordance with U.S. federal income tax regulations. (c) Where applicable, assumes the reinvestment of distributions. (d) Includes a payment received from an affiliate, which had no impact on the Fund’s total return. (e) Includes the Fund’s share of the Master Portfolios’ allocated expenses and/or net investment income. (f) Excludes fees and expenses incurred indirectly as a result of investments in underlying funds. (g) Includes the Fund’s share of the Master Portfolio’s allocated fees waived of less than 0.01%. (h) Includes the Fund’s share of the Master Portfolio’s allocated fees waived of 0.01%. (i) Includes mortgage dollar roll transactions (“MDRs”). Additional information regarding portfolio turnover rate is as follows:
|
|
|||||||||||||||||||||
| Year Ended 09/30/23 |
Year Ended 09/30/22 |
Year Ended 09/30/21 |
Year Ended 09/30/20 |
Year Ended 09/30/19 |
||||||||||||||||||
| Portfolio turnover rate (excluding MDRs) |
171 | % | 42 | % | 161 | % | 274 | % | 241 | % | ||||||||||||
See notes to financial statements.
| F I N A N C I A L H I G H L I G H T S |
19 |
| 1. | ORGANIZATION |
BlackRock Bond Fund, Inc. (the “Corporation”) is registered under the Investment Company Act of 1940, as amended (the “1940 Act”), as an open-end management investment company. The Corporation is organized as a Maryland corporation. BlackRock Total Return Fund (the “Fund”) is a series of the Corporation. The Fund is classified as diversified. The Fund seeks to achieve its investment objective by investing all of its assets in Master Total Return Portfolio (the “Master Portfolio”) of Master Bond LLC, an affiliate of the Fund, which has the same investment objective and strategies as the Fund. The Master Bond LLC is organized as a Delaware limited liability company. The value of the Fund’s investment in the Master Portfolio reflects the Fund’s proportionate interest in the net assets of the Master Portfolio. The performance of the Fund is directly affected by the performance of the Master Portfolio. At September 30, 2023, the percentage of the Master Portfolio owned by the Fund was 96.8%. The financial statements of the Master Portfolio, including the Consolidated Schedule of Investments, are included elsewhere in this report and should be read in conjunction with the Fund’s financial statements.
The Fund offers multiple classes of shares. All classes of shares have identical voting, dividend, liquidation and other rights and are subject to the same terms and conditions, except that certain classes bear expenses related to the shareholder servicing and distribution of such shares. Institutional, Service and Class K Shares are sold only to certain eligible investors. Class R Shares are sold only to certain employer-sponsored retirement plans. Service, Investor A, Investor A1, Investor C and Class R Shares bear certain expenses related to shareholder servicing of such shares, and Investor C and Class R Shares also bear certain expenses related to the distribution of such shares. Investor A and Investor C Shares are generally available through financial intermediaries. Investor A1 Shares are only available for dividend and capital gain reinvestment by existing shareholders, and for purchase by certain employer-sponsored retirement plans. Each class has exclusive voting rights with respect to matters relating to its shareholder servicing and distribution expenditures (except that Investor C shareholders may vote on material changes to the Investor A Shares distribution and service plan).
The Board of Directors of the Corporation and Board of Directors of the Master Bond LLC are referred to throughout this report as the “Board of Directors” or the “Board” and the members are referred to as “Directors”.
| Share Class | Initial Sales Charge | CDSC | Conversion Privilege | |||||||||
| Institutional, Service, Class K and Class R Shares |
No | No | None | |||||||||
| Investor A Shares |
Yes | No | (a) | None | ||||||||
| Investor A1 Shares |
No | (b) | No | (c) | None | |||||||
| Investor C Shares |
No | Yes | (d) | To Investor A Shares after approximately 8 years | ||||||||
| (a) | Investor A Shares may be subject to a contingent deferred sales charge (“CDSC”) where no initial sales charge was paid at the time of purchase. |
| (b) | Investor A1 Shares are subject to a maximum sales charge on purchases of 1.00%. The sales charge does not apply to dividend and capital gain reinvestments by existing shareholders and new purchases for certain employer-sponsored retirement plans, which are currently the only investors who may invest in Investor A1 Shares. |
| (c) | Investor A1 Shares may be subject to a CDSC for certain redemptions where no initial sales charge was paid at the time of purchase. However, the CDSC does not apply to redemptions by certain employer-sponsored retirement plans, or to redemptions of shares acquired through reinvestment of dividends and capital gains by existing shareholders. |
| (d) | A CDSC of 1.00% is assessed on certain redemptions of Investor C Shares made within one year of after purchase. |
The Fund, together with certain other registered investment companies advised by BlackRock Advisors, LLC (the “Manager”) or its affiliates, is included in a complex of funds referred to as the BlackRock Fixed-Income Complex.
On June 1, 2023, the Board of Directors of the Fund approved a proposal pursuant to which the Fund will cease to invest in Master Total Return Portfolio (the “Master Portfolio”), a series of Master Bond LLC, as part of a “master/feeder” structure and will instead operate as a stand-alone fund. The change is expected to be completed in the first quarter of 2024.
| 2. | SIGNIFICANT ACCOUNTING POLICIES |
The financial statements are prepared in conformity with accounting principles generally accepted in the United States of America (“U.S. GAAP”), which may require management to make estimates and assumptions that affect the reported amounts of assets and liabilities in the financial statements, disclosure of contingent assets and liabilities at the date of the financial statements and the reported amounts of increases and decreases in net assets from operations during the reporting period. Actual results could differ from those estimates. The Fund is considered an investment company under U.S. GAAP and follows the accounting and reporting guidance applicable to investment companies. Below is a summary of significant accounting policies:
Investment Transactions and Income Recognition: For financial reporting purposes, contributions to and withdrawals from the Master Portfolio are accounted for on a trade date basis. The Fund records its proportionate share of the Master Portfolio’s income, expenses and realized and unrealized gains and losses on a daily basis. Realized and unrealized gains and losses are adjusted utilizing partnership tax allocation rules. In addition, the Fund accrues its own expenses. Income, expenses and realized and unrealized gains and losses are allocated daily to each class based on its relative net assets.
Distributions: Distributions from net investment income are declared daily and paid monthly. Distributions of capital gains are recorded on the ex-dividend dates and made at least annually. The portion of distributions, if any, that exceeds a fund’s current and accumulated earnings and profits, as measured on a tax basis, constitute a non-taxable return of capital. The character and timing of distributions are determined in accordance with U.S. federal income tax regulations, which may differ from U.S. GAAP.
Deferred Compensation Plan: Under the Deferred Compensation Plan (the “Plan”) approved by the Corporation’s Board, the directors who are not “interested persons” of the Corporation, as defined in the 1940 Act (“Independent Directors”), may defer a portion of their annual complex-wide compensation. Deferred amounts earn an approximate return as though equivalent dollar amounts had been invested in common shares of certain funds in the BlackRock Fixed-Income Complex selected by the Independent Directors. This has the same economic effect for the Independent Directors as if the Independent Directors had invested the deferred amounts directly in certain funds in the BlackRock Fixed-Income Complex.
| 20 | 2 0 2 3 B L A C K R O C K A N N U A L R E P O R T T O S H A R E H O L D E R S |
Notes to Financial Statements (continued)
The Plan is not funded and obligations thereunder represent general unsecured claims against the general assets of the Fund, as applicable. Deferred compensation liabilities, if any, are included in the Officer’s fees payable in the Statement of Assets and Liabilities and will remain as a liability of the Fund until such amounts are distributed in accordance with the Plan. Net appreciation (depreciation) in the value of participants’ deferral accounts is allocated among the participating funds in the BlackRock Fixed Income Complex and reflected as Officer expense on the Statement of Operations. The Officer expense may be negative as a result of a decrease in value of the deferred account.
Indemnifications: In the normal course of business, the Fund enters into contracts that contain a variety of representations that provide general indemnification. The Fund’s maximum exposure under these arrangements is unknown because it involves future potential claims against the Fund, which cannot be predicted with any certainty.
Other: Expenses directly related to the Fund or its classes are charged to the Fund or the applicable class. Expenses directly related to the Fund and other shared expenses prorated to the Fund are allocated daily to each class based on its relative net assets or other appropriate methods. Other operating expenses shared by several funds, including other funds managed by the Manager, are prorated among those funds on the basis of relative net assets or other appropriate methods.
The Fund has an arrangement with its custodian whereby credits are earned on uninvested cash balances, which could be used to reduce custody fees and/or overdraft charges. The Fund may incur charges on overdrafts, subject to certain conditions.
| 3. | INVESTMENT VALUATION AND FAIR VALUE MEASUREMENTS |
The Fund’s policy is to value its financial instruments at fair value. The Fund records its investment in the Master Portfolio at fair value based on the Fund’s proportionate interest in the net assets of the Master Portfolio. Valuation of securities held by the Master Portfolio is discussed in Note 3 of the Master Portfolio’s Consolidated Notes to Financial Statements, which are included elsewhere in this report.
| 4. | INVESTMENT ADVISORY AGREEMENT AND OTHER TRANSACTIONS WITH AFFILIATES |
Investment Advisory: The Corporation, on behalf of the Fund, entered into an Investment Advisory Agreement with the Manager, the Fund’s investment adviser and an indirect, wholly-owned subsidiary of BlackRock, Inc. (“BlackRock”), to provide investment advisory and administrative services. The Manager is responsible for the management of the Fund’s portfolio and provides the personnel, facilities, equipment and certain other services necessary to the operations of the Fund.
For such services, the Fund pays the Manager a monthly fee at an annual rate equal to the following percentages of the average daily value of the Fund’s net assets:
| Average Daily Net Assets | Investment Advisory Fees(a) |
|||
| First $250 million |
0.32 | % | ||
| $250 million — $500 million |
0.31 | |||
| $500 million — $750 million |
0.30 | |||
| Greater than $750 million |
0.29 | |||
| (a) | This investment advisory fee applies to the Fund for as long as the Fund invests in the Master Portfolio or another master fund advised by the Manager or an affiliate thereof in a master-feeder structure. If the Fund ceases to operate as a feeder fund in a master/feeder structure, the maximum actual investment advisory fees payable to the Manager (as a percentage of average daily net assets) by the Fund are as follows: 0.48% (first $250 million), 0.43% ($250 million - $500 million), 0.38% ($500 million - $750 million) and 0.34% (greater than $750 million). |
With respect to the Fund, the Manager entered into separate sub-advisory agreements with each of BlackRock International Limited (“BIL”) and BlackRock (Singapore) Limited (“BSL”), each an affiliate of the Manager. The Manager pays BIL and BSL for services they provide for that portion of the Fund for which BIL and BSL, as applicable, act as sub-advisers, a monthly fee that is equal to a percentage of the investment advisory fees paid by the Fund to the Manager.
Service and Distribution Fees: The Corporation, on behalf of the Fund, entered into a Distribution Agreement and a Distribution and Service Plan with BlackRock Investments, LLC (“BRIL”), an affiliate of the Manager. Pursuant to the Distribution and Service Plan and in accordance with Rule 12b-1 under the 1940 Act, the Fund pays BRIL ongoing service and distribution fees. The fees are accrued daily and paid monthly at annual rates based upon the average daily net assets of the relevant share class of the Fund as follows:
| Share Class | Service Fees | Distribution Fees | ||||||
| Service |
0.25 | % | N/A | |||||
| Investor A |
0.25 | N/A | ||||||
| Investor A1 |
0.10 | N/A | ||||||
| Investor C |
0.25 | 0.75 | % | |||||
| Class R |
0.25 | 0.25 | ||||||
BRIL and broker-dealers, pursuant to sub-agreements with BRIL, provide shareholder servicing and distribution services to the Fund. The ongoing service and/or distribution fee compensates BRIL and each broker-dealer for providing shareholder servicing and/or distribution related services to shareholders.
For the year ended September 30, 2023, the following table shows the class specific service and distribution fees borne directly by each share class of the Fund:
| Service | Investor A | Investor A1 | Investor C | Class R | Total | |||||||||||||||||||
| Service and distribution — class specific |
$ | 101,557 | $ | 3,288,638 | $ | 19,482 | $ | 491,117 | $ | 326,913 | $ | 4,227,707 | ||||||||||||
| N O T E S T O F I N A N C I A L S T A T E M E N T S |
21 |
Notes to Financial Statements (continued)
Transfer Agent: Pursuant to written agreements, certain financial intermediaries, some of which may be affiliates, provide the Fund with sub-accounting, recordkeeping, sub-transfer agency and other administrative services with respect to servicing of underlying investor accounts. For these services, these entities receive an asset-based fee or an annual fee per shareholder account, which will vary depending on share class and/or net assets. For the year ended September 30, 2023, the Fund paid $0 for the Fund’s Institutional Shares to affiliates of BlackRock in return for these services, which are included in transfer agent — class specific in the Statement of Operations.
The Manager maintains a call center that is responsible for providing certain shareholder services to the Fund. Shareholder services include responding to inquiries and processing purchases and sales based upon instructions from shareholders. For the year ended September 30, 2023, the Fund reimbursed the Manager the following amounts for costs incurred in running the call center, which are included in transfer agent — class specific in the Statement of Operations:
|
|
||||||||||||||||||||||||||||||||
| Institutional | Service | Investor A | Investor A1 | Investor C | Class K | Class R | Total | |||||||||||||||||||||||||
|
|
||||||||||||||||||||||||||||||||
| Reimbursed amounts |
$ | 19,276 | $ | 196 | $ | 14,614 | $ | 189 | $ | 608 | $ | 17,639 | $ | 1,447 | $ | 53,969 | ||||||||||||||||
|
|
||||||||||||||||||||||||||||||||
For the year ended September 30, 2023, the following table shows the class specific transfer agent fees borne directly by each share class of the Fund:
|
|
||||||||||||||||||||||||||||||||
| Institutional | Service | Investor A | Investor A1 | Investor C | Class K | Class R | Total | |||||||||||||||||||||||||
|
|
||||||||||||||||||||||||||||||||
| Transfer agent — class specific |
$ | 8,855,870 | $ | 72,732 | $ | 1,667,690 | $ | 49,201 | $ | 61,420 | $ | 500,050 | $ | 124,368 | $ | 11,331,331 | ||||||||||||||||
|
|
||||||||||||||||||||||||||||||||
Other Fees: For the year ended September 30, 2023, affiliates earned underwriting discounts, direct commissions and dealer concessions on sales of the Fund’s Investor A Shares for a total of $18,541.
For the year ended September 30, 2023, affiliates received CDSCs as follows:
|
|
||||
| Share Class | Amounts | |||
|
|
||||
| Investor A |
$ | 67,941 | ||
| Investor C |
2,385 | |||
Expense Limitations, Waivers and Reimbursements: With the exception of the Fund’s investment in the Master Portfolio, the Manager contractually agreed to waive its investment advisory fee with respect to any portion of the Fund’s assets invested in affiliated equity and fixed-income mutual funds and affiliated exchange-traded funds that have a contractual management fee through June 30, 2024. The contractual agreement may be terminated upon 90 days’ notice by a majority of the Independent Directors, or by a vote of a majority of the outstanding voting securities of the Fund. For the year ended September 30, 2023, there were no fees waived by the Manager pursuant to this arrangement.
With respect to the Fund, the Manager contractually agreed to waive and/or reimburse fees or expenses in order to limit expenses, excluding interest expense, dividend expense, tax expense, acquired fund fees and expenses, and certain other fund expenses, which constitute extraordinary expenses not incurred in the ordinary course of the Fund’s business (“expense limitation”). The expense limitations as a percentage of average daily net assets are as follows:
|
|
||||
| Share Class | Expense Limitations |
|||
|
|
||||
| Institutional |
0.44 | % | ||
| Service |
0.75 | |||
| Investor A |
0.78 | |||
| Investor A1 |
0.59 | |||
| Investor C |
1.44 | |||
| Class K |
0.39 | |||
| Class R |
1.03 | |||
|
|
||||
The Manager has agreed not to reduce or discontinue the contractual expense limitations through June 30, 2024, unless approved by the Board, including a majority of the Independent Directors, or by a vote of a majority of the outstanding voting securities of the Fund. For the year ended September 30, 2023, there were no fees waived and/or reimbursed by the Manager pursuant to this agreement.
In addition, these amounts waived and/or reimbursed by the Manager are included in transfer agent fees waived and/or reimbursed — class specific in the Statement of Operations. For the year ended September 30, 2023, class specific waivers and/or reimbursements were as follows:
|
|
||||||||||||||||||||||||||||
| Institutional | Service | Investor A1 | Investor C | Class K | Class R | Total | ||||||||||||||||||||||
|
|
||||||||||||||||||||||||||||
| Transfer agent fees waived and/or reimbursed — class specific |
$ | 1,144,637 | $ | 14,561 | $ | 23,224 | $ | 20,724 | $ | 1,664 | $ | 10,905 | $ | 1,215,715 | ||||||||||||||
|
|
||||||||||||||||||||||||||||
Interfund Lending: In accordance with an exemptive order (the “Order”) from the U.S. Securities and Exchange Commission (“SEC”), the Fund may participate in a joint lending and borrowing facility for temporary purposes (the “Interfund Lending Program”), subject to compliance with the terms and conditions of the Order, and to the extent permitted by the Fund’s investment policies and restrictions. The Fund is currently permitted to borrow and lend under the Interfund Lending Program.
A lending BlackRock fund may lend in aggregate up to 15% of its net assets but may not lend more than 5% of its net assets to any one borrowing fund through the Interfund Lending Program. A borrowing BlackRock fund may not borrow through the Interfund Lending Program or from any other source more than 33 1/3% of its total assets (or any lower threshold provided for by the fund’s investment restrictions). If a borrowing BlackRock fund’s total outstanding borrowings exceed 10% of its total assets, each of its outstanding interfund loans will be subject to collateralization of at least 102% of the outstanding principal value of the loan. All interfund loans are for temporary or emergency
| 22 | 2 0 2 3 B L A C K R O C K A N N U A L R E P O R T T O S H A R E H O L D E R S |
Notes to Financial Statements (continued)
purposes and the interest rate to be charged will be the average of the highest current overnight repurchase agreement rate available to a lending fund and the bank loan rate, as calculated according to a formula established by the Board.
During the year ended September 30, 2023, the Fund did not participate in the Interfund Lending Program.
Directors and Officers: Certain directors and/or officers of the Corporation are directors and/or officers of BlackRock or its affiliates. The Fund reimburses the Manager for a portion of the compensation paid to the Corporation’s Chief Compliance Officer, which is included in Officer in the Statement of Operations.
| 5. | INCOME TAX INFORMATION |
It is the Fund’s policy to comply with the requirements of the Internal Revenue Code of 1986, as amended, applicable to regulated investment companies, and to distribute substantially all of its taxable income to its shareholders. Therefore, no U.S. federal income tax provision is required.
The Fund files U.S. federal and various state and local tax returns. No income tax returns are currently under examination. The statute of limitations on the Fund’s U.S. federal tax returns generally remains open for a period of three years after they are filed. The statutes of limitations on the Fund’s state and local tax returns may remain open for an additional year depending upon the jurisdiction.
Management has analyzed tax laws and regulations and their application to the Fund as of September 30, 2023, inclusive of the open tax return years, and does not believe that there are any uncertain tax positions that require recognition of a tax liability in the Fund’s financial statements.
The tax character of distributions paid was as follows:
|
|
||||||||||||
| Year Ended 09/30/23 |
|
Year Ended 09/30/22 |
||||||||||
|
|
||||||||||||
| Ordinary income |
$ | 656,211,309 | $ | 477,820,291 | ||||||||
| Long-term capital gains |
— | 87,854,188 | ||||||||||
| Return of capital |
41,838,712 | — | ||||||||||
|
|
|
|
|
|||||||||
| $ | 698,050,021 | $ | 565,674,479 | |||||||||
|
|
|
|
|
|||||||||
|
|
||||||||||||
As of September 30, 2023, the tax components of accumulated earnings (loss) were as follows:
|
|
||||||||||||||||||||||
| Fund Name |
|
Non-expiring Capital Loss Carryforwards |
|
|
|
Net Unrealized Gains (Losses) |
(a) |
|
|
Qualified Late-Year Ordinary Losses |
|
|
Total | |||||||||
|
|
||||||||||||||||||||||
| BlackRock Total Return Fund |
$ | (2,336,188,911 | ) | $ | (1,858,123,569) | $ (17,350,723 | ) | $ | (4,211,663,203 | ) | ||||||||||||
|
|
||||||||||||||||||||||
| (a) | The difference between book-basis and tax-basis net unrealized gains was attributable primarily to the timing of income recognition on partnership interests. |
| 6. | CAPITAL SHARE TRANSACTIONS |
Transactions in capital shares for each class were as follows:
| Year Ended 09/30/23 | Year Ended 09/30/22 | |||||||||||||||
|
|
|
|
|
|||||||||||||
| Share Class | Shares | Amount | Shares | Amount | ||||||||||||
| Institutional |
||||||||||||||||
| Shares sold |
448,340,202 | $ | 4,464,830,242 | 471,198,724 | $ | 5,294,524,445 | ||||||||||
| Shares issued in reinvestment of distributions |
34,294,163 | 340,307,553 | 23,849,602 | 262,361,092 | ||||||||||||
| Shares redeemed |
(379,303,795 | ) | (3,763,225,096 | ) | (422,169,779 | ) | (4,601,574,876 | ) | ||||||||
|
|
|
|
|
|
|
|
|
|||||||||
| 103,330,570 | $ | 1,041,912,699 | 72,878,547 | $ | 955,310,661 | |||||||||||
|
|
|
|
|
|
|
|
|
|||||||||
| Service |
||||||||||||||||
| Shares sold |
847,711 | $ | 8,451,565 | 955,363 | $ | 10,691,567 | ||||||||||
| Shares issued in reinvestment of distributions |
149,370 | 1,483,527 | 118,949 | 1,310,630 | ||||||||||||
| Shares redeemed |
(1,490,796 | ) | (14,858,247 | ) | (1,388,626 | ) | (15,040,752 | ) | ||||||||
|
|
|
|
|
|
|
|
|
|||||||||
| (493,715 | ) | $ | (4,923,155 | ) | (314,314 | ) | $ | (3,038,555 | ) | |||||||
|
|
|
|
|
|
|
|
|
|||||||||
| N O T E S T O F I N A N C I A L S T A T E M E N T S |
23 |
Notes to Financial Statements (continued)
| Year Ended 09/30/23 | Year Ended 09/30/22 | |||||||||||||||
|
|
|
|
|
|||||||||||||
| Share Class | Shares | Amount | Shares | Amount | ||||||||||||
| Investor A |
||||||||||||||||
| Shares sold |
32,659,966 | $ | 325,116,421 | 33,567,548 | $ | 373,631,405 | ||||||||||
| Shares issued in reinvestment of distributions |
3,441,563 | 34,175,875 | 2,640,697 | 29,156,417 | ||||||||||||
| Shares redeemed |
(42,205,930 | ) | (419,585,117 | ) | (52,383,659 | ) | (576,880,831 | ) | ||||||||
|
|
|
|
|
|
|
|
|
|||||||||
| (6,104,401 | ) | $ | (60,292,821 | ) | (16,175,414 | ) | $ | (174,093,009 | ) | |||||||
|
|
|
|
|
|
|
|
|
|||||||||
| Investor A1 |
||||||||||||||||
| Shares sold |
424,387 | $ | 4,215,352 | 614,430 | $ | 6,895,105 | ||||||||||
| Shares issued in reinvestment of distributions |
8,157 | 80,955 | 6,605 | 72,696 | ||||||||||||
| Shares redeemed |
(745,157 | ) | (7,439,964 | ) | (396,358 | ) | (4,299,413 | ) | ||||||||
|
|
|
|
|
|
|
|
|
|||||||||
| (312,613 | ) | $ | (3,143,657 | ) | 224,677 | $ | 2,668,388 | |||||||||
|
|
|
|
|
|
|
|
|
|||||||||
| Investor C |
||||||||||||||||
| Shares sold |
1,007,181 | $ | 10,042,763 | 575,953 | $ | 6,423,509 | ||||||||||
| Shares issued in reinvestment of distributions |
127,481 | 1,264,934 | 114,547 | 1,269,910 | ||||||||||||
| Shares redeemed |
(2,446,949 | ) | (24,283,023 | ) | — | — | ||||||||||
| Shares redeemed and automatic conversion of shares |
— | — | (3,310,438 | ) | (36,470,705 | ) | ||||||||||
|
|
|
|
|
|
|
|
|
|||||||||
| (1,312,287 | ) | $ | (12,975,326 | ) | (2,619,938 | ) | $ | (28,777,286 | ) | |||||||
|
|
|
|
|
|
|
|
|
|||||||||
| Class K |
||||||||||||||||
| Shares sold |
196,109,413 | $ | 1,957,201,931 | 141,634,495 | $ | 1,580,228,305 | ||||||||||
| Shares issued in reinvestment of distributions |
25,220,951 | 250,297,342 | 18,480,602 | 203,331,003 | ||||||||||||
| Shares redeemed |
(180,124,640 | ) | (1,790,195,524 | ) | (219,382,907 | ) | (2,438,386,314 | ) | ||||||||
|
|
|
|
|
|
|
|
|
|||||||||
| 41,205,724 | $ | 417,303,749 | (59,267,810 | ) | $ | (654,827,006 | ) | |||||||||
|
|
|
|
|
|
|
|
|
|||||||||
| Class R |
||||||||||||||||
| Shares sold |
2,065,525 | $ | 20,551,929 | 1,800,108 | $ | 19,919,767 | ||||||||||
| Shares issued in reinvestment of distributions |
221,838 | 2,202,186 | 161,358 | 1,777,727 | ||||||||||||
| Shares redeemed |
(1,896,891 | ) | (18,857,002 | ) | (2,503,561 | ) | (27,225,452 | ) | ||||||||
|
|
|
|
|
|
|
|
|
|||||||||
| 390,472 | $ | 3,897,113 | (542,095 | ) | $ | (5,527,958 | ) | |||||||||
|
|
|
|
|
|
|
|
|
|||||||||
| 136,703,750 | $ | 1,381,778,602 | (5,816,347 | ) | $ | 91,715,235 | ||||||||||
|
|
|
|
|
|
|
|
|
|||||||||
As of September 30, 2023, BlackRock HoldCo 2, Inc., an affiliate of the Fund, owned 264,970 Class K shares of the Fund.
| 7. | SUBSEQUENT EVENTS |
Management has evaluated the impact of all subsequent events on the Fund through the date the financial statements were issued and has determined that there were no subsequent events requiring adjustment or additional disclosure in the financial statements.
| 24 | 2 0 2 3 B L A C K R O C K A N N U A L R E P O R T T O S H A R E H O L D E R S |
Report of Independent Registered Public Accounting Firm
To the Shareholders of BlackRock Total Return Fund and the Board of Directors of BlackRock Bond Fund, Inc.:
Opinion on the Financial Statements and Financial Highlights
We have audited the accompanying statement of assets and liabilities of BlackRock Total Return Fund of Blackrock Bond Fund, Inc. (the “Fund”), as of September 30, 2023, the related statement of operations for the year then ended, the statements of changes in net assets for each of the two years in the period then ended, the financial highlights for each of the five years in the period then ended, and the related notes. In our opinion, the financial statements and financial highlights present fairly, in all material respects, the financial position of the Fund as of September 30, 2023, and the results of its operations for the year then ended, the changes in its net assets for each of the two years in the period then ended, and the financial highlights for each of the five years in the period then ended, in conformity with accounting principles generally accepted in the United States of America.
Basis for Opinion
These financial statements and financial highlights are the responsibility of the Fund’s management. Our responsibility is to express an opinion on the Fund’s financial statements and financial highlights based on our audits. We are a public accounting firm registered with the Public Company Accounting Oversight Board (United States) (PCAOB) and are required to be independent with respect to the Fund in accordance with the U.S. federal securities laws and the applicable rules and regulations of the Securities and Exchange Commission and the PCAOB.
We conducted our audits in accordance with the standards of the PCAOB. Those standards require that we plan and perform the audit to obtain reasonable assurance about whether the financial statements and financial highlights are free of material misstatement, whether due to error or fraud. The Fund is not required to have, nor were we engaged to perform, an audit of its internal control over financial reporting. As part of our audits we are required to obtain an understanding of internal control over financial reporting but not for the purpose of expressing an opinion on the effectiveness of the Fund’s internal control over financial reporting. Accordingly, we express no such opinion.
Our audits included performing procedures to assess the risks of material misstatement of the financial statements and financial highlights, whether due to error or fraud, and performing procedures that respond to those risks. Such procedures included examining, on a test basis, evidence regarding the amounts and disclosures in the financial statements and financial highlights. Our audits also included evaluating the accounting principles used and significant estimates made by management, as well as evaluating the overall presentation of the financial statements and financial highlights. We believe that our audits provide a reasonable basis for our opinion.
Deloitte & Touche LLP
Boston, Massachusetts
November 20, 2023
We have served as the auditor of one or more BlackRock investment companies since 1992.
| R E P O R T O F I N D E P E N D E N T R E G I S T E R E D P U B L I C A C C O U N T I N G F I R M |
25 |
Important Tax Information (unaudited)
The following amount, or maximum amount allowable by law, is hereby designated as qualified dividend income for individuals for the fiscal year ended September 30, 2023:
|
|
||||
| Fund Name | Qualified Dividend Income |
|||
|
|
||||
| BlackRock Total Return Fund |
$ | 3,849,777 | ||
|
|
||||
The Fund hereby designates the following amount, or maximum amount allowable by law, of distributions from direct federal obligation interest for the fiscal year ended September 30, 2023:
|
|
||||
| Fund Name | Federal Obligation Interest |
|||
|
|
||||
| BlackRock Total Return Fund |
$ | 86,483,759 | ||
|
|
||||
The law varies in each state as to whether and what percent of ordinary income dividends attribute to federal obligations is exempt from state income tax. Shareholders are advised to check with their tax advisers to determine if any portion of the dividends received is exempt from state income tax.
The following percentage, or maximum percentage allowable by law, of ordinary income distributions paid during the fiscal year ended September 30, 2023 qualified for the dividends-received deduction for corporate shareholders:
|
|
||||
| Fund Name | Dividends-Received Deduction |
|||
|
|
||||
| BlackRock Total Return Fund |
0.58 | % | ||
|
|
||||
The Fund hereby designates the following amount, or maximum amount allowable by law, as interest income eligible to be treated as a Section 163(j) interest dividend for the fiscal year ended September 30, 2023:
|
|
||||
| Fund Name | Interest Dividends | |||
|
|
||||
| BlackRock Total Return Fund |
$ | 732,768,561 | ||
|
|
||||
The Fund hereby designates the following amount, or maximum amount allowable by law, as interest-related dividends eligible for exemption from U.S. withholding tax for nonresident aliens and foreign corporations, for the fiscal year ended September 30, 2023:
|
|
||||
| Fund Name | Interest- Related Dividends |
|||
|
|
||||
| BlackRock Total Return Fund |
$ | 579,848,830 | ||
|
|
||||
| 26 | 2 0 2 3 B L A C K R O C K A N N U A L R E P O R T T O S H A R E H O L D E R S |
| Portfolio Information as of September 30, 2023 | Master Total Return Portfolio |
PORTFOLIO COMPOSITION
| Asset Type | Percent of Total Investments(a) |
|||
| U.S. Government Sponsored Agency Securities |
39.0% | |||
| U.S. Treasury Obligations |
21.3 | |||
| Corporate Bonds |
20.6 | |||
| Asset-Backed Securities |
8.3 | |||
| Non-Agency Mortgage-Backed Securities |
7.3 | |||
| Floating Rate Loan Interests |
1.5 | |||
| Foreign Government Obligations |
0.9 | |||
| Municipal Bonds |
0.5 | |||
| Common Stocks |
0.2 | |||
| Preferred Securities |
0.2 | |||
| Investment Companies |
0.1 | |||
| Foreign Agency Obligations |
0.1 | |||
| Fixed Rate Loan Interests |
—(b) | |||
| Warrants |
—(b) | |||
CREDIT QUALITY ALLOCATION
| Credit Rating(c) | Percent of Total Investments(a) |
|||||||
| AAA/Aaa(d) |
66.1% | |||||||
| AA/Aa |
2.4 | |||||||
| A |
7.7 | |||||||
| BBB/Baa |
12.1 | |||||||
| BB/Ba |
1.4 | |||||||
| B |
0.9 | |||||||
| CCC/Caa |
0.4 | |||||||
| CC/Ca |
0.3 | |||||||
| C |
0.2 | |||||||
| N/R |
8.5 | |||||||
| (a) | Total investments exclude short-term securities, options purchased, options written and TBA sale commitments. |
| (b) | Amount is less than 1%. |
| (c) | For financial reporting purposes, credit quality ratings shown above reflect the highest rating assigned by either S&P Global Ratings or Moody’s if ratings differ. These rating agencies are independent, nationally recognized statistical rating organizations and are widely used. Investment grade ratings are credit ratings of BBB/Baa or higher. Below investment grade ratings are credit ratings of BB/Ba or lower. Investments designated N/R are not rated by either rating agency. Unrated investments do not necessarily indicate low credit quality. Credit quality ratings are subject to change. |
| (d) | The investment adviser evaluates the credit quality of unrated investments based upon certain factors including, but not limited to, credit ratings for similar investments and financial analysis of sectors, individual investments and/or issuers. Using this approach, the investment adviser has deemed unrated U.S. Government Sponsored Agency Securities and U.S. Treasury Obligations to be of similar credit quality as investments rated AAA/Aaa. |
| P O R T F O L I O I N F O R M A T I O N |
27 |
| Consolidated Schedule of Investments September 30, 2023 |
Master Total Return Portfolio (Percentages shown are based on Net Assets) |
| Security | Par (000) |
Value | ||||||||||
| Asset-Backed Securities |
||||||||||||
| 510 Loan Acquisition Trust, Series 2020-1, Class A, 5.11%, 09/25/60(a)(b) |
USD | 4,632 | $ | 4,542,961 | ||||||||
| 522 Funding CLO Ltd. |
||||||||||||
| Series 2019-4A, Class CR, (3-mo. CME Term SOFR + 2.66%), 7.99%, 04/20/30(a)(c) |
625 | 622,604 | ||||||||||
| Series 2019-4A, Class DR, (3-mo. CME Term SOFR + 3.91%), 9.24%, 04/20/30(a)(c) |
2,170 | 2,127,420 | ||||||||||
| Series 2019-5A, Class AR, (3-mo. CME Term SOFR + 1.33%), 6.64%, 04/15/35(a)(c) |
510 | 503,625 | ||||||||||
| ACE Securities Corp. Home Equity Loan Trust |
||||||||||||
| Series 2003-OP1, Class A2, (1-mo. CME Term SOFR + 0.83%), 6.15%, 12/25/33(c) |
534 | 494,657 | ||||||||||
| Series 2006-CW1, Class A2C, (1-mo. CME Term SOFR + 0.39%), 5.71%, 07/25/36(c) |
243 | 185,847 | ||||||||||
| Series 2007-HE4, Class A2A, (1-mo. CME Term SOFR + 0.37%), 5.69%, 05/25/37(c) |
2,417 | 411,689 | ||||||||||
| Series 2007-HE4, Class A2C, (1-mo. CME Term SOFR + 0.71%), 6.03%, 05/25/37(c) |
213 | 36,378 | ||||||||||
| AGL CLO 11 Ltd., Series 2021-11A, Class E, (3-mo. CME Term SOFR + 6.62%), 11.93%, 04/15/34(a)(c) |
250 | 235,881 | ||||||||||
| AGL CLO 12 Ltd., Series 2021-12A, Class A1, (3-mo. CME Term SOFR + 1.42%), 6.75%, 07/20/34(a)(c) |
7,640 | 7,587,556 | ||||||||||
| AGL CLO 14 Ltd., Series 2021-14A, Class A, (3-mo. CME Term SOFR + 1.41%), 6.75%, 12/02/34(a)(c) |
1,000 | 991,077 | ||||||||||
| AGL CLO 5 Ltd., Series 2020-5A, Class A1R, (3-mo. CME Term SOFR + 1.42%), 6.75%, 07/20/34(a)(c) |
2,000 | 1,984,000 | ||||||||||
| AGL CLO 7 Ltd. |
||||||||||||
| Series 2020-7A, Class AR, (3-mo. CME Term SOFR + 1.46%), 6.77%, 07/15/34(a)(c) |
2,400 | 2,383,405 | ||||||||||
| Series 2020-7A, Class DR, (3-mo. CME Term SOFR + 3.36%), 8.67%, 07/15/34(a)(c) |
500 | 483,608 | ||||||||||
| AGL CLO 9 Ltd., Series 2020-9A, Class D, (3-mo. CME Term SOFR + 3.96%), 9.29%, 01/20/34(a)(c) |
250 | 241,319 | ||||||||||
| AGL Core CLO 15 Ltd., Series 2021-15A, Class A1, (3-mo. CME Term SOFR + 1.41%), 6.74%, 01/20/35(a)(c) |
250 | 248,161 | ||||||||||
| AGL Core CLO 2 Ltd., Series 2019-2A, Class A1, (3-mo. CME Term SOFR + 1.65%), 6.98%, 04/20/32(a)(c) |
8,805 | 8,792,042 | ||||||||||
| AGL Core CLO 4 Ltd., Series 2020-4A, Class A1R, (3-mo. CME Term SOFR + 1.33%), 6.66%, 04/20/33(a)(c) |
3,620 | 3,600,046 | ||||||||||
| AGL Static CLO 18 Ltd., Series 2022-18A, Class B, (3-mo. CME Term SOFR + 2.00%), 7.33%, 04/21/31(a)(c) |
1,400 | 1,391,690 | ||||||||||
| AIG CLO Ltd., Series 2018-1A, Class A1R, (3-mo. CME Term SOFR + 1.38%), 6.71%, 04/20/32(a)(c) |
2,380 | 2,374,050 | ||||||||||
| AIMCO CLO |
||||||||||||
| Series 2015-AA, Class BR2, (3-mo. CME Term SOFR + 1.86%), 7.17%, 10/17/34(a)(c) |
1,200 | 1,187,520 | ||||||||||
| Series 2017-AA, Class AR, (3-mo. CME Term SOFR + 1.31%), 6.64%, 04/20/34(a)(c) |
250 | 247,537 | ||||||||||
| Series 2017-AA, Class CR, (3-mo. CME Term SOFR + 2.36%), 7.69%, 04/20/34(a)(c) |
500 | 491,068 | ||||||||||
| Series 2017-AA, Class DR, (3-mo. CME Term SOFR + 3.41%), 8.74%, 04/20/34(a)(c) |
250 | 239,055 | ||||||||||
| Security | Par (000) |
Value | ||||||||||
| Asset-Backed Securities (continued) |
|
|||||||||||
| AIMCO CLO |
||||||||||||
| Series 2018-BA, Class AR, (3-mo. CME Term SOFR + 1.36%), 6.67%, 01/15/32(a)(c) |
USD | 5,770 | $ | 5,750,319 | ||||||||
| Ajax Mortgage Loan Trust |
||||||||||||
| Series 2021-G, Class A, 1.88%, 06/25/61(a)(c) |
38,953 | 36,461,817 | ||||||||||
| Series 2021-G, Class B, 3.75%, 06/25/61(a)(c) |
8,006 | 7,122,158 | ||||||||||
| Series 2021-G, Class C, 0.00%, 06/25/61(a)(d) |
14,417 | 13,632,821 | ||||||||||
| Series 2023-B, Class A, 4.25%, 10/25/62(a)(b) |
17,894 | 16,654,444 | ||||||||||
| Series 2023-B, Class B, 4.25%, 10/25/62(a)(b) |
1,749 | 1,397,954 | ||||||||||
| Series 2023-B, Class C, 0.00%, 10/25/62(a)(d) |
4,462 | 1,639,184 | ||||||||||
| Series 2023-B, Class SA, 0.00%, 10/25/62(a)(d) |
1,315 | 960,579 | ||||||||||
| Allegro CLO II-S Ltd., Series 2014-1RA, Class A1, (3-mo. CME Term SOFR + 1.34%), 6.68%, 10/21/28(a)(c) |
2,015 | 2,013,301 | ||||||||||
| Allegro CLO IV Ltd., Series 2016-1A, Class BR2, (3-mo. CME Term SOFR + 1.81%), 7.12%, 01/15/30(a)(c) |
400 | 393,920 | ||||||||||
| Allegro CLO VIII Ltd., Series 2018-2A, Class B1, (3-mo. CME Term SOFR + 1.93%), 7.24%, 07/15/31(a)(c) |
250 | 245,400 | ||||||||||
| Allegro CLO XI Ltd. |
||||||||||||
| Series 2019-2A, Class A2A, (3-mo. CME Term SOFR + 2.11%), 7.43%, 01/19/33(a)(c) |
500 | 494,666 | ||||||||||
| Series 2019-2A, Class C, (3-mo. CME Term SOFR + 3.26%), 8.58%, 01/19/33(a)(c) |
250 | 249,381 | ||||||||||
| ALM Ltd. |
||||||||||||
| Series 2020-1A, Class A2, (3-mo. CME Term SOFR + 2.11%), 7.42%, 10/15/29(a)(c) |
8,318 | 8,310,514 | ||||||||||
| Series 2020-1A, Class B, (3-mo. CME Term SOFR + 2.26%), 7.57%, 10/15/29(a)(c) |
250 | 247,851 | ||||||||||
| ALME Loan Funding V BV, Series 5A, Class ER, (3-mo. EURIBOR + 5.41%), 9.07%, 07/15/31(a)(c) |
EUR | 1,500 | 1,571,529 | |||||||||
| AMMC CLO 21 Ltd., Series 2017-21A, Class A, (3-mo. CME Term SOFR + 1.51%), 6.88%, 11/02/30(a)(c) |
USD | 676 | 674,253 | |||||||||
| AMMC CLO 22 Ltd., Series 2018-22A, Class B, (3-mo. CME Term SOFR + 1.71%), 7.06%, 04/25/31(a)(c) |
500 | 493,739 | ||||||||||
| AMMC CLO XIII Ltd., Series 2013-13A, Class A1R2, (3-mo. CME Term SOFR + 1.31%), 6.66%, 07/24/29(a)(c) |
900 | 898,752 | ||||||||||
| AMSR Trust |
||||||||||||
| Series 2020-SFR1, Class E, 3.22%, 04/17/37(a) |
1,280 | 1,199,667 | ||||||||||
| Series 2020-SFR2, Class D, 3.28%, 07/17/37(a) |
2,437 | 2,286,457 | ||||||||||
| Series 2020-SFR3, Class E1, 2.56%, 09/17/37(a) |
2,490 | 2,275,513 | ||||||||||
| Series 2020-SFR4, Class E2, 2.46%, 11/17/37(a) |
2,500 | 2,267,545 | ||||||||||
| Series 2020-SFR4, Class F, 2.86%, 11/17/37(a) |
2,760 | 2,509,585 | ||||||||||
| Anchorage Capital CLO 16 Ltd., Series 2020-16A, Class A1R, (3-mo. CME Term SOFR + 1.46%), 6.78%, 01/19/35(a)(c) |
250 | 247,744 | ||||||||||
| Anchorage Capital CLO 17 Ltd., Series 2021-17A, Class A1, (3-mo. CME Term SOFR + 1.43%), 6.74%, 07/15/34(a)(c) |
11,115 | 10,992,735 | ||||||||||
| Anchorage Capital CLO 3-R Ltd. |
||||||||||||
| Series 2014-3RA, Class A, (3-mo. CME Term SOFR + 1.31%), 6.68%, 01/28/31(a)(c) |
2,015 | 2,007,843 | ||||||||||
| 28 | 2 0 2 3 B L A C K R O C K A N N U A L R E P O R T T O S H A R E H O L D E R S |
| Consolidated Schedule of Investments (continued) September 30, 2023 |
Master Total Return Portfolio (Percentages shown are based on Net Assets) |
| Security | Par (000) |
Value | ||||||||||
| Asset-Backed Securities (continued) |
|
|||||||||||
| Anchorage Capital CLO 3-R Ltd. |
||||||||||||
| Series 2014-3RA, Class B, (3-mo. CME Term SOFR + 1.76%), |
USD | 3,850 | $ | 3,788,400 | ||||||||
| Series 2014-3RA, Class C, (3-mo. CME Term SOFR + 2.11%), |
500 | 490,086 | ||||||||||
| Anchorage Capital CLO 4-R Ltd., Series 2014- 4RA, Class A, (3-mo. CME Term SOFR + 1.31%), 6.68%, 01/28/31(a)(c) |
4,425 | 4,408,319 | ||||||||||
| Anchorage Capital CLO 6 Ltd., Series 2015-6A, Class ARR, (3-mo. CME Term SOFR + 1.31%), 6.62%, 07/15/30(a)(c) |
4,303 | 4,292,041 | ||||||||||
| Anchorage Capital CLO 7 Ltd. |
||||||||||||
| Series 2015-7A, Class AR2, (3-mo. CME Term SOFR + 1.35%), |
4,605 | 4,578,903 | ||||||||||
| Series 2015-7A, Class BR2, (3-mo. CME Term SOFR + 2.01%), |
7,620 | 7,568,184 | ||||||||||
| Series 2015-7A, Class CR2, (3-mo. CME Term SOFR + 2.46%), |
4,250 | 4,227,918 | ||||||||||
| Series 2015-7A, Class D1R2, (3-mo. CME Term SOFR + 3.76%), |
1,140 | 1,073,257 | ||||||||||
| Anchorage Capital CLO 8 Ltd., Series 2016-8A, Class BR2, (3-mo. CME Term SOFR + 2.06%), 7.42%, 10/27/34(a)(c) |
2,800 | 2,781,800 | ||||||||||
| Anchorage Capital CLO Ltd. |
||||||||||||
| Series 2013-1A, Class A1R, (3-mo. CME Term SOFR + 1.51%), |
2,544 | 2,537,975 | ||||||||||
| Series 2013-1A, Class A2R, (3-mo. CME Term SOFR + 1.91%), |
750 | 746,250 | ||||||||||
| Series 2013-1A, Class BR, (3-mo. CME Term SOFR + 2.41%), |
1,410 | 1,397,283 | ||||||||||
| Anchorage Capital Europe CLO 2 DAC |
||||||||||||
| Series 2A, Class B1R, (3-mo. EURIBOR + 1.60%), 5.26%, 04/15/34(a)(c) |
EUR | 1,327 | 1,354,776 | |||||||||
| Series 2A, Class DR, (3-mo. EURIBOR + 3.55%), 7.21%, 04/15/34(a)(c) |
1,380 | 1,390,239 | ||||||||||
| Anchorage Capital Europe CLO DAC, Series 4A, Class D, (3-mo. EURIBOR + 3.20%), 6.92%, 04/25/34(a)(c) |
542 | 543,809 | ||||||||||
| Apidos CLO XII, Series 2013-12A, Class AR, (3-mo. CME Term SOFR + 1.34%), 6.65%, 04/15/31(a)(c) |
USD | 3,641 | 3,632,188 | |||||||||
| Apidos CLO XV, Series 2013-15A, Class A1RR, (3-mo. CME Term SOFR + 1.27%), 6.60%, 04/20/31(a)(c) |
1,077 | 1,072,773 | ||||||||||
| Apidos CLO XVIII, Series 2018-18A, Class A1, (3-mo. CME Term SOFR + 1.40%), 6.75%, 10/22/30(a)(c) |
880 | 878,240 | ||||||||||
| Apidos CLO XX |
||||||||||||
| Series 2015-20A, Class A1RA, (3-mo. CME Term SOFR + 1.36%), |
450 | 448,841 | ||||||||||
| Series 2015-20A, Class A2RR, (3-mo. CME Term SOFR + 1.81%), |
250 | 247,175 | ||||||||||
| Apidos CLO XXII |
||||||||||||
| Series 2015-22A, Class A1R, (3-mo. CME Term SOFR + 1.32%), |
249 | 248,605 | ||||||||||
| Series 2015-22A, Class A2R, (3-mo. CME Term SOFR + 1.76%), |
500 | 494,400 | ||||||||||
| Series 2015-22A, Class BR, (3-mo. CME Term SOFR + 2.21%), |
250 | 246,939 | ||||||||||
| Series 2015-22A, Class CR, (3-mo. CME Term SOFR + 3.21%), |
850 | 835,743 | ||||||||||
| Security | Par (000) |
Value | ||||||||||
| Asset-Backed Securities (continued) |
||||||||||||
| Apidos CLO XXVI, Series 2017-26A, Class BR, (3-mo. CME Term SOFR + 2.21%), 7.52%, 07/18/29(a)(c) |
USD | 570 | $ | 563,944 | ||||||||
| Apidos CLO XXX, Series XXXA, Class A1A, (3-mo. CME Term SOFR + 1.40%), 6.71%, 10/18/31(a)(c) |
250 | 249,120 | ||||||||||
| Apidos CLO XXXI, Series 2019-31A, Class BR, (3-mo. CME Term SOFR + 1.81%), 7.12%, 04/15/31(a)(c) |
500 | 495,850 | ||||||||||
| Apidos CLO XXXII |
||||||||||||
| Series 2019-32A, Class C, (3-mo. CME Term SOFR + 2.66%), 7.99%, 01/20/33(a)(c) |
250 | 250,054 | ||||||||||
| Series 2019-32A, Class D, (3-mo. CME Term SOFR + 3.76%), 9.09%, 01/20/33(a)(c) |
300 | 289,633 | ||||||||||
| Apidos CLO XXXIV, Series 2020-34A, Class A1R, (3-mo. CME Term SOFR + 1.41%), 6.74%, 01/20/35(a)(c) |
954 | 950,380 | ||||||||||
| Apidos CLO XXXVII |
||||||||||||
| Series 2021-37A, Class A, (3-mo. CME Term SOFR + 1.39%), 6.74%, 10/22/34(a)(c) |
450 | 446,763 | ||||||||||
| Series 2021-37A, Class E, (3-mo. CME Term SOFR + 6.56%), 11.91%, 10/22/34(a)(c) |
455 | 446,510 | ||||||||||
| Apres Static CLO Ltd., Series 2019-1A, Class A2R, (3-mo. CME Term SOFR + 1.96%), 7.27%, 10/15/28(a)(c) |
250 | 248,953 | ||||||||||
| Aqua Finance Trust, Series 2021-A, Class A, 1.54%, 07/17/46(a) |
429 | 376,876 | ||||||||||
| Arbor Realty Commercial Real Estate Notes Ltd. |
||||||||||||
| Series 2021-FL1, Class A, (1-mo. CME Term SOFR + 1.08%), 6.42%, 12/15/35(a)(c) |
814 | 801,844 | ||||||||||
| Series 2021-FL4, Class A, (1-mo. CME Term SOFR + 1.46%), 6.80%, 11/15/36(a)(c) |
681 | 671,143 | ||||||||||
| Series 2022-FL1, Class A, (SOFR (30-day) + 1.45%), 6.76%, 01/15/37(a)(c) |
1,010 | 996,744 | ||||||||||
| Series 2022-FL2, Class A, (1-mo. CME Term SOFR + 1.85%), 7.18%, 05/15/37(a)(c) |
8,708 | 8,635,095 | ||||||||||
| Ares European CLO XII DAC, Series 12A, Class B1R, (3-mo. EURIBOR + 1.70%), 5.41%, 04/20/32(a)(c) |
EUR | 889 | 916,549 | |||||||||
| Ares LII CLO Ltd. |
||||||||||||
| Series 2019-52A, Class A1R, (3-mo. CME Term SOFR + 1.31%), 6.66%, 04/22/31(a)(c) |
USD | 7,910 | 7,862,614 | |||||||||
| Series 2019-52A, Class A2R, (3-mo. CME Term SOFR + 1.71%), 7.06%, 04/22/31(a)(c) |
250 | 243,188 | ||||||||||
| Ares LIX CLO Ltd., Series 2021-59A, Class A, (3-mo. CME Term SOFR + 1.29%), 6.64%, 04/25/34(a)(c) |
500 | 496,124 | ||||||||||
| Ares LVI CLO Ltd., Series 2020-56A, Class AR, (3-mo. CME Term SOFR + 1.42%), 6.77%, 10/25/34(a)(c) |
2,110 | 2,102,041 | ||||||||||
| Ares XLVIII CLO Ltd., Series 2018-48A, Class B, (3-mo. CME Term SOFR + 1.84%), 7.17%, 07/20/30(a)(c) |
370 | 366,559 | ||||||||||
| Ares XXXVII CLO Ltd., Series 2015-4A, Class A1R, (3-mo. CME Term SOFR + 1.43%), 6.74%, 10/15/30(a)(c) |
1,087 | 1,083,898 | ||||||||||
| Argent Mortgage Loan Trust, Series 2005-W1, Class A2, (1-mo. CME Term SOFR + 0.59%), 5.91%, 05/25/35(c) |
2,619 | 2,274,655 | ||||||||||
| ARM Master Trust LLC Agricultural Loan Backed Notes, Series 2021-T1, Class A, 2.43%, 11/15/27(a) |
1,819 | 1,713,405 | ||||||||||
| M A S T E R P O R T F O L I O S C H E D U L E O F I N V E S T M E N T S |
29 |
| Consolidated Schedule of Investments (continued) September 30, 2023 |
Master Total Return Portfolio (Percentages shown are based on Net Assets) |
| Security | Par (000) |
Value | ||||||||||
| Asset-Backed Securities (continued) |
|
|||||||||||
| Armada Euro CLO III DAC, Series 3A, Class DR, (3-mo. EURIBOR + 3.30%), 6.96%, 07/15/31(a)(c) |
EUR | 1,563 | $ | 1,588,629 | ||||||||
| Assurant CLO Ltd., Series 2018-2A, Class A, (3-mo. CME Term SOFR + 1.30%), 6.63%, 04/20/31(a)(c) |
USD | 735 | 732,655 | |||||||||
| Atrium IX, Series 9A, Class AR2, (3-mo. CME Term SOFR + 1.25%), 6.64%, 05/28/30(a)(c) |
3,916 | 3,904,583 | ||||||||||
| Atrium XIII |
||||||||||||
| Series 13A, Class A1, (3-mo. CME Term SOFR + 1.44%), 6.79%, 11/21/30(a)(c) |
491 | 489,518 | ||||||||||
| Series 13A, Class B, (3-mo. CME Term SOFR + 1.76%), 7.11%, 11/21/30(a)(c) |
1,250 | 1,236,625 | ||||||||||
| Series 13A, Class C, (3-mo. CME Term SOFR + 2.06%), 7.41%, 11/21/30(a)(c) |
390 | 382,493 | ||||||||||
| Avoca CLO XV DAC, Series 15X, Class B2R, (3-mo. EURIBOR + 1.05%), 4.71%, 04/15/31(c)(e) |
EUR | 400 | 407,237 | |||||||||
| Avoca CLO XVIII DAC, Series 18X, Class C, (3-mo. EURIBOR + 1.75%), 5.41%, 04/15/31(c)(e) |
400 | 409,717 | ||||||||||
| Avoca CLO XXII DAC |
||||||||||||
| Series 22A, Class D, (3-mo. EURIBOR + 2.90%), 6.56%, 04/15/35(a)(c) |
500 | 493,268 | ||||||||||
| Series 22X, Class B1, (3-mo. EURIBOR + 1.30%), 4.96%, 04/15/35(c)(e) |
850 | 855,974 | ||||||||||
| Avoca CLO XXIII DAC, Series 23A, Class D, (3-mo. EURIBOR + 3.05%), 6.71%, 04/15/34(a)(c) |
500 | 485,629 | ||||||||||
| Babson CLO Ltd., Series 2015-IA, Class BR, (3-mo. CME Term SOFR + 1.66%), 6.99%, 01/20/31(a)(c) |
USD | 610 | 602,741 | |||||||||
| Bain Capital Credit CLO Ltd. |
||||||||||||
| Series 2017-1A, Class BR, (3-mo. CME Term SOFR + 1.76%), |
850 | 838,239 | ||||||||||
| Series 2018-2A, Class A1, (3-mo. CME Term SOFR + 1.34%), |
1,670 | 1,663,320 | ||||||||||
| Series 2018-2A, Class B, (3-mo. CME Term SOFR + 1.86%), 7.18%, 07/19/31(a)(c) |
500 | 492,750 | ||||||||||
| Series 2021-3A, Class D, (3-mo. CME Term SOFR + 3.36%), 8.71%, 07/24/34(a)(c) |
250 | 241,875 | ||||||||||
| Series 2021-4A, Class A1, (3-mo. CME Term SOFR + 1.43%), |
560 | 556,925 | ||||||||||
| Ballyrock CLO 14 Ltd., Series 2020-14A, Class D, (3-mo. CME Term SOFR + 7.26%), 12.59%, 01/20/34(a)(c) |
250 | 247,076 | ||||||||||
| Ballyrock CLO Ltd. |
||||||||||||
| Series 2018-1A, Class A2, (3-mo. CME Term SOFR + 1.86%), |
500 | 494,950 | ||||||||||
| Series 2020-2A, Class DR, (3-mo. CME Term SOFR + 6.41%), 11.74%, 10/20/31(a)(c) |
250 | 236,238 | ||||||||||
| BankAmerica Manufactured Housing Contract Trust |
||||||||||||
| Series 1997-2, Class B1, 7.07%, 02/10/22(c) |
1,680 | 395,437 | ||||||||||
| Series 1998-2, Class B1, 7.32%, 12/10/25(c) |
2,790 | 498,063 | ||||||||||
| Bankers Healthcare Group Securitization Trust, |
||||||||||||
| Series 2020-A, Class C, 5.17%, 09/17/31(a) |
410 | 384,849 | ||||||||||
| Bardot CLO Ltd., Series 2019-2A, Class DR, (3-mo. CME Term SOFR + 3.26%), 8.61%, 10/22/32(a)(c) |
250 | 245,305 | ||||||||||
| Barings CLO Ltd. |
||||||||||||
| Series 2015-2A, Class AR, (3-mo. CME Term SOFR + 1.45%), |
2,417 | 2,410,964 | ||||||||||
| Security | Par (000) |
Value | ||||||||||
| Asset-Backed Securities (continued) |
|
|||||||||||
| Barings CLO Ltd. |
||||||||||||
| Series 2018-3A, Class A1, (3-mo. CME Term SOFR + 1.21%), 6.54%, 07/20/29(a)(c) |
USD | 405 | $ | 403,917 | ||||||||
| Series 2019-3A, Class A1R, (3-mo. CME Term SOFR + 1.33%), 6.66%, 04/20/31(a)(c) |
1,330 | 1,323,595 | ||||||||||
| Battalion CLO 18 Ltd., Series 2020-18A, Class BR, (3-mo. CME Term SOFR + 2.01%), |
1,827 | 1,782,239 | ||||||||||
| Battalion CLO IX Ltd., Series 2015-9A, Class DR, (3-mo. CME Term SOFR + 3.51%), 8.82%, 07/15/31(a)(c) |
250 | 239,031 | ||||||||||
| Battalion CLO VIII Ltd. |
||||||||||||
| Series 2015-8A, Class A1R2, (3-mo. CME Term SOFR + 1.33%), 6.64%, 07/18/30(a)(c) |
5,928 | 5,901,454 | ||||||||||
| Series 2015-8A, Class A2R2, (3-mo. CME Term SOFR + 1.81%), 7.12%, 07/18/30(a)(c) |
3,250 | 3,185,975 | ||||||||||
| Series 2015-8A, Class BR2, (3-mo. CME Term SOFR + 2.26%), 7.57%, 07/18/30(a)(c) |
2,901 | 2,869,754 | ||||||||||
| Battalion CLO XI Ltd., Series 2017-11A, Class BR, (3-mo. CME Term SOFR + 1.98%), |
1,000 | 977,200 | ||||||||||
| Battalion CLO XX Ltd., Series 2021-20A, Class A, (3-mo. CME Term SOFR +
1.44%), |
4,520 | 4,492,880 | ||||||||||
| Bayview Financial Revolving Asset Trust |
||||||||||||
| Series 2004-B, Class A1, (1-mo. CME Term SOFR + 1.11%), 6.18%, 05/28/39(a)(c) |
6,569 | 5,166,547 | ||||||||||
| Series 2004-B, Class A2, (1-mo. CME Term SOFR + 1.41%), 6.48%, 05/28/39(a)(c) |
313 | 261,570 | ||||||||||
| Series 2005-A, Class A1, (1-mo. CME Term SOFR + 1.11%), 6.43%, 02/28/40(a)(c) |
1,347 | 1,177,691 | ||||||||||
| Series 2005-E, Class A1, (1-mo. CME Term SOFR + 1.11%), 6.43%, 12/28/40(a)(c) |
182 | 183,321 | ||||||||||
| BCMSC Trust |
||||||||||||
| Series 2000-A, Class A2, 7.58%, 06/15/30(c) |
|
1,674 | 198,520 | |||||||||
| Series 2000-A, Class A3, 7.83%, 06/15/30(c) |
|
1,554 | 190,454 | |||||||||
| Series 2000-A, Class A4, 8.29%, 06/15/30(c) |
|
1,121 | 145,458 | |||||||||
| BDS Ltd., Series 2022-FL11, Class ATS, (1-mo. CME Term SOFR + 1.80%), 7.13%, 03/19/39(a)(c) |
8,979 | 8,855,539 | ||||||||||
| Bean Creek CLO Ltd., Series 2015-1A, Class AR, (3-mo. CME Term SOFR + 1.28%), |
230 | 228,610 | ||||||||||
| Bear Stearns Asset-Backed Securities I Trust |
||||||||||||
| Series 2004-HE7, Class M2, (1-mo. CME Term SOFR + 1.84%), 7.16%, 08/25/34(c) |
28 | 27,993 | ||||||||||
| Series 2006-HE1, Class 1M4, (1-mo. CME Term SOFR + 1.13%), 5.06%, 12/25/35(c) |
1,689 | 2,451,376 | ||||||||||
| Series 2006-HE7, Class 1A2, (1-mo. CME Term SOFR + 0.45%), 5.77%, 09/25/36(c) |
989 | 969,213 | ||||||||||
| Series 2007-FS1, Class 1A3, (1-mo. CME Term SOFR + 0.45%), 5.77%, 05/25/35(c) |
101 | 99,502 | ||||||||||
| Series 2007-HE2, Class 1A4, (1-mo. CME Term SOFR + 0.43%), 5.75%, 03/25/37(c) |
1,153 | 991,675 | ||||||||||
| Series 2007-HE2, Class 22A, (1-mo. CME Term SOFR + 0.25%), 5.57%, 03/25/37(c) |
420 | 376,179 | ||||||||||
| Series 2007-HE2, Class 23A, (1-mo. CME Term SOFR + 0.25%), 5.57%, 03/25/37(c) |
567 | 509,644 | ||||||||||
| Series 2007-HE3, Class 1A3, (1-mo. CME Term SOFR + 0.36%), 5.68%, 04/25/37(c) |
392 | 565,843 | ||||||||||
| Series 2007-HE3, Class 1A4, (1-mo. CME Term SOFR + 0.46%), 5.78%, 04/25/37(c) |
6,115 | 6,114,745 | ||||||||||
| 30 | 2 0 2 3 B L A C K R O C K A N N U A L R E P O R T T O S H A R E H O L D E R S |
| Consolidated Schedule of Investments (continued) September 30, 2023 |
Master Total Return Portfolio (Percentages shown are based on Net Assets) |
| Security | Par (000) |
Value | ||||||||||
| Asset-Backed Securities (continued) |
| |||||||||||
| Benefit Street Partners CLO II Ltd., Series 2013- IIA, Class A2R2, (3-mo. CME Term SOFR + 1.71%), 7.02%, 07/15/29(a)(c) |
USD | 3,570 | $ | 3,558,220 | ||||||||
| Benefit Street Partners CLO III Ltd. |
||||||||||||
| Series 2013-IIIA, Class A1R2, (3-mo. CME Term SOFR + 1.26%), |
167 | 166,303 | ||||||||||
| Series 2013-IIIA, Class A2R2, (3-mo. CME Term SOFR + 1.91%), |
1,810 | 1,802,036 | ||||||||||
| Benefit Street Partners CLO Ltd., Series 2021- 23A, Class E, (3-mo. CME Term SOFR + 7.07%), 12.42%, 04/25/34(a)(c) |
750 | 701,218 | ||||||||||
| Benefit Street Partners CLO V-B Ltd., Series 2018-5BA, Class A1A, (3-mo. CME Term SOFR + 1.35%), 6.68%, 04/20/31(a)(c) |
4,360 | 4,353,975 | ||||||||||
| Benefit Street Partners CLO VIII Ltd., Series 2015-8A, Class A1AR, (3-mo. CME Term SOFR + 1.36%), 6.69%, 01/20/31(a)(c) |
2,024 | 2,021,381 | ||||||||||
| Benefit Street Partners CLO XII Ltd. |
||||||||||||
| Series 2017-12A, Class A1R, (3-mo. CME Term SOFR + 1.21%), |
314 | 312,846 | ||||||||||
| Series 2017-12A, Class B, (3-mo. CME Term SOFR + 2.26%), |
1,545 | 1,527,621 | ||||||||||
| Benefit Street Partners CLO XIX Ltd., Series 2019-19A, Class B, (3-mo. CME Term SOFR + 2.26%), 7.57%, 01/15/33(a)(c) |
250 | 249,100 | ||||||||||
| Benefit Street Partners CLO XX Ltd. |
||||||||||||
| Series 2020-20A, Class AR, (3-mo. CME Term SOFR + 1.43%), |
2,000 | 1,988,380 | ||||||||||
| Series 2020-20A, Class ER, (3-mo. CME Term SOFR + 7.01%), |
250 | 237,979 | ||||||||||
| Benefit Street Partners CLO XXIII Ltd., Series 2021-23A, Class A1, (3-mo. CME Term SOFR + 1.34%), 6.69%, 04/25/34(a)(c) |
800 | 791,355 | ||||||||||
| Benefit Street Partners CLO XXIV Ltd., Series 2021-24A, Class D, (3-mo. CME Term SOFR + 3.61%), 8.94%, 10/20/34(a)(c) |
500 | 493,933 | ||||||||||
| BHG Securitization Trust |
||||||||||||
| Series 2021-A, Class B, 2.79%, 11/17/33(a) |
1,007 | 888,276 | ||||||||||
| Series 2021-A, Class C, 3.69%, 11/17/33(a) |
100 | 86,475 | ||||||||||
| Series 2022-A, Class E, 4.30%, 02/20/35(a) |
300 | 209,943 | ||||||||||
| Series 2022-C, Class B, 5.93%, 10/17/35(a) |
1,625 | 1,582,548 | ||||||||||
| Birch Grove CLO 2 Ltd. |
||||||||||||
| Series 2021-2A, Class A1, (3-mo. CME Term SOFR + 1.52%), |
680 | 672,650 | ||||||||||
| Series 2021-2A, Class B, (3-mo. CME Term SOFR + 2.01%), |
250 | 246,250 | ||||||||||
| Series 2021-2A, Class D1, (3-mo. CME Term SOFR + 3.56%), |
250 | 240,642 | ||||||||||
| Birch Grove CLO Ltd. |
||||||||||||
| Series 19A, Class AR, (3-mo. CME Term SOFR + 1.39%), 6.80%, 06/15/31(a)(c) |
238 | 237,591 | ||||||||||
| Series 19A, Class BR, (3-mo. CME Term SOFR + 2.01%), 7.42%, 06/15/31(a)(c) |
250 | 244,875 | ||||||||||
| Series 19A, Class CR, (3-mo. CME Term SOFR + 2.46%), 7.87%, 06/15/31(a)(c) |
1,250 | 1,241,081 | ||||||||||
| Series 19A, Class DR, (3-mo. CME Term SOFR + 3.61%), 9.02%, 06/15/31(a)(c) |
2,695 | 2,679,348 | ||||||||||
| BlueMountain CLO Ltd. |
||||||||||||
| Series 2013-2A, Class A1R, (3-mo. CME Term SOFR + 1.44%), |
5,630 | 5,608,637 | ||||||||||
| Series 2013-2A, Class BR, (3-mo. CME Term SOFR + 1.86%), |
500 | 490,000 | ||||||||||
| Security | Par (000) |
Value | ||||||||||
| Asset-Backed Securities (continued) |
| |||||||||||
| BlueMountain CLO Ltd. |
||||||||||||
| Series 2015-3A, Class A1R, (3-mo. CME Term SOFR + 1.26%), 6.59%, 04/20/31(a)(c) |
USD | 2,453 | $ | 2,448,858 | ||||||||
| Series 2018-2A, Class B, (3-mo. CME Term SOFR + 1.96%), 7.33%, 08/15/31(a)(c) |
300 | 295,200 | ||||||||||
| BlueMountain CLO XXII Ltd., Series 2018-22A, Class B, (3-mo. CME Term SOFR + 1.76%), 7.07%, 07/15/31(a)(c) |
3,970 | 3,887,027 | ||||||||||
| BlueMountain CLO XXIII Ltd. |
||||||||||||
| Series 2018-23A, Class B, (3-mo. CME Term SOFR + 1.96%), 7.29%, 10/20/31(a)(c) |
250 | 246,375 | ||||||||||
| Series 2018-23A, Class C, (3-mo. CME Term SOFR + 2.41%), 7.74%, 10/20/31(a)(c) |
650 | 640,971 | ||||||||||
| BlueMountain CLO XXIX Ltd., Series 2020-29A, Class BR, (3-mo. CME Term SOFR + 2.01%), 7.36%, 07/25/34(a)(c) |
1,080 | 1,058,724 | ||||||||||
| BlueMountain CLO XXV Ltd., Series 2019-25A, Class BR, (3-mo. CME Term SOFR + 1.96%), 7.27%, 07/15/36(a)(c) |
250 | 245,325 | ||||||||||
| BlueMountain CLO XXVIII Ltd., Series 2021-28A, Class A, (3-mo. CME Term SOFR + 1.52%), 6.83%, 04/15/34(a)(c) |
570 | 567,283 | ||||||||||
| BlueMountain CLO XXXI Ltd., Series 2021-31A, Class A1, (3-mo. CME Term SOFR + 1.41%), 6.73%, 04/19/34(a)(c) |
1,000 | 991,007 | ||||||||||
| BlueMountain Euro CLO DAC, Series 2021-2A, Class B1, (3-mo. EURIBOR + 1.75%), 5.41%, 10/15/35(a)(c) |
EUR | 3,280 | 3,312,771 | |||||||||
| BlueMountain Fuji U.S. CLO III Ltd. |
||||||||||||
| Series 2017-3A, Class A2, (3-mo. CME Term SOFR + 1.41%), 6.72%, 01/15/30(a)(c) |
USD | 750 | 736,352 | |||||||||
| Series 2017-3A, Class B, (3-mo. CME Term SOFR + 1.64%), 6.95%, 01/15/30(a)(c) |
250 | 244,730 | ||||||||||
| BPCRE Ltd., Series 2022-FL2, Class A, (1-mo. CME Term SOFR + 2.40%), 7.73%, 01/16/37(a)(c) |
4,517 | 4,480,515 | ||||||||||
| Bridge Street CLO II Ltd., Series 2021-1A, Class A1A, (3-mo. CME Term SOFR + 1.49%), 6.82%, 07/20/34(a)(c) |
500 | 495,577 | ||||||||||
| Bristol Park CLO Ltd., Series 2016-1A, Class BR, (3-mo. CME Term SOFR + 1.71%), 7.02%, 04/15/29(a)(c) |
400 | 395,240 | ||||||||||
| Burnham Park CLO Ltd., Series 2016-1A, Class BR, (3-mo. CME Term SOFR + 1.76%), 7.09%, 10/20/29(a)(c) |
250 | 248,675 | ||||||||||
| Buttermilk Park CLO Ltd. |
||||||||||||
| Series 2018-1A, Class A1, (3-mo. CME Term SOFR + 1.36%), 6.67%, 10/15/31(a)(c) |
750 | 748,433 | ||||||||||
| Series 2018-1A, Class D, (3-mo. CME Term SOFR + 3.36%), 8.67%, 10/15/31(a)(c) |
625 | 596,756 | ||||||||||
| Canyon Capital CLO Ltd., |
2,680 | 2,647,926 | ||||||||||
| Canyon CLO Ltd. |
||||||||||||
| Series 2018-1A, Class A, (3-mo. CME Term SOFR + 1.33%), 6.64%, 07/15/31(a)(c) |
250 | 248,890 | ||||||||||
| Series 2020-3A, Class B, (3-mo. CME Term SOFR + 1.96%), 7.27%, 01/15/34(a)(c) |
1,610 | 1,578,605 | ||||||||||
| Series 2020-3A, Class E, (3-mo. CME Term SOFR + 7.51%), 12.82%, 01/15/34(a)(c) |
250 | 244,112 | ||||||||||
| M A S T E R P O R T F O L I O S C H E D U L E O F I N V E S T M E N T S |
31 |
| Consolidated Schedule of Investments (continued) September 30, 2023 |
Master Total Return Portfolio (Percentages shown are based on Net Assets) |
| Security | Par (000) |
Value | ||||||||||
| Asset-Backed Securities (continued) |
| |||||||||||
| Carlyle C17 CLO Ltd., Series C17A, Class A1AR, (3-mo. CME Term SOFR + 1.29%), 6.66%, 04/30/31(a)(c) |
USD | 7,610 | $ | 7,573,724 | ||||||||
| Carlyle Global Market Strategies CLO Ltd. |
||||||||||||
| Series 2013-3A, Class A1AR, (3-mo. CME Term SOFR + 1.36%), |
223 | 221,990 | ||||||||||
| Series 2013-4A, Class A1RR, (3-mo. CME Term SOFR + 1.26%), |
2,032 | 2,024,673 | ||||||||||
| Series 2014-1A, Class A1R2, (3-mo. CME Term SOFR + 1.23%), |
3,696 | 3,680,794 | ||||||||||
| Series 2014-3RA, Class A1A, (3-mo. CME Term SOFR + 1.31%), |
248 | 247,103 | ||||||||||
| Series 2016-1A, Class A1R2, (3-mo. CME Term SOFR + 1.40%), |
250 | 248,438 | ||||||||||
| Carlyle U.S. CLO Ltd. |
||||||||||||
| Series 2016-4A, Class A2R, (3-mo. CME Term SOFR + 1.71%), |
750 | 748,346 | ||||||||||
| Series 2017-4A, Class A1, (3-mo. CME Term SOFR + 1.44%), |
4,351 | 4,341,658 | ||||||||||
| Series 2018-1A, Class A2, (3-mo. CME Term SOFR + 1.76%), |
250 | 246,550 | ||||||||||
| Series 2018-4A, Class B, (3-mo. CME Term SOFR + 2.33%), 7.66%, 01/20/31(a)(c) |
470 | 465,668 | ||||||||||
| Series 2019-1A, Class A1AR, (3-mo. CME Term SOFR + 1.34%), |
1,410 | 1,405,908 | ||||||||||
| Series 2019-2A, Class A1R, (3-mo. CME Term SOFR + 1.38%), |
4,000 | 3,983,110 | ||||||||||
| Series 2021-1A, Class A1, (3-mo. CME Term SOFR + 1.40%), |
250 | 248,365 | ||||||||||
| Series 2021-6A, Class A1, (3-mo. CME Term SOFR + 1.42%), |
3,590 | 3,561,280 | ||||||||||
| Carrington Mortgage Loan Trust |
||||||||||||
| Series 2006-NC1, Class M2, (1-mo. CME Term SOFR + 0.74%), 6.06%, 01/25/36(c) |
610 | 475,232 | ||||||||||
| Series 2006-NC4, Class A3, (1-mo. CME Term SOFR + 0.27%), 5.59%, 10/25/36(c) |
324 | 309,621 | ||||||||||
| CarVal CLO II Ltd., Series 2019-1A, Class CR, (3-mo. CME Term SOFR + 2.26%), 7.59%, 04/20/32(a)(c) |
700 | 687,837 | ||||||||||
| CarVal CLO III Ltd., Series 2019-2A, Class E, (3-mo. CME Term SOFR + 6.70%), 12.03%, 07/20/32(a)(c) |
250 | 235,014 | ||||||||||
| CarVal CLO VC Ltd. |
||||||||||||
| Series 2021-2A, Class D, (3-mo. CME Term SOFR + 3.51%), 8.82%, 10/15/34(a)(c) |
250 | 243,782 | ||||||||||
| Series 2021-2A, Class E, (3-mo. CME Term SOFR + 7.01%), 12.32%, 10/15/34(a)(c) |
250 | 237,559 | ||||||||||
| Cascade MH Asset Trust, Series 2019-MH1, Class A, 4.00%, 11/25/44(a)(c) |
7,805 | 7,393,494 | ||||||||||
| CBAM Ltd. |
||||||||||||
| Series 2017-1A, Class A1, (3-mo. CME Term SOFR + 1.51%), |
5,692 | 5,685,643 | ||||||||||
| Series 2017-1A, Class C, (3-mo. CME Term SOFR + 2.66%), 7.99%, 07/20/30(a)(c) |
750 | 723,385 | ||||||||||
| Series 2018-6A, Class B1R, (3-mo. CME Term SOFR + 2.36%), |
250 | 247,297 | ||||||||||
| Series 2018-7A, Class A, (3-mo. CME Term SOFR + 1.36%), 6.69%, 07/20/31(a)(c) |
250 | 248,171 | ||||||||||
| Series 2018-7A, Class B1, (3-mo. CME Term SOFR + 1.86%), |
250 | 245,025 | ||||||||||
| Series 2019-9A, Class B2, (3-mo. CME Term SOFR + 2.16%), |
500 | 495,250 | ||||||||||
| Security | Par (000) |
Value | ||||||||||
| Asset-Backed Securities (continued) |
| |||||||||||
| C-BASS Trust, Series 2006-CB7, Class A4, (1- mo. CME Term SOFR + 0.43%), 5.75%, 10/25/36(c) |
USD | 388 | $ | 243,511 | ||||||||
| Cedar Funding II CLO Ltd. |
||||||||||||
| Series 2013-1A, Class ARR, (3-mo. CME Term SOFR + 1.34%), |
3,255 | 3,215,407 | ||||||||||
| Series 2013-1A, Class BRR, (3-mo. CME Term SOFR + 1.61%), |
3,110 | 3,020,369 | ||||||||||
| Cedar Funding IX CLO Ltd. |
||||||||||||
| Series 2018-9A, Class A1, (3-mo. CME Term SOFR + 1.24%), 6.57%, 04/20/31(a)(c) |
1,315 | 1,311,713 | ||||||||||
| Series 2018-9A, Class D, (3-mo. CME Term SOFR + 2.86%), 8.19%, 04/20/31(a)(c) |
250 | 237,635 | ||||||||||
| Cedar Funding V CLO Ltd., Series 2016-5A, Class A1R, (3-mo. CME Term SOFR + 1.36%), 6.67%, 07/17/31(a)(c) |
2,130 | 2,125,740 | ||||||||||
| Cedar Funding VI CLO Ltd., Series 2016-6A, Class ARR, (3-mo. CME Term SOFR + 1.31%), 6.64%, 04/20/34(a)(c) |
18,290 | 18,093,456 | ||||||||||
| Cedar Funding VII CLO Ltd., Series 2018-7A, Class A2, (3-mo. CME Term SOFR + 1.39%), 6.72%, 01/20/31(a)(c) |
250 | 242,980 | ||||||||||
| Cedar Funding XI CLO Ltd., Series 2019-11A, Class A2R, (3-mo. CME Term SOFR + 1.61%), 7.02%, 05/29/32(a)(c) |
1,220 | 1,202,044 | ||||||||||
| Cedar Funding XIV CLO Ltd., Series 2021-14A, Class D, (3-mo. CME Term SOFR + 3.51%), 8.82%, 07/15/33(a)(c) |
250 | 237,870 | ||||||||||
| CIFC European Funding CLO II DAC, Series 2X, Class B1, (3-mo. EURIBOR + 1.60%), 5.26%, 04/15/33(c)(e) |
EUR | 900 | 919,545 | |||||||||
| CIFC Funding Ltd. |
||||||||||||
| Series 2013-1A, Class A2R, (3-mo. CME Term SOFR + 2.01%), |
USD | 750 | 745,050 | |||||||||
| Series 2013-1A, Class CR, (3-mo. CME Term SOFR + 3.81%), |
250 | 247,179 | ||||||||||
| Series 2013-4A, Class BRR, (3-mo. CME Term SOFR + 1.86%), |
500 | 495,850 | ||||||||||
| Series 2013-4A, Class DRR, (3-mo. CME Term SOFR + 3.06%), |
250 | 245,359 | ||||||||||
| Series 2014-2RA, Class A1, (3-mo. CME Term SOFR + 1.31%), |
226 | 226,050 | ||||||||||
| Series 2014-2RA, Class B1, (3-mo. CME Term SOFR + 3.06%), |
650 | 636,857 | ||||||||||
| Series 2014-3A, Class BR2, (3-mo. CME Term SOFR + 2.06%), |
700 | 695,170 | ||||||||||
| Series 2015-1A, Class ARR, (3-mo. CME Term SOFR + 1.37%), |
247 | 246,304 | ||||||||||
| Series 2015-1A, Class BRR, (3-mo. CME Term SOFR + 1.71%), |
250 | 246,275 | ||||||||||
| Series 2015-3A, Class BR, (3-mo. CME Term SOFR + 1.41%), |
1,420 | 1,398,416 | ||||||||||
| Series 2017-1A, Class AR, (3-mo. CME Term SOFR + 1.27%), |
4,617 | 4,607,770 | ||||||||||
| Series 2017-1A, Class B, (3-mo. CME Term SOFR + 1.96%), |
2,910 | 2,903,307 | ||||||||||
| Series 2017-1A, Class C, (3-mo. CME Term SOFR + 2.71%), |
250 | 251,013 | ||||||||||
| Series 2017-5A, Class A1, (3-mo. CME Term SOFR + 1.44%), 6.75%, 11/16/30(a)(c) |
326 | 325,405 | ||||||||||
| Series 2017-5A, Class C, (3-mo. CME Term SOFR + 3.11%), 8.42%, 11/16/30(a)(c) |
300 | 292,943 | ||||||||||
| 32 | 2 0 2 3 B L A C K R O C K A N N U A L R E P O R T T O S H A R E H O L D E R S |
| Consolidated Schedule of Investments (continued) September 30, 2023 |
Master Total Return Portfolio (Percentages shown are based on Net Assets) |
| Security | Par (000) |
Value | ||||||||||
| Asset-Backed Securities (continued) |
| |||||||||||
| CIFC Funding Ltd. |
||||||||||||
| Series 2018-1A, Class A, (3-mo. CME Term SOFR + 1.26%), |
USD | 6,964 | $ | 6,943,673 | ||||||||
| Series 2019-5A, Class A1R1, (3-mo. CME Term SOFR + 1.40%), |
400 | 396,901 | ||||||||||
| Series 2020-1A, Class A1R, (3-mo. CME Term SOFR + 1.41%), |
1,200 | 1,192,813 | ||||||||||
| Series 2020-1A, Class BR, (3-mo. CME Term SOFR + 1.91%), |
3,260 | 3,232,616 | ||||||||||
| Series 2020-3A, Class A1R, (3-mo. CME Term SOFR + 1.39%), |
7,210 | 7,165,232 | ||||||||||
| Series 2021-1A, Class A1, (3-mo. CME Term SOFR + 1.37%), |
500 | 498,538 | ||||||||||
| Series 2021-4A, Class A, (3-mo. CME Term SOFR + 1.31%), 6.62%, 07/15/33(a)(c) |
6,450 | 6,433,623 | ||||||||||
| Series 2021-4A, Class B, (3-mo. CME Term SOFR + 1.84%), 7.15%, 07/15/33(a)(c) |
500 | 496,400 | ||||||||||
| Series 2021-4A, Class C, (3-mo. CME Term SOFR + 2.11%), 7.42%, 07/15/33(a)(c) |
250 | 245,481 | ||||||||||
| Series 2021-5A, Class A, (3-mo. CME Term SOFR + 1.40%), 6.71%, 07/15/34(a)(c) |
2,030 | 2,015,558 | ||||||||||
| Citigroup Mortgage Loan Trust |
||||||||||||
| Series 2007-AHL2, Class A3B, (1-mo. CME Term SOFR + 0.31%), 5.63%, 05/25/37(c) |
4,651 | 2,984,666 | ||||||||||
| Series 2007-AHL2, Class A3C, (1-mo. CME Term SOFR + 0.38%), 5.70%, 05/25/37(c) |
2,113 | 1,355,818 | ||||||||||
| Series 2007-AHL3, Class A3B, (1-mo. CME Term SOFR + 0.28%), 5.32%, 07/25/45(c) |
3,403 | 2,311,670 | ||||||||||
| Clear Creek CLO |
||||||||||||
| Series 2015-1A, Class AR, (3-mo. CME Term SOFR + 1.46%), |
892 | 888,773 | ||||||||||
| Series 2015-1A, Class DR, (3-mo. CME Term SOFR + 3.21%), |
620 | 611,455 | ||||||||||
| Clontarf Park CLO DAC, Series 1X, Class CE, (3-mo. EURIBOR + 3.05%), 6.77%, 08/05/30(c)(e) |
EUR | 1,750 | 1,845,978 | |||||||||
| College Ave Student Loans LLC |
||||||||||||
| Series 2021-B, Class B, 2.42%, 06/25/52(a) |
USD | 892 | 765,618 | |||||||||
| Series 2021-B, Class C, 2.72%, 06/25/52(a) |
480 | 421,904 | ||||||||||
| Series 2021-B, Class D, 3.78%, 06/25/52(a) |
120 | 105,332 | ||||||||||
| Series 2021-C, Class D, 4.11%, 07/26/55(a) |
270 | 231,061 | ||||||||||
| Conseco Finance Corp. |
||||||||||||
| Series 1997-3, Class M1, 7.53%, 03/15/28(c) |
634 | 617,766 | ||||||||||
| Series 1997-6, Class M1, 7.21%, 01/15/29(c) |
114 | 109,270 | ||||||||||
| Series 1998-4, Class M1, 6.83%, 04/01/30(c) |
221 | 202,819 | ||||||||||
| Series 1998-8, Class M1, 6.98%, 09/01/30(c) |
2,002 | 1,860,497 | ||||||||||
| Series 1999-5, Class A5, 7.86%, 03/01/30(c) |
803 | 307,453 | ||||||||||
| Series 1999-5, Class A6, 7.50%, 03/01/30(c) |
861 | 316,382 | ||||||||||
| Conseco Finance Securitizations Corp. |
||||||||||||
| Series 2000-1, Class A5, 8.06%, 09/01/29(c) |
1,445 | 277,019 | ||||||||||
| Series 2000-4, Class A6, 8.31%, 05/01/32(c) |
1,224 | 227,944 | ||||||||||
| Series 2000-5, Class A6, 7.96%, 05/01/31 |
2,105 | 587,284 | ||||||||||
| Series 2000-5, Class A7, 8.20%, 05/01/31 |
3,840 | 1,103,660 | ||||||||||
| Cook Park CLO Ltd., Series 2018-1A, Class B, (3-mo. CME Term SOFR + 1.66%), 6.97%, 04/17/30(a)(c) |
250 | 246,575 | ||||||||||
| Countrywide Asset-Backed Certificates |
||||||||||||
| Series 2004-5, Class A, (1-mo. CME Term SOFR + 1.01%), 6.33%, 10/25/34(c) |
348 | 335,432 | ||||||||||
| Series 2005-16, Class 1AF, 4.52%, 04/25/36(c) |
2,200 | 1,839,086 | ||||||||||
| Series 2006-11, Class 3AV2, (1-mo. CME Term SOFR + 0.43%), 5.75%, 09/25/46(c) |
9 | 8,984 | ||||||||||
| Security | Par (000) |
Value | ||||||||||
| Asset-Backed Securities (continued) |
| |||||||||||
| Countrywide Asset-Backed Certificates |
||||||||||||
| Series 2006-12, Class 1A, (1-mo. CME Term SOFR + 0.37%), 5.69%, 12/25/36(c) |
USD | 1,590 | $ | 1,415,840 | ||||||||
| Series 2006-17, Class 2A2, (1-mo. CME Term SOFR + 0.41%), 5.73%, 03/25/47(c) |
93 | 90,579 | ||||||||||
| Series 2006-18, Class M1, (1-mo. CME Term SOFR + 0.56%), 5.88%, 03/25/37(c) |
6,550 | 5,079,986 | ||||||||||
| Series 2006-22, Class M1, (1-mo. CME Term SOFR + 0.34%), 5.66%, 05/25/47(c) |
799 | 615,030 | ||||||||||
| Series 2006-SPS1, Class A, (1-mo. CME Term SOFR + 0.33%), 5.65%, 12/25/25(c) |
4 | 37,322 | ||||||||||
| Series 2007-12, Class 1A2, (1-mo. CME Term SOFR + 0.95%), 6.27%, 08/25/47(c) |
3,190 | 2,976,771 | ||||||||||
| Countrywide Asset-Backed Certificates Revolving Home Equity Loan Trust, Series 2004-U, Class 2A, (1-mo. CME Term SOFR + 0.38%), 5.72%, 03/15/34(c) |
208 | 201,018 | ||||||||||
| Credit Suisse First Boston Mortgage Securities Corp., Series 2001-MH29, Class B1, 8.10%, 09/25/31(c) |
659 | 651,289 | ||||||||||
| Credit Suisse Mortgage Trust, Series 2021-JR1, Class A1, 2.47%, 09/27/66(a)(c) |
20,041 | 19,388,929 | ||||||||||
| Credit-Based Asset Servicing & Securitization LLC |
||||||||||||
| Series 2006-CB2, Class AF4, 3.05%, 12/25/36(b) |
338 | 269,206 | ||||||||||
| Series 2006-MH1, Class B1, 6.75%, 10/25/36(a)(b) |
506 | 483,469 | ||||||||||
| Series 2006-SL1, Class A2, 6.06%, 09/25/36(a)(b) |
2,778 | 150,938 | ||||||||||
| Series 2007-CB6, Class A4, (1-mo. CME Term SOFR + 0.45%), |
436 | 274,520 | ||||||||||
| Crown City CLO III, Series 2021-1A, Class A1A, (3-mo. CME Term SOFR + 1.43%), 6.76%, 07/20/34(a)(c) |
250 | 247,255 | ||||||||||
| CVC Cordatus Loan Fund IV DAC, Series 4X, Class BR1, (3-mo. EURIBOR + 1.30%), 5.12%, 02/22/34(c)(e) |
EUR | 990 | 1,000,757 | |||||||||
| CVC Cordatus Loan Fund V DAC, Series 5X, Class B1R, (3-mo. EURIBOR + 1.50%), 5.15%, 07/21/30(c)(e) |
250 | 258,310 | ||||||||||
| CWHEQ Home Equity Loan Trust |
||||||||||||
| Series 2006-S3, Class A4, 5.56%, 01/25/29(b) |
USD | 42 | 60,082 | |||||||||
| Series 2006-S5, Class A5, 6.16%, 06/25/35 |
56 | 66,125 | ||||||||||
| CWHEQ Revolving Home Equity Loan Resuritization Trust |
||||||||||||
| Series 2006-RES, Class 4Q1B, (1-mo. CME Term SOFR + 0.41%), |
65 | 64,777 | ||||||||||
| Series 2006-RES, Class 5B1A, (1-mo. CME Term SOFR + 0.30%), |
6 | 6,129 | ||||||||||
| Series 2006-RES, Class 5B1B, (1-mo. CME Term SOFR + 0.30%), |
38 | 37,370 | ||||||||||
| CWHEQ Revolving Home Equity Loan Trust |
||||||||||||
| Series 2005-B, Class 2A, (1-mo. CME Term SOFR + 0.29%), 5.63%, 05/15/35(c) |
97 | 95,549 | ||||||||||
| Series 2006-C, Class 2A, (1-mo. CME Term SOFR + 0.29%), 5.63%, 05/15/36(c) |
672 | 646,810 | ||||||||||
| Series 2006-H, Class 1A, (1-mo. CME Term SOFR + 0.26%), 5.60%, 11/15/36(c) |
382 | 373,780 | ||||||||||
| Series 2006-I, Class 1A, (1-mo. CME Term SOFR + 0.25%), 5.59%, 01/15/37(c) |
274 | 245,679 | ||||||||||
| M A S T E R P O R T F O L I O S C H E D U L E O F I N V E S T M E N T S |
33 |
| Consolidated Schedule of Investments (continued) September 30, 2023 |
Master Total Return Portfolio (Percentages shown are based on Net Assets) |
| Security | Par (000) |
Value | ||||||||||
| Asset-Backed Securities (continued) |
| |||||||||||
| Deer Creek CLO Ltd. |
||||||||||||
| Series 2017-1A, Class A, (3-mo. CME Term SOFR + 1.44%), 6.77%, 10/20/30(a)(c) |
USD | 4,039 | $ | 4,031,004 | ||||||||
| Series 2017-1A, Class B, (3-mo. CME Term SOFR + 1.91%), 7.24%, 10/20/30(a)(c) |
500 | 491,150 | ||||||||||
| Diameter Capital CLO 1 Ltd., Series 2021-1A, Class A1A, (3-mo. CME Term SOFR + 1.50%), 6.81%, 07/15/36(a)(c) |
1,180 | 1,172,303 | ||||||||||
| Diameter Capital CLO 2 Ltd., Series 2021-2A, Class A1, (3-mo. CME Term SOFR + 1.48%), 6.79%, 10/15/36(a)(c) |
250 | 246,691 | ||||||||||
| Diameter Capital CLO 3 Ltd., Series 2022-3A, Class A1A, (3-mo. CME Term SOFR + 1.39%), 6.70%, 04/15/37(a)(c) |
510 | 503,187 | ||||||||||
| Dryden 40 Senior Loan Fund, Series 2015-40A, Class CR, (3-mo. CME Term SOFR + 2.36%), 7.73%, 08/15/31(a)(c) |
300 | 296,884 | ||||||||||
| Dryden 42 Senior Loan Fund, Series 2016-42A, Class CR, (3-mo. CME Term SOFR + 2.31%), 7.62%, 07/15/30(a)(c) |
250 | 244,702 | ||||||||||
| Dryden 43 Senior Loan Fund, Series 2016-43A, Class AR2, (3-mo. CME Term SOFR + 1.30%), 6.63%, 04/20/34(a)(c) |
5,540 | 5,496,625 | ||||||||||
| Dryden 45 Senior Loan Fund, Series 2016-45A, Class BR, (3-mo. CME Term SOFR + 1.96%), 7.27%, 10/15/30(a)(c) |
3,440 | 3,393,904 | ||||||||||
| Dryden 49 Senior Loan Fund |
||||||||||||
| Series 2017-49A, Class AR, (3-mo. CME Term SOFR + 1.21%), 6.52%, 07/18/30(a)(c) |
931 | 927,888 | ||||||||||
| Series 2017-49A, Class BR, (3-mo. CME Term SOFR + 1.86%), 7.17%, 07/18/30(a)(c) |
500 | 494,750 | ||||||||||
| Dryden 50 Senior Loan Fund, Series 2017-50A, Class B, (3-mo. CME Term SOFR + 1.91%), 7.22%, 07/15/30(a)(c) |
450 | 445,455 | ||||||||||
| Dryden 53 CLO Ltd., Series 2017-53A, Class A, (3-mo. CME Term SOFR + 1.38%), 6.69%, 01/15/31(a)(c) |
18,031 | 18,002,382 | ||||||||||
| Dryden 65 CLO Ltd., Series 2018-65A, Class B, (3-mo. CME Term SOFR + 1.86%), 7.17%, 07/18/30(a)(c) |
300 | 296,640 | ||||||||||
| Dryden 76 CLO Ltd., Series 2019-76A, Class A1R, (3-mo. CME Term SOFR + 1.41%), 6.74%, 10/20/34(a)(c) |
750 | 744,712 | ||||||||||
| Dryden 77 CLO Ltd. |
||||||||||||
| Series 2020-77A, Class AR, (3-mo. CME Term SOFR + 1.38%), 6.76%, 05/20/34(a)(c) |
3,580 | 3,551,360 | ||||||||||
| Series 2020-77A, Class XR, (3-mo. CME Term SOFR + 1.26%), 6.64%, 05/20/34(a)(c) |
344 | 343,367 | ||||||||||
| Dryden 78 CLO Ltd. |
||||||||||||
| Series 2020-78A, Class B, (3-mo. CME Term SOFR + 1.76%), 7.07%, 04/17/33(a)(c) |
500 | 493,900 | ||||||||||
| Series 2020-78A, Class D, (3-mo. CME Term SOFR + 3.26%), 8.57%, 04/17/33(a)(c) |
250 | 235,625 | ||||||||||
| Dryden 83 CLO Ltd. |
||||||||||||
| Series 2020-83A, Class A, (3-mo. CME Term SOFR + 1.48%), 6.79%, 01/18/32(a)(c) |
250 | 249,234 | ||||||||||
| Series 2020-83A, Class E, (3-mo. CME Term SOFR + 5.81%), 11.12%, 01/18/32(a)(c) |
350 | 319,694 | ||||||||||
| Dryden Senior Loan Fund, Series 2021-87A, Class A1, (3-mo. CME Term SOFR + 1.36%), 6.74%, 05/20/34(a)(c) |
2,330 | 2,311,371 | ||||||||||
| Security | Par (000) |
Value | ||||||||||
| Asset-Backed Securities (continued) |
| |||||||||||
| Dryden XXVI Senior Loan Fund, Series 2013- 26A, Class AR, (3-mo. CME Term SOFR + 1.16%), 6.47%, 04/15/29(a)(c) |
USD | 912 | $ | 908,611 | ||||||||
| Dryden XXVIII Senior Loan Fund, Series 2013- 28A, Class A1LR, (3-mo. CME Term SOFR + 1.46%), 6.83%, 08/15/30(a)(c) |
8,453 | 8,438,941 | ||||||||||
| Eaton Vance CLO Ltd. |
||||||||||||
| Series 2014-1RA, Class A2, (3-mo. CME Term SOFR + 1.75%), 7.06%, 07/15/30(a)(c) |
250 | 247,282 | ||||||||||
| Series 2018-1A, Class C, (3-mo. CME Term SOFR + 2.46%), 7.77%, 10/15/30(a)(c) |
3,550 | 3,504,011 | ||||||||||
| EDvestinU Private Education Loan Issue No. 4 LLC, Series 2022-A, Class A, 5.25%, 11/25/40(a) |
3,013 | 2,929,059 | ||||||||||
| Elmwood CLO 23 Ltd., Series 2023-2A, Class A, (3-mo. CME Term SOFR + 1.80%), 6.86%, 04/16/36(a)(c) |
1,000 | 999,919 | ||||||||||
| Elmwood CLO I Ltd., Series 2019-1A, Class AR, (3-mo. CME Term SOFR + 1.71%), 7.04%, 10/20/33(a)(c) |
250 | 249,922 | ||||||||||
| Elmwood CLO II Ltd. |
||||||||||||
| Series 2019-2A, Class AR, (3-mo. CME Term SOFR + 1.41%), 6.74%, 04/20/34(a)(c) |
3,750 | 3,735,255 | ||||||||||
| Series 2019-2A, Class BR, (3-mo. CME Term SOFR + 1.91%), 7.24%, 04/20/34(a)(c) |
500 | 496,250 | ||||||||||
| Series 2019-2A, Class ER, (3-mo. CME Term SOFR + 7.06%), 12.39%, 04/20/34(a)(c) |
1,500 | 1,480,390 | ||||||||||
| Elmwood CLO IV Ltd., Series 2020-1A, Class D, (3-mo. CME Term SOFR + 3.41%), 8.72%, 04/15/33(a)(c) |
1,000 | 984,001 | ||||||||||
| Elmwood CLO V Ltd. |
||||||||||||
| Series 2020-2A, Class BR, (3-mo. CME Term SOFR + 1.91%), 7.24%, 10/20/34(a)(c) |
2,880 | 2,856,672 | ||||||||||
| Series 2020-2A, Class CR, (3-mo. CME Term SOFR + 2.26%), 7.59%, 10/20/34(a)(c) |
2,514 | 2,478,215 | ||||||||||
| Elmwood CLO X Ltd. |
||||||||||||
| Series 2021-3A, Class A, (3-mo. CME Term SOFR + 1.30%), 6.63%, 10/20/34(a)(c) |
7,250 | 7,222,131 | ||||||||||
| Series 2021-3A, Class C, (3-mo. CME Term SOFR + 2.21%), 7.54%, 10/20/34(a)(c) |
1,200 | 1,182,890 | ||||||||||
| Elmwood CLO XII Ltd., Series 2021-5A, Class A, (3-mo. CME Term SOFR + 1.41%), 6.74%, 01/20/35(a)(c) |
790 | 785,513 | ||||||||||
| Euro-Galaxy III CLO BV |
||||||||||||
| Series 2013-3A, Class CRRR, (3-mo. EURIBOR + 2.35%), 6.05%, 04/24/34(a)(c) |
EUR | 700 | 716,747 | |||||||||
| Series 2013-3A, Class DRRR, (3-mo. EURIBOR + 3.25%), 6.95%, 04/24/34(a)(c) |
1,585 | 1,613,176 | ||||||||||
| Fairstone Financial Issuance Trust I, Series 2020- 1A, Class B, 3.74%, 10/20/39(a) |
CAD | 2,743 | 1,905,669 | |||||||||
| FBR Securitization Trust, Series 2005-5, Class M2, (1-mo. CME Term SOFR + 0.82%), 6.14%, 11/25/35(c) |
USD | 4,717 | 4,562,525 | |||||||||
| Fidelity Grand Harbour CLO DAC, Series 2021- 1A, Class D, (3-mo. EURIBOR + 3.60%), 7.26%, 10/15/34(a)(c) |
EUR | 500 | 492,609 | |||||||||
| First Franklin Mortgage Loan Trust |
||||||||||||
| Series 2004-FFH3, Class M3, (1-mo. CME Term SOFR + 1.16%), 6.48%, 10/25/34(c) |
USD | 1,000 | 890,481 | |||||||||
| Series 2006-FF13, Class A1, (1-mo. CME Term SOFR + 0.35%), 5.67%, 10/25/36(c) |
1,981 | 1,301,379 | ||||||||||
| 34 | 2 0 2 3 B L A C K R O C K A N N U A L R E P O R T T O S H A R E H O L D E R S |
| Consolidated Schedule of Investments (continued) September 30, 2023 |
Master Total Return Portfolio (Percentages shown are based on Net Assets) |
| Security | Par (000) |
Value | ||||||||||
| Asset-Backed Securities (continued) |
| |||||||||||
| First Franklin Mortgage Loan Trust |
||||||||||||
| Series 2006-FF13, Class A2C, (1-mo. CME Term SOFR + 0.43%), 5.75%, 10/25/36(c) |
USD | 1,161 | $ | 741,974 | ||||||||
| Series 2006-FF16, Class 2A3, (1-mo. CME Term SOFR + 0.39%), 5.71%, 12/25/36(c) |
9,771 | 4,008,418 | ||||||||||
| Series 2006-FF17, Class A5, (1-mo. CME Term SOFR + 0.26%), 5.58%, 12/25/36(c) |
9,712 | 8,381,022 | ||||||||||
| Series 2006-FFH1, Class M2, (1-mo. CME Term SOFR + 0.71%), 6.03%, 01/25/36(c) |
2,812 | 2,395,999 | ||||||||||
| FirstKey Homes Trust, Series 2020-SFR1, Class F1, 3.64%, 08/17/37(a) |
2,690 | 2,494,657 | ||||||||||
| Flatiron CLO 18 Ltd., Series 2018-1A, Class A, (3-mo. CME Term SOFR + 1.21%), 6.52%, 04/17/31(a)(c) |
1,145 | 1,144,421 | ||||||||||
| Flatiron CLO 19 Ltd., Series 2019-1A, Class DR, (3-mo. CME Term SOFR + 3.26%), 8.63%, 11/16/34(a)(c) |
250 | 245,782 | ||||||||||
| Flatiron CLO 21 Ltd., Series 2021-1A, Class A1, (3-mo. LIBOR US + 1.11%), 6.69%, 07/19/34(a)(c) |
13,960 | 13,821,221 | ||||||||||
| Foundation Finance Trust, Series 2021-2A, Class A, 2.19%, 01/15/42(a) |
3,804 | 3,388,040 | ||||||||||
| Fremont Home Loan Trust, Series 2006-3, Class 1A1, (1-mo. CME Term SOFR + 0.39%), 5.71%, 02/25/37(c) |
1,961 | 1,486,377 | ||||||||||
| FS Rialto Issuer Ltd. |
||||||||||||
| Series 2021-FL3, Class A, (1-mo. CME Term SOFR + 1.36%), 6.70%, 11/16/36(a)(c) |
4,032 | 3,948,739 | ||||||||||
| Series 2022-FL4, Class A, (SOFR (30-day) + 1.90%), 7.21%, 01/19/39(a)(c) |
15,719 | 15,548,356 | ||||||||||
| Series 2022-FL5, Class A, (1-mo. CME Term SOFR + 2.30%), 7.63%, 06/19/37(a)(c) |
4,435 | 4,392,218 | ||||||||||
| Series 2022-FL6, Class A, (1-mo. CME Term SOFR + 2.58%), 7.91%, 08/17/37(a)(c) |
10,459 | 10,432,852 | ||||||||||
| Galaxy XIX CLO Ltd., Series 2015-19A, Class A2RR, (3-mo. CME Term SOFR + 1.66%), 7.01%, 07/24/30(a)(c) |
250 | 244,827 | ||||||||||
| Galaxy XV CLO Ltd., Series 2013-15A, Class ARR, (3-mo. CME Term SOFR + 1.23%), 6.54%, 10/15/30(a)(c) |
1,275 | 1,271,729 | ||||||||||
| Galaxy XVIII CLO Ltd., Series 2018-28A, Class A1, (3-mo. CME Term SOFR + 1.36%), 6.67%, 07/15/31(a)(c) |
1,220 | 1,216,449 | ||||||||||
| Galaxy XX CLO Ltd., Series 2015-20A, Class AR, (3-mo. CME Term SOFR + 1.26%), 6.59%, 04/20/31(a)(c) |
246 | 245,770 | ||||||||||
| Galaxy XXII CLO Ltd., Series 2016-22A, Class ARR, (3-mo. CME Term SOFR + 1.46%), 6.77%, 04/16/34(a)(c) |
4,180 | 4,138,321 | ||||||||||
| Galaxy XXV CLO Ltd., Series 2018-25A, Class A, (3-mo. CME Term SOFR + 1.41%), 6.76%, 10/25/31(a)(c) |
750 | 745,633 | ||||||||||
| Galaxy XXVIII CLO Ltd., Series 2018-28A, Class A2, (3-mo. CME Term SOFR + 1.56%), 6.87%, 07/15/31(a)(c) |
1,000 | 997,970 | ||||||||||
| Generate CLO 2 Ltd., Series 2A, Class AR, (3- mo. CME Term SOFR + 1.41%), 6.76%, 01/22/31(a)(c) |
246 | 245,016 | ||||||||||
| Generate CLO 3 Ltd., Series 3A, Class BR, (3- mo. CME Term SOFR + 2.01%), 7.34%, 10/20/29(a)(c) |
3,380 | 3,357,016 | ||||||||||
| Security | Par (000) |
Value | ||||||||||
| Asset-Backed Securities (continued) |
| |||||||||||
| Generate CLO 4 Ltd. |
||||||||||||
| Series 4A, Class A1R, (3-mo. CME Term SOFR + 1.35%), 6.68%, 04/20/32(a)(c) |
USD | 8,039 | $ | 8,007,402 | ||||||||
| Series 4A, Class BR, (3-mo. CME Term SOFR + 1.81%), 7.14%, 04/20/32(a)(c) |
3,000 | 2,931,300 | ||||||||||
| Generate CLO 7 Ltd. |
||||||||||||
| Series 7A, Class A1, (3-mo. CME Term SOFR + 1.63%), 6.98%, 01/22/33(a)(c) |
250 | 249,467 | ||||||||||
| Series 7A, Class C, (3-mo. CME Term SOFR + 3.01%), 8.36%, 01/22/33(a)(c) |
500 | 497,503 | ||||||||||
| Gilbert Park CLO Ltd. |
||||||||||||
| Series 2017-1A, Class A, (3-mo. CME Term SOFR + 1.45%), 6.76%, 10/15/30(a)(c) |
480 | 478,886 | ||||||||||
| Series 2017-1A, Class B, (3-mo. CME Term SOFR + 1.86%), 7.17%, 10/15/30(a)(c) |
250 | 248,150 | ||||||||||
| Series 2017-1A, Class C, (3-mo. CME Term SOFR + 2.21%), 7.52%, 10/15/30(a)(c) |
3,360 | 3,321,891 | ||||||||||
| Series 2017-1A, Class D, (3-mo. CME Term SOFR + 3.21%), 8.52%, 10/15/30(a)(c) |
2,652 | 2,609,853 | ||||||||||
| GITSIT Mortgage Loan Trust, Series 2023-NPL1, Class A1, 8.35%, 05/25/53(a)(b) |
6,773 | 6,788,724 | ||||||||||
| GoldenTree Loan Management U.S. CLO 1 Ltd. |
||||||||||||
| Series 2017-1A, Class A1R2, (3-mo. CME Term SOFR + 1.28%), 6.61%, 04/20/34(a)(c) |
450 | 446,499 | ||||||||||
| Series 2021-11A, Class A, (3-mo. CME Term SOFR + 1.39%), 6.72%, 10/20/34(a)(c) |
5,520 | 5,504,878 | ||||||||||
| Series 2021-11A, Class E, (3-mo. CME Term SOFR + 5.61%), 10.94%, 10/20/34(a)(c) |
250 | 232,130 | ||||||||||
| Series 2021-9A, Class E, (3-mo. CME Term SOFR + 5.01%), 10.34%, 01/20/33(a)(c) |
250 | 228,022 | ||||||||||
| GoldenTree Loan Management U.S. CLO 3 Ltd., Series 2018-3A, Class B1, (3-mo. CME Term SOFR + 1.81%), 7.14%, 04/20/30(a)(c) |
500 | 497,250 | ||||||||||
| GoldenTree Loan Opportunities IX Ltd. |
||||||||||||
| Series 2014-9A, Class AR2, (3-mo. CME Term SOFR + 1.37%), 6.74%, 10/29/29(a)(c) |
891 | 889,819 | ||||||||||
| Series 2014-9A, Class BR2, (3-mo. CME Term SOFR + 1.86%), 7.23%, 10/29/29(a)(c) |
1,000 | 996,031 | ||||||||||
| GoldenTree Loan Opportunities X Ltd. |
||||||||||||
| Series 2015-10A, Class AR, (3-mo. CME Term SOFR + 1.38%), 6.71%, 07/20/31(a)(c) |
4,688 | 4,676,789 | ||||||||||
| Series 2015-10A, Class DR, (3-mo. CME Term SOFR + 3.31%), 8.64%, 07/20/31(a)(c) |
500 | 493,070 | ||||||||||
| GoldenTree Loan Opportunities XI Ltd., |
||||||||||||
| Series 2015-11A, Class AR2, (3-mo. CME Term SOFR + 1.33%), 6.64%, 01/18/31(a)(c) |
3,483 | 3,479,791 | ||||||||||
| Goldman Home Improvement Trust, Series 2022- GRN2, Class A, 6.80%, 10/25/52(a) |
2,846 | 2,819,810 | ||||||||||
| Golub Capital Partners CLO Ltd., Series 2021- 55A, Class A, (3-mo. CME Term SOFR + 1.46%), 6.79%, 07/20/34(a)(c) |
430 | 425,830 | ||||||||||
| GoodLeap Sustainable Home Solutions Trust |
||||||||||||
| Series 2022-3CS, Class A, 4.95%, 07/20/49(a) |
4,979 | 4,441,579 | ||||||||||
| Series 2023-1GS, Class A, 5.52%, 02/22/55(a) |
4,571 | 4,234,075 | ||||||||||
| Gracie Point International Funding |
||||||||||||
| Series 2022-2A, Class A, (SOFR (30-day) + 2.75%), 8.07%, 07/01/24(a)(c) |
7,062 | 7,095,125 | ||||||||||
| Series 2022-2A, Class B, (SOFR (30-day) + 3.35%), 8.67%, 07/01/24(a)(c) |
3,708 | 3,735,125 | ||||||||||
| Series 2022-3A, Class A, (SOFR (30-day) + 3.25%), 8.56%, 11/01/24(a)(c) |
4,288 | 4,295,631 | ||||||||||
| M A S T E R P O R T F O L I O S C H E D U L E O F I N V E S T M E N T S |
35 |
| Consolidated Schedule of Investments (continued) September 30, 2023 |
Master Total Return Portfolio (Percentages shown are based on Net Assets) |
| Security | Par (000) |
Value | ||||||||||
| Asset-Backed Securities (continued) |
| |||||||||||
| GreenPoint Manufactured Housing |
||||||||||||
| Series 1999-5, Class M1B, 8.29%, 12/15/29(c) |
USD | 190 | $ | 189,139 | ||||||||
| Series 1999-5, Class M2, 9.23%, 12/15/29(c) |
801 | 700,436 | ||||||||||
| Greenwood Park CLO Ltd., Series 2018-1A, Class A1, (3-mo. CME Term SOFR + 1.29%), 6.60%, 04/15/31(a)(c) |
1,000 | 996,460 | ||||||||||
| Greystone CRE Notes Ltd., Series 2021-FL3, Class A, (1-mo. CME Term SOFR + 1.13%), 6.47%, 07/15/39(a)(c) |
1,368 | 1,344,165 | ||||||||||
| Grippen Park CLO Ltd. |
||||||||||||
| Series 2017-1A, Class A, (3-mo. CME Term SOFR + 1.52%), 6.85%, 01/20/30(a)(c) |
682 | 680,931 | ||||||||||
| Series 2017-1A, Class D, (3-mo. CME Term SOFR + 3.56%), 8.89%, 01/20/30(a)(c) |
250 | 247,137 | ||||||||||
| GSAA Home Equity Trust |
||||||||||||
| Series 2005-14, Class 1A2, (1-mo. CME Term SOFR + 0.81%), 6.13%, 12/25/35(c) |
836 | 358,163 | ||||||||||
| Series 2006-4, Class 1A1, 3.66%, 03/25/36(c) |
1,614 | 1,099,856 | ||||||||||
| Series 2006-5, Class 2A1, (1-mo. CME Term SOFR + 0.25%), 5.57%, 03/25/36(c) |
11 | 3,765 | ||||||||||
| Series 2007-2, Class AF3, 5.92%, 03/25/37(c) |
451 | 86,093 | ||||||||||
| GSAMP Trust |
||||||||||||
| Series 2007-H1, Class A1B, (1-mo. CME Term SOFR + 0.51%), 5.83%, 01/25/47(c) |
735 | 372,482 | ||||||||||
| Series 2007-HS1, Class M6, (1-mo. CME Term SOFR + 3.49%), 8.81%, 02/25/47(c) |
1,300 | 1,208,319 | ||||||||||
| GT Loan Financing I Ltd., Series 2013-1A, Class CR, (3-mo. CME Term SOFR + 2.36%), 7.73%, 07/28/31(a)(c) |
250 | 249,125 | ||||||||||
| Gulf Stream Meridian 1 Ltd. |
||||||||||||
| Series 2020-IA, Class A1, (3-mo. CME Term SOFR + 1.63%), 6.94%, 04/15/33(a)(c) |
6,320 | 6,368,809 | ||||||||||
| Series 2020-IA, Class B, (3-mo. CME Term SOFR + 2.26%), 7.57%, 04/15/33(a)(c) |
250 | 248,475 | ||||||||||
| Gulf Stream Meridian 3 Ltd., Series 2021-IIIA, Class A1, (3-mo. CME Term SOFR + 1.58%), 6.89%, 04/15/34(a)(c) |
300 | 297,000 | ||||||||||
| Gulf Stream Meridian 4 Ltd. |
||||||||||||
| Series 2021-4A, Class A1, (3-mo. CME Term SOFR + 1.46%), 6.77%, 07/15/34(a)(c) |
12,060 | 11,981,749 | ||||||||||
| Series 2021-4A, Class A2, (3-mo. CME Term SOFR + 2.11%), 7.42%, 07/15/34(a)(c) |
1,750 | 1,747,375 | ||||||||||
| Gulf Stream Meridian 5 Ltd., Series 2021-5A, Class A2, (3-mo. CME Term SOFR + 2.06%), 7.37%, 07/15/34(a)(c) |
470 | 468,872 | ||||||||||
| Gulf Stream Meridian 7 Ltd., Series 2022-7A, Class A1, (3-mo. CME Term SOFR + 1.36%), 6.67%, 07/15/35(a)(c) |
1,950 | 1,927,692 | ||||||||||
| Harriman Park CLO Ltd., Series 2020-1A, Class A1R, (3-mo. CME Term SOFR + 1.38%), 6.71%, 04/20/34(a)(c) |
|
500 | 496,357 | |||||||||
| Henley CLO IV DAC |
||||||||||||
| Series 4A, Class D, (3-mo. EURIBOR + 3.00%), 6.72%, 04/25/34(a)(c) |
EUR | 750 | 744,189 | |||||||||
| Series 4X, Class B1, (3-mo. EURIBOR + 1.35%), 5.07%, 04/25/34(c)(e) |
540 | 547,337 | ||||||||||
| Highbridge Loan Management Ltd. |
||||||||||||
| Series 12A-18, Class A1B, (3-mo. CME Term SOFR + 1.51%), 6.82%, 07/18/31(a)(c) |
USD | 750 | 736,162 | |||||||||
| Series 3A-2014, Class A1R, (3-mo. CME Term SOFR + 1.44%), 6.75%, 07/18/29(a)(c) |
2,156 | 2,154,315 | ||||||||||
| Security | Par (000) |
Value | ||||||||||
| Asset-Backed Securities (continued) |
| |||||||||||
| Hipgnosis Music Assets LP, Series 2022-1, Class A, 5.00%, 05/16/62(a) |
USD | 7,212 | $ | 6,767,817 | ||||||||
| Home Equity Asset Trust |
||||||||||||
| Series 2006-3, Class M2, (1-mo. CME Term SOFR + 0.71%), 6.03%, 07/25/36(c) |
2,440 | 2,154,884 | ||||||||||
| Series 2007-1, Class 2A3, (1-mo. CME Term SOFR + 0.41%), 5.73%, 05/25/37(c) |
1,812 | 1,365,725 | ||||||||||
| Home Equity Mortgage Loan Asset-Backed Trust, Series 2004-A, Class M2, (1-mo. CME Term SOFR + 2.14%), 3.73%, 07/25/34(c) |
288 | 275,942 | ||||||||||
| Home Equity Mortgage Trust, Series 2006-2, Class 1A1, 5.87%, 07/25/36(b) |
1,701 | 191,518 | ||||||||||
| Home Partners of America Trust, Series 2021-2, Class F, 3.80%, 12/17/26(a) |
8,745 | 7,451,862 | ||||||||||
| HPS Loan Management Ltd. |
||||||||||||
| Series 10A-16, Class A1RR, (3-mo. CME Term SOFR + 1.40%), 6.73%, 04/20/34(a)(c) |
5,620 | 5,582,481 | ||||||||||
| Series 6A-2015, Class A1R, (3-mo. CME Term SOFR + 1.26%), 6.63%, 02/05/31(a)(c) |
10,275 | 10,205,070 | ||||||||||
| Series 9A-2016, Class A1BR, (3-mo. CME Term SOFR + 1.66%), 6.98%, 07/19/30(a)(c) |
300 | 293,004 | ||||||||||
| Invesco Euro CLO V DAC, Series 5X, Class D, (3-mo. EURIBOR + 3.80%), 7.46%, 01/15/34(c)(e) |
EUR | 350 | 344,954 | |||||||||
| Jamestown CLO XVI Ltd., Series 2021-16A, Class B, (3-mo. CME Term SOFR + 2.06%), 7.41%, 07/25/34(a)(c) |
USD | 250 | 248,800 | |||||||||
| JPMorgan Mortgage Acquisition Trust, Series 2006-CW1, Class M1, (1-mo. CME Term SOFR + 0.52%), 5.84%, 05/25/36(c) |
745 | 714,832 | ||||||||||
| Kapitus Asset Securitization LLC, Series 2022-1A, Class A, 3.38%, 07/10/28(a) |
7,928 | 7,470,928 | ||||||||||
| KKR CLO 10 Ltd., Series 10, Class BR, (3-mo. CME Term SOFR + 1.96%), 7.37%, 09/15/29(a)(c) |
360 | 359,100 | ||||||||||
| LCM 26 Ltd., Series 26A, Class A1, (3-mo. CME Term SOFR + 1.33%), 6.66%, 01/20/31(a)(c) |
6,983 | 6,953,029 | ||||||||||
| LCM 29 Ltd., Series 29A, Class AR, (3-mo. CME Term SOFR + 1.33%), 6.64%, 04/15/31(a)(c) |
850 | 837,310 | ||||||||||
| LCM XIV LP, Series 14A, Class AR, (3-mo. CME Term SOFR + 1.30%), 6.63%, 07/20/31(a)(c) |
500 | 495,732 | ||||||||||
| LCM XVII LP, Series 17A, Class A1AR, (3-mo. CME Term SOFR + 1.39%), 6.70%, 10/15/31(a)(c) |
350 | 348,042 | ||||||||||
| LCM XX LP |
||||||||||||
| Series 20A, Class AR, (3-mo. CME Term SOFR + 1.30%), 6.63%, 10/20/27(a)(c) |
25 | 25,173 | ||||||||||
| Series 20A, Class BR, (3-mo. CME Term SOFR + 1.81%), 7.14%, 10/20/27(a)(c) |
610 | 609,817 | ||||||||||
| LCM XXI LP, Series 21A, Class BR, (3-mo. CME Term SOFR + 1.66%), 6.99%, 04/20/28(a)(c) |
161 | 160,572 | ||||||||||
| Legacy Mortgage Asset Trust |
||||||||||||
| Series 2019-SL2, Class A, 3.38%, 02/25/59(a)(c) |
3,583 | 3,351,450 | ||||||||||
| Series 2019-SL2, Class B, 0.00%, 02/25/59(a)(d) |
1,966 | 321,279 | ||||||||||
| Series 2019-SL2, Class M, 4.25%, 02/25/59(a)(c) |
2,196 | 1,744,892 | ||||||||||
| Lehman ABS Manufactured Housing Contract Trust |
||||||||||||
| Series 2001-B, Class M1, 6.63%, 04/15/40(c) |
1,737 | 1,732,848 | ||||||||||
| Series 2002-A, Class C, 0.00%, 06/15/33(d) |
201 | 184,510 | ||||||||||
| 36 | 2 0 2 3 B L A C K R O C K A N N U A L R E P O R T T O S H A R E H O L D E R S |
| Consolidated Schedule of Investments (continued) September 30, 2023 |
Master Total Return Portfolio (Percentages shown are based on Net Assets) |
| Security | Par (000) |
Value | ||||||||||
| Asset-Backed Securities (continued) |
| |||||||||||
| Lehman ABS Mortgage Loan Trust, Series 2007-1, Class 2A1, (1-mo. CME Term SOFR + 0.20%), 5.52%, 06/25/37(a)(c) |
USD | 307 | $ | 192,339 | ||||||||
| Lendmark Funding Trust |
||||||||||||
| Series 2021-2A, Class D, 4.46%, 04/20/32(a) |
730 | 558,881 | ||||||||||
| Series 2022-1A, Class A, 5.12%, 07/20/32(a) |
8,420 | 8,205,670 | ||||||||||
| LoanCore Issuer Ltd., Series 2022-CRE7, Class A, (SOFR (30-day) + 1.55%), 6.86%, 01/17/37(a)(c) |
2,712 | 2,658,191 | ||||||||||
| Loanpal Solar Loan Ltd. |
||||||||||||
| Series 2020-2GF, Class A, 2.75%, 07/20/47(a) |
5,003 | 3,792,533 | ||||||||||
| Series 2021-1GS, Class A, 2.29%, 01/20/48(a) |
4,887 | 3,669,472 | ||||||||||
| Logan CLO I Ltd., Series 2021-1A, Class A, (3- mo. CME Term SOFR + 1.42%), 6.75%, 07/20/34(a)(c) |
4,510 | 4,490,119 | ||||||||||
| Long Beach Mortgage Loan Trust |
||||||||||||
| Series 2006-5, Class 2A3, (1-mo. CME Term SOFR + 0.41%), 5.73%, 06/25/36(c) |
3,019 | 1,401,050 | ||||||||||
| Series 2006-7, Class 2A3, (1-mo. CME Term SOFR + 0.43%), 5.75%, 08/25/36(c) |
8,137 | 3,091,936 | ||||||||||
| Long Point Park CLO Ltd., Series 2017-1A, Class A2, (3-mo. CME Term SOFR + 1.64%), 6.95%, 01/17/30(a)(c) |
430 | 424,625 | ||||||||||
| Longfellow Place CLO Ltd., Series 2013-1A, Class BR3, (3-mo. CME Term SOFR + 2.01%), 7.32%, 04/15/29(a)(c) |
298 | 297,939 | ||||||||||
| Louisiana Local Government Environmental Facilities & Community Development Authority, Series 2022-ELL, Class A2, 4.15%, 02/01/33 |
2,630 | 2,467,021 | ||||||||||
| Madison Avenue Manufactured Housing Contract Trust, Series 2002-A, Class B2, (1-mo. CME Term SOFR + 3.36%), 8.68%, 03/25/32(c) |
150 | 149,893 | ||||||||||
| Madison Park Euro Funding XVI DAC, Series 16A, Class D, (3-mo. EURIBOR + 3.20%), 6.86%, 05/25/34(a)(c) |
EUR | 1,000 | 990,254 | |||||||||
| Madison Park Funding XI Ltd., Series 2013-11A, Class AR2, (3-mo. CME Term SOFR + 1.16%), 6.51%, 07/23/29(a)(c) |
USD | 4,976 | 4,951,223 | |||||||||
| Madison Park Funding XIII Ltd. |
||||||||||||
| Series 2014-13A, Class AR2, (3-mo. CME Term SOFR + 1.21%), 6.53%, 04/19/30(a)(c) |
6,173 | 6,154,595 | ||||||||||
| Series 2014-13A, Class BR2, (3-mo. CME Term SOFR + 1.76%), 7.08%, 04/19/30(a)(c) |
5,140 | 5,113,272 | ||||||||||
| Madison Park Funding XIX Ltd. |
||||||||||||
| Series 2015-19A, Class A1R2, (3-mo. CME Term SOFR + 1.18%), 6.53%, 01/22/28(a)(c) |
6,053 | 6,027,205 | ||||||||||
| Series 2015-19A, Class A2R2, (3-mo. CME Term SOFR + 1.76%), 7.11%, 01/22/28(a)(c) |
1,000 | 995,400 | ||||||||||
| Madison Park Funding XLI Ltd. |
||||||||||||
| Series 12A, Class AR, (3-mo. CME Term SOFR + 1.09%), 6.44%, 04/22/27(a)(c) |
876 | 874,292 | ||||||||||
| Series 12A, Class CR, (3-mo. CME Term SOFR + 1.91%), 7.26%, 04/22/27(a)(c) |
2,381 | 2,356,876 | ||||||||||
| Madison Park Funding XLIX Ltd., Series 2021- 49A, Class E, (3-mo. CME Term SOFR + 6.51%), 11.83%, 10/19/34(a)(c) |
250 | 245,033 | ||||||||||
| Madison Park Funding XLV Ltd., Series 2020- 45A, Class AR, (3-mo. CME Term SOFR + 1.38%), 6.69%, 07/15/34(a)(c) |
4,660 | 4,623,667 | ||||||||||
| Madison Park Funding XVIII Ltd., Series 2015- 18A, Class ARR, (3-mo. CME Term SOFR + 1.20%), 6.54%, 10/21/30(a)(c) |
14,741 | 14,670,360 | ||||||||||
| Security | Par (000) |
Value | ||||||||||
| Asset-Backed Securities (continued) |
| |||||||||||
| Madison Park Funding XXII Ltd., Series 2016- 22A, Class A1R, (3-mo. CME Term SOFR + 1.52%), 6.83%, 01/15/33(a)(c) |
USD | 3,000 | $ | 2,993,478 | ||||||||
| Madison Park Funding XXIII Ltd. |
||||||||||||
| Series 2017-23A, Class AR, (3-mo. CME Term SOFR + 1.23%), 6.59%, 07/27/31(a)(c) |
1,466 | 1,460,736 | ||||||||||
| Series 2017-23A, Class BR, (3-mo. CME Term SOFR + 1.81%), 7.17%, 07/27/31(a)(c) |
500 | 496,300 | ||||||||||
| Series 2017-23A, Class CR, (3-mo. CME Term SOFR + 2.26%), 7.62%, 07/27/31(a)(c) |
900 | 889,070 | ||||||||||
| Madison Park Funding XXIV Ltd., Series 2016- 24A, Class BR, (3-mo. CME Term SOFR + 2.01%), 7.34%, 10/20/29(a)(c) |
510 | 507,297 | ||||||||||
| Madison Park Funding XXV Ltd., Series 2017- 25A, Class A2R, (3-mo. CME Term SOFR + 1.91%), 7.26%, 04/25/29(a)(c) |
1,430 | 1,418,989 | ||||||||||
| Madison Park Funding XXVI Ltd., Series 2017- 26A, Class AR, (3-mo. CME Term SOFR + 1.46%), 6.83%, 07/29/30(a)(c) |
11,160 | 11,148,569 | ||||||||||
| Madison Park Funding XXVII Ltd., Series 2018- 27A, Class A1A, (3-mo. CME Term SOFR + 1.29%), 6.62%, 04/20/30(a)(c) |
497 | 494,718 | ||||||||||
| Madison Park Funding XXXI Ltd. |
||||||||||||
| Series 2018-31A, Class B, (3-mo. CME Term SOFR + 1.96%), 7.31%, 01/23/31(a)(c) |
500 | 497,000 | ||||||||||
| Series 2018-31A, Class C, (3-mo. CME Term SOFR + 2.41%), 7.76%, 01/23/31(a)(c) |
1,250 | 1,234,052 | ||||||||||
| Madison Park Funding XXXIII Ltd., Series 2019- 33A, Class AR, (3-mo. CME Term SOFR + 1.29%), 6.60%, 10/15/32(a)(c) |
1,560 | 1,546,781 | ||||||||||
| Madison Park Funding XXXIV Ltd. |
||||||||||||
| Series 2019-34A, Class AR, (3-mo. CME Term SOFR + 1.38%), 6.73%, 04/25/32(a)(c) |
250 | 249,284 | ||||||||||
| Series 2019-34A, Class DR, (3-mo. CME Term SOFR + 3.61%), 8.96%, 04/25/32(a)(c) |
250 | 243,728 | ||||||||||
| Madison Park Funding XXXVII Ltd., Series 2019- 37A, Class AR, (3-mo. CME Term SOFR + 1.33%), 6.64%, 07/15/33(a)(c) |
2,110 | 2,101,560 | ||||||||||
| Madison Park Funding XXXVIII Ltd., Series 2021- 38A, Class A, (3-mo. CME Term SOFR + 1.38%), 6.69%, 07/17/34(a)(c) |
5,010 | 4,978,938 | ||||||||||
| Man GLG Euro CLO, Series 6A, Class DR, (3-mo. EURIBOR + 3.50%), 7.16%, 10/15/32(a)(c) |
EUR | 1,680 | 1,673,639 | |||||||||
| Marble Point CLO XI Ltd., Series 2017-2A, Class A, (3-mo. CME Term SOFR + 1.44%), 6.75%, 12/18/30(a)(c) |
USD | 1,803 | 1,795,106 | |||||||||
| Marble Point CLO XXII Ltd., Series 2021-2A, Class B, (3-mo. CME Term SOFR + 2.11%), 7.46%, 07/25/34(a)(c) |
250 | 243,875 | ||||||||||
| Marble Point CLO XXIII Ltd., Series 2021-4A, Class D1, (3-mo. LIBOR US + 3.65%), 9.26%, 01/22/35(a)(c) |
250 | 240,241 | ||||||||||
| Mariner CLO LLC |
||||||||||||
| Series 2016-3A, Class AR2, (3-mo. CME Term SOFR + 1.25%), 6.60%, 07/23/29(a)(c) |
901 | 896,996 | ||||||||||
| Series 2016-3A, Class BR2, (3-mo. CME Term SOFR + 1.76%), 7.11%, 07/23/29(a)(c) |
1,978 | 1,965,341 | ||||||||||
| Series 2016-3A, Class CR2, (3-mo. CME Term SOFR + 2.31%), 7.66%, 07/23/29(a)(c) |
5,162 | 5,121,524 | ||||||||||
| Series 2016-3A, Class DR2, (3-mo. CME Term SOFR + 3.16%), 8.51%, 07/23/29(a)(c) |
500 | 498,664 | ||||||||||
| M A S T E R P O R T F O L I O S C H E D U L E O F I N V E S T M E N T S |
37 |
| Consolidated Schedule of Investments (continued) September 30, 2023 |
Master Total Return Portfolio (Percentages shown are based on Net Assets) |
| Security | Par (000) |
Value | ||||||||||
| Asset-Backed Securities (continued) |
| |||||||||||
| Mariner Finance Issuance Trust |
||||||||||||
| Series 2019-AA, Class B, 3.51%, 07/20/32(a) |
USD | 2,420 | $ | 2,396,348 | ||||||||
| Series 2019-AA, Class C, 4.01%, 07/20/32(a) |
2,150 | 2,106,717 | ||||||||||
| Series 2020-AA, Class C, 4.10%, 08/21/34(a) |
1,536 | 1,413,562 | ||||||||||
| Series 2021-BA, Class E, 4.68%, 11/20/36(a) |
1,265 | 980,370 | ||||||||||
| MASTR Asset-Backed Securities Trust |
||||||||||||
| Series 2006-AM2, Class A4, (1-mo. CME Term SOFR + 0.63%), |
1,020 | 875,279 | ||||||||||
| Series 2007-HE1, Class A4, (1-mo. CME Term SOFR + 0.39%), 5.71%, 05/25/37(c) |
1,318 | 1,001,511 | ||||||||||
| MASTR Specialized Loan Trust, Series 2006-3, Class A, (1-mo. CME Term SOFR + 0.63%), 5.95%, 06/25/46(a)(c) |
240 | 226,616 | ||||||||||
| Mercury Financial Credit Card Master Trust, Series 2022-1A, Class A, 2.50%, 09/21/26(a) |
6,046 | 5,787,510 | ||||||||||
| Merrill Lynch First Franklin Mortgage Loan Trust, Series 2007-2, Class A2C, (1-mo. CME Term SOFR + 0.59%), 5.91%, 05/25/37(c) |
1,473 | 1,052,494 | ||||||||||
| Merrill Lynch Mortgage Investors Trust |
||||||||||||
| Series 2006-OPT1, Class M1, (1-mo. CME Term SOFR + 0.50%), 5.82%, 08/25/37(c) |
392 | 303,505 | ||||||||||
| Series 2006-RM3, Class A2B, (1-mo. CME Term SOFR + 0.29%), 5.61%, 06/25/37(c) |
850 | 187,970 | ||||||||||
| MF1 LLC |
||||||||||||
| Series 2022-FL10, Class A, (1-mo. CME Term SOFR + 2.64%), |
2,265 | 2,268,533 | ||||||||||
| Series 2022-FL9, Class A, (1-mo. CME Term SOFR + 2.15%), |
4,653 | 4,638,459 | ||||||||||
| Series 2023-FL12, Class A, (1-mo. CME Term SOFR + 2.07%), |
2,218 | 2,206,910 | ||||||||||
| MF1 Ltd., Series 2021-FL7, Class A, (1-mo. CME Term SOFR + 1.19%), 6.53%, 10/16/36(a)(c) |
850 | 835,125 | ||||||||||
| MidOcean Credit CLO III, Series 2014-3A, Class A3A2, (3-mo. CME Term SOFR + 1.23%), 6.57%, 04/21/31(a)(c) |
1,782 | 1,773,439 | ||||||||||
| Mill City Solar Loan Ltd., Series 2019-2GS, Class A, 3.69%, 07/20/43(a) |
4,368 | 3,642,848 | ||||||||||
| Morgan Stanley ABS Capital I, Inc. Trust |
||||||||||||
| Series 2005-HE1, Class A2MZ, (1-mo. CME Term SOFR + 0.71%), 6.03%, 12/25/34(c) |
820 | 720,873 | ||||||||||
| Series 2005-HE5, Class M4, (1-mo. CME Term SOFR + 0.98%), 6.30%, 09/25/35(c) |
2,781 | 2,175,675 | ||||||||||
| Series 2007-SEA1, Class 2A1, (1-mo. CME Term SOFR + 3.91%), |
544 | 492,967 | ||||||||||
| Morgan Stanley Home Equity Loan Trust, Series 2006-3, Class A3, (1-mo. CME Term SOFR + 0.43%), 5.75%, 04/25/36(c) |
1,435 | 1,018,736 | ||||||||||
| Morgan Stanley Mortgage Loan Trust |
||||||||||||
| Series 2006-16AX, Class 1A, (1-mo. CME Term SOFR + 0.45%), 5.77%, 11/25/36(c) |
3,661 | 656,430 | ||||||||||
| Series 2007-3XS, Class 2A3S, 6.36%, 01/25/47(b) |
1,474 | 548,326 | ||||||||||
| Series 2007-3XS, Class 2A4S, 6.46%, 01/25/47(b) |
6,416 | 2,386,647 | ||||||||||
| Mosaic Solar Loan Trust |
||||||||||||
| Series 2018-2GS, Class A, 4.20%, 02/22/44(a) |
1,606 | 1,427,958 | ||||||||||
| Series 2019-2A, Class A, 2.88%, 09/20/40(a) |
532 | 453,419 | ||||||||||
| Series 2020-1A, Class A, 2.10%, 04/20/46(a) |
777 | 654,667 | ||||||||||
| Series 2022-2A, Class A, 4.38%, 01/21/53(a) |
1,752 | 1,593,312 | ||||||||||
| Series 2022-3A, Class A, 6.10%, 06/20/53(a) |
1,505 | 1,479,146 | ||||||||||
| Series 2023-1A, Class A, 5.32%, 06/20/53(a) |
5,202 | 4,919,564 | ||||||||||
| Security | Par (000) |
Value | ||||||||||
| Asset-Backed Securities (continued) |
| |||||||||||
| MP CLO III Ltd., Series 2013-1A, Class AR, (3- mo. CME Term SOFR + 1.51%), 6.84%, 10/20/30(a)(c) |
USD | 2,407 | $ | 2,404,252 | ||||||||
| MP CLO VII Ltd., Series 2015-1A, Class BRR, (3-mo. CME Term SOFR + 1.86%), 7.17%, 10/18/28(a)(c) |
750 | 738,225 | ||||||||||
| Myers Park CLO Ltd. |
||||||||||||
| Series 2018-1A, Class B1, (3-mo. CME Term SOFR + 1.86%), |
250 | 247,925 | ||||||||||
| Series 2018-1A, Class C, (3-mo. CME Term SOFR + 2.31%), 7.64%, 10/20/30(a)(c) |
250 | 247,444 | ||||||||||
| Nationstar Home Equity Loan Trust, Series 2007-B, Class M1, (1-mo. CME Term SOFR + 0.52%), 5.84%, 04/25/37(c) |
3,320 | 2,929,413 | ||||||||||
| Navient Private Education Loan Trust Series 2014-AA, Class B, 3.50%, 08/15/44(a) |
6,000 | 5,521,214 | ||||||||||
| Series 2020-A, Class A2B, (1-mo. CME Term SOFR + 1.01%), |
1,508 | 1,493,621 | ||||||||||
| Navient Private Education Refi Loan Trust |
||||||||||||
| Series 2019-CA, Class A2, 3.13%, 02/15/68(a) |
. | 151 | 143,425 | |||||||||
| Series 2020-FA, Class B, 2.69%, 07/15/69(a) |
2,590 | 1,991,378 | ||||||||||
| Series 2021-DA, Class B, 2.61%, 04/15/60(a) |
1,700 | 1,506,973 | ||||||||||
| Series 2021-DA, Class C, 3.48%, 04/15/60(a) |
4,380 | 3,838,418 | ||||||||||
| Series 2021-DA, Class D, 4.00%, 04/15/60(a) |
1,400 | 1,253,962 | ||||||||||
| Nelnet Student Loan Trust |
||||||||||||
| Series 2021-A, Class B2, 2.85%, 04/20/62(a) |
22,590 | 18,034,467 | ||||||||||
| Series 2021-A, Class C, 3.75%, 04/20/62(a) |
1,706 | 1,372,403 | ||||||||||
| Series 2021-A, Class D, 4.93%, 04/20/62(a) |
2,323 | 1,892,802 | ||||||||||
| Series 2021-BA, Class B, 2.68%, 04/20/62(a) |
13,069 | 10,277,651 | ||||||||||
| Series 2021-BA, Class C, 3.57%, 04/20/62(a) |
836 | 664,110 | ||||||||||
| Series 2021-BA, Class D, 4.75%, 04/20/62(a) |
1,499 | 1,190,594 | ||||||||||
| Series 2021-CA, Class B, 2.53%, 04/20/62(a) |
12,397 | 9,680,226 | ||||||||||
| Series 2021-CA, Class C, 3.36%, 04/20/62(a) |
650 | 509,509 | ||||||||||
| Series 2021-CA, Class D, 4.44%, 04/20/62(a) |
990 | 776,305 | ||||||||||
| Series 2021-DA, Class B, 2.90%, 04/20/62(a) |
6,556 | 5,231,823 | ||||||||||
| Series 2021-DA, Class D, 4.38%, 04/20/62(a) |
331 | 255,143 | ||||||||||
| Neuberger Berman CLO XIV Ltd., Series 2013- 14A, Class AR2, (3-mo. CME Term SOFR + 1.29%), 6.66%, 01/28/30(a)(c) |
916 | 913,407 | ||||||||||
| Neuberger Berman CLO XV, Series 2013-15A, Class A1R2, (3-mo. CME Term SOFR + 1.18%), 6.49%, 10/15/29(a)(c) |
729 | 725,731 | ||||||||||
| Neuberger Berman CLO XVII Ltd. |
||||||||||||
| Series 2014-17A, Class BR2, (3-mo. CME Term SOFR + 1.76%), |
1,500 | 1,488,150 | ||||||||||
| Series 2014-17A, Class CR2, (3-mo. CME Term SOFR + 2.26%), |
1,900 | 1,878,864 | ||||||||||
| Neuberger Berman CLO XVI-S Ltd., Series 2017- 16SA, Class AR, (3-mo. CME Term SOFR +
1.30%), |
2,690 | 2,673,517 | ||||||||||
| Neuberger Berman CLO XX Ltd. |
||||||||||||
| Series 2015-20A, Class ARR, (3-mo. CME Term SOFR + 1.42%), |
1,000 | 994,236 | ||||||||||
| Series 2015-20A, Class BRR, (3-mo. CME Term SOFR + 1.91%), |
750 | 743,625 | ||||||||||
| Neuberger Berman CLO XXII Ltd. |
||||||||||||
| Series 2016-22A, Class BR, (3-mo. CME Term SOFR + 1.91%), |
250 | 248,150 | ||||||||||
| Series 2016-22A, Class CR, (3-mo. CME Term SOFR + 2.46%), |
250 | 244,364 | ||||||||||
| 38 | 2 0 2 3 B L A C K R O C K A N N U A L R E P O R T T O S H A R E H O L D E R S |
| Consolidated Schedule of Investments (continued) September 30, 2023 |
Master Total Return Portfolio (Percentages shown are based on Net Assets) |
| Security | Par (000) |
Value | ||||||||||
| Asset-Backed Securities (continued) |
| |||||||||||
| Neuberger Berman Loan Advisers CLO 25 Ltd., Series 2017-25A, Class BR, (3-mo. CME Term SOFR + 1.61%), 6.92%, 10/18/29(a)(c) |
USD | 250 | $ | 246,650 | ||||||||
| Neuberger Berman Loan Advisers CLO 26 Ltd. |
||||||||||||
| Series 2017-26A, Class AR, (3-mo. CME Term SOFR + 1.18%), |
6,575 | 6,542,347 | ||||||||||
| Series 2017-26A, Class BR, (3-mo. CME Term SOFR + 1.66%), 6.97%, 10/18/30(a)(c) |
250 | 246,800 | ||||||||||
| Neuberger Berman Loan Advisers CLO 29 Ltd. |
||||||||||||
| Series 2018-29A, Class A1, (3-mo. CME Term SOFR + 1.39%), |
500 | 498,919 | ||||||||||
| Series 2018-29A, Class B1, (3-mo. CME Term SOFR + 1.96%), |
250 | 248,375 | ||||||||||
| Neuberger Berman Loan Advisers CLO 34 Ltd., Series 2019-34A, Class BR, (3-mo. CME Term SOFR + 1.75%), 7.08%, 01/20/35(a)(c) |
500 | 494,400 | ||||||||||
| Neuberger Berman Loan Advisers CLO 37 Ltd., Series 2020-37A, Class BR, (3-mo. CME Term SOFR + 1.71%), 7.04%, 07/20/31(a)(c) |
1,000 | 989,200 | ||||||||||
| Neuberger Berman Loan Advisers CLO 39 Ltd., Series 2020-39A, Class E, (3-mo. CME Term SOFR + 7.46%), 12.79%, 01/20/32(a)(c) |
250 | 247,582 | ||||||||||
| Neuberger Berman Loan Advisers CLO 42 Ltd., Series 2021-42A, Class A, (3-mo. CME Term SOFR + 1.36%), 6.67%, 07/16/35(a)(c) |
3,940 | 3,909,753 | ||||||||||
| New Century Home Equity Loan Trust, Series 2005-C, Class M2, (1-mo. CME Term SOFR + 0.79%), 6.11%, 12/25/35(c) |
2,175 | 1,699,689 | ||||||||||
| Newark BSL CLO 1 Ltd., Series 2016-1A, Class A1R, (3-mo. CME Term SOFR + 1.36%), 6.72%, 12/21/29(a)(c) |
217 | 215,936 | ||||||||||
| Nomura Asset Acceptance Corp. Alternative Loan Trust, Series 2006-S5, Class A1, (1-mo. CME Term SOFR + 0.51%), 5.83%, 10/25/36(a)(c) |
67 | 76,037 | ||||||||||
| OAK Hill European Credit Partners V Designated Activity Co., Series 2016-5A, Class BR, (3-mo. EURIBOR + 1.90%), 5.55%, 01/21/35(a)(c) |
EUR | 400 | 410,237 | |||||||||
| Oakwood Mortgage Investors, Inc. |
||||||||||||
| Series 2001-D, Class A2, 5.26%, 01/15/19(c) |
USD | 498 | 214,653 | |||||||||
| Series 2001-D, Class A4, 6.93%, 09/15/31(c) |
317 | 165,364 | ||||||||||
| Series 2002-B, Class M1, 7.62%, 06/15/32(c) |
4,563 | 4,318,062 | ||||||||||
| Ocean Trails CLO X, Series 2020-10A, Class BR, (3-mo. CME Term SOFR + 2.06%), 7.37%, 10/15/34(a)(c) |
250 | 245,300 | ||||||||||
| OCP CLO Ltd. |
||||||||||||
| Series 2013-4A, Class A2RR, (3-mo. CME Term SOFR + 1.71%), |
2,500 | 2,484,250 | ||||||||||
| Series 2013-4A, Class BRR, (3-mo. CME Term SOFR + 2.16%), |
4,618 | 4,573,412 | ||||||||||
| Series 2013-4A, Class CRR, (3-mo. CME Term SOFR + 3.26%), |
3,000 | 2,971,450 | ||||||||||
| Series 2014-5A, Class A1R, (3-mo. CME Term SOFR + 1.34%), |
656 | 654,039 | ||||||||||
| Series 2014-5A, Class A2R, (3-mo. CME Term SOFR + 1.66%), |
1,070 | 1,052,974 | ||||||||||
| Series 2014-7A, Class A1RR, (3-mo. CME Term SOFR + 1.38%), |
370 | 369,001 | ||||||||||
| Series 2014-7A, Class A2RR, (3-mo. CME Term SOFR + 1.91%), |
1,250 | 1,243,375 | ||||||||||
| Series 2017-14A, Class B, (3-mo. CME Term SOFR + 2.21%), |
500 | 494,475 | ||||||||||
| Security | Par (000) |
Value | ||||||||||
| Asset-Backed Securities (continued) |
| |||||||||||
| OCP CLO Ltd. |
||||||||||||
| Series 2019-16A, Class AR, (3-mo. CME Term SOFR + 1.26%), 6.54%, 04/10/33(a)(c) |
USD | 1,480 | $ | 1,471,136 | ||||||||
| Series 2019-17A, Class A1R, (3-mo. CME Term SOFR + 1.30%), 6.63%, 07/20/32(a)(c) |
1,000 | 994,362 | ||||||||||
| Series 2020-18A, Class AR, (3-mo. CME Term SOFR + 1.35%), 6.68%, 07/20/32(a)(c) |
2,080 | 2,071,380 | ||||||||||
| Series 2020-19A, Class BR, (3-mo. CME Term SOFR + 1.96%), 7.29%, 10/20/34(a)(c) |
500 | 490,350 | ||||||||||
| Series 2021-22A, Class A, (3-mo. CME Term SOFR + 1.44%), 6.77%, 12/02/34(a)(c) |
2,010 | 1,994,393 | ||||||||||
| OCP Euro CLO DAC |
||||||||||||
| Series 2017-2X, Class B, (3-mo. EURIBOR + 1.35%), 5.01%, 01/15/32(c)(e) |
EUR | 1,130 | 1,165,513 | |||||||||
| Series 2019-3A, Class CR, (3-mo. EURIBOR + 2.30%), 6.01%, 04/20/33(a)(c) |
250 | 251,845 | ||||||||||
| Series 2019-3A, Class DR, (3-mo. EURIBOR + 3.30%), 7.01%, 04/20/33(a)(c) |
250 | 251,741 | ||||||||||
| Octagon 56 Ltd., Series 2021-1A, Class B, (3-mo. CME Term SOFR + 1.91%), 7.22%, 10/15/34(a)(c) |
USD | 250 | 246,125 | |||||||||
| Octagon 57 Ltd., Series 2021-1A, Class A, (3-mo. CME Term SOFR + 1.41%), 6.72%, 10/15/34(a)(c) |
500 | 496,613 | ||||||||||
| Octagon 67 Ltd., Series 2023-1A, Class A1, (3- mo. CME Term SOFR + 1.80%), 6.57%, 04/25/36(a)(c) |
750 | 755,178 | ||||||||||
| Octagon Investment Partners 18-R Ltd., Series 2018-18A, Class A1A, (3-mo. CME Term SOFR + 1.22%), 6.53%, 04/16/31(a)(c) |
7,300 | 7,280,483 | ||||||||||
| Octagon Investment Partners 33 Ltd., Series 2017-1A, Class A1, (3-mo. CME Term SOFR + 1.45%), 6.78%, 01/20/31(a)(c) |
486 | 484,964 | ||||||||||
| Octagon Investment Partners 36 Ltd., Series 2018-1A, Class A1, (3-mo. CME Term SOFR + 1.23%), 6.54%, 04/15/31(a)(c) |
1,244 | 1,239,998 | ||||||||||
| Octagon Investment Partners 37 Ltd., Series 2018-2A, Class A2, (3-mo. CME Term SOFR + 1.84%), 7.19%, 07/25/30(a)(c) |
750 | 739,425 | ||||||||||
| Octagon Investment Partners 39 Ltd., Series 2018-3A, Class B, (3-mo. CME Term SOFR + 1.91%), 7.24%, 10/20/30(a)(c) |
350 | 346,395 | ||||||||||
| Octagon Investment Partners 43 Ltd., Series 2019-1A, Class A2, (3-mo. CME Term SOFR + 1.91%), 7.26%, 10/25/32(a)(c) |
250 | 243,049 | ||||||||||
| Octagon Investment Partners 46 Ltd., Series 2020-2A, Class BR, (3-mo. CME Term SOFR + 1.91%), 7.22%, 07/15/36(a)(c) |
3,290 | 3,226,832 | ||||||||||
| Octagon Investment Partners XV Ltd., Series 2013-1A, Class A2R, (3-mo. CME Term SOFR + 1.61%), 6.93%, 07/19/30(a)(c) |
1,430 | 1,429,863 | ||||||||||
| Octagon Investment Partners XVI Ltd., Series 2013-1A, Class A1R, (3-mo. CME Term SOFR + 1.28%), 6.59%, 07/17/30(a)(c) |
3,580 | 3,568,422 | ||||||||||
| Octagon Investment Partners XVII Ltd., Series 2013-1A, Class A1R2, (3-mo. CME Term SOFR + 1.26%), 6.61%, 01/25/31(a)(c) |
8,206 | 8,187,953 | ||||||||||
| Octagon Loan Funding Ltd., Series 2014-1A, Class BRR, (3-mo. CME Term SOFR + 1.96%), 7.34%, 11/18/31(a)(c) |
250 | 246,775 | ||||||||||
| M A S T E R P O R T F O L I O S C H E D U L E O F I N V E S T M E N T S |
39 |
| Consolidated Schedule of Investments (continued) September 30, 2023 |
Master Total Return Portfolio (Percentages shown are based on Net Assets) |
| Security | Par (000) |
Value | ||||||||||
| Asset-Backed Securities (continued) |
|
|||||||||||
| OHA Credit Funding 2 Ltd., Series 2019-2A, Class AR, (3-mo. LIBOR US + 1.15%), 6.75%, 04/21/34(a)(c) |
USD | 14,440 | $ | 14,378,366 | ||||||||
| OHA Credit Funding 3 Ltd. |
||||||||||||
| Series 2019-3A, Class AR, (3-mo. CME Term SOFR + 1.40%), 6.73%, 07/02/35(a)(c) |
3,475 | 3,452,412 | ||||||||||
| Series 2019-3A, Class BR, (3-mo. CME Term SOFR + 1.91%), 7.24%, 07/02/35(a)(c) |
2,989 | 2,962,697 | ||||||||||
| OHA Credit Funding 4 Ltd., Series 2019-4A, Class AR, (3-mo. CME Term SOFR + 1.41%), 6.76%, 10/22/36(a)(c) |
1,000 | 992,845 | ||||||||||
| OHA Credit Funding 6 Ltd., Series 2020-6A, Class AR, (3-mo. CME Term SOFR + 1.40%), 6.73%, 07/20/34(a)(c) |
850 | 846,185 | ||||||||||
| OHA Loan Funding Ltd. |
||||||||||||
| Series 2013-2A, Class AR, (3-mo. CME Term SOFR + 1.30%), 6.68%, 05/23/31(a)(c) |
6,174 | 6,155,298 | ||||||||||
| Series 2016-1A, Class B1R, (3-mo. CME Term SOFR + 1.86%), 7.19%, 01/20/33(a)(c) |
250 | 247,875 | ||||||||||
| OneMain Financial Issuance Trust |
||||||||||||
| Series 2019-2A, Class A, 3.14%, 10/14/36(a) |
5,083 | 4,600,121 | ||||||||||
| Series 2020-1A, Class A, 3.84%, 05/14/32(a) |
730 | 728,507 | ||||||||||
| Series 2020-2A, Class C, 2.76%, 09/14/35(a) |
2,620 | 2,258,565 | ||||||||||
| Series 2021-1A, Class A2, (SOFR (30-day) + 0.76%), 6.07%, 06/16/36(a)(c) |
1,958 | 1,915,793 | ||||||||||
| Option One Mortgage Loan Trust |
||||||||||||
| Series 2005-4, Class M3, (1-mo. CME Term SOFR + 0.85%), 6.17%, 11/25/35(c) |
4,030 | 3,252,093 | ||||||||||
| Series 2007-CP1, Class 2A3, (1-mo. CME Term SOFR + 0.32%), 5.64%, 03/25/37(c) |
2,360 | 1,882,434 | ||||||||||
| Series 2007-FXD1, Class 1A1, 5.87%, 01/25/37(b) |
1,831 | 1,410,153 | ||||||||||
| Series 2007-FXD1, Class 2A1, 5.87%, 01/25/37(b) |
4,574 | 3,628,076 | ||||||||||
| Series 2007-FXD2, Class 1A1, 5.82%, 03/25/37(b) |
2,304 | 1,949,852 | ||||||||||
| Origen Manufactured Housing Contract Trust |
||||||||||||
| Series 2001-A, Class M1, 7.82%, 03/15/32(c) |
937 | 887,822 | ||||||||||
| Series 2007-B, Class A1, (1-mo. LIBOR US + 1.20%), 6.65%, 10/15/37(a)(c) |
544 | 525,478 | ||||||||||
| Ownit Mortgage Loan Trust Series, Series 2006-2, Class A2C, 6.50%, 01/25/37(b) |
1,652 | 1,407,141 | ||||||||||
| OZLM Funding IV Ltd. |
||||||||||||
| Series 2013-4A, Class A1R, (3-mo. CME Term SOFR + 1.51%), 6.86%, 10/22/30(a)(c) |
8,841 | 8,813,110 | ||||||||||
| Series 2013-4A, Class A2R, (3-mo. CME Term SOFR + 1.96%), 7.31%, 10/22/30(a)(c) |
2,120 | 2,088,412 | ||||||||||
| OZLM VIII Ltd., Series 2014-8A, Class BR3, (3-mo. CME Term SOFR + 2.36%), 7.67%, 10/17/29(a)(c) |
1,160 | 1,160,814 | ||||||||||
| OZLM XVIII Ltd., Series 2018-18A, Class A, (3-mo. CME Term SOFR + 1.28%), 6.59%, 04/15/31(a)(c) |
2,932 | 2,911,673 | ||||||||||
| OZLM XX Ltd., Series 2018-20A, Class A2, (3- mo. CME Term SOFR + 1.91%), 7.24%, 04/20/31(a)(c) |
850 | 833,425 | ||||||||||
| OZLM XXI Ltd., Series 2017-21A, Class B, (3-mo. CME Term SOFR + 2.16%), 7.49%, 01/20/31(a)(c) |
930 | 916,602 | ||||||||||
| OZLM XXII Ltd., Series 2018-22A, Class A1, (3-mo. CME Term SOFR + 1.33%), 6.64%, 01/17/31(a)(c) |
844 | 841,328 | ||||||||||
| Security | Par (000) |
Value | ||||||||||
| Asset-Backed Securities (continued) |
|
|||||||||||
| OZLM XXIV Ltd., Series 2019-24A, Class A2AR, (3-mo. CME Term SOFR + 1.96%), 7.29%, 07/20/32(a)(c) |
USD | 750 | $ | 740,716 | ||||||||
| Pagaya AI Technology in Housing Trust, Series 2023-1, Class F, 3.60%, 09/01/28(a) |
3,423 | 2,149,950 | ||||||||||
| Palmer Square CLO Ltd. |
||||||||||||
| Series 2013-2A, Class A1A3, (3-mo. CME Term SOFR + 1.26%), 6.57%, 10/17/31(a)(c) |
3,390 | 3,374,286 | ||||||||||
| Series 2014-1A, Class A1R2, (3-mo. CME Term SOFR + 1.39%), 6.70%, 01/17/31(a)(c) |
3,617 | 3,610,671 | ||||||||||
| Series 2015-1A, Class A2R4, (3-mo. CME Term SOFR + 1.96%), 7.34%, 05/21/34(a)(c) |
1,250 | 1,237,500 | ||||||||||
| Series 2015-2A, Class A2R2, (3-mo. CME Term SOFR + 1.81%), 7.14%, 07/20/30(a)(c) |
2,500 | 2,483,250 | ||||||||||
| Series 2015-2A, Class CR2, (3-mo. CME Term SOFR + 3.01%), 8.34%, 07/20/30(a)(c) |
1,000 | 978,483 | ||||||||||
| Series 2018-1A, Class A1, (3-mo. CME Term SOFR + 1.29%), 6.60%, 04/18/31(a)(c) |
4,828 | 4,821,254 | ||||||||||
| Series 2018-2A, Class A1A, (3-mo. CME Term SOFR + 1.36%), 6.67%, 07/16/31(a)(c) |
4,820 | 4,812,477 | ||||||||||
| Series 2018-2A, Class A1B, (3-mo. CME Term SOFR + 1.61%), 6.92%, 07/16/31(a)(c) |
250 | 244,774 | ||||||||||
| Series 2018-2A, Class A2, (3-mo. CME Term SOFR + 1.91%), 7.22%, 07/16/31(a)(c) |
1,500 | 1,487,250 | ||||||||||
| Series 2018-2A, Class D, (3-mo. CME Term SOFR + 5.86%), 11.17%, 07/16/31(a)(c) |
250 | 235,169 | ||||||||||
| Series 2020-3A, Class A1AR, (3-mo. CME Term SOFR + 1.34%), 6.71%, 11/15/31(a)(c) |
1,020 | 1,017,864 | ||||||||||
| Series 2021-1A, Class A2, (3-mo. CME Term SOFR + 1.66%), 6.99%, 04/20/34(a)(c) |
250 | 246,575 | ||||||||||
| Series 2021-3A, Class A1, (3-mo. CME Term SOFR + 1.41%), 6.72%, 01/15/35(a)(c) |
360 | 357,997 | ||||||||||
| Series 2022-5A, Class A, (3-mo. CME Term SOFR + 2.00%), 7.33%, 10/20/35(a)(c) |
500 | 503,297 | ||||||||||
| Palmer Square Loan Funding Ltd. |
||||||||||||
| Series 2020-4A, Class A2, (3-mo. CME Term SOFR + 1.86%), 7.25%, 11/25/28(a)(c) |
2,640 | 2,632,300 | ||||||||||
| Series 2020-4A, Class C, (3-mo. CME Term SOFR + 3.86%), 9.25%, 11/25/28(a)(c) |
500 | 499,635 | ||||||||||
| Series 2021-1A, Class D, (3-mo. CME Term SOFR + 6.26%), 11.59%, 04/20/29(a)(c) |
500 | 488,202 | ||||||||||
| Series 2021-2A, Class A2, (3-mo. CME Term SOFR + 1.51%), 6.89%, 05/20/29(a)(c) |
1,430 | 1,412,657 | ||||||||||
| Series 2021-2A, Class D, (3-mo. CME Term SOFR + 5.26%), 10.64%, 05/20/29(a)(c) |
500 | 463,504 | ||||||||||
| Series 2021-4A, Class C, (3-mo. CME Term SOFR + 2.86%), 8.17%, 10/15/29(a)(c) |
250 | 243,378 | ||||||||||
| Series 2021-4A, Class D, (3-mo. CME Term SOFR + 5.26%), 10.57%, 10/15/29(a)(c) |
1,480 | 1,396,350 | ||||||||||
| Series 2022-2A, Class A2, (3-mo. CME Term SOFR + 1.90%), 7.21%, 10/15/30(a)(c) |
1,810 | 1,803,724 | ||||||||||
| Series 2022-2A, Class B, (3-mo. CME Term SOFR + 2.20%), 7.51%, 10/15/30(a)(c) |
390 | 380,894 | ||||||||||
| Series 2022-2A, Class C, (3-mo. CME Term SOFR + 3.10%), 8.41%, 10/15/30(a)(c) |
250 | 244,420 | ||||||||||
| Parallel Ltd., Series 2015-1A, Class C1R, (3-mo. CME Term SOFR + 2.01%), |
507 | 506,442 | ||||||||||
| Park Avenue Institutional Advisers CLO Ltd. Series 2019-1A, Class A1, (3-mo. CME Term SOFR + 1.74%), 7.11%, 05/15/32(a)(c) |
500 | 497,543 | ||||||||||
| 40 | 2 0 2 3 B L A C K R O C K A N N U A L R E P O R T T O S H A R E H O L D E R S |
| Consolidated Schedule of Investments (continued) September 30, 2023 |
Master Total Return Portfolio (Percentages shown are based on Net Assets) |
| Security | Par (000) |
Value | ||||||||||
| Asset-Backed Securities (continued) |
| |||||||||||
| Park Avenue Institutional Advisers CLO Ltd. |
||||||||||||
| Series 2019-1A, Class A2A, (3-mo. CME Term SOFR + 2.26%), |
USD | 500 | $ | 493,650 | ||||||||
| Series 2021-2A, Class D, (3-mo. CME Term SOFR + 3.66%), 8.97%, 07/15/34(a)(c) |
250 | 243,762 | ||||||||||
| Penta CLO, Series 2022-11A, Class B, (3-mo. EURIBOR + 2.45%), 6.23%, 11/15/34(a)(c) |
EUR | 2,720 | 2,853,004 | |||||||||
| Pikes Peak CLO 1, Series 2018-1A, Class A, (3-mo. CME Term SOFR + 1.44%), 6.79%, 07/24/31(a)(c) |
USD | 975 | 969,461 | |||||||||
| Pikes Peak CLO 8, Series 2021-8A, Class A, (3-mo. CME Term SOFR + 1.43%), 6.76%, 07/20/34(a)(c) |
7,000 | 6,946,248 | ||||||||||
| Post CLO Ltd. |
||||||||||||
| Series 2018-1A, Class D, (3-mo. CME Term SOFR + 3.21%), 8.52%, 04/16/31(a)(c) |
500 | 498,612 | ||||||||||
| Series 2023-1A, Class A, (3-mo. CME Term SOFR + 1.95%), 6.83%, 04/20/36(a)(c) |
500 | 502,251 | ||||||||||
| PPM CLO 2 Ltd. |
||||||||||||
| Series 2019-2A, Class BR, (3-mo. CME Term SOFR + 2.01%), |
500 | 494,550 | ||||||||||
| Series 2019-2A, Class DR, (3-mo. CME Term SOFR + 3.66%), |
250 | 246,954 | ||||||||||
| PRET LLC, Series 2021-RN4, Class A1, 2.49%, 10/25/51(a)(c) |
5,487 | 4,974,791 | ||||||||||
| Prima Capital CRE Securitization Ltd. |
||||||||||||
| Series 2015-4A, Class C, 4.00%, 08/24/49(a) |
1,205 | 1,114,005 | ||||||||||
| Series 2016-6A, Class C, 4.00%, 08/24/40(a) |
7,170 | 6,323,472 | ||||||||||
| Prodigy Finance DAC |
||||||||||||
| Series 2021-1A, Class A, (1-mo. CME Term SOFR + 1.36%), 6.68%, 07/25/51(a)(c) |
2,493 | 2,468,527 | ||||||||||
| Series 2021-1A, Class B, (1-mo. CME Term SOFR + 2.61%), 7.93%, 07/25/51(a)(c) |
489 | 486,563 | ||||||||||
| Series 2021-1A, Class C, (1-mo. CME Term SOFR + 3.86%), 9.18%, 07/25/51(a)(c) |
283 | 283,410 | ||||||||||
| Series 2021-1A, Class D, (1-mo. CME Term SOFR + 6.01%), 11.33%, 07/25/51(a)(c) |
417 | 415,326 | ||||||||||
| Progress Residential Trust |
||||||||||||
| Series 2020-SFR2, Class B, 2.58%, 06/17/37(a) |
550 | 516,423 | ||||||||||
| Series 2020-SFR2, Class D, 3.87%, 06/17/37(a) |
1,886 | 1,799,230 | ||||||||||
| Series 2020-SFR3, Class E, 2.30%, 10/17/27(a) |
2,870 | 2,600,638 | ||||||||||
| Series 2020-SFR3, Class F, 2.80%, 10/17/27(a) |
5,410 | 4,923,983 | ||||||||||
| Series 2021-SFR1, Class F, 2.76%, 04/17/38(a) |
2,900 | 2,513,737 | ||||||||||
| Series 2021-SFR10, Class E2, 3.67%, 12/17/40(a) |
2,118 | 1,766,713 | ||||||||||
| Series 2021-SFR10, Class F, 4.61%, 12/17/40(a) |
8,552 | 7,117,431 | ||||||||||
| Series 2021-SFR2, Class F, 3.40%, 04/19/38(a) |
5,967 | 5,205,173 | ||||||||||
| Series 2021-SFR3, Class F, 3.44%, 05/17/26(a) |
6,640 | 5,763,156 | ||||||||||
| Series 2021-SFR4, Class F, 3.41%, 05/17/38(a) |
8,330 | 7,277,046 | ||||||||||
| Series 2021-SFR9, Class F, 4.05%, 11/17/40(a) |
1,342 | 1,080,205 | ||||||||||
| Series 2022-SFR1, Class F, 4.88%, 02/17/41(a) |
2,617 | 2,167,576 | ||||||||||
| Security | Par (000) |
Value | ||||||||||
| Asset-Backed Securities (continued) |
| |||||||||||
| Progress Residential Trust |
||||||||||||
| Series 2022-SFR1, Class G, 5.52%, 02/17/41(a) |
USD | 2,617 | $ | 2,144,652 | ||||||||
| Series 2022-SFR5, Class E1, 6.62%, 06/17/39(a) |
1,766 | 1,693,234 | ||||||||||
| Race Point IX CLO Ltd., Series 2015-9A, Class A1A2, (3-mo. CME Term SOFR + 1.20%), 6.51%, 10/15/30(a)(c) |
4,530 | 4,512,280 | ||||||||||
| Race Point X CLO Ltd., Series 2016-10A, Class A1R, (3-mo. CME Term SOFR + 1.36%), 6.71%, 07/25/31(a)(c) |
5,470 | 5,450,422 | ||||||||||
| Rad CLO 15 Ltd. |
||||||||||||
| Series 2021-15A, Class A, (3-mo. CME Term SOFR + 1.35%), 6.68%, 01/20/34(a)(c) |
2,300 | 2,285,337 | ||||||||||
| Series 2021-15A, Class B, (3-mo. CME Term SOFR + 1.91%), 7.24%, 01/20/34(a)(c) |
430 | 422,819 | ||||||||||
| Rad CLO 16 Ltd., Series 2022-16A, Class A1, (3-mo. CME Term SOFR + 2.25%), 7.56%, 10/15/34(a)(c) |
325 | 328,830 | ||||||||||
| Rad CLO 2 Ltd., Series 2018-2A, Class AR, (3- mo. CME Term SOFR + 1.34%), 6.65%, 10/15/31(a)(c) |
3,255 | 3,242,570 | ||||||||||
| Rad CLO 3 Ltd. |
||||||||||||
| Series 2019-3A, Class BR, (3-mo. CME Term SOFR + 1.81%), 7.12%, 04/15/32(a)(c) |
250 | 245,575 | ||||||||||
| Series 2019-3A, Class CR, (3-mo. CME Term SOFR + 2.11%), 7.42%, 04/15/32(a)(c) |
475 | 464,942 | ||||||||||
| Rad CLO 4 Ltd., Series 2019-4A, Class C, (3-mo. CME Term SOFR + 3.06%), 8.41%, 04/25/32(a)(c) |
675 | 660,560 | ||||||||||
| Rad CLO 5 Ltd., Series 2019-5A, Class AR, (3- mo. CME Term SOFR + 1.38%), 6.73%, 07/24/32(a)(c) |
3,770 | 3,742,470 | ||||||||||
| Rad CLO 7 Ltd., Series 2020-7A, Class A1, (3- mo. CME Term SOFR + 1.46%), 6.77%, 04/17/33(a)(c) |
500 | 496,916 | ||||||||||
| Rad CLO 9 Ltd., Series 2020-9A, Class B1, (3- mo. CME Term SOFR + 2.16%), 7.47%, 01/15/34(a)(c) |
250 | 248,625 | ||||||||||
| RAMP Series Trust, Series 2004-RS7, Class A2A, (1-mo. LIBOR US + 0.62%), 4.71%, 07/25/34(c) |
1,212 | 932,273 | ||||||||||
| Recette CLO Ltd., Series 2015-1A, Class BRR, (3-mo. CME Term SOFR + 1.66%), 6.99%, 04/20/34(a)(c) |
500 | 490,800 | ||||||||||
| Regatta IX Funding Ltd., Series 2017-1A, Class C, (3-mo. CME Term SOFR + 2.71%), 8.02%, 04/17/30(a)(c) |
250 | 250,968 | ||||||||||
| Regatta VI Funding Ltd., Series 2016-1A, Class AR2, (3-mo. CME Term SOFR + 1.42%), 6.75%, 04/20/34(a)(c) |
4,700 | 4,671,800 | ||||||||||
| Regatta VII Funding Ltd. |
||||||||||||
| Series 2016-1A, Class A1R2, (3-mo. CME Term SOFR + 1.41%), 6.81%, 06/20/34(a)(c) |
1,600 | 1,594,085 | ||||||||||
| Series 2016-1A, Class BR2, (3-mo. CME Term SOFR + 1.86%), 7.26%, 06/20/34(a)(c) |
500 | 495,150 | ||||||||||
| Regatta VIII Funding Ltd., Series 2017-1A, Class B, (3-mo. CME Term SOFR + 1.96%), 7.27%, 10/17/30(a)(c) |
750 | 748,800 | ||||||||||
| Regatta X Funding Ltd., Series 2017-3A, Class B, (3-mo. CME Term SOFR + 1.71%), 7.02%, 01/17/31(a)(c) |
250 | 247,250 | ||||||||||
| M A S T E R P O R T F O L I O S C H E D U L E O F I N V E S T M E N T S |
41 |
| Consolidated Schedule of Investments (continued) September 30, 2023 |
Master Total Return Portfolio (Percentages shown are based on Net Assets) |
| Security | Par (000) |
Value | ||||||||||
| Asset-Backed Securities (continued) |
| |||||||||||
| Regatta XIII Funding Ltd., Series 2018-2A, Class C, (3-mo. CME Term SOFR + 3.36%), 8.67%, 07/15/31(a)(c) |
USD | 375 | $ | 367,309 | ||||||||
| Regatta XVI Funding Ltd., Series 2019-2A, Class B, (3-mo. CME Term SOFR + 2.31%), 7.62%, 01/15/33(a)(c) |
250 | 249,825 | ||||||||||
| Regatta XVIII Funding Ltd., Series 2021-1A, Class B, (3-mo. CME Term SOFR + 1.71%), 7.02%, 01/15/34(a)(c) |
750 | 742,425 | ||||||||||
| Regatta XXIV Funding Ltd., Series 2021-5A, Class D, (3-mo. CME Term SOFR + 3.36%), 8.69%, 01/20/35(a)(c) |
250 | 244,543 | ||||||||||
| Regional Management Issuance Trust |
||||||||||||
| Series 2021-2, Class A, 1.90%, 08/15/33(a) |
1,053 | 900,032 | ||||||||||
| Series 2021-3, Class A, 3.88%, 10/08/26(f) |
21,460 | 18,670,200 | ||||||||||
| Series 2022-1, Class A, 3.07%, 03/15/32(a) |
417 | 388,749 | ||||||||||
| Series 2022-1, Class B, 3.71%, 03/15/32(a) |
810 | 725,637 | ||||||||||
| Series 2022-1, Class C, 4.46%, 03/15/32(a) |
534 | 462,662 | ||||||||||
| Series 2022-1, Class D, 6.72%, 03/15/32(a) |
1,695 | 1,476,025 | ||||||||||
| Riserva CLO Ltd., Series 2016-3A, Class ARR, (3-mo. CME Term SOFR + 1.32%), 6.63%, 01/18/34(a)(c) |
5,690 | 5,630,255 | ||||||||||
| Rockford Tower CLO Ltd. |
||||||||||||
| Series 2017-1A, Class AR2, (3-mo. CME Term SOFR + 1.36%), 6.69%, 04/20/34(a)(c) |
4,827 | 4,752,150 | ||||||||||
| Series 2017-2A, Class BR, (3-mo. CME Term SOFR + 1.76%), 7.07%, 10/15/29(a)(c) |
8,271 | 8,185,809 | ||||||||||
| Series 2017-2A, Class CR, (3-mo. CME Term SOFR + 2.16%), 7.47%, 10/15/29(a)(c) |
2,750 | 2,717,963 | ||||||||||
| Series 2017-2A, Class DR, (3-mo. CME Term SOFR + 3.11%), 8.42%, 10/15/29(a)(c) |
4,766 | 4,666,529 | ||||||||||
| Series 2017-3A, Class A, (3-mo. CME Term SOFR + 1.45%), 6.78%, 10/20/30(a)(c) |
14,483 | 14,441,944 | ||||||||||
| Series 2018-1A, Class A, (3-mo. CME Term SOFR + 1.36%), 6.74%, 05/20/31(a)(c) |
1,890 | 1,883,982 | ||||||||||
| Series 2018-1A, Class B, (3-mo. CME Term SOFR + 1.98%), 7.36%, 05/20/31(a)(c) |
1,500 | 1,487,550 | ||||||||||
| Series 2018-2A, Class A, (3-mo. CME Term SOFR + 1.42%), 6.75%, 10/20/31(a)(c) |
1,000 | 996,700 | ||||||||||
| Series 2019-2A, Class BR, (3-mo. CME Term SOFR + 1.91%), 7.29%, 08/20/32(a)(c) |
1,250 | 1,225,125 | ||||||||||
| Series 2020-1A, Class B, (3-mo. CME Term SOFR + 2.06%), 7.39%, 01/20/32(a)(c) |
680 | 676,872 | ||||||||||
| Rockford Tower Europe CLO DAC |
||||||||||||
| Series 2018-1X, Class B, (3-mo. EURIBOR + 1.85%), |
EUR | 2,448 | 2,552,808 | |||||||||
| Series 2018-1X, Class C, (3-mo. EURIBOR + 2.47%), |
1,305 | 1,344,410 | ||||||||||
| Romark CLO Ltd., Series 2017-1A, Class B, (3-mo. CME Term SOFR + 2.41%), 7.76%, 10/23/30(a)(c) |
USD | 750 | 738,737 | |||||||||
| Romark WM-R Ltd., Series 2018-1A, Class A1, (3-mo. CME Term SOFR + 1.29%), 6.62%, 04/20/31(a)(c) |
5,208 | 5,173,260 | ||||||||||
| RR 1 LLC, Series 2017-1A, Class A1AB, (3-mo. CME Term SOFR + 1.41%), 6.72%, 07/15/35(a)(c) |
9,490 | 9,423,843 | ||||||||||
| RR 3 Ltd., Series 2018-3A, Class A1R2, (3-mo. CME Term SOFR + 1.35%), 6.66%, 01/15/30(a)(c) |
3,716 | 3,706,812 | ||||||||||
| RR 4 Ltd., Series 2018-4A, Class A2, (3-mo. CME Term SOFR + 1.81%), 7.12%, 04/15/30(a)(c) |
1,400 | 1,389,780 | ||||||||||
| Security | Par (000) |
Value | ||||||||||
| Asset-Backed Securities (continued) |
| |||||||||||
| RR 5 Ltd., Series 2018-5A, Class A2, (3-mo. CME Term SOFR + 1.91%), 7.22%, 10/15/31(a)(c) |
USD | 1,000 | $ | 993,500 | ||||||||
| RRE 5 Loan Management DAC, Series 5A, Class A2R, (3-mo. EURIBOR + 1.75%), 5.41%, 01/15/37(a)(c) |
EUR | 1,160 | 1,190,981 | |||||||||
| Securitized Asset Backed Receivables LLC Trust, Series 2006-OP1, Class M6, (1-mo. CME Term SOFR + 1.12%), 6.44%, 10/25/35(c) |
USD | 340 | 243,545 | |||||||||
| Securitized Asset-Backed Receivables LLC Trust |
||||||||||||
| Series 2007-BR1, Class A2A, (1-mo. CME Term SOFR + 0.33%), 5.65%, 02/25/37(c) |
356 | 147,440 | ||||||||||
| Series 2007-BR1, Class A2B, (1-mo. CME Term SOFR + 0.65%), 5.97%, 02/25/37(c) |
3,789 | 1,571,189 | ||||||||||
| Service Experts Issuer LLC, Series 2021-1A, Class A, 2.67%, 02/02/32(a) |
4,844 | 4,403,074 | ||||||||||
| SESAC Finance LLC, Series 2022-1, Class A2, 5.50%, 07/25/52(a) |
2,565 | 2,425,452 | ||||||||||
| SG Mortgage Securities Trust, Series 2006-FRE2, Class A2C, (1-mo. CME Term SOFR + 0.43%), 5.75%, 07/25/36(c) |
878 | 180,055 | ||||||||||
| Shackleton CLO Ltd., Series 2019-14A, Class BR, (3-mo. CME Term SOFR + 2.06%), 7.39%, 07/20/34(a)(c) |
250 | 247,057 | ||||||||||
| Signal Peak CLO 1 Ltd. |
||||||||||||
| Series 2014-1A, Class AR3, (3-mo. CME Term SOFR + 1.42%), |
11,570 | 11,504,730 | ||||||||||
| Series 2014-1A, Class BR3, (3-mo. CME Term SOFR + 2.06%), |
3,010 | 2,964,850 | ||||||||||
| Signal Peak CLO 2 LLC |
||||||||||||
| Series 2015-1A, Class BR2, (3-mo. CME Term SOFR + 1.76%), |
7,152 | 7,109,088 | ||||||||||
| Series 2015-1A, Class CR2, (3-mo. CME Term SOFR + 2.16%), |
2,000 | 1,985,583 | ||||||||||
| Signal Peak CLO 5 Ltd., Series 2018-5A, Class A, (3-mo. CME Term SOFR + 1.37%), 6.72%, 04/25/31(a)(c) |
3,698 | 3,688,033 | ||||||||||
| Signal Peak CLO 8 Ltd. |
||||||||||||
| Series 2020-8A, Class A, (3-mo. CME Term SOFR + 1.53%), 6.86%, 04/20/33(a)(c) |
3,010 | 2,991,639 | ||||||||||
| Series 2020-8A, Class B, (3-mo. CME Term SOFR + 1.91%), 7.24%, 04/20/33(a)(c) |
1,000 | 981,855 | ||||||||||
| Silver Creek CLO Ltd. |
||||||||||||
| Series 2014-1A, Class AR, (3-mo. CME Term SOFR + 1.50%), |
3,061 | 3,063,617 | ||||||||||
| Series 2014-1A, Class CR, (3-mo. CME Term SOFR + 2.56%), |
500 | 495,000 | ||||||||||
| Sixth Street CLO XIX Ltd., Series 2021-19A, Class A, (3-mo. CME Term SOFR + 1.36%), 6.69%, 07/20/34(a)(c) |
16,995 | 16,871,307 | ||||||||||
| Sixth Street CLO XVI Ltd., Series 2020-16A, Class A1A, (3-mo. CME Term SOFR + 1.58%), 6.91%, 10/20/32(a)(c) |
650 | 649,354 | ||||||||||
| Sixth Street CLO XVII Ltd., Series 2021-17A, Class E, (3-mo. CME Term SOFR + 6.46%), 11.79%, 01/20/34(a)(c) |
625 | 604,516 | ||||||||||
| Sixth Street CLO XX Ltd., Series 2021-20A, Class A1, (3-mo. CME Term SOFR + 1.42%), 6.75%, 10/20/34(a)(c) |
250 | 248,266 | ||||||||||
| SLM Private Credit Student Loan Trust, Series 2004-A, Class A3, (3-mo. CME Term SOFR + 0.66%), 6.07%, 06/15/33(c) |
643 | 633,489 | ||||||||||
| 42 | 2 0 2 3 B L A C K R O C K A N N U A L R E P O R T T O S H A R E H O L D E R S |
| Consolidated Schedule of Investments (continued) September 30, 2023 |
Master Total Return Portfolio (Percentages shown are based on Net Assets) |
| Security | Par (000) |
Value | ||||||||||
| Asset-Backed Securities (continued) |
| |||||||||||
| SLM Private Education Loan Trust, Series 2010-C, Class A5, (1-mo. CME Term SOFR + 4.86%), 10.20%, 10/15/41(a)(c) |
USD | 13,068 | $ | 13,807,370 | ||||||||
| SMB Private Education Loan Trust |
||||||||||||
| Series 2015-B, Class B, 3.50%, 12/17/40(a) |
2,441 | 2,343,248 | ||||||||||
| Series 2020-PTA, Class A2A, 1.60%, 09/15/54(a) |
11,103 | 9,842,766 | ||||||||||
| Series 2020-PTA, Class B, 2.50%, 09/15/54(a) |
. | 6,740 | 5,238,318 | |||||||||
| Series 2021-A, Class C, 2.99%, 01/15/53(a) |
8,954 | 7,492,523 | ||||||||||
| Series 2021-C, Class B, 2.30%, 01/15/53(a) |
880 | 791,893 | ||||||||||
| Series 2021-C, Class C, 3.00%, 01/15/53(a) |
644 | 547,969 | ||||||||||
| Sound Point CLO II Ltd., Series 2013-1A, Class A1R, (3-mo. CME Term SOFR + 1.33%), 6.68%, 01/26/31(a)(c) |
808 | 802,479 | ||||||||||
| Sound Point CLO XII Ltd., Series 2016-2A, Class CR2, (3-mo. CME Term SOFR + 2.31%), 7.64%, 10/20/28(a)(c) |
4,500 | 4,479,579 | ||||||||||
| Sound Point CLO XV Ltd. |
||||||||||||
| Series 2017-1A, Class ARR, (3-mo. CME Term SOFR + 1.16%), 6.51%, 01/23/29(a)(c) |
431 | 430,256 | ||||||||||
| Series 2017-1A, Class BR, (3-mo. CME Term SOFR + 1.76%), 7.11%, 01/23/29(a)(c) |
350 | 346,077 | ||||||||||
| Sound Point CLO XXII Ltd., Series 2019-1A, Class AR, (3-mo. CME Term SOFR + 1.34%), 6.67%, 01/20/32(a)(c) |
600 | 594,234 | ||||||||||
| Sound Point CLO XXVIII Ltd., Series 2020-3A, Class A1, (3-mo. CME Term SOFR + 1.54%), 6.89%, 01/25/32(a)(c) |
2,065 | 2,052,304 | ||||||||||
| Soundview Home Loan Trust, Series 2004- WMC1, Class M2, (1-mo. CME Term SOFR + 0.91%), 6.23%, 01/25/35(c) |
35 | 31,509 | ||||||||||
| St. Paul’s CLO XII DAC, Series 12X, Class B1, (3-mo. EURIBOR + 1.60%), 5.26%, 04/15/33(c)(e) |
EUR | 1,420 | 1,451,243 | |||||||||
| STAR Trust, Series 2021-SFR1, Class F, (1-mo. CME Term SOFR + 2.51%), 7.85%, 04/17/38(a)(c) |
USD | 1,030 | 994,799 | |||||||||
| Steele Creek CLO Ltd., Series 2017-1A, Class A, (3-mo. CME Term SOFR + 1.51%), 6.82%, 10/15/30(a)(c) |
3,882 | 3,867,029 | ||||||||||
| Stewart Park CLO Ltd., Series 2015-1A, Class CR, (3-mo. CME Term SOFR + 2.06%), 7.37%, 01/15/30(a)(c) |
1,630 | 1,590,659 | ||||||||||
| Stratus CLO Ltd. |
||||||||||||
| Series 2021-1A, Class E, (3-mo. CME Term SOFR + 5.26%), 10.59%, 12/29/29(a)(c) |
1,000 | 936,915 | ||||||||||
| Series 2021-1A, Class SUB, 0.00%, 12/29/29(a)(c)(d) |
1,000 | 503,170 | ||||||||||
| Series 2021-2A, Class E, (3-mo. CME Term SOFR + 6.01%), 11.34%, 12/28/29(a)(c) |
250 | 247,049 | ||||||||||
| Series 2021-3A, Class C, (3-mo. CME Term SOFR + 2.31%), 7.64%, 12/29/29(a)(c) |
250 | 247,655 | ||||||||||
| Series 2021-3A, Class E, (3-mo. CME Term SOFR + 6.01%), 11.34%, 12/29/29(a)(c) |
250 | 241,058 | ||||||||||
| Structured Asset Securities Corp. Assistance Loan Trust, Series 2003-AL2, Class A, 3.36%, 01/25/31(a) |
83 | 76,682 | ||||||||||
| Sutton Park CLO DAC, Series 1X, Class BE, (3-mo. EURIBOR + 2.35%), 6.13%, 11/15/31(c)(e) |
EUR | 940 | 961,632 | |||||||||
| Security | Par (000) |
Value | ||||||||||
| Asset-Backed Securities (continued) |
| |||||||||||
| Symphony CLO XVI Ltd., Series 2015-16A, Class AR, (3-mo. CME Term SOFR + 1.41%), 6.72%, 10/15/31(a)(c) |
USD | 450 | $ | 448,044 | ||||||||
| Symphony CLO XVII Ltd., Series 2016-17A, Class AR, (3-mo. CME Term SOFR + 1.14%), 6.45%, 04/15/28(a)(c) |
550 | 549,634 | ||||||||||
| Symphony CLO XXII Ltd., Series 2020-22A, Class B, (3-mo. CME Term SOFR + 1.96%), 7.27%, 04/18/33(a)(c) |
250 | 248,025 | ||||||||||
| Symphony CLO XXIII Ltd. |
||||||||||||
| Series 2020-23A, Class BR, (3-mo. CME Term SOFR + 1.86%), 7.17%, 01/15/34(a)(c) |
500 | 493,668 | ||||||||||
| Series 2020-23A, Class CR, (3-mo. CME Term SOFR + 2.26%), 7.57%, 01/15/34(a)(c) |
500 | 494,279 | ||||||||||
| Series 2020-23A, Class ER, (3-mo. CME Term SOFR + 6.41%), 11.72%, 01/15/34(a)(c) |
250 | 239,489 | ||||||||||
| Symphony CLO XXIV Ltd., Series 2020-24A, Class A, (3-mo. CME Term SOFR + 1.46%), 6.81%, 01/23/32(a)(c) |
250 | 249,284 | ||||||||||
| Symphony CLO XXVI Ltd., Series 2021-26A, Class AR, (3-mo. CME Term SOFR + 1.34%), 6.67%, 04/20/33(a)(c) |
2,377 | 2,361,097 | ||||||||||
| TCI-Flatiron CLO Ltd., Series 2017-1A, Class AR, (3-mo. CME Term SOFR + 1.22%), 6.60%, 11/18/30(a)(c) |
3,278 | 3,268,217 | ||||||||||
| TCW CLO AMR Ltd., Series 2019-1A, Class ASNR, (3-mo. CME Term SOFR + 1.48%), 6.85%, 08/16/34(a)(c) |
250 | 246,895 | ||||||||||
| TIAA CLO III Ltd., Series 2017-2A, Class A, (3- mo. CME Term SOFR + 1.41%), 6.72%, 01/16/31(a)(c) |
1,327 | 1,322,582 | ||||||||||
| TICP CLO IX Ltd. |
||||||||||||
| Series 2017-9A, Class A, (3-mo. CME Term SOFR + 1.40%), 6.73%, 01/20/31(a)(c) |
2,785 | 2,782,444 | ||||||||||
| Series 2017-9A, Class B, (3-mo. CME Term SOFR + 1.86%), 7.19%, 01/20/31(a)(c) |
450 | 447,255 | ||||||||||
| Series 2017-9A, Class D, (3-mo. CME Term SOFR + 3.16%), 8.49%, 01/20/31(a)(c) |
500 | 492,832 | ||||||||||
| TICP CLO VI Ltd., Series 2016-6A, Class AR2, (3-mo. CME Term SOFR + 1.38%), 6.69%, 01/15/34(a)(c) |
4,870 | 4,850,014 | ||||||||||
| TICP CLO XI Ltd. |
||||||||||||
| Series 2018-11A, Class A, (3-mo. CME Term SOFR + 1.44%), 6.77%, 10/20/31(a)(c) |
750 | 749,479 | ||||||||||
| Series 2018-11A, Class B, (3-mo. CME Term SOFR + 1.99%), 7.32%, 10/20/31(a)(c) |
250 | 247,700 | ||||||||||
| Series 2018-11A, Class D, (3-mo. CME Term SOFR + 3.31%), 8.64%, 10/20/31(a)(c) |
250 | 246,629 | ||||||||||
| TICP CLO XII Ltd., Series 2018-12A, Class AR, (3-mo. CME Term SOFR + 1.43%), 6.74%, 07/15/34(a)(c) |
500 | 498,299 | ||||||||||
| Trestles CLO III Ltd., Series 2020-3A, Class C, (3-mo. LIBOR US + 2.25%), |
750 | 730,547 | ||||||||||
| Trestles CLO IV Ltd., Series 2021-4A, Class A, (3-mo. CME Term SOFR + 1.43%), 6.77%, 07/21/34(a)(c) |
6,950 | 6,884,072 | ||||||||||
| Trestles CLO Ltd. |
||||||||||||
| Series 2017-1A, Class A1R, (3-mo. CME Term SOFR + 1.25%), 6.60%, 04/25/32(a)(c) |
250 | 247,069 | ||||||||||
| Series 2017-1A, Class CR, (3-mo. CME Term SOFR + 3.16%), 8.51%, 04/25/32(a)(c) |
250 | 246,959 | ||||||||||
| M A S T E R P O R T F O L I O S C H E D U L E O F I N V E S T M E N T S |
43 |
| Consolidated Schedule of Investments (continued) September 30, 2023 |
Master Total Return Portfolio (Percentages shown are based on Net Assets) |
| Security | Par (000) |
Value | ||||||||||
| Asset-Backed Securities (continued) |
| |||||||||||
| Trestles CLO V Ltd. |
||||||||||||
| Series 2021-5A, Class A1, (3-mo. CME Term SOFR + 1.43%), 6.76%, 10/20/34(a)(c) |
USD | 1,000 | $ | 993,114 | ||||||||
| Series 2021-5A, Class E, (3-mo. CME Term SOFR + 6.61%), 11.94%, 10/20/34(a)(c) |
250 | 242,450 | ||||||||||
| Tricon American Homes Trust |
||||||||||||
| Series 2017-SFR2, Class F, 5.10%, 01/17/36(a) |
8,715 | 8,649,867 | ||||||||||
| Series 2018-SFR1, Class E, 4.56%, 05/17/37(a) |
890 | 856,732 | ||||||||||
| Series 2018-SFR1, Class F, 4.96%, 05/17/37(a) |
610 | 589,229 | ||||||||||
| Series 2020-SFR1, Class D, 2.55%, 07/17/38(a) |
6,675 | 5,985,130 | ||||||||||
| Tricon Residential Trust |
||||||||||||
| Series 2021-SFR1, Class F, 3.69%, 07/17/38(a) |
4,805 | 4,180,275 | ||||||||||
| Series 2021-SFR1, Class G, 4.13%, 07/17/38(a) |
3,324 | 2,909,343 | ||||||||||
| Trimaran Cavu Ltd. |
||||||||||||
| Series 2019-1A, Class A2, (3-mo. CME Term SOFR + 2.16%), 7.49%, 07/20/32(a)(c) |
250 | 248,750 | ||||||||||
| Series 2019-1A, Class B, (3-mo. CME Term SOFR + 2.46%), 7.79%, 07/20/32(a)(c) |
750 | 747,075 | ||||||||||
| Series 2019-1A, Class C1, (3-mo. CME Term SOFR + 3.41%), 8.74%, 07/20/32(a)(c) |
500 | 499,876 | ||||||||||
| Series 2019-2A, Class C, (3-mo. CME Term SOFR + 4.98%), 10.29%, 11/26/32(a)(c) |
500 | 501,908 | ||||||||||
| Series 2021-2A, Class D1, (3-mo. CME Term SOFR + 3.51%), 8.86%, 10/25/34(a)(c) |
250 | 245,766 | ||||||||||
| Trinitas CLO IV Ltd., Series 2016-4A, Class A2L2, (3-mo. CME Term SOFR + 1.66%), 6.97%, 10/18/31(a)(c) |
970 | 951,945 | ||||||||||
| Trinitas CLO XIV Ltd., Series 2020-14A, Class B, (3-mo. CME Term SOFR + 2.26%), 7.61%, 01/25/34(a)(c) |
3,460 | 3,409,138 | ||||||||||
| Venture CLO Ltd., Series 2018-32A, Class A2A, (3-mo. CME Term SOFR + 1.33%), 6.64%, 07/18/31(a)(c) |
1,480 | 1,470,694 | ||||||||||
| Venture XVIII CLO Ltd., Series 2014-18A, Class AR, (3-mo. CME Term SOFR + 1.48%), 6.79%, 10/15/29(a)(c) |
6,738 | 6,729,717 | ||||||||||
| VERDE CLO Ltd., Series 2019-1A, Class AR, (3-mo. CME Term SOFR + 1.36%), 6.67%, 04/15/32(a)(c) |
250 | 248,629 | ||||||||||
| VOLT CVI LLC, Series 2021-NP12, Class A1, 2.73%, 12/26/51(a)(b) |
5,098 | 4,592,453 | ||||||||||
| Voya CLO Ltd. |
||||||||||||
| Series 2014-4A, Class A1RA, (3-mo. CME Term SOFR + 1.36%), 6.67%, 07/14/31(a)(c) |
248 | 247,106 | ||||||||||
| Series 2015-3A, Class A1R, (3-mo. CME Term SOFR + 1.45%), 6.78%, 10/20/31(a)(c) |
250 | 249,022 | ||||||||||
| Series 2017-1A, Class A1R, (3-mo. CME Term SOFR + 1.21%), 6.52%, 04/17/30(a)(c) |
371 | 369,737 | ||||||||||
| Series 2017-3A, Class A1R, (3-mo. CME Term SOFR + 1.30%), 6.63%, 04/20/34(a)(c) |
2,178 | 2,165,500 | ||||||||||
| Series 2017-4A, Class A1, (3-mo. CME Term SOFR + 1.39%), 6.70%, 10/15/30(a)(c) |
5,968 | 5,944,788 | ||||||||||
| Series 2017-4A, Class B, (3-mo. CME Term SOFR + 1.71%), 7.02%, 10/15/30(a)(c) |
250 | 246,925 | ||||||||||
| Series 2018-1A, Class A2, (3-mo. CME Term SOFR + 1.56%), 6.88%, 04/19/31(a)(c) |
250 | 245,000 | ||||||||||
| Security | Par (000) |
Value | ||||||||||
| Asset-Backed Securities (continued) |
| |||||||||||
| Voya CLO Ltd. |
||||||||||||
| Series 2019-1A, Class AR, (3-mo. CME Term SOFR + 1.32%), 6.63%, 04/15/31(a)(c) |
USD | 9,238 | $ | 9,200,801 | ||||||||
| Voya Euro CLO II DAC, Series 2A, Class CR, (3-mo. EURIBOR + 2.15%), 5.81%, 07/15/35(a)(c) |
EUR | 750 | 756,720 | |||||||||
| Voya Euro CLO V DAC, Series 5A, Class B1, (3-mo. EURIBOR + 1.75%), 5.41%, 04/15/35(a)(c) |
1,970 | 2,022,081 | ||||||||||
| Washington Mutual Asset-Backed Certificates Trust |
||||||||||||
| Series 2006-HE4, Class 2A2, (1-mo. CME Term SOFR + 0.47%), 5.79%, 09/25/36(c) |
USD | 4,041 | 1,091,562 | |||||||||
| Series 2006-HE5, Class 1A, (1-mo. CME Term SOFR + 0.42%), 4.19%, 10/25/36(c) |
1,255 | 917,536 | ||||||||||
| Series 2007-HE3, Class 2A3, (1-mo. CME Term SOFR + 0.35%), 5.67%, 05/25/37(c) |
933 | 787,074 | ||||||||||
| Wellfleet CLO Ltd., Series 2017-3A, Class B, (3-mo. CME Term SOFR + 2.21%), 7.52%, 01/17/31(a)(c) |
750 | 731,264 | ||||||||||
| Whitebox CLO I Ltd. |
||||||||||||
| Series 2019-1A, Class ANAR, (3-mo. CME Term SOFR + 1.39%), 6.74%, 07/24/32(a)(c) |
350 | 348,604 | ||||||||||
| Series 2019-1A, Class CR, (3-mo. CME Term SOFR + 3.31%), 8.66%, 07/24/32(a)(c) |
4,120 | 4,067,620 | ||||||||||
| Series 2019-1A, Class DR, (3-mo. CME Term SOFR + 6.66%), 12.01%, 07/24/32(a)(c) |
3,300 | 3,122,170 | ||||||||||
| Whitebox CLO II Ltd. |
||||||||||||
| Series 2020-2A, Class BR, (3-mo. CME Term SOFR + 2.01%), 7.36%, 10/24/34(a)(c) |
1,470 | 1,452,087 | ||||||||||
| Series 2020-2A, Class DR, (3-mo. CME Term SOFR + 3.61%), 8.96%, 10/24/34(a)(c) |
1,470 | 1,435,598 | ||||||||||
| Whitebox CLO III Ltd. |
||||||||||||
| Series 2021-3A, Class D, (3-mo. CME Term SOFR + 3.61%), 8.92%, 10/15/34(a)(c) |
1,250 | 1,208,543 | ||||||||||
| Series 2021-3A, Class E, (3-mo. CME Term SOFR + 7.11%), 12.42%, 10/15/34(a)(c) |
1,000 | 969,991 | ||||||||||
| Yale Mortgage Loan Trust, Series 2007-1, Class A, (1-mo. CME Term SOFR + 0.51%), 5.83%, 06/25/37(a)(c) |
2,105 | 666,494 | ||||||||||
|
|
|
|||||||||||
| Total Asset-Backed Securities — 9.7% |
|
1,766,482,519 | ||||||||||
|
|
|
|||||||||||
| Shares | ||||||||||||
| Common Stocks |
||||||||||||
| Aerospace & Defense — 0.0% | ||||||||||||
| Astra Space, Inc. |
24,283 | 44,923 | ||||||||||
| Space Exploration Technologies Corp. (Acquired 08/21/23, |
25,626 | 2,075,706 | ||||||||||
| Space Exploration Technologies Corp. (Acquired 08/21/23, |
27,504 | 2,227,824 | ||||||||||
|
|
|
|||||||||||
| 4,348,453 | ||||||||||||
| Banks — 0.1% | ||||||||||||
| Citigroup, Inc. |
20,881 | 858,836 | ||||||||||
| First Citizens BancShares, Inc., Class A |
2,395 | 3,305,340 | ||||||||||
| New York Community Bancorp, Inc., Class A |
92,100 | 1,044,414 | ||||||||||
| Texas Capital Bancshares, Inc.(h)(i) |
10,016 | 589,942 | ||||||||||
|
|
|
|||||||||||
| 5,798,532 | ||||||||||||
| Capital Markets — 0.0% | ||||||||||||
| Crown PropTech Acquisitions(f) |
147,660 | 94,502 | ||||||||||
| 44 | 2 0 2 3 B L A C K R O C K A N N U A L R E P O R T T O S H A R E H O L D E R S |
| Consolidated Schedule of Investments (continued) September 30, 2023 |
Master Total Return Portfolio (Percentages shown are based on Net Assets) |
| Security | Shares | Value | ||||||||||
| Capital Markets (continued) | ||||||||||||
| Crown PropTech Acquisitions, Class A(h) |
85,597 | $ | 898,769 | |||||||||
| Crown PropTech Founders Unvested(f) |
32,099 | — | ||||||||||
|
|
|
|||||||||||
| 993,271 | ||||||||||||
| Chemicals — 0.0% | ||||||||||||
| Element Solutions, Inc. |
78,915 | 1,547,523 | ||||||||||
|
|
|
|||||||||||
| Energy Equipment & Services — 0.1% | ||||||||||||
| Halliburton Co. |
25,141 | 1,018,211 | ||||||||||
| Transocean Ltd.(h) |
530,387 | 4,354,477 | ||||||||||
|
|
|
|||||||||||
| 5,372,688 | ||||||||||||
| Entertainment — 0.0% | ||||||||||||
| Lions Gate Entertainment Corp., Class A(h)(i) |
114,665 | 972,359 | ||||||||||
| Playstudios, Inc. |
457,322 | 1,454,284 | ||||||||||
|
|
|
|||||||||||
| 2,426,643 | ||||||||||||
| Financial Services — 0.0% | ||||||||||||
| Mr. Cooper Group, Inc.(h) |
25,463 | 1,363,798 | ||||||||||
| Proof Acquisition Corp. I(f) |
43,947 | 168,317 | ||||||||||
|
|
|
|||||||||||
| 1,532,115 | ||||||||||||
| Hotel & Resort REITs — 0.0% | ||||||||||||
| DiamondRock Hospitality Co. |
143,244 | 1,150,249 | ||||||||||
| Park Hotels & Resorts, Inc. |
72,765 | 896,465 | ||||||||||
| Service Properties Trust |
196,054 | 1,507,655 | ||||||||||
| Sonder Holdings, Inc., Class A |
19,017 | 156,127 | ||||||||||
| Sunstone Hotel Investors, Inc. |
66,393 | 620,775 | ||||||||||
| Xenia Hotels & Resorts, Inc. |
85,018 | 1,001,512 | ||||||||||
|
|
|
|||||||||||
| 5,332,783 | ||||||||||||
| Hotels, Restaurants & Leisure — 0.0% | ||||||||||||
| Boyd Gaming Corp. |
1,870 | 113,752 | ||||||||||
| Caesars Entertainment, Inc.(h) |
14,400 | 667,440 | ||||||||||
|
|
|
|||||||||||
| 781,192 | ||||||||||||
| Interactive Media & Services — 0.0% | ||||||||||||
| Genius Sports Ltd.(h) |
712,487 | 3,797,556 | ||||||||||
|
|
|
|||||||||||
| IT Services — 0.0% | ||||||||||||
| CXApp, Inc. (Acquired 05/25/23, |
89,820 | 154,490 | ||||||||||
|
|
|
|||||||||||
| Machinery — 0.0% | ||||||||||||
| Rotor Acquisition Corp. |
11,463 | 8,597 | ||||||||||
| Sarcos Technology & Robotics Corp. |
464,024 | 396,555 | ||||||||||
|
|
|
|||||||||||
| 405,152 | ||||||||||||
| Metals & Mining — 0.0% | ||||||||||||
| Northern Graphite Corp.(h) |
99,612 | 16,868 | ||||||||||
| United States Steel Corp. |
73,680 | 2,393,126 | ||||||||||
|
|
|
|||||||||||
| 2,409,994 | ||||||||||||
| Oil, Gas & Consumable Fuels — 0.1% | ||||||||||||
| California Resources Corp.(j) |
36,836 | 2,063,185 | ||||||||||
| Chesapeake Energy Corp. |
8,158 | 703,464 | ||||||||||
| Green Plains, Inc.(h) |
67,342 | 2,026,994 | ||||||||||
| Marathon Petroleum Corp. |
11,268 | 1,705,299 | ||||||||||
| Phillips 66 |
16,149 | 1,940,302 | ||||||||||
| Valero Energy Corp. |
6,774 | 959,944 | ||||||||||
|
|
|
|||||||||||
| 9,399,188 | ||||||||||||
| Real Estate Management & Development — 0.0% | ||||||||||||
| Forestar Group, Inc.(h)(i) |
31,138 | 838,858 | ||||||||||
| Opendoor Technologies, Inc.(h) |
575,955 | 1,520,521 | ||||||||||
|
|
|
|||||||||||
| 2,359,379 | ||||||||||||
| Security | Shares | Value | ||||||||||
| Software — 0.0% | ||||||||||||
| Informatica, Inc., Class A(h) |
19,271 | $ | 406,040 | |||||||||
| Latch, Inc. |
411,849 | 387,138 | ||||||||||
|
|
|
|||||||||||
| 793,178 | ||||||||||||
|
|
|
|||||||||||
| Total Common Stocks — 0.3% |
|
47,452,137 | ||||||||||
|
|
|
|||||||||||
| Par (000) |
||||||||||||
| Corporate Bonds |
||||||||||||
| Aerospace & Defense — 1.3% | ||||||||||||
| BAE Systems PLC |
||||||||||||
| 3.40%, 04/15/30(a) |
USD | 26,824 | 23,357,788 | |||||||||
| 1.90%, 02/15/31(a) |
7,192 | 5,549,274 | ||||||||||
| Boeing Co. (The) |
||||||||||||
| 3.95%, 08/01/59 |
9,247 | 6,136,051 | ||||||||||
| 5.93%, 05/01/60 |
2,778 | 2,494,416 | ||||||||||
| Embraer Netherlands Finance BV |
||||||||||||
| 6.95%, 01/17/28(a) |
446 | 445,701 | ||||||||||
| 6.95%, 01/17/28(e) |
200 | 199,866 | ||||||||||
| 7.00%, 07/28/30(a) |
294 | 290,788 | ||||||||||
| Huntington Ingalls Industries, Inc. |
||||||||||||
| 3.48%, 12/01/27 |
10,438 | 9,542,291 | ||||||||||
| 2.04%, 08/16/28 |
17,495 | 14,696,231 | ||||||||||
| 4.20%, 05/01/30 |
7,708 | 6,970,928 | ||||||||||
| L3Harris Technologies, Inc. |
||||||||||||
| 3.85%, 12/15/26 |
6,275 | 5,942,304 | ||||||||||
| 4.40%, 06/15/28 |
11,379 | 10,767,444 | ||||||||||
| 2.90%, 12/15/29 |
8,105 | 6,901,452 | ||||||||||
| 1.80%, 01/15/31 |
10,934 | 8,351,538 | ||||||||||
| 5.40%, 07/31/33 |
4,783 | 4,597,768 | ||||||||||
| 5.60%, 07/31/53 |
1,870 | 1,748,753 | ||||||||||
| Lockheed Martin Corp. |
||||||||||||
| 4.45%, 05/15/28 |
4,431 | 4,288,395 | ||||||||||
| 1.85%, 06/15/30 |
4,750 | 3,831,062 | ||||||||||
| 3.60%, 03/01/35 |
6,406 | 5,412,967 | ||||||||||
| 4.50%, 05/15/36 |
3,428 | 3,124,153 | ||||||||||
| Northrop Grumman Corp. |
||||||||||||
| 4.70%, 03/15/33 |
15,246 | 14,234,058 | ||||||||||
| 4.03%, 10/15/47 |
18,159 | 13,899,359 | ||||||||||
| 5.25%, 05/01/50 |
7,474 | 6,891,831 | ||||||||||
| 4.95%, 03/15/53 |
8,847 | 7,767,900 | ||||||||||
| Raytheon Technologies Corp. |
||||||||||||
| 7.20%, 08/15/27 |
2,353 | 2,441,469 | ||||||||||
| 7.00%, 11/01/28 |
7,205 | 7,443,676 | ||||||||||
| 3.75%, 11/01/46 |
7,638 | 5,408,532 | ||||||||||
| RTX Corp. |
||||||||||||
| 4.13%, 11/16/28 |
15,584 | 14,531,387 | ||||||||||
| 4.15%, 05/15/45 |
1,895 | 1,434,772 | ||||||||||
| 3.13%, 07/01/50 |
2,946 | 1,831,643 | ||||||||||
| 2.82%, 09/01/51 |
10,381 | 5,943,434 | ||||||||||
| 3.03%, 03/15/52 |
16,198 | 9,743,562 | ||||||||||
| Sabena Technics SAS, 6.58%, 09/30/29 (Acquired 10/28/22, cost $7,400,265)(f)(g) |
EUR | 7,533 | 7,964,264 | |||||||||
| Textron, Inc. |
||||||||||||
| 3.90%, 09/17/29 |
USD | 8,086 | 7,283,809 | |||||||||
| 3.00%, 06/01/30 |
9,514 | 8,005,703 | ||||||||||
| 2.45%, 03/15/31 |
3,607 | 2,866,174 | ||||||||||
|
|
|
|||||||||||
| 242,340,743 | ||||||||||||
| Air Freight & Logistics — 0.0% | ||||||||||||
| GXO Logistics, Inc., 2.65%, 07/15/31 |
2,600 | 1,972,676 | ||||||||||
|
|
|
|||||||||||
| M A S T E R P O R T F O L I O S C H E D U L E O F I N V E S T M E N T S |
45 |
| Consolidated Schedule of Investments (continued) September 30, 2023 |
Master Total Return Portfolio (Percentages shown are based on Net Assets) |
| Security | Par (000) |
Value | ||||||||||
| Automobile Components — 0.0% | ||||||||||||
| Dana, Inc., 4.25%, 09/01/30 |
USD | 416 | $ | 333,882 | ||||||||
| Metalsa Sapi De Cv, 3.75%, 05/04/31(e) |
631 | 462,839 | ||||||||||
| Tenneco, Inc., 8.00%, 11/17/28(a) |
2,722 | 2,215,027 | ||||||||||
| Tupy Overseas SA, 4.50%, 02/16/31(e) |
315 | 252,217 | ||||||||||
|
|
|
|||||||||||
| 3,263,965 | ||||||||||||
| Automobiles — 0.0% | ||||||||||||
| Ford Motor Co., 3.25%, 02/12/32 |
595 | 458,545 | ||||||||||
| Lightning eMotors,
Inc., |
2,487 | 211,395 | ||||||||||
|
|
|
|||||||||||
| 669,940 | ||||||||||||
| Banks — 2.3% | ||||||||||||
| Banco Espirito Santo SA |
||||||||||||
| 2.63%, 05/08/17(e)(h)(l) |
EUR | 400 | 109,954 | |||||||||
| 4.75%, 01/15/18(e)(h)(l) |
2,200 | 604,747 | ||||||||||
| 4.00%, 01/21/19(e)(h)(l) |
6,300 | 1,731,776 | ||||||||||
| Banco Votorantim SA, 4.50%, 09/24/24(e) |
USD | 200 | 194,930 | |||||||||
| Bangkok Bank PCL |
||||||||||||
| 5.30%, 09/21/28(a) |
306 | 300,660 | ||||||||||
| 5.50%, 09/21/33(a) |
306 | 295,256 | ||||||||||
| 5.50%, 09/21/33(e) |
500 | 482,445 | ||||||||||
| 3.73%, 09/25/34(e) |
600 | 499,302 | ||||||||||
| Bank of America Corp. |
||||||||||||
| 3.97%, 03/05/29 |
14,238 | 13,042,375 | ||||||||||
| 5.82%, 09/15/29 |
66,788 | 65,968,340 | ||||||||||
| 2.59%, 04/29/31 |
2,183 | 1,754,240 | ||||||||||
| 1.90%, 07/23/31 |
2,363 | 1,795,540 | ||||||||||
| 1.92%, 10/24/31 |
2,506 | 1,890,612 | ||||||||||
| 2.65%, 03/11/32 |
8,093 | 6,368,917 | ||||||||||
| 2.97%, 02/04/33 |
15,256 | 12,030,197 | ||||||||||
| 4.57%, 04/27/33 |
9,927 | 8,813,520 | ||||||||||
| Barclays PLC |
||||||||||||
| 7.44%, 11/02/33 |
8,350 | 8,574,431 | ||||||||||
| 6.22%, 05/09/34 |
13,242 | 12,544,006 | ||||||||||
| 6.69%, 09/13/34 |
7,595 | 7,414,855 | ||||||||||
| Citigroup, Inc., 6.27%, 11/17/33 |
41,332 | 41,209,797 | ||||||||||
| First Horizon Bank, 5.75%, 05/01/30 |
1,000 | 895,075 | ||||||||||
| JPMorgan Chase & Co. |
||||||||||||
| 5.30%, 07/24/29 |
3,717 | 3,616,577 | ||||||||||
| 3.70%, 05/06/30 |
4,531 | 4,041,111 | ||||||||||
| 4.57%, 06/14/30 |
15,212 | 14,190,300 | ||||||||||
| 2.74%, 10/15/30 |
8,262 | 6,909,239 | ||||||||||
| 2.58%, 04/22/32 |
2,186 | 1,724,372 | ||||||||||
| 2.96%, 01/25/33 |
21,084 | 16,785,539 | ||||||||||
| 4.59%, 04/26/33 |
3,685 | 3,321,826 | ||||||||||
| 5.35%, 06/01/34 |
31,492 | 29,863,134 | ||||||||||
| Lehman Brothers Holdings Capital Trust VII, 5.86%(f)(h)(l)(m) |
1,888 | — | ||||||||||
| Morgan Stanley Bank N.A., 4.75%, 04/21/26 |
16,655 | 16,279,487 | ||||||||||
| Sumitomo Mitsui Financial Group, Inc., 5.72%, 09/14/28 |
500 | 493,469 | ||||||||||
| Texas Capital Bank N.A., (3-mo. LIBOR US + 4.50%), 10.04%, 09/30/24(a)(c) |
13,455 | 13,334,184 | ||||||||||
| Washington Mutual Escrow Bonds |
||||||||||||
| 0.00% (d)(f)(h)(l)(m) |
13,308 | 1 | ||||||||||
| 0.00% (d)(f)(h)(l)(m) |
11,911 | 1 | ||||||||||
| 0.00% (d)(f)(h)(l)(m) |
2,570 | — | ||||||||||
| 0.00% (d)(f)(h)(l)(m) |
3,115 | — | ||||||||||
| Wells Fargo & Co. |
||||||||||||
| 5.57%, 07/25/29 |
19,378 | 18,905,015 | ||||||||||
| 2.57%, 02/11/31 |
2,200 | 1,778,295 | ||||||||||
| 5.39%, 04/24/34 |
28,551 | 26,692,536 | ||||||||||
| Security | Par (000) |
Value | ||||||||||
| Banks (continued) | ||||||||||||
| Wells Fargo & Co. |
||||||||||||
| 5.56%, 07/25/34 |
USD | 31,986 | $ | 30,287,010 | ||||||||
| Wells Fargo Bank N.A., 5.45%, 08/07/26 |
34,514 | 34,282,943 | ||||||||||
|
|
|
|||||||||||
| 409,026,014 | ||||||||||||
| Beverages — 0.0% | ||||||||||||
| Anheuser-Busch InBev Worldwide, Inc., 8.00%, 11/15/39 |
1,382 | 1,645,874 | ||||||||||
|
|
|
|||||||||||
| Biotechnology — 0.8% | ||||||||||||
| AbbVie, Inc. |
||||||||||||
| 4.55%, 03/15/35 |
17,671 | 16,073,312 | ||||||||||
| 4.50%, 05/14/35 |
17,246 | 15,582,362 | ||||||||||
| 4.45%, 05/14/46 |
5,295 | 4,325,733 | ||||||||||
| 4.25%, 11/21/49 |
2,271 | 1,797,864 | ||||||||||
| Amgen, Inc. |
||||||||||||
| 4.05%, 08/18/29 |
15,855 | 14,716,769 | ||||||||||
| 5.25%, 03/02/30 |
27,012 | 26,390,366 | ||||||||||
| 4.40%, 02/22/62 |
2,203 | 1,632,098 | ||||||||||
| 5.75%, 03/02/63 |
30,136 | 27,799,876 | ||||||||||
| Gilead Sciences, Inc. |
||||||||||||
| 1.65%, 10/01/30 |
17,679 | 13,803,895 | ||||||||||
| 2.60%, 10/01/40 |
15,283 | 10,087,896 | ||||||||||
| 4.80%, 04/01/44 |
3,063 | 2,670,755 | ||||||||||
| 4.50%, 02/01/45 |
3,278 | 2,730,699 | ||||||||||
|
|
|
|||||||||||
| 137,611,625 | ||||||||||||
| Broadline Retail — 0.1% | ||||||||||||
| Amazon.com, Inc. |
||||||||||||
| 3.10%, 05/12/51 |
2,601 | 1,716,443 | ||||||||||
| 4.25%, 08/22/57 |
2,736 | 2,190,225 | ||||||||||
| Rakuten Group, Inc. |
||||||||||||
| 3.55%, 11/27/24(e) |
12,400 | 11,470,091 | ||||||||||
| 10.25%, 11/30/24(a) |
905 | 904,030 | ||||||||||
|
|
|
|||||||||||
| 16,280,789 | ||||||||||||
| Building Products — 0.0% | ||||||||||||
| Owens Corning, 3.88%, 06/01/30 |
2,170 | 1,916,878 | ||||||||||
|
|
|
|||||||||||
| Capital Markets — 2.7% | ||||||||||||
| Charles Schwab Corp. (The) |
||||||||||||
| 5.85%, 05/19/34 |
5,952 | 5,659,718 | ||||||||||
| 6.14%, 08/24/34 |
13,546 | 13,176,961 | ||||||||||
| Credit Suisse AG |
||||||||||||
| 0.50%, 02/02/24 |
2,714 | 2,661,234 | ||||||||||
| 4.75%, 08/09/24 |
23,958 | 23,617,522 | ||||||||||
| 3.63%, 09/09/24 |
13,134 | 12,782,623 | ||||||||||
| 7.95%, 01/09/25 |
13,454 | 13,691,898 | ||||||||||
| 3.70%, 02/21/25 |
25,010 | 24,108,754 | ||||||||||
| 2.95%, 04/09/25 |
3,319 | 3,153,695 | ||||||||||
| 5.00%, 07/09/27 |
12,729 | 12,227,185 | ||||||||||
| 7.50%, 02/15/28 |
15,177 | 15,875,535 | ||||||||||
| 0.25%, 09/01/28(e) |
EUR | 1,350 | 1,171,478 | |||||||||
| Deutsche Bank AG |
||||||||||||
| 5.37%, 09/09/27 |
USD | 12,695 | 12,396,998 | |||||||||
| 6.72%, 01/18/29 |
7,130 | 7,087,623 | ||||||||||
| Goldman Sachs Group, Inc. (The) |
7,579 | 7,560,962 | ||||||||||
| 3.50%, 04/01/25 |
18,603 | 17,912,296 | ||||||||||
| 3.62%, 03/15/28 |
5,403 | 4,985,207 | ||||||||||
| 4.48%, 08/23/28 |
3,736 | 3,536,165 | ||||||||||
| 3.81%, 04/23/29 |
3,195 | 2,901,175 | ||||||||||
| 2.62%, 04/22/32 |
20,436 | 15,962,085 | ||||||||||
| 2.38%, 07/21/32 |
4,128 | 3,143,838 | ||||||||||
| 2.65%, 10/21/32 |
45,090 | 34,803,510 | ||||||||||
| 46 | 2 0 2 3 B L A C K R O C K A N N U A L R E P O R T T O S H A R E H O L D E R S |
| Consolidated Schedule of Investments (continued) September 30, 2023 |
Master Total Return Portfolio (Percentages shown are based on Net Assets) |
| Security | Par (000) |
Value | ||||||||||
| Capital Markets (continued) | ||||||||||||
| Lehman Brothers Holdings, Inc., 6.75%, 12/28/17(f)(h)(l) |
USD | 7,360 | $ | 1 | ||||||||
| Moody’s Corp. |
||||||||||||
| 3.25%, 01/15/28 |
4,450 | 4,080,090 | ||||||||||
| 3.10%, 11/29/61 |
3,900 | 2,265,192 | ||||||||||
| Morgan Stanley |
||||||||||||
| 5.12%, 02/01/29 |
9,480 | 9,129,389 | ||||||||||
| 5.16%, 04/20/29 |
23,318 | 22,433,193 | ||||||||||
| 5.45%, 07/20/29 |
32,888 | 32,048,328 | ||||||||||
| 4.43%, 01/23/30 |
9,604 | 8,885,086 | ||||||||||
| 2.70%, 01/22/31 |
27,646 | 22,603,669 | ||||||||||
| 1.79%, 02/13/32 |
14,476 | 10,720,170 | ||||||||||
| 2.24%, 07/21/32 |
19,683 | 14,834,804 | ||||||||||
| 2.51%, 10/20/32 |
9,929 | 7,593,325 | ||||||||||
| 4.89%, 07/20/33 |
7,455 | 6,773,805 | ||||||||||
| 6.34%, 10/18/33 |
1,737 | 1,746,899 | ||||||||||
| 5.25%, 04/21/34 |
23,026 | 21,379,179 | ||||||||||
| 5.42%, 07/21/34 |
31,715 | 29,916,500 | ||||||||||
| UBS Group AG |
||||||||||||
| 3.75%, 03/26/25 |
9,118 | 8,769,778 | ||||||||||
| 2.59%, 09/11/25(a) |
3,210 | 3,089,560 | ||||||||||
| 4.55%, 04/17/26 |
4,391 | 4,217,355 | ||||||||||
| 2.19%, 06/05/26(a) |
6,071 | 5,646,391 | ||||||||||
| 1.36%, 01/30/27(a) |
4,081 | 3,625,962 | ||||||||||
| 0.65%, 01/14/28(e) |
EUR | 3,500 | 3,225,167 | |||||||||
| 6.44%, 08/11/28(a) |
USD | 10,860 | 10,850,665 | |||||||||
| 2.75%, 02/11/33(a) |
8,573 | 6,481,564 | ||||||||||
| 6.54%, 08/12/33(a) |
2,725 | 2,693,154 | ||||||||||
| 9.02%, 11/15/33(a) |
9,931 | 11,468,464 | ||||||||||
|
|
|
|||||||||||
| 492,894,152 | ||||||||||||
| Chemicals — 0.2% | ||||||||||||
| Braskem Netherlands Finance BV |
||||||||||||
| 8.50%, 01/12/31(a) |
227 | 224,304 | ||||||||||
| 7.25%, 02/13/33(a) |
200 | 183,520 | ||||||||||
| 8.50%, 01/23/81(a) |
200 | 196,954 | ||||||||||
| Eastman Chemical Co., 5.75%, 03/08/33 |
2,555 | 2,441,270 | ||||||||||
| Olympus Water U.S. Holding Corp. |
||||||||||||
| 7.13%, 10/01/27(a) |
559 | 517,054 | ||||||||||
| 9.75%, 11/15/28(a) |
7,148 | 7,132,548 | ||||||||||
| Pioneer Midco, 10.50%, 11/18/30(f) |
6,626 | 6,526,655 | ||||||||||
| Project Montelena, 10.25%, 03/31/31(f) |
EUR | 8,300 | 8,599,672 | |||||||||
| Rain Carbon, Inc., 12.25%, 09/01/29(a) |
USD | 853 | 894,584 | |||||||||
| Sasol Financing U.S.A. LLC, 5.88%, 03/27/24 |
1,846 | 1,819,713 | ||||||||||
|
|
|
|||||||||||
| 28,536,274 | ||||||||||||
| Commercial Services & Supplies — 0.1% | ||||||||||||
| Covanta Holding Corp., 4.88%, 12/01/29(a) |
780 | 639,912 | ||||||||||
| Garda World Security Corp., 7.75%, 02/15/28(a) |
377 | 369,612 | ||||||||||
| Pitney Bowes, Inc., 6.88%, 03/15/27(a) |
8,615 | 6,784,313 | ||||||||||
| Republic Services, Inc., 5.00%, 04/01/34 |
3,237 | 3,064,204 | ||||||||||
| Waste Management, Inc., 4.88%, 02/15/34 |
6,659 | 6,301,894 | ||||||||||
|
|
|
|||||||||||
| 17,159,935 | ||||||||||||
| Communications Equipment — 0.2% | ||||||||||||
| Motorola Solutions, Inc. |
||||||||||||
| 2.75%, 05/24/31 |
15,050 | 11,887,246 | ||||||||||
| 5.60%, 06/01/32 |
11,352 | 10,859,958 | ||||||||||
| 5.50%, 09/01/44 |
7,531 | 6,601,977 | ||||||||||
|
|
|
|||||||||||
| 29,349,181 | ||||||||||||
| Construction & Engineering — 0.0% | ||||||||||||
| China City Construction International Co. Ltd., 5.35%, 07/03/17(e)(f)(h)(l) |
CNH | 340 | — | |||||||||
| Security | Par (000) |
Value | ||||||||||
| Construction & Engineering (continued) | ||||||||||||
| GMR Hyderabad International Airport Ltd., 4.25%, 10/27/27(e) |
USD | 384 | $ | 341,572 | ||||||||
| Homes by West Bay LLC, 9.50%, 05/03/27(f) |
|
7,801 | 7,293,935 | |||||||||
|
|
|
|||||||||||
| 7,635,507 | ||||||||||||
| Consumer Finance — 0.1% | ||||||||||||
| Capital One Financial Corp., 5.82%, 02/01/34 |
|
8,023 | 7,230,321 | |||||||||
| General Motors Financial Co., Inc., 4.00%, 01/15/25 |
|
14,339 | 13,926,371 | |||||||||
|
|
|
|||||||||||
| 21,156,692 | ||||||||||||
| Consumer Staples Distribution & Retail — 0.0% | ||||||||||||
| CK Hutchison International 23 Ltd. |
||||||||||||
| 4.75%, 04/21/28(e) |
|
640 | 616,473 | |||||||||
| 4.88%, 04/21/33(e) |
|
405 | 376,820 | |||||||||
| CVS Health Corp. |
||||||||||||
| 5.25%, 01/30/31 |
|
2,808 | 2,697,990 | |||||||||
| 5.63%, 02/21/53 |
|
940 | 844,869 | |||||||||
| Frigorifico Concepcion SA, 7.70%, 07/21/28(a) |
|
796 | 657,894 | |||||||||
|
|
|
|||||||||||
| 5,194,046 | ||||||||||||
| Containers & Packaging — 0.1% | ||||||||||||
| Amcor Finance U.S.A., Inc., 5.63%, 05/26/33 |
|
2,447 | 2,349,534 | |||||||||
| Ardagh Metal Packaging Finance U.S.A. LLC/Ardagh Metal Packaging Finance PLC, 3.25%, 09/01/28(a) |
2,193 | 1,828,506 | ||||||||||
| Ardagh Packaging Finance PLC/Ardagh Holdings U.S.A., Inc., 5.25%, 04/30/25(a) |
|
2,193 | 2,137,629 | |||||||||
| Mauser Packaging Solutions Holding Co., 7.88%, 08/15/26(a) |
|
4,502 | 4,343,241 | |||||||||
| Trivium Packaging Finance BV, 5.50%, 08/15/26(a) |
|
942 | 878,352 | |||||||||
|
|
|
|||||||||||
| 11,537,262 | ||||||||||||
| Diversified REITs — 1.6% | ||||||||||||
| American Tower Corp. |
||||||||||||
| 3.80%, 08/15/29 |
|
17,483 | 15,551,305 | |||||||||
| 2.90%, 01/15/30 |
|
3,781 | 3,141,325 | |||||||||
| 2.10%, 06/15/30 |
|
9,974 | 7,762,511 | |||||||||
| 1.88%, 10/15/30 |
|
4,797 | 3,629,999 | |||||||||
| 2.70%, 04/15/31 |
|
10,757 | 8,531,025 | |||||||||
| 2.30%, 09/15/31 |
|
10,899 | 8,271,250 | |||||||||
| 5.65%, 03/15/33 |
|
7,407 | 7,120,104 | |||||||||
| Crown Castle International Corp. |
||||||||||||
| 4.45%, 02/15/26 |
|
2,370 | 2,294,830 | |||||||||
| 3.30%, 07/01/30 |
|
14,514 | 12,249,604 | |||||||||
| Crown Castle, Inc. |
||||||||||||
| 3.10%, 11/15/29 |
|
8,664 | 7,370,278 | |||||||||
| 2.25%, 01/15/31 |
|
16,608 | 12,888,922 | |||||||||
| 2.10%, 04/01/31 |
|
15,976 | 12,187,479 | |||||||||
| 2.50%, 07/15/31 |
|
10,502 | 8,190,311 | |||||||||
| 5.10%, 05/01/33 |
|
10,413 | 9,627,301 | |||||||||
| Equinix, Inc., 2.15%, 07/15/30 |
|
7,739 | 6,078,455 | |||||||||
| Freed Corp., 10.00%, 12/07/24(f) |
|
6,841 | 6,532,959 | |||||||||
| GLP Capital LP/GLP Financing II, Inc. |
||||||||||||
| 5.75%, 06/01/28 |
|
12,298 | 11,791,329 | |||||||||
| 5.30%, 01/15/29 |
|
5,053 | 4,684,233 | |||||||||
| 4.00%, 01/15/30 |
|
11,970 | 10,151,216 | |||||||||
| 4.00%, 01/15/31 |
|
5,896 | 4,908,518 | |||||||||
| 3.25%, 01/15/32 |
|
13,159 | 10,212,553 | |||||||||
| VICI Properties LP, 4.95%, 02/15/30 |
|
15,069 | 13,787,647 | |||||||||
| VICI Properties LP/VICI Note Co., Inc. |
||||||||||||
| 4.50%, 09/01/26(a) |
|
8,259 | 7,758,957 | |||||||||
| 4.25%, 12/01/26(a) |
|
23,767 | 22,144,928 | |||||||||
| 5.75%, 02/01/27(a) |
|
14,148 | 13,696,221 | |||||||||
| M A S T E R P O R T F O L I O S C H E D U L E O F I N V E S T M E N T S |
47 |
| Consolidated Schedule of Investments (continued) September 30, 2023 |
Master Total Return Portfolio (Percentages shown are based on Net Assets) |
| Security | Par (000) |
Value | ||||||||||
| Diversified REITs (continued) | ||||||||||||
| VICI Properties LP/VICI Note Co., Inc. |
||||||||||||
| 3.75%, 02/15/27(a) |
USD | 13,619 | $ | 12,358,063 | ||||||||
| 4.50%, 01/15/28(a) |
5,573 | 5,085,861 | ||||||||||
| 3.88%, 02/15/29(a) |
12,680 | 10,956,958 | ||||||||||
| 4.63%, 12/01/29(a) |
17,641 | 15,648,449 | ||||||||||
| 4.13%, 08/15/30(a) |
20,942 | 17,808,658 | ||||||||||
|
|
|
|||||||||||
| 292,421,249 | ||||||||||||
| Diversified Telecommunication Services — 0.8% | ||||||||||||
| AT&T Inc. |
||||||||||||
| 5.40%, 02/15/34 |
2,791 | 2,612,092 | ||||||||||
| 4.50%, 05/15/35 |
13,502 | 11,516,844 | ||||||||||
| 5.25%, 03/01/37 |
2,455 | 2,229,398 | ||||||||||
| 4.85%, 03/01/39 |
1,948 | 1,648,332 | ||||||||||
| 4.50%, 03/09/48 |
11,703 | 8,849,878 | ||||||||||
| 5.15%, 02/15/50 |
805 | 665,295 | ||||||||||
| 3.50%, 09/15/53 |
8,090 | 4,998,399 | ||||||||||
| 3.55%, 09/15/55 |
2,568 | 1,572,022 | ||||||||||
| 3.80%, 12/01/57 |
9,687 | 6,136,964 | ||||||||||
| 3.65%, 09/15/59 |
22,714 | 13,820,288 | ||||||||||
| Digicel International Finance Ltd./Digicel Holdings Bermuda Ltd. |
||||||||||||
| 8.75%, 05/25/24(a) |
554 | 493,771 | ||||||||||
| (6.00% Cash and 7.00% PIK), 13.00%, 12/31/25(a)(h)(l)(n) |
337 | 233,523 | ||||||||||
| 8.00%, 12/31/26(a)(h)(l) |
221 | 13,277 | ||||||||||
| Frontier Florida LLC, Series E, 6.86%, 02/01/28 |
|
4,835 | 4,491,425 | |||||||||
| Frontier North, Inc., Series G, 6.73%, 02/15/28 |
1,500 | 1,380,000 | ||||||||||
| Liquid Telecommunications Financing PLC, 5.50%, 09/04/26(a) |
319 | 201,196 | ||||||||||
| Verizon Communications, Inc. |
||||||||||||
| 3.15%, 03/22/30 |
15,489 | 13,220,461 | ||||||||||
| 7.75%, 12/01/30 |
1,970 | 2,193,758 | ||||||||||
| 1.75%, 01/20/31 |
9,024 | 6,800,108 | ||||||||||
| 2.36%, 03/15/32 |
54,826 | 41,829,959 | ||||||||||
| 4.50%, 08/10/33 |
2,509 | 2,233,875 | ||||||||||
| 4.40%, 11/01/34 |
10,959 | 9,502,735 | ||||||||||
| 3.40%, 03/22/41 |
4,487 | 3,181,019 | ||||||||||
| 2.85%, 09/03/41 |
3,010 | 1,945,924 | ||||||||||
| 3.00%, 11/20/60 |
2,500 | 1,353,626 | ||||||||||
| 3.70%, 03/22/61 |
2,558 | 1,627,797 | ||||||||||
|
|
|
|||||||||||
| 144,751,966 | ||||||||||||
| Electric Utilities — 2.7% | ||||||||||||
| AEP Texas, Inc. |
||||||||||||
| 3.95%, 06/01/28 |
6,518 | 6,037,478 | ||||||||||
| 2.10%, 07/01/30 |
5,906 | 4,665,485 | ||||||||||
| 5.40%, 06/01/33 |
7,895 | 7,526,764 | ||||||||||
| 3.80%, 10/01/47 |
2,473 | 1,678,229 | ||||||||||
| 3.45%, 05/15/51 |
2,926 | 1,859,023 | ||||||||||
| 5.25%, 05/15/52 |
5,238 | 4,487,227 | ||||||||||
| Series H, 3.45%, 01/15/50 |
1,475 | 950,548 | ||||||||||
| AEP Transmission Co. LLC |
||||||||||||
| 3.75%, 12/01/47 |
2,214 | 1,602,420 | ||||||||||
| 4.25%, 09/15/48 |
2,124 | 1,658,126 | ||||||||||
| 3.80%, 06/15/49 |
2,302 | 1,666,339 | ||||||||||
| 3.15%, 09/15/49 |
3,515 | 2,254,161 | ||||||||||
| Series M, 3.65%, 04/01/50 |
8,101 | 5,740,893 | ||||||||||
| Series O, 4.50%, 06/15/52 |
7,156 | 5,797,202 | ||||||||||
| Alabama Power Co. |
||||||||||||
| 3.75%, 03/01/45 |
10,979 | 7,962,195 | ||||||||||
| 3.00%, 03/15/52 |
3,227 | 1,950,742 | ||||||||||
| American Transmission Systems, Inc., 2.65%, 01/15/32(a) |
9,610 | 7,596,835 | ||||||||||
| Security | Par (000) |
Value | ||||||||||
| Electric Utilities (continued) | ||||||||||||
| Baltimore Gas & Electric Co. |
||||||||||||
| 4.25%, 09/15/48 |
USD | 2,200 | $ | 1,694,158 | ||||||||
| 3.20%, 09/15/49 |
3,823 | 2,462,108 | ||||||||||
| 2.90%, 06/15/50 |
4,364 | 2,599,787 | ||||||||||
| 4.55%, 06/01/52 |
3,263 | 2,617,040 | ||||||||||
| 5.40%, 06/01/53 |
2,141 | 1,967,524 | ||||||||||
| CenterPoint Energy Houston Electric LLC |
||||||||||||
| 2.35%, 04/01/31 |
3,260 | 2,625,517 | ||||||||||
| 3.95%, 03/01/48 |
532 | 401,406 | ||||||||||
| 4.25%, 02/01/49 |
3,381 | 2,670,004 | ||||||||||
| 3.35%, 04/01/51 |
3,693 | 2,459,400 | ||||||||||
| 4.85%, 10/01/52 |
1,780 | 1,546,588 | ||||||||||
| Commonwealth Edison Co. |
||||||||||||
| 4.00%, 03/01/49 |
2,790 | 2,092,598 | ||||||||||
| 3.13%, 03/15/51 |
6,727 | 4,228,531 | ||||||||||
| 2.75%, 09/01/51 |
2,450 | 1,389,457 | ||||||||||
| Series 133, 3.85%, 03/15/52 |
2,417 | 1,738,039 | ||||||||||
| Consolidated Edison Co. of New York, Inc. |
||||||||||||
| 4.50%, 12/01/45 |
2,227 | 1,772,824 | ||||||||||
| 4.50%, 05/15/58 |
2,480 | 1,882,314 | ||||||||||
| DTE Electric Co. |
||||||||||||
| 3.95%, 03/01/49 |
3,229 | 2,398,785 | ||||||||||
| 3.25%, 04/01/51 |
6,000 | 3,863,023 | ||||||||||
| 5.40%, 04/01/53 |
5,605 | 5,238,942 | ||||||||||
| Series A, 4.05%, 05/15/48 |
5,713 | 4,332,181 | ||||||||||
| Duke Energy Carolinas LLC |
||||||||||||
| 3.75%, 06/01/45 |
2,487 | 1,786,032 | ||||||||||
| 3.70%, 12/01/47 |
5,364 | 3,825,531 | ||||||||||
| 3.95%, 03/15/48 |
5,124 | 3,766,870 | ||||||||||
| 3.45%, 04/15/51 |
873 | 584,284 | ||||||||||
| 5.35%, 01/15/53 |
6,289 | 5,748,137 | ||||||||||
| Duke Energy Florida LLC |
||||||||||||
| 2.50%, 12/01/29 |
13,021 | 11,037,110 | ||||||||||
| 1.75%, 06/15/30 |
2,371 | 1,865,790 | ||||||||||
| 4.20%, 07/15/48 |
2,168 | 1,677,524 | ||||||||||
| 3.00%, 12/15/51 |
10,810 | 6,583,079 | ||||||||||
| 5.95%, 11/15/52 |
9,036 | 8,874,782 | ||||||||||
| Duke Energy Ohio, Inc., 5.65%, 04/01/53 |
2,105 | 1,985,361 | ||||||||||
| Duke Energy Progress LLC |
||||||||||||
| 3.45%, 03/15/29 |
7,757 | 7,033,502 | ||||||||||
| 2.50%, 08/15/50 |
5,236 | 2,859,041 | ||||||||||
| 4.00%, 04/01/52 |
3,300 | 2,400,652 | ||||||||||
| 5.35%, 03/15/53 |
13,404 | 12,183,042 | ||||||||||
| Edison International |
||||||||||||
| 4.95%, 04/15/25 |
7,471 | 7,321,702 | ||||||||||
| 5.75%, 06/15/27 |
7,303 | 7,235,421 | ||||||||||
| 4.13%, 03/15/28 |
1,949 | 1,795,221 | ||||||||||
| 5.25%, 11/15/28 |
11,123 | 10,701,906 | ||||||||||
| 6.95%, 11/15/29 |
10,001 | 10,314,128 | ||||||||||
| Engie Energia Chile SA, 3.40%, 01/28/30(e) |
250 | 205,957 | ||||||||||
| Entergy Louisiana LLC, 4.20%, 09/01/48 |
7,609 | 5,772,619 | ||||||||||
| Entergy Mississippi LLC, 2.85%, 06/01/28 |
3,137 | 2,784,624 | ||||||||||
| Eversource Energy, 5.45%, 03/01/28 |
8,529 | 8,430,180 | ||||||||||
| Exelon Corp. |
||||||||||||
| 5.10%, 06/15/45 |
3,704 | 3,166,978 | ||||||||||
| 5.60%, 03/15/53 |
2,723 | 2,476,964 | ||||||||||
| FirstEnergy Corp. |
||||||||||||
| 2.05%, 03/01/25 |
1,392 | 1,306,035 | ||||||||||
| Series B, 4.15%, 07/15/27 |
9,423 | 8,758,402 | ||||||||||
| Series B, 2.25%, 09/01/30 |
2,734 | 2,119,294 | ||||||||||
| Series C, 3.40%, 03/01/50 |
4,237 | 2,633,503 | ||||||||||
| 48 | 2 0 2 3 B L A C K R O C K A N N U A L R E P O R T T O S H A R E H O L D E R S |
| Consolidated Schedule of Investments (continued) September 30, 2023 |
Master Total Return Portfolio (Percentages shown are based on Net Assets) |
| Security | Par (000) |
Value | ||||||||||
| Electric Utilities (continued) | ||||||||||||
| FirstEnergy Transmission LLC, 4.55%, 04/01/49(a) |
USD | 11,626 | $ | 9,101,690 | ||||||||
| Florida Power & Light Co. |
||||||||||||
| 3.99%, 03/01/49 |
6,574 | 4,939,124 | ||||||||||
| 3.15%, 10/01/49 |
2,743 | 1,785,448 | ||||||||||
| Generacion Mediterranea SA/Central Termica Roca SA, 9.88%, 12/01/27(a) |
1,327 | 1,144,025 | ||||||||||
| Georgia Power Co., 4.95%, 05/17/33 |
2,144 | 2,009,653 | ||||||||||
| India Green Power Holdings, 4.00%, 02/22/27(e) |
423 | 369,825 | ||||||||||
| MidAmerican Energy Co. |
||||||||||||
| 3.65%, 08/01/48 |
3,347 | 2,385,143 | ||||||||||
| 3.15%, 04/15/50 |
2,450 | 1,551,060 | ||||||||||
| NextEra Energy Capital Holdings, Inc., 5.75%, 09/01/25 |
11,840 | 11,806,752 | ||||||||||
| Northern States Power Co. |
||||||||||||
| 4.00%, 08/15/45 |
1,818 | 1,365,138 | ||||||||||
| 2.90%, 03/01/50 |
4,953 | 3,031,561 | ||||||||||
| 2.60%, 06/01/51 |
2,833 | 1,601,893 | ||||||||||
| 3.20%, 04/01/52 |
3,123 | 1,997,088 | ||||||||||
| 5.10%, 05/15/53 |
9,359 | 8,373,681 | ||||||||||
| NRG Energy, Inc. |
||||||||||||
| 2.45%, 12/02/27(a) |
4,222 | 3,578,849 | ||||||||||
| 7.00%, 03/15/33(a) |
605 | 584,536 | ||||||||||
| Ohio Power Co. |
||||||||||||
| 2.60%, 04/01/30 |
4,526 | 3,747,738 | ||||||||||
| 5.00%, 06/01/33 |
8,281 | 7,769,855 | ||||||||||
| 4.00%, 06/01/49 |
3,666 | 2,671,856 | ||||||||||
| Series Q, 1.63%, 01/15/31 |
9,259 | 7,033,558 | ||||||||||
| Series R, 2.90%, 10/01/51 |
10,633 | 6,302,634 | ||||||||||
| Pacific Gas & Electric Co. |
||||||||||||
| 4.95%, 07/01/50 |
30,942 | 23,063,191 | ||||||||||
| 3.50%, 08/01/50 |
6,626 | 3,944,510 | ||||||||||
| 5.25%, 03/01/52 |
2,175 | 1,676,261 | ||||||||||
| 6.70%, 04/01/53 |
4,077 | 3,828,938 | ||||||||||
| PECO Energy Co. |
||||||||||||
| 2.80%, 06/15/50 |
2,832 | 1,672,731 | ||||||||||
| 3.05%, 03/15/51 |
6,614 | 4,087,132 | ||||||||||
| 2.85%, 09/15/51 |
7,028 | 4,159,646 | ||||||||||
| 4.38%, 08/15/52 |
3,510 | 2,806,601 | ||||||||||
| Public Service Co. of New Hampshire, 5.15%, 01/15/53 |
6,767 | 6,096,412 | ||||||||||
| Public Service Electric & Gas Co. |
||||||||||||
| 3.65%, 09/01/28 |
2,811 | 2,606,570 | ||||||||||
| 3.80%, 03/01/46 |
2,396 | 1,774,920 | ||||||||||
| 3.60%, 12/01/47 |
2,012 | 1,439,405 | ||||||||||
| 3.85%, 05/01/49 |
3,410 | 2,522,066 | ||||||||||
| 2.05%, 08/01/50 |
5,935 | 3,030,823 | ||||||||||
| 3.00%, 03/01/51 |
2,726 | 1,703,773 | ||||||||||
| San Diego Gas & Electric Co. |
||||||||||||
| 5.35%, 04/01/53 |
13,150 | 11,942,447 | ||||||||||
| Series RRR, 3.75%, 06/01/47 |
3,474 | 2,463,783 | ||||||||||
| Southern California Edison Co. |
||||||||||||
| 5.65%, 10/01/28 |
2,205 | 2,201,054 | ||||||||||
| 2.85%, 08/01/29 |
4,532 | 3,908,835 | ||||||||||
| 2.25%, 06/01/30 |
13,795 | 11,075,591 | ||||||||||
| 2.50%, 06/01/31 |
8,192 | 6,511,241 | ||||||||||
| 2.75%, 02/01/32 |
2,548 | 2,037,391 | ||||||||||
| 5.95%, 11/01/32 |
13,056 | 13,021,140 | ||||||||||
| 5.70%, 03/01/53 |
587 | 539,309 | ||||||||||
| Series A, 4.20%, 03/01/29 |
2,310 | 2,150,147 | ||||||||||
| Tampa Electric Co., 4.45%, 06/15/49 |
2,671 | 2,079,191 | ||||||||||
| Security | Par (000) |
Value | ||||||||||
| Electric Utilities (continued) | ||||||||||||
| Trans-Allegheny Interstate Line Co., 3.85%, 06/01/25(a) |
USD | 18,145 | $ | 17,520,944 | ||||||||
| Union Electric Co., 5.45%, 03/15/53 |
3,359 | 3,098,189 | ||||||||||
|
|
|
|||||||||||
| 486,760,912 | ||||||||||||
| Electrical Equipment — 0.1% | ||||||||||||
| FreeWire Technologies, Inc., 12.59%, 04/26/25(f) |
8,230 | 8,271,406 | ||||||||||
| Otis Worldwide Corp., 5.25%, 08/16/28 |
6,172 | 6,066,893 | ||||||||||
|
|
|
|||||||||||
| 14,338,299 | ||||||||||||
| Energy Equipment & Services — 0.0% | ||||||||||||
| Transocean, Inc., 8.75%, 02/15/30(a) |
675 | 690,648 | ||||||||||
|
|
|
|||||||||||
| Financial Services — 0.5% | ||||||||||||
| ABRA Global Finance, (6.00% Cash and 5.50% PIK), 11.50%, 03/02/28(a)(n) |
1,399 | 1,120,204 | ||||||||||
| ASG Finance Designated Activity Co., 7.88%, 12/03/24(a) |
839 | 815,231 | ||||||||||
| Avianca Midco 2 Ltd., 9.00%, 12/01/28(a) |
1,143 | 970,316 | ||||||||||
| Azul Investments LLP |
||||||||||||
| 5.88%, 10/26/24(a) |
979 | 912,917 | ||||||||||
| 5.88%, 10/26/24(e) |
819 | 763,717 | ||||||||||
| Azul Secured Finance LLP, 11.93%, 08/28/28(a) |
200 | 198,176 | ||||||||||
| CDI Escrow Issuer, Inc., 5.75%, 04/01/30(a) |
917 | 828,435 | ||||||||||
| CNH Industrial Capital LLC, 4.20%, 01/15/24 |
3,283 | 3,264,525 | ||||||||||
| Credit Suisse U.S.A., Inc., 7.13%, 07/15/32 |
4,322 | 4,611,985 | ||||||||||
| Emerald Debt Merger Sub LLC, |
1,243 | 1,196,605 | ||||||||||
| Fortune Star BVI
Ltd., |
540 | 492,124 | ||||||||||
| Freedom Mortgage Corp. |
||||||||||||
| 8.13%, 11/15/24(a) |
1,315 | 1,315,117 | ||||||||||
| 8.25%, 04/15/25(a) |
679 | 679,140 | ||||||||||
| GEMS MENASA Cayman Ltd./GEMS Education Delaware LLC, 7.13%, 07/31/26(a) |
241 | 234,131 | ||||||||||
| Glencore Funding LLC |
||||||||||||
| 6.38%, 10/06/30(a) |
12,135 | 12,102,331 | ||||||||||
| 2.63%, 09/23/31(a) |
2,308 | 1,781,355 | ||||||||||
| 5.70%, 05/08/33(a) |
10,240 | 9,709,867 | ||||||||||
| GTCR W-2 Merger Sub LLC/GTCR W Dutch Finance Sub BV, 8.50%, 01/15/31(a) |
GBP | 676 | 842,314 | |||||||||
| Lessen Senior Secured Notes, 10.00%, 01/05/28(f) |
USD | 10,556 | 9,910,355 | |||||||||
| Nasdaq, Inc. |
||||||||||||
| 5.55%, 02/15/34 |
6,567 | 6,267,890 | ||||||||||
| 6.10%, 06/28/63 |
5,989 | 5,569,694 | ||||||||||
| Nationstar Mortgage Holdings, Inc. |
||||||||||||
| 6.00%, 01/15/27(a) |
410 | 387,418 | ||||||||||
| 5.50%, 08/15/28(a) |
1,859 | 1,639,760 | ||||||||||
| 5.13%, 12/15/30(a) |
1,626 | 1,320,193 | ||||||||||
| 5.75%, 11/15/31(a) |
801 | 662,605 | ||||||||||
| Oceana 2-Year Note, 12.00%, 07/31/25(f) |
AUD | 2,009 | 1,290,136 | |||||||||
| Oceana 3-Year Note, 12.50%, 07/31/26(f) |
3,013 | 1,933,528 | ||||||||||
| Oceana 4-Year Note, 12.50%, 07/31/27(f) |
5,022 | 3,220,823 | ||||||||||
| Pearl Holding II Ltd., (6.00% Cash or 6.00% PIK), 6.00%(e)(m)(n) |
USD | 286 | 7,165 | |||||||||
| Pearl Holding III Ltd., 9.00%, 10/22/25(e) |
228 | 69,482 | ||||||||||
| RELX Capital, Inc., 3.00%, 05/22/30 |
2,121 | 1,815,764 | ||||||||||
| Rocket Mortgage LLC/Rocket Mortgage Co- Issuer, Inc., 3.63%, 03/01/29(a) |
1,599 | 1,321,950 | ||||||||||
| Sun Country Airlines |
||||||||||||
| Series 2019-1B, 4.70%, 12/15/25(f) |
1,599 | 1,551,096 | ||||||||||
| Series 2019-1C, 7.00%, 12/15/23(f) |
1,298 | 1,293,394 | ||||||||||
| M A S T E R P O R T F O L I O S C H E D U L E O F I N V E S T M E N T S |
49 |
| Consolidated Schedule of Investments (continued) September 30, 2023 |
Master Total Return Portfolio (Percentages shown are based on Net Assets) |
| Security | Par (000) |
Value | ||||||||||
| Financial Services (continued) | ||||||||||||
| Sun Country Airlines |
||||||||||||
| Series 2022-1A, 4.84%, 03/15/31(f) |
USD | 4,029 | $ | 3,908,299 | ||||||||
| United Wholesale Mortgage LLC, 5.50%, 11/15/25(a) |
4,793 | 4,558,995 | ||||||||||
|
|
|
|||||||||||
| 88,567,037 | ||||||||||||
| Food Products — 0.0% | ||||||||||||
| Gruma SAB de CV, 4.88%, 12/01/24(e) |
754 | 742,358 | ||||||||||
| Grupo Bimbo SAB de CV, 3.88%, 06/27/24(e) |
636 | 624,822 | ||||||||||
| Kernel Holding SA |
||||||||||||
| 6.50%, 10/17/24(e) |
550 | 385,352 | ||||||||||
| 6.75%, 10/27/27(e) |
200 | 118,702 | ||||||||||
| Minerva Luxembourg SA, 8.88%, 09/13/33(a) |
227 | 224,957 | ||||||||||
| Pilgrim’s Pride Corp., 6.25%, 07/01/33 |
3,142 | 2,952,818 | ||||||||||
|
|
|
|||||||||||
| 5,049,009 | ||||||||||||
| Gas Utilities — 0.0% | ||||||||||||
| AmeriGas Partners LP/AmeriGas Finance Corp., |
||||||||||||
| 9.38%, 06/01/28(a) |
1,977 | 2,004,184 | ||||||||||
| Atmos Energy Corp., 5.75%, 10/15/52 |
3,530 | 3,455,435 | ||||||||||
| Piedmont Natural Gas Co., Inc., 2.50%, 03/15/31 |
|
4,095 | 3,227,305 | |||||||||
| Promigas SA ESP/Gases del Pacifico SAC, 3.75%, 10/16/29(e) |
341 | 280,472 | ||||||||||
|
|
|
|||||||||||
| 8,967,396 | ||||||||||||
| Ground Transportation — 0.4% | ||||||||||||
| Burlington Northern Santa Fe LLC |
||||||||||||
| 5.75%, 05/01/40 |
3,968 | 3,939,132 | ||||||||||
| 3.55%, 02/15/50 |
2,780 | 1,975,563 | ||||||||||
| 3.30%, 09/15/51 |
11,653 | 7,812,116 | ||||||||||
| 2.88%, 06/15/52 |
3,307 | 2,034,174 | ||||||||||
| CSX Corp. |
||||||||||||
| 4.30%, 03/01/48 |
2,204 | 1,742,206 | ||||||||||
| 4.75%, 11/15/48 |
2,004 | 1,694,513 | ||||||||||
| 3.35%, 09/15/49 |
2,236 | 1,491,111 | ||||||||||
| 4.25%, 11/01/66 |
3,597 | 2,682,103 | ||||||||||
| Norfolk Southern Corp. |
||||||||||||
| 3.05%, 05/15/50 |
6,811 | 4,225,051 | ||||||||||
| 4.05%, 08/15/52 |
9,784 | 7,257,761 | ||||||||||
| 3.70%, 03/15/53 |
5,911 | 4,064,312 | ||||||||||
| 4.55%, 06/01/53 |
2,076 | 1,676,145 | ||||||||||
| Penske Truck Leasing Co. LP/PTL Finance Corp. |
||||||||||||
| 5.88%, 11/15/27(a) |
7,785 | 7,649,652 | ||||||||||
| 5.70%, 02/01/28(a) |
8,756 | 8,533,604 | ||||||||||
| Ryder System, Inc., 5.25%, 06/01/28 |
2,234 | 2,174,221 | ||||||||||
| Union Pacific Corp. |
||||||||||||
| 3.95%, 08/15/59 |
2,062 | 1,480,483 | ||||||||||
| 3.84%, 03/20/60 |
2,335 | 1,636,475 | ||||||||||
| 3.55%, 05/20/61 |
3,563 | 2,326,493 | ||||||||||
| 2.97%, 09/16/62 |
9,550 | 5,423,827 | ||||||||||
| 4.10%, 09/15/67 |
3,513 | 2,546,044 | ||||||||||
| 3.85%, 02/14/72 |
2,572 | 1,754,236 | ||||||||||
| Union Pacific Railroad Co. Pass-Through Trust, Series 2014-1, 3.23%, 05/14/26 |
2,247 | 2,121,874 | ||||||||||
|
|
|
|||||||||||
| 76,241,096 | ||||||||||||
| Health Care Equipment & Supplies — 0.1% | ||||||||||||
| Bausch & Lomb Escrow Corp., 8.38%, 10/01/28(a) |
215 | 215,639 | ||||||||||
| Medline Borrower LP, 3.88%, 04/01/29(a) |
2,291 | 1,936,863 | ||||||||||
| Thermo Fisher Scientific, Inc. |
||||||||||||
| 4.95%, 11/21/32 |
6,610 | 6,353,619 | ||||||||||
| 5.09%, 08/10/33 |
13,482 | 13,036,371 | ||||||||||
|
|
|
|||||||||||
| 21,542,492 | ||||||||||||
| Security | Par (000) |
Value | ||||||||||
| Health Care Providers & Services — 0.7% | ||||||||||||
| Elevance Health, Inc. |
||||||||||||
| 4.38%, 12/01/47 |
USD | 3,403 | $ | 2,707,631 | ||||||||
| 3.13%, 05/15/50 |
2,814 | 1,770,006 | ||||||||||
| 3.60%, 03/15/51 |
2,273 | 1,559,637 | ||||||||||
| 6.10%, 10/15/52 |
3,245 | 3,265,256 | ||||||||||
| HCA, Inc. |
||||||||||||
| 5.38%, 02/01/25 |
1,370 | 1,355,501 | ||||||||||
| 5.25%, 04/15/25 |
16,196 | 15,995,658 | ||||||||||
| 5.25%, 06/15/26 |
16,622 | 16,272,733 | ||||||||||
| 5.38%, 09/01/26 |
1,827 | 1,793,017 | ||||||||||
| 5.88%, 02/01/29 |
205 | 201,675 | ||||||||||
| 3.38%, 03/15/29 |
2,414 | 2,115,062 | ||||||||||
| 4.13%, 06/15/29 |
4,328 | 3,918,057 | ||||||||||
| 3.50%, 09/01/30 |
39,195 | 33,159,970 | ||||||||||
| 2.38%, 07/15/31 |
4,274 | 3,271,273 | ||||||||||
| Select Medical Corp., 6.25%, 08/15/26(a) |
5,720 | 5,588,332 | ||||||||||
| Tenet Healthcare Corp. |
||||||||||||
| 4.25%, 06/01/29 |
2,390 | 2,057,187 | ||||||||||
| 4.38%, 01/15/30 |
2,281 | 1,961,944 | ||||||||||
| UnitedHealth Group, Inc. |
||||||||||||
| 3.75%, 10/15/47 |
5,011 | 3,685,374 | ||||||||||
| 4.45%, 12/15/48 |
2,372 | 1,956,711 | ||||||||||
| 3.25%, 05/15/51 |
2,873 | 1,888,016 | ||||||||||
| 4.75%, 05/15/52 |
8,510 | 7,256,015 | ||||||||||
| 4.95%, 05/15/62 |
3,673 | 3,166,151 | ||||||||||
| 6.05%, 02/15/63 |
3,743 | 3,787,163 | ||||||||||
|
|
|
|||||||||||
| 118,732,369 | ||||||||||||
| Hotel & Resort REITs — 0.0% | ||||||||||||
| Park Intermediate Holdings LLC/PK Domestic Property LLC/PK Finance Co-Issuer, 4.88%, 05/15/29(a) |
2,502 | 2,116,567 | ||||||||||
| Service Properties Trust |
||||||||||||
| 4.50%, 03/15/25 |
1,396 | 1,306,505 | ||||||||||
| 7.50%, 09/15/25 |
3,867 | 3,799,076 | ||||||||||
| 5.50%, 12/15/27 |
397 | 339,290 | ||||||||||
| XHR LP, 4.88%, 06/01/29(a) |
385 | 327,250 | ||||||||||
|
|
|
|||||||||||
| 7,888,688 | ||||||||||||
| Hotels, Restaurants & Leisure — 0.2% | ||||||||||||
| Affinity Interactive, 6.88%, 12/15/27(a) |
1,122 | 951,208 | ||||||||||
| Caesars Entertainment, Inc., 8.13%, 07/01/27(a) |
2,327 | 2,338,093 | ||||||||||
| Full House Resorts, Inc., 8.25%, 02/15/28(a) |
749 | 655,375 | ||||||||||
| Grupo Posadas SAB de CV, (4.00% Cash and 6.00% PIK), 5.00%, 12/30/27(b)(e)(n) |
1,274 | 1,074,955 | ||||||||||
| HR Ottawa LP, 11.00%, 03/31/31(a) |
23,577 | 23,205,085 | ||||||||||
| Midwest Gaming Borrower LLC/Midwest Gaming Finance Corp., 4.88%, 05/01/29(a) |
1,799 | 1,531,615 | ||||||||||
| Minor International PCL, 2.70%(e)(m) |
500 | 453,160 | ||||||||||
| REXLot Holdings Ltd., 4.50%, 04/17/19(e)(h)(k)(l) |
HKD | 1,161 | 148 | |||||||||
| Sands China Ltd. |
||||||||||||
| 5.38%, 08/08/25 |
USD | 400 | 386,948 | |||||||||
| 5.65%, 08/08/28 |
300 | 281,437 | ||||||||||
| Sonder Holdings, Inc., 7.26%, 01/19/27(f) |
10,048 | 8,615,865 | ||||||||||
| Wynn Macau Ltd., 4.88%, 10/01/24(a) |
253 | 245,537 | ||||||||||
| Wynn Resorts Finance LLC/Wynn Resorts Capital Corp., 5.13%, 10/01/29(a) |
1,412 | 1,234,267 | ||||||||||
|
|
|
|||||||||||
| 40,973,693 | ||||||||||||
| Household Durables — 0.2% | ||||||||||||
| Ashton Woods U.S.A. LLC/Ashton Woods Finance Co. |
||||||||||||
| 6.63%, 01/15/28(a) |
3,130 | 2,952,910 | ||||||||||
| 4.63%, 08/01/29(a) |
573 | 483,534 | ||||||||||
| 50 | 2 0 2 3 B L A C K R O C K A N N U A L R E P O R T T O S H A R E H O L D E R S |
| Consolidated Schedule of Investments (continued) September 30, 2023 |
Master Total Return Portfolio (Percentages shown are based on Net Assets) |
| Security | Par (000) |
Value | ||||||||||
| Household Durables (continued) | ||||||||||||
| Ashton Woods U.S.A. LLC/Ashton Woods Finance Co. 4.63%, 04/01/30(a) |
USD | 1,574 | $ | 1,288,468 | ||||||||
| Beazer Homes U.S.A., Inc., 7.25%, 10/15/29 |
4,961 | 4,655,012 | ||||||||||
| Brookfield Residential Properties, Inc./Brookfield Residential U.S. LLC, 5.00%, 06/15/29(a) |
742 | 610,718 | ||||||||||
| Century Communities, Inc., 6.75%, 06/01/27 |
2,837 | 2,787,956 | ||||||||||
| Landsea Homes Corp., 11.00%, 07/17/28(f) |
20,532 | 19,916,040 | ||||||||||
| M/I Homes, Inc., 4.95%, 02/01/28 |
2,745 | 2,473,918 | ||||||||||
| Mattamy Group Corp. |
||||||||||||
| 5.25%, 12/15/27(a) |
1,432 | 1,306,888 | ||||||||||
| 4.63%, 03/01/30(a) |
1,691 | 1,439,175 | ||||||||||
| New Home Co., Inc. (The), 8.25%, 10/15/27(a) |
608 | 563,648 | ||||||||||
| TRI Pointe Group, Inc. |
||||||||||||
| 5.25%, 06/01/27 |
1,395 | 1,305,395 | ||||||||||
| 5.70%, 06/15/28 |
179 | 164,248 | ||||||||||
| Weekley Homes LLC/Weekley Finance Corp., 4.88%, 09/15/28(a) |
1,019 | 884,339 | ||||||||||
|
|
|
|||||||||||
| 40,832,249 | ||||||||||||
| Household Products — 0.0% | ||||||||||||
| SC Johnson & Son, Inc., 3.35%, 09/30/24(a) |
535 | 520,688 | ||||||||||
|
|
|
|||||||||||
| Independent Power and Renewable Electricity Producers — 0.0% | ||||||||||||
| Continuum Energy Levanter Pte Ltd. |
||||||||||||
| 4.50%, 02/09/27(a) |
969 | 905,817 | ||||||||||
| 4.50%, 02/09/27(e) |
275 | 257,496 | ||||||||||
| SCC Power PLC |
||||||||||||
| (8.00% Cash or 4.00% Cash and 4.00% PIK), 8.00%, 12/31/28(a)(n) |
2,752 | 1,056,880 | ||||||||||
| (4.00% Cash or 4.00% PIK), 4.00%, 05/17/32(a)(n) |
2,061 | 239,101 | ||||||||||
| Star Energy Geothermal Wayang Windu Ltd., 6.75%, 04/24/33(e) |
405 | 388,669 | ||||||||||
| Stem, Inc., 0.50%, 12/01/28(a)(k) |
622 | 357,961 | ||||||||||
|
|
|
|||||||||||
| 3,205,924 | ||||||||||||
| Industrial REITs — 0.1% | ||||||||||||
| Prologis LP, 5.13%, 01/15/34 |
9,890 | 9,339,772 | ||||||||||
|
|
|
|||||||||||
| Insurance — 0.1% | ||||||||||||
| AIA Group Ltd., 4.95%, 04/04/33(e) |
400 | 378,972 | ||||||||||
| Ambac Assurance Corp., 5.10%(a)(m) |
462 | 660,950 | ||||||||||
| Aon Corp., 3.75%, 05/02/29 |
1,972 | 1,787,785 | ||||||||||
| Aon Corp./Aon Global Holdings PLC |
||||||||||||
| 2.60%, 12/02/31 |
6,260 | 4,943,874 | ||||||||||
| 5.00%, 09/12/32 |
1,924 | 1,803,553 | ||||||||||
| 5.35%, 02/28/33 |
10,753 | 10,308,427 | ||||||||||
| Marsh & McLennan Cos., Inc., 2.90%, 12/15/51 |
3,336 | 1,992,282 | ||||||||||
| Nippon Life Insurance Co., 6.25%, 09/13/53(e) |
500 | 494,590 | ||||||||||
|
|
|
|||||||||||
| 22,370,433 | ||||||||||||
| IT Services — 0.2% | ||||||||||||
| Booz Allen Hamilton, Inc., 5.95%, 08/04/33 |
8,084 | 7,886,750 | ||||||||||
| Gen Digital, Inc., 7.13%, 09/30/30(a) |
500 | 492,564 | ||||||||||
| Global Payments, Inc. |
||||||||||||
| 3.20%, 08/15/29 |
12,654 | 10,761,175 | ||||||||||
| 5.30%, 08/15/29 |
3,305 | 3,151,800 | ||||||||||
| 2.90%, 05/15/30 |
12,851 | 10,535,591 | ||||||||||
| S&P Global, Inc., 5.25%, 09/15/33(a) |
6,646 | 6,478,057 | ||||||||||
|
|
|
|||||||||||
| 39,305,937 | ||||||||||||
| Machinery — 0.0% | ||||||||||||
| GrafTech Global Enterprises, Inc., 9.88%, 12/15/28(a) |
421 | 398,897 | ||||||||||
| Security | Par (000) |
Value | ||||||||||
| Machinery (continued) | ||||||||||||
| HTA Group Ltd., 7.00%, 12/18/25(a) |
USD | 354 | $ | 340,559 | ||||||||
| TK Elevator U.S. Newco, Inc., 5.25%, 07/15/27(a) |
2,530 | 2,318,817 | ||||||||||
|
|
|
|||||||||||
| 3,058,273 | ||||||||||||
| Media — 0.5% | ||||||||||||
| Charter Communications Operating LLC/Charter Communications Operating Capital |
||||||||||||
| 5.38%, 05/01/47 |
11,429 | 8,709,166 | ||||||||||
| 4.80%, 03/01/50 |
11,643 | 8,141,554 | ||||||||||
| 3.70%, 04/01/51 |
3,801 | 2,211,775 | ||||||||||
| 3.90%, 06/01/52 |
7,524 | 4,498,441 | ||||||||||
| 5.25%, 04/01/53 |
5,048 | 3,773,396 | ||||||||||
| 6.83%, 10/23/55 |
3,272 | 2,891,302 | ||||||||||
| 4.40%, 12/01/61 |
2,169 | 1,336,316 | ||||||||||
| 3.95%, 06/30/62 |
10,205 | 5,788,727 | ||||||||||
| Comcast Corp. |
||||||||||||
| 2.65%, 02/01/30 |
5,135 | 4,337,309 | ||||||||||
| 3.40%, 07/15/46 |
3,610 | 2,459,066 | ||||||||||
| 3.97%, 11/01/47 |
3,092 | 2,306,896 | ||||||||||
| 2.80%, 01/15/51 |
3,408 | 1,994,812 | ||||||||||
| 5.50%, 05/15/64 |
2,137 | 1,944,550 | ||||||||||
| Cox Communications, Inc., 3.15%, 08/15/24(a) |
734 | 716,163 | ||||||||||
| CSC Holdings LLC |
||||||||||||
| 5.25%, 06/01/24 |
4,985 | 4,741,947 | ||||||||||
| 5.50%, 04/15/27(a) |
3,800 | 3,256,886 | ||||||||||
| DISH DBS Corp., 5.88%, 11/15/24 |
3,076 | 2,863,105 | ||||||||||
| DISH Network Corp., 0.00%, 12/15/25(d)(k) |
2,118 | 1,413,765 | ||||||||||
| FactSet Research Systems, Inc., 3.45%, 03/01/32 |
12,321 | 10,210,512 | ||||||||||
| Meta Platforms, Inc., 5.75%, 05/15/63 |
8,049 | 7,587,346 | ||||||||||
| Nexstar Broadcasting, Inc., 4.75%, 11/01/28(a) |
2,080 | 1,721,635 | ||||||||||
| TWDC Enterprises 18 Corp., 3.00%, 07/30/46 |
2,572 | 1,628,588 | ||||||||||
|
|
|
|||||||||||
| 84,533,257 | ||||||||||||
| Metals & Mining — 0.3% | ||||||||||||
| Anglo American Capital PLC |
||||||||||||
| 4.75%, 04/10/27(a) |
4,614 | 4,416,290 | ||||||||||
| 2.25%, 03/17/28(a) |
3,263 | 2,773,844 | ||||||||||
| 3.88%, 03/16/29(a) |
4,539 | 4,066,944 | ||||||||||
| 5.63%, 04/01/30(a) |
4,509 | 4,348,592 | ||||||||||
| 2.88%, 03/17/31(a) |
9,765 | 7,747,746 | ||||||||||
| 5.50%, 05/02/33(a) |
7,338 | 6,851,858 | ||||||||||
| Arsenal AIC Parent LLC, 8.00%, 10/01/30(a) |
196 | 195,024 | ||||||||||
| Big River Steel LLC/BRS Finance Corp., 6.63%, 01/31/29(a) |
|
1,786 | 1,764,640 | |||||||||
| Cleveland-Cliffs, Inc., 6.75%, 04/15/30(a) |
5,178 | 4,839,444 | ||||||||||
| CSN Resources SA, 5.88%, 04/08/32(a) |
232 | 186,992 | ||||||||||
| FMG Resources August 2006 Pty Ltd., 4.38%, 04/01/31(a) |
1,539 | 1,266,274 | ||||||||||
| Metinvest BV |
||||||||||||
| 8.50%, 04/23/26(a) |
223 | 157,215 | ||||||||||
| 8.50%, 04/23/26(e) |
275 | 193,875 | ||||||||||
| 7.65%, 10/01/27(e) |
263 | 172,265 | ||||||||||
| Mineral Resources Ltd., 9.25%, 10/01/28(a) |
2,295 | 2,317,950 | ||||||||||
| Newmont Corp., 2.25%, 10/01/30 |
6,638 | 5,284,912 | ||||||||||
| Periama Holdings LLC, 5.95%, 04/19/26(e) |
425 | 402,161 | ||||||||||
| Vedanta Resources Finance II PLC |
||||||||||||
| 8.95%, 03/11/25(a) |
1,885 | 1,385,060 | ||||||||||
| 8.95%, 03/11/25(e) |
598 | 439,398 | ||||||||||
| Vedanta Resources Ltd., 6.13%, 08/09/24(a) |
669 | 422,440 | ||||||||||
|
|
|
|||||||||||
| 49,232,924 | ||||||||||||
| M A S T E R P O R T F O L I O S C H E D U L E O F I N V E S T M E N T S |
51 |
| Consolidated Schedule of Investments (continued) September 30, 2023 |
Master Total Return Portfolio (Percentages shown are based on Net Assets) |
| Security | Par (000) |
Value | ||||||||||
| Multi-Utilities — 0.4% | ||||||||||||
| Ameren Illinois Co. |
||||||||||||
| 3.80%, 05/15/28 |
USD | 3,603 | $ | 3,386,300 | ||||||||
| 3.25%, 03/15/50 |
3,444 | 2,261,521 | ||||||||||
| 2.90%, 06/15/51 |
2,647 | 1,596,488 | ||||||||||
| 5.90%, 12/01/52 |
2,053 | 2,049,996 | ||||||||||
| Baltimore Gas & Electric Co., 3.75%, 08/15/47 |
5,433 | 3,868,883 | ||||||||||
| CenterPoint Energy Resources Corp., 5.25%, 03/01/28 |
3,723 | 3,674,098 | ||||||||||
| Consumers Energy Co. |
||||||||||||
| 4.63%, 05/15/33 |
13,246 | 12,330,635 | ||||||||||
| 3.75%, 02/15/50 |
5,099 | 3,688,880 | ||||||||||
| 3.50%, 08/01/51 |
4,324 | 2,999,255 | ||||||||||
| 4.20%, 09/01/52 |
5,270 | 4,105,221 | ||||||||||
| NiSource, Inc. |
||||||||||||
| 3.49%, 05/15/27 |
2,387 | 2,212,468 | ||||||||||
| 5.25%, 03/30/28 |
11,546 | 11,315,522 | ||||||||||
| 5.40%, 06/30/33 |
3,110 | 2,980,783 | ||||||||||
| Pacific Gas & Electric Co. |
||||||||||||
| 3.85%, 11/15/23 |
3,065 | 3,056,426 | ||||||||||
| 3.25%, 02/16/24 |
154 | 152,198 | ||||||||||
| Virginia Electric & Power Co., 4.65%, 08/15/43 |
4,803 | 3,946,490 | ||||||||||
|
|
|
|||||||||||
| 63,625,164 | ||||||||||||
| Oil, Gas & Consumable Fuels — 4.9% | ||||||||||||
| AI Candelaria Spain SA, 7.50%, 12/15/28(e) |
267 | 243,782 | ||||||||||
| Antero Resources Corp. |
||||||||||||
| 7.63%, 02/01/29(a) |
2,800 | 2,837,677 | ||||||||||
| 5.38%, 03/01/30(a) |
11,157 | 10,271,898 | ||||||||||
| Apache Corp. |
||||||||||||
| 5.25%, 02/01/42 |
5,970 | 4,673,962 | ||||||||||
| 4.75%, 04/15/43 |
3,264 | 2,377,376 | ||||||||||
| Buckeye Partners LP |
||||||||||||
| 4.35%, 10/15/24 |
2,500 | 2,415,423 | ||||||||||
| 4.13%, 03/01/25(a) |
619 | 588,002 | ||||||||||
| Calumet Specialty Products Partners LP/Calumet Finance Corp., 9.75%, 07/15/28(a) |
3,371 | 3,328,345 | ||||||||||
| Cameron LNG LLC |
||||||||||||
| 3.30%, 01/15/35(a) |
13,988 | 11,134,692 | ||||||||||
| 3.40%, 01/15/38(a) |
12,436 | 9,805,743 | ||||||||||
| Cheniere Corpus Christi Holdings LLC |
||||||||||||
| 5.88%, 03/31/25 |
22,450 | 22,282,970 | ||||||||||
| 5.13%, 06/30/27 |
21,122 | 20,525,346 | ||||||||||
| 3.70%, 11/15/29 |
13,609 | 12,072,840 | ||||||||||
| 2.74%, 12/31/39 |
8,932 | 6,679,256 | ||||||||||
| Cheniere Energy Partners LP |
||||||||||||
| 4.50%, 10/01/29 |
24,818 | 22,472,034 | ||||||||||
| 4.00%, 03/01/31 |
26,071 | 22,289,036 | ||||||||||
| 3.25%, 01/31/32 |
22,546 | 17,919,513 | ||||||||||
| 5.95%, 06/30/33(a) |
23,319 | 22,490,476 | ||||||||||
| Chesapeake Energy Corp. |
||||||||||||
| 0.00%, 02/15/26(d)(f)(h)(l) |
9,090 | 1 | ||||||||||
| 0.00%, 06/15/26(d)(f)(h)(l) |
425 | — | ||||||||||
| 0.00%, 08/15/26(d)(f)(h)(l) |
623 | — | ||||||||||
| Civitas Resources, Inc., 8.38%, 07/01/28(a) |
4,301 | 4,376,267 | ||||||||||
| Colgate Energy Partners III LLC, 5.88%, 07/01/29(a) |
796 | 748,785 | ||||||||||
| Crestwood Midstream Partners LP/Crestwood Midstream Finance Corp., 7.38%, 02/01/31(a) |
18,000 | 18,332,100 | ||||||||||
| Devon Energy Corp. |
||||||||||||
| 5.25%, 09/15/24 |
7,431 | 7,374,541 | ||||||||||
| 5.85%, 12/15/25 |
1,567 | 1,559,030 | ||||||||||
| 5.25%, 10/15/27 |
4,892 | 4,765,561 | ||||||||||
| 5.88%, 06/15/28 |
1,735 | 1,729,185 | ||||||||||
| Security | Par (000) |
Value | ||||||||||
| Oil, Gas & Consumable Fuels (continued) | ||||||||||||
| Diamondback Energy, Inc. |
||||||||||||
| 3.25%, 12/01/26 |
USD | 48,600 | $ | 45,439,018 | ||||||||
| 3.50%, 12/01/29 |
48,137 | 42,714,888 | ||||||||||
| 3.13%, 03/24/31 |
47,287 | 39,389,193 | ||||||||||
| Earthstone Energy Holdings LLC, 8.00%, 04/15/27(a) |
2,171 | 2,222,062 | ||||||||||
| EIG Pearl Holdings Sarl, 4.39%, 11/30/46(a) |
1,643 | 1,189,516 | ||||||||||
| Enbridge, Inc. |
||||||||||||
| 5.70%, 03/08/33 |
9,791 | 9,379,764 | ||||||||||
| 2.50%, 08/01/33 |
2,356 | 1,747,586 | ||||||||||
| Energean Israel Finance Ltd., 8.50%, 09/30/33(a)(e) |
355 | 353,935 | ||||||||||
| Energy Transfer LP |
||||||||||||
| 7.60%, 02/01/24 |
1,907 | 1,910,425 | ||||||||||
| 4.25%, 04/01/24 |
3,259 | 3,229,475 | ||||||||||
| 3.90%, 05/15/24 |
5,610 | 5,535,153 | ||||||||||
| 4.05%, 03/15/25 |
2,850 | 2,771,404 | ||||||||||
| 5.95%, 12/01/25 |
2,805 | 2,796,967 | ||||||||||
| 5.75%, 02/15/33 |
3,261 | 3,134,680 | ||||||||||
| 6.50%, 02/01/42 |
8,142 | 7,784,381 | ||||||||||
| 6.10%, 02/15/42 |
2,093 | 1,884,080 | ||||||||||
| 5.15%, 02/01/43 |
1,970 | 1,565,538 | ||||||||||
| 6.13%, 12/15/45 |
4,188 | 3,725,233 | ||||||||||
| 5.30%, 04/15/47 |
15,676 | 12,733,216 | ||||||||||
| 5.40%, 10/01/47 |
9,475 | 7,814,494 | ||||||||||
| 5.00%, 05/15/50 |
33,162 | 26,013,845 | ||||||||||
| EQT Corp. |
||||||||||||
| 3.13%, 05/15/26(a) |
10,651 | 9,854,202 | ||||||||||
| 3.90%, 10/01/27 |
18,154 | 16,791,971 | ||||||||||
| 5.70%, 04/01/28 |
7,868 | 7,711,309 | ||||||||||
| 5.00%, 01/15/29 |
8,195 | 7,703,382 | ||||||||||
| 7.00%, 02/01/30 |
12,917 | 13,288,246 | ||||||||||
| 3.63%, 05/15/31(a) |
12,523 | 10,593,707 | ||||||||||
| GS Caltex Corp., 5.38%, 08/07/28(e) |
1,410 | 1,377,598 | ||||||||||
| Hammerhead Resources, Inc., Series AI, 9.00%, 07/10/24(f) |
1,857 | 1,857,162 | ||||||||||
| Hess Corp. |
||||||||||||
| 6.00%, 01/15/40 |
1,812 | 1,706,182 | ||||||||||
| 5.60%, 02/15/41 |
3,800 | 3,431,284 | ||||||||||
| Kinder Morgan Energy Partners LP |
||||||||||||
| 6.50%, 02/01/37 |
2,734 | 2,673,141 | ||||||||||
| 7.50%, 11/15/40 |
346 | 363,107 | ||||||||||
| Kinder Morgan, Inc. |
||||||||||||
| 4.30%, 03/01/28 |
21,652 | 20,377,793 | ||||||||||
| 5.20%, 06/01/33 |
11,376 | 10,521,932 | ||||||||||
| Leviathan Bond Ltd., 6.75%, 06/30/30(a)(e) |
312 | 286,805 | ||||||||||
| MC Brazil Downstream Trading S.a.r.l, 7.25%, 06/30/31(e) |
461 | 350,631 | ||||||||||
| MC Brazil Downstream Trading S.a.r.l, 7.25%, 06/30/31(a) |
923 | 701,997 | ||||||||||
| MPLX LP, 5.65%, 03/01/53 |
292 | 250,913 | ||||||||||
| NGPL PipeCo LLC |
||||||||||||
| 4.88%, 08/15/27(a) |
9,848 | 9,296,327 | ||||||||||
| 3.25%, 07/15/31(a) |
18,793 | 14,938,763 | ||||||||||
| Northern Oil & Gas, Inc., 8.75%, 06/15/31(a) |
1,424 | 1,434,681 | ||||||||||
| Northwest Pipeline LLC, 4.00%, 04/01/27 |
13,416 | 12,665,897 | ||||||||||
| Occidental Petroleum Corp. |
||||||||||||
| 7.88%, 09/15/31 |
6,227 | 6,738,243 | ||||||||||
| 6.45%, 09/15/36 |
3,573 | 3,508,454 | ||||||||||
| ONEOK, Inc., 6.63%, 09/01/53 |
7,827 | 7,664,239 | ||||||||||
| Permian Resources Operating LLC, 7.00%, 01/15/32(a) |
939 | 926,054 | ||||||||||
| 52 | 2 0 2 3 B L A C K R O C K A N N U A L R E P O R T T O S H A R E H O L D E R S |
| Consolidated Schedule of Investments (continued) September 30, 2023 |
Master Total Return Portfolio (Percentages shown are based on Net Assets) |
| Security | Par (000) |
Value | ||||||||||
| Oil, Gas & Consumable Fuels (continued) | ||||||||||||
| Pioneer Natural Resources Co. |
||||||||||||
| 1.90%, 08/15/30 |
USD | 2,877 | $ | 2,257,155 | ||||||||
| 2.15%, 01/15/31 |
2,842 | 2,242,618 | ||||||||||
| Puma International Financing SA, 5.00%, 01/24/26(e) |
1,352 | 1,227,481 | ||||||||||
| Sabine Pass Liquefaction LLC |
||||||||||||
| 5.75%, 05/15/24 |
3,942 | 3,933,673 | ||||||||||
| 5.63%, 03/01/25 |
32,075 | 31,872,859 | ||||||||||
| 5.88%, 06/30/26 |
24,341 | 24,298,330 | ||||||||||
| 5.00%, 03/15/27 |
11,394 | 11,053,513 | ||||||||||
| 5.90%, 09/15/37 |
6,418 | 6,317,359 | ||||||||||
| Shelf Drilling Holdings Ltd. |
||||||||||||
| 8.88%, 11/15/24(a) |
436 | 434,910 | ||||||||||
| 9.63%, 04/15/29(a) |
8,819 | 8,727,610 | ||||||||||
| Shelf Drilling North Sea Holdings Ltd., 10.25%, 10/31/25(a) |
4,473 | 4,484,406 | ||||||||||
| SierraCol Energy Andina LLC, 6.00%, 06/15/28(e) |
248 | 196,634 | ||||||||||
| Sitio Royalties Corp., 10.05%, 09/21/26 |
11,206 | 11,542,077 | ||||||||||
| Sitio Royalties Operating Partnership LP/Sitio Finance Corp., 7.88%, 11/01/28(a) |
1,352 | 1,355,380 | ||||||||||
| Sunoco LP/Sunoco Finance Corp., 4.50%, 04/30/30 |
1,688 | 1,461,762 | ||||||||||
| Targa Resources Corp. |
||||||||||||
| 5.20%, 07/01/27 |
5,555 | 5,443,469 | ||||||||||
| 4.20%, 02/01/33 |
11,756 | 9,995,982 | ||||||||||
| Targa Resources Partners LP/Targa Resources Partners Finance Corp. |
||||||||||||
| 6.50%, 07/15/27 |
1,748 | 1,761,547 | ||||||||||
| 5.00%, 01/15/28 |
10,917 | 10,382,067 | ||||||||||
| 5.50%, 03/01/30 |
13,434 | 12,573,037 | ||||||||||
| 4.88%, 02/01/31 |
15,244 | 13,653,284 | ||||||||||
| 4.00%, 01/15/32 |
8,104 | 6,819,354 | ||||||||||
| Texas Eastern Transmission LP |
||||||||||||
| 3.50%, 01/15/28(a) |
12,268 | 11,196,973 | ||||||||||
| 7.00%, 07/15/32 |
937 | 1,002,805 | ||||||||||
| Transcontinental Gas Pipe Line Co. LLC |
||||||||||||
| 7.85%, 02/01/26 |
12,137 | 12,618,658 | ||||||||||
| 4.00%, 03/15/28 |
11,280 | 10,504,945 | ||||||||||
| 4.60%, 03/15/48 |
6,219 | 4,926,157 | ||||||||||
| 3.95%, 05/15/50 |
2,211 | 1,571,681 | ||||||||||
| Transocean Aquila Ltd., 8.00%, 09/30/28(a) |
375 | 375,000 | ||||||||||
| Transocean Titan Financing Ltd., 8.38%, 02/01/28(a) |
674 | 685,795 | ||||||||||
| Vantage Drilling International, 9.50%, 02/15/28(a) |
2,145 | 2,102,100 | ||||||||||
| Venture Global LNG, Inc., 8.13%, 06/01/28(a) |
7,465 | 7,391,417 | ||||||||||
| Viper Energy Partners LP, 5.38%, 11/01/27(a) |
25,081 | 23,757,601 | ||||||||||
| Western Midstream Operating LP, 6.35%, 01/15/29 |
6,365 | 6,378,125 | ||||||||||
| Williams Cos., Inc. (The), 3.50%, 10/15/51 |
2,367 | 1,509,613 | ||||||||||
|
|
|
|||||||||||
| 879,698,091 | ||||||||||||
| Paper & Forest Products — 0.0% | ||||||||||||
| Suzano Austria GmbH, 5.00%, 01/15/30 |
351 | 318,476 | ||||||||||
|
|
|
|||||||||||
| Passenger Airlines — 0.2% | ||||||||||||
| Air Canada Pass-Through Trust |
||||||||||||
| Series 2017-1, Class AA, 3.30%, 01/15/30(a) |
1,636 | 1,431,323 | ||||||||||
| Series 2017-1, Class B, 3.70%, 01/15/26(a) |
13 | 12,130 | ||||||||||
| Allegiant Travel Co. |
||||||||||||
| 8.50%, 02/05/24(a) |
5,339 | 5,339,000 | ||||||||||
| 7.25%, 08/15/27(a) |
1,070 | 1,007,138 | ||||||||||
| American Airlines Pass-Through Trust |
||||||||||||
| 4.00%, 06/15/24(f) |
802 | 790,364 | ||||||||||
| 3.50%, 06/15/26(f) |
3,569 | 3,337,295 | ||||||||||
| Security | Par (000) |
Value | ||||||||||
| Passenger Airlines (continued) | ||||||||||||
| American Airlines Pass-Through Trust |
||||||||||||
| Series 2017-1, Class AA, 3.65%, 02/15/29 |
USD | 528 | $ | 478,482 | ||||||||
| Series 2019-1, Class AA, 3.15%, 02/15/32 |
3,820 | 3,270,945 | ||||||||||
| American Airlines, Inc., 4.87%, 10/22/23(f) |
295 | 294,607 | ||||||||||
| Delta Air Lines Pass-Through Trust, Series 2019-1, Class AA, 3.20%, 04/25/24 |
10,553 | 10,379,483 | ||||||||||
| Turkish Airlines Pass-Through Trust, Series 2015-1, Class A, 4.20%, 03/15/27(a) |
898 | 819,233 | ||||||||||
| United Airlines Pass-Through Trust |
||||||||||||
| Series 2014-1, Class A, 4.00%, 04/11/26 |
2,978 | 2,828,840 | ||||||||||
| Series 2016-1, Class AA, 3.10%, 07/07/28 |
468 | 423,089 | ||||||||||
| Series 2016-2, Class AA, 2.88%, 10/07/28 |
396 | 349,328 | ||||||||||
| Series 2016-2, Class B, 3.65%, 10/07/25 |
161 | 152,030 | ||||||||||
| Series 2019-2, Class AA, 2.70%, 05/01/32 |
776 | 639,770 | ||||||||||
| Series 2020-1, Class B, 4.88%, 01/15/26 |
2,502 | 2,422,074 | ||||||||||
|
|
|
|||||||||||
| 33,975,131 | ||||||||||||
| Personal Care Products — 0.0% | ||||||||||||
| Coty, Inc./HFC Prestige Products, Inc./HFC Prestige International U.S. LLC, 6.63%, 07/15/30(a) |
415 | 405,181 | ||||||||||
|
|
|
|||||||||||
| Pharmaceuticals — 0.3% | ||||||||||||
| Pfizer Investment Enterprises Pte Ltd. |
||||||||||||
| 4.75%, 05/19/33 |
15,655 | 14,798,323 | ||||||||||
| 5.30%, 05/19/53 |
23,033 | 21,401,170 | ||||||||||
| 5.34%, 05/19/63 |
5,829 | 5,325,050 | ||||||||||
| Takeda Pharmaceutical Co. Ltd., 2.05%, 03/31/30 |
11,079 | 8,909,030 | ||||||||||
|
|
|
|||||||||||
| 50,433,573 | ||||||||||||
| Real Estate Management & Development — 0.0% | ||||||||||||
| Aldar Investment Properties Sukuk Ltd., 4.88%, 05/24/33(e) |
685 | 651,093 | ||||||||||
| Fantasia Holdings Group Co. Ltd. |
||||||||||||
| 6.95%, 12/17/21(e)(h)(l) |
465 | 18,600 | ||||||||||
| 11.75%, 04/17/22(e)(h)(l) |
2,430 | 97,200 | ||||||||||
| 11.88%, 06/01/23(e)(h)(l) |
1,093 | 43,720 | ||||||||||
| 12.25%, 10/18/23(h)(l) |
200 | 8,000 | ||||||||||
| 10.88%, 01/09/24(h)(l) |
2,657 | 106,280 | ||||||||||
| 7.95%, 06/30/24(h)(l) |
530 | 23,182 | ||||||||||
| Five Point Operating Co. LP/Five Point Capital Corp., 7.88%, 11/15/25(a) |
2,299 | 2,169,089 | ||||||||||
| Forestar Group, Inc. |
||||||||||||
| 3.85%, 05/15/26(a) |
797 | 723,431 | ||||||||||
| 5.00%, 03/01/28(a) |
1,884 | 1,691,352 | ||||||||||
| Howard Hughes Corp. (The), 5.38%, 08/01/28(a) |
2,364 | 2,082,849 | ||||||||||
| RKPF Overseas 2019 A Ltd., 6.00%, 09/04/25(e) |
345 | 153,525 | ||||||||||
| RKPF Overseas 2020 A Ltd., 5.13%, 07/26/26(e) |
400 | 128,800 | ||||||||||
| Theta Capital Pte Ltd., 8.13%, 01/22/25(e) |
500 | 387,415 | ||||||||||
| Yanlord Land HK Co. Ltd., 5.13%, 05/20/26(e) |
200 | 115,500 | ||||||||||
|
|
|
|||||||||||
| 8,400,036 | ||||||||||||
| Residential REITs — 0.1% | ||||||||||||
| National Retail Properties, Inc., 3.50%, 04/15/51 |
6,750 | 4,242,923 | ||||||||||
| Realty Income Corp. |
||||||||||||
| 3.10%, 12/15/29 |
2,947 | 2,551,682 | ||||||||||
| 4.85%, 03/15/30 |
2,729 | 2,571,944 | ||||||||||
| 3.25%, 01/15/31 |
2,181 | 1,832,676 | ||||||||||
|
|
|
|||||||||||
| 11,199,225 | ||||||||||||
| Semiconductors & Semiconductor Equipment — 0.4% | ||||||||||||
| Broadcom, Inc. |
||||||||||||
| 2.60%, 02/15/33(a) |
12,892 | 9,613,359 | ||||||||||
| 3.47%, 04/15/34(a) |
24,053 | 18,891,496 | ||||||||||
| M A S T E R P O R T F O L I O S C H E D U L E O F I N V E S T M E N T S |
53 |
| Consolidated Schedule of Investments (continued) September 30, 2023 |
Master Total Return Portfolio (Percentages shown are based on Net Assets) |
| Security | Par (000) |
Value | ||||||||||
| Semiconductors & Semiconductor Equipment (continued) | ||||||||||||
| Broadcom, Inc. |
||||||||||||
| 3.14%, 11/15/35(a) |
USD | 10,286 | $ | 7,499,334 | ||||||||
| 3.19%, 11/15/36(a) |
12,864 | 9,236,198 | ||||||||||
| Intel Corp. |
||||||||||||
| 4.90%, 08/05/52 |
5,117 | 4,292,167 | ||||||||||
| 5.05%, 08/05/62 |
2,401 | 2,009,712 | ||||||||||
| KLA Corp. |
||||||||||||
| 5.00%, 03/15/49 |
2,871 | 2,519,284 | ||||||||||
| 3.30%, 03/01/50 |
5,345 | 3,551,997 | ||||||||||
| 5.25%, 07/15/62 |
1,937 | 1,740,112 | ||||||||||
| NXP BV/NXP Funding LLC/NXP U.S.A., Inc. |
||||||||||||
| 4.30%, 06/18/29 |
6,526 | 5,969,202 | ||||||||||
| 2.50%, 05/11/31 |
2,304 | 1,793,733 | ||||||||||
|
|
|
|||||||||||
| 67,116,594 | ||||||||||||
| Software — 0.4% | ||||||||||||
| Central Parent LLC/CDK Global II LLC/CDK Financing Co., Inc., 8.00%, 06/15/29(a) |
421 | 419,442 | ||||||||||
| GoTo Group, Inc., 5.50%, 09/01/27(a) |
7,500 | 4,167,769 | ||||||||||
| MSCI, Inc. |
||||||||||||
| 4.00%, 11/15/29(a) |
15,500 | 13,613,687 | ||||||||||
| 3.63%, 09/01/30(a) |
2,991 | 2,506,880 | ||||||||||
| 3.88%, 02/15/31(a) |
2,162 | 1,831,658 | ||||||||||
| 3.63%, 11/01/31(a) |
8,174 | 6,686,959 | ||||||||||
| 3.25%, 08/15/33(a) |
4,548 | 3,500,364 | ||||||||||
| Oracle Corp. |
||||||||||||
| 3.85%, 07/15/36 |
6,266 | 4,954,270 | ||||||||||
| 3.60%, 04/01/40 |
17,772 | 12,841,009 | ||||||||||
| 4.50%, 07/08/44 |
2,205 | 1,706,039 | ||||||||||
| 4.13%, 05/15/45 |
14,741 | 10,685,960 | ||||||||||
| 4.00%, 07/15/46 |
4,079 | 2,878,312 | ||||||||||
| 3.60%, 04/01/50 |
16,564 | 10,714,465 | ||||||||||
| 3.95%, 03/25/51 |
5,593 | 3,834,254 | ||||||||||
| Playtika Holding Corp., 4.25%, 03/15/29(a) |
465 | 388,275 | ||||||||||
|
|
|
|||||||||||
| 80,729,343 | ||||||||||||
| Specialized REITs — 0.0% | ||||||||||||
| Extra Space Storage LP, 5.50%, 07/01/30 |
3,695 | 3,572,957 | ||||||||||
|
|
|
|||||||||||
| Specialty Retail — 0.1% | ||||||||||||
| Lowe’s Cos., Inc. |
||||||||||||
| 4.50%, 04/15/30 |
8,234 | 7,683,216 | ||||||||||
| 5.00%, 04/15/40 |
2,339 | 2,052,057 | ||||||||||
| 2.80%, 09/15/41 |
15,604 | 10,078,780 | ||||||||||
|
|
|
|||||||||||
| 19,814,053 | ||||||||||||
| Technology Hardware, Storage & Peripherals — 0.2% | ||||||||||||
| CA Magnum Holdings, 5.38%, 10/31/26(e) |
400 | 352,936 | ||||||||||
| Dell International LLC/EMC Corp. |
||||||||||||
| 6.02%, 06/15/26 |
4,659 | 4,677,165 | ||||||||||
| 4.90%, 10/01/26 |
13,002 | 12,685,425 | ||||||||||
| 5.25%, 02/01/28 |
2,311 | 2,275,717 | ||||||||||
| EquipmentShare.com, Inc., 9.00%, 05/15/28(a) |
7,253 | 6,971,946 | ||||||||||
| Hewlett Packard Enterprise Co., 5.25%, 07/01/28 |
6,046 | 5,902,380 | ||||||||||
| SK Hynix, Inc., 6.38%, 01/17/28(e) |
200 | 199,588 | ||||||||||
| Xerox Holdings Corp., 5.00%, 08/15/25(a) |
3,285 | 3,120,381 | ||||||||||
|
|
|
|||||||||||
| 36,185,538 | ||||||||||||
| Textiles, Apparel & Luxury Goods — 0.0% | ||||||||||||
| William Carter Co. (The), 5.63%, 03/15/27(a) |
105 | 100,984 | ||||||||||
|
|
|
|||||||||||
| Tobacco — 0.4% | ||||||||||||
| Altria Group, Inc. |
||||||||||||
| 4.80%, 02/14/29 |
17,196 | 16,354,894 | ||||||||||
| 4.50%, 05/02/43 |
5,369 | 3,990,898 | ||||||||||
| 5.38%, 01/31/44 |
6,241 | 5,594,202 | ||||||||||
| Security | Par (000) |
Value | ||||||||||
| Tobacco (continued) | ||||||||||||
| BAT Capital Corp. |
||||||||||||
| 4.54%, 08/15/47 |
USD | 5,190 | $ | 3,572,493 | ||||||||
| 4.76%, 09/06/49 |
12,262 | 8,623,535 | ||||||||||
| 3.98%, 09/25/50 |
6,445 | 4,044,896 | ||||||||||
| 7.08%, 08/02/53 |
7,310 | 6,905,449 | ||||||||||
| Philip Morris International, Inc., 5.13%, 11/17/27 |
16,186 | 15,849,175 | ||||||||||
| Reynolds American, Inc., 5.85%, 08/15/45 |
3,057 | 2,532,204 | ||||||||||
|
|
|
|||||||||||
| 67,467,746 | ||||||||||||
| Wireless Telecommunication Services — 0.5% | ||||||||||||
| Digicel Group Holdings Ltd., (5.00% Cash and 3.00% PIK or 8.00% PIK), 8.00%, 04/01/25(a)(h)(l)(n) |
1,101 | 187,140 | ||||||||||
| Kenbourne Invest SA |
||||||||||||
| 6.88%, 11/26/24(a) |
1,190 | 991,270 | ||||||||||
| 6.88%, 11/26/24(e) |
280 | 233,240 | ||||||||||
| 4.70%, 01/22/28(a) |
285 | 175,132 | ||||||||||
| 4.70%, 01/22/28(e) |
251 | 154,239 | ||||||||||
| Millicom International Cellular SA |
||||||||||||
| 6.63%, 10/15/26(a) |
495 | 464,275 | ||||||||||
| 5.13%, 01/15/28(e) |
275 | 230,786 | ||||||||||
| Sprint LLC |
||||||||||||
| 7.13%, 06/15/24 |
36,385 | 36,606,330 | ||||||||||
| 7.63%, 02/15/25 |
24,264 | 24,619,565 | ||||||||||
| 7.63%, 03/01/26 |
5,814 | 5,975,152 | ||||||||||
| Sprint Spectrum Co. LLC/Sprint Spectrum Co. II LLC/Sprint Spectrum Co. III LLC, 5.15%, 03/20/28(a) |
315 | 309,471 | ||||||||||
| T-Mobile U.S.A., Inc., 3.88%, 04/15/30 |
17,826 | 15,793,318 | ||||||||||
| Vodafone Group PLC, 5.75%, 02/10/63 |
900 | 789,014 | ||||||||||
|
|
|
|||||||||||
| 86,528,932 | ||||||||||||
|
|
|
|||||||||||
| Total Corporate Bonds — 24.3% |
4,397,086,888 | |||||||||||
|
|
|
|||||||||||
| Fixed Rate Loan Interests |
||||||||||||
| Real Estate Management & Development — 0.0% | ||||||||||||
| OD Intermediate SUBI Holdco II LLC, Closing Date Advance, 10.00%, 04/01/26(f) |
7,735,779 | 7,240,690 | ||||||||||
| Software — 0.0% | ||||||||||||
| Avaya, Inc., Tranche B-3 Term Loan, 14.56%, 12/15/27(c) |
127,872 | 31,968 | ||||||||||
|
|
|
|||||||||||
| Total Fixed Rate Loan Interests — 0.0% |
|
7,272,658 | ||||||||||
|
|
|
|||||||||||
| Security | Par (000) |
Value | ||||||||||
| Floating Rate Loan Interests |
||||||||||||
| Beverages — 0.0% | ||||||||||||
| City Brewing Co. LLC, Closing Date Term Loan (First Lien), (3-mo. CME Term SOFR at 0.75% Floor + 3.50%), 9.07%, 04/05/28(c) |
USD | 2,126 | 1,386,967 | |||||||||
| Naked Juice LLC, Initial Loan (Second Lien), (3-mo. CME Term SOFR at 0.50% Floor + 6.00%), 11.49%, 01/24/30(c) |
460 | 371,307 | ||||||||||
| Triton Water Holdings, Inc., Initial Term Loan (First Lien), (3-mo. CME Term SOFR at 0.50% Floor + 3.25%), 8.90%, 03/31/28(c) |
986 | 959,283 | ||||||||||
|
|
|
|||||||||||
| 2,717,557 | ||||||||||||
| 54 | 2 0 2 3 B L A C K R O C K A N N U A L R E P O R T T O S H A R E H O L D E R S |
| Consolidated Schedule of Investments (continued) September 30, 2023 |
Master Total Return Portfolio (Percentages shown are based on Net Assets) |
| Security | Par (000) |
Value | ||||||||||
| Building Products — 0.0% | ||||||||||||
| Cornerstone Building Brands, Inc., Tranche B Term Loan, (1-mo. CME Term SOFR at 0.50% Floor + 3.25%), 8.68%, 04/12/28(c) |
USD | 996 | $ | 969,206 | ||||||||
| CP Iris Holdco I, Inc., Initial Term Loan (First Lien), (1-mo. CME Term SOFR at 0.50% Floor + 3.75%), 9.17%, 10/05/28 |
4 | 3,944 | ||||||||||
|
|
|
|||||||||||
| 973,150 | ||||||||||||
| Chemicals — 0.1% | ||||||||||||
| Aruba Investments Holdings LLC, Initial Dollar Term Loan (First Lien), (1-mo. CME Term SOFR at 0.75% Floor + 4.00%), 9.42%, 11/24/27(c) |
1,074 | 1,050,749 | ||||||||||
| Bakelite U.S. Holdco, Inc., Initial Loan, (3-mo. CME Term SOFR at 0.50% Floor + 4.00%), 9.54%, 05/27/29(c) |
4,257 | 4,203,368 | ||||||||||
| Flexsys Holdings, Inc., Initial Term Loan (First Lien), (3-mo. CME Term SOFR at 0.75% Floor + 5.25%), 10.90%, 11/01/28(c) |
2,277 | 2,129,294 | ||||||||||
| SCIH Salt Holdings, Inc., Incremental Term B-1 Loan (First Lien), (3-mo. CME Term SOFR at 0.75% Floor + 4.00%), 9.63%, 03/16/27(c) |
2,218 | 2,202,683 | ||||||||||
|
|
|
|||||||||||
| 9,586,094 | ||||||||||||
| Commercial Services & Supplies — 0.2% | ||||||||||||
| Allied Universal Holdco LLC (FKA USAGM Holdco LLC), Initial U.S. Dollar Term Loan, (1-mo. CME Term SOFR at 0.50% Floor + 3.75%), 9.17%, 05/14/28(c) |
3,710 | 3,578,305 | ||||||||||
| Alorica, Inc., Term Loan, (1-mo. CME Term SOFR at 1.00% Floor + 6.88%), 12.19%, 12/21/27(c)(f) |
5,257 | 5,151,806 | ||||||||||
| American Auto Auction Group LLC, Tranche B Term Loan (First Lien), (3-mo. CME Term SOFR at 0.75% Floor + 5.00%), 10.39%, 12/30/27(c) |
1,551 | 1,465,571 | ||||||||||
| DRI Holding, Inc., Closing Date Term Loan (First Lien), (1-mo. CME Term SOFR at 0.50% Floor + 5.25%), 10.67%, 12/21/28(c) |
3,130 | 2,852,513 | ||||||||||
| DS Parent, Inc., Term B-1 Loan, (6-mo. CME Term SOFR at 0.00% Floor + 5.75%), 11.34%, 12/10/28(c)(o) |
2,075 | 2,044,271 | ||||||||||
| Interface Security Systems LLC, Initial Term Loan, (1-mo. CME Term SOFR at 1.75% Floor + 7.00%), 12.42%, 08/07/24(c)(f) |
6,757 | 5,608,697 | ||||||||||
| ProFrac Holdings II LLC, Term Loan, (3-mo. CME Term SOFR at 1.00% Floor + 7.25%), 12.78%, 03/04/25(c) |
5,102 | 5,095,836 | ||||||||||
| Signal Parent, Inc., Initial Term Loan, (1-mo. CME Term SOFR at 0.75% Floor + 3.50%), 8.92%, 04/01/28(c) |
3,367 | 2,834,313 | ||||||||||
|
|
|
|||||||||||
| 28,631,312 | ||||||||||||
| Construction & Engineering — 0.1% | ||||||||||||
| DuPont Hotel Project Owner LLC, Loan, (1-mo. CME Term SOFR at 1.00% Floor + 2.50%), 7.94%, 04/01/25(f) |
12,000 | 11,749,545 | ||||||||||
| Orion Group |
||||||||||||
| Term Loan, 1.00%, 03/19/27(c)(o) |
1,058 | 1,049,167 | ||||||||||
| Term Loan, 6.25%, 03/19/27(c)(o) |
2,333 | 2,315,291 | ||||||||||
| Term Loan, 6.25%, 03/19/27(c)(o) |
1,244 | 1,234,822 | ||||||||||
| Term Loan, 6.50%, 03/19/27(c)(o) |
237 | 234,938 | ||||||||||
| Term Loan, 11.65%, 03/19/27(c)(o) |
401 | 398,892 | ||||||||||
| Term Loan, 11.65%, 03/19/27(c)(o) |
40 | 39,847 | ||||||||||
| Security | Par (000) |
Value | ||||||||||
| Construction & Engineering (continued) | ||||||||||||
| Orion Group |
||||||||||||
| Term Loan, 11.65%, 03/19/27(c)(o) |
USD | 203 | $ | 201,748 | ||||||||
| Term Loan, 11.65%, 03/19/27(c)(o) |
2,370 | 2,354,381 | ||||||||||
|
|
|
|||||||||||
| 19,578,631 | ||||||||||||
| Consumer Finance — 0.0% | ||||||||||||
| Crédito Real SAB de CV, SOFOM, ENR (Marevalley Corp.), Term B Loan, (1-mo. LIBOR at 0.00% Floor + 3.75%), 5.25%, 06/26/26(f)(h)(l)(o) |
571 | 62,755 | ||||||||||
|
|
|
|||||||||||
| Diversified Telecommunication Services — 0.0% | ||||||||||||
| Connect Finco S.a.r.l., Amendment No. 1 Refinancing Term Loan, (1-mo. CME Term SOFR at 1.00% Floor + 3.50%), 8.82%, 12/12/26(c) |
2,446 | 2,392,971 | ||||||||||
| Level 3 Financing, Inc., Tranche B 2027 Term Loan, (1-mo. CME Term SOFR at 0.00% Floor + 1.75%), 7.18%, 03/01/27(c) |
1,084 | 1,021,941 | ||||||||||
|
|
|
|||||||||||
| 3,414,912 | ||||||||||||
| Electronic Equipment, Instruments & Components — 0.0% | ||||||||||||
| Emerald Technologies (U.S.) Acquisitionco, Inc., Term B Loan, (3-mo. CME Term SOFR at 1.00% Floor + 6.25%), 11.82%, 12/29/27(c)(f) |
1,607 | 1,519,006 | ||||||||||
| Robertshaw U.S. Holding Corp., Fifth-Out Term Loan, (3-mo. CME Term SOFR at 1.00% Floor +
8.00%), |
1,795 | 394,900 | ||||||||||
|
|
|
|||||||||||
| 1,913,906 | ||||||||||||
| Financial Services — 0.7% | ||||||||||||
| 621 17th Street Operating Co. LLC (633 17th Street Operating Co. LLC), Loan, (1-mo. LIBOR at 0.00% Floor + 4.00%), 0.00%, 11/15/23(f)(h)(l) |
7,082 | 2,882,812 | ||||||||||
| Aspen Owner LLC, Advance, (1-mo. CME Term SOFR at 0.10% Floor + 2.90%), 8.23%, 02/09/27(c)(f) |
15,899 | 15,349,632 | ||||||||||
| BRE Park Avenue Tower Owner LLC, Mezzanine A Loan, (1-mo. CME Term SOFR at 0.00% Floor +
2.17%), |
16,743 | 15,740,648 | ||||||||||
| BSREP II Houston Office 1HC Owner LLC, Mezzanine Loan, (1-mo. CME Term SOFR at 0.00% Floor +
2.21%), |
12,143 | 9,558,105 | ||||||||||
| Caliber Home Loans, Inc., Advances, (1-mo. SOFR at 0.00% Floor + 3.25%), 8.66%, 07/15/26(c)(f) |
15,659 | 15,690,280 | ||||||||||
| HLP Hotel LLC, Term Loan, (1-mo. CME Term SOFR at 1.00% Floor + 3.55%), 8.99%, 09/09/26(c)(f) |
12,200 | 11,975,083 | ||||||||||
| HP LQ Investment LP, Term Loan, (1-mo. CME Term SOFR at 0.00% Floor + 3.00%), 8.44- 7.70%%, 12/09/26(c)(f) |
10,317 | 10,024,163 | ||||||||||
| Mensa II Austin Hotel LP, Promissory Note A-3, (1-mo. CME Term SOFR at 0.25% Floor + 3.59%), 8.92%, 06/01/26(c)(f) |
13,166 | 12,780,090 | ||||||||||
| Project Pearl Pasco Holdings LLC, Advance, (1- mo. CME Term SOFR at 0.00% Floor + 2.86%), 8.20%, 09/15/24(c)(f) |
22,795 | 22,719,140 | ||||||||||
| M A S T E R P O R T F O L I O S C H E D U L E O F I N V E S T M E N T S |
55 |
| Consolidated Schedule of Investments (continued) September 30, 2023 |
Master Total Return Portfolio (Percentages shown are based on Net Assets) |
| Security | Par (000) |
Value | ||||||||||
| Financial Services (continued) | ||||||||||||
| The Vinoy St. Petersburg, Note A, (1-mo. CME Term SOFR at 0.39% Floor + 2.67%), 7.99%, 06/09/26(c)(f) |
USD | 14,628 | $ | 13,986,809 | ||||||||
| Woof Holdings, Inc., Initial Term Loan (First Lien), (3-mo. CME Term SOFR at 0.75% Floor + 3.75%), 9.40%, 12/21/27(c) |
807 | 636,962 | ||||||||||
|
|
|
|||||||||||
| 131,343,724 | ||||||||||||
| Food Products — 0.0% | ||||||||||||
| BCPE North Star U.S. Holdco 2, Inc., Initial Term Loan (First Lien), (1-mo. CME Term SOFR at 0.75% Floor + 4.00%), 9.43%, 06/10/28(c) |
4,886 | 4,348,348 | ||||||||||
| Shearer’s Foods LLC, Refinancing Term Loan (First Lien), (1-mo. CME Term SOFR at 0.75% Floor + 3.50%), 8.93%, 09/23/27(c) |
962 | 959,902 | ||||||||||
|
|
|
|||||||||||
| 5,308,250 | ||||||||||||
| Health Care Providers & Services — 0.0% | ||||||||||||
| Medical Solutions Holdings, Inc., Initial Term Loan (Second Lien), (3-mo. CME Term SOFR at 0.50% Floor + 7.00%), 12.52%, 11/01/29(c) |
1,587 | 1,416,397 | ||||||||||
|
|
|
|||||||||||
| Hotels, Restaurants & Leisure — 0.3% | ||||||||||||
| Aimbridge Acquisition Co., Inc. |
||||||||||||
| 2021 Term Loan (First Lien), (1-mo. CME Term SOFR at 0.00% Floor + 4.75%), 10.18%, 02/02/26(c) |
873 | 843,233 | ||||||||||
| Initial Term Loan (2019) (First Lien), |
1,664 | 1,593,313 | ||||||||||
| Bally’s Corp., Term B Facility Loan, (3-mo. CME Term SOFR at 0.50% Floor + 3.25%), 8.84%, 10/01/28(c) |
11,617 | 11,368,130 | ||||||||||
| CML Terranea Resort (AKA Long Point Development LLC), Refinancing Debt, (1-mo. CME Term SOFR at 0.00% Floor + 4.35%), 9.68%, 01/01/28(c)(f) |
7,500 | 7,500,000 | ||||||||||
| ECL Entertainment LLC, Term B Facility Loan, (3-mo. CME Term SOFR at 0.75% Floor + 4.75%), 10.14%, 08/31/30(c) |
4,905 | 4,890,677 | ||||||||||
| Fertitta Entertainment LLC, Initial B Term Loan, (1-mo. CME Term SOFR at 0.50% Floor + 4.00%), 9.32%, 01/27/29(c) |
7,271 | 7,189,236 | ||||||||||
| HRNI Holdings LLC (FKA Spectacle Gary Holdings LLC), Term B Loan, (3-mo. CME Term SOFR at 0.75% Floor + 4.25%), 9.77%, 12/10/28(c) |
8,609 | 8,369,641 | ||||||||||
| Maverick Gaming LLC, Term B Facility Loan, (3- mo. CME Term SOFR at 1.00% Floor + 7.50%), 13.18%, 09/03/26(c) |
2,773 | 2,052,115 | ||||||||||
| Sodalite Tahoe Hotel LLC (AKA Lake Tahoe), Loan, (1-mo. CME Term SOFR at 0.00% Floor + 2.90%), 8.34%, 10/25/26(c)(f) |
8,946 | 8,599,348 | ||||||||||
|
|
|
|||||||||||
| 52,405,693 | ||||||||||||
| Household Products — 0.0% | ||||||||||||
| Conair Holdings LLC, Initial Term Loan (First Lien), (3-mo. CME Term SOFR at 0.50% Floor + 3.75%), 9.40%, 05/17/28(c) |
536 | 512,685 | ||||||||||
| Security | Par (000) |
Value | ||||||||||
| Household Products (continued) | ||||||||||||
| Kronos Acquisition Holdings, Inc., Initial Loan, (3-mo. CME Term SOFR at 1.00% Floor + 6.00%), 11.57%, 12/22/26(c) |
USD | 729 | $ | 728,734 | ||||||||
| SWF Holdings I Corp., Initial Term Loan (First Lien), (1-mo. CME Term SOFR at 0.75% Floor + 4.00%), 9.43%, 10/06/28(c) |
1,961 | 1,663,690 | ||||||||||
|
|
|
|||||||||||
| 2,905,109 | ||||||||||||
| IT Services — 0.0% | ||||||||||||
| CoreWeave Compute Acquisition Co. II LLC, Delayed Draw Term Loan, (3-mo. CME Term SOFR at 0.00% Floor + 8.75%), 14.07%, 12/31/26(c)(f) |
718 | 705,000 | ||||||||||
| GoTo Group, Inc., Initial Term Loan (First Lien), (3-mo. CME Term SOFR at 0.00% Floor + 4.75%), 10.27%, 08/31/27(c) |
1,587 | 1,046,483 | ||||||||||
|
|
|
|||||||||||
| 1,751,483 | ||||||||||||
| Leisure Products — 0.0% | ||||||||||||
| J & J Ventures Gaming LLC, Initial Term Loan, (3-mo. CME Term SOFR at 0.75% Floor + 4.00%), 9.65%, 04/26/28(c) |
1,894 | 1,803,811 | ||||||||||
|
|
|
|||||||||||
| Machinery — 0.0% | ||||||||||||
| Apex Tool Group LLC, Initial Term Loan (First Lien), (1-mo. CME Term SOFR at 0.50% Floor + 5.25%), 10.67%, 02/08/29(c) |
2,881 | 2,618,131 | ||||||||||
| Hydrofarm Holdings Group, Inc., Term Loan, |
2,248 | 1,798,368 | ||||||||||
|
|
|
|||||||||||
| 4,416,499 | ||||||||||||
| Media — 0.0% | ||||||||||||
| DirecTV Financing LLC, Closing Date Term Loan, (1-mo. CME Term SOFR at 0.75% Floor + 5.00%), 10.43%, 08/02/27(c) |
1,883 | 1,837,986 | ||||||||||
| Gray Television, Inc., Term D Loan, (1-mo. CME Term SOFR at 0.00% Floor + 3.00%), 8.44%, 12/01/28(c) |
3,037 | 2,957,601 | ||||||||||
|
|
|
|||||||||||
| 4,795,587 | ||||||||||||
| Metals & Mining — 0.0% | ||||||||||||
| American Rock Salt Co. LLC, Initial Loan (First Lien), (1-mo. CME Term SOFR at 0.75% Floor + 4.00%), 9.43%, 06/11/28(c) |
548 | 505,865 | ||||||||||
|
|
|
|||||||||||
| Oil, Gas & Consumable Fuels — 0.0% | ||||||||||||
| DT Midstream, Inc., Term B Loan, (1-mo. LIBOR at 0.50% Floor + 2.00%), 7.32%, 06/10/28(c)(o) |
734 | 734,681 | ||||||||||
|
|
|
|||||||||||
| Passenger Airlines — 0.0% | ||||||||||||
| WestJet Airlines Ltd., Term Loan, (1-mo. CME Term SOFR at 1.00% Floor + 3.00%), 8.42%, 12/11/26(c) |
3 | 2,530 | ||||||||||
|
|
|
|||||||||||
| Personal Care Products — 0.0% | ||||||||||||
| AI Mansart (Luxembourg) Bidco S.C.S., Facility A, (3-mo. LIBOR at 0.00% Floor), 5.67%, 06/23/28(c) |
664 | 644,080 | ||||||||||
|
|
|
|||||||||||
| Professional Services — 0.0% | ||||||||||||
| Vaco Holdings LLC, Initial Term Loan, (6-mo. CME Term SOFR at 0.75% Floor + 5.00%), 10.59%, 01/21/29(c) |
1,640 | 1,570,158 | ||||||||||
|
|
|
|||||||||||
| 56 | 2 0 2 3 B L A C K R O C K A N N U A L R E P O R T T O S H A R E H O L D E R S |
| Consolidated Schedule of Investments (continued) September 30, 2023 |
Master Total Return Portfolio (Percentages shown are based on Net Assets) |
| Security | Par (000) |
Value | ||||||||||
| Software — 0.1% | ||||||||||||
| ConnectWise LLC, Initial Term Loan, |
2,192 | $ | 2,153,737 | |||||||||
| EIS Group Ltd., Closing Date Term Loan, (1-mo. CME Term SOFR at 0.75% Floor + 7.00%), 12.32%, 07/08/28(c)(f) |
USD | 12,826 | 12,393,360 | |||||||||
| EIS Group, Ltd., Revolving Loan, (3-mo. CME Term SOFR at 0.75% Floor + 7.00%), 12.33%, 07/08/28(c)(f)(o) |
1,283 | 1,239,336 | ||||||||||
|
|
|
|||||||||||
| 15,786,433 | ||||||||||||
| Specialty Retail — 0.0% | ||||||||||||
| Fanatics Commerce Intermediate Holdco LLC, Term B Loan, (3-mo. LIBOR at 0.50% Floor + 3.25%), 3.25%, 11/23/28(c)(o) |
1,616 | 1,611,071 | ||||||||||
| Park River Holdings, Inc., Initial Term Loan (First Lien), (3-mo. LIBOR at 0.75% Floor + 3.25%), 8.52%, 12/28/27(c) |
524 | 505,222 | ||||||||||
|
|
|
|||||||||||
| 2,116,293 | ||||||||||||
| Technology Hardware, Storage & Peripherals — 0.1% | ||||||||||||
| Redstone Holdco 2 LP |
||||||||||||
| Initial Loan (Second Lien), (1-mo. CME Term SOFR at 0.75% Floor + 7.75%), 13.18%, 08/06/29(c) |
4,728 | 3,025,920 | ||||||||||
| Initial Term Loan (First Lien), (1-mo. CME Term SOFR at 0.75% Floor + 4.75%), 10.18%, 04/27/28(c) |
4,319 | 3,679,589 | ||||||||||
|
|
|
|||||||||||
| 6,705,509 | ||||||||||||
| Textiles, Apparel & Luxury Goods — 0.0% | ||||||||||||
| Tory Burch LLC, Initial Term B Loan, |
2,201 | 2,167,489 | ||||||||||
|
|
|
|||||||||||
| Transportation Infrastructure — 0.1% | ||||||||||||
| Green Plains Operating Co. LLC, Loan, (3-mo. LIBOR at 0.00% Floor + 8.00%), 13.67%, 07/20/26(c)(f) |
6,244 | 6,134,754 | ||||||||||
|
|
|
|||||||||||
| Total Floating Rate Loan Interests — 1.7% |
|
309,392,662 | ||||||||||
|
|
|
|||||||||||
| Foreign Agency Obligations |
||||||||||||
| Argentina — 0.0% | ||||||||||||
| YPF SA |
||||||||||||
| 6.95%, 07/21/27(e) |
487 | 388,324 | ||||||||||
| 8.50%, 06/27/29(e) |
157 | 125,486 | ||||||||||
| 7.00%, 09/30/33(b)(e) |
827 | 625,231 | ||||||||||
| 7.00%, 12/15/47(a) |
664 | 421,640 | ||||||||||
|
|
|
|||||||||||
| 1,560,681 | ||||||||||||
| Brazil — 0.0% | ||||||||||||
| Banco do Brasil SA, 6.25%, 04/18/30(a) |
292 | 283,203 | ||||||||||
|
|
|
|||||||||||
| Chile — 0.0% | ||||||||||||
| Empresa Nacional del Petroleo, 3.75%, 08/05/26(e) |
426 | 394,923 | ||||||||||
|
|
|
|||||||||||
| Colombia — 0.1% | ||||||||||||
| Ecopetrol SA |
||||||||||||
| 4.13%, 01/16/25 |
403 | 388,178 | ||||||||||
| 6.88%, 04/29/30 |
2,730 | 2,481,570 | ||||||||||
| 8.88%, 01/13/33 |
1,236 | 1,204,142 | ||||||||||
| Oleoducto Central SA, 4.00%, 07/14/27(e) |
670 | 596,970 | ||||||||||
|
|
|
|||||||||||
| 4,670,860 | ||||||||||||
| Security | Par (000) |
Value | ||||||||||
| Hungary — 0.0% | ||||||||||||
| MFB Magyar Fejlesztesi Bank Zrt, 6.50%, 06/29/28(e) |
USD | 825 | $ | 817,039 | ||||||||
|
|
|
|||||||||||
| India — 0.0% | ||||||||||||
| Export-Import Bank of India, 3.88%, 03/12/24(e) |
300 | 297,120 | ||||||||||
| REC Ltd., 5.63%, 04/11/28(e) |
200 | 194,760 | ||||||||||
|
|
|
|||||||||||
| 491,880 | ||||||||||||
| Indonesia — 0.0% | ||||||||||||
| Bank Negara Indonesia Persero Tbk PT, 3.75%, 03/30/26(e) |
420 | 386,400 | ||||||||||
| Freeport Indonesia PT, 4.76%, 04/14/27(e) |
385 | 365,230 | ||||||||||
| Pertamina Geothermal Energy PT, 5.15%, 04/27/28(e) |
510 | 496,669 | ||||||||||
| Pertamina Persero PT, 3.65%, 07/30/29(e) |
401 | 357,026 | ||||||||||
|
|
|
|||||||||||
| 1,605,325 | ||||||||||||
| Malaysia — 0.0% | ||||||||||||
| Khazanah Capital Ltd., 4.88%, 06/01/33(e) |
885 | 831,847 | ||||||||||
| Khazanah Global Sukuk Bhd, 4.69%, 06/01/28(e) |
895 | 866,995 | ||||||||||
|
|
|
|||||||||||
| 1,698,842 | ||||||||||||
| Mexico — 0.1% | ||||||||||||
| Comision Federal de Electricidad, 4.88%, 01/15/24(e) |
1,107 | 1,097,724 | ||||||||||
| Petroleos Mexicanos |
||||||||||||
| 4.88%, 01/18/24 |
1,107 | 1,097,779 | ||||||||||
| 7.19%, 09/12/24 |
MXN | 25,657 | 1,388,087 | |||||||||
| 3.63%, 11/24/25(e) |
EUR | 152 | 143,701 | |||||||||
| 6.88%, 08/04/26 |
USD | 5,934 | 5,435,188 | |||||||||
| 8.75%, 06/02/29 |
2,148 | 1,894,729 | ||||||||||
| 6.70%, 02/16/32 |
198 | 146,619 | ||||||||||
| 5.50%, 06/27/44 |
600 | 328,524 | ||||||||||
|
|
|
|||||||||||
| 11,532,351 | ||||||||||||
| Morocco — 0.0% | ||||||||||||
| OCP SA, 4.50%, 10/22/25(e) |
761 | 731,595 | ||||||||||
|
|
|
|||||||||||
| Oman — 0.0% | ||||||||||||
| EDO Sukuk Ltd., 5.88%, 09/21/33(a) |
412 | 406,850 | ||||||||||
|
|
|
|||||||||||
| Poland — 0.0% | ||||||||||||
| Bank Gospodarstwa Krajowego, 5.38%, 05/22/33(a) |
1,968 | 1,849,920 | ||||||||||
|
|
|
|||||||||||
| Saudi Arabia — 0.0% | ||||||||||||
| Gaci First Investment Co. |
||||||||||||
| 5.00%, 10/13/27(e) |
1,720 | 1,676,054 | ||||||||||
| 4.75%, 02/14/30(e) |
1,635 | 1,555,245 | ||||||||||
|
|
|
|||||||||||
| 3,231,299 | ||||||||||||
| South Korea — 0.0% | ||||||||||||
| Korea National Oil Corp. |
||||||||||||
| 4.75%, 04/03/26(e) |
200 | 195,912 | ||||||||||
| 4.88%, 04/03/28(e) |
200 | 194,710 | ||||||||||
|
|
|
|||||||||||
| 390,622 | ||||||||||||
|
|
|
|||||||||||
| Total Foreign Agency Obligations — 0.2% |
29,665,390 | |||||||||||
|
|
|
|||||||||||
| Foreign Government Obligations |
||||||||||||
| Angola — 0.0% | ||||||||||||
| Republic of Angola, 8.75%, 04/14/32(a) |
1,078 | 864,243 | ||||||||||
|
|
|
|||||||||||
| M A S T E R P O R T F O L I O S C H E D U L E O F I N V E S T M E N T S |
57 |
| Consolidated Schedule of Investments (continued) September 30, 2023 |
Master Total Return Portfolio (Percentages shown are based on Net Assets) |
| Security | Par (000) |
Value | ||||||||||
| Argentina — 0.0% | ||||||||||||
| Republic of Argentina |
||||||||||||
| 3.63%, 07/09/35(b) |
USD | 1,512 | $ | 374,946 | ||||||||
| 4.25%, 01/09/38(b) |
1,278 | 373,955 | ||||||||||
|
|
|
|||||||||||
| 748,901 | ||||||||||||
| Bahrain — 0.0% | ||||||||||||
| Kingdom of Bahrain, 5.45%, 09/16/32(e) |
200 | 173,644 | ||||||||||
|
|
|
|||||||||||
| Benin — 0.0% | ||||||||||||
| Republic of Benin |
||||||||||||
| 4.88%, 01/19/32(e) |
EUR | 295 | 230,869 | |||||||||
| 6.88%, 01/19/52(e) |
294 | 206,697 | ||||||||||
|
|
|
|||||||||||
| 437,566 | ||||||||||||
| Chile — 0.0% | ||||||||||||
| Republic of Chile, 4.34%, 03/07/42 |
USD | 200 | 161,234 | |||||||||
|
|
|
|||||||||||
| Colombia — 0.1% | ||||||||||||
| Colombian TES |
||||||||||||
| 7.50%, 08/26/26 |
COP | 23,303,000 | 5,243,825 | |||||||||
| 5.75%, 11/03/27 |
14,812,000 | 3,019,424 | ||||||||||
| Republic of Colombia |
||||||||||||
| 4.50%, 01/28/26 |
USD | 267 | 254,972 | |||||||||
| 3.88%, 04/25/27 |
200 | 181,678 | ||||||||||
| 3.13%, 04/15/31 |
337 | 248,874 | ||||||||||
| 8.00%, 04/20/33 |
1,056 | 1,043,296 | ||||||||||
| 4.13%, 05/15/51 |
1,020 | 566,100 | ||||||||||
|
|
|
|||||||||||
| 10,558,169 | ||||||||||||
| Côte d’Ivoire — 0.0% | ||||||||||||
| Republic of Cote d’Ivoire |
||||||||||||
| 6.38%, 03/03/28(e) |
481 | 448,965 | ||||||||||
| 5.88%, 10/17/31(e) |
EUR | 100 | 87,177 | |||||||||
| 4.88%, 01/30/32(e) |
215 | 172,250 | ||||||||||
| 6.13%, 06/15/33(e) |
USD | 400 | 330,868 | |||||||||
| 6.88%, 10/17/40(e) |
EUR | 252 | 196,629 | |||||||||
| 6.63%, 03/22/48(e) |
239 | 173,522 | ||||||||||
|
|
|
|||||||||||
| 1,409,411 | ||||||||||||
| Czechia — 0.1% | ||||||||||||
| Czech Republic |
||||||||||||
| 5.50%, 12/12/28 |
CZK | 110,660 | 4,955,469 | |||||||||
| 5.00%, 09/30/30 |
59,700 | 2,620,955 | ||||||||||
| 4.20%, 12/04/36(e) |
19,790 | 799,609 | ||||||||||
|
|
|
|||||||||||
| 8,376,033 | ||||||||||||
| Dominican Republic — 0.0% | ||||||||||||
| Dominican Republic |
||||||||||||
| 6.88%, 01/29/26(e) |
USD | 251 | 250,418 | |||||||||
| 5.95%, 01/25/27(e) |
353 | 341,153 | ||||||||||
| 4.50%, 01/30/30(a) |
403 | 340,604 | ||||||||||
| 7.05%, 02/03/31(a) |
150 | 144,685 | ||||||||||
| 4.88%, 09/23/32(a) |
647 | 525,163 | ||||||||||
| 4.88%, 09/23/32(e) |
186 | 150,974 | ||||||||||
| 5.30%, 01/21/41(e) |
186 | 136,476 | ||||||||||
|
|
|
|||||||||||
| 1,889,473 | ||||||||||||
| Egypt — 0.0% | ||||||||||||
| Arab Republic of Egypt |
||||||||||||
| 6.38%, 04/11/31(e) |
EUR | 361 | 212,066 | |||||||||
| 7.63%, 05/29/32(e) |
USD | 321 | 184,443 | |||||||||
| 8.50%, 01/31/47(e) |
403 | 214,485 | ||||||||||
| 7.90%, 02/21/48(e) |
411 | 209,848 | ||||||||||
| 7.50%, 02/16/61(a) |
200 | 100,398 | ||||||||||
| 7.50%, 02/16/61(e) |
1,024 | 514,038 | ||||||||||
|
|
|
|||||||||||
| 1,435,278 | ||||||||||||
| Security | Par (000) |
Value | ||||||||||
| Ghana — 0.0% | ||||||||||||
| Republic of Ghana |
||||||||||||
| 7.63%, 05/16/29(e)(h)(l) |
USD | 1,133 | $ | 498,871 | ||||||||
| 8.95%, 03/26/51(e)(h)(l) |
446 | 188,507 | ||||||||||
|
|
|
|||||||||||
| 687,378 | ||||||||||||
| Guatemala — 0.0% | ||||||||||||
| Republic of Guatemala |
||||||||||||
| 4.50%, 05/03/26(e) |
200 | 189,426 | ||||||||||
| 5.25%, 08/10/29(a) |
61 | 56,124 | ||||||||||
| 7.05%, 10/04/32(a) |
290 | 291,015 | ||||||||||
| 3.70%, 10/07/33(e) |
200 | 153,052 | ||||||||||
| 4.65%, 10/07/41(a) |
222 | 163,398 | ||||||||||
|
|
|
|||||||||||
| 853,015 | ||||||||||||
| Hungary — 0.0% | ||||||||||||
| Hungarian People’s Republic |
||||||||||||
| 5.38%, 03/25/24 |
16 | 15,960 | ||||||||||
| 5.25%, 06/16/29(a) |
200 | 190,868 | ||||||||||
|
|
|
|||||||||||
| 206,828 | ||||||||||||
| Indonesia — 0.1% | ||||||||||||
| Perusahaan Penerbit SBSN Indonesia III, 4.40%, 06/06/27(a) |
200 | 192,622 | ||||||||||
| Republic of Indonesia |
||||||||||||
| 4.10%, 04/24/28 |
200 | 188,554 | ||||||||||
| 2.85%, 02/14/30 |
2,600 | 2,209,974 | ||||||||||
| 6.75%, 01/15/44(e) |
400 | 432,700 | ||||||||||
| 3.05%, 03/12/51 |
11,595 | 7,494,080 | ||||||||||
|
|
|
|||||||||||
| 10,517,930 | ||||||||||||
| Jordan — 0.0% | ||||||||||||
| Kingdom of Jordan, 5.85%, 07/07/30(e) |
511 | 452,148 | ||||||||||
|
|
|
|||||||||||
| Kenya — 0.0% | ||||||||||||
| Republic of Kenya, 8.00%, 05/22/32(e) |
400 | 310,000 | ||||||||||
|
|
|
|||||||||||
| Mexico — 0.4% | ||||||||||||
| United Mexican States |
||||||||||||
| 7.50%, 06/03/27 |
MXN | 82,900 | 4,348,058 | |||||||||
| 3.75%, 01/11/28 |
USD | 200 | 184,946 | |||||||||
| 8.50%, 05/31/29 |
MXN | 249,397 | 13,420,607 | |||||||||
| 2.66%, 05/24/31 |
USD | 27,026 | 21,334,054 | |||||||||
| 8.50%, 11/18/38 |
MXN | 113,408 | 5,759,064 | |||||||||
| 4.50%, 01/31/50 |
USD | 25,868 | 18,615,130 | |||||||||
| 6.34%, 05/04/53 |
825 | 748,687 | ||||||||||
|
|
|
|||||||||||
| 64,410,546 | ||||||||||||
| Morocco — 0.0% | ||||||||||||
| Kingdom of Morocco |
||||||||||||
| 5.95%, 03/08/28(a) |
200 | 196,714 | ||||||||||
| 6.50%, 09/08/33(a) |
2,124 | 2,083,602 | ||||||||||
| 6.50%, 09/08/33(e) |
255 | 250,150 | ||||||||||
| 4.00%, 12/15/50(e) |
417 | 257,093 | ||||||||||
|
|
|
|||||||||||
| 2,787,559 | ||||||||||||
| Nigeria — 0.0% | ||||||||||||
| Republic of Nigeria |
||||||||||||
| 7.88%, 02/16/32(e) |
323 | 253,952 | ||||||||||
| 7.38%, 09/28/33(e) |
1,108 | 816,729 | ||||||||||
| 7.63%, 11/28/47(e) |
701 | 464,195 | ||||||||||
| 9.25%, 01/21/49(e) |
523 | 401,654 | ||||||||||
|
|
|
|||||||||||
| 1,936,530 | ||||||||||||
| 58 | 2 0 2 3 B L A C K R O C K A N N U A L R E P O R T T O S H A R E H O L D E R S |
| Consolidated Schedule of Investments (continued) September 30, 2023 |
Master Total Return Portfolio (Percentages shown are based on Net Assets) |
| Security | Par (000) |
Value | ||||||||||
| Oman — 0.0% | ||||||||||||
| Sultanate of Oman |
||||||||||||
| 6.50%, 03/08/47(e) |
USD | 400 | $ | 356,420 | ||||||||
| 6.75%, 01/17/48(e) |
426 | 390,433 | ||||||||||
|
|
|
|||||||||||
| 746,853 | ||||||||||||
| Panama — 0.1% | ||||||||||||
| Republic of Panama |
||||||||||||
| 3.88%, 03/17/28 |
17,669 | 16,223,146 | ||||||||||
| 3.16%, 01/23/30 |
272 | 227,974 | ||||||||||
| 6.40%, 02/14/35 |
1,815 | 1,754,016 | ||||||||||
| 6.85%, 03/28/54 |
1,007 | 934,657 | ||||||||||
| 4.50%, 04/01/56 |
10,739 | 7,034,045 | ||||||||||
|
|
|
|||||||||||
| 26,173,838 | ||||||||||||
| Peru — 0.0% | ||||||||||||
| Republic of Peru |
||||||||||||
| 2.78%, 01/23/31 |
171 | 139,722 | ||||||||||
| 1.86%, 12/01/32 |
326 | 234,893 | ||||||||||
| 3.55%, 03/10/51 |
9,365 | 6,149,715 | ||||||||||
|
|
|
|||||||||||
| 6,524,330 | ||||||||||||
| Philippines — 0.1% | ||||||||||||
| Republic of the Philippines |
||||||||||||
| 3.00%, 02/01/28 |
11,468 | 10,400,903 | ||||||||||
| 3.20%, 07/06/46 |
15,450 | 10,140,144 | ||||||||||
|
|
|
|||||||||||
| 20,541,047 | ||||||||||||
| Poland — 0.0% | ||||||||||||
| Republic of Poland |
||||||||||||
| 4.88%, 10/04/33 |
87 | 80,660 | ||||||||||
| 4.25%, 02/14/43(e) |
EUR | 59 | 57,617 | |||||||||
| 5.50%, 04/04/53 |
USD | 135 | 121,848 | |||||||||
|
|
|
|||||||||||
| 260,125 | ||||||||||||
| Qatar — 0.0% | ||||||||||||
| State of Qatar, 4.00%, 03/14/29(e) |
200 | 190,256 | ||||||||||
|
|
|
|||||||||||
| Romania — 0.0% | ||||||||||||
| Romania |
||||||||||||
| 5.25%, 11/25/27(a) |
92 | 89,338 | ||||||||||
| 2.13%, 03/07/28(e) |
EUR | 1,275 | 1,167,915 | |||||||||
| 2.88%, 03/11/29(e) |
190 | 175,549 | ||||||||||
| 2.50%, 02/08/30(e) |
200 | 172,860 | ||||||||||
| 2.12%, 07/16/31(e) |
237 | 185,290 | ||||||||||
|
|
|
|||||||||||
| 1,790,952 | ||||||||||||
| Russian Federation — 0.0% | ||||||||||||
| Russian Federation, 6.10%, 07/18/35(h)(l) |
RUB | 363,972 | 924,074 | |||||||||
|
|
|
|||||||||||
| Saudi Arabia — 0.0% | ||||||||||||
| Kingdom of Saudi Arabia |
||||||||||||
| 4.50%, 04/17/30(e) |
USD | 200 | 190,552 | |||||||||
| 5.00%, 01/18/53(a) |
200 | 165,754 | ||||||||||
| 3.45%, 02/02/61(e) |
1,877 | 1,145,702 | ||||||||||
|
|
|
|||||||||||
| 1,502,008 | ||||||||||||
| Senegal — 0.0% | ||||||||||||
| Republic of Senegal |
||||||||||||
| 4.75%, 03/13/28(e) |
EUR | 184 | 165,655 | |||||||||
| 6.25%, 05/23/33(e) |
USD | 200 | 160,112 | |||||||||
| 5.38%, 06/08/37(e) |
EUR | 283 | 191,582 | |||||||||
| 6.75%, 03/13/48(e) |
USD | 294 | 196,610 | |||||||||
|
|
|
|||||||||||
| 713,959 | ||||||||||||
| South Africa — 0.0% | ||||||||||||
| Republic of South Africa |
240 | 205,485 | ||||||||||
| Security | Par (000) |
Value | ||||||||||
| South Africa (continued) | ||||||||||||
| Republic of South Africa |
||||||||||||
| 5.88%, 04/20/32 |
USD | 296 | $ | 251,319 | ||||||||
| 5.00%, 10/12/46 |
513 | 316,403 | ||||||||||
|
|
|
|||||||||||
| 773,207 | ||||||||||||
| Sri Lanka — 0.0% | ||||||||||||
| Republic of Sri Lanka |
||||||||||||
| 6.85%, 03/14/24(e)(h)(l) |
628 | 296,542 | ||||||||||
| 5.75%, 04/18/24(h)(l) |
200 | 94,680 | ||||||||||
| 6.35%, 06/28/24(e)(h)(l) |
459 | 217,226 | ||||||||||
| 6.83%, 07/18/26(e)(h)(l) |
200 | 95,598 | ||||||||||
|
|
|
|||||||||||
| 704,046 | ||||||||||||
| Ukraine — 0.0% | ||||||||||||
| Ukraine Government |
||||||||||||
| 7.75%, 09/01/25(e)(h)(l) |
105 | 34,388 | ||||||||||
| 7.75%, 09/01/28(e)(h)(l) |
424 | 120,840 | ||||||||||
| 7.75%, 09/01/29(e)(h)(l) |
1,941 | 551,244 | ||||||||||
| 4.38%, 01/27/32(e)(h)(l) |
EUR | 1,274 | 316,530 | |||||||||
| 7.38%, 09/25/34(e)(h)(l) |
USD | 3,504 | 916,296 | |||||||||
| 7.38%, 09/25/34(a)(h)(l) |
728 | 190,372 | ||||||||||
| 7.25%, 03/15/35(a)(h)(l) |
1,173 | 306,739 | ||||||||||
| 7.25%, 03/15/35(e)(h)(l) |
1,150 | 300,725 | ||||||||||
| 7.75%, 08/01/41(c)(e)(h)(l) |
1,664 | 761,280 | ||||||||||
|
|
|
|||||||||||
| 3,498,414 | ||||||||||||
| Uruguay — 0.1% | ||||||||||||
| Oriental Republic of Uruguay |
||||||||||||
| 4.38%, 10/27/27 |
5,923 | 5,841,629 | ||||||||||
| 5.75%, 10/28/34 |
189 | 192,942 | ||||||||||
| 5.10%, 06/18/50 |
6,207 | 5,499,358 | ||||||||||
|
|
|
|||||||||||
| 11,533,929 | ||||||||||||
|
|
|
|||||||||||
| Total Foreign Government Obligations — 1.0% |
|
184,092,924 | ||||||||||
|
|
|
|||||||||||
| Shares | ||||||||||||
| Investment Companies |
||||||||||||
| Equity Funds — 0.0% | ||||||||||||
| Formentera Partners Fund II LP(f)(p)(q) |
— | 2,580,111 | ||||||||||
| SPDR S&P Regional Banking ETF(i) |
35,324 | 1,475,484 | ||||||||||
|
|
|
|||||||||||
| 4,055,595 | ||||||||||||
| Fixed-Income Funds — 0.2% | ||||||||||||
| iShares iBoxx $ Investment Grade Corporate Bond ETF(i)(r) |
239,000 | 24,382,780 | ||||||||||
| Vanguard Long-Term Corporate Bond ETF(i) |
19,000 | 1,360,780 | ||||||||||
|
|
|
|||||||||||
| 25,743,560 | ||||||||||||
|
|
|
|||||||||||
| Total Investment Companies — 0.2% |
29,799,155 | |||||||||||
|
|
|
|||||||||||
| Par (000) |
||||||||||||
| Municipal Bonds |
||||||||||||
| California — 0.3% | ||||||||||||
| Bay Area Toll Authority, RB, Series S1, 7.04%, 04/01/50 |
USD | 9,275 | 10,669,972 | |||||||||
| Los Angeles Community College District, GO, 6.60%, 08/01/42 |
3,990 | 4,361,749 | ||||||||||
| Los Angeles Unified School District |
||||||||||||
| GO, 5.75%, 07/01/34 |
555 | 558,912 | ||||||||||
| GO, 6.76%, 07/01/34 |
9,940 | 10,746,484 | ||||||||||
| M A S T E R P O R T F O L I O S C H E D U L E O F I N V E S T M E N T S |
59 |
| Consolidated Schedule of Investments (continued) September 30, 2023 |
Master Total Return Portfolio (Percentages shown are based on Net Assets) |
| Security | Par (000) |
Value | ||||||||||
| California (continued) | ||||||||||||
| State of California |
||||||||||||
| GO, 7.55%, 04/01/39 |
USD | 4,000 | $ | 4,686,226 | ||||||||
| Refunding GO, 4.60%, 04/01/38 |
22,215 | 20,050,327 | ||||||||||
| University of California, RB, 4.86%, 05/15/2112 |
2,467 | 2,028,078 | ||||||||||
|
|
|
|||||||||||
| 53,101,748 | ||||||||||||
| Georgia — 0.0% | ||||||||||||
| Municipal Electric Authority of Georgia, RB, 6.64%, 04/01/57 |
3,223 | 3,391,473 | ||||||||||
|
|
|
|||||||||||
| Illinois — 0.1% | ||||||||||||
| State of Illinois, GO, 5.10%, 06/01/33 |
17,635 | 16,736,426 | ||||||||||
|
|
|
|||||||||||
| Massachusetts — 0.0% | ||||||||||||
| Massachusetts HFA, RB, Series A, 4.50%, 12/01/48 |
965 | 815,309 | ||||||||||
|
|
|
|||||||||||
| New Jersey — 0.0% | ||||||||||||
| New Jersey Turnpike Authority, RB, Series F, 7.41%, 01/01/40 |
4,596 | 5,359,733 | ||||||||||
|
|
|
|||||||||||
| New York — 0.1% | ||||||||||||
| Metropolitan Transportation Authority |
||||||||||||
| RB, 5.87%, 11/15/39 |
985 | 938,568 | ||||||||||
| RB, 6.67%, 11/15/39 |
3,060 | 3,132,755 | ||||||||||
| RB, Series E, 6.81%, 11/15/40 |
1,025 | 1,074,182 | ||||||||||
| New York City Water & Sewer System |
||||||||||||
| RB, 6.01%, 06/15/42 |
2,430 | 2,498,045 | ||||||||||
| RB, 5.88%, 06/15/44 |
1,665 | 1,685,844 | ||||||||||
| New York State Dormitory Authority, RB, Series H, 5.39%, 03/15/40 |
1,470 | 1,414,766 | ||||||||||
| Port Authority of New York & New Jersey |
||||||||||||
| RB, 5.65%, 11/01/40 |
2,780 | 2,760,935 | ||||||||||
| RB, 4.96%, 08/01/46 |
5,020 | 4,559,366 | ||||||||||
| RB, 4.93%, 10/01/51 |
1,400 | 1,264,399 | ||||||||||
|
|
|
|||||||||||
| 19,328,860 | ||||||||||||
| Ohio — 0.0% | ||||||||||||
| American Municipal Power, Inc., RB, Series B, 8.08%, 02/15/50 |
3,555 | 4,421,361 | ||||||||||
|
|
|
|||||||||||
| Texas — 0.1% | ||||||||||||
| City of San Antonio, TX Electric & Gas Systems Revenue, RB, 5.81%, 02/01/41 |
4,375 | 4,386,713 | ||||||||||
| State of Texas, GO, 5.52%, 04/01/39 |
5,715 | 5,688,171 | ||||||||||
|
|
|
|||||||||||
| 10,074,884 | ||||||||||||
|
|
|
|||||||||||
| Total Municipal Bonds — 0.6% |
113,229,794 | |||||||||||
|
|
|
|||||||||||
| Non-Agency Mortgage-Backed Securities |
| |||||||||||
| Collateralized Mortgage Obligations — 4.0% | ||||||||||||
| Adjustable Rate Mortgage Trust, Series 2005-8, Class 3A1, 4.51%, 11/25/35(c) |
3,820 | 2,783,666 | ||||||||||
| Ajax Mortgage Loan Trust |
||||||||||||
| Series 2017-D, Class B, 0.00%, 12/25/57(a)(c)(d) |
37 | 18,007 | ||||||||||
| Series 2019-E, Class C, 0.00%, 09/25/59(a)(d) |
156 | 257,666 | ||||||||||
| Series 2020-C, Class A, 2.25%, 09/27/60(a)(b) |
513 | 506,965 | ||||||||||
| Series 2020-C, Class B, 5.00%, 09/27/60(a)(b) |
2,981 | 2,869,484 | ||||||||||
| Series 2020-C, Class C, 0.00%, 09/27/60(a)(d) |
9,346 | 8,445,994 | ||||||||||
| Series 2020-D, Class A, 2.25%, 06/25/60(a)(b) |
3,593 | 3,463,754 | ||||||||||
| Series 2020-D, Class B, 5.00%, 06/25/60(a)(b) |
4,238 | 4,079,925 | ||||||||||
| Series 2020-D, Class C, 0.00%, 06/25/60(a)(d) |
9,998 | 9,292,911 | ||||||||||
| Series 2021-C, Class A, 2.12%, 01/25/61(a)(b) |
10,890 | 10,223,489 | ||||||||||
| Series 2021-C, Class B, 3.72%, 01/25/61(a)(b) |
3,277 | 3,051,910 | ||||||||||
| Security | Par (000) |
Value | ||||||||||
| Collateralized Mortgage Obligations (continued) | ||||||||||||
| Ajax Mortgage Loan Trust |
||||||||||||
| Series 2021-C, Class C, |
USD | 8,224 | $ | 9,129,326 | ||||||||
| Series 2021-D,
Class A, |
23,150 | 21,247,685 | ||||||||||
| Series 2021-D, Class
B, |
5,836 | 5,429,784 | ||||||||||
| Series 2021-D, Class
C, |
8,540 | 9,493,111 | ||||||||||
| Series 2021-E, Class A1, 1.74%, 12/25/60(a)(c) |
23,270 | 19,575,984 | ||||||||||
| Series 2021-E, Class A2, 2.69%, 12/25/60(a)(c) |
4,422 | 3,518,576 | ||||||||||
| Series 2021-E, Class B1, 3.73%, 12/25/60(a)(c) |
2,669 | 2,098,475 | ||||||||||
| Series 2021-E, Class B3, 4.08%, 12/25/60(a)(c) |
7,641 | 3,197,716 | ||||||||||
| Series 2021-E, Class M1, 2.94%, 12/25/60(a)(c) |
1,744 | 1,353,195 | ||||||||||
| Series 2021-E, Class SA, 0.00%, 12/25/60(a)(c)(d) |
94 | 43,479 | ||||||||||
| Series 2021-F,
Class A, |
41,452 | 37,099,192 | ||||||||||
| Series 2021-F, Class
B, |
6,403 | 5,948,534 | ||||||||||
| Series 2021-F, Class
C, |
11,879 | 10,786,876 | ||||||||||
| Series 2022-A, Class A1, 3.50%, 10/25/61(a)(b) |
21,480 | 20,167,309 | ||||||||||
| Series 2022-A, Class A2, 3.00%, 10/25/61(a)(c) |
1,244 | 1,025,956 | ||||||||||
| Series 2022-A, Class A3, 3.00%, 10/25/61(a)(c) |
664 | 536,711 | ||||||||||
| Series 2022-A, Class B, 3.00%, 10/25/61(a) |
4,977 | 3,380,082 | ||||||||||
| Series 2022-A, Class C, 3.00%, 10/25/61(a) |
2,473 | 3,638,099 | ||||||||||
| Series 2022-A, Class M1, 3.00%, 10/25/61(a) |
726 | 572,131 | ||||||||||
| Series 2022-A, Class M2, 3.00%, 10/25/61(a) |
3,256 | 2,467,645 | ||||||||||
| Series 2022-A, Class M3, 3.00%, 10/25/61(a) |
208 | 151,579 | ||||||||||
| Series 2022-B, Class A1, 3.50%, 03/27/62(a)(b) |
23,379 | 21,448,408 | ||||||||||
| Series 2022-B, Class A2, 3.00%, 03/27/62(a)(c) |
937 | 704,930 | ||||||||||
| Series 2022-B, Class A3, 3.00%, 03/27/62(a)(c) |
804 | 592,549 | ||||||||||
| Series 2022-B, Class B, 3.00%, 03/27/62(a) |
4,464 | 2,697,216 | ||||||||||
| Series 2022-B, Class
C, |
3,025 | 2,626,257 | ||||||||||
| Series 2022-B, Class M1, 3.00%, 03/27/62(a) |
603 | 433,039 | ||||||||||
| Series 2022-B, Class M2, 3.00%, 03/27/62(a) |
2,991 | 2,059,315 | ||||||||||
| Series 2023-A, Class A1, 3.50%, 07/25/62(a)(b) |
29,120 | 26,606,073 | ||||||||||
| Series 2023-A, Class A2, 3.00%, 07/25/62(a)(c) |
1,258 | 1,014,537 | ||||||||||
| Series 2023-A, Class A3, 2.50%, 07/25/62(a)(c) |
713 | 537,688 | ||||||||||
| Series 2023-A, Class
B, |
4,194 | 2,728,417 | ||||||||||
| Series 2023-A, Class
C, |
2,301 | 2,250,647 | ||||||||||
| Series 2023-A, Class M1, 2.50%, 07/25/62(a)(c) |
2,160 | 1,579,133 | ||||||||||
| Series 2023-C, Class A1, 3.50%, 05/25/63(a)(b) |
26,816 | 24,594,758 | ||||||||||
| Series 2023-C, Class A2, 3.00%, 05/25/63(a)(c) |
1,567 | 1,225,951 | ||||||||||
| Series 2023-C, Class A3, 2.50%, 05/25/63(a)(c) |
836 | 612,700 | ||||||||||
| Series 2023-C, Class
C, |
6,602 | 5,195,598 | ||||||||||
| Series 2023-C, Class M1, 2.50%, 05/25/63(a)(c) |
731 | 520,641 | ||||||||||
| Series 2023-C, Class M2, 2.50%, 05/25/63(a)(c) |
4,534 | 2,955,524 | ||||||||||
| American Home Mortgage Assets Trust |
||||||||||||
| Series 2006-3, Class 2A11, (12-mo. Federal Reserve Cumulative Average US + 0.94%), 5.57%, 10/25/46(c) |
613 | 412,623 | ||||||||||
| Series 2006-4, Class 1A12, (1-mo. CME Term SOFR + 0.32%), 5.64%, 10/25/46(c) |
1,682 | 885,793 | ||||||||||
| Series 2007-1, Class A1, (12-mo. Federal Reserve Cumulative Average US + 0.70%), 5.33%, 02/25/47(c) |
622 | 240,356 | ||||||||||
| American Home Mortgage Investment Trust, Series 2007-1, Class GA1C, (1-mo. CME Term SOFR + 0.30%), 5.62%, 05/25/47(c) |
2,334 | 1,233,330 | ||||||||||
| Angel Oak Mortgage Trust, Series 2020-4, Class A3, 2.81%, 06/25/65(a)(c) |
844 | 790,631 | ||||||||||
| Angel Oak Mortgage Trust LLC, |
1,456 | 1,350,638 | ||||||||||
| 60 | 2 0 2 3 B L A C K R O C K A N N U A L R E P O R T T O S H A R E H O L D E R S |
| Consolidated Schedule of Investments (continued) September 30, 2023 |
Master Total Return Portfolio (Percentages shown are based on Net Assets) |
| Security | Par (000) |
Value | ||||||||||
| Collateralized Mortgage Obligations (continued) | ||||||||||||
| APS Resecuritization Trust |
||||||||||||
| Series 2016-1, Class 1MZ, 3.03%, 07/31/57(a)(c) |
USD | 8,119 | $ | 3,130,210 | ||||||||
| Series 2016-3, Class 3A, (1-mo. CME Term SOFR + 2.96%), 8.28%, 09/27/46(a)(c) |
663 | 661,831 | ||||||||||
| ARI Investments LLC, Series 2019-1, 4.55%, 01/30/25(f) |
3,103 | 3,010,360 | ||||||||||
| Banc of America Funding Trust |
||||||||||||
| Series 2014-R2, Class 1C, 0.00%, 11/26/36(a)(c)(d) |
3,472 | 993,982 | ||||||||||
| Series 2016-R2, Class 1A1, 4.70%, 05/01/33(a)(c) |
936 | 906,737 | ||||||||||
| Barclays Mortgage Loan Trust |
||||||||||||
| Series 2021-NPL1, Class A, 2.00%, 11/25/51(a)(b) |
23,860 | 21,418,509 | ||||||||||
| Series 2021-NPL1, Class B, 4.63%, 11/25/51(a)(b) |
3,139 | 2,731,443 | ||||||||||
| Series 2021-NPL1, Class C, 0.00%, 11/25/51(a)(d)(f) |
6,944 | 6,773,549 | ||||||||||
| Series 2022-NQM1, Class A1, 4.55%, 07/25/52(a)(b) |
5,863 | 5,514,215 | ||||||||||
| Series 2022-RPL1, Class A, 4.25%, 02/25/28(a)(b) |
12,505 | 11,916,624 | ||||||||||
| Series 2022-RPL1, Class B, 4.25%, 02/25/28(a)(b) |
2,105 | 1,941,149 | ||||||||||
| Series 2022-RPL1, Class C, 0.00%, 02/25/28(a)(d) |
3,737 | 2,062,514 | ||||||||||
| Series 2022-RPL1, Class SA, 0.00%, 02/25/28(a)(d) |
127 | 67,268 | ||||||||||
| BCAP LLC Trust, Series 2011-RR5, Class 11A5, (1-mo. CME Term SOFR + 0.26%), 3.97%, 05/28/36(a)(c) |
2,044 | 1,932,965 | ||||||||||
| Bear Stearns ALT-A Trust |
||||||||||||
| Series 2006-2, Class 22A1, 3.96%, 03/25/36(c) |
3,414 | 2,156,197 | ||||||||||
| Series 2007-1, Class 1A1, (1-mo. CME Term SOFR + 0.43%), 5.75%, 01/25/47(c) |
914 | 729,575 | ||||||||||
| Bear Stearns Asset-Backed Securities I Trust, Series 2005-AC9, Class A5, 6.25%, 12/25/35(b) |
151 | 91,581 | ||||||||||
| Bear Stearns Mortgage Funding Trust |
||||||||||||
| Series 2006-SL1, Class A1, (1-mo. CME Term SOFR + 0.39%), 5.71%, 08/25/36(c) |
354 | 340,782 | ||||||||||
| Series 2007-AR2, Class A1, (1-mo. CME Term SOFR + 0.45%), 5.77%, 03/25/37(c) |
199 | 181,517 | ||||||||||
| Series 2007-AR3, Class 1A1, (1-mo. CME Term SOFR + 0.25%), 5.57%, 03/25/37(c) |
354 | 296,373 | ||||||||||
| Series 2007-AR4, Class 2A1, (1-mo. CME Term SOFR + 0.32%), 5.64%, 06/25/37(c) |
321 | 297,378 | ||||||||||
| BlackRock Capital Finance LP, Series 1997-R2, Class AP, 1.82%, 12/25/35(a)(c)(f)(r) |
3 | — | ||||||||||
| Chase Mortgage Finance Trust, Series 2007-S6, Class 1A1, 6.00%, 12/25/37 |
18,866 | 8,020,823 | ||||||||||
| CHNGE Mortgage Trust |
||||||||||||
| Series 2022-1, Class A1, 3.01%, 01/25/67(a)(c) |
2,209 | 1,946,221 | ||||||||||
| Series 2022-4, Class A1, 6.00%, 10/25/57(a)(b) |
750 | 729,752 | ||||||||||
| CIM Trust, Series 2023-I2, Class A2, 6.85%, 12/25/67(a)(b) |
3,849 | 3,828,928 | ||||||||||
| Citicorp Mortgage Securities Trust |
||||||||||||
| Series 2007-9, Class 1A1, 6.25%, 12/25/37 |
1,100 | 892,155 | ||||||||||
| Series 2008-2, Class 1A1, 6.50%, 06/25/38 |
3,528 | 2,677,587 | ||||||||||
| CitiMortgage Alternative Loan Trust, Series 2007-A6, Class 1A11, 6.00%, 06/25/37 |
500 | 424,324 | ||||||||||
| Security | Par (000) |
Value | ||||||||||
| Collateralized Mortgage Obligations (continued) | ||||||||||||
| COLT Mortgage Loan Trust, Series 2020-3, Class A3, 2.38%, 04/27/65(a)(c) |
USD | 296 | $ | 277,714 | ||||||||
| Countrywide Alternative Loan Trust |
||||||||||||
| Series 2005-22T1, Class A1, (1-mo. CME Term SOFR + 0.46%), 5.42%, 06/25/35(c) |
2,618 | 2,125,623 | ||||||||||
| Series 2005-76, Class 2A1, (12-mo. Federal Reserve Cumulative Average US + 1.00%), 5.63%, 02/25/36(c) |
451 | 402,723 | ||||||||||
| Series 2006-11CB, Class 3A1, 6.50%, 05/25/36 |
1,384 | 683,332 | ||||||||||
| Series 2006-15CB, Class A1, 6.50%, 06/25/36 |
314 | 148,362 | ||||||||||
| Series 2006-23CB, Class 2A5, (1-mo. CME Term SOFR + 0.51%), 5.83%, 08/25/36(c) |
4,881 | 980,451 | ||||||||||
| Series 2006-OA14, Class 1A1, (12-mo. Federal Reserve Cumulative Average US + 1.73%), 6.36%, 11/25/46(c) |
2,049 | 1,556,645 | ||||||||||
| Series 2006-OA16, Class A2, (1-mo. CME Term SOFR + 0.49%), 5.81%, 10/25/46(c) |
2,263 | 2,015,607 | ||||||||||
| Series 2006-OA16, Class A4C, (1-mo. CME Term SOFR + 0.79%), 6.11%, 10/25/46(c) |
3,604 | 2,549,935 | ||||||||||
| Series 2006-OA21, Class A1, (1-mo. CME Term SOFR + 0.30%), 5.63%, 03/20/47(c) |
5,084 | 4,088,769 | ||||||||||
| Series 2006-OA8, Class 1A1, (1-mo. CME Term SOFR + 0.49%), 5.81%, 07/25/46(c) |
255 | 214,003 | ||||||||||
| Series 2006-OC10, Class 2A3, (1-mo. CME Term SOFR + 0.57%), 5.89%, 11/25/36(c) |
1,607 | 1,366,768 | ||||||||||
| Series 2006-OC7, Class 2A3, (1-mo. CME Term SOFR + 0.61%), 5.93%, 07/25/46(c) |
1,720 | 1,523,054 | ||||||||||
| Series 2007-14T2, Class A1, 6.00%, 07/25/37 |
2,095 | 1,011,017 | ||||||||||
| Series 2007-3T1, Class 1A1, 6.00%, 04/25/37 |
267 | 123,490 | ||||||||||
| Series 2007-AL1, Class A1, (1-mo. CME Term SOFR + 0.36%), 5.68%, 06/25/37(c) |
4,441 | 3,494,551 | ||||||||||
| Series 2007-OA3, Class 1A1, (1-mo. CME Term SOFR + 0.39%), 5.71%, 04/25/47(c) |
624 | 542,085 | ||||||||||
| Series 2007-OA3, Class 2A2, (1-mo. CME Term SOFR + 0.47%), 5.79%, 04/25/47(c) |
2 | 195 | ||||||||||
| Series 2007-OA8, Class 2A1, (1-mo. CME Term SOFR + 0.47%), 5.79%, 06/25/47(c) |
207 | 152,032 | ||||||||||
| Series 2007-OH2, Class A2A, (1-mo. CME Term SOFR + 0.59%), 5.91%, 08/25/47(c) |
223 | 191,608 | ||||||||||
| Countrywide Home Loan Mortgage Pass-Through Trust |
||||||||||||
| Series 2004-29, Class 1A1, (1-mo. CME Term SOFR + 0.65%), 5.97%, 02/25/35(c) |
126 | 111,638 | ||||||||||
| Series 2005-16, Class A28, 5.50%, 09/25/35 |
3,061 | 1,945,023 | ||||||||||
| Series 2006-OA4, Class A1, (12-mo. Federal Reserve Cumulative Average US + 0.96%), 5.59%, 04/25/46(c) |
1,205 | 365,043 | ||||||||||
| Series 2006-OA5, Class 3A1, (1-mo. CME Term SOFR + 0.51%), 5.83%, 04/25/46(c) |
384 | 353,515 | ||||||||||
| Series 2007-15, Class 2A2, 6.50%, 09/25/37 |
7,438 | 2,703,616 | ||||||||||
| Credit Suisse Mortgage Capital Certificates |
||||||||||||
| Series 2009-12R, Class 3A1, 6.50%, 10/27/37(a) |
8,101 | 3,113,826 | ||||||||||
| Series 2021-RPL9, Class A1, 2.44%, 02/25/61(a)(c) |
10,641 | 9,691,497 | ||||||||||
| Credit Suisse Mortgage Capital Trust, Series 2006-4, Class 1A4, 6.00%, 05/25/36 |
742 | 410,728 | ||||||||||
| Credit Suisse Mortgage Trust |
||||||||||||
| Series 2006-4, Class 1A3, 6.00%, 05/25/36 |
982 | 543,343 | ||||||||||
| Series 2014-4R, Class 16A3, (1-mo. CME Term SOFR + 0.31%), |
430 | 395,267 | ||||||||||
| M A S T E R P O R T F O L I O S C H E D U L E O F I N V E S T M E N T S |
61 |
| Consolidated Schedule of Investments (continued) September 30, 2023 |
Master Total Return Portfolio (Percentages shown are based on Net Assets) |
| Security | Par (000) |
Value | ||||||||||
| Collateralized Mortgage Obligations (continued) | ||||||||||||
| Credit Suisse Mortgage Trust |
||||||||||||
| Series 2014-9R, Class 9A1, (1-mo. CME Term SOFR + 0.23%), |
USD | 767 | $ | 569,142 | ||||||||
| Series 2020-RPL2, Class A12, |
2,332 | 2,320,702 | ||||||||||
| CSFB Mortgage-Backed Pass-Through Certificates, Series 2005-10, Class 10A1, (1- mo. CME Term SOFR + 1.46%), 6.25%, 11/25/35(c) |
1,196 | 274,320 | ||||||||||
| Deutsche Alt-A Securities Mortgage Loan Trust, Series 2007-OA4, Class A2A, (1-mo. CME Term SOFR + 0.45%), 5.77%, 08/25/47(c) |
814 | 709,569 | ||||||||||
| Deutsche Alt-B Securities Mortgage Loan Trust |
||||||||||||
| Series 2006-AB3, Class A3, 6.51%, 07/25/36(c) |
292 | 229,703 | ||||||||||
| Series 2006-AB3, Class A8, 6.36%, 07/25/36(c) |
186 | 146,483 | ||||||||||
| GCAT Trust, Series 2022-NQM4, Class A1, 5.27%, 08/25/67(a)(b) |
5,943 | 5,795,573 | ||||||||||
| GreenPoint Mortgage Funding Trust, Series 2006- AR2, Class 4A1, (12-mo. Federal Reserve Cumulative Average US + 2.00%), 6.63%, 03/25/36(c) |
435 | 376,790 | ||||||||||
| GS Mortgage Securities Trust, Series 2019-PJ2, Class B4, 4.38%, 11/25/49(a)(c) |
1,459 | 1,157,223 | ||||||||||
| GSR Mortgage Loan Trust |
||||||||||||
| Series 2007-1F, Class 2A4, 5.50%, 01/25/37 |
53 | 68,365 | ||||||||||
| Series 2007-OA2, Class 2A1, 2.99%, 06/25/47(c) |
901 | 559,106 | ||||||||||
| HarborView Mortgage Loan Trust |
||||||||||||
| Series 2006-12, Class 1A1A, (1-mo. CME Term SOFR + 0.52%), 5.85%, 12/19/36(c) |
5,383 | 4,194,964 | ||||||||||
| Series 2007-4, Class 2A2, (1-mo. CME Term SOFR + 0.61%), 5.69%, 07/19/47(c) |
411 | 373,904 | ||||||||||
| Homeward Opportunities Fund I Trust |
||||||||||||
| Series 2020-2, Class A3, |
5,763 | 5,325,611 | ||||||||||
| Series 2022-1, Class A1, |
5,885 | 5,693,023 | ||||||||||
| Impac CMB Trust |
||||||||||||
| Series 2004-11, Class 1A2, (1-mo. CME Term SOFR + 0.63%), 5.95%, 03/25/35(c) |
703 | 692,883 | ||||||||||
| Series 2005-6, Class 1A1, (1-mo. CME Term SOFR + 0.61%), 5.93%, 10/25/35(c) |
515 | 444,601 | ||||||||||
| Impac Secured Assets Trust, Series 2006-3, Class A1, (1-mo. CME Term SOFR + 0.45%), 5.77%, 11/25/36(c) |
927 | 814,616 | ||||||||||
| IndyMac Index Mortgage Loan Trust |
||||||||||||
| Series 2006-AR15, Class A1, (1-mo. CME Term SOFR + 0.35%), 5.67%, 07/25/36(c) |
303 | 293,331 | ||||||||||
| Series 2007-AR19, Class 3A1, 3.69%, 09/25/37(c) |
2,551 | 1,706,083 | ||||||||||
| Series 2007-FLX5, Class 2A2, (1-mo. CME Term SOFR + 0.35%), 5.67%, 08/25/37(c) |
549 | 475,541 | ||||||||||
| JPMorgan Alternative Loan Trust |
||||||||||||
| Series 2007-A1, Class 1A4, (1-mo. CME Term SOFR + 0.53%), 5.85%, 03/25/37(c) |
986 | 900,973 | ||||||||||
| Series 2007-A2, Class 2A1, 4.56%, 05/25/37(c) |
189 | 169,404 | ||||||||||
| JPMorgan Mortgage Trust |
||||||||||||
| Series 2021-4, Class B3, 2.90%, |
3,634 | 2,442,056 | ||||||||||
| Series 2021-INV5, Class
A5A, |
9,292 | 6,814,102 | ||||||||||
| Security | Par (000) |
Value | ||||||||||
| Collateralized Mortgage Obligations (continued) | ||||||||||||
| JPMorgan Mortgage Trust |
||||||||||||
| Series 2021-INV5, Class B4, 3.19%, 12/25/51(a)(c) |
USD | 1,276 | $ | 826,402 | ||||||||
| Series 2021-INV5, Class B5, 3.19%, 12/25/51(a)(c) |
447 | 272,942 | ||||||||||
| Series 2021-INV5, Class B6, 2.94%, 12/25/51(a)(c) |
1,524 | 583,580 | ||||||||||
| Series 2021-INV7, Class A3A, 2.50%, 02/25/52(a)(c) |
26,071 | 22,036,745 | ||||||||||
| Series 2021-INV7, Class A4A, 2.50%, 02/25/52(a)(c) |
10,539 | 6,353,014 | ||||||||||
| Series 2021-INV7, Class A5A, 2.50%, 02/25/52(a)(c) |
5,562 | 4,078,975 | ||||||||||
| Series 2021-INV7, Class B1, 3.27%, 02/25/52(a)(c) |
3,236 | 2,454,577 | ||||||||||
| Series 2021-INV7, Class B2, 3.27%, 02/25/52(a)(c) |
760 | 555,734 | ||||||||||
| Series 2021-INV7, Class B3, 3.27%, 02/25/52(a)(c) |
1,056 | 720,737 | ||||||||||
| Series 2021-INV7, Class B4, 3.27%, 02/25/52(a)(c) |
561 | 363,447 | ||||||||||
| Series 2021-INV7, Class B5, 3.27%, 02/25/52(a)(c) |
231 | 140,943 | ||||||||||
| Series 2021-INV7, Class B6, 3.01%, 02/25/52(a)(c) |
759 | 283,119 | ||||||||||
| Legacy Mortgage Asset Trust |
||||||||||||
| Series 2020-SL1, Class A, 5.73%, 01/25/60(a)(b) |
492 | 491,134 | ||||||||||
| Series 2021-GS2, Class A1, 1.75%, 04/25/61(a)(b) |
17,764 | 16,407,526 | ||||||||||
| Lehman XS Trust |
||||||||||||
| Series 2007-16N, Class AF2, (1-mo. CME Term SOFR + 2.01%), 7.33%, 09/25/47(c) |
1,815 | 2,276,108 | ||||||||||
| Series 2007-20N, Class A1, (1-mo. CME Term SOFR + 2.41%), 7.73%, 12/25/37(c) |
481 | 482,355 | ||||||||||
| MASTR Resecuritization Trust, |
650 | 415,682 | ||||||||||
| MCM Trust |
||||||||||||
| Series 2021-VFN1, Class Cert, 3.00%, 08/25/28(f) |
14,556 | 9,598,546 | ||||||||||
| Series 2021-VFN1, Class Note, 2.50%, 09/25/31(f) |
23,028 | 22,132,868 | ||||||||||
| Merrill Lynch Alternative Note Asset Trust, Series 2007-OAR2, Class A2, (1-mo. CME Term SOFR + 0.53%), 5.85%, 04/25/37(c) |
1,105 | 871,265 | ||||||||||
| Merrill Lynch Mortgage Investors Trust, Series 2006-A3, Class 6A1, 4.65%, 05/25/36(c) |
573 | 512,805 | ||||||||||
| MFA Trust |
||||||||||||
| Series 2020-NQM1, Class A3, 2.30%, 08/25/49(a)(c) |
149 | 132,965 | ||||||||||
| Series 2021-NQM1, Class B1, 3.51%, 04/25/65(a)(c) |
3,310 | 2,355,388 | ||||||||||
| Morgan Stanley Resecuritization Trust, Series 2013-R7, Class 1B, (1-mo. CME Term SOFR +
0.27%), |
721 | 651,527 | ||||||||||
| Morgan Stanley Residential Mortgage Loan Trust, Series 2014-1A, Class B3, 6.82%, 06/25/44(a)(c) |
323 | 314,758 | ||||||||||
| Mortgage Loan Resecuritization Trust, Series 2009-RS1, Class A85, (1-mo. LIBOR US + 0.34%), 5.78%, 04/16/36(a)(c) |
2,054 | 1,958,324 | ||||||||||
| 62 | 2 0 2 3 B L A C K R O C K A N N U A L R E P O R T T O S H A R E H O L D E R S |
| Consolidated Schedule of Investments (continued) September 30, 2023 |
Master Total Return Portfolio (Percentages shown are based on Net Assets) |
| Security | Par (000) |
Value | ||||||||||
| Collateralized Mortgage Obligations (continued) | ||||||||||||
| NACC Reperforming Loan REMIC Trust |
||||||||||||
| Series 2004-R1, Class A1, 6.50%, 03/25/34(a) |
USD | 1,758 | $ | 1,477,928 | ||||||||
| Series 2004-R1, Class A2, 7.50%, 03/25/34(a) |
404 | 350,867 | ||||||||||
| New Residential Mortgage Loan Trust |
||||||||||||
| Series 2019-2A, Class A1, 4.25%, 12/25/57(a)(c) |
803 | 751,303 | ||||||||||
| Series 2020-RPL1, Class B3, 3.88%, 11/25/59(a)(c) |
6,210 | 4,166,526 | ||||||||||
| Nomura Asset Acceptance Corp. Alternative Loan Trust |
||||||||||||
| Series 2001-R1A, Class A, 7.00%, 02/19/30(a)(c) |
275 | 261,963 | ||||||||||
| Series 2006-AF1, Class 1A4, 7.13%, 05/25/36(b) |
520 | 97,787 | ||||||||||
| Series 2007-2, Class A4, (1-mo. CME Term SOFR + 0.53%), 5.85%, 06/25/37(c) |
278 | 240,178 | ||||||||||
| NYMT Loan Trust, Series 2020-SP2, Class A1, 2.94%, 10/25/60(a)(c) |
11,124 | 11,070,922 | ||||||||||
| Preston Ridge Partners Mortgage LLC |
||||||||||||
| Series 2022-1, Class A1, 3.72%, 02/25/27(a)(b) |
766 | 733,426 | ||||||||||
| Series 2023-1, Class A1, 6.88%, 02/25/28(a)(c) |
8,158 | 8,134,113 | ||||||||||
| PRKCM Trust |
||||||||||||
| Series 2021-AFC2, Class A1, 2.07%, 11/25/56(a)(c) |
1,481 | 1,203,471 | ||||||||||
| Series 2022-AFC1, Class A1A, 4.10%, 04/25/57(a)(c) |
814 | 749,280 | ||||||||||
| Series 2022-AFC2, Class A1, 5.34%, 08/25/57(a)(c) |
6,038 | 5,872,138 | ||||||||||
| RALI Trust, Series 2007-QH9, Class A1, 5.94%, 11/25/37(c) |
468 | 376,553 | ||||||||||
| RCO VI Mortgage LLC, Series 2022-1, Class A1, 3.00%, 01/25/27(a)(b) |
9,705 | 9,208,537 | ||||||||||
| Reperforming Loan REMIC Trust |
||||||||||||
| Series 2005-R2, Class 1AF1, (1-mo. CME Term SOFR + 0.45%), 5.77%, 06/25/35(a)(c) |
226 | 206,190 | ||||||||||
| Series 2005-R3, Class AF, (1-mo. CME Term SOFR + 0.51%), 5.83%, 09/25/35(a)(c) |
75 | 63,805 | ||||||||||
| Residential Mortgage Loan Trust, Series 2020-2, Class M1, 3.57%, 05/25/60(a)(c) |
7,854 | 6,435,209 | ||||||||||
| RFMSI Series Trust |
||||||||||||
| Series 2006-SA2, Class 2A1, 5.34%, 08/25/36(c) |
4,576 | 3,188,547 | ||||||||||
| Series 2007-SA4, Class 3A1, 5.26%, 10/25/37(c) |
318 | 196,933 | ||||||||||
| RMF Buyout Issuance Trust |
||||||||||||
| Series 2021-HB1, Class M3, 3.69%, 11/25/31(a)(c) |
3,112 | 2,666,816 | ||||||||||
| Series 2021-HB1, Class M6, 6.00%, 11/25/31(a)(c)(f) |
2,041 | 1,229,818 | ||||||||||
| Seasoned Credit Risk Transfer Trust, Series 2018-1, Class BX, 3.31%, 05/25/57(c) |
523 | 174,198 | ||||||||||
| Seasoned Loans Structured Transaction Trust |
||||||||||||
| Series 2020-2, Class M1, 4.75%, 09/25/60(a)(c) |
18,400 | 17,646,852 | ||||||||||
| Series 2020-3, Class M1, 4.75%, 04/26/60(a)(c) |
881 | 853,006 | ||||||||||
| Sequoia Mortgage Trust, Series 2007-3, Class 2AA1, 3.92%, 07/20/37(c) |
744 | 589,181 | ||||||||||
| SG Residential Mortgage Trust, Series 2022-2, Class A1, 5.35%, 08/25/62(a)(b) |
1,230 | 1,188,677 | ||||||||||
| Structured Adjustable Rate Mortgage Loan Trust, Series 2006-3, Class 4A, 3.96%, 04/25/36(c) |
523 | 297,867 | ||||||||||
| Security | Par (000) |
Value | ||||||||||
| Collateralized Mortgage Obligations (continued) | ||||||||||||
| Structured Asset Mortgage Investments II Trust |
||||||||||||
| Series 2006-AR4, Class 3A1, (1-mo. CME Term SOFR + 0.49%), 5.81%, 06/25/36(c) |
USD | 1,766 | $ | 1,472,622 | ||||||||
| Series 2006-AR5, Class 2A1, (1-mo. CME Term SOFR + 0.53%), 5.85%, 05/25/46(c) |
324 | 214,339 | ||||||||||
| Thornburg Mortgage Securities Trust |
||||||||||||
| Series 2006-3, Class A1, 3.68%, 06/25/46(c) |
1,034 | 680,208 | ||||||||||
| Series 2007-3, Class 4A1, (12-mo. CME Term SOFR + 1.97%), 7.43%, 06/25/47(c) |
30 | 28,994 | ||||||||||
| TVC DSCR |
||||||||||||
| Series 21-1, Class A, 2.38%, 02/01/51(f) |
28,642 | 26,666,064 | ||||||||||
| Series 21-1, Class CERT, 0.00%, 02/01/51(d)(f) |
7,160 | 6,239,110 | ||||||||||
| TVC Mortgage Trust, Series 2023-RTL1, Class A1, 8.25%, 11/25/27(a) |
3,528 | 3,516,151 | ||||||||||
| Verus Securitization Trust |
||||||||||||
| Series 2019-INV2, Class
M1, |
835 | 756,900 | ||||||||||
| Series 2020-4, Class A3, 2.32%, 05/25/65(a)(b) |
771 | 706,774 | ||||||||||
| Series 2020-4, Class M1, 3.29%, 05/25/65(a)(c) |
3,120 | 2,562,960 | ||||||||||
| Series 2020-INV1, Class
A2, |
1,895 | 1,804,843 | ||||||||||
| Series 2020-INV1, Class
A3, |
1,800 | 1,675,669 | ||||||||||
| Series 2022-1, Class B1, 4.01%, 01/25/67(a)(c) |
1,354 | 833,723 | ||||||||||
| Visio Trust |
||||||||||||
| Series 2019-2, Class B1, 3.91%, 11/25/54(a)(c) |
906 | 613,228 | ||||||||||
| Series 2020-1, Class M1, 4.45%, 08/25/55(a)(c) |
1,100 | 944,260 | ||||||||||
| Vista Point Securitization Trust |
||||||||||||
| Series 2020-2, Class A3, 2.50%, 04/25/65(a)(c) |
940 | 841,311 | ||||||||||
| Series 2020-2, Class B1, 4.90%, 04/25/65(a)(c) |
640 | 518,646 | ||||||||||
| Series 2020-2, Class M1, 3.40%, 04/25/65(a)(c) |
1,532 | 1,262,126 | ||||||||||
| Washington Mutual Mortgage Pass-Through Certificates Trust |
||||||||||||
| Series 2006-1, Class 4CB, 6.50%, 02/25/36 |
855 | 667,438 | ||||||||||
| Series 2006-4, Class 1A1, 6.00%, 04/25/36 |
1,812 | 1,575,667 | ||||||||||
| Series 2006-4, Class 3A1, 6.50%, 05/25/36(b) |
812 | 657,496 | ||||||||||
| Series 2006-4, Class 3A5, 6.35%, 05/25/36(b) |
315 | 254,939 | ||||||||||
| Series 2007-OA3, Class 5A, (12-mo. Federal Reserve Cumulative Average US + 1.25%), 5.88%, 04/25/47(c) |
980 | 814,123 | ||||||||||
| Series 2007-OA5, Class 1A, (12-mo. Federal Reserve Cumulative Average US + 0.75%), 5.38%, 06/25/47(c) |
2,404 | 1,903,228 | ||||||||||
| Series 2007-OA5, Class 2A, (12-mo. Federal Reserve Cumulative Average US + 0.80%), 5.42%, 06/25/47(c) |
1,078 | 812,443 | ||||||||||
| Western Mortgage Reference Notes |
||||||||||||
| Series 2021-CL2, Class M1, (SOFR |
6,478 | 6,480,905 | ||||||||||
| Series 2021-CL2, Class M2, (SOFR |
8,527 | 8,553,203 | ||||||||||
|
|
|
|||||||||||
| 732,216,972 | ||||||||||||
| Commercial Mortgage-Backed Securities — 4.3% | ||||||||||||
| 1211 Avenue of the Americas Trust |
||||||||||||
| Series 2015-1211, Class C, 4.28%, 08/10/35(a)(c) |
600 | 541,895 | ||||||||||
| Series 2015-1211, Class D, 4.28%, 08/10/35(a)(c) |
4,972 | 4,351,511 | ||||||||||
| Series 2015-1211, Class E, 4.28%, 08/10/35(a)(c) |
1,110 | 932,283 | ||||||||||
| M A S T E R P O R T F O L I O S C H E D U L E O F I N V E S T M E N T S |
63 |
| Consolidated Schedule of Investments (continued) September 30, 2023 |
Master Total Return Portfolio (Percentages shown are based on Net Assets) |
| Security | Par (000) |
Value | ||||||||||
| Commercial Mortgage-Backed Securities (continued) | ||||||||||||
| 245 Park Avenue Trust |
||||||||||||
| Series 2017-245P, Class D, 3.78%, 06/05/37(a)(c) |
USD | 480 | $ | 389,904 | ||||||||
| Series 2017-245P, Class E, 3.78%, 06/05/37(a)(c) |
2,463 | 1,951,945 | ||||||||||
| 280 Park Avenue Mortgage Trust |
||||||||||||
| Series 2017-280P, Class D, (1-mo. CME Term SOFR + 1.59%), 7.17%, 09/15/34(a)(c) |
2,920 | 2,635,087 | ||||||||||
| Series 2017-280P, Class E, (1-mo. CME Term SOFR + 2.17%), 7.75%, 09/15/34(a)(c) |
4,928 | 4,250,401 | ||||||||||
| ACREC LLC, Series 2023-FL2, Class A, |
5,580 | 5,568,103 | ||||||||||
| Alen Mortgage Trust |
||||||||||||
| Series 2021-ACEN, Class A, (1-mo. CME Term SOFR + 1.26%), 6.60%, 04/15/34(a)(c) |
1,144 | 1,036,966 | ||||||||||
| Series 2021-ACEN, Class D, (1-mo. CME Term SOFR + 3.21%), 8.55%, 04/15/34(a)(c) |
2,670 | 1,794,772 | ||||||||||
| Arbor Multifamily Mortgage Securities Trust |
||||||||||||
| Series 2020-MF1, Class E, 1.75%, 05/15/53(a) |
636 | 328,439 | ||||||||||
| Series 2021-MF3, Class A5, 2.58%, 10/15/54(a) |
1,529 | 1,202,601 | ||||||||||
| AREIT LLC |
||||||||||||
| Series 2022-CRE7, Class A, (1-mo. CME Term SOFR + 2.24%), 7.57%, 06/17/39(a)(c) |
5,030 | 4,992,281 | ||||||||||
| Series 2023-CRE8, Class A, (1-mo. CME Term SOFR + 2.11%), 7.44%, 02/17/28(a)(c) |
2,974 | 2,956,963 | ||||||||||
| Ashford Hospitality Trust, Series 2018-ASHF, Class D, (1-mo. CME Term SOFR + 2.27%), 7.61%, 04/15/35(a)(c) |
1,525 | 1,466,079 | ||||||||||
| Atrium Hotel Portfolio Trust, Series 2017-ATRM, Class D, (1-mo. CME Term SOFR + 2.25%), 7.58%, 12/15/36(a)(c) |
4,070 | 3,665,425 | ||||||||||
| Banc of America Commercial Mortgage Trust, Series 2015-UBS7, Class B, 4.49%, 09/15/48(c) |
536 | 467,506 | ||||||||||
| Banc of America Merrill Lynch Commercial Mortgage Securities Trust |
||||||||||||
| Series 2015-200P, Class F, 3.72%, 04/14/33(a)(c) |
2,311 | 1,941,037 | ||||||||||
| Series 2017-SCH, Class AF, (1-mo. CME Term SOFR + 1.05%), 6.38%, 11/15/33(a)(c) |
150 | 144,035 | ||||||||||
| Series 2017-SCH, Class BF, (1-mo. CME Term SOFR + 1.45%), 6.78%, 11/15/33(a)(c) |
2,870 | 2,522,383 | ||||||||||
| Series 2017-SCH, Class CL, (1-mo. CME Term SOFR + 1.55%), 6.88%, 11/15/32(a)(c) |
970 | 905,230 | ||||||||||
| Series 2017-SCH, Class DL, (1-mo. CME Term SOFR + 2.05%), 7.38%, 11/15/32(a)(c) |
1,930 | 1,742,806 | ||||||||||
| Series 2018-DSNY, Class B, (1-mo. CME Term SOFR + 1.20%), 6.78%, 09/15/34(a)(c) |
10,633 | 10,582,593 | ||||||||||
| Series 2018-DSNY, Class C, (1-mo. CME Term SOFR + 1.40%), 6.98%, 09/15/34(a)(c) |
350 | 347,621 | ||||||||||
| Series 2018-DSNY, Class D, (1-mo. CME Term SOFR + 1.75%), 7.33%, 09/15/34(a)(c) |
3,681 | 3,648,853 | ||||||||||
| Bayview Commercial Asset Trust |
||||||||||||
| Series 2005-3A, Class A1, (1-mo. CME Term SOFR + 0.59%), 5.75%, 11/25/35(a)(c) |
1,494 | 1,350,475 | ||||||||||
| Series 2005-4A, Class A1, (1-mo. CME Term SOFR + 0.56%), 5.88%, 01/25/36(a)(c) |
2,993 | 2,715,759 | ||||||||||
| Series 2005-4A, Class A2, (1-mo. CME Term SOFR + 0.70%), 6.02%, 01/25/36(a)(c) |
47 | 42,422 | ||||||||||
| Security | Par (000) |
Value | ||||||||||
| Commercial Mortgage-Backed Securities (continued) | ||||||||||||
| Bayview Commercial Asset Trust |
||||||||||||
| Series 2005-4A, Class M1, (1-mo. CME Term SOFR + 0.79%), |
USD | 124 | $ | 113,442 | ||||||||
| Series 2006-1A, Class A2, (1-mo. CME Term SOFR + 0.65%), |
163 | 146,450 | ||||||||||
| Series 2006-2A, Class A2, (1-mo. CME Term SOFR + 0.53%), |
533 | 478,378 | ||||||||||
| Series 2006-3A, Class A1, (1-mo. CME Term SOFR + 0.49%), |
237 | 218,440 | ||||||||||
| Series 2006-3A, Class A2, (1-mo. CME Term SOFR + 0.56%), |
166 | 152,661 | ||||||||||
| Series 2006-4A, Class A1, (1-mo. CME Term SOFR + 0.46%), |
982 | 903,481 | ||||||||||
| Series 2007-1, Class A2, (1-mo. CME Term SOFR + 0.52%), |
783 | 702,476 | ||||||||||
| Series 2007-6A, Class A4A, (1-mo. CME Term SOFR + 1.61%), |
1,919 | 1,623,362 | ||||||||||
| Series 2008-2, Class A4A, (1-mo. CME Term SOFR + 2.61%), |
1,356 | 1,319,557 | ||||||||||
| BBCMS Mortgage Trust |
||||||||||||
| Series 2015-SRCH, Class A1, 3.31%, 08/10/35(a) |
1,647 | 1,495,029 | ||||||||||
| Series 2018-CHRS, Class E, 4.41%, 08/05/38(a)(c) |
980 | 633,079 | ||||||||||
| Series 2018-TALL, Class A, (1-mo. CME Term SOFR + 0.92%), |
1,131 | 1,046,274 | ||||||||||
| Series 2018-TALL, Class B, (1-mo. CME Term SOFR + 1.17%), |
616 | 526,680 | ||||||||||
| BB-UBS Trust, Series 2012-SHOW, Class E, 4.16%, 11/05/36(a)(c) |
790 | 684,946 | ||||||||||
| BDS LLC, Series 2022-FL12, Class A, (1-mo. CME Term SOFR + 2.14%), 7.46%, 08/19/38(a)(c) |
3,060 | 3,044,700 | ||||||||||
| Beast Mortgage Trust |
||||||||||||
| Series 2021-SSCP, Class A, (1-mo. CME Term SOFR + 0.86%), |
3,037 | 2,964,516 | ||||||||||
| Series 2021-SSCP, Class B, (1-mo. CME Term SOFR + 1.21%), |
3,731 | 3,573,673 | ||||||||||
| Series 2021-SSCP, Class C, (1-mo. CME Term SOFR + 1.46%), |
4,582 | 4,384,333 | ||||||||||
| Series 2021-SSCP, Class D, (1-mo. CME Term SOFR + 1.71%), |
4,292 | 4,069,374 | ||||||||||
| Series 2021-SSCP, Class E, (1-mo. CME Term SOFR + 2.21%), |
3,650 | 3,409,119 | ||||||||||
| Series 2021-SSCP, Class F, (1-mo. CME Term SOFR + 3.01%), |
3,508 | 3,284,914 | ||||||||||
| Series 2021-SSCP, Class G, (1-mo. CME Term SOFR + 3.91%), |
3,947 | 3,677,783 | ||||||||||
| Series 2021-SSCP, Class H, (1-mo. CME Term SOFR + 5.02%), |
2,773 | 2,583,665 | ||||||||||
| Benchmark Mortgage Trust, Series 2021-B29, Class A5, 2.39%, 09/15/54 |
1,140 | 885,115 | ||||||||||
| BFLD Trust, Series 2020-EYP, Class E, (1-mo. CME Term SOFR + 3.81%), 9.15%, 10/15/35(a)(c) |
3,978 | 1,353,625 | ||||||||||
| BHMS, Series 2018-ATLS, Class A, (1-mo. CME Term SOFR + 1.55%), 6.88%, 07/15/35(a)(c) |
2,770 | 2,734,597 | ||||||||||
| BLP Commercial Mortgage Trust, Series 2023- IND, Class A, (1-mo. CME Term SOFR + 1.69%), 7.02%, 03/15/40(a)(c) |
3,610 | 3,591,923 | ||||||||||
| 64 | 2 0 2 3 B L A C K R O C K A N N U A L R E P O R T T O S H A R E H O L D E R S |
| Consolidated Schedule of Investments (continued) September 30, 2023 |
Master Total Return Portfolio (Percentages shown are based on Net Assets) |
| Security | Par (000) |
Value | ||||||||||
| Commercial Mortgage-Backed Securities (continued) | ||||||||||||
| BOCA Commercial Mortgage Trust, Series 2022- BOCA, Class A, (1-mo. CME Term SOFR +
1.77%), |
USD | 2,431 | $ | 2,421,136 | ||||||||
| BPR Trust, Series 2022-SSP, Class A, (1-mo. CME Term SOFR + 3.00%), |
1,270 | 1,266,827 | ||||||||||
| BWAY Mortgage Trust |
||||||||||||
| Series 2013-1515, Class A2, 3.45%, 03/10/33(a) |
1,962 | 1,842,864 | ||||||||||
| Series 2013-1515, Class D, 3.63%, 03/10/33(a) |
1,400 | 1,265,182 | ||||||||||
| Series 2013-1515, Class E, 3.72%, 03/10/33(a) |
250 | 220,554 | ||||||||||
| Series 2013-1515, Class F, 4.06%, 03/10/33(a)(c) |
250 | 212,585 | ||||||||||
| BX Commercial Mortgage Trust |
||||||||||||
| Series 2019-XL, Class A, (1-mo. CME Term SOFR + 1.03%), 6.37%, 10/15/36(a)(c) |
1,013 | 1,010,407 | ||||||||||
| Series 2019-XL, Class G, (1-mo. CME Term SOFR + 2.41%), 7.75%, 10/15/36(a)(c) |
18,463 | 18,159,029 | ||||||||||
| Series 2019-XL, Class J, (1-mo. CME Term SOFR + 2.76%), 8.10%, 10/15/36(a)(c) |
19,742 | 19,338,751 | ||||||||||
| Series 2020-VIV2, Class
C, |
2,550 | 2,079,604 | ||||||||||
| Series 2020-VIV3, Class
B, |
4,952 | 4,117,280 | ||||||||||
| Series 2020-VIV4, Class A, 2.84%, 03/09/44(a) |
5,920 | 4,811,725 | ||||||||||
| Series 2020-VKNG, Class A, (1-mo. CME Term SOFR + 1.04%), 6.38%, 10/15/37(a)(c) |
453 | 448,513 | ||||||||||
| Series 2020-VKNG, Class F, (1-mo. CME Term SOFR + 2.86%), 8.20%, 10/15/37(a)(c) |
3,269 | 3,153,890 | ||||||||||
| Series 2021-CIP, Class A, (1-mo. CME Term SOFR + 1.04%), 6.37%, 12/15/38(a)(c) |
536 | 524,567 | ||||||||||
| Series 2021-NWM, Class A, (1-mo. CME Term SOFR + 1.02%), 6.36%, 02/15/33(a)(c) |
14,245 | 13,875,616 | ||||||||||
| Series 2021-NWM, Class B, (1-mo. CME Term SOFR + 2.26%), 7.60%, 02/15/33(a)(c) |
8,727 | 8,564,728 | ||||||||||
| Series 2021-NWM, Class C, (1-mo. CME Term SOFR + 4.36%), 9.70%, 02/15/33(a)(c) |
5,842 | 5,720,050 | ||||||||||
| Series 2021-SOAR, Class G, (1-mo. CME Term SOFR + 2.91%), 8.25%, 06/15/38(a)(c) |
3,783 | 3,604,947 | ||||||||||
| Series 2022-CSMO, Class C, (1-mo. CME Term SOFR + 3.89%), 9.22%, 06/15/27(a)(c) |
1,760 | 1,758,895 | ||||||||||
| BX Trust |
||||||||||||
| Series 2019-OC11, Class A, 3.20%, 12/09/41(a) |
1,183 | 997,127 | ||||||||||
| Series 2019-OC11, Class
D, |
8,267 | 6,795,772 | ||||||||||
| Series 2019-OC11, Class
E, |
4,881 | 3,889,246 | ||||||||||
| Series 2021-ARIA, Class A, (1-mo. CME Term SOFR + 1.01%), 6.35%, 10/15/36(a)(c) |
2,174 | 2,120,099 | ||||||||||
| Series 2021-ARIA, Class D, (1-mo. CME Term SOFR + 2.01%), 7.34%, 10/15/36(a)(c) |
2,090 | 1,994,244 | ||||||||||
| Series 2021-ARIA, Class G, (1-mo. CME Term SOFR + 3.26%), 8.59%, 10/15/36(a)(c) |
1,831 | 1,711,680 | ||||||||||
| Series 2021-LBA, Class AJV, (1-mo. CME Term SOFR + 0.91%), 6.25%, 02/15/36(a)(c) |
5,674 | 5,570,762 | ||||||||||
| Series 2021-LBA, Class AV, (1-mo. CME Term SOFR + 0.91%), 6.25%, 02/15/36(a)(c) |
964 | 946,457 | ||||||||||
| Series 2021-LBA, Class FJV, (1-mo. CME Term SOFR + 2.51%), 7.85%, 02/15/36(a)(c) |
6,390 | 5,967,488 | ||||||||||
| Series 2021-LBA, Class FV, (1-mo. CME Term SOFR + 2.51%), 7.85%, 02/15/36(a)(c) |
4,055 | 3,787,135 | ||||||||||
| Security | Par (000) |
Value | ||||||||||
| Commercial Mortgage-Backed Securities (continued) | ||||||||||||
| BX Trust |
||||||||||||
| Series 2021-LBA, Class GJV, (1-mo. CME Term SOFR + 3.11%), |
USD | 1,244 | $ | 1,146,017 | ||||||||
| Series 2021-LBA, Class GV, (1-mo. CME Term SOFR + 3.11%), |
4,206 | 3,874,187 | ||||||||||
| Series 2021-MFM1, Class E, (1-mo. CME Term SOFR + 2.36%), |
1,492 | 1,440,458 | ||||||||||
| Series 2021-MFM1, Class F, (1-mo. CME Term SOFR + 3.11%), |
2,306 | 2,226,094 | ||||||||||
| Series 2021-SDMF, Class A, (1-mo. CME Term SOFR + 0.70%), |
898 | 876,305 | ||||||||||
| Series 2022-GPA, Class A, (1-mo. CME Term SOFR + 2.17%), |
19,990 | 20,027,581 | ||||||||||
| Series 2022-GPA, Class B, (1-mo. CME Term SOFR + 2.66%), |
620 | 620,000 | ||||||||||
| Series 2022-GPA, Class D, (1-mo. CME Term SOFR + 4.06%), |
1,960 | 1,960,000 | ||||||||||
| Series 2022-LBA6, Class A, (1-mo. CME Term SOFR + 1.00%), |
2,678 | 2,617,523 | ||||||||||
| Series 2022-LBA6, Class D, (1-mo. CME Term SOFR + 2.00%), |
2,890 | 2,817,712 | ||||||||||
| Series 2022-VAMF, Class A, (1-mo. CME Term SOFR + 0.85%), |
1,547 | 1,514,005 | ||||||||||
| Series 2022-VAMF, Class B, (1-mo. CME Term SOFR + 1.28%), |
673 | 656,958 | ||||||||||
| Series 2023-DELC, Class A, (1-mo. CME Term SOFR + 2.69%), |
8,160 | 8,170,218 | ||||||||||
| BXP Trust |
||||||||||||
| Series 2017-CC, Class D, 3.67%, 08/13/37(a)(c) |
750 | 542,542 | ||||||||||
| Series 2017-CC, Class
E, |
1,450 | 957,397 | ||||||||||
| Series 2017-GM, Class D, 3.54%, 06/13/39(a)(c) |
590 | 488,266 | ||||||||||
| Series 2017-GM, Class E, 3.54%, 06/13/39(a)(c) |
1,240 | 945,353 | ||||||||||
| Series 2021-601L, Class D, 2.87%, 01/15/44(a)(c) |
2,010 | 1,165,159 | ||||||||||
| CAMB Commercial Mortgage Trust, Series 2019- LIFE, Class D, (1-mo. CME Term SOFR + 1.80%), 7.13%, 12/15/37(a)(c) |
3,619 | 3,575,171 | ||||||||||
| Cassia SRL, Series 2022-1A, Class A, (3-mo. EURIBOR + 2.50%), 6.32%, 05/22/34(a)(c) |
EUR | 7,964 | 8,118,060 | |||||||||
| CD Mortgage Trust |
||||||||||||
| Series 2017-CD3, Class A4, 3.63%, 02/10/50 |
USD | 850 | 763,548 | |||||||||
| Series 2017-CD5, Class B, 3.96%, 08/15/50(c) |
2,091 | 1,738,873 | ||||||||||
| Series 2017-CD6, Class B, 3.91%, 11/13/50(c) |
. | 597 | 477,595 | |||||||||
| CENT Trust, Series 2023-CITY, Class A, |
9,482 | 9,477,732 | ||||||||||
| CFCRE Commercial Mortgage Trust, Series 2016-C3, Class A3, 3.87%, 01/10/48 |
410 | 387,278 | ||||||||||
| CFK Trust, Series 2019-FAX, Class D, 4.79%, 01/15/39(a)(c) |
2,643 | 2,234,700 | ||||||||||
| Citigroup Commercial Mortgage Trust |
||||||||||||
| Series 2014-GC19, Class C, 5.25%, 03/11/47(c) |
440 | 423,620 | ||||||||||
| Series 2015-GC27, Class B, 3.77%, 02/10/48 |
990 | 922,614 | ||||||||||
| Series 2016-GC37, Class C, 5.08%, 04/10/49(c) |
640 | 555,173 | ||||||||||
| Series 2019-PRM, Class D, 4.35%, 05/10/36(a) |
1,120 | 1,115,254 | ||||||||||
| M A S T E R P O R T F O L I O S C H E D U L E O F I N V E S T M E N T S |
65 |
| Consolidated Schedule of Investments (continued) September 30, 2023 |
Master Total Return Portfolio (Percentages shown are based on Net Assets) |
| Security | Par (000) |
Value | ||||||||||
| Commercial Mortgage-Backed Securities (continued) | ||||||||||||
| Citigroup Commercial Mortgage Trust |
||||||||||||
| Series 2019-PRM, Class E, 4.89%, 05/10/36(a)(c) |
USD | 5,271 | $ | 5,252,776 | ||||||||
| Series 2019-PRM, Class F, 4.89%, 05/10/36(a)(c) |
5,180 | 5,161,104 | ||||||||||
| Series 2019-SMRT, Class D, 4.90%, 01/10/36(a)(c) |
7,200 | 7,187,744 | ||||||||||
| Series 2019-SMRT, Class E, 4.90%, 01/10/36(a)(c) |
419 | 418,281 | ||||||||||
| Series 2020-420K, Class E, 3.42%, 11/10/42(a)(c) |
1,540 | 1,031,234 | ||||||||||
| COAST Commercial Mortgage Trust |
||||||||||||
| Series 2023-2HTL, Class A, (1-mo. CME Term SOFR + 2.59%), 7.92%, 08/15/36(a)(c) |
2,681 | 2,672,538 | ||||||||||
| Series 2023-2HTL, Class D, (1-mo. CME Term SOFR + 4.44%), 9.77%, 08/15/36(a)(c) |
4,620 | 4,605,060 | ||||||||||
| Cold Storage Trust |
||||||||||||
| Series 2020-ICE5, Class A, (1-mo. CME Term SOFR + 1.01%), 6.35%, 11/15/37(a)(c) |
8,885 | 8,795,863 | ||||||||||
| Series 2020-ICE5, Class E, (1-mo. CME Term SOFR + 2.88%), 8.21%, 11/15/37(a)(c) |
9,270 | 9,188,009 | ||||||||||
| Series 2020-ICE5, Class F, (1-mo. CME Term SOFR + 3.61%), 8.94%, 11/15/37(a)(c) |
7,356 | 7,238,801 | ||||||||||
| Commercial Mortgage Trust |
||||||||||||
| Series 2014-UBS2, Class A5, 3.96%, 03/10/47 |
422 | 418,797 | ||||||||||
| Series 2015-LC19, Class B, 3.83%, 02/10/48(c) |
512 | 466,379 | ||||||||||
| Series 2016-667M, Class D, 3.29%, 10/10/36(a)(c) |
630 | 484,004 | ||||||||||
| Credit Suisse Mortgage Capital Certificates |
||||||||||||
| Series 2019-ICE4, Class A, (1-mo. CME Term SOFR + 1.03%), 6.36%, 05/15/36(a)(c) |
2,650 | 2,647,539 | ||||||||||
| Series 2019-ICE4, Class E, (1-mo. CME Term SOFR + 2.20%), 7.53%, 05/15/36(a)(c) |
2,594 | 2,575,399 | ||||||||||
| Series 2022-LION, 3.95%, 02/09/27(f) |
10,100 | 9,074,883 | ||||||||||
| Credit Suisse Mortgage Trust |
||||||||||||
| Series 2017-CALI, Class C, 3.90%, 11/10/32(a)(c) |
1,729 | 786,695 | ||||||||||
| Series 2017-PFHP, Class A, (1-mo. CME Term SOFR + 1.00%), 6.33%, 12/15/30(a)(c) |
900 | 857,209 | ||||||||||
| Series 2017-TIME, Class A, 3.65%, 11/13/39(a) |
850 | 707,361 | ||||||||||
| Series 2020-FACT, Class E, (1-mo. CME Term SOFR + 4.98%), 10.31%, 10/15/37(a)(c) |
3,424 | 3,097,777 | ||||||||||
| Series 2020-NET, Class D, 3.83%, 08/15/37(a)(c) |
710 | 610,560 | ||||||||||
| Series 2021-BHAR, Class A, (1-mo. CME Term SOFR + 1.26%), 6.60%, 11/15/38(a)(c) |
2,817 | 2,785,184 | ||||||||||
| Series 2021-BHAR, Class B, (1-mo. CME Term SOFR + 1.61%), 6.95%, 11/15/38(a)(c) |
1,150 | 1,130,873 | ||||||||||
| Series 2021-BHAR, Class C, (1-mo. CME Term SOFR + 2.11%), |
5,338 | 5,257,593 | ||||||||||
| Series 2021-BHAR, Class E, (1-mo. CME Term SOFR + 3.61%), 8.95%, 11/15/38(a)(c) |
1,166 | 1,142,592 | ||||||||||
| Series 2022-NWPT, Class A, (1-mo. CME Term SOFR + 3.14%), 8.48%, 09/09/24(a)(c) |
5,652 | 5,694,115 | ||||||||||
| CRSO Trust, Series 2023-BRND, 7.12%, 07/10/40(a) |
2,271 | 2,254,552 | ||||||||||
| CSAIL Commercial Mortgage Trust |
||||||||||||
| Series 2016-C5, Class B, 4.46%, 11/15/48(c) |
2,410 | 2,220,219 | ||||||||||
| Series 2018-CX12, Class C, 4.86%, 08/15/51(c) |
570 | 447,356 | ||||||||||
| Series 2019-C15, Class A4, 4.05%, 03/15/52 |
4,080 | 3,676,335 | ||||||||||
| Security | Par (000) |
Value | ||||||||||
| Commercial Mortgage-Backed Securities (continued) | ||||||||||||
| CSAIL Commercial Mortgage Trust |
||||||||||||
| Series 2019-C16, Class C, 4.24%, 06/15/52(c) |
USD | 1,439 | $ | 1,094,729 | ||||||||
| Series 2020-C19, Class A3, 2.56%, 03/15/53 |
6,155 | 4,987,043 | ||||||||||
| DBGS Mortgage Trust |
||||||||||||
| Series 2018-5BP, Class B, (1-mo. CME Term SOFR + 1.08%), |
2,890 | 2,591,645 | ||||||||||
| Series 2019-1735, Class F, 4.33%, 04/10/37(a)(c) |
423 | 246,581 | ||||||||||
| Deutsche Bank JPMorgan Mortgage Trust, Series 2016-C1, Class A4, 3.28%, 05/10/49 |
1,430 | 1,331,232 | ||||||||||
| Deutsche Bank UBS Mortgage Trust |
||||||||||||
| Series 2017-BRBK, Class D, 3.65%, 10/10/34(a)(c) |
1,800 | 1,448,949 | ||||||||||
| Series 2017-BRBK, Class E, 3.65%, 10/10/34(a)(c) |
3,097 | 2,278,089 | ||||||||||
| Series 2017-BRBK, Class F, 3.65%, 10/10/34(a)(c) |
920 | 639,970 | ||||||||||
| ELP Commercial Mortgage Trust, Series 2021- ELP, Class G, (1-mo. CME Term SOFR + 3.23%), 8.56%, 11/15/38(a)(c) |
3,881 | 3,657,926 | ||||||||||
| Extended Stay America Trust |
||||||||||||
| Series 2021-ESH, Class D, (1-mo. CME Term SOFR + 2.36%), |
4,425 | 4,352,306 | ||||||||||
| Series 2021-ESH, Class E, (1-mo. CME Term SOFR + 2.96%), |
7,632 | 7,479,106 | ||||||||||
| Series 2021-ESH, Class F, (1-mo. CME Term SOFR + 3.81%), |
5,384 | 5,235,554 | ||||||||||
| FREMF Mortgage Trust |
||||||||||||
| Series 2017-KGX1, Class BFX, 3.72%, 10/25/27(a)(c) |
1,190 | 1,055,646 | ||||||||||
| Series 2018-K74, Class
B, |
120 | 110,702 | ||||||||||
| Series 2018-K80, Class
B, |
1,043 | 963,381 | ||||||||||
| FS Rialto Issuer Ltd., Series 2022-FL7, Class A, (1-mo. CME Term SOFR + 2.90%), 8.23%, 10/19/39(a)(c) |
4,865 | 4,867,203 | ||||||||||
| GCT Commercial Mortgage Trust, Series 2021- GCT, Class D, (1-mo. CME Term SOFR + 2.46%), 7.80%, 02/15/38(a)(c) |
440 | 138,530 | ||||||||||
| Grace Trust, Series 2020-GRCE, Class E, 2.77%, 12/10/40(a)(c) |
1,489 | 970,276 | ||||||||||
| GS Mortgage Securities Corp. II, Series 2005- ROCK, Class A, 5.37%, 05/03/32(a) |
2,750 | 2,658,968 | ||||||||||
| GS Mortgage Securities Trust |
||||||||||||
| Series 2014-GC20, Class B, 4.53%, 04/10/47(c) |
140 | 131,355 | ||||||||||
| Series 2015-590M, Class E, 3.93%, 10/10/35(a)(c) |
1,100 | 908,985 | ||||||||||
| Series 2015-GC32, Class C, 4.55%, 07/10/48(c) |
1,049 | 939,611 | ||||||||||
| Series 2015-GS1, Class A3, 3.73%, 11/10/48 |
670 | 631,951 | ||||||||||
| Series 2017-GPTX, Class A, 2.86%, 05/10/34(a) |
2,290 | 1,568,650 | ||||||||||
| Series 2019-GSA1, Class C, 3.93%, 11/10/52(c) |
260 | 191,452 | ||||||||||
| Series 2021-DM, Class A, (1-mo. CME Term SOFR + 1.00%), |
3,852 | 3,779,077 | ||||||||||
| Series 2022-AGSS, Class A, (1-mo. CME Term SOFR + 2.69%), |
8,490 | 8,459,596 | ||||||||||
| Series 2022-ECI, Class A, (1-mo. CME Term SOFR + 2.19%), |
5,160 | 5,166,138 | ||||||||||
| 66 | 2 0 2 3 B L A C K R O C K A N N U A L R E P O R T T O S H A R E H O L D E R S |
| Consolidated Schedule of Investments (continued) September 30, 2023 |
Master Total Return Portfolio (Percentages shown are based on Net Assets) |
| Security | Par (000) |
Value | ||||||||||
| Commercial Mortgage-Backed Securities (continued) | ||||||||||||
| GS Mortgage Securities Trust |
||||||||||||
| Series 2023-FUN, Class A, (1-mo. CME Term SOFR + 2.09%), 7.42%, 03/15/28(a)(c) |
USD | 3,500 | $ | 3,464,909 | ||||||||
| Series 2023-SHIP, Class E, 7.68%, 09/10/38(a)(c) |
16,757 | 16,163,335 | ||||||||||
| HIT Trust, Series 2022-HI32, Class A, |
1,124 | 1,122,883 | ||||||||||
| HMH Trust, Series 2017-NSS, Class A, 3.06%, 07/05/31(a) |
3,390 | 3,139,140 | ||||||||||
| HONO Mortgage Trust, Series 2021-LULU, Class E, (1-mo. CME Term SOFR + 3.46%), 8.80%, 10/15/36(a)(c) |
765 | 695,867 | ||||||||||
| Hudson Yards Mortgage Trust, Series 2019-55HY, Class F, 3.04%, 12/10/41(a)(c) |
2,975 | 2,032,521 | ||||||||||
| ILPT Commercial Mortgage Trust, Series 2022- LPF2, Class A, (1-mo. CME Term SOFR +
2.25%), |
9,809 | 9,784,632 | ||||||||||
| IMT Trust |
||||||||||||
| Series 2017-APTS, Class AFX, 3.48%, 06/15/34(a) |
1,540 | 1,499,166 | ||||||||||
| Series 2017-APTS, Class DFX, 3.61%, 06/15/34(a)(c) |
1,600 | 1,537,332 | ||||||||||
| Series 2017-APTS, Class EFX, 3.61%, 06/15/34(a)(c) |
810 | 773,325 | ||||||||||
| Independence Plaza Trust |
||||||||||||
| Series 2018-INDP, Class B, 3.91%, 07/10/35(a) |
700 | 650,610 | ||||||||||
| Series 2018-INDP, Class C, 4.16%, 07/10/35(a) |
1,600 | 1,466,024 | ||||||||||
| INTOWN Mortgage Trust, Series 2022-STAY, Class A, (1-mo. CME Term SOFR + 2.49%), 7.82%, 08/15/39(a)(c) |
5,685 | 5,692,124 | ||||||||||
| JPMBB Commercial Mortgage Securities Trust, Series 2015-C33, Class D1, 4.29%, 12/15/48(a)(c) |
1,585 | 1,252,713 | ||||||||||
| JPMDB Commercial Mortgage Securities Trust, Series 2018-C8, Class AS, 4.42%, 06/15/51 |
198 | 174,059 | ||||||||||
| JPMorgan Chase Commercial Mortgage Securities Corp., Series 2021-MHC, Class F, (1-mo. CME Term SOFR + 3.06%), 8.40%, 04/15/38(a)(c) |
2,750 | 2,630,775 | ||||||||||
| JPMorgan Chase Commercial Mortgage Securities Trust |
||||||||||||
| Series 2015-JP1, Class C, 4.88%, 01/15/49(c) |
710 | 584,676 | ||||||||||
| Series 2016-NINE, Class B, 2.95%, 09/06/38(a)(c) |
3,688 | 3,099,371 | ||||||||||
| Series 2017-JP7, Class B, 4.05%, 09/15/50 |
320 | 260,468 | ||||||||||
| Series 2018-AON, Class A, 4.13%, 07/05/31(a) |
1,819 | 1,637,100 | ||||||||||
| Series 2018-PHH, Class A, (1-mo. CME Term SOFR + 1.26%), 6.59%, 06/15/35(a)(c) |
1,938 | 1,758,724 | ||||||||||
| Series 2019-COR5, Class A3, 3.12%, 06/13/52 |
1,700 | 1,439,500 | ||||||||||
| Series 2019-MFP, Class E, (1-mo. CME Term SOFR + 2.21%), 7.54%, 07/15/36(a)(c) |
2,460 | 2,364,251 | ||||||||||
| Series 2020-609M, Class D, (1-mo. CME Term SOFR + 2.88%), 8.22%, 10/15/33(a)(c) |
1,600 | 1,299,280 | ||||||||||
| Series 2021-MHC, Class A, (1-mo. CME Term SOFR + 0.91%), 6.25%, 04/15/38(a)(c) |
1,062 | 1,049,921 | ||||||||||
| Series 2021-MHC, Class E, (1-mo. CME Term SOFR + 2.56%), 7.90%, 04/15/38(a)(c) |
8,804 | 8,488,628 | ||||||||||
| Series 2022-CGSS, Class A, (1-mo. CME Term SOFR + 2.47%), 7.80%, 12/15/36(a)(c) |
5,794 | 5,799,222 | ||||||||||
| Security | Par (000) |
Value | ||||||||||
| Commercial Mortgage-Backed Securities (continued) | ||||||||||||
| JPMorgan Chase Commercial Mortgage Securities Trust |
||||||||||||
| Series 2022-NLP, Class F, (1-mo. CME Term SOFR + 3.54%), |
USD | 5,516 | $ | 4,776,314 | ||||||||
| Series 2022-NXSS, Class A, (1-mo. CME Term SOFR + 2.18%), |
8,514 | 8,529,908 | ||||||||||
| Series 2022-OPO, Class D, 3.57%, 01/05/39(a)(c) |
3,654 | 2,381,587 | ||||||||||
| KKR Industrial Portfolio Trust, Series 2021-KDIP, Class F, (1-mo. CME Term SOFR + 2.16%), 7.50%, 12/15/37(a)(c) |
2,490 | 2,410,185 | ||||||||||
| KNDL Mortgage Trust, Series 2019-KNSQ, Class E, (1-mo. CME Term SOFR + 2.00%), 7.33%, 05/15/36(a)(c) |
3,575 | 3,530,674 | ||||||||||
| Lehman Brothers Small Balance Commercial Mortgage Trust |
||||||||||||
| Series 2006-2A, Class M3, (1-mo. CME Term SOFR + 0.56%), |
1,321 | 1,249,562 | ||||||||||
| Series 2007-1A, Class 1A, (1-mo. CME Term SOFR + 0.36%), |
31 | 31,368 | ||||||||||
| Life Mortgage Trust, Series 2021-BMR, Class F, (1-mo. CME Term SOFR + 2.46%), 7.80%, 03/15/38(a)(c) |
4,154 | 3,969,720 | ||||||||||
| LSTAR Commercial Mortgage Trust, Series 2015-3, Class AS, |
105 | 100,867 | ||||||||||
| LUX, Series 2023-LION, Class A, (1-mo. CME Term SOFR + 2.69%), 8.02%, 08/15/28(a)(c) |
2,294 | 2,301,260 | ||||||||||
| MAD Mortgage Trust |
||||||||||||
| Series 2017-330M, Class D, 4.11%, 08/15/34(a)(c) |
1,085 | 793,015 | ||||||||||
| Series 2017-330M, Class E, 4.17%, 08/15/34(a)(c) |
1,846 | 1,293,968 | ||||||||||
| Med Trust |
||||||||||||
| Series 2021-MDLN, Class E, (1-mo. CME Term SOFR + 3.26%), |
1,038 | 988,838 | ||||||||||
| Series 2021-MDLN, Class G, (1-mo. CME Term SOFR + 5.36%), |
25,165 | 23,781,531 | ||||||||||
| MF1, Series 2021-W10, Class G, (1-mo. CME Term SOFR + 4.22%), 9.55%, 12/15/34(a)(c) |
1,005 | 934,160 | ||||||||||
| MFT Trust, Series 2020-ABC, Class C, 3.59%, 02/10/42(a)(c) |
1,773 | 951,742 | ||||||||||
| MHC Commercial Mortgage Trust |
||||||||||||
| Series 2021-MHC, Class A, (1-mo. CME Term SOFR + 0.92%), |
545 | 537,670 | ||||||||||
| Series 2021-MHC, Class E, (1-mo. CME Term SOFR + 2.22%), |
10,457 | 10,267,072 | ||||||||||
| Series 2021-MHC, Class F, (1-mo. CME Term SOFR + 2.72%), |
1,074 | 1,041,374 | ||||||||||
| MIRA Trust, Series 2023-MILE, Class A, 6.76%, 06/10/38(a) |
3,432 | 3,361,336 | ||||||||||
| Morgan Stanley Bank of America Merrill Lynch Trust |
||||||||||||
| Series 2015-C25, Class B, 4.67%, 10/15/48(c) |
2,910 | 2,677,546 | ||||||||||
| Series 2015-C25, Class C, 4.67%, 10/15/48(c) |
430 | 381,419 | ||||||||||
| Morgan Stanley Capital I Trust |
||||||||||||
| Series 2017-ASHF, Class G, (1-mo. CME Term SOFR + 7.07%), |
1,275 | 1,115,680 | ||||||||||
| Series 2017-H1, Class C, 4.28%, 06/15/50(c) |
221 | 179,535 | ||||||||||
| Series 2017-HR2, Class D, 2.73%, 12/15/50 |
430 | 291,216 | ||||||||||
| Series 2018-MP, Class E, |
2,730 | 1,778,085 | ||||||||||
| M A S T E R P O R T F O L I O S C H E D U L E O F I N V E S T M E N T S |
67 |
| Consolidated Schedule of Investments (continued) September 30, 2023 |
Master Total Return Portfolio (Percentages shown are based on Net Assets) |
| Security | Par (000) |
Value | ||||||||||
| Commercial Mortgage-Backed Securities (continued) | ||||||||||||
| Morgan Stanley Capital I Trust |
||||||||||||
| Series 2018-SUN, Class A, (1-mo. CME Term SOFR + 1.26%), 6.59%, 07/15/35(a)(c) |
USD | 1,410 | $ | 1,399,348 | ||||||||
| Series 2018-SUN, Class F, (1-mo. CME Term SOFR + 2.91%), 8.24%, 07/15/35(a)(c) |
28 | 26,943 | ||||||||||
| MSCG Trust |
||||||||||||
| Series 2018-SELF, Class E, (1-mo. CME Term SOFR + 2.20%), 7.53%, 10/15/37(a)(c) |
679 | 664,897 | ||||||||||
| Series 2018-SELF, Class F, (1-mo. CME Term SOFR + 3.10%), 8.43%, 10/15/37(a)(c) |
3,153 | 3,094,285 | ||||||||||
| MSDB Trust, Series 2017-712F, Class B, 3.57%, 07/11/39(a)(c) |
1,650 | 1,300,095 | ||||||||||
| MTN Commercial Mortgage Trust |
||||||||||||
| Series 2022-LPFL, Class A, (1-mo. CME Term SOFR + 1.40%), 6.74%, 03/15/39(a)(c) |
3,160 | 3,119,386 | ||||||||||
| Series 2022-LPFL, Class F, (1-mo. CME Term SOFR + 5.29%), 10.63%, 03/15/39(a)(c) |
1,362 | 1,253,621 | ||||||||||
| Natixis Commercial Mortgage Securities Trust |
||||||||||||
| Series 2018-FL1, Class A, (1-mo. CME Term SOFR + 1.06%), 6.40%, 06/15/35(a)(c) |
206 | 194,855 | ||||||||||
| Series 2018-SOX, Class A, 4.40%, 06/17/38(a) |
4,162 | 3,801,866 | ||||||||||
| Series 2019-LVL, Class D, 4.44%, 08/15/38(a) |
1,550 | 1,239,330 | ||||||||||
| Olympic Tower Mortgage Trust, Series 2017-OT, Class E, 4.08%, 05/10/39(a)(c) |
2,910 | 1,711,210 | ||||||||||
| One Bryant Park Trust, Series 2019-OBP, Class A, 2.52%, 09/15/54(a) |
1,019 | 809,358 | ||||||||||
| One New York Plaza Trust, Series 2020-1NYP, Class D, (1-mo. CME Term SOFR + 2.86%), 8.20%, 01/15/36(a)(c) |
960 | 729,600 | ||||||||||
| PFP Ltd., Series 2022-9, Class A, (1-mo. CME Term SOFR + 2.27%), 7.61%, 08/19/35(a)(c) |
5,272 | 5,265,410 | ||||||||||
| Ready Capital Mortgage Financing LLC |
||||||||||||
| Series 2022-FL10, Class A, (1-mo. CME Term SOFR + 2.55%), 7.87%, 10/25/39(a)(c) |
9,356 | 9,364,305 | ||||||||||
| Series 2022-FL9, Class A, (1-mo. CME Term SOFR + 2.47%), 7.79%, 06/25/37(a)(c) |
1,839 | 1,836,268 | ||||||||||
| Series 2023-FL11, Class A, (1-mo. CME Term SOFR + 2.37%), 7.69%, 10/25/39(a)(c) |
5,457 | 5,446,841 | ||||||||||
| RIAL Issuer Ltd., Series 2022-FL8, Class A, (1-mo. CME Term SOFR + 2.25%), 7.58%, 01/19/37(a)(c) |
10,125 | 9,921,994 | ||||||||||
| Scorpio European Loan Conduit No. 34 DAC, Series 34A, Class C, (1-day SONIA + 2.22%), 7.10%, 05/17/29(a)(c) |
GBP | 1,148 | 1,381,960 | |||||||||
| SG Commercial Mortgage Securities Trust, Series 2019-PREZ, Class D, 3.59%, 09/15/39(a)(c) |
USD | 2,200 | 1,671,349 | |||||||||
| SMRT |
||||||||||||
| Series 2022-MINI, Class A, (1-mo. CME Term SOFR + 1.00%), 6.33%, 01/15/39(a)(c) |
1,660 | 1,616,265 | ||||||||||
| Series 2022-MINI, Class E, (1-mo. CME Term SOFR + 2.70%), 8.03%, 01/15/39(a)(c) |
1,550 | 1,467,394 | ||||||||||
| SREIT Trust |
||||||||||||
| Series 2021-MFP, Class F, (1-mo. CME Term SOFR + 2.74%), 8.07%, 11/15/38(a)(c) |
5,400 | 5,219,751 | ||||||||||
| Series 2021-MFP2, Class A, (1-mo. CME Term SOFR + 0.94%), 6.27%, 11/15/36(a)(c) |
1,180 | 1,159,639 | ||||||||||
| Series 2021-MFP2, Class F, (1-mo. CME Term SOFR + 2.73%), 8.07%, 11/15/36(a)(c) |
4,101 | 3,916,052 | ||||||||||
| Taubman Centers Commercial Mortgage Trust, Series 2022-DPM, Class A, (1-mo. CME Term SOFR + 2.19%), 7.52%, 05/15/37(a)(c) |
9,831 | 9,639,867 | ||||||||||
| Security | Par (000) |
Value | ||||||||||
| Commercial Mortgage-Backed Securities (continued) | ||||||||||||
| TPGI Trust, Series 2021-DGWD, Class A, (1-mo. CME Term SOFR + 0.81%), 6.15%, 06/15/26(a)(c) |
USD | 548 | $ | 537,879 | ||||||||
| UBS Commercial Mortgage Trust, Series 2017- C7, Class A4, 3.68%, 12/15/50 |
880 | 785,035 | ||||||||||
| Velocity Commercial Capital Loan Trust |
||||||||||||
| Series 2017-2, Class M3, 4.24%, 11/25/47(a)(c) |
212 | 175,096 | ||||||||||
| Series 2017-2, Class M4, 5.00%, 11/25/47(a)(c) |
128 | 101,798 | ||||||||||
| Series 2018-1, Class M2, 4.26%, 04/25/48(a) |
115 | 100,240 | ||||||||||
| Series 2020-1, Class M1, 2.80%, 02/25/50(a)(c) |
629 | 497,139 | ||||||||||
| Series 2020-1, Class M2, 2.98%, 02/25/50(a)(c) |
724 | 570,516 | ||||||||||
| Series 2021-4, Class A, 2.52%, 12/26/51(a)(c) |
10,496 | 8,264,767 | ||||||||||
| Series 2021-4, Class M4, 4.48%, 12/26/51(a)(c) |
1,144 | 818,401 | ||||||||||
| Series 2022-2, Class M3, 5.84%, 04/25/52(a)(c) |
2,230 | 1,916,244 | ||||||||||
| Series 2022-4, Class M2, 6.97%, 08/25/52(a)(c) |
890 | 821,723 | ||||||||||
| Series 2022-4, Class M3, 7.54%, 08/25/52(a)(c) |
737 | 625,322 | ||||||||||
| Series 2023-2, Class A, 6.22%, 05/25/53(a)(c) |
4,328 | 4,149,711 | ||||||||||
| Series 2023-2, Class M1, 7.03%, 05/25/53(a)(c) |
2,076 | 2,014,918 | ||||||||||
| VNDO Trust, Series 2016-350P, Class D, 4.03%, 01/10/35(a)(c) |
3,390 | 2,941,048 | ||||||||||
| Wells Fargo Commercial Mortgage Trust |
||||||||||||
| Series 2016-C32, Class A3FL, (1-mo. CME Term SOFR + 1.53%), 6.87%, 01/15/59(c) |
2,978 | 2,933,933 | ||||||||||
| Series 2016-C34, Class A3FL, (1-mo. CME Term SOFR + 1.15%), 6.49%, 06/15/49(a)(c) |
1,830 | 1,774,360 | ||||||||||
| Series 2018-1745, Class A, 3.87%, 06/15/36(a)(c) |
1,253 | 1,037,910 | ||||||||||
| Series 2018-AUS, Class A, 4.19%, 08/17/36(a)(c) |
1,680 | 1,492,346 | ||||||||||
| Series 2018-C45, Class C, 4.73%, 06/15/51 |
236 | 195,296 | ||||||||||
| Series 2018-C48, Class B, 4.90%, 01/15/52(c) |
3,612 | 3,145,367 | ||||||||||
| Series 2020-SDAL, Class D, (1-mo. CME Term SOFR + 2.20%), 7.54%, 02/15/37(a)(c) |
2,562 | 2,491,547 | ||||||||||
| Series 2020-SDAL, Class E, (1-mo. CME Term SOFR + 2.85%), 8.19%, 02/15/37(a)(c) |
1,300 | 1,193,482 | ||||||||||
| WFRBS Commercial Mortgage Trust, Series 2014-C24, Class B, 4.20%, 11/15/47(c) |
770 | 660,080 | ||||||||||
| WMRK Commercial Mortgage Trust |
||||||||||||
| Series 2022-WMRK, Class A, (1-mo. CME Term SOFR + 2.79%), 8.12%, 11/15/27(a)(c) |
6,274 | 6,273,949 | ||||||||||
| Series 2022-WMRK, Class B, (1-mo. CME Term SOFR + 3.44%), 8.77%, 11/15/27(a)(c) |
2,500 | 2,496,846 | ||||||||||
|
|
|
|||||||||||
| 774,644,033 | ||||||||||||
| Interest Only Collateralized Mortgage Obligations — 0.2% | ||||||||||||
| Ajax Mortgage Loan Trust, Series 2021-E, |
107,375 | 4,426,762 | ||||||||||
| Ginnie Mae |
||||||||||||
| 3.00%, 08/01/50 |
51,133 | 7,828,435 | ||||||||||
| 3.00%, 02/01/51 |
42,789 | 6,550,232 | ||||||||||
| JPMorgan Mortgage Trust |
||||||||||||
| Series 2021-INV5, Class A2X, 0.50%, 12/25/51(a)(c) |
51,093 | 1,919,047 | ||||||||||
| Series 2021-INV5, Class A5X, 0.50%, 12/25/51(a)(c) |
5,642 | 211,912 | ||||||||||
| Series 2021-INV5, Class AX1, 0.19%, 12/25/51(a)(c) |
101,557 | 914,877 | ||||||||||
| Series 2021-INV7, Class A2X, 0.50%, 02/25/52(a)(c) |
27,572 | 1,032,623 | ||||||||||
| Series 2021-INV7, Class A3X, 0.50%, 02/25/52(a)(c) |
16,712 | 361,635 | ||||||||||
| Series 2021-INV7, Class A4X, 0.50%, 02/25/52(a)(c) |
6,756 | 268,972 | ||||||||||
| 68 | 2 0 2 3 B L A C K R O C K A N N U A L R E P O R T T O S H A R E H O L D E R S |
| Consolidated Schedule of Investments (continued) September 30, 2023 |
Master Total Return Portfolio (Percentages shown are based on Net Assets) |
| Security | Par (000) |
Value | ||||||||||
| Interest Only Collateralized Mortgage Obligations (continued) | ||||||||||||
| JPMorgan Mortgage Trust |
||||||||||||
| Series 2021-INV7, Class A5X, 0.50%, 02/25/52(a)(c) |
USD | 3,002 | $ | 112,434 | ||||||||
| Series 2021-INV7, Class AX1, 0.27%, 02/25/52(a)(c) |
54,043 | 692,284 | ||||||||||
| Seasoned Credit Risk Transfer Trust, Series 2017-3, Class BIO, 0.93%, 07/25/56(a)(c) |
2,839 | 279,806 | ||||||||||
| Voyager OPTONE Delaware Trust, Series 2009-1, Class SAA7, 2.07%, 02/25/38(a)(c) |
12,137 | 2,806,078 | ||||||||||
|
|
|
|||||||||||
| 27,405,097 | ||||||||||||
| Interest Only Commercial Mortgage-Backed Securities — 0.1% | ||||||||||||
| 245 Park Avenue Trust, Series 2017-245P, Class XA, 0.27%, 06/05/37(a)(c) |
13,000 | 77,682 | ||||||||||
| BANK, Series 2019-BN20, Class XB, 0.47%, 09/15/62(c) |
39,279 | 728,386 | ||||||||||
| Bank of America Merrill Lynch Commercial Mortgage Trust |
||||||||||||
| Series 2017-BNK3, Class XB, 0.74%, 02/15/50(c) |
11,850 | 209,984 | ||||||||||
| Series 2017-BNK3, Class XD, 1.39%, 02/15/50(a)(c) |
5,000 | 177,790 | ||||||||||
| BBCMS Mortgage Trust |
||||||||||||
| Series 2015-SRCH, Class XA, 1.06%, 08/10/35(a)(c) |
16,142 | 420,458 | ||||||||||
| Series 2020-C7, Class XB, 1.10%, 04/15/53(c) |
. | 1,596 | 87,497 | |||||||||
| Benchmark Mortgage Trust |
||||||||||||
| Series 2019-B9, Class XA, 1.18%, 03/15/52(c) |
. | 12,814 | 533,288 | |||||||||
| Series 2020-B17, Class XB, 0.65%, 03/15/53(c) |
7,100 | 175,305 | ||||||||||
| Series 2021-B23, Class XA, 1.38%, 02/15/54(c) |
27,374 | 1,684,257 | ||||||||||
| BMO Mortgage Trust, Series 2023-C5, Class XA, 0.95%, 06/15/56(c) |
14,383 | 729,025 | ||||||||||
| BX Trust, Series 2022-GPA, Class XCP, 0.00%, 08/15/23(a)(c)(d) |
107,548 | 3,151 | ||||||||||
| CFCRE Commercial Mortgage Trust |
||||||||||||
| Series 2016-C3, Class XD, 1.86%, 01/10/48(a)(c) |
5,497 | 180,873 | ||||||||||
| Series 2016-C4, Class XB, 0.85%, 05/10/58(c) |
. | 5,810 | 92,657 | |||||||||
| Citigroup Commercial Mortgage Trust, Series 2020-420K, Class X, 0.91%, 11/10/42(a)(c) |
46,500 | 2,157,530 | ||||||||||
| Commercial Mortgage Pass-Through Certificates |
||||||||||||
| Series 2015-3BP, Class XA, 0.17%, 02/10/35(a)(c) |
150,000 | 162,435 | ||||||||||
| Series 2015-CR25, Class XA, 0.94%, 08/10/48(c) |
4,144 | 48,412 | ||||||||||
| Series 2018-COR3, Class XD, 1.75%, 05/10/51(a)(c) |
3,200 | 198,794 | ||||||||||
| CSAIL Commercial Mortgage Trust |
||||||||||||
| Series 2017-CX10, Class XB, 0.26%, 11/15/50(c) |
12,490 | 125,640 | ||||||||||
| Series 2019-C16, Class XA, 1.71%, 06/15/52(c) |
30,129 | 1,924,648 | ||||||||||
| Series 2019-C17, Class XA, 1.49%, 09/15/52(c) |
10,165 | 527,745 | ||||||||||
| Series 2019-C17, Class XB, 0.70%, 09/15/52(c) |
19,090 | 505,902 | ||||||||||
| DBGS Mortgage Trust, Series 2019-1735, Class X, 0.43%, 04/10/37(a)(c) |
21,535 | 317,923 | ||||||||||
| Security | Par (000) |
Value | ||||||||||
| Interest Only Commercial Mortgage-Backed Securities (continued) | ||||||||||||
| Deutsche Bank JPMorgan Mortgage Trust, Series 2017-C6, Class XD, 1.00%, 06/10/50(c) |
USD | 5,780 | $ | 170,555 | ||||||||
| FREMF Mortgage Trust, Series 2019-KW08, Class X2A, 0.10%, 01/25/29(a) |
154,093 | 588,036 | ||||||||||
| GS Mortgage Securities Corp. II, Series 2005- ROCK, Class X1, 0.40%, 05/03/32(a)(c) |
21,000 | 77,238 | ||||||||||
| GS Mortgage Securities Trust |
||||||||||||
| Series 2019-GSA1, Class XA, 0.94%, 11/10/52(c) |
7,790 | 293,570 | ||||||||||
| Series 2020-GSA2, Class XA, 1.83%, 12/12/53(a)(c) |
18,442 | 1,543,948 | ||||||||||
| JPMBB Commercial Mortgage Securities Trust |
||||||||||||
| Series 2014-C22, Class XA, 0.94%, 09/15/47(c) |
1,539 | 6,229 | ||||||||||
| Series 2014-C23, Class XA, 0.74%, 09/15/47(c) |
21,972 | 87,563 | ||||||||||
| Series 2015-C29, Class XA, 0.69%, 05/15/48(c) |
1,328 | 9,093 | ||||||||||
| JPMDB Commercial Mortgage Securities Trust, Series 2016-C4, Class XC, 0.75%, 12/15/49(a)(c) |
4,940 | 93,444 | ||||||||||
| JPMorgan Chase Commercial Mortgage Securities Trust |
||||||||||||
| Series 2013-LC11, Class XB, 0.61%, 04/15/46(c) |
4,570 | 115 | ||||||||||
| Series 2016-JP3, Class XC, 0.75%, 08/15/49(a)(c) |
13,040 | 232,325 | ||||||||||
| Ladder Capital Commercial Mortgage Trust, Series 2013-GCP, Class XA, 1.32%, 02/15/36(a)(c) |
3,623 | 143,360 | ||||||||||
| LSTAR Commercial Mortgage Trust, Series 2017-5, |
2,546 | 43,342 | ||||||||||
| Morgan Stanley Bank of America Merrill Lynch Trust |
||||||||||||
| Series 2014-C19, Class XF, 1.33%, 12/15/47(a)(c) |
4,370 | 59,783 | ||||||||||
| Series 2015-C26, Class XD, 1.45%, 10/15/48(a)(c) |
4,490 | 105,524 | ||||||||||
| Morgan Stanley Capital I Trust |
||||||||||||
| Series 2016-UBS9, Class XD, 1.75%, 03/15/49(a)(c) |
13,984 | 470,034 | ||||||||||
| Series 2017-H1, Class XD, 2.31%, 06/15/50(a)(c) |
3,293 | 210,204 | ||||||||||
| Series 2019-H6, Class XB, 0.87%, 06/15/52(c) |
23,510 | 782,500 | ||||||||||
| Series 2019-L2, Class XA, 1.17%, 03/15/52(c) |
8,614 | 352,125 | ||||||||||
| Olympic Tower Mortgage Trust, Series 2017-OT, Class XA, 0.51%, 05/10/39(a)(c) |
36,697 | 450,808 | ||||||||||
| One Market Plaza Trust |
||||||||||||
| Series 2017-1MKT, Class XCP, 0.00%, 02/10/32(a)(c)(d) |
53,230 | 1,522 | ||||||||||
| Series 2017-1MKT, Class XNCP, 0.22%, 02/10/32(a)(c) |
10,646 | 27,624 | ||||||||||
| UBS Commercial Mortgage Trust |
||||||||||||
| Series 2019-C17, Class XA, 1.60%, 10/15/52(c) |
31,536 | 1,980,523 | ||||||||||
| Series 2019-C18, Class XA, 1.14%, 12/15/52(c) |
34,562 | 1,399,012 | ||||||||||
| Wells Fargo Commercial Mortgage Trust |
||||||||||||
| Series 2015-NXS4, Class XA, 1.17%, 12/15/48(c) |
2,180 | 36,686 | ||||||||||
| M A S T E R P O R T F O L I O S C H E D U L E O F I N V E S T M E N T S |
69 |
| Consolidated Schedule of Investments (continued) September 30, 2023 |
Master Total Return Portfolio (Percentages shown are based on Net Assets) |
| Security | Par (000) |
Value | ||||||||||
| Interest Only Commercial Mortgage-Backed Securities (continued) | ||||||||||||
| Wells Fargo Commercial Mortgage Trust |
||||||||||||
| Series 2016-BNK1, Class XD, 1.39%, 08/15/49(a)(c) |
USD | 4,420 | $ | 128,771 | ||||||||
| Series 2019-C50, Class XA, 1.58%, 05/15/52(c) |
22,040 | 1,196,958 | ||||||||||
|
|
|
|||||||||||
| 21,560,274 | ||||||||||||
| Principal Only Collateralized Mortgage Obligations — 0.0% | ||||||||||||
| Seasoned Credit Risk Transfer Trust, Series 2017-3, Class B, 0.00%, 07/25/56(a)(d) |
|
1,521 | 151,548 | |||||||||
|
|
|
|||||||||||
| Total Non-Agency Mortgage-Backed |
|
1,555,977,924 | ||||||||||
|
|
|
|||||||||||
| Preferred Securities |
||||||||||||
| Capital Trusts — 0.0% | ||||||||||||
| Banks — 0.0% | ||||||||||||
| Ahli United Sukuk Ltd., 3.88%(e)(m) |
350 | 317,188 | ||||||||||
| Bangkok Bank PCL, 5.00%(e)(m) |
500 | 469,115 | ||||||||||
| Emirates NBD Bank PJSC, |
425 | 418,599 | ||||||||||
| Rizal Commercial Banking Corp., 6.50%(e)(m) |
500 | 453,690 | ||||||||||
|
|
|
|||||||||||
| 1,658,592 | ||||||||||||
| Capital Markets — 0.0% | ||||||||||||
| State Street Corp., Series F, (3-mo. CME Term SOFR + 3.86%), |
1,338 | 1,340,897 | ||||||||||
|
|
|
|||||||||||
| Real Estate Management & Development — 0.0% | ||||||||||||
| MAF Global Securities Ltd., |
200 | 192,708 | ||||||||||
|
|
|
|||||||||||
| Total Capital Trusts — 0.0% |
3,192,197 | |||||||||||
|
|
|
|||||||||||
| Shares | ||||||||||||
| Preferred Stocks — 0.2% | ||||||||||||
| Financial Services — 0.0% | ||||||||||||
| SCI PH, Inc. (Acquired 02/10/23, cost $1,875,000)(f)(g) |
1,875 | 1,722,994 | ||||||||||
|
|
|
|||||||||||
| Household Durables — 0.1% | ||||||||||||
| Dream Finders Homes, Inc.(f) |
15,124 | 13,970,795 | ||||||||||
| Lessen, Inc., Series C(f)(k) |
143,367 | 1,283,135 | ||||||||||
|
|
|
|||||||||||
| 15,253,930 | ||||||||||||
| IT Services — 0.0% | ||||||||||||
| Cap Hill Brands(f) |
2,670,520 | 721,040 | ||||||||||
|
|
|
|||||||||||
| Software — 0.1% | ||||||||||||
| Versa Networks, Inc. (Acquired 10/14/22, cost $12,017,972)(f)(g) |
4,118,274 | 13,054,928 | ||||||||||
|
|
|
|||||||||||
| Total Preferred Stocks — 0.2% |
30,752,892 | |||||||||||
|
|
|
|||||||||||
| Total Preferred Securities — 0.2% |
|
33,945,089 | ||||||||||
|
|
|
|||||||||||
| Par (000) |
||||||||||||
| U.S. Government Sponsored Agency Securities |
| |||||||||||
| Agency Obligations — 0.0% | ||||||||||||
| Fannie Mae, 6.63%, 11/15/30 |
USD | 1,450 | 1,605,069 | |||||||||
|
|
|
|||||||||||
| Collateralized Mortgage Obligations — 0.0% | ||||||||||||
| Fannie Mae, Series 2003-W5, Class A, (1-mo. LIBOR US + 0.11%), 5.54%, 04/25/33(c) |
1 | 913 | ||||||||||
| Security | Par (000) |
Value | ||||||||||
| Collateralized Mortgage Obligations (continued) | ||||||||||||
| Freddie Mac |
||||||||||||
| Series 2015-DN1, Class B, (SOFR (30-day) + 11.61%), 16.93%, 01/25/25(c) |
USD | 269 | $ | 273,866 | ||||||||
| Series 2015-HQ2, Class B, (SOFR (30-day) + 8.06%), 13.38%, 05/25/25(c) |
510 | 540,580 | ||||||||||
|
|
|
|||||||||||
| 815,359 | ||||||||||||
| Commercial Mortgage-Backed Securities — 0.0% | ||||||||||||
| Fannie Mae, Series 2006-M2, Class A2A, 5.27%, 10/25/32(c) |
253 | 249,037 | ||||||||||
| Ginnie Mae, Series 2023-118, Class BA, 3.75%, 05/16/65(c) |
1,382 | 1,194,307 | ||||||||||
|
|
|
|||||||||||
| 1,443,344 | ||||||||||||
| Interest Only Collateralized Mortgage Obligations — 0.3% | ||||||||||||
| Fannie Mae |
||||||||||||
| Series 2020-32, Class PI, 4.00%, 05/25/50 |
5,693 | 1,180,393 | ||||||||||
| Series 2020-77, Class HI, 4.00%, 11/25/50 |
21,548 | 4,325,080 | ||||||||||
| Series 2021-3, Class MI, 3.50%, 02/25/51 |
8,700 | 1,569,623 | ||||||||||
| Series 2021-31, Class IB, 4.00%, 06/25/51 |
10,370 | 2,065,172 | ||||||||||
| Series 2021-50, Class IO, 4.00%, 08/25/51 |
8,346 | 1,634,954 | ||||||||||
| Series 427, Class C71, 3.00%, 10/25/49 |
28,279 | 4,646,079 | ||||||||||
| Series 427, Class C85, 3.50%, 08/25/49 |
9,116 | 1,639,353 | ||||||||||
| Series 428, Class C16, 3.00%, 03/25/50 |
13,424 | 2,311,104 | ||||||||||
| Freddie Mac |
||||||||||||
| Series 389, Class C45, 3.00%, 10/15/52 |
32,166 | 5,344,085 | ||||||||||
| Series 5052, Class KI, 4.00%, 12/25/50 |
13,351 | 2,688,723 | ||||||||||
| Series 5081, Class AI, 3.50%, 03/25/51 |
5,060 | 897,113 | ||||||||||
| Series 5081, Class PI, 3.00%, 03/25/51 |
10,520 | 1,723,343 | ||||||||||
| Series 5112, Class KI, 3.50%, 06/25/51 |
23,074 | 4,207,262 | ||||||||||
| Series 5127, Class AI, 3.00%, 06/25/51 |
8,318 | 1,318,939 | ||||||||||
| Series 5129, Class IO, 3.00%, 09/25/50 |
2,405 | 400,103 | ||||||||||
| Series 5145, Class HI, 3.00%, 09/25/51 |
2,375 | 377,840 | ||||||||||
| Series 5152, Class EI, 3.50%, 10/25/51 |
10,922 | 1,994,229 | ||||||||||
| Series 5155, Class NI, 3.00%, 10/25/51 |
6,365 | 910,965 | ||||||||||
| Series 5161, Class LI, 3.00%, 11/25/51 |
7,511 | 1,013,066 | ||||||||||
| Series 5164, Class IB, 3.00%, 11/25/51 |
7,823 | 1,191,010 | ||||||||||
| Series 5167, Class MI, 3.00%, 11/25/51 |
3,390 | 466,071 | ||||||||||
| Series 5196, Class DI, 3.00%, 02/25/52 |
15,858 | 2,465,645 | ||||||||||
| Ginnie Mae |
||||||||||||
| Series 2020-144, Class IO, 2.50%, 09/20/50 |
6,493 | 863,533 | ||||||||||
| Series 2020-146, Class DI, 2.50%, 10/20/50 |
5,244 | 697,997 | ||||||||||
| Series 2020-151, Class MI, 2.50%, 10/20/50 |
10,907 | 1,444,053 | ||||||||||
| Series 2020-175, Class DI, 2.50%, 11/20/50 |
1,820 | 237,153 | ||||||||||
| Series 2020-185, Class MI, 2.50%, 12/20/50 |
6,561 | 872,877 | ||||||||||
| Series 2021-15, Class GI, 3.50%, 01/20/51 |
3,719 | 629,012 | ||||||||||
| Series 2021-161, Class IB, 4.00%, 09/20/51 |
2,292 | 429,595 | ||||||||||
| Series 2021-176, Class IA, 3.50%, 10/20/51 |
5,399 | 927,086 | ||||||||||
| Series 2021-209, Class TJ, 3.50%, 11/20/51 |
2,406 | 398,971 | ||||||||||
| Series 2021-214, Class AI, 4.00%, 12/20/51 |
5,325 | 1,000,775 | ||||||||||
| Series 2021-215, Class LI, 3.00%, 12/20/51 |
4,202 | 613,746 | ||||||||||
| Series 2021-221, Class CI, 3.00%, 12/20/51 |
2,433 | 358,051 | ||||||||||
| Series 2021-67, Class QI, 3.00%, 04/20/51 |
3,868 | 586,669 | ||||||||||
| Series 2021-76, Class JI, 3.00%, 08/20/50 |
3,974 | 601,801 | ||||||||||
| Series 2021-78, Class IC, 4.00%, 05/20/51 |
3,699 | 621,359 | ||||||||||
| Series 2021-83, Class PI, 3.00%, 05/20/51 |
15,948 | 2,352,656 | ||||||||||
| Series 2021-96, Class MI, 3.00%, 06/20/51 |
6,937 | 1,050,471 | ||||||||||
| Series 2022-78, Class IO, 3.00%, 08/20/51 |
8,625 | 1,306,500 | ||||||||||
|
|
|
|||||||||||
| 59,362,457 | ||||||||||||
| Interest Only Commercial Mortgage-Backed Securities — 0.0% | ||||||||||||
| Freddie Mac |
||||||||||||
| Series K121, Class X1, 1.12%, 10/25/30(c) |
13,718 | 737,315 | ||||||||||
| Series KL06, Class XFX, 1.47%, 12/25/29(c) |
6,710 | 379,818 | ||||||||||
| 70 | 2 0 2 3 B L A C K R O C K A N N U A L R E P O R T T O S H A R E H O L D E R S |
| Consolidated Schedule of Investments (continued) September 30, 2023 |
Master Total Return Portfolio (Percentages shown are based on Net Assets) |
| Security | Par (000) |
Value | ||||||||||
| Interest Only Commercial Mortgage-Backed Securities (continued) | ||||||||||||
| Freddie Mac |
USD | 36,487 | $ | 1,204,754 | ||||||||
| Ginnie Mae |
||||||||||||
| Series 2013-30, Class IO, 0.52%, 09/16/53(c) |
2,787 | 39,103 | ||||||||||
| Series 2015-37, Class IO, 0.62%, 10/16/56(c) |
513 | 13,147 | ||||||||||
| Series 2015-48, Class IO, 0.92%, 02/16/50(c) |
433 | 9,923 | ||||||||||
| Series 2016-36, Class IO, 0.68%, 08/16/57(c) |
655 | 18,377 | ||||||||||
| Series 2016-96, Class IO, 0.77%, 12/16/57(c) |
3,230 | 116,045 | ||||||||||
|
|
|
|||||||||||
| 2,518,482 | ||||||||||||
| Mortgage-Backed Securities — 45.6% | ||||||||||||
| Fannie Mae Mortgage-Backed Securities |
||||||||||||
| 1.50%, 12/01/35 - 03/01/51 |
251,723 | 194,151,587 | ||||||||||
| 2.00%, 10/01/31 - 03/01/52 |
696,382 | 544,359,750 | ||||||||||
| 2.50%, 09/01/27 - 02/01/52 |
650,874 | 531,151,047 | ||||||||||
| 3.00%, 04/01/28 - 05/01/52 |
160,170 | 138,534,660 | ||||||||||
| 3.50%, 08/01/28 - 01/01/51(s) |
236,251 | 207,499,891 | ||||||||||
| 4.00%, 08/01/31 - 05/01/52 |
485,835 | 440,028,936 | ||||||||||
| 4.50%, 02/01/25 - 07/01/52 |
147,103 | 137,914,063 | ||||||||||
| 5.00%, 11/01/32 - 04/01/53 |
49,135 | 46,897,621 | ||||||||||
| 5.50%, 12/01/32 - 06/01/53 |
65,420 | 63,566,961 | ||||||||||
| 6.00%, 02/01/34 - 08/01/53 |
89,910 | 88,965,908 | ||||||||||
| 6.50%, 05/01/40 |
1,146 | 1,175,073 | ||||||||||
| Freddie Mac Mortgage-Backed Securities |
||||||||||||
| 1.50%, 04/01/36 - 10/01/50 |
42,899 | 33,842,487 | ||||||||||
| 2.00%, 09/01/35 - 02/01/52 |
434,823 | 341,178,906 | ||||||||||
| 2.50%, 04/01/27 - 04/01/52(s) |
515,685 | 415,531,743 | ||||||||||
| 3.00%, 09/01/27 - 08/01/52 |
279,591 | 235,927,821 | ||||||||||
| 3.50%, 02/01/31 - 06/01/50 |
81,404 | 72,982,891 | ||||||||||
| 4.00%, 08/01/40 - 06/01/52 |
182,310 | 165,617,519 | ||||||||||
| 4.50%, 02/01/39 - 08/01/52 |
85,301 | 79,621,054 | ||||||||||
| 5.00%, 07/01/35 - 02/01/53 |
33,767 | 32,037,674 | ||||||||||
| 5.50%, 02/01/35 - 08/01/53 |
52,817 | 51,142,805 | ||||||||||
| 6.00%, 11/01/52 - 06/01/53 |
53,217 | 52,581,235 | ||||||||||
| Ginnie Mae Mortgage-Backed Securities |
||||||||||||
| 2.00%, 08/20/50 - 10/15/53(t) |
266,633 | 211,143,930 | ||||||||||
| 2.50%, 04/20/51 - 10/15/53(t) |
272,691 | 222,982,939 | ||||||||||
| 3.00%, 12/20/44 - 10/15/53(t) |
200,348 | 170,283,148 | ||||||||||
| 3.50%, 01/15/42 - 10/15/53(t) |
148,286 | 130,361,823 | ||||||||||
| 4.00%, 04/20/39 - 10/15/53(t) |
103,544 | 93,694,114 | ||||||||||
| 4.50%, 12/20/39 - 10/15/53(t) |
84,291 | 78,047,629 | ||||||||||
| 5.00%, 04/15/33 - 10/15/53(t) |
74,314 | 70,508,665 | ||||||||||
| 5.50%, 10/15/53(t) |
53,866 | 52,271,061 | ||||||||||
| 6.00%, 10/15/53(t) |
50,920 | 50,442,079 | ||||||||||
| 6.50%, 10/15/53(t) |
27,770 | 27,919,295 | ||||||||||
| Uniform Mortgage-Backed Securities |
||||||||||||
| 1.50%, 10/01/38 - 10/01/53(t) |
8,783 | 6,844,269 | ||||||||||
| 2.00%, 10/01/38 - 10/01/53(t) |
253,803 | 197,328,363 | ||||||||||
| 2.50%, 10/01/38(t) |
27,703 | 24,408,940 | ||||||||||
| 3.00%, 10/01/38 - 10/01/53(t) |
1,062,970 | 879,361,255 | ||||||||||
| 3.50%, 10/01/38 - 10/01/53(t) |
439,841 | 378,230,520 | ||||||||||
| 4.00%, 10/01/38 - 10/01/53(t) |
15,849 | 14,354,319 | ||||||||||
| 4.50%, 10/01/38 - 10/01/53(t) |
221,870 | 204,242,833 | ||||||||||
| 5.00%, 10/01/53(t) |
528,815 | 498,904,274 | ||||||||||
| 5.50%, 10/01/53(t) |
802,975 | 775,969,134 | ||||||||||
| 6.00%, 10/01/53(t) |
214,345 | 211,531,821 | ||||||||||
| 6.50%, 10/01/53(t) |
67,975 | 68,283,012 | ||||||||||
| 7.00%, 10/01/53(t) |
20,464 | 20,888,468 | ||||||||||
|
|
|
|||||||||||
| 8,262,711,523 | ||||||||||||
|
|
|
|||||||||||
| Total U.S. Government Sponsored Agency Securities — 45.9% |
|
8,328,456,234 | ||||||||||
|
|
|
|||||||||||
| Security | Par (000) |
Value | ||||||||||
| U.S. Treasury Obligations |
||||||||||||
| U.S. Treasury Bonds |
||||||||||||
| 4.50%, 08/15/39 |
USD | 90,240 | $ | 87,398,946 | ||||||||
| 4.63%, 02/15/40 |
10,812 | 10,590,270 | ||||||||||
| 1.13%, 05/15/40 - 08/15/40 |
18,140 | 10,361,766 | ||||||||||
| 4.38%, 05/15/40 - 05/15/41 |
72,868 | 68,964,349 | ||||||||||
| 3.88%, 08/15/40 - 02/15/43 |
67,346 | 58,802,120 | ||||||||||
| 1.38%, 11/15/40 |
9,070 | 5,367,952 | ||||||||||
| 4.25%, 11/15/40 |
10,812 | 10,056,005 | ||||||||||
| 4.75%, 02/15/41 |
27,747 | 27,442,433 | ||||||||||
| 2.38%, 02/15/42 - 05/15/51 |
102,080 | 66,604,492 | ||||||||||
| 4.00%, 11/15/42 - 11/15/52 |
85,756 | 76,059,003 | ||||||||||
| 2.88%, 05/15/43 |
32,692 | 24,220,175 | ||||||||||
| 3.63%, 08/15/43 - 05/15/53 |
194,832 | 161,533,230 | ||||||||||
| 3.75%, 11/15/43 |
44,917 | 38,126,813 | ||||||||||
| 3.13%, 08/15/44 |
45,120 | 34,474,500 | ||||||||||
| 2.50%, 02/15/45 |
102,915 | 69,885,717 | ||||||||||
| 3.00%, 05/15/47 - 08/15/52(u) |
422,891 | 309,073,380 | ||||||||||
| 2.75%, 11/15/47 |
103,431 | 72,126,961 | ||||||||||
| 2.25%, 08/15/49 |
55,494 | 34,545,015 | ||||||||||
| 1.63%, 11/15/50 |
44,842 | 23,487,749 | ||||||||||
| 1.88%, 02/15/51 - 11/15/51 |
77,609 | 43,358,808 | ||||||||||
| 4.13%, 08/15/53 |
89,000 | 80,795,313 | ||||||||||
| U.S. Treasury Inflation Indexed Bonds, 1.50%, 02/15/53 |
27,167 | 22,449,947 | ||||||||||
| U.S. Treasury Notes |
||||||||||||
| 1.50%, 10/31/24 - 02/15/30(j) |
175,815 | 163,684,574 | ||||||||||
| 1.75%, 12/31/24 |
253,956 | 242,984,308 | ||||||||||
| 3.88%, 03/31/25 - 12/31/29 |
406,201 | 392,879,755 | ||||||||||
| 2.63%, 04/15/25 - 07/31/29 |
190,242 | 176,513,797 | ||||||||||
| 0.38%, 04/30/25 - 09/30/27(j) |
225,984 | 205,782,572 | ||||||||||
| 2.75%, 05/15/25 - 08/15/32 |
258,464 | 232,412,773 | ||||||||||
| 2.88%, 06/15/25 - 05/15/32 |
96,020 | 91,955,691 | ||||||||||
| 0.25%, 06/30/25 - 07/31/25 |
170,325 | 156,239,966 | ||||||||||
| 3.50%, 09/15/25 |
87,085 | 84,533,681 | ||||||||||
| 4.00%, 12/15/25 - 10/31/29(u) |
311,586 | 302,278,625 | ||||||||||
| 0.50%, 02/28/26 - 08/31/27 |
356,663 | 309,449,312 | ||||||||||
| 0.75%, 05/31/26 |
40,427 | 36,306,920 | ||||||||||
| 0.88%, 06/30/26 |
89,834 | 80,829,545 | ||||||||||
| 4.50%, 07/15/26 |
98,076 | 97,171,862 | ||||||||||
| 0.63%, 07/31/26 |
55,494 | 49,391,828 | ||||||||||
| 1.63%, 11/30/26 - 05/15/31 |
238,749 | 205,654,069 | ||||||||||
| 1.88%, 02/28/27 |
60,677 | 55,225,551 | ||||||||||
| 2.38%, 05/15/27 - 03/31/29 |
53,663 | 48,419,440 | ||||||||||
| 2.25%, 08/15/27 |
20,160 | 18,422,775 | ||||||||||
| 3.13%, 11/15/28 |
6,518 | 6,069,124 | ||||||||||
| 3.75%, 05/31/30 |
90,300 | 85,728,562 | ||||||||||
| 4.13%, 08/31/30 |
34,405 | 33,394,547 | ||||||||||
| 1.25%, 08/15/31 |
179,368 | 140,194,309 | ||||||||||
|
|
|
|||||||||||
| Total U.S. Treasury Obligations — 25.1% |
|
4,551,248,530 | ||||||||||
|
|
|
|||||||||||
| Shares | ||||||||||||
| Warrants(h) |
||||||||||||
| Automobile Components — 0.0% | ||||||||||||
| Aurora Innovation, Inc. (Issued/Exercisable 05/04/22, 1 Share for 1 Warrant, Expires 12/31/28, Strike Price USD 11.50) |
16,026 | 5,129 | ||||||||||
|
|
|
|||||||||||
| M A S T E R P O R T F O L I O S C H E D U L E O F I N V E S T M E N T S |
71 |
| Consolidated Schedule of Investments (continued) September 30, 2023 |
Master Total Return Portfolio (Percentages shown are based on Net Assets) |
| Security | Shares | Value | ||||||||||
| Automobiles — 0.0% | ||||||||||||
| EVgo, Inc. (Issued/Exercisable 11/10/20, 1 Share for 1 Warrant, Expires 09/15/25, Strike Price USD 11.50) |
75,790 | $ | 28,042 | |||||||||
| Lightning eMotors, Inc. (Issued/Exercisable 03/03/22, 1 Share for 1 Warrant, Expires 12/15/25, Strike Price USD 11.50) |
216,261 | 498 | ||||||||||
|
|
|
|||||||||||
| 28,540 | ||||||||||||
| Capital Markets — 0.0% | ||||||||||||
| Cano Health, Inc. (Issued/Exercisable 07/06/21, 1 Share for 1 Warrant, Expires 07/06/25, Strike Price USD 11.50) |
57,179 | 2,859 | ||||||||||
| Crown PropTech Acquisitions (Issued/Exercisable 01/25/21, 1 Share for 1 Warrant, Expires 02/01/26, Strike Price USD 11.50)(f) |
214,560 | 4,291 | ||||||||||
| Crown PropTech Acquisitions (Issued/Exercisable 01/25/21, 1 Share for 1 Warrant, Expires 12/31/27, Strike Price USD 11.50) |
128,396 | 3,210 | ||||||||||
|
|
|
|||||||||||
| 10,360 | ||||||||||||
| Consumer Staples Distribution & Retail — 0.0% | ||||||||||||
| Lavoro Ltd. (Issued/Exercisable 12/27/22, 1 Share for 1 Warrant, Expires 12/27/27, Strike Price USD 11.50) |
79,561 | 44,196 | ||||||||||
|
|
|
|||||||||||
| Electrical Equipment — 0.0% | ||||||||||||
| FreeWire Technologies, Inc. (Issued/Exercisable 06/05/22, 1 Share for 1 Warrant, Expires 04/26/27, Strike Price USD 3.35) - Tranche A(f) |
853,096 | 145,026 | ||||||||||
| FreeWire Technologies, Inc. (Issued/Exercisable 06/27/22, 1 Share for 1 Warrant, Expires 04/26/29, Strike Price USD 3.35) - Tranche B(f) |
42,655 | 7,252 | ||||||||||
| FreeWire Technologies, Inc. (Issued/Exercisable 06/14/23, 1 Share for 1 Warrant, Expires 04/26/29, Strike Price USD 3.35) - Tranche B(f) |
810,441 | 8 | ||||||||||
|
|
|
|||||||||||
| 152,286 | ||||||||||||
| Financial Services — 0.0% | ||||||||||||
| Proof Acquisition Corp. I (Issued/Exercisable 05/02/22, 1 Share for 1 Warrant, Expires 10/01/26, Strike Price USD 11.50)(f) |
109,868 | 9,888 | ||||||||||
|
|
|
|||||||||||
| Hotels, Restaurants & Leisure — 0.0% | ||||||||||||
| Sonder Holdings, Inc. (Issued/Exercisable 02/19/21, 1 Share for 1 Warrant, Expires 11/19/26, Strike Price USD 12.50)(f) |
126,555 | 1 | ||||||||||
|
|
|
|||||||||||
| Machinery — 0.0% | ||||||||||||
| Rotor Acquisition Corp. (Issued/Exercisable 01/11/22, 1 Share for 1 Warrant, Expires 01/31/26, Strike Price USD 11.50) |
72,998 | 1,460 | ||||||||||
| Sarcos Technology & Robotics Corp. (Issued/Exercisable 12/21/20, 1 Share for 1 Warrant, Expires 06/15/27, Strike Price USD 11.50) |
267,474 | 4,574 | ||||||||||
|
|
|
|||||||||||
| 6,034 | ||||||||||||
| Oil, Gas & Consumable Fuels — 0.0% | ||||||||||||
| California Resources Corp. (Issued/Exercisable 11/03/20, 1 Share for 1 Warrant, Expires 10/28/24, Strike Price USD 36.00) |
2,236 | 47,649 | ||||||||||
|
|
|
|||||||||||
| Real Estate Management & Development — 0.0% | ||||||||||||
| Offerpad Solutions, Inc. (Issued/Exercisable 10/13/20, 1 Share for 1 Warrant, Expires 10/13/25, Strike Price USD 11.50) |
111,610 | 1,685 | ||||||||||
|
|
|
|||||||||||
| Security | Shares | Value | ||||||||||
| Software — 0.0% | ||||||||||||
| CXApp, Inc. (Issued/Exercisable 02/02/21, |
868,890 | $ | 87,063 | |||||||||
| Latch, Inc. (Issued/Exercisable 12/29/20, |
49,166 | — | ||||||||||
| Pear Therapeutics, Inc. (Issued/Exercisable 03/23/21, |
63,832 | 13 | ||||||||||
| Versa Networks, Inc. (Issued/Exercisable 10/05/22, |
507,586 | 1,436,468 | ||||||||||
|
|
|
|||||||||||
| 1,523,544 | ||||||||||||
|
|
|
|||||||||||
| Total Warrants — 0.0% |
1,829,312 | |||||||||||
|
|
|
|||||||||||
| Total Long-Term Investments — 117.8% |
|
21,355,931,216 | ||||||||||
|
|
|
|||||||||||
| Short-Term Securities |
||||||||||||
| Money Market Funds — 5.3% | ||||||||||||
| BlackRock Liquidity Funds, T-Fund, Institutional |
923,558,671 | 923,558,671 | ||||||||||
| SL Liquidity Series, LLC, Money Market Series, 5.52%(r)(v)(w) |
28,707,403 | 28,716,016 | ||||||||||
|
|
|
|||||||||||
| Total Short-Term Securities — 5.3% |
|
952,274,687 | ||||||||||
|
|
|
|||||||||||
| Options Purchased — 0.7% |
| |||||||||||
| (Cost: $85,173,914) |
|
115,139,736 | ||||||||||
|
|
|
|||||||||||
| Total Investments Before Options Written and TBA Sale Commitments — 123.8% |
|
22,423,345,639 | ||||||||||
|
|
|
|||||||||||
| Par (000) |
||||||||||||
| TBA Sale Commitments(t) |
||||||||||||
| Mortgage-Backed Securities — (9.6)% | ||||||||||||
| Ginnie Mae Mortgage-Backed Securities |
||||||||||||
| 2.00%, 10/15/53 |
USD | (1,448 | ) | (1,144,542 | ) | |||||||
| 2.50%, 10/15/53 |
(1,263 | ) | (1,032,155 | ) | ||||||||
| 3.00%, 10/15/53 |
(711 | ) | (602,517 | ) | ||||||||
| 3.50%, 10/15/53 |
(1,165 | ) | (1,020,376 | ) | ||||||||
| 4.00%, 10/15/53 |
(600 | ) | (540,539 | ) | ||||||||
| 6.00%, 10/15/53 |
(19,969 | ) | (19,786,471 | ) | ||||||||
| 6.50%, 10/15/53 |
(11,058 | ) | (11,120,201 | ) | ||||||||
| Uniform Mortgage-Backed Securities |
||||||||||||
| 1.50%, 10/01/38 - 10/01/53 |
(407 | ) | (327,998 | ) | ||||||||
| 2.00%, 10/01/38 - 10/01/53 |
(3,193 | ) | (2,501,068 | ) | ||||||||
| 2.50%, 10/01/38 - 10/01/53 |
(229,993 | ) | (182,578,971 | ) | ||||||||
| 3.00%, 10/01/38 - 10/01/53 |
(145,340 | ) | (120,168,129 | ) | ||||||||
| 3.50%, 10/01/38 - 10/01/53 |
(308,467 | ) | (265,283,760 | ) | ||||||||
| 4.00%, 10/01/53 |
(566,303 | ) | (504,142,751 | ) | ||||||||
| 4.50%, 10/01/53 |
(255,546 | ) | (234,623,171 | ) | ||||||||
| 5.00%, 10/01/53 |
(110,823 | ) | (104,554,574 | ) | ||||||||
| 5.50%, 10/01/53 |
(194,955 | ) | (188,398,114 | ) | ||||||||
| 72 | 2 0 2 3 B L A C K R O C K A N N U A L R E P O R T T O S H A R E H O L D E R S |
| Consolidated Schedule of Investments (continued) September 30, 2023 |
Master Total Return Portfolio (Percentages shown are based on Net Assets) |
| Security | Par (000) |
Value | ||||||||||
|
|
||||||||||||
| Mortgage-Backed Securities (continued) | ||||||||||||
| Uniform Mortgage-Backed Securities |
|
|||||||||||
| 6.00%, 10/01/53 |
USD | (69,361 | ) | $ | (68,450,637 | ) | ||||||
| 6.50%, 10/01/53 |
(30,570 | ) | (30,708,520 | ) | ||||||||
|
|
|
|||||||||||
| Total TBA Sale Commitments — (9.6)% |
|
(1,736,984,494 | ) | |||||||||
|
|
|
|||||||||||
| Options Written — (0.7)% |
|
|||||||||||
| (Premiums Received: $(78,343,944)) |
|
(123,057,526 | ) | |||||||||
|
|
|
|||||||||||
| Total Investments Net of Options Written and TBA Sale Commitments — 113.5% |
|
20,563,303,619 | ||||||||||
| Liabilities in Excess of Other Assets — (13.5)% |
|
(2,438,223,027 | ) | |||||||||
|
|
|
|||||||||||
| Net Assets — 100.0% |
|
$ | 18,125,080,592 | |||||||||
|
|
|
|||||||||||
| (a) | Security exempt from registration pursuant to Rule 144A under the Securities Act of 1933, as amended. These securities may be resold in transactions exempt from registration to qualified institutional investors. |
| (b) | Step-up bond that pays an initial coupon rate for the first period and then a higher coupon rate for the following periods. Rate as of period end. |
| (c) | Variable rate security. Interest rate resets periodically. The rate shown is the effective interest rate as of period end. Security description also includes the reference rate and spread if published and available. |
| (d) | Zero-coupon bond. |
| (e) | This security may be resold to qualified foreign investors and foreign institutional buyers under Regulation S of the Securities Act of 1933. |
| (f) | Security is valued using significant unobservable inputs and is classified as Level 3 in the fair value hierarchy. |
| (g) | Restricted security as to resale, excluding 144A securities. The Master Portfolio held restricted securities with a current value of $28,636,674, representing 0.2% of its net assets as of period end, and an original cost of $25,596,941. |
| (h) | Non-income producing security. |
| (i) | All or a portion of this security is on loan. |
| (j) | All or a portion of the security has been pledged and/or segregated as collateral in connection with outstanding exchange-traded options written. |
| (k) | Convertible security. |
| (l) | Issuer filed for bankruptcy and/or is in default. |
| (m) | Perpetual security with no stated maturity date. |
| (n) | Payment-in-kind security which may pay interest/dividends in additional par/shares and/or in cash. Rates shown are the current rate and possible payment rates. |
| (o) | Represents an unsettled loan commitment at period end. Certain details associated with this purchase are not known prior to the settlement date, including coupon rate. |
| (p) | All or a portion of the security is held by a wholly-owned subsidiary. See Note 1 of the Notes to Consolidated Financial Statements for details on the wholly-owned subsidiary. |
| (q) | Investment does not issue shares. |
| (r) | Affiliate of the Master Portfolio. |
| (s) | All or a portion of the security has been pledged as collateral in connection with outstanding TBA commitments. |
| (t) | Represents or includes a TBA transaction. |
| (u) | All or a portion of the security has been pledged as collateral in connection with outstanding OTC derivatives. |
| (v) | Annualized 7-day yield as of period end. |
| (w) | All or a portion of this security was purchased with the cash collateral from loaned securities. |
| M A S T E R P O R T F O L I O S C H E D U L E O F I N V E S T M E N T S |
73 |
| Consolidated Schedule of Investments (continued) September 30, 2023 |
Master Total Return Portfolio |
Affiliates
Investments in issuers considered to be affiliate(s) of the Master Portfolio during the year ended September 30, 2023 for purposes of Section 2(a)(3) of the Investment Company Act of 1940, as amended, were as follows:
| Affiliated Issuer | Value at 09/30/22 |
Purchases at Cost |
Proceeds from Sale |
Net Realized Gain (Loss) |
Change in Unrealized Appreciation (Depreciation) |
Value at 09/30/23 |
Par/Shares Held at 09/30/23 |
Income | Capital Gain Distributions from Underlying Funds |
|||||||||||||||||||||||||||||||||
|
|
BlackRock Capital Finance LP, Series 1997-R2, Class AP |
$ | 2,571 | $ | — | $ | — | $ | — | $ | (2,571 | ) | $ | — | 2,839 | $ | — | $ | — | |||||||||||||||||||||||
| BlackRock Liquidity Funds, T-Fund, Institutional Class |
436,896,201 | 486,662,470 | (a) | — | — | — | 923,558,671 | 923,558,672 | 41,591,749 | — | ||||||||||||||||||||||||||||||||
| iShares 1-5 Year Investment Grade Corporate Bond ETF(b) |
— | 181,288,072 | (181,725,876 | ) | 437,804 | — | — | — | — | — | ||||||||||||||||||||||||||||||||
| iShares iBoxx $ Investment Grade Corporate Bond ETF |
— | 393,496,098 | (366,506,790 | ) | (1,335,071 | ) | (1,271,457 | ) | 24,382,780 | 239,000 | 1,694,015 | — | ||||||||||||||||||||||||||||||
| iShares J.P. Morgan USD Emerging Markets Bond ETF(b) |
— | 16,514,978 | (16,485,864 | ) | (29,114 | ) | — | — | — | — | — | |||||||||||||||||||||||||||||||
| iShares MSCI U.S.A. Momentum Factor ETF(b) |
— | 28,232,863 | (28,560,956 | ) | 328,093 | — | — | — | — | — | ||||||||||||||||||||||||||||||||
| iShares TIPS Bond ETF(b) |
— | 7,760,214 | (7,801,262 | ) | 41,048 | — | — | — | — | — | ||||||||||||||||||||||||||||||||
| SL Liquidity Series, LLC, Money Market Series |
4,095,774 | 24,618,969 | (a) | — | (2,030 | ) | 3,303 | 28,716,016 | 28,707,403 | 246,427 | (c) | — | ||||||||||||||||||||||||||||||
|
|
|
|
|
|
|
|
|
|
|
|||||||||||||||||||||||||||||||||
| $ | (559,270 | ) | $ | (1,270,725 | ) | $ | 976,657,467 | $ | 43,532,191 | $ | — | |||||||||||||||||||||||||||||||
|
|
|
|
|
|
|
|
|
|
|
|||||||||||||||||||||||||||||||||
| (a) | Represents net shares purchased (sold). |
| (b) | As of period end, the entity is no longer held by the Master Portfolio. |
| (c) | All or a portion represents securities lending income earned from the reinvestment of cash collateral from loaned securities, net of fees and collateral investment expenses, and other payments to and from borrowers of securities. |
For Master Portfolio compliance purposes, the Master Portfolio’s industry classifications refer to one or more of the industry sub-classifications used by one or more widely recognized market indexes or rating group indexes, and/or as defined by the investment adviser. These definitions may not apply for purposes of this report, which may combine such industry sub-classifications for reporting ease.
Derivative Financial Instruments Outstanding as of Period End
Futures Contracts
| Description | Number of Contracts |
Expiration Date |
Notional Amount (000) |
Value/ Unrealized Appreciation (Depreciation) |
||||||||||||||||
| Long Contracts |
||||||||||||||||||||
| Australian 10-Year Bonds |
142 | 12/15/23 | $ | 10,223 | $ | (258,687 | ) | |||||||||||||
| NASDAQ 100 E-Mini Index |
26 | 12/15/23 | 7,730 | (44,861 | ) | |||||||||||||||
| Canadian Government Bonds (10 Year) |
420 | 12/18/23 | 35,601 | (484,552 | ) | |||||||||||||||
| U.S. Treasury Bonds (30 Year) |
2,024 | 12/19/23 | 230,293 | (8,908,831 | ) | |||||||||||||||
| U.S. Ultra Treasury Bonds |
896 | 12/19/23 | 106,344 | (3,467,416 | ) | |||||||||||||||
| U.S. Ultra Treasury Notes (10 Year) |
254 | 12/19/23 | 28,337 | 9,075 | ||||||||||||||||
| U.S. Treasury Notes (2 Year) |
3,208 | 12/29/23 | 650,297 | 1,187,326 | ||||||||||||||||
| 74 |
2 0 2 3 B L A C K R O C K A N N U A L R E P O R T T O S H A R E H O L D E R S |
| Consolidated Schedule of Investments (continued) September 30, 2023 |
Master Total Return Portfolio |
Futures Contracts (continued)
| Description | Number of Contracts |
Expiration Date |
Notional Amount (000) |
Value/ Unrealized Appreciation (Depreciation) |
||||||||||||||||
| Long Contracts (continued) |
||||||||||||||||||||
| U.S. Treasury Notes (5 Year) |
13,647 | 12/29/23 | $ | 1,437,839 | $ | (2,012,713 | ) | |||||||||||||
| 3-month SOFR |
1,050 | 06/18/24 | 248,391 | (192,099 | ) | |||||||||||||||
|
|
|
|||||||||||||||||||
| (14,172,758 | ) | |||||||||||||||||||
|
|
|
|||||||||||||||||||
| Short Contracts |
||||||||||||||||||||
| Euro-Bobl |
24 | 12/07/23 | 2,937 | 30,682 | ||||||||||||||||
| Euro-Buxl |
190 | 12/07/23 | 24,580 | 1,630,185 | ||||||||||||||||
| Japanese Government Bonds (10 Year) |
150 | 12/13/23 | 145,503 | 672,997 | ||||||||||||||||
| Australian 3-Year Bonds |
1,890 | 12/15/23 | 128,008 | 1,012,764 | ||||||||||||||||
| E-Mini Russell 2000 Index |
186 | 12/15/23 | 16,727 | 683,951 | ||||||||||||||||
| E-Mini S&P 500 Index |
80 | 12/15/23 | 17,302 | 744,131 | ||||||||||||||||
| Euro STOXX 50 Index |
289 | 12/15/23 | 12,845 | 236,199 | ||||||||||||||||
| Euro STOXX Banks Index |
768 | 12/15/23 | 4,545 | (127,941 | ) | |||||||||||||||
| U.S. Treasury Notes (10 Year) |
2,933 | 12/19/23 | 316,947 | 4,152,716 | ||||||||||||||||
| 3-month SOFR |
604 | 03/18/25 | 144,069 | (120,294 | ) | |||||||||||||||
|
|
|
|||||||||||||||||||
| 8,915,390 | ||||||||||||||||||||
|
|
|
|||||||||||||||||||
| $ | (5,257,368 | ) | ||||||||||||||||||
|
|
|
|||||||||||||||||||
Forward Foreign Currency Exchange Contracts
| Currency Purchased | Currency Sold | Counterparty | Settlement Date |
Unrealized Appreciation |
||||||||||||||||||||||
| USD |
921,000 | BRL | 4,539,517 | Citibank N.A. | 10/03/23 | $ | 18,418 | |||||||||||||||||||
| USD |
921,000 | BRL | 4,539,517 | Citibank N.A. | 10/03/23 | 18,418 | ||||||||||||||||||||
| USD |
1,375,000 | BRL | 6,824,194 | Goldman Sachs International | 10/03/23 | 18,160 | ||||||||||||||||||||
| USD |
2,252,000 | BRL | 11,267,544 | Goldman Sachs International | 10/03/23 | 11,699 | ||||||||||||||||||||
| USD |
2,252,000 | BRL | 11,267,544 | Goldman Sachs International | 10/03/23 | 11,699 | ||||||||||||||||||||
| USD |
927,000 | BRL | 4,637,234 | JPMorgan Chase Bank N.A. | 10/03/23 | 4,989 | ||||||||||||||||||||
| BRL |
4,707,849 | USD | 932,000 | BNP Paribas SA | 10/05/23 | 3,779 | ||||||||||||||||||||
| BRL |
4,707,849 | USD | 932,000 | BNP Paribas SA | 10/05/23 | 3,779 | ||||||||||||||||||||
| USD |
932,000 | BRL | 4,616,289 | BNP Paribas SA | 10/05/23 | 14,420 | ||||||||||||||||||||
| USD |
932,000 | BRL | 4,616,289 | BNP Paribas SA | 10/05/23 | 14,420 | ||||||||||||||||||||
| EUR |
867,000 | BRL | 4,581,488 | Goldman Sachs International | 10/11/23 | 7,234 | ||||||||||||||||||||
| EUR |
867,000 | BRL | 4,581,488 | Goldman Sachs International | 10/11/23 | 7,234 | ||||||||||||||||||||
| USD |
1,323,500 | TWD | 41,174,085 | BNP Paribas SA | 10/11/23 | 46,075 | ||||||||||||||||||||
| USD |
1,323,500 | TWD | 41,174,085 | BNP Paribas SA | 10/11/23 | 46,075 | ||||||||||||||||||||
| AUD |
2,065,000 | USD | 1,325,513 | Citibank N.A. | 10/18/23 | 3,126 | ||||||||||||||||||||
| CAD |
1,780,075 | EUR | 1,221,000 | UBS AG | 10/18/23 | 18,977 | ||||||||||||||||||||
| CAD |
1,780,075 | EUR | 1,221,000 | UBS AG | 10/18/23 | 18,977 | ||||||||||||||||||||
| CLP |
411,957,260 | USD | 458,000 | Bank of America N.A. | 10/18/23 | 4,923 | ||||||||||||||||||||
| CLP |
1,228,379,400 | USD | 1,380,000 | Barclays Bank PLC | 10/18/23 | 350 | ||||||||||||||||||||
| CLP |
1,653,422,600 | USD | 1,844,000 | Citibank N.A. | 10/18/23 | 13,979 | ||||||||||||||||||||
| CLP |
825,562,500 | USD | 925,000 | Morgan Stanley & Co. International PLC | 10/18/23 | 2,698 | ||||||||||||||||||||
| CLP |
739,465,500 | USD | 823,000 | TD Securities, Inc. | 10/18/23 | 7,950 | ||||||||||||||||||||
| CLP |
739,465,500 | USD | 823,000 | TD Securities, Inc. | 10/18/23 | 7,950 | ||||||||||||||||||||
| CNH |
17,134,710 | USD | 2,349,000 | BNP Paribas SA | 10/18/23 | 691 | ||||||||||||||||||||
| CNH |
17,134,710 | USD | 2,349,000 | BNP Paribas SA | 10/18/23 | 691 | ||||||||||||||||||||
| EUR |
434,000 | USD | 456,289 | Citibank N.A. | 10/18/23 | 2,927 | ||||||||||||||||||||
| EUR |
1,301,000 | USD | 1,368,584 | HSBC Bank PLC | 10/18/23 | 8,008 | ||||||||||||||||||||
| EUR |
1,301,000 | USD | 1,368,584 | HSBC Bank PLC | 10/18/23 | 8,008 | ||||||||||||||||||||
| EUR |
1,736,000 | USD | 1,825,402 | JPMorgan Chase Bank N.A. | 10/18/23 | 11,466 | ||||||||||||||||||||
| INR |
115,793,125 | USD | 1,393,000 | JPMorgan Chase Bank N.A. | 10/18/23 | 50 | ||||||||||||||||||||
| INR |
115,793,125 | USD | 1,393,000 | JPMorgan Chase Bank N.A. | 10/18/23 | 50 | ||||||||||||||||||||
| JPY |
689,142,016 | CAD | 6,276,000 | JPMorgan Chase Bank N.A. | 10/18/23 | 5,450 | ||||||||||||||||||||
| JPY |
219,874,878 | EUR | 1,395,000 | UBS AG | 10/18/23 | 331 | ||||||||||||||||||||
| MXN |
23,504,302 | GBP | 1,089,000 | Morgan Stanley & Co. International PLC | 10/18/23 | 15,371 | ||||||||||||||||||||
| MXN |
23,504,302 | GBP | 1,089,000 | Morgan Stanley & Co. International PLC | 10/18/23 | 15,371 | ||||||||||||||||||||
| M A S T E R P O R T F O L I O S C H E D U L E O F I N V E S T M E N T S |
|
75 |
|
| Consolidated Schedule of Investments (continued) September 30, 2023 |
Master Total Return Portfolio |
Forward Foreign Currency Exchange Contracts (continued)
| Currency Purchased | Currency Sold | Counterparty | Settlement Date |
Unrealized Appreciation |
||||||||||||||||||||||
| MXN |
24,175,225 | USD | 1,368,000 | BNP Paribas SA | 10/18/23 | $ | 14,591 | |||||||||||||||||||
| MXN |
56,799,110 | USD | 3,214,000 | Goldman Sachs International | 10/18/23 | 34,364 | ||||||||||||||||||||
| MXN |
32,296,692 | USD | 1,822,000 | HSBC Bank PLC | 10/18/23 | 25,061 | ||||||||||||||||||||
| MXN |
40,227,331 | USD | 2,279,000 | JPMorgan Chase Bank N.A. | 10/18/23 | 21,617 | ||||||||||||||||||||
| NOK |
19,766,661 | USD | 1,833,000 | Citibank N.A. | 10/18/23 | 15,936 | ||||||||||||||||||||
| NOK |
9,816,347 | USD | 912,000 | Deutsche Bank AG | 10/18/23 | 6,202 | ||||||||||||||||||||
| NOK |
9,986,372 | USD | 922,000 | Goldman Sachs International | 10/18/23 | 12,106 | ||||||||||||||||||||
| NOK |
14,873,550 | USD | 1,381,000 | Goldman Sachs International | 10/18/23 | 10,244 | ||||||||||||||||||||
| PLN |
9,386,961 | EUR | 2,028,000 | Morgan Stanley & Co. International PLC | 10/18/23 | 1,683 | ||||||||||||||||||||
| PLN |
9,386,961 | EUR | 2,028,000 | Morgan Stanley & Co. International PLC | 10/18/23 | 1,683 | ||||||||||||||||||||
| SEK |
10,273,458 | USD | 926,000 | NatWest Markets PLC | 10/18/23 | 15,060 | ||||||||||||||||||||
| SEK |
10,273,486 | USD | 926,000 | NatWest Markets PLC | 10/18/23 | 15,062 | ||||||||||||||||||||
| USD |
1,324,000 | CAD | 1,794,831 | Citibank N.A. | 10/18/23 | 2,213 | ||||||||||||||||||||
| USD |
1,363,000 | CAD | 1,849,577 | Citibank N.A. | 10/18/23 | 895 | ||||||||||||||||||||
| USD |
1,363,000 | CAD | 1,849,577 | Citibank N.A. | 10/18/23 | 895 | ||||||||||||||||||||
| USD |
1,804,000 | CAD | 2,441,228 | HSBC Bank PLC | 10/18/23 | 6,179 | ||||||||||||||||||||
| USD |
288,000 | CAD | 389,725 | HSBC Bank PLC | 10/18/23 | 991 | ||||||||||||||||||||
| USD |
2,769,000 | CLP | 2,460,256,500 | TD Securities, Inc. | 10/18/23 | 4,369 | ||||||||||||||||||||
| USD |
1,388,000 | CNH | 10,112,339 | Goldman Sachs International | 10/18/23 | 1,290 | ||||||||||||||||||||
| USD |
1,397,000 | CNH | 10,156,615 | State Street Bank and Trust Co. | 10/18/23 | 4,218 | ||||||||||||||||||||
| USD |
1,397,000 | CNH | 10,157,020 | State Street Bank and Trust Co. | 10/18/23 | 4,163 | ||||||||||||||||||||
| USD |
1,145,000 | COP | 4,642,815,845 | Citibank N.A. | 10/18/23 | 13,742 | ||||||||||||||||||||
| USD |
916,000 | COP | 3,714,252,676 | Citibank N.A. | 10/18/23 | 10,993 | ||||||||||||||||||||
| USD |
916,000 | COP | 3,714,252,676 | Citibank N.A. | 10/18/23 | 10,993 | ||||||||||||||||||||
| USD |
226,000 | COP | 899,409,714 | Royal Bank of Canada | 10/18/23 | 6,852 | ||||||||||||||||||||
| USD |
226,000 | COP | 899,409,714 | Royal Bank of Canada | 10/18/23 | 6,852 | ||||||||||||||||||||
| USD |
2,325,000 | COP | 9,252,776,925 | Royal Bank of Canada | 10/18/23 | 70,489 | ||||||||||||||||||||
| USD |
1,388,000 | CZK | 32,040,981 | UBS AG | 10/18/23 | 434 | ||||||||||||||||||||
| USD |
2,303,766 | EUR | 2,170,000 | Citibank N.A. | 10/18/23 | 7,682 | ||||||||||||||||||||
| USD |
1,375,681 | EUR | 1,295,000 | JPMorgan Chase Bank N.A. | 10/18/23 | 5,437 | ||||||||||||||||||||
| USD |
1,388,380 | GBP | 1,118,000 | HSBC Bank PLC | 10/18/23 | 24,144 | ||||||||||||||||||||
| USD |
1,388,380 | GBP | 1,118,000 | HSBC Bank PLC | 10/18/23 | 24,144 | ||||||||||||||||||||
| USD |
1,372,000 | JPY | 201,135,570 | Deutsche Bank AG | 10/18/23 | 21,443 | ||||||||||||||||||||
| USD |
1,081,000 | MXN | 18,650,341 | Barclays Bank PLC | 10/18/23 | 14,379 | ||||||||||||||||||||
| USD |
1,081,000 | MXN | 18,650,362 | Barclays Bank PLC | 10/18/23 | 14,378 | ||||||||||||||||||||
| USD |
4,626,000 | MXN | 79,558,873 | Citibank N.A. | 10/18/23 | 75,996 | ||||||||||||||||||||
| USD |
922,000 | MXN | 15,888,089 | Citibank N.A. | 10/18/23 | 13,354 | ||||||||||||||||||||
| USD |
922,000 | MXN | 15,888,088 | Citibank N.A. | 10/18/23 | 13,354 | ||||||||||||||||||||
| USD |
4,582,000 | MXN | 80,005,386 | Citibank N.A. | 10/18/23 | 6,459 | ||||||||||||||||||||
| USD |
4,529,000 | MXN | 78,981,231 | Citibank N.A. | 10/18/23 | 12,031 | ||||||||||||||||||||
| USD |
4,626,000 | MXN | 79,829,406 | Morgan Stanley & Co. International PLC | 10/18/23 | 60,524 | ||||||||||||||||||||
| USD |
927,000 | PLN | 3,984,084 | Goldman Sachs International | 10/18/23 | 15,535 | ||||||||||||||||||||
| USD |
927,000 | PLN | 3,984,084 | Goldman Sachs International | 10/18/23 | 15,535 | ||||||||||||||||||||
| USD |
921,000 | ZAR | 17,449,266 | BNP Paribas SA | 10/18/23 | 980 | ||||||||||||||||||||
| USD |
921,000 | ZAR | 17,449,266 | BNP Paribas SA | 10/18/23 | 980 | ||||||||||||||||||||
| USD |
1,375,000 | ZAR | 25,903,944 | Citibank N.A. | 10/18/23 | 9,203 | ||||||||||||||||||||
| USD |
1,381,000 | ZAR | 26,101,229 | Goldman Sachs International | 10/18/23 | 4,801 | ||||||||||||||||||||
| USD |
2,277,000 | ZAR | 42,878,633 | Morgan Stanley & Co. International PLC | 10/18/23 | 16,205 | ||||||||||||||||||||
| ZAR |
16,898,996 | EUR | 830,000 | Citibank N.A. | 10/18/23 | 12,781 | ||||||||||||||||||||
| ZAR |
16,898,996 | EUR | 830,000 | Citibank N.A. | 10/18/23 | 12,781 | ||||||||||||||||||||
| ZAR |
52,380,109 | USD | 2,756,000 | Bank of America N.A. | 10/18/23 | 5,764 | ||||||||||||||||||||
| ZAR |
43,508,963 | USD | 2,279,000 | Bank of America N.A. | 10/18/23 | 15,029 | ||||||||||||||||||||
| ZAR |
35,105,950 | USD | 1,833,000 | Citibank N.A. | 10/18/23 | 17,977 | ||||||||||||||||||||
| ZAR |
17,460,499 | USD | 911,000 | Goldman Sachs International | 10/18/23 | 9,613 | ||||||||||||||||||||
| ZAR |
17,460,499 | USD | 911,000 | Goldman Sachs International | 10/18/23 | 9,613 | ||||||||||||||||||||
| BRL |
18,450,301 | USD | 3,644,000 | Citibank N.A. | 11/03/23 | 8,487 | ||||||||||||||||||||
| BRL |
13,905,200 | USD | 2,743,000 | JPMorgan Chase Bank N.A. | 11/03/23 | 9,722 | ||||||||||||||||||||
| USD |
3,644,000 | BRL | 18,349,362 | Deutsche Bank AG | 11/03/23 | 11,496 | ||||||||||||||||||||
| USD |
1,375,000 | BRL | 6,910,049 | Goldman Sachs International | 11/03/23 | 7,062 | ||||||||||||||||||||
| USD |
1,368,000 | BRL | 6,881,888 | JPMorgan Chase Bank N.A. | 11/03/23 | 5,637 | ||||||||||||||||||||
| 76 |
2 0 2 3 B L A C K R O C K A N N U A L R E P O R T T O S H A R E H O L D E R S |
| Consolidated Schedule of Investments (continued) September 30, 2023 |
Master Total Return Portfolio |
Forward Foreign Currency Exchange Contracts (continued)
| Currency Purchased | Currency Sold | Counterparty | Settlement Date |
Unrealized Appreciation |
||||||||||||||||||||||
| USD |
1,231,590 | EUR | 1,120,540 | UBS AG | 11/07/23 | $ | 44,926 | |||||||||||||||||||
| USD |
5,826,080 | ZAR | 109,900,307 | State Street Bank and Trust Co. | 11/07/23 | 41,872 | ||||||||||||||||||||
| ZAR |
109,900,307 | USD | 5,718,051 | Morgan Stanley & Co. International PLC | 11/07/23 | 66,157 | ||||||||||||||||||||
| MXN |
44,469,590 | USD | 2,507,834 | Bank of New York Mellon | 11/15/23 | 23,379 | ||||||||||||||||||||
| USD |
4,559,543 | COP | 18,401,175,000 | Citibank N.A. | 11/15/23 | 108,169 | ||||||||||||||||||||
| USD |
1,417,179 | MXN | 24,865,393 | Citibank N.A. | 11/15/23 | 1,839 | ||||||||||||||||||||
| USD |
26,378,847 | MXN | 462,835,334 | Citibank N.A. | 11/15/23 | 34,222 | ||||||||||||||||||||
| USD |
93,832 | EUR | 87,095 | JPMorgan Chase Bank N.A. | 12/14/23 | 1,419 | ||||||||||||||||||||
| USD |
556,651 | EUR | 516,683 | JPMorgan Chase Bank N.A. | 12/14/23 | 8,421 | ||||||||||||||||||||
| USD |
125,501 | EUR | 116,490 | JPMorgan Chase Bank N.A. | 12/14/23 | 1,899 | ||||||||||||||||||||
| COP |
3,985,915,908 | USD | 929,443 | Bank of New York Mellon | 12/20/23 | 27,680 | ||||||||||||||||||||
| COP |
6,729,218,007 | USD | 1,595,554 | Bank of New York Mellon | 12/20/23 | 20,307 | ||||||||||||||||||||
| EUR |
16,188,000 | GBP | 13,992,274 | HSBC Bank PLC | 12/20/23 | 100,758 | ||||||||||||||||||||
| EUR |
10,760,000 | USD | 11,362,431 | JPMorgan Chase Bank N.A. | 12/20/23 | 59,007 | ||||||||||||||||||||
| GBP |
7,047,471 | EUR | 8,094,000 | JPMorgan Chase Bank N.A. | 12/20/23 | 12,291 | ||||||||||||||||||||
| GBP |
3,100,000 | USD | 3,767,390 | Morgan Stanley & Co. International PLC | 12/20/23 | 17,219 | ||||||||||||||||||||
| USD |
8,381,038 | AUD | 12,978,000 | JPMorgan Chase Bank N.A. | 12/20/23 | 12,539 | ||||||||||||||||||||
| USD |
8,968,064 | CAD | 12,082,000 | NatWest Markets PLC | 12/20/23 | 60,739 | ||||||||||||||||||||
| USD |
11,410,175 | EUR | 10,730,000 | Barclays Bank PLC | 12/20/23 | 20,581 | ||||||||||||||||||||
| USD |
15,315,634 | EUR | 14,310,000 | Citibank N.A. | 12/20/23 | 125,970 | ||||||||||||||||||||
| USD |
369,153 | EUR | 345,641 | Deutsche Bank AG | 12/20/23 | 2,264 | ||||||||||||||||||||
| USD |
583,602 | EUR | 546,433 | Deutsche Bank AG | 12/20/23 | 3,580 | ||||||||||||||||||||
| USD |
221,646 | EUR | 207,527 | Deutsche Bank AG | 12/20/23 | 1,362 | ||||||||||||||||||||
| USD |
145,607 | EUR | 136,334 | Deutsche Bank AG | 12/20/23 | 893 | ||||||||||||||||||||
| USD |
268,736 | EUR | 251,615 | Deutsche Bank AG | 12/20/23 | 1,653 | ||||||||||||||||||||
| USD |
475,282 | EUR | 445,007 | Deutsche Bank AG | 12/20/23 | 2,920 | ||||||||||||||||||||
| USD |
7,599,463 | EUR | 7,140,000 | Deutsche Bank AG | 12/20/23 | 20,554 | ||||||||||||||||||||
| USD |
15,319,095 | EUR | 14,330,000 | JPMorgan Chase Bank N.A. | 12/20/23 | 108,202 | ||||||||||||||||||||
| USD |
7,753,463 | EUR | 7,220,000 | JPMorgan Chase Bank N.A. | 12/20/23 | 89,635 | ||||||||||||||||||||
| USD |
7,606,344 | EUR | 7,110,000 | JPMorgan Chase Bank N.A. | 12/20/23 | 59,279 | ||||||||||||||||||||
| USD |
3,813,271 | EUR | 3,590,000 | JPMorgan Chase Bank N.A. | 12/20/23 | 2,586 | ||||||||||||||||||||
| USD |
16,073,034 | EUR | 14,997,767 | TD Securities, Inc. | 12/20/23 | 153,325 | ||||||||||||||||||||
| USD |
15,413,805 | EUR | 14,390,000 | UBS AG | 12/20/23 | 139,224 | ||||||||||||||||||||
| USD |
7,701,547 | EUR | 7,190,000 | UBS AG | 12/20/23 | 69,564 | ||||||||||||||||||||
| USD |
28,156,288 | EUR | 26,282,233 | UBS AG | 12/20/23 | 258,435 | ||||||||||||||||||||
| USD |
7,593,815 | GBP | 6,190,000 | Barclays Bank PLC | 12/20/23 | 36,805 | ||||||||||||||||||||
| USD |
7,603,753 | GBP | 6,190,000 | Goldman Sachs International | 12/20/23 | 46,743 | ||||||||||||||||||||
| USD |
7,816,176 | JPY | 1,138,000,000 | Bank of America N.A. | 12/20/23 | 94,792 | ||||||||||||||||||||
| USD |
15,644,995 | JPY | 2,274,000,000 | HSBC Bank PLC | 12/20/23 | 215,798 | ||||||||||||||||||||
| USD |
38,975,000 | JPY | 5,720,360,750 | Morgan Stanley & Co. International PLC | 12/20/23 | 162,082 | ||||||||||||||||||||
| USD |
4,588,144 | IDR | 70,767,538,876 | Citibank N.A. | 01/31/24 | 10,803 | ||||||||||||||||||||
| USD |
3,787,957 | CZK | 85,590,862 | Bank of America N.A. | 03/04/24 | 88,065 | ||||||||||||||||||||
| USD |
5,380,757 | CZK | 122,740,889 | HSBC Bank PLC | 03/04/24 | 74,956 | ||||||||||||||||||||
|
|
|
|||||||||||||||||||||||||
| $ | 3,608,360 | |||||||||||||||||||||||||
|
|
|
|||||||||||||||||||||||||
| BRL |
4,629,949 | USD | 927,000 | Bank of America N.A. | 10/03/23 | (6,437 | ) | |||||||||||||||||||
| BRL |
4,529,568 | USD | 928,000 | Citibank N.A. | 10/03/23 | (27,396 | ) | |||||||||||||||||||
| BRL |
4,529,568 | USD | 928,000 | Citibank N.A. | 10/03/23 | (27,396 | ) | |||||||||||||||||||
| BRL |
4,538,597 | USD | 916,000 | Citibank N.A. | 10/03/23 | (13,601 | ) | |||||||||||||||||||
| BRL |
4,538,597 | USD | 916,000 | Citibank N.A. | 10/03/23 | (13,601 | ) | |||||||||||||||||||
| BRL |
6,879,606 | USD | 1,375,000 | Goldman Sachs International | 10/03/23 | (7,143 | ) | |||||||||||||||||||
| BRL |
6,525,417 | USD | 1,329,000 | HSBC Bank PLC | 10/03/23 | (31,565 | ) | |||||||||||||||||||
| BRL |
6,525,417 | USD | 1,329,000 | HSBC Bank PLC | 10/03/23 | (31,565 | ) | |||||||||||||||||||
| BRL |
4,602,903 | EUR | 867,000 | Deutsche Bank AG | 10/11/23 | (2,981 | ) | |||||||||||||||||||
| BRL |
4,602,903 | EUR | 867,000 | Deutsche Bank AG | 10/11/23 | (2,981 | ) | |||||||||||||||||||
| CLP |
1,221,396,450 | USD | 1,383,000 | BNP Paribas SA | 10/18/23 | (10,496 | ) | |||||||||||||||||||
| CNH |
10,093,383 | USD | 1,388,000 | BNP Paribas SA | 10/18/23 | (3,889 | ) | |||||||||||||||||||
| COP |
3,672,324,900 | GBP | 738,000 | Morgan Stanley & Co. International PLC | 10/18/23 | (5,752 | ) | |||||||||||||||||||
| COP |
3,672,324,900 | GBP | 738,000 | Morgan Stanley & Co. International PLC | 10/18/23 | (5,752 | ) | |||||||||||||||||||
| COP |
9,234,900,000 | USD | 2,325,000 | Citibank N.A. | 10/18/23 | (74,845 | ) | |||||||||||||||||||
| COP |
4,667,020,000 | USD | 1,145,000 | Deutsche Bank AG | 10/18/23 | (7,844 | ) | |||||||||||||||||||
| M A S T E R P O R T F O L I O S C H E D U L E O F I N V E S T M E N T S |
|
77 |
|
| Consolidated Schedule of Investments (continued) September 30, 2023 |
Master Total Return Portfolio |
Forward Foreign Currency Exchange Contracts (continued)
| Currency Purchased | Currency Sold | Counterparty | Settlement Date |
Unrealized Appreciation |
||||||||||||||||||||||
| CZK |
21,110,942 | USD | 916,000 | Barclays Bank PLC | 10/18/23 | $ | (1,770 | ) | ||||||||||||||||||
| CZK |
31,649,315 | USD | 1,388,000 | NatWest Markets PLC | 10/18/23 | (17,396 | ) | |||||||||||||||||||
| CZK |
52,328,525 | USD | 2,295,000 | NatWest Markets PLC | 10/18/23 | (28,863 | ) | |||||||||||||||||||
| CZK |
52,322,099 | USD | 2,295,000 | NatWest Markets PLC | 10/18/23 | (29,141 | ) | |||||||||||||||||||
| EUR |
1,291,000 | USD | 1,390,400 | JPMorgan Chase Bank N.A. | 10/18/23 | (24,388 | ) | |||||||||||||||||||
| EUR |
1,291,000 | USD | 1,390,400 | JPMorgan Chase Bank N.A. | 10/18/23 | (24,388 | ) | |||||||||||||||||||
| EUR |
1,295,000 | USD | 1,383,183 | JPMorgan Chase Bank N.A. | 10/18/23 | (12,939 | ) | |||||||||||||||||||
| EUR |
1,300,000 | USD | 1,375,940 | JPMorgan Chase Bank N.A. | 10/18/23 | (406 | ) | |||||||||||||||||||
| EUR |
1,300,000 | USD | 1,375,940 | JPMorgan Chase Bank N.A. | 10/18/23 | (406 | ) | |||||||||||||||||||
| EUR |
2,142,000 | USD | 2,266,976 | JPMorgan Chase Bank N.A. | 10/18/23 | (518 | ) | |||||||||||||||||||
| EUR |
2,944,000 | USD | 3,170,012 | Standard Chartered Bank | 10/18/23 | (54,956 | ) | |||||||||||||||||||
| EUR |
2,944,000 | USD | 3,169,688 | Standard Chartered Bank | 10/18/23 | (54,632 | ) | |||||||||||||||||||
| GBP |
1,630,000 | USD | 2,038,049 | BNP Paribas SA | 10/18/23 | (49,046 | ) | |||||||||||||||||||
| GBP |
1,630,000 | USD | 2,038,049 | BNP Paribas SA | 10/18/23 | (49,046 | ) | |||||||||||||||||||
| HUF |
494,005,575 | USD | 1,371,000 | Barclays Bank PLC | 10/18/23 | (34,679 | ) | |||||||||||||||||||
| HUF |
156,381,050 | USD | 434,000 | Barclays Bank PLC | 10/18/23 | (10,978 | ) | |||||||||||||||||||
| IDR |
24,216,335,000 | USD | 1,573,000 | JPMorgan Chase Bank N.A. | 10/18/23 | (6,163 | ) | |||||||||||||||||||
| IDR |
24,216,335,000 | USD | 1,573,000 | JPMorgan Chase Bank N.A. | 10/18/23 | (6,163 | ) | |||||||||||||||||||
| JPY |
192,630,823 | USD | 1,314,000 | Bank of New York Mellon | 10/18/23 | (20,549 | ) | |||||||||||||||||||
| KRW |
1,240,258,800 | USD | 935,000 | BNP Paribas SA | 10/18/23 | (14,910 | ) | |||||||||||||||||||
| KRW |
1,240,258,800 | USD | 935,000 | BNP Paribas SA | 10/18/23 | (14,910 | ) | |||||||||||||||||||
| KRW |
1,851,936,191 | USD | 1,381,000 | Morgan Stanley & Co. International PLC | 10/18/23 | (7,135 | ) | |||||||||||||||||||
| MXN |
15,841,772 | USD | 906,000 | Barclays Bank PLC | 10/18/23 | (3 | ) | |||||||||||||||||||
| MXN |
15,841,772 | USD | 906,000 | Barclays Bank PLC | 10/18/23 | (3 | ) | |||||||||||||||||||
| MXN |
79,832,076 | USD | 4,626,000 | BNP Paribas SA | 10/18/23 | (60,371 | ) | |||||||||||||||||||
| MXN |
80,545,210 | USD | 4,626,000 | Morgan Stanley & Co. International PLC | 10/18/23 | (19,587 | ) | |||||||||||||||||||
| MXN |
15,949,775 | USD | 925,000 | TD Securities, Inc. | 10/18/23 | (12,826 | ) | |||||||||||||||||||
| MXN |
15,949,775 | USD | 925,000 | TD Securities, Inc. | 10/18/23 | (12,826 | ) | |||||||||||||||||||
| MYR |
8,587,975 | USD | 1,837,000 | Barclays Bank PLC | 10/18/23 | (5,477 | ) | |||||||||||||||||||
| MYR |
8,587,975 | USD | 1,837,000 | Barclays Bank PLC | 10/18/23 | (5,477 | ) | |||||||||||||||||||
| SGD |
1,880,022 | USD | 1,380,000 | Citibank N.A. | 10/18/23 | (3,526 | ) | |||||||||||||||||||
| THB |
32,991,200 | USD | 920,000 | Goldman Sachs International | 10/18/23 | (12,460 | ) | |||||||||||||||||||
| THB |
62,601,786 | USD | 1,756,750 | JPMorgan Chase Bank N.A. | 10/18/23 | (34,666 | ) | |||||||||||||||||||
| THB |
62,601,786 | USD | 1,756,750 | JPMorgan Chase Bank N.A. | 10/18/23 | (34,666 | ) | |||||||||||||||||||
| USD |
250,209 | AUD | 390,000 | JPMorgan Chase Bank N.A. | 10/18/23 | (721 | ) | |||||||||||||||||||
| USD |
1,523,706 | AUD | 2,375,000 | JPMorgan Chase Bank N.A. | 10/18/23 | (4,390 | ) | |||||||||||||||||||
| USD |
1,380,000 | CLP | 1,247,395,800 | JPMorgan Chase Bank N.A. | 10/18/23 | (21,720 | ) | |||||||||||||||||||
| USD |
458,000 | CLP | 415,318,980 | Morgan Stanley & Co. International PLC | 10/18/23 | (8,701 | ) | |||||||||||||||||||
| USD |
1,383,000 | CLP | 1,239,582,900 | Standard Chartered Bank | 10/18/23 | (9,940 | ) | |||||||||||||||||||
| USD |
916,000 | CZK | 21,186,749 | Deutsche Bank AG | 10/18/23 | (1,513 | ) | |||||||||||||||||||
| USD |
1,381,000 | KRW | 1,863,756,170 | JPMorgan Chase Bank N.A. | 10/18/23 | (1,634 | ) | |||||||||||||||||||
| USD |
1,822,000 | MXN | 31,890,286 | Barclays Bank PLC | 10/18/23 | (1,818 | ) | |||||||||||||||||||
| USD |
912,000 | MXN | 16,134,283 | Citibank N.A. | 10/18/23 | (10,726 | ) | |||||||||||||||||||
| USD |
912,000 | MXN | 16,134,283 | Citibank N.A. | 10/18/23 | (10,726 | ) | |||||||||||||||||||
| USD |
2,279,000 | MXN | 40,466,986 | Goldman Sachs International | 10/18/23 | (35,323 | ) | |||||||||||||||||||
| USD |
922,000 | NOK | 9,879,608 | BNP Paribas SA | 10/18/23 | (2,120 | ) | |||||||||||||||||||
| USD |
1,381,000 | NOK | 14,855,894 | JPMorgan Chase Bank N.A. | 10/18/23 | (8,592 | ) | |||||||||||||||||||
| USD |
2,745,000 | NOK | 29,472,083 | Morgan Stanley & Co. International PLC | 10/18/23 | (11,763 | ) | |||||||||||||||||||
| USD |
926,000 | SEK | 10,402,996 | JPMorgan Chase Bank N.A. | 10/18/23 | (26,925 | ) | |||||||||||||||||||
| USD |
926,000 | SEK | 10,402,996 | JPMorgan Chase Bank N.A. | 10/18/23 | (26,925 | ) | |||||||||||||||||||
| USD |
920,000 | THB | 33,596,468 | Barclays Bank PLC | 10/18/23 | (4,190 | ) | |||||||||||||||||||
| USD |
1,833,000 | ZAR | 34,968,205 | Bank of America N.A. | 10/18/23 | (10,714 | ) | |||||||||||||||||||
| USD |
912,000 | ZAR | 17,548,978 | Barclays Bank PLC | 10/18/23 | (13,278 | ) | |||||||||||||||||||
| USD |
912,000 | ZAR | 17,548,978 | Barclays Bank PLC | 10/18/23 | (13,278 | ) | |||||||||||||||||||
| USD |
2,277,000 | ZAR | 43,367,514 | Barclays Bank PLC | 10/18/23 | (9,571 | ) | |||||||||||||||||||
| USD |
2,279,000 | ZAR | 43,935,246 | HSBC Bank PLC | 10/18/23 | (37,505 | ) | |||||||||||||||||||
| ZAR |
17,525,328 | USD | 925,000 | Barclays Bank PLC | 10/18/23 | (969 | ) | |||||||||||||||||||
| ZAR |
17,525,328 | USD | 925,000 | Barclays Bank PLC | 10/18/23 | (969 | ) | |||||||||||||||||||
| ZAR |
17,156,634 | USD | 908,500 | State Street Bank and Trust Co. | 10/18/23 | (3,909 | ) | |||||||||||||||||||
| ZAR |
14,852,779 | USD | 786,500 | State Street Bank and Trust Co. | 10/18/23 | (3,381 | ) | |||||||||||||||||||
| 78 |
2 0 2 3 B L A C K R O C K A N N U A L R E P O R T T O S H A R E H O L D E R S |
| Consolidated Schedule of Investments (continued) September 30, 2023 |
Master Total Return Portfolio |
Forward Foreign Currency Exchange Contracts (continued)
| Currency Purchased | Currency Sold | Counterparty | Settlement Date |
Unrealized Appreciation |
||||||||||||||||||||||
| BRL |
11,317,404 | USD | 2,252,000 | Goldman Sachs International | 11/03/23 | $ | (11,567 | ) | ||||||||||||||||||
| BRL |
11,317,403 | USD | 2,252,000 | Goldman Sachs International | 11/03/23 | (11,567 | ) | |||||||||||||||||||
| USD |
932,000 | BRL | 4,725,851 | BNP Paribas SA | 11/03/23 | (3,546 | ) | |||||||||||||||||||
| USD |
932,000 | BRL | 4,725,851 | BNP Paribas SA | 11/03/23 | (3,546 | ) | |||||||||||||||||||
| USD |
456,000 | BRL | 2,311,008 | Deutsche Bank AG | 11/03/23 | (1,495 | ) | |||||||||||||||||||
| USD |
456,000 | BRL | 2,311,008 | Deutsche Bank AG | 11/03/23 | (1,495 | ) | |||||||||||||||||||
| EUR |
57,560 | USD | 61,768 | Morgan Stanley & Co. International PLC | 12/14/23 | (693 | ) | |||||||||||||||||||
| EUR |
14,390,000 | USD | 15,399,876 | Barclays Bank PLC | 12/20/23 | (125,294 | ) | |||||||||||||||||||
| EUR |
14,330,000 | USD | 15,372,207 | Goldman Sachs International | 12/20/23 | (161,314 | ) | |||||||||||||||||||
| EUR |
14,360,000 | USD | 15,401,373 | JPMorgan Chase Bank N.A. | 12/20/23 | (158,636 | ) | |||||||||||||||||||
| EUR |
14,360,000 | USD | 15,407,562 | JPMorgan Chase Bank N.A. | 12/20/23 | (164,825 | ) | |||||||||||||||||||
| EUR |
7,110,000 | USD | 7,597,781 | JPMorgan Chase Bank N.A. | 12/20/23 | (50,716 | ) | |||||||||||||||||||
| GBP |
7,016,639 | EUR | 8,094,000 | JPMorgan Chase Bank N.A. | 12/20/23 | (25,349 | ) | |||||||||||||||||||
| GBP |
12,380,000 | USD | 15,172,433 | Barclays Bank PLC | 12/20/23 | (58,414 | ) | |||||||||||||||||||
| IDR |
129,680,129,696 | USD | 8,416,415 | JPMorgan Chase Bank N.A. | 12/20/23 | (27,251 | ) | |||||||||||||||||||
| JPY |
5,652,754,715 | USD | 38,975,000 | Barclays Bank PLC | 12/20/23 | (620,792 | ) | |||||||||||||||||||
| JPY |
2,274,000,000 | USD | 15,687,353 | TD Securities, Inc. | 12/20/23 | (258,156 | ) | |||||||||||||||||||
| JPY |
1,138,000,000 | USD | 7,850,575 | TD Securities, Inc. | 12/20/23 | (129,192 | ) | |||||||||||||||||||
| USD |
10,715,674 | COP | 46,621,218,361 | Bank of America N.A. | 12/20/23 | (479,303 | ) | |||||||||||||||||||
| USD |
594,752 | COP | 2,515,798,862 | Citibank N.A. | 12/20/23 | (9,358 | ) | |||||||||||||||||||
| USD |
7,599,975 | EUR | 7,160,000 | Deutsche Bank AG | 12/20/23 | (164 | ) | |||||||||||||||||||
| USD |
11,423,084 | GBP | 9,360,000 | Barclays Bank PLC | 12/20/23 | (3,993 | ) | |||||||||||||||||||
| USD |
3,767,495 | GBP | 3,090,000 | JPMorgan Chase Bank N.A. | 12/20/23 | (4,905 | ) | |||||||||||||||||||
| COP |
18,401,175,000 | USD | 4,256,575 | Morgan Stanley & Co. International PLC | 08/15/24 | (39,918 | ) | |||||||||||||||||||
|
|
|
|||||||||||||||||||||||||
| $ | (3,571,304 | ) | ||||||||||||||||||||||||
|
|
|
|||||||||||||||||||||||||
| $ | 37,056 | |||||||||||||||||||||||||
|
|
|
|||||||||||||||||||||||||
Exchange-Traded Options Purchased
| Description | Number of Contracts |
Expiration Date |
Exercise Price |
Notional Amount (000) |
Value | |||||||||||||||||||||||||||
| Call |
||||||||||||||||||||||||||||||||
| 1 Year Mid-Curve Options on 3-Month SOFR Futures |
22,391 | 10/13/23 | USD | 95.63 | USD | 5,340,813 | $ | 2,518,987 | ||||||||||||||||||||||||
| Invesco QQQ Trust, Series 1 ETF |
1,303 | 11/03/23 | USD | 385.00 | USD | 46,683 | 130,300 | |||||||||||||||||||||||||
| U.S. Treasury 5-Year Notes Futures |
110 | 11/24/23 | USD | 105.50 | USD | 11,586 | 81,641 | |||||||||||||||||||||||||
| U.S. Treasury 5-Year Notes Futures |
134 | 11/24/23 | USD | 106.50 | USD | 14,114 | 50,250 | |||||||||||||||||||||||||
| Invesco QQQ Trust, Series 1 ETF |
2,084 | 12/15/23 | USD | 390.00 | USD | 74,664 | 615,822 | |||||||||||||||||||||||||
|
|
|
|||||||||||||||||||||||||||||||
| $ | 3,397,000 | |||||||||||||||||||||||||||||||
|
|
|
|||||||||||||||||||||||||||||||
| Put |
||||||||||||||||||||||||||||||||
| S&P 500 INDEX |
119 | 10/02/23 | USD | 4,200.00 | USD | 51,028 | 8,033 | |||||||||||||||||||||||||
| CME 3-Month SOFR Futures |
7,627 | 10/13/23 | USD | 94.88 | USD | 1,802,737 | 6,244,606 | |||||||||||||||||||||||||
| CME 3-Month SOFR Futures |
11,440 | 10/13/23 | USD | 95.00 | USD | 2,703,987 | 12,941,500 | |||||||||||||||||||||||||
| CME 3-Month SOFR Futures |
19,067 | 10/13/23 | USD | 95.63 | USD | 4,506,724 | 51,242,562 | |||||||||||||||||||||||||
| CBOE Volatility Index |
5,197 | 10/18/23 | USD | 15.00 | USD | 9,105 | 142,918 | |||||||||||||||||||||||||
| U.S. Treasury 2-Year Notes Futures |
239 | 10/27/23 | USD | 101.25 | USD | 48,444 | 85,891 | |||||||||||||||||||||||||
| SPDR S&P 500 ETF Trust |
666 | 11/03/23 | USD | 435.00 | USD | 28,470 | 724,608 | |||||||||||||||||||||||||
| CME 3-Month SOFR Futures |
780 | 12/15/23 | USD | 94.00 | USD | 184,363 | 14,625 | |||||||||||||||||||||||||
|
|
|
|||||||||||||||||||||||||||||||
| $ | 71,404,743 | |||||||||||||||||||||||||||||||
|
|
|
|||||||||||||||||||||||||||||||
| $ | 74,801,743 | |||||||||||||||||||||||||||||||
|
|
|
|||||||||||||||||||||||||||||||
| M A S T E R P O R T F O L I O S C H E D U L E O F I N V E S T M E N T S |
|
79 |
|
| Consolidated Schedule of Investments (continued) September 30, 2023 |
Master Total Return Portfolio |
OTC Barrier Options Purchased
| Description | Type of Option |
Counterparty | Number of Contracts |
Expiration Date |
Exercise Price |
Barrier Price/Range |
Notional Amount |
Value | ||||||||||||||||||||||||||||||||||
| Call |
||||||||||||||||||||||||||||||||||||||||||
| EUR Currency |
One-Touch | HSBC Bank PLC | — | 10/13/23 | USD | 1.12 | USD | 1.13 | EUR | 1,455 | $ | 163 | ||||||||||||||||||||||||||||||
| EUR Currency |
One-Touch | HSBC Bank PLC | — | 11/01/23 | PLN | 4.66 | PLN | 4.66 | EUR | 426 | 148,377 | |||||||||||||||||||||||||||||||
| USD Currency |
Up-and-Out | JPMorgan Chase Bank N.A. | — | 12/07/23 | CNH | 7.35 | CNH | 7.60 | USD | 59,560 | 115,927 | |||||||||||||||||||||||||||||||
|
|
|
|||||||||||||||||||||||||||||||||||||||||
| 264,467 | ||||||||||||||||||||||||||||||||||||||||||
|
|
|
|||||||||||||||||||||||||||||||||||||||||
| Put |
||||||||||||||||||||||||||||||||||||||||||
| EUR Currency |
One-Touch | HSBC Bank PLC | — | 11/16/23 | USD | 1.05 | USD | 1.05 | EUR | 339 | 119,628 | |||||||||||||||||||||||||||||||
| EUR Currency |
One-Touch | HSBC Bank PLC | — | 11/22/23 | USD | 1.05 | USD | 1.05 | EUR | 2,970 | 1,056,052 | |||||||||||||||||||||||||||||||
| USD Currency |
One-Touch | HSBC Bank PLC | — | 11/22/23 | MXN | 17.00 | MXN | 17.00 | USD | 2,970 | 352,388 | |||||||||||||||||||||||||||||||
|
|
|
|||||||||||||||||||||||||||||||||||||||||
| 1,528,068 | ||||||||||||||||||||||||||||||||||||||||||
|
|
|
|||||||||||||||||||||||||||||||||||||||||
| $ | 1,792,535 | |||||||||||||||||||||||||||||||||||||||||
|
|
|
|||||||||||||||||||||||||||||||||||||||||
OTC Options Purchased
| Description | Counterparty | Number of Contracts |
Expiration Date |
Exercise Price |
Notional Amount (000) |
Value | ||||||||||||||||||||
| Call |
||||||||||||||||||||||||||
| USD Currency |
Goldman Sachs International | — | 10/26/23 | ZAR | 19.30 | USD | 3,666 | $ | 33,199 | |||||||||||||||||
| USD Currency |
Goldman Sachs International | — | 11/08/23 | HKD | 7.81 | USD | 74,330 | 193,526 | ||||||||||||||||||
| USD Currency |
Bank of America N.A. | — | 11/16/23 | BRL | 5.05 | USD | 3,700 | 72,823 | ||||||||||||||||||
|
|
|
|||||||||||||||||||||||||
| 299,548 | ||||||||||||||||||||||||||
|
|
|
|||||||||||||||||||||||||
| Put |
||||||||||||||||||||||||||
| EUR Currency |
Bank of America N.A. | — | 10/06/23 | BRL | 5.40 | EUR | 3,404 | 62,916 | ||||||||||||||||||
| EUR Currency |
Bank of America N.A. | — | 10/06/23 | BRL | 5.20 | EUR | 3,404 | 3,052 | ||||||||||||||||||
| USD Currency |
Barclays Bank PLC | — | 10/06/23 | MXN | 17.20 | USD | 3,726 | 5,447 | ||||||||||||||||||
| EUR Currency |
Barclays Bank PLC | — | 10/16/23 | USD | 1.08 | EUR | 3,388 | 77,293 | ||||||||||||||||||
| EUR Currency |
JPMorgan Chase Bank N.A. | — | 10/26/23 | USD | 1.05 | EUR | 4,334 | 20,050 | ||||||||||||||||||
| USD Currency |
Goldman Sachs International | — | 10/27/23 | JPY | 146.00 | USD | 57,369 | 196,772 | ||||||||||||||||||
| USD Currency |
Bank of America N.A. | — | 11/30/23 | CLP | 900.00 | USD | 3,644 | 108,787 | ||||||||||||||||||
| USD Currency |
JPMorgan Chase Bank N.A. | — | 12/22/23 | JPY | 140.00 | USD | 28,733 | 115,169 | ||||||||||||||||||
|
|
|
|||||||||||||||||||||||||
| 589,486 | ||||||||||||||||||||||||||
|
|
|
|||||||||||||||||||||||||
| $ | 889,034 | |||||||||||||||||||||||||
|
|
|
|||||||||||||||||||||||||
OTC Interest Rate Swaptions Purchased
| Paid by the Fund | Received by the Fund | Expiration Date |
Exercise Rate |
Notional Amount (000) |
Value |
|||||||||||||||||||||||||||||||||
|
|
|
|||||||||||||||||||||||||||||||||||||
| Description | Rate | Frequency | Rate | Frequency | Counterparty | |||||||||||||||||||||||||||||||||
|
|
Call |
|||||||||||||||||||||||||||||||||||||
| 1-Year Interest Rate Swap, 01/24/25 |
1-day SOFR, 5.31% |
Quarterly | 4.50% | Semi-Annual | Citibank N.A. | 01/22/24 | 4.50 | % | USD | 3,803,870 | $ | 2,147,674 | ||||||||||||||||||||||||||
| 1-Year Interest Rate Swap, 01/26/25 |
1-day SOFR, 5.31% |
Quarterly | 4.55% | Semi-Annual | Citibank N.A. | 01/24/24 | 4.55 | % | USD | 3,803,870 | 2,462,623 | |||||||||||||||||||||||||||
| 5-Year Interest Rate Swap, 03/28/29 |
1-day SOFR, 5.31% |
Quarterly | 4.24% | Semi-Annual | Citibank N.A. | 03/26/24 | 4.24 | % | USD | 376,194 | 5,914,692 | |||||||||||||||||||||||||||
| 80 |
2 0 2 3 B L A C K R O C K A N N U A L R E P O R T T O S H A R E H O L D E R S |
| Consolidated Schedule of Investments (continued) September 30, 2023 |
Master Total Return Portfolio |
OTC Interest Rate Swaptions Purchased (continued)
| Paid by the Fund | Received by the Fund | Counterparty | Expiration Date |
Exercise Rate |
Notional Amount (000) |
Value | ||||||||||||||||||||||||||||||
|
|
| |||||||||||||||||||||||||||||||||||
| Description | Rate | Frequency | Rate | Frequency | ||||||||||||||||||||||||||||||||
| 1-Year Interest Rate Swap, 08/09/25 |
3-month EURIBOR, 3.95% |
Semi-Annual | 3.00% |
Annual | Goldman Sachs International |
08/07/24 | 3.00 | % | EUR | 133,160 | $ | 223,468 | ||||||||||||||||||||||||
|
|
1-Year Interest Rate Swap, 08/29/25 |
3-month EURIBOR, 3.95% |
Semi-Annual | 3.00% | Annual | JPMorgan Chase Bank N.A. |
08/27/24 | 3.00 | % | EUR | 133,890 | 253,126 | ||||||||||||||||||||||||
| 10-Year Interest Rate Swap, 10/01/35 |
1-day SOFR, 5.31% |
Quarterly | 4.00% | Semi-Annual | Goldman Sachs International |
09/29/25 | 4.00 | % | USD | 6,821 | 306,636 | |||||||||||||||||||||||||
| 10-Year Interest Rate Swap, 06/17/36 |
1-day SOFR, 5.31% |
Quarterly | 3.24% | Semi-Annual | Barclays Bank PLC |
06/15/26 | 3.24 | % | USD | 8,822 | 207,983 | |||||||||||||||||||||||||
| 10-Year Interest Rate Swap, 07/22/36 |
1-day SOFR, 5.31% |
Quarterly | 3.21% | Semi-Annual | Barclays Bank PLC |
07/20/26 | 3.21 | % | USD | 10,240 | 263,107 | |||||||||||||||||||||||||
| 10-Year Interest Rate Swap, 07/22/36 |
1-day SOFR, 5.31% |
Quarterly | 3.23% | Semi-Annual | Barclays Bank PLC |
07/20/26 | 3.23 | % | USD | 19,660 | 511,626 | |||||||||||||||||||||||||
| 10-Year Interest Rate Swap, 08/05/36 |
1-day SOFR, 5.31% |
Quarterly | 3.58% | Semi-Annual | Barclays Bank PLC |
08/03/26 | 3.58 | % | USD | 18,964 | 677,454 | |||||||||||||||||||||||||
| 10-Year Interest Rate Swap, 08/13/36 |
1-day SOFR, 5.31% |
Quarterly | 3.63% | Semi-Annual | Barclays Bank PLC |
08/11/26 | 3.63 | % | USD | 27,616 | 1,028,716 | |||||||||||||||||||||||||
| 10-Year Interest Rate Swap, 09/10/36 |
1-day SOFR, 5.31% |
Quarterly | 3.77% | Semi-Annual | Goldman Sachs International |
09/08/26 | 3.77 | % | USD | 27,518 | 1,077,799 | |||||||||||||||||||||||||
| 10-Year Interest Rate Swap, 09/30/36 |
1-day SOFR, 5.31% |
Quarterly | 4.03% | Semi-Annual | Goldman Sachs International |
09/28/26 | 4.03 | % | USD | 13,536 | 687,712 | |||||||||||||||||||||||||
| M A S T E R P O R T F O L I O S C H E D U L E O F I N V E S T M E N T S |
|
81 |
|
| Consolidated Schedule of Investments (continued) September 30, 2023 |
Master Total Return Portfolio |
OTC Interest Rate Swaptions Purchased (continued)
| Paid by the Fund | Received by the Fund | Counterparty | Expiration Date |
Exercise Rate |
Notional Amount (000) |
Value | ||||||||||||||||||||||||||||||||
|
|
| |||||||||||||||||||||||||||||||||||||
| Description | Rate | Frequency | Rate | Frequency | ||||||||||||||||||||||||||||||||||
|
|
10-Year Interest Rate Swap, 09/30/36 |
1-day SOFR, 5.31% |
Quarterly | 4.07% | Semi-Annual | Goldman Sachs International |
09/28/26 | 4.07 | % | USD | 33,839 | $ | 1,771,744 | |||||||||||||||||||||||||
| 10-Year Interest Rate Swap, 09/30/36 |
1-day SOFR, 5.31% |
Quarterly | 4.14% | Semi-Annual | Citibank N.A. |
09/28/26 | 4.15 | % | USD | 16,243 | 900,296 | |||||||||||||||||||||||||||
|
|
|
|||||||||||||||||||||||||||||||||||||
| 18,434,656 | ||||||||||||||||||||||||||||||||||||||
|
|
|
|||||||||||||||||||||||||||||||||||||
| Put |
||||||||||||||||||||||||||||||||||||||
| 5-Year Interest Rate Swap, 03/28/29 |
4.24% | Semi-Annual | 1-day SOFR, 5.31% |
Quarterly | Citibank N.A. |
03/26/24 | 4.24 | % | USD | 376,194 | $ | 6,232,553 | ||||||||||||||||||||||||||
| 10-Year Interest Rate Swap, 10/01/35 |
4.00% | Semi-Annual | 1-day SOFR, 5.31% |
Quarterly | Goldman Sachs International |
09/29/25 | 4.00 | % | USD | 6,821 | 370,217 | |||||||||||||||||||||||||||
| 10-Year Interest Rate Swap, 06/17/36 |
3.24% | Semi-Annual | 1-day SOFR, 5.31% |
Quarterly | Barclays Bank PLC |
06/15/26 | 3.24 | % | USD | 8,822 | 784,002 | |||||||||||||||||||||||||||
| 10-Year Interest Rate Swap, 07/22/36 |
3.21% | Semi-Annual | 1-day SOFR, 5.31% |
Quarterly | Barclays Bank PLC |
07/20/26 | 3.21 | % | USD | 10,240 | 950,085 | |||||||||||||||||||||||||||
| 10-Year Interest Rate Swap, 07/22/36 |
3.23% | Semi-Annual | 1-day SOFR, 5.31% |
Quarterly | Barclays Bank PLC |
07/20/26 | 3.23 | % | USD | 19,661 | 1,810,946 | |||||||||||||||||||||||||||
| 10-Year Interest Rate Swap, 08/05/36 |
3.58% | Semi-Annual | 1-day SOFR, 5.31% |
Quarterly | Barclays Bank PLC |
08/03/26 | 3.58 | % | USD | 18,964 | 1,448,689 | |||||||||||||||||||||||||||
| 10-Year Interest Rate Swap, 08/13/36 |
3.63% | Semi-Annual | 1-day SOFR, 5.31% |
Quarterly | Barclays Bank PLC |
08/11/26 | 3.63 | % | USD | 27,616 | 2,058,983 | |||||||||||||||||||||||||||
| 10-Year Interest Rate Swap, 09/10/36 |
3.77% | Semi-Annual | 1-day SOFR, 5.31% |
Quarterly | Goldman Sachs International |
09/08/26 | 3.77 | % | USD | 27,518 | 1,835,622 | |||||||||||||||||||||||||||
| 10-Year Interest Rate Swap, 09/30/36 |
4.03% | Semi-Annual | 1-day SOFR, 5.31% |
Quarterly | Goldman Sachs International |
09/28/26 | 4.03 | % | USD | 13,536 | 816,992 | |||||||||||||||||||||||||||
| 82 |
2 0 2 3 B L A C K R O C K A N N U A L R E P O R T T O S H A R E H O L D E R S |
| Consolidated Schedule of Investments (continued) September 30, 2023 |
Master Total Return Portfolio |
OTC Interest Rate Swaptions Purchased (continued)
| Paid by the Fund | Received by the Fund | Counterparty | Expiration Date |
Exercise Rate |
Notional Amount (000) |
Value | ||||||||||||||||||||||||||||||||||||||
|
|
|
|
|
|||||||||||||||||||||||||||||||||||||||||
| Description | Rate | Frequency | Rate | Frequency | ||||||||||||||||||||||||||||||||||||||||
|
|
10-Year Interest Rate Swap, 09/30/36 |
4.07% | Semi-Annual | |
1-day SOFR, 5.31% |
|
Quarterly | Goldman Sachs International |
09/28/26 | 4.07 | % | USD | 33,839 | $ | 1,996,516 | |||||||||||||||||||||||||||||
| 10-Year Interest Rate Swap, 09/30/36 |
4.14% | Semi-Annual | |
1-day SOFR, 5.31% |
|
Quarterly | Citibank N.A. |
09/28/26 | 4.15 | % | USD | 16,243 | 917,163 | |||||||||||||||||||||||||||||||
|
|
|
|||||||||||||||||||||||||||||||||||||||||||
| 19,221,768 | ||||||||||||||||||||||||||||||||||||||||||||
|
|
|
|||||||||||||||||||||||||||||||||||||||||||
| $ | 37,656,424 | |||||||||||||||||||||||||||||||||||||||||||
|
|
|
|||||||||||||||||||||||||||||||||||||||||||
Exchange-Traded Options Written
| Description | Number of Contracts |
Expiration Date |
Exercise Price |
Notional Amount (000) |
Value | |||||||||||||||||||||||
| Call |
||||||||||||||||||||||||||||
| 1 Year Mid-Curve Options on 3-Month SOFR Futures |
22,391 | 10/13/23 | USD | 95.88 | USD | 5,340,813 | $ | (839,662 | ) | |||||||||||||||||||
| U.S. Treasury 2-Year Notes Futures |
179 | 10/27/23 | USD | 102.13 | USD | 36,282 | (13,984 | ) | ||||||||||||||||||||
|
|
|
|||||||||||||||||||||||||||
| (853,646 | ) | |||||||||||||||||||||||||||
|
|
|
|||||||||||||||||||||||||||
| Put |
||||||||||||||||||||||||||||
| CME 3-Month SOFR Futures |
7,627 | 10/13/23 | USD | 95.13 | USD | 1,802,737 | (10,963,812 | ) | ||||||||||||||||||||
| CME 3-Month SOFR Futures |
11,440 | 10/13/23 | USD | 95.25 | USD | 2,703,987 | (20,020,000 | ) | ||||||||||||||||||||
| CME 3-Month SOFR Futures |
19,067 | 10/13/23 | USD | 95.38 | USD | 4,506,724 | (39,325,687 | ) | ||||||||||||||||||||
| U.S. Treasury 2-Year Notes Futures |
239 | 10/27/23 | USD | 101.00 | USD | 48,444 | (44,813 | ) | ||||||||||||||||||||
| U.S. Treasury 10-Year Notes Futures |
125 | 11/24/23 | USD | 108.00 | USD | 13,502 | (156,250 | ) | ||||||||||||||||||||
| U.S. Treasury 5-Year Notes Futures |
1,041 | 11/24/23 | USD | 105.50 | USD | 109,647 | (919,008 | ) | ||||||||||||||||||||
| Invesco QQQ Trust, Series 1 ETF |
1,564 | 12/15/23 | USD | 350.00 | USD | 56,033 | (1,380,230 | ) | ||||||||||||||||||||
|
|
|
|||||||||||||||||||||||||||
| (72,809,800 | ) | |||||||||||||||||||||||||||
|
|
|
|||||||||||||||||||||||||||
| (73,663,446 | ) | |||||||||||||||||||||||||||
|
|
|
|||||||||||||||||||||||||||
OTC Barrier Options Written
| Description | Type of Option |
Counterparty | Number of Contracts |
Expiration Date |
Exercise Price |
Barrier Price/Range |
Notional Amount (000) |
Value | ||||||||||||||||||||||||
| Put |
||||||||||||||||||||||||||||||||
| EUR Currency |
Down-and-In | HSBC Bank PLC | — | 11/22/23 | USD | 1.06 | USD | 1.05 | EUR | 118,780 | $ | (1,362,793 | ) | |||||||||||||||||||
|
|
|
|||||||||||||||||||||||||||||||
OTC Options Written
| Description | Counterparty | Number of Contracts |
Expiration Date |
Exercise Price | Notional Amount (000) |
Value | ||||||||||||||||||||||||
| Call |
||||||||||||||||||||||||||||||
| EUR Currency |
Bank of America N.A. | — | 10/06/23 | BRL | 5.70 | EUR | 3,404 | $ | (211 | ) | ||||||||||||||||||||
| USD Currency |
Barclays Bank PLC | — | 10/06/23 | MXN | 18.30 | USD | 2,794 | (1,218 | ) | |||||||||||||||||||||
| EUR Currency |
Barclays Bank PLC | — | 10/16/23 | USD | 1.12 | EUR | 3,388 | (16 | ) | |||||||||||||||||||||
| USD Currency |
Goldman Sachs International | — | 10/26/23 | ZAR | 19.80 | USD | 4,582 | (18,100 | ) | |||||||||||||||||||||
| USD Currency |
Bank of America N.A. | — | 11/16/23 | BRL | 5.25 | USD | 5,552 | (43,029 | ) | |||||||||||||||||||||
| USD Currency |
Bank of America N.A. | — | 11/30/23 | CLP | 950.00 | USD | 2,732 | (21,605 | ) | |||||||||||||||||||||
|
|
|
|||||||||||||||||||||||||||||
| (84,179 | ) | |||||||||||||||||||||||||||||
|
|
|
|||||||||||||||||||||||||||||
| Put |
||||||||||||||||||||||||||||||
| EUR Currency |
Bank of America N.A. | — | 10/06/23 | BRL | 5.20 | EUR | 3,404 | (3,052 | ) | |||||||||||||||||||||
| M A S T E R P O R T F O L I O S C H E D U L E O F I N V E S T M E N T S |
|
83 |
|
| Consolidated Schedule of Investments (continued) September 30, 2023 |
Master Total Return Portfolio |
OTC Options Written (continued)
| Description | Counterparty | Number of Contracts |
Expiration Date |
Exercise Price | Notional Amount (000) |
Value | ||||||||||||||||||||||||
| USD Currency |
Barclays Bank PLC | — | 10/06/23 | MXN | 16.70 | USD | 3,726 | $ | (62 | ) | ||||||||||||||||||||
| USD Currency |
JPMorgan Chase Bank N.A. | — | 10/23/23 | JPY | 144.00 | USD | 28,733 | (36,635 | ) | |||||||||||||||||||||
| USD Currency |
Goldman Sachs International | — | 10/27/23 | JPY | 143.00 | USD | 57,369 | (66,505 | ) | |||||||||||||||||||||
| USD Currency |
Bank of America N.A. | — | 11/30/23 | CLP | 860.00 | USD | 3,644 | (34,732 | ) | |||||||||||||||||||||
|
|
|
|||||||||||||||||||||||||||||
| (140,986 | ) | |||||||||||||||||||||||||||||
|
|
|
|||||||||||||||||||||||||||||
| $ | (225,165 | ) | ||||||||||||||||||||||||||||
|
|
|
|||||||||||||||||||||||||||||
OTC Interest Rate Swaptions Written
| Paid by the Fund | Received by the Fund | Counterparty |
Expiration Date |
Exercise Rate |
Notional Amount (000) |
Value |
||||||||||||||||||||||||
|
|
| |||||||||||||||||||||||||||||
| Description | Rate | Frequency | Rate | Frequency | ||||||||||||||||||||||||||
| Call |
||||||||||||||||||||||||||||||
| 1-Year Interest Rate Swap, 01/24/25 |
3.80% | Semi-Annual | 1-day SOFR, 5.31% |
Quarterly | Citibank N.A. | 01/22/24 | 3.80 | % | USD | 3,803,870 | $ | (665,124 | ) | |||||||||||||||||
| 1-Year Interest Rate Swap, 01/26/25 |
3.85% | Semi-Annual | 1-day SOFR, 5.31% |
Quarterly | Citibank N.A. | 01/24/24 | 3.85 | % | USD | 3,803,870 | (770,814 | ) | ||||||||||||||||||
| 5-Year Interest Rate Swap, 03/13/29 |
4.00% | Semi-Annual | 1-day SOFR, 5.31% |
Quarterly | Citibank N.A. | 03/11/24 | 4.00 | % | USD | 376,195 | (3,849,873 | ) | ||||||||||||||||||
| 5-Year Interest Rate Swap, 03/14/29 |
4.00% | Semi-Annual | 1-day SOFR, 5.31% |
Quarterly | Citibank N.A. | 03/12/24 | 4.00 | % | USD | 376,195 | (3,873,714 | ) | ||||||||||||||||||
| 5-Year Interest Rate Swap, 03/16/29 |
3.96% | Semi-Annual | 1-day SOFR, 5.31% |
Quarterly | Barclays Bank PLC |
03/14/24 | 3.96 | % | USD | 376,195 | (3,518,440 | ) | ||||||||||||||||||
| 5-Year Interest Rate Swap, 03/17/29 |
4.03% | Semi-Annual | 1-day SOFR, 5.31% |
Quarterly | Morgan Stanley & Co. International PLC |
03/15/24 | 4.03 | % | USD | 188,098 | (2,073,609 | ) | ||||||||||||||||||
| 1-Year Interest Rate Swap, 08/09/25 |
2.00% | Annual | 3-month EURIBOR, 3.95% |
Semi-Annual | Goldman Sachs International |
08/07/24 | 2.00 | % | EUR | 133,160 | (55,556 | ) | ||||||||||||||||||
| 1-Year Interest Rate Swap, 08/29/25 |
2.00% | Annual | 3-month EURIBOR, 3.95% |
Semi-Annual | JPMorgan Chase Bank N.A. |
08/27/24 | 2.00 | % | EUR | 133,890 | (65,750 | ) | ||||||||||||||||||
| 84 |
2 0 2 3 B L A C K R O C K A N N U A L R E P O R T T O S H A R E H O L D E R S |
| Consolidated Schedule of Investments (continued) September 30, 2023 |
Master Total Return Portfolio |
OTC Interest Rate Swaptions Written (continued)
| Paid by the Fund | Received by the Fund | Counterparty |
Expiration Date |
Exercise Rate |
Notional Amount (000) |
Value |
||||||||||||||||||||||||||||||
|
|
| |||||||||||||||||||||||||||||||||||
| Description | Rate | Frequency | Rate | Frequency | ||||||||||||||||||||||||||||||||
| 10-Year Interest Rate Swap, 08/31/35 |
3.59% |
Semi-Annual | 1-day SOFR, 5.31% |
Quarterly | Bank of America N.A. |
08/29/25 | 3.59 | % | USD | 13,562 | $ | (382,551 | ) | |||||||||||||||||||||||
| 10-Year Interest Rate Swap, 09/30/36 |
4.17% |
Semi-Annual | 1-day SOFR, 5.31% |
Quarterly | JPMorgan Chase Bank N.A. |
09/28/26 | 4.17 | % | USD | 24,401 | (1,376,673 | ) | ||||||||||||||||||||||||
|
|
|
|||||||||||||||||||||||||||||||||||
| (16,632,104 | ) | |||||||||||||||||||||||||||||||||||
|
|
|
|||||||||||||||||||||||||||||||||||
| Put |
||||||||||||||||||||||||||||||||||||
| 5-Year Interest Rate Swap, 03/13/29 |
1-day SOFR, 5.31% |
Quarterly | 4.00% | Semi-Annual | Citibank N.A. |
03/11/24 | 4.00 | % | USD | 376,195 | $ | (8,212,042 | ) | |||||||||||||||||||||||
| 5-Year Interest Rate Swap, 03/14/29 |
1-day SOFR, 5.31% |
Quarterly | 4.00% | Semi-Annual | Citibank N.A. |
03/12/24 | 4.00 | % | USD | 376,195 | (8,221,291 | ) | ||||||||||||||||||||||||
| 5-Year Interest Rate Swap, 03/16/29 |
1-day SOFR, 5.31% |
Quarterly | 3.96% | Semi-Annual | Barclays Bank PLC |
03/14/24 | 3.96 | % | USD | 376,195 | (8,491,616 | ) | ||||||||||||||||||||||||
| 5-Year Interest Rate Swap, 03/17/29 |
1-day SOFR, 5.31% |
Quarterly | 4.03% | Semi-Annual | Morgan Stanley & Co. International PLC |
03/15/24 | 4.03 | % | USD | 188,097 | (3,966,037 | ) | ||||||||||||||||||||||||
| 10-Year Interest Rate Swap, 08/31/35 |
1-day SOFR, 5.31% |
Quarterly | 3.59% | Semi-Annual | Bank of America N.A. |
08/29/25 | 3.59 | % | USD | 13,562 | (924,293 | ) | ||||||||||||||||||||||||
| 10-Year Interest Rate Swap, 09/30/36 |
1-day SOFR, 5.31% |
Quarterly | 4.17% | Semi-Annual | JPMorgan Chase Bank N.A. |
09/28/26 | 4.17 | % | USD | 24,401 | (1,358,739 | ) | ||||||||||||||||||||||||
|
|
|
|||||||||||||||||||||||||||||||||||
| (31,174,018 | ) | |||||||||||||||||||||||||||||||||||
|
|
|
|||||||||||||||||||||||||||||||||||
| $ | (47,806,122 | ) | ||||||||||||||||||||||||||||||||||
|
|
|
|||||||||||||||||||||||||||||||||||
Centrally Cleared Credit Default Swaps — Buy Protection
| Reference Obligation/Index | Financing Rate Paid by the Fund |
Payment Frequency |
Termination Date |
Notional Amount (000) |
Value | Upfront (Received) |
Unrealized Appreciation (Depreciation) |
|||||||||||||||||||||||||
| CDX.NA.HY.40.V1 |
5.00 | % | Quarterly | 06/20/28 | USD | 12,884 | $ | (221,626 | ) | $ | 3,560 | $ | (225,186 | ) | ||||||||||||||||||
| CDX.NA.HY.41.V1 |
5.00 | Quarterly | 12/20/28 | USD | 18,324 | (177,018 | ) | (135,677 | ) | (41,341 | ) | |||||||||||||||||||||
| ITRAXX.EUR.40.V1 |
1.00 | Quarterly | 12/20/28 | EUR | 17,284 | (183,716 | ) | 1,019 | (184,735 | ) | ||||||||||||||||||||||
| ITRAXX.FINSR.40.V1 |
1.00 | Quarterly | 12/20/28 | EUR | 54,428 | (280,469 | ) | 3,208 | (283,677 | ) | ||||||||||||||||||||||
| ITRAXX.XO.40.V1 |
5.00 | Quarterly | 12/20/28 | EUR | 18,032 | (601,775 | ) | (623,423 | ) | 21,648 | ||||||||||||||||||||||
|
|
|
|
|
|
|
|||||||||||||||||||||||||||
| $ | (1,464,604 | ) | $ | (751,313 | ) | $ | (713,291 | ) | ||||||||||||||||||||||||
|
|
|
|
|
|
|
|||||||||||||||||||||||||||
| M A S T E R P O R T F O L I O S C H E D U L E O F I N V E S T M E N T S |
|
85 |
|
| Consolidated Schedule of Investments (continued) September 30, 2023 |
Master Total Return Portfolio |
Centrally Cleared Inflation Swaps
| Paid by the Fund |
Received by the Fund | Termination Date |
Notional Amount (000) |
Value |
Upfront Premium (Received) |
Unrealized Appreciation (Depreciation) |
||||||||||||||||||||||||||||||
| Reference | Frequency | Rate | Frequency | |||||||||||||||||||||||||||||||||
| Eurostat Eurozone HICP Ex Tobacco NSA (CPTFEMU) |
At Termination | 2.65 | % | At Termination | 09/15/33 | EUR | 90,300 | $ | 897,333 | $ | 109,291 | $ | 788,042 | |||||||||||||||||||||||
| Eurostat Eurozone HICP Ex Tobacco NSA (CPTFEMU) |
At Termination | 2.82 | % | At Termination | 08/15/53 | EUR | 6,662 | 121,711 | 26,115 | 95,596 | ||||||||||||||||||||||||||
| Eurostat Eurozone HICP Ex Tobacco NSA (CPTFEMU) |
At Termination | 2.81 | % | At Termination | 08/15/53 | EUR | 6,662 | 98,374 | 1,477 | 96,897 | ||||||||||||||||||||||||||
| Eurostat Eurozone HICP Ex Tobacco NSA (CPTFEMU) |
At Termination | 2.81 | % | At Termination | 09/15/53 | EUR | 3,200 | 46,671 | — | 46,671 | ||||||||||||||||||||||||||
|
|
|
|
|
|
|
|||||||||||||||||||||||||||||||
| $ | 1,164,089 | $ | 136,883 | $ | 1,027,206 | |||||||||||||||||||||||||||||||
|
|
|
|
|
|
|
|||||||||||||||||||||||||||||||
Centrally Cleared Interest Rate Swaps
|
|
||||||||||||||||||||||||||||||||||||||
| Paid by the Fund |
Received by the Fund |
Effective Date |
Termination Date |
Notional Amount (000) |
Value | Upfront Premium Paid (Received) |
Unrealized Appreciation (Depreciation) |
|
||||||||||||||||||||||||||||||
| Rate | Frequency | Rate | Frequency | |||||||||||||||||||||||||||||||||||
|
|
||||||||||||||||||||||||||||||||||||||
| 28-day MXIBTIIE, 11.50% |
Monthly | 11.70% |
Monthly | N/A | 02/12/24 | MXN | 241,928 | $ | 9,043 | $ | 9,080 | $ | (37 | ) | ||||||||||||||||||||||||
|
|
28-day MXIBTIIE, 11.50% |
Monthly | 11.72% |
Monthly | N/A | 02/14/24 | MXN | 144,274 | 6,064 | 6,134 | (70 | ) | ||||||||||||||||||||||||||
| 3-month JIBAR, 8.33% |
Quarterly | 7.20% |
Quarterly | 03/20/24 | (a) | 03/20/25 | ZAR | 252,370 | (156,872 | ) | (112,621 | ) | (44,251 | ) | ||||||||||||||||||||||||
| 1-day SOFR, 5.31% |
At Termination | 4.18% |
At Termination | 07/29/24 | (a) | 07/29/25 | USD | 202,453 | (928,753 | ) | (973,356 | ) | 44,603 | |||||||||||||||||||||||||
| 3.23% |
At Termination | 1-day ESTR, 3.88% |
At Termination | 07/29/24 | (a) | 07/29/25 | EUR | 179,131 | 164,461 | 217,368 | (52,907 | ) | ||||||||||||||||||||||||||
| 0.35% |
At Termination | 1-day TONA, (0.06)% |
At Termination | 09/13/24 | (a) | 09/13/25 | JPY | 13,583,000 | (1,716 | ) | 17,063 | (18,779 | ) | |||||||||||||||||||||||||
| 28-day MXIBTIIE, 11.50% |
Monthly | 9.20% |
Monthly | 09/18/24 | (a) | 09/17/25 | MXN | 110,338 | (36,316 | ) | (6,036 | ) | (30,280 | ) | ||||||||||||||||||||||||
| 28-day MXIBTIIE, 11.50% |
Monthly | 9.43% |
Monthly | 09/18/24 | (a) | 09/17/25 | MXN | 470,281 | (101,694 | ) | 27,235 | (128,929 | ) | |||||||||||||||||||||||||
| 0.38% |
At Termination | 1-day TONA, (0.06)% |
At Termination | 09/24/24 | (a) | 09/24/25 | JPY | 11,356,000 | (18,123 | ) | (3,025 | ) | (15,098 | ) | ||||||||||||||||||||||||
| 4.53% |
At Termination | 1-day SOFR, 5.31% |
At Termination | 09/24/24 | (a) | 09/24/25 | USD | 66,310 | (26,359 | ) | 29,280 | (55,639 | ) | |||||||||||||||||||||||||
| 28-day MXIBTIIE, 11.50% |
Monthly | 10.84% |
Monthly | N/A | 09/25/25 | MXN | 139,972 | 28,676 | — | 28,676 | ||||||||||||||||||||||||||||
| 1-day CORRA, 5.01% |
Semi-Annual | 4.39% |
Semi-Annual | N/A | 07/20/26 | CAD | 89,522 | (751,393 | ) | (708,451 | ) | (42,942 | ) | |||||||||||||||||||||||||
| 1-day CORRA, 5.01% |
Semi-Annual | 4.40% |
Semi-Annual | N/A | 07/20/26 | CAD | 89,522 | (723,832 | ) | (682,752 | ) | (41,080 | ) | |||||||||||||||||||||||||
| 3-month KWCDC, 3.83% |
Quarterly | 3.19% |
Quarterly | N/A | 09/20/26 | KRW | 12,458,201 | (169,869 | ) | 249,280 | (419,149 | ) | ||||||||||||||||||||||||||
| 3-month KWCDC, 3.83% |
Quarterly | 3.19% |
Quarterly | N/A | 09/20/26 | KRW | 9,208,236 | (125,067 | ) | 183,483 | (308,550 | ) | ||||||||||||||||||||||||||
| 3-month KWCDC, 3.83% |
Quarterly | 3.33% |
Quarterly | N/A | 09/20/26 | KRW | 4,958,603 | (52,639 | ) | 75,651 | (128,290 | ) | ||||||||||||||||||||||||||
| 86 |
2 0 2 3 B L A C K R O C K A N N U A L R E P O R T T O S H A R E H O L D E R S |
| Consolidated Schedule of Investments (continued) September 30, 2023 |
Master Total Return Portfolio |
Centrally Cleared Interest Rate Swaps (continued)
|
|
||||||||||||||||||||||||||||||||||||||
| Paid by the Fund |
Received by the Fund |
Effective Date |
Termination Date |
Notional Amount (000) |
Value | Upfront Premium Paid (Received) |
Unrealized (Depreciation) |
|
||||||||||||||||||||||||||||||
| Rate | Frequency | Rate | Frequency | |||||||||||||||||||||||||||||||||||
|
|
||||||||||||||||||||||||||||||||||||||
| 3-month KWCDC, 3.83% |
Quarterly | 3.38% |
Quarterly | N/A | 09/20/26 | KRW | 4,959,347 | $ | (47,392 | ) | $ | 67,392 | $ | (114,784 | ) | |||||||||||||||||||||||
| 3-month KWCDC, 3.83% |
Quarterly | 3.39% |
Quarterly | N/A | 09/20/26 | KRW | 4,959,347 | (47,129 | ) | 66,978 | (114,107 | ) | ||||||||||||||||||||||||||
| 3-month KWCDC, 3.83% |
Quarterly | 3.55% |
Quarterly | N/A | 09/20/26 | KRW | 6,461,505 | (39,154 | ) | 52,246 | (91,400 | ) | ||||||||||||||||||||||||||
| 28-day MXIBTIIE, 11.50% |
Monthly | 8.35% |
Monthly | N/A | 04/28/28 | MXN | 60,636 | (169,690 | ) | (132,533 | ) | (37,157 | ) | |||||||||||||||||||||||||
| 6-month EURIBOR, 4.13% |
Annual | 3.15% |
Semi-Annual | N/A | 07/21/28 | EUR | 6,216 | (83,720 | ) | (53,973 | ) | (29,747 | ) | |||||||||||||||||||||||||
| 28-day MXIBTIIE, 11.50% |
Monthly | 9.44% |
Monthly | N/A | 09/19/28 | MXN | 20,552 | (7,773 | ) | — | (7,773 | ) | ||||||||||||||||||||||||||
|
|
5.71% |
Annual | 6-month WIBOR, 5.63% |
Semi-Annual | N/A | 09/20/28 | PLN | 17,062 | (198,577 | ) | (225,808 | ) | 27,231 | |||||||||||||||||||||||||
| 6-month PRIBOR, 7.00% |
Annual | 4.32% |
Semi-Annual | N/A | 09/20/28 | CZK | 134,826 | (93,084 | ) | (19,899 | ) | (73,185 | ) | |||||||||||||||||||||||||
| 4.30% |
Annual | 1-day SOFR, 5.31% |
Annual | N/A | 09/21/28 | USD | 37,999 | 168,432 | (12,079 | ) | 180,511 | |||||||||||||||||||||||||||
| 28-day MXIBTIIE, 11.50% |
Monthly | 9.89% |
Monthly | N/A | 09/22/28 | MXN | 62,981 | 40,236 | — | 40,236 | ||||||||||||||||||||||||||||
| 6-month EURIBOR, 4.13% |
Annual | 3.38% |
Semi-Annual | N/A | 09/29/28 | EUR | 2,141 | (3,444 | ) | — | (3,444 | ) | ||||||||||||||||||||||||||
| 4.23% |
Annual | 1-day SOFR, 5.31% |
Annual | 03/20/24 | (a) | 03/20/29 | USD | 110,198 | 77,024 | — | 77,024 | |||||||||||||||||||||||||||
| 6-month EURIBOR, 4.13% |
Annual | 2.44% |
Semi-Annual | 07/14/27 | (a) | 07/14/32 | EUR | 9,100 | (326,039 | ) | (236,280 | ) | (89,759 | ) | ||||||||||||||||||||||||
| 0.89% |
Annual | 1-day TONA, (0.06)% |
Annual | N/A | 02/15/33 | JPY | 1,765,619 | (47,994 | ) | (6,077 | ) | (41,917 | ) | |||||||||||||||||||||||||
| 0.90% |
Annual | 1-day TONA, (0.06)% |
Annual | N/A | 02/15/33 | JPY | 3,531,237 | (130,323 | ) | (44,714 | ) | (85,609 | ) | |||||||||||||||||||||||||
| 0.90% |
Annual | 1-day TONA, (0.06)% |
Annual | N/A | 02/15/33 | JPY | 1,765,619 | (62,300 | ) | (19,644 | ) | (42,656 | ) | |||||||||||||||||||||||||
| 0.92% |
Annual | 1-day TONA, (0.06)% |
Annual | N/A | 02/15/33 | JPY | 5,114,206 | (246,758 | ) | (119,774 | ) | (126,984 | ) | |||||||||||||||||||||||||
| 1-day CORRA, 5.01% |
Semi-Annual | 3.54% |
Semi-Annual | N/A | 06/15/33 | CAD | 58,300 | (2,273,764 | ) | (1,622,527 | ) | (651,237 | ) | |||||||||||||||||||||||||
| 3.57% |
Semi-Annual | 1-day CORRA, 5.01% |
Semi-Annual | N/A | 07/20/33 | CAD | 29,310 | 1,072,745 | 767,769 | 304,976 | ||||||||||||||||||||||||||||
| 3.57% |
Semi-Annual | 1-day CORRA, 5.01% |
Semi-Annual | N/A | 07/20/33 | CAD | 29,309 | 1,076,228 | 771,210 | 305,018 | ||||||||||||||||||||||||||||
| 1-day TONA, (0.06)% |
Annual | 1.32% |
Annual | 09/13/28 | (a) | 09/13/33 | JPY | 2,885,000 | (46,369 | ) | (7,578 | ) | (38,791 | ) | ||||||||||||||||||||||||
| 1-day CORRA, 5.01% |
Semi-Annual | 4.00% |
Semi-Annual | N/A | 09/21/33 | CAD | 15,235 | (144,387 | ) | (7,206 | ) | (137,181 | ) | |||||||||||||||||||||||||
| 1-day TONA, (0.06)% |
Annual | 1.32% |
Annual | 09/21/28 | (a) | 09/21/33 | JPY | 2,410,000 | (35,489 | ) | (3,144 | ) | (32,345 | ) | ||||||||||||||||||||||||
| M A S T E R P O R T F O L I O S C H E D U L E O F I N V E S T M E N T S |
|
87 |
|
| Consolidated Schedule of Investments (continued) September 30, 2023 |
Master Total Return Portfolio |
Centrally Cleared Interest Rate Swaps (continued)
| Paid by the Fund |
Received by the Fund |
Effective Date |
Termination Date |
Notional (000) |
Value |
Upfront (Received) |
Unrealized (Depreciation) |
|||||||||||||||||||||||||
| Rate | Frequency | Rate | Frequency | |||||||||||||||||||||||||||||
| 3.40% |
Semi-Annual | 1-day CORRA, 5.01% |
Semi-Annual | N/A | 06/15/53 | CAD | 25,911 | $ | 1,705,420 | $ | 1,055,131 | $ | 650,289 | |||||||||||||||||||
| 3.72% |
Semi-Annual | 1-day CORRA, 5.01% |
Semi-Annual | N/A | 09/21/53 | CAD | 6,670 | 145,904 | (8,670 | ) | 154,574 | |||||||||||||||||||||
|
|
|
|
|
|
|
|||||||||||||||||||||||||||
| $ | (2,601,786 | ) | $ | (1,410,847 | ) | $ | (1,190,939 | ) | ||||||||||||||||||||||||
|
|
|
|
|
|
|
|||||||||||||||||||||||||||
| (a) | Forward Swap. |
OTC Credit Default Swaps — Buy Protection
| Reference Obligation/Index | Financing Rate Paid by the Fund |
Payment Frequency |
Counterparty | Termination Date |
Notional Amount (000) |
Value | Upfront Premium Paid (Received) |
Unrealized Appreciation (Depreciation) |
||||||||||||||||||||||||||
| DISH DBS Corp. |
5.00 | % | Quarterly | Goldman Sachs International |
12/20/23 | USD | 2,168 | $ | 17 | $ | 4,900 | $ | (4,883 | ) | ||||||||||||||||||||
| KB Home |
5.00 | Quarterly | JPMorgan Chase Bank N.A. |
12/20/23 | USD | 2,138 | (25,256 | ) | (7,877 | ) | (17,379 | ) | ||||||||||||||||||||||
| Realogy Group LLC |
5.00 | Quarterly | JPMorgan Chase Bank N.A. |
12/20/23 | USD | 1,069 | (2,051 | ) | (460 | ) | (1,591 | ) | ||||||||||||||||||||||
| RR Donnelley & Sons Co. |
5.00 | Quarterly | JPMorgan Chase Bank N.A. |
12/20/23 | USD | 1,070 | (8,141 | ) | 2,382 | (10,523 | ) | |||||||||||||||||||||||
| Staples, Inc. |
5.00 | Quarterly | Morgan Stanley & Co. International PLC |
12/20/23 | USD | 1,000 | 2,924 | 3,053 | (129 | ) | ||||||||||||||||||||||||
| Beazer Homes U.S.A., Inc. |
5.00 | Quarterly | Barclays Bank PLC |
06/20/24 | USD | 1,199 | (39,644 | ) | (11,543 | ) | (28,101 | ) | ||||||||||||||||||||||
| Beazer Homes U.S.A., Inc. |
5.00 | Quarterly | BNP Paribas S.A. |
06/20/24 | USD | 1,000 | (33,065 | ) | (8,501 | ) | (24,564 | ) | ||||||||||||||||||||||
| Beazer Homes U.S.A., Inc. |
5.00 | Quarterly | BNP Paribas S.A. |
06/20/24 | USD | 1,103 | (36,470 | ) | (10,118 | ) | (26,352 | ) | ||||||||||||||||||||||
| Pitney Bowes, Inc. |
1.00 | Quarterly | Barclays Bank PLC |
06/20/24 | USD | 1,025 | 5,078 | 48,062 | (42,984 | ) | ||||||||||||||||||||||||
| Pitney Bowes, Inc. |
1.00 | Quarterly | Barclays Bank PLC |
06/20/24 | USD | 320 | 1,585 | 15,431 | (13,846 | ) | ||||||||||||||||||||||||
| Staples, Inc. |
5.00 | Quarterly | Barclays Bank PLC |
06/20/24 | USD | 315 | 6,479 | 13,227 | (6,748 | ) | ||||||||||||||||||||||||
| Staples, Inc. |
5.00 | Quarterly | Goldman Sachs International |
06/20/24 | USD | 525 | 10,798 | 18,707 | (7,909 | ) | ||||||||||||||||||||||||
| Tenet Healthcare Corp. |
5.00 | Quarterly | Barclays Bank PLC |
06/20/24 | USD | 1,000 | (33,464 | ) | (1,697 | ) | (31,767 | ) | ||||||||||||||||||||||
| Tenet Healthcare Corp. |
5.00 | Quarterly | Goldman Sachs International |
06/20/24 | USD | 1,175 | (39,475 | ) | (6,115 | ) | (33,360 | ) | ||||||||||||||||||||||
| Tenet Healthcare Corp. |
5.00 | Quarterly | Goldman Sachs International |
06/20/24 | USD | 1,150 | (38,635 | ) | (5,985 | ) | (32,650 | ) | ||||||||||||||||||||||
| Tenet Healthcare Corp. |
5.00 | Quarterly | Goldman Sachs International |
06/20/24 | USD | 1,175 | (39,475 | ) | (6,120 | ) | (33,355 | ) | ||||||||||||||||||||||
| Tenet Healthcare Corp. |
5.00 | Quarterly | Goldman Sachs International |
06/20/24 | USD | 1,223 | (40,926 | ) | (2,510 | ) | (38,416 | ) | ||||||||||||||||||||||
| Tenet Healthcare Corp. |
5.00 | Quarterly | JPMorgan Chase Bank N.A. |
06/20/24 | USD | 500 | (16,797 | ) | (993 | ) | (15,804 | ) | ||||||||||||||||||||||
| Xerox Corp. |
1.00 | Quarterly | BNP Paribas S.A. |
06/20/24 | USD | 1,000 | (579 | ) | 13,679 | (14,258 | ) | |||||||||||||||||||||||
| Avis Budget Group, Inc. |
5.00 | Quarterly | JPMorgan Chase Bank N.A. |
12/20/24 | USD | 750 | (35,186 | ) | 15,504 | (50,690 | ) | |||||||||||||||||||||||
| Avis Budget Group, Inc. |
5.00 | Quarterly | JPMorgan Chase Bank N.A. |
12/20/24 | USD | 1,680 | (78,248 | ) | 34,410 | (112,658 | ) | |||||||||||||||||||||||
| Boeing Co. (The) |
1.00 | Quarterly | BNP Paribas S.A. |
12/20/24 | USD | 2,250 | (16,798 | ) | (10,969 | ) | (5,829 | ) | ||||||||||||||||||||||
| Boeing Co. (The) |
1.00 | Quarterly | Morgan Stanley & Co. International PLC |
12/20/24 | USD | 5,950 | (44,421 | ) | (17,170 | ) | (27,251 | ) | ||||||||||||||||||||||
| Federative Republic of Brazil |
1.00 | Quarterly | Barclays Bank PLC |
12/20/24 | USD | 3,216 | (22,646 | ) | 19,812 | (42,458 | ) | |||||||||||||||||||||||
| Federative Republic of Brazil |
1.00 | Quarterly | Barclays Bank PLC |
12/20/24 | USD | 3,215 | (22,638 | ) | 19,806 | (42,444 | ) | |||||||||||||||||||||||
| Federative Republic of Brazil |
1.00 | Quarterly | Barclays Bank PLC |
12/20/24 | USD | 3,220 | (22,674 | ) | 19,836 | (42,510 | ) | |||||||||||||||||||||||
| Federative Republic of Brazil |
1.00 | Quarterly | Barclays Bank PLC |
12/20/24 | USD | 3,215 | (22,638 | ) | 19,429 | (42,067 | ) | |||||||||||||||||||||||
| Federative Republic of Brazil |
1.00 | Quarterly | Barclays Bank PLC |
12/20/24 | USD | 4,500 | (31,687 | ) | 27,194 | (58,881 | ) | |||||||||||||||||||||||
| Federative Republic of Brazil |
1.00 | Quarterly | Barclays Bank PLC |
12/20/24 | USD | 1,948 | (13,717 | ) | 11,772 | (25,489 | ) | |||||||||||||||||||||||
| Avis Budget Group, Inc. |
5.00 | Quarterly | JPMorgan Chase Bank N.A. |
06/20/25 | USD | 2,540 | (143,273 | ) | 108,512 | (251,785 | ) | |||||||||||||||||||||||
| Pitney Bowes, Inc. |
1.00 | Quarterly | Goldman Sachs International |
06/20/25 | USD | 500 | 33,180 | 89,647 | (56,467 | ) | ||||||||||||||||||||||||
| Caterpillar, Inc. |
1.00 | Quarterly | Deutsche Bank AG |
06/20/27 | USD | 4,300 | (109,692 | ) | (76,981 | ) | (32,711 | ) | ||||||||||||||||||||||
| General Electric Co. |
1.00 | Quarterly | Morgan Stanley & Co. International PLC |
06/20/27 | USD | 706 | (11,953 | ) | 11,028 | (22,981 | ) | |||||||||||||||||||||||
| General Electric Co. |
1.00 | Quarterly | Morgan Stanley & Co. International PLC |
06/20/27 | USD | 706 | (11,953 | ) | 11,028 | (22,981 | ) | |||||||||||||||||||||||
| General Electric Co. |
1.00 | Quarterly | Morgan Stanley & Co. International PLC |
06/20/27 | USD | 943 | (15,968 | ) | 13,841 | (29,809 | ) | |||||||||||||||||||||||
| BorgWarner, Inc. |
1.00 | Quarterly | BNP Paribas S.A. |
12/20/27 | USD | 1,000 | (15,850 | ) | 11,730 | (27,580 | ) | |||||||||||||||||||||||
| Pitney Bowes, Inc. |
1.00 | Quarterly | Bank of America N.A. |
12/20/27 | USD | 620 | 189,465 | 139,060 | 50,405 | |||||||||||||||||||||||||
| Pitney Bowes, Inc. |
1.00 | Quarterly | Citibank N.A. |
12/20/27 | USD | 250 | 76,397 | 57,669 | 18,728 | |||||||||||||||||||||||||
| Pitney Bowes, Inc. |
1.00 | Quarterly | Citibank N.A. |
12/20/27 | USD | 380 | 116,124 | 90,317 | 25,807 | |||||||||||||||||||||||||
| 88 |
2 0 2 3 B L A C K R O C K A N N U A L R E P O R T T O S H A R E H O L D E R S |
| Consolidated Schedule of Investments (continued) September 30, 2023 |
Master Total Return Portfolio |
OTC Credit Default Swaps — Buy Protection (continued)
| Reference Obligation/Index | Financing Rate Paid by the Fund |
Payment Frequency |
Counterparty | Termination Date |
Notional Amount (000) |
Value | Upfront Premium Paid (Received) |
Unrealized Appreciation (Depreciation) |
||||||||||||||||||||||||
| Pitney Bowes, Inc. |
1.00 | % | Quarterly | Goldman Sachs International |
12/20/27 | USD | 780 | $ | 238,359 | $ | 229,944 | $ | 8,415 | |||||||||||||||||||
| Simon Property Group LP |
1.00 | Quarterly | Goldman Sachs International |
12/20/27 | USD | 3,640 | (27,641 | ) | 47,785 | (75,426 | ) | |||||||||||||||||||||
| Credit Suisse Group AG |
1.00 | Quarterly | Barclays Bank PLC |
06/20/28 | EUR | 1,350 | (11,540 | ) | 81,687 | (93,227 | ) | |||||||||||||||||||||
| Credit Suisse Group AG |
1.00 | Quarterly | JPMorgan Chase Bank N.A. |
06/20/28 | EUR | 7,000 | (59,837 | ) | 236,029 | (295,866 | ) | |||||||||||||||||||||
| Deutsche Bank AG |
1.00 | Quarterly | BNP Paribas S.A. |
06/20/28 | EUR | 4,400 | 27,813 | 342,015 | (314,202 | ) | ||||||||||||||||||||||
| Deutsche Bank AG |
1.00 | Quarterly | Goldman Sachs International |
06/20/28 | EUR | 4,400 | 27,813 | 239,681 | (211,868 | ) | ||||||||||||||||||||||
| Abbott Laboratories |
1.00 | Quarterly | JPMorgan Chase Bank N.A. |
12/20/28 | USD | 7,786 | (189,856 | ) | (153,514 | ) | (36,342 | ) | ||||||||||||||||||||
| American Electric Power Co., Inc. |
1.00 | Quarterly | Goldman Sachs International |
12/20/28 | USD | 19,990 | (523,445 | ) | (504,795 | ) | (18,650 | ) | ||||||||||||||||||||
| American Expreses Co. |
1.00 | Quarterly | Citibank N.A. |
12/20/28 | USD | 19,990 | (442,909 | ) | (447,833 | ) | 4,924 | |||||||||||||||||||||
| Federative Republic of Brazil |
1.00 | Quarterly | Goldman Sachs International |
12/20/28 | USD | 8,286 | 310,624 | 356,250 | (45,626 | ) | ||||||||||||||||||||||
| Republic of Colombia |
1.00 | Quarterly | Barclays Bank PLC |
12/20/28 | USD | 7,277 | 429,419 | 419,570 | 9,849 | |||||||||||||||||||||||
| Republic of Colombia |
1.00 | Quarterly | JPMorgan Chase Bank N.A. |
12/20/28 | USD | 8,524 | 503,040 | 484,460 | 18,580 | |||||||||||||||||||||||
| Republic of South Africa |
1.00 | Quarterly | Barclays Bank PLC |
12/20/28 | USD | 2,037 | 155,599 | 165,321 | (9,722 | ) | ||||||||||||||||||||||
| Republic of South Africa |
1.00 | Quarterly | Barclays Bank PLC |
12/20/28 | USD | 1,630 | 124,480 | 133,555 | (9,075 | ) | ||||||||||||||||||||||
| Republic of South Africa |
1.00 | Quarterly | Barclays Bank PLC |
12/20/28 | USD | 1,843 | 140,743 | 150,270 | (9,527 | ) | ||||||||||||||||||||||
| United Mexican States |
1.00 | Quarterly | Barclays Bank PLC |
12/20/28 | USD | 6,624 | 76,419 | 54,460 | 21,959 | |||||||||||||||||||||||
| CMBX.NA.9.AAA |
0.50 | Monthly | Morgan Stanley & Co. International PLC |
09/17/58 | USD | 3,030 | 11,672 | 31,574 | (19,902 | ) | ||||||||||||||||||||||
| CMBX.NA.9.AAA |
0.50 | Monthly | Morgan Stanley & Co. International PLC |
09/17/58 | USD | 64 | 245 | 727 | (482 | ) | ||||||||||||||||||||||
| CMBX.NA.9.BBB- |
3.00 | Monthly | Citigroup Global Markets, Inc. |
09/17/58 | USD | 2,080 | 448,760 | 65,127 | 383,633 | |||||||||||||||||||||||
| CMBX.NA.9.BBB- |
3.00 | Monthly | Goldman Sachs International |
09/17/58 | USD | 3,544 | 764,618 | 261,506 | 503,112 | |||||||||||||||||||||||
| CMBX.NA.9.BBB- |
3.00 | Monthly | Morgan Stanley & Co. International PLC |
09/17/58 | USD | 204 | 44,013 | 10,458 | 33,555 | |||||||||||||||||||||||
| CMBX.NA.6.AAA |
0.50 | Monthly | Deutsche Bank AG |
05/11/63 | USD | 3 | — | 1 | (1 | ) | ||||||||||||||||||||||
| CMBX.NA.6.AAA |
0.50 | Monthly | Deutsche Bank AG |
05/11/63 | USD | 8 | — | (2 | ) | 2 | ||||||||||||||||||||||
|
|
|
|
|
|
|
|||||||||||||||||||||||||||
| $ | 1,517,116 | $ | 2,857,273 | $ | (1,340,157 | ) | ||||||||||||||||||||||||||
|
|
|
|
|
|
|
|||||||||||||||||||||||||||
OTC Credit Default Swaps — Sell Protection
| Reference Obligation/Index | Financing Rate Received by the Fund |
Payment Frequency |
Counterparty | Termination Date |
Credit Rating |
Notional Amount (000) |
Value | Upfront Premium Paid |
Unrealized Appreciation (Depreciation) |
|||||||||||||||||||||||||||
| Vistra Operations Co. LLC |
5.00 | % | Quarterly | JPMorgan Chase Bank N.A. |
12/20/23 | BB | USD | 4,396 | $ | 44,666 | $ | 39,902 | $ | 4,764 | ||||||||||||||||||||||
| Vistra Operations Co. LLC |
5.00 | Quarterly | JPMorgan Chase Bank N.A. |
12/20/25 | BB | USD | 1,015 | 69,335 | 39,768 | 29,567 | ||||||||||||||||||||||||||
| CMBX.NA.7.AAA |
0.50 | Monthly | Morgan Stanley & Co. International PLC |
01/17/47 | AAA | USD | 787 | 53 | (19,876 | ) | 19,929 | |||||||||||||||||||||||||
| CMBX.NA.9.BBB- |
3.00 | Monthly | Deutsche Bank AG |
09/17/58 | N/R | USD | 906 | (195,469 | ) | (96,041 | ) | (99,428 | ) | |||||||||||||||||||||||
| CMBX.NA.9.BBB- |
3.00 | Monthly | Goldman Sachs International |
09/17/58 | N/R | USD | 1,310 | (282,632 | ) | (135,243 | ) | (147,389 | ) | |||||||||||||||||||||||
| CMBX.NA.9.BBB- |
3.00 | Monthly | J.P. Morgan Securities LLC |
09/17/58 | N/R | USD | 121 | (26,106 | ) | (25,278 | ) | (828 | ) | |||||||||||||||||||||||
| CMBX.NA.9.BBB- |
3.00 | Monthly | Morgan Stanley & Co. International PLC |
09/17/58 | N/R | USD | 1,000 | (215,750 | ) | (244,009 | ) | 28,259 | ||||||||||||||||||||||||
| CMBX.NA.9.BBB- |
3.00 | Monthly | Morgan Stanley & Co. International PLC |
09/17/58 | N/R | USD | 1,060 | (228,695 | ) | (47,456 | ) | (181,239 | ) | |||||||||||||||||||||||
| CMBX.NA.9.BBB- |
3.00 | Monthly | Morgan Stanley & Co. International PLC |
09/17/58 | N/R | USD | 231 | (49,838 | ) | (12,433 | ) | (37,405 | ) | |||||||||||||||||||||||
| CMBX.NA.9.BBB- |
3.00 | Monthly | Morgan Stanley & Co. International PLC |
09/17/58 | N/R | USD | 1,200 | (258,900 | ) | (1,379 | ) | (257,521 | ) | |||||||||||||||||||||||
| CMBX.NA.10.A |
2.00 | Monthly | Deutsche Bank AG |
11/17/59 | BBB+ | USD | 3,340 | (315,605 | ) | (128,858 | ) | (186,747 | ) | |||||||||||||||||||||||
| CMBX.NA.10.A |
2.00 | Monthly | Deutsche Bank AG |
11/17/59 | BBB+ | USD | 1,670 | (157,803 | ) | (65,512 | ) | (92,291 | ) | |||||||||||||||||||||||
| CMBX.NA.10.BBB- |
3.00 | Monthly | J.P. Morgan Securities LLC |
11/17/59 | BB- | USD | 60 | (16,545 | ) | (4,580 | ) | (11,965 | ) | |||||||||||||||||||||||
| CMBX.NA.14.BBB- |
3.00 | Monthly | Goldman Sachs International |
12/16/72 | N/R | USD | 2,070 | (499,001 | ) | (354,925 | ) | (144,076 | ) | |||||||||||||||||||||||
|
|
|
|
|
|
|
|||||||||||||||||||||||||||||||
| $ | (2,132,290 | ) | $ | (1,055,920 | ) | $ | (1,076,370 | ) | ||||||||||||||||||||||||||||
|
|
|
|
|
|
|
|||||||||||||||||||||||||||||||
| M A S T E R P O R T F O L I O S C H E D U L E O F I N V E S T M E N T S |
89 |
| Consolidated Schedule of Investments (continued) September 30, 2023 |
Master Total Return Portfolio |
OTC Interest Rate Swaps
| Paid by the Fund |
Received by the Fund |
Termination Date |
Notional Amount (000) |
Value |
Upfront Premium Paid (Received) |
Unrealized Appreciation (Depreciation) |
||||||||||||||||||||||||||
| Rate | Frequency | Rate | Frequency | Counterparty | ||||||||||||||||||||||||||||
| 12.62% |
At Termination | 1-day BZDIOVER, 0.05% |
At Termination | Citibank N.A. |
01/02/24 | BRL | 180,259 | $ | (1,048 | ) | $ | — | $ | (1,048 | ) | |||||||||||||||||
| 12.37% |
At Termination | 1-day COOIS, 12.29% |
At Termination | Citibank N.A. |
04/18/24 | COP | 44,297,919 | (26,330 | ) | — | (26,330 | ) | ||||||||||||||||||||
| 11.90% |
At Termination | 1-day COOIS, 12.29% |
At Termination | Bank of America N.A. |
10/19/24 | COP | 22,971,880 | 29,458 | — | 29,458 | ||||||||||||||||||||||
| 1-day BZDIOVER, 0.05% |
At Termination | 11.87% |
At Termination | Bank of America N.A. |
01/02/25 | BRL | 33,225 | 34,364 | — | 34,364 | ||||||||||||||||||||||
| 1-day BZDIOVER, 0.05% |
At Termination | 10.60% |
At Termination | JPMorgan Chase Bank N.A. |
01/02/25 | BRL | 95,168 | (69,099 | ) | — | (69,099 | ) | ||||||||||||||||||||
| 1-day BZDIOVER, 0.05% |
At Termination | 10.92% |
At Termination | JPMorgan Chase Bank N.A. |
01/02/25 | BRL | 40,205 | 7,744 | — | 7,744 | ||||||||||||||||||||||
| 1-day BZDIOVER, 0.05% |
At Termination | 11.75% |
At Termination | Citibank N.A. |
01/02/26 | BRL | 31,817 | 85,836 | — | 85,836 | ||||||||||||||||||||||
| 1-day BZDIOVER, 0.05% |
At Termination | 11.80% |
At Termination | Citibank N.A. |
01/02/26 | BRL | 32,055 | 93,684 | — | 93,684 | ||||||||||||||||||||||
| 1-day BZDIOVER, 0.05% |
At Termination | 10.11% |
At Termination | Goldman Sachs International |
01/02/26 | BRL | 41,566 | (80,800 | ) | — | (80,800 | ) | ||||||||||||||||||||
| 1-day BZDIOVER, 0.05% |
At Termination | 9.98% |
At Termination | HSBC Bank PLC |
01/02/26 | BRL | 41,086 | (96,799 | ) | — | (96,799 | ) | ||||||||||||||||||||
| 10.56% |
At Termination | 1-day BZDIOVER, 0.05% |
At Termination | Morgan Stanley & Co. International PLC |
01/04/27 | BRL | 22,585 | 25,491 | — | 25,491 | ||||||||||||||||||||||
|
|
|
|
|
|
|
|||||||||||||||||||||||||||
| $ | 2,501 | $ | — | $ | 2,501 | |||||||||||||||||||||||||||
|
|
|
|
|
|
|
|||||||||||||||||||||||||||
OTC Total Return Swaps
| Paid by the Fund |
Received by the Fund |
Counterparty |
Termination Date |
Notional (000) |
Value |
Upfront (Received) |
Unrealized (Depreciation) |
|||||||||||||||||||||||
| Reference | Frequency | Rate | Frequency | |||||||||||||||||||||||||||
| Western Alliance |
At Termination | 1-day SOFR minus 1.00%, 5.31% |
At Termination | Citibank N.A. | 10/05/23 | USD | 309 | $ | 29,708 | $ | — | $ | 29,708 | |||||||||||||||||
| 0.00% |
At Termination | Goldman Sachs U.S. Series 4 Excess Return Strategy |
At Termination | Goldman Sachs International | 11/15/23 | USD | 4,604 | 80,115 | — | 80,115 | ||||||||||||||||||||
| 0.00% |
At Termination | Goldman Sachs Systematic Skew U.S. Series 10 Excess Return Strategy |
At Termination | Goldman Sachs International | 12/07/23 | USD | 4,865 | 39,088 | — | 39,088 | ||||||||||||||||||||
|
|
|
|
|
|
|
|||||||||||||||||||||||||
| $ | 148,911 | $ | — | $ | 148,911 | |||||||||||||||||||||||||
|
|
|
|
|
|
|
|||||||||||||||||||||||||
OTC Total Return Swaps
| Reference Entity | Payment Frequency |
Counterparty(a) | Termination Date |
Net Notional |
Accrued Unrealized Appreciation (Depreciation) |
Net Value of Reference Entity |
Gross Notional Net Asset |
|||||||||||||||||
| Equity Securities Long/Short |
Monthly | JPMorgan Chase Bank N.A.(b) | 02/08/24 | $ | (36,001,288 | ) | $ | 507,774 | (c) | $ | (35,413,120 | ) | 0.2 | % | ||||||||||
| Monthly | Merrill Lynch International(d) | 05/15/24 | (56,704,736 | ) | 931,546 | (e) | (55,628,639 | ) | 0.3 | |||||||||||||||
|
|
|
|
|
|||||||||||||||||||||
| $ | 1,439,320 | $ | (91,041,759 | ) | ||||||||||||||||||||
|
|
|
|
|
|||||||||||||||||||||
| (a) | The Master Portfolio receives the total return on a portfolio of long positions underlying the total return swap. The Master Portfolio pays the total return on a portfolio of short positions underlying the total return swap. In addition, the Master Portfolio pays or receives a variable rate of interest, based on a specified benchmark. The benchmark and spread are determined based upon the country and/or currency of the individual underlying positions. |
| (c) | Amount includes $(80,394) of net dividends and financing fees. |
| (e) | Amount includes $(144,551) of net dividends and financing fees. |
| 90 | 2 0 2 3 B L A C K R O C K A N N U A L R E P O R T T O S H A R E H O L D E R S |
| Consolidated Schedule of Investments (continued) September 30, 2023 |
Master Total Return Portfolio |
The following are the specified benchmarks (plus or minus a range) used in determining the variable rate of interest:
| (b) | (d) | |||||||
| Range: |
15 - 280 basis points |
75 - 300 basis points |
||||||
|
Benchmarks: |
USD - 1D Overnight Bank Funding Rate (OBFR01) |
USD - 1D Overnight Bank Funding Rate (OBFR01) |
||||||
The following table represents the individual short positions and related values of equity securities underlying the total return swap with JPMorgan Chase Bank N.A., as of period end, termination date February 8, 2024:
|
|
||||||||||||||||
| Shares | Value | % of Basket Value |
||||||||||||||
|
|
||||||||||||||||
| Reference Entity — Long |
||||||||||||||||
| Common Stocks | ||||||||||||||||
| Banks | ||||||||||||||||
| Banc of California, Inc. |
60,758 | $ | 752,184 | (2.1 | )% | |||||||||||
|
|
|
|
|
|||||||||||||
| Reference Entity — Short |
| |||||||||||||||
| Common Stocks | ||||||||||||||||
| Banks | ||||||||||||||||
| Bank of America Corp. |
17,285 | (473,263 | ) | 1.3 | % | |||||||||||
| Bank of Hawaii Corp. |
15,937 | (791,910 | ) | 2.2 | ||||||||||||
| BankUnited, Inc. |
13,752 | (312,170 | ) | 0.9 | ||||||||||||
| Banner Corp. |
10,102 | (428,123 | ) | 1.2 | ||||||||||||
| Community Bank System, Inc. |
20,359 | (859,353 | ) | 2.4 | ||||||||||||
| FB Financial Corp. |
17,987 | (510,111 | ) | 1.4 | ||||||||||||
| Glacier Bancorp, Inc. |
16,368 | (466,488 | ) | 1.3 | ||||||||||||
| Independent Bank Group, Inc. |
13,544 | (535,665 | ) | 1.5 | ||||||||||||
| OceanFirst Financial Corp. |
17,165 | (248,378 | ) | 0.7 | ||||||||||||
| Pacific Premier Bancorp, Inc. |
12,986 | (282,575 | ) | 0.8 | ||||||||||||
| PacWest Bancorp |
92,492 | (731,612 | ) | 2.1 | ||||||||||||
| Prosperity Bancshares, Inc. |
7,589 | (414,208 | ) | 1.2 | ||||||||||||
| Simmons First National Corp., Class A |
28,055 | (475,813 | ) | 1.4 | ||||||||||||
| Truist Financial Corp. |
32,786 | (938,008 | ) | 2.7 | ||||||||||||
| Valley National Bancorp |
158,506 | (1,356,811 | ) | 3.8 | ||||||||||||
| Washington Federal, Inc. |
17,862 | (457,624 | ) | 1.3 | ||||||||||||
| Western Alliance Bancorp |
15,276 | (702,238 | ) | 2.0 | ||||||||||||
| Zions Bancorp N.A |
12,294 | (428,938 | ) | 1.2 | ||||||||||||
|
|
|
|
|
|||||||||||||
| (10,413,288 | ) | |||||||||||||||
| Capital Markets | ||||||||||||||||
| Charles Schwab Corp. (The) |
19,206 | (1,054,409 | ) | 3.0 | ||||||||||||
| Morgan Stanley |
4,910 | (401,000 | ) | 1.1 | ||||||||||||
|
|
|
|
|
|||||||||||||
| (1,455,409 | ) | |||||||||||||||
|
|
||||||||||||||||
| Shares | Value | % of Basket Value |
||||||||||||||
|
|
||||||||||||||||
| Investment Companies | ||||||||||||||||
| Fixed-Income Funds | ||||||||||||||||
| iShares iBoxx $ Investment Grade Corporate Bond ETF |
85,000 | $ | (8,671,700 | ) | 24.5 | % | ||||||||||
| Vanguard Intermediate-Term Corporate Bond ETF |
205,645 | (15,624,907 | ) | 44.1 | ||||||||||||
|
|
|
|
|
|||||||||||||
| (24,296,607 | ) | |||||||||||||||
|
|
|
|||||||||||||||
| Total Reference Entity — Short |
(36,165,304 | ) | ||||||||||||||
|
|
|
|||||||||||||||
| Net Value of Reference Entity — JPMorgan Chase Bank N.A |
$ | (35,413,120 | ) | |||||||||||||
|
|
|
|||||||||||||||
The following table represents the individual short positions and related values of equity securities underlying the total return swap with Merrill Lynch International, as of period end, termination date May 15, 2024:
|
|
||||||||||||||||
| Shares | Value | % of Basket Value |
||||||||||||||
|
|
||||||||||||||||
| Reference Entity — Short |
||||||||||||||||
| Investment Companies | ||||||||||||||||
| Fixed-Income Funds | ||||||||||||||||
| iShares iBoxx $ Investment Grade Corporate Bond ETF |
350,092 | $ | (35,716,386 | ) | 64.2 | % | ||||||||||
| iShares iBoxx High Yield Corporate Bond ETF |
79,197 | (5,838,403 | ) | 10.5 | ||||||||||||
| iShares Preferred & Income Securities ETF |
95,000 | (2,864,250 | ) | 5.1 | ||||||||||||
| SPDR Bloomberg High Yield Bond ETF |
124,000 | (11,209,600 | ) | 20.2 | ||||||||||||
|
|
|
|
|
|||||||||||||
| (55,628,639 | ) | |||||||||||||||
|
|
|
|||||||||||||||
| Net Value of Reference Entity — Merrill Lynch International |
$ | (55,628,639 | ) | |||||||||||||
|
|
|
|||||||||||||||
Balances Reported in the Statements of Assets and Liabilities for Centrally Cleared Swaps, OTC Swaps and Options Written
| Swap Premiums Paid |
Swap Premiums Received |
Unrealized Appreciation |
Unrealized Depreciation |
Value | ||||||||||||||||
| Centrally Cleared Swaps(a) |
$ | 3,739,970 | $ | (5,765,247 | ) | $ | 2,861,992 | $ | (3,739,016 | ) | $ | — | ||||||||
| OTC Swaps |
4,210,126 | (2,408,773 | ) | 3,026,296 | (3,852,091 | ) | — | |||||||||||||
| Options Written |
N/A | N/A | 14,219,558 | (58,933,140 | ) | (123,057,526 | ) | |||||||||||||
| (a) | Includes cumulative appreciation (depreciation) on centrally cleared swaps, as reported in the Consolidated Schedule of Investments. Only current day’s variation margin is reported within the Consolidated Statement of Assets and Liabilities and is net of any previously paid (received) swap premium amounts. |
| M A S T E R P O R T F O L I O S C H E D U L E O F I N V E S T M E N T S |
91 |
| Consolidated Schedule of Investments (continued) September 30, 2023 |
Master Total Return Portfolio |
Derivative Financial Instruments Categorized by Risk Exposure
As of period end, the fair values of derivative financial instruments located in the Consolidated Statement of Assets and Liabilities were as follows:
| Commodity Contracts |
Credit Contracts |
Equity Contracts |
Foreign Currency Exchange Contracts |
Interest Rate Contracts |
Other Contracts |
Total | ||||||||||||||||||||||
| Assets — Derivative Financial Instruments |
||||||||||||||||||||||||||||
| Futures contracts |
||||||||||||||||||||||||||||
| Unrealized appreciation on futures contracts(a) |
$ | — | $ | — | $ | 1,664,281 | $ | — | $ | 8,695,745 | $ | — | $ | 10,360,026 | ||||||||||||||
| Forward foreign currency exchange contracts |
||||||||||||||||||||||||||||
| Unrealized appreciation on forward foreign currency exchange contracts |
— | — | — | 3,608,360 | — | — | 3,608,360 | |||||||||||||||||||||
| Options purchased |
||||||||||||||||||||||||||||
| Investments at value — unaffiliated(b) |
— | — | 1,621,681 | 2,681,569 | 110,836,486 | — | 115,139,736 | |||||||||||||||||||||
| Swaps — centrally cleared |
||||||||||||||||||||||||||||
| Unrealized appreciation on centrally cleared swaps(a) |
— | 21,648 | — | — | 1,813,138 | 1,027,206 | 2,861,992 | |||||||||||||||||||||
| Swaps — OTC |
||||||||||||||||||||||||||||
| Unrealized appreciation on OTC swaps; Swap premiums paid |
— | 5,371,614 | 1,588,231 | — | 276,577 | — | 7,236,422 | |||||||||||||||||||||
|
|
|
|
|
|
|
|
|
|
|
|
|
|
|
|||||||||||||||
| $ | — | $ | 5,393,262 | $ | 4,874,193 | $ | 6,289,929 | $ | 121,621,946 | $ | 1,027,206 | $ | 139,206,536 | |||||||||||||||
|
|
|
|
|
|
|
|
|
|
|
|
|
|
|
|||||||||||||||
| Liabilities — Derivative Financial Instruments |
||||||||||||||||||||||||||||
| Futures contracts |
||||||||||||||||||||||||||||
| Unrealized depreciation on futures contracts(a) |
$ | — | $ | — | $ | 172,802 | $ | — | $ | 15,444,592 | $ | — | $ | 15,617,394 | ||||||||||||||
| Forward foreign currency exchange contracts |
||||||||||||||||||||||||||||
| Unrealized depreciation on forward foreign currency exchange contracts |
— | — | — | 3,571,304 | — | — | 3,571,304 | |||||||||||||||||||||
| Options written |
||||||||||||||||||||||||||||
| Options written at value |
— | — | 1,380,230 | 1,587,958 | 120,089,338 | — | 123,057,526 | |||||||||||||||||||||
| Swaps — centrally cleared |
||||||||||||||||||||||||||||
| Unrealized depreciation on centrally cleared swaps(a) |
— | 734,939 | — | — | 3,004,077 | — | 3,739,016 | |||||||||||||||||||||
| Swaps — OTC |
||||||||||||||||||||||||||||
| Unrealized depreciation on OTC swaps; Swap premiums received |
— | 5,986,788 | — | — | 274,076 | — | 6,260,864 | |||||||||||||||||||||
|
|
|
|
|
|
|
|
|
|
|
|
|
|
|
|||||||||||||||
| $ | — | $ | 6,721,727 | $ | 1,553,032 | $ | 5,159,262 | $ | 138,812,083 | $ | — | $ | 152,246,104 | |||||||||||||||
|
|
|
|
|
|
|
|
|
|
|
|
|
|
|
|||||||||||||||
| (a) | Net cumulative unrealized appreciation (depreciation) on futures contracts and centrally cleared swaps, if any, are reported in the Consolidated Schedule of Investments. In the Consolidated Statements of Assets and Liabilities, only current day’s variation margin is reported in receivables or payables and the net cumulative unrealized appreciation (depreciation) is included in accumulated earnings (loss). |
| (b) | Includes options purchased at value as reported in the Consolidated Schedule of Investments. |
For the period ended September 30, 2023, the effect of derivative financial instruments in the Consolidated Statement of Operations was as follows:
| Commodity Contracts |
Credit Contracts |
Equity Contracts |
Foreign Currency Exchange Contracts |
Interest Rate Contracts |
Other Contracts |
Total | ||||||||||||||||||||||
| Net Realized Gain (Loss) from: |
||||||||||||||||||||||||||||
| Futures contracts |
$ | — | $ | — | $ | (13,645,621 | ) | $ | — | $ | (137,498,162 | ) | $ | — | $ | (151,143,783 | ) | |||||||||||
| Forward foreign currency exchange contracts |
— | — | — | (13,268,198 | ) | — | — | (13,268,198 | ) | |||||||||||||||||||
| Options purchased(a) |
— | (736,274 | ) | (10,437,131 | ) | (25,872,747 | ) | 10,913,877 | — | (26,132,275 | ) | |||||||||||||||||
| Options written |
— | 47,350 | 726,970 | 12,922,231 | (71,826,583 | ) | — | (58,130,032 | ) | |||||||||||||||||||
| Swaps |
— | (3,208,783 | ) | 1,347,868 | — | (33,746,941 | ) | 2,895,335 | (32,712,521 | ) | ||||||||||||||||||
|
|
|
|
|
|
|
|
|
|
|
|
|
|
|
|||||||||||||||
| $ | — | $ | (3,897,707 | ) | $ | (22,007,914 | ) | $ | (26,218,714 | ) | $ | (232,157,809 | ) | $ | 2,895,335 | $ | (281,386,809 | ) | ||||||||||
|
|
|
|
|
|
|
|
|
|
|
|
|
|
|
|||||||||||||||
| Net Change in Unrealized Appreciation (Depreciation) on: |
||||||||||||||||||||||||||||
| Futures contracts |
$ | — | $ | — | $ | (12,225,262 | ) | $ | — | $ | 106,218,776 | $ | — | $ | 93,993,514 | |||||||||||||
| Forward foreign currency exchange contracts |
— | — | — | (8,557,182 | ) | — | — | (8,557,182 | ) | |||||||||||||||||||
| Options purchased(b) |
— | 88,109 | (72,509 | ) | 850,914 | 4,729,087 | — | 5,595,601 | ||||||||||||||||||||
| 92 | 2 0 2 3 B L A C K R O C K A N N U A L R E P O R T T O S H A R E H O L D E R S |
| Consolidated Schedule of Investments (continued) September 30, 2023 |
Master Total Return Portfolio |
|
|
||||||||||||||||||||||||||||
| Commodity Contracts |
Credit Contracts |
Equity Contracts |
Foreign Currency Exchange Contracts |
Interest Rate Contracts |
Other Contracts |
Total | ||||||||||||||||||||||
|
|
||||||||||||||||||||||||||||
| Options written |
$ | — | $ | (17,241 | ) | $ | 430,806 | $ | (277,339 | ) | $ | 30,013,754 | $ | — | $ | 30,149,980 | ||||||||||||
| Swaps |
— | (4,645,964 | ) | 1,461,611 | — | 18,096,446 | 1,027,206 | 15,939,299 | ||||||||||||||||||||
|
|
|
|
|
|
|
|
|
|
|
|
|
|
|
|||||||||||||||
| $ | — | $ | (4,575,096 | ) | $ | (10,405,354 | ) | $ | (7,983,607 | ) | $ | 159,058,063 | $ | 1,027,206 | $ | 137,121,212 | ||||||||||||
|
|
|
|
|
|
|
|
|
|
|
|
|
|
|
|||||||||||||||
| (a) | Options purchased are included in net realized gain (loss) from investments — unaffiliated. |
| (b) | Options purchased are included in net change in unrealized appreciation (depreciation) on investments. |
Average Quarterly Balances of Outstanding Derivative Financial Instruments
| Futures contracts |
||||
| Average notional value of contracts — long |
$5,573,328,404 | |||
| Average notional value of contracts — short |
$841,405,289 | |||
| Forward foreign currency exchange contracts |
||||
| Average amounts purchased — in USD |
$401,474,677 | |||
| Average amounts sold — in USD |
$281,258,873 | |||
| Options: |
||||
| Average value of option contracts purchased |
$44,911,999 | |||
| Average value of option contracts written |
$41,825,426 | |||
| Average notional value of swaption contracts purchased |
$3,966,041,679 | |||
| Average notional value of swaption contracts written |
$6,408,560,693 | |||
| Credit default swaps |
||||
| Average notional value — buy protection |
$261,334,583 | |||
| Average notional value — sell protection |
$69,793,515 | |||
| Total return swaps |
||||
| Average notional amount |
$98,928,133 | |||
| Interest rate swaps |
||||
| Average notional value — pays fixed rate |
$2,164,150,079 | |||
| Average notional value — received fixed rate |
$798,610,760 | |||
| Inflation swaps |
||||
| Average notional amount — pays |
$35,477,759 | |||
| Average notional amount — receives |
$9,767,877 | |||
For more information about the Master Portfolio’s investment risks regarding derivative financial instruments, refer to the Notes to Consolidated Financial Statements.
Derivative Financial Instruments – Offsetting as of Period End
The Master Portfolio’s derivative assets and liabilities (by type) were as follows:
|
|
||||||||
| Assets | Liabilities | |||||||
|
|
||||||||
| Derivative Financial Instruments |
||||||||
| Futures contracts |
$ | 3,727,926 | $ | 1,442,279 | ||||
| Forward foreign currency exchange contracts |
3,608,360 | 3,571,304 | ||||||
| Options |
115,139,736 | 123,057,526 | ||||||
| Swaps — centrally cleared |
2,939,262 | — | ||||||
| Swaps — OTC(a) |
7,236,422 | 6,260,864 | ||||||
|
|
|
|
|
|||||
| Total derivative assets and liabilities in the Statements of Assets and Liabilities |
$ | 132,651,706 | $ | 134,331,973 | ||||
|
|
|
|
|
|||||
| Derivatives not subject to a Master Netting Agreement or similar agreement (“MNA”) |
(81,468,931 | ) | (75,105,725 | ) | ||||
|
|
|
|
|
|||||
| Total derivative assets and liabilities subject to an MNA |
$ | 51,182,775 | $ | 59,226,248 | ||||
|
|
|
|
|
|||||
| (a) | Includes unrealized appreciation (depreciation) on OTC swaps and swap premiums (paid/received) in the Consolidated Statements of Assets and Liabilities. |
The following tables present the Master Portfolio’s derivative assets and liabilities by counterparty net of amounts available for offset under an MNA and net of the related collateral received and pledged by the Master Portfolio:
|
|
||||||||||||||||||||
| Counterparty | Derivative Assets Subject to an MNA by Counterparty |
Derivatives Available for Offset(a) |
Non- Cash Collateral Received |
Cash Collateral Received(b) |
Net Amount of Derivative Assets(c) |
|||||||||||||||
|
|
||||||||||||||||||||
| Bank of America N.A. |
$ | 709,438 | $ | (709,438 | ) | $ | — | $ | — | $ | — | |||||||||
| M A S T E R P O R T F O L I O S C H E D U L E O F I N V E S T M E N T S |
93 |
| Consolidated Schedule of Investments (continued) September 30, 2023 |
Master Total Return Portfolio |
|
|
||||||||||||||||||||
| Counterparty | Derivative Assets Subject to an MNA by Counterparty |
Derivatives Available for Offset(a) |
Non- Cash Collateral Received |
Cash Collateral Received(b) |
Net Amount of Derivative Assets(c) |
|||||||||||||||
|
|
||||||||||||||||||||
| Bank of New York Mellon |
$ | 71,366 | $ | (20,549 | ) | $ | — | $ | — | $ | 50,817 | |||||||||
| Barclays Bank PLC |
11,142,064 | (11,142,064 | ) | — | — | — | ||||||||||||||
| BNP Paribas S.A. |
513,905 | (513,905 | ) | — | — | — | ||||||||||||||
| Citibank N.A. |
19,565,317 | (19,565,317 | ) | — | — | — | ||||||||||||||
| Citigroup Global Markets, Inc. |
448,760 | — | — | (390,520 | ) | 58,240 | ||||||||||||||
| Deutsche Bank AG |
72,370 | (72,370 | ) | — | — | — | ||||||||||||||
| Goldman Sachs International |
11,612,285 | (2,326,103 | ) | — | (7,010,000 | ) | 2,276,182 | |||||||||||||
| HSBC Bank PLC |
2,164,655 | (1,560,227 | ) | — | — | 604,428 | ||||||||||||||
| JPMorgan Chase Bank N.A. |
2,453,364 | (2,453,364 | ) | — | — | — | ||||||||||||||
| Merrill Lynch International |
931,546 | — | — | — | 931,546 | |||||||||||||||
| Morgan Stanley & Co. International PLC |
547,936 | (547,936 | ) | — | — | — | ||||||||||||||
| NatWest Markets PLC |
90,861 | (75,400 | ) | — | — | 15,461 | ||||||||||||||
| Royal Bank of Canada |
84,193 | — | — | — | 84,193 | |||||||||||||||
| State Street Bank and Trust Co. |
50,253 | (7,290 | ) | — | — | 42,963 | ||||||||||||||
| TD Securities, Inc. |
173,594 | (173,594 | ) | — | — | — | ||||||||||||||
| UBS AG |
550,868 | — | — | — | 550,868 | |||||||||||||||
|
|
|
|
|
|
|
|
|
|
|
|||||||||||
| $ | 51,182,775 | $ | (39,167,557 | ) | $ | — | $ | (7,400,520 | ) | $ | 4,614,698 | |||||||||
|
|
|
|
|
|
|
|
|
|
|
|||||||||||
|
|
||||||||||||||||||||
| Counterparty | Derivative Liabilities Subject to an MNA by Counterparty |
Derivatives Available for Offset(a) |
Non- Cash Collateral Pledged(b) |
Cash Collateral Pledged(b) |
Net Amount of Derivative Liabilities(d) |
|||||||||||||||
|
|
||||||||||||||||||||
| Bank of America N.A. |
$ | 1,905,927 | $ | (709,438 | ) | $ | (1,196,489 | ) | $ | — | $ | — | ||||||||
| Bank of New York Mellon |
20,549 | (20,549 | ) | — | — | — | ||||||||||||||
| Barclays Bank PLC |
13,434,391 | (11,142,064 | ) | (2,292,327 | ) | — | — | |||||||||||||
| BNP Paribas S.A. |
654,253 | (513,905 | ) | — | — | 140,348 | ||||||||||||||
| Citibank N.A. |
26,259,244 | (19,565,317 | ) | (6,693,927 | ) | — | — | |||||||||||||
| Deutsche Bank AG |
797,045 | (72,370 | ) | (724,675 | ) | — | — | |||||||||||||
| Goldman Sachs International |
2,326,103 | (2,326,103 | ) | — | — | — | ||||||||||||||
| HSBC Bank PLC |
1,560,227 | (1,560,227 | ) | — | — | — | ||||||||||||||
| J.P. Morgan Securities LLC |
42,651 | — | — | — | 42,651 | |||||||||||||||
| JPMorgan Chase Bank N.A. |
4,529,670 | (2,453,364 | ) | — | — | 2,076,306 | ||||||||||||||
| Morgan Stanley & Co. International PLC |
7,080,970 | (547,936 | ) | (6,533,034 | ) | — | — | |||||||||||||
| NatWest Markets PLC |
75,400 | (75,400 | ) | — | — | — | ||||||||||||||
| Standard Chartered Bank |
119,528 | — | — | — | 119,528 | |||||||||||||||
| State Street Bank and Trust Co. |
7,290 | (7,290 | ) | — | — | — | ||||||||||||||
| TD Securities, Inc. |
413,000 | (173,594 | ) | — | — | 239,406 | ||||||||||||||
|
|
|
|
|
|
|
|
|
|
|
|||||||||||
| $ | 59,226,248 | $ | (39,167,557 | ) | $ | (17,440,452 | ) | $ | — | $ | 2,618,239 | |||||||||
|
|
|
|
|
|
|
|
|
|
|
|||||||||||
| (a) | The amount of derivatives available for offset is limited to the amount of derivative assets and/or liabilities that are subject to an MNA. |
| (b) | Excess of collateral received/pledged, if any, from the individual counterparty is not shown for financial reporting purposes. |
| (c) | Net amount represents the net amount receivable from the counterparty in the event of default. |
| (d) | Net amount represents the net amount payable due to the counterparty in the event of default. Net amount may be offset further by the options written receivable/payable on the Consolidated Statement of Assets and Liabilities. |
| 94 | 2 0 2 3 B L A C K R O C K A N N U A L R E P O R T T O S H A R E H O L D E R S |
| Consolidated Schedule of Investments (continued) September 30, 2023 |
Master Total Return Portfolio |
Fair Value Hierarchy as of Period End
Various inputs are used in determining the fair value of financial instruments. For description of the input levels and information about the Master Portfolio’s policy regarding valuation of financial instruments, refer to the Consolidated Notes to Financial Statements.
The following table summarizes the Master Portfolio’s investments categorized in the fair value hierarchy. The breakdown of the Master Portfolio’s investments into major categories is disclosed in the Consolidated Schedule of Investments above.
|
|
||||||||||||||||
| Level 1 | Level 2 | Level 3 | Total | |||||||||||||
|
|
||||||||||||||||
| Assets |
||||||||||||||||
| Investments |
||||||||||||||||
| Long-Term Investments |
||||||||||||||||
| Asset-Backed Securities |
$ | — | $ | 1,747,812,319 | $ | 18,670,200 | $ | 1,766,482,519 | ||||||||
| Common Stocks |
||||||||||||||||
| Aerospace & Defense |
— | 44,923 | 4,303,530 | 4,348,453 | ||||||||||||
| Banks |
5,798,532 | — | — | 5,798,532 | ||||||||||||
| Capital Markets |
898,769 | — | 94,502 | 993,271 | ||||||||||||
| Chemicals |
1,547,523 | — | — | 1,547,523 | ||||||||||||
| Energy Equipment & Services |
5,372,688 | — | — | 5,372,688 | ||||||||||||
| Entertainment |
972,359 | 1,454,284 | — | 2,426,643 | ||||||||||||
| Financial Services |
1,363,798 | — | 168,317 | 1,532,115 | ||||||||||||
| Hotel & Resort REITs |
5,176,656 | 156,127 | — | 5,332,783 | ||||||||||||
| Hotels, Restaurants & Leisure |
781,192 | — | — | 781,192 | ||||||||||||
| Interactive Media & Services |
3,797,556 | — | — | 3,797,556 | ||||||||||||
| IT Services |
— | — | 154,490 | 154,490 | ||||||||||||
| Machinery |
— | 405,152 | — | 405,152 | ||||||||||||
| Metals & Mining |
2,409,994 | — | — | 2,409,994 | ||||||||||||
| Oil, Gas & Consumable Fuels |
9,399,188 | — | — | 9,399,188 | ||||||||||||
| Real Estate Management & Development |
2,359,379 | — | — | 2,359,379 | ||||||||||||
| Software |
406,040 | 387,138 | — | 793,178 | ||||||||||||
| Corporate Bonds |
— | 4,293,979,029 | 103,107,859 | 4,397,086,888 | ||||||||||||
| Fixed Rate Loan Interests |
— | 31,968 | 7,240,690 | 7,272,658 | ||||||||||||
| Floating Rate Loan Interests |
— | 115,829,025 | 193,563,637 | 309,392,662 | ||||||||||||
| Foreign Agency Obligations |
— | 29,665,390 | — | 29,665,390 | ||||||||||||
| Foreign Government Obligations |
— | 184,092,924 | — | 184,092,924 | ||||||||||||
| Investment Companies |
27,219,044 | — | 2,580,111 | 29,799,155 | ||||||||||||
| Municipal Bonds |
— | 113,229,794 | — | 113,229,794 | ||||||||||||
| Non-Agency Mortgage-Backed Securities |
— | 1,468,626,469 | 87,351,455 | 1,555,977,924 | ||||||||||||
| Preferred Securities |
— | 3,192,197 | 30,752,892 | 33,945,089 | ||||||||||||
| U.S. Government Sponsored Agency Securities |
— | 8,328,456,234 | — | 8,328,456,234 | ||||||||||||
| U.S. Treasury Obligations |
— | 4,551,248,530 | — | 4,551,248,530 | ||||||||||||
| Warrants |
||||||||||||||||
| Automobile Components |
5,129 | — | — | 5,129 | ||||||||||||
| Automobiles |
28,042 | 498 | — | 28,540 | ||||||||||||
| Capital Markets |
6,069 | — | 4,291 | 10,360 | ||||||||||||
| Consumer Staples Distribution & Retail |
44,196 | — | — | 44,196 | ||||||||||||
| Electrical Equipment |
— | — | 152,286 | 152,286 | ||||||||||||
| Financial Services |
— | — | 9,888 | 9,888 | ||||||||||||
| Hotels, Restaurants & Leisure |
— | — | 1 | 1 | ||||||||||||
| Machinery |
— | 6,034 | — | 6,034 | ||||||||||||
| Oil, Gas & Consumable Fuels |
47,649 | — | — | 47,649 | ||||||||||||
| Real Estate Management & Development |
1,685 | — | — | 1,685 | ||||||||||||
| Software |
87,063 | — | 1,436,481 | 1,523,544 | ||||||||||||
| Short-Term Securities |
||||||||||||||||
| Money Market Funds |
923,558,671 | — | — | 923,558,671 | ||||||||||||
| Options Purchased |
||||||||||||||||
| Equity Contracts |
1,621,681 | — | — | 1,621,681 | ||||||||||||
| Foreign Currency Exchange Contracts |
— | 2,681,569 | — | 2,681,569 | ||||||||||||
| Interest Rate Contracts |
73,180,062 | 37,656,424 | — | 110,836,486 | ||||||||||||
| Liabilities |
||||||||||||||||
| TBA Sale Commitments |
— | (1,736,984,494 | ) | — | (1,736,984,494 | ) | ||||||||||
| Unfunded Floating Rate Loan Interests |
— | (22 | ) | (423,460 | ) | (423,482 | ) | |||||||||
|
|
|
|
|
|
|
|
|
|||||||||
| $ | 1,066,082,965 | $ | 19,141,971,512 | $ | 449,167,170 | 20,657,221,647 | ||||||||||
|
|
|
|
|
|
|
|
|
|||||||||
| Investments valued at NAV(a) |
28,716,016 | |||||||||||||||
|
|
|
|||||||||||||||
| $ | 20,685,937,663 | |||||||||||||||
|
|
|
|||||||||||||||
| M A S T E R P O R T F O L I O S C H E D U L E O F I N V E S T M E N T S |
95 |
| Consolidated Schedule of Investments (continued) September 30, 2023 |
Master Total Return Portfolio |
|
|
||||||||||||||||
| Level 1 | Level 2 | Level 3 | Total | |||||||||||||
|
|
||||||||||||||||
| Derivative Financial Instruments(b) |
||||||||||||||||
| Assets |
||||||||||||||||
| Credit Contracts |
$ | — | $ | 1,183,136 | $ | — | $ | 1,183,136 | ||||||||
| Equity Contracts |
1,664,281 | 1,588,231 | — | 3,252,512 | ||||||||||||
| Foreign Currency Exchange Contracts |
— | 3,608,360 | — | 3,608,360 | ||||||||||||
| Interest Rate Contracts |
8,695,745 | 2,089,715 | — | 10,785,460 | ||||||||||||
| Other Contracts |
— | 1,027,206 | — | 1,027,206 | ||||||||||||
| Liabilities |
||||||||||||||||
| Credit Contracts |
— | (4,312,954 | ) | — | (4,312,954 | ) | ||||||||||
| Equity Contracts |
(1,553,032 | ) | — | — | (1,553,032 | ) | ||||||||||
| Foreign Currency Exchange Contracts |
— | (5,159,262 | ) | — | (5,159,262 | ) | ||||||||||
| Interest Rate Contracts |
(87,727,808 | ) | (51,084,275 | ) | — | (138,812,083 | ) | |||||||||
|
|
|
|
|
|
|
|
|
|||||||||
| $ | (78,920,814 | ) | $ | (51,059,843 | ) | $ | — | $ | (129,980,657 | ) | ||||||
|
|
|
|
|
|
|
|
|
|||||||||
| (a) | Certain investments of the Master Portfolio were fair valued using NAV as a practical expedient as no quoted market value is available and therefore have been excluded from the fair value hierarchy. |
| (b) | Derivative financial instruments are swaps, futures contracts, forward foreign currency exchange contracts and options written. Swaps, futures contracts and forward foreign currency exchange contracts are valued at the unrealized appreciation (depreciation) on the instrument and options written are shown at value. |
A reconciliation of Level 3 investments is presented when the Master Portfolio had a significant amount of Level 3 investments at the beginning and/or end of the period in relation to net assets. The following tables are a reconciliation of Level 3 investments for which significant unobservable inputs were used in determining fair value:
|
|
||||||||||||||||||||||||||||||||||
| Asset-Backed Securities |
|
Common Stocks |
|
Corporate Bonds |
|
Fixed Rate Loan Interests |
|
Floating Rate Loan Interests |
|
Investment Companies |
||||||||||||||||||||||||
|
|
||||||||||||||||||||||||||||||||||
| Assets |
||||||||||||||||||||||||||||||||||
| Opening Balance, as of September 30, 2022 |
$ | 68,815,237 | $ | 348,874 | $ | 43,313,634 | $ | — | $ | 263,305,796 | $ | — | ||||||||||||||||||||||
| Transfers into Level 3 |
— | — | 7,890,383 | — | 3,578,660 | — | ||||||||||||||||||||||||||||
| Transfers out of Level 3(a) |
(32,315,540 | ) | (209,580 | ) | — | — | (16,456,326 | ) | — | |||||||||||||||||||||||||
| Other(b) |
(15,664,125 | ) | — | — | 13,822,871 | (13,822,871 | ) | — | ||||||||||||||||||||||||||
| Accrued discounts/premiums |
— | 173 | 318,691 | 58,938 | 238,969 | — | ||||||||||||||||||||||||||||
| Net realized gain (loss) |
— | — | 4,886 | 48,030 | (1,567,566 | ) | — | |||||||||||||||||||||||||||
| Net change in unrealized appreciation (depreciation)(c)(d) |
(619,844 | ) | 277,843 | 1,567,901 | 79,658 | (6,203,668 | ) | 122,862 | ||||||||||||||||||||||||||
| Purchases |
— | 4,303,529 | 52,483,334 | — | 47,250,043 | 2,721,154 | ||||||||||||||||||||||||||||
| Sales |
(1,545,528 | ) | — | (2,470,970 | ) | (6,768,807 | ) | (82,759,400 | ) | (263,905 | ) | |||||||||||||||||||||||
|
|
|
|
|
|
|
|
|
|
|
|
|
|||||||||||||||||||||||
| Closing Balance, as of September 30, 2023 |
$ | 18,670,200 | $ | 4,720,839 | $ | 103,107,859 | $ | 7,240,690 | $ | 193,563,637 | $ | 2,580,111 | ||||||||||||||||||||||
|
|
|
|
|
|
|
|
|
|
|
|
|
|||||||||||||||||||||||
| Net change in unrealized appreciation (depreciation) on investments still held at September 30, 2023(d) |
$ | (643,800 | ) | $ | 277,843 | $ | 1,567,901 | $ | 79,658 | $ | (7,989,613 | ) | $ | 122,862 | ||||||||||||||||||||
|
|
|
|
|
|
|
|
|
|
|
|
|
|||||||||||||||||||||||
|
|
||||||||||||||||||||||||||||||||||||
| Non-Agency Mortgage-Backed Securities |
|
Preferred Securities |
|
Rights | U.S. Government Sponsored Agency Securities |
|
Warrants | Total | ||||||||||||||||||||||||||||
|
|
||||||||||||||||||||||||||||||||||||
| Assets |
||||||||||||||||||||||||||||||||||||
| Opening Balance, as of September 30, 2022 |
$ | 213,991,954 | $ | 18,825,589 | $ | 4,291 | $ | 4,460,883 | $ | 959,745 | $ | 614,026,003 | ||||||||||||||||||||||||
| Transfers into Level 3 |
9,863,122 | — | — | — | 10,838 | 21,343,003 | ||||||||||||||||||||||||||||||
| Transfers out of Level 3(a) |
(146,786,450 | ) | — | — | (4,034,487 | ) | (28,179 | ) | (199,830,562 | ) | ||||||||||||||||||||||||||
| Other(b) |
15,664,125 | — | (4,291 | ) | — | 4,291 | — | |||||||||||||||||||||||||||||
| Accrued discounts/premiums |
298,152 | — | — | (59,486 | ) | — | 855,437 | |||||||||||||||||||||||||||||
| Net realized gain (loss) |
(180,216 | ) | — | — | (119,333 | ) | — | (1,814,199 | ) | |||||||||||||||||||||||||||
| Net change in unrealized appreciation (depreciation)(c)(d) |
(5,755,760 | ) | (3,821,741 | ) | — | 155,611 | 656,251 | (13,540,887 | ) | |||||||||||||||||||||||||||
| Purchases |
17,203,752 | 15,749,044 | — | — | 1 | 139,710,857 | ||||||||||||||||||||||||||||||
| Sales |
(16,947,224 | ) | — | — | (403,188 | ) | — | (111,159,022 | ) | |||||||||||||||||||||||||||
|
|
|
|
|
|
|
|
|
|
|
|
|
|||||||||||||||||||||||||
| Closing Balance, as of September 30, 2023 |
$ | 87,351,455 | $ | 30,752,892 | $ | — | $ | — | $ | 1,602,947 | $ | 449,590,630 | ||||||||||||||||||||||||
|
|
|
|
|
|
|
|
|
|
|
|
|
|||||||||||||||||||||||||
| Net change in unrealized appreciation (depreciation) on investments still held at September 30, 2023(d) |
$ | (5,749,363 | ) | $ | (3,821,741 | ) | $ | — | $ | — | $ | 656,251 | $ | (15,500,002 | ) | |||||||||||||||||||||
|
|
|
|
|
|
|
|
|
|
|
|
|
|||||||||||||||||||||||||
| 96 | 2 0 2 3 B L A C K R O C K A N N U A L R E P O R T T O S H A R E H O L D E R S |
| Consolidated Schedule of Investments (continued) September 30, 2023 |
Master Total Return Portfolio |
|
|
||||
| Unfunded Floating Rate Loan Interests |
||||
|
|
||||
| Liabilities |
||||
| Opening Balance, as of September 30, 2022 |
$ | (384,063 | ) | |
| Transfers into Level 3 |
— | |||
| Transfers out of Level 3(a) |
12,179 | |||
| Accrued discounts/premiums |
— | |||
| Net realized gain (loss) |
— | |||
| Net change in unrealized appreciation (depreciation)(c)(d) |
(51,576 | ) | ||
| Purchases |
— | |||
| Sales |
— | |||
|
|
|
|||
| Closing Balance, as of September 30, 2023 |
$ | (423,460 | ) | |
|
|
|
|||
| Net change in unrealized appreciation (depreciation) on investments still held at September 30, 2023(d) |
$ | (184,604 | ) | |
|
|
|
|||
| (a) | As of September 30, 2022, the Master Portfolio used significant unobservable inputs in determining the value of certain investments. As of September 30, 2023, the Master Portfolio used observable inputs in determining the value of the same investments. As a result, investments at beginning of period value were transferred from Level 3 to Level 2 in the disclosure hierarchy. |
| (b) | Certain Level 3 investments were re-classified between Asset-Backed Securities and Non-Agency Mortgage-Backed Securities, between Fixed Rate Loan Interests and Floating Rate Loan Interests, and between Rights and Warrants. |
| (c) | Included in the related net change in unrealized appreciation (depreciation) in the Consolidated Statement of Operations |
| (d) | Any difference between net change in unrealized appreciation (depreciation) and net change in unrealized appreciation (depreciation) on investments still held at September 30, 2023, is generally due to investments no longer held or categorized as Level 3 at period end. |
|
|
||||||||
| Foreign Currency Exchange Contracts |
||||||||
|
|
|
|||||||
| Assets | Liabilities | |||||||
|
|
||||||||
| Opening Balance, as of September 30, 2022 |
$ | 2,680,210 | $ | — | ||||
| Transfers into Level 3 |
— | — | ||||||
| Transfers out of Level 3 |
— | — | ||||||
| Accrued discounts/premiums |
— | — | ||||||
| Net realized gain (loss) |
(3,816,474 | ) | — | |||||
| Net change in unrealized appreciation (depreciation)(a)(b) |
1,136,264 | — | ||||||
| Purchases |
— | — | ||||||
| Issues |
— | — | ||||||
| Settlements |
— | — | ||||||
| Sales |
— | — | ||||||
|
|
|
|
|
|||||
| Closing Balance, as of September 30, 2023 |
$ | — | $ | — | ||||
|
|
|
|
|
|||||
| Net change in unrealized appreciation (depreciation) on investments still held at September 30, 2023(b) |
$ | — | $ | — | ||||
|
|
|
|
|
|||||
| (a) | Included in the related net change in unrealized appreciation (depreciation) in the Consolidated Statement of Operations. |
| (b) | Any difference between net change in unrealized appreciation (depreciation) and net change in unrealized appreciation (depreciation) on investments still held at September 30, 2023, is generally due to investments no longer held or categorized as Level 3 at period end. |
| M A S T E R P O R T F O L I O S C H E D U L E O F I N V E S T M E N T S |
97 |
| Consolidated Schedule of Investments (continued) September 30, 2023 |
Master Total Return Portfolio |
The following table summarizes the valuation approaches used and unobservable inputs utilized by the Valuation Committee to determine the value of certain of the Master Portfolio’s Level 3 investments as of period end. The table does not include Level 3 investments with values based upon unadjusted third party pricing information in the amount of $99,735,576. A significant change in the third party information could result in a significantly lower or higher value of such Level 3 investments.
| Value | Valuation Approach | Unobservable Inputs |
Range of Unobservable Inputs Utilized(a) |
|
Weighted Average of Unobservable Inputs Based on Fair Value |
|||||||||||||||||
| Assets |
||||||||||||||||||||||
| Asset-Backed Securities |
$ | 18,670,200 | Income | Discount Rate | 9% | — | ||||||||||||||||
| Common Stocks |
4,566,349 | Market | Volatility | 44% - 51% | 47% | |||||||||||||||||
| Time to Exit | 1.2 - 1.4 years | 1.3 years | ||||||||||||||||||||
| EBITDA Multiple | 10.59x | — | ||||||||||||||||||||
| Corporate Bonds |
96,581,200 | Income | Discount Rate | 4% - 48% | 15% | |||||||||||||||||
| Fixed Rate Loan Interests |
7,240,690 | Income | Discount Rate | 14% | — | |||||||||||||||||
| Floating Rate Loan Interests(b)(c) |
189,788,608 | Income | Discount Rate | 3% - 15% | 9% | |||||||||||||||||
| Credit Spread | 321 - 632 | 432 | ||||||||||||||||||||
| Esimtated Recovery Value | 41% - 79% | 70% | ||||||||||||||||||||
| Market | EBITDA Multiple | 15.25x | — | |||||||||||||||||||
| Investment Companies |
2,580,111 | Income | Discount Rate | 13% | — | |||||||||||||||||
| Non-Agency Mortgage-Backed Securities |
10,304,701 | Income | Discount Rate | 14% | — | |||||||||||||||||
| Prepayment Speed | 27.50% | — | ||||||||||||||||||||
| Loss on Repayments | 5.00% | — | ||||||||||||||||||||
| Credit Spread | 517 | — | ||||||||||||||||||||
| Preferred Stock |
30,752,892 | Income | Discount Rate | 12% - 16% | 12% | |||||||||||||||||
| Market | Revenue Multiple | 9.50x | — | |||||||||||||||||||
| EBITDA Multiple | 7.00x - 8.00x | 7.70x | ||||||||||||||||||||
| Volatility | 90% | — | ||||||||||||||||||||
| Time to Exit | 0.3 years | — | ||||||||||||||||||||
| Gross Profit Multiple | 6.75x | — | ||||||||||||||||||||
| Warrants |
1,602,925 | Market | Revenue Multiple | 3.25x - 9.50x | 8.90x | |||||||||||||||||
| Volatility | 40% - 60% | 58% | ||||||||||||||||||||
| Time to Exit | 0.3 - 1.6 years | 1.5 years | ||||||||||||||||||||
|
|
|
|||||||||||||||||||||
| $ | 362,087,676 | |||||||||||||||||||||
|
|
|
|||||||||||||||||||||
| (a) | A significant change in unobservable input would have resulted in a correlated (inverse) significant change to value. |
| (b) | For the period end September 30, 2023, the valuation technique for investments classified as Floating Rate Loan Interests amounting to $12,393,360 changed to a Discount Cash Flow approach. The investments were previously valued utilizing a recent transaction. The change was due to consideration of the information that was available at the time the investments were valued. |
| (c) | For the period end Septmeber 30, 2023, the valuation technique for investments classified as Floating Rate Loan Interests amounting to $5,608,697 changed to a Market approach. The investments were previously valued utilizing a Discount Cash Flow approach. The change was due to consideration of the information that was available at the time the investments were valued. |
See notes to consolidated financial statements.
| 98 | 2 0 2 3 B L A C K R O C K A N N U A L R E P O R T T O S H A R E H O L D E R S |
Consolidated Statement of Assets and Liabilities
September 30, 2023
| Master Total Return Portfolio |
||||||
|
| ||||||
| ASSETS |
||||||
| Investments, at value — unaffiliated(a)(b) |
$ | 21,446,688,172 | ||||
| Investments, at value — affiliated(c) |
976,657,467 | |||||
| Cash |
2,216,210 | |||||
| Cash pledged: |
||||||
| Collateral — OTC derivatives |
5,143,200 | |||||
| Collateral — TBA commitments |
287,000 | |||||
| Futures contracts |
40,840,010 | |||||
| Centrally cleared swaps |
16,023,000 | |||||
| Foreign currency, at value(d) |
49,470,372 | |||||
| Receivables: |
||||||
| Investments sold |
113,807,636 | |||||
| Options written |
4,765,632 | |||||
| Securities lending income — affiliated |
6,861 | |||||
| Swaps |
12,514,893 | |||||
| TBA sale commitments |
1,756,068,604 | |||||
| Contributions from investors |
76,869 | |||||
| Dividends — unaffiliated |
24,438 | |||||
| Dividends — affiliated |
654 | |||||
| Interest — unaffiliated |
142,390,631 | |||||
| Variation margin on futures contracts |
3,727,926 | |||||
| Variation margin on centrally cleared swaps |
2,939,262 | |||||
| Swap premiums paid |
4,210,126 | |||||
| Unrealized appreciation on: |
||||||
| Forward foreign currency exchange contracts |
3,608,360 | |||||
| OTC swaps |
3,026,296 | |||||
| Prepaid expenses |
51,150 | |||||
|
|
|
|||||
| Total assets |
24,584,544,769 | |||||
|
|
|
|||||
| LIABILITIES |
||||||
| Cash received: |
||||||
| Collateral — OTC derivatives |
10,070,520 | |||||
| Centrally cleared swaps |
370 | |||||
| Collateral on securities loaned |
28,717,943 | |||||
| Options written, at value(f) |
123,057,526 | |||||
| TBA sale commitments at value(g) |
1,736,984,494 | |||||
| Payables: |
||||||
| Investments purchased |
4,491,789,254 | |||||
| Swaps |
12,349,461 | |||||
| Interest expense |
2,108,355 | |||||
| Investment advisory fees |
1,517,211 | |||||
| Directors’ fees |
285,682 | |||||
| Options written |
319,669 | |||||
| Other accrued expenses |
643,529 | |||||
| Professional fees |
165,265 | |||||
| Variation margin on futures contracts |
1,442,279 | |||||
| Withdrawals to investors |
39,756,969 | |||||
| Swap premiums received |
2,408,773 | |||||
| Unrealized depreciation on: |
||||||
| Forward foreign currency exchange contracts |
3,571,304 | |||||
| OTC swaps |
3,852,091 | |||||
| Unfunded floating rate loan interests |
423,482 | |||||
|
|
|
|||||
| Total liabilities |
6,459,464,177 | |||||
|
|
|
|||||
| Commitments and contingent liabilities |
||||||
| NET ASSETS |
$ | 18,125,080,592 | ||||
|
|
|
|||||
| M A S T E R P O R T F O L I O F I N A N C I A L S T A T E M E N T S |
99 |
Consolidated Statement of Assets and Liabilities (continued)
September 30, 2023
| Master Total Return Portfolio |
||||||
|
| ||||||
| NET ASSETS CONSIST OF |
||||||
| Investors’ capital |
$ | 19,985,274,005 | ||||
| Net unrealized appreciation (depreciation) |
(1,860,193,413 | ) | ||||
|
|
|
|||||
| NET ASSETS |
$ | 18,125,080,592 | ||||
|
|
|
|||||
| (a) Investments, at cost — unaffiliated |
$ | 23,268,513,523 | ||||
| (b) Securities loaned, at value |
$ | 28,060,716 | ||||
| (c) Investments, at cost — affiliated |
$ | 977,927,426 | ||||
| (d) Foreign currency, at cost |
$ | 50,772,466 | ||||
| (f) Premiums received |
$ | 78,343,944 | ||||
| (g) Proceeds from TBA sale commitments |
$ | 1,756,068,604 | ||||
See notes to consolidated financial statements.
| 100 | 2 0 2 3 B L A C K R O C K A N N U A L R E P O R T T O S H A R E H O L D E R S |
Consolidated Statement of Operations
Year Ended September 30, 2023
| Master Total Return Portfolio |
||||||
| INVESTMENT INCOME |
||||||
| Dividends — unaffiliated |
$ | 3,298,636 | ||||
| Dividends — affiliated |
43,285,764 | |||||
| Interest — unaffiliated |
765,737,104 | |||||
| Securities lending income — affiliated — net |
246,427 | |||||
| Foreign taxes withheld |
(1,915 | ) | ||||
|
|
|
|||||
| Total investment income |
812,566,016 | |||||
|
|
|
|||||
| EXPENSES |
||||||
| Investment advisory |
9,527,309 | |||||
| Accounting services |
510,000 | |||||
| Professional |
422,562 | |||||
| Directors |
89,917 | |||||
| Printing and postage |
11,702 | |||||
| Custodian |
170 | |||||
| Miscellaneous |
892,413 | |||||
|
|
|
|||||
| Total expenses excluding interest expense |
11,454,073 | |||||
| Interest expense |
1,758 | |||||
|
|
|
|||||
| Total expenses |
11,455,831 | |||||
| Less: |
||||||
| Fees waived and/or reimbursed by the Manager |
(702,458 | ) | ||||
|
|
|
|||||
| Total expenses after fees waived and/or reimbursed |
10,753,373 | |||||
|
|
|
|||||
| Net investment income |
801,812,643 | |||||
|
|
|
|||||
| REALIZED AND UNREALIZED GAIN (LOSS) |
||||||
| Net realized gain (loss) from: |
||||||
| Investments — unaffiliated(a) |
(902,497,443 | ) | ||||
| Investments — affiliated |
(559,270 | ) | ||||
| Options written |
(58,130,032 | ) | ||||
| Futures contracts |
(151,143,783 | ) | ||||
| Forward foreign currency exchange contracts |
(13,268,198 | ) | ||||
| Foreign currency transactions |
15,433,931 | |||||
| Swaps |
(32,712,521 | ) | ||||
|
|
|
|||||
| (1,142,877,316 | ) | |||||
|
|
|
|||||
| Net change in unrealized appreciation (depreciation) on: |
||||||
| Investments — unaffiliated |
466,213,351 | |||||
| Investments — affiliated |
(1,270,725 | ) | ||||
| Options written |
30,149,980 | |||||
| Futures contracts |
93,993,514 | |||||
| Forward foreign currency exchange contracts |
(8,557,182 | ) | ||||
| Foreign currency translations |
(3,380,739 | ) | ||||
| Swaps |
15,939,299 | |||||
| Unfunded floating rate loan interests |
(39,419 | ) | ||||
|
|
|
|||||
| 593,048,079 | ||||||
|
|
|
|||||
| Net realized and unrealized loss |
(549,829,237 | ) | ||||
|
|
|
|||||
| NET INCREASE IN NET ASSETS RESULTING FROM OPERATIONS |
$ | 251,983,406 | ||||
|
|
|
|||||
| (a) Net of foreign capital gain tax of |
$ | (15,922 | ) | |||
See notes to consolidated financial statements.
| M A S T E R P O R T F O L I O F I N A N C I A L S T A T E M E N T S |
101 |
Statements of Changes in Net Assets
| Master Total Return Portfolio | ||||||||||
|
|
|
|||||||||
| Year Ended 09/30/23(a) |
Year Ended 09/30/22 |
| ||||||||
| INCREASE (DECREASE) IN NET ASSETS |
||||||||||
| OPERATIONS |
||||||||||
| Net investment income |
$ | 801,812,643 | $ | 550,138,082 | ||||||
| Net realized loss |
(1,142,877,316 | ) | (1,364,435,913 | ) | ||||||
| Net change in unrealized appreciation (depreciation) |
593,048,079 | (2,590,778,415 | ) | |||||||
|
|
|
|
|
|||||||
| Net increase (decrease) in net assets resulting from operations |
251,983,406 | (3,405,076,246 | ) | |||||||
|
|
|
|
|
|||||||
| CAPITAL TRANSACTIONS |
||||||||||
| Net proceeds from sale of shares |
6,763,814,354 | 7,567,387,796 | ||||||||
| Costs of shares redeemed |
(6,202,714,532 | ) | (8,475,995,704 | ) | ||||||
|
|
|
|
|
|||||||
| Net increase (decrease) in net assets derived from capital transactions |
561,099,822 | (908,607,908 | ) | |||||||
|
|
|
|
|
|||||||
| NET ASSETS |
||||||||||
| Total increase (decrease) in net assets |
813,083,228 | (4,313,684,154 | ) | |||||||
| Beginning of year |
17,311,997,364 | 21,625,681,518 | ||||||||
|
|
|
|
|
|||||||
| End of year |
$ | 18,125,080,592 | $ | 17,311,997,364 | ||||||
|
|
|
|
|
|||||||
| (a) | Consolidated Statement of Changes in Net Assets. |
See notes to consolidated financial statements.
| 102 | 2 0 2 3 B L A C K R O C K A N N U A L R E P O R T T O S H A R E H O L D E R S |
(For a share outstanding throughout each period)
| Master Total Return Portfolio | ||||||||||||||||||||
| |
Year Ended 09/30/23 |
(a) |
|
Year Ended 09/30/22 |
|
|
Year Ended 09/30/21 |
|
|
Year Ended 09/30/20 |
|
|
Year Ended 09/30/19 |
(a) | ||||||
| Total Return |
||||||||||||||||||||
| Total return |
1.69 | % | (15.60 | )% | 1.63 | % | 7.90 | % | 10.60 | % | ||||||||||
|
|
|
|
|
|
|
|
|
|
|
|||||||||||
| Ratios to Average Net Assets(b) |
||||||||||||||||||||
| Total expenses |
0.06 | % | 0.07 | % | 0.07 | % | 0.07 | % | 0.07 | % | ||||||||||
|
|
|
|
|
|
|
|
|
|
|
|||||||||||
| Total expenses after fees waived and/or reimbursed |
0.06 | % | 0.06 | % | 0.07 | % | 0.06 | % | 0.07 | % | ||||||||||
|
|
|
|
|
|
|
|
|
|
|
|||||||||||
| Total expenses after fees waived and/or reimbursed and excluding interest expense |
0.06 | % | 0.06 | % | 0.07 | % | 0.06 | % | 0.07 | % | ||||||||||
|
|
|
|
|
|
|
|
|
|
|
|||||||||||
| Net investment income |
4.46 | % | 2.65 | % | 2.25 | % | 2.70 | % | 3.70 | % | ||||||||||
|
|
|
|
|
|
|
|
|
|
|
|||||||||||
| Supplemental Data |
||||||||||||||||||||
| Net assets, end of year (000) |
$ | 18,125,081 | $ | 17,311,997 | $ | 21,625,682 | $ | 20,004,450 | $ | 15,712,831 | ||||||||||
|
|
|
|
|
|
|
|
|
|
|
|||||||||||
| Portfolio turnover rate(c) |
380 | % | 289 | % | 459 | % | 556 | % | 574 | % | ||||||||||
|
|
|
|
|
|
|
|
|
|
|
|||||||||||
| (a) | Consolidated Financial Highlights. |
| (b) | Excludes fees and expenses incurred indirectly as a result of investments in underlying funds. |
| (c) | Includes mortgage dollar roll transactions (“MDRs”). Additional information regarding portfolio turnover rate is as follows: |
| Year Ended 09/30/23 |
Year Ended 09/30/22 |
Year Ended 09/30/21 |
Year Ended 09/30/20 |
Year Ended 09/30/19 |
||||||||||||||||
| Portfolio turnover rate (excluding MDRs) |
171 | % | 42 | % | 161 | % | 274 | % | 241 | % | ||||||||||
See notes to consolidated financial statements.
| M A S T E R P O R T F O L I O F I N A N C I A L H I G H L I G H T S |
103 |
Notes to Consolidated Financial Statements
| 1. | ORGANIZATION |
Master Bond LLC is registered under the Investment Company Act of 1940, as amended (the “1940 Act”), as an open-end management investment company. The Master Bond LLC is organized as a Delaware limited liability company. Master Total Return Portfolio (the “Master Portfolio”) is a series of Master Bond LLC. The Master Portfolio is classified as diversified. The Master Bond LLC’s Limited Liability Company Agreement permits the Board of Directors of Master Bond LLC (the “Board”) to issue non-transferable interests, subject to certain limitations.
The Master Portfolio, together with certain other registered investment companies advised by BlackRock Advisors, LLC (the “Manager”) or its affiliates, is included in a complex of funds referred to as the BlackRock Fixed-Income Complex.
On June 1, 2023, the Board of Directors of the Fund approved a proposal pursuant to which the Fund will cease to invest in Master Total Return Portfolio (the “Master Portfolio”), a series of Master Bond LLC, as part of a “master/feeder” structure and will instead operate as a stand-alone fund. The change is expected to be completed in the first quarter of 2024.
Basis of Consolidation: The accompanying consolidated financial statements of the Master Portfolio include the accounts of BlackRock Cayman Master Total Return Portfolio II, Ltd. (the “Cayman Subsidiary”), which is a wholly-owned subsidiary of the Master Portfolio and primarily invests in commodity-related instruments. The Cayman Subsidiary enables the Master Portfolio to hold these commodity-related instruments and satisfy regulated investment company tax requirements. The Master Portfolio may invest up to 25% of its total assets in the Cayman Subsidiary. The net assets of the Cayman Subsidiary as of period end were $13,882, which is less than 0.1% of the Master Portfolio’s consolidated net assets. Intercompany accounts and transactions, if any, have been eliminated. The Cayman Subsidiary is subject to the same investment policies and restrictions that apply to the Master Portfolio, except that the Cayman Subsidiary may invest without limitation in commodity-related instruments.
The accompanying consolidated financial statements of the Master Portfolio include the accounts of BlackRock Master Total Return Portfolio Subsidiary, LLC (the “Taxable Subsidiary”), which is a wholly-owned taxable subsidiary of the Master Portfolio. The Taxable Subsidiary enables the Master Portfolio to hold certain pass-through investments and satisfy Regulated Investment Company (“RIC”) tax requirements. Income earned and gains realized on the investment held by the Taxable Subsidiary are taxable to such subsidiary. A tax provision for income, if any, is shown as income tax in the Consolidated Statement of Operations for the Master Portfolio. A tax provision for realized and unrealized gains, if any, is included as a reduction of realized and/or unrealized gain (loss) in the Consolidated Statement of Operations for the Master Portfolio. Taxes payable or deferred as of September 30, 2023, if any, are disclosed in the Consolidated Statement of Assets and Liabilities. The Master Portfolio may invest up to 25% of its total assets in the Taxable Subsidiary. The net assets of the Taxable Subsidiary as of period end were $2,845,179, which is less than 0.1% of the Master Portfolio’s consolidated net assets. Intercompany accounts and transactions, if any, have been eliminated. The Taxable Subsidiary is subject to the same investment policies and restrictions that apply to the Master Portfolio.
| 2. | SIGNIFICANT ACCOUNTING POLICIES |
The consolidated financial statements are prepared in conformity with accounting principles generally accepted in the United States of America (“U.S. GAAP”), which may require management to make estimates and assumptions that affect the reported amounts of assets and liabilities in the consolidated financial statements, disclosure of contingent assets and liabilities at the date of the consolidated financial statements and the reported amounts of increases and decreases in net assets from operations during the reporting period. Actual results could differ from those estimates. The Master Portfolio is considered an investment company under U.S. GAAP and follows the accounting and reporting guidance applicable to investment companies. Below is a summary of significant accounting policies:
Investment Transactions and Income Recognition: For financial reporting purposes, investment transactions are recorded on the dates the transactions are executed. Realized gains and losses on investment transactions are determined using the specific identification method. Dividend income and capital gain distributions, if any, are recorded on the ex-dividend dates. Non-cash dividends, if any, are recorded on the ex-dividend dates at fair value. Dividends from foreign securities where the ex-dividend dates may have passed are subsequently recorded when the Master Portfolio is informed of the ex-dividend dates. Under the applicable foreign tax laws, a withholding tax at various rates may be imposed on capital gains, dividends and interest. Upon notification from issuers, a portion of the dividend income received from a real estate investment trust may be redesignated as a reduction of cost of the related investment and/or realized gain. Interest income, including amortization and accretion of premiums and discounts on debt securities, and payment-in-kind interest are recognized daily on an accrual basis. For convertible securities, premiums attributable to the debt instrument are amortized, but premiums attributable to the conversion feature are not amortized.
Foreign Currency Translation: The Master Portfolio’s books and records are maintained in U.S. dollars. Securities and other assets and liabilities denominated in foreign currencies are translated into U.S. dollars using exchange rates determined as of the close of trading on the New York Stock Exchange (“NYSE”). Purchases and sales of investments are recorded at the rates of exchange prevailing on the respective dates of such transactions. Generally, when the U.S. dollar rises in value against a foreign currency, the investments denominated in that currency will lose value; the opposite effect occurs if the U.S. dollar falls in relative value.
The Master Portfolio does not isolate the effect of fluctuations in foreign exchange rates from the effect of fluctuations in the market prices of investments for financial reporting purposes. Accordingly, the effects of changes in exchange rates on investments are not segregated in the Consolidated Statement of Operations from the effects of changes in market prices of those investments, but are included as a component of net realized and unrealized gain (loss) from investments. The Master Portfolio reports realized currency gains (losses) on foreign currency related transactions as components of net realized gain (loss) for financial reporting purposes, whereas such components are generally treated as ordinary income for U.S. federal income tax purposes.
Foreign Taxes: The Master Portfolio may be subject to foreign taxes (a portion of which may be reclaimable) on income, stock dividends, capital gains on investments, or certain foreign currency transactions. All foreign taxes are recorded in accordance with the applicable foreign tax regulations and rates that exist in the foreign jurisdictions in which the Master Portfolio invests. These foreign taxes, if any, are paid by the Master Portfolio and are reflected in its Consolidated Statement of Operations as follows: foreign taxes withheld at source are presented as a reduction of income, foreign taxes on securities lending income are presented as a reduction of securities lending income, foreign
| 104 | 2 0 2 3 B L A C K R O C K A N N U A L R E P O R T T O S H A R E H O L D E R S |
Notes to Consolidated Financial Statements (continued)
taxes on stock dividends are presented as “Foreign taxes withheld”, and foreign taxes on capital gains from sales of investments and foreign taxes on foreign currency transactions are included in their respective net realized gain (loss) categories. Foreign taxes payable or deferred as of September 30, 2023, if any, are disclosed in the Consolidated Statement of Assets and Liabilities.
The Master Portfolio files withholding tax reclaims in certain jurisdictions to recover a portion of amounts previously withheld. The Master Portfolio may record a reclaim receivable based on collectability, which includes factors such as the jurisdiction’s applicable laws, payment history and market convention. The Consolidated Statement of Operations includes tax reclaims recorded as well as professional and other fees, if any, associated with recovery of foreign withholding taxes.
Collateralization: If required by an exchange or counterparty agreement, the Master Portfolio may be required to deliver/deposit cash and/or securities to/with an exchange, or broker-dealer or custodian as collateral for certain investments.
Deferred Compensation Plan: Under the Deferred Compensation Plan (the “Plan”) approved by the Master Portfolio’s Board, the directors who are not “interested persons” of the Master Bond LLC, as defined in the 1940 Act (“Independent Directors”), may defer a portion of their annual complex-wide compensation. Deferred amounts earn an approximate return as though equivalent dollar amounts had been invested in common shares of certain funds in the BlackRock Fixed-Income Complex selected by the Independent Directors. This has the same economic effect for the Independent Directors as if the Independent Directors had invested the deferred amounts directly in certain funds in the BlackRock Fixed-Income Complex.
The Plan is not funded and obligations thereunder represent general unsecured claims against the general assets of the Fund, as applicable. Deferred compensation liabilities, if any, are included in the Director’s fees payable in the Consolidated Statement of Assets and Liabilities and will remain as a liability of the Fund until such amounts are distributed in accordance with the Plan. Net appreciation (depreciation) in the value of participants’ deferral accounts is allocated among the participating funds in the BlackRock Fixed Income Complex and reflected as Director expense on the Consolidated Statement of Operations. The Director expense may be negative as a result of a decrease in value of the deferred accounts.
Indemnifications: In the normal course of business, the Master Portfolio enters into contracts that contain a variety of representations that provide general indemnification. The Master Portfolio’s maximum exposure under these arrangements is unknown because it involves future potential claims against the Master Portfolio, which cannot be predicted with any certainty.
Other: Expenses directly related to the Master Portfolio are charged to the Master Portfolio. Other operating expenses shared by several funds, including other funds managed by the Manager, are prorated among those funds on the basis of relative net assets or other appropriate methods.
The Master Portfolio has an arrangement with its custodian whereby credits are earned on uninvested cash balances, which could be used to reduce custody fees and/or overdraft charges. The Master Portfolio may incur charges on overdrafts, subject to certain conditions.
| 3. | INVESTMENT VALUATION AND FAIR VALUE MEASUREMENTS |
Investment Valuation Policies: The Master Portfolio’s investments are valued at fair value (also referred to as “market value” within the financial statements) each day that the Master Portfolio is open for business and, for financial reporting purposes, as of the report date. U.S. GAAP defines fair value as the price the Master Portfolio would receive to sell an asset or pay to transfer a liability in an orderly transaction between market participants at the measurement date. The Board has approved the designation of the Manager as the valuation designee for the Master Portfolio under rule 2a-5 under the 1940 Act. The Master Portfolio determines the fair values of its financial instruments using various independent dealers or pricing services under the Manager’s policies. If a security’s market price is not readily available or does not otherwise accurately represent the fair value of the security, the security will be valued in accordance with the Manager’s policies and procedures as reflecting fair value. The Manager has formed a committee (the “Valuation Committee”) to develop pricing policies and procedures and to oversee the pricing function for all financial instruments, with assistance from other BlackRock pricing committees.
Fair Value Inputs and Methodologies: The following methods and inputs are used to establish the fair value of the Master Portfolio’s assets and liabilities:
| • | Equity investments traded on a recognized securities exchange are valued at that day’s official closing price, as applicable, on the exchange where the stock is primarily traded. Equity investments traded on a recognized exchange for which there were no sales on that day may be valued at the last available bid (long positions) or ask (short positions) price. |
| • | Fixed-income investments for which market quotations are readily available are generally valued using the last available bid price or current market quotations provided by independent dealers or third-party pricing services. Floating rate loan interests are valued at the mean of the bid prices from one or more independent brokers or dealers as obtained from a third-party pricing service. Pricing services generally value fixed-income securities assuming orderly transactions of an institutional round lot size, but a fund may hold or transact in such securities in smaller, odd lot sizes. Odd lots may trade at lower prices than institutional round lots. The pricing services may use matrix pricing or valuation models that utilize certain inputs and assumptions to derive values, including transaction data (e.g., recent representative bids and offers), market data, credit quality information, perceived market movements, news, and other relevant information. Certain fixed-income securities, including asset-backed and mortgage related securities may be valued based on valuation models that consider the estimated cash flows of each tranche of the entity, establish a benchmark yield and develop an estimated tranche specific spread to the benchmark yield based on the unique attributes of the tranche. The amortized cost method of valuation may be used with respect to debt obligations with sixty days or less remaining to maturity unless the Manager determines such method does not represent fair value. |
| • | Investments in open-end U.S. mutual funds (including money market funds) are valued at that day’s published net asset value (“NAV”). |
| • | The Master Portfolio values its investment in SL Liquidity Series, LLC, Money Market Series (the “Money Market Series”) at fair value, which is ordinarily based upon its pro rata ownership in the underlying fund’s net assets. |
| • | Futures contracts are valued based on that day’s last reported settlement or trade price on the exchange where the contract is traded. |
| M A S T E R P O R T F O L I O N O T E S T O C O N S O L I D A T E D F I N A N C I A L S T A T E M E N T S |
105 |
Notes to Consolidated Financial Statements (continued)
| • | Forward foreign currency exchange contracts are valued at the mean between the bid and ask prices and are determined as of the close of trading on the NYSE based on that day’s prevailing forward exchange rate for the underlying currencies. |
| • | Exchange-traded options are valued at the mean between the last bid and ask prices at the close of the options market in which the options trade. An exchange-traded option for which there is no mean price, is valued at the last bid (long positions) or ask (short positions) price. If no bid or ask price is available, the prior day’s price will be used, unless it is determined that the prior day’s price no longer reflects the fair value of the option. Over-the-counter (“OTC”) options and options on swaps (“swaptions”) are valued by an independent pricing service using a mathematical model, which incorporates a number of market data factors, such as the trades and prices of the underlying instruments. |
| • | Swap agreements are valued utilizing quotes received daily by independent pricing services or through brokers, which are derived using daily swap curves and models that incorporate a number of market data factors, such as discounted cash flows, trades and values of the underlying reference instruments. |
Generally, trading in foreign instruments is substantially completed each day at various times prior to the close of trading on the New York Stock Exchange (“NYSE”). Each business day, the Master Portfolio uses current market factors supplied by independent pricing services to value certain foreign instruments (“Systematic Fair Value Price”). The Systematic Fair Value Price is designed to value such foreign securities at fair value as of the close of trading on the NYSE, which follows the close of the local markets.
If events (e.g., market volatility, company announcement or a natural disaster) occur that are expected to materially affect the value of such investment, or in the event that application of these methods of valuation results in a price for an investment that is deemed not to be representative of the market value of such investment, or if a price is not available, the investment will be valued by the Valuation Committee in accordance with the Manager’s policies and procedures as reflecting fair value (“Fair Valued Investments”). The fair valuation approaches that may be used by the Valuation Committee include market approach, income approach and cost approach. Valuation techniques such as discounted cash flow, use of market comparables and matrix pricing are types of valuation approaches and are typically used in determining fair value. When determining the price for Fair Valued Investments, the Valuation Committee seeks to determine the price that the Master Portfolio might reasonably expect to receive or pay from the current sale or purchase of that asset or liability in an arm’s-length transaction. Fair value determinations shall be based upon all available factors that the Valuation Committee deems relevant and consistent with the principles of fair value measurement.
For investments in equity or debt issued by privately held companies or funds (“Private Company” or collectively, the “Private Companies”) and other Fair Valued Investments, the fair valuation approaches that are used by the Valuation Committee and third-party pricing services utilized by the Valuation Committee include one or a combination of, but not limited to, the following inputs.
| Standard Inputs Generally Considered By The Valuation Committee And Third-Party Pricing Services | ||||
| Market approach |
(i) | recent market transactions, including subsequent rounds of financing, in the underlying investment or comparable issuers; | ||
| (ii) | recapitalizations and other transactions across the capital structure; and | |||
| (iii) | market multiples of comparable issuers. | |||
| Income approach |
(i) | future cash flows discounted to present and adjusted as appropriate for liquidity, credit, and/or market risks; | ||
| (ii) | quoted prices for similar investments or assets in active markets; and | |||
| (iii) | other risk factors, such as interest rates, yield curves, volatilities, prepayment speeds, loss severities, credit risks, recovery rates, liquidation amounts and/or default rates. | |||
| Cost approach |
(i) | audited or unaudited financial statements, investor communications and financial or operational metrics issued by the Private Company; | ||
| (ii) | changes in the valuation of relevant indices or publicly traded companies comparable to the Private Company; | |||
| (iii) | relevant news and other public sources; and | |||
| (iv) | known secondary market transactions in the Private Company’s interests and merger or acquisition activity in companies comparable to the Private Company. | |||
Investments in series of preferred stock issued by Private Companies are typically valued utilizing market approach in determining the enterprise value of the company. Such investments often contain rights and preferences that differ from other series of preferred and common stock of the same issuer. Enterprise valuation techniques such as an option pricing model (“OPM”), a probability weighted expected return model (“PWERM”), current value method or a hybrid of those techniques are used as deemed appropriate under the circumstances. The use of these valuation techniques involve a determination of the exit scenarios of the investment in order to appropriately allocate the enterprise value of the company among the various parts of its capital structure.
The Private Companies are not subject to the public company disclosure, timing, and reporting standards applicable to other investments held by the Master Portfolio. Typically, the most recently available information by a Private Company is as of a date that is earlier than the date the Master Portfolio is calculating its NAV. This factor may result in a difference between the value of the investment and the price the Master Portfolio could receive upon the sale of the investment.
Fair Value Hierarchy: Various inputs are used in determining the fair value of financial instruments. These inputs to valuation techniques are categorized into a fair value hierarchy consisting of three broad levels for financial reporting purposes as follows:
| • | Level 1 – Unadjusted price quotations in active markets/exchanges for identical assets or liabilities that the Master Portfolio has the ability to access; |
| • | Level 2 – Other observable inputs (including, but not limited to, quoted prices for similar assets or liabilities in markets that are active, quoted prices for identical or similar assets or liabilities in markets that are not active, inputs other than quoted prices that are observable for the assets or liabilities (such as interest rates, yield curves, volatilities, prepayment speeds, loss severities, credit risks and default rates) or other market–corroborated inputs); and |
| • | Level 3 – Unobservable inputs based on the best information available in the circumstances, to the extent observable inputs are not available (including the Valuation Committee’s assumptions used in determining the fair value of financial instruments). |
| 106 | 2 0 2 3 B L A C K R O C K A N N U A L R E P O R T T O S H A R E H O L D E R S |
Notes to Consolidated Financial Statements (continued)
The hierarchy gives the highest priority to unadjusted quoted prices in active markets for identical assets or liabilities (Level 1 measurements) and the lowest priority to unobservable inputs (Level 3 measurements). Accordingly, the degree of judgment exercised in determining fair value is greatest for instruments categorized in Level 3. The inputs used to measure fair value may fall into different levels of the fair value hierarchy. In such cases, for disclosure purposes, the fair value hierarchy classification is determined based on the lowest level input that is significant to the fair value measurement in its entirety. Investments classified within Level 3 have significant unobservable inputs used by the Valuation Committee in determining the price for Fair Valued Investments. Level 3 investments include equity or debt issued by Private Companies that may not have a secondary market and/or may have a limited number of investors. The categorization of a value determined for financial instruments is based on the pricing transparency of the financial instruments and is not necessarily an indication of the risks associated with investing in those securities.
As of September 30, 2023, certain investments of the Master Portfolio were fair valued using NAV as a practical expedient as no quoted market value is available and therefore have been excluded from the fair value hierarchy.
| 4. | SECURITIES AND OTHER INVESTMENTS |
Asset-Backed and Mortgage-Backed Securities: Asset-backed securities are generally issued as pass-through certificates or as debt instruments. Asset-backed securities issued as pass-through certificates represent undivided fractional ownership interests in an underlying pool of assets. Asset-backed securities issued as debt instruments, which are also known as collateralized obligations, are typically issued as the debt of a special purpose entity organized solely for the purpose of owning such assets and issuing such debt. Asset-backed securities are often backed by a pool of assets representing the obligations of a number of different parties. The yield characteristics of certain asset-backed securities may differ from traditional debt securities. One such major difference is that all or a principal part of the obligations may be prepaid at any time because the underlying assets (i.e., loans) may be prepaid at any time. As a result, a decrease in interest rates in the market may result in increases in the level of prepayments as borrowers, particularly mortgagors, refinance and repay their loans. An increased prepayment rate with respect to an asset-backed security will have the effect of shortening the maturity of the security. In addition, the Master Portfolio may subsequently have to reinvest the proceeds at lower interest rates. If the Master Portfolio has purchased such an asset-backed security at a premium, a faster than anticipated prepayment rate could result in a loss of principal to the extent of the premium paid.
For mortgage pass-through securities (the “Mortgage Assets”) there are a number of important differences among the agencies and instrumentalities of the U.S. Government that issue mortgage-related securities and among the securities that they issue. For example, mortgage-related securities guaranteed by Ginnie Mae are guaranteed as to the timely payment of principal and interest by Ginnie Mae and such guarantee is backed by the full faith and credit of the United States. However, mortgage-related securities issued by Freddie Mac and Fannie Mae, including Freddie Mac and Fannie Mae guaranteed mortgage pass-through certificates, which are solely the obligations of Freddie Mac and Fannie Mae, are not backed by or entitled to the full faith and credit of the United States, but are supported by the right of the issuer to borrow from the U.S. Treasury.
Non-agency mortgage-backed securities are securities issued by non-governmental issuers and have no direct or indirect government guarantees of payment and are subject to various risks. Non-agency mortgage loans are obligations of the borrowers thereunder only and are not typically insured or guaranteed by any other person or entity. The ability of a borrower to repay a loan is dependent upon the income or assets of the borrower. A number of factors, including a general economic downturn, acts of God, terrorism, social unrest and civil disturbances, may impair a borrower’s ability to repay its loans.
Collateralized Debt Obligations: Collateralized debt obligations (“CDOs”), including collateralized bond obligations (“CBOs”) and collateralized loan obligations (“CLOs”), are types of asset-backed securities. A CDO is an entity that is backed by a diversified pool of debt securities (CBOs) or syndicated bank loans (CLOs). The cash flows of the CDO can be split into multiple segments, called “tranches,” which will vary in risk profile and yield. The riskiest segment is the subordinated or “equity” tranche. This tranche bears the greatest risk of defaults from the underlying assets in the CDO and serves to protect the other, more senior, tranches from default in all but the most severe circumstances. Since it is shielded from defaults by the more junior tranches, a “senior” tranche will typically have higher credit ratings and lower yields than their underlying securities, and often receive investment grade ratings from one or more of the nationally recognized rating agencies. Despite the protection from the more junior tranches, senior tranches can experience substantial losses due to actual defaults, increased sensitivity to future defaults and the disappearance of one or more protecting tranches as a result of changes in the credit profile of the underlying pool of assets.
Inflation-Indexed Bonds: Inflation-indexed bonds (other than municipal inflation-indexed and certain corporate inflation-indexed bonds) are fixed-income securities whose principal value is periodically adjusted according to the rate of inflation. If the index measuring inflation rises or falls, the principal value of inflation-indexed bonds (other than municipal inflation-indexed and certain corporate inflation-indexed bonds) will be adjusted upward or downward, and consequently the interest payable on these securities (calculated with respect to a larger or smaller principal amount) will be increased or reduced, respectively. Any upward or downward adjustment in the principal amount of an inflation-indexed bond is included as interest income in the Consolidated Statement of Operations, even though investors do not receive their principal until maturity. Repayment of the original bond principal upon maturity (as adjusted for inflation) is guaranteed in the case of U.S. Treasury inflation-indexed bonds. For bonds that do not provide a similar guarantee, the adjusted principal value of the bond repaid at maturity may be less than the original principal. With regard to municipal inflation-indexed bonds and certain corporate inflation-indexed bonds, the inflation adjustment is typically reflected in the semi-annual coupon payment. As a result, the principal value of municipal inflation-indexed bonds and such corporate inflation-indexed bonds does not adjust according to the rate of inflation.
Multiple Class Pass-Through Securities: Multiple class pass-through securities, including collateralized mortgage obligations (“CMOs”) and commercial mortgage-backed securities, may be issued by Ginnie Mae, U.S. Government agencies or instrumentalities or by trusts formed by private originators of, or investors in, mortgage loans. In general, CMOs are debt obligations of a legal entity that are collateralized by a pool of residential or commercial mortgage loans or Mortgage Assets. The payments on these are used to make payments on the CMOs or multiple pass-through securities. Multiple class pass-through securities represent direct ownership interests in the Mortgage Assets. Classes of CMOs include interest only (“IOs”), principal only (“POs”), planned amortization classes and targeted amortization classes. IOs and POs are stripped mortgage-backed securities representing interests in a pool of mortgages, the cash flow from which has been separated into interest and principal components. IOs receive the interest portion of the cash flow while POs receive the principal portion. IOs and POs can be extremely volatile in response to changes in interest rates. As interest rates rise and fall, the value of IOs tends to move in the same direction as interest rates. POs perform best when prepayments on the underlying mortgages rise since this increases the
| M A S T E R P O R T F O L I O N O T E S T O C O N S O L I D A T E D F I N A N C I A L S T A T E M E N T S |
107 |
Notes to Consolidated Financial Statements (continued)
rate at which the principal is returned and the yield to maturity on the PO. When payments on mortgages underlying a PO are slower than anticipated, the life of the PO is lengthened and the yield to maturity is reduced. If the underlying Mortgage Assets experience greater than anticipated prepayments of principal, the Master Portfolio’s initial investment in the IOs may not fully recoup.
Stripped Mortgage-Backed Securities: Stripped mortgage-backed securities are typically issued by the U.S. Government, its agencies and instrumentalities. Stripped mortgage-backed securities are usually structured with two classes that receive different proportions of the interest (IOs) and principal (POs) distributions on a pool of Mortgage Assets. Stripped mortgage-backed securities may be privately issued.
Zero-Coupon Bonds: Zero-coupon bonds are normally issued at a significant discount from face value and do not provide for periodic interest payments. These bonds may experience greater volatility in market value than other debt obligations of similar maturity which provide for regular interest payments.
Capital Securities and Trust Preferred Securities: Capital securities, including trust preferred securities, are typically issued by corporations, generally in the form of interest-bearing notes with preferred securities characteristics. In the case of trust preferred securities, an affiliated business trust of a corporation issues these securities, generally in the form of beneficial interests in subordinated debentures or similarly structured securities. The securities can be structured with either a fixed or adjustable coupon that can have either a perpetual or stated maturity date. For trust preferred securities, the issuing bank or corporation pays interest to the trust, which is then distributed to holders of these securities as a dividend. Dividends can be deferred without creating an event of default or acceleration, although maturity cannot take place unless all cumulative payment obligations have been met. The deferral of payments does not affect the purchase or sale of these securities in the open market. These securities generally are rated below that of the issuing company’s senior debt securities and are freely callable at the issuer’s option.
Preferred Stocks: Preferred stock has a preference over common stock in liquidation (and generally in receiving dividends as well), but is subordinated to the liabilities of the issuer in all respects. As a general rule, the market value of preferred stock with a fixed dividend rate and no conversion element varies inversely with interest rates and perceived credit risk, while the market price of convertible preferred stock generally also reflects some element of conversion value. Because preferred stock is junior to debt securities and other obligations of the issuer, deterioration in the credit quality of the issuer will cause greater changes in the value of a preferred stock than in a more senior debt security with similar stated yield characteristics. Unlike interest payments on debt securities, preferred stock dividends are payable only if declared by the issuer’s board of directors. Preferred stock also may be subject to optional or mandatory redemption provisions.
Floating Rate Loan Interests: Floating rate loan interests are typically issued to companies (the “borrower”) by banks, other financial institutions, or privately and publicly offered corporations (the “lender”). Floating rate loan interests are generally non-investment grade, often involve borrowers whose financial condition is troubled or uncertain and companies that are highly leveraged or in bankruptcy proceedings. In addition, transactions in floating rate loan interests may settle on a delayed basis, which may result in proceeds from the sale not being readily available for a fund to make additional investments or meet its redemption obligations. Floating rate loan interests may include fully funded term loans or revolving lines of credit. Floating rate loan interests are typically senior in the corporate capital structure of the borrower. Floating rate loan interests generally pay interest at rates that are periodically determined by reference to a base lending rate plus a premium. Since the rates reset only periodically, changes in prevailing interest rates (and particularly sudden and significant changes) can be expected to cause some fluctuations in the NAV of a fund to the extent that it invests in floating rate loan interests. The base lending rates are generally the lending rate offered by one or more European banks, such as the Secured Overnight Financing Rate (“SOFR”), the prime rate offered by one or more U.S. banks or the certificate of deposit rate. Floating rate loan interests may involve foreign borrowers, and investments may be denominated in foreign currencies. These investments are treated as investments in debt securities for purposes of a fund’s investment policies.
When a fund purchases a floating rate loan interest, it may receive a facility fee and when it sells a floating rate loan interest, it may pay a facility fee. On an ongoing basis, a fund may receive a commitment fee based on the undrawn portion of the underlying line of credit amount of a floating rate loan interest. Facility and commitment fees are typically amortized to income over the term of the loan or term of the commitment, respectively. Consent and amendment fees are recorded to income as earned. Prepayment penalty fees, which may be received by a fund upon the prepayment of a floating rate loan interest by a borrower, are recorded as realized gains. A fund may invest in multiple series or tranches of a loan. A different series or tranche may have varying terms and carry different associated risks.
Floating rate loan interests are usually freely callable at the borrower’s option. A fund may invest in such loans in the form of participations in loans (“Participations”) or assignments (“Assignments”) of all or a portion of loans from third parties. Participations typically will result in a fund having a contractual relationship only with the lender, not with the borrower. A fund has the right to receive payments of principal, interest and any fees to which it is entitled only from the lender selling the Participation and only upon receipt by the lender of the payments from the borrower. In connection with purchasing Participations, a fund generally will have no right to enforce compliance by the borrower with the terms of the loan agreement, nor any rights of offset against the borrower. A fund may not benefit directly from any collateral supporting the loan in which it has purchased the Participation. As a result, a fund assumes the credit risk of both the borrower and the lender that is selling the Participation. A fund’s investment in loan participation interests involves the risk of insolvency of the financial intermediaries who are parties to the transactions. In the event of the insolvency of the lender selling the Participation, a fund may be treated as a general creditor of the lender and may not benefit from any offset between the lender and the borrower. Assignments typically result in a fund having a direct contractual relationship with the borrower, and a fund may enforce compliance by the borrower with the terms of the loan agreement.
In connection with floating rate loan interests, the Master Portfolio may also enter into unfunded floating rate loan interests (“commitments”). In connection with these commitments, the Master Portfolio earns a commitment fee, typically set as a percentage of the commitment amount. Such fee income, which is included in interest income in the Consolidated Statement of Operations, is recognized ratably over the commitment period. Unfunded floating rate loan interests are marked-to-market daily, and any
| 108 | 2 0 2 3 B L A C K R O C K A N N U A L R E P O R T T O S H A R E H O L D E R S |
Notes to Consolidated Financial Statements (continued)
unrealized appreciation (depreciation) is included in the Consolidated Statement of Assets and Liabilities and Consolidated Statement of Operations. As of period end, the Master Portfolio had the following unfunded floating rate loan interests:
|
|
||||||||||||||||
| Borrower | Par | Commitment Amount |
Value | Unrealized Appreciation (Depreciation) |
||||||||||||
|
|
||||||||||||||||
| Aspen Owner LLC, Advance |
$ | 500,840 | $ | 499,992 | $ | 483,530 | $ | (16,463 | ) | |||||||
| BRE Park Avenue Tower Owner LLC, Mezzanine A Loan |
257,083 | 257,083 | 241,693 | (15,390 | ) | |||||||||||
| CoreWeave Compute Acquisition Co. II LLC, Delayed Draw Term Loan |
15,497,443 | 15,485,667 | 15,226,238 | (259,429 | ) | |||||||||||
| CP Iris Holdco I, Inc., Delayed Draw Term Loan (First Lien) |
708 | 706 | 684 | (22 | ) | |||||||||||
| HP LQ Investment LP, Term Loan |
1,882,817 | 1,879,196 | 1,829,343 | (49,853 | ) | |||||||||||
| Mensa II Austin Hotel LP, Promissory Note A-3 |
1,294,458 | 1,291,441 | 1,256,559 | (34,882 | ) | |||||||||||
| Sodalite Tahoe Hotel LLC (AKA Lake Tahoe), Loan |
753,012 | 751,736 | 723,834 | (27,901 | ) | |||||||||||
| The Vinoy St. Petersburg, Note A |
471,875 | 470,729 | 451,188 | (19,542 | ) | |||||||||||
|
|
|
|||||||||||||||
| $(423,482 | ) | |||||||||||||||
|
|
|
|||||||||||||||
Forward Commitments, When-Issued and Delayed Delivery Securities: The Master Portfolio may purchase securities on a when-issued basis and may purchase or sell securities on a forward commitment basis. Settlement of such transactions normally occurs within a month or more after the purchase or sale commitment is made. The Master Portfolio may purchase securities under such conditions with the intention of actually acquiring them but may enter into a separate agreement to sell the securities before the settlement date. Since the value of securities purchased may fluctuate prior to settlement, the Master Portfolio may be required to pay more at settlement than the security is worth. In addition, a fund is not entitled to any of the interest earned prior to settlement. When purchasing a security on a delayed delivery basis, the Master Portfolio assumes the rights and risks of ownership of the security, including the risk of price and yield fluctuations. In the event of default by the counterparty, the Master Portfolio’s maximum amount of loss is the unrealized appreciation of unsettled when-issued transactions.
TBA Commitments: TBA commitments are forward agreements for the purchase or sale of securities, including mortgage-backed securities for a fixed price, with payment and delivery on an agreed upon future settlement date. The specific securities to be delivered are not identified at the trade date. However, delivered securities must meet specified terms, including issuer, rate and mortgage terms. When entering into TBA commitments, a fund may take possession of or deliver the underlying mortgage-backed securities but can extend the settlement or roll the transaction. TBA commitments involve a risk of loss if the value of the security to be purchased or sold declines or increases, respectively, prior to settlement date, if there are expenses or delays in connection with the TBA transactions, or if the counterparty fails to complete the transaction.
In order to better define contractual rights and to secure rights that will help a fund mitigate its counterparty risk, TBA commitments may be entered into by a fund under Master Securities Forward Transaction Agreements (each, an “MSFTA”). An MSFTA typically contains, among other things, collateral posting terms and netting provisions in the event of default and/or termination event. The collateral requirements are typically calculated by netting the mark-to-market amount for each transaction under such agreement and comparing that amount to the value of the collateral currently pledged by a fund and the counterparty. Cash collateral that has been pledged to cover the obligations of a fund and cash collateral received from the counterparty, if any, is reported separately in the Consolidated Statement of Assets and Liabilities as cash pledged as collateral for TBA commitments or cash received as collateral for TBA commitments, respectively. Non-cash collateral pledged by a fund, if any, is noted in the Consolidated Schedule of Investments. Typically, a fund is permitted to sell, re-pledge or use the collateral it receives; however, the counterparty is not permitted to do so. To the extent amounts due to a fund are not fully collateralized, contractually or otherwise, a fund bears the risk of loss from counterparty non-performance.
Mortgage Dollar Roll Transactions: The Master Portfolio may sell TBA mortgage-backed securities and simultaneously contract to repurchase substantially similar (i.e., same type, coupon and maturity) securities on a specific future date at an agreed upon price. During the period between the sale and repurchase, a fund is not entitled to receive interest and principal payments on the securities sold. Mortgage dollar roll transactions are treated as purchases and sales and a fund realizes gains and losses on these transactions. Mortgage dollar rolls involve the risk that the market value of the securities that a fund is required to purchase may decline below the agreed upon repurchase price of those securities.
Commitments: Commitments are agreements to acquire an investment at a future date (subject to conditions) in connection with a potential public or non-public offering. Such agreements may obligate a fund to make future cash payments. As of September 30, 2023, the Master Portfolio had outstanding commitments of $3,919,439. These commitments are not included in the net assets of the Master Portfolio as of September 30, 2023.
Securities Lending: The Master Portfolio may lend its securities to approved borrowers, such as brokers, dealers and other financial institutions. The borrower pledges and maintains with the Master Portfolio collateral consisting of cash, an irrevocable letter of credit issued by a bank, or securities issued or guaranteed by the U.S. Government. The initial collateral received by the Master Portfolio is required to have a value of at least 102% of the current value of the loaned securities for securities traded on U.S. exchanges and a value of at least 105% for all other securities. The collateral is maintained thereafter at a value equal to at least 100% of the current market value of the securities on loan. The market value of the loaned securities is determined at the close of each business day of the Master Portfolio and any additional required collateral is delivered to the Master Portfolio, or excess collateral returned by the Master Portfolio, on the next business day. During the term of the loan, the Master Portfolio is entitled to all distributions made on or in respect of the loaned securities, but does not receive interest income on securities received as collateral. Loans of securities are terminable at any time and the borrower, after notice, is required to return borrowed securities within the standard time period for settlement of securities transactions.
As of period end, any securities on loan were collateralized by cash and/or U.S. Government obligations. Cash collateral invested by the securities lending agent, BlackRock Investment Management, LLC (“BIM”), if any, is disclosed in the Consolidated Schedule of Investments. Any non-cash collateral received cannot be sold, re-invested or pledged by the Master Portfolio, except in the event of borrower default. The securities on loan, if any, are disclosed in the Master Portfolio’s Consolidated Schedule of Investments. The market value of any securities on loan and the value of related collateral, if any, are shown separately in the Consolidated Statement of Assets and Liabilities as a component of investments at value – unaffiliated and collateral on securities loaned, respectively.
| M A S T E R P O R T F O L I O N O T E S T O C O N S O L I D A T E D F I N A N C I A L S T A T E M E N T S |
109 |
Notes to Consolidated Financial Statements (continued)
Securities lending transactions are entered into by the Master Portfolio under Master Securities Lending Agreements (each, an “MSLA”), which provide the right, in the event of default (including bankruptcy or insolvency), for the non-defaulting party to liquidate the collateral and calculate a net exposure to the defaulting party or request additional collateral. In the event that a borrower defaults, the Master Portfolio, as lender, would offset the market value of the collateral received against the market value of the securities loaned. When the value of the collateral is greater than that of the market value of the securities loaned, the lender is left with a net amount payable to the defaulting party. However, bankruptcy or insolvency laws of a particular jurisdiction may impose restrictions on or prohibitions against such a right of offset in the event of an MSLA counterparty’s bankruptcy or insolvency. Under the MSLA, absent an event of default, the borrower can resell or re-pledge the loaned securities, and the Master Portfolio can reinvest cash collateral received in connection with loaned securities. Upon an event of default, the parties’ obligations to return the securities or collateral to the other party are extinguished, and the parties can resell or re-pledge the loaned securities or the collateral received in connection with the loaned securities in order to satisfy the defaulting party’s net payment obligation for all transactions under the MSLA. The defaulting party remains liable for any deficiency.
As of period end, the following table is a summary of the Master Portfolio’s securities on loan by counterparty which are subject to offset under an MSLA:
|
|
||||||||||||||||||||||||
| Counterparty |
|
Securities Loaned at Value |
|
|
Cash Collateral Received |
(a) |
|
Non-Cash Collateral Received |
(a) |
|
Net Amount |
| ||||||||||||
|
|
||||||||||||||||||||||||
| BNP Paribas SA |
$ | 294,229 | $ | (294,229 | ) | $ | — | $ | — | |||||||||||||||
| Citigroup Global Markets, Inc. |
7,270,659 | (7,270,659 | ) | — | — | |||||||||||||||||||
| Goldman Sachs & Co. LLC |
2,948,101 | (2,948,101 | ) | — | — | |||||||||||||||||||
| National Financial Services LLC |
1,598,977 | (1,598,977 | ) | — | — | |||||||||||||||||||
| TD Prime Services LLC |
15,948,750 | (15,948,750 | ) | — | — | |||||||||||||||||||
|
|
|
|
|
|
|
|
|
|||||||||||||||||
| $ | 28,060,716 | $ | (28,060,716 | ) | $ | — | $ | — | ||||||||||||||||
|
|
|
|
|
|
|
|
|
|||||||||||||||||
| (a) | Collateral received, if any, in excess of the market value of securities on loan is not presented in this table. The total cash collateral received by the Master Portfolio is disclosed in the Master Portfolio’s Consolidated Statement of Assets and Liabilities. |
The risks of securities lending include the risk that the borrower may not provide additional collateral when required or may not return the securities when due. To mitigate these risks, the Master Portfolio benefits from a borrower default indemnity provided by BIM. BIM’s indemnity allows for full replacement of the securities loaned to the extent the collateral received does not cover the value on the securities loaned in the event of borrower default. The Master Portfolio could incur a loss if the value of an investment purchased with cash collateral falls below the market value of loaned securities or if the value of an investment purchased with cash collateral falls below the value of the original cash collateral received. Such losses are borne entirely by the Master Portfolio.
| 5. | DERIVATIVE FINANCIAL INSTRUMENTS |
The Master Portfolio engages in various portfolio investment strategies using derivative contracts both to increase the returns of the Master Portfolio and/or to manage its exposure to certain risks such as credit risk, equity risk, interest rate risk, foreign currency exchange rate risk, commodity price risk or other risks (e.g., inflation risk). Derivative financial instruments categorized by risk exposure are included in the Consolidated Schedule of Investments. These contracts may be transacted on an exchange or OTC.
Futures Contracts: Futures contracts are purchased or sold to gain exposure to, or manage exposure to, changes in interest rates (interest rate risk) and changes in the value of equity securities (equity risk) or foreign currencies (foreign currency exchange rate risk) or to the applicable commodities market (commodities price risk).
Futures contracts are exchange-traded agreements between the Master Portfolio and a counterparty to buy or sell a specific quantity of an underlying instrument at a specified price and on a specified date. Depending on the terms of a contract, it is settled either through physical delivery of the underlying instrument on the settlement date or by payment of a cash amount on the settlement date. The Master Portfolio may invest in carbon credit futures that are traded on a commodity exchanges with the Commodity Futures Trading Commission. Upon entering into a futures contract, the Master Portfolio is required to deposit initial margin with the broker in the form of cash or securities in an amount that varies depending on a contract’s size and risk profile. The initial margin deposit must then be maintained at an established level over the life of the contract. Amounts pledged, which are considered restricted, are included in cash pledged for futures contracts in the Consolidated Statement of Assets and Liabilities.
Securities deposited as initial margin are designated in the Consolidated Schedule of Investments and cash deposited, if any, are shown as cash pledged for futures contracts in the Consolidated Statement of Assets and Liabilities. Pursuant to the contract, the Master Portfolio agrees to receive from or pay to the broker an amount of cash equal to the daily fluctuation in market value of the contract (“variation margin”). Variation margin is recorded as unrealized appreciation (depreciation) and, if any, shown as variation margin receivable (or payable) on futures contracts in the Consolidated Statement of Assets and Liabilities. When the contract is closed, a realized gain or loss is recorded in the Consolidated Statement of Operations equal to the difference between the notional amount of the contract at the time it was opened and the notional amount at the time it was closed. The use of futures contracts involves the risk of an imperfect correlation in the movements in the price of futures contracts and interest rates, foreign currency exchange rates or underlying assets.
Forward Foreign Currency Exchange Contracts: Forward foreign currency exchange contracts are entered into to gain or reduce exposure to foreign currencies (foreign currency exchange rate risk).
A forward foreign currency exchange contract is an agreement between two parties to buy and sell a currency at a set exchange rate on a specified date. These contracts help to manage the overall exposure to the currencies in which some of the investments held by the Master Portfolio are denominated and in some cases, may be used to obtain exposure to a particular market. The contracts are traded OTC and not on an organized exchange.
The contract is marked-to-market daily and the change in market value is recorded as unrealized appreciation (depreciation) in the Consolidated Statement of Assets and Liabilities. When a contract is closed, a realized gain or loss is recorded in the Consolidated Statement of Operations equal to the difference between the value at the time it
| 110 | 2 0 2 3 B L A C K R O C K A N N U A L R E P O R T T O S H A R E H O L D E R S |
Notes to Consolidated Financial Statements (continued)
was opened and the value at the time it was closed. Non-deliverable forward foreign currency exchange contracts are settled with the counterparty in cash without the delivery of foreign currency. The use of forward foreign currency exchange contracts involves the risk that the value of a forward foreign currency exchange contract changes unfavorably due to movements in the value of the referenced foreign currencies, and such value may exceed the amount(s) reflected in the Consolidated Statement of Assets and Liabilities. Cash amounts pledged for forward foreign currency exchange contracts are considered restricted and are included in cash pledged as collateral for OTC derivatives in the Consolidated Statement of Assets and Liabilities. The Master Portfolio’s risk of loss from counterparty credit risk on OTC derivatives is generally limited to the aggregate unrealized gain netted against any collateral held by the Master Portfolio.
Options: The Master Portfolio may purchase and write call and put options to increase or decrease its exposure to the risks of underlying instruments, including equity risk, interest rate risk and/or commodity price risk and/or, in the case of options written, to generate gains from options premiums.
A call option gives the purchaser (holder) of the option the right (but not the obligation) to buy, and obligates the seller (writer) to sell (when the option is exercised) the underlying instrument at the exercise or strike price at any time or at a specified time during the option period. A put option gives the holder the right to sell and obligates the writer to buy the underlying instrument at the exercise or strike price at any time or at a specified time during the option period.
Premiums paid on options purchased and premiums received on options written, as well as the daily fluctuation in market value, are included in investments at value –unaffiliated and options written at value, respectively, in the Consolidated Statement of Assets and Liabilities. When an instrument is purchased or sold through the exercise of an option, the premium is offset against the cost or proceeds of the underlying instrument. When an option expires, a realized gain or loss is recorded in the Consolidated Statement of Operations to the extent of the premiums received or paid. When an option is closed or sold, a gain or loss is recorded in the Consolidated Statement of Operations to the extent the cost of the closing transaction exceeds the premiums received or paid. When the Master Portfolio writes a call option, such option is typically “covered,” meaning that it holds the underlying instrument subject to being called by the option counterparty. When the Master Portfolio writes a put option, cash is segregated in an amount sufficient to cover the obligation. These amounts, which are considered restricted, are included in cash pledged as collateral for options written in the Consolidated Statement of Assets and Liabilities.
| • | Swaptions – The Master Portfolio may purchase and write swaptions primarily to preserve a return or spread on a particular investment or portion of the Master Portfolio’s holdings, as a duration management technique or to protect against an increase in the price of securities it anticipates purchasing at a later date. The purchaser and writer of a swaption is buying or granting the right to enter into a previously agreed upon interest rate or credit default swap agreement (interest rate risk and/or credit risk) at any time before the expiration of the option. |
| • | Interest rate caps and floors – Interest rate caps and floors are entered into to gain or reduce exposure to interest rates (interest rate risk and/or other risk). Caps are agreements whereby one party agrees to make payments to the other, in return for a premium, to the extent that interest rate indexes exceed a specified rate, or “cap.” Floors are agreements whereby one party agrees to make payments to the other, in return for a premium, to the extent that interest rate indexes fall below a specified rate, or “floor.” The maximum potential amount of future payments that the Master Portfolio would be required to make under an interest rate cap would be the notional amount times the percentage increase in interest rates determined by the difference between the interest rate index current value and the value at the time the cap was entered into. |
| • | Foreign currency options – The Master Portfolio may purchase and write foreign currency options, foreign currency futures and options on foreign currency futures to gain or reduce exposure to foreign currencies (foreign currency exchange rate risk). Foreign currency options give the purchaser the right to buy from or sell to the writer a foreign currency at any time before the expiration of the option. |
| • | Barrier options – The Master Portfolio may purchase and write a variety of options with non-standard payout structures or other features (“barrier options”) that are generally traded OTC. |
The Master Portfolio may invest in various types of barrier options, including down-and-out options, down-and-in options, double no-touch options, one-touch options, instant one-touch options, up-and-out options and up-and-in options. Down-and-out options expire worthless to the purchaser if the price of the underlying instrument falls below a specific barrier price level prior to the expiration date. Down-and-in options expire worthless to the purchaser unless the price of the underlying instrument falls below a specific barrier price level prior to the expiration date. Double no-touch options provide the purchaser an agreed-upon payout if the price of the underlying instrument does not reach or surpass predetermined barrier price levels prior to the option’s expiration date. One-touch options and instant one-touch options provide the purchaser an agreed-upon payout if the price of the underlying instrument reaches or surpasses predetermined barrier price levels prior to the expiration date. Up-and-out options expire worthless to the purchaser if the price of the underlying instrument increases beyond a predetermined barrier price level prior to the expiration date. Up-and-in options can only be exercised when the price of the underlying instrument increases beyond a predetermined barrier price level.
| • | Structured options – The Master Portfolio may invest in structured options to increase or decrease its exposure to an underlying index or group of securities (equity risk). |
These options may consist of single or multiple OTC options which are priced as a single instrument. They may only be exercised at the expiration date but may be transferred/sold prior to the expiration date. The value of a structured option may either increase or decrease with the underlying index or group of securities, depending on the combination of options used. Structured options are issued in units whereby each unit represents a structure based on the specific index with an initial reference strike price. One type of structure involves the combination of selling a put while buying a call on a specific index. This option would rise in value as the underlying index increases and fall in value as the underlying index decreases. Alternatively, another structure involves the sale of a call and the purchase of a put. This option structure would rise in value as the underlying index decreases and fall in value as the underlying index increases. Upon the exercise of the structured option, the Master Portfolio will receive a payment from, or be required to remit a payment to, the counterparty depending on the value of the underlying index at exercise.
In purchasing and writing options, the Master Portfolio bears the risk of an unfavorable change in the value of the underlying instrument or the risk that it may not be able to enter into a closing transaction due to an illiquid market. Exercise of a written option could result in the Master Portfolio purchasing or selling a security when it otherwise would not, or at a price different from the current market value.
| M A S T E R P O R T F O L I O N O T E S T O C O N S O L I D A T E D F I N A N C I A L S T A T E M E N T S |
111 |
Notes to Consolidated Financial Statements (continued)
Swaps: Swap contracts are entered into to manage exposure to issuers, markets and securities. Such contracts are agreements between the Master Portfolio and a counterparty to make periodic net payments on a specified notional amount or a net payment upon termination. Swap agreements are privately negotiated in the OTC market and may be entered into as a bilateral contract (“OTC swaps”) or centrally cleared (“centrally cleared swaps”).
For OTC swaps, any upfront premiums paid and any upfront fees received are shown as swap premiums paid and swap premiums received, respectively, in the Consolidated Statement of Assets and Liabilities and amortized over the term of the contract. The daily fluctuation in market value is recorded as unrealized appreciation (depreciation) on OTC Swaps in the Consolidated Statement of Assets and Liabilities. Payments received or paid are recorded in the Consolidated Statement of Operations as realized gains or losses, respectively. When an OTC swap is terminated, a realized gain or loss is recorded in the Consolidated Statement of Operations equal to the difference between the proceeds from (or cost of) the closing transaction and the Master Portfolio’s basis in the contract, if any. Generally, the basis of the contract is the premium received or paid.
In a centrally cleared swap, immediately following execution of the swap contract, the swap contract is novated to a central counterparty (the “CCP”) and the CCP becomes the Master Portfolio’s counterparty on the swap. The Master Portfolio is required to interface with the CCP through the broker. Upon entering into a centrally cleared swap, the Master Portfolio is required to deposit initial margin with the broker in the form of cash or securities in an amount that varies depending on the size and risk profile of the particular swap. Securities deposited as initial margin are designated in the Consolidated Schedule of Investments and cash deposited is shown as cash pledged for centrally cleared swaps in the Consolidated Statement of Assets and Liabilities. Amounts pledged, which are considered restricted cash, are included in cash pledged for centrally cleared swaps in the Consolidated Statement of Assets and Liabilities. Pursuant to the contract, the Master Portfolio agrees to receive from or pay to the broker variation margin. Variation margin is recorded as unrealized appreciation (depreciation) and shown as variation margin receivable (or payable) on centrally cleared swaps in the Consolidated Statement of Assets and Liabilities. Payments received from (paid to) the counterparty are amortized over the term of the contract and recorded as realized gains (losses) in the Consolidated Statement of Operations, including those at termination.
| • | Credit default swaps — Credit default swaps are entered into to manage exposure to the market or certain sectors of the market, to reduce risk exposure to defaults of corporate and/or sovereign issuers or to create exposure to corporate and/or sovereign issuers to which a fund is not otherwise exposed (credit risk). |
The Master Portfolio may either buy or sell (write) credit default swaps on single-name issuers (corporate or sovereign), a combination or basket of single-name issuers or traded indexes. Credit default swaps are agreements in which the protection buyer pays fixed periodic payments to the seller in consideration for a promise from the protection seller to make a specific payment should a negative credit event take place with respect to the referenced entity (e.g., bankruptcy, failure to pay, obligation acceleration, repudiation, moratorium or restructuring). As a buyer, if an underlying credit event occurs, the Master Portfolio will either (i) receive from the seller an amount equal to the notional amount of the swap and deliver the referenced security or underlying securities comprising the index, or (ii) receive a net settlement of cash equal to the notional amount of the swap less the recovery value of the security or underlying securities comprising the index. As a seller (writer), if an underlying credit event occurs, the Master Portfolio will either pay the buyer an amount equal to the notional amount of the swap and take delivery of the referenced security or underlying securities comprising the index or pay a net settlement of cash equal to the notional amount of the swap less the recovery value of the security or underlying securities comprising the index.
| • | Total return swaps — Total return swaps are entered into to obtain exposure to a security or market without owning such security or investing directly in such market or to exchange the risk/return of one security or market (e.g., fixed-income) with another security or market (e.g., equity or commodity prices) (equity risk, commodity price risk and/or interest rate risk). |
Total return swaps are agreements in which there is an exchange of cash flows whereby one party commits to make payments based on the total return (distributions plus capital gains/losses) of an underlying instrument, or basket of underlying instruments, in exchange for fixed or floating rate interest payments. If the total return of the instrument(s) or index underlying the transaction exceeds or falls short of the offsetting fixed or floating interest rate obligation, the Master Portfolio receives payment from or makes a payment to the counterparty.
Certain total return swaps are designed to function as a portfolio of direct investments in long and short equity positions. This means that the Master Portfolio has the ability to trade in and out of these long and short positions within the swap and will receive the economic benefits and risks equivalent to direct investment in these positions, subject to certain adjustments due to events related to the counterparty. Benefits and risks include capital appreciation (depreciation), corporate actions and dividends received and paid, all of which are reflected in the swap’s market value. The market value also includes interest charges and credits (“financing fees”) related to the notional values of the long and short positions and cash balances within the swap. These interest charges and credits are based on a specified benchmark rate plus or minus a specified spread determined based upon the country and/or currency of the positions in the portfolio.
Positions within the swap and financing fees are reset periodically. During a reset, any unrealized appreciation (depreciation) on positions and accrued financing fees become available for cash settlement between the Master Portfolio and the counterparty. The amounts that are available for cash settlement are recorded as realized gains or losses in the Consolidated Statement of Operations. Cash settlement in and out of the swap may occur at a reset date or any other date, at the discretion of the Master Portfolio and the counterparty, over the life of the agreement. Certain swaps have no stated expiration and can be terminated by either party at any time.
| • | Interest rate swaps — Interest rate swaps are entered into to gain or reduce exposure to interest rates or to manage duration, the yield curve or interest rate (interest rate risk). |
Interest rate swaps are agreements in which one party pays a stream of interest payments, either fixed or floating, in exchange for another party’s stream of interest payments, either fixed or floating, on the same notional amount for a specified period of time. In more complex interest rate swaps, the notional principal amount may decline (or amortize) over time.
| • | Currency swaps — Currency swaps are entered into to gain or reduce exposure to foreign currencies (foreign currency exchange rate risk). |
| 112 | 2 0 2 3 B L A C K R O C K A N N U A L R E P O R T T O S H A R E H O L D E R S |
Notes to Consolidated Financial Statements (continued)
Currency swaps are interest rate swaps in which one party pays a stream of interest payments, either fixed or floating, in exchange for another party’s stream of interest payments, either fixed or floating, based on the notional amounts of two different currencies. The notional amounts are typically determined based on the spot exchange rates at the inception of the trade. Currency swaps may also involve an exchange of notional amounts at the start, during and/or at expiration of the contract, either at the current spot rate or another specified rate.
| • | Forward swaps — The Master Portfolio may enter into forward interest rate swaps and forward total return swaps. In a forward swap, the Master Portfolio and the counterparty agree to make periodic net payments beginning on a specified date or a net payment at termination. |
| • | Inflation swaps — Inflation swaps are entered into to gain or reduce exposure to inflation (inflation risk). In an inflation swap, one party makes fixed interest payments on a notional principal amount in exchange for another party’s variable payments based on an inflation index, such as the Consumer Price Index. |
Swap transactions involve, to varying degrees, elements of interest rate, credit and market risks in excess of the amounts recognized in the Consolidated Statement of Assets and Liabilities. Such risks involve the possibility that there will be no liquid market for these agreements, that the counterparty to the agreements may default on its obligation to perform or disagree as to the meaning of the contractual terms in the agreements, and that there may be unfavorable changes in interest rates and/or market values associated with these transactions.
Master Netting Arrangements: In order to define its contractual rights and to secure rights that will help mitigate its counterparty risk, the Master Portfolio may enter into an International Swaps and Derivatives Association, Inc. Master Agreement (“ISDA Master Agreement”) or similar agreement with its derivative contract counterparties. An ISDA Master Agreement is a bilateral agreement between the Master Portfolio and a counterparty that governs certain OTC derivatives and typically contains, among other things, collateral posting terms and netting provisions in the event of a default and/or termination event. Under an ISDA Master Agreement, the Master Portfolio may, under certain circumstances, offset with the counterparty certain derivative financial instruments’ payables and/or receivables with collateral held and/or posted and create one single net payment. The provisions of the ISDA Master Agreement typically permit a single net payment in the event of default including the bankruptcy or insolvency of the counterparty. When the Master Portfolio enters into an ISDA Master Agreement and an MRA and/or MSLA with the same counterparty, the agreements may contain a set-off provision allowing the Master Portfolio to offset a net amount payable with amounts due to the Master Portfolio upon default of the counterparty. Bankruptcy or insolvency laws of a particular jurisdiction may restrict or prohibit the right of offset in bankruptcy, insolvency or other events. For example, notwithstanding what contractual rights may be included in an ISDA Master Agreement, such laws may prohibit the Master Portfolio from setting off amounts owed to a defaulting counterparty under an ISDA Master Agreement against amounts owed to the Master Portfolio by affiliates of the defaulting counterparty. The insolvency regimes of many jurisdictions do, however, generally permit set-off of simultaneous payables and receivables under certain types of financial contracts between the same legal entity upon a default of the entity, regardless of the existence of a contractual set-off right in those contracts.
Collateral Requirements: For derivatives traded under an ISDA Master Agreement, the collateral requirements are typically calculated by netting the mark-to-market amount for each transaction under such agreement and comparing that amount to the value of any collateral currently pledged by the Master Portfolio and the counterparty.
Cash collateral that has been pledged to cover obligations of the Master Portfolio and cash collateral received from the counterparty, if any, is reported separately in the Consolidated Statement of Assets and Liabilities as cash pledged as collateral and cash received as collateral, respectively. Non-cash collateral pledged by the Master Portfolio, if any, is noted in the Consolidated Schedule of Investments. Generally, the amount of collateral due from or to a counterparty is subject to a certain minimum transfer amount threshold before a transfer is required, which is determined at the close of business of the Master Portfolio. Any additional required collateral is delivered to/pledged by the Master Portfolio on the next business day. Typically, the counterparty is not permitted to sell, re-pledge or use cash and non-cash collateral it receives. The Master Portfolio generally agrees not to use non-cash collateral that it receives but may, absent default or certain other circumstances defined in the underlying ISDA Master Agreement, be permitted to use cash collateral received. In such cases, interest may be paid pursuant to the collateral arrangement with the counterparty. To the extent amounts due to the Master Portfolio from the counterparties are not fully collateralized, the Master Portfolio bears the risk of loss from counterparty non-performance. Likewise, to the extent the Master Portfolio has delivered collateral to a counterparty and stands ready to perform under the terms of its agreement with such counterparty, the Master Portfolio bears the risk of loss from a counterparty in the amount of the value of the collateral in the event the counterparty fails to return such collateral. Based on the terms of agreements, collateral may not be required for all derivative contracts.
For financial reporting purposes, the Master Portfolio does not offset derivative assets and derivative liabilities that are subject to netting arrangements, if any, in the Consolidated Statement of Assets and Liabilities.
| 6. | INVESTMENT ADVISORY AGREEMENT AND OTHER TRANSACTIONS WITH AFFILIATES |
Investment Advisory: The Master Bond LLC, on behalf of the Master Portfolio, entered into an Investment Advisory Agreement with the Manager, the Master Portfolio’s investment adviser and an indirect, wholly-owned subsidiary of BlackRock, Inc. (“BlackRock”), to provide investment advisory and administrative services. The Manager is responsible for the management of the Master Portfolio’s portfolio and provides the personnel, facilities, equipment and certain other services necessary to the operations of the Master Portfolio.
For such services, the Master Portfolio pays the Manager a monthly fee at an annual rate equal to the following percentages of the average daily value of the Master Portfolio’s net assets:
|
|
||||
| Average Daily Net Assets | Investment Advisory Fees | |||
|
|
||||
| First $250 million |
0.16% | |||
| $250 million — $500 million |
0.12 | |||
| $500 million — $750 million |
0.08 | |||
| Greater than $750 million |
0.05 | |||
|
|
||||
| M A S T E R P O R T F O L I O N O T E S T O C O N S O L I D A T E D F I N A N C I A L S T A T E M E N T S |
113 |
Notes to Consolidated Financial Statements (continued)
With respect to the Master Portfolio, the Manager entered into separate sub-advisory agreements with each of BlackRock International Limited (“BIL”) and BlackRock (Singapore) Limited (“BSL”), each an affiliate of the Manager. The Manager pays BIL and BSL for services they provide, for that portion of the Master Portfolio for which BIL and BSL, as applicable, act as sub-adviser, a monthly fee that is equal to a percentage of the investment advisory fees paid by the Master Portfolio to the Manager.
Expense Waivers and Reimbursements: With respect to the Master Portfolio, the Manager contractually agreed to waive its investment advisory fees by the amount of investment advisory fees the Master Portfolio pays to the Manager indirectly through its investment in affiliated money market funds (the “affiliated money market fund waiver”) through June 30, 2024. The contractual agreement may be terminated upon 90 days’ notice by a majority of the Independent Directors, or by a vote of a majority of the outstanding voting securities of the Master Portfolio. This amount is included in fees waived and/or reimbursed by the Manager in the Consolidated Statement of Operations. For the year ended September 30, 2023, the amount waived was $682,562.
The Manager has contractually agreed to waive its investment advisory fee with respect to any portion of the Master Portfolio’s assets invested in affiliated equity and fixed-income mutual funds and affiliated exchange-traded funds that have a contractual management fee through June 30, 2024. The contractual agreement may be terminated upon 90 days’ notice by a majority of the Independent Directors, or by a vote of a majority of the outstanding voting securities of the Master Portfolio. This amount is included in fees waived and/or reimbursed by the Manager in the Consolidated Statement of Operations. For the year ended September 30, 2023, the Manager waived $19,896 in investment advisory fees pursuant to this arrangement.
Securities Lending: The U.S. Securities and Exchange Commission (“SEC”) has issued an exemptive order which permits BIM, an affiliate of the Manager, to serve as securities lending agent for the Master Portfolio, subject to applicable conditions. As securities lending agent, BIM bears all operational costs directly related to securities lending. The Master Portfolio is responsible for expenses in connection with the investment of cash collateral received for securities on loan (the “collateral investment expenses”). The cash collateral is invested in a private investment company, SL Liquidity Series, LLC, Money Market Series (the “Money Market Series”), managed by the Manager or its affiliates. However, BIM has agreed to cap the collateral investment expenses of the Money Market Series to an annual rate of 0.04%. The investment adviser to the Money Market Series will not charge any advisory fees with respect to shares purchased by the Master Portfolio. The Money Market Series may, under certain circumstances, impose a liquidity fee of up to 2% of the value withdrawn or temporarily restrict withdrawals for up to 10 business days during a 90 day period, in the event that the private investment company’s weekly liquid assets fall below certain thresholds. The Money Market Series seeks current income consistent with maintaining liquidity and preserving capital. Although the Money Market Series is not registered under the 1940 Act, its investments may follow the parameters of investments by a money market fund that is subject to Rule 2a-7 under the 1940 Act.
Securities lending income is equal to the total of income earned from the reinvestment of cash collateral, net of fees and other payments to and from borrowers of securities, and less the collateral investment expenses. The Master Portfolio retains a portion of securities lending income and remits a remaining portion to BIM as compensation for its services as securities lending agent.
Pursuant to the current securities lending agreement, the Master Portfolio retains 81% of securities lending income (which excludes collateral investment expenses), and this amount retained can never be less than 70% of the total of securities lending income plus the collateral investment expenses.
In addition, commencing the business day following the date that the aggregate securities lending income earned across the BlackRock Fixed-Income Complex in a calendar year exceeds a specified threshold, the Master Portfolio, pursuant to the securities lending agreement, will retain for the remainder of that calendar year securities lending income in an amount equal to 81% of securities lending income (which excludes collateral investment expenses), and this amount retained can never be less than 70% of the total of securities lending income plus the collateral investment expenses.
The share of securities lending income earned by the Master Portfolio is shown as securities lending income — affiliated — net in the Consolidated Statement of Operations. For the year ended September 30, 2023, the Master Portfolio paid BIM $58,449 for securities lending agent services.
Interfund Lending: In accordance with an exemptive order (the “Order”) from the SEC, the Master Portfolio may participate in a joint lending and borrowing facility for temporary purposes (the “Interfund Lending Program”), subject to compliance with the terms and conditions of the Order, and to the extent permitted by the Master Portfolio’s investment policies and restrictions. The Master Portfolio is currently permitted to borrow and lend under the Interfund Lending Program.
A lending BlackRock fund may lend in aggregate up to 15% of its net assets but may not lend more than 5% of its net assets to any one borrowing fund through the Interfund Lending Program. A borrowing BlackRock fund may not borrow through the Interfund Lending Program or from any other source more than 33 1/3% of its total assets (or any lower threshold provided for by the fund’s investment restrictions). If a borrowing BlackRock fund’s total outstanding borrowings exceed 10% of its total assets, each of its outstanding interfund loans will be subject to collateralization of at least 102% of the outstanding principal value of the loan. All interfund loans are for temporary or emergency purposes and the interest rate to be charged will be the average of the highest current overnight repurchase agreement rate available to a lending fund and the bank loan rate, as calculated according to a formula established by the Board.
During the year ended September 30, 2023, the Master Portfolio did not participate in the Interfund Lending Program.
Directors and Officers: Certain directors and/or officers of the Master Bond LLC are directors and/or officers of BlackRock or its affiliates.
| 114 | 2 0 2 3 B L A C K R O C K A N N U A L R E P O R T T O S H A R E H O L D E R S |
Notes to Consolidated Financial Statements (continued)
| 7. | PURCHASES AND SALES |
For the year ended September 30, 2023, purchases and sales of investments, including paydowns and mortgage dollar rolls and excluding short-term securities, were as follows:
|
|
||||||||
| Purchases | Sales | |||||||
|
|
||||||||
| Non-U.S. Government Securities |
$ | 61,518,610,576 | $ | 61,780,245,881 | ||||
| U.S. Government Securities |
8,973,076,978 | 5,781,253,022 | ||||||
|
|
||||||||
For the year ended September 30, 2023, purchases and sales related to mortgage dollar rolls were as follows:
|
|
||||||||
| Purchases | Sales | |||||||
|
|
||||||||
| Mortgage Dollar Rolls |
$ | 37,130,486,226 | $ | 37,126,156,634 | ||||
|
|
||||||||
| 8. | INCOME TAX INFORMATION |
The Master Portfolio is classified as a partnership for U.S. federal income tax purposes. As such, each investor in the Master Portfolio is treated as the owner of its proportionate share of net assets, income, expenses and realized and unrealized gains and losses of the Master Portfolio. Therefore, no U.S. federal income tax provision is required. It is intended that the Master Portfolio’s assets will be managed so an investor in the Master Portfolio can satisfy the requirements of Subchapter M of the Internal Revenue Code of 1986, as amended.
The Master Portfolio files U.S. federal and various state and local tax returns. No income tax returns are currently under examination. The statute of limitations on the Master Portfolio’s U.S. federal tax returns generally remains open for a period of three years after they are filed. The statutes of limitations on the Master Portfolio’s state and local tax returns may remain open for an additional year depending upon the jurisdiction.
Management has analyzed tax laws and regulations and their application to the Master Portfolio as of September 30, 2023, inclusive of the open tax return years, and does not believe that there are any uncertain tax positions that require recognition of a tax liability in the Master Portfolio’s financial statements.
As of September 30, 2023, gross unrealized appreciation and depreciation based on cost of investments (including short positions and derivatives, if any) for U.S. federal income tax purposes were as follows:
|
|
||||
| Amounts | ||||
|
|
||||
| Tax cost |
$ | 24,296,482,861 | ||
|
|
|
|||
| Gross unrealized appreciation |
$ | 146,862,368 | ||
| Gross unrealized depreciation |
(2,047,410,904 | ) | ||
|
|
|
|||
| Net unrealized appreciation (depreciation) |
$ | (1,900,548,536 | ) | |
|
|
|
|||
|
|
||||
| 9. | BANK BORROWINGS |
The Master Bond LLC, on behalf of the Master Portfolio, along with certain other funds managed by the Manager and its affiliates (“Participating Funds”), is party to a 364-day, $2.50 billion credit agreement with a group of lenders. Under this agreement, the Master Portfolio may borrow to fund shareholder redemptions. Excluding commitments designated for certain individual funds, the Participating Funds, including the Master Portfolio, can borrow up to an aggregate commitment amount of $1.75 billion at any time outstanding, subject to asset coverage and other limitations as specified in the agreement. The credit agreement has the following terms: a fee of 0.10% per annum on unused commitment amounts and interest at a rate equal to the higher of (a) Overnight Bank Funding Rate (“OBFR”) (but, in any event, not less than 0.00%) on the date the loan is made plus 0.80% per annum, (b) the Fed Funds rate (but, in any event, not less than 0.00%) in effect from time to time plus 0.80% per annum on amounts borrowed or (c) the sum of (x) Daily Simple SOFR (but, in any event, not less than 0.00%) on the date the loan is made plus 0.10% and (y) 0.80% per annum. The agreement expires in April 2024 unless extended or renewed. These fees were allocated among such funds based upon portions of the aggregate commitment available to them and relative net assets of Participating Funds. During the year ended September 30, 2023, the Master Portfolio did not borrow under the credit agreement.
| 10. | PRINCIPAL RISKS |
In the normal course of business, the Master Portfolio invests in securities or other instruments and may enter into certain transactions, and such activities subject the Master Portfolio to various risks, including among others, fluctuations in the market (market risk) or failure of an issuer to meet all of its obligations. The value of securities or other instruments may also be affected by various factors, including, without limitation: (i) the general economy; (ii) the overall market as well as local, regional or global political and/or social instability; (iii) regulation, taxation or international tax treaties between various countries; or (iv) currency, interest rate and price fluctuations. Local, regional or global events such as war, acts of terrorism, the spread of infectious illness or other public health issues, recessions, or other events could have a significant impact on the Master Portfolio and its investments. The Master Portfolio’s prospectus provides details of the risks to which the Master Portfolio is subject.
The Master Portfolio may be exposed to additional risks when reinvesting cash collateral in money market funds that do not seek to maintain a stable NAV per share of $1.00, which may be subject to redemption gates or liquidity fees under certain circumstances.
| M A S T E R P O R T F O L I O N O T E S T O C O N S O L I D A T E D F I N A N C I A L S T A T E M E N T S |
115 |
Notes to Consolidated Financial Statements (continued)
Market Risk: The Master Portfolio may be exposed to prepayment risk, which is the risk that borrowers may exercise their option to prepay principal earlier than scheduled during periods of declining interest rates, which would force the Master Portfolio to reinvest in lower yielding securities. The Master Portfolio may also be exposed to reinvestment risk, which is the risk that income from the Master Portfolio’s portfolio will decline if the Master Portfolio invests the proceeds from matured, traded or called fixed-income securities at market interest rates that are below the Master Portfolio’s current earnings rate.
Municipal securities are subject to the risk that litigation, legislation or other political events, local business or economic conditions, credit rating downgrades, or the bankruptcy of the issuer could have a significant effect on an issuer’s ability to make payments of principal and/or interest or otherwise affect the value of such securities. Municipal securities can be significantly affected by political or economic changes, including changes made in the law after issuance of the securities, as well as uncertainties in the municipal market related to, taxation, legislative changes or the rights of municipal security holders, including in connection with an issuer insolvency. Municipal securities backed by current or anticipated revenues from a specific project or specific assets can be negatively affected by the discontinuance of the tax benefits supporting the project or assets or the inability to collect revenues for the project or from the assets. Municipal securities may be less liquid than taxable bonds, and there may be less publicly available information on the financial condition of municipal security issuers than for issuers of other securities.
Infectious Illness Risk: An outbreak of an infectious illness, such as the COVID-19 pandemic, may adversely impact the economies of many nations, and the global economy, and may impact individual issuers and capital markets in ways that cannot be foreseen. An infectious illness outbreak may result in, among other things, closed international borders, prolonged quarantines, supply chain disruptions, market volatility or disruptions and other significant economic, social and political impacts.
Valuation Risk: The market values of equities, such as common stocks and preferred securities or equity related investments, such as futures and options, may decline due to general market conditions which are not specifically related to a particular company. They may also decline due to factors which affect a particular industry or industries. The Master Portfolio may invest in illiquid investments. An illiquid investment is any investment that the Master Portfolio reasonably expects cannot be sold or disposed of in current market conditions in seven calendar days or less without the sale or disposition significantly changing the market value of the investment. The Master Portfolio may experience difficulty in selling illiquid investments in a timely manner at the price that it believes the investments are worth. Prices may fluctuate widely over short or extended periods in response to company, market or economic news. Markets also tend to move in cycles, with periods of rising and falling prices. This volatility may cause the Master Portfolio’s NAV to experience significant increases or decreases over short periods of time. If there is a general decline in the securities and other markets, the NAV of the Master Portfolio may lose value, regardless of the individual results of the securities and other instruments in which the Master Portfolio invests.
The price the Master Portfolio could receive upon the sale of any particular portfolio investment may differ from the Master Portfolio’s valuation of the investment, particularly for securities that trade in thin or volatile markets or that are valued using a fair valuation technique or a price provided by an independent pricing service. Changes to significant unobservable inputs and assumptions (i.e., publicly traded company multiples, growth rate, time to exit) due to the lack of observable inputs may significantly impact the resulting fair value and therefore the Master Portfolio’s results of operations. As a result, the price received upon the sale of an investment may be less than the value ascribed by the Master Portfolio, and the Master Portfolio could realize a greater than expected loss or lesser than expected gain upon the sale of the investment. The Master Portfolio’s ability to value its investments may also be impacted by technological issues and/or errors by pricing services or other third-party service providers.
Counterparty Credit Risk: The Master Portfolio may be exposed to counterparty credit risk, or the risk that an entity may fail to or be unable to perform on its commitments related to unsettled or open transactions, including making timely interest and/or principal payments or otherwise honoring its obligations. The Master Portfolio manages counterparty credit risk by entering into transactions only with counterparties that the Manager believes have the financial resources to honor their obligations and by monitoring the financial stability of those counterparties. Financial assets, which potentially expose the Master Portfolio to market, issuer and counterparty credit risks, consist principally of financial instruments and receivables due from counterparties. The extent of the Master Portfolio’s exposure to market, issuer and counterparty credit risks with respect to these financial assets is approximately their value recorded in the Consolidated Statement of Assets and Liabilities, less any collateral held by the Master Portfolio.
A derivative contract may suffer a mark-to-market loss if the value of the contract decreases due to an unfavorable change in the market rates or values of the underlying instrument. Losses can also occur if the counterparty does not perform under the contract.
For OTC options purchased, the Master Portfolio bears the risk of loss in the amount of the premiums paid plus the positive change in market values net of any collateral held by the Master Portfolio should the counterparty fail to perform under the contracts. Options written by the Master Portfolio do not typically give rise to counterparty credit risk, as options written generally obligate the Master Portfolio, and not the counterparty, to perform. The Master Portfolio may be exposed to counterparty credit risk with respect to options written to the extent the Master Portfolio deposits collateral with its counterparty to a written option.
With exchange-traded options purchased and exchange-traded futures and centrally cleared swaps, there is less counterparty credit risk to the Master Portfolio since the exchange or clearinghouse, as counterparty to such instruments, guarantees against a possible default. The clearinghouse stands between the buyer and the seller of the contract; therefore, credit risk is limited to failure of the clearinghouse. While offset rights may exist under applicable law, the Master Portfolio does not have a contractual right of offset against a clearing broker or clearinghouse in the event of a default (including the bankruptcy or insolvency). Additionally, credit risk exists in exchange-traded futures and centrally cleared swaps with respect to initial and variation margin that is held in a clearing broker’s customer accounts. While clearing brokers are required to segregate customer margin from their own assets, in the event that a clearing broker becomes insolvent or goes into bankruptcy and at that time there is a shortfall in the aggregate amount of margin held by the clearing broker for all its clients, typically the shortfall would be allocated on a pro rata basis across all the clearing broker’s customers, potentially resulting in losses to the Master Portfolio.
Geographic/Asset Class Risk: A diversified portfolio, where this is appropriate and consistent with the Master Portfolio’s objectives, minimizes the risk that a price change of a particular investment will have a material impact on the NAV of the Master Portfolio. The investment concentrations within the Master Portfolio’s portfolio are disclosed in its Consolidated Schedule of Investments.
The Master Portfolio invests a significant portion of its assets in fixed-income securities and/or uses derivatives tied to the fixed-income markets. Changes in market interest rates or economic conditions may affect the value and/or liquidity of such investments. Interest rate risk is the risk that prices of bonds and other fixed-income securities will decrease as interest rates rise and increase as interest rates fall. The Master Portfolio may be subject to a greater risk of rising interest rates due to the recent period of
| 116 | 2 0 2 3 B L A C K R O C K A N N U A L R E P O R T T O S H A R E H O L D E R S |
Notes to Consolidated Financial Statements (continued)
historically low interest rates. The Federal Reserve has recently begun to raise the federal funds rate as part of its efforts to address inflation. There is a risk that interest rates will continue to rise, which will likely drive down the prices of bonds and other fixed-income securities, and could negatively impact the Master Portfolio’s performance.
The Master Portfolio invests a significant portion of its assets in securities backed by commercial or residential mortgage loans or in issuers that hold mortgage and other asset-backed securities. When the Master Portfolio concentrates its investments in this manner, it assumes a greater risk of prepayment or payment extension by securities issuers. Changes in economic conditions, including delinquencies and/or defaults on assets underlying these securities, can affect the value, income and/or liquidity of such positions. Investment percentages in these securities are presented in the Consolidated Schedule of Investments.
The Master Portfolio invests a significant portion of its assets in securities of issuers located in the United States. A decrease in imports or exports, changes in trade regulations, inflation and/or an economic recession in the United States may have a material adverse effect on the U.S. economy and the securities listed on U.S. exchanges. Proposed and adopted policy and legislative changes in the United States may also have a significant effect on U.S. markets generally, as well as on the value of certain securities. Governmental agencies project that the United States will continue to maintain elevated public debt levels for the foreseeable future which may constrain future economic growth. Circumstances could arise that could prevent the timely payment of interest or principal on U.S. government debt, such as reaching the legislative “debt ceiling.” Such non-payment would result in substantial negative consequences for the U.S. economy and the global financial system. If U.S. relations with certain countries deteriorate, it could adversely affect issuers that rely on the United States for trade. The United States has also experienced increased internal unrest and discord. If these trends were to continue, they may have an adverse impact on the U.S. economy and the issuers in which the Master Portfolio invests.
Significant Shareholder Redemption Risk: Certain shareholders may own or manage a substantial amount of fund shares and/or hold their fund investments for a limited period of time. Large redemptions of fund shares by these shareholders may force a fund to sell portfolio securities, which may negatively impact the fund’s NAV, increase the fund’s brokerage costs, and/or accelerate the realization of taxable income/gains and cause the fund to make additional taxable distributions to shareholders.
LIBOR Transition Risk: The Master Portfolio may be exposed to financial instruments that recently transitioned from, or continue to be tied to, the London Interbank Offered Rate (“LIBOR”) to determine payment obligations, financing terms, hedging strategies or investment value. The United Kingdom’s Financial Conduct Authority, which regulates LIBOR, has ceased publishing all LIBOR settings, but some USD LIBOR settings will continue to be published under a synthetic methodology until September 30, 2024 for certain legacy contracts. SOFR has been used increasingly on a voluntary basis in new instruments and transactions. Under U.S. regulations that implement a statutory fallback mechanism to replace LIBOR, benchmark rates based on SOFR have replaced LIBOR in certain financial contracts. The ultimate effect of the LIBOR transition process on the Master Portfolio is uncertain.
| 11. | SUBSEQUENT EVENTS |
Management has evaluated the impact of all subsequent events on the Master Portfolio through the date the financial statements were issued and has determined that there were no subsequent events requiring adjustment or additional disclosure in the financial statements.
| M A S T E R P O R T F O L I O N O T E S T O C O N S O L I D A T E D F I N A N C I A L S T A T E M E N T S |
117 |
Report of Independent Registered Public Accounting Firm
To the Investors of Master Total Return Portfolio and the Board of Directors of Master Bond LLC:
Opinion on the Financial Statements and Financial Highlights
We have audited the accompanying consolidated statement of assets and liabilities of Master Total Return Portfolio of Master Bond LLC (the “Master Portfolio”), including the consolidated schedule of investments, as of September 30, 2023, the related consolidated statement of operations for the year then ended, the consolidated statements of changes in net assets for each of the two years in the period then ended, the consolidated financial highlights for each of the five years in the period then ended, and the related notes. In our opinion, the financial statements and financial highlights present fairly, in all material respects, the financial position of the Master Portfolio as of September 30, 2023, and the results of its operations for the year then ended, the changes in its net assets for each of the two years in the period then ended, and the financial highlights for each of the five years in the period then ended, in conformity with accounting principles generally accepted in the United States of America.
Basis for Opinion
These financial statements and financial highlights are the responsibility of the Master Portfolio’s management. Our responsibility is to express an opinion on the Master Portfolio’s financial statements and financial highlights based on our audits. We are a public accounting firm registered with the Public Company Accounting Oversight Board (United States) (PCAOB) and are required to be independent with respect to the Master Portfolio in accordance with the U.S. federal securities laws and the applicable rules and regulations of the Securities and Exchange Commission and the PCAOB.
We conducted our audits in accordance with the standards of the PCAOB. Those standards require that we plan and perform the audit to obtain reasonable assurance about whether the financial statements and financial highlights are free of material misstatement, whether due to error or fraud. The Master Portfolio is not required to have, nor were we engaged to perform, an audit of its internal control over financial reporting. As part of our audits we are required to obtain an understanding of internal control over financial reporting but not for the purpose of expressing an opinion on the effectiveness of the Master Portfolio’s internal control over financial reporting. Accordingly, we express no such opinion.
Our audits included performing procedures to assess the risks of material misstatement of the financial statements and financial highlights, whether due to error or fraud, and performing procedures that respond to those risks. Such procedures included examining, on a test basis, evidence regarding the amounts and disclosures in the financial statements and financial highlights. Our audits also included evaluating the accounting principles used and significant estimates made by management, as well as evaluating the overall presentation of the financial statements and financial highlights. Our procedures included confirmation of securities owned as of September 30, 2023, by correspondence with custodians or counterparties; when replies were not received, we performed other auditing procedures. We believe that our audits provide a reasonable basis for our opinion.
Deloitte & Touche LLP
Boston, Massachusetts
November 20, 2023
We have served as the auditor of one or more BlackRock investment companies since 1992.
| 118 | 2 0 2 3 B L A C K R O C K A N N U A L R E P O R T T O S H A R E H O L D E R S |
Director and Officer Information
| Independent Directors(a) | ||||||||
| Name Year of Birth(b) |
Position(s) Held (Length of Service)(c) |
Principal Occupation(s) During Past 5 Years | Number of BlackRock-Advised Registered Investment Companies (“RICs”) Consisting of Investment Portfolios (“Portfolios”) Overseen |
Public Company and Other Investment Company Directorships Held During Past 5 Years | ||||
| R. Glenn Hubbard 1958 |
Chair of the Board (Since 2022) Director (Since 2019) |
Dean, Columbia Business School from 2004 to 2019; Faculty member, Columbia Business School since 1988. |
70 RICs consisting of 104 Portfolios | ADP (data and information services) from 2004 to 2020; Metropolitan Life Insurance Company (insurance); TotalEnergies SE (multi-energy) | ||||
| W. Carl Kester(d) 1951 |
Vice Chair of the Board (Since 2022) Director (Since 2019) |
Baker Foundation Professor and George Fisher Baker Jr. Professor of Business Administration, Emeritus, Harvard Business School since 2022; George Fisher Baker Jr. Professor of Business Administration, Harvard Business School from 2008 to 2022; Deputy Dean for Academic Affairs from 2006 to 2010; Chairman of the Finance Unit, from 2005 to 2006; Senior Associate Dean and Chairman of the MBA Program from 1999 to 2005; Member of the faculty of Harvard Business School since 1981. |
72 RICs consisting of 106 Portfolios | None | ||||
| Cynthia L. Egan 1955 |
Director (Since 2019) |
Advisor, U.S. Department of the Treasury from 2014 to 2015; President, Retirement Plan Services, for T. Rowe Price Group, Inc. from 2007 to 2012; executive positions within Fidelity Investments from 1989 to 2007. |
70 RICs consisting of 104 Portfolios | Unum (insurance); The Hanover Insurance Group (Board Chair); Huntsman Corporation (Lead Independent Director and non Executive Vice Chair of the Board) (chemical products) | ||||
| Frank J. Fabozzi(d) 1948 |
Director (Since 2019) |
Editor of The Journal of Portfolio Management since 1986; Professor of Finance, EDHEC Business School (France) from 2011 to 2022; Professor of Practice, Johns Hopkins University since 2021; Professor in the Practice of Finance, Yale University School of Management from 1994 to 2011 and currently a Teaching Fellow in Yale’s Executive Programs; Visiting Professor, Rutgers University for the Spring 2019 semester; Visiting Professor, New York University for the 2019 academic year; Adjunct Professor of Finance, Carnegie Mellon University in fall 2020 semester. |
72 RICs consisting of 106 Portfolios | None | ||||
| Lorenzo A. Flores 1964 |
Director (Since 2021) |
Vice Chairman, Kioxia, Inc. since 2019; Chief Financial Officer, Xilinx, Inc. from 2016 to 2019; Corporate Controller, Xilinx, Inc. from 2008 to 2016. |
70 RICs consisting of 104 Portfolios | None | ||||
| Stayce D. Harris 1959 |
Director (Since 2021) |
Lieutenant General, Inspector General of the United States Air Force from 2017 to 2019; Lieutenant General, Assistant Vice Chief of Staff and Director, Air Staff, United States Air Force from 2016 to 2017; Major General, Commander, 22nd Air Force, AFRC, Dobbins Air Reserve Base, Georgia from 2014 to 2016; Pilot, United Airlines from 1990 to 2020. |
70 RICs consisting of 104 Portfolios | KULR Technology Group, Inc. in 2021; The Boeing Company (airplane manufacturer) | ||||
| D I R E C T O R A N D O F F I C E R I N F O R M A T I O N |
119 |
Director and Officer Information (continued)
| Independent Directors(a) | ||||||||
| Name Year of Birth(b) |
Position(s) Held (Length of Service)(c) |
Principal Occupation(s) During Past 5 Years | Number of BlackRock-Advised Registered Investment Companies (“RICs”) Consisting of Investment Portfolios (“Portfolios”) Overseen |
Public Company and Other Investment Company Directorships Held During Past 5 Years | ||||
| J. Phillip Holloman 1955 |
Director (Since 2021) |
President and Chief Operating Officer, Cintas Corporation from 2008 to 2018. |
70 RICs consisting of 104 Portfolios | PulteGroup, Inc. (home construction); Rockwell Automation Inc. (industrial automation) | ||||
| Catherine A. Lynch(d) 1961 |
Director (Since 2019) |
Chief Executive Officer, Chief Investment Officer and various other positions, National Railroad Retirement Investment Trust from 2003 to 2016; Associate Vice President for Treasury Management, The George Washington University from 1999 to 2003; Assistant Treasurer, Episcopal Church of America from 1995 to 1999. |
72 RICs consisting of 106 Portfolios | PennyMac Mortgage Investment Trust | ||||
| 120 | 2 0 2 3 B L A C K R O C K A N N U A L R E P O R T T O S H A R E H O L D E R S |
Director and Officer Information (continued)
| Interested Directors(a)(e) | ||||||||
| Name Year of Birth(b) |
Position(s) Held (Length of Service)(c) |
Principal Occupation(s) During Past 5 Years | Number of BlackRock-Advised Registered Investment Companies (“RICs”) Consisting of Investment Portfolios (“Portfolios”) Overseen |
Public Company and Other Investment Company Directorships Held During Past 5 Years | ||||
| Robert Fairbairn 1965 |
Director (Since 2015) |
Vice Chairman of BlackRock, Inc. since 2019; Member of BlackRock’s Global Executive and Global Operating Committees; Co-Chair of BlackRock’s Human Capital Committee; Senior Managing Director of BlackRock, Inc. from 2010 to 2019; oversaw BlackRock’s Strategic Partner Program and Strategic Product Management Group from 2012 to 2019; Member of the Board of Managers of BlackRock Investments, LLC from 2011 to 2018; Global Head of BlackRock’s Retail and iShares® businesses from 2012 to 2016. |
98 RICs consisting of 272 Portfolios | None | ||||
| John M. Perlowski(d) 1964 |
Director (Since 2015), President and Chief Executive Officer (Since 2010) |
Managing Director of BlackRock, Inc. since 2009; Head of BlackRock Global Accounting and Product Services since 2009; Advisory Director of Family Resource Network (charitable foundation) since 2009. |
100 RICs consisting of 274 Portfolios | None | ||||
| (a) | The address of each Director is c/o BlackRock, Inc., 55 East 52nd Street, New York, New York 10001. |
| (b) | Each Independent Director holds office until his or her successor is duly elected and qualifies or until his or her earlier death, resignation, retirement or removal as provided by the Corporation/Master Bond LLC’s by-laws or charter or statute, or until December 31 of the year in which he or she turns 75. Directors who are “interested persons,” as defined in the Investment Company Act serve until their successor is duly elected and qualifies or until their earlier death, resignation, retirement or removal as provided by the Corporation/Master Bond LLC’s by-laws or statute, or until December 31 of the year in which they turn 72. The Board may determine to extend the terms of Independent Directors on a case-by-case basis, as appropriate. |
| (c) | Following the combination of Merrill Lynch Investment Managers, L.P. (“MLIM”) and BlackRock, Inc. in September 2006, the various legacy MLIM and legacy BlackRock fund boards were realigned and consolidated into three new fund boards in 2007. Certain Independent Directors first became members of the boards of other legacy MLIM or legacy BlackRock funds as follows: Frank J. Fabozzi, 1988; R. Glenn Hubbard, 2004; and W. Carl Kester. Certain other Independent Directors became members of the boards of the closed-end funds in the Fixed-Income Complex as follows: Cynthia L. Egan, 2016; and Catherine A. Lynch, 2016. |
| (d) | Dr. Fabozzi, Dr. Kester, Ms. Lynch and Mr. Perlowski are also directors of the BlackRock Credit Strategies Fund and BlackRock Private Investments Fund. |
| (e) | Mr. Fairbairn and Mr. Perlowski are both “interested persons,” as defined in the 1940 Act, of the Corporation/Master Bond LLC based on their positions with BlackRock, Inc. and its affiliates. Mr. Fairbairn and Mr. Perlowski are also board members of the BlackRock Multi-Asset Complex. |
| D I R E C T O R A N D O F F I C E R I N F O R M A T I O N |
121 |
Director and Officer Information (continued)
| Officers Who Are Not Directors(a) | ||||
| Name Year of Birth(b) |
Position(s) Held (Length of Service) |
Principal Occupation(s) During Past 5 Years | ||
| Jennifer McGovern 1977 |
Vice President (Since 2014) |
Managing Director of BlackRock, Inc. since 2016; Director of BlackRock, Inc. from 2011 to 2015; Head of Americas Product Development and Governance for BlackRock’s Global Product Group since 2019; Head of Product Structure and Oversight for BlackRock’s U.S. Wealth Advisory Group from 2013 to 2019.
| ||
| Trent Walker 1974 |
Chief Financial Officer (Since 2021) |
Managing Director of BlackRock, Inc. since September 2019; Executive Vice President of PIMCO from 2016 to 2019; Senior Vice President of PIMCO from 2008 to 2015; Treasurer from 2013 to 2019 and Assistant Treasurer from 2007 to 2017 of PIMCO Funds, PIMCO Variable Insurance Trust, PIMCO ETF Trust, PIMCO Equity Series, PIMCO Equity Series VIT, PIMCO Managed Accounts Trust, 2 PIMCO-sponsored interval funds and 21 PIMCO-sponsored closed-end funds. | ||
| Jay M. Fife 1970 |
Treasurer (Since 2007) |
Managing Director of BlackRock, Inc. since 2007. | ||
| Aaron Wasserman 1974 |
Chief Compliance Officer (Since 2023) |
Managing Director of BlackRock, Inc. since 2018; Chief Compliance Officer of the BlackRock-advised funds in the BlackRock Multi-Asset Complex, the BlackRock Fixed-Income Complex and the iShares Complex since 2023; Deputy Chief Compliance Officer for the BlackRock-advised funds in the BlackRock Multi-Asset Complex, the BlackRock Fixed-Income Complex and the iShares Complex from 2014 to 2023. | ||
| Lisa Belle 1968 |
Anti-Money Laundering Compliance Officer (Since 2019) |
Managing Director of BlackRock, Inc. since 2019; Global Financial Crime Head for Asset and Wealth Management of JP Morgan from 2013 to 2019; Managing Director of RBS Securities from 2012 to 2013; Head of Financial Crimes for Barclays Wealth Americas from 2010 to 2012. | ||
| Janey Ahn 1975 |
Secretary (Since 2019) |
Managing Director of BlackRock, Inc. since 2018; Director of BlackRock, Inc. from 2009 to 2017. | ||
| (a) | The address of each Officer is c/o BlackRock, Inc., 55 East 52nd Street, New York, New York 10001. |
| (b) | Officers of the Master Bond LLC serve at the pleasure of the Board. |
Further information about the Corporation/Master Bond LLC’s Directors and Officers is available in the Corporation/Master Bond LLC’s Statement of Additional Information, which can be obtained without charge by calling (800) 441-7762.
Effective July 1, 2023, Aaron Wasserman replaced Charles Park as Chief Compliance Officer of the Master Bond LLC.
Effective November 9, 2023, Arthur P. Steinmetz was appointed as a Director of the Master Bond LLC.
| 122 | 2 0 2 3 B L A C K R O C K A N N U A L R E P O R T T O S H A R E H O L D E R S |
Disclosure of Investment Advisory Agreements and Sub-Advisory Agreements
The Board of Directors of the Master Bond LLC (the “Master Portfolio”) met on May 4, 2023 (the “May Meeting”) and June 1-2, 2023 (the “June Meeting”) to consider the approval to continue the investment advisory agreement (the “Master Fund Advisory Agreement”) between the Master Portfolio, on behalf of Master Total Return Portfolio (the “Master Fund”) and BlackRock Advisors, LLC (the “Manager”), the Master Portfolio’s investment adviser. The Board of Directors of the Master Portfolio also considered the approval to continue the sub-advisory agreements (together, the “Master Fund Sub-Advisory Agreements”) between the Manager and BlackRock International Limited and BlackRock (Singapore) Limited (together, the “Sub-Advisors”), with respect to the Master Fund. The BlackRock Total Return Fund (the “Feeder Fund”), a series of BlackRock Bond Fund, Inc. (the “Feeder Corporation”), is a “feeder” fund that invests all of its investable assets in the Master Fund. Accordingly, the Board of Directors of the Feeder Corporation also considered the approval to continue the investment advisory agreement (the “Feeder Fund Advisory Agreement” and together with the Master Fund Advisory Agreement, the “Advisory Agreements”) between the Feeder Corporation, on behalf of the Feeder Fund, and the Manager, and the sub-advisory agreements (the “Feeder Fund Sub-Advisory Agreements” and collectively with the Master Fund Sub-Advisory Agreements, the “Sub-Advisory Agreements”) between the Manager and the Sub-Advisors, with respect to the Feeder Fund. The Manager and the Sub-Advisors are referred to herein as “BlackRock.” The Advisory Agreements and the Sub-Advisory Agreements are referred to herein as the “Agreements.” For simplicity: (a) the Board of Directors of the Master Portfolio and the Board of Directors of the Feeder Corporation are referred to herein collectively as the “Board,” and the members are referred to as “Board Members”; (b) the shareholders of the Feeder Fund and the interest holders of the Master Fund are referred to as “shareholders,” and (c) the Master Fund and the Feeder Fund are referred to herein together as the “Fund.”
The Approval Process
Consistent with the requirements of the Investment Company Act of 1940 (the “1940 Act”), the Board considers the approval of the continuation of the Agreements for the Master Portfolio on an annual basis. The Board members who are not “interested persons” of the Master Portfolio, as defined in the 1940 Act, are considered independent Board members (the “Independent Board Members”). The Board’s consideration entailed a year-long deliberative process during which the Board and its committees assessed BlackRock’s various services to the Master Portfolio, including through the review of written materials and oral presentations, and the review of additional information provided in response to requests from the Independent Board Members. The Board had four quarterly meetings per year, each of which extended over a two-day period, as well as additional ad hoc meetings and executive sessions throughout the year, as needed. The committees of the Board similarly met throughout the year. The Board also had an additional one-day meeting to consider specific information regarding the renewals of the Agreements. In considering the renewal of the Agreements, the Board assessed, among other things, the nature, extent and quality of the services provided to the Fund by BlackRock, BlackRock’s personnel and affiliates, including (as applicable): investment management services; accounting oversight; administrative and shareholder services; oversight of the Fund’s service providers; risk management and oversight; and legal, regulatory and compliance services. Throughout the year, including during the contract renewal process, the Independent Board Members were advised by independent legal counsel, and met with independent legal counsel in various executive sessions outside of the presence of BlackRock’s management.
During the year, the Board, acting directly and through its committees, considers information that was relevant to its annual consideration of the renewal of the Agreements, including the services and support provided by BlackRock to the Master Fund, the Feeder Fund and their shareholders. BlackRock also furnished additional information to the Board in response to specific questions from the Board. Among the matters the Board considered were: (a) investment performance for one-year, three-year, five-year, and/or since inception periods, as applicable, against peer funds, relevant benchmarks, and other performance metrics, as applicable, as well as BlackRock senior management’s and portfolio managers’ analyses of the reasons for any outperformance or underperformance relative to its peers, benchmarks, and other performance metrics, as applicable; (b) fees, including advisory, administration, if applicable, and other amounts paid to BlackRock and its affiliates by the Fund for services; (c) the Fund’s operating expenses and how BlackRock allocates expenses to the Fund; (d) the resources devoted to risk oversight of, and compliance reports relating to, implementation of the Fund’s investment objective, policies and restrictions, and meeting regulatory requirements; (e) BlackRock’s and the Fund’s adherence to applicable compliance policies and procedures; (f) the nature, character and scope of non-investment management services provided by BlackRock and its affiliates and the estimated cost of such services, as applicable; (g) BlackRock’s and other service providers’ internal controls and risk and compliance oversight mechanisms; (h) BlackRock’s implementation of the proxy voting policies approved by the Board; (i) execution quality of portfolio transactions; (j) BlackRock’s implementation of the Fund’s valuation and liquidity procedures; (k) an analysis of management fees paid to BlackRock for products with similar investment mandates across the open-end fund, exchange-traded fund (“ETF”), closed-end fund, sub-advised mutual fund, separately managed account, collective investment trust, and institutional separate account product channels, as applicable, and the similarities and differences between these products and the services provided as compared to the Fund; (l) BlackRock’s compensation methodology for its investment professionals and the incentives and accountability it creates, along with investment professionals’ investments in the fund(s) they manage; and (m) periodic updates on BlackRock’s business.
Prior to and in preparation for the May Meeting, the Board received and reviewed materials specifically relating to the renewal of the Agreements. The Independent Board Members are continuously engaged in a process with their independent legal counsel and BlackRock to review the nature and scope of the information provided to the Board to better assist its deliberations. The materials provided in connection with the May Meeting included, among other things: (a) information independently compiled and prepared by Broadridge Financial Solutions, Inc. (“Broadridge”), based on either a Lipper classification or Morningstar category, regarding fees and expenses of the Fund, as applicable, as compared with a peer group of funds as determined by Broadridge (“Expense Peers”), and the investment performance of the Fund as compared with a peer group of funds (“ Performance Peers”); (b) information on the composition of the Expense Peers and Performance Peers, and a description of Broadridge’s methodology; (c) information on the estimated profits realized by BlackRock and its affiliates pursuant to the Agreements and a discussion of fall-out benefits to BlackRock and its affiliates; (d) a general analysis provided by BlackRock concerning investment management fees received in connection with other types of investment products, such as institutional accounts, sub-advised mutual funds, ETFs, closed-end funds, open-end funds, and separately managed accounts, under similar investment mandates, as well as the performance of such other products, as applicable; (e) a review of non-management fees; (f) the existence, impact and sharing of potential economies of scale, if any, with the Fund; (g) a summary of aggregate amounts paid by the Fund to BlackRock; (h) sales and redemption data regarding the Feeder Fund’s shares; and (i) various additional information requested by the Board as appropriate regarding BlackRock’s, the Fund’s operations.
At the May Meeting, the Board reviewed materials relating to its consideration of the Agreements, and the Independent Board Members presented BlackRock with questions and requests for additional information. BlackRock responded to these questions and requests with additional written information in advance of the June Meeting.
At the June Meeting, the Board concluded its assessment of, among other things: (a) the nature, extent and quality of the services provided by BlackRock; (b) the investment performance of the Fund as compared to its Performance Peers and to other metrics, as applicable; (c) the advisory fee and the estimated cost of the services and estimated
| D I S C L O S U R E O F I N V E S T M E N T A D V I S O R Y A G R E E M E N T S A N D S U B - A D V I S O R Y A G R E E M E N T S |
123 |
Disclosure of Investment Advisory Agreements and Sub-Advisory Agreements (continued)
profits realized by BlackRock and its affiliates from their relationship with the Fund; (d) the Fund’s fees and expenses compared to its Expense Peers; (e) the existence and sharing of potential economies of scale; (f) any fall-out benefits to BlackRock and its affiliates as a result of BlackRock’s relationship with the Fund; and (g) other factors deemed relevant by the Board Members.
The Board also considered other matters it deemed important to the approval process, such as other payments made to BlackRock or its affiliates relating to securities lending and cash management, and BlackRock’s services related to the valuation and pricing of portfolio holdings of the Master Fund. The Board noted the willingness of BlackRock’s personnel to engage in open, candid discussions with the Board. The Board Members evaluated the information available to them on a fund-by-fund basis. The following paragraphs provide more information about some of the primary factors that were relevant to the Board’s decision. The Board Members did not identify any particular information, or any single factor as determinative, and each Board Member may have attributed different weights to the various items and factors considered.
A. Nature, Extent and Quality of the Services Provided by BlackRock
The Board, including the Independent Board Members, reviewed the nature, extent and quality of services provided by BlackRock, including the investment advisory services and the resulting performance of the Fund. Throughout the year, the Board compared the Fund’s performance to the performance of a comparable group of mutual funds, relevant benchmarks, and performance metrics, as applicable. The Board met with BlackRock’s senior management personnel responsible for investment activities, including the senior investment officers. The Board also reviewed the materials provided by the Fund’s portfolio management team discussing the Fund’s performance and the Fund’s investment strategies and outlook.
The Board considered, among other factors, with respect to BlackRock: the experience of investment personnel generally and the Fund’s portfolio management team; research capabilities; investments by portfolio managers in the funds they manage; portfolio trading capabilities; use of technology; commitment to compliance; credit analysis capabilities; risk analysis and oversight capabilities; and the approach to training and retaining portfolio managers and other research, advisory and management personnel. The Board also considered BlackRock’s overall risk management program, including the continued efforts of BlackRock and its affiliates to address cybersecurity risks and the role of BlackRock’s Risk & Quantitative Analysis Group. The Board engaged in a review of BlackRock’s compensation structure with respect to the Master Fund’s portfolio management team and BlackRock’s ability to attract and retain high-quality talent and create performance incentives.
In addition to investment advisory services, the Board considered the nature and quality of the administrative and other non-investment advisory services provided to the Fund. BlackRock and its affiliates provide the Fund with certain administrative, shareholder and other services (in addition to any such services provided to the Fund by third parties) and officers and other personnel as are necessary for the operations of the Fund. In particular, BlackRock and its affiliates provide the Fund with administrative services including, among others: (i) responsibility for disclosure documents, such as the prospectus, the summary prospectus (as applicable), the statement of additional information and periodic shareholder reports; (ii) oversight of daily accounting and pricing; (iii) responsibility for periodic filings with regulators; (iv) overseeing and coordinating the activities of third-party service providers including, among others, the custodian, fund accountant, transfer agent, and auditor for the Fund, as applicable; (v) organizing Board meetings and preparing the materials for such Board meetings; (vi) providing legal and compliance support; (vii) furnishing analytical and other support to assist the Board in its consideration of strategic issues such as the merger, consolidation or repurposing of certain open-end funds; and (viii) performing or managing administrative functions necessary for the operation of the Fund, such as tax reporting, expense management, fulfilling regulatory filing requirements, overseeing the Feeder Fund’s distribution partners, and shareholder call center and other services. The Board reviewed the structure and duties of BlackRock’s fund administration, shareholder services, and legal and compliance departments and considered BlackRock’s policies and procedures for assuring compliance with applicable laws and regulations.
The Board considered the operation of BlackRock’s business continuity plans The Board noted that the engagement of the Sub-Advisors with respect to the Fund facilitates the provision of investment advice and trading by investment personnel out of non-U.S. jurisdictions. The Board considered that this arrangement provides additional flexibility to the portfolio management team, which may benefit the Fund and its shareholders
B. The Investment Performance of the Fund and BlackRock
The Board, including the Independent Board Members, also reviewed and considered the performance history of the Fund throughout the year and at the May Meeting. The Board noted that the Feeder Fund’s investment results correspond directly to the investment results of the Master Fund. In preparation for the May Meeting, the Board was provided with reports independently prepared by Broadridge, which included an analysis of the Fund’s performance as of December 31, 2022, as compared to its Performance Peers. Broadridge ranks funds in quartiles, ranging from first to fourth, where first is the most desirable quartile position and fourth is the least desirable. In connection with its review, the Board received and reviewed information regarding the investment performance of the Fund as compared to its Performance Peers and the respective Morningstar Category (“Morningstar Category”). The Board and its Performance Oversight Committee regularly review, and meet with Fund management to discuss, the performance of the Fund, as applicable, throughout the year.
In evaluating performance, the Board focused particular attention on funds with less favorable performance records. The Board also noted that while it found the data provided by Broadridge generally useful, it recognized the limitations of such data, including in particular, that notable differences may exist between a fund and its Performance Peers (for example, the investment objectives and strategies). Further, the Board recognized that the performance data reflects a snapshot of a period as of a particular date and that selecting a different performance period could produce significantly different results. The Board also acknowledged that long-term performance could be impacted by even one period of significant outperformance or underperformance and that a single investment theme could have the ability to disproportionately affect long-term performance.
The Board noted that for the one-, three- and five-year periods reported, the Fund ranked in the third, second and second quartiles, respectively, against its Morningstar Category. The Board noted that BlackRock believes that the Morningstar Category is an appropriate performance metric for the Fund, and that BlackRock has explained its rationale for this belief to the Board. The Board and BlackRock reviewed the Fund’s underperformance relative to its Morningstar Category during the applicable period.
| 124 | 2 0 2 3 B L A C K R O C K A N N U A L R E P O R T T O S H A R E H O L D E R S |
Disclosure of Investment Advisory Agreements and Sub-Advisory Agreements (continued)
C. Consideration of the Advisory/Management Fees and the Estimated Cost of the Services and Estimated Profits Realized by BlackRock and its Affiliates from their Relationship with the Fund
The Board, including the Independent Board Members, reviewed the Fund’s contractual management fee rate compared with those of the Fund’s Expense Peers. The contractual management fee rate represents a combination of the advisory fee and any administrative fees, before taking into account any reimbursements or fee waivers. The Board also compared the Fund’s total expense ratio, as well as the Fund’s actual management fee rate, to those of the Fund’s Expense Peers. The total expense ratio represents a fund’s total net operating expenses, including any 12b-1 or non 12b-1 service fees. The total expense ratio gives effect to any expense reimbursements or fee waivers, and the actual management fee rate gives effect to any management fee reimbursements or waivers. The Board considered that the fee and expense information in the Broadridge report for the Fund reflected information for a specific period and that historical asset levels and expenses may differ from current levels, particularly in a period of market volatility. The Board considered the services provided and the fees charged by BlackRock and its affiliates to other types of clients with similar investment mandates, as applicable, including institutional accounts and sub-advised mutual funds (including mutual funds sponsored by third parties).
The Board received and reviewed statements relating to BlackRock’s financial condition. The Board reviewed BlackRock’s profitability methodology and was also provided with an estimated profitability analysis that detailed the revenues earned and the expenses incurred by BlackRock for services provided to the Fund. The Board reviewed BlackRock’s estimated profitability with respect to the Fund, as applicable, and other funds the Board currently oversees for the year ended December 31, 2022 compared to available aggregate estimated profitability data provided for the prior two years. The Board reviewed BlackRock’s estimated profitability with respect to certain other U.S. fund complexes managed by the Manager and/or its affiliates. The Board reviewed BlackRock’s assumptions and methodology of allocating expenses in the estimated profitability analysis, noting the inherent limitations in allocating costs among various advisory products. The Board recognized that profitability may be affected by numerous factors including, among other things, fee waivers and expense reimbursements by the Manager, the types of funds managed, precision of expense allocations and business mix. The Board thus recognized that calculating and comparing profitability at the individual fund level is difficult.
The Board noted that, in general, individual fund or product line profitability of other advisors is not publicly available. The Board reviewed BlackRock’s overall operating margin, in general, compared to that of certain other publicly traded asset management firms. The Board considered the differences between BlackRock and these other firms, including the contribution of technology at BlackRock, BlackRock’s expense management, and the relative product mix.
The Board considered whether BlackRock has the financial resources necessary to attract and retain high quality investment management personnel to perform its obligations under the Agreements and to continue to provide the high quality of services that is expected by the Board. The Board further considered factors including but not limited to BlackRock’s commitment of time and resources, assumption of risk, and liability profile in servicing the Fund, including in contrast to what is required of BlackRock with respect to other products with similar investment mandates across the open-end fund, ETF, closed-end fund, sub-advised mutual fund, separately managed account, collective investment trust, and institutional separate account product channels, as applicable.
The Board noted that the Fund’s contractual management fee rate ranked in the second quartile, and that the actual management fee rate and total expense ratio each ranked in the second quartile relative to the Fund’s Expense Peers. The Board also noted that the Fund has an advisory fee arrangement that includes breakpoints that adjust the fee rate downward as the size of the Fund increases above certain contractually specified levels. The Board additionally noted that the breakpoints can, conversely, adjust the advisory fee rate upward as the size of the Fund decreases below certain contractually specified levels. The Board noted that BlackRock and the Board have contractually agreed to a cap on the Fund’s total expenses as a percentage of the Fund’s average daily net assets on a class-by-class basis.
D. Economies of Scale
The Board, including the Independent Board Members, considered the extent to which economies of scale might be realized as the assets of the Fund increase, including the existence of fee waivers and/or expense caps, as applicable, noting that any contractual fee waivers and contractual expense caps had been approved by the Board. In its consideration, the Board further considered the continuation and/or implementation of fee waivers and/or expense caps, as applicable. The Board also considered the extent to which the Fund benefit from such economies of scale in a variety of ways, and whether there should be changes in the advisory fee rate or breakpoint structure in order to enable the Fund to more fully participate in these economies of scale. The Board considered the Master Fund’s asset levels and whether the current fee schedule was appropriate.
E. Other Factors Deemed Relevant by the Board Members
The Board, including the Independent Board Members, also took into account other ancillary or “fall-out” benefits that BlackRock or its affiliates may derive from BlackRock’s respective relationships with the Fund, both tangible and intangible, such as BlackRock’s ability to leverage its investment professionals who manage other portfolios and its risk management personnel, an increase in BlackRock’s profile in the investment advisory community, and the engagement of BlackRock’s affiliates as service providers to the Fund, including for administrative, distribution, securities lending and cash management services. With respect to securities lending, during the year the Board also considered information provided by independent third-party consultants related to the performance of each BlackRock affiliate as securities lending agent. The Board also considered BlackRock’s overall operations and its efforts to expand the scale of, and improve the quality of, its operations. The Board also noted that, subject to applicable law, BlackRock may use and benefit from third party research obtained by soft dollars generated by certain registered fund transactions to assist in managing all or a number of its other client accounts.
In connection with its consideration of the Agreements, the Board also received information regarding BlackRock’s brokerage and soft dollar practices. The Board received reports from BlackRock which included information on brokerage commissions and trade execution practices throughout the year.
The Board noted the competitive nature of the open-end fund marketplace, and that shareholders are able to redeem their Feeder Fund shares if they believe that the Fund’s fees and expenses are too high or if they are dissatisfied with the performance of the Fund.
| D I S C L O S U R E O F I N V E S T M E N T A D V I S O R Y A G R E E M E N T S A N D S U B - A D V I S O R Y A G R E E M E N T S |
125 |
Disclosure of Investment Advisory Agreements and Sub-Advisory Agreements (continued)
Conclusion
At the June Meeting, in a continuation of the discussions that occurred during the May Meeting, and as a culmination of the Board’s year-long deliberative process, the Board of the Master Portfolio, including the Independent Board Members, unanimously approved the continuation of the Advisory Agreement between the Manager and the Master Portfolio, on behalf of the Master Fund for a one-year term ending June 30, 2024, and the Sub-Advisory Agreements between the Manager and the Sub-Advisors, with respect to the Master Fund, for a one-year term ending June 30, 2024. Based upon its evaluation of all of the aforementioned factors in their totality, as well as other information, the Board of the Master Portfolio, including the Independent Board Members, was satisfied that the terms of the Agreements were fair and reasonable and in the best interest of the Master Fund and its shareholders. The Board of the Feeder Corporation, including the Independent Board Members, also considered the continuation of the Agreements with respect to the Master Fund and found the Agreements to be satisfactory. In arriving at its decision to approve the Agreements, the Board of the Master Portfolio did not identify any single factor or group of factors as all-important or controlling, but considered all factors together, and different Board Members may have attributed different weights to the various factors considered. The Independent Board Members were advised by independent legal counsel throughout the deliberative process.
| 126 | 2 0 2 3 B L A C K R O C K A N N U A L R E P O R T T O S H A R E H O L D E R S |
Tailored Shareholder Reports for Open-End Mutual Funds and ETFs
Effective January 24, 2023, the SEC adopted rule and form amendments to require open-end mutual funds and ETFs to transmit concise and visually engaging streamlined annual and semiannual reports to shareholders that highlight key information. Other information, including financial statements, will no longer appear in a streamlined shareholder report but must be available online, delivered free of charge upon request, and filed on a semiannual basis on Form N-CSR. The rule and form amendments have a compliance date of July 24, 2024. At this time, management is evaluating the impact of these amendments on the shareholder reports for the Master Portfolio.
General Information
Quarterly performance, semi-annual and annual reports, current net asset value and other information regarding the Fund may be found on BlackRock’s website, which can be accessed at blackrock.com. Any reference to BlackRock’s website in this report is intended to allow investors public access to information regarding the Fund and does not, and is not intended to, incorporate BlackRock’s website in this report.
Householding
The Fund will mail one copy of shareholder documents, including prospectuses, annual and semi-annual reports, Rule 30e-3 notices and proxy statements, to shareholders with multiple accounts at the same address. This practice is commonly called "householding” and is intended to reduce expenses and eliminate duplicate mailings of shareholder documents. Mailings of your shareholder documents may be householded indefinitely unless you instruct us otherwise. If you do not want the mailing of these documents to be combined with those or other members of your household, please call the Fund at (800) 441-7762.
Availability of Quarterly Schedule of Investments
The Fund/Master Portfolio file their complete schedules of portfolio holdings with the SEC for the first and third quarters of each fiscal year as an exhibit to their reports on Form N-PORT. The Fund’s/Master Portfolio’s Forms N-PORT are available on the SEC’s website at sec.gov. Additionally, the Fund/Master Portfolio make their portfolio holdings for the first and third quarters of each fiscal year available at blackrock.com/fundreports.
Availability of Proxy Voting Policies, Procedures and Voting Records
A description of the policies and procedures that the Fund/Master Portfolio use to determine how to vote proxies relating to portfolio securities and information about how the Fund/Master Portfolio voted proxies relating to securities held in the Fund’s/Master Portfolio’s portfolios during the most recent 12-month period ended June 30 is available without charge, upon request (1) by calling (800) 441-7762; (2) on the BlackRock website at blackrock.com; and (3) on the SEC’s website at sec.gov.
BlackRock’s Mutual Fund Family
BlackRock offers a diverse lineup of open-end mutual funds crossing all investment styles and managed by experts in equity, fixed-income and tax-exempt investing. Visit blackrock.com for more information.
Shareholder Privileges
Account Information
Call us at (800) 441-7762 from 8:00 AM to 6:00 PM ET on any business day to get information about your account balances, recent transactions and share prices. You can also visit blackrock.com for more information.
Automatic Investment Plans
Investor class shareholders who want to invest regularly can arrange to have $50 or more automatically deducted from their checking or savings account and invested in any of the BlackRock funds.
Systematic Withdrawal Plans
Investor class shareholders can establish a systematic withdrawal plan and receive periodic payments of $50 or more from their BlackRock funds, as long as their account balance is at least $10,000.
Retirement Plans
Shareholders may make investments in conjunction with Traditional, Rollover, Roth, Coverdell, Simple IRAs, SEP IRAs and 403(b) Plans.
BlackRock Privacy Principles
BlackRock is committed to maintaining the privacy of its current and former fund investors and individual clients (collectively, “Clients”) and to safeguarding their non-public personal information. The following information is provided to help you understand what personal information BlackRock collects, how we protect that information and why in certain cases we share such information with select parties.
| A D D I T I O N A L I N F O R M A T I O N |
127 |
Additional Information (continued)
If you are located in a jurisdiction where specific laws, rules or regulations require BlackRock to provide you with additional or different privacy-related rights beyond what is set forth below, then BlackRock will comply with those specific laws, rules or regulations.
BlackRock obtains or verifies personal non-public information from and about you from different sources, including the following: (i) information we receive from you or, if applicable, your financial intermediary, on applications, forms or other documents; (ii) information about your transactions with us, our affiliates, or others; (iii) information we receive from a consumer reporting agency; and (iv) from visits to our websites.
BlackRock does not sell or disclose to non-affiliated third parties any non-public personal information about its Clients, except as permitted by law or as is necessary to respond to regulatory requests or to service Client accounts. These non-affiliated third parties are required to protect the confidentiality and security of this information and to use it only for its intended purpose.
We may share information with our affiliates to service your account or to provide you with information about other BlackRock products or services that may be of interest to you. In addition, BlackRock restricts access to non-public personal information about its Clients to those BlackRock employees with a legitimate business need for the information. BlackRock maintains physical, electronic and procedural safeguards that are designed to protect the non-public personal information of its Clients, including procedures relating to the proper storage and disposal of such information.
Fund and/or Master Portfolio Service Providers
Investment Adviser
BlackRock Advisors, LLC
Wilmington, DE 19809
Sub-Advisers
BlackRock International Limited
Edinburgh, EH3 8BL
United Kingdom
BlackRock (Singapore) Limited
079912 Singapore
Accounting Agent and Transfer Agent
BNY Mellon Investment Servicing (US) Inc.
Wilmington, DE 19809
Custodian
The Bank of New York Mellon
New York, NY 10286
Independent Registered Public Accounting Firm
Deloitte & Touche LLP
Boston, MA 02116
Distributor
BlackRock Investments, LLC
New York, NY 10001
Legal Counsel
Willkie Farr & Gallagher LLP
New York, NY 10019
Address of the Corporation/Master Bond LLC
100 Bellevue Parkway
Wilmington, DE 19809
| 128 | 2 0 2 3 B L A C K R O C K A N N U A L R E P O R T T O S H A R E H O L D E R S |
Glossary of Terms Used in this Report
| Currency Abbreviation | ||
| AUD | Australian Dollar | |
| BRL | Brazilian Real | |
| CAD | Canadian Dollar | |
| CLP | Chilean Peso | |
| CNH | Chinese Yuan Offshore | |
| COP | Colombian Peso | |
| CZK | Czech Koruna | |
| EUR | Euro | |
| GBP | British Pound | |
| HKD | Hong Kong Dollar | |
| HUF | Hungarian Forint | |
| IDR | Indonesian Rupiah | |
| INR | Indian Rupee | |
| JPY | Japanese Yen | |
| KRW | South Korean Won | |
| MXN | Mexican Peso | |
| MYR | Malaysian Ringgit | |
| NOK | Norwegian Krone | |
| PLN | Polish Zloty | |
| RUB | Russian Ruble | |
| SEK | Swedish Krona | |
| SGD | Singapore Dollar | |
| THB | Thai Baht | |
| TWD | Taiwan New Dollar | |
| USD | United States Dollar | |
| ZAR | South African Rand | |
| Portfolio Abbreviation | ||
| ABS | Asset-Backed Security | |
| AKA | Also Known As | |
| BZDIOVER | Overnight Brazil CETIP - Interbank Rate | |
| CDI | CREST Depository Interest | |
| CLO | Collateralized Loan Obligation | |
| COOIS | Colombia Overnight Interbank Reference Rate | |
| CORRA | Canadian OvernightRepo Rate Average | |
| CPTFEMU | Eurozone Inflation Index | |
| DAC | Designated Activity Co. | |
| ESTR | Euro Short-Term Rate | |
| ETF | Exchange-Traded Fund | |
| EURIBOR | Euro Interbank Offered Rate | |
| FKA | Formally Known As | |
| GO | General Obligation Bonds | |
| HFA | Housing Finance Agency | |
| IO | Interest Only | |
| JIBAR | Johannesburg Interbank Average Rate | |
| KWCDC | KRW Certificate of Deposit | |
| LIBOR | London Interbank Offered Rate | |
| LP | Limited Partnership | |
| MXIBTIIE | Mexico Interbank TIIE 28-Day | |
| OTC | Over-the-Counter | |
| PIK | Payment-in-Kind | |
| PRIBOR | Prague Inter Bank Offered Rate | |
| RB | Revenue Bonds | |
| REMIC | Real Estate Mortgage Investment Conduit | |
| S&P | Standard & Poor’s | |
| SOFR | Secured Overnight Financing Rate | |
| SONIA | Sterling Overnight Index Average | |
| SPDR | Standard & Poor’s Depository Receipt | |
| TBA | To-be-Announced | |
| TONA | Tokyo Overnight Average Rate | |
| WIBOR | Warsaw Interbank Offer Rate | |
| G L O S S A R Y O F T E R M S U S E D I N T H I S R E P O R T |
129 |
Want to know more?
blackrock.com | 800-441-7762
This report is intended for current holders. It is not authorized for use as an offer of sale or a solicitation of an offer to buy shares of the Fund unless preceded or accompanied by the Fund’s current prospectus. Past performance results shown in this report should not be considered a representation of future performance. Investment returns and principal value of shares will fluctuate so that shares, when redeemed, may be worth more or less than their original cost. Statements and other information herein are as dated and are subject to change.
TR-09/23-AR
|
|

|

(b) Not Applicable
| Item 3 – | Audit Committee Financial Expert – Each registrant’s board of directors (the “board of directors”), has determined that (i) the registrant has the following audit committee financial experts serving on its audit committee and (ii) each audit committee financial expert is independent: |
Frank J. Fabozzi
Lorenzo A. Flores
Catherine A. Lynch
Under applicable securities laws, a person determined to be an audit committee financial expert will not be deemed an “expert” for any purpose, including without limitation for the purposes of Section 11 of the Securities Act of 1933, as a result of being designated or identified as an audit committee financial expert. The designation or identification of a person as an audit committee financial expert does not impose on such person any duties, obligations, or liabilities greater than the duties, obligations, and liabilities imposed on such person as a member of the audit committee and board of directors in the absence of such designation or identification. The designation or identification of a person as an audit committee financial expert does not affect the duties, obligations, or liability of any other member of the audit committee or board of directors.
| Item 4 – | Principal Accountant Fees and Services |
The following table presents fees billed by Deloitte & Touche LLP (“D&T”) in each of the last two fiscal years for the services rendered to the Funds:
| (a) Audit Fees | (b) Audit-Related Fees1 |
(c) Tax Fees2 | (d) All Other Fees | |||||||||||||
| Entity Name | Current Fiscal Year End |
Previous Fiscal Year End |
Current Fiscal Year End |
Previous Fiscal Year End |
Current Fiscal Year End |
Previous Fiscal Year End |
Current Fiscal Year End |
Previous Fiscal Year End | ||||||||
| BlackRock Total Return Fund | $8,262 | $7,956 | $0 | $44 | $19,700 | $18,900 | $0 | $431 | ||||||||
| Master Total Return Portfolio | $86,700 | $83,334 | $0 | $44 | $31,200 | $30,000 | $407 | $431 | ||||||||
The following table presents fees billed by D&T that were required to be approved by each registrant’s audit committee (the “Committee”) for services that relate directly to the operations or financial reporting of the Funds and that are rendered on behalf of BlackRock Advisors, LLC ( the “Investment Adviser” or “BlackRock”) and entities controlling, controlled by, or under common control with BlackRock (not including any sub-adviser whose role is primarily portfolio management and is subcontracted with or overseen by another investment adviser) that provide ongoing services to the Funds (“Affiliated Service Providers”):
2
| Current Fiscal Year End | Previous Fiscal Year End | |||
| (b) Audit-Related Fees1 |
$0 | $0 | ||
| (c) Tax Fees2 |
$0 | $0 | ||
| (d) All Other Fees3 |
$2,154,000 | $2,098,000 |
1 The nature of the services includes assurance and related services reasonably related to the performance of the audit or review of financial statements not included in Audit Fees, including accounting consultations, agreed-upon procedure reports, attestation reports, comfort letters, out-of-pocket expenses and internal control reviews not required by regulators.
2 The nature of the services includes tax compliance and/or tax preparation, including services relating to the filing or amendment of federal, state or local income tax returns, regulated investment company qualification reviews, taxable income and tax distribution calculations.
3 Non-audit fees of $2,154,000 and $2,098,000 for the current fiscal year and previous fiscal year, respectively, were paid to each Fund’s principal accountant in their entirety by BlackRock, in connection with services provided to the Affiliated Service Providers of each Fund and of certain other funds sponsored and advised by BlackRock or its affiliates for a service organization review and an accounting research tool subscription. These amounts represent aggregate fees paid by BlackRock and were not allocated on a per fund basis.
(e)(1) Audit Committee Pre-Approval Policies and Procedures:
Each Committee has adopted policies and procedures with regard to the pre-approval of services. Audit, audit-related and tax compliance services provided to the registrants on an annual basis require specific pre-approval by each Committee. Each Committee also must approve other non-audit services provided to the registrants and those non-audit services provided to the Investment Adviser and Affiliated Service Providers that relate directly to the operations and the financial reporting of the registrants. Certain of these non-audit services that each Committee believes are (a) consistent with the SEC’s auditor independence rules and (b) routine and recurring services that will not impair the independence of the independent accountants may be approved by each Committee without consideration on a specific case-by-case basis (“general pre-approval”). The term of any general pre-approval is 12 months from the date of the pre-approval, unless each Committee provides for a different period. Tax or other non-audit services provided to the registrants, which have a direct impact on the operations or financial reporting of the registrants will only be deemed pre-approved provided that any individual project does not exceed $10,000 attributable to the registrants or $50,000 per project. For this purpose, multiple projects will be aggregated to determine if they exceed the previously mentioned cost levels.
Any proposed services exceeding the pre-approved cost levels will require specific pre-approval by each Committee, as will any other services not subject to general pre-approval (e.g., unanticipated but permissible services). Each Committee is informed of each service approved subject to general pre-approval at the next regularly scheduled in-person board meeting. At this meeting, an analysis of such services is presented to each Committee for ratification. Each Committee may delegate to the Committee Chairman the authority to approve the provision of and fees for any specific engagement of permitted non-audit services, including services exceeding pre-approved cost levels.
(e)(2) None of the services described in each of Items 4(b) through (d) were approved by either Committee pursuant to the de minimis exception in paragraph (c)(7)(i)(C) of Rule 2-01 of Regulation S-X.
(f) Not Applicable
(g) The aggregate non-audit fees, defined as the sum of the fees shown under “Audit-Related Fees,” “Tax Fees” and “All Other Fees,” paid to the accountant for services rendered by the accountant to the registrants, the Investment Adviser and the Affiliated Service Providers were:
| Entity Name | Current Fiscal Year End |
Previous Fiscal Year End | ||
| BlackRock Total Return Fund | $19,700 | $19,376 | ||
| Master Total Return Portfolio | $31,607 | $30,476 |
3
Additionally, the amounts billed by D&T in connection with services provided to the Affiliated Service Providers of the Funds and of other funds sponsored and advised by BlackRock or its affiliates during the current and previous fiscal years for a service organization review and an accounting research tool subscription were:
| Current Fiscal Year End |
Previous Fiscal Year End | |
|
$2,154,000 |
$2,098,000 |
These amounts represent aggregate fees paid by BlackRock and were not allocated on a per fund basis.
(h) The Committee has considered and determined that the provision of non-audit services that were rendered to the Investment Adviser and the Affiliated Service Providers that were not pre-approved pursuant to paragraph (c)(7)(ii) of Rule 2-01 of Regulation S-X is compatible with maintaining the principal accountant’s independence.
(i) – Not Applicable
(j) – Not Applicable
| Item 5 – | Audit Committee of Listed Registrants – Not Applicable |
| Item 6 – | Investments |
(a) The registrants’ Schedules of Investments are included as part of the Report to Stockholders filed under Item 1(a) of this Form.
(b) Not Applicable due to no such divestments during the semi-annual period covered since the previous Form N-CSR filing.
| Item 7 – | Disclosure of Proxy Voting Policies and Procedures for Closed-End Management Investment Companies – Not Applicable |
| Item 8 – | Portfolio Managers of Closed-End Management Investment Companies – Not Applicable |
| Item 9 – | Purchases of Equity Securities by Closed-End Management Investment Company and Affiliated Purchasers – Not Applicable |
| Item 10 – | Submission of Matters to a Vote of Security Holders – There have been no material changes to these procedures. |
| Item 11 – | Controls and Procedures |
(a) The registrants’ principal executive and principal financial officers, or persons performing similar functions, have concluded that the registrants’ disclosure controls and procedures (as defined in Rule 30a-3(c) under the Investment Company Act of 1940, as amended (the “1940 Act”)) are effective as of a date
4
within 90 days of the filing of this report based on the evaluation of these controls and procedures required by Rule 30a-3(b) under the 1940 Act and Rule 15d-15(b) under the Securities Exchange Act of 1934, as amended.
(b) There were no changes in the registrants’ internal control over financial reporting (as defined in Rule 30a-3(d) under the 1940 Act) that occurred during the period covered by this report that have materially affected, or are reasonably likely to materially affect, the registrants’ internal control over financial reporting.
| Item 12 – | Disclosure of Securities Lending Activities for Closed-End Management Investment Companies – Not Applicable |
| Item 13 – | Exhibits attached hereto |
(a)(1) Code of Ethics – See Item 2
(a)(2) Section 302 Certifications are attached
(a)(3) Any written solicitation to purchase securities under Rule 23c-1 – Not Applicable
(a)(4) Change in Registrant’s independent public accountant – Not Applicable
(b) Section 906 Certifications are attached
5
Pursuant to the requirements of the Securities Exchange Act of 1934 and the Investment Company Act of 1940, each registrant has duly caused this report to be signed on its behalf by the undersigned, thereunto duly authorized.
BlackRock Bond Fund, Inc. and Master Bond LLC
| By: |
/s/ John M. Perlowski | |||
| John M. Perlowski | ||||
| Chief Executive Officer (principal executive officer) of | ||||
| BlackRock Bond Fund, Inc. and Master Bond LLC |
Date: November 20, 2023
Pursuant to the requirements of the Securities Exchange Act of 1934 and the Investment Company Act of 1940, this report has been signed below by the following persons on behalf of each registrant and in the capacities and on the dates indicated.
| By: |
/s/ John M. Perlowski | |||
| John M. Perlowski | ||||
| Chief Executive Officer (principal executive officer) of | ||||
| BlackRock Bond Fund, Inc. and Master Bond LLC |
Date: November 20, 2023
| By: |
/s/ Trent Walker | |||
| Trent Walker | ||||
| Chief Financial Officer (principal financial officer) of | ||||
| BlackRock Bond Fund, Inc. and Master Bond LLC |
Date: November 20, 2023
6