Exhibit 99.2

Q4 and FY 2020 Earnings Conference CallFebruary 25, 2021 NYSE: CW Listen-Only dial-in numbers:(844)
220-4970 (domestic)(262) 558-6349 (international)Conference ID: 6585187
Safe Harbor Statement Please note that the information provided in this presentation is accurate as of
the date of the original presentation. The presentation will remain posted on this website from one to twelve months following the initial presentation, but content will not be updated to reflect new information that may become available
after the original presentation posting. The presentation contains forward-looking statements within the meaning of Section 27A of the Securities Act of 1933, as amended ("Securities Act"), Section 21E of the Securities Exchange Act of 1934,
as amended ("Exchange Act"), and the Private Securities Litigation Reform Act of 1995. Such forward-looking statements only speak as of the date of this report and Curtiss-Wright Corporation assumes no obligation to update the information
included in this report. Such forward-looking statements include, among other things, management's estimates of future performance, revenue and earnings, our management's growth objectives, our management’s ability to integrate our
acquisition, and our management's ability to produce consistent operating improvements. These forward-looking statements are based on expectations as of the time the statements were made only, and are subject to a number of risks and
uncertainties which could cause us to fail to achieve our then-current financial projections and other expectations, including the impact of a global pandemic or national epidemic. Any references to organic growth exclude the effects of
restructuring costs, foreign currency fluctuations, acquisitions and divestitures, unless otherwise noted. This presentation also includes certain non-GAAP financial measures with reconciliations to GAAP financial measures being made
available in the earnings release that is posted to our website and furnished with the SEC. We undertake no duty to update this information. More information about potential factors that could affect our business and financial results is
included in our filings with the Securities and Exchange Commission, including our Annual Reports on Form 10-K and Quarterly Reports on Form 10-Q, including, among other sections, under the captions, "Risk Factors" and "Management's
Discussion and Analysis of Financial Condition and Results of Operations," which is on file with the SEC and available at the SEC's website at www.sec.gov.

Leadership Transition Advancing the One Curtiss-Wright VisionContinued focus on top quartile
performancePivot to GrowthAcceleration of organic growth and acquisitionsIncreasing focus on internal investmentsSimplification of CW story and value propositionUnveiling new Segment and End Market structureDriving improved alignment of
strategies and industry driversHosting Investor Day on May 26, 2021

COVID-19 Update Maintaining focus on Employee health and safetyGlobal workforce following guidelines
and safety protocolsStrong IT focus with enhanced security protocolsMaintain real-time tracking and reporting system across all sites world-wideOngoing rollout of vaccines remains paramount to ensuring employee safety and business continuity
Preserving Profitability and Free Cash FlowSuccessfully implemented restructuring plans Reduced incentive compensation (including leadership)Reduced discretionary spendingSlowed pace of CapEx spendingMaintained R&D investment
levelStrong focus on balance sheet and liquidity OPERATIONAL STATUS MANAGEMENT ACTIONS

Strong Finish to 2020: Q4 and FY’20 Highlights Fourth Quarter 2020 Highlights FY 2020
Highlights Net Sales increased 2% YOY; Up 17% SequentiallyStrong defense market growth, up 27% overall (15% organic); Sequentially higher sales across all commercial marketsAdjusted Operating Income rose 8%, with Adjusted Operating Margin up
100bps to 19.8% Benefits of ongoing cost containment actions and restructuring savings in all segmentsAdjusted Diluted EPS of $2.39, up 12%Record Reported FCF of $246M; Adjusted FCF of $256M, up 3%Closed PacStar acquisition for $400M in
cash Net Sales of $2.4B, down 4%Strong defense market growth, up 17% overall (10% organic); Commercial market weakness principally driven by COVID-19 impactsAdjusted Operating Margin nearly flat YOY at 16.3%Savings generated by ongoing
restructuring actions mitigated significant portion of commercial market challengesAdjusted Diluted EPS of $6.87, exceeded guidanceTotal Share Repurchases $200M ($150M opportunistically)Record Adjusted FCF of $394M, up 6% (137% FCF
conversion)Book-to-bill: 1.0x (Defense Markets ~1.1x) Notes: 2020 Adjusted results exclude restructuring costs, one-time inventory step-up, backlog amortization and transaction costs for acquisitions, one-time transition and IT security
costs associated with the relocation of our DRG business, and an impairment loss for our industrial valve business in Germany being classified as held for sale during the fourth quarter of 20202020 Adjusted Free Cash Flow excludes a voluntary
contribution to the Company’s corporate defined benefit pension plan, the cash impact from restructuring, and a capital investment related to construction of a new, state-of-the-art naval facility for the DRG business (Power segment).

Fourth Quarter 2020 Financial Review ($ in millions) Q4’20 Adjusted Q4’19 Adjusted Chg vs.
Q4’19 2020 Key Drivers Commercial / Industrial $249 $296 (16%) Reduced YOY demand in commercial aerospace and general industrial (Up sequentially vs Q3)Partially offset by higher F-35 sales in aerospace defense Defense $217 $173
26% Strong 5% organic growth, led by aerospace (electronics) and naval defense Contribution from PacStar and 901D acquisitions Power $202 $186 8% Strong growth in naval defense Partially offset by reduced aftermarket power generation
revenues Total Sales $668 $656 2% Commercial / IndustrialMargin $47 19.0% $49 16.7% (4%) 230 bps Benefit of restructuring savings and ongoing cost reduction measures helped to mitigate unfavorable absorption on lower
sales DefenseMargin $53 24.2% $44 25.5% 20%(130 bps) Benefit of restructuring savings mainly offset by increased R&DContribution from acquisitions PowerMargin $43 21.1% $38 20.4% 12% 70 bps Strong naval defense revenues and
benefits of cost containment / restructuring savings Total Op. IncomeCW Margin $133 19.8% $123 18.8% 8%100 bps Restructuring savings drove Q4 benefit of $14M; FY’20 benefit of $25M Note: Amounts may not add down due to rounding. 2019
Adjusted results exclude first year purchase accounting costs, specifically one-time inventory step-up, backlog amortization and transaction costs for acquisition of TCG (Defense segment), and one-time transition and IT security costs
associated with the relocation of our DRG business (Power segment).2020 Adjusted results exclude restructuring costs, one-time inventory step-up, backlog amortization and transaction costs for acquisitions, one-time transition and IT security
costs associated with the relocation of our DRG business, and an impairment loss for our industrial valve business in Germany being classified as held for sale during the fourth quarter of 2020.
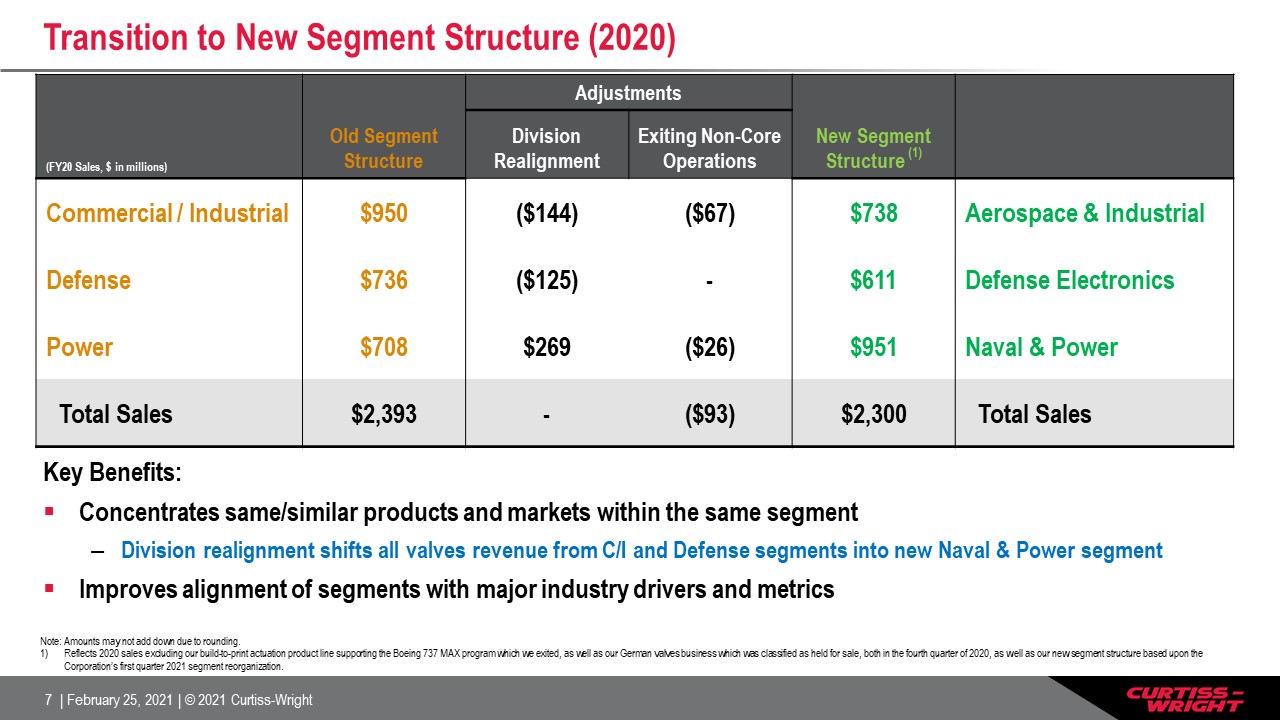
(FY20 Sales, $ in millions) Old Segment Structure Adjustments New Segment Structure
(1) Division Realignment Exiting Non-Core Operations Commercial / Industrial $950 ($144) ($67) $738 Aerospace & Industrial Defense $736 ($125) - $611 Defense Electronics Power $708 $269 ($26) $951 Naval &
Power Total Sales $2,393 - ($93) $2,300 Total Sales Transition to New Segment Structure (2020) Note: Amounts may not add down due to rounding. Reflects 2020 sales excluding our build-to-print actuation product line supporting the
Boeing 737 MAX program which we exited, as well as our German valves business which was classified as held for sale, both in the fourth quarter of 2020, as well as our new segment structure based upon the Corporation’s first quarter 2021
segment reorganization. Key Benefits:Concentrates same/similar products and markets within the same segmentDivision realignment shifts all valves revenue from C/I and Defense segments into new Naval & Power segmentImproves alignment of
segments with major industry drivers and metrics
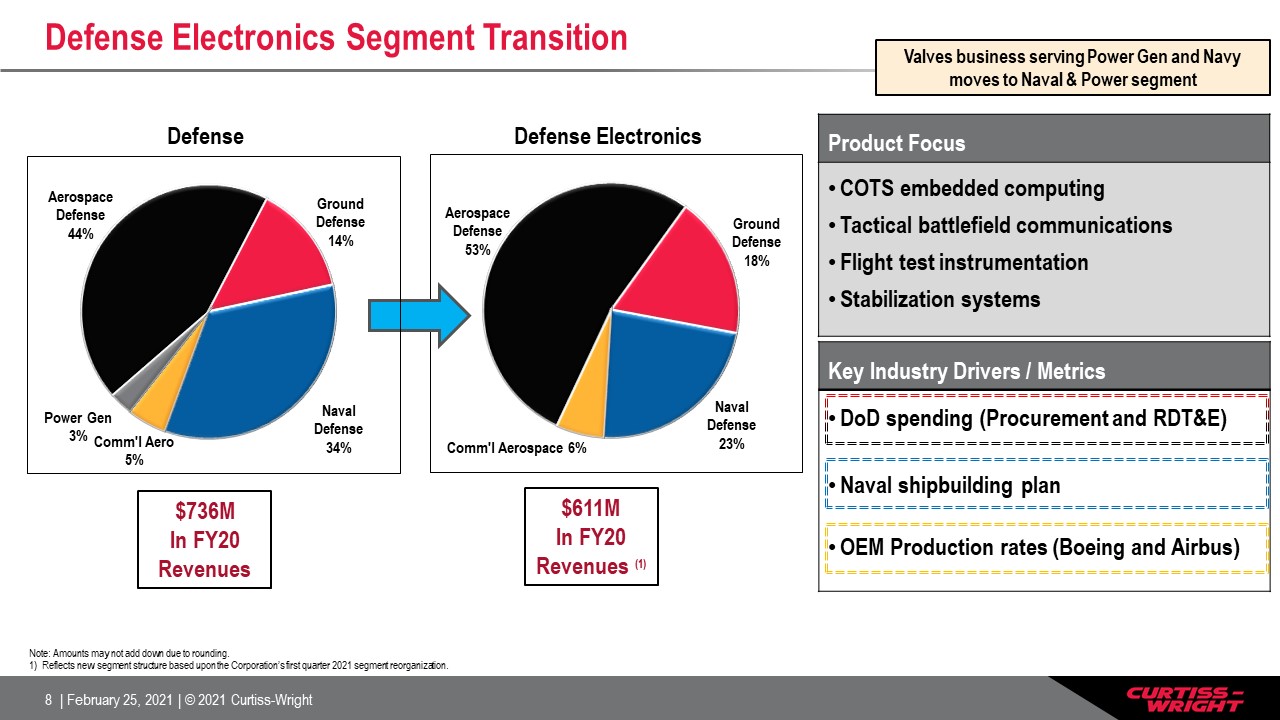
Key Industry Drivers / Metrics DoD spending (Procurement and RDT&E)Naval shipbuilding planOEM
Production rates (Boeing and Airbus) Defense Electronics Segment Transition Note: Amounts may not add down due to rounding. Reflects new segment structure based upon the Corporation’s first quarter 2021 segment
reorganization. Defense Defense Electronics $736MIn FY20Revenues $611MIn FY20Revenues (1) Valves business serving Power Gen and Navy moves to Naval & Power segment Product Focus COTS embedded computingTactical battlefield
communicationsFlight test instrumentationStabilization systems
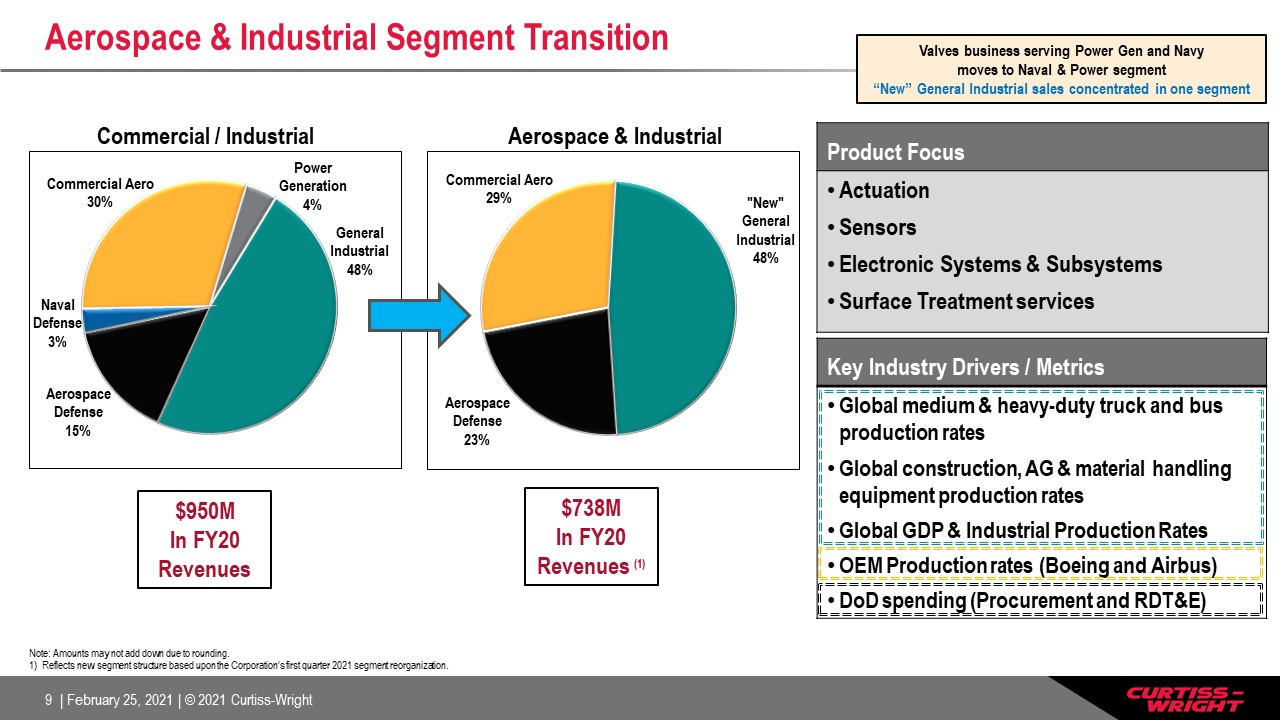
Aerospace & Industrial Segment Transition Key Industry Drivers / Metrics Global medium &
heavy-duty truck and bus production ratesGlobal construction, AG & material handling equipment production ratesGlobal GDP & Industrial Production Rates OEM Production rates (Boeing and Airbus)DoD spending (Procurement and
RDT&E) Commercial / Industrial Aerospace & Industrial $950MIn FY20Revenues $738MIn FY20Revenues (1) Valves business serving Power Gen and Navy moves to Naval & Power segment“New” General Industrial sales concentrated
in one segment Product Focus ActuationSensors Electronic Systems & SubsystemsSurface Treatment services Note: Amounts may not add down due to rounding. Reflects new segment structure based upon the Corporation’s first quarter 2021
segment reorganization.
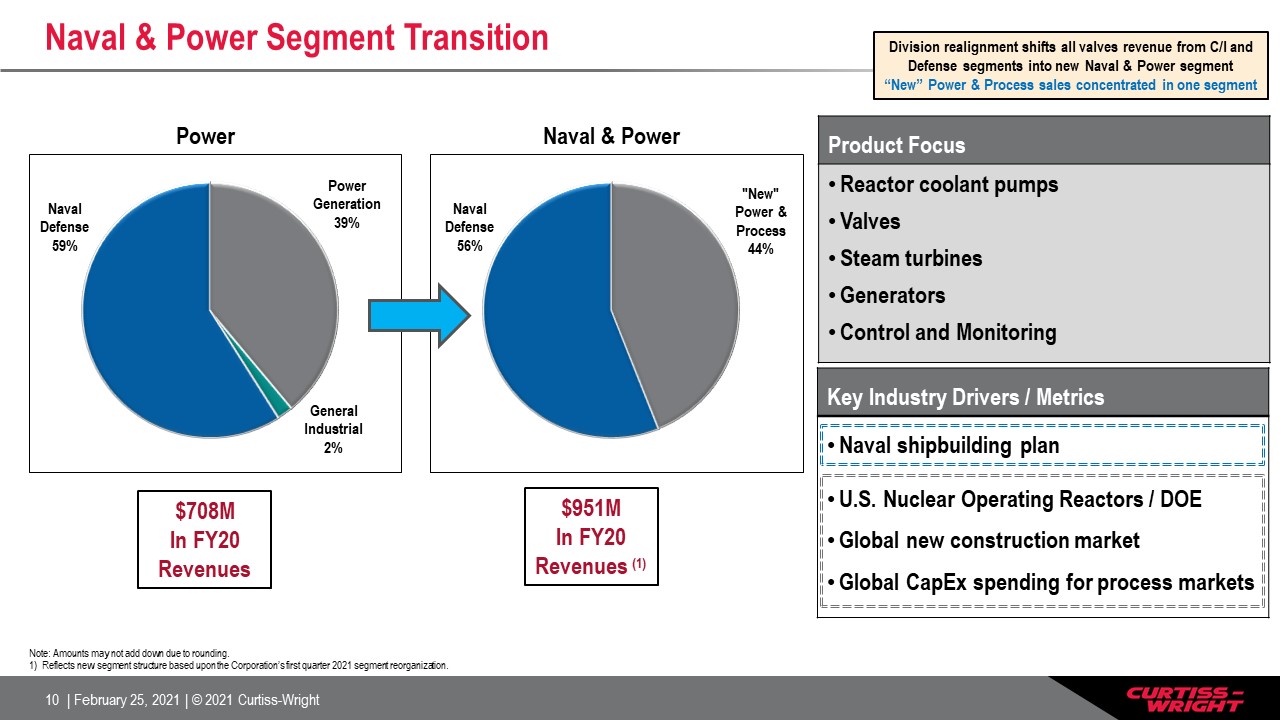
Naval & Power Segment Transition Key Industry Drivers / Metrics Naval shipbuilding planU.S.
Nuclear Operating Reactors / DOEGlobal new construction market Global CapEx spending for process markets Power Naval & Power $708MIn FY20Revenues $951MIn FY20Revenues (1) Division realignment shifts all valves revenue from C/I
and Defense segments into new Naval & Power segment“New” Power & Process sales concentrated in one segment Product Focus Reactor coolant pumpsValvesSteam turbinesGeneratorsControl and Monitoring Note: Amounts may not add down due
to rounding. Reflects new segment structure based upon the Corporation’s first quarter 2021 segment reorganization.
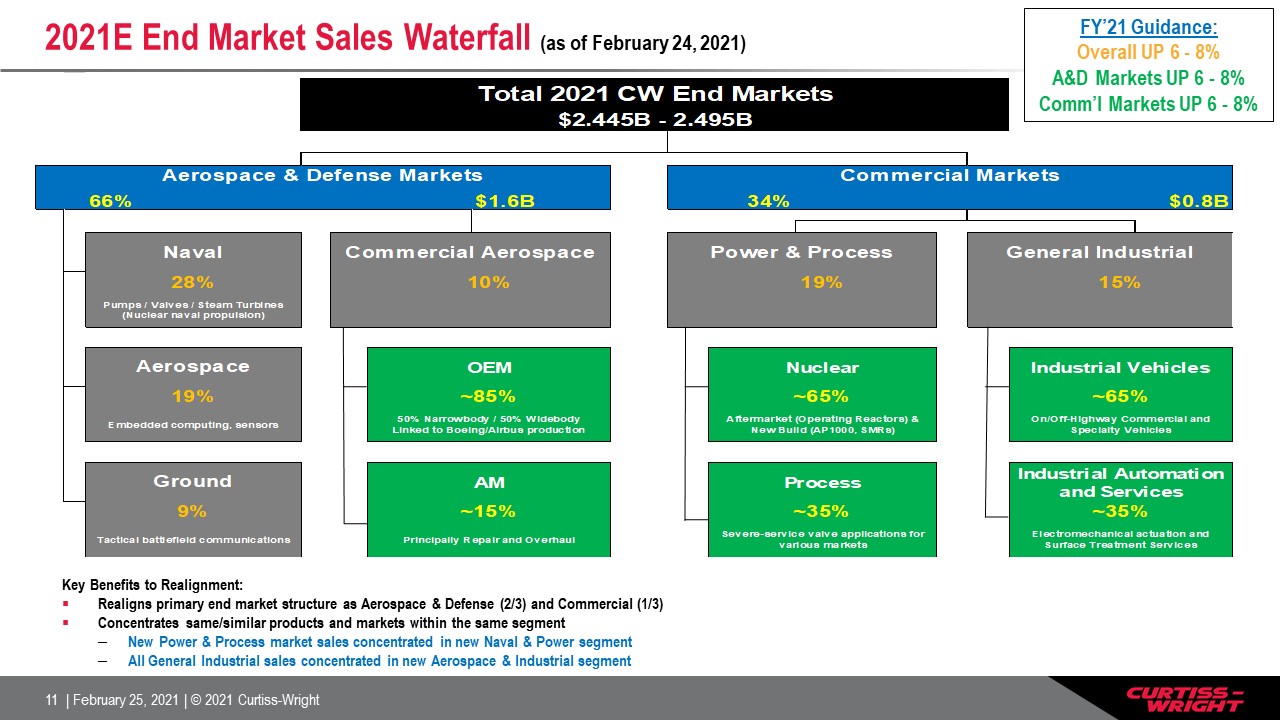
2021E End Market Sales Waterfall (as of February 24, 2021) FY’21 Guidance:Overall UP 6 - 8%A&D
Markets UP 6 - 8%Comm’l Markets UP 6 - 8% Key Benefits to Realignment:Realigns primary end market structure as Aerospace & Defense (2/3) and Commercial (1/3)Concentrates same/similar products and markets within the same segmentNew Power
& Process market sales concentrated in new Naval & Power segmentAll General Industrial sales concentrated in new Aerospace & Industrial segment
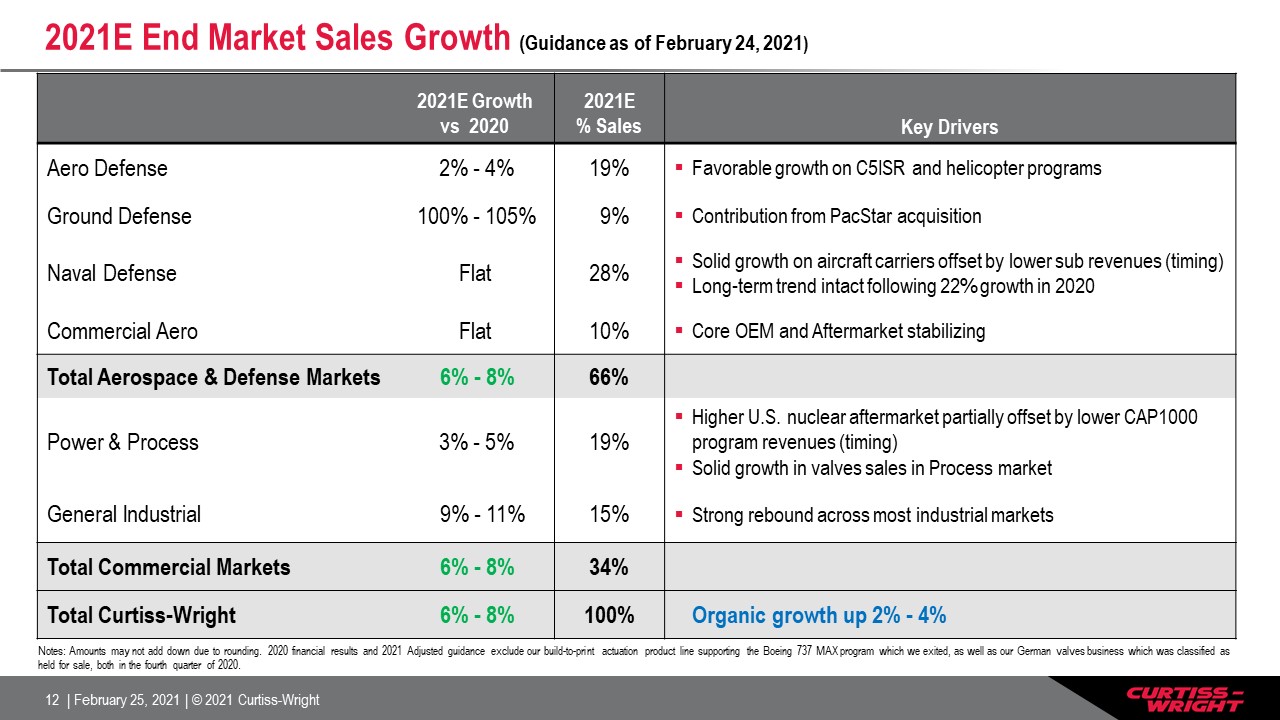
2021E End Market Sales Growth (Guidance as of February 24, 2021) 2021E Growth vs 2020 2021E %
Sales Key Drivers Aero Defense 2% - 4% 19% Favorable growth on C5ISR and helicopter programs Ground Defense 100% - 105% 9% Contribution from PacStar acquisition Naval Defense Flat 28% Solid growth on aircraft carriers offset
by lower sub revenues (timing)Long-term trend intact following 22% growth in 2020 Commercial Aero Flat 10% Core OEM and Aftermarket stabilizing Total Aerospace & Defense Markets 6% - 8% 66% Power & Process 3% -
5% 19% Higher U.S. nuclear aftermarket partially offset by lower CAP1000 program revenues (timing) Solid growth in valves sales in Process market General Industrial 9% - 11% 15% Strong rebound across most industrial markets Total
Commercial Markets 6% - 8% 34% Total Curtiss-Wright 6% - 8% 100% Organic growth up 2% - 4% Notes: Amounts may not add down due to rounding. 2020 financial results and 2021 Adjusted guidance exclude our build-to-print actuation
product line supporting the Boeing 737 MAX program which we exited, as well as our German valves business which was classified as held for sale, both in the fourth quarter of 2020.

($ in millions) 2020 Adjusted (1)(New Structure) 2021E Adjusted (3) 2021E Change vs 2020 Adjusted
(2)(3) Aerospace & Industrial $738 $745 - 760 1% - 3% Strong rebound in general industrial markets; part. offset by lower A&D Defense Electronics $611 $740 - 755 21% - 24% Solid organic growth (up 3-6%) driven by higher
Aero Defense salesPacStar contributing HSD revenue growth Naval & Power $951 $960 - 980 1% - 3% Modest sales increases in Power & Process markets Total Sales $2,300 $2,445 - 2,495 6% - 8% Organic growth up 2% -
4% Aerospace & IndustrialMargin $9813.3% $112 - 115 15.0% - 15.2% 14% - 18%170 - 190 bps Benefit of PY restructuring savingsSegment profitability returning to 2019 levels Defense ElectronicsMargin $144 23.6% $157 - 162 21.2% -
21.4% 9% - 12% (220 - 240 bps) Sales contribution from acquisition dilution to marginAccelerated R&D investments $6M; Unfavorable mix (more systems work) Naval & PowerMargin $17118.0% $172 - 177 18.0% - 18.1% 1% - 4% 0 - 10
bps Benefit of PY restructuring savingsImproved segment profitability despite winding down on CAP1000 program Corporate and Other ($38) ($38 - 39) - Total Op. IncomeCW Margin $37516.3% $404 - 41416.5% - 16.6% 7% - 10% +20 - 30
bps On path to 17% margin despite R&D increase ($10M) 2021E Financial Outlook (Guidance as of February 24, 2021) Note: Amounts may not add down due to rounding. 2020 Adjusted results exclude restructuring costs, first year purchase
accounting costs associated with acquisitions, a non-cash impairment of capitalized development costs related to a commercial aerospace program, and one-time transition and IT security costs related to the relocation of the DRG business, as
well as a $10 million non-cash currency translation loss (within non-operating income) related to the liquidation of a foreign legal entity. 2020 financial results excludes our build-to-print actuation product line supporting the Boeing 737
MAX program which we exited, as well as our German valves business which was classified as an asset held for sale, both in the fourth quarter of 2020, and also reflects the first quarter 2021 segment reorganization. 2021 Adjusted guidance
excludes our build-to-print actuation product line supporting the Boeing 737 MAX program which we exited, as well as our German valves business which was classified as an asset held for sale, both in the fourth quarter of 2020, first year
purchase accounting costs, specifically one-time backlog amortization and transaction costs associated with acquisitions, and pension costs (within non-operating income), and also reflects the first quarter 2021 segment reorganization.

2021E Financial Outlook (Guidance as of February 24, 2021) ($ in millions, except EPS) 2020
Adjusted (1)(New Structure) 2021E Adjusted (2) Total Operating Income $375 $404 - 414 Solid growth, up 7-10%, despite increased R&D ($10M) Other Income/(Expense) $21 $15 - 17 Pension (lower discount rates) Interest Expense
($36) ($41 - 42) Includes full year of $300M senior notes Diluted EPS $6.59 $7.00 - 7.20 Solid growth, up 6-9%, despite increased R&D ($0.18) Diluted Shares Outstanding 42.0 41.4 Expect minimum $50 million in share
repurchases Free Cash Flow $394 $330 - 360 Maintain solid FCF generation following record 2020 Free Cash Flow Conversion 137% 114% - 121% Remain above 110% long-term target Capital Expenditures $37 $50 - 60 Return to normal
discretionary spending Depreciation & Amortization $116 $115 - 125 Notes: Amounts may not add down due to rounding. 2020 financial results and 2021 Adjusted guidance exclude our build-to-print actuation product line supporting the
Boeing 737 MAX program which we exited, as well as our German valves business which was classified as held for sale, both in the fourth quarter of 2020, and also reflects the first quarter 2021 segment reorganization. Free Cash Flow is
defined as cash flow from operations less capital expenditures. FCF Conversion is calculated as free cash flow divided by net earnings from continuing operations. Adjusted FCF Conversion is calculated as adjusted free cash flow divided by net
earnings from continuing operations.2020 Adjusted results exclude restructuring costs, first year purchase accounting costs associated with acquisitions, a non-cash impairment of capitalized development costs related to a commercial aerospace
program, and one-time transition and IT security costs related to the relocation of the DRG business, as well as a $10 million non-cash currency translation loss (within non-operating income) related to the liquidation of a foreign legal
entity. 2020 Adjusted Free Cash Flow guidance excludes a voluntary contribution to the Company’s corporate defined benefit pension plan of $150 million, a $22 million cash impact from restructuring, and a $10 million capital investment
related to construction of a new, state-of-the-art naval facility for the DRG business (Power segment). 2021 Adjusted guidance for operating income and diluted EPS excludes first year purchase accounting costs, specifically one-time backlog
amortization and transaction costs associated with acquisitions, and a one-time, $3 million pension settlement charge related to the retirement of two former executives (within non-operating income).
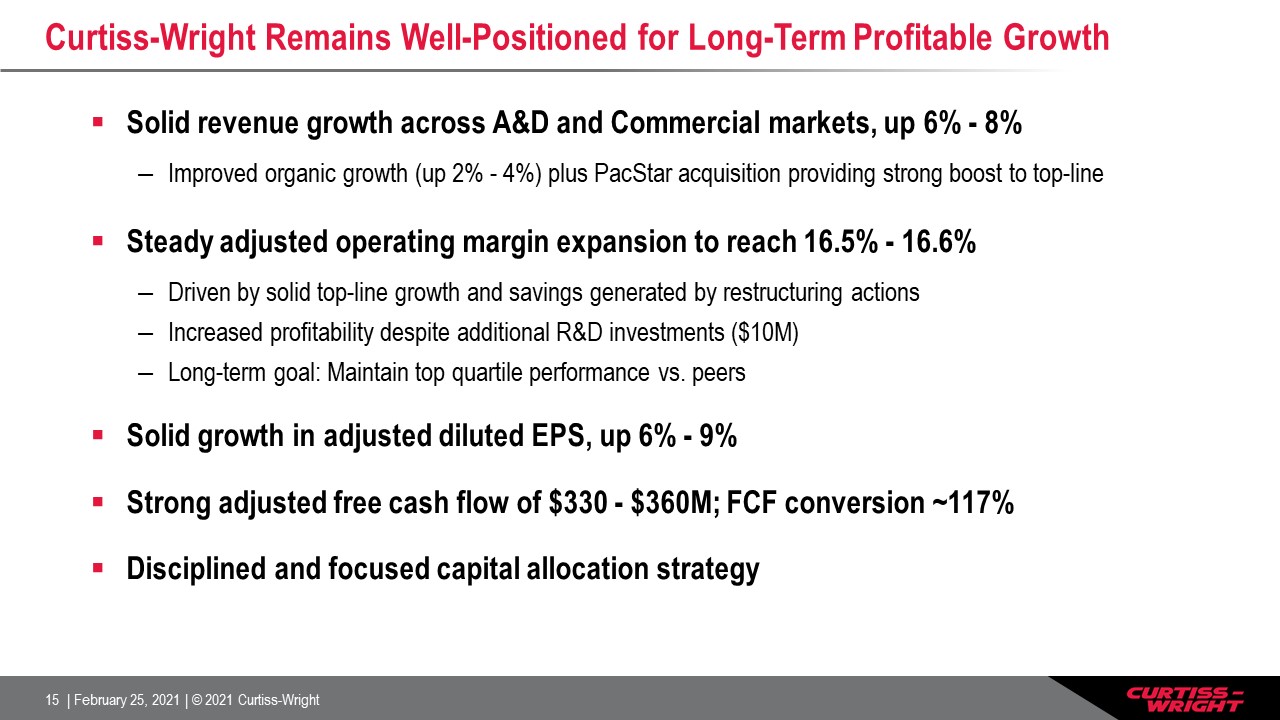
Curtiss-Wright Remains Well-Positioned for Long-Term Profitable Growth Solid revenue growth across
A&D and Commercial markets, up 6% - 8%Improved organic growth (up 2% - 4%) plus PacStar acquisition providing strong boost to top-lineSteady adjusted operating margin expansion to reach 16.5% - 16.6% Driven by solid top-line growth and
savings generated by restructuring actionsIncreased profitability despite additional R&D investments ($10M)Long-term goal: Maintain top quartile performance vs. peersSolid growth in adjusted diluted EPS, up 6% - 9%Strong adjusted free
cash flow of $330 - $360M; FCF conversion ~117% Disciplined and focused capital allocation strategy

Appendix Non-GAAP Financial Results The company reports its financial performance in accordance with
accounting principles generally accepted in the United States of America ("GAAP"). This press release refers to "Adjusted" amounts, which are Non-GAAP financial measures described below. We utilize a number of different financial measures in
analyzing and assessing the overall performance of our business, and in making operating decisions, forecasting and planning for future periods. We consider the use of the non-GAAP measures to be helpful in assessing the performance of the
ongoing operation of our business. We believe that disclosing non-GAAP financial measures provides useful supplemental data that, while not a substitute for financial measures prepared in accordance with GAAP, allows for greater transparency
in the review of our financial and operational performance. The Company’s presentation of its financials and guidance includes an Adjusted (non-GAAP) view that excludes an impairment of a German valves business classified as held for sale,
significant restructuring costs in 2020 associated with its operations, including one-time actions taken in response to COVID-19, a non-cash impairment of capitalized development costs related to a commercial aerospace program, first year
purchase accounting costs associated with its acquisitions, as well as one-time transition and IT security costs, and capital investments, specifically associated with the relocation of the DRG business in the Power segment. Transition costs
include relocation of employees and equipment as well as overlapping facility and labor costs associated with the relocation. We believe this Adjusted view will provide improved transparency to the investment community in order to better
measure Curtiss-Wright’s ongoing operating and financial performance and better comparisons of our key financial metrics to our peers. Reconciliations of “Reported” GAAP amounts to “Adjusted” non-GAAP amounts are furnished within this
release.Reconciliations of “Reported” GAAP amounts to “Adjusted” non-GAAP amounts are furnished with this presentation. All per share amounts are reported on a diluted basis. The following definitions are provided: Adjusted Operating Income,
Operating Margin, Net Earnings and Diluted EPSThese Adjusted financials are defined as Reported Operating Income, Operating Margin, Net Earnings and Diluted Earnings per Share (EPS) under GAAP excluding: (i) the impact of first year purchase
accounting costs associated with acquisitions for current and prior year periods, specifically one-time inventory step-up, backlog amortization and transaction costs; (ii) one-time transition and IT security costs associated with the
relocation of a business in the current year period; (iii) the non-cash impairment of capitalized development costs related to a commercial aerospace program; and (iv) significant restructuring costs in 2020 associated with its operations,
and (v) an impairment of a German valves business classified as held for sale.Free Cash Flow and Free Cash Flow ConversionThe Corporation discloses free cash flow because it measures cash flow available for investing and financing activities.
Free cash flow represents cash available to repay outstanding debt, invest in the business, acquire businesses, return capital to shareholders and make other strategic investments. Free cash flow is defined as cash flow provided by operating
activities less capital expenditures. Adjusted free cash flow excludes: (i) a capital investment in the Power segment related to the new, state-of-the-art naval facility principally for DRG; (ii) a voluntary contribution to the Company’s
corporate defined benefit pension plan made in the first quarter of 2020; and (iii) the cash impact from restructuring in 2020. The Corporation discloses free cash flow conversion because it measures the proportion of net earnings converted
into free cash flow and is defined as free cash flow divided by net earnings from continuing operations. Adjusted free cash flow conversion is defined as Adjusted free cash flow divided by Adjusted net earnings.
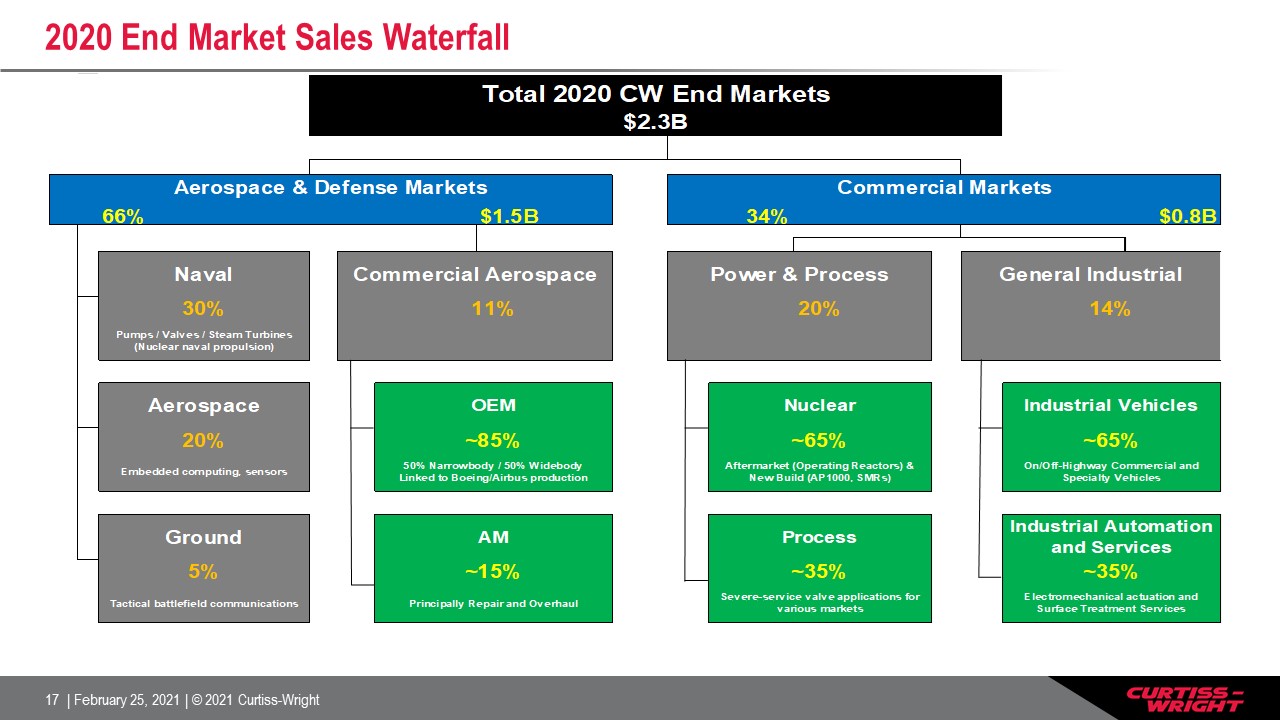
2020 End Market Sales Waterfall
Non-GAAP Reconciliation – 2020 vs. 2019 (Adjusted)

Non-GAAP Reconciliation – 2020 vs 2021 (Adjusted)
Non-GAAP Reconciliation – 2020 vs 2021 (Adjusted)
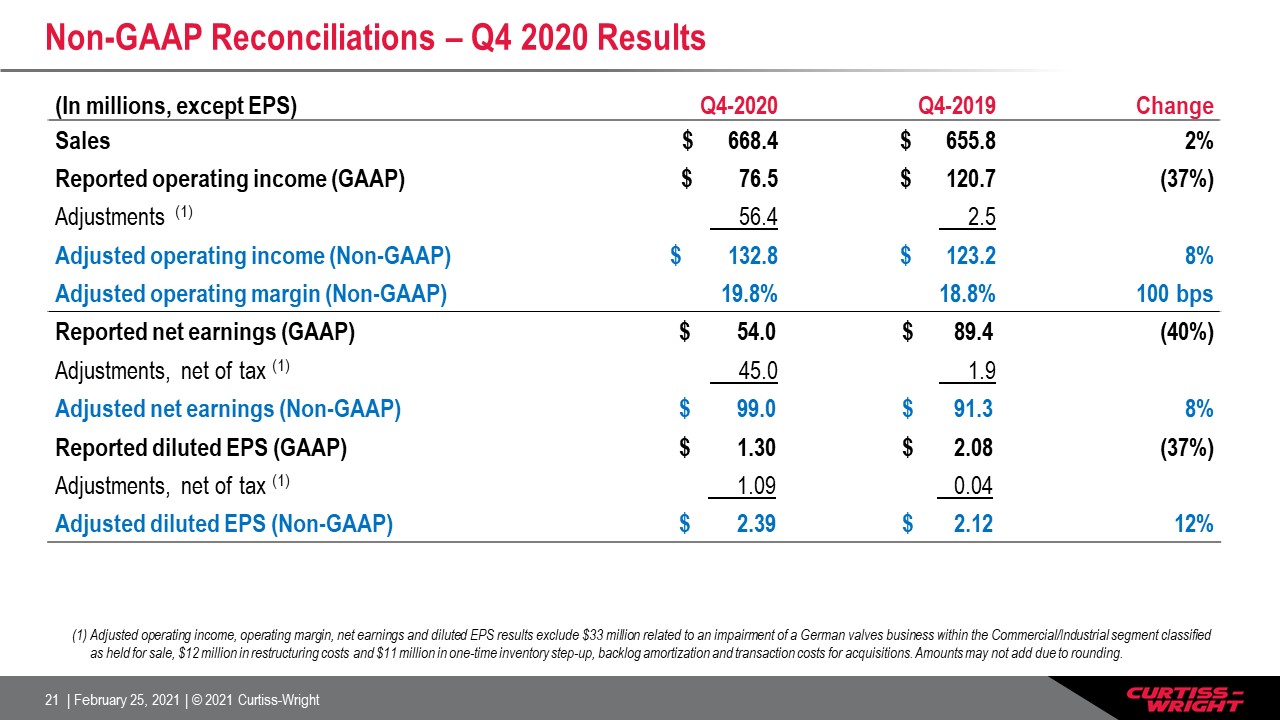
Non-GAAP Reconciliations – Q4 2020 Results (In millions, except EPS) Q4-2020 Q4-2019
Change Sales $ 668.4 $ 655.8 2% Reported operating income (GAAP) $ 76.5 $ 120.7 (37%) Adjustments (1) 56.4 2.5 Adjusted operating income (Non-GAAP) $ 132.8 $ 123.2 8% Adjusted operating margin (Non-GAAP)
19.8% 18.8% 100 bps Reported net earnings (GAAP) $ 54.0 $ 89.4 (40%) Adjustments, net of tax (1) 45.0 1.9 Adjusted net earnings (Non-GAAP) $ 99.0 $ 91.3 8% Reported diluted EPS (GAAP) $ 1.30 $ 2.08 (37%) Adjustments,
net of tax (1) 1.09 0.04 Adjusted diluted EPS (Non-GAAP) $ 2.39 $ 2.12 12% Adjusted operating income, operating margin, net earnings and diluted EPS results exclude $33 million related to an impairment of a German valves business
within the Commercial/Industrial segment classified as held for sale, $12 million in restructuring costs and $11 million in one-time inventory step-up, backlog amortization and transaction costs for acquisitions. Amounts may not add due to
rounding.
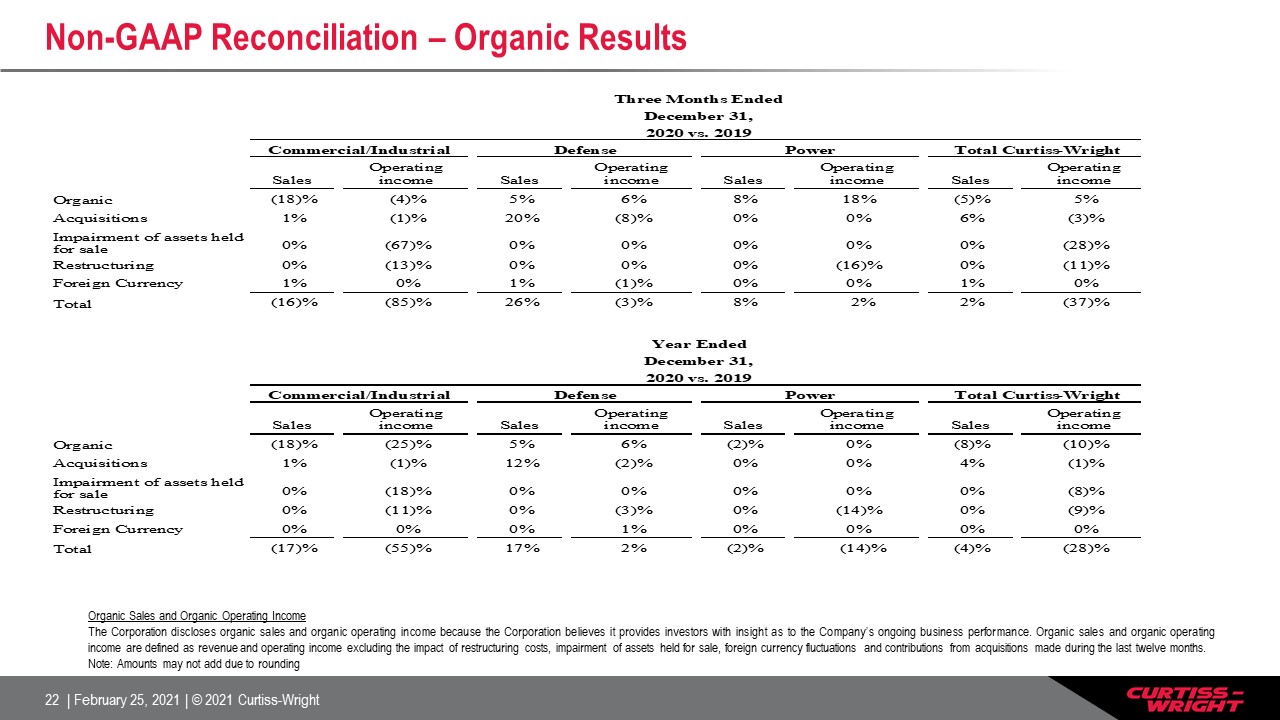
Non-GAAP Reconciliation – Organic Results Organic Sales and Organic Operating IncomeThe Corporation
discloses organic sales and organic operating income because the Corporation believes it provides investors with insight as to the Company’s ongoing business performance. Organic sales and organic operating income are defined as revenue and
operating income excluding the impact of restructuring costs, impairment of assets held for sale, foreign currency fluctuations and contributions from acquisitions made during the last twelve months.Note: Amounts may not add due to rounding