UNITED STATES
SECURITIES AND EXCHANGE COMMISSION
Washington, D.C. 20549
_______________________________________________________________________
FORM 10-K
ý | ANNUAL REPORT PURSUANT TO SECTION 13 OR 15(d) OF THE SECURITIES EXCHANGE ACT OF 1934 |
For the fiscal year ended December 31, 2015
or
¨ | TRANSITION REPORT PURSUANT TO SECTION 13 OR 15(d) OF THE SECURITIES EXCHANGE ACT OF 1934 |
For the transition period from to
Commission file number 001-11312
___________________________________________________
COUSINS PROPERTIES INCORPORATED
(Exact name of registrant as specified in its charter)
Georgia | 58-0869052 |
(State or other jurisdiction of incorporation or organization) | (I.R.S. Employer Identification No.) |
191 Peachtree Street NE, Suite 500, Atlanta, Georgia | 30303-1740 |
(Address of principal executive offices) | (Zip Code) |
(404) 407-1000 | |
(Registrant’s telephone number, including area code) | |
Securities registered pursuant to Section 12(b) of the Act:
Title of each class | Name of Exchange on which registered |
Common Stock ($1 par value) | New York Stock Exchange |
___________________________________________________________
Indicate by check mark if the registrant is a well-known seasoned issuer, as defined in Rule 405 of the Securities Act. Yes ý No ¨
Indicate by check mark if the registrant is not required to file reports pursuant to Section 13 or Section 15(d) of the Exchange Act. Yes ¨ No ý
Indicate by check mark whether the registrant (1) has filed all reports required to be filed by Section 13 or 15(d) of the Securities Exchange Act of 1934 during the preceding 12 months (or for such shorter period that the registrant was required to file such reports), and (2) has been subject to such filing requirements for the past 90 days. Yes ý No ¨
Indicate by check mark whether the registrant has submitted electronically and posted on its corporate Website, if any, every Interactive Data File required to be submitted and posted pursuant to Rule 405 of Regulation S-T during the preceding 12 months (or for such shorter period that the registrant was required to submit and post such files). Yes ý No ¨
Indicate by check mark if disclosure of delinquent filers pursuant to Item 405 of Regulation S-K is not contained herein, and will not be contained, to the best of registrant’s knowledge, in definitive proxy or information statements incorporated by reference in Part III of this Form 10-K or any amendment to this Form 10-K. ý
Indicate by check mark whether the registrant is a large accelerated filer, an accelerated filer, a non-accelerated filer, or a smaller reporting company. See the definitions of “large accelerated filer,” “accelerated filer” and “smaller reporting company” in Rule 12b-2 of the Exchange Act. (Check one):
Large accelerated filer | ý | Accelerated filer | ¨ |
Non-accelerated filer | o (Do not check if a smaller reporting company) | Smaller reporting company | ¨ |
Indicate by check mark whether the registrant is a shell company (as defined in Rule 12b-2 of the Exchange Act). Yes ¨ No ý
As of June 30, 2015, the aggregate market value of the common stock of Cousins Properties Incorporated held by non-affiliates was $2,128,680,591 based on the closing sales price as reported on the New York Stock Exchange. As of February 5, 2016, 211,441,397 shares of common stock were outstanding.
DOCUMENTS INCORPORATED BY REFERENCE
Portions of the Registrant’s proxy statement for the annual stockholders meeting to be held on May 3, 2016 are incorporated by reference into Part III of this Form 10-K.
Table of Contents
PART I | ||
Item 1. | ||
Item 1A. | ||
Item 1B. | ||
Item 2. | ||
Item 3. | ||
Item 4. | ||
Item X. | ||
PART II | ||
Item 5. | ||
Item 6. | ||
Item 7. | ||
Item 7A. | ||
Item 8. | ||
Item 9. | ||
Item 9A. | ||
Item 9B. | ||
PART III | ||
Item 10. | ||
Item 11. | ||
Item 12. | ||
Item 13. | ||
Item 14. | ||
PART IV | ||
Item 15. | ||
FORWARD-LOOKING STATEMENTS
Certain matters contained in this report are “forward-looking statements” within the meaning of the federal securities laws and are subject to uncertainties and risks, as itemized in Item 1A included in this Form 10-K. These forward-looking statements include information about possible or assumed future results of the business of Cousins Properties Incorporated ("the Company") and the Company's financial condition, liquidity, results of operations, plans, and objectives. They also include, among other things, statements regarding subjects that are forward-looking by their nature, such as:
• | our business and financial strategy; |
• | our ability to obtain future financing arrangements; |
• | future acquisitions and future dispositions of operating assets; |
• | future acquisitions of land; |
• | future development and redevelopment opportunities; |
• | future dispositions of land and other non-core assets; |
• | future repurchases of our common stock; |
• | projected operating results; |
• | market and industry trends; |
• | future distributions; |
• | projected capital expenditures; and |
• | interest rates. |
Any forward-looking statements are based upon management's beliefs, assumptions, and expectations of our future performance, taking into account information currently available. These beliefs, assumptions, and expectations may change as a result of possible events or factors, not all of which are known. If a change occurs, our business, financial condition, liquidity, and results of operations may vary materially from those expressed in forward-looking statements. Actual results may vary from forward-looking statements due to, but not limited to, the following:
• | the availability and terms of capital and financing; |
• | the ability to refinance or repay indebtedness as it matures; |
• | the failure of purchase, sale, or other contracts to ultimately close; |
• | the failure to achieve anticipated benefits from acquisitions and investments or from dispositions; |
• | the potential dilutive effect of any common stock offerings; |
• | the failure to achieve benefits from the repurchase of our common stock; |
• | the availability of buyers and adequate pricing with respect to the disposition of assets; |
• | risks related to the geographic concentration of our portfolio, including, but not limited to, metropolitan Houston and |
metropolitan Atlanta;
• | risks related to industry concentration of our portfolio including, but, not limited to, the energy industry; |
• | risks and uncertainties related to national and local economic conditions, the real estate industry in general, and the |
commercial real estate markets in particular;
• | changes to our strategy with regard to land and other non-core holdings that require impairment losses to be recognized; |
• | leasing risks, including the ability to obtain new tenants or renew expiring tenants, and the ability to lease newly developed |
and/or recently acquired space;
• | the adverse change in the financial condition of one or more of our major tenants; |
• | volatility in interest rates and insurance rates; |
• | the availability of sufficient investment opportunities; |
• | competition from other developers or investors; |
• | the risks associated with real estate developments (such as zoning approval, receipt of required permits, construction |
delays, cost overruns, and leasing risk);
• | the loss of key personnel; |
• | the potential liability for uninsured losses, condemnation, or environmental issues; |
• | the potential liability for a failure to meet regulatory requirements; |
• | the financial condition and liquidity of, or disputes with, joint venture partners; |
• | any failure to comply with debt covenants under credit agreements; and |
• | any failure to continue to qualify for taxation as a real estate investment trust. |
The words “believes,” “expects,” “anticipates,” “estimates,” “plans,” “may,” “intend,” “will,” or similar expressions are intended to identify forward-looking statements. Although we believe that our plans, intentions, and expectations reflected in any forward-looking statements are reasonable, we can give no assurance that such plans, intentions, or expectations will be achieved. We undertake no obligation to publicly update or revise any forward-looking statement, whether as a result of future events, new information, or otherwise, except as required under U.S. federal securities laws.
PART I
Item 1. | Business |
Corporate Profile
Cousins Properties Incorporated (the “Registrant” or “Cousins”) is a Georgia corporation, which has elected to be taxed as a real estate investment trust (“REIT”). Through December 31, 2014, Cousins Real Estate Corporation (“CREC”), including its subsidiaries, was a taxable entity wholly-owned by the Registrant, which was consolidated with the Registrant. CREC owned, developed, and managed its own real estate portfolio and performed certain real estate related services for other parties. On December 31, 2014, CREC merged into the Registrant. Coincident with this merger, the Registrant formed Cousins TRS Services LLC ("CTRS"), a new taxable entity wholly-owned by the Registrant. Upon formation, CTRS received a capital contribution of certain real estate assets and contracts that were previously owned by CREC. CTRS owns and manages its own real estate portfolio and performs certain real estate related services for other parties beginning in 2015. The Registrant, its subsidiaries, CREC and CTRS combined are hereafter referred to as “we,” “us,” “our” and the “Company.” Our common stock trades on the New York Stock Exchange under the symbol “CUZ.”
Our operations are conducted through a number of segments based on our method of internal reporting, which classifies operations by property and geographical area. For financial information related to each of our operating segments, see note 17 to the consolidated financial statements included in this Annual Report on Form 10-K.
Company Strategy
Our strategy is to create value for our stockholders through the acquisition, development, ownership, and management of Class A office assets and opportunistic mixed-use developments in Sunbelt markets, with a particular focus on Georgia, Texas, and North Carolina. This strategy is based on a simple platform, trophy assets, opportunistic investments, and a strong balance sheet. This approach enables us to maintain a targeted, asset-specific approach to investing where we seek to leverage our acquisition and development skills, relationships, market knowledge, and operational expertise.
2015 Activities
During 2015, we shifted our investment activities from acquisitions to development by initiating and completing Class A office assets in our target markets, enhancing the value of our existing assets through leasing activities, and maintaining a strong balance sheet. The following is a summary of our significant 2015 activities.
Investment Activity
• | Commenced construction on NCR Corporation's corporate headquarters building in midtown Atlanta, Georgia. The project is expected to contain 485,000 square feet of space with a total projected cost of $200.0 million. |
• | Formed a joint venture to potentially develop HICO Avalon, an office building in Alpharetta, Georgia. |
• | Formed a joint venture to develop Carolina Square, a mixed-use property in Chapel Hill, North Carolina, which is expected to have 159,000 square feet of office space, 246 apartment units, and 43,000 square feet of retail space. Total project costs are expected to be $123.0 million. |
• | Opened Research Park V, a Class-A office tower in Austin, Texas, containing 173,000 square feet of space. |
• | Opened Colorado Tower, a Class-A office tower in downtown Austin, Texas, containing 373,000 square feet of space. |
• | Opened the second phase of Emory Point in Atlanta, Georgia, a mixed-use property which consists of 307 apartments and 45,000 square feet of retail space. |
• | Initiated a $100.0 million share repurchase program. Through year-end, we repurchased 5.2 million shares for $47.8 million. |
Disposition Activity
• | Sold 200, 333, and 555 North Point Center East, office buildings located in Atlanta, Georgia, containing 411,000 square feet, for $70.3 million. |
• | Sold The Points at Waterview, a 203,000 square foot office tower in Dallas, Texas, for $26.8 million |
• | Sold 2100 Ross, an 844,000 square foot office tower in Dallas, Texas, for $131.0 million. |
• | Sold 8,643 acres of residential land for total gross proceeds of $20.9 million. |
Financing Activity
2
• | Repaid without recourse, the $14.2 million The Points at Waterview mortgage loan. |
• | Reduced total consolidated indebtedness by $71.1 million and maintained strong leverage ratios. |
Portfolio Activity
• | Leased or renewed 3.0 million square feet of office space. |
• | Increased second generation net rent per square foot by 36.7% in accordance with accounting principles generally accepted in the United States ("GAAP") and 19.8% on a cash basis. |
• | Increased same property net operating income by 3.3% on a GAAP basis and 7.3% on a cash basis. |
Other Activity
• | In the first quarter of 2015, increased the quarterly common stock dividend from $0.075 per share to $0.080 per share. |
Environmental Matters
Our business operations are subject to various federal, state, and local environmental laws and regulations governing land, water, and wetlands resources. Among these are certain laws and regulations under which an owner or operator of real estate could become liable for the costs of removal or remediation of certain hazardous or toxic substances present on or in such property. Such laws often impose liability without regard to whether the owner knew of, or was responsible for, the presence of such hazardous or toxic substances. The presence of such substances, or the failure to properly remediate such substances, may subject the owner to substantial liability and may adversely affect the owner’s ability to develop the property or to borrow using such real estate as collateral.
We typically manage this potential liability through performance of Phase I Environmental Site Assessments and, as necessary, Phase II environmental sampling, on properties we acquire or develop, although no assurance can be given that environmental liabilities do not exist, that the reports revealed all environmental liabilities, or that no prior owner created any material environmental condition not known to us. In certain situations, we have also sought to avail ourselves of legal and regulatory protections offered by federal and state authorities to prospective purchasers of property. Where applicable studies have resulted in the determination that remediation was required by applicable law, the necessary remediation is typically incorporated into the acquisition or development activity of the relevant property. We are not aware of any environmental liability that we believe would have a material adverse effect on our business, assets, or results of operations.
Certain environmental laws impose liability on a previous owner of a property to the extent that hazardous or toxic substances were present during the prior ownership period. A transfer of the property does not necessarily relieve an owner of such liability. Thus, although we are not aware of any such situation, we may have such liabilities on properties previously sold. We believe that we and our properties are in compliance in all material respects with applicable federal, state, and local laws, ordinances, and regulations governing the environment.
Competition
We compete with other real estate owners with similar properties located in our markets and distinguish ourselves to tenants/buyers primarily on the basis of location, rental rates/sales prices, services provided, reputation, and the design and condition of the facilities. We also compete with other real estate companies, financial institutions, pension funds, partnerships, individual investors, and others when attempting to acquire and develop properties.
Executive Offices; Employees
Our executive offices are located at 191 Peachtree Street NE, Suite 500, Atlanta, Georgia 30303-1740. On December 31, 2015, we employed 257 people.
Available Information
We make available free of charge on the “Investor Relations” page of our website, www.cousinsproperties.com, our filed and furnished reports on Forms 10-K, 10-Q, and 8-K, and all amendments thereto, as soon as reasonably practicable after the reports are filed with or furnished to the Securities and Exchange Commission (the “SEC”).
Our Corporate Governance Guidelines, Director Independence Standards, Code of Business Conduct and Ethics, and the Charters of the Audit Committee, the Investment Committee, and the Compensation, Succession, Nominating and Governance Committee of the Board of Directors are also available on the “Investor Relations” page of our website. The information contained on our website is not incorporated herein by reference. Copies of these documents (without exhibits, when applicable) are also available free of charge upon request to us at 191 Peachtree Street NE, Suite 500, Atlanta, Georgia 30303-1740, Attention: Marli
3
Quesinberry, Investor Relations. Ms. Quesinberry may also be reached by telephone at (404) 407-1898 or by facsimile at (404) 407-1899. In addition, the SEC maintains a website that contains reports, proxy and information statements, and other information regarding issuers, including us, that file electronically with the SEC at www.sec.gov.
Item 1A. | Risk Factors |
Set forth below are the risks we believe investors should consider carefully in evaluating an investment in the securities of Cousins Properties Incorporated.
General Risks of Owning and Operating Real Estate
Our ownership of commercial real estate involves a number of risks, the effects of which could adversely affect our business.
General economic and market risks. Our assets are subject to general economic and market risks. As such, in a general economic decline or recessionary climate, our assets may not generate sufficient cash to pay expenses, service debt, or cover maintenance, and, as a result, our results of operations and cash flows may be adversely affected. Factors that may adversely affect the economic performance and value of our properties include, among other things:
• | changes in the national, regional, and local economic climate; |
• | local real estate conditions such as an oversupply of rentable space or a reduction in demand for rentable space; |
• | the attractiveness of our properties to tenants or buyers; |
• | competition from other available properties; |
• | changes in market rental rates and related concessions granted to tenants including, but not limited to, free rent, tenant allowances, and tenant improvement allowances; and |
• | the need to periodically repair, renovate, and re-lease buildings. |
Uncertain economic conditions may adversely impact current tenants in our various markets and, accordingly, could affect their ability to pay rents owed to us pursuant to their leases. In periods of economic uncertainty, tenants are more likely to close less profitable locations and/or to declare bankruptcy; and, pursuant to various bankruptcy laws, leases may be rejected and thereby terminated. Furthermore, our ability to sell or lease our properties at favorable rates, or at all, may be negatively impacted by general or local economic conditions.
Our ability to collect rent from tenants may affect our ability to pay for adequate maintenance, insurance, and other operating costs (including real estate taxes). Also, the expense of owning and operating a property is not necessarily reduced when circumstances such as market factors cause a reduction in income from the property. If a property is mortgaged and we are unable to meet the mortgage payments, the lender could foreclose on the mortgage and take title to the property. In addition, interest rate levels, availability of financing, changes in laws, and governmental regulations (including those governing usage, zoning and taxes) may adversely affect our financial condition.
Impairment risks. We regularly review our real estate assets for impairment; and based on these reviews, we may record impairment losses that have an adverse effect on our results of operations. Negative or uncertain market and economic conditions, as well as market volatility, increase the likelihood of incurring impairment losses. If we decide to sell a real estate asset rather than holding it for long term investment or reduce our estimates of future cash flows on a real estate asset, the risk of impairment increases. The magnitude and frequency with which these charges occur could materially and adversely affect our business, financial condition, and results of operations.
Leasing risk. Our operating revenues are dependent upon entering into leases with, and collecting rents from, our tenants. Tenants whose leases are expiring may desire to decrease the space they lease and/or may be unwilling to continue their lease. When leases expire or are terminated, replacement tenants may not be available upon acceptable terms and market rental rates may be lower than the previous contractual rental rates. Also, our tenants may approach us for additional concessions in order to remain open and operating. The granting of these concessions may adversely affect our results of operations and cash flows to the extent that they result in reduced rental rates, additional capital improvements, or allowances paid to, or on behalf of, the tenants.
Tenant and property concentration risk. As of December 31, 2015, our top 20 tenants represented 41% of our annualized base rental revenues with no single tenant accounting for more than 8% of our annualized base rent. In addition, as of December 31, 2015, 23% of our annualized base rent comes from tenants in the energy sector with no other sector representing more than 17% of our annualized base rent. The inability of any of our significant tenants to pay rent or a decision by a significant tenant to vacate their premises prior to, or at the conclusion of, their lease term could have a significant negative impact on our results of
4
operations or financial condition if a suitable replacement tenant is not secured in a timely manner. In addition, a prolonged period of low oil or natural gas prices or other factors negatively impacting the energy industry could have an adverse impact on our energy tenants' ability to pay rent or could cause them to vacate their premises prior to, or at the conclusion of, their lease terms. These events could have a significant adverse impact on our results of operations or financial condition.
For the three months ended December 31, 2015, 45% of our net operating income was derived from the metropolitan Houston area and 41% was derived from the metropolitan Atlanta area. Any adverse economic conditions impacting Houston or Atlanta could adversely affect our overall results of operations and financial condition. Given the fact that the Houston metropolitan area has a significant presence in the energy sector, a prolonged period of low oil or natural gas prices, or other factors negatively impacting the energy industry could have an adverse impact on our ability to maintain the occupancy of our Houston properties or could cause us to lease space at rates below current in-place rents, or at rates below the rates we have leased space in our Houston properties in the prior year. In addition, factors negatively impacting the energy industry could reduce the market values of our Houston properties which could reduce our net asset value and adversely affect our financial condition and results of operations, or cause a decline in the value of our common stock.
Uninsured losses and condemnation costs. Accidents, earthquakes, terrorism incidents, and other losses at our properties could adversely affect our operating results. Casualties may occur that significantly damage an operating property, and insurance proceeds may be less than the total loss incurred by us. Although we maintain casualty insurance under policies we believe to be adequate and appropriate, including rent loss insurance on operating properties, some types of losses, such as those related to the termination of longer-term leases and other contracts, generally are not insured. Certain types of insurance may not be available or may be available on terms that could result in large uninsured losses. Property ownership also involves potential liability to third parties for such matters as personal injuries occurring on the property. Such losses may not be fully insured. In addition to uninsured losses, various government authorities may condemn all or parts of operating properties. Such condemnations could adversely affect the viability of such projects.
Environmental issues. Environmental issues that arise at our properties could have an adverse effect on our financial condition and results of operations. Federal, state, and local laws and regulations relating to the protection of the environment may require a current or previous owner or operator of real estate to investigate and clean up hazardous or toxic substances or petroleum product releases at a property. If determined to be liable, the owner or operator may have to pay a governmental entity or third parties for property damage and for investigation and clean-up costs incurred by such parties in connection with the contamination, or perform such investigation and clean-up itself. Although certain legal protections may be available to prospective purchasers of property, these laws typically impose clean-up responsibility and liability without regard to whether the owner or operator knew of or caused the presence of the regulated substances. Even if more than one person may have been responsible for the release of regulated substances at the property, each person covered by the environmental laws may be held responsible for all of the clean-up costs incurred. In addition, third parties may sue the owner or operator of a site for damages and costs resulting from regulated substances emanating from that site. We are not currently aware of any environmental liabilities at locations that we believe could have a material adverse effect on our business, assets, financial condition, or results of operations. Unidentified environmental liabilities could arise, however, and could have an adverse effect on our financial condition and results of operations.
Joint venture structure risks. Similar to other real estate companies, we have interests in various joint ventures (including partnerships and limited liability companies) and may in the future invest in real estate through such structures. Our venture partners may have rights to take actions over which we have no control, or the right to withhold approval of actions that we propose, either of which could adversely affect our interests in the related joint ventures, and in some cases, our overall financial condition and results of operations. These structures involve participation by other parties whose interests and rights may not be the same as ours. For example, a venture partner might have economic and/or other business interests or goals which are incompatible with our business interests or goals and that venture partner may be in a position to take action contrary to our interests. In addition, such venture partners may default on their obligations, which could have an adverse impact on the financial condition and operations of the joint venture. Such defaults may result in our fulfilling their obligations that may, in some cases, require us to contribute additional capital to the ventures. Furthermore, the success of a project may be dependent upon the expertise, business judgment, diligence, and effectiveness of our venture partners in matters that are outside our control. Thus, the involvement of venture partners could adversely impact the development, operation, ownership, financing, or disposition of the underlying properties.
Liquidity risk. Real estate investments are relatively illiquid and can be difficult to sell and convert to cash quickly. As a result, our ability to sell one or more of our properties, whether in response to any changes in economic or other conditions or in response to a change in strategy, may be limited. In the event we want to sell a property, we may not be able to do so in the desired time period, the sales price of the property may not meet our expectations or requirements, and we may be required to record an impairment loss on the property as a result.
5
Compliance or failure to comply with federal, state, and local regulatory requirements could result in substantial costs.
Our properties are subject to various federal, state, and local regulatory requirements, such as the Americans with Disabilities Act and state and local fire, health, and life safety requirements. Compliance with these regulations may involve upfront expenditures and/or ongoing costs. If we fail to comply with these requirements, we could incur fines or other monetary damages. We do not know whether existing requirements will change or whether compliance with existing or future requirements will require significant unanticipated expenditures that will affect our cash flows and results of operations.
Financing Risks
At certain times, interest rates and other market conditions for obtaining capital are unfavorable, and, as a result, we may be unable to raise the capital needed to invest in acquisition or development opportunities, maintain our properties, or otherwise satisfy our commitments on a timely basis, or we may be forced to raise capital at a higher cost or under restrictive terms, which could adversely affect returns on our investments, our cash flows, and results of operations.
We generally finance our acquisition and development projects through one or more of the following: our Unsecured Credit Facility ("Credit Facility"), non-recourse mortgages, the sale of assets, construction loans, joint venture equity, and the issuance of common stock. Each of these sources may be constrained from time to time because of market conditions, and the related cost of raising this capital may be unfavorable at any given point in time. These sources of capital, and the risks associated with each, include the following:
• | Credit facilities. Terms and conditions available in the marketplace for credit facilities vary over time. We can provide no assurance that the amount we need from our Credit Facility will be available at any given time, or at all, or that the rates and fees charged by the lenders will be reasonable. We incur interest under our Credit Facility at a variable rate. Variable rate debt creates higher debt service requirements if market interest rates increase, which would adversely affect our cash flow and results of operations. Our Credit Facility contains customary restrictions, requirements and other limitations on our ability to incur indebtedness, including restrictions on unsecured debt outstanding, restrictions on secured recourse debt outstanding, and requirements to maintain minimum fixed charge coverage ratios. Our continued ability to borrow under our Credit Facility is subject to compliance with these covenants. |
• | Non-recourse mortgages. The availability of financing is dependent upon various conditions, including the willingness of mortgage lenders to lend at any given point in time. Interest rates and loan-to-value ratios may also be volatile, and we may from time to time elect not to proceed with mortgage financing due to unfavorable terms offered by lenders. Inability to access the mortgage market could adversely affect our ability to finance acquisition or development activities. In addition, if a property is mortgaged to secure payment of indebtedness and we are unable to make the mortgage payments, the lender may foreclose, resulting in loss of income and asset value. We may not be able to refinance debt secured by our properties at the same levels or on the same terms, which could adversely affect our business, financial condition and results of operations. Further, at the time a mortgage matures, the property may be worth less than the mortgage amount and, as a result, we may determine not to refinance the mortgage and permit foreclosure, generating a loss to us and defaults on other mortgages. |
• | Property sales. Real estate markets tend to experience market cycles. Because of such cycles, the potential terms and conditions of sales, including prices, may be unfavorable for extended periods of time. In addition, our status as a REIT limits our ability to sell properties, which may affect our ability to liquidate an investment. As a result, our ability to raise capital through property sales in order to fund our acquisition and development projects or other cash needs could be limited. In addition, mortgage financing on a property may prohibit prepayment and/or impose a prepayment penalty upon the sale of that property, which may decrease the proceeds from a sale or refinancing or make the sale or refinancing impractical. |
• | Construction loans. Construction loans generally relate to specific assets under construction and fund costs above an initial equity amount deemed acceptable to the lender. Terms and conditions of construction facilities vary, but they generally carry a term of two to five years, charge interest at variable rates, require the lender to be satisfied with the nature and amount of construction costs prior to funding, and require the lender to be satisfied with the level of pre-leasing prior to closing. Construction loans frequently require a portion of the loan to be recourse to us in addition to being recourse to the equity in the asset. In addition, construction loans generally require a completion guarantee by the borrower. While construction lending is generally competitive and offered by many financial institutions, there may be times when these facilities are not available or are only available upon |
6
unfavorable terms which could have an adverse effect on our ability to fund development projects or on our ability to achieve the returns we expect.
• | Joint ventures. Joint ventures, including partnerships or limited liability companies, tend to be complex arrangements, and there are only a limited number of parties willing to undertake such investment structures. There is no guarantee that we will be able to undertake these ventures at the times we need capital. |
• | Common stock. Common stock offerings may have a dilutive effect on our earnings per share and funds from operations per share. The actual amount of dilution, if any, from any future offering of common stock will be based on numerous factors, particularly the use of proceeds and any return generated thereby, and cannot be determined at this time. The per share trading price of our common stock could decline as a result of sales of a large number of shares of our common stock in the market in connection with an offering, or otherwise, or as a result of the perception or expectation that such sales could occur. We can also provide no assurance that conditions will be favorable for future issuances of common stock when we need the capital, which could have an adverse effect on our ability to fund acquisition and development activities. |
As a result of any additional indebtedness incurred to consummate investment activities, we may experience a potential material adverse effect on our financial condition and results of operations.
The incurrence of new indebtedness could have adverse consequences on our business, such as:
• | requiring us to use a substantial portion of our cash flow from operations to service our indebtedness, which would reduce the available cash flow to fund working capital, capital expenditures, development projects, and other general corporate purposes and reduce cash for distributions; |
• | limiting our ability to obtain additional financing to fund our working capital needs, acquisitions, capital expenditures, or other debt service requirements or for other purposes; |
• | increasing the costs of incurring additional debt; |
• | increasing our exposure to floating interest rates; |
• | limiting our ability to compete with other companies who are not as highly leveraged, as we may be less capable of responding to adverse economic and industry conditions; |
• | restricting us from making strategic acquisitions, developing properties, or exploiting business opportunities; |
• | restricting the way in which we conduct our business because of financial and operating covenants in the agreements governing our existing and future indebtedness; |
• | exposing us to potential events of default (if not cured or waived) under covenants contained in our debt instruments that could have a material adverse effect on our business, financial condition, and operating results; |
• | increasing our vulnerability to a downturn in general economic conditions; and |
• | limiting our ability to react to changing market conditions in our industry. |
The impact of any of these potential adverse consequences could have a material adverse effect on our results of operations, financial condition, and liquidity.
Covenants contained in our Credit Facility and mortgages could restrict or hinder our operational flexibility, which could adversely affect our results of operations.
Our Credit Facility imposes financial and operating covenants on us. These covenants may be modified from time to time, but covenants of this type typically include restrictions and limitations on our ability to incur debt, as well as limitations on the amount of our unsecured debt and on the amount of joint venture activity in which we may engage. These covenants may limit our flexibility in making business decisions. If we fail to comply with these covenants, our ability to borrow may be impaired, which could potentially make it more difficult to fund our capital and operating needs. Our failure to comply with such covenants could cause a default, and we may then be required to repay our outstanding debt with capital from other sources. Under those circumstances, other sources of capital may not be available to us or may be available only on unattractive terms, which could materially and adversely affect our financial condition and results of operations. In addition, the cross default provision on the Credit Facility may affect business decisions on other mortgage debt.
Some of our property mortgages contain customary negative covenants, including limitations on our ability, without the lender’s prior consent, to further mortgage that property, to enter into new leases, to modify existing leases, or to sell the property. Compliance with these covenants and requirements could harm our operational flexibility and financial condition.
7
Our degree of leverage could limit our ability to obtain additional financing or affect the market price of our securities.
Total debt as a percentage of either total asset value or total market capitalization is often used by analysts to gauge the financial health of equity REITs such as us. If our degree of leverage is viewed unfavorably by lenders or potential joint venture partners, it could affect our ability to obtain additional financing. In general, our degree of leverage could also make us more vulnerable to a downturn in business or the economy. In addition, increases in our debt to market capitalization ratio, which is in part a function of our stock price, or to other measures of asset value used by financial analysts may have an adverse effect on the market price of common stock.
The repurchase of our shares of common stock may not result in benefits to our shareholders.
In 2015, we initiated a plan to repurchase shares of our common stock. We repurchase shares in our discretion based on the price of our common stock and the relative expected profitability of other investment options available to us, including acquisition and development properties. As with any investment, there can be no assurance that the benefits of repurchasing our common stock will be superior to other investment options available to us.
Real Estate Acquisition and Development Risks
We face risks associated with the development of real estate, such as delay, cost overruns, and the possibility that we are unable to lease a portion of the space that we build, which could adversely affect our results.
Development activities contain certain inherent risks. Although we seek to minimize risks from commercial development through various management controls and procedures, development risks cannot be eliminated. Some of the key factors affecting development of commercial property are as follows:
• | The availability of sufficient development opportunities. Absence of sufficient development opportunities could result in our experiencing slower growth in earnings and cash flows. Development opportunities are dependent upon a wide variety of factors. Availability of these opportunities can be volatile as a result of, among other things, economic conditions and product supply/demand characteristics in a particular market. |
• | Abandoned predevelopment costs. The development process inherently requires that a large number of opportunities be pursued with only a few actually being developed. We may incur significant costs for predevelopment activity for projects that are later abandoned, which would directly affect our results of operations. For projects that are later abandoned, we must expense certain costs, such as salaries, that would have otherwise been capitalized. We have procedures and controls in place that are intended to minimize this risk, but it is likely that we will incur predevelopment expense on subsequently abandoned projects on an ongoing basis. |
• | Project costs. Construction and leasing of a project involves a variety of costs that cannot always be identified at the beginning of a project. Costs may arise that have not been anticipated or actual costs may exceed estimated costs. These additional costs can be significant and could adversely impact our return on a project and the expected results of operations upon completion of the project. Also, construction costs vary over time based upon many factors, including the demand for building materials. We attempt to mitigate the risk of unanticipated increases in construction costs on our development projects through guaranteed maximum price contracts and pre-ordering of certain materials, but we may be adversely affected by increased construction costs on our current and future projects. |
• | Construction delays. Real estate development carries the risk that the project could be delayed due to a number of issues that may arise including, but not limited to, weather and other forces of nature, availability of materials, availability of skilled labor, and the financial health of general contractors or sub-contractors. Construction delays could cause adverse financial impacts to us which could include higher interest and other carrying costs than originally budgeted, monetary penalties from tenants pursuant to their leases, and higher construction costs. Delays could also result in a violation of terms of construction loans that could increase fees, interest, or trigger additional recourse of the loan to us. |
• | Leasing risk. The success of a commercial real estate development project is heavily dependent upon entering into leases with acceptable terms within a predefined lease-up period. Although our policy is to achieve pre-leasing goals (which vary by market, product type, and circumstances) before committing to a project, it is expected that not all the space in a project will be leased at the time we commit to the project. If the additional space is not leased on schedule and upon the expected terms and conditions, our returns, future earnings, and results of operations |
8
from the project could be adversely impacted. Whether or not tenants are willing to enter into leases on the terms and conditions we project and on the timetable we expect will depend upon a number of factors, many of which are outside our control. These factors may include:
• | general business conditions in the local or broader economy or in the prospective tenants’ industries; |
• | supply and demand conditions for space in the marketplace; and |
• | level of competition in the marketplace. |
• | Reputation risks. We have historically developed and managed a significant portion of our real estate portfolio and believe that we have built a positive reputation for quality and service with our lenders, joint venture partners, and tenants. If we were viewed as developing underperforming properties, suffered sustained losses on our investments, defaulted on a significant level of loans or experienced significant foreclosure or deed in lieu of foreclosure of our properties, our reputation could be damaged. Damage to our reputation could make it more difficult to successfully develop or acquire properties in the future and to continue to grow and expand our relationships with our lenders, joint venture partners and tenants, which could adversely affect our business, financial condition, and results of operations. |
• | Governmental approvals. All necessary zoning, land-use, building, occupancy, and other required governmental permits and authorization may not be obtained, may only be obtained subject to onerous conditions or may not be obtained on a timely basis resulting in possible delays, decreased profitability, and increased management time and attention. |
We may face risks associated with property acquisitions.
The risks associated with property acquisitions are similar to those described above for real estate development. However, certain additional risks may be present for property acquisitions. These risks may include:
• | difficulty finding properties that are consistent with our strategy and that meet our standards; |
• | difficulty negotiating with new or existing tenants; |
• | the extent of competition in a particular market for attractive acquisitions may hinder our desired level of property acquisitions or redevelopment projects; |
• | the costs and timing of repositioning or redeveloping acquired properties may be greater than our estimates; |
• | the occupancy levels, lease-up timing, and rental rates may not meet our expectations; |
• | the acquired properties may fail to meet internal projections or otherwise fail to perform as expected; |
• | the acquired property may be in a market that is unfamiliar to us and could present additional unforeseen business challenges; |
• | the timing of property acquisitions may not match the timing of property dispositions, leading to periods of time where projects' proceeds are not invested as profitably as we desire or where we increase short-term borrowings until sales proceeds become available; |
• | the inability to obtain financing for acquisitions on favorable terms or at all; |
• | the inability to successfully integrate the operations, maintain consistent standards, controls, policies and procedures, or realize the anticipated benefits of acquisitions within the anticipated time frames or at all; |
• | the inability to effectively monitor and manage our expanded portfolio of properties, retain key employees or attract highly qualified new employees; |
• | the possible decline in value of the acquired assets; |
• | the diversion of our management’s attention away from other business concerns; and |
• | the exposure to any undisclosed or unknown issues, expenses, or potential liabilities relating to acquisitions. |
In addition, we may acquire properties subject to liabilities with no, or limited, recourse against the prior owners or other third parties. As a result, if a liability were asserted against us based upon ownership of those properties, we might have to pay substantial sums to settle or contest it, which might not be fully covered by owner's title insurance policies. Any of these risks could cause a failure to realize the intended benefits of our acquisitions and could have a material adverse effect on our financial condition, results of operations, and the market price of our common stock.
General Business Risks
9
We are dependent upon the services of certain key personnel, the loss of any of whom could adversely impair our ability to execute our business.
One of our objectives is to develop and maintain a strong management group at all levels. At any given time, we could lose the services of key executives and other employees. None of our key executives or other employees is subject to employment contracts. Further, we do not carry key person insurance on any of our executive officers or other key employees. The loss of services of any of our key employees could have an adverse effect upon our results of operations, financial condition, and our ability to execute our business strategy.
Our restated and amended articles of incorporation contain limitations on ownership of our stock, which may prevent a change in control that might otherwise be in the best interests of our stockholders.
Our restated and amended articles of incorporation impose limitations on the ownership of our stock. In general, except for certain individuals who owned stock at the time of adoption of these limitations, and except for persons that are granted waivers by our Board of Directors, no individual or entity may own more than 3.9% of the value of our outstanding stock. We provide waivers to this limitation on a case by case basis, which could result in increased voting control by a shareholder. The ownership limitation may have the effect of delaying, inhibiting, or preventing a transaction or a change in control that might involve a premium price for our stock or otherwise be in the best interest of our stockholders.
The market price of our common stock may fluctuate.
The market prices of shares of our common stock have been, and may continue to be, subject to fluctuation due to many events and factors such as those described in this report including:
• | actual or anticipated variations in our operating results, funds from operations, or liquidity; |
• | the general reputation of real estate as an attractive investment in comparison to other equity securities and/or the reputation of the product types of our assets compared to other sectors of the real estate industry; |
• | material changes in the energy industry or other significant tenant industry concentration; |
• | the general stock and bond market conditions, including changes in interest rates or fixed income securities; |
• | changes in tax laws; |
• | changes to our dividend policy; |
• | changes in market valuations of our properties; |
• | adverse market reaction to the amount of our outstanding debt at any time, the amount of our maturing debt, and our ability to refinance such debt on favorable terms; |
• | any failure to comply with existing debt covenants; |
• | any foreclosure or deed in lieu of foreclosure of our properties; |
• | additions or departures of key executives and other employees; |
• | actions by institutional stockholders; |
• | uncertainties in world financial markets; |
• | the realization of any of the other risk factors described in this report; and |
• | general market and economic conditions, in particular, market and economic conditions of Atlanta, Georgia and Houston, Texas. |
Many of the factors listed above are beyond our control. Those factors may cause market prices of shares of our common stock to decline, regardless of our financial performance, condition, and prospects. The market price of shares of our common stock may fall significantly in the future, and it may be difficult for our stockholders to resell our common stock at prices they find attractive.
If our future operating performance does not meet the projections of our analysts or investors, our stock price could decline.
Independent securities analysts publish quarterly and annual projections of our financial performance. These projections are developed independently by third-party securities analysts based on their own analyses, and we undertake no obligation to monitor, and take no responsibility for, such projections. Such estimates are inherently subject to uncertainty and should not be relied upon as being indicative of the performance that we anticipate for any applicable period. Our actual revenues, net income, and funds from operations may differ materially from what is projected by securities analysts. If our actual results do not meet analysts’ guidance, our stock price could decline significantly.
10
We face risks associated with security breaches through cyber attacks, cyber intrusions, or otherwise, as well as other significant disruptions of our information technology (IT) networks and related systems.
We face risks associated with security breaches or disruptions, whether through cyber attacks or cyber intrusions over the internet, malware, computer viruses, attachments to emails, persons inside our organization, or persons with access to systems inside our organization, and other significant disruptions of our IT networks and related systems. The risk of a security breach or disruption, particularly through cyber attacks or cyber intrusion, including by computer hackers, foreign governments, and cyber terrorists, has generally increased as the number, intensity, and sophistication of attempted attacks and intrusions from around the world have increased. Our IT networks and related systems are essential to the operation of our business and our ability to perform day-to-day operations (including managing our building systems) and, in some cases, may be critical to the operations of certain of our tenants. There can be no assurance that our efforts to maintain the security and integrity of these types of IT networks and related systems will be effective or that attempted security breaches or disruptions would not be successful or damaging. A security breach or other significant disruption involving our IT networks and related systems could adversely impact our financial condition, results of operations, cash flows, liquidity, and the market price of our common stock.
Federal Income Tax Risks
Any failure to continue to qualify as a REIT for federal income tax purposes could have a material adverse impact on us and our stockholders.
We intend to continue to operate in a manner to qualify as a REIT for federal income tax purposes. Qualification as a REIT involves the application of highly technical and complex provisions of the Internal Revenue Code (the “Code”), for which there are only limited judicial or administrative interpretations. Certain facts and circumstances not entirely within our control may affect our ability to qualify as a REIT. In addition, we can provide no assurance that legislation, new regulations, administrative interpretations, or court decisions will not adversely affect our qualification as a REIT or the federal income tax consequences of our REIT status.
If we were to fail to qualify as a REIT, we would not be allowed a deduction for distributions to stockholders in computing our taxable income. In this case, we would be subject to federal income tax (including any applicable alternative minimum tax) on our taxable income at regular corporate rates. Unless entitled to relief under certain Code provisions, we also would be disqualified from operating as a REIT for the four taxable years following the year during which qualification was lost. As a result, we would be subject to federal and state income taxes which could adversely affect our results of operations and distributions to stockholders. Although we currently intend to operate in a manner designed to qualify as a REIT, it is possible that future economic, market, legal, tax, or other considerations may cause us to revoke the REIT election.
In order to qualify as a REIT, under current law, we generally are required each taxable year to distribute to our stockholders at least 90% of our net taxable income (excluding any net capital gain). To the extent that we do not distribute all of our net capital gain or distribute at least 90%, but less than 100%, of our other taxable income, we are subject to tax on the undistributed amounts at regular corporate rates. In addition, we are subject to a 4% nondeductible excise tax to the extent that distributions paid by us during the calendar year are less than the sum of the following:
• | 85% of our ordinary income; |
• | 95% of our net capital gain income for that year; and |
• | 100% of our undistributed taxable income (including any net capital gains) from prior years. |
We generally intend to make distributions to our stockholders to comply with the 90% distribution requirement to avoid corporate-level tax on undistributed taxable income and to avoid the nondeductible excise tax. Distributions could be made in cash, stock or in a combination of cash and stock. Differences in timing between taxable income and cash available for distribution could require us to borrow funds to meet the 90% distribution requirement, to avoid corporate-level tax on undistributed taxable income, and to avoid the nondeductible excise tax. Satisfying the distribution requirements may also make it more difficult to fund new investment or development projects.
Certain property transfers may be characterized as prohibited transactions, resulting in a tax on any gain attributable to the transaction.
From time to time, we may transfer or otherwise dispose of some of our properties. Under the Code, any gains resulting from transfers or dispositions, from other than our taxable REIT subsidiary, that are deemed to be prohibited transactions would be subject to a 100% tax on any gain associated with the transaction. Prohibited transactions generally include sales of assets that constitute inventory or other property held for sale to customers in the ordinary course of business. Since we acquire properties primarily for investment purposes, we do not believe that our occasional transfers or disposals of property are deemed to be prohibited transactions. However, whether or not a transfer or sale of property qualifies as a prohibited transaction depends on
11
all the facts and circumstances surrounding the particular transaction. The Internal Revenue Service may contend that certain transfers or disposals of properties by us are prohibited transactions. While we believe that the Internal Revenue Service would not prevail in any such dispute, if the Internal Revenue Service were to argue successfully that a transfer or disposition of property constituted a prohibited transaction, we would be required to pay a tax equal to 100% of any gain allocable to us from the prohibited transaction. In addition, income from a prohibited transaction might adversely affect our ability to satisfy the income tests for qualification as a REIT for federal income tax purposes.
Disclosure Controls and Internal Control over Financial Reporting Risks
Our business could be adversely impacted if we have deficiencies in our disclosure controls and procedures or internal control over financial reporting.
The design and effectiveness of our disclosure controls and procedures and internal control over financial reporting may not prevent all errors, misstatements, or misrepresentations. In addition, new system implementations, such as our recent conversion from the JD Edwards information system to the Yardi information system, increase the risk that undetected errors in publicly disclosed financial information could occur. While management will continue to review the effectiveness of our disclosure controls and procedures and internal control over financial reporting, there can be no guarantee that our internal control over financial reporting will be effective in accomplishing all control objectives at all times. Deficiencies, including any material weakness, in our internal control over financial reporting which may occur in the future could result in misstatements of our results of operations, restatements of our financial statements, a decline in our stock price, or otherwise materially adversely affect our business, reputation, results of operations, financial condition, or liquidity.
Item 1B. | Unresolved Staff Comments |
Not applicable.
Item 2. | Properties |
The following table sets forth certain information related to operating properties in which we have an ownership interest. Information presented in note 5 to the consolidated financial statements provides additional information related to our unconsolidated joint ventures. Except as noted, all information presented is as of December 31, 2015:
12
Operating Properties
Company's Share | |||||||||||||||||||||||||
Property Description | Metropolitan Area | Rentable Square Feet | Financial Statement Presentation | Company's Ownership Interest | End of Period Leased | Weighted Average Occupancy (1) | % of Total Net Operating Income (2) | Property Level Debt ($000) | Annualized Base Rents (7) | ||||||||||||||||
I. | OFFICE PROPERTIES | ||||||||||||||||||||||||
Greenway Plaza (3) | Houston | 4,348,000 | Consolidated | 100% | 89.8% | 88.7% | 33% | $ | — | ||||||||||||||||
Post Oak Central (3) | Houston | 1,280,000 | Consolidated | 100% | 95.4% | 95.7% | 12% | 181,770 | |||||||||||||||||
816 Congress | Austin | 435,000 | Consolidated | 100% | 93.4% | 91.6% | 4% | 85,000 | |||||||||||||||||
Colorado Tower | Austin | 373,000 | Consolidated | 100% | 100.0% | 76.8% | 4% | — | |||||||||||||||||
Research Park V (4) | Austin | 173,000 | Consolidated | 100% | 29.9% | —% | —% | — | |||||||||||||||||
TEXAS | 6,609,000 | 53% | 266,770 | ||||||||||||||||||||||
Northpark Town Center (3) | Atlanta | 1,528,000 | Consolidated | 100% | 84.5% | 85.2% | 10% | — | |||||||||||||||||
191 Peachtree Tower | Atlanta | 1,225,000 | Consolidated | 100% | 91.5% | 89.4% | 8% | 100,000 | |||||||||||||||||
Promenade | Atlanta | 777,000 | Consolidated | 100% | 93.0% | 91.0% | 5% | 108,203 | |||||||||||||||||
The American Cancer Society Center | Atlanta | 996,000 | Consolidated | 100% | 86.6% | 86.6% | 5% | 129,342 | |||||||||||||||||
Terminus 100 | Atlanta | 659,000 | Unconsolidated | 50% | 92.3% | 90.5% | 3% | 64,608 | |||||||||||||||||
Terminus 200 | Atlanta | 566,000 | Unconsolidated | 50% | 92.2% | 90.4% | 3% | 41,000 | |||||||||||||||||
Meridian Mark Plaza | Atlanta | 160,000 | Consolidated | 100% | 98.2% | 97.7% | 2% | 24,978 | |||||||||||||||||
Emory University Hospital Midtown Medical Office Tower | Atlanta | 358,000 | Unconsolidated | 50% | 98.8% | 99.7% | 2% | 37,143 | |||||||||||||||||
100 North Point Center East (5) | Atlanta | 129,000 | Consolidated | 100% | 99.9% | 99.9% | 1% | — | |||||||||||||||||
GEORGIA | 6,398,000 | 39% | 505,274 | ||||||||||||||||||||||
Fifth Third Center | Charlotte | 698,000 | Consolidated | 100% | 94.6% | 84.5% | 6% | — | |||||||||||||||||
Gateway Village | Charlotte | 1,065,000 | Unconsolidated | 50% | 100.0% | 100% | —% | 8,768 | |||||||||||||||||
NORTH CAROLINA | 1,763,000 | 6% | 8,768 | ||||||||||||||||||||||
TOTAL OFFICE PROPERTIES | 14,770,000 | 98% | $ | 780,812 | $ | 241,719 | (8) | ||||||||||||||||||
II. | OTHER PROPERTIES | ||||||||||||||||||||||||
Emory Point Apartments (Phase I) (6) | Atlanta | 404,000 | Unconsolidated | 75% | 95.7% | 96.0% | 2% | $ | 36,123 | ||||||||||||||||
Emory Point Retail (Phase I) | Atlanta | 80,000 | Unconsolidated | 75% | 84.7% | 76.8% | —% | 7,399 | |||||||||||||||||
Emory Point Retail (Phase II) | Atlanta | 45,000 | Unconsolidated | 75% | 69.1% | 64.7% | —% | 4,602 | |||||||||||||||||
Emory Point Apartments (Phase II) (6) | Atlanta | 257,000 | Unconsolidated | 75% | 42.7% | 36.4% | —% | 26,081 | |||||||||||||||||
TOTAL OTHER PROPERTIES | 786,000 | 2% | 74,205 | $ | 8,717 | ||||||||||||||||||||
TOTAL PORTFOLIO | 15,556,000 | 100% | $ | 855,017 | |||||||||||||||||||||
(1) | Weighted average economic occupancy represents an average of the square footage occupied at the property during the year. If the property was purchased during the year, average economic occupancy is calculated from the date of purchase forward. |
(2) | Net operating income represents rental property revenues less rental property operating expenses for the three months ended December 31, 2015. |
(3) | Contains multiple buildings that are grouped together for reporting purposes. |
(4) | Research Park V became operational on December 1, 2015. |
(5) | 100 North Point Center East was sold in January 2016. |
(6) | Phase I consists of 443 units and Phase II consists of 307 units. |
(7) | Annualized base rents represents the sum of the annualized rent each tenant is paying as of the end of the reporting period. If a tenant is not paying rent due to a free rent concession, annualized base rent is calculated based on the annualized base rent the tenant will pay in the first period it is required to pay rent. |
(8) | Included in this amount is $9.6 million of Annualized Base Rent for tenants in a free rent period. |
Office Lease Expirations
As of December 31, 2015, our portfolio included 16 operating office properties. The weighted average remaining lease term of these office properties was 7 years as of December 31, 2015. Most of the major tenant leases in these properties provide for pass through of operating expenses and contractual rents which escalate over time. The leases expire as follows:
13
Year of Expiration | Number of Tenants | Square Feet Expiring (1) | % of Leased Space | Annual Contractual Rents ($000's) (1)(2) | % of Total Annual Contractual Rents | Annual Contractual Rent/Sq. Ft. (2) | ||||||||||||||
2016 | 123 | 657,081 | 5.3 | % | $ | 12,454 | 4.2 | % | $ | 18.95 | ||||||||||
2017 | 112 | 877,583 | 7.2 | % | 18,904 | 6.5 | % | 21.54 | ||||||||||||
2018 | 90 | 602,005 | 4.9 | % | 13,882 | 4.8 | % | 23.06 | ||||||||||||
2019 | 96 | 1,576,714 | 13.0 | % | 35,505 | 12.2 | % | 22.52 | ||||||||||||
2020 | 74 | 761,835 | 6.3 | % | 17,501 | 6.0 | % | 22.97 | ||||||||||||
2021 | 68 | 1,204,654 | 9.9 | % | 30,115 | 10.3 | % | 25.00 | ||||||||||||
2022 | 43 | 1,309,819 | 10.8 | % | 31,009 | 10.6 | % | 23.67 | ||||||||||||
2023 | 44 | 1,497,307 | 12.3 | % | 34,083 | 11.7 | % | 22.76 | ||||||||||||
2024 | 21 | 731,773 | 6.0 | % | 20,878 | 7.2 | % | 28.53 | ||||||||||||
2025 &Thereafter | 59 | 2,954,394 | 24.3 | % | 77,377 | 26.5 | % | 26.19 | ||||||||||||
Total | 730 | 12,173,165 | 100.0 | % | $ | 291,708 | 100.0 | % | $ | 23.96 | ||||||||||
(1) Company's share. | |||
(2) Annual Contractual Rent shown is the rate in the year of expiration. It includes the minimum contractual rent paid by the tenant which may or may not include a base year of operating expenses depending upon the terms of the lease. | |||
Development Pipeline (1)
As of December 31, 2015, we had the following projects under development:
Project | Type | Metropolitan Area | Company's Ownership Interest | Project Start Date | Number of Square Feet /Apartment Units | Estimated Project Cost (2) ($ in thousands) | Project Cost Incurred to Date (2) ($ in thousands) | Percent Leased | Initial Occupancy (3) | Estimated Stabilization (4) | |||||||||||||||||
Carolina Square | Mixed | Chapel Hill, NC | 50 | % | 2Q15 | $ | 123,000 | $ | 14,698 | ||||||||||||||||||
Office | 159,000 | 67 | % | 2Q17 | 2Q18 | ||||||||||||||||||||||
Retail | 43,000 | — | % | 2Q17 | 2Q18 | ||||||||||||||||||||||
Apartments | 246 | — | % | 2Q17 | 2Q18 | ||||||||||||||||||||||
NCR Phase I | Office | Atlanta, GA | 100 | % | 3Q15 | 485,000 | 200,000 | 27,890 | 100 | % | 1Q18 | 1Q18 | |||||||||||||||
Total | $ | 323,000 | $ | 42,588 | |||||||||||||||||||||||
(1) | This schedule shows projects currently under active development through the substantial completion of construction. Amounts included in the estimated project cost column represent the estimated costs of the project through stabilization. Significant estimation is required to derive these costs, and the final costs may differ from these estimates. The projected stabilization dates are also estimates and are subject to change as the project proceeds through the development process. | ||||
(2) | Amount represents 100% of the estimated project cost. Carolina Square is expected to be funded with a combination of equity from the partners and up to $80.0 million from a construction loan, which has no outstanding balance as of December 31, 2015. | ||||
(3) | Represents the quarter which the Company estimates the first tenant occupies space. | ||||
(4) | Stabilization represents the earlier of the quarter in which the Company estimates it will achieve 90% economic occupancy or one year from initial occupancy. | ||||
14
Land Holdings
As of December 31, 2015, we owned the following land holdings, either directly, or indirectly, through joint ventures:
Metropolitan Area | Company's Ownership Interest | Total Developable Land (Acres) | Company's Share | |||||||||
Commercial | ||||||||||||
North Point | Atlanta | 100.00% | 32 | |||||||||
Wildwood Office Park | Atlanta | 50.00% | 22 | |||||||||
The Avenue Forsyth-Adjacent Land | Atlanta | 100.00% | 10 | |||||||||
NCR Phase II (1) | Atlanta | 100.00% | 1 | |||||||||
Georgia | 65 | |||||||||||
Victory Center | Dallas | 75.0% | 3 | |||||||||
Texas | 3 | |||||||||||
Commercial Land Held (Acres) | 68 | 56 | ||||||||||
Cost Basis of Commercial Land Held | $ | 39,364 | $ | 20,577 | ||||||||
Residential (2) | ||||||||||||
Paulding County | Atlanta | 50.00% | 478 | |||||||||
Callaway Gardens (3) | Atlanta | 100.00% | 218 | |||||||||
Georgia | 696 | |||||||||||
Padre Island | Corpus Christi | 50.00% | 15 | |||||||||
Texas | 15 | |||||||||||
Residential Land Held (Acres) | 711 | 465 | ||||||||||
Cost Basis of Residential Land Held | $ | 11,899 | $ | 8,363 | ||||||||
Grand Total Land Held (Acres) | 779 | 521 | ||||||||||
Grand Total Cost Basis of Land Held | $ | 51,263 | $ | 28,940 | ||||||||
(1) | Represents land adjacent to NCR Development project. Upon completion of the NCR development project, NCR is required to pay rent on this land. | ||||
(2) | Residential represents land that may be sold to third parties as lots or in large tracts for residential development. | ||||
(3) | Company's ownership interest is shown at 100% as Callaway Gardens is owned in a joint venture which is consolidated with the Company. | ||||
Item 3. | Legal Proceedings |
We are subject to various legal proceedings, claims, and administrative proceedings arising in the ordinary course of business, some of which are expected to be covered by liability insurance. Management makes assumptions and estimates concerning the likelihood and amount of any potential loss relating to these matters using the latest information available. We record a liability for litigation if an unfavorable outcome is probable and the amount of loss or range of loss can be reasonably estimated. If an unfavorable outcome is probable and a reasonable estimate of the loss is a range, we accrue the best estimate within the range. If no amount within the range is a better estimate than any other amount, we accrue the minimum amount within the range. If an unfavorable outcome is probable but the amount of the loss cannot be reasonably estimated, we disclose the nature of the litigation and indicate that an estimate of the loss or range of loss cannot be made. If an unfavorable outcome is reasonably possible and the estimated loss is material, we disclose the nature and estimate of the possible loss of the litigation. We do not disclose information with respect to litigation where an unfavorable outcome is considered to be remote or where the estimated loss would not be material. Based on current expectations, such matters, both individually and in the aggregate, are not expected to have a material adverse effect on our liquidity, results of operations, business, or financial condition.
Item 4. | Mine Safety Disclosures |
Not applicable.
Item X. | Executive Officers of the Registrant |
The Executive Officers of the Registrant as of the date hereof are as follows:
15
Name | Age | Office Held | ||
Lawrence L. Gellerstedt III | 59 | President, Chief Executive Officer | ||
Gregg D. Adzema | 51 | Executive Vice President, Chief Financial Officer | ||
M. Colin Connolly | 39 | Executive Vice President, Chief Investment Officer | ||
John S. McColl | 53 | Executive Vice President | ||
John D. Harris, Jr. | 56 | Senior Vice President, Chief Accounting Officer, Treasurer and Assistant Secretary | ||
Pamela F. Roper | 42 | Senior Vice President, General Counsel and Corporate Secretary | ||
Family Relationships
There are no family relationships among the Executive Officers or Directors.
Term of Office
The term of office for all officers expires at the annual stockholders’ meeting. The Board retains the power to remove any officer at any time.
Business Experience
Mr. Gellerstedt was appointed President and Chief Executive Officer and Director in July 2009. From February 2009 to July 2009, Mr. Gellerstedt served as President and Chief Operating Officer. From May 2008 to February 2009, Mr. Gellerstedt served as Executive Vice President and Chief Development Officer.
Mr. Adzema was appointed Executive Vice President and Chief Financial Officer in November 2010. Prior to joining the Company, Mr. Adzema served as Chief Investment Officer of Hayden Harper Inc., an investment advisory and hedge fund company, from October 2009 to November 2010.
Mr. Connolly was appointed Executive Vice President and Chief Investment Officer in December 2015. From May 2013 to December 2015, Mr. Connolly served as Senior Vice President and Chief Investment Officer. From September 2011 to May 2013, Mr. Connolly served as Senior Vice President. Prior to joining the Company, Mr. Connolly served as Executive Director with Morgan Stanley from December 2009 to August 2011 and as Vice President with Morgan Stanley from December 2006 to December 2009.
Mr. McColl was appointed Executive Vice President in December 2011. From February 2010 to December 2011, Mr. McColl served as Executive Vice President-Development, Office Leasing and Asset Management. From May 1997 to February 2010, Mr. McColl served as Senior Vice President.
Mr. Harris was appointed Senior Vice President and Chief Accounting Officer in February 2005. In May 2005, Mr. Harris was appointed Assistant Secretary. In December 2014, Mr. Harris was appointed Treasurer.
Ms. Roper was appointed Senior Vice President, General Counsel and Corporate Secretary in October 2012. From February 2008 to October 2012, Ms. Roper served as Senior Vice President, Associate General Counsel and Assistant Secretary.
PART II
Item 5. Market for Registrant’s Common Stock and Related Stockholder Matters
Market Information
The high and low sales prices for our common stock and dividends declared per common share were as follows:
2015 Quarters | 2014 Quarters | ||||||||||||||||||||||||||||||
First | Second | Third | Fourth | First | Second | Third | Fourth | ||||||||||||||||||||||||
High | $ | 11.63 | $ | 10.96 | $ | 10.89 | $ | 10.37 | $ | 11.77 | $ | 12.50 | $ | 13.30 | $ | 13.20 | |||||||||||||||
Low | $ | 10.01 | $ | 9.40 | $ | 8.68 | $ | 8.87 | $ | 10.10 | $ | 11.23 | $ | 11.95 | $ | 10.69 | |||||||||||||||
Dividends | $ | 0.080 | $ | 0.080 | $ | 0.080 | $ | 0.080 | $ | 0.075 | $ | 0.075 | $ | 0.075 | $ | 0.075 | |||||||||||||||
Payment Date | 2/23/2015 | 5/28/2015 | 8/24/2015 | 12/18/2015 | 2/24/2014 | 5/28/2014 | 8/25/2014 | 12/19/2014 | |||||||||||||||||||||||
Holders
16
Our common stock trades on the New York Stock Exchange (ticker symbol CUZ). On February 5, 2016, there were 730 common stockholders of record.
Purchases of Equity Securities
For information on our equity compensation plans, see note 12 of the accompanying consolidated financial statements, which is incorporated herein.
We purchased the following common shares during the fourth quarter of 2015:
Total Number of Shares Purchased (1) | Average Price Paid per Share (1) | |||||
October 1 - 31 | 1,351 | $ | 10.25 | |||
November 1 - 30 | — | $ | — | |||
December 1 - 31 | 3,157,438 | $ | 9.20 | |||
3,158,789 | $ | 9.20 | ||||
(1) | All activity for the fourth quarter of 2015 is related to the remittances of shares for option exercises and share repurchases. Share repurchases were made under our $100 million share repurchase program initiated in September 2015. Share repurchases may be executed in the open market, through private negotiations, or other transactions permitted by law. |
Performance Graph
The following graph compares the five-year cumulative total return of our common stock with the NYSE Composite Index, the FTSE NAREIT Equity Index, and the SNL US REIT Office Index. The graph assumes a $100 investment in each of the indices on December 31, 2010 and the reinvestment of all dividends.
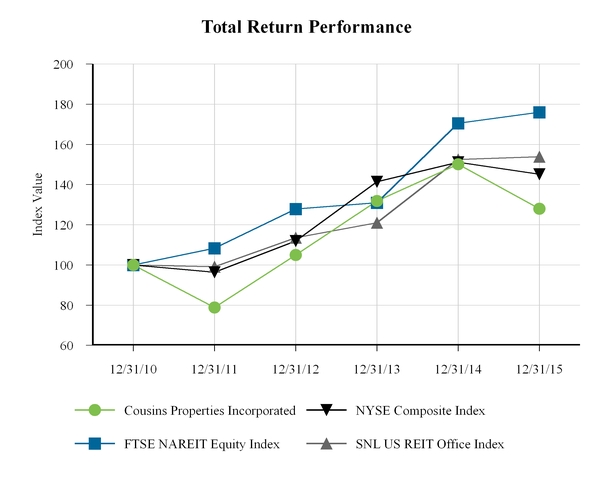
COMPARISON OF CUMULATIVE TOTAL RETURN OF ONE OR MORE COMPANIES, PEER
17
GROUPS, INDUSTRY INDICES AND/OR BROAD MARKETS
Fiscal Year Ended | |||||||||||||||||
Index | 12/31/2010 | 12/31/2011 | 12/31/2012 | 12/31/2013 | 12/31/2014 | 12/31/2015 | |||||||||||
Cousins Properties Incorporated | 100.00 | 78.77 | 105.01 | 131.86 | 150.06 | 127.92 | |||||||||||
NYSE Composite Index | 100.00 | 96.33 | 111.89 | 141.41 | 151.12 | 145.12 | |||||||||||
FTSE NAREIT Equity Index | 100.00 | 108.29 | 127.85 | 131.01 | 170.49 | 175.94 | |||||||||||
SNL US REIT Office Index | 100.00 | 99.10 | 113.54 | 120.99 | 152.53 | 153.87 | |||||||||||
Item 6. | Selected Financial Data |
The following selected financial data sets forth consolidated financial and operating information on a historical basis. This data has been derived from our consolidated financial statements and should be read in conjunction with the consolidated financial statements and notes thereto. The data below has been restated for discontinued operations detailed in note 3 of the consolidated financial statements.
18
For the Years Ended December 31, | |||||||||||||||||||
2015 | 2014 | 2013 | 2012 | 2011 | |||||||||||||||
(in thousands, except per share amounts) | |||||||||||||||||||
Rental property revenues | $ | 373,068 | $ | 343,910 | $ | 194,420 | $ | 114,208 | $ | 94,704 | |||||||||
Fee income | 7,297 | 12,519 | 10,891 | 17,797 | 13,821 | ||||||||||||||
Other | 1,278 | 4,954 | 5,430 | 4,841 | 9,600 | ||||||||||||||
Total revenues | 381,643 | 361,383 | 210,741 | 136,846 | 118,125 | ||||||||||||||
Rental property operating expenses | 156,157 | 155,934 | 90,498 | 50,329 | 40,817 | ||||||||||||||
Reimbursed expenses | 3,430 | 3,652 | 5,215 | 7,063 | 6,208 | ||||||||||||||
General and administrative expenses | 17,099 | 19,969 | 22,460 | 23,208 | 24,166 | ||||||||||||||
Interest expense | 30,723 | 29,110 | 21,709 | 23,933 | 26,677 | ||||||||||||||
Depreciation and amortization | 135,416 | 140,018 | 76,277 | 39,424 | 30,666 | ||||||||||||||
Impairment losses | — | — | — | 488 | 96,818 | ||||||||||||||
Other | 1,299 | 4,674 | 11,177 | 7,922 | 9,951 | ||||||||||||||
Total expenses | 344,124 | 353,357 | 227,336 | 152,367 | 235,303 | ||||||||||||||
Loss on extinguishment of debt and interest rate swaps | — | — | — | (94 | ) | — | |||||||||||||
Benefit (provision) for income taxes from operations | — | 20 | 23 | (91 | ) | 186 | |||||||||||||
Income (loss) from unconsolidated joint ventures | 8,302 | 11,268 | 67,325 | 39,258 | (18,299 | ) | |||||||||||||
Gain on sale of investment properties | 80,394 | 12,536 | 61,288 | 4,053 | 3,494 | ||||||||||||||
Income (loss) from continuing operations | 126,215 | 31,850 | 112,041 | 27,605 | (131,797 | ) | |||||||||||||
Income (loss) from discontinued operations | (586 | ) | 21,158 | 14,788 | 20,314 | 8,330 | |||||||||||||
Net income (loss) | 125,629 | 53,008 | 126,829 | 47,919 | (123,467 | ) | |||||||||||||
Net income attributable to noncontrolling interests | (111 | ) | (1,004 | ) | (5,068 | ) | (2,191 | ) | (4,958 | ) | |||||||||
Preferred share original issuance costs | — | (3,530 | ) | (2,656 | ) | — | — | ||||||||||||
Preferred dividends | — | (2,955 | ) | (10,008 | ) | (12,907 | ) | (12,907 | ) | ||||||||||
Net income (loss) available to common stockholders | $ | 125,518 | $ | 45,519 | $ | 109,097 | $ | 32,821 | $ | (141,332 | ) | ||||||||
Net income (loss) from continuing operations attributable to controlling interest per common share—basic and diluted | $ | 0.58 | $ | 0.12 | $ | 0.66 | $ | 0.12 | $ | (1.44 | ) | ||||||||
Net income (loss) per common share—basic and diluted | $ | 0.58 | $ | 0.22 | $ | 0.76 | $ | 0.32 | $ | (1.36 | ) | ||||||||
Dividends declared per common share | $ | 0.32 | $ | 0.30 | $ | 0.18 | $ | 0.18 | $ | 0.18 | |||||||||
Total assets (at year-end) | $ | 2,597,803 | $ | 2,667,330 | $ | 2,273,206 | $ | 1,124,242 | $ | 1,235,535 | |||||||||
Notes payable (at year-end) | $ | 721,293 | $ | 792,344 | $ | 630,094 | $ | 425,410 | $ | 5,394,423 | |||||||||
Stockholders’ investment (at year-end) | $ | 1,683,415 | $ | 1,673,458 | $ | 1,457,401 | $ | 620,342 | $ | 603,692 | |||||||||
Common shares outstanding (at year-end) | 211,513 | 216,513 | 189,666 | 104,090 | 103,702 | ||||||||||||||
Item 7. | Management's Discussion and Analysis of Financial Condition and Results of Operations |
The following discussion and analysis should be read in conjunction with the selected financial data and the consolidated financial statements and notes.
Overview of 2015 Performance and Company and Industry Trends
Our strategy is to create value for our stockholders through the acquisition, development, ownership, and management of Class A office assets and opportunistic mixed-use developments in Sunbelt markets, with a particular focus on Georgia, Texas,
19
and North Carolina. During 2015, we completed the development of two office projects and one mixed-use project and commenced development activities on two other development projects, all within our target markets. To fund our investment activities, we completed the disposition of three of our non-core office assets and several land holdings.
Investment Activity
Our investment strategy is to purchase Class A office assets or locate opportunistic development or redevelopment projects in our core markets to which we can add value through relationships, capital, or market expertise. During 2015, we purchased land and commenced construction on the NCR corporate headquarters, a 485,000 square foot office tower in the midtown sub-market of Atlanta, which is expected to cost $200.0 million. With a joint venture partner, we also commenced construction of Carolina Square, a mixed-use property containing 159,000 square feet of office space, 246 apartments, and 43,000 square feet of retail space. The total estimated project costs for Carolina Square are $123.0 million.
In 2015, we substantially completed construction and opened Colorado Tower, a 373,000 square foot office tower, and Research Park V, a 173,000 square foot office tower, in Austin, Texas. Colorado Tower is currently 100% leased and Research Park is 30% leased. We also substantially completed construction and opened the second phase of Emory Point, a mixed-use project containing 307 apartments and 45,000 square feet of retail space. The apartments at Emory Point Phase II are 43% leased and the retail portion of the project is 69% leased.
We are currently conducting pre-development activities on projects in Decatur, Georgia; Alpharetta, Georgia; Dallas, Texas; and Charlotte, North Carolina. We are pursuing additional development opportunities that may result in projects that commence in 2016 or thereafter.
We have grown significantly over the past two to three years through acquisition and development activities that management believes provide opportunity to increase value through leasing and superior management of the properties. We believe that the number of similar acquisition and development opportunities will be lower in 2016, and management will focus on leasing, renewing, and servicing tenants at our existing properties.
In addition to these traditional investment activities, we also initiated a stock repurchase plan in 2015 which provides that management may repurchase up to $100.0 million of shares over the next two years. In determining the timing and amount of shares to be repurchased, we assess the returns from investing in our common stock against other investment options. In 2015, we repurchased 5.2 million shares totaling $47.8 million at an average per share price of $9.22.
Disposition Activity
We funded the investment activity discussed above primarily with the sale of certain non-core assets in 2015. We sold 2100 Ross, an 844,000 square foot office tower in Dallas, Texas, for $131.0 million. We sold The Points at Waterview, a 203,000 square foot office tower in Dallas, Texas, for $26.8 million. We also sold 200, 333, and 555 North Point Center East, office buildings located in Atlanta, Georgia, containing 411,000 square feet, for $70.3 million. Subsequent to year end, we sold our final building at North Point, 100 North Point Center East, containing 129,000 square feet, for $22.0 million.
Throughout 2015, we sold 8,643 acres of land, including the sale of land in Wildwood, 549/555/557 Peachtree Street, Paulding County, and Blalock Lakes, which generated gross proceeds of $20.9 million.
Financing Activity
We entered 2015 with a strong balance sheet, and one of our ongoing strategic objectives is to maintain a strong balance sheet that provides us with the flexibility to act on investment opportunities as they arise. As a result of the fact that we used proceeds from disposition activities to fund our development activities, our credit ratios remain strong. Our debt to total undepreciated assets ratio at December 31, 2015 was 27.5%, down from 29.5% at December 31, 2014. Also, our fixed charges coverage ratio improved to 4.8 times for 2015, up from 4.3 times in 2014. Our debt to annualized EBITDA ratio remained consistent and strong at 4.0.
Portfolio Activity
In 2015, we leased or renewed approximately 3.0 million square feet of office space. The weighted average net effective rent per square foot, representing base rent less operating expense reimbursements and leasing costs, for new or renewed non-amenity leases with terms greater than one year was $14.66 per square foot in 2015. Cash basis net effective rent per square foot increased 19.8% on spaces that have been previously occupied in the past year. Cash basis net effective rent represents net rent at the end of the term paid by the prior tenant compared to the net rent at the beginning of the term paid by the current tenant. The same property leasing percentage remained stable throughout the year.
20
Market Conditions
We continue to target high barrier-to-entry submarkets in Atlanta, Austin, Charlotte, Dallas, and Houston. We believe these Sunbelt cities possess some of the most robust economic and market fundamentals including above-average population and job growth, steady office absorption, positive rent growth, and limited new supply.
Atlanta is currently our strongest market in terms of total new employment. After averaging 64,000 new jobs per year in 2013 and 2014, Atlanta added over 78,000 new jobs in 2015, which ranks fourth in total job growth nationally. Office fundamentals are equally strong. 2015 net absorption eclipsed 3.6 million square feet for the first time in the last 30 years, and due to limited new supply, vacancy rates reached 12.1%, the lowest level since 2000.
Austin’s economy continues to grow well ahead of the national pace. Job growth in Austin over the past year was 3.8%, and its unemployment rate at the end of 2015 was 3.1%, below the national average of 4.8%, and one of the lowest in the country. Although new construction is increasing in and around Austin, our Austin portfolio is well leased and market-wide vacancy rates have dropped to 8.0%.
The Charlotte office market continues to gain momentum as the low cost, business-friendly environment which has helped sustain increased demand in 2015. Charlotte’s employment has passed the pre-recession peak of 2007, and 2015 job growth is among the best in the nation at 3.3%. Multiple high-profile relocations and expansions have been announced over the last year in a vast array of industries signaling a more diversified Charlotte economy.
Dallas ranks third nationally in total job growth adding more than 100,000 new jobs in 2015. A number of corporate relocations and expansions has translated into strong demand leading to vacancy compression in the best submarkets. Class A office net absorption has been the best in recent years at over 7 million square feet in 2015. Management expects market fundamentals to remain strong in 2016; but with an increasing amount of speculative construction underway, we will continue to view Dallas as a more opportunistic market.
Houston’s office market showed signs of slowing over the course of 2015. However, our portfolio is defensively positioned for the near and long term, and operating results and leasing metrics posted strong numbers during the year. Our 5.6 million square foot portfolio is 91% leased with approximately 6.5 years in average remaining lease term and no significant expirations until late 2019. In addition, of our top 10 customers in Houston, representing 52% of the entire Houston portfolio, eight carry an investment grade rating. With this tenant roster and limited roll-over exposure, management believes that it is well-positioned in Houston.
Going forward, we expect to generate returns and create stockholder value through the lease up of our existing portfolio, through the execution of our development pipeline, and through opportunistic acquisition and development investments within our core markets.
Critical Accounting Policies
Our financial statements are prepared in accordance with GAAP as outlined in the Financial Accounting Standards Board’s ("FASB") Accounting Standards Codification ("ASC"), and the notes to consolidated financial statements include a summary of the significant accounting policies for the Company. The preparation of financial statements in accordance with GAAP requires the use of certain estimates, a change in which could materially affect revenues, expenses, assets, or liabilities. Some of the our accounting policies are considered to be critical accounting policies, which are ones that are both important to the portrayal of our financial condition, results of operations, and cash flows, and ones that also require significant judgment or complex estimation processes. Our critical accounting policies are as follows:
Real Estate Assets
Cost Capitalization. We are involved in all stages of real estate ownership, including development. Prior to the point a project becomes probable of being developed (defined as more likely than not), we expense predevelopment costs. After we determine a project is probable, all subsequently incurred predevelopment costs, as well as interest, real estate taxes, and certain internal personnel and associated costs directly related to the project under development, are capitalized in accordance with accounting rules. If we abandon development of a project that had earlier been deemed probable, we charge all previously capitalized costs to expense. If this occurs, our predevelopment expenses could rise significantly. The determination of whether a project is probable requires judgment. If we determine that a project is probable, interest, general and administrative, and other expenses could be materially different than if management determines the project is not probable.
During the predevelopment period of a probable project and the period in which a project is under construction, we capitalize all direct and indirect costs associated with planning, developing, leasing, and constructing the project. Determination
21
of what costs constitute direct and indirect project costs requires us, in some cases, to exercise judgment. If we determine certain costs to be direct or indirect project costs, amounts recorded in projects under development on the balance sheet and amounts recorded in general and administrative and other expenses on the statements of operations could be materially different than if we determine these costs are not directly or indirectly associated with the project.
Once a project is constructed and deemed substantially complete and held for occupancy, carrying costs, such as real estate taxes, interest, internal personnel, and associated costs, are expensed as incurred. Determination of when construction of a project is substantially complete and held available for occupancy requires judgment. We consider projects and/or project phases to be both substantially complete and held for occupancy at the earlier of the date on which the project or phase reached economic occupancy of 90% or one year after it is substantially complete. Our judgment of the date the project is substantially complete has a direct impact on our operating expenses and net income for the period.
Operating Property Acquisitions. Upon acquisition of an operating property, we record the acquired tangible and intangible assets and assumed liabilities at fair value at the acquisition date. Fair value is based on estimated cash flow projections that utilize available market information and discount and/or capitalization rates as appropriate. Estimates of future cash flows are based on a number of factors including historical operating results, known and anticipated trends, and market and economic conditions. The acquired assets and assumed liabilities for an acquired operating property generally include, but are not limited to: land, buildings, and identified tangible and intangible assets and liabilities associated with in-place leases, including tenant improvements, leasing costs, value of above-market and below-market leases, and value of acquired in-place leases.
The fair value of land is derived from comparable sales of land within the same submarket and/or region. The fair value of buildings, tenant improvements, and leasing costs are based upon current market replacement costs and other relevant market rate information.
The fair value of the above-market or below-market component of an acquired in-place lease is based upon the present value (calculated using a market discount rate) of the difference between (i) the contractual rents to be paid pursuant to the lease over its remaining term and (ii) management’s estimate of the rents that would be paid using fair market rental rates and rent escalations at the date of acquisition over the remaining term of the lease. In-place leases at acquired properties are reviewed at the time of acquisition to determine if contractual rents are above or below current market rents for the acquired property, and an identifiable intangible asset or liability is recorded if there is an above-market or below-market lease.
The fair value of acquired in-place leases is derived based on our assessment of lost revenue and costs incurred for the period required to lease the “assumed vacant” property to the occupancy level when purchased. This fair value is based on a variety of considerations including, but not necessarily limited to: (1) the value associated with avoiding the cost of originating the acquired in-place leases; (2) the value associated with lost revenue related to tenant reimbursable operating costs estimated to be incurred during the assumed lease-up period; and (3) the value associated with lost rental revenue from existing leases during the assumed lease-up period. Factors considered in performing these analyses include an estimate of the carrying costs during the expected lease-up periods, such as real estate taxes, insurance, and other operating expenses, current market conditions, and costs to execute similar leases, such as leasing commissions, legal, and other related expenses.
The amounts recorded for above-market and in-place leases are included in other assets on the balance sheets, and the amounts for below-market leases are included in other liabilities on the balance sheets. These amounts are amortized on a straight-line basis as an adjustment to rental income over the remaining term of the applicable leases.
The determination of the fair value of the acquired tangible and intangible assets and assumed liabilities of operating property acquisitions requires significant judgments and assumptions about the numerous inputs discussed above. The use of different assumptions in these fair value calculations could significantly affect the reported amounts of the allocation of the acquisition related assets and liabilities and the related amortization and depreciation expense recorded for such assets and liabilities. In addition, since the values of above-market and below-market leases are amortized as either a reduction or increase to rental income, respectively, the judgments for these intangibles could have a significant impact on reported rental revenues and results of operations.
Depreciation and Amortization. We depreciate or amortize operating real estate assets over their estimated useful lives using the straight-line method of depreciation. We use judgment when estimating the life of real estate assets and when allocating certain indirect project costs to projects under development. Historical data, comparable properties, and replacement costs are some of the factors considered in determining useful lives and cost allocations. The use of different assumptions for the estimated useful life of assets or cost allocations could significantly affect depreciation and amortization expense and the carrying amount of our real estate assets.
22
Impairment. We review our real estate assets on a property-by-property basis for impairment. This review includes our operating properties and land holdings.
The first step in this process is for us to use judgment to determine whether an asset is considered to be held and used or held for sale, in accordance with accounting guidance. In order to be considered a real estate asset held for sale, we must, among other things, have the authority to commit to a plan to sell the asset in its current condition, have commenced the plan to sell the asset, and have determined that it is probable that the asset will sell within one year. If we determine that an asset is held for sale, it must record an impairment loss if the fair value less costs to sell is less than the carrying amount. All real estate assets not meeting the held for sale criteria are considered to be held and used.
In the impairment analysis for assets held and used, we must use judgment to determine whether there are indicators of impairment. For operating properties, these indicators could include a decline in a property’s leasing percentage, a current period operating loss or negative cash flows combined with a history of losses at the property, a decline in lease rates for that property or others in the property’s market, or an adverse change in the financial condition of significant tenants. For land holdings, indicators could include an overall decline in the market value of land in the region, a decline in development activity for the intended use of the land or other adverse economic and market conditions.
If we determine that an asset that is held and used has indicators of impairment, we must determine whether the undiscounted cash flows associated with the asset exceed the carrying amount of the asset. If the undiscounted cash flows are less than the carrying amount of the asset, we must reduce the carrying amount of the asset to fair value.
In calculating the undiscounted net cash flows of an asset, we must estimate a number of inputs. For operating properties, we must estimate future rental rates, expenditures for future leases, future operating expenses, and market capitalization rates for residual values, among other things. For land holdings, we must estimate future sales prices as well as operating income, carrying costs, and residual capitalization rates for land held for future development. In addition, if there are alternative strategies for the future use of the asset, we must assess the probability of each alternative strategy and perform a probability-weighted undiscounted cash flow analysis to assess the recoverability of the asset. We must use considerable judgment in determining the alternative strategies and in assessing the probability of each strategy selected.
In determining the fair value of an asset, we exercise judgment on a number of factors. We may determine fair value by using a discounted cash flow calculation or by utilizing comparable market information. We must determine an appropriate discount rate to apply to the cash flows in the discounted cash flow calculation. We must use judgment in analyzing comparable market information because no two real estate assets are identical in location and price.
The estimates and judgments used in the impairment process are highly subjective and susceptible to frequent change. If we determine that an asset is held and used, the results of operations could be materially different than if it determines that an asset is held for sale. Different assumptions we use in the calculation of undiscounted net cash flows of a project, including the assumptions associated with alternative strategies and the probabilities associated with alternative strategies, could cause a material impairment loss to be recognized when no impairment is otherwise warranted. Our assumptions about the discount rate used in a discounted cash flow estimate of fair value and our judgment with respect to market information could materially affect the decision to record impairment losses or, if required, the amount of the impairment losses.
Revenue Recognition – Valuation of Receivables
Notes and accounts receivable are reduced by an allowance for amounts that may become uncollectible in the future. We review our receivables regularly for potential collection problems in computing the allowance to record against our receivables. This review requires us to make certain judgments regarding collectibility, notwithstanding the fact that ultimate collections are inherently difficult to predict. Economic conditions fluctuate over time, and we have tenants in many different industries which experience changes in economic health, making collectibility prediction difficult. Therefore, certain receivables currently deemed collectible could become uncollectible, and those reserved could ultimately be collected. A change in judgments made could result in an adjustment to the allowance for doubtful accounts with a corresponding effect on net income.
Investment in Joint Ventures
We hold ownership interests in a number of joint ventures with varying structures. We evaluate all of our joint ventures and other variable interests to determine if the entity is a variable interest entity (“VIE”), as defined in accounting rules. If the venture is a VIE, and if we determine that we are the primary beneficiary, we consolidate the assets, liabilities, and results of operations of the VIE. We quarterly reassess our conclusions as to whether the entity is a VIE and whether consolidation is appropriate as required under the rules. For entities that are not determined to be VIEs, we evaluate whether or not we have control or significant influence over the joint venture to determine the appropriate consolidation and presentation. Generally,
23
entities under our control are consolidated, and entities over which we can exert significant influence, but do not control, are accounted for under the equity method of accounting.
We use judgment to determine whether an entity is a VIE, whether we are the primary beneficiary of the VIE, and whether we exercise control over the entity. If we determine that an entity is a VIE and we are the primary beneficiary or if we conclude that we exercise control over the entity, the balance sheets and statements of operations would be significantly different than if we concluded otherwise. In addition, VIEs require different disclosures in the notes to the financial statements than entities that are not VIEs. We may also change our conclusions and, thereby, change our balance sheets, statements of comprehensive income, and notes to the financial statements, based on facts and circumstances that arise after the original consolidation determination is made. These changes could include additional equity contributed to entities, changes in the allocation of cash flow to entity partners, and changes in the expected results within the entity.
We perform an impairment analysis of the recoverability of our investments in joint ventures on a quarterly basis. As part of this analysis, we first determine whether there are any indicators of impairment in any joint venture investment. If indicators of impairment are present for any of our investments in joint ventures, we calculate the fair value of the investment. If the fair value of the investment is less than the carrying value of the investment, we must determine whether the impairment is temporary or other than temporary, as defined by GAAP. If we assesses the impairment to be temporary, we do not record an impairment charge. If we conclude that the impairment is other than temporary, we record an impairment charge.
We use considerable judgment in the determination of whether there are indicators of impairment present and in the assumptions, estimations, and inputs used in calculating the fair value of the investment. These judgments are similar to those outlined above in the impairment of real estate assets. We also use judgment in making the determination as to whether the impairment is temporary or other than temporary. We utilize guidance provided by the SEC in making the determination of whether the impairment is temporary. The guidance indicates that companies consider the length of time that the impairment has existed, the financial condition of the joint venture, and the ability and intent of the holder to retain the investment long enough for a recovery in market value. Our judgment as to the fair value of the investment or on the conclusion of the nature of the impairment could have a material impact on our financial condition, results of operations, and cash flows.
Income Taxes – Valuation Allowance
We establish a valuation allowance against deferred tax assets if, based on the available evidence, it is more likely than not that such assets will not be realized. The realization of a deferred tax asset ultimately depends on the existence of sufficient taxable income in either the carryback or carryforward periods under tax law. We periodically assesses the need for valuation allowances for deferred tax assets based on the "more likely than not" realization threshold criterion. In the assessment, appropriate consideration is given to all positive and negative evidence related to the realization of the deferred tax assets. This assessment requires considerable judgment by management and includes, among other matters, the nature, frequency, and severity of current and cumulative losses, forecasts of future profitability, the duration of statutory carryforward periods, our experience with operating loss and tax credit carryforwards, and tax planning alternatives. If management determines that we require a valuation allowance on our deferred tax assets, income tax expense or benefit could be materially different than if we determine no such valuation allowance is necessary.
Recoveries from Tenants
Recoveries from tenants for operating expenses are determined on a calendar year and on a lease-by-lease basis. The most common types of cost reimbursements in our leases are utility expenses, building operating expenses, real estate taxes, and insurance, for which the tenant pays its pro rata share in excess of a base year amount, if applicable. The computation of these amounts is complex and involves numerous judgments, including the interpretation of lease terms and other customer lease provisions. Leases are not uniform in dealing with such cost reimbursements and there are many variations in the computation. We accrue income related to these payments each month. We make monthly accrual adjustments, positive or negative, to recorded amounts to our best estimate of the annual amounts to be billed and collected with respect to the cost reimbursements. After the end of the calendar year, we compute each customer's final cost reimbursements and, after considering amounts paid by the tenant during the year, issue a bill or credit for the appropriate amount to the tenant. The differences between the amounts billed less previously received payments and the accrual adjustments are recorded as increases or decreases to revenues when the final bills are prepared, which occurs during the first half of the subsequent year.
Stock-based Compensation
We have several types of stock-based compensation plans. These plans are described in note 12, as are the accounting policies by type of award. Compensation cost for all stock-based awards requires measurement at estimated fair value on the grant date, and compensation cost is recognized over the service vesting period, which represents the requisite service period. For compensation plans that contain market performance measures, we must estimate the fair value of the awards on a quarterly
24
basis and must adjust compensation expense accordingly. The fair values of these awards are estimated using complex pricing valuation models that require a number of estimates and assumptions. For awards that are based on our future earnings, we must estimate future earnings and adjust the estimated fair value of the awards accordingly.
We use considerable judgments in determining the fair value of these awards. Compensation expense associated with these awards could vary significantly based upon these estimates.
Discussion of New Accounting Pronouncements
In 2015, the FASB issued ASC 2015-02 "Consolidation (Topic 810): Amendments to the Consolidation Analysis." All legal entities are subject to reevaluation under the revised consolidation model. The amendment modifies the evaluation of whether limited partnerships and similar legal entities are variable interest entities or voting interest entities. It also eliminates the presumption that a general partner should consolidate a limited partnership. The guidance is effective for public entities with periods beginning after December 15, 2015 with early adoption permitted. We adopted this guidance effective January 1, 2016, and expect no material impact to our financial statements.
In 2015, the FASB issued ASU 2015-03, "Simplifying the Presentation of Debt Issuance Costs," which will require companies to present debt issuance costs as a direct deduction from the related debt rather than as an asset. These costs will continue to be amortized into interest expense. The guidance is effective for periods beginning after December 15, 2015 with early adoption permitted. ASU 2015-15 was issued further clarifying that entities may defer and present debt costs as an asset and amortize the deferred debt issuance costs ratably over the term for line of credit arrangements, regardless of the outstanding balance. We adopted this guidance in ASU 2015-03 effective January 1, 2016 for mortgage debt and have elected to defer adoption for costs related to line of credit arrangements. We expect no material impact to our financial statements.
In 2015, the FASB voted to defer ASU 2014-09, "Revenue from Contracts with Customers (Topic 606)." Under the new guidance, companies will recognize revenue when the seller satisfies a performance obligation, which would be when the buyer takes control of the good or service. This new guidance could result in different amounts of revenue being recognized and could result in revenue being recognized in different reporting periods than under the current guidance. The standard specifically excludes revenue associated with lease contracts. The guidance is effective for periods beginning after December 15, 2017, with early adoption permitted for periods beginning after December 15, 2016. We expect to adopt this guidance effective January 1, 2018, and we are currently assessing the potential impact of adopting the new guidance.
Results of Operations For The Three Years Ended December 31, 2015
General
Our financial results have historically been significantly affected by purchase and sale transactions. Accordingly, our historical financial statements may not be indicative of future operating results. During 2014, we purchased Fifth Third Center and Northpark Town Center (collectively, the "2014 Acquisitions"). During 2013, we purchased Greenway Plaza, 777 Main, 816 Congress, and Post Oak Central (collectively, the "2013 Acquisitions"). There were no operating property acquisitions in 2015. During 2015, we sold 2100 Ross, The Points at Waterview, and 200, 333, and 555 North Point Center East (collectively, the "2015 Dispositions"). During 2014, we sold 600 University Park Place, Lakeshore Park Plaza, Mahan Village, and 777 Main (collectively, the "2014 Dispositions"). During 2013, we sold Terminus 100 to the Terminus Office Holdings LLC joint venture, Tiffany Springs MarketCenter, and Inhibitex (collectively, the "2013 Dispositions").
Rental Property Net Operating Income
The following results include the performance of our Same Property portfolio. Our Same Property portfolio includes office properties that have been fully operational in each of the comparable reporting periods. A fully operational property is one that has achieved 90% economic occupancy for each of the periods presented or has been substantially complete and owned by us for each of the periods presented. Same Property amounts for the 2015 vs 2014 comparison are from properties that have been owned since January 1, 2014 through the end of the current reporting period, excluding dispositions. Same Property amounts for the 2014 vs 2013 comparison are from properties that were owned from January 1, 2013 to December 31, 2014, excluding dispositions. This information includes revenues and expenses of only consolidated properties.
We use Net Operating Income ("NOI"), a non-GAAP financial measure, to measure operating performance of our properties. NOI is also widely used by industry analysts and investors to evaluate performance. NOI, which is rental property revenues less rental property operating expenses, excludes certain components from net income in order to provide results that are more closely related to a property's results of operations. Certain items, such as interest expense, while included in FFO and net income, do not affect the operating performance of a real estate asset and are often incurred at the corporate level as opposed to the property level. As a result, management uses only those income and expense items that are incurred at the property level to evaluate a
25
property's performance. Depreciation and amortization are also excluded from NOI. Same Property NOI allows analysts, investors, and management to analyze continuing operations and evaluate the growth trend of our portfolio.
NOI increased $28.9 million between the 2015 and 2014 periods as follows:
Year Ended December 31, | ||||||||||||||
2015 | 2014 | $ Change | % Change | |||||||||||
Rental Property Revenues | ||||||||||||||
Same Property | $ | 260,634 | $ | 260,055 | $ | 579 | 0.2 | % | ||||||
Non-Same Property | 112,434 | 83,855 | 28,579 | 34.1 | % | |||||||||
$ | 373,068 | $ | 343,910 | $ | 29,158 | 8.5 | % | |||||||
Rental Property Operating Expenses | ||||||||||||||
Same Property | $ | 110,209 | $ | 114,691 | $ | (4,482 | ) | (3.9 | )% | |||||
Non-Same Property | 45,948 | 41,243 | 4,705 | 11.4 | % | |||||||||
$ | 156,157 | $ | 155,934 | $ | 223 | 0.1 | % | |||||||
Same Property NOI | $ | 150,425 | $ | 145,364 | $ | 5,061 | 3.5 | % | ||||||
Non-Same Property NOI | $ | 66,486 | $ | 42,612 | $ | 23,874 | 56.0 | % | ||||||
Total NOI | $ | 216,911 | $ | 187,976 | $ | 28,935 | 59.5 | % | ||||||
The increase in Same Property NOI was primarily driven by decreased real estate tax expense in 2015 from Greenway Plaza and Post Oak Central.
The increase in Non-Same Property NOI is primarily due to commencement of operations at Colorado Tower and the 2014 Acquisitions, offset by decreases from the 2015 and 2014 Dispositions.
NOI increased $84.1 million between the 2014 and 2013 periods as follows:
Year Ended December 31, | ||||||||||||||
2014 | 2013 | $ Change | % Change | |||||||||||
Rental Property Revenues | ||||||||||||||
Same Property | $ | 73,558 | $ | 72,584 | $ | 974 | 1.3 | % | ||||||
Non-Same Property | 270,352 | 121,836 | 148,516 | 121.9 | % | |||||||||
$ | 343,910 | $ | 194,420 | $ | 149,490 | 76.9 | % | |||||||
Rental Property Operating Expenses | ||||||||||||||
Same Property | $ | 32,925 | $ | 33,109 | $ | (184 | ) | (0.6 | )% | |||||
Non-Same Property | 123,009 | 57,389 | 65,620 | 114.3 | % | |||||||||
$ | 155,934 | $ | 90,498 | $ | 65,436 | 72.3 | % | |||||||
Same Property NOI | $ | 40,633 | $ | 39,475 | $ | 1,158 | 2.9 | % | ||||||
Non-Same Property NOI | $ | 147,343 | $ | 64,447 | $ | 82,896 | 128.6 | % | ||||||
Total NOI | $ | 187,976 | $ | 103,922 | $ | 84,054 | 131.5 | % | ||||||
The increase in Same Property NOI was primarily caused by increased occupancy at American Cancer Society Center and 191 Peachtree. These increases were offset by lower occupancy at The Points at Waterview.
The increase in Non-Same Property NOI was primarily due to the 2014 and 2013 Acquisitions, and an increase in average occupancy at 2100 Ross, offset by decreases from the 2014 and 2013 Dispositions.
Fee Income
26
Fee income decreased $5.2 million (41.7%) between 2015 and 2014 and increased $1.6 million (14.9%) between 2014 and 2013. Fee income for 2014 was higher than 2015 and 2013 because the 2014 amount includes a $4.5 million participant interest related to a contract that was assumed in the acquisition of an entity several years ago. In addition, between 2013 and 2015, we have fewer third party development fee engagements on which we receive management fees.
Other Revenues
Other revenues decreased $3.7 million (74.2%) between 2015 and 2014 and decreased by $476,000 (8.8%) between 2014 and 2013. These decreases were primarily due to lower lease termination fees recognized in 2015 and 2014 compared to the prior periods.
Reimbursed Expenses
Reimbursed expenses decreased $222,000 (6.1%) between 2015 and 2014 and decreased $1.6 million (30.0%) between 2014 and 2013. Reimbursed expenses are primarily incurred on projects where we pay various expenses on third party and joint venture management and development fee engagements that are later reimbursed by the client. The offsetting income related to these expenses is recorded in fee income. The decreases are a result of fewer third party development engagements and fewer joint ventures on which we receive management fees.
General and Administrative Expenses
General and administrative expenses decreased $2.9 million (14.4%) between 2015 and 2014 and decreased $2.5 million (11.1%) between 2014 and 2013 primarily as a result of fluctuations in stock-based compensation expense due to the volatility in our stock price relative to office peers included in the SNL US Office REIT Index. Additionally, in 2015 and 2014 there were higher capitalized salaries associated with software implementation and development activities as compared to 2013.
Interest Expense
Interest expense increased $1.6 million (5.5%) between 2015 and 2014 primarily as a result of higher interest expense related the 816 Congress loan which closed in 2014 and higher interest expense on the Credit Facility due to higher average borrowings. These increases were partially offset by higher capitalized interest as a result of increased development expenditures.
Interest expense increased $7.4 million (34.1%) between 2014 and 2013 primarily as a result of higher interest expense on the Post Oak and Promenade loans that closed in 2013 and the 816 Congress loan. In 2014, there was also higher interest expense on the Credit Facility due to higher average borrowings. These increases were offset by higher capitalized interest due to an increase in development expenditures.
Depreciation and Amortization
Depreciation and amortization decreased $4.6 million (3.3%) between 2015 and 2014 primarily due to the 2015 and 2014 Dispositions, partially offset by an increase related to the commencement of operations of Colorado Tower and the 2014 Acquisitions.
Depreciation and amortization increased $63.7 million (83.6%) between 2014 and 2013 primarily due to increases related to the 2014 and 2013 Acquisitions. These increases were partially offset by decreases related to the 2014 and 2013 Dispositions.
Acquisition and Related Costs
Acquisition and related costs decreased $831,000 between 2015 and 2014 and decreased $6.4 million between 2014 and 2013. In 2015, we did not purchase any operating properties. In 2014, we incurred costs related to the 2014 Acquisitions. In 2013, we incurred costs related to the 2013 Acquisitions.
Income from Unconsolidated Joint Ventures
Income from unconsolidated joint ventures consisted of the following in 2015, 2014 and 2013:
27
Year Ended December 31, | |||||||||||
2015 | 2014 | 2013 | |||||||||
Net operating income | $ | 24,335 | $ | 25,896 | $ | 27,763 | |||||
Other income | 787 | 717 | 501 | ||||||||
Depreciation and amortization | (11,645 | ) | (11,913 | ) | (13,435 | ) | |||||
Interest expense | (7,455 | ) | (7,364 | ) | (7,963 | ) | |||||
Land sales gain | 2,280 | 2,165 | 115 | ||||||||
Other gains | — | 1,767 | 60,344 | ||||||||
Income from unconsolidated joint ventures | $ | 8,302 | $ | 11,268 | $ | 67,325 | |||||
Income from unconsolidated joint ventures decreased between 2015 and 2014 primarily because of a gain of $1.8 million on the sale of our investment in Cousins Watkins LLC in 2014. Income from unconsolidated joint ventures decreased between 2014 and 2013 primarily as a result of gains totaling $60.3 million on the sale or effective sale of our interests in CP Venture Five LLC, CP Venture Two LLC, and CF Murfreesboro Associates in 2013. NOI, depreciation and amortization, and interest expense decreased in 2014 as a result of these sales.
Gain on Sale of Investment Properties
Gain on sale of investment properties increased $67.9 million between 2015 and 2014 and decreased $48.8 million between 2014 and 2013. The variance is due to increased operating property sales in 2015 and 2013. The 2015 amount includes gains on the sales of 200, 333, and 555 North Point Center East, The Points at Waterview, and 2100 Ross of $35.7 million, $6.7 million, and $36.2 million, respectively. The combined sales prices of these assets represents a weighted average capitalization rate of 6.5%. Capitalization rates are calculated by dividing projected annualized NOI by the sales price. The 2014 amount includes gains of the sale of 777 Main and Mahan Village of $6.2 million and $4.6 million, respectively. The 2013 amount includes a gain on the sale of our 50% interest in Terminus 100 of $37.1 million, a gain on the acquisition of Terminus 200, which was acquired in stages, of $19.7 million, and the recognition of a deferred gain associated with the sale of our interest in CP Venture Two LLC of $3.6 million.
Discontinued Operations
Income from discontinued operations decreased $21.7 million between the 2015 and 2014 periods and increased $6.4 million between 2014 and 2013. The 2015 decrease is due to new accounting guidance issued by the FASB on discontinued operations. Under the new guidance, only assets held for sale and disposals representing a major strategic shift in operations will be presented as discontinued operations. We adopted this new standard in the second quarter of 2014. Therefore, the properties sold subsequently are not reflected as discontinued operations in our consolidated statements of operations.
Discontinued operations includes the operations and gains or losses associated with the 2014 dispositions of 600 University Park Place and Lakeshore Park Plaza and the 2013 dispositions of Tiffany Springs MarketCenter and Inhibitex. The combined sales prices of the 2014 Dispositions represents a weighted average capitalization rate of 6.3%. The capitalization rate on the sale of Tiffany Springs MarketCenter was 7.9% and the capitalization rate on Inhibitex was 9.1%.
Net Income Attributable to Noncontrolling Interest
We consolidate certain entities and allocate the partner's share of those entities' results to net income attributable to noncontrolling interests on the consolidated statements of operations. The noncontrolling interests' share of our net income decreased $893,000 between 2015 and 2014, and decreased $4.1 million between 2014 and 2013. The 2015 and 2014 amounts represented amounts that were allocated to the noncontrolling partner in the entity that sold Mahan Village. The 2013 amount includes $3.4 million that was allocated to the noncontrolling partner in CP Venture Six LLC in connection with our purchase of the partner's interest.
Preferred Stock Original Issuance Costs
In 2014, we redeemed all outstanding shares of our 7.5% Series B Cumulative Redeemable Preferred Stock. In connection with the redemption of Preferred Stock, net income available for common shareholders decreased by $3.5 million (non-cash), which represents the original issuance costs applicable to the shares redeemed.
28
In 2013, we redeemed all outstanding shares of our 7.75% Series A Cumulative Redeemable Preferred Stock. In connection with the redemption of Preferred Stock, net loss available for common shareholders decreased by $2.7 million (non-cash), which represents the original issuance costs applicable to the shares redeemed.
Dividends to Preferred Stockholders
We redeemed Series B preferred stock in 2014 and redeemed Series A preferred stock in 2013. We had no remaining outstanding preferred stock as of December 31, 2014 and, as a result, in future periods will have no preferred stock dividends.
Funds from Operations
The table below shows Funds from Operations Available to Common Stockholders (“FFO”), a non-GAAP financial measure, and the related reconciliation to net income available to common stockholders for the Company. The Company calculates FFO in accordance with the National Association of Real Estate Investment Trusts’ ("NAREIT") definition, which is net income available to common stockholders (computed in accordance with GAAP), excluding extraordinary items, cumulative effect of change in accounting principle and gains on sale or impairment losses on depreciable property, plus depreciation and amortization of real estate assets, and after adjustments for unconsolidated partnerships and joint ventures to reflect FFO on the same basis.
FFO is used by industry analysts and investors as a supplemental measure of a REIT’s operating performance. Historical cost accounting for real estate assets implicitly assumes that the value of real estate assets diminishes predictably over time. Since real estate values instead have historically risen or fallen with market conditions, many industry investors and analysts have considered presentation of operating results for real estate companies that use historical cost accounting to be insufficient by themselves. Thus, NAREIT created FFO as a supplemental measure of REIT operating performance that excludes historical cost depreciation, among other items, from GAAP net income. The use of FFO, combined with the required primary GAAP presentations, has been fundamentally beneficial, improving the understanding of operating results of REITs among the investing public and making comparisons of REIT operating results more meaningful. Our management evaluates operating performance in part based on FFO. Additionally, the our management uses FFO, along with other measures, to assess performance in connection with evaluating and granting incentive compensation to our officers and other key employees. The reconciliation of net income (loss) available to common stockholders to FFO is as follows for the years ended December 31, 2015, 2014, and 2013 (in thousands, except per share information):
Year Ended December 31, | ||||||||||||
2015 | 2014 | 2013 | ||||||||||
Net Income Available to Common Stockholders | $ | 125,518 | $ | 45,519 | $ | 109,097 | ||||||
Depreciation and amortization: | ||||||||||||
Consolidated properties | 133,796 | — | 139,151 | 78,607 | ||||||||
Share of unconsolidated joint ventures | 11,645 | 11,915 | 13,434 | |||||||||
Gain on sale of depreciated properties: | ||||||||||||
Consolidated properties | (78,210 | ) | (30,188 | ) | (67,056 | ) | ||||||
Share of unconsolidated joint ventures | — | (1,767 | ) | (60,345 | ) | |||||||
Noncontrolling interest related to the sale of depreciated properties | — | 574 | 3,397 | |||||||||
Funds From Operations Available to Common Stockholders | $ | 192,749 | $ | 165,204 | $ | 77,134 | ||||||
Per Common Share—Basic and Diluted: | ||||||||||||
Net Income Available | $ | 0.58 | $ | 0.22 | $ | 0.76 | ||||||
Funds From Operations | $ | 0.89 | $ | 0.81 | $ | 0.53 | ||||||
Weighted Average Shares—Basic | 215,827 | 204,216 | 144,255 | |||||||||
Weighted Average Shares—Diluted | 215,979 | 204,460 | 144,420 | |||||||||
Liquidity and Capital Resources
Our primary short-term and long-term liquidity needs include the following:
• | property acquisitions; |
• | expenditures on development projects; |
• | building improvements, tenant improvements, and leasing costs; |
• | principal and interest payments on indebtedness; |
• | repurchase of our common stock; and |
• | common stock dividends. |
29
We may satisfy these needs with one or more of the following:
• | net cash from operations; |
• | sales of assets; |
• | borrowings under our Credit Facility; |
• | proceeds from mortgage notes payable; |
• | proceeds from equity offerings; and |
• | joint venture formations. |
Financial Condition
A key component of our strategy is to maintain a conservative balance sheet with leverage ratios that will enable us to be positioned for future growth. During 2015, we acquired no operating properties but commenced two development projects and completed three previously commenced development projects. Expenditures on these development projects, along with capital improvements on our existing projects totaled $195.0 million. In addition, in 2015, we initiated a $100 million stock repurchase plan. Under this plan, we may repurchase shares of common stock through September 8, 2017. The repurchases may be executed in the open market, through private negotiations, or in other transactions permitted under applicable law. The timing, manner, price and amount of any repurchases will be in our discretion and will be subject to economic and market conditions, stock price, applicable legal requirements and other factors. Through December 31, 2015, we repurchased approximately 5.2 million shares for a total aggregate cost of approximately $47.8 million. Subsequent to year-end, through January 31, 2016, we repurchased an additional 192,800 shares for a total cost of $1.6 million. The repurchased shares were recorded as treasury shares on the consolidated balance sheets. We may discontinue or suspend repurchases at any time.
We funded these investment activities with cash from operations and with proceeds from the 2015 Dispositions. In addition, we reduced overall consolidated indebtedness by $71.1 million thereby maintaining and improving our already strong leverage ratios. As of December 31, 2015, we had $92.0 million outstanding under our Credit Facility, down from $140.2 million at December 31, 2014, and had the ability to borrow an additional $407.0 million under the Credit Facility.
We will continue to pursue acquisition and development opportunities that are consistent with our strategy. We expect to fund any additional future investments with one or more of the following: sale of additional non-core assets, additional borrowings under our Credit Facility, additional mortgage loans secured by existing or newly acquired properties, construction loans, the issuance of common equity, and joint ventures with third parties.
Contractual Obligations and Commitments
At December 31, 2015, we were subject to the following contractual obligations and commitments (in thousands):
Total | Less than 1 Year | 1-3 Years | 3-5 Years | More than 5 years | |||||||||||||||
Contractual Obligations: | |||||||||||||||||||
Company debt: | |||||||||||||||||||
Unsecured Credit Facility | $ | 92,000 | $ | — | $ | — | $ | 92,000 | $ | — | |||||||||
Mortgage notes payable | 629,293 | 10,070 | 243,929 | 204,469 | 170,825 | ||||||||||||||
Interest commitments (1) | 149,988 | 53,373 | 47,893 | 33,174 | 15,548 | ||||||||||||||
Ground leases | 144,674 | 1,648 | 3,306 | 3,316 | 136,404 | ||||||||||||||
Other operating leases | 262 | 136 | 126 | — | — | ||||||||||||||
Total contractual obligations | $ | 1,016,217 | $ | 65,227 | $ | 295,254 | $ | 332,959 | $ | 322,777 | |||||||||
Commitments: | |||||||||||||||||||
Unfunded tenant improvements and other | 82,400 | 48,943 | 17,299 | 16,158 | — | ||||||||||||||
Letters of credit | 1,000 | 1,000 | — | — | — | ||||||||||||||
Performance bonds | 946 | 113 | — | — | 833 | ||||||||||||||
Total commitments | $ | 84,346 | $ | 50,056 | $ | 17,299 | $ | 16,158 | $ | 833 | |||||||||
(1) | Interest on variable rate obligations is based on rates effective as of December 31, 2015. |
In addition, we have several standing or renewable service contracts mainly related to the operation of our buildings. These contracts were entered into in the ordinary course of business and are generally one year or less. These contracts are not included in the above table and are usually reimbursed in whole or in part by tenants.
30
In 2015, we repaid the The Points at Waterview mortgage loan totaling $14.2 million. In 2014, we entered into an $85.0 million non-recourse mortgage note payable, secured by 816 Congress. The loan has a fixed interest rate of 3.75% and matures in 2024.
Our existing mortgage debt is primarily non-recourse, fixed-rate mortgage notes secured by various real estate assets. Many of our non-recourse mortgages contain covenants which, if not satisfied, could result in acceleration of the maturity of the debt. We expect to either refinance the non-recourse mortgages at maturity or repay the mortgages with proceeds from other financings. As of December 31, 2015, the weighted average interest rate on our consolidated debt was 4.18%.
Credit Facility Information
We maintain a $500 million Credit Facility that matures in May 2019. The Credit Facility may be expanded to $750 million. The Credit Facility bears interest at the London Interbank Offered Rate (“LIBOR”) plus a spread, based on our leverage ratio, as defined in the Credit Facility. At December 31, 2015, we had $92.0 million drawn on the facility and a total available borrowing capacity of $407.0 million. The amount that we may draw is a defined calculation based on our unencumbered assets and other factors and is reduced by both letters of credit and borrowings outstanding.
The Credit Facility includes customary events of default, including, but not limited to, the failure to pay any interest or principal when due, the failure to perform under covenants of the credit agreement, incorrect or misleading representations or warranties, insolvency or bankruptcy, change of control, the occurrence of certain ERISA events and certain judgment defaults. The amounts outstanding under the Credit Facility may be accelerated upon an event of default. The Credit Facility contains restrictive covenants pertaining to our operations, including limitations on the amount of debt that may be incurred, the sale of assets, transactions with affiliates, dividends and distributions. The Credit Facility also includes certain financial covenants (as defined in the agreement) that require, among other things, the maintenance of an unencumbered interest coverage ratio of at least 2.00; a fixed charge coverage ratio of 1.50; and a leverage ratio of no more than 60%. We are currently in compliance with our financial covenants.
Future Capital Requirements
Over the long term, we intend to actively manage our portfolio of properties and strategically sell assets to exit our non-core holdings, reposition our portfolio of income-producing assets geographically, and generate capital for future investment activities. We expect to continue to utilize indebtedness to fund future commitments and expect to place long-term mortgages on selected assets as well as to utilize construction facilities for some development assets, if available and under appropriate terms.
We may also generate capital through the issuance of securities that include common or preferred stock, warrants, debt securities or depositary shares. In March 2013, we filed a shelf registration statement to allow for the issuance from time to time of such securities. Management will continue to evaluate all public equity sources and select the most appropriate options as capital is required.
Our business model is dependent upon raising or recycling capital to meet obligations. If one or more sources of capital are not available when required, we may be forced to reduce the number of projects we acquire or develop and/or raise capital on potentially unfavorable terms, or may be unable to raise capital, which could have an adverse effect on our financial position or results of operations.
Cash Flows
We report and analyze our cash flows based on operating activities, investing activities and financing activities. Cash and cash equivalents were $2.0 million, $0, and $975,000 at December 31, 2015, 2014, and 2013, respectively. The following table sets forth the changes in cash flows (in thousands):
Year Ended December 31, | |||||||||||||||||||
2015 | 2014 | 2013 | 2015 to 2014 Change | 2014 to 2013 Change | |||||||||||||||
Net cash provided by operating activities | $ | 151,661 | $ | 142,400 | $ | 137,340 | $ | 9,261 | $ | 5,060 | |||||||||
Net cash provided by (used in) investing activities | 38,482 | (461,615 | ) | (1,266,193 | ) | 500,097 | 804,578 | ||||||||||||
Net cash provided by (used in) financing activities | (188,140 | ) | 318,240 | 952,936 | (506,380 | ) | (634,696 | ) | |||||||||||
The reasons for significant increases and decreases in cash flows between the periods are as follows:
31
Cash Flows from Operating Activities. Cash provided by operating activities increased $9.3 million between the 2015 and 2014 periods. This difference is primarily caused by an increase in cash provided from property operations. Cash provided by operating activities increased $5.1 million between the 2014 and 2013 periods primarily due to cash provided by the 2014 and 2013 Acquisitions, offset by a decrease in operating distributions from joint ventures.
Cash Flows from Investing Activities. Cash flows provided by investing activities increased $500.1 million between the 2015 and 2014 periods. This primarily relates to decreases in acquisition, development and tenant expenditures during 2015 as compared to 2014. Cash flows from investing activities increased $804.6 million between the 2014 and 2013 period due to a decrease in acquisition, development and tenant asset expenditures and an increase in proceeds from investment sales. These amounts were partially offset by a decrease in distributions from unconsolidated joint ventures.
Cash Flows from Financing Activities. Cash flows used in financing activities decreased $506.4 million between the 2015 and 2014 periods and decreased $634.7 million between 2014 and 2013 periods. The decreases in each period are a result of a decrease of proceeds from common stock offerings and a decrease in net proceeds from indebtedness.
Capital Expenditures
We incur costs related to our real estate assets that include acquisition of properties, development of new properties, redevelopment of existing or newly purchased properties, leasing costs for new or replacement tenants and ongoing property repairs and maintenance.
Capital expenditures for assets we develop or acquire and then hold and operate are included in the property acquisition, development, and tenant asset expenditures line item within investing activities on the statements of cash flows. Amounts accrued are removed from the table below (accrued capital expenditures adjustment) to show the components of these costs on a cash basis. Components of costs included in this line item for the years ended December 31, 2015, 2014 and 2013 are as follows (in thousands):
2015 | 2014 | 2013 | |||||||||
Acquisition of property | $ | — | $ | 551,153 | $ | 1,470,147 | |||||
Projects under development | 52,015 | 63,911 | 16,829 | ||||||||
Operating properties—leasing costs | 28,052 | 10,431 | 14,594 | ||||||||
Operating properties—building improvements | 83,615 | 76,296 | 20,726 | ||||||||
Land held for investment | 8,098 | — | — | ||||||||
Capitalized interest | 3,579 | 2,535 | 518 | ||||||||
Capitalized salaries | 7,146 | 6,821 | 5,230 | ||||||||
Accrued capital expenditures adjustment | 2,483 | (404 | ) | (1,781 | ) | ||||||
Total property acquisition, development and tenant asset expenditures | $ | 184,988 | $ | 710,743 | $ | 1,526,263 | |||||
Capital expenditures decreased $525.8 million between 2015 and 2014 and decreased $815.5 million between 2014 and 2013, mainly due to decreased operating property acquisition activity. Leasing costs, as well as some of the tenant improvements and capitalized personnel costs, are a function of the number and size of executed new and renewed leases. The amount of tenant improvements and leasing costs on a per square foot basis for 2015 were as follows:
New leases | $5.90 | |
Renewal leases | $2.15 | |
Expansion leases | $6.32 | |
The amounts of tenant improvement and leasing costs on a per square foot basis vary by lease and by market. Given the level of expected leasing and renewal activity, in future periods, we expect tenant improvements and leasing costs per square foot to remain consistent with those experienced during 2015.
Dividends. We paid common and preferred dividends of $69.2 million, $64.5 million, and $37.2 million in 2015, 2014 and 2013, respectively, which we funded with cash provided by operating activities. We expect to fund our quarterly distributions to common stockholders with cash provided by operating activities, proceeds from investment property sales, distributions from unconsolidated joint ventures and indebtedness, if necessary.
32
On a quarterly basis, we review the amount of the common dividend in light of current and projected future cash flows from the sources noted above and also consider the requirements needed to maintain our REIT status. In addition, we have certain covenants under our Credit Facility which could limit the amount of dividends paid. In general, dividends of any amount can be paid as long as leverage, as defined in the facility, is less than 60% and we are not in default under our facility. Certain conditions also apply in which we can still pay dividends if leverage is above that amount. We routinely monitor the status of our dividend payments in light of the Credit Facility covenants. In the first quarter of 2015, we increased the quarterly dividend on our common stock from $0.075 per share to $0.080 per share.
Effects of Inflation
We attempt to minimize the effects of inflation on income from operating properties by providing periodic fixed-rent increases or increases based on the Consumer Price Index and/or pass-through of certain operating expenses of properties to tenants or, in certain circumstances, rents tied to tenants’ sales.
Off Balance Sheet Arrangements
General. We have a number of off balance sheet joint ventures with varying structures, as described in note 5 of notes to consolidated financial statements. Most of the joint ventures in which we have an interest are involved in the ownership and/or development of real estate. A venture will fund capital requirements or operational needs with cash from operations or financing proceeds, if possible. If additional capital is deemed necessary, a venture may request a contribution from the partners, and we will evaluate such request. Except as previously discussed, based on the nature of the activities conducted in these ventures, management cannot estimate with any degree of accuracy amounts that we may be required to fund in the short or long-term. However, management does not believe that additional funding of these ventures will have a material adverse effect on our financial condition or results of operations.
Debt. At December 31, 2015, our unconsolidated joint ventures had aggregate outstanding indebtedness to third parties of $402.0 million. These loans are generally mortgage or construction loans, most of which are non-recourse to us, except as described below. In addition, in certain instances, we provide “non-recourse carve-out guarantees” on these non-recourse loans. Certain of these loans have variable interest rates, which creates exposure to the ventures in the form of market risk due to interest rate changes. At December 31, 2015, $3.1 million of the $40.9 million in recourse loans at unconsolidated joint ventures were recourse to us.
We guarantee repayment of up to $8.6 million of the EP II construction loan, which has a maximum amount available of $46.0 million. At December 31, 2015, we guaranteed $8.6 million based on amounts outstanding as of that date under this loan. This guarantee may be reduced and/or eliminated based on achievement of certain criteria. We also guarantee 12.5% of the loan amount related to the Carolina Square construction loan, which has a lending capacity of $79.8 million, and no outstanding balance as of December 31, 2015.
Item 7A. | Quantitative and Qualitative Disclosure about Market Risk |
Our primary exposure to market risk results from our debt, which bears interest at both fixed and variable rates. We mitigate this risk by limiting our debt exposure in total and our maturities in any one year and weighting more towards fixed-rate, non-recourse debt compared to recourse, variable-rate debt in our portfolio. The fixed rate debt obligations limit the risk of fluctuating interest rates, and generally are mortgage loans secured by certain of our real estate assets. We do not have consolidated fixed-rate mortgage debt maturing in 2016 and have only one such mortgage maturing in 2017 in the amount of $129.3 million. We, therefore, do not have significant exposure for the refinancing of our mortgage debt in the near term. At December 31, 2015, we had $629.3 million of fixed rate debt outstanding at a weighted average interest rate of 4.57%. At December 31, 2014, we had $652.1 million of fixed rate debt outstanding at a weighted average interest rate of 4.60%. The amount of fixed-rate debt outstanding decreased and the weighted average interest rate decreased from 2014 to 2015 as a result of us repaying the $14.2 million The Points at Waterview mortgage which had an interest rate of 5.66% and was scheduled to mature in 2016. See note 8 of the notes to consolidated financial statements included in this Annual Report on Form 10-K for additional information regarding 2015 debt activity.
At December 31, 2015, we had $92.0 million of variable rate debt outstanding, which consisted of the Credit Facility at a weighted average interest rate of 1.53%. As of December 31, 2014, we had $140.2 million of variable rate debt outstanding which consisted of the Credit Facility at a weighted average interest rate of 1.27%. Borrowings under the Credit Facility decreased in 2015 due to the cash inflow resulting from the investment property sales. Based on our average variable rate debt balances in 2015, interest incurred would have increased by $1.8 million in 2015 if these interest rates had been 1% higher.
33
The following table summarizes our market risk associated with notes payable as of December 31, 2015. It includes the principal maturing, an estimate of the weighted average interest rates on those expected principal maturity dates and the fair values of the Company’s fixed and variable rate notes payable. Fair value was calculated by discounting future principal payments at estimated rates at which similar loans could have been obtained at December 31, 2015. The information presented below should be read in conjunction with note 8 of notes to consolidated financial statements included in this Annual Report on Form 10-K. We did not have a significant level of notes receivable at December 31, 2015, and the table does not include information related to notes receivable.
($ in thousands) | 2016 | 2017 | 2018 | 2019 | 2020 | Thereafter | Total | Estimated Fair Value | |||||||||||||||||||||||
Notes Payable: | |||||||||||||||||||||||||||||||
Fixed Rate | $ | 10,070 | $ | 138,195 | $ | 105,734 | $ | 9,447 | $ | 195,022 | $ | 170,825 | $ | 629,293 | $ | 646,136 | |||||||||||||||
Average Interest Rate | 4.87 | % | 6.27 | % | 3.43 | % | 4.27 | % | 4.46 | % | 4.03 | % | 4.57 | % | — | % | |||||||||||||||
Variable Rate | $ | — | $ | — | $ | — | $ | 92,000 | $ | — | $ | — | $ | 92,000 | $ | 92,000 | |||||||||||||||
Average Interest Rate (1) | — | — | — | 1.53 | % | — | % | — | 1.53 | % | — | % | |||||||||||||||||||
(1) | Interest rates on variable rate notes payable are equal to the variable rates in effect on December 31, 2015. |
Item 8. | Financial Statements and Supplementary Data |
The consolidated financial statements, notes to consolidated financial statements, and report of independent registered public accounting firm are included on pages F-1 through F-29.
The following selected quarterly financial information (unaudited) for the years ended December 31, 2015 and 2014 should be read in conjunction with the consolidated financial statements and notes thereto included herein (in thousands, except per share amounts):
Quarters | |||||||||||||||
First | Second | Third | Fourth | ||||||||||||
2015 | (Unaudited) | ||||||||||||||
Revenues | $ | 91,976 | $ | 97,903 | $ | 98,146 | $ | 93,618 | |||||||
Income from unconsolidated joint ventures | 1,611 | 1,761 | 3,716 | 1,214 | |||||||||||
Gain (loss) on sale of investment properties | 1,105 | (576 | ) | 37,145 | 42,720 | ||||||||||
Income from continuing operations | 7,768 | 7,957 | 53,614 | 56,876 | |||||||||||
Income (loss) from discontinued operations | (565 | ) | (6 | ) | 6 | (21 | ) | ||||||||
Net income | 7,203 | 7,951 | 53,620 | 56,855 | |||||||||||
Net income attributable to controlling interest | 7,203 | 7,951 | 53,620 | 56,744 | |||||||||||
Net income available to common stockholders | 7,203 | 7,951 | 53,620 | 56,744 | |||||||||||
Basic and diluted net income per common share | 0.03 | 0.04 | 0.25 | 0.27 | |||||||||||
Quarters | |||||||||||||||
First | Second | Third | Fourth | ||||||||||||
2014 | (Unaudited) | ||||||||||||||
Revenues | $ | 81,725 | $ | 84,505 | $ | 89,098 | $ | 106,055 | |||||||
Income from unconsolidated joint ventures | 1,287 | 2,027 | 2,030 | 5,924 | |||||||||||
Gain on sale of investment properties | 161 | 1,327 | 81 | 10,967 | |||||||||||
Income (loss) from continuing operations | (121 | ) | 2,034 | 6,073 | 23,864 | ||||||||||
Income (loss) from discontinued operations | 7,255 | 580 | 13,341 | (18 | ) | ||||||||||
Net income | 7,134 | 2,614 | 19,414 | 23,846 | |||||||||||
Net income attributable to controlling interest | 6,979 | 2,485 | 19,322 | 23,218 | |||||||||||
Net income (loss) available to common stockholders | 5,202 | (2,223 | ) | 19,322 | 23,218 | ||||||||||
Basic and diluted net income (loss) per common share | 0.03 | (0.01 | ) | 0.09 | 0.11 | ||||||||||
34
The above per share quarterly information does not sum to full year per share information due to rounding. Other financial statements and financial statement schedules required under Regulation S-X are filed pursuant to item 15 of part IV of this report. The amounts presented in 2014 have been restated from previous period presentations due to reclassifications related to discontinued operations. See note 3 in the notes to the consolidated financial statements for further detail.
During 2015 and 2014, our quarterly results varied as a result of the timing of the sales of assets, which generated gains within quarters of each year. These gains were recorded within gain (loss) on sale of investment properties, income (loss) from discontinued operations and income from unconsolidated joint ventures.
Item 9. | Changes in and Disagreements with Accountants on Accounting and Financial Disclosure |
Not applicable.
Item 9A. | Controls and Procedures |
We maintain disclosure controls and procedures that are designed to ensure that information required to be disclosed in our Exchange Act reports is recorded, processed, summarized and reported within the time periods specified in the SEC’s rules and forms, and that such information is accumulated and communicated to management, including the Chief Executive Officer and Chief Financial Officer, as appropriate, to allow timely decisions regarding required disclosure. Management necessarily applied judgment in assessing the costs and benefits of such controls and procedures, which, by their nature, can provide only reasonable assurance regarding our control objectives.
As of the end of the period covered by this annual report, we carried out an evaluation, under the supervision and with the participation of management, including the Chief Executive Officer along with the Chief Financial Officer, of the effectiveness, design and operation of our disclosure controls and procedures (as defined in Exchange Act Rules 13a-15(e) and 15d-15(e)). Based upon the foregoing, the Chief Executive Officer along with the Chief Financial Officer concluded that our disclosure controls and procedures were effective. In addition, based on such evaluation we have identified no changes in our internal control over financial reporting that occurred during the most recent fiscal quarter that have materially affected, or are reasonably likely to materially affect, our internal control over financial reporting.
Report of Management on Internal Control over Financial Reporting
Management of the Company is responsible for establishing and maintaining adequate internal control over financial reporting, as such term is defined in Exchange Act Rule 13a-15(f). Internal control over financial reporting is a process designed to provide reasonable assurance regarding the reliability of financial reporting and the preparation of financial statements for external reporting purposes in accordance with GAAP. Internal control over financial reporting includes those policies and procedures that (1) pertain to the maintenance of records that, in reasonable detail, accurately and fairly reflect the transactions and dispositions of our assets; (2) provide reasonable assurance that transactions are recorded as necessary to permit preparation of financial statements in accordance with GAAP and that our receipts and expenditures are being made only in accordance with authorizations of our management and directors; and (3) provide reasonable assurance regarding prevention or timely detection of unauthorized acquisition, use or disposition of our assets that could have a material effect on the financial statements.
Management, under the supervision of and with the participation of the Chief Executive Officer and the Chief Financial Officer, assessed the effectiveness of our internal control over financial reporting as of December 31, 2015. The framework on which the assessment was based is described in “Internal Control – Integrated Framework” (2013) issued by the Committee of Sponsoring Organizations of the Treadway Commission. Based on this assessment, we concluded that we maintained effective internal control over financial reporting as of December 31, 2015. Deloitte & Touche, our independent registered public accounting firm, issued an opinion on the effectiveness of our internal control over financial reporting as of December 31, 2015, which follows this report of management.
35
REPORT OF INDEPENDENT REGISTERED PUBLIC ACCOUNTING FIRM
To the Board of Directors and Stockholders of
Cousins Properties Incorporated
Atlanta, Georgia
We have audited the internal control over financial reporting of Cousins Properties Incorporated and subsidiaries (the "Company") as of December 31, 2015, based on criteria established in Internal Control - Integrated Framework (2013) issued by the Committee of Sponsoring Organizations of the Treadway Commission. The Company's management is responsible for maintaining effective internal control over financial reporting and for its assessment of the effectiveness of internal control over financial reporting, included in the accompanying Report of Management on Internal Control over Financial Reporting. Our responsibility is to express an opinion on the Company's internal control over financial reporting based on our audit.
We conducted our audit in accordance with the standards of the Public Company Accounting Oversight Board (United States). Those standards require that we plan and perform the audit to obtain reasonable assurance about whether effective internal control over financial reporting was maintained in all material respects. Our audit included obtaining an understanding of internal control over financial reporting, assessing the risk that a material weakness exists, testing and evaluating the design and operating effectiveness of internal control based on the assessed risk, and performing such other procedures as we considered necessary in the circumstances. We believe that our audit provides a reasonable basis for our opinion.
A company's internal control over financial reporting is a process designed by, or under the supervision of, the company's principal executive and principal financial officers, or persons performing similar functions, and effected by the company's board of directors, management, and other personnel to provide reasonable assurance regarding the reliability of financial reporting and the preparation of financial statements for external purposes in accordance with generally accepted accounting principles. A company's internal control over financial reporting includes those policies and procedures that (1) pertain to the maintenance of records that, in reasonable detail, accurately and fairly reflect the transactions and dispositions of the assets of the company; (2) provide reasonable assurance that transactions are recorded as necessary to permit preparation of financial statements in accordance with generally accepted accounting principles, and that receipts and expenditures of the company are being made only in accordance with authorizations of management and directors of the company; and (3) provide reasonable assurance regarding prevention or timely detection of unauthorized acquisition, use, or disposition of the company's assets that could have a material effect on the financial statements.
Because of the inherent limitations of internal control over financial reporting, including the possibility of collusion or improper management override of controls, material misstatements due to error or fraud may not be prevented or detected on a timely basis. Also, projections of any evaluation of the effectiveness of the internal control over financial reporting to future periods are subject to the risk that the controls may become inadequate because of changes in conditions, or that the degree of compliance with the policies or procedures may deteriorate.
In our opinion, the Company maintained, in all material respects, effective internal control over financial reporting as of December 31, 2015, based on the criteria established in Internal Control - Integrated Framework (2013) issued by the Committee of Sponsoring Organizations of the Treadway Commission.
We have also audited, in accordance with the standards of the Public Company Accounting Oversight Board (United States), the consolidated financial statements and financial statement schedule as of and for the year ended December 31, 2015 of the Company and our report dated February 10, 2016 expressed an unqualified opinion on those consolidated financial statements and financial statement schedule and included an explanatory paragraph regarding the Company’s change in method of accounting for and disclosure of discontinued operations and disposals of components of an entity due to the adoption of a new accounting standard.
/s/ DELOITTE & TOUCHE LLP
Atlanta, Georgia
February 10, 2016
36
Item 9B. | Other Information |
None.
PART III
Item 10. | Directors, Executive Officers and Corporate Governance |
The information required by Items 401, 405, 406 and 407 of Regulation S-K is presented in item X in part I above and is included under the captions “Proposal 1 - Election of Directors” and “Section 16(a) Beneficial Ownership Reporting Compliance” in the Proxy Statement relating to the 2016 Annual Meeting of the Registrant’s Stockholders, and is incorporated herein by reference. The Company has a Code of Business Conduct and Ethics (the “Code”) applicable to its Board of Directors and all of its employees. The Code is publicly available on the “Investor Relations” page of its website site at www.cousinsproperties.com. Section 1 of the Code applies to the Company’s senior executive and financial officers and is a “code of ethics” as defined by applicable SEC rules and regulations. If the Company makes any amendments to the Code other than technical, administrative or other non-substantive amendments, or grants any waivers, including implicit waivers, from a provision of the Code to the Company’s senior executive or financial officers, the Company will disclose on its website the nature of the amendment or waiver, its effective date and to whom it applies. There were no amendments or waivers during 2015.
Item 11. | Executive Compensation |
The information required by Items 402 and 407 of Regulation S-K is included under the captions “Executive Compensation” “Director Compensation” and "Compensation Committee Interlocks and Insider Participation" in the Proxy Statement relating to the 2016 Annual Meeting of the Registrant’s Stockholders is incorporated herein by reference.
Item 12. | Security Ownership of Certain Beneficial Owners and Management and Related Stockholder Matters |
The information under the captions “Beneficial Ownership of Common Stock” and "Equity Compensation Plan Information" in the Proxy Statement relating to the 2016 Annual Meeting of the Registrant’s Stockholders is incorporated herein by reference.
Item 13. | Certain Relationships and Related Transactions, and Director Independence |
The information under the caption “Certain Transactions” and “Director Independence” in the Proxy Statement relating to the 2016 Annual Meeting of the Registrant’s Stockholders is incorporated herein by reference.
Item 14. | Principal Accountant Fees and Services |
The information under the caption “Summary of Fees to Independent Registered Public Accounting Firm” in the Proxy Statement relating to the 2016 Annual Meeting of the Registrant’s Stockholders has fee information for fiscal years 2015 and 2014 and is incorporated herein by reference.
PART IV
Item 15. Exhibits and Financial Statement Schedules
(a) | 1. Financial Statements |
A. | The following consolidated financial statements of the Registrant, together with the applicable report of independent registered public accounting firm, are filed as a part of this report: |
37
Page Number | ||
Report of Independent Registered Public Accounting Firm | F-2 | |
Consolidated Balance Sheets—December 31, 2015 and 2014 | F-3 | |
Consolidated Statements of Operations for the Years Ended December 31, 2015, 2014, and 2013 | F-4 | |
Consolidated Statements of Equity for the Years Ended December 31, 2015, 2014, and 2013 | F-5 | |
Consolidated Statements of Cash Flows for the Years Ended December 31, 2015, 2014, and 2013 | F-6 | |
Notes to Consolidated Financial Statements | F-7 | |
2. | Financial Statement Schedule |
The following financial statement schedule for the Registrant is filed as a part of this report:
Page Number | ||
A. Schedule III—Real Estate and Accumulated Depreciation—December 31, 2015 | S-1 through S-3 | |
NOTE: Other schedules are omitted because of the absence of conditions under which they are required or because the required information is given in the financial statements or notes thereto.
(b) | Exhibits |
2.1 | First Amendment to Membership Interest Purchase Agreement between 3280 Peachtree III LLC and MSREF VII Global U.S. Holdings (FRC), L.L.C., dated January 30, 2013, filed as Exhibit 2.2 to the Registrant's Form 8-K/A filed on March 26, 2013, and incorporated herein by reference. (Schedules and exhibits omitted pursuant to Item 601(b)(2) of Regulation S-K. The Registrant agrees to furnish supplementally a copy of any omitted exhibit or schedule to the Securities and Exchange Commission upon request.) | |
2.2 | Sale and Contribution Agreement between Cousins Properties Incorporated, 3280 Peachtree I LLC, 3280 Peachtree III LLC and Terminus Acquisition Company LLC, dated February 4, 2013, filed as Exhibit 2.3 to the Registrant's Form 8-K/A filed on March 26, 2013, and incorporated herein by reference. (Schedules and exhibits omitted pursuant to Item 601(b)(2) of Regulation S-K. The Registrant agrees to furnish supplementally a copy of any omitted exhibit or schedule to the Securities and Exchange Commission upon request.) | |
2.3 | Purchase and Sale Agreement (Post Oak Central) between Crescent POC Investors, L.P. and Cousins POC I LLC, dated February 4, 2013, filed as Exhibit 2.4 to the Registrant's Form 8-K/A filed on March 26, 2013, and incorporated herein by reference. (Schedules and exhibits omitted pursuant to Item 601(b)(2) of Regulation S-K. The Registrant agrees to furnish supplementally a copy of any omitted exhibit or schedule to the Securities and Exchange Commission upon request.) | |
2.4 | Purchase and Sale Contract, dated as of July 19, 2013, by and between Crescent Crown Greenway Plaza SPV, LLC, Crescent Crown Seven Greenway SPV, LLC, Crescent Crown Nine Greenway SPV, LLC, and Crescent Crown Edloe Garage SPV, LLC and Cousins Properties Incorporated, filed as Exhibit 2.1 to the Registrant’s Current Report on Form 8-K filed July 29, 2013 and incorporated herein by reference. (Schedules and exhibits omitted pursuant to Item 601(b)(2) of Regulation S-K. The Registrant agrees to furnish supplementally a copy of any omitted exhibit or schedule to the Securities and Exchange Commission upon request.) | |
2.5 | Purchase and Sale Contract, dated as of July 19, 2013, by and between Crescent One SPV, LLC and Cousins Properties Incorporated, filed as Exhibit 2.2 to the Registrant’s Current Report on Form 8-K filed July 29, 2013 and incorporated herein by reference. (Schedules and exhibits omitted pursuant to Item 601(b)(2) of Regulation S-K. The Registrant agrees to furnish supplementally a copy of any omitted exhibit or schedule to the Securities and Exchange Commission upon request.) | |
2.6 | Purchase and Sale Contract for Northpark Town Center, dated as of August 1, 2014, by and between FulcoProp400LLC and FulcoProp56 LLC and Cousins Acquisitions Entity, LLC, a wholly owned subsidiary of the Registrant, filed as Exhibit 2.1 to the Registrant’s Form 10-Q for the quarter ended September 30, 2014 and incorporated herein by reference. (Schedules and exhibits omitted pursuant to Item 601(b)(2) of Regulation S-K. The Registrant agrees to furnish supplementally a copy of any omitted exhibit or schedule to the Securities and Exchange Commission upon request.) | |
3.1 | Restated and Amended Articles of Incorporation of the Registrant, as amended August 9, 1999, filed as Exhibit 3.1 to the Registrant’s Form 10-Q for the quarter ended June 30, 2002, and incorporated herein by reference. | |
38
3.1.1 | Articles of Amendment to Restated and Amended Articles of Incorporation of the Registrant, as amended July 22, 2003, filed as Exhibit 4.1 to the Registrant’s Current Report on Form 8-K filed on July 23, 2003, and incorporated herein by reference. | |
3.1.2 | Articles of Amendment to Restated and Amended Articles of Incorporation of the Registrant, as amended December 15, 2004, filed as Exhibit 3(a)(i) to the Registrant’s Form 10-K for the year ended December 31, 2004, and incorporated herein by reference. | |
3.1.3 | Articles of Amendment to Restated and Amended Articles of Incorporation of the Registrant, dated May 4, 2010, filed as Exhibit 3.1 to the Registrant’s Current Report on Form 8-K filed on May 10, 2010, and incorporated herein by reference. | |
3.1.4 | Articles of Amendment to Restated and Amended Articles of Incorporation of the Registrant, as amended May 9, 2014, filed as Exhibit 3.1.4 to the Registrant’s Form 10-Q for the quarter ended June 30, 2014, and incorporated herein by reference. | |
3.2 | Bylaws of the Registrant, as amended and restated December 4, 2012, filed as Exhibit 3.1 to the Registrant’s Current Report on Form 8-K filed on December 7, 2012, and incorporated herein by reference. | |
4(a) | Dividend Reinvestment Plan as restated as of March 27, 1995, filed in the Registrant’s Form S-3 dated March 27, 1995, and incorporated herein by reference. | |
10(a)(i)* | Cousins Properties Incorporated 1999 Incentive Stock Plan, as amended and restated, approved by the Stockholders on May 6, 2008, filed as Annex B to the Registrant’s Proxy Statement dated April 13, 2008, and incorporated herein by reference. | |
10(a)(ii)* | Cousins Properties Incorporated 2005 Restricted Stock Unit Plan, filed as Exhibit 10.1 to the Registrant’s Current Report on Form 8-K dated December 9, 2005, and incorporated herein by reference. | |
10(a)(iii)* | Amendment No. 1 to Cousins Properties Incorporated 2005 Restricted Stock Unit Plan, filed as Exhibit 10(a)(iii) to the Registrant’s Form 10-Q for the quarter ended March 31, 2006, and incorporated herein by reference. | |
10(a)(iv)* | Cousins Properties Incorporated 1999 Incentive Stock Plan – Form of Key Employee Non-Incentive Stock Option and Stock Appreciation Right Certificate, amended effective December 6, 2007, filed as Exhibit 10(a)(vi) to the Registrant’s Form 10-K for the year ended December 31, 2007, and incorporated herein by reference. | |
10(a)(v)* | Cousins Properties Incorporated 1999 Incentive Stock Plan – Form of Key Employee Incentive Stock Option and Stock Appreciation Right Certificate, amended effective December 6, 2007, filed as Exhibit 10(a)(vii) to the Registrant’s Form 10-K for the year ended December 31, 2007, and incorporated herein by reference. | |
10(a)(vi)* | Cousins Properties Incorporated 2005 Restricted Stock Unit Plan – Form of Restricted Stock Unit Certificate, filed as Exhibit 10.3 to the Registrant’s Current Report on Form 8-K dated December 11, 2006, and incorporated herein by reference. | |
10(a)(vii)* | Amendment No. 2 to the Cousins Properties Incorporated 2005 Restricted Stock Unit Plan, filed as Exhibit 10.1 to the Registrant’s Current Report on Form 8-K filed on August 18, 2006, and incorporated herein by reference. | |
10(a)(viii)* | Cousins Properties Incorporated 2005 Restricted Stock Unit Plan – Form of Restricted Stock Unit Certificate for Directors, filed as Exhibit 10.2 to the Registrant’s Current Report on Form 8-K filed on August 18, 2006, and incorporated herein by reference. | |
10(a)(ix)* | Form of Change in Control Severance Agreement, filed as Exhibit 10.1 to the Registrant’s Current Report on Form 8-K filed on August 31, 2007, and incorporated herein by reference. | |
10(a)(x)* | Amendment No. 1 to the Cousins Properties Incorporated 1999 Incentive Stock Plan, filed as Exhibit 10(a)(ii) to the Registrant’s Form 10-Q for the quarter ended March 31, 2008, and incorporated herein by reference. | |
10(a)(xi)* | Amendment No. 4 to the Cousins Properties Incorporated 2005 Restricted Stock Unit Plan dated September 8, 2008, filed as Exhibit 10(a)(xiii) to the Registrant’s Form 10-K for the year ended December 31, 2008, and incorporated herein by reference. | |
10(a)(xii)* | Amendment No. 5 to the Cousins Properties Incorporated 2005 Restricted Stock Unit Plan dated February 16, 2009, filed as Exhibit 10(a)(xiv) to the Registrant’s Form 10-K for the year ended December 31, 2008, and incorporated herein by reference. | |
10(a)(xiii)* | Form of Amendment Number One to Change in Control Severance Agreement filed as Exhibit 10.2 to the Registrant’s Current Report on Form 8-K dated May 12, 2009, and incorporated herein by reference. | |
39
10(a)(xiv)* | Amendment Number 6 to the Cousins Properties Incorporated 2005 Restricted Stock Unit Plan filed as Exhibit 10.3 to the Registrant’s Current Report on Form 8-K dated May 12, 2009, and incorporated herein by reference. | |
10(a)(xv)* | Form of Cousins Properties Incorporated Cash Long Term Incentive Award Certificate filed as Exhibit 10.3 to the Registrant’s Current Report on Form 8-K dated May 12, 2009, and incorporated herein by reference. | |
10(a)(xvi)* | Cousins Properties Incorporated 2009 Incentive Stock Plan, as approved by the Stockholders on May 12, 2009, filed as Annex B to the Registrant’s Proxy Statement dated April 3, 2009, and incorporated herein by reference. | |
10(a)(xvii)* | Cousins Properties Incorporated Director Non-Incentive Stock Option and Stock Appreciation Right Certificate under the Cousins Properties Incorporated 2009 Incentive Stock Plan, filed as Exhibit 10.2 to the Registrant’s Form 10-Q for the quarter ended June 30, 2009, and incorporated herein by reference. | |
10(a)(xviii)* | Cousins Properties Incorporated 2005 Restricted Stock Unit Plan – Form of Restricted Stock Unit Certificate for 2010-2012 Performance Period filed as Exhibit 10(a)(xx) to the Registrant’s Form 10-K for the year ended December 31, 2009, and incorporated herein by reference. | |
10(a)(xix)* | Cousins Properties Incorporated 2009 Incentive Stock Plan – Form of Key Employee Non-Incentive Stock Option Certificate filed as Exhibit 10(a)(xxi) to the Registrant’s Form 10-K for the year ended December 31, 2009, and incorporated herein by reference. | |
10(a)(xx)* | Cousins Properties Incorporated 2009 Incentive Stock Plan – Form of Stock Grant Certificate filed as Exhibit 10(a)(xxii) to the Registrant’s Form 10-K for the year ended December 31, 2009, and incorporated herein by reference. | |
10(a)(xxi)* | Form of New Change in Control Severance Agreement, filed as Exhibit 10.1 to the Registrant’s Current Report on Form 8-K filed on January 7, 2011, and incorporated herein by reference. | |
10(a)(xxii)* | Form of Amendment Number Two to Change in Control Severance Agreement, filed as Exhibit 10.2 to the Registrant’s Current Report on Form 8-K filed on January 7, 2011, and incorporated herein by reference. | |
10(a)(xxiii)* | Cousins Properties Incorporated 2009 Incentive Stock Plan – Form of Stock Grant Certificate filed as Exhibit 10(a)(xxv) to the Registrant’s Form 10-K for the year ended December 31, 2010, and incorporated herein by reference. | |
10(a)(xxiv)* | Cousins Properties Incorporated 2009 Incentive Stock Plan – Form of Key Employee Non-Incentive Stock Option Certificate filed as Exhibit 10(a)(xxvi) to the Registrant’s Form 10-K for the year ended December 31, 2010, and incorporated herein by reference. | |
10(a)(xxv)* | Cousins Properties Incorporated 2009 Incentive Stock Plan – Form of Key Employee Incentive Stock Option Certificate filed as Exhibit 10(a)(xxvii) to the Registrant’s Form 10-K for the year ended December 31, 2010, and incorporated herein by reference. | |
10(a)(xxvi)* | Cousins Properties Incorporated 2005 Restricted Stock Unit Plan – Form of Restricted Stock Unit Certificate for 2011-2013 Performance Period filed as Exhibit 10(a)(xxviii) to the Registrant’s Form 10-K for the year ended December 31, 2010, and incorporated herein by reference. | |
10(a)(xxvii)* | Cousins Properties Incorporated 2005 Restricted Stock Unit Plan – Form of Restricted Stock Unit Certificate for 2012-2016 Performance Period filed as Exhibit 10.1 to the Registrant’s Current Report on Form 8-K filed on February 3, 2012, and incorporated herein by reference. | |
10(a)(xxviii)* | Cousins Properties Incorporated 2009 Incentive Stock Plan – Form of Key Employee Incentive Stock Option Certificate filed as Exhibit 10.2 to the Registrant’s Current Report on Form 8-K filed on February 3, 2012, and incorporated herein by reference. | |
10(a)(xxix)* | Cousins Properties Incorporated 2005 Restricted Stock Unit Plan – Form of Restricted Stock Unit Certificate for 2012-2016 Performance Period, filed as Exhibit 10.1 to the Registrant's Current Report on Form 8-K filed on February 3, 2012 and incorporated herein by reference. | |
10(a)(xxx)* | Cousins Properties Incorporated 2009 Incentive Stock Plan – Form of Stock Grant Certificate, filed as Exhibit 10.2 to the Registrant's Current Report on Form 8-K filed on February 3, 2012 and incorporated herein by reference. | |
10(a)(xxxi)* | Cousins Properties Incorporated 2005 Restricted Stock Unit Plan — Form of Restricted Stock Unit Certificate for 2014-2016 Performance Period, filed as Exhibit 10(a)(xxxi) to the Registrant's Form 10-K for the year ended December 31, 2013, and incorporated herein by reference. | |
40
10(a)(xxxii)* | Cousins Properties Incorporated 2009 Incentive Stock Plan – Form of Stock Grant Certificate, filed as Exhibit 10(a)(xxxii) to the Registrant's Form 10-K for the year ended December 31, 2013, and incorporated herein by reference. | |
10(a)(xxxiii)* | Cousins Properties Incorporated 2005 Restricted Stock Unit Plan — Form of Restricted Stock Unit Certificate for 2015-2017 Performance Period, filed as Exhibit 10(a)(xxxiii) to the Registrant's Form 10-K for the year ended December 31, 2014, and incorporated herein by reference. | |
10(a)(xxxiv)*† | Cousins Properties Incorporated 2005 Restricted Stock Unit Plan — Form of Restricted Stock Unit Certificate for 2016-2018 Performance Period. | |
10(a)(xxxv)*† | Cousins Properties Incorporated 2009 Incentive Stock Plan – Form of Stock Grant Certificate. | |
10(a)(xxxvi)*† | Form of Amendment Number One to Change in Control Severance Agreement. | |
10(d) | Loan Agreement dated as of August 31, 2007, between Cousins Properties Incorporated, a Georgia corporation, as Borrower and JP Morgan Chase Bank, N.A., a banking association chartered under the laws of the United States of America, as Lender, filed as Exhibit 10.1 to the Registrant’s Current Report on Form 8-K filed on September 7, 2007, and incorporated herein by reference. | |
10(e) | Loan Agreement dated as of October 16, 2007, between 3280 Peachtree I LLC, a Georgia limited liability corporation, as Borrower and The Northwestern Mutual Life Insurance Company, as Lender, filed as Exhibit 10.1 to the Registrant’s Current Report on Form 8-K filed October 17, 2007, and incorporated herein by reference. | |
10(f) | Contribution and Formation Agreement between Cousins Properties Incorporated, CP Venture Three LLC and The Prudential Insurance Company of America, including Exhibit U thereto, filed as Exhibit 10.1 to the Registrant’s Form 8-K filed on May 4, 2006, and incorporated herein by reference. | |
10(g) | Form of Indemnification Agreement, filed as Exhibit 10.1 to the Registrant’s Form 8-K dated June 18, 2007, and incorporated herein by reference. | |
10(h) | Third Amended and Restated Credit Agreement, dated as of May 28, 2014, among Cousins Properties Incorporated as the Borrower (and the Borrower Parties, as defined, and the Guarantors, as defined); JPMorgan Chase Bank, N.A., as Syndication Agent and an L/C Issuer; Bank of America, N.A., as Administrative Agent, Swing Line Lender and an L/C Issuer; SunTrust Bank as Documentation Agent and an L/C Issuer; Wells Fargo Bank, N.A., PNC Bank, N. A., U.S. Bank National, N. A., Citizens Bank, N.A. and Morgan Stanley Senior Funding, Inc. as Co-Documentation Agents; The Northern Trust Company, First Tennessee Bank N.A. and Atlantic Capital Bank as Other Lender Parties; J.P. Morgan Securities LLC, Merrill Lynch, Pierce, Fenner & Smith Inc. and SunTrust Robinson Humphrey, Inc. as Joint Lead Arrangers and Joint Bookrunners, filed as Exhibit 10.1 to the Registrant’s Current Report on Form 8-K filed on May 28, 2014, and incorporated herein by reference. | |
10(i) | Loan Agreement dated as of July 29, 2013 among Cousins Properties Incorporated, as the Borrower, certain consolidated entities of the Borrower from time to time party thereto, as the Guarantors, JPMorgan Chase Bank, N.A., as Administrative Agent, Bank of America, N.A., as Syndication Agent, and the other Lenders party thereto, filed as Exhibit 10.1 to the Registrant’s Amendment No. 1 to Current Report on Form 8-K filed July 29, 2013 and incorporated herein by reference. | |
11 | Computation of Per Share Earnings. Data required by SFAS No. 128, “Earnings Per Share,” is provided in note 15 of notes to consolidated financial statements included in this Annual Report on Form 10-K, and incorporated herein by reference. | |
21† | Subsidiaries of the Registrant. | |
23† | Consent of Independent Registered Public Accounting Firm. | |
31.1† | Certification of the Chief Executive Officer Pursuant to Rule 13a-14(a), as adopted pursuant to Section 302 of the Sarbanes-Oxley Act of 2002. | |
31.2† | Certification of the Chief Financial Officer Pursuant to Rule 13a-14(a), as adopted pursuant to Section 302 of the Sarbanes-Oxley Act of 2002. | |
32.1† | Certification of the Chief Executive Officer Pursuant to 18 U.S.C. Section 1350, as Adopted Pursuant to Section 906 of the Sarbanes-Oxley Act of 2002. | |
32.2† | Certification of the Chief Financial Officer Pursuant to 18 U.S.C. Section 1350, as Adopted Pursuant to Section 906 of the Sarbanes-Oxley Act of 2002. | |
41
101† | The following financial information for the Registrant, formatted in XBRL (Extensible Business Reporting Language): (i) the condensed consolidated balance sheets, (ii) the condensed consolidated statements of operations, (iii) the condensed consolidated statements of equity, (iv) the condensed consolidated statements of cash flows, and (v) the notes to condensed consolidated financial statements. | |
* | Indicates a management contract or compensatory plan or arrangement. |
† | Filed herewith. |
42
SIGNATURES
Pursuant to the requirements of Section 13 or 15(d) of the Securities Exchange Act of 1934, the Registrant has duly caused this report to be signed on its behalf by the undersigned, thereunto duly authorized.
Cousins Properties Incorporated (Registrant) | ||||
Dated: | February 10, 2016 | |||
BY: | /s/ Gregg D. Adzema | |||
Gregg D. Adzema | ||||
Executive Vice President and Chief Financial Officer (Duly Authorized Officer and Principal Financial Officer) | ||||
Pursuant to the requirements of the Securities Exchange Act of 1934, this report has been signed below by the following persons on behalf of the Registrant and in the capacities and on the date indicated.
Signature | Capacity | Date | ||
/s/ Lawrence L. Gellerstedt III | Chief Executive Officer, | February 10, 2016 | ||
Lawrence L. Gellerstedt III | President and Director (Principal Executive Officer) | |||
/s/ Gregg D. Adzema | Executive Vice President and | February 10, 2016 | ||
Gregg D. Adzema | Chief Financial Officer (Principal Financial Officer) | |||
/s/ John D. Harris, Jr. | Senior Vice President, Chief | February 10, 2016 | ||
John D. Harris, Jr. | Accounting Officer, Treasurer and Assistant Secretary (Principal Accounting Officer) | |||
/s/ Robert M. Chapman | Director | February 10, 2016 | ||
Robert M. Chapman | ||||
/s/ Tom G. Charlesworth | Director | February 10, 2016 | ||
Tom G. Charlesworth | ||||
/s/ Lillian C. Giornelli | Director | February 10, 2016 | ||
Lillian C. Giornelli | ||||
/s/ S. Taylor Glover | Chairman of the Board of Directors | February 10, 2016 | ||
S. Taylor Glover | ||||
/s/ James H. Hance, Jr. | Director | February 10, 2016 | ||
James H. Hance, Jr. | ||||
/s/ Donna W. Hyland | Director | February 10, 2016 | ||
Donna W. Hyland | ||||
/s/ R. Dary Stone | Director | February 10, 2016 | ||
R. Dary Stone | ||||
43
INDEX TO CONSOLIDATED FINANCIAL STATEMENTS
Cousins Properties Incorporated | Page |
Report of Independent Registered Public Accounting Firm | |
Consolidated Balance Sheets—December 31, 2015 and 2014 | |
Consolidated Statements of Operations for the Years Ended December 31, 2015, 2014, and 2013 | |
Consolidated Statements of Equity for the Years Ended December 31, 2015, 2014, and 2013 | |
Consolidated Statements of Cash Flows for the Years Ended December 31, 2015, 2014, and 2013 | |
Notes to Consolidated Financial Statements | |
REPORT OF INDEPENDENT REGISTERED PUBLIC ACCOUNTING FIRM
To the Board of Directors and Stockholders of
Cousins Properties Incorporated:
Atlanta, Georgia
We have audited the accompanying consolidated balance sheets of Cousins Properties Incorporated and subsidiaries (the "Company") as of December 31, 2015 and 2014, and the related consolidated statements of operations, equity, and cash flows for each of the three years in the period ended December 31, 2015. Our audits also included the financial statement schedule listed in the Index at Item 15. These financial statements and financial statement schedule are the responsibility of the Company's management. Our responsibility is to express an opinion on the financial statements and financial statement schedule based on our audits.
We conducted our audits in accordance with the standards of the Public Company Accounting Oversight Board (United States). Those standards require that we plan and perform the audit to obtain reasonable assurance about whether the financial statements are free of material misstatement. An audit includes examining, on a test basis, evidence supporting the amounts and disclosures in the financial statements. An audit also includes assessing the accounting principles used and significant estimates made by management, as well as evaluating the overall financial statement presentation. We believe that our audits provide a reasonable basis for our opinion.
In our opinion, such consolidated financial statements present fairly, in all material respects, the financial position of Cousins Properties Incorporated and subsidiaries as of December 31, 2015 and 2014, and the results of their operations and their cash flows for each of the three years in the period ended December 31, 2015, in conformity with accounting principles generally accepted in the United States of America. Also, in our opinion, such financial statement schedules, when considered in relation to the basic consolidated financial statements taken as a whole, present fairly, in all material respects, the information set forth therein.
As discussed in Note 2 to the consolidated financial statements, during the second quarter of 2014, the Company changed its method of accounting for and disclosure of discontinued operations and disposals of components of an entity due to the adoption of Accounting Standards Update 2014-08, “Reporting Discontinued Operations and Disclosures of Disposals of Components of an Entity”.
We have also audited, in accordance with the standards of the Public Company Accounting Oversight Board (United States), the Company's internal control over financial reporting as of December 31, 2015, based on the criteria established in Internal Control - Integrated Framework (2013) issued by the Committee of Sponsoring Organizations of the Treadway Commission and our report dated February 10, 2016 expressed an unqualified opinion on the Company’s internal control over financial reporting.
/s/ DELOITTE & TOUCHE LLP
Atlanta, Georgia
February 10, 2016
F-2
COUSINS PROPERTIES INCORPORATED AND SUBSIDIARIES CONSOLIDATED BALANCE SHEETS (in thousands, except share and per share amounts) | |||||||
December 31, | |||||||
2015 | 2014 | ||||||
Assets: | |||||||
Real estate assets: | |||||||
Operating properties, net of accumulated depreciation of $352,350 and $324,543 in 2015 and 2014, respectively | $ | 2,194,781 | $ | 2,181,684 | |||
Projects under development | 27,890 | 91,615 | |||||
Land | 17,829 | 21,646 | |||||
2,240,500 | 2,294,945 | ||||||
Real estate assets and other assets held for sale, net of accumulated depreciation and amortization of $7,200 in 2015 | 7,246 | — | |||||
Cash and cash equivalents | 2,003 | — | |||||
Restricted cash | 4,304 | 5,042 | |||||
Notes and accounts receivable, net of allowance for doubtful accounts of $1,353 and $1,643 in 2015 and 2014, respectively | 10,828 | 10,732 | |||||
Deferred rents receivable | 67,258 | 57,939 | |||||
Investment in unconsolidated joint ventures | 102,577 | 100,498 | |||||
Intangible assets, net of accumulated amortization of $103,458 and $76,050 in 2015 and 2014, respectively | 124,615 | 163,244 | |||||
Other assets | 38,472 | 34,930 | |||||
Total assets | $ | 2,597,803 | $ | 2,667,330 | |||
Liabilities: | |||||||
Notes payable | $ | 721,293 | $ | 792,344 | |||
Accounts payable and accrued expenses | 71,739 | 76,240 | |||||
Deferred income | 29,788 | 23,277 | |||||
Intangible liabilities, net of accumulated amortization of $26,890 and $16,897 in 2015 and 2014, respectively | 59,592 | 70,020 | |||||
Other liabilities | 30,629 | 31,991 | |||||
Liabilities of real estate assets held for sale | 1,347 | — | |||||
Total liabilities | 914,388 | 993,872 | |||||
Commitments and contingencies | — | — | |||||
Equity: | |||||||
Stockholders' investment: | |||||||
Preferred stock, $1 par value, 20,000,000 shares authorized, -0- shares issued and outstanding in 2015 and 2014 | — | — | |||||
Common stock, $1 par value, 350,000,000 shares authorized, 220,255,676 and 220,082,610 shares issued in 2015 and 2014, respectively | 220,256 | 220,083 | |||||
Additional paid-in capital | 1,722,224 | 1,720,972 | |||||
Treasury stock at cost, 8,742,181 and 3,570,082 shares in 2015 and 2014, respectively | (134,630 | ) | (86,840 | ) | |||
Distributions in excess of cumulative net income | (124,435 | ) | (180,757 | ) | |||
Total equity | 1,683,415 | 1,673,458 | |||||
Total liabilities and equity | $ | 2,597,803 | $ | 2,667,330 | |||
F-3
COUSINS PROPERTIES INCORPORATED AND SUBSIDIARIES CONSOLIDATED STATEMENTS OF OPERATIONS (In thousands, except per share amounts) | |||||||||||
Year Ended December 31, | |||||||||||
2015 | 2014 | 2013 | |||||||||
Revenues: | |||||||||||
Rental property revenues | $ | 373,068 | $ | 343,910 | $ | 194,420 | |||||
Fee income | 7,297 | 12,519 | 10,891 | ||||||||
Other | 1,278 | 4,954 | 5,430 | ||||||||
381,643 | 361,383 | 210,741 | |||||||||
Costs and expenses: | |||||||||||
Rental property operating expenses | 156,157 | 155,934 | 90,498 | ||||||||
Reimbursed expenses | 3,430 | 3,652 | 5,215 | ||||||||
General and administrative expenses | 17,099 | 19,969 | 22,460 | ||||||||
Interest expense | 30,723 | 29,110 | 21,709 | ||||||||
Depreciation and amortization | 135,416 | 140,018 | 76,277 | ||||||||
Acquisition and related costs | 299 | 1,130 | 7,484 | ||||||||
Other | 1,000 | 3,544 | 3,693 | ||||||||
344,124 | 353,357 | 227,336 | |||||||||
Income (loss) from continuing operations before taxes, unconsolidated joint ventures, and sale of investment properties | 37,519 | 8,026 | (16,595 | ) | |||||||
Benefit for income taxes from operations | — | 20 | 23 | ||||||||
Income from unconsolidated joint ventures | 8,302 | 11,268 | 67,325 | ||||||||
Income from continuing operations before gain on sale of investment properties | 45,821 | 19,314 | 50,753 | ||||||||
Gain on sale of investment properties | 80,394 | 12,536 | 61,288 | ||||||||
Income from continuing operations | 126,215 | 31,850 | 112,041 | ||||||||
Income (loss) from discontinued operations: | |||||||||||
Income (loss) from discontinued operations | (35 | ) | 1,800 | 3,299 | |||||||
Gain (loss) on sale from discontinued operations | (551 | ) | 19,358 | 11,489 | |||||||
(586 | ) | 21,158 | 14,788 | ||||||||
Net income | 125,629 | 53,008 | 126,829 | ||||||||
Net income attributable to noncontrolling interests | (111 | ) | (1,004 | ) | (5,068 | ) | |||||
Net income attributable to controlling interests | 125,518 | 52,004 | 121,761 | ||||||||
Preferred share original issuance costs | — | (3,530 | ) | (2,656 | ) | ||||||
Dividends to preferred stockholders | — | (2,955 | ) | (10,008 | ) | ||||||
Net income available to common stockholders | $ | 125,518 | $ | 45,519 | $ | 109,097 | |||||
Per common share information — basic and diluted: | |||||||||||
Income from continuing operations attributable to controlling interest | $ | 0.58 | $ | 0.12 | $ | 0.66 | |||||
Income from discontinued operations | — | 0.10 | 0.10 | ||||||||
Net income available to common stockholders | $ | 0.58 | $ | 0.22 | $ | 0.76 | |||||
Weighted average shares — basic | 215,827 | 204,216 | 144,255 | ||||||||
Weighted average shares — diluted | 215,979 | 204,460 | 144,420 | ||||||||
F-4
COUSINS PROPERTIES INCORPORATED AND SUBSIDIARIES
CONSOLIDATED STATEMENTS OF EQUITY
(In thousands) | Preferred Stock | Common Stock | Additional Paid-In Capital | Treasury Stock | Distributions in Excess of Cumulative Net Income | Stockholders’ Investment | Nonredeemable Noncontrolling Interests | Total Equity | ||||||||||||||||||||||||
Balance December 31, 2012 | $ | 169,602 | $ | 107,660 | $ | 690,024 | $ | (86,840 | ) | $ | (260,104 | ) | $ | 620,342 | $ | 22,611 | $ | 642,953 | ||||||||||||||
Net income (loss) | — | — | — | — | 121,761 | 121,761 | 5,000 | 126,761 | ||||||||||||||||||||||||
Common stock issued pursuant to: | ||||||||||||||||||||||||||||||||
Common stock offering, net of issuance costs | — | 85,507 | 740,726 | — | — | 826,233 | — | 826,233 | ||||||||||||||||||||||||
Stock based compensation | — | 111 | (917 | ) | — | — | (806 | ) | — | (806 | ) | |||||||||||||||||||||
Amortization of stock options and restricted stock, net of forfeitures | — | (42 | ) | 1,940 | — | — | 1,898 | — | 1,898 | |||||||||||||||||||||||
Distribution to nonredeemable noncontrolling interests | — | — | — | — | — | — | (26,040 | ) | (26,040 | ) | ||||||||||||||||||||||
Redemption of preferred shares | (74,827 | ) | — | (10,822 | ) | — | 10,822 | (74,827 | ) | — | (74,827 | ) | ||||||||||||||||||||
Preferred dividends | — | — | — | — | (10,008 | ) | (10,008 | ) | — | (10,008 | ) | |||||||||||||||||||||
Common dividends ($0.18 per share) | — | — | — | — | (27,192 | ) | (27,192 | ) | — | (27,192 | ) | |||||||||||||||||||||
Balance December 31, 2013 | $ | 94,775 | $ | 193,236 | $ | 1,420,951 | $ | (86,840 | ) | $ | (164,721 | ) | $ | 1,457,401 | $ | 1,571 | $ | 1,458,972 | ||||||||||||||
Net income | 52,004 | 52,004 | 1,004 | 53,008 | ||||||||||||||||||||||||||||
Common stock issued pursuant to: | ||||||||||||||||||||||||||||||||
Common stock offering, net of issuance costs | — | 26,700 | 295,196 | — | — | 321,896 | — | 321,896 | ||||||||||||||||||||||||
Stock based compensation | — | 156 | (706 | ) | — | — | (550 | ) | — | (550 | ) | |||||||||||||||||||||
Amortization of stock options and restricted stock, net of forfeitures | — | (9 | ) | 2,001 | — | — | 1,992 | — | 1,992 | |||||||||||||||||||||||
Distributions to nonredeemable noncontrolling interests | — | — | — | — | — | — | (2,575 | ) | (2,575 | ) | ||||||||||||||||||||||
Redemption of preferred shares | (94,775 | ) | — | 3,530 | — | (3,530 | ) | (94,775 | ) | — | (94,775 | ) | ||||||||||||||||||||
Preferred dividends | — | — | — | — | (2,955 | ) | (2,955 | ) | — | (2,955 | ) | |||||||||||||||||||||
Common dividends ($0.30 per share) | — | — | — | — | (61,555 | ) | (61,555 | ) | — | (61,555 | ) | |||||||||||||||||||||
Balance December 31, 2014 | $ | — | $ | 220,083 | $ | 1,720,972 | $ | (86,840 | ) | $ | (180,757 | ) | $ | 1,673,458 | $ | — | $ | 1,673,458 | ||||||||||||||
Net income | — | 125,518 | 125,518 | 111 | 125,629 | |||||||||||||||||||||||||||
Common stock issued pursuant to stock based compensation | — | 173 | (245 | ) | — | — | (72 | ) | — | (72 | ) | |||||||||||||||||||||
Amortization of stock options and restricted stock, net of forfeitures | — | — | 1,473 | — | — | 1,473 | — | 1,473 | ||||||||||||||||||||||||
Distributions to nonredeemable noncontrolling interests | — | — | — | — | — | — | (111 | ) | (111 | ) | ||||||||||||||||||||||
Repurchase of common stock | — | — | — | (47,790 | ) | — | (47,790 | ) | — | (47,790 | ) | |||||||||||||||||||||
Common dividends ($0.32 per share) | — | — | — | — | (69,196 | ) | (69,196 | ) | — | (69,196 | ) | |||||||||||||||||||||
Other | — | — | 24 | — | — | 24 | — | 24 | ||||||||||||||||||||||||
Balance December 31, 2015 | $ | — | $ | 220,256 | $ | 1,722,224 | $ | (134,630 | ) | $ | (124,435 | ) | $ | 1,683,415 | $ | — | $ | 1,683,415 | ||||||||||||||
See notes to consolidated financial statements.
F-5
COUSINS PROPERTIES INCORPORATED AND SUBSIDIARIES CONSOLIDATED STATEMENTS OF CASH FLOWS (In thousands) | |||||||||||
Year Ended December 31, | |||||||||||
2015 | 2014 | 2013 | |||||||||
CASH FLOWS FROM OPERATING ACTIVITIES: | |||||||||||
Net income | $ | 125,629 | $ | 53,008 | $ | 126,829 | |||||
Adjustments to reconcile net income to net cash provided by operating activities: | |||||||||||
Gain on sale of investment properties, including discontinued operations | (79,843 | ) | (31,894 | ) | (68,200 | ) | |||||
Gain on sale of third party management and leasing business | — | — | (4,577 | ) | |||||||
Depreciation and amortization, including discontinued operations | 135,462 | 141,022 | 76,478 | ||||||||
Amortization of deferred financing costs | 1,423 | 604 | 615 | ||||||||
Amortization of stock options and restricted stock, net of forfeitures | 1,473 | 1,992 | 1,898 | ||||||||
Effect of certain non-cash adjustments to rental revenues | (26,475 | ) | (30,039 | ) | (11,660 | ) | |||||
Income from unconsolidated joint ventures | (8,302 | ) | (11,268 | ) | (67,325 | ) | |||||
Operating distributions from unconsolidated joint ventures | 8,760 | 10,296 | 67,101 | ||||||||
Land and multi-family cost of sales, net of closing costs paid | — | 302 | 967 | ||||||||
Changes in other operating assets and liabilities: | |||||||||||
Change in other receivables and other assets, net | (10,937 | ) | (644 | ) | (9,619 | ) | |||||
Change in operating liabilities | 4,471 | 9,021 | 24,833 | ||||||||
Net cash provided by operating activities | 151,661 | 142,400 | 137,340 | ||||||||
CASH FLOWS FROM INVESTING ACTIVITIES: | |||||||||||
Proceeds from investment property sales | 225,307 | 244,471 | 178,966 | ||||||||
Proceeds from sale of third party management and leasing business | — | — | 4,577 | ||||||||
Property acquisition, development and tenant asset expenditures | (184,988 | ) | (710,743 | ) | (1,526,263 | ) | |||||
Investment in unconsolidated joint ventures | (9,985 | ) | (18,342 | ) | (11,922 | ) | |||||
Distributions from unconsolidated joint ventures | 7,555 | 26,179 | 88,635 | ||||||||
Change in notes receivable and other assets | 118 | (1,819 | ) | (75 | ) | ||||||
Change in restricted cash | 475 | (1,361 | ) | (111 | ) | ||||||
Net cash provided by (used in) investing activities | 38,482 | (461,615 | ) | (1,266,193 | ) | ||||||
CASH FLOWS FROM FINANCING ACTIVITIES: | |||||||||||
Proceeds from credit facility | 355,900 | 764,575 | 365,075 | ||||||||
Repayment of credit facility | (404,100 | ) | (664,450 | ) | (325,000 | ) | |||||
Proceeds from notes payable | — | 85,068 | 304,275 | ||||||||
Repayment of notes payable | (22,851 | ) | (22,943 | ) | (77,887 | ) | |||||
Payment of loan issuance costs | — | (3,995 | ) | (1,693 | ) | ||||||
Common stock issued, net of expenses | 8 | 321,845 | 826,233 | ||||||||
Repurchase of common stock | (47,790 | ) | — | — | |||||||
Redemption of preferred shares | — | (94,775 | ) | (74,827 | ) | ||||||
Common dividends paid | (69,196 | ) | (61,555 | ) | (27,192 | ) | |||||
Preferred dividends paid | — | (2,955 | ) | (10,008 | ) | ||||||
Distributions to nonredeemable noncontrolling interests | (111 | ) | (2,575 | ) | (26,040 | ) | |||||
Net cash provided by (used in) financing activities | (188,140 | ) | 318,240 | 952,936 | |||||||
NET INCREASE (DECREASE) IN CASH AND CASH EQUIVALENTS | 2,003 | (975 | ) | (175,917 | ) | ||||||
CASH AND CASH EQUIVALENTS AT BEGINNING OF PERIOD | — | 975 | 176,892 | ||||||||
CASH AND CASH EQUIVALENTS AT END OF PERIOD | $ | 2,003 | $ | — | $ | 975 | |||||
See notes to consolidated financial statements.
F-6
COUSINS PROPERTIES INCORPORATED AND SUBSIDIARIES
NOTES TO CONSOLIDATED FINANCIAL STATEMENTS
1. | DESCRIPTION OF BUSINESS AND BASIS OF PRESENTATION |
Description of Business: Cousins Properties Incorporated (“Cousins”), a Georgia corporation, is a self-administered and self-managed real estate investment trust (“REIT”). Through December 31, 2014, Cousins Real Estate Corporation (“CREC”) was a taxable entity wholly-owned by and consolidated within Cousins. CREC owned, developed, and managed its own real estate portfolio and performed certain real estate related services for other parties. On December 31, 2014, CREC merged into Cousins and coincident with this merger, Cousins formed Cousins TRS Services LLC ("CTRS"), a new taxable entity wholly-owned by Cousins. Upon formation, CTRS received a capital contribution of some of the real estate assets and contracts that were previously owned by CREC. CTRS owns and manages its own real estate portfolio and performs certain real estate related services for other parties beginning in 2015.
Cousins, CREC, CTRS and their subsidiaries (collectively, the “Company”) develop, acquire, lease, manage, and own primarily Class A office properties and opportunistic mixed-use developments in Sunbelt markets with a focus on Georgia, Texas, and North Carolina. As of December 31, 2015, the Company’s portfolio of real estate assets consisted of interests in 14.8 million square feet of office space, 786,000 square feet of mixed use space.
Basis of Presentation: The consolidated financial statements include the accounts of the Company and its consolidated partnerships and wholly-owned subsidiaries. Intercompany transactions and balances have been eliminated in consolidation. The Company presents its financial statements in accordance with accounting principles generally accepted in the United States (“GAAP”) as outlined in the Financial Accounting Standard Board’s Accounting Standards Codification (the “Codification” or “ASC”). The Codification is the single source of authoritative accounting principles applied by nongovernmental entities in the preparation of financial statements in conformity with GAAP.
For the three years ended December 31, 2015, there were no items of other comprehensive income. Therefore, no presentation of comprehensive income is required.
The Company evaluates all partnerships, joint ventures and other arrangements with variable interests to determine if the entity or arrangement qualifies as a variable interest entity (“VIE”), as defined in the Codification. If the entity or arrangement qualifies as a VIE and the Company is determined to be the primary beneficiary, the Company is required to consolidate the assets, liabilities, and results of operations of the VIE.
The Company has a joint venture with Callaway Gardens Resort, Inc. (“Callaway”) for the development of residential lots, which is anticipated to be funded fully through Company contributions. Callaway has the right to receive returns, but no obligation to fund any costs or absorb any losses. The Company is the sole decision maker for the venture and the development manager. The Company has determined that Callaway is a VIE, and the Company is the primary beneficiary. Therefore, the Company consolidates this joint venture. As of December 31, 2015 and 2014, Callaway had total assets of $4.6 million, and no significant liabilities.
Certain prior year amounts have been reclassified for consistency with the current period presentation. In 2015, the Company concluded that certain liabilities associated with variable stock-based compensation should be classified as other liabilities. Previously, these items had been classified as accounts payable and accrued expenses. This change in classification does not affect the previously reported consolidated statement of cash flows or consolidated statement of operations for any period.
Recently Issued Accounting Standards: In 2015, the FASB issued ASC 2015-02 "Consolidation (Topic 810): Amendments to the Consolidation Analysis." All legal entities are subject to reevaluation under the revised consolidation model. The amendment modifies the evaluation of whether limited partnerships and similar legal entities are variable interest entities or voting interest entities. It also eliminates the presumption that a general partner should consolidate a limited partnership. The guidance is effective for public entities with periods beginning after December 15, 2015 with early adoption permitted. The Company adopted this guidance effective January 1, 2016, and expects no material impact to the financial statements.
In 2015, the FASB issued ASU 2015-03, "Simplifying the Presentation of Debt Issuance Costs," which will require companies to present debt issuance costs as a direct deduction from the related debt rather than as an asset. These costs will continue to be amortized into interest expense. The guidance is effective for periods beginning after December 15, 2015 with early adoption permitted. ASU 2015-15 was issued further clarifying that entities may defer and present debt costs as an asset and amortize the deferred debt issuance costs ratably over the term for line of credit arrangements, regardless of the outstanding balance. The Company adopted the guidance in ASU 2015-03 effective January 1, 2016 for mortgage debt and has elected to defer adoption for costs related to line of credit arrangements. The Company expects no material impact to the financial statements.
F-7
In 2015, the FASB voted to defer ASU 2014-09, "Revenue from Contracts with Customers (Topic 606)." Under the new guidance, companies will recognize revenue when the seller satisfies a performance obligation, which would be when the buyer takes control of the good or service. This new guidance could result in different amounts of revenue being recognized and could result in revenue being recognized in different reporting periods than under the current guidance. The standard specifically excludes revenue associated with lease contracts. The guidance is effective for periods beginning after December 15, 2017, with early adoption permitted for periods beginning after December 15, 2016. The Company expects to adopt this guidance effective January 1, 2018 and is currently assessing the potential impact of adopting the new guidance.
2. | SIGNIFICANT ACCOUNTING POLICIES |
Real Estate Assets
Cost Capitalization: Costs related to planning, developing, leasing, and constructing a property, including costs of development personnel working directly on projects under development, are capitalized. In addition, the Company capitalizes interest to qualifying assets under development based on average accumulated expenditures outstanding during the period. In capitalizing interest to qualifying assets, the Company first uses the interest incurred on specific project debt, if any, and next uses the Company’s weighted average interest rate for non-project specific debt. The Company also capitalizes interest to investments accounted for under the equity method when the investee has property under development with a carrying value in excess of the investee’s borrowings. To the extent debt exists within an unconsolidated joint venture during the construction period, the venture capitalizes interest on that venture-specific debt.
The Company capitalizes interest, real estate taxes, and certain operating expenses on the unoccupied portion of recently completed development properties from the date a project is substantially complete to the earlier of (1) the date on which the project achieves 90% economic occupancy or (2) one year after it is substantially complete.
The Company capitalizes direct leasing costs related to leases that are probable of being executed. These costs include commissions paid to outside brokers, legal costs incurred to negotiate and document a lease agreement, and internal costs that are based on time spent by leasing personnel on successful leases. The Company allocates these costs to individual tenant leases and amortizes them over the related lease term.
Impairment: For real estate assets that are considered to be held for sale according to accounting guidance, the Company records impairment losses if the fair value of the asset net of estimated selling costs is less than the carrying amount. For those long-lived assets that are held and used according to accounting guidance, management reviews each asset for the existence of any indicators of impairment. If indicators of impairment are present, the Company calculates the expected undiscounted future cash flows to be derived from such assets. If the undiscounted cash flows are less than the carrying amount of the asset, the Company reduces the asset to its fair value.
Acquisition of Operating Properties: The Company records the acquired tangible and intangible assets and assumed liabilities of operating property acquisitions at fair value at the acquisition date. The acquired assets and assumed liabilities for an operating property acquisition generally include but are not limited to: land, buildings and improvements, and identified tangible and intangible assets and liabilities associated with in-place leases, including leasing costs, value of above-market and below-market tenant leases, value of above-market and below-market ground leases, acquired in-place lease values, and tenant relationships, if any.
The fair value of land is derived from comparable sales of land within the same submarket and/or region. The fair value of buildings and improvements, tenant improvements, and leasing costs are based upon current market replacement costs and other relevant market rate information.
The fair value of the above-market or below-market component of an acquired in-place lease is based upon the present value (calculated using a market discount rate) of the difference between (i) the contractual rents to be paid pursuant to the lease over its remaining term and (ii) management’s estimate of the rents that would be paid using fair market rental rates and rent escalations at the date of acquisition over the remaining term of the lease. The amounts recorded for above-market and below-market ground leases are included in intangible liabilities and intangible assets, respectively, and are amortized on a straight-line basis into rental property operating expenses over the remaining terms of the applicable leases.
The fair value of acquired in-place leases is derived based on management’s assessment of lost revenue and costs incurred for the period required to lease the “assumed vacant” property to the occupancy level when purchased. The amount recorded for acquired in-place leases is included in intangible assets and amortized as an increase to depreciation and amortization expense over the remaining term of the applicable leases.
F-8
Depreciation and Amortization: Real estate assets are stated at depreciated cost less impairment losses, if any. Buildings are depreciated over their estimated useful lives, which range generally from 24 to 42 years. The life of a particular building depends upon a number of factors including whether the building was developed or acquired and the condition of the building upon acquisition. Furniture, fixtures and equipment are depreciated over their estimated useful lives of three to five years. Tenant improvements, leasing costs and leasehold improvements are amortized over the term of the applicable leases or the estimated useful life of the assets, whichever is shorter. The Company accelerates the depreciation of tenant assets if it estimates that the lease term will end prior to the termination date. This acceleration may occur if a tenant files for bankruptcy, vacates its premises or defaults in another manner on its lease. Deferred expenses are amortized over the period of estimated benefit. The Company uses the straight-line method for all depreciation and amortization.
Discontinued Operations: Beginning in the second quarter 2014, only assets held for sale and disposals representing strategic shifts in operations are reflected in discontinued operations. Prior to 2014, the Company classified the results of operations of all properties that were sold or otherwise qualified as held for sale as discontinued operations if the property's operations were expected to be eliminated from ongoing operations and the Company would not have any significant continuing involvement in the operations of the property after the sale. During 2015, there were no held for sale assets or disposals that represented a strategic shift in operations. The Company ceases depreciation of a property when it is categorized as held for sale.
Investment in Joint Ventures
For joint ventures that the Company does not control, but exercises significant influence, the Company uses the equity method of accounting. The Company's judgment with regard to its level of influence or control of an entity involves consideration of various factors including the form of its ownership interest; its representation in the entity's governance; its ability to participate in policy-making decisions; and the rights of other investors to participate in the decision-making process, to replace the Company as manager, and/or to liquidate the venture. These ventures are recorded at cost and adjusted for equity in earnings (losses) and cash contributions and distributions. Any difference between the carrying amount of these investments on the Company’s balance sheet and the underlying equity in net assets on the joint venture’s balance sheet is adjusted as the related underlying assets are depreciated, amortized, or sold. The Company generally allocates income and loss from an unconsolidated joint venture based on the venture's distribution priorities, which may be different from its stated ownership percentage.
The Company evaluates the recoverability of its investment in unconsolidated joint ventures in accordance with accounting standards for equity investments by first reviewing each investment for any indicators of impairment. If indicators are present, the Company estimates the fair value of the investment. If the carrying value of the investment is greater than the estimated fair value, management makes an assessment of whether the impairment is “temporary” or “other-than-temporary.” In making this assessment, management considers the following: (1) the length of time and the extent to which fair value has been less than cost, (2) the financial condition and near-term prospects of the entity, and (3) the Company’s intent and ability to retain its interest long enough for a recovery in market value. If management concludes that the impairment is "other than temporary," the Company reduces the investment to its estimated fair value.
The Company consolidates certain joint ventures that it controls. In cases where the entity’s documents do not contain a required redemption clause, the Company records the partner’s share of the entity in the equity section of the balance sheets in nonredeemable noncontrolling interests. In cases where the entity’s documents contain a provision requiring the Company to purchase the partner’s share of the venture at a certain value upon demand or at a future date, the Company records the partner’s share of the entity in redeemable noncontrolling interests on the balance sheets. Amounts recorded in redeemable noncontrolling interests are adjusted to the higher of fair value or the partner’s cost basis each reporting period. The effect of these adjustments is recorded in additional paid-in capital within total stockholders’ investment. The noncontrolling partners' share of all consolidated joint ventures' income is reflected in net income attributable to noncontrolling interest on the statements of operations.
Revenue Recognition
Rental Property Revenues: The Company recognizes contractual revenues from leases on a straight-line basis over the term of the respective lease. Certain of these leases also provide for percentage rents based upon the level of sales achieved by the lessee. Percentage rents are recognized once the specified sales target is achieved. In addition, leases typically provide for reimbursement of the tenants' share of real estate taxes, insurance, and other operating expenses to the Company. Operating expense reimbursements are recognized as the related expenses are incurred. During 2015, 2014, and 2013, the Company recognized $93.3 million, $86.0 million, and $43.9 million, respectively, in revenues, including discontinued operations, from tenants related to operating expenses.
F-9
The Company makes valuation adjustments to all tenant-related accounts receivable based upon its estimate of the likelihood of collectibility of amounts due from the tenant. The amount of any valuation adjustment is based on the tenant’s credit and business risk, history of payment, and other factors considered by management.
Fee Income: The Company recognizes development, management and leasing fees when earned. The Company recognizes development and leasing fees received from unconsolidated joint ventures and related salaries and other direct costs incurred by the Company as income and expense based on the percentage of the joint venture which the Company does not own. Correspondingly, the Company adjusts the investment in unconsolidated joint ventures asset when fees are paid to the Company by a joint venture in which the Company has an ownership interest. See note 5 for more information related to fee income received by unconsolidated joint ventures.
Gain on Sale of Investment Properties: The Company recognizes a gain on sale of investment property when the sale of a property is consummated, the buyer’s initial and continuing investment is adequate to demonstrate commitment to pay, any receivable obtained is not subject to future subordination, the usual risks and rewards of ownership are transferred, and the Company has no substantial continuing involvement with the property. If the Company has a commitment to the buyer and that commitment is a specific dollar amount, this commitment is accrued and the gain on sale that the Company recognizes is reduced. If the Company has a construction commitment to the buyer, management makes an estimate of this commitment, defers a portion of the profit from the sale, and recognizes the deferred profit as or when the commitment is fulfilled.
Income Taxes
Cousins has elected to be taxed as a REIT under the Internal Revenue Code of 1986, as amended (the “Code”). To qualify as a REIT, Cousins must distribute annually at least 90% of its adjusted taxable income, as defined in the Code, to its stockholders and satisfy certain other organizational and operating requirements. It is management’s current intention to adhere to these requirements and maintain Cousins’ REIT status. As a REIT, Cousins generally will not be subject to federal income tax at the corporate level on the taxable income it distributes to its stockholders. If Cousins fails to qualify as a REIT in any taxable year, it will be subject to federal income taxes at regular corporate rates (including any applicable alternative minimum tax) and may not be able to qualify as a REIT for four subsequent taxable years. Cousins may be subject to certain state and local taxes on its income and property, and to federal income taxes on its undistributed taxable income.
CTRS is a C-Corporation for federal income tax purposes and uses the liability method for accounting for income taxes. Tax return positions are recognized in the financial statements when they are “more-likely-than-not” to be sustained upon examination by the taxing authority. Deferred income tax assets and liabilities result from temporary differences. Temporary differences are differences between the tax bases of assets and liabilities and their reported amounts in the financial statements that will result in taxable or deductible amounts in future periods. A valuation allowance may be placed on deferred income tax assets, if it is determined that it is more likely than not that a deferred tax asset may not be realized.
Stock-Based Compensation
The Company has several types of stock-based compensation plans. These plans are described in note 12, as are the accounting policies by type of award. The Company recognizes compensation expense, net of forfeitures, arising from share-based payment arrangements granted to employees and directors in general and administrative expense in the statements of operations over the related awards’ vesting period, which may be accelerated under the Company’s retirement feature.
Earnings per Share (“EPS”)
Net income per share-basic is calculated as net income available to common stockholders divided by the weighted average number of common shares outstanding during the period, including nonvested restricted stock which has nonforfeitable dividend rights. Net income per share-diluted is calculated as net income available to common stockholders divided by the diluted weighted average number of common shares outstanding during the period. Diluted weighted average number of common shares uses the same weighted average share number as in the basic calculation and adds the potential dilution that would occur if stock options (or any other contracts to issue common stock) were exercised and resulted in additional common shares outstanding, calculated using the treasury stock method. The numerator is reduced for the effect of preferred dividends in both the basic and diluted net income per share calculations.
Stock options are dilutive when the average market price of the Company’s stock during the period exceeds the option exercise price.
Cash and Cash Equivalents and Restricted Cash
Cash and cash equivalents include cash and highly-liquid money market instruments. Highly-liquid money market instruments include securities and repurchase agreements with original maturities of three months or less, money market mutual
F-10
funds, and United States Treasury Bills with maturities of 30 days or less. Restricted cash primarily represents amounts restricted under debt agreements for future capital expenditures or for specific future operating costs.
Software Cost Capitalization
Internal and external costs to develop computer software for internal use are capitalized during the development stage in accordance with GAAP. These capitalized costs include the costs to obtain the software, internal and external development costs, and automated data conversion. Training and manual data conversion costs are expensed as incurred.
Use of Estimates
The preparation of financial statements in conformity with GAAP requires management to make estimates and assumptions that affect the reported amounts of assets and liabilities and disclosure of contingent assets and liabilities at the date of the financial statements and the reported amounts of revenues and expenses during the reporting period. Actual results could differ from those estimates.
3. REAL ESTATE TRANSACTIONS
Dispositions
The Company sold the following properties in 2015, 2014, and 2013 ($ in thousands):
Property | Property Type | Location | Square Feet | Sales Price | Discontinued Operations | ||||||||
2015 | |||||||||||||
2100 Ross | Office | Dallas, Texas | 844,000 | $ | 131,000 | No | |||||||
200, 333, and 555 North Point Center East | Office | Atlanta, Georgia | 411,000 | $ | 70,300 | No | |||||||
The Points at Waterview | Office | Dallas, Texas | 203,000 | $ | 26,800 | No | |||||||
2014 | |||||||||||||
777 Main | Office | Ft. Worth, TX | 980,000 | $ | 167,000 | No | |||||||
Lakeshore Park Plaza | Office | Birmingham, AL | 197,000 | $ | 25,000 | Yes | |||||||
Mahan Village | Retail | Tallahassee, FL | 147,000 | $ | 29,500 | No | |||||||
600 University Park Place | Office | Birmingham, AL | 123,000 | $ | 19,700 | Yes | |||||||
2013 | |||||||||||||
Tiffany Springs MarketCenter | Retail | Kansas City, MO | 238,000 | $ | 53,500 | Yes | |||||||
Inhibitex | Office | Atlanta, GA | 51,000 | $ | 8,300 | Yes | |||||||
None of the dispositions during the year ended December 31, 2015 represented a strategic shift in operations and, therefore, did not qualify for discontinued operations. The following table details the components of income from discontinued operations, and gains (losses) related on the sales of discontinued operations for the years ended December 31, 2015, 2014, and 2013 (in thousands):
2015 | 2014 | 2013 | ||||||||||
Rental property revenues | $ | 4 | $ | 2,927 | $ | 10,552 | ||||||
Other revenues | 6 | 29 | 40 | |||||||||
Third party management and leasing revenues | — | — | 76 | |||||||||
Third party management and leasing expenses | — | — | (99 | ) | ||||||||
Depreciation and amortization | — | — | (3,083 | ) | ||||||||
Other expenses | (27 | ) | (28 | ) | (25 | ) | ||||||
Rental property operating expenses | (18 | ) | (1,128 | ) | (4,162 | ) | ||||||
Income (loss) from discontinued operations | $ | (35 | ) | $ | 1,800 | $ | 3,299 | |||||
Gain (loss) on sale of discontinued operations, net | $ | (551 | ) | $ | 19,358 | $ | 11,489 | |||||
Held for sale
F-11
As of December 31, 2015, 100 North Point Center East, an 129,000 square foot office building in Atlanta, Georgia was classified as held for sale. The sale does not represent a strategic shift in operations and, therefore, will be presented in continuing operations on the consolidated statements of operations. The major classes of assets and liabilities of the property held for sale as of December 31, 2015 are as follows (in thousands):
Real estate assets and related assets held for sale | ||||
Operating Properties, net of accumulated depreciation of $7,072 | $ | 6,421 | ||
Notes and accounts receivable | 210 | |||
Deferred rents receivable | 496 | |||
Other assets, net of accumulated amortization of $128 | 119 | |||
$ | 7,246 | |||
Liabilities of real estate assets held for sale | ||||
Accounts payable and accrued expenses | $ | 140 | ||
Deferred Income | 200 | |||
Other liabilities | 1,007 | |||
$ | 1,347 | |||
In January 2016, the Company sold this property for a gross sales price of $22.0 million.
Acquisitions
In 2015, the Company acquired a 4.16 acre land site located in Atlanta, Georgia for $27.0 million for the development of NCR's corporate headquarters, a 485,000 square foot office building. The site also includes an additional parcel for a second office building development.
In 2014, the Company acquired Northpark Town Center, a 1.5 million square foot office asset located in Atlanta, Georgia. The gross purchase price for this property was $348.0 million, before adjustments for customary closing costs and other closing credits. The Company incurred $643,000 in acquisition and related costs associated with this acquisition.
In 2014, the Company acquired Fifth Third Center, a 698,000 square foot Class A office tower located in the Charlotte, North Carolina central business district. The gross purchase price for this property was $215.0 million, before adjustments for customary closing costs and other closing credits. The Company incurred $328,000 in acquisition and related costs associated with this acquisition.
In 2013, the Company acquired Greenway Plaza, a 10-building, 4.3 million square foot office complex in Houston, Texas, and 777 Main, a 980,000 square foot Class A office building in the central business district of Fort Worth, Texas (collectively the “Texas Acquisition”). The aggregate purchase price for the Texas Acquisition was $1.1 billion, before adjustment for brokers fees, transfer taxes and other customary closing costs.
In conjunction with the Texas Acquisition, the Company entered into a $950 million Loan Agreement with JPMorgan Chase Bank, N.A. and Bank of America, N.A. (the "Term Loan") to assist, if necessary, in the funding of the Texas Acquisition. The Term Loan was not used to finance the Texas Acquisition and, pursuant to the agreement, terminated on the acquisition date. The Company incurred fees and other costs associated with the Term Loan of $2.6 million. In addition, the Company incurred $4.2 million in other acquisition costs related to the Texas Acquisition. The term loan costs and other acquisition costs are included in acquisition and related costs on the statement of operations.
In 2013, the Company acquired 816 Congress Avenue, a 435,000 square foot Class-A office property located in the central business district of Austin, Texas. The purchase price for this property, net of rent credits, was $102.4 million. The Company incurred $342,000 in acquisition and related costs associated with this acquisition.
In 2013, the Company purchased the remaining 80% interest in MSREF/ Cousins Terminus 200 LLC for $53.8 million and simultaneously repaid the mortgage loan secured by the Terminus 200 property in the amount of $74.6 million. The Company recognized a gain of $19.7 million on this acquisition achieved in stages. Immediately thereafter, the Company contributed its interest in the Terminus 200 property and its interest in the Terminus 100 property, together with the existing mortgage loan secured by the Terminus 100 property, to a newly-formed entity, Terminus Office Holdings LLC (“TOH”), and sold 50% of TOH to institutional investors advised by J.P. Morgan Asset Management for $112.2 million. The Company recognized a gain of $37.1 million on this transaction. The Company incurred $122,000 in acquisition and related costs associated with these transactions. TOH closed a new mortgage loan on the Terminus 200 property in the amount of $82.0 million, and the Company
F-12
received a distribution of $39.2 million from TOH as a result. TOH is an unconsolidated joint venture of the Company (see note 5).
In 2013, the Company purchased Post Oak Central, a 1.3 million square foot, Class-A office complex in the Galleria district of Houston, Texas for $230.9 million, net of rent credits, from an affiliate of J.P. Morgan Asset Management. The Company incurred $231,000 in acquisition and related costs associated with this acquisition.
The following tables summarize allocations of the estimated fair values of the assets and liabilities of the operating property acquisitions discussed above (in thousands):
2014 | 2013 | |||||||||||||||||||||||
Northpark Town Center | Fifth Third Center | Post Oak Central | Terminus 200 | 816 Congress Avenue | Texas Acquisition | |||||||||||||||||||
Tangible assets: | ||||||||||||||||||||||||
Land and improvements | $ | 24,577 | $ | 22,863 | $ | 88,406 | $ | 25,040 | $ | 6,817 | $ | 306,563 | ||||||||||||
Building | 274,151 | 163,649 | 118,470 | 101,472 | 86,391 | 586,150 | ||||||||||||||||||
Tenant improvements | 21,674 | 16,781 | 10,877 | 17,600 | 3,500 | 114,220 | ||||||||||||||||||
Other assets | — | 1,014 | — | 101 | — | — | ||||||||||||||||||
Deferred rents receivable | — | — | — | 44 | — | — | ||||||||||||||||||
Tangible assets | 320,402 | 204,307 | 217,753 | 144,257 | 96,708 | 1,006,933 | ||||||||||||||||||
Intangible assets: | ||||||||||||||||||||||||
Above-market leases | 2,846 | 632 | 995 | 1,512 | 89 | 4,959 | ||||||||||||||||||
In-place leases | 30,159 | 17,096 | 26,968 | 14,355 | 8,222 | 117,630 | ||||||||||||||||||
Below-market ground leases | — | 338 | — | — | — | 2,958 | ||||||||||||||||||
Ground lease purchase option | — | — | — | — | 2,403 | — | ||||||||||||||||||
Total intangible assets | 33,005 | 18,066 | 27,963 | 15,867 | 10,714 | 125,547 | ||||||||||||||||||
Tangible liabilities: | ||||||||||||||||||||||||
Accounts payable and accrued expenses | — | (1,026 | ) | — | — | — | — | |||||||||||||||||
Total tangible liabilities | — | (1,026 | ) | — | — | — | — | |||||||||||||||||
Intangible liabilities: | ||||||||||||||||||||||||
Below-market leases | (8,018 | ) | (9,374 | ) | (14,792 | ) | (9,273 | ) | (2,820 | ) | (47,170 | ) | ||||||||||||
Above-market ground lease | — | — | — | — | (1,981 | ) | (2,508 | ) | ||||||||||||||||
Total intangible liabilities | (8,018 | ) | (9,374 | ) | (14,792 | ) | (9,273 | ) | (4,801 | ) | (49,678 | ) | ||||||||||||
Total net assets acquired | $ | 345,389 | $ | 211,973 | $ | 230,924 | $ | 150,851 | $ | 102,621 | $ | 1,082,802 | ||||||||||||
See note 6 for a schedule of the timing of amortization of the intangible assets and liabilities and the weighted average amortization periods.
The following unaudited supplemental pro forma information is presented for acquisitions for the years ended December 31, 2014 and 2013, respectively. The pro forma information is based upon the Company's historical consolidated statements of operations, adjusted as if the Northpark Town Center, Post Oak Central, Terminus, 816 Congress Avenue, and the Texas Acquisition transactions discussed above had occurred at the beginning of each of the periods presented below. The supplemental pro forma information is not necessarily indicative of future results or of actual results that would have been achieved had the transactions been consummated at the beginning of each period.
F-13
2014 | 2013 | |||||||
(unaudited, in thousands, except per share amounts) | ||||||||
Revenues | $ | 388,791 | $ | 354,047 | ||||
Income from continuing operations | 31,695 | 119,825 | ||||||
Net income | 52,853 | 134,613 | ||||||
Net income available to common stockholders | 45,364 | 116,881 | ||||||
Per share information: | ||||||||
Basic | $ | 0.22 | $ | 0.62 | ||||
Diluted | $ | 0.22 | $ | 0.62 | ||||
4. NOTES AND ACCOUNTS RECEIVABLE
At December 31, 2015 and 2014, notes and accounts receivables included the following (in thousands):
2015 | 2014 | ||||||
Notes receivable | $ | 414 | $ | 414 | |||
Allowance for doubtful accounts related to notes receivable | (414 | ) | (414 | ) | |||
Tenant and other receivables | 11,767 | 11,961 | |||||
Allowance for doubtful accounts related to tenant and other receivables | (939 | ) | (1,229 | ) | |||
$ | 10,828 | $ | 10,732 | ||||
At December 31, 2015 and 2014, the fair value of the Company’s notes receivable approximated the cost basis. Fair value was calculated by discounting future cash flows from the notes receivable at estimated rates in which similar loans would have been made at December 31, 2015 and 2014. The estimate of the rate, which is the most significant input in the discounted cash flow calculation, is intended to replicate notes of similar type and maturity. This fair value calculation is considered to be a Level 3 calculation under the accounting guidelines, as the Company utilizes internally generated assumptions regarding current interest rates at which similar instruments would be executed.
5.INVESTMENT IN UNCONSOLIDATED JOINT VENTURES
The following information summarizes financial data and principal activities of the Company’s unconsolidated joint ventures. The information included in the following table entitled summary of financial position is as of December 31, 2015 and 2014. The information included in the summary of operations table is for the years ended December 31, 2015, 2014, and 2013 (in thousands).
Total Assets | Total Debt | Total Equity (Deficit) | Company's Investment | |||||||||||||||||||||||||||||
SUMMARY OF FINANCIAL POSITION: | 2015 | 2014 | 2015 | 2014 | 2015 | 2014 | 2015 | 2014 | ||||||||||||||||||||||||
Terminus Office Holdings | $ | 277,444 | $ | 288,415 | $ | 211,216 | $ | 213,640 | $ | 56,369 | $ | 62,830 | $ | 29,110 | $ | 32,323 | ||||||||||||||||
EP I LLC | 83,115 | 85,228 | 58,029 | 58,029 | 24,172 | 26,671 | 21,502 | 22,905 | ||||||||||||||||||||||||
EP II LLC | 70,704 | 42,772 | 40,910 | 12,735 | 24,331 | 24,969 | 19,118 | 19,905 | ||||||||||||||||||||||||
Charlotte Gateway Village, LLC | 123,531 | 130,272 | 17,536 | 35,530 | 104,336 | 92,808 | 11,190 | 11,218 | ||||||||||||||||||||||||
HICO Victory Center LP | 13,532 | 10,450 | — | — | 13,229 | 10,450 | 9,138 | 7,572 | ||||||||||||||||||||||||
Carolina Square Holdings LP | 15,729 | — | — | — | 12,085 | — | 6,782 | — | ||||||||||||||||||||||||
CL Realty, L.L.C. | 7,872 | 7,264 | — | — | 7,662 | 7,042 | 3,515 | 3,546 | ||||||||||||||||||||||||
HICO Avalon LLC | 2,107 | — | — | — | 1,646 | — | 1,245 | — | ||||||||||||||||||||||||
Temco Associates, LLC | 5,284 | 6,910 | — | — | 5,133 | 6,709 | 977 | 3,027 | ||||||||||||||||||||||||
Wildwood Associates | 16,419 | 16,400 | — | — | 16,354 | 16,389 | (1,122 | ) | (1) | (1,106 | ) | (1) | ||||||||||||||||||||
Crawford Long - CPI, LLC | 29,143 | 29,946 | 74,286 | 75,000 | (46,238 | ) | (45,762 | ) | (22,021 | ) | (1) | (21,931 | ) | (1) | ||||||||||||||||||
Other | — | 1,411 | — | — | — | 979 | — | 2 | ||||||||||||||||||||||||
$ | 644,880 | $ | 619,068 | $ | 401,977 | $ | 394,934 | $ | 219,079 | $ | 203,085 | $ | 79,434 | $ | 77,461 | |||||||||||||||||
F-14
Total Revenues | Net Income (Loss) | Company's Share of Net Income (Loss) | |||||||||||||||||||||||||||||||||
SUMMARY OF OPERATIONS: | 2015 | 2014 | 2013 | 2015 | 2014 | 2013 | 2015 | 2014 | 2013 | ||||||||||||||||||||||||||
Terminus Office Holdings | $ | 40,250 | $ | 39,531 | $ | 33,109 | $ | 2,789 | $ | 663 | $ | (408 | ) | $ | 1,395 | $ | 308 | $ | (182 | ) | |||||||||||||||
EP I LLC | 12,558 | 12,049 | 8,261 | 3,177 | 2,583 | 100 | 2,197 | 1,937 | 75 | ||||||||||||||||||||||||||
EP II LLC | 1,264 | — | — | (638 | ) | — | — | (466 | ) | — | — | ||||||||||||||||||||||||
Charlotte Gateway Village, LLC | 33,724 | 33,903 | 33,281 | 12,737 | 11,645 | 10,693 | 1,183 | 1,176 | 1,176 | ||||||||||||||||||||||||||
HICO Victory Center LP | 262 | — | — | 204 | — | — | 102 | — | — | ||||||||||||||||||||||||||
CL Realty, L.L.C. | 855 | 1,573 | 1,603 | 424 | 1,069 | 1,027 | 220 | 542 | 524 | ||||||||||||||||||||||||||
HICO Avalon LLC | — | — | — | (40 | ) | — | — | (23 | ) | — | — | ||||||||||||||||||||||||
Temco Associates, LLC | 9,485 | 2,155 | 630 | 2,358 | 495 | 96 | 2,351 | (6 | ) | (12 | ) | ||||||||||||||||||||||||
Wildwood Associates | — | 3,329 | — | (120 | ) | (1,704 | ) | (151 | ) | (59 | ) | 2,097 | (75 | ) | |||||||||||||||||||||
Crawford Long - CPI, LLC | 12,291 | 11,945 | 11,829 | 2,820 | 2,775 | 2,827 | 1,416 | 1,407 | 1,372 | ||||||||||||||||||||||||||
Other | — | 4,841 | 48,394 | — | 7,831 | 58,710 | (14 | ) | 3,807 | 64,447 | |||||||||||||||||||||||||
$ | 110,689 | $ | 109,326 | $ | 137,107 | $ | 23,711 | $ | 25,357 | $ | 72,894 | $ | 8,302 | $ | 11,268 | $ | 67,325 | ||||||||||||||||||
(1) Negative balances are included in deferred income on the consolidated balance sheets.
Terminus Office Holdings LLC ("TOH") – TOH is a 50-50 joint venture between the Company and institutional investors advised by J.P. Morgan Asset Management ("JPM"), which owns and operates two office buildings in Atlanta, Georgia. TOH has two non-recourse mortgage loans totaling $211.2 million that mature on January 1, 2023. The weighted average interest rate on these fixed rate loans is 4.69%. The Company does not consolidate TOH because the Company and its partner share decision making abilities and have joint control over the venture. Operating cash flows and proceeds from capital transactions of TOH are allocated to the partners equally until JPM receives an agreed upon return, after which the Company may receive an additional promoted interest. The assets of the venture in the above table include a cash balance of $5.2 million at December 31, 2015.
EP I LLC ("EP I") – EP I is a joint venture between the Company, with a 75% ownership interest, and Lion Gables Realty Limited Partnership (“Gables”), with a 25% ownership interest, which owns the first phase of Emory Point, a mixed-use property in Atlanta, Georgia. The Company does not consolidate EP I because the Company and Gables share decision making abilities and have joint control over the venture. Operating cash flows and proceeds from capital transactions of EP I are allocated to the partners pro rata based on their percentage ownership interests. EP I has a non-recourse construction loan with an outstanding balance $58.0 million at December 31, 2015, and the loan bears interest at LIBOR plus 1.75%. The assets of the venture in the above table include a cash balance of $1.5 million at December 31, 2015.
EP II LLC ("EP II") – EP II is a joint venture between the Company, with a 75% ownership interest, and Lion Gables Realty Limited Partnership (“Gables”), with a 25% ownership interest. The venture owns the second phase of Emory Point. The Company does not consolidate EP II because the Company and Gables share decision making abilities and have joint control over the venture. Operating cash flows and proceeds from capital transactions of EP II are allocated to the partners pro rata based on their percentage ownership interests. EP II has a construction loan to provide for up to $46.0 million to fund construction, $40.9 million of which was outstanding at December 31, 2015. The loan bears interest at LIBOR plus 1.85%. The loan matures October 9, 2016 and may be extended for two, one-year periods if certain conditions are met. The Company and Gables guarantee up to $8.6 million and $2.9 million of the construction loan, respectively. These guarantees may be eliminated after project completion, based on certain conditions. The assets of the venture in the above table include a cash balance of $1.3 million at December 31, 2015.
Charlotte Gateway Village, LLC ("Gateway") – Gateway is a 50-50 joint venture between the Company and Bank of America Corporation (“BOA”), which owns and operates Gateway Village, a 1.1 million square foot office building in Charlotte, North Carolina. The project is 100% leased to BOA through December 31, 2026. Through December 1, 2016, Gateway’s net income or loss and cash distributions are allocated to the members as follows: first to the Company so that it receives a cumulative compounded return equal to 11.46% on its capital contributions, second to BOA until it receives an amount equal to the aggregate amount distributed to the Company, and then 50% to each member. After December 1, 2016, net income and cash flows are allocated 50% to each member. Proceeds from capital transactions are allocated first, to BOA in an amount not to exceed $80.9 million, second 50% to each member until the Company receives a 17% internal rate of return, and third, 80% to BOA and 20% to the Company. The Company’s total project return on Gateway is ultimately limited to an internal rate of return of 17% on its invested capital. Gateway has a non-recourse mortgage loan with an outstanding balance at December 31, 2015 of $17.5 million which will amortize through the maturity date of December 1, 2016. The loan has an interest rate of 6.41%. The assets of the venture in the above table include a cash balance of $2.3 million at December 31, 2015.
HICO Victory Center LP ("HICO") – In 2014, HICO, a joint venture between the Company and Hines Victory Center Associates Limited Partnership ("Hines Victory"), was formed for the purpose of acquiring and subsequently developing an
F-15
office parcel in Dallas, Texas. Pursuant to the joint venture agreement, all pre-development expenditures, other than land, are funded equally by the partners. The Company is required to fund 75% of the cost of land while Hines Victory is required to fund 25%. If the partners decide to commence construction of an office building, the capital accounts and economics of the venture will be adjusted such that the Company will effectively own at least 90% of the venture and Hines will own up to 10%. As of December 31, 2015 the Company accounted for its investment in HICO under the equity method because it does not control the activities of the venture. If the partners decide to construct an office building within the venture, the Company expects to consolidate the venture. The Company's investment in HICO at December 31, 2015 includes its share of pre-development expenditures and its share of land purchased by the venture. The assets of the venture in the table above include a cash balance of $35,000 at December 31, 2015.
Carolina Square Holdings LP ("Carolina Square") - In 2015, Carolina Square, a 50-50 joint venture between the Company and NR 123 Franklin LLC ("Northwood Ravin") was formed for the purpose of developing and constructing a mixed-use property in Chapel Hill, North Carolina pursuant to a ground lease. Upon formation, each partner contributed $1.7 million in cash towards pre-development costs. Carolina Square also entered into a construction loan agreement, secured by the project, which is expected to provide up to $79.8 million to fund future construction costs. The loan bears interest at LIBOR plus 1.90% and matures on May 1, 2018. The Company and Northwood Ravin will each guarantee 12.5% of the outstanding loan amount and guarantee completion of the project. As of December 31, 2015, there is no outstanding balance on this construction loan. The assets of the venture in the table above include a cash balance of $103,000 at December 31, 2015.
CL Realty, L.L.C. ("CL Realty") – CL Realty is a 50-50 joint venture between the Company and Forestar Realty Inc. ("Forestar"), that owns one parcel of land in Texas and mineral rights associated with one project in Texas. The assets of the venture in the above table include a cash balance of $326,000 at December 31, 2015.
HICO Avalon LLC ("HICO Avalon") – In 2015, HICO Avalon, a joint venture between the Company and Hines Avalon Investor LLC ("Hines Avalon") was formed for the purpose of acquiring and potentially developing an office building in Alpharetta, Georgia. Pursuant to the joint venture agreement, all pre-development expenditures, other than land, are funded 75% by Cousins and 25% by Hines. If the project moves forward and HICO Avalon acquires land and commences construction, the acquisition of land and subsequent development expenditures will be funded 90% by Cousins and 10% by Hines. As of December 31, 2015, the Company accounted for its investment in HICO Avalon under the equity method as it does not currently control the activities of the venture. If the project moves to commence construction, the capital accounts and economics of the venture will be adjusted such that the Company will effectively own at least 90% of the venture, and Hines Avalon will own up to 10%. Additionally, Cousins will have unilateral control over the operational aspects of the venture, and the Company expects to consolidate the venture at that time. The Company's investment in HICO Avalon at December 31, 2015 includes only its share of pre-development expenditures. The assets of the venture in the table above include a cash balance of $5,000 at December 31, 2015.
Temco Associates, LLC ("Temco") – Temco is a 50-50 joint venture between the Company and Forestar, that owns various parcels of land and a golf course. The assets of the venture in the above table include a cash balance of $205,000 at December 31, 2015.
Wildwood Associates ("Wildwood") – Wildwood is a 50-50 joint venture between the Company and IBM which owns 27 acres of undeveloped land in the Wildwood Office Park in Atlanta, Georgia. In 2014, Wildwood sold a tract of land resulting in the Company recognizing income from unconsolidated joint ventures of $2.1 million. Of this income, $582,000 represents recognition of deferred income associated with Wildwood's negative investment. At December 31, 2015, the Company’s investment in Wildwood was a credit balance of $1.1 million. This credit balance resulted from cumulative distributions from Wildwood over time that exceeded the Company’s basis in its contributions, and essentially represents deferred gain not recognized at venture formation. This credit balance will decline as the venture’s remaining land is sold. The Company does not have any obligation to fund Wildwood’s working capital needs.
Crawford Long—CPI, LLC ("Crawford Long") – Crawford Long is a 50-50 joint venture between the Company and Emory University and owns the Emory University Hospital Midtown Medical Office Tower, a 358,000 square foot medical office building located in Atlanta, Georgia. Crawford Long has a $74.3 million 3.5% fixed rate mortgage note, which matures on June 1, 2023. The assets of the venture in the above table include a cash balance of $762,000 at December 31, 2015.
Other – In 2013, the Company sold its interests in CP Venture Five LLC, CP Venture Two LLC, and CF Murfreesboro Associates. In 2014, the Company sold its interests in Cousins Watkins LLC. Results of operations of these investments, including the gains recognized upon disposition, are included in Other in the table above.
At December 31, 2015, the Company's unconsolidated joint ventures had aggregate outstanding indebtedness to third parties of $402.0 million. These loans are generally mortgage or construction loans, most of which are non-recourse to the
F-16
Company, except as described above. In addition, in certain instances, the Company provides “non-recourse carve-out guarantees” on these non-recourse loans.
The Company recognized $6.0 million, $5.4 million, and $8.0 million of development, leasing, and management fees, including salary and expense reimbursements, from unconsolidated joint ventures in 2015, 2014 and 2013, respectively. See note 2, fee income, for a discussion of the accounting treatment for fees and reimbursements from unconsolidated joint ventures.
6. INTANGIBLE ASSETS
At December 31, 2015 and 2014, intangible assets included the following (in thousands):
2015 | 2014 | |||||||
In-place leases, net of accumulated amortization of $88,035 and $62,302 in 2015 and 2014, respectively | $ | 112,937 | $ | 147,360 | ||||
Above-market tenant leases, net of accumulated amortization of $15,423 and $13,748 in 2015 and 2014, respectively | 8,031 | 12,017 | ||||||
Goodwill | 3,647 | 3,867 | ||||||
$ | 124,615 | $ | 163,244 | |||||
Intangible assets, other than goodwill, mainly relate to the acquisitions in 2015, 2014, and 2013 (see note 3). Aggregate net amortization expense related to intangible assets and liabilities was $23.7 million, $32.7 million, and $16.9 million for the years ended December 31, 2015, 2014, and 2013, respectively. Over the next five years and thereafter, aggregate amortization of these intangible assets and liabilities is anticipated to be as follows (in thousands):
Below Market Rents | Above Market Ground Lease | Above Market Rents | In Place Leases | Total | |||||||||||||||
2016 | $ | (9,020 | ) | $ | (55 | ) | $ | 1,843 | $ | 23,510 | $ | 16,278 | |||||||
2017 | (8,569 | ) | (55 | ) | 1,384 | 19,893 | 12,653 | ||||||||||||
2018 | (7,793 | ) | (55 | ) | 1,305 | 16,763 | 10,220 | ||||||||||||
2019 | (7,314 | ) | (55 | ) | 883 | 13,644 | 7,158 | ||||||||||||
2020 | (5,427 | ) | (55 | ) | 734 | 10,289 | 5,541 | ||||||||||||
Thereafter | (18,969 | ) | (2,225 | ) | 1,882 | 28,838 | 9,526 | ||||||||||||
$ | (57,092 | ) | $ | (2,500 | ) | $ | 8,031 | $ | 112,937 | $ | 61,376 | ||||||||
Weighted average remaining lease term | 9 years | 48 years | 7 years | 7 years | |||||||||||||||
Goodwill relates entirely to the Company's office assets. As office assets are sold, either by the Company or by joint ventures in which the Company has an interest, goodwill is allocated to the cost of each sale. The following is a summary of goodwill activity for the years ended December 31, 2015 and 2014 (in thousands):
2015 | 2014 | ||||||
Beginning Balance | $ | 3,867 | $ | 4,131 | |||
Allocated to property sales | (220 | ) | (264 | ) | |||
Ending Balance | $ | 3,647 | $ | 3,867 | |||
7. OTHER ASSETS
At December 31, 2015 and 2014, other assets included the following (in thousands):
F-17
2015 | 2014 | |||||||
FF&E and leasehold improvements, net of accumulated depreciation of $22,572 and $19,137 in 2015 and 2014, respectively | $ | 13,523 | $ | 10,590 | ||||
Lease inducements, net of accumulated amortization of $6,865 and $5,475 in 2015 and 2014, respectively | 13,306 | 12,245 | ||||||
Prepaid expenses and other assets | 4,408 | 3,428 | ||||||
Predevelopment costs and earnest money | 1,780 | 1,789 | ||||||
Loan closing costs, net of accumulated amortization of $3,388 and $2,286 in 2015 and 2014, respectively | 5,455 | 6,878 | ||||||
$ | 38,472 | $ | 34,930 | |||||
Lease inducements represent incentives paid to tenants in conjunction with leasing space, such as moving costs, sublease arrangements of prior space and other costs. These amounts are amortized into rental revenues over the individual underlying lease terms.
Predevelopment costs represent amounts that are capitalized related to predevelopment projects that the Company determines are probable of future development.
8. NOTES PAYABLE
The following table summarizes the terms of notes payable outstanding at December 31, 2015 and 2014 (in thousands):
Description | Interest Rate | Maturity | 2015 | 2014 | |||||||||
Post Oak Central mortgage note | 4.26% | 2020 | $ | 181,770 | $ | 185,109 | |||||||
The American Cancer Society Center mortgage note | 6.45% | 2017 | 129,342 | 131,083 | |||||||||
Promenade mortgage note | 4.27% | 2022 | 108,203 | 110,946 | |||||||||
191 Peachtree Tower mortgage note | 3.35% | 2018 | 100,000 | 100,000 | |||||||||
Credit Facility, unsecured | 1.53% | 2019 | 92,000 | 140,200 | |||||||||
816 Congress mortgage note | 3.75% | 2024 | 85,000 | 85,000 | |||||||||
Meridian Mark Plaza mortgage note | 6.00% | 2020 | 24,978 | 25,408 | |||||||||
The Points at Waterview | 5.66% | — | — | 14,598 | |||||||||
$ | 721,293 | $ | 792,344 | ||||||||||
Credit Facility
The Company has a $500 million senior unsecured line of credit (the "Credit Facility") that matures on May 28, 2019. The Credit Facility may be expanded to $750 million at the election of the Company, subject to the receipt of additional commitments from the lenders and other customary conditions.
The Credit Facility contains financial covenants that require, among other things, the maintenance of an unencumbered interest coverage ratio of at least 2.00; a fixed charge coverage ratio of at least 1.50; an overall leverage ratio of no more than 60%; and a minimum shareholders' equity in an amount equal to $1.0 billion, plus a portion of the net cash proceeds from certain equity issuances. The Credit Facility also contains customary representations and warranties and affirmative and negative covenants, as well as customary events of default. The amounts outstanding under the Credit Facility may be accelerated upon the occurrence of any events of default.
The interest rate applicable to the Credit Facility varies according to the Company’s leverage ratio, and may, at the election of the Company, be determined based on either (1) the current London Interbank Offered Rate ("LIBOR") plus the applicable spread as detailed below or (2) the greater of Bank of America's prime rate, the federal funds rate plus 0.50% or the one-month LIBOR plus 1.0% (the “Base Rate”), plus the applicable spread as detailed below. Fees on letters of credit issued under the Credit Facility are payable at an annual rate equal to the spread applicable to loans bearing interest based on LIBOR. The Company also pays an annual facility fee on the total commitments under the Credit Facility. The pricing spreads and the facility fee under the Credit Facility are as follows:
F-18
Leverage Ratio | Applicable % Spread for LIBOR | Applicable % Spread for Base Rate | Annual Facility Fee % | |||
≤ 30% | 1.10% | 0.10% | 0.15% | |||
>30% but ≤ 35% | 1.10% | 0.10% | 0.20% | |||
>35% but ≤ 40% | 1.15% | 0.15% | 0.20% | |||
>40% but ≤ 45% | 1.20% | 0.20% | 0.20% | |||
>45% but ≤ 50% | 1.20% | 0.20% | 0.25% | |||
>50% | 1.45% | 0.45% | 0.30% | |||
At December 31, 2015, the Credit Facility's spread over LIBOR was 1.1%. The amount that the Company may draw under the Credit Facility is a defined calculation based on the Company's unencumbered assets and other factors. The total available borrowing capacity under the Credit Facility was $407.0 million at December 31, 2015, and the Credit Facility is recourse to the Company.
Other Debt Information
In 2015, the Company prepaid, without penalty, the $14.2 million The Points at Waterview mortgage note. The note was scheduled to mature on January 1, 2016.
The real estate and other assets of The American Cancer Society Center (the “ACS Center”) are restricted under the ACS Center loan agreement in that they are not available to settle debts of the Company. However, provided that the ACS Center loan has not incurred any uncured event of default, as defined in the loan agreement, the cash flows from the ACS Center, after payments of debt service, operating expenses and reserves, are available for distribution to the Company.
The majority of the Company’s consolidated debt is fixed-rate long-term non-recourse mortgage notes payable. Assets with depreciated carrying values of $675.7 million were pledged as security on the $629.3 million mortgage notes payable. As of December 31, 2015, the weighted average maturity of the Company’s consolidated debt was 4.5 years.
At December 31, 2015 and 2014, the estimated fair value of the Company’s notes payable was $738.1 million and $835.4 million, respectively, calculated by discounting the debt's remaining contractual cash flows at estimated rates at which similar loans could have been obtained at December 31, 2015 and 2014. The estimate of the current market rate, which is the most significant input in the discounted cash flow calculation, is intended to replicate debt of similar maturity and loan-to-value relationship. These fair value calculations are considered to be Level 2 under the guidelines as set forth in ASC 820 as the Company utilizes market rates for similar type loans from third party brokers.
For the years ended December 31, 2015, 2014, and 2013, interest was recorded as follows (in thousands):
2015 | 2014 | 2013 | |||||||||
Total interest incurred | $ | 34,302 | $ | 31,862 | $ | 22,227 | |||||
Interest capitalized | (3,579 | ) | (2,752 | ) | (518 | ) | |||||
Total interest expense | $ | 30,723 | $ | 29,110 | $ | 21,709 | |||||
Debt Maturities
Future principal payments due on the Company's notes payable at December 31, 2015 are as follows (in thousands):
2016 | $ | 10,070 | |
2017 | 138,195 | ||
2018 | 105,734 | ||
2019 | 101,447 | ||
2020 | 195,022 | ||
Thereafter | 170,825 | ||
$ | 721,293 | ||
9. COMMITMENTS AND CONTINGENCIES
Commitments
F-19
The Company had a total of $82.4 million in future obligations under leases to fund tenant improvements and in other future construction obligations at December 31, 2015. The Company had outstanding letters of credit and performance bonds totaling $1.9 million at December 31, 2015. The Company recorded lease expense of $2.0 million, $1.3 million, and $1.1 million in 2015, 2014, and 2013, respectively. The Company has future lease commitments under ground leases and operating leases totaling $144.9 million over weighted average remaining terms of 85.6 and 2.2 years, respectively. Amounts due under these lease commitments are as follows (in thousands):
2016 | $ | 1,784 | |
2017 | 1,736 | ||
2018 | 1,696 | ||
2019 | 1,657 | ||
2020 | 1,659 | ||
Thereafter | 136,404 | ||
$ | 144,936 | ||
Litigation
The Company is subject to various legal proceedings, claims and administrative proceedings arising in the ordinary course of business, some of which are expected to be covered by liability insurance. Management makes assumptions and estimates concerning the likelihood and amount of any potential loss relating to these matters using the latest information available. The Company records a liability for litigation if an unfavorable outcome is probable and the amount of loss or range of loss can be reasonably estimated. If an unfavorable outcome is probable and a reasonable estimate of the loss is a range, the Company accrues the best estimate within the range. If no amount within the range is a better estimate than any other amount, the Company accrues the minimum amount within the range. If an unfavorable outcome is probable but the amount of the loss cannot be reasonably estimated, the Company discloses the nature of the litigation and indicates that an estimate of the loss or range of loss cannot be made. If an unfavorable outcome is reasonably possible and the estimated loss is material, the Company discloses the nature and estimate of the possible loss of the litigation. The Company does not disclose information with respect to litigation where an unfavorable outcome is considered to be remote or where the estimated loss would not be material. Based on current expectations, such matters, both individually and in the aggregate, are not expected to have a material adverse effect on the liquidity, results of operations, business or financial condition of the Company.
10. STOCKHOLDERS' EQUITY
In 2015, the Board of Directors of the Company authorized the repurchase of up to $100 million of its outstanding common shares. The plan expires on September 8, 2017. The repurchases may be executed in the open market, through private negotiations, or in other transactions permitted under applicable law. The timing, manner, price and amount of any repurchases will be determined by the Company in its discretion and will be subject to economic and market conditions, stock price, applicable legal requirements and other factors. The share repurchase program may be suspended or discontinued at any time.
Under this plan, through December 31, 2015, the Company has repurchased 5.2 million shares of its common stock for a total cost of $47.8 million, including broker commissions. The share repurchases were funded from cash on hand, borrowings under the Company's Credit Facility, and proceeds from the sale of assets. The repurchased shares were recorded as treasury shares on the consolidated balance sheet.
Subsequent to year-end, through January 31, 2016, the Company has repurchased 193,000 shares of its common stock for a total cost of $1.6 million.
In 2014, the Company issued 26.7 million shares of common stock, in two offerings, resulting in net proceeds to the Company of $321.9 million, which includes customary legal, accounting, and other expenses. In 2013, the Company issued 85.6 million shares of common stock, in two offerings, resulting in net proceeds to the Company of $826.2 million.
In 2014, the Company redeemed all outstanding shares of its 7.5% Series B Cumulative Redeemable Preferred Stock, par value $1 per share, for $25 per share or $94.8 million, excluding accrued dividends. In connection with this redemption, the Company decreased net income available for common stockholders by $3.5 million (non-cash), which represents the original issuance costs applicable to the shares redeemed.
Ownership Limitations — In order to minimize the risk that the Company will not meet one of the requirements for qualification as a REIT, the Company's Articles of Incorporation include certain restrictions on the ownership of more than 3.9% of the Company’s total common and preferred stock, subject to waiver by Board of Directors.
F-20
Distribution of REIT Taxable Income — The following reconciles dividends paid and dividends applied in 2015, 2014, and 2013 to meet REIT distribution requirements (in thousands):
2015 | 2014 | 2013 | |||||||||
Common and preferred dividends paid | $ | 69,196 | $ | 64,510 | $ | 37,200 | |||||
Dividends treated as taxable compensation | (94 | ) | (110 | ) | (98 | ) | |||||
Portion of dividends declared in current year, and paid in current year, which was applied to the prior year distribution requirements | (731 | ) | (2,182 | ) | (470 | ) | |||||
Portion of dividends declared in subsequent year, and paid in subsequent year, which apply to current year distribution requirements | 34 | 731 | 2,182 | ||||||||
Dividends applied to meet current year REIT distribution requirements | $ | 68,405 | $ | 62,949 | $ | 38,814 | |||||
Tax Status of Distributions — The following summarizes the components of the taxability of the Company’s distributions for the years ended December 31, 2015, 2014, and 2013:
Total Distributions Per Share | Ordinary Dividends | Long-Term Capital Gain | Unrecaptured Section 1250 Gain (A) | Cash Liquidation Distributions | |||||||||||||||
Common: | |||||||||||||||||||
2015 | $ | 0.320000 | $ | 0.161738 | $ | 0.158262 | $ | 0.097271 | $ | — | |||||||||
2014 | $ | 0.300000 | $ | 0.281564 | $ | 0.018436 | $ | 0.018436 | $ | — | |||||||||
2013 | $ | 0.180000 | $ | 0.170355 | $ | 0.009645 | $ | 0.009457 | $ | — | |||||||||
Series A Preferred: | |||||||||||||||||||
2013 | $ | 25.968750 | $ | 0.966882 | $ | 0.001868 | $ | — | $ | 25.000000 | |||||||||
Series B Preferred: | |||||||||||||||||||
2014 | $ | 25.776040 | $ | 0.467750 | $ | 0.001000 | $ | 0.001000 | $ | 25.307290 | |||||||||
2013 | $ | 1.875000 | $ | 1.774673 | $ | 0.100327 | $ | 0.098519 | $ | — | |||||||||
(A) | Represents a portion of the dividend allocated to long-term capital gain. |
11. FUTURE MINIMUM RENTS
The Company’s leases typically contain escalation provisions and provisions requiring tenants to pay a pro rata share of operating expenses. The leases typically include renewal options and are classified and accounted for as operating leases.
At December 31, 2015 future minimum rents to be received by consolidated entities under existing non-cancelable leases are as follows (in thousands):
2016 | $ | 217,863 | ||
2017 | 219,458 | |||
2018 | 217,711 | |||
2019 | 202,868 | |||
2020 | 174,144 | |||
Thereafter | 639,051 | |||
$ | 1,671,095 | |||
12. STOCK-BASED COMPENSATION
The Company maintains the 2009 Incentive Stock Plan (the “2009 Plan”), which allows the Company to issue awards of stock options, stock grants, or stock appreciation rights to employees and directors. As of December 31, 2015, 2,426,451 shares were authorized to be awarded pursuant to the 2009 Plan. The Company also maintains the 2005 Restricted Stock Unit ("RSU")Plan, as amended, which allows the Company to issue awards to employees that are paid in cash on the vesting date in an amount equal to the fair market value, as defined, of one share of the Company’s stock. The Company has granted stock options, restricted stock, and restricted stock units to employees as discussed below.
Stock Options
F-21
At December 31, 2015, the Company had 1,763,316 stock options outstanding to key employees and outside directors pursuant to the 2009 Plan. The Company typically uses authorized, unissued shares to provide shares for option exercises. The stock options have a term of ten years from the date of grant and have a vesting period of four years, except director stock options, which vest immediately.
The Company calculates the fair value of each option grant on the grant date using the Black-Scholes option-pricing model, which requires the Company to provide certain inputs as follows:
• | The risk-free interest rate utilized is the interest rate on U.S. Treasury Strips or Bonds having a term equal to the estimated life of the Company’s option awards. |
• | Expected life of the options granted is estimated based on historical data reflecting actual hold periods plus an estimated hold period for unexercised options outstanding. |
• | Expected volatility is based on the historical volatility of the Company’s stock over a period equal to the estimated option life. |
• | The assumed dividend yield is based on the Company’s expectation of an annual dividend rate for regular dividends over the estimated life of the option. |
In 2015, 2014, and 2013, there were no stock option grants.
The Company recognizes compensation expense using the straight-line method over the vesting period of the options, with the offset recognized in additional paid-in capital. During 2015, 2014, and 2013, $15,000, $140,000 and $226,000, respectively, was recognized as compensation expense.
The Company does not anticipate recognizing any future compensation expense related to stock options outstanding at December 31, 2015. During 2015, total cash proceeds from the exercise of options equaled $185,000. As of December 31, 2015, the intrinsic value of the options outstanding and exercisable was $888,000. The intrinsic value is calculated using the exercise prices of the options compared to the market value of the Company’s stock. At December 31, 2015 and 2014, the weighted-average contractual lives for the options outstanding and exercisable were 2.3 years and 2.8 years, respectively.
The following is a summary of stock option activity for the years ended December 31, 2015, 2014, and 2013:
Number of Options (000s) | Weighted Average Exercise Price Per Option | |||||
Outstanding at December 31, 2012 | 4,437 | $ | 21.74 | |||
Exercised | (283 | ) | 8.12 | |||
Forfeited/Expired | (1,076 | ) | 21.98 | |||
Outstanding at December 31, 2013 | 3,078 | 22.90 | ||||
Exercised | (206 | ) | 8.26 | |||
Forfeited/Expired | (661 | ) | 28.18 | |||
Outstanding at December 31, 2014 | 2,211 | 22.69 | ||||
Exercised | (23 | ) | 8.02 | |||
Forfeited/Expired | (425 | ) | 26.13 | |||
Outstanding at December 31, 2015 | 1,763 | 22.05 | ||||
Options Exercisable at December 31, 2015 | 1,763 | $ | 22.05 | |||
Restricted Stock
In 2015, 2014, and 2013, the Company issued 165,922, 137,591, and 159,782 shares of restricted stock to employees, which vest ratably over three years from the issuance date. In 2015, 2014, and 2013, the Company also issued 78,985, 55,293, and 50,085 shares of stock to independent members of the board of directors which vested immediately on the issuance date. All shares of restricted stock receive dividends and have voting rights during the vesting period. The Company records restricted stock in common stock and additional paid-in capital at fair value on the grant date, with the offsetting deferred compensation also recorded in additional paid-in capital. The Company records compensation expense over the vesting period. Compensation expense related to restricted stock was $1.5 million, $1.8 million, and $1.8 million in 2015, 2014, and 2013, respectively.
As of December 31, 2015, the Company had recorded $1.8 million of unrecognized compensation cost included in additional paid-in capital related to restricted stock, which will be recognized over a weighted average period of 1.8 years. The
F-22
total fair value of the restricted stock which vested during 2015 was $2.0 million. The following table summarizes restricted stock activity for the years ended December 31, 2015, 2014, and 2013:
Number of Shares (000s) | Weighted-Average Grant Date Fair Value | |||||
Non-vested restricted stock at December 31, 2012 | 703 | $ | 7.55 | |||
Granted | 160 | 8.91 | ||||
Vested | (361 | ) | 7.50 | |||
Forfeited | (52 | ) | 8.24 | |||
Non-vested restricted stock at December 31, 2013 | 450 | 8.00 | ||||
Granted | 138 | 10.75 | ||||
Vested | (236 | ) | 8.00 | |||
Forfeited | (10 | ) | 9.48 | |||
Non-vested restricted stock at December 31, 2014 | 342 | 9.08 | ||||
Granted | 166 | 11.06 | ||||
Vested | (210 | ) | 8.41 | |||
Forfeited | (5 | ) | 10.68 | |||
Non-vested restricted stock at December 31, 2015 | 293 | $ | 10.65 | |||
Restricted Stock Units
During 2015, 2014, and 2013, the Company awarded two types of performance-based RSUs to key employees: one based on the total stockholder return of the Company, as defined, relative to that of office peers included in the SNL US Office REIT Index (the "TSR RSUs") and the other based on the ratio of cumulative funds from operations per share to targeted cumulative funds from operations per share (the “FFO RSUs”). The performance period for these awards is three years and the ultimate payout of these awards can range from 0% to 200% of the targeted number of units depending on the achievement of the performance metrics described above. Both of these RSUs are to be settled in cash with payment dependent upon the attainment of required service, market, and performance criteria. The Company expenses an estimate of the fair value of the TSR RSUs over the performance period using a quarterly Monte Carlo valuation. The Company expenses the FFO RSUs over the vesting period using the fair market value of the Company’s stock at the reporting date multiplied by the anticipated number of units to be paid based on the current estimate of what the ratio is expected to be upon vesting. Dividend equivalents on the TSR RSUs and FFO RSUs will also be paid based upon the percentage vested. The targeted number of performance-based RSUs outstanding at December 31, 2015 are 241,370, 159,745, and 160,107 related to the 2015, 2014, and 2013 grants, respectively.
In 2012, the Company also issued 281,532 performance-based RSUs to the Chief Executive Officer. The payout of these awards can range from 0% to 150% of the targeted number of units depending on the total stockholder return of the Company, as defined, as compared to that of a peer group of companies. The performance period of the awards is five years with interim performance measurement dates at each of the third, fourth and fifth anniversaries. To the extent that the Company has attained the defined performance goals at the end each of these periods, one-third of the units may be credited after each of the third and fourth anniversaries, with the balance credited at the end of the fifth anniversary, and to be awarded in cash subject to continuous employment on the fifth anniversary. This award is expensed using a quarterly Monte Carlo valuation over the vesting period.
The following table summarizes the performance-based RSU activity as of December 31, 2015, 2014, and 2013 (in thousands):
F-23
Outstanding at December 31, 2012 | 782 | |
Granted | 196 | |
Exercised | (94 | ) |
Forfeited | (129 | ) |
Outstanding at December 31, 2013 | 755 | |
Granted | 205 | |
Exercised | (150 | ) |
Forfeited | (14 | ) |
Outstanding at December 31, 2014 | 796 | |
Granted | 244 | |
Exercised | (191 | ) |
Forfeited | (6 | ) |
Outstanding at December 31, 2015 | 843 | |
The Company estimates future expense for all types of RSUs outstanding at December 31, 2015 to be $2.0 million (using stock prices and estimated target percentages as of December 31, 2015), which will be recognized over a weighted-average period of 1.2 years. During 2015, total cash paid for all types of RSUs and related dividend payments was $4.4 million.
During 2015, 2014, and 2013, $67,000, $5.4 million, and $5.3 million, respectively, was recognized as compensation expense related to RSUs for employees and directors.
Other Long-Term Compensation
In 2009, the Company granted a long-term incentive compensation award to key employees to be settled in cash if the Company’s stock price achieved a specified level of growth at the testing dates and a service requirement is met. This award was valued using the Monte Carlo method. The Company reversed $28,000 and $286,000 in compensation expense related to this plan in 2014 and 2013, respectively. This award expired in 2014 with no amounts paid to key employees thereunder.
13. RETIREMENT SAVINGS PLAN
The Company maintains a defined contribution plan (the “Retirement Savings Plan”) pursuant to Section 401 of the Internal Revenue Code (the “Code”) which covers active regular employees. Employees are eligible under the Retirement Savings Plan immediately upon hire, and pre-tax contributions are allowed up to the limits set by the Code. The Company has a match program of up to 3% of an employee’s eligible pre-tax Retirement Savings Plan contributions up to certain Code limits. Employees vest in Company contributions over a three-year period. The Company may change this percentage at its discretion, and, in addition, the Company could decide to make discretionary contributions in the future. The Company contributed $639,000, $592,000, and $422,000 to the Retirement Savings Plan for the 2015, 2014, and 2013 plan years, respectively.
14. INCOME TAXES
On December 31, 2014, CREC merged into Cousins and Cousins formed CTRS. Amounts included in the following table for 2015 reflect the benefit (provision) of CTRS and the amounts for 2014 and 2013 reflect the benefit (provision) for CREC.
2015 | 2014 | 2013 | |||||||||
Current tax benefit: | |||||||||||
Federal | $ | — | $ | — | $ | — | |||||
State | 20 | 23 | |||||||||
— | 20 | 23 | |||||||||
Deferred tax benefit: | |||||||||||
Federal | — | — | — | ||||||||
State | — | — | — | ||||||||
— | — | — | |||||||||
Benefit for income taxes from operations | $ | — | $ | 20 | $ | 23 | |||||
F-24
The net income tax benefit differs from the amount computed by applying the statutory federal income tax rate to CTRS' income before taxes for the year ended December 31, 2015, and to CREC’s income before taxes for the years ended 2014 and 2013 as follows ($ in thousands):
2015 | 2014 | 2013 | ||||||||||||||||||
Amount | Rate | Amount | Rate | Amount | Rate | |||||||||||||||
Federal income tax benefit (expense) | $ | 778 | 35 | % | $ | (1,124 | ) | (35 | )% | $ | (1,287 | ) | (35 | )% | ||||||
State income tax benefit (expense), net of federal income tax effect | 90 | 4 | % | (125 | ) | (4 | )% | (147 | ) | (4 | )% | |||||||||
Valuation allowance | (833 | ) | (37 | )% | 1,644 | 50 | % | (361 | ) | (10 | )% | |||||||||
State deferred tax adjustment | (35 | ) | (2 | )% | (375 | ) | (11 | )% | 1,818 | 49 | % | |||||||||
Benefit applicable to income (loss) from continuing operations | $ | — | — | % | $ | 20 | — | % | $ | 23 | — | % | ||||||||
On December 31, 2014, CREC merged into Cousins and Cousins contributed some of the assets and contracts that were previously owned by CREC to CTRS, a newly formed taxable REIT subsidiary of Cousins. Cousins retained many of CREC's tax benefits, including the significant portion of CREC's Federal and state tax carryforwards. Some of CREC's tax benefits were assumed by CTRS upon the contributions Cousins made to CTRS immediately following CREC's merger into Cousins. The tax effect of significant temporary differences representing deferred tax assets and liabilities of CTRS as of December 31, 2015 and 2014 are as follows (in thousands):
2015 | 2014 | ||||||
Income from unconsolidated joint ventures | $ | 928 | $ | 2,441 | |||
Federal and state tax carryforwards | 680 | — | |||||
Total deferred tax assets | 1,608 | 2,441 | |||||
Valuation allowance | (1,608 | ) | (2,441 | ) | |||
Net deferred tax asset | $ | — | $ | — | |||
A valuation allowance is required to be recorded against deferred tax assets if, based on the available evidence, it is more likely than not that such assets will not be realized. When assessing the need for a valuation allowance, appropriate consideration should be given to all positive and negative evidence related to this realization. This evidence includes, among other things, the existence of current and recent cumulative losses, forecasts of future profitability, the length of statutory carryforward periods, the Company’s history with loss carryforwards and available tax planning strategies.
As of December 31, 2015 and 2014 the deferred tax asset of CTRS equaled $1.6 million and $2.4 million, respectively, with a valuation allowance placed against the full amount of each. The conclusion that a valuation allowance should be recorded as of December 31, 2015 and 2014 was based the lack of evidence that CTRS, could generate future taxable income to realize the benefit of the deferred tax assets.
15. EARNINGS PER SHARE
The following table reconciles the denominator for the basic and diluted earnings per share computations shown on the consolidated statements of operations for the years ended December 31, 2015, 2014, and 2013 (in thousands):
2015 | 2014 | 2013 | ||||||
Weighted average shares—basic | 215,827 | 204,216 | 144,255 | |||||
Dilutive potential common shares—stock options | 152 | 244 | 165 | |||||
Weighted average shares—diluted | 215,979 | 204,460 | 144,420 | |||||
Weighted average anti-dilutive stock options | 1,128 | 1,553 | 2,208 | |||||
Anti-dilutive stock options represent stock options whose exercise price exceeds the average market value of the Company’s stock. These anti-dilutive stock options are not included in the current calculation of dilutive weighted average shares, but could be dilutive in the future.
F-25
16. CONSOLIDATED STATEMENTS OF CASH FLOWS - SUPPLEMENTAL INFORMATION
Supplemental information related to cash flows, including significant non-cash activity affecting the consolidated statements of cash flows, for the years ended December 31, 2015, 2014, and 2013 is as follows (in thousands):
2015 | 2014 | 2013 | |||||||||
Interest paid, net of amounts capitalized | $ | 29,337 | $ | 28,840 | $ | 21,216 | |||||
Income taxes paid | 2 | 4 | 90 | ||||||||
Non-Cash Transactions: | |||||||||||
Transfer from projects under development to operating properties | 121,709 | — | 25,629 | ||||||||
Transfer from operating properties and related assets to real estate assets and other assets held for sale | 7,246 | — | 24,554 | ||||||||
Transfer from operating properties and related liabilities to liabilities of real estate assets held for sale | 1,347 | — | — | ||||||||
Change in accrued property acquisition, development, and tenant asset expenditures | (2,483 | ) | (531 | ) | 1,559 | ||||||
Transfer from other assets to projects under development | — | — | 3,062 | ||||||||
Transfer from land to projects under development | — | 5,185 | — | ||||||||
17. REPORTABLE SEGMENTS
The Company's segments are based on the method of internal reporting which classifies operations by property type and geographical area. The segments by property type are: Office, Mixed Use, and Other. The segments by geographical region are: Atlanta, Houston, Austin, Charlotte, and Other. In 2014 and 2013, the Company's reportable segments were Office, Retail, Land and Other. In 2014, the Company sold the remaining stand-alone retail properties, completing a strategic shift to focus on office properties. In conjunction, segment reporting has been adjusted to reflect the current Company profile and internal reporting. These reportable segments represent an aggregation of operating segments reported to the Chief Operating Decision Maker based on similar economic characteristics that include the type of product and the geographical location. Prior period information has been revised to reflect the change in segment reporting. Each segment includes both consolidated operations and the Company's share of joint venture operations.
Company management evaluates the performance of its reportable segments in part based on net operating income (“NOI”). NOI represents rental property expenses less rental property operating expenses. NOI is not a measure of cash flows or operating results as measured by GAAP, is not indicative of cash available to fund cash needs and should not be considered an alternative to cash flows as a measure of liquidity. All companies may not calculate NOI in the same manner. The Company considers NOI to be an appropriate supplemental measure to net income as it helps both management and investors understand the core operations of the Company's operating assets. NOI excludes corporate general and administrative expenses, interest expense, depreciation and amortization, impairments, gains/loss on sales of real estate, and other non-operating items.
Segment net income, amount of capital expenditures, and total assets are not presented in the following tables because management does not utilize these measures when analyzing its segments or when making resource allocation decisions. Information on the Company's segments along with a reconciliation of NOI to net income available to common stockholders is as follows (in thousands):
F-26
Year ended December 31, 2015 | Office | Mixed-Use | Other | Total | ||||||||||||
Net Operating Income: | ||||||||||||||||
Houston | $ | 103,210 | $ | — | $ | — | $ | 103,210 | ||||||||
Atlanta | 93,438 | 5,854 | — | 99,292 | ||||||||||||
Austin | 15,294 | — | — | 15,294 | ||||||||||||
Charlotte | 16,164 | — | — | 16,164 | ||||||||||||
Other | 7,104 | — | 168 | 7,272 | ||||||||||||
Total Net Operating Income | $ | 235,210 | $ | 5,854 | $ | 168 | 241,232 | |||||||||
Net operating income from unconsolidated joint ventures | (24,335 | ) | ||||||||||||||
Net operating loss from discontinued operations | 14 | |||||||||||||||
Fee income | 7,297 | |||||||||||||||
Other income | 1,278 | |||||||||||||||
General and administrative expenses | (17,099 | ) | ||||||||||||||
Reimbursed expenses | (3,430 | ) | ||||||||||||||
Interest expense | (30,723 | ) | ||||||||||||||
Depreciation and amortization | (135,416 | ) | ||||||||||||||
Other expenses | (1,299 | ) | ||||||||||||||
Income from unconsolidated joint ventures | 8,302 | |||||||||||||||
Loss from discontinued operations | (586 | ) | ||||||||||||||
Gain on sale of investment properties | 80,394 | |||||||||||||||
Net income attributable to noncontrolling interests | (111 | ) | ||||||||||||||
Net income available to common stockholders | $ | 125,518 | ||||||||||||||
F-27
Year ended December 31, 2014 | Office | Mixed-Use | Other | Total | ||||||||||||
Net Operating Income: | ||||||||||||||||
Houston | $ | 100,816 | $ | — | $ | — | $ | 100,816 | ||||||||
Atlanta | 73,434 | 5,727 | — | 79,161 | ||||||||||||
Austin | 6,992 | — | — | 6,992 | ||||||||||||
Charlotte | 6,839 | — | — | 6,839 | ||||||||||||
Other | 18,470 | — | 3,395 | 18,470 | ||||||||||||
Total Net Operating Income | $ | 206,551 | $ | 5,727 | $ | 3,395 | 215,673 | |||||||||
Net operating income from unconsolidated joint ventures | (25,897 | ) | ||||||||||||||
Net operating income from discontinued operations | (1,800 | ) | ||||||||||||||
Fee income | 12,519 | |||||||||||||||
Other income | 4,954 | |||||||||||||||
General and administrative expenses | (19,969 | ) | ||||||||||||||
Reimbursed expenses | (3,652 | ) | ||||||||||||||
Interest expense | (29,110 | ) | ||||||||||||||
Depreciation and amortization | (140,018 | ) | ||||||||||||||
Other expenses | (4,654 | ) | ||||||||||||||
Preferred share original issuance costs | (3,530 | ) | ||||||||||||||
Dividends to preferred stockholders | (2,955 | ) | ||||||||||||||
Income from unconsolidated joint ventures | 11,268 | |||||||||||||||
Income from discontinued operations | 21,158 | |||||||||||||||
Gain on sale of investment properties | 12,536 | |||||||||||||||
Net income attributable to noncontrolling interests | (1,004 | ) | ||||||||||||||
Net income available to common stockholders | $ | 45,519 | ||||||||||||||
F-28
Year ended December 31, 2013 | Office | Mixed-Use | Other | Total | ||||||||||||
Net Operating Income: | ||||||||||||||||
Houston | $ | 40,199 | $ | — | $ | — | $ | 40,199 | ||||||||
Atlanta | 62,211 | 3,511 | — | 65,722 | ||||||||||||
Austin | 4,029 | — | — | 4,029 | ||||||||||||
Charlotte | 1,208 | — | — | 1,208 | ||||||||||||
Other | 14,856 | — | 12,066 | 26,922 | ||||||||||||
Total Net Operating Income | $ | 122,503 | $ | 3,511 | $ | 12,066 | 138,080 | |||||||||
Net operating income from unconsolidated joint ventures | (27,768 | ) | ||||||||||||||
Net operating income from discontinued operations | (6,390 | ) | ||||||||||||||
Fee income | 10,891 | |||||||||||||||
Other income | 5,430 | |||||||||||||||
General and administrative expenses | (22,460 | ) | ||||||||||||||
Reimbursed expenses | (5,215 | ) | ||||||||||||||
Interest expense | (21,709 | ) | ||||||||||||||
Depreciation and amortization | (76,277 | ) | ||||||||||||||
Other expenses | (11,154 | ) | ||||||||||||||
Preferred share original issuance costs | (2,656 | ) | ||||||||||||||
Dividends to preferred stockholders | (10,008 | ) | ||||||||||||||
Income from unconsolidated joint ventures | 67,325 | |||||||||||||||
Income from discontinued operations | 14,788 | |||||||||||||||
Gain on sale of investment properties | 61,288 | |||||||||||||||
Net income attributable to noncontrolling interests | (5,068 | ) | ||||||||||||||
Net income available to common stockholders | $ | 109,097 | ||||||||||||||
F-29
SCHEDULE III
(Page 1 of 3)
COUSINS PROPERTIES INCORPORATED AND SUBSIDIARIES
REAL ESTATE AND ACCUMULATED DEPRECIATION
December 31, 2015
(in thousands)
Initial Cost to Company | Costs Capitalized Subsequent to Acquisition | Gross Amount at Which Carried at Close of Period | |||||||||||||||||||||||||||||||||||||||
Description/Metropolitan Area | Encumbrances | Land and Improvements | Buildings and Improvements | Land and Improvements less Cost of Sales, Transfers and Other | Building and Improvements less Cost of Sales, Transfers and Other | Land and Improvements less Cost of Sales, Transfers and Other | Building and Improvements less Cost of Sales, Transfers and Other | Total (a) | Accumulated Depreciation (a) | Date of Construction/ Renovation | Date Acquired | Life on Which Depreciation in 2015 Statement of Operations is Computed (b) | |||||||||||||||||||||||||||||
OPERATING PROPERTIES | |||||||||||||||||||||||||||||||||||||||||
Greenway Plaza | $ | — | $ | 273,651 | $ | 595,547 | $ | — | $ | 76,561 | $ | 273,651 | $ | 672,108 | $ | 945,759 | $ | 85,617 | — | 2013 | 30 years | ||||||||||||||||||||
Houston, TX | |||||||||||||||||||||||||||||||||||||||||
Northpark Town Center | — | 24,577 | 295,825 | — | 10,741 | 24,577 | 306,566 | 331,143 | 15,006 | — | 2014 | 39 years | |||||||||||||||||||||||||||||
Atlanta, GA | |||||||||||||||||||||||||||||||||||||||||
Fifth Third Center | — | 22,863 | 180,430 | — | 5,701 | 22,863 | 186,131 | 208,994 | 8,671 | — | 2014 | 40 years | |||||||||||||||||||||||||||||
Charlotte, NC | |||||||||||||||||||||||||||||||||||||||||
191 Peachtree Tower | 100,000 | 5,355 | 141,012 | 4,034 | 98,643 | 9,389 | 239,655 | 249,044 | 88,637 | — | 2006 | 40 years | |||||||||||||||||||||||||||||
Atlanta, GA | |||||||||||||||||||||||||||||||||||||||||
Post Oak Central | 181,770 | 87,264 | 129,347 | — | 36,047 | 87,264 | 165,394 | 252,658 | 26,333 | — | 2013 | 42 years | |||||||||||||||||||||||||||||
Houston, TX | |||||||||||||||||||||||||||||||||||||||||
Promenade | 108,203 | 13,439 | 102,790 | — | 33,987 | 13,439 | 136,777 | 150,216 | 25,841 | — | 2011 | 34 years | |||||||||||||||||||||||||||||
Atlanta, GA | |||||||||||||||||||||||||||||||||||||||||
The American Cancer Society Center | 129,342 | 5,226 | 67,370 | — | 31,953 | 5,226 | 99,323 | 104,549 | 68,082 | — | 1999 | 25 years | |||||||||||||||||||||||||||||
Atlanta, GA | |||||||||||||||||||||||||||||||||||||||||
816 Congress | 85,000 | 6,817 | 89,891 | 3,282 | 10,712 | 10,099 | 100,603 | 110,702 | 10,096 | — | 2013 | 42 years | |||||||||||||||||||||||||||||
Austin, TX | |||||||||||||||||||||||||||||||||||||||||
Meridian Mark Plaza | 24,978 | 2,219 | — | — | 28,142 | 2,219 | 28,142 | 30,361 | 17,656 | 1997 | 1997 | 30 years | |||||||||||||||||||||||||||||
Atlanta, GA | |||||||||||||||||||||||||||||||||||||||||
221 Peachtree Center Avenue Parking Garage | — | 4,217 | 13,337 | 1 | 347 | 4,218 | 13,684 | 17,902 | 3,127 | — | 2007 | 39 years | |||||||||||||||||||||||||||||
Atlanta, GA | |||||||||||||||||||||||||||||||||||||||||
Colorado Tower | — | — | — | 4,014 | 110,906 | 4,014 | 110,906 | 114,920 | 3,284 | 2013 | 2013 | 30 years | |||||||||||||||||||||||||||||
Austin, TX | |||||||||||||||||||||||||||||||||||||||||
Research Park | — | 4,373 | — | — | 26,510 | 4,373 | 26,510 | 30,883 | — | 2014 | 1998 | 0 years | |||||||||||||||||||||||||||||
Austin, TX | |||||||||||||||||||||||||||||||||||||||||
Total Operating Properties | $ | 629,293 | $ | 450,001 | $ | 1,615,549 | $ | 11,331 | $ | 470,250 | $ | 461,332 | $ | 2,085,799 | $ | 2,547,131 | $ | 352,350 | |||||||||||||||||||||||
S-1
SCHEDULE III
(Page 2 of 3)
COUSINS PROPERTIES INCORPORATED AND SUBSIDIARIES
REAL ESTATE AND ACCUMULATED DEPRECIATION
December 31, 2015
(in thousands)
Initial Cost to Company | Costs Capitalized Subsequent to Acquisition | Gross Amount at Which Carried at Close of Period | |||||||||||||||||||||||||||||||||||||||
Description/Metropolitan Area | Encumbrances | Land and Improvements | Buildings and Improvements | Land and Improvements less Cost of Sales, Transfers and Other | Building and Improvements less Cost of Sales, Transfers and Other | Land and Improvements less Cost of Sales, Transfers and Other | Building and Improvements less Cost of Sales, Transfers and Other | Total (a) | Accumulated Depreciation (a) | Date of Construction/ Renovation | Date Acquired | Life on Which Depreciation in 2015 Statement of Operations is Computed (b) | |||||||||||||||||||||||||||||
PROJECTS UNDER DEVELOPMENT | |||||||||||||||||||||||||||||||||||||||||
NCR Phase 1 | — | 20,032 | — | — | 7,858 | 20,032 | 7,858 | 27,890 | — | 2015 | 2015 | 0 years | |||||||||||||||||||||||||||||
Atlanta, GA | |||||||||||||||||||||||||||||||||||||||||
Total Projects Under Development | $ | — | $ | 20,032 | $ | — | $ | — | $ | 7,858 | $ | 20,032 | $ | 7,858 | $ | 27,890 | $ | — | |||||||||||||||||||||||
LAND | |||||||||||||||||||||||||||||||||||||||||
Commercial Land | |||||||||||||||||||||||||||||||||||||||||
Land Adjacent to The Avenue Forsyth | — | 11,240 | — | (7,540 | ) | — | 3,700 | — | 3,700 | — | — | 2007 | 0 years | ||||||||||||||||||||||||||||
Suburban Atlanta, GA | |||||||||||||||||||||||||||||||||||||||||
NCR Phase II | — | 8,099 | — | — | — | 8,099 | — | 8,099 | — | — | 2015 | 0 years | |||||||||||||||||||||||||||||
Atlanta, GA | |||||||||||||||||||||||||||||||||||||||||
North Point | — | 10,294 | — | (8,851 | ) | — | 1,443 | — | 1,443 | — | — | 1970-1985 | 0 years | ||||||||||||||||||||||||||||
Suburban Atlanta, GA | |||||||||||||||||||||||||||||||||||||||||
Total Commercial Land | $ | — | $ | 29,633 | $ | — | $ | (16,391 | ) | $ | — | $ | 13,242 | $ | — | $ | 13,242 | $ | — | ||||||||||||||||||||||
Residential Land | |||||||||||||||||||||||||||||||||||||||||
Callaway Gardens | — | 1,584 | — | 3,003 | — | 4,587 | — | 4,587 | — | 2006 | 2006 | 0 years | |||||||||||||||||||||||||||||
Pine Mountain, GA | |||||||||||||||||||||||||||||||||||||||||
Total Residential Land | $ | — | $ | 1,584 | $ | — | $ | 3,003 | $ | — | $ | 4,587 | $ | — | $ | 4,587 | $ | — | |||||||||||||||||||||||
Total Land | $ | — | $ | 31,217 | $ | — | $ | (13,388 | ) | $ | — | $ | 17,829 | $ | — | $ | 17,829 | $ | — | ||||||||||||||||||||||
Operating properties held for sale | |||||||||||||||||||||||||||||||||||||||||
100 North Point Center East | — | 1,475 | 9,625 | (11 | ) | 2,404 | 1,464 | 12,029 | 13,493 | 7,072 | — | 2003 | 25 years | ||||||||||||||||||||||||||||
Suburban Atlanta, GA | |||||||||||||||||||||||||||||||||||||||||
Total Operating Properties held for sale | $ | — | $ | 1,475 | $ | 9,625 | $ | (11 | ) | $ | 2,404 | $ | 1,464 | $ | 12,029 | $ | 13,493 | $ | 7,072 | ||||||||||||||||||||||
Total Properties | $ | 629,293 | $ | 502,725 | $ | 1,625,174 | $ | (2,068 | ) | $ | 480,512 | $ | 500,657 | $ | 2,105,686 | $ | 2,606,343 | $ | 359,422 | ||||||||||||||||||||||
S-2
SCHEDULE III
(Page 3 of 3)
COUSINS PROPERTIES INCORPORATED AND SUBSIDIARIES
REAL ESTATE AND ACCUMULATED DEPRECIATION
December 31, 2015
(in thousands)
NOTES:
(a) | Reconciliations of total real estate carrying value and accumulated depreciation for the three years ended December 31, 2015 are as follows: |
Real Estate | Accumulated Depreciation | ||||||||||||||||||||||
2015 | 2014 | 2013 | 2015 | 2014 | 2013 | ||||||||||||||||||
Balance at beginning of period | $ | 2,619,488 | $ | 2,164,815 | $ | 997,323 | $ | 324,543 | $ | 257,151 | $ | 258,258 | |||||||||||
Additions during the period: | |||||||||||||||||||||||
Acquisition | 28,131 | 523,695 | 1,321,394 | — | — | — | |||||||||||||||||
Improvements and other capitalized costs | 139,676 | 109,959 | 86,376 | — | — | — | |||||||||||||||||
Depreciation expense | — | — | — | 99,067 | 86,824 | 56,234 | |||||||||||||||||
167,807 | 633,654 | 1,407,770 | 99,067 | 86,824 | 56,234 | ||||||||||||||||||
Deductions during the period: | |||||||||||||||||||||||
Cost of real estate sold or foreclosed | (180,952 | ) | (178,981 | ) | (240,278 | ) | (64,188 | ) | (19,432 | ) | (57,341 | ) | |||||||||||
Write-off of fully depreciated assets | — | — | — | — | — | — | |||||||||||||||||
(180,952 | ) | (178,981 | ) | (240,278 | ) | (64,188 | ) | (19,432 | ) | (57,341 | ) | ||||||||||||
Balance at end of period | $ | 2,606,343 | $ | 2,619,488 | $ | 2,164,815 | $ | 359,422 | $ | 324,543 | $ | 257,151 | |||||||||||
(b) | Buildings and improvements are depreciated over 24 to 42 years. Leasehold improvements and other capitalized leasing costs are depreciated over the life of the asset or the term of the lease, whichever is shorter. |
S-3