o Written communications pursuant to Rule 425 under the Securities Act (17 CFR 230.425) |
o Soliciting material pursuant to Rule 14a-12 under the Exchange Act (17 CFR 240.14a-12) |
o Pre-commencement communications pursuant to Rule 14d-2(b) under the Exchange Act (17 CFR 240.14d-2(b)) |
o Pre-commencement communications pursuant to Rule 13e-4(c) under the Exchange Act (17 CFR 240.13e-4(c)) |
By: | /s/ Gregg D. Adzema |
Gregg D. Adzema | Marli Quesinberry | |
Executive Vice President and | Director, Investor Relations and | |
Chief Financial Officer | Corporate Communications | |
(404) 407-1116 | (404) 407-1898 | |
greggadzema@cousinsproperties.com | marliquesinberry@cousinsproperties.com |
• | Funds From Operations were $0.24 per share. |
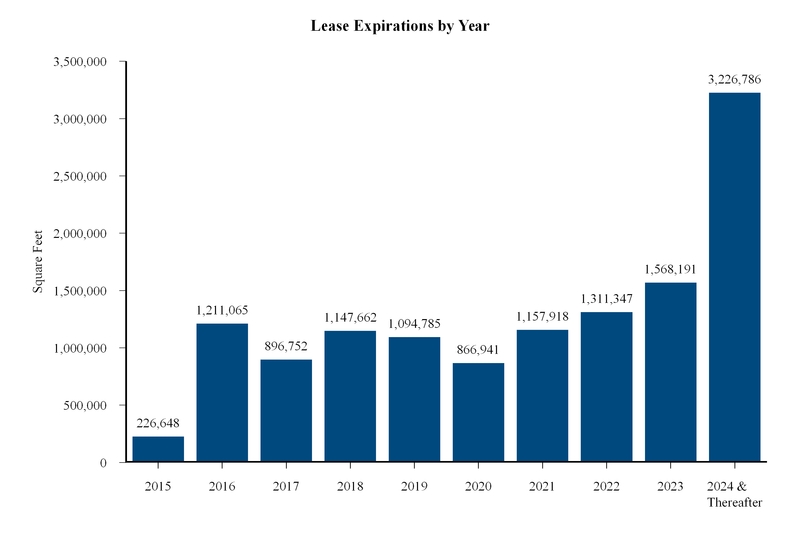
• | Leased or renewed 770,009 square feet of office space. |
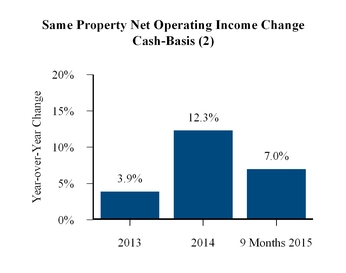
• | Same property net operating income on a cash basis was up 1.2% over the prior year. |
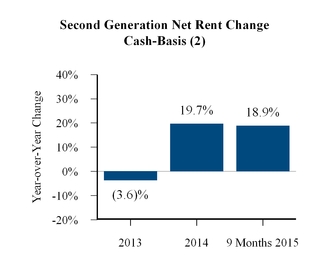
• | Second generation net rent per square foot on a cash basis increased 14.1%. |
• | Opened Emory Point Phase II, a mixed-used development in Atlanta, Georgia. The project contains 307 apartments and 45,000 square feet of retail space. |
• | Signed a 15-year lease with NCR Corporation to develop an approximately 485,000 square foot headquarters building in Midtown Atlanta. |
• | Entered into a pre-formation agreement with a third party to form a 50-50 joint venture to develop a 259,000 square foot office building in Charlotte, North Carolina that will be 100% leased by the joint venture partner. |
• | Sold 2100 Ross, an 844,000 square foot office tower in Dallas, Texas, for $131.0 million and recognized a gain of $36.2 million. |
• | Initiated a $100 million share repurchase plan and through September 30, 2015, repurchased approximately 2.0 million shares of common stock for $18.7 million. |
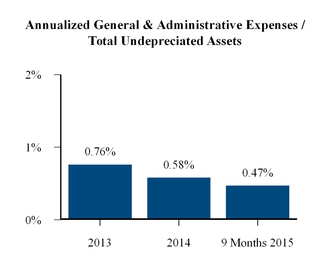
• | General and administrative expenses of $19 million to $21 million, net of capitalized salaries. |
Three Months Ended | Nine Months Ended | ||||||||||||||
September 30, | September 30, | ||||||||||||||
2015 | 2014 | 2015 | 2014 | ||||||||||||
Revenues: | |||||||||||||||
Rental property revenues | $ | 96,016 | $ | 86,857 | $ | 282,226 | $ | 244,375 | |||||||
Fee income | 1,686 | 1,802 | 5,206 | 6,165 | |||||||||||
Other | 444 | 439 | 593 | 4,786 | |||||||||||
98,146 | 89,098 | 288,025 | 255,326 | ||||||||||||
Costs and expenses: | |||||||||||||||
Rental property operating expenses | 41,331 | 38,685 | 120,672 | 109,501 | |||||||||||
Reimbursed expenses | 686 | 783 | 2,514 | 2,703 | |||||||||||
General and administrative expenses | 2,971 | 5,021 | 12,502 | 16,388 | |||||||||||
Interest expense | 7,673 | 6,817 | 23,219 | 20,954 | |||||||||||
Depreciation and amortization | 32,538 | 32,704 | 103,564 | 101,979 | |||||||||||
Acquisition and related costs | 19 | 644 | 104 | 815 | |||||||||||
Other | 175 | 481 | 873 | 1,936 | |||||||||||
85,393 | 85,135 | 263,448 | 254,276 | ||||||||||||
Income from continuing operations before taxes, unconsolidated joint ventures, and gain on sale of investment properties | 12,753 | 3,963 | 24,577 | 1,050 | |||||||||||
Benefit (provision) for income taxes from operations | — | (1 | ) | — | 20 | ||||||||||
Income from unconsolidated joint ventures | 3,716 | 2,030 | 7,088 | 5,343 | |||||||||||
Income from continuing operations before gain on sale of investment properties | 16,469 | 5,992 | 31,665 | 6,413 | |||||||||||
Gain on sale of investment properties | 37,145 | 81 | 37,674 | 1,569 | |||||||||||
Income from continuing operations | 53,614 | 6,073 | 69,339 | 7,982 | |||||||||||
Income (loss) from discontinued operations: | |||||||||||||||
Income (loss) from discontinued operations | 6 | 348 | (14 | ) | 1,806 | ||||||||||
Gain (loss) on sale from discontinued operations | — | 12,993 | (551 | ) | 19,372 | ||||||||||
6 | 13,341 | (565 | ) | 21,178 | |||||||||||
Net income | 53,620 | 19,414 | 68,774 | 29,160 | |||||||||||
Net income attributable to noncontrolling interests | — | (92 | ) | — | (376 | ) | |||||||||
Net income attributable to controlling interests | 53,620 | 19,322 | 68,774 | 28,784 | |||||||||||
Dividends to preferred stockholders | — | — | — | (2,955 | ) | ||||||||||
Preferred share original issuance costs | — | — | — | (3,530 | ) | ||||||||||
Net income available to common stockholders | $ | 53,620 | $ | 19,322 | $ | 68,774 | $ | 22,299 | |||||||
Per common share information — basic and diluted: | |||||||||||||||
Income from continuing operations attributable to controlling interest | $ | 0.25 | $ | 0.03 | $ | 0.32 | $ | — | |||||||
Income from discontinued operations | — | 0.06 | — | 0.11 | |||||||||||
Net income available to common stockholders | $ | 0.25 | $ | 0.09 | $ | 0.32 | $ | 0.11 | |||||||
Weighted average shares — basic | 216,261 | 209,839 | 216,485 | 200,073 | |||||||||||
Weighted average shares — diluted | 216,374 | $ | 210,111 | 216,625 | 200,325 | ||||||||||
Dividends declared per common share | $ | 0.080 | $ | 0.075 | $ | 0.240 | $ | 0.225 |
Three Months Ended September 30, | Nine Months Ended September 30, | ||||||||||||||
2015 | 2014 | 2015 | 2014 | ||||||||||||
Net Income Available to Common Stockholders | $ | 53,620 | $ | 19,322 | $ | 68,774 | $ | 22,299 | |||||||
Depreciation and amortization of real estate assets: | |||||||||||||||
Consolidated properties | 32,123 | 32,473 | 102,353 | 101,361 | |||||||||||
Share of unconsolidated joint ventures | 2,891 | 2,874 | 8,406 | 8,958 | |||||||||||
(Gain) loss on sale of depreciated properties: | |||||||||||||||
Consolidated properties | (36,167 | ) | — | (35,893 | ) | — | |||||||||
Discontinued properties | — | (12,993 | ) | — | (19,362 | ) | |||||||||
Share of unconsolidated joint ventures | — | — | — | 387 | |||||||||||
Funds From Operations Available to Common Stockholders | $ | 52,467 | $ | 41,676 | $ | 143,640 | $ | 113,643 | |||||||
Per Common Share — Basic and Diluted: | |||||||||||||||
Net Income Available | $ | 0.25 | $ | 0.09 | $ | 0.32 | $ | 0.11 | |||||||
Funds From Operations | $ | 0.24 | $ | 0.20 | $ | 0.66 | $ | 0.57 | |||||||
Weighted Average Shares — Basic | 216,261 | 209,839 | 216,485 | 200,073 | |||||||||||
Weighted Average Shares — Diluted | 216,374 | 210,111 | 216,625 | 200,325 |
September 30, 2015 | December 31, 2014 | ||||||
(unaudited) | |||||||
Assets: | |||||||
Real estate assets: | |||||||
Operating properties, net of accumulated depreciation of $385,657 and $324,543 in 2015 and 2014, respectively | $ | 2,160,655 | $ | 2,181,684 | |||
Projects under development | 53,118 | 91,615 | |||||
Land | 17,829 | 21,646 | |||||
2,231,602 | 2,294,945 | ||||||
Real estate assets and other assets held for sale, net of accumulated depreciation and amortization of $60,078 in 2015 | 50,491 | — | |||||
Cash and cash equivalents | 5,331 | — | |||||
Restricted cash | 4,486 | 5,042 | |||||
Notes and accounts receivable, net of allowance for doubtful accounts of $1,736 and $1,643 in 2015 and 2014, respectively | 9,513 | 10,732 | |||||
Deferred rents receivable | 63,738 | 57,939 | |||||
Investment in unconsolidated joint ventures | 103,470 | 100,498 | |||||
Intangible assets, net of accumulated amortization of $96,349 and $76,050 in 2015 and 2014, respectively | 131,858 | 163,244 | |||||
Other assets | 37,118 | 34,930 | |||||
Total assets | $ | 2,637,607 | $ | 2,667,330 | |||
Liabilities: | |||||||
Notes payable | $ | 779,570 | $ | 792,344 | |||
Accounts payable and accrued expenses | 66,049 | 76,240 | |||||
Deferred income | 24,132 | 23,277 | |||||
Intangible liabilities, net of accumulated amortization of $24,464 and $16,897 in 2015 and 2014, respectively | 62,019 | 70,020 | |||||
Other liabilities | 30,407 | 31,991 | |||||
Liabilities of real estate assets held for sale | 2,843 | — | |||||
Total liabilities | 965,020 | 993,872 | |||||
Commitments and contingencies | — | — | |||||
Equity: | |||||||
Stockholders' investment: | |||||||
Common stock, $1 par value, 350,000,000 shares authorized, 220,255,502 and 220,082,610 shares issued in 2015 and 2014, respectively | 220,256 | 220,083 | |||||
Additional paid-in capital | 1,721,856 | 1,720,972 | |||||
Treasury stock at cost, 5,584,743 and 3,570,082 shares in 2015 and 2014, respectively | (105,531 | ) | (86,840 | ) | |||
Distributions in excess of cumulative net income | (163,994 | ) | (180,757 | ) | |||
Total equity | 1,672,587 | 1,673,458 | |||||
Total liabilities and equity | $ | 2,637,607 | $ | 2,667,330 |
Three Months Ended September 30, | Nine Months Ended September 30, | ||||||||||||||||
2015 | 2014 | 2015 | 2014 | ||||||||||||||
Net Operating Income - Consolidated Properties | |||||||||||||||||
Rental property revenues | $ | 96,016 | $ | 86,857 | $ | 282,226 | $ | 244,375 | |||||||||
Rental property expenses | (41,331 | ) | (38,685 | ) | (120,672 | ) | (109,501 | ) | |||||||||
54,685 | 48,172 | 161,554 | 134,874 | ||||||||||||||
Net Operating Income - Discontinued Operations | |||||||||||||||||
Rental property revenues | — | 601 | 4 | 2,923 | |||||||||||||
Rental property expenses | — | (262 | ) | (18 | ) | (1,126 | ) | ||||||||||
— | 339 | (14 | ) | 1,797 | |||||||||||||
Net Operating Income - Unconsolidated Joint Ventures | 6,131 | 6,601 | 18,103 | — | 19,747 | ||||||||||||
Total Net Operating Income | $ | 60,816 | $ | 55,112 | $ | 179,643 | $ | 156,418 | |||||||||
Net Operating Income | |||||||||||||||||
Same Property | $ | 44,647 | $ | 44,165 | $ | 131,841 | $ | 128,476 | |||||||||
Non-Same Property | 16,169 | 10,947 | 47,802 | 27,942 | |||||||||||||
$ | 60,816 | $ | 55,112 | $ | 179,643 | $ | 156,418 | ||||||||||
Non-Cash Items | |||||||||||||||||
Straight-line rent | $ | 4,623 | $ | 4,169 | $ | 16,694 | $ | 16,818 | |||||||||
Other | 1,526 | 1,554 | 4,460 | 4,763 | |||||||||||||
6,149 | 5,723 | 21,154 | 21,581 | ||||||||||||||
Cash Basis Property Net Operating Income | |||||||||||||||||
Same Property | 41,088 | — | 40,583 | 119,838 | — | 112,031 | |||||||||||
Non-Same Property | 13,579 | — | 8,806 | 38,651 | — | 22,806 | |||||||||||
$ | 54,667 | $ | 49,389 | $ | 158,489 | $ | 134,837 |
TABLE OF CONTENTS |
Key Performance Metrics | |
Funds From Operations - Detail | |
Portfolio Statistics | |
Office Leasing Activity | |
Office Lease Expirations | |
Top 20 Office Tenants | |
Tenant Industry Diversification | |
Investment Activity | |
Land Inventory | |
Debt Schedule | |
Non-GAAP Financial Measures - Calculations and Reconciliations | |
Non-GAAP Financial Measures - Discussion | |
Cousins Properties Incorporated | Q3 2015 Supplemental Information |
KEY PERFORMANCE METRICS |
2013 | 2014 1st | 2014 2nd | 2014 3rd | 2014 4th | 2014 | 2015 1st | 2015 2nd | 2015 3rd | 2015 YTD | |||||||||||
Property Statistics | ||||||||||||||||||||
Consolidated Operating Properties | 14 | 13 | 13 | 13 | 12 | 12 | 13 | 13 | 12 | 12 | ||||||||||
Consolidated Rentable Square Feet (in thousands) | 12,255 | 12,132 | 12,132 | 12,633 | 13,034 | 13,034 | 13,407 | 13,407 | 12,563 | 12,563 | ||||||||||
Unconsolidated Operating Properties | 9 | 9 | 9 | 9 | 5 | 5 | 5 | 5 | 6 | 6 | ||||||||||
Unconsolidated Rentable Square Feet (in thousands) | 3,468 | 3,468 | 3,468 | 3,468 | 3,129 | 3,129 | 3,129 | 3,129 | 3,431 | 3,431 | ||||||||||
Total Operating Properties | 23 | 22 | 22 | 22 | 17 | 17 | 18 | 18 | 18 | 18 | ||||||||||
Total Rentable Square Feet (in thousands) | 15,723 | 15,600 | 15,600 | 16,101 | 16,163 | 16,163 | 16,536 | 16,536 | 15,994 | 15,994 | ||||||||||
Office Leasing Activity (1) | ||||||||||||||||||||
Net Leased during the period (square feet in thousands) | 1,256 | 369 | 317 | 550 | 637 | 1,874 | 441 | 521 | 770 | 1,732 | ||||||||||
Net Rent (per square foot) | $18.54 | $21.05 | $22.39 | $22.99 | $24.10 | $22.88 | $18.93 | $23.23 | $23.42 | $21.44 | ||||||||||
Total Leasing Costs (per square foot) | (5.25) | (5.91) | (5.02) | (6.18) | (5.54) | (5.71) | (4.62) | (6.27) | (5.83) | (5.64) | ||||||||||
Net Effective Rent (per square foot) | $13.29 | $15.14 | $17.37 | $16.81 | $18.56 | $17.17 | $14.31 | $16.96 | $17.59 | $15.80 | ||||||||||
Change in Second Generation Net Rent | 12.9 | % | 12.7 | % | 48.4 | % | 36.3 | % | 43.8 | % | 38.0 | % | 33.6 | % | 43.8 | % | 28.1 | % | 36.2 | % |
Change in Cash-Basis Second Generation Net Rent | (3.6 | )% | (0.4 | )% | 33.3 | % | 7.6 | % | 27.7 | % | 19.7 | % | 8.0 | % | 32.8 | % | 14.1 | % | 18.9 | % |
Same Property Information (2) | ||||||||||||||||||||
Percent Leased (period end) | 90.7 | % | 90.7 | % | 91.0 | % | 91.6 | % | 91.2 | % | 91.2 | % | 91.7 | % | 91.7 | % | 91.8 | % | 91.8 | % |
Weighted Average Occupancy | 90.1 | % | 89.9 | % | 89.8 | % | 89.9 | % | 89.3 | % | 89.7 | % | 91.5 | % | 90.4 | % | 90.6 | % | 90.6 | % |
Change in Net Operating Income (over prior year period) | 4.6 | % | 2.2 | % | 7.7 | % | 3.6 | % | 0.6 | % | 3.6 | % | 5.2 | % | 1.6 | % | 1.1 | % | 2.6 | % |
Change in Cash-Basis Net Operating Income (over prior year period) | 3.9 | % | 10.2 | % | 15.0 | % | 12.8 | % | 11.1 | % | 12.3 | % | 15.9 | % | 5.2 | % | 1.2 | % | 7.0 | % |
Development Pipeline | ||||||||||||||||||||
Estimated Project Costs (in thousands) (3) | $283,600 | $181,075 | $181,075 | $182,575 | $226,575 | $226,575 | $100,475 | $161,975 | $306,500 | $306,500 | ||||||||||
Estimated Project Costs (3) / Total Undepreciated Assets | 9.8 | % | 6.1 | % | 6.0 | % | 5.6 | % | 6.6 | % | 6.6 | % | 2.9 | % | 4.6 | % | 8.6 | % | 8.6 | % |
Market Capitalization (4) | ||||||||||||||||||||
Common Stock Price (period end) | $10.30 | $11.47 | $12.45 | $11.95 | $11.42 | $11.42 | $10.60 | $10.38 | $9.22 | $9.22 | ||||||||||
Common Shares Outstanding (period end in thousands) | 189,666 | 198,423 | 198,474 | 216,509 | 216,513 | 216,513 | 216,470 | 216,686 | 214,671 | 214,671 | ||||||||||
Equity Market Capitalization (in thousands) | $1,953,560 | $2,275,912 | $2,471,001 | $2,587,283 | $2,472,578 | $2,472,578 | $2,294,582 | $2,249,201 | $1,979,267 | $1,979,267 | ||||||||||
Preferred Stock (in thousands) | 94,775 | 94,775 | — | — | — | — | — | — | — | — | ||||||||||
Debt (in thousands) | 858,583 | 814,016 | 890,093 | 895,618 | 1,007,502 | 1,007,502 | 1,067,376 | 1,075,013 | 1,006,764 | 1,006,764 | ||||||||||
Total Market Capitalization (in thousands) | $2,906,918 | $3,184,703 | $3,361,094 | $3,482,901 | $3,480,080 | $3,480,080 | $3,361,958 | $3,324,214 | $2,986,031 | $2,986,031 | ||||||||||
Cousins Properties Incorporated | 3 | Q3 2015 Supplemental Information |
KEY PERFORMANCE METRICS |
2013 | 2014 1st | 2014 2nd | 2014 3rd | 2014 4th | 2014 | 2015 1st | 2015 2nd | 2015 3rd | 2015 YTD | |||||||||||
Credit Ratios (4) | ||||||||||||||||||||
Debt/Total Market Capitalization | 29.5 | % | 25.6 | % | 26.5 | % | 25.7 | % | 29.0 | % | 29.0 | % | 31.7 | % | 32.3 | % | 33.7 | % | 33.7 | % |
Debt/Total Undepreciated Assets | 30.0 | % | 27.6 | % | 29.5 | % | 27.5 | % | 29.5 | % | 29.5 | % | 30.7 | % | 30.5 | % | 28.3 | % | 28.3 | % |
Fixed Charges Coverage | 2.64 | 3.56 | 4.00 | 4.61 | 4.98 | 4.27 | 4.67 | 4.54 | 5.19 | 4.80 | ||||||||||
Debt/Annualized EBITDA | 4.72 | 4.31 | 4.48 | 4.37 | 4.05 | 4.05 | 4.77 | 4.86 | 4.02 | 4.34 | ||||||||||
Dividend Information (4) | ||||||||||||||||||||
Common Dividend per Share | $0.18 | $0.075 | $0.075 | $0.075 | $0.075 | $0.30 | $0.08 | $0.08 | $0.08 | $0.24 | ||||||||||
FFO Payout Ratio | 35.3 | % | 39.3 | % | 41.6 | % | 39.0 | % | 31.4 | % | 37.3 | % | 37.8 | % | 38.3 | % | 33.0 | % | 36.2 | % |
FAD Payout Ratio | 61.6 | % | 61.1 | % | 69.4 | % | 68.9 | % | 51.1 | % | 61.6 | % | 67.8 | % | 71.5 | % | 54.8 | % | 63.9 | % |
Operations Ratios (4) | ||||||||||||||||||||
Annualized General and Administrative Expenses/Total Undepreciated Assets | 0.76 | % | 0.76 | % | 0.76 | % | 0.62 | % | 0.40 | % | 0.58 | % | 0.40 | % | 0.67 | % | 0.33 | % | 0.47 | % |
Additional Information (4) | ||||||||||||||||||||
Straight Line Rental Revenue | $12,826 | $7,648 | $5,001 | $4,169 | $5,275 | $22,093 | $6,285 | $5,786 | $4,623 | $16,694 | ||||||||||
Above and Below Market Rents Amortization | $3,785 | $1,952 | $2,027 | $1,933 | $2,135 | $8,047 | $2,030 | $1,973 | $2,030 | $6,033 | ||||||||||
Second Generation Capital Expenditures | $16,414 | $3,295 | $7,317 | $12,023 | $12,419 | $35,054 | $12,020 | $13,259 | $14,208 | $39,487 | ||||||||||
Cousins Properties Incorporated | 4 | Q3 2015 Supplemental Information |
KEY PERFORMANCE METRICS |
Cousins Properties Incorporated | 5 | Q3 2015 Supplemental Information |
FUNDS FROM OPERATIONS - SUMMARY |
2013 | 2014 1st | 2014 2nd | 2014 3rd | 2014 4th | 2014 | 2015 1st | 2015 2nd | 2015 3rd | 2015 YTD | |||||||||||
(in thousands, except per share amounts) | ||||||||||||||||||||
Net Operating Income | ||||||||||||||||||||
Office | 122,503 | 47,598 | 48,821 | 52,691 | 57,441 | 206,551 | 56,734 | 59,269 | 59,328 | 175,331 | ||||||||||
Other | 15,577 | 2,420 | 2,467 | 2,421 | 1,812 | 9,122 | 1,319 | 1,505 | 1,488 | 4,312 | ||||||||||
Total Net Operating Income | 138,080 | 50,018 | 51,288 | 55,112 | 59,253 | 215,673 | 58,053 | 60,774 | 60,816 | 179,643 | ||||||||||
Sales Less Cost of Sales | 1,464 | 160 | 1,373 | 82 | 2,295 | 3,910 | 810 | (324 | ) | 3,016 | 3,502 | |||||||||
Fee Income | 10,890 | 2,339 | 2,025 | 1,803 | 6,353 | 12,520 | 1,816 | 1,704 | 1,686 | 5,206 | ||||||||||
Other Income | 8,693 | 1,943 | 2,484 | 559 | 415 | 5,401 | 407 | 238 | 845 | 1,490 | ||||||||||
Reimbursed Expenses | (5,216 | ) | (932 | ) | (988 | ) | (783 | ) | (949 | ) | (3,652 | ) | (1,111 | ) | (717 | ) | (686 | ) | (2,514 | ) |
General and Administrative Expenses | (21,940 | ) | (5,695 | ) | (5,756 | ) | (5,022 | ) | (3,499 | ) | (19,972 | ) | (3,595 | ) | (5,936 | ) | (2,971 | ) | (12,502 | ) |
Interest Expense | (29,672 | ) | (9,012 | ) | (8,813 | ) | (8,660 | ) | (9,989 | ) | (36,474 | ) | (9,498 | ) | (9,696 | ) | (9,518 | ) | (28,712 | ) |
Other Expenses | (11,217 | ) | (678 | ) | (917 | ) | (1,170 | ) | (2,059 | ) | (4,824 | ) | (476 | ) | (431 | ) | (307 | ) | (1,214 | ) |
Income Tax Benefit (Provision) | 23 | 12 | 9 | (1 | ) | — | 20 | — | — | — | — | |||||||||
Depreciation and Amortization of Non-Real Estate Assets | (787 | ) | (196 | ) | (213 | ) | (244 | ) | (260 | ) | (913 | ) | (471 | ) | (374 | ) | (414 | ) | (1,259 | ) |
Preferred Stock Dividends and Original Issuance Costs | (12,664 | ) | (1,777 | ) | (4,708 | ) | — | — | (6,485 | ) | — | — | — | — | ||||||
FFO | 77,134 | 36,182 | 35,784 | 41,676 | 51,560 | 165,204 | 45,935 | 45,238 | 52,467 | 143,640 | ||||||||||
Weighted Average Shares - Basic | 144,255 | 191,739 | 198,440 | 209,839 | 216,511 | 204,216 | 216,568 | 216,630 | 216,261 | 216,485 | ||||||||||
Weighted Average Shares - Diluted | 144,420 | 191,952 | 198,702 | 210,111 | 216,733 | 204,460 | 216,754 | 216,766 | 216,374 | 216,625 | ||||||||||
FFO per Share - Basic and Diluted | 0.53 | 0.19 | 0.18 | 0.20 | 0.24 | 0.81 | 0.21 | 0.21 | 0.24 | 0.66 |
Cousins Properties Incorporated | 6 | Q3 2015 Supplemental Information |
FUNDS FROM OPERATIONS - DETAIL |
2013 | 2014 1st | 2014 2nd | 2014 3rd | 2014 4th | 2014 | 2015 1st | 2015 2nd | 2015 3rd | 2015 YTD | |||||||||||
(in thousands, except per share amounts) | ||||||||||||||||||||
Net Operating Income | ||||||||||||||||||||
Office Consolidated Properties | ||||||||||||||||||||
Greenway Plaza | 24,606 | 18,202 | 19,295 | 20,356 | 19,526 | 77,379 | 18,403 | 18,916 | 19,544 | 56,863 | ||||||||||
Post Oak Central | 15,593 | 5,564 | 5,886 | 6,032 | 5,955 | 23,437 | 6,675 | 6,516 | 6,495 | 19,686 | ||||||||||
Northpark Town Center | — | — | — | — | 5,794 | 5,794 | 5,825 | 5,651 | 5,127 | 16,603 | ||||||||||
191 Peachtree Tower | 16,040 | 4,198 | 4,650 | 4,115 | 4,046 | 17,009 | 4,082 | 4,060 | 4,173 | 12,315 | ||||||||||
Fifth Third Center | — | — | — | 2,196 | 3,435 | 5,631 | 3,641 | 3,709 | 3,770 | 11,120 | ||||||||||
Promenade | 9,568 | 2,772 | 2,792 | 3,030 | 2,841 | 11,435 | 3,542 | 3,581 | 3,623 | 10,746 | ||||||||||
The American Cancer Society Center | 11,539 | 2,992 | 3,022 | 3,329 | 3,030 | 12,373 | 3,114 | 3,206 | 3,039 | 9,359 | ||||||||||
Colorado Tower | — | — | — | — | — | — | 328 | 1,797 | 2,268 | 4,393 | ||||||||||
816 Congress Avenue | 4,029 | 1,536 | 1,740 | 1,862 | 1,854 | 6,992 | 1,858 | 2,117 | 2,156 | 6,131 | ||||||||||
North Point Center East | 5,909 | 1,606 | 1,564 | 1,471 | 1,435 | 6,076 | 1,537 | 1,633 | 1,691 | 4,861 | ||||||||||
Meridian Mark Plaza | 4,111 | 908 | 1,008 | 898 | 914 | 3,728 | 918 | 954 | 946 | 2,818 | ||||||||||
The Points at Waterview | 1,876 | 415 | 329 | 348 | 356 | 1,448 | 410 | 507 | 486 | 1,403 | ||||||||||
Other (2) | 9,353 | 4,032 | 3,380 | 4,139 | 3,740 | 15,291 | 1,770 | 2,133 | 1,366 | 5,269 | ||||||||||
Subtotal - Office Consolidated | 102,624 | 42,225 | 43,666 | 47,776 | 52,926 | 186,593 | 52,103 | 54,780 | 54,684 | 161,567 | ||||||||||
Office Unconsolidated Properties | ||||||||||||||||||||
Terminus 100 | 6,892 | 1,973 | 1,875 | 1,831 | 1,876 | 7,555 | 1,922 | 1,754 | 1,780 | 5,456 | ||||||||||
Terminus 200 | 4,278 | 1,235 | 1,466 | 1,449 | 1,354 | 5,504 | 1,436 | 1,442 | 1,575 | 4,453 | ||||||||||
Emory University Hospital Midtown Medical Office Tower | 3,874 | 998 | 962 | 1,008 | 992 | 3,960 | 987 | 996 | 992 | 2,975 | ||||||||||
Gateway Village (1) | 1,208 | 302 | 302 | 302 | 302 | 1,208 | 302 | 302 | 302 | 906 | ||||||||||
Other | (61 | ) | (15 | ) | (12 | ) | (15 | ) | (9 | ) | (51 | ) | (5 | ) | (5 | ) | (5 | ) | (15 | ) |
Subtotal - Office Unconsolidated | 16,191 | 4,493 | 4,593 | 4,575 | 4,515 | 18,176 | 4,642 | 4,489 | 4,644 | 13,775 | ||||||||||
Discontinued Operations | 3,688 | 880 | 562 | 340 | — | 1,782 | (11 | ) | — | — | (11 | ) | ||||||||
Total Office Net Operating Income | 122,503 | 47,598 | 48,821 | 52,691 | 57,441 | 206,551 | 56,734 | 59,269 | 59,328 | 175,331 | ||||||||||
Other | ||||||||||||||||||||
Consolidated Properties (2) | 1,293 | 402 | 407 | 396 | 178 | 1,383 | (24 | ) | 12 | — | (12 | ) | ||||||||
Unconsolidated Properties | ||||||||||||||||||||
Emory Point Apartments (Phase 1) | 2,300 | 1,118 | 1,181 | 1,200 | 1,148 | 4,647 | 1,071 | 1,244 | 1,213 | 3,528 | ||||||||||
Emory Point Retail (Phase 1) | 1,211 | 321 | 312 | 257 | 190 | 1,080 | 281 | 255 | 222 | 758 | ||||||||||
Emory Point Retail (Phase 2) | — | — | — | — | — | — | — | — | 56 | 56 | ||||||||||
Emory Point Apartments (Phase 2) (3) | — | — | — | — | — | — | — | — | 1 | 1 | ||||||||||
Other (2) | 8,061 | 567 | 562 | 569 | 295 | 1,993 | (6 | ) | (6 | ) | (4 | ) | (16 | ) | ||||||
Subtotal - Other | 11,572 | 2,006 | 2,055 | 2,026 | 1,633 | 7,720 | 1,346 | 1,493 | 1,488 | 4,327 | ||||||||||
Discontinued Operations | 2,712 | 12 | 5 | (1 | ) | 1 | 19 | (3 | ) | — | — | (3 | ) | |||||||
Total Other Net Operating Income | 15,577 | 2,420 | 2,467 | 2,421 | 1,812 | 9,122 | 1,319 | 1,505 | 1,488 | 4,312 | ||||||||||
Total Net Operating Income | 138,080 | 50,018 | 51,288 | 55,112 | 59,253 | 215,673 | 58,053 | 60,774 | 60,816 | 179,643 | ||||||||||
Cousins Properties Incorporated | 7 | Q3 2015 Supplemental Information |
FUNDS FROM OPERATIONS - DETAIL |
2013 | 2014 1st | 2014 2nd | 2014 3rd | 2014 4th | 2014 | 2015 1st | 2015 2nd | 2015 3rd | 2015 YTD | |||||||||||
(in thousands, except per share amounts) | ||||||||||||||||||||
Sales Less Cost of Sales | ||||||||||||||||||||
Land Sales Less Cost of Sales - Consolidated | 1,353 | 160 | 1,326 | 82 | 135 | 1,703 | 810 | (566 | ) | 978 | 1,222 | |||||||||
Land Sales Less Cost of Sales - Unconsolidated | 111 | — | 47 | — | 2,160 | 2,207 | — | 242 | 2,038 | 2,280 | ||||||||||
Total Sales Less Cost of Sales | 1,464 | 160 | 1,373 | 82 | 2,295 | 3,910 | 810 | (324 | ) | 3,016 | 3,502 | |||||||||
Fee Income | ||||||||||||||||||||
Management Fees (3) | 7,223 | 1,315 | 1,446 | 1,203 | 1,118 | 5,082 | 1,503 | 1,184 | 1,128 | 3,815 | ||||||||||
Development Fees | 3,102 | 937 | 541 | 571 | 5,216 | 7,265 | 308 | 461 | 531 | 1,300 | ||||||||||
Leasing & Other Fees | 565 | 87 | 38 | 29 | 19 | 173 | 5 | 59 | 27 | 91 | ||||||||||
Total Fee Income | 10,890 | 2,339 | 2,025 | 1,803 | 6,353 | 12,520 | 1,816 | 1,704 | 1,686 | 5,206 | ||||||||||
Other Income | ||||||||||||||||||||
Termination Fees | 2,952 | 1,843 | 2,210 | 280 | 240 | 4,573 | 193 | 28 | 499 | 720 | ||||||||||
Termination Fees - Discontinued Operations | — | — | 2 | — | — | 2 | — | — | — | |||||||||||
Interest and Other Income | 5,213 | 72 | 44 | 116 | 29 | 261 | 55 | 22 | 222 | 299 | ||||||||||
Interest and Other Income - Discontinued Operations | 15 | — | — | 8 | (4 | ) | 4 | — | — | — | — | |||||||||
Other - Unconsolidated | 513 | 28 | 228 | 155 | 150 | 561 | 159 | 188 | 124 | 471 | ||||||||||
Total Other Income | 8,693 | 1,943 | 2,484 | 559 | 415 | 5,401 | 407 | 238 | 845 | 1,490 | ||||||||||
Reimbursed Expenses | (5,216 | ) | (932 | ) | (988 | ) | (783 | ) | (949 | ) | (3,652 | ) | (1,111 | ) | (717 | ) | (686 | ) | (2,514 | ) |
General and Administrative Expenses | (22,460 | ) | (5,695 | ) | (5,756 | ) | (5,022 | ) | (3,499 | ) | (19,972 | ) | (3,595 | ) | (5,936 | ) | (2,971 | ) | (12,502 | ) |
Interest Expense | ||||||||||||||||||||
Consolidated Debt | ||||||||||||||||||||
The American Cancer Society Center | (8,813 | ) | (2,158 | ) | (2,175 | ) | (2,192 | ) | (2,185 | ) | (8,710 | ) | (2,131 | ) | (2,147 | ) | (2,164 | ) | (6,442 | ) |
Post Oak Central | (2,618 | ) | (2,044 | ) | (2,036 | ) | (2,028 | ) | (2,019 | ) | (8,127 | ) | (2,010 | ) | (2,001 | ) | (1,992 | ) | (6,003 | ) |
Promenade | (1,568 | ) | (1,223 | ) | (1,216 | ) | (1,209 | ) | (1,202 | ) | (4,850 | ) | (1,194 | ) | (1,187 | ) | (1,180 | ) | (3,561 | ) |
Unsecured Credit Facility | (2,260 | ) | (575 | ) | (616 | ) | (705 | ) | (1,458 | ) | (3,354 | ) | (966 | ) | (1,072 | ) | (1,089 | ) | (3,127 | ) |
191 Peachtree Tower | (3,483 | ) | (861 | ) | (861 | ) | (861 | ) | (861 | ) | (3,444 | ) | (861 | ) | (861 | ) | (861 | ) | (2,583 | ) |
816 Congress Avenue | — | — | — | — | (709 | ) | (709 | ) | (817 | ) | (818 | ) | (817 | ) | (2,452 | ) | ||||
Meridian Mark Plaza | (1,587 | ) | (393 | ) | (391 | ) | (390 | ) | (388 | ) | (1,562 | ) | (387 | ) | (385 | ) | (384 | ) | (1,156 | ) |
The Points at Waterview | (903 | ) | (221 | ) | (219 | ) | (217 | ) | (215 | ) | (872 | ) | (213 | ) | (211 | ) | (209 | ) | (633 | ) |
Other | (995 | ) | (65 | ) | (66 | ) | (65 | ) | (38 | ) | (234 | ) | — | — | — | — | ||||
Capitalized | 518 | 373 | 610 | 850 | 919 | 2,752 | 903 | 813 | 1,023 | 2,739 | ||||||||||
Subtotal - Consolidated | (21,709 | ) | (7,167 | ) | (6,970 | ) | (6,817 | ) | (8,156 | ) | (29,110 | ) | (7,676 | ) | (7,869 | ) | (7,673 | ) | (23,218 | ) |
Unconsolidated Debt | ||||||||||||||||||||
Terminus 100 | (3,193 | ) | (879 | ) | (875 | ) | (872 | ) | (868 | ) | (3,494 | ) | (865 | ) | (861 | ) | (857 | ) | (2,583 | ) |
Terminus 200 | (1,369 | ) | (390 | ) | (390 | ) | (390 | ) | (390 | ) | (1,560 | ) | (390 | ) | (390 | ) | (390 | ) | (1,170 | ) |
Emory University Hospital Midtown Medical Office Tower | (1,358 | ) | (334 | ) | (334 | ) | (334 | ) | (334 | ) | (1,336 | ) | (334 | ) | (334 | ) | (333 | ) | (1,001 | ) |
Emory Point | (867 | ) | (242 | ) | (244 | ) | (247 | ) | (241 | ) | (974 | ) | (233 | ) | (242 | ) | (265 | ) | (740 | ) |
Other | (1,176 | ) | — | — | — | — | — | — | — | — | — | |||||||||
Subtotal - Unconsolidated | (7,963 | ) | (1,845 | ) | (1,843 | ) | (1,843 | ) | (1,833 | ) | (7,364 | ) | (1,822 | ) | (1,827 | ) | (1,845 | ) | (5,494 | ) |
Total Interest Expense | (29,672 | ) | (9,012 | ) | (8,813 | ) | (8,660 | ) | (9,989 | ) | (36,474 | ) | (9,498 | ) | (9,696 | ) | (9,518 | ) | (28,712 | ) |
Cousins Properties Incorporated | 8 | Q3 2015 Supplemental Information |
FUNDS FROM OPERATIONS - DETAIL |
2013 | 2014 1st | 2014 2nd | 2014 3rd | 2014 4th | 2014 | 2015 1st | 2015 2nd | 2015 3rd | 2015 YTD | |||||||||||
(in thousands, except per share amounts) | ||||||||||||||||||||
Other Expenses | ||||||||||||||||||||
Noncontrolling Interests | (1,671 | ) | (156 | ) | (129 | ) | (92 | ) | (47 | ) | (424 | ) | — | — | — | — | ||||
Property Taxes and Other Holding Costs | (1,570 | ) | (271 | ) | (276 | ) | (288 | ) | (388 | ) | (1,223 | ) | (287 | ) | (242 | ) | (141 | ) | (670 | ) |
Predevelopment & Other | (492 | ) | (229 | ) | (363 | ) | (146 | ) | (1,309 | ) | (2,047 | ) | (106 | ) | (187 | ) | (147 | ) | (440 | ) |
Acquisition and Related Costs | (7,484 | ) | (22 | ) | (149 | ) | (644 | ) | (315 | ) | (1,130 | ) | (83 | ) | (2 | ) | (19 | ) | (104 | ) |
Total Other Expenses | (11,217 | ) | (678 | ) | (917 | ) | (1,170 | ) | (2,059 | ) | (4,824 | ) | (476 | ) | (431 | ) | (307 | ) | (1,214 | ) |
Income Tax Provision (Benefit) | 23 | 12 | 9 | (1 | ) | — | 20 | — | — | — | — | |||||||||
Depreciation and Amortization of Non-Real Estate Assets | ||||||||||||||||||||
Consolidated | (753 | ) | (185 | ) | (201 | ) | (232 | ) | (249 | ) | (867 | ) | (423 | ) | (374 | ) | (414 | ) | (1,211 | ) |
Unconsolidated | (34 | ) | (11 | ) | (12 | ) | (12 | ) | (11 | ) | (46 | ) | (48 | ) | — | — | (48 | ) | ||
Total Non-Real Estate Depreciation and Amoritization | (787 | ) | (196 | ) | (213 | ) | (244 | ) | (260 | ) | (913 | ) | (471 | ) | (374 | ) | (414 | ) | (1,259 | ) |
Preferred Stock Dividends and Original Issuance Costs | (12,664 | ) | (1,777 | ) | (4,708 | ) | — | — | (6,485 | ) | — | — | — | — | ||||||
FFO | 77,134 | 36,182 | 35,784 | 41,676 | 51,560 | 165,204 | 45,935 | 45,238 | 52,467 | 143,640 | ||||||||||
Weighted Average Shares - Basic | 144,255 | 191,739 | 198,440 | 209,839 | 216,511 | 204,216 | 216,568 | 216,630 | 216,261 | 216,485 | ||||||||||
Weighted Average Shares - Diluted | 144,420 | 191,952 | 198,702 | 210,111 | 216,733 | 204,460 | 216,754 | 216,766 | 216,374 | 216,625 | ||||||||||
FFO per Share - Basic and Diluted | 0.53 | 0.19 | 0.18 | 0.20 | 0.24 | 0.81 | 0.21 | 0.21 | 0.24 | 0.66 |
Note: Amounts may differ slightly from other schedules contained herein due to rounding. | |||||||||||||||||
(1) The Company receives an 11.46% current return on its $10.4 million investment in Gateway Village and recognizes this amount as NOI from this venture. See Joint Venture Information included herein for further details. | |||||||||||||||||
(2) Represents NOI for properties sold in prior periods. | |||||||||||||||||
(3) Management Fees include reimbursement of expenses that are included in the "Reimbursed Expenses" line item. |
Cousins Properties Incorporated | 9 | Q3 2015 Supplemental Information |
PORTFOLIO STATISTICS |
Company's Share | ||||||||||||||||||||||||||||||
Property Description | Metropolitan Area | Rentable Square Feet | Financial Statement Presentation | Company's Ownership Interest | End of Period Leased 3Q15 | End of Period Leased 2Q15 | Weighted Average Occupancy 3Q15 | Weighted Average Occupancy 2Q15 | % of Total Net Operating Income (1) | Property Level Debt ($000) | ||||||||||||||||||||
Office | ||||||||||||||||||||||||||||||
Greenway Plaza (2) | Houston | 4,348,000 | Consolidated | 100 | % | 89.3 | % | 89.6 | % | 88.8 | % | 89.4 | % | 33 | % | $ | — | |||||||||||||
Post Oak Central (2) | Houston | 1,280,000 | Consolidated | 100 | % | 96.0 | % | 95.2 | % | 95.1 | % | 95.2 | % | 11 | % | 182,618 | ||||||||||||||
Colorado Tower | Austin | 373,000 | Consolidated | 100 | % | 100.0 | % | 98.4 | % | 73.4 | % | 59.7 | % | 4 | % | — | ||||||||||||||
816 Congress | Austin | 435,000 | Consolidated | 100 | % | 95.2 | % | 94.4 | % | 85.1 | % | 85.7 | % | 3 | % | 85,000 | ||||||||||||||
The Points at Waterview (3) | Dallas | 203,000 | Consolidated | 100 | % | 92.0 | % | 92.0 | % | 92.0 | % | 92.0 | % | 1 | % | 14,171 | ||||||||||||||
Texas | 6,639,000 | 52 | % | 281,789 | ||||||||||||||||||||||||||
Northpark Town Center (2) | Atlanta | 1,528,000 | Consolidated | 100 | % | 85.2 | % | 88.0 | % | 86.0 | % | 91.1 | % | 9 | % | — | ||||||||||||||
191 Peachtree Tower | Atlanta | 1,225,000 | Consolidated | 100 | % | 93.9 | % | 93.8 | % | 88.7 | % | 86.2 | % | 7 | % | 100,000 | ||||||||||||||
Promenade | Atlanta | 777,000 | Consolidated | 100 | % | 94.2 | % | 93.5 | % | 90.6 | % | 89.9 | % | 6 | % | 108,899 | ||||||||||||||
The American Cancer Society Center | Atlanta | 996,000 | Consolidated | 100 | % | 86.5 | % | 84.0 | % | 86.5 | % | 84.4 | % | 5 | % | 129,794 | ||||||||||||||
Terminus 100 | Atlanta | 656,000 | Unconsolidated | 50 | % | 90.9 | % | 90.0 | % | 90.3 | % | 90.0 | % | 3 | % | 64,917 | ||||||||||||||
North Point Center East (2) | Atlanta | 540,000 | Consolidated | 100 | % | 92.1 | % | 95.8 | % | 92.6 | % | 93.3 | % | 3 | % | — | ||||||||||||||
Terminus 200 | Atlanta | 566,000 | Unconsolidated | 50 | % | 92.2 | % | 92.2 | % | 87.8 | % | 87.8 | % | 3 | % | 41,000 | ||||||||||||||
Meridian Mark Plaza | Atlanta | 160,000 | Consolidated | 100 | % | 97.7 | % | 97.8 | % | 97.9 | % | 98.2 | % | 2 | % | 25,088 | ||||||||||||||
Emory University Hospital Midtown Medical Office Tower | Atlanta | 358,000 | Unconsolidated | 50 | % | 98.8 | % | 100.0 | % | 100.0 | % | 100.0 | % | 2 | % | 37,322 | ||||||||||||||
Georgia | 6,806,000 | 40 | % | 507,020 | ||||||||||||||||||||||||||
Fifth Third Center | Charlotte | 698,000 | Consolidated | 100 | % | 93.9 | % | 85.1 | % | 83.6 | % | 82.7 | % | 6 | % | — | ||||||||||||||
Gateway Village | Charlotte | 1,065,000 | Unconsolidated | 50 | % | 100.0 | % | 100.0 | % | 100.0 | % | 100.0 | % | — | % | 11,071 | ||||||||||||||
North Carolina | 1,763,000 | 6 | % | 11,071 | ||||||||||||||||||||||||||
Total Office Properties | 15,208,000 | 98 | % | $ | 799,880 | |||||||||||||||||||||||||
Other | ||||||||||||||||||||||||||||||
Emory Point Apartments (Phase 1) (4) | Atlanta | 404,000 | Unconsolidated | 75 | % | 96.2 | % | 92.6 | % | 94.9 | % | 91.9 | % | 2 | % | $ | 36,123 | |||||||||||||
Emory Point Retail (Phase 1) | Atlanta | 80,000 | Unconsolidated | 75 | % | 76.8 | % | 82.0 | % | 80.9 | % | 82.0 | % | — | % | 7,399 | ||||||||||||||
Emory Point Retail (Phase 2) | Atlanta | 45,000 | Unconsolidated | 75 | % | 69.1 | % | — | % | 51.3 | % | — | % | — | % | 4,404 | ||||||||||||||
Emory Point Apartments (Phase 2) (4) | Atlanta | 257,000 | Unconsolidated | 75 | % | 34.2 | % | — | % | 24.2 | % | — | % | — | % | 24,958 | ||||||||||||||
Total Other | 786,000 | 2 | % | 72,884 | ||||||||||||||||||||||||||
Total Portfolio | 15,994,000 | 100 | % | $ | 872,764 | |||||||||||||||||||||||||
(1) | Net Operating Income represents the Company's share of rental property revenues less rental property operating expenses. Calculation is based on amounts for the three months ended September 30, 2015. | |||||||||||||||||||||||||||||
(2) | Contains multiple buildings that are grouped together for reporting purposes. | |||||||||||||||||||||||||||||
(3) | On October 1, 2015, The Points at Waterview mortgage note was repaid in full without penalty. | |||||||||||||||||||||||||||||
(4) | Phase 1 consists of 443 units and Phase 2 consists of 307 units. | |||||||||||||||||||||||||||||
Cousins Properties Incorporated | 10 | Q3 2015 Supplemental Information |
PORTFOLIO STATISTICS |
Cousins Properties Incorporated | 11 | Q3 2015 Supplemental Information |
SAME PROPERTY PERFORMANCE (1) |
Net Operating Income ($ in thousands) | |||||||||||||||||
Three Months Ended | |||||||||||||||||
September 30, 2015 | September 30, 2014 | June 30, 2015 | 3Q15 vs. 3Q14 % Change | 3Q15 vs. 2Q15 % Change | |||||||||||||
Property Revenues (2) | $ | 77,753 | $ | 76,899 | $ | 76,692 | 1.1 | % | 1.4 | % | |||||||
Property Operating Expenses (2) | 33,106 | 32,734 | 32,825 | 1.1 | % | 0.9 | % | ||||||||||
Property Net Operating Income | $ | 44,647 | $ | 44,165 | $ | 43,867 | 1.1 | % | 1.8 | % | |||||||
% of Total Property Net Operating Income | 73.4 | % | 80.1 | % | 72.2 | % | |||||||||||
Cash Basis Property Revenues (3) | $ | 74,181 | $ | 73,319 | $ | 72,772 | 1.2 | % | 1.9 | % | |||||||
Cash Basis Property Operating Expenses (4) | 33,093 | 32,736 | 32,831 | 1.1 | % | 0.8 | % | ||||||||||
Cash Basis Property Net Operating Income | $ | 41,088 | $ | 40,583 | $ | 39,941 | 1.2 | % | 2.9 | % | |||||||
% of Total Property Cash Basis Net Operating Income | 75.2 | % | 81.7 | % | 74.6 | % | |||||||||||
End of Period Leased | 91.8 | % | 93.4 | % | 91.7 | % | |||||||||||
Weighted Average Occupancy | 90.6 | % | 90.9 | % | 90.4 | % |
Nine Months Ended | |||||||||||||
September 30, 2015 | September 30, 2014 | % Change | |||||||||||
Property Revenues (2) | $ | 228,009 | $ | 222,370 | 2.5 | % | |||||||
Property Operating Expenses (2) | 96,168 | 93,894 | 2.4 | % | |||||||||
Property Net Operating Income | $ | 131,841 | $ | 128,476 | 2.6 | % | |||||||
Cash Basis Property Revenues (3) | $ | 216,003 | $ | 205,932 | 4.9 | % | |||||||
Cash Basis Property Operating Expenses (4) | 96,165 | 93,901 | 2.4 | % | |||||||||
Cash Basis Property Net Operating Income | $ | 119,838 | $ | 112,031 | 7.0 | % |
(1) | Same Properties include office properties that were operational and stabilized on January 1, 2014, excluding properties subsequently sold. Properties included in this reporting period are as follows: |
Greenway Plaza The American Cancer Society Center Terminus 200 | |
Post Oak Central Promenade Meridian Mark Plaza | |
The Points at Waterview Terminus 100 Emory University Hospital Midtown Medical Office Tower | |
191 Peachtree Tower North Point Center East Gateway Village | |
(2) | Property Revenues and Expenses include results for the Company and its share of unconsolidated joint ventures. |
(3) | Cash Basis Same Property Revenues include that of the Company and its share of unconsolidated joint ventures. It represents Property Revenues, excluding straight-line rents, amortization of lease inducements and amortization of acquired above and below market rents. |
(4) | Cash Basis Same Property Operating Expenses include that of the Company and its share of unconsolidated joint ventures. It represents Property Operating Expenses, excluding straight-line ground rent expense and amortization of above and below market ground rent expense. |
Cousins Properties Incorporated | 12 | Q3 2015 Supplemental Information |
OFFICE LEASING ACTIVITY(1) |
Three Months Ended September 30, 2015 | Nine Months Ended September 30, 2015 | ||||||||||||||||||||||||||||||
New | Renewal | Expansion | Total | New | Renewal | Expansion | Total | ||||||||||||||||||||||||
Gross leased (square feet) | 827,275 | 1,879,717 | |||||||||||||||||||||||||||||
Less: Leases less than one year, amenity leases, percentage rent leases, storage leases, intercompany leases, and license agreements | (57,266 | ) | (147,521) | ||||||||||||||||||||||||||||
Net leased (square feet) | 617,469 | 129,531 | 23,009 | 770,009 | 918,097 | 743,631 | 70,468 | 1,732,196 | |||||||||||||||||||||||
Number of transactions | 18 | 12 | 5 | 35 | 46 | 49 | 14 | 109 | |||||||||||||||||||||||
Lease term (years) (2)(3) | 5.88 | 9.13 | 7.42 | 7.48 | 7.71 | 6.43 | 5.80 | 6.84 | |||||||||||||||||||||||
Net rent (per square foot) (2)(3)(4) | $ | 22.56 | $ | 24.58 | $ | 21.85 | $ | 23.42 | $ | 21.98 | $ | 21.04 | $ | 22.39 | $ | 21.44 | |||||||||||||||
Total leasing costs (per square foot) (2)(3)(5) | (6.21 | ) | (5.28 | ) | (6.75 | ) | (5.83 | ) | (6.44 | ) | (5.13 | ) | (6.09 | ) | (5.64 | ) | |||||||||||||||
Net effective rent (per square foot) (2)(3) | $ | 16.35 | $ | 19.30 | $ | 15.10 | $ | 17.59 | $ | 15.54 | $ | 15.91 | $ | 16.30 | $ | 15.80 | |||||||||||||||
Second generation leased square feet (3)(6) | 182,124 | 894,621 | |||||||||||||||||||||||||||||
Increase in second generation net rent (3)(4)(6) | 28.1 | % | 36.2 | % | |||||||||||||||||||||||||||
Increase in cash basis second generation net rent(3)(6)(7) | 14.1 | % | 18.9 | % | |||||||||||||||||||||||||||
(1) Excludes apartment and retail leasing. | |||||||||||||||||||||||||||||||
(2) Excludes NCR lease of 485,000 square feet due to final financial terms not being determined until construction completion. | |||||||||||||||||||||||||||||||
(3) Weighted average. | |||||||||||||||||||||||||||||||
(4) Represents straight-lined net rent per square foot (operating expenses deducted from gross leases) over the lease term. | |||||||||||||||||||||||||||||||
(5) Includes tenant improvements, external leasing commissions, and free rent. | |||||||||||||||||||||||||||||||
(6) Excludes leases executed for spaces that were vacant upon acquisition, new leases in a development property, and leases for spaces that have been vacant for one year or more. | |||||||||||||||||||||||||||||||
(7) Represents increase in net rent at the end of term paid by the prior tenant compared to net rent at beginning of term paid by the current tenant. For early renewals, represents increase in net rent at the end of the term of the original lease compared to net rent at the beginning of the extended term of the lease. |
Cousins Properties Incorporated | 13 | Q3 2015 Supplemental Information |
OFFICE LEASE EXPIRATIONS |
Year of Expiration | Square Feet Expiring (1) | % of Leased Space | Annual Contractual Rents ($000's) (1)(2) | % of Total Annual Contractual Rents | Annual Contractual Rent/Sq. Ft. (2) | ||||||||||||
2015 | 226,648 | 1.8 | % | $ | 3,508 | 1.1 | % | $ | 15.48 | ||||||||
2016 | 1,211,065 | 9.5 | % | 23,475 | 7.7 | % | 19.38 | ||||||||||
2017 | 896,752 | 7.1 | % | 19,251 | 6.3 | % | 21.47 | ||||||||||
2018 | 1,147,662 | 9.0 | % | 24,245 | 8.0 | % | 21.13 | ||||||||||
2019 | 1,094,785 | 8.6 | % | 27,304 | 9.0 | % | 24.94 | ||||||||||
2020 | 866,941 | 6.8 | % | 20,056 | 6.6 | % | 23.13 | ||||||||||
2021 | 1,157,918 | 9.1 | % | 29,122 | 9.5 | % | 25.15 | ||||||||||
2022 | 1,311,347 | 10.3 | % | 30,620 | 10.0 | % | 23.35 | ||||||||||
2023 | 1,568,191 | 12.4 | % | 35,423 | 11.6 | % | 22.59 | ||||||||||
2024 &Thereafter | 3,226,786 | 25.4 | % | 92,101 | 30.2 | % | 28.54 | ||||||||||
Total | 12,708,095 | 100.0 | % | $ | 305,105 | 100.0 | % | $ | 24.01 |
Expiration Date | Tenant | Market | Building | Square Feet Expiring (1) | ||||||
December 2016 | Bank of America | Charlotte | Gateway Village | 514,396 | ||||||
December 2018 | Apache Corporation | Houston | Post Oak Central | 524,342 |
Cousins Properties Incorporated | 14 | Q3 2015 Supplemental Information |
OFFICE LEASE EXPIRATIONS |
Cousins Properties Incorporated | 15 | Q3 2015 Supplemental Information |
TOP 20 OFFICE TENANTS |
Tenant (1) | Company's Share of Square Footage | Company's Share of Annualized Base Rent | Percentage of Total Company's Share of Annualized Base Rent (2) | Average Remaining Lease Term (Years) (3) | |||||
1 | Occidental Oil & Gas Corp. | 961,491 | $ | 18,366,458 | 7% | 11 | |||
2 | Apache Corporation | 524,342 | 9,092,950 | 4% | 3 | ||||
3 | Invesco Management Group, Inc. | 400,332 | 6,626,873 | 3% | 8 | ||||
4 | Bank of America (4) | 865,872 | 6,253,505 | 3% | 3 | ||||
5 | McGuire Woods, LLP | 198,648 | 5,617,946 | 2% | 11 | ||||
6 | Deloitte LLP | 259,998 | 5,397,558 | 2% | 9 | ||||
7 | Transocean Offshore Deepwater | 264,002 | 5,241,160 | 2% | 7 | ||||
8 | American Cancer Society, Inc. | 275,198 | 4,829,991 | 2% | 7 | ||||
9 | Smith Gambrell & Russell | 159,136 | 4,767,099 | 2% | 6 | ||||
10 | Stewart Information Services | 235,290 | 4,068,203 | 2% | 4 | ||||
11 | US South Communications | 219,659 | 3,977,498 | 2% | 6 | ||||
12 | Internap Network Services | 120,298 | 3,521,033 | 1% | 5 | ||||
13 | Direct Energy | 197,422 | 2,996,984 | 1% | 8 | ||||
14 | National Union Fire Insurance | 105,362 | 2,891,242 | 1% | 3 | ||||
15 | Northside Hospital | 99,185 | 2,855,822 | 1% | 7 | ||||
16 | MedAssets Supply Chain Systems, LLC | 120,660 | 2,717,827 | 1% | 15 | ||||
17 | Wells Fargo Bank, N.A. | 94,215 | 2,438,183 | 1% | 5 | ||||
18 | Gulf South Pipeline Company LP | 98,616 | 2,366,784 | 1% | 9 | ||||
19 | Parsley Energy, L.P. | 73,843 | 2,141,447 | 1% | 9 | ||||
20 | Emory University | 86,496 | 2,116,824 | 1% | 13 | ||||
Total Top 20 | 5,360,065 | $ | 98,285,387 | 40% | 7 | ||||
(1) | In some cases, the actual tenant may be an affiliate of the entity shown. | ||||||||
(2) | Annualized Base Rent represents the annualized minimum rent paid by the tenant as of the date of this report. If the tenant is in a free rent period as of the date of this report, Annualized Base Rent represents the annualized minimum contractual rent the tenant will pay in the first month it is required to pay rent which may or may not include a base year of operating expenses depending upon the terms of the lease. | ||||||||
(3) | Weighted average. | ||||||||
(4) | A portion of the Company's economic exposure for this tenant is limited to a fixed return through a joint venture arrangement. | ||||||||
Note: | This schedule includes tenants whose leases have commenced and/or have taken occupancy. Leases that have been signed but have not commenced are excluded from this schedule. |
Cousins Properties Incorporated | 16 | Q3 2015 Supplemental Information |
TENANT INDUSTRY DIVERSIFICATION |
Cousins Properties Incorporated | 17 | Q3 2015 Supplemental Information |
INVESTMENT ACTIVITY |
Property | Type | Metropolitan Area | Company's Ownership Interest | Timing | Square Feet | Gross Purchase Price ($ in thousands) | |||||||||
2014 | |||||||||||||||
Fifth Third Center | Office | Charlotte | 100.0% | 3Q | 698,000 | $ | 215,000 | ||||||||
Northpark Town Center | Office | Atlanta | 100.0% | 4Q | 1,528,000 | 348,000 | |||||||||
2013 | |||||||||||||||
Post Oak Central | Office | Houston | 100.0% | 1Q | 1,280,000 | 230,900 | |||||||||
Terminus 200 | Office | Atlanta | 50.0% | 1Q | 566,000 | 164,000 | |||||||||
816 Congress | Office | Austin | 100.0% | 2Q | 435,000 | 102,400 | |||||||||
Greenway Plaza | Office | Houston | 100.0% | 3Q | 4,348,000 | 950,000 | |||||||||
777 Main | Office | Fort Worth | 100.0% | 3Q | 980,000 | 160,000 | |||||||||
2012 | |||||||||||||||
2100 Ross | Office | Dallas | 100.0% | 3Q | 844,000 | 59,200 | |||||||||
2011 | |||||||||||||||
Promenade | Office | Atlanta | 100.0% | 4Q | 775,000 | 134,700 | |||||||||
11,454,000 | $ | 2,364,200 | |||||||||||||
Project | Type | Metropolitan Area | Company's Ownership Interest | Timing | Square Feet | Project Cost ($ in thousands) | |||||||||
2015 | |||||||||||||||
Colorado Tower | Office | Austin | 100.0% | 1Q | 373,000 | $ | 126,100 | ||||||||
Emory Point - Phase 2 | Mixed | Atlanta | 75.0% | 3Q | 302,000 | 75,400 | |||||||||
2013 | |||||||||||||||
Emory Point - Phase 1 | Mixed | Atlanta | 75.0% | 4Q | 484,000 | 102,300 | |||||||||
2012 | |||||||||||||||
Mahan Village | Retail | Tallahassee | 50.5% | 4Q | 147,000 | 25,800 | |||||||||
1,306,000 | $ | 329,600 | |||||||||||||
Cousins Properties Incorporated | 18 | Q3 2015 Supplemental Information |
INVESTMENT ACTIVITY |
Property | Type | Metropolitan Area | Company's Ownership Interest | Timing | Square Feet | Gross Sales Price ($ in thousands) | |||||||||
2015 | |||||||||||||||
2100 Ross | Office | Dallas | 100.0% | 3Q | 844,000 | $ | 131,000 | ||||||||
2014 | |||||||||||||||
600 University Park Place | Office | Birmingham | 100.0% | 1Q | 123,000 | 19,700 | |||||||||
Lakeshore Park Plaza | Office | Birmingham | 100.0% | 3Q | 197,000 | 25,000 | |||||||||
Mahan Village | Retail | Florida | 50.5% | 4Q | 147,000 | 29,500 | |||||||||
Cousins Watkins LLC | Retail | Other | 50.5% | 4Q | 339,000 | 79,500 | |||||||||
777 Main | Office | Fort Worth | 100.0% | 4Q | 980,000 | 167,000 | |||||||||
2013 | |||||||||||||||
Terminus 100 | Office | Atlanta | 100.0% | 1Q | 656,000 | 209,200 | |||||||||
Tiffany Springs MarketCenter | Retail | Kansas City | 88.5% | 3Q | 238,000 | 53,500 | |||||||||
The Avenue Murfreesboro | Retail | Nashville | 50.0% | 3Q | 752,000 | 164,000 | |||||||||
CP Venture Two LLC | Retail | Other | 10.3% | 3Q | 934,000 | 226,100 | |||||||||
CP Venture Five LLC | Retail | Other | 11.5% | 3Q | 1,179,000 | 296,200 | |||||||||
Inhibitex | Office | Atlanta | 100.0% | 4Q | 51,000 | 8,300 | |||||||||
2012 | |||||||||||||||
The Avenue Collierville | Retail | Memphis | 100.0% | 2Q | 511,000 | 55,000 | |||||||||
Galleria 75 | Office | Atlanta | 100.0% | 2Q | 111,000 | 9,200 | |||||||||
Ten Peachtree Place | Office | Atlanta | 50.0% | 2Q | 260,000 | 45,300 | |||||||||
The Avenue Web Gin | Retail | Atlanta | 100.0% | 4Q | 322,000 | 59,600 | |||||||||
The Avenue Forsyth | Retail | Atlanta | 88.5% | 4Q | 524,000 | 119,000 | |||||||||
Cosmopolitan Center | Office | Atlanta | 100.0% | 4Q | 51,000 | 7,000 | |||||||||
Palisades West | Office | Austin | 50.0% | 4Q | 373,000 | 64,800 | |||||||||
Presbyterian Medical Plaza | Office | Charlotte | 11.5% | 4Q | 69,000 | 4,500 | |||||||||
2011 | |||||||||||||||
King Mill | Industrial | Atlanta | 75.0% | 4Q | 796,000 | 28,300 | |||||||||
Lakeside Ranch | Industrial | Dallas | 100.0% | 4Q | 749,000 | 28,400 | |||||||||
One Georgia Center | Office | Atlanta | 88.5% | 3Q | 376,000 | 48,600 | |||||||||
Jefferson Mill | Industrial | Atlanta | 75.0% | 1Q | 459,000 | 22,000 | |||||||||
11,041,000 | $ | 1,900,700 |
Cousins Properties Incorporated | 19 | Q3 2015 Supplemental Information |
DEVELOPMENT PIPELINE (1) |
Project | Type | Metropolitan Area | Company's Ownership Interest | Project Start Date | Number of Apartment Units/Square Feet | Estimated Project Cost (2) ($ in thousands) | Project Cost Incurred to Date (2) ($ in thousands) | Percent Leased | Percent Occupied | Initial Occupancy | Estimated Stabilization (5) | |||||||||||||||||||||
Research Park V | Office | Austin, TX | 100 | % | 4Q14 | 173,000 | $ | 45,000 | $ | 26,797 | — | % | — | % | 1Q16 | (3 | ) | 1Q17 | ||||||||||||||
Carolina Square | Mixed | Chapel Hill, NC | 50 | % | 2Q15 | 123,000 | 8,643 | |||||||||||||||||||||||||
Office | 159,000 | 39 | % | — | % | 2Q17 | (3 | ) | 2Q18 | |||||||||||||||||||||||
Apartments | 246 | — | % | — | % | 2Q17 | (4 | ) | 2Q18 | |||||||||||||||||||||||
Retail | 43,000 | — | % | — | % | 2Q17 | (4 | ) | 2Q18 | |||||||||||||||||||||||
NCR | Office | Atlanta, GA | 100 | % | 3Q15 | 485,000 | 200,000 | 26,030 | 100 | % | — | % | 1Q18 | (3 | ) | 1Q18 | ||||||||||||||||
Total | $ | 368,000 | $ | 61,470 |
Cousins Properties Incorporated | 20 | Q3 2015 Supplemental Information |
LAND INVENTORY |
Metropolitan Area | Company's Ownership Interest | Total Developable Land (Acres) | Company's Share | |||||||||
Commercial | ||||||||||||
North Point | Atlanta | 100.0% | 32 | |||||||||
Wildwood Office Park | Atlanta | 50.0% | 22 | |||||||||
The Avenue Forsyth-Adjacent Land | Atlanta | 100.0% | 10 | |||||||||
NCR Phase II (3) | Atlanta | 100.0% | 1 | |||||||||
Georgia | 65 | |||||||||||
Victory Center | Dallas | 75.0% | 3 | |||||||||
Texas | 3 | |||||||||||
Commercial Land Held (Acres) | 68 | 57 | ||||||||||
Cost Basis of Commercial Land Held | $ | 39,364 | $ | 20,577 | ||||||||
Residential (1) | ||||||||||||
Paulding County | Atlanta | 50.0% | 478 | |||||||||
Callaway Gardens (2) | Atlanta | 100.0% | 218 | |||||||||
Georgia | 696 | |||||||||||
Padre Island | Corpus Christi | 50.0% | 15 | |||||||||
Texas | 15 | |||||||||||
Residential Land Held (Acres) | 711 | 465 | ||||||||||
Cost Basis of Residential Land Held | $ | 11,899 | $ | 8,363 | ||||||||
Grand Total Land Held (Acres) | 779 | 522 | ||||||||||
Grand Total Cost Basis of Land Held | $ | 51,263 | $ | 28,940 | ||||||||
Cousins Properties Incorporated | 21 | Q3 2015 Supplemental Information |
DEBT SCHEDULE |
Company's Share of Debt Maturities and Principal Payments | ||||||||||||||||||||||||||||||||||||||||
Description (Interest Rate Base, if not fixed) | Company's Ownership Interest | Rate at End of Quarter | Maturity Date | 2015 | 2016 | 2017 | 2018 | 2019 | Thereafter | Total | Company's Share Recourse (1) | |||||||||||||||||||||||||||||
Consolidated Debt | ||||||||||||||||||||||||||||||||||||||||
Floating Rate Debt | ||||||||||||||||||||||||||||||||||||||||
Credit Facility, Unsecured (LIBOR + 1.10%-1.45%; $500mm facility)(2) | 100.0 | % | 1.29 | % | 5/28/19 | $ | — | $ | — | $ | — | $ | — | $134,000 | $ | — | $134,000 | $134,000 | ||||||||||||||||||||||
Total Floating Rate Debt | — | — | — | — | 134,000 | — | 134,000 | 134,000 | ||||||||||||||||||||||||||||||||
Fixed Rate Debt | ||||||||||||||||||||||||||||||||||||||||
The Points at Waterview (3) | 100.0 | % | 5.66 | % | 1/1/16 | 146 | 14,025 | — | — | — | — | 14,171 | — | |||||||||||||||||||||||||||
The American Cancer Society Center (4) | 100.0 | % | 6.45 | % | 9/1/17 | 452 | 1,834 | 127,508 | — | — | — | 129,794 | — | |||||||||||||||||||||||||||
191 Peachtree Tower | 100.0 | % | 3.35 | % | 10/1/18 | — | 1,305 | 2,013 | 96,682 | — | — | 100,000 | — | |||||||||||||||||||||||||||
Meridian Mark Plaza | 100.0 | % | 6.00 | % | 8/1/20 | 110 | 456 | 484 | 514 | 546 | 22,978 | 25,088 | — | |||||||||||||||||||||||||||
Post Oak Central | 100.0 | % | 4.26 | % | 10/1/20 | 848 | 3,485 | 3,636 | 3,794 | 3,959 | 166,896 | 182,618 | — | |||||||||||||||||||||||||||
Promenade | 100.0 | % | 4.27 | % | 10/1/22 | 695 | 2,862 | 2,986 | 3,116 | 3,252 | 95,988 | 108,899 | — | |||||||||||||||||||||||||||
816 Congress | 100.0 | % | 3.75 | % | 11/1/24 | — | 128 | 1,568 | 1,628 | 1,690 | 79,986 | 85,000 | — | |||||||||||||||||||||||||||
Total Fixed Rate Debt | 2,251 | 24,095 | 138,195 | 105,734 | 9,447 | 365,848 | 645,570 | — | ||||||||||||||||||||||||||||||||
Total Consolidated Debt | 2,251 | 24,095 | 138,195 | 105,734 | 143,447 | 365,848 | 779,570 | 134,000 | ||||||||||||||||||||||||||||||||
Unconsolidated Debt | ||||||||||||||||||||||||||||||||||||||||
Floating Rate Debt | ||||||||||||||||||||||||||||||||||||||||
Emory Point (LIBOR + 1.75%) | 75.0 | % | 1.94 | % | 10/9/16 | — | 43,522 | — | — | — | — | 43,522 | — | |||||||||||||||||||||||||||
Emory Point II (LIBOR + 1.85%, $46mm facility) | 75.0 | % | 2.04 | % | 10/9/16 | — | 29,362 | — | — | — | — | 29,362 | 2,936 | |||||||||||||||||||||||||||
Carolina Square (LIBOR + 1.90%, $79.8mm facility) (5) | 50.0 | % | 2.09 | % | 5/1/18 | — | — | — | — | — | — | — | — | |||||||||||||||||||||||||||
Total Floating Rate Debt | — | 72,884 | — | — | — | — | 72,884 | 2,936 | ||||||||||||||||||||||||||||||||
Fixed Rate Debt | ||||||||||||||||||||||||||||||||||||||||
Gateway Village (6) | 50.0 | % | 6.41 | % | 12/1/16 | 2,303 | 8,768 | — | — | — | — | 11,071 | — | |||||||||||||||||||||||||||
Terminus 100 | 50.0 | % | 5.25 | % | 1/1/23 | 309 | 1,277 | 1,346 | 1,418 | 1,494 | 59,073 | 64,917 | — | |||||||||||||||||||||||||||
Terminus 200 | 50.0 | % | 3.79 | % | 1/1/23 | — | 559 | 770 | 800 | 831 | 38,040 | 41,000 | — | |||||||||||||||||||||||||||
Emory University Hospital Midtown Medical Office Tower | 50.0 | % | 3.50 | % | 6/1/23 | 179 | 732 | 758 | 785 | 813 | 34,055 | 37,322 | — | |||||||||||||||||||||||||||
Total Fixed Rate Debt | 2,791 | 11,336 | 2,874 | 3,003 | 3,138 | 131,168 | 154,310 | — | ||||||||||||||||||||||||||||||||
Total Unconsolidated Debt | 2,791 | 84,220 | 2,874 | 3,003 | 3,138 | 131,168 | 227,194 | 2,936 | ||||||||||||||||||||||||||||||||
Total Debt | $ | 5,042 | $ | 108,315 | $ | 141,069 | $ | 108,737 | $ | 146,585 | $ | 497,016 | $ | 1,006,764 | $ | 136,936 | ||||||||||||||||||||||||
Total Maturities (7) | $ | — | $ | 86,909 | $ | 127,508 | $ | 96,682 | $ | 134,000 | $ | 472,361 | $ | 917,460 | ||||||||||||||||||||||||||
% of Maturities | —% | 9% | 14% | 11% | 15% | 51% | 100% |
Total Debt ($) | Total Debt (%) | Weighted Average Interest Rate | Weighted Average Maturity (Yrs.) | ||||||||||
Floating Rate Debt | $ | 206,884 | 21 | % | 1.53 | % | 2.7 | ||||||
Fixed Rate Debt | 799,880 | 79 | % | 4.58 | % | 5.2 | |||||||
Total Debt | $ | 1,006,764 | 100 | % | 3.95 | % | 4.7 | ||||||
Cousins Properties Incorporated | 22 | Q3 2015 Supplemental Information |
DEBT SCHEDULE |
Cousins Properties Incorporated | 23 | Q3 2015 Supplemental Information |
JOINT VENTURE INFORMATION (1) |
Cash Flows to Cousins | Financial Statement Presentation | |||||||||
Joint Ventures | Properties | Operating | Capital Transactions/Other | GAAP Accounting | ||||||
EP I LLC | Emory Point (Phase I) | 75% of operating cash flows. | 75% of proceeds. | Recognize 75% of net income from venture. | Unconsolidated | |||||
EP II LLC | Emory Point (Phase II) | 75% of operating cash flows. | 75% of proceeds. | Recognize 75% of net income from venture. | Unconsolidated | |||||
Crawford Long-CPI, LLC | Emory University Hospital Midtown Medical Office Tower | 50% of operating cash flows. | 50% of proceeds. | Recognize 50% of net income from venture. | Unconsolidated | |||||
Charlotte Gateway Village LLC | Gateway Village | Preferred return on investment of 11.46%. | 50% of proceeds after partner receives $66.8 million until a 17% leveraged IRR. Thereafter, 20% of remaining proceeds. | Recognize 11.46% of invested capital each period. | Unconsolidated | |||||
Terminus Office Holdings LLC | Terminus 100, Terminus 200 | 50% of operating cash flows until partner receives an agreed upon return. Thereafter, receive an additional promoted interest if certain return thresholds are met. | Same as operating cash flow. | Recognize 50% of net income from venture. | Unconsolidated | |||||
Carolina Square Holdings LP | Carolina Square | 50% of operating cash flows. | 50% of proceeds. | Recognize 50% of net income from venture. | Unconsolidated | |||||
HICO Victory Center LP (2) | Land/ Future Office Development | Cousins funds 75% of land and 50% of other expenses in predevelopment stage. | Same as operating cash flow. | Recognize 50% of net income from joint venture. | Unconsolidated (2) | |||||
CL Realty, L.L.C. | Land | 50% of operating cash flows. | 50% of proceeds. | Recognize 50% of net income from venture. | Unconsolidated | |||||
Temco Associates, LLC | Land | 50% of operating cash flows. | 50% of proceeds. | Recognize 50% of net income from venture. | Unconsolidated | |||||
Wildwood Associates | Land | 50% of operating cash flows. | 50% of proceeds. | Recognize 50% of net income from venture. | Unconsolidated | |||||
Cousins/Callaway LLC | Land | The first $2.0 million of cash flows; 77% of the next $17.7 million of cash flows; 50% of remaining cash flows until a 20% IRR; 40% of remaining cash flows until a 25% IRR; 25% of remainder. | Same as operating cash flow. | Recognize revenues and expenses as if a wholly-owned property. Recognize noncontrolling interest based on amounts earned by partner. | Consolidated |
Cousins Properties Incorporated | 24 | Q3 2015 Supplemental Information |
NON-GAAP FINANCIAL MEASURES - CALCULATIONS AND RECONCILIATIONS |
2013 | 2014 1st | 2014 2nd | 2014 3rd | 2014 4th | 2014 | 2015 1st | 2015 2nd | 2015 3rd | 2015 YTD | |||||||||||
2nd Generation TI & Leasing Costs & Building CAPEX: | ||||||||||||||||||||
Office | ||||||||||||||||||||
Second Generation Leasing Related Costs | 12,139 | 2,745 | 5,388 | 12,023 | 11,031 | 31,187 | 11,513 | 12,294 | 10,941 | 34,748 | ||||||||||
Second Generation Building Improvements | 3,814 | 550 | 1,929 | — | 1,388 | 3,867 | 507 | 965 | 3,267 | 4,739 | ||||||||||
15,954 | 3,295 | 7,317 | 12,023 | 12,419 | 35,054 | 12,020 | 13,259 | 14,208 | 39,487 | |||||||||||
Net Operating Income | ||||||||||||||||||||
Office Consolidated Properties | 102,624 | 42,225 | 43,666 | 47,776 | 52,926 | 186,593 | 52,103 | 54,780 | 54,685 | 161,568 | ||||||||||
Other Consolidated Properties | 1,299 | 402 | 409 | 396 | 178 | 1,385 | (24 | ) | 10 | — | (14 | ) | ||||||||
Net Operating Income - Consolidated | 103,923 | 42,627 | 44,075 | 48,172 | 53,104 | 187,978 | 52,079 | 54,790 | 54,685 | 161,554 | ||||||||||
Rental Property Revenues | 194,420 | 77,484 | 80,034 | 86,857 | 99,535 | 343,910 | 90,033 | 96,177 | 96,016 | 282,226 | ||||||||||
Rental Property Operating Expenses | (90,497 | ) | (34,857 | ) | (35,959 | ) | (38,685 | ) | (46,434 | ) | (155,934 | ) | (37,954 | ) | (41,387 | ) | (41,331 | ) | (120,672 | ) |
Net Operating Income - Consolidated | 103,923 | 42,627 | 44,075 | 48,172 | 53,101 | 187,976 | 52,079 | 54,790 | 54,685 | 161,554 | ||||||||||
Income from Discontinued Operations | ||||||||||||||||||||
Rental Property Revenues | 10,552 | 1,356 | 967 | 601 | 4 | 2,927 | 4 | — | — | 4 | ||||||||||
Rental Property Operating Expenses | (4,163 | ) | (464 | ) | (402 | ) | (262 | ) | (2 | ) | (1,128 | ) | (18 | ) | — | — | (18 | ) | ||
Net Operating Income | 6,389 | 892 | 565 | 339 | 2 | 1,799 | (14 | ) | — | — | (14 | ) | ||||||||
Termination Fees | — | — | 2 | — | — | 2 | — | — | — | — | ||||||||||
Interest and Other Income (Expense) | 15 | — | — | 8 | (4 | ) | 3 | — | (6 | ) | 6 | — | ||||||||
FFO from Discontinued Operations | 6,404 | 892 | 567 | 349 | (2 | ) | 1,804 | (14 | ) | (6 | ) | 6 | (14 | ) | ||||||
Third Party Management and Leasing Revenues | 76 | — | — | — | — | — | — | — | — | — | ||||||||||
Third Party Management and Leasing Expenses | (97 | ) | — | — | (1 | ) | (1 | ) | (2 | ) | — | — | — | — | ||||||
FFO from Third Party Management and Leasing | (21 | ) | — | — | (1 | ) | (1 | ) | (2 | ) | — | — | — | — | ||||||
FFO from Discontinued Operations | 6,383 | 892 | 567 | 348 | (3 | ) | 1,802 | (14 | ) | (6 | ) | 6 | (14 | ) | ||||||
Depreciation and Amortization of Real Estate | (3,086 | ) | — | — | — | — | — | — | — | — | ||||||||||
Income from Discontinued Operations | 3,297 | 892 | 567 | 348 | (3 | ) | 1,804 | (14 | ) | (6 | ) | 6 | (14 | ) | ||||||
Income (Loss) from Unconsolidated Joint Ventures | ||||||||||||||||||||
Net Operating Income | ||||||||||||||||||||
Office Properties | 16,195 | 4,493 | 4,593 | 4,575 | 4,515 | 18,176 | 4,642 | 4,489 | 4,644 | 13,775 | ||||||||||
Other Properties | 11,572 | 2,006 | 2,055 | 2,026 | 1,633 | 7,720 | 1,346 | 1,495 | 1,487 | 4,328 | ||||||||||
Net Operating Income | 27,767 | 6,499 | 6,648 | 6,601 | 6,148 | 25,896 | 5,988 | 5,984 | 6,131 | 18,103 | ||||||||||
Residential Lot, Outparcel and Tract Sales Less Cost of Sales | 115 | — | 5 | — | 2,160 | 2,165 | — | 242 | 2,038 | 2,280 | ||||||||||
Other Sales Less Cost of Sales | (4 | ) | — | 42 | — | — | 42 | — | — | — | — | |||||||||
Termination Fees | 19 | — | 72 | — | 113 | 185 | 120 | 28 | 271 | 419 | ||||||||||
Interest Expense | (7,963 | ) | (1,845 | ) | (1,843 | ) | (1,843 | ) | (1,833 | ) | (7,364 | ) | (1,822 | ) | (1,827 | ) | (1,845 | ) | (5,494 | ) |
Other Expense | 513 | 28 | 203 | 155 | 150 | 536 | 68 | 106 | 12 | 186 | ||||||||||
Depreciation and Amortization of Non-Real Estate Assets | (34 | ) | (11 | ) | (12 | ) | (12 | ) | (11 | ) | (46 | ) | — | — | — | — |
Cousins Properties Incorporated | 25 | Q3 2015 Supplemental Information |
NON-GAAP FINANCIAL MEASURES - CALCULATIONS AND RECONCILIATIONS |
2013 | 2014 1st | 2014 2nd | 2014 3rd | 2014 4th | 2014 | 2015 1st | 2015 2nd | 2015 3rd | 2015 YTD | |||||||||||
Funds from Operations - Unconsolidated Joint Ventures | 20,413 | 4,671 | 5,115 | 4,901 | 6,727 | 21,414 | 4,354 | 4,533 | 6,607 | 15,494 | ||||||||||
Gain on Sale of Depreciated Investment Properties, net | 60,344 | (387 | ) | — | — | 2,154 | 1,767 | — | — | — | — | |||||||||
Depreciation and Amortization of Real Estate | (13,435 | ) | (2,998 | ) | (3,088 | ) | (2,870 | ) | (2,957 | ) | (11,913 | ) | (2,743 | ) | (2,772 | ) | (2,891 | ) | (8,406 | ) |
Net Income from Unconsolidated Joint Ventures | 67,322 | 1,286 | 2,027 | 2,031 | 5,924 | 11,268 | 1,611 | 1,761 | 3,716 | 7,088 | ||||||||||
Market Capitalization | ||||||||||||||||||||
Common Stock price at Period End | 10.30 | 11.47 | 12.45 | 11.95 | 11.42 | 11.42 | 10.60 | 10.38 | 9.22 | 9.22 | ||||||||||
Number of Common Shares Outstanding at Period End | 189,666 | 198,423 | 198,474 | 216,509 | 216,513 | 216,513 | 216,470 | 216,686 | 214,671 | 214,671 | ||||||||||
Common Stock Capitalization | 1,953,560 | 2,275,912 | 2,471,001 | 2,587,283 | 2,472,578 | 2,472,578 | 2,294,582 | 2,249,201 | 1,979,267 | 1,979,267 | ||||||||||
Preferred Stock Series B Price at Liquidation Value | 94,775 | 94,775 | — | — | — | — | — | — | — | — | ||||||||||
Preferred Stock at Liquidation Value | 94,775 | 94,775 | — | — | — | — | — | — | — | — | ||||||||||
Debt | 630,094 | 587,442 | 665,852 | 671,074 | 792,344 | 792,344 | 847,948 | 849,772 | 779,570 | 779,570 | ||||||||||
Share of Unconsolidated Debt | 228,489 | 226,574 | 224,241 | 224,544 | 215,158 | 215,158 | 219,428 | 225,241 | 227,194 | 227,194 | ||||||||||
Debt (2) | 858,583 | 814,016 | 890,093 | 895,618 | 1,007,502 | 1,007,502 | 1,067,376 | 1,075,013 | 1,006,764 | 1,006,764 | ||||||||||
Total Market Capitalization | 2,906,918 | 3,184,703 | 3,361,094 | 3,482,901 | 3,480,080 | 3,480,080 | 3,361,958 | 3,324,214 | 2,986,031 | 2,986,031 | ||||||||||
EBITDA (2) | ||||||||||||||||||||
FFO | 77,134 | 36,182 | 35,784 | 41,676 | 51,560 | 165,204 | 45,935 | 45,238 | 52,467 | 143,640 | ||||||||||
Interest Expense | 29,672 | 9,012 | 8,813 | 8,660 | 9,989 | 36,474 | 9,498 | 9,696 | 9,518 | 28,712 | ||||||||||
Non-Real Estate Depreciation and Amortization | 787 | 196 | 213 | 244 | 260 | 913 | 423 | 374 | 414 | 1,211 | ||||||||||
Income Tax Provision (Benefit) | (23 | ) | (12 | ) | (9 | ) | 1 | — | (20 | ) | — | — | — | — | ||||||
Gain on Sale of Third Party Management & Leasing Business | 787 | (7 | ) | — | (5 | ) | 15 | 3 | — | — | — | — | ||||||||
Acquisition and Related Costs | 77,134 | 22 | 149 | 644 | 315 | 1,130 | 83 | 2 | 19 | 104 | ||||||||||
Preferred Stock Dividends and Original Issuance Costs | 29,672 | 1,777 | 4,708 | — | — | 6,485 | — | — | — | — | ||||||||||
EBITDA (2) | 787 | 47,170 | 49,658 | 51,220 | 62,139 | 210,189 | 55,939 | 55,310 | 62,418 | 173,667 | ||||||||||
Credit Ratios | ||||||||||||||||||||
Debt (2) | 858,583 | 814,016 | 890,093 | 895,618 | 1,007,502 | 1,007,502 | 1,067,376 | 1,075,013 | 1,006,764 | 1,006,764 | ||||||||||
Total Market Capitalization | 2,906,918 | 3,184,703 | 3,361,094 | 3,482,901 | 3,480,080 | 3,480,080 | 3,361,958 | 3,324,214 | 2,986,031 | 2,986,031 | ||||||||||
Debt (2) / Total Market Capitalization | 29.5 | % | 25.6 | % | 26.5 | % | 25.7 | % | 29.0 | % | 29.0 | % | 31.7 | % | 32.3 | % | 33.7 | % | 33.7 | % |
Total Assets - Consolidated | 2,273,206 | 2,294,038 | 2,280,243 | 2,533,660 | 2,667,330 | 2,667,330 | 2,684,661 | 2,637,607 | 2,635,397 | 2,635,397 | ||||||||||
Accumulated Depreciation - Consolidated | 257,151 | 319,865 | 355,711 | 376,832 | 400,593 | 400,593 | 435,939 | 470,360 | 542,084 | 542,084 | ||||||||||
Undepreciated Assets - Unconsolidated (2) | 441,928 | 446,890 | 492,640 | 459,931 | 450,535 | 450,535 | 454,835 | 466,438 | 482,606 | 482,606 | ||||||||||
Less: Investment in Unconsolidated Joint Ventures | (107,082 | ) | (107,106 | ) | (111,164 | ) | (111,353 | ) | (100,498 | ) | (100,498 | ) | (100,821 | ) | (103,665 | ) | (103,470 | ) | (103,470 | ) |
Total Undepreciated Assets (2) | 2,865,203 | 2,953,687 | 3,017,430 | 3,259,070 | 3,417,960 | 3,417,960 | 3,474,614 | 3,523,306 | 3,556,617 | 3,556,617 | ||||||||||
Debt (2) | 858,583 | 814,016 | 890,093 | 895,618 | 1,007,502 | 1,007,502 | 1,067,376 | 1,075,013 | 1,006,764 | 1,006,764 | ||||||||||
Debt (2) / Total Undepreciated Assets (2) | 30.0 | % | 27.6 | % | 29.5 | % | 27.5 | % | 29.5 | % | 29.5 | % | 30.7 | % | 30.5 | % | 28.3 | % | 28.3 | % |
Cousins Properties Incorporated | 26 | Q3 2015 Supplemental Information |
NON-GAAP FINANCIAL MEASURES - CALCULATIONS AND RECONCILIATIONS |
2013 | 2014 1st | 2014 2nd | 2014 3rd | 2014 4th | 2014 | 2015 1st | 2015 2nd | 2015 3rd | 2015 YTD | |||||||||||
Interest Expense | 29,672 | 9,012 | 8,813 | 8,660 | 9,989 | 36,474 | 9,498 | 9,696 | 9,518 | 28,712 | ||||||||||
Scheduled Principal Payments | 7,032 | 2,445 | 2,430 | 2,460 | 2,501 | 9,836 | 2,493 | 2,477 | 2,507 | 7,477 | ||||||||||
Preferred Stock Dividends | 10,008 | 1,777 | 1,178 | — | — | 2,955 | — | — | — | — | ||||||||||
Fixed Charges | 46,712 | 13,234 | 12,421 | 11,120 | 12,490 | 49,265 | 11,991 | 12,173 | 12,025 | 36,189 | ||||||||||
EBITDA | 123,142 | 47,170 | 49,658 | 51,220 | 62,139 | 210,189 | 55,939 | 55,310 | 62,418 | 173,667 | ||||||||||
Fixed Charges Coverage Ratio (2) | 2.64 | 3.56 | 4.00 | 4.61 | 4.98 | 4.27 | 4.67 | 4.54 | 5.19 | 4.80 | ||||||||||
Debt (2) | 858,583 | 814,016 | 890,093 | 895,618 | 1,007,502 | 1,007,502 | 1,067,376 | 1,075,013 | 1,006,764 | 1,006,764 | ||||||||||
Annualized EBITDA (3) | 181,728 | 188,680 | 198,632 | 204,880 | 248,556 | 248,556 | 223,756 | 221,240 | 250,260 | 231,752 | ||||||||||
Debt (2) / Annualized EBITDA (3) | 4.72 | 4.31 | 4.48 | 4.37 | 4.05 | 4.05 | 4.77 | 4.86 | 4.02 | 4.34 | ||||||||||
Dividend Information | ||||||||||||||||||||
Cash Common Dividends | 27,192 | 14,232 | 14,882 | 16,236 | 16,213 | 61,563 | 17,349 | 17,328 | 17,334 | 52,011 | ||||||||||
FFO | 77,134 | 36,182 | 35,784 | 41,676 | 51,560 | 165,204 | 45,935 | 45,238 | 52,467 | 143,640 | ||||||||||
FFO Payout Ratio | 35.3 | % | 39.3 | % | 41.6 | % | 39.0 | % | 31.4 | % | 37.3 | % | 37.8 | % | 38.3 | % | 33.0 | % | 36.2 | % |
FFO | 77,134 | 36,182 | 35,784 | 41,676 | 51,560 | 165,204 | 45,935 | 45,238 | 52,467 | 143,640 | ||||||||||
Straight Line Rental Revenue | (12,826 | ) | (7,648 | ) | (5,001 | ) | (4,169 | ) | (5,275 | ) | (22,093 | ) | (6,285 | ) | (5,786 | ) | (4,623 | ) | (16,694 | ) |
Above and Below Market Rents | (3,785 | ) | (1,952 | ) | (2,027 | ) | (1,933 | ) | (2,135 | ) | (8,047 | ) | (2,030 | ) | (1,973 | ) | (2,030 | ) | (6,033 | ) |
Second Generation CAPEX | (16,414 | ) | (3,295 | ) | (7,317 | ) | (12,023 | ) | (12,419 | ) | (35,054 | ) | (12,020 | ) | (13,259 | ) | (14,208 | ) | (39,487 | ) |
FAD (2) | 44,109 | 23,286 | 21,439 | 23,551 | 31,731 | 100,010 | 25,600 | 24,220 | 31,606 | 81,426 | ||||||||||
Common Dividends | 27,192 | 14,232 | 14,882 | 16,236 | 16,213 | 61,563 | 17,349 | 17,328 | 17,334 | 52,011 | ||||||||||
FAD Payout Ratio (2) | 61.6 | % | 61.1 | % | 69.4 | % | 68.9 | % | 51.1 | % | 61.6 | % | 67.8 | % | 71.5 | % | 54.8 | % | 63.9 | % |
Operations Ratios | ||||||||||||||||||||
Total Undepreciated Assets (2) | 2,865,203 | 2,953,687 | 3,017,430 | 3,259,070 | 3,417,960 | 3,417,960 | 3,474,614 | 3,523,306 | 3,556,617 | 3,556,617 | ||||||||||
Annualized General and Administrative Expenses (4) / Total Undepreciated Assets | 0.76 | % | 0.76 | % | 0.76 | % | 0.62 | % | 0.40 | % | 0.58 | % | 0.40 | % | 0.67 | % | 0.33 | % | 0.47 | % |
Cousins Properties Incorporated | 27 | Q3 2015 Supplemental Information |
NON-GAAP FINANCIAL MEASURES - CALCULATIONS AND RECONCILIATIONS |
Three Months Ended ($ in thousands) | Nine Months Ended | |||||||||||||||||||
September 30, 2015 | September 30, 2014 | June 30, 2015 | September 30, 2015 | September 30, 2014 | ||||||||||||||||
Rental Property Revenues | ||||||||||||||||||||
Same Property | $ | 77,753 | $ | 76,899 | $ | 76,692 | $ | 228,009 | $ | 222,370 | ||||||||||
Non-Same Property | 28,001 | 20,227 | 28,529 | 81,975 | 53,372 | |||||||||||||||
$ | 105,754 | $ | 97,126 | $ | 105,221 | $ | 309,984 | $ | 275,742 | |||||||||||
Rental Property Operating Expenses | ||||||||||||||||||||
Same Property | $ | 33,106 | $ | 32,734 | $ | 32,825 | $ | 96,168 | $ | 93,894 | ||||||||||
Non-Same Property | 11,834 | 9,280 | 11,623 | 34,175 | 25,432 | |||||||||||||||
$ | 44,940 | $ | 42,014 | $ | 44,448 | $ | 130,343 | $ | 119,326 | |||||||||||
Rental Property Revenues | ||||||||||||||||||||
Consolidated Properties | $ | 96,016 | $ | 86,857 | $ | 96,177 | $ | 282,226 | $ | 244,375 | ||||||||||
Discontinued Operations | — | 601 | — | 4 | 2,923 | |||||||||||||||
Share of Unconsolidated Joint Ventures | 9,738 | 9,668 | 9,044 | 27,754 | 28,444 | |||||||||||||||
$ | 105,754 | $ | 97,126 | $ | 105,221 | $ | 309,984 | $ | 275,742 | |||||||||||
Rental Property Operating Expenses | ||||||||||||||||||||
Consolidated Properties | $ | 41,331 | $ | 38,685 | $ | 41,387 | $ | 120,672 | $ | 109,501 | ||||||||||
Discontinued Operations | — | 260 | — | 18 | 1,126 | |||||||||||||||
Share of Unconsolidated Joint Ventures | 3,609 | 3,069 | 3,061 | 9,653 | 8,700 | |||||||||||||||
$ | 44,940 | $ | 42,014 | $ | 44,448 | $ | 130,343 | $ | 119,327 | |||||||||||
Cash Basis Rental Property Revenues | ||||||||||||||||||||
Rental Property Revenues | $ | 105,754 | $ | 97,126 | $ | 105,221 | $ | 309,984 | $ | 275,742 | ||||||||||
Less: Straight Line Rent | 4,623 | 4,169 | 5,786 | 16,694 | 16,818 | |||||||||||||||
Less: Other | 1,526 | 1,551 | 1,456 | 4,517 | 4,753 | |||||||||||||||
$ | 99,605 | $ | 91,406 | $ | 97,979 | $ | 288,773 | $ | 254,171 | |||||||||||
Cash Basis Rental Property Revenues | ||||||||||||||||||||
Same Property | $ | 74,181 | $ | 73,319 | $ | 72,772 | $ | 216,003 | $ | 205,932 | ||||||||||
Non-Same Property | 25,424 | 18,087 | 25,207 | 72,770 | 48,239 | |||||||||||||||
$ | 99,605 | $ | 91,406 | $ | 97,979 | $ | 288,773 | $ | 254,171 | |||||||||||
Cash Basis Rental Property Operating Expenses | ||||||||||||||||||||
Rental Property Operating Expenses | $ | 44,940 | $ | 42,014 | $ | 44,448 | $ | 130,343 | $ | 119,327 | ||||||||||
Non-Cash Ground Rent Expense | — | 3 | 19 | (58 | ) | 9 | ||||||||||||||
$ | 44,940 | $ | 42,017 | $ | 44,467 | $ | 130,285 | $ | 119,336 | |||||||||||
Cash Basis Rental Property Operating Expenses | ||||||||||||||||||||
Same Property | $ | 33,093 | $ | 32,736 | $ | 32,831 | $ | 96,165 | $ | 93,901 | ||||||||||
Non-Same Property | 11,847 | 9,281 | 11,636 | 34,120 | 25,435 | |||||||||||||||
$ | 44,940 | $ | 42,017 | $ | 44,467 | $ | 130,285 | $ | 119,336 | |||||||||||
(1) Amounts may differ slightly from other schedules contained herein due to rounding. | ||||||||||||||||||||
(2) Includes Company share of unconsolidated joint ventures. | ||||||||||||||||||||
(3) Annualized represents quarter amount annualized. | ||||||||||||||||||||
(4) Quarter figures annualized represent quarter amount annualized, year-to-date represents year-to-date annualized. |
Cousins Properties Incorporated | 28 | Q3 2015 Supplemental Information |
NON-GAAP FINANCIAL MEASURES - DISCUSSION |
The Company uses non-GAAP financial measures in its filings and other public disclosures. The following is a list of non-GAAP financial measures that the Company commonly uses and a description for each measure of (1) the reasons that management believes the measure is useful to investors and (2) if material, any additional uses of the measure by management of the Company. “2nd Generation Tenant Improvements and Leasing Costs and Building Capital Expenditures” is used in the valuation and analysis of real estate. Because the Company develops and acquires properties, in addition to operating existing properties, its property acquisition and development expenditures included in the Statements of Cash Flows includes both initial costs associated with developing and acquiring investment assets and those expenditures necessary for operating and maintaining existing properties at historic performance levels. The latter costs are referred to as second generation costs and are useful in evaluating the economic performance of the asset and in valuing the asset. Accordingly, the Company discloses the portion of its property acquisition and development expenditures that pertain to second generation space in its operating properties. The Company excludes from second generation costs amounts incurred to lease vacant space and other building improvements associated with properties acquired for redevelopment or repositioning. “Cash Basis Net Operating Income” represents Net Operating Income excluding straight-line rents, amortization of lease inducements, amortization of acquired above and below market rents, and non-cash ground lease expense. “EBITDA” represents FFO plus consolidated and Company share of unconsolidated interest expense, non-real estate depreciation and amortization, income taxes, impairment losses, predevelopment charges, loss on debt extinguishment, gain on sale of third party business, participation interest income, acquisition and related costs, and preferred stock dividends and original issuance costs. Management believes that EBITDA provides analysts and investors with appropriate information to use in various ratios that evaluate the Company's level of debt. "Funds Available for Distribution” (“FAD”) represents FFO adjusted to exclude the effect of straight-line rent and above and below market lease amortization less 2nd Generation Tenant Improvements and Leasing Costs and Building Capital Expenditures. Management believes that FAD provides analysts and investors with information that assists in the comparability of the Company's dividend policy with other real estate companies. “FAD Before Certain Charges” represents FAD before preferred share issuance costs write off, non-depreciable impairment losses, predevelopment and other charges, loss on debt extinguishment, acquisition and related costs, gain on sale of third party business, participation interest income and separation charges. Management believes that FAD Before Certain Charges provides analysts and investors with appropriate information related to the Company's core operations and for comparability of the results of its operations and dividend policy with other real estate companies. “Funds From Operations Available to Common Stockholders” (“FFO”) is a supplemental operating performance measure used in the real estate industry. The Company calculates FFO in accordance with the National Association of Real Estate Investment Trusts' (“NAREIT”) definition, which is net income (loss) available to common | stockholders (computed in accordance with accounting principles generally accepted in the United States (“GAAP”)), excluding extraordinary items, cumulative effect of change in accounting principle and gains or losses from sales of depreciable real property, plus depreciation and amortization of real estate assets, impairment losses on depreciable investment property and after adjustments for unconsolidated partnerships and joint ventures to reflect FFO on the same basis. FFO is used by industry analysts and investors as a supplemental measure of an equity REIT's operating performance. Historical cost accounting for real estate assets implicitly assumes that the value of real estate assets diminishes predictably over time. Since real estate values instead have historically risen or fallen with market conditions, many industry investors and analysts have considered presentation of operating results for real estate companies that use historical cost accounting to be insufficient by themselves. Thus, NAREIT created FFO as a supplemental measure of REIT operating performance that excludes historical cost depreciation, among other items, from GAAP net income. Management believes that the use of FFO, combined with the required primary GAAP presentations, has been fundamentally beneficial, improving the understanding of operating results of REITs among the investing public and making comparisons of REIT operating results more meaningful. Company management evaluates operating performance in part based on FFO. Additionally, the Company uses FFO and FFO per share, along with other measures, as a performance measure for incentive compensation to its officers and other key employees. “FFO Before Certain Charges” represents FFO before preferred share issuance costs write off, non-depreciable impairment losses, predevelopment and other charges, loss on debt extinguishment, acquisition and related costs, gain on sale of third party business, participation interest income and separation charges. Management believes that FFO Before Certain Charges provides analysts and investors with appropriate information related to the Company's core operations and for comparability of the results of its operations with other real estate companies. “Net Operating Income” is used by industry analysts, investors and Company management to measure operating performance of the Company's properties. Net Operating Income, which is rental property revenues less rental property operating expenses, excludes certain components from net income in order to provide results that are more closely related to a property's results of operations. Certain items, such as interest expense, while included in FFO and net income, do not affect the operating performance of a real estate asset and are often incurred at the corporate level as opposed to the property level. As a result, management uses only those income and expense items that are incurred at the property level to evaluate a property's performance. Depreciation and amortization are also excluded from Net Operating Income for the reasons described under FFO above. “Same Property Net Operating Income” represents Net Operating Income or Cash Basis Net Operating Income for those office properties that have been fully operational in each of the comparable reporting periods. A fully operational property is one that achieved 90% economic occupancy for each of the two periods presented or has been substantially complete and owned by the Company for each of the two periods presented and the preceding year. Same-Property Net Operating Income or Cash Basis Same Property Net Operating Income allows analysts, investors and management to analyze continuing operations and evaluate the growth trend of the Company's portfolio. |
Cousins Properties Incorporated | 29 | Q3 2015 Supplemental Information |
>+[W['X?G
MTN_U#\]O#G[ 7[0'@_X5_P#!&V_CU+PAK/Q$_P""8?A2\\)_$+X6V'CG4].\
M _&&36?V.?%O[+=SXE\+^,K[P6\ECJGAK6];M?%?AD>)/!ULY\)ZKXNT>6>T
MUFXM#=?(/[.W_!'7]J?]E?2=<\/Z#JG[,WQ_77O^"-6A?L(W%Y\;;WQE-X0F
M^.W@_7_C!XAM-(\4^!;7P3=7WC3]G7Q'!\4M/\!3%_%/ASQ+9?#SPU-IMYX?
MN#+I]@H!^K_[7W_!1GX4?LS_ U3X]^!F\*?M#Z;X<^.?P0^!GBO0/A_P#$
MWPY'=^'->^-?Q$\(> K"74]0L;3Q/#8W^CP^-=%\5#0]3MM.FUKP] ;"W;=@!XF(^29$?D @_6&GW]KJ=E;:A9R"6VNXEFA<<$JW!5ASMD1@R
M2(>4D5D/(-?&=>H_#;Q7_95Z-%OI,:?J$H^SR.WRVE\^%49)PL-UA8WZ*DWE
MOP'E:O\ 6G]EM],=^"W'\?!/C_-/9>%WB7FM&.2X[&UN7"\%<>8OV6$PF,=6
M I%W5_K%2"PV$YHZ\N'P\J]&7\/&RLF?(X
MWBC%U[PPD5A:>JY]*E9KOS- \O^J< ?6VM-]7_9S\(?$34?B;XQTZVGC1KWPUI/BKXK1?#O1-90"&]\0^$_'\=F;C
M3X+2]N?U/H **** "BBB@ HHHH **** "BBB@ HHHH **** "BBB@ HHHH *
M*** "BBB@ HHHH **** "BBB@ HHHH **** "BBB@ HHHH **** "BBB@ HH
MHH **** "BBB@ HHHH **** "BBB@ HHHH **** "BBB@ HHHH **** "BBB
M@ HHHH **** "BBB@ HHHH **** "BBB@ HHHH **** "BBB@ H(SQS^!(Z'
M/48/U]>AXHHH 0 #I_GV'H/8<4M%% !1110 4444 %%%% !1110 4444 %%%
M% !2 < 8')_$G)/U)))/3&2%...7):0\#E\= *S*_@;Q,XI_ULXMS#'4:G/EV$?\ 9N5V
M=X/!X64TZ\;:-8O$2K8J+:4E3K4X._(C_07POX4_U1X/R[ UJ?L\QQJ_M3-;
MJTXXW%PIM8>?9X/#PH8223<74HU*D?XC;****^ /T,**** "BBB@ HHHH **
M/T^O _$]JZOP[X)\3>*&4Z3IDKVI;:^HW1^R:='TR3=3 +*0#DQVRSR^B5Q9
MAF67Y3A:F.S3'83+L'2_B8K&XBEAJ$'T3JUI0AS2VC%-RD[**;:1G5JTJ$'4
MK5(4J<=YU)*$5VUDTKOHMV]$
G7]F]7[U/GY))NZE%IZIG[!AZT<1
M0HUX_#6I4ZJ6]E.*E;U5[/S04445ZAL%%%% !1110 4444 %%%% !1110 44
M44 %%%% !1110 4444 %%%% !1110 4444 %%%% !1110 4444 %%%% !111
M0 4444 %%%% !1110 4444 %?EK_ ,%2_&*Z?\-_AUX%CE"W'B?QE=:_<1JP
MW'3O">ER1#S%S]QM4U^P9,C!> D .:"Q^5\'8W+,D7+*MQ%Q/.CPQD6'I2M:O
M+'YU/"*O1U5I8.GB92>D8R>A]#E_"N>YC%5*. J4E-O9)O0^TU!:2.) 7EF8)#$@+RS2,<+'#&H+RR,2 J1JSL3@ FN8^)/
MCCP+\&K:.X^+OC?PK\-9KB!KBPT/Q5JGE>-=7B7;EM%^'6EPZI\0=5!WKMEM
MO#!M"#DW:+\P_(KQ%^V=^VC\>KB\T7PIX@\/?L]>#;@/!=>%/V;],N_"%U'8
MR'/V?Q9\>/$%QK?Q@UJ1XODF71_$OAF&Z#.L.FB-ME=Y^S[^R?IEYJEQX@O0
M;R5[O[3XG\::JTEU>7M\29K@0W^K27=_K.L,I,MUK>OWU]/9JQO+F:%BL$G]
MS^%O[-[#XS@?.O&7QE\2L/P3X(\(T_:\5>)LL#BLHX-IUH5%262<(9AFV#J\
M0>)G%>-Q:>6Y9PUPCPK[/,,QE1P%3B'+*N*HU5\3QEQ=P=P/F&&X:GCL1QIQ
M]F"_X3^!^%'26*7-'GCB\YS7%PG0R3*Z<6JV(QF.PM-O"\^(P=/%JG**^G_&
MO[:&D>#?!>N?$WP?X+\1/H6@31V&@>)_B 4\')XJ\77ZNOAO0?"O@NQGU+Q+
M?/J$J27E_/X@U/PQ_9V@V][J5]IAAC6&7]G_ -C#XT_#?X[>$H;2SM--\&_%
MFPT33]4\6>'X&^TQZY:WMM;S/XK\,7MZYU.^T">XGV7MA)=377AR[<6EUYEG
M)87UU_'E^TY\<=/^-GQ=T;PGX'VV_P (/A??2>'_ 5;0,XM]=U*>[BB\0^-
M;@%@;F?6Y+9H-.N9]UP=&M+:9F274+E*_27X9>+?$WA+1_AI\1_!NK76B^+/
M"VF:'J>F:K:LAEC>VM8X)XYX^(+NSF59(+_3[A'MKVPFNK*ZC>.61:_O+!^
M_!?@G]'Y<1Y)X9YUAN&,1Q)EW$'%GAQQ#GF<2XMQ/#N+R*OF$*V?RPV