Exhibit 99.1
 |
NEWS |
Cooper Tire & Rubber Company Reports Fourth Quarter and Full Year 2015 Results
Company closes 2015 with operating profit
of $354 million; looks forward to continued
strong financial performance in 2016
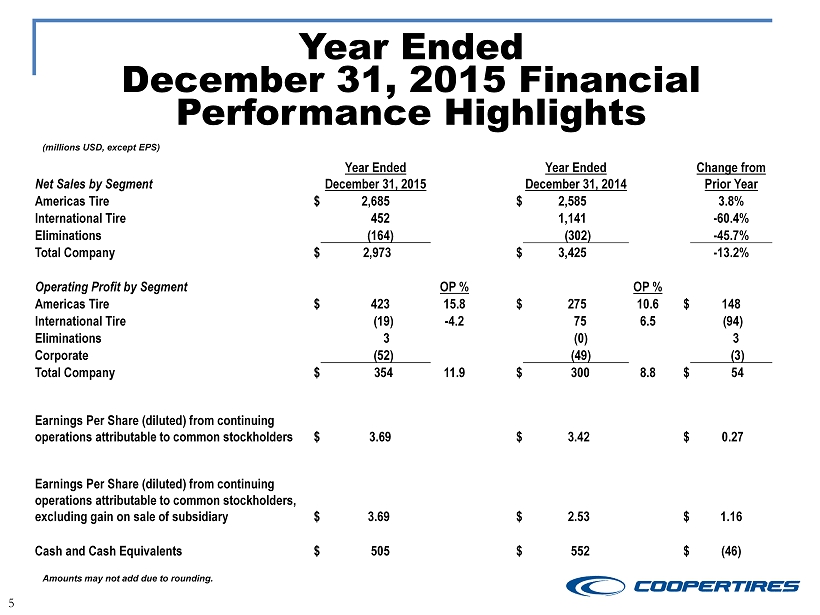
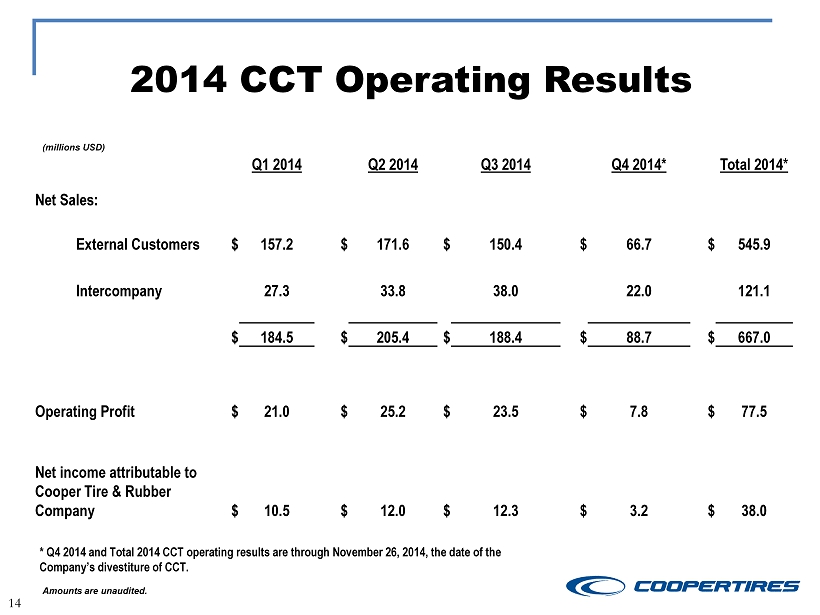
FINDLAY, Ohio, Feb. 23, 2016 – Cooper Tire & Rubber Company (NYSE:CTB) today reported full year 2015 net income of $213 million, or diluted earnings per share of $3.69, compared with $214 million, or $3.42 per share, one year ago. The 2014 results include a gain of $56 million net of tax from the sale of the company’s former CCT joint venture in China in the fourth quarter of 2014.
Fourth Quarter Highlights (comparisons to prior results exclude CCT):
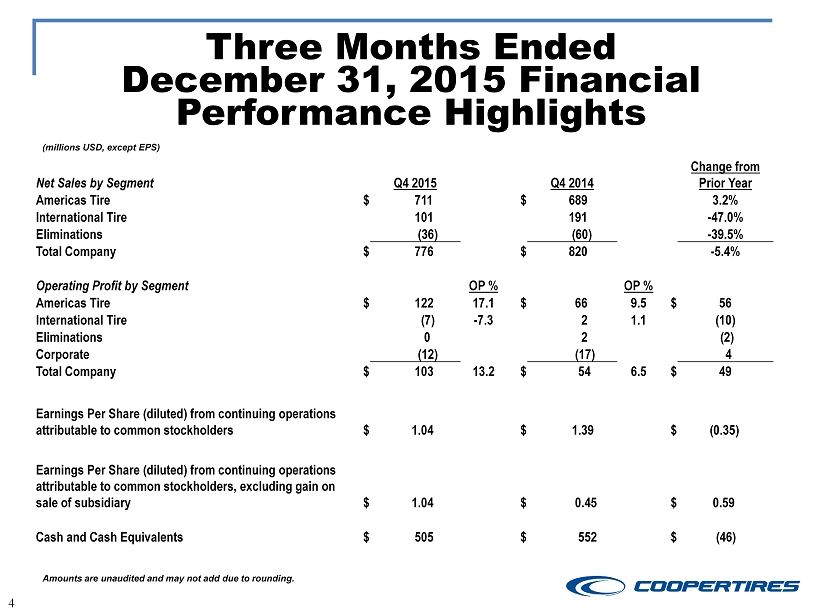
| · | Net sales increased 3.0 percent to $776 million |
| · | Unit volume up 6.0 percent, with increases in all regions |
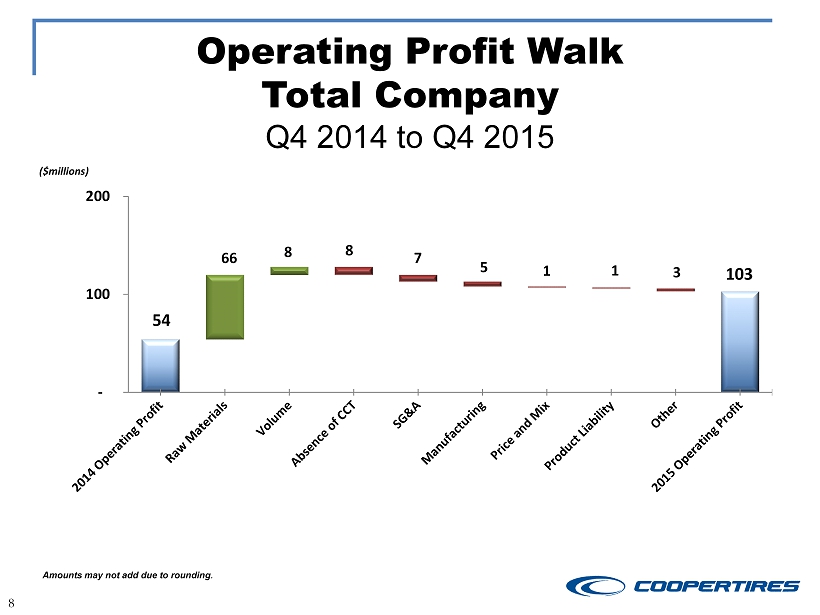
| · | Operating profit more than doubled to $103 million, or 13.2 percent of net sales |
| · | Diluted earnings per share of $1.04 |
| · | Announced strategic agreement to drive growth with new joint venture in China |
Full Year 2015 Highlights (comparisons to prior results exclude CCT):
| · | Net sales increased 3.3 percent to $2.97 billion |
| · | Unit volume up 6.8 percent year-over-year, driven by increases in all regions |
| · | Record operating profit of $354 million, or 11.9 percent of net sales, representing a 59 percent increase over prior year |
| · | Diluted earnings per share of $3.69 |
| · | Announced $200 million share repurchase program in February 2015 |
“It was an exciting year for Cooper as we took numerous steps around the globe to continue to transform and enhance our business,” said Cooper Chairman, Chief Executive Officer and President Roy Armes. “Our fourth quarter and full year performance was very strong, with unit volume increases in all regions and excellent operating profit. In fact, our full year operating margin of nearly 12 percent exceeded the 8 to 10 percent that we established as a mid-term goal for Cooper. We continued to execute our strategic plan and invest in operations around the globe to improve our competitive position. Specifically, we invested in modernizing and enhancing our facilities and continued to invest in technology and product innovation. We are seeing a return on these investments as Cooper moves upstream, selling more high value, high margin products. In addition, we continued to return cash to shareholders through share repurchases and our ongoing dividend.”
Armes added, “In 2015, we broadened our global reach and capabilities through expansion in Latin America and strategic partnerships such as our recently announced agreement to acquire a majority interest in China-based Qingdao Ge Rui Da Rubber Co., Ltd. (GRT). We look forward to another exciting year in 2016, and want to thank all of our employees around the world for their continued dedication and hard work.”
Consolidated Results:
| Cooper Tire | Q4 2015 ($M) | Q4 2014 ($M) | % Change | 2015 ($M) | 2014 ($M) | % Change | ||||||||||||||||||
| Net Sales | $ | 776 | $ | 820 | (5.4 | )% | $ | 2,973 | $ | 3,425 | (13.2 | )% | ||||||||||||
| Operating Profit | $ | 103 | $ | 54 | 91.3 | % | $ | 354 | $ | 300 | 18.0 | % | ||||||||||||
| Operating Margin | 13.2 | % | 6.5 | % | NA | 11.9 | % | 8.8 | % | NA | ||||||||||||||
Consolidated Fourth Quarter Highlights:
| · | Fourth quarter net sales were $776 million. Excluding the impact of CCT, which contributed sales of $67 million in the same period a year ago (net of company eliminations), this represents an increase of 3.0 percent compared to the prior year quarter. Fourth quarter results include higher unit volume of $45 million excluding CCT, with unit volume increases in both the Americas and International segments. The unit volume increase was partially offset by unfavorable price and mix of $17 million, primarily due to pricing and promotion actions related to raw material costs, and negative currency impact of $5 million. |
-more-
Cooper Tire Q4/Full Year 2015 Results—2
| · | Fourth quarter operating profit was $103 million compared with $54 million for the same period last year, which included $8 million from CCT. Fourth quarter operating margin was 13.2 percent versus 6.5 percent in 2014. Excluding the impact of CCT, operating profit increased as a result of favorable raw material costs of $66 million and higher volume of $8 million. These benefits were partially offset by $7 million of unfavorable SG&A, $5 million of higher manufacturing costs, $4 million of negative currency impact and other costs, as well as $1 million of unfavorable price and mix. |
| · | Fourth quarter SG&A was $69 million, which compares with $67 million in the fourth quarter of 2014. The $2 million increase reflects the absence of $5 million in SG&A from the sale of CCT, which was more than offset by SG&A increases of $7 million. The increases included $8 million of higher incentive costs based on the strong financial performance of the company, and $3 million of other costs. These costs were partially offset by $4 million of lower mark-to-market costs of stock-based liabilities. SG&A expense for the quarter was 8.9 percent of sales, compared with 8.1 percent of sales in the fourth quarter of 2014. |
| · | The higher manufacturing costs were concentrated in the Americas segment and were related to the greater complexity of manufacturing more high value, high margin tires as well as higher incentive costs based on the strong financial performance of the company. |
| · | The effective tax rate for the fourth quarter was 38.0 percent. The effective tax rate increased due to an increased mix of earnings in higher tax jurisdictions compared to 2014 and discrete items recognized during the quarter, which included a $2 million revaluation of certain deferred tax assets as a result of a change in the statutory rates in the United Kingdom. Additionally, the 2014 effective tax rate in the fourth quarter was favorably impacted by a lower tax rate on the gain on sale of CCT. |
| · | At year end, Cooper had $505 million in cash and cash equivalents,
compared with $552 million at Dec. 31, 2014. Capital expenditures in the fourth quarter were $54 million compared with $33 million
in 2014. |
| · | During the fourth quarter, 641,000 shares were repurchased for $26 million. |
Consolidated Full Year 2015 Highlights:
| · | Full year 2015 net sales were $2.97 billion. Excluding the impact of CCT, which contributed sales of $546 million in 2014, this represents a 3.3 percent increase over the prior year. Net sales were impacted by higher unit volume of $194 million, excluding CCT. The unit volume increase was partially offset by unfavorable price and mix of $73 million, primarily due to pricing and promotion actions related to raw material costs, and negative currency impact of $27 million. |
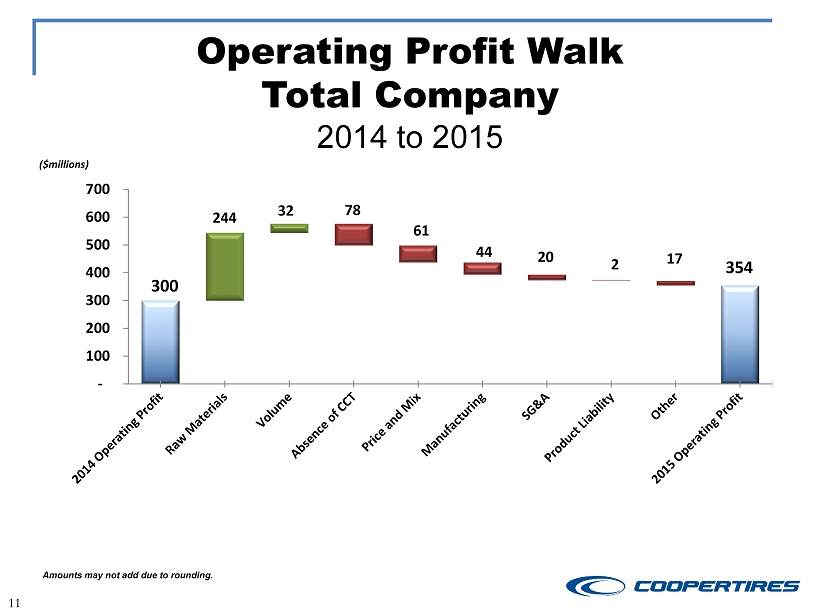
| · | Operating profit was $354 million compared with $300 million for the same period last year, which included $78 million from CCT. Excluding the impact of CCT, the operating profit increased as a result of favorable raw material costs of $244 million and higher volume of $32 million. These benefits were partially offset by $61 million of unfavorable price and mix, $44 million of higher manufacturing costs, $20 million of unfavorable SG&A, and $19 million of negative currency and other costs. |
| · | The effective tax rate for 2015 was 35.4 percent, compared with 32 percent for fiscal 2014. The increased tax rate was partially the result of the change in mix of earnings in 2015, which included a higher percentage of overall earnings in the United States. Additionally, the 2014 effective tax rate was favorably impacted by a lower tax rate on the gain on sale of CCT. |
| · | Full year capital expenditures were $183 million compared with $145 million in 2014. |
| · | In February 2015, the company announced a new $200 million share repurchase program. In the full year, 2,751,454 shares were repurchased under this program for $109 million, or an average price of $39.55 per share. Purchases continued under this authorization in early 2016 with an additional 497,094 shares purchased at an average cost of $35.45 for $17.6 million through Feb. 19, 2016. Since share repurchases began in August 2014, the company has repurchased 9.6 million shares at an average price of $34.00. |
-more-
Cooper Tire Q4/Full Year 2015 Results—3
A summary presentation of information related to the quarter and full year 2015 is posted on the company's website at http://investors.coopertire.com/Quarterly-Results.
Americas Tire Operations:
| Americas Tire Operations | Q4 2015 ($M) | Q4 2014 ($M) | % Change | 2015 ($M) | 2014 ($M) | % Change | ||||||||||||||||||
| Net Sales | $ | 711 | $ | 689 | 3.2 | % | $ | 2,685 | $ | 2,585 | 3.8 | % | ||||||||||||
| Operating Profit | $ | 122 | $ | 66 | 85.4 | % | $ | 423 | $ | 275 | 53.9 | % | ||||||||||||
| Operating Margin | 17.1 | % | 9.5 | % | NA | 15.8 | % | 10.6 | % | NA | ||||||||||||||
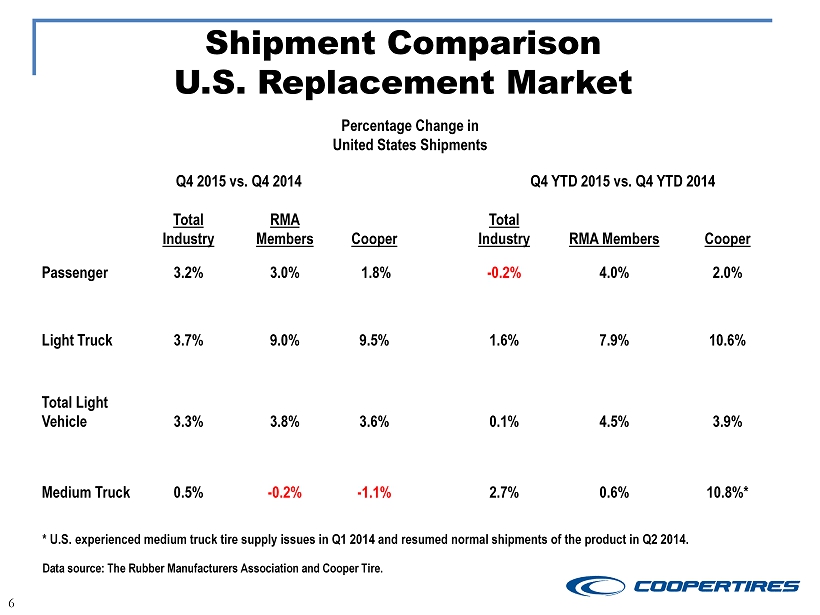
Fourth quarter net sales in the Americas segment rose 3.2 percent as a result of higher unit volume of $22 million. Segment unit shipments increased 3.2 percent compared with the same period last year. Cooper's total light vehicle tire shipments in the United States increased 3.6 percent during the quarter. The Rubber Manufacturers Association (RMA) reported that its member shipments were up 3.8 percent, and total industry shipments (including an estimate for non-RMA members) increased 3.3 percent for the period. Cooper’s full year total light vehicle tire shipments in the United States increased 3.9 percent. For the same period, RMA member shipments were up 4.5 percent and total industry shipments increased 0.1 percent. Unit volume growth in Latin America was strong, with a double-digit year-over-year increase in the fourth quarter.
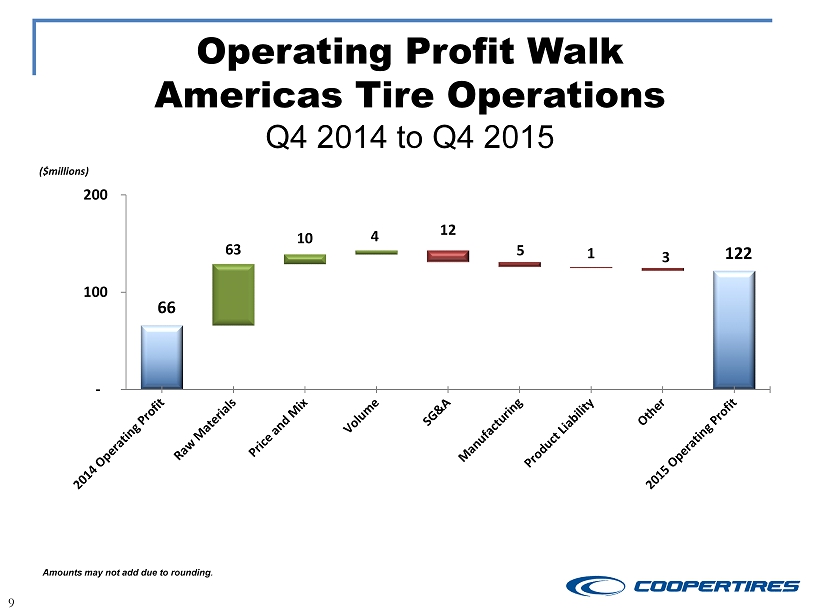
Fourth quarter operating profit was $122 million, or 17.1 percent of net sales, compared with $66 million, or 9.5 percent of net sales, in the fourth quarter of 2014. The higher operating profit reflected favorable raw material costs of $63 million, favorable price and mix of $10 million, and higher unit volume of $4 million. These were partially offset by increased SG&A costs of $12 million, which included $8 million of higher incentive costs based on the strong financial performance of the company, as well as higher manufacturing costs of $5 million and negative currency and other costs of $4 million.
International Tire Operations:
| International Tire Operations | Q4 2015 ($M) | Q4 2014 ($M) | % Change | 2015 ($M) | 2014 ($M) | % Change | ||||||||||||||||||
| Net Sales | $ | 101 | $ | 191 | (47.0 | )% | $ | 452 | $ | 1,141 | (60.4 | )% | ||||||||||||
| Operating Profit (Loss) | $ | (7 | ) | $ | 2 | (439.7 | )% | $ | (19 | ) | $ | 75 | (125.7 | )% | ||||||||||
| Operating Margin | (7.3 | )% | 1.1 | % | NA | (4.2 | )% | 6.5 | % | NA | ||||||||||||||
Fourth quarter net sales in the International segment declined to $101 million from $191 million in 2014. The decrease primarily reflected $87 million, before intercompany eliminations, from the absence of CCT. Excluding CCT, sales decreased $3 million, as higher volume of $15 million was more than offset by $12 million of unfavorable price and mix, and $6 million of negative currency impact. Unit volume increased in both Europe and Asia. Domestic unit sales in China were 60 percent higher year-over-year as a result of growth in both the replacement and original equipment markets.
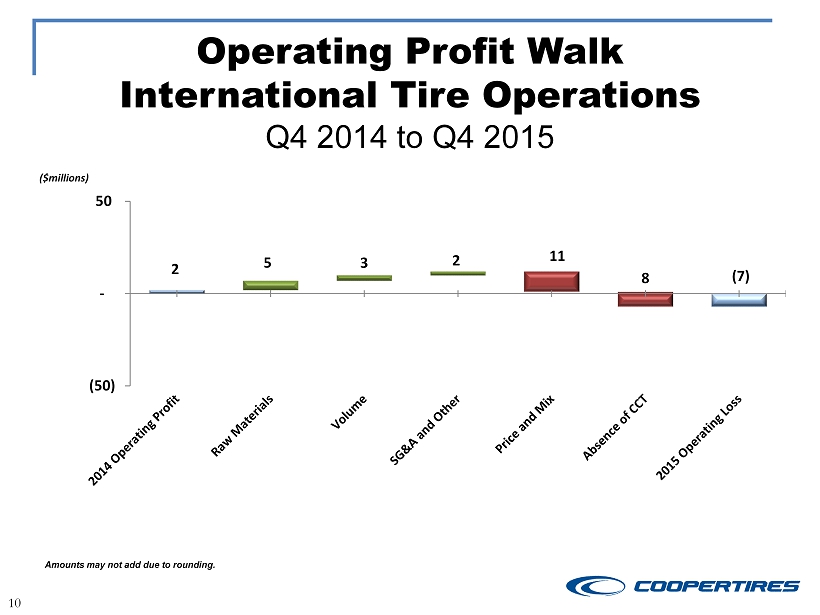
International operations recorded a fourth quarter operating loss of $7 million compared with an operating profit of $2 million for the same period a year ago. Drivers of the operating loss included the absence of CCT, which contributed $8 million to 2014 fourth quarter operating profit, and unfavorable price and mix of $11 million. These unfavorable items were partially offset by lower raw material costs of $5 million, increased volume of $3 million, and reduced SG&A and other costs of $2 million.
Outlook
For 2016, the company anticipates:
| · | Unit volume growth in each of its segments, and unit volume growth in its U.S. operations at or above the industry |
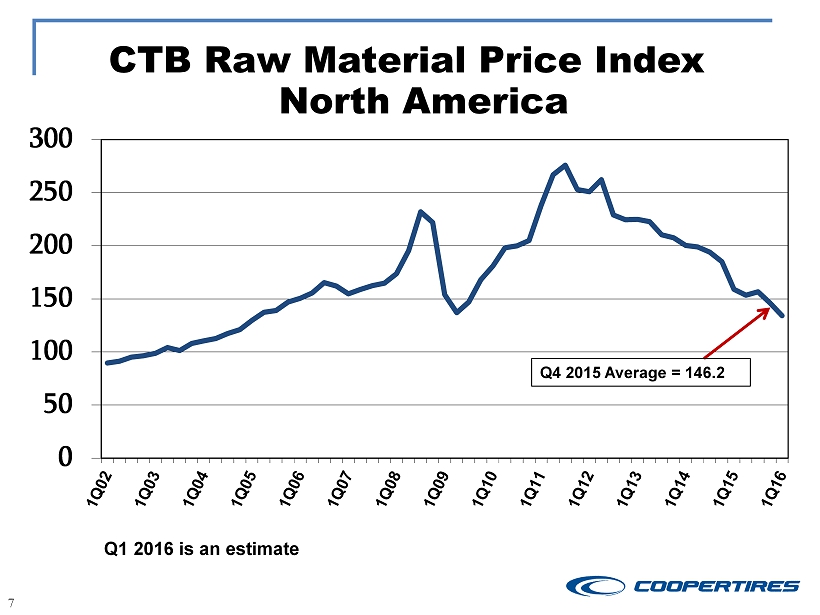
| · | Further declines in raw material costs in the first quarter of 2016 |
| · | Total company operating margin, excluding the impact of acquisitions, to be above the high end of the company’s mid-term target of 8 to 10 percent, but not likely to exceed the 2015 results |
| · | The International segment, excluding the impact of acquisitions, to substantially improve operating profit in 2016 and approach break-even operating profit by the fourth quarter |
-more-
Cooper Tire Q4/Full Year 2015 Results—4
| · | Full year 2016 effective tax rate to be in a range of 34 to 36 percent |
| · | Capital expenditures for 2016 to be in a range of $240 million to $260 million, excluding the impact of any acquisitions. |
Fourth Quarter and Full Year 2015 Conference Call Today at 10 a.m. Eastern
Management will discuss the financial and operating results for the fourth quarter and full year 2015 on a conference call for analysts and investors today at 10 a.m. EST. The call may be accessed on the investor relations page of the company’s website at http://investors.coopertire.com or at http://services.choruscall.com/links/ctb160223. Following the conference call, the webcast will be archived and available for 90 days at these websites.
Forward-Looking Statements
This release contains what the company believes are “forward-looking statements,” as that term is defined
under the Private Securities Litigation Reform Act of 1995, regarding projections, expectations or matters
that the company anticipates may happen with respect to the future performance of the industries in which
the company operates, the economies of the United States and other countries, or the performance of the company itself, which involve
uncertainty and risk.
Such “forward-looking statements” are generally, though not always, preceded by words such as “anticipates,” “expects,” “will,” “should,” “believes,” “projects,” “intends,” “plans,” “estimates,” and similar terms that connote a view to the future and are not merely recitations of historical fact. Such statements are made solely on the basis of the company’s current views and perceptions of future events, and there can be no assurance that such statements will prove to be true.
It is possible that actual results may differ materially from projections or expectations due to a variety of factors, including but not limited to:
| • | volatility in raw material and energy prices, including those of rubber, steel, petroleum based products and natural gas or the unavailability of such raw materials or energy sources; |
| • | the failure of the company’s suppliers to timely deliver products in accordance with contract specifications; |
| • | changes to tariffs or the imposition of new tariffs or trade restrictions, including changes related to the anti-dumping and countervailing duties for passenger car and light truck tires imported into the United States from China; and any duties from the recent open investigation into truck and bus tires imported into the United States from China |
| • | changes in economic and business conditions in the world; |
| • | increased competitive activity including actions by larger competitors or lower-cost producers; |
| • | the failure to achieve expected sales levels; |
| • | changes in the company’s customer relationships, including loss of particular business for competitive or other reasons; |
| • | the ultimate outcome of litigation brought against the company, including stockholders lawsuits relating to the terminated Apollo merger as well as product liability claims, in each case which could result in commitment of significant resources and time to defend and possible material damages against the company or other unfavorable outcomes; |
| • | a disruption in, or failure of, the company’s information technology systems, including those related to cyber security, could adversely affect the company’s business operations and financial performance; |
| • | changes in pension expense and/or funding resulting from investment performance of the company’s pension plan assets and changes in discount rate, salary increase rate, and expected return on plan assets assumptions, or changes to related accounting regulations; |
| • | government regulatory and legislative initiatives including environmental and healthcare matters; |
| • | volatility in the capital and financial markets or changes to the credit markets and/or access to those markets; |
| • | changes in interest or foreign exchange rates; |
| • | an adverse change in the company’s credit ratings, which could increase borrowing costs and/or hamper access to the credit markets; |
| • | failure to implement information technologies or related systems, including failure by the company to successfully implement an ERP system; |
| • | the risks associated with doing business outside of the United States; |
| • | the failure to develop technologies, processes or products needed to support consumer demand; |
-more-
Cooper Tire Q4/Full Year 2015 Results—5
| • | technology advancements; |
| • | the inability to recover the costs to develop and test new products or processes; |
| • | the impact of labor problems, including labor disruptions at the company, its joint venture, or at one or more of its large customers or suppliers; |
| • | failure to attract or retain key personnel; |
| • | consolidation among the company’s competitors or customers; |
| • | inaccurate assumptions used in developing the company’s strategic plan or operating plans or the inability or failure to successfully implement such plans; |
| • | risks relating to acquisitions, such as the proposed acquisition of a majority interest in China based Qingdao Ge Rui Da Rubber Co., Ltd., including the failure to successfully complete acquisitions or integrate them into operations or their related financings may impact liquidity and capital resources; |
| • | changes in the company’s relationship with its joint-venture partner or suppliers, including any changes with respect to CCT’s production of Cooper-branded products; |
| • | the ability to find alternative sources for products supplied by CCT; |
| • | the inability to obtain and maintain price increases to offset higher production or material costs; |
| • | inability to adequately protect the company’s intellectual property rights; and |
| • | inability to use deferred tax assets. |
It is not possible to foresee or identify all such factors. Any forward-looking statement in this release is based on certain assumptions and analyses made by the company in light of its experience and perception of historical trends, current conditions, expected future developments and other factors it believes are appropriate in the circumstances. Prospective investors are cautioned that any such statements are not a guarantee of future performance and actual results or developments may differ materially from those projected.
The company makes no commitment to update any forward-looking statement included herein or to disclose any facts, events or circumstances that may affect the accuracy of any forward-looking statement. Further information covering issues that could materially affect financial performance is contained in the company's periodic filings with the U. S. Securities and Exchange Commission (“SEC”).
###
About Cooper Tire & Rubber Company
Cooper Tire & Rubber Company (NYSE: CTB) is the parent company of a global family of companies that specializes in the design, manufacture, marketing and sale of passenger car and light truck tires. Cooper and its subsidiaries also sell medium truck, motorcycle and racing tires. Cooper's headquarters is in Findlay, Ohio, with manufacturing, sales, distribution, technical and design operations within its family of companies located in more than one dozen countries around the world. For more information on Cooper, visit www.coopertire.com, www.facebook.com/coopertire or www.twitter.com/coopertire.
Investor Contact:
Jerry Bialek
419.424.4165
investorrelations@coopertire.com
Media Contact:
Anne Roman
419.429.7189
alroman@coopertire.com
Cooper Tire & Rubber Company
Condensed Consolidated Statements of Income
(Dollar amounts in thousands except per share amounts)
| Three Months Ended | ||||||||||||||||
| December 31, | Year Ended | |||||||||||||||
| (Unaudited) | December 31, | |||||||||||||||
| 2015 | 2014 | 2015 | 2014 | |||||||||||||
| Net sales | $ | 775,546 | $ | 819,584 | $ | 2,972,901 | $ | 3,424,809 | ||||||||
| Cost of products sold | 603,696 | 699,241 | 2,355,451 | 2,852,051 | ||||||||||||
| Gross profit | 171,850 | 120,343 | 617,450 | 572,758 | ||||||||||||
| Selling, general and administrative expense | 69,319 | 66,760 | 262,970 | 272,300 | ||||||||||||
| Operating profit | 102,531 | 53,583 | 354,480 | 300,458 | ||||||||||||
| Interest expense | (5,335 | ) | (7,178 | ) | (23,820 | ) | (28,138 | ) | ||||||||
| Interest income | 602 | 412 | 2,211 | 1,500 | ||||||||||||
| Gain on sale of interest in subsidiary | - | 77,471 | - | 77,471 | ||||||||||||
| Other non-operating income (expense) | (1,876 | ) | (1,985 | ) | 1,157 | (2,772 | ) | |||||||||
| Income before income taxes | 95,922 | 122,303 | 334,028 | 348,519 | ||||||||||||
| Provision for income taxes | 36,406 | 36,604 | 118,224 | 111,697 | ||||||||||||
| Net income | 59,516 | 85,699 | 215,804 | 236,822 | ||||||||||||
| Net income attributable to noncontrolling shareholders' interests | 270 | 3,436 | 3,038 | 23,244 | ||||||||||||
| Net income attributable to Cooper Tire & Rubber Company | $ | 59,246 | $ | 82,263 | $ | 212,766 | $ | 213,578 | ||||||||
| Basic earnings per share: | ||||||||||||||||
| Net income attributable to Cooper Tire & Rubber Company common stockholders | $ | 1.06 | $ | 1.42 | $ | 3.73 | $ | 3.48 | ||||||||
| Diluted earnings per share: | ||||||||||||||||
| Net income attributable to Cooper Tire & Rubber Company common stockholders | $ | 1.04 | $ | 1.39 | $ | 3.69 | $ | 3.42 | ||||||||
| Weighted average shares outstanding (000s): | ||||||||||||||||
| Basic | 56,061 | 58,132 | 57,012 | 61,402 | ||||||||||||
| Diluted | 56,699 | 59,219 | 57,623 | 62,401 | ||||||||||||
| Segment information: | ||||||||||||||||
| Net Sales: | ||||||||||||||||
| Americas Tire | $ | 710,760 | $ | 688,818 | $ | 2,684,754 | $ | 2,585,484 | ||||||||
| International Tire | 101,027 | 190,645 | 451,879 | 1,140,826 | ||||||||||||
| Eliminations | (36,241 | ) | (59,879 | ) | (163,732 | ) | (301,501 | ) | ||||||||
| Segment profit (loss) | ||||||||||||||||
| Americas Tire | $ | 121,889 | $ | 65,757 | $ | 422,929 | $ | 274,837 | ||||||||
| International Tire | (7,379 | ) | 2,172 | (19,133 | ) | 74,566 | ||||||||||
| Unallocated corporate charges | (12,258 | ) | (16,707 | ) | (52,342 | ) | (48,930 | ) | ||||||||
| Eliminations | 279 | 2,361 | 3,026 | (15 | ) | |||||||||||
Cooper Tire & Rubber Company
Condensed Consolidated Balance Sheets
| (Dollar amounts in thousands) | December 31, | |||||||
| 2015 | 2014 | |||||||
| Assets | ||||||||
| Current assets: | ||||||||
| Cash and cash equivalents | $ | 505,157 | $ | 551,652 | ||||
| Notes receivable | 8,750 | 4,546 | ||||||
| Accounts receivable | 371,757 | 368,393 | ||||||
| Inventories | 412,561 | 421,851 | ||||||
| Other current assets | 36,405 | 40,114 | ||||||
| Total current assets | 1,334,630 | 1,386,556 | ||||||
| Property, plant and equipment, net | 795,198 | 740,203 | ||||||
| Goodwill | 18,851 | 18,851 | ||||||
| Intangibles | 133,490 | 137,784 | ||||||
| Restricted cash | 802 | 653 | ||||||
| Deferred income tax assets | 136,310 | 189,179 | ||||||
| Other assets | 16,895 | 15,711 | ||||||
| Total assets | $ | 2,436,176 | $ | 2,488,937 | ||||
| Liabilities and Equity | ||||||||
| Current liabilities: | ||||||||
| Notes payable | $ | 12,437 | $ | 64,551 | ||||
| Accounts payable | 215,850 | 258,373 | ||||||
| Accrued liabilities | 199,368 | 184,332 | ||||||
| Income taxes payable | 4,748 | 1,994 | ||||||
| Current portion of long-term debt | 600 | 2,115 | ||||||
| Total current liabilities | 433,003 | 511,365 | ||||||
| Long-term debt | 296,412 | 297,937 | ||||||
| Postretirement benefits other than pensions | 249,650 | 264,305 | ||||||
| Pension benefits | 304,621 | 373,360 | ||||||
| Other long-term liabilities | 132,594 | 152,775 | ||||||
| Deferred income tax liabilities | 2,285 | 4,934 | ||||||
| Total parent stockholders' equity | 979,248 | 843,792 | ||||||
| Noncontrolling shareholders' interests in consolidated subsidiaries | 38,363 | 40,469 | ||||||
| Total liabilities and equity | $ | 2,436,176 | $ | 2,488,937 | ||||
Cooper Tire & Rubber Company
Condensed Consolidated Statements of Cash Flows
(Dollar amounts in thousands)
| Year Ended December 31, | ||||||||
| 2015 | 2014 | |||||||
| Operating activities: | ||||||||
| Net income | $ | 215,804 | $ | 236,822 | ||||
| Adjustments to reconcile net income to net cash provided by operations: | ||||||||
| Depreciation and amortization | 121,408 | 139,166 | ||||||
| Deferred income taxes | 25,034 | 3,629 | ||||||
| Stock-based compensation | 14,919 | 9,047 | ||||||
| Change in LIFO reserve | (53,108 | ) | (35,205 | ) | ||||
| Amortization of unrecognized postretirement benefits | 46,170 | 35,907 | ||||||
| Gain on sale of interest in subsidiary, net of tax | - | (55,704 | ) | |||||
| Changes in operating assets and liabilities of continuing operations, net of effect of sale of interest in subsidiary: | ||||||||
| Accounts and notes receivable | (15,155 | ) | (64,636 | ) | ||||
| Inventories | 51,864 | (524 | ) | |||||
| Other current assets | (931 | ) | (2,162 | ) | ||||
| Accounts payable | (42,068 | ) | 67,734 | |||||
| Accrued liabilities | 21,719 | 25,943 | ||||||
| Other items | (85,342 | ) | (40,933 | ) | ||||
| Net cash provided by operating activities | 300,314 | 319,084 | ||||||
| Investing activities: | ||||||||
| Additions to property, plant and equipment and capitalized software | (182,544 | ) | (145,041 | ) | ||||
| Proceeds from sale of interest in subsidiary, net of cash sold | - | 170,711 | ||||||
| Proceeds from the sale of assets | 1,651 | 1,248 | ||||||
| Net cash (used in) provided by investing activities | (180,893 | ) | 26,918 | |||||
| Financing activities: | ||||||||
| Net (payments on) issuances of short-term debt | (41,303 | ) | 55,447 | |||||
| Additions to long-term debt | - | 15,634 | ||||||
| Repayments of long-term debt | (3,125 | ) | (35,715 | ) | ||||
| Payment of financing fees | (2,586 | ) | - | |||||
| Repurchase of common stock | (108,821 | ) | (200,000 | ) | ||||
| Payment of dividends to noncontrolling shareholders | (917 | ) | (7,813 | ) | ||||
| Payment of dividends | (23,880 | ) | (25,538 | ) | ||||
| Issuance of common shares and excess tax benefits on options | 23,965 | 3,230 | ||||||
| Net cash used in financing activities | (156,667 | ) | (194,755 | ) | ||||
| Effects of exchange rate changes on cash of continuing operations | (9,249 | ) | 2,674 | |||||
| Changes in cash and cash equivalents | (46,495 | ) | 153,921 | |||||
| Cash and cash equivalents at beginning of year | 551,652 | 397,731 | ||||||
| Cash and cash equivalents at end of year | $ | 505,157 | $ | 551,652 | ||||