UNITEDSTATES
SECURITIESANDEXCHANGECOMMISSION
Washington,D.C.20549
FORM N-CSR
CERTIFIED SHAREHOLDER REPORT OF REGISTERED MANAGEMENT
INVESTMENT COMPANIES
Investment Company Act file number 811-02688
Name of Fund: BlackRock Municipal Bond Fund, Inc.
BlackRock High Yield Municipal Fund
BlackRock Municipal Fund
BlackRock National Municipal Fund
BlackRock Short-Term Municipal Fund
Fund Address: 100 Bellevue Parkway, Wilmington, DE 19809
Name and address of agent for service: John M. Perlowski, Chief Executive Officer, BlackRock
Municipal Bond Fund, Inc., 55 East 52nd Street, New York, NY 10055
Registrant’s telephone number, including area code: (800) 441-7762
Date of fiscal year end: 06/30/2011
Date of reporting period: 06/30/2011
Item 1 – Report to Stockholders
June 30, 2011
Annual Report
BlackRock Municipal Bond Fund, Inc.
BlackRock Short-Term Municipal Fund
BlackRock Municipal Fund
BlackRock National Municipal Fund
BlackRock High Yield Municipal Fund
BlackRock Multi-State Municipal Series Trust
BlackRock New York Municipal Bond Fund
Not FDIC Insured • No Bank Guarantee • May Lose Value
| Table of Contents | |
| Page | |
| Dear Shareholder | 3 |
| Annual Report: | |
| Fund Summaries | 4 |
| About Fund Performance | 14 |
| Disclosure of Expenses | 15 |
| The Benefits and Risks of Leveraging | 16 |
| Derivative Financial Instruments | 16 |
| Financial Statements: | |
| Schedules of Investments | 17 |
| Statements of Assets and Liabilities | 43 |
| Statements of Operations | 45 |
| Statements of Changes in Net Assets | 46 |
| Financial Highlights | 51 |
| Notes to Financial Statements | 70 |
| Report of Independent Registered Public Accounting Firm | 81 |
| Important Tax Information | 81 |
| Disclosure of Investment Advisory Agreements and Sub-Advisory Agreements | 82 |
| Officers and Directors | 86 |
| Additional Information | 89 |
| Mutual Fund Family | 91 |
| 2 | ANNUAL REPORT | JUNE | 30, 2011 |
Dear Shareholder
The recent downgrade of US long-term debt by Standard & Poor’s marked an historic event for financial
markets. Stocks tumbled in the days before and after the announcement on August 5 as investors con-
templated the pervasiveness of the lower US credit rating across asset classes and the future direction
of the global economy. BlackRock was well prepared for the possibility of a downgrade and the firm had
no need to execute any forced selling of securities in response to the S&P action.Through periods of
uncertainty, as ever, BlackRock’s full resources are dedicated to the management of our clients’ assets.
The pages that follow reflect your mutual fund’s reporting period ended June 30, 2011.Accordingly, the
below discussion is intended to provide you with perspective on the performance of your investments
during that period.
Economic conditions in the second quarter of 2011 were strikingly similar to the scenario of the same
quarter last year.The sovereign debt crisis in Europe, tightening monetary policy in China and a global
economic slowdown were again the key concerns that drove investors away from risky assets.The sec-
ond-quarter correction in 2010 was significant, but markets were revived toward the end of the summer
as positive economic news and robust corporate earnings whetted investor appetite for yield.The global
economy had finally gained traction and investor fear turned to optimism with the anticipation of a sec-
ond round of quantitative easing (“QE2”) from the US Federal Reserve Board (the “Fed”). Stock markets
rallied despite the ongoing European debt crisis and inflationary pressures looming over emerging mar-
kets. Fixed income markets, however, saw yields move sharply upward, pushing prices down, especially
on the long end of the historically steep yield curve.While high yield bonds benefited from the risk rally,
most fixed income sectors declined in the fourth quarter.The tax-exempt municipal market faced addi-
tional headwinds as it became evident that the Build America Bond program would not be extended and
municipal finance troubles abounded.
The new year brought spikes of volatility as political turmoil swept across the Middle East/North Africa
region and prices of oil and other commodities soared. Natural disasters in Japan disrupted industry
supply chains and concerns mounted over US debt and deficit issues. Equities quickly rebounded from
each of these events as investors chose to focus on the continuing stream of strong corporate earnings
and positive economic data. Global credit markets were surprisingly resilient in this environment and
yields regained relative stability in 2011.The tax-exempt market saw relief from its headwinds and
steadily recovered from its fourth-quarter lows. Equities, commodities and high yield bonds outpaced
higher-quality assets as investors responded to the Fed’s early 2011 reaffirmation that it will keep inter-
est rates low.
However, longer-term headwinds had been brewing. Inflationary pressures intensified in emerging
economies, many of which were overheating, and the European debt crisis was not over. Markets were
met with a sharp reversal in May when political unrest in Greece pushed the nation closer to defaulting
on its debt.This development rekindled fears about the broader debt crisis and its further contagion
among peripheral European countries. Concurrently, it became evident that the pace of global economic
growth had slowed. Higher oil prices and supply chain disruptions in Japan finally caught up with eco-
nomic data. Investors pulled back from riskier assets and stocks generally declined throughout most of
May and June, but year-to-date performance in global equity markets was positive, and 12-month
returns were remarkably strong. In bond markets, yields were volatile but generally moved lower for the
period as a whole (pushing prices up). Continued low short-term interest rates kept yields on money
market securities near their all-time lows.
Sincerely,
Rob Kapito
President, BlackRock Advisors, LLC

“Markets generally moved higher
despite heightened volatility during
the reporting period.”
Rob Kapito
President, BlackRock Advisors, LLC
| Total Returns as of June 30, 2011 | 6-month 12-month | |
| US large cap equities | 6.02% | 30.69% |
| (S&P 500® Index) | ||
| US small cap equities | 6.21 | 37.41 |
| (Russell 2000® Index) | ||
| International equities | 4.98 | 30.36 |
| (MSCI Europe,Australasia, | ||
| Far East Index) | ||
| Emerging market equities | 0.88 | 27.80 |
| (MSCI Emerging Markets Index) | ||
| 3-month Treasury bill | 0.08 | 0.16 |
| (BofA Merrill Lynch 3-Month | ||
| Treasury Bill Index) | ||
| US Treasury securities | 3.26 | 1.88 |
| (BofA Merrill Lynch 10-Year | ||
| US Treasury Index) | ||
| US investment grade bonds | 2.72 | 3.90 |
| (Barclays Capital US Aggregate | ||
| Bond Index) | ||
| Tax-exempt municipal bonds | 4.42 | 3.48 |
| (Barclays Capital Municipal | ||
| Bond Index) | ||
| US high yield bonds | 4.98 | 15.53 |
| (Barclays Capital US | ||
| Corporate High Yield 2% | ||
| Issuer Capped Index) | ||
Past performance is no guarantee of future results.
Index performance is shown for illustrative purposes only.
You cannot invest directly in an index.
| THIS PAGE NOT PART OF YOUR FUND REPORT | 3 |
Fund Summary as of June 30, 2011 BlackRock Short-Term Municipal Fund
Investment Objective
BlackRock Short-Term Municipal Fund’s (the “Fund”) investment objective is to provide shareholders with as high a level of income exempt from federal
income taxes as is consistent with the investment policies of the Fund.
Portfolio Management Commentary
How did the Fund perform?
• For the 12-month period ended June 30, 2011, the Fund underperformed
its primary benchmark, the S&P/Investortools Main Municipal Bond Index,
and its secondary benchmark, the S&P/Investortools Limited Maturity
Municipal Bond Index. The following discussion of relative performance
pertains to the Fund’s secondary benchmark, the S&P/Investortools
Limited Maturity Municipal Bond Index.
What factors influenced performance?
• The Fund maintains a shorter weighted average maturity than the bench-
mark index and will, therefore, generally underperform during periods of
falling interest rates as seen during most of the reporting period. Unusually
high demand for short-term securities coupled with very low new issuance
exacerbated underperformance during the period, as these conditions
steepened the yield curve. Due to its shorter maturity profile, the Fund
is limited in its ability to take advantage of the steepness of the yield
curve as compared to the benchmark index.
• The Fund benefited from its shorter duration profile (lower sensitivity to
interest rate movements) in the fourth quarter of 2010, when municipal
bond redemptions and adverse headlines about municipal credit resulted
in a dramatic rise in yields across the yield curve. In addition, the Fund
maintained minimal cash reserves over the year. As a cash substitute, the
Fund invested in short-duration bonds, which provide both additional
income and capital appreciation.
Describe recent portfolio activity.
• The Fund was fully invested over the 12-month period; however, the ability
to make significant changes to the structure of the portfolio was limited
due to the extremely low rate of new issuance in the later half of the
period. Purchases during the period were mostly essential-service revenue
bonds. A steep yield curve compelled us to extend the Fund’s average
portfolio duration.
Describe portfolio positioning at period end.
• At period end, the Fund was fully invested with minimal cash reserves,
and its average duration was neutral to the benchmark.
The views expressed reflect the opinions of BlackRock as of the date of this report and are subject to change based on changesin market, economic or other conditions. These
views are not intended to be a forecast of future events and are no guarantee of future results.
| Portfolio Information | |
| Percent of | |
| Sector Allocations | Long-Term Investments |
| State | 31% |
| County/City/Special District/School District | 20 |
| Utilities | 19 |
| Education | 7 |
| Health | 7 |
| Transportation | 7 |
| Corporate | 7 |
| Housing | 1 |
| Tobacco | 1 |
| Percent of | |
| Credit Quality Allocations1 | Long-Term Investments |
| AAA/Aaa | 20% |
| AA/Aa | 58 |
| A | 17 |
| BBB/Baa | 4 |
| Not Rated2 | 1 |
1 Using the higher of Standard & Poor’s (“S&P’s”) or Moody’s Investors Service
(“Moody’s”) ratings.
2 The investment advisor has deemed certain of these non-rated securities to be
of investment grade quality. As of June 30, 2011, the market value of these securities
was $2,253,420, representing 0.2% of the Fund’s long-term investments.
| 4 | ANNUAL REPORT | JUNE | 30, 2011 |
BlackRock Short-Term Municipal Fund
Total Return Based on a $10,000 Investment
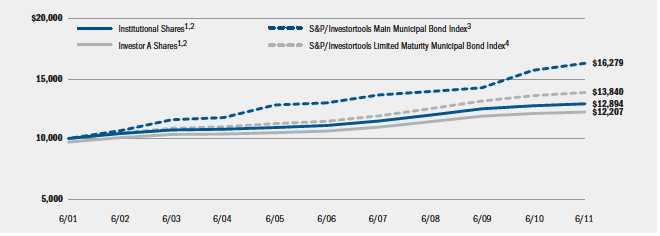
1 Assuming maximum sales charge, transaction costs and other operating expenses, including advisory fees, if any. Institutional Shares do not have a sales charge.
2 The Fund invests primarily in investment grade municipal bonds or in municipal notes, including variable rate demand obligations. The Fund will maintain a dollar
weighted maturity of no more than two years.
3 The S&P/Investortools Main Municipal Bond Index is composed of bonds held by managed municipal bond fund customers of Standard& Poor’s Securities Pricing,
Inc. that are priced daily. Bonds in the S&P/Investortools Main Municipal Bond Index must have an outstanding par value of at least $2 million and a remaining
maturity of not less than 1 month.
4 The S&P/Investortools Limited Maturity Municipal Bond Index includes all bonds in the S&P/Investortools Main Municipal Bond Index with a remaining maturity of
less than 4 years.
Performance Summary for the Period Ended June 30, 2011
| Average Annual Total Returns5 | ||||||||
| 1 Year | 5 Years | 10 Years | ||||||
| Standardized | 6-Month | w/o sales | w/sales | w/o sales | w/sales | w/o sales | w/sales | |
| 30-Day Yields | Total Returns | charge | charge | charge | charge | charge | charge | |
| BlackRock | 0.45% | 1.10% | 1.17% | N/A | 3.05% | N/A | 2.56% | N/ |
| Institutional | 0.43 | 1.20 | 1.27 | N/A | 3.07 | N/A | 2.57 | N/A |
| Investor A | 0.15 | 1.06 | 0.99 | (2.04)% | 2.83 | 2.20% | 2.33 | 2.01% |
| Investor A1 | 0.30 | 1.14 | 1.14 | 0.13 | 2.96 | 2.75 | 2.47 | 2.37 |
| Investor B | 0.02 | 1.00 | 0.85 | (0.15) | 2.69 | 2.69 | 2.19 | 2.19 |
| Investor C | 0.00 | 0.57 | 0.21 | (0.79) | 2.03 | 2.03 | 1.55 | 1.55 |
| S&P/Investortools Main Municipal Bond | ||||||||
| Index | — | 4.58 | 3.69 | N/A | 4.64 | N/A | 4.99 | N/A |
| S&P/Investortools Limited Maturity Municipal | ||||||||
| Bond Index | — | 1.63 | 1.95 | N/A | 3.88 | N/A | 3.30 | N/A |
5 Assuming maximum sales charges, if any. Average annual total returns with and without sales charges reflect reductions for distribution and service fees. See “About Fund
Performance” on page 14 for a detailed description of share classes, including any related sales charges and fees.
N/A — Not applicable as share class and index do not have a sales charge.
Past performance is not indicative of future results.
Expense Example
| Actual | Hypothetical7 | ||||||
| Beginning | Ending | Beginning | Ending | Annualized | |||
| Account Value | Account Value | Expenses Paid | Account Value | Account Value | Expenses Paid | Expense | |
| January 1, 2011 | June 30, 2011 | During the Period6 | January 1, 2011 | June 30, 2011 | During the Period6 | Ratio | |
| BlackRock | $1,000.00 | $1,011.00 | $1.94 | $1,000.00 | $1,022.85 | $1.96 | 0.39% |
| Institutional | $1,000.00 | $1,012.00 | $2.00 | $1,000.00 | $1,022.83 | $2.01 | 0.40% |
| Investor A | $1,000.00 | $1,010.60 | $3.34 | $1,000.00 | $1,021.48 | $3.36 | 0.67% |
| Investor A1 | $1,000.00 | $1,011.40 | $2.54 | $1,000.00 | $1,022.25 | $2.56 | 0.51% |
| Investor B | $1,000.00 | $1,010.00 | $3.99 | $1,000.00 | $1,020.83 | $4.01 | 0.80% |
| Investor C | $1,000.00 | $1,005.70 | $7.21 | $1,000.00 | $1,017.67 | $7.23 | 1.45% |
6 For each class of the Fund, expenses are equal to the annualized expense ratio for the class, multiplied by the average account value over the period, multiplied by 181/365
(to reflect the one-half year period shown). Expenses are net of waiver.
7 Hypothetical 5% annual return before expenses is calculated by pro rating the number of days in the most recent fiscal half year divided by 365.
See “Disclosure of Expenses” on page 15 for further information on how expenses were calculated.
| ANNUAL | REPORT | JUNE | 30, 2011 | 5 |
Fund Summary as of June 30, 2011 BlackRock Municipal Fund
(Formerly BlackRock Municipal Insured Fund)
Investment Objective
BlackRock Municipal Fund’s (the “Fund”) investment objective is to provide shareholders with as high a level of income exempt from federal income taxes
as is consistent with the investment policies of the Fund.
Portfolio Management Commentary
How did the Fund perform?
• Effective January 3, 2011, BlackRock Municipal Insured Fund was renamed
BlackRock Municipal Fund. Also effective on that date, the Fund’s principal
investment strategies were revised to eliminate the Fund’s non-fundamental
investment policy to invest at least 80% of its assets in municipal bonds
covered by insurance.
• For the 12-month period ended June 30, 2011, the Fund underperformed
its primary benchmark, the S&P/Investortools Main Municipal Bond Index,
and its secondary benchmark, the S&P/Investortools Customized Insured
Municipal Bond Index. The following discussion of the Fund’s relative per-
formance pertains to the S&P/Investortools Customized Insured Municipal
Bond Index.
What factors influenced performance?
• The Fund’s holdings of longer-maturity bonds had a negative impact on
performance as the long-end of the municipal yield curve underperformed
over the one-year period. The Fund’s holdings of zero-coupon bonds also
detracted from performance for the period as spreads generally widened
during the reporting period.
• The Fund benefited from its holdings with shorter maturities and shorter
durations (lower sensitivity to interest rate movements) as the short end of
the curve performed well over the one-year period. The Fund also benefited
from its holdings in the housing, healthcare and corporate sectors, all of
which performed well during the period.
Describe recent portfolio activity.
• During the 12-month period, we focused on purchasing newly issued
bonds with higher coupons and better call protection. After the insurance
mandate was removed from the Fund, portfolio activity also focused on
opportunistically purchasing attractively priced securities that do not carry
bond insurance. The change in mandate significantly increased the Fund’s
investment flexibility as the availability of newly issued insured bonds has
recently become quite limited.
Describe portfolio positioning at period end.
• At period end, the Fund continued to exhibit a modestly positive stance
toward the market with its long duration relative to the benchmark.
• On March 18, 2011, the Board of Directors of the BlackRock Municipal
Bond Fund, Inc. (the “Corporation”) approved a plan of reorganization,
whereby BlackRock National Municipal Fund, a series of the Corporation,
will acquire substantially all of the assets and assume certain stated
liabilities of the Fund in exchange for newly issued shares of BlackRock
National Municipal Fund. At a shareholder meeting on June 24, 2011,
shareholders of the Fund approved the plan of reorganization. The
reorganization took place on July 18, 2011.
The views expressed reflect the opinions of BlackRock as of the date of this report and are subject to change based on changesin market, economic or other conditions. These
views are not intended to be a forecast of future events and are no guarantee of future results.
| Portfolio Information | |
| Percent of | |
| Sector Allocations | Long-Term Investments |
| County/City/Special District/School District | 25% |
| Transportation | 23 |
| State | 18 |
| Utilities | 17 |
| Health | 6 |
| Corporate | 6 |
| Education | 3 |
| Housing | 2 |
| Percent of | |
| Credit Quality Allocations1 | Long-Term Investments |
| AAA/Aaa | 16% |
| AA/Aa | 54 |
| A | 28 |
| BBB/Baa | 2 |
| 1 Using the higher of S&P’s or Moody’s ratings. |
| 6 | ANNUAL REPORT | JUNE | 30, 2011 |
BlackRock Municipal Fund
(Formerly BlackRock Municipal Insured Fund)
Total Return Based on a $10,000 Investment
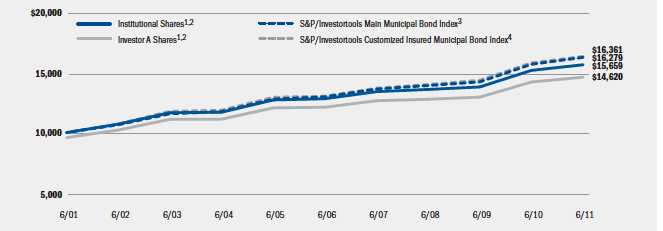
1 Assuming maximum sales charge, transaction costs and other operating expenses, including advisory fees, if any. Institutional Shares do not have a sales charge.
2 The Fund invests primarily in investment grade municipal bonds. The Fund will usually invest in municipal bonds that have a maturity of five years or longer. The
Fund may invest in insured and uninsured municipal bonds.
3 The S&P/Investortools Main Municipal Bond Index is composed of bonds held by managed municipal bond fund customers of Standard& Poor’s Securities Pricing,
Inc. that are priced daily. Bonds in the S&P/Investortools Main Municipal Bond Index must have an outstanding par value of at least $2 million and a remaining
maturity of not less than 1 month.
4 The S&P/Investortools Customized Insured Municipal Bond Index includes insured bonds in the S&P/Investortools Main Municipal Bond Index, excluding those that
are pre-refunded, escrowed to maturity, or insured by ACA Financial Guaranty Corporation.
Performance Summary for the Period Ended June 30, 2011
| Average Annual Total Returns5 | ||||||||
| 1 Year | 5 Years | 10 Years | ||||||
| Standardized | 6-Month | w/o sales | w/sales | w/o sales | w/sales | |||
| 30-Day Yields | Total Returns | charge | charge | charge | charge | charge | charge | |
| Institutional | 4.32% | 5.29% | 3.07% | N/A | 4.08% | N/A | 4.59% | N/A |
| Investor A | 3.86 | 5.15 | 2.80 | (1.57)% | 3.83 | 2.94% | 4.32 | 3.87% |
| Investor B | 3.52 | 5.04 | 2.42 | (1.52) | 3.31 | 2.97 | 3.81 | 3.81 |
| Investor C | 3.26 | 4.91 | 2.05 | 1.06 | 3.07 | 3.07 | 3.56 | 3.56 |
| Investor C1 | 3.44 | 4.87 | 2.24 | 1.25 | 3.26 | 3.26 | 3.76 | 3.76 |
| S&P/Investortools Main Municipal Bond | ||||||||
| Index | — | 4.58 | 3.69 | N/A | 4.64 | N/A | 4.99 | N/A |
| S&P/Investortools Customized Insured | ||||||||
| Municipal Bond Index | — | 4.77 | 3.40 | N/A | 4.64 | N/A | 5.05 | N/A |
5 Assuming maximum sales charges, if any. Average annual total returns with and without sales charges reflect reductions for distribution and service fees. See “About Fund
Performance” on page 14 for a detailed description of share classes, including any related sales charges and fees.
N/A — Not applicable as share class and index do not have a sales charge.
Past performance is not indicative of future results.
Expense Example
| Actual | Hypothetical8 | ||||||||
| Expenses Paid | Including Interest Expense | Excluding Interest Expense | |||||||
| During the Period | and Fees | and Fees | |||||||
| Ending | Including | Excluding | Ending | Ending | |||||
| Beginning | Account Value | Interest | Interest | Beginning | Account Value Expenses Account Value Expenses | ||||
| Account Value | June 30, | Expense | Expense | Account Value | June 30, | Paid During | June 30, | Paid During | |
| January 1, 2011 | 2011 | and Fees6 | and Fees7 | January 1, 2011 | 2011 | the Period6 | 2011 | the Period7 | |
| Institutional | $1,000.00 | $1,052.90 | $2.70 | $2.34 | $1,000.00 | $1,022.17 | $2.66 | $1,022.51 | $2.31 |
| Investor A | $1,000.00 | $1,051.50 | $4.07 | $3.71 | $1,000.00 | $1,020.83 | $4.01 | $1,021.17 | $3.66 |
| Investor B | $1,000.00 | $1,050.40 | $6.61 | $6.25 | $1,000.00 | $1,018.35 | $6.51 | $1,018.70 | $6.16 |
| Investor C | $1,000.00 | $1,049.10 | $7.77 | $7.47 | $1,000.00 | $1,017.21 | $7.65 | $1,017.50 | $7.35 |
| Investor C1 | $1,000.00 | $1,048.70 | $6.81 | $6.50 | $1,000.00 | $1,018.15 | $6.71 | $1,018.45 | $6.41 |
6 For each class of the Fund, expenses are equal to the annualized expense ratio for the class (0.53% for Institutional, 0.80% for Investor A, 1.30% for Investor B, 1.53% for Investor C
and 1.34% for Investor C1), multiplied by the average account value over the period, multiplied by 181/365 (to reflect the one-half year period shown). Expenses are net of waiver.
7 For each class of the Fund, expenses are equal to the annualized expense ratio for the class (0.46% for Institutional, 0.73% for Investor A, 1.23% for Investor B, 1.47% for Investor C
and 1.28% for Investor C1), multiplied by the average account value over the period, multiplied by 181/365 (to reflect the one-half year period shown). Expenses are net of waiver.
8 Hypothetical 5% annual return before expenses is calculated by pro rating the number of days in the most recent fiscal half year divided by 365.
See “Disclosure of Expenses” on page 15 for further information on how expenses were calculated.
| ANNUAL | REPORT | JUNE | 30, 2011 | 7 |
Fund Summary as of June 30, 2011 BlackRock National Municipal Fund
Investment Objective
BlackRock National Municipal Fund’s (the “Fund”) investment objective is to provide shareholders with as high a level of income exempt from federal
income taxes as is consistent with the investment policies of the Fund.
Portfolio Management Commentary
How did the Fund perform?
• For the 12-month period ended June 30, 2011, the Fund underperformed
its benchmark, the S&P/Investortools Main Municipal Bond Index.
What factors influenced performance?
• While the tax-exempt market saw a general trend of credit spread tighten-
ing over the past year, not all geographic regions and lower-quality sectors
participated equally in the price improvement. The Fund’s holdings in
California did not depreciate, but also did not improve in valuation to
the same degree as other regions. However, many of the Fund’s California
holdings delivered a high level of income.
• A lack of exposure to the tobacco sector hurt relative returns in the later
half of the period when tobacco bonds rallied significantly as spreads tight
ened on news of greater potential for improving fundamentals in the sector
• The Fund engaged in Treasury futures contracts for the purpose of hedging
price volatility. This strategy had a negative impact on performance as
Treasury yields continued lower over the period. Amid heightening global
financial tensions, particularly the sovereign debt crisis in Europe, investors
fled to the relative safety of US Treasury securities.
• The tax-exempt market experienced significant volatility and mutual fund
outflows mid-period due to widespread municipal credit concerns. Given
these market conditions, the Fund, at times, held relatively large reserves
of cash and cash equivalents, which hindered performance due to the
near-zero interest rates on cash investments versus longer assets.
• The Fund maintained an above-industry-average coupon structure in order
to maximize its income accrual. In addition, the Fund maximized its expo-
sure to tender option bonds in order to take advantage of the historically
steep municipal yield curve and low borrowing rates during the period.
These strategies enabled the Fund to generate an above-average current
yield, which contributed positively to total return.
Describe recent portfolio activity.
• During the period, we utilized the tighter credit quality spreads to sell
some of the Fund’s lower-rated securities that had previously lacked
liquidity. These transactions enabled the Fund to take advantage of
improved valuations and increase its credit quality profile. New purchases
during the period were concentrated in the primary market where more
generous (higher) coupons could be structured. Overall, our focus remained
on maximizing the Fund’s income accrual using a high-quality asset mix,
while managing NAV volatility.
Describe portfolio positioning at period end.
• The Fund ended the period with a long duration posture relative to the
benchmark index. The Fund’s cash reserves were elevated in order to
maintain liquidity during periods of heightened volatility. The Fund main-
tained exposure to tender option bonds at the maximum level specified
in the prospectus. We continue to maintain the Fund’s bias toward high-
quality securities and a high average coupon rate, which stood at 6.08%
at period end.
• On March 18, 2011, the Board of Directors of the Corporation approved
separate plans of reorganization, whereby the Fund will acquire sub-
stantially all of the assets and assume certain stated liabilities of the
BlackRock Municipal Fund, a series of the Corporation, and BlackRock
AMT-Free Municipal Bond Portfolio, a series of BlackRock Funds II (the
“Target Funds”), in exchange for newly issued shares of the Fund. At
shareholder meetings on June 24, 2011, shareholders of the Target
Funds approved the plans of reorganization. The reorganizations took
place on July 18, 2011.
The views expressed reflect the opinions of BlackRock as of the date of this report and are subject to change based on changesin market, economic or other conditions. These
views are not intended to be a forecast of future events and are no guarantee of future results.
| Portfolio Information | |
| Percent of | |
| Sector Allocations | Long-Term Investments |
| Utilities | 24% |
| Transportation | 20 |
| Health | 18 |
| County/City/Special District/School District | 18 |
| State | 8 |
| Corporate | 6 |
| Education | 3 |
| Housing | 2 |
| Tobacco | 1 |
| Percent of | |
| Credit Quality Allocations1 | Long-Term Investments |
| AAA/Aaa | 12% |
| AA/Aa | 43 |
| A | 31 |
| BBB/Baa | 8 |
| BB/Ba | 1 |
| Not Rated2 | 5 |
1 Using the higher of S&P’s or Moody’s ratings.
2 The investment advisor has deemed certain of these non-rated securities to be
of investment grade quality. As of June 30, 2011, the market value of these securities
was $113,989,990, representing 4% of the Fund’s long-term investments.
| 8 | ANNUAL REPORT | JUNE | 30, 2011 |
BlackRock National Municipal Fund
Total Return Based on a $10,000 Investment
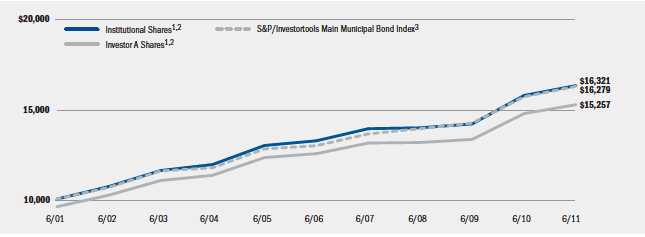
1 Assuming maximum sales charge, transaction costs and other operating expenses, including advisory fees, if any. Institutional Shares do not have a sales charge.
2 The Fund invests primarily in municipal bonds rated in any rating category or in unrated municipal bonds. The Fund will usuallyinvest in municipal bonds that have
a maturity of five years or longer.
3 The S&P/Investortools Main Municipal Bond Index is composed of bonds held by managed municipal bond fund customers of Standard& Poor’s Securities Pricing,
Inc. that are priced daily. Bonds in the S&P/Investortools Main Municipal Bond Index must have an outstanding par value of at least $2 million and a remaining
maturity of not less than 1 month.
Performance Summary for the Period Ended June 30, 2011
| Average Annual Total Returns4 | ||||||||
| 1 Year | 5 Years | 10 Years | ||||||
| Standardized | 6-Month | w/o sales | w/sales | w/o sales | w/sales | w/o sales | w/sales | |
| 30-Day Yields | Total Returns | charge | charge | charge | charge | charge | charge | |
| Institutional | 4.56% | 4.53% | 3.49% | N/A | 4.26% | N/A | 5.02% | N/A |
| Investor A | 4.11 | 4.42 | 3.36 | (1.03)% | 4.02 | 3.12% | 4.77 | 4.32% |
| Investor B | 4.03 | 4.22 | 2.89 | (1.06) | 3.49 | 3.15 | 4.24 | 4.24 |
| Investor C | 3.57 | 4.04 | 2.60 | 1.61 | 3.23 | 3.23 | 3.98 | 3.98 |
| Investor C1 | 3.80 | 4.25 | 2.80 | 1.81 | 3.46 | 3.46 | 4.20 | 4.20 |
| S&P/Investortools Main Municipal Bond | ||||||||
| Index | — | 4.58 | 3.69 | N/A | 4.64 | N/A | 4.99 | N/A |
4 Assuming maximum sales charges, if any. Average annual total returns with and without sales charges reflect reductions for distribution and service fees. See “About Fund
Performance” on page 14 for a detailed description of share classes, including any related sales charges and fees.
N/A — Not applicable as share class and index do not have a sales charge.
Past performance is not indicative of future results.
Expense Example
| Actual | Hypothetical7 | ||||||||
| Expenses Paid | Including Interest Expense | Excluding Interest Expense | |||||||
| During the Period | and Fees | and Fees | |||||||
| Ending | Including | Excluding | Ending | Ending | |||||
| Beginning | Account Value | Interest | Interest | Beginning | Account Value Expenses Account Value Expenses | ||||
| Account Value | June 30, | Expense | Expense | Account Value | June 30, | Paid During | June 30, | Paid During | |
| January 1, 2011 | 2011 | and Fees5 | and Fees6 | January 1, 2011 | 2011 | the Period5 | 2011 | the Period6 | |
| Institutional | $1,000.00 | $1,045.30 | $3.70 | $3.19 | $1,000.00 | $1,021.17 | $3.66 | $1,021.67 | $3.16 |
| Investor A | $1,000.00 | $1,042.20 | $4.76 | $4.25 | $1,000.00 | $1,020.13 | $4.71 | $1,020.63 | $4.21 |
| Investor B | $1,000.00 | $1,042.50 | $6.74 | $6.18 | $1,000.00 | $1,018.20 | $6.66 | $1,018.74 | $6.11 |
| Investor C | $1,000.00 | $1,044.20 | $8.52 | $7.96 | $1,000.00 | $1,016.46 | $8.40 | $1,017.01 | $7.85 |
| Investor C1 | $1,000.00 | $1,040.40 | $7.49 | $6.93 | $1,000.00 | $1,017.46 | $7.40 | $1,018.00 | $6.85 |
5 For each class of the Fund, expenses are equal to the annualized expense ratio for the class (0.73% for Institutional, 0.94% for Investor A, 1.33% for Investor B, 1.68% for Investor C
and 1.48% for Investor C1), multiplied by the average account value over the period, multiplied by 181/365 (to reflect the one-half year period shown). Expenses are net of waiver.
6 For each class of the Fund, expenses are equal to the annualized expense ratio for the class (0.63% for Institutional, 0.84% for Investor A, 1.22% for Investor B, 1.57% for Investor C
and 1.37% for Investor C1), multiplied by the average account value over the period, multiplied by 181/365 (to reflect the one-half year period shown). Expenses are net of waiver.
7 Hypothetical 5% annual return before expenses is calculated by pro rating the number of days in the most recent fiscal half year divided by 365.
See “Disclosure of Expenses” on page 15 for further information on how expenses were calculated.
| ANNUAL | REPORT | JUNE | 30, 2011 | 9 |
Fund Summary as of June 30, 2011 BlackRock High Yield Municipal Fund
Investment Objective
BlackRock High Yield Municipal Fund’s (the “Fund”) investment objective is to provide shareholders with as high a level of income exempt from federal
income taxes as is consistent with the investment policies of the Fund.
Portfolio Management Commentary
How did the Fund perform?
• The Fund’s Institutional and Investor A Shares outperformed its primary
benchmark, the S&P/Investortools Main Municipal Bond Index, for the
12-month period ended June 30, 2011, while Investor C Shares under-
performed the index. The Fund also underperformed its secondary
benchmark, the S&P/Investortools Customized High Yield Municipal
Bond Index. The following discussion of relative performance pertains
to the S&P/Investortools Customized High Yield Municipal Bond Index.
What factors influenced performance?
• The Fund’s long duration bias and emphasis on longer-dated bonds
detracted from relative performance as the yield curve steepened during
the period in the context of moderately higher municipal rates. Also
hindering returns was the Fund’s underweight exposure (relative to the
benchmark index) to the development district sector, which modestly
outperformed the broader market. In addition, the Fund’s exposure to
zero-coupon bonds had a negative impact on performance as the sector
lagged the broader municipal market recovery in recent months.
• Contributing positively to performance was sector allocation and security
selection among education, healthcare, transportation, housing and indus-
trial development bonds (IDBs). The Fund’s emphasis on low investment-
grade issues was beneficial, particularly in the final quarter of the reporting
period when investor appetite for this quality tier increased. The Fund’s
holdings with maturities of ten years or less had a positive impact on
returns as issues in that part of the yield curve benefited disproportionately
from curve steepening during the period. In addition, the Fund’s improving
distribution yield, attributable to trading activity and a modest increase in
leverage, was a positive factor.
Describe recent portfolio activity.
• During the 12-month period, we extended the Fund’s average maturity
profile by selling bonds in the 10- to 15-year range and reinvesting the
proceeds further out the yield curve. Purchases were largely value-oriented
and most were made in the primary new-issue market. Fund sales were
targeted toward dealer demand in order to minimize transaction-related
costs, which tend to be higher in a liquidity-challenged secondary market.
The Fund’s sector concentrations in health, transportation and education
increased during the period, while exposure to IDBs and housing
decreased. We increased exposure to tender option bonds in order to raise
the Fund’s leverage from approximately 5% of total managed assets at the
beginning of the period to 9% at period end.
Describe portfolio positioning at period end.
• As of period end, we remain constructive on the high yield municipal bond
market given the strong technical backdrop. Mutual fund flows appear to
have turned positive, with high yield mutual funds garnering the majority of
the new money. The Fund remains positioned to benefit from credit-spread
narrowing and yield curve-flattening.
The views expressed reflect the opinions of BlackRock as of the date of this report and are subject to change based on changesin market, economic or other conditions. These
views are not intended to be a forecast of future events and are no guarantee of future results.
| Portfolio Information | |
| Percent of | |
| Sector Allocations | Long-Term Investments |
| Health | 34% |
| Corporate | 17 |
| Transportation | 12 |
| Utilities | 10 |
| County/City/Special District/School District | 7 |
| Education | 7 |
| State | 7 |
| Housing | 3 |
| Tobacco | 3 |
| Percent of | |
| Credit Quality Allocations1 | Long-Term Investments |
| AAA/Aaa | 4% |
| AA/Aa | 18 |
| A | 13 |
| BBB/Baa | 31 |
| BB/Ba | 4 |
| B | 4 |
| CCC/Caa | 3 |
| CC/Ca | 1 |
| Not Rated2 | 22 |
1 Using the higher of S&P’s or Moody’s ratings.
2 The investment advisor has deemed certain of these non-rated securities to be of
investment grade quality. As of June 30, 2011, the market value of these securities
was $32,135,454, representing 19% of the Fund’s long-term investments.
| 10 | ANNUAL REPORT | JUNE | 30, 2011 |
BlackRock High Yield Municipal Fund
Total Return Based on a $10,000 Investment
![]()
1 Assuming maximum sales charge, transaction costs and other operating expenses, including advisory fees, if any. Institutional Shares do not have a sales charge.
2 The Fund invests primarily in municipal bonds rated in any rating category or in unrated municipal bonds. The Fund will usuallyinvest in municipal bonds that have
a maturity of five years or longer.
3 The S&P/Investortools Main Municipal Bond Index is composed of bonds held by managed municipal bond fund customers of Standard& Poor’s Securities Pricing,
Inc. that are priced daily. Bonds in the S&P/Investortools Main Municipal Bond Index must have an outstanding par value of at least $2 million and a remaining
maturity of not less than 1 month.
4 The S&P/Investortools Customized High Yield Municipal Bond Index is a blended subset of the S&P/Investortools Main Municipal Bond Index that includes non-
insured bonds rated below BBB– or non-rated (85%) and bonds rated BBB (15%), excluding those that are in default, are pre-refunded, or are escrowed to maturity.
5 Commencement of Operations.
Performance Summary for the Period Ended June 30, 2011
| Average Annual Total Returns6 | ||||||
| 1 Year | Since Inception7 | |||||
| Standardized | 6-Month | w/o sales | w/sales | w/o sales | w/sales | |
| 30-Day Yields | Total Returns | charge | charge | charge | charge | |
| Institutional | 5.80% | 4.88% | 4.14% | N/A | 1.74% | N/A |
| Investor A | 5.27 | 4.74 | 3.73 | (0.68)% | 1.43 | 0.53% |
| Investor C | 4.69 | 4.35 | 3.07 | 2.08 | 0.72 | 0.72 |
| S&P/Investortools Main Municipal Bond Index | — | 4.58 | 3.69 | N/A | 4.46 | N/A |
| S&P/Investortools Customized High Yield Municipal Bond Index | — | 4.67 | 4.52 | N/A | 2.30 | N/A |
6 Assuming maximum sales charges, if any. Average annual total returns with and without sales charges reflect reductions for distribution and service fees. See “About Fund
Performance” on page 14 for a detailed description of share classes, including any related sales charges and fees.
7 The Portfolio commenced operations on 8/01/06.
N/A — Not applicable as share class and index do not have a sales charge.
Past performance is not indicative of future results.
Expense Example
| Actual | Hypothetical10 | ||||||||
| Expenses Paid | Including Interest Expense | Excluding Interest Expense | |||||||
| During the Period | and Fees | and Fees | |||||||
| Ending | Including | Excluding | Ending | Ending | |||||
| Beginning | Account Value | Interest | Interest | Beginning | Account Value Expenses Account Value | Expenses | |||
| Account Value | June 30, | Expense | Expense | Account Value | June 30, | Paid During | June 30, | Paid During | |
| January 1, 2011 | 2011 | and Fees8 | and Fees9 | January 1, 2011 | 2011 | the Period8 | 2011 | the Period9 | |
| Institutional | $1,000.00 | $1,048.80 | $3.96 | $3.66 | $1,000.00 | $1,020.93 | $3.91 | $1,021.22 | $3.61 |
| Investor A | $1,000.00 | $1,047.40 | $5.18 | $4.92 | $1,000.00 | $1,019.74 | $5.11 | $1,019.84 | $4.86 |
| Investor C | $1,000.00 | $1,043.50 | $9.22 | $8.92 | $1,000.00 | $1,015.77 | $9.10 | $1,016.07 | $8.80 |
8 For each class of the Fund, expenses are equal to the annualized expense ratio for the class (0.78% for Institutional, 1.02% for Investor A, and 1.82% for Investor C), multiplied by
the average account value over the period, multiplied by 181/365 (to reflect the one-half year period shown). Expenses are net of waiver.
9 For each class of the Fund, expenses are equal to the annualized expense ratio for the class (0.72% for Institutional, 0.97% forInvestor A, and 1.76% for Investor C), multiplied by
the average account value over the period, multiplied by 181/365 (to reflect the one-half year period shown). Expenses are net of waiver.
10 Hypothetical 5% annual return before expenses is calculated by pro rating the number of days in the most recent fiscal half year divided by 365.
See “Disclosure of Expenses” on page 15 for further information on how expenses were calculated.
| ANNUAL | REPORT | JUNE | 30, 2011 | 11 |
Fund Summary as of June 30, 2011 BlackRock New York Municipal Bond Fund
Investment Objective
BlackRock New York Municipal Fund’s (the “Fund”) investment objective is to provide shareholders with income exempt from federal income tax and New
York State and New York City personal income taxes.
Portfolio Management Commentary
How did the Fund perform?
• For the 12-month period ended June 30, 2011, the Fund underperformed
its primary benchmark, the S&P/Investortools Main Municipal Bond Index,
and its secondary benchmark, the S&P/Investortools New York Municipal
Bond Index. The following discussion of relative performance
pertains to the Fund’s secondary benchmark, the S&P/Investortools
New York Municipal Bond Index.
What factors influenced performance?
• Detracting from performance was the Fund’s underexposure to tobacco,
which was the strongest performing sector for the period. The Fund’s hold-
ings in higher education had a negative impact on returns as that sector
underperformed. For most of the period, the Fund maintained a slightly
long duration bias and was overweight (relative to the benchmark index) in
the long end of the yield curve. Both of these factors detracted from the
Fund’s performance.
• Ultimately, at the close of the period, long rates were higher than where
they started and, therefore, positive performance came from sectors that
added to incremental income. The Fund’s exposure to higher-yielding sec-
tors including housing, healthcare and corporate/industrial development
bonds contributed positively to performance. The Fund also benefited from
its exposure to lower-quality bonds, which, in addition to offering higher
embedded yields, experienced some price appreciation due to spread
compression during the period.
Describe recent portfolio activity.
• We increased the Fund’s holdings in higher education despite recent
underperformance in the sector. These holdings help diversify the portfolio
and we believe that they will outperform during periods of scarce new-
issue supply.
• To the extent that supply was available, the Fund participated in new
issues, which provided the Fund with better structured bonds, better call
protection and, in most cases, higher yields than were available in the
secondary market. As we are cognizant of the growing importance of indi-
vidual investors in driving municipal market demand, we structured many
of the Fund’s new-issue purchases to appeal to buyers in the secondary
market. While this activity did not have enough impact to alter the overall
profile of the portfolio, it did provide the Fund with a significant component
of higher-beta bonds, which outperformed the broader market when munic
ipal bonds rallied toward the end of the period. We funded many of these
new-issue purchases with sales of older bonds with less convexity, which
were slower to appreciate as interest rates fell.
Describe portfolio positioning at period end.
• As of period end, the Fund remained fully invested with minimal cash
reserves. The Fund ended the period with a slightly long duration bias.
The views expressed reflect the opinions of BlackRock as of the date of this report and are subject to change based on changesin market, economic or other conditions. These
views are not intended to be a forecast of future events and are no guarantee of future results.
| Portfolio Information | |
| Percent of | |
| Sector Allocations | Long-Term Investments |
| County/City/Special District/School District | 20% |
| Health | 15 |
| Education | 14 |
| Transportation | 13 |
| Corporate | 11 |
| Utilities | 9 |
| Housing | 8 |
| State | 7 |
| Tobacco | 3 |
| Percent of | |
| Credit Quality Allocations1 | Long-Term Investments |
| AAA/Aaa | 4% |
| AA/Aa | 27 |
| A | 36 |
| BBB/Baa | 14 |
| BB/Ba | 5 |
| B | 1 |
| CCC/Caa | 2 |
| Not Rated2 | 11 |
1 Using the higher of S&P’s or Moody’s ratings.
2 The investment advisor has deemed certain of these non-rated securities to be
of investment grade quality. As of June 30, 2011, the market value of these securities
was $2,187,489, representing 1% of the Fund’s long-term investments.
| 12 | ANNUAL REPORT | JUNE | 30, 2011 |
BlackRock New York Municipal Bond Fund
Total Return Based on a $10,000 Investment
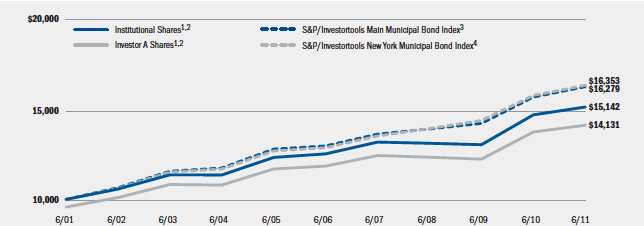
1 Assuming maximum sales charge, transaction costs and other operating expenses, including advisory fees, if any. Institutional Shares do not have a sales charge.
2 The Fund invests primarily in a portfolio of investment grade New York municipal bonds. The Fund expects to maintain an averageweighted maturity of greater than
ten years.
3 The S&P/Investortools Main Municipal Bond Index is composed of bonds held by managed municipal bond fund customers of Standard& Poor’s Securities Pricing,
Inc. that are priced daily. Bonds in the S&P/Investortools Main Municipal Bond Index must have an outstanding par value of at least $2 million and a remaining
maturity of not less than 1 month.
4 The S&P/Investortools New York Municipal Bond Index includes all New York bonds in the S&P/Investortools Main Municipal Bond Index.
Performance Summary for the Period Ended June 30, 2011
| Average Annual Total Returns5 | ||||||||
| 1 Year | 5 Years | 10 Years | ||||||
| Standardized | 6-Month | w/o sales | w/sales | w/o sales | w/sales | w/o sales | w/sales | |
| 30-Day Yields | Total Returns | charge | charge | charge | charge | charge | charge | |
| Institutional | 4.35% | 3.98% | 2.97% | N/A | 3.85% | N/A | 4.24% | N/A |
| Investor A | 3.81 | 3.92 | 2.76 | (1.61)% | 3.58 | 2.68% | 3.97 | 3.52% |
| Investor A1 | 4.11 | 4.02 | 2.95 | (1.17) | 3.76 | 2.91 | 4.14 | 3.71 |
| Investor B | 3.81 | 3.81 | 2.52 | (1.41) | 3.34 | 3.00 | 3.71 | 3.71 |
| Investor C | 3.32 | 3.56 | 2.03 | 1.05 | 2.82 | 2.82 | 3.20 | 3.20 |
| Investor C1 | 3.74 | 3.77 | 2.44 | 1.46 | 3.25 | 3.25 | 3.61 | 3.61 |
| S&P/Investortools Main Municipal Bond Index | — | 4.58 | 3.69 | N/A | 4.64 | N/A | 4.99 | N/A |
| S&P/Investortools New York Municipal Bond Index | — | 4.34 | 3.58 | N/A | 4.90 | N/A | 5.04 | N/A |
5 Assuming maximum sales charges, if any. Average annual total returns with and without sales charges reflect reductions for distribution and service fees. See “About Fund
Performance” on page 14 for a detailed description of share classes, including any related sales charges and fees.
N/A — Not applicable as share class and index do not have a sales charge.
Past performance is not indicative of future results.
Expense Example
| Actual | Hypothetical8 | ||||||||
| Expenses Paid | Including Interest Expense | Excluding Interest Expense | |||||||
| During the Period | and Fees | and Fees | |||||||
| Ending | Including | Excluding | Ending | Ending | |||||
| Beginning | Account Value Interest | Interest | Beginning | Account Value Expenses Account Value Expenses | |||||
| Account Value | June 30, | Expense | Expense | Account Value | June 30, Paid During | June 30, | Paid During | ||
| January 1, 2011 | 2011 | and Fees6 | and Fees7 | January 1, 2011 | 2011 | the Period6 | 2011 | the Period7 | |
| Institutional | $1,000.00 | $1,039.80 | $3.54 | $3.49 | $1,000.00 | $1,021.32 | $3.51 | $1,021.37 | $3.46 |
| Investor A | $1,000.00 | $1,039.20 | $5.11 | $5.06 | $1,000.00 | $1,019.79 | $5.06 | $1,019.84 | $5.01 |
| Investor A1 | $1,000.00 | $1,040.20 | $4.15 | $4.10 | $1,000.00 | $1,020.73 | $4.11 | $1,020.78 | $4.06 |
| Investor B | $1,000.00 | $1,038.10 | $6.22 | $6.17 | $1,000.00 | $1,018.70 | $6.16 | $1,018.74 | $6.11 |
| Investor C | $1,000.00 | $1,035.60 | $8.58 | $8.53 | $1,000.00 | $1,016.36 | $8.50 | $1,016.41 | $8.45 |
| Investor C1 | $1,000.00 | $1,037.70 | $6.57 | $6.52 | $1,000.00 | $1,018.35 | $6.51 | $1,018.40 | $6.46 |
6 For each class of the Fund, expenses are equal to the annualized expense ratio for the class (0.70% for Institutional, 1.01% for Investor A, 0.82% for Investor A1, 1.23% for Investor B,
1.70% for Investor C and 1.30% for Investor C1), multiplied by the average account value over the period, multiplied by 181/365 (to reflect the one-half year period shown).
Expenses are net of waiver.
7 For each class of the Fund, expenses are equal to the annualized expense ratio for the class (0.69% for Institutional, 1.00% for Investor A, 0.81% for Investor A1, 1.22% for Investor B,
1.69% for Investor C and 1.29% for Investor C1), multiplied by the average account value over the period, multiplied by 181/365 (to reflect the one-half year period shown).
Expenses are net of waiver.
8 Hypothetical 5% annual return before expenses is calculated by pro rating the number of days in the most recent fiscal half year divided by 365.
See “Disclosure of Expenses” on page 15 for further information on how expenses were calculated.
| ANNUAL | REPORT | JUNE | 30, 2011 | 13 |
About Fund Performance
• BlackRock and Institutional Shares (BlackRock Shares are available only
in BlackRock Short-Term Municipal Fund) are not subject to any sales
charge. These shares bear no ongoing distribution or service fees and are
available only to eligible investors. Prior to October 2, 2006, BlackRock
Share performance results are those of the Institutional Shares.
• Investor A Shares incur a maximum initial sales charge (front-end load)
of 4.25% for all Funds except BlackRock Short-Term Municipal Fund, which
incurs a 3.00% maximum initial sales charge, and all Funds incur a service
fee of 0.25% per year (but no distribution fee). Prior to the Investor A
Shares inception date of October 2, 2006 (for all Funds except BlackRock
High Yield Municipal Fund, BlackRock Municipal Fund and BlackRock
National Municipal Fund), Investor A Share performance results are those
of the Institutional Shares (which have no distribution or service fees)
restated to reflect Investor A Share fees.
• Investor A1 Shares (available only in BlackRock Short-Term Municipal
Fund and BlackRock New York Municipal Bond Fund) incur a maximum
initial sales charge (front-end load) of 1% for BlackRock Short-Term
Municipal Fund and 4% for BlackRock New York Municipal Fund; and
a service fee of 0.10% per year (but no distribution fee).
• Investor B Shares (available to all Funds except BlackRock High Yield
Municipal Fund) are subject to the following maximum contingent deferred
sales charges:
| Maximum Contingent | |
| Deferred Sales Charges | |
| BlackRock Short-Term Municipal Fund | 1%, declining to 0% after 3 years |
| BlackRock Municipal Fund | 4%, declining to 0% after 6 years |
| BlackRock National Municipal Fund | 4%, declining to 0% after 6 years |
| BlackRock New York Municipal Bond Fund | 4%, declining to 0% after 6 years |
In addition, these shares are subject to distribution and service fees per
year as follows:
| Distribution | Service | |
| Fee | Fee | |
| BlackRock Short-Term Municipal Fund | 0.20% | 0.15% |
| BlackRock Municipal Fund | 0.50% | 0.25% |
| BlackRock National Municipal Fund | 0.50% | 0.25% |
| BlackRock New York Municipal Bond Fund | 0.25% | 0.25% |
For BlackRock Short-Term Municipal Fund and BlackRock New York
Municipal Bond Fund, the shares automatically convert to Investor A1
Shares after approximately 10 years. For BlackRock Municipal Fund and
BlackRock National Municipal Fund, the shares automatically convert to
Investor A Shares after approximately 10 years. (There is no initial sales
charge for automatic sales conversions.)
• Investor C Shares are subject to a 1.00% contingent deferred sales
charge if redeemed within one year of purchase. In addition, these shares
are subject to a distribution fee of 0.75% per year and a service fee of
0.25% per year. Prior to the Investor C Shares inception date of October 2,
2006 (for all Funds except BlackRock High Yield Municipal Fund), Investor
C Share performance results are those of Institutional Shares (which have
no distribution or service fees) restated to reflect Investor C Share fees.
• Investor C1 Shares (available to all Funds except BlackRock High Yield
Municipal Fund and BlackRock Short-Term Municipal Fund) are subject
to a 1.00% contingent deferred sales charge if redeemed within one year
of purchase.
In addition, these shares are subject to distribution and service fees per
year as follows:
| Distribution | Service | |
| Fee | Fee | |
| BlackRock Municipal Fund | 0.55% | 0.25% |
| BlackRock National Municipal Fund | 0.55% | 0.25% |
| BlackRock New York Municipal Bond Fund | 0.35% | 0.25% |
Investor A1, Investor B and Investor C1 Shares of each Fund are only
available through exchanges, dividend reinvestment by existing sharehold-
ers or for purchase by certain qualified employee benefit plans.
Performance information reflects past performance and does not guarantee
future results. Current performance may be lower or higher than the per-
formance data quoted. Refer to www.blackrock.com/funds to obtain per-
formance data current to the most recent month end. Performance results
do not reflect the deduction of taxes that a shareholder would pay on fund
distributions or the redemption of fund shares. Figures shown in each of
the performance tables on the previous pages assume reinvestment of all
dividends and capital gain distributions, if any, at net asset value on the
payable date. Investment return and principal value of shares will fluctuate
so that shares, when redeemed, may be worth more or less than their origi-
nal cost. Dividends paid to each class of shares will vary because of the
different levels of service, distribution and transfer agency fees applicable
to each class, which are deducted from the income available to be paid
to shareholders. The Funds’ investment advisor reimbursed a portion of
each Fund’s expenses. Without such reimbursement, a Fund’s performance
would have been lower.
| 14 | ANNUAL REPORT | JUNE | 30, 2011 |
Disclosure of Expenses
Shareholders of these Funds may incur the following charges: (a) expenses
related to transactions, including sales charges and exchange fees; and
(b) operating expenses including advisory fees, service and distribution
fees including 12b-1 fees, and other Fund expenses. The expense exam-
ples on the previous pages (which are based on a hypothetical investment
of $1,000 invested on January 1, 2011 and held through June 30, 2011)
are intended to assist shareholders both in calculating expenses based on
an investment in a Fund and in comparing these expenses with similar
costs of investing in other mutual funds.
The tables provide information about actual account values and actual
expenses. In order to estimate the expenses a shareholder paid during the
period covered by this report, shareholders can divide their account value by
$1,000 and then multiply the result by the number corresponding to their
Fund and share class under the headings entitled “Expenses Paid During
the Period.”
The tables also provide information about hypothetical account values and
hypothetical expenses based on each Fund’s actual expense ratio and an
assumed rate of return of 5% per year before expenses. In order to assist
shareholders in comparing the ongoing expenses of investing in these
Funds and other funds, compare the 5% hypothetical example with the 5%
hypothetical examples that appear in other funds’ shareholder reports.
The expenses shown in the tables are intended to highlight shareholders’
ongoing costs only and do not reflect any transactional expenses, such as
sales charges or exchange fees, if any. Therefore, the hypothetical examples
are useful in comparing ongoing expenses only, and will not help share-
holders determine the relative total expenses of owning different funds. If
these transactional expenses were included, shareholder expenses would
have been higher.
| ANNUAL | REPORT | JUNE | 30, 2011 | 15 |
The Benefits and Risks of Leveraging
The Funds may utilize leverage to seek to enhance the yield and net asset
value (“NAV”). However, these objectives cannot be achieved in all interest
rate environments.
The Funds may leverage their assets through the use of tender option bond
(“TOB”) programs, as described in Note 1 of the Notes to Financial
Statements. TOB investments generally will provide the Funds with eco-
nomic benefits in periods of declining short-term interest rates, but
expose the Funds to risks during periods of rising short-term interest rates.
Additionally, fluctuations in the market value of municipal bonds deposited
into the TOB trust may adversely affect each Fund’s NAVs per share.
In general, the concept of leveraging is based on the premise that the
financing cost of assets to be obtained from leverage, which will be based
on short-term interest rates, will normally be lower than the income earned
by each Fund on its longer-term portfolio investments. To the extent that the
total assets of each Fund (including the assets obtained from leverage) are
invested in higher-yielding portfolio investments, each Fund’s shareholders
will benefit from the incremental net income.
The interest earned on securities purchased with the proceeds from lever-
age is paid to shareholders in the form of dividends, and the value of these
portfolio holdings is reflected in the per share NAV. However, in order to
benefit shareholders, the yield curve must be positively sloped; that is,
short-term interest rates must be lower than long-term interest rates. If the
yield curve becomes negatively sloped, meaning short-term interest rates
exceed long-term interest rates, income to shareholders will be lower than
if the Funds had not used leverage.
Furthermore, the value of the Funds’ portfolio investments generally varies
inversely with the direction of long-term interest rates, although other fac-
tors can influence the value of portfolio investments. Changes in interest
rates can influence the Funds’ NAV positively or negatively in addition to
the impact on the Funds’ performance from leverage.
The use of leverage may enhance opportunities for increased income to
the Funds, but as described above, it also creates risks as short- or long-
term interest rates fluctuate. Leverage also will generally cause greater
changes in the Funds’ NAV and dividend rate than a comparable portfolio
without leverage. If the income derived from securities purchased with
assets received from leverage exceeds the cost of leverage, the Funds’ net
income will be greater than if leverage had not been used. Conversely, if the
income from the securities purchased is not sufficient to cover the cost of
leverage, each Fund’s net income will be less than if leverage had not been
used, and therefore the amount available for distribution to shareholders
will be reduced. Each Fund may be required to sell portfolio securities at
inopportune times or at distressed values in order to comply with regula-
tory requirements applicable to the use of leverage or as required by the
terms of leverage instruments, which may cause a Fund to incur losses. The
use of leverage may limit each Fund’s ability to invest in certain types of
securities or use certain types of hedging strategies. Each Fund will incur
expenses in connection with the use of leverage, all of which are borne by
shareholders and may reduce income.
Derivative Financial Instruments
The Funds may invest in various derivative financial instruments, including
financial futures contracts as specified in Note 2 of the Notes to Financial
Statements, which may constitute forms of economic leverage. Such instru-
ments are used to obtain exposure to a market without owning or taking
physical custody of securities or to hedge market and/or interest rate risks.
Such derivative financial instruments involve risks, including the imperfect
correlation between the value of a derivative financial instrument and the
underlying asset, possible default of the counterparty to the transaction or
illiquidity of the derivative financial instrument. The Funds ability to use a
derivative financial instrument successfully depends on the investment
advisor’s ability to predict pertinent market movements accurately, which
cannot be assured. The use of derivative financial instruments may result in
losses greater than if they had not been used, may require a Fund to sell or
purchase portfolio investments at inopportune times or for distressed val-
ues, may limit the amount of appreciation a Fund can realize on an invest-
ment, may result in lower dividends paid to shareholders or may cause a
Fund to hold an investment that it might otherwise sell. The Funds’ invest-
ments in these instruments are discussed in detail in the Notes to
Financial Statements.
| 16 | ANNUAL REPORT | JUNE | 30, 2011 |
BlackRock Short-Term Municipal Fund
Schedule of Investments June 30, 2011 (Percentages shown are based on Net Assets)
| Par | ||
| Municipal Bonds | (000) | Value |
| Arizona — 1.2% | ||
| Arizona State Transportation Board, RB, Maricopa County | ||
| Regional Area Road, 5.00%, 7/01/12 | $ 3,250 | $ 3,404,862 |
| Salt River Project Agricultural Improvement & Power | ||
| District, Refunding RB, Salt River Project, Series A, | ||
| 5.00%, 1/01/12 | 3,160 | 3,236,188 |
| Yavapai County IDA, RB, Waste Management Inc. | ||
| Project, Series A, Mandatory Put Bonds, AMT, | ||
| 2.88%, 3/01/28 (a) | 5,000 | 5,050,850 |
| 11,691,900 | ||
| California — 9.4% | ||
| California Health Facilities Financing Authority, | ||
| Refunding RB, Catholic Healthcare West, Series C, | ||
| Mandatory Put Bonds, 5.00%, 7/01/37 (a) | 2,300 | 2,399,153 |
| California Municipal Finance Authority, RB, Waste | ||
| Management Inc. Project, Series A, Mandatory | ||
| Put Bonds, 1.63%, 2/01/19 (a) | 7,000 | 7,003,710 |
| California State Department of Water Resources, | ||
| Refunding RB: | ||
| Series L, 5.00%, 5/01/12 | 10,000 | 10,395,300 |
| Series M, 3.00%, 5/01/13 | 3,095 | 3,233,563 |
| Series M, 5.00%, 5/01/14 | 35,000 | 39,026,750 |
| California Statewide Communities Development | ||
| Authority, RB: | ||
| Kaiser Permanente, Series A, 5.00%, 4/01/13 | 5,150 | 5,537,898 |
| Kaiser Permanente, Series A, 5.00%, 4/01/14 | 1,000 | 1,099,710 |
| Proposition 1A Receivables Program, 5.00%, 6/15/13 3,730 | 4,008,780 | |
| City of Long Beach California, Refunding RB, Series B, | ||
| AMT (NPFGC), 5.50%, 5/15/14 | 5,215 | 5,768,781 |
| Los Angeles County Schools California, Pooled | ||
| Participation Certificates, Series F-2, 2.00%, 2/01/12 | 4,300 | 4,329,756 |
| Los Angeles Department of Water & Power, RB, | ||
| Power System, Series A, 2.00%, 7/01/12 | 6,000 | 6,105,720 |
| Los Angeles Unified School District California, GO, | ||
| Election of 2004, Series H (AGM), 4.50%, 7/01/12 | 6,000 | 6,239,160 |
| 95,148,281 | ||
| Colorado — 1.6% | ||
| Adams County Colorado School District Number 12, GO, | ||
| Refunding, Series A (AGM), 5.00%, 12/15/11 | 4,190 | 4,280,965 |
| City & County of Denver Colorado, RB, Series A, AMT, | ||
| 3.00%, 11/15/12 | 3,000 | 3,094,440 |
| City & County of Denver Colorado, Refunding RB, | ||
| Series B (FGIC), 5.50%, 11/15/14 | 3,500 | 3,555,860 |
| Colorado Health Facilities Authority, Refunding RB, | ||
| Catholic Healthcare, Series B, Mandatory Put Bonds, | ||
| 5.00%, 7/01/39 (a) | 5,000 | 5,293,350 |
| 16,224,615 | ||
| Par | ||
| Municipal Bonds | (000) | Value |
| Connecticut — 3.1% | ||
| Connecticut Municipal Electric Energy Cooperative, | ||
| Refunding RB, Series A (AGC), 5.00%, 1/01/14 | $ 2,115 | $ 2,325,252 |
| State of Connecticut, GO, Economic Recovery, Series A: | ||
| 5.00%, 1/01/13 | 11,500 | 12,279,240 |
| 5.00%, 1/01/14 | 7,280 | 8,047,603 |
| State of Connecticut, RB, Transportation Infrastructure, | ||
| Series A, 5.00%, 11/01/14 | 2,700 | 3,057,264 |
| State of Connecticut, Special Tax Bonds, Transportation | ||
| Infrastructure, Series A, 5.00%, 11/01/13 | 5,000 | 5,501,700 |
| 31,211,059 | ||
| Delaware — 2.2% | ||
| Delaware State Economic Development Authority, | ||
| Refunding RB, Pollution Control Delmarva, | ||
| 0.75%, 5/01/26 (a) | 7,000 | 7,004,830 |
| State of Delaware, GO, Refunding, Series 2009C, | ||
| 5.00%, 10/01/13 | 7,700 | 8,487,094 |
| University of Delaware, RB, Series A, | ||
| 0.85%, 11/01/37 (a) | 7,000 | 7,010,850 |
| 22,502,774 | ||
| District of Columbia — 0.5% | ||
| Metropolitan Washington Airports Authority, RB, Series A, | ||
| AMT (NPFGC), 5.25%, 10/01/13 | 5,000 | 5,418,350 |
| Florida — 4.6% | ||
| County of Escambia Florida, Refunding RB, Gulf | ||
| Power Co. Project, First Series, Mandatory Put Bonds, | ||
| 2.00%, 4/01/39 (a) | 9,000 | 9,093,420 |
| Florida State Board of Education, GO, Refunding, Public | ||
| Education, Series C, 5.00%, 6/01/12 | 5,000 | 5,215,600 |
| Florida State Department of Environmental Protection, | ||
| RB, Florida Forever, Series A, 5.00%, 7/01/13 | 4,675 | 5,059,940 |
| Florida State Department of Environmental Protection, | ||
| Refunding RB, Series C, 4.00%, 7/01/12 | 8,500 | 8,801,580 |
| Florida State Department of Transportation, | ||
| Refunding RB, Department of Transportation, | ||
| Series A, 5.00%, 7/01/12 | 4,575 | 4,779,731 |
| Highlands County Health Facilities Authority, RB, | ||
| Hospital, Adventist Health System/Sunbelt, Mandatory | ||
| Put Bonds, 3.95%, 11/15/32 (a) | 6,000 | 6,222,300 |
| Jacksonville Electric Authority Florida, RB, Issue Three, | ||
| Series One, 4.00%, 10/01/11 | 2,320 | 2,341,599 |
| Jacksonville Electric Authority Florida, Refunding RB, | ||
| Issue 2, 17th Series, 5.25%, 10/01/12 | 5,000 | 5,058,950 |
| 46,573,120 |
| Portfolio Abbreviations | |||||
| To simplify the listings of portfolio holdings in the | COP | Certificates of Participation | LRB | Lease Revenue Bonds | |
| Schedules of Investments, the names and descriptions of | EDA | Economic Development Authority | M/F | Multi-Family | |
| many of the securities have been abbreviated according to | EDC | Economic Development Corp. | MRB | Mortgage Revenue Bonds | |
| the following list: | ERB | Education Revenue Bond | NPFGC | National Public Finance Guarantee Corp. | |
| ERS | Extendible Reset Securities | PCRB | Pollution Control Revenue Bonds | ||
| ACA | ACA Financial Guaranty Corp. | FGIC | Financial Guaranty Insurance Co. | PILOT | Payment in Lieu of Taxes |
| AGC | Assured Guaranty Corp. | FHA | Federal Housing Administration | PSF-GTD | Permanent School Fund Guaranteed |
| AGM | Assured Guaranty Municipal Corp. | GO | General Obligation Bonds | Radian | Radian Group, Inc. |
| AMBAC | American Municipal Bond Assurance Corp. | HDA | Housing Development Agency | RB | Revenue Bonds |
| AMT | Alternative Minimum Tax (subject to) | HFA | Housing Finance Agency | S/F | Single-Family |
| ARB | Airport Revenue Bonds | HRB | Housing Revenue Bonds | SAN | State Aid Notes |
| BAN | Bond Anticipation Notes | IDA | Industrial Development Authority | SONYMA | State of New York Mortgage Agency |
| BHAC | Berkshire Hathaway Assurance Corp. | IDB | Industrial Development Board | Syncora | Syncora Guarantee |
| CAB | Capital Appreciation Bonds | IDRB | Industrial Development Revenue Bonds | TIF | Tax Increment Financing |
| CIFG | CDC IXIS Financial Guaranty | ISD | Independent School District | VRDN | Variable Rate Demand Notes |
See Notes to Financial Statements.
| ANNUAL | REPORT | JUNE | 30, 2011 | 17 |
BlackRock Short-Term Municipal Fund
Schedule of Investments (continued) (Percentages shown are based on Net Assets)
| Par | ||
| Municipal Bonds | (000) | Value |
| Georgia — 2.7% | ||
| Burke County Development Authority, Refunding RB, | ||
| Georgia Power Co. Plant Vogtle Project, Mandatory | ||
| Put Bonds (a): | ||
| 0.80%, 11/01/48 | $10,535 | $ 10,543,323 |
| 5.05%, 11/01/48 | 6,000 | 6,138,300 |
| Private Colleges & Universities Authority, Refunding RB, | ||
| Emory University, Series A, 5.25%, 9/01/11 | 10,280 | 10,367,894 |
| 27,049,517 | ||
| Hawaii — 0.4% | ||
| State of Hawaii, Refunding RB, Series B, AMT, | ||
| 5.00%, 7/01/13 | 4,000 | 4,271,600 |
| Illinois — 1.2% | ||
| Illinois Finance Authority, RB, University of Chicago, | ||
| Series B, 5.00%, 7/01/13 | 2,000 | 2,172,420 |
| Illinois Finance Authority, Refunding RB, University of | ||
| Chicago, Series A, 5.25%, 7/01/11 (b) | 5,000 | 5,050,700 |
| Railsplitter Tobacco Settlement Authority, RB, | ||
| 4.00%, 6/01/13 | 5,100 | 5,270,544 |
| 12,493,664 | ||
| Indiana — 0.6% | ||
| Indiana Finance Authority, RB, Ascension Health Credit | ||
| Group, Mandatory Put Bonds (a): | ||
| Series A1, 3.63%, 11/15/36 | 4,135 | 4,146,744 |
| Series A3, 5.00%, 11/01/27 | 2,265 | 2,428,963 |
| 6,575,707 | ||
| Iowa — 0.3% | ||
| Iowa Higher Education Loan Authority, RB, Private | ||
| College Facility: | ||
| 4.00%, 12/01/12 | 1,500 | 1,578,225 |
| 4.00%, 12/01/13 | 1,150 | 1,243,426 |
| 2,821,651 | ||
| Kansas — 0.5% | ||
| Kansas State Department of Transportation, | ||
| Refunding RB, Series A, 5.00%, 9/01/12 | 5,000 | 5,275,500 |
| Kentucky — 2.0% | ||
| Kentucky Economic Development Finance Authority, | ||
| Refunding RB, Baptist Healthcare System, Series A, | ||
| 5.00%, 8/15/12 | 2,650 | 2,774,895 |
| Kentucky State Property & Buildings Commission, | ||
| Refunding RB, Project No. 87 (FGIC), 5.00%, 3/01/12 | 2,000 | 2,061,500 |
| Louisville/Jefferson County Metropolitan Government, | ||
| Refunding RB, Louisville Gas & Electric Project, | ||
| Mandatory Put Bonds, 1.90%, 10/01/33 (a) | 15,000 | 15,114,300 |
| 19,950,695 | ||
| Louisiana — 2.5% | ||
| State of Louisiana, GO, Refunding: | ||
| Series A (NPFGC), 5.00%, 8/01/14 | 12,000 | 13,515,600 |
| Series B, 5.00%, 4/15/12 | 4,220 | 4,378,883 |
| State of Louisiana, GO, Series A, 5.00%, 5/01/13 | 7,075 | 7,661,588 |
| 25,556,071 | ||
| Maine — 0.2% | ||
| Maine Municipal Bond Bank, RB, Series D, | ||
| 5.00%, 11/01/12 | 1,460 | 1,551,892 |
| Maryland — 0.8% | ||
| State of Maryland, GO, State & Local Facilities Loan, | ||
| 2nd Series, 5.00%, 7/15/11 | 3,815 | 3,822,630 |
| University System of Maryland, Refunding RB, Auxiliary | ||
| Facility & Tuition, Series C, 4.00%, 10/01/11 | 4,695 | 4,741,152 |
| 8,563,782 |
| Par | ||
| Municipal Bonds | (000) | Value |
| Massachusetts — 4.4% | ||
| Commonwealth of Massachusetts, GO, Consolidated Loan, | ||
| Series A, 5.00%, 8/01/12 | $ 1,180 | $ 1,240,994 |
| Commonwealth of Massachusetts, GO, Refunding, | ||
| Consolidated Loan, Series D (NPFGC): | ||
| 5.50%, 11/01/12 | 4,235 | 4,530,349 |
| 6.00%, 11/01/13 | 5,000 | 5,623,600 |
| Massachusetts Bay Transportation Authority, Refunding RB, | ||
| General Transportation System, Series A (NPFGC), | ||
| 5.80%, 3/01/12 | 3,745 | 3,882,179 |
| Massachusetts Health & Educational Facilities | ||
| Authority, Refunding RB, Partners Health, Series C, | ||
| 5.75%, 7/01/11 (b) | 7,600 | 7,677,140 |
| Massachusetts State Department of Transportation, | ||
| Refunding RB, Senior Series B, 5.00%, 1/01/14 | 12,155 | 13,236,917 |
| University of Massachusetts Building Authority, RB, | ||
| Senior Series 1, 5.00%, 11/01/13 | 7,555 | 8,326,063 |
| 44,517,242 | ||
| Michigan — 1.3% | ||
| City of Detroit Michigan, RB, Second Lien, Series B | ||
| (FGIC), 5.50%, 7/01/11 (b) | 5,000 | 5,050,750 |
| City of Detroit Michigan, Refunding RB, Series C (NPFGC), | ||
| 5.00%, 7/01/14 | 2,500 | 2,685,725 |
| Michigan State Hospital Finance Authority, RB, Ascension | ||
| Health Senior Center, 1.35%, 11/15/47 (a) | 2,300 | 2,327,807 |
| State of Michigan, GO Refunding, 5.25%, 12/01/12 | 3,000 | 3,199,830 |
| 13,264,112 | ||
| Minnesota — 2.6% | ||
| State of Minnesota, GO: | ||
| 5.00%, 8/01/11 | 3,675 | 3,690,214 |
| Various Purpose, Series H, 5.00%, 11/01/12 | 15,000 | 15,942,600 |
| State of Minnesota, GO, Refunding, State Various | ||
| Purpose, Series D, 5.00%, 8/01/14 | 6,000 | 6,771,540 |
| 26,404,354 | ||
| Missouri — 1.4% | ||
| County of Jackson Missouri, RB, Harry S. Truman Sports | ||
| Complex (AMBAC), 5.00%, 12/01/12 | 2,000 | 2,106,600 |
| Missouri State Health & Educational Facilities Authority, | ||
| RB, Ascension Health Senior Credit, Series C-4, | ||
| Mandatory Put Bonds, 1.25%, 11/15/26 (a) | 12,000 | 12,092,280 |
| 14,198,880 | ||
| Nebraska — 0.3% | ||
| Nebraska Public Power District, Refunding RB, General, | ||
| Series B-1 (NPFGC), 5.00%, 1/01/14 | 3,000 | 3,292,740 |
| Nevada — 1.5% | ||
| Clark County School District, GO, Limited Tax, Building, | ||
| Series C, 5.00%, 6/15/13 | 6,305 | 6,786,576 |
| Clark County School District, GO, Refunding, Series B | ||
| (NPFGC), 5.00%, 6/15/12 | 6,000 | 6,261,300 |
| Truckee Meadows Water Authority, RB, Series A (AGM), | ||
| 5.13%, 7/01/11 (b) | 2,590 | 2,590,363 |
| 15,638,239 | ||
| New Jersey — 5.5% | ||
| County of Essex New Jersey, GO, Improvement, Series A, | ||
| 5.00%, 8/01/13 | 2,290 | 2,485,589 |
| Gloucester County Improvement Authority, Refunding RB, | ||
| Waste Management Inc. Project, Series A, Mandatory | ||
| Put Bonds, 2.63%, 12/01/29 (a) | 4,625 | 4,675,135 |
| New Jersey State Housing & Mortgage Finance Agency, | ||
| RB, Series B (AGM), 1.15%, 11/01/12 | 6,800 | 6,811,968 |
| New Jersey Transportation Trust Fund Authority, | ||
| Refunding RB, Transportation System, Series B | ||
| (NPFGC), 5.25%, 12/15/12 | 4,990 | 5,317,543 |
See Notes to Financial Statements.
| 18 | ANNUAL REPORT | JUNE | 30, 2011 |
BlackRock Short-Term Municipal Fund
Schedule of Investments (continued) (Percentages shown are based on Net Assets)
| Par | ||
| Municipal Bonds | (000) | Value |
| New Jersey (concluded) | ||
| Salem County Utilities Authority, Refunding RB, Public | ||
| Service Electric and Gas Co., Series A, Mandatory | ||
| Put Bonds, 0.95%, 5/01/28 (a) | $13,000 | $ 13,005,070 |
| State of New Jersey, GO, Refunding: | ||
| 4.00%, 8/01/12 | 7,115 | 7,400,027 |
| Series Q, 4.00%, 8/15/13 | 15,000 | 16,032,000 |
| 55,727,332 | ||
| New Mexico — 0.9% | ||
| New Mexico Finance Authority, Refunding RB, Senior Lien, | ||
| Series A, 5.00%, 6/15/13 | 8,000 | 8,708,560 |
| New York — 13.3% | ||
| City of New York New York, GO, Refunding: | ||
| Series B, 5.25%, 8/01/11 | 4,000 | 4,017,240 |
| Series B, 5.00%, 8/01/13 | 22,750 | 24,763,830 |
| Series B (NPFGC), 5.75%, 8/01/13 | 3,050 | 3,214,731 |
| Series C, 5.00%, 8/01/13 | 8,225 | 8,953,077 |
| Series D, 5.00%, 2/01/13 | 2,000 | 2,136,420 |
| Series H, 5.00%, 8/01/12 | 3,400 | 3,567,722 |
| Metropolitan Transportation Authority, RB, Transportation, | ||
| Series B, Mandatory Put Bonds, 5.00%, 11/15/16 (a) | 4,000 | 4,070,000 |
| New York City Transitional Finance Authority, Future Tax | ||
| Secured, Sub Series E, RB: | ||
| 4.00%, 11/01/12 | 3,000 | 3,148,140 |
| 5.00%, 11/01/13 | 2,000 | 2,202,840 |
| New York City Transitional Finance Authority, Refunding RB, | ||
| Future Tax Secured, Sub-Series D-2, 5.00%, 11/01/12 | 20,315 | 21,588,750 |
| New York State Dormitory Authority, RB, General Purpose: | ||
| Series A, 5.00%, 3/15/15 | 5,560 | 6,335,731 |
| Series E, 5.00%, 2/15/13 | 5,865 | 6,296,077 |
| New York State Dormitory Authority, Refunding RB: | ||
| Mount Sinai School of Medicine, Series A, | ||
| 5.00%, 7/01/14 | 1,195 | 1,301,534 |
| State University Educational Facilities, 3rd General | ||
| Resolution, Series B, Mandatory Put Bonds, | ||
| 5.25%, 11/15/23 (a) | 6,000 | 6,237,300 |
| New York State Energy Research & Development | ||
| Authority, Refunding RB, Consolidated Edison Co. of | ||
| New York, Inc. Project, Mandatory Put Bonds, AMT, | ||
| 1.45%, 6/01/36 (a) | 5,000 | 5,018,700 |
| New York State Environmental Facilities Corp., RB, | ||
| Waste Management Inc. Project, Series A, Mandatory | ||
| Put Bonds, 2.50%, 7/01/17 (a) | 5,000 | 5,036,900 |
| New York State Thruway Authority, RB, BAN, | ||
| 4.00%, 7/15/11 | 2,250 | 2,253,420 |
| New York State Thruway Authority, Refunding RB: | ||
| General, Second Series B (NPFGC), 5.00%, 4/01/13 | 5,550 | 5,973,077 |
| Series A, 5.00%, 4/01/12 | 5,000 | 5,179,650 |
| New York State Urban Development Corp., Refunding RB, | ||
| Service Contract, Series A-1, 5.00%, 1/01/13 | 7,320 | 7,787,455 |
| State of New York, GO, Refunding, Series C, | ||
| 5.00%, 4/15/12 | 5,285 | 5,484,562 |
| 134,567,156 | ||
| North Carolina — 3.5% | ||
| County of Mecklenburg, GO, Refunding, Series C, | ||
| 5.00%, 2/01/13 | 9,400 | 10,093,250 |
| County of Wake North Carolina, GO, Refunding, Series C, | ||
| 5.00%, 3/01/12 | 5,185 | 5,350,816 |
| State of North Carolina, GO, Public Improvement, Series A, | ||
| 5.00%, 3/01/13 | 9,000 | 9,696,600 |
| State of North Carolina, RB, Series A, 5.00%, 5/01/13 | 8,055 | 8,724,371 |
| University of North Carolina at Chapel Hill, RB, Series A, | ||
| 4.00%, 2/01/13 | 1,605 | 1,681,093 |
| 35,546,130 |
| Par | ||
| Municipal Bonds | (000) | Value |
| Ohio — 1.4% | ||
| Ohio Air Quality Development Authority, Refunding | ||
| PCRB, FirstEnergy, Series D, Mandatory Put Bonds, | ||
| 4.75%, 8/01/29 (a) | $10,000 | $ 10,355,300 |
| Ohio State University, Refunding RB, Series A, | ||
| 5.00%, 12/01/12 | 4,000 | 4,261,720 |
| 14,617,020 | ||
| Oregon — 0.6% | ||
| City of Portland Oregon, Refunding RB, Second Lien, | ||
| Series A, 5.00%, 3/01/14 | 4,950 | 5,498,906 |
| County of Gilliam Oregon, RB, Waste Management Inc. | ||
| Project, Mandatory Put Bonds, 1.70%, 10/01/18 (a) | 1,000 | 1,000,550 |
| 6,499,456 | ||
| Pennsylvania — 6.3% | ||
| City of Philadelphia Pennsylvania, Refunding RB, Series A | ||
| (AGM), 5.00%, 6/15/13 | 9,000 | 9,640,170 |
| Commonwealth of Pennsylvania, GO: | ||
| First, Series, 5.00%, 3/15/13 | 7,455 | 8,029,408 |
| First, Series A, 5.00%, 2/15/13 | 8,280 | 8,888,994 |
| Third, Series A, 5.00%, 7/15/12 | 5,000 | 5,247,200 |
| Commonwealth of Pennsylvania, GO, Refunding: | ||
| 5.00%, 7/15/12 | 2,500 | 2,623,550 |
| Second Series (NPFGC), 5.00%, 7/01/12 | 13,000 | 13,619,450 |
| Pennsylvania Economic Development Financing | ||
| Authority, RB: | ||
| Convention Center Project, Series A, 5.00%, 6/15/12 | 4,000 | 4,165,080 |
| Waste Management Inc. Project, 2.75%, 9/01/13 | 4,250 | 4,294,242 |
| Waste Management Inc. Project, Mandatory | ||
| Put Bonds, 2.63%, 12/01/33 (a) | 3,500 | 3,537,940 |
| Pennsylvania Intergovernmental Cooperation Authority, | ||
| Special Tax Bonds, Refunding, Philadelphia Funding | ||
| Program, 5.00%, 6/15/13 | 3,085 | 3,345,775 |
| 63,391,809 | ||
| South Carolina — 0.9% | ||
| South Carolina State Public Service Authority, | ||
| Refunding RB, Series A, 5.00%, 1/01/12 | 3,000 | 3,071,850 |
| State of South Carolina, GO, State Highway, Series B, | ||
| 4.50%, 4/01/12 | 6,000 | 6,081,360 |
| 9,153,210 | ||
| Tennessee — 1.3% | ||
| County of Shelby Tennessee, GO, Refunding, Series A | ||
| (AMBAC), 5.00%, 4/01/12 | 4,000 | 4,144,200 |
| Metropolitan Government of Nashville & Davidson County | ||
| Tennessee, Refunding RB (NPFGC), 5.00%, 1/01/14 | 8,110 | 8,956,603 |
| 13,100,803 | ||
| Texas — 8.5% | ||
| City of Dallas Texas, GO, 5.00%, 2/15/12 | 4,775 | 4,917,104 |
| City of El Paso Texas, Refunding RB, Series A, | ||
| 4.00%, 3/01/14 | 2,000 | 2,162,040 |
| City of Houston Texas, Refunding RB, Sub Lien (c): | ||
| Series A, AMT, 5.00%, 7/01/14 | 4,000 | 4,306,920 |
| Series B, 5.00%, 7/01/14 | 1,500 | 1,651,950 |
| County of Harris Texas, Refunding RB, Toll Road, | ||
| Senior Lien, Series B-1 (NPFGC), 5.00%, 8/15/14 | 1,295 | 1,449,623 |
| Dallas ISD, GO, Refunding, 4.50%, 2/15/12 | 6,000 | 6,156,360 |
| Harris County Cultural Education Facilities Finance | ||
| Corp., RB, Methodist Hospital System, Series B, | ||
| 5.25%, 12/01/14 | 2,600 | 2,948,634 |
| Harris County Cultural Education Facilities Finance Corp., | ||
| Refunding RB, Methodist Hospital System: | ||
| 5.00%, 6/01/12 | 3,450 | 3,597,143 |
| 5.00%, 6/01/13 | 10,000 | 10,800,400 |
| Lower Colorado River Authority, RB, LCRA Transmission | ||
| Service (AGM), 5.38%, 5/15/12 | 3,475 | 3,626,406 |
See Notes to Financial Statements.
| ANNUAL | REPORT | JUNE | 30, 2011 | 19 |
BlackRock Short-Term Municipal Fund
Schedule of Investments (continued) (Percentages shown are based on Net Assets)
| Par | ||
| Municipal Bonds | (000) | Value |
| Texas (concluded) | ||
| Lower Colorado River Authority, Refunding RB, | ||
| 5.00%, 5/15/13 | $ 6,000 | $ 6,475,260 |
| North Texas Tollway Authority, RB, System, First Tier, | ||
| Series L-2, Mandatory Put Bonds, 6.00%, 1/01/38 (a) | 3,700 | 3,967,177 |
| State of Texas, GO, Refunding, Public Finance Authority: | ||
| 5.00%, 10/01/12 | 11,170 | 11,841,205 |
| Series A, 5.00%, 10/01/12 | 3,500 | 3,710,315 |
| Texas A&M University, RB, Financing System, Series D, | ||
| 5.00%, 5/15/13 | 3,325 | 3,606,029 |
| Texas A&M University, Refunding RB, Financing System, | ||
| Series B, 5.00%, 5/15/12 | 4,000 | 4,166,440 |
| Texas Public Finance Authority, RB, Unemployment | ||
| Compensation, Series A, 5.00%, 7/01/13 | 10,000 | 10,880,900 |
| 86,263,906 | ||
| Utah — 0.7% | ||
| City of Riverton Utah, RB, IHC Health Services, Inc., | ||
| 5.00%, 8/15/13 | 1,400 | 1,524,572 |
| State of Utah, GO, Series C, 3.00%, 7/01/12 | 5,500 | 5,653,615 |
| 7,178,187 | ||
| Virginia — 6.1% | ||
| County of Fairfax Virginia, GO, Refunding, Public | ||
| Improvement, Series A, 5.25%, 4/01/12 | 3,940 | 4,089,444 |
| County of Fairfax Virginia, GO, Series D, 5.00%, 10/01/13 | 10,000 | 11,019,800 |
| Louisa IDA, RB, Virginia Electric & Power Co. | ||
| Project, Series A, Mandatory Put Bonds, AMT, | ||
| 2.50%, 3/01/31 (a) | 20,000 | 20,398,600 |
| Virginia Public Building Authority, RB: | ||
| Series B, 5.00%, 8/01/12 | 7,185 | 7,556,393 |
| Series C, 5.00%, 8/01/12 | 1,000 | 1,051,690 |
| Virginia Public School Authority, RB, School Educational | ||
| Technology Notes: | ||
| Series IX, 5.00%, 4/15/12 | 4,065 | 4,218,738 |
| Series XI, 2.00%, 4/15/13 | 7,880 | 8,104,580 |
| Virginia Public School Authority, Refunding RB, Series A, | ||
| 5.00%, 8/01/12 | 1,000 | 1,051,690 |
| Virginia Resources Authority, Refunding RB, Series A, | ||
| 4.00%, 10/01/12 | 4,145 | 4,338,489 |
| 61,829,424 | ||
| Washington — 2.7% | ||
| City of Seattle Washington, GO, Refunding, Limited Tax, | ||
| Series B, 5.00%, 8/01/13 | 5,000 | 5,468,650 |
| City of Seattle Washington, Refunding RB, Improvement, | ||
| Series B, 5.00%, 2/01/14 | 10,000 | 11,080,400 |
| State of Washington, GO, Refunding, Various Purpose, | ||
| Series R-2011B, 5.00%, 7/01/14 | 10,000 | 11,234,200 |
| 27,783,250 | ||
| Total Long-Term Investments | ||
| (Cost — $975,292,496) — 97.0% | 984,561,988 |
| Par | ||
| Short-Term Securities | (000) | Value |
| Illinois — 1.9% | ||
| Regional Transit Authority, Refunding RB, ERS, VRDN, | ||
| Series B, 1.35%, 7/01/11 (d) | $18,800 | $ 18,800,000 |
| Shares | ||
| Money Market — 0.2% | ||
| FFI Institutional Tax-Exempt Fund, 0.01% (e)(f) | 1,487,006 | 1,487,006 |
| Total Short-Term Securities | ||
| (Cost — $20,287,006) — 2.1% | 20,287,006 | |
| Total Investments (Cost — $995,579,502*) — 99.1% | 1,004,848,994 | |
| Other Assets Less Liabilities — 0.9% | 9,419,541 | |
| Net Assets — 100.0% | $1,014,268,535 |
* The cost and unrealized appreciation (depreciation) of investments as of June 30,
2011, as computed for federal income tax purposes, were as follows:
| Aggregate cost | $ 995,579,502 |
| Gross unrealized appreciation | $ 9,856,524 |
| Gross unrealized depreciation | (587,032) |
| Net unrealized appreciation | $ 9,269,492 |
(a) Variable rate security. Rate shown is as of report date.
(b) US government securities, held in escrow, are used to pay interest on this security as
well as to retire the bond in full at the date indicated, typically at a premium to par.
(c) When-issued security. Unsettled when-issued transactions were as follows:
| Unrealized | ||
| Counterparty | Value | Appreciation |
| Goldman Sachs & Co. | $5,958,870 | $ 17,280 |
(d) Variable rate security. Rate shown is as of report date and maturity shown is the
date the principal owed can be recovered through demand.
(e) Investments in companies considered to be an affiliate of the Fund during the
year, for purposes of Section 2(a)(3) of the Investment Company Act of 1940, as
amended, were as follows:
| Shares Held | Shares Held | |||
| at June 30, | Net | at June 30, | ||
| Affiliate | 2010 | Activity | 2011 | Income |
| FFI Institutional | ||||
| Tax-Exempt Fund | 24,582,016 | (23,095,010) | 1,487,006 | $13,112 |
(f) Represents the current yield as of report date.
See Notes to Financial Statements.
| 20 | ANNUAL REPORT | JUNE | 30, 2011 |
BlackRock Short-Term Municipal Fund
Schedule of Investments (concluded)
• Fair Value Measurements — Various inputs are used in determining the fair value
of investments. These inputs are categorized in three broad levels for financial
statements purposes as follows:
• Level 1 — price quotations in active markets/exchanges for identical assets
and liabilities
• Level 2 — other observable inputs (including, but not limited to: quoted prices for
similar assets or liabilities in markets that are active, quoted prices for identical
or similar assets or liabilities in markets that are not active, inputs other than
quoted prices that are observable for the assets or liabilities (such as interest
rates, yield curves, volatilities, prepayment speeds, loss severities, credit risks and
default rates) or other market-corroborated inputs)
• Level 3 — unobservable inputs based on the best information available in the
circumstances, to the extent observable inputs are not available (including the
Fund’s own assumptions used in determining the fair value of investments)
The categorization of a value determined for investments is based on the pricing
transparency of the investment does not necessarily correspond to the Fund’s per-
ceived risk of investing in those securities. For information about the Fund’s policy
regarding valuation of investments and other significant accounting policies, please
refer to Note 1 of the Notes to financial statements.
The following table summarizes the inputs used as of June 30, 2011 in determining
the fair valuation of the Fund’s investments:
| Valuation Inputs | Level 1 | Level 2 | Level 3 | Total |
| Assets: | ||||
| Investments: | ||||
| Long-Term | ||||
| Investments1 . | — | $ 984,561,988 | — | $ 984,561,988 |
| Short-Term | ||||
| Securities | $ 1,487,006 | 18,800,000 | — | 20,287,006 |
| Total | $ 1,487,006 | $1,003,361,988 | — | $1,004,848,994 |
1 See above Schedule of Investments for values in each state or
political subdivision.
See Notes to Financial Statements.
| ANNUAL | REPORT | JUNE | 30, 2011 | 21 |
BlackRock Municipal Fund
Schedule of Investments June 30, 2011 (Percentages shown are based on Net Assets)
| Par | ||
| Municipal Bonds | (000) | Value |
| Alabama — 0.2% | ||
| Birmingham Special Care Facilities Financing Authority, | ||
| RB, Children’s Hospital (AGC), 6.00%, 6/01/39 | $ 1,350 | $ 1,435,158 |
| Alaska — 1.1% | ||
| Borough of Matanuska-Susitna Alaska, RB, Goose Creek | ||
| Correctional Center (AGC): | ||
| 6.00%, 9/01/28 | 2,000 | 2,249,600 |
| 6.00%, 9/01/32 | 5,250 | 5,764,185 |
| 8,013,785 | ||
| Arizona — 0.5% | ||
| State of Arizona, COP, Department of Administration, | ||
| Series A (AGM): | ||
| 5.00%, 10/01/27 | 2,375 | 2,400,436 |
| 5.25%, 10/01/28 | 1,025 | 1,045,541 |
| 3,445,977 | ||
| California — 10.4% | ||
| Antelope Valley Community College District, GO, | ||
| Election of 2004, Series B (NPFGC), 5.25%, 8/01/39 | 1,050 | 1,063,577 |
| California Health Facilities Financing Authority, | ||
| Refunding RB, St. Joseph Health System, Series A, | ||
| 5.75%, 7/01/39 | 1,000 | 1,013,430 |
| City of San Jose California, GO, Libraries, Parks, and | ||
| Public Safety Project (NPFGC), 5.00%, 9/01/30 | 3,700 | 3,755,944 |
| City of San Jose California, Refunding RB, Series A, AMT | ||
| (AMBAC), 5.50%, 3/01/32 | 6,285 | 6,187,645 |
| Fresno Unified School District California, GO, Election | ||
| of 2001: | ||
| Series D (NPFGC), 5.00%, 8/01/27 | 2,500 | 2,521,025 |
| Series E (AGM), 5.00%, 8/01/30 | 1,500 | 1,510,635 |
| Los Angeles Department of Airports, RB, Los Angeles | ||
| International, Sub-Series B, 5.00%, 5/15/35 | 5,000 | 4,924,350 |
| Los Angeles Municipal Improvement Corp., RB, Series B1 | ||
| (NPFGC), 4.75%, 8/01/37 | 9,550 | 8,515,066 |
| Mount Diablo Unified School District California, GO, | ||
| Election of 2002 (NPFGC), 5.00%, 7/01/27 | 7,250 | 7,306,260 |
| Orange County Sanitation District, COP, Series B (AGM), | ||
| 5.00%, 2/01/31 | 1,380 | 1,421,248 |
| Palm Springs Financing Authority, Refunding RB, | ||
| Convention Center Project, Series A (NPFGC), | ||
| 5.50%, 11/01/35 | 6,190 | 6,051,468 |
| Palomar Community College District, GO, Election | ||
| of 2006, Series B, CAB, 6.20%, 8/01/39 (a) | 15,000 | 5,912,400 |
| Rialto Unified School District California, GO, CAB, | ||
| Series A (NPFGC), 4.22%, 6/01/25 (b) | 11,685 | 4,949,182 |
| Roseville Joint Union High School District California, GO, | ||
| Election of 2004, Series A (NPFGC), 5.00%, 8/01/29 | 5,000 | 5,048,150 |
| San Diego Community College District California, GO, | ||
| Election of 2002 (AGM), 5.00%, 5/01/30 | 2,685 | 2,716,549 |
| San Jose Unified School District Santa Clara County | ||
| California, GO, Election of 2002, Series B (NPFGC), | ||
| 5.00%, 8/01/29 | 3,650 | 3,718,656 |
| San Marcos Unified School District, GO, Election of 2010, | ||
| Series A (c): | ||
| 5.00%, 8/01/34 | 1,000 | 985,140 |
| 5.00%, 8/01/38 | 950 | 927,913 |
| Tahoe-Truckee Unified School District, GO, School Facility | ||
| Improvement District 2, Election of 2002, Series A | ||
| (NPFGC), 5.25%, 8/01/29 | 2,535 | 2,594,547 |
| University of California, RB, Series O, 5.75%, 5/15/34 | 1,450 | 1,561,012 |
| 72,684,197 |
| Par | ||
| Municipal Bonds | (000) | Value |
| Florida — 12.9% | ||
| Broward County School Board Florida, COP, Series A | ||
| (AGM), 5.25%, 7/01/33 | $10,000 | $ 10,093,200 |
| City of Jacksonville Florida, RB, Series A: | ||
| 5.25%, 10/01/32 | 3,775 | 3,877,114 |
| 5.25%, 10/01/33 | 3,975 | 4,060,025 |
| Collier County School Board, COP (AGM), | ||
| 5.00%, 2/15/23 | 2,000 | 2,067,380 |
| County of Broward Florida, RB, Series A, | ||
| 5.25%, 10/01/34 | 1,450 | 1,514,728 |
| County of Duval Florida, COP, Master Lease Program | ||
| (AGM), 5.00%, 7/01/33 | 12,050 | 11,860,453 |
| County of Miami-Dade Florida, GO, Building Better | ||
| Communities Program, Series B-1, 5.75%, 7/01/33 | 2,400 | 2,537,160 |
| County of Miami-Dade Florida, RB: | ||
| Miami International Airport, Series A, AMT (AGC), | ||
| 5.50%, 10/01/26 | 7,000 | 7,205,870 |
| Miami International Airport, Series A, AMT (AGC), | ||
| 5.50%, 10/01/27 | 5,495 | 5,629,737 |
| Water & Sewer System (AGM), 5.00%, 10/01/39 | 7,150 | 7,181,031 |
| County of Miami-Dade Florida, Refunding RB, Miami | ||
| International Airport, AMT (AGC), 5.00%, 10/01/40 | 7,380 | 6,543,108 |
| Florida Ports Financing Commission, Refunding RB, | ||
| State Transportation Trust Fund, Series B, AMT: | ||
| 5.13%, 6/01/27 | 10,000 | 9,897,700 |
| 5.38%, 10/01/29 | 1,650 | 1,655,660 |
| Hillsborough County Aviation Authority Florida, RB, | ||
| Series A, AMT (AGC), 5.38%, 10/01/33 | 5,000 | 4,957,900 |
| Orange County School Board, COP, Series A (NPFGC), | ||
| 5.00%, 8/01/32 | 6,975 | 6,992,856 |
| Sarasota County Public Hospital District, RB, Sarasota | ||
| Memorial Hospital Project, Series A, 5.63%, 7/01/39 | 500 | 500,475 |
| South Florida Water Management District, COP (AGC), | ||
| 5.00%, 10/01/22 | 3,500 | 3,672,585 |
| 90,246,982 | ||
| Georgia — 4.8% | ||
| County of DeKalb Georgia, Refunding RB, Series B (AGM), | ||
| 5.25%, 10/01/32 | 1,500 | 1,523,535 |
| Gwinnett County Hospital Authority, Refunding RB, | ||
| Gwinnett Hospital System, Series D (AGM), | ||
| 5.50%, 7/01/41 | 475 | 476,829 |
| Municipal Electric Authority of Georgia, RB, | ||
| Series Y (AMBAC): | ||
| 6.40%, 1/01/13 | 5,740 | 6,005,360 |
| 6.40%, 1/01/13 (d) | 340 | 358,948 |
| Municipal Electric Authority of Georgia, Refunding RB, | ||
| Series EE (AMBAC), 7.00%, 1/01/25 | 20,000 | 25,393,000 |
| 33,757,672 | ||
| Illinois — 7.1% | ||
| Chicago Park District, GO, Harbor Facilities, Series C, | ||
| 5.25%, 1/01/40 | 1,000 | 1,017,210 |
| City of Chicago Illinois, ARB, General, Third Lien, | ||
| Series B-2, AMT (NPFGC), 6.00%, 1/01/27 | 17,690 | 18,009,835 |
| City of Chicago Illinois, GO, Refunding, Series A (AGM), | ||
| 5.00%, 1/01/25 | 5,000 | 5,058,200 |
| City of Chicago Illinois, RB, Series A (BHAC), | ||
| 5.50%, 1/01/38 | 3,000 | 3,085,740 |
| County of Cook Illinois, GO, Refunding, Series A, | ||
| 5.25%, 11/15/33 | 2,300 | 2,342,481 |
See Notes to Financial Statements.
| 22 | ANNUAL REPORT | JUNE | 30, 2011 |
BlackRock Municipal Fund
Schedule of Investments (continued) (Percentages shown are based on Net Assets)
| Par | |||
| Municipal Bonds | (000) | Value | |
| Illinois (concluded) | |||
| Illinois Finance Authority, RB, Carle Foundation, Series A | |||
| (AGM), 6.00%, 8/15/41 | $ 3,500 | $ 3,582,355 | |
| Illinois Finance Authority, Refunding RB, Central DuPage | |||
| Health, Series B, 5.50%, 11/01/39 | 4,200 | 4,227,552 | |
| Illinois State Toll Highway Authority, RB, Series B, | |||
| 5.50%, 1/01/33 | 3,125 | 3,200,375 | |
| Illinois State Toll Highway Authority, Refunding RB, Senior | |||
| Series A-1, 5.00%, 1/01/31 | 5,000 | 5,013,750 | |
| State of Illinois, RB, Build Illinois, Series B, | |||
| 5.25%, 6/15/34 | 4,500 | 4,523,130 | |
| 50,060,628 | |||
| Indiana — 1.5% | |||
| Indiana Municipal Power Agency, RB, Series B, | |||
| 5.75%, 1/01/34 | 700 | 710,731 | |
| Indianapolis Local Public Improvement Bond Bank, | |||
| Refunding RB, Waterworks Project: | |||
| Series A, 5.75%, 1/01/38 | 2,800 | 2,933,616 | |
| Series P, (AGC), 5.50%, 1/01/38 | 6,900 | 7,179,243 | |
| 10,823,590 | |||
| Iowa — 0.8% | |||
| Iowa Finance Authority, RB, Series A (AGC), | |||
| 5.63%, 8/15/37 | 5,600 | 5,751,984 | |
| Maryland — 0.7% | |||
| Maryland Health & Higher Educational Facilities Authority, | |||
| RB, University of Maryland Medical System, Series B | |||
| (NPFGC), 7.00%, 7/01/22 | 4,400 | 5,150,200 | |
| Massachusetts — 2.4% | |||
| Massachusetts HFA, RB, AMT (AGM): | |||
| Rental Mortgage, Series C, 5.60%, 1/01/45 | 4,000 | 4,004,600 | |
| S/F Housing, Series 128, 4.88%, 12/01/38 (e) | 95 | 92,268 | |
| Massachusetts HFA, Refunding RB, AMT: | |||
| Rental Housing, Series A (AGM), 5.15%, 7/01/26 | 970 | 976,043 | |
| Series C, 5.35%, 12/01/42 | 1,950 | 1,883,797 | |
| Massachusetts School Building Authority, RB, Series A | |||
| (AGM), 5.00%, 8/15/30 | 7,000 | 7,252,630 | |
| Massachusetts Water Resources Authority, Refunding RB, | |||
| General, Series A (NPFGC), 5.00%, 8/01/34 | 2,800 | 2,878,204 | |
| 17,087,542 | |||
| Michigan — 3.1% | |||
| City of Detroit Michigan, Second Lien, Series B, RB: | |||
| (AGM), 6.25%, 7/01/36 | 675 | 733,333 | |
| (AGM), 7.00%, 7/01/36 | 350 | 399,921 | |
| System (NPFGC), 5.00%, 7/01/36 | 3,500 | 3,254,790 | |
| City of Detroit Michigan, Refunding RB, Second Lien, | |||
| Series E (BHAC), 5.75%, 7/01/31 | 4,000 | 4,187,440 | |
| Kalamazoo Hospital Finance Authority, RB, Bronson | |||
| Methodist Hospital (AGM), 5.25%, 5/15/36 | 750 | 745,830 | |
| Lansing Board of Water & Light, RB, Series A, | |||
| 5.50%, 7/01/41 | 3,150 | 3,320,982 | |
| Michigan State HDA, RB, Series C, AMT, 5.50%, 12/01/28 | 1,800 | 1,797,912 | |
| Michigan Strategic Fund, Refunding RB, Detroit Edison Co. | |||
| Project, Series A AMT (Syncora), 5.50%, 6/01/30 | 7,345 | 7,259,578 | |
| 21,699,786 | |||
| Par | ||
| Municipal Bonds | (000) | Value |
| Mississippi — 0.2% | ||
| Harrison County Wastewater Management District, | ||
| Refunding RB, Wastewater Treatment Facilities, | ||
| Series A (FGIC), 8.50%, 2/01/13 (d) | $ 1,320 | $ 1,425,666 |
| Nevada — 1.4% | ||
| City of Las Vegas Nevada, GO, Limited Tax, Performing | ||
| Arts Center, 6.00%, 4/01/34 | 1,450 | 1,560,447 |
| Clark County Water Reclamation District, GO, Series B, | ||
| 5.75%, 7/01/34 | 3,125 | 3,409,187 |
| County of Clark Nevada, RB: | ||
| Las Vegas-McCarran International Airport, Series A | ||
| (AGC), 5.25%, 7/01/39 | 2,700 | 2,676,510 |
| System, Subordinate Lien, Series C (AGM), | ||
| 5.00%, 7/01/26 | 2,350 | 2,407,598 |
| 10,053,742 | ||
| New Jersey — 10.7% | ||
| Cape May County Industrial Pollution Control Financing | ||
| Authority, Refunding RB, Atlantic City Electric Co., | ||
| Series A (NPFGC), 6.80%, 3/01/21 | 6,810 | 8,307,791 |
| Garden State Preservation Trust, RB, Election of 2005, | ||
| Series A (AGM): | ||
| 5.80%, 11/01/21 | 3,125 | 3,612,406 |
| 5.80%, 11/01/22 | 8,310 | 9,513,870 |
| 5.80%, 11/01/23 | 4,340 | 4,962,920 |
| New Jersey EDA, RB, Motor Vehicle Surcharge, Series A | ||
| (NPFGC), 5.25%, 7/01/33 | 26,500 | 26,638,595 |
| New Jersey Higher Education Student Assistance | ||
| Authority, RB, Series 1, AMT (c): | ||
| 5.50%, 12/01/25 | 950 | 957,448 |
| 5.75%, 12/01/27 | 500 | 504,260 |
| 5.75%, 12/01/28 | 450 | 451,373 |
| New Jersey State Housing & Mortgage Finance Agency, | ||
| RB, Series AA, 6.38%, 10/01/28 | 1,840 | 1,972,204 |
| New Jersey State Turnpike Authority, RB, Series C (AGM), | ||
| 5.00%, 1/01/30 | 13,500 | 13,703,310 |
| New Jersey Transportation Trust Fund Authority, RB, | ||
| Transportation System, Series A, 5.88%, 12/15/38 | 4,255 | 4,503,322 |
| 75,127,499 | ||
| New York — 6.9% | ||
| City of New York New York, GO, Series C (Syncora), | ||
| 5.63%, 3/15/18 | 5 | 5,149 |
| City of Niagara Falls New York, GO, Public Improvement | ||
| (NPFGC), 6.90%, 3/01/24 | 5 | 5,006 |
| New York City Municipal Water Finance Authority, RB, | ||
| Fiscal 2009, Series A, 5.75%, 6/15/40 | 700 | 768,404 |
| New York State Thruway Authority, RB, Series G (AGM), | ||
| 5.00%, 1/01/32 | 10,000 | 10,210,600 |
| New York State Urban Development Corp., RB, State | ||
| Personal Income Tax, State Facilities, Series A-1 | ||
| (NPFGC), 5.25%, 3/15/34 | 10,050 | 10,242,056 |
| Sales Tax Asset Receivable Corp., RB, Series A: | ||
| (AMBAC), 5.00%, 10/15/32 | 15,650 | 16,030,139 |
| (NPFGC), 5.00%, 10/15/20 | 10,000 | 11,022,900 |
| 48,284,254 | ||
| North Carolina — 0.5% | ||
| North Carolina Medical Care Commission, RB, Novant | ||
| Health Obligation, Series A, 4.75%, 11/01/43 | 3,950 | 3,297,223 |
See Notes to Financial Statements.
| ANNUAL | REPORT | JUNE | 30, 2011 | 23 |
BlackRock Municipal Fund
Schedule of Investments (continued) (Percentages shown are based on Net Assets)
| Par | ||
| Municipal Bonds | (000) | Value |
| North Dakota — 0.3% | ||
| North Dakota State HFA, RB, Housing Finance Program, | ||
| Series C, AMT (AMBAC), 5.30%, 7/01/22 | $ 1,655 | $ 1,701,853 |
| Pennsylvania — 1.3% | ||
| City of Philadelphia Pennsylvania, RB, 12th Series B | ||
| (NPFGC), 7.00%, 5/15/20 (d) | 4,310 | 5,358,235 |
| Pennsylvania Turnpike Commission, RB, Subordinate, | ||
| Special Motor License Fund, 6.00%, 12/01/36 | 950 | 1,053,769 |
| Philadelphia School District, GO, Series E, | ||
| 6.00%, 9/01/38 | 2,300 | 2,412,953 |
| 8,824,957 | ||
| Puerto Rico — 1.1% | ||
| Puerto Rico Sales Tax Financing Corp., RB, | ||
| First Sub-Series A, 6.38%, 8/01/39 | 7,100 | 7,586,634 |
| South Carolina — 0.4% | ||
| South Carolina Jobs-EDA, Refunding RB, Palmetto Health, | ||
| Series A (AGM), 6.50%, 8/01/39 | 380 | 393,323 |
| South Carolina State Public Service Authority, RB, | ||
| Santee Cooper, Series A, 5.50%, 1/01/38 | 2,300 | 2,449,592 |
| 2,842,915 | ||
| Texas — 10.7% | ||
| City of Houston Texas, Refunding RB, Combined, | ||
| First Lien, Series A (AGC), 6.00%, 11/15/35 | 3,650 | 4,050,296 |
| County of Harris Texas, Refunding RB, Senior Lien-Toll | ||
| Road (AGM), 5.00%, 8/15/30 | 10,000 | 10,092,000 |
| Dallas Area Rapid Transit, Refunding RB, Senior Lien, | ||
| 5.25%, 12/01/38 | 5,000 | 5,205,350 |
| Dallas-Fort Worth International Airport Facilities | ||
| Improvement Corp., RB, AMT, Series A (NPFGC): | ||
| 6.00%, 11/01/28 | 25,950 | 25,981,140 |
| 5.50%, 11/01/33 | 2,000 | 1,979,540 |
| Mansfield ISD Texas, GO, School Building (PSF-GTD), | ||
| 5.00%, 2/15/33 | 3,000 | 3,114,420 |
| North Texas Tollway Authority, First Tier, Refunding RB: | ||
| Series A, 6.00%, 1/01/28 | 1,000 | 1,070,960 |
| System (NPFGC), 5.75%, 1/01/40 | 9,870 | 9,907,111 |
| System, Series A (AMBAC), 5.63%, 1/01/33 | 2,040 | 2,070,457 |
| System, Series B (NPFGC), 5.75%, 1/01/40 | 7,700 | 7,728,952 |
| Texas Department of Housing & Community Affairs, MRB, | ||
| Series A, AMT (NPFGC): | ||
| 5.45%, 9/01/23 | 1,720 | 1,728,841 |
| 5.50%, 3/01/26 | 2,220 | 2,226,216 |
| 75,155,283 | ||
| Utah — 0.6% | ||
| Utah Transit Authority, RB, Series A (AGM), | ||
| 5.00%, 6/15/36 | 4,000 | 4,103,840 |
| Virginia — 0.1% | ||
| Fairfax County IDA Virginia, Refunding RB, Health Care, | ||
| Inova Health System, Series A, 5.50%, 5/15/35 | 600 | 619,296 |
| Par | ||
| Municipal Bonds | (000) | Value |
| Washington — 3.4% | ||
| Central Puget Sound Regional Transit Authority, RB, | ||
| Series A, 5.00%, 11/01/36 | $10,000 | $ 10,195,100 |
| Chelan County Public Utility District No. 1, RB, | ||
| Chelan Hydro System, Series A, AMT (AMBAC), | ||
| 5.45%, 7/01/37 | 10,710 | 10,621,750 |
| Washington Health Care Facilities Authority, RB, | ||
| Providence Health & Services, Series A: | ||
| 5.00%, 10/01/39 | 1,950 | 1,926,580 |
| 5.25%, 10/01/39 | 1,075 | 1,087,696 |
| 23,831,126 | ||
| Wisconsin — 1.9% | ||
| City of Superior Wisconsin, Refunding RB, Midwest Energy | ||
| Resources, Series E (NPFGC), 6.90%, 8/01/21 | 9,000 | 11,107,080 |
| Wisconsin Health & Educational Facilities Authority, | ||
| RB, Ascension Health Senior Credit Group, | ||
| 5.00%, 11/15/33 | 2,400 | 2,411,280 |
| 13,518,360 | ||
| Total Municipal Bonds — 85.0% | 596,530,149 | |
| Municipal Bonds Transferred to | ||
| Tender Option Bond Trusts (f) | ||
| Arizona — 1.0% | ||
| City of Mesa Arizona, RB, 5.00%, 7/01/35 | 7,000 | 7,143,640 |
| California — 2.1% | ||
| San Diego County Water Authority, COP, Refunding, | ||
| Series 2008-A (AGM), 5.00%, 5/01/33 | 4,500 | 4,562,100 |
| Sequoia Union High School District California, GO, | ||
| Refunding, Election of 2004, Series B (AGM), | ||
| 5.50%, 7/01/35 | 10,055 | 10,360,118 |
| 14,922,218 | ||
| Colorado — 0.2% | ||
| Colorado Health Facilities Authority, Refunding RB, | ||
| Catholic Healthcare, Series A, 5.50%, 7/01/34 | 1,580 | 1,623,821 |
| District of Columbia — 1.4% | ||
| Metropolitan Washington Airports Authority, RB, Series B, | ||
| AMT (AGM), 5.00%, 10/01/36 | 10,000 | 9,624,166 |
| Florida — 2.7% | ||
| City of Tallahassee Florida, RB (NPFGC), | ||
| 5.00%, 10/01/37 | 10,000 | 10,031,200 |
| Jacksonville Electric Authority Florida, RB, Sub-Series A, | ||
| 5.63%, 10/01/32 | 6,300 | 6,700,743 |
| Orange County School Board, COP, Series A (NPFGC), | ||
| 5.00%, 8/01/30 | 2,000 | 2,015,980 |
| 18,747,923 | ||
| Illinois — 1.3% | ||
| City of Chicago Illinois, Refunding RB, Second Lien | ||
| (AGM), 5.25%, 11/01/33 | 5,000 | 5,097,150 |
| Illinois Finance Authority, RB, Carle Foundation, Series A | ||
| (AGM), 6.00%, 8/15/41 | 3,600 | 3,684,708 |
| 8,781,858 | ||
| Louisiana — 1.8% | ||
| State of Louisiana, RB, Series A (AGM), 5.00%, 5/01/31 | 11,950 | 12,279,581 |
See Notes to Financial Statements.
| 24 | ANNUAL REPORT | JUNE | 30, 2011 |
BlackRock Municipal Fund
Schedule of Investments (continued) (Percentages shown are based on Net Assets)
| Municipal Bonds Transferred to | Par | |
| Tender Option Bond Trusts (f) | (000) | Value |
| Massachusetts — 2.2% | ||
| Massachusetts School Building Authority, RB, Series A | ||
| (AGM), 5.00%, 8/15/30 | $15,000 | $ 15,541,350 |
| New York — 2.4% | ||
| New York State Dormitory Authority, ERB, Series B, | ||
| 5.75%, 3/15/36 | 2,010 | 2,207,663 |
| Sales Tax Asset Receivable Corp., RB, Series A (AMBAC), | ||
| 5.25%, 10/15/27 | 13,931 | 14,942,725 |
| 17,150,388 | ||
| Ohio — 0.1% | ||
| State of Ohio, RB, Cleveland Clinic Health, Series B, | ||
| 5.50%, 1/01/34 | 1,000 | 1,037,290 |
| Texas — 2.7% | ||
| Cypress-Fairbanks ISD, GO, Refunding, Schoolhouse | ||
| (PSF-GTD), 5.00%, 2/15/32 | 10,000 | 10,427,200 |
| Harris County Cultural Education Facilities Finance Corp., | ||
| RB, Hospital, Texas Children’s Hospital Project, | ||
| 5.50%, 10/01/39 | 8,500 | 8,680,030 |
| 19,107,230 | ||
| Washington — 1.5% | ||
| State of Washington, GO, Series D (AGM), | ||
| 5.00%, 1/01/28 | 10,000 | 10,363,500 |
| Wisconsin — 0.4% | ||
| Wisconsin Health & Educational Facilities Authority, | ||
| Refunding RB, Froedtert & Community Health Inc., | ||
| 5.25%, 4/01/39 | 2,499 | 2,484,784 |
| Total Municipal Bonds Transferred to | ||
| Tender Option Bond Trusts — 19.8% | 138,807,749 | |
| Total Long-Term Investments | ||
| (Cost — $721,238,771) — 104.8% | 735,337,898 |
| Short-Term Securities | Shares | Value |
| FFI Institutional Tax-Exempt Fund, 0.01% (g)(h) | 37,528,861 | $ 37,528,861 |
| Total Short-Term Securities | ||
| (Cost — $37,528,861) — 5.3% | 37,528,861 | |
| Total Investments (Cost — $758,767,632*) — 110.1% | 772,866,759 | |
| Liabilities in Excess of Other Assets — (0.7)% | (4,652,000) | |
| Liability for TOB Trust Certificates, Including Interest | ||
| Expense and Fees Payable — (9.4)% | (66,350,848) | |
| Net Assets — 100.0% | $ 701,863,911 | |
* The cost and unrealized appreciation (depreciation) of investments as of June 30,
2011, as computed for federal income tax purposes, were as follows:
| Aggregate cost | $ 693,915,655 |
| Gross unrealized appreciation | $ 20,484,133 |
| Gross unrealized depreciation | (7,833,332) |
| Net unrealized appreciation | $ 12,650,801 |
(a) Represents a step-up bond that pays an initial coupon rate for the first period and
then a higher coupon rate for the following periods. Rate shown is as of report date
(b) Represents a zero-coupon bond. Rate shown reflects the current yield as of
report date.
(c) When-issued security. Unsettled when-issued transactions were as follows:
| Unrealized | ||
| Appreciation | ||
| Counterparty | Value | (Depreciation) |
| Bank of America Merrill Lynch | $1,913,081 | $ 28,559 |
| Stone & Youngberg | $1,913,053 | $ (17,589) |
(d) Security is collateralized by Municipal or US Treasury obligations.
(e) Variable rate security. Rate shown is as of report date.
(f) Securities represent bonds transferred to a TOB trust in exchange for which the
Fund acquired residual interest certificates. These securities serve as collateral in a
financing transaction. See Note 1 of the Notes to Financial Statements for details of
municipal bonds transferred to TOBs.
(g) Investments in companies considered to be an affiliate of the Fund during the year, for purposes of Section 2(a)(3) of theInvestment Company Act of 1940, as amended,
were as follows:
| Shares Held | Shares Held | Value at | |||||
| at June 30, | Shares | Shares | at June 30, | June 30 | Realized | ||
| Affiliate | 2010 | Purchased | Sold | 2011 | 2011 | Loss | Income |
| BlackRock Insured Municipal Term Trust, Inc. | 204,800 | — | (204,800) | — | — | $(213,126) | $89,498 |
| FFI Institutional Tax-Exempt Fund | 16,338,498 | 21,190,3631 | — | 37,528,861 | $37,528,861 | — | $31,810 |
| 1 Represents net shares purchased. |
(h) Represents the current yield as of report date.
See Notes to Financial Statements.
| ANNUAL | REPORT | JUNE | 30, 2011 | 25 |
BlackRock Municipal Fund
Schedule of Investments (concluded)
• Financial futures contracts sold as of June 30, 2011 were as follows:
| Notional Unrealized | |||
| Contracts Issue | Exchange Expiration | Value Appreciation | |
| 230 10-Year US | Chicago Board September | ||
| Treasury Note | of Trade | 201 | $28,184,954 $ 49,485 |
• Fair Value Measurements — Various inputs are used in determining the fair value of
investments and derivative financial instruments. These inputs are categorized in
three broad levels for financial statement purposes as follows:
• Level 1 — price quotations in active markets/exchanges for identical assets
and liabilities
• Level 2 — other observable inputs (including, but not limited to: quoted prices for
similar assets or liabilities in markets that are active, quoted prices for identical
or similar assets or liabilities in markets that are not active, inputs other than
quoted prices that are observable for the assets or liabilities (such as interest
rates, yield curves, volatilities, prepayment speeds, loss severities, credit risks and
default rates) or other market-corroborated inputs)
• Level 3 — unobservable inputs based on the best information available in the
circumstances, to the extent observable inputs are not available (including the
Fund’s own assumptions used in determining the fair value of investments and
derivative financial instruments)
The categorization of a value determined for investments and derivative financial
instruments is based on the pricing transparency of the investment and derivative
financial instrument and does not necessarily correspond to the Fund’s perceived
risk of investing in those securities. For information about the Fund’s policy regarding
valuation of investments and derivative financial instruments and other significant
policies please refer to the please refer to Note 1 of the Notes to Financial
Statements.
The following tables summarize the inputs used as of June 30, 2011 in determining
the fair valuation of the Fund’s investments and derivative financial instruments:
| Valuation Inputs | Level 1 | Level 2 | Level 3 | Total | |
| Assets: | |||||
| Investments: | |||||
| Long-Term | |||||
| Investments1 . | — | $ 735,337,898 | — | $ 735,337,898 | |
| Short-Term | |||||
| Securities | $ 37,528,861 | — | — | 37,528,861 | |
| Total | $ 37,528,861 | $ 735,337,898 | — | $ 772,866,759 | |
| 1 See above Schedule of Investments for values in each state or | |||||
| political subdivision. | |||||
| Valuation Inputs Level 1 | Level 2 | Level 3 | Total |
| Derivative Financial Instruments2 | |||
| Assets: | |||
| Interest Rate | |||
| Contracts $ 49,485 | — | — | $ 49,485 |
| 2 Derivative financial instruments are futures contracts, which are valued at the | |||
| unrealized appreciation/depreciation on the instrument. | |||
See Notes to Financial Statements.
| 26 | ANNUAL REPORT | JUNE | 30, 2011 |
BlackRock National Municipal Fund
Schedule of Investments June 30, 2011 (Percentages shown are based on Net Assets)
| Par | ||
| Municipal Bonds | (000) | Value |
| Alabama — 1.2% | ||
| Alabama State Docks Department, Refunding RB, | ||
| 6.00%, 10/01/40 | $15,500 | $ 15,818,060 |
| Birmingham Special Care Facilities Financing Authority, | ||
| RB, Children’s Hospital (AGC), 6.00%, 6/01/39 | 10,275 | 10,923,147 |
| Courtland IDB Alabama, RB, International Paper Co. | ||
| Projects, Series A, 6.25%, 11/01/33 | 2,590 | 2,693,678 |
| Courtland IDB, Refunding RB, AMT: | ||
| Champion International Corp. Project, | ||
| 6.00%, 8/01/29 | 185 | 185,000 |
| International Paper Co., Series B, 6.25%, 8/01/25 | 750 | 758,767 |
| 30,378,652 | ||
| Alaska — 0.1% | ||
| Northern Tobacco Securitization Corp., RB, Series A, | ||
| 5.00%, 6/01/46 | 4,020 | 2,603,151 |
| Arizona — 1.0% | ||
| City of Mesa Arizona, RB, 5.00%, 7/01/35 | 10,450 | 10,664,434 |
| Maricopa County & Phoenix Industrial Development | ||
| Authorities, Refunding RB, S/F, Series A-2, AMT | ||
| (Ginnie Mae), 5.80%, 7/01/40 | 2,200 | 2,242,416 |
| Maricopa County IDA Arizona, RB, Arizona Charter | ||
| Schools Project, Series A, 6.75%, 7/01/29 | 3,100 | 2,058,865 |
| Peoria Improvement District No. 8401 Arizona, Special | ||
| Assessment Bonds, No. 8802, 7.20%, 1/01/13 | 510 | 519,609 |
| Pima County IDA, IDRB, Tucson Electric Power, Series A, | ||
| 6.38%, 9/01/29 | 4,065 | 4,087,154 |
| Pinal County IDA Arizona, RB, San Manuel Facility Project, | ||
| AMT, 6.25%, 6/01/26 | 500 | 442,200 |
| Prescott Valley Improvement District Arizona, Special | ||
| Assessment Bonds, Sewer Collection System Roadway | ||
| Repair, 7.90%, 1/01/12 | 60 | 61,928 |
| Vistancia Community Facilities District Arizona, GO: | ||
| 6.75%, 7/15/22 | 3,000 | 3,079,440 |
| 5.75%, 7/15/24 | 2,125 | 2,222,920 |
| 25,378,966 | ||
| California — 16.4% | ||
| ABAG Finance Authority for Nonprofit Corps, | ||
| Refunding RB, Sharp Healthcare, 6.25%, 8/01/39 | 9,000 | 9,252,090 |
| California Health Facilities Financing Authority, RB, | ||
| Sutter Health, Series A, 6.25%, 8/15/35 | 2,500 | 2,502,600 |
| California Health Facilities Financing Authority, | ||
| Refunding RB: | ||
| Catholic Healthcare West, Series E, 5.63%, 7/01/25 | 5,000 | 5,286,750 |
| Series A, 6.00%, 7/01/39 | 11,905 | 12,325,128 |
| Series B, 6.00%, 8/15/42 | 17,375 | 18,373,541 |
| Stanford Hospital, Series A 3, 5.50%, 11/15/40 | 7,500 | 7,636,050 |
| California State Public Works Board, RB, Various | ||
| Capital Projects: | ||
| Sub-Series A-1, 6.00%, 3/01/35 | 12,875 | 13,205,888 |
| Sub-Series I-1, 6.38%, 11/01/34 | 9,705 | 10,222,762 |
| Sub-Series I-1, 6.63%, 11/01/34 | 3,605 | 3,875,411 |
| California Statewide Communities Development Authority, | ||
| RB, Health Facility, Memorial Health Services, Series A, | ||
| 6.00%, 10/01/23 | 9,880 | 10,247,931 |
| California Statewide Communities Development Authority, | ||
| Refunding RB, Catholic Healthcare West, Series B, | ||
| 5.50%, 7/01/30 | 2,985 | 3,013,835 |
| Chula Vista Community Facilities District California, | ||
| Special Tax Bonds, District No. 06-1, Eastlake-Woods, | ||
| Improvement Area A, 6.15%, 9/01/26 | 3,215 | 3,261,489 |
| City of Chula Vista California, Refunding RB, San Diego | ||
| Gas & Electric, Series A, 5.88%, 2/15/34 | 4,875 | 5,206,744 |
| City of Newport Beach California, RB, Hoag Memorial | ||
| Hospital Presbyterian, 6.00%, 12/01/40 | 6,410 | 6,887,609 |
| City of Roseville California, Special Tax Bonds, Stoneridge | ||
| Community Facilities No. 1, 6.30%, 9/01/11 (a) | 2,500 | 2,575,475 |
| Par | ||
| Municipal Bonds | (000) | Value |
| California (concluded) | ||
| City of San Jose California, RB, Convention Center | ||
| Expansion & Renovation Project: | ||
| 6.50%, 5/01/36 | $ 1,510 | $ 1,558,531 |
| 6.50%, 5/01/42 | 5,130 | 5,271,947 |
| County of Sacramento California, RB, Subordinated and | ||
| Passenger Facility Charges/Grant, Series C: | ||
| 6.00%, 7/01/39 | 13,265 | 13,802,365 |
| 6.00%, 7/01/41 | 7,495 | 7,794,125 |
| East Bay Municipal Utility District, Refunding RB, | ||
| Sub-Series A, 5.00%, 6/01/36 | 10,400 | 10,793,640 |
| Los Angeles Municipal Improvement Corp., RB, Real | ||
| Property, Series E: | ||
| 6.00%, 9/01/34 | 2,680 | 2,831,956 |
| 6.00%, 9/01/39 | 9,450 | 9,953,591 |
| Metropolitan Water District of Southern California, RB, | ||
| Series A, 5.00%, 7/01/37 | 10,000 | 10,255,200 |
| Modesto Irrigation District, COP, Capital Improvements, | ||
| Series A, 6.00%, 10/01/39 | 9,820 | 10,188,250 |
| Orange County Sanitation District, COP, Series A, | ||
| 5.00%, 2/01/35 | 10,000 | 10,240,500 |
| Orange County Water District, COP: | ||
| Refunding, 5.00%, 8/15/39 | 15,000 | 15,296,550 |
| Series B (NPFGC), 5.00%, 8/15/34 | 10,000 | 10,063,500 |
| Pittsburg Redevelopment Agency, Tax Allocation Bonds, | ||
| Refunding, Subordinate, Los Medanos Community | ||
| Project, Series A, 6.50%, 9/01/28 | 10,000 | 9,826,600 |
| Pittsburg Unified School District, COP, 6.20%, 9/01/34 | 10,465 | 10,590,789 |
| Port of Oakland, RB, Series K, AMT (NPFGC), | ||
| 5.88%, 11/01/30 | 10,950 | 10,950,986 |
| San Francisco City & County Airports Commission, RB, | ||
| Series E, 6.00%, 5/01/39 | 24,300 | 26,003,916 |
| San Francisco City & County Airports Commission, | ||
| Refunding RB, Second Series 34E, AMT (AGM): | ||
| 5.75%, 5/01/21 | 8,220 | 9,178,699 |
| 5.75%, 5/01/23 | 17,000 | 18,345,380 |
| San Francisco City & County Redevelopment Agency, | ||
| Special Tax Bonds, Community Facilities District | ||
| No. 6-Mission, Series A: | ||
| 6.00%, 8/01/21 | 5,000 | 5,001,750 |
| 6.00%, 8/01/25 | 2,550 | 2,549,694 |
| San Francisco Uptown Parking Corp. California, RB, | ||
| Union Square (NPFGC), 6.00%, 7/01/20 | 1,075 | 1,100,789 |
| San Joaquin County Transportation Authority, RB, | ||
| Limited Tax Measure K, Series A, 6.00%, 3/01/36 | 10,700 | 11,648,662 |
| San Juan Water District, COP, Series A, 6.00%, 2/01/39 | 10,000 | 10,709,100 |
| Santa Margarita Water District California, Special Tax | ||
| Bonds, Refunding, Facilities District No. 99-1, | ||
| 6.20%, 9/01/20 | 2,650 | 2,653,657 |
| State of California, GO, Various Purpose, 6.50%, 4/01/33 | 38,000 | 42,215,340 |
| Tuolumne Wind Project Authority, RB, Tuolumne Co. | ||
| Project, Series A, 5.88%, 1/01/29 | 16,130 | 17,507,663 |
| 400,206,483 | ||
| Colorado — 0.6% | ||
| Colorado Health Facilities Authority, RB, Catholic Health | ||
| Initiatives, Series D, 6.25%, 10/01/33 | 3,540 | 3,821,713 |
| Colorado Housing & Finance Authority, RB, S/F Program, | ||
| Senior Series B-3, 6.55%, 10/01/16 | 70 | 72,930 |
| Colorado Housing & Finance Authority, Refunding RB, | ||
| S/F Program: | ||
| Senior Series A-2, AMT, 7.50%, 4/01/31 | 115 | 118,930 |
| Senior Series A-3, 7.35%, 10/01/30 | 55 | 57,669 |
| Senior Series C-3 (FHA), 6.75%, 10/01/21 | 205 | 224,321 |
| Senior Series C-3 (FHA), 7.15%, 10/01/30 | 55 | 56,022 |
| Series B-2, AMT, 7.10%, 4/01/17 | 40 | 41,432 |
| Series B-2, AMT, 7.25%, 10/01/31 | 405 | 415,599 |
| Series C-2 AMT (FHA), 7.25%, 10/01/31 | 165 | 165,850 |
See Notes to Financial Statements.
| ANNUAL | REPORT | JUNE | 30, 2011 | 27 |
BlackRock National Municipal Fund
Schedule of Investments (continued) (Percentages shown are based on Net Assets)
| Par | ||
| Municipal Bonds | (000) | Value |
| Colorado (concluded) | ||
| Plaza Metropolitan District No. 1 Colorado, Tax Allocation | ||
| Bonds, Public Improvement Fee, Tax Increment: | ||
| 8.00%, 12/01/25 | $ 7,700 | $ 7,680,981 |
| Subordinate, 8.13%, 12/01/25 | 1,885 | 1,717,612 |
| 14,373,059 | ||
| Connecticut — 0.1% | ||
| Connecticut State Development Authority, RB, Bridgeport, | ||
| AMT (AMBAC), 6.15%, 4/01/35 | 1,250 | 1,249,887 |
| Connecticut State Health & Educational Facility | ||
| Authority, RB, Bridgeport Hospital, Series A (NPFGC), | ||
| 6.63%, 7/01/18 | 1,000 | 1,008,290 |
| Connecticut State Health & Educational Facility Authority, | ||
| Refunding RB (Radian), 6.63%, 7/01/26 | 640 | 642,349 |
| 2,900,526 | ||
| Delaware — 0.5% | ||
| County of Sussex Delaware, RB, NRG Energy, Inc., | ||
| Indian River Project, 6.00%, 10/01/40 | 12,000 | 12,033,720 |
| District of Columbia — 1.6% | ||
| District of Columbia, RB, Series A, 5.50%, 12/01/30 | 17,000 | 18,845,520 |
| District of Columbia Water & Sewer Authority, RB, Series A: | ||
| 6.00%, 10/01/35 | 12,630 | 14,315,094 |
| 5.50%, 10/01/39 | 6,475 | 6,887,911 |
| 40,048,525 | ||
| Florida — 6.3% | ||
| Anthem Park Community Development District, Special | ||
| Assessment Bonds, 5.80%, 5/01/36 (b)(c) | 1,815 | 999,593 |
| County of Escambia Florida, RB, International Paper Co. | ||
| Projects, Series B, 6.25%, 11/01/33 | 7,500 | 7,800,225 |
| County of Lee Florida, RB, Series A, AMT (AGM), | ||
| 6.00%, 10/01/29 | 13,015 | 13,054,045 |
| County of Miami-Dade Florida, GO, Building Better | ||
| Communities Program: | ||
| Series B, 6.38%, 7/01/28 | 7,750 | 8,625,440 |
| Series B-1, 6.00%, 7/01/38 | 25,000 | 26,920,250 |
| County of Miami-Dade Florida, Refunding RB, Miami | ||
| International Airport, Series C, 6.00%, 10/01/23 | 20,000 | 22,738,000 |
| Fiddlers Creek Community Development District No. 2, | ||
| Special Assessment Bonds (b)(c): | ||
| Series A, 6.38%, 5/01/35 | 6,850 | 2,190,630 |
| Series B, 5.75%, 5/01/13 | 555 | 177,489 |
| Florida Housing Finance Corp., Refunding RB, AMT, | ||
| Homeowner Mortgage, Series 1 (Ginnie Mae), | ||
| 6.00%, 7/01/39 | 3,340 | 3,413,614 |
| Harbor Bay Community Development District Florida, | ||
| Special Assessment Bonds, Series A, 7.00%, 5/01/33 | 935 | 884,061 |
| Highland Meadows Community Development | ||
| District, Special Assessment Bonds, Series A, | ||
| 5.50%, 5/01/36 (b)(c) | 1,090 | 420,141 |
| Highlands County Health Facilities Authority, RB, Adventist | ||
| Health System/Sunbelt, Series B, 6.00%, 11/15/37 | 4,990 | 5,247,534 |
| Hillsborough County IDA, RB, AMT, National Gypsum Co.: | ||
| Series A, 7.13%, 4/01/30 | 6,000 | 5,412,480 |
| Series B, 7.13%, 4/01/30 | 7,750 | 6,991,120 |
| Jacksonville Economic Development Commission, RB, | ||
| Mayo Clinic: | ||
| Jacksonville, Series B, 5.50%, 11/15/36 | 2,000 | 2,013,000 |
| Series A (NPFGC), 5.50%, 11/15/36 | 1,000 | 1,009,410 |
| Jacksonville Electric Authority Florida, RB: | ||
| Scherer 4 Project, Series A, 6.00%, 10/01/37 | 8,225 | 8,834,637 |
| Sub-Series A, 5.63%, 10/01/32 | 10,525 | 11,194,495 |
| Jacksonville Port Authority, RB, AMT (AGC), | ||
| 6.00%, 11/01/38 | 8,240 | 8,318,033 |
| Lee County Housing Finance Authority, RB, | ||
| Multi-County Program, Series A-2, AMT (Ginnie Mae), | ||
| 6.00%, 9/01/40 | 495 | 542,386 |
| Par | ||
| Municipal Bonds | (000) | Value |
| Florida (concluded) | ||
| Lexington Oaks Community District, Special Assessment | ||
| Bonds, Series A, 6.70%, 5/01/33 | $ 1,030 | $ 1,046,356 |
| Mid-Bay Bridge Authority, RB, Series A, 7.25%, 10/01/40 | 5,000 | 5,066,250 |
| Panther Trace II Community Development District, Special | ||
| Assessment Bonds, 5.13%, 11/01/13 | 6,915 | 6,213,335 |
| St. Lucie West Services District, Refunding RB, | ||
| Senior Lien (NPFGC), 6.00%, 10/01/22 | 2,000 | 2,046,660 |
| Sterling Hill Community Development District, | ||
| Special Assessment Bonds, Refunding, Series B, | ||
| 5.50%, 11/01/10 (b) | 165 | 115,467 |
| Watergrass Community Development District, Special | ||
| Assessment Bonds, Series B: | ||
| 5.13%, 11/01/14 | 1,000 | 646,080 |
| 6.96%, 11/01/17 | 1,950 | 1,767,149 |
| 153,687,880 | ||
| Georgia — 3.0% | ||
| City of Atlanta Georgia, RB, General, Series B, AMT | ||
| (NPFGC), 5.63%, 1/01/30 | 20,000 | 20,042,600 |
| City of Atlanta Georgia, Refunding RB, General, Series C, | ||
| 6.00%, 1/01/30 | 25,000 | 27,751,250 |
| DeKalb County Hospital Authority Georgia, RB, DeKalb | ||
| Medical Center Inc. Project, 6.13%, 9/01/40 | 3,535 | 3,388,934 |
| Fulton County Residential Care Facilities for the Elderly | ||
| Authority, Refunding RB, Canterbury Court Project, | ||
| Series A, 6.00%, 2/15/22 | 2,250 | 2,099,047 |
| Municipal Electric Authority of Georgia, Refunding RB, | ||
| Project One, Sub-Series D, 6.00%, 1/01/23 | 10,000 | 11,243,500 |
| Richmond County Development Authority, RB, Recovery | ||
| Zone Facility, International Paper Co., Series B, | ||
| 6.25%, 11/01/33 | 3,625 | 3,770,109 |
| Rockdale County Development Authority, RB, Visy Paper | ||
| Project, Series A, AMT, 6.13%, 1/01/34 | 5,000 | 4,453,650 |
| 72,749,090 | ||
| Illinois — 9.3% | ||
| Bolingbrook Special Service Area No. 1, Special Tax | ||
| Bonds, Forest City Project, 5.90%, 3/01/27 | 1,000 | 807,290 |
| Chicago Transit Authority, RB, Federal Transit Administration | ||
| Section 5309, Series A (AGC), 6.00%, 6/01/26 | 12,425 | 13,729,252 |
| City of Chicago Illinois, ARB, General, Third Lien, | ||
| Series B-2, AMT (Syncora), 6.00%, 1/01/29 | 55,000 | 56,007,050 |
| City of Chicago Illinois, Refunding RB, General, Third Lien, | ||
| Series C, 6.50%, 1/01/41 | 23,700 | 26,005,773 |
| City of Chicago Illinois, Special Assessment Bonds, | ||
| Lake Shore East, 6.75%, 12/01/32 | 2,000 | 1,955,180 |
| County of Cook Illinois, RB, Navistar International Corp. | ||
| Project, Recovery Zone Facility, 6.50%, 10/15/40 | 6,500 | 6,675,565 |
| Illinois Finance Authority, RB: | ||
| Advocate Health Care Network, Series D, | ||
| 6.50%, 11/01/38 | 5,710 | 6,157,435 |
| Carle Foundation, Series A, 6.00%, 8/15/41 | 2,450 | 2,455,316 |
| Community Rehabilitation, 6.50%, 7/01/22 (a) | 1,730 | 1,854,197 |
| Community Rehabilitation Providers Facilities, | ||
| Series A, 6.50%, 7/01/22 | 1,410 | 1,324,667 |
| DePaul University, Series A, 6.13%, 10/01/40 | 11,660 | 12,105,179 |
| Navistar International, Recovery Zone, | ||
| 6.50%, 10/15/40 | 4,500 | 4,621,545 |
| Roosevelt University Project, 6.50%, 4/01/39 | 8,000 | 8,053,760 |
| Rush University Medical Center Obligation Group, | ||
| Series A, 7.25%, 11/01/30 | 6,900 | 7,598,280 |
| Rush University Medical Center Obligation Group, | ||
| Series B, 7.25%, 11/01/30 | 5,280 | 5,814,336 |
| Rush University Medical Center, Series C, | ||
| 6.38%, 11/01/29 | 2,860 | 3,008,034 |
| University of Chicago, Series B, 6.25%, 7/01/38 | 20,000 | 22,478,200 |
See Notes to Financial Statements.
| 28 | ANNUAL REPORT | JUNE | 30, 2011 |
BlackRock National Municipal Fund
Schedule of Investments (continued) (Percentages shown are based on Net Assets)
| Par | ||
| Municipal Bonds | (000) | Value |
| Illinois (concluded) | ||
| Illinois Finance Authority, Refunding RB, Series A: | ||
| Northwestern Memorial Hospital, 6.00%, 8/15/39 | $10,685 | $ 11,346,615 |
| OSF Healthcare System, 7.00%, 11/15/27 | 3,335 | 3,490,044 |
| OSF Healthcare System, 7.13%, 11/15/35 | 1,870 | 1,943,641 |
| OSF Healthcare System, 6.00%, 5/15/39 | 5,000 | 5,054,400 |
| Railsplitter Tobacco Settlement Authority, RB, | ||
| 6.00%, 6/01/28 | 13,565 | 13,756,538 |
| Village of Hodgkins Illinois, RB, Metropolitan Biosolids | ||
| Management LLC Project, AMT, 6.00%, 11/01/23 | 10,000 | 10,002,100 |
| Village of Wheeling Illinois, Tax Allocation Bonds, North | ||
| Milwaukee/Lake-Cook TIF Project, 6.00%, 1/01/25 | 1,540 | 1,396,888 |
| 227,641,285 | ||
| Indiana — 2.6% | ||
| Indiana Finance Authority, RB: | ||
| Sisters of St. Francis Health, 5.25%, 11/01/39 | 10,820 | 10,740,257 |
| Trinity Health, Series A, 5.63%, 12/01/38 | 10,000 | 10,307,000 |
| Indiana Finance Authority, Refunding RB: | ||
| Duke Energy Indiana Project, Series B, | ||
| 6.00%, 8/01/39 | 9,335 | 9,885,578 |
| Improvement, U.S. Steel Corp., 6.00%, 12/01/26 | 5,000 | 5,026,450 |
| Indiana Municipal Power Agency, RB, Series B, | ||
| 6.00%, 1/01/39 | 15,500 | 16,145,110 |
| Indianapolis Local Public Improvement Bond Bank, | ||
| Refunding RB, Waterworks Project, Series A (AGC), | ||
| 5.75%, 1/01/38 | 10,000 | 10,477,200 |
| 62,581,595 | ||
| Kansas — 0.0% | ||
| Sedgwick & Shawnee Counties Kansas, RB, | ||
| Mortgage-Backed Securities, Series A1, AMT | ||
| (Ginnie Mae), 6.95%, 6/01/29 | 650 | 674,980 |
| Kentucky — 0.8% | ||
| Kentucky Economic Development Finance Authority, | ||
| RB, Louisville Arena, Sub-Series A-1 (AGC), | ||
| 6.00%, 12/01/42 | 2,500 | 2,569,550 |
| Kentucky Economic Development Finance Authority, | ||
| Refunding RB, Owensboro Medical Health System, | ||
| Series A, 6.38%, 6/01/40 | 5,000 | 4,944,350 |
| Louisville/Jefferson County Metropolitan Government, | ||
| Refunding RB, Jewish Hospital & St. Mary’s HealthCare, | ||
| 6.13%, 2/01/37 | 12,000 | 12,118,800 |
| 19,632,700 | ||
| Louisiana — 0.8% | ||
| Louisiana HFA, RB, S/F, Series D-2, AMT (Ginnie Mae), | ||
| 5.80%, 6/01/20 | 115 | 119,027 |
| Louisiana Local Government Environmental Facilities & | ||
| Community Development Authority, RB, Westlake | ||
| Chemical Corp.: | ||
| Projects, 6.75%, 11/01/32 | 3,500 | 3,643,780 |
| Series A, 6.50%, 8/01/29 | 6,665 | 6,928,934 |
| Series A-1, 6.50%, 11/01/35 | 8,360 | 8,652,767 |
| 19,344,508 | ||
| Maryland — 0.3% | ||
| Maryland Community Development Administration, HRB, | ||
| Series B, AMT, 6.15%, 1/01/21 | 445 | 445,574 |
| Maryland Community Development Administration, RB, | ||
| Waters Landing II Apartments, Series A, Mandatory | ||
| Put Bonds, AMT, 5.88%, 8/01/33 (d) | 1,000 | 1,010,100 |
| Maryland Health & Higher Educational Facilities | ||
| Authority, Refunding RB, Charlestown Community, | ||
| 6.25%, 1/01/41 | 5,000 | 5,085,900 |
| 6,541,574 |
| Par | |||
| Municipal Bonds | (000) | Value | |
| Massachusetts — 0.2% | |||
| Massachusetts HFA, RB, Series B, 7.00%, 12/01/38 | $ 5,000 | $ 5,483,450 | |
| Michigan — 2.3% | |||
| County of Wayne Michigan, GO, Building Improvement, | |||
| Series A, 6.75%, 11/01/39 | 2,170 | 2,238,616 | |
| Eastern Michigan University, Refunding RB, General | |||
| (AMBAC), 6.00%, 6/01/24 | 415 | 416,394 | |
| Flint Hospital Building Authority Michigan, Refunding RB, | |||
| Hurley Medical Center, 6.00%, 7/01/20 | 2,430 | 2,338,559 | |
| Kalamazoo Hospital Finance Authority, Refunding RB, | |||
| Bronson Methodist Hospital, 5.50%, 5/15/36 | 10,000 | 9,852,700 | |
| Lansing Board of Water & Light, RB, Series A, | |||
| 5.50%, 7/01/41 | 3,335 | 3,516,024 | |
| Michigan State Building Authority, Refunding RB, Facilities | |||
| Program, Series I: | |||
| 6.00%, 10/15/38 | 10,875 | 11,477,366 | |
| 6.25%, 10/15/38 | 6,250 | 6,694,313 | |
| Royal Oak Hospital Finance Authority Michigan, | |||
| Refunding RB, William Beaumont Hospital: | |||
| 8.25%, 9/01/39 | 15,195 | 17,476,377 | |
| Series W, 6.00%, 8/01/39 | 2,900 | 2,944,312 | |
| 56,954,661 | |||
| Minnesota — 0.9% | |||
| City of Eden Prairie Minnesota, RB, Rolling Hills Project, | |||
| Series A (Ginnie Mae), 6.15%, 8/20/31 | 1,000 | 1,051,130 | |
| City of Minneapolis Minnesota, Refunding RB, Fairview | |||
| Health Services: | |||
| Series A, 6.75%, 11/15/32 | 4,780 | 5,176,979 | |
| Series B (AGC), 6.50%, 11/15/38 | 14,460 | 15,662,638 | |
| Ramsey County Housing & Redevelopment Authority | |||
| Minnesota, RB, Hanover Townhouses Project, AMT, | |||
| 6.00%, 7/01/31 | 1,110 | 1,110,466 | |
| 23,001,213 | |||
| Mississippi — 0.1% | |||
| County of Warren Mississippi, Refunding RB, International | |||
| Paper Co. Project, Series B, AMT, 6.75%, 8/01/21 | 1,700 | 1,710,098 | |
| Missouri — 0.1% | |||
| City of Fenton Missouri, Tax Allocation Bonds, Refunding, | |||
| Gravois Bluffs Redevelopment Project, 5.00%, 4/01/14 | 1,000 | 1,069,510 | |
| Nevada — 3.6% | |||
| City of Las Vegas Nevada, GO, Limited Tax, Performing Arts | |||
| Center, 6.00%, 4/01/34 | 10,000 | 10,761,700 | |
| City of Reno Nevada, Special Assessment Bonds, | |||
| Somerset Parkway, 6.63%, 12/01/22 | 1,640 | 1,513,359 | |
| Clark County Water Reclamation District, GO, Series B, | |||
| 5.75%, 7/01/38 | 26,000 | 28,401,100 | |
| County of Clark Nevada, RB, Series B, 5.75%, 7/01/42 | 41,700 | 42,928,065 | |
| Nevada Housing Division, RB, Multi-Unit Housing, | |||
| Series A, AMT (Freddie Mac), 6.30%, 4/01/32 | 4,950 | 4,953,366 | |
| 88,557,590 | |||
| New Jersey — 2.2% | |||
| New Jersey EDA, RB: | |||
| Cedar Crest Village Inc. Facility, Series A, | |||
| 7.25%, 11/15/11 (a) | 3,300 | 3,418,767 | |
| Cigarette Tax, 5.75%, 6/15/29 | 2,530 | 2,384,146 | |
| New Jersey EDA, Refunding RB, New Jersey American | |||
| Water Co., Inc. Project, Series B, AMT, 5.60%, 11/01/34 | 8,250 | 8,323,672 | |
| New Jersey Educational Facilities Authority, Refunding RB, | |||
| University of Medicine & Dentistry, Series B: | |||
| 7.13%, 12/01/23 | 1,870 | 2,147,826 | |
| 7.50%, 12/01/32 | 7,200 | 8,084,520 | |
| New Jersey Health Care Facilities Financing Authority, RB, | |||
| AHS Hospital Corp., 6.00%, 7/01/41 | 11,025 | 11,461,921 | |
| New Jersey State Housing & Mortgage Finance Agency, | |||
| Refunding RB, Series B (AGM), 6.25%, 11/01/26 | 640 | 645,997 | |
See Notes to Financial Statements.
| ANNUAL | REPORT | JUNE | 30, 2011 | 29 |
BlackRock National Municipal Fund
Schedule of Investments (continued) (Percentages shown are based on Net Assets)
| Par | ||
| Municipal Bonds | (000) | Value |
| New Jersey (concluded) | ||
| New Jersey Transportation Trust Fund Authority, RB, | ||
| Transportation System, Series A: | ||
| 5.13%, 6/15/28 | $10,000 | $ 10,136,000 |
| 5.13%, 6/15/29 | 8,010 | 8,100,112 |
| 54,702,961 | ||
| New Mexico — 0.1% | ||
| County of Santa Fe New Mexico, RB (AGM), | ||
| 6.00%, 2/01/27 | 250 | 289,468 |
| New Mexico Mortgage Finance Authority, RB, S/F Mortgage | ||
| Program, Series D, AMT (Fannie Mae), 6.15%, 7/01/35 | 1,470 | 1,581,617 |
| 1,871,085 | ||
| New York — 6.1% | ||
| Chautauqua County Industrial Development Agency, RB, | ||
| NRG Energy, Dunkirk Power Project, 5.88%, 4/01/42 | 2,500 | 2,383,125 |
| City of New York New York, GO, Series E-1, | ||
| 6.25%, 10/15/28 | 7,600 | 8,658,300 |
| Long Island Power Authority, Refunding RB, General, | ||
| Series A, 6.00%, 5/01/33 | 40,800 | 44,660,088 |
| Metropolitan Transportation Authority, RB, Series 2008C, | ||
| 6.50%, 11/15/28 | 17,420 | 19,996,941 |
| New York City Housing Development Corp., RB, Series M: | ||
| 6.50%, 11/01/28 | 4,300 | 4,529,792 |
| 6.88%, 11/01/38 | 5,700 | 6,019,542 |
| New York City Industrial Development Agency, RB, | ||
| Special Needs Facilities Pooled Program, Series C-1, | ||
| 6.00%, 7/01/12 | 530 | 528,744 |
| New York State Dormitory Authority, ERB, Series B, | ||
| 5.75%, 3/15/36 | 14,250 | 15,651,345 |
| New York State Dormitory Authority, Refunding RB, | ||
| State University Educational Facilities, Series A, | ||
| 7.50%, 5/15/13 | 3,000 | 3,356,010 |
| New York State Environmental Facilities Corp., Refunding | ||
| RB, Revolving Funds, New York City Municipal Water | ||
| Project, Series K, 5.00%, 6/15/28 | 22,500 | 23,144,850 |
| Oneida County Industrial Development Agency New York, | ||
| RB, Civic Facility, Faxton Hospital, Series C (Radian), | ||
| 6.63%, 1/01/15 | 1,885 | 1,900,118 |
| Port Authority of New York & New Jersey, Refunding RB, | ||
| Consolidated, 152nd Series, AMT, 5.75%, 11/01/30 | 3,250 | 3,449,712 |
| Triborough Bridge & Tunnel Authority, Refunding RB, | ||
| Series C, 5.00%, 11/15/38 | 5,070 | 5,188,993 |
| Westchester County Industrial Development Agency | ||
| New York, MRB, Kendal on Hudson Project, Series A, | ||
| 6.50%, 1/01/13 (a) | 8,095 | 8,812,298 |
| Westchester County Industrial Development Agency | ||
| New York, RB, Special Needs Facilities Pooled Program, | ||
| Series E-1, 6.00%, 7/01/12 | 150 | 149,644 |
| 148,429,502 | ||
| North Carolina — 0.4% | ||
| Columbus County Industrial Facilities & Pollution Control | ||
| Financing Authority North Carolina, RB, International | ||
| Paper Co. Projects, Series B, 6.25%, 11/01/33 | 3,000 | 3,120,090 |
| North Carolina HFA, RB, Homeownership Ownership, | ||
| Series 9A, AMT, 5.80%, 1/01/20 | 2,900 | 3,001,558 |
| North Carolina Medical Care Commission, RB, First | ||
| Mortgage (a): | ||
| Forest at Duke Project, 6.38%, 9/01/12 | 1,000 | 1,069,430 |
| Givens Estates Project, Series A, 6.50%, 7/01/13 | 2,500 | 2,823,825 |
| 10,014,903 | ||
| Ohio — 1.3% | ||
| County of Allen Ohio, Refunding RB, Catholic Healthcare, | ||
| Series B, 5.25%, 9/01/27 | 10,000 | 10,292,600 |
| County of Lucas Ohio, Refunding RB, Promedica | ||
| Healthcare, Series A, 6.50%, 11/15/37 | 10,120 | 11,155,377 |
| Par | ||
| Municipal Bonds | (000) | Value |
| Ohio (concluded) | ||
| County of Montgomery Ohio, Refunding RB, Catholic | ||
| Healthcare, Series A, 5.50%, 5/01/34 | $10,000 | $ 10,300,500 |
| Ohio HFA, Refunding RB, Residential Mortgage Backed, | ||
| Series C, AMT (Ginnie Mae), 5.90%, 9/01/35 | 170 | 170,597 |
| 31,919,074 | ||
| Oregon — 0.0% | ||
| City of Portland Oregon, HRB, Lovejoy Station Apartments | ||
| Project, AMT (NPFGC), 5.90%, 7/01/23 | 475 | 475,461 |
| Pennsylvania — 2.1% | ||
| Allegheny County Hospital Development Authority, | ||
| Refunding RB, Health System, West Penn, Series A, | ||
| 5.38%, 11/15/40 | 7,250 | 6,022,502 |
| Cumberland County Municipal Authority, RB, Diakon | ||
| Lutheran, 6.38%, 1/01/39 | 8,975 | 9,041,325 |
| Cumberland County Municipal Authority, Refunding RB, | ||
| Diakon Lutheran, 6.50%, 1/01/39 | 2,245 | 2,257,819 |
| Dauphin County General Authority, Refunding RB, | ||
| Pinnacle Health System Project, Series A: | ||
| 6.00%, 6/01/29 | 8,000 | 8,140,640 |
| 6.00%, 6/01/36 | 1,835 | 1,845,221 |
| Delaware County IDA Pennsylvania, Refunding RB, | ||
| Resource Recovery Facility, Series A, 6.10%, 7/01/13 | 3,620 | 3,629,050 |
| Lancaster County Hospital Authority, RB, Brethren Village | ||
| Project, Series A: | ||
| 6.25%, 7/01/26 | 1,160 | 1,133,007 |
| 6.50%, 7/01/40 | 2,500 | 2,405,550 |
| Pennsylvania Economic Development Financing | ||
| Authority, RB: | ||
| Allegheny Energy Supply Co., 7.00%, 7/15/39 | 10,000 | 10,480,900 |
| American Water Co. Project, 6.20%, 4/01/39 | 2,475 | 2,637,533 |
| Philadelphia Authority for Industrial Development, RB, | ||
| Commercial Development, AMT, 7.75%, 12/01/17 | 1,265 | 1,265,848 |
| Sayre Health Care Facilities Authority, Refunding RB, | ||
| Guthrie Health, Series A, 5.88%, 12/01/31 | 1,210 | 1,220,648 |
| 50,080,043 | ||
| Puerto Rico — 1.9% | ||
| Puerto Rico Industrial Tourist Educational Medical & | ||
| Environmental Control Facilities Financing Authority, RB, | ||
| Hospital De La Concepcion, Series A, 6.13%, 11/15/25 4,000 | 4,051,920 | |
| Puerto Rico Sales Tax Financing Corp., RB, First | ||
| Sub-Series A: | ||
| 6.38%, 8/01/39 | 15,000 | 16,028,100 |
| 6.50%, 8/01/44 | 25,000 | 26,916,750 |
| 46,996,770 | ||
| Rhode Island — 0.8% | ||
| Rhode Island Health & Educational Building Corp., RB, | ||
| Hospital Financing, LifeSpan Obligation, Series A | ||
| (AGC), 7.00%, 5/15/39 | 6,250 | 7,005,750 |
| Rhode Island Health & Educational Building Corp., | ||
| Refunding RB, Public Schools Financing Program, | ||
| Series E (AGC), 6.00%, 5/15/29 | 11,070 | 12,022,573 |
| 19,028,323 | ||
| South Carolina — 0.5% | ||
| County of Richland South Carolina, Refunding RB, | ||
| International Paper Co. Project, AMT, 6.10%, 4/01/23 | 3,000 | 3,024,090 |
| Medical University Hospital Authority, Refunding RB, | ||
| Series A (a): | ||
| 6.38%, 8/15/12 | 5,400 | 5,764,716 |
| 6.50%, 8/15/12 | 2,450 | 2,618,903 |
| 11,407,709 | ||
See Notes to Financial Statements.
| 30 | ANNUAL REPORT | JUNE | 30, 2011 |
BlackRock National Municipal Fund
Schedule of Investments (continued) (Percentages shown are based on Net Assets)
| Par | ||
| Municipal Bonds | (000) | Value |
| Tennessee — 0.3% | ||
| Memphis-Shelby County Airport Authority, RB, AMT, | ||
| Series D (AMBAC), 6.00%, 3/01/24 | $ 175 | $ 175,191 |
| Shelby County Health Educational & Housing Facilities | ||
| Board, Refunding RB, Methodist Healthcare, | ||
| 6.50%, 9/01/12 (a) | 7,300 | 7,796,546 |
| 7,971,737 | ||
| Texas — 8.4% | ||
| Bexar County Health Facilities Development Corp. Texas, | ||
| Refunding RB, Army Retirement Residence Project, | ||
| AMT, 6.30%, 7/01/12 (a) | 1,750 | 1,864,223 |
| Brazos River Harbor Navigation District, Refunding RB, | ||
| Dow Chemical Co. Project, Series A7, 6.63%, 5/15/33 | 7,040 | 7,110,752 |
| City of Houston Texas, RB, Subordinate Lien, Series A, | ||
| AMT (AGM), 5.63%, 7/01/30 | 1,150 | 1,150,196 |
| City of Houston Texas, Refunding RB, Combined First Lien, | ||
| Series A (AGC), 6.00%, 11/15/35 | 23,900 | 26,521,113 |
| Dallas-Fort Worth International Airport Facilities | ||
| Improvement Corp., RB, Series A, AMT (NPFGC), | ||
| 6.00%, 11/01/24 | 25,000 | 25,116,250 |
| Gulf Coast Waste Disposal Authority, Refunding RB, | ||
| Series A, AMT, 6.10%, 8/01/24 | 4,025 | 4,077,888 |
| Harris County Cultural Education Facilities Finance Corp., | ||
| Refunding RB, St. Luke’s, 5.63%, 2/15/25 | 5,000 | 5,389,500 |
| Harris County Health Facilities Development Corp., | ||
| Refunding RB, Memorial Hermann Healthcare System, | ||
| Series B, 7.25%, 12/01/35 | 3,900 | 4,303,494 |
| La Vernia Higher Education Finance Corp., RB, KIPP Inc., | ||
| 6.25%, 8/15/39 | 1,000 | 1,018,380 |
| Matagorda County Navigation District No. 1 Texas, | ||
| Refunding RB, Central Power & Light Co. Project, | ||
| Series A, 6.30%, 11/01/29 | 7,300 | 7,653,101 |
| North Texas Tollway Authority, RB, Toll, Second Tier, | ||
| Series F, 6.13%, 1/01/31 | 19,030 | 19,582,631 |
| North Texas Tollway Authority, Refunding RB, System, | ||
| First Tier, 6.00%, 1/01/34 | 11,490 | 11,945,234 |
| Port of Bay City Authority Texas, RB, Hoechst Celanese | ||
| Corp. Project, AMT, 6.50%, 5/01/26 | 4,000 | 3,950,920 |
| Tarrant County Cultural Education Facilities Finance Corp., | ||
| RB, Scott & White Healthcare, 6.00%, 8/15/45 | 40,000 | 41,504,000 |
| Tarrant County Cultural Education Facilities Finance Corp., | ||
| Refunding RB, Northwest Senior Housing, Edgemere | ||
| Project, Series A, 6.00%, 11/15/26 | 2,200 | 2,120,756 |
| Texas Private Activity Bond Surface Transportation Corp., | ||
| RB, Senior Lien: | ||
| LBJ Infrastructure Group LLC, LBJ Freeway Managed | ||
| Lanes Project, 7.00%, 6/30/40 | 20,000 | 21,175,800 |
| NTE Mobility Partners LLC, North Tarrant Express | ||
| Managed Lanes Project, 6.88%, 12/31/39 | 20,350 | 21,633,474 |
| 206,117,712 | ||
| Washington — 2.1% | ||
| Central Puget Sound Regional Transit Authority, RB, | ||
| Series A, 5.00%, 11/01/36 | 20,000 | 20,390,200 |
| Seattle Housing Authority Washington, HRB, Replacement | ||
| Housing Projects, 6.13%, 12/01/32 | 4,355 | 4,007,253 |
| Seattle Housing Authority Washington, RB, Newholly | ||
| Project, AMT, 6.25%, 12/01/35 | 2,750 | 2,274,773 |
| Washington Health Care Facilities Authority, RB, Swedish | ||
| Health Services, Series A, 6.75%, 11/15/41 | 14,200 | 15,037,800 |
| Washington Health Care Facilities Authority, Refunding RB, | ||
| Catholic Health Initiatives, Series D, 6.38%, 10/01/36 | 10,000 | 10,726,400 |
| 52,436,426 |
| Par | ||
| Municipal Bonds | (000) | Value |
| Wisconsin — 0.8% | ||
| State of Wisconsin, Refunding RB, Series A, | ||
| 6.00%, 5/01/36 | $12,595 | $ 13,743,286 |
| Wisconsin Health & Educational Facilities Authority, RB, | ||
| SynergyHealth Inc., 6.00%, 11/15/23 | 5,010 | 5,170,921 |
| Wisconsin Housing & EDA, RB, Series C, AMT, | ||
| 6.00%, 9/01/36 | 350 | 364,998 |
| 19,279,205 | ||
| Total Municipal Bonds — 78.8% | 1,928,284,127 | |
| Municipal Bonds Transferred to | ||
| Tender Option Bond Trusts (e) | ||
| Arizona — 3.8% | ||
| City of Mesa Arizona, RB, 5.00%, 7/01/35 | 18,000 | 18,369,360 |
| Salt River Project Agricultural Improvement & Power | ||
| District, Series A, RB: | ||
| 5.00%, 1/01/37 | 22,774 | 23,130,948 |
| 5.00%, 1/01/38 | 37,015 | 37,880,697 |
| Salt River Project Agricultural Improvement & Power | ||
| District, Refunding RB, Series A, 5.00%, 1/01/35 | 13,700 | 13,909,473 |
| 93,290,478 | ||
| Arkansas — 0.9% | ||
| University of Arkansas, RB, Various Facilities, UAMS | ||
| Campus (NPFGC), 5.00%, 3/01/36 | 21,290 | 21,723,464 |
| California — 8.1% | ||
| Anaheim Public Financing Authority, RB, Distribution | ||
| System, Second Lien (BHAC), 5.00%, 10/01/34 | 10,995 | 11,082,720 |
| County of Orange California, RB, Series B, | ||
| 5.25%, 7/01/34 | 13,045 | 13,307,039 |
| Los Angeles Department of Airports, Refunding RB, | ||
| Senior, Los Angeles International Airport, Series A, | ||
| 5.00%, 5/15/40 | 19,510 | 19,522,682 |
| Los Angeles Department of Water & Power, RB, Power | ||
| System, Sub-Series A-1 (AMBAC), 5.00%, 7/01/37 | 20,000 | 20,206,400 |
| Metropolitan Water District of Southern California, RB, | ||
| Series A, 5.00%, 1/01/39 | 10,000 | 10,302,500 |
| Metropolitan Water District of Southern California, | ||
| Refunding RB: | ||
| Series B, 5.00%, 7/01/35 | 9,998 | 10,234,250 |
| Series C, 5.00%, 7/01/35 | 13,375 | 13,893,136 |
| San Diego Community College District California, | ||
| GO (AGM): | ||
| Election of 2002, 5.00%, 5/01/30 | 20,000 | 20,235,000 |
| Election of 2006, 5.00%, 8/01/32 | 18,000 | 18,244,260 |
| San Diego Public Facilities Financing Authority, | ||
| Refunding RB, Series B, 5.38%, 8/01/34 | 15,000 | 15,643,200 |
| San Francisco City & County Public Utilities Commission, | ||
| Refunding RB, Series A, 5.13%, 11/01/39 | 23,000 | 23,495,880 |
| University of California, RB, Series O, 5.25%, 5/15/39 | 20,695 | 21,312,058 |
| 197,479,125 | ||
| Florida — 3.8% | ||
| Florida State Board of Education, GO: | ||
| Capital Outlay 2008, Series E, 5.00%, 6/01/37 | 39,730 | 41,115,783 |
| Series 2006C, 5.00%, 6/01/37 | 49,996 | 51,346,925 |
| 92,462,708 | ||
| Illinois — 0.5% | ||
| Illinois Finance Authority, RB, Carle Foundation, Series A | ||
| (AGM), 6.00%, 8/15/41 | 12,000 | 12,282,360 |
See Notes to Financial Statements.
| ANNUAL | REPORT | JUNE | 30, 2011 | 31 |
BlackRock National Municipal Fund
Schedule of Investments (continued) (Percentages shown are based on Net Assets)
| Municipal Bonds Transferred | Par | ||
| to Tender Option Bond Trusts (e) | (000) | Value | |
| Indiana — 3.2% | |||
| Indiana Finance Authority, RB, Sisters of St. Francis | |||
| Health, 5.25%, 11/01/39 | $20,640 | $ 20,487,883 | |
| Indianapolis Local Public Improvement Bond Bank, | |||
| Refunding RB: | |||
| PILOT, Infrastructure Project, Series F (AGM), | |||
| 5.00%, 1/01/35 | 23,550 | 23,728,509 | |
| Waterworks Project, Series A (AGC), 5.50%, 1/01/38 | 34,125 | 35,505,900 | |
| 79,722,292 | |||
| Nebraska — 0.4% | |||
| Omaha Public Power District, RB, Series A, | |||
| 5.00%, 2/01/43 | 10,000 | 10,165,100 | |
| New York — 0.4% | |||
| New York City Municipal Water Finance Authority, | |||
| Refunding RB, Series A, 5.13%, 6/15/34 | 8,935 | 8,987,431 | |
| Ohio — 0.8% | |||
| County of Hamilton Ohio, Refunding RB, Sub-Series A | |||
| (AGM), 5.00%, 12/01/32 | 20,000 | 20,169,200 | |
| Pennsylvania — 0.8% | |||
| Pennsylvania HFA, Refunding RB, Series 105C, | |||
| 5.00%, 10/01/39 | 19,470 | 19,480,903 | |
| Texas — 4.1% | |||
| City of Houston Texas, Refunding RB, Combined, | |||
| First Lien, Series A: | |||
| (AGC), 5.38%, 11/15/38 | 26,160 | 27,502,793 | |
| (NPFGC), 5.13%, 5/15/28 | 20,000 | 20,886,400 | |
| City of San Antonio Texas, Refunding RB, | |||
| 5.00%, 2/01/32 | 24,000 | 24,757,800 | |
| Dallas Area Rapid Transit, Refunding RB, Senior Lien | |||
| (AMBAC), 5.00%, 12/01/36 | 27,860 | 28,334,621 | |
| 101,481,614 | |||
| Total Municipal Bonds Transferred to | |||
| Tender Option Bond Trusts — 26.8% | 657,244,675 | ||
| Total Long-Term Investments | |||
| (Cost — $2,524,021,337) — 105.6% | 2,585,528,802 | ||
| Short-Term Securities | |||
| Michigan — 0.3% | |||
| Michigan Finance Authority, RB, SAN, Detroit Schools, | |||
| Series-A1, 6.45%, 2/20/12 | 7,600 | 7,711,188 | |
| Shares | |||
| Money Market — 5.2% | |||
| FFI Institutional Tax-Exempt Fund, 0.01% (f)(g) | 127,360,041 | 127,360,041 | |
| Total Short-Term Securities | |||
| (Cost — $134,960,041) — 5.5% | 135,071,229 | ||
| Total Investments (Cost — $2,658,981,378*) — 111.1% | 2,720,600,031 | ||
| Other Assets Less Liabilities — 2.0% | 49,041,319 | ||
| Liability for TOB Trust Certificates, Including Interest | |||
| Expense and Fees Payable — (13.1)% | (321,619,966) | ||
| Net Assets — 100.0% | $2,448,021,384 | ||
* The cost and unrealized appreciation (depreciation) of investments as of June 30,
2011, as computed for federal income tax purposes, were as follows:
| Aggregate cost | $2,334,610,146 |
| Gross unrealized appreciation | $ 85,121,127 |
| Gross unrealized depreciation | (20,533,515) |
| Net unrealized appreciation | $ 64,587,612 |
(a) US government securities, held in escrow, are used to pay interest on this security as
well as to retire the bond in full at the date indicated, typically at a premium to par.
(b) Issuer filed for bankruptcy and/or is in default of interest payments.
(c) Non-income producing security.
(d) Variable rate security. Rate shown is as of report date.
(e) Securities represent bonds transferred to a TOB trust in exchange for which the
Fund acquired residual interest certificates. These securities serve as collateral in a
financing transaction. See Note 1 of the Notes to Financial Statements for details of
municipal bonds transferred to TOBs.
(f) Investments in companies considered to be an affiliate of the Fund during the
year, for purposes of Section 2(a)(3) of the Investment Company Act of 1940, as
amended, were as follows:
| Shares Held | Shares Held | |||
| at June 30, | Net | at June 30, | ||
| Affiliate | 2010 | Activity | 2011 | Income |
| FFI Institutional | ||||
| Tax-Exempt Fund | 115,316,742 | 12,043,299 | 127,360,041 | $223,418 |
(g) Represents the current yield as of report date.
See Notes to Financial Statements.
| 32 | ANNUAL REPORT | JUNE | 30, 2011 |
BlackRock National Municipal Fund
Schedule of Investments (concluded)
• Fair Value Measurements — Various inputs are used in determining the fair value of
investments. These inputs are categorized in three broad levels for financial reporting
purposes as follows:
• Level 1 — price quotations in active markets/exchanges for identical assets
and liabilities
• Level 2 — other observable inputs (including, but not limited to: quoted prices for
similar assets or liabilities in markets that are active, quoted prices for identical
or similar assets or liabilities in markets that are not active, inputs other than
quoted prices that are observable for the assets or liabilities (such as interest
rates, yield curves, volatilities, prepayment speeds, loss severities, credit risks and
default rates) or other market-corroborated inputs)
• Level 3 — unobservable inputs based on the best information available in the
circumstances, to the extent observable inputs are not available (including the
Fund’s own assumptions used in determining the fair value of investments)
The categorization of a value determined for investments is based on the pricing
transparency of the investments and does not necessarily correspond to the Fund’s
perceived risk of investing in those securities. For information about the Fund’s
policy regarding valuation of investments and other significant accounting policies,
please refer to Note 1 of the Notes to Financial Statements.
The following table summarizes the inputs used as of June 30, 2011 in determining
the fair valuation of the Fund’s investments:
| Valuation Inputs | Level 1 | Level 2 | Level 3 | Total |
| Assets: | ||||
| Investments: | ||||
| Long-Term | ||||
| Investments1 . | — | $2,585,528,802 | — | $2,585,528,802 |
| Short-Term | ||||
| Securities | $ 127,360,041 | 7,711,188 | — | 135,071,229 |
| Total | $ 127,360,041 | $2,593,239,990 | — | $2,720,600,031 |
| 1 See above Schedule of Investments for values in each state or | ||||
| political subdivision. | ||||
See Notes to Financial Statements.
| ANNUAL | REPORT | JUNE | 30, 2011 | 33 |
BlackRock High Yield Municipal Fund
Schedule of Investments June 30, 2011 (Percentages shown are based on Net Assets)
| Par | |||
| Municipal Bonds | (000) | Value | |
| Alabama — 1.5% | |||
| Alabama State Docks Department, Refunding RB, | |||
| 6.00%, 10/01/40 | $ 710 | $ 724,569 | |
| County of Jefferson Alabama, RB, Series A: | |||
| 5.25%, 1/01/17 | 1,000 | 916,930 | |
| 5.25%, 1/01/20 | 500 | 441,705 | |
| 4.75%, 1/01/25 | 260 | 209,747 | |
| 2,292,951 | |||
| Alaska — 0.5% | |||
| Northern Tobacco Securitization Corp., RB, Asset Backed | |||
| Series A, 5.00%, 6/01/46 | 1,235 | 799,724 | |
| Arizona — 4.8% | |||
| Maricopa County IDA Arizona, RB, Arizona Charter Schools | |||
| Project, Series A: | |||
| 6.63%, 7/01/20 | 125 | 96,440 | |
| 6.75%, 7/01/29 | 300 | 199,245 | |
| Phoenix IDA Arizona, Refunding RB, America West | |||
| Airlines Inc. Project, AMT, 6.30%, 4/01/23 | 1,000 | 844,230 | |
| Pima County IDA, IDRB, Tucson Electric Power, Series A, | |||
| 6.38%, 9/01/29 | 780 | 784,251 | |
| Pima County IDA, RB, Tucson Electric Power, Series A, | |||
| 5.25%, 10/01/40 | 1,390 | 1,264,858 | |
| Pima County IDA, Refunding IDRB, Tucson Electric Power, | |||
| 5.75%, 9/01/29 | 290 | 291,702 | |
| Queen Creek Improvement District No. 1, Special | |||
| Assessment Bonds, 5.00%, 1/01/32 | 500 | 471,835 | |
| Salt Verde Financial Corp., RB, Senior: | |||
| 5.00%, 12/01/32 | 750 | 672,683 | |
| 5.00%, 12/01/37 | 3,180 | 2,806,859 | |
| University Medical Center Corp. Arizona, RB, | |||
| 6.25%, 7/01/29 | 180 | 186,291 | |
| 7,618,394 | |||
| Arkansas — 0.8% | |||
| Benton County Public Facilities Board, Refunding RB, | |||
| BCCSO Project, Series A, 6.00%, 6/01/40 | 750 | 758,205 | |
| County of Little River Arkansas, Refunding RB, Georgia | |||
| Pacific Corp. Project, AMT, 5.60%, 10/01/26 | 555 | 521,195 | |
| 1,279,400 | |||
| California — 6.8% | |||
| California Health Facilities Financing Authority, | |||
| Refunding RB: | |||
| Catholic Healthcare West, Series A, 6.00%, 7/01/39 | 265 | 274,352 | |
| St. Joseph Health System, Series A, 5.75%, 7/01/39 | 1,000 | 1,013,430 | |
| Sutter Health, Series B, 6.00%, 8/15/42 | 1,000 | 1,057,470 | |
| California Pollution Control Financing Authority, RB, | |||
| Waste Management Inc. Project, Series C, AMT, | |||
| 5.13%, 11/01/23 | 750 | 765,592 | |
| California Pollution Control Financing Authority, Refunding | |||
| RB, Waste Management Inc. Project, Series B, AMT, | |||
| 5.00%, 7/01/27 | 1,000 | 1,000,510 | |
| California Statewide Communities Development | |||
| Authority, RB: | |||
| John Muir Health, 5.13%, 7/01/39 | 425 | 401,787 | |
| Sutter Health, Series A, 6.00%, 8/15/42 | 400 | 425,980 | |
| California Statewide Communities Development Authority, | |||
| Refunding RB: | |||
| American Baptist Homes of the West, | |||
| 6.25%, 10/01/39 | 575 | 565,938 | |
| Senior Living, Southern California, 6.63%, 11/15/24 | 650 | 696,469 | |
| City of Chula Vista California, Refunding RB, San Diego | |||
| Gas & Electric, Series A, 5.88%, 2/15/34 | 500 | 534,025 | |
| City of Roseville California, Special Tax Bonds, | |||
| Fiddyment Ranch Community Facilities District No. 1, | |||
| 5.25%, 9/01/36 | 465 | 379,133 | |
| Par | |||
| Municipal Bonds | (000) | Value | |
| California (concluded) | |||
| City of San Jose California, RB: | |||
| 6.50%, 5/01/36 | $ 310 | $ 319,963 | |
| 6.50%, 5/01/42 | 760 | 781,029 | |
| Lammersville School District Community Facilities District, | |||
| Special Tax Bonds, District No. 2002, Mountain House, | |||
| 5.13%, 9/01/35 | 325 | 266,110 | |
| Roseville Finance Authority, Special Tax Bonds, Refunding, | |||
| Senior Lien, Series A (AMBAC), 4.50%, 9/01/33 | 725 | 520,420 | |
| State of California, GO, Various Purpose, 6.00%, 3/01/33 | 1,400 | 1,515,836 | |
| Temecula Public Financing Authority, Special Tax Bonds, | |||
| Refunding, Harveston, Sub-Series B, 5.10%, 9/01/36 | 180 | 141,719 | |
| 10,659,763 | |||
| Colorado — 0.8% | |||
| E-470 Public Highway Authority, Refunding RB, CAB, | |||
| 9/01/35, 7.08% (a) | 1,305 | 215,103 | |
| Regional Transportation District, RB, Denver Transport | |||
| Partners, 6.00%, 1/15/41 | 1,000 | 1,002,730 | |
| 1,217,833 | |||
| Connecticut — 0.3% | |||
| Mohegan Tribe of Indians of Connecticut, RB, Public | |||
| Improvement, Priority Distribution, 6.25%, 1/01/31 | 605 | 482,723 | |
| Delaware — 1.4% | |||
| County of Kent Delaware, Refunding RB, Charter | |||
| School, Inc. Project, 7.38%, 5/01/37 | 860 | 860,052 | |
| Delaware State EDA, RB, Indian River Power, | |||
| 5.38%, 10/01/45 | 1,480 | 1,331,852 | |
| 2,191,904 | |||
| District Of Columbia — 4.0% | |||
| District of Columbia, RB, Methodist Home District of | |||
| Columbia, Series A: | |||
| 7.38%, 1/01/30 | 310 | 310,044 | |
| 7.50%, 1/01/39 | 500 | 500,000 | |
| District of Columbia, Refunding RB, Howard University, | |||
| Series A, 6.50%, 10/01/41 | 1,275 | 1,312,115 | |
| District of Columbia Tobacco Settlement Financing Corp., | |||
| Refunding RB, Asset-Backed, 6.50%, 5/15/33 | 1,510 | 1,536,440 | |
| Metropolitan Washington Airports Authority, RB: | |||
| CAB, 2nd Senior Lien, Series B (AGC), | |||
| 6.55%, 10/01/30 (a) | 3,005 | 900,208 | |
| First Senior Lien, Series A, 5.00%, 10/01/39 | 85 | 84,231 | |
| First Senior Lien, Series A, 5.25%, 10/01/44 | 1,610 | 1,609,855 | |
| 6,252,893 | |||
| Florida — 7.5% | |||
| County of Miami-Dade Florida, Refunding RB, | |||
| Miami International Airport, Series A, 5.38%, 10/01/41 | 315 | 310,662 | |
| Florida Housing Finance Corp., HRB, Willow Lake | |||
| Apartments, Series J-1, AMT (AMBAC), 5.35%, 7/01/27 | 1,930 | 1,712,971 | |
| Highland Meadows Community Development District, | |||
| Special Assessment Bonds, Special Assessment, | |||
| Series A, 5.50%, 5/01/36 (b)(c) | 490 | 188,871 | |
| Hillsborough County IDA, RB: | |||
| National Gypsum Co., Series B, AMT, 7.13%, 4/01/30 | 1,500 | 1,353,120 | |
| Tampa General Hospital Project, 5.25%, 10/01/41 | 1,000 | 868,400 | |
| Jacksonville Economic Development Commission, RB, | |||
| Gerdau Ameristeel US Inc., AMT, 5.30%, 5/01/37 | 300 | 255,495 | |
| Lakewood Ranch Stewardship District, Special | |||
| Assessment Bonds, Lakewood Center & NW Sector | |||
| Projects, 8.00%, 5/01/40 | 515 | 506,940 | |
| Mid-Bay Bridge Authority, RB, Series A, 7.25%, 10/01/40 | 1,450 | 1,469,213 | |
| Palm Beach County Health Facilities Authority, RB, Acts | |||
| Retirement Life Community, 5.50%, 11/15/33 | 1,500 | 1,390,800 | |
| Santa Rosa Bay Bridge Authority, RB, 6.25%, 7/01/28 (b) | 500 | 160,280 | |
See Notes to Financial Statements.
| 34 | ANNUAL REPORT | JUNE | 30, 2011 |
BlackRock High Yield Municipal Fund
Schedule of Investments (continued) (Percentages shown are based on Net Assets)
| Par | |||
| Municipal Bonds | (000) | Value | |
| Florida (concluded) | |||
| Sarasota County Health Facilities Authority, Refunding RB, | |||
| Village On The Isle Project: | |||
| 5.50%, 1/01/27 | $ 210 | $ 189,298 | |
| 5.50%, 1/01/32 | 190 | 165,543 | |
| Sumter Landing Community Development District Florida, | |||
| RB, Sub-Series B, 5.70%, 10/01/38 | 815 | 633,997 | |
| Tolomato Community Development District, Special | |||
| Assessment Bonds, Special Assessment, | |||
| 6.65%, 5/01/40 (b) | 700 | 422,345 | |
| Village Community Development District No. 9, Special | |||
| Assessment Bonds, 7.00%, 5/01/41 | 1,770 | 1,827,649 | |
| Watergrass Community Development District, Special | |||
| Assessment Bonds, Series A, 5.38%, 5/01/39 | 650 | 320,983 | |
| 11,776,567 | |||
| Georgia — 1.9% | |||
| Clayton County Development Authority, RB, Delta | |||
| Air Lines Inc. Project, Series A, 8.75%, 6/01/29 | 635 | 721,290 | |
| County of Clayton Georgia, Tax Allocation Bonds, | |||
| Ellenwood Project, 7.50%, 7/01/33 | 450 | 421,164 | |
| DeKalb County Hospital Authority Georgia, RB, Dekalb | |||
| Medical Center Inc. Project, 6.13%, 9/01/40 | 1,240 | 1,188,763 | |
| Gainesville & Hall County Development Authority, | |||
| Refunding RB, Acts Retirement Life Community, | |||
| Series A-2, 6.63%, 11/15/39 | 220 | 226,451 | |
| Richmond County Development Authority, RB, International | |||
| Paper Co. Projects, Series A, AMT, 5.00%, 8/01/30 | 500 | 453,415 | |
| 3,011,083 | |||
| Guam — 0.7% | |||
| Guam Government Waterworks Authority, Refunding RB, | |||
| Water, 6.00%, 7/01/25 | 735 | 719,359 | |
| Territory of Guam, GO, Series A: | |||
| 6.00%, 11/15/19 | 100 | 99,002 | |
| 6.75%, 11/15/29 | 150 | 152,184 | |
| 7.00%, 11/15/39 | 160 | 164,589 | |
| 1,135,134 | |||
| Idaho — 0.2% | |||
| Power County Industrial Development Corp., RB, | |||
| FMC Corp. Project, 6.45%, 8/01/32 | 265 | 265,162 | |
| Illinois — 3.9% | |||
| City of Chicago Illinois, Refunding RB, American | |||
| Airlines Inc. Project, 5.50%, 12/01/30 | 1,000 | 764,170 | |
| Illinois Finance Authority, RB: | |||
| MJH Education Assistance IV LLC, Sub-Series A, | |||
| 5.13%, 6/01/35 (b)(c) | 90 | 49,361 | |
| Roosevelt University Project, 6.50%, 4/01/44 | 830 | 846,866 | |
| Illinois Finance Authority, Refunding RB: | |||
| Central Dupage Health, Series B, 5.50%, 11/01/39 | 1,400 | 1,409,184 | |
| Friendship Village of Schaumburg, 7.13%, 2/15/39 | 1,000 | 945,890 | |
| Swedish Covenant, Series A, 6.00%, 8/15/38 | 1,000 | 964,920 | |
| Metropolitan Pier & Exposition Authority, Refunding RB, | |||
| McCormick, Series B (AGM), 6.25%, 6/15/44 (a) | 3,455 | 418,297 | |
| Railsplitter Tobacco Settlement Authority, RB: | |||
| 5.50%, 6/01/23 | 355 | 360,133 | |
| 6.00%, 6/01/28 | 390 | 395,507 | |
| 6,154,328 | |||
| Indiana — 0.6% | |||
| Indiana Health Facility Financing Authority, Refunding RB, | |||
| Methodist Hospital Inc: | |||
| 5.38%, 9/15/22 | 185 | 170,254 | |
| 5.50%, 9/15/31 | 525 | 442,948 | |
| Par | |||
| Municipal Bonds | (000) | Value | |
| Indiana (concluded) | |||
| Vigo County Hospital Authority Indiana, RB, Union | |||
| Hospital Inc. : | |||
| 5.70%, 9/01/37 | $ 155 | $ 127,887 | |
| 5.75%, 9/01/42 | 190 | 155,534 | |
| 896,623 | |||
| Iowa — 0.3% | |||
| Iowa Finance Authority, Refunding RB, Development, | |||
| Care Initiatives Project, Series A, 5.00%, 7/01/19 | 500 | 439,510 | |
| Kansas — 1.1% | |||
| Kansas Development Finance Authority, Refunding RB, | |||
| Lifespace Communities Inc., Series S, 5.00%, 5/15/30 | 2,000 | 1,805,020 | |
| Kentucky — 1.0% | |||
| Kentucky Economic Development Finance Authority, | |||
| Refunding RB: | |||
| Norton Healthcare Inc, Series B (NPFGC), | |||
| 5.90%, 10/01/24 (a) | 250 | 115,090 | |
| Owensboro Medical Health System, Series A, | |||
| 6.38%, 6/01/40 | 1,050 | 1,038,313 | |
| Owensboro Medical Health System, Series B, | |||
| 6.38%, 3/01/40 | 395 | 390,596 | |
| 1,543,999 | |||
| Louisiana — 1.1% | |||
| Louisiana Local Government Environmental Facilities & | |||
| Community Development Authority, RB, Westlake | |||
| Chemical Corp. Projects, 6.75%, 11/01/32 | 1,000 | 1,041,080 | |
| Louisiana Public Facilities Authority, RB, Belle Chasse | |||
| Educational Foundation Project, 6.75%, 5/01/41 | 645 | 655,339 | |
| 1,696,419 | |||
| Maryland — 3.8% | |||
| County of Howard Maryland, Refunding RB, Vantage | |||
| House Facility, Series A, 5.25%, 4/01/33 | 500 | 349,635 | |
| Gaithersburg Maryland, Refunding RB, Asbury Maryland | |||
| Obligation, Series B, 6.00%, 1/01/23 | 750 | 768,547 | |
| Maryland EDC, RB: | |||
| Term Project, Series B, 5.75%, 6/01/35 | 1,500 | 1,443,405 | |
| Transportation Facilities Project, Series A, | |||
| 5.75%, 6/01/35 | 265 | 255,002 | |
| Maryland EDC, Refunding RB, CNX Marine Terminals Inc, | |||
| 5.75%, 9/01/25 | 1,415 | 1,383,007 | |
| Maryland Health & Higher Educational Facilities | |||
| Authority, RB, Washington Christian Academy, | |||
| 5.25%, 7/01/18 (b)(c) | 250 | 99,948 | |
| Maryland Health & Higher Educational Facilities | |||
| Authority, Refunding RB, Doctors Community Hospital, | |||
| 5.75%, 7/01/38 | 890 | 756,811 | |
| Maryland State Energy Financing Administration, RB, | |||
| Cogeneration, AES Warrior Run, 7.40%, 9/01/19 | 1,000 | 1,000,000 | |
| 6,056,355 | |||
| Massachusetts — 1.0% | |||
| Massachusetts Development Finance Agency, RB: | |||
| Foxborough Regional Charter School, Series A, | |||
| 7.00%, 7/01/42 | 350 | 355,359 | |
| Linden Ponds Inc. Facility, Series A, 5.75%, 11/15/35 | 500 | 279,900 | |
| Massachusetts Development Finance Agency, Refunding RB : | |||
| Eastern Nazarene College, 5.63%, 4/01/29 | 500 | 424,380 | |
| Tufts Medical Center, Series I, 6.75%, 1/01/36 | 510 | 518,211 | |
| 1,577,850 | |||
See Notes to Financial Statements.
| ANNUAL | REPORT | JUNE | 30, 2011 | 35 |
BlackRock High Yield Municipal Fund
Schedule of Investments (continued) (Percentages shown are based on Net Assets)
| Par | ||
| Municipal Bonds | (000) | Value |
| Michigan — 2.1% | ||
| Advanced Technology Academy, RB, 6.00%, 11/01/37 $ | 275 | $ 226,798 |
| County of Wayne Michigan, GO, Building Improvement, | ||
| Series A, 6.75%, 11/01/39 | 165 | 170,217 |
| Garden City Hospital Finance Authority Michigan, | ||
| Refunding RB, Garden City Hospital Obligation, | ||
| Series A, 5.00%, 8/15/38 | 310 | 212,914 |
| Michigan State Hospital Finance Authority, Refunding RB, | ||
| Hospital, Henry Ford Health, 5.75%, 11/15/39 | 1,710 | 1,700,390 |
| Royal Oak Hospital Finance Authority Michigan, | ||
| Refunding RB, William Beaumont Hospital, | ||
| 8.25%, 9/01/39 | 915 | 1,052,378 |
| 3,362,697 | ||
| Missouri — 0.7% | ||
| City of Kansas City Missouri, Tax Allocation Bonds, | ||
| Kansas City MainCor Project, Series A, 5.25%, 3/01/18 | 600 | 584,172 |
| Kirkwood IDA Missouri, RB, Aberdeen Heights, Series A, | ||
| 8.25%, 5/15/39 | 435 | 446,188 |
| 1,030,360 | ||
| Nevada — 0.0% | ||
| County of Clark Nevada, RB, Southwest Gas Corp. Project, | ||
| Series A, AMT (FGIC), 4.75%, 9/01/36 | 20 | 17,213 |
| New Hampshire — 0.6% | ||
| New Hampshire Health & Education Facilities Authority, | ||
| Refunding RB: | ||
| Dartmouth-Hitchcock, 6.00%, 8/01/38 | 435 | 463,323 |
| Havenwood-Heritage Heights, Series A, | ||
| 5.40%, 1/01/30 | 500 | 434,505 |
| 897,828 | ||
| New Jersey — 4.1% | ||
| Burlington County Bridge Commission, Refunding RB, | ||
| The Evergreens Project, 5.63%, 1/01/38 | 750 | 606,983 |
| New Jersey EDA, RB: | ||
| Cigarette Tax, 5.50%, 6/15/24 | 650 | 618,741 |
| Cigarette Tax, 5.75%, 6/15/29 | 1,100 | 1,036,585 |
| Cigarette Tax, 5.75%, 6/15/34 | 535 | 494,040 |
| Continental Airlines Inc Project, AMT, 6.63%, 9/15/12 | 1,380 | 1,392,461 |
| Continental Airlines Inc Project, AMT, 6.40%, 9/15/23 | 1,000 | 974,640 |
| New Jersey Educational Facilities Authority, Refunding RB, | ||
| University of Medicine & Dentistry, Series B, | ||
| 7.13%, 12/01/23 | 580 | 666,171 |
| New Jersey Health Care Facilities Financing | ||
| Authority, RB, Pascack Valley Hospital Association, | ||
| 6.63%, 7/01/36 (b)(c) | 650 | 7 |
| New Jersey Health Care Facilities Financing Authority, | ||
| Refunding RB, St. Joseph’s Healthcare System, | ||
| 6.63%, 7/01/38 | 725 | 730,437 |
| 6,520,065 | ||
| New Mexico — 0.3% | ||
| City of Farmington New Mexico, Refunding RB, Arizona | ||
| Public Service, Series A, 4.70%, 5/01/24 | 500 | 487,735 |
| New York — 4.2% | ||
| Chautauqua County Industrial Development Agency, RB, | ||
| NRG Energy, Dunkirk Power Project, 5.88%, 4/01/42 | 1,115 | 1,062,874 |
| Genesee County Industrial Development Agency New York, | ||
| Refunding RB, United Memorial Medical Center Project, | ||
| 5.00%, 12/01/32 | 500 | 385,720 |
| Hudson Yards Infrastructure Corp., RB, Series A, | ||
| 5.00%, 2/15/47 | 1,000 | 903,090 |
| New York City Industrial Development Agency, RB, AMT: | ||
| American Airlines Inc., JFK International Airport, | ||
| 8.00%, 8/01/28 | 235 | 243,110 |
| JetBlue Airways Corp. Project, 5.13%, 5/15/30 | 1,750 | 1,408,085 |
| Par | ||
| Municipal Bonds | (000) | Value |
| New York (concluded) | ||
| New York Liberty Development Corp., Refunding RB, | ||
| 2nd Priority, 6.38%, 7/15/49 | $ 375 | $ 384,529 |
| Port Authority of New York & New Jersey, RB, | ||
| JFK International Airport, 6.00%, 12/01/42 | 430 | 434,532 |
| Westchester County Industrial Development Agency | ||
| New York, MRB, Kendal On Hudson Project, Series A, | ||
| 6.38%, 1/01/24 | 1,500 | 1,436,910 |
| Yonkers Industrial Development Agency New York, | ||
| RB, Sarah Lawrence College Project, Series A, | ||
| 6.00%, 6/01/41 | 410 | 423,792 |
| 6,682,642 | ||
| North Carolina — 2.0% | ||
| North Carolina Medical Care Commission, RB, First | ||
| Mortgage, Whitestone, Series A, 7.75%, 3/01/41 | 830 | 830,141 |
| North Carolina Medical Care Commission, Refunding RB: | ||
| Carolina Village Project, 6.00%, 4/01/38 | 1,000 | 848,970 |
| First Mortgage, Galloway Ridge Project, Series A, | ||
| 6.00%, 1/01/39 | 1,520 | 1,403,173 |
| 3,082,284 | ||
| Ohio — 1.0% | ||
| State of Ohio, RB, Ford Motor Company Project, AMT, | ||
| 5.75%, 4/01/35 | 1,620 | 1,500,493 |
| Pennsylvania — 4.4% | ||
| Allegheny County Hospital Development Authority, | ||
| Refunding RB, Health System, West Penn, Series A, | ||
| 5.38%, 11/15/40 | 2,140 | 1,777,676 |
| City of Philadelphia Pennsylvania, RB, Ninth Series, | ||
| 5.25%, 8/01/40 | 1,000 | 937,740 |
| Cumberland County Municipal Authority, RB, Diakon | ||
| Lutheran, 6.38%, 1/01/39 | 2,335 | 2,352,256 |
| Lancaster County Hospital Authority, RB, Brethren Village | ||
| Project, Series A, 6.50%, 7/01/40 | 835 | 803,454 |
| Pennsylvania Economic Development Financing Authority, | ||
| RB, US Airways Group, Series A, 7.50%, 5/01/20 | 1,100 | 1,101,375 |
| 6,972,501 | ||
| Puerto Rico — 2.7% | ||
| Commonwealth of Puerto Rico, GO, Refunding, Public | ||
| Improvement, Series C, 6.00%, 7/01/39 | 1,560 | 1,587,737 |
| Puerto Rico Electric Power Authority, RB, Series WW, | ||
| 5.50%, 7/01/38 | 1,000 | 993,040 |
| Puerto Rico Sales Tax Financing Corp., RB, | ||
| First Sub-Series A, 6.50%, 8/01/44 | 750 | 807,502 |
| Puerto Rico Sales Tax Financing Corp., Refunding RB, | ||
| First Sub-Series C, 6.61%, 8/01/38 (a) | 5,000 | 798,200 |
| 4,186,479 | ||
| South Carolina — 0.3% | ||
| South Carolina Jobs-EDA, Refunding RB, First Mortgage, | ||
| Lutheran Homes, 5.50%, 5/01/28 | 600 | 496,740 |
| Tennessee — 0.8% | ||
| Tennessee Energy Acquisition Corp., RB, Series A, | ||
| 5.25%, 9/01/26 | 1,250 | 1,208,050 |
| Texas — 13.7% | ||
| Bexar County Health Facilities Development Corp., RB, | ||
| Army Retirement Residence Project, 6.20%, 7/01/45 | 1,320 | 1,310,734 |
| Brazos River Authority, RB, TXU Electric, Series A, AMT, | ||
| 8.25%, 10/01/30 | 750 | 305,550 |
| Central Texas Regional Mobility Authority, RB: | ||
| CAB, 7.48%, 1/01/28 (a) | 3,000 | 1,009,500 |
| CAB, 7.560%, 1/01/29 (a) | 500 | 155,120 |
| CAB, 7.65%, 1/01/30 (a) | 1,330 | 381,816 |
| Senior Lien, 5.75%, 1/01/25 | 250 | 257,447 |
| Senior Lien, 6.25%, 1/01/46 | 765 | 757,090 |
See Notes to Financial Statements.
| 36 | ANNUAL REPORT | JUNE | 30, 2011 |
BlackRock High Yield Municipal Fund
Schedule of Investments (continued) (Percentages shown are based on Net Assets)
| Par | |||
| Municipal Bonds | (000) | Value | |
| Texas (concluded) | |||
| City of Houston Texas, RB: | |||
| Senior Lien, Series A, 5.50%, 7/01/39 | $ 120 | $ 123,366 | |
| Special Facilities, Continental Airlines, Series E, AMT, | |||
| 6.75%, 7/01/21 | 630 | 627,335 | |
| Special Facilities, Continental Airlines, Series E, AMT, | |||
| 7.38%, 7/01/22 | 500 | 501,265 | |
| Dallas-Fort Worth International Airport Facilities | |||
| Improvement Corp., Refunding RB, American Airlines Inc. | |||
| Project, AMT, 5.50%, 11/01/30 | 1,000 | 676,270 | |
| Danbury Higher Education Authority Inc., RB, A.W. Brown | |||
| Fellowship Charter, Series A (ACA), 5.00%, 8/15/26 | 355 | 410,710 | |
| Houston Higher Education Finance Corp., RB, Cosmos | |||
| Foundation, Inc. Series A: | |||
| 6.50%, 5/15/31 | 1,000 | 1,015,180 | |
| 6.88%, 5/15/41 | 205 | 210,322 | |
| Love Field Airport Modernization Corp., RB, Southwest | |||
| Airlines Co. Project, 5.25%, 11/01/40 | 1,000 | 906,540 | |
| Matagorda County Navigation District No. 1 Texas, | |||
| Refunding RB, Central Power & Light Co. Project, | |||
| Series A, 6.30%, 11/01/29 | 290 | 304,027 | |
| North Texas Tollway Authority, RB: | |||
| CAB, Special Projects System, Series B, | |||
| 7.55%, 9/01/37 (a) | 725 | 126,425 | |
| Toll, 2nd Tier, Series F, 6.13%, 1/01/31 | 1,150 | 1,183,396 | |
| Sabine River Authority Texas, TXU Electric Co. Project, | |||
| Mandatory Put Bonds, Refunding RB: | |||
| Series A, 5.50%, 5/01/22 | 1,270 | 1,247,940 | |
| Series B, AMT, 5.75%, 5/01/30 | 1,000 | 982,630 | |
| Tarrant County Cultural Education Facilities Finance Corp., | |||
| RB, Series A: | |||
| CC Young Memorial Home, 8.00%, 2/15/38 | 330 | 326,014 | |
| Senior Living Center Project, 8.25%, 11/15/44 | 800 | 795,376 | |
| Tarrant County Cultural Education Facilities Finance Corp., | |||
| Refunding RB, Northwest Senior Housing, Edgemere | |||
| Project, Series A, 6.00%, 11/15/36 | 1,500 | 1,379,415 | |
| Texas Private Activity Bond Surface Transportation Corp., | |||
| RB, Senior Lien: | |||
| LBJ Infrastructure, 7.00%, 6/30/40 | 2,320 | 2,456,393 | |
| Note Mobility, 6.88%, 12/31/39 | 1,740 | 1,849,742 | |
| Texas State Public Finance Authority, Refunding ERB, | |||
| KIPP Inc., Series A (ACA): | |||
| 5.00%, 2/15/28 | 2,000 | 1,730,460 | |
| 5.00%, 2/15/36 | 680 | 624,458 | |
| 21,654,521 | |||
| Utah — 0.5% | |||
| Utah State Charter School Finance Authority, RB, | |||
| Navigator Pointe Academy, Series A, 5.63%, 7/15/40 | 1,000 | 853,060 | |
| Vermont — 0.6% | |||
| Vermont Economic Development Authority, Refunding | |||
| MRB, Wake Robin Corp. Project, Series A (ACA), | |||
| 6.30%, 3/01/33 | 1,000 | 905,920 | |
| Virginia — 2.9% | |||
| Albemarle County IDA, Refunding RB, Westminster- | |||
| Canterbury, 5.00%, 1/01/31 | 500 | 430,615 | |
| City of Norfolk Virginia, Refunding RB, Series B (AMBAC), | |||
| 5.50%, 2/01/31 | 220 | 214,584 | |
| Fairfax County EDA, Refunding RB, Goodwin House Inc.: | |||
| 5.13%, 10/01/37 | 2,040 | 1,832,573 | |
| 5.13%, 10/01/42 | 290 | 255,826 | |
| Lexington IDA, Refunding MRB, Kendal at Lexington, | |||
| Series A, 5.38%, 1/01/28 | 210 | 174,701 | |
| Par | |||
| Municipal Bonds | (000) | Value | |
| Virginia (concluded) | |||
| Mosaic District Community Development Authority, | |||
| Tax Allocation Bonds, Series A: | |||
| 6.63%, 3/01/26 | $ 515 | $ 523,570 | |
| 6.88%, 3/01/36 | 450 | 457,403 | |
| Watkins Centre Community Development Authority, RB, | |||
| 5.40%, 3/01/20 | 750 | 725,752 | |
| 4,615,024 | |||
| Washington — 1.9% | |||
| Tobacco Settlement Authority of Washington, RB, | |||
| Asset-Backed, 6.50%, 6/01/26 | 2,265 | 2,296,846 | |
| Washington Health Care Facilities Authority, RB, Swedish | |||
| Health Services, Series A, 6.75%, 11/15/41 | 730 | 773,070 | |
| 3,069,916 | |||
| Wisconsin — 1.0% | |||
| Wisconsin Health & Educational Facilities Authority, RB, | |||
| Wheaton Franciscan Healthcare, 5.25%, 8/15/34 | 1,565 | 1,387,013 | |
| Wisconsin Health & Educational Facilities Authority, | |||
| Refunding RB, St. John’s Communities Inc., Series A: | |||
| 7.25%, 9/15/29 | 75 | 75,365 | |
| 7.63%, 9/15/39 | 145 | 146,000 | |
| 1,608,378 | |||
| Total Municipal Bonds — 87.8% | 138,305,541 | ||
| Municipal Bonds Transferred to | |||
| Tender Option Bond Trusts (d) | |||
| California — 1.4% | |||
| Bay Area Toll Authority, Refunding RB, San Francisco | |||
| Bay Area, Series F-1, 5.63%, 4/01/44 | 480 | 503,845 | |
| Los Angeles Department of Airports, Refunding RB, | |||
| Senior, Los Angeles International Airport, Series A, | |||
| 5.00%, 5/15/40 | 1,680 | 1,681,092 | |
| 2,184,937 | |||
| District of Columbia — 0.7% | |||
| District of Columbia Water & Sewer Authority, RB, Series A, | |||
| 6.00%, 10/01/35 | 950 | 1,076,904 | |
| Illinois — 1.6% | |||
| Illinois Finance Authority, RB, Carle Foundation, Series A | |||
| (AGM), 6.00%, 8/15/41 | 2,480 | 2,538,354 | |
| New York — 6.8% | |||
| New York City Municipal Water Finance Authority, RB, | |||
| Second General Resolution: | |||
| Series EE, 5.50%, 6/15/43 | 3,795 | 4,081,599 | |
| Series HH, 5.00%, 6/15/31 | 3,015 | 3,166,589 | |
| New York State Dormitory Authority, ERB, Series F, | |||
| 5.00%, 3/15/35 | 3,405 | 3,469,980 | |
| 10,718,168 | |||
| Ohio — 2.7% | |||
| County of Allen Ohio, Refunding RB, Catholic Healthcare, | |||
| Series A, 5.25%, 6/01/38 | 2,200 | 2,178,000 | |
| State of Ohio, Refunding RB, Cleveland Clinic Health, | |||
| Series A, 5.50%, 1/01/39 | 2,000 | 2,059,400 | |
| 4,237,400 | |||
| South Carolina — 1.1% | |||
| South Carolina State Housing Finance & Development | |||
| Authority, Refunding RB, Series B-1, 5.55%, 7/01/39 | 1,779 | 1,818,258 | |
See Notes to Financial Statements.
| ANNUAL | REPORT | JUNE | 30, 2011 | 37 |
BlackRock High Yield Municipal Fund
Schedule of Investments (concluded) (Percentages shown are based on Net Assets)
| Municipal Bonds Transferred | Par | |
| to Tender Option Bond Trusts (d) | (000) | Value |
| Virginia — 2.9% | ||
| Virginia HDA, RB, Sub-Series H-1 (NPFGC), | ||
| 5.38%, 7/01/36 | $ 2,110 | $ 2,110,823 |
| Virginia Small Business Financing Authority, | ||
| Refunding RB, Sentara Healthcare, 5.00%, 11/01/40 | 2,501 | 2,521,968 |
| 4,632,791 | ||
| Wisconsin — 1.4% | ||
| Wisconsin Health & Educational Facilities Authority, | ||
| Refunding RB, Froedtert & Community Health Inc., | ||
| 5.25%, 4/01/39 | 2,180 | 2,166,731 |
| Total Municipal Bonds Transferred to | ||
| Tender Option Bond Trusts — 18.6% | 29,373,543 | |
| Total Long-Term Investments | ||
| (Cost — $169,965,805) — 106.4% | 167,679,084 | |
| Short-Term Securities | ||
| Michigan — 0.7% | ||
| Michigan Finance Authority, RB, SAN, Detroit Schools, | ||
| Series A-1, 6.45%, 2/20/12 | 1,150 | 1,166,825 |
| Shares | ||
| Money Market — 1.1% | ||
| FFI Institutional Tax-Exempt Fund, 0.01% (e)(f) | 1,739,592 | 1,739,592 |
| Total Short-Term Securities | ||
| (Cost — $2,889,592) — 1.8% | 2,906,417 | |
| Total Investments (Cost — $172,855,397*) — 108.2% | 170,585,501 | |
| Other Assets Less Liabilities — 1.9% | 3,068,728 | |
| Liability for TOB Trust Certificates, Including Interest | ||
| Expense and Fees Payable (10.1)% | (16,046,805) | |
| Net Assets — 100.0% | $ 157,607,424 |
* The cost and unrealized appreciation (depreciation) of investments as of June 30,
2011, as computed for federal income tax purposes, were as follows:
| Aggregate cost | $ 156,767,804 |
| Gross unrealized appreciation | $ 4,758,850 |
| Gross unrealized depreciation | (6,980,199) |
| Net unrealized depreciation | $ (2,221,349) |
(a) Represents a zero-coupon bond. Rate shown reflects the current yield as of
report date.
(b) Issuer filed for bankruptcy and/or is in default of interest payments.
(c) Non-income producing security.
(d) Securities represent bonds transferred to a TOB trust in exchange for which the
Fund acquired residual interest certificates. These securities serve as collateral in a
financing transaction. See Note 1 of the Notes to Financial Statements for details of
municipal bonds transferred to TOBs.
(e) Investments in companies considered to be an affiliate of the Fund during the
year, for purposes of Section 2(a)(3) of the Investment Company Act of 1940, as
amended, were as follows:
| Shares Held | Shares Held | |||
| at June 30, | Net | at June 30, | ||
| Affiliate | 2010 | Activity | 2011 | Income |
| FFI Institutional | ||||
| Tax-Exempt Fund | 1,632,976 | 106,616 | 1,739,592 | $ 7,951 |
(f) Represents the current yield as of report date.
• Financial futures contracts sold as of June 30, 2011 were as follows:
| Notional Unrealized | ||||
| Contracts Issue | Exchange Expiration | Value Appreciation | ||
| 54 10-Year U.S. | Chicago Board September | |||
| Treasury Note | of Trade | 2011 | $6,614,351 | $ 8,632 |
• Fair Value Measurements — Various inputs are used in determining the fair value of
investments and derivative financial instruments. These inputs are categorized in
three broad levels for financial statement purposes as follows:
• Level 1 — price quotations in active markets/exchanges for identical assets
and liabilities
• Level 2 — other observable inputs (including, but not limited to: quoted prices for
similar assets or liabilities in markets that are active, quoted prices for identical
or similar assets or liabilities in markets that are not active, inputs other than
quoted prices that are observable for the assets or liabilities (such as interest
rates, yield curves, volatilities, prepayment speeds, loss severities, credit risks and
default rates) or other market-corroborated inputs)
• Level 3 — unobservable inputs based on the best information available in the
circumstances, to the extent observable inputs are not available (including the
Fund’s own assumptions used in determining the fair value of investments and
derivative financial instruments)
The categorization of a value determined for investments and derivative financial
instruments is based on the pricing transparency of the investment and derivative
financial instrument and does not necessarily correspond to the Fund’s perceived
risk of investing in those securities. For information about the Fund’s policy regarding
valuation of investments and derivative financial instruments and other significant
accounting policies, please refer to Note 1 of the Notes to Financial Statements.
The following tables summarize the inputs used as of June 30, 2011 in determining
the fair valuation of the Fund’s investments and derivative financial instruments:
| Valuation Inputs | Level 1 | Level 2 | Level 3 | Total | |
| Assets: | |||||
| Investments: | |||||
| Long-Term | |||||
| Investments1 . | — | $ 167,679,084 | — | $ 167,679,084 | |
| Short-Term | |||||
| Securities | $ 1,739,592 | 1,166,825 | — | 2,906,417 | |
| Total | $ 1,739,592 | $ 168,845,909 | — | $ 170,585,501 | |
| 1 See above Schedule of Investments for values in each state or | |||||
| political subdivision. | |||||
| Valuation Inputs Level 1 | Level 2 | Level 3 | Total | |
| Derivative Financial Instruments2 | ||||
| Assets: | ||||
| Interest Rate | ||||
| Contracts | $ 8,632 | — | — | $8,632 |
| 2 Derivative financial instruments are financial futures contracts, which are valued | ||||
| at the unrealized appreciation/depreciation on the instrument. | ||||
See Notes to Financial Statements.
| 38 | ANNUAL REPORT | JUNE | 30, 2011 |
BlackRock New York Municipal Bond Fund
Schedule of Investments June 30, 2011 (Percentages shown are based on Net Assets)
| Par | ||
| Municipal Bonds | (000) | Value |
| New York — 85.7% | ||
| Corporate — 10.2% | ||
| Chautauqua County Industrial Development Agency, RB, | ||
| NRG Dunkirk Power Project, 5.88%, 4/01/42 | $ 1,000 | $ 953,250 |
| Essex County Industrial Development Agency New York, | ||
| RB, International Paper Co. Project, Series A, AMT, | ||
| 6.63%, 9/01/32 | 350 | 365,768 |
| Jefferson County Industrial Development Agency | ||
| New York, Refunding RB, Solid Waste, Series A, AMT, | ||
| 5.20%, 12/01/20 | 250 | 245,250 |
| New York City Industrial Development Agency, RB, AMT: | ||
| 1990 American Airlines Inc. Project, 5.40%, 7/01/20 | 3,500 | 2,794,750 |
| American Airlines Inc., JFK International Airport, | ||
| 7.75%, 8/01/31 (a) | 2,000 | 2,041,720 |
| British Airways Plc Project, 5.25%, 12/01/32 | 1,000 | 814,150 |
| Continental Airlines Inc. Project, 8.00%, 11/01/12 | 750 | 764,745 |
| Continental Airlines Inc. Project, Mandatory | ||
| Put Bonds, 8.38%, 11/01/16 | 250 | 258,260 |
| New York City Industrial Development Agency, Refunding | ||
| RB, Terminal One Group Association Project, AMT, | ||
| 5.50%, 1/01/24 (a) | 2,500 | 2,566,050 |
| New York Liberty Development Corp., RB, Goldman Sachs | ||
| Headquarters: | ||
| 5.25%, 10/01/35 | 5,000 | 4,979,200 |
| 5.50%, 10/01/37 | 405 | 412,326 |
| Suffolk County Industrial Development Agency New York, | ||
| RB, KeySpan, Port Jefferson, AMT, 5.25%, 6/01/27 | 1,360 | 1,344,047 |
| Suffolk County Industrial Development Agency New York, | ||
| Refunding RB, Ogden Martin System Huntington, AMT | ||
| (AMBAC), 6.25%, 10/01/12 | 7,155 | 7,641,111 |
| 25,180,627 | ||
| County/City/Special District/School District — 17.5% | ||
| Amherst Development Corp., RB, University at Buffalo | ||
| Foundation Faculty-Student Housing Corp., Series A | ||
| (AGM), 4.63%, 10/01/40 | 305 | 274,543 |
| Buffalo & Erie County Industrial Land Development Corp., | ||
| RB, Buffalo State College Foundation Housing Corp., | ||
| 5.38%, 10/01/41 | 840 | 831,869 |
| City of New York, New York, GO, Sub-Series I-1, | ||
| 5.38%, 4/01/36 | 2,650 | 2,764,904 |
| Hudson Yards Infrastructure Corp., RB, Series A: | ||
| 5.00%, 2/15/47 | 7,100 | 6,411,940 |
| (NPFGC), 4.50%, 2/15/47 | 1,815 | 1,526,978 |
| New York City Industrial Development Agency, PILOT, RB: | ||
| CAB, Yankee Stadium (AGC), 6.06%, 3/01/42 (b) | 5,000 | 768,600 |
| Queens Baseball Stadium (AGC), 6.50%, 1/01/46 | 700 | 721,749 |
| Queens Baseball Stadium (AMBAC), 5.00%, 1/01/36 | 2,110 | 1,788,394 |
| Queens Baseball Stadium (AMBAC), 5.00%, 1/01/39 | 2,850 | 2,381,631 |
| New York City Transitional Finance Authority, RB: | ||
| Fiscal 2008, Series S-1, 4.50%, 1/15/38 | 500 | 470,465 |
| Fiscal 2009, Series S-1, 5.63%, 7/15/38 | 200 | 212,826 |
| Fiscal 2009, Series S-3, 5.25%, 1/15/39 | 2,100 | 2,173,941 |
| Series S-2 (NPFGC), 4.50%, 1/15/31 | 1,250 | 1,245,150 |
| New York Convention Center Development Corp., RB, | ||
| Hotel Unit Fee Secured (AMBAC): | ||
| 5.00%, 11/15/35 | 3,200 | 3,151,072 |
| 5.00%, 11/15/44 | 2,990 | 2,909,390 |
| New York Liberty Development Corp., Refunding RB, | ||
| Second Priority, Bank of America Tower at One Bryant | ||
| Park Project: | ||
| 5.63%, 7/15/47 | 8,805 | 8,849,201 |
| 6.38%, 7/15/49 | 1,200 | 1,230,492 |
| Par | |||
| Municipal Bonds | (000) | Value | |
| New York (continued) | |||
| County/City/Special District/School District (concluded) | |||
| New York State Dormitory Authority, RB, State University | |||
| Dormitory Facilities, Series A: | |||
| 5.25%, 7/01/29 | $ 5 | $ 5,322 | |
| 5.00%, 7/01/39 | 750 | 759,375 | |
| Niagara County Industrial Development Agency, | |||
| Refunding RB, Series A, Mandatory Put Bonds, AMT, | |||
| 5.45%, 11/15/26 (a) | 3,975 | 4,033,432 | |
| North Country Development Authority, Refunding RB | |||
| (AGM), 6.00%, 5/15/15 | 625 | 677,825 | |
| 43,189,099 | |||
| Education — 13.2% | |||
| City of Troy New York, Refunding RB, Rensselaer | |||
| Polytechnic, Series A, 5.13%, 9/01/40 | 4,375 | 4,287,062 | |
| Hempstead Town Industrial Development Agency, RB, | |||
| Adelphi University Civic Facility: | |||
| 5.75%, 6/01/22 | 700 | 734,706 | |
| 5.50%, 6/01/32 | 2,250 | 2,356,402 | |
| Madison County Industrial Development Agency | |||
| New York, RB, Commons II LLC, Student Housing, | |||
| Series A (CIFG), 5.00%, 6/01/33 | 400 | 359,648 | |
| Nassau County Industrial Development Agency, | |||
| Refunding RB, New York Institute of Technology | |||
| Project, Series A, 4.75%, 3/01/26 | 1,000 | 990,560 | |
| New York City Industrial Development Agency, RB: | |||
| Lycee Francais de New York Project, Series A (ACA), | |||
| 5.50%, 6/01/15 | 250 | 261,778 | |
| Lycee Francais de New York Project, Series A (ACA), | |||
| 5.38%, 6/01/23 | 195 | 198,346 | |
| Series C, 6.80%, 6/01/28 | 2,500 | 2,584,450 | |
| New York State Dormitory Authority, RB: | |||
| 5.83%, 7/01/39 (c) | 1,000 | 877,030 | |
| Convent of the Sacred Heart (AGM), | |||
| 5.63%, 11/01/35 | 1,000 | 1,043,280 | |
| The New School (AGM), 5.50%, 7/01/43 | 1,815 | 1,870,848 | |
| New York University, Series 1 (AMBAC), | |||
| 5.50%, 7/01/40 | 1,000 | 1,094,200 | |
| Rochester Institute of Technology, Series A, | |||
| 6.00%, 7/01/33 | 1,000 | 1,074,960 | |
| Rochester University, Series A, 5.13%, 7/01/14 (d) | 1,500 | 1,698,810 | |
| New York State Dormitory Authority, Refunding RB: | |||
| Brooklyn Law School, 5.75%, 7/01/33 | 475 | 497,301 | |
| Skidmore College, Series A, 5.25%, 7/01/29 | 135 | 142,860 | |
| Teachers College, 5.50%, 3/01/39 | 850 | 876,732 | |
| Schenectady County Industrial Development Agency, | |||
| Refunding RB, Union College Project, 5.00%, 7/01/31 | 2,000 | 1,980,040 | |
| Suffolk County Industrial Development Agency, | |||
| Refunding RB, New York Institute of Technology Project, | |||
| 5.00%, 3/01/26 | 750 | 752,693 | |
| Tompkins County Development Corp., RB, Ithaca College | |||
| Project (AGM), 5.50%, 7/01/33 | 450 | 470,318 | |
| Trust for Cultural Resources, RB, Series A: | |||
| Carnegie Hall, 4.75%, 12/01/39 | 1,550 | 1,489,209 | |
| Carnegie Hall, 5.00%, 12/01/39 | 1,325 | 1,322,946 | |
| Juilliard School, 5.00%, 1/01/39 | 1,050 | 1,076,397 | |
| Utica Industrial Development Agency New York, RB: | |||
| Munson-Williams-Proctor Arts Institute, | |||
| 5.38%, 7/15/20 | 1,000 | 1,011,190 | |
| Munson-Williams-Proctor Arts Institute, | |||
| 5.40%, 7/15/30 | 1,210 | 1,219,583 | |
| Utica College Project, Series A, 5.75%, 8/01/28 | 1,430 | 1,263,734 | |
| Yonkers Industrial Development Agency New York, | |||
| RB, Sarah Lawrence College Project, Series A, | |||
| 6.00%, 6/01/41 | 1,000 | 1,033,640 | |
| 32,568,723 | |||
See Notes to Financial Statements.
| ANNUAL | REPORT | JUNE | 30, 2011 | 39 |
BlackRock New York Municipal Bond Fund
Schedule of Investments (continued) (Percentages shown are based on Net Assets)
| Par | ||
| Municipal Bonds | (000) | Value |
| New York (continued) | ||
| Health — 15.1% | ||
| Dutchess County Industrial Development Agency New York, | ||
| RB, St. Francis Hospital, Series B, 7.25%, 3/01/19 $ | 815 | $ 811,487 |
| Dutchess County Local Development Corp., Refunding RB, | ||
| Health Quest System Inc., Series A, 5.75%, 7/01/40 | 300 | 301,044 |
| Erie County Industrial Development Agency, RB, Episcopal | ||
| Church Home, Series A: | ||
| 5.88%, 2/01/18 | 675 | 669,087 |
| 6.00%, 2/01/28 | 375 | 353,212 |
| Genesee County Industrial Development Agency New York, | ||
| Refunding RB, United Memorial Medical Center Project: | ||
| 5.00%, 12/01/27 | 500 | 400,775 |
| 5.00%, 12/01/32 | 1,080 | 833,155 |
| Monroe County Industrial Development Corp., RB, Unity | ||
| Hospital of Rochester Project (FHA), 5.50%, 8/15/40 | 1,050 | 1,093,197 |
| Nassau County Industrial Development Agency, Refunding | ||
| RB, Special Needs Facilities Pooled Program, Series F-1 | ||
| (ACA), 4.90%, 7/01/21 | 525 | 438,559 |
| New York City Health & Hospital Corp., Refunding RB, | ||
| Health System, Series A, 5.00%, 2/15/30 | 1,000 | 1,010,410 |
| New York City Industrial Development Agency, RB: | ||
| A Very Special Place Inc. Project, Series A, | ||
| 6.13%, 1/01/13 | 155 | 152,177 |
| A Very Special Place Inc. Project, Series A, | ||
| 7.00%, 1/01/33 | 1,600 | 1,449,120 |
| PSCH Inc. Project, 6.38%, 7/01/33 | 2,555 | 2,187,489 |
| Special Needs Facilities Pooled Program, Series A-1, | ||
| 6.50%, 7/01/17 | 1,000 | 971,600 |
| Special Needs Facilities Pooled Program, Series C-1, | ||
| 6.50%, 7/01/17 | 2,540 | 2,467,864 |
| New York City Industrial Development Agency, Refunding | ||
| RB (ACA), Special Needs Facilities Pooled Program: | ||
| Series A-1, 4.38%, 7/01/20 | 1,000 | 817,740 |
| Series A-1, 4.50%, 7/01/30 | 210 | 145,587 |
| Series C-1, 5.10%, 7/01/31 | 525 | 389,886 |
| New York State Dormitory Authority, RB: | ||
| Healthcare, Series A, 5.00%, 3/15/38 | 250 | 257,393 |
| Hudson Valley Hospital (BHAC), 5.00%, 8/15/36 | 750 | 757,042 |
| NYU Hospital Center, Series A, 5.75%, 7/01/31 | 1,055 | 1,081,808 |
| NYU Hospital Center, Series B, 5.63%, 7/01/37 | 530 | 533,615 |
| New York & Presbyterian Hospital (AGM), | ||
| 5.00%, 8/15/36 | 1,000 | 1,002,230 |
| New York State Association for Retarded | ||
| Children, Inc., Series B (AMBAC), 6.00%, 7/01/32 | 700 | 742,861 |
| New York State Dormitory Authority, Refunding RB: | ||
| Mount Sinai Hospital, Series A, 5.00%, 7/01/26 | 1,635 | 1,667,062 |
| North Shore-Long Island Jewish Health System, | ||
| Series A, 5.50%, 5/01/37 | 1,675 | 1,691,850 |
| North Shore-Long Island Jewish Health System, | ||
| Series A, 5.75%, 5/01/37 | 1,725 | 1,766,331 |
| North Shore-Long Island Jewish Health System, | ||
| Series E, 5.50%, 5/01/33 | 1,000 | 1,014,530 |
| Orange County Industrial Development Agency New York, | ||
| RB, Special Needs Facilities Pooled Program, | ||
| Series G-1 (ACA), 4.90%, 7/01/21 | 845 | 705,871 |
| Suffolk County Industrial Development Agency | ||
| New York, RB: | ||
| Huntington Hospital Project, Series B, | ||
| 5.88%, 11/01/32 | 2,000 | 2,010,640 |
| Special Needs Facilities Pooled Program, Series D-1, | ||
| 6.50%, 7/01/17 | 135 | 131,166 |
| Special Needs Facilities Pooled Program, Series D-1 | ||
| (ACA), 4.90%, 7/01/21 | 330 | 275,666 |
| Par | |||
| Municipal Bonds | (000) | Value | |
| New York (continued) | |||
| Health (concluded) | |||
| Sullivan County Industrial Development Agency New York, | |||
| RB, Special Needs Facilities Pooled Program, Series H-1 | |||
| (ACA), 4.90%, 7/01/21 | $ 330 | $ 275,666 | |
| Westchester County Healthcare Corp. New York, | |||
| Refunding RB, Senior Lien, Series B, 6.00%, 11/01/30 | 375 | 383,842 | |
| Westchester County Industrial Development Agency | |||
| New York, MRB, Kendal on Hudson Project, Series A: | |||
| 6.50%, 1/01/13 (d) | 5,200 | 5,660,772 | |
| 6.38%, 1/01/24 | 1,000 | 957,940 | |
| Westchester County Industrial Development Agency | |||
| New York, RB, Special Needs Facilities Pooled Program, | |||
| Series E-1 (ACA), 4.90%, 7/01/21 | 350 | 292,373 | |
| Yonkers Industrial Development Agency New York, RB, | |||
| Sacred Heart Associations Project, Series A, AMT | |||
| (SONYMA), 5.00%, 10/01/37 | 1,640 | 1,548,373 | |
| 37,249,420 | |||
| Housing — 6.6% | |||
| Monroe County Industrial Development Agency, | |||
| IDRB, Southview Towers Project, AMT (SONYMA), | |||
| 6.25%, 2/01/31 | 1,000 | 1,004,610 | |
| New York City Housing Development Corp., RB, AMT: | |||
| Series A, 5.50%, 11/01/34 | 2,500 | 2,505,250 | |
| Series C, 5.05%, 11/01/36 | 1,220 | 1,125,011 | |
| New York Mortgage Agency, Refunding RB, AMT: | |||
| Series 101, 5.40%, 4/01/32 | 2,240 | 2,240,246 | |
| Series 133, 4.95%, 10/01/21 | 395 | 401,348 | |
| Series 143, 4.90%, 10/01/37 | 1,835 | 1,733,928 | |
| New York State HFA, RB, AMT, Series A: | |||
| Division Street, (SONYMA), 5.10%, 2/15/38 | 875 | 847,700 | |
| Highland Avenue Senior Apartments, (SONYMA), | |||
| 5.00%, 2/15/39 | 2,000 | 1,793,480 | |
| Kensico Terrace Apartments, (SONYMA), | |||
| 4.90%, 2/15/38 | 645 | 600,553 | |
| M/F Housing, Watergate II, 4.75%, 2/15/34 | 580 | 546,221 | |
| Yonkers Economic Development Corp., Refunding RB, | |||
| Riverview II (Freddie Mac), 4.50%, 5/01/25 | 3,000 | 2,978,460 | |
| Yonkers Industrial Development Agency New York, | |||
| RB, Monastery Manor Associates LP Project, AMT | |||
| (SONYMA), 5.25%, 4/01/37 | 585 | 549,625 | |
| 16,326,432 | |||
| State — 5.7% | |||
| New York Municipal Bond Bank Agency, RB, Series C, | |||
| 5.25%, 12/01/22 | 1,000 | 1,051,490 | |
| New York State Dormitory Authority, LRB, Municipal | |||
| Health Facilities, Sub-Series 2-4, 4.75%, 1/15/30 | 1,700 | 1,691,670 | |
| New York State Dormitory Authority, RB, Mental Health | |||
| Services Facilities Improvement, Series A (AGM), | |||
| 5.00%, 2/15/22 | 1,000 | 1,085,290 | |
| New York State Dormitory Authority, Refunding RB, | |||
| Upstate Community Colleges, Series B, 5.25%, 7/01/21 | 1,565 | 1,696,757 | |
| New York State Thruway Authority, Refunding RB, | |||
| Series A-1, 5.00%, 4/01/29 | 1,000 | 1,048,360 | |
| New York State Urban Development Corp., Refunding RB: | |||
| Clarkson Center for Advance Materials, | |||
| 5.50%, 1/01/20 | 1,685 | 1,978,358 | |
| University Facilities Grants, 5.50%, 1/01/19 | 3,500 | 4,101,895 | |
| State of New York, GO, Series A, 5.00%, 2/15/39 | 1,250 | 1,295,613 | |
| 13,949,433 | |||
See Notes to Financial Statements.
| 40 | ANNUAL REPORT | JUNE | 30, 2011 |
BlackRock New York Municipal Bond Fund
Schedule of Investments (continued) (Percentages shown are based on Net Assets)
| Par | ||
| Municipal Bonds | (000) | Value |
| New York (concluded) | ||
| Tobacco — 2.4% | ||
| Chautauqua Tobacco Asset Securitization Corp. New York, | ||
| RB, 6.75%, 7/01/40 | $ 1,000 | $ 910,730 |
| Nassau County Tobacco Settlement Corp., Refunding RB, | ||
| Asset-Backed, Senior Series A-3, 5.00%, 6/01/35 | 2,000 | 1,468,840 |
| New York Counties Tobacco Trust I, RB, Tobacco Pass Thru, | ||
| Series B: | ||
| 6.50%, 6/01/35 | 750 | 703,410 |
| 6.63%, 6/01/42 | 490 | 460,100 |
| Niagara County Tobacco Asset Securitization Corp. | ||
| New York, RB, Asset-Backed, 6.25%, 5/15/40 | 1,000 | 896,150 |
| Tobacco Settlement Financing Corp. New York, RB, | ||
| Asset-Backed, Series A-1 (AMBAC), 5.25%, 6/01/20 | 1,455 | 1,536,247 |
| 5,975,477 | ||
| Transportation — 9.3% | ||
| Hudson Yards Infrastructure Corp., RB: | ||
| (AGC), 5.00%, 2/15/47 | 1,000 | 953,190 |
| Series A (AGM), 5.00%, 2/15/47 | 2,500 | 2,382,975 |
| Metropolitan Transportation Authority, RB: | ||
| Series 2008C, 6.50%, 11/15/28 | 1,760 | 2,020,357 |
| Series A, 4.50%, 11/15/38 | 1,400 | 1,239,070 |
| Series A, 5.63%, 11/15/39 | 500 | 525,655 |
| Onondaga County Industrial Development Agency | ||
| New York, RB, AMT, Air Cargo: | ||
| Senior, 6.13%, 1/01/32 | 3,945 | 3,486,433 |
| Subordinate, 7.25%, 1/01/32 | 1,365 | 1,248,606 |
| Port Authority of New York & New Jersey, RB: | ||
| Consolidated, 116th Series, 4.13%, 9/15/32 | 1,000 | 939,920 |
| Special Project, JFK International Air Terminal, | ||
| Series 6, 6.00%, 12/01/42 | 2,000 | 2,021,080 |
| Special Project, JFK International Air Terminal, | ||
| Series 6, (NPFGC), 6.25%, 12/01/13 | 2,575 | 2,703,492 |
| Special Project, JFK International Air Terminal, | ||
| Series 6, AMT (NPFGC), 6.25%, 12/01/11 | 2,555 | 2,589,774 |
| Special Project, JFK International Air Terminal, | ||
| Series 6, AMT (NPFGC), 6.25%, 12/01/14 | 2,620 | 2,775,707 |
| 22,886,259 | ||
| Utilities — 5.7% | ||
| Long Island Power Authority, RB, General, Series C (CIFG), | ||
| 5.25%, 9/01/29 | 3,000 | 3,222,810 |
| Long Island Power Authority, Refunding RB, Series A: | ||
| 5.50%, 4/01/24 | 1,250 | 1,367,313 |
| 5.75%, 4/01/39 | 300 | 320,646 |
| General, 6.00%, 5/01/33 | 2,450 | 2,681,794 |
| New York City Municipal Water Finance Authority, RB: | ||
| Fiscal 2008, Series A, 5.00%, 6/15/38 | 1,570 | 1,601,557 |
| Fiscal 2009, Series A, 5.75%, 6/15/40 | 500 | 548,860 |
| Second Generation Resolution HH, 5.00%, 6/15/32 | 2,300 | 2,400,832 |
| Series FF-2, 5.50%, 6/15/40 | 800 | 854,104 |
| New York State Environmental Facilities Corp., RB, | ||
| Revolving Funds NYC Municipal Water, 5.00%, 6/15/36 | 1,000 | 1,036,500 |
| 14,034,416 | ||
| Total Municipal Bonds in New York | 211,359,886 | |
| Guam — 1.5% | ||
| State — 0.4% | ||
| Territory of Guam, GO, Series A, 7.00%, 11/15/39 | 970 | 997,820 |
| Tobacco — 0.3% | ||
| Guam Economic Development & Commerce Authority, | ||
| Refunding RB, Tobacco Settlement Asset-Backed, | ||
| 5.63%, 6/01/47 | 1,075 | 899,796 |
| Par | ||
| Municipal Bonds | (000) | Value |
| Guam (concluded) | ||
| Utilities — 0.8% | ||
| Guam Government Waterworks Authority, Refunding RB, | ||
| Water, 5.88%, 7/01/35 | $ 2,000 | $ 1,890,560 |
| Total Municipal Bonds in Guam | 3,788,176 | |
| Puerto Rico — 7.4% | ||
| Corporate — 0.4% | ||
| Puerto Rico Industrial Medical & Environmental Pollution | ||
| Control Facilities Financing Authority, RB, Special | ||
| Facilities, American Airlines, Series A, 6.45%, 12/01/25 | 1,000 | 881,120 |
| County/City/Special District/School District — 0.8% | ||
| Puerto Rico Sales Tax Financing Corp., RB, First | ||
| Sub-Series A (AGM), 5.00%, 8/01/40 | 1,000 | 975,990 |
| Puerto Rico Sales Tax Financing Corp., Refunding RB, | ||
| CAB, Series A (NPFGC), 5.75%, 8/01/41 (b) | 7,500 | 1,046,325 |
| 2,022,315 | ||
| Education — 0.4% | ||
| Puerto Rico Industrial Tourist Educational Medical & | ||
| Environmental Control Facilities Financing Authority, | ||
| RB, University Plaza Project, Series A (NPFGC), | ||
| 5.00%, 7/01/33 | 1,000 | 884,280 |
| Housing — 1.1% | ||
| Puerto Rico Housing Finance Authority, Refunding RB, | ||
| Subordinate, Capital Fund Modernization, | ||
| 5.13%, 12/01/27 | 2,750 | 2,774,365 |
| State — 1.2% | ||
| Puerto Rico Commonwealth Infrastructure Financing | ||
| Authority, RB, CAB, Series A (b): | ||
| (AMBAC), 4.99%, 7/01/44 | 1,100 | 99,506 |
| (FGIC), 4.77%, 7/01/42 | 7,470 | 791,073 |
| Puerto Rico Public Buildings Authority, RB, Government | ||
| Facilities, Series I, 5.25%, 7/01/14 (d) | 55 | 62,160 |
| Puerto Rico Sales Tax Financing Corp., RB, First | ||
| Sub-Series A, 5.75%, 8/01/37 | 2,000 | 2,037,400 |
| 2,990,139 | ||
| Tobacco — 0.3% | ||
| Children’s Trust Fund, Refunding RB, Asset-Backed, | ||
| 5.63%, 5/15/43 | 1,000 | 847,620 |
| Transportation — 2.7% | ||
| Puerto Rico Highway & Transportation Authority, RB, | ||
| Series Y (AGM), 6.25%, 7/01/21 | 1,000 | 1,130,310 |
| Puerto Rico Highway & Transportation Authority, | ||
| Refunding RB: | ||
| Series AA-1 (AGM), 4.95%, 7/01/26 | 3,700 | 3,680,649 |
| Series CC (AGM), 5.50%, 7/01/30 | 450 | 468,387 |
| Series M, 5.00%, 7/01/32 | 1,500 | 1,363,830 |
| 6,643,176 | ||
| Utilities — 0.5% | ||
| Puerto Rico Aqueduct & Sewer Authority, RB, Senior Lien, | ||
| Series A, 6.00%, 7/01/38 | 500 | 501,555 |
| Puerto Rico Electric Power Authority, Refunding RB, | ||
| Series VV (NPFGC), 5.25%, 7/01/30 | 745 | 737,058 |
| 1,238,613 | ||
| Total Municipal Bonds in Puerto Rico | 18,281,628 |
See Notes to Financial Statements.
| ANNUAL | REPORT | JUNE | 30, 2011 | 41 |
BlackRock New York Municipal Bond Fund
Schedule of Investments (concluded) (Percentages shown are based on Net Assets)
| Par | |||
| Municipal Bonds | (000) | Value | |
| U.S. Virgin Islands — 1.8% | |||
| Corporate — 1.8% | |||
| United States Virgin Islands, Refunding RB, Senior | |||
| Secured, Hovensa Coker Project, AMT, 6.50%, 7/01/21 $ 4,500 | $ 4,425,210 | ||
| Total Municipal Bonds in the U.S. Virgin Islands | 4,425,210 | ||
| Total Municipal Bonds — 96.4% | 237,854,900 | ||
| Municipal Bonds Transferred to | |||
| Tender Option Bond Trusts (e) | |||
| New York — 3.0% | |||
| County/City/Special District/School District — 1.4% | |||
| City of New York New York, GO, Series J, 5.00%, 5/15/23 | 1,800 | 1,929,996 | |
| New York State Dormitory Authority, RB, State University | |||
| Dormitory Facilities, Series A, 5.25%, 7/01/29 | 1,350 | 1,437,007 | |
| 3,367,003 | |||
| Utilities — 1.6% | |||
| New York City Municipal Water Finance Authority, | |||
| Refunding RB, Series A, 4.75%, 6/15/30 | 4,000 | 4,089,440 | |
| Total Municipal Bonds Transferred to | |||
| Tender Option Bond Trusts — 3.0% | 7,456,443 | ||
| Total Long-Term Investments | |||
| (Cost — $244,707,306) — 99.4% | 245,311,343 | ||
| Short-Term Securities | Shares | ||
| BIF New York Municipal Money Fund, 0.00% (f)(g) | 1,241,982 | 1,241,982 | |
| Total Short-Term Securities | |||
| (Cost — $1,241,982) — 0.5% | 1,241,982 | ||
| Total Investments (Cost — $245,949,288*) — 99.9% | 246,553,325 | ||
| Other Assets Less Liabilities — 1.5% | 3,789,664 | ||
| Liability for TOB Trust Certificates, Including Interest | |||
| Expense and Fees Payable — (1.4)% | (3,576,490) | ||
| Net Assets — 100.0% | $ 246,766,499 | ||
* The cost and unrealized appreciation (depreciation) of investments as of June 30,
2011, as computed for federal income tax purposes, were as follows:
| Aggregate cost | $ 242,125,737 |
| Gross unrealized appreciation | $ 7,544,264 |
| Gross unrealized depreciation | (6,691,676) |
| Net unrealized appreciation | $ 852,588 |
(a) Variable rate security. Rate shown is as of report date.
(b) Represents a zero-coupon bond. Rate shown reflects the current yield as of
report date.
(c) Represents a step-up bond that pays an initial coupon rate for the first period and
then a higher coupon rate for the following periods. Rate shown is as of report date.
(d) US government securities, held in escrow, are used to pay interest on this security as
well as to retire the bond in full at the date indicated, typically at a premium to par.
(e) Securities represent bonds transferred to a TOB trust in exchange for which the
Fund acquired residual interest certificates. These securities serve as collateral in a
financing transaction. See Note 1 of the Notes to Financial Statements for details of
municipal bonds transferred to TOBs.
(f) Investments in companies considered to be an affiliate of the Fund during the
year, for purposes of Section 2(a)(3) of the Investment Company Act of 1940,
as amended, were as follows:
| Shares Held | Shares Held | |||
| at June 30, | Net | at June 30, | ||
| Affiliate | 2010 | Activity | 2011 | Income |
| BIF New York | ||||
| Municipal | ||||
| Money Fund | 366,652 | 875,330 | 1,241,982 | $ 272 |
(g) Represents the current yield as of report date.
• Financial futures contracts sold as of June 30, 2011 were as follows:
| Notional Unrealized | |||
| Contracts Issue | Exchange Expiration | Value Appreciation | |
| 50 30-Year U.S. | Chicago Board September | ||
| Treasury Bond | of Trade | 2011 | $6,228,421 $ 76,858 |
• Fair Value Measurements — Various inputs are used in determining the fair value of
investments and derivative financial instruments. These inputs are categorized in
three broad levels for financial statement purposes as follows:
• Level 1 — price quotations in active markets/exchanges for identical assets
and liabilities
• Level 2 — other observable inputs (including, but not limited to: quoted prices for
similar assets or liabilities in markets that are active, quoted prices for identical
or similar assets or liabilities in markets that are not active, inputs other than
quoted prices that are observable for the assets or liabilities (such as interest
rates, yield curves, volatilities, prepayment speeds, loss severities, credit risks and
default rates) or other market-corroborated inputs)
• Level 3 — unobservable inputs based on the best information available in the
circumstances, to the extent observable inputs are not available (including the
Fund’s own assumptions used in determining the fair value of investments and
derivative financial instruments)
The categorization of a value determined for investments and derivative financial
instruments is based on the pricing transparency of the investment and derivative
financial instrument and does not necessarily correspond to the Fund’s perceived
risk of investing in those securities. For information about the Fund’s policy regarding
valuation of investments and derivative financial instruments and other significant
accounting policies, please refer to Note 1 of the Notes to Financial Statements.
The following tables summarize the inputs used as of June 30, 2011 in determining
the fair valuation of the Fund’s investments and derivative financial instruments:
| Valuation Inputs | Level 1 | Level 2 | Level 3 | Total |
| Assets: | ||||
| Investments: | ||||
| Long-Term | ||||
| Investments1 . | — | $ 245,311,343 | — | $ 245,311,343 |
| Short–Term | ||||
| Securities | $ 1,241,982 | — | — | 1,241,982 |
| Total | $ 1,241,982 | $ 245,311,343 | — | $ 246,553,325 |
| 1 See above Schedule of Investments for values in each sector. | ||||
| Valuation Inputs Level 1 | Level 2 | Level 3 | Total | |
| Derivative Financial Instruments2 | ||||
| Assets: | ||||
| Interest Rate | ||||
| Contracts | $ 76,858 | — | — | $ 76,858 |
| 2 Derivative financial instruments are financial futures contracts, which are valued | ||||
| at the unrealized appreciation/depreciation on the instrument. | ||||
See Notes to Financial Statements.
| 42 | ANNUAL REPORT | JUNE | 30, 2011 |
| Statements of Assets and Liabilities | |||||
| BlackRock | BlackRock | BlackRock | BlackRock | ||
| Short-Term | BlackRock | National | High Yield | New York | |
| Municipal | Municipal | Municipal | Municipal | Municipal | |
| June 30, 2011 | Fund | Fund | Fund | Fund | Bond Fund |
| Assets | |||||
| Investments at value — unaffiliated1 | $1,003,361,988 | $ 735,337,898 | $2,593,239,990 | $ 168,845,909 | $ 245,311,343 |
| Investments at value — affiliated2 | 1,487,006 | 37,528,861 | 127,360,041 | 1,739,592 | 1,241,982 |
| Cash | 46 | 79 | 4,223 | 141,015 | — |
| Cash pledged as collateral for financial futures contracts | — | 495,000 | 390,000 | 69,000 | 120,000 |
| Interest receivable | 12,316,388 | 12,430,487 | 40,094,051 | 2,638,463 | 4,273,421 |
| Capital shares sold receivable | 6,157,498 | 895,549 | 11,012,234 | 413,263 | 679,128 |
| Investments sold receivable | — | 594,715 | 11,961,200 | 765,000 | — |
| Variation margin receivable | — | 118,594 | — | 27,844 | 26,563 |
| Prepaid expenses | 64,321 | 22,031 | 80,187 | 26,588 | 31,263 |
| Total assets | 1,023,387,247 | 787,423,214 | 2,784,141,926 | 174,666,674 | 251,683,700 |
| Liabilities | |||||
| Investments purchased payable | 5,941,590 | 3,816,610 | — | — | — |
| Capital shares redeemed payable | 1,893,337 | 1,168,595 | 6,429,902 | 215,854 | 404,154 |
| Income dividends payable | 598,194 | 1,980,818 | 5,904,999 | 605,508 | 681,504 |
| Investment advisory fees payable | 512,998 | 207,919 | 942,960 | 70,155 | 111,172 |
| Service and distribution fees payable | 122,504 | 97,800 | 471,144 | 19,780 | 41,688 |
| Interest expense and fees payable | — | 50,545 | 217,693 | 7,759 | 1,490 |
| Other affiliates payable | 6,223 | 4,764 | 15,371 | 893 | 3,104 |
| Officer's and Directors’ fees payable | 1,575 | 1,246 | 3,093 | 580 | 693 |
| TOB trust payable | – | 11,750,000 | — | — | — |
| Other accrued expenses payable | 42,291 | 180,703 | 733,107 | 99,675 | 98,396 |
| Total accrued liabilities | 9,118,712 | 19,259,000 | 14,718,269 | 1,020,204 | 1,342,201 |
| Other Liabilities | |||||
| TOB Trust certificates | — | 66,300,303 | 321,402,273 | 16,039,046 | 3,575,000 |
| Total liabilities | 9,118,712 | 85,559,303 | 336,120,542 | 17,059,250 | 4,917,201 |
| Net Assets | $1,014,268,535 | $ 701,863,911 | $2,448,021,384 | $ 157,607,424 | $ 246,766,499 |
| Net Assets Consist of | |||||
| Paid-in capital | $1,012,298,492 | $ 711,402,623 | $2,473,083,228 | $ 171,991,498 | $ 257,968,811 |
| Undistributed net investment income | 483,959 | 2,281,895 | 1,888,807 | 314,041 | 799,549 |
| Accumulated net realized loss | (7,783,408) | (25,969,219) | (88,569,304) | (12,436,851) | (12,682,756) |
| Net unrealized appreciation/depreciation | 9,269,492 | 14,148,612 | 61,618,653 | (2,261,264) | 680,895 |
| Net Assets | $1,014,268,535 | $ 701,863,911 | $2,448,021,384 | $ 157,607,424 | $ 246,766,499 |
| 1 Investments at cost — unaffiliated | $ 994,092,496 | $ 721,238,771 | $2,531,621,337 | $ 171,115,805 | $ 244,707,306 |
| 2 Investments at cost — affiliated | $ 1,487,006 | $ 37,528,861 | $ 127,360,041 | $ 1,739,592 | $ 1,241,982 |
See Notes to Financial Statements.
| ANNUAL | REPORT | JUNE | 30, 2011 | 43 |
| Statements of Assets and Liabilities (concluded) | |||||||
| BlackRock | BlackRock | BlackRock | BlackRock | ||||
| Short-Term | BlackRock | National | High Yield | New York | |||
| Municipal | Municipal | Municipal | Municipal | Municipal | |||
| June 30, 2011 | Fund | Fund | Fund | Fund | Bond Fund | ||
| Net Asset Value | |||||||
| BlackRock: | |||||||
| Net assets | $ 43,940,536 | — | — | — | — | ||
| Shares outstanding, $0.10 par value | 4,315,693 | — | — | — | — | ||
| Net asset value | $ 10.18 | — | — | — | — | ||
| Par value per share | $ 0.10 | — | — | — | — | ||
| Shares authorized | 150 Million | — | — | — | — | ||
| Institutional: | |||||||
| Net assets | $ 603,837,305 | $ 445,889,025 | $1,207,500,571 | $ 111,668,694 | $ 25,863,580 | ||
| Shares outstanding, $0.10 par value | 59,316,914 | 60,329,363 | 120,091,817 | 13,380,122 | 2,495,487 | ||
| Net asset value | $ 10.18 | $ 7.39 | $ 10.05 | $ 8.35 | $ 10.36 | ||
| Par value per share | $ 0.10 | $ 0.10 | $ 0.10 | $ 0.10 | $ 0.10 | ||
| Shares authorized | 150 Million | 500 Million | 375 Million | 100 Million | Unlimited | ||
| Investor A: | |||||||
| Net assets | $ 221,827,441 | $ 172,176,037 | $ 855,849,146 | $ 27,993,423 | $ 35,751,149 | ||
| Shares outstanding, $0.10 par value | 21,777,960 | 23,305,953 | 85,076,333 | 3,361,461 | 3,446,899 | ||
| Net asset value | $ 10.19 | $ 7.39 | $ 10.06 | $ 8.33 | $ 10.37 | ||
| Par value per share | $ 0.10 | $ 0.10 | $ 0.10 | $ 0.10 | $ 0.10 | ||
| Shares authorized | 150 Million | 500 Million | 375 Million | 100 Million | Unlimited | ||
| Investor A1: | |||||||
| Net assets | $ 53,141,035 | — | — | — | $151,326,987 | ||
| Shares outstanding, $0.10 par value | 5,216,023 | — | — | — | 14,591,250 | ||
| Net asset value | $ 10.19 | — | — | — | $ 10.37 | ||
| Par value per share | $ 0.10 | — | — | — | $ 0.10 | ||
| Shares authorized | 150 Million | — | — | — | Unlimited | ||
| Investor B: | |||||||
| Net assets | $ 5,257,859 | $ 11,480,876 | $ 30,346,003 | — | $ 5,950,416 | ||
| Shares outstanding, $0.10 par value | 516,425 | 1,554,589 | 3,019,161 | — | 573,959 | ||
| Net asset value | $ 10.18 | $ 7.39 | $ 10.05 | — | $ 10.37 | ||
| Par value per share | $ 0.10 | $ 0.10 | $ 0.10 | — | $ 0.10 | ||
| Shares authorized | 150 Million | 375 Million | 375 Million | — | Unlimited | ||
| Investor C: | |||||||
| Net assets | $ 86,264,359 | $ 43,846,128 | $ 281,024,151 | $ 17,945,307 | $ 17,180,308 | ||
| Shares outstanding, $0.10 par value | 8,471,539 | 5,927,944 | 27,934,109 | 2,149,650 | 1,657,179 | ||
| Net asset value | $ 10.18 | $ 7.40 | $ 10.06 | $ 8.35 | $ 10.37 | ||
| Par value per share | $ 0.10 | $ 0.10 | $ 0.10 | $ 0.10 | $ 0.10 | ||
| Shares authorized | 150 Million | 375 Million | 375 Million | 100 Million | Unlimited | ||
| Investor C1: | |||||||
| Net assets | — | $ 28,471,845 | $ 73,301,513 | — | $ 10,694,059 | ||
| Shares outstanding, $0.10 par value | — | 3,854,159 | 7,289,144 | — | 1,031,260 | ||
| Net asset value | — | $ 7.39 | $ 10.06 | — | $ 10.37 | ||
| Par value per share | — | $ 0.10 | $ 0.10 | — | $ 0.10 | ||
| Shares authorized | — | 375 Million | 375 Million | — | Unlimited | ||
See Notes to Financial Statements.
| 44 | ANNUAL REPORT | JUNE | 30, 2011 |
| Statements of Operations | |||||
| BlackRock | BlackRock | BlackRock | BlackRock | ||
| Short-Term | BlackRock | National | High Yield | New York | |
| Municipal | Municipal | Municipal | Municipal | Municipal | |
| Year Ended June 30, 2011 | Fund | Fund | Fund | Fund | Bond Fund |
| Investment Income | |||||
| Interest | $ 18,012,790 | $ 39,948,872 | $ 134,279,326 | $ 9,537,595 | $ 14,136,465 |
| Income — affiliated | 13,112 | 121,308 | 223,418 | 7,951 | 272 |
| Total income | 18,025,902 | 40,070,180 | 134,502,744 | 9,545,546 | 14,136,737 |
| Expenses | |||||
| Investment advisory | 3,603,131 | 2,716,354 | 11,623,005 | 822,333 | 1,416,323 |
| Service — Investor A | 644,197 | 470,361 | 2,116,463 | 66,722 | 96,179 |
| Service — Investor A1 | 58,822 | — | — | — | 156,255 |
| Service and distribution — Investor B | 24,135 | 106,158 | 285,693 | — | 40,376 |
| Service and distribution — Investor C | 1,036,256 | 463,272 | 2,927,225 | 169,020 | 178,819 |
| Service and distribution — Investor C1 | — | 247,713 | 644,752 | — | 68,918 |
| Transfer agent — BlackRock | 218 | — | — | — | — |
| Transfer agent — Institutional | 630,590 | 168,533 | 956,681 | 20,096 | 7,618 |
| Transfer agent — Investor A | 66,891 | 96,057 | 508,710 | 10,350 | 30,358 |
| Transfer agent — Investor A1 | 28,793 | — | — | — | 74,617 |
| Transfer agent — Investor B | 5,234 | 9,323 | 33,283 | — | 5,548 |
| Transfer agent — Investor C | 57,123 | 21,935 | 159,004 | 10,374 | 7,951 |
| Transfer agent — Investor C1 | — | 17,534 | 47,264 | — | 4,921 |
| Accounting services | 236,484 | 177,032 | 428,794 | 46,902 | 62,252 |
| Registration | 146,387 | 87,607 | 214,699 | 58,192 | 69,811 |
| Printing | 80,924 | 47,755 | 135,228 | 10,384 | 28,722 |
| Custodian | 68,704 | 50,926 | 118,330 | 18,884 | 17,373 |
| Professional | 63,157 | 59,660 | 108,398 | 48,392 | 88,921 |
| Officer and Directors | 37,672 | 31,101 | 63,121 | 19,582 | 21,726 |
| Reorganization | — | — | 69,296 | — | — |
| Miscellaneous | 53,764 | 50,101 | 77,829 | 29,688 | 39,569 |
| Total expenses excluding interest expense and fees | 6,842,482 | 4,821,422 | 20,517,775 | 1,330,919 | 2,416,257 |
| Interest expense and fees1 | — | 462,270 | 2,023,258 | 79,287 | 30,929 |
| Total expenses | 6,842,482 | 5,283,692 | 22,541,033 | 1,410,206 | 2,447,186 |
| Less fees waived by advisor | (40,333) | (11,232) | (71,629) | (2,385) | (7,283) |
| Less transfer agent fees waived and/or reimbursed — class specific | (590,306) | — | (21,814) | — | — |
| Less fees paid indirectly | (199) | (42) | (116) | — | (6) |
| Total expenses after fees waived and/or reimbursed and paid indirectly | 6,211,644 | 5,272,418 | 22,447,474 | 1,407,821 | 2,439,897 |
| Net investment income | 11,814,258 | 34,797,762 | 112,055,270 | 8,137,725 | 11,696,840 |
| Realized and Unrealized Gain (Loss) | |||||
| Net realized gain (loss) from: | |||||
| Investments — unaffiliated | 1,083,019 | (7,958,757) | ( 16,048,572) | (2,880,742) | (492,919) |
| Investments — affiliated | — | (213,126) | — | — | — |
| Financial futures contracts | (349,061) | (1,933,400) | (4,190,847) | (499,532) | (604,012) |
| 733,958 | (10,105,283) | (20,239,419) | (3,380,274) | (1,096,931) | |
| Net change in unrealized appreciation/depreciation on: | |||||
| Investments | (1,618,994) | (6,745,151) | (22,729,886) | 1,084,178 | (4,287,091) |
| Financial futures contracts | — | 134,303 | 393,128 | 8,632 | 77,464 |
| (1,618,994) | (6,610,848) | (22,336,758) | 1,092,810 | (4,209,627) | |
| Total realized and unrealized loss | (885,036) | (16,716,131) | (42,576,177) | (2,287,464) | (5,306,558) |
| Net Increase in Net Assets Resulting from Operations | $ 10,929,222 | $ 18,081,631 | $ 69,479,093 | $ 5,850,261 | $ 6,390,282 |
| 1 Related to TOBs. |
See Notes to Financial Statements.
| ANNUAL | REPORT | JUNE | 30, 2011 | 45 |
| Statements of Changes in Net Assets | BlackRock Short-Term Municipal Fund | |
| Year Ended June 30, | ||
| Increase (Decrease) in Net Assets: | 2011 | 2010 |
| Operations | ||
| Net investment income | $ 11,814,258 | $ 13,068,301 |
| Net realized gain | 733,958 | 494,322 |
| Net change in unrealized appreciation/depreciation | (1,618,994) | 3,555,853 |
| Net increase in net assets resulting from operations | 10,929,222 | 17,118,476 |
| Dividends to Shareholders From | ||
| Net investment income: | ||
| BlackRock | (296,867) | (126,369) |
| Institutional | (7,987,166) | (8,667,629) |
| Investor A | (2,574,837) | (2,658,864) |
| Investor A1 | (671,515) | (1,043,367) |
| Investor B | (59,313) | (101,560) |
| Investor C | (224,914) | (470,373) |
| Decrease in net assets resulting from dividends to shareholders | (11,814,612) | (13,068,162) |
| Capital Share Transactions | ||
| Net increase (decrease) in net assets derived from capital share transactions | (120,319,787) | 446,346,568 |
| Net Assets | ||
| Total increase (decrease) in net assets | (121,205,177) | 450,396,882 |
| Beginning of year | 1,135,473,712 | 685,076,830 |
| End of year | $ 1,014,268,535 | $1,135,473,712 |
| Undistributed net investment income | $ 483,959 | $ 484,369 |
See Notes to Financial Statements.
| 46 | ANNUAL REPORT | JUNE | 30, 2011 |
| Statements of Changes in Net Assets | BlackRock Municipal Fund | |
| Year Ended June 30, | ||
| Increase (Decrease) in Net Assets: | 2011 | 2010 |
| Operations | ||
| Net investment income | $ 34,797,762 | $ 36,974,681 |
| Net realized gain (loss) | (10,105,283) | 109,019 |
| Net change in unrealized appreciation/depreciation | (6,610,848) | 37,425,412 |
| Net increase in net assets resulting from operations | 18,081,631 | 74,509,112 |
| Dividends to Shareholders From | ||
| Net investment income: | ||
| Institutional | (22,679,913) | (24,523,908) |
| Investor A | (8,498,229) | (8,923,096) |
| Investor B | (566,753) | (776,512) |
| Investor C | (1,747,524) | (1,381,082) |
| Investor C1 | (1,226,459) | (1,392,487) |
| Decrease in net assets resulting from dividends to shareholders | (34,718,878) | (36,997,085) |
| Capital Share Transactions | ||
| Net decrease in net assets derived from capital share transactions | (77,379,349) | (7,051,731) |
| Net Assets | ||
| Total increase (decrease) in net assets | (94,016,596) | 30,460,296 |
| Beginning of year | 795,880,507 | 765,420,211 |
| End of year | $ 701,863,911 | $ 795,880,507 |
| Undistributed net investment income | $ 2,281,895 | $ 2,416,717 |
See Notes to Financial Statements.
| ANNUAL | REPORT | JUNE | 30, 2011 | 47 |
| Statements of Changes in Net Assets | BlackRock National Municipal Fund | |
| Year Ended June 30, | ||
| Increase (Decrease) in Net Assets: | 2011 | 2010 |
| Operations | ||
| Net investment income | $ 112,055,270 | $ 96,333,720 |
| Net realized loss | (20,239,419) | (2,064,058) |
| Net change in unrealized appreciation/depreciation | (22,336,758) | 120,680,314 |
| Net increase in net assets resulting from operations | 69,479,093 | 214,949,976 |
| Dividends to Shareholders From | ||
| Net investment income: | ||
| Institutional | (57,025,147) | (48,071,614) |
| Investor A | (38,918,106) | (32,665,327) |
| Investor B | (1,562,654) | (2,064,417) |
| Investor C | (11,251,949) | (9,329,434) |
| Investor C1 | (3,251,474) | (3,673,746) |
| Decrease in net assets resulting from dividends to shareholders | (112,009,330) | (95,804,538) |
| Capital Share Transactions | ||
| Net increase in net assets derived from capital share transactions | 140,450,808 | 311,714,029 |
| Net Assets | ||
| Total increase in net assets | 97,920,571 | 430,859,467 |
| Beginning of year | 2,350,100,813 | 1,919,241,346 |
| End of year | $ 2,448,021,384 | $ 2,350,100,813 |
| Undistributed net investment income | $ 1,888,807 | $ 2,532,137 |
See Notes to Financial Statements.
| 48 | ANNUAL REPORT | JUNE | 30, 2011 |
| Statements of Changes in Net Assets | BlackRock High Yield Municipal Fund | |
| Year Ended June 30, | ||
| Increase (Decrease) in Net Assets: | 2011 | 2010 |
| Operations | ||
| Net investment income | $ 8,137,725 | $ 5,380,956 |
| Net realized loss | (3,380,274) | (862,425) |
| Net change in unrealized appreciation/depreciation | 1,092,810 | 12,678,898 |
| Net increase in net assets resulting from operations | 5,850,261 | 17,197,429 |
| Dividends to Shareholders From | ||
| Net investment income: | ||
| Institutional | (5,823,873) | (4,001,250) |
| Investor A | (1,388,936) | (889,571) |
| Investor C | (752,102) | (440,107) |
| Decrease in net assets resulting from dividends to shareholders | (7,964,911) | (5,330,928) |
| Capital Share Transactions | ||
| Net increase in net assets derived from capital share transactions | 25,911,196 | 65,759,877 |
| Net Assets | ||
| Total increase in net assets | 23,796,546 | 77,626,378 |
| Beginning of year | 133,810,878 | 56,184,500 |
| End of year | $ 157,607,424 | $ 133,810,878 |
| Undistributed net investment income | $ 314,041 | $ 316,237 |
See Notes to Financial Statements.
| ANNUAL | REPORT | JUNE | 30, 2011 | 49 |
| Statements of Changes in Net Assets | BlackRock New York Municipal Bond Fund | |
| Year Ended June 30, | ||
| Increase (Decrease) in Net Assets: | 2011 | 2010 |
| Operations | ||
| Net investment income | $ 11,696,840 | $ 11,530,532 |
| Net realized gain (loss) | (1,096,931) | 837,288 |
| Net change in unrealized appreciation/depreciation | (4,209,627) | 16,848,788 |
| Net increase in net assets resulting from operations | 6,390,282 | 29,216,608 |
| Dividends to Shareholders From | ||
| Net investment income: | ||
| Institutional | (1,205,096) | (994,195) |
| Investor A | (1,709,124) | (1,383,566) |
| Investor A1 | (7,233,004) | (7,515,339) |
| Investor B | (338,853) | (454,361) |
| Investor C | (666,985) | (588,088) |
| Investor C1 | (474,356) | (514,636) |
| Decrease in net assets resulting from dividends to shareholders | (11,627,418) | (11,450,185) |
| Capital Share Transactions | ||
| Net increase (decrease) in net assets derived from capital share transactions | (11,511,267) | 11,855,642 |
| Net Assets | ||
| Total increase (decrease) in net assets | (16,748,403) | 29,622,065 |
| Beginning of year | 263,514,902 | 233,892,837 |
| End of year | $ 246,766,499 | $ 263,514,902 |
| Undistributed net investment income | $ 799,549 | $ 732,806 |
See Notes to Financial Statements.
| 50 | ANNUAL REPORT | JUNE | 30, 2011 |
| Financial Highlights | BlackRock Short-Term Municipal Fund | ||||
| BlackRock | |||||
| Period | |||||
| October 2, 20061 | |||||
| Year Ended June 30, | to June 30, | ||||
| 2011 | 2010 | 2009 | 2008 | 2007 | |
| Per Share Operating Performance | |||||
| Net asset value, beginning of period | $ 10.19 | $ 10.14 | $ 9.98 | $ 9.89 | $ 9.93 |
| Net investment income2 | 0.12 | 0.15 | 0.26 | 0.33 | 0.25 |
| Net realized and unrealized gain (loss) | (0.00)3 | 0.06 | 0.17 | 0.09 | (0.04) |
| Net increase from investment operations | 0.12 | 0.21 | 0.43 | 0.42 | 0.21 |
| Dividends from net investment income | (0.13) | (0.16) | (0.27) | (0.33) | (0.25) |
| Net asset value, end of period | $ 10.18 | $ 10.19 | $ 10.14 | $ 9.98 | $ 9.89 |
| Total Investment Return3 | |||||
| Based on net asset value | 1.17% | 2.04% | 4.36% | 4.26% | 2.09%4 |
| Ratios to Average Net Assets | |||||
| Total expenses | 0.40% | 0.41% | 0.45% | 0.42% | 0.45%5 |
| Total expenses after fees waived and paid indirectly | 0.39% | 0.40% | 0.44% | 0.39% | 0.35%5 |
| Net investment income | 1.25% | 1.42% | 2.65% | 3.28% | 3.34%5 |
| Supplemental Data | |||||
| Net assets, end of period (000) | $ 43,941 | $ 17,244 | $ 2,424 | $ 1,822 | $ 2,457 |
| Portfolio turnover | 44% | 36% | 21% | 33% | 110% |
1 Commencement of operations.
2 Based on average shares outstanding.
3 Where applicable, total investment returns include the reinvestment of dividends and distributions.
4 Aggregate total investment return.
5 Annualized.
See Notes to Financial Statements.
| ANNUAL | REPORT | JUNE | 30, 2011 | 51 |
| Financial Highlights (continued) | BlackRock Short-Term Municipal Fund | |||||
| Institutional | ||||||
| Year Ended June 30, | ||||||
| 2011 | 2010 | 2009 | 2008 | 2007 | ||
| Per Share Operating Performance | ||||||
| Net asset value, beginning of year | $ 10.18 | $ 10.13 | $ 9.97 | $ 9.88 | $ 9.88 | |
| Net investment income1 | 0.13 | 0.15 | 0.27 | 0.33 | 0.32 | |
| Net realized and unrealized gain (loss) | (0.00)2 | 0.06 | 0.17 | 0.09 | 0.003 | |
| Net increase from investment operations | 0.13 | 0.21 | 0.44 | 0.42 | 0.32 | |
| Dividends from net investment income | (0.13) | (0.16) | (0.28) | (0.33) | (0.32) | |
| Net asset value, end of year | $ 10.18 | $ 10.18 | $ 10.13 | $ 9.97 | $ 9.88 | |
| Total Investment Return4 | ||||||
| Based on net asset value | 1.27% | 2.04% | 4.45% | 4.31% | 3.32% | |
| Ratios to Average Net Assets | ||||||
| Total expenses | 0.49% | 0.48% | 0.47% | 0.49% | 0.48% | |
| Total expenses after fees waived and paid indirectly | 0.40% | 0.40% | 0.35% | 0.35% | 0.38% | |
| Net investment income | 1.26% | 1.50% | 2.68% | 3.30% | 3.27% | |
| Supplemental Data | ||||||
| Net assets, end of year (000) | $ 603,837 | $ 628,194 | $ 403,143 | $ 181,624 | $ 131,061 | |
| Portfolio turnover | 44% | 36% | 21% | 33% | 110% | |
1 Based on average shares outstanding.
2 Amount is less than $(0.01) per share.
3 Amount is less than $0.01 per share.
4 Where applicable, total investment returns exclude the effects of any sales charges and include the reinvestment of dividends and distributions.
See Notes to Financial Statements.
| 52 | ANNUAL REPORT | JUNE | 30, 2011 |
| Financial Highlights (continued) | BlackRock Short-Term Municipal Fund | ||||
| Investor A | |||||
| Period | |||||
| October 2, 20061 | |||||
| Year Ended June 30, | to June 30, | ||||
| 2011 | 2010 | 2009 | 2008 | 2007 | |
| Per Share Operating Performance | |||||
| Net asset value, beginning of period | $ 10.19 | $ 10.13 | $ 9.98 | $ 9.88 | $ 9.93 |
| Net investment income2 | 0.10 | 0.12 | 0.21 | 0.30 | 0.23 |
| Net realized and unrealized gain (loss) | (0.00)3 | 0.07 | 0.19 | 0.11 | (0.05) |
| Net increase from investment operations | 0.10 | 0.19 | 0.40 | 0.41 | 0.18 |
| Dividends from net investment income | (0.10) | (0.13) | (0.25) | (0.31) | (0.23) |
| Net asset value, end of period | $ 10.19 | $ 10.19 | $ 10.13 | $ 9.98 | $ 9.88 |
| Total Investment Return3 | |||||
| Based on net asset value | 0.99% | 1.86% | 4.08% | 4.15% | 1.79%4 |
| Ratios to Average Net Assets | |||||
| Total expenses | 0.67% | 0.68% | 0.72% | 0.79% | 1.06%5 |
| Total expenses after fees waived and paid indirectly | 0.67% | 0.67% | 0.60% | 0.60% | 0.61%5 |
| Net investment income | 1.00% | 1.20% | 2.26% | 3.03% | 3.12%5 |
| Supplemental Data | |||||
| Net assets, end of period (000) | $ 221,827 | $ 297,336 | $ 121,355 | $ 9,403 | $ 1,456 |
| Portfolio turnover | 44% | 36% | 21% | 33% | 110% |
1 Commencement of operations.
2 Based on average shares outstanding.
3 Where applicable, total investment returns exclude the effects of any sales charges and include the reinvestment of dividends and distributions.
4 Aggregate total investment return.
5 Annualized.
See Notes to Financial Statements.
| ANNUAL | REPORT | JUNE | 30, 2011 | 53 |
| Financial Highlights (continued) | BlackRock Short-Term Municipal Fund | ||||||||||||
| Investor A1 | Investor B | ||||||||||||
| Year Ended June 30, | Year Ended June 30, | ||||||||||||
| 2011 | 2010 | 2009 | 2008 | 2007 | 2011 | 2010 | 2009 | 2008 | 2007 | ||||
| Per Share Operating Performance | |||||||||||||
| Net asset value, beginning of year | $ 10.19 | $ 10.14 | $ 9.98 | $ 9.89 | $ 9.89 | $ 10.18 | $ 10.13 | $ 9.97 | $ 9.88 | $ 9.88 | |||
| Net investment income1 | 0.12 | 0.14 | 0.27 | 0.32 | 0.32 | 0.09 | 0.11 | 0.24 | 0.30 | 0.29 | |||
| Net realized and unrealized gain (loss) | (0.00)2 | 0.05 | 0.16 | 0.09 | (0.01) | (0.00)2 | 0.05 | 0.16 | 0.08 | (0.00)2 | |||
| Net increase from investment operations | 0.12 | 0.19 | 0.43 | 0.41 | 0.31 | 0.09 | 0.16 | 0.40 | 0.38 | 0.29 | |||
| Dividends from net investment income | (0.12) | (0.14) | (0.27) | (0.32) | (0.31) | (0.09) | (0.11) | (0.24) | (0.29) | (0.29) | |||
| Net asset value, end of year | $ 10.19 | $ 10.19 | $ 10.14 | $ 9.98 | $ 9.89 | $ 10.18 | $ 10.18 | $ 10.13 | $ 9.97 | $ 9.88 | |||
| Total Investment Return2 | |||||||||||||
| Based on net asset value | 1.14% | 1.91% | 4.34% | 4.20% | 3.21% | 0.85% | 1.62% | 4.08% | 3.94% | 2.95% | |||
| Ratios to Average Net Assets | |||||||||||||
| Total expenses | 0.54% | 0.55% | 0.58% | 0.59% | 0.58% | 0.82% | 0.82% | 0.85% | 0.85% | 0.85% | |||
| Total expenses after fees waived and | |||||||||||||
| paid indirectly | 0.52% | 0.52% | 0.45% | 0.45% | 0.48% | 0.81% | 0.81% | 0.70% | 0.70% | 0.74% | |||
| Net investment income | 1.14% | 1.41% | 2.70% | 3.22% | 3.18% | 0.86% | 1.13% | 2.41% | 2.97% | 2.90% | |||
| Supplemental Data | |||||||||||||
| Net assets, end of year (000) | $ 53,141 | $ 66,404 | $ 78,606 | $105,580 | $122,281 | $ 5,258 | $ 8,503 | $ 9,917 | $ 10,612 | $ 14,380 | |||
| Portfolio turnover | 44% | 36% | 21% | 33% | 110% | 44% | 36% | 21% | 33% | 110% | |||
1 Based on average shares outstanding.
2 Where applicable, total investment returns exclude the effects of any sales charges and include the reinvestment of dividends and distributions.
See Notes to Financial Statements.
| 54 | ANNUAL REPORT | JUNE | 30, 2011 |
| Financial Highlights (concluded) | BlackRock Short-Term Municipal Fund | ||||
| Investor C | |||||
| Period | |||||
| October 2, 20061 | |||||
| Year Ended June 30, | to June 30, | ||||
| 2011 | 2010 | 2009 | 2008 | 2007 | |
| Per Share Operating Performance | |||||
| Net asset value, beginning of period | $ 10.18 | $ 10.13 | $ 9.97 | $ 9.88 | $ 9.93 |
| Net investment income2 | 0.02 | 0.05 | 0.15 | 0.23 | 0.17 |
| Net realized and unrealized gain (loss) | (0.00)3 | 0.05 | 0.19 | 0.09 | (0.05) |
| Net increase from investment operations | 0.02 | 0.10 | 0.34 | 0.32 | 0.12 |
| Dividends from net investment income | (0.02) | (0.05) | (0.18) | (0.23) | (0.17) |
| Net asset value, end of period | $ 10.18 | $ 10.18 | $ 10.13 | $ 9.97 | $ 9.88 |
| Total Investment Return4 | |||||
| Based on net asset value | 0.21% | 0.97% | 3.41% | 3.27% | 1.23%5 |
| Ratios to Average Net Assets | |||||
| Total expenses | 1.45% | 1.46% | 1.52% | 1.78% | 2.06%6 |
| Total expenses after fees waived and paid indirectly | 1.45% | 1.45% | 1.35% | 1.35% | 1.36%6 |
| Net investment income | 0.22% | 0.44% | 1.56% | 2.28% | 2.37%6 |
| Supplemental Data | |||||
| Net assets, end of period (000) | $ 86,264 | $ 117,792 | $ 69,632 | $ 7,365 | $ 2,084 |
| Portfolio turnover | 44% | 36% | 21% | 33% | 110% |
1 Commencement of operations.
2 Based on average shares outstanding.
3 Amount is less than $(0.01) per share.
4 Where applicable, total investment returns exclude the effects of any sales charges and include the reinvestment of dividends and distributions.
5 Aggregate total investment return.
6 Annualized.
See Notes to Financial Statements.
| ANNUAL | REPORT | JUNE | 30, 2011 | 55 |
| Financial Highlights | BlackRock Municipal Fund | |||||||||||
| Institutional | Investor A | |||||||||||
| Year Ended June 30, | Year Ended June 30, | |||||||||||
| 2011 | 2010 | 2009 | 2008 | 2007 | 2011 | 2010 | 2009 | 2008 | 2007 | |||
| Per Share Operating Performance | ||||||||||||
| Net asset value, beginning of year | $ 7.52 | $ 7.17 | $ 7.42 | $ 7.67 | $ 7.69 | $ 7.52 | $ 7.17 | $ 7.41 | $ 7.67 | $ 7.68 | ||
| Net investment income1 | 0.35 | 0.36 | 0.35 | 0.33 | 0.32 | 0.34 | 0.34 | 0.33 | 0.31 | 0.33 | ||
| Net realized and unrealized gain (loss) | (0.13) | 0.35 | (0.25) | (0.23) | 0.03 | (0.14) | 0.35 | (0.24) | (0.24) | 0.01 | ||
| Net increase from investment operations | 0.22 | 0.71 | 0.10 | 0.10 | 0.35 | 0.20 | 0.69 | 0.09 | 0.07 | 0.34 | ||
| Dividends and distributions from: | ||||||||||||
| Net investment income | (0.35) | (0.36) | (0.35) | (0.34) | (0.33) | (0.33) | (0.34) | (0.33) | (0.32) | (0.31) | ||
| Net realized gain | — | — | (0.00)2 | (0.01) | (0.04) | — | — | (0.00)2 | (0.01) | (0.04) | ||
| Total dividends and distributions | (0.35) | (0.36) | (0.35) | (0.35) | (0.37) | (0.33) | (0.34) | (0.33) | (0.33) | (0.35) | ||
| Net asset value, end of year | $ 7.39 | $ 7.52 | $ 7.17 | $ 7.42 | $ 7.67 | $ 7.39 | $ 7.52 | $ 7.17 | $ 7.41 | $ 7.67 | ||
| Total Investment Return3 | ||||||||||||
| Based on net asset value | 3.07% | 10.04% | 1.52% | 1.37% | 4.60% | 2.80% | 9.76% | 1.39% | 0.96% | 4.47% | ||
| Ratios to Average Net Assets | ||||||||||||
| Total expenses | 0.52% | 0.52% | 0.67% | 0.85% | 0.87% | 0.79% | 0.78% | 0.93% | 1.11% | 1.13% | ||
| Total expenses after fees waived | 0.52% | 0.52% | 0.66% | 0.84% | 0.87% | 0.79% | 0.78% | 0.92% | 1.10% | 1.12% | ||
| Total expenses after fees waived and paid indirectly | ||||||||||||
| and excluding interest expense and fees4 | 0.46% | 0.46% | 0.47% | 0.46% | 0.47% | 0.73% | 0.72% | 0.73% | 0.72% | 0.72% | ||
| Net investment income | 4.79% | 4.82% | 4.93% | 4.38% | 4.42% | 4.52% | 4.56% | 4.67% | 4.12% | 4.17% | ||
| Supplemental Data | ||||||||||||
| Net assets, end of year (000) | $445,889 | $505,547 | $493,427 | $545,130 | $604,691 | $172,176 | $196,325 | $189,614 | $169,010 | $172,236 | ||
| Portfolio turnover | 21% | 14% | 15% | 40% | 36% | 21% | 14% | 15% | 40% | 36% | ||
1 Based on average shares outstanding.
2 Amount is less than $(0.01) per share.
3 Where applicable, total investment returns exclude the effects of any sales charges and include the reinvestment of dividends and distributions.
4 Interest expense and fees relate to TOBs. See Note 1 of the Notes to Financial Statements for details of municipal bonds transferred to TOBs.
See Notes to Financial Statements.
| 56 | ANNUAL REPORT | JUNE | 30, 2011 |
| Financial Highlights (continued) | BlackRock Municipal Fund | ||||
| Investor B | |||||
| Year Ended June 30, | |||||
| 2011 | 2010 | 2009 | 2008 | 2007 | |
| Per Share Operating Performance | |||||
| Net asset value, beginning of year | $ 7.51 | $ 7.16 | $ 7.41 | $ 7.67 | $ 7.68 |
| Net investment income1 | 0.30 | 0.30 | 0.29 | 0.27 | 0.29 |
| Net realized and unrealized gain (loss) | (0.12) | 0.35 | (0.25) | (0.24) | 0.01 |
| Net increase (decrease) from investment operations | 0.18 | 0.65 | 0.04 | 0.03 | 0.30 |
| Dividends and distributions from: | |||||
| Net investment income | (0.30) | (0.30) | (0.29) | (0.28) | (0.27) |
| Net realized gain | — | — | (0.00)2 | (0.01) | (0.04) |
| Total dividends and distributions | (0.30) | (0.30) | (0.29) | (0.29) | (0.31) |
| Net asset value, end of year | $ 7.39 | $ 7.51 | $ 7.16 | $ 7.41 | $ 7.67 |
| Total Investment Return3 | |||||
| Based on net asset value | 2.42% | 9.20% | 0.73% | 0.45% | 3.95% |
| Ratios to Average Net Assets | |||||
| Total expenses | 1.30% | 1.30% | 1.45% | 1.61% | 1.63% |
| Total expenses after fees waived and paid indirectly | 1.30% | 1.29% | 1.44% | 1.61% | 1.63% |
| Total expenses after fees waived and paid indirectly and excluding interest expense and fees4 . | 1.24% | 1.24% | 1.25% | 1.23% | 1.23% |
| Net investment income | 4.01% | 4.04% | 4.15% | 3.61% | 3.67% |
| Supplemental Data | |||||
| Net assets, end of year (000) | $ 11,481 | $ 16,987 | $ 20,504 | $ 33,422 | $ 45,533 |
| Portfolio turnover | 21% | 14% | 15% | 40% | 36% |
1 Based on average shares outstanding.
2 Amount is less than $(0.01) per share.
3 Where applicable, total investment returns exclude the effects of any sales charges and include the reinvestment of dividends and distributions.
4 Interest expense and fees relate to TOBs. See Note 1 of the Notes to Financial Statements for details of municipal bonds transferred to TOBs.
See Notes to Financial Statements.
| ANNUAL | REPORT | JUNE | 30, 2011 | 57 |
| Financial Highlights (concluded) | BlackRock Municipal Fund | ||||||||||
| Investor C | Investor C1 | ||||||||||
| Period | |||||||||||
| October 2, 20061 | |||||||||||
| Year Ended June 30, | to June 30, | Year Ended June 30, | |||||||||
| 2011 | 2010 | 2009 | 2008 | 2007 | 2011 | 2010 | 2009 | 2008 | 2007 | ||
| Per Share Operating Performance | |||||||||||
| Net asset value, beginning of period | $ 7.53 | $ 7.17 | $ 7.42 | $ 7.68 | $ 7.88 | $ 7.52 | $ 7.16 | $ 7.41 | $ 7.67 | $ 7.68 | |
| Net investment income2 | 0.28 | 0.28 | 0.28 | 0.25 | 0.17 | 0.29 | 0.30 | 0.29 | 0.27 | 0.28 | |
| Net realized and unrealized gain (loss) | (0.13) | 0.36 | (0.26) | (0.24) | (0.14) | (0.12) | 0.36 | (0.25) | (0.24) | 0.02 | |
| Net increase (decrease) from investment | |||||||||||
| operations | 0.15 | 0.64 | 0.02 | 0.01 | 0.03 | 0.17 | 0.66 | 0.04 | 0.03 | 0.30 | |
| Dividends and distributions from: | |||||||||||
| Net investment income | (0.28) | (0.28) | (0.27) | (0.26) | (0.19) | (0.30) | (0.30) | (0.29) | (0.28) | (0.27) | |
| Net realized gain | — | — | (0.00)2 | (0.01) | (0.04) | — | — | (0.00)3 | (0.01) | (0.04) | |
| Total dividends and distributions | (0.28) | (0.28) | (0.27) | (0.27) | (0.23) | (0.30) | (0.30) | (0.29) | (0.29) | (0.31) | |
| Net asset value, end of period | $ 7.40 | $ 7.53 | $ 7.17 | $ 7.42 | $ 7.68 | $ 7.39 | $ 7.52 | $ 7.16 | $ 7.41 | $ 7.67 | |
| Total Investment Return4 | |||||||||||
| Based on net asset value | 2.05% | 9.09% | 0.51% | 0.22% | 0.34%5 | 2.24% | 9.30% | 0.69% | 0.41% | 3.90% | |
| Ratios to Average Net Assets | |||||||||||
| Total expenses | 1.53% | 1.53% | 1.68% | 1.85% | 1.90%6 | 1.34% | 1.34% | 1.49% | 1.66% | 1.68% | |
| Total expenses after fees waived and | |||||||||||
| paid indirectly | 1.53% | 1.53% | 1.67% | 1.84% | 1.90%6 | 1.34% | 1.34% | 1.48% | 1.65% | 1.68% | |
| Total expenses after fees waived and | |||||||||||
| paid indirectly and excluding interest expense | |||||||||||
| and fees7 | 1.47% | 1.47% | 1.48% | 1.46% | 1.51%6 | 1.28% | 1.28% | 1.29% | 1.27% | 1.28% | |
| Net investment income | 3.78% | 3.81% | 3.92% | 3.37% | 3.37% | 3.97% | 4.00% | 4.11% | 3.57% | 3.63% | |
| Supplemental Data | |||||||||||
| Net assets, end of period (000) | $ 43,846 | $ 43,505 | $ 27,375 | $ 13,674 | $ 4,542 | $ 28,472 | $ 33,515 | $ 34,500 | $ 42,655 | $ 51,452 | |
| Portfolio turnover | 21% | 14% | 15% | 40% | 36% | 21% | 14% | 15% | 40% | 36% | |
1 Commencement of operations.
2 Based on average shares outstanding.
3 Amount is less than $(0.01) per share.
4 Where applicable, total investment returns exclude the effects of any sales charges and include the reinvestment of dividends and distributions.
5 Aggregate total investment return.
6 Annualized.
7 Interest expense and fees relate to TOBs. See Note 1 of the Notes to Financial Statements for details of municipal bonds transferred to TOBs.
See Notes to Financial Statements.
| 58 | ANNUAL REPORT | JUNE | 30, 2011 |
| Financial Highlights | BlackRock National Municipal Fund | |||||||||||
| Institutional | Investor A | |||||||||||
| Year Ended June 30, | Year Ended June 30, | |||||||||||
| 2011 | 2010 | 2009 | 2008 | 2007 | 2011 | 2010 | 2009 | 2008 | 2007 | |||
| Per Share Operating Performance | ||||||||||||
| Net asset value, beginning of year | $ 10.19 | $ 9.61 | $ 9.95 | $ 10.39 | $ 10.36 | $ 10.19 | $ 9.62 | $ 9.96 | $ 10.39 | $ 10.37 | ||
| Net investment income1 | 0.49 | 0.48 | 0.48 | 0.48 | 0.49 | 0.46 | 0.45 | 0.46 | 0.45 | 0.46 | ||
| Net realized and unrealized gain (loss) | (0.14) | 0.57 | (0.35) | (0.44) | 0.05 | (0.13) | 0.57 | (0.35) | (0.43) | 0.03 | ||
| Net increase from investment operations | 0.35 | 1.05 | 0.13 | 0.04 | 0.54 | 0.33 | 1.02 | 0.11 | 0.02 | 0.49 | ||
| Dividends from net investment income | (0.49) | (0.47) | (0.47) | (0.48) | (0.51) | (0.46) | (0.45) | (0.45) | (0.45) | (0.47) | ||
| Net asset value, end of year | $ 10.05 | $ 10.19 | $ 9.61 | $ 9.95 | $ 10.39 | $ 10.06 | $ 10.19 | $ 9.62 | $ 9.96 | $ 10.39 | ||
| Total Investment Return2 | ||||||||||||
| Based on net asset value | 3.49% | 11.16% | 1.56% | 0.35% | 5.06% | 3.36% | 10.77% | 1.32% | 0.22% | 4.71% | ||
| Ratios to Average Net Assets | ||||||||||||
| Total expenses | 0.69% | 0.62% | 0.67% | 0.79% | 1.00% | 0.92% | 0.87% | 0.91% | 1.02% | 1.24% | ||
| Total expenses after fees waived and | ||||||||||||
| paid indirectly | 0.69% | 0.62% | 0.65% | 0.78% | 0.99% | 0.92% | 0.87% | 0.90% | 1.01% | 1.24% | ||
| Total expenses after fees waived and | ||||||||||||
| paid indirectly and excluding interest expense | ||||||||||||
| and fees3 | 0.60% | 0.59% | 0.60% | 0.60% | 0.59% | 0.83% | 0.84% | 0.84% | 0.82% | 0.84% | ||
| Net investment income | 4.83% | 4.76% | 5.10% | 4.69% | 4.66% | 4.60% | 4.52% | 4.87% | 4.46% | 4.43% | ||
| Supplemental Data | ||||||||||||
| Net assets, end of year (000) | $1,207,501 $1,103,381 $934,807 | $977,642 | $976,153 | $855,849 | $820,009 | $635,090 | $472,018 | $349,225 | ||||
| Portfolio turnover | 51% | 70% | 65% | 61% | 46% | 51% | 70% | 65% | 61% | 46% | ||
1 Based on average shares outstanding.
2 Where applicable, total investment returns exclude the effects of any sales charges and include the reinvestment of dividends and distributions.
3 Interest expense and fees relate to TOBs. See Note 1 of the Notes to Financial Statements for details of municipal bonds transferred to TOBs.
See Notes to Financial Statements.
| ANNUAL | REPORT | JUNE | 30, 2011 | 59 |
| Financial Highlights (continued) | BlackRock National Municipal Fund | |||||
| Investor B | ||||||
| Year Ended June 30, | ||||||
| 2011 | 2010 | 2009 | 2008 | 2007 | ||
| Per Share Operating Performance | ||||||
| Net asset value, beginning of year | $ 10.18 | $ 9.61 | $ 9.95 | $ 10.38 | $ 10.36 | |
| Net investment income1 | 0.41 | 0.40 | 0.41 | 0.40 | 0.41 | |
| Net realized and unrealized gain (loss) | (0.12) | 0.57 | (0.35) | (0.43) | 0.02 | |
| Net increase (decrease) from investment operations | 0.29 | 0.97 | 0.06 | (0.03) | 0.43 | |
| Dividends from net investment income | (0.42) | (0.40) | (0.40) | (0.40) | (0.41) | |
| Net asset value, end of year | $ 10.05 | $ 10.18 | $ 9.61 | $ 9.95 | $ 10.38 | |
| Total Investment Return2 | ||||||
| Based on net asset value | 2.89% | 10.21% | 0.79% | (0.30)% | 4.18% | |
| Ratios to Average Net Assets | ||||||
| Total expenses | 1.44% | 1.39% | 1.43% | 1.54% | 1.75% | |
| Total expenses after fees waived and paid indirectly | 1.38% | 1.38% | 1.41% | 1.53% | 1.75% | |
| Total expenses after fees waived and paid indirectly and excluding interest expense and fees3 . | 1.30% | 1.36% | 1.36% | 1.35% | 1.34% | |
| Net investment income | 4.10% | 3.99% | 4.35% | 3.94% | 3.92% | |
| Supplemental Data | ||||||
| Net assets, end of year (000) | $ 30,346 | $ 46,152 | $ 58,079 | $ 69,859 | $ 101,260 | |
| Portfolio turnover | 51% | 70% | 65% | 61% | 46% | |
1 Based on average shares outstanding.
2 Where applicable, total investment returns exclude the effects of any sales charges and include the reinvestment of dividends and distributions.
3 Interest expense and fees relate to TOBs. See Note 1 of the Notes to Financial Statements for details of municipal bonds transferred to TOBs.
See Notes to Financial Statements.
| 60 | ANNUAL REPORT | JUNE | 30, 2011 |
| Financial Highlights (concluded) | BlackRock National Municipal Fund | ||||||||||
| Investor C | Investor C1 | ||||||||||
| Period | |||||||||||
| October 2, 20061 | |||||||||||
| Year Ended June 30, | to June 30, | Year Ended June 30, | |||||||||
| 2011 | 2010 | 2009 | 2008 | 2007 | 2011 | 2010 | 2009 | 2008 | 2007 | ||
| Per Share Operating Performance | |||||||||||
| Net asset value, beginning of period | $ 10.19 | $ 9.62 | $ 9.96 | $ 10.39 | $ 10.57 | $ 10.19 | $ 9.61 | $ 9.95 | $ 10.39 | $ 10.36 | |
| Net investment income2 | 0.39 | 0.38 | 0.39 | 0.37 | 0.25 | 0.41 | 0.40 | 0.41 | 0.40 | 0.41 | |
| Net realized and unrealized gain (loss) | (0.13) | 0.57 | (0.35) | (0.43) | (0.16) | (0.13) | 0.57 | (0.35) | (0.44) | 0.04 | |
| Net increase (decrease) from investment | |||||||||||
| operations | 0.26 | 0.95 | 0.04 | (0.06) | 0.09 | 0.28 | 0.97 | 0.06 | (0.04) | 0.45 | |
| Dividends from net investment income | (0.39) | (0.38) | (0.38) | (0.37) | (0.27) | (0.41) | (0.39) | (0.40) | (0.40) | (0.42) | |
| Net asset value, end of period | $ 10.06 | $ 10.19 | $ 9.62 | $ 9.96 | $ 10.39 | $ 10.06 | $ 10.19 | $ 9.61 | $ 9.95 | $ 10.39 | |
| Total Investment Return3 | |||||||||||
| Based on net asset value | 2.60% | 9.95% | 0.56% | (0.57)% | 0.96%4 | 2.80% | 10.28% | 0.76% | (0.44)% | 4.23% | |
| Ratios to Average Net Assets | |||||||||||
| Total expenses | 1.66% | 1.61% | 1.66% | 1.82% | 2.05%5 | 1.47% | 1.42% | 1.46% | 1.58% | 1.80% | |
| Total expenses after fees waived and | |||||||||||
| paid indirectly | 1.66% | 1.61% | 1.65% | 1.81% | 2.05%5 | 1.46% | 1.42% | 1.44% | 1.57% | 1.80% | |
| Total expenses after fees waived and | |||||||||||
| paid indirectly and excluding interest expense | |||||||||||
| and fees6 | 1.58% | 1.58% | 1.59% | 1.62% | 1.65%5 | 1.38% | 1.39% | 1.39% | 1.39% | 1.39% | |
| Net investment income | 3.85% | 3.77% | 4.12% | 3.66% | 3.59%5 | 4.04% | 3.96% | 4.32% | 3.90% | 3.88% | |
| Supplemental Data | |||||||||||
| Net assets, end of period (000) | $281,024 | $292,132 | $195,475 | $103,504 | $ 41,676 | $ 73,302 | $ 88,427 | $ 95,790 | $114,746 | $140,653 | |
| Portfolio turnover | 51% | 70% | 65% | 61% | 46% | 51% | 70% | 65% | 61% | 46% | |
1 Commencement of operations.
2 Based on average shares outstanding.
3 Where applicable, total investment returns exclude the effects of any sales charges and include the reinvestment of dividends and distributions.
4 Aggregate total investment return.
5 Annualized.
6 Interest expense and fees relate to TOBs. See Note 1 of the Notes to Financial Statements for details of municipal bonds transferred to TOBs.
See Notes to Financial Statements.
| ANNUAL | REPORT | JUNE | 30, 2011 | 61 |
| Financial Highlights | BlackRock High Yield Municipal Fund | ||||||||||
| Institutional | Investor A | ||||||||||
| Period | Period | ||||||||||
| August 1, 20061 | August 1, 20061 | ||||||||||
| Year Ended June 30, | to June 30, | Year Ended June 30, | to June 30, | ||||||||
| 2011 | 2010 | 2009 | 2008 | 2007 | 2011 | 2010 | 2009 | 2008 | 2007 | ||
| Per Share Operating Performance | |||||||||||
| Net asset value, beginning of period | $ 8.47 | $ 7.29 | $ 8.68 | $ 9.96 | $ 10.00 | $ 8.46 | $ 7.28 | $ 8.67 | $ 9.95 | $ 10.00 | |
| Net investment income2 | 0.46 | 0.46 | 0.48 | 0.44 | 0.39 | 0.43 | 0.43 | 0.44 | 0.41 | 0.32 | |
| Net realized and unrealized gain (loss) | (0.13) | 1.18 | (1.40) | (1.26) | (0.03) | (0.13) | 1.18 | (1.39) | (1.26) | 0.01 | |
| Net increase (decrease) from investment | |||||||||||
| operations | 0.33 | 1.64 | (0.92) | (0.82) | 0.36 | 0.30 | 1.61 | (0.95) | (0.85) | 0.33 | |
| Dividends and distributions from: | |||||||||||
| Net investment income | (0.45) | (0.46) | (0.47) | (0.44) | (0.40) | (0.43) | (0.43) | (0.44) | (0.41) | (0.38) | |
| Net realized gain | — | — | — | (0.02) | (0.00)3 | — | — | — | (0.02) | (0.00)3 | |
| Total dividends and distributions | (0.45) | (0.46) | (0.47) | (0.46) | (0.40) | (0.43) | (0.43) | (0.44) | (0.43) | (0.38) | |
| Net asset value, end of period | $ 8.35 | $ 8.47 | $ 7.29 | $ 8.68 | $ 9.96 | $ 8.33 | $ 8.46 | $ 7.28 | $ 8.67 | $ 9.95 | |
| Total Investment Return4 | |||||||||||
| Based on net asset value | 4.14% | 22.88% | (10.40)% | (8.38)% | 3.59%5 | 3.73% | 22.58% | (10.67)% | (8.62)% | 3.26%5 | |
| Ratios to Average Net Assets | |||||||||||
| Total expenses | 0.78% | 0.83% | 0.93% | 0.84% | 0.96%6 | 1.05% | 1.09% | 1.18% | 1.08% | 1.19%6 | |
| Total expenses after fees waived | 0.78% | 0.83% | 0.92% | 0.81% | 0.62%6 | 1.05% | 1.09% | 1.17% | 1.05% | 0.89%6 | |
| Total expenses after fees waived and excluding | |||||||||||
| interest expense and fees7 | 0.72% | 0.79% | 0.89% | 0.78% | 0.62%6 | 0.99% | 1.05% | 1.14% | 1.03% | 0.89%6 | |
| Net investment income | 5.49% | 5.63% | 6.52% | 4.76% | 4.35%6 | 5.21% | 5.33% | 6.13% | 4.52% | 4.16%6 | |
| Supplemental Data | |||||||||||
| Net assets, end of period (000) | $111,669 | $ 94,146 | $ 45,997 | $ 71,203 | $ 62,464 | $ 27,993 | $ 25,105 | $ 4,798 | $ 6,513 | $ 5,892 | |
| Portfolio turnover | 31% | 32% | 39% | 33% | 16% | 31% | 32% | 39% | 33% | 16% | |
1 Commencement of operations.
2 Based on average shares outstanding.
3 Amount is less than $(0.01) per share.
4 Where applicable, total investment returns exclude the effects of any sales charges and include the reinvestment of dividends and distributions.
5 Aggregate total investment return.
6 Annualized.
7 Interest expense and fees relate to TOBs. See Note 1 of the Notes to Financial Statements for details of municipal bonds transferred to TOBs.
See Notes to Financial Statements.
| 62 | ANNUAL REPORT | JUNE | 30, 2011 |
| Financial Highlights (concluded) | BlackRock High Yield Municipal Fund | ||||
| Investor C | |||||
| Period | |||||
| August 1, 20061 | |||||
| Year Ended June 30, | to June 30, | ||||
| 2011 | 2010 | 2009 | 2008 | 2007 | |
| Per Share Operating Performance | |||||
| Net asset value, beginning of period | $ 8.47 | $ 7.29 | $ 8.68 | $ 9.97 | $ 10.00 |
| Net investment income2 | 0.37 | 0.37 | 0.41 | 0.34 | 0.30 |
| Net realized and unrealized gain (loss) | (0.12) | 1.18 | (1.41) | (1.27) | (0.02) |
| Net increase (decrease) from investment operations | 0.25 | 1.55 | (1.00) | (0.93) | 0.28 |
| Dividends and distributions from: | |||||
| Net investment income | (0.37) | (0.37) | (0.39) | (0.34) | (0.31) |
| Net realized gain | — | — | — | (0.02) | (0.00)3 |
| Total dividends and distributions | (0.37) | (0.37) | (0.39) | (0.36) | (0.31) |
| Net asset value, end of period | $ 8.35 | $ 8.47 | $ 7.29 | $ 8.68 | $ 9.97 |
| Total Investment Return4 | |||||
| Based on net asset value | 3.07% | 21.61% | (11.33)% | (9.40)% | 2.84%5 |
| Ratios to Average Net Assets | |||||
| Total expenses | 1.82% | 1.88% | 1.97% | 1.85% | 1.84%6 |
| Total expenses after fees waived | 1.82% | 1.88% | 1.97% | 1.82% | 1.53%6 |
| Total expenses after fees waived and excluding interest expense and fees7 | 1.77% | 1.84% | 1.94% | 1.80% | 1.53%6 |
| Net investment income | 4.45% | 4.58% | 5.59% | 3.76% | 3.50%6 |
| Supplemental Data | |||||
| Net assets, end of period (000) | $ 17,945 | $ 14,560 | $ 5,389 | $ 4,527 | $ 4,378 |
| Portfolio turnover | 31% | 32% | 39% | 33% | 16% |
1 Commencement of operations.
2 Based on average shares outstanding.
3 Amount is less than $(0.01) per share.
4 Where applicable, total investment returns exclude the effects of any sales charges and include the reinvestment of dividends and distributions.
5 Aggregate total investment return.
6 Annualized.
7 Interest expense and fees relate to TOBs. See Note 1 of the Notes to Financial Statements for details of municipal bonds transferred to TOBs.
See Notes to Financial Statements.
| ANNUAL | REPORT | JUNE | 30, 2011 | 63 |
| Financial Highlights | BlackRock New York Municipal Bond Fund | ||||||
| Institutional | |||||||
| Period | |||||||
| October 1, | |||||||
| 2007 to | |||||||
| Year Ended June 30, | June 30, | Year Ended September 30, | |||||
| 2011 | 2010 | 2009 | 2008 | 2007 | 2006 | ||
| Per Share Operating Performance | |||||||
| Net asset value, beginning of period | $ 10.55 | $ 9.81 | $ 10.38 | $ 10.84 | $ 11.10 | $ 11.05 | |
| Net investment income1 | 0.50 | 0.49 | 0.48 | 0.36 | 0.49 | 0.51 | |
| Net realized and unrealized gain (loss) | (0.20) | 0.74 | (0.56) | (0.46) | (0.26) | 0.04 | |
| Net increase (decrease) from investment operations | 0.30 | 1.23 | (0.08) | (0.10) | 0.23 | 0.55 | |
| Dividends from net investment income | (0.49) | (0.49) | (0.49) | (0.36) | (0.49) | (0.50) | |
| Net asset value, end of period | $ 10.36 | $ 10.55 | $ 9.81 | $ 10.38 | $ 10.84 | $ 11.10 | |
| Total Investment Return2 | |||||||
| Based on net asset value | 2.97% | 12.74% | (0.60)% | (0.91)%3 | 2.12% | 5.19% | |
| Ratios to Average Net Assets | |||||||
| Total expenses | 0.72% | 0.76% | 0.78% | 0.82%4 | 0.85% | 0.90% | |
| Total expenses, after fees waived and paid indirectly | 0.72% | 0.76% | 0.77% | 0.81%4 | 0.85% | 0.90% | |
| Total expenses after fees waived and paid indirectly and excluding interest | |||||||
| expense and fees5 | 0.70% | 0.75% | 0.76% | 0.74%4 | 0.73% | 0.74% | |
| Net investment income | 4.78% | 4.77% | 5.01% | 4.56%4 | 4.51% | 4.64% | |
| Supplemental Data | |||||||
| Net assets, end of period (000) | $ 25,864 | $ 23,841 | $ 19,105 | $ 17,949 | $ 14,927 | $ 10,995 | |
| Portfolio turnover | 17 % | 19% | 30% | 16% | 19% | 46% | |
1 Based on average shares outstanding.
2 Where applicable, total investment returns exclude the effects of any sales charges and include the reinvestment of dividends and distributions.
3 Aggregate total investment return.
4 Annualized.
5 Interest expense and fees relate to TOBs. See Note 1 of the Notes to Financial Statements for details of municipal bonds transferred to TOBs.
See Notes to Financial Statements.
| 64 | ANNUAL REPORT | JUNE | 30, 2011 |
| Financial Highlights (continued) | BlackRock New York Municipal Bond Fund | |||||
| Investor A | ||||||
| Period | Period | |||||
| October 1, | October 2, | |||||
| 2007 | 20061 to | |||||
| Year Ended June 30, | to June 30, | September 30, | ||||
| 2011 | 2010 | 2009 | 2008 | 2007 | ||
| Per Share Operating Performance | ||||||
| Net asset value, beginning of period | $ 10.55 | $ 9.82 | $ 10.39 | $ 10.85 | $ 11.10 | |
| Net investment income2 | 0.47 | 0.47 | 0.46 | 0.34 | 0.46 | |
| Net realized and unrealized gain (loss) | (0.19) | 0.72 | (0.57) | (0.46) | (0.25) | |
| Net increase (decrease) from investment operations | 0.28 | 1.19 | (0.11) | (0.12) | 0.21 | |
| Dividends from net investment income | (0.46) | (0.46) | (0.46) | (0.34) | (0.46) | |
| Net asset value, end of period | $ 10.37 | $ 10.55 | $ 9.82 | $ 10.39 | $ 10.85 | |
| Total Investment Return3 | ||||||
| Based on net asset value | 2.76% | 12.33% | (0.85)% | (1.10)%4 | 1.93%4 | |
| Ratios to Average Net Assets | ||||||
| Total expenses | 1.02% | 1.02% | 1.05% | 1.07%5 | 1.10%5 | |
| Total expenses after fees waived and paid indirectly | 1.01% | 1.02% | 1.04% | 1.06%5 | 1.10%5 | |
| Total expenses after fees waived and paid indirectly and excluding interest expense and fees6 . | 1.00% | 1.01% | 1.02% | 0.99%5 | 0.99%5 | |
| Net investment income | 4.47% | 4.50% | 4.77% | 4.31%5 | 4.27%5 | |
| Supplemental Data | ||||||
| Net assets, end of period (000) | $ 35,751 | $ 37,736 | $ 20,528 | $ 16,181 | $ 11,964 | |
| Portfolio turnover | 17% | 19% | 30% | 16% | 19% | |
1 Commencement of operations.
2 Based on average shares outstanding.
3 Where applicable, total investment returns exclude the effects of any sales charges and include the reinvestment of dividends and distributions.
4 Aggregate total investment return.
5 Annualized.
6 Interest expense and fees relate to TOBs. See Note 1 of the Notes to Financial Statements for details of municipal bonds transferred to TOBs.
See Notes to Financial Statements.
| ANNUAL | REPORT | JUNE | 30, 2011 | 65 |
| Financial Highlights (continued) | BlackRock New York Municipal Bond Fund | ||||||
| Investor A1 | |||||||
| Period | |||||||
| October 1, | |||||||
| 2007 to | |||||||
| Year Ended June 30, | June 30, | Year Ended September 30, | |||||
| 2011 | 2010 | 2009 | 2008 | 2007 | 2006 | ||
| Per Share Operating Performance | |||||||
| Net asset value, beginning of period | $ 10.55 | $ 9.82 | $ 10.39 | $ 10.85 | $ 11.10 | $ 11.05 | |
| Net investment income1 | 0.49 | 0.48 | 0.48 | 0.36 | 0.49 | 0.50 | |
| Net realized and unrealized gain (loss) | (0.19) | 0.73 | (0.57) | (0.47) | (0.26) | 0.04 | |
| Net increase (decrease) from investment operations | 0.30 | 1.21 | (0.09) | (0.11) | 0.23 | 0.54 | |
| Dividends from net investment income | (0.48) | (0.48) | (0.48) | (0.35) | (0.48) | (0.49) | |
| Net asset value, end of period | $ 10.37 | $ 10.55 | $ 9.82 | $ 10.39 | $ 10.85 | $ 11.10 | |
| Total Investment Return2 | |||||||
| Based on net asset value | 2.95% | 12.49% | (0.70)% | (0.99)%3 | 2.11% | 5.08% | |
| Ratios to Average Net Assets | |||||||
| Total expenses | 0.84% | 0.88% | 0.89% | 0.92%4 | 0.95% | 1.00% | |
| Total expenses after fees waived and paid indirectly | 0.83% | 0.87% | 0.88% | 0.91%4 | 0.95% | 0.99% | |
| Total expenses after fees waived and paid indirectly and excluding interest | |||||||
| expense and fees5 | 0.82% | 0.86% | 0.87% | 0.84%4 | 0.83% | 0.84% | |
| Net investment income | 4.66% | 4.65% | 4.90% | 4.45%4 | 4.40% | 4.52% | |
| Supplemental Data | |||||||
| Net assets, end of period (000) | $ 151,327 | $ 162,305 | $ 157,706 | $ 177,080 | $ 204,497 | $ 223,322 | |
| Portfolio turnover | 17% | 19% | 30% | 16% | 19% | 46% | |
1 Based on average shares outstanding.
2 Where applicable, total investment returns exclude the effects of any sales charges and include the reinvestment of dividends and distributions.
3 Aggregate total investment return.
4 Annualized.
5 Interest expense and fees relate to TOBs. See Note 1 of the Notes to Financial Statements for details of municipal bonds transferred to TOBs.
See Notes to Financial Statements.
| 66 | ANNUAL REPORT | JUNE | 30, 2011 |
| Financial Highlights (continued) | BlackRock New York Municipal Bond Fund | ||||||
| Investor B | |||||||
| Period | |||||||
| October 1, | |||||||
| 2007 to | |||||||
| Year Ended June 30, | June 30, | Year Ended September 30, | |||||
| 2011 | 2010 | 2009 | 2008 | 2007 | 2006 | ||
| Per Share Operating Performance | |||||||
| Net asset value, beginning of period | $ 10.55 | $ 9.81 | $ 10.38 | $ 10.84 | $ 11.10 | $ 11.06 | |
| Net investment income1 | 0.44 | 0.44 | 0.44 | 0.33 | 0.44 | 0.45 | |
| Net realized and unrealized gain (loss) | (0.18) | 0.74 | (0.57) | (0.47) | (0.26) | 0.04 | |
| Net increase (decrease) from investment operations | 0.26 | 1.18 | (0.13) | (0.14) | 0.18 | 0.49 | |
| Dividends from net investment income | (0.44) | (0.44) | (0.44) | (0.32) | (0.44) | (0.45) | |
| Net asset value, end of period | $ 10.37 | $ 10.55 | $ 9.81 | $ 10.38 | $ 10.84 | $ 11.10 | |
| Total Investment Return2 | |||||||
| Based on net asset value | 2.52% | 12.15% | (1.11)% | (1.29)%3 | 1.60% | 4.56% | |
| Ratios to Average Net Assets | |||||||
| Total expenses | 1.26% | 1.29% | 1.30% | 1.31%4 | 1.36% | 1.41% | |
| Total expenses after fees waived and paid indirectly | 1.26% | 1.28% | 1.29% | 1.31%4 | 1.36% | 1.41% | |
| Total expenses after fees waived and paid indirectly and excluding interest | |||||||
| expense and fees5 | 1.24% | 1.28% | 1.27% | 1.24%4 | 1.24% | 1.25% | |
| Net investment income | 4.22% | 4.25% | 4.48% | 4.06%4 | 3.99% | 4.14% | |
| Supplemental Data | |||||||
| Net assets, end of period (000) | $ 5,950 | $ 9,645 | $ 11,770 | $ 18,535 | $ 25,264 | $ 34,921 | |
| Portfolio turnover | 17% | 19% | 30% | 16% | 19% | 46% | |
1 Based on average shares outstanding.
2 Where applicable, total investment returns exclude the effects of any sales charges and include the reinvestment of dividends and distributions.
3 Aggregate total investment return.
4 Annualized.
5 Interest expense and fees relate to TOBs. See Note 1 of the Notes to Financial Statements for details of municipal bonds transferred to TOBs.
See Notes to Financial Statements.
| ANNUAL | REPORT | JUNE | 30, 2011 | 67 |
| Financial Highlights (continued) | BlackRock New York Municipal Bond Fund | |||||
| Investor C | ||||||
| Period | Period | |||||
| October 1, | October 2, | |||||
| 2007 | 20061 to | |||||
| Year Ended June 30, | to June 30, | September 30, | ||||
| 2011 | 2010 | 2009 | 2008 | 2007 | ||
| Per Share Operating Performance | ||||||
| Net asset value, beginning of period | $ 10.55 | $ 9.81 | $ 10.38 | $ 10.84 | $ 11.10 | |
| Net investment income2 | 0.39 | 0.39 | 0.39 | 0.28 | 0.37 | |
| Net realized and unrealized gain (loss) | (0.18) | 0.74 | (0.56) | (0.46) | (0.25) | |
| Net increase (decrease) from investment operations | 0.21 | 1.13 | (0.17) | (0.18) | 0.12 | |
| Dividends from net investment income | (0.39) | (0.39) | (0.40) | (0.28) | (0.38) | |
| Net asset value, end of period | $ 10.37 | $ 10.55 | $ 9.81 | $ 10.38 | $ 10.84 | |
| Total Investment Return3 | ||||||
| Based on net asset value | 2.03% | 11.62% | (1.59)% | (1.65)%4 | 1.08%4 | |
| Ratios to Average Net Assets | ||||||
| Total expenses | 1.73% | 1.77% | 1.79% | 1.82%5 | 1.85%5 | |
| Total expenses after fees waived and paid indirectly | 1.73% | 1.76% | 1.78% | 1.81%5 | 1.85%5 | |
| Total expenses after fees waived and paid indirectly and excluding interest expense and fees6 . | 1.72% | 1.75% | 1.76% | 1.74%5 | 1.74%5 | |
| Net investment income | 3.76% | 3.76% | 4.03% | 3.57%5 | 3.52%5 | |
| Supplemental Data | ||||||
| Net assets, end of period (000) | $ 17,180 | $ 17,597 | $ 12,294 | $ 8,535 | $ 4,611 | |
| Portfolio turnover | 17% | 19% | 30% | 16% | 19% | |
1 Commencement of operations.
2 Based on average shares outstanding.
3 Where applicable, total investment returns exclude the effects of any sales charges and include the reinvestment of dividends and distributions.
4 Aggregate total investment return.
5 Annualized.
6 Interest expense and fees relate to TOBs. See Note 1 of the Notes to Financial Statements for details of municipal bonds transferred to TOBs.
See Notes to Financial Statements.
| 68 | ANNUAL | REPORT | JUNE | 30, 2011 |
| Financial Highlights (concluded) | BlackRock New York Municipal Bond Fund | ||||||
| Investor C1 | |||||||
| Period | |||||||
| October 1, | |||||||
| 2007 to | |||||||
| Year Ended June 30, | June 30, | Year Ended September 30, | |||||
| 2011 | 2010 | 2009 | 2008 | 2007 | 2006 | ||
| Per Share Operating Performance | |||||||
| Net asset value, beginning of period | $ 10.55 | $ 9.81 | $ 10.39 | $ 10.85 | $ 11.10 | $ 11.06 | |
| Net investment income1 | 0.43 | 0.43 | 0.43 | 0.32 | 0.43 | 0.44 | |
| Net realized and unrealized gain (loss) | (0.18) | 0.74 | (0.58) | (0.47) | (0.25) | 0.04 | |
| Net increase (decrease) from investment operations | 0.25 | 1.17 | (0.15) | (0.15) | 0.18 | 0.48 | |
| Dividends from net investment income | (0.43) | (0.43) | (0.43) | (0.31) | (0.43) | (0.44) | |
| Net asset value, end of period | $ 10.37 | $ 10.55 | $ 9.81 | $ 10.39 | $ 10.85 | $ 11.10 | |
| Total Investment Return2 | |||||||
| Based on net asset value | 2.44% | 12.06% | (1.29)% | (1.35)%3 | 1.61% | 4.46% | |
| Ratios to Average Net Assets | |||||||
| Total expenses | 1.33% | 1.37% | 1.38% | 1.41%4 | 1.45% | 1.51% | |
| Total expenses after fees waived and paid indirectly | 1.33% | 1.37% | 1.37% | 1.40%4 | 1.45% | 1.50% | |
| Total expenses after fees waived and paid indirectly and excluding interest | |||||||
| expense and fees5 | 1.32% | 1.36% | 1.36% | 1.33%4 | 1.33% | 1.35% | |
| Net investment income | 4.16% | 4.16% | 4.41% | 3.97%4 | 3.91% | 4.03% | |
| Supplemental Data | |||||||
| Net assets, end of period (000) | $ 10,694 | $ 12,391 | $ 12,491 | $ 14,217 | $ 16,364 | $ 18,984 | |
| Portfolio turnover | 17% | 19% | 30% | 16% | 19% | 46% | |
1 Based on average shares outstanding.
2 Where applicable, total investment returns exclude the effects of any sales charges and include the reinvestment of dividends and distributions.
3 Aggregate total investment return.
4 Annualized.
5 Interest expense and fees relate to TOBs. See Note 1 of the Notes to Financial Statements for details of municipal bonds transferred to TOBs.
See Notes to Financial Statements.
| ANNUAL | REPORT | JUNE | 30, 2011 | 69 |
Notes to Financial Statements
1. Organization and Significant Accounting Policies:
BlackRock Short-Term Municipal Fund (“Short-Term Municipal”), BlackRock
Municipal Fund (“Municipal”), BlackRock National Municipal Fund
(“National Municipal”) and BlackRock High Yield Municipal Fund
(“High Yield Municipal”) of BlackRock Municipal Bond Fund, Inc. (the
“Corporation”) and BlackRock New York Municipal Bond Fund (“New York
Municipal”) of BlackRock Multi-State Municipal Series Trust (the “Trust”)
(collectively, the “Funds” or individually as the “Fund”) are registered under
the Investment Company Act of 1940, as amended (the “1940 Act”), as
diversified, open-end management investment companies. The Corporation
is organized as a Maryland corporation. The Trust is organized as a
Massachusetts business trust. The Funds’ financial statements are prepared
in conformity with accounting principles generally accepted in the United
States of America (“US GAAP”), which may require management to make
estimates and assumptions that affect the reported amounts and disclo-
sures in the financial statements. Actual results could differ from those
estimates. The Board of Directors of the Corporation and the Board of
Trustees of the Trust are referred to throughout this report as the “Board
of Directors” or the “Board”. Each Fund offers multiple classes of shares.
BlackRock and Institutional Shares are sold without a sales charge and
only to certain eligible investors. Investor A and Investor A1 Shares are
generally sold with a front-end sales charge. Investor B, Investor C and
Investor C1 Shares may be subject to a contingent deferred sales charge.
All classes of shares have identical voting, dividend, liquidation and other
rights and the same terms and conditions, except that Investor A, Investor
A1, Investor B, Investor C and Investor C1 Shares bear certain expenses
related to the shareholder servicing of such shares, and Investor B, Investor
C and Investor C1 Shares also bear certain expenses related to the distri-
bution of such shares. For Short-Term Municipal and New York Municipal,
Investor B Shares automatically convert to Investor A1 Shares after approxi-
mately 10 years. For Municipal and National Municipal, Investor B Shares
automatically convert to Investor A Shares after approximately 10 years.
Investor A1, Investor B and Investor C1 Shares are only available through
exchanges, dividend reinvestment by existing shareholders or for purchase
by certain qualified employee benefits plans. Each class has exclusive
voting rights with respect to matters relating to its shareholder servicing
and distribution expenditures (except that Investor B shareholders may vote
on material changes to the Investor A and Investor A1 distribution plan).
On January 3, 2011, BlackRock Municipal Insured Fund was renamed
BlackRock Municipal Fund.
Reorganizations: On March 18, 2011, the Board approved separate plans
of reorganization, whereby National Municipal will acquire substantially
all of the assets and assume certain stated liabilities of Municipal and
BlackRock AMT-Free Municipal Bond Portfolio, a series of BlackRock Funds
II (the “Target Funds”), in exchange for newly issued shares of National
Municipal. At shareholder meetings on June 24, 2011, shareholders of
the Target Funds approved the plans of reorganization.
The following is a summary of significant accounting policies followed by
the Funds:
Valuation: US GAAP defines fair value as the price the Funds would receive
to sell an asset or pay to transfer a liability in an orderly transaction
between market participants at the measurement date. The Funds fair
value their financial instruments at market value using independent
dealers or pricing services under policies approved by the Board. Municipal
investments (including commitments to purchase such investments on a
“when-issued” basis) are valued on the basis of prices provided by dealers
or pricing services. In determining the value of a particular investment,
pricing services may use certain information with respect to transactions
in such investments, quotations from dealers, pricing matrixes, market
transactions in comparable investments and information with respect to
various relationships between investments. Financial futures contracts
traded on exchanges are valued at their last sale price. Investments in
open-end investment companies are valued at net asset value each
business day. Short-term securities with remaining maturities of 60 days
or less may be valued at amortized cost, which approximates fair value.
In the event that application of these methods of valuation results in a
price for an investment which is deemed not to be representative of the
market value of such investment or is not available, the investment will
be valued in accordance with a policy approved by the Board as reflecting
fair value (“Fair Value Assets”). When determining the price for Fair Value
Assets, the investment advisor and/or the sub-advisor seeks to determine
the price that each Fund might reasonably expect to receive from the cur-
rent sale of that asset in an arm’s-length transaction. Fair value determina-
tions shall be based upon all available factors that the investment advisor
and/or sub-advisor deems relevant. The pricing of all Fair Value Assets is
subsequently reported to the Board or a committee thereof.
Zero-Coupon Bonds: The Funds may invest in zero-coupon bonds, which
are normally issued at a significant discount from face value and do not
provide for periodic interest payments. Zero-coupon bonds may experience
greater volatility in market value than similar maturity debt obligations
which provide for regular interest payments.
Forward Commitments and When-Issued Delayed Delivery Securities: The
Funds may purchase securities on a when-issued basis and may purchase
or sell securities on a forward commitment basis. Settlement of such
transactions normally occurs within a month or more after the purchase or
sale commitment is made. The Funds may purchase securities under such
conditions with the intention of actually acquiring them, but may enter
into a separate agreement to sell the securities before the settlement date.
Since the value of securities purchased may fluctuate prior to settlement,
the Funds may be required to pay more at settlement than the security is
worth. In addition, the Funds are not entitled to any of the interest earned
prior to settlement. When purchasing a security on a delayed delivery
basis, the Funds assume the rights and risks of ownership of the security,
including the risk of price and yield fluctuations. In the event of default
by the counterparty, the Funds’ maximum amount of loss is the unrealized
appreciation of unsettled when-issued transactions, which is shown in the
Schedules of Investments.
Municipal Bonds Transferred to TOBs: The Funds leverage their assets
through the use of TOBs. A TOB is established by a third party sponsor
forming a special purpose entity, into which one or more funds, or an agent
on behalf of the funds, transfers municipal bonds. Other funds managed by
the investment advisor may also contribute municipal bonds to a TOB into
which a Fund has contributed bonds. A TOB typically issues two classes of
beneficial interests: short-term floating rate certificates, which are sold to
third party investors, and residual certificates (“TOB Residuals”), which are
generally issued to the participating funds that made the transfer. The TOB
Residuals held by a Fund include the right of a Fund (1) to cause the
holders of a proportional share of the short-term floating rate certificates to
tender their certificates at par, including during instances of a rise in short-
term interest rates, and (2) to transfer, within seven days, a corresponding
share of the municipal bonds from the TOB to a Fund. The TOB may also be
terminated without the consent of a Fund upon the occurrence of certain
| 70 | ANNUAL REPORT | JUNE | 30, 2011 |
Notes to Financial Statements (continued)
events as defined in the TOB agreements. Such termination events may
include the bankruptcy or default of the municipal bond, a substantial
downgrade in credit quality of the municipal bond, the inability of the TOB
to obtain quarterly or annual renewal of the liquidity support agreement, a
substantial decline in market value of the municipal bond or the inability to
remarket the short-term floating rate certificates to third party investors.
During the year ended June 30, 2011, no TOBs that the Funds participated
in were terminated without the consent of the Funds.
The cash received by the TOB from the sale of the short-term floating rate
certificates, less transaction expenses, is paid to a Fund, which typically
invests the cash in additional municipal bonds. Each Fund’s transfer of
the municipal bonds to a TOB is accounted for as a secured borrowing;
therefore, the municipal bonds deposited into a TOB are presented in the
Funds’ Schedules of Investments, and the proceeds from the issuance of
the short-term floating rate certificates are shown as TOB trust certificates
under other liabilites in the Statements of Assets and Liabilities.
Interest income, including amortization and accretion of premiums
and discounts, from the underlying municipal bonds is recorded by the
Funds on an accrual basis. Interest expense incurred on the secured
borrowing and other expenses related to remarketing, administration
and trustee services to a TOB are shown as interest expense and fees
in the Statements of Operations. The short-term floating rate certificates
have interest rates that generally reset weekly and their holders have the
option to tender certificates to the TOB for redemption at par at each reset
date. At June 30, 2011, the aggregate value of the underlying municipal
bonds transferred to TOBs, the related liability for TOB trust certificates
and the range of interest rates on the liability for TOB trust certificates were
as follows:
| Underlying | |||
| Municipal | |||
| Bonds | Liability | Range of | |
| Transferred | for TOB Trust | Interest | |
| to TOBs | Certificates | Rates | |
| Municipal | $138,807,749 | $ 66,300,303 | 0.06% – 0.21% |
| National Municipal. | $657,244,675 | $321,402,273 | 0.09% – 0.24% |
| High Yield Municipal | $ 29,373,543 | $ 16,039,046 | 0.09% – 0.19% |
| New York Municipal | $ 7,456,443 | $ 3,575,000 | 0.09% – 0.15% |
For the year ended June 30, 2011, the Funds’ average TOB trust certificates
outstanding and the daily weighted average interest rate, including fees,
were as follows:
| Average TOB Trust | Daily Weighted | |
| Certificates | Average | |
| Outstanding | Interest Rate | |
| Municipal. | $ 70,722,145 | 0.65% |
| National Municipal | $254,018,646 | 0.80% |
| High Yield Municipal. | $ 9,603,985 | 0.83% |
| New York Municipal | $ 3,868,528 | 0.80% |
Should short-term interest rates rise, the Funds’ investments in TOBs
may adversely affect the Funds’ net investment income and dividends to
shareholders. Also, fluctuations in the market values of municipal bonds
deposited into the TOB may adversely affect the Funds’ net asset values per
share.
Segregation and Collateralization: In cases in which the 1940 Act and the
interpretive positions of the Securities and Exchange Commission (“SEC”)
require that the Funds either deliver collateral or segregate assets in con-
nection with certain investments (e.g., financial futures contracts), the
Funds will, consistent with SEC rules and/or certain interpretive letters
issued by the SEC, segregate collateral or designate on their books and
records cash or liquid securities having a market value at least equal to
the amount that would otherwise be required to be physically segregated.
Furthermore, based on requirements and agreements with certain
exchanges and third party broker-dealers, each party to such transactions
has requirements to deliver/deposit securities as collateral for certain
investments.
Investment Transactions and Investment Income: For financial reporting
purposes, investment transactions are recorded on the dates the trans-
actions are entered into (the trade dates). Realized gains and losses on
investment transactions are determined on the identified cost basis.
Interest income, including amortization and accretion of premiums and
discounts on debt securities, is recognized on the accrual basis. Income
and realized and unrealized gains and losses are allocated daily to each
class based on its relative net assets.
Dividends and Distributions: Dividends from net investment income are
declared daily and paid monthly. Distributions of capital gains are recorded
on the ex-dividend dates. The amount and timing of dividends and distribu-
tions are determined in accordance with federal income tax regulations,
which may differ from US GAAP.
Income Taxes: It is each Fund’s policy to comply with the requirements of
the Internal Revenue Code of 1986, as amended, applicable to regulated
investment companies and to distribute substantially all of its taxable
income to its shareholders. Therefore, no federal income tax provision
is required.
Each Fund files US federal and various state and local tax returns. No
income tax returns are currently under examination. The statute of limita-
tions on the Funds’ US federal tax returns remains open for each of the
four years ended June 30, 2011, except for New York Municipal. The statute
of limitations on New York Municipal’s US federal tax returns remains
open for the period ended June 30, 2008 and three years ended June 30,
2011. The statutes of limitations on the Funds’ state and local tax returns
may remain open for an additional year depending upon the jurisdiction.
Management does not believe there are any uncertain tax positions that
require recognition of a tax liability.
Recent Accounting Standard: In May 2011, the Financial Accounting
Standards Board issued amended guidance to improve disclosure about
fair value measurements which will require the following disclosures for
fair value measurements categorized as Level 3: quantitative information
about unobservable inputs and assumptions used in the fair value
measurement, a description of the valuation policies and procedures
and a narrative description of sensitivity of the fair value measurement to
changes in unobservable inputs and the interrelationships between those
unobservable inputs. In addition, the amounts and reasons for all transfers
in and out of Level 1 and Level 2 will be required to be disclosed. The
amended guidance is effective for financial statements for fiscal years
beginning after December 15, 2011, and interim periods within those fiscal
years. Management is evaluating the impact of this guidance on the Funds’
financial statements and disclosures.
Other: Expenses directly related to a Fund or its classes are charged to
that Fund or class. Other operating expenses shared by several funds are
pro rated among those funds on the basis of relative net assets or other
| ANNUAL | REPORT | JUNE | 30, 2011 | 71 |
Notes to Financial Statements (continued)
appropriate methods. Other expenses of the Funds are allocated daily to
each class based on its relative net assets.
The Funds have an arrangement with the custodians whereby fees may be
reduced by credits earned on uninvested cash balances, which, if applica-
ble, are shown as fees paid indirectly in the Statements of Operations. The
custodians impose fees on overdrawn cash balances, which can be offset
by accumulated credits earned or may result in additional custody charges.
2. Derivative Financial Instruments:
The Funds engage in various portfolio investment strategies using derivative
contracts both to increase the returns of the Funds and to economically
hedge, or protect, their exposure to certain risks such as interest rate risk.
These contracts may be transacted on an exchange.
Losses may arise if the value of the contract decreases due to an unfavor-
able change in the market rates or values of the underlying instrument or
if the counterparty does not perform under the contract. Counterparty risk
related to exchange-traded financial futures contracts is deemed to be
minimal due to the protection against defaults provided by the exchange
on which these contracts trade.
Financial Futures Contracts: The Funds purchase or sell financial futures
contracts and options on financial futures contracts to gain exposure to, or
economically hedge against, changes in interest rates (interest rate risk).
Financial futures contracts are agreements between the Funds and the
counterparty to buy or sell a specific quantity of an underlying instrument
at a specified price and at a specified date. Depending on the terms of
the particular contract, futures contracts are settled either through physical
delivery of the underlying instrument on the settlement date or by payment
of a cash settlement amount on the settlement date. Pursuant to the
contract, the Funds agree to receive from or pay to the broker an amount
of cash equal to the daily fluctuation in value of the contract. Such receipts
or payments are known as margin variation and are recorded by the Funds
as unrealized appreciation or depreciation. When the contract is closed,
the Funds record a realized gain or loss equal to the difference between
the value of the contract at the time it was opened and the value at the
time it was closed. The use of financial futures contracts involves the risk of
an imperfect correlation in the movements in the price of financial futures
contracts, interest rates and the underlying assets.
| Derivative Financial Instruments Categorized by Risk Exposure: | |||
| Fair Values of Derivative Financial Instruments as of June 30, 2011 | |||
| Asset Derivatives | |||
| High Yield New York | |||
| Municipal | Municipal Municipal | ||
| Statements of Assets and | |||
| Liabilities Location | Value | ||
| Net unrealized | |||
| Interest rate | appreciation/ | ||
| contracts | depreciation* | $ 49,485 | $ 8,632 $76,858 |
* Includes cumulative appreciation/depreciation of financial futures contracts as
reported in the Schedules of Investments. Only current day’s margin variation is
reported within the Statements of Assets and Liabilities.
| The Effect of Derivative Financial Instruments in the Statements of Operations | |||||
| Year Ended June 30, 2011 | |||||
|
| |||||
| Net Realized Loss from | |||||
|
| |||||
| Short-Term | National | High Yield | New York | ||
| Municipal | Municipal | Municipal | Municipal | Municipal | |
| Interest rate | |||||
| contracts: | |||||
| Financial | |||||
| futures | |||||
| contracts: $(349,061) $(1,933,400) $(4,190,847) $(499,532) $(604,012) | |||||
| Net Change in Unrealized Appreciation/Depreciation on | |||
|
| |||
| National | High Yield | New York | |
| Municipal Municipal | Municipal | Municipal | |
| Interest rate | |||
| contracts: | |||
| Financial | |||
| futures | |||
| contracts: | $ 134,303 $ 393,128 | $ 8,632 | $ 77,464 |
For the year ended June 30, 2011, the average quarterly balances of
outstanding derivative financial instruments were as follows:
| Short-Term | National | High Yield | New York | ||
| Municipal | Municipal | Municipal | Municipal | Municipal | |
| Financial futures | |||||
| contracts: | |||||
| Average | |||||
| number of | |||||
| contracts | |||||
| sold | 150 | 120 | 63 | 30 | 31 |
| Average notional | |||||
| value of | |||||
| contracts | |||||
| sold | $32,830,965 $14,453,346 | $7,407,108 $3,638,693 $3,790,976 | |||
3. Investment Advisory Agreement and Other Transactions
with Affiliates:
The PNC Financial Services Group, Inc. (“PNC”) and Barclays Bank PLC
(“Barclays”) are the largest stockholders of BlackRock, Inc. (“BlackRock”).
Due to the ownership structure, PNC is an affiliate of the Funds for 1940
Act purposes, but Barclays is not.
The Corporation and the Trust, on behalf of each Fund, entered into
an Investment Advisory Agreement with BlackRock Advisors, LLC (the
“Manager”), the Funds’ investment advisor, an indirect, wholly owned
subsidiary of BlackRock, to provide investment advisory and administration
services. The Manager is responsible for the management of each Fund’s
portfolio and provides the necessary personnel, facilities, equipment and
certain other services necessary to the operations of each Fund. For such
services, each Fund pays the Manager a monthly fee at an annual rate of
each Fund’s average daily net assets as follows:
| Aggregate of Average | Rate of Advisory Fee | ||
| Daily Net Assets of the | Short-Term | National | |
| Three Combined Funds1 | Municipal | Municipal | Municipal |
| Not exceeding $250 million | 0.400% | 0.400% | 0.500% |
| In excess of $250 million, | |||
| but not exceeding $400 million | 0.375% | 0.375% | 0.475% |
| In excess of $400 million, | |||
| but not exceeding $550 million | 0.350% | 0.375% | 0.475% |
| In excess of $550 million, | |||
| but not exceeding $1.5 billion | 0.325% | 0.375% | 0.475% |
| In excess of $1.5 billion | 0.325% | 0.350% | 0.475% |
1 The portion of the assets of a Fund to which the rate of each breakpoint level
applies will be determined on a “uniform percentage” basis. The uniform percentage
| 72 | ANNUAL REPORT | JUNE | 30, 2011 |
Notes to Financial Statements (continued)
applicable to a breakpoint level is determined by dividing the amount of the aggre-
gate average daily net assets of the three combined Funds that falls within that
breakpoint level by the aggregate average daily net assets of the three combined
Funds. The amount of the fee for a Fund at each breakpoint level is determined by
multiplying the average daily net assets of that Fund by the uniform percentage appli-
cable to that breakpoint level and multiplying the product by the advisory fee rate.
High Yield Municipal’s annual investment advisory fee rates are as follows:
| Portion of Average Daily Net Assets | Rate |
| Not exceeding $250 million | 0.550% |
| In excess of $250 million, but not exceeding $500 million | 0.525% |
| In excess of $500 million | 0.500% |
New York Municipal’s annual investment advisory fee rates are as follows:
| Portion of Average Daily Net Assets | Rate |
| Not exceeding $500 million | 0.550% |
| In excess of $500 million, but not exceeding $1 billion | 0.525% |
| In excess of $1 billion | 0.500% |
For Short-Term Municipal, the Manager voluntarily agreed to waive and/or
reimburse fees and expenses, excluding interest expense, dividend
expense, acquired fund fees and expenses and certain other fund
expenses, in order to limit expenses. The expense limitations as a
percentage of net assets are as follows:
| Institutional | 0.40% |
| Investor A | 0.69% |
| Investor A1 | 0.52% |
| Investor B | 0.81% |
| Investor C | 1.55% |
As a result, for Short-Term Municipal, the Manager waived or reimbursed
the following amounts which are shown as transfer agent fees waived
and/or reimbursed — class specific in the Statements of Operations:
| Institutional | $577,604 |
| Investor A1 | $ 12,113 |
| Investor B | $ 589 |
These voluntary waivers and/or reimbursements may be reduced or
discontinued at any time without notice.
For National Municipal, the Manager voluntarily agreed to waive and/or
reimburse fees and expenses, excluding interest expense, dividend
expense, acquired fund fees and expenses and certain other fund
expenses on Investor B, in order to limit expenses to 1.34%. The Manager
waived or reimbursed in the amount of $21,814 for Investor B which is
shown as transfer agent fees waived and/or reimbursed — class specific
in the Statements of Operations.
The Manager voluntarily agreed to waive its investment advisory fees by
the amount of investment advisory fees each Fund pays to the Manager
indirectly through its investment in affiliated money market funds, however,
the Manager does not waive its investment advisory fees by the amount
of investment advisory fees paid through each Fund’s investment in other
affiliated investment companies, if any. These amounts are shown as,
or included in, fees waived by advisor in the Statements of Operations.
For the year ended June 30, 2011, the amounts waived were as follows:
| Short-Term Municipal | $40,333 |
| Municipal | $11,232 |
| National Municipal | $71,629 |
| High Yield Municipal | $ 2,385 |
| New York Municipal | $ 7,283 |
The Corporation and the Trust, on behalf of the Manager, entered into a
sub-advisory agreement with BlackRock Investment Management, LLC
(“BIM”), an affiliate of the Manager. The Manager pays BIM for services it
provides, a monthly fee that is a percentage of the investment advisory
fees paid by each Fund to the Manager.
For the year ended June 30, 2011, each Fund reimbursed the Manager
for certain accounting services, which are included in accounting services
in the Statements of Operations. The reimbursements were as follows:
| Short-Term Municipal | $17,317 |
| Municipal | $13,081 |
| National Municipal | $42,321 |
| High Yield Municipal | $ 2,524 |
| New York Municipal | $ 4,191 |
The Funds entered into a Distribution Agreement and Distribution and
Service Plan with BlackRock Investments, LLC (“BRIL”), an affiliate of the
Manager. Pursuant to the Distribution and Service Plan and in accordance
with Rule 12b-1 under the 1940 Act, each Fund pay BRIL ongoing service
and distribution fees. The fees are accrued daily and paid monthly at
annual rates based upon the average daily net assets of the shares of
each Fund as follows:
| Service Fees | |||||
| Short-Term | National | High Yield | New York | ||
| Municipal | Municipal | Municipal | Municipal | Municipal | |
| Investor A | 0.25% | 0.25% | 0.25% | 0.25% | 0.25% |
| Investor A1. | 0.10% | — | — | — | 0.10% |
| Investor B. | 0.15% | 0.25% | 0.25% | — | 0.25% |
| Investor C. | 0.25% | 0.25% | 0.25% | 0.25% | 0.25% |
| Investor C1. | — | 0.25% | 0.25% | — | 0.25% |
| Distribution Fees | |||||
| Short-Term | National | High Yield | New York | ||
| Municipal | Municipal | Municipal | Municipal | Municipal | |
| Investor B. | 0.20% | 0.50% | 0.50% | — | 0.25% |
| Investor C. | 0.75% | 0.75% | 0.75% | 0.75% | 0.75% |
| Investor C1. | — | 0.55% | 0.55% | — | 0.35% |
Pursuant to sub-agreements with BRIL, broker-dealers and BRIL provide
shareholder servicing and distribution services to each Fund. The ongoing
service and/or distribution fee compensates BRIL and each broker-dealer
for providing shareholder servicing and/or distribution related services to
Investor A, Investor A1, Investor B, Investor C and Investor C1 shareholders.
For the year ended June 30, 2011, affiliates earned underwriting discounts,
direct commissions and dealer concessions on sales of the Funds’ Investor
A Shares as follows:
| Short-Term | National | High Yield | New York | ||
| Municipal | Municipal | Municipal | Municipal | Municipal | |
| Investor A | $13,758 | $20,728 | $125,578 | $15,045 | $ 7,098 |
| ANNUAL | REPORT | JUNE | 30, 2011 | 73 |
Notes to Financial Statements (continued)
For the year ended June 30, 2011, affiliates received the following
contingent deferred sales charges relating to transactions in Investor B,
Investor C and Investor C1 Shares:
| Short-Term | National | High Yield | New York | ||
| Municipal | Municipal | Municipal | Municipal | Municipal | |
| Investor B | $ 1,554 | $ 639 | $ 9,379 | — | $ 5,548 |
| Investor C | $36,355 | $18,809 | $ 81,281 | $ 3,006 | $ 4,678 |
| Investor C1 | — | $ 941 | $ 1,102 | — | $ 2,398 |
Furthermore, affiliates received contingent deferred sale charges relating to
transactions subject to front-end sales charge waivers on Investor A Shares
as follows:
| Short-Term | National | High Yield | New York | ||
| Municipal | Municipal | Municipal | Municipal | Municipal | |
| Investor A | $110,017 | $12,428 | $157,258 | $51,579 | $ 347 |
The Manager maintains a call center, which is responsible for providing
certain shareholder services to the Funds, such as responding to share-
holder inquiries and processing transactions based upon instructions
from shareholders with respect to the subscription and redemption of
Fund shares. For the year ended June 30, 2011, each Fund reimbursed
the Manager the following amounts for costs incurred in running the
call center, which are included in transfer agent — class specific in the
Statements of Operations:
| Call Center Fees | |||||
| Short-Term | National | High Yield | New York | ||
| Municipal | Municipal | Municipal | Municipal | Municipal | |
| BlackRock | $ 59 | — | — | — | — |
| Institutional | $2,864 | $5,845 | $19,262 | $ 378 | $ 146 |
| Investor A | $2,962 | $2,717 | $13,811 | $ 494 | $ 420 |
| Investor A1 | $ 635 | — | — | — | $2,211 |
| Investor B | $ 111 | $ 175 | $ 647 | — | $ 100 |
| Investor C | $1,439 | $ 579 | $ 3,848 | $ 356 | $ 281 |
| Investor C1 | — | $ 370 | $ 896 | — | $ 120 |
4. Investments:
Purchases and sales of investments, excluding short-term securities, for the
year ended June 30, 2011, were as follows:
| Purchases | Sales | |
| Short-Term Municipal | $ 455,392,816 | $ 509,433,333 |
| Municipal | $ 164,670,656 | $ 258,025,248 |
| National Municipal | $1,537,883,441 | $1,291,308,655 |
| High Yield Municipal | $ 79,938,288 | $ 47,541,175 |
| New York Municipal | $ 44,744,352 | $ 62,388,838 |
5. Income Tax Information:
Reclassifications: US GAAP requires that certain components of net assets be adjusted to reflect permanent differences between financial and tax report-
ing. These reclassifications have no effect on net assets or net asset values per share. The following permanent differences as of June 30, 2011 attributable
to amortization methods on fixed income securities, non-deductible expenses and the sale of bonds received from tender option bond trusts were reclassi-
fied to the following accounts:
| Short-Term | National | High Yield | New York | ||
| Municipal | Municipal | Municipal | Municipal | Municipal | |
| Paid-in capital | — | — | $ (69,296) | — | $ (5,945) |
| Undistributed net investment income | $ (56) | $ (213,706) | $ (689,270) | $ (175,010) | $ (2,679) |
| Accumulated net realized loss | $ 56 | $ 213,706 | $ 758,566 | $ 175,010 | $ 8,624 |
The tax character of distributions paid during the fiscal years ended June 30, 2011 and June 30, 2010 was as follows:
| Short-Term | National | High Yield | New York | |||
| Municipal | Municipal | Municipal | Municipal | Municipal | ||
| Tax-exempt income | 6/30/11 | $11,814,462 | $34,715,328 | $111,766,061 | $7,889,554 | $11,596,179 |
| 6/30/10 | 13,068,162 | 36,997,085 | 95,804,538 | 5,278,832 | 11,450,185 | |
| Ordinary income | 6/30/11 | 150 | 3,550 | 243,269 | 75,357 | 31,239 |
| 6/30/10 | — | — | — | 52,096 | — | |
| Total | 6/30/11 | $11,814,612 | $34,718,878 | $112,009,330 | $7,964,911 | $11,627,418 |
| 6/30/10 | $13,068,162 | $36,997,085 | $ 95,804,538 | $5,330,928 | $11,450,185 |
As of June 30, 2011, the tax components of accumulated net earnings (losses) were as follows:
| Short-Term | National | High Yield | New York | ||
| Municipal | Municipal | Municipal | Municipal | Municipal | |
| Undistributed tax-exempt income | $ 483,959 | $ 2,333,557 | $ 1,332,148 | $ 182,126 | $ 312,271 |
| Undistributed ordinary income | — | 4,951 | 26,415 | 2,655 | 14,532 |
| Capital loss carryforwards | (7,783,408) | (13,606,807) | (62,744,916) | (10,655,760) | (12,350,955) |
| Net unrealized gains (losses)* | 9,269,492 | 1,729,587 | 36,324,509 | (3,913,095) | 821,840 |
| Total | $ 1,970,043 | $ (9,538,712) | $(25,061,844) | $(14,384,074) | $(11,202,312) |
* The differences between book-basis and tax-basis net unrealized gains (losses) is attributable primarily to the tax deferral of losses on wash sales, the tax deferral of losses on
straddles, amortization methods for premiums and discounts on fixed income securities, the accrual of income on securities in default, the realization for tax purposes of unreal-
ized gains/losses on certain futures contracts, the deferral of post-October capital losses for tax purposes, the timing and recognition of partnership income and the treatment of
residual interests in tender option bond trusts.
| 74 | ANNUAL REPORT | JUNE | 30, 2011 |
Notes to Financial Statements (continued)
As of June 30, 2011, the Funds had capital loss carryforwards available to
offset future realized capital gains through the indicated expiration dates:
| Expires | Short-Term | National | High Yield | New York | |
| June 30, | Municipal | Municipal | Municipal | Municipal | Municipal |
| 2012 | — | — $ 1,046,803 | — | — | |
| 2013 | $ 362,313 | — | 48,027 | — $ 8,935,207 | |
| 2014 | 4,110,940 | — | — | — | — |
| 2015 | 2,987,949 | — | 259,851 | — | — |
| 2016 | 322,206 | — | 1,320,166 | $ 258,523 | — |
| 2017 | — | $ 6,021,988 | 19,350,079 | 3,758,709 | 2,020,225 |
| 2018 | — | 7,049,052 | 40,719,990 | 4,665,271 | 367,311 |
| 2019 | — | 535,767 | — | 1,973,257 | 1,028,212 |
| Total | $7,783,408 | $13,606,807 $62,744,916 $10,655,760 $12,350,955 | |||
Under the recently enacted Regulated Investment Company Modernization
Act of 2010, capital losses incurred by the Funds after June 30, 2011 will
not be subject to expiration. In addition, these losses must be utilized prior
to the losses incurred in pre-enactment taxable years.
6. Borrowings:
The Funds, along with certain other funds managed by the Manager and
its affiliates, are a party to a $500 million credit agreement with a group
of lenders, which expired in November 2010. The Funds may borrow under
the credit agreement to fund shareholder redemptions. Effective November
2009, the credit agreement had the following terms: 0.02% upfront fee
on the aggregate commitment amount which was allocated to each Fund
based on its net assets as of October 31, 2009, a commitment fee of
0.10% per annum based on each Fund’s pro rata share of the unused
portion of the credit agreement and interest at a rate equal to the higher
of (a) the one-month LIBOR plus 1.25% per annum and (b) the Fed
Funds rate plus 1.25% per annum on amounts borrowed. In addition, the
Funds paid administration and arrangement fees which were allocated
to the Funds based on their net assets as of October 31, 2009. Effective
November 2010, the credit agreement was renewed until November 2011
with the following terms: a commitment fee of 0.08% per annum based
on the Funds’ pro rata share of the unused portion of the credit agreement
and interest at a rate equal to the higher of (a) the one-month LIBOR plus
1.00% per annum and (b) the Fed Funds rate plus 1.00% per annum on
amounts borrowed. In addition, the Funds paid administration and arrange-
ment fees which were allocated to the Funds based on their net assets as
of October 31, 2010. The Funds did not borrow under the credit agreement
during the year ended June 30, 2011.
7. Concentration, Market and Credit Risk:
New York Municipal invests a substantial amount of its assets in issuers
located in a single state or limited number of states. Please see New York
Municipal’s Schedule of Investments for concentrations in specific states.
Many municipalities insure repayment of their bonds, which may reduce the
potential for loss due to credit risk. The market value of these bonds may
fluctuate for other reasons, including market perception of the value of
such insurance, and there is no guarantee that the insurer will meet its
obligation. In the normal course of business, the Funds invest in securities
and enter into transactions where risks exist due to fluctuations in the
market (market risk) or failure of the issuer of a security to meet all its
obligations (issuer credit risk). The value of securities held by the Funds
may decline in response to certain events, including those directly involving
the issuers whose securities are owned by the Funds; conditions affecting
the general economy; overall market changes; local, regional or global
political, social or economic instability; and currency and interest rate and
price fluctuations. Similar to issuer credit risk, the Funds may be exposed
to counterparty credit risk, or the risk that an entity with which the Funds
have unsettled or open transactions may fail to or be unable to perform
on its commitments. The Funds manage counterparty credit risk by entering
into transactions only with counterparties that they believe have the finan-
cial resources to honor their obligations and by monitoring the financial
stability of those counterparties. Financial assets, which potentially expose
the Funds to market, issuer and counterparty credit risks, consist principally
of financial instruments and receivables due from counterparties. The
extent of the Funds’ exposure to market, issuer and counterparty credit
risks with respect to these financial assets is generally approximated by
their value recorded in the Funds’ Statements of Assets and Liabilities, less
any collateral held by the Funds.
As of June 30, 2011, Short-Term Municipal invested a significant portion of
its assets in securities in the state and county/city/special district/school
district sectors. Municipal invested a significant portion of its assets in the
county/city/special district/school district and transportation sectors.
National Municipal invested a significant portion of its assets in securities
in the utilities and transportation sectors. High Yield Municipal invested a
significant portion of its assets in securities in the health sector and New
York Municipal invested a significant portion of its assets in securities in
the county/city/special district/school district sector. Changes in economic
conditions affecting the health, county/city/special district/school district,
state, transportation and utilities sectors would have a greater impact on
the Funds and could affect the value, income and/or liquidity of positions
in such securities.
| ANNUAL | REPORT | JUNE | 30, 2011 | 75 |
Notes to Financial Statements (continued)
8. Capital Share Transactions:
Transactions in capital shares for each class were as follows:
| Year Ended | Year Ended | |||
| June 30, 2011 | June 30, 2010 | |||
| Short-Term Municipal | Shares | Amount | Shares | Amount |
| BlackRock | ||||
| Shares sold | 3,196,351 | $ 32,406,000 | 1,582,401 | $ 16,127,185 |
| Shares issued to shareholders in reinvestment of dividends | ||||
| and distributions | 29,185 | 296,667 | 12,328 | 125,546 |
| Total issued | 3,225,536 | 32,702,667 | 1,594,729 | 16,252,731 |
| Shares redeemed | (602,469) | (6,134,904) | (141,213) | (1,436,769) |
| Net increase | 2,623,067 | $ 26,567,763 | 1,453,516 | $ 14,815,962 |
| Institutional | ||||
| Shares sold | 33,475,138 | $340,121,082 | 52,363,133 | $532,717,993 |
| Shares issued to shareholders in reinvestment of dividends | ||||
| and distributions | 342,602 | 3,481,932 | 377,255 | 3,839,445 |
| Total issued | 33,817,740 | 343,603,014 | 52,740,388 | 536,557,438 |
| Shares redeemed | (36,198,366) | (367,502,652) | (30,848,241) | (313,950,174) |
| Net increase (decrease) | (2,380,626) | $ (23,899,638) | 21,892,147 | $222,607,264 |
| Investor A | ||||
| Shares sold and automatic conversion of shares | 9,605,026 | $ 97,784,236 | 28,575,477 | $290,988,619 |
| Shares issued to shareholders in reinvestment of dividends | ||||
| and distributions | 198,989 | 2,024,025 | 204,464 | 2,081,727 |
| Total issued | 9,804,015 | 99,808,261 | 28,779,941 | 293,070,346 |
| Shares redeemed | (17,211,292) | (174,908,611) | (11,570,462) | (117,804,897) |
| Net increase (decrease) | (7,407,277) | $ (75,100,350) | 17,209,479 | $175,265,449 |
| Investor A1 | ||||
| Shares sold | 86,611 | $ 880,738 | 54,166 | $ 551,863 |
| Shares issued to shareholders in reinvestment of dividends | ||||
| and distributions | 37,013 | 376,554 | 59,182 | 602,778 |
| Total issued | 123,624 | 1,257,292 | 113,348 | 1,154,641 |
| Shares redeemed and automatic conversion of shares | (1,424,180) | (14,493,105) | (1,351,733) | (13,766,456) |
| Net decrease | (1,300,556) | $ (13,235,813) | (1,238,385) | $ (12,611,815) |
| Investor B | ||||
| Shares sold | 23,038 | $ 233,890 | 73,159 | $ 744,817 |
| Shares issued to shareholders in reinvestment of dividends | ||||
| and distributions | 4,074 | 41,423 | 6,889 | 70,104 |
| Total issued | 27,112 | 275,313 | 80,048 | 814,921 |
| Shares redeemed | (345,678) | (3,509,881) | (224,138) | (2,280,979) |
| Net decrease | (318,566) | $ (3,234,568) | (144,090) | $ (1,466,058) |
| Investor C | ||||
| Shares sold | 2,102,990 | $ 21,388,921 | 8,054,247 | $ 81,953,486 |
| Shares issued to shareholders in reinvestment of dividends | ||||
| and distributions | 16,363 | 166,373 | 33,652 | 342,474 |
| Total issued | 2,119,353 | 21,555,294 | 8,087,899 | 82,295,960 |
| Shares redeemed | (5,213,299) | (52,972,475) | (3,395,705) | (34,560,194) |
| Net increase (decrease) | (3,093,946) | $ (31,417,181) | 4,692,194 | $ 47,735,766 |
| 76 | ANNUAL REPORT | JUNE | 30, 2011 |
Notes to Financial Statements (continued)
| Year Ended | Year Ended | |||
| June 30, 2011 | June 30, 2010 | |||
| Municipal | Shares | Amount | Shares | Amount |
| Institutional | ||||
| Shares sold | 2,497,188 | $ 18,388,376 | 3,442,209 | $ 25,773,152 |
| Shares issued to shareholders in reinvestment of dividends | ||||
| and distributions | 1,525,464 | 11,275,782 | 1,603,346 | 11,976,884 |
| Total issued | 4,022,652 | 29,664,158 | 5,045,555 | 37,750,036 |
| Shares redeemed | (10,913,293) | (79,337,966) | (6,661,286) | (49,761,757) |
| Net decrease | (6,890,641) | $ (49,673,808) | (1,615,731) | $ (12,011,721) |
| Investor A | ||||
| Shares sold and automatic conversion of shares | 3,225,754 | $ 24,139,760 | 4,807,352 | $ 35,778,191 |
| Shares issued to shareholders in reinvestment of dividends | ||||
| and distributions | 609,896 | 4,504,667 | 609,674 | 4,552,842 |
| Total issued | 3,835,650 | 28,644,427 | 5,417,026 | 40,331,033 |
| Shares redeemed | (6,645,299) | (48,319,726) | (5,763,518) | (42,864,852) |
| Net decrease | (2,809,649) | $ (19,675,299) | (346,492) | $ (2,533,819) |
| Investor B | ||||
| Shares sold | 15,119 | $ 115,122 | 51,725 | $ 386,429 |
| Shares issued to shareholders in reinvestment of dividends | ||||
| and distributions | 31,327 | 231,673 | 43,534 | 324,831 |
| Total issued | 46,446 | 346,795 | 95,259 | 711,260 |
| Shares redeemed | (752,377) | (5,518,844) | (697,429) | (5,192,938) |
| Net decrease | (705,931) | $ (5,172,049) | (602,170) | $ (4,481,678) |
| Investor C | ||||
| Shares sold | 1,606,875 | $ 12,103,287 | 2,722,025 | $ 20,321,090 |
| Shares issued to shareholders in reinvestment of dividends | ||||
| and distributions | 159,585 | 1,179,079 | 118,621 | 887,801 |
| Total issued | 1,766,460 | 13,282,366 | 2,840,646 | 21,208,891 |
| Shares redeemed and automatic conversion of shares | (1,618,712) | (11,731,246) | (876,537) | (6,569,384) |
| Net increase | 147,748 | $ 1,551,120 | 1,964,109 | $ 14,639,507 |
| Investor C1 | ||||
| Shares sold | 883 | $ 6,502 | 1,530 | $ 11,444 |
| Shares issued to shareholders in reinvestment of dividends | ||||
| and distributions | 86,267 | 637,454 | 100,282 | 748,709 |
| Total issued | 87,150 | 643,956 | 101,812 | 760,153 |
| Shares redeemed and automatic conversion of shares | (691,566) | (5,053,269) | (458,405) | (3,424,173) |
| Net decrease | (604,416) | $ (4,409,313) | (356,593) | $ (2,664,020) |
| National Municipal | ||||
| Institutional | ||||
| Shares sold | 39,093,064 | $397,384,403 | 23,929,880 | $240,734,514 |
| Shares issued to shareholders in reinvestment of dividends | 4,148,257 | 41,607,185 | 3,264,368 | 32,795,888 |
| Total issued | 43,241,321 | 438,991,588 | 27,194,248 | 273,530,402 |
| Shares redeemed | (31,453,097) | (313,408,653) | (16,149,886) | (162,180,381) |
| Net increase | 11,788,224 | $125,582,935 | 11,044,362 | $111,350,021 |
| ANNUAL | REPORT | JUNE | 30, 2011 | 77 |
Notes to Financial Statements (continued)
| Year Ended | Year Ended | |||
| June 30, 2011 | June 30, 2010 | |||
| National Municipal (concluded) | Shares | Amount | Shares | Amount |
| Investor A | ||||
| Shares sold and automatic conversion of shares | 32,944,655 | $329,287,957 | 25,587,832 | $257,098,651 |
| Shares issued to shareholders in reinvestment of dividends | 2,260,688 | 22,698,564 | 1,751,962 | 17,621,515 |
| Total issued | 35,205,343 | 351,986,521 | 27,339,794 | 274,720,166 |
| Shares redeemed | (30,577,063) | (302,644,541) | (12,935,435) | (129,790,408) |
| Net increase | 4,628,280 | $ 49,341,980 | 14,404,359 | $144,929,758 |
| Investor B | ||||
| Shares sold | 79,100 | $ 783,623 | 115,773 | $ 1,161,245 |
| Shares issued to shareholders in reinvestment of dividends | 73,349 | 736,467 | 95,845 | 960,773 |
| Total issued | 152,449 | 1,520,090 | 211,618 | 2,122,018 |
| Shares redeemed and automatic conversion of shares | (1,665,029) | (16,604,956) | (1,724,753) | (17,212,430) |
| Net decrease | (1,512,580) | $ (15,084,866) | (1,513,135) | $ (15,090,412) |
| Investor C | ||||
| Shares sold | 7,754,446 | $ 78,331,889 | 12,581,518 | $126,083,884 |
| Shares issued to shareholders in reinvestment of dividends | 805,169 | 8,083,890 | 660,323 | 6,642,068 |
| Total issued | 8,559,615 | 86,415,779 | 13,241,841 | 132,725,952 |
| Shares redeemed | (9,284,072) | (92,009,941) | (4,909,381) | (49,343,444) |
| Net increase (decrease) | (724,457) | $ (5,594,162) | 8,332,460 | $ 83,382,508 |
| Investor C1 | ||||
| Shares sold | 5,088 | $ 51,933 | 6,202 | $ 61,511 |
| Shares issued to shareholders in reinvestment of dividends | 196,503 | 1,973,965 | 220,956 | 2,218,142 |
| Total issued | 201,591 | 2,025,898 | 227,158 | 2,279,653 |
| Shares redeemed | (1,590,814) | (15,820,977) | (1,513,481) | (15,137,499) |
| Net decrease | (1,389,223) | $ (13,795,079) | (1,286,323) | $ (12,857,846) |
| High Yield Municipal | ||||
| Institutional | ||||
| Shares sold | 6,149,068 | $ 51,299,139 | 6,465,527 | $ 52,954,961 |
| Shares issued to shareholders in reinvestment of dividends | ||||
| and distributions | 233,028 | 1,943,654 | 107,697 | 900,772 |
| Total issued | 6,382,096 | 53,242,793 | 6,573,224 | 53,855,733 |
| Shares redeemed | (4,115,993) | (34,165,925) | (1,767,419) | (14,445,195) |
| Net increase | 2,266,103 | $ 19,076,868 | 4,805,805 | $ 39,410,538 |
| Investor A | ||||
| Shares sold and automatic conversion of shares | 2,565,047 | $ 21,343,797 | 3,588,086 | $ 28,712,678 |
| Shares issued to shareholders in reinvestment of dividends | ||||
| and distributions | 106,181 | 885,713 | 67,920 | 560,971 |
| Total issued | 2,671,228 | 22,229,510 | 3,656,006 | 29,273,649 |
| Shares redeemed | (2,278,814) | (19,113,460) | (1,346,044) | (10,935,891) |
| Net increase | 392,414 | $ 3,116,050 | 2,309,962 | $ 18,337,758 |
| Investor C | ||||
| Shares sold | 1,249,127 | $ 10,496,942 | 1,174,052 | $ 9,607,134 |
| Shares issued to shareholders in reinvestment of dividends | ||||
| and distributions | 63,641 | 529,304 | 31,696 | 260,753 |
| Total issued | 1,312,768 | 11,026,246 | 1,205,748 | 9,867,887 |
| Shares redeemed | (881,601) | (7,307,968) | (226,312) | (1,856,306) |
| Net increase | 431,167 | $ 3,718,278 | 979,436 | $ 8,011,581 |
| 78 | ANNUAL REPORT | JUNE | 30, 2011 |
Notes to Financial Statements (continued)
| Year Ended | Year Ended | |||||
| June 30, 2011 | June 30, 2010 | |||||
| New York Municipal | Shares | Amount | Shares | Amount | ||
| Institutional | ||||||
| Shares sold | 891,752 | $ 9,296,262 | 886,783 | $ 9,279,487 | ||
| Shares issued to shareholders in reinvestment of dividends | 65,748 | 682,553 | 50,961 | 529,695 | ||
| Total issued | 957,500 | 9,978,815 | 937,744 | 9,809,182 | ||
| Shares redeemed | (722,809) | (7,399,948) | (624,770) | (6,490,743) | ||
| Net increase | 234,691 | $ 2,578,867 | 312,974 | $ 3,318,439 | ||
| Investor A | ||||||
| Shares sold and automatic conversion of shares | 852,297 | $ 9,007,593 | 2,099,796 | $ 21,588,976 | ||
| Shares issued to shareholders in reinvestment of dividends | 127,802 | 1,326,522 | 97,249 | 1,014,531 | ||
| Total issued | 980,099 | 10,334,115 | 2,197,045 | 22,603,507 | ||
| Shares redeemed | (1,108,881) | (11,399,887) | (712,498) | (7,337,173) | ||
| Net increase (decrease) | (128,782) | $ (1,065,772) | 1,484,547 | $ 15,266,334 | ||
| Investor A1 | ||||||
| Shares sold and automatic conversion of shares | 201,631 | $ 2,067,823 | 172,822 | $ 1,789,159 | ||
| Shares issued to shareholders in reinvestment of dividends | 433,519 | 4,504,716 | 443,216 | 4,607,722 | ||
| Total issued | 635,150 | 6,572,539 | 616,038 | 6,396,881 | ||
| Shares redeemed | (1,423,955) | (14,617,083) | (1,302,313) | (13,478,561) | ||
| Net decrease | (788,805) | $ (8,044,544) | (686,275) | $ (7,081,680) | ||
| Investor B | ||||||
| Shares sold | 4,881 | $ 49,501 | 4,270 | $ 43,229 | ||
| Shares issued to shareholders in reinvestment of dividends | 16,248 | 169,016 | 19,786 | 205,456 | ||
| Total issued | 21,129 | 218,517 | 24,056 | 248,685 | ||
| Shares redeemed and automatic conversion of shares | (361,409) | (3,719,896) | (309,285) | (3,191,369) | ||
| Net decrease | (340,280) | $ (3,501,379) | (285,229) | $ (2,942,684) | ||
| Investor C | ||||||
| Shares sold | 472,359 | $ 4,956,141 | 704,190 | $ 7,313,334 | ||
| Shares issued to shareholders in reinvestment of dividends | 39,903 | 413,964 | 31,573 | 328,646 | ||
| Total issued | 512,262 | 5,370,105 | 735,763 | 7,641,980 | ||
| Shares redeemed | (523,147) | (5,371,233) | (320,565) | (3,353,350) | ||
| Net increase (decrease) | (10,885) | $ (1,128) | 415,198 | $ 4,288,630 | ||
| Investor C1 | ||||||
| Shares sold | 712 | $ 7,180 | 98 | $ 1,002 | ||
| Shares issued to shareholders in reinvestment of dividends | 27,481 | 285,720 | 29,872 | 310,513 | ||
| Total issued | 28,193 | 292,900 | 29,970 | 311,515 | ||
| Shares redeemed | (171,218) | (1,770,211) | (128,288) | (1,304,912) | ||
| Net decrease | (143,025) | $ (1,477,311) | (98,318) | $ (993,397) | ||
| ANNUAL | REPORT | JUNE | 30, 2011 | 79 |
Notes to Financial Statements (concluded)
9. Subsequent Events:
Management’s evaluation of the impact of all subsequent events on the
Funds’ financial statements was completed through the date the financial
statements were issued and the following item was noted:
The Board of National Municipal and the Board and shareholders of each
of Municipal and BlackRock AMT-Free Municipal Bond Portfolio of
BlackRock Funds II (“AMT-Free Municipal”) (individually, a “Target Fund” and
collectively the “Target Funds”) approved the reorganizations of each Target
Fund into National Municipal pursuant to which National Municipal
acquired substantially all of the assets and substantially all of the liabilities
of each Target Fund in exchange for an equal aggregate value of newly-
issued shares of National Municipal.
Each Shareholder of a Target Fund received shares of National Municipal in
an amount equal to the aggregate net asset value of such shareholder’s
Target Fund shares, as determined at the close of business on July 15,
2011 (although cash was distributed for any fractional shares).
The reorganizations were accomplished by a tax-free exchange of shares of
National Municipal in the following amounts and at the following conver-
sion ratios:
| Shares | National | Shares of | |||
| Target | Target Fund’s | Prior to | Conversion Municipal’s National | ||
| Fund | Share Class Reorganization | Ratio | Share Class Municipal | ||
| Municipal | Institutional | 60,313,178 | 0.73000752 | BlackRock | 44,029,074 |
| Municipal | Investor A 23,362,907 0.72932033 Investor A | 17,039,043 | |||
| Municipal | Investor B | 1,504,648 | 0.72970352 | Investor B | 1,097,947 |
| Municipal | Investor C | 5,968,504 | 0.73017144 | Investor C | 4,358,031 |
| Municipal | Investor C1 | 3,835,529 | 0.72955036 | Investor C1 | 2,798,212 |
| AMT-Free | |||||
| Municipal | BlackRock | 32,187 | 1.04459481 | BlackRock | 33,622 |
| AMT-Free | |||||
| Municipal | Institutional | 36,915,636 | 1.04362536 Institutional | 38,526,093 | |
| AMT-Free | |||||
| Municipal | Service | 807,665 | 1.04194269 | Service | 841,541 |
| AMT-Free | |||||
| Municipal | Investor A | 4,388,828 | 1.04337638 | Investor A | 4,579,199 |
| AMT-Free | |||||
| Municipal | Investor B | 66,195 | 1.04405653 | Investor B1 | 69,111 |
| AMT-Free | |||||
| Municipal | Investor C | 2,211,771 | 1.04317692 | Investor C | 2,307,268 |
Each Target Fund’s net assets and composition of net assets on July 15,
2011, the date of the merger, were as follows:
| Undistributed | |||||
| Net | Accumulated | ||||
| Target | Paid in Investment Net Realized | Net Unrealized | |||
| Fund | Net Assets | Capital | Income | Loss | Appreciation |
| Municipal | $700,874,018 $711,447,251 | — | $(30,654,747) | $20,081,514 | |
| AMT-Free | |||||
| Municipal | $468,651,298 $478,775,502 | — | $(26,705,971) | $16,581,767 | |
For financial reporting purposes, assets received and shares issued by
National Municipal were recorded at fair value; however, the cost basis
of the investments received from the Target Funds were carried forward
to align ongoing reporting of National Municipal’s realized and unrealized
gains and losses with amounts distributable to shareholders for
tax purposes.
The aggregate net assets of National Municipal immediately after the
acquisition amounted to $3,651,145,054. Each Target Fund’s fair value
and cost of investments prior to the reorganization were as follows:
| Fair Value | ||
| of | Cost of | |
| Target Fund | Investments | Investments |
| Municipal | $697,035,650 | $676,954,136 |
| AMT-Free Municipal | $464,643,093 | $448,061,326 |
The purpose of these transactions was to combine three funds
managed by the Manager with the same or substantially similar (but
not identical) investment objectives, investment policies, strategies, risks
and restrictions. Each reorganization was a tax-free event and was
effective on July 18, 2011.
In connection with the reorganizations, National Municipal’s Manager con-
tractually agreed to waive and/or reimburse fees and expenses, excluding
interest expense, dividend expense, acquired fund fees and expenses and
certain other fund expenses, in order to limit expenses. This agreement is in
effect until November 1, 2013. The expense limitations as a percentage of
average daily net assets are as follows:
| Service | 0.46% |
| Investor A | 0.72% |
| Investor B | 1.23% |
| Investor C | 1.47% |
| Investor C1 | 1.28% |
In connection with the reorganizations, National Municipal issued newly
created BlackRock, Service and Investor B1 Share classes.
| 80 | ANNUAL REPORT | JUNE | 30, 2011 |
Report of Independent Registered Public Accounting Firm
To the Shareholders of BlackRock Short-Term Municipal
Fund, BlackRock Municipal Fund, BlackRock National
Municipal Fund, BlackRock High Yield Municipal Fund and
BlackRock New York Municipal Bond Fund and Board of
Directors of BlackRock Municipal Bond Fund, Inc. and Board
of Trustees of BlackRock Multi-State Municipal Series Trust:
We have audited the accompanying statements of assets and liabilities,
including the schedules of investments, of BlackRock Short-Term Municipal
Fund, BlackRock Municipal Fund (formerly BlackRock Municipal Insured
Fund), BlackRock National Municipal Fund and BlackRock High Yield
Municipal Fund of BlackRock Municipal Bond Fund, Inc. and BlackRock
New York Municipal Bond Fund of BlackRock Multi-State Municipal Series
Trust (collectively the “Funds”), as of June 30, 2011, and the related state-
ments of operations for the year then ended, the statements of changes
in net assets for each of the two years in the period then ended, and the
financial highlights for each of the periods presented. These financial
statements and financial highlights are the responsibility of the Funds’
management. Our responsibility is to express an opinion on these
financial statements and financial highlights based on our audits.
We conducted our audits in accordance with the standards of the Public
Company Accounting Oversight Board (United States). Those standards
require that we plan and perform the audit to obtain reasonable assurance
about whether the financial statements and financial highlights are free
of material misstatement. The Funds are not required to have, nor were
we engaged to perform, an audit of their internal control over financial
reporting. Our audits included consideration of internal control over
financial reporting as a basis for designing audit procedures that are
appropriate in the circumstances, but not for the purpose of expressing an
opinion on the effectiveness of the Funds’ internal control over financial
reporting. Accordingly, we express no such opinion. An audit also includes
examining, on a test basis, evidence supporting the amounts and disclo-
sures in the financial statements, assessing the accounting principles used
and significant estimates made by management, as well as evaluating the
overall financial statement presentation. Our procedures included confirma-
tion of securities owned as of June 30, 2011, by correspondence with the
custodians and brokers; where replies were not received from brokers, we
performed other auditing procedures. We believe that our audits provide a
reasonable basis for our opinion.
In our opinion, the financial statements and financial highlights referred
to above present fairly, in all material respects, the financial positions
of BlackRock Short-Term Municipal Fund, BlackRock Municipal Fund,
BlackRock National Municipal Fund and BlackRock High Yield Municipal
Fund of BlackRock Municipal Bond Fund, Inc. and BlackRock New York
Municipal Bond Fund of BlackRock Multi-State Municipal Series Trust,
as of June 30, 2011, the results of their operations for the year then
ended, the changes in their net assets for each of the two years in the
period then ended, and the financial highlights for each of the periods
presented, in conformity with accounting principles generally accepted in
the United States of America.
Deloitte & Touche LLP
Princeton, New Jersey
August 26, 2011
Important Tax Information (Unaudited)
The following table summarizes the taxable per share distributions paid by
the Funds during the taxable year ended June 30, 2011.
| Payable | Ordinary | |
| Date | Income1 | |
| Short-Term Municipal | 12/21/10 | $0.000002 |
| Municipal | 12/21/10 | $0.000034 |
| National Municipal | 12/21/10 | $0.000976 |
| High Yield Municipal | 12/21/10 | $0.004310 |
| New York Municipal | 12/21/10 | $0.001241 |
1 Additionally, all ordinary income distributions are comprised of interest related
dividends for non-US residents and are eligible for exemption from US withholding
tax for nonresident aliens and foreign corporations.
All other net investment income distributions paid by BlackRock Short-Term
Municipal Fund, BlackRock Municipal Fund, BlackRock National Municipal
Fund, BlackRock High Yield Municipal Fund and BlackRock New York
Municipal Bond Fund qualify as tax-exempt interest dividends for federal
income tax purposes.
| ANNUAL | REPORT | JUNE | 30, 2011 | 81 |
Disclosure of Investment Advisory Agreements and Sub-Advisory Agreements
The Board of Directors of BlackRock High Yield Municipal Fund (the
“High Yield Fund”), BlackRock Municipal Fund (the “Municipal Fund”),
BlackRock National Municipal Fund (the “National Fund”) and BlackRock
Short-Term Municipal Fund (the “Short-Term Fund”), each a series of
BlackRock Municipal Bond Fund, Inc. (the “Corporation”), and the Board
of Trustees of the BlackRock New York Municipal Bond Fund (the “New York
Fund,” along with the High Yield Fund, Municipal Fund, National Fund, and
Short-Term Fund, each a “Fund,” and collectively, the “Funds”), a series of
BlackRock Multi-State Municipal Series Trust (the “Trust”), (collectively, the
“Board,” and the members of which are referred to as “Board Members”)
met on April 12, 2011 and May 10 — 11, 2011 to consider the approval of
the Corporation’s, on behalf of the High Yield Fund, the Municipal Fund,
the National Fund and the Short-Term Fund, and the Trust’s on behalf of
the New York Fund, investment advisory agreements (collectively, the
“Advisory Agreements”) with BlackRock Advisors, LLC (the “Manager”),
each Fund’s investment advisor. The Board also considered the approval of
the sub-advisory agreements (collectively, the “Sub-Advisory Agreements”)
between the Manager and BlackRock Investment Management, LLC (the
“Sub-Advisor”), with respect to each Fund. The Manager and the Sub-
Advisor are referred to herein as “BlackRock.” The Advisory Agreements and
the Sub-Advisory Agreements are referred to herein as the “Agreements.”
Activities and Composition of the Board
The Board consists of thirteen individuals, ten of whom are not “interested
persons” of the Corporation or the Trust as defined in the Investment
Company Act of 1940, as amended (the “1940 Act”) (the “Independent
Board Members”). The Board Members are responsible for the oversight
of the operations of the Funds and perform the various duties imposed on
the directors of investment companies by the 1940 Act. The Independent
Board Members have retained independent legal counsel to assist them in
connection with their duties. The Chairman of the Board is an Independent
Board Member. The Board has established five standing committees: an
Audit Committee, a Governance and Nominating Committee, a Compliance
Committee, a Performance Oversight Committee and an Executive
Committee, each of which is composed of Independent Board Members
(except for the Performance Oversight Committee and the Executive
Committee, each of which also has one interested Board Member) and
is chaired by Independent Board Members. The Board also established an
ad hoc committee, the Joint Product Pricing Committee, which consisted
of Independent Board Members and directors/trustees of the boards of
certain other BlackRock-managed funds, who were not “interested persons”
of their respective funds.
The Agreements
Pursuant to the 1940 Act, the Board is required to consider the continua-
tion of the Agreements on an annual basis. In connection with this process,
the Board assessed, among other things, the nature, scope and quality of
the services provided to each Fund by BlackRock, its personnel and its
affiliates, including investment management, administrative and share-
holder services, oversight of fund accounting and custody, marketing
services, risk oversight, compliance program and assistance in meeting
applicable legal and regulatory requirements.
The Board, acting directly and through its committees, considers at each of
its meetings, and from time to time as appropriate, factors that are relevant
to its annual consideration of the renewal of the Agreements, including
the services and support provided by BlackRock to each Fund and its
shareholders. Among the matters the Board considered were: (a) invest-
ment performance for one-, three- and five-year periods, as applicable,
against peer funds, and applicable benchmarks, if any, as well as senior
management’s and portfolio managers’ analysis of the reasons for any over
performance or underperformance against its peers and/or benchmark, as
applicable; (b) fees, including advisory, administration, if applicable, and
other amounts paid to BlackRock and its affiliates by each Fund for serv-
ices, such as transfer agency, marketing and distribution, call center and
fund accounting; (c) Fund operating expenses and how BlackRock allo-
cates expenses to each Fund; (d) the resources devoted to, risk oversight
of, and compliance reports relating to, implementation of each Fund’s
investment objective, policies and restrictions; (e) each Fund’s compliance
with its Code of Ethics and other compliance policies and procedures; (f)
the nature, cost and character of non-investment management services
provided by BlackRock and its affiliates; (g) BlackRock’s and other service
providers’ internal controls and risk and compliance oversight mechanisms;
(h) BlackRock’s implementation of the proxy voting policies approved by
the Board; (i) execution quality of portfolio transactions; (j) BlackRock’s
implementation of each Fund’s valuation and liquidity procedures; (k) an
analysis of contractual and actual management fees for products with simi-
lar investment objectives across the open-end fund, exchange traded fund
(“ETF”), closed-end fund and institutional account product channels, as
applicable; (l) BlackRock’s compensation methodology for its investment
professionals and the incentives it creates; and (m) periodic updates on
BlackRock’s business.
Board Considerations in Approving the Agreements
The Approval Process: Prior to the April 12, 2011 meeting, the Board
requested and received materials specifically relating to the Agreements.
The Board is engaged in a process with BlackRock to review periodically
the nature and scope of the information provided to better assist its delib-
erations. The materials provided in connection with the April meeting
included (a) information independently compiled and prepared by Lipper,
Inc. (“Lipper”) on Fund fees and expenses and the investment performance
of each Fund as compared with a peer group of funds as determined by
Lipper and, for the Municipal Fund, National Fund and Short-Term Fund, a
customized peer group selected by BlackRock (collectively, “Peers”); (b)
information on the profitability of the Agreements to BlackRock and a dis-
cussion of fall-out benefits to BlackRock and its affiliates and significant
shareholders; (c) a general analysis provided by BlackRock concerning
investment management fees (a combination of the advisory fee and the
administration fee, if any) charged to other clients, such as institutional
clients, ETFs and closed-end funds, under similar investment mandates, as
well as the performance of such other clients, as applicable; (d) the impact
of economies of scale; (e) a summary of aggregate amounts paid by each
Fund to BlackRock; (f) sales and redemption data regarding each Fund’s
shares; and (g) if applicable, a comparison of management fees to similar
BlackRock open-end funds, as classified by Lipper.
| 82 | ANNUAL REPORT | JUNE | 30, 2011 |
Disclosure of Investment Advisory Agreements and Sub-Advisory Agreements (continued)
At an in-person meeting held on April 12, 2011, the Board reviewed mate-
rials relating to its consideration of the Agreements. As a result of the dis-
cussions that occurred during the April 12, 2011 meeting, and as a
culmination of the Board’s year-long deliberative process, the Board pre-
sented BlackRock with questions and requests for additional information.
BlackRock responded to these requests with additional written information
in advance of the May 10 — 11, 2011 Board meeting.
At an in-person meeting held on May 10 — 11, 2011, the Board, including
the Independent Board Members, unanimously approved the continuation
of the Advisory Agreements between the Manager and the Corporation, on
behalf of the High Yield Fund, the Municipal Fund, the National Fund and
the Short-Term Fund, and the Trust, on behalf of the New York Fund, and
the Sub-Advisory Agreements between the Manager and the Sub-Advisor
with respect to each Fund, each for a one-year term ending June 30, 2012.
In approving the continuation of the Agreements, the Board considered: (a)
the nature, extent and quality of the services provided by BlackRock; (b)
the investment performance of each Fund and BlackRock; (c) the advisory
fee and the cost of the services and profits to be realized by BlackRock
and its affiliates from their relationship with each Fund; (d) economies of
scale; (e) fall-out benefits to BlackRock as a result of its relationship with
each Fund; and (f) other factors deemed relevant by the Board Members.
The Board also considered other matters it deemed important to the
approval process, such as payments made to BlackRock or its affiliates
relating to the distribution of Fund shares, services related to the valuation
and pricing of Fund portfolio holdings, direct and indirect benefits to
BlackRock and its affiliates and significant shareholders from their relation-
ship with each Fund and advice from independent legal counsel with
respect to the review process and materials submitted for the Board’s
review. The Board noted the willingness of BlackRock personnel to engage
in open, candid discussions with the Board. The Board did not identify any
particular information as controlling, and each Board Member may have
attributed different weights to the various items considered.
A. Nature, Extent and Quality of the Services Provided by BlackRock:
The Board, including the Independent Board Members, reviewed the
nature, extent and quality of services provided by BlackRock, including
the investment advisory services and the resulting performance of each
Fund. Throughout the year, the Board compared Fund performance to the
performance of a comparable group of mutual funds and/or the perform-
ance of a relevant benchmark, if any. The Board met with BlackRock’s sen-
ior management personnel responsible for investment operations, including
the senior investment officers. The Board also reviewed the materials pro-
vided by each Fund’s portfolio management team discussing Fund perform-
ance and each Fund’s investment objective, strategies and outlook.
The Board considered, among other factors, the number, education and
experience of BlackRock’s investment personnel generally and each Fund’s
portfolio management team, investments by portfolio managers in the
funds they manage, BlackRock’s portfolio trading capabilities, BlackRock’s
use of technology, BlackRock’s commitment to compliance, BlackRock’s
credit analysis capabilities, BlackRock’s risk analysis capabilities and
BlackRock’s approach to training and retaining portfolio managers and
other research, advisory and management personnel. The Board engaged
in a review of BlackRock’s compensation structure with respect to each
Fund’s portfolio management team and BlackRock’s ability to attract and
retain high-quality talent and create performance incentives.
In addition to advisory services, the Board considered the quality of
the administrative and non-investment advisory services provided to each
Fund. BlackRock and its affiliates and significant shareholders provide
each Fund with certain administrative, transfer agency, shareholder and
other services (in addition to any such services provided to a Fund by
third parties) and officers and other personnel as are necessary for the
operations of the Fund. In addition to investment advisory services,
BlackRock and its affiliates provide each Fund with other services,
including (i) preparing disclosure documents, such as the prospectus, the
statement of additional information and periodic shareholder reports;
(ii) assisting with daily accounting and pricing; (iii) overseeing and coordi-
nating the activities of other service providers; (iv) organizing Board meet-
ings and preparing the materials for such Board meetings; (v) providing
legal and compliance support; and (vi) performing other administrative
functions necessary for the operation of each Fund, such as tax reporting,
fulfilling regulatory filing requirements and call center services. The
Board reviewed the structure and duties of BlackRock’s fund administra-
tion, accounting, legal and compliance departments and considered
BlackRock’s policies and procedures for assuring compliance with
applicable laws and regulations.
B. The Investment Performance of each Fund and BlackRock: The Board,
including the Independent Board Members, also reviewed and considered
the performance history of each Fund. In preparation for the April 12, 2011
meeting, the Board worked with BlackRock and Lipper to develop a tem-
plate for, and was provided with, reports independently prepared by Lipper,
which included a comprehensive analysis of each Fund’s performance. The
Board also reviewed a narrative and statistical analysis of the Lipper data
that was prepared by BlackRock, which analyzed various factors that affect
Lipper’s rankings. In connection with its review, the Board received and
reviewed information regarding the investment performance of each Fund
as compared to funds in the Fund’s applicable Lipper category and, for the
Municipal Fund, National Fund and Short-Term Fund, a customized peer
group selected by BlackRock. The Board was provided with a description of
the methodology used by Lipper to select peer funds. The Board and the
Board’s Performance Oversight Committee regularly review, and meet with
Fund management to discuss, the performance of each Fund throughout
the year.
The Board noted that the High Yield Fund ranked in the third, fourth and
fourth quartiles against its Lipper Performance Composite for the one-year,
three-year and since-inception periods reported, respectively. The Board
and BlackRock reviewed and discussed the reasons for the High Yield
Fund’s underperformance during these periods compared with its Peers.
The Board was informed that, among other things, the High Yield Fund’s
more conservative credit profile has hindered performance.
The Board and BlackRock discussed BlackRock’s strategy for improving the
High Yield Fund’s performance and BlackRock’s commitment to providing
the resources necessary to assist the High Yield Fund’s portfolio managers
and to improve the High Yield Fund’s performance.
| ANNUAL | REPORT | JUNE | 30, 2011 | 83 |
Disclosure of Investment Advisory Agreements and Sub-Advisory Agreements (continued)
The Board noted that the Municipal Fund ranked in the first, first and third
quartiles against its Customized Lipper Peer Group- Composite for the one-,
three- and five-year periods reported, respectively.
The Board noted that the National Fund ranked in the first quartile against
its Customized Lipper Peer Group- Composite for each of the one-, three-
and five-year periods reported.
The Board noted that the Short-Term Fund ranked in the fourth, third
and fourth quartiles against its Customized Lipper Peer Group for the
one-, three- and five-year periods reported, respectively. The Board and
BlackRock reviewed and discussed the reasons for the Short-Term Fund’s
underperformance during these periods compared with its Peers. The Board
was informed that, among other things, underperformance in the one-year
period can be attributed to the Short-Term Fund’s inability to capitalize on
what has been an extraordinary steep yield curve and purchase securities
with maturities of greater than four years.
The Board and BlackRock discussed BlackRock’s strategy for improving the
Short-Term Fund’s performance and BlackRock’s commitment to providing
the resources necessary to assist the Short-Term Fund’s portfolio managers
and to improve the Short-Term Fund’s performance.
The Board noted that the New York Fund ranked in the first, third and sec-
ond quartiles against its Lipper Performance Composite for the one-, three-
and five-year periods reported, respectively.
The Board noted that BlackRock has made changes to the organization of
the overall fixed income group management structure designed to result in
a strengthened leadership team.
C. Consideration of the Advisory/Management Fees and the Cost of the
Services and Profits to be Realized by BlackRock and its Affiliates from
their Relationship with each Fund: The Board, including the Independent
Board Members, reviewed each Fund’s contractual management fee ratio
compared with the other funds in its Lipper category. It also compared
each Fund’s total expense ratio, as well as actual management fee ratio, to
those of other funds in its Lipper category. The Board considered the serv-
ices provided and the fees charged by BlackRock to other types of clients
with similar investment mandates, including separately managed institu-
tional accounts.
The Board received and reviewed statements relating to BlackRock’s finan-
cial condition and profitability with respect to the services it provided
each Fund. The Board was also provided with a profitability analysis that
detailed the revenues earned and the expenses incurred by BlackRock for
services provided to each Fund. The Board reviewed BlackRock’s profitabil-
ity with respect to each Fund and other funds the Board currently oversees
for the year ended December 31, 2010 compared to available aggregate
profitability data provided for the years ended December 31, 2009 and
December 31, 2008. The Board reviewed BlackRock’s profitability with
respect to other fund complexes managed by the Manager and/or its
affiliates. The Board reviewed BlackRock’s assumptions and methodology
of allocating expenses in the profitability analysis, noting the inherent limi-
tations in allocating costs among various advisory products. The Board rec-
ognized that profitability may be affected by numerous factors including,
among other things, fee waivers and expense reimbursements by the
Manager, the types of funds managed, expense allocations and business
mix, and the difficulty of comparing profitability as a result of those factors.
The Board noted that, in general, individual fund or product line profitabil-
ity of other advisors is not publicly available. The Board considered
BlackRock’s operating margin, in general, compared to the operating
margin for leading investment management firms whose operations include
advising open-end funds, among other product types. That data indicates
that operating margins for BlackRock, in general and with respect to its
registered funds, are generally consistent with margins earned by similarly
situated publicly traded competitors. In addition, the Board considered,
among other things, certain third party data comparing BlackRock’s operat-
ing margin with that of other publicly-traded asset management firms. That
third party data indicates that larger asset bases do not, in themselves,
translate to higher profit margins.
In addition, the Board considered the cost of the services provided to
each Fund by BlackRock, and BlackRock’s and its affiliates’ profits relating
to the management and distribution of each Fund and the other funds
advised by BlackRock and its affiliates. As part of its analysis, the Board
reviewed BlackRock’s methodology in allocating its costs to the manage-
ment of each Fund. The Board also considered whether BlackRock has the
financial resources necessary to attract and retain high quality investment
management personnel to perform its obligations under the Agreements
and to continue to provide the high quality of services that is expected by
the Board.
The Board noted that the High Yield Fund’s contractual management fee
ratio (a combination of the advisory fee and the administration fee, if any)
was lower than or equal to the median contractual management fee ratio
paid by the High Yield Fund’s Peers, in each case before taking into
account any expense reimbursements or fee waivers. The Board also noted
that the High Yield Fund has an advisory fee arrangement that includes
breakpoints that adjust the fee ratio downward as the size of the High Yield
Fund increases above certain contractually specified levels.
The Board noted that the Municipal Fund’s contractual management fee
ratio (a combination of the advisory fee and the administration fee, if any)
was lower than or equal to the median contractual management fee ratio
paid by the Municipal Fund’s Peers, in each case before taking into
account any expense reimbursements or fee waivers. The Board also noted
that the Municipal Fund has an advisory fee arrangement that includes
breakpoints that adjust the fee ratio downward as the aggregate assets of
the Municipal Fund, combined with the assets of the National Fund and
the Short-Term Fund, increase above certain contractually specified levels.
The Board noted that the National Fund’s contractual management fee
ratio (a combination of the advisory fee and the administration fee, if
any) was above the median contractual management fee ratio paid by
the National Fund’s Peers, in each case before taking into account any
expense reimbursements or fee waivers. The Board also noted that the
National Fund is expected to be part of a fund reorganization, where the
National Fund would be the surviving fund. The Board further noted that
the National Fund has an advisory fee arrangement that includes break-
| 84 | ANNUAL REPORT | JUNE | 30, 2011 |
Disclosure of Investment Advisory Agreements and Sub-Advisory Agreements (concluded)
points that adjust the fee ratio downward as the aggregate assets of the
National Fund, combined with the assets of the Municipal Fund and the
Short-Term Fund, increase above certain contractually specified levels. In
addition, the Board noted that BlackRock has voluntarily agreed to waive
fees or reimburse expenses in order to limit, to a specified amount,
the National Fund’s total net expenses on a class-by-class basis,
as applicable.
The Board noted that the Short-Term Fund’s contractual management fee
ratio (a combination of the advisory fee and the administration fee,
if any) was lower than or equal to the median contractual management
fee ratio paid by the Short-Term Fund’s Peers, in each case before taking
into account any expense reimbursements or fee waivers. The Board
further noted that the Short-Term Fund has an advisory fee arrangement
that includes breakpoints that adjust the fee ratio downward as the
aggregate assets of the Short-Term Fund, combined with the assets of
the Municipal Fund and the National Fund, increase above certain contrac-
tually specified levels. In addition, the Board noted that BlackRock has
voluntarily agreed to waive fees or reimburse expenses in order to limit,
to a specified amount, the Short-Term Fund’s total net expenses on a
class-by-class basis, as applicable.
The Board noted that the New York Fund’s contractual management fee
ratio (a combination of the advisory fee and the administration fee, if any)
was above the median contractual management fee ratio paid by the New
York Fund’s Peers, in each case before taking into account any expense
reimbursements or fee waivers. The Board also noted, however, that the
New York Fund’s contractual management fee ratio was reasonable relative
to the median contractual management fee ratio paid by the New York
Fund’s peers. The Board further noted that the New York Fund has an advi-
sory fee arrangement that includes breakpoints that adjust the fee ratio
downward as the size of the New York Fund increases above certain con-
tractually specified levels.
D. Economies of Scale: The Board, including the Independent Board
Members, considered the extent to which economies of scale might be
realized as the assets of each Fund increase. The Board also considered
the extent to which each Fund benefits from such economies and whether
there should be changes in the advisory fee rate or structure in order to
enable each Fund to participate in these economies of scale, for example
through the use of revised breakpoints in the advisory fee based upon the
asset level of a Fund, and in the case of the Municipal Fund, National Fund
and Short-Term Fund, based on the combined assets of those three Funds.
E. Other Factors Deemed Relevant by the Board Members: The Board,
including the Independent Board Members, also took into account other
ancillary or “fall-out” benefits that BlackRock or its affiliates and significant
shareholders may derive from their respective relationships with each
Fund, both tangible and intangible, such as BlackRock’s ability to leverage
its investment professionals who manage other portfolios and risk manage-
ment personnel, an increase in BlackRock’s profile in the investment
advisory community, and the engagement of BlackRock’s affiliates and
significant shareholders as service providers to the Fund, including for
administrative, transfer agency, distribution and securities lending services.
The Board also considered BlackRock’s overall operations and its efforts to
expand the scale of, and improve the quality of, its operations. The Board
also noted that BlackRock may use and benefit from third party research
obtained by soft dollars generated by certain registered fund transactions
to assist in managing all or a number of its other client accounts. The
Board further noted that BlackRock’s funds may invest in affiliated ETFs
without any offset against the management fees payable by the funds
to BlackRock.
In connection with its consideration of the Agreements, the Board also
received information regarding BlackRock’s brokerage and soft dollar prac-
tices. The Board received reports from BlackRock which included informa-
tion on brokerage commissions and trade execution practices throughout
the year.
The Board noted the competitive nature of the open-end fund marketplace,
and that shareholders are able to redeem their Fund shares if they believe
that the Fund’s fees and expenses are too high or if they are dissatisfied
with the performance of the Fund.
Conclusion
The Board, including the Independent Board Members, unanimously
approved the continuation of the Advisory Agreements between the
Manager and the Corporation, on behalf of the High Yield Fund, the
Municipal Fund, the National Fund and the Short-Term Fund, and the
Trust, on behalf of the New York Fund, for a one-year term ending June
30, 2012 and the Sub-Advisory Agreements between the Manager and
the Sub-Advisor, with respect to each Fund, for a one-year term ending
June 30, 2012. As part of its approval, the Board considered the detailed
review of BlackRock’s fee structure, as it applies to each Fund, conducted
by the ad hoc Joint Product Pricing Committee. Based upon its evaluation
of all of the aforementioned factors in their totality, the Board, including
the Independent Board Members, was satisfied that the terms of the
Agreements were fair and reasonable and in the best interest of each Fund
and its shareholders. In arriving at its decision to approve the Agreements,
the Board did not identify any single factor or group of factors as all-impor-
tant or controlling, but considered all factors together, and different Board
Members may have attributed different weights to the various factors con-
sidered. The Independent Board Members were also assisted by the advice
of independent legal counsel in making this determination. The contractual
fee arrangements for each Fund reflect the results of several years of review
by the Board Members and predecessor Board Members, and discussions
between such Board Members (and predecessor Board Members) and
BlackRock. As a result, the Board Members’ conclusions may be based in
part on their consideration of these arrangements in prior years.
| ANNUAL | REPORT | JUNE | 30, 2011 | 85 |
| Officers and Directors | |||||
| Number of BlackRock- | |||||
| Advised Registered | |||||
| Length | Investment Companies | ||||
| Position(s) | of Time | (“RICs”) Consisting of | |||
| Name, Address | Held with | Served as | Investment Portfolios | Public | |
| and Year of Birth | Funds | a Director2 | Principal Occupation(s) During Past Five Years | (“Portfolios”) Overseen | Directorships |
| Independent Directors1 | |||||
| Robert M. Hernandez | Chair of | Since | Director, Vice Chairman and Chief Financial Officer of USX | 34 RICs consisting of | ACE Limited |
| 55 East 52nd Street | the Board | 2007 | Corporation (energy and steel business) from 1991 to 2001. | 97 Portfolios | (insurance company); |
| New York, NY 10055 | and Director | Eastman Chemical | |||
| 1944 | Company (chemicals); | ||||
| RTI International | |||||
| Metals, Inc. (metals); | |||||
| TYCO Electronics | |||||
| (electronics) | |||||
| Fred G. Weiss | Vice Chair | Since | Managing Director, FGW Associates (consulting and investment | 34 RICs consisting of | Watson |
| 55 East 52nd Street | of the Board | 2007 | company) since 1997; Director and Treasurer, Michael J. Fox | 97 Portfolios | Pharmaceuticals, Inc. |
| New York, NY 10055 | and Director | Foundation for Parkinson’s Research since 2000; Director, BTG | |||
| 1941 | International Plc (medical technology commercialization company) | ||||
| from 2001 to 2007. | |||||
| James H. Bodurtha | Director | Since | Director, The China Business Group, Inc. (consulting firm) since | 34RICs consisting of | None |
| 55 East 52nd Street | 1995 | 1996 and Executive Vice President thereof from 1996 to 2003; | 97 Portfolios | ||
| New York, NY 10055 | Chairman of the Board, Berkshire Holding Corporation since 1980. | ||||
| 1944 | |||||
| Bruce R. Bond | Director | Since | Trustee and Member of the Governance Committee, State Street | 34 RICs consisting of | None |
| 55 East 52nd Street | 2007 | Research Mutual Funds from 1997 to 2005; Board Member | 97 Portfolios | ||
| New York, NY 10055 | of Governance, Audit and Finance Committee, Avaya Inc. | ||||
| 1946 | (computer equipment) from 2003 to 2007. | ||||
| Donald W. Burton | Director | Since | Managing General Partner, The Burton Partnership, LP (an | 34 RICs consisting of | Knology, Inc. (tele- |
| 55 East 52nd Street | 2007 | investment partnership) since 1979; Managing General Partner, | 97 Portfolios | communications); | |
| New York, NY 10055 | The South Atlantic Venture Funds since 1983; Director, Lifestyle | Capital Southwest | |||
| 1944 | Family Fitness (fitness industry) since 2006; Director, IDology, Inc. | (financial) | |||
| (technology solutions) since 2006; Member of the Investment | |||||
| Advisory Council of the Florida State Board of Administration | |||||
| from 2001 to 2007. | |||||
| Honorable Stuart E. | Director | Since | Partner and Head of International Practice, Covington and | 34 RICs consisting of | Alcatel-Lucent (tele- |
| Eizenstat | 2007 | Burling LLP (law firm) since 2001; International Advisory Board | 97 Portfolios | communications); | |
| 55 East 52nd Street | Member, The Coca-Cola Company since 2002; Advisory Board | Global Specialty | |||
| New York, NY 10055 | Member, Veracity Worldwide, LLC (risk management) since 2007; | Metallurgical (metal- | |||
| 1943 | Member of the Board of Directors, Chicago Climate Exchange | lurgical industry); | |||
| (environment) since 2006; Member of the International Advisory | UPS Corporation | ||||
| Board GML (energy) since 2003; Advisory Board Member, BT | (delivery service) | ||||
| Americas (telecommunications) from 2004to 2010. | |||||
| Kenneth A. Froot | Director | Since | Professor, Harvard University since 1992. | 34 RICs consisting of | None |
| 55 East 52nd Street | 2005 | 97 Portfolios | |||
| New York, NY 10055 | |||||
| 1957 | |||||
| John F. O’Brien | Director | Since | Chairman and Director, Woods Hole Oceanographic Institute | 34 RICs consisting of | Cabot Corporation |
| 55 East 52nd Street | 2007 | since 2009 and Trustee thereof from 2003 to 2009; Director, | 97 Portfolios | (chemicals); LKQ | |
| New York, NY 10055 | Allmerica Financial Corporation from 1995 to 2003; Director, | Corporation (auto | |||
| 1943 | ABIOMED from 1989 to 2006; Director, Ameresco,Inc. | parts manufacturing); | |||
| (energy solutions company) from 2006 to 2007; Vice Chairman | TJX Companies, Inc. | ||||
| and Director, Boston Lyric Opera from 2002 to 2007. | (retailer) | ||||
| Roberta Cooper Ramo | Director | Since | Shareholder, Modrall, Sperling, Roehl, Harris & Sisk, P.A. (law | 34 RICs consisting of | None |
| 55 East 52nd Street | 2000 | firm) since 1993; Chairman of the Board, Cooper’s Inc., (retail) | 97 Portfolios | ||
| New York, NY 10055 | since 2000; Director, ECMC Group (service provider to | ||||
| 1942 | students, schools and lenders) since 2001; President, The | ||||
| American Law Institute (non-profit) since 2008; President, | |||||
| American Bar Association from 1995 to 1996. | |||||
| 86 | ANNUAL REPORT | JUNE | 30, 2011 |
| Officers and Directors (continued) | |||||
| Number of BlackRock- | |||||
| Advised Registered | |||||
| Length | Investment Companies | ||||
| Position(s) | of Time | (“RICs”) Consisting of | |||
| Name, Address | Held with | Served as | Investment Portfolios | Public | |
| and Year of Birth | Funds | a Director2 | Principal Occupation(s) During Past Five Years | (“Portfolios”) Overseen | Directorships |
| Independent Directors1 (concluded) | |||||
| David H. Walsh | Director | Since | Director, National Museum of Wildlife Art since 2007; Trustee, | 34 RICs consisting of | None |
| 55 East 52nd Street | 2007 | University of Wyoming Foundation since 2008; Director, | 97 Portfolios | ||
| New York, NY 10055 | Ruckelshaus Institute and Haub School of Natural Resources at | ||||
| 1941 | the University of Wyoming from 2006 to 2008; Director, The | ||||
| American Museum of Fly Fishing since 1997; Director, The | |||||
| National Audubon Society from 1998 to 2005. | |||||
| 1 Directors serve until their resignation, removal or death, or until December 31 of the year in which they turn 72. | |||||
| 2 Date shown is the earliest date a person has served for the Funds covered by this annual report. Following the combination of Merrill Lynch Investment | |||||
| Managers, L.P. (“MLIM”) and BlackRock, Inc. (“BlackRock”) in September 2006, the various legacy MLIM and legacy BlackRock Fundboards were realigned | |||||
| and consolidated into three new Fund boards in 2007. As a result, although the chart shows certain directors as joining the Funds’ board in 2007, each | |||||
| director first became a member of the board of other legacy MLIM or legacy BlackRock Funds as follows: James H. Bodurtha, 1995;Bruce R. Bond, 2005; | |||||
| Donald W. Burton, 2002; Honorable Stuart E. Eizenstat, 2001; Kenneth A. Froot, 2005; Robert M. Hernandez, 1996; John F. O’Brien, 2004; Roberta Cooper | |||||
| Ramo, 2000; David H. Walsh, 2003 and Fred G. Weiss, 1998. | |||||
| Interested Directors3 | |||||
| Richard S. Davis | Director | Since | Managing Director, BlackRock, Inc. since 2005; Chief Executive | 165 RICs consisting of | None |
| 55 East 52nd Street | 2007 | Officer, State Street Research & Management Company from | 291 Portfolios | ||
| New York, NY 10055 | 2000 to 2005; Chairman of the Board of Trustees, State Street | ||||
| 1945 | Research Mutual Funds from 2000 to 2005. | ||||
| Laurence D. Fink | Director | Since | Chairman and Chief Executive Officer of BlackRock, Inc. since its | 34 RICs consisting of | None |
| 55 East 52nd Street | 2007 | formation in 1998 and of BlackRock, Inc.’s predecessor entities | 97 Portfolios | ||
| New York, NY 10055 | since 1988 and Chairman of the Executive and Management | ||||
| 1952 | Committees; Formerly Managing Director, The First Boston Corp- | ||||
| oration, Member of its Management Committee, Co-head of its | |||||
| Taxable Fixed Income Division and Head of its Mortgage and Real | |||||
| Estate Products Group; Chairman of the Board of several of | |||||
| BlackRock’s alternative investment vehicles; Director of several of | |||||
| BlackRock’s offshore funds; Member ofthe Board of Trustees of | |||||
| New York University, Chair of the Financial Affairs Committee and | |||||
| a member of the Executive Committee,the Ad Hoc Committee on | |||||
| Board Governance, and the Committee on Trustees; Co-Chairman | |||||
| of the NYU Hospitals Center Board ofTrustees, Chairman of the | |||||
| Development/Trustee Stewardship Committee and Chairman of | |||||
| the Finance Committee; Trustee, The Boys’ Club of New York. | |||||
|
| |||||
| Henry Gabbay | Director | Since | Consultant, BlackRock, Inc. from 2007 to 2008; Managing | 165 RICs consisting of | None |
| 55 East 52nd Street | 2007 | Director, BlackRock, Inc. from 1989 to 2007; Chief | 291 Portfolios | ||
| New York, NY 10055 | Administrative Officer, BlackRock Advisors, LLC from 1998 to | ||||
| 1947 | 2007; President of BlackRock Funds and BlackRock Bond | ||||
| Allocation Target Shares from 2005 to 2007 and Treasurer of | |||||
| certain closed-end funds in the BlackRock fund complex from | |||||
| 1989 to 2006. | |||||
| 3 Messrs. Davis and Fink are both “interested persons,” as defined in the 1940 Act, of the Funds based on their positions with BlackRock, Inc. and its affiliates. | |||||
| Mr. Gabbay is an "interested person" of the Funds based on his former positions with BlackRock, Inc. and its affiliated as wellas his ownership of BlackRock, | |||||
| Inc. and The PNC Financial Services Group, Inc. securities. Directors serve until their resignation, removal or death, or until December 31 of the year in which | |||||
| they turn 72. | |||||
| ANNUAL | REPORT | JUNE | 30, 2011 | 87 |
| Officers and Directors (concluded) | |||
| Position(s) | |||
| Name, Address | Held with | Length of | |
| and Year of Birth | Funds | Time Served | Principal Occupation(s) During Past Five Years |
| Officers1 | |||
| John M. Perlowski | President and | Since | Managing Director of BlackRock, Inc. since 2009; Global Head of BlackRock Fund Administration since 2009; |
| 55 East 52nd Street | Chief | 2010 | Managing Director and Chief Operating Officer of the Global Product Group at Goldman Sachs Asset Management, |
| New York, NY 10055 | Executive | L.P. from 2003 to 2009; Treasurer of Goldman Sachs Mutual Funds from 2003 to 2009 and Senior Vice President | |
| 1964 | Officer | thereof from 2007 to 2009; Director of Goldman Sachs Offshore Funds from 2002 to 2009; Director, Family Resource | |
| Network (charitable foundation) since 2009. | |||
| Brendan Kyne | Vice | Since | Managing Director of BlackRock, Inc. since 2010; Director of BlackRock, Inc. from 2008 to 2009; Head of Product |
| 55 East 52nd Street | President | 2009 | Development and Management for BlackRock's U.S. Retail Group since 2009, Co-head thereof from 2007 to |
| New York, NY 10055 | 2009; Vice President of BlackRock, Inc. from 2005 to 2008. | ||
| 1977 | |||
| Neal Andrews | Chief | Since | Managing Director of BlackRock, Inc. since 2006; Senior Vice President and Line of Business Head of Fund |
| 55 East 52nd Street | Financial | 2007 | Accounting and Administration at PNC Global Investment Servicing (U.S.)Inc. from 1992 to 2006. |
| New York, NY 10055 | Officer | ||
| 1966 | |||
| Jay Fife | Treasurer | Since | Managing Director of BlackRock, Inc. since 2007; Director of BlackRock, Inc. in 2006; Assistant Treasurer of the MLIM |
| 55 East 52nd Street | 2007 | and Fund Asset Management, L.P.-advised funds from 2005 to 2006; Director of MLIM Fund Services Group from | |
| New York, NY 10055 | 2001 to 2006. | ||
| 1970 | |||
| Brian Kindelan | Chief | Since | Chief Compliance Officer of the BlackRock-advised funds since 2007; Managing Director and Senior Counsel of |
| 55 East 52nd Street | Compliance | 2007 | BlackRock, Inc. since 2005. |
| New York, NY 10055 | Officer and | ||
| 1959 | Anti-Money | ||
| Laundering Officer | |||
| Ira P. Shapiro | Secretary | Since | Managing Director of BlackRock, Inc. since 2009; Managing Director and Associate General Counsel of Barclays Global |
| 55 East 52nd Street | 2010 | Investors from 2008 to 2009 and Principal thereof from 2004 to 2008. | |
| New York, NY 10055 | |||
| 1963 | |||
| 1 Officers of the Funds serve at the pleasure of the Board. | |||
| Further information about the Series’ Officers and Directors is available in the Funds’ Statement of Additional Information, which can be obtained without | |||
| charge by calling (800) 441-7762. | |||
| Investment Advisor | Custodians | Accounting Agent | Legal Counsel | Address of Funds |
| BlackRock Advisors, LLC | The Bank of | State Street Bank | Willkie Farr & Gallagher LLP | 100 Bellevue Parkway |
| Wilmington, DE 19809 | New York Mellon2 | and Trust Company | New York, NY 10019 | Wilmington, DE 19809 |
| New York, NY 10286 | Boston, MA 02116 | |||
| Sub-Advisor | Independent Registered | |||
| BlackRock Investment | State Street Bank | Distributor | Public Accounting Firm | |
| Management, LLC | and Trust Company3 | BlackRock Investments, LLC | Deloitte & Touche LLP | |
| Princeton, NJ 08540 | Boston, MA 02111 | New York, NY 10022 | Princeton, NJ 08540 | |
| Transfer Agent | ||||
| BNY Mellon Investment | ||||
| Servicing (US) Inc. | ||||
| Wilmington, DE 19809 |
2 For BlackRock Municipal Bond Fund, Inc.
3 For BlackRock Multi-State Municipal Series Trust.
| 88 | ANNUAL REPORT | JUNE | 30, 2011 |
Additional Information
Proxy Results
At a special meeting of all shareholders of BlackRock Municipal Fund, a
series of BlackRock Municipal Bond Fund, Inc., held on June 24, 2011
the results were as follows:
Proposal 1.
To consider a proposal to approve an Agreement and Plan of
Reorganization (the “Reorganization Agreement”) pursuant to which the
Fund would transfer all of its assets to the BlackRock National Municipal
Fund (the “Acquiring Fund”), a series of BlackRock Municipal Bond Fund,
Inc., in exchange for the assumption by the Acquiring Fund of certain
stated liabilities of the Fund and shares of the Acquiring Fund, as detailed
in the Reorganization Agreement, which shares will be distributed by your
Fund to you on a pro rata basis in complete liquidation of your Fund.
| Votes For | Votes Against | Abstain |
| 42,480,516 | 3,119,677 | 3,819,332 |
General Information
Electronic Delivery
Electronic copies of most financial reports and prospectuses are available
on the Fund’s website or shareholders can sign up for e-mail notifications
of quarterly statements, annual and semi-annual reports and prospectuses
by enrolling in the Fund’s electronic delivery program.
To enroll:
Shareholders Who Hold Accounts with Investment Advisors, Banks or
Brokerages:
Please contact your financial advisor. Please note that not all investment
advisors, banks or brokerages may offer this service.
Shareholders Who Hold Accounts Directly with BlackRock:
1) Access the BlackRock website at
http://www.blackrock.com/edelivery
2) Select “eDelivery” under the “More Information” section
3) Log into your account
Householding
The Funds will mail only one copy of shareholder documents, including
prospectuses, annual and semi-annual reports and proxy statements, to
shareholders with multiple accounts at the same address. This practice is
commonly called “householding” and it is intended to reduce expenses
and eliminate duplicate mailings of shareholder documents. Mailings of
your shareholder documents may be householded indefinitely unless you
instruct us otherwise. If you do not want the mailing of these documents to
be combined with those for other members of your household, please con-
tact the Funds at (800) 441-7762.
Availability of Quarterly Schedule of Investments
The Funds file their complete schedule of portfolio holdings with the SEC
for the first and third quarters of each fiscal year on Form N-Q. The Funds’
Forms N-Q are available on the SEC’s website at http://www.sec.gov and
may also be reviewed and copied at the SEC’s Public Reference Room in
Washington, D.C. Information on how to access documents on the SEC’s
website may be obtained by calling (800) SEC-0330. The Funds’ Forms N-
Q may also be obtained upon request and without charge by calling (800)
441-7762.
Availability of Proxy Voting Policies and Procedures
A description of the policies and procedures that the Funds use to
determine how to vote proxies relating to portfolio securities is avail-
able (1) without charge, upon request, by calling (800) 441-7762;
(2) at http://www.blackrock.com; and (3) on the SEC’s website at
http://www.sec.gov.
Availability of Proxy Voting Record
Information about how the Funds voted proxies relating to securities
held in the Funds’ portfolios during the most recent 12-month period
ended June 30 is available upon request and without charge (1) at
http://www.blackrock.com or by calling (800) 441-7762 and (2) on
the SEC’s website at http://www.sec.gov.
| ANNUAL | REPORT | JUNE | 30, 2011 | 89 |
Additional Information (concluded)
Shareholder Privileges
Account Information
Call us at (800) 441-7762 from 8:00 AM to 6:00 PM EST on any business
day to get information about your account balances, recent transactions
and share prices. You can also reach us on the Web at
http://www.blackrock.com/funds.
Automatic Investment Plans
Investor Class shareholders who want to invest regularly can arrange to
have $50 or more automatically deducted from their checking or savings
account and invested in any of the BlackRock funds.
Systematic Withdrawal Plans
Investor Class shareholders can establish a systematic withdrawal plan and
receive periodic payments of $50 or more from their BlackRock funds, as
long as their account balance is at least $10,000.
Retirement Plans
Shareholders may make investments in conjunction with Traditional, Rollover,
Roth, Coverdell, Simple IRAs, SEP IRAs and 403(b) Plans.
BlackRock Privacy Principles
BlackRock is committed to maintaining the privacy of its current and
former fund investors and individual clients (collectively, “Clients”) and
to safeguarding their non-public personal information. The following infor-
mation is provided to help you understand what personal information
BlackRock collects, how we protect that information and why in certain
cases we share such information with select parties.
If you are located in a jurisdiction where specific laws, rules or regulations
require BlackRock to provide you with additional or different privacy-related
rights beyond what is set forth below, then BlackRock will comply with
those specific laws, rules or regulations.
BlackRock obtains or verifies personal non-public information from and
about you from different sources, including the following: (i) information we
receive from you or, if applicable, your financial intermediary, on applica-
tions, forms or other documents; (ii) information about your transactions
with us, our affiliates, or others; (iii) information we receive from a con-
sumer reporting agency; and (iv) from visits to our websites.
BlackRock does not sell or disclose to non-affiliated third parties any non-
public personal information about its Clients, except as permitted by law or
as is necessary to respond to regulatory requests or to service Client
accounts. These non-affiliated third parties are required to protect the con-
fidentiality and security of this information and to use it only for its
intended purpose.
We may share information with our affiliates to service your account or to
provide you with information about other BlackRock products or services
that may be of interest to you. In addition, BlackRock restricts access to
non-public personal information about its Clients to those BlackRock
employees with a legitimate business need for the information. BlackRock
maintains physical, electronic and procedural safeguards that are designed
to protect the non-public personal information of its Clients, including pro-
cedures relating to the proper storage and disposal of such information.
| 90 | ANNUAL REPORT | JUNE | 30, 2011 |
| A World-Class Mutual Fund Family | ||||||
| BlackRock offers a diverse lineup of open-end mutual funds crossing all investment styles and managed by experts in equity, fixed income and | ||||||
| tax-exempt investing. | ||||||
| Equity Funds | ||||||
| BlackRock ACWI ex-US Index Fund | BlackRock Global Opportunities Portfolio | BlackRock Natural Resources Trust | ||||
| BlackRock All-Cap Energy & Resources Portfolio | BlackRock Global SmallCap Fund | BlackRock Pacific Fund | ||||
| BlackRock Asset Allocation Portfolio† | BlackRock Health Sciences Opportunities Portfolio | BlackRock Russell 1000 Index Fund | ||||
| BlackRock Balanced Capital Fund† | BlackRock Healthcare Fund | BlackRock Science & Technology | ||||
| BlackRock Basic Value Fund | BlackRock Index Equity Portfolio | Opportunities Portfolio | ||||
| BlackRock Capital Appreciation Fund | BlackRock India Fund | BlackRock Small Cap Growth Equity Portfolio | ||||
| BlackRock China Fund | BlackRock International Fund | BlackRock Small Cap Growth Fund II | ||||
| BlackRock Energy & Resources Portfolio | BlackRock International Index Fund | BlackRock Small Cap Index Fund | ||||
| BlackRock Equity Dividend Fund | BlackRock International Opportunities Portfolio | BlackRock Small/Mid-Cap Growth Portfolio | ||||
| BlackRock EuroFund | BlackRock Large Cap Core Fund | BlackRock S&P 500 Index Fund | ||||
| BlackRock Focus Growth Fund | BlackRock Large Cap Core Plus Fund | BlackRock S&P 500 Stock Fund | ||||
| BlackRock Focus Value Fund | BlackRock Large Cap Growth Fund | BlackRock U.S. Opportunities Portfolio | ||||
| BlackRock Global Allocation Fund† | BlackRock Large Cap Value Fund | BlackRock Utilities and Telecommunications Fund | ||||
| BlackRock Global Dividend Income Portfolio | BlackRock Latin America Fund | BlackRock Value Opportunities Fund | ||||
| BlackRock Global Dynamic Equity Fund | BlackRock Mid-Cap Growth Equity Portfolio | BlackRock World Gold Fund | ||||
| BlackRock Global Emerging Markets Fund | BlackRock Mid-Cap Value Equity Portfolio | |||||
| BlackRock Global Growth Fund | BlackRock Mid Cap Value Opportunities Fund | |||||
| Fixed Income Funds | ||||||
| BlackRock Bond Index Fund | BlackRock Income Portfolio† | BlackRock Strategic Income | ||||
| BlackRock Core Bond Fund | BlackRock Inflation Protected Bond Portfolio | Opportunities Portfolio | ||||
| BlackRock Emerging Market Debt Portfolio | BlackRock International Bond Portfolio | BlackRock Total Return Fund | ||||
| BlackRock Floating Rate Income Portfolio | BlackRock Long Duration Bond Portfolio | BlackRock US Government Bond Fund | ||||
| BlackRock GNMA Portfolio | BlackRock Low Duration Bond Portfolio | BlackRock World Income Fund | ||||
| BlackRock High Income Fund | BlackRock Multi-Sector Bond Portfolio | US Mortgage Portfolio | ||||
| BlackRock High Yield Bond Portfolio | ||||||
| Municipal Bond Funds | ||||||
| BlackRock California Municipal Bond Fund | BlackRock National Municipal Fund | BlackRock Pennsylvania Municipal Bond Fund | ||||
| BlackRock High Yield Municipal Fund | BlackRock New Jersey Municipal Bond Fund | BlackRock Short-Term Municipal Fund | ||||
| BlackRock Intermediate Municipal Fund | BlackRock New York Municipal Bond Fund | |||||
| Target Risk & Target Date Funds† | ||||||
| BlackRock Prepared Portfolios | BlackRock Lifecycle Prepared Portfolios | LifePath Portfolios | LifePath Index Portfolios | |||
| Conservative Prepared Portfolio | 2015 | 2035 | Retirement | 2040 | Retirement | 2040 |
| Moderate Prepared Portfolio | 2020 | 2040 | 2020 | 2045 | 2020 | 2045 |
| Growth Prepared Portfolio | 2025 | 2045 | 2025 | 2050 | 2025 | 2050 |
| Aggressive Growth Prepared Portfolio | 2030 | 2050 | 2030 | 2055 | 2030 | 2055 |
| 2035 | 2035 | |||||
† Mixed asset fund.
BlackRock mutual funds are currently distributed by BlackRock Investments, LLC. You should consider the investment objectives,risks, charges and
expenses of the funds under consideration carefully before investing. Each fund’s prospectus contains this and other information and is available at
www.blackrock.com or by calling (800) 441-7762 or from your financial advisor. The prospectus should be read carefully before investing.
| ANNUAL | REPORT | JUNE | 30, 2011 | 91 |
This report is not authorized for use as an offer of sale or a solicitation of an offer to buy shares of the Funds unless accompanied or
preceded by the Funds’ current prospectus. Past performance results shown in this report should not be considered a representation
of future performance. Investment returns and principal value of shares will fluctuate so that shares, when redeemed, may be worth
more or less than their original cost. Statements and other information herein are as dated and are subject to change.

Item 2 – Code of Ethics – The registrant (or the “Fund”) has adopted a code of ethics, as of the end
of the period covered by this report, applicable to the registrant’s principal executive officer,
principal financial officer, principal accounting officer or controller, or persons performing
similar functions. During the period covered by this report, there have been no amendments
to or waivers granted under the code of ethics. A copy of the code of ethics is available
without charge at www.blackrock.com.
Item 3 – Audit Committee Financial Expert – The registrant’s board of directors (the “board of
directors”), has determined that (i) the registrant has the following audit committee financial
experts serving on its audit committee and (ii) each audit committee financial expert is
independent:
Robert M. Hernandez
Fred G. Weiss
Under applicable securities laws, a person determined to be an audit committee financial
expert will not be deemed an “expert” for any purpose, including without limitation for the
purposes of Section 11 of the Securities Act of 1933, as a result of being designated or
identified as an audit committee financial expert. The designation or identification of a
person as an audit committee financial expert does not impose on such person any duties,
obligations, or liabilities greater than the duties, obligations, and liabilities imposed on such
person as a member of the audit committee and board of directors in the absence of such
designation or identification.
Item 4 – Principal Accountant Fees and Services
The following table presents fees billed by Deloitte & Touche LLP (“D&T”) in each of the
last two fiscal years for the services rendered to the Fund:
| (a) Audit Fees | (b) Audit-Related Fees1 | (c) Tax Fees2 | (d) All Other Fees3 | |||||
| Current | Previous | Current | Previous | Current | Previous | Current | Previous | |
| Fiscal Year | Fiscal Year | Fiscal Year | Fiscal Year | Fiscal Year | Fiscal Year | Fiscal Year | Fiscal Year | |
| Entity Name | End | End | End | End | End | End | End | End |
| BlackRock High Yield | $32,900 | $31,900 | $0 | $0 | $12,100 | $6,100 | $0 | $15 |
| Municipal Fund | ||||||||
| BlackRock Municipal | ||||||||
| Fund | $37,100 | $36,000 | $0 | $0 | $12,100 | $6,100 | $0 | $217 |
| BlackRock National | $37,100 | $36,000 | $16,800 | $0 | $24,200 | $6,100 | $0 | $520 |
| Municipal Fund | ||||||||
| BlackRock Short-Term | ||||||||
| Municipal Fund | $28,700 | $27,700 | $0 | $0 | $12,100 | $6,100 | $0 | $120 |
The following table presents fees billed by D&T that were required to be approved by the
registrant’s audit committee (the “Committee”) for services that relate directly to the
operations or financial reporting of the Fund and that are rendered on behalf of BlackRock
Advisors, LLC (“Investment Adviser” or “BlackRock”) and entities controlling, controlled
by, or under common control with BlackRock (not including any sub-adviser whose role is
primarily portfolio management and is subcontracted with or overseen by another investment
adviser) that provide ongoing services to the Fund (“Fund Service Providers”):
| Current Fiscal Year End | Previous Fiscal Year End | |
| (b) Audit-Related Fees1 | $0 | $0 |
| (c) Tax Fees2 | $0 | $0 |
| (d) All Other Fees3 | $3,030,000 | $2,950,000 |
The nature of the services includes assurance and related services reasonably related to the performance of the audit of financial statements
not included in Audit Fees.
2 The nature of the services includes tax compliance, tax advice and tax planning.
3 The nature of the services includes a review of compliance procedures and attestation thereto.
(e)(1) Audit Committee Pre-Approval Policies and Procedures:
The Committee has adopted policies and procedures with regard to the pre-approval
of services. Audit, audit-related and tax compliance services provided to the registrant on
an annual basis require specific pre-approval by the Committee. The Committee also must
approve other non-audit services provided to the registrant and those non-audit services
provided to the Investment Adviser and Fund Service Providers that relate directly to the
operations and the financial reporting of the registrant. Certain of these non-audit services
that the Committee believes are a) consistent with the SEC’s auditor independence rules and
b) routine and recurring services that will not impair the independence of the independent
accountants may be approved by the Committee without consideration on a specific case-
by-case basis (“general pre-approval”). The term of any general pre-approval is 12 months
from the date of the pre-approval, unless the Committee provides for a different period. Tax
or other non-audit services provided to the registrant which have a direct impact on the
operations or financial reporting of the registrant will only be deemed pre-approved
provided that any individual project does not exceed $10,000 attributable to the registrant or
$50,000 per project. For this purpose, multiple projects will be aggregated to determine if
they exceed the previously mentioned cost levels.
Any proposed services exceeding the pre-approved cost levels will require specific
pre-approval by the Committee, as will any other services not subject to general pre-
approval (e.g., unanticipated but permissible services). The Committee is informed of each
service approved subject to general pre-approval at the next regularly scheduled in-person
board meeting. At this meeting, an analysis of such services is presented to the Committee
for ratification. The Committee may delegate to the Committee Chairman the authority to
approve the provision of and fees for any specific engagement of permitted non-audit
services, including services exceeding pre-approved cost levels.
(e)(2) None of the services described in each of Items 4(b) through (d) were approved by
the Committee pursuant to paragraph (c)(7)(i)(C) of Rule 2-01 of Regulation S-X.
(f) Not Applicable
(g) The aggregate non-audit fees paid to the accountant for services rendered by the
accountant to the registrant, the Investment Adviser and the Fund Service Providers were:
| Current Fiscal Year | Previous Fiscal Year | |
| Entity Name | End | End |
| BlackRock High Yield Municipal | $12,100 | $16,892 |
| Fund | ||
| BlackRock Municipal Fund | $12,100 | $17,094 |
| BlackRock National Municipal | ||
| Fund | $41,000 | $17,397 |
| BlackRock Short-Term Municipal | $12,100 | $16,997 |
| Fund |
Additionally, SAS No. 70 fees for the current and previous fiscal years of $3,030,000 and
$2,950,000, respectively, were billed by D&T to the Investment Adviser.
(h) The Committee has considered and determined that the provision of non-audit services
that were rendered to the Investment Adviser, and the Fund Service Providers that were not
pre-approved pursuant to paragraph (c)(7)(ii) of Rule 2-01 of Regulation S-X is compatible
with maintaining the principal accountant’s independence.
Item 5 – Audit Committee of Listed Registrants – Not Applicable
Item 6 – Investments
(a) The registrant’s Schedule of Investments is included as part of the Report to
Stockholders filed under Item 1 of this Form.
(b) Not Applicable due to no such divestments during the semi-annual period covered since
the previous Form N-CSR filing.
Item 7 – Disclosure of Proxy Voting Policies and Procedures for Closed-End Management
Investment Companies – Not Applicable
Item 8 – Portfolio Managers of Closed-End Management Investment Companies – Not Applicable
Item 9 – Purchases of Equity Securities by Closed-End Management Investment Company and
Affiliated Purchasers – Not Applicable
Item 10 – Submission of Matters to a Vote of Security Holders – There have been no material
changes to these procedures.
Item 11 – Controls and Procedures
11(a) – The registrant’s principal executive and principal financial officers, or persons performing
similar functions, have concluded that the registrant’s disclosure controls and procedures (as
defined in Rule 30a-3(c) under the Investment Company Act of 1940, as amended (the
“1940 Act”)) are effective as of a date within 90 days of the filing of this report based on the
evaluation of these controls and procedures required by Rule 30a-3(b) under the 1940 Act
and Rule 15d-15(b) under the Securities Exchange Act of 1934, as amended.
11(b) – There were no changes in the registrant’s internal control over financial reporting (as
defined in Rule 30a-3(d) under the 1940 Act) that occurred during the second fiscal quarter
of the period covered by this report that have materially affected, or are reasonably likely to
materially affect, the registrant’s internal control over financial reporting.
Item 12 – Exhibits attached hereto
12(a)(1) – Code of Ethics – See Item 2
12(a)(2) – Certifications – Attached hereto
12(a)(3) – Not Applicable
12(b) – Certifications – Attached hereto
Pursuant to the requirements of the Securities Exchange Act of 1934 and the Investment
Company Act of 1940, the registrant has duly caused this report to be signed on its behalf
by the undersigned, thereunto duly authorized.
BlackRock Municipal Bond Fund, Inc.
By: /S/ John M. Perlowski
John M. Perlowski
Chief Executive Officer (principal executive officer) of
BlackRock Municipal Bond Fund, Inc.
Date: September 2, 2011
Pursuant to the requirements of the Securities Exchange Act of 1934 and the Investment
Company Act of 1940, this report has been signed below by the following persons on behalf
of the registrant and in the capacities and on the dates indicated.
By: /S/ John M. Perlowski
John M. Perlowski
Chief Executive Officer (principal executive officer) of
BlackRock Municipal Bond Fund, Inc.
Date: September 2, 2011
By: /S/ Neal J. Andrews
Neal J. Andrews
Chief Financial Officer (principal financial officer) of
BlackRock Municipal Bond Fund, Inc.
Date: September 2, 2011