UNITED STATES SECURITIES AND EXCHANGE COMMISSION
Washington, D.C. 20549
FORM N-CSRS
CERTIFIED SHAREHOLDER REPORT OF REGISTERED MANAGEMENT INVESTMENT COMPANIES
Investment Company Act file number 811-02688
Name of Fund: BlackRock Municipal Bond Fund, Inc.
|
BlackRock High Yield Municipal Fund BlackRock Municipal Insured Fund BlackRock National Municipal Fund BlackRock Short-Term Municipal Fund |
| Fund Address: 100 Bellevue Parkway, Wilmington, DE 19809 |
| Name and address of agent for service: Donald C. Burke, Chief Executive Officer, BlackRock |
| Municipal Bond Fund, Inc., 800 Scudders Mill Road, Plainsboro, NJ, 08536. Mailing |
| address: P.O. Box 9011, Princeton, NJ, 08543-9011 |
| Registrant’s telephone number, including area code: (800) 441-7762 |
| Date of fiscal year end: 06/30/2008 |
| Date of reporting period: 07/01/2007 – 12/31/2007 |
| Item 1 – Report to Stockholders |
EQUITIES FIXED INCOME REAL ESTATE LIQUIDITY ALTERNATIVES BLACKROCK SOLUTIONS
![]()
|
BlackRock Municipal Bond |
| SEMI-ANNUAL REPORT DECEMBER 31, 2007 | (UNAUDITED) |
| BlackRock Short-Term Municipal Fund BlackRock Municipal Insured Fund BlackRock National Municipal Fund BlackRock High Yield Municipal Fund |
NOT FDIC INSURED
MAY LOSE VALUE
NO BANK GUARANTEE
| Table of Contents | ||
|
|
|
|
| Page | ||
|
|
|
|
| A Letter to Shareholders | 3 | |
| Semi-Annual Report: | ||
| Fund Summaries | 4 | |
| About Fund Performance | 12 | |
| Disclosure of Expenses | 14 | |
| Financial Statements: | ||
| Schedules of Investments | 18 | |
| Statements of Assets and Liabilities | 38 | |
| Statements of Operations | 40 | |
| Statements of Changes in Net Assets | 41 | |
| Financial Highlights | 45 | |
| Notes to Financial Statements | 64 | |
| Proxy Results | 74 | |
| Officers and Directors | 76 | |
| Swap Agreements | 76 | |
| BlackRock Fund Information | 77 | |
| Mutual Fund Family | 79 | |
2 BLACKROCK MUNICIPAL BOND FUND, INC.
| DECEMBER 31, 2007 |
| A Letter to Shareholders |
Dear Shareholder
Financial markets endured heightened volatility during 2007, culminating in mixed results for some of the major benchmark indexes:
| Total Returns as of December 31, 2007 | 6-month | 12-month | |||
|
|
|
| |||
| U.S. equities (S&P 500 Index) | –1.37% | + 5.49% | |||
|
|
|
|
| ||
| Small cap U.S. equities (Russell 2000 Index) | –7.53 | – 1.57 | |||
|
|
|
|
| ||
| International equities (MSCI Europe, Australasia, Far East Index) | +0.39 | +11.17 | |||
|
|
|
| |||
| Fixed income (Lehman Brothers U.S. Aggregate Bond Index) | +5.93 | + 6.97 | |||
|
|
|
|
| ||
| Tax-exempt fixed income (Lehman Brothers Municipal Bond Index) | +3.22 | + 3.36 | |||
|
|
|
|
| ||
| High yield bonds (Lehman Brothers U.S. Corporate High Yield 2% Issuer Cap Index) | –0.67 | + 2.27 | |||
|
|
|
|
| ||
Past performance is no guarantee of future results. Index performance shown for illustrative purposes only. You cannot invest directly in an index.
Subprime mortgage woes dominated headlines for much of 2007, spawning a widespread liquidity and credit crisis with ramifications across global markets. The Federal Reserve Board (the “Fed”) stepped in to inject liquidity into the markets and bolster investor confidence, cutting the federal funds rate by 0.50% in September, 0.25% in October and 0.25% in December, which brought the target short-term interest rate to 4.25% . In taking action, the central bankers, who had long deemed themselves inflation fighters, were seeking to stem the fallout from the credit crunch and forestall a wider economic unraveling.
Amid the volatility, equity markets displayed surprising resilience. Market fundamentals generally held firm, dividend payouts and share buybacks continued, and valuations remained attractive. To some extent, the credit turmoil dampened corporate merger-and-acquisition (M&A) activity, a key source of strength for equity markets, but 2007 remained a record year for global M&A nonetheless. As the returns indicate, the most recent six months were more trying, reflecting the slowing U.S. economy, a troubled housing market and a more difficult corporate earnings backdrop. Overall, large cap stocks outperformed small caps as investors grew increasingly risk averse. International markets fared better than their U.S. counterparts, benefiting from generally stronger economies.
In fixed income markets, mixed economic signals and subprime fallout resulted in a flight to quality. Investors shunned bonds associated with the housing and credit markets in favor of higher-quality Treasury issues. The yield on 10-year Treasury issues, which touched 5.30% in June (its highest level in five years), fell to 4.04% by year-end, while prices correspondingly rose. The tax-exempt bond market waffled amid the economic uncertainty and concerns around the credit worthiness of bond insurers, but set a new-issuance record in 2007. A drop in municipal bond prices created buying opportunities, and the heightened supply was generally well absorbed.
As you navigate the uncertainties inherent in the financial markets, we encourage you to start the year by reviewing your investment goals with your financial professional and making portfolio changes, as needed. For more reflection on 2007 and our 10 predictions for 2008, please ask your financial professional for a copy of “What’s Ahead in 2008: An Investment Perspective,” or view it online at www.blackrock.com/funds. As always, we thank you for entrusting BlackRock with your investment assets, and we look forward to continuing to serve you in the new year and beyond.
Sincerely,
THIS PAGE NOT PART OF YOUR FUND REPORT
3
| Fund Summary | BlackRock Short-Term Municipal Fund | |
|
|
| |
| Portfolio Management Commentary | ||
|
|
|
- How did the Fund perform?
- The Fund’s total return lagged its broad market benchmark, but exceeded its comparable Lipper category average for the six months ended December 31, 2007.
What factors influenced performance? - Interest rates rose early in 2007 until the U.S. housing slowdown and subprime turmoil caused asset-backed securities to decline in value, putting pressure on financial markets and the overall economy. This eventually led the Federal Reserve Board (the “Fed”) to cut interest rates. Yields generally declined in the fourth quarter, with municipals largely underperforming. Mortgage-related losses in the monoline muni- cipal insurers also hindered price improvement in tax-exempt issues.Municipal bonds rated AAA and AA, and maturing inside 10 years,performed the best. Credit spreads generally continued to widen, leading to poor performance among lower-quality issues.
- New municipal issuance for 2007 totaled $427.5 billion, a new annual record. Volume was up 11.5% versus 2006 and 5% versus 2005, the previous record year. Issuance slowed late in 2007 as market volatility and potential downgrades for the municipal insurance companies led to the postponement of several larger deals.
- The Fund’s conservative investment strategy and overweight in the front part of the yield curve were the main factors behind the outperformance of the Lipper group. Much of this occurred later in 2007 as the turmoil in the credit markets caused a flight to quality and to shorter maturities. Additionally, the Fed began easing monetary policy in September, whichfurther aided performance as the front end of the curve benefited mostfrom this action. Interest rates on one-year general obligation bonds fell 60 basis points (.60%) for the year, while rates on 20-year bonds rose approximately 20 basis points (as their prices correspondingly fell). This outperformance in shorter-dated issues benefited the Fund, which was more heavily weighted in the one- to two-year part of the curve.
- The main detractor from performance was the portfolio’s small position in lower-rated issues, which suffered as credit spreads generally widened amid the market turmoil.
Describe recent portfolio activity. - We drew the Fund’s cash reserves down to a minimum in the belief that Fed easing would have the greatest beneficial impact on very short- maturity bonds. Also, given the negative outlook for some monoline insurers, we generally focused purchases on high-quality general obli- gation bonds and prerefunded bonds. The portfolio’s duration was extended modestly to approximately 1.5 years as a result of spending cash reserves.
Describe Fund positioning at period-end. - The Fund is positioned for additional Fed interest rate cuts, which would benefit performance as the curve continues to steepen. We believe the portfolio’s average credit quality of AA also bodes well given the contin- ued uncertainty in the economy and the impact this has already had on lower-quality issues.
| Fund Profile as of December 31, 2007 | ||
|
|
| |
| Percent of | ||
| Long Term | ||
| Investments | ||
|
|
| |
| Other Revenue Bonds | 44.3% | |
| General Obligation & Tax Revenue Bonds | 32.6 | |
| Prerefunded Bonds | 23.1 | |
4 BLACKROCK MUNICIPAL BOND FUND, INC.
| DECEMBER 31, 2007 |
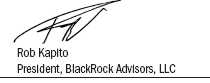
| BlackRock Short-Term Municipal Fund |
| Total Return Based on a $10,000 Investment |
| * Assuming maximum sales charge, if any, transaction costs and other operating expenses, including advisory fees. † The Fund invests primarily in investment grade municipal bonds (bonds rated Baa or better) with a maximum maturity not to exceed four years. † † This unmanaged Index consists of revenue bonds, prerefunded bonds, general obligation bonds and insured bonds, all of which mature within 30 years. † † † This unmanaged Index consists of state and local government obligation bonds that mature in three – four years, rated Baa or better. |
| Performance Summary for the Period Ended December 31, 2007 | ||||||||||||||||
|
|
|
|
|
|
|
| ||||||||||
| Average Annual Total Returns* | ||||||||||||||||
|
|
|
|
|
| ||||||||||||
| 1 Year | 5 Years | 10 Years | ||||||||||||||
|
|
|
|
|
| ||||||||||||
| Standardized | 6-Month | w/o sales | w/sales | w/o sales | w/sales | w/o sales | w/sales | |||||||||
| 30-Day Yields | Total Returns | charge | charge | charge | charge | charge | charge | |||||||||
|
|
|
|
|
|
|
|
|
| ||||||||
| BlackRock | 3.02% | +2.62% | +4.04% | — | +2.10% | — | +3.11% | — | ||||||||
| Institutional | 3.13 | +2.65 | +3.97 | — | +2.08 | — | +3.10 | — | ||||||||
| Investor A | 2.79 | +2.62 | +3.81 | +0.70% | +1.85 | +1.23% | +2.86 | +2.54% | ||||||||
| Investor A1 | 3.00 | +2.60 | +3.87 | +2.83 | +1.98 | +1.78 | +3.00 | +2.90 | ||||||||
| Investor B | 2.78 | +2.47 | +3.61 | +2.61 | +1.72 | +1.72 | +2.73 | +2.73 | ||||||||
| Investor C | 2.13 | +2.14 | +2.93 | +1.93 | +1.07 | +1.07 | +2.08 | +2.08 | ||||||||
| Lehman Brothers 3-Year | ||||||||||||||||
| General Obligation | ||||||||||||||||
| Bond Index | — | +3.73 | +4.99 | — | +2.70 | — | +3.96 | — | ||||||||
| Lehman Brothers Municipal | ||||||||||||||||
| Bond Index | — | +3.22 | +3.36 | — | +4.30 | — | +5.18 | — | ||||||||
|
|
|
|
|
|
|
|
|
| ||||||||
| * Assuming maximum sales charges. See “About Fund Performance” on pages 12–13 for a detailed description of share classes, including any related sales charges and fees. Past performance is not indicative of future results. |
| BLACKROCK MUNICIPAL BOND FUND, INC. |
| DECEMBER 31, 2007 |
| 5 |
| Fund Summary | BlackRock Municipal Insured Fund | |
|
|
| |
| Portfolio Management Commentary | ||
|
|
|
How did the Fund perform?
- The Fund performed in line with its comparable Lipper category average for the six-month period ended December 31, 2007, but underperformed the Lehman Brothers Municipal Bond Index.
- Conversely, the Fund’s yield curve position detracted from performance. The curve steepened significantly during the period, leading shorter maturities to outperform longer maturities. The Fund was early in extending out on the yield curve in the previous reporting period, there- by missing some of the relative outperformance at the short end.
What factors influenced performance?
- Interest rates rose early in 2007 until the U.S. housing slowdown and subprime turmoil caused asset-backed securities to decline in value, putting pressure on financial markets and the overall economy. This eventually led the Federal Reserve Board to cut interest rates in September, October and December. Yields generally declined in the fourth quarter, with municipals largely underperforming. Mortgage- related losses in the monoline municipal insurers also hindered price improvement in tax-exempt issues. Municipal bonds rated AAA and AA, and maturing inside 10 years, performed the best. Credit spreads generally widened, leading to poor performance among lower-quality issues.
- New municipal issuance for 2007 totaled $427.5 billion, a new annual record. Volume increased 11.5% versus 2006 and 5% versus 2005, the previous record year. Issuance slowed late in 2007 as market volatility and potential downgrades for the municipal insurance companies led to the postponement of several larger deals.
- During this period of high volatility, the Fund remained essentially fully invested, which helped maintain a strong income accrual and aided performance as yields fell toward period-end. Our efforts to lengthen call protections also contributed to performance as yields fell.
| Describe recent portfolio activity. |
- During the fourth quarter of 2007, the monoline insurers of municipal bonds experienced significant stress. The exact nature of each insurer’s problems (if any) and the extent thereof evolved throughout the period, but was largely unresolved at the end. Working with our Municipal Research Group, we combed through the Fund’s holdings to identify sale candidates based on our underlying issuer rating and insurer profile. At the same time, we looked to purchase strong underlying credits with favored insurers, particularly Financial Security Assurance Inc.
- Generally speaking, the municipal market experienced significant volatility and certain sectors, despite high credit quality, came under pressure. We sought to add to positions in these areas, such as airports and certain callable zero-coupon bonds, as spreads had widened significantly.
Describe Fund positioning at period-end.
- The Fund ended the period fully invested with a modestly constructive view of the market and a bias toward the longer end of the yield curve.
The yield curve steepened significantly in the past six months. We willlook to add bonds that can be advance refunded, premium-coupon bonds with favored insurers, and strong underlying credits in the 20-to 25-year area of the curve.
| Fund Profile as of December 31, 2007 | ||
| Percent of | ||
| Long Term | ||
| Investments | ||
|
|
| |
| Other Revenue Bonds | 77.8% | |
| General Obligation & Tax Revenue Bonds | 11.6 | |
| Prerefunded Bonds | 10.6 | |
6 BLACKROCK MUNICIPAL BOND FUND, INC.
| DECEMBER 31, 2007 |
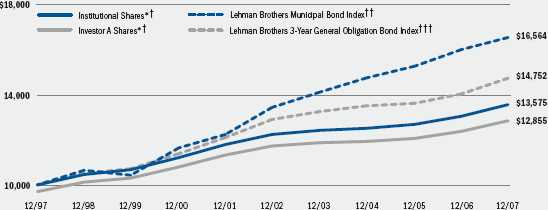
| BlackRock Municipal Insured Fund |
| Total Return Based on a $10,000 Investment |
| * Assuming maximum sales charge, if any, transaction costs and other operating expenses, including advisory fees. † The Fund invests primarily in long-term, investment grade municipal bonds (bonds rated Baa or better) covered by portfolio insurance guaranteeing the timely payment of principal at maturity and interest. This unmanaged Index consists of revenue bonds, prerefunded bonds, general obligation bonds and insured bonds, all of which mature within 30 years. |
| Performance Summary for the Period Ended December 31, 2007 | ||||||||||||||||
|
|
|
|
|
|
|
| ||||||||||
| Average Annual Total Returns* | ||||||||||||||||
|
|
|
|
|
| ||||||||||||
| 1 Year | 5 Years | 10 Years | ||||||||||||||
|
|
|
|
|
| ||||||||||||
| Standardized | 6-Month | w/o sales | w/sales | w/o sales | w/sales | w/o sales | w/sales | |||||||||
| 30-Day Yields | Total Returns | charge | charge | charge | charge | charge | charge | |||||||||
|
|
|
|
|
|
|
|
|
| ||||||||
| Institutional | 3.95% | +2.31% | +2.34% | — | +4.05% | — | +4.70% | — | ||||||||
| Investor A | 3.53 | +2.18 | +2.07 | –2.26% | +3.79 | +2.89% | +4.44 | +3.99% | ||||||||
| Investor B | 3.18 | +1.92 | +1.56 | –2.36 | +3.27 | +2.93 | +3.91 | +3.91 | ||||||||
| Investor C | 2.94 | +1.80 | +1.31 | +0.33 | +3.04 | +3.04 | +3.67 | +3.67 | ||||||||
| Investor C1 | 3.14 | +1.90 | +1.52 | +0.54 | +3.22 | +3.22 | +3.86 | +3.86 | ||||||||
| Lehman Brothers Municipal | ||||||||||||||||
| Bond Index | — | +3.22 | +3.36 | — | +4.30 | — | +5.18 | — | ||||||||
|
|
|
|
|
|
|
|
|
| ||||||||
| * Assuming maximum sales charges. See “About Fund Performance” on pages 12–13 for a detailed description of share classes, including any related sales charges and fees. Past performance is not indicative of future results. |
| BLACKROCK MUNICIPAL BOND FUND, INC. |
| DECEMBER 31, 2007 |
| 7 |
| Fund Summary | BlackRock National Municipal Fund | |
|
|
| |
| Portfolio Management Commentary | ||
|
|
|
How did the Fund perform?
- The Fund’s total return lagged the broad-market benchmark and its comparable Lipper category average for the six months ended December 31, 2007.
What factors influenced performance?
- Interest rates rose early in 2007 until the U.S. housing slowdown and subprime turmoil caused asset-backed securities to decline in value, putting pressure on financial markets and the overall economy. This eventually led the Federal Reserve Board to cut interest rates in September, October and December. Yields generally declined in the fourth quarter, with municipals largely underperforming. Mortgage- related losses in the monoline municipal insurers also hindered price improvement in tax-exempt issues. Municipal bonds rated AAA and AA, and maturing inside 10 years, performed the best. Credit spreads generally widened, leading to poor performance among lower- quality issues.
- New municipal issuance for 2007 totaled $427.5 billion, a new annual record. Volume increased 11.5% versus 2006 and 5% versus 2005, the previous record year.
- Against the underlying backdrop, Fund performance was hindered by our relatively short duration stance (a measure of interest rate sensitivity); longer yield curve position at a time when shorter-term securities outperformed; and exposure, albeit limited, to lower-rated municipal credits, which underperformed as spreads widened.
- We have consistently focused our efforts on achieving a steady, high level of income for shareholders. This contributes to the Fund’s above- average accrual rate and current yield advantage. However, the flight to quality experienced in the fixed income markets left the Fund in a defensive interest rate posture, which caused it to trail on a price appreciation basis amid the dramatic fall in interest rates.
| Describe recent portfolio activity. |
- We purchased and sold securities in keeping with our aim to maximize the Fund’s coupon structure and optimize current income for share- holders. This involved swapping into more attractive opportunities in the secondary market — in one case, we sold a lower-coupon bond (5%) to purchase a 5.50% coupon bond from the same issuer. With the dramatic widening in credit spreads, we also participated in some primary issuance in the high yield sector.
- We continued to use inverse floating-rate product as the steepening of the tax-exempt yield curve resulted in lower borrowing rates, thereby improving the execution on these products.
Describe Fund positioning at period-end.
- With respect to interest rate sensitivity, the Fund entered 2008 with a continued low duration posture. Long-term tax-exempt bonds currently yield less than when the 10-year Treasury yielded 3.10% and the federal funds target rate was 1%. As such, we see little value in the current level of high-grade municipal securities.
- In terms of lower-rated municipal debt, we are working closely with our Municipal Research Group to review each sector and the Fund’s exposures therein. We have ample cash to take advantage of appro- priate opportunities as they present themselves.
| Fund Profile as of December 31, 2007 | ||
| Percent of | ||
| Long Term | ||
| Investments | ||
|
|
| |
| Other Revenue Bonds | 78.7% | |
| General Obligation & Tax Revenue Bonds | 7.9 | |
| Prerefunded Bonds | 13.4 | |
8
BLACKROCK MUNICIPAL BOND FUND, INC.
| DECEMBER 31, 2007 |
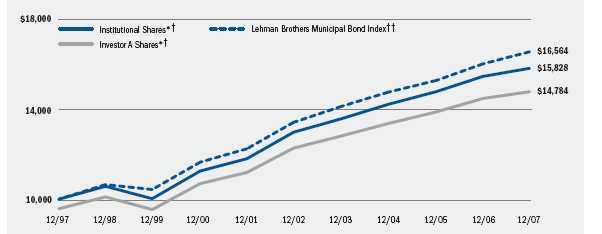
| BlackRock National Municipal Fund |
| Total Return Based on a $10,000 Investment |
| * Assuming maximum sales charge, if any, transaction costs and other operating expenses, including advisory fees. † The Fund invests primarily in long-term municipal bonds rated in any rating category. † † This unmanaged Index consists of revenue bonds, prerefunded bonds, general obligation bonds and insured bonds, all of which mature within 30 years. |
| Performance Summary for the Period Ended December 31, 2007 | ||||||||||||||||
|
|
|
|
|
|
|
| ||||||||||
| Average Annual Total Returns* | ||||||||||||||||
|
|
|
|
|
| ||||||||||||
| 1 Year | 5 Years | 10 Years | ||||||||||||||
|
|
|
|
|
| ||||||||||||
| Standardized | 6-Month | w/o sales | w/sales | w/o sales | w/sales | w/o sales | w/sales | |||||||||
| 30-Day Yields | Total Returns | charge | charge | charge | charge | charge | charge | |||||||||
|
|
|
|
|
|
|
|
|
| ||||||||
| Institutional | 4.20% | +0.97% | +1.57% | — | +4.70% | — | +4.93% | — | ||||||||
| Investor A | 3.80 | +0.96 | +1.34 | –2.97% | +4.47 | +3.56% | +4.69 | +4.23% | ||||||||
| Investor B | 3.45 | +0.70 | +0.82 | –3.06 | +3.94 | +3.60 | +4.15 | +4.15 | ||||||||
| Investor C | 3.17 | +0.56 | +0.54 | –0.43 | +3.66 | +3.66 | +3.89 | +3.89 | ||||||||
| Investor C1 | 3.41 | +0.58 | +0.77 | –0.20 | +3.87 | +3.87 | +4.10 | +4.10 | ||||||||
| Lehman Brothers Municipal | ||||||||||||||||
| Bond Index | — | +3.22 | +3.36 | — | +4.30 | — | +5.18 | — | ||||||||
|
|
|
|
|
|
|
|
|
| ||||||||
| * Assuming maximum sales charges. See “About Fund Performance” on pages 12–13 for a detailed description of share classes, including any related sales charges and fees. Past performance is not indicative of future results. |
| BLACKROCK MUNICIPAL BOND FUND, INC. |
| DECEMBER 31, 2007 |
| 9 |
| Fund Summary | BlackRock High Yield Municipal Fund | |
|
|
| |
| Portfolio Management Commentary | ||
|
|
|
How did the Fund perform?
- The Fund’s total return lagged its benchmark and comparable Lipper category average for the six months ended December 31, 2007.
What factors influenced performance?
- Interest rates rose early in 2007 until the U.S. housing slowdown and subprime turmoil caused asset-backed securities to decline in value, putting pressure on financial markets and the overall economy. This eventually led the Federal Reserve Board to cut interest rates in September, October and December. Yields generally declined in the fourth quarter, with municipals largely underperforming. Mortgage- related losses in the monoline municipal insurers also hindered price improvement in tax-exempt issues. Municipal bonds rated AAA and AA, and maturing inside 10 years, performed the best. Credit spreads generally widened, leading to poor performance among lower-quality issues.
- New municipal issuance for 2007 totaled $427.5 billion, a new annual record. Volume increased 11.5% versus 2006 and 5% versus 2005, the previous record year. Issuance slowed late in 2007 as market volatility and potential downgrades for the municipal insurance companies led to the postponement of several larger deals.
- Fund results suffered as credit spreads widened appreciably amid heightened investor risk aversion and deteriorating liquidity. The Fund’s exposure at the lower end of the credit spectrum suffered dispropor- tionately due to a prevalence of discounted securities exhibiting relatively high duration profiles. These had been purchased during the Fund’s first year of operations, when the supply of attractively structured low duration, high yield securities was quite sparse.
- The Fund’s yield curve exposure also proved detrimental. The municipal curve continued to steepen, with the best performance occurring on the short end. However, much of our focus has been on the long end in an effort to generate a more competitive distribution yield.
- An increasing bias toward higher-quality bonds helped to insulate the portfolio from some of the widening in credit spreads. However, these high-quality investments failed to perform as well as expected given the mounting uncertainty surrounding the monoline insurers.
| Describe recent portfolio activity. |
• We continued to seek opportunities to boost the Fund’s distribution yield. Some progress was made amid the volatility and associated widening of credit spreads during the fourth quarter.
• Also, given the change in the yield curve, market conditions have grown more favorable for the creation of tender option bond trusts, which are a leveraged form of income enhancement. We established a modest position, but expect to add to it as opportunities present themselves.
Describe Fund positioning at period-end.
- The portfolio remains positioned for lower interest rates. However, given the low absolute level of market yields, we have tempered somewhat the Fund’s above-market duration. Of more interest to us are the evolving opportunities in the high yield municipal space as spreads have widened. Given the swift return to more attractive valuations, we expect to selectively add credit exposure in the coming months.
| Fund Profile as of December 31, 2007 | ||
| Percent of | ||
| Long Term | ||
| Investments | ||
|
|
| |
| Other Revenue Bonds | 98.5% | |
| General Obligation & Tax Revenue Bonds | 1.5 | |
10 BLACKROCK MUNICIPAL BOND FUND, INC.
| DECEMBER 31, 2007 |
| BlackRock High Yield Municipal Fund |
| Total Return Based on a $10,000 Investment |
![]()
| * Assuming maximum sales charge, if any, transaction costs and other operating expenses, including advisory fees. ** Commencement of Operations. † The Fund invests primarily in municipal bonds rated in any rating category or in unrated municipal bonds. ††This unmanaged Index consists of revenue bonds, prerefunded bonds, general obligation bonds and insured bonds, all of which mature within 30 years. |
| Performance Summary for the Period Ended December 31, 2007 | ||||||||||||
|
|
|
|
|
|
| |||||||
| Average Annual Total Returns* | ||||||||||||
|
|
|
| ||||||||||
| 1 Year | Since Inception** | |||||||||||
|
|
| |||||||||||
| Standardized | 6-Month | w/o sales | w/sales | w/o sales | w/sales | |||||||
| 30-Day Yields | Total Returns | charge | charge | charge | charge | |||||||
|
|
|
|
|
|
|
| ||||||
| Institutional | 4.95% | –5.91% | –5.88% | — | –1.77% | — | ||||||
| Investor A | 4.49 | –6.03 | –6.04 | –10.04% | –2.09 | –5.05% | ||||||
| Investor C | 3.94 | –6.49 | –6.76 | – 7.65 | –2.71 | –2.71 | ||||||
| Lehman Brothers Municipal Bond Index | — | +3.22 | +3.36 | — | +4.70 | — | ||||||
|
|
|
|
|
|
|
| ||||||
| * Assuming maximum sales charges. See “About Fund Performance” on pages 12–13 for a detailed description of share classes, including any related sales charges and fees. ** The Portfolio commenced operations on 8/1/06. Past performance is not indicative of future results. |
| BLACKROCK MUNICIPAL BOND FUND, INC. |
| DECEMBER 31, 2007 |
| 11 |
| About Fund Performance For BlackRock Short-Term Municipal Fund |
- BlackRock Shares are not subject to any sales charge. BlackRock Shares bear no ongoing distribution or service fees and are available only to eligible investors. Prior to October 2, 2006, BlackRock Share performance results are those of the Institutional Shares (which have no distribution or service fees).
- Institutional Shares are not subject to any sales charge. Institutional Shares bear no ongoing distribution or service fees and are available only to eligible investors.
- Investor A Shares incur a maximum initial sales charge (front-end load) of 3% and a service fee of 0.25% per year (but no distribution fee).
Prior to October 2, 2006, Investor A Share performance results are thoseof the Institutional Shares (which have no distribution or service fees)restated to reflect Investor A Share fees.
- Investor A1 Shares incur a maximum initial sales charge (front-end load) of 1% and a service fee of 0.10% per year (but no distribution fee).
- Investor B Shares are subject to a maximum contingent deferred sales charge of 1% declining to 0% after three years. In addition, Investor B
Shares are subject to a distribution fee of 0.20% per year and a servicefee of 0.15% per year. These shares automatically convert to Investor A1 Shares after approximately 10 years. (There is no initial sales charge forautomatic share conversions.) - Investor C Shares are subject to a distribution fee of 0.75% per year and a service fee of 0.25% per year. In addition, Investor C shares are subject to a 1% contingent deferred sales charge if redeemed within one year of purchase. Prior to October 2, 2006, Investor C Share perform- ance results are those of the Institutional Shares (which have no distri- bution or service fees) restated to reflect Investor C Share fees.
| For BlackRock Municipal Insured Fund and BlackRock National Municipal Fund |
- Institutional Shares are not subject to any sales charge. Institutional Shares bear no ongoing distribution or service fees and are available only to eligible investors.
- Investor A Shares incur a maximum initial sales charge (front-end load) of 4.25% and a service fee of 0.25% per year (but no distribution fee).
- Investor B Shares are subject to a maximum contingent deferred sales charge of 4% declining to 0% after six years. In addition, Investor B
Shares are subject to a distribution fee of 0.50% per year and a servicefee of 0.25% per year. These shares automatically convert to Investor AShares after approximately 10 years. (There is no initial sales charge forautomatic share conversions.). - Investor C Shares are subject to a distribution fee of 0.75% per year and a service fee of 0.25% per year. In addition, Investor C shares are subject to a 1% contingent deferred sales charge if redeemed within one year of purchase. Prior to October 2, 2006, Investor C Share performance results are those of the Institutional Shares (which have no distribution or service fees) restated to reflect Investor C Share fees.
- Investor C1 Shares are subject to a distribution fee of 0.55% per year and a service fee of 0.25% per year. In addition, Investor C1 shares are subject to a 1% contingent deferred sales charge if redeemed within one year of purchase.
12 BLACKROCK MUNICIPAL BOND FUND, INC.
| DECEMBER 31, 2007 |
About Fund Performance (concluded)
For BlackRock High Yield Municipal Fund
- Institutional Shares are not subject to any sales charge. Institutional Shares bear no ongoing distribution or service fees and are available only to eligible investors.
- Investor A Shares incur a maximum initial sales charge (front-end load) of 4.25% and a service fee of 0.25% per year (but no distribution fee).
- Investor C Shares are subject to a distribution fee of 0.75% per year and a service fee of 0.25% per year. In addition, Investor C shares are subject to a 1% contingent deferred sales charge if redeemed within one year of purchase.
For All Funds
Performance information reflects past performance and does not guarantee future results. Current performance may be lower or higher than the performance data quoted. Refer to www.blackrock.com/funds to obtain performance data current to the most recent month-end. Performance results do not reflect the deduction of taxes that a shareholder would pay on fund distributions or the redemption of fund shares. Figures shown in each of the performance tables on pages 5, 7, 9 and 11 assume reinvestment of all dividends and capital gain distributions, if any, at net asset value on the payable date. The Fund’s investment adviser reimbursed a portion of the Fund’s expenses. Without such reimbursement, the Fund’s performance would have been lower. Investment return and principal value of shares will fluctuate so that shares, when redeemed, may be worth more or less than their original cost. Dividends paid to each class of shares will vary because of the different levels of service, distribution and transfer agency fees applicable to each class, which are deducted from the income available to be paid to shareholders.
| BLACKROCK MUNICIPAL BOND FUND, INC. |
| DECEMBER 31, 2007 |
| 13 |
Disclosure of Expenses
|
Shareholders of these Funds may incur the following charges: (a) expenses related to transactions, including sales charges, redemption fees and exchange fees; and (b) operating expenses including advisory fees, distribution fees including 12b-1 fees, and other Fund expenses. The expense examples on pages 14 – 17 (which are based on a hypothetical investment of $1,000 invested on July 1, 2007 and held through December 31, 2007) is intended to assist shareholders both in calculat- ing expenses based on an investment in the Fund and in comparing these expenses with similar costs of investing in other mutual funds. The tables provide information about actual account values and actual expenses. In order to estimate the expenses a shareholder paid during the period covered by this report, shareholders can divide their account value by $1,000 and then multiply the result by the number correspon- ding to their share class under the heading entitled “Expenses Paid During the Period.” |
|
The tables also provide information about hypothetical account values and hypothetical expenses based on the Fund’s actual expense ratio and an assumed rate of return of 5% per year before expenses. In order to assist shareholders in comparing the ongoing expenses of investing in these Funds and other funds, compare the 5% hypothetical example with the 5% hypothetical examples that appear in other funds’ shareholder reports. The expenses shown in the tables are intended to highlight shareholders’ ongoing costs only and do not reflect any transactional expenses, such as sales charges, redemption fees or exchange fees. Therefore, the hypotheti- cal tables are useful in comparing ongoing expenses only, and will not help shareholders determine the relative total expenses of owning differ- ent funds. If these transactional expenses were included, shareholder expenses would have been higher. |
| BlackRock Short-Term Municipal Fund | ||||||||||||
|
|
|
|
|
|
|
|
||||||
| Actual | Hypothetical** | |||||||||||
|
|
|
|
|
|
|
|||||||
| Beginning | Ending | Beginning | Ending | |||||||||
| Account Value | Account Value | Expenses Paid | Account Value | Account Value | Expenses Paid | |||||||
| July 1, 2007 | December 31, 2007 During the Period* | July 1, 2007 | December 31, 2007 During the Period* | |||||||||
|
|
|
|
|
|
||||||||
| BlackRock | $1,000 | $1,026.20 | $2.09 | $1,000 | $1,023.14 | $2.09 | ||||||
| Institutional | $1,000 | $1,026.50 | $1.79 | $1,000 | $1,023.44 | $1.79 | ||||||
| Investor A | $1,000 | $1,026.20 | $3.06 | $1,000 | $1,022.18 | $3.06 | ||||||
| Investor A1 | $1,000 | $1,026.00 | $2.30 | $1,000 | $1,022.94 | $2.29 | ||||||
| Investor B | $1,000 | $1,024.70 | $3.57 | $1,000 | $1,021.68 | $3.57 | ||||||
| Investor C | $1,000 | $1,021.40 | $6.88 | $1,000 | $1,018.40 | $6.87 | ||||||
|
|
|
|
|
|
|
|
||||||
|
* For each class of the Fund, expenses are equal to the annualized expense ratio for the class (.41% for BlackRock, .35% for Institutional, .60% for Investor A, .45% for
Investor A1, .70% for Investor B and 1.35% for Investor C), multiplied by the average account value over the period, multiplied by 184/365 to reflect the one-half year period shown. ** Hypothetical 5% annual return before expenses is calculated by pro-rating the number of days in the most recent fiscal half year divided by 365. |
14 BLACKROCK MUNICIPAL BOND FUND, INC.
| DECEMBER 31, 2007 |
| Disclosure of Expenses (continued) | ||||||||||||
|
|
|
|
|
|
||||||||
| BlackRock Municipal Insured Fund (Including Interest Expense and Fees) | ||||||||||||
|
|
|
|
|
|
||||||||
| Actual | Hypothetical** | |||||||||||
|
|
|
|
|
|
|
|||||||
| Beginning | Ending | Beginning | Ending | |||||||||
| Account Value | Account Value | Expenses Paid | Account Value | Account Value | Expenses Paid | |||||||
| July 1, 2007 | December 31, 2007 During the Period* | July 1, 2007 | December 31, 2007 During the Period* | |||||||||
|
|
|
|
|
|
||||||||
| Institutional | $1,000 | $1,023.10 | $ 5.00 | $1,000 | $1,020.27 | $ 4.99 | ||||||
| Investor A | $1,000 | $1,021.80 | $ 6.32 | $1,000 | $1,018.95 | $ 6.31 | ||||||
| Investor B | $1,000 | $1,019.20 | $ 8.96 | $1,000 | $1,016.33 | $ 8.94 | ||||||
| Investor C | $1,000 | $1,018.00 | $10.12 | $1,000 | $1,015.17 | $10.11 | ||||||
| Investor C1 | $1,000 | $1,019.00 | $ 9.11 | $1,000 | $1,016.18 | $ 9.10 | ||||||
|
|
|
|
|
|
|
|
||||||
|
* For each class of the Fund, expenses are equal to the annualized expense ratio for the class (.98% for Institutional, 1.24% for Investor A, 1.76% for Investor B, 1.99% for
Investor C and 1.79% for Investor C1), multiplied by the average account value over the period, multiplied by 184/365 (to reflect the one-half year period shown). ** Hypothetical 5% annual return before expenses is calculated by pro-rating the number of days in the most recent fiscal half year divided by 365. |
| BlackRock Municipal Insured Fund (Excluding Interest Expense and Fees) | ||||||||||||
|
|
|
|
|
|
||||||||
| Actual | Hypothetical** | |||||||||||
|
|
|
|
|
|
|
|||||||
| Beginning | Ending | Beginning | Ending | |||||||||
| Account Value | Account Value | Expenses Paid | Account Value | Account Value | Expenses Paid | |||||||
| July 1, 2007 | December 31, 2007 During the Period* | July 1, 2007 | December 31, 2007 During the Period* | |||||||||
|
|
|
|
|
|
||||||||
| Institutional | $1,000 | $1,023.10 | $2.40 | $1,000 | $1,022.84 | $2.40 | ||||||
| Investor A | $1,000 | $1,021.80 | $3.72 | $1,000 | $1,021.53 | $3.72 | ||||||
| Investor B | $1,000 | $1,019.20 | $6.31 | $1,000 | $1,018.95 | $6.31 | ||||||
| Investor C | $1,000 | $1,018.00 | $7.48 | $1,000 | $1,017.80 | $7.48 | ||||||
| Investor C1 | $1,000 | $1,019.00 | $6.51 | $1,000 | $1,018.75 | $6.51 | ||||||
|
|
|
|
|
|
|
|
||||||
|
* For each class of the Fund, expenses are equal to the annualized expense ratio for the class (.47% for Institutional, .73% for Investor A, 1.24% for Investor B, 1.47% for
Investor C and 1.28% for Investor C1), multiplied by the average account value over the period, multiplied by 184/365 to reflect the one-half year period shown. ** Hypothetical 5% annual return before expenses is calculated by pro-rating the number of days in the most recent fiscal half year divided by 365. |
| BLACKROCK MUNICIPAL BOND FUND, INC. |
| DECEMBER 31, 2007 |
| 15 |
| Disclosure of Expenses (continued) | ||||||||||||
|
|
|
|
|
|
||||||||
| BlackRock National Municipal Fund (Including Interest Expense and Fees) | ||||||||||||
|
|
|
|
|
|
||||||||
| Actual | Hypothetical** | |||||||||||
|
|
|
|
|
|
|
|||||||
| Beginning | Ending | Beginning | Ending | |||||||||
| Account Value | Account Value | Expenses Paid | Account Value | Account Value | Expenses Paid | |||||||
| July 1, 2007 | December 31, 2007 During the Period* | July 1, 2007 | December 31, 2007 During the Period* | |||||||||
|
|
|
|
|
|
||||||||
| Institutional | $1,000 | $1,009.70 | $4.61 | $1,000 | $1,020.62 | $4.63 | ||||||
| Investor A | $1,000 | $1,009.60 | $5.72 | $1,000 | $1,019.51 | $5.75 | ||||||
| Investor B | $1,000 | $1,007.00 | $8.40 | $1,000 | $1,016.84 | $8.44 | ||||||
| Investor C | $1,000 | $1,005.60 | $9.81 | $1,000 | $1,015.43 | $9.86 | ||||||
| Investor C1 | $1,000 | $1,005.80 | $8.54 | $1,000 | $1,016.69 | $8.59 | ||||||
|
|
|
|
|
|
|
|
||||||
|
* For each class of the Fund, expenses are equal to the annualized expense ratio for the class (.91% for Institutional, 1.13% for Investor A, 1.66% for Investor B, 1.94% for
Investor C and 1.69% for Investor C1), multiplied by the average account value over the period, multiplied by 184/365 to reflect the one-half year period shown. ** Hypothetical 5% annual return before expenses is calculated by pro-rating the number of days in the most recent fiscal half year divided by 365. |
| BlackRock National Municipal Fund (Excluding Interest Expense and Fees) | ||||||||||||
|
|
|
|
|
|
||||||||
| Actual | Hypothetical** | |||||||||||
|
|
|
|
|
|
|
|||||||
| Beginning | Ending | Beginning | Ending | |||||||||
| Account Value | Account Value | Expenses Paid | Account Value | Account Value | Expenses Paid | |||||||
| July 1, 2007 | December 31, 2007 During the Period* | July 1, 2007 | December 31, 2007 During the Period* | |||||||||
|
|
|
|
|
|
||||||||
| Institutional | $1,000 | $1,009.70 | $3.04 | $1,000 | $1,022.18 | $3.06 | ||||||
| Investor A | $1,000 | $1,009.60 | $4.15 | $1,000 | $1,021.07 | $4.18 | ||||||
| Investor B | $1,000 | $1,007.00 | $6.83 | $1,000 | $1,018.40 | $6.87 | ||||||
| Investor C | $1,000 | $1,000.50 | $8.24 | $1,000 | $1,016.99 | $8.29 | ||||||
| Investor C1 | $1,000 | $1,005.80 | $7.03 | $1,000 | $1,018.20 | $7.07 | ||||||
|
|
|
|
|
|
|
|
||||||
|
* For each class of the Fund, expenses are equal to the annualized expense ratio for the class (.60% for Institutional, .82% for Investor A, 1.35% for Investor B, 1.63% for
Investor C and 1.39% for Investor C1), multiplied by the average account value over the period, multiplied by 184/365 to reflect the one-half year period shown. ** Hypothetical 5% annual return before expenses is calculated by pro-rating the number of days in the most recent fiscal half year divided by 365. |
16 BLACKROCK MUNICIPAL BOND FUND, INC.
| DECEMBER 31, 2007 |
| Disclosure of Expenses (concluded) | ||||||||||||
|
|
|
|
|
|
||||||||
| BlackRock High Yield Municipal Fund (Including Interest Expense and Fees) | ||||||||||||
|
|
|
|
|
|
||||||||
| Actual | Hypothetical** | |||||||||||
|
|
|
|
|
|
|
|||||||
| Beginning | Ending | Beginning | Ending | |||||||||
| Account Value | Account Value | Expenses Paid | Account Value | Account Value | Expenses Paid | |||||||
| July 1, 2007 | December 31, 2007 During the Period* | July 1, 2007 | December 31, 2007 During the Period* | |||||||||
|
|
|
|
|
|
||||||||
| Institutional | $1,000 | $940.90 | $3.77 | $1,000 | $1,021.32 | $3.92 | ||||||
| Investor A | $1,000 | $939.70 | $4.94 | $1,000 | $1,020.11 | $5.14 | ||||||
| Investor C | $1,000 | $935.10 | $8.73 | $1,000 | $1,016.18 | $9.10 | ||||||
|
|
|
|
|
|
|
|
||||||
|
* For each class of the Fund, expenses are equal to the annualized expense ratio for the class (.77% for Institutional, 1.01% for Investor A and 1.79% for Investor C), multiplied by the average account value over the period, multiplied by 184/365 to reflect the one-half year period shown. ** Hypothetical 5% annual return before expenses is calculated by pro-rating the number of days in the most recent fiscal half year divided by 365. |
| BlackRock High Yield Municipal Fund (Excluding Interest Expense and Fees) | ||||||||||||
|
|
|
|
|
|
||||||||
| Actual | Hypothetical** | |||||||||||
|
|
|
|
|
|
|
|||||||
| Beginning | Ending | Beginning | Ending | |||||||||
| Account Value | Account Value | Expenses Paid | Account Value | Account Value | Expenses Paid | |||||||
| July 1, 2007 | December 31, 2007 During the Period* | July 1, 2007 | December 31, 2007 During the Period* | |||||||||
|
|
|
|
|
|
||||||||
| Institutional | $1,000 | $940.90 | $3.72 | $1,000 | $1,021.37 | $3.87 | ||||||
| Investor A | $1,000 | $939.70 | $4.94 | $1,000 | $1,020.11 | $5.14 | ||||||
| Investor C | $1,000 | $935.10 | $8.68 | $1,000 | $1,016.23 | $9.05 | ||||||
|
|
|
|
|
|
|
|
||||||
|
* For each class of the Fund, expenses are equal to the annualized expense ratio for the class (.76% for Institutional, 1.01% for Investor A and 1.78% for Investor C), multiplied by the average account value over the period, multiplied by 184/365 to reflect the one-half year period shown. ** Hypothetical 5% annual return before expenses is calculated by pro-rating the actual days in the most recent fiscal half year divided by 365. |
| BLACKROCK MUNICIPAL BOND FUND, INC. |
| DECEMBER 31, 2007 |
| 17 |
| Schedule of Investments as of December 31, 2007 BlackRock Short-Term Municipal Fund (In Thousands) (Unaudited) |
| Face | ||||
| Amount | Municipal Bonds | Value | ||
|
|
|
| ||
| Alabama — 3.1% | ||||
| $ 8,095 | Huntsville, Alabama, GO, Refunding, Series A, 5.25% | |||
| due 2/01/2009 (j) | $ 8,286 | |||
|
|
|
| ||
| Arizona — 2.6% | ||||
| 7,000 | Yavapai County, Arizona, IDA, Solid Waste Disposal | |||
| Revenue Bonds (Waste Management Inc. Project), | ||||
| AMT, 4% due 6/01/2027 | 6,909 | |||
|
|
|
| ||
| California — 0.3% | ||||
| 750 | California Pollution Control Financing Authority, | |||
| Solid Waste Disposal Revenue Bonds (Republic | ||||
| Services, Inc. Project), VRDN, AMT, 4.15% | ||||
| due 3/01/2028 (b) | 750 | |||
|
|
|
| ||
| District of Columbia — 1.8% | ||||
| 4,665 | Metropolitan Washington Airports Authority, D.C., | |||
| Airport System Revenue Refunding Bonds, AMT, | ||||
| Series A, 5% due 10/01/2010 (a) | 4,843 | |||
|
|
|
| ||
| Florida — 9.0% | ||||
| 7,000 | Florida Hurricane Catastrophe Fund Financing | |||
| Corporation Revenue Bonds, Series A, 5% | ||||
| due 7/01/2010 | 7,285 | |||
| 2,020 | Miami-Dade County, Florida, Educational Facilities | |||
| Authority Revenue Bonds (University of Miami), | ||||
| Series A, 5.75% due 4/01/2010 (a)(c) | 2,154 | |||
| 14,195 | Orange County, Florida, Tourist Development, Tax | |||
| Revenue Bonds, 5.50% due 10/01/2009 (a)(c) | 14,795 | |||
|
|
|
| ||
| Georgia — 8.7% | ||||
| 5,600 | Catoosa County, Georgia, School District, GO, 4.25% | |||
| due 8/01/2008 (h) | 5,642 | |||
| 6,005 | Georgia Municipal Electric Authority, Power Revenue | |||
| Refunding Bonds, Series DD, 7% due 1/01/2008 (h) | 6,005 | |||
| 11,905 | Georgia State, GO, Series B, 5% due 3/01/2008 | 11,945 | ||
|
|
|
| ||
| Illinois — 2.0% | ||||
| 5,000 | Illinois Educational Facilities Authority, Revenue | |||
| Refunding Bonds (University of Chicago), | ||||
| Series A, 5.25% due 7/01/2011 (c) | 5,390 | |||
|
|
|
| ||
| Indiana — 2.2% | ||||
| 4,750 | Indiana Bond Bank Revenue Bonds (State Revolving | |||
| Fund), Series B, 5.30% due 8/01/2010 (c) | 5,049 | |||
| 1,000 | Indiana State Development Finance Authority, IDR | |||
| (Republic Services, Inc. Project), VRDN, AMT, 3.79% | ||||
| due 11/01/2035 (b) | 1,000 | |||
|
|
|
| ||
| Massachusetts — 3.2% | ||||
| 8,505 | Massachusetts State Consolidated Loan, GO, | |||
| Series C, 5% due 5/01/2008 (f) | 8,561 | |||
|
|
|
| ||
| Face | ||||||
| Amount | Municipal Bonds | Value | ||||
|
|
|
|
| |||
| Michigan — 3.7% | ||||||
| $ 5,000 | Detroit, Michigan, Water Supply System Revenue | |||||
| Bonds, Second Lien, Series B, 5.50% | ||||||
| due 7/01/2011 (c)(g) | $ 5,428 | |||||
| 280 | Michigan State Strategic Fund, Limited Obligation | |||||
| Revenue Bonds (Kay Screen Printing, Inc. Project), | ||||||
| VRDN, AMT, 3.70% due 5/01/2020 (b) | 280 | |||||
| 4,120 | Michigan State Trunk Line Fund, Revenue Refunding | |||||
| Bonds, Series B, 5% due 9/01/2010 (j) | 4,317 | |||||
|
|
|
|
| |||
| Minnesota — 1.0% | ||||||
| 2,620 | Minneapolis and Saint Paul, Minnesota, Metropolitan | |||||
| Airports Commission, Airport Revenue Bonds, AMT, | ||||||
| Series B, 5.50% due 1/01/2010 (g) | 2,691 | |||||
|
|
|
|
| |||
| Nebraska — 0.9% | ||||||
| 2,500 | Central Plains Energy Project, Nebraska, Revenue | |||||
| Bonds (Gas Project Number 1), VRDN, 3.908% | ||||||
| due 12/01/2010 (b) | 2,453 | |||||
|
|
|
|
| |||
| Nevada — 5.3% | ||||||
| 6,500 | Clark County, Nevada, Airport System Subordinate | |||||
| Lien Revenue Bonds, AMT, Series B-1, 5% | ||||||
| due 7/01/2008 | 6,559 | |||||
| 7,500 | Clark County, Nevada, EDR (Alexander Dawson | |||||
| School of Nevada Project), 5.50% due 5/15/2009 (c) | 7,814 | |||||
|
|
|
| ||||
| New Jersey — 1.9% | ||||||
| 4,790 | New Jersey Building Authority, State Building | |||||
| Revenue Refunding Bonds, Series B, 5.25% | ||||||
| due 12/15/2010 (a) | 5,077 | |||||
|
|
|
|
| |||
| New Mexico — 2.1% | ||||||
| 5,685 | New Mexico State, Severance Tax Bonds, | |||||
| Series A, 5% due 7/01/2008 (h) | 5,742 | |||||
|
|
|
|
| |||
| New York — 4.9% | ||||||
| 5,000 | Metropolitan Transportation Authority, New York, | |||||
| Dedicated Tax Fund Revenue Bonds, Series A, | ||||||
| 5.875% due 4/01/2010 (c)(g) | 5,304 | |||||
| 7,705 | New York State Urban Development Corporation, | |||||
| Personal Income Tax Revenue Bonds, Series C, 5% | ||||||
| due 3/15/2010 | 8,009 | |||||
|
|
|
|
| |||
| Ohio — 3.2% | ||||||
| 4,400 | Ohio State Building Authority, State Facilities Revenue | |||||
| Bonds (Administrative Building Fund Projects), | ||||||
| Series A, 5.375% due 10/01/2008 (c) | 4,521 | |||||
| 3,875 | Ohio State, Common Schools, GO, Series A, 5% | |||||
| due 3/15/2011 | 4,090 | |||||
|
|
|
|
| |||
| Portfolio Abbreviations | ||||||||||
|
|
|
|
|
| ||||||
| To simplify the listings of BlackRock Municipal Bond | CARS | Complementary Auction Rate Securities | IDA | Industrial Development Authority | ||||||
| Fund, Inc.’s portfolio holdings in the Schedules of | COP | Certificates of Participation | IDB | Industrial Development Board | ||||||
| Investments, we have abbreviated the names of | CP | Commercial Paper | IDR | Industrial Development Revenue Bonds | ||||||
| many of the securities according to the list below | DRIVERS | Derivative Inverse Tax-Exempt Receipts | M/F | Multi-Family | ||||||
| and at right. | EDA | Economic Development Authority | PCR | Pollution Control Revenue Bonds | ||||||
| EDR | Economic Development Revenue Bonds | S/F | Single-Family | |||||||
| AMT | Alternative Minimum Tax (subject to) | GO | General Obligation Bonds | SAVRS | Select Auction Variable Rate Securities | |||||
| ARS | Auction Rate Securities | HDA | Housing Development Agency | TRAN | Tax Revenue Anticipation Notes | |||||
| BAN | Bond Anticipation Notes | HFA | Housing Finance Agency | VRDN | Variable Rate Demand Notes | |||||
18 BLACKROCK MUNICIPAL BOND FUND, INC.
| DECEMBER 31, 2007 |
| Schedule of Investments (concluded) BlackRock Short-Term Municipal Fund (In Thousands) |
| Face | ||||||
| Amount | Municipal Bonds | Value | ||||
|
|
|
|
| |||
| Pennsylvania — 5.4% | ||||||
| $ 4,000 | Bethlehem, Pennsylvania, Area School District, GO, | |||||
| Refunding, Series A, 5% due 9/01/2010 (h) | $ 4,191 | |||||
| 5,000 | Pennsylvania State, GO, Refunding, Third Series, 5% | |||||
| due 7/01/2009 | 5,144 | |||||
| 5,000 | University of Pittsburgh, Pennsylvania, The | |||||
| Commonwealth System of Higher Education, | ||||||
| Revenue Refunding Bonds (Pittsburgh Asset Notes — | ||||||
| Panthers), 5% due 8/01/2010 | 5,206 | |||||
|
|
|
|
| |||
| South Carolina — 3.4% | ||||||
| 4,590 | Aiken County, South Carolina, Consolidated School | |||||
| District, GO, Refunding, 5% due 3/01/2009 | 4,695 | |||||
| Hilton Head Island, South Carolina, Public Facility | ||||||
| Corporation, COP (Beach Preservation Fee Pledge) (h): | ||||||
| 2,160 | 5% due 8/01/2008 | 2,184 | ||||
| 2,240 | 5% due 8/01/2009 | 2,303 | ||||
|
|
|
|
| |||
| Tennessee — 1.5% | ||||||
| 4,000 | Tennessee Energy Acquisition Corporation, Gas | |||||
| Revenue Bonds, Series A, 5% due 9/01/2009 | 4,078 | |||||
|
|
|
|
| |||
| Texas — 15.2% | ||||||
| 3,980 | Austin, Texas, Independent School District, GO, | |||||
| Refunding, 5.25% due 8/01/2009 | 4,115 | |||||
| 5,000 | Harris County, Texas, Toll Road Revenue Refunding | |||||
| Bonds, Series B-2, 5% due 8/15/2021 (b)(g) | 5,135 | |||||
| 2,200 | Montgomery County, Texas, Unlimited Tax Adjustable | |||||
| Rate Road, GO, Series B, 5% due 3/01/2028 (b)(j) | 2,228 | |||||
| 2,790 | North Texas Thruway Authority, Dallas North Thruway | |||||
| System, Revenue Refunding Bonds, Series B, 5% | ||||||
| due 1/01/2038 (a)(b) | 2,812 | |||||
| 7,000 | North Texas Thruway Authority Revenue Bonds, | |||||
| BAN, 4.125% due 11/19/2008 | 7,010 | |||||
| 5,000 | San Antonio, Texas, Electric and Gas Revenue Bonds, | |||||
| Junior Lien, VRDN, 3.625% due 12/01/2027 (b) | 5,021 | |||||
| 4,275 | Tarrant County, Texas, Cultural Education Facilities | |||||
| Financing Corporation, Revenue Refunding | ||||||
| Bonds (Texas Health Resources), Series A, 5% | ||||||
| due 2/15/2011 | 4,457 | |||||
| Face | ||||||
| Amount | Municipal Bonds | Value | ||||
|
|
|
|
| |||
| Texas (concluded) | ||||||
| $ 5,000 | Texas State, GO, TRAN, 4.50% due 8/28/2008 | $ 5,049 | ||||
| 5,000 | University of Texas, Financing System Revenue | |||||
| Refunding Bonds, Series B, 5% due 8/15/2010 | 5,236 | |||||
|
|
|
|
| |||
| Virginia — 1.8% | ||||||
| 4,885 | Virginia State Public School Authority, School | |||||
| Financing Revenue Bonds, Series B, 5% | ||||||
| due 8/01/2008 (c) | 4,990 | |||||
|
|
|
|
| |||
| Washington — 4.9% | ||||||
| 9,940 | Energy Northwest, Washington, Electric Revenue | |||||
| Refunding Bonds (Columbia Generating Station), | ||||||
| Series A, 5.25% due 7/01/2009 (a) | 10,257 | |||||
| 2,900 | Tacoma, Washington, Electric System Revenue | |||||
| Refunding Bonds, Series A, 5.625% | ||||||
| due 1/01/2011 (c)(j) | 3,130 | |||||
|
|
|
|
| |||
| Wisconsin — 2.7% | ||||||
| 7,070 | Wisconsin Public Power Inc., Power Supply System, | |||||
| Revenue Refunding Bonds, Series A, 5.25% | ||||||
| due 7/01/2010 (h) | 7,407 | |||||
|
|
|
|
| |||
| Puerto Rico — 3.1% | ||||||
| 8,400 | Government Development Bank of Puerto Rico, | |||||
| CP, 4.25% due 1/09/2008 | 8,400 | |||||
|
|
|
|
| |||
| Total Municipal Bonds | ||||||
| (Cost — $252,023) — 93.9% | 253,947 | |||||
|
|
|
|
| |||
| Shares | ||||||
| Held | Short-Term Securities | |||||
|
|
|
|
| |||
| 12,521 | Merrill Lynch Institutional Tax-Exempt Fund, 3.35% (d)(e) | 12,521 | ||||
|
|
|
| ||||
| Total Short-Term Securities | ||||||
| (Cost — $12,521) — 4.6% | 12,521 | |||||
|
|
|
|
| |||
| Total Investments (Cost — $264,544*) — 98.5% | 266,468 | |||||
| Other Assets Less Liabilities — 1.5% | 4,151 | |||||
|
|
| |||||
| Net Assets — 100.0% | $ 270,619 | |||||
|
| ||||||
| * | The cost and unrealized appreciation (depreciation) of investments as of December 31, 2007, as computed for federal income tax purposes, were as follows: |
| Aggregate cost | $ 264,544 | |
|
| ||
| Gross unrealized appreciation | $ 2,046 | |
| Gross unrealized depreciation | (122) | |
|
| ||
| Net unrealized appreciation | $ 1,924 | |
|
|
| (a) | AMBAC Insured. |
| (b) | Security may have a maturity of more than one year at time of issuance, but has variable rate and demand features that qualify it as a short-term security. The rate disclosed is that currently in effect. This rate changes periodically based upon prevailing market rates. |
| See Notes to Financial Statements. | |
(c) Prerefunded.
(d) Investments in companies considered to be an affiliate of the Fund, for purposes of Section 2(a)(3) of the Investment Company Act of 1940, were as follows:
| Net | Dividend | |||
| Affiliate | Activity | Income | ||
|
|
|
| ||
| Merrill Lynch Institutional Tax-Exempt Fund | 5,918 | $236 | ||
|
|
|
| ||
| (e) Represents the current yield as of December 31, 2007. | ||||
| (f) CIFG Insured. | ||||
| (g) FGIC Insured. | ||||
| (h) MBIA Insured. | ||||
| (j) FSA Insured. |
| BLACKROCK MUNICIPAL BOND FUND, INC. |
| DECEMBER 31, 2007 |
| 19 |
| Schedule of Investments as of December 31, 2007 BlackRock Municipal Insured Fund (In Thousands) (Unaudited) |
| Face | ||||||
| Amount | Municipal Bonds | Value | ||||
|
|
|
|
| |||
| Alabama — 3.1% | ||||||
| $10,000 | Lauderdale County and Florence, Alabama, Health | |||||
| Care Authority Revenue Refunding Bonds (Coffee | ||||||
| Health Group), Series A, 6% due 7/01/2029 (g) | $ 10,693 | |||||
| 7,840 | University of Alabama, General Revenue Bonds, | |||||
| Series A, 5% due 7/01/2034 (g) | 8,028 | |||||
| 7,000 | University of Alabama, University Revenue Bonds | |||||
| (Birmingham), 6% due 10/01/2009 (c)(h) | 7,354 | |||||
|
|
|
|
| |||
| Arizona — 0.7% | ||||||
| 5,000 | Downtown Phoenix Hotel Corporation, Arizona, | |||||
| Revenue Bonds, Senior Series A, 5% | ||||||
| due 7/01/2040 (c) | 5,030 | |||||
| 1,250 | Salt Verde Financial Corporation, Arizona, Senior Gas | |||||
| Revenue Bonds, 5% due 12/01/2037 | 1,169 | |||||
|
|
|
|
| |||
| Arkansas — 0.5% | ||||||
| 4,000 | University of Arkansas, University Revenue Bonds | |||||
| (Various Facilities — Fayetteville Campus), 5% | ||||||
| due 12/01/2027 (c) | 4,117 | |||||
|
|
|
|
| |||
| California — 15.0% | ||||||
| 1,050 | Antelope Valley, California, Community College | |||||
| District, GO (Election of 2004), Series B, 5.25% | ||||||
| due 8/01/2039 (g) | 1,123 | |||||
| 2,800 | Arcadia, California, Unified School District, Capital | |||||
| Appreciation, GO (Election of 2006), Series A, 4.96% | ||||||
| due 8/01/2039 (e)(m) | 508 | |||||
| 4,100 | Cabrillo, California, Community College District, | |||||
| GO (Election of 2004), Series B, 5.20% | ||||||
| due 8/01/2037 (g)(m) | 830 | |||||
| 2,075 | California State Department of Veteran Affairs, Home | |||||
| Purchase Revenue Refunding Bonds, Series A, 5.35% | ||||||
| due 12/01/2027 (a) | 2,170 | |||||
| 5,800 | Coast Community College District, California, GO | |||||
| (Election of 2002), Series C, 5.392% | ||||||
| due 8/01/2036 (e)(m) | 1,267 | |||||
| 2,000 | Corona-Norco, California, Unified School District, GO | |||||
| (Election of 2006), Series A, 5% due 8/01/2031 (e) | 2,098 | |||||
| Fresno, California, Unified School District, GO | ||||||
| (Election of 2001): | ||||||
| 5,170 | Series D, 5% due 8/01/2027 (g) | 5,402 | ||||
| 1,500 | Series E, 5% due 8/01/2030 (e) | 1,568 | ||||
| 5,595 | Grossmont-Cuyamaca Community College District, | |||||
| California, GO (Election of 2002), Series B, 5% | ||||||
| due 8/01/2029 (c) | 5,813 | |||||
| 15,000 | Los Angeles, California, Municipal Improvement | |||||
| Corporation, Lease Revenue Bonds, Series B1, 4.75% | ||||||
| due 8/01/2037 (c) | 14,882 | |||||
| 8,965 | Modesto, California, Schools Infrastructure | |||||
| Financing Agency, Special Tax Bonds, 5.50% | ||||||
| due 9/01/2036 (a) | 9,413 | |||||
| 1,380 | Orange County, California, Sanitation District, COP, | |||||
| Series B, 5% due 2/01/2031 (e) | 1,424 | |||||
| 6,440 | Palm Springs, California, Financing Authority, Lease | |||||
| Revenue Refunding Bonds (Convention Center | ||||||
| Project), Series A, 5.50% due 11/01/2035 (g) | 6,949 | |||||
| 10,500 | Ramona, California, Unified School District, | |||||
| Convertible Capital Appreciation Refunding Bonds, | ||||||
| COP, 5.106% due 5/01/2032 (c)(m) | 8,658 | |||||
| 675 | Rancho Cucamonga, California, Redevelopment | |||||
| Agency, Tax Allocation Refunding Bonds (Rancho | ||||||
| Redevelopment Project), Series A, 5% | ||||||
| due 9/01/2034 (g) | 690 | |||||
| 3,900 | Redlands, California, Unified School District, GO | |||||
| (Election of 2002), 5% due 7/01/2025 (e) | 4,091 | |||||
|
|
|
|||||
| Face | ||||||
| Amount | Municipal Bonds | Value | ||||
|
|
|
|
| |||
| California (concluded) | ||||||
| $11,685 | Rialto, California, Unified School District, GO, | |||||
| Series A, 6.24% due 6/01/2025 (c)(m) | $ 4,927 | |||||
| 5,000 | Roseville, California, Joint Union High School | |||||
| District, GO (Election of 2004), Series A, 5% | ||||||
| due 8/01/2029 (c) | 5,173 | |||||
| 5,075 | Sacramento, California, Unified School District, GO | |||||
| (Election of 1999), Series B, 5% due 7/01/2026 (c) | 5,236 | |||||
| 2,685 | San Diego, California, Community College District, | |||||
| GO (Election of 2002), 5% due 5/01/2030 (e) | 2,794 | |||||
| 6,600 | San Jose, California, Airport Revenue Refunding | |||||
| Bonds, AMT, Series A, 5.50% due 3/01/2032 (a) | 6,889 | |||||
| 3,700 | San Jose, California, GO (Libraries, Parks and Public | |||||
| Safety Projects), 5% due 9/01/2030 (g) | 3,820 | |||||
| 10,055 | Sequoia, California, Unified High School District, GO, | |||||
| Refunding, Series B, 5.50% due 7/01/2035 (e) | 10,959 | |||||
| 2,755 | Tahoe Truckee, California, Unified School District, GO | |||||
| (School Facilities Improvement District Number 2), | ||||||
| Series A, 5.25% due 8/01/2029 (g) | 2,885 | |||||
| Tustin, California, Unified School District, Senior Lien | ||||||
| Special Tax Bonds (Community Facilities District | ||||||
| Number 97-1), Series A (e): | ||||||
| 7,980 | 5% due 9/01/2032 | 8,100 | ||||
| 9,330 | 5% due 9/01/2038 | 9,461 | ||||
|
|
|
|
| |||
| Colorado — 2.5% | ||||||
| 19,250 | Aurora, Colorado, COP, 6% due 12/01/2010 (a)(h) | 20,767 | ||||
|
|
|
| ||||
| Connecticut — 0.7% | ||||||
| 6,035 | Connecticut State, HFA, Housing Mortgage Finance | |||||
| Program Revenue Bonds, AMT, Sub-Series B-2, 5.10% | ||||||
| due 11/15/2038 (a) | 5,870 | |||||
|
|
|
|
| |||
| Florida — 0.8% | ||||||
| 3,800 | Duval County, Florida, School Board, COP (Master | |||||
| Lease Program), 5% due 7/01/2033 (e) | 3,887 | |||||
| 1,350 | Miami, Florida, Special Obligation Revenue Bonds | |||||
| (Street and Sidewalk Improvement Program), 5% | ||||||
| due 1/01/2037 (g) | 1,365 | |||||
| 1,260 | West Coast Regional Water Supply Authority, Florida, | |||||
| Capital Improvement Revenue Bonds, 10.40% | ||||||
| due 10/01/2010 (a)(h) | 1,410 | |||||
|
|
|
|
| |||
| Georgia — 4.3% | ||||||
| Georgia Municipal Electric Authority, Power Revenue | ||||||
| Refunding Bonds: | ||||||
| 20,000 | Series EE, 7% due 1/01/2025 (a) | 26,264 | ||||
| 90 | Series Y, 6.40% due 1/01/2011 (h) | 98 | ||||
| 490 | Series Y, 6.40% due 1/01/2013 (a)(b) | 544 | ||||
| 8,420 | Series Y, 6.40% due 1/01/2013 (a) | 9,271 | ||||
|
|
|
|
| |||
| Illinois — 1.0% | ||||||
| 8,640 | Chicago, Illinois, O'Hare International Airport, | |||||
| Revenue Refunding Bonds, Third Lien, AMT, | ||||||
| Series C-2, 5.25% due 1/01/2034 (k) | 8,675 | |||||
|
|
|
|
| |||
| Indiana — 0.4% | ||||||
| 3,530 | Indiana Municipal Power Agency, Power Supply System | |||||
| Revenue Bonds, Series A, 5% due 1/01/2037 (g) | 3,615 | |||||
|
|
|
|
| |||
| Kansas — 0.6% | ||||||
| 5,145 | Manhattan, Kansas, Hospital Revenue Bonds (Mercy | |||||
| Health Center), 5.50% due 8/15/2020 (e) | 5,463 | |||||
|
|
|
|
| |||
| Louisiana — 1.8% | ||||||
| 2,500 | Louisiana State Citizens Property Insurance | |||||
| Corporation, Assessment Revenue Bonds, | ||||||
| Series B, 5% due 6/01/2022 (a) | 2,590 | |||||
20
BLACKROCK MUNICIPAL BOND FUND, INC.
| DECEMBER 31, 2007 |
| Schedule of Investments (continued) BlackRock Municipal Insured Fund (In Thousands) |
| Face | ||||||
| Amount | Municipal Bonds | Value | ||||
|
|
|
|
| |||
| Louisiana (concluded) | ||||||
| $ 2,400 | Louisiana State, Gas and Fuels Tax Revenue Bonds, | |||||
| Series A, 4.75% due 5/01/2039 (e) | $ 2,365 | |||||
| 2,800 | New Orleans, Louisiana, Aviation Board Revenue | |||||
| Bonds, AMT, Series A, 5% due 1/01/2038 (e) | 2,774 | |||||
| 5,000 | New Orleans, Louisiana, GO (Public Improve- | |||||
| ments), 5.25% due 12/01/2029 (a) | 5,266 | |||||
| 2,800 | Rapides Financing Authority, Louisiana, Revenue | |||||
| Bonds (Cleco Power LLC Project), AMT, 4.70% | ||||||
| due 11/01/2036 (a) | 2,616 | |||||
|
|
|
|
| |||
| Maryland — 0.7% | ||||||
| 4,400 | Maryland State Health and Higher Educational | |||||
| Facilities Authority Revenue Bonds (University of | ||||||
| Maryland Medical System), Series B, 7% | ||||||
| due 7/01/2022 (c) | 5,644 | |||||
|
|
|
|
| |||
| Massachusetts — 5.7% | ||||||
| 15,000 | Massachusetts State School Building Authority, | |||||
| Dedicated Sales Tax Revenue Bonds, Series A, 5% | ||||||
| due 8/15/2030 (e) | 15,616 | |||||
| 4,000 | Massachusetts State, HFA, Rental Housing | |||||
| Mortgage Revenue Bonds, AMT, Series C, 5.60% | ||||||
| due 1/01/2045 (e) | 4,119 | |||||
| Massachusetts State, HFA, S/F Housing Revenue | ||||||
| Bonds, AMT(e): | ||||||
| 2,845 | Series 128, 4.80% due 12/01/2027 | 2,715 | ||||
| 7,000 | Series 128, 4.875% due 12/01/2038 | 6,500 | ||||
| 17,500 | Massachusetts State Special Obligation Dedicated | |||||
| Tax Revenue Bonds, 5.25% due 1/01/2014 (c)(h) | 19,214 | |||||
|
|
|
| ||||
| Michigan — 0.2% | ||||||
| 1,500 | Detroit, Michigan, Water Supply System Revenue | |||||
| Bonds, Senior Lien, Series A, 5% due 7/01/2030 (c) | 1,522 | |||||
|
|
|
| ||||
| Minnesota — 1.8% | ||||||
| 5,860 | Delano, Minnesota, Independent School | |||||
| District Number 879, GO, Series A, 5.875% | ||||||
| due 2/01/2025 (e) | 6,295 | |||||
| Sauk Rapids, Minnesota, Independent School | ||||||
| District Number 047, GO, Series A (g): | ||||||
| 3,735 | 5.65% due 2/01/2020 | 3,988 | ||||
| 4,440 | 5.70% due 2/01/2021 | 4,747 | ||||
|
|
|
|
| |||
| Mississippi — 1.5% | ||||||
| 1,320 | Harrison County, Mississippi, Wastewater | |||||
| Management District, Revenue Refunding Bonds | ||||||
| (Wastewater Treatment Facilities), Series A, 8.50% | ||||||
| due 2/01/2013 (b)(c) | 1,631 | |||||
| 10,000 | Mississippi Hospital Equipment and Facilities | |||||
| Authority Revenue Bonds (Forrest County General | ||||||
| Hospital Project), 6% due 1/01/2011 (e)(h) | 10,895 | |||||
|
|
|
|
| |||
| Missouri — 4.3% | ||||||
| Kansas City, Missouri, Airport Revenue Refunding and | ||||||
| Improvement Bonds, Series A (g): | ||||||
| 12,990 | 5.50% due 9/01/2013 | 13,209 | ||||
| 9,000 | 5.50% due 9/01/2014 | 9,152 | ||||
| Missouri Joint Municipal Electric Utility Commission, | ||||||
| Power Project Revenue Bonds (Latan 2 Project), | ||||||
| Series A (a): | ||||||
| 5,595 | 5% due 1/01/2027 | 5,755 | ||||
| 8,325 | 5% due 1/01/2028 | 8,540 | ||||
|
|
|
|
| |||
| Nebraska — 0.6% | ||||||
| 5,000 | Public Power Generation Agency, Nebraska, Revenue | |||||
| Bonds (Whelan Energy Center Unit 2), Series A, 5% | ||||||
| due 1/01/2032 (a) | 5,168 | |||||
|
|
|
|
| |||
| Face | ||||||
| Amount | Municipal Bonds | Value | ||||
|
|
|
|
| |||
| Nevada — 0.4% | ||||||
| Clark County, Nevada, IDR (Southwest Gas | ||||||
| Corporation Project), AMT (c): | ||||||
| $ 1,300 | Series A, 4.75% due 9/01/2036 | $ 1,221 | ||||
| 2,200 | Series D, 5.25% due 3/01/2038 | 2,223 | ||||
|
|
|
|
| |||
| New Jersey — 8.6% | ||||||
| 6,810 | Cape May County, New Jersey, Industrial Pollution | |||||
| Control Financing Authority, Revenue Refunding | ||||||
| Bonds (Atlantic City Electric Company Project), | ||||||
| Series A, 6.80% due 3/01/2021 (g) | 8,685 | |||||
| Garden State Preservation Trust of New Jersey, Open | ||||||
| Space and Farmland Preservation Revenue Bonds, | ||||||
| Series A (e): | ||||||
| 3,125 | 5.80% due 11/01/2021 | 3,568 | ||||
| 8,310 | 5.80% due 11/01/2022 | 9,469 | ||||
| 4,340 | 5.80% due 11/01/2023 | 4,937 | ||||
| New Jersey EDA, Motor Vehicle Surcharge Revenue | ||||||
| Bonds, Series A (g): | ||||||
| 5,000 | 5% due 7/01/2027 | 5,191 | ||||
| 23,000 | 5.25% due 7/01/2033 | 24,174 | ||||
| New Jersey State Transportation Trust Fund Authority, | ||||||
| Transportation System Revenue Bonds, Series D: | ||||||
| 4,240 | 5% due 6/15/2018 (a) | 4,539 | ||||
| 11,530 | 5% due 6/15/2019 (e) | 12,297 | ||||
|
|
|
|
| |||
| New Mexico — 0.6% | ||||||
| 5,000 | New Mexico Finance Authority, Senior Lien State | |||||
| Transportation Revenue Bonds, Series A, 5.125% | ||||||
| due 6/15/2018 (g) | 5,382 | |||||
|
|
|
|
| |||
| New York — 11.7% | ||||||
| New York City, New York, GO: | ||||||
| 11,495 | Series C, 5.625% due 3/15/2012 (h)(k) | 12,583 | ||||
| 5 | Series C, 5.625% due 3/15/2018 (k) | 5 | ||||
| 6,155 | Series I, 6% due 4/15/2012 (e) | 6,224 | ||||
| 3 | New York City, New York, Sales Tax Asset Receivable | |||||
| Corporation Revenue Bonds, DRIVERS, Series 1133Z, | ||||||
| 6.753% due 10/15/2012 (a)(j) | 3 | |||||
| New York City, New York, Sales Tax Asset Receivable | ||||||
| Corporation Revenue Bonds, Series A: | ||||||
| 16,905 | 5% due 10/15/2020 (g) | 17,990 | ||||
| 15,650 | 5% due 10/15/2032 (a) | 16,269 | ||||
| 11,795 | New York State Dormitory Authority Revenue Bonds | |||||
| (School Districts Financing Program), Series D, 5.25% | ||||||
| due 10/01/2023 (g) | 12,558 | |||||
| 9,110 | New York State Urban Development Corporation, | |||||
| Personal Income Tax Revenue Bonds (State | ||||||
| Facilities), Series A-1, 5.25% due 3/15/2034 (c) | 9,552 | |||||
| 5 | Niagara Falls, New York, GO, Public Improvement, 6.90% | |||||
| due 3/01/2024 (g) | 5 | |||||
| 22,500 | Tobacco Settlement Financing Corporation of | |||||
| New York Revenue Bonds, Series A-1, 5.25% | ||||||
| due 6/01/2022 (a) | 23,879 | |||||
|
|
|
|
| |||
| North Carolina — 0.3% | ||||||
| 2,880 | North Carolina HFA, Home Ownership Revenue | |||||
| Bonds, AMT, Series 14-A, 5.35% due 1/01/2022 (a) | 2,913 | |||||
|
|
|
| ||||
| North Dakota — 0.3% | ||||||
| 2,630 | North Dakota State, HFA, Revenue Bonds | |||||
| (Housing Finance Program), Series C, 5.30% | ||||||
| due 7/01/2022 (a) | 2,656 | |||||
|
|
|
|
| |||
| Oklahoma — 0.8% | ||||||
| 6,385 | Oklahoma State Industries Authority, Health System | |||||
| Revenue Refunding Bonds (Integris Obligated Group), | ||||||
| Series A, 6.25% due 8/15/2009 (g)(h) | 6,768 | |||||
|
|
|
|
| |||
| BLACKROCK MUNICIPAL BOND FUND, INC. |
| DECEMBER 31, 2007 |
| 21 |
| Schedule of Investments (continued) BlackRock Municipal Insured Fund (In Thousands) |
| Face | ||||||
| Amount | Municipal Bonds | Value | ||||
|
|
|
|
| |||
| Oregon — 1.6% | ||||||
| $ 8,700 | Oregon State Department, Administrative Services, | |||||
| COP, Series A, 6.25% due 5/01/2010 (a)(h) | $ 9,393 | |||||
| 3,865 | Port of Portland, Oregon, Airport Revenue Refunding | |||||
| Bonds (Portland International Airport), AMT, | ||||||
| Series 7-B, 7.10% due 1/01/2012 (g)(h) | 4,388 | |||||
|
|
|
|
| |||
| Pennsylvania — 2.3% | ||||||
| 5,510 | Philadelphia, Pennsylvania, Gas Works Revenue | |||||
| Bonds, 12th Series B, 7% due 5/15/2020 (b)(g) | 6,606 | |||||
| 4,420 | Philadelphia, Pennsylvania, Redevelopment Authority | |||||
| Revenue Bonds (Neighborhood Transformation), | ||||||
| Series A, 5.50% due 4/15/2020 (c) | 4,742 | |||||
| 7,010 | Pittsburgh, Pennsylvania, GO, Series C, 5.25% | |||||
| due 9/01/2018 (e) | 7,756 | |||||
|
|
|
|
| |||
| Rhode Island — 0.9% | ||||||
| 6,815 | Rhode Island State Economic Development | |||||
| Corporation, Airport Revenue Bonds, Series B, 6% | ||||||
| due 7/01/2010 (c)(h) | 7,347 | |||||
|
|
|
|
| |||
| Texas — 4.8% | ||||||
| 25,950 | Dallas-Fort Worth, Texas, International Airport Revenue | |||||
| Bonds, AMT, Series A, 6% due 11/01/2028 (c) | 26,750 | |||||
| 3,500 | Houston, Texas, Water Conveyance System Contract, | |||||
| COP, Series J, 6.25% due 12/15/2013 (a) | 3,999 | |||||
| 8,110 | Lewisville, Texas, Independent School District, | |||||
| Capital Appreciation and School Building, GO, | ||||||
| Refunding, 4.67% due 8/15/2024 (c)(m) | 3,482 | |||||
| 1,500 | North Texas Thruway Authority, Dallas North | |||||
| Thruway System Revenue Bonds, Series A, 5% | ||||||
| due 1/01/2035 (e) | 1,547 | |||||
| Texas State Department of Housing and Community | ||||||
| Affairs, S/F Mortgage Revenue Bonds, AMT, | ||||||
| Series A (d)(g): | ||||||
| 2,065 | 5.45% due 9/01/2023 | 2,099 | ||||
| 2,700 | 5.50% due 3/01/2026 | 2,736 | ||||
|
|
|
|
| |||
| Utah — 1.1% | ||||||
| 11,930 | Utah Transit Authority, Sales Tax Revenue Refunding | |||||
| Bonds, Sub-Series A, 5.30% due 6/15/2036 (g)(m) | 2,634 | |||||
| Utah Water Finance Agency Revenue Bonds (Pooled | ||||||
| Loan Financing Program), Series A (a): | ||||||
| 2,515 | 5.75% due 10/01/2015 | 2,678 | ||||
| 3,770 | 6% due 10/01/2020 | 4,018 | ||||
|
|
|
|
| |||
| Vermont — 0.2% | ||||||
| 1,300 | Vermont HFA, Revenue Refunding Bonds, AMT, | |||||
| Series C, 5.50% due 11/01/2038 (e) | 1,315 | |||||
|
|
|
|
| |||
| Washington — 0.9% | ||||||
| 7,225 | Chelan County, Washington, Public Utility District | |||||
| Number 001, Consolidated Revenue Bonds | ||||||
| (Chelan Hydro System), AMT, Series A, 5.45% | ||||||
| due 7/01/2037 (a) | 7,377 | |||||
|
|
|
|
| |||
| Wisconsin — 1.4% | ||||||
| 9,000 | Superior, Wisconsin, Limited Obligation Revenue | |||||
| Refunding Bonds (Midwest Energy Resources), | ||||||
| Series E, 6.90% due 8/01/2021 (c) | 11,509 | |||||
| 670 | Wisconsin State, GO, AMT, Series B, 6.50% | |||||
| due 5/01/2025 (g) | 671 | |||||
| 2 | Wisconsin State Health and Educational Facilities | |||||
| Authority Revenue Bonds, DRIVERS, Series 2310Z, | ||||||
| 6.151% due 10/01/2015 (j)(k) | 2 | |||||
|
|
|
|
| |||
| Total Municipal Bonds | ||||||
| (Cost — $663,174) — 82.1% | 695,211 | |||||
|
|
|
|
| |||
| Face | Municipal Bonds Transferred to | |||||
| Amount | Tender Option Bond Trusts (l) | Value | ||||
|
|
|
|
| |||
| California — 4.8% | ||||||
| $ 7,500 | San Jose, California, Financing Authority, Lease | |||||
| Revenue Refunding Bonds (Civic Center Project), | ||||||
| Series B, 5% due 6/1/2032 (a) | $ 7,681 | |||||
| 10,000 | Hesperia, California, Public Financing Authority | |||||
| Revenue Bonds, Series 2126, 6.86% | ||||||
| due 9/01/2017 (j)(k) | 10,736 | |||||
| 12,040 | Mount Diablo, California, Unified School District, GO | |||||
| (Election of 2002), 5% due 7/01/2007 (c) | 12,404 | |||||
| 10,000 | Washington, California, Unified School | |||||
| District, 5.125% due 8/01/2037 (a) | 10,224 | |||||
|
|
|
|
| |||
| Florida — 5.8% | ||||||
| Miami-Dade County, Florida, Aviation Revenue | ||||||
| Refunding Bonds (Miami International Airport), AMT, | ||||||
| Series A: | ||||||
| 15,000 | 5% due 10/01/2039 (g) | 14,776 | ||||
| 9,980 | 5% due 10/01/2040 (k) | 9,661 | ||||
| 14,600 | 5% due 10/01/2040 (k) | 14,133 | ||||
| 10,000 | Tallahassee, Florida, Energy System Revenue Bonds, | |||||
| 5% due 10/01/2037 (g) | 10,295 | |||||
|
|
|
|
| |||
| Maryland — 2.6% | ||||||
| 21,640 | Baltimore, Maryland, Convention Center Hotel Revenue | |||||
| Bonds, Senior Series A, 5.25% due 9/01/2039 (k) | 22,091 | |||||
|
|
|
| ||||
| Michigan — 1.6% | ||||||
| 13,145 | Michigan State Strategic Fund, Limited Obligation | |||||
| Revenue Refunding Bonds (Detroit Edison Company | ||||||
| Pollution Control Project), AMT, Series A, 5.50% | ||||||
| due 6/1/2030 (k) | 13,505 | |||||
|
|
|
|
| |||
| Illinois — 3.4% | ||||||
| 17,690 | Chicago, Illinois, O'Hare International Airport | |||||
| Revenue Bonds, Third Lien, AMT, Series B-2, 6% | ||||||
| due 1/1/2027 (g) | 18,869 | |||||
| 10,000 | Illinois Municipal Electric Agency, Power Supply | |||||
| Revenue Bonds, Series A, 0.05% due 2/01/2035 (c) | 10,219 | |||||
|
|
|
| ||||
| Nebraska — 1.4% | ||||||
| 11,300 | Public Power Generation Agency, Nebraska Revenue | |||||
| Bonds (Whelan Energy Center Unit 2-A), 5% | ||||||
| due 1/01/2025 (a) | 11,791 | |||||
|
|
|
|
| |||
| New York — 3.8% | ||||||
| 13,925 | New York City, New York, Sales Tax Asset Receivable | |||||
| Corporation Revenue Bonds, Series A, 5.25% | ||||||
| due 10/15/2027 (a) | 14,788 | |||||
| 16,830 | New York State Thruway Authority, General Revenue | |||||
| Refunding Bonds, Series G, 5% due 1/01/2032 (e) | 17,524 | |||||
|
|
|
| ||||
| New Jersey — 1.7% | ||||||
| 13,500 | New Jersey State Turnpike Authority, Turnpike Revenue | |||||
| Bonds, Series C, 5% due 1/01/2030 (e) | 14,008 | |||||
|
|
|
|
| |||
| Texas — 0.6% | ||||||
| 5,000 | Dallas-Fort Worth, Texas, International Airport Revenue | |||||
| Bonds, AMT, Series A, 5.50% due 11/1/2033 (g) | 5,105 | |||||
|
|
|
|
| |||
| Wisconsin — 1.7% | ||||||
| 13,675 | Wisconsin State Health and Educational | |||||
| Facilities Authority Revenue Bonds,VRDN, | ||||||
| Series 2310Z, 6.151% due 10/01/2015 (j)(k) | 14,078 | |||||
|
|
|
|
| |||
| Total Municipal Bonds Transferred to Tender | ||||||
| Option Bond Trusts (Cost — $237,233) — 27.4% | 231,888 | |||||
|
|
|
|
| |||
22 BLACKROCK MUNICIPAL BOND FUND, INC.
| DECEMBER 31, 2007 |
| Schedule of Investments (concluded) BlackRock Municipal Insured Fund (In Thousands) |
| Shares | ||||
| Held | Mutual Funds (f) | Value | ||
|
|
|
| ||
| 300 | BlackRock California Insured Municipal 2008 Term | |||
| Trust, Inc. | $ 4,527 | |||
| 810 | BlackRock Insured Municipal 2008 Term Trust, Inc. | 12,175 | ||
| 205 | BlackRock Insured Municipal Term Trust, Inc. | 2,017 | ||
|
|
|
| ||
| Total Mutual Funds | ||||
| (Cost — $21,127) — 2.2% | 18,719 | |||
|
|
|
| ||
| Shares | ||||
| Held | Short-Term Securities | Value | ||
|
|
|
| ||
| 16,454 | Merrill Lynch Institutional Tax-Exempt | |||
| Fund, 3.35% (f)(i) | $ 16,454 | |||
|
|
|
| ||
| Total Short-Term Securities | ||||
| (Cost — $16,454) — 1.9% | 16,454 | |||
|
|
|
| ||
| Total Investments (Cost — $937,988*) — 113.6% | 962,272 | |||
| Other Assets Less Liabilities — 0.4% | 3,606 | |||
| Liability for Trust Certificates, Including Interest | ||||
| Expense Payable — (14.0%) | (118,498) | |||
|
| ||||
| Net Assets — 100.0% | $ 847,380 | |||
|
| ||||
| * | The cost and unrealized appreciation (depreciation) of investments as of December 31, 2007, as computed for federal income tax purposes, were as follows: |
| Aggregate cost | $ 820,953 | |
|
| ||
| Gross unrealized appreciation | $ 32,496 | |
| Gross unrealized depreciation | (8,445) | |
|
| ||
| Net unrealized appreciation | $ 24,051 | |
|
|
| (a) | AMBAC Insured. |
| (b) | Escrowed to maturity. |
| (c) | FGIC Insured. |
| (d) | FNMA/GNMA Collateralized. |
| (e) | FSA Insured. |
| (f) | Investments in companies considered to be an affiliate of the Fund, for purposes of Section 2(a)(3) of the Investment Company Act of 1940, were as follows: |
| Purchase | Sales | Realized | Dividend | |||||
| Affiliate | Cost | Cost | Gain | Income | ||||
|
|
|
|
|
| ||||
| BlackRock California Insured | ||||||||
| Municipal 2008 | ||||||||
| Term Trust, Inc. | — | — | — | $ 96 | ||||
| BlackRock Insured Municipal | ||||||||
| 2008 Term Trust, Inc. | — | — | — | $313 | ||||
| BlackRock Insured Municipal | ||||||||
| Term Trust, Inc. | — | — | — | $ 39 | ||||
| Merrill Lynch Institutional | ||||||||
| Tax-Exempt Fund | $13,217† | — | — | $162 | ||||
|
|
|
|
|
| ||||
† Represents net purchase cost.
See Notes to Financial Statements.
| (g) | MBIA Insured. |
| (h) | Prerefunded. |
| (i) | Represents the current yield as of December 31, 2007. |
| (j) | The rate disclosed is that currently in effect. This rate changes periodically and inversely based upon prevailing market rates. |
| (k) | XL Capital Insured. |
| (l) | Securities represent underlying bonds transferred to a separate securitization trust established in a tender option bond transaction in which the Fund may have acquired the residual interest certificates. These securities serve as collateral in a financing transaction. See Note 1(c) of the Notes to Financial Statements for details of munici- pal bonds transferred to tender option bond trusts. |
| (m) | Represents a zero coupon or step bond; the interest rate shown reflects the effective yield at the time of purchase. |
• Forward interest rate swaps outstanding as of December 31,2007 were as follows:
| Notional | Unrealized | |||
| Amount | Depreciation | |||
|
|
|
| ||
| Pay a fixed rate of 3.878% and receive | ||||
| a floating rate based on 1-week SIFMA | ||||
| Municipal Swap Index | ||||
| Broker, JPMorgan Chase | ||||
| Expires February 2028 | $20,000 | $(313) | ||
|
|
|
| ||
| BLACKROCK MUNICIPAL BOND FUND, INC. |
| DECEMBER 31, 2007 |
| 23 |
| Schedule of Investments as of December 31, 2007 BlackRock National Municipal Fund (In Thousands) (Unaudited) |
| Face | ||||||
| Amount | Municipal Bonds | Value | ||||
|
|
|
|
| |||
| Alabama — 0.8% | ||||||
| $ 3,820 | Alabama Incentives Financing Authority, Special | |||||
| Obligation Revenue Refunding Bonds, Series A, 6% | ||||||
| due 10/01/2029 (c) | $ 4,039 | |||||
| 3,525 | Jefferson County, Alabama, Public Building Authority, | |||||
| Lease Revenue Bonds, 5.125% due 4/01/2021 (c) | 3,773 | |||||
| 500 | Mobile, Alabama, Industrial Development Board, | |||||
| Environmental Improvement Revenue Refunding | ||||||
| Bonds (International Paper Company Project), AMT, | ||||||
| Series A, 6.35% due 5/15/2016 | 516 | |||||
| 2,500 | Selma, Alabama, IDB, Environmental Improvement | |||||
| Revenue Refunding Bonds (International Paper | ||||||
| Company Project), AMT, Series A, 6.70% | ||||||
| due 2/01/2018 | 2,601 | |||||
| 3,400 | Tuscaloosa, Alabama, Special Care Facilities Financing | |||||
| Authority, Residential Care Facility Revenue Bonds | ||||||
| (Capstone Village, Inc. Project), Series A, 5.875% | ||||||
| due 8/01/2036 | 3,139 | |||||
|
|
|
|
| |||
| Alaska — 0.3% | ||||||
| 3,860 | Anchorage, Alaska, School, GO, Series B, 5.875% | |||||
| due 12/01/2010 (d)(n) | 4,151 | |||||
|
|
|
|
| |||
| Arizona — 3.0% | ||||||
| 4,000 | Arizona Health Facilities Authority Revenue Bonds | |||||
| (Catholic Healthcare West), Series A, 6.625% | ||||||
| due 7/01/2020 | 4,362 | |||||
| 7,750 | Maricopa County and Phoenix, Arizona, IDA, | |||||
| S/F Mortgage Revenue Bonds, AMT, Series A-2, | ||||||
| 5.80% due 7/01/2040 (g) | 8,252 | |||||
| 3,100 | Maricopa County, Arizona, IDA, Education Revenue | |||||
| Bonds (Arizona Charter Schools Project 1), | ||||||
| Series A, 6.75% due 7/01/2029 | 2,929 | |||||
| 1,625 | Maricopa County, Arizona, IDA, Health Facilities | |||||
| Revenue Refunding Bonds (Catholic Healthcare | ||||||
| West Project), Series A, 5% due 7/01/2021 | 1,630 | |||||
| 1,000 | Maricopa County, Arizona, Pollution Control | |||||
| Corporation, PCR, Refunding (Public Service | ||||||
| Company of New Mexico Project), Series A, 6.30% | ||||||
| due 12/01/2026 | 1,005 | |||||
| Peoria, Arizona, Improvement District Number 8801, | ||||||
| Special Assessment Bonds: | ||||||
| 190 | 7.30% due 1/01/2009 | 195 | ||||
| 430 | 7.20% due 1/01/2010 | 442 | ||||
| 395 | 7.30% due 1/01/2011 | 406 | ||||
| 510 | 7.20% due 1/01/2013 | 524 | ||||
| 3,685 | Phoenix, Arizona, IDA, Airport Facility, Revenue | |||||
| Refunding Bonds (America West Airlines Inc. Project), | ||||||
| AMT, 6.30% due 4/01/2023 | 3,508 | |||||
| 500 | Pinal County, Arizona, IDA, Wastewater Revenue | |||||
| Bonds (San Manuel Facilities Project), AMT, 6.25% | ||||||
| due 6/01/2026 | 521 | |||||
| 323 | Prescott Valley, Arizona, Improvement District, Special | |||||
| Assessment Bonds (Sewer Collection System | ||||||
| Roadway Repair), 7.90% due 1/01/2012 | 336 | |||||
| 12,900 | Salt Verde Financial Corporation, Arizona, Senior Gas | |||||
| Revenue Bonds, 5.50% due 12/01/2029 | 13,147 | |||||
| 3,515 | Tucson, Arizona, IDA, Senior Living Facilities Revenue | |||||
| Bonds (Christian Care Tucson Inc. Project), | ||||||
| Series A, 6.125% due 7/01/2010 (k)(n) | 3,797 | |||||
| Face | ||||
| Amount | Municipal Bonds | Value | ||
|
|
|
| ||
| Arizona (concluded) | ||||
| $ 1,000 | University of Arizona, COP (University of | |||
| Arizona Parking and Student Housing), 5.75% | ||||
| due 6/01/2009 (c)(n) | $ 1,038 | |||
| University of Arizona, COP (University of | ||||
| Arizona Projects), Refunding, Series A (c): | ||||
| 2,915 | 5.50% due 6/01/2012 (n) | 3,184 | ||
| 265 | 5.50% due 6/01/2018 | 285 | ||
| Vistancia Community Facilities District, Arizona, GO: | ||||
| 3,000 | 6.75% due 7/15/2022 | 3,180 | ||
| 2,125 | 5.75% due 7/15/2024 | 2,168 | ||
|
|
|
| ||
| Arkansas — 0.1% | ||||
| 250 | Arkansas State Student Loan Authority Revenue | |||
| Bonds, AMT, Sub-Series B, 7.25% due 6/01/2009 | 253 | |||
| 200 | Jonesboro, Arkansas, Residential Housing and Health | |||
| Care Facilities Board, Hospital Revenue Refunding | ||||
| Bonds (Saint Bernards Regional Medical Center), | ||||
| Series B, 5.90% due 7/01/2016 (c) | 202 | |||
| 250 | North Little Rock, Arkansas, Health Facilities Board, | |||
| Health Care Revenue Bonds (Baptist Health), 5.50% | ||||
| due 7/01/2016 | 256 | |||
| 500 | Pine Bluff, Arkansas, Environmental Improvement | |||
| Revenue Refunding Bonds (International Paper | ||||
| Company Project), AMT, Series A, 6.70% | ||||
| due 8/01/2020 | 518 | |||
| 250 | University of Central Arkansas, Housing System | |||
| Revenue Bonds, 6.50% due 1/01/2010 (h)(n) | 271 | |||
|
|
|
| ||
| California — 17.7% | ||||
| 2,500 | Agua Caliente Band of Cahuilla Indians, California, | |||
| Casino Revenue Bonds, 6% due 7/01/2018 | 2,537 | |||
| 12,000 | Antelope Valley, California, Health Care District | |||
| Revenue Bonds, VRDN, Series A, 5.25% | ||||
| due 9/01/2017 (r) | 12,093 | |||
| Bay Area Toll Authority, California, Toll Bridge Revenue | ||||
| Refunding Bonds (San Francisco Bay Area), Series F: | ||||
| 20,000 | 5% due 4/01/2031 | 20,878 | ||
| 10,000 | 5% due 4/01/2031 | 10,482 | ||
| California Pollution Control Financing Authority, | ||||
| Solid Waste Disposal Revenue Bonds (Waste | ||||
| Management Inc. Project), AMT: | ||||
| 6,000 | Series A-2, 5.40% due 4/01/2025 | 5,900 | ||
| 6,750 | Series C, 5.125% due 11/01/2023 | 6,547 | ||
| 4,150 | California Pollution Control Financing Authority, | |||
| Solid Waste Disposal Revenue Refunding Bonds | ||||
| (Republic Services Inc. Project), AMT Series C, 5.25% | ||||
| due 6/01/2023 | 4,299 | |||
| 4,970 | California Rural Home Mortgage Finance Authority, | |||
| S/F Mortgage Revenue Bonds (Mortgage-Backed | ||||
| Securities Program), AMT, Sub-Series FH-1, 5.50% | ||||
| due 8/01/2047 | 5,158 | |||
| 45 | California Rural Home Mortgage Finance Authority, | |||
| S/F Mortgage Revenue Refunding Bonds | ||||
| (Mortgage-Backed Securities Program), AMT, | ||||
| Series A-2, 7% due 9/01/2029 (f)(g) | 46 | |||
| 5 | California State, GO, 5.25% due 4/01/2029 | 5 | ||
| California State, GO, Refunding: | ||||
| 15 | 5.75% due 5/01/2010 (n) | 16 | ||
| 115 | 5.75% due 5/01/2030 | 121 | ||
| 18,330 | 5% due 6/01/2032 | 18,517 | ||
24 BLACKROCK MUNICIPAL BOND FUND, INC.
| DECEMBER 31, 2007 |
| Schedule of Investments (continued) BlackRock National Municipal Fund (In Thousands) |
| Face | ||||
| Amount | Municipal Bonds | Value | ||
|
|
|
| ||
| California (continued) | ||||
| California State, Various Purpose, GO: | ||||
| $10,000 | 5.25% due 11/01/2027 | $ 10,427 | ||
| 14,100 | 5.50% due 11/01/2033 | 14,967 | ||
| 9,880 | California Statewide Communities Development | |||
| Authority, Health Facility Revenue Bonds (Memorial | ||||
| Health Services), Series A, 6% due 10/01/2023 | 10,452 | |||
| 12,895 | Chabot-Las Positas, California, Community College | |||
| District, GO (Election of 2004), Series B, 5% | ||||
| due 8/01/2031 (c) | 13,433 | |||
| Chula Vista, California, Community Facilities District | ||||
| Number 06-1, Special Tax Bonds (Eastlake Woods | ||||
| Area), Series A: | ||||
| 1,080 | 6.05% due 9/01/2020 | 1,111 | ||
| 2,965 | 6.15% due 9/01/2026 | 3,006 | ||
| 10,000 | Chula Vista, California, IDR, Refunding (San Diego | |||
| Gas & Electric Co.), AMT, Series C, 5.25% | ||||
| due 12/01/2027 | 10,019 | |||
| Contra Costa County, California, Special Tax Bonds | ||||
| (Community Facilities District Number 2001-01): | ||||
| 1,585 | 6% due 9/01/2026 | 1,593 | ||
| 1,200 | 6.10% due 9/01/2031 | 1,205 | ||
| 3,100 | Elk Grove, California, Poppy Ridge Community | |||
| Facilities Number 3 Special Tax, Series 1, 6% | ||||
| due 9/01/2008 (n) | 3,185 | |||
| 10,000 | Fremont, California, Unified School District, Alameda | |||
| County, GO (Election of 2002), Series B, 5% | ||||
| due 8/01/2028 (h) | 10,429 | |||
| 12,730 | Los Angeles County, California, Metropolitan | |||
| Transportation Authority, Sales Tax Revenue Refunding | ||||
| Bonds, Proposition A, First Tier Senior-Series A, 5% | ||||
| due 7/01/2035 (c) | 13,189 | |||
| 20,000 | Metropolitan Water District of Southern California, | |||
| Waterworks Revenue Bonds, Series A, 5% | ||||
| due 7/01/2037 | 20,987 | |||
| 10,000 | Metropolitan Water District of Southern California, | |||
| Waterworks Revenue Refunding Bonds, Series B, 5% | ||||
| due 7/01/2035 | 10,458 | |||
| 23,200 | Palomar Pomerado Health Care District, California, | |||
| GO (Election of 2004), Series A, 5.125% | ||||
| due 8/01/2037 (j) | 24,208 | |||
| 1,100 | Poway, California, Unified School District, Special Tax | |||
| Bonds (Community Facilities District Number 6), | ||||
| Series A, 6.05% due 9/01/2025 | 1,122 | |||
| 8,000 | Rancho Mirage, California, Joint Powers Financing | |||
| Authority Revenue Bonds (Eisenhower Medical | ||||
| Center), Series A, 5% due 7/01/2038 | 7,727 | |||
| 2,695 | Riverside, California, Improvement Bond Act of | |||
| 1915, Special Assessment (Riverwalk Assessment | ||||
| District), 6.375% due 9/02/2026 | 2,754 | |||
| Roseville, California, Special Tax Bonds: | ||||
| 3,915 | (Fiddyment Ranch Community Facilities | |||
| Number 1), 5.125% due 9/01/2026 | 3,570 | |||
| 1,125 | (Stoneridge Community Facilities Number 1), | |||
| 6% due 9/01/2011 (n) | 1,257 | |||
| 1,250 | (Stoneridge Community Facilities Number 1), | |||
| 6.20% due 9/01/2011 (n) | 1,405 | |||
| 2,500 | (Stoneridge Community Facilities Number 1), | |||
| 6.30% due 9/01/2011 (n) | 2,819 | |||
| Sacramento, California, Special Tax (North | ||||
| Natomas Community Facilities): | ||||
| 2,200 | Series 01-03, 6% due 9/01/2028 | 2,202 | ||
| 2,270 | Series 4-C, 6% due 9/01/2028 | 2,272 | ||
| Face | ||||||
| Amount | Municipal Bonds | Value | ||||
|
|
|
|
| |||
| California (concluded) | ||||||
| $10,000 | San Diego, California, Public Facilities Financing | |||||
| Authority, Subordinated Water Revenue Refunding | ||||||
| Bonds, 5% due 8/01/2032 (j) | $ 10,223 | |||||
| 5,865 | San Francisco, California, Bay Area Rapid Transit | |||||
| District, Sales Tax Revenue Refunding Bonds, | ||||||
| Series A, 4.25% due 7/01/2036 (h) | 5,465 | |||||
| San Francisco, California, City and County | ||||||
| Redevelopment Agency, Community Facilities District | ||||||
| Number 6, Special Tax Bonds (Mission Bay South | ||||||
| Public Improvements Project): | ||||||
| 5,000 | 6% due 8/01/2021 | 5,085 | ||||
| 2,500 | Series A, 6% due 8/01/2025 | 2,527 | ||||
| 1,075 | San Francisco, California, Uptown Parking | |||||
| Corporation, Parking Revenue Bonds | ||||||
| (Union Square), 6% due 7/01/2020 (j) | 1,178 | |||||
| Santa Margarita, California, Water District, Special | ||||||
| Tax Refunding Bonds (Community Facilities District | ||||||
| Number 99), Series 1: | ||||||
| 1,030 | 6.20% due 9/01/2009 (n) | 1,102 | ||||
| 2,950 | 6.25% due 9/01/2009 (n) | 3,150 | ||||
| 2,650 | 6.20% due 9/01/2020 | 2,735 | ||||
| 4,500 | Southern California HFA, S/F Mortgage Revenue | |||||
| Bonds, AMT, Series A, 5.80% due 12/01/2049 (f)(g) | 4,791 | |||||
| 2,000 | Tustin, California, Community Facilities District | |||||
| Number 07-1, Special Tax Bonds (Tustin Legacy), | ||||||
| 6% due 9/01/2037 | 1,981 | |||||
|
|
|
|
| |||
| Colorado — 1.6% | ||||||
| 500 | Boulder County, Colorado, Hospital Development | |||||
| Revenue Bonds (Longmont United Hospital Project), | ||||||
| 6% due 12/01/2010 (k)(n) | 539 | |||||
| 225 | Colorado HFA, Revenue Bonds (S/F Program), | |||||
| Series B-3 6.55% due 10/01/2016 | 231 | |||||
| Colorado HFA, Revenue Redunding Bonds | ||||||
| (S/F Program): | ||||||
| 255 | AMT, Senior Series A-2, 7.50% due 4/01/2031 | 264 | ||||
| 100 | AMT Senior Series B-2, 7.10% due 4/01/2017 | 103 | ||||
| 760 | AMT Senior Series B-2, 7.25% due 10/01/2031 | 817 | ||||
| 20 | AMT, Senior Series B-3, 6.80% due 11/01/2028 | 21 | ||||
| 275 | AMT, Senior Series C-2, 7.25% due 10/01/2031 (e) | 277 | ||||
| 90 | Senior Series A-3, 7.35% due 10/01/2030 | 93 | ||||
| 475 | Senior Series C-3, 6.75% due 10/01/2021 (e) | 519 | ||||
| 100 | Senior Series C-3, 7.15% due 10/01/2030 (e) | 102 | ||||
| 1,000 | Colorado Health Facilities Authority, Revenue | |||||
| Refunding Bonds (Christian Living Communities | ||||||
| Project), Series A, 5.75% due 1/01/2037 | 926 | |||||
| Colorado Water Resource and Power Development | ||||||
| Authority, Small Water Resources Revenue Bonds | ||||||
| Series A (d): | ||||||
| 350 | 5.80% due 11/01/2010 (n) | 375 | ||||
| 200 | 5.80% due 11/01/2020 | 212 | ||||
| Elk Valley, Colorado, Public Improvement Revenue | ||||||
| Bonds (Public Improvement Fee): | ||||||
| 7,560 | Series A, 7.35% due 9/01/2031 | 7,812 | ||||
| 880 | Series B, 7.45% due 9/01/2031 | 911 | ||||
| 3,685 | Larimer County, Colorado, Poudre School District | |||||
| Number R-1, GO, 6% due 12/15/2010 (d)(n) | 3,982 | |||||
| Plaza Metropolitan District Number 1, Colorado, Tax | ||||||
| Allocation Revenue Bonds (Public Improvement Fees): | ||||||
| 7,700 | 8% due 12/01/2025 | 8,207 | ||||
| 1,910 | 8.125% due 12/01/2025 | 1,903 | ||||
|
|
|
|
| |||
| BLACKROCK MUNICIPAL BOND FUND, INC. |
| DECEMBER 31, 2007 |
| 25 |
| Schedule of Investments (continued) BlackRock National Municipal Fund (In Thousands) |
| Face | ||||
| Amount | Municipal Bonds | Value | ||
|
|
|
| ||
| Connecticut — 1.8% | ||||
| $ 1,000 | Connecticut State Development Authority, | |||
| Governmental Lease Revenue Bonds, 6.60% | ||||
| due 6/15/2014 (j) | $ 1,003 | |||
| Connecticut State Development Authority, Water | ||||
| Facility Revenue Bonds: | ||||
| 2,750 | (Aquarion Water Company Project), AMT, 5.10% | |||
| due 9/01/2037 (l) | 2,704 | |||
| 1,250 | (Bridgeport Hydraulic Company), AMT, 6.15% | |||
| due 4/01/2035 (c) | 1,277 | |||
| 960 | Connecticut State, HFA, Revenue Refunding | |||
| Bonds (Housing Mortgage Finance Program), | ||||
| Series C-1, 6.30% due 11/15/2017 | 990 | |||
| Connecticut State Health and Educational Facilities | ||||
| Authority Revenue Bonds: | ||||
| 1,000 | (Bridgeport Hospital), (Series A, 6.625% | |||
| due 7/01/2018 (j) | 1,004 | |||
| 1,500 | (Waterbury Hospital Issue), Series C, 5.75% | |||
| due 7/01/2020 (k) | 1,537 | |||
| 1,000 | (Westover School) Series A, 5.70% | |||
| due 7/01/2010 (k)(n) | 1,071 | |||
| Connecticut State Health and Educational Facilities | ||||
| Authority, Revenue Refunding Bonds (k): | ||||
| 12,045 | (Eastern Connecticut Health Network), | |||
| Series A, 6.50% due 7/01/2010 (n) | 13,129 | |||
| 640 | (Sacred Heart University), 6.625% | |||
| due 7/01/2026 | 648 | |||
| 5,710 | (University of Hartford), Series E, 5.50% | |||
| due 7/01/2022 | 5,935 | |||
| 460 | Connecticut State Higher Education Supplemental | |||
| Loan Authority, Revenue Bonds (Family | ||||
| Education Loan Program), AMT, Series A, 5.50% | ||||
| due 11/15/2020 (j) | 463 | |||
| 860 | Waterbury, Connecticut, GO, 6% | |||
| due 2/01/2009 (k)(n) | 896 | |||
|
|
|
| ||
| Delaware — 0.1% | ||||
| 1,685 | New Castle County, Delaware, PCR (General Motors | |||
| Corporation Project), VRDN, 7% due 10/01/2008 (r) | 1,685 | |||
|
|
|
| ||
| Florida — 6.7% | ||||
| 5,500 | Alachua County, Florida, IDR (North Florida | |||
| Retirement Village), Refunding, 5.875% | ||||
| due 11/15/2036 | 5,123 | |||
| 1,975 | Anthem Park Community Development District, | |||
| Florida, Capital Improvement Revenue Bonds, 5.80% | ||||
| due 5/01/2036 | 1,737 | |||
| 2,000 | Ave Maria Stewardship Community District, Florida, | |||
| Capital Improvement Revenue Bonds, Series A, | ||||
| 5.125% due 5/01/2038 | 1,555 | |||
| 1,500 | Ave Maria Stewardship Community District, Florida, | |||
| Revenue Bonds, 4.80% due 11/01/2012 | 1,379 | |||
| 1,640 | Ballantrae, Florida, Community Development | |||
| District, Capital Improvement Revenue Bonds, 6% | ||||
| due 5/01/2035 | 1,627 | |||
| 4,900 | Bartram Springs Community Development | |||
| District, Florida, Special Assessment Refunding | ||||
| Bonds, 4.75% due 5/01/2034 | 3,994 | |||
| 1,755 | Beacon Tradeport Community, Florida, Development | |||
| District, Special Assessment Revenue Refunding | ||||
| Bonds (Commercial Project), Series A, 5.25% | ||||
| due 5/01/2016 (k) | 1,811 | |||
| Face | ||||||
| Amount | Municipal Bonds | Value | ||||
|
|
|
|
| |||
| Florida (continued) | ||||||
| $ 2,500 | CFM Community Development District, Florida, | |||||
| Capital Improvement Revenue Bonds, | ||||||
| Series B, 5.875% due 5/01/2014 | $ 2,295 | |||||
| 2,725 | Duval County, Florida, School Board, COP, 5.75% | |||||
| due 7/01/2017 (h) | 2,822 | |||||
| 7,005 | Escambia County, Florida, Health Facilities | |||||
| Authority, Health Facility Revenue Refunding Bonds | ||||||
| (Azalea Trace Inc.), VRDN, Series A, 5.10% | ||||||
| due 11/15/2015 (k)(r) | 7,005 | |||||
| Fiddlers Creek, Florida, Community Development | ||||||
| District Number 2, Special Assessment Revenue | ||||||
| Bonds: | ||||||
| 5,350 | Series A, 6.375% due 5/01/2035 | 5,178 | ||||
| 600 | Series B, 5.75% due 5/01/2013 | 597 | ||||
| 7,000 | Halifax Hospital Medical Center, Florida, Hospital | |||||
| Revenue Refunding and Improvement Bonds, | ||||||
| Series A, 5.25% due 6/01/2026 | 6,894 | |||||
| 1,135 | Highland Meadows Community Development District, | |||||
| Florida, Special Assessment Bonds, Series A, 5.50% | ||||||
| due 5/01/2036 | 905 | |||||
| 5,000 | Hillsborough County, Florida, IDA, Exempt Facilities | |||||
| Revenue Bonds (National Gypsum Company), AMT, | ||||||
| Series A, 7.125% due 4/01/2030 | 5,132 | |||||
| 16,845 | Hillsborough County, Florida, IDA, Hospital Revenue | |||||
| Bonds (Tampa General Hospital Project), 5.25% | ||||||
| due 10/01/2041 | 16,201 | |||||
| 2,000 | Lee County, Florida, IDA, Health Care Facilities, | |||||
| Revenue Refunding Bonds (Shell Point/Alliance | ||||||
| Obligor Group), 5% due 11/15/2029 | 1,765 | |||||
| 1,140 | Lexington Oaks, Florida, Community Development | |||||
| District, Special Assessment Revenue Bonds, | ||||||
| Series A, 6.70% due 5/01/2033 | 1,183 | |||||
| 945 | Mediterra, Florida, South Community Development | |||||
| District, Capital Improvement Revenue Bonds, 6.85% | ||||||
| due 5/01/2031 | 980 | |||||
| 2,500 | Middle Village Community Development District, | |||||
| Florida, Special Assessment Bonds, Series A, 6% | ||||||
| due 5/01/2035 | 2,480 | |||||
| 6,625 | Midtown Miami, Florida, Community Development | |||||
| District, Special Assessment Revenue Bonds, | ||||||
| Series A, 6.25% due 5/01/2037 | 6,408 | |||||
| 1,000 | New River Community Development District, Florida, | |||||
| Capital Improvement Revenue Bonds, Series B, 5% | ||||||
| due 5/01/2013 | 922 | |||||
| 1,490 | Old Palm Community Development District, Florida, | |||||
| Special Assessment Bonds (Palm Beach Gardens), | ||||||
| Series B, 5.375% due 5/01/2014 | 1,332 | |||||
| 3,500 | Orange County, Florida, HFA, M/F Housing Revenue | |||||
| Bonds (Loma Vista Project), Series G, 5.50% | ||||||
| due 3/01/2032 | 3,510 | |||||
| 1,000 | Orange County, Florida, Health Facilities Authority, | |||||
| Hospital Revenue Bonds (Orlando Regional | ||||||
| Healthcare), 5.70% due 7/01/2026 | 935 | |||||
| Panther Trace Community Development District II, | ||||||
| Florida, Special Assessment Revenue Bonds: | ||||||
| 5,000 | 5.125% due 11/01/2013 | 4,606 | ||||
| 5,000 | Series A, 5.60% due 5/01/2035 | 4,216 | ||||
| Park Place Community Development District, Florida, | ||||||
| Special Assessment Revenue Bonds: | ||||||
| 960 | 6.75% due 5/01/2032 | 999 | ||||
| 2,300 | 6.375% due 5/01/2034 | 2,328 | ||||
26 BLACKROCK MUNICIPAL BOND FUND, INC.
| DECEMBER 31, 2007 |
Schedule of Investments (continued) BlackRock National Municipal Fund (In Thousands)
| Face | ||||||
| Amount | Municipal Bonds | Value | ||||
|
|
|
|
| |||
| Florida (concluded) | ||||||
| $ 2,000 | Saint Lucie, Florida, West Services District, Utility | |||||
| Revenue Refunding Bonds, Senior Lien, 6% | ||||||
| due 10/01/2022 (j) | $ 2,157 | |||||
| Sarasota County, Florida, Health Facilities Authority, | ||||||
| Retirement Facility Revenue Refunding Bonds (Village | ||||||
| on the Isle Project): | ||||||
| 780 | 5.50% due 1/01/2027 | 720 | ||||
| 1,645 | 5.50% due 1/01/2032 | 1,463 | ||||
| 2,875 | Somerset Community Development District, Florida, | |||||
| Capital Improvement Revenue Bonds, 5% | ||||||
| due 5/01/2015 | 2,583 | |||||
| 210 | Sterling Hill, Florida, Community Development District, | |||||
| Capital Improvement Revenue Refunding Bonds, | ||||||
| Series B, 5.50% due 11/01/2010 | 209 | |||||
| 80 | Stoneybrook West, Florida, Community Development | |||||
| District, Special Assessment Revenue Bonds, | ||||||
| Series B, 6.45% due 5/01/2010 | 80 | |||||
| 1,190 | Tern Bay Community Development District, Florida, | |||||
| Capital Improvement Revenue Refunding Bonds, | ||||||
| Series B, 5% due 5/01/2015 | 997 | |||||
| 3,000 | Tolomato Community Development District, Florida, | |||||
| Special Assessment Bonds, 6.45% due 5/01/2023 | 2,928 | |||||
| 3,520 | University of South Florida Financing Corporation, | |||||
| COP (Master Lease Program), Refunding, | ||||||
| Series A, 5.375% due 7/01/2022 (c) | 3,770 | |||||
| 1,455 | Watergrass Community Development District, Florida, | |||||
| Special Assessment Revenue Bonds, Series B, | ||||||
| 4.875% due 11/01/2010 | 1,388 | |||||
|
|
|
|
| |||
| Georgia — 2.1% | ||||||
| 5,000 | Atlanta, Georgia, Tax Allocation Bonds (Atlantic | |||||
| Station Project), 7.90% due 12/01/2011 (n) | 5,903 | |||||
| Brunswick and Glynn County, Georgia, Development | ||||||
| Authority, First Mortgage Revenue Bonds (Coastal | ||||||
| Community Retirement Corporation Project), | ||||||
| Series A (p)(s): | ||||||
| 2,285 | 7.125% due 1/01/2025 | 1,320 | ||||
| 4,555 | 7.25% due 1/01/2035 | 2,631 | ||||
| 5,210 | College Park, Georgia, Business and IDA | |||||
| Revenue Bonds (Civic Center Project), 5.75% | ||||||
| due 9/01/2010 (c)(n) | 5,649 | |||||
| 1,940 | Fulton County, Georgia, Development Authority, | |||||
| PCR, Refunding (General Motors Corporation), | ||||||
| VRDN, 6.50% due 4/01/2010 (r) | 1,940 | |||||
| 3,450 | Fulton County, Georgia, Development Authority | |||||
| Revenue Bonds (Morehouse College Project), 5.875% | ||||||
| due 12/01/2010 (c)(n) | 3,744 | |||||
| 2,250 | Fulton County, Georgia, Residential Care Facilities, | |||||
| Revenue Refunding Bonds (Canterbury Court Project), | ||||||
| Series A, 6% due 2/15/2022 | 2,225 | |||||
| Gainesville, Georgia, Redevelopment Authority, | ||||||
| Educational Facilities Revenue Refunding | ||||||
| Bonds (Riverside Military Academy): | ||||||
| 4,350 | 5.125% due 3/01/2027 | 4,097 | ||||
| 1,800 | 5.125% due 3/01/2037 | 1,639 | ||||
| 1,500 | Milledgeville-Baldwin County, Georgia, Development | |||||
| Authority Revenue Bonds (Georgia College and State | ||||||
| University Foundation), 6% due 9/01/2014 (n) | 1,739 | |||||
| 5,000 | Rockdale County, Georgia, Development Authority | |||||
| Revenue Bonds (Visy Paper Project), AMT, | ||||||
| Series A, 6.125% due 1/01/2034 | 4,786 | |||||
|
|
|
|
| |||
| Face | ||||||
| Amount | Municipal Bonds | Value | ||||
|
|
|
|
| |||
| Illinois — 6.3% | ||||||
| $ 1,000 | Bolingbrook, Illinois, Special Services Area Number 1, | |||||
| Special Tax Bonds (Forest City Project), 5.90% | ||||||
| due 3/01/2027 | $ 1,059 | |||||
| 26,800 | Chicago, Illinois, O'Hare International Airport | |||||
| Revenue Bonds, Third Lien, AMT, Series B-2, 6% | ||||||
| due 1/01/2029 (l) | 28,474 | |||||
| 350 | Chicago, Illinois, Park District, GO, Refunding, | |||||
| Series B, 5.75% due 1/01/2015 (d) | 374 | |||||
| 230 | Chicago, Illinois, Park District, Limited Tax, GO, | |||||
| Series A, 5.75% due 1/01/2016 (d) | 246 | |||||
| 315 | Chicago, Illinois, S/F Mortgage Revenue Bonds, AMT, | |||||
| Series A, 7.15% due 9/01/2031 (f)(g) | 325 | |||||
| 2,000 | Chicago, Illinois, Special Assessment Bonds (Lake | |||||
| Shore East), 6.75% due 12/01/2032 | 2,080 | |||||
| 3,210 | Cicero, Illinois, GO, Refunding (Corporate | |||||
| Purpose), 6% due 12/01/2028 (j) | 3,403 | |||||
| 7,000 | Decatur, Illinois, GO, Refunding, 6% | |||||
| due 3/01/2008 (d)(n) | 7,035 | |||||
| 10,000 | Hodgkins, Illinois, Environmental Improvement | |||||
| Revenue Bonds (Metro Biosolids Management LLC | ||||||
| Project), AMT, 6% due 11/01/2023 | 10,039 | |||||
| 3,140 | Illinois Development Finance Authority Revenue | |||||
| Bonds (Community Rehabilitation Providers Facilities), | ||||||
| Series A, 6.50% due 7/01/2022 | 3,331 | |||||
| Illinois State Finance Authority Revenue Bonds, | ||||||
| Series A: | ||||||
| 1,750 | (Friendship Village of Schaumburg), | |||||
| 5.625% due 2/15/2037 | 1,597 | |||||
| 2,155 | (Landing at Plymouth Place Project), | |||||
| 6% due 5/15/2037 | 2,040 | |||||
| 3,500 | Illinois State Finance Authority, Revenue Refunding | |||||
| Bonds (Sherman Health System Project), | ||||||
| Series A, 5.50% due 8/01/2037 | 3,352 | |||||
| Illinois State, GO, 1st Series (j): | ||||||
| 8,890 | 5.75% due 12/01/2015 | 9,501 | ||||
| 3,745 | 5.75% due 12/01/2016 | 4,003 | ||||
| 4,000 | 5.75% due 12/01/2017 | 4,276 | ||||
| 3,000 | Illinois State, Sales Tax Revenue Bonds, 6% | |||||
| due 6/15/2020 | 3,174 | |||||
| 2,000 | Illinois State, Sales Tax Revenue Refunding Bonds, | |||||
| Series Q, 6% due 6/15/2009 | 2,039 | |||||
| 16,160 | Metropolitan Pier and Exposition Authority, Illinois, | |||||
| Dedicated State Tax Revenue Bonds (McCormick | ||||||
| Place Expansion), Series A, 5.25% due 6/15/2042 (j) | 16,717 | |||||
| 625 | Naperville, Illinois, IDR (General Motors Corporation), | |||||
| Refunding, VRDN, 6.50% due 12/01/2012 (r) | 625 | |||||
| 1,585 | Village of Wheeling, Illinois, Revenue Bonds (North | |||||
| Milwaukee/Lake-Cook Tax Increment Financing (TIF) | ||||||
| Redevelopment Project), 6% due 1/01/2025 | 1,526 | |||||
|
|
|
|
| |||
| Indiana — 1.7% | ||||||
| 7,350 | Indiana Bond Bank, Special Program Revenue | |||||
| Bonds (Town of Westfield and West Central | ||||||
| Conservancy District Projects), Series A, 5.125% | ||||||
| due 10/01/2022 (j) | 7,733 | |||||
| 20,825 | Indiana Health Facilities Financing Authority, Revenue | |||||
| Refunding Bonds (Ascension Health Credit Group), | ||||||
| ARS, VRDN, Series E-6, 6% due 11/15/2039 (r) | 20,825 | |||||
|
|
|
|
| |||
| BLACKROCK MUNICIPAL BOND FUND, INC. |
| DECEMBER 31, 2007 |
| 27 |
Schedule of Investments (continued) BlackRock National Municipal Fund (In Thousands)
| Face | ||||
| Amount | Municipal Bonds | Value | ||
|
|
|
| ||
| Iowa — 0.3% | ||||
| $ 1,000 | Iowa City, Iowa, Sewer Revenue Bonds, 5.75% | |||
| due 7/01/2021 (j) | $ 1,002 | |||
| 3,905 | Iowa Finance Authority, Health Care Facilities, | |||
| Revenue Refunding Bonds (Care Initiatives | ||||
| Project), 9.25% due 7/01/2011 (n) | 4,718 | |||
|
|
|
| ||
| Kansas — 0.7% | ||||
| 6,605 | Sedgwick and Shawnee Counties, Kansas, | |||
| S/F Mortgage Revenue Bonds (Mortgage-Backed | ||||
| Securities Program), AMT, Series B-2, 5.25% | ||||
| due 12/01/2038 (f)(g) | 6,848 | |||
| 1,300 | Sedgwick and Shawnee Counties, Kansas, | |||
| S/F Revenue Bonds, AMT, Series A-1, 6.95% | ||||
| due 6/01/2029 (i) | 1,368 | |||
| 2,500 | Wichita, Kansas, Hospital Facilities Revenue | |||
| Refunding and Improvement Bonds, Series III, 6.25% | ||||
| due 11/15/2019 | 2,682 | |||
|
|
|
| ||
| Louisiana — 1.6% | ||||
| 5,000 | Jefferson Parish, Louisiana, Finance Authority, | |||
| S/F Mortgage Revenue Bonds, Series B, 5.70% | ||||
| due 12/01/2048 (f)(g) | 5,272 | |||
| 275 | Louisiana HFA, S/F Mortgage Revenue Bonds, AMT, | |||
| Series D-2, 5.80% due 6/01/2020 (g) | 278 | |||
| Louisiana Local Government Environmental Facilities | ||||
| and Community Development Authority Revenue | ||||
| Bonds: | ||||
| 7,000 | (Capital Projects and Equipment Acquisition), | |||
| Series A, 6.30% due 7/01/2030 (c) | 8,318 | |||
| 5,000 | (Westlake Chemical Corporation), 6.75% | |||
| due 11/01/2032 | 4,957 | |||
| 5,000 | Louisiana Public Facilities Authority Revenue Bonds | |||
| (University of New Orleans Research and Technology | ||||
| Foundation, Inc. — Student Housing Project), 5.25% | ||||
| due 3/01/2037 (j) | 5,292 | |||
| 2,000 | Rapides Finance Authority, Louisiana, Environmental | |||
| Improvement Revenue Bonds (International | ||||
| Paper Company Project), AMT, Series A, 6.55% | ||||
| due 11/15/2023 | 2,054 | |||
|
|
|
| ||
| Maryland — 0.4% | ||||
| 500 | Anne Arundel County, Maryland, Special Obligation | |||
| Revenue Bonds (Arundel Mills Project), 7.10% | ||||
| due 7/01/2009 (n) | 538 | |||
| 1,000 | Maryland State Community Development | |||
| Administration, Department of Housing and | ||||
| Community Development, Housing Revenue Bonds, | ||||
| AMT, Series B, 6.15% due 1/01/2021 | 1,022 | |||
| 1,000 | Maryland State Community Development | |||
| Administration, Department of Housing and | ||||
| Community Development Revenue Bonds (Waters | ||||
| Landing II Apartments), AMT, Series A, 5.875% | ||||
| due 8/01/2033 | 1,030 | |||
| 1,000 | Maryland State Energy Financing Administration, | |||
| Solid Waste Disposal Revenue Bonds, Limited | ||||
| Obligation (Wheelabrator Water Projects), AMT, 6.45% | ||||
| due 12/01/2016 | 1,012 | |||
| 3,200 | Maryland State Health and Higher Educational | |||
| Facilities Authority Revenue Bonds (King | ||||
| Farm Presbyterian Community), Series B, 5% | ||||
| due 1/01/2017 | 3,154 | |||
|
|
|
| ||
| Face | ||||||
| Amount | Municipal Bonds | Value | ||||
|
|
|
|
| |||
| Massachusetts — 0.5% | ||||||
| $ 240 | Massachusetts Educational Financing Authority, | |||||
| Education Loan Revenue Refunding Bonds, AMT, | ||||||
| Issue E, 5.85% due 7/01/2014 (c) | $ 242 | |||||
| 3,000 | Massachusetts State Development Finance Agency | |||||
| Revenue Bonds (Linden Ponds, Inc. Facility), Series A, | ||||||
| 5.75% due 11/15/2035 | 2,721 | |||||
| 3,850 | Massachusetts State Health and Educational Facilities | |||||
| Authority Revenue Bonds (Medical Center of | ||||||
| Central Massachusetts), CARS, Series B, 8.72% | ||||||
| due 6/23/2022 (c)(m) | 4,018 | |||||
| 130 | Massachusetts State Water Pollution Abatement Trust, | |||||
| Water Abatement Revenue Bonds, Series A, 6.375% | ||||||
| due 2/01/2015 | 130 | |||||
| 1,600 | Montachusett, Massachusetts, Regional | |||||
| Vocational Technical School District, GO, 5.95% | ||||||
| due 1/15/2010 (j)(n) | 1,694 | |||||
|
|
|
|
| |||
| Michigan — 1.6% | ||||||
| 7,500 | Delta County, Michigan, Economic Development | |||||
| Corporation, Environmental Improvement Revenue | ||||||
| Refunding Bonds (Mead Westvaco-Escanaba), | ||||||
| Series A, 6.25% due 4/15/2012 (n) | 8,368 | |||||
| 500 | Dickinson County, Michigan, Economic Development | |||||
| Corporation, Environmental Improvement Revenue | ||||||
| Refunding Bonds (International Paper Company | ||||||
| Project), Series A, 5.75% due 6/01/2016 | 517 | |||||
| Eastern Michigan University, General Revenue | ||||||
| Refunding Bonds (c): | ||||||
| 585 | 6% due 6/01/2010 (n) | 629 | ||||
| 415 | 6% due 6/01/2024 | 441 | ||||
| 3,000 | Flint, Michigan, Hospital Building Authority, Revenue | |||||
| Refunding Bonds (Hurley Medical Center), 6% | ||||||
| due 7/01/2020 | 3,024 | |||||
| 3,325 | Macomb County, Michigan, Hospital Finance Authority, | |||||
| Hospital Revenue Bonds (Mount Clemens General | ||||||
| Hospital), Series B, 5.875% due 11/15/2034 | 3,262 | |||||
| 1,500 | Michigan State Hospital Finance Authority, Revenue | |||||
| Refunding Bonds (Mercy-Mount Clemens), Series A, | ||||||
| 6% due 5/15/2009 (j)(n) | 1,574 | |||||
| 10,000 | Michigan Tobacco Settlement Financing Authority, | |||||
| Tobacco Settlement Asset-Backed Revenue Bonds, | ||||||
| Senior Series A, 6% due 6/01/2048 | 9,733 | |||||
|
|
|
|
| |||
| Minnesota — 0.8% | ||||||
| 240 | Anoka County, Minnesota, Solid Waste Disposal | |||||
| Revenue Bonds (Natural Rural Utilities), AMT, Series A, | ||||||
| 6.95% due 12/01/2008 | 242 | |||||
| 1,000 | Eden Prairie, Minnesota, M/F Housing Revenue | |||||
| Bonds (Rolling Hills Project), Series A, 6.15% | ||||||
| due 8/20/2031 (i) | 1,076 | |||||
| Minneapolis and Saint Paul, Minnesota, Metropolitan | ||||||
| Airports Commission, Airport Revenue Bonds, AMT, | ||||||
| Sub-Series D (d): | ||||||
| 470 | 5.75% due 1/01/2012 | 498 | ||||
| 470 | 5.75% due 1/01/2014 | 497 | ||||
| 2,060 | 5.75% due 1/01/2015 | 2,153 | ||||
| Minneapolis, Minnesota, Health Care System Revenue | ||||||
| Bonds (Allina Health System), Series A (n): | ||||||
| 1,500 | 5.70% due 11/15/2012 | 1,661 | ||||
| 2,665 | 5.75% due 11/15/2012 | 2,957 | ||||
28 BLACKROCK MUNICIPAL BOND FUND, INC.
| DECEMBER 31, 2007 |
Schedule of Investments (continued) BlackRock National Municipal Fund (In Thousands)
| Face | ||||||
| Amount | Municipal Bonds | Value | ||||
|
|
|
|
| |||
| Minnesota (concluded) | ||||||
| $ 1,110 | Ramsey County, Minnesota, Housing and | |||||
| Redevelopment Authority, M/F Housing Revenue | ||||||
| Bonds (Hanover Townhouses Project), AMT, 6% | ||||||
| due 7/01/2031 | $ 1,123 | |||||
| 1,000 | Saint Cloud, Minnesota, Health Care Revenue | |||||
| Refunding Bonds (Saint Cloud Hospital Obligation | ||||||
| Group), Series A, 6.25% due 5/01/2020 (h) | 1,070 | |||||
| 1,500 | Waconia, Minnesota, Health Care Facilities Revenue | |||||
| Bonds (Ridgeview Medical Center Project), | ||||||
| Series A, 6.125% due 1/01/2010 (k)(n) | 1,586 | |||||
|
|
|
|
| |||
| Mississippi — 0.4% | ||||||
| 3,935 | Mississippi Home Corporation, S/F Mortgage Revenue | |||||
| Bonds, Series A-1, 5.50% due 6/01/2038 (f)(g) | 4,213 | |||||
| 1,700 | Warren County, Mississippi, Environmental | |||||
| Improvement Revenue Refunding Bonds (International | ||||||
| Paper Company Project), AMT, Series B, 6.75% | ||||||
| due 8/01/2021 | 1,758 | |||||
|
|
|
|
| |||
| Missouri — 0.6% | ||||||
| 1,000 | Fenton, Missouri, Tax Increment Revenue | |||||
| Refunding and Improvement Bonds (Gravois Bluffs | ||||||
| Redevelopment Project), 5% due 4/01/2014 | 1,045 | |||||
| 1,500 | Kansas City, Missouri, IDA, First Mortgage Health | |||||
| Facilities Revenue Bonds (Bishop Spencer Place), | ||||||
| Series A, 6.50% due 1/01/2035 | 1,508 | |||||
| 6,435 | Missouri State Housing Development Commission, | |||||
| S/F Mortgage Revenue Bonds (Homeownership Loan | ||||||
| Program), AMT, Series E-1, 5.60% due 3/01/2037 (g) | 6,763 | |||||
|
|
|
| ||||
| Montana — 1.1% | ||||||
| 2,925 | Montana State Board of Housing, S/F Mortgage | |||||
| Revenue Refunding Bonds, AMT, Series A-2, 5.50% | ||||||
| due 6/01/2037 | 3,081 | |||||
| Montana State Higher Education Student Assistance | ||||||
| Corporation, Student Loan Revenue Refunding | ||||||
| Bonds, AMT: | ||||||
| 10,000 | ARS, VRDN, Series A, 6.40% due 12/01/2033 (r) | 10,000 | ||||
| 6,000 | Sub-Series B, 6.40% due 12/01/2032 | 6,113 | ||||
|
|
|
|
| |||
| Nevada — 3.0% | ||||||
| 3,500 | Clark County, Nevada, Airport Revenue Bonds | |||||
| (Jet Aviation Fuel Tax), AMT, Series C, 5.375% | ||||||
| due 7/01/2020 (c) | 3,639 | |||||
| 1,525 | Clark County, Nevada, Improvement District | |||||
| Number 142, Special Assessment Bonds, 6.375% | ||||||
| due 8/01/2023 | 1,570 | |||||
| Elko, Nevada, GO (Airport Improvement), AMT, | ||||||
| Series B (j): | ||||||
| 165 | 6.10% due 10/01/2014 | 167 | ||||
| 245 | 6.30% due 10/01/2019 | 248 | ||||
| 320 | 6.75% due 10/01/2024 | 324 | ||||
| 225 | 7% due 10/01/2029 | 228 | ||||
| 20,000 | Henderson, Nevada, Health Care Facilities, Revenue | |||||
| Refunding Bonds (Catholic Healthcare West), | ||||||
| Series B, 5.25% due 7/01/2031 | 20,074 | |||||
| 10,000 | Reno, Nevada, Health Revenue Refunding Bonds | |||||
| (Catholic Healthcare West), Series A, 5.25% | ||||||
| due 7/01/2031 | 10,037 | |||||
| 1,850 | Reno, Nevada, Special Assessment District Number 4 | |||||
| (Somerset Parkway), 6.625% due 12/01/2022 | 1,906 | |||||
| Sparks, Nevada, Redevelopment Agency, Tax | ||||||
| Allocation Revenue Refunding Bonds, Series A (k): | ||||||
| 3,110 | 6% due 1/15/2015 | 3,260 | ||||
| 6,315 | 6% due 1/15/2023 | 6,528 | ||||
|
|
|
|
| |||
| Face | ||||||
| Amount | Municipal Bonds | Value | ||||
|
|
|
|
| |||
| New Hampshire — 0.2% | ||||||
| New Hampshire Health and Education Facilities | ||||||
| Authority, Revenue Refunding Bonds: | ||||||
| $ 1,750 | (Elliot Hospital), Series B, 5.60% | |||||
| due 10/01/2022 | $ 1,808 | |||||
| 540 | (Havenwood-Heritage Heights Retirement | |||||
| Community), Series A, 5% due 1/01/2016 | 502 | |||||
| 1,035 | (Havenwood-Heritage Heights Retirement | |||||
| Community), Series A, 5.35% due 1/01/2026 | 928 | |||||
|
|
|
| ||||
| New Jersey — 2.0% | ||||||
| 195 | Camden County, New Jersey, Pollution Control | |||||
| Financing Authority, Solid Waste Resource Recovery, | ||||||
| Revenue Refunding Bonds, AMT, Series B, 7.50% | ||||||
| due 12/01/2009 | 195 | |||||
| 3,300 | New Jersey EDA, Retirement Community Revenue | |||||
| Bonds (Cedar Crest Village Inc. Facility), | ||||||
| Series A, 7.25% due 11/15/2011 (n) | 3,794 | |||||
| 3,680 | New Jersey EDA, State Lease Revenue Bonds (State | |||||
| Office Buildings Projects), 6% due 6/15/2010 (c)(n) | 3,930 | |||||
| 3,130 | New Jersey Health Care Facilities Financing Authority | |||||
| Revenue Bonds (South Jersey Hospital), 6% | ||||||
| due 7/01/2012 (n) | 3,471 | |||||
| 2,250 | New Jersey Health Care Facilities Financing Authority, | |||||
| Revenue Refunding Bonds (Capital Health System | ||||||
| Inc.), Series A, 5.75% due 7/01/2023 | 2,310 | |||||
| 640 | New Jersey State Housing and Mortgage Finance | |||||
| Agency, M/F Housing Revenue Refunding Bonds, | ||||||
| Series B, 6.25% due 11/01/2026 (h) | 659 | |||||
| New Jersey State Turnpike Authority, Turnpike | ||||||
| Revenue Refunding Bonds, Series A (j): | ||||||
| 7,025 | 5.75% due 1/01/2010 (n) | 7,382 | ||||
| 2,975 | 5.75% due 1/01/2018 | 3,104 | ||||
| 7,000 | Tobacco Settlement Financing Corporation of | |||||
| New Jersey, Asset-Backed Revenue Bonds, 7% | ||||||
| due 6/01/2013 (n) | 8,219 | |||||
|
|
|
|
| |||
| New Mexico — 0.7% | ||||||
| 8,000 | Farmington, New Mexico, PCR, Refunding (Public | |||||
| Service Company of New Mexico — San Juan Project), | ||||||
| Series B, 6.30% due 12/01/2016 | 8,019 | |||||
| 40 | New Mexico Mortgage Finance Authority, Revenue | |||||
| Refunding Bonds, Mortgage-Backed Securities, | ||||||
| Series F, 7% due 1/01/2026 (g) | 41 | |||||
| 2,865 | New Mexico Mortgage Financing Authority, | |||||
| S/F Mortgage Program Revenue Bonds, AMT, | ||||||
| Series D, 6.15% due 7/01/2035 (f)(g) | 3,053 | |||||
| 250 | Santa Fe County, New Mexico, Correctional System | |||||
| Revenue Bonds, 6% due 2/01/2027 (h) | 294 | |||||
|
|
|
|
| |||
| New York — 4.8% | ||||||
| 3,230 | New York City, New York, City IDA, Civic Facility | |||||
| Revenue Bonds (Special Needs Facilities Pooled | ||||||
| Program), Series C-1, 6% due 7/01/2012 | 3,253 | |||||
| 4,050 | New York City, New York, City IDA, Special Facility | |||||
| Revenue Bonds (British Airways Plc Project), | ||||||
| AMT, 7.625% due 12/01/2032 | 4,254 | |||||
| New York City, New York, GO, Refunding, Series A: | ||||||
| 6,540 | 6% due 5/15/2010 (n) | 7,040 | ||||
| 2,205 | 6.25% due 5/15/2010 (l)(n) | 2,386 | ||||
| 60 | 6% due 5/15/2021 (l) | 64 | ||||
| BLACKROCK MUNICIPAL BOND FUND, INC. |
| DECEMBER 31, 2007 |
| 29 |
| Schedule of Investments (continued) BlackRock National Municipal Fund (In Thousands) |
| Face | ||||||
| Amount | Municipal Bonds | Value | ||||
|
|
|
|
| |||
| New York (concluded) | ||||||
| New York City, New York, GO, Series B (j): | ||||||
| $ 6,640 | 5.875% due 8/01/2010 (n) | $ 7,166 | ||||
| 1,300 | 5.875% due 8/01/2015 | 1,396 | ||||
| 25,000 | New York State, HFA, Revenue Bonds (125 West 31st | |||||
| Street Housing), ARS, VRDN, AMT, Series A, 6.25% | ||||||
| due 5/15/2038 (r)(t) | 25,000 | |||||
| New York State Dormitory Authority, Non-State | ||||||
| Supported Debt, Revenue Refunding Bonds (Mount | ||||||
| Sinai-NYU Medical Center Health System), Series A: | ||||||
| 590 | 6.50% due 7/01/2010 (n) | 644 | ||||
| 2,410 | 6.50% due 7/01/2016 | 2,534 | ||||
| New York State Dormitory Authority, Revenue | ||||||
| Refunding Bonds, Series A: | ||||||
| 1,680 | (Mount Sinai Health), 6.50% due 7/01/2025 | 1,750 | ||||
| 3,000 | (State University Educational Facilities), 7.50% | |||||
| due 5/15/2013 | 3,571 | |||||
| 1,360 | New York State Environmental Facilities Corporation, | |||||
| State Clean Water and Drinking Revenue Bonds | ||||||
| (Revolving Funds), Series B, 5.875% due 1/15/2019 | 1,425 | |||||
| 2,285 | Oneida County, New York, IDA Revenue Bonds | |||||
| (Civic Facility-Faxton Hospital), Series C, 6.625% | ||||||
| due 1/01/2015 (k) | 2,423 | |||||
| 3,000 | Port Authority of New York and New Jersey, | |||||
| Consolidated Revenue Bonds, AMT, Thirty-Seventh | ||||||
| Series, 5.50% due 7/15/2018 (h) | 3,228 | |||||
| 95 | Suffolk County, New York, IDA, Civic Facility Revenue | |||||
| Bonds (Special Needs Facilities Pooled Program), | ||||||
| Series D-1, 6% due 7/01/2012 | 96 | |||||
| 5,000 | Triborough Bridge and Tunnel Authority, New York, | |||||
| Subordinate Revenue Bonds, 5.125% | ||||||
| due 11/15/2026 (c) | 5,232 | |||||
| 705 | Westchester County, New York, IDA, Civic Facilities | |||||
| Revenue Bonds (Special Needs Facilities Pooled | ||||||
| Program), Series E-1, 6% due 7/01/2012 | 709 | |||||
| 8,095 | Westchester County, New York, IDA, Continuing Care | |||||
| Retirement, Mortgage Revenue Bonds (Kendal on | ||||||
| Hudson Project), Series A, 6.50% due 1/01/2013 (n) | 9,156 | |||||
|
|
|
| ||||
| North Carolina — 2.7% | ||||||
| 920 | Brunswick County, North Carolina, COP, 6% | |||||
| due 6/01/2010 (h)(n) | 990 | |||||
| 4,000 | North Carolina Eastern Municipal Power Agency, | |||||
| Power System Revenue Bonds, Series D, 6.75% | ||||||
| due 1/01/2026 | 4,219 | |||||
| 4,440 | North Carolina Eastern Municipal Power Agency, | |||||
| Power System Revenue Refunding Bonds, | ||||||
| Series D, 6.70% due 1/01/2019 (b) | 4,679 | |||||
| 3,930 | North Carolina HFA, Home Ownership Revenue Bonds, | |||||
| AMT, Series 9-A, 5.80% due 1/01/2020 | 4,066 | |||||
| North Carolina Medical Care Commission, Health Care | ||||||
| Facilities, First Mortgage Revenue Bonds (Presbyterian | ||||||
| Homes Project): | ||||||
| 2,500 | 6.875% due 10/01/2010 (n) | 2,744 | ||||
| 3,000 | 5.50% due 10/01/2031 | 2,888 | ||||
| North Carolina Medical Care Commission, Health Care | ||||||
| Facilities, First Mortgage Revenue Refunding Bonds: | ||||||
| 2,500 | (Presbyterian Homes Project), Series B, 5.20% | |||||
| due 10/01/2021 | 2,433 | |||||
| 1,100 | (Salemtowne Project), 5.10% due 10/01/2030 | 946 | ||||
| Face | ||||||
| Amount | Municipal Bonds | Value | ||||
|
|
|
|
| |||
| North Carolina (concluded) | ||||||
| North Carolina Medical Care Commission, Retirement | ||||||
| Facilities, First Mortgage Revenue Bonds: | ||||||
| $ 1,625 | (Forest at Duke Project), 6.375% | |||||
| due 9/01/2012 (n) | $ 1,819 | |||||
| 2,500 | (Givens Estates Project), Series A, 6.50% | |||||
| due 7/01/2013 (n) | 2,907 | |||||
| North Carolina Medical Care Commission, Retirement | ||||||
| Facilities, First Mortgage Revenue Refunding Bonds: | ||||||
| 5,000 | (Forest at Duke Project), 5.125% due 9/01/2032 | 4,742 | ||||
| 1,000 | (Givens Estates Project), 5% due 7/01/2033 | 881 | ||||
| North Carolina Municipal Power Agency Number 1, | ||||||
| Catawba Electric Revenue Refunding Bonds, Series B: | ||||||
| 500 | 6.375% due 1/01/2013 | 530 | ||||
| 1,080 | 6.375% due 1/01/2013 (b) | 1,145 | ||||
| 5,000 | 6.50% due 1/01/2020 | 5,279 | ||||
| 2,500 | 6.50% due 1/01/2020 (b) | 2,640 | ||||
| Piedmont Triad Airport Authority, North Carolina, | ||||||
| Airport Revenue Refunding Bonds, Series A (h)(n): | ||||||
| 1,000 | 6% due 7/01/2009 | 1,053 | ||||
| 1,000 | 6.375% due 7/01/2009 | 1,059 | ||||
|
|
|
|
| |||
| Ohio — 3.4% | ||||||
| 23,000 | Buckeye Tobacco Settlement Financing Authority, | |||||
| Ohio, Tobacco Settlement Asset-Backed Bonds, | ||||||
| Series A-2, 6.50% due 6/01/2047 | 23,617 | |||||
| 6,685 | Ohio HFA, Mortgage Revenue Refunding Bonds, AMT, | |||||
| Series C, 5.90% due 9/01/2035 (g) | 6,977 | |||||
| 1,470 | Port of Greater Cincinnati Development Authority, | |||||
| Ohio, Special Assessment Revenue Bonds | ||||||
| (Cooperative Public Parking Infrastructure | ||||||
| Project), 6.40% due 2/15/2034 | 1,493 | |||||
| 22,600 | Student Loan Funding Corporation, Cincinnati, Ohio, | |||||
| Student Loan Revenue Bonds, ARS, VRDN, AMT, | ||||||
| Series B-5, 6.40% due 6/01/2025 (r)(c) | 22,600 | |||||
| 3,005 | Toledo-Lucas County, Ohio, Lodging Tax Revenue | |||||
| Refunding Bonds (Convention Center Project), 5.70% | ||||||
| due 10/01/2015 (j) | 3,041 | |||||
|
|
|
|
| |||
| Oklahoma — 0.6% | ||||||
| 10,000 | Tulsa County, Oklahoma, Industrial Authority, Health | |||||
| Care Revenue Refunding Bonds (Saint Francis Health | ||||||
| System), 5% due 12/15/2036 | 9,909 | |||||
|
|
|
|
| |||
| Oregon — 0.3% | ||||||
| Forest Grove, Oregon, Campus Improvement | ||||||
| Revenue Refunding Bonds (Pacific University) (k)(n): | ||||||
| 250 | 6% due 5/01/2010 | 266 | ||||
| 250 | 6.20% due 5/01/2010 (k)(n) | 267 | ||||
| Oregon State Housing and Community Services | ||||||
| Department, Mortgage Revenue Refunding Bonds | ||||||
| (S/F Mortgage Program), Series A: | ||||||
| 35 | AMT, 6.20% due 7/01/2027 | 36 | ||||
| 55 | 6.40% due 7/01/2018 | 56 | ||||
| 500 | Portland, Oregon, M/F Housing Authority Revenue | |||||
| Bonds (Lovejoy Station Apartments Project), | ||||||
| AMT, 5.90% due 7/01/2023 (j) | 510 | |||||
| Portland, Oregon, Urban Renewal and Redevelopment | ||||||
| Revenue Refunding Bonds, Series A (c): | ||||||
| 1,000 | (Downtown Waterfront), 5.75% due 6/15/2018 | 1,063 | ||||
| 3,190 | (South Park Blocks), 5.75% due 6/15/2018 | 3,390 | ||||
|
|
|
|
| |||
30 BLACKROCK MUNICIPAL BOND FUND, INC.
| DECEMBER 31, 2007 |
Schedule of Investments (continued) BlackRock National Municipal Fund (In Thousands)
| Face | ||||||
| Amount | Municipal Bonds | Value | ||||
|
|
|
|
| |||
| Pennsylvania — 1.9% | ||||||
| $ 3,640 | Allegheny County, Pennsylvania, IDA, Environmental | |||||
| Improvement Revenue Refunding Bonds, 5.50% | ||||||
| due 11/01/2016 | $ 3,689 | |||||
| 2,220 | Allegheny County, Pennsylvania, Sanitation Authority, | |||||
| Sewer Revenue Bonds, 5.75% due 12/01/2010 (j)(n) | 2,397 | |||||
| 1,760 | Bucks County, Pennsylvania, IDA, Retirement | |||||
| Community Revenue Bonds (Ann's Choice Inc.), | ||||||
| Series A, 6.125% due 1/01/2025 | 1,764 | |||||
| 7,750 | Delaware County, Pennsylvania, IDA, Revenue | |||||
| Refunding Bonds (Resource Recovery Facility), | ||||||
| Series A, 6.10% due 7/01/2013 | 7,876 | |||||
| Lancaster County, Pennsylvania, Hospital Authority | ||||||
| Revenue Bonds (Brethren Village Project), Series A: | ||||||
| 1,160 | 6.25% due 7/01/2026 | 1,152 | ||||
| 1,000 | 6.50% due 7/01/2040 | 1,002 | ||||
| 3,200 | Langhorne Manor Boro, Pennsylvania, Higher | |||||
| Education and Health Authority, Retirement Revenue | ||||||
| Refunding Bonds (Wesley Enhanced Living), VRDN, | ||||||
| Series B, 5.10% due 10/01/2032 (k)(r) | 3,200 | |||||
| 4,000 | Pennsylvania State Higher Educational Facilities | |||||
| Authority Revenue Bonds (University of Pennsylvania | ||||||
| Medical Center Health System), Series A, 6% | ||||||
| due 1/15/2031 | 4,276 | |||||
| 1,265 | Philadelphia, Pennsylvania, Authority for IDR, | |||||
| Commercial Development, 7.75% due 12/01/2017 | 1,267 | |||||
| Sayre, Pennsylvania, Health Care Facilities Authority, | ||||||
| Revenue Refunding Bonds (Guthrie Healthcare | ||||||
| System), Series A: | ||||||
| 3,915 | 5.875% due 12/01/2011 (n) | 4,331 | ||||
| 1,085 | 5.875% due 12/01/2031 | 1,120 | ||||
|
|
|
|
| |||
| Rhode Island — 0.5% | ||||||
| Rhode Island State Economic Development | ||||||
| Corporation Revenue Bonds: | ||||||
| 1,000 | (Providence Place Mall), 6.125% | |||||
| due 7/01/2020 (k) | 1,061 | |||||
| 6,815 | Series B, 6% due 7/01/2010 (d)(n) | 7,347 | ||||
|
|
|
|
| |||
| South Carolina — 2.1% | ||||||
| Medical University Hospital Authority, South Carolina, | ||||||
| Hospital Facilities Revenue Refunding Bonds (n): | ||||||
| 2,450 | 6.50% due 8/15/2012 | 2,783 | ||||
| 5,400 | Series A, 6.375% due 8/15/2012 | 6,106 | ||||
| 5,000 | South Carolina Jobs EDA, Residential Care Facilities | |||||
| Revenue Bonds (South Carolina Episcopal — Still | ||||||
| Hopes Residence Project), Series A, 6.375% | ||||||
| due 5/15/2032 | 5,003 | |||||
| 21,215 | South Carolina State Ports Authority, Ports Revenue | |||||
| Bonds, AMT, 5.30% due 7/01/2026 | 21,326 | |||||
|
|
|
|
| |||
| South Dakota — 0.2% | ||||||
| 3,750 | Pierre, South Dakota, School District Number 32-2, | |||||
| GO, 5.75% due 8/01/2010 (h)(n) | 3,993 | |||||
|
|
|
|
| |||
| Tennessee — 1.1% | ||||||
| Chattanooga, Tennessee, IDB, Lease Rent Revenue | ||||||
| Bonds (Southside Redevelopment Corporation) (c): | ||||||
| 4,485 | 5.75% due 10/01/2017 | 4,777 | ||||
| 3,740 | 5.75% due 10/01/2018 | 3,958 | ||||
| 1,000 | Johnson City, Tennessee, Health and Educational | |||||
| Facilities Board, Retirement Facility Revenue | ||||||
| Bonds (Appalachian Christian Village Project), | ||||||
| Series A, 6.25% due 2/15/2032 | 980 | |||||
| Face | ||||||
| Amount | Municipal Bonds | Value | ||||
|
|
|
|
| |||
| Tennessee (concluded) | ||||||
| $ 7,300 | Shelby County, Tennessee, Health, Educational | |||||
| and Housing Facility Board, Hospital Revenue | ||||||
| Refunding Bonds (Methodist Healthcare), 6.50% | ||||||
| due 9/01/2012 (n) | $ 8,320 | |||||
|
|
|
| ||||
| Texas — 13.2% | ||||||
| 5,000 | Alliance Airport Authority, Inc., Texas, Special Facilities | |||||
| Revenue Refunding Bonds (American Airlines Inc. | ||||||
| Project), AMT, 5.25% due 12/01/2029 | 3,935 | |||||
| Austin, Texas, Convention Center Revenue Bonds | ||||||
| (Convention Enterprises Inc.), First Tier, Series A (n): | ||||||
| 5,300 | 6.60% due 1/01/2011 | 5,820 | ||||
| 2,300 | 6.70% due 1/01/2011 | 2,532 | ||||
| 10,630 | Austin, Texas, Revenue Bonds (Town Lake Community | |||||
| Events Center Venue), 6.20% due 11/15/2009 (d)(n) | 11,240 | |||||
| Bexar County, Texas, Health Facilities Development | ||||||
| Corporation, Revenue Refunding Bonds (Army | ||||||
| Retirement Residence Project) (n): | ||||||
| 600 | 6.125% due 7/01/2012 | 676 | ||||
| 1,750 | 6.30% due 7/01/2012 | 1,983 | ||||
| 11,450 | Brazos River Authority, Texas, PCR, Refunding (TXU | |||||
| Energy Company Project), AMT, Series C, 5.75% | ||||||
| due 5/01/2036 | 10,964 | |||||
| 4,250 | Brazos River Authority, Texas, Revenue Refunding | |||||
| Bonds (Reliant Energy Inc. Project), Series B, 7.75% | ||||||
| due 12/01/2018 | 4,352 | |||||
| 3,700 | Brazos River, Texas, Harbor Navigation District, | |||||
| Brazoria County Environmental Revenue Refunding | ||||||
| Bonds (Dow Chemical Company Project), AMT, | ||||||
| Series A-7, 6.625% due 5/15/2033 | 3,881 | |||||
| 370 | Central Texas Housing Finance Corporation, | |||||
| S/F Mortgage Revenue Bonds (GNMA Mortgage | ||||||
| Program), AMT, 8.20% due 6/28/2017 (i) | 384 | |||||
| 3,620 | Dallas-Fort Worth, Texas, International Airport Facility | |||||
| Improvement Corporation, Revenue Bonds (Learjet | ||||||
| Inc.), AMT, Series A-1, 6.15% due 1/01/2016 | 3,520 | |||||
| Dallas-Fort Worth, Texas, International Airport | ||||||
| Revenue Bonds, AMT, Series A: | ||||||
| 36,500 | 6% due 11/01/2024 (d) | 37,626 | ||||
| 11,250 | 5.50% due 11/01/2033 (j) | 11,485 | ||||
| Gregg County, Texas, Health Facilities Development | ||||||
| Corporation, Hospital Revenue Bonds (Good | ||||||
| Shepherd Medical Center Project) (k)(n): | ||||||
| 3,500 | 6.375% due 10/01/2010 | 3,827 | ||||
| 1,000 | 6.875% due 10/01/2010 | 1,106 | ||||
| 5,465 | Gulf Coast Waste Disposal Authority, Texas, Revenue | |||||
| Refunding Bonds (International Paper Company), | ||||||
| AMT, Series A, 6.10% due 8/01/2024 | 5,556 | |||||
| HFDC of Central Texas, Inc., Retirement Facilities | ||||||
| Revenue Bonds, Series A: | ||||||
| 2,255 | 5.75% due 11/01/2036 | 2,013 | ||||
| 1,850 | (Village at Gleannloch Farms), 5.50% | |||||
| due 2/15/2037 | 1,590 | |||||
| 6,000 | Houston, Texas, Airport System, Special Facilities | |||||
| Revenue Bonds (Continental Airlines), AMT, | ||||||
| Series E, 7% due 7/01/2029 | 6,120 | |||||
| 4,000 | Kerrville, Texas, Health Facilities Development | |||||
| Corporation, Hospital Revenue Bonds (Sid Peterson | ||||||
| Memorial Hospital Project), 5.25% due 8/15/2021 | 3,936 | |||||
| 8,080 | Matagorda County, Texas, Navigation District | |||||
| Number 1, Revenue Refunding Bonds (Reliant | ||||||
| Energy Inc.), Series C, 8% due 5/01/2029 | 8,280 | |||||
| BLACKROCK MUNICIPAL BOND FUND, INC. |
| DECEMBER 31, 2007 |
| 31 |
| Schedule of Investments (continued) BlackRock National Municipal Fund (In Thousands) |
| Face | ||||
| Amount | Municipal Bonds | Value | ||
|
|
|
| ||
| Texas (concluded) | ||||
| $ 7,350 | Matagorda County, Texas, Port of Bay City Authority | |||
| Revenue Bonds (Hoechst Celanese Corp. Project), | ||||
| AMT, 6.50% due 5/01/2026 | $ 7,124 | |||
| 1,000 | Red River, Texas, Education Finance Revenue | |||
| Bonds (Saint Mark’s School — Texas Project), 6% | ||||
| due 2/15/2010 (n) | 1,038 | |||
| 5,000 | SA Energy Acquisition Public Facilities Corporation, | |||
| Texas, Gas Supply Revenue Bonds, 5.50% | ||||
| due 8/01/2027 | 5,133 | |||
| 780 | South Plains, Texas, Housing Finance Corporation, | |||
| S/F Mortgage Revenue Bonds, AMT, Series A, 7.30% | ||||
| due 9/01/2031 (g) | 792 | |||
| 120 | Southeast Texas Housing Finance Corporation, | |||
| Revenue Bonds, AMT, Series B, 8.50% | ||||
| due 11/01/2025 (f)(i) | 122 | |||
| Tarrant County, Texas, Cultural Education Facilities | ||||
| Financing Corporation, Retirement Facilities Revenue | ||||
| Refunding Bonds (Northwest Senior Housing — | ||||
| Edgemere Project), Series A: | ||||
| 2,200 | 6% due 11/15/2026 | 2,158 | ||
| 3,000 | 6% due 11/15/2036 | 2,896 | ||
| Texas State Affordable Housing Corporation, | ||||
| S/F Mortgage Revenue Bonds. AMT (f)(g): | ||||
| 4,973 | (Fire Fighter and Law Enforcement or Security | |||
| Officer Home Loan Program), Series C, | ||||
| 5.45% due 12/01/2039 | 5,115 | |||
| 6,225 | (Professional Educators Home Loan Program), | |||
| Series A-1, 5.50% due 12/01/2039 | 6,427 | |||
| Texas State Public Finance Authority, Building | ||||
| Revenue Bonds (h)(n): | ||||
| 2,100 | (General Services Commission Project), Series A, | |||
| 6% due 2/01/2010 | 2,221 | |||
| 1,000 | (State Preservation Project), Series B, | |||
| 6% due 8/01/2009 | 1,046 | |||
| 45,000 | Texas State Turnpike Authority, Central Texas Turnpike | |||
| System Revenue Bonds, First Tier, Series A, 5.75% | ||||
| due 8/15/2038 (c) | 48,448 | |||
| 4,930 | Upper Trinity Regional Water District, Texas, Water | |||
| Revenue Bonds (Regional Treated Water Supply | ||||
| System), Series A, 6% due 8/01/2010 (d)(n) | 5,280 | |||
| 1,500 | Webster, Texas, GO, COP, Series A (h): | |||
| 6% due 3/01/2010 (n) | 1,590 | |||
| 805 | 6% due 3/01/2021 | 847 | ||
| 1,250 | West Central Texas Regional Housing Finance | |||
| Corporation, S/F Mortgage Revenue Bonds | ||||
| (Mortgage-Backed Securities Program), AMT, | ||||
| Series A, 5.35% due 12/01/2039 (f)(g) | 1,274 | |||
|
|
|
| ||
| Utah — 0.0% | ||||
| 700 | Utah State, HFA, S/F Mortgage Revenue | |||
| Refunding Bonds, AMT, Series C, Class III, 5.50% | ||||
| due 1/01/2018 | 714 | |||
|
|
|
| ||
| Vermont — 1.5% | ||||
| 25,850 | Vermont State Student Assistance Corporation, | |||
| Education Loan Revenue Bonds, SAVRS, VRDN, AMT, | ||||
| Series N, 5.50% due 12/15/2032 (r)(c) | 25,850 | |||
|
|
|
| ||
| Face | ||||||
| Amount | Municipal Bonds | Value | ||||
|
|
|
|
| |||
| Virginia — 0.7% | ||||||
| Albemarle County, Virginia, IDA, Residential Care | ||||||
| Facilities, Mortgage Revenue Refunding Bonds | ||||||
| (Westminster-Canterbury): | ||||||
| $ 1,750 | 5% due 1/01/2024 | $ 1,602 | ||||
| 1,100 | 5% due 1/01/2031 | 966 | ||||
| 2,425 | Chesterfield County, Virginia, IDA, PCR, Refunding | |||||
| (Virginia Electric and Power Company), | ||||||
| Series B, 5.875% due 6/01/2017 | 2,572 | |||||
| 3,250 | Fairfax County, Virginia, EDA, Residential Care | |||||
| Facilities, Mortgage Revenue Refunding Bonds | ||||||
| (Goodwin House, Inc.), 5.125% due 10/01/2037 | 2,979 | |||||
| Norfolk, Virginia, Redevelopment and Housing | ||||||
| Authority, First Mortgage Revenue Bonds (Retirement | ||||||
| Community), Series A: | ||||||
| 500 | 6% due 1/01/2025 | 487 | ||||
| 1,100 | 6.125% due 1/01/2035 | 1,063 | ||||
| 2,500 | Watkins Centre Community Development Authority, | |||||
| Virginia, Revenue Bonds, 5.40% due 3/01/2020 | 2,411 | |||||
|
|
|
|
| |||
| Washington — 0.8% | ||||||
| 3,000 | Port of Seattle, Washington, Special Facilities Revenue | |||||
| Bonds, Series A, 6% due 3/01/2010 (j)(n) | 3,208 | |||||
| 3,010 | Seattle, Washington, Drain and Wastewater Utility | |||||
| Revenue Bonds, 5.75% due 11/01/2009 (j)(n) | 3,184 | |||||
| Seattle, Washington, Housing Authority Revenue Bonds: | ||||||
| 2,750 | (Newholly Project), AMT, 6.25% due 12/01/2035 | 2,802 | ||||
| 4,620 | (Replacement Housing Project), 6.125% | |||||
| due 12/01/2032 | 4,675 | |||||
|
|
|
|
| |||
| Wisconsin — 0.7% | ||||||
| 950 | Wisconsin Housing and EDA, Home Ownership | |||||
| Revenue Bonds, AMT, Series C, 6% due 9/01/2036 | 1,011 | |||||
| 1,960 | Wisconsin State, GO, AMT, Series B, 6.20% | |||||
| due 11/01/2026 (j) | 1,983 | |||||
| Wisconsin State Health and Educational Facilities | ||||||
| Authority Revenue Bonds (SynergyHealth Inc.): | ||||||
| 5,655 | 6% due 11/15/2023 | 5,724 | ||||
| 3,700 | 6% due 11/15/2032 | 3,653 | ||||
|
|
|
|
| |||
| Guam — 0.0% | ||||||
| 115 | Guam Housing Corporation S/F Mortgage Revenue | |||||
| Bonds, AMT Series A, 5.75% due 9/01/2031 (f) | 121 | |||||
|
|
|
|
| |||
| Puerto Rico — 1.2% | ||||||
| 8,045 | Puerto Rico Commonwealth Highway and | |||||
| Transportation Authority, Transportation Revenue | ||||||
| Bonds, 5.75% due 7/01/2022 | 8,450 | |||||
| Puerto Rico Commonwealth Infrastructure | ||||||
| Financing Authority, Special Tax and Capital | ||||||
| Appreciation Revenue Bonds, Series A (p): | ||||||
| 20,000 | 4.915% due 7/01/2030 (d) | 6,240 | ||||
| 12,605 | 4.96% due 7/01/2035 (c) | 3,068 | ||||
| 785 | Puerto Rico Commonwealth, Public Improvement, GO, | |||||
| Refunding, 5.70% due 7/01/2020 (j) | 828 | |||||
| 15,000 | Puerto Rico Sales Tax Financing Corporation, Sales | |||||
| Tax Revenue Refunding Bonds, Series A, 5.04% | ||||||
| due 8/01/2045 (j)(p) | 2,190 | |||||
|
|
|
|
| |||
| U.S. Virgin Islands — 0.5% | ||||||
| 8,000 | Virgin Islands Government Refinery Facilities, Revenue | |||||
| Refunding Bonds (Hovensa Coker Project) AMT, 6.50% | ||||||
| due 7/01/2021 | 8,317 | |||||
|
|
|
|
| |||
| Total Municipal Bonds | ||||||
| (Cost — $1,531,556) — 92.3% | 1,553,225 | |||||
|
|
|
| ||||
32 BLACKROCK MUNICIPAL BOND FUND, INC.
| DECEMBER 31, 2007 |
Schedule of Investments (concluded) BlackRock National Municipal Fund (In Thousands)
| Face | Municipal Bonds Transferred to | |||||
| Amount | Tender Option Bond Trusts (a) | Value | ||||
|
|
|
|
| |||
| Florida — 2.1% | ||||||
| $14,000 | Lee County, Florida, Airport Revenue Bonds, AMT, | |||||
| Series A, 6% due 10/01/2029 (h) | $ 14,787 | |||||
| 20,115 | Port St. Lucie, Florida, Utility Revenue | |||||
| Bonds, 5.125% due 9/01/2036 (j) | 20,910 | |||||
|
|
|
|
| |||
| Michigan — 0.8% | ||||||
| 13,500 | Hartland, Michigan, Consolidated School District, GO, | |||||
| Refunding, 5.125% due 5/01/2029 | 13,805 | |||||
|
|
|
|
| |||
| New Jersey — 2.6% | ||||||
| 22,000 | New Jersey EDA, School Facilities Construction | |||||
| Revenue Bonds, Series O, 5.25% due 3/01/2024 | 23,584 | |||||
| 20,000 | New Jersey State Turnpike Authority, Turnpike Revenue | |||||
| Refunding Bonds, Series A, 5.75% due 1/01/2018 (j) | 20,893 | |||||
|
|
|
| ||||
| Pennsylvania — 2.3% | ||||||
| 36,210 | Philadelphia, Pennsylvania, Redevelopment Authority | |||||
| Revenue Bonds (Neighborhood Transformation), | ||||||
| Series A, 5.30% due 4/15/2026 (d) | 38,163 | |||||
|
|
|
|
| |||
| South Carolina — 1.3% | ||||||
| 21,215 | South Carolina State Ports Authority, Ports Revenue | |||||
| Bonds, AMT, 5.30% due 7/01/2026 (h) | 21,326 | |||||
|
|
|
|
| |||
| Texas — 3.3% | ||||||
| Houston, Texas, Airport System Revenue | ||||||
| Refunding Bonds, Sub-Lien: | ||||||
| 15,000 | AMT, Series A, 5.50% due 7/01/2023 (h) | 15,354 | ||||
| 18,860 | Series B, 5.20% due 7/01/2018 (d) | 19,109 | ||||
| Face | Municipal Bonds Transferred to | |||
| Amount | Tender Option Bond Trusts (a) | Value | ||
|
|
|
| ||
| Texas (concluded) | ||||
| $20,000 | Houston, Texas, Combined Utility System, First Lien | |||
| Revenue Refunding Bonds, Series A, 5.125% | ||||
| due 5/15/2028 (j) | $ 20,789 | |||
|
|
|
| ||
| Puerto Rico — 0.5% | ||||
| Puerto Rico Industrial Tourist Educational, Medical | ||||
| and Environmental Control Facilities Revenue Bonds | ||||
| (Hospital de la Concepcion), Series A: | ||||
| 4,000 | 6.125% due 11/15/2025 | 4,247 | ||
| 4,220 | 6.125% due 11/15/2030 | 4,444 | ||
|
|
|
| ||
| Total Municipal Bonds Transferred to Tender | ||||
| Option Bond Trusts (Cost — $216,925) — 12.9% | 217,411 | |||
|
|
|
| ||
| Shares | ||||
| Held | Short-Term Securities | |||
|
|
|
| ||
| 440 | Merrill Lynch Institutional Tax-Exempt | |||
| Fund, 3.35% (o)(q) | 440 | |||
|
|
|
| ||
| Total Short-Term Securities | ||||
| (Cost — $440) — 0.0% | 440 | |||
|
|
|
| ||
| Total Investments (Cost — $1,748,921*) — 105.2% | 1,771,076 | |||
| Other Assets Less Liabilities — 1.2% | 19,616 | |||
| Liability for Trust Certificates, Including Interest | ||||
| Expense Payable — (6.4%) | (108,053) | |||
|
| ||||
| Net Assets — 100.0% | $1,682,639 | |||
|
| ||||
| * | The cost and unrealized appreciation (depreciation) of investments as of December 31, 2007, as computed for federal income tax purposes, were as follows: |
| Aggregate cost | $ 1,644,556 | |
|
| ||
| Gross unrealized appreciation | $ 40,741 | |
| Gross unrealized depreciation | (21,115) | |
|
| ||
| Net unrealized appreciation | $ 19,626 | |
|
|
| (a) | Securities represent underlying bonds transferred to a separate securitization trust established in a tender option bond transaction in which the Fund may have acquired the residual interest certificates. These securities serve as collateral in a financing transaction. See Note 1(c) of the Notes to Financial Statements for details of munici- pal bonds transferred to tender option bond trusts. |
| (b) | ACA Insured. |
| (c) | AMBAC Insured. |
| (d) | FGIC Insured. |
| (e) | FHA Insured. |
| (f) | FHLMC Collateralized. |
| (g) | FNMA/GNMA Collateralized. |
| (h) | FSA Insured. |
| (i) | GNMA Collateralized. |
| (j) | MBIA Insured. |
| (k) | Radian Insured. |
| (l) | XL Capital Insured. |
| (m) | The rate disclosed is that currently in effect. This rate changes periodically and inversely based upon prevailing market rates. |
| (n) | Prerefunded. |
| (o) | Investments in companies considered to be an affiliate of the Fund, for purposes of Section 2(a)(3) of the Investment Company Act of 1940, were as follows: |
| Net | Dividend | |||
| Affiliate | Activity | Income | ||
|
|
|
| ||
| Merrill Lynch Institutional Tax-Exempt Fund | (28,166) | $647 | ||
|
|
|
| ||
| (p) | Represents a zero coupon bond; the interest rate shown reflects the effective yield at the time of purchase. |
| (q) | Represents the current yield as of December 31, 2007. |
| (r) | Security may have a maturity of more than one year at time of issuance, but has variable rate and demand features that qualify it as a short-term security. The rate disclosed is that currently in effect. This rate changes periodically based upon prevailing market rates. |
| (s) | Non-income producing security; issuer filed for bankruptcy or is in default of interest payments. |
| (t) | FNMA Collateralized. |
| See Notes to Financial Statements. |
| BLACKROCK MUNICIPAL BOND FUND, INC. |
| DECEMBER 31, 2007 |
| 33 |
| Schedule of Investments as of December 31, 2007 BlackRock High Yield Municipal Fund (In Thousands) (Unaudited) |
| Face | ||||||
| Amount | Municipal Bonds | Value | ||||
|
|
|
|
| |||
| Alabama — 0.7% | ||||||
| $ 500 | Tuscaloosa, Alabama, Special Care Facilities Financing | |||||
| Authority, Residential Care Facility Revenue Bonds | ||||||
| (Capstone Village, Inc. Project), Series A, 5.875% | ||||||
| due 8/01/2036 | $ 462 | |||||
|
|
|
| ||||
| Arizona — 6.4% | ||||||
| 300 | Maricopa County, Arizona, IDA, Education Revenue | |||||
| Bonds (Arizona Charter Schools Project 1), Series A, | ||||||
| 6.75% due 7/01/2029 | 284 | |||||
| 1,000 | Phoenix, Arizona, IDA, Airport Facility, Revenue | |||||
| Refunding Bonds (America West Airlines Inc. Project), | ||||||
| AMT, 6.30% due 4/01/2023 | 952 | |||||
| 685 | Pima County, Arizona, IDA, Education Revenue | |||||
| Bonds (American Charter Schools Foundation), | ||||||
| Series A, 5.625% due 7/01/2038 | 640 | |||||
| 285 | Pima County, Arizona, IDA, Education Revenue | |||||
| Refunding Bonds (Arizona Charter Schools Project), | ||||||
| Series O, 5.25% due 7/01/2031 | 259 | |||||
| 100 | Pima County, Arizona, IDA, S/F Mortgage | |||||
| Revenue Refunding Bonds, VRDN, AMT, 4.89% | ||||||
| due 4/25/2008 (k) | 100 | |||||
| 500 | Queen Creek Improvement District Number 001, | |||||
| Arizona, Special Assessment Bonds, 5% | ||||||
| due 1/01/2032 | 457 | |||||
| Salt Verde Financial Corporation, Arizona, Senior Gas | ||||||
| Revenue Bonds: | ||||||
| 750 | 5% due 12/01/2032 | 709 | ||||
| 1,045 | 5% due 12/01/2037 | 977 | ||||
|
|
|
|
| |||
| California — 4.7% | ||||||
| 750 | California Pollution Control Financing Authority, Solid | |||||
| Waste Disposal Revenue Bonds (Waste Management | ||||||
| Inc. Project), AMT, Series C, 5.125% due 11/01/2023 | 727 | |||||
| 500 | Lammersville, California, School District, Special Tax | |||||
| Bonds (Community Facilities District Number 2002 — | ||||||
| Mountain House), 5.125% due 9/01/2035 | 452 | |||||
| 500 | Roseville, California, Special Tax Bonds (Fiddyment | |||||
| Ranch Community Facilities Number 1), 5.25% | ||||||
| due 9/01/2036 | 453 | |||||
| 630 | Southern California Public Power Authority, Natural | |||||
| Gas Project Number 1 Revenue Bonds, Series A, 5% | ||||||
| due 11/01/2029 | 618 | |||||
| 565 | Temecula Valley, California, Unified School District, | |||||
| Community Facilities District Number 2005-1, | ||||||
| Special Tax Bonds, 5% due 9/01/2036 | 489 | |||||
| 500 | Temecula, California, Public Financing Authority, | |||||
| Community Facilities District Number 01-2, | ||||||
| Special Tax Refunding Bonds, Sub-Series B, 5.10% | ||||||
| due 9/01/2036 | 442 | |||||
|
|
|
|
| |||
| Colorado — 2.1% | ||||||
| 1,000 | Colorado HFA, Revenue Refunding Bonds (Adventist | |||||
| Health System/Sunbelt Obligor Group), Series D, 5.25% | ||||||
| due 11/15/2035 | 1,001 | |||||
| 450 | Colorado Health Facilities Authority, Revenue | |||||
| Refunding Bonds (Christian Living Communities | ||||||
| Project), Series A, 5.75% due 1/01/2037 | 417 | |||||
|
|
|
|
| |||
| Connecticut — 1.4% | ||||||
| 1,000 | Connecticut State Health and Educational Facilities | |||||
| Authority Revenue Bonds (University of Hartford), | ||||||
| Series G, 5.25% due 7/01/2036 (h) | 997 | |||||
|
|
|
|
| |||
| Face | ||||||
| Amount | Municipal Bonds | Value | ||||
|
|
|
|
| |||
| Florida — 10.2% | ||||||
| $ 605 | Easton Park Community Development District, Florida, | |||||
| Capital Improvement Revenue Bonds, 5.20% | ||||||
| due 5/01/2037 | $ 478 | |||||
| 490 | Highland Meadows Community Development District, | |||||
| Florida, Special Assessment Bonds, Series A, 5.50% | ||||||
| due 5/01/2036 | 391 | |||||
| 1,000 | Hillsborough County, Florida, IDA, Hospital Revenue | |||||
| Bonds (Tampa General Hospital Project), 5.25% | ||||||
| due 10/01/2041 | 962 | |||||
| 300 | Jacksonville, Florida, Economic Development | |||||
| Commission, IDR (Gerdau Ameristeel US, Inc.), | ||||||
| AMT, 5.30% due 5/01/2037 | 257 | |||||
| Lee County, Florida, IDA, Health Care Facilities, | ||||||
| Revenue Refunding Bonds (Shell Point/Alliance | ||||||
| Obligor Group): | ||||||
| 500 | 5% due 11/15/2029 | 441 | ||||
| 600 | 5% due 11/15/2032 | 519 | ||||
| 570 | Lee County, Florida, IDA, IDR (Lee Charter | |||||
| Foundation), Series A, 5.375% due 6/15/2037 | 486 | |||||
| 500 | New River Community Development District, Florida, | |||||
| Capital Improvement Revenue Bonds, Series B, 5% | ||||||
| due 5/01/2013 | 461 | |||||
| 1,000 | Pine Ridge Plantation Community Development | |||||
| District, Florida, Capital Improvement and Special | ||||||
| Assessment Bonds, Series B, 5% due 5/01/2011 | 948 | |||||
| 500 | Santa Rosa Bay Bridge Authority, Florida, Revenue | |||||
| Bonds, 6.25% due 7/01/2028 | 469 | |||||
| Sarasota County, Florida, Health Facilities Authority, | ||||||
| Retirement Facility Revenue Refunding Bonds (Village | ||||||
| on the Isle Project): | ||||||
| 210 | 5.50% due 1/01/2027 | 194 | ||||
| 190 | 5.50% due 1/01/2032 | 169 | ||||
| 700 | Tolomato Community Development District, Florida, | |||||
| Special Assessment Bonds, 6.65% due 5/01/2040 | 677 | |||||
| 650 | Watergrass Community Development District, Florida, | |||||
| Special Assessment Revenue Bonds, Series A, 5.375% | ||||||
| due 5/01/2039 | 523 | |||||
|
|
|
|
| |||
| Georgia — 2.6% | ||||||
| 500 | Brunswick and Glynn County, Georgia, Development | |||||
| Authority, First Mortgage Revenue Bonds (Coastal | ||||||
| Community Retirement Corporation Project), | ||||||
| Series A, 7.25% due 1/01/2035 (i) | 289 | |||||
| 1,000 | Richmond County, Georgia, Development Authority, | |||||
| Environmental Improvement Revenue Bonds | ||||||
| (International Paper Co. Projects), AMT, Series A, 5% | ||||||
| due 8/01/2030 | 887 | |||||
| 600 | Rockdale County, Georgia, Development Authority | |||||
| Revenue Bonds (Visy Paper Project), AMT, | ||||||
| Series A, 6.125% due 1/01/2034 | 574 | |||||
|
|
|
|
| |||
| Illinois — 2.6% | ||||||
| 1,000 | Chicago, Illinois, O'Hare International Airport, Special | |||||
| Facility Revenue Refunding Bonds (American Airlines | ||||||
| Inc. Project), 5.50% due 12/01/2030 | 856 | |||||
| Illinois State Finance Authority Revenue Bonds, | ||||||
| Series A: | ||||||
| 430 | (Monarch Landing, Inc. Project), 7% | |||||
| due 12/01/2037 | 429 | |||||
| 500 | (Three Crowns Park Plaza), 5.875% | |||||
| due 2/15/2038 | 460 | |||||
|
|
|
|
| |||
34 BLACKROCK MUNICIPAL BOND FUND, INC.
| DECEMBER 31, 2007 |
| Schedule of Investments (continued) BlackRock High Yield Municipal Fund (In Thousands) |
| Face | ||||||
| Amount | Municipal Bonds | Value | ||||
|
|
|
|
| |||
| Indiana — 2.4% | ||||||
| $ 700 | Indiana Health and Educational Facilities Financing | |||||
| Authority, Hospital Revenue Bonds (Community | ||||||
| Foundation of Northwest Indiana), 5.50% | ||||||
| due 3/01/2037 | $ 643 | |||||
| Indiana Health Facilities Financing Authority, Hospital | ||||||
| Revenue Refunding Bonds (Methodist Hospital, Inc.): | ||||||
| 185 | 5.375% due 9/15/2022 | 185 | ||||
| 525 | 5.50% due 9/15/2031 | 509 | ||||
| Vigo County, Indiana, Hospital Authority Revenue | ||||||
| Bonds (Union Hospital, Inc.): | ||||||
| 155 | 5.70% due 9/01/2037 | 144 | ||||
| 190 | 5.75% due 9/01/2042 | 174 | ||||
|
|
|
|
| |||
| Iowa — 0.7% | ||||||
| 500 | Iowa Financing Authority, Health Facilities Revenue | |||||
| Refunding Bonds (Care Initiatives Project), | ||||||
| Series A, 5% due 7/01/2019 | 487 | |||||
|
|
|
|
| |||
| Kansas — 4.7% | ||||||
| 1,350 | Lenexa, Kansas, Health Care Facility, Revenue | |||||
| Refunding Bonds, 5.50% due 5/15/2039 | 1,195 | |||||
| 650 | Manhattan, Kansas, Health Care Facilities Revenue | |||||
| Bonds (Meadowlark Hills Retirement), Series B, 5.125% | ||||||
| due 5/15/2042 | 535 | |||||
| 970 | Sedgwick and Shawnee Counties, Kansas, | |||||
| S/F Mortgage Revenue Bonds (Mortgage-Backed | ||||||
| Securities Program), AMT, Series B-2, 5.25% | ||||||
| due 12/01/2038 (b)(c) | 1,006 | |||||
| 450 | Wyandotte County, Kansas, Kansas City Unified | |||||
| Government Revenue Refunding Bonds (General | ||||||
| Motors Corporation Project), 6% due 6/01/2025 | 424 | |||||
|
|
|
|
| |||
| Kentucky — 2.5% | ||||||
| 1,725 | Trimble County, Kentucky, Environmental | |||||
| Facilities Revenue Refunding Bonds, 4.60% | ||||||
| due 6/01/2033 (a) | 1,686 | |||||
|
|
|
|
| |||
| Louisiana — 1.5% | ||||||
| 1,000 | Louisiana Local Government Environmental | |||||
| Facilities and Community Development Authority | ||||||
| Revenue Bonds (Westlake Chemical Corporation), 6.75% | ||||||
| due 11/01/2032 | 991 | |||||
|
|
|
|
| |||
| Maine — 1.1% | ||||||
| 750 | Jay, Maine, Solid Waste Disposal, Revenue Refunding | |||||
| Bonds (International Paper Company Project), AMT, | ||||||
| Series A, 4.90% due 11/01/2017 | 717 | |||||
|
|
|
|
| |||
| Maryland — 3.9% | ||||||
| 540 | Baltimore, Maryland, Convention Center | |||||
| Hotel Revenue Bonds, Sub-Series B, 5.875% | ||||||
| due 9/01/2039 | 539 | |||||
| 500 | Howard County, Maryland, Retirement Community | |||||
| Revenue Refunding Bonds (Columbia Vantage House | ||||||
| Corporation), Series A, 5.25% due 4/01/2033 | 436 | |||||
| 1,000 | Maryland State Energy Financing Administration, | |||||
| Limited Obligation Revenue Bonds (Cogeneration- | ||||||
| AES Warrior Run), AMT, 7.40% due 9/01/2019 | 1,002 | |||||
| Maryland State Health and Higher Educational | ||||||
| Facilities Authority Revenue Bonds: | ||||||
| 500 | (King Farm Presbyterian Community), | |||||
| Series A, 5.30% due 1/01/2037 | 434 | |||||
| 250 | (Washington Christian Academy), 5.25% | |||||
| due 7/01/2018 | 242 | |||||
|
|
|
|
| |||
| Face | ||||||
| Amount | Municipal Bonds | Value | ||||
|
|
|
|
| |||
| Massachusetts — 2.8% | ||||||
| Massachusetts State Development Finance Agency | ||||||
| Revenue Bonds, Series A: | ||||||
| $ 390 | (Curry College), 5.25% due 3/01/2026 (e) | $ 369 | ||||
| 1,000 | (Linden Ponds, Inc. Facility), 5.75% | |||||
| due 11/15/2042 | 896 | |||||
| 645 | Massachusetts State Health and Educational | |||||
| Facilities Authority, Revenue Refunding Bonds | ||||||
| (Bay Cove Human Services Issue), Series A, 5.90% | ||||||
| due 4/01/2028 | 637 | |||||
|
|
|
|
| |||
| Michigan — 0.4% | ||||||
| 310 | Garden City, Michigan, Hospital Finance Authority, | |||||
| Hospital Revenue Refunding Bonds (Garden City | ||||||
| Hospital Obligation), Series A, 5% due 8/15/2038 | 248 | |||||
|
|
|
| ||||
| Mississippi — 0.6% | ||||||
| 500 | Mississippi Business Finance Corporation Revenue | |||||
| Bonds (Northrop Grumman Ship System), 4.55% | ||||||
| due 12/01/2028 | 440 | |||||
|
|
|
|
| |||
| Missouri — 0.9% | ||||||
| 600 | Kansas City, Missouri, Tax Increment Financing | |||||
| Commission, Tax Allocation Revenue Bonds | ||||||
| (Kansas City MainCor Project), Series A, 5.25% | ||||||
| due 3/01/2018 | 586 | |||||
|
|
|
|
| |||
| Nevada — 1.4% | ||||||
| 1,000 | Clark County, Nevada, IDR (Southwest Gas Corp. | |||||
| Project), AMT, Series A, 4.75% due 9/01/2036 (f) | 939 | |||||
|
|
|
| ||||
| New Hampshire — 2.6% | ||||||
| New Hampshire Health and Education Facilities | ||||||
| Authority, Revenue Refunding Bonds: | ||||||
| 950 | (Havenwood-Heritage Heights Retirement | |||||
| Community), Series A, 5.40% due 1/01/2030 | 837 | |||||
| 1,015 | (Southern New Hampshire University), 5% | |||||
| due 1/01/2027 (e) | 902 | |||||
|
|
|
|
| |||
| New Jersey — 7.0% | ||||||
| 750 | Burlington County, New Jersey, Bridge Commission, | |||||
| EDR, Refunding (The Evergreens Project), 5.625% | ||||||
| due 1/01/2038 | 692 | |||||
| 1,140 | New Jersey EDA, Cigarette Tax Revenue Bonds, 5.50% | |||||
| due 6/15/2024 | 1,103 | |||||
| 1,000 | New Jersey EDA, Retirement Community Revenue | |||||
| Refunding Bonds (Seabrook Village, Inc.), 5.25% | ||||||
| due 11/15/2036 | 851 | |||||
| 490 | New Jersey EDA, Special Facility Revenue Bonds | |||||
| (Continental Airlines Inc. Project), AMT, 6.625% | ||||||
| due 9/15/2012 | 488 | |||||
| 650 | New Jersey Health Care Facilities Financing Authority, | |||||
| Revenue Bonds (Pascack Valley Hospital Association), | ||||||
| 6.625% due 7/01/2036 | 351 | |||||
| 1,000 | New Jersey Health Care Facilities Financing Authority | |||||
| Revenue Refunding Bonds (South Jersey Hospital | ||||||
| System), 5% due 7/01/2046 | 962 | |||||
| 385 | Tobacco Settlement Financing Corporation of New | |||||
| Jersey, Asset-Backed Revenue Refunding Bonds, | ||||||
| Series 1A, 5% due 6/01/2041 | 321 | |||||
|
|
|
|
| |||
| BLACKROCK MUNICIPAL BOND FUND, INC. |
| DECEMBER 31, 2007 |
| 35 |
| Schedule of Investments (continued) BlackRock High Yield Municipal Fund (In Thousands) |
| Face | ||||||
| Amount | Municipal Bonds | Value | ||||
|
|
|
|
| |||
| New York — 4.3% | ||||||
| $ 500 | Genesee County, New York, IDA, Civic Facility Revenue | |||||
| Refunding Bonds (United Memorial Medical Center | ||||||
| Project), 5% due 12/01/2032 | $ 428 | |||||
| 750 | New York City, New York, City IDA, Special Facility | |||||
| Revenue Bonds (JetBlue Airways Corporation Project), | ||||||
| AMT, 5.125% due 5/15/2030 | 601 | |||||
| 1,000 | New York Liberty Development Corporation Revenue | |||||
| Bonds (National Sports Museum Project), | ||||||
| Series A, 6.125% due 2/15/2019 | 993 | |||||
| 1,000 | New York State Dormitory Authority, Non-State | |||||
| Supported Debt, Revenue Refunding Bonds | ||||||
| (New York University Hospital Center), Series A, 5% | ||||||
| due 7/01/2026 | 928 | |||||
|
|
|
|
| |||
| North Carolina — 1.4% | ||||||
| 1,000 | Ward County, North Dakota, Health Care Facility | |||||
| Revenue Refunding Bonds (Trinity Health Obligated | ||||||
| Group), 5.125% due 7/01/2029 | 955 | |||||
|
|
|
|
| |||
| Ohio — 3.4% | ||||||
| 800 | Buckeye Tobacco Settlement Financing Authority, | |||||
| Ohio, Tobacco Settlement Asset-Backed Bonds, | ||||||
| Series A-2, 6.50% due 6/01/2047 | 822 | |||||
| 875 | Richland County, Ohio, Hospital Facilities Revenue | |||||
| Refunding Bonds (MedCentral Health System), 5.25% | ||||||
| due 11/15/2036 | 858 | |||||
| 600 | Trumbull County, Ohio, Health Care Facilities Revenue | |||||
| Bonds (Shepherd of the Valley), VRDN, 3.63% | ||||||
| due 10/01/2031 (h)(k) | 600 | |||||
|
|
|
|
| |||
| Pennsylvania — 1.7% | ||||||
| 735 | Allegheny County, Pennsylvania, Hospital Development | |||||
| Authority, Health System Revenue Refunding Bonds | ||||||
| (West Penn Allegheny Health System), Series A, 5.375% | ||||||
| due 11/15/2040 | 636 | |||||
| 500 | Harrisburg, Pennsylvania, Authority, University Revenue | |||||
| Bonds (Harrisburg University of Science), Series B, 6% | ||||||
| due 9/01/2036 | 495 | |||||
|
|
|
|
| |||
| Rhode Island — 1.3% | ||||||
| 1,000 | Rhode Island Housing and Mortgage Finance | |||||
| Corporation, Homeownership Opportunity Revenue | ||||||
| Bonds, AMT, Series 53-B, 5% due 10/01/2046 | 915 | |||||
|
|
|
|
| |||
| South Carolina — 2.2% | ||||||
| 1,000 | Connector 2000 Association, Inc., South Carolina, | |||||
| Toll Road and Capital Appreciation Revenue Bonds, | ||||||
| Senior-Series B, 7.97% due 1/01/2015 (j) | 526 | |||||
| 500 | Myrtle Beach, South Carolina, Tax Increment Revenue | |||||
| Bonds (Myrtle Beach Air Force Base), Series A, 5.25% | ||||||
| due 11/01/2026 | 447 | |||||
| 600 | South Carolina Jobs, EDA, Health Care Facilities, First | |||||
| Mortgage Revenue Refunding Bonds (Lutheran | ||||||
| Homes), 5.50% due 5/01/2028 | 542 | |||||
|
|
|
|
| |||
| Tennessee — 1.0% | ||||||
| 700 | Sullivan County, Tennessee, Health, Educational & | |||||
| Housing Facilities Board, Hospital Revenue Bonds | ||||||
| (Wellmont Health System Project), Series C, 5.25% | ||||||
| due 9/01/2036 | 660 | |||||
|
|
|
|
| |||
| Face | ||||||
| Amount | Municipal Bonds | Value | ||||
|
|
|
|
| |||
| Texas — 7.4% | ||||||
| $ 1,000 | Alliance Airport Authority, Inc., Texas, Special Facilities | |||||
| Revenue Refunding Bonds (American Airlines Inc. | ||||||
| Project), AMT, 5.75% due 12/01/2029 | $ 829 | |||||
| 500 | Brazos River Authority, Texas, PCR (TXU Energy | |||||
| Company LLC Project), AMT, 5% due 3/01/2041 | 361 | |||||
| 655 | HFDC of Central Texas, Inc., Retirement Facilities | |||||
| Revenue Bonds, Series A, 5.75% due 11/01/2036 | 585 | |||||
| 1,000 | Harlandale, Texas, Independent School District, | |||||
| School Building, GO (Permanent School Fund Bond | ||||||
| Guarantee Program), 4.75% due 8/15/2040 | 993 | |||||
| 500 | Houston, Texas, Airport System, Special Facilities | |||||
| Revenue Bonds (Continental Airlines), AMT, | ||||||
| Series E, 7.375% due 7/01/2022 | 517 | |||||
| 1,000 | Mission, Texas, Economic Development Corporation, | |||||
| Solid Waste Disposal Revenue Bonds (Allied Waste | ||||||
| N.A. Inc Project), Series A, 5.20% due 4/01/2018 | 909 | |||||
| 1,000 | Texas State Public Financing Authority, Charter School | |||||
| Financing Corporation, Revenue Refunding Bonds | ||||||
| (KIPP, Inc.), Series A, 5% due 2/15/2036 (e) | 838 | |||||
|
|
|
|
| |||
| Utah — 0.0% | ||||||
| 15 | Utah Housing Corporation, S/F Mortgage Revenue | |||||
| Bonds, AMT, Series A-1, Class I, 5% due 7/01/2037 | 14 | |||||
|
|
|
| ||||
| Virginia — 8.2% | ||||||
| 1,150 | Albemarle County, Virginia, IDA, Residential Care | |||||
| Facilities, Mortgage Revenue Refunding Bonds | ||||||
| (Westminster-Canterbury), 5% due 1/01/2031 | 1,010 | |||||
| 300 | Fairfax County, Virginia, EDA, Residential Care | |||||
| Facilities, Mortgage Revenue Refunding Bonds | ||||||
| (Goodwin House, Inc.), 5.125% due 10/01/2042 | 271 | |||||
| 500 | Fairfax County, Virginia, EDA, Retirement Revenue | |||||
| Refunding Bonds (Greenspring Village Inc.), | ||||||
| Series A, 4.875% due 10/01/2036 | 448 | |||||
| 500 | Farms of New Kent Community Development | |||||
| Authority, Virginia, Special Assessment Bonds, | ||||||
| Series C, 5.80% due 3/01/2036 | 450 | |||||
| 450 | Henrico County, Virginia, EDA, Residential Care | |||||
| Facility, Mortgage Revenue Refunding Bonds | ||||||
| (Westminster-Canterbury Of Winchester, Inc.), 5% | ||||||
| due 10/01/2027 | 424 | |||||
| 210 | Lexington, Virginia, IDA, Residential Care Facility, | |||||
| Mortgage Revenue Refunding Bonds (Kendal at | ||||||
| Lexington), Series A, 5.375% due 1/01/2028 | 191 | |||||
| 750 | Lynchburg, Virginia, IDA, Residential Care Facility, | |||||
| Mortgage Revenue Refunding Bonds (Westminster- | ||||||
| Canterbury), 5% due 7/01/2031 | 635 | |||||
| 500 | Tobacco Settlement Financing Corporation of Virginia, | |||||
| Revenue Refunding Bonds, Senior Series B-1, 5% | ||||||
| due 6/01/2047 | 415 | |||||
| 1,000 | Virginia State, HDA, Commonwealth Mortgage | |||||
| Revenue Bonds, Series H, Sub-Series H-1, 5.35% | ||||||
| due 7/01/2031 (g) | 1,018 | |||||
| 750 | Watkins Centre Community Development Authority, | |||||
| Virginia, Revenue Bonds, 5.40% due 3/01/2020 | 723 | |||||
|
|
|
|
| |||
| Washington — 0.7% | ||||||
| 550 | Washington State Housing Financing Commission, | |||||
| Nonprofit Revenue Bonds (Skyline at First Hill | ||||||
| Project), Series A, 5.625% due 1/01/2038 | 495 | |||||
|
|
|
|
| |||
36 BLACKROCK MUNICIPAL BOND FUND, INC.
| DECEMBER 31, 2007 |
| Schedule of Investments (concluded) BlackRock High Yield Municipal Fund (In Thousands) |
| Face | ||||
| Amount | Municipal Bonds | Value | ||
|
|
|
| ||
| West Virginia — 1.4% | ||||
| $ 1,000 | Pleasants County, West Virginia, PCR, Refunding | |||
| (Allegheny Energy Supply Company, LLC), | ||||
| Series F, 5.25% due 10/15/2037 | $ 968 | |||
|
|
|
| ||
| Wisconsin — 0.7% | ||||
| 500 | Wisconsin State Health and Educational Facilities | |||
| Authority, Revenue Refunding Bonds (Franciscan | ||||
| Sisters Healthcare), 5% due 9/01/2026 | 456 | |||
|
|
|
| ||
| Total Municipal Bonds | ||||
| (Cost — $72,040) — 96.9% | 65,833 | |||
|
|
|
| ||
| Face | Municipal Bonds Transferred to | |||
| Amount | Tender Options Bond Trusts (d) | Value | ||
|
|
|
| ||
| Virginia — 3.6% | ||||
| $ 2,410 | Virginia State, HDA, Commonwealth Mortgage | |||
| Revenue Bonds, Series H Sub-Series H-1, 5.375% | ||||
| due 7/01/2036 (g) | $ 2,446 | |||
|
|
|
| ||
| Total Municipal Bonds Transferred to Tender | ||||
| Option Bond Trusts (Cost — $2,454) — % | 2,446 | |||
|
|
|
| ||
| Total Investments (Cost — $74,494*) — 100.5% | 68,279 | |||
| Other Assets Less Liabilities — 1.3% | 857 | |||
| Liability for Trust Certifiates, Including Interest | ||||
| Expense Payable — (1.8%) | (1,206) | |||
|
| ||||
| Net Assets — 100.0% | $ 67,930 | |||
|
| ||||
| * | The cost and unrealized appreciation (depreciation) of investments as of December 31, 2007, as computed for federal income tax purposes, were as follows: |
| Aggregate cost | $ 73,290 | |
|
| ||
| Gross unrealized appreciation | $ 8 | |
| Gross unrealized depreciation | (6,224) | |
|
| ||
| Net unrealized depreciation | $ (6,216) | |
|
|
| (a) | AMBAC Insured. |
| (b) | FHLMC Collateralized. |
| (c) | FNMA/GNMA Collateralized. |
| (d) | Securities represent underlying bonds transferred to a separate securitization trust established in a tender option bond transaction in which the Fund may have acquired the residual interest certificates. These securities serve as collateral in a financing transaction. See Note 1(c) of the Notes to Financial Statements for details of muni- cipal bonds transferred to tender option bond trusts. |
| (e) | ACA Insured. |
| (f) | FGIC Insured. |
| (g) | MBIA Insured. |
| (h) | Radian Insured. |
| (i) | Non-income producing security; issuer filed for bankruptcy or is in default of interest payments. |
| (j) | Represents a zero coupon bond; the interest rate shown reflects the effective yield at the time of purchase. |
| (k) | Security may have a maturity of more than one year at time of issuance, but has vari- able rate and demand features that qualify it as a short-term security. The rate dis- closed is that currently in effect. This rate changes periodically based upon prevailing market rates. |
• Forward interest rate swaps outstanding as of December 31,2007 were as follows:
| Notional | Unrealized | |||
| Amount | Depreciation | |||
|
|
|
| ||
| Pay a fixed rate of 3.9765% and receive | ||||
| a floating rate based on 1-week (SIFMA) | ||||
| Municipal Swap Index rate | ||||
| Broker, JPMorganChase | ||||
| Expires January 2023 | $3,100 | ($117) | ||
|
|
|
| ||
• Financial futures contracts sold as of December 31,2007 were as follows:
| Number of | Expiration | Face | Unrealized | |||||
| Contracts | issue | Date | Value | Depreciation | ||||
|
|
|
|
|
| ||||
| 10-Year | ||||||||
| U.S. Treasury | March | |||||||
| 75 | Bond | 2008 | $8,455 | $(49) | ||||
|
|
|
|
|
| ||||
| See Notes to Financial Statements. |
| BLACKROCK MUNICIPAL BOND FUND, INC. |
| DECEMBER 31, 2007 |
| 37 |
| Statements of Assets and Liabilities | ||||||||
| BlackRock | BlackRock | BlackRock | BlackRock | |||||
| Short-Term | Municipal | National | High Yield | |||||
| Municipal | Insured | Municipal | Municipal | |||||
| As of December 31, 2007 (Unaudited) | Fund | Fund | Fund | Fund | ||||
|
|
|
|
|
| ||||
| Assets | ||||||||
|
|
|
|
|
| ||||
| Investments in unaffiliated securities, at value* | $ 253,947,276 | $ 927,099,142 | $1,770,635,960 | $ 68,278,557 | ||||
| Investments in affiliated securities, at value** | 12,520,981 | 35,172,840 | 439,643 | — | ||||
| Cash | 92,203 | 66,482 | 39,628 | 6,421 | ||||
| Receivables: | ||||||||
| Interest | 4,188,103 | 14,769,876 | 28,324,029 | 1,104,634 | ||||
| Securities sold | — | — | 26,968,990 | — | ||||
| Capital shares sold | 918,157 | 2,559,701 | 19,347,702 | 294,294 | ||||
| Variation margin | — | — | — | 82,031 | ||||
| Prepaid expenses and other assets | 32,357 | 854,636 | 136,573 | 28,289 | ||||
|
|
|
|
| |||||
| Total assets | 271,699,077 | 980,522,677 | 1,845,892,525 | 69,794,226 | ||||
|
|
|
|
|
| ||||
| Liabilities | ||||||||
|
|
|
|
|
| ||||
| Trust certificates‡ | — | 117,268,292 | 106,893,871 | 1,205,000 | ||||
| Unrealized depreciation on forward interest rate swaps | — | 313,420 | — | 117,481 | ||||
| Payables: | ||||||||
| Securities purchased | — | 10,071,372 | 44,423,986 | — | ||||
| Dividends to shareholders | 712,724 | 2,722,256 | 5,256,659 | 292,070 | ||||
| Capital shares redeemed | 259,150 | 985,638 | 4,165,322 | 165,494 | ||||
| Interest expense | — | 1,230,069 | 1,158,836 | 1,229 | ||||
| Investment adviser | 43,386 | 268,937 | 683,997 | 34,901 | ||||
| Distributor | 18,331 | 104,217 | 287,110 | 4,157 | ||||
| Other affiliates | 25,467 | 75,495 | 262,478 | 2,677 | ||||
| Accrued expenses and other liabilities | 20,913 | 103,060 | 121,454 | 40,787 | ||||
|
|
|
|
| |||||
| Total liabilities | 1,079,971 | 133,142,756 | 163,253,713 | 1,863,796 | ||||
|
|
|
|
|
| ||||
| Net Assets | ||||||||
|
|
|
|
|
| ||||
| Net assets | $ 270,619,106 | $ 847,379,921 | $1,682,638,812 | $ 67,930,430 | ||||
|
|
|
|
|
| ||||
| Net Assets Consist of | ||||||||
|
|
|
|
|
| ||||
| BlackRock Common Stock, $.10 par value† | $ 22,953 | — | — | — | ||||
| Institutional Common Stock, $.10 par value†† | 1,331,531 | $ 7,573,284 | $ 9,685,704 | $ 653,475 | ||||
| Investor A Common Stock, $.10 par value††† | 83,690 | 2,223,429 | 4,004,890 | 48,716 | ||||
| Investor A1 Common Stock, $.10 par value†††† | 1,104,007 | — | — | — | ||||
| Investor B Common Stock, $.10 par value††††† | 124,088 | 531,066 | 825,116 | — | ||||
| Investor C Common Stock, $.10 par value†††††† | 46,643 | 114,909 | 648,073 | 40,973 | ||||
| Investor C1 Common Stock, $.10 par value††††††† | — | 615,693 | 1,249,454 | — | ||||
| Paid-in capital in excess of par | 275,008,807 | 811,650,713 | 1,676,655,054 | 74,331,678 | ||||
| Undistributed investment income — net | 484,004 | 2,688,996 | 768,438 | 101,874 | ||||
| Accumulated realized capital losses — net | (9,510,991) | (1,988,911) | (33,352,407) | (863,493) | ||||
| Unrealized appreciation (depreciation) — net | 1,924,374 | 23,970,742 | 22,154,490 | (6,382,793) | ||||
|
|
|
|
| |||||
| Net Assets | $ 270,619,106 | $ 847,379,921 | $1,682,638,812 | $ 67,930,430 | ||||
|
|
|
|
| |||||
38 BLACKROCK MUNICIPAL BOND FUND, INC.
| DECEMBER 31, 2007 |
| Statements of Assets and Liabilities (concluded) | ||||||||
| BlackRock | BlackRock | BlackRock | BlackRock | |||||
| Short-Term | Municipal | National | High Yield | |||||
| Municipal | Insured | Municipal | Municipal | |||||
| As of December 31, 2007 (Unaudited) | Fund | Fund | Fund | Fund | ||||
|
|
|
|
|
| ||||
| Net Asset Value | ||||||||
|
|
|
|
|
| ||||
| BlackRock: | ||||||||
| Net assets | $ 2,290,362 | — | — | — | ||||
|
|
|
|
| |||||
| Shares outstanding | 229,532 | — | — | — | ||||
|
|
|
|
| |||||
| Net asset value and redemption price per share | $ 9.98 | — | — | — | ||||
|
|
|
|
| |||||
| Institutional: | ||||||||
| Net assets | $ 132,769,175 | $ 580,393,822 | $ 992,826,912 | $ 59,737,524 | ||||
|
|
|
|
| |||||
| Shares outstanding | 13,315,305 | 75,732,842 | 96,857,043 | 6,534,748 | ||||
|
|
|
|
| |||||
| Net asset value and redemption price per share | $ 9.97 | $ 7.66 | $ 10.25 | $ 9.14 | ||||
|
|
|
|
| |||||
| Investor A: | ||||||||
| Net assets | $ 8,349,491 | $ 170,340,098 | $ 410,710,033 | $ 4,447,028 | ||||
|
|
|
|
| |||||
| Shares outstanding | 836,902 | 22,234,290 | 40,048,902 | 487,156 | ||||
|
|
|
|
| |||||
| Net asset value and redemption price per share | $ 9.98 | $ 7.66 | $ 10.26 | $ 9.13 | ||||
|
|
|
|
| |||||
| Investor A1: | ||||||||
| Net assets | $ 110,182,666 | — | — | — | ||||
|
|
|
|
| |||||
| Shares outstanding | 11,040,075 | — | — | — | ||||
|
|
|
|
| |||||
| Net asset value and redemption price per share | $ 9.98 | — | — | — | ||||
|
|
|
|
| |||||
| Investor B: | ||||||||
| Net assets | $ 12,375,069 | $ 40,670,050 | $ 84,544,731 | — | ||||
|
|
|
|
| |||||
| Shares outstanding | 1,240,885 | 5,310,661 | 8,251,156 | — | ||||
|
|
|
|
| |||||
| Net asset value and redemption price per share | $ 9.97 | $ 7.66 | $ 10.25 | — | ||||
|
|
|
|
| |||||
| Investor C: | ||||||||
| Net assets | $ 4,652,343 | $ 8,812,448 | $ 66,465,892 | $ 3,745,878 | ||||
|
|
|
|
| |||||
| Shares outstanding | 466,425 | 1,149,091 | 6,480,731 | 409,726 | ||||
|
|
|
|
| |||||
| Net asset value and redemption price per share | $ 9.97 | $ 7.67 | $ 10.26 | $ 9.14 | ||||
|
|
|
|
| |||||
| Investor C1: | ||||||||
| Net assets | — | $ 47,163,503 | $ 128,091,244 | — | ||||
|
|
|
|
| |||||
| Shares outstanding | — | 6,156,926 | 12,494,537 | — | ||||
|
|
|
|
| |||||
| Net asset value and redemption price per share | — | $ 7.66 | $ 10.25 | — | ||||
|
|
|
|
| |||||
| * Identified cost for unaffiliated securities | $ 252,022,902 | $ 900,406,896 | $1,748,481,470 | $ 74,494,486 | ||||
|
|
|
|
| |||||
| ** Identified cost for affiliated securities | $ 12,520,981 | $ 37,580,924 | $ 439,643 | — | ||||
|
|
|
|
| |||||
| † Authorized shares — BlackRock | 150,000,000 | — | — | — | ||||
|
|
|
|
| |||||
| †† Authorized shares — Institutional | 150,000,000 | 500,000,000 | 375,000,000 | 100,000,000 | ||||
|
|
|
|
| |||||
| ††† Authorized shares — Investor A | 150,000,000 | 500,000,000 | 375,000,000 | 100,000,000 | ||||
|
|
|
|
| |||||
| †††† Authorized shares — Investor A1 | 150,000,000 | — | — | — | ||||
|
|
|
|
| |||||
| ††††† Authorized shares — Investor B | 150,000,000 | 375,000,000 | 375,000,000 | — | ||||
|
|
|
|
| |||||
| †††††† Authorized shares — Investor C | 150,000,000 | 375,000,000 | 375,000,000 | 100,000,000 | ||||
|
|
|
|
| |||||
| ††††††† Authorized shares — Investor C1 | — | 375,000,000 | 375,000,000 | — | ||||
|
|
|
|
| |||||
| ‡ Represents short-term floating rate certificates issued by tender option bond trusts. | ||||||||
| See Notes to Financial Statements. | ||||||||
| BLACKROCK MUNICIPAL BOND FUND, INC. |
| DECEMBER 31, 2007 |
| 39 |
| Statements of Operations | ||||||||
| BlackRock | BlackRock | BlackRock | BlackRock | |||||
| Short-Term | Municipal | National | High Yield | |||||
| Municipal | Insured | Municipal | Municipal | |||||
| For the Six Months Ended December 31, 2007 (Unaudited) | Fund | Fund | Fund | Fund | ||||
|
|
|
|
|
| ||||
| Investment Income | ||||||||
|
|
|
|
|
| ||||
| Interest | $ 4,838,068 | $ 22,876,095 | $ 44,687,115 | $ 1,977,054 | ||||
| Dividends from affiliates | 235,638 | 610,467 | 647,209 | — | ||||
|
|
|
|
| |||||
| Total income | 5,073,706 | 23,486,562 | 45,334,324 | 1,977,054 | ||||
|
|
|
|
|
| ||||
| Expenses | ||||||||
|
|
|
|
|
| ||||
| Investment advisory fees | 452,032 | 1,582,395 | 3,899,742 | 204,156 | ||||
| Interest expense and fees | — | 2,235,950 | 2,517,219 | 2,309 | ||||
| Service and distribution fees — Investor C1 | — | 199,129 | 541,226 | — | ||||
| Service and distribution fees — Investor B | 23,887 | 159,494 | 350,722 | — | ||||
| Service fees — Investor A | 5,366 | 214,953 | 454,596 | 7,241 | ||||
| Transfer agent fees — Institutional | 30,812 | 104,476 | 328,869 | 3,439 | ||||
| Accounting services | 50,421 | 132,419 | 237,063 | 18,409 | ||||
| Registration fees | 23,708 | 28,673 | 50,727 | 20,918 | ||||
| Transfer agent fees — Investor A | 2,697 | 38,272 | 73,851 | 264 | ||||
| Printing and shareholder reports | 10,366 | 26,390 | 57,266 | 1,305 | ||||
| Professional fees | 24,283 | 28,173 | 33,727 | 23,434 | ||||
| Service and distribution fees — Investor C | 15,757 | 29,352 | 274,116 | 17,578 | ||||
| Custodian fees | 13,218 | 28,848 | 49,039 | 5,201 | ||||
| Service fees — Investor A1 | 57,884 | — | — | — | ||||
| Transfer agent fees — Investor C1 | — | 11,592 | 36,447 | — | ||||
| Transfer agent fees — Investor B | 4,066 | 12,864 | 31,440 | — | ||||
| Pricing services | 4,897 | 12,271 | 32,096 | 10,548 | ||||
| Directors’ fees and expenses | 8,847 | 16,419 | 14,507 | 7,229 | ||||
| Transfer agent fees — Investor A1 | 22,972 | — | — | — | ||||
| Transfer agent fees — Investor C | 6,531 | 1,275 | 25,260 | 738 | ||||
| Transfer agent fees — BlackRock | 146 | — | — | — | ||||
| Other | 11,788 | 22,235 | 34,333 | 7,511 | ||||
|
|
|
|
| |||||
| Total expenses before waiver | 769,678 | 4,885,180 | 9,042,246 | 330,280 | ||||
| Waiver of expenses | (195,278) | (9,305) | (37,643) | (20,094) | ||||
|
|
|
|
| |||||
| Total expenses after waiver | 574,400 | 4,875,875 | 9,004,603 | 310,186 | ||||
|
|
|
|
| |||||
| Investment income — net | 4,499,306 | 18,610,687 | 36,329,721 | 1,666,868 | ||||
|
|
|
|
|
| ||||
| Realized & Unrealized Gain (Loss) — Net | ||||||||
|
|
|
|
|
| ||||
| Realized gain (loss) on: | ||||||||
| Investments — net | 7,524 | 3,415,930 | (2,632,448) | (772,541) | ||||
| Forward interest rate swaps — net | — | (655,000) | — | (90,947) | ||||
|
|
|
|
| |||||
| Total realized gain (loss) — net | 7,524 | 2,760,930 | (2,632,448) | (863,488) | ||||
|
|
|
|
| |||||
| Change in unrealized appreciation/depreciation on: | ||||||||
| Investments — net | 2,440,378 | (1,525,096) | (18,679,154) | (5,282,655) | ||||
| Financial futures contracts and forward interest rate swaps — net | — | (603,820) | — | (154,632) | ||||
|
|
|
|
| |||||
| Total change in unrealized appreciation/depreciation — net | 2,440,378 | (2,128,916) | (18,679,154) | (5,437,287) | ||||
|
|
|
|
| |||||
| Total realized and unrealized gain (loss) — net | 2,447,902 | 632,014 | (21,311,602) | (6,300,775) | ||||
|
|
|
|
| |||||
| Net Increase (Decrease) in Net Assets Resulting from Operations | $ 6,947,208 | $ 19,242,701 | $ 15,018,119 | $ (4,633,907) | ||||
|
|
|
|
| |||||
| See Notes to Financial Statements. | ||||||||
40 BLACKROCK MUNICIPAL BOND FUND, INC.
| DECEMBER 31, 2007 |
| Statements of Changes in Net Assets | BlackRock Short-Term Municipal Fund | |||
| For the | For the | |||
| Six Months Ended | Year Ended | |||
| December 31, 2007 | June 30, | |||
| Increase (Decrease) in Net Assets: | (Unaudited) | 2007 | ||
|
|
|
| ||
| Operations | ||||
|
|
|
| ||
| Investment income — net | $ 4,499,306 | $ 9,759,232 | ||
| Realized gain (loss) — net | 7,524 | (1,713,793) | ||
| Change in unrealized appreciation/depreciation — net | 2,440,378 | 1,804,264 | ||
|
|
| |||
| Net increase in net assets resulting from operations | 6,947,208 | 9,849,703 | ||
|
|
|
| ||
| Dividends to Shareholders | ||||
|
|
|
| ||
| Investment income — net: | ||||
| BlackRock | (39,660) | (140,524) | ||
| Institutional | (2,225,059) | (4,626,244) | ||
| Investor A | (67,851) | (19,319) | ||
| Investor A1 | (1,919,517) | (4,174,606) | ||
| Investor B | (209,331) | (522,656) | ||
| Investor C | (37,888) | (18,188) | ||
| Class C† | — | (257,695) | ||
|
|
| |||
| Net decrease in net assets resulting from dividends to shareholders | (4,499,306) | (9,759,232) | ||
|
|
|
| ||
| Capital Share Transactions | ||||
|
|
|
| ||
| Net decrease in net assets derived from capital share transactions | (5,547,646) | (62,634,810) | ||
|
|
|
| ||
| Net Assets | ||||
|
|
|
| ||
| Total decrease in net assets | (3,099,744) | (62,544,339) | ||
| Beginning of period | 273,718,850 | 336,263,189 | ||
|
|
| |||
| End of period* | $ 270,619,106 | $ 273,718,850 | ||
|
|
| |||
| * Undistributed investment income — net | $ 484,004 | $ 484,004 | ||
|
|
| |||
†On August 25, 2006, Class C was converted to Class A (Investor A1).
See Notes to Financial Statements.
| BLACKROCK MUNICIPAL BOND FUND, INC. |
| DECEMBER 31, 2007 |
| 41 |
| Statements of Changes in Net Assets | BlackRock Municipal Insured Fund | |||
| For the | For the | |||
| Six Months Ended | Year Ended | |||
| December 31, 2007 | June 30, | |||
| Increase (Decrease) in Net Assets: | (Unaudited) | 2007 | ||
|
|
|
| ||
| Operations | ||||
|
|
|
| ||
| Investment income — net | $ 18,610,687 | $ 39,380,614 | ||
| Realized gain — net | 2,760,930 | 1,216,879 | ||
| Change in unrealized appreciation — net | (2,128,916) | 1,716,956 | ||
|
|
| |||
| Net increase in net assets resulting from operations | 19,242,701 | 42,314,449 | ||
|
|
|
| ||
| Dividends & Distributions to Shareholders | ||||
|
|
|
| ||
| Investment income — net: | ||||
| Institutional | (13,353,030) | (26,786,243) | ||
| Investor A | (3,628,651) | (6,958,170) | ||
| Investor B | (789,383) | (1,954,906) | ||
| Investor C | (101,703) | (53,001) | ||
| Investor C1 | (913,489) | (1,973,504) | ||
| Realized gain — net: | ||||
| Institutional | (1,052,942) | (3,420,292) | ||
| Investor A | (306,404) | (945,702) | ||
| Investor B | (73,110) | (299,416) | ||
| Investor C | (15,328) | (6,273) | ||
| Investor C1 | (86,569) | (312,142) | ||
|
|
| |||
| Net decrease in net assets resulting from dividends and distributions to shareholders | (20,320,609) | (42,709,649) | ||
|
|
|
| ||
| Capital Share Transactions | ||||
|
|
|
| ||
| Net decrease in net assets derived from capital share transactions | (29,995,250) | (60,444,977) | ||
|
|
|
| ||
| Net Assets | ||||
|
|
|
| ||
| Total decrease in net assets | (31,073,158) | (60,840,177) | ||
| Beginning of period | 878,453,079 | 939,293,256 | ||
|
|
| |||
| End of period* | $ 847,379,921 | $ 878,453,079 | ||
|
|
| |||
| * Undistributed investment income — net | $ 2,688,996 | $ 2,864,565 | ||
|
|
| |||
| See Notes to Financial Statements. | ||||
42 BLACKROCK MUNICIPAL BOND FUND, INC.
| DECEMBER 31, 2007 |
| Statements of Changes in Net Assets | BlackRock National Municipal Fund | |||
| For the | For the | |||
| Six Months Ended | Year Ended | |||
| December 31, 2007 | June 30, | |||
| Increase (Decrease) in Net Assets: | (Unaudited) | 2007 | ||
|
|
|
| ||
| Operations | ||||
|
|
|
| ||
| Investment income — net | $ 36,329,721 | $ 68,679,752 | ||
| Realized gain (loss) — net | (2,632,448) | 8,716,953 | ||
| Change in unrealized depreciation — net | (18,679,154) | (7,313,633) | ||
|
|
| |||
| Net increase in net assets resulting from operations | 15,018,119 | 70,083,072 | ||
|
|
|
| ||
| Dividends to Shareholders | ||||
|
|
|
| ||
| Investment income — net: | ||||
| Institutional | (23,044,309) | (43,499,106) | ||
| Investor A | (8,063,224) | (14,096,416) | ||
| Investor B | (1,829,822) | (4,665,176) | ||
| Investor C | (989,886) | (572,654) | ||
| Investor C1 | (2,618,241) | (5,809,148) | ||
|
|
| |||
| Net decrease in net assets resulting from dividends to shareholders | (36,545,482) | (68,642,500) | ||
|
|
|
| ||
| Capital Share Transactions | ||||
|
|
|
| ||
| Net increase in net assets derived from capital share transactions | 95,199,573 | 159,104,907 | ||
|
|
|
| ||
| Net Assets | ||||
|
|
|
| ||
| Total increase in net assets | 73,672,210 | 160,545,479 | ||
| Beginning of period | 1,608,966,602 | 1,448,421,123 | ||
|
|
| |||
| End of period* | $1,682,638,812 | $1,608,966,602 | ||
|
|
| |||
| * Undistributed investment income — net | $ 768,438 | $ 984,199 | ||
|
|
| |||
| See Notes to Financial Statements. | ||||
| BLACKROCK MUNICIPAL BOND FUND, INC. |
| DECEMBER 31, 2007 |
| 43 |
| Statement of Changes in Net Assets | BlackRock High Yield Municipal Fund | |||
| For the | For the Period | |||
| Six Months Ended | August 1, 2006† | |||
| December 31, 2007 | to June 30, | |||
| Increase (Decrease) in Net Assets: | (Unaudited) | 2007 | ||
|
|
|
| ||
| Operations | ||||
|
|
|
| ||
| Investment income — net | $ 1,666,868 | $ 2,089,925 | ||
| Realized gain — net | (863,488) | 162,355 | ||
| Change in unrealized appreciation/depreciation — net | (5,437,287) | (945,506) | ||
|
|
| |||
| Net increase in net assets resulting from operations | (4,633,907) | 1,306,774 | ||
|
|
|
| ||
| Dividends & Distributions to Shareholders | ||||
|
|
|
| ||
| Investment income — net: | ||||
| Institutional | (1,482,999) | (1,933,439) | ||
| Investor A | (123,771) | (73,543) | ||
| Investor C | (61,944) | (82,943) | ||
| Realized gain — net: | ||||
| Institutional | (135,095) | (9,444) | ||
| Investor A | (9,128) | (407) | ||
| Investor C | (7,832) | (454) | ||
|
|
| |||
| Net decrease in net assets resulting from dividends and distributions to shareholders | (1,820,769) | (2,100,230) | ||
|
|
|
| ||
| Capital Share Transactions | ||||
|
|
|
| ||
| Net increase in net assets derived from capital share transactions | 1,650,939 | 73,526,873 | ||
|
|
|
| ||
| Net Assets | ||||
|
|
|
| ||
| Total increase in net assets | (4,803,737) | 72,733,417 | ||
| Beginning of period | 72,734,167 | 750 | ||
|
|
| |||
| End of period* | $ 67,930,430 | $ 72,734,167 | ||
|
|
| |||
| * Undistributed investment income — net | $ 101,874 | $ 103,720 | ||
|
|
| |||
†Commencement of operations.
See Notes to Financial Statements.
44
BLACKROCK MUNICIPAL BOND FUND, INC.
| DECEMBER 31, 2007 |
| Financial Highlights | BlackRock Short-Term Municipal Fund | |||||
| BlackRock | ||||||
|
| ||||||
| For the Six | ||||||
| Months Ended | For the Period | |||||
| December 31, | October 2, 2006†† | |||||
| The following per share data and ratios have been derived | 2007 | to June 30, | ||||
| from information provided in the financial statements. | (Unaudited) | 2007 | ||||
|
|
|
|
| |||
| Per Share Operating Performance | ||||||
|
|
|
|
| |||
| Net asset value, beginning of period | $ 9.89 | $ 9.93 | ||||
|
|
| |||||
| Investment income — net† | .17 | .25 | ||||
| Realized and unrealized gain (loss) — net | .09 | (.04) | ||||
|
|
|
| ||||
| Total from investment operations | .26 | .21 | ||||
|
|
|
| ||||
| Less dividends from investment income — net | (.17) | (.25) | ||||
|
|
|
| ||||
| Net asset value, end of period | $ 9.98 | $ 9.89 | ||||
|
|
|
| ||||
| Total Investment Return | ||||||
|
|
|
|
| |||
| Based on net asset value per share | 2.62%** | 2.09%** | ||||
|
|
|
| ||||
| Ratios to Average Net Assets | ||||||
|
|
|
|
| |||
| Expenses, net of waiver | .41%* | .35%* | ||||
|
|
|
| ||||
| Expenses | .46%* | .45%* | ||||
|
|
|
| ||||
| Investment income — net | 3.35%* | 3.34%* | ||||
|
|
|
|
| |||
| Supplemental Data | ||||||
|
|
|
|
| |||
| Net assets, end of period (in thousands) | $ 2,290 | $ 2,457 | ||||
|
|
| |||||
| Portfolio turnover | 17% | 110% | ||||
|
|
|
| ||||
| * | Annualized. |
| ** | Aggregate total investment return. |
| † Based on average shares outstanding. |
††Commencement of operations.
See Notes to Financial Statements.
| BLACKROCK MUNICIPAL BOND FUND, INC. |
| DECEMBER 31, 2007 |
| 45 |
| Financial Highlights (continued) | BlackRock Short-Term Municipal Fund | |||||||||||||
| Institutional | ||||||||||||||
| For the Six | ||||||||||||||
| Months Ended | ||||||||||||||
| The following per share data and ratios have been derived | December 31, 2007 | For the Year Ended June 30, | ||||||||||||
| from information provided in the financial statements. | (Unaudited) | 2007 | 2006 | 2005 | 2004 | 2003 | ||||||||
|
|
|
|
|
|
|
|
| |||||||
| Per Share Operating Performance | ||||||||||||||
|
|
|
|
|
|
|
|
| |||||||
| Net asset value, beginning of period | $ 9.88 | $ 9.88 $ | 9.99 | $ 10.05 | $ 10.17 | $ 10.13 | ||||||||
|
|
|
|
|
|
| |||||||||
| Investment income — net† | .17 | .32 | .27 | .19 | .18 | .27 | ||||||||
| Realized and unrealized gain (loss) — net | .09 | —†† | (.11) | (.06) | (.12) | .02 | ||||||||
|
|
|
|
|
|
|
| ||||||||
| Total from investment operations | .26 | .32 | .16 | .13 | .06 | .29 | ||||||||
|
|
|
|
|
|
|
| ||||||||
| Less dividends from investment income — net | (.17) | (.32) | (.27) | (.19) | (.18) | (.25) | ||||||||
|
|
|
|
|
|
|
| ||||||||
| Net asset value, end of period | $ 9.97 | $ 9.88 $ | 9.88 | $ 9.99 | $ 10.05 | $ 10.17 | ||||||||
|
|
|
|
|
|
|
| ||||||||
| Total Investment Return** | ||||||||||||||
|
|
|
|
|
|
|
|
| |||||||
| Based on net asset value per share | 2.65%‡ | 3.32% | 1.57% | 1.30% | .59% | 2.87% | ||||||||
|
|
|
|
|
|
|
|
| |||||||
| Ratios to Average Net Assets | ||||||||||||||
|
|
|
|
|
|
|
|
| |||||||
| Expenses, net of waiver | .35%* | .38% | .44% | .43% | .42% | .42% | ||||||||
|
|
|
|
|
|
|
| ||||||||
| Expenses | .49%* | .48% | .45% | .44% | .43% | .43% | ||||||||
|
|
|
|
|
|
|
| ||||||||
| Investment income — net | 3.41%* | 3.27% | 2.66% | 1.88% | 1.78% | 2.44% | ||||||||
|
|
|
|
|
|
|
|
| |||||||
| Supplemental Data | ||||||||||||||
|
|
|
|
|
|
|
|
| |||||||
| Net assets, end of period (in thousands) | $ 132,769 | $ 131,061 | $ 149,333 | $ 186,877 | $ 243,443 | $ 251,137 | ||||||||
|
|
|
|
|
|
|
| ||||||||
| Portfolio turnover | 17% | 110% | 83% | 87% | 69% | 45% | ||||||||
|
|
|
|
|
|
|
| ||||||||
| * | Annualized. |
| ** | Total investment returns exclude the effects of any sales charges. |
| † Based on average shares outstanding. |
††Amount is less than $.01 per share.
‡ Aggregate total investment return.
See Notes to Financial Statements.
46
BLACKROCK MUNICIPAL BOND FUND, INC.
| DECEMBER 31, 2007 |
| Financial Highlights (continued) | BlackRock Short-Term Municipal Fund | |||
| Investor A | ||||
|
| ||||
| For the Six | ||||
| Months Ended | For the Period | |||
| December 31, October 2, 2006†† | ||||
| The following per share data and ratios have been derived | 2007 | to June 30, | ||
| from information provided in the financial statements. | (Unaudited) | 2007 | ||
|
|
|
| ||
| Per Share Operating Performance | ||||
|
|
|
| ||
| Net asset value, beginning of period | $ 9.88 | $ 9.93 | ||
|
|
| |||
| Investment income — net† | .15 | .23 | ||
| Realized and unrealized gain (loss) — net | .11 | (.05) | ||
|
|
| |||
| Total from investment operations | .26 | .18 | ||
|
|
| |||
| Less dividends from investment income — net | (.16) | (.23) | ||
|
|
| |||
| Net asset value, end of period | $ 9.98 | $ 9.88 | ||
|
|
|
| ||
| Total Investment Return** | ||||
|
|
|
| ||
| Based on net asset value per share | 2.62%‡ | 1.79%‡ | ||
|
|
|
| ||
| Ratios to Average Net Assets | ||||
|
|
|
| ||
| Expenses, net of waiver | .60%* | .61%* | ||
|
|
| |||
| Expenses | .82%* | 1.06%* | ||
|
|
| |||
| Investment income — net | 3.16%* | 3.12%* | ||
|
|
|
| ||
| Supplemental Data | ||||
|
|
|
| ||
| Net assets, end of period (in thousands) | $ 8,349 | $ 1,456 | ||
|
|
| |||
| Portfolio turnover | 17% | 110% | ||
|
|
| |||
| * | Annualized. |
| ** | Total investment returns exclude the effects of sales charges. |
| † Based on average shares outstanding. |
††Commencement of operations.
‡ Aggregate total investment return.See Notes to Financial Statements.
| BLACKROCK MUNICIPAL BOND FUND, INC. |
| DECEMBER 31, 2007 |
| 47 |
| Financial Highlights (continued) | BlackRock Short-Term Municipal Fund | |||||||||||||
| Investor A1 | ||||||||||||||
| For the Six | ||||||||||||||
| Months Ended | ||||||||||||||
| The following per share data and ratios have been derived | December 31, 2007 | For the Year Ended June 30, | ||||||||||||
| from information provided in the financial statements. | (Unaudited) | 2007 | 2006 | 2005 | 2004 | 2003 | ||||||||
|
|
|
|
|
|
|
|
| |||||||
| Per Share Operating Performance | ||||||||||||||
|
|
|
|
|
|
|
|
| |||||||
| Net asset value, beginning of period | $ 9.89 | $ 9.89 | $ 10.00 | $ 10.06 | $ 10.18 | $ 10.14 | ||||||||
|
|
|
|
|
|
| |||||||||
| Investment income — net† | .17 | .32 | .26 | .18 | .17 | .24 | ||||||||
| Realized and unrealized gain (loss) — net | .08 | (.01) | (.11) | (.06) | (.12) | .04 | ||||||||
|
|
|
|
|
|
|
| ||||||||
| Total from investment operations | .25 | .31 | .15 | .12 | .05 | .28 | ||||||||
|
|
|
|
|
|
|
| ||||||||
| Less dividends from investment income — net | (.16) | (.31) | (.26) | (.18) | (.17) | (.24) | ||||||||
|
|
|
|
|
|
|
| ||||||||
| Net asset value, end of period | $ 9.98 | $ 9.89 | $ 9.89 | $ 10.00 | $ 10.06 | $ 10.18 | ||||||||
|
|
|
|
|
|
|
| ||||||||
| Total Investment Return* | ||||||||||||||
|
|
|
|
|
|
|
|
| |||||||
| Based on net asset value per share | 2.60%‡ | 3.21% | 1.47% | 1.20% | .50% | 2.77% | ||||||||
|
|
|
|
|
|
|
|
| |||||||
| Ratios to Average Net Assets | ||||||||||||||
|
|
|
|
|
|
|
|
| |||||||
| Expenses, net of waiver | .45%** | .48% | .54% | .53% | .52% | .52% | ||||||||
|
|
|
|
|
|
| |||||||||
| Expenses | .58%** | .58% | .55% | .54% | .53% | .53% | ||||||||
|
|
|
|
|
|
| |||||||||
| Investment income — net | 3.31%** | 3.18% | 2.55% | 1.76% | 1.68% | 2.31% | ||||||||
|
|
|
|
|
|
|
| ||||||||
| Supplemental Data | ||||||||||||||
|
|
|
|
|
|
|
|
| |||||||
| Net assets, end of period (in thousands) | $ 110,183 | $ 122,281 | $ 99,293 | $ 141,172 | $ 244,741 | $ 248,454 | ||||||||
|
|
|
|
|
|
| |||||||||
| Portfolio turnover | 17% | 110% | 83% | 87% | 69% | 45% | ||||||||
|
|
|
|
|
|
|
| ||||||||
| * | Total investment returns exclude the effects of sales charges. |
| ** | Annualized. |
| † Based on average shares outstanding. |
††Aggregate total investment return.
See Notes to Financial Statements.
48
BLACKROCK MUNICIPAL BOND FUND, INC.
| DECEMBER 31, 2007 |
| Financial Highlights (continued) | BlackRock Short-Term Municipal Fund | |||||||||||||||
| Investor B | ||||||||||||||||
| For the Six | ||||||||||||||||
| Months Ended | ||||||||||||||||
| The following per share data and ratios have been derived | December 31, 2007 | For the Year Ended June 30, | ||||||||||||||
| from information provided in the financial statements. | (Unaudited) | 2007 | 2006 | 2005 | 2004 | 2003 | ||||||||||
|
|
|
|
|
|
|
|
|
| ||||||||
| Per Share Operating Performance | ||||||||||||||||
|
|
|
|
|
|
|
|
|
| ||||||||
| Net asset value, beginning of period | $ 9.88 | $ 9.88 | $ 10.00 | $ 10.05 | $ 10.17 | $ 10.13 | ||||||||||
|
|
|
|
|
|
| |||||||||||
| Investment income — net† | .15 | .29 | .23 | .15 | .14 | .21 | ||||||||||
| Realized and unrealized gain (loss) — net | .09 | —†† | (.12) | (.05) | (.12) | .04 | ||||||||||
|
|
|
|
|
|
|
| ||||||||||
| Total from investment operations | .24 | .29 | .11 | .10 | .02 | .25 | ||||||||||
|
|
|
|
|
|
|
|
| |||||||||
| Less dividends from investment income — net | (.15) | (.29) | (.23) | (.15) | (.14) | (.21) | ||||||||||
|
|
|
|
|
|
|
|
| |||||||||
| Net asset value, end of period | $ 9.97 | $ 9.88 | $ 9.88 | $ 10.00 | $ 10.05 | $ 10.17 | ||||||||||
|
|
|
|
|
|
|
| ||||||||||
| Total Investment Return* | ||||||||||||||||
|
|
|
|
|
|
|
|
|
| ||||||||
| Based on net asset value per share | 2.47%‡ | 2.95% | 1.11% | 1.04% | .24% | 2.51% | ||||||||||
|
|
|
|
|
|
|
|
|
| ||||||||
| Ratios to Average Net Assets | ||||||||||||||||
|
|
|
|
|
|
|
|
|
| ||||||||
| Expenses, net of waiver | .70%** | .74% | .80% | .79% | .77% | .78% | ||||||||||
|
|
|
|
|
|
|
| ||||||||||
| Expenses | .85%** | .85% | .81% | .80% | .78% | .79% | ||||||||||
|
|
|
|
|
|
|
| ||||||||||
| Investment income — net | 3.06%** | 2.90% | 2.28% | 1.50% | 1.43% | 2.10% | ||||||||||
|
|
|
|
|
|
|
|
| |||||||||
| Supplemental Data | ||||||||||||||||
|
|
|
|
|
|
|
|
|
| ||||||||
| Net assets, end of period (in thousands) | $ 12,375 | $ 14,380 | $ 23,769 | $ 38,565 | $ 63,135 | $ 83,886 | ||||||||||
|
|
|
|
|
|
| |||||||||||
| Portfolio turnover | 17% | 110% | 83% | 87% | 69% | 45% | ||||||||||
|
|
|
|
|
|
|
|
| |||||||||
| * | Total investment returns exclude the effects of sales charges. |
| ** | Annualized. |
| † Based on average shares outstanding. |
††Amount is less than $(.01) per share.
‡ Aggregate total investment return.
See Notes to Financial Statements.
| BLACKROCK MUNICIPAL BOND FUND, INC. |
| DECEMBER 31, 2007 |
| 49 |
| Financial Highlights (continued) | BlackRock Short-Term Municipal Fund | |||
| Investor C | ||||
|
| ||||
| For the Six | ||||
| Months Ended | For the Period | |||
| December 31, October 2, 2006†† | ||||
| The following per share data and ratios have been derived | 2007 | to June 30, | ||
| from information provided in the financial statements. | (Unaudited) | 2007 | ||
|
|
|
| ||
| Per Share Operating Performance | ||||
|
|
|
| ||
| Net asset value, beginning of period | $ 9.88 | $ 9.93 | ||
|
|
| |||
| Investment income — net† | .12 | .17 | ||
| Realized and unrealized gain (loss) — net | .09 | (.05) | ||
|
|
| |||
| Total from investment operations | .21 | .12 | ||
|
|
| |||
| Less dividends from investment income — net | (.12) | (.17) | ||
|
|
| |||
| Net asset value, end of period | $ 9.97 | $ 9.88 | ||
|
|
|
| ||
| Total Investment Return** | ||||
|
|
|
| ||
| Based on net asset value per share | 2.14%‡ | 1.23%‡ | ||
|
|
|
| ||
| Ratios to Average Net Assets | ||||
|
|
|
| ||
| Expenses, net of waiver | 1.35%* | 1.36%* | ||
|
|
| |||
| Expenses | 1.86%* | 2.06%* | ||
|
|
| |||
| Investment income — net | 2.41%* | 2.37%* | ||
|
|
|
| ||
| Supplemental Data | ||||
|
|
|
| ||
| Net assets, end of period (in thousands) | $ 4,652 | $ 2,084 | ||
|
|
| |||
| Portfolio turnover | 17% | 110% | ||
|
|
| |||
| * | Annualized. |
| ** | Total investment returns exclude the effects of sales charges. |
| † Based on average shares outstanding. |
††Commencement of operations.
‡ Aggregate total investment return.
See Notes to Financial Statements.
50
BLACKROCK MUNICIPAL BOND FUND, INC.
| DECEMBER 31, 2007 |
| Financial Highlights (continued) | BlackRock Municipal Insured Fund | |||||||||||
| Institutional | ||||||||||||
|
|
|
|
|
| ||||||||
| For the Six | ||||||||||||
| Months Ended | ||||||||||||
| The following per share data and ratios have been derived | December 31, 2007 | For the Year Ended June 30, | ||||||||||
| from information provided in the financial statements. | (Unaudited) | 2007 | 2006 | 2005 | 2004 | 2003 | ||||||
|
|
|
|
|
|
|
| ||||||
| Per Share Operating Performance | ||||||||||||
|
|
|
|
|
|
|
| ||||||
| Net asset value, beginning of period | $ 7.67 | $7.69 | $ 8.00 | $ 7.70 | $ 8.07 | $ 7.80 | ||||||
|
|
|
|
|
|
| |||||||
| Investment income — net** | .17 | .32 | .35 | .36 | .40 | .41 | ||||||
| Realized and unrealized gain (loss) — net | —‡‡ | .03 | (.28) | .30 | (.37) | .27 | ||||||
|
|
|
|
|
|
| |||||||
| Total from investment operations | .17 | .35 | .07 | .66 | .03 | .68 | ||||||
|
|
|
|
|
|
| |||||||
| Less dividends and distributions: | ||||||||||||
| Investment income — net | (.17) | (.33) | (.35) | (.36) | (.40) | (.41) | ||||||
| Realized gain — net | (.01) | (.04) | (.03) | — | — | — | ||||||
|
|
|
|
|
|
| |||||||
| Total dividends and distributions | (.18) | (.37) | (.38) | (.36) | (.40) | (.41) | ||||||
|
|
|
|
|
|
| |||||||
| Net asset value, end of period | $ 7.66 | $7.67 | $ 7.69 | $ 8.00 | $ 7.70 | $ 8.07 | ||||||
|
|
|
|
|
|
|
| ||||||
| Total Investment Return* | ||||||||||||
|
|
|
|
|
|
|
| ||||||
| Based on net asset value per share | 2.31%‡ | 4.60% | .82% | 8.74% | .35% | 8.88% | ||||||
|
|
|
|
|
|
|
| ||||||
| Ratios to Average Net Assets | ||||||||||||
|
|
|
|
|
|
|
| ||||||
| Expenses, net of waiver and excluding interest expense and fees† | .47%†† | .47% | .45% | .46% | .46% | .46% | ||||||
|
|
|
|
|
|
| |||||||
| Expenses, net of waiver | .98%†† | .87% | .74% | .63% | .66% | .71% | ||||||
|
|
|
|
|
|
| |||||||
| Expenses | .98%†† | .87% | .74% | .64% | .67% | .71% | ||||||
|
|
|
|
|
|
| |||||||
| Investment income — net | 4.43%†† | 4.42% | 4.40% | 4.58% | 5.04% | 5.13% | ||||||
|
|
|
|
|
|
|
| ||||||
| Supplemental Data | ||||||||||||
|
|
|
|
|
|
|
| ||||||
| Net assets, end of period (in thousands) | $ 580,394 | $604,691 | $ 639,687 | $ 707,134 | $ 733,310 | $ 855,757 | ||||||
|
|
|
|
|
|
| |||||||
| Portfolio turnover | 22% | 36% | 41% | 47% | 44% | 33% | ||||||
|
|
|
|
|
|
| |||||||
| * | Total investment returns exclude the effects of any sales charges. |
| ** | Based on average shares outstanding. |
† Interest expense and fees primarily from the trust certificates liability related to tender option bond trusts.
††Annualized.
‡ Aggregate total investment return.
‡‡Amount is less than $.01 per share.
See Notes to Financial Statements.
| BLACKROCK MUNICIPAL BOND FUND, INC. |
| DECEMBER 31, 2007 |
| 51 |
| Financial Highlights (continued) | BlackRock Municipal Insured Fund | |||||||||||
| Investor A | ||||||||||||
| For the Six | ||||||||||||
| Months Ended | ||||||||||||
| The following per share data and ratios have been derived | December 31, 2007 | For the Year Ended June 30, | ||||||||||
| from information provided in the financial statements. | (Unaudited) | 2007 | 2006 | 2005 | 2004 | 2003 | ||||||
|
|
|
|
|
|
|
| ||||||
| Per Share Operating Performance | ||||||||||||
|
|
|
|
|
|
|
| ||||||
| Net asset value, beginning of period | $ 7.67 | $7.68 | $ 8.00 | $ 7.70 | $ 8.07 | $ 7.79 | ||||||
|
|
|
|
|
|
| |||||||
| Investment income — net** | .16 | .33 | .33 | .34 | .38 | .39 | ||||||
| Realized and unrealized gain (loss) — net | —‡‡ | .01 | (.29) | .30 | (.37) | .28 | ||||||
|
|
|
|
|
|
| |||||||
| Total from investment operations | .16 | .34 | .04 | .64 | .01 | .67 | ||||||
|
|
|
|
|
|
| |||||||
| Less dividends and distributions: | ||||||||||||
| Investment income — net | (.16) | (.31) | (.33) | (.34) | (.38) | (.39) | ||||||
| Realized gain — net | (.01) | (.04) | (.03) | — | — | — | ||||||
|
|
|
|
|
|
| |||||||
| Total dividends and distributions | (.17) | (.35) | (.36) | (.34) | (.38) | (.39) | ||||||
|
|
|
|
|
|
| |||||||
| Net asset value, end of period | $ 7.66 | $7.67 | $ 7.68 | $ 8.00 | $ 7.70 | $ 8.07 | ||||||
|
|
|
|
|
|
|
| ||||||
| Total Investment Return* | ||||||||||||
|
|
|
|
|
|
|
| ||||||
| Based on net asset value per share | 2.18%‡ | 4.47% | .44% | 8.47% | .10% | 8.77% | ||||||
|
|
|
|
|
|
|
| ||||||
| Ratios to Average Net Assets | ||||||||||||
|
|
|
|
|
|
|
| ||||||
| Expenses, net of waiver and excluding interest expense and fees† | .73%†† | .72% | .70% | .71% | .71% | .71% | ||||||
|
|
|
|
|
|
| |||||||
| Expenses, net of waiver | 1.24%†† | 1.12% | .99% | .88% | .91% | .96% | ||||||
|
|
|
|
|
|
| |||||||
| Expenses | 1.24%†† | 1.13% | .99% | .89% | .91% | .96% | ||||||
|
|
|
|
|
|
| |||||||
| Investment income — net | 4.18%†† | 4.17% | 4.15% | 4.33% | 4.79% | 4.88% | ||||||
|
|
|
|
|
|
|
| ||||||
| Supplemental Data | ||||||||||||
|
|
|
|
|
|
|
| ||||||
| Net assets, end of period (in thousands) | $ 170,340 | $ 172,236 | $ 172,083 | $ 182,216 | $ 183,007 | $ 187,805 | ||||||
|
|
|
|
|
|
| |||||||
| Portfolio turnover | 22% | 36% | 41% | 47% | 44% | 33% | ||||||
|
|
|
|
|
|
| |||||||
| * | Total investment returns exclude the effects of sales charges. |
| ** | Based on average shares outstanding. |
† Interest expense and fees primarily from the trust certificates liability related to tender option bond trusts.
††Annualized.
‡ Aggregate total investment return.
‡‡Amount is less than $.01 per share.
See Notes to Financial Statements.
52
BLACKROCK MUNICIPAL BOND FUND, INC.
| DECEMBER 31, 2007 |
| Financial Highlights (continued) | BlackRock Municipal Insured Fund | |||||||||||
| Investor B | ||||||||||||
| For the Six | ||||||||||||
| Months Ended | ||||||||||||
| The following per share data and ratios have been derived | December 31, 2007 | For the Year Ended June 30, | ||||||||||
| from information provided in the financial statements. | (Unaudited) | 2007 | 2006 | 2005 | 2004 | 2003 | ||||||
|
|
|
|
|
|
|
| ||||||
| Per Share Operating Performance | ||||||||||||
|
|
|
|
|
|
|
| ||||||
| Net asset value, beginning of period | $ 7.67 | $7.68 | $ 7.99 | $ 7.69 | $ 8.07 | $ 7.79 | ||||||
|
|
|
|
|
|
| |||||||
| Investment income — net** | .14 | .29 | .29 | .30 | .34 | .35 | ||||||
| Realized and unrealized gain (loss) — net | —‡‡ | .01 | (.28) | .30 | (.38) | .28 | ||||||
|
|
|
|
|
|
| |||||||
| Total from investment operations | .14 | .30 | .01 | .60 | (.04) | .63 | ||||||
|
|
|
|
|
|
| |||||||
| Less dividends and distributions: | ||||||||||||
| Investment income — net | (.14) | (.27) | (.29) | (.30) | (.34) | (.35) | ||||||
| Realized gain — net | (.01) | (.04) | (.03) | — | — | — | ||||||
|
|
|
|
|
|
| |||||||
| Total dividends and distributions | (.15) | (.31) | (.32) | (.30) | (.34) | (.35) | ||||||
|
|
|
|
|
|
| |||||||
| Net asset value, end of period | $ 7.66 | $ 7.67 | $ 7.68 | $ 7.99 | $ 7.69 | $ 8.07 | ||||||
|
|
|
|
|
|
|
| ||||||
| Total Investment Return* | ||||||||||||
|
|
|
|
|
|
|
| ||||||
| Based on net asset value per share | 1.92%‡ | 3.95% | .05% | 7.93% | (.53%) | 8.21% | ||||||
|
|
|
|
|
|
|
| ||||||
| Ratios to Average Net Assets | ||||||||||||
|
|
|
|
|
|
|
| ||||||
| Expenses, net of waiver and excluding interest expense and fees† | 1.24%†† | 1.23% | 1.21% | 1.21% | 1.21% | 1.22% | ||||||
|
|
|
|
|
|
| |||||||
| Expenses, net of waiver | 1.76%†† | 1.63% | 1.50% | 1.39% | 1.42% | 1.47% | ||||||
|
|
|
|
|
|
| |||||||
| Expenses | 1.76%†† | 1.63% | 1.50% | 1.40% | 1.42% | 1.47% | ||||||
|
|
|
|
|
|
| |||||||
| Investment income — net | 3.66%†† | 3.67% | 3.64% | 3.83% | 4.29% | 4.38% | ||||||
|
|
|
|
|
|
|
| ||||||
| Supplemental Data | ||||||||||||
|
|
|
|
|
|
|
| ||||||
| Net assets, end of period (in thousands) | $ 40,670 | $45,533 | $ 66,477 | $ 91,355 | $ 111,524 | $ 160,177 | ||||||
|
|
|
|
|
|
| |||||||
| Portfolio turnover | 22% | 36% | 41% | 47% | 44% | 33% | ||||||
|
|
|
|
|
|
| |||||||
| * | Total investment returns exclude the effects of sales charges. |
| ** | Based on average shares outstanding. |
† Interest expense and fees primarily from the trust certificates liability related to tender option bond trusts.
††Annualized.
‡ Aggregate total investment return.
‡‡ Amount is less than $.01 per share. See Notes to Financial Statements.
| BLACKROCK MUNICIPAL BOND FUND, INC. |
| DECEMBER 31, 2007 |
| 53 |
| Financial Highlights (continued) | BlackRock Municipal Insured Fund | |||||
| Investor C | ||||||
|
| ||||||
| For the Six | ||||||
| Months Ended | For the Period | |||||
| December 31, | October 2, 2006† | |||||
| The following per share data and ratios have been derived | 2007 | to June 30, | ||||
| from information provided in the financial statements. | (Unaudited) | 2007 | ||||
|
|
|
|
| |||
| Per Share Operating Performance | ||||||
|
|
|
|
| |||
| Net asset value, beginning of period | $ 7.68 | $ 7.88 | ||||
|
|
| |||||
| Investment income — net†† | .13 | .17 | ||||
| Realized and unrealized gain (loss) — net | —‡‡‡ | (.14) | ||||
|
|
| |||||
| Total from investment operations | .13 | .03 | ||||
|
|
|
| ||||
| Less dividends and distributions: | ||||||
| Investment income — net | (.13) | (.19) | ||||
| Realized gain — net | (.01) | (.04) | ||||
|
|
|
| ||||
| Total dividends and distributions | (.14) | (.23) | ||||
|
|
|
| ||||
| Net asset value, end of period | $ 7.67 | $ 7.68 | ||||
|
|
|
| ||||
| Total Investment Return** | ||||||
|
|
|
|
| |||
| Based on net asset value per share | 1.80%‡ | .34%‡ | ||||
|
|
|
|
| |||
| Ratios to Average Net Assets | ||||||
|
|
|
|
| |||
| Expenses, net of waiver and excluding interest expense and fees‡‡ | 1.47%* | 1.51%* | ||||
|
|
|
| ||||
| Expenses, net of waiver | 1.99%* | 1.90%* | ||||
|
|
|
| ||||
| Expenses | 1.99%* | 1.90%* | ||||
|
|
|
| ||||
| Investment income — net | 3.42%* | 3.37%* | ||||
|
|
|
|
| |||
| Supplemental Data | ||||||
|
|
|
|
| |||
| Net assets, end of period (in thousands) | $ 8,812 | $ 4,542 | ||||
|
|
| |||||
| Portfolio turnover | 22% | 36% | ||||
|
|
|
| ||||
| * | Annualized. |
| ** | Total investment returns exclude the effects of sales charges. |
| † Commencement of operations. |
††Based on average shares outstanding. ‡ Aggregate total investment return.
‡‡ Interest expense and fees primarily from the trust certificates liability related to tender option bond trusts.
‡‡‡Amount is less than $.01 per share.
See Notes to Financial Statements.
54
BLACKROCK MUNICIPAL BOND FUND, INC.
| DECEMBER 31, 2007 |
| Financial Highlights (continued) | BlackRock Municipal Insured Fund | |||||||||||
| Investor C1 | ||||||||||||
| For the Six | ||||||||||||
| Months Ended | ||||||||||||
| The following per share data and ratios have been derived | December 31, 2007 | For the Year Ended June 30, | ||||||||||
| from information provided in the financial statements. | (Unaudited) | 2007 | 2006 | 2005 | 2004 | 2003 | ||||||
|
|
|
|
|
|
|
| ||||||
| Per Share Operating Performance | ||||||||||||
|
|
|
|
|
|
|
| ||||||
| Net asset value, beginning of period | $ 7.67 | $7.68 | $ 8.00 | $ 7.69 | $ 8.07 | $ 7.79 | ||||||
|
|
|
|
|
|
| |||||||
| Investment income — net** | .14 | .28 | .28 | .30 | .33 | .34 | ||||||
| Realized and unrealized gain (loss) — net | —‡‡ | .02 | (.29) | .31 | (.38) | .28 | ||||||
|
|
|
|
|
|
| |||||||
| Total from investment operations | .14 | .30 | (.01) | .61 | (.05) | .62 | ||||||
|
|
|
|
|
|
| |||||||
| Less dividends and distributions: | ||||||||||||
| Investment income — net | (.14) | (.27) | (.28) | (.30) | (.33) | (.34) | ||||||
| Realized gain — net | (.01) | (.04) | (.03) | — | — | — | ||||||
|
|
|
|
|
|
| |||||||
| Total dividends and distributions | (.15) | (.31) | (.31) | (.30) | (.33) | (.34) | ||||||
|
|
|
|
|
|
| |||||||
| Net asset value, end of period | $ 7.66 | $ 7.67 | $ 7.68 | $ 8.00 | $ 7.69 | $ 8.07 | ||||||
|
|
|
|
|
|
|
| ||||||
| Total Investment Return* | ||||||||||||
|
|
|
|
|
|
|
| ||||||
| Based on net asset value per share | 1.90%‡ | 3.90% | (.12%) | 8.01% | (.58%) | 8.16% | ||||||
|
|
|
|
|
|
|
| ||||||
| Ratios to Average Net Assets | ||||||||||||
|
|
|
|
|
|
|
| ||||||
| Expenses, net of waiver and excluding interest expense and fees† | 1.28%†† | 1.28% | 1.26% | 1.26% | 1.26% | 1.27% | ||||||
|
|
|
|
|
|
| |||||||
| Expenses, net of waiver | 1.79%†† | 1.68% | 1.55% | 1.44% | 1.47% | 1.52% | ||||||
|
|
|
|
|
|
| |||||||
| Expenses | 1.79%†† | 1.68% | 1.55% | 1.45% | 1.47% | 1.52% | ||||||
|
|
|
|
|
|
| |||||||
| Investment income — net | 3.62%†† | 3.63% | 3.59% | 3.77% | 4.23% | 4.31% | ||||||
|
|
|
|
|
|
|
| ||||||
| Supplemental Data | ||||||||||||
|
|
|
|
|
|
|
| ||||||
| Net assets, end of period (in thousands) | $ 47,164 | $51,452 | $ 61,046 | $ 64,682 | $ 61,794 | $ 66,089 | ||||||
|
|
|
|
|
|
| |||||||
| Portfolio turnover | 22% | 36% | 41% | 47% | 44% | 33% | ||||||
|
|
|
|
|
|
| |||||||
| * | Total investment returns exclude the effects of sales charges. |
| ** | Based on average shares outstanding. |
† Interest expense and fees primarily from the trust certificates liability related to tender option bond trusts.
††Annualized.
‡ Aggregate total investment return.
‡‡Amount is less than $.01 per share.
See Notes to Financial Statements.
| BLACKROCK MUNICIPAL BOND FUND, INC. |
| DECEMBER 31, 2007 |
| 55 |
| Financial Highlights (continued) | BlackRock National Municipal Fund | |||||||||||||
| Institutional | ||||||||||||||
| For the Six | ||||||||||||||
| Months Ended | ||||||||||||||
| The following per share data and ratios have been derived | December 31, 2007 | For the Year Ended June 30, | ||||||||||||
| from information provided in the financial statements. | (Unaudited) | 2007 | 2006 | 2005 | 2004 | 2003 | ||||||||
|
|
|
|
|
|
|
|
| |||||||
| Per Share Operating Performance | ||||||||||||||
|
|
|
|
|
|
|
|
| |||||||
| Net asset value, beginning of period | $ 10.39 | $ 10.36 | $ 10.66 | $ 10.29 | $ 10.54 | $ 10.26 | ||||||||
|
|
|
|
|
|
| |||||||||
| Investment income — net** | .24 | .49 | .51 | .53 | .55 | .56 | ||||||||
| Realized and unrealized gain (loss) — net | (.14) | .05 | (.30) | .37 | (.25) | .28 | ||||||||
|
|
|
|
|
|
|
| ||||||||
| Total from investment operations | .10 | .54 | .21 | .90 | .30 | .84 | ||||||||
|
|
|
|
|
|
|
| ||||||||
| Less dividends from investment income — net | (.24) | (.51) | (.51) | (.53) | (.55) | (.56) | ||||||||
|
|
|
|
|
|
|
| ||||||||
| Net asset value, end of period | $ 10.25 | $ 10.39 | $ 10.36 | $ 10.66 | $ 10.29 | $ 10.54 | ||||||||
|
|
|
|
|
|
|
| ||||||||
| Total Investment Return* | ||||||||||||||
|
|
|
|
|
|
|
|
| |||||||
| Based on net asset value per share | .97%‡ | 5.06% | 2.02% | 8.89% | 2.88% | 8.34% | ||||||||
|
|
|
|
|
|
|
|
| |||||||
| Ratios to Average Net Assets | ||||||||||||||
|
|
|
|
|
|
|
|
| |||||||
| Expenses, net of waiver and excluding interest expense and fees† | .60%‡‡ | .59% | .58% | .59% | .60% | .59% | ||||||||
|
|
|
|
|
|
| |||||||||
| Expenses, net of waiver | .91%‡‡ | .99% | .84% | .72% | .70% | .75% | ||||||||
|
|
|
|
|
|
| |||||||||
| Expenses | .91%‡‡ | 1.00% | .85% | .72% | .70% | .75% | ||||||||
|
|
|
|
|
|
| |||||||||
| Investment income — net | 4.63%‡‡ | 4.66% | 4.87% | 5.02% | 5.23% | 5.35% | ||||||||
|
|
|
|
|
|
|
| ||||||||
| Supplemental Data | ||||||||||||||
|
|
|
|
|
|
|
|
| |||||||
| Net assets, end of period (in thousands) | $ 992,827 | $ 976,153 | $ 890,984 | $ 909,125 | $ 907,419 | $ 624,192 | ||||||||
|
|
|
|
|
|
| |||||||||
| Portfolio turnover | 25% | 46% | 56% | 33% | 20% | 34% | ||||||||
|
|
|
|
|
|
|
| ||||||||
| * | Total investment returns exclude the effects of any sales charges. |
| ** | Based on average shares outstanding. |
† Interest expense and fees primarily from the trust certificates liability related to tender option bond trusts.
‡ Aggregate total investment return.
‡‡Annualized.
See Notes to Financial Statements.
56
BLACKROCK MUNICIPAL BOND FUND, INC.
| DECEMBER 31, 2007 |
| Financial Highlights (continued) | BlackRock National Municipal Fund | |||||||||||||
| Investor A | ||||||||||||||
| For the Six | ||||||||||||||
| Months Ended | ||||||||||||||
| The following per share data and ratios have been derived | December 31, 2007 | For the Year Ended June 30, | ||||||||||||
| from information provided in the financial statements. | (Unaudited) | 2007 | 2006 | 2005 | 2004 | 2003 | ||||||||
|
|
|
|
|
|
|
|
| |||||||
| Per Share Operating Performance | ||||||||||||||
|
|
|
|
|
|
|
|
| |||||||
| Net asset value, beginning of period | $ 10.39 | $ 10.37 | $ 10.67 | $ 10.29 | $ 10.54 | $ 10.27 | ||||||||
|
|
|
|
|
|
| |||||||||
| Investment income — net** | .23 | .46 | .49 | .50 | .52 | .53 | ||||||||
| Realized and unrealized gain (loss) — net | (.13) | .03 | (.30) | .38 | (.25) | .27 | ||||||||
|
|
|
|
|
|
|
| ||||||||
| Total from investment operations | .10 | .49 | .19 | .88 | .27 | .80 | ||||||||
|
|
|
|
|
|
|
| ||||||||
| Less dividends from investment income — net | (.23) | (.47) | (.49) | (.50) | (.52) | (.53) | ||||||||
|
|
|
|
|
|
|
| ||||||||
| Net asset value, end of period | $ 10.26 | $ 10.39 | $ 10.37 | $ 10.67 | $ 10.29 | $ 10.54 | ||||||||
|
|
|
|
|
|
|
| ||||||||
| Total Investment Return* | ||||||||||||||
|
|
|
|
|
|
|
|
| |||||||
| Based on net asset value per share | .96%‡ | 4.71% | 1.77% | 8.73% | 2.62% | 7.98% | ||||||||
|
|
|
|
|
|
|
|
| |||||||
| Ratios to Average Net Assets | ||||||||||||||
|
|
|
|
|
|
|
|
| |||||||
| Expenses, net of waiver and excluding interest expense and fees† | .82%‡‡ | .84% | .83% | .84% | .85% | .84% | ||||||||
|
|
|
|
|
|
| |||||||||
| Expenses, net of waiver | 1.13%‡‡ | 1.24% | 1.09% | .97% | .95% | 1.00% | ||||||||
|
|
|
|
|
|
| |||||||||
| Expenses | 1.14%‡‡ | 1.24% | 1.10% | .97% | .95% | 1.00% | ||||||||
|
|
|
|
|
|
| |||||||||
| Investment income — net | 4.40%‡‡ | 4.43% | 4.61% | 4.76% | 4.97% | 5.10% | ||||||||
|
|
|
|
|
|
|
| ||||||||
| Supplemental Data | ||||||||||||||
|
|
|
|
|
|
|
|
| |||||||
| Net assets, end of period (in thousands) | $ 410,710 | $ 349,225 | $ 283,814 | $ 248,231 | $ 207,376 | $ 200,108 | ||||||||
|
|
|
|
|
|
| |||||||||
| Portfolio turnover | 25% | 46% | 56% | 33% | 20% | 34% | ||||||||
|
|
|
|
|
|
|
| ||||||||
| * | Total investment returns exclude the effects of sales charges. |
| ** | Based on average shares outstanding. |
† Interest expense and fees primarily from the trust certificates liability related to tender option bond trusts.
‡ Aggregate total investment return.
‡‡Annualized.
See Notes to Financial Statements.
| BLACKROCK MUNICIPAL BOND FUND, INC. |
| DECEMBER 31, 2007 |
| 57 |
| Financial Highlights (continued) | BlackRock National Municipal Fund | |||||||||||||
| Investor B | ||||||||||||||
| For the Six | ||||||||||||||
| Months Ended | ||||||||||||||
| The following per share data and ratios have been derived | December 31, 2007 | For the Year Ended June 30, | ||||||||||||
| from information provided in the financial statements. | (Unaudited) | 2007 | 2006 | 2005 | 2004 | 2003 | ||||||||
|
|
|
|
|
|
|
|
| |||||||
| Per Share Operating Performance | ||||||||||||||
|
|
|
|
|
|
|
|
| |||||||
| Net asset value, beginning of period | $ 10.38 | $ 10.36 | $ 10.66 | $ 10.28 | $ 10.53 | $ 10.26 | ||||||||
|
|
|
|
|
|
| |||||||||
| Investment income — net** | .20 | .41 | .43 | .45 | .47 | .48 | ||||||||
| Realized and unrealized gain (loss) — net | (.13) | .02 | (.30) | .38 | (.26) | .27 | ||||||||
|
|
|
|
|
|
|
| ||||||||
| Total from investment operations | .07 | .43 | .13 | .83 | .21 | .75 | ||||||||
|
|
|
|
|
|
|
| ||||||||
| Less dividends from investment income — net | (.20) | (.41) | (.43) | (.45) | (.46) | (.48) | ||||||||
|
|
|
|
|
|
|
| ||||||||
| Net asset value, end of period | $ 10.25 | $ 10.38 | $ 10.36 | $ 10.66 | $ 10.28 | $ 10.53 | ||||||||
|
|
|
|
|
|
|
| ||||||||
| Total Investment Return* | ||||||||||||||
|
|
|
|
|
|
|
|
| |||||||
| Based on net asset value per share | .70%‡ | 4.18% | 1.25% | 8.18% | 2.10% | 7.43% | ||||||||
|
|
|
|
|
|
|
|
| |||||||
| Ratios to Average Net Assets | ||||||||||||||
|
|
|
|
|
|
|
|
| |||||||
| Expenses, net of waiver and excluding interest expense and fees† | 1.35%‡‡ | 1.34% | 1.34% | 1.35% | 1.35% | 1.34% | ||||||||
|
|
|
|
|
|
| |||||||||
| Expenses, net of waiver | 1.66%‡‡ | 1.75% | 1.60% | 1.48% | 1.45% | 1.50% | ||||||||
|
|
|
|
|
|
| |||||||||
| Expenses | 1.66%‡‡ | 1.75% | 1.61% | 1.48% | 1.46% | 1.51% | ||||||||
|
|
|
|
|
|
| |||||||||
| Investment income — net | 3.88%‡‡ | 3.92% | 4.11% | 4.27% | 4.47% | 4.59% | ||||||||
|
|
|
|
|
|
|
| ||||||||
| Supplemental Data | ||||||||||||||
|
|
|
|
|
|
|
|
| |||||||
| Net assets, end of period (in thousands) | $ 84,545 | $ 101,260 | $ 134,177 | $ 177,553 | $ 217,814 | $ 321,477 | ||||||||
|
|
|
|
|
|
| |||||||||
| Portfolio turnover | 25% | 46% | 56% | 33% | 20% | 34% | ||||||||
|
|
|
|
|
|
|
| ||||||||
| * | Total investment returns exclude the effects of sales charges. |
| ** | Based on average shares outstanding. |
† Interest expense and fees primarily from the trust certificates liability related to tender option bond trusts.
‡ Aggregate total investment return.
‡‡Annualized.
See Notes to Financial Statements.
58
BLACKROCK MUNICIPAL BOND FUND, INC.
| DECEMBER 31, 2007 |
| Financial Highlights (continued) | BlackRock National Municipal Fund | |||||
| Investor C | ||||||
|
| ||||||
| For the Six | ||||||
| Months Ended | For the Period | |||||
| December 31, | October 2, 2006† | |||||
| The following per share data and ratios have been derived | 2007 | to June 30, | ||||
| from information provided in the financial statements. | (Unaudited) | 2007 | ||||
|
|
|
|
| |||
| Per Share Operating Performance | ||||||
|
|
|
|
| |||
| Net asset value, beginning of period | $ 10.39 | $ 10.57 | ||||
|
|
| |||||
| Investment income — net** | .19 | .25 | ||||
| Realized and unrealized gain (loss) — net | (.13) | (.16) | ||||
|
|
|
| ||||
| Total from investment operations | .06 | .09 | ||||
|
|
|
| ||||
| Less dividends from investment income — net | (.19) | (.27) | ||||
|
|
|
| ||||
| Net asset value, end of period | $ 10.26 | $ 10.39 | ||||
|
|
|
| ||||
| Total Investment Return‡ | ||||||
|
|
|
|
| |||
| Based on net asset value per share | .56%†† | .96%†† | ||||
|
|
|
| ||||
| Ratios to Average Net Assets | ||||||
|
|
|
|
| |||
| Expenses, net of waiver and excluding interest expense and fees††† | 1.63%* | 1.65%* | ||||
|
|
|
| ||||
| Expenses, net of waiver | 1.94%* | 2.05%* | ||||
|
|
|
| ||||
| Expenses | 1.94%* | 2.05%* | ||||
|
|
|
| ||||
| Investment income — net | 3.60%* | 3.59%* | ||||
|
|
|
|
| |||
| Supplemental Data | ||||||
|
|
|
|
| |||
| Net assets, end of period (in thousands) | $ 66,466 | $ 41,676 | ||||
|
|
| |||||
| Portfolio turnover | 25% | 46% | ||||
|
|
|
| ||||
| * | Annualized. |
| ** | Based on average shares outstanding. |
† Commencement of operations.
††Aggregate total investment return.
†††Interest expense and fees primarily from the trust certificates liability related to tender option bond trusts.
‡Total investment returns exclude the effects of sales charges. See Notes to Financial Statements.
| BLACKROCK MUNICIPAL BOND FUND, INC. |
| DECEMBER 31, 2007 |
| 59 |
| Financial Highlights (continued) | BlackRock National Municipal Fund | |||||||||||||
| Investor C1 | ||||||||||||||
| For the Six | ||||||||||||||
| Months Ended | ||||||||||||||
| The following per share data and ratios have been derived | December 31, 2007 | For the Year Ended June 30, | ||||||||||||
| from information provided in the financial statements. | (Unaudited) | 2007 | 2006 | 2005 | 2004 | 2003 | ||||||||
|
|
|
|
|
|
|
|
| |||||||
| Per Share Operating Performance | ||||||||||||||
|
|
|
|
|
|
|
|
| |||||||
| Net asset value, beginning of period | $ 10.39 | $ 10.36 | $ 10.66 | $ 10.29 | $ 10.54 | $ 10.26 | ||||||||
|
|
|
|
|
|
| |||||||||
| Investment income — net** | .20 | .41 | .43 | .44 | .46 | .47 | ||||||||
| Realized and unrealized gain (loss) — net | (.14) | .04 | (.29) | .37 | (.25) | .28 | ||||||||
|
|
|
|
|
|
|
| ||||||||
| Total from investment operations | .06 | .45 | .14 | .81 | .21 | .75 | ||||||||
|
|
|
|
|
|
|
| ||||||||
| Less dividends from investment income — net | (.20) | (.42) | (.44) | (.44) | (.46) | (.47) | ||||||||
|
|
|
|
|
|
|
| ||||||||
| Net asset value, end of period | $ 10.25 | $ 10.39 | $ 10.36 | $ 10.66 | $ 10.29 | $ 10.54 | ||||||||
|
|
|
|
|
|
|
| ||||||||
| Total Investment Return* | ||||||||||||||
|
|
|
|
|
|
|
|
| |||||||
| Based on net asset value per share | .58%‡ | 4.23% | 1.20% | 8.02% | 2.05% | 7.48% | ||||||||
|
|
|
|
|
|
|
|
| |||||||
| Ratios to Average Net Assets | ||||||||||||||
|
|
|
|
|
|
|
|
| |||||||
| Expenses, net of waiver and excluding interest expense and fees† | 1.39%‡‡ | 1.39% | 1.39% | 1.40% | 1.40% | 1.39% | ||||||||
|
|
|
|
|
|
| |||||||||
| Expenses, net of waiver | 1.69%‡‡ | 1.80% | 1.65% | 1.53% | 1.50% | 1.55% | ||||||||
|
|
|
|
|
|
| |||||||||
| Expenses | 1.70%‡‡ | 1.80% | 1.65% | 1.53% | 1.51% | 1.56% | ||||||||
|
|
|
|
|
|
| |||||||||
| Investment income — net | 3.84%‡‡ | 3.88% | 4.05% | 4.20% | 4.42% | 4.54% | ||||||||
|
|
|
|
|
|
|
| ||||||||
| Supplemental Data | ||||||||||||||
|
|
|
|
|
|
|
|
| |||||||
| Net assets, end of period (in thousands) | $ 128,091 | $ 140,653 | $ 139,447 | $ 107,893 | $ 74,849 | $ 77,906 | ||||||||
|
|
|
|
|
|
| |||||||||
| Portfolio turnover | 25% | 46% | 56% | 33% | 20% | 34% | ||||||||
|
|
|
|
|
|
|
| ||||||||
| * | Total investment returns exclude the effects of sales charges. |
| ** | Based on average shares outstanding. |
† Interest expense and fees primarily from the trust certificates liability related to tender option bond trusts.
‡ Aggregate total investment return.
‡‡Annualized.
See Notes to Financial Statements.
60
BLACKROCK MUNICIPAL BOND FUND, INC.
| DECEMBER 31, 2007 |
| Financial Highlights (continued) | BlackRock High Yield Municipal Fund | |||||
| Institutional | ||||||
|
| ||||||
| For the Six | ||||||
| Months Ended | For the Period | |||||
| December 31, | August 1, 2006†† | |||||
| The following per share data and ratios have been derived | 2007 | to June 30, | ||||
| from information provided in the financial statements. | (Unaudited) | 2007 | ||||
|
|
|
|
| |||
| Per Share Operating Performance | ||||||
|
|
|
|
| |||
| Net asset value, beginning of period | $ 9.96 | $ 10.00 | ||||
|
|
| |||||
| Investment income — net† | .22 | .39 | ||||
| Realized and unrealized loss — net | (.80) | (.03) | ||||
|
|
|
| ||||
| Total from investment operations | (.58) | .36 | ||||
|
|
|
| ||||
| Less dividends and distributions: | ||||||
| Investment income — net | (.22) | (.40) | ||||
| Realized gain — net | (.02) | —‡‡ | ||||
|
|
|
| ||||
| Total dividends and distributions | (.24) | (.40) | ||||
|
|
|
| ||||
| Net asset value, end of period | $ 9.14 | $ 9.96 | ||||
|
|
|
| ||||
| Total Investment Return | ||||||
|
|
|
|
| |||
| Based on net asset value per share | (5.91%)‡ | 3.59%‡ | ||||
|
|
|
| ||||
| Ratios to Average Net Assets | ||||||
|
|
|
|
| |||
| Expenses, net of waiver and excluding interest expense and fees‡‡‡ | .76%* | .62%* | ||||
|
|
| |||||
| Expenses, net of waiver | .77%* | .62%* | ||||
|
|
| |||||
| Expenses | .82%* | .96%* | ||||
|
|
| |||||
| Investment income — net | 4.55%* | 4.35%* | ||||
|
|
|
| ||||
| Supplemental Data | ||||||
|
|
|
|
| |||
| Net assets, end of period (in thousands) | $ 59,738 | $ 62,464 | ||||
|
|
| |||||
| Portfolio turnover | 18% | 16% | ||||
|
|
|
| ||||
|
* Annualized. † Based on average shares outstanding. |
† † Commencement of operations.
‡ Aggregate total investment return.
| ‡‡ Amount is less than $(.01) per share. |
‡‡‡ Interest expense and fees primarily from the trust certificates liability related to tender option bond trusts.
See Notes to Financial Statements.
| BLACKROCK MUNICIPAL BOND FUND, INC. |
| DECEMBER 31, 2007 |
| 61 |
| Financial Highlights (continued) | BlackRock High Yield Municipal Fund | |||||
| Investor A | ||||||
|
| ||||||
| For the Six | ||||||
| Months Ended | For the Period | |||||
| December 31, | August 1, 2006†† | |||||
| The following per share data and ratios have been derived | 2007 | to June 30, | ||||
| from information provided in the financial statements. | (Unaudited) | 2007 | ||||
|
|
|
|
| |||
| Per Share Operating Performance | ||||||
|
|
|
|
| |||
| Net asset value, beginning of period | $ 9.95 | $ 10.00 | ||||
|
|
| |||||
| Investment income — net† | .21 | .32 | ||||
| Realized and unrealized gain (loss) — net | (.80) | .01 | ||||
|
|
|
| ||||
| Total from investment operations | (.59) | .33 | ||||
|
|
|
| ||||
| Less dividends and distributions: | ||||||
| Investment income — net | (.21) | (.38) | ||||
| Realized gain — net | (.02) | —‡‡ | ||||
|
|
|
| ||||
| Total dividends and distributions | (.23) | (.38) | ||||
|
|
|
| ||||
| Net asset value, end of period | $ 9.13 | $ 9.95 | ||||
|
|
|
| ||||
| Total Investment Return** | ||||||
|
|
|
|
| |||
| Based on net asset value per share | (6.03%)‡ | 3.26%‡ | ||||
|
|
|
| ||||
| Ratios to Average Net Assets | ||||||
|
|
|
|
| |||
| Expenses, net of waiver, and excluding interest expense and fees‡‡‡ | 1.01%* | .89%* | ||||
|
|
| |||||
| Expenses, net of waiver | 1.01%* | .89%* | ||||
|
|
| |||||
| Expenses | 1.07%* | 1.19%* | ||||
|
|
| |||||
| Investment income — net | 4.29%* | 4.16%* | ||||
|
|
|
| ||||
| Supplemental Data | ||||||
|
|
|
|
| |||
| Net assets, end of period (in thousands) | $ 4,447 | $ 5,892 | ||||
|
|
| |||||
| Portfolio turnover | 18% | 16% | ||||
|
|
|
| ||||
| * | Annualized. |
| ** | Total investment returns exclude the effects of sales charges. |
| † Based on average shares outstanding. |
††Commencement of operations.
‡ Aggregate total investment return.
| ‡‡ Amount is less than $(.01) per share. |
‡‡‡Interest expense and fees primarily from the trust certificates liability related to tender option bond trusts.
See Notes to Financial Statements.
62
BLACKROCK MUNICIPAL BOND FUND, INC.
| DECEMBER 31, 2007 |
| Financial Highlights (concluded) | BlackRock High Yield Municipal Fund | |||||
| Investor C | ||||||
|
| ||||||
| For the Six | ||||||
| Months Ended | For the Period | |||||
| December 31, | August 1, 2006†† | |||||
| The following per share data and ratios have been derived | 2007 | to June 30, | ||||
| from information provided in the financial statements. | (Unaudited) | 2007 | ||||
|
|
|
|
| |||
| Per Share Operating Performance | ||||||
|
|
|
|
| |||
| Net asset value, beginning of period | $ 9.97 | $ 10.00 | ||||
|
|
| |||||
| Investment income — net† | .17 | .30 | ||||
| Realized and unrealized loss — net | (.81) | (.02) | ||||
|
|
|
| ||||
| Total from investment operations | (.64) | .28 | ||||
|
|
|
| ||||
| Less dividends and distributions: | ||||||
| Investment income — net | (.17) | (.31) | ||||
| Realized gain — net | (.02) | —‡‡ | ||||
|
|
|
| ||||
| Total dividends and distributions | (.19) | (.31) | ||||
|
|
|
| ||||
| Net asset value, end of period | $ 9.14 | $ 9.97 | ||||
|
|
|
| ||||
| Total Investment Return** | ||||||
|
|
|
|
| |||
| Based on net asset value per share | (6.49%)‡ | 2.84%‡ | ||||
|
|
|
| ||||
| Ratios to Average Net Assets | ||||||
|
|
|
|
| |||
| Expenses, net of waiver, and excluding interest expense and fees‡‡‡ | 1.78%* | 1.53%* | ||||
|
|
| |||||
| Expenses, net of waiver | 1.79%* | 1.53%* | ||||
|
|
| |||||
| Expenses | 1.85%* | 1.84%* | ||||
|
|
| |||||
| Investment income — net | 3.51%* | 3.50%* | ||||
|
|
|
| ||||
| Supplemental Data | ||||||
|
|
|
|
| |||
| Net assets, end of period (in thousands) | $ 3,746 | $ 4,378 | ||||
|
|
| |||||
| Portfolio turnover | 18% | 16% | ||||
|
|
|
| ||||
| * | Annualized. |
| ** | Total investment returns exclude the effects of sales charges. |
| † Based on average shares outstanding. |
††Commencement of operations.
‡ Aggregate total investment return.
| ‡‡ Amount is less than $(.01) per share. |
‡‡‡Interest expense and fees primarily from the trust certificates liability related to tender option bond trusts.
See Notes to Financial Statements.
| BLACKROCK MUNICIPAL BOND FUND, INC. |
| DECEMBER 31, 2007 |
| 63 |
Notes to Financial Statements (Unaudited)
1. Significant Accounting Policies:
BlackRock Municipal Bond Fund, Inc. (the “Bond Fund”), consisting of BlackRock Short-Term Municipal Fund, BlackRock Municipal Insured Fund, BlackRock National Municipal Fund and BlackRock High Yield Municipal Fund (the “Funds” or individually as the “Fund”) is registered under the Investment Company Act of 1940, as amended, as a diversified, open-end management investment company. The Bond Fund’s financial statements are prepared in conformity with U.S. generally accepted accounting principles, which may require the use of management accruals and estimates. Actual results may differ from these estimates. These unaudited financial statements reflect all adjustments, which are, in the opinion of management, necessary to present a fair statement of the results for the interim period. All such adjustments are of a normal, recurring nature. The Funds offer multiple classes of shares. BlackRock and Institutional Shares are sold only to certain eligible investors. Investor A and Investor A1 Shares are sold with a front-end sales charge. Shares of Investor B, Investor C and Investor C1 may be subject to a contingent deferred sales charge. All classes of shares have identical voting, dividend, liquidation and other rights and the same terms and conditions, except that Investor A, Investor A1, Investor B, Investor C and Investor C1 Shares bear certain expenses related to the shareholder servicing of such shares, and Investor B, Investor C and Investor C1 Shares also bear certain expenses related to the distribution of such shares. Each class has exclusive voting rights with respect to matters relating to its shareholder servicing and distribution expenditures (except that Investor B share-holders may vote on certain changes to the Investor A and Investor A1 distribution plan, as applicable). Income, expenses (other than expenses attributable to a specific class) and realized and unrealized gains and losses are allocated daily to each class based on its relative net assets. The following is a summary of significant accounting policies followed by the Bond Fund.
(a) Valuation of investments — Municipal bonds are traded primarily in the over-the-counter (“OTC”) markets and are valued at the last available bid price in the OTC market or on the basis of values as obtained by a pricing service. Pricing services use valuation matrixes that incorporate both dealer-supplied valuations and valuation models. The procedures of the pricing service and its valuations are reviewed by the officers of the Bond Fund under the general direction of the Board of Directors. Such valuations and procedures are reviewed periodically by the Board of Directors of the Bond Fund. Financial futures contracts and options thereon, which are traded on exchanges, are valued at their closing prices as of the close of such exchanges. Effective September 4, 2007, exchange-traded options are valued at the mean between the last bid and ask prices at the close of the options market in which the options trade and previously were valued at the last sales price as of the close of options trading on applicable exchanges. Options traded in the OTC market are valued at the last asked price (options written) or the last bid price (options purchased). Swap agreements are valued based upon quoted fair valuations received daily by the Bond Fund from a pricing service. Short-term investments are valued at amortized cost, which approximates market value. Investments in open-end investment companies are valued at their net asset value each business day. Securities and other assets for which market quotations are not readily available are valued at fair value as determined in good faith by or under the direction of the Board of Directors of the Bond Fund.
(b) Derivative financial instruments — The Funds may engage in various portfolio investment strategies both to increase their returns and to hedge, or protect, their exposure to interest rate movements and movements in the securities markets. Losses may arise due to changes in the value of the contract due to an unfavorable change in the price of the underlying security, or index, or if the counterparty does not perform under the contract. The counterparty, for certain instruments, may pledge cash or securities as collateral.
- Financial futures contracts — The Funds may purchase or sell finan- cial futures contracts and options on such financial futures contracts.
Financial futures contracts are contracts for delayed delivery ofsecurities at a specific future date and at a specific price or yields.Upon entering into a contract, the Funds deposit and maintains ascollateral such initial margin as required by the exchange on whichthe transaction is effected. Pursuant to the contract, the Funds agreeto receive from or pay to the broker an amount of cash equal to thedaily fluctuation in value of the contract. Such receipts or paymentsare known as variation margin and are recorded by the Funds asunrealized gains or losses. When the contract is closed, the Fundsrecord a realized gain or loss equal to the difference between thevalue of the contract at the time it was opened and the value at thetime it was closed. - Forward interest rate swaps — The Funds may enter into forward interest rate swaps. In a forward interest rate swap, the Funds and the counterparty agree to pay or receive interest on a specified notional contract amount, commencing on a specified future effective date, unless terminated earlier. The value of the agreement is deter- mined by quoted fair values received daily by the Funds from the counterparty. When the agreement is closed, the Funds record a real- ized gain or loss in an amount equal to the value of the agreement.
- Swaps — Each Fund may enter into swap agreements, which are OTC contracts in which each Fund and a counterparty agree to make peri- odic net payments on a specified notional amount. The net payments can be made for a set period of time or may be triggered by a pre- determined credit event. The net periodic payments may be based on a fixed or variable interest rate; the change in market value of a specified security, basket of securities or index; or the return generat- ed by a security. These periodic payments received or made by each Fund are recorded in the accompanying Statement of Operations as
64
BLACKROCK MUNICIPAL BOND FUND, INC.
| DECEMBER 31, 2007 |
Notes to Financial Statements (continued)
realized gains or losses, respectively. Gains or losses are also realized upon termination of the swap agreements. Swaps are marked-to-market daily and changes in value are recorded as unrealized appreciation (depreciation). Risks include changes in the returns of the underlying instruments, failure of the counterparties to perform under the contracts’ terms and the possible lack of liquidity with respect to the swap agreements.
(c) Municipal bonds transferred to tender option bond trusts — The BlackRock Municipal Insured Fund, BlackRock National Municipal Fund and BlackRock High Yield Municipal Fund invest in leveraged residual certificates (“TOB Residuals”) issued by tender option bond trusts (“TOBs”). A TOB is established by a third party sponsor forming a special purpose entity, into which a fund, or an agent on behalf of the fund, transfers municipal securities. A TOB typically issues two classes of beneficial interests: short-term floating rate certificates, which are sold to third party investors, and residual certificates, which are generally issued to the fund which made the transfer or to affiliates of the fund. Each of these Funds’ transfers of the municipal securities to a TOB do not qualify for sale treatment under Statement of Financial Accounting Standards No. 140 “Accounting for Transfers and Servicing of Financial Assets and Extinguishments of Liabilities,” therefore the municipal securities deposited into a TOB are presented in each of these Funds’ schedules of investments and the proceeds from the transactions are reported as a liability for trust certificates of each of these Funds. Interest income from the underlying security is recorded by these Funds on an accrual basis. Interest expense incurred on the secured borrowing and other expenses related to remarketing, administration and trustee services to a TOB are reported as expenses of a Fund. The floating rate certificates have interest rates that generally reset weekly and their holders have the option to tender certificates to the TOB for redemption at par at each reset date. The residual interests held by these Funds include the right of the Funds (1) to cause the holders of a proportional share of floating rate certificates to tender their certificates at par, and (2) to transfer a corresponding share of the municipal securities from the TOB to the Funds. At December 31, 2007, the aggregate value of the underlying municipal securities transferred to TOBs and the related liability for trust certificates were:
| Range of | ||||||
| Interest | Underlying | |||||
| Rates on | Municipal | |||||
| Liability for | the Liability | Bonds | ||||
| Trust | for Trust | Transferred | ||||
| Certificates | Certificates | to TOBs | ||||
|
|
|
|
|
|||
| BlackRock Municipal | 3.45% – | |||||
| Insured Fund | $117,268,292 | 3.696% | $231,888,278 | |||
| BlackRock National | 3.472% – | |||||
| Municipal Fund | $106,893,871 | 3.690% | $217,410,844 | |||
| BlackRock High Yield | ||||||
| Municipal Fund | $ 1,205,000 | 3.42% | $ 2,446,415 | |||
|
|
|
|
|
Financial transactions executed through TOBs generally will underperform the market for fixed rate municipal bonds in a rising interest rate environment, but tend to outperform the market for fixed rate bonds when interest rates decline or remain relatively stable. Should short-term interest rates rise, the Funds’ investments in TOB Residuals likely will adversely affect the Funds’ investment income-net and distributions to shareholders. Fluctuations in the market value of municipal securities deposited into the TOB may adversely affect these Funds’ net asset value per share.
While the Funds’ investment policies and restrictions expressly permit investments in inverse floating rate securities such as TOB Residuals, they generally do not allow the Funds to borrow money for purposes of making investments. The Funds’ management believes that the Funds’ restrictions on borrowings do not apply to the secured borrowings deemed to have occurred for accounting purposes.
(d) Income taxes — It is the Bond Fund’s policy to comply with the requirements of the Internal Revenue Code applicable to regulated investment companies and to distribute substantially all of its taxable income to its shareholders. Therefore, no federal income tax provision is required.
(e) Security transactions and investment income — Security transactions are recorded on the dates the transactions are entered into (the trade dates). Realized gains and losses on security transactions are determined on the identified cost basis. Dividend income is recorded on the ex-dividend dates. Interest income is recognized on the accrual basis. The Funds amortize all premiums and discounts on debt securities.
(f) Prepaid registration fees — Prepaid registration fees are charged to expense as the related shares are issued.
(g) Dividends and distributions — Dividends from net investment income are declared daily and paid monthly. Distributions of capital gains are recorded on the ex-dividend dates.
(h) Expenses — Certain expenses have been allocated to the individual Funds in the Bond Fund on a pro rata basis based upon the respective aggregate net asset value of each Fund included in the Bond Fund.
(i) Insurance — BlackRock Municipal Insured Fund: Where bonds in the Fund have not been insured pursuant to policies obtained by the issuer, the Fund has obtained insurance with respect to the payment of interest and principal of each bond. Such insurance is valid as long as the bonds are held by the Fund.
| BLACKROCK MUNICIPAL BOND FUND, INC. |
| DECEMBER 31, 2007 |
| 65 |
Notes to Financial Statements (continued)
(j) Offering costs — BlackRock Municipal High Yield Fund: Offering costs are amortized over a 12-month period beginning with the commencement of operations of the Fund.
(k) Recent accounting pronouncements — Effective June 29, 2007, the Funds implemented Financial Accounting Standards Board (“FASB”) Interpretation No. 48, “Accounting for Uncertainty in Income Taxes — an interpretation of FASB Statement No. 109” (“FIN 48”). FIN 48 prescribes the minimum recognition threshold a tax position must meet in connection with accounting for uncertainties in income tax positions taken or expected to be taken by an entity, including investment companies, before being measured and recognized in the financial statements. Management has evaluated the application of FIN 48 to the Funds, and has determined that the adoption of FIN 48 does not have a material impact on the Funds’ financial statements. The Funds file U.S. federal and various state and local tax returns. No income tax returns are currently under examination. The statute of limitations on the Funds’ U.S. federal tax returns remains open for the years ended June 30, 2004 through June 30, 2007. The statute of limitations on the Funds’ state and local tax returns may remain open for an additional year depending upon the jurisdiction.
In September 2006, Statement of Financial Accounting Standards No. 157, “Fair Value Measurements” (“FAS 157”), was issued and is effective for fiscal years beginning after November 15, 2007. FAS 157 defines fair value, establishes a framework for measuring fair value and expands disclosures about fair value measurements. At this time, management is currently evaluating the implications of FAS 157 and its impact on the Funds’ financial statements, if any, has not been determined.
In addition, in February 2007, Statement of Financial Accounting Standard No. 159, “The Fair Value Option for Financial Assets and Financial Liabilities” (“FAS 159”), was issued and is effective for fiscal years beginning after November 15, 2007. Early adoption is permitted as of the beginning of a fiscal year that begins on or before November 15, 2007, provided the entity also elects to apply the provisions of FAS 157. FAS 159 permits entities to choose to measure many financial instruments and certain other items at fair value that are not currently required to be measured at fair value. FAS 159 also establishes presentation and disclosure requirements designed to facilitate comparisons between entities that choose different measurement attributes for similar types of assets and liabilities. At this time, management is evaluating the implications of FAS 159 and its impact on the Funds’ financial statements, if any, has not been determined.
2. Investment Advisory Agreement and Transactions with Affiliates:
Each Fund has entered into an Investment Advisory Agreement with BlackRock Advisors, LLC (the “Manager”), an indirect, wholly owned subsidiary of BlackRock, Inc. The Funds have also entered into separate Distribution Agreements with FAM Distributors, Inc. (“FAMD”) and BlackRock Distributors, Inc. and its affiliates (“BDI”) (collectively, the “Distributor”) and has adopted separate Distribution Plans with respect to its Investor A, Investor A1, Investor B, Investor C and Investor C1 Shares. FAMD is a wholly owned subsidiary of Merrill Lynch Group, Inc. and BDI is an affiliate of BlackRock, Inc. Merrill Lynch & Co., Inc. (“Merrill Lynch”) and The PNC Financial Services Group, Inc. (“PNC”) are the principal owners of BlackRock, Inc.
The Manager is responsible for the management of each Fund’s portfolio and provides the necessary personnel, facilities, equipment and certain other services necessary to the operation of the Bond Fund. For such services, the Manager receives at the end of each month a fee with respect to each Fund at the annual rates set forth below which are based upon the average daily value of the Fund’s net assets.
| Rate of Advisory Fee | ||||||
|
| ||||||
| BlackRock BlackRock BlackRock | ||||||
| Aggregate of Average | Short-Term | Municipal | National | |||
| Daily Net Assets of the | Municipal | Insured | Municipal | |||
| Three Combined Funds* | Fund | Fund | Fund | |||
|
|
|
|
| |||
| Not exceeding $250 million | .40 % | .40 % | .50 % | |||
| In excess of $250 million but | ||||||
| not exceeding $400 million | .375% | .375% | .475% | |||
| In excess of $400 million but | ||||||
| not exceeding $550 million | .35 % | .375% | .475% | |||
| In excess of $550 million but | ||||||
| not exceeding $1.5 billion | .325% | .375% | .475% | |||
| In excess of $1.5 billion | .325% | .35 % | .475% | |||
|
|
|
|
| |||
| * | The portion of the assets of a Fund to which the rate at each breakpoint level applies will be determined on a “uniform percentage” basis. The uniform percentage applicable to a breakpoint level is determined by dividing the amount of the aggregate average daily net assets of the three combined Funds that falls within that breakpoint level by the aggregate average daily net assets of the three combined Funds. The amount of the fee for a Fund at each breakpoint level is determined by multiplying the average daily net assets of that Fund by the uniform percentage applicable to that breakpoint level and multiplying the product by the advisory fee rate. |
The BlackRock High Yield Municipal Fund’s rates are as follows: .55% of the Fund’s average daily net assets not exceeding $250 million; .525% of average daily net assets in excess of $250 million but not exceeding $500 million; and .50% of average daily net assets in excess of $500 million. In addition, for the BlackRock High Yield Municipal Fund, the Manager has voluntarily agreed to waive a portion of the management fee. The amount of the waiver is determined monthly and can be discontinued at any time. For the six months ended December 31, 2007, the Manager earned fees of $204,156, of which $18,171 was waived.
For the BlackRock Short-Term Municipal Fund, the Manager has voluntarily agreed to waive fees or expenses in order to limit expenses as follows: .35% for Institutional Shares, .60% for Investor A Shares, .45% for Investor A1 Shares, .70% for Investor B Shares and 1.35% for Investor C Shares. For the six months ended December 31, 2007, the Manager earned fees of $452,032 of which $182,087 was waived.
66
BLACKROCK MUNICIPAL BOND FUND, INC.
| DECEMBER 31, 2007 |
Notes to Financial Statements (continued)
In addition, the Manager has entered into sub-advisory agreements with BlackRock Investment Management, LLC, an affiliate of the Manager, under which the Manager pays the sub-adviser for services it provides to each Fund, a monthly fee that is a percentage of the management fee paid by each Fund to the Manager.
The Manager has agreed to waive its advisory fee for each Fund by the amount of advisory fee each Fund pays to the Manager indirectly through each Fund’s investment in the Merrill Lynch Institutional Tax-Exempt Fund. For the six months ended December 31, 2007, the waivers were as follows:
| BlackRock Short-Term Municipal Fund | $ 13,191 | |
| BlackRock Municipal Insured Fund | $ 9,305 | |
| BlackRock National Municipal Fund | $ 37,643 | |
| BlackRock High Yield Municipal Fund | $ 1,923 | |
|
|
|
Pursuant to the Distribution Plans adopted by the Bond Fund on behalf of the Funds in accordance with Rule 12b-1 under the Investment Company Act of 1940, each Fund pays the Distributor ongoing service and distribution fees. The fees are accrued daily and paid monthly at annual rates based upon the average daily net assets of the shares as follows:
| Service Fees | ||||||||
|
|
|
| ||||||
| BlackRock | BlackRock | BlackRock | BlackRock | |||||
| Short-Term | Municipal | National | High Yield | |||||
| Municipal | Insured | Municipal | Municipal | |||||
| Fund | Fund | Fund | Fund | |||||
|
|
|
|
|
| ||||
| Investor A | .25% | .25% | .25% | .25% | ||||
| Investor A1 | .10% | — | — | — | ||||
| Investor B | .15% | .25% | .25% | — | ||||
| Investor C | .25% | .25% | .25% | .25% | ||||
| Investor C1 | — | .25% | .25% | — | ||||
|
|
|
|
|
| ||||
| Distribution Fees | ||||||||
|
|
|
| ||||||
| BlackRock | BlackRock | BlackRock | BlackRock | |||||
| Short-Term | Municipal | National | High Yield | |||||
| Municipal | Insured | Municipal | Municipal | |||||
| Fund | Fund | Fund | Fund | |||||
|
|
|
|
|
| ||||
| Investor B | .20% | .50% | .50% | — | ||||
| Investor C | .75% | .75% | .75% | .75% | ||||
| Investor C1 | — | .55% | .55% | — | ||||
|
|
|
|
|
| ||||
Pursuant to sub-agreements with each Distributor, broker-dealers, including Merrill Lynch, Pierce, Fenner & Smith Incorporated (“MLPF&S”), a wholly owned subsidiary of Merrill Lynch and the Distributor, provide shareholder servicing and distribution services to the Bond Fund. The ongoing service fee compensates the Distributor and each broker-dealer (including MLPF&S) for providing shareholder servicing to Investor A, Investor A1, Investor B, Investor C and Investor C1 shareholders. The ongoing distribution fee compensates each Distributor and the broker-dealers for providing distribution-related services to Investor B, Investor C and Investor C1 shareholders.
For the six months ended December 31, 2007, FAMD and BDI earned underwriting discounts and direct commissions and MLPF&S earned dealer concessions on sales of the Funds’ Investor A Shares as follows:
| BlackRock | BlackRock | BlackRock | BlackRock | |||||
| Short-Term | Municipal | National | High Yield | |||||
| Municipal | Insured | Municipal | Municipal | |||||
| Fund | Fund | Fund | Fund | |||||
|
|
|
|
|
| ||||
| Investor A Shares | $33,820 | $60,920 | $198,917 | $9,700 | ||||
|
|
|
|
|
|
For the six months ended December 31, 2007, affiliates received contingent deferred sales charges relating to Investor B, Investor C and Investor C1 Shares as follows:
| Investor B | Investor C | Investor C1 | ||||
|
|
|
|
| |||
| BlackRock Short-Term | ||||||
| Municipal Fund | $ 2,699 | $ 2,106 | $ — | |||
| BlackRock Municipal | ||||||
| Insured Fund | $17,638 | $ 712 | $ 642 | |||
| BlackRock National | ||||||
| Municipal Fund | $28,442 | $22,963 | $1,701 | |||
| BlackRock High Yield | ||||||
| Municipal Fund | $ — | $ 1,199 | $ — | |||
|
|
|
|
|
| Furthermore, MLPF&S received contingent deferred sales charges relat- | ||
| ing to transactions subject to front-end sales charge waivers as follows: | ||
|
| ||
| Investor A | ||
|
|
| |
| BlackRock Short-Term Municipal Fund | $ 9 | |
| BlackRock National Municipal Fund | $2,537 | |
|
|
| |
The Manager maintains a call center, which is responsible for providing certain shareholder services to the Bond Fund, such as responding to shareholder inquiries and processing transactions based upon instructions from shareholders with respect to the subscription and redemption of fund shares.
| BLACKROCK MUNICIPAL BOND FUND, INC. |
| DECEMBER 31, 2007 |
| 67 |
Notes to Financial Statements (continued)
During the six months ended December 31, 2007, the following amounts have been accrued by each Fund to reimburse the Manager for costs incurred running the call center, which are a component of the transfer agent fees in the accompanying Statements of Operations.
| Call Center Fees | ||||||||
|
|
|
| ||||||
| BlackRock | BlackRock | BlackRock | BlackRock | |||||
| Short-Term | Municipal | National | High Yield | |||||
| Municipal | Insured | Municipal | Municipal | |||||
| Fund | Fund | Fund | Fund | |||||
|
|
|
|
|
| ||||
| BlackRock | $ 30 | — | — | — | ||||
| Institutional | $ 2,810 | $19,226 | $57,994 | $ 472 | ||||
| Investor A | $ 72 | $ 5,537 | $11,071 | $ 113 | ||||
| Investor A1 | $ 2,166 | — | — | — | ||||
| Investor B | $ 348 | $ 1,195 | $ 2,890 | — | ||||
| Investor C | $ 86 | $ 94 | $ 929 | $ 78 | ||||
| Investor C1 | — | $ 1,076 | $ 2,654 | — | ||||
|
|
|
|
|
| ||||
For the six months ended December 31, 2007, each Fund reimbursed the Manager for certain accounting services. The reimbursements were as follows:
| BlackRock Short-Term Municipal Fund | $ 2,164 | |
| BlackRock Municipal Insured Fund | $ 7,752 | |
| BlackRock National Municipal Fund | $14,462 | |
| BlackRock High Yield Municipal Fund | $ 611 | |
|
|
|
PFPC Inc., an indirect, wholly owned subsidiary of PNC and an affiliate of the Manager is the Fund’s transfer agent.
Certain officers and/or directors of the Bond Fund are officers and/or directors of BlackRock, Inc. or its affiliates.
3. Investments:
Purchases and sales of investments, excluding short-term securities, for the six months ended December 31, 2007 were as follows:
| Purchases | Sales | |||
|
|
|
| ||
| BlackRock Short-Term Municipal Fund | $ 39,156,618 | $ 51,745,101 | ||
| BlackRock Municipal Insured Fund | $209,553,633 | $220,943,809 | ||
| BlackRock National Municipal Fund | $438,125,236 | $423,613,396 | ||
| BlackRock High Yield Municipal Fund | $ 18,467,318 | $ 13,045,496 | ||
|
|
|
|
4. Capital Share Transactions:
Net increase (decrease) in net assets derived from capital share transactions for the six months ended December 31, 2007 and the year ended June 30, 2007 were as follows:
| For the | For the | |||
| Six Months Ended | Year Ended | |||
| December 31, 2007 | June 30, 2007 | |||
|
|
|
| ||
| BlackRock Short-Term Municipal Fund | $ (5,547,646) | $ (62,634,810) | ||
| BlackRock Municipal Insured Fund | $(29,995,250) | $ (60,444,977) | ||
| BlackRock National Municipal Fund | $ 95,199,573 | $159,104,907 | ||
| BlackRock High Yield Municipal Fund | $ 1,650,939 | $ 73,526,873 | ||
|
|
|
|
68
BLACKROCK MUNICIPAL BOND FUND, INC.
| DECEMBER 31, 2007 |
| Notes to Financial Statements (continued) | ||||||||||
| Transactions in capital shares for each class were as follows: | ||||||||||
| For the Six Months Ended | For the Period October 2, 2006* | |||||||||
| December 31, 2007 | to June 30, 2007 | |||||||||
|
|
|
|
|
|||||||
| Shares | Amount | Shares | Amount | |||||||
|
|
|
|
|
|
||||||
| BlackRock Short-Term Municipal Fund | ||||||||||
|
|
|
|
|
|
|
|||||
| BlackRock Shares | ||||||||||
|
|
|
|
|
|
|
|||||
| Shares sold | —† | $ 1 | 2,874 | 28,519 | ||||||
| Shares issued resulting from reorganization | — | — | 1,094,165 | 10,856,031 | ||||||
| Shares issued to shareholders in reinvestment of dividends | 3,995 | 39,689 | 13,277 | 131,697 | ||||||
|
|
|
|
|
|
||||||
| Total issued | 3,995 | 39,690 | 1,110,316 | 11,016,247 | ||||||
| Shares redeemed | (22,917) | (227,245) | (861,862) | (8,542,264) | ||||||
|
|
|
|
|
|
||||||
| Net increase (decrease) | (18,922) | (187,555) | 248,454 | 2,473,983 | ||||||
|
|
|
|
|
|
||||||
| † Less than 1 share. | ||||||||||
| * Commencement of operations. | ||||||||||
|
|
|
|
|
|
|
|||||
| Institutional Shares | For the Year Ended June 30, 2007 | |||||||||
|
|
|
|
|
|
||||||
| Shares sold | 1,048,050 | $ 10,414,747 | 2,062,719 | $ 20,427,498 | ||||||
| Shares issued resulting from reorganization | — | — | 721,266 | 7,153,239 | ||||||
| Shares issued to shareholders in reinvestment of dividends | 112,748 | 1,116,218 | 247,581 | 2,449,491 | ||||||
|
|
|
|
|
|
||||||
| Total issued | 1,160,798 | 11,530,965 | 3,031,566 | 30,030,228 | ||||||
| Shares redeemed | (1,110,399) | (11,009,659) | (4,877,444) | (48,321,661) | ||||||
|
|
|
|
|
|||||||
| Net increase (decrease) | 50,399 | $ 521,306 | (1,845,878) | $ (18,291,433) | ||||||
|
|
|
|
|
|
||||||
| For the Period October 2, 2006* | ||||||||||
| Investor A Shares | to June 30, 2007 | |||||||||
|
|
|
|
|
|
||||||
| Shares sold and automatic conversion of shares | 803,666 | $ 7,988,479 | 185,469 | $ 1,838,827 | ||||||
| Shares issued resulting from reorganization | — | — | 2,042 | 20,254 | ||||||
| Shares issued to shareholders in reinvestment of dividends | 4,323 | 42,989 | 1,586 | 15,703 | ||||||
|
|
|
|
|
|
||||||
| Total issued | 807,989 | 8,031,468 | 189,097 | 1,874,784 | ||||||
| Shares redeemed | (118,410) | (1,178,868) | (41,774) | (414,043) | ||||||
|
|
|
|
|
|||||||
| Net increase | 689,579 | $ 6,852,600 | 147,323 | $ 1,460,741 | ||||||
|
|
|
|
|
|||||||
| * Commencement of operations. | ||||||||||
|
|
|
|
|
|
|
|||||
| Investor A1 Shares | For the Year Ended June 30, 2007 | |||||||||
|
|
|
|
|
|
||||||
| Shares sold and automatic conversion of shares | 89,375 | $ 889,068 | 678,506 | $ 6,730,670 | ||||||
| Shares issued resulting from conversion of Class C | — | — | 6,091,469 | 60,465,669 | ||||||
| Shares issued to shareholders in reinvestment of dividends | 99,717 | 990,718 | 226,609 | 2,247,647 | ||||||
|
|
|
|
|
|
||||||
| Total issued | 189,092 | 1,879,786 | 6,996,584 | 69,443,986 | ||||||
| Shares redeemed | (1,514,369) | (15,022,746) | (4,669,705) | (46,309,628) | ||||||
|
|
|
|
|
|||||||
| Net increase (decrease) | (1,325,277) | $ (13,142,960) | 2,326,879 | $ 23,134,358 | ||||||
|
|
|
|
|
|
||||||
| Investor B Shares | For the Year Ended June 30, 2007 | |||||||||
|
|
|
|
|
|
||||||
| Shares sold | 34,513 | $ 341,385 | 37,626 | $ 372,718 | ||||||
| Shares issued to shareholders in reinvestment of dividends | 12,231 | 121,416 | 33,215 | 329,149 | ||||||
|
|
|
|
|
|
||||||
| Total issued | 46,744 | 462,801 | 70,841 | 701,867 | ||||||
| Shares redeemed and automatic conversion of shares | (261,107) | (2,591,650) | (1,020,520) | (10,116,602) | ||||||
|
|
|
|
|
|||||||
| Net decrease | (214,363) | $ (2,128,849) | (949,679) | $ (9,414,735) | ||||||
|
|
|
|
|
|||||||
| BLACKROCK MUNICIPAL BOND FUND, INC. |
| DECEMBER 31, 2007 |
| 69 |
| Notes to Financial Statements (continued) | ||||||||||
| For the Six Months Ended | For the Period October 2, 2006* | |||||||||
| December 31, 2007 | to June 30, 2007 | |||||||||
|
|
|
| ||||||||
| Shares | Amount | Shares | Amount | |||||||
|
|
|
|
|
| ||||||
| Investor C Shares | ||||||||||
|
|
|
|
|
|
| |||||
| Shares sold | 351,051 | $ 3,486,675 | 231,602 | $ 2,295,349 | ||||||
| Shares issued to shareholders in reinvestment of dividends | 3,043 | 30,224 | 1,443 | 14,283 | ||||||
|
|
|
|
|
| ||||||
| Total issued | 354,094 | 3,516,899 | 233,045 | 2,309,632 | ||||||
| Shares redeemed | (98,576) | (979,087) | (22,138) | (219,427) | ||||||
|
|
|
|
|
| ||||||
| Net increase | 255,518 | $ 2,537,812 | 210,907 | $ 2,090,205 | ||||||
|
|
|
|
| |||||||
| * Commencement of operations. | ||||||||||
|
|
|
|
|
|
| |||||
| For the Period July 1, 2006 | ||||||||||
| Class C Shares | to August 25, 2006* | |||||||||
|
|
|
|
|
| ||||||
| Shares sold | 62,189 | $ 613,069 | ||||||||
| Shares issued to shareholders in reinvestment of dividends | 18,853 | 185,978 | ||||||||
|
|
| |||||||||
| Total issued | 81,042 | 799,047 | ||||||||
|
|
| |||||||||
| Shares redeemed | (448,474) | (4,421,307) | ||||||||
| Shares redeemed resulting from conversion to Investor A1 | (6,122,405) | (60,465,669) | ||||||||
|
|
| |||||||||
| Total redeemed | (6,570,879) | (64,886,976) | ||||||||
|
|
| |||||||||
| Net decrease | (6,489,837) | $ (64,087,929) | ||||||||
|
|
| |||||||||
| * On August 25, 2006, Class C was converted to Class A (Investor A1). | ||||||||||
|
|
|
|
|
| ||||||
| BlackRock Municipal Insured Fund | ||||||||||
|
|
|
|
|
|
| |||||
| Institutional Shares | For the Year Ended June 30, 2007 | |||||||||
|
|
|
|
|
| ||||||
| Shares sold | 772,058 | $ 5,910,514 | 1,615,547 | $ 12,595,757 | ||||||
| Shares issued to shareholders in reinvestment of dividends | ||||||||||
| and distributions | 859,007 | 6,598,101 | 1,793,351 | 14,025,199 | ||||||
|
|
|
|
|
| ||||||
| Total issued | 1,631,065 | 12,508,615 | 3,408,898 | 26,620,956 | ||||||
| Shares redeemed | (4,703,930) | (36,069,145) | (7,836,614) | (61,267,411) | ||||||
|
|
|
|
| |||||||
| Net decrease | (3,072,865) | $ (23,560,530) | (4,427,716) | $ (34,646,455) | ||||||
|
|
|
|
|
| ||||||
| Investor A Shares | ||||||||||
|
|
|
|
|
|
| |||||
| Shares sold and automatic conversion of shares | 1,704,056 | $ 13,071,875 | 2,710,670 | $ 21,170,114 | ||||||
| Shares issued to shareholders in reinvestment of dividends | ||||||||||
| and distributions | 259,098 | 1,990,148 | 511,923 | 4,001,861 | ||||||
|
|
|
|
|
| ||||||
| Total issued | 1,963,154 | 15,062,023 | 3,222,593 | 25,171,975 | ||||||
| Shares redeemed | (2,182,969) | (16,744,129) | (3,167,212) | (24,734,287) | ||||||
|
|
|
|
| |||||||
| Net increase (decrease) | (219,815) | $ (1,682,106) | 55,381 | $ 437,688 | ||||||
|
|
|
|
|
| ||||||
| Investor B Shares | ||||||||||
|
|
|
|
|
|
| |||||
| Shares sold | 179,929 | $ 1,378,884 | 70,027 | $ 547,519 | ||||||
| Shares issued to shareholders in reinvestment of dividends | ||||||||||
| and distributions | 48,898 | 375,408 | 127,963 | 1,000,612 | ||||||
|
|
|
|
|
| ||||||
| Total issued | 228,827 | 1,754,292 | 197,990 | 1,548,131 | ||||||
| Shares redeemed and automatic conversion of shares | (856,382) | (6,565,280) | (2,915,911) | ( 22,747,070) | ||||||
|
|
|
|
| |||||||
| Net decrease | (627,555) | $ (4,810,988) | (2,717,921) | $ (21,198,939) | ||||||
|
|
|
|
| |||||||
70
BLACKROCK MUNICIPAL BOND FUND, INC.
| DECEMBER 31, 2007 |
| Notes to Financial Statements (continued) | ||||||||||
| For the Six Months Ended | For the Period October 2, 2006* | |||||||||
| December 31, 2007 | to June 30, 2007 | |||||||||
|
|
|
| ||||||||
| Shares | Amount | Shares | Amount | |||||||
|
|
|
|
|
| ||||||
| Investor C Shares | ||||||||||
|
|
|
|
|
|
| |||||
| Shares sold | 594,755 | $ 4,567,905 | 595,100 | $ 4,659,402 | ||||||
| Shares issued to shareholders in reinvestment of dividends | ||||||||||
| and distributions | 8,959 | 68,898 | 4,158 | 32,362 | ||||||
|
|
|
|
|
| ||||||
| Total issued | 603,714 | 4,636,803 | 599,258 | 4,691,764 | ||||||
| Shares redeemed | (46,096) | (353,920) | (7,785) | (61,282) | ||||||
|
|
|
|
|
| ||||||
| Net increase | 557,618 | $ 4,282,883 | 591,473 | $ 4,630,482 | ||||||
|
|
|
|
| |||||||
| * Commencement of operations. | ||||||||||
|
|
|
|
|
|
| |||||
| Investor C1 Shares | For the Year Ended June 30, 2007 | |||||||||
|
|
|
|
|
| ||||||
| Shares sold | 94 | $ 723 | 252,508 | $ 1,971,349 | ||||||
| Shares issued to shareholders in reinvestment of dividends | ||||||||||
| and distributions | 66,475 | 510,525 | 150,681 | 1,178,188 | ||||||
|
|
|
|
|
| ||||||
| Total issued | 66,569 | 511,248 | 403,189 | 3,149,537 | ||||||
| Shares redeemed | (618,044) | (4,735,757) | (1,641,491) | (12,817,290) | ||||||
|
|
|
|
| |||||||
| Net decrease | (551,475) | $ (4,224,509) | (1,238,302) | $ (9,667,753) | ||||||
|
|
|
|
|
| ||||||
| BlackRock National Municipal Fund | ||||||||||
|
|
|
|
|
|
| |||||
| Institutional Shares | ||||||||||
|
|
|
|
|
|
| |||||
| Shares sold | 7,174,686 | $ 73,905,998 | 13,585,783 | $ 142,980,852 | ||||||
| Shares issued to shareholders in reinvestment of dividends | 1,466,612 | 15,131,879 | 2,842,429 | 29,937,810 | ||||||
|
|
|
|
| |||||||
| Total issued | 8,641,298 | 89,037,877 | 16,428,212 | 172,918,662 | ||||||
| Shares redeemed | (5,763,495) | (59,347,538) | (8,439,693) | (88,795,553) | ||||||
|
|
|
|
| |||||||
| Net increase | 2,877,803 | $ 29,690,339 | 7,988,519 | $ 84,123,109 | ||||||
|
|
|
|
|
| ||||||
| Investor A Shares | ||||||||||
|
|
|
|
|
|
| |||||
| Shares sold and automatic conversion of shares | 9,266,101 | $ 95,347,730 | 10,447,588 | $ 109,935,783 | ||||||
| Shares issued to shareholders in reinvestment of dividends | 397,612 | 4,103,637 | 716,831 | 7,552,056 | ||||||
|
|
|
|
|
| ||||||
| Total issued | 9,663,713 | 99,451,367 | 11,164,419 | 117,487,839 | ||||||
| Shares redeemed | (3,221,128) | (33,185,490) | (4,936,616) | (51,956,483) | ||||||
|
|
|
|
| |||||||
| Net increase | 6,442,585 | $ 66,265,877 | 6,227,803 | $ 65,531,356 | ||||||
|
|
|
|
|
| ||||||
| Investor B Shares | ||||||||||
|
|
|
|
|
|
| |||||
| Shares sold | 92,066 | $ 949,346 | 638,307 | $ 6,734,106 | ||||||
| Shares issued to shareholders in reinvestment of dividends | 78,580 | 810,347 | 200,896 | 2,114,751 | ||||||
|
|
|
|
|
| ||||||
| Total issued | 170,646 | 1,759,693 | 839,203 | 8,848,857 | ||||||
| Shares redeemed and automatic conversion of shares | (1,672,175) | (17,237,795) | (4,041,389) | (42,518,597) | ||||||
|
|
|
|
| |||||||
| Net decrease | (1,501,529) | $ (15,478,102) | (3,202,186) | $ (33,669,740) | ||||||
|
|
|
|
| |||||||
| BLACKROCK MUNICIPAL BOND FUND, INC. |
| DECEMBER 31, 2007 |
| 71 |
| Notes to Financial Statements (continued) | ||||||||||
| For the Six Months Ended | For the Period October 2, 2006* | |||||||||
| December 31, 2007 | to June 30, 2007 | |||||||||
|
|
|
| ||||||||
| Shares | Amount | Shares | Amount | |||||||
|
|
|
|
|
| ||||||
| Investor C Shares | ||||||||||
|
|
|
|
|
|
| |||||
| Shares sold | 2,991,677 | $ 30,862,380 | 4,176,661 | $ 44,069,366 | ||||||
| Shares issued to shareholders in reinvestment of dividends | 65,970 | 680,633 | 35,768 | 375,990 | ||||||
|
|
|
|
|
| ||||||
| Total issued | 3,057,647 | 31,543,013 | 4,212,429 | 44,445,356 | ||||||
| Shares redeemed | (587,008) | (6,044,867) | (202,337) | (2,132,581) | ||||||
|
|
|
|
| |||||||
| Net increase | 2,470,639 | $ 25,498,146 | 4,010,092 | $ 42,312,775 | ||||||
|
|
|
|
| |||||||
| * Commencement of operations. | ||||||||||
|
|
|
|
|
|
| |||||
| Investor CI Shares | For the Year Ended June 30, 2007 | |||||||||
|
|
|
|
|
| ||||||
| Shares sold | 28,383 | $ 292,972 | 2,120,136 | $ 22,245,747 | ||||||
| Shares issued to shareholders in reinvestment of dividends | 167,407 | 1,727,403 | 371,250 | 3,911,253 | ||||||
|
|
|
|
|
| ||||||
| Total issued | 195,790 | 2,020,375 | 2,491,386 | 26,157,000 | ||||||
| Shares redeemed | (1,240,843) | (12,797,062) | (2,408,164) | (25,349,593) | ||||||
|
|
|
|
| |||||||
| Net increase (decrease) | (1,045,053) | $ (10,776,687) | 83,222 | $ 807,407 | ||||||
|
|
|
|
|
| ||||||
| BlackRock High Yield Municipal Fund | ||||||||||
|
|
|
|
|
|
| |||||
| Institutional Shares | ||||||||||
|
|
|
|
|
|
| |||||
| Shares sold | 2,066,063 | $ 19,649,586 | 6,785,278 | $ 68,322,908 | ||||||
| Shares issued to shareholders in reinvestment of dividends | ||||||||||
| and distributions | 2,152 | 20,401 | 2,198 | 22,293 | ||||||
|
|
|
|
|
| ||||||
| Total issued | 2,068,215 | 19,669,987 | 6,787,476 | 68,345,201 | ||||||
| Shares redeemed | (1,802,035) | (16,771,773) | (518,933) | (5,228,829) | ||||||
|
|
|
|
| |||||||
| Net increase | 266,180 | $ 2,898,214 | 6,268,543 | $ 63,116,372 | ||||||
|
|
|
|
| |||||||
| * Commencement of operations. | ||||||||||
|
|
|
|
|
|
| |||||
| For the Period August 1, 2006* | ||||||||||
| Investor A Shares | to June 30, 2007 | |||||||||
|
|
|
|
|
| ||||||
| Shares sold | 124,224 | $ 1,162,122 | 691,133 | $ 6,961,080 | ||||||
| Shares issued to shareholders in reinvestment of dividends | ||||||||||
| and distributions | 10,385 | 98,572 | 3,655 | 36,897 | ||||||
|
|
|
|
|
| ||||||
| Total issued | 134,609 | 1,260,694 | 694,788 | 6,997,977 | ||||||
| Shares redeemed | (239,663) | (2,223,439) | (102,603) | (1,035,823) | ||||||
|
|
|
|
| |||||||
| Net increase (decrease) | (105,054) | $ (962,745) | 592,185 | $ 5,962,154 | ||||||
|
|
|
|
| |||||||
| * Commencement of operations. | ||||||||||
|
|
|
|
|
|
| |||||
| Investor C Shares | ||||||||||
|
|
|
|
|
|
| |||||
| Shares sold | 136,629 | $ 1,281,246 | 456,486 | $ 4,621,438 | ||||||
| Shares issued to shareholders in reinvestment of dividends | ||||||||||
| and distributions | 5,304 | 50,199 | 5,243 | 53,125 | ||||||
|
|
|
|
|
| ||||||
| Total issued | 141,933 | 1,331,445 | 461,729 | 4,674,563 | ||||||
| Shares redeemed | (171,528) | (1,615,975) | (22,433) | (226,216) | ||||||
|
|
|
|
| |||||||
| Net increase (decrease) | (29,595) | $ (284,530) | 439,296 | $ 4,448,347 | ||||||
|
|
|
|
| |||||||
| * Commencement of operations. | ||||||||||
72
BLACKROCK MUNICIPAL BOND FUND, INC.
| DECEMBER 31, 2007 |
Notes to Financial Statements (concluded)
5. Short-Term Borrowings:
The Bond Fund, on behalf of the Funds, along with certain other funds managed by the Manager and its affiliates is a party to a $500,000,000 credit agreement with a group of lenders. The Bond Fund may borrow under the credit agreement to fund shareholder redemptions and for other lawful purposes other than for leverage. The Bond Fund may borrow up to the maximum amount allowable under the Bond Fund’s current prospectus and statement of additional information, subject to various other legal, regulatory or contractual limits. On November 21, 2007 the credit agreement was renewed for one year under substantially the same terms. The Bond Fund pays a commitment fee of .06% per annum based on the Bond Fund’s pro rata share of the unused portion of the credit agreement. Amounts borrowed under the credit agreement bear interest at a rate equal to, at each fund’s election, the federal funds rate plus .35% or a base rate as defined in the credit agreement. The Bond Fund did not borrow under the credit agreement during the six months ended December 31, 2007.
6. Capital Loss Carryforward
BlackRock Short-Term Municipal Fund
On June 30, 2007, the Fund had a net capital loss carryforward of $9,187,219, of which $119,413 expires in 2008, $426,094 expires in 2009, $32,641 expires in 2011, $331,374 expires in 2012, $1,178,808 expires in 2013, $4,110,940 expires in 2014 and $2,987,949 expires in 2015. This amount will be available to offset like amounts of any future taxable gains.
BlackRock National Municipal Fund
On June 30, 2007, the Fund had a net capital loss carryforward of $26,847,836, of which $23,869,173 expires in 2009, $444,566 expires in 2010, $942,957 expires in 2011 and $1,591,140 expires in 2012. This amount will be available to offset like amounts of any future taxable gains.
| BLACKROCK MUNICIPAL BOND FUND, INC. |
| DECEMBER 31, 2007 |
| 73 |
Proxy Results
During the six-month period ended December 31, 2007, the shareholders in each Fund of BlackRock Municipal Bond Fund, Inc. voted on the following proposal, which was approved at a special shareholders’ meeting on September 7, 2007. This proposal was a part of the reorganization of the Fund’s Board of Directors that took effect on November 1, 2007. A description of the proposal and number of shares voted are as follows:
| BlackRock Short-Term Municipal Fund | ||||||
|
|
||||||
| Shares Voted | Shares Withheld | |||||
| For | From Voting | |||||
|
|
|
|
|
|||
| To elect the Fund’s Board of Directors: | James H. Bodurtha | 26,381,725 | 205,092 | |||
| Bruce R. Bond | 26,381,725 | 205,092 | ||||
| Donald W. Burton | 26,381,725 | 205,092 | ||||
| Richard S. Davis | 26,381,725 | 205,092 | ||||
| Stuart E. Eizenstat | 26,381,725 | 205,092 | ||||
| Laurence D. Fink | 26,373,848 | 212,969 | ||||
| Kenneth A. Froot | 26,373,848 | 212,969 | ||||
| Henry Gabbay | 26,373,848 | 212,969 | ||||
| Robert M. Hernandez | 26,373,848 | 212,969 | ||||
| John F. O’Brien | 26,373,848 | 212,969 | ||||
| Roberta Cooper Ramo | 26,381,725 | 205,092 | ||||
| Jean Margo Reid | 26,381,725 | 205,092 | ||||
| David H. Walsh | 26,381,725 | 205,092 | ||||
| Fred G. Weiss | 26,381,725 | 205,092 | ||||
| Richard R. West | 26,381,725 | 205,092 | ||||
|
|
|
|
|
|||
74 BLACKROCK MUNICIPAL BOND FUND, INC.
| DECEMBER 31, 2007 |
| BlackRock Municipal Insured Fund | BlackRock National Municipal Fund | BlackRock High Yield Municipal Fund | ||||||||
|
|
|
| ||||||||
| Shares Voted | Shares Withheld | Shares Voted | Shares Withheld | Shares Voted | Shares Withheld | |||||
| For | From Voting | For | From Voting | For | From Voting | |||||
|
|
|
|
|
|
| |||||
| 96,113,669 | 1,985,856 | 123,052,859 | 2,091,359 | 6,995,336 | 0 | |||||
| 96,118,510 | 1,981,015 | 123,012,123 | 2,132,095 | 6,995,336 | 0 | |||||
| 96,118,301 | 1,981,224 | 122,992,108 | 2,152,110 | 6,995,336 | 0 | |||||
| 96,054,356 | 2,045,169 | 122,998,742 | 2,145,476 | 6,995,336 | 0 | |||||
| 96,106,371 | 1,993,154 | 123,046,950 | 2,097,268 | 6,995,336 | 0 | |||||
| 96,105,925 | 1,993,600 | 123,010,764 | 2,133,454 | 6,995,336 | 0 | |||||
| 96,054,379 | 2,045,146 | 123,005,066 | 2,139,152 | 6,995,336 | 0 | |||||
| 96,049,788 | 2,049,737 | 122,988,848 | 2,155,370 | 6,995,336 | 0 | |||||
| 96,093,291 | 2,006,234 | 122,985,110 | 2,159,108 | 6,995,336 | 0 | |||||
| 96,100,506 | 1,999,019 | 123,005,761 | 2,138,457 | 6,995,336 | 0 | |||||
| 96,077,576 | 2,021,949 | 123,072,000 | 2,072,218 | 6,995,336 | 0 | |||||
| 96,078,976 | 2,020,549 | 123,076,386 | 2,067,832 | 6,995,336 | 0 | |||||
| 96,132,723 | 1,966,802 | 123,007,357 | 2,136,861 | 6,995,336 | 0 | |||||
| 96,132,753 | 1,966,772 | 123,066,050 | 2,078,168 | 6,995,336 | 0 | |||||
| 96,132,723 | 1,966,802 | 123,048,112 | 2,096,106 | 6,995,336 | 0 | |||||
|
|
|
|
|
|
| |||||
| BLACKROCK MUNICIPAL BOND FUND, INC. |
| DECEMBER 31, 2007 |
| 75 |
| Officers and Directors James H. Bodurtha, Director Bruce R. Bond, Director Donald W. Burton, Director Richard S. Davis, Director Stuart E. Eizenstat, Director Laurence D. Fink, Director Kenneth A. Froot, Director Henry Gabbay, Director Robert M. Hernandez, Director John F. O’Brien, Director Roberta Cooper Ramo, Director Jean Margo Reid, Director David H. Walsh, Director Fred G. Weiss, Director Richard R. West, Director Joe Grills, Advisory Board Member* Donald C. Burke, Fund President and Chief Executive Officer Anne F. Ackerley, Vice President Neal J. Andrews, Chief Financial Officer Jay M. Fife, Treasurer Brian . Kindelan, Chief Compliance Officer Howard Surloff, Secretary * Joe Grills resigned from the Advisory Board of the Fund, effective December 31, 2007. |
| Custodian The Bank of New York Mellon New York, NY 10286 Transfer Agent PFPC Inc. Wilmington, DE 19809 Accounting Agent State Street Bank and Trust Company Princeton, NJ 08540 Independent Registered Public Accounting Firm Deloitte & Touche LLP Princeton, NJ 08540 Legal Counsel Willkie Farr & Gallagher LLP New York, NY 10019 Fund Address BlackRock Municipal Bond Fund, Inc. 100 Bellevue Parkway Wilmington, DE 19809 |
Swap Agreements
BlackRock Municipal Insured Fund, BlackRock National Municipal Fund and BlackRock High Yield Municipal Fund of BlackRock Municipal Bond Fund, Inc. may invest in swap agreements, which are over-the-counter contracts in which one party agrees to make periodic payments based on the change in market value of a specified bond, basket of bonds or index in return for periodic payments based on a fixed or variable interest rate or the change in market value of a different bond, basket of bonds or index. Swap agreements may be used to obtain exposure to a bond or market without owning or taking physical custody of securities. Swap agreements involve the risk that the party with whom the Fund has entered into a swap will default on its obligation to pay the Fund and the risk that the Fund will not be able to meet its obligations to pay the other party to the agreement. The swap agreements in which the Fund may invest includes credit default swap agreements.
76
BLACKROCK MUNICIPAL BOND FUND, INC.
| DECEMBER 31, 2007 |
|
BlackRock Fund Information BlackRock Privacy Principles BlackRock is committed to maintaining the privacy of its current and former fund investors and individual clients (collectively, “Clients”) and to safeguarding their nonpublic personal information. The following infor- mation is provided to help you understand what personal information BlackRock collects, how we protect that information and why in certain cases we share such information with select parties. If you are located in a jurisdiction where specific laws, rules or regulations require BlackRock to provide you with additional or different privacy-related rights beyond what is set forth below, then BlackRock will comply with those specific laws, rules or regulations. BlackRock obtains or verifies personal nonpublic information from and about you from different sources, including the following: (i) information we receive from you or, if applicable, your financial intermediary, on appli- cations, forms or other documents; (ii) information about your trans- actions with us, our affiliates, or others; (iii) information we receive from a consumer reporting agency; and (iv) from visits to our websites. |
|
BlackRock does not sell or disclose to nonaffiliated third parties any non- public personal information about its Clients, except as permitted by law or as is necessary to respond to regulatory requests or to service Client accounts. These nonaffiliated third parties are required to protect the confidentiality and security of this information and to use it only for its intended purpose. We may share information with our affiliates to service your account or to provide you with information about other BlackRock products or services that may be of interest to you. In addition, BlackRock restricts access to nonpublic personal information about its Clients to those BlackRock employees with a legitimate business need for the information. BlackRock maintains physical, electronic and procedural safeguards that are designed to protect the nonpublic personal information of its Clients, including proce- dures relating to the proper storage and disposal of such information. |
|
Availability of Additional Information Electronic copies of most financial reports and prospectuses are available on the Fund’s website or shareholders can sign up for e-mail notifications of quarterly statements, annual and semi-annual reports and prospectuses by enrolling in the Fund’s electronic delivery program. To enroll: Shareholders Who Hold Accounts with Investment Advisers, Banks or Brokerages: Please contact your financial advisor. Please note that not all investment advisers, banks or brokerages may offer this service. |
| Shareholders Who Hold Accounts Directly with BlackRock: |
|
1) Access the BlackRock website at http://www.blackrock.com/edelivery 2) Select “eDelivery” under the “More Information” section 3) Log into your account |
|
The Fund will mail only one copy of shareholder documents, including prospectuses, annual and semi-annual reports and proxy statements, to shareholders with multiple accounts at the same address. This practice is commonly called “householding” and it is intended to reduce expenses and eliminate duplicate mailings of shareholder documents. Mailings of your shareholder documents may be householded indefinitely unless you instruct us otherwise. If you do not want the mailing of these documents to be combined with those for other members of your household, please contact the Fund at (800) 441-7762. |
| BLACKROCK MUNICIPAL BOND FUND, INC. |
| DECEMBER 31, 2007 |
| 77 |
| BlackRock Fund Information (concluded) Availability of Additional Information (concluded) Availability of Proxy Voting Policies and Procedures The Fund has delegated proxy voting responsibilities to BlackRock and its affiliates, subject to the general oversight of the Fund’s Board of Directors. A description of the policies and procedures that BlackRock and its affiliates use to determine how to vote proxies relating to portfolio securities is available without charge, upon request, on our website at www.blackrock.com, by calling (800) 441-7762, or on the website of the Securities and Exchange Commission (the “Commission”) at http://www.sec.gov. Availability of Proxy Voting Record Information on how proxies relating to the Fund’s voting securities were voted (if any) by BlackRock during the most recent 12-month period ended June 30 is available, upon request and without charge, on our website at www.blackrock.com, by calling (800) 441-7762 or on the website of the Commission at http://www.sec.gov. |
| Availability of Quarterly Portfolio Schedule The Fund files its complete schedule of portfolio holdings for the first and third quarters of its fiscal year with the Commission on Form N-Q. The Fund’s Forms N-Q are available on the Commission’s website at http://www.sec.gov and may be reviewed and copied at the Commission’s Public Reference Room in Washington, D.C. Information regarding the operation of the Public Reference Room may be obtained by calling (800) SEC-0330. The Fund’s Forms N-Q may also be obtained upon request, without charge, by calling (800) 441-7762. |
| Shareholder Privileges Account Information Call us at (800) 441-7762 8:00 AM – 6:00 PM EST to get information about your account balances, recent transactions and share prices. You can also reach us on the Web at www.blackrock.com/funds. Automatic Investment Plans Investor Class shareholders who want to invest regularly can arrange to have $50 or more automatically deducted from their checking or savings account and invested in any of the BlackRock funds. |
| Systematic Withdrawal Plans Investor Class shareholders can establish a systematic withdrawal plan and receive periodic payments of $50 or more from their BlackRock funds, as long as their account is at least $10,000. Retirement Plans Shareholders may make investments in conjunction with Traditional, Rollover, Roth, Coverdell, Simple IRAs, SEP IRAs and 403(b) Plans. |
78
BLACKROCK MUNICIPAL BOND FUND, INC.
| DECEMBER 31, 2007 |
A World-Class Mutual Fund Family
BlackRock offers a diverse lineup of open-end mutual funds crossing all investment styles and managed by experts in equity, fixed income and tax-exempt investing.
| Equity Funds | ||||
|
|
|
|
||
| BlackRock All-Cap Global Resources Portfolio | BlackRock Global Opportunities Portfolio | BlackRock Mid-Cap Growth Equity Portfolio | ||
| BlackRock Aurora Portfolio | BlackRock Global Resources Portfolio | BlackRock Mid-Cap Value Equity Portfolio | ||
| BlackRock Asset Allocation Portfolio† | BlackRock Global Science & Technology | BlackRock Mid Cap Value Opportunities Fund | ||
| BlackRock Balanced Capital Fund† | Opportunities Portfolio | BlackRock Natural Resources Trust | ||
| BlackRock Basic Value Fund | BlackRock Global SmallCap Fund | BlackRock Pacific Fund | ||
| BlackRock Capital Appreciation Portfolio | BlackRock Healthcare Fund | BlackRock Small Cap Core Equity Portfolio | ||
| BlackRock Developing Capital Markets Fund | BlackRock Health Sciences Opportunities Portfolio* | BlackRock Small Cap Growth Equity Portfolio | ||
| BlackRock Equity Dividend Fund | BlackRock Index Equity Portfolio* | BlackRock Small Cap Growth Fund II | ||
| BlackRock EuroFund | BlackRock International Fund | BlackRock Small Cap Index Fund | ||
| BlackRock Focus Growth Fund | BlackRock International Index Fund | BlackRock Small Cap Value Equity Portfolio* | ||
| BlackRock Focus Value Fund | BlackRock International Opportunities Portfolio* | BlackRock Small/Mid-Cap Growth Portfolio | ||
| BlackRock Fundamental Growth Fund | BlackRock International Value Fund | BlackRock S&P 500 Index Fund | ||
| BlackRock Global Allocation Fund† | BlackRock Large Cap Core Fund | BlackRock Technology Fund | ||
| BlackRock Global Dynamic Equity Fund | BlackRock Large Cap Growth Fund | BlackRock U.S. Opportunities Portfolio | ||
| BlackRock Global Financial Services Fund | BlackRock Large Cap Value Fund | BlackRock Utilities and Telecommunications Fund | ||
| BlackRock Global Growth Fund | BlackRock Latin America Fund | BlackRock Value Opportunities Fund | ||
|
|
|
|
||
| Fixed Income Funds | ||||
|
|
|
|
||
| BlackRock Commodity Strategies Fund | BlackRock Inflation Protected Bond Portfolio | BlackRock Managed Income Portfolio | ||
| BlackRock Enhanced Income Portfolio | BlackRock Intermediate Bond Portfolio II | BlackRock Short-Term Bond Fund | ||
| BlackRock GNMA Portfolio | BlackRock Intermediate Government | BlackRock Total Return Fund | ||
| BlackRock Government Income Portfolio | Bond Portfolio | BlackRock Total Return Portfolio II | ||
| BlackRock High Income Fund | BlackRock International Bond Portfolio | BlackRock World Income Fund | ||
| BlackRock High Yield Bond Portfolio | BlackRock Low Duration Bond Portfolio | |||
|
|
|
|
||
| Municipal Bond Funds | ||||
|
|
|
|
||
| BlackRock AMT-Free Municipal Bond Portfolio | BlackRock Intermediate Municipal Fund | BlackRock New York Municipal Bond Fund | ||
| BlackRock California Insured Municipal Bond Fund | BlackRock Kentucky Municipal Bond Portfolio | BlackRock Ohio Municipal Bond Portfolio | ||
| BlackRock Delaware Municipal Bond Portfolio | BlackRock Municipal Insured Fund | BlackRock Pennsylvania Municipal Bond Fund | ||
| BlackRock Florida Municipal Bond Fund | BlackRock National Municipal Fund | BlackRock Short-Term Municipal Fund | ||
| BlackRock High Yield Municipal Fund | BlackRock New Jersey Municipal Bond Fund | |||
|
|
|
|
||
| Target Risk & Target Date Funds | ||||
|
|
|
|
||
| BlackRock Prepared Portfolios | BlackRock Lifecycle Prepared Portfolios | |||
| Conservative Prepared Portfolio | Prepared Portfolio 2010 | Prepared Portfolio 2030 | ||
| Moderate Prepared Portfolio | Prepared Portfolio 2015 | Prepared Portfolio 2035 | ||
| Growth Prepared Portfolio | Prepared Portfolio 2020 | Prepared Portfolio 2040 | ||
| Aggressive Growth Prepared Portfolio | Prepared Portfolio 2025 | Prepared Portfolio 2045 | ||
| Prepared Portfolio 2050 | ||||
| * See the prospectus for information on specific limitations on investments in the fund. | ||||
| † Mixed asset fund. | ||||
BlackRock mutual funds are distributed by BlackRock Distributors, Inc. and certain funds are also distributed by FAM Distributors, Inc. You should consider the investment objectives, risks, charges and expenses of the funds under consideration carefully before investing. Each fund’s prospectus contains this and other information and is available at www.blackrock.com or by calling 800-882-0052 or from your financial advisor. The prospectus should be read carefully before investing.
| BLACKROCK MUNICIPAL BOND FUND, INC. |
| DECEMBER 31, 2007 |
| 79 |
This report is transmitted to shareholders only. It is not authorized for use as an offer of sale or a solicitation of an offer to buy shares of the Funds unless accompanied or preceded by the Fund’s current prospectus. Past performance results shown in this report should not be considered a representation of future performance. Investment return and principal value of shares will fluctuate so that shares, when redeemed, may be worth more or less than their original cost. Statements and other information herein are as dated and are subject to change.


| #10249-12/07 |
|
Item 2 – Code of Ethics – Not Applicable to this semi-annual report Item 3 – Audit Committee Financial Expert – Not Applicable to this semi-annual report Item 4 – Principal Accountant Fees and Services – Not Applicable to this semi-annual report Item 5 – Audit Committee of Listed Registrants – Not Applicable Item 6 – Schedule of Investments – The registrant’s Schedule of Investments is included as part of the Report to Stockholders filed under Item 1 of this form. Item 7 – Disclosure of Proxy Voting Policies and Procedures for Closed-End Management Investment Companies – Not Applicable Item 8 – Portfolio Managers of Closed-End Management Investment Companies – Not Applicable Item 9 – Purchases of Equity Securities by Closed-End Management Investment Company and Affiliated Purchasers – Not Applicable Item 10 – Submission of Matters to a Vote of Security Holders – The registrant’s Nominating and Governance Committee will consider nominees to the Board recommended by shareholders when a vacancy becomes available. Shareholders who wish to recommend a nominee should send nominations which include biographical information and set forth the qualifications of the proposed nominee to the registrant’s Secretary. There have been no material changes to these procedures. Item 11 – Controls and Procedures |
|
11(a) – The registrant’s principal executive and principal financial officers or persons performing similar functions have concluded that the registrant’s disclosure controls and procedures (as defined in Rule 30a-3(c) under the Investment Company Act of 1940, as amended (the “1940 Act”)) are effective as of a date within 90 days of the filing of this report based on the evaluation of these controls and procedures required by Rule 30a-3(b) under the 1940 Act and Rule 15d-15(b) under the Securities Exchange Act of 1934, as amended. |
11(b) – There were no changes in the registrant’s internal control over financial reporting (as
defined in Rule 30a-3(d) under the 1940 Act) that occurred during the second fiscal quarter of the period covered by this report that have materially affected, or are reasonably likely to materially affect, the registrant’s internal control over financial reporting.
|
Item 12 – Exhibits attached hereto 12(a)(1) – Code of Ethics – Not Applicable to this semi-annual report 12(a)(2) – Certifications – Attached hereto 12(a)(3) – Not Applicable 12(b) – Certifications – Attached hereto |
Pursuant to the requirements of the Securities Exchange Act of 1934 and the Investment Company Act of 1940, the registrant has duly caused this report to be signed on its behalf by the undersigned, thereunto duly authorized.
| BlackRock Municipal Bond Fund, Inc. |
| By: | /s/ Donald C. Burke | |
| Donald C. Burke | ||
| Chief Executive Officer of | ||
| BlackRock Municipal Bond Fund, Inc. |
Date: February 21, 2008
Pursuant to the requirements of the Securities Exchange Act of 1934 and the Investment Company Act of 1940, this report has been signed below by the following persons on behalf of the registrant and in the capacities and on the dates indicated.
By: /s/ Donald C. Burke
Donald C. Burke
Chief Executive Officer (principal executive officer) of BlackRock Municipal Bond Fund, Inc.
|
Date: February 21, 2008 By: /s/ Neal J. Andrews |
Neal J. Andrews
Chief Financial Officer (principal financial officer) of BlackRock Municipal Bond Fund, Inc.
| Date: February 21, 2008 |