UNITED STATES
SECURITIES AND EXCHANGE COMMISSION
Washington, D.C. 20549
FORM N-CSR
CERTIFIED SHAREHOLDER REPORT OF REGISTERED
MANAGEMENT INVESTMENT COMPANIES
Investment Company Act file number 811-02737
Fidelity Summer Street Trust
(Exact name of registrant as specified in charter)
245 Summer St., Boston, MA 02210
(Address of principal executive offices) (Zip code)
Cynthia Lo Bessette, Secretary
245 Summer St.
Boston, Massachusetts 02210
(Name and address of agent for service)
Registrant's telephone number, including area code:
617-563-7000
Date of fiscal year end: | April 30 |
Date of reporting period: | October 31, 2019 |
Item 1.
Reports to Stockholders
Fidelity® Capital & Income Fund
Semi-Annual Report
October 31, 2019

See the inside front cover for important information about access to your fund’s shareholder reports.
Beginning on January 1, 2021, as permitted by regulations adopted by the Securities and Exchange Commission, paper copies of a fund’s shareholder reports will no longer be sent by mail, unless you specifically request paper copies of the reports from the fund or from your financial intermediary, such as a financial advisor, broker-dealer or bank. Instead, the reports will be made available on a website, and you will be notified by mail each time a report is posted and provided with a website link to access the report.
If you already elected to receive shareholder reports electronically, you will not be affected by this change and you need not take any action. You may elect to receive shareholder reports and other communications from a fund electronically, by contacting your financial intermediary. For Fidelity customers, visit Fidelity's web site or call Fidelity using the contact information listed below.
You may elect to receive all future reports in paper free of charge. If you wish to continue receiving paper copies of your shareholder reports, you may contact your financial intermediary or, if you are a Fidelity customer, visit Fidelity’s website, or call Fidelity at the applicable toll-free number listed below. Your election to receive reports in paper will apply to all funds held with the fund complex/your financial intermediary.
| Account Type | Website | Phone Number |
| Brokerage, Mutual Fund, or Annuity Contracts: | fidelity.com/mailpreferences | 1-800-343-3548 |
| Employer Provided Retirement Accounts: | netbenefits.fidelity.com/preferences (choose 'no' under Required Disclosures to continue to print) | 1-800-343-0860 |
| Advisor Sold Accounts Serviced Through Your Financial Intermediary: | Contact Your Financial Intermediary | Your Financial Intermediary's phone number |
| Advisor Sold Accounts Serviced by Fidelity: | institutional.fidelity.com | 1-877-208-0098 |
Contents
To view a fund's proxy voting guidelines and proxy voting record for the 12-month period ended June 30, visit http://www.fidelity.com/proxyvotingresults or visit the Securities and Exchange Commission's (SEC) web site at http://www.sec.gov.
You may also call 1-800-544-8544 to request a free copy of the proxy voting guidelines.
Standard & Poor's, S&P and S&P 500 are registered service marks of The McGraw-Hill Companies, Inc. and have been licensed for use by Fidelity Distributors Corporation.
Other third-party marks appearing herein are the property of their respective owners.
All other marks appearing herein are registered or unregistered trademarks or service marks of FMR LLC or an affiliated company. © 2019 FMR LLC. All rights reserved.
This report and the financial statements contained herein are submitted for the general information of the shareholders of the Fund. This report is not authorized for distribution to prospective investors in the Fund unless preceded or accompanied by an effective prospectus.
A fund files its complete schedule of portfolio holdings with the SEC for the first and third quarters of each fiscal year on Form N-PORT. Forms N-PORT are available on the SEC’s web site at http://www.sec.gov. A fund's Forms N-PORT may be reviewed and copied at the SEC’s Public Reference Room in Washington, DC. Information regarding the operation of the SEC's Public Reference Room may be obtained by calling 1-800-SEC-0330.
For a complete list of a fund's portfolio holdings, view the most recent holdings listing, semiannual report, or annual report on Fidelity's web site at http://www.fidelity.com, http://www.institutional.fidelity.com, or http://www.401k.com, as applicable.
NOT FDIC INSURED •MAY LOSE VALUE •NO BANK GUARANTEE
Neither the Fund nor Fidelity Distributors Corporation is a bank.
Investment Summary (Unaudited)
Top Five Holdings as of October 31, 2019
| (by issuer, excluding cash equivalents) | % of fund's net assets |
| CCO Holdings LLC/CCO Holdings Capital Corp. | 3.3 |
| Ally Financial, Inc. | 2.7 |
| Bank of America Corp. | 2.3 |
| JPMorgan Chase & Co. | 2.0 |
| Citigroup, Inc. | 1.6 |
| 11.9 |
Top Five Market Sectors as of October 31, 2019
| % of fund's net assets | |
| Energy | 12.9 |
| Banks & Thrifts | 11.0 |
| Technology | 9.6 |
| Healthcare | 7.5 |
| Telecommunications | 7.1 |
Quality Diversification (% of fund's net assets)
| As of October 31, 2019 | ||
| AAA,AA,A | 0.1% | |
| BBB | 6.6% | |
| BB | 26.7% | |
| B | 25.8% | |
| CCC,CC,C | 8.8% | |
| D | 1.2% | |
| Not Rated | 0.5% | |
| Equities | 20.6% | |
| Short-Term Investments and Net Other Assets | 9.7% | |
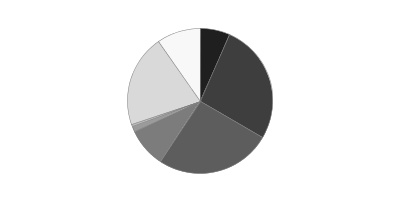
We have used ratings from Moody's Investors Service, Inc. Where Moody's® ratings are not available, we have used S&P® ratings. All ratings are as of the date indicated and do not reflect subsequent changes.
Asset Allocation (% of fund's net assets)
| As of October 31, 2019* | ||
| Nonconvertible Bonds | 55.8% | |
| Convertible Bonds, Preferred Stocks | 0.2% | |
| Common Stocks | 20.6% | |
| Bank Loan Obligations | 4.4% | |
| Other Investments | 9.3% | |
| Short-Term Investments and Net Other Assets (Liabilities) | 9.7% | |

* Foreign investments – 14.8%
Schedule of Investments October 31, 2019 (Unaudited)
Showing Percentage of Net Assets
| Corporate Bonds - 56.0% | |||
| Principal Amount (000s) | Value (000s) | ||
| Convertible Bonds - 0.2% | |||
| Automotive & Auto Parts - 0.0% | |||
| Exide Technologies 7.25% 4/30/27 pay-in-kind (a)(b) | $1,694 | $254 | |
| Energy - 0.2% | |||
| Denbury Resources, Inc. 6.375% 12/31/24 (a) | 37,706 | 20,426 | |
| TOTAL CONVERTIBLE BONDS | 20,680 | ||
| Nonconvertible Bonds - 55.8% | |||
| Aerospace - 2.7% | |||
| BBA U.S. Holdings, Inc. 5.375% 5/1/26 (a) | 4,405 | 4,603 | |
| Bombardier, Inc.: | |||
| 6.125% 1/15/23 (a) | 10,790 | 10,547 | |
| 7.5% 12/1/24 (a) | 2,990 | 2,898 | |
| 7.5% 3/15/25 (a) | 47,010 | 44,953 | |
| 7.875% 4/15/27 (a) | 33,840 | 31,979 | |
| BWX Technologies, Inc. 5.375% 7/15/26 (a) | 8,510 | 9,013 | |
| DAE Funding LLC 4% 8/1/20 (a) | 5,145 | 5,177 | |
| TransDigm UK Holdings PLC 6.875% 5/15/26 | 35,725 | 38,136 | |
| TransDigm, Inc.: | |||
| 5.5% 11/15/27 (a)(c) | 55,655 | 55,471 | |
| 6.25% 3/15/26 (a) | 17,925 | 19,202 | |
| 6.375% 6/15/26 | 61,985 | 64,852 | |
| 6.5% 5/15/25 | 16,505 | 17,145 | |
| 7.5% 3/15/27 | 18,012 | 19,453 | |
| 323,429 | |||
| Air Transportation - 0.2% | |||
| Air Canada 2013-1 Pass Through Trust 5.375% 11/15/22 (a) | 1,989 | 2,047 | |
| Continental Airlines, Inc. pass-thru certificates 6.903% 10/19/23 | 390 | 406 | |
| Delta Air Lines, Inc. pass-thru trust certificates 8.021% 2/10/24 | 4,789 | 5,291 | |
| Hawaiian Airlines pass-thru certificates Series 2013-1 Class B, 4.95% 7/15/23 | 3,478 | 3,542 | |
| U.S. Airways pass-thru certificates: | |||
| Series 2011-1 Class A, 7.125% 4/22/25 | 6,872 | 7,804 | |
| Series 2012-2 Class B, 6.75% 6/3/21 | 2,521 | 2,657 | |
| Series 2013-1 Class B, 5.375% 11/15/21 | 3,440 | 3,592 | |
| 25,339 | |||
| Automotive & Auto Parts - 0.3% | |||
| Allison Transmission, Inc.: | |||
| 5% 10/1/24 (a) | 11,405 | 11,690 | |
| 5.875% 6/1/29 (a) | 7,960 | 8,577 | |
| Exide Technologies: | |||
| 10.75% 10/31/21 pay-in-kind (a)(b)(d) | 839 | 755 | |
| 11% 10/31/24 pay-in-kind (a)(b)(d) | 2,063 | 1,341 | |
| 11% 10/31/24 pay-in-kind (a)(b)(d) | 857 | 386 | |
| IAA Spinco, Inc. 5.5% 6/15/27 (a) | 4,680 | 5,014 | |
| LKQ Corp. 4.75% 5/15/23 | 2,190 | 2,233 | |
| Penske Automotive Group, Inc. 5.5% 5/15/26 | 8,565 | 8,950 | |
| 38,946 | |||
| Banks & Thrifts - 2.7% | |||
| Ally Financial, Inc.: | |||
| 8% 11/1/31 | 20,638 | 28,371 | |
| 8% 11/1/31 | 206,609 | 288,734 | |
| 317,105 | |||
| Broadcasting - 1.6% | |||
| iHeartCommunications, Inc.: | |||
| 6.375% 5/1/26 | 671 | 722 | |
| 8.375% 5/1/27 | 1,216 | 1,304 | |
| 11.25% 3/1/21 (d) | 11,660 | 0 | |
| Netflix, Inc.: | |||
| 4.375% 11/15/26 | 5,760 | 5,863 | |
| 4.875% 4/15/28 | 28,755 | 29,712 | |
| 5.375% 11/15/29 (a) | 11,075 | 11,670 | |
| 5.875% 11/15/28 | 64,825 | 71,389 | |
| Nexstar Escrow, Inc. 5.625% 7/15/27 (a) | 12,530 | 13,215 | |
| Sirius XM Radio, Inc.: | |||
| 4.625% 5/15/23 (a) | 4,925 | 5,002 | |
| 5% 8/1/27 (a) | 14,525 | 15,269 | |
| 5.375% 4/15/25 (a) | 12,000 | 12,480 | |
| 5.375% 7/15/26 (a) | 11,315 | 11,937 | |
| Tegna, Inc. 5% 9/15/29 (a) | 12,060 | 12,226 | |
| 190,789 | |||
| Building Materials - 0.1% | |||
| Advanced Drain Systems, Inc. 5% 9/30/27 (a) | 2,325 | 2,377 | |
| Summit Materials LLC/Summit Materials Finance Corp. 5.125% 6/1/25 (a) | 5,095 | 5,229 | |
| U.S. Concrete, Inc. 6.375% 6/1/24 | 5,535 | 5,761 | |
| 13,367 | |||
| Cable/Satellite TV - 5.5% | |||
| CCO Holdings LLC/CCO Holdings Capital Corp.: | |||
| 4.75% 3/1/30 (a) | 56,140 | 57,193 | |
| 5% 2/1/28 (a) | 91,490 | 95,721 | |
| 5.125% 2/15/23 | 30,665 | 31,317 | |
| 5.125% 5/1/23 (a) | 14,050 | 14,384 | |
| 5.125% 5/1/27 (a) | 69,885 | 73,641 | |
| 5.375% 5/1/25 (a) | 14,050 | 14,577 | |
| 5.375% 6/1/29 (a) | 18,080 | 19,300 | |
| 5.5% 5/1/26 (a) | 17,605 | 18,551 | |
| 5.75% 9/1/23 | 9,495 | 9,685 | |
| 5.75% 1/15/24 | 1,638 | 1,678 | |
| 5.75% 2/15/26 (a) | 20,340 | 21,479 | |
| 5.875% 5/1/27 (a) | 17,965 | 19,043 | |
| CSC Holdings LLC: | |||
| 5.375% 2/1/28 (a) | 23,655 | 25,015 | |
| 5.5% 5/15/26 (a) | 50,968 | 53,708 | |
| 5.75% 1/15/30 (a) | 67,025 | 70,544 | |
| 6.5% 2/1/29 (a) | 24,795 | 27,693 | |
| 7.5% 4/1/28 (a) | 14,375 | 16,172 | |
| LCPR Senior Secured Financing DAC 6.75% 10/15/27 (a) | 11,285 | 11,581 | |
| Videotron Ltd. 5.125% 4/15/27 (a) | 12,060 | 12,814 | |
| Virgin Media Finance PLC 4.875% 2/15/22 | 10,880 | 10,989 | |
| Ziggo B.V.: | |||
| 4.875% 1/15/30 (a) | 7,990 | 8,132 | |
| 5.5% 1/15/27 (a) | 22,875 | 24,133 | |
| Ziggo Bond Co. BV 6% 1/15/27 (a) | 11,435 | 11,950 | |
| Ziggo Bond Finance BV 5.875% 1/15/25 (a) | 1,175 | 1,210 | |
| 650,510 | |||
| Capital Goods - 0.1% | |||
| AECOM 5.125% 3/15/27 | 11,885 | 12,535 | |
| Stevens Holding Co., Inc. 6.125% 10/1/26 (a) | 3,245 | 3,488 | |
| 16,023 | |||
| Chemicals - 1.7% | |||
| CF Industries Holdings, Inc.: | |||
| 4.95% 6/1/43 | 46,712 | 46,770 | |
| 5.15% 3/15/34 | 21,693 | 22,995 | |
| 5.375% 3/15/44 | 30,801 | 31,571 | |
| Element Solutions, Inc. 5.875% 12/1/25 (a) | 18,605 | 19,422 | |
| LSB Industries, Inc. 9.625% 5/1/23 (a) | 6,090 | 6,455 | |
| Neon Holdings, Inc. 10.125% 4/1/26 (a) | 12,060 | 11,924 | |
| NOVA Chemicals Corp.: | |||
| 4.875% 6/1/24 (a) | 15,135 | 15,362 | |
| 5.25% 6/1/27 (a) | 12,980 | 13,337 | |
| OCI NV: | |||
| 5.25% 11/1/24 (a) | 16,670 | 17,253 | |
| 6.625% 4/15/23 (a) | 5,370 | 5,605 | |
| Starfruit Finco BV / Starfruit U.S. Holdco LLC 8% 10/1/26 (a) | 11,315 | 11,258 | |
| Valvoline, Inc. 5.5% 7/15/24 | 4,170 | 4,328 | |
| 206,280 | |||
| Consumer Products - 0.1% | |||
| First Quality Finance Co., Inc. 5% 7/1/25 (a) | 9,675 | 10,016 | |
| Containers - 0.6% | |||
| Crown Cork & Seal, Inc.: | |||
| 7.375% 12/15/26 | 4,845 | 5,814 | |
| 7.5% 12/15/96 | 12,871 | 14,158 | |
| Labl Escrow Issuer LLC: | |||
| 6.75% 7/15/26 (a) | 18,015 | 18,646 | |
| 10.5% 7/15/27 (a) | 12,010 | 12,040 | |
| Trivium Packaging Finance BV: | |||
| 5.5% 8/15/26 (a) | 6,930 | 7,259 | |
| 8.5% 8/15/27 (a) | 6,950 | 7,410 | |
| 65,327 | |||
| Diversified Financial Services - 3.7% | |||
| AssuredPartners, Inc. 7% 8/15/25 (a) | 4,865 | 4,847 | |
| FLY Leasing Ltd. 5.25% 10/15/24 | 9,470 | 9,754 | |
| Icahn Enterprises LP/Icahn Enterprises Finance Corp.: | |||
| 6.25% 5/15/26 | 24,085 | 25,530 | |
| 6.375% 12/15/25 | 54,810 | 57,551 | |
| 6.75% 2/1/24 | 10,075 | 10,503 | |
| Intelsat Connect Finance SA 9.5% 2/15/23 (a) | 18,015 | 16,711 | |
| James Hardie International Finance Ltd.: | |||
| 4.75% 1/15/25 (a) | 8,815 | 9,144 | |
| 5% 1/15/28 (a) | 8,900 | 9,323 | |
| MSCI, Inc.: | |||
| 5.25% 11/15/24 (a) | 6,725 | 6,910 | |
| 5.75% 8/15/25 (a) | 7,185 | 7,535 | |
| Navient Corp.: | |||
| 5.5% 1/25/23 | 44,765 | 46,500 | |
| 5.875% 10/25/24 | 28,294 | 28,931 | |
| 6.125% 3/25/24 | 15,595 | 16,301 | |
| 6.5% 6/15/22 | 27,055 | 28,949 | |
| 7.25% 1/25/22 | 27,370 | 29,688 | |
| 7.25% 9/25/23 | 5,688 | 6,214 | |
| Park Aerospace Holdings Ltd.: | |||
| 4.5% 3/15/23 (a) | 4,315 | 4,533 | |
| 5.25% 8/15/22 (a) | 9,140 | 9,734 | |
| 5.5% 2/15/24 (a) | 790 | 869 | |
| Springleaf Finance Corp.: | |||
| 6.625% 1/15/28 | 7,305 | 8,090 | |
| 6.875% 3/15/25 | 51,610 | 58,448 | |
| 7.125% 3/15/26 | 38,380 | 43,753 | |
| 439,818 | |||
| Diversified Media - 0.4% | |||
| Block Communications, Inc. 6.875% 2/15/25 (a) | 9,080 | 9,466 | |
| Liberty Media Corp.: | |||
| 8.25% 2/1/30 | 12,298 | 12,513 | |
| 8.5% 7/15/29 | 7,900 | 8,157 | |
| Quebecor Media, Inc. 5.75% 1/15/23 | 15,820 | 17,120 | |
| 47,256 | |||
| Energy - 9.7% | |||
| Antero Midstream Partners LP/Antero Midstream Finance Corp. 5.75% 1/15/28 (a) | 14,790 | 10,982 | |
| Antero Resources Corp. 5.625% 6/1/23 (Reg. S) | 2,240 | 1,571 | |
| Antero Resources Finance Corp. 5.375% 11/1/21 | 2,795 | 2,495 | |
| Callon Petroleum Co. 6.125% 10/1/24 | 4,090 | 3,886 | |
| Carrizo Oil & Gas, Inc. 6.25% 4/15/23 | 7,400 | 6,882 | |
| Chesapeake Energy Corp.: | |||
| 8% 1/15/25 | 7,850 | 5,181 | |
| 8% 6/15/27 | 4,560 | 2,850 | |
| Citgo Holding, Inc. 9.25% 8/1/24 (a) | 27,185 | 28,374 | |
| CNX Midstream Partners LP 6.5% 3/15/26 (a) | 6,675 | 6,224 | |
| Comstock Escrow Corp. 9.75% 8/15/26 | 61,450 | 48,546 | |
| Consolidated Energy Finance SA: | |||
| 3 month U.S. LIBOR + 3.750% 5.8685% 6/15/22 (a)(b)(e) | 3,025 | 3,002 | |
| 6.5% 5/15/26 (a) | 12,170 | 11,714 | |
| 6.875% 6/15/25 (a) | 6,050 | 5,869 | |
| Covey Park Energy LLC 7.5% 5/15/25 (a) | 10,865 | 8,040 | |
| Crestwood Midstream Partners LP/Crestwood Midstream Finance Corp.: | |||
| 5.625% 5/1/27 (a) | 18,015 | 18,128 | |
| 5.75% 4/1/25 | 8,985 | 9,277 | |
| 6.25% 4/1/23 | 9,260 | 9,419 | |
| CVR Refining LLC/Coffeyville Finance, Inc. 6.5% 11/1/22 | 20,970 | 21,180 | |
| DCP Midstream LLC 5.85% 5/21/43 (a)(b) | 18,335 | 16,410 | |
| Denbury Resources, Inc.: | |||
| 7.75% 2/15/24 (a) | 43,134 | 31,703 | |
| 9% 5/15/21 (a) | 47,050 | 41,169 | |
| 9.25% 3/31/22 (a) | 7,030 | 5,765 | |
| Diamondback Energy, Inc.: | |||
| 4.75% 11/1/24 | 9,930 | 10,265 | |
| 5.375% 5/31/25 | 5,155 | 5,387 | |
| EG Global Finance PLC 8.5% 10/30/25 (a) | 11,590 | 12,174 | |
| Endeavor Energy Resources LP/EER Finance, Inc.: | |||
| 5.5% 1/30/26 (a) | 9,698 | 9,989 | |
| 5.75% 1/30/28 (a) | 16,811 | 17,694 | |
| Energy Transfer Equity LP 5.5% 6/1/27 | 16,735 | 19,250 | |
| EP Energy LLC/Everest Acquisition Finance, Inc. 7.75% 5/15/26 (a)(f) | 76,525 | 53,185 | |
| EQT Corp. 3.9% 10/1/27 | 27,454 | 24,223 | |
| Exterran Energy Solutions LP 8.125% 5/1/25 | 11,280 | 11,167 | |
| Exterran Partners LP/EXLP Finance Corp. 6% 10/1/22 | 8,075 | 8,136 | |
| Extraction Oil & Gas, Inc. 7.375% 5/15/24 (a) | 7,165 | 2,938 | |
| Forum Energy Technologies, Inc. 6.25% 10/1/21 | 13,870 | 11,235 | |
| Genesis Energy LP/Genesis Energy Finance Corp. 6.25% 5/15/26 | 9,130 | 8,445 | |
| Hess Infrastructure Partners LP 5.625% 2/15/26 (a) | 15,535 | 16,253 | |
| Hilcorp Energy I LP/Hilcorp Finance Co.: | |||
| 5% 12/1/24 (a) | 9,920 | 8,807 | |
| 5.75% 10/1/25 (a) | 11,285 | 10,072 | |
| 6.25% 11/1/28 (a) | 12,280 | 10,377 | |
| Holly Energy Partners LP/Holly Finance Corp. 6% 8/1/24 (a) | 7,145 | 7,440 | |
| Indigo Natural Resources LLC 6.875% 2/15/26 (a) | 22,135 | 20,143 | |
| Jonah Energy LLC 7.25% 10/15/25 (a) | 18,030 | 5,048 | |
| MPLX LP 6.375% 5/1/24 (a) | 4,570 | 4,787 | |
| Murphy Oil U.S.A., Inc.: | |||
| 4.75% 9/15/29 | 6,860 | 7,160 | |
| 5.625% 5/1/27 | 6,030 | 6,471 | |
| Nabors Industries, Inc.: | |||
| 5.1% 9/15/23 | 15,755 | 12,053 | |
| 5.75% 2/1/25 | 19,210 | 14,317 | |
| NextEra Energy Partners LP 4.25% 7/15/24 (a) | 12,015 | 12,342 | |
| NGL Energy Partners LP/NGL Energy Finance Corp.: | |||
| 6.125% 3/1/25 | 11,920 | 11,026 | |
| 7.5% 4/15/26 (a) | 12,005 | 11,461 | |
| NGPL PipeCo LLC: | |||
| 4.375% 8/15/22 (a) | 2,995 | 3,110 | |
| 4.875% 8/15/27 (a) | 3,000 | 3,227 | |
| Nine Energy Service, Inc. 8.75% 11/1/23 (a) | 6,245 | 4,684 | |
| NuStar Logistics LP 6% 6/1/26 | 12,025 | 12,851 | |
| Parsley Energy LLC/Parsley: | |||
| 5.25% 8/15/25 (a) | 5,435 | 5,571 | |
| 5.625% 10/15/27 (a) | 3,105 | 3,206 | |
| PBF Holding Co. LLC/PBF Finance Corp.: | |||
| 7% 11/15/23 | 32,600 | 33,578 | |
| 7.25% 6/15/25 | 22,875 | 23,904 | |
| PBF Logistics LP/PBF Logistics Finance, Inc. 6.875% 5/15/23 | 8,455 | 8,666 | |
| PDC Energy, Inc. 6.125% 9/15/24 | 3,555 | 3,451 | |
| Range Resources Corp.: | |||
| 4.875% 5/15/25 | 8,965 | 7,194 | |
| 5% 3/15/23 | 33,270 | 28,779 | |
| Sanchez Energy Corp.: | |||
| 6.125% 1/15/23 (f) | 34,330 | 1,545 | |
| 7.25% 2/15/23 (a)(f) | 24,505 | 16,663 | |
| SemGroup Corp.: | |||
| 6.375% 3/15/25 | 5,990 | 6,207 | |
| 7.25% 3/15/26 | 11,220 | 12,118 | |
| SESI LLC 7.75% 9/15/24 | 7,245 | 3,985 | |
| SM Energy Co.: | |||
| 5.625% 6/1/25 | 7,285 | 6,174 | |
| 6.625% 1/15/27 | 36,085 | 30,311 | |
| 6.75% 9/15/26 | 4,550 | 3,902 | |
| Southern Natural Gas Co.: | |||
| 7.35% 2/15/31 | 23,497 | 30,723 | |
| 8% 3/1/32 | 12,475 | 17,941 | |
| Southern Star Central Corp. 5.125% 7/15/22 (a) | 6,750 | 6,833 | |
| Southwestern Energy Co.: | |||
| 4.1% 3/15/22 | 15,400 | 14,900 | |
| 6.2% 1/23/25 (b) | 1,805 | 1,588 | |
| 7.5% 4/1/26 | 20,490 | 17,982 | |
| 7.75% 10/1/27 | 12,945 | 11,133 | |
| SRC Energy, Inc. 6.25% 12/1/25 | 7,435 | 6,950 | |
| Summit Midstream Holdings LLC 5.75% 4/15/25 | 5,390 | 4,177 | |
| Sunoco LP/Sunoco Finance Corp.: | |||
| 4.875% 1/15/23 | 9,145 | 9,385 | |
| 5.5% 2/15/26 | 11,640 | 12,034 | |
| Targa Resources Partners LP/Targa Resources Partners Finance Corp. 5% 1/15/28 | 3,650 | 3,623 | |
| Teine Energy Ltd. 6.875% 9/30/22 (a) | 11,950 | 11,950 | |
| Tennessee Gas Pipeline Co. 7.625% 4/1/37 | 5,445 | 7,297 | |
| TerraForm Power Operating LLC: | |||
| 4.25% 1/31/23 (a) | 6,270 | 6,458 | |
| 4.75% 1/15/30 (a) | 11,110 | 11,485 | |
| 5% 1/31/28 (a) | 6,295 | 6,639 | |
| Tervita Escrow Corp. 7.625% 12/1/21 (a) | 2,475 | 2,444 | |
| Transocean, Inc. 7.5% 1/15/26 (a) | 12,910 | 11,490 | |
| Ultra Resources, Inc. 11% 7/12/24 pay-in-kind | 10,628 | 1,594 | |
| Unit Corp. 6.625% 5/15/21 | 2,202 | 1,453 | |
| Viper Energy Partners LP 5.375% 11/1/27 (a) | 15,415 | 15,685 | |
| W&T Offshore, Inc. 9.75% 11/1/23 (a) | 41,795 | 39,183 | |
| Whiting Petroleum Corp. 6.625% 1/15/26 | 8,380 | 5,196 | |
| WPX Energy, Inc.: | |||
| 5.25% 9/15/24 | 8,725 | 8,812 | |
| 5.25% 10/15/27 | 15,080 | 14,665 | |
| 5.75% 6/1/26 | 9,125 | 9,171 | |
| 1,160,429 | |||
| Entertainment/Film - 0.1% | |||
| Lions Gate Entertainment Corp. 5.875% 11/1/24 (a) | 3,865 | 3,643 | |
| New Cotai LLC/New Cotai Capital Corp. 10.625% 5/1/19 pay-in-kind (a)(b)(f) | 28,594 | 13,725 | |
| 17,368 | |||
| Environmental - 0.4% | |||
| ADS Waste Holdings, Inc. 5.625% 11/15/24 (a) | 10,140 | 10,584 | |
| Covanta Holding Corp.: | |||
| 5.875% 3/1/24 | 7,775 | 7,989 | |
| 5.875% 7/1/25 | 3,205 | 3,325 | |
| 6% 1/1/27 | 12,335 | 12,890 | |
| Kissner Holdings LP/Kissner Milling Co. Ltd./BSC Holding, Inc./Kissner U.S.A. 8.375% 12/1/22 (a) | 9,525 | 9,912 | |
| 44,700 | |||
| Food & Drug Retail - 0.1% | |||
| Performance Food Group, Inc. 5.5% 10/15/27 (a) | 12,635 | 13,362 | |
| Food/Beverage/Tobacco - 1.9% | |||
| JBS Investments II GmbH: | |||
| 5.75% 1/15/28 (a) | 10,705 | 11,155 | |
| 7% 1/15/26 (a) | 11,630 | 12,607 | |
| JBS U.S.A. LLC/JBS U.S.A. Finance, Inc.: | |||
| 5.75% 6/15/25 (a) | 24,630 | 25,584 | |
| 6.75% 2/15/28 (a) | 18,350 | 20,185 | |
| JBS U.S.A. Lux SA / JBS Food Co.: | |||
| 5.5% 1/15/30 (a) | 20,180 | 21,744 | |
| 6.5% 4/15/29 (a) | 29,320 | 32,619 | |
| KeHE Distributors LLC / KeHE Finance Corp. 8.625% 10/15/26 (a) | 9,735 | 9,984 | |
| Lamb Weston Holdings, Inc.: | |||
| 4.625% 11/1/24 (a) | 7,660 | 8,053 | |
| 4.875% 11/1/26 (a) | 7,740 | 8,137 | |
| Pilgrim's Pride Corp. 5.75% 3/15/25 (a) | 17,930 | 18,602 | |
| Post Holdings, Inc.: | |||
| 5% 8/15/26 (a) | 17,030 | 17,713 | |
| 5.5% 3/1/25 (a) | 10,085 | 10,565 | |
| 5.5% 12/15/29 (a) | 14,975 | 15,787 | |
| 5.75% 3/1/27 (a) | 7,710 | 8,208 | |
| 220,943 | |||
| Gaming - 0.5% | |||
| MCE Finance Ltd.: | |||
| 4.875% 6/6/25 (a) | 30,275 | 30,939 | |
| 5.25% 4/26/26 (a) | 12,015 | 12,503 | |
| Transocean, Inc. 7.25% 11/1/25 (a) | 12,270 | 10,828 | |
| 54,270 | |||
| Healthcare - 5.3% | |||
| BCPE Cycle Merger Sub II, Inc. 10.625% 7/15/27 (a) | 24,025 | 22,463 | |
| Catalent Pharma Solutions: | |||
| 4.875% 1/15/26 (a) | 4,000 | 4,130 | |
| 5% 7/15/27 (a) | 3,765 | 3,934 | |
| Centene Corp. 5.375% 6/1/26 (a) | 30,420 | 32,200 | |
| Charles River Laboratories International, Inc. 4.25% 5/1/28 (a) | 3,400 | 3,464 | |
| Community Health Systems, Inc.: | |||
| 8% 3/15/26 (a) | 64,115 | 62,672 | |
| 8.125% 6/30/24 (a) | 67,698 | 51,450 | |
| 8.625% 1/15/24 (a) | 48,790 | 49,860 | |
| 9.875% 6/30/23 (a) | 36,023 | 30,079 | |
| Encompass Health Corp.: | |||
| 5.125% 3/15/23 | 6,440 | 6,569 | |
| 5.75% 11/1/24 | 20,291 | 20,519 | |
| Hologic, Inc.: | |||
| 4.375% 10/15/25 (a) | 6,295 | 6,449 | |
| 4.625% 2/1/28 (a) | 4,255 | 4,452 | |
| Horizon Pharma U.S.A., Inc. 5.5% 8/1/27 (a) | 12,050 | 12,562 | |
| IMS Health, Inc. 5% 5/15/27 (a) | 12,070 | 12,794 | |
| MPH Acquisition Holdings LLC 7.125% 6/1/24 (a) | 6,095 | 5,684 | |
| MPT Operating Partnership LP/MPT Finance Corp.: | |||
| 4.625% 8/1/29 | 18,080 | 18,860 | |
| 5% 10/15/27 | 25,968 | 27,331 | |
| 5.25% 8/1/26 | 7,453 | 7,826 | |
| 6.375% 3/1/24 | 3,970 | 4,144 | |
| NVA Holdings, Inc. 6.875% 4/1/26 (a) | 6,560 | 7,036 | |
| Polaris Intermediate Corp. 8.5% 12/1/22 pay-in-kind (a)(b) | 29,900 | 25,116 | |
| Service Corp. International 5.125% 6/1/29 | 5,665 | 6,033 | |
| Teleflex, Inc. 4.625% 11/15/27 | 4,975 | 5,211 | |
| Tenet Healthcare Corp.: | |||
| 4.625% 7/15/24 | 6,055 | 6,237 | |
| 4.625% 9/1/24 (a) | 12,045 | 12,353 | |
| 4.875% 1/1/26 (a) | 30,115 | 31,150 | |
| 5.125% 5/1/25 | 6,055 | 6,199 | |
| 5.125% 11/1/27 (a) | 18,070 | 18,838 | |
| 6.25% 2/1/27 (a) | 17,930 | 18,939 | |
| Valeant Pharmaceuticals International, Inc.: | |||
| 5.5% 11/1/25 (a) | 20,817 | 21,754 | |
| 5.75% 8/15/27 (a) | 3,120 | 3,388 | |
| 7% 1/15/28 (a) | 24,125 | 26,025 | |
| 7.25% 5/30/29 (a) | 12,065 | 13,287 | |
| 8.5% 1/31/27 (a) | 21,745 | 24,463 | |
| Vizient, Inc. 6.25% 5/15/27 (a) | 2,760 | 2,976 | |
| Wellcare Health Plans, Inc.: | |||
| 5.25% 4/1/25 | 9,245 | 9,675 | |
| 5.375% 8/15/26 (a) | 7,920 | 8,425 | |
| 634,547 | |||
| Homebuilders/Real Estate - 0.9% | |||
| Alliant Holdings Intermediate LLC 6.75% 10/15/27 (a) | 5,555 | 5,778 | |
| Howard Hughes Corp. 5.375% 3/15/25 (a) | 12,730 | 13,223 | |
| Lennar Corp. 4.75% 11/29/27 | 12,205 | 13,181 | |
| LGI Homes, Inc. 6.875% 7/15/26 (a) | 12,190 | 12,617 | |
| Mattamy Group Corp. 6.875% 12/15/23 (a) | 8,755 | 9,072 | |
| Odebrecht Finance Ltd.: | |||
| 4.375% 4/25/25 (a)(f) | 12,020 | 856 | |
| 5.25% 6/27/29 (a)(f) | 10,987 | 786 | |
| 7.125% 6/26/42 (a)(f) | 5,370 | 376 | |
| Starwood Property Trust, Inc. 4.75% 3/15/25 | 11,625 | 12,072 | |
| Taylor Morrison Communities, Inc./Monarch Communities, Inc.: | |||
| 5.625% 3/1/24 (a) | 1,312 | 1,415 | |
| 5.875% 6/15/27 (a) | 9,260 | 10,341 | |
| TRI Pointe Homes, Inc. 5.875% 6/15/24 | 16,130 | 17,380 | |
| William Lyon Homes, Inc.: | |||
| 5.875% 1/31/25 | 7,125 | 7,250 | |
| 6% 9/1/23 | 7,430 | 7,690 | |
| 112,037 | |||
| Hotels - 0.8% | |||
| Choice Hotels International, Inc. 5.75% 7/1/22 | 3,035 | 3,293 | |
| FelCor Lodging LP 6% 6/1/25 | 10,935 | 11,413 | |
| Hilton Domestic Operating Co., Inc.: | |||
| 4.875% 1/15/30 (a) | 18,000 | 19,125 | |
| 5.125% 5/1/26 | 18,255 | 19,168 | |
| Hilton Worldwide Finance LLC/Hilton Worldwide Finance Corp.: | |||
| 4.625% 4/1/25 | 17,975 | 18,469 | |
| 4.875% 4/1/27 | 8,435 | 8,920 | |
| Marriott Ownership Resorts, Inc. 6.5% 9/15/26 | 9,495 | 10,266 | |
| 90,654 | |||
| Insurance - 0.5% | |||
| Acrisure LLC / Acrisure Finance, Inc.: | |||
| 7% 11/15/25 (a) | 17,915 | 16,392 | |
| 8.125% 2/15/24 (a) | 12,845 | 13,688 | |
| AmWINS Group, Inc. 7.75% 7/1/26 (a) | 6,100 | 6,558 | |
| HUB International Ltd. 7% 5/1/26 (a) | 11,770 | 12,123 | |
| USIS Merger Sub, Inc. 6.875% 5/1/25 (a) | 12,080 | 12,291 | |
| 61,052 | |||
| Leisure - 0.5% | |||
| Merlin Entertainments PLC 5.75% 6/15/26 (a) | 12,170 | 12,961 | |
| Six Flags Entertainment Corp.: | |||
| 4.875% 7/31/24 (a) | 14,040 | 14,496 | |
| 5.5% 4/15/27 (a) | 7,460 | 7,814 | |
| Studio City Co. Ltd. 7.25% 11/30/21 (a) | 6,220 | 6,366 | |
| Viking Cruises Ltd. 5.875% 9/15/27 (a) | 11,595 | 12,320 | |
| Voc Escrow Ltd. 5% 2/15/28 (a) | 10,755 | 11,185 | |
| 65,142 | |||
| Metals/Mining - 1.0% | |||
| Alcoa Nederland Holding BV: | |||
| 6.125% 5/15/28 (a) | 3,565 | 3,823 | |
| 6.75% 9/30/24 (a) | 7,705 | 8,119 | |
| 7% 9/30/26 (a) | 6,385 | 6,936 | |
| Aleris International, Inc. 6% 6/1/20 (a)(d) | 151 | 151 | |
| First Quantum Minerals Ltd.: | |||
| 6.5% 3/1/24 (a) | 2,110 | 2,068 | |
| 6.875% 3/1/26 (a) | 18,720 | 18,346 | |
| 7.5% 4/1/25 (a) | 1,810 | 1,812 | |
| FMG Resources (August 2006) Pty Ltd.: | |||
| 4.5% 9/15/27 (a) | 9,015 | 8,897 | |
| 4.75% 5/15/22 (a) | 7,950 | 8,189 | |
| 5.125% 3/15/23 (a) | 12,860 | 13,390 | |
| 5.125% 5/15/24 (a) | 9,780 | 10,269 | |
| Freeport-McMoRan, Inc. 5.45% 3/15/43 | 5,135 | 4,776 | |
| Joseph T Ryerson & Son, Inc. 11% 5/15/22 (a) | 6,445 | 6,824 | |
| Mineral Resources Ltd. 8.125% 5/1/27 (a) | 18,015 | 18,961 | |
| Murray Energy Corp.: | |||
| 11.25% 4/15/21 (a)(f) | 8,915 | 11 | |
| 12% 4/15/24 pay-in-kind (a)(b)(f) | 10,343 | 90 | |
| SunCoke Energy Partners LP/SunCoke Energy Partners Finance Corp. 7.5% 6/15/25 (a) | 9,795 | 8,326 | |
| 120,988 | |||
| Paper - 0.1% | |||
| Boise Cascade Co. 5.625% 9/1/24 (a) | 4,105 | 4,269 | |
| Mercer International, Inc. 7.375% 1/15/25 (a) | 12,070 | 12,523 | |
| NewPage Corp.: | |||
| 3 month U.S. LIBOR + 6.250% 6.7159% 5/1/12 (b)(d)(e)(f) | 6,337 | 0 | |
| 11.375% 12/31/2014 (d)(f) | 12,582 | 0 | |
| 16,792 | |||
| Publishing/Printing - 0.4% | |||
| Cengage Learning, Inc. 9.5% 6/15/24 (a) | 24,130 | 21,596 | |
| Getty Images, Inc. 9.75% 3/1/27 (a) | 20,665 | 20,897 | |
| 42,493 | |||
| Restaurants - 1.4% | |||
| 1011778 BC Unlimited Liability Co./New Red Finance, Inc.: | |||
| 3.875% 1/15/28 (a) | 9,165 | 9,214 | |
| 5% 10/15/25 (a) | 65,605 | 67,573 | |
| Golden Nugget, Inc.: | |||
| 6.75% 10/15/24 (a) | 22,555 | 23,234 | |
| 8.75% 10/1/25 (a) | 24,245 | 25,518 | |
| KFC Holding Co./Pizza Hut Holding LLC: | |||
| 4.75% 6/1/27 (a) | 9,215 | 9,630 | |
| 5% 6/1/24 (a) | 8,800 | 9,130 | |
| 5.25% 6/1/26 (a) | 8,800 | 9,306 | |
| Yum! Brands, Inc. 4.75% 1/15/30 (a) | 10,355 | 10,860 | |
| 164,465 | |||
| Services - 1.2% | |||
| Avantor, Inc. 6% 10/1/24 (a) | 12,090 | 12,923 | |
| BidFair MergeRight, Inc. 7.375% 10/15/27 (a) | 25,215 | 25,215 | |
| CDK Global, Inc. 5.875% 6/15/26 | 4,545 | 4,863 | |
| GEMS MENASA Cayman Ltd. 7.125% 7/31/26 (a) | 8,765 | 9,110 | |
| Iron Mountain, Inc. 4.875% 9/15/29 (a) | 24,110 | 24,683 | |
| KAR Auction Services, Inc. 5.125% 6/1/25 (a) | 10,355 | 10,808 | |
| Ritchie Bros. Auctioneers, Inc. 5.375% 1/15/25 (a) | 3,510 | 3,659 | |
| Tempo Acquisition LLC 6.75% 6/1/25 (a) | 8,815 | 9,068 | |
| The Brink's Co. 4.625% 10/15/27 (a) | 12,180 | 12,332 | |
| The GEO Group, Inc.: | |||
| 5.125% 4/1/23 | 5,835 | 5,135 | |
| 5.875% 10/15/24 | 5,045 | 4,213 | |
| 6% 4/15/26 | 4,130 | 3,273 | |
| United Rentals North America, Inc.: | |||
| 3.875% 11/15/27 (c) | 5,560 | 5,617 | |
| 5.5% 5/15/27 | 7,325 | 7,723 | |
| 138,622 | |||
| Steel - 0.6% | |||
| Algoma Steel SCA 0% 12/31/23 (d) | 1,982 | 1,407 | |
| Cleveland-Cliffs, Inc.: | |||
| 4.875% 1/15/24 (a) | 12,165 | 12,500 | |
| 5.75% 3/1/25 | 3,141 | 3,102 | |
| 5.875% 6/1/27 (a) | 18,030 | 17,196 | |
| Commercial Metals Co. 5.75% 4/15/26 | 9,135 | 9,420 | |
| Infrabuild Australia Pty Ltd. 12% 10/1/24 (a) | 9,055 | 9,228 | |
| JMC Steel Group, Inc. 9.875% 6/15/23 (a) | 3,000 | 3,164 | |
| United States Steel Corp. 6.25% 3/15/26 | 12,205 | 10,219 | |
| 66,236 | |||
| Technology - 2.1% | |||
| Ascend Learning LLC: | |||
| 6.875% 8/1/25 (a) | 11,865 | 12,384 | |
| 6.875% 8/1/25 (a) | 4,115 | 4,305 | |
| Balboa Merger Sub, Inc. 11.375% 12/1/21 (a) | 23,415 | 24,205 | |
| Banff Merger Sub, Inc. 9.75% 9/1/26 (a) | 34,618 | 32,238 | |
| Camelot Finance SA 4.5% 11/1/26 (a) | 10,590 | 10,700 | |
| CDW LLC/CDW Finance Corp. 5% 9/1/25 | 6,380 | 6,667 | |
| Ensemble S Merger Sub, Inc. 9% 9/30/23 (a) | 19,115 | 19,629 | |
| Go Daddy Operating Co. LLC / GD Finance Co., Inc. 5.25% 12/1/27 (a) | 9,345 | 9,906 | |
| j2 Cloud Services LLC/j2 Global Communications, Inc. 6% 7/15/25 (a) | 8,065 | 8,569 | |
| JDA Escrow LLC/JDA Bond Finance, Inc. 7.375% 10/15/24 (a) | 4,060 | 4,211 | |
| MTS Systems Corp. 5.75% 8/15/27 (a) | 3,140 | 3,289 | |
| NCR Corp.: | |||
| 5.75% 9/1/27 (a) | 9,035 | 9,250 | |
| 6.125% 9/1/29 (a) | 9,035 | 9,464 | |
| Open Text Corp. 5.875% 6/1/26 (a) | 8,535 | 9,100 | |
| Parametric Technology Corp. 6% 5/15/24 | 3,490 | 3,708 | |
| Qorvo, Inc. 5.5% 7/15/26 | 6,085 | 6,496 | |
| Sensata Technologies BV 5% 10/1/25 (a) | 11,210 | 12,081 | |
| Sensata Technologies UK Financing Co. PLC 6.25% 2/15/26 (a) | 11,535 | 12,335 | |
| Symantec Corp. 5% 4/15/25 (a) | 10,050 | 10,301 | |
| Veritas U.S., Inc./Veritas Bermuda Ltd.: | |||
| 7.5% 2/1/23 (a) | 16,225 | 15,941 | |
| 10.5% 2/1/24 (a) | 29,743 | 28,107 | |
| 252,886 | |||
| Telecommunications - 5.9% | |||
| C&W Senior Financing Designated Activity Co. 6.875% 9/15/27 (a) | 22,740 | 23,934 | |
| Connect Finco SARL / Connect U.S. Finco LLC 6.75% 10/1/26 (a) | 24,135 | 25,070 | |
| CyrusOne LP/CyrusOne Finance Corp.: | |||
| 5% 3/15/24 | 3,190 | 3,290 | |
| 5.375% 3/15/27 | 2,735 | 2,923 | |
| Frontier Communications Corp. 8.5% 4/1/26 (a) | 31,445 | 31,524 | |
| GCI, Inc. 6.875% 4/15/25 | 10,905 | 11,464 | |
| Gogo Intermediate Holdings LLC/Gogo Finance Co., Inc. 9.875% 5/1/24 (a) | 24,025 | 25,286 | |
| Intelsat Jackson Holdings SA: | |||
| 5.5% 8/1/23 | 15,020 | 14,044 | |
| 8.5% 10/15/24 (a) | 46,525 | 46,883 | |
| 9.75% 7/15/25 (a) | 56,970 | 59,117 | |
| Sable International Finance Ltd. 5.75% 9/7/27 (a) | 15,035 | 15,636 | |
| SFR Group SA: | |||
| 5.5% 1/15/28 (a) | 22,110 | 22,525 | |
| 7.375% 5/1/26 (a) | 125,670 | 134,573 | |
| 8.125% 2/1/27 (a) | 7,635 | 8,465 | |
| Sprint Capital Corp.: | |||
| 6.875% 11/15/28 | 60,109 | 65,218 | |
| 8.75% 3/15/32 | 67,236 | 81,986 | |
| Sprint Corp. 7.625% 3/1/26 | 34,025 | 37,640 | |
| Telenet Finance Luxembourg Notes SARL 5.5% 3/1/28 (a) | 25,600 | 27,226 | |
| Telesat Canada/Telesat LLC 6.5% 10/15/27 (a) | 7,880 | 8,225 | |
| U.S. West Communications 7.25% 9/15/25 | 1,480 | 1,697 | |
| UPCB Finance IV Ltd. 5.375% 1/15/25 (a) | 11,930 | 12,303 | |
| Zayo Group LLC/Zayo Capital, Inc.: | |||
| 5.75% 1/15/27 (a) | 31,195 | 31,706 | |
| 6% 4/1/23 | 11,035 | 11,350 | |
| 6.375% 5/15/25 | 2,440 | 2,508 | |
| 704,593 | |||
| Transportation Ex Air/Rail - 0.3% | |||
| Avolon Holdings Funding Ltd.: | |||
| 5.125% 10/1/23 (a) | 3,310 | 3,571 | |
| 5.25% 5/15/24 (a) | 17,970 | 19,596 | |
| 5.5% 1/15/23 (a) | 5,305 | 5,725 | |
| Navios South American Logistics, Inc./Navios Logistics Finance U.S., Inc. 7.25% 5/1/22 (a) | 10,180 | 10,065 | |
| 38,957 | |||
| Utilities - 2.4% | |||
| EnLink Midstream Partners LP: | |||
| 4.15% 6/1/25 | 5,410 | 4,882 | |
| 4.4% 4/1/24 | 5,415 | 5,077 | |
| Global Partners LP/GLP Finance Corp. 7% 6/15/23 | 11,295 | 11,670 | |
| NextEra Energy Partners LP: | |||
| 4.25% 9/15/24 (a) | 8,025 | 8,346 | |
| 4.5% 9/15/27 (a) | 5,580 | 5,692 | |
| NRG Energy, Inc.: | |||
| 5.75% 1/15/28 | 34,385 | 37,222 | |
| 6.625% 1/15/27 | 26,747 | 28,987 | |
| Pacific Gas & Electric Co.: | |||
| 3.75% 8/15/42 (f) | 7,585 | 6,902 | |
| 3.95% 12/1/47 (f) | 53,930 | 48,807 | |
| 4% 12/1/46 (f) | 24,380 | 22,186 | |
| 4.25% 3/15/46 (f) | 2,400 | 2,208 | |
| 4.3% 3/15/45 (f) | 5,995 | 5,515 | |
| 6.05% 3/1/34 (f) | 7,690 | 7,709 | |
| Pattern Energy Group, Inc. 5.875% 2/1/24 (a) | 5,475 | 5,612 | |
| The AES Corp. 4.5% 3/15/23 | 5,175 | 5,291 | |
| Vertiv Group Corp. 9.25% 10/15/24 (a) | 2,785 | 2,620 | |
| Vistra Operations Co. LLC: | |||
| 5% 7/31/27 (a) | 22,585 | 23,375 | |
| 5.5% 9/1/26 (a) | 16,965 | 17,927 | |
| 5.625% 2/15/27 (a) | 28,195 | 29,887 | |
| 279,915 | |||
| TOTAL NONCONVERTIBLE BONDS | 6,644,656 | ||
| TOTAL CORPORATE BONDS | |||
| (Cost $6,527,631) | 6,665,336 | ||
| Shares | Value (000s) | ||
| Common Stocks - 20.6% | |||
| Air Transportation - 1.0% | |||
| Air Canada (g) | 3,438,100 | 122,426 | |
| Automotive & Auto Parts - 0.2% | |||
| Allison Transmission Holdings, Inc. | 285,200 | 12,438 | |
| Chassix Holdings, Inc. warrants 7/29/20 (d)(g) | 37,382 | 184 | |
| Exide Technologies (d)(g) | 9,824 | 10 | |
| Exide Technologies (d)(g) | 32,746 | 0 | |
| Exide Technologies (d)(h) | 146,110 | 1,302 | |
| Motors Liquidation Co. GUC Trust (g) | 11,464 | 113 | |
| UC Holdings, Inc. (d)(g) | 677,217 | 13,077 | |
| TOTAL AUTOMOTIVE & AUTO PARTS | 27,124 | ||
| Banks & Thrifts - 0.5% | |||
| Bank of America Corp. | 747,115 | 23,362 | |
| JPMorgan Chase & Co. | 250,380 | 31,277 | |
| TOTAL BANKS & THRIFTS | 54,639 | ||
| Broadcasting - 0.5% | |||
| iHeartMedia, Inc. (g)(i) | 118,490 | 1,699 | |
| iHeartMedia, Inc. warrants 5/1/39 (g) | 104 | 1 | |
| Nexstar Broadcasting Group, Inc. Class A | 376,429 | 36,623 | |
| Sinclair Broadcast Group, Inc. Class A | 402,800 | 16,048 | |
| TOTAL BROADCASTING | 54,371 | ||
| Cable/Satellite TV - 0.8% | |||
| Altice U.S.A., Inc. Class A (g) | 1,930,500 | 59,749 | |
| Comcast Corp. Class A | 806,200 | 36,134 | |
| TOTAL CABLE/SATELLITE TV | 95,883 | ||
| Capital Goods - 0.7% | |||
| Fortive Corp. | 268,800 | 18,547 | |
| Thermo Fisher Scientific, Inc. | 112,300 | 33,912 | |
| Zebra Technologies Corp. Class A (g) | 115,500 | 27,474 | |
| TOTAL CAPITAL GOODS | 79,933 | ||
| Chemicals - 0.2% | |||
| CF Industries Holdings, Inc. | 355,000 | 16,099 | |
| Hexion U.S. Finance Corp. (g) | 90,260 | 912 | |
| The Chemours Co. LLC | 781,940 | 12,832 | |
| TOTAL CHEMICALS | 29,843 | ||
| Consumer Products - 0.1% | |||
| Reddy Ice Holdings, Inc. (d) | 199,717 | 60 | |
| Reddy Ice Holdings, Inc. (d)(g) | 496,439 | 0 | |
| Ulta Beauty, Inc. (g) | 72,500 | 16,903 | |
| TOTAL CONSUMER PRODUCTS | 16,963 | ||
| Diversified Financial Services - 1.3% | |||
| American Express Co. | 270,700 | 31,748 | |
| MasterCard, Inc. Class A | 317,600 | 87,915 | |
| OneMain Holdings, Inc. | 764,900 | 30,596 | |
| Penson Worldwide, Inc. Class A (d)(g) | 10,322,034 | 0 | |
| PJT Partners, Inc. | 5,092 | 211 | |
| TOTAL DIVERSIFIED FINANCIAL SERVICES | 150,470 | ||
| Energy - 0.1% | |||
| Chaparral Energy, Inc. Class A (g)(i) | 146,806 | 138 | |
| Forbes Energy Services Ltd. (g) | 193,218 | 58 | |
| Goodrich Petroleum Corp. (g) | 129,527 | 1,247 | |
| Harvest Oil & Gas Corp. | 254,828 | 1,389 | |
| MEG Energy Corp. (g) | 2,376,100 | 9,128 | |
| Ultra Petroleum Corp. warrants 7/14/25 (g) | 211,400 | 0 | |
| VNR Finance Corp. (d)(g) | 119,961 | 0 | |
| VNR Finance Corp. (a)(d)(g) | 577,714 | 0 | |
| TOTAL ENERGY | 11,960 | ||
| Food & Drug Retail - 0.1% | |||
| Southeastern Grocers, Inc. (d)(g) | 183,263 | 6,445 | |
| Food/Beverage/Tobacco - 0.9% | |||
| Darling International, Inc. (g) | 1,038,617 | 20,045 | |
| JBS SA | 12,222,900 | 86,220 | |
| TOTAL FOOD/BEVERAGE/TOBACCO | 106,265 | ||
| Gaming - 1.6% | |||
| Boyd Gaming Corp. | 1,699,600 | 46,314 | |
| Eldorado Resorts, Inc. (g)(i) | 1,155,536 | 51,733 | |
| Melco Crown Entertainment Ltd. sponsored ADR | 940,927 | 20,268 | |
| MGM Mirage, Inc. | 603,800 | 17,208 | |
| Penn National Gaming, Inc. (g) | 1,786,500 | 38,079 | |
| Studio City International Holdings Ltd. ADR | 695,700 | 13,371 | |
| TOTAL GAMING | 186,973 | ||
| Healthcare - 1.9% | |||
| Alexion Pharmaceuticals, Inc. (g) | 182,800 | 19,267 | |
| Charles River Laboratories International, Inc. (g) | 185,000 | 24,046 | |
| Cigna Corp. | 158,700 | 28,322 | |
| Encompass Health Corp. | 34 | 2 | |
| Humana, Inc. | 105,400 | 31,009 | |
| IQVIA Holdings, Inc. (g) | 393,500 | 56,829 | |
| Jazz Pharmaceuticals PLC (g) | 197,900 | 24,862 | |
| Rotech Healthcare, Inc. (d)(g) | 185,710 | 1,924 | |
| UnitedHealth Group, Inc. | 144,600 | 36,540 | |
| TOTAL HEALTHCARE | 222,801 | ||
| Homebuilders/Real Estate - 0.0% | |||
| American Tower Corp. | 11,612 | 2,532 | |
| Leisure - 0.1% | |||
| Royal Caribbean Cruises Ltd. | 148,900 | 16,205 | |
| Metals/Mining - 0.1% | |||
| Aleris Corp. (d)(g) | 127,520 | 0 | |
| Elah Holdings, Inc. (g) | 906 | 53 | |
| First Quantum Minerals Ltd. | 1,764,200 | 14,908 | |
| TOTAL METALS/MINING | 14,961 | ||
| Services - 1.6% | |||
| Air Lease Corp. Class A | 594,900 | 26,164 | |
| HD Supply Holdings, Inc. (g) | 1,062,000 | 41,991 | |
| Novus Holdings Ltd. | 100,408 | 18 | |
| Penhall Acquisition Co.: | |||
| Class A (d)(g) | 26,163 | 1,717 | |
| Class B (d)(g) | 8,721 | 572 | |
| United Rentals, Inc. (g) | 524,794 | 70,097 | |
| Visa, Inc. Class A | 255,040 | 45,616 | |
| TOTAL SERVICES | 186,175 | ||
| Steel - 0.0% | |||
| Algoma Steel GP (d) | 198,162 | 4 | |
| Algoma Steel SCA (d) | 198,162 | 32 | |
| TOTAL STEEL | 36 | ||
| Super Retail - 0.4% | |||
| Amazon.com, Inc. (g) | 22,800 | 40,508 | |
| Arena Brands Holding Corp. Class B (d)(g)(h) | 659,302 | 5,301 | |
| TOTAL SUPER RETAIL | 45,809 | ||
| Technology - 6.4% | |||
| Adobe, Inc. (g) | 256,400 | 71,261 | |
| Advanced Micro Devices, Inc. (g) | 800,500 | 27,161 | |
| Alphabet, Inc. Class A (g) | 49,800 | 62,688 | |
| CDW Corp. | 247,000 | 31,594 | |
| EPAM Systems, Inc. (g) | 261,900 | 46,084 | |
| Facebook, Inc. Class A (g) | 257,000 | 49,254 | |
| Fiserv, Inc. (g) | 316,513 | 33,595 | |
| Global Payments, Inc. | 456,924 | 77,302 | |
| GoDaddy, Inc. (g) | 281,500 | 18,306 | |
| Lam Research Corp. | 153,700 | 41,659 | |
| Microchip Technology, Inc. (i) | 511,900 | 48,267 | |
| Micron Technology, Inc. (g) | 528,100 | 25,111 | |
| Microsoft Corp. | 513,800 | 73,664 | |
| ON Semiconductor Corp. (g) | 1,315,038 | 26,827 | |
| PayPal Holdings, Inc. (g) | 609,400 | 63,439 | |
| Salesforce.com, Inc. (g) | 153,800 | 24,068 | |
| SS&C Technologies Holdings, Inc. | 333,382 | 17,339 | |
| Verra Mobility Corp. (g) | 627,800 | 9,009 | |
| VMware, Inc. Class A | 113,600 | 17,979 | |
| TOTAL TECHNOLOGY | 764,607 | ||
| Telecommunications - 1.1% | |||
| Crown Castle International Corp. | 293,400 | 40,721 | |
| Palo Alto Networks, Inc. (g) | 118,300 | 26,900 | |
| T-Mobile U.S., Inc. (g) | 810,400 | 66,988 | |
| TOTAL TELECOMMUNICATIONS | 134,609 | ||
| Transportation Ex Air/Rail - 0.0% | |||
| Tricer Holdco SCA: | |||
| Class A1 (d)(g)(h) | 598,287 | 1 | |
| Class A2 (d)(g)(h) | 598,287 | 1 | |
| Class A3 (d)(g)(h) | 598,287 | 1 | |
| Class A4 (d)(g)(h) | 598,287 | 1 | |
| Class A5 (d)(g)(h) | 598,287 | 1 | |
| Class A6 (d)(g)(h) | 598,287 | 1 | |
| Class A7 (d)(g)(h) | 598,287 | 1 | |
| Class A8 (d)(g)(h) | 598,287 | 1 | |
| Class A9 (d)(g)(h) | 598,287 | 1 | |
| U.S. Shipping Partners Corp. (d)(g) | 51,736 | 0 | |
| U.S. Shipping Partners Corp. warrants 12/31/29 (d)(g) | 484,379 | 0 | |
| TOTAL TRANSPORTATION EX AIR/RAIL | 9 | ||
| Utilities - 1.0% | |||
| NRG Energy, Inc. | 986,100 | 39,562 | |
| Portland General Electric Co. | 14,817 | 843 | |
| Vistra Energy Corp. | 3,126,400 | 84,507 | |
| TOTAL UTILITIES | 124,912 | ||
| TOTAL COMMON STOCKS | |||
| (Cost $1,871,633) | 2,455,951 | ||
| Nonconvertible Preferred Stocks - 0.0% | |||
| Transportation Ex Air/Rail - 0.0% | |||
| Tricer Holdco SCA (d)(g)(h) | |||
| (Cost $10,250) | 287,159,690 | 97 | |
| Principal Amount (000s) | Value (000s) | ||
| Bank Loan Obligations - 4.4% | |||
| Air Transportation - 0.0% | |||
| Dynasty Acquisition Co., Inc.: | |||
| Tranche B 1LN, term loan 3 month U.S. LIBOR + 4.000% 6.1044% 4/4/26 (b)(e) | 1,197 | 1,198 | |
| Tranche B 2LN, term loan 3 month U.S. LIBOR + 4.000% 6.1044% 4/4/26 (b)(e) | 643 | 644 | |
| TOTAL AIR TRANSPORTATION | 1,842 | ||
| Automotive & Auto Parts - 0.2% | |||
| Wand NewCo 3, Inc. Tranche B 1LN, term loan 3 month U.S. LIBOR + 3.500% 5.2859% 2/5/26 (b)(e) | 17,880 | 17,938 | |
| Banks & Thrifts - 0.0% | |||
| Citadel Securities LP Tranche B, term loan 3 month U.S. LIBOR + 3.500% 5.2859% 2/27/26 (b)(e) | 2,980 | 2,986 | |
| Broadcasting - 0.1% | |||
| iHeartMedia Capital I LLC 1LN, term loan 3 month U.S. LIBOR + 4.000% 6.0315% 5/1/26 (b)(e) | 2,313 | 2,320 | |
| Nexstar Broadcasting, Inc. Tranche B, term loan 3 month U.S. LIBOR + 2.750% 4.5543% 9/19/26 (b)(e) | 4,445 | 4,459 | |
| TOTAL BROADCASTING | 6,779 | ||
| Building Materials - 0.0% | |||
| Traverse Midstream Partners Ll Tranche B, term loan 3 month U.S. LIBOR + 4.000% 5.8% 9/27/24 (b)(e) | 2,950 | 2,581 | |
| Cable/Satellite TV - 0.0% | |||
| LCPR Loan Financing LLC Tranche B 1LN, term loan 3 month U.S. LIBOR + 5.000% 6.8282% 10/22/26 (b)(e) | 2,140 | 2,152 | |
| Energy - 1.7% | |||
| BCP Raptor II LLC Tranche B, term loan 3 month U.S. LIBOR + 4.750% 6.5359% 11/3/25 (b)(e) | 6,055 | 5,306 | |
| BCP Raptor LLC Tranche B, term loan 3 month U.S. LIBOR + 4.250% 6.0359% 6/24/24 (b)(e) | 8,846 | 7,752 | |
| California Resources Corp.: | |||
| Tranche 1LN, term loan 3 month U.S. LIBOR + 10.375% 12.1746% 12/31/21 (b)(e) | 90,370 | 59,644 | |
| Tranche B, term loan 3 month U.S. LIBOR + 4.750% 6.5496% 12/31/22 (b)(e) | 102,975 | 88,095 | |
| Citgo Holding, Inc. Tranche B 1LN, term loan 3 month U.S. LIBOR + 7.000% 8.7859% 8/1/23 (b)(e) | 1,405 | 1,416 | |
| Epic Crude Services LP Tranche B 1LN, term loan 3 month U.S. LIBOR + 5.000% 7.04% 3/1/26 (b)(e) | 35,950 | 33,771 | |
| Forbes Energy Services LLC Tranche B, term loan 16% 4/13/21 (b)(d) | 1,879 | 1,893 | |
| Sanchez Energy Corp. 1LN, term loan 3 month U.S. LIBOR + 8.000% 10% 5/11/20 (b)(d)(e)(j) | 10,780 | 10,241 | |
| TOTAL ENERGY | 208,118 | ||
| Healthcare - 0.3% | |||
| U.S. Renal Care, Inc. Tranche B 1LN, term loan 3 month U.S. LIBOR + 5.000% 6.7859% 6/13/26 (b)(e) | 37,715 | 34,772 | |
| Valeant Pharmaceuticals International, Inc. Tranche B, term loan 3 month U.S. LIBOR + 3.000% 4.9213% 6/1/25 (b)(e) | 2,003 | 2,009 | |
| TOTAL HEALTHCARE | 36,781 | ||
| Hotels - 0.2% | |||
| Travelport Finance Luxembourg SARL Tranche B 2LN, term loan 3 month U.S. LIBOR + 9.000% 11.1044% 5/28/27 (b)(e) | 23,945 | 20,353 | |
| Insurance - 0.2% | |||
| HUB International Ltd. Tranche B, term loan: | |||
| 3 month U.S. LIBOR + 3.000% 4.9395% 4/25/25 (b)(e) | 5,372 | 5,250 | |
| 3 month U.S. LIBOR + 4.000% 4/25/25 (e)(k) | 19,275 | 19,236 | |
| TOTAL INSURANCE | 24,486 | ||
| Metals/Mining - 0.1% | |||
| Murray Energy Corp.: | |||
| term loan 3 month U.S. LIBOR + 11.000% 7.4286% 7/29/20 (b)(e) | 7,607 | 6,998 | |
| Tranche B 2LN, term loan 3 month U.S. LIBOR + 7.250% 10/17/22 (e)(f)(k) | 22,488 | 7,079 | |
| TOTAL METALS/MINING | 14,077 | ||
| Services - 0.4% | |||
| Almonde, Inc. Tranche 2LN, term loan 3 month U.S. LIBOR + 7.250% 9.4463% 6/13/25 (b)(e) | 30,761 | 28,697 | |
| BidFair MergeRight, Inc. 1LN, term loan 3 month U.S. LIBOR + 5.500% 7.4085% 1/23/27 (b)(e) | 11,264 | 10,989 | |
| KUEHG Corp. Tranche B 2LN, term loan 3 month U.S. LIBOR + 8.250% 10.3544% 8/22/25 (b)(e) | 6,055 | 6,010 | |
| TOTAL SERVICES | 45,696 | ||
| Technology - 1.1% | |||
| Boxer Parent Co., Inc. Tranche B, term loan 3 month U.S. LIBOR + 4.250% 6.0359% 10/2/25 (b)(e) | 36,737 | 33,943 | |
| Camelot Finance SA Tranche B, term loan 3 month U.S. LIBOR + 3.250% 10/31/26 (e)(k) | 1,150 | 1,153 | |
| Curie Merger Sub LLC 1LN, term loan 3 month U.S. LIBOR + 4.250% 10/28/26 (e)(k) | 600 | 599 | |
| Kronos, Inc. 2LN, term loan 3 month U.S. LIBOR + 8.250% 10.5031% 11/1/24 (b)(e) | 19,695 | 19,772 | |
| Landesk Group, Inc. term loan: | |||
| 3 month U.S. LIBOR + 4.250% 6.2% 1/20/24 (b)(e) | 3,085 | 3,014 | |
| 3 month U.S. LIBOR + 9.000% 10.95% 1/20/25 (b)(e) | 10,270 | 10,065 | |
| McAfee LLC Tranche B, term loan: | |||
| 3 month U.S. LIBOR + 3.750% 5.5549% 9/29/24 (b)(e) | 4,598 | 4,595 | |
| 3 month U.S. LIBOR + 8.500% 10.3049% 9/29/25 (b)(e) | 24,662 | 24,748 | |
| ON Semiconductor Corp. Tranche B 1LN, term loan 3 month U.S. LIBOR + 2.000% 3.7859% 9/19/26 (b)(e) | 7,845 | 7,875 | |
| Web.com Group, Inc.: | |||
| 2LN, term loan 3 month U.S. LIBOR + 7.750% 9.6635% 10/11/26 (b)(e) | 15,014 | 14,404 | |
| Tranche B 1LN, term loan 3 month U.S. LIBOR + 3.750% 5.6635% 10/11/25 (b)(e) | 11,054 | 10,747 | |
| TOTAL TECHNOLOGY | 130,915 | ||
| Telecommunications - 0.1% | |||
| Iridium Satellite LLC 1LN, term loan 1 month U.S. LIBOR + 3.750% 10/18/26 (e)(k) | 2,125 | 2,136 | |
| Triton Bidco Tranche B 1LN, term loan 3 month U.S. LIBOR + 4.500% 9/23/26 (e)(k) | 9,050 | 8,906 | |
| TOTAL TELECOMMUNICATIONS | 11,042 | ||
| TOTAL BANK LOAN OBLIGATIONS | |||
| (Cost $597,077) | 525,746 | ||
| Preferred Securities - 9.3% | |||
| Banks & Thrifts - 7.8% | |||
| Bank of America Corp.: | |||
| 5.125% (b)(l) | 36,030 | 38,643 | |
| 5.2% (b)(l) | 61,440 | 65,387 | |
| 5.875% (b)(l) | 102,630 | 113,615 | |
| 6.25% (b)(l) | 28,555 | 31,861 | |
| Citigroup, Inc.: | |||
| 5% (b)(l) | 60,300 | 62,825 | |
| 5.8% (b)(l) | 41,925 | 43,069 | |
| 5.9% (b)(l) | 27,015 | 28,906 | |
| 5.95% (b)(l) | 51,015 | 54,778 | |
| 6.3% (b)(l) | 5,610 | 6,197 | |
| Goldman Sachs Group, Inc.: | |||
| 3 month U.S. LIBOR + 3.884% 6.065% (b)(e)(l) | 25,687 | 26,099 | |
| 5% (b)(l) | 84,915 | 86,255 | |
| 5.375% (b)(l) | 31,615 | 32,884 | |
| Huntington Bancshares, Inc. 5.7% (b)(l) | 12,990 | 13,428 | |
| JPMorgan Chase & Co.: | |||
| 3 month U.S. LIBOR + 3.320% 5.4186% (b)(e)(l) | 43,545 | 44,016 | |
| 5% (b)(l) | 30,845 | 32,419 | |
| 5.3% (b)(l) | 16,855 | 17,554 | |
| 6% (b)(l) | 69,385 | 75,513 | |
| 6.125% (b)(l) | 17,585 | 19,174 | |
| 6.75% (b)(l) | 8,330 | 9,471 | |
| Wells Fargo & Co.: | |||
| 5.875% (b)(l) | 50,420 | 56,965 | |
| 5.9% (b)(l) | 63,075 | 69,534 | |
| TOTAL BANKS & THRIFTS | 928,593 | ||
| Diversified Financial Services - 0.3% | |||
| AerCap Holdings NV 5.875% 10/10/79 (b) | 33,325 | 34,859 | |
| Energy - 1.2% | |||
| DCP Midstream Partners LP 7.375% (b)(l) | 15,260 | 15,115 | |
| Energy Transfer Partners LP: | |||
| 6.25% (b)(l) | 70,123 | 66,143 | |
| 6.625% (b)(l) | 27,290 | 26,411 | |
| MPLX LP 6.875% (b)(l) | 30,450 | 31,310 | |
| Summit Midstream Partners LP 9.5% (b)(l) | 15,260 | 9,249 | |
| TOTAL ENERGY | 148,228 | ||
| Homebuilders/Real Estate - 0.0% | |||
| Odebrecht Finance Ltd. 7.5% (a)(f)(l) | 2,940 | 221 | |
| TOTAL PREFERRED SECURITIES | |||
| (Cost $1,066,761) | 1,111,901 | ||
| Shares | Value (000s) | ||
| Money Market Funds - 10.1% | |||
| Fidelity Cash Central Fund 1.83% (m) | 1,147,771,189 | 1,148,001 | |
| Fidelity Securities Lending Cash Central Fund 1.84% (m)(n) | 57,487,687 | 57,493 | |
| TOTAL MONEY MARKET FUNDS | |||
| (Cost $1,205,447) | 1,205,494 | ||
| TOTAL INVESTMENT IN SECURITIES - 100.4% | |||
| (Cost $11,278,799) | 11,964,525 | ||
| NET OTHER ASSETS (LIABILITIES) - (0.4)% | (52,217) | ||
| NET ASSETS - 100% | $11,912,308 |
Values shown as $0 in the Schedule of Investments may reflect amounts less than $500.
Legend
(a) Security exempt from registration under Rule 144A of the Securities Act of 1933. These securities may be resold in transactions exempt from registration, normally to qualified institutional buyers. At the end of the period, the value of these securities amounted to $4,070,982,000 or 34.2% of net assets.
(b) Coupon rates for floating and adjustable rate securities reflect the rates in effect at period end.
(c) Security or a portion of the security purchased on a delayed delivery or when-issued basis.
(d) Level 3 security
(e) Coupon is indexed to a floating interest rate which may be multiplied by a specified factor and/or subject to caps or floors.
(f) Non-income producing - Security is in default.
(g) Non-income producing
(h) Restricted securities - Investment in securities not registered under the Securities Act of 1933 (excluding 144A issues). At the end of the period, the value of restricted securities (excluding 144A issues) amounted to $6,706,000 or 0.1% of net assets.
(i) Security or a portion of the security is on loan at period end.
(j) Position or a portion of the position represents an unfunded loan commitment. At period end, the total principal amount and market value of unfunded commitments totaled $7,700,000 and $7,315,000, respectively.
(k) The coupon rate will be determined upon settlement of the loan after period end.
(l) Security is perpetual in nature with no stated maturity date.
(m) Affiliated fund that is generally available only to investment companies and other accounts managed by Fidelity Investments. The rate quoted is the annualized seven-day yield of the fund at period end. A complete unaudited listing of the fund's holdings as of its most recent quarter end is available upon request. In addition, each Fidelity Central Fund's financial statements are available on the SEC's website or upon request.
(n) Investment made with cash collateral received from securities on loan.
Additional information on each restricted holding is as follows:
| Security | Acquisition Date | Acquisition Cost (000s) |
| Arena Brands Holding Corp. Class B | 6/18/97 - 1/12/99 | $21,592 |
| Exide Technologies | 4/30/15 - 6/1/19 | $2,366 |
| Tricer Holdco SCA | 10/16/09 - 12/30/17 | $10,248 |
| Tricer Holdco SCA Class A1 | 10/16/09 - 10/29/09 | $1,653 |
| Tricer Holdco SCA Class A2 | 10/16/09 - 10/29/09 | $1,653 |
| Tricer Holdco SCA Class A3 | 10/16/09 - 10/29/09 | $1,653 |
| Tricer Holdco SCA Class A4 | 10/16/09 - 10/29/09 | $1,653 |
| Tricer Holdco SCA Class A5 | 10/16/09 - 10/29/09 | $1,653 |
| Tricer Holdco SCA Class A6 | 10/16/09 - 10/29/09 | $1,653 |
| Tricer Holdco SCA Class A7 | 10/16/09 - 10/29/09 | $1,653 |
| Tricer Holdco SCA Class A8 | 10/16/09 - 10/29/09 | $1,653 |
| Tricer Holdco SCA Class A9 | 10/16/09 - 10/29/09 | $1,654 |
Affiliated Central Funds
Information regarding fiscal year to date income earned by the Fund from investments in Fidelity Central Funds is as follows:
| Fund | Income earned |
| (Amounts in thousands) | |
| Fidelity Cash Central Fund | $10,780 |
| Fidelity Securities Lending Cash Central Fund | 123 |
| Total | $10,903 |
Amounts in the income column in the above table include any capital gain distributions from underlying funds, which are presented in the corresponding line-item in the Statement of Operations, if applicable. Amount for Fidelity Securities Lending Cash Central Fund represents the income earned on investing cash collateral, less rebates paid to borrowers and any lending agent fees associated with the loan, plus any premium payments received for lending certain types of securities.
Investment Valuation
The following is a summary of the inputs used, as of October 31, 2019, involving the Fund's assets and liabilities carried at fair value. The inputs or methodology used for valuing securities may not be an indication of the risk associated with investing in those securities. For more information on valuation inputs, and their aggregation into the levels used below, please refer to the Investment Valuation section in the accompanying Notes to Financial Statements.
| Valuation Inputs at Reporting Date: | ||||
| Description | Total | Level 1 | Level 2 | Level 3 |
| (Amounts in thousands) | ||||
| Investments in Securities: | ||||
| Equities: | ||||
| Communication Services | $329,184 | $329,183 | $1 | $-- |
| Consumer Discretionary | 280,463 | 260,589 | -- | 19,874 |
| Consumer Staples | 112,770 | 106,265 | -- | 6,505 |
| Energy | 11,960 | 11,960 | -- | -- |
| Financials | 117,307 | 117,307 | -- | -- |
| Health Care | 256,713 | 254,789 | -- | 1,924 |
| Industrials | 294,076 | 291,681 | -- | 2,395 |
| Information Technology | 840,570 | 840,570 | -- | -- |
| Materials | 44,840 | 44,804 | -- | 36 |
| Real Estate | 43,253 | 43,253 | -- | -- |
| Utilities | 124,912 | 124,912 | -- | -- |
| Corporate Bonds | 6,665,336 | -- | 6,661,296 | 4,040 |
| Bank Loan Obligations | 525,746 | -- | 513,612 | 12,134 |
| Preferred Securities | 1,111,901 | -- | 1,111,901 | -- |
| Money Market Funds | 1,205,494 | 1,205,494 | -- | -- |
| Total Investments in Securities: | $11,964,525 | $3,630,807 | $8,286,810 | $46,908 |
Other Information
Distribution of investments by country or territory of incorporation, as a percentage of Total Net Assets, is as follows (Unaudited):
| United States of America | 85.2% |
| Canada | 4.1% |
| Luxembourg | 1.7% |
| Cayman Islands | 1.4% |
| France | 1.4% |
| Netherlands | 1.3% |
| Multi-National | 1.1% |
| Others (Individually Less Than 1%) | 3.8% |
| 100.0% |
See accompanying notes which are an integral part of the financial statements.
Financial Statements
Statement of Assets and Liabilities
| Amounts in thousands (except per-share amount) | October 31, 2019 (Unaudited) | |
| Assets | ||
| Investment in securities, at value (including securities loaned of $55,767) — See accompanying schedule: Unaffiliated issuers (cost $10,073,352) | $10,759,031 | |
| Fidelity Central Funds (cost $1,205,447) | 1,205,494 | |
| Total Investment in Securities (cost $11,278,799) | $11,964,525 | |
| Cash | 6,812 | |
| Receivable for investments sold | 24,629 | |
| Receivable for fund shares sold | 10,545 | |
| Dividends receivable | 301 | |
| Interest receivable | 124,061 | |
| Distributions receivable from Fidelity Central Funds | 1,532 | |
| Prepaid expenses | 21 | |
| Other receivables | 566 | |
| Total assets | 12,132,992 | |
| Liabilities | ||
| Payable for investments purchased | ||
| Regular delivery | $79,005 | |
| Delayed delivery | 61,215 | |
| Payable for fund shares redeemed | 11,073 | |
| Distributions payable | 4,464 | |
| Accrued management fee | 5,437 | |
| Other affiliated payables | 1,197 | |
| Other payables and accrued expenses | 799 | |
| Collateral on securities loaned | 57,494 | |
| Total liabilities | 220,684 | |
| Net Assets | $11,912,308 | |
| Net Assets consist of: | ||
| Paid in capital | $11,098,021 | |
| Total accumulated earnings (loss) | 814,287 | |
| Net Assets, for 1,188,113 shares outstanding | $11,912,308 | |
| Net Asset Value, offering price and redemption price per share ($11,912,308 ÷ 1,188,113 shares) | $10.03 |
See accompanying notes which are an integral part of the financial statements.
Statement of Operations
| Amounts in thousands | Six months ended October 31, 2019 (Unaudited) | |
| Investment Income | ||
| Dividends | $43,814 | |
| Interest | 241,931 | |
| Income from Fidelity Central Funds (including $123 from security lending) | 10,903 | |
| Total income | 296,648 | |
| Expenses | ||
| Management fee | $32,415 | |
| Transfer agent fees | 6,436 | |
| Accounting fees | 724 | |
| Custodian fees and expenses | 58 | |
| Independent trustees' fees and expenses | 33 | |
| Registration fees | 154 | |
| Audit | 61 | |
| Legal | 97 | |
| Miscellaneous | 88 | |
| Total expenses before reductions | 40,066 | |
| Expense reductions | (32) | |
| Total expenses after reductions | 40,034 | |
| Net investment income (loss) | 256,614 | |
| Realized and Unrealized Gain (Loss) | ||
| Net realized gain (loss) on: | ||
| Investment securities: | ||
| Unaffiliated issuers | 51,020 | |
| Fidelity Central Funds | 2 | |
| Total net realized gain (loss) | 51,022 | |
| Change in net unrealized appreciation (depreciation) on: | ||
| Investment securities: | ||
| Unaffiliated issuers | (97,330) | |
| Assets and liabilities in foreign currencies | 2 | |
| Total change in net unrealized appreciation (depreciation) | (97,328) | |
| Net gain (loss) | (46,306) | |
| Net increase (decrease) in net assets resulting from operations | $210,308 |
See accompanying notes which are an integral part of the financial statements.
Statement of Changes in Net Assets
| Amounts in thousands | Six months ended October 31, 2019 (Unaudited) | Year ended April 30, 2019 |
| Increase (Decrease) in Net Assets | ||
| Operations | ||
| Net investment income (loss) | $256,614 | $514,624 |
| Net realized gain (loss) | 51,022 | 78,620 |
| Change in net unrealized appreciation (depreciation) | (97,328) | 114,337 |
| Net increase (decrease) in net assets resulting from operations | 210,308 | 707,581 |
| Distributions to shareholders | (271,923) | (807,791) |
| Share transactions | ||
| Proceeds from sales of shares | 1,256,229 | 2,212,313 |
| Reinvestment of distributions | 240,851 | 721,792 |
| Cost of shares redeemed | (1,154,279) | (3,255,515) |
| Net increase (decrease) in net assets resulting from share transactions | 342,801 | (321,410) |
| Total increase (decrease) in net assets | 281,186 | (421,620) |
| Net Assets | ||
| Beginning of period | 11,631,122 | 12,052,742 |
| End of period | $11,912,308 | $11,631,122 |
| Other Information | ||
| Shares | ||
| Sold | 125,725 | 223,038 |
| Issued in reinvestment of distributions | 24,156 | 73,721 |
| Redeemed | (115,539) | (333,577) |
| Net increase (decrease) | 34,342 | (36,818) |
See accompanying notes which are an integral part of the financial statements.
Financial Highlights
Fidelity Capital & Income Fund
| Six months ended (Unaudited) October 31, | Years endedApril 30, | |||||
| 2019 | 2019 | 2018 | 2017 | 2016 | 2015 | |
| Selected Per–Share Data | ||||||
| Net asset value, beginning of period | $10.08 | $10.12 | $10.09 | $9.24 | $9.99 | $10.07 |
| Income from Investment Operations | ||||||
| Net investment income (loss)A | .219 | .432 | .482 | .430 | .404 | .416 |
| Net realized and unrealized gain (loss) | (.037) | .207 | .065 | .824 | (.710) | .276 |
| Total from investment operations | .182 | .639 | .547 | 1.254 | (.306) | .692 |
| Distributions from net investment income | (.200) | (.487) | (.410) | (.405) | (.387) | (.411) |
| Distributions from net realized gain | (.032) | (.192) | (.107) | – | (.058) | (.362) |
| Total distributions | (.232) | (.679) | (.517) | (.405) | (.445) | (.773) |
| Redemption fees added to paid in capitalA | – | – | –B | .001 | .001 | .001 |
| Net asset value, end of period | $10.03 | $10.08 | $10.12 | $10.09 | $9.24 | $9.99 |
| Total ReturnC,D | 1.84% | 6.74% | 5.51% | 13.85% | (3.05)% | 7.17% |
| Ratios to Average Net AssetsE,F | ||||||
| Expenses before reductions | .68%G | .69% | .67% | .73% | .75% | .72% |
| Expenses net of fee waivers, if any | .68%G | .69% | .67% | .73% | .75% | .72% |
| Expenses net of all reductions | .68%G | .69% | .67% | .73% | .74% | .72% |
| Net investment income (loss) | 4.36%G | 4.37% | 4.71% | 4.45% | 4.30% | 4.16% |
| Supplemental Data | ||||||
| Net assets, end of period (in millions) | $11,912 | $11,631 | $12,053 | $11,230 | $10,188 | $11,160 |
| Portfolio turnover rateH | 51%G | 43% | 39% | 39% | 35% | 41% |
A Calculated based on average shares outstanding during the period.
B Amount represents less than $.0005 per share.
C Total returns for periods of less than one year are not annualized.
D Total returns would have been lower if certain expenses had not been reduced during the applicable periods shown.
E Fees and expenses of any underlying Fidelity Central Funds are not included in the Fund's expense ratio. The Fund indirectly bears its proportionate share of the expenses of any underlying Fidelity Central Funds.
F Expense ratios reflect operating expenses of the Fund. Expenses before reductions do not reflect amounts reimbursed by the investment adviser or reductions from brokerage service arrangements or reductions from other expense offset arrangements and do not represent the amount paid by the Fund during periods when reimbursements or reductions occur. Expenses net of fee waivers reflect expenses after reimbursement by the investment adviser but prior to reductions from brokerage service arrangements or other expense offset arrangements. Expenses net of all reductions represent the net expenses paid by the Fund.
G Annualized
H Amount does not include the portfolio activity of any underlying Fidelity Central Funds.
See accompanying notes which are an integral part of the financial statements.
Notes to Financial Statements (Unaudited)
For the period ended October 31, 2019
(Amounts in thousands except percentages)
1. Organization.
Fidelity Capital & Income Fund (the Fund) is a fund of Fidelity Summer Street Trust (the Trust) and is authorized to issue an unlimited number of shares. Share transactions on the Statement of Changes in Net Assets may contain exchanges between affiliated funds. The Trust is registered under the Investment Company Act of 1940, as amended (the 1940 Act), as an open-end management investment company organized as a Massachusetts business trust.
2. Investments in Fidelity Central Funds.
The Fund invests in Fidelity Central Funds, which are open-end investment companies generally available only to other investment companies and accounts managed by the investment adviser and its affiliates. The Fund's Schedule of Investments lists each of the Fidelity Central Funds held as of period end, if any, as an investment of the Fund, but does not include the underlying holdings of each Fidelity Central Fund. As an Investing Fund, the Fund indirectly bears its proportionate share of the expenses of the underlying Fidelity Central Funds.
The Money Market Central Funds seek preservation of capital and current income and are managed by Fidelity Investments Money Management, Inc. (FIMM), an affiliate of the investment adviser. Annualized expenses of the Money Market Central Funds as of their most recent shareholder report date ranged from less than .005% to .01%.
A complete unaudited list of holdings for each Fidelity Central Fund is available upon request or at the Securities and Exchange Commission (the SEC) website at www.sec.gov. In addition, the financial statements of the Fidelity Central Funds are available on the SEC website or upon request.
3. Significant Accounting Policies.
The Fund is an investment company and applies the accounting and reporting guidance of the Financial Accounting Standards Board (FASB) Accounting Standards Codification Topic 946 Financial Services – Investments Companies. The financial statements have been prepared in conformity with accounting principles generally accepted in the United States of America (GAAP), which require management to make certain estimates and assumptions at the date of the financial statements. Actual results could differ from those estimates. Subsequent events, if any, through the date that the financial statements were issued have been evaluated in the preparation of the financial statements. The following summarizes the significant accounting policies of the Fund:
Investment Valuation. Investments are valued as of 4:00 p.m. Eastern time on the last calendar day of the period. The Board of Trustees (the Board) has delegated the day to day responsibility for the valuation of the Fund's investments to the Fair Value Committee (the Committee) established by the Fund's investment adviser. In accordance with valuation policies and procedures approved by the Board, the Fund attempts to obtain prices from one or more third party pricing vendors or brokers to value its investments. When current market prices, quotations or currency exchange rates are not readily available or reliable, investments will be fair valued in good faith by the Committee, in accordance with procedures adopted by the Board. Factors used in determining fair value vary by investment type and may include market or investment specific events, changes in interest rates and credit quality. The frequency with which these procedures are used cannot be predicted and they may be utilized to a significant extent. The Committee oversees the Fund's valuation policies and procedures and reports to the Board on the Committee's activities and fair value determinations. The Board monitors the appropriateness of the procedures used in valuing the Fund's investments and ratifies the fair value determinations of the Committee.
The Fund categorizes the inputs to valuation techniques used to value its investments into a disclosure hierarchy consisting of three levels as shown below:
- Level 1 – quoted prices in active markets for identical investments
- Level 2 – other significant observable inputs (including quoted prices for similar investments, interest rates, prepayment speeds, etc.)
- Level 3 – unobservable inputs (including the Fund's own assumptions based on the best information available)
Valuation techniques used to value the Fund's investments by major category are as follows:
Debt securities, including restricted securities, are valued based on evaluated prices received from third party pricing vendors or from brokers who make markets in such securities. Corporate bonds, bank loan obligations and preferred securities are valued by pricing vendors who utilize matrix pricing which considers yield or price of bonds of comparable quality, coupon, maturity and type or by broker-supplied prices. When independent prices are unavailable or unreliable, debt securities may be valued utilizing pricing methodologies which consider similar factors that would be used by third party pricing vendors. Debt securities are generally categorized as Level 2 in the hierarchy but may be Level 3 depending on the circumstances. The Fund invests a significant portion of its assets in below investment grade securities. The value of these securities can be more volatile due to changes in the credit quality of the issuer and is sensitive to changes in economic, market and regulatory conditions.
Equity securities, including restricted securities, for which market quotations are readily available, are valued at the last reported sale price or official closing price as reported by a third party pricing vendor on the primary market or exchange on which they are traded and are categorized as Level 1 in the hierarchy. In the event there were no sales during the day or closing prices are not available, securities are valued at the last quoted bid price or may be valued using the last available price and are generally categorized as Level 2 in the hierarchy. For foreign equity securities, when market or security specific events arise, comparisons to the valuation of American Depositary Receipts (ADRs), futures contracts, Exchange-Traded Funds (ETFs) and certain indexes as well as quoted prices for similar securities may be used and would be categorized as Level 2 in the hierarchy. For equity securities, including restricted securities, where observable inputs are limited, assumptions about market activity and risk are used and these securities may be categorized as Level 3 in the hierarchy.
Investments in open-end mutual funds, including the Fidelity Central Funds, are valued at their closing net asset value (NAV) each business day and are categorized as Level 1 in the hierarchy.
Changes in valuation techniques may result in transfers in or out of an assigned level within the disclosure hierarchy. The aggregate value of investments by input level as of October 31, 2019 is included at the end of the Fund's Schedule of Investments.
Foreign Currency. The Fund may use foreign currency contracts to facilitate transactions in foreign-denominated securities. Gains and losses from these transactions may arise from changes in the value of the foreign currency or if the counterparties do not perform under the contracts' terms.
Foreign-denominated assets, including investment securities, and liabilities are translated into U.S. dollars at the exchange rates at period end. Purchases and sales of investment securities, income and dividends received and expenses denominated in foreign currencies are translated into U.S. dollars at the exchange rate in effect on the transaction date.
The effects of exchange rate fluctuations on investments are included with the net realized and unrealized gain (loss) on investment securities. Other foreign currency transactions resulting in realized and unrealized gain (loss) are disclosed separately.
Investment Transactions and Income. For financial reporting purposes, the Fund's investment holdings and NAV include trades executed through the end of the last business day of the period. The NAV per share for processing shareholder transactions is calculated as of the close of business of the New York Stock Exchange (NYSE), normally 4:00 p.m. Eastern time and includes trades executed through the end of the prior business day. Gains and losses on securities sold are determined on the basis of identified cost and include proceeds received from litigation. Dividend income is recorded on the ex-dividend date, except for certain dividends from foreign securities where the ex-dividend date may have passed, which are recorded as soon as the Fund is informed of the ex-dividend date. Non-cash dividends included in dividend income, if any, are recorded at the fair market value of the securities received. Income and capital gain distributions from Fidelity Central Funds, if any, are recorded on the ex-dividend date. Certain distributions received by the Fund represent a return of capital or capital gain. The Fund determines the components of these distributions subsequent to the ex-dividend date, based upon receipt of tax filings or other correspondence relating to the underlying investment. These distributions are recorded as a reduction of cost of investments and/or as a realized gain. Interest income is accrued as earned and includes coupon interest and amortization of premium and accretion of discount on debt securities as applicable. Paid in Kind (PIK) income is recorded at the fair market value of the securities received. Investment income is recorded net of foreign taxes withheld where recovery of such taxes is uncertain. Debt obligations may be placed on non-accrual status and related interest income may be reduced by ceasing current accruals and writing off interest receivables when the collection of all or a portion of interest has become doubtful based on consistently applied procedures. A debt obligation is removed from non-accrual status when the issuer resumes interest payments or when collectability of interest is reasonably assured.
Expenses. Expenses directly attributable to a fund are charged to that fund. Expenses attributable to more than one fund are allocated among the respective funds on the basis of relative net assets or other appropriate methods. Expense estimates are accrued in the period to which they relate and adjustments are made when actual amounts are known.
Deferred Trustee Compensation. Under a Deferred Compensation Plan (the Plan) for the Fund, certain independent Trustees have elected to defer receipt of a portion of their annual compensation. Deferred amounts are invested in a cross-section of Fidelity funds, are marked-to-market and remain in the Fund until distributed in accordance with the Plan. The investment of deferred amounts and the offsetting payable to the Trustees of $539 are included in the accompanying Statement of Assets and Liabilities in other receivables and other payables and accrued expenses, respectively.
Income Tax Information and Distributions to Shareholders. Each year, the Fund intends to qualify as a regulated investment company under Subchapter M of the Internal Revenue Code, including distributing substantially all of its taxable income and realized gains. As a result, no provision for U.S. Federal income taxes is required. The Fund files a U.S. federal tax return, in addition to state and local tax returns as required. The Fund's federal income tax returns are subject to examination by the Internal Revenue Service (IRS) for a period of three fiscal years after they are filed. State and local tax returns may be subject to examination for an additional fiscal year depending on the jurisdiction. Foreign taxes are provided for based on the Fund's understanding of the tax rules and rates that exist in the foreign markets in which it invests.
Distributions are declared and recorded daily and paid monthly from net investment income. Distributions from realized gains, if any, are declared and recorded on the ex-dividend date. Income and capital gain distributions are determined in accordance with income tax regulations, which may differ from GAAP.
Capital accounts within the financial statements are adjusted for permanent book-tax differences. These adjustments have no impact on net assets or the results of operations. Capital accounts are not adjusted for temporary book-tax differences which will reverse in a subsequent period.
Book-tax differences are primarily due to foreign currency transactions, market discount, partnerships, deferred trustees compensation and losses deferred due to wash sales.
As of period end, the cost and unrealized appreciation (depreciation) in securities, and derivatives if applicable, for federal income tax purposes were as follows:
| Gross unrealized appreciation | $1,205,021 |
| Gross unrealized depreciation | (485,478) |
| Net unrealized appreciation (depreciation) | $719,543 |
| Tax cost | $11,244,982 |
Delayed Delivery Transactions and When-Issued Securities. During the period, the Fund transacted in securities on a delayed delivery or when-issued basis. Payment and delivery may take place after the customary settlement period for that security. The price of the underlying securities and the date when the securities will be delivered and paid for are fixed at the time the transaction is negotiated. The securities purchased on a delayed delivery or when-issued basis are identified as such in the Fund's Schedule of Investments. The Fund may receive compensation for interest forgone in the purchase of a delayed delivery or when-issued security. With respect to purchase commitments, the Fund identifies securities as segregated in its records with a value at least equal to the amount of the commitment. Losses may arise due to changes in the value of the underlying securities or if the counterparty does not perform under the contract's terms, or if the issuer does not issue the securities due to political, economic, or other factors.
Restricted Securities. The Fund may invest in securities that are subject to legal or contractual restrictions on resale. These securities generally may be resold in transactions exempt from registration or to the public if the securities are registered. Disposal of these securities may involve time-consuming negotiations and expense, and prompt sale at an acceptable price may be difficult. Information regarding restricted securities is included at the end of the Fund's Schedule of Investments.
Loans and Other Direct Debt Instruments. The Fund invests in direct debt instruments which are interests in amounts owed to lenders by corporate or other borrowers. These instruments may be in the form of loans, trade claims or other receivables and may include standby financing commitments such as revolving credit facilities that obligate the Fund to supply additional cash to the borrower on demand. Loans may be acquired through assignment or participation. The Fund also invests in unfunded loan commitments, which are contractual obligations for future funding. Information regarding unfunded commitments is included at the end of the Fund's Schedule of Investments.
4. Purchases and Sales of Investments.
Purchases and sales of securities, other than short-term securities, aggregated $2,736,206 and $2,735,304, respectively.
5. Fees and Other Transactions with Affiliates.
Management Fee. Fidelity Management & Research Company (the investment adviser) and its affiliates provide the Fund with investment management related services for which the Fund pays a monthly management fee. The management fee is the sum of an individual fund fee rate that is based on an annual rate of .45% of the Fund's average net assets and an annualized group fee rate that averaged .10% during the period. The group fee rate is based upon the average net assets of all the mutual funds advised by the investment adviser, including any mutual funds previously advised by the investment adviser that are currently advised by Fidelity SelectCo, LLC, an affiliate of the investment adviser. The group fee rate decreases as assets under management increase and increases as assets under management decrease. For the reporting period, the total annualized management fee rate was .55% of the Fund's average net assets.
Transfer Agent Fees. Fidelity Investments Institutional Operations Company, Inc. (FIIOC), an affiliate of the investment adviser, is the Fund's transfer, dividend disbursing and shareholder servicing agent. FIIOC receives account fees and asset-based fees that vary according to account size and type of account. FIIOC pays for typesetting, printing and mailing of shareholder reports, except proxy statements. For the period, the transfer agent fees were equivalent to an annualized rate of .11% of average net assets.
Accounting Fees. Fidelity Service Company, Inc. (FSC), an affiliate of the investment adviser, maintains the Fund's accounting records. The accounting fee is based on the level of average net assets for each month. For the period, the fees were equivalent to an annualized rate of .01%.
Brokerage Commissions. The Fund placed a portion of its portfolio transactions with brokerage firms which are affiliates of the investment adviser. Brokerage commissions are included in net realized gain (loss) and change in net unrealized appreciation (depreciation) in the Statement of Operations. The commissions paid to these affiliated firms were $25 for the period.
Interfund Trades. The Fund may purchase from or sell securities to other Fidelity Funds under procedures adopted by the Board. The procedures have been designed to ensure these interfund trades are executed in accordance with Rule 17a-7 of the 1940 Act. Interfund trades are included within the respective purchases and sales amounts shown in the Purchases and Sales of Investments note.
6. Committed Line of Credit.
The Fund participates with other funds managed by the investment adviser or an affiliate in a $4.25 billion credit facility (the "line of credit") to be utilized for temporary or emergency purposes to fund shareholder redemptions or for other short-term liquidity purposes. The Fund has agreed to pay commitment fees on its pro-rata portion of the line of credit, which amounted to $14 and is reflected in Miscellaneous expenses on the Statement of Operations. During the period, the Fund did not borrow on this line of credit.
7. Security Lending.
The Fund lends portfolio securities from time to time in order to earn additional income. For equity securities, lending agents are used, including National Financial Services (NFS), an affiliate of the Fund. Pursuant to a securities lending agreement, NFS will receive a fee, which is capped at 9.9% of daily lending revenue, for its services as lending agent. The Fund may lend securities to certain qualified borrowers, including NFS. On the settlement date of the loan, the Fund receives collateral (in the form of U.S. Treasury obligations, letters of credit and/or cash) against the loaned securities and maintains collateral in an amount not less than 100% of the market value of the loaned securities during the period of the loan. The market value of the loaned securities is determined at the close of business of the Fund and any additional required collateral is delivered to the Fund on the next business day. The Fund or borrower may terminate the loan at any time, and if the borrower defaults on its obligation to return the securities loaned because of insolvency or other reasons, the Fund may apply collateral received from the borrower against the obligation. The Fund may experience delays and costs in recovering the securities loaned. Any cash collateral received is invested in the Fidelity Securities Lending Cash Central Fund. The value of loaned securities and cash collateral at period end are disclosed on the Fund's Statement of Assets and Liabilities. At period end, there were no security loans outstanding with NFS, as affiliated borrower. Total fees paid by the Fund to NFS, as lending agent, amounted to $4. Security lending income represents the income earned on investing cash collateral, less rebates paid to borrowers and any lending agent fees associated with the loan, plus any premium payments received for lending certain types of securities. Security lending income is presented in the Statement of Operations as a component of income from Fidelity Central Funds, and includes $3 from securities loaned to NFS, as affiliated borrower.
8. Expense Reductions.
Through arrangements with the Fund's custodian, credits realized as a result of certain uninvested cash balances were used to reduce the Fund's expenses by $5.
In addition, during the period the investment adviser reimbursed and/or waived a portion of operating expenses in the amount of $27.
9. Other.
The Fund's organizational documents provide former and current trustees and officers with a limited indemnification against liabilities arising in connection with the performance of their duties to the Fund. In the normal course of business, the Fund may also enter into contracts that provide general indemnifications. The Fund's maximum exposure under these arrangements is unknown as this would be dependent on future claims that may be made against the Fund. The risk of material loss from such claims is considered remote.
10. Litigation.
The Fund and other entities managed by FMR or its affiliates were named as defendants in a lawsuit filed in the United States Bankruptcy Court for the Southern District of New York in 2009. The lawsuit was brought by creditors of Motors Liquidation Company (f/k/a General Motors), which went through Chapter 11 bankruptcy proceedings in 2009, and is captioned Official Committee of Unsecured Creditors of Motors Liquidation Company v. JPMorgan Chase Bank, N.A., et al., Adversary No. 09-00504 (REG). The plaintiffs sought an order that the Fund and other defendants return proceeds received in 2009 in full payment of the principal and interest on General Motors secured debt. The plaintiffs contended that the Fund and the other defendants were not secured creditors at the time of the 2009 payments and, thus, were not entitled to payment in full. In May 2019, the parties reached a settlement that has been approved by the Bankruptcy Court. Under the terms of the settlement, the Fund will not be required to return any of the proceeds received in 2009, and will be entitled to recover a portion of the legal costs incurred in defending the case.
Shareholder Expense Example
As a shareholder of the Fund, you incur two types of costs: (1) transaction costs and (2) ongoing costs, including management fees and other Fund expenses. This Example is intended to help you understand your ongoing costs (in dollars) of investing in the Fund and to compare these costs with the ongoing costs of investing in other mutual funds.
The Example is based on an investment of $1,000 invested at the beginning of the period and held for the entire period (May 1, 2019 to October 31, 2019).
Actual Expenses
The first line of the accompanying table provides information about actual account values and actual expenses. You may use the information in this line, together with the amount you invested, to estimate the expenses that you paid over the period. Simply divide your account value by $1,000.00 (for example, an $8,600 account value divided by $1,000.00 = 8.6), then multiply the result by the number in the first line under the heading entitled "Expenses Paid During Period" to estimate the expenses you paid on your account during this period. In addition, the Fund, as a shareholder in the underlying Fidelity Central Funds, will indirectly bear its pro-rata share of the fees and expenses incurred by the underlying Fidelity Central Funds. These fees and expenses are not included in the Fund's annualized expense ratio used to calculate the expense estimate in the table below.
Hypothetical Example for Comparison Purposes
The second line of the accompanying table provides information about hypothetical account values and hypothetical expenses based on the Fund's actual expense ratio and an assumed rate of return of 5% per year before expenses, which is not the Fund's actual return. The hypothetical account values and expenses may not be used to estimate the actual ending account balance or expenses you paid for the period. You may use this information to compare the ongoing costs of investing in the Fund and other funds. To do so, compare this 5% hypothetical example with the 5% hypothetical examples that appear in the shareholder reports of the other funds. In addition, the Fund, as a shareholder in the underlying Fidelity Central Funds, will indirectly bear its pro-rata share of the fees and expenses incurred by the underlying Fidelity Central Funds. These fees and expenses are not included in the Fund's annualized expense ratio used to calculate the expense estimate in the table below.
Please note that the expenses shown in the table are meant to highlight your ongoing costs only and do not reflect any transaction costs. Therefore, the second line of the table is useful in comparing ongoing costs only, and will not help you determine the relative total costs of owning different funds.
| Annualized Expense Ratio-A | Beginning Account Value May 1, 2019 | Ending Account Value October 31, 2019 | Expenses Paid During Period-B May 1, 2019 to October 31, 2019 |
|
| Actual | .68% | $1,000.00 | $1,018.40 | $3.45 |
| Hypothetical-C | $1,000.00 | $1,021.72 | $3.46 |
A Annualized expense ratio reflects expenses net of applicable fee waivers.
B Expenses are equal to the Fund's annualized expense ratio, multiplied by the average account value over the period, multiplied by 184/366 (to reflect the one-half year period).
C 5% return per year before expenses
![]()
CAI-SANN-1219
1.538653.122
Fidelity® High Income Fund
Semi-Annual Report
October 31, 2019
Includes Fidelity and Fidelity Advisor share classes
See the inside front cover for important information about access to your fund’s shareholder reports.
Beginning on January 1, 2021, as permitted by regulations adopted by the Securities and Exchange Commission, paper copies of a fund’s shareholder reports will no longer be sent by mail, unless you specifically request paper copies of the reports from the fund or from your financial intermediary, such as a financial advisor, broker-dealer or bank. Instead, the reports will be made available on a website, and you will be notified by mail each time a report is posted and provided with a website link to access the report.
If you already elected to receive shareholder reports electronically, you will not be affected by this change and you need not take any action. You may elect to receive shareholder reports and other communications from a fund electronically, by contacting your financial intermediary. For Fidelity customers, visit Fidelity's web site or call Fidelity using the contact information listed below.
You may elect to receive all future reports in paper free of charge. If you wish to continue receiving paper copies of your shareholder reports, you may contact your financial intermediary or, if you are a Fidelity customer, visit Fidelity’s website, or call Fidelity at the applicable toll-free number listed below. Your election to receive reports in paper will apply to all funds held with the fund complex/your financial intermediary.
| Account Type | Website | Phone Number |
| Brokerage, Mutual Fund, or Annuity Contracts: | fidelity.com/mailpreferences | 1-800-343-3548 |
| Employer Provided Retirement Accounts: | netbenefits.fidelity.com/preferences (choose 'no' under Required Disclosures to continue to print) | 1-800-343-0860 |
| Advisor Sold Accounts Serviced Through Your Financial Intermediary: | Contact Your Financial Intermediary | Your Financial Intermediary's phone number |
| Advisor Sold Accounts Serviced by Fidelity: | institutional.fidelity.com | 1-877-208-0098 |
Contents
To view a fund's proxy voting guidelines and proxy voting record for the 12-month period ended June 30, visit http://www.fidelity.com/proxyvotingresults or visit the Securities and Exchange Commission's (SEC) web site at http://www.sec.gov.
You may also call 1-800-544-8544 if you’re an individual investing directly with Fidelity, call 1-800-835-5092 if you’re a plan sponsor or participant with Fidelity as your recordkeeper or call 1-877-208-0098 on institutional accounts or if you’re an advisor or invest through one to request a free copy of the proxy voting guidelines.
Standard & Poor's, S&P and S&P 500 are registered service marks of The McGraw-Hill Companies, Inc. and have been licensed for use by Fidelity Distributors Corporation.
Other third-party marks appearing herein are the property of their respective owners.
All other marks appearing herein are registered or unregistered trademarks or service marks of FMR LLC or an affiliated company. © 2019 FMR LLC. All rights reserved.
This report and the financial statements contained herein are submitted for the general information of the shareholders of the Fund. This report is not authorized for distribution to prospective investors in the Fund unless preceded or accompanied by an effective prospectus.
A fund files its complete schedule of portfolio holdings with the SEC for the first and third quarters of each fiscal year on Form N-PORT. Forms N-PORT are available on the SEC’s web site at http://www.sec.gov. A fund's Forms N-PORT may be reviewed and copied at the SEC’s Public Reference Room in Washington, DC. Information regarding the operation of the SEC's Public Reference Room may be obtained by calling 1-800-SEC-0330.
For a complete list of a fund's portfolio holdings, view the most recent holdings listing, semiannual report, or annual report on Fidelity's web site at http://www.fidelity.com, http://www.institutional.fidelity.com, or http://www.401k.com, as applicable.
NOT FDIC INSURED •MAY LOSE VALUE •NO BANK GUARANTEE
Neither the Fund nor Fidelity Distributors Corporation is a bank.
Investment Summary (Unaudited)
Top Five Holdings as of October 31, 2019
| (by issuer, excluding cash equivalents) | % of fund's net assets |
| CCO Holdings LLC/CCO Holdings Capital Corp. | 2.9 |
| Tenet Healthcare Corp. | 2.1 |
| Community Health Systems, Inc. | 1.8 |
| Valeant Pharmaceuticals International, Inc. | 1.5 |
| CSC Holdings LLC | 1.6 |
| 9.9 |
Top Five Market Sectors as of October 31, 2019
| % of fund's net assets | |
| Energy | 14.3 |
| Telecommunications | 10.5 |
| Healthcare | 9.1 |
| Diversified Financial Services | 6.8 |
| Cable/Satellite TV | 6.6 |
Quality Diversification (% of fund's net assets)
| As of October 31, 2019 | ||
| BBB | 4.5% | |
| BB | 40.3% | |
| B | 33.7% | |
| CCC,CC,C | 13.3% | |
| D | 0.3% | |
| Not Rated | 0.7% | |
| Equities | 0.5% | |
| Short-Term Investments and Net Other Assets | 6.7% | |
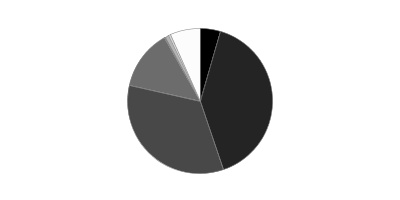
We have used ratings from Moody's Investors Service, Inc. Where Moody's® ratings are not available, we have used S&P® ratings. All ratings are as of the date indicated and do not reflect subsequent changes.
Asset Allocation (% of fund's net assets)
| As of October 31, 2019* | ||
| Nonconvertible Bonds | 87.8% | |
| Convertible Bonds, Preferred Stocks | 0.6% | |
| Common Stocks | 0.4% | |
| Bank Loan Obligations | 2.0% | |
| Other Investments | 2.5% | |
| Short-Term Investments and Net Other Assets (Liabilities) | 6.7% | |

* Foreign investments - 24.1%
Schedule of Investments October 31, 2019 (Unaudited)
Showing Percentage of Net Assets
| Corporate Bonds - 88.3% | |||
| Principal Amount (000s) | Value (000s) | ||
| Convertible Bonds - 0.5% | |||
| Broadcasting - 0.5% | |||
| DISH Network Corp.: | |||
| 2.375% 3/15/24 | $3,133 | $2,808 | |
| 3.375% 8/15/26 | 26,345 | 24,634 | |
| 27,442 | |||
| Nonconvertible Bonds - 87.8% | |||
| Aerospace - 3.1% | |||
| BBA U.S. Holdings, Inc. 5.375% 5/1/26 (a) | 22,816 | 23,843 | |
| Bombardier, Inc.: | |||
| 6.125% 1/15/23 (a) | 4,738 | 4,631 | |
| 7.5% 12/1/24 (a) | 17,059 | 16,537 | |
| 7.5% 3/15/25 (a) | 26,233 | 25,085 | |
| 7.875% 4/15/27 (a) | 14,387 | 13,596 | |
| BWX Technologies, Inc. 5.375% 7/15/26 (a) | 17,280 | 18,300 | |
| TransDigm, Inc.: | |||
| 6% 7/15/22 | 1,116 | 1,135 | |
| 6.25% 3/15/26 (a) | 21,499 | 23,031 | |
| 6.5% 7/15/24 | 31,608 | 32,635 | |
| 6.5% 5/15/25 | 3,319 | 3,448 | |
| 162,241 | |||
| Air Transportation - 0.6% | |||
| Aercap Global Aviation Trust 6.5% 6/15/45 (a)(b) | 27,898 | 30,583 | |
| Banks & Thrifts - 1.4% | |||
| Ally Financial, Inc.: | |||
| 3.875% 5/21/24 | 7,994 | 8,349 | |
| 4.25% 4/15/21 | 3,755 | 3,850 | |
| 5.75% 11/20/25 | 47,050 | 52,402 | |
| 8% 11/1/31 | 7,348 | 10,269 | |
| 74,870 | |||
| Broadcasting - 1.5% | |||
| Sirius XM Radio, Inc.: | |||
| 3.875% 8/1/22 (a) | 6,349 | 6,484 | |
| 4.625% 7/15/24 (a) | 7,142 | 7,463 | |
| 5% 8/1/27 (a) | 20,227 | 21,264 | |
| 5.375% 4/15/25 (a) | 21,979 | 22,858 | |
| 5.375% 7/15/26 (a) | 18,249 | 19,253 | |
| 77,322 | |||
| Building Materials - 0.3% | |||
| Advanced Drain Systems, Inc. 5% 9/30/27 (a) | 14,301 | 14,623 | |
| Cable/Satellite TV - 6.2% | |||
| Cablevision Systems Corp. 5.875% 9/15/22 | 1,170 | 1,262 | |
| CCO Holdings LLC/CCO Holdings Capital Corp.: | |||
| 4% 3/1/23 (a) | 7,641 | 7,775 | |
| 5% 2/1/28 (a) | 12,013 | 12,569 | |
| 5.125% 2/15/23 | 5,238 | 5,349 | |
| 5.125% 5/1/23 (a) | 5,390 | 5,518 | |
| 5.125% 5/1/27 (a) | 18,817 | 19,828 | |
| 5.5% 5/1/26 (a) | 26,948 | 28,396 | |
| 5.75% 9/1/23 | 6,129 | 6,252 | |
| 5.75% 2/15/26 (a) | 26,531 | 28,017 | |
| 5.875% 4/1/24 (a) | 21,485 | 22,398 | |
| 5.875% 5/1/27 (a) | 21,160 | 22,430 | |
| CSC Holdings LLC: | |||
| 5.25% 6/1/24 | 1,517 | 1,635 | |
| 5.375% 7/15/23 (a) | 15,336 | 15,719 | |
| 5.5% 5/15/26 (a) | 32,797 | 34,560 | |
| 5.5% 4/15/27 (a) | 12,869 | 13,641 | |
| 7.5% 4/1/28 (a) | 4,650 | 5,231 | |
| 7.75% 7/15/25 (a) | 9,015 | 9,669 | |
| DISH DBS Corp.: | |||
| 5.875% 11/15/24 | 3,152 | 3,160 | |
| 7.75% 7/1/26 | 15,777 | 15,917 | |
| Virgin Media Secured Finance PLC 5.5% 8/15/26 (a) | 12,703 | 13,354 | |
| Ziggo B.V. 5.5% 1/15/27 (a) | 28,636 | 30,211 | |
| Ziggo Bond Co. BV 6% 1/15/27 (a) | 2,185 | 2,283 | |
| Ziggo Bond Finance BV 5.875% 1/15/25 (a) | 21,563 | 22,210 | |
| 327,384 | |||
| Capital Goods - 0.8% | |||
| AECOM: | |||
| 5.125% 3/15/27 | 26,360 | 27,802 | |
| 5.875% 10/15/24 | 14,724 | 15,884 | |
| 43,686 | |||
| Chemicals - 2.2% | |||
| Blue Cube Spinco, Inc.: | |||
| 9.75% 10/15/23 | 3,990 | 4,349 | |
| 10% 10/15/25 | 5,806 | 6,488 | |
| CF Industries Holdings, Inc.: | |||
| 5.15% 3/15/34 | 12,380 | 13,123 | |
| 5.375% 3/15/44 | 11,479 | 11,766 | |
| Element Solutions, Inc. 5.875% 12/1/25 (a) | 16,697 | 17,430 | |
| OCI NV 6.625% 4/15/23 (a) | 18,719 | 19,538 | |
| Olin Corp. 5.125% 9/15/27 | 2,193 | 2,256 | |
| The Chemours Co. LLC: | |||
| 5.375% 5/15/27 | 8,302 | 7,377 | |
| 6.625% 5/15/23 | 5,481 | 5,452 | |
| 7% 5/15/25 | 14,582 | 14,072 | |
| TPC Group, Inc. 10.5% 8/1/24 (a) | 3,167 | 3,357 | |
| Trinseo Materials Operating SCA/Trinseo Materials Finance, Inc. 5.375% 9/1/25 (a) | 4,391 | 4,232 | |
| Valvoline, Inc.: | |||
| 4.375% 8/15/25 | 1,483 | 1,509 | |
| 5.5% 7/15/24 | 1,850 | 1,920 | |
| W. R. Grace & Co.-Conn.: | |||
| 5.125% 10/1/21 (a) | 1,816 | 1,884 | |
| 5.625% 10/1/24 (a) | 1,762 | 1,903 | |
| 116,656 | |||
| Consumer Products - 0.0% | |||
| Prestige Brands, Inc. 6.375% 3/1/24 (a) | 671 | 700 | |
| Containers - 2.8% | |||
| Ard Securities Finance SARL 8.75% 1/31/23 pay-in-kind (a)(b) | 5,451 | 5,669 | |
| Ardagh Packaging Finance PLC/Ardagh MP Holdings U.S.A., Inc.: | |||
| 4.625% 5/15/23 (a) | 23,095 | 23,644 | |
| 6% 2/15/25 (a) | 31,069 | 32,622 | |
| Crown Americas LLC/Crown Americas Capital Corp. IV 4.5% 1/15/23 | 1,934 | 2,021 | |
| Crown Americas LLC/Crown Americas Capital Corp. V 4.25% 9/30/26 | 24,662 | 25,741 | |
| OI European Group BV 4% 3/15/23 (a) | 3,094 | 3,079 | |
| Owens-Brockway Glass Container, Inc.: | |||
| 5% 1/15/22 (a) | 6,060 | 6,257 | |
| 5.375% 1/15/25 (a) | 7,524 | 7,590 | |
| Reynolds Group Issuer, Inc./Reynolds Group Issuer LLC/Reynolds Group Issuer (Luxembourg) SA: | |||
| 5.125% 7/15/23 (a) | 9,149 | 9,386 | |
| 7% 7/15/24 (a) | 9,359 | 9,687 | |
| Silgan Holdings, Inc. 4.75% 3/15/25 | 1,062 | 1,086 | |
| Trivium Packaging Finance BV: | |||
| 5.5% 8/15/26 (a) | 15,341 | 16,070 | |
| 8.5% 8/15/27 (a) | 3,065 | 3,268 | |
| 146,120 | |||
| Diversified Financial Services - 6.3% | |||
| Chobani LLC/Finance Corp., Inc. 7.5% 4/15/25 (a) | 1,018 | 977 | |
| Crown Americas LLC/Crown Americas Capital Corp. IV 4.75% 2/1/26 | 14,220 | 14,931 | |
| FLY Leasing Ltd.: | |||
| 5.25% 10/15/24 | 27,627 | 28,456 | |
| 6.375% 10/15/21 | 9,325 | 9,482 | |
| Icahn Enterprises LP/Icahn Enterprises Finance Corp.: | |||
| 5.875% 2/1/22 | 4,171 | 4,207 | |
| 6.25% 2/1/22 | 19,908 | 20,381 | |
| 6.25% 5/15/26 | 11,621 | 12,318 | |
| 6.375% 12/15/25 | 19,248 | 20,210 | |
| 6.75% 2/1/24 | 10,182 | 10,615 | |
| MSCI, Inc.: | |||
| 4.75% 8/1/26 (a) | 1,552 | 1,626 | |
| 5.375% 5/15/27 (a) | 5,150 | 5,498 | |
| 5.75% 8/15/25 (a) | 3,216 | 3,373 | |
| Navient Corp.: | |||
| 5% 10/26/20 | 2,120 | 2,159 | |
| 5.5% 1/25/23 | 2,834 | 2,944 | |
| 5.875% 10/25/24 | 255 | 261 | |
| 6.125% 3/25/24 | 3,593 | 3,756 | |
| 6.5% 6/15/22 | 10,436 | 11,167 | |
| 6.625% 7/26/21 | 3,671 | 3,877 | |
| 6.75% 6/25/25 | 10,471 | 11,044 | |
| 6.75% 6/15/26 | 2,590 | 2,707 | |
| 7.25% 1/25/22 | 6,603 | 7,162 | |
| 7.25% 9/25/23 | 8,735 | 9,542 | |
| 8% 3/25/20 | 8,818 | 9,005 | |
| Park Aerospace Holdings Ltd.: | |||
| 4.5% 3/15/23 (a) | 4,621 | 4,854 | |
| 5.25% 8/15/22 (a) | 16,501 | 17,573 | |
| 5.5% 2/15/24 (a) | 18,619 | 20,470 | |
| Quicken Loans, Inc. 5.25% 1/15/28 (a) | 24,206 | 24,962 | |
| Radiate Holdco LLC/Radiate Financial Service Ltd.: | |||
| 6.625% 2/15/25 (a) | 18,601 | 18,787 | |
| 6.875% 2/15/23 (a) | 19,527 | 19,966 | |
| Springleaf Finance Corp.: | |||
| 6.875% 3/15/25 | 8,214 | 9,302 | |
| 7.125% 3/15/26 | 15,263 | 17,400 | |
| 329,012 | |||
| Diversified Media - 0.9% | |||
| MDC Partners, Inc. 6.5% 5/1/24 (a) | 14,205 | 13,584 | |
| Nielsen Co. SARL (Luxembourg) 5% 2/1/25 (a) | 15,772 | 15,693 | |
| Nielsen Finance LLC/Nielsen Finance Co. 5% 4/15/22 (a) | 19,531 | 19,629 | |
| 48,906 | |||
| Energy - 13.6% | |||
| Archrock Partners LP / Archrock Partners Finance Corp. 6.875% 4/1/27 (a) | 6,858 | 7,080 | |
| California Resources Corp. 8% 12/15/22 (a) | 41,050 | 11,905 | |
| Cheniere Corpus Christi Holdings LLC: | |||
| 5.875% 3/31/25 | 2,027 | 2,248 | |
| 7% 6/30/24 | 34,528 | 39,710 | |
| Cheniere Energy Partners LP: | |||
| 5.25% 10/1/25 | 53,308 | 55,174 | |
| 5.625% 10/1/26 | 6,657 | 7,031 | |
| Chesapeake Energy Corp.: | |||
| 8% 1/15/25 | 26,130 | 17,246 | |
| 8% 6/15/27 | 16,965 | 10,603 | |
| Citgo Holding, Inc. 9.25% 8/1/24 (a) | 5,208 | 5,436 | |
| Citgo Petroleum Corp. 6.25% 8/15/22 (a) | 19,057 | 19,248 | |
| Comstock Escrow Corp. 9.75% 8/15/26 | 19,678 | 15,546 | |
| Consolidated Energy Finance SA: | |||
| 3 month U.S. LIBOR + 3.750% 5.8685% 6/15/22 (a)(b)(c) | 8,576 | 8,512 | |
| 6.5% 5/15/26 (a) | 9,790 | 9,423 | |
| 6.875% 6/15/25 (a) | 2,295 | 2,226 | |
| Crestwood Midstream Partners LP/Crestwood Midstream Finance Corp.: | |||
| 5.75% 4/1/25 | 11,117 | 11,478 | |
| 6.25% 4/1/23 | 13,789 | 14,026 | |
| CVR Refining LLC/Coffeyville Finance, Inc. 6.5% 11/1/22 | 13,176 | 13,308 | |
| DCP Midstream Operating LP 5.375% 7/15/25 | 16,932 | 17,821 | |
| Denbury Resources, Inc.: | |||
| 7.75% 2/15/24 (a) | 24,563 | 18,054 | |
| 9% 5/15/21 (a) | 2,173 | 1,901 | |
| 9.25% 3/31/22 (a) | 17,284 | 14,173 | |
| EP Energy LLC/Everest Acquisition Finance, Inc. 7.75% 5/15/26 (a)(d) | 8,278 | 5,753 | |
| EQT Corp. 3.9% 10/1/27 | 24,454 | 21,576 | |
| Hess Infrastructure Partners LP 5.625% 2/15/26 (a) | 22,545 | 23,588 | |
| Hilcorp Energy I LP/Hilcorp Finance Co.: | |||
| 5% 12/1/24 (a) | 14,327 | 12,720 | |
| 5.75% 10/1/25 (a) | 5,635 | 5,029 | |
| Indigo Natural Resources LLC 6.875% 2/15/26 (a) | 857 | 780 | |
| Jonah Energy LLC 7.25% 10/15/25 (a) | 23,715 | 6,640 | |
| Magnolia Oil & Gas Operating LLC 6% 8/1/26 (a) | 3,588 | 3,588 | |
| MEG Energy Corp.: | |||
| 6.375% 1/30/23 (a) | 8,880 | 8,392 | |
| 7% 3/31/24 (a) | 14,494 | 13,614 | |
| Nabors Industries, Inc.: | |||
| 5.5% 1/15/23 | 1,270 | 1,073 | |
| 5.75% 2/1/25 | 11,381 | 8,482 | |
| Noble Holding International Ltd.: | |||
| 5.25% 3/15/42 | 4,122 | 1,566 | |
| 6.05% 3/1/41 | 4,073 | 1,426 | |
| 7.875% 2/1/26 (a) | 4,880 | 3,221 | |
| Parsley Energy LLC/Parsley: | |||
| 5.25% 8/15/25 (a) | 12,257 | 12,564 | |
| 5.375% 1/15/25 (a) | 6,104 | 6,284 | |
| 5.625% 10/15/27 (a) | 2,154 | 2,224 | |
| 6.25% 6/1/24 (a) | 906 | 943 | |
| PBF Holding Co. LLC/PBF Finance Corp.: | |||
| 7% 11/15/23 | 16,541 | 17,037 | |
| 7.25% 6/15/25 | 959 | 1,002 | |
| PBF Logistics LP/PBF Logistics Finance, Inc. 6.875% 5/15/23 | 4,650 | 4,766 | |
| Range Resources Corp.: | |||
| 4.875% 5/15/25 | 10,799 | 8,666 | |
| 5% 3/15/23 | 4,861 | 4,205 | |
| Rose Rock Midstream LP/Rose Rock Finance Corp. 5.625% 7/15/22 | 12,277 | 12,412 | |
| Sanchez Energy Corp. 7.25% 2/15/23 (a)(d) | 32,078 | 21,813 | |
| SemGroup Corp. 6.375% 3/15/25 | 25,410 | 26,331 | |
| Semgroup Corp. / Rose Rock Finance 5.625% 11/15/23 | 10,020 | 10,245 | |
| Southwestern Energy Co.: | |||
| 7.5% 4/1/26 | 9,071 | 7,961 | |
| 7.75% 10/1/27 | 6,173 | 5,309 | |
| Summit Midstream Holdings LLC 5.75% 4/15/25 | 33,036 | 25,603 | |
| Sunoco LP/Sunoco Finance Corp.: | |||
| 4.875% 1/15/23 | 6,398 | 6,566 | |
| 5.5% 2/15/26 | 4,592 | 4,747 | |
| Targa Resources Partners LP/Targa Resources Partners Finance Corp.: | |||
| 4.25% 11/15/23 | 5,987 | 6,015 | |
| 5.125% 2/1/25 | 460 | 472 | |
| 5.25% 5/1/23 | 17,324 | 17,389 | |
| 5.375% 2/1/27 | 460 | 471 | |
| 5.875% 4/15/26 | 15,924 | 16,622 | |
| 6.75% 3/15/24 | 3,167 | 3,285 | |
| TerraForm Power Operating LLC: | |||
| 4.25% 1/31/23 (a) | 7,171 | 7,386 | |
| 5% 1/31/28 (a) | 2,805 | 2,958 | |
| Tervita Escrow Corp. 7.625% 12/1/21 (a) | 6,210 | 6,132 | |
| U.S.A. Compression Partners LP: | |||
| 6.875% 4/1/26 | 11,701 | 11,818 | |
| 6.875% 9/1/27 (a) | 3,813 | 3,813 | |
| Valaris PLC: | |||
| 4.5% 10/1/24 | 4,264 | 2,175 | |
| 5.2% 3/15/25 | 2,296 | 1,194 | |
| 7.75% 2/1/26 | 13,271 | 6,967 | |
| Viper Energy Partners LP 5.375% 11/1/27 (a) | 13,363 | 13,597 | |
| Weatherford International Ltd.: | |||
| 5.95% 4/15/42 (d) | 443 | 133 | |
| 6.5% 8/1/36 (d) | 4,450 | 1,346 | |
| 7% 3/15/38 (d) | 14,847 | 4,454 | |
| 9.875% 2/15/24 (d) | 5,443 | 1,660 | |
| Weatherford International, Inc.: | |||
| 6.8% 6/15/37 (d) | 4,264 | 1,290 | |
| 9.875% 3/1/25 (d) | 21,396 | 6,633 | |
| 714,085 | |||
| Environmental - 0.4% | |||
| LBC Tank Terminals Holding Netherlands BV 6.875% 5/15/23 (a) | 21,248 | 21,584 | |
| Food/Beverage/Tobacco - 3.7% | |||
| C&S Group Enterprises LLC 5.375% 7/15/22 (a) | 15,147 | 15,185 | |
| Cott Holdings, Inc. 5.5% 4/1/25 (a) | 8,092 | 8,436 | |
| ESAL GmbH 6.25% 2/5/23 (a) | 5,009 | 5,106 | |
| JBS U.S.A. LLC/JBS U.S.A. Finance, Inc.: | |||
| 5.75% 6/15/25 (a) | 24,735 | 25,693 | |
| 5.875% 7/15/24 (a) | 10,985 | 11,328 | |
| 6.75% 2/15/28 (a) | 35,558 | 39,114 | |
| JBS U.S.A. Lux SA / JBS Food Co.: | |||
| 5.5% 1/15/30 (a) | 14,010 | 15,096 | |
| 6.5% 4/15/29 (a) | 21,269 | 23,662 | |
| Lamb Weston Holdings, Inc.: | |||
| 4.625% 11/1/24 (a) | 6,613 | 6,952 | |
| 4.875% 11/1/26 (a) | 1,537 | 1,616 | |
| Post Holdings, Inc.: | |||
| 5% 8/15/26 (a) | 8,003 | 8,324 | |
| 5.5% 3/1/25 (a) | 5,899 | 6,180 | |
| 5.75% 3/1/27 (a) | 5,155 | 5,488 | |
| U.S. Foods, Inc. 5.875% 6/15/24 (a) | 4,215 | 4,341 | |
| Vector Group Ltd. 6.125% 2/1/25 (a) | 19,644 | 18,858 | |
| 195,379 | |||
| Gaming - 6.0% | |||
| Boyd Gaming Corp.: | |||
| 6% 8/15/26 | 3,294 | 3,492 | |
| 6.375% 4/1/26 | 2,007 | 2,132 | |
| Caesars Resort Collection LLC 5.25% 10/15/25 (a) | 45,745 | 46,831 | |
| Eldorado Resorts, Inc.: | |||
| 6% 4/1/25 | 12,600 | 13,246 | |
| 6% 9/15/26 | 2,330 | 2,554 | |
| GLP Capital LP/GLP Financing II, Inc.: | |||
| 5.25% 6/1/25 | 12,203 | 13,381 | |
| 5.375% 4/15/26 | 999 | 1,099 | |
| Golden Entertainment, Inc. 7.625% 4/15/26 (a) | 25,220 | 26,513 | |
| MCE Finance Ltd. 4.875% 6/6/25 (a) | 7,170 | 7,327 | |
| MGM Growth Properties Operating Partnership LP: | |||
| 4.5% 9/1/26 | 22,885 | 24,315 | |
| 4.5% 1/15/28 | 1,429 | 1,497 | |
| 5.625% 5/1/24 | 12,713 | 14,000 | |
| 5.75% 2/1/27 (a) | 4,396 | 4,967 | |
| MGM Mirage, Inc. 5.75% 6/15/25 | 7,759 | 8,603 | |
| Penn National Gaming, Inc. 5.625% 1/15/27 (a) | 12,629 | 13,008 | |
| Scientific Games Corp.: | |||
| 5% 10/15/25 (a) | 12,639 | 13,018 | |
| 10% 12/1/22 | 9,822 | 10,104 | |
| Stars Group Holdings BV 7% 7/15/26 (a) | 29,757 | 32,100 | |
| Station Casinos LLC 5% 10/1/25 (a) | 1,640 | 1,663 | |
| Sugarhouse HSP Gaming Prop Mezz LP/Sugarhouse HSP Gaming Finance Corp. 5.875% 5/15/25 (a) | 12,732 | 12,605 | |
| Twin River Worldwide Holdings, Inc. 6.75% 6/1/27 (a) | 10,537 | 11,093 | |
| Wynn Las Vegas LLC/Wynn Las Vegas Capital Corp. 5.25% 5/15/27 (a) | 13,276 | 13,840 | |
| Wynn Macau Ltd.: | |||
| 4.875% 10/1/24 (a) | 21,553 | 21,661 | |
| 5.5% 10/1/27 (a) | 13,548 | 13,912 | |
| 312,961 | |||
| Healthcare - 9.1% | |||
| Catalent Pharma Solutions 4.875% 1/15/26 (a) | 2,448 | 2,528 | |
| Charles River Laboratories International, Inc.: | |||
| 4.25% 5/1/28 (a) | 1,503 | 1,531 | |
| 5.5% 4/1/26 (a) | 6,755 | 7,194 | |
| Community Health Systems, Inc.: | |||
| 6.25% 3/31/23 | 29,297 | 28,546 | |
| 8% 3/15/26 (a) | 51,306 | 50,152 | |
| 8.625% 1/15/24 (a) | 14,103 | 14,412 | |
| CTR Partnership LP/CareTrust Capital Corp. 5.25% 6/1/25 | 8,669 | 9,016 | |
| HCA Holdings, Inc.: | |||
| 4.5% 2/15/27 | 2,560 | 2,764 | |
| 5% 3/15/24 | 1,875 | 2,045 | |
| 5.25% 6/15/26 | 5,380 | 6,020 | |
| 5.375% 2/1/25 | 12,370 | 13,592 | |
| 5.375% 9/1/26 | 4,518 | 4,925 | |
| 5.875% 5/1/23 | 12,331 | 13,530 | |
| 6.25% 2/15/21 | 7,573 | 7,933 | |
| Hologic, Inc.: | |||
| 4.375% 10/15/25 (a) | 5,698 | 5,838 | |
| 4.625% 2/1/28 (a) | 259 | 271 | |
| IMS Health, Inc.: | |||
| 5% 10/15/26 (a) | 3,785 | 3,993 | |
| 5% 5/15/27 (a) | 13,648 | 14,467 | |
| MPH Acquisition Holdings LLC 7.125% 6/1/24 (a) | 19,781 | 18,446 | |
| MPT Operating Partnership LP/MPT Finance Corp.: | |||
| 5% 10/15/27 | 4,068 | 4,282 | |
| 5.25% 8/1/26 | 8,245 | 8,657 | |
| 5.5% 5/1/24 | 9,237 | 9,479 | |
| 6.375% 3/1/24 | 4,606 | 4,808 | |
| Service Corp. International 5.125% 6/1/29 | 7,078 | 7,538 | |
| Teleflex, Inc. 4.875% 6/1/26 | 11,052 | 11,587 | |
| Tenet Healthcare Corp.: | |||
| 4.625% 7/15/24 | 994 | 1,024 | |
| 5.125% 5/1/25 | 11,738 | 12,017 | |
| 6.25% 2/1/27 (a) | 7,729 | 8,164 | |
| 6.75% 6/15/23 | 19,086 | 20,231 | |
| 7% 8/1/25 | 11,645 | 12,023 | |
| 8.125% 4/1/22 | 52,490 | 56,818 | |
| Valeant Pharmaceuticals International, Inc.: | |||
| 5.5% 11/1/25 (a) | 12,649 | 13,218 | |
| 5.875% 5/15/23 (a) | 4,205 | 4,266 | |
| 6.125% 4/15/25 (a) | 22,023 | 22,863 | |
| 7% 3/15/24 (a) | 15,880 | 16,613 | |
| 8.5% 1/31/27 (a) | 4,269 | 4,803 | |
| 9% 12/15/25 (a) | 6,339 | 7,138 | |
| 9.25% 4/1/26 (a) | 10,250 | 11,596 | |
| Vizient, Inc. 6.25% 5/15/27 (a) | 1,190 | 1,283 | |
| Wellcare Health Plans, Inc.: | |||
| 5.25% 4/1/25 | 12,742 | 13,335 | |
| 5.375% 8/15/26 (a) | 16,100 | 17,126 | |
| 476,072 | |||
| Homebuilders/Real Estate - 1.0% | |||
| Alliant Holdings Intermediate LLC 6.75% 10/15/27 (a) | 16,510 | 17,172 | |
| Howard Hughes Corp. 5.375% 3/15/25 (a) | 20,858 | 21,666 | |
| Starwood Property Trust, Inc.: | |||
| 4.75% 3/15/25 | 10,069 | 10,456 | |
| 5% 12/15/21 | 4,592 | 4,753 | |
| 54,047 | |||
| Hotels - 0.8% | |||
| Hilton Domestic Operating Co., Inc. 5.125% 5/1/26 | 25,631 | 26,913 | |
| Hilton Escrow Issuer LLC 4.25% 9/1/24 | 11,034 | 11,227 | |
| Hilton Worldwide Finance LLC/Hilton Worldwide Finance Corp. 4.875% 4/1/27 | 573 | 606 | |
| Wyndham Hotels & Resorts, Inc. 5.375% 4/15/26 (a) | 1,797 | 1,896 | |
| 40,642 | |||
| Insurance - 0.5% | |||
| AmWINS Group, Inc. 7.75% 7/1/26 (a) | 13,153 | 14,139 | |
| USIS Merger Sub, Inc. 6.875% 5/1/25 (a) | 12,296 | 12,511 | |
| 26,650 | |||
| Leisure - 0.3% | |||
| Mattel, Inc. 6.75% 12/31/25 (a) | 15,992 | 16,732 | |
| Metals/Mining - 1.2% | |||
| First Quantum Minerals Ltd.: | |||
| 6.5% 3/1/24 (a) | 13,569 | 13,298 | |
| 7.25% 5/15/22 (a) | 2,784 | 2,805 | |
| 7.25% 4/1/23 (a) | 12,815 | 12,883 | |
| Freeport-McMoRan, Inc.: | |||
| 3.55% 3/1/22 | 5,593 | 5,656 | |
| 3.875% 3/15/23 | 10,764 | 10,925 | |
| Nufarm Australia Ltd. 5.75% 4/30/26 (a) | 18,583 | 18,676 | |
| 64,243 | |||
| Paper - 0.7% | |||
| Berry Global Escrow Corp. 4.875% 7/15/26 (a) | 10,529 | 11,069 | |
| Flex Acquisition Co., Inc.: | |||
| 6.875% 1/15/25 (a) | 17,561 | 16,463 | |
| 7.875% 7/15/26 (a) | 7,562 | 7,108 | |
| NewPage Corp. 11.375% 12/31/2014 (d)(e) | 30,078 | 0 | |
| 34,640 | |||
| Restaurants - 1.1% | |||
| 1011778 BC Unlimited Liability Co./New Red Finance, Inc.: | |||
| 4.25% 5/15/24 (a) | 12,673 | 13,006 | |
| 5% 10/15/25 (a) | 4,631 | 4,770 | |
| Golden Nugget, Inc. 6.75% 10/15/24 (a) | 22,557 | 23,236 | |
| KFC Holding Co./Pizza Hut Holding LLC 5% 6/1/24 (a) | 14,553 | 15,099 | |
| 56,111 | |||
| Services - 3.4% | |||
| ADT Corp. 4.875% 7/15/32 (a) | 1,591 | 1,377 | |
| APX Group, Inc.: | |||
| 7.625% 9/1/23 | 12,208 | 10,743 | |
| 7.875% 12/1/22 | 10,231 | 10,218 | |
| 8.75% 12/1/20 | 1,824 | 1,797 | |
| Aramark Services, Inc.: | |||
| 4.75% 6/1/26 | 12,385 | 12,710 | |
| 5% 4/1/25 (a) | 6,344 | 6,606 | |
| 5.125% 1/15/24 | 3,280 | 3,383 | |
| Avantor, Inc. 6% 10/1/24 (a) | 11,543 | 12,338 | |
| Brand Energy & Infrastructure Services, Inc. 8.5% 7/15/25 (a) | 12,463 | 12,089 | |
| CDK Global, Inc.: | |||
| 4.875% 6/1/27 | 700 | 738 | |
| 5.25% 5/15/29 (a) | 2,315 | 2,458 | |
| 5.875% 6/15/26 | 8,821 | 9,438 | |
| Corrections Corp. of America: | |||
| 4.125% 4/1/20 | 5,057 | 5,058 | |
| 4.625% 5/1/23 | 2,448 | 2,292 | |
| 5% 10/15/22 | 11,751 | 11,648 | |
| Frontdoor, Inc. 6.75% 8/15/26 (a) | 4,078 | 4,465 | |
| GEMS MENASA Cayman Ltd. 7.125% 7/31/26 (a) | 18,509 | 19,238 | |
| Laureate Education, Inc. 8.25% 5/1/25 (a) | 19,600 | 21,266 | |
| Prime Securities Services Borrower LLC/Prime Finance, Inc. 9.25% 5/15/23 (a) | 919 | 967 | |
| Tempo Acquisition LLC 6.75% 6/1/25 (a) | 26,747 | 27,516 | |
| The GEO Group, Inc.: | |||
| 5.875% 10/15/24 | 2,244 | 1,874 | |
| 6% 4/15/26 | 580 | 460 | |
| 178,679 | |||
| Super Retail - 0.2% | |||
| The William Carter Co. 5.625% 3/15/27 (a) | 7,749 | 8,262 | |
| Technology - 4.7% | |||
| Ascend Learning LLC: | |||
| 6.875% 8/1/25 (a) | 10,201 | 10,647 | |
| 6.875% 8/1/25 (a) | 1,712 | 1,791 | |
| Banff Merger Sub, Inc. 9.75% 9/1/26 (a) | 17,345 | 16,153 | |
| Camelot Finance SA 4.5% 11/1/26 (a) | 12,670 | 12,802 | |
| Ensemble S Merger Sub, Inc. 9% 9/30/23 (a) | 8,664 | 8,897 | |
| Fair Isaac Corp. 5.25% 5/15/26 (a) | 4,224 | 4,583 | |
| Gartner, Inc. 5.125% 4/1/25 (a) | 514 | 539 | |
| Micron Technology, Inc. 5.5% 2/1/25 | 720 | 741 | |
| Nuance Communications, Inc. 5.625% 12/15/26 | 14,955 | 15,872 | |
| Open Text Corp. 5.875% 6/1/26 (a) | 18,180 | 19,384 | |
| Qorvo, Inc. 5.5% 7/15/26 | 15,067 | 16,084 | |
| Rackspace Hosting, Inc. 8.625% 11/15/24 (a) | 17,189 | 15,728 | |
| Sensata Technologies BV 5% 10/1/25 (a) | 2,966 | 3,196 | |
| Sensata Technologies UK Financing Co. PLC 6.25% 2/15/26 (a) | 465 | 497 | |
| Solera LLC/Solera Finance, Inc. 10.5% 3/1/24 (a) | 40,042 | 41,894 | |
| SS&C Technologies, Inc. 5.5% 9/30/27 (a) | 17,621 | 18,799 | |
| Symantec Corp.: | |||
| 4.2% 9/15/20 | 3,148 | 3,188 | |
| 5% 4/15/25 (a) | 30,251 | 31,007 | |
| TTM Technologies, Inc. 5.625% 10/1/25 (a) | 26,531 | 26,796 | |
| 248,598 | |||
| Telecommunications - 10.0% | |||
| Altice Financing SA: | |||
| 6.625% 2/15/23 (a) | 9,360 | 9,615 | |
| 7.5% 5/15/26 (a) | 37,330 | 39,663 | |
| Altice Finco SA: | |||
| 7.625% 2/15/25 (a) | 19,610 | 20,100 | |
| 8.125% 1/15/24 (a) | 5,140 | 5,301 | |
| C&W Senior Financing Designated Activity Co.: | |||
| 6.875% 9/15/27 (a) | 42,092 | 44,302 | |
| 7.5% 10/15/26 (a) | 27,637 | 29,675 | |
| Citizens Utilities Co. 7.05% 10/1/46 | 22,473 | 10,113 | |
| Cogent Communications Group, Inc. 5.375% 3/1/22 (a) | 3,779 | 3,930 | |
| Intelsat Jackson Holdings SA 8.5% 10/15/24 (a) | 18,102 | 18,241 | |
| Level 3 Communications, Inc. 5.75% 12/1/22 | 1,645 | 1,649 | |
| Level 3 Financing, Inc.: | |||
| 5.125% 5/1/23 | 26,326 | 26,655 | |
| 5.375% 1/15/24 | 22,126 | 22,541 | |
| 5.375% 5/1/25 | 3,764 | 3,891 | |
| Millicom International Cellular SA: | |||
| 6% 3/15/25 (a) | 1,815 | 1,879 | |
| 6.625% 10/15/26 (a) | 34,393 | 37,359 | |
| Neptune Finco Corp.: | |||
| 6.625% 10/15/25 (a) | 23,208 | 24,717 | |
| 10.875% 10/15/25 (a) | 2,345 | 2,646 | |
| Qwest Corp. 6.75% 12/1/21 | 891 | 962 | |
| SFR Group SA: | |||
| 7.375% 5/1/26 (a) | 30,996 | 33,192 | |
| 8.125% 2/1/27 (a) | 16,423 | 18,209 | |
| Sprint Communications, Inc. 6% 11/15/22 | 31,289 | 33,088 | |
| Sprint Corp.: | |||
| 7.125% 6/15/24 | 14,710 | 15,960 | |
| 7.875% 9/15/23 | 36,405 | 40,182 | |
| T-Mobile U.S.A., Inc.: | |||
| 4.5% 2/1/26 | 1,493 | 1,540 | |
| 5.125% 4/15/25 | 1,473 | 1,531 | |
| 6% 4/15/24 | 10,368 | 10,757 | |
| 6.375% 3/1/25 | 1,116 | 1,158 | |
| Telecom Italia Capital SA: | |||
| 6% 9/30/34 | 4,978 | 5,314 | |
| 6.375% 11/15/33 | 2,795 | 3,081 | |
| Telecom Italia SpA 5.303% 5/30/24 (a) | 12,228 | 13,084 | |
| Telenet Finance Luxembourg Notes SARL 5.5% 3/1/28 (a) | 15,200 | 16,165 | |
| U.S. West Communications 7.25% 9/15/25 | 984 | 1,128 | |
| Zayo Group LLC/Zayo Capital, Inc.: | |||
| 5.75% 1/15/27 (a) | 7,289 | 7,408 | |
| 6.375% 5/15/25 | 17,671 | 18,166 | |
| 523,202 | |||
| Transportation Ex Air/Rail - 0.8% | |||
| Avolon Holdings Funding Ltd.: | |||
| 5.125% 10/1/23 (a) | 18,616 | 20,087 | |
| 5.25% 5/15/24 (a) | 4,895 | 5,338 | |
| 5.5% 1/15/23 (a) | 12,815 | 13,829 | |
| 39,254 | |||
| Utilities - 4.2% | |||
| Calpine Corp. 5.75% 1/15/25 | 10,471 | 10,746 | |
| Clearway Energy Operating LLC 5.75% 10/15/25 | 1,180 | 1,211 | |
| DCP Midstream Operating LP 5.125% 5/15/29 | 13,706 | 13,912 | |
| Dynegy, Inc. 5.875% 6/1/23 | 1,287 | 1,314 | |
| Global Partners LP/GLP Finance Corp.: | |||
| 7% 6/15/23 | 15,111 | 15,613 | |
| 7% 8/1/27 (a) | 11,357 | 11,813 | |
| InterGen NV 7% 6/30/23 (a) | 42,782 | 40,664 | |
| Nextera Energy Operating Partn: | |||
| 4.25% 9/15/24 (a) | 13,775 | 14,326 | |
| 4.5% 9/15/27 (a) | 357 | 364 | |
| NRG Energy, Inc.: | |||
| 5.25% 6/15/29 (a) | 10,490 | 11,251 | |
| 5.75% 1/15/28 | 4,166 | 4,510 | |
| 6.625% 1/15/27 | 1,757 | 1,904 | |
| 7.25% 5/15/26 | 979 | 1,072 | |
| NRG Yield Operating LLC 5% 9/15/26 | 3,515 | 3,515 | |
| NSG Holdings II LLC/NSG Holdings, Inc. 7.75% 12/15/25 (a) | 20,060 | 21,664 | |
| Talen Energy Supply LLC 10.5% 1/15/26 (a) | 18,401 | 15,825 | |
| The AES Corp.: | |||
| 4.5% 3/15/23 | 1,018 | 1,041 | |
| 4.875% 5/15/23 | 2,181 | 2,216 | |
| 5.125% 9/1/27 | 2,599 | 2,794 | |
| 6% 5/15/26 | 9,707 | 10,365 | |
| Vistra Operations Co. LLC: | |||
| 5% 7/31/27 (a) | 9,776 | 10,118 | |
| 5.5% 9/1/26 (a) | 23,678 | 25,021 | |
| 221,259 | |||
| TOTAL NONCONVERTIBLE BONDS | 4,604,503 | ||
| TOTAL CORPORATE BONDS | |||
| (Cost $4,578,445) | 4,631,945 | ||
| Shares | Value (000s) | ||
| Common Stocks - 0.4% | |||
| Automotive & Auto Parts - 0.0% | |||
| Motors Liquidation Co. GUC Trust (f) | 1,502 | 15 | |
| Energy - 0.0% | |||
| Forbes Energy Services Ltd. (f) | 47,062 | 14 | |
| Food & Drug Retail - 0.4% | |||
| Southeastern Grocers, Inc. (e)(f) | 559,052 | 19,662 | |
| Telecommunications - 0.0% | |||
| CUI Acquisition Corp. Class E (e)(f) | 1 | 24 | |
| TOTAL COMMON STOCKS | |||
| (Cost $20,154) | 19,715 | ||
| Convertible Preferred Stocks - 0.1% | |||
| Telecommunications - 0.1% | |||
| Crown Castle International Corp. Series A, 6.875% | |||
| (Cost $2,170) | 2,170 | 2,702 | |
| Principal Amount (000s) | Value (000s) | ||
| Bank Loan Obligations - 2.0% | |||
| Cable/Satellite TV - 0.4% | |||
| WideOpenWest Finance LLC Tranche B, term loan 3 month U.S. LIBOR + 3.250% 5.0543% 8/19/23 (b)(c) | 20,280 | 19,437 | |
| Energy - 0.6% | |||
| California Resources Corp.: | |||
| Tranche 1LN, term loan 3 month U.S. LIBOR + 10.375% 12.1746% 12/31/21 (b)(c) | 4,474 | 2,953 | |
| Tranche B, term loan 3 month U.S. LIBOR + 4.750% 6.5496% 12/31/22 (b)(c) | 6,941 | 5,938 | |
| Gavilan Resources LLC Tranche 2LN, term loan 3 month U.S. LIBOR + 6.000% 7.7859% 3/1/24 (b)(c) | 18,924 | 7,964 | |
| Sanchez Energy Corp. 1LN, term loan 3 month U.S. LIBOR + 8.000% 10% 5/11/20 (b)(c)(e)(g) | 14,414 | 13,693 | |
| TOTAL ENERGY | 30,548 | ||
| Gaming - 0.0% | |||
| Golden Entertainment, Inc. Tranche B, term loan 3 month U.S. LIBOR + 3.000% 4.81% 10/20/24 (b)(c) | 1,935 | 1,936 | |
| Insurance - 0.2% | |||
| HUB International Ltd. Tranche B, term loan 3 month U.S. LIBOR + 3.000% 4.9395% 4/25/25 (b)(c) | 10,817 | 10,572 | |
| Publishing/Printing - 0.0% | |||
| Springer Nature Deutschland Gm Tranche B16 1LN, term loan 3 month U.S. LIBOR + 3.500% 8/24/24 (c)(h) | 632 | 627 | |
| Restaurants - 0.1% | |||
| Burger King Worldwide, Inc. Tranche B, term loan 3 month U.S. LIBOR + 2.250% 4.0359% 2/17/24 (b)(c) | 3,897 | 3,900 | |
| Services - 0.3% | |||
| Almonde, Inc.: | |||
| Tranche 2LN, term loan 3 month U.S. LIBOR + 7.250% 9.4463% 6/13/25 (b)(c) | 85 | 79 | |
| Tranche B 1LN, term loan 3 month U.S. LIBOR + 3.500% 5.6963% 6/13/24 (b)(c) | 16,338 | 15,593 | |
| Brand Energy & Infrastructure Services, Inc. Tranche B, term loan 3 month U.S. LIBOR + 4.250% 6.2356% 6/21/24 (b)(c) | 2,165 | 2,100 | |
| TOTAL SERVICES | 17,772 | ||
| Telecommunications - 0.4% | |||
| Level 3 Financing, Inc. Tranche B, term loan 3 month U.S. LIBOR + 2.250% 4.0359% 2/22/24 (b)(c) | 1,570 | 1,571 | |
| Radiate Holdco LLC Tranche B, term loan 3 month U.S. LIBOR + 3.000% 4.7859% 2/1/24 (b)(c) | 20,257 | 20,034 | |
| TOTAL TELECOMMUNICATIONS | 21,605 | ||
| TOTAL BANK LOAN OBLIGATIONS | |||
| (Cost $111,529) | 106,397 | ||
| Preferred Securities - 2.5% | |||
| Banks & Thrifts - 1.9% | |||
| Bank of America Corp.: | |||
| 5.2% (b)(i) | 25,606 | 27,251 | |
| 5.875% (b)(i) | 1,278 | 1,415 | |
| 6.25% (b)(i) | 18,934 | 21,126 | |
| 6.5% (b)(i) | 622 | 706 | |
| Barclays PLC 7.875% (Reg. S) (b)(i) | 14,724 | 15,850 | |
| Royal Bank of Scotland Group PLC 7.5% (b)(i) | 10,241 | 10,500 | |
| Wells Fargo & Co. 5.9% (b)(i) | 20,648 | 22,763 | |
| TOTAL BANKS & THRIFTS | 99,611 | ||
| Diversified Financial Services - 0.5% | |||
| AerCap Holdings NV 5.875% 10/10/79 (b) | 26,096 | 27,297 | |
| Energy - 0.1% | |||
| MPLX LP 6.875% (b)(i) | 1,899 | 1,953 | |
| Summit Midstream Partners LP 9.5% (b)(i) | 5,208 | 3,156 | |
| TOTAL ENERGY | 5,109 | ||
| TOTAL PREFERRED SECURITIES | |||
| (Cost $127,789) | 132,017 | ||
| Shares | Value (000s) | ||
| Money Market Funds - 6.3% | |||
| Fidelity Cash Central Fund 1.83% (j) | |||
| (Cost $332,824) | 332,778,964 | 332,846 | |
| TOTAL INVESTMENT IN SECURITIES - 99.6% | |||
| (Cost $5,172,911) | 5,225,622 | ||
| NET OTHER ASSETS (LIABILITIES) - 0.4% | 18,881 | ||
| NET ASSETS - 100% | $5,244,503 |
Values shown as $0 in the Schedule of Investments may reflect amounts less than $500.
Legend
(a) Security exempt from registration under Rule 144A of the Securities Act of 1933. These securities may be resold in transactions exempt from registration, normally to qualified institutional buyers. At the end of the period, the value of these securities amounted to $2,862,678,000 or 54.6% of net assets.
(b) Coupon rates for floating and adjustable rate securities reflect the rates in effect at period end.
(c) Coupon is indexed to a floating interest rate which may be multiplied by a specified factor and/or subject to caps or floors.
(d) Non-income producing - Security is in default.
(e) Level 3 security
(f) Non-income producing
(g) Position or a portion of the position represents an unfunded loan commitment. At period end, the total principal amount and market value of unfunded commitments totaled $10,296,000 and $9,781,000, respectively.
(h) The coupon rate will be determined upon settlement of the loan after period end.
(i) Security is perpetual in nature with no stated maturity date.
(j) Affiliated fund that is generally available only to investment companies and other accounts managed by Fidelity Investments. The rate quoted is the annualized seven-day yield of the fund at period end. A complete unaudited listing of the fund's holdings as of its most recent quarter end is available upon request. In addition, each Fidelity Central Fund's financial statements are available on the SEC's website or upon request.
Affiliated Central Funds
Information regarding fiscal year to date income earned by the Fund from investments in Fidelity Central Funds is as follows:
| Fund | Income earned |
| (Amounts in thousands) | |
| Fidelity Cash Central Fund | $2,499 |
| Total | $2,499 |
Amounts in the income column in the above table include any capital gain distributions from underlying funds, which are presented in the corresponding line-item in the Statement of Operations, if applicable.
Investment Valuation
The following is a summary of the inputs used, as of October 31, 2019, involving the Fund's assets and liabilities carried at fair value. The inputs or methodology used for valuing securities may not be an indication of the risk associated with investing in those securities. For more information on valuation inputs, and their aggregation into the levels used below, please refer to the Investment Valuation section in the accompanying Notes to Financial Statements.
| Valuation Inputs at Reporting Date: | ||||
| Description | Total | Level 1 | Level 2 | Level 3 |
| (Amounts in thousands) | ||||
| Investments in Securities: | ||||
| Equities: | ||||
| Communication Services | $24 | $-- | $-- | $24 |
| Consumer Staples | 19,662 | -- | -- | 19,662 |
| Energy | 14 | 14 | -- | -- |
| Financials | 15 | 15 | -- | -- |
| Real Estate | 2,702 | -- | 2,702 | -- |
| Corporate Bonds | 4,631,945 | -- | 4,631,945 | -- |
| Bank Loan Obligations | 106,397 | -- | 92,704 | 13,693 |
| Preferred Securities | 132,017 | -- | 132,017 | -- |
| Money Market Funds | 332,846 | 332,846 | -- | -- |
| Total Investments in Securities: | $5,225,622 | $332,875 | $4,859,368 | $33,379 |
Other Information
Distribution of investments by country or territory of incorporation, as a percentage of Total Net Assets, is as follows (Unaudited):
| United States of America | 75.9% |
| Canada | 4.6% |
| Netherlands | 4.3% |
| Luxembourg | 4.2% |
| Multi-National | 3.2% |
| Cayman Islands | 2.9% |
| Ireland | 1.4% |
| France | 1.0% |
| Others (Individually Less Than 1%) | 2.5% |
| 100.0% |
See accompanying notes which are an integral part of the financial statements.
Financial Statements
Statement of Assets and Liabilities
| Amounts in thousands (except per-share amounts) | October 31, 2019 (Unaudited) | |
| Assets | ||
| Investment in securities, at value — See accompanying schedule: Unaffiliated issuers (cost $4,840,087) | $4,892,776 | |
| Fidelity Central Funds (cost $332,824) | 332,846 | |
| Total Investment in Securities (cost $5,172,911) | $5,225,622 | |
| Cash | 122 | |
| Receivable for investments sold | ||
| Regular delivery | 300 | |
| Delayed delivery | 14 | |
| Receivable for fund shares sold | 4,572 | |
| Dividends receivable | 38 | |
| Interest receivable | 71,938 | |
| Distributions receivable from Fidelity Central Funds | 499 | |
| Prepaid expenses | 9 | |
| Total assets | 5,303,114 | |
| Liabilities | ||
| Payable for investments purchased | $47,687 | |
| Payable for fund shares redeemed | 3,299 | |
| Distributions payable | 4,424 | |
| Accrued management fee | 2,448 | |
| Distribution and service plan fees payable | 85 | |
| Other affiliated payables | 604 | |
| Other payables and accrued expenses | 64 | |
| Total liabilities | 58,611 | |
| Net Assets | $5,244,503 | |
| Net Assets consist of: | ||
| Paid in capital | $5,416,576 | |
| Total accumulated earnings (loss) | (172,073) | |
| Net Assets | $5,244,503 | |
| Net Asset Value and Maximum Offering Price | ||
| Class A: | ||
| Net Asset Value and redemption price per share ($170,346 ÷ 19,249 shares)(a) | $8.85 | |
| Maximum offering price per share (100/96.00 of $8.85) | $9.22 | |
| Class M: | ||
| Net Asset Value and redemption price per share ($52,920 ÷ 5,980 shares)(a) | $8.85 | |
| Maximum offering price per share (100/96.00 of $8.85) | $9.22 | |
| Class C: | ||
| Net Asset Value and offering price per share ($45,976 ÷ 5,193 shares)(a) | $8.85 | |
| Fidelity High Income Fund: | ||
| Net Asset Value, offering price and redemption price per share ($4,393,393 ÷ 496,405 shares) | $8.85 | |
| Class I: | ||
| Net Asset Value, offering price and redemption price per share ($521,033 ÷ 58,879 shares) | $8.85 | |
| Class Z: | ||
| Net Asset Value, offering price and redemption price per share ($60,835 ÷ 6,875 shares) | $8.85 |
(a) Redemption price per share is equal to net asset value less any applicable contingent deferred sales charge.
See accompanying notes which are an integral part of the financial statements.
Statement of Operations
| Amounts in thousands | Six months ended October 31, 2019 (Unaudited) | |
| Investment Income | ||
| Dividends | $3,943 | |
| Interest | 150,592 | |
| Income from Fidelity Central Funds | 2,499 | |
| Total income | 157,034 | |
| Expenses | ||
| Management fee | $14,402 | |
| Transfer agent fees | 3,015 | |
| Distribution and service plan fees | 520 | |
| Accounting fees | 590 | |
| Custodian fees and expenses | 21 | |
| Independent trustees' fees and expenses | 15 | |
| Registration fees | 90 | |
| Audit | 47 | |
| Legal | 19 | |
| Miscellaneous | 23 | |
| Total expenses before reductions | 18,742 | |
| Expense reductions | (21) | |
| Total expenses after reductions | 18,721 | |
| Net investment income (loss) | 138,313 | |
| Realized and Unrealized Gain (Loss) | ||
| Net realized gain (loss) on: | ||
| Investment securities: | ||
| Unaffiliated issuers | 12,350 | |
| Redemptions in-kind with affiliated entities | 4,389 | |
| Total net realized gain (loss) | 16,739 | |
| Change in net unrealized appreciation (depreciation) on: | ||
| Investment securities: | ||
| Unaffiliated issuers | (10,532) | |
| Fidelity Central Funds | 1 | |
| Total change in net unrealized appreciation (depreciation) | (10,531) | |
| Net gain (loss) | 6,208 | |
| Net increase (decrease) in net assets resulting from operations | $144,521 |
See accompanying notes which are an integral part of the financial statements.
Statement of Changes in Net Assets
| Amounts in thousands | Six months ended October 31, 2019 (Unaudited) | Year ended April 30, 2019 |
| Increase (Decrease) in Net Assets | ||
| Operations | ||
| Net investment income (loss) | $138,313 | $256,659 |
| Net realized gain (loss) | 16,739 | (105,222) |
| Change in net unrealized appreciation (depreciation) | (10,531) | 124,490 |
| Net increase (decrease) in net assets resulting from operations | 144,521 | 275,927 |
| Distributions to shareholders | (131,171) | (256,881) |
| Share transactions - net increase (decrease) | 107,361 | 780,403 |
| Total increase (decrease) in net assets | 120,711 | 799,449 |
| Net Assets | ||
| Beginning of period | 5,123,792 | 4,324,343 |
| End of period | $5,244,503 | $5,123,792 |
See accompanying notes which are an integral part of the financial statements.
Financial Highlights
Fidelity High Income Fund Class A
| Six months ended (Unaudited) October 31, | Years endedApril 30, | |
| 2019 | 2019 A | |
| Selected Per–Share Data | ||
| Net asset value, beginning of period | $8.83 | $8.56 |
| Income from Investment Operations | ||
| Net investment income (loss)B | .223 | .192 |
| Net realized and unrealized gain (loss) | .008 | .286 |
| Total from investment operations | .231 | .478 |
| Distributions from net investment income | (.211) | (.208) |
| Distributions from net realized gain | – | – |
| Total distributions | (.211) | (.208) |
| Net asset value, end of period | $8.85 | $8.83 |
| Total ReturnC,D,E | 2.64% | 5.68% |
| Ratios to Average Net AssetsF,G | ||
| Expenses before reductions | .98%H | .99%H |
| Expenses net of fee waivers, if any | .98%H | .99%H |
| Expenses net of all reductions | .98%H | .99%H |
| Net investment income (loss) | 5.02%H | 5.60%H |
| Supplemental Data | ||
| Net assets, end of period (in millions) | $170 | $170 |
| Portfolio turnover rateI | 26%H,J | 62%K |
A For the period December 4, 2018 (commencement of sale of shares) to April 30, 2019.
B Calculated based on average shares outstanding during the period.
C Total returns for periods of less than one year are not annualized.
D Total returns would have been lower if certain expenses had not been reduced during the applicable periods shown.
E Total returns do not include the effect of the sales charges.
F Fees and expenses of any underlying Fidelity Central Funds are not included in the Fund's expense ratio. The Fund indirectly bears its proportionate share of the expenses of any underlying Fidelity Central Funds.
G Expense ratios reflect operating expenses of the class. Expenses before reductions do not reflect amounts reimbursed by the investment adviser or reductions from brokerage service arrangements or reductions from other expense offset arrangements and do not represent the amount paid by the class during periods when reimbursements or reductions occur. Expense ratios before reductions for start-up periods may not be representative of longer-term operating periods. Expenses net of fee waivers reflect expenses after reimbursement by the investment adviser but prior to reductions from brokerage service arrangements or other expense offset arrangements. Expenses net of all reductions represent the net expenses paid by the class.
H Annualized
I Amount does not include the portfolio activity of any underlying Fidelity Central Funds.
J Portfolio turnover rate excludes securities received or delivered in-kind.
K The portfolio turnover rate does not include the assets acquired in the merger.
See accompanying notes which are an integral part of the financial statements.
Fidelity High Income Fund Class M
| Six months ended (Unaudited) October 31, | Years endedApril 30, | |
| 2019 | 2019 A | |
| Selected Per–Share Data | ||
| Net asset value, beginning of period | $8.83 | $8.56 |
| Income from Investment Operations | ||
| Net investment income (loss)B | .222 | .191 |
| Net realized and unrealized gain (loss) | .008 | .286 |
| Total from investment operations | .230 | .477 |
| Distributions from net investment income | (.210) | (.207) |
| Distributions from net realized gain | – | – |
| Total distributions | (.210) | (.207) |
| Net asset value, end of period | $8.85 | $8.83 |
| Total ReturnC,D,E | 2.64% | 5.68% |
| Ratios to Average Net AssetsF,G | ||
| Expenses before reductions | .99%H | 1.01%H |
| Expenses net of fee waivers, if any | .99%H | 1.01%H |
| Expenses net of all reductions | .99%H | 1.01%H |
| Net investment income (loss) | 5.01%H | 5.59%H |
| Supplemental Data | ||
| Net assets, end of period (in millions) | $53 | $50 |
| Portfolio turnover rateI | 26%H,J | 62%K |
A For the period December 4, 2018 (commencement of sale of shares) to April 30, 2019.
B Calculated based on average shares outstanding during the period.
C Total returns for periods of less than one year are not annualized.
D Total returns would have been lower if certain expenses had not been reduced during the applicable periods shown.
E Total returns do not include the effect of the sales charges.
F Fees and expenses of any underlying Fidelity Central Funds are not included in the Fund's expense ratio. The Fund indirectly bears its proportionate share of the expenses of any underlying Fidelity Central Funds.
G Expense ratios reflect operating expenses of the class. Expenses before reductions do not reflect amounts reimbursed by the investment adviser or reductions from brokerage service arrangements or reductions from other expense offset arrangements and do not represent the amount paid by the class during periods when reimbursements or reductions occur. Expense ratios before reductions for start-up periods may not be representative of longer-term operating periods. Expenses net of fee waivers reflect expenses after reimbursement by the investment adviser but prior to reductions from brokerage service arrangements or other expense offset arrangements. Expenses net of all reductions represent the net expenses paid by the class.
H Annualized
I Amount does not include the portfolio activity of any underlying Fidelity Central Funds.
J Portfolio turnover rate excludes securities received or delivered in-kind.
K The portfolio turnover rate does not include the assets acquired in the merger.
See accompanying notes which are an integral part of the financial statements.
Fidelity High Income Fund Class C
| Six months ended (Unaudited) October 31, | Years endedApril 30, | |
| 2019 | 2019 A | |
| Selected Per–Share Data | ||
| Net asset value, beginning of period | $8.83 | $8.56 |
| Income from Investment Operations | ||
| Net investment income (loss)B | .189 | .166 |
| Net realized and unrealized gain (loss) | .008 | .285 |
| Total from investment operations | .197 | .451 |
| Distributions from net investment income | (.177) | (.181) |
| Distributions from net realized gain | – | – |
| Total distributions | (.177) | (.181) |
| Net asset value, end of period | $8.85 | $8.83 |
| Total ReturnC,D,E | 2.25% | 5.36% |
| Ratios to Average Net AssetsF,G | ||
| Expenses before reductions | 1.74%H | 1.77%H |
| Expenses net of fee waivers, if any | 1.74%H | 1.77%H |
| Expenses net of all reductions | 1.74%H | 1.77%H |
| Net investment income (loss) | 4.25%H | 4.84%H |
| Supplemental Data | ||
| Net assets, end of period (in millions) | $46 | $52 |
| Portfolio turnover rateI | 26%H,J | 62%K |
A For the period December 4, 2018 (commencement of sale of shares) to April 30, 2019.
B Calculated based on average shares outstanding during the period.
C Total returns for periods of less than one year are not annualized.
D Total returns would have been lower if certain expenses had not been reduced during the applicable periods shown.
E Total returns do not include the effect of the contingent deferred sales charge.
F Fees and expenses of any underlying Fidelity Central Funds are not included in the Fund's expense ratio. The Fund indirectly bears its proportionate share of the expenses of any underlying Fidelity Central Funds.
G Expense ratios reflect operating expenses of the class. Expenses before reductions do not reflect amounts reimbursed by the investment adviser or reductions from brokerage service arrangements or reductions from other expense offset arrangements and do not represent the amount paid by the class during periods when reimbursements or reductions occur. Expense ratios before reductions for start-up periods may not be representative of longer-term operating periods. Expenses net of fee waivers reflect expenses after reimbursement by the investment adviser but prior to reductions from brokerage service arrangements or other expense offset arrangements. Expenses net of all reductions represent the net expenses paid by the class.
H Annualized
I Amount does not include the portfolio activity of any underlying Fidelity Central Funds.
J Portfolio turnover rate excludes securities received or delivered in-kind.
K The portfolio turnover rate does not include the assets acquired in the merger.
See accompanying notes which are an integral part of the financial statements.
Fidelity High Income Fund
| Six months ended (Unaudited) October 31, | Years endedApril 30, | |||||
| 2019 | 2019 | 2018 | 2017 | 2016 | 2015 | |
| Selected Per–Share Data | ||||||
| Net asset value, beginning of period | $8.83 | $8.83 | $8.94 | $8.31 | $9.04 | $9.45 |
| Income from Investment Operations | ||||||
| Net investment income (loss)A | .236 | .493 | .513 | .501 | .503 | .495 |
| Net realized and unrealized gain (loss) | .008 | –B | (.137) | .597 | (.741) | (.291) |
| Total from investment operations | .244 | .493 | .376 | 1.098 | (.238) | .204 |
| Distributions from net investment income | (.224) | (.493) | (.486) | (.469) | (.493) | (.486) |
| Distributions from net realized gain | – | – | – | – | – | (.129) |
| Total distributions | (.224) | (.493) | (.486) | (.469) | (.493) | (.615) |
| Redemption fees added to paid in capitalA | – | – | –B | .001 | .001 | .001 |
| Net asset value, end of period | $8.85 | $8.83 | $8.83 | $8.94 | $8.31 | $9.04 |
| Total ReturnC,D | 2.79% | 5.83% | 4.27% | 13.56% | (2.47)% | 2.29% |
| Ratios to Average Net AssetsE,F | ||||||
| Expenses before reductions | .69%G | .70% | .70% | .72% | .73% | .72% |
| Expenses net of fee waivers, if any | .69%G | .70% | .70% | .72% | .73% | .72% |
| Expenses net of all reductions | .69%G | .70% | .70% | .72% | .73% | .72% |
| Net investment income (loss) | 5.31%G | 5.66% | 5.73% | 5.81% | 6.00% | 5.38% |
| Supplemental Data | ||||||
| Net assets, end of period (in millions) | $4,393 | $4,392 | $4,324 | $4,492 | $4,434 | $5,347 |
| Portfolio turnover rateH | 26%G,I | 62%J | 51% | 52% | 33% | 37% |
A Calculated based on average shares outstanding during the period.
B Amount represents less than $.0005 per share.
C Total returns for periods of less than one year are not annualized.
D Total returns would have been lower if certain expenses had not been reduced during the applicable periods shown.
E Fees and expenses of any underlying Fidelity Central Funds are not included in the Fund's expense ratio. The Fund indirectly bears its proportionate share of the expenses of any underlying Fidelity Central Funds.
F Expense ratios reflect operating expenses of the class. Expenses before reductions do not reflect amounts reimbursed by the investment adviser or reductions from brokerage service arrangements or reductions from other expense offset arrangements and do not represent the amount paid by the class during periods when reimbursements or reductions occur. Expenses net of fee waivers reflect expenses after reimbursement by the investment adviser but prior to reductions from brokerage service arrangements or other expense offset arrangements. Expenses net of all reductions represent the net expenses paid by the class.
G Annualized
H Amount does not include the portfolio activity of any underlying Fidelity Central Funds.
I Portfolio turnover rate excludes securities received or delivered in-kind.
J The portfolio turnover rate does not include the assets acquired in the merger.
See accompanying notes which are an integral part of the financial statements.
Fidelity High Income Fund Class I
| Six months ended (Unaudited) October 31, | Years endedApril 30, | |
| 2019 | 2019 A | |
| Selected Per–Share Data | ||
| Net asset value, beginning of period | $8.83 | $8.56 |
| Income from Investment Operations | ||
| Net investment income (loss)B | .233 | .199 |
| Net realized and unrealized gain (loss) | .008 | .286 |
| Total from investment operations | .241 | .485 |
| Distributions from net investment income | (.221) | (.215) |
| Distributions from net realized gain | – | – |
| Total distributions | (.221) | (.215) |
| Net asset value, end of period | $8.85 | $8.83 |
| Total ReturnC,D | 2.76% | 5.77% |
| Ratios to Average Net AssetsE,F | ||
| Expenses before reductions | .74%G | .78%G |
| Expenses net of fee waivers, if any | .74%G | .78%G |
| Expenses net of all reductions | .74%G | .78%G |
| Net investment income (loss) | 5.26%G | 5.81%G |
| Supplemental Data | ||
| Net assets, end of period (in millions) | $521 | $448 |
| Portfolio turnover rateH | 26%G,I | 62%J |
A For the period December 4, 2018 (commencement of sale of shares) to April 30, 2019.
B Calculated based on average shares outstanding during the period.
C Total returns for periods of less than one year are not annualized.
D Total returns would have been lower if certain expenses had not been reduced during the applicable periods shown.
E Fees and expenses of any underlying Fidelity Central Funds are not included in the Fund's expense ratio. The Fund indirectly bears its proportionate share of the expenses of any underlying Fidelity Central Funds.
F Expense ratios reflect operating expenses of the class. Expenses before reductions do not reflect amounts reimbursed by the investment adviser or reductions from brokerage service arrangements or reductions from other expense offset arrangements and do not represent the amount paid by the class during periods when reimbursements or reductions occur. Expense ratios before reductions for start-up periods may not be representative of longer-term operating periods. Expenses net of fee waivers reflect expenses after reimbursement by the investment adviser but prior to reductions from brokerage service arrangements or other expense offset arrangements. Expenses net of all reductions represent the net expenses paid by the class.
G Annualized
H Amount does not include the portfolio activity of any underlying Fidelity Central Funds.
I Portfolio turnover rate excludes securities received or delivered in-kind.
J The portfolio turnover rate does not include the assets acquired in the merger.
See accompanying notes which are an integral part of the financial statements.
Fidelity High Income Fund Class Z
| Six months ended (Unaudited) October 31, | Years endedApril 30, | |
| 2019 | 2019 A | |
| Selected Per–Share Data | ||
| Net asset value, beginning of period | $8.83 | $8.56 |
| Income from Investment Operations | ||
| Net investment income (loss)B | .233 | .201 |
| Net realized and unrealized gain (loss) | .013 | .289 |
| Total from investment operations | .246 | .490 |
| Distributions from net investment income | (.226) | (.220) |
| Distributions from net realized gain | – | – |
| Total distributions | (.226) | (.220) |
| Net asset value, end of period | $8.85 | $8.83 |
| Total ReturnC,D | 2.82% | 5.83% |
| Ratios to Average Net AssetsE,F | ||
| Expenses before reductions | .63%G | .64%G |
| Expenses net of fee waivers, if any | .63%G | .64%G |
| Expenses net of all reductions | .63%G | .63%G |
| Net investment income (loss) | 5.37%G | 5.85%G |
| Supplemental Data | ||
| Net assets, end of period (in millions) | $61 | $13 |
| Portfolio turnover rateH | 26%G,I | 62%J |
A For the period December 4, 2018 (commencement of sale of shares) to April 30, 2019.
B Calculated based on average shares outstanding during the period.
C Total returns for periods of less than one year are not annualized.
D Total returns would have been lower if certain expenses had not been reduced during the applicable periods shown.
E Fees and expenses of any underlying Fidelity Central Funds are not included in the Fund's expense ratio. The Fund indirectly bears its proportionate share of the expenses of any underlying Fidelity Central Funds.
F Expense ratios reflect operating expenses of the class. Expenses before reductions do not reflect amounts reimbursed by the investment adviser or reductions from brokerage service arrangements or reductions from other expense offset arrangements and do not represent the amount paid by the class during periods when reimbursements or reductions occur. Expense ratios before reductions for start-up periods may not be representative of longer-term operating periods. Expenses net of fee waivers reflect expenses after reimbursement by the investment adviser but prior to reductions from brokerage service arrangements or other expense offset arrangements. Expenses net of all reductions represent the net expenses paid by the class.
G Annualized
H Amount does not include the portfolio activity of any underlying Fidelity Central Funds.
I Portfolio turnover rate excludes securities received or delivered in-kind.
J The portfolio turnover rate does not include the assets acquired in the merger.
See accompanying notes which are an integral part of the financial statements.
Notes to Financial Statements (Unaudited)
For the period ended October 31, 2019
(Amounts in thousands except percentages)
1. Organization.
Fidelity High Income Fund (the Fund) is a fund of Fidelity Summer Street Trust (the Trust) and is authorized to issue an unlimited number of shares. The Trust is registered under the Investment Company Act of 1940, as amended (the 1940 Act), as an open-end management investment company organized as a Massachusetts business trust. The Fund commenced sale of Class A, Class M, Class C, Class I and Class Z shares on December 4, 2018. The Fund offers Class A, Class M, Class C, Fidelity High Income Fund, Class I and Class Z shares, each of which has equal rights as to assets and voting privileges. Each class has exclusive voting rights with respect to matters that affect that class. Effective March 1, 2019, Class C shares will automatically convert to Class A shares after a holding period of ten years from the initial date of purchase, with certain exceptions.
2. Investments in Fidelity Central Funds.
The Fund invests in Fidelity Central Funds, which are open-end investment companies generally available only to other investment companies and accounts managed by the investment adviser and its affiliates. The Fund's Schedule of Investments lists each of the Fidelity Central Funds held as of period end, if any, as an investment of the Fund, but does not include the underlying holdings of each Fidelity Central Fund. As an Investing Fund, the Fund indirectly bears its proportionate share of the expenses of the underlying Fidelity Central Funds.
The Money Market Central Funds seek preservation of capital and current income and are managed by Fidelity Investments Money Management, Inc. (FIMM), an affiliate of the investment adviser. Annualized expenses of the Money Market Central Funds as of their most recent shareholder report date ranged from less than .005% to .01%.
A complete unaudited list of holdings for each Fidelity Central Fund is available upon request or at the Securities and Exchange Commission (the SEC) website at www.sec.gov. In addition, the financial statements of the Fidelity Central Funds are available on the SEC website or upon request.
3. Significant Accounting Policies.
The Fund is an investment company and applies the accounting and reporting guidance of the Financial Accounting Standards Board (FASB) Accounting Standards Codification Topic 946 Financial Services – Investments Companies. The financial statements have been prepared in conformity with accounting principles generally accepted in the United States of America (GAAP), which require management to make certain estimates and assumptions at the date of the financial statements. Actual results could differ from those estimates. Subsequent events, if any, through the date that the financial statements were issued have been evaluated in the preparation of the financial statements. The following summarizes the significant accounting policies of the Fund:
Investment Valuation. Investments are valued as of 4:00 p.m. Eastern time on the last calendar day of the period. The Board of Trustees (the Board) has delegated the day to day responsibility for the valuation of the Fund's investments to the Fair Value Committee (the Committee) established by the Fund's investment adviser. In accordance with valuation policies and procedures approved by the Board, the Fund attempts to obtain prices from one or more third party pricing vendors or brokers to value its investments. When current market prices, quotations or currency exchange rates are not readily available or reliable, investments will be fair valued in good faith by the Committee, in accordance with procedures adopted by the Board. Factors used in determining fair value vary by investment type and may include market or investment specific events, changes in interest rates and credit quality. The frequency with which these procedures are used cannot be predicted and they may be utilized to a significant extent. The Committee oversees the Fund's valuation policies and procedures and reports to the Board on the Committee's activities and fair value determinations. The Board monitors the appropriateness of the procedures used in valuing theFund's investments and ratifies the fair value determinations of the Committee.
The Fund categorizes the inputs to valuation techniques used to value its investments into a disclosure hierarchy consisting of three levels as shown below:
- Level 1 – quoted prices in active markets for identical investments
- Level 2 – other significant observable inputs (including quoted prices for similar investments, interest rates, prepayment speeds, etc.)
- Level 3 – unobservable inputs (including the Fund's own assumptions based on the best information available)
Valuation techniques used to value the Fund's investments by major category are as follows:
Debt securities, including restricted securities, are valued based on evaluated prices received from third party pricing vendors or from brokers who make markets in such securities. Corporate bonds, bank loan obligations and preferred securities are valued by pricing vendors who utilize matrix pricing which considers yield or price of bonds of comparable quality, coupon, maturity and type or by broker-supplied prices. When independent prices are unavailable or unreliable, debt securities may be valued utilizing pricing methodologies which consider similar factors that would be used by third party pricing vendors. Debt securities are generally categorized as Level 2 in the hierarchy but may be Level 3 depending on the circumstances. The Fund invests a significant portion of its assets in below investment grade securities. The value of these securities can be more volatile due to changes in the credit quality of the issuer and is sensitive to changes in economic, market and regulatory conditions.
Equity securities, including restricted securities, for which market quotations are readily available, are valued at the last reported sale price or official closing price as reported by a third party pricing vendor on the primary market or exchange on which they are traded and are categorized as Level 1 in the hierarchy. In the event there were no sales during the day or closing prices are not available, securities are valued at the last quoted bid price or may be valued using the last available price and are generally categorized as Level 2 in the hierarchy. For foreign equity securities, when market or security specific events arise, comparisons to the valuation of American Depositary Receipts (ADRs), futures contracts, Exchange-Traded Funds (ETFs) and certain indexes as well as quoted prices for similar securities may be used and would be categorized as Level 2 in the hierarchy. For equity securities, including restricted securities, where observable inputs are limited, assumptions about market activity and risk are used and these securities may be categorized as Level 3 in the hierarchy.
Investments in open-end mutual funds, including the Fidelity Central Funds, are valued at their closing net asset value (NAV) each business day and are categorized as Level 1 in the hierarchy.
Changes in valuation techniques may result in transfers in or out of an assigned level within the disclosure hierarchy. The aggregate value of investments by input level as of October 31, 2019 is included at the end of the Fund's Schedule of Investments.
Investment Transactions and Income. For financial reporting purposes, the Fund's investment holdings and NAV include trades executed through the end of the last business day of the period. The NAV per share for processing shareholder transactions is calculated as of the close of business of the New York Stock Exchange (NYSE), normally 4:00 p.m. Eastern time and includes trades executed through the end of the prior business day. Gains and losses on securities sold are determined on the basis of identified cost and include proceeds received from litigation. Dividend income is recorded on the ex-dividend date, except for certain dividends from foreign securities where the ex-dividend date may have passed, which are recorded as soon as the Fund is informed of the ex-dividend date. Non-cash dividends included in dividend income, if any, are recorded at the fair market value of the securities received. Income and capital gain distributions from Fidelity Central Funds, if any, are recorded on the ex-dividend date. Certain distributions received by the Fund represent a return of capital or capital gain. The Fund determines the components of these distributions subsequent to the ex-dividend date, based upon receipt of tax filings or other correspondence relating to the underlying investment. These distributions are recorded as a reduction of cost of investments and/or as a realized gain. Interest income is accrued as earned and includes coupon interest and amortization of premium and accretion of discount on debt securities as applicable. Paid in Kind (PIK) income is recorded at the fair market value of the securities received. Debt obligations may be placed on non-accrual status and related interest income may be reduced by ceasing current accruals and writing off interest receivables when the collection of all or a portion of interest has become doubtful based on consistently applied procedures. A debt obligation is removed from non-accrual status when the issuer resumes interest payments or when collectability of interest is reasonably assured.
Class Allocations and Expenses. Investment income, realized and unrealized capital gains and losses, common expenses of the Fund, and certain fund-level expense reductions, if any, are allocated daily on a pro-rata basis to each class based on the relative net assets of each class to the total net assets of the Fund. Each class differs with respect to transfer agent and distribution and service plan fees incurred. Certain expense reductions may also differ by class. For the reporting period, the allocated portion of income and expenses to each class as a percent of its average net assets may vary due to the timing of recording these transactions in relation to fluctuating net assets of the classes. Expenses directly attributable to a fund are charged to that fund. Expenses attributable to more than one fund are allocated among the respective funds on the basis of relative net assets or other appropriate methods. Expense estimates are accrued in the period to which they relate and adjustments are made when actual amounts are known.
Income Tax Information and Distributions to Shareholders. Each year, the Fund intends to qualify as a regulated investment company under Subchapter M of the Internal Revenue Code, including distributing substantially all of its taxable income and realized gains. As a result, no provision for U.S. Federal income taxes is required. The Fund files a U.S. federal tax return, in addition to state and local tax returns as required. The Fund's federal income tax returns are subject to examination by the Internal Revenue Service (IRS) for a period of three fiscal years after they are filed. State and local tax returns may be subject to examination for an additional fiscal year depending on the jurisdiction.
Distributions are declared and recorded daily and paid monthly from net investment income. Distributions from realized gains, if any, are declared and recorded on the ex-dividend date. Income and capital gain distributions are declared separately for each class. Income and capital gain distributions are determined in accordance with income tax regulations, which may differ from GAAP.
Capital accounts within the financial statements are adjusted for permanent book-tax differences. These adjustments have no impact on net assets or the results of operations. Capital accounts are not adjusted for temporary book-tax differences which will reverse in a subsequent period.
Book-tax differences are primarily due to foreign currency transactions, market discount, equity-debt classifications, certain conversion ratio adjustments, partnerships, capital loss carryforwards and losses deferred due to wash sales.
As of period end, the cost and unrealized appreciation (depreciation) in securities, and derivatives if applicable, for federal income tax purposes were as follows:
| Gross unrealized appreciation | $213,586 |
| Gross unrealized depreciation | (141,772) |
| Net unrealized appreciation (depreciation) | $71,814 |
| Tax cost | $5,153,808 |
Capital loss carryforwards are only available to offset future capital gains of the Fund to the extent provided by regulations and may be limited. Under the Regulated Investment Company Modernization Act of 2010 (the Act), the Fund is permitted to carry forward capital losses incurred in taxable years beginning after December 22, 2010 for an unlimited period and such capital losses are required to be used prior to any losses that expire. The capital loss carryforward information presented below, including any applicable limitation, is estimated as of prior fiscal period end and is subject to adjustment.
| No expiration | |
| Short-term | $(61,686) |
| Long-term | (210,187) |
| Total capital loss carryforward | $(271,873) |
Approximately $30,460 of the Fund's realized capital losses and $21,009 of the Fund's unrealized capital losses are subject to limitation. Due to this limitation, the Fund will only be permitted to use approximately $17,403 of those capital losses per year to offset capital gains. These realized and unrealized losses were acquired from Fidelity Advisor High Income Fund when it merged into the Fund on December 7, 2018.
Delayed Delivery Transactions and When-Issued Securities. During the period, the Fund transacted in securities on a delayed delivery or when-issued basis. Payment and delivery may take place after the customary settlement period for that security. The price of the underlying securities and the date when the securities will be delivered and paid for are fixed at the time the transaction is negotiated. The Fund may receive compensation for interest forgone in the purchase of a delayed delivery or when-issued security. With respect to purchase commitments, the Fund identifies securities as segregated in its records with a value at least equal to the amount of the commitment. Losses may arise due to changes in the value of the underlying securities or if the counterparty does not perform under the contract's terms, or if the issuer does not issue the securities due to political, economic, or other factors.
Restricted Securities. The Fund may invest in securities that are subject to legal or contractual restrictions on resale. These securities generally may be resold in transactions exempt from registration or to the public if the securities are registered. Disposal of these securities may involve time-consuming negotiations and expense, and prompt sale at an acceptable price may be difficult. Information regarding restricted securities is included at the end of the Fund's Schedule of Investments.
Loans and Other Direct Debt Instruments. The Fund invests in direct debt instruments which are interests in amounts owed to lenders by corporate or other borrowers. These instruments may be in the form of loans, trade claims or other receivables and may include standby financing commitments such as revolving credit facilities that obligate the Fund to supply additional cash to the borrower on demand. Loans may be acquired through assignment or participation. The Fund also invests in unfunded loan commitments, which are contractual obligations for future funding. Information regarding unfunded commitments is included at the end of the Fund's Schedule of Investments.
4. Purchases and Sales of Investments.
Purchases and sales of securities, other than short-term securities and in-kind transactions, aggregated $742,074 and $632,014, respectively.
5. Fees and Other Transactions with Affiliates.
Management Fee. Fidelity Management & Research Company (the investment adviser) and its affiliates provide the Fund with investment management related services for which the Fund pays a monthly management fee. The management fee is the sum of an individual fund fee rate that is based on an annual rate of .45% of the Fund's average net assets and an annualized group fee rate that averaged .10% during the period. The group fee rate is based upon the average net assets of all the mutual funds advised by the investment adviser, including any mutual funds previously advised by the investment adviser that are currently advised by Fidelity SelectCo, LLC, an affiliate of the investment adviser. The group fee rate decreases as assets under management increase and increases as assets under management decrease. For the reporting period, the total annualized management fee rate was .55% of the Fund's average net assets.
Distribution and Service Plan Fees. In accordance with Rule 12b-1 of the 1940 Act, the Fund has adopted separate Distribution and Service Plans for each class of shares. Certain classes pay Fidelity Distributors Corporation (FDC), an affiliate of the investment adviser, separate Distribution and Service Fees, each of which is based on an annual percentage of each class' average net assets. In addition, FDC may pay financial intermediaries for selling shares of the Fund and providing shareholder support services. For the period, the Distribution and Service Fee rates, total fees and amounts retained by FDC were as follows:
| Distribution Fee | Service Fee | Total Fees | Retained by FDC | |
| Class A | -% | .25% | $211 | $3 |
| Class M | -% | .25% | 64 | – |
| Class C | .75% | .25% | 245 | 11 |
| $520 | $14 |
Sales Load. FDC may receive a front-end sales charge of up to 4.00% for selling Class A shares and Class M shares, some of which is paid to financial intermediaries for selling shares of the Fund. Depending on the holding period, FDC may receive contingent deferred sales charges levied on Class A, Class M and Class C redemptions. The deferred sales charges are 1.00% for Class C shares, 1.00% for certain purchases of Class A shares and .25% for certain purchases of Class M shares.
For the period, sales charge amounts retained by FDC were as follows:
| Retained by FDC | |
| Class A | $23 |
| Class M | 6 |
| Class C(a) | 1 |
| $30 |
(a) When Class C shares are initially sold, FDC pays commissions from its own resources to financial intermediaries through which the sales are made.
Transfer Agent Fees. Fidelity Investments Institutional Operations Company, Inc., (FIIOC), an affiliate of the investment adviser, is the transfer, dividend disbursing and shareholder servicing agent for each class of the Fund. FIIOC receives account fees and asset-based fees that vary according to the account size and type of account of the shareholders of the respective classes of the Fund, except for Class Z. FIIOC receives an asset-based fee of Class Z's average net assets. FIIOC pays for typesetting, printing and mailing of shareholder reports, except proxy statements.
For the period, transfer agent fees for each class were as follows:
| Amount | % of Class-Level Average Net Assets(a) | |
| Class A | $129 | .15 |
| Class M | 43 | .16 |
| Class C | 42 | .17 |
| Fidelity High Income Fund | 2,391 | .11 |
| Class I | 402 | .16 |
| Class Z | 8 | .05 |
| $3,015 |
(a) Annualized
Accounting Fees. Fidelity Service Company, Inc. (FSC), an affiliate of the investment adviser, maintains the Fund's accounting records. The fee is based on the level of average net assets for each month. For the period, the fees were equivalent to an annualized rate of .02%.
Interfund Trades. The Fund may purchase from or sell securities to other Fidelity Funds under procedures adopted by the Board. The procedures have been designed to ensure these interfund trades are executed in accordance with Rule 17a-7 of the 1940 Act. Interfund trades are included within the respective purchases and sales amounts shown in the Purchases and Sales of Investments note.
Affiliated Redemptions In-Kind. During the period, 12,631 shares of the Fund were redeemed in-kind for investments, including accrued interest, and cash with a value of $112,257. The net realized gain of $4,389 on investments delivered through in-kind redemptions is included in the accompanying Statement of Operations. The amount of the in-kind redemptions is included in share transactions in the accompanying Statement of Changes in Net Assets as well as the Notes to Financial Statements. The Fund recognized no gain or loss for federal income tax purposes.
6. Committed Line of Credit.
The Fund participates with other funds managed by the investment adviser or an affiliate in a $4.25 billion credit facility (the "line of credit") to be utilized for temporary or emergency purposes to fund shareholder redemptions or for other short-term liquidity purposes. The Fund has agreed to pay commitment fees on its pro-rata portion of the line of credit, which amounted to $6 and is reflected in Miscellaneous expenses on the Statement of Operations. During the period, the Fund did not borrow on this line of credit.
7. Expense Reductions.
Through arrangements with the Fund's custodian, credits realized as a result of certain uninvested cash balances were used to reduce the Fund's expenses. During the period, custodian credits reduced the Fund's expenses by $9.
In addition, during the period the investment adviser reimbursed and/or waived a portion of fund-level operating expenses in the amount of $12.
8. Distributions to Shareholders.
Distributions to shareholders of each class were as follows:
| Six months ended October 31, 2019 | Year ended April 30, 2019(a) |
|
| Distributions to shareholders | ||
| Class A | $4,025 | $3,743 |
| Class M | 1,226 | 1,162 |
| Class C | 981 | 1,257 |
| Fidelity High Income Fund | 111,823 | 240,114 |
| Class I | 12,272 | 10,446 |
| Class Z | 844 | 159 |
| Total | $131,171 | $256,881 |
(a) Distributions for Class A, Class M, Class C, Class I and Class Z are for the period December 4, 2018 (commencement of sale of shares) to April 30, 2019.
9. Share Transactions.
Share transactions for each class were as follows and may contain automatic conversions between classes or exchanges between affiliated funds:
| Shares | Shares | Dollars | Dollars | |
| Six months ended October 31, 2019 | Year ended April 30, 2019(a) | Six months ended October 31, 2019 | Year ended April 30, 2019(a) | |
| Class A | ||||
| Shares sold | 1,503 | 2,457 | $13,255 | $21,373 |
| Issued in exchange for the shares of Fidelity Advisor High Income Fund | – | 18,670 | – | 159,252 |
| Reinvestment of distributions | 403 | 383 | 3,556 | 3,281 |
| Shares redeemed | (1,895) | (2,272) | (16,710) | (19,430) |
| Net increase (decrease) | 11 | 19,238 | $101 | $164,476 |
| Class M | ||||
| Shares sold | 576 | 259 | $5,100 | $2,238 |
| Issued in exchange for the shares of Fidelity Advisor High Income Fund | – | 5,803 | – | 49,500 |
| Reinvestment of distributions | 129 | 126 | 1,139 | 1,076 |
| Shares redeemed | (378) | (535) | (3,336) | (4,599) |
| Net increase (decrease) | 327 | 5,653 | $2,903 | $48,215 |
| Class C | ||||
| Shares sold | 169 | 275 | $1,498 | $2,378 |
| Issued in exchange for the shares of Fidelity Advisor High Income Fund | – | 7,719 | – | 65,765 |
| Reinvestment of distributions | 102 | 137 | 898 | 1,174 |
| Shares redeemed | (951) | (2,258) | (8,400) | (19,621) |
| Net increase (decrease) | (680) | 5,873 | $(6,004) | $49,696 |
| Fidelity High Income Fund | ||||
| Shares sold | 57,873 | 126,441 | $510,844 | $1,102,580 |
| Reinvestment of distributions | 10,198 | 22,383 | 90,065 | 194,157 |
| Shares redeemed | (69,216)(b) | (140,878) | (610,566)(b) | (1,223,927) |
| Net increase (decrease) | (1,145) | 7,946 | $(9,657) | $72,810 |
| Class I | ||||
| Shares sold | 16,598 | 7,919 | $146,817 | $68,533 |
| Issued in exchange for the shares of Fidelity Advisor High Income Fund | – | 48,879 | – | 416,933 |
| Reinvestment of distributions | 1,162 | 1,170 | 10,263 | 10,028 |
| Shares redeemed | (9,594)(b) | (7,255) | (84,923)(b) | (62,518) |
| Net increase (decrease) | 8,166 | 50,713 | $72,157 | $432,976 |
| Class Z | ||||
| Shares sold | 5,706 | 1,483 | $50,046 | $12,847 |
| Issued in exchange for the shares of Fidelity Advisor High Income Fund | – | 222 | – | 1,895 |
| Reinvestment of distributions | 71 | 10 | 626 | 87 |
| Shares redeemed | (318) | (299) | (2,811) | (2,599) |
| Net increase (decrease) | 5,459 | 1,416 | $47,861 | $12,230 |
(a) Share transactions for Class A, Class M, Class C, Class I and Class Z are for the period December 4, 2018 (commencement of sale of shares) to April 30, 2019.
(b) Amount includes in-kind redemptions (see the Affiliated Redemptions In-Kind note for additional details).
10. Other.
The Fund's organizational documents provide former and current trustees and officers with a limited indemnification against liabilities arising in connection with the performance of their duties to the Fund. In the normal course of business, the Fund may also enter into contracts that provide general indemnifications. The Fund's maximum exposure under these arrangements is unknown as this would be dependent on future claims that may be made against the Fund. The risk of material loss from such claims is considered remote.
11. Prior Fiscal Year Merger Information.
On December 7, 2018, the Fund acquired all of the assets and assumed all of the liabilities of Fidelity Advisor High Income Fund ("Target Fund") pursuant to an Agreement and Plan of Reorganization approved by the Board of Trustees ("The Board"). In addition, the Board approved the creation of additional classes of shares that commenced sale of shares on December 4, 2018. The acquisition was accomplished by an exchange of each class of the Fund for corresponding shares then outstanding of the Target Fund at their respective net asset value on the acquisition date. The reorganization provides shareholders of the Target Fund access to a larger portfolio with a similar investment objective and lower expenses. The reorganization qualified as a tax-free reorganization for federal income tax purposes with no gain or loss recognized to the funds or their shareholders. The Target Fund's net assets of $693,345, including securities of $686,303 and unrealized depreciation of $28,031, was combined with the Fund's net assets of $4,115,643 for total net assets after the acquisition of $4,808,988.
Pro forma results of operations of the combined entity for the entire period ended April 30, 2019, as though the acquisition had occurred as of the beginning of the year (rather than on the actual acquisition date), are as follows:
| Net investment income (loss) | $279,393 |
| Total net realized gain (loss) | (107,293) |
| Total change in net unrealized appreciation (depreciation) | 99,966 |
| Net increase (decrease) in net assets resulting from operations | $272,066 |
Because the combined investment portfolios have been managed as a single portfolio since the acquisition was completed, it is not practicable to separate the amounts of revenue and earnings of the acquired fund that has been included in the Fund's accompanying Statement of Operations since December 7, 2018.
12. Litigation.
The Fund and other entities managed by FMR or its affiliates were named as defendants in a lawsuit filed in the United States Bankruptcy Court for the Southern District of New York in 2009. The lawsuit was brought by creditors of Motors Liquidation Company (f/k/a General Motors), which went through Chapter 11 bankruptcy proceedings in 2009, and is captioned Official Committee of Unsecured Creditors of Motors Liquidation Company v. JPMorgan Chase Bank, N.A., et al., Adversary No. 09-00504 (REG). The plaintiffs sought an order that the Fund and other defendants return proceeds received in 2009 in full payment of the principal and interest on General Motors secured debt. The plaintiffs contended that the Fund and the other defendants were not secured creditors at the time of the 2009 payments and, thus, were not entitled to payment in full. In May 2019, the parties reached a settlement that has been approved by the Bankruptcy Court. Under the terms of the settlement, the Fund will not be required to return any of the proceeds received in 2009, and will be entitled to recover a portion of the legal costs incurred in defending the case.
Shareholder Expense Example
As a shareholder of the Fund, you incur two types of costs: (1) transaction costs, including sales charges (loads) on purchase payments or redemption proceeds, and (2) ongoing costs, including management fees, distribution and/or service (12b-1) fees and other Fund expenses. This Example is intended to help you understand your ongoing costs (in dollars) of investing in the Fund and to compare these costs with the ongoing costs of investing in other mutual funds.
The Example is based on an investment of $1,000 invested at the beginning of the period and held for the entire period (May 1, 2019 to October 31, 2019).
Actual Expenses
The first line of the accompanying table for each class of the Fund provides information about actual account values and actual expenses. You may use the information in this line, together with the amount you invested, to estimate the expenses that you paid over the period. Simply divide your account value by $1,000.00 (for example, an $8,600 account value divided by $1,000.00 = 8.6), then multiply the result by the number in the first line for a class of the Fund under the heading entitled "Expenses Paid During Period" to estimate the expenses you paid on your account during this period. In addition, the Fund, as a shareholder in the underlying Fidelity Central Funds, will indirectly bear its pro-rata share of the fees and expenses incurred by the underlying Fidelity Central Funds. These fees and expenses are not included in the Fund's annualized expense ratio used to calculate the expense estimate in the table below.
Hypothetical Example for Comparison Purposes
The second line of the accompanying table for each class of the Fund provides information about hypothetical account values and hypothetical expenses based on a Class' actual expense ratio and an assumed rate of return of 5% per year before expenses, which is not the Class' actual return. The hypothetical account values and expenses may not be used to estimate the actual ending account balance or expenses you paid for the period. You may use this information to compare the ongoing costs of investing in the Fund and other funds. To do so, compare this 5% hypothetical example with the 5% hypothetical examples that appear in the shareholder reports of the other funds. In addition, the Fund, as a shareholder in the underlying Fidelity Central Funds, will indirectly bear its pro-rata share of the fees and expenses incurred by the underlying Fidelity Central Funds. These fees and expenses are not included in the Fund's annualized expense ratio used to calculate the expense estimate in the table below.
Please note that the expenses shown in the table are meant to highlight your ongoing costs only and do not reflect any transaction costs. Therefore, the second line of the table is useful in comparing ongoing costs only, and will not help you determine the relative total costs of owning different funds. In addition, if these transactional costs were included, your costs would have been higher.
| Annualized Expense Ratio-A | Beginning Account Value May 1, 2019 | Ending Account Value October 31, 2019 | Expenses Paid During Period-B May 1, 2019 to October 31, 2019 |
|
| Class A | .98% | |||
| Actual | $1,000.00 | $1,026.40 | $4.99 | |
| Hypothetical-C | $1,000.00 | $1,020.21 | $4.98 | |
| Class M | .99% | |||
| Actual | $1,000.00 | $1,026.40 | $5.04 | |
| Hypothetical-C | $1,000.00 | $1,020.16 | $5.03 | |
| Class C | 1.74% | |||
| Actual | $1,000.00 | $1,022.50 | $8.85 | |
| Hypothetical-C | $1,000.00 | $1,016.39 | $8.82 | |
| Fidelity High Income Fund | .69% | |||
| Actual | $1,000.00 | $1,027.90 | $3.52 | |
| Hypothetical-C | $1,000.00 | $1,021.67 | $3.51 | |
| Class I | .74% | |||
| Actual | $1,000.00 | $1,027.60 | $3.77 | |
| Hypothetical-C | $1,000.00 | $1,021.42 | $3.76 | |
| Class Z | .63% | |||
| Actual | $1,000.00 | $1,028.20 | $3.21 | |
| Hypothetical-C | $1,000.00 | $1,021.97 | $3.20 |
A Annualized expense ratio reflects expenses net of applicable fee waivers.
B Expenses are equal to each Class' annualized expense ratio, multiplied by the average account value over the period, multiplied by 184/366 (to reflect the one-half year period).
C 5% return per year before expenses
![]()
SPH-SANN-1219
1.538299.122
Fidelity® Focused High Income Fund
Semi-Annual Report
October 31, 2019
See the inside front cover for important information about access to your fund’s shareholder reports.
Beginning on January 1, 2021, as permitted by regulations adopted by the Securities and Exchange Commission, paper copies of a fund’s shareholder reports will no longer be sent by mail, unless you specifically request paper copies of the reports from the fund or from your financial intermediary, such as a financial advisor, broker-dealer or bank. Instead, the reports will be made available on a website, and you will be notified by mail each time a report is posted and provided with a website link to access the report.
If you already elected to receive shareholder reports electronically, you will not be affected by this change and you need not take any action. You may elect to receive shareholder reports and other communications from a fund electronically, by contacting your financial intermediary. For Fidelity customers, visit Fidelity's web site or call Fidelity using the contact information listed below.
You may elect to receive all future reports in paper free of charge. If you wish to continue receiving paper copies of your shareholder reports, you may contact your financial intermediary or, if you are a Fidelity customer, visit Fidelity’s website, or call Fidelity at the applicable toll-free number listed below. Your election to receive reports in paper will apply to all funds held with the fund complex/your financial intermediary.
| Account Type | Website | Phone Number |
| Brokerage, Mutual Fund, or Annuity Contracts: | fidelity.com/mailpreferences | 1-800-343-3548 |
| Employer Provided Retirement Accounts: | netbenefits.fidelity.com/preferences (choose 'no' under Required Disclosures to continue to print) | 1-800-343-0860 |
| Advisor Sold Accounts Serviced Through Your Financial Intermediary: | Contact Your Financial Intermediary | Your Financial Intermediary's phone number |
| Advisor Sold Accounts Serviced by Fidelity: | institutional.fidelity.com | 1-877-208-0098 |
Contents
To view a fund's proxy voting guidelines and proxy voting record for the 12-month period ended June 30, visit http://www.fidelity.com/proxyvotingresults or visit the Securities and Exchange Commission's (SEC) web site at http://www.sec.gov.
You may also call 1-800-544-8544 to request a free copy of the proxy voting guidelines.
Standard & Poor's, S&P and S&P 500 are registered service marks of The McGraw-Hill Companies, Inc. and have been licensed for use by Fidelity Distributors Corporation.
Other third-party marks appearing herein are the property of their respective owners.
All other marks appearing herein are registered or unregistered trademarks or service marks of FMR LLC or an affiliated company. © 2019 FMR LLC. All rights reserved.
This report and the financial statements contained herein are submitted for the general information of the shareholders of the Fund. This report is not authorized for distribution to prospective investors in the Fund unless preceded or accompanied by an effective prospectus.
A fund files its complete schedule of portfolio holdings with the SEC for the first and third quarters of each fiscal year on Form N-PORT. Forms N-PORT are available on the SEC’s web site at http://www.sec.gov. A fund's Forms N-PORT may be reviewed and copied at the SEC’s Public Reference Room in Washington, DC. Information regarding the operation of the SEC's Public Reference Room may be obtained by calling 1-800-SEC-0330.
For a complete list of a fund's portfolio holdings, view the most recent holdings listing, semiannual report, or annual report on Fidelity's web site at http://www.fidelity.com, http://www.institutional.fidelity.com, or http://www.401k.com, as applicable.
NOT FDIC INSURED •MAY LOSE VALUE •NO BANK GUARANTEE
Neither the Fund nor Fidelity Distributors Corporation is a bank.
Investment Summary (Unaudited)
Top Five Holdings as of October 31, 2019
| (by issuer, excluding cash equivalents) | % of fund's net assets |
| CCO Holdings LLC/CCO Holdings Capital Corp. | 2.9 |
| Navient Corp. | 2.7 |
| JBS U.S.A. LLC/JBS U.S.A. Finance, Inc. | 1.9 |
| Icahn Enterprises LP/Icahn Enterprises Finance Corp. | 1.8 |
| Level 3 Financing, Inc. | 1.7 |
| 11.0 |
Top Five Market Sectors as of October 31, 2019
| % of fund's net assets | |
| Energy | 11.7 |
| Telecommunications | 9.3 |
| Diversified Financial Services | 9.1 |
| Healthcare | 8.2 |
| Cable/Satellite TV | 7.3 |
Quality Diversification (% of fund's net assets)
| As of October 31, 2019 | ||
| BBB | 7.4% | |
| BB | 63.1% | |
| B | 20.6% | |
| CCC,CC,C | 0.1% | |
| Short-Term Investments and Net Other Assets | 8.8% | |
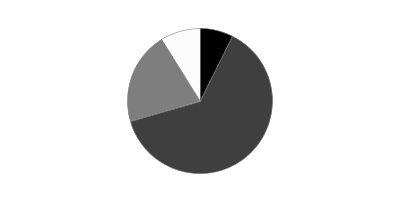
We have used ratings from Moody's Investors Service, Inc. Where Moody's® ratings are not available, we have used S&P® ratings. All ratings are as of the date indicated and do not reflect subsequent changes.
Asset Allocation (% of fund's net assets)
| As of October 31, 2019* | ||
| Nonconvertible Bonds | 86.0% | |
| Convertible Bonds, Preferred Stocks | 0.6% | |
| Other Investments | 4.6% | |
| Short-Term Investments and Net Other Assets (Liabilities) | 8.8% | |

* Foreign investments - 22.3%
Schedule of Investments October 31, 2019 (Unaudited)
Showing Percentage of Net Assets
| Corporate Bonds - 86.6% | |||
| Principal Amount | Value | ||
| Convertible Bonds - 0.6% | |||
| Broadcasting - 0.6% | |||
| DISH Network Corp.: | |||
| 2.375% 3/15/24 | $1,230,000 | $1,102,575 | |
| 3.375% 8/15/26 | 680,000 | 635,842 | |
| 1,738,417 | |||
| Nonconvertible Bonds - 86.0% | |||
| Aerospace - 2.1% | |||
| BBA U.S. Holdings, Inc. 5.375% 5/1/26 (a) | 1,620,000 | 1,692,900 | |
| BWX Technologies, Inc. 5.375% 7/15/26 (a) | 2,000,000 | 2,118,100 | |
| TransDigm, Inc. 6.25% 3/15/26 (a) | 2,605,000 | 2,790,606 | |
| 6,601,606 | |||
| Air Transportation - 0.6% | |||
| Aercap Global Aviation Trust 6.5% 6/15/45 (a)(b) | 1,750,000 | 1,918,438 | |
| Banks & Thrifts - 1.6% | |||
| Ally Financial, Inc.: | |||
| 3.875% 5/21/24 | 485,000 | 506,534 | |
| 5.125% 9/30/24 | 770,000 | 846,007 | |
| 5.75% 11/20/25 | 2,735,000 | 3,046,106 | |
| 8% 11/1/31 | 450,000 | 628,875 | |
| 5,027,522 | |||
| Broadcasting - 1.1% | |||
| Sirius XM Radio, Inc.: | |||
| 4.625% 7/15/24 (a) | 430,000 | 449,350 | |
| 5% 8/1/27 (a) | 2,285,000 | 2,402,106 | |
| 5.375% 7/15/26 (a) | 800,000 | 844,000 | |
| 3,695,456 | |||
| Cable/Satellite TV - 7.3% | |||
| CCO Holdings LLC/CCO Holdings Capital Corp.: | |||
| 5% 2/1/28 (a) | 3,055,000 | 3,196,294 | |
| 5.125% 5/1/23 (a) | 1,105,000 | 1,131,244 | |
| 5.125% 5/1/27 (a) | 2,110,000 | 2,223,413 | |
| 5.5% 5/1/26 (a) | 1,150,000 | 1,211,813 | |
| 5.875% 5/1/27 (a) | 1,630,000 | 1,727,800 | |
| CSC Holdings LLC: | |||
| 5.375% 7/15/23 (a) | 3,745,000 | 3,838,550 | |
| 5.5% 4/15/27 (a) | 1,320,000 | 1,399,213 | |
| DISH DBS Corp.: | |||
| 5.875% 11/15/24 | 1,330,000 | 1,333,325 | |
| 7.75% 7/1/26 | 815,000 | 822,213 | |
| Virgin Media Secured Finance PLC 5.5% 8/15/26 (a) | 1,460,000 | 1,534,825 | |
| Ziggo B.V. 5.5% 1/15/27 (a) | 4,455,000 | 4,700,001 | |
| Ziggo Bond Co. BV 6% 1/15/27 (a) | 300,000 | 313,500 | |
| 23,432,191 | |||
| Capital Goods - 1.0% | |||
| AECOM: | |||
| 5.125% 3/15/27 | 2,000,000 | 2,109,400 | |
| 5.875% 10/15/24 | 1,155,000 | 1,245,956 | |
| 3,355,356 | |||
| Chemicals - 2.5% | |||
| CF Industries Holdings, Inc. 5.15% 3/15/34 | 80,000 | 84,800 | |
| OCI NV 6.625% 4/15/23 (a) | 1,270,000 | 1,325,563 | |
| Olin Corp.: | |||
| 5% 2/1/30 | 360,000 | 354,600 | |
| 5.125% 9/15/27 | 1,695,000 | 1,743,901 | |
| The Chemours Co. LLC: | |||
| 5.375% 5/15/27 | 1,000,000 | 888,590 | |
| 7% 5/15/25 | 1,205,000 | 1,162,825 | |
| Valvoline, Inc. 4.375% 8/15/25 | 1,065,000 | 1,083,638 | |
| W. R. Grace & Co.-Conn. 5.625% 10/1/24 (a) | 1,200,000 | 1,296,000 | |
| 7,939,917 | |||
| Containers - 2.3% | |||
| Ardagh Packaging Finance PLC/Ardagh MP Holdings U.S.A., Inc. 4.625% 5/15/23 (a) | 2,090,000 | 2,139,638 | |
| Crown Americas LLC/Crown Americas Capital Corp. V 4.25% 9/30/26 | 1,770,000 | 1,847,438 | |
| OI European Group BV 4% 3/15/23 (a) | 1,230,000 | 1,223,850 | |
| Owens-Brockway Glass Container, Inc. 5.375% 1/15/25 (a) | 460,000 | 464,025 | |
| Reynolds Group Issuer, Inc./Reynolds Group Issuer LLC/Reynolds Group Issuer (Luxembourg) SA 5.125% 7/15/23 (a) | 890,000 | 913,096 | |
| Silgan Holdings, Inc. 4.75% 3/15/25 | 810,000 | 828,225 | |
| 7,416,272 | |||
| Diversified Financial Services - 8.3% | |||
| FLY Leasing Ltd. 5.25% 10/15/24 | 1,385,000 | 1,426,550 | |
| Icahn Enterprises LP/Icahn Enterprises Finance Corp.: | |||
| 4.75% 9/15/24 (a) | 1,000,000 | 1,013,750 | |
| 5.875% 2/1/22 | 2,185,000 | 2,204,119 | |
| 6.25% 2/1/22 | 1,970,000 | 2,016,788 | |
| 6.25% 5/15/26 | 700,000 | 742,000 | |
| MSCI, Inc.: | |||
| 4.75% 8/1/26 (a) | 2,350,000 | 2,461,508 | |
| 5.375% 5/15/27 (a) | 545,000 | 581,788 | |
| Navient Corp.: | |||
| 5.5% 1/25/23 | 1,670,000 | 1,734,713 | |
| 5.875% 10/25/24 | 110,000 | 112,475 | |
| 6.125% 3/25/24 | 1,210,000 | 1,264,813 | |
| 6.5% 6/15/22 | 460,000 | 492,200 | |
| 6.625% 7/26/21 | 2,370,000 | 2,503,313 | |
| 7.25% 1/25/22 | 605,000 | 656,244 | |
| 7.25% 9/25/23 | 1,765,000 | 1,928,227 | |
| Park Aerospace Holdings Ltd.: | |||
| 4.5% 3/15/23 (a) | 375,000 | 393,938 | |
| 5.25% 8/15/22 (a) | 965,000 | 1,027,677 | |
| 5.5% 2/15/24 (a) | 1,775,000 | 1,951,435 | |
| Quicken Loans, Inc. 5.25% 1/15/28 (a) | 2,320,000 | 2,392,500 | |
| Springleaf Finance Corp.: | |||
| 6.875% 3/15/25 | 1,105,000 | 1,251,413 | |
| 7.125% 3/15/26 | 500,000 | 570,000 | |
| 26,725,451 | |||
| Diversified Media - 1.0% | |||
| Nielsen Co. SARL (Luxembourg) 5% 2/1/25 (a) | 945,000 | 940,275 | |
| Nielsen Finance LLC/Nielsen Finance Co. 5% 4/15/22 (a) | 2,300,000 | 2,311,546 | |
| 3,251,821 | |||
| Energy - 11.2% | |||
| Cheniere Corpus Christi Holdings LLC: | |||
| 5.875% 3/31/25 | 1,590,000 | 1,763,056 | |
| 7% 6/30/24 | 1,245,000 | 1,431,850 | |
| Cheniere Energy Partners LP: | |||
| 5.25% 10/1/25 | 2,585,000 | 2,675,475 | |
| 5.625% 10/1/26 | 1,155,000 | 1,219,969 | |
| Consolidated Energy Finance SA 3 month U.S. LIBOR + 3.750% 5.8685% 6/15/22 (a)(b)(c) | 1,290,000 | 1,280,378 | |
| Crestwood Midstream Partners LP/Crestwood Midstream Finance Corp.: | |||
| 5.75% 4/1/25 | 2,795,000 | 2,885,838 | |
| 6.25% 4/1/23 | 845,000 | 859,534 | |
| CVR Refining LLC/Coffeyville Finance, Inc. 6.5% 11/1/22 | 1,130,000 | 1,141,300 | |
| DCP Midstream Operating LP 5.375% 7/15/25 | 1,060,000 | 1,115,650 | |
| Denbury Resources, Inc.: | |||
| 7.75% 2/15/24 (a) | 980,000 | 720,300 | |
| 9.25% 3/31/22 (a) | 95,000 | 77,900 | |
| EQT Corp. 3.9% 10/1/27 | 1,000,000 | 882,297 | |
| Hess Infrastructure Partners LP 5.625% 2/15/26 (a) | 2,090,000 | 2,186,663 | |
| Hilcorp Energy I LP/Hilcorp Finance Co.: | |||
| 5% 12/1/24 (a) | 2,530,000 | 2,246,134 | |
| 5.75% 10/1/25 (a) | 964,000 | 860,370 | |
| Jonah Energy LLC 7.25% 10/15/25 (a) | 750,000 | 210,000 | |
| Magnolia Oil & Gas Operating LLC 6% 8/1/26 (a) | 230,000 | 230,000 | |
| Nabors Industries, Inc. 5.5% 1/15/23 | 490,000 | 414,050 | |
| Parsley Energy LLC/Parsley 5.25% 8/15/25 (a) | 1,850,000 | 1,896,287 | |
| PBF Holding Co. LLC/PBF Finance Corp. 7% 11/15/23 | 1,200,000 | 1,236,000 | |
| Range Resources Corp.: | |||
| 4.875% 5/15/25 | 660,000 | 529,650 | |
| 5% 3/15/23 | 295,000 | 255,175 | |
| Rose Rock Midstream LP/Rose Rock Finance Corp. 5.625% 7/15/22 | 395,000 | 399,353 | |
| SemGroup Corp. 6.375% 3/15/25 | 190,000 | 196,888 | |
| Semgroup Corp. / Rose Rock Finance 5.625% 11/15/23 | 1,000,000 | 1,022,500 | |
| Summit Midstream Holdings LLC 5.75% 4/15/25 | 1,975,000 | 1,530,625 | |
| Sunoco LP/Sunoco Finance Corp. 5.5% 2/15/26 | 800,000 | 827,080 | |
| Targa Resources Partners LP/Targa Resources Partners Finance Corp.: | |||
| 4.25% 11/15/23 | 1,135,000 | 1,140,335 | |
| 5.125% 2/1/25 | 780,000 | 799,516 | |
| 5.375% 2/1/27 | 390,000 | 399,263 | |
| 5.875% 4/15/26 | 1,840,000 | 1,920,684 | |
| TerraForm Power Operating LLC: | |||
| 4.25% 1/31/23 (a) | 355,000 | 365,650 | |
| 5% 1/31/28 (a) | 385,000 | 406,060 | |
| Viper Energy Partners LP 5.375% 11/1/27 (a) | 800,000 | 814,000 | |
| 35,939,830 | |||
| Environmental - 0.3% | |||
| LBC Tank Terminals Holding Netherlands BV 6.875% 5/15/23 (a) | 900,000 | 914,220 | |
| Food/Beverage/Tobacco - 4.4% | |||
| C&S Group Enterprises LLC 5.375% 7/15/22 (a) | 905,000 | 907,263 | |
| JBS U.S.A. LLC/JBS U.S.A. Finance, Inc.: | |||
| 5.75% 6/15/25 (a) | 2,615,000 | 2,716,331 | |
| 5.875% 7/15/24 (a) | 2,340,000 | 2,413,125 | |
| 6.75% 2/15/28 (a) | 1,245,000 | 1,369,512 | |
| JBS U.S.A. Lux SA / JBS Food Co.: | |||
| 5.5% 1/15/30 (a) | 825,000 | 888,938 | |
| 6.5% 4/15/29 (a) | 2,800,000 | 3,115,084 | |
| Lamb Weston Holdings, Inc.: | |||
| 4.625% 11/1/24 (a) | 875,000 | 919,844 | |
| 4.875% 11/1/26 (a) | 565,000 | 593,956 | |
| Vector Group Ltd. 6.125% 2/1/25 (a) | 1,195,000 | 1,147,200 | |
| 14,071,253 | |||
| Gaming - 5.1% | |||
| GLP Capital LP/GLP Financing II, Inc. 5.25% 6/1/25 | 995,000 | 1,091,037 | |
| MCE Finance Ltd. 4.875% 6/6/25 (a) | 1,225,000 | 1,251,866 | |
| MGM Growth Properties Operating Partnership LP: | |||
| 4.5% 9/1/26 | 3,300,000 | 3,506,250 | |
| 4.5% 1/15/28 | 1,525,000 | 1,597,438 | |
| 5.75% 2/1/27 (a) | 270,000 | 305,100 | |
| MGM Mirage, Inc. 5.75% 6/15/25 | 1,320,000 | 1,463,550 | |
| Scientific Games Corp. 5% 10/15/25 (a) | 790,000 | 813,700 | |
| Twin River Worldwide Holdings, Inc. 6.75% 6/1/27 (a) | 900,000 | 947,520 | |
| Wynn Las Vegas LLC/Wynn Las Vegas Capital Corp.: | |||
| 5.25% 5/15/27 (a) | 1,930,000 | 2,012,025 | |
| 5.5% 3/1/25 (a) | 900,000 | 956,250 | |
| Wynn Macau Ltd. 4.875% 10/1/24 (a) | 2,115,000 | 2,125,575 | |
| Wynn Resorts Ltd. 5.125% 10/1/29 (a) | 380,000 | 397,100 | |
| 16,467,411 | |||
| Healthcare - 8.2% | |||
| Charles River Laboratories International, Inc.: | |||
| 4.25% 5/1/28 (a) | 90,000 | 91,697 | |
| 5.5% 4/1/26 (a) | 825,000 | 878,625 | |
| CTR Partnership LP/CareTrust Capital Corp. 5.25% 6/1/25 | 1,195,000 | 1,242,800 | |
| HCA Holdings, Inc.: | |||
| 5% 3/15/24 | 255,000 | 278,164 | |
| 5.25% 6/15/26 | 1,545,000 | 1,728,899 | |
| 5.875% 2/15/26 | 1,500,000 | 1,687,500 | |
| Hologic, Inc.: | |||
| 4.375% 10/15/25 (a) | 780,000 | 799,133 | |
| 4.625% 2/1/28 (a) | 150,000 | 156,938 | |
| IMS Health, Inc.: | |||
| 5% 10/15/26 (a) | 1,500,000 | 1,582,500 | |
| 5% 5/15/27 (a) | 820,000 | 869,200 | |
| MPT Operating Partnership LP/MPT Finance Corp.: | |||
| 5% 10/15/27 | 1,710,000 | 1,799,775 | |
| 5.25% 8/1/26 | 1,455,000 | 1,527,750 | |
| 6.375% 3/1/24 | 880,000 | 918,500 | |
| Service Corp. International 5.125% 6/1/29 | 425,000 | 452,625 | |
| Teleflex, Inc.: | |||
| 4.625% 11/15/27 | 505,000 | 528,988 | |
| 4.875% 6/1/26 | 1,955,000 | 2,049,695 | |
| Tenet Healthcare Corp.: | |||
| 4.625% 7/15/24 | 2,520,000 | 2,595,600 | |
| 5.125% 5/1/25 | 1,200,000 | 1,228,500 | |
| 6.25% 2/1/27 (a) | 470,000 | 496,438 | |
| Valeant Pharmaceuticals International, Inc. 7% 3/15/24 (a) | 2,540,000 | 2,657,285 | |
| Wellcare Health Plans, Inc.: | |||
| 5.25% 4/1/25 | 500,000 | 523,281 | |
| 5.375% 8/15/26 (a) | 2,205,000 | 2,345,569 | |
| 26,439,462 | |||
| Homebuilders/Real Estate - 0.6% | |||
| Howard Hughes Corp. 5.375% 3/15/25 (a) | 1,345,000 | 1,397,119 | |
| Starwood Property Trust, Inc. 4.75% 3/15/25 | 440,000 | 456,913 | |
| 1,854,032 | |||
| Hotels - 1.1% | |||
| Hilton Escrow Issuer LLC 4.25% 9/1/24 | 1,345,000 | 1,368,538 | |
| Hilton Worldwide Finance LLC/Hilton Worldwide Finance Corp.: | |||
| 4.625% 4/1/25 | 750,000 | 770,625 | |
| 4.875% 4/1/27 | 445,000 | 470,579 | |
| Wyndham Hotels & Resorts, Inc. 5.375% 4/15/26 (a) | 1,020,000 | 1,076,100 | |
| 3,685,842 | |||
| Leisure - 0.3% | |||
| Mattel, Inc. 6.75% 12/31/25 (a) | 895,000 | 936,394 | |
| Metals/Mining - 1.0% | |||
| Freeport-McMoRan, Inc.: | |||
| 3.55% 3/1/22 | 1,885,000 | 1,906,206 | |
| 4.55% 11/14/24 | 340,000 | 353,600 | |
| Nufarm Australia Ltd. 5.75% 4/30/26 (a) | 1,110,000 | 1,115,550 | |
| 3,375,356 | |||
| Paper - 0.2% | |||
| Berry Global Escrow Corp. 4.875% 7/15/26 (a) | 635,000 | 667,544 | |
| Restaurants - 0.7% | |||
| 1011778 BC Unlimited Liability Co./New Red Finance, Inc. 4.25% 5/15/24 (a) | 825,000 | 846,656 | |
| KFC Holding Co./Pizza Hut Holding LLC 5% 6/1/24 (a) | 1,300,000 | 1,348,750 | |
| 2,195,406 | |||
| Services - 2.6% | |||
| ADT Corp. 4.875% 7/15/32 (a) | 695,000 | 601,384 | |
| Aramark Services, Inc. 4.75% 6/1/26 | 2,960,000 | 3,037,700 | |
| CDK Global, Inc.: | |||
| 4.875% 6/1/27 | 2,505,000 | 2,639,644 | |
| 5.25% 5/15/29 (a) | 140,000 | 148,663 | |
| Corrections Corp. of America: | |||
| 4.125% 4/1/20 | 305,000 | 305,061 | |
| 4.625% 5/1/23 | 145,000 | 135,756 | |
| 5% 10/15/22 | 530,000 | 525,363 | |
| GEMS MENASA Cayman Ltd. 7.125% 7/31/26 (a) | 775,000 | 805,516 | |
| 8,199,087 | |||
| Super Retail - 0.2% | |||
| The William Carter Co. 5.625% 3/15/27 (a) | 465,000 | 495,806 | |
| Technology - 5.8% | |||
| Entegris, Inc. 4.625% 2/10/26 (a) | 1,400,000 | 1,441,339 | |
| Fair Isaac Corp. 5.25% 5/15/26 (a) | 1,305,000 | 1,415,925 | |
| Gartner, Inc. 5.125% 4/1/25 (a) | 390,000 | 408,993 | |
| Nuance Communications, Inc. 5.625% 12/15/26 | 1,495,000 | 1,586,644 | |
| Open Text Corp. 5.875% 6/1/26 (a) | 2,015,000 | 2,148,494 | |
| Qorvo, Inc. 5.5% 7/15/26 | 1,330,000 | 1,419,748 | |
| Sensata Technologies BV 5% 10/1/25 (a) | 1,915,000 | 2,063,796 | |
| Sensata Technologies UK Financing Co. PLC 6.25% 2/15/26 (a) | 435,000 | 465,178 | |
| SoftBank Corp. 5.375% 7/30/22 (Reg. S) | 1,000,000 | 1,038,750 | |
| Symantec Corp. 5% 4/15/25 (a) | 4,385,000 | 4,494,625 | |
| TTM Technologies, Inc. 5.625% 10/1/25 (a) | 2,265,000 | 2,287,650 | |
| 18,771,142 | |||
| Telecommunications - 9.3% | |||
| Altice Financing SA: | |||
| 6.625% 2/15/23 (a) | 2,240,000 | 2,300,928 | |
| 7.5% 5/15/26 (a) | 433,000 | 460,063 | |
| C&W Senior Financing Designated Activity Co.: | |||
| 6.875% 9/15/27 (a) | 1,255,000 | 1,320,888 | |
| 7.5% 10/15/26 (a) | 3,470,000 | 3,725,913 | |
| Equinix, Inc. 5.875% 1/15/26 | 1,625,000 | 1,726,075 | |
| Level 3 Financing, Inc.: | |||
| 4.625% 9/15/27 (a) | 1,400,000 | 1,422,750 | |
| 5.25% 3/15/26 | 1,186,000 | 1,237,888 | |
| 5.375% 5/1/25 | 900,000 | 930,375 | |
| 5.625% 2/1/23 | 2,000,000 | 2,020,000 | |
| Millicom International Cellular SA: | |||
| 6% 3/15/25 (a) | 110,000 | 113,850 | |
| 6.625% 10/15/26 (a) | 2,125,000 | 2,308,281 | |
| Neptune Finco Corp. 6.625% 10/15/25 (a) | 1,600,000 | 1,704,000 | |
| Qwest Corp. 6.75% 12/1/21 | 510,000 | 550,428 | |
| Sable International Finance Ltd. 5.75% 9/7/27 (a) | 1,090,000 | 1,133,600 | |
| SBA Communications Corp. 4.875% 9/1/24 | 1,000,000 | 1,038,750 | |
| SFR Group SA 7.375% 5/1/26 (a) | 1,800,000 | 1,927,521 | |
| T-Mobile U.S.A., Inc. 4.5% 2/1/26 | 845,000 | 871,406 | |
| Telecom Italia Capital SA: | |||
| 6% 9/30/34 | 295,000 | 314,913 | |
| 6.375% 11/15/33 | 165,000 | 181,865 | |
| Telecom Italia SpA 5.303% 5/30/24 (a) | 2,540,000 | 2,717,800 | |
| Telenet Finance Luxembourg Notes SARL 5.5% 3/1/28 (a) | 1,200,000 | 1,276,200 | |
| U.S. West Communications 7.25% 9/15/25 | 560,000 | 642,234 | |
| 29,925,728 | |||
| Transportation Ex Air/Rail - 1.1% | |||
| Avolon Holdings Funding Ltd.: | |||
| 5.125% 10/1/23 (a) | 2,045,000 | 2,206,555 | |
| 5.25% 5/15/24 (a) | 520,000 | 567,060 | |
| 5.5% 1/15/23 (a) | 820,000 | 884,862 | |
| 3,658,477 | |||
| Utilities - 6.1% | |||
| Clearway Energy Operating LLC 5.75% 10/15/25 | 525,000 | 538,781 | |
| DCP Midstream Operating LP 5.125% 5/15/29 | 1,000,000 | 1,015,000 | |
| Global Partners LP/GLP Finance Corp. 7% 8/1/27 (a) | 900,000 | 936,153 | |
| InterGen NV 7% 6/30/23 (a) | 1,635,000 | 1,554,068 | |
| Nextera Energy Operating Partn: | |||
| 4.25% 9/15/24 (a) | 1,760,000 | 1,830,400 | |
| 4.5% 9/15/27 (a) | 255,000 | 260,100 | |
| NRG Energy, Inc.: | |||
| 5.25% 6/15/29 (a) | 625,000 | 670,313 | |
| 5.75% 1/15/28 | 515,000 | 557,488 | |
| 6.625% 1/15/27 | 2,390,000 | 2,590,163 | |
| NRG Yield Operating LLC 5% 9/15/26 | 790,000 | 790,000 | |
| NSG Holdings II LLC/NSG Holdings, Inc. 7.75% 12/15/25 (a) | 2,768,685 | 2,990,179 | |
| The AES Corp. 6% 5/15/26 | 1,880,000 | 2,007,464 | |
| Vistra Operations Co. LLC: | |||
| 5% 7/31/27 (a) | 590,000 | 610,650 | |
| 5.5% 9/1/26 (a) | 3,020,000 | 3,191,294 | |
| 19,542,053 | |||
| TOTAL NONCONVERTIBLE BONDS | 276,503,073 | ||
| TOTAL CORPORATE BONDS | |||
| (Cost $267,844,233) | 278,241,490 | ||
| Preferred Securities - 4.6% | |||
| Banks & Thrifts - 3.3% | |||
| Bank of America Corp.: | |||
| 6.1% (b)(d) | 1,335,000 | 1,487,625 | |
| 6.25% (b)(d) | 3,180,000 | 3,548,203 | |
| 6.5% (b)(d) | 450,000 | 510,961 | |
| Barclays PLC 7.875% (Reg. S) (b)(d) | 890,000 | 958,083 | |
| Royal Bank of Scotland Group PLC 7.5% (b)(d) | 630,000 | 645,921 | |
| Wells Fargo & Co. 5.9% (b)(d) | 3,000,000 | 3,307,221 | |
| TOTAL BANKS & THRIFTS | 10,458,014 | ||
| Diversified Financial Services - 0.8% | |||
| AerCap Holdings NV 5.875% 10/10/79 (b) | 2,520,000 | 2,635,999 | |
| Energy - 0.5% | |||
| MPLX LP 6.875% (b)(d) | 1,700,000 | 1,748,011 | |
| TOTAL PREFERRED SECURITIES | |||
| (Cost $14,012,755) | 14,842,024 | ||
| Shares | Value | ||
| Money Market Funds - 7.9% | |||
| Fidelity Cash Central Fund 1.83% (e) | |||
| (Cost $25,594,410) | 25,589,292 | 25,594,410 | |
| TOTAL INVESTMENT IN SECURITIES - 99.1% | |||
| (Cost $307,451,398) | 318,677,924 | ||
| NET OTHER ASSETS (LIABILITIES) - 0.9% | 2,743,049 | ||
| NET ASSETS - 100% | $321,420,973 |
Legend
(a) Security exempt from registration under Rule 144A of the Securities Act of 1933. These securities may be resold in transactions exempt from registration, normally to qualified institutional buyers. At the end of the period, the value of these securities amounted to $159,173,388 or 49.5% of net assets.
(b) Coupon rates for floating and adjustable rate securities reflect the rates in effect at period end.
(c) Coupon is indexed to a floating interest rate which may be multiplied by a specified factor and/or subject to caps or floors.
(d) Security is perpetual in nature with no stated maturity date.
(e) Affiliated fund that is generally available only to investment companies and other accounts managed by Fidelity Investments. The rate quoted is the annualized seven-day yield of the fund at period end. A complete unaudited listing of the fund's holdings as of its most recent quarter end is available upon request. In addition, each Fidelity Central Fund's financial statements are available on the SEC's website or upon request.
Affiliated Central Funds
Information regarding fiscal year to date income earned by the Fund from investments in Fidelity Central Funds is as follows:
| Fund | Income earned |
| Fidelity Cash Central Fund | $170,600 |
| Total | $170,600 |
Amounts in the income column in the above table include any capital gain distributions from underlying funds, which are presented in the corresponding line-item in the Statement of Operations, if applicable.
Investment Valuation
The following is a summary of the inputs used, as of October 31, 2019, involving the Fund's assets and liabilities carried at fair value. The inputs or methodology used for valuing securities may not be an indication of the risk associated with investing in those securities. For more information on valuation inputs, and their aggregation into the levels used below, please refer to the Investment Valuation section in the accompanying Notes to Financial Statements.
| Valuation Inputs at Reporting Date: | ||||
| Description | Total | Level 1 | Level 2 | Level 3 |
| Investments in Securities: | ||||
| Corporate Bonds | $278,241,490 | $-- | $278,241,490 | $-- |
| Preferred Securities | 14,842,024 | -- | 14,842,024 | -- |
| Money Market Funds | 25,594,410 | 25,594,410 | -- | -- |
| Total Investments in Securities: | $318,677,924 | $25,594,410 | $293,083,514 | $-- |
Other Information
Distribution of investments by country or territory of incorporation, as a percentage of Total Net Assets, is as follows (Unaudited):
| United States of America | 77.7% |
| Netherlands | 4.6% |
| Multi-National | 3.9% |
| Cayman Islands | 3.9% |
| Luxembourg | 2.8% |
| Canada | 1.8% |
| Ireland | 1.6% |
| United Kingdom | 1.2% |
| Others (Individually Less Than 1%) | 2.5% |
| 100.0% |
See accompanying notes which are an integral part of the financial statements.
Financial Statements
Statement of Assets and Liabilities
| October 31, 2019 (Unaudited) | ||
| Assets | ||
| Investment in securities, at value — See accompanying schedule: Unaffiliated issuers (cost $281,856,988) | $293,083,514 | |
| Fidelity Central Funds (cost $25,594,410) | 25,594,410 | |
| Total Investment in Securities (cost $307,451,398) | $318,677,924 | |
| Receivable for fund shares sold | 397,486 | |
| Interest receivable | 3,670,168 | |
| Distributions receivable from Fidelity Central Funds | 24,557 | |
| Prepaid expenses | 552 | |
| Total assets | 322,770,687 | |
| Liabilities | ||
| Payable for investments purchased | $770,140 | |
| Payable for fund shares redeemed | 194,139 | |
| Distributions payable | 149,263 | |
| Accrued management fee | 144,837 | |
| Other affiliated payables | 49,456 | |
| Other payables and accrued expenses | 41,879 | |
| Total liabilities | 1,349,714 | |
| Net Assets | $321,420,973 | |
| Net Assets consist of: | ||
| Paid in capital | $319,592,897 | |
| Total accumulated earnings (loss) | 1,828,076 | |
| Net Assets, for 36,314,710 shares outstanding | $321,420,973 | |
| Net Asset Value, offering price and redemption price per share ($321,420,973 ÷ 36,314,710 shares) | $8.85 |
See accompanying notes which are an integral part of the financial statements.
Statement of Operations
| Six months ended October 31, 2019 (Unaudited) | ||
| Investment Income | ||
| Dividends | $354,730 | |
| Interest | 7,604,205 | |
| Income from Fidelity Central Funds | 170,600 | |
| Total income | 8,129,535 | |
| Expenses | ||
| Management fee | $855,801 | |
| Transfer agent fees | 227,608 | |
| Accounting fees | 64,215 | |
| Custodian fees and expenses | 3,188 | |
| Independent trustees' fees and expenses | 871 | |
| Registration fees | 27,210 | |
| Audit | 39,479 | |
| Legal | 291 | |
| Miscellaneous | 921 | |
| Total expenses before reductions | 1,219,584 | |
| Expense reductions | (827) | |
| Total expenses after reductions | 1,218,757 | |
| Net investment income (loss) | 6,910,778 | |
| Realized and Unrealized Gain (Loss) | ||
| Net realized gain (loss) on: | ||
| Investment securities: | ||
| Unaffiliated issuers | 1,610,528 | |
| Total net realized gain (loss) | 1,610,528 | |
| Change in net unrealized appreciation (depreciation) on investment securities | 5,209,739 | |
| Net gain (loss) | 6,820,267 | |
| Net increase (decrease) in net assets resulting from operations | $13,731,045 |
See accompanying notes which are an integral part of the financial statements.
Statement of Changes in Net Assets
| Six months ended October 31, 2019 (Unaudited) | Year ended April 30, 2019 | |
| Increase (Decrease) in Net Assets | ||
| Operations | ||
| Net investment income (loss) | $6,910,778 | $15,002,290 |
| Net realized gain (loss) | 1,610,528 | 28,481 |
| Change in net unrealized appreciation (depreciation) | 5,209,739 | 5,646,422 |
| Net increase (decrease) in net assets resulting from operations | 13,731,045 | 20,677,193 |
| Distributions to shareholders | (6,658,640) | (15,270,755) |
| Share transactions | ||
| Proceeds from sales of shares | 60,683,655 | 41,191,306 |
| Reinvestment of distributions | 5,440,866 | 11,912,459 |
| Cost of shares redeemed | (54,557,215) | (153,578,554) |
| Net increase (decrease) in net assets resulting from share transactions | 11,567,306 | (100,474,789) |
| Total increase (decrease) in net assets | 18,639,711 | (95,068,351) |
| Net Assets | ||
| Beginning of period | 302,781,262 | 397,849,613 |
| End of period | $321,420,973 | $302,781,262 |
| Other Information | ||
| Shares | ||
| Sold | 6,908,752 | 4,881,029 |
| Issued in reinvestment of distributions | 621,120 | 1,418,128 |
| Redeemed | (6,229,682) | (18,271,518) |
| Net increase (decrease) | 1,300,190 | (11,972,361) |
See accompanying notes which are an integral part of the financial statements.
Financial Highlights
Fidelity Focused High Income Fund
| Six months ended (Unaudited) October 31, | Years endedApril 30, | |||||
| 2019 | 2019 | 2018 | 2017 | 2016 | 2015 | |
| Selected Per–Share Data | ||||||
| Net asset value, beginning of period | $8.65 | $8.47 | $8.67 | $8.22 | $8.73 | $9.12 |
| Income from Investment Operations | ||||||
| Net investment income (loss)A | .195 | .399 | .380 | .397 | .396 | .390 |
| Net realized and unrealized gain (loss) | .193 | .190 | (.219) | .423 | (.519) | (.116) |
| Total from investment operations | .388 | .589 | .161 | .820 | (.123) | .274 |
| Distributions from net investment income | (.188) | (.409) | (.362) | (.373) | (.389) | (.388) |
| Distributions from net realized gain | – | – | – | – | – | (.278) |
| Total distributions | (.188) | (.409) | (.362) | (.373) | (.389) | (.666) |
| Redemption fees added to paid in capitalA | – | – | .001 | .003 | .002 | .002 |
| Net asset value, end of period | $8.85 | $8.65 | $8.47 | $8.67 | $8.22 | $8.73 |
| Total ReturnB,C | 4.53% | 7.21% | 1.86% | 10.22% | (1.30)% | 3.20% |
| Ratios to Average Net AssetsD,E | ||||||
| Expenses before reductions | .78%F | .79% | .80% | .83% | .85% | .85% |
| Expenses net of fee waivers, if any | .78%F | .79% | .80% | .83% | .85% | .85% |
| Expenses net of all reductions | .78%F | .78% | .79% | .82% | .85% | .85% |
| Net investment income (loss) | 4.44%F | 4.73% | 4.38% | 4.70% | 4.80% | 4.40% |
| Supplemental Data | ||||||
| Net assets, end of period (000 omitted) | $321,421 | $302,781 | $397,850 | $548,971 | $769,732 | $625,413 |
| Portfolio turnover rateG | 29%F | 49% | 47% | 51% | 47% | 62% |
A Calculated based on average shares outstanding during the period.
B Total returns for periods of less than one year are not annualized.
C Total returns would have been lower if certain expenses had not been reduced during the applicable periods shown.
D Fees and expenses of any underlying Fidelity Central Funds are not included in the Fund's expense ratio. The Fund indirectly bears its proportionate share of the expenses of any underlying Fidelity Central Funds.
E Expense ratios reflect operating expenses of the Fund. Expenses before reductions do not reflect amounts reimbursed by the investment adviser or reductions from expense offset arrangements and do not represent the amount paid by the Fund during periods when reimbursements or reductions occur. Expenses net of fee waivers reflect expenses after reimbursement by the investment adviser but prior to reductions from expense offset arrangements. Expenses net of all reductions represent the net expenses paid by the Fund.
F Annualized
G Amount does not include the portfolio activity of any underlying Fidelity Central Funds.
See accompanying notes which are an integral part of the financial statements.
Notes to Financial Statements (Unaudited)
For the period ended October 31, 2019
1. Organization.
Fidelity Focused High Income Fund (the Fund) is a fund of Fidelity Summer Street Trust (the Trust) and is authorized to issue an unlimited number of shares. Share transactions on the Statement of Changes in Net Assets may contain exchanges between affiliated funds. The Trust is registered under the Investment Company Act of 1940, as amended (the 1940 Act), as an open-end management investment company organized as a Massachusetts business trust.
2. Investments in Fidelity Central Funds.
The Fund invests in Fidelity Central Funds, which are open-end investment companies generally available only to other investment companies and accounts managed by the investment adviser and its affiliates. The Fund's Schedule of Investments lists each of the Fidelity Central Funds held as of period end, if any, as an investment of the Fund, but does not include the underlying holdings of each Fidelity Central Fund. As an Investing Fund, the Fund indirectly bears its proportionate share of the expenses of the underlying Fidelity Central Funds.
The Money Market Central Funds seek preservation of capital and current income and are managed by Fidelity Investments Money Management, Inc. (FIMM), an affiliate of the investment adviser. Annualized expenses of the Money Market Central Funds as of their most recent shareholder report date ranged from less than .005% to .01%.
A complete unaudited list of holdings for each Fidelity Central Fund is available upon request or at the Securities and Exchange Commission (the SEC) website at www.sec.gov. In addition, the financial statements of the Fidelity Central Funds are available on the SEC website or upon request.
3. Significant Accounting Policies.
The Fund is an investment company and applies the accounting and reporting guidance of the Financial Accounting Standards Board (FASB) Accounting Standards Codification Topic 946 Financial Services – Investments Companies. The financial statements have been prepared in conformity with accounting principles generally accepted in the United States of America (GAAP), which require management to make certain estimates and assumptions at the date of the financial statements. Actual results could differ from those estimates. Subsequent events, if any, through the date that the financial statements were issued have been evaluated in the preparation of the financial statements. The following summarizes the significant accounting policies of the Fund:
Investment Valuation. Investments are valued as of 4:00 p.m. Eastern time on the last calendar day of the period. The Board of Trustees (the Board) has delegated the day to day responsibility for the valuation of the Fund's investments to the Fair Value Committee (the Committee) established by the Fund's investment adviser. In accordance with valuation policies and procedures approved by the Board, the Fund attempts to obtain prices from one or more third party pricing vendors or brokers to value its investments. When current market prices, quotations or currency exchange rates are not readily available or reliable, investments will be fair valued in good faith by the Committee, in accordance with procedures adopted by the Board. Factors used in determining fair value vary by investment type and may include market or investment specific events, changes in interest rates and credit quality. The frequency with which these procedures are used cannot be predicted and they may be utilized to a significant extent. The Committee oversees the Fund's valuation policies and procedures and reports to the Board on the Committee's activities and fair value determinations. The Board monitors the appropriateness of the procedures used in valuing the Fund's investments and ratifies the fair value determinations of the Committee.
The Fund categorizes the inputs to valuation techniques used to value its investments into a disclosure hierarchy consisting of three levels as shown below:
- Level 1 – quoted prices in active markets for identical investments
- Level 2 – other significant observable inputs (including quoted prices for similar investments, interest rates, prepayment speeds, etc.)
- Level 3 – unobservable inputs (including the Fund's own assumptions based on the best information available)
Valuation techniques used to value the Fund's investments by major category are as follows:
Debt securities, including restricted securities, are valued based on evaluated prices received from third party pricing vendors or from brokers who make markets in such securities. Corporate bonds and preferred securities are valued by pricing vendors who utilize matrix pricing which considers yield or price of bonds of comparable quality, coupon, maturity and type or by broker-supplied prices. When independent prices are unavailable or unreliable, debt securities may be valued utilizing pricing methodologies which consider similar factors that would be used by third party pricing vendors. The Fund invests a significant portion of its assets in below investment grade securities. The value of these securities can be more volatile due to changes in the credit quality of the issuer and is sensitive to changes in economic, market and regulatory conditions.
Investments in open-end mutual funds, including the Fidelity Central Funds, are valued at their closing net asset value (NAV) each business day and are categorized as Level 1 in the hierarchy.
Changes in valuation techniques may result in transfers in or out of an assigned level within the disclosure hierarchy. The aggregate value of investments by input level as of October 31, 2019 is included at the end of the Fund's Schedule of Investments.
Investment Transactions and Income. For financial reporting purposes, the Fund's investment holdings and NAV include trades executed through the end of the last business day of the period. The NAV per share for processing shareholder transactions is calculated as of the close of business of the New York Stock Exchange (NYSE), normally 4:00 p.m. Eastern time and includes trades executed through the end of the prior business day. Gains and losses on securities sold are determined on the basis of identified cost. Dividend income is recorded on the ex-dividend date. Income and capital gain distributions from Fidelity Central Funds, if any, are recorded on the ex-dividend date. Interest income is accrued as earned and includes coupon interest and amortization of premium and accretion of discount on debt securities as applicable. Debt obligations may be placed on non-accrual status and related interest income may be reduced by ceasing current accruals and writing off interest receivables when the collection of all or a portion of interest has become doubtful based on consistently applied procedures. A debt obligation is removed from non-accrual status when the issuer resumes interest payments or when collectability of interest is reasonably assured.
Expenses. Expenses directly attributable to a fund are charged to that fund. Expenses attributable to more than one fund are allocated among the respective funds on the basis of relative net assets or other appropriate methods. Expense estimates are accrued in the period to which they relate and adjustments are made when actual amounts are known.
Income Tax Information and Distributions to Shareholders. Each year, the Fund intends to qualify as a regulated investment company under Subchapter M of the Internal Revenue Code, including distributing substantially all of its taxable income and realized gains. As a result, no provision for U.S. Federal income taxes is required. The Fund files a U.S. federal tax return, in addition to state and local tax returns as required. The Fund's federal income tax returns are subject to examination by the Internal Revenue Service (IRS) for a period of three fiscal years after they are filed. State and local tax returns may be subject to examination for an additional fiscal year depending on the jurisdiction.
Distributions are declared and recorded daily and paid monthly from net investment income. Distributions from realized gains, if any, are declared and recorded on the ex-dividend date. Income and capital gain distributions are determined in accordance with income tax regulations, which may differ from GAAP.
Capital accounts within the financial statements are adjusted for permanent book-tax differences. These adjustments have no impact on net assets or the results of operations. Capital accounts are not adjusted for temporary book-tax differences which will reverse in a subsequent period.
Book-tax differences are primarily due to market discount, partnerships, capital loss carryforwards and losses deferred due to wash sales.
As of period end, the cost and unrealized appreciation (depreciation) in securities, and derivatives if applicable, for federal income tax purposes were as follows:
| Gross unrealized appreciation | $13,740,981 |
| Gross unrealized depreciation | (1,664,640) |
| Net unrealized appreciation (depreciation) | $12,076,341 |
| Tax cost | $306,601,583 |
Capital loss carryforwards are only available to offset future capital gains of the Fund to the extent provided by regulations and may be limited. Under the Regulated Investment Company Modernization Act of 2010 (the Act), the Fund is permitted to carry forward capital losses incurred in taxable years beginning after December 22, 2010 for an unlimited period and such capital losses are required to be used prior to any losses that expire. The capital loss carryforward information presented below, including any applicable limitation, is estimated as of prior fiscal period end and is subject to adjustment.
| No expiration | |
| Short-term | $(12,090,215) |
Restricted Securities. The Fund may invest in securities that are subject to legal or contractual restrictions on resale. These securities generally may be resold in transactions exempt from registration or to the public if the securities are registered. Disposal of these securities may involve time-consuming negotiations and expense, and prompt sale at an acceptable price may be difficult. Information regarding restricted securities is included at the end of the Fund's Schedule of Investments.
4. Purchases and Sales of Investments.
Purchases and sales of securities, other than short-term securities, aggregated $45,035,294 and $42,867,976, respectively.
5. Fees and Other Transactions with Affiliates.
Management Fee. Fidelity Management & Research Company (the investment adviser) and its affiliates provide the Fund with investment management related services for which the Fund pays a monthly management fee. The management fee is the sum of an individual fund fee rate that is based on an annual rate of .45% of the Fund's average net assets and an annualized group fee rate that averaged .10% during the period. The group fee rate is based upon the average net assets of all the mutual funds advised by the investment adviser, including any mutual funds previously advised by the investment adviser that are currently advised by Fidelity SelectCo, LLC, an affiliate of the investment adviser. The group fee rate decreases as assets under management increase and increases as assets under management decrease. For the reporting period, the total annualized management fee rate was .55% of the Fund's average net assets.
Transfer Agent Fees. Fidelity Investments Institutional Operations Company, Inc. (FIIOC), an affiliate of the investment adviser, is the Fund's transfer, dividend disbursing and shareholder servicing agent. FIIOC receives account fees and asset-based fees that vary according to account size and type of account. FIIOC pays for typesetting, printing and mailing of shareholder reports, except proxy statements. For the period, the transfer agent fees were equivalent to an annualized rate of .15% of average net assets.
Accounting Fees. Fidelity Service Company, Inc. (FSC), an affiliate of the investment adviser, maintains the Fund's accounting records. The fee is based on the level of average net assets for each month. For the period, the fees were equivalent to an annualized rate of .04%.
Interfund Trades. The Fund may purchase from or sell securities to other Fidelity Funds under procedures adopted by the Board. The procedures have been designed to ensure these interfund trades are executed in accordance with Rule 17a-7 of the 1940 Act. Interfund trades are included within the respective purchases and sales amounts shown in the Purchases and Sales of Investments note.
6. Committed Line of Credit.
The Fund participates with other funds managed by the investment adviser or an affiliate in a $4.25 billion credit facility (the "line of credit") to be utilized for temporary or emergency purposes to fund shareholder redemptions or for other short-term liquidity purposes. The Fund has agreed to pay commitment fees on its pro-rata portion of the line of credit, which amounted to $375 and is reflected in Miscellaneous expenses on the Statement of Operations. During the period, the Fund did not borrow on this line of credit.
7. Expense Reductions.
Through arrangements with the Fund's custodian, credits realized as a result of certain uninvested cash balances were used to reduce the Fund's expenses by $109.
In addition, during the period the investment adviser reimbursed and/or waived a portion of operating expenses in the amount of $718.
8. Other.
The Fund's organizational documents provide former and current trustees and officers with a limited indemnification against liabilities arising in connection with the performance of their duties to the Fund. In the normal course of business, the Fund may also enter into contracts that provide general indemnifications. The Fund's maximum exposure under these arrangements is unknown as this would be dependent on future claims that may be made against the Fund. The risk of material loss from such claims is considered remote.
Shareholder Expense Example
As a shareholder of the Fund, you incur two types of costs: (1) transaction costs and (2) ongoing costs, including management fees and other Fund expenses. This Example is intended to help you understand your ongoing costs (in dollars) of investing in the Fund and to compare these costs with the ongoing costs of investing in other mutual funds.
The Example is based on an investment of $1,000 invested at the beginning of the period and held for the entire period (May 1, 2019 to October 31, 2019).
Actual Expenses
The first line of the accompanying table provides information about actual account values and actual expenses. You may use the information in this line, together with the amount you invested, to estimate the expenses that you paid over the period. Simply divide your account value by $1,000.00 (for example, an $8,600 account value divided by $1,000.00 = 8.6), then multiply the result by the number in the first line under the heading entitled "Expenses Paid During Period" to estimate the expenses you paid on your account during this period. In addition, the Fund, as a shareholder in the underlying Fidelity Central Funds, will indirectly bear its pro-rata share of the fees and expenses incurred by the underlying Fidelity Central Funds. These fees and expenses are not included in the Fund's annualized expense ratio used to calculate the expense estimate in the table below.
Hypothetical Example for Comparison Purposes
The second line of the accompanying table provides information about hypothetical account values and hypothetical expenses based on the Fund's actual expense ratio and an assumed rate of return of 5% per year before expenses, which is not the Fund's actual return. The hypothetical account values and expenses may not be used to estimate the actual ending account balance or expenses you paid for the period. You may use this information to compare the ongoing costs of investing in the Fund and other funds. To do so, compare this 5% hypothetical example with the 5% hypothetical examples that appear in the shareholder reports of the other funds. In addition, the Fund, as a shareholder in the underlying Fidelity Central Funds, will indirectly bear its pro-rata share of the fees and expenses incurred by the underlying Fidelity Central Funds. These fees and expenses are not included in the Fund's annualized expense ratio used to calculate the expense estimate in the table below.
Please note that the expenses shown in the table are meant to highlight your ongoing costs only and do not reflect any transaction costs. Therefore, the second line of the table is useful in comparing ongoing costs only, and will not help you determine the relative total costs of owning different funds.
| Annualized Expense Ratio-A | Beginning Account Value May 1, 2019 | Ending Account Value October 31, 2019 | Expenses Paid During Period-B May 1, 2019 to October 31, 2019 |
|
| Actual | .78% | $1,000.00 | $1,045.30 | $4.01 |
| Hypothetical-C | $1,000.00 | $1,021.22 | $3.96 |
A Annualized expense ratio reflects expenses net of applicable fee waivers.
B Expenses are equal to the Fund's annualized expense ratio, multiplied by the average account value over the period, multiplied by 184/366 (to reflect the one-half year period).
C 5% return per year before expenses
![]()
FFH-SANN-1219
1.801609.116
Fidelity® Series High Income Fund
Semi-Annual Report
October 31, 2019
See the inside front cover for important information about access to your fund’s shareholder reports.
Beginning on January 1, 2021, as permitted by regulations adopted by the Securities and Exchange Commission, paper copies of a fund’s shareholder reports will no longer be sent by mail, unless you specifically request paper copies of the reports from the fund or from your financial intermediary, such as a financial advisor, broker-dealer or bank. Instead, the reports will be made available on a website, and you will be notified by mail each time a report is posted and provided with a website link to access the report.
If you already elected to receive shareholder reports electronically, you will not be affected by this change and you need not take any action. You may elect to receive shareholder reports and other communications from a fund electronically, by contacting your financial intermediary. For Fidelity customers, visit Fidelity's web site or call Fidelity using the contact information listed below.
You may elect to receive all future reports in paper free of charge. If you wish to continue receiving paper copies of your shareholder reports, you may contact your financial intermediary or, if you are a Fidelity customer, visit Fidelity’s website, or call Fidelity at the applicable toll-free number listed below. Your election to receive reports in paper will apply to all funds held with the fund complex/your financial intermediary.
| Account Type | Website | Phone Number |
| Brokerage, Mutual Fund, or Annuity Contracts: | fidelity.com/mailpreferences | 1-800-343-3548 |
| Employer Provided Retirement Accounts: | netbenefits.fidelity.com/preferences (choose 'no' under Required Disclosures to continue to print) | 1-800-343-0860 |
| Advisor Sold Accounts Serviced Through Your Financial Intermediary: | Contact Your Financial Intermediary | Your Financial Intermediary's phone number |
| Advisor Sold Accounts Serviced by Fidelity: | institutional.fidelity.com | 1-877-208-0098 |
Contents
To view a fund's proxy voting guidelines and proxy voting record for the 12-month period ended June 30, visit http://www.fidelity.com/proxyvotingresults or visit the Securities and Exchange Commission's (SEC) web site at http://www.sec.gov.
You may also call 1-800-544-8544 to request a free copy of the proxy voting guidelines.
Standard & Poor's, S&P and S&P 500 are registered service marks of The McGraw-Hill Companies, Inc. and have been licensed for use by Fidelity Distributors Corporation.
Other third-party marks appearing herein are the property of their respective owners.
All other marks appearing herein are registered or unregistered trademarks or service marks of FMR LLC or an affiliated company. © 2019 FMR LLC. All rights reserved.
This report and the financial statements contained herein are submitted for the general information of the shareholders of the Fund. This report is not authorized for distribution to prospective investors in the Fund unless preceded or accompanied by an effective prospectus.
A fund files its complete schedule of portfolio holdings with the SEC for the first and third quarters of each fiscal year on Form N-PORT. Forms N-PORT are available on the SEC’s web site at http://www.sec.gov. A fund's Forms N-PORT may be reviewed and copied at the SEC’s Public Reference Room in Washington, DC. Information regarding the operation of the SEC's Public Reference Room may be obtained by calling 1-800-SEC-0330.
For a complete list of a fund's portfolio holdings, view the most recent holdings listing, semiannual report, or annual report on Fidelity's web site at http://www.fidelity.com, http://www.institutional.fidelity.com, or http://www.401k.com, as applicable.
NOT FDIC INSURED •MAY LOSE VALUE •NO BANK GUARANTEE
Neither the Fund nor Fidelity Distributors Corporation is a bank.
Investment Summary (Unaudited)
Top Five Holdings as of October 31, 2019
| (by issuer, excluding cash equivalents) | % of fund's net assets |
| Tenet Healthcare Corp. | 2.7 |
| CCO Holdings LLC/CCO Holdings Capital Corp. | 2.5 |
| Cheniere Energy Partners LP | 2.1 |
| JBS U.S.A. LLC/JBS U.S.A. Finance, Inc. | 1.9 |
| Valeant Pharmaceuticals International, Inc. | 1.7 |
| 10.9 |
Top Five Market Sectors as of October 31, 2019
| % of fund's net assets | |
| Energy | 15.1 |
| Telecommunications | 11.4 |
| Healthcare | 10.2 |
| Diversified Financial Services | 6.7 |
| Gaming | 5.7 |
Quality Diversification (% of fund's net assets)
| As of October 31, 2019 | ||
| BBB | 4.4% | |
| BB | 40.4% | |
| B | 32.9% | |
| CCC,CC,C | 14.6% | |
| D | 0.4% | |
| Not Rated | 0.8% | |
| Equities | 1.0% | |
| Short-Term Investments and Net Other Assets | 5.5% | |
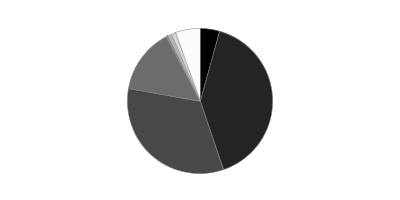
We have used ratings from Moody's Investors Service, Inc. Where Moody's® ratings are not available, we have used S&P® ratings. All ratings are as of the date indicated and do not reflect subsequent changes.
Asset Allocation (% of fund's net assets)
| As of October 31, 2019* | ||
| Nonconvertible Bonds | 89.5% | |
| Convertible Bonds, Preferred Stocks | 0.7% | |
| Common Stocks | 0.9% | |
| Bank Loan Obligations | 1.1% | |
| Other Investments | 2.3% | |
| Short-Term Investments and Net Other Assets (Liabilities) | 5.5% | |

* Foreign investments - 25.1%
Schedule of Investments October 31, 2019 (Unaudited)
Showing Percentage of Net Assets
| Corporate Bonds - 90.1% | |||
| Principal Amount | Value | ||
| Convertible Bonds - 0.6% | |||
| Broadcasting - 0.6% | |||
| DISH Network Corp.: | |||
| 2.375% 3/15/24 | $757,000 | $678,577 | |
| 3.375% 8/15/26 | 9,285,000 | 8,682,044 | |
| 9,360,621 | |||
| Nonconvertible Bonds - 89.5% | |||
| Aerospace - 3.5% | |||
| BBA U.S. Holdings, Inc. 5.375% 5/1/26 (a) | 7,334,000 | 7,664,030 | |
| Bombardier, Inc.: | |||
| 6.125% 1/15/23 (a) | 102,000 | 99,705 | |
| 7.5% 12/1/24 (a) | 6,206,000 | 6,015,941 | |
| 7.5% 3/15/25 (a) | 10,102,000 | 9,660,038 | |
| 7.875% 4/15/27 (a) | 4,893,000 | 4,623,885 | |
| BWX Technologies, Inc. 5.375% 7/15/26 (a) | 5,995,000 | 6,349,005 | |
| TransDigm, Inc.: | |||
| 6% 7/15/22 | 24,000 | 24,408 | |
| 6.25% 3/15/26 (a) | 11,876,000 | 12,722,165 | |
| 6.5% 7/15/24 | 10,832,000 | 11,184,040 | |
| 6.5% 5/15/25 | 71,000 | 73,751 | |
| 58,416,968 | |||
| Air Transportation - 0.6% | |||
| Aercap Global Aviation Trust 6.5% 6/15/45 (a)(b) | 9,328,000 | 10,225,820 | |
| Banks & Thrifts - 1.4% | |||
| Ally Financial, Inc.: | |||
| 3.875% 5/21/24 | 2,576,000 | 2,690,374 | |
| 4.25% 4/15/21 | 1,290,000 | 1,322,624 | |
| 5.75% 11/20/25 | 15,005,000 | 16,711,819 | |
| 8% 11/1/31 | 2,332,000 | 3,258,970 | |
| 23,983,787 | |||
| Broadcasting - 1.6% | |||
| Sirius XM Radio, Inc.: | |||
| 3.875% 8/1/22 (a) | 2,746,000 | 2,804,353 | |
| 4.625% 7/15/24 (a) | 2,298,000 | 2,401,410 | |
| 5% 8/1/27 (a) | 7,633,000 | 8,024,191 | |
| 5.375% 4/15/25 (a) | 6,694,960 | 6,962,758 | |
| 5.375% 7/15/26 (a) | 6,784,000 | 7,157,120 | |
| 27,349,832 | |||
| Building Materials - 0.3% | |||
| Advanced Drain Systems, Inc. 5% 9/30/27 (a) | 4,519,000 | 4,620,678 | |
| Cable/Satellite TV - 5.6% | |||
| Cablevision Systems Corp. 5.875% 9/15/22 | 25,000 | 26,969 | |
| CCO Holdings LLC/CCO Holdings Capital Corp.: | |||
| 4% 3/1/23 (a) | 164,000 | 166,870 | |
| 5% 2/1/28 (a) | 2,162,000 | 2,261,993 | |
| 5.125% 2/15/23 | 112,000 | 114,380 | |
| 5.125% 5/1/23 (a) | 115,000 | 117,731 | |
| 5.125% 5/1/27 (a) | 5,123,000 | 5,398,361 | |
| 5.5% 5/1/26 (a) | 7,602,000 | 8,010,608 | |
| 5.75% 9/1/23 | 131,000 | 133,620 | |
| 5.75% 2/15/26 (a) | 7,889,000 | 8,330,784 | |
| 5.875% 4/1/24 (a) | 8,265,000 | 8,616,263 | |
| 5.875% 5/1/27 (a) | 8,528,000 | 9,039,680 | |
| CSC Holdings LLC: | |||
| 5.25% 6/1/24 | 33,000 | 35,558 | |
| 5.375% 7/15/23 (a) | 329,000 | 337,218 | |
| 5.5% 5/15/26 (a) | 10,888,000 | 11,473,230 | |
| 5.5% 4/15/27 (a) | 4,086,000 | 4,331,201 | |
| 7.5% 4/1/28 (a) | 1,885,000 | 2,120,625 | |
| 7.75% 7/15/25 (a) | 3,770,000 | 4,043,325 | |
| DISH DBS Corp.: | |||
| 5.875% 11/15/24 | 68,000 | 68,170 | |
| 7.75% 7/1/26 | 6,273,000 | 6,328,516 | |
| Virgin Media Secured Finance PLC 5.5% 8/15/26 (a) | 2,947,000 | 3,098,034 | |
| Ziggo B.V. 5.5% 1/15/27 (a) | 10,404,000 | 10,976,220 | |
| Ziggo Bond Finance BV 5.875% 1/15/25 (a) | 7,787,000 | 8,020,610 | |
| 93,049,966 | |||
| Capital Goods - 0.8% | |||
| AECOM: | |||
| 5.125% 3/15/27 | 7,495,000 | 7,904,977 | |
| 5.875% 10/15/24 | 4,321,000 | 4,661,279 | |
| 12,566,256 | |||
| Chemicals - 2.2% | |||
| Blue Cube Spinco, Inc.: | |||
| 9.75% 10/15/23 | 85,000 | 92,650 | |
| 10% 10/15/25 | 124,000 | 138,570 | |
| CF Industries Holdings, Inc.: | |||
| 5.15% 3/15/34 | 7,790,000 | 8,257,400 | |
| 5.375% 3/15/44 | 246,000 | 252,150 | |
| Element Solutions, Inc. 5.875% 12/1/25 (a) | 4,248,000 | 4,434,519 | |
| OCI NV 6.625% 4/15/23 (a) | 6,126,000 | 6,394,013 | |
| Olin Corp. 5.125% 9/15/27 | 47,000 | 48,356 | |
| The Chemours Co. LLC: | |||
| 5.375% 5/15/27 | 1,038,000 | 922,356 | |
| 6.625% 5/15/23 | 3,636,000 | 3,616,656 | |
| 7% 5/15/25 | 4,953,000 | 4,779,645 | |
| TPC Group, Inc. 10.5% 8/1/24 (a) | 1,008,000 | 1,068,480 | |
| Trinseo Materials Operating SCA/Trinseo Materials Finance, Inc. 5.375% 9/1/25 (a) | 1,799,000 | 1,733,786 | |
| Valvoline, Inc.: | |||
| 4.375% 8/15/25 | 32,000 | 32,560 | |
| 5.5% 7/15/24 | 2,115,000 | 2,194,973 | |
| W. R. Grace & Co.-Conn.: | |||
| 5.125% 10/1/21 (a) | 1,194,000 | 1,238,775 | |
| 5.625% 10/1/24 (a) | 1,513,000 | 1,634,040 | |
| 36,838,929 | |||
| Consumer Products - 0.0% | |||
| Prestige Brands, Inc. 6.375% 3/1/24 (a) | 14,000 | 14,613 | |
| Containers - 1.5% | |||
| Ard Securities Finance SARL 8.75% 1/31/23 pay-in-kind (a)(b) | 1,908,149 | 1,984,475 | |
| Ardagh Packaging Finance PLC/Ardagh MP Holdings U.S.A., Inc.: | |||
| 4.625% 5/15/23 (a) | 495,000 | 506,756 | |
| 6% 2/15/25 (a) | 9,378,000 | 9,846,900 | |
| Crown Americas LLC/Crown Americas Capital Corp. IV 4.5% 1/15/23 | 41,000 | 42,845 | |
| Crown Americas LLC/Crown Americas Capital Corp. V 4.25% 9/30/26 | 528,000 | 551,100 | |
| OI European Group BV 4% 3/15/23 (a) | 66,000 | 65,670 | |
| Owens-Brockway Glass Container, Inc.: | |||
| 5% 1/15/22 (a) | 130,000 | 134,225 | |
| 5.375% 1/15/25 (a) | 161,000 | 162,409 | |
| Reynolds Group Issuer, Inc./Reynolds Group Issuer LLC/Reynolds Group Issuer (Luxembourg) SA: | |||
| 5.125% 7/15/23 (a) | 2,706,000 | 2,776,221 | |
| 7% 7/15/24 (a) | 3,186,000 | 3,297,510 | |
| Silgan Holdings, Inc. 4.75% 3/15/25 | 23,000 | 23,518 | |
| Trivium Packaging Finance BV: | |||
| 5.5% 8/15/26 (a) | 4,854,000 | 5,084,565 | |
| 8.5% 8/15/27 (a) | 890,000 | 948,963 | |
| 25,425,157 | |||
| Diversified Financial Services - 6.2% | |||
| Chobani LLC/Finance Corp., Inc. 7.5% 4/15/25 (a) | 22,000 | 21,120 | |
| Crown Americas LLC/Crown Americas Capital Corp. IV 4.75% 2/1/26 | 8,984,000 | 9,433,200 | |
| FLY Leasing Ltd.: | |||
| 5.25% 10/15/24 | 6,572,000 | 6,769,160 | |
| 6.375% 10/15/21 | 5,167,000 | 5,254,193 | |
| Icahn Enterprises LP/Icahn Enterprises Finance Corp.: | |||
| 5.875% 2/1/22 | 89,000 | 89,779 | |
| 6.25% 2/1/22 | 5,402,000 | 5,530,298 | |
| 6.25% 5/15/26 | 3,734,000 | 3,958,040 | |
| 6.375% 12/15/25 | 6,562,000 | 6,890,100 | |
| 6.75% 2/1/24 | 3,213,000 | 3,349,553 | |
| MSCI, Inc.: | |||
| 4.75% 8/1/26 (a) | 33,000 | 34,566 | |
| 5.375% 5/15/27 (a) | 110,000 | 117,425 | |
| 5.75% 8/15/25 (a) | 1,704,000 | 1,787,070 | |
| Navient Corp.: | |||
| 5% 10/26/20 | 2,470,000 | 2,515,572 | |
| 5.5% 1/25/23 | 61,000 | 63,364 | |
| 5.875% 10/25/24 | 5,000 | 5,113 | |
| 6.125% 3/25/24 | 3,632,000 | 3,796,530 | |
| 6.5% 6/15/22 | 5,254,000 | 5,621,780 | |
| 6.625% 7/26/21 | 79,000 | 83,444 | |
| 6.75% 6/25/25 | 6,964,000 | 7,344,931 | |
| 6.75% 6/15/26 | 1,765,000 | 1,844,425 | |
| 7.25% 1/25/22 | 1,067,000 | 1,157,375 | |
| 7.25% 9/25/23 | 3,232,000 | 3,530,895 | |
| 8% 3/25/20 | 189,000 | 193,016 | |
| Park Aerospace Holdings Ltd.: | |||
| 4.5% 3/15/23 (a) | 1,639,000 | 1,721,770 | |
| 5.25% 8/15/22 (a) | 3,169,000 | 3,374,827 | |
| 5.5% 2/15/24 (a) | 6,349,000 | 6,980,091 | |
| Quicken Loans, Inc. 5.25% 1/15/28 (a) | 5,054,000 | 5,211,938 | |
| Radiate Holdco LLC/Radiate Financial Service Ltd.: | |||
| 6.625% 2/15/25 (a) | 2,694,000 | 2,720,940 | |
| 6.875% 2/15/23 (a) | 4,903,000 | 5,013,318 | |
| Springleaf Finance Corp.: | |||
| 6.875% 3/15/25 | 1,911,000 | 2,164,208 | |
| 7.125% 3/15/26 | 5,792,000 | 6,602,880 | |
| 103,180,921 | |||
| Diversified Media - 1.0% | |||
| MDC Partners, Inc. 6.5% 5/1/24 (a) | 4,207,000 | 4,022,944 | |
| Nielsen Co. SARL (Luxembourg) 5% 2/1/25 (a) | 4,958,000 | 4,933,210 | |
| Nielsen Finance LLC/Nielsen Finance Co. 5% 4/15/22 (a) | 7,364,000 | 7,400,967 | |
| 16,357,121 | |||
| Energy - 14.3% | |||
| Archrock Partners LP / Archrock Partners Finance Corp. 6.875% 4/1/27 (a) | 2,257,000 | 2,330,127 | |
| California Resources Corp. 8% 12/15/22 (a) | 15,735,000 | 4,563,150 | |
| Cheniere Corpus Christi Holdings LLC: | |||
| 5.875% 3/31/25 | 43,000 | 47,680 | |
| 7% 6/30/24 | 5,255,000 | 6,043,670 | |
| Cheniere Energy Partners LP: | |||
| 5.25% 10/1/25 | 31,037,000 | 32,123,259 | |
| 5.625% 10/1/26 | 2,413,000 | 2,548,731 | |
| Chesapeake Energy Corp.: | |||
| 8% 1/15/25 | 8,515,000 | 5,619,900 | |
| 8% 6/15/27 | 5,369,000 | 3,355,625 | |
| Citgo Holding, Inc. 9.25% 8/1/24 (a) | 1,657,000 | 1,729,494 | |
| Citgo Petroleum Corp. 6.25% 8/15/22 (a) | 6,536,000 | 6,601,360 | |
| Comstock Escrow Corp. 9.75% 8/15/26 | 6,222,000 | 4,915,380 | |
| Consolidated Energy Finance SA: | |||
| 3 month U.S. LIBOR + 3.750% 5.8685% 6/15/22 (a)(b)(c) | 184,000 | 182,628 | |
| 6.5% 5/15/26 (a) | 4,345,000 | 4,182,063 | |
| 6.875% 6/15/25 (a) | 1,120,000 | 1,086,400 | |
| Crestwood Midstream Partners LP/Crestwood Midstream Finance Corp.: | |||
| 5.75% 4/1/25 | 238,000 | 245,735 | |
| 6.25% 4/1/23 | 7,651,000 | 7,782,597 | |
| CVR Refining LLC/Coffeyville Finance, Inc. 6.5% 11/1/22 | 3,182,000 | 3,213,820 | |
| DCP Midstream Operating LP 5.375% 7/15/25 | 5,258,000 | 5,534,045 | |
| Denbury Resources, Inc.: | |||
| 7.75% 2/15/24 (a) | 10,746,000 | 7,898,310 | |
| 9% 5/15/21 (a) | 47,000 | 41,125 | |
| 9.25% 3/31/22 (a) | 4,577,000 | 3,753,140 | |
| EP Energy LLC/Everest Acquisition Finance, Inc. 7.75% 5/15/26 (a)(d) | 4,542,000 | 3,156,690 | |
| EQT Corp. 3.9% 10/1/27 | 7,646,000 | 6,746,040 | |
| Hess Infrastructure Partners LP 5.625% 2/15/26 (a) | 6,070,000 | 6,350,738 | |
| Hilcorp Energy I LP/Hilcorp Finance Co.: | |||
| 5% 12/1/24 (a) | 3,570,000 | 3,169,446 | |
| 5.75% 10/1/25 (a) | 1,620,000 | 1,445,850 | |
| Indigo Natural Resources LLC 6.875% 2/15/26 (a) | 18,000 | 16,380 | |
| Jonah Energy LLC 7.25% 10/15/25 (a) | 9,408,000 | 2,634,240 | |
| Magnolia Oil & Gas Operating LLC 6% 8/1/26 (a) | 892,000 | 892,000 | |
| MEG Energy Corp.: | |||
| 6.375% 1/30/23 (a) | 2,835,000 | 2,679,075 | |
| 7% 3/31/24 (a) | 4,891,000 | 4,594,116 | |
| Nabors Industries, Inc.: | |||
| 5.5% 1/15/23 | 27,000 | 22,815 | |
| 5.75% 2/1/25 | 4,324,000 | 3,222,677 | |
| Noble Holding International Ltd.: | |||
| 5.25% 3/15/42 | 88,000 | 33,440 | |
| 6.05% 3/1/41 | 87,000 | 30,450 | |
| 7.875% 2/1/26 (a) | 2,875,000 | 1,897,500 | |
| Parsley Energy LLC/Parsley: | |||
| 5.25% 8/15/25 (a) | 3,713,000 | 3,805,899 | |
| 5.375% 1/15/25 (a) | 2,316,000 | 2,384,276 | |
| 5.625% 10/15/27 (a) | 1,456,000 | 1,503,320 | |
| 6.25% 6/1/24 (a) | 1,049,000 | 1,092,271 | |
| PBF Holding Co. LLC/PBF Finance Corp.: | |||
| 7% 11/15/23 | 5,549,000 | 5,715,470 | |
| 7.25% 6/15/25 | 721,000 | 753,445 | |
| PBF Logistics LP/PBF Logistics Finance, Inc. 6.875% 5/15/23 | 100,000 | 102,500 | |
| Range Resources Corp.: | |||
| 4.875% 5/15/25 | 3,436,000 | 2,757,390 | |
| 5% 3/15/23 | 1,549,000 | 1,339,885 | |
| Rose Rock Midstream LP/Rose Rock Finance Corp. 5.625% 7/15/22 | 263,000 | 265,898 | |
| Sanchez Energy Corp. 7.25% 2/15/23 (a)(d) | 11,797,000 | 8,021,960 | |
| SemGroup Corp. 6.375% 3/15/25 | 11,720,000 | 12,144,850 | |
| Semgroup Corp. / Rose Rock Finance 5.625% 11/15/23 | 215,000 | 219,838 | |
| Southwestern Energy Co.: | |||
| 7.5% 4/1/26 | 2,179,000 | 1,912,269 | |
| 7.75% 10/1/27 | 1,845,000 | 1,586,700 | |
| Summit Midstream Holdings LLC 5.75% 4/15/25 | 7,183,000 | 5,566,825 | |
| Sunoco LP/Sunoco Finance Corp.: | |||
| 4.875% 1/15/23 | 2,532,000 | 2,598,465 | |
| 5.5% 2/15/26 | 1,378,000 | 1,424,645 | |
| Targa Resources Partners LP/Targa Resources Partners Finance Corp.: | |||
| 4.25% 11/15/23 | 4,313,000 | 4,333,271 | |
| 5.125% 2/1/25 | 10,000 | 10,250 | |
| 5.25% 5/1/23 | 371,000 | 372,391 | |
| 5.375% 2/1/27 | 10,000 | 10,238 | |
| 5.875% 4/15/26 | 9,481,000 | 9,896,742 | |
| 6.75% 3/15/24 | 1,558,000 | 1,615,829 | |
| TerraForm Power Operating LLC: | |||
| 4.25% 1/31/23 (a) | 2,904,000 | 2,991,120 | |
| 5% 1/31/28 (a) | 1,355,000 | 1,429,119 | |
| Tervita Escrow Corp. 7.625% 12/1/21 (a) | 4,030,000 | 3,979,625 | |
| U.S.A. Compression Partners LP: | |||
| 6.875% 4/1/26 | 3,811,000 | 3,849,110 | |
| 6.875% 9/1/27 (a) | 2,097,000 | 2,097,000 | |
| Valaris PLC: | |||
| 4.5% 10/1/24 | 91,000 | 46,410 | |
| 5.2% 3/15/25 | 2,654,000 | 1,380,080 | |
| 7.75% 2/1/26 | 3,154,000 | 1,655,850 | |
| Viper Energy Partners LP 5.375% 11/1/27 (a) | 4,037,000 | 4,107,648 | |
| Weatherford International Ltd.: | |||
| 5.95% 4/15/42 (d) | 10,000 | 3,000 | |
| 6.5% 8/1/36 (d) | 95,000 | 28,738 | |
| 7% 3/15/38 (d) | 318,000 | 95,400 | |
| 9.875% 2/15/24 (d) | 2,212,000 | 674,660 | |
| Weatherford International, Inc.: | |||
| 6.8% 6/15/37 (d) | 1,811,000 | 547,828 | |
| 9.875% 3/1/25 (d) | 12,589,000 | 3,902,590 | |
| 236,912,501 | |||
| Environmental - 0.8% | |||
| LBC Tank Terminals Holding Netherlands BV 6.875% 5/15/23 (a) | 13,470,000 | 13,682,826 | |
| Food/Beverage/Tobacco - 4.0% | |||
| C&S Group Enterprises LLC 5.375% 7/15/22 (a) | 9,035,000 | 9,057,588 | |
| Cott Holdings, Inc. 5.5% 4/1/25 (a) | 3,048,000 | 3,177,540 | |
| JBS U.S.A. LLC/JBS U.S.A. Finance, Inc.: | |||
| 5.75% 6/15/25 (a) | 15,105,000 | 15,690,319 | |
| 5.875% 7/15/24 (a) | 2,890,000 | 2,980,313 | |
| 6.75% 2/15/28 (a) | 11,672,000 | 12,839,317 | |
| JBS U.S.A. Lux SA / JBS Food Co.: | |||
| 5.5% 1/15/30 (a) | 4,490,000 | 4,837,975 | |
| 6.5% 4/15/29 (a) | 5,081,000 | 5,652,765 | |
| Lamb Weston Holdings, Inc.: | |||
| 4.625% 11/1/24 (a) | 142,000 | 149,278 | |
| 4.875% 11/1/26 (a) | 1,078,000 | 1,133,248 | |
| Post Holdings, Inc.: | |||
| 5% 8/15/26 (a) | 2,727,000 | 2,836,353 | |
| 5.5% 3/1/25 (a) | 126,000 | 131,998 | |
| 5.75% 3/1/27 (a) | 2,365,000 | 2,517,850 | |
| U.S. Foods, Inc. 5.875% 6/15/24 (a) | 90,000 | 92,700 | |
| Vector Group Ltd. 6.125% 2/1/25 (a) | 6,241,000 | 5,991,360 | |
| 67,088,604 | |||
| Gaming - 5.7% | |||
| Boyd Gaming Corp.: | |||
| 6% 8/15/26 | 2,231,000 | 2,364,860 | |
| 6.375% 4/1/26 | 43,000 | 45,688 | |
| Caesars Resort Collection LLC 5.25% 10/15/25 (a) | 10,030,000 | 10,268,213 | |
| Eldorado Resorts, Inc.: | |||
| 6% 4/1/25 | 4,020,000 | 4,226,025 | |
| 6% 9/15/26 | 1,340,000 | 1,468,975 | |
| GLP Capital LP/GLP Financing II, Inc.: | |||
| 5.25% 6/1/25 | 3,642,000 | 3,993,526 | |
| 5.375% 4/15/26 | 1,221,000 | 1,342,673 | |
| Golden Entertainment, Inc. 7.625% 4/15/26 (a) | 7,980,000 | 8,388,975 | |
| MCE Finance Ltd. 4.875% 6/6/25 (a) | 2,855,000 | 2,917,614 | |
| MGM Growth Properties Operating Partnership LP: | |||
| 4.5% 9/1/26 | 5,335,000 | 5,668,438 | |
| 4.5% 1/15/28 | 31,000 | 32,473 | |
| 5.625% 5/1/24 | 7,742,000 | 8,525,878 | |
| 5.75% 2/1/27 (a) | 1,434,000 | 1,620,420 | |
| MGM Mirage, Inc. 5.75% 6/15/25 | 3,296,000 | 3,654,440 | |
| Penn National Gaming, Inc. 5.625% 1/15/27 (a) | 4,071,000 | 4,193,130 | |
| Scientific Games Corp.: | |||
| 5% 10/15/25 (a) | 4,006,000 | 4,126,180 | |
| 10% 12/1/22 | 210,000 | 216,038 | |
| Stars Group Holdings BV 7% 7/15/26 (a) | 10,663,000 | 11,502,711 | |
| Station Casinos LLC 5% 10/1/25 (a) | 35,000 | 35,481 | |
| Sugarhouse HSP Gaming Prop Mezz LP/Sugarhouse HSP Gaming Finance Corp. 5.875% 5/15/25 (a) | 273,000 | 270,270 | |
| Twin River Worldwide Holdings, Inc. 6.75% 6/1/27 (a) | 3,361,000 | 3,538,461 | |
| Wynn Las Vegas LLC/Wynn Las Vegas Capital Corp. 5.25% 5/15/27 (a) | 4,769,000 | 4,971,683 | |
| Wynn Macau Ltd.: | |||
| 4.875% 10/1/24 (a) | 6,917,000 | 6,951,585 | |
| 5.5% 10/1/27 (a) | 4,085,000 | 4,194,784 | |
| 94,518,521 | |||
| Healthcare - 10.2% | |||
| Catalent Pharma Solutions 4.875% 1/15/26 (a) | 1,007,000 | 1,039,728 | |
| Charles River Laboratories International, Inc.: | |||
| 4.25% 5/1/28 (a) | 472,000 | 480,897 | |
| 5.5% 4/1/26 (a) | 2,695,000 | 2,870,175 | |
| Community Health Systems, Inc.: | |||
| 6.25% 3/31/23 | 6,523,000 | 6,355,848 | |
| 8% 3/15/26 (a) | 15,019,000 | 14,681,073 | |
| 8.625% 1/15/24 (a) | 8,242,000 | 8,422,829 | |
| CTR Partnership LP/CareTrust Capital Corp. 5.25% 6/1/25 | 4,651,000 | 4,837,040 | |
| HCA Holdings, Inc.: | |||
| 4.5% 2/15/27 | 55,000 | 59,391 | |
| 5% 3/15/24 | 40,000 | 43,634 | |
| 5.25% 6/15/26 | 2,980,000 | 3,334,705 | |
| 5.375% 2/1/25 | 265,000 | 291,169 | |
| 5.375% 9/1/26 | 3,032,000 | 3,304,880 | |
| 5.875% 5/1/23 | 7,614,000 | 8,354,081 | |
| 6.25% 2/15/21 | 5,262,000 | 5,511,945 | |
| Hologic, Inc.: | |||
| 4.375% 10/15/25 (a) | 2,967,000 | 3,039,781 | |
| 4.625% 2/1/28 (a) | 6,000 | 6,278 | |
| IMS Health, Inc. 5% 5/15/27 (a) | 4,387,000 | 4,650,220 | |
| MPH Acquisition Holdings LLC 7.125% 6/1/24 (a) | 6,234,000 | 5,813,205 | |
| MPT Operating Partnership LP/MPT Finance Corp.: | |||
| 5% 10/15/27 | 87,000 | 91,568 | |
| 5.25% 8/1/26 | 2,072,000 | 2,175,600 | |
| 5.5% 5/1/24 | 1,713,000 | 1,757,966 | |
| 6.375% 3/1/24 | 2,694,000 | 2,811,863 | |
| Service Corp. International 5.125% 6/1/29 | 2,272,000 | 2,419,680 | |
| Teleflex, Inc. 4.875% 6/1/26 | 3,382,000 | 3,545,816 | |
| Tenet Healthcare Corp.: | |||
| 4.625% 7/15/24 | 21,000 | 21,630 | |
| 5.125% 5/1/25 | 2,027,000 | 2,075,141 | |
| 6.25% 2/1/27 (a) | 4,281,000 | 4,521,806 | |
| 6.75% 6/15/23 | 10,414,000 | 11,038,840 | |
| 7% 8/1/25 | 6,085,000 | 6,282,763 | |
| 8.125% 4/1/22 | 17,985,000 | 19,468,763 | |
| Valeant Pharmaceuticals International, Inc.: | |||
| 5.5% 11/1/25 (a) | 3,916,000 | 4,092,259 | |
| 5.875% 5/15/23 (a) | 1,369,000 | 1,388,851 | |
| 6.125% 4/15/25 (a) | 6,777,000 | 7,035,373 | |
| 7% 3/15/24 (a) | 3,285,000 | 3,436,685 | |
| 8.5% 1/31/27 (a) | 2,946,000 | 3,314,250 | |
| 9% 12/15/25 (a) | 4,871,000 | 5,484,990 | |
| 9.25% 4/1/26 (a) | 4,165,000 | 4,711,740 | |
| Vizient, Inc. 6.25% 5/15/27 (a) | 385,000 | 415,196 | |
| Wellcare Health Plans, Inc.: | |||
| 5.25% 4/1/25 | 4,278,000 | 4,477,194 | |
| 5.375% 8/15/26 (a) | 5,965,000 | 6,345,269 | |
| 170,010,122 | |||
| Homebuilders/Real Estate - 0.9% | |||
| Alliant Holdings Intermediate LLC 6.75% 10/15/27 (a) | 5,225,000 | 5,434,575 | |
| Howard Hughes Corp. 5.375% 3/15/25 (a) | 5,982,000 | 6,213,803 | |
| Starwood Property Trust, Inc.: | |||
| 4.75% 3/15/25 | 3,421,000 | 3,552,495 | |
| 5% 12/15/21 | 98,000 | 101,430 | |
| 15,302,303 | |||
| Hotels - 0.8% | |||
| Hilton Domestic Operating Co., Inc. 5.125% 5/1/26 | 9,924,000 | 10,420,200 | |
| Hilton Escrow Issuer LLC 4.25% 9/1/24 | 2,236,000 | 2,275,130 | |
| Hilton Worldwide Finance LLC/Hilton Worldwide Finance Corp. 4.875% 4/1/27 | 12,000 | 12,690 | |
| Wyndham Hotels & Resorts, Inc. 5.375% 4/15/26 (a) | 38,000 | 40,090 | |
| 12,748,110 | |||
| Insurance - 0.6% | |||
| AmWINS Group, Inc. 7.75% 7/1/26 (a) | 4,162,000 | 4,474,150 | |
| USIS Merger Sub, Inc. 6.875% 5/1/25 (a) | 4,869,000 | 4,954,208 | |
| 9,428,358 | |||
| Leisure - 0.2% | |||
| Mattel, Inc. 6.75% 12/31/25 (a) | 3,508,000 | 3,670,245 | |
| Metals/Mining - 0.9% | |||
| First Quantum Minerals Ltd.: | |||
| 6.5% 3/1/24 (a) | 2,641,000 | 2,588,180 | |
| 7.25% 4/1/23 (a) | 3,410,000 | 3,428,209 | |
| Freeport-McMoRan, Inc.: | |||
| 3.55% 3/1/22 | 120,000 | 121,350 | |
| 3.875% 3/15/23 | 2,066,000 | 2,096,990 | |
| Nufarm Australia Ltd. 5.75% 4/30/26 (a) | 5,812,000 | 5,841,060 | |
| 14,075,789 | |||
| Paper - 0.8% | |||
| Berry Global Escrow Corp. 4.875% 7/15/26 (a) | 3,396,000 | 3,570,045 | |
| Flex Acquisition Co., Inc.: | |||
| 6.875% 1/15/25 (a) | 7,329,000 | 6,870,938 | |
| 7.875% 7/15/26 (a) | 3,018,000 | 2,836,920 | |
| NewPage Corp. 11.375% 12/31/2014 (d)(e) | 57,102,203 | 6 | |
| 13,277,909 | |||
| Restaurants - 0.9% | |||
| 1011778 BC Unlimited Liability Co./New Red Finance, Inc.: | |||
| 4.25% 5/15/24 (a) | 4,770,000 | 4,895,213 | |
| 5% 10/15/25 (a) | 1,804,000 | 1,858,120 | |
| Golden Nugget, Inc. 6.75% 10/15/24 (a) | 6,818,000 | 7,023,222 | |
| KFC Holding Co./Pizza Hut Holding LLC 5% 6/1/24 (a) | 312,000 | 323,700 | |
| 14,100,255 | |||
| Services - 3.5% | |||
| ADT Corp. 4.875% 7/15/32 (a) | 34,000 | 29,420 | |
| APX Group, Inc.: | |||
| 7.625% 9/1/23 | 6,812,000 | 5,994,560 | |
| 7.875% 12/1/22 | 5,609,000 | 5,601,989 | |
| 8.75% 12/1/20 | 39,000 | 38,415 | |
| Aramark Services, Inc.: | |||
| 4.75% 6/1/26 | 265,000 | 271,956 | |
| 5% 4/1/25 (a) | 4,016,000 | 4,181,660 | |
| 5.125% 1/15/24 | 2,475,000 | 2,552,344 | |
| Avantor, Inc. 6% 10/1/24 (a) | 247,000 | 264,013 | |
| Brand Energy & Infrastructure Services, Inc. 8.5% 7/15/25 (a) | 4,052,000 | 3,930,440 | |
| CDK Global, Inc.: | |||
| 4.875% 6/1/27 | 15,000 | 15,806 | |
| 5.25% 5/15/29 (a) | 745,000 | 791,097 | |
| 5.875% 6/15/26 | 2,899,000 | 3,101,930 | |
| Corrections Corp. of America: | |||
| 4.125% 4/1/20 | 1,608,000 | 1,608,322 | |
| 4.625% 5/1/23 | 1,337,000 | 1,251,766 | |
| 5% 10/15/22 | 5,682,000 | 5,632,283 | |
| Frontdoor, Inc. 6.75% 8/15/26 (a) | 1,942,000 | 2,126,490 | |
| GEMS MENASA Cayman Ltd. 7.125% 7/31/26 (a) | 5,846,000 | 6,076,186 | |
| Laureate Education, Inc. 8.25% 5/1/25 (a) | 5,945,000 | 6,450,325 | |
| Prime Securities Services Borrower LLC/Prime Finance, Inc. 9.25% 5/15/23 (a) | 20,000 | 21,040 | |
| Tempo Acquisition LLC 6.75% 6/1/25 (a) | 7,683,000 | 7,903,886 | |
| The GEO Group, Inc.: | |||
| 5.875% 10/15/24 | 676,000 | 564,460 | |
| 6% 4/15/26 | 185,000 | 146,613 | |
| 58,555,001 | |||
| Super Retail - 0.3% | |||
| The William Carter Co. 5.625% 3/15/27 (a) | 4,251,000 | 4,532,629 | |
| Technology - 5.1% | |||
| Ascend Learning LLC: | |||
| 6.875% 8/1/25 (a) | 4,624,000 | 4,826,300 | |
| 6.875% 8/1/25 (a) | 793,000 | 829,676 | |
| Banff Merger Sub, Inc. 9.75% 9/1/26 (a) | 5,500,000 | 5,121,875 | |
| Camelot Finance SA 4.5% 11/1/26 (a) | 3,870,000 | 3,910,248 | |
| Ensemble S Merger Sub, Inc. 9% 9/30/23 (a) | 1,711,000 | 1,756,975 | |
| Fair Isaac Corp. 5.25% 5/15/26 (a) | 1,581,000 | 1,715,385 | |
| Gartner, Inc. 5.125% 4/1/25 (a) | 11,000 | 11,536 | |
| Micron Technology, Inc. 5.5% 2/1/25 | 15,000 | 15,429 | |
| Nuance Communications, Inc. 5.625% 12/15/26 | 4,915,000 | 5,216,290 | |
| Open Text Corp. 5.875% 6/1/26 (a) | 3,690,000 | 3,934,463 | |
| Qorvo, Inc. 5.5% 7/15/26 | 4,473,000 | 4,774,838 | |
| Rackspace Hosting, Inc. 8.625% 11/15/24 (a) | 5,426,000 | 4,964,790 | |
| Sensata Technologies BV 5% 10/1/25 (a) | 64,000 | 68,973 | |
| Solera LLC/Solera Finance, Inc. 10.5% 3/1/24 (a) | 17,168,000 | 17,962,020 | |
| SS&C Technologies, Inc. 5.5% 9/30/27 (a) | 7,899,000 | 8,427,246 | |
| Symantec Corp.: | |||
| 4.2% 9/15/20 | 2,212,000 | 2,240,296 | |
| 5% 4/15/25 (a) | 9,138,000 | 9,366,450 | |
| TTM Technologies, Inc. 5.625% 10/1/25 (a) | 9,454,000 | 9,548,540 | |
| 84,691,330 | |||
| Telecommunications - 11.1% | |||
| Altice Financing SA: | |||
| 6.625% 2/15/23 (a) | 2,450,000 | 2,516,640 | |
| 7.5% 5/15/26 (a) | 12,375,000 | 13,148,438 | |
| Altice Finco SA: | |||
| 7.625% 2/15/25 (a) | 7,680,000 | 7,872,000 | |
| 8.125% 1/15/24 (a) | 2,320,000 | 2,392,500 | |
| C&W Senior Financing Designated Activity Co.: | |||
| 6.875% 9/15/27 (a) | 11,645,000 | 12,256,363 | |
| 7.5% 10/15/26 (a) | 11,872,000 | 12,747,560 | |
| Citizens Utilities Co. 7.05% 10/1/46 | 12,307,000 | 5,538,150 | |
| Cogent Communications Group, Inc. 5.375% 3/1/22 (a) | 2,531,000 | 2,632,240 | |
| Intelsat Jackson Holdings SA 8.5% 10/15/24 (a) | 4,778,000 | 4,814,791 | |
| Level 3 Communications, Inc. 5.75% 12/1/22 | 35,000 | 35,088 | |
| Level 3 Financing, Inc.: | |||
| 5.125% 5/1/23 | 564,000 | 571,050 | |
| 5.375% 1/15/24 | 14,984,000 | 15,264,950 | |
| 5.375% 5/1/25 | 201,000 | 207,784 | |
| Millicom International Cellular SA: | |||
| 6% 3/15/25 (a) | 945,000 | 978,075 | |
| 6.625% 10/15/26 (a) | 7,662,000 | 8,322,848 | |
| Neptune Finco Corp. 6.625% 10/15/25 (a) | 9,962,000 | 10,609,530 | |
| Qwest Corp. 6.75% 12/1/21 | 19,000 | 20,506 | |
| SFR Group SA: | |||
| 7.375% 5/1/26 (a) | 13,319,000 | 14,262,585 | |
| 8.125% 2/1/27 (a) | 5,562,000 | 6,166,868 | |
| Sprint Communications, Inc. 6% 11/15/22 | 10,986,000 | 11,617,695 | |
| Sprint Corp.: | |||
| 7.125% 6/15/24 | 5,180,000 | 5,620,300 | |
| 7.875% 9/15/23 | 11,155,000 | 12,312,331 | |
| T-Mobile U.S.A., Inc.: | |||
| 4.5% 2/1/26 | 32,000 | 33,000 | |
| 5.125% 4/15/25 | 32,000 | 33,250 | |
| 6% 4/15/24 | 5,327,000 | 5,526,763 | |
| 6.375% 3/1/25 | 24,000 | 24,905 | |
| Telecom Italia Capital SA: | |||
| 6% 9/30/34 | 2,727,000 | 2,911,073 | |
| 6.375% 11/15/33 | 1,530,000 | 1,686,381 | |
| Telecom Italia SpA 5.303% 5/30/24 (a) | 9,517,000 | 10,183,190 | |
| Telenet Finance Luxembourg Notes SARL 5.5% 3/1/28 (a) | 5,400,000 | 5,742,900 | |
| U.S. West Communications 7.25% 9/15/25 | 21,000 | 24,084 | |
| Zayo Group LLC/Zayo Capital, Inc.: | |||
| 5.75% 1/15/27 (a) | 2,071,000 | 2,104,923 | |
| 6.375% 5/15/25 | 6,419,000 | 6,598,732 | |
| 184,777,493 | |||
| Transportation Ex Air/Rail - 1.0% | |||
| Avolon Holdings Funding Ltd.: | |||
| 5.125% 10/1/23 (a) | 4,938,000 | 5,328,102 | |
| 5.25% 5/15/24 (a) | 2,605,000 | 2,840,753 | |
| 5.5% 1/15/23 (a) | 7,255,000 | 7,828,871 | |
| 15,997,726 | |||
| Utilities - 3.7% | |||
| Calpine Corp. 5.75% 1/15/25 | 224,000 | 229,880 | |
| Clearway Energy Operating LLC 5.75% 10/15/25 | 25,000 | 25,656 | |
| DCP Midstream Operating LP 5.125% 5/15/29 | 3,994,000 | 4,053,910 | |
| Dynegy, Inc. 5.875% 6/1/23 | 28,000 | 28,595 | |
| Global Partners LP/GLP Finance Corp.: | |||
| 7% 6/15/23 | 3,429,000 | 3,542,962 | |
| 7% 8/1/27 (a) | 3,643,000 | 3,789,339 | |
| InterGen NV 7% 6/30/23 (a) | 15,134,000 | 14,384,867 | |
| NextEra Energy Partners LP: | |||
| 4.25% 9/15/24 (a) | 4,580,000 | 4,763,200 | |
| 4.5% 9/15/27 (a) | 8,000 | 8,160 | |
| NRG Energy, Inc.: | |||
| 5.25% 6/15/29 (a) | 3,365,000 | 3,608,963 | |
| 5.75% 1/15/28 | 2,269,000 | 2,456,193 | |
| 6.625% 1/15/27 | 38,000 | 41,183 | |
| 7.25% 5/15/26 | 21,000 | 22,996 | |
| NRG Yield Operating LLC 5% 9/15/26 | 1,810,000 | 1,810,000 | |
| NSG Holdings II LLC/NSG Holdings, Inc. 7.75% 12/15/25 (a) | 3,079,381 | 3,325,732 | |
| Talen Energy Supply LLC 10.5% 1/15/26 (a) | 6,606,000 | 5,681,160 | |
| The AES Corp.: | |||
| 4.5% 3/15/23 | 22,000 | 22,495 | |
| 4.875% 5/15/23 | 47,000 | 47,752 | |
| 5.125% 9/1/27 | 1,756,000 | 1,887,665 | |
| 6% 5/15/26 | 208,000 | 222,102 | |
| Vistra Operations Co. LLC: | |||
| 5% 7/31/27 (a) | 3,159,000 | 3,269,565 | |
| 5.5% 9/1/26 (a) | 8,542,000 | 9,026,502 | |
| 62,248,877 | |||
| TOTAL NONCONVERTIBLE BONDS | 1,487,648,647 | ||
| TOTAL CORPORATE BONDS | |||
| (Cost $1,476,481,902) | 1,497,009,268 | ||
| Shares | Value | ||
| Common Stocks - 0.9% | |||
| Food & Drug Retail - 0.9% | |||
| Southeastern Grocers, Inc. (e)(f) | 436,231 | 15,342,244 | |
| Metals/Mining - 0.0% | |||
| Aleris Corp. (e)(f) | 46,900 | 0 | |
| Elah Holdings, Inc. (f)(g) | 333 | 19,311 | |
| TOTAL METALS/MINING | 19,311 | ||
| TOTAL COMMON STOCKS | |||
| (Cost $16,160,228) | 15,361,555 | ||
| Convertible Preferred Stocks - 0.1% | |||
| Telecommunications - 0.1% | |||
| Crown Castle International Corp. Series A, 6.875% | |||
| (Cost $1,463,147) | 1,450 | 1,805,613 | |
| Principal Amount | Value | ||
| Bank Loan Obligations - 1.1% | |||
| Cable/Satellite TV - 0.0% | |||
| WideOpenWest Finance LLC Tranche B, term loan 3 month U.S. LIBOR + 3.250% 5.0543% 8/19/23 (b)(c) | 435,000 | 416,921 | |
| Energy - 0.7% | |||
| California Resources Corp.: | |||
| Tranche 1LN, term loan 3 month U.S. LIBOR + 10.375% 12.1746% 12/31/21 (b)(c) | 96,000 | 63,360 | |
| Tranche B, term loan 3 month U.S. LIBOR + 4.750% 6.5496% 12/31/22 (b)(c) | 4,259,000 | 3,643,575 | |
| Gavilan Resources LLC Tranche 2LN, term loan 3 month U.S. LIBOR + 6.000% 7.7859% 3/1/24 (b)(c) | 6,001,000 | 2,525,401 | |
| Sanchez Energy Corp. 1LN, term loan 3 month U.S. LIBOR + 8.000% 10% 5/11/20 (b)(c)(e)(h) | 4,887,466 | 4,643,093 | |
| TOTAL ENERGY | 10,875,429 | ||
| Insurance - 0.2% | |||
| HUB International Ltd. Tranche B, term loan 3 month U.S. LIBOR + 3.000% 4.9395% 4/25/25 (b)(c) | 3,828,516 | 3,741,685 | |
| Restaurants - 0.0% | |||
| Burger King Worldwide, Inc. Tranche B, term loan 3 month U.S. LIBOR + 2.250% 4.0359% 2/17/24 (b)(c) | 84,000 | 84,063 | |
| Services - 0.0% | |||
| Almonde, Inc. Tranche B 1LN, term loan 3 month U.S. LIBOR + 3.500% 5.6963% 6/13/24 (b)(c) | 350,000 | 334,033 | |
| Telecommunications - 0.2% | |||
| Radiate Holdco LLC Tranche B, term loan 3 month U.S. LIBOR + 3.000% 4.7859% 2/1/24 (b)(c) | 2,453,803 | 2,426,885 | |
| TOTAL BANK LOAN OBLIGATIONS | |||
| (Cost $18,847,015) | 17,879,016 | ||
| Preferred Securities - 2.3% | |||
| Banks & Thrifts - 1.7% | |||
| Bank of America Corp.: | |||
| 5.2% (b)(i) | 549,000 | 584,267 | |
| 5.875% (b)(i) | 27,000 | 29,890 | |
| 6.25% (b)(i) | 10,521,000 | 11,739,196 | |
| 6.5% (b)(i) | 13,000 | 14,761 | |
| Barclays PLC 7.875% (Reg. S) (b)(i) | 4,681,000 | 5,039,079 | |
| Royal Bank of Scotland Group PLC 7.5% (b)(i) | 3,239,000 | 3,320,855 | |
| Wells Fargo & Co. 5.9% (b)(i) | 6,392,000 | 7,046,586 | |
| TOTAL BANKS & THRIFTS | 27,774,634 | ||
| Diversified Financial Services - 0.5% | |||
| AerCap Holdings NV 5.875% 10/10/79 (b) | 8,354,000 | 8,738,546 | |
| Energy - 0.1% | |||
| MPLX LP 6.875% (b)(i) | 41,000 | 42,158 | |
| Summit Midstream Partners LP 9.5% (b)(i) | 3,512,000 | 2,128,550 | |
| TOTAL ENERGY | 2,170,708 | ||
| TOTAL PREFERRED SECURITIES | |||
| (Cost $38,440,374) | 38,683,888 | ||
| Shares | Value | ||
| Money Market Funds - 4.4% | |||
| Fidelity Cash Central Fund 1.83% (j) | 71,977,047 | 71,991,443 | |
| Fidelity Securities Lending Cash Central Fund 1.84% (j)(k) | 5,924 | 5,925 | |
| TOTAL MONEY MARKET FUNDS | |||
| (Cost $71,994,429) | 71,997,368 | ||
| TOTAL INVESTMENT IN SECURITIES - 98.9% | |||
| (Cost $1,623,387,095) | 1,642,736,708 | ||
| NET OTHER ASSETS (LIABILITIES) - 1.1% | 18,440,078 | ||
| NET ASSETS - 100% | $1,661,176,786 |
Legend
(a) Security exempt from registration under Rule 144A of the Securities Act of 1933. These securities may be resold in transactions exempt from registration, normally to qualified institutional buyers. At the end of the period, the value of these securities amounted to $929,838,576 or 56.0% of net assets.
(b) Coupon rates for floating and adjustable rate securities reflect the rates in effect at period end.
(c) Coupon is indexed to a floating interest rate which may be multiplied by a specified factor and/or subject to caps or floors.
(d) Non-income producing - Security is in default.
(e) Level 3 security
(f) Non-income producing
(g) Security or a portion of the security is on loan at period end.
(h) Position or a portion of the position represents an unfunded loan commitment. At period end, the total principal amount and market value of unfunded commitments totaled $3,491,047 and $3,316,495, respectively.
(i) Security is perpetual in nature with no stated maturity date.
(j) Affiliated fund that is generally available only to investment companies and other accounts managed by Fidelity Investments. The rate quoted is the annualized seven-day yield of the fund at period end. A complete unaudited listing of the fund's holdings as of its most recent quarter end is available upon request. In addition, each Fidelity Central Fund's financial statements are available on the SEC's website or upon request.
(k) Investment made with cash collateral received from securities on loan.
Affiliated Central Funds
Information regarding fiscal year to date income earned by the Fund from investments in Fidelity Central Funds is as follows:
| Fund | Income earned |
| Fidelity Cash Central Fund | $384,867 |
| Fidelity Securities Lending Cash Central Fund | 39 |
| Total | $384,906 |
Amounts in the income column in the above table include any capital gain distributions from underlying funds, which are presented in the corresponding line-item in the Statement of Operations, if applicable. Amount for Fidelity Securities Lending Cash Central Fund represents the income earned on investing cash collateral, less rebates paid to borrowers and any lending agent fees associated with the loan, plus any premium payments received for lending certain types of securities.
Investment Valuation
The following is a summary of the inputs used, as of October 31, 2019, involving the Fund's assets and liabilities carried at fair value. The inputs or methodology used for valuing securities may not be an indication of the risk associated with investing in those securities. For more information on valuation inputs, and their aggregation into the levels used below, please refer to the Investment Valuation section in the accompanying Notes to Financial Statements.
| Valuation Inputs at Reporting Date: | ||||
| Description | Total | Level 1 | Level 2 | Level 3 |
| Investments in Securities: | ||||
| Equities: | ||||
| Consumer Staples | $15,342,244 | $-- | $-- | $15,342,244 |
| Materials | 19,311 | 19,311 | -- | -- |
| Real Estate | 1,805,613 | -- | 1,805,613 | -- |
| Corporate Bonds | 1,497,009,268 | -- | 1,497,009,262 | 6 |
| Bank Loan Obligations | 17,879,016 | -- | 13,235,923 | 4,643,093 |
| Preferred Securities | 38,683,888 | -- | 38,683,888 | -- |
| Money Market Funds | 71,997,368 | 71,997,368 | -- | -- |
| Total Investments in Securities: | $1,642,736,708 | $72,016,679 | $1,550,734,686 | $19,985,343 |
The following is a reconciliation of Investments in Securities for which Level 3 inputs were used in determining value:
| Investments in Securities: | |
| Beginning Balance | $15,934,791 |
| Net Realized Gain (Loss) on Investment Securities | 24,354 |
| Net Unrealized Gain (Loss) on Investment Securities | (638,547) |
| Cost of Purchases | 4,643,093 |
| Proceeds of Sales | (24,354) |
| Amortization/Accretion | 67,984 |
| Transfers into Level 3 | -- |
| Transfers out of Level 3 | (21,978) |
| Ending Balance | $19,985,343 |
| The change in unrealized gain (loss) for the period attributable to Level 3 securities held at October 31, 2019 | $(28,723) |
The information used in the above reconciliations represents fiscal year to date activity for any Investments in Securities identified as using Level 3 inputs at either the beginning or the end of the current fiscal period, and includes securities received through affiliated in-kind transactions. Transfers in or out of Level 3 represent the beginning value of any Security or Instrument where a change in the pricing level occurred from the beginning to the end of the period. The cost of purchases and the proceeds of sales may include securities received or delivered through corporate actions or exchanges. Realized and unrealized gains (losses) disclosed in the reconciliations are included in Net Gain (Loss) on the Fund's Statement of Operations.
Other Information
Distribution of investments by country or territory of incorporation, as a percentage of Total Net Assets, is as follows (Unaudited):
| United States of America | 74.9% |
| Netherlands | 4.9% |
| Canada | 4.3% |
| Luxembourg | 4.3% |
| Multi-National | 3.1% |
| Cayman Islands | 3.1% |
| Ireland | 1.5% |
| France | 1.3% |
| Others (Individually Less Than 1%) | 2.6% |
| 100.0% |
See accompanying notes which are an integral part of the financial statements.
Financial Statements
Statement of Assets and Liabilities
| October 31, 2019 (Unaudited) | ||
| Assets | ||
| Investment in securities, at value (including securities loaned of $5,500) — See accompanying schedule: Unaffiliated issuers (cost $1,551,392,666) | $1,570,739,340 | |
| Fidelity Central Funds (cost $71,994,429) | 71,997,368 | |
| Total Investment in Securities (cost $1,623,387,095) | $1,642,736,708 | |
| Cash | 1,557,967 | |
| Receivable for investments sold | ||
| Regular delivery | 194,513 | |
| Delayed delivery | 24,354 | |
| Receivable for fund shares sold | 9,555,599 | |
| Dividends receivable | 24,063 | |
| Interest receivable | 23,460,180 | |
| Distributions receivable from Fidelity Central Funds | 79,924 | |
| Other receivables | 367 | |
| Total assets | 1,677,633,675 | |
| Liabilities | ||
| Payable for investments purchased | $16,202,911 | |
| Payable for fund shares redeemed | 239,524 | |
| Other payables and accrued expenses | 8,529 | |
| Collateral on securities loaned | 5,925 | |
| Total liabilities | 16,456,889 | |
| Net Assets | $1,661,176,786 | |
| Net Assets consist of: | ||
| Paid in capital | $1,939,806,769 | |
| Total accumulated earnings (loss) | (278,629,983) | |
| Net Assets, for 175,632,411 shares outstanding | $1,661,176,786 | |
| Net Asset Value, offering price and redemption price per share ($1,661,176,786 ÷ 175,632,411 shares) | $9.46 |
See accompanying notes which are an integral part of the financial statements.
Statement of Operations
| Six months ended October 31, 2019 (Unaudited) | ||
| Investment Income | ||
| Dividends | $1,197,465 | |
| Interest | 45,964,203 | |
| Income from Fidelity Central Funds (including $39 from security lending) | 384,906 | |
| Total income | 47,546,574 | |
| Expenses | ||
| Custodian fees and expenses | $6,790 | |
| Independent trustees' fees and expenses | 4,684 | |
| Commitment fees | 1,860 | |
| Total expenses before reductions | 13,334 | |
| Expense reductions | (7,491) | |
| Total expenses after reductions | 5,843 | |
| Net investment income (loss) | 47,540,731 | |
| Realized and Unrealized Gain (Loss) | ||
| Net realized gain (loss) on: | ||
| Investment securities: | ||
| Unaffiliated issuers | 2,572,834 | |
| Total net realized gain (loss) | 2,572,834 | |
| Change in net unrealized appreciation (depreciation) on investment securities | (5,674,127) | |
| Net gain (loss) | (3,101,293) | |
| Net increase (decrease) in net assets resulting from operations | $44,439,438 |
See accompanying notes which are an integral part of the financial statements.
Statement of Changes in Net Assets
| Six months ended October 31, 2019 (Unaudited) | Year ended April 30, 2019 | |
| Increase (Decrease) in Net Assets | ||
| Operations | ||
| Net investment income (loss) | $47,540,731 | $164,663,192 |
| Net realized gain (loss) | 2,572,834 | (76,864,585) |
| Change in net unrealized appreciation (depreciation) | (5,674,127) | 54,057,179 |
| Net increase (decrease) in net assets resulting from operations | 44,439,438 | 141,855,786 |
| Distributions to shareholders | (51,240,667) | (167,180,454) |
| Share transactions | ||
| Proceeds from sales of shares | 163,291,588 | 156,636,382 |
| Reinvestment of distributions | 51,240,667 | 167,180,454 |
| Cost of shares redeemed | (57,295,720) | (1,671,555,581) |
| Net increase (decrease) in net assets resulting from share transactions | 157,236,535 | (1,347,738,745) |
| Total increase (decrease) in net assets | 150,435,306 | (1,373,063,413) |
| Net Assets | ||
| Beginning of period | 1,510,741,480 | 2,883,804,893 |
| End of period | $1,661,176,786 | $1,510,741,480 |
| Other Information | ||
| Shares | ||
| Sold | 17,196,757 | 16,663,280 |
| Issued in reinvestment of distributions | 5,413,151 | 17,863,731 |
| Redeemed | (6,049,174) | (177,266,032) |
| Net increase (decrease) | 16,560,734 | (142,739,021) |
See accompanying notes which are an integral part of the financial statements.
Financial Highlights
Fidelity Series High Income Fund
| Six months ended (Unaudited) October 31, | Years endedApril 30, | |||||
| 2019 | 2019 | 2018 | 2017 | 2016 | 2015 | |
| Selected Per–Share Data | ||||||
| Net asset value, beginning of period | $9.50 | $9.56 | $9.68 | $8.96 | $9.87 | $10.58 |
| Income from Investment Operations | ||||||
| Net investment income (loss)A | .296 | .607 | .623 | .557 | .550 | .565 |
| Net realized and unrealized gain (loss) | (.017) | (.051) | (.141) | .687 | (.867) | (.382) |
| Total from investment operations | .279 | .556 | .482 | 1.244 | (.317) | .183 |
| Distributions from net investment income | (.315) | (.616) | (.602) | (.524) | (.546) | (.552) |
| Distributions from net realized gain | (.004) | – | – | – | (.047) | (.341) |
| Total distributions | (.319) | (.616) | (.602) | (.524) | (.593) | (.893) |
| Net asset value, end of period | $9.46 | $9.50 | $9.56 | $9.68 | $8.96 | $9.87 |
| Total ReturnB,C | 2.99% | 6.12% | 5.08% | 14.25% | (3.08)% | 1.86% |
| Ratios to Average Net AssetsD,E | ||||||
| Expenses before reductions | - %F,G | - %G | .06% | .69% | .69% | .69% |
| Expenses net of fee waivers, if any | - %F,G | - %G | .05% | .69% | .69% | .69% |
| Expenses net of all reductions | - %F,G | - %G | .05% | .69% | .69% | .69% |
| Net investment income (loss) | 6.23%F | 6.44% | 6.44% | 6.00% | 6.07% | 5.51% |
| Supplemental Data | ||||||
| Net assets, end of period (000 omitted) | $1,661,177 | $1,510,741 | $2,883,805 | $1,285,072 | $2,417,317 | $2,835,891 |
| Portfolio turnover rateH | 25%F,I | 69% | 49% | 44% | 34% | 31% |
A Calculated based on average shares outstanding during the period.
B Total returns for periods of less than one year are not annualized.
C Total returns would have been lower if certain expenses had not been reduced during the applicable periods shown.
D Fees and expenses of any underlying Fidelity Central Funds are not included in the Fund's expense ratio. The Fund indirectly bears its proportionate share of the expenses of any underlying Fidelity Central Funds.
E Expense ratios reflect operating expenses of the Fund. Expenses before reductions do not reflect amounts reimbursed by the investment adviser or reductions from brokerage service arrangements or reductions from other expense offset arrangements and do not represent the amount paid by the Fund during periods when reimbursements or reductions occur. Expenses net of fee waivers reflect expenses after reimbursement by the investment adviser but prior to reductions from brokerage service arrangements or other expense offset arrangements. Expenses net of all reductions represent the net expenses paid by the Fund.
F Annualized
G Amount represents less than .005%.
H Amount does not include the portfolio activity of any underlying Fidelity Central Funds.
I Portfolio turnover rate excludes securities received or delivered in-kind.
See accompanying notes which are an integral part of the financial statements.
Notes to Financial Statements (Unaudited)
For the period ended October 31, 2019
1. Organization.
Fidelity Series High Income Fund (the Fund) is a fund of Fidelity Summer Street Trust (the Trust) and is authorized to issue an unlimited number of shares. Shares are offered only to certain other Fidelity funds and Fidelity managed 529 plans. The Trust is registered under the Investment Company Act of 1940, as amended (the 1940 Act), as an open-end management investment company organized as a Massachusetts business trust.
2. Investments in Fidelity Central Funds.
The Fund invests in Fidelity Central Funds, which are open-end investment companies generally available only to other investment companies and accounts managed by the investment adviser and its affiliates. The Fund's Schedule of Investments lists each of the Fidelity Central Funds held as of period end, if any, as an investment of the Fund, but does not include the underlying holdings of each Fidelity Central Fund. As an Investing Fund, the Fund indirectly bears its proportionate share of the expenses of the underlying Fidelity Central Funds.
The Money Market Central Funds seek preservation of capital and current income and are managed by Fidelity Investments Money Management, Inc. (FIMM), an affiliate of the investment adviser. Annualized expenses of the Money Market Central Funds as of their most recent shareholder report date ranged from less than .005% to .01%.
A complete unaudited list of holdings for each Fidelity Central Fund is available upon request or at the Securities and Exchange Commission (the SEC) website at www.sec.gov. In addition, the financial statements of the Fidelity Central Funds are available on the SEC website or upon request.
3. Significant Accounting Policies.
The Fund is an investment company and applies the accounting and reporting guidance of the Financial Accounting Standards Board (FASB) Accounting Standards Codification Topic 946 Financial Services – Investments Companies. The financial statements have been prepared in conformity with accounting principles generally accepted in the United States of America (GAAP), which require management to make certain estimates and assumptions at the date of the financial statements. Actual results could differ from those estimates. Subsequent events, if any, through the date that the financial statements were issued have been evaluated in the preparation of the financial statements. The following summarizes the significant accounting policies of the Fund:
Investment Valuation. Investments are valued as of 4:00 p.m. Eastern time on the last calendar day of the period. The Board of Trustees (the Board) has delegated the day to day responsibility for the valuation of the Fund's investments to the Fair Value Committee (the Committee) established by the Fund's investment adviser. In accordance with valuation policies and procedures approved by the Board, the Fund attempts to obtain prices from one or more third party pricing vendors or brokers to value its investments. When current market prices, quotations or currency exchange rates are not readily available or reliable, investments will be fair valued in good faith by the Committee, in accordance with procedures adopted by the Board. Factors used in determining fair value vary by investment type and may include market or investment specific events, changes in interest rates and credit quality. The frequency with which these procedures are used cannot be predicted and they may be utilized to a significant extent. The Committee oversees the Fund's valuation policies and procedures and reports to the Board on the Committee's activities and fair value determinations. The Board monitors the appropriateness of the procedures used in valuing the Fund's investments and ratifies the fair value determinations of the Committee.
The Fund categorizes the inputs to valuation techniques used to value its investments into a disclosure hierarchy consisting of three levels as shown below:
- Level 1 – quoted prices in active markets for identical investments
- Level 2 – other significant observable inputs (including quoted prices for similar investments, interest rates, prepayment speeds, etc.)
- Level 3 – unobservable inputs (including the Fund's own assumptions based on the best information available)
Valuation techniques used to value the Fund's investments by major category are as follows:
Debt securities, including restricted securities, are valued based on evaluated prices received from third party pricing vendors or from brokers who make markets in such securities. Corporate bonds, bank loan obligations and preferred securities are valued by pricing vendors who utilize matrix pricing which considers yield or price of bonds of comparable quality, coupon, maturity and type or by broker-supplied prices. When independent prices are unavailable or unreliable, debt securities may be valued utilizing pricing methodologies which consider similar factors that would be used by third party pricing vendors. Debt securities are generally categorized as Level 2 in the hierarchy but may be Level 3 depending on the circumstances. The Fund invests a significant portion of its assets in below investment grade securities. The value of these securities can be more volatile due to changes in the credit quality of the issuer and is sensitive to changes in economic, market and regulatory conditions.
Equity securities, including restricted securities, for which market quotations are readily available, are valued at the last reported sale price or official closing price as reported by a third party pricing vendor on the primary market or exchange on which they are traded and are categorized as Level 1 in the hierarchy. In the event there were no sales during the day or closing prices are not available, securities are valued at the last quoted bid price or may be valued using the last available price and are generally categorized as Level 2 in the hierarchy. For foreign equity securities, when market or security specific events arise, comparisons to the valuation of American Depositary Receipts (ADRs), futures contracts, Exchange-Traded Funds (ETFs) and certain indexes as well as quoted prices for similar securities may be used and would be categorized as Level 2 in the hierarchy. For equity securities, including restricted securities, where observable inputs are limited, assumptions about market activity and risk are used and these securities may be categorized as Level 3 in the hierarchy. Equity securities, including restricted securities, for which observable inputs are not available are valued using alternate valuation approaches, including the market approach and the income approach and are categorized as Level 3 in the hierarchy. The market approach generally consists of using comparable market transactions while the income approach generally consists of using the net present value of estimated future cash flows, adjusted as appropriate for liquidity, credit, market and/or other risk factors.
Investments in open-end mutual funds, including the Fidelity Central Funds, are valued at their closing net asset value (NAV) each business day and are categorized as Level 1 in the hierarchy.
The following provides information on Level 3 securities held by the Fund that were valued at period end based on unobservable inputs. These amounts exclude valuations provided by a broker.
| Asset Type | Fair Value | Valuation Technique (s) | Unobservable Input | Amount or Range / Weighted Average | Impact to Valuation from an Increase in Input(a) |
| Equities | $15,342,244 | Market comparable | Discount rate | 9.0% | Decrease |
| Discount for lack of marketability | 10.0% | Decrease | |||
| Enterprise value/EBITDA (EV/EBITDA) | 5.7 | Increase | |||
| Book value | Book value multiple | 0.0 | Increase | ||
| Corporate Bonds | $6 | Recovery value | Recovery value | 0.0% | Increase |
| Bank Loan Obligations | $4,643,093 | Market approach | Transaction price | $95.00 | Increase |
(a) Represents the directional change in the fair value of the Level 3 investments that could have resulted from an increase in the corresponding input as of period end. A decrease to the unobservable input would have had the opposite effect. Significant changes in these inputs may have resulted in a significantly higher or lower fair value measurement at period end.
Changes in valuation techniques may result in transfers in or out of an assigned level within the disclosure hierarchy. The aggregate value of investments by input level as of October 31, 2019, as well as a roll forward of Level 3 investments, is included at the end of the Fund's Schedule of Investments.
Investment Transactions and Income. For financial reporting purposes, the Fund's investment holdings and NAV include trades executed through the end of the last business day of the period. The NAV per share for processing shareholder transactions is calculated as of the close of business of the New York Stock Exchange (NYSE), normally 4:00 p.m. Eastern time and includes trades executed through the end of the prior business day. Gains and losses on securities sold are determined on the basis of identified cost and include proceeds received from litigation. Dividend income is recorded on the ex-dividend date, except for certain dividends from foreign securities where the ex-dividend date may have passed, which are recorded as soon as the Fund is informed of the ex-dividend date. Non-cash dividends included in dividend income, if any, are recorded at the fair market value of the securities received. Income and capital gain distributions from Fidelity Central Funds, if any, are recorded on the ex-dividend date. Certain distributions received by the Fund represent a return of capital or capital gain. The Fund determines the components of these distributions subsequent to the ex-dividend date, based upon receipt of tax filings or other correspondence relating to the underlying investment. These distributions are recorded as a reduction of cost of investments and/or as a realized gain. Interest income is accrued as earned and includes coupon interest and amortization of premium and accretion of discount on debt securities as applicable. Paid in Kind (PIK) income is recorded at the fair market value of the securities received. Debt obligations may be placed on non-accrual status and related interest income may be reduced by ceasing current accruals and writing off interest receivables when the collection of all or a portion of interest has become doubtful based on consistently applied procedures. A debt obligation is removed from non-accrual status when the issuer resumes interest payments or when collectability of interest is reasonably assured.
Expenses. Expenses directly attributable to a fund are charged to that fund. Expenses attributable to more than one fund are allocated among the respective funds on the basis of relative net assets or other appropriate methods. Expense estimates are accrued in the period to which they relate and adjustments are made when actual amounts are known.
Income Tax Information and Distributions to Shareholders. Each year, the Fund intends to qualify as a regulated investment company under Subchapter M of the Internal Revenue Code, including distributing substantially all of its taxable income and realized gains. As a result, no provision for U.S. Federal income taxes is required. The Fund files a U.S. federal tax return, in addition to state and local tax returns as required. The Fund's federal income tax returns are subject to examination by the Internal Revenue Service (IRS) for a period of three fiscal years after they are filed. State and local tax returns may be subject to examination for an additional fiscal year depending on the jurisdiction.
Distributions are declared and recorded daily and paid monthly from net investment income. Distributions from realized gains, if any, are declared and recorded on the ex-dividend date. Income and capital gain distributions are determined in accordance with income tax regulations, which may differ from GAAP.
Capital accounts within the financial statements are adjusted for permanent book-tax differences. These adjustments have no impact on net assets or the results of operations. Capital accounts are not adjusted for temporary book-tax differences which will reverse in a subsequent period.
Book-tax differences are primarily due to foreign currency transactions, market discount, certain conversion ratio adjustments, equity-debt classifications, partnerships, capital loss carryforwards and losses deferred due to wash sales.
As of period end, the cost and unrealized appreciation (depreciation) in securities, and derivatives if applicable, for federal income tax purposes were as follows:
| Gross unrealized appreciation | $73,755,511 |
| Gross unrealized depreciation | (46,971,171) |
| Net unrealized appreciation (depreciation) | $26,784,340 |
| Tax cost | $1,615,952,368 |
Capital loss carryforwards are only available to offset future capital gains of the Fund to the extent provided by regulations and may be limited. Under the Regulated Investment Company Modernization Act of 2010 (the Act), the Fund is permitted to carry forward capital losses incurred in taxable years beginning after December 22, 2010 for an unlimited period and such capital losses are required to be used prior to any losses that expire. The capital loss carryforward information presented below, including any applicable limitation, is estimated as of prior fiscal period end and is subject to adjustment.
| No expiration | |
| Short-term | $(18,430,279) |
| Long-term | (291,998,337) |
| Total capital loss carryforward | $(310,428,616) |
Delayed Delivery Transactions and When-Issued Securities. During the period, the Fund transacted in securities on a delayed delivery or when-issued basis. Payment and delivery may take place after the customary settlement period for that security. The price of the underlying securities and the date when the securities will be delivered and paid for are fixed at the time the transaction is negotiated. The Fund may receive compensation for interest forgone in the purchase of a delayed delivery or when-issued security. With respect to purchase commitments, the Fund identifies securities as segregated in its records with a value at least equal to the amount of the commitment. Losses may arise due to changes in the value of the underlying securities or if the counterparty does not perform under the contract's terms, or if the issuer does not issue the securities due to political, economic, or other factors.
Restricted Securities. The Fund may invest in securities that are subject to legal or contractual restrictions on resale. These securities generally may be resold in transactions exempt from registration or to the public if the securities are registered. Disposal of these securities may involve time-consuming negotiations and expense, and prompt sale at an acceptable price may be difficult. Information regarding restricted securities is included at the end of the Fund's Schedule of Investments.
Loans and Other Direct Debt Instruments. The Fund invests in direct debt instruments which are interests in amounts owed to lenders by corporate or other borrowers. These instruments may be in the form of loans, trade claims or other receivables and may include standby financing commitments such as revolving credit facilities that obligate the Fund to supply additional cash to the borrower on demand. Loans may be acquired through assignment or participation. The Fund also invests in unfunded loan commitments, which are contractual obligations for future funding. Information regarding unfunded commitments is included at the end of the Fund's Schedule of Investments.
4. Purchases and Sales of Investments.
Purchases and sales of securities, other than short-term securities and in-kind transactions, aggregated $192,006,277 and $186,208,456, respectively.
5. Fees and Other Transactions with Affiliates.
Management Fee. Fidelity Management & Research Company (the investment adviser) and its affiliates provide the Fund with investment management related services for which the Fund does not pay a management fee. Under the management contract, the investment adviser or an affiliate pays all ordinary operating expenses of the Fund, except custody fees, fees and expenses of the independent Trustees, and certain miscellaneous expenses such as proxy and shareholder meeting expenses.
Brokerage Commissions. The Fund placed a portion of its portfolio transactions with brokerage firms which are affiliates of the investment adviser. Brokerage commissions are included in net realized gain (loss) and change in net unrealized appreciation (depreciation) in the Statement of Operations. The commissions paid to these affiliated firms were $5 for the period.
Interfund Trades. The Fund may purchase from or sell securities to other Fidelity Funds under procedures adopted by the Board. The procedures have been designed to ensure these interfund trades are executed in accordance with Rule 17a-7 of the 1940 Act. Interfund trades are included within the respective purchases and sales amounts shown in the Purchases and Sales of Investments note.
Affiliated Exchanges In-Kind. During the period, the Fund received investments, including accrued interest, and cash valued at $112,256,713 in exchange for 11,804,071 shares of the Fund. The amount of in-kind exchanges is included in share transactions in the accompanying Statement of Changes in Net Assets.
6. Committed Line of Credit.
The Fund participates with other funds managed by the investment adviser or an affiliate in a $4.25 billion credit facility (the "line of credit") to be utilized for temporary or emergency purposes to fund shareholder redemptions or for other short-term liquidity purposes. The Fund has agreed to pay commitment fees on its pro-rata portion of the line of credit, which amounted to $1,860 and is reflected in Commitment fees on the Statement of Operations. During the period, the Fund did not borrow on this line of credit.
7. Security Lending.
The Fund lends portfolio securities from time to time in order to earn additional income. For equity securities, lending agents are used, including National Financial Services (NFS), an affiliate of the Fund. Pursuant to a securities lending agreement, NFS will receive a fee, which is capped at 9.9% of daily lending revenue, for its services as lending agent. The Fund may lend securities to certain qualified borrowers, including NFS. On the settlement date of the loan, the Fund receives collateral (in the form of U.S. Treasury obligations, letters of credit and/or cash) against the loaned securities and maintains collateral in an amount not less than 100% of the market value of the loaned securities during the period of the loan. The market value of the loaned securities is determined at the close of business of the Fund and any additional required collateral is delivered to the Fund on the next business day. The Fund or borrower may terminate the loan at any time, and if the borrower defaults on its obligation to return the securities loaned because of insolvency or other reasons, the Fund may apply collateral received from the borrower against the obligation. The Fund may experience delays and costs in recovering the securities loaned. Any cash collateral received is invested in the Fidelity Securities Lending Cash Central Fund. The value of loaned securities and cash collateral at period end are disclosed on the Fund's Statement of Assets and Liabilities. Total fees paid by the Fund to NFS, as lending agent, amounted to $3. Security lending income represents the income earned on investing cash collateral, less rebates paid to borrowers and any lending agent fees associated with the loan, plus any premium payments received for lending certain types of securities. Security lending income is presented in the Statement of Operations as a component of income from Fidelity Central Funds. During the period, there were no securities loaned to NFS.
8. Expense Reductions.
Through arrangements with the Fund's custodian, credits realized as a result of certain uninvested cash balances were used to reduce the Fund's expenses by $7,491.
9. Other.
The Fund's organizational documents provide former and current trustees and officers with a limited indemnification against liabilities arising in connection with the performance of their duties to the Fund. In the normal course of business, the Fund may also enter into contracts that provide general indemnifications. The Fund's maximum exposure under these arrangements is unknown as this would be dependent on future claims that may be made against the Fund. The risk of material loss from such claims is considered remote.
At the end of the period, mutual funds and accounts managed by the investment adviser or its affiliates were the owners of record of all of the outstanding shares of the Fund.
Shareholder Expense Example
As a shareholder of the Fund, you incur two types of costs: (1) transaction costs and (2) ongoing costs, including other Fund expenses. This Example is intended to help you understand your ongoing costs (in dollars) of investing in the Fund and to compare these costs with the ongoing costs of investing in other mutual funds.
The Example is based on an investment of $1,000 invested at the beginning of the period and held for the entire period (May 1, 2019 to October 31, 2019).
Actual Expenses
The first line of the accompanying table provides information about actual account values and actual expenses. You may use the information in this line, together with the amount you invested, to estimate the expenses that you paid over the period. Simply divide your account value by $1,000.00 (for example, an $8,600 account value divided by $1,000.00 = 8.6), then multiply the result by the number in the first line under the heading entitled "Expenses Paid During Period" to estimate the expenses you paid on your account during this period. In addition, the Fund, as a shareholder in the underlying Fidelity Central Funds, will indirectly bear its pro-rata share of the fees and expenses incurred by the underlying Fidelity Central Funds. These fees and expenses are not included in the Fund's annualized expense ratio used to calculate the expense estimate in the table below.
Hypothetical Example for Comparison Purposes
The second line of the accompanying table provides information about hypothetical account values and hypothetical expenses based on the Fund's actual expense ratio and an assumed rate of return of 5% per year before expenses, which is not the Fund's actual return. The hypothetical account values and expenses may not be used to estimate the actual ending account balance or expenses you paid for the period. You may use this information to compare the ongoing costs of investing in the Fund and other funds. To do so, compare this 5% hypothetical example with the 5% hypothetical examples that appear in the shareholder reports of the other funds. In addition, the Fund, as a shareholder in the underlying Fidelity Central Funds, will indirectly bear its pro-rata share of the fees and expenses incurred by the underlying Fidelity Central Funds. These fees and expenses are not included in the Fund's annualized expense ratio used to calculate the expense estimate in the table below.
Please note that the expenses shown in the table are meant to highlight your ongoing costs only and do not reflect any transaction costs. Therefore, the second line of the table is useful in comparing ongoing costs only, and will not help you determine the relative total costs of owning different funds.
| Annualized Expense Ratio-A | Beginning Account Value May 1, 2019 | Ending Account Value October 31, 2019 | Expenses Paid During Period-B May 1, 2019 to October 31, 2019 |
|
| Actual | - %-C | $1,000.00 | $1,029.90 | $--D |
| Hypothetical-E | $1,000.00 | $1,025.14 | $--D |
A Annualized expense ratio reflects expenses net of applicable fee waivers.
B Expenses are equal to the Fund's annualized expense ratio, multiplied by the average account value over the period, multiplied by 184/366 (to reflect the one-half year period).
C Amount represents less than .005%.
D Amount represents less than $.005.
E 5% return per year before expenses
![]()
FSH-SANN-1219
1.924273.108
Fidelity® Global High Income Fund
Semi-Annual Report
October 31, 2019
Includes Fidelity and Fidelity Advisor share classes
See the inside front cover for important information about access to your fund’s shareholder reports.
Beginning on January 1, 2021, as permitted by regulations adopted by the Securities and Exchange Commission, paper copies of a fund’s shareholder reports will no longer be sent by mail, unless you specifically request paper copies of the reports from the fund or from your financial intermediary, such as a financial advisor, broker-dealer or bank. Instead, the reports will be made available on a website, and you will be notified by mail each time a report is posted and provided with a website link to access the report.
If you already elected to receive shareholder reports electronically, you will not be affected by this change and you need not take any action. You may elect to receive shareholder reports and other communications from a fund electronically, by contacting your financial intermediary. For Fidelity customers, visit Fidelity's web site or call Fidelity using the contact information listed below.
You may elect to receive all future reports in paper free of charge. If you wish to continue receiving paper copies of your shareholder reports, you may contact your financial intermediary or, if you are a Fidelity customer, visit Fidelity’s website, or call Fidelity at the applicable toll-free number listed below. Your election to receive reports in paper will apply to all funds held with the fund complex/your financial intermediary.
| Account Type | Website | Phone Number |
| Brokerage, Mutual Fund, or Annuity Contracts: | fidelity.com/mailpreferences | 1-800-343-3548 |
| Employer Provided Retirement Accounts: | netbenefits.fidelity.com/preferences (choose 'no' under Required Disclosures to continue to print) | 1-800-343-0860 |
| Advisor Sold Accounts Serviced Through Your Financial Intermediary: | Contact Your Financial Intermediary | Your Financial Intermediary's phone number |
| Advisor Sold Accounts Serviced by Fidelity: | institutional.fidelity.com | 1-877-208-0098 |
Contents
To view a fund's proxy voting guidelines and proxy voting record for the 12-month period ended June 30, visit http://www.fidelity.com/proxyvotingresults or visit the Securities and Exchange Commission's (SEC) web site at http://www.sec.gov.
You may also call 1-800-544-8544 if you’re an individual investing directly with Fidelity, call 1-800-835-5092 if you’re a plan sponsor or participant with Fidelity as your recordkeeper or call 1-877-208-0098 on institutional accounts or if you’re an advisor or invest through one to request a free copy of the proxy voting guidelines.
Standard & Poor's, S&P and S&P 500 are registered service marks of The McGraw-Hill Companies, Inc. and have been licensed for use by Fidelity Distributors Corporation.
Other third-party marks appearing herein are the property of their respective owners.
All other marks appearing herein are registered or unregistered trademarks or service marks of FMR LLC or an affiliated company. © 2019 FMR LLC. All rights reserved.
This report and the financial statements contained herein are submitted for the general information of the shareholders of the Fund. This report is not authorized for distribution to prospective investors in the Fund unless preceded or accompanied by an effective prospectus.
A fund files its complete schedule of portfolio holdings with the SEC for the first and third quarters of each fiscal year on Form N-PORT. Forms N-PORT are available on the SEC’s web site at http://www.sec.gov. A fund's Forms N-PORT may be reviewed and copied at the SEC’s Public Reference Room in Washington, DC. Information regarding the operation of the SEC's Public Reference Room may be obtained by calling 1-800-SEC-0330.
For a complete list of a fund's portfolio holdings, view the most recent holdings listing, semiannual report, or annual report on Fidelity's web site at http://www.fidelity.com, http://www.institutional.fidelity.com, or http://www.401k.com, as applicable.
NOT FDIC INSURED •MAY LOSE VALUE •NO BANK GUARANTEE
Neither the Fund nor Fidelity Distributors Corporation is a bank.
Investment Summary (Unaudited)
Top Five Holdings as of October 31, 2019
| (by issuer, excluding cash equivalents) | % of fund's net assets |
| NRG Energy, Inc. | 1.4 |
| Ally Financial, Inc. | 1.4 |
| Tenet Healthcare Corp. | 1.4 |
| CCO Holdings LLC/CCO Holdings Capital Corp. | 1.3 |
| Citigroup, Inc. | 1.1 |
| 6.6 |
Top Five Countries as of October 31, 2019
| (excluding cash equivalents) | % of fund's net assets |
| United States of America | 42.2 |
| Cayman Islands | 10.0 |
| Netherlands | 6.7 |
| Luxembourg | 6.1 |
| Canada | 2.6 |
Top Five Market Sectors as of October 31, 2019
| % of fund's net assets | |
| Energy | 13.4 |
| Banks & Thrifts | 7.4 |
| Healthcare | 7.2 |
| Telecommunications | 6.9 |
| Homebuilders/Real Estate | 6.6 |
Quality Diversification (% of fund's net assets)
| As of October 31, 2019 | ||
| AAA,AA,A | 0.6% | |
| BBB | 4.3% | |
| BB | 38.0% | |
| B | 32.9% | |
| CCC,CC,C | 11.7% | |
| D | 0.6% | |
| Not Rated | 4.3% | |
| Equities | 1.0% | |
| Short-Term Investments and Net Other Assets | 6.6% | |
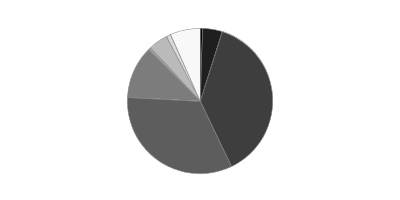
We have used ratings from Moody's Investors Service, Inc. Where Moody's® ratings are not available, we have used S&P® ratings. All ratings are as of the date indicated and do not reflect subsequent changes.
Asset Allocation (% of fund's net assets)
| As of October 31, 2019* | ||
| Corporate Bonds | 79.2% | |
| Government Obligations | 0.8% | |
| Stocks | 1.0% | |
| Preferred Securities | 7.3% | |
| Other Investments | 5.1% | |
| Short-Term Investments and Net Other Assets (Liabilities) | 6.6% | |

* Foreign investments - 51.1%
Schedule of Investments October 31, 2019 (Unaudited)
Showing Percentage of Net Assets
| Corporate Bonds - 79.2% | |||
| Principal Amount(a) | Value | ||
| Convertible Bonds - 0.7% | |||
| Broadcasting - 0.3% | |||
| DISH Network Corp.: | |||
| 2.375% 3/15/24 | $120,000 | $107,568 | |
| 3.375% 8/15/26 | 264,000 | 246,856 | |
| 354,424 | |||
| Energy - 0.0% | |||
| Denbury Resources, Inc. 6.375% 12/31/24 (b) | 89,000 | 48,212 | |
| Steel - 0.0% | |||
| Vallourec SA 4.125% 10/4/22 | EUR | 7,847 | 47,096 |
| Utilities - 0.4% | |||
| SolarCity Corp. 1.625% 11/1/19 | 407,000 | 406,743 | |
| TOTAL CONVERTIBLE BONDS | 856,475 | ||
| Nonconvertible Bonds - 78.5% | |||
| Aerospace - 1.5% | |||
| BBA U.S. Holdings, Inc.: | |||
| 4% 3/1/28 (b) | 70,000 | 69,475 | |
| 5.375% 5/1/26 (b) | 30,000 | 31,350 | |
| Bombardier, Inc.: | |||
| 7.5% 12/1/24 (b) | 96,000 | 93,060 | |
| 7.5% 3/15/25 (b) | 40,000 | 38,250 | |
| 7.875% 4/15/27 (b) | 425,000 | 401,625 | |
| BWX Technologies, Inc. 5.375% 7/15/26 (b) | 65,000 | 68,838 | |
| DAE Funding LLC 4.5% 8/1/22 (b) | 50,000 | 50,987 | |
| TransDigm UK Holdings PLC 6.875% 5/15/26 | 200,000 | 213,500 | |
| TransDigm, Inc.: | |||
| 5.5% 11/15/27 (b)(c) | 455,000 | 453,494 | |
| 6.25% 3/15/26 (b) | 80,000 | 85,700 | |
| 7.5% 3/15/27 | 285,000 | 307,800 | |
| 1,814,079 | |||
| Air Transportation - 1.0% | |||
| Aeropuertos Argentina 2000 SA 6.875% 2/1/27 (b) | 421,875 | 390,366 | |
| Azul Investments LLP 5.875% 10/26/24 (b) | 300,000 | 309,750 | |
| Leonardo SpA 1.5% 6/7/24 (Reg. S) | EUR | 100,000 | 114,644 |
| Rumo Luxembourg Sarl 7.375% 2/9/24 (b) | 300,000 | 321,390 | |
| 1,136,150 | |||
| Automotive & Auto Parts - 1.2% | |||
| Allison Transmission, Inc. 4.75% 10/1/27 (b) | 300,000 | 306,750 | |
| IAA Spinco, Inc. 5.5% 6/15/27 (b) | 30,000 | 32,142 | |
| IHO Verwaltungs GmbH: | |||
| 3.625% 5/15/25 pay-in-kind (Reg. S) (d) | EUR | 100,000 | 113,900 |
| 3.75% 9/15/26 pay-in-kind(Reg. S) (d) | EUR | 100,000 | 112,924 |
| LKQ European Holdings BV 3.625% 4/1/26 | EUR | 100,000 | 116,131 |
| Metalsa SA de CV 4.9% 4/24/23 (b) | 350,000 | 361,156 | |
| Novem Group GmbH 3 month EURIBOR + 5.250% 5.25% 5/15/24 (Reg. S) (d)(e) | EUR | 100,000 | 112,740 |
| Samvardhana Motherson Automotive Systems Group BV 1.8% 7/6/24 (Reg. S) | EUR | 100,000 | 104,281 |
| Volvo Car AB 2.125% 4/2/24 (Reg. S) | EUR | 100,000 | 114,736 |
| 1,374,760 | |||
| Banks & Thrifts - 3.8% | |||
| Access Bank PLC 10.5% 10/19/21 (b) | 200,000 | 221,938 | |
| Akbank TAS 7.2% 3/16/27 (b)(d) | 200,000 | 188,688 | |
| Ally Financial, Inc.: | |||
| 5.75% 11/20/25 | 335,000 | 373,106 | |
| 8% 11/1/31 | 155,000 | 213,079 | |
| 8% 11/1/31 | 738,000 | 1,031,355 | |
| Banco Macro SA 6.75% 11/4/26 (b)(d) | 300,000 | 220,594 | |
| Bank of Ireland 10% 12/19/22 | EUR | 100,000 | 142,422 |
| Bankia SA 3.375% 3/15/27 (Reg. S) (d) | EUR | 300,000 | 352,833 |
| Georgia Bank Joint Stock Co. 6% 7/26/23 (b) | 400,000 | 411,000 | |
| Industrial Senior Trust 5.5% 11/1/22 (b) | 200,000 | 208,531 | |
| Intesa Sanpaolo SpA 3.928% 9/15/26 (Reg. S) | EUR | 200,000 | 251,398 |
| Pearl Holding III Ltd. 9.5% 12/11/22 | 200,000 | 143,295 | |
| PT Bukit Makmur Mandiri Utama 7.75% 2/13/22 (b) | 200,000 | 205,250 | |
| TBC Bank JSC 5.75% 6/19/24 (b) | 200,000 | 205,250 | |
| Turkiye Garanti Bankasi A/S 6.125% 5/24/27 (b)(d) | 200,000 | 178,813 | |
| Turkiye Is Bankasi A/S 5.5% 4/21/22 (b) | 200,000 | 199,250 | |
| 4,546,802 | |||
| Broadcasting - 1.7% | |||
| AMC Networks, Inc.: | |||
| 4.75% 12/15/22 | 100,000 | 100,625 | |
| 4.75% 8/1/25 | 125,000 | 126,250 | |
| Cable Onda SA 4.5% 1/30/30 (b) | 200,000 | 202,250 | |
| Cumulus Media New Holdings, Inc. 6.75% 7/1/26 (b) | 40,000 | 42,400 | |
| Entercom Media Corp. 6.5% 5/1/27 (b) | 40,000 | 41,800 | |
| Netflix, Inc.: | |||
| 4.875% 4/15/28 | 85,000 | 87,830 | |
| 5.875% 11/15/28 | 140,000 | 154,175 | |
| Nexstar Escrow, Inc. 5.625% 7/15/27 (b) | 75,000 | 79,103 | |
| Scripps Escrow, Inc. 5.875% 7/15/27 (b) | 60,000 | 61,482 | |
| Sirius XM Radio, Inc.: | |||
| 4.625% 7/15/24 (b) | 100,000 | 104,500 | |
| 5% 8/1/27 (b) | 125,000 | 131,406 | |
| 5.375% 7/15/26 (b) | 380,000 | 400,900 | |
| Tegna, Inc. 5% 9/15/29 (b) | 120,000 | 121,650 | |
| TV Azteca SA de CV 8.25% 8/9/24 (Reg. S) | 400,000 | 375,625 | |
| 2,029,996 | |||
| Building Materials - 0.7% | |||
| Advanced Drain Systems, Inc. 5% 9/30/27 (b) | 15,000 | 15,338 | |
| CEMEX Finance LLC 6% 4/1/24 (Reg. S) | 200,000 | 204,866 | |
| Elementia S.A.B. de CV 5.5% 1/15/25 (b) | 200,000 | 200,750 | |
| HD Supply, Inc. 5.375% 10/15/26 (b) | 120,000 | 126,600 | |
| HMAN Finance Sub Corp. 6.375% 7/15/22 (b) | 100,000 | 92,000 | |
| Loxam SAS 3.25% 1/14/25 (Reg. S) | EUR | 100,000 | 111,112 |
| Titan Global Finance PLC 2.375% 11/16/24 (Reg. S) | EUR | 100,000 | 115,073 |
| 865,739 | |||
| Cable/Satellite TV - 5.6% | |||
| Altice Luxembourg SA: | |||
| 8% 5/15/27 (Reg. S) | EUR | 175,000 | 213,989 |
| 10.5% 5/15/27 (b) | 225,000 | 254,531 | |
| Altice SA: | |||
| 6.25% 2/15/25 (Reg. S) | EUR | 150,000 | 173,773 |
| 7.625% 2/15/25 (b) | 700,000 | 721,875 | |
| Cablevision SA 6.5% 6/15/21 (b) | 200,000 | 188,750 | |
| CCO Holdings LLC/CCO Holdings Capital Corp.: | |||
| 4.75% 3/1/30 (b) | 140,000 | 142,625 | |
| 5.125% 2/15/23 | 85,000 | 86,806 | |
| 5.125% 5/1/23 (b) | 155,000 | 158,681 | |
| 5.125% 5/1/27 (b) | 890,000 | 937,838 | |
| 5.5% 5/1/26 (b) | 110,000 | 115,913 | |
| 5.75% 1/15/24 | 46,000 | 47,136 | |
| 5.75% 2/15/26 (b) | 65,000 | 68,640 | |
| CSC Holdings LLC: | |||
| 5.375% 2/1/28 (b) | 165,000 | 174,488 | |
| 5.5% 4/15/27 (b) | 115,000 | 121,901 | |
| 5.75% 1/15/30 (b) | 100,000 | 105,250 | |
| 6.5% 2/1/29 (b) | 165,000 | 184,284 | |
| 7.5% 4/1/28 (b) | 230,000 | 258,750 | |
| 7.75% 7/15/25 (b) | 105,000 | 112,613 | |
| Digi Communications NV 5% 10/15/23 (Reg. S) | EUR | 130,000 | 148,659 |
| DISH DBS Corp.: | |||
| 5% 3/15/23 | 500,000 | 503,750 | |
| 5.875% 11/15/24 | 55,000 | 55,138 | |
| 7.75% 7/1/26 | 185,000 | 186,637 | |
| LCPR Senior Secured Financing DAC 6.75% 10/15/27 (b) | 200,000 | 205,250 | |
| UPC Holding BV 3.875% 6/15/29 (Reg. S) | EUR | 100,000 | 115,555 |
| Virgin Media Finance PLC 4.5% 1/15/25 (Reg. S) | EUR | 100,000 | 114,575 |
| Virgin Media Secured Finance PLC 5.5% 5/15/29 (b) | 320,000 | 340,000 | |
| VTR Finance BV 6.875% 1/15/24 (b) | 539,000 | 552,475 | |
| Ziggo B.V.: | |||
| 4.25% 1/15/27 (Reg. S) | EUR | 100,000 | 120,128 |
| 4.875% 1/15/30 (b) | 50,000 | 50,891 | |
| Ziggo Bond Co. BV 6% 1/15/27 (b) | 160,000 | 167,200 | |
| 6,628,101 | |||
| Chemicals - 1.9% | |||
| Bayer AG 3% 7/1/75 (Reg S.) (d) | EUR | 100,000 | 112,894 |
| Braskem Netherlands BV 4.5% 1/31/30 (b) | 200,000 | 198,300 | |
| CF Industries Holdings, Inc.: | |||
| 4.95% 6/1/43 | 270,000 | 270,338 | |
| 5.15% 3/15/34 | 335,000 | 355,100 | |
| 5.375% 3/15/44 | 105,000 | 107,625 | |
| CTC BondCo GmbH 5.25% 12/15/25 | EUR | 200,000 | 230,861 |
| OCI NV: | |||
| 5.25% 11/1/24 (b) | 110,000 | 113,850 | |
| 6.625% 4/15/23 (b) | 110,000 | 114,813 | |
| OCP SA 5.625% 4/25/24 (b) | 200,000 | 219,250 | |
| Petkim Petrokimya Holding A/S 5.875% 1/26/23 (b) | 200,000 | 196,688 | |
| Starfruit Finco BV / Starfruit U.S. Holdco LLC 8% 10/1/26 (b) | 150,000 | 149,250 | |
| Tronox Finance PLC 5.75% 10/1/25 (b) | 45,000 | 42,413 | |
| Tronox, Inc. 6.5% 4/15/26 (b) | 110,000 | 105,600 | |
| 2,216,982 | |||
| Consumer Products - 0.9% | |||
| Bonitron Designated Activity Co. 8.75% 10/30/22 (b) | 170,000 | 182,963 | |
| EVOCA SpA 3 month EURIBOR + 4.250% 4.25% 11/1/26 (Reg. S) (d)(e) | EUR | 100,000 | 111,982 |
| International Design Group SpA: | |||
| 3 month EURIBOR + 6.000% 6% 11/15/25 (Reg. S) (d)(e) | EUR | 100,000 | 111,569 |
| 6.5% 11/15/25 (Reg. S) | EUR | 100,000 | 112,645 |
| Spectrum Brands Holdings, Inc. 5% 10/1/29 (b) | 400,000 | 409,000 | |
| The Scotts Miracle-Gro Co. 4.5% 10/15/29 (b) | 90,000 | 90,450 | |
| 1,018,609 | |||
| Containers - 2.1% | |||
| ARD Finance SA 6.625% 9/15/23 pay-in-kind (d) | EUR | 100,000 | 115,439 |
| Ardagh Packaging Finance PLC/Ardagh MP Holdings U.S.A., Inc.: | |||
| 2.75% 3/15/24 (Reg. S) | EUR | 200,000 | 227,242 |
| 5.25% 8/15/27 (b) | 200,000 | 205,000 | |
| 6% 2/15/25 (b) | 200,000 | 210,000 | |
| 6.75% 5/15/24 (Reg. S) | EUR | 100,000 | 117,111 |
| Ball Corp.: | |||
| 4.375% 12/15/23 | EUR | 300,000 | 387,626 |
| 4.875% 3/15/26 | 205,000 | 222,425 | |
| Berry Global, Inc. 4.5% 2/15/26 (b) | 200,000 | 201,250 | |
| Crown Americas LLC/Crown Americas Capital Corp. V 4.25% 9/30/26 | 60,000 | 62,625 | |
| Crown European Holdings SA 2.875% 2/1/26 | EUR | 100,000 | 119,477 |
| OI European Group BV 6.75% 9/15/20 (Reg. S) | EUR | 75,000 | 88,199 |
| Plastipak Holdings, Inc. 6.25% 10/15/25 (b) | 20,000 | 16,500 | |
| Reynolds Group Issuer, Inc./Reynolds Group Issuer LLC/Reynolds Group Issuer (Luxembourg) SA 5.75% 10/15/20 | 276,196 | 277,149 | |
| Schoeller Packaging BV 6.375% 11/1/24 (Reg. S) | EUR | 124,000 | 139,601 |
| Trivium Packaging Finance BV: | |||
| 5.5% 8/15/26 (b) | 40,000 | 41,900 | |
| 8.5% 8/15/27 (b) | 40,000 | 42,650 | |
| 2,474,194 | |||
| Diversified Financial Services - 4.7% | |||
| Arena Lux Finance Sarl 2.875% 11/1/24 (Reg. S) | EUR | 100,000 | 115,434 |
| Chobani LLC/Finance Corp., Inc. 7.5% 4/15/25 (b) | 120,000 | 115,200 | |
| Comcel Trust 6.875% 2/6/24 (b) | 220,000 | 226,531 | |
| Credito Real S.A.B. de CV 9.5% 2/7/26 (b) | 200,000 | 229,156 | |
| Crown Americas LLC/Crown Americas Capital Corp. IV 4.75% 2/1/26 | 370,000 | 388,500 | |
| Diamond Sports Group LLC/Diamond Sports Finance Co. 5.375% 8/15/26 (b) | 140,000 | 146,125 | |
| FLY Leasing Ltd. 5.25% 10/15/24 | 60,000 | 61,800 | |
| Fortune Star (BVI) Ltd. 6.75% 7/2/23 (Reg. S) | 200,000 | 205,938 | |
| Garfunkelux Holdco 3 SA 7.5% 8/1/22 (Reg. S) | EUR | 100,000 | 105,383 |
| Icahn Enterprises LP/Icahn Enterprises Finance Corp.: | |||
| 5.875% 2/1/22 | 270,000 | 272,363 | |
| 6.25% 5/15/26 | 260,000 | 275,600 | |
| 6.375% 12/15/25 | 215,000 | 225,750 | |
| Intelsat Connect Finance SA 9.5% 2/15/23 (b) | 80,000 | 74,208 | |
| International Personal Finance PLC 5.75% 4/7/21 (Reg S.) | EUR | 100,000 | 103,667 |
| James Hardie International Finance Ltd. 4.75% 1/15/25 (b) | 200,000 | 207,468 | |
| Lincoln Financing SARL 3.625% 4/1/24 (Reg. S) | EUR | 225,000 | 255,779 |
| MSCI, Inc.: | |||
| 5.375% 5/15/27 (b) | 500,000 | 533,750 | |
| 5.75% 8/15/25 (b) | 50,000 | 52,438 | |
| Navient Corp.: | |||
| 5.875% 10/25/24 | 40,000 | 40,900 | |
| 7.25% 9/25/23 | 55,000 | 60,086 | |
| 8% 3/25/20 | 190,000 | 194,038 | |
| Park Aerospace Holdings Ltd.: | |||
| 4.5% 3/15/23 (b) | 20,000 | 21,010 | |
| 5.25% 8/15/22 (b) | 95,000 | 101,170 | |
| 5.5% 2/15/24 (b) | 565,000 | 621,161 | |
| Radiate Holdco LLC/Radiate Financial Service Ltd.: | |||
| 6.625% 2/15/25 (b) | 185,000 | 186,850 | |
| 6.875% 2/15/23 (b) | 85,000 | 86,913 | |
| Springleaf Finance Corp.: | |||
| 6.875% 3/15/25 | 75,000 | 84,938 | |
| 7.125% 3/15/26 | 295,000 | 336,300 | |
| Verisure Holding AB 3.5% 5/15/23 (Reg. S) | EUR | 100,000 | 114,894 |
| Yihua Overseas Investment Ltd. 8.5% 10/23/20 (Reg. S) | 200,000 | 109,500 | |
| 5,552,850 | |||
| Diversified Media - 0.2% | |||
| E.W. Scripps Co. 5.125% 5/15/25 (b) | 30,000 | 30,413 | |
| Viacom, Inc.: | |||
| 5.875% 2/28/57 (d) | 75,000 | 77,906 | |
| 6.25% 2/28/57 (d) | 90,000 | 98,100 | |
| 206,419 | |||
| Energy - 12.0% | |||
| Antero Midstream Partners LP/Antero Midstream Finance Corp.: | |||
| 5.75% 3/1/27 (b) | 140,000 | 104,300 | |
| 5.75% 1/15/28 (b) | 60,000 | 44,550 | |
| Apergy Corp. 6.375% 5/1/26 | 30,000 | 29,325 | |
| Areva SA 4.875% 9/23/24 | EUR | 200,000 | 260,159 |
| California Resources Corp. 8% 12/15/22 (b) | 705,000 | 204,450 | |
| Callon Petroleum Co. 6.375% 7/1/26 | 35,000 | 32,638 | |
| Centennial Resource Production LLC: | |||
| 5.375% 1/15/26 (b) | 75,000 | 70,313 | |
| 6.875% 4/1/27 (b) | 65,000 | 63,700 | |
| Cheniere Corpus Christi Holdings LLC 5.125% 6/30/27 | 135,000 | 145,463 | |
| Cheniere Energy Partners LP 5.625% 10/1/26 | 90,000 | 95,063 | |
| Chesapeake Energy Corp.: | |||
| 4.875% 4/15/22 | 70,000 | 55,606 | |
| 5.75% 3/15/23 | 65,000 | 47,450 | |
| 8% 6/15/27 | 185,000 | 115,625 | |
| Citgo Holding, Inc. 9.25% 8/1/24 (b) | 185,000 | 193,094 | |
| Citgo Petroleum Corp. 6.25% 8/15/22 (b) | 85,000 | 85,850 | |
| Comstock Escrow Corp. 9.75% 8/15/26 | 140,000 | 110,600 | |
| Consolidated Energy Finance SA: | |||
| 3 month U.S. LIBOR + 3.750% 5.8685% 6/15/22 (b)(d)(e) | 320,000 | 317,613 | |
| 6.5% 5/15/26 (b) | 185,000 | 178,063 | |
| 6.875% 6/15/25 (b) | 200,000 | 194,000 | |
| Covey Park Energy LLC 7.5% 5/15/25 (b) | 210,000 | 155,400 | |
| DCP Midstream LLC 5.85% 5/21/43 (b)(d) | 60,000 | 53,700 | |
| DCP Midstream Operating LP 5.375% 7/15/25 | 135,000 | 142,088 | |
| Denbury Resources, Inc.: | |||
| 7.75% 2/15/24 (b) | 421,000 | 309,435 | |
| 9.25% 3/31/22 (b) | 45,000 | 36,900 | |
| Duke Energy Field Services 8.125% 8/16/30 | 5,000 | 6,138 | |
| Ecopetrol SA: | |||
| 5.375% 6/26/26 | 100,000 | 112,313 | |
| 5.875% 5/28/45 | 100,000 | 115,259 | |
| EG Global Finance PLC: | |||
| 6.75% 2/7/25 (b) | 275,000 | 275,000 | |
| 8.5% 10/30/25 (b) | 75,000 | 78,779 | |
| Endeavor Energy Resources LP/EER Finance, Inc.: | |||
| 5.5% 1/30/26 (b) | 35,000 | 36,051 | |
| 5.75% 1/30/28 (b) | 35,000 | 36,838 | |
| EnLink Midstream LLC 5.375% 6/1/29 | 25,000 | 22,188 | |
| Envision Energy Overseas Capital Co. Ltd. 7.5% 4/26/21 | 200,000 | 159,750 | |
| EP Energy LLC/Everest Acquisition Finance, Inc. 7.75% 5/15/26 (b)(f) | 725,000 | 503,875 | |
| Exterran Partners LP/EXLP Finance Corp. 6% 10/1/22 | 200,000 | 201,500 | |
| GeoPark Ltd. 6.5% 9/21/24 (b) | 200,000 | 206,063 | |
| Greenko Dutch BV 5.25% 7/24/24 | 200,000 | 201,875 | |
| Hess Infrastructure Partners LP 5.625% 2/15/26 (b) | 100,000 | 104,625 | |
| Hilcorp Energy I LP/Hilcorp Finance Co.: | |||
| 5% 12/1/24 (b) | 195,000 | 173,121 | |
| 5.75% 10/1/25 (b) | 143,000 | 127,628 | |
| 6.25% 11/1/28 (b) | 20,000 | 16,900 | |
| Indigo Natural Resources LLC 6.875% 2/15/26 (b) | 45,000 | 40,950 | |
| Indika Energy Capital III Pte. Ltd. 5.875% 11/9/24 (b) | 200,000 | 190,600 | |
| Jonah Energy LLC 7.25% 10/15/25 (b) | 215,000 | 60,200 | |
| KLX Energy Services Holdings, Inc. 11.5% 11/1/25 (b) | 95,000 | 83,125 | |
| Kosmos Energy Ltd. 7.125% 4/4/26 (b) | 400,000 | 417,125 | |
| Magnolia Oil & Gas Operating LLC 6% 8/1/26 (b) | 85,000 | 85,000 | |
| Medco Oak Tree Pte Ltd. 7.375% 5/14/26 (b) | 200,000 | 202,885 | |
| Medco Platinum Road Pte Ltd. 6.75% 1/30/25 (Reg. S) | 200,000 | 202,250 | |
| MEG Energy Corp.: | |||
| 6.375% 1/30/23 (b) | 305,000 | 288,225 | |
| 7% 3/31/24 (b) | 360,000 | 338,148 | |
| Mongolian Mining Corp. / Energy Resources LLC 9.25% 4/15/24 (Reg. S) | 200,000 | 184,000 | |
| MPLX LP 6.375% 5/1/24 (b) | 45,000 | 47,138 | |
| Nabors Industries, Inc.: | |||
| 5.5% 1/15/23 | 105,000 | 88,725 | |
| 5.75% 2/1/25 | 200,000 | 149,060 | |
| Neerg Energy Ltd. 6% 2/13/22 (Reg. S) | 200,000 | 197,750 | |
| Noble Holding International Ltd.: | |||
| 6.05% 3/1/41 | 5,000 | 1,750 | |
| 6.2% 8/1/40 | 85,000 | 32,725 | |
| 7.75% 1/15/24 | 48,000 | 28,800 | |
| 7.875% 2/1/26 (b) | 15,000 | 9,900 | |
| 7.95% 4/1/25 (d) | 35,000 | 19,688 | |
| Nostrum Oil & Gas Finance BV 8% 7/25/22 (b) | 400,000 | 215,000 | |
| Oasis Petroleum, Inc. 6.875% 3/15/22 | 43,000 | 38,163 | |
| Pacific Drilling SA 12% 4/1/24 pay-in-kind (b)(d) | 9,097 | 3,775 | |
| Pan American Energy LLC 7.875% 5/7/21 (b) | 266,667 | 269,000 | |
| Parsley Energy LLC/Parsley: | |||
| 5.625% 10/15/27 (b) | 435,000 | 449,138 | |
| 6.25% 6/1/24 (b) | 10,000 | 10,413 | |
| PBF Holding Co. LLC/PBF Finance Corp. 7.25% 6/15/25 | 70,000 | 73,150 | |
| PBF Logistics LP/PBF Logistics Finance, Inc. 6.875% 5/15/23 | 130,000 | 133,250 | |
| Peabody Energy Corp.: | |||
| 6% 3/31/22 (b) | 20,000 | 18,500 | |
| 6.375% 3/31/25 (b) | 25,000 | 20,688 | |
| Petrobras Global Finance BV: | |||
| 5.093% 1/15/30 (b) | 88,000 | 93,104 | |
| 7.375% 1/17/27 | 150,000 | 181,650 | |
| Petroleos Mexicanos 4.875% 1/18/24 | 300,000 | 314,175 | |
| Pride International, Inc. 7.875% 8/15/40 | 95,000 | 48,450 | |
| Puma International Financing SA 5.125% 10/6/24 (Reg. S) | 200,000 | 195,616 | |
| Repsol International Finance BV 4.5% 3/25/75 (Reg. S) (d) | EUR | 200,000 | 255,999 |
| Rose Rock Midstream LP/Rose Rock Finance Corp. 5.625% 7/15/22 | 125,000 | 126,378 | |
| Sanchez Energy Corp.: | |||
| 6.125% 1/15/23 (f) | 235,000 | 10,575 | |
| 7.25% 2/15/23 (b)(f) | 275,000 | 187,000 | |
| SemGroup Corp. 7.25% 3/15/26 | 185,000 | 199,800 | |
| SESI LLC 7.75% 9/15/24 | 40,000 | 22,000 | |
| SM Energy Co.: | |||
| 5% 1/15/24 | 65,000 | 57,363 | |
| 5.625% 6/1/25 | 110,000 | 93,227 | |
| 6.625% 1/15/27 | 65,000 | 54,600 | |
| 6.75% 9/15/26 | 25,000 | 21,438 | |
| Southwestern Energy Co.: | |||
| 7.5% 4/1/26 | 65,000 | 57,043 | |
| 7.75% 10/1/27 | 50,000 | 43,000 | |
| Sunoco LP/Sunoco Finance Corp.: | |||
| 4.875% 1/15/23 | 90,000 | 92,363 | |
| 5.5% 2/15/26 | 75,000 | 77,539 | |
| 6% 4/15/27 | 175,000 | 183,750 | |
| Targa Resources Partners LP/Targa Resources Partners Finance Corp.: | |||
| 5.125% 2/1/25 | 35,000 | 35,876 | |
| 5.375% 2/1/27 | 35,000 | 35,831 | |
| 5.875% 4/15/26 | 70,000 | 73,070 | |
| 6.5% 7/15/27 (b) | 40,000 | 42,801 | |
| 6.875% 1/15/29 (b) | 70,000 | 75,688 | |
| Tecpetrol SA 4.875% 12/12/22 (b) | 100,000 | 92,234 | |
| Teine Energy Ltd. 6.875% 9/30/22 (b) | 85,000 | 85,000 | |
| TerraForm Power Operating LLC: | |||
| 4.25% 1/31/23 (b) | 150,000 | 154,500 | |
| 4.75% 1/15/30 (b) | 225,000 | 232,594 | |
| 5% 1/31/28 (b) | 50,000 | 52,735 | |
| Transocean Poseidon Ltd. 6.875% 2/1/27 (b) | 110,000 | 110,910 | |
| Transocean Sentry Ltd. 5.375% 5/15/23 (b) | 85,000 | 84,150 | |
| Transportadora de Gas del Sur SA 6.75% 5/2/25 (b) | 500,000 | 418,000 | |
| Tullow Oil PLC 6.25% 4/15/22 (b) | 200,000 | 201,500 | |
| U.S.A. Compression Partners LP 6.875% 4/1/26 | 35,000 | 35,350 | |
| Ultra Resources, Inc. 11% 7/12/24 pay-in-kind | 62,702 | 9,405 | |
| Valaris PLC: | |||
| 5.2% 3/15/25 | 30,000 | 15,600 | |
| 7.75% 2/1/26 | 85,000 | 44,625 | |
| Viper Energy Partners LP 5.375% 11/1/27 (b) | 30,000 | 30,525 | |
| W&T Offshore, Inc. 9.75% 11/1/23 (b) | 75,000 | 70,313 | |
| Weatherford International Ltd. 9.875% 2/15/24 (f) | 80,000 | 24,400 | |
| Weatherford International, Inc. 9.875% 3/1/25 (f) | 420,000 | 130,200 | |
| YPF SA: | |||
| 8.5% 3/23/21 (b) | 275,000 | 250,938 | |
| 8.5% 7/28/25 (b) | 400,000 | 316,800 | |
| 14,260,524 | |||
| Entertainment/Film - 0.5% | |||
| Live Nation Entertainment, Inc. 4.75% 10/15/27 (b) | 80,000 | 83,408 | |
| New Cotai LLC/New Cotai Capital Corp. 10.625% 5/1/19 pay-in-kind (b)(d)(f) | 1,068,694 | 512,973 | |
| 596,381 | |||
| Environmental - 0.7% | |||
| Covanta Holding Corp.: | |||
| 5.875% 3/1/24 | 110,000 | 113,025 | |
| 5.875% 7/1/25 | 15,000 | 15,563 | |
| 6% 1/1/27 | 135,000 | 141,075 | |
| LBC Tank Terminals Holding Netherlands BV 6.875% 5/15/23 (b) | 465,000 | 472,347 | |
| Paprec Holding 3 month EURIBOR + 3.500% 3.5% 3/31/25 (d)(e) | EUR | 100,000 | 100,544 |
| 842,554 | |||
| Food & Drug Retail - 0.3% | |||
| Cumberland Farms, Inc. 6.75% 5/1/25 (b) | 25,000 | 26,795 | |
| Performance Food Group, Inc. 5.5% 10/15/27 (b) | 75,000 | 79,313 | |
| Sigma Holdco BV 5.75% 5/15/26 (Reg. S) | EUR | 210,000 | 223,088 |
| Tops Markets LLC 13% 11/19/24 pay-in-kind (d) | 31,655 | 31,655 | |
| 360,851 | |||
| Food/Beverage/Tobacco - 2.7% | |||
| Biostime International Holdings Ltd. 5.625% 10/24/24 (Reg. S) | 200,000 | 203,750 | |
| Central American Bottling Corp. 5.75% 1/31/27 (b) | 200,000 | 210,375 | |
| ESAL GmbH 6.25% 2/5/23 (b) | 21,000 | 21,407 | |
| JBS Investments II GmbH: | |||
| 5.75% 1/15/28 (b) | 200,000 | 208,400 | |
| 7% 1/15/26 (b) | 600,000 | 650,400 | |
| JBS U.S.A. LLC/JBS U.S.A. Finance, Inc.: | |||
| 5.75% 6/15/25 (b) | 30,000 | 31,163 | |
| 5.875% 7/15/24 (b) | 40,000 | 41,250 | |
| 6.75% 2/15/28 (b) | 185,000 | 203,502 | |
| JBS U.S.A. Lux SA / JBS Food Co.: | |||
| 5.5% 1/15/30 (b) | 120,000 | 129,300 | |
| 6.5% 4/15/29 (b) | 175,000 | 194,693 | |
| KeHE Distributors LLC / KeHE Finance Corp. 8.625% 10/15/26 (b) | 60,000 | 61,538 | |
| Lamb Weston Holdings, Inc.: | |||
| 4.625% 11/1/24 (b) | 45,000 | 47,306 | |
| 4.875% 11/1/26 (b) | 45,000 | 47,306 | |
| MHP SA 7.75% 5/10/24 (b) | 300,000 | 318,000 | |
| Pilgrim's Pride Corp. 5.75% 3/15/25 (b) | 225,000 | 233,438 | |
| Post Holdings, Inc.: | |||
| 5% 8/15/26 (b) | 255,000 | 265,226 | |
| 5.625% 1/15/28 (b) | 110,000 | 117,700 | |
| 5.75% 3/1/27 (b) | 160,000 | 170,341 | |
| Vector Group Ltd. 6.125% 2/1/25 (b) | 90,000 | 86,400 | |
| 3,241,495 | |||
| Gaming - 2.6% | |||
| Caesars Resort Collection LLC 5.25% 10/15/25 (b) | 300,000 | 307,125 | |
| Cleopatra Finance Ltd. 4.75% 2/15/23 (Reg. S) | EUR | 100,000 | 122,127 |
| GLP Capital LP/GLP Financing II, Inc.: | |||
| 5.25% 6/1/25 | 95,000 | 104,169 | |
| 5.375% 4/15/26 | 30,000 | 32,990 | |
| International Game Technology PLC 6.25% 1/15/27 (b) | 50,000 | 55,625 | |
| LHMC Finco SARL 6.25% 12/20/23 (Reg. S) | EUR | 100,000 | 118,082 |
| MCE Finance Ltd.: | |||
| 5.25% 4/26/26 (b) | 200,000 | 208,119 | |
| 5.625% 7/17/27 (Reg. S) | 250,000 | 260,742 | |
| MGM China Holdings Ltd. 5.875% 5/15/26 (Reg. S) | 200,000 | 212,000 | |
| MGM Growth Properties Operating Partnership LP: | |||
| 4.5% 1/15/28 | 350,000 | 366,625 | |
| 5.75% 2/1/27 (b) | 70,000 | 79,100 | |
| Penn National Gaming, Inc. 5.625% 1/15/27 (b) | 15,000 | 15,450 | |
| Station Casinos LLC 5% 10/1/25 (b) | 90,000 | 91,238 | |
| Transocean, Inc. 7.25% 11/1/25 (b) | 160,000 | 141,200 | |
| Twin River Worldwide Holdings, Inc. 6.75% 6/1/27 (b) | 40,000 | 42,112 | |
| Wynn Las Vegas LLC/Wynn Las Vegas Capital Corp. 5.25% 5/15/27 (b) | 245,000 | 255,413 | |
| Wynn Macau Ltd.: | |||
| 4.875% 10/1/24 (b) | 200,000 | 201,000 | |
| 4.875% 10/1/24 (Reg. S) | 200,000 | 201,000 | |
| 5.5% 10/1/27 (b) | 200,000 | 205,375 | |
| Wynn Resorts Ltd. 5.125% 10/1/29 (b) | 85,000 | 88,825 | |
| 3,108,317 | |||
| Healthcare - 6.6% | |||
| BCPE Cycle Merger Sub II, Inc. 10.625% 7/15/27 (b) | 110,000 | 102,850 | |
| Catalent Pharma Solutions 5% 7/15/27 (b) | 20,000 | 20,900 | |
| Centene Corp. 5.375% 6/1/26 (b) | 245,000 | 259,333 | |
| Charles River Laboratories International, Inc.: | |||
| 4.25% 5/1/28 (b) | 20,000 | 20,377 | |
| 5.5% 4/1/26 (b) | 65,000 | 69,225 | |
| Community Health Systems, Inc.: | |||
| 5.125% 8/1/21 | 100,000 | 99,750 | |
| 6.25% 3/31/23 | 490,000 | 477,444 | |
| 8% 3/15/26 (b) | 440,000 | 430,100 | |
| 8.125% 6/30/24 (b) | 55,000 | 41,800 | |
| CTR Partnership LP/CareTrust Capital Corp. 5.25% 6/1/25 | 100,000 | 104,000 | |
| DaVita HealthCare Partners, Inc.: | |||
| 5% 5/1/25 | 360,000 | 364,500 | |
| 5.125% 7/15/24 | 150,000 | 153,116 | |
| Encompass Health Corp. 5.75% 9/15/25 | 15,000 | 15,656 | |
| Eurofins Scientific SA 2.125% 7/25/24 (Reg. S) | EUR | 100,000 | 113,158 |
| HCA Holdings, Inc.: | |||
| 4.5% 2/15/27 | 500,000 | 539,914 | |
| 5.375% 9/1/26 | 85,000 | 92,650 | |
| 5.625% 9/1/28 | 150,000 | 168,563 | |
| 5.875% 2/15/26 | 85,000 | 95,625 | |
| 5.875% 2/1/29 | 45,000 | 51,019 | |
| 7.5% 2/15/22 | 180,000 | 199,710 | |
| Hologic, Inc.: | |||
| 4.375% 10/15/25 (b) | 75,000 | 76,840 | |
| 4.625% 2/1/28 (b) | 30,000 | 31,388 | |
| IMS Health, Inc.: | |||
| 3.25% 3/15/25 (Reg. S) | EUR | 200,000 | 228,073 |
| 5% 10/15/26 (b) | 120,000 | 126,600 | |
| InRetail Pharma SA 5.375% 5/2/23 (b) | 200,000 | 211,000 | |
| MPT Operating Partnership LP/MPT Finance Corp.: | |||
| 5% 10/15/27 | 330,000 | 347,325 | |
| 5.25% 8/1/26 | 100,000 | 105,000 | |
| NVA Holdings, Inc. 6.875% 4/1/26 (b) | 50,000 | 53,625 | |
| Polaris Intermediate Corp. 8.5% 12/1/22 pay-in-kind (b)(d) | 145,000 | 121,800 | |
| Sabra Health Care LP/Sabra Capital Corp. 3.9% 10/15/29 | 72,000 | 71,460 | |
| Service Corp. International 5.125% 6/1/29 | 35,000 | 37,275 | |
| Teleflex, Inc. 4.625% 11/15/27 | 30,000 | 31,425 | |
| Tenet Healthcare Corp.: | |||
| 4.625% 7/15/24 | 160,000 | 164,800 | |
| 5.125% 5/1/25 | 210,000 | 214,988 | |
| 6.25% 2/1/27 (b) | 195,000 | 205,969 | |
| 6.75% 6/15/23 | 400,000 | 424,000 | |
| 8.125% 4/1/22 | 515,000 | 557,488 | |
| Teva Pharmaceutical Finance Netherlands III BV: | |||
| 1.125% 10/15/24 | EUR | 300,000 | 267,672 |
| 2.8% 7/21/23 | 155,000 | 134,075 | |
| Valeant Pharmaceuticals International, Inc.: | |||
| 5.5% 3/1/23 (b) | 24,000 | 24,210 | |
| 5.5% 11/1/25 (b) | 110,000 | 114,951 | |
| 5.75% 8/15/27 (b) | 20,000 | 21,719 | |
| 5.875% 5/15/23 (b) | 66,000 | 66,957 | |
| 6.125% 4/15/25 (b) | 65,000 | 67,478 | |
| 6.5% 3/15/22 (b) | 80,000 | 82,416 | |
| 7% 3/15/24 (b) | 160,000 | 167,388 | |
| 8.5% 1/31/27 (b) | 60,000 | 67,500 | |
| 9.25% 4/1/26 (b) | 230,000 | 260,192 | |
| Vizient, Inc. 6.25% 5/15/27 (b) | 15,000 | 16,176 | |
| Wellcare Health Plans, Inc.: | |||
| 5.25% 4/1/25 | 50,000 | 52,328 | |
| 5.375% 8/15/26 (b) | 55,000 | 58,506 | |
| 7,830,314 | |||
| Homebuilders/Real Estate - 5.7% | |||
| Alliant Holdings Intermediate LLC 6.75% 10/15/27 (b) | 90,000 | 93,610 | |
| Cementos Progreso Trust 7.125% 11/6/23 (b) | 200,000 | 205,063 | |
| China Aoyuan Property Group Ltd. 7.95% 2/19/23 (Reg. S) | 400,000 | 419,194 | |
| China SCE Property Holdings Ltd. 8.75% 1/15/21 (Reg. S) | 200,000 | 206,500 | |
| Easy Tactic Ltd.: | |||
| 5.875% 2/13/23 (Reg. S) | 200,000 | 186,752 | |
| 8.125% 2/27/23 (Reg. S) | 200,000 | 198,750 | |
| Evergrande Real Estate Group Ltd.: | |||
| 8.25% 3/23/22 (Reg. S) | 200,000 | 185,250 | |
| 8.75% 6/28/25 (Reg. S) | 200,000 | 167,500 | |
| Fantasia Holdings Group Co. Ltd. 7.375% 10/4/21 (Reg. S) | 200,000 | 185,308 | |
| iStar Financial, Inc. 4.75% 10/1/24 | 120,000 | 123,750 | |
| Jababeka International BV 6.5% 10/5/23 (Reg. S) | 200,000 | 177,250 | |
| Jingrui Holdings Ltd.: | |||
| 7.75% 4/12/20 | 200,000 | 194,188 | |
| 9.45% 4/23/21 (Reg. S) | 200,000 | 184,500 | |
| Kaisa Group Holdings Ltd.: | |||
| 8.5% 6/30/22 (Reg. S) | 200,000 | 189,563 | |
| 11.75% 2/26/21 (Reg. S) | 200,000 | 207,938 | |
| KWG Property Holding Ltd.: | |||
| 5.2% 9/21/22 (Reg. S) | 200,000 | 193,250 | |
| 7.875% 9/1/23 (Reg. S) | 200,000 | 205,282 | |
| Lennar Corp. 5.375% 10/1/22 | 55,000 | 58,850 | |
| Lodha Development Intrnl Mauritius Ltd. 12% 3/13/20 (Reg. S) | 200,000 | 159,425 | |
| Mattamy Group Corp. 6.875% 12/15/23 (b) | 25,000 | 25,906 | |
| Modernland Overseas Pte Ltd. 6.95% 4/13/24 | 200,000 | 175,562 | |
| MTN (Mauritius) Investments Ltd. 6.5% 10/13/26 (b) | 300,000 | 331,219 | |
| Redco Group 11% 8/29/20 (Reg. S) | 200,000 | 201,760 | |
| Redsun Properties Group Ltd. 11.5% 3/4/21 (Reg. S) | 200,000 | 199,125 | |
| Ronshine China Holdings Ltd. 11.25% 8/22/21 (Reg. S) | 200,000 | 212,422 | |
| Scenery Journey Ltd. 11% 11/6/20 (Reg. S) | 200,000 | 205,250 | |
| Starwood Property Trust, Inc. 4.75% 3/15/25 | 75,000 | 77,883 | |
| Sunac China Holdings Ltd.: | |||
| 7.5% 2/1/24 (Reg. S) | 200,000 | 198,350 | |
| 8.375% 1/15/21 (Reg. S) | 400,000 | 412,250 | |
| Taylor Morrison Communities, Inc./Monarch Communities, Inc.: | |||
| 5.75% 1/15/28 (b) | 80,000 | 88,500 | |
| 5.875% 6/15/27 (b) | 55,000 | 61,419 | |
| Times China Holdings Ltd. 7.85% 6/4/21 (Reg. S) | 200,000 | 205,536 | |
| Yango Justice International Ltd. 9.5% 4/3/21 (Reg. S) | 200,000 | 196,625 | |
| Yuzhou Properties Co. 8.625% 1/23/22 (Reg. S) | 200,000 | 209,064 | |
| Zhenro Properties Group Ltd.: | |||
| 8.7% 8/3/22 (Reg. S) | 200,000 | 199,750 | |
| 10.5% 6/28/20 (Reg. S) | 200,000 | 204,375 | |
| 6,746,919 | |||
| Hotels - 0.3% | |||
| Hilton Domestic Operating Co., Inc.: | |||
| 4.875% 1/15/30 (b) | 120,000 | 127,500 | |
| 5.125% 5/1/26 | 230,000 | 241,500 | |
| Hilton Worldwide Finance LLC/Hilton Worldwide Finance Corp. 4.875% 4/1/27 | 40,000 | 42,299 | |
| 411,299 | |||
| Insurance - 0.3% | |||
| Acrisure LLC / Acrisure Finance, Inc.: | |||
| 7% 11/15/25 (b) | 115,000 | 105,225 | |
| 8.125% 2/15/24 (b) | 55,000 | 58,609 | |
| HUB International Ltd. 7% 5/1/26 (b) | 90,000 | 92,700 | |
| USIS Merger Sub, Inc. 6.875% 5/1/25 (b) | 75,000 | 76,313 | |
| 332,847 | |||
| Leisure - 0.1% | |||
| Cedar Fair LP/Canada's Wonderland Co. 5.375% 4/15/27 | 35,000 | 37,275 | |
| Voc Escrow Ltd. 5% 2/15/28 (b) | 70,000 | 72,800 | |
| 110,075 | |||
| Metals/Mining - 2.8% | |||
| Abja Investment Co. Pte Ltd. 5.45% 1/24/28 | 300,000 | 291,738 | |
| Alpha Natural Resources, Inc. 9.75% 4/15/18 (f)(g) | 210,000 | 0 | |
| Celtic Resources Holdings DAC 4.125% 10/9/24 (b) | 200,000 | 200,796 | |
| Constellium NV 5.875% 2/15/26 (b) | 250,000 | 260,625 | |
| First Quantum Minerals Ltd.: | |||
| 6.5% 3/1/24 (b) | 200,000 | 196,000 | |
| 6.875% 3/1/26 (b) | 200,000 | 196,000 | |
| 7.25% 4/1/23 (b) | 300,000 | 301,602 | |
| 7.5% 4/1/25 (b) | 200,000 | 200,250 | |
| FMG Resources (August 2006) Pty Ltd.: | |||
| 4.75% 5/15/22 (b) | 45,000 | 46,350 | |
| 5.125% 3/15/23 (b) | 95,000 | 98,919 | |
| Minsur SA 6.25% 2/7/24 (Reg. S) | 200,000 | 220,188 | |
| Polyus Finance PLC 5.25% 2/7/23 (b) | 200,000 | 211,500 | |
| Stillwater Mining Co. 6.125% 6/27/22 (b) | 300,000 | 305,625 | |
| Vedanta Resources PLC: | |||
| 6.125% 8/9/24 | 200,000 | 183,625 | |
| 6.375% 7/30/22 (b) | 400,000 | 396,125 | |
| 6.375% 7/30/22 (Reg. S) | 200,000 | 198,063 | |
| 3,307,406 | |||
| Paper - 0.2% | |||
| Berry Global Escrow Corp.: | |||
| 4.875% 7/15/26 (b) | 40,000 | 42,050 | |
| 5.625% 7/15/27 (b) | 35,000 | 37,144 | |
| Progroup AG 3% 3/31/26 (Reg. S) | EUR | 100,000 | 108,841 |
| 188,035 | |||
| Restaurants - 0.6% | |||
| 1011778 BC Unlimited Liability Co./New Red Finance, Inc. 5% 10/15/25 (b) | 140,000 | 144,200 | |
| Golden Nugget, Inc.: | |||
| 6.75% 10/15/24 (b) | 120,000 | 123,612 | |
| 8.75% 10/1/25 (b) | 65,000 | 68,413 | |
| KFC Holding Co./Pizza Hut Holding LLC: | |||
| 4.75% 6/1/27 (b) | 50,000 | 52,250 | |
| 5% 6/1/24 (b) | 195,000 | 202,313 | |
| 5.25% 6/1/26 (b) | 100,000 | 105,750 | |
| 696,538 | |||
| Services - 2.5% | |||
| Algeco Scotsman Global Finance PLC 3 month EURIBOR + 6.250% 6.25% 2/15/23 (d)(e) | EUR | 100,000 | 111,450 |
| BidFair MergeRight, Inc. 7.375% 10/15/27 (b) | 150,000 | 150,000 | |
| Brand Energy & Infrastructure Services, Inc. 8.5% 7/15/25 (b) | 250,000 | 242,500 | |
| CDK Global, Inc.: | |||
| 4.875% 6/1/27 | 105,000 | 110,644 | |
| 5.25% 5/15/29 (b) | 35,000 | 37,166 | |
| 5.875% 6/15/26 | 35,000 | 37,450 | |
| eHi Car Service Co. Ltd. 5.875% 8/14/22 | 200,000 | 185,500 | |
| Elis SA 2.875% 2/15/26 (Reg. S) | EUR | 100,000 | 122,386 |
| GEMS MENASA Cayman Ltd. 7.125% 7/31/26 (b) | 200,000 | 207,875 | |
| Global A&T Electronics Ltd. 8.5% 1/12/23 | 200,000 | 186,788 | |
| H&E Equipment Services, Inc. 5.625% 9/1/25 | 180,000 | 189,225 | |
| IHS Markit Ltd.: | |||
| 4% 3/1/26 (b) | 35,000 | 36,898 | |
| 4.75% 2/15/25 (b) | 65,000 | 71,524 | |
| Intrum Justitia AB: | |||
| 2.75% 7/15/22 (Reg. S) | EUR | 50,000 | 56,404 |
| 3% 9/15/27 (Reg. S) | EUR | 233,000 | 251,419 |
| 3.5% 7/15/26 (Reg. S) | EUR | 100,000 | 111,987 |
| IPD BV 4.5% 7/15/22 (Reg. S) | EUR | 200,000 | 227,566 |
| Laureate Education, Inc. 8.25% 5/1/25 (b) | 495,000 | 537,075 | |
| Tempo Acquisition LLC 6.75% 6/1/25 (b) | 55,000 | 56,581 | |
| 2,930,438 | |||
| Steel - 1.1% | |||
| Big River Steel LLC/BRS Finance Corp. 7.25% 9/1/25 (b) | 55,000 | 56,513 | |
| Cleveland-Cliffs, Inc. 5.75% 3/1/25 | 55,000 | 54,313 | |
| CSN Resources SA 7.625% 2/13/23 (b) | 300,000 | 310,594 | |
| Infrabuild Australia Pty Ltd. 12% 10/1/24 (b) | 60,000 | 61,147 | |
| JSW Steel Ltd. 5.375% 4/4/25 (Reg. S) | 200,000 | 198,750 | |
| Metinvest BV 7.75% 4/23/23 (b) | 300,000 | 312,750 | |
| Usiminas International SARL 5.875% 7/18/26 (b) | 200,000 | 203,500 | |
| Vallourec SA 2.25% 9/30/24 (Reg. S) | EUR | 100,000 | 71,388 |
| 1,268,955 | |||
| Technology - 2.4% | |||
| Banff Merger Sub, Inc. 9.75% 9/1/26 (b) | 330,000 | 307,313 | |
| Camelot Finance SA 4.5% 11/1/26 (b) | 65,000 | 65,676 | |
| CDW LLC/CDW Finance Corp. 4.25% 4/1/28 | 80,000 | 82,900 | |
| Ensemble S Merger Sub, Inc. 9% 9/30/23 (b) | 267,000 | 274,174 | |
| Entegris, Inc. 4.625% 2/10/26 (b) | 85,000 | 87,510 | |
| Fair Isaac Corp. 5.25% 5/15/26 (b) | 50,000 | 54,250 | |
| Go Daddy Operating Co. LLC / GD Finance Co., Inc. 5.25% 12/1/27 (b) | 55,000 | 58,300 | |
| InterXion Holding NV 4.75% 6/15/25 (Reg. S) | EUR | 100,000 | 121,273 |
| Itron, Inc. 5% 1/15/26 (b) | 30,000 | 31,050 | |
| j2 Cloud Services LLC/j2 Global Communications, Inc. 6% 7/15/25 (b) | 45,000 | 47,813 | |
| Jain International Trading BV 7.125% 2/1/22 (Reg. S) | 200,000 | 57,000 | |
| Match Group, Inc.: | |||
| 5% 12/15/27 (b) | 60,000 | 62,625 | |
| 5.625% 2/15/29 (b) | 65,000 | 69,631 | |
| Orano SA 3.375% 4/23/26 (Reg. S) | EUR | 100,000 | 119,890 |
| Qorvo, Inc. 4.375% 10/15/29 (b) | 45,000 | 45,253 | |
| Sensata Technologies BV 4.875% 10/15/23 (b) | 120,000 | 126,752 | |
| Sensata Technologies, Inc. 4.375% 2/15/30 (b) | 95,000 | 95,653 | |
| SoftBank Corp. 4% 9/19/29 (Reg. S) | EUR | 200,000 | 227,941 |
| Solera LLC/Solera Finance, Inc. 10.5% 3/1/24 (b) | 410,000 | 428,963 | |
| TTM Technologies, Inc. 5.625% 10/1/25 (b) | 25,000 | 25,250 | |
| Veritas U.S., Inc./Veritas Bermuda Ltd.: | |||
| 7.5% 2/1/23 (b) | 75,000 | 73,688 | |
| 10.5% 2/1/24 (b) | 460,000 | 434,700 | |
| 2,897,605 | |||
| Telecommunications - 6.2% | |||
| Altice Finco SA 7.625% 2/15/25 (b) | 800,000 | 820,000 | |
| Axtel S.A.B. de CV 6.375% 11/14/24 (b) | 300,000 | 310,421 | |
| C&W Senior Financing Designated Activity Co.: | |||
| 6.875% 9/15/27 (b) | 340,000 | 357,850 | |
| 7.5% 10/15/26 (b) | 100,000 | 107,375 | |
| Cellnex Telecom SA 2.375% 1/16/24 (Reg. S) | EUR | 100,000 | 118,224 |
| Colombia Telecomunicaciones SA 5.375% 9/27/22 (b) | 225,000 | 227,039 | |
| CyrusOne LP/CyrusOne Finance Corp.: | |||
| 5% 3/15/24 | 45,000 | 46,406 | |
| 5.375% 3/15/27 | 40,000 | 42,750 | |
| Digicel Group Ltd. 6.75% 3/1/23 (b) | 150,000 | 78,797 | |
| eircom Finance Ltd. 1.75% 11/1/24 (Reg. S) | EUR | 100,000 | 110,902 |
| Equinix, Inc. 5.375% 5/15/27 | 50,000 | 54,250 | |
| Frontier Communications Corp.: | |||
| 8% 4/1/27 (b) | 115,000 | 120,750 | |
| 8.5% 4/1/26 (b) | 225,000 | 225,563 | |
| 11% 9/15/25 | 215,000 | 101,050 | |
| Globo Comunicacao e Participacoes SA 5.125% 3/31/27 (b) | 200,000 | 208,000 | |
| GTH Finance BV 7.25% 4/26/23 (b) | 200,000 | 223,344 | |
| GTT Communications, Inc. 7.875% 12/31/24 (b) | 180,000 | 104,850 | |
| IHS Netherlands Holdco BV 8% 9/18/27 (b) | 200,000 | 209,250 | |
| Intelsat Jackson Holdings SA 8% 2/15/24 (b) | 190,000 | 195,166 | |
| Intelsat Luxembourg SA 8.125% 6/1/23 | 266,000 | 222,609 | |
| Millicom International Cellular SA 5.125% 1/15/28 (b) | 250,000 | 257,734 | |
| Sable International Finance Ltd. 5.75% 9/7/27 (b) | 125,000 | 130,000 | |
| SFR Group SA: | |||
| 5.5% 1/15/28 (b) | 130,000 | 132,438 | |
| 7.375% 5/1/26 (b) | 150,000 | 160,627 | |
| 8.125% 2/1/27 (b) | 245,000 | 271,644 | |
| Sprint Capital Corp.: | |||
| 6.875% 11/15/28 | 190,000 | 206,150 | |
| 8.75% 3/15/32 | 290,000 | 353,620 | |
| Sprint Corp.: | |||
| 7.125% 6/15/24 | 200,000 | 217,000 | |
| 7.625% 3/1/26 | 70,000 | 77,438 | |
| TBG Global Pte. Ltd. 5.25% 2/10/22 (Reg. S) | 400,000 | 405,692 | |
| Telecom Argentina SA 8% 7/18/26 (b) | 15,000 | 13,420 | |
| Telecom Italia SpA 4% 4/11/24 (Reg. S) | EUR | 100,000 | 123,387 |
| Telefonica Celular del Paraguay SA 5.875% 4/15/27 (b) | 200,000 | 215,412 | |
| Telenet Finance Luxembourg Notes SARL 3.5% 3/1/28 (Reg. S) | EUR | 200,000 | 242,553 |
| Telesat Canada/Telesat LLC 6.5% 10/15/27 (b) | 45,000 | 46,969 | |
| Turk Telekomunikasyon A/S 6.875% 2/28/25 (b) | 200,000 | 212,313 | |
| Turkcell Iletisim Hizmet A/S 5.8% 4/11/28 (b) | 200,000 | 194,625 | |
| Zayo Group LLC/Zayo Capital, Inc. 5.75% 1/15/27 (b) | 135,000 | 137,211 | |
| 7,282,829 | |||
| Textiles/Apparel - 0.1% | |||
| CBR Fashion Finance BV 5.125% 10/1/22 (Reg. S) | EUR | 100,000 | 111,493 |
| Transportation Ex Air/Rail - 1.1% | |||
| Atlantia SpA 1.625% 2/3/25 (Reg. S) | EUR | 100,000 | 108,529 |
| Autostrade per L'italia SpA: | |||
| 1.625% 6/12/23 | EUR | 75,000 | 84,019 |
| 1.875% 9/26/29 (Reg. S) | EUR | 100,000 | 105,740 |
| Avolon Holdings Funding Ltd.: | |||
| 5.125% 10/1/23 (b) | 290,000 | 312,910 | |
| 5.25% 5/15/24 (b) | 135,000 | 147,218 | |
| 5.5% 1/15/23 (b) | 95,000 | 102,515 | |
| Navios Maritime Acquisition Corp./Navios Acquisition Finance U.S., Inc. 8.125% 11/15/21 (b) | 235,000 | 191,525 | |
| Navios Maritime Holdings, Inc.: | |||
| 7.375% 1/15/22 (b) | 90,000 | 52,988 | |
| 11.25% 8/15/22 (b) | 135,000 | 95,175 | |
| Teekay Corp. 9.25% 11/15/22 (b) | 60,000 | 62,100 | |
| 1,262,719 | |||
| Utilities - 4.4% | |||
| ContourGlobal Power Holdings SA 4.125% 8/1/25 (Reg. S) | EUR | 225,000 | 264,280 |
| DCP Midstream Operating LP 5.125% 5/15/29 | 105,000 | 106,575 | |
| DTEK Finance PLC 10.75% 12/31/24 pay-in-kind (d) | 175,000 | 177,505 | |
| Dynegy, Inc. 5.875% 6/1/23 | 70,000 | 71,488 | |
| Energias de Portugal SA 4.496% 4/30/79 (Reg. S) (d) | EUR | 100,000 | 123,783 |
| Greenko Investment Co. 4.875% 8/16/23 (Reg. S) | 200,000 | 197,875 | |
| InterGen NV 7% 6/30/23 (b) | 845,000 | 803,173 | |
| Nextera Energy Partners LP: | |||
| 4.25% 9/15/24 (b) | 50,000 | 52,000 | |
| 4.5% 9/15/27 (b) | 35,000 | 35,700 | |
| NRG Energy, Inc.: | |||
| 5.25% 6/15/29 (b) | 60,000 | 64,350 | |
| 5.75% 1/15/28 | 1,345,000 | 1,455,919 | |
| NSG Holdings II LLC/NSG Holdings, Inc. 7.75% 12/15/25 (b) | 272,223 | 294,000 | |
| Pacific Gas & Electric Co.: | |||
| 3.75% 8/15/42 (f) | 10,000 | 9,100 | |
| 3.95% 12/1/47 (f) | 10,000 | 9,050 | |
| 4% 12/1/46 (f) | 5,000 | 4,550 | |
| 6.05% 3/1/34 (f) | 115,000 | 115,288 | |
| Pattern Energy Group, Inc. 5.875% 2/1/24 (b) | 30,000 | 30,750 | |
| Petrobras Global Finance BV 8.75% 5/23/26 | 75,000 | 96,000 | |
| Teollisuuden Voima Oyj 1.125% 3/9/26 (Reg. S) | EUR | 107,000 | 118,189 |
| TerraForm Global, Inc. 6.125% 3/1/26 (b) | 310,000 | 316,975 | |
| The AES Corp.: | |||
| 4% 3/15/21 | 195,000 | 198,169 | |
| 5.125% 9/1/27 | 55,000 | 59,124 | |
| TVO Power Co. 2.125% 2/4/25 (Reg. S) | EUR | 100,000 | 117,846 |
| Vertiv Group Corp. 9.25% 10/15/24 (b) | 60,000 | 56,438 | |
| Vistra Operations Co. LLC: | |||
| 5% 7/31/27 (b) | 140,000 | 144,900 | |
| 5.5% 9/1/26 (b) | 115,000 | 121,523 | |
| 5.625% 2/15/27 (b) | 185,000 | 196,100 | |
| 5,240,650 | |||
| TOTAL NONCONVERTIBLE BONDS | 92,892,925 | ||
| TOTAL CORPORATE BONDS | |||
| (Cost $94,787,146) | 93,749,400 | ||
| Government Obligations - 0.8% | |||
| Germany - 0.6% | |||
| German Federal Republic: | |||
| 0% 6/12/20 | EUR | 400,000 | 447,788 |
| 2% 8/15/23 | EUR | 200,000 | 245,995 |
| TOTAL GERMANY | 693,783 | ||
| Sri Lanka - 0.2% | |||
| Democratic Socialist Republic of Sri Lanka 7.85% 3/14/29(Reg. S) | 200,000 | 206,000 | |
| TOTAL GOVERNMENT OBLIGATIONS | |||
| (Cost $906,782) | 899,783 | ||
| Shares | Value | ||
| Common Stocks - 1.0% | |||
| Automotive & Auto Parts - 0.1% | |||
| UC Holdings, Inc. (g)(h) | 3,510 | 67,778 | |
| Energy - 0.2% | |||
| Pacific Drilling SA (h) | 19,106 | 47,765 | |
| Tidewater, Inc.: | |||
| warrants 11/14/42 (h) | 5,448 | 96,430 | |
| warrants 11/14/42 (h) | 1,897 | 33,577 | |
| Ultra Petroleum Corp. warrants 7/14/25 (h) | 1,260 | 0 | |
| TOTAL ENERGY | 177,772 | ||
| Food & Drug Retail - 0.1% | |||
| Southeastern Grocers, Inc. (g)(h) | 1,789 | 62,919 | |
| Tops Markets Corp. (g) | 165 | 58,007 | |
| Tops Markets Corp. (Escrow) (g)(i) | 165,000 | 2 | |
| TOTAL FOOD & DRUG RETAIL | 120,928 | ||
| Gaming - 0.2% | |||
| Boyd Gaming Corp. | 4,800 | 130,800 | |
| Penn National Gaming, Inc. (h) | 4,600 | 98,049 | |
| TOTAL GAMING | 228,849 | ||
| Healthcare - 0.0% | |||
| HCA Holdings, Inc. | 400 | 53,416 | |
| Metals/Mining - 0.0% | |||
| Warrior Metropolitan Coal, Inc. | 69 | 1,344 | |
| Services - 0.1% | |||
| United Rentals, Inc. (h) | 1,000 | 133,570 | |
| Utilities - 0.3% | |||
| NRG Energy, Inc. | 3,200 | 128,384 | |
| Vistra Energy Corp. | 9,795 | 264,759 | |
| TOTAL UTILITIES | 393,143 | ||
| TOTAL COMMON STOCKS | |||
| (Cost $1,645,395) | 1,176,800 | ||
| Principal Amount | Value | ||
| Bank Loan Obligations - 5.1% | |||
| Aerospace - 0.4% | |||
| TransDigm, Inc.: | |||
| Tranche E, term loan 3 month U.S. LIBOR + 2.500% 4.2859% 5/30/25 (d)(e) | 124,170 | 123,153 | |
| Tranche F, term loan 3 month U.S. LIBOR + 2.500% 4.2859% 6/9/23 (d)(e) | 78,406 | 78,004 | |
| Tranche G, term loan 3 month U.S. LIBOR + 2.500% 4.2859% 8/22/24 (d)(e) | 216,631 | 214,837 | |
| TOTAL AEROSPACE | 415,994 | ||
| Cable/Satellite TV - 0.5% | |||
| LCPR Loan Financing LLC Tranche B 1LN, term loan 3 month U.S. LIBOR + 5.000% 6.8282% 10/22/26 (d)(e) | 15,000 | 15,084 | |
| WideOpenWest Finance LLC Tranche B, term loan 3 month U.S. LIBOR + 3.250% 5.0543% 8/19/23 (d)(e) | 577,565 | 553,561 | |
| Zayo Group LLC Tranche B 2LN, term loan 3 month U.S. LIBOR + 2.250% 4.0359% 1/19/24 (d)(e) | 5,000 | 5,005 | |
| TOTAL CABLE/SATELLITE TV | 573,650 | ||
| Chemicals - 0.0% | |||
| Oxea Corp. Tranche B2, term loan 3 month U.S. LIBOR + 3.500% 5.5625% 10/11/24 (d)(e) | 9,100 | 9,032 | |
| PQ Corp. Tranche B, term loan 3 month U.S. LIBOR + 2.500% 4.4271% 2/8/25 (d)(e) | 4,173 | 4,167 | |
| Starfruit U.S. Holdco LLC Tranche B, term loan 3 month U.S. LIBOR + 3.250% 5.1903% 10/1/25 (d)(e) | 43,634 | 42,499 | |
| TOTAL CHEMICALS | 55,698 | ||
| Diversified Financial Services - 0.1% | |||
| BCP Renaissance Parent LLC Tranche B, term loan 3 month U.S. LIBOR + 3.500% 5.3631% 10/31/24 (d)(e) | 14,813 | 13,359 | |
| HarbourVest Partners LLC Tranche B 1LN, term loan 3 month U.S. LIBOR + 2.250% 4.1713% 3/1/25 (d)(e) | 17,735 | 17,702 | |
| UFC Holdings LLC Tranche B 1LN, term loan 3 month U.S. LIBOR + 3.250% 5.04% 4/29/26 (d)(e) | 69,654 | 69,567 | |
| TOTAL DIVERSIFIED FINANCIAL SERVICES | 100,628 | ||
| Energy - 0.8% | |||
| BCP Raptor LLC Tranche B, term loan 3 month U.S. LIBOR + 4.250% 6.0359% 6/24/24 (d)(e) | 48,875 | 42,827 | |
| California Resources Corp.: | |||
| Tranche 1LN, term loan 3 month U.S. LIBOR + 10.375% 12.1746% 12/31/21 (d)(e) | 230,000 | 151,800 | |
| Tranche B, term loan 3 month U.S. LIBOR + 4.750% 6.5496% 12/31/22 (d)(e) | 185,000 | 158,268 | |
| Citgo Holding, Inc. Tranche B 1LN, term loan 3 month U.S. LIBOR + 7.000% 8.7859% 8/1/23 (d)(e) | 10,000 | 10,075 | |
| Citgo Petroleum Corp. Tranche B 1LN, term loan 3 month U.S. LIBOR + 5.000% 7.1044% 3/28/24 (d)(e) | 154,225 | 154,225 | |
| Epic Crude Services LP Tranche B 1LN, term loan 3 month U.S. LIBOR + 5.000% 7.04% 3/1/26 (d)(e) | 270,000 | 253,633 | |
| Sanchez Energy Corp. 1LN, term loan 3 month U.S. LIBOR + 8.000% 10% 5/11/20 (d)(e)(g)(j) | 120,977 | 114,928 | |
| TOTAL ENERGY | 885,756 | ||
| Food & Drug Retail - 0.6% | |||
| BI-LO LLC Tranche B, term loan 3 month U.S. LIBOR + 8.000% 10.1334% 5/31/24 (d)(e) | 691,250 | 645,455 | |
| Tops Markets LLC 1LN, term loan 3 month U.S. LIBOR + 8.500% 10.625% 11/19/23 (d)(e)(g) | 66,535 | 67,616 | |
| TOTAL FOOD & DRUG RETAIL | 713,071 | ||
| Gaming - 0.0% | |||
| Gateway Casinos & Entertainment Ltd. Tranche B 1LN, term loan 3 month U.S. LIBOR + 3.000% 5.1044% 3/13/25 (d)(e) | 19,750 | 19,256 | |
| Healthcare - 0.4% | |||
| U.S. Renal Care, Inc. Tranche B 1LN, term loan 3 month U.S. LIBOR + 5.000% 6.7859% 6/13/26 (d)(e) | 335,000 | 308,857 | |
| Vizient, Inc. Tranche B 1LN, term loan 3 month U.S. LIBOR + 2.500% 4.2859% 5/6/26 (d)(e) | 9,950 | 9,947 | |
| VVC Holding Corp. Tranche B 1LN, term loan 3 month U.S. LIBOR + 4.500% 6.681% 2/11/26 (d)(e) | 194,025 | 192,267 | |
| TOTAL HEALTHCARE | 511,071 | ||
| Hotels - 0.2% | |||
| Travelport Finance Luxembourg SARL 1LN, term loan 3 month U.S. LIBOR + 5.000% 7.1044% 5/29/26 (d)(e) | 260,000 | 241,800 | |
| Insurance - 0.2% | |||
| Alliant Holdings Intermediate LLC: | |||
| Tranche B, term loan 3 month U.S. LIBOR + 3.000% 4.8043% 5/10/25 (d)(e) | 4,887 | 4,757 | |
| Tranche B-2 1LN, term loan 3 month U.S. LIBOR + 3.250% 5.1713% 5/9/25 (d)(e) | 64,838 | 63,670 | |
| HUB International Ltd. Tranche B, term loan 3 month U.S. LIBOR + 4.000% 4/25/25 (e)(k) | 115,000 | 114,770 | |
| USI, Inc. Tranche B, term loan 3 month U.S. LIBOR + 3.000% 5.1044% 5/16/24 (d)(e) | 14,700 | 14,255 | |
| TOTAL INSURANCE | 197,452 | ||
| Leisure - 0.2% | |||
| Alterra Mountain Co. Tranche B 1LN, term loan 3 month U.S. LIBOR + 3.000% 4.7859% 7/31/24 (d)(e) | 4,913 | 4,917 | |
| Crown Finance U.S., Inc. Tranche B 1LN, term loan 3 month U.S. LIBOR + 2.250% 4.0359% 2/28/25 (d)(e) | 229,484 | 226,226 | |
| TOTAL LEISURE | 231,143 | ||
| Restaurants - 0.2% | |||
| Burger King Worldwide, Inc. Tranche B, term loan 3 month U.S. LIBOR + 2.250% 4.0359% 2/17/24 (d)(e) | 287,036 | 287,251 | |
| Services - 0.5% | |||
| Almonde, Inc. Tranche 2LN, term loan 3 month U.S. LIBOR + 7.250% 9.4463% 6/13/25 (d)(e) | 220,000 | 205,242 | |
| BidFair MergeRight, Inc. 1LN, term loan 3 month U.S. LIBOR + 5.500% 7.4085% 1/23/27 (d)(e) | 112,028 | 109,298 | |
| IRI Holdings, Inc. Tranche B 1LN, term loan 3 month U.S. LIBOR + 4.500% 6.6241% 11/30/25 (d)(e) | 193,313 | 180,425 | |
| KUEHG Corp. Tranche B 2LN, term loan 3 month U.S. LIBOR + 8.250% 10.3544% 8/22/25 (d)(e) | 95,000 | 94,288 | |
| TOTAL SERVICES | 589,253 | ||
| Technology - 0.7% | |||
| ATS Consolidated, Inc. Tranche B 1LN, term loan 3 month U.S. LIBOR + 3.750% 5.5359% 2/28/25 (d)(e) | 9,850 | 9,854 | |
| Financial & Risk U.S. Holdings, Inc. Tranche B, term loan 3 month U.S. LIBOR + 3.750% 5.5359% 10/1/25 (d)(e) | 388,045 | 389,888 | |
| Kronos, Inc.: | |||
| 2LN, term loan 3 month U.S. LIBOR + 8.250% 10.5031% 11/1/24 (d)(e) | 115,000 | 115,452 | |
| Tranche B 1LN, term loan 3 month U.S. LIBOR + 3.000% 5.2531% 11/1/23 (d)(e) | 90,000 | 89,767 | |
| SS&C Technologies, Inc.: | |||
| Tranche B 3LN, term loan 3 month U.S. LIBOR + 2.250% 4.0359% 4/16/25 (d)(e) | 114,482 | 114,674 | |
| Tranche B 4LN, term loan 3 month U.S. LIBOR + 2.250% 4.0359% 4/16/25 (d)(e) | 74,732 | 74,856 | |
| Ultimate Software Group, Inc. 1LN, term loan 3 month U.S. LIBOR + 3.750% 5.5359% 5/4/26 (d)(e) | 20,000 | 20,031 | |
| Vertafore, Inc. Tranche B 2LN, term loan 3 month U.S. LIBOR + 7.250% 9.0359% 7/2/26 (d)(e) | 65,000 | 62,102 | |
| TOTAL TECHNOLOGY | 876,624 | ||
| Telecommunications - 0.3% | |||
| SFR Group SA Tranche B 12LN, term loan 3 month U.S. LIBOR + 3.688% 5.6088% 1/31/26 (d)(e) | 382,691 | 372,986 | |
| Utilities - 0.0% | |||
| Pike Corp. Tranche B 1LN, term loan 3 month U.S. LIBOR + 3.250% 5.04% 7/24/26 (d)(e) | 14,662 | 14,650 | |
| TOTAL BANK LOAN OBLIGATIONS | |||
| (Cost $6,289,089) | 6,086,283 | ||
| Preferred Securities - 7.3% | |||
| Automotive & Auto Parts - 0.2% | |||
| Volkswagen International Finance NV 3.875% (Reg. S) (d)(l) | EUR | 200,000 | 240,158 |
| Banks & Thrifts - 3.6% | |||
| AIB Group PLC 5.25% (Reg. S) (d)(l) | EUR | 200,000 | 231,810 |
| Alfa Bond Issuance PLC 8% (Reg. S) (d)(l) | 200,000 | 208,976 | |
| Banco de Sabadell SA 6.5% (Reg. S) (d)(l) | EUR | 200,000 | 231,551 |
| Banco Do Brasil SA 9% (b)(d)(l) | 200,000 | 234,489 | |
| Banco Mercantil del Norte SA 7.625% (b)(d)(l) | 360,000 | 379,264 | |
| Bank of America Corp. 5.875% (d)(l) | 355,000 | 392,998 | |
| Bank of East Asia Ltd. 5.875% (Reg. S) (d) | 300,000 | 312,731 | |
| Citigroup, Inc.: | |||
| 5% (d)(l) | 180,000 | 187,536 | |
| 5.35% (d)(l) | 550,000 | 581,468 | |
| 5.95% (d)(l) | 575,000 | 617,417 | |
| Intesa Sanpaolo SpA 7% (Reg. S) (d)(l) | EUR | 200,000 | 239,663 |
| Itau Unibanco Holding SA 6.125% (b)(d)(l) | 200,000 | 210,409 | |
| JPMorgan Chase & Co. 5% (d)(l) | 185,000 | 194,438 | |
| UniCredit SpA 9.25% (Reg. S) (d)(l) | EUR | 200,000 | 265,296 |
| TOTAL BANKS & THRIFTS | 4,288,046 | ||
| Consumer Products - 0.6% | |||
| Cosan Overseas Ltd. 8.25% (l) | 700,000 | 742,029 | |
| Diversified Financial Services - 0.5% | |||
| AerCap Holdings NV 5.875% 10/10/79 (d) | 115,000 | 120,294 | |
| LeasePlan Corp. NV 7.375% (Reg. S) (d)(l) | EUR | 200,000 | 250,358 |
| Nanyang Commercial Bank Ltd. 5% (Reg. S) (d)(l) | 200,000 | 203,785 | |
| TOTAL DIVERSIFIED FINANCIAL SERVICES | 574,437 | ||
| Energy - 0.4% | |||
| Gas Natural Fenosa Finance BV 4.125% (Reg. S) (d)(l) | EUR | 200,000 | 250,199 |
| SMC Global Power Holdings Corp. 5.95% (d)(l) | 200,000 | 202,000 | |
| TOTAL ENERGY | 452,199 | ||
| Healthcare - 0.2% | |||
| Fullerton Healthcare Corp. Ltd. 7% (Reg. S) (d)(l) | 200,000 | 191,930 | |
| Homebuilders/Real Estate - 0.9% | |||
| Agile Property Holdings Ltd. 6.875% (Reg. S) (d)(l) | 200,000 | 200,265 | |
| CIFI Holdings Group Co. Ltd. 5.375% (Reg. S) (d)(l) | 200,000 | 191,880 | |
| Grand City Properties SA 3.75% (d)(l) | EUR | 100,000 | 121,177 |
| RKI Overseas Finance 2017 (A) 7% (Reg. S) (l) | 200,000 | 176,509 | |
| TLG Finance SARL 3.375% (Reg. S) (d)(l) | EUR | 200,000 | 229,218 |
| Yuzhou Properties Co. 5.375% (Reg. S) (d)(l) | 200,000 | 183,162 | |
| TOTAL HOMEBUILDERS/REAL ESTATE | 1,102,211 | ||
| Telecommunications - 0.4% | |||
| Colombia Telecomunicaciones SA 8.5% (b)(d)(l) | 200,000 | 205,051 | |
| Telefonica Europe BV 3.875% (Reg. S) (d)(l) | EUR | 200,000 | 238,374 |
| TOTAL TELECOMMUNICATIONS | 443,425 | ||
| Utilities - 0.5% | |||
| EDF SA: | |||
| 4% (Reg. S) (d)(l) | EUR | 100,000 | 120,795 |
| 5% (Reg. S) (d)(l) | EUR | 100,000 | 130,631 |
| 5.375% 12/31/99 (d) | EUR | 200,000 | 264,769 |
| RWE AG 3.5% 4/21/75 (Reg. S) (d) | EUR | 100,000 | 124,202 |
| TOTAL UTILITIES | 640,397 | ||
| TOTAL PREFERRED SECURITIES | |||
| (Cost $8,464,950) | 8,674,832 | ||
| Shares | Value | ||
| Money Market Funds - 6.7% | |||
| Fidelity Cash Central Fund 1.83% (m) | |||
| (Cost $7,862,983) | 7,861,596 | 7,863,169 | |
| TOTAL INVESTMENT IN SECURITIES - 100.1% | |||
| (Cost $119,956,345) | 118,450,267 | ||
| NET OTHER ASSETS (LIABILITIES) - (0.1)% | (145,338) | ||
| NET ASSETS - 100% | $118,304,929 |
Currency Abbreviations
EUR – European Monetary Unit
Legend
(a) Amount is stated in United States dollars unless otherwise noted.
(b) Security exempt from registration under Rule 144A of the Securities Act of 1933. These securities may be resold in transactions exempt from registration, normally to qualified institutional buyers. At the end of the period, the value of these securities amounted to $52,369,039 or 44.3% of net assets.
(c) Security or a portion of the security purchased on a delayed delivery or when-issued basis.
(d) Coupon rates for floating and adjustable rate securities reflect the rates in effect at period end.
(e) Coupon is indexed to a floating interest rate which may be multiplied by a specified factor and/or subject to caps or floors.
(f) Non-income producing - Security is in default.
(g) Level 3 security
(h) Non-income producing
(i) Restricted securities - Investment in securities not registered under the Securities Act of 1933 (excluding 144A issues). At the end of the period, the value of restricted securities (excluding 144A issues) amounted to $2 or 0.0% of net assets.
(j) Position or a portion of the position represents an unfunded loan commitment. At period end, the total principal amount and market value of unfunded commitments totaled $86,412 and $82,091, respectively.
(k) The coupon rate will be determined upon settlement of the loan after period end.
(l) Security is perpetual in nature with no stated maturity date.
(m) Affiliated fund that is generally available only to investment companies and other accounts managed by Fidelity Investments. The rate quoted is the annualized seven-day yield of the fund at period end. A complete unaudited listing of the fund's holdings as of its most recent quarter end is available upon request. In addition, each Fidelity Central Fund's financial statements are available on the SEC's website or upon request.
Additional information on each restricted holding is as follows:
| Security | Acquisition Date | Acquisition Cost |
| Tops Markets Corp. (Escrow) | 11/16/18 | $0 |
Affiliated Central Funds
Information regarding fiscal year to date income earned by the Fund from investments in Fidelity Central Funds is as follows:
| Fund | Income earned |
| Fidelity Cash Central Fund | $74,260 |
| Total | $74,260 |
Amounts in the income column in the above table include any capital gain distributions from underlying funds, which are presented in the corresponding line-item in the Statement of Operations, if applicable.
Investment Valuation
The following is a summary of the inputs used, as of October 31, 2019, involving the Fund's assets and liabilities carried at fair value. The inputs or methodology used for valuing securities may not be an indication of the risk associated with investing in those securities. For more information on valuation inputs, and their aggregation into the levels used below, please refer to the Investment Valuation section in the accompanying Notes to Financial Statements.
| Valuation Inputs at Reporting Date: | ||||
| Description | Total | Level 1 | Level 2 | Level 3 |
| Investments in Securities: | ||||
| Equities: | ||||
| Consumer Discretionary | $296,627 | $228,849 | $-- | $67,778 |
| Consumer Staples | 120,928 | -- | -- | 120,928 |
| Energy | 177,772 | 177,772 | -- | -- |
| Health Care | 53,416 | 53,416 | -- | -- |
| Industrials | 133,570 | 133,570 | -- | -- |
| Materials | 1,344 | 1,344 | -- | -- |
| Utilities | 393,143 | 393,143 | -- | -- |
| Corporate Bonds | 93,749,400 | -- | 93,749,400 | -- |
| Government Obligations | 899,783 | -- | 899,783 | -- |
| Bank Loan Obligations | 6,086,283 | -- | 5,903,739 | 182,544 |
| Preferred Securities | 8,674,832 | -- | 8,674,832 | -- |
| Money Market Funds | 7,863,169 | 7,863,169 | -- | -- |
| Total Investments in Securities: | $118,450,267 | $8,851,263 | $109,227,754 | $371,250 |
Other Information
Distribution of investments by country or territory of incorporation, as a percentage of Total Net Assets, is as follows (Unaudited):
| United States of America | 48.8% |
| Cayman Islands | 10.0% |
| Netherlands | 6.7% |
| Luxembourg | 6.1% |
| Canada | 2.6% |
| United Kingdom | 2.5% |
| Multi-National | 2.2% |
| France | 1.9% |
| Argentina | 1.9% |
| Ireland | 1.8% |
| Mexico | 1.5% |
| Italy | 1.4% |
| Germany | 1.4% |
| Singapore | 1.2% |
| British Virgin Islands | 1.2% |
| Turkey | 1.0% |
| Others (Individually Less Than 1%) | 7.8% |
| 100.0% |
See accompanying notes which are an integral part of the financial statements.
Financial Statements
Statement of Assets and Liabilities
| October 31, 2019 (Unaudited) | ||
| Assets | ||
| Investment in securities, at value — See accompanying schedule: Unaffiliated issuers (cost $112,093,362) | $110,587,098 | |
| Fidelity Central Funds (cost $7,862,983) | 7,863,169 | |
| Total Investment in Securities (cost $119,956,345) | $118,450,267 | |
| Cash | 35,878 | |
| Foreign currency held at value (cost $113,043) | 113,163 | |
| Receivable for investments sold | 324,218 | |
| Receivable for fund shares sold | 85,718 | |
| Dividends receivable | 14,001 | |
| Interest receivable | 1,499,926 | |
| Distributions receivable from Fidelity Central Funds | 10,711 | |
| Prepaid expenses | 216 | |
| Other receivables | 5,249 | |
| Total assets | 120,539,347 | |
| Liabilities | ||
| Payable for investments purchased | ||
| Regular delivery | $1,489,320 | |
| Delayed delivery | 455,000 | |
| Payable for fund shares redeemed | 64,500 | |
| Distributions payable | 74,352 | |
| Accrued management fee | 77,528 | |
| Distribution and service plan fees payable | 5,227 | |
| Other affiliated payables | 18,067 | |
| Other payables and accrued expenses | 50,424 | |
| Total liabilities | 2,234,418 | |
| Net Assets | $118,304,929 | |
| Net Assets consist of: | ||
| Paid in capital | $123,624,515 | |
| Total accumulated earnings (loss) | (5,319,586) | |
| Net Assets | $118,304,929 | |
| Net Asset Value and Maximum Offering Price | ||
| Class A: | ||
| Net Asset Value and redemption price per share ($6,889,895 ÷ 727,724 shares)(a) | $9.47 | |
| Maximum offering price per share (100/96.00 of $9.47) | $9.86 | |
| Class M: | ||
| Net Asset Value and redemption price per share ($3,978,800 ÷ 420,292 shares)(a) | $9.47 | |
| Maximum offering price per share (100/96.00 of $9.47) | $9.86 | |
| Class C: | ||
| Net Asset Value and offering price per share ($3,523,696 ÷ 372,176 shares)(a) | $9.47 | |
| Global High Income: | ||
| Net Asset Value, offering price and redemption price per share ($95,753,175 ÷ 10,112,513 shares) | $9.47 | |
| Class I: | ||
| Net Asset Value, offering price and redemption price per share ($8,159,363 ÷ 861,713 shares) | $9.47 |
(a) Redemption price per share is equal to net asset value less any applicable contingent deferred sales charge.
See accompanying notes which are an integral part of the financial statements.
Statement of Operations
| Six months ended October 31, 2019 (Unaudited) | ||
| Investment Income | ||
| Dividends | $208,026 | |
| Interest | 3,299,625 | |
| Income from Fidelity Central Funds | 74,260 | |
| Total income | 3,581,911 | |
| Expenses | ||
| Management fee | $416,837 | |
| Transfer agent fees | 83,979 | |
| Distribution and service plan fees | 31,727 | |
| Accounting fees | 24,604 | |
| Custodian fees and expenses | 17,353 | |
| Independent trustees' fees and expenses | 340 | |
| Registration fees | 24,387 | |
| Audit | 37,064 | |
| Legal | 471 | |
| Miscellaneous | 348 | |
| Total expenses before reductions | 637,110 | |
| Expense reductions | (9,487) | |
| Total expenses after reductions | 627,623 | |
| Net investment income (loss) | 2,954,288 | |
| Realized and Unrealized Gain (Loss) | ||
| Net realized gain (loss) on: | ||
| Investment securities: | ||
| Unaffiliated issuers | (98,677) | |
| Foreign currency transactions | (6,294) | |
| Total net realized gain (loss) | (104,971) | |
| Change in net unrealized appreciation (depreciation) on: | ||
| Investment securities: | ||
| Unaffiliated issuers | (145,655) | |
| Fidelity Central Funds | 1 | |
| Assets and liabilities in foreign currencies | 1,884 | |
| Total change in net unrealized appreciation (depreciation) | (143,770) | |
| Net gain (loss) | (248,741) | |
| Net increase (decrease) in net assets resulting from operations | $2,705,547 |
See accompanying notes which are an integral part of the financial statements.
Statement of Changes in Net Assets
| Six months ended October 31, 2019 (Unaudited) | Year ended April 30, 2019 | |
| Increase (Decrease) in Net Assets | ||
| Operations | ||
| Net investment income (loss) | $2,954,288 | $6,690,427 |
| Net realized gain (loss) | (104,971) | (1,440,603) |
| Change in net unrealized appreciation (depreciation) | (143,770) | (726,200) |
| Net increase (decrease) in net assets resulting from operations | 2,705,547 | 4,523,624 |
| Distributions to shareholders | (2,832,252) | (6,909,437) |
| Share transactions - net increase (decrease) | (1,597,938) | (30,207,682) |
| Total increase (decrease) in net assets | (1,724,643) | (32,593,495) |
| Net Assets | ||
| Beginning of period | 120,029,572 | 152,623,067 |
| End of period | $118,304,929 | $120,029,572 |
See accompanying notes which are an integral part of the financial statements.
Financial Highlights
Fidelity Global High Income Fund Class A
| Six months ended (Unaudited) October 31, | Years endedApril 30, | |||||
| 2019 | 2019 | 2018 | 2017 | 2016 | 2015 | |
| Selected Per–Share Data | ||||||
| Net asset value, beginning of period | $9.48 | $9.61 | $9.54 | $9.07 | $9.60 | $10.21 |
| Income from Investment Operations | ||||||
| Net investment income (loss)A | .226 | .468 | .462 | .463 | .462 | .476 |
| Net realized and unrealized gain (loss) | (.020) | (.115) | .006 | .422 | (.541) | (.293)B |
| Total from investment operations | .206 | .353 | .468 | .885 | (.079) | .183 |
| Distributions from net investment income | (.216) | (.457) | (.399) | (.418) | (.454) | (.486) |
| Distributions from net realized gain | – | (.026) | – | – | – | (.310) |
| Total distributions | (.216) | (.483) | (.399) | (.418) | (.454) | (.796) |
| Redemption fees added to paid in capitalA | – | – | .001 | .003 | .003 | .003 |
| Net asset value, end of period | $9.47 | $9.48 | $9.61 | $9.54 | $9.07 | $9.60 |
| Total ReturnC,D,E | 2.20% | 3.88% | 4.94% | 10.00% | (.65)% | 1.97%B |
| Ratios to Average Net AssetsF,G | ||||||
| Expenses before reductions | 1.31%H | 1.32% | 1.31% | 1.36% | 1.38% | 1.28% |
| Expenses net of fee waivers, if any | 1.25%H | 1.25% | 1.25% | 1.25% | 1.25% | 1.25% |
| Expenses net of all reductions | 1.25%H | 1.25% | 1.25% | 1.25% | 1.25% | 1.25% |
| Net investment income (loss) | 4.76%H | 5.00% | 4.75% | 4.98% | 5.11% | 4.82% |
| Supplemental Data | ||||||
| Net assets, end of period (000 omitted) | $6,890 | $7,365 | $8,712 | $7,102 | $6,187 | $7,036 |
| Portfolio turnover rateI | 46%H | 44% | 48% | 48% | 41% | 44% |
A Calculated based on average shares outstanding during the period.
B Amount includes a reimbursement from the investment adviser for an operational error which amounted to less than $.01 per share. Excluding this reimbursement, the total return would have been 1.93%.
C Total returns for periods of less than one year are not annualized.
D Total returns would have been lower if certain expenses had not been reduced during the applicable periods shown.
E Total returns do not include the effect of the sales charges.
F Fees and expenses of any underlying Fidelity Central Funds are not included in the Fund's expense ratio. The Fund indirectly bears its proportionate share of the expenses of any underlying Fidelity Central Funds.
G Expense ratios reflect operating expenses of the class. Expenses before reductions do not reflect amounts reimbursed by the investment adviser or reductions from brokerage service arrangements or reductions from other expense offset arrangements and do not represent the amount paid by the class during periods when reimbursements or reductions occur. Expenses net of fee waivers reflect expenses after reimbursement by the investment adviser but prior to reductions from brokerage service arrangements or other expense offset arrangements. Expenses net of all reductions represent the net expenses paid by the class.
H Annualized
I Amount does not include the portfolio activity of any underlying Fidelity Central Funds.
See accompanying notes which are an integral part of the financial statements.
Fidelity Global High Income Fund Class M
| Six months ended (Unaudited) October 31, | Years endedApril 30, | |||||
| 2019 | 2019 | 2018 | 2017 | 2016 | 2015 | |
| Selected Per–Share Data | ||||||
| Net asset value, beginning of period | $9.48 | $9.61 | $9.54 | $9.07 | $9.60 | $10.21 |
| Income from Investment Operations | ||||||
| Net investment income (loss)A | .226 | .467 | .462 | .464 | .462 | .474 |
| Net realized and unrealized gain (loss) | (.020) | (.114) | .006 | .421 | (.541) | (.291)B |
| Total from investment operations | .206 | .353 | .468 | .885 | (.079) | .183 |
| Distributions from net investment income | (.216) | (.457) | (.399) | (.418) | (.454) | (.486) |
| Distributions from net realized gain | – | (.026) | – | – | – | (.310) |
| Total distributions | (.216) | (.483) | (.399) | (.418) | (.454) | (.796) |
| Redemption fees added to paid in capitalA | – | – | .001 | .003 | .003 | .003 |
| Net asset value, end of period | $9.47 | $9.48 | $9.61 | $9.54 | $9.07 | $9.60 |
| Total ReturnC,D,E | 2.21% | 3.88% | 4.94% | 10.00% | (.65)% | 1.98%B |
| Ratios to Average Net AssetsF,G | ||||||
| Expenses before reductions | 1.38%H | 1.40% | 1.40% | 1.50% | 1.48% | 1.40% |
| Expenses net of fee waivers, if any | 1.25%H | 1.25% | 1.25% | 1.25% | 1.25% | 1.25% |
| Expenses net of all reductions | 1.25%H | 1.25% | 1.25% | 1.25% | 1.25% | 1.25% |
| Net investment income (loss) | 4.76%H | 5.00% | 4.75% | 4.98% | 5.11% | 4.82% |
| Supplemental Data | ||||||
| Net assets, end of period (000 omitted) | $3,979 | $3,971 | $4,301 | $3,029 | $1,436 | $1,745 |
| Portfolio turnover rateI | 46%H | 44% | 48% | 48% | 41% | 44% |
A Calculated based on average shares outstanding during the period.
B Amount includes a reimbursement from the investment adviser for an operational error which amounted to less than $.01 per share. Excluding this reimbursement, the total return would have been 1.94%.
C Total returns for periods of less than one year are not annualized.
D Total returns would have been lower if certain expenses had not been reduced during the applicable periods shown.
E Total returns do not include the effect of the sales charges.
F Fees and expenses of any underlying Fidelity Central Funds are not included in the Fund's expense ratio. The Fund indirectly bears its proportionate share of the expenses of any underlying Fidelity Central Funds.
G Expense ratios reflect operating expenses of the class. Expenses before reductions do not reflect amounts reimbursed by the investment adviser or reductions from brokerage service arrangements or reductions from other expense offset arrangements and do not represent the amount paid by the class during periods when reimbursements or reductions occur. Expenses net of fee waivers reflect expenses after reimbursement by the investment adviser but prior to reductions from brokerage service arrangements or other expense offset arrangements. Expenses net of all reductions represent the net expenses paid by the class.
H Annualized
I Amount does not include the portfolio activity of any underlying Fidelity Central Funds.
See accompanying notes which are an integral part of the financial statements.
Fidelity Global High Income Fund Class C
| Six months ended (Unaudited) October 31, | Years endedApril 30, | |||||
| 2019 | 2019 | 2018 | 2017 | 2016 | 2015 | |
| Selected Per–Share Data | ||||||
| Net asset value, beginning of period | $9.48 | $9.61 | $9.54 | $9.07 | $9.60 | $10.21 |
| Income from Investment Operations | ||||||
| Net investment income (loss)A | .191 | .398 | .390 | .394 | .394 | .401 |
| Net realized and unrealized gain (loss) | (.020) | (.115) | .005 | .422 | (.540) | (.292)B |
| Total from investment operations | .171 | .283 | .395 | .816 | (.146) | .109 |
| Distributions from net investment income | (.181) | (.387) | (.326) | (.349) | (.387) | (.412) |
| Distributions from net realized gain | – | (.026) | – | – | – | (.310) |
| Total distributions | (.181) | (.413) | (.326) | (.349) | (.387) | (.722) |
| Redemption fees added to paid in capitalA | – | – | .001 | .003 | .003 | .003 |
| Net asset value, end of period | $9.47 | $9.48 | $9.61 | $9.54 | $9.07 | $9.60 |
| Total ReturnC,D,E | 1.82% | 3.10% | 4.16% | 9.19% | (1.39)% | 1.22%B |
| Ratios to Average Net AssetsF,G | ||||||
| Expenses before reductions | 2.07%H | 2.08% | 2.08% | 2.18% | 2.20% | 2.12% |
| Expenses net of fee waivers, if any | 2.00%H | 2.00% | 2.00% | 2.00% | 2.00% | 2.00% |
| Expenses net of all reductions | 2.00%H | 2.00% | 2.00% | 2.00% | 2.00% | 2.00% |
| Net investment income (loss) | 4.01%H | 4.25% | 4.00% | 4.23% | 4.36% | 4.07% |
| Supplemental Data | ||||||
| Net assets, end of period (000 omitted) | $3,524 | $3,723 | $4,420 | $3,775 | $3,437 | $3,811 |
| Portfolio turnover rateI | 46%H | 44% | 48% | 48% | 41% | 44% |
A Calculated based on average shares outstanding during the period.
B Amount includes a reimbursement from the investment adviser for an operational error which amounted to less than $.01 per share. Excluding this reimbursement, the total return would have been 1.18%.
C Total returns for periods of less than one year are not annualized.
D Total returns would have been lower if certain expenses had not been reduced during the applicable periods shown.
E Total returns do not include the effect of the contingent deferred sales charge.
F Fees and expenses of any underlying Fidelity Central Funds are not included in the Fund's expense ratio. The Fund indirectly bears its proportionate share of the expenses of any underlying Fidelity Central Funds.
G Expense ratios reflect operating expenses of the class. Expenses before reductions do not reflect amounts reimbursed by the investment adviser or reductions from brokerage service arrangements or reductions from other expense offset arrangements and do not represent the amount paid by the class during periods when reimbursements or reductions occur. Expenses net of fee waivers reflect expenses after reimbursement by the investment adviser but prior to reductions from brokerage service arrangements or other expense offset arrangements. Expenses net of all reductions represent the net expenses paid by the class.
H Annualized
I Amount does not include the portfolio activity of any underlying Fidelity Central Funds.
See accompanying notes which are an integral part of the financial statements.
Fidelity Global High Income Fund
| Six months ended (Unaudited) October 31, | Years endedApril 30, | |||||
| 2019 | 2019 | 2018 | 2017 | 2016 | 2015 | |
| Selected Per–Share Data | ||||||
| Net asset value, beginning of period | $9.48 | $9.62 | $9.54 | $9.07 | $9.60 | $10.21 |
| Income from Investment Operations | ||||||
| Net investment income (loss)A | .238 | .491 | .487 | .486 | .486 | .508 |
| Net realized and unrealized gain (loss) | (.020) | (.125) | .015 | .423 | (.542) | (.301)B |
| Total from investment operations | .218 | .366 | .502 | .909 | (.056) | .207 |
| Distributions from net investment income | (.228) | (.480) | (.423) | (.442) | (.477) | (.510) |
| Distributions from net realized gain | – | (.026) | – | – | – | (.310) |
| Total distributions | (.228) | (.506) | (.423) | (.442) | (.477) | (.820) |
| Redemption fees added to paid in capitalA | – | – | .001 | .003 | .003 | .003 |
| Net asset value, end of period | $9.47 | $9.48 | $9.62 | $9.54 | $9.07 | $9.60 |
| Total ReturnC,D | 2.33% | 4.03% | 5.31% | 10.28% | (.40)% | 2.23%B |
| Ratios to Average Net AssetsE,F | ||||||
| Expenses before reductions | 1.01%G | 1.01% | 1.02% | 1.14% | 1.20% | 1.05% |
| Expenses net of fee waivers, if any | 1.00%G | 1.00% | 1.00% | 1.00% | 1.00% | 1.00% |
| Expenses net of all reductions | 1.00%G | 1.00% | 1.00% | 1.00% | 1.00% | 1.00% |
| Net investment income (loss) | 5.01%G | 5.25% | 5.00% | 5.23% | 5.35% | 5.07% |
| Supplemental Data | ||||||
| Net assets, end of period (000 omitted) | $95,753 | $97,619 | $125,192 | $85,188 | $93,256 | $119,712 |
| Portfolio turnover rateH | 46%G | 44% | 48% | 48% | 41% | 44% |
A Calculated based on average shares outstanding during the period.
B Amount includes a reimbursement from the investment adviser for an operational error which amounted to less than $.01 per share. Excluding this reimbursement, the total return would have been 2.19%.
C Total returns for periods of less than one year are not annualized.
D Total returns would have been lower if certain expenses had not been reduced during the applicable periods shown.
E Fees and expenses of any underlying Fidelity Central Funds are not included in the Fund's expense ratio. The Fund indirectly bears its proportionate share of the expenses of any underlying Fidelity Central Funds.
F Expense ratios reflect operating expenses of the class. Expenses before reductions do not reflect amounts reimbursed by the investment adviser or reductions from brokerage service arrangements or reductions from other expense offset arrangements and do not represent the amount paid by the class during periods when reimbursements or reductions occur. Expenses net of fee waivers reflect expenses after reimbursement by the investment adviser but prior to reductions from brokerage service arrangements or other expense offset arrangements. Expenses net of all reductions represent the net expenses paid by the class.
G Annualized
H Amount does not include the portfolio activity of any underlying Fidelity Central Funds.
See accompanying notes which are an integral part of the financial statements.
Fidelity Global High Income Fund Class I
| Six months ended (Unaudited) October 31, | Years endedApril 30, | |||||
| 2019 | 2019 | 2018 | 2017 | 2016 | 2015 | |
| Selected Per–Share Data | ||||||
| Net asset value, beginning of period | $9.48 | $9.62 | $9.54 | $9.07 | $9.60 | $10.21 |
| Income from Investment Operations | ||||||
| Net investment income (loss)A | .238 | .491 | .485 | .486 | .483 | .501 |
| Net realized and unrealized gain (loss) | (.020) | (.125) | .017 | .423 | (.539) | (.293)B |
| Total from investment operations | .218 | .366 | .502 | .909 | (.056) | .208 |
| Distributions from net investment income | (.228) | (.480) | (.423) | (.442) | (.477) | (.511) |
| Distributions from net realized gain | – | (.026) | – | – | – | (.310) |
| Total distributions | (.228) | (.506) | (.423) | (.442) | (.477) | (.821) |
| Redemption fees added to paid in capitalA | – | – | .001 | .003 | .003 | .003 |
| Net asset value, end of period | $9.47 | $9.48 | $9.62 | $9.54 | $9.07 | $9.60 |
| Total ReturnC,D | 2.33% | 4.03% | 5.31% | 10.28% | (.40)% | 2.23%B |
| Ratios to Average Net AssetsE,F | ||||||
| Expenses before reductions | 1.00%G | 1.05% | 1.03% | 1.16% | 1.10% | 1.02% |
| Expenses net of fee waivers, if any | 1.00%G | 1.00% | 1.00% | 1.00% | 1.00% | 1.00% |
| Expenses net of all reductions | 1.00%G | 1.00% | 1.00% | 1.00% | 1.00% | 1.00% |
| Net investment income (loss) | 5.01%G | 5.25% | 5.00% | 5.23% | 5.35% | 5.07% |
| Supplemental Data | ||||||
| Net assets, end of period (000 omitted) | $8,159 | $7,352 | $9,999 | $2,817 | $1,905 | $2,481 |
| Portfolio turnover rateH | 46%G | 44% | 48% | 48% | 41% | 44% |
A Calculated based on average shares outstanding during the period.
B Amount includes a reimbursement from the investment adviser for an operational error which amounted to less than $.01 per share. Excluding this reimbursement, the total return would have been 2.19%.
C Total returns for periods of less than one year are not annualized.
D Total returns would have been lower if certain expenses had not been reduced during the applicable periods shown.
E Fees and expenses of any underlying Fidelity Central Funds are not included in the Fund's expense ratio. The Fund indirectly bears its proportionate share of the expenses of any underlying Fidelity Central Funds.
F Expense ratios reflect operating expenses of the class. Expenses before reductions do not reflect amounts reimbursed by the investment adviser or reductions from brokerage service arrangements or reductions from other expense offset arrangements and do not represent the amount paid by the class during periods when reimbursements or reductions occur. Expenses net of fee waivers reflect expenses after reimbursement by the investment adviser but prior to reductions from brokerage service arrangements or other expense offset arrangements. Expenses net of all reductions represent the net expenses paid by the class.
G Annualized
H Amount does not include the portfolio activity of any underlying Fidelity Central Funds.
See accompanying notes which are an integral part of the financial statements.
Notes to Financial Statements (Unaudited)
For the period ended October 31, 2019
1. Organization.
Fidelity Global High Income Fund (the Fund) is a fund of Fidelity Summer Street Trust (the Trust) and is authorized to issue an unlimited number of shares. The Trust is registered under the Investment Company Act of 1940, as amended (the 1940 Act), as an open-end management investment company organized as a Massachusetts business trust. The Fund offers Class A, Class M, Class C, Global High Income and Class I shares, each of which has equal rights as to assets and voting privileges. Each class has exclusive voting rights with respect to matters that affect that class. Effective March 1, 2019, Class C shares will automatically convert to Class A shares after a holding period of ten years from the initial date of purchase, with certain exceptions.
2. Investments in Fidelity Central Funds.
The Fund invests in Fidelity Central Funds, which are open-end investment companies generally available only to other investment companies and accounts managed by the investment adviser and its affiliates. The Fund's Schedule of Investments lists each of the Fidelity Central Funds held as of period end, if any, as an investment of the Fund, but does not include the underlying holdings of each Fidelity Central Fund. As an Investing Fund, the Fund indirectly bears its proportionate share of the expenses of the underlying Fidelity Central Funds.
The Money Market Central Funds seek preservation of capital and current income and are managed by Fidelity Investments Money Management, Inc. (FIMM), an affiliate of the investment adviser. Annualized expenses of the Money Market Central Funds as of their most recent shareholder report date ranged from less than .005% to .01%.
A complete unaudited list of holdings for each Fidelity Central Fund is available upon request or at the Securities and Exchange Commission (the SEC) website at www.sec.gov. In addition, the financial statements of the Fidelity Central Funds are available on the SEC website or upon request.
3. Significant Accounting Policies.
The Fund is an investment company and applies the accounting and reporting guidance of the Financial Accounting Standards Board (FASB) Accounting Standards Codification Topic 946 Financial Services – Investments Companies. The financial statements have been prepared in conformity with accounting principles generally accepted in the United States of America (GAAP), which require management to make certain estimates and assumptions at the date of the financial statements. Actual results could differ from those estimates. Subsequent events, if any, through the date that the financial statements were issued have been evaluated in the preparation of the financial statements. The following summarizes the significant accounting policies of the Fund:
Investment Valuation. Investments are valued as of 4:00 p.m. Eastern time on the last calendar day of the period. The Board of Trustees (the Board) has delegated the day to day responsibility for the valuation of the Fund's investments to the Fair Value Committee (the Committee) established by the Fund's investment adviser. In accordance with valuation policies and procedures approved by the Board, the Fund attempts to obtain prices from one or more third party pricing vendors or brokers to value its investments. When current market prices, quotations or currency exchange rates are not readily available or reliable, investments will be fair valued in good faith by the Committee, in accordance with procedures adopted by the Board. Factors used in determining fair value vary by investment type and may include market or investment specific events, changes in interest rates and credit quality. The frequency with which these procedures are used cannot be predicted and they may be utilized to a significant extent. The Committee oversees the Fund's valuation policies and procedures and reports to the Board on the Committee's activities and fair value determinations. The Board monitors the appropriateness of the procedures used in valuing the Fund's investments and ratifies the fair value determinations of the Committee.
The Fund categorizes the inputs to valuation techniques used to value its investments into a disclosure hierarchy consisting of three levels as shown below:
- Level 1 – quoted prices in active markets for identical investments
- Level 2 – other significant observable inputs (including quoted prices for similar investments, interest rates, prepayment speeds, etc.)
- Level 3 – unobservable inputs (including the Fund's own assumptions based on the best information available)
Valuation techniques used to value the Fund's investments by major category are as follows:
Debt securities, including restricted securities, are valued based on evaluated prices received from third party pricing vendors or from brokers who make markets in such securities. Corporate bonds, bank loan obligations, foreign government and government agency obligations and preferred securities are valued by pricing vendors who utilize matrix pricing which considers yield or price of bonds of comparable quality, coupon, maturity and type or by broker-supplied prices. When independent prices are unavailable or unreliable, debt securities may be valued utilizing pricing methodologies which consider similar factors that would be used by third party pricing vendors. For foreign debt securities, when significant market or security specific events arise, valuations may be determined in good faith in accordance with procedures adopted by the Board. Debt securities are generally categorized as Level 2 in the hierarchy but may be Level 3 depending on the circumstances. The Fund invests a significant portion of its assets in below investment grade securities. The value of these securities can be more volatile due to changes in the credit quality of the issuer and is sensitive to changes in economic, market and regulatory conditions.
Equity securities, including restricted securities, for which market quotations are readily available, are valued at the last reported sale price or official closing price as reported by a third party pricing vendor on the primary market or exchange on which they are traded and are categorized as Level 1 in the hierarchy. In the event there were no sales during the day or closing prices are not available, securities are valued at the last quoted bid price or may be valued using the last available price and are generally categorized as Level 2 in the hierarchy. For equity securities, including restricted securities, where observable inputs are limited, assumptions about market activity and risk are used and these securities may be categorized as Level 3 in the hierarchy.
Investments in open-end mutual funds, including the Fidelity Central Funds, are valued at their closing net asset value (NAV) each business day and are categorized as Level 1 in the hierarchy.
Changes in valuation techniques may result in transfers in or out of an assigned level within the disclosure hierarchy. The aggregate value of investments by input level as of October 31, 2019 is included at the end of the Fund's Schedule of Investments.
Foreign Currency. The Fund may use foreign currency contracts to facilitate transactions in foreign-denominated securities. Gains and losses from these transactions may arise from changes in the value of the foreign currency or if the counterparties do not perform under the contracts' terms.
Foreign-denominated assets, including investment securities, and liabilities are translated into U.S. dollars at the exchange rates at period end. Purchases and sales of investment securities, income and dividends received and expenses denominated in foreign currencies are translated into U.S. dollars at the exchange rate in effect on the transaction date.
The effects of exchange rate fluctuations on investments are included with the net realized and unrealized gain (loss) on investment securities. Other foreign currency transactions resulting in realized and unrealized gain (loss) are disclosed separately.
Investment Transactions and Income. For financial reporting purposes, the Fund's investment holdings and NAV include trades executed through the end of the last business day of the period. The NAV per share for processing shareholder transactions is calculated as of the close of business of the New York Stock Exchange (NYSE), normally 4:00 p.m. Eastern time and includes trades executed through the end of the prior business day. Gains and losses on securities sold are determined on the basis of identified cost and include proceeds received from litigation. Dividend income is recorded on the ex-dividend date, except for certain dividends from foreign securities where the ex-dividend date may have passed, which are recorded as soon as the Fund is informed of the ex-dividend date. Non-cash dividends included in dividend income, if any, are recorded at the fair market value of the securities received. Income and capital gain distributions from Fidelity Central Funds, if any, are recorded on the ex-dividend date. Certain distributions received by the Fund represent a return of capital or capital gain. The Fund determines the components of these distributions subsequent to the ex-dividend date, based upon receipt of tax filings or other correspondence relating to the underlying investment. These distributions are recorded as a reduction of cost of investments and/or as a realized gain. Interest income is accrued as earned and includes coupon interest and amortization of premium and accretion of discount on debt securities as applicable. Paid in Kind (PIK) income is recorded at the fair market value of the securities received. Investment income is recorded net of foreign taxes withheld where recovery of such taxes is uncertain. Debt obligations may be placed on non-accrual status and related interest income may be reduced by ceasing current accruals and writing off interest receivables when the collection of all or a portion of interest has become doubtful based on consistently applied procedures. A debt obligation is removed from non-accrual status when the issuer resumes interest payments or when collectability of interest is reasonably assured.
Class Allocations and Expenses. Investment income, realized and unrealized capital gains and losses, common expenses of the Fund, and certain fund-level expense reductions, if any, are allocated daily on a pro-rata basis to each class based on the relative net assets of each class to the total net assets of the Fund. Each class differs with respect to transfer agent and distribution and service plan fees incurred. Certain expense reductions may also differ by class. For the reporting period, the allocated portion of income and expenses to each class as a percent of its average net assets may vary due to the timing of recording these transactions in relation to fluctuating net assets of the classes. Expenses directly attributable to a fund are charged to that fund. Expenses attributable to more than one fund are allocated among the respective funds on the basis of relative net assets or other appropriate methods. Expense estimates are accrued in the period to which they relate and adjustments are made when actual amounts are known.
Income Tax Information and Distributions to Shareholders. Each year, the Fund intends to qualify as a regulated investment company under Subchapter M of the Internal Revenue Code, including distributing substantially all of its taxable income and realized gains. As a result, no provision for U.S. Federal income taxes is required. The Fund files a U.S. federal tax return, in addition to state and local tax returns as required. The Fund's federal income tax returns are subject to examination by the Internal Revenue Service (IRS) for a period of three fiscal years after they are filed. State and local tax returns may be subject to examination for an additional fiscal year depending on the jurisdiction. Foreign taxes are provided for based on the Fund's understanding of the tax rules and rates that exist in the foreign markets in which it invests.
Distributions are declared and recorded daily and paid monthly from net investment income. Distributions from realized gains, if any, are declared and recorded on the ex-dividend date. Income and capital gain distributions are declared separately for each class. Income and capital gain distributions are determined in accordance with income tax regulations, which may differ from GAAP.
Capital accounts within the financial statements are adjusted for permanent book-tax differences. These adjustments have no impact on net assets or the results of operations. Capital accounts are not adjusted for temporary book-tax differences which will reverse in a subsequent period.
Book-tax differences are primarily due to foreign currency transactions, defaulted bonds, market discount, equity-debt classifications, capital loss carryforwards and losses deferred due to wash sales.
As of period end, the cost and unrealized appreciation (depreciation) in securities, and derivatives if applicable, for federal income tax purposes were as follows:
| Gross unrealized appreciation | $4,060,833 |
| Gross unrealized depreciation | (4,808,637) |
| Net unrealized appreciation (depreciation) | $(747,804) |
| Tax cost | $119,198,071 |
Capital loss carryforwards are only available to offset future capital gains of the Fund to the extent provided by regulations and may be limited. Under the Regulated Investment Company Modernization Act of 2010 (the Act), the Fund is permitted to carry forward capital losses incurred in taxable years beginning after December 22, 2010 for an unlimited period and such capital losses are required to be used prior to any losses that expire. The capital loss carryforward information presented below, including any applicable limitation, is estimated as of prior fiscal period end and is subject to adjustment.
| No expiration | |
| Short-term | $(1,166,690) |
| Long-term | (3,367,790) |
| Total capital loss carryforward | $(4,534,480) |
Delayed Delivery Transactions and When-Issued Securities. During the period, the Fund transacted in securities on a delayed delivery or when-issued basis. Payment and delivery may take place after the customary settlement period for that security. The price of the underlying securities and the date when the securities will be delivered and paid for are fixed at the time the transaction is negotiated. The securities purchased on a delayed delivery or when-issued basis are identified as such in the Fund's Schedule of Investments. The Fund may receive compensation for interest forgone in the purchase of a delayed delivery or when-issued security. With respect to purchase commitments, the Fund identifies securities as segregated in its records with a value at least equal to the amount of the commitment. Losses may arise due to changes in the value of the underlying securities or if the counterparty does not perform under the contract's terms, or if the issuer does not issue the securities due to political, economic, or other factors.
Restricted Securities. The Fund may invest in securities that are subject to legal or contractual restrictions on resale. These securities generally may be resold in transactions exempt from registration or to the public if the securities are registered. Disposal of these securities may involve time-consuming negotiations and expense, and prompt sale at an acceptable price may be difficult. Information regarding restricted securities is included at the end of the Fund's Schedule of Investments.
Loans and Other Direct Debt Instruments. The Fund invests in direct debt instruments which are interests in amounts owed to lenders by corporate or other borrowers. These instruments may be in the form of loans, trade claims or other receivables and may include standby financing commitments such as revolving credit facilities that obligate the Fund to supply additional cash to the borrower on demand. Loans may be acquired through assignment or participation. The Fund also invests in unfunded loan commitments, which are contractual obligations for future funding. Information regarding unfunded commitments is included at the end of the Fund's Schedule of Investments.
4. Purchases and Sales of Investments.
Purchases and sales of securities, other than short-term securities, aggregated $25,431,694 and $27,702,237, respectively.
5. Fees and Other Transactions with Affiliates.
Management Fee. Fidelity Management & Research Company (the investment adviser) and its affiliates provide the Fund with investment management related services for which the Fund pays a monthly management fee. The management fee is the sum of an individual fund fee rate that is based on an annual rate of .60% of the Fund's average net assets and an annualized group fee rate that averaged .10% during the period. The group fee rate is based upon the average net assets of all the mutual funds advised by the investment adviser, including any mutual funds previously advised by the investment adviser that are currently advised by Fidelity SelectCo, LLC, an affiliate of the investment adviser. The group fee rate decreases as assets under management increase and increases as assets under management decrease. For the reporting period, the total annualized management fee rate was .70% of the Fund's average net assets.
Distribution and Service Plan Fees. In accordance with Rule 12b-1 of the 1940 Act, the Fund has adopted separate Distribution and Service Plans for each class of shares. Certain classes pay Fidelity Distributors Corporation (FDC), an affiliate of the investment adviser, separate Distribution and Service Fees, each of which is based on an annual percentage of each class' average net assets. In addition, FDC may pay financial intermediaries for selling shares of the Fund and providing shareholder support services. For the period, the Distribution and Service Fee rates, total fees and amounts retained by FDC were as follows:
| Distribution Fee | Service Fee | Total Fees | Retained by FDC | |
| Class A | -% | .25% | $8,519 | $490 |
| Class M | -% | .25% | 5,016 | – |
| Class C | .75% | .25% | 18,192 | 1,795 |
| $31,727 | $2,285 |
Sales Load. FDC may receive a front-end sales charge of up to 4.00% for selling Class A shares and Class M shares, some of which is paid to financial intermediaries for selling shares of the Fund. Depending on the holding period, FDC may receive contingent deferred sales charges levied on Class A, Class M and Class C redemptions. The deferred sales charges are 1.00% for Class C shares, 1.00% for certain purchases of Class A shares and .25% for certain purchases of Class M shares.
For the period, sales charge amounts retained by FDC were as follows:
| Retained by FDC | |
| Class A | $1,051 |
| Class M | 158 |
| Class C(a) | 35 |
| $1,244 |
(a) When Class C shares are initially sold, FDC pays commissions from its own resources to financial intermediaries through which the sales are made.
Transfer Agent Fees. Fidelity Investments Institutional Operations Company, Inc., (FIIOC), an affiliate of the investment adviser, is the transfer, dividend disbursing and shareholder servicing agent for each class of the Fund. FIIOC receives account fees and asset-based fees that vary according to the account size and type of account of the shareholders of the respective classes of the Fund. FIIOC pays for typesetting, printing and mailing of shareholder reports, except proxy statements.
For the period, transfer agent fees for each class were as follows:
| Amount | % of Class-Level Average Net Assets(a) | |
| Class A | $6,424 | .19 |
| Class M | 5,245 | .26 |
| Class C | 3,746 | .20 |
| Global High Income | 63,772 | .13 |
| Class I | 4,792 | .14 |
| $83,979 |
(a) Annualized
Accounting Fees. Fidelity Service Company, Inc. (FSC), an affiliate of the investment adviser, maintains the Fund's accounting records. The fee is based on the level of average net assets for each month. For the period, the fees were equivalent to an annualized rate of .04%.
Interfund Trades. The Fund may purchase from or sell securities to other Fidelity Funds under procedures adopted by the Board. The procedures have been designed to ensure these interfund trades are executed in accordance with Rule 17a-7 of the 1940 Act. Interfund trades are included within the respective purchases and sales amounts shown in the Purchases and Sales of Investments note.
6. Committed Line of Credit.
The Fund participates with other funds managed by the investment adviser or an affiliate in a $4.25 billion credit facility (the "line of credit") to be utilized for temporary or emergency purposes to fund shareholder redemptions or for other short-term liquidity purposes. The Fund has agreed to pay commitment fees on its pro-rata portion of the line of credit, which amounted to $145 and is reflected in Miscellaneous expenses on the Statement of Operations. During the period, the Fund did not borrow on this line of credit.
7. Expense Reductions.
The investment adviser contractually agreed to reimburse each class to the extent annual operating expenses exceeded certain levels of class-level average net assets as noted in the table below. This reimbursement will remain in place through August 31, 2020. Some expenses, for example the compensation of the independent Trustees, and certain miscellaneous expenses such as proxy and shareholder meeting expenses, are excluded from this reimbursement.
The following classes were in reimbursement during the period:
| Expense Limitations | Reimbursement | |
| Class A | 1.25% | $2,095 |
| Class M | 1.25% | 2,679 |
| Class C | 2.00% | 1,343 |
| Global High Income | 1.00% | 2,464 |
| Class I | 1.00% | 93 |
| $8,674 |
Commissions paid to certain brokers with whom the investment adviser, or its affiliates, places trades on behalf of the Fund include an amount in addition to trade execution, which may be rebated back to the Fund to offset certain expenses. This amount totaled $24 for the period. In addition, through arrangements with the Fund's custodian, credits realized as a result of certain uninvested cash balances were used to reduce the Fund's expenses. During the period, custodian credits reduced the Fund's expenses by $493.
In addition, during the period the investment adviser reimbursed and/or waived a portion of fund-level operating expenses in the amount of $296.
8. Distributions to Shareholders.
Distributions to shareholders of each class were as follows:
| Six months ended October 31, 2019 | Year ended April 30, 2019 |
|
| Distributions to shareholders | ||
| Class A | $156,149 | $391,427 |
| Class M | 91,915 | 205,532 |
| Class C | 69,639 | 180,304 |
| Global High Income | 2,354,623 | 5,783,573 |
| Class I | 159,926 | 348,601 |
| Total | $2,832,252 | $6,909,437 |
9. Share Transactions.
Share transactions for each class were as follows and may contain automatic conversions between classes or exchanges between affiliated funds:
| Shares | Shares | Dollars | Dollars | |
| Six months ended October 31, 2019 | Year ended April 30, 2019 | Six months ended October 31, 2019 | Year ended April 30, 2019 | |
| Class A | ||||
| Shares sold | 67,561 | 161,804 | $638,600 | $1,505,999 |
| Reinvestment of distributions | 15,774 | 40,182 | 149,091 | 374,959 |
| Shares redeemed | (132,702) | (331,036) | (1,252,645) | (3,106,435) |
| Net increase (decrease) | (49,367) | (129,050) | $(464,954) | $(1,225,477) |
| Class M | ||||
| Shares sold | 23,192 | 61,952 | $218,795 | $578,414 |
| Reinvestment of distributions | 9,506 | 21,579 | 89,826 | 201,288 |
| Shares redeemed | (31,409) | (111,896) | (297,042) | (1,039,339) |
| Net increase (decrease) | 1,289 | (28,365) | $11,579 | $(259,637) |
| Class C | ||||
| Shares sold | 15,240 | 68,330 | $144,375 | $639,377 |
| Reinvestment of distributions | 7,212 | 18,636 | 68,167 | 173,728 |
| Shares redeemed | (43,072) | (153,859) | (406,857) | (1,442,196) |
| Net increase (decrease) | (20,620) | (66,893) | $(194,315) | $(629,091) |
| Global High Income | ||||
| Shares sold | 1,328,195 | 3,114,879 | $12,573,764 | $29,075,801 |
| Reinvestment of distributions | 203,876 | 527,744 | 1,927,129 | 4,924,322 |
| Shares redeemed | (1,718,523) | (6,363,830) | (16,264,999) | (59,508,602) |
| Net increase (decrease) | (186,452) | (2,721,207) | $(1,764,106) | $(25,508,479) |
| Class I | ||||
| Shares sold | 397,813 | 485,713 | $3,752,745 | $4,504,729 |
| Reinvestment of distributions | 13,706 | 29,106 | 129,543 | 271,715 |
| Shares redeemed | (325,419) | (779,082) | (3,068,430) | (7,361,442) |
| Net increase (decrease) | 86,100 | (264,263) | $813,858 | $(2,584,998) |
10. Other.
The Fund's organizational documents provide former and current trustees and officers with a limited indemnification against liabilities arising in connection with the performance of their duties to the Fund. In the normal course of business, the Fund may also enter into contracts that provide general indemnifications. The Fund's maximum exposure under these arrangements is unknown as this would be dependent on future claims that may be made against the Fund. The risk of material loss from such claims is considered remote.
11. Credit Risk.
The Fund's relatively large investment in countries with limited or developing capital markets may involve greater risks than investments in more developed markets and the prices of such investments may be volatile. The yields of emerging market debt obligations reflect, among other things, perceived credit risk. The consequences of political, social or economic changes in these markets may have disruptive effects on the market prices of the Fund's investments and the income they generate, as well as the Fund's ability to repatriate such amounts.
Shareholder Expense Example
As a shareholder of the Fund, you incur two types of costs: (1) transaction costs, including sales charges (loads) on purchase payments or redemption proceeds, and (2) ongoing costs, including management fees, distribution and/or service (12b-1) fees and other Fund expenses. This Example is intended to help you understand your ongoing costs (in dollars) of investing in the Fund and to compare these costs with the ongoing costs of investing in other mutual funds.
The Example is based on an investment of $1,000 invested at the beginning of the period and held for the entire period (May 1, 2019 to October 31, 2019).
Actual Expenses
The first line of the accompanying table for each class of the Fund provides information about actual account values and actual expenses. You may use the information in this line, together with the amount you invested, to estimate the expenses that you paid over the period. Simply divide your account value by $1,000.00 (for example, an $8,600 account value divided by $1,000.00 = 8.6), then multiply the result by the number in the first line for a class of the Fund under the heading entitled "Expenses Paid During Period" to estimate the expenses you paid on your account during this period. In addition, the Fund, as a shareholder in the underlying Fidelity Central Funds, will indirectly bear its pro-rata share of the fees and expenses incurred by the underlying Fidelity Central Funds. These fees and expenses are not included in the Fund's annualized expense ratio used to calculate the expense estimate in the table below.
Hypothetical Example for Comparison Purposes
The second line of the accompanying table for each class of the Fund provides information about hypothetical account values and hypothetical expenses based on a Class' actual expense ratio and an assumed rate of return of 5% per year before expenses, which is not the Class' actual return. The hypothetical account values and expenses may not be used to estimate the actual ending account balance or expenses you paid for the period. You may use this information to compare the ongoing costs of investing in the Fund and other funds. To do so, compare this 5% hypothetical example with the 5% hypothetical examples that appear in the shareholder reports of the other funds. In addition, the Fund, as a shareholder in the underlying Fidelity Central Funds, will indirectly bear its pro-rata share of the fees and expenses incurred by the underlying Fidelity Central Funds. These fees and expenses are not included in the Fund's annualized expense ratio used to calculate the expense estimate in the table below.
Please note that the expenses shown in the table are meant to highlight your ongoing costs only and do not reflect any transaction costs. Therefore, the second line of the table is useful in comparing ongoing costs only, and will not help you determine the relative total costs of owning different funds. In addition, if these transactional costs were included, your costs would have been higher.
| Annualized Expense Ratio-A | Beginning Account Value May 1, 2019 | Ending Account Value October 31, 2019 | Expenses Paid During Period-B May 1, 2019 to October 31, 2019 |
|
| Class A | 1.25% | |||
| Actual | $1,000.00 | $1,022.00 | $6.35 | |
| Hypothetical-C | $1,000.00 | $1,018.85 | $6.34 | |
| Class M | 1.25% | |||
| Actual | $1,000.00 | $1,022.10 | $6.35 | |
| Hypothetical-C | $1,000.00 | $1,018.85 | $6.34 | |
| Class C | 2.00% | |||
| Actual | $1,000.00 | $1,018.20 | $10.15 | |
| Hypothetical-C | $1,000.00 | $1,015.08 | $10.13 | |
| Global High Income | 1.00% | |||
| Actual | $1,000.00 | $1,023.30 | $5.09 | |
| Hypothetical-C | $1,000.00 | $1,020.11 | $5.08 | |
| Class I | 1.00% | |||
| Actual | $1,000.00 | $1,023.30 | $5.09 | |
| Hypothetical-C | $1,000.00 | $1,020.11 | $5.08 |
A Annualized expense ratio reflects expenses net of applicable fee waivers.
B Expenses are equal to each Class' annualized expense ratio, multiplied by the average account value over the period, multiplied by 184/366 (to reflect the one-half year period).
C 5% return per year before expenses
![]()
GHI-SANN-1219
1.926252.108
Fidelity® Short Duration High Income Fund
Semi-Annual Report
October 31, 2019
Includes Fidelity and Fidelity Advisor share classes
See the inside front cover for important information about access to your fund’s shareholder reports.
Beginning on January 1, 2021, as permitted by regulations adopted by the Securities and Exchange Commission, paper copies of a fund’s shareholder reports will no longer be sent by mail, unless you specifically request paper copies of the reports from the fund or from your financial intermediary, such as a financial advisor, broker-dealer or bank. Instead, the reports will be made available on a website, and you will be notified by mail each time a report is posted and provided with a website link to access the report.
If you already elected to receive shareholder reports electronically, you will not be affected by this change and you need not take any action. You may elect to receive shareholder reports and other communications from a fund electronically, by contacting your financial intermediary. For Fidelity customers, visit Fidelity's web site or call Fidelity using the contact information listed below.
You may elect to receive all future reports in paper free of charge. If you wish to continue receiving paper copies of your shareholder reports, you may contact your financial intermediary or, if you are a Fidelity customer, visit Fidelity’s website, or call Fidelity at the applicable toll-free number listed below. Your election to receive reports in paper will apply to all funds held with the fund complex/your financial intermediary.
| Account Type | Website | Phone Number |
| Brokerage, Mutual Fund, or Annuity Contracts: | fidelity.com/mailpreferences | 1-800-343-3548 |
| Employer Provided Retirement Accounts: | netbenefits.fidelity.com/preferences (choose 'no' under Required Disclosures to continue to print) | 1-800-343-0860 |
| Advisor Sold Accounts Serviced Through Your Financial Intermediary: | Contact Your Financial Intermediary | Your Financial Intermediary's phone number |
| Advisor Sold Accounts Serviced by Fidelity: | institutional.fidelity.com | 1-877-208-0098 |
Contents
To view a fund's proxy voting guidelines and proxy voting record for the 12-month period ended June 30, visit http://www.fidelity.com/proxyvotingresults or visit the Securities and Exchange Commission's (SEC) web site at http://www.sec.gov.
You may also call 1-800-544-8544 if you’re an individual investing directly with Fidelity, call 1-800-835-5092 if you’re a plan sponsor or participant with Fidelity as your recordkeeper or call 1-877-208-0098 on institutional accounts or if you’re an advisor or invest through one to request a free copy of the proxy voting guidelines.
Standard & Poor's, S&P and S&P 500 are registered service marks of The McGraw-Hill Companies, Inc. and have been licensed for use by Fidelity Distributors Corporation.
Other third-party marks appearing herein are the property of their respective owners.
All other marks appearing herein are registered or unregistered trademarks or service marks of FMR LLC or an affiliated company. © 2019 FMR LLC. All rights reserved.
This report and the financial statements contained herein are submitted for the general information of the shareholders of the Fund. This report is not authorized for distribution to prospective investors in the Fund unless preceded or accompanied by an effective prospectus.
A fund files its complete schedule of portfolio holdings with the SEC for the first and third quarters of each fiscal year on Form N-PORT. Forms N-PORT are available on the SEC’s web site at http://www.sec.gov. A fund's Forms N-PORT may be reviewed and copied at the SEC’s Public Reference Room in Washington, DC. Information regarding the operation of the SEC's Public Reference Room may be obtained by calling 1-800-SEC-0330.
For a complete list of a fund's portfolio holdings, view the most recent holdings listing, semiannual report, or annual report on Fidelity's web site at http://www.fidelity.com, http://www.institutional.fidelity.com, or http://www.401k.com, as applicable.
NOT FDIC INSURED •MAY LOSE VALUE •NO BANK GUARANTEE
Neither the Fund nor Fidelity Distributors Corporation is a bank.
Investment Summary (Unaudited)
Top Five Holdings as of October 31, 2019
| (by issuer, excluding cash equivalents) | % of fund's net assets |
| CCO Holdings LLC/CCO Holdings Capital Corp. | 3.8 |
| Icahn Enterprises LP/Icahn Enterprises Finance Corp. | 3.0 |
| Sprint Corp. | 2.6 |
| Navient Corp. | 2.3 |
| Bombardier, Inc. | 2.2 |
| 13.9 |
Top Five Market Sectors as of October 31, 2019
| % of fund's net assets | |
| Energy | 15.3 |
| Telecommunications | 13.1 |
| Diversified Financial Services | 9.2 |
| Cable/Satellite TV | 8.2 |
| Healthcare | 6.7 |
Quality Diversification (% of fund's net assets)
| As of October 31, 2019 | ||
| BBB | 9.9% | |
| BB | 38.7% | |
| B | 34.2% | |
| CCC,CC,C | 8.8% | |
| D | 0.2% | |
| Not Rated | 0.3% | |
| Short-Term Investments and Net Other Assets | 7.9% | |
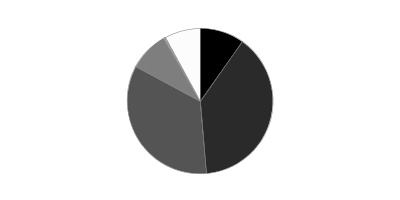
We have used ratings from Moody's Investors Service, Inc. Where Moody's® ratings are not available, we have used S&P® ratings. All ratings are as of the date indicated and do not reflect subsequent changes.
Asset Allocation (% of fund's net assets)
| As of October 31, 2019* | ||
| Nonconvertible Bonds | 90.2% | |
| Convertible Bonds, Preferred Stocks | 0.4% | |
| Bank Loan Obligations | 0.7% | |
| Other Investments | 0.8% | |
| Short-Term Investments and Net Other Assets (Liabilities) | 7.9% | |

* Foreign investments - 19.3%
Schedule of Investments October 31, 2019 (Unaudited)
Showing Percentage of Net Assets
| Corporate Bonds - 90.6% | |||
| Principal Amount | Value | ||
| Convertible Bonds - 0.4% | |||
| Broadcasting - 0.4% | |||
| DISH Network Corp. 2.375% 3/15/24 | $510,000 | $457,165 | |
| Energy - 0.0% | |||
| Denbury Resources, Inc. 6.375% 12/31/24 (a) | 78,000 | 42,253 | |
| TOTAL CONVERTIBLE BONDS | 499,418 | ||
| Nonconvertible Bonds - 90.2% | |||
| Aerospace - 4.2% | |||
| Bombardier, Inc.: | |||
| 6.125% 1/15/23 (a) | 2,530,000 | 2,473,075 | |
| 7.5% 12/1/24 (a) | 105,000 | 101,784 | |
| TransDigm, Inc.: | |||
| 6% 7/15/22 | 2,110,000 | 2,145,870 | |
| 6.25% 3/15/26 (a) | 215,000 | 230,319 | |
| 4,951,048 | |||
| Air Transportation - 0.3% | |||
| United Continental Holdings, Inc. 4.25% 10/1/22 | 345,000 | 356,288 | |
| Banks & Thrifts - 2.3% | |||
| Ally Financial, Inc.: | |||
| 3.875% 5/21/24 | 970,000 | 1,013,068 | |
| 4.125% 2/13/22 | 1,200,000 | 1,240,500 | |
| Bank of America Corp. 4.2% 8/26/24 | 250,000 | 269,383 | |
| Deutsche Bank AG New York Branch 2.7% 7/13/20 | 250,000 | 250,086 | |
| 2,773,037 | |||
| Broadcasting - 2.0% | |||
| Cumulus Media New Holdings, Inc. 6.75% 7/1/26 (a) | 45,000 | 47,700 | |
| LIN Television Corp. 5.875% 11/15/22 | 300,000 | 304,500 | |
| Sirius XM Radio, Inc.: | |||
| 3.875% 8/1/22 (a) | 1,830,000 | 1,868,888 | |
| 4.625% 7/15/24 (a) | 120,000 | 125,400 | |
| 2,346,488 | |||
| Building Materials - 0.2% | |||
| Advanced Drain Systems, Inc. 5% 9/30/27 (a) | 245,000 | 250,513 | |
| Cable/Satellite TV - 8.2% | |||
| Cablevision Systems Corp. 5.875% 9/15/22 | 2,345,000 | 2,529,669 | |
| CCO Holdings LLC/CCO Holdings Capital Corp.: | |||
| 4% 3/1/23 (a) | 1,415,000 | 1,439,763 | |
| 5.125% 2/15/23 | 1,800,000 | 1,838,250 | |
| 5.125% 5/1/23 (a) | 1,220,000 | 1,248,975 | |
| CSC Holdings LLC 5.375% 7/15/23 (a) | 750,000 | 768,735 | |
| DISH DBS Corp.: | |||
| 5.125% 5/1/20 | 45,000 | 45,450 | |
| 5.875% 7/15/22 | 1,260,000 | 1,317,721 | |
| 5.875% 11/15/24 | 155,000 | 155,388 | |
| 6.75% 6/1/21 | 430,000 | 451,500 | |
| 9,795,451 | |||
| Chemicals - 2.3% | |||
| CF Industries Holdings, Inc.: | |||
| 3.4% 12/1/21 (a) | 60,000 | 61,007 | |
| 3.45% 6/1/23 | 805,000 | 817,075 | |
| NOVA Chemicals Corp. 5.25% 8/1/23 (a) | 500,000 | 504,688 | |
| OCI NV 6.625% 4/15/23 (a) | 565,000 | 589,719 | |
| The Chemours Co. LLC 6.625% 5/15/23 | 750,000 | 746,010 | |
| 2,718,499 | |||
| Containers - 5.5% | |||
| Ard Securities Finance SARL 8.75% 1/31/23 pay-in-kind (a)(b) | 28,478 | 29,617 | |
| Ardagh Packaging Finance PLC/Ardagh MP Holdings U.S.A., Inc.: | |||
| 4.25% 9/15/22 (a) | 700,000 | 708,750 | |
| 4.625% 5/15/23 (a) | 1,200,000 | 1,228,500 | |
| Ball Corp.: | |||
| 4% 11/15/23 | 300,000 | 312,000 | |
| 5% 3/15/22 | 300,000 | 317,250 | |
| Berry Global, Inc. 5.125% 7/15/23 | 700,000 | 717,500 | |
| OI European Group BV 4% 3/15/23 (a) | 950,000 | 945,250 | |
| Reynolds Group Issuer, Inc./Reynolds Group Issuer LLC/Reynolds Group Issuer (Luxembourg) SA: | |||
| 3 month U.S. LIBOR + 3.500% 5.5009% 7/15/21 (a)(b)(c) | 310,000 | 310,775 | |
| 5.125% 7/15/23 (a) | 1,700,000 | 1,744,115 | |
| Trivium Packaging Finance BV: | |||
| 5.5% 8/15/26 (a) | 220,000 | 230,450 | |
| 8.5% 8/15/27 (a) | 55,000 | 58,644 | |
| 6,602,851 | |||
| Diversified Financial Services - 9.2% | |||
| Aircastle Ltd. 4.125% 5/1/24 | 80,000 | 83,779 | |
| Capital One Financial Corp. 3.2% 1/30/23 | 200,000 | 205,480 | |
| Financial & Risk U.S. Holdings, Inc. 6.25% 5/15/26 (a) | 170,000 | 184,663 | |
| FLY Leasing Ltd.: | |||
| 5.25% 10/15/24 | 790,000 | 813,700 | |
| 6.375% 10/15/21 | 250,000 | 254,219 | |
| Icahn Enterprises LP/Icahn Enterprises Finance Corp.: | |||
| 5.875% 2/1/22 | 770,000 | 776,738 | |
| 6.25% 2/1/22 | 2,805,000 | 2,871,606 | |
| Morgan Stanley 4.1% 5/22/23 | 200,000 | 211,937 | |
| Navient Corp. 7.25% 1/25/22 | 2,485,000 | 2,695,480 | |
| Park Aerospace Holdings Ltd.: | |||
| 4.5% 3/15/23 (a) | 251,000 | 263,676 | |
| 5.25% 8/15/22 (a) | 105,000 | 111,820 | |
| 5.5% 2/15/24 (a) | 1,000,000 | 1,099,400 | |
| Springleaf Finance Corp. 6.125% 3/15/24 | 1,300,000 | 1,421,875 | |
| 10,994,373 | |||
| Diversified Media - 1.1% | |||
| Nielsen Finance LLC/Nielsen Finance Co. 5% 4/15/22 (a) | 1,315,000 | 1,321,601 | |
| Energy - 15.0% | |||
| California Resources Corp. 8% 12/15/22 (a) | 655,000 | 189,950 | |
| Cheniere Corpus Christi Holdings LLC 7% 6/30/24 | 350,000 | 402,528 | |
| Chesapeake Energy Corp. 8% 6/15/27 | 375,000 | 234,375 | |
| Citgo Petroleum Corp. 6.25% 8/15/22 (a) | 650,000 | 656,500 | |
| Consolidated Energy Finance SA 3 month U.S. LIBOR + 3.750% 5.8685% 6/15/22 (a)(b)(c) | 525,000 | 521,084 | |
| Crestwood Midstream Partners LP/Crestwood Midstream Finance Corp. 6.25% 4/1/23 | 500,000 | 508,600 | |
| CVR Refining LLC/Coffeyville Finance, Inc. 6.5% 11/1/22 | 1,085,000 | 1,095,850 | |
| DCP Midstream Operating LP 5.375% 7/15/25 | 1,400,000 | 1,473,500 | |
| Denbury Resources, Inc.: | |||
| 7.75% 2/15/24 (a) | 477,000 | 350,595 | |
| 9.25% 3/31/22 (a) | 465,000 | 381,300 | |
| EG Global Finance PLC 6.75% 2/7/25 (a) | 500,000 | 500,000 | |
| Energy Transfer Partners LP: | |||
| 4.25% 3/15/23 | 475,000 | 497,954 | |
| 7.5% 10/15/20 | 105,000 | 110,171 | |
| EQT Corp. 3% 10/1/22 | 300,000 | 286,226 | |
| Exterran Partners LP/EXLP Finance Corp. 6% 10/1/22 | 1,300,000 | 1,309,750 | |
| MEG Energy Corp. 6.375% 1/30/23 (a) | 1,100,000 | 1,039,500 | |
| MPLX LP 6.25% 10/15/22 (a) | 135,000 | 137,441 | |
| NextEra Energy Partners LP 4.25% 7/15/24 (a) | 250,000 | 256,800 | |
| Nine Energy Service, Inc. 8.75% 11/1/23 (a) | 445,000 | 333,750 | |
| PBF Logistics LP/PBF Logistics Finance, Inc. 6.875% 5/15/23 | 650,000 | 666,250 | |
| Plains All American Pipeline LP/PAA Finance Corp. 2.6% 12/15/19 | 100,000 | 100,002 | |
| Precision Drilling Corp.: | |||
| 6.5% 12/15/21 | 159,600 | 158,403 | |
| 7.75% 12/15/23 | 235,000 | 222,075 | |
| Range Resources Corp.: | |||
| 4.875% 5/15/25 | 245,000 | 196,613 | |
| 5% 8/15/22 | 840,000 | 793,800 | |
| 5% 3/15/23 | 110,000 | 95,150 | |
| 5.75% 6/1/21 | 500,000 | 496,875 | |
| Rose Rock Midstream LP/Rose Rock Finance Corp. 5.625% 7/15/22 | 700,000 | 707,714 | |
| Sanchez Energy Corp. 7.25% 2/15/23 (a)(d) | 150,000 | 102,000 | |
| Southwestern Energy Co. 4.1% 3/15/22 | 300,000 | 290,250 | |
| Summit Midstream Holdings LLC 5.5% 8/15/22 | 590,000 | 528,050 | |
| Sunoco LP/Sunoco Finance Corp. 4.875% 1/15/23 | 300,000 | 307,875 | |
| Targa Resources Partners LP/Targa Resources Partners Finance Corp.: | |||
| 4.25% 11/15/23 | 625,000 | 627,938 | |
| 5.25% 5/1/23 | 1,600,000 | 1,606,000 | |
| TerraForm Power Operating LLC 4.25% 1/31/23 (a) | 350,000 | 360,500 | |
| Valaris PLC 4.5% 10/1/24 | 205,000 | 104,550 | |
| Weatherford International Ltd. 9.875% 2/15/24 (d) | 500,000 | 152,500 | |
| Weatherford International, Inc. 9.875% 3/1/25 (d) | 500,000 | 155,000 | |
| 17,957,419 | |||
| Environmental - 1.0% | |||
| LBC Tank Terminals Holding Netherlands BV 6.875% 5/15/23 (a) | 1,150,000 | 1,168,170 | |
| Food/Beverage/Tobacco - 1.6% | |||
| C&S Group Enterprises LLC 5.375% 7/15/22 (a) | 1,225,000 | 1,228,063 | |
| Imperial Tobacco Finance PLC 2.95% 7/21/20 (a) | 200,000 | 200,908 | |
| JBS U.S.A. LLC/JBS U.S.A. Finance, Inc. 5.875% 7/15/24 (a) | 35,000 | 36,094 | |
| Vector Group Ltd. 6.125% 2/1/25 (a) | 415,000 | 398,400 | |
| 1,863,465 | |||
| Gaming - 3.6% | |||
| Golden Entertainment, Inc. 7.625% 4/15/26 (a) | 555,000 | 583,444 | |
| MGM China Holdings Ltd. 5.375% 5/15/24 (a) | 500,000 | 523,750 | |
| MGM Mirage, Inc. 6% 3/15/23 | 1,000,000 | 1,102,820 | |
| Scientific Games Corp.: | |||
| 5% 10/15/25 (a) | 115,000 | 118,450 | |
| 6.625% 5/15/21 | 935,000 | 946,688 | |
| 10% 12/1/22 | 24,000 | 24,690 | |
| Wynn Las Vegas LLC/Wynn Las Vegas Capital Corp. 4.25% 5/30/23 (a) | 500,000 | 517,550 | |
| Wynn Macau Ltd. 4.875% 10/1/24 (a) | 500,000 | 502,500 | |
| 4,319,892 | |||
| Healthcare - 6.7% | |||
| Bayer U.S. Finance II LLC 3.875% 12/15/23 (a) | 200,000 | 209,496 | |
| Cigna Corp. 3.5% 6/15/24 (a) | 200,000 | 208,073 | |
| Community Health Systems, Inc.: | |||
| 5.125% 8/1/21 | 800,000 | 798,000 | |
| 6.25% 3/31/23 | 1,085,000 | 1,057,197 | |
| DaVita HealthCare Partners, Inc. 5.125% 7/15/24 | 500,000 | 510,385 | |
| Encompass Health Corp. 5.125% 3/15/23 | 255,000 | 260,100 | |
| HCA Holdings, Inc.: | |||
| 4.75% 5/1/23 | 300,000 | 321,151 | |
| 5% 3/15/24 | 300,000 | 327,252 | |
| 6.25% 2/15/21 | 800,000 | 838,000 | |
| Mylan NV 3.15% 6/15/21 | 200,000 | 202,567 | |
| Tenet Healthcare Corp.: | |||
| 6.75% 6/15/23 | 1,165,000 | 1,234,900 | |
| 8.125% 4/1/22 | 485,000 | 525,013 | |
| Teva Pharmaceutical Finance Netherlands III BV 2.2% 7/21/21 | 250,000 | 237,005 | |
| Valeant Pharmaceuticals International, Inc.: | |||
| 5.875% 5/15/23 (a) | 383,000 | 388,554 | |
| 6.5% 3/15/22 (a) | 785,000 | 808,707 | |
| Vizient, Inc. 6.25% 5/15/27 (a) | 20,000 | 21,569 | |
| 7,947,969 | |||
| Leisure - 0.6% | |||
| Studio City Co. Ltd.: | |||
| 5.875% 11/30/19 (a) | 200,000 | 200,100 | |
| 7.25% 11/30/21 (a) | 500,000 | 511,719 | |
| 711,819 | |||
| Metals/Mining - 0.7% | |||
| First Quantum Minerals Ltd. 7.25% 4/1/23 (a) | 175,000 | 175,935 | |
| FMG Resources (August 2006) Pty Ltd.: | |||
| 4.75% 5/15/22 (a) | 300,000 | 309,000 | |
| 5.125% 3/15/23 (a) | 90,000 | 93,713 | |
| Freeport-McMoRan, Inc. 3.55% 3/1/22 | 300,000 | 303,375 | |
| 882,023 | |||
| Paper - 0.3% | |||
| Berry Global Escrow Corp. 4.875% 7/15/26 (a) | 175,000 | 183,969 | |
| CommScope Finance LLC: | |||
| 5.5% 3/1/24 (a) | 100,000 | 101,350 | |
| 6% 3/1/26 (a) | 100,000 | 102,750 | |
| 388,069 | |||
| Restaurants - 2.7% | |||
| 1011778 BC Unlimited Liability Co./New Red Finance, Inc. 5% 10/15/25 (a) | 1,100,000 | 1,133,000 | |
| Golden Nugget, Inc. 6.75% 10/15/24 (a) | 800,000 | 824,080 | |
| Yum! Brands, Inc. 3.875% 11/1/23 | 1,225,000 | 1,268,096 | |
| 3,225,176 | |||
| Services - 2.0% | |||
| Air Lease Corp. 2.125% 1/15/20 | 200,000 | 199,968 | |
| APX Group, Inc. 8.75% 12/1/20 | 103,000 | 101,455 | |
| Aramark Services, Inc. 5.125% 1/15/24 | 300,000 | 309,375 | |
| Corrections Corp. of America: | |||
| 4.125% 4/1/20 | 1,105,000 | 1,105,221 | |
| 5% 10/15/22 | 25,000 | 24,781 | |
| Laureate Education, Inc. 8.25% 5/1/25 (a) | 575,000 | 623,875 | |
| Prime Securities Services Borrower LLC/Prime Finance, Inc. 9.25% 5/15/23 (a) | 45,000 | 47,340 | |
| 2,412,015 | |||
| Technology - 3.9% | |||
| NXP BV/NXP Funding LLC: | |||
| 3.875% 9/1/22 (a) | 415,000 | 429,179 | |
| 4.125% 6/1/21 (a) | 175,000 | 179,855 | |
| Sensata Technologies BV 4.875% 10/15/23 (a) | 155,000 | 163,722 | |
| Solera LLC/Solera Finance, Inc. 10.5% 3/1/24 (a) | 1,600,000 | 1,674,000 | |
| Symantec Corp. 4.2% 9/15/20 | 1,900,000 | 1,924,305 | |
| Veritas U.S., Inc./Veritas Bermuda Ltd. 7.5% 2/1/23 (a) | 300,000 | 294,750 | |
| 4,665,811 | |||
| Telecommunications - 12.6% | |||
| Altice Financing SA 6.625% 2/15/23 (a) | 700,000 | 719,040 | |
| Cogent Communications Group, Inc. 5.375% 3/1/22 (a) | 775,000 | 806,000 | |
| Equinix, Inc.: | |||
| 5.375% 1/1/22 | 600,000 | 611,820 | |
| 5.375% 4/1/23 | 580,000 | 592,441 | |
| Frontier Communications Corp. 10.5% 9/15/22 | 175,000 | 82,469 | |
| Intelsat Jackson Holdings SA 8.5% 10/15/24 (a) | 200,000 | 201,540 | |
| Level 3 Financing, Inc. 5.625% 2/1/23 | 2,300,000 | 2,323,000 | |
| Qwest Corp. 6.75% 12/1/21 | 700,000 | 755,489 | |
| SBA Communications Corp.: | |||
| 4% 10/1/22 | 500,000 | 510,075 | |
| 4.875% 9/1/24 | 500,000 | 519,375 | |
| Sprint Communications, Inc. 6% 11/15/22 | 915,000 | 967,613 | |
| Sprint Corp.: | |||
| 7.25% 9/15/21 | 500,000 | 533,530 | |
| 7.875% 9/15/23 | 2,280,000 | 2,516,550 | |
| T-Mobile U.S.A., Inc. 4% 4/15/22 | 1,725,000 | 1,780,562 | |
| Telecom Italia SpA 5.303% 5/30/24 (a) | 700,000 | 749,000 | |
| Zayo Group LLC/Zayo Capital, Inc. 6% 4/1/23 | 1,300,000 | 1,337,063 | |
| 15,005,567 | |||
| Transportation Ex Air/Rail - 1.0% | |||
| Avolon Holdings Funding Ltd.: | |||
| 5.125% 10/1/23 (a) | 580,000 | 625,820 | |
| 5.25% 5/15/24 (a) | 155,000 | 169,028 | |
| 5.5% 1/15/23 (a) | 165,000 | 178,052 | |
| Teekay Corp. 9.25% 11/15/22 (a) | 250,000 | 258,750 | |
| 1,231,650 | |||
| Utilities - 3.2% | |||
| Calpine Corp. 6% 1/15/22 (a) | 500,000 | 500,700 | |
| Dynegy, Inc. 5.875% 6/1/23 | 1,300,000 | 1,327,625 | |
| Nextera Energy Operating Partn 4.25% 9/15/24 (a) | 155,000 | 161,200 | |
| The AES Corp.: | |||
| 4% 3/15/21 | 185,000 | 188,006 | |
| 4.5% 3/15/23 | 120,000 | 122,700 | |
| 4.875% 5/15/23 | 1,389,000 | 1,411,224 | |
| Williams Partners LP 3.35% 8/15/22 | 150,000 | 153,735 | |
| 3,865,190 | |||
| TOTAL NONCONVERTIBLE BONDS | 107,754,384 | ||
| TOTAL CORPORATE BONDS | |||
| (Cost $108,088,208) | 108,253,802 | ||
| Shares | Value | ||
| Common Stocks - 0.0% | |||
| Energy - 0.0% | |||
| Forbes Energy Services Ltd. (e) | |||
| (Cost $301,607) | 6,468 | 1,940 | |
| Principal Amount | Value | ||
| Bank Loan Obligations - 0.7% | |||
| Air Transportation - 0.0% | |||
| Dynasty Acquisition Co., Inc.: | |||
| Tranche B 1LN, term loan 3 month U.S. LIBOR + 4.000% 6.1044% 4/4/26 (b)(c) | 6,504 | 6,513 | |
| Tranche B 2LN, term loan 3 month U.S. LIBOR + 4.000% 6.1044% 4/4/26 (b)(c) | 3,497 | 3,501 | |
| TOTAL AIR TRANSPORTATION | 10,014 | ||
| Energy - 0.1% | |||
| Forbes Energy Services LLC Tranche B, term loan 16% 4/13/21 (b)(f) | 62,900 | 63,372 | |
| Sanchez Energy Corp. 1LN, term loan 3 month U.S. LIBOR + 8.000% 10% 5/11/20 (b)(c)(f)(g) | 65,987 | 62,688 | |
| TOTAL ENERGY | 126,060 | ||
| Food & Drug Retail - 0.1% | |||
| Tops Markets LLC 1LN, term loan 3 month U.S. LIBOR + 8.500% 10.625% 11/19/23 (b)(c)(f) | 80,648 | 81,959 | |
| Telecommunications - 0.5% | |||
| Intelsat Jackson Holdings SA Tranche B-5, term loan 6.625% 1/2/24 | 500,000 | 511,015 | |
| Securus Technologies, Inc. Tranche B, term loan 3 month U.S. LIBOR + 8.250% 10.0359% 11/1/25 (b)(c) | 165,000 | 77,963 | |
| TOTAL TELECOMMUNICATIONS | 588,978 | ||
| TOTAL BANK LOAN OBLIGATIONS | |||
| (Cost $896,931) | 807,011 | ||
| Preferred Securities - 0.8% | |||
| Banks & Thrifts - 0.6% | |||
| Bank of America Corp. 5.2% (b)(h) | 300,000 | 319,271 | |
| Citigroup, Inc.: | |||
| 5.95% (b)(h) | 100,000 | 109,749 | |
| 5.95% (b)(h) | 10,000 | 10,346 | |
| Royal Bank of Scotland Group PLC 7.5% (b)(h) | 225,000 | 230,686 | |
| TOTAL BANKS & THRIFTS | 670,052 | ||
| Energy - 0.2% | |||
| Energy Transfer Partners LP 6.25% (b)(h) | 265,000 | 249,961 | |
| TOTAL PREFERRED SECURITIES | |||
| (Cost $884,053) | 920,013 | ||
| Shares | Value | ||
| Money Market Funds - 6.7% | |||
| Fidelity Cash Central Fund 1.83% (i) | |||
| (Cost $8,029,383) | 8,027,894 | 8,029,500 | |
| TOTAL INVESTMENT IN SECURITIES - 98.8% | |||
| (Cost $118,200,182) | 118,012,266 | ||
| NET OTHER ASSETS (LIABILITIES) - 1.2% | 1,487,508 | ||
| NET ASSETS - 100% | $119,499,774 |
Legend
(a) Security exempt from registration under Rule 144A of the Securities Act of 1933. These securities may be resold in transactions exempt from registration, normally to qualified institutional buyers. At the end of the period, the value of these securities amounted to $41,150,695 or 34.4% of net assets.
(b) Coupon rates for floating and adjustable rate securities reflect the rates in effect at period end.
(c) Coupon is indexed to a floating interest rate which may be multiplied by a specified factor and/or subject to caps or floors.
(d) Non-income producing - Security is in default.
(e) Non-income producing
(f) Level 3 security
(g) Position or a portion of the position represents an unfunded loan commitment. At period end, the total principal amount and market value of unfunded commitments totaled $47,134 and $44,777, respectively.
(h) Security is perpetual in nature with no stated maturity date.
(i) Affiliated fund that is generally available only to investment companies and other accounts managed by Fidelity Investments. The rate quoted is the annualized seven-day yield of the fund at period end. A complete unaudited listing of the fund's holdings as of its most recent quarter end is available upon request. In addition, each Fidelity Central Fund's financial statements are available on the SEC's website or upon request.
Affiliated Central Funds
Information regarding fiscal year to date income earned by the Fund from investments in Fidelity Central Funds is as follows:
| Fund | Income earned |
| Fidelity Cash Central Fund | $84,409 |
| Total | $84,409 |
Amounts in the income column in the above table include any capital gain distributions from underlying funds, which are presented in the corresponding line-item in the Statement of Operations, if applicable.
Investment Valuation
The following is a summary of the inputs used, as of October 31, 2019, involving the Fund's assets and liabilities carried at fair value. The inputs or methodology used for valuing securities may not be an indication of the risk associated with investing in those securities. For more information on valuation inputs, and their aggregation into the levels used below, please refer to the Investment Valuation section in the accompanying Notes to Financial Statements.
| Valuation Inputs at Reporting Date: | ||||
| Description | Total | Level 1 | Level 2 | Level 3 |
| Investments in Securities: | ||||
| Equities: | ||||
| Energy | $1,940 | $1,940 | $-- | $-- |
| Corporate Bonds | 108,253,802 | -- | 108,253,802 | -- |
| Bank Loan Obligations | 807,011 | -- | 598,992 | 208,019 |
| Preferred Securities | 920,013 | -- | 920,013 | -- |
| Money Market Funds | 8,029,500 | 8,029,500 | -- | -- |
| Total Investments in Securities: | $118,012,266 | $8,031,440 | $109,772,807 | $208,019 |
Other Information
Distribution of investments by country or territory of incorporation, as a percentage of Total Net Assets, is as follows (Unaudited):
| United States of America | 80.7% |
| Canada | 5.8% |
| Netherlands | 3.6% |
| Cayman Islands | 2.9% |
| Luxembourg | 1.6% |
| Multi-National | 1.6% |
| Bermuda | 1.1% |
| Others (Individually Less Than 1%) | 2.7% |
| 100.0% |
See accompanying notes which are an integral part of the financial statements.
Financial Statements
Statement of Assets and Liabilities
| October 31, 2019 (Unaudited) | ||
| Assets | ||
| Investment in securities, at value — See accompanying schedule: Unaffiliated issuers (cost $110,170,799) | $109,982,766 | |
| Fidelity Central Funds (cost $8,029,383) | 8,029,500 | |
| Total Investment in Securities (cost $118,200,182) | $118,012,266 | |
| Receivable for investments sold | 39,995 | |
| Receivable for fund shares sold | 105,094 | |
| Interest receivable | 1,595,946 | |
| Distributions receivable from Fidelity Central Funds | 12,475 | |
| Prepaid expenses | 209 | |
| Receivable from investment adviser for expense reductions | 36,224 | |
| Total assets | 119,802,209 | |
| Liabilities | ||
| Payable to custodian bank | $38,917 | |
| Payable for investments purchased | 47,340 | |
| Payable for fund shares redeemed | 35,908 | |
| Payable for audit fees | 36,808 | |
| Distributions payable | 58,432 | |
| Accrued management fee | 54,970 | |
| Distribution and service plan fees payable | 7,210 | |
| Other affiliated payables | 16,210 | |
| Other payables and accrued expenses | 6,640 | |
| Total liabilities | 302,435 | |
| Net Assets | $119,499,774 | |
| Net Assets consist of: | ||
| Paid in capital | $124,486,477 | |
| Total accumulated earnings (loss) | (4,986,703) | |
| Net Assets | $119,499,774 | |
| Net Asset Value and Maximum Offering Price | ||
| Class A: | ||
| Net Asset Value and redemption price per share ($14,688,522 ÷ 1,560,290 shares)(a) | $9.41 | |
| Maximum offering price per share (100/96.00 of $9.41) | $9.80 | |
| Class M: | ||
| Net Asset Value and redemption price per share ($2,348,746 ÷ 249,519 shares)(a) | $9.41 | |
| Maximum offering price per share (100/96.00 of $9.41) | $9.80 | |
| Class C: | ||
| Net Asset Value and offering price per share ($4,368,079 ÷ 463,944 shares)(a) | $9.42 | |
| Short Duration High Income: | ||
| Net Asset Value, offering price and redemption price per share ($91,139,244 ÷ 9,680,791 shares) | $9.41 | |
| Class I: | ||
| Net Asset Value, offering price and redemption price per share ($4,632,149 ÷ 492,014 shares) | $9.41 | |
| Class Z: | ||
| Net Asset Value, offering price and redemption price per share ($2,323,034 ÷ 246,672 shares) | $9.42 |
(a) Redemption price per share is equal to net asset value less any applicable contingent deferred sales charge.
See accompanying notes which are an integral part of the financial statements.
Statement of Operations
| Six months ended October 31, 2019 (Unaudited) | ||
| Investment Income | ||
| Dividends | $38,572 | |
| Interest | 2,806,116 | |
| Income from Fidelity Central Funds | 84,409 | |
| Total income | 2,929,097 | |
| Expenses | ||
| Management fee | $323,267 | |
| Transfer agent fees | 72,352 | |
| Distribution and service plan fees | 44,014 | |
| Accounting fees | 24,256 | |
| Custodian fees and expenses | 10,910 | |
| Independent trustees' fees and expenses | 330 | |
| Registration fees | 74,101 | |
| Audit | 34,767 | |
| Legal | 102 | |
| Miscellaneous | 322 | |
| Total expenses before reductions | 584,421 | |
| Expense reductions | (70,972) | |
| Total expenses after reductions | 513,449 | |
| Net investment income (loss) | 2,415,648 | |
| Realized and Unrealized Gain (Loss) | ||
| Net realized gain (loss) on: | ||
| Investment securities: | ||
| Unaffiliated issuers | (909,000) | |
| Total net realized gain (loss) | (909,000) | |
| Change in net unrealized appreciation (depreciation) on investment securities | 408,820 | |
| Net gain (loss) | (500,180) | |
| Net increase (decrease) in net assets resulting from operations | $1,915,468 |
See accompanying notes which are an integral part of the financial statements.
Statement of Changes in Net Assets
| Six months ended October 31, 2019 (Unaudited) | Year ended April 30, 2019 | |
| Increase (Decrease) in Net Assets | ||
| Operations | ||
| Net investment income (loss) | $2,415,648 | $5,175,031 |
| Net realized gain (loss) | (909,000) | (210,272) |
| Change in net unrealized appreciation (depreciation) | 408,820 | 158,060 |
| Net increase (decrease) in net assets resulting from operations | 1,915,468 | 5,122,819 |
| Distributions to shareholders | (2,333,475) | (5,003,921) |
| Share transactions - net increase (decrease) | 4,875,484 | 7,008,413 |
| Total increase (decrease) in net assets | 4,457,477 | 7,127,311 |
| Net Assets | ||
| Beginning of period | 115,042,297 | 107,914,986 |
| End of period | $119,499,774 | $115,042,297 |
See accompanying notes which are an integral part of the financial statements.
Financial Highlights
Fidelity Short Duration High Income Fund Class A
| Six months ended (Unaudited) October 31, | Years endedApril 30, | |||||
| 2019 | 2019 | 2018 | 2017 | 2016 | 2015 | |
| Selected Per–Share Data | ||||||
| Net asset value, beginning of period | $9.44 | $9.42 | $9.57 | $9.14 | $9.86 | $10.10 |
| Income from Investment Operations | ||||||
| Net investment income (loss)A | .186 | .409 | .381 | .395 | .429 | .358 |
| Net realized and unrealized gain (loss) | (.036) | .004B | (.159) | .397 | (.737) | (.246) |
| Total from investment operations | .150 | .413 | .222 | .792 | (.308) | .112 |
| Distributions from net investment income | (.180) | (.393) | (.373) | (.365) | (.413) | (.358) |
| Distributions from net realized gain | – | – | – | – | (.002) | – |
| Total distributions | (.180) | (.393) | (.373) | (.365) | (.415) | (.358) |
| Redemption fees added to paid in capitalA | – | – | .001 | .003 | .003 | .006 |
| Net asset value, end of period | $9.41 | $9.44 | $9.42 | $9.57 | $9.14 | $9.86 |
| Total ReturnC,D,E | 1.60% | 4.52% | 2.36% | 8.84% | (3.06)% | 1.22% |
| Ratios to Average Net AssetsF,G | ||||||
| Expenses before reductions | 1.20%H | 1.15% | 1.16% | 1.22% | 1.24% | 1.29% |
| Expenses net of fee waivers, if any | 1.05%H | 1.05% | 1.05% | 1.05% | 1.05% | 1.05% |
| Expenses net of all reductions | 1.05%H | 1.05% | 1.05% | 1.05% | 1.05% | 1.05% |
| Net investment income (loss) | 3.94%H | 4.37% | 4.00% | 4.21% | 4.65% | 3.63% |
| Supplemental Data | ||||||
| Net assets, end of period (000 omitted) | $14,689 | $15,050 | $12,351 | $9,304 | $6,823 | $4,398 |
| Portfolio turnover rateI | 82%H | 33% | 65% | 105% | 56% | 84% |
A Calculated based on average shares outstanding during the period.
B The amount shown for a share outstanding does not correspond with the aggregate net gain (loss) on investments for the period due to the timing of sales and repurchases of shares in relation to fluctuating market values of the investments of the Fund.
C Total returns for periods of less than one year are not annualized.
D Total returns would have been lower if certain expenses had not been reduced during the applicable periods shown.
E Total returns do not include the effect of the sales charges.
F Fees and expenses of any underlying Fidelity Central Funds are not included in the Fund's expense ratio. The Fund indirectly bears its proportionate share of the expenses of any underlying Fidelity Central Funds.
G Expense ratios reflect operating expenses of the class. Expenses before reductions do not reflect amounts reimbursed by the investment adviser or reductions from brokerage service arrangements or reductions from other expense offset arrangements and do not represent the amount paid by the class during periods when reimbursements or reductions occur. Expenses net of fee waivers reflect expenses after reimbursement by the investment adviser but prior to reductions from brokerage service arrangements or other expense offset arrangements. Expenses net of all reductions represent the net expenses paid by the class.
H Annualized
I Amount does not include the portfolio activity of any underlying Fidelity Central Funds.
See accompanying notes which are an integral part of the financial statements.
Fidelity Short Duration High Income Fund Class M
| Six months ended (Unaudited) October 31, | Years endedApril 30, | |||||
| 2019 | 2019 | 2018 | 2017 | 2016 | 2015 | |
| Selected Per–Share Data | ||||||
| Net asset value, beginning of period | $9.44 | $9.42 | $9.57 | $9.14 | $9.86 | $10.10 |
| Income from Investment Operations | ||||||
| Net investment income (loss)A | .186 | .408 | .382 | .395 | .433 | .360 |
| Net realized and unrealized gain (loss) | (.036) | .005B | (.160) | .397 | (.741) | (.247) |
| Total from investment operations | .150 | .413 | .222 | .792 | (.308) | .113 |
| Distributions from net investment income | (.180) | (.393) | (.373) | (.365) | (.413) | (.359) |
| Distributions from net realized gain | – | – | – | – | (.002) | – |
| Total distributions | (.180) | (.393) | (.373) | (.365) | (.415) | (.359) |
| Redemption fees added to paid in capitalA | – | – | .001 | .003 | .003 | .006 |
| Net asset value, end of period | $9.41 | $9.44 | $9.42 | $9.57 | $9.14 | $9.86 |
| Total ReturnC,D,E | 1.60% | 4.52% | 2.36% | 8.84% | (3.06)% | 1.23% |
| Ratios to Average Net AssetsF,G | ||||||
| Expenses before reductions | 1.21%H | 1.16% | 1.16% | 1.22% | 1.25% | 1.31% |
| Expenses net of fee waivers, if any | 1.05%H | 1.05% | 1.05% | 1.05% | 1.05% | 1.05% |
| Expenses net of all reductions | 1.05%H | 1.05% | 1.05% | 1.05% | 1.05% | 1.05% |
| Net investment income (loss) | 3.94%H | 4.37% | 4.00% | 4.21% | 4.65% | 3.63% |
| Supplemental Data | ||||||
| Net assets, end of period (000 omitted) | $2,349 | $2,537 | $2,081 | $2,703 | $2,426 | $2,930 |
| Portfolio turnover rateI | 82%H | 33% | 65% | 105% | 56% | 84% |
A Calculated based on average shares outstanding during the period.
B The amount shown for a share outstanding does not correspond with the aggregate net gain (loss) on investments for the period due to the timing of sales and repurchases of shares in relation to fluctuating market values of the investments of the Fund.
C Total returns for periods of less than one year are not annualized.
D Total returns would have been lower if certain expenses had not been reduced during the applicable periods shown.
E Total returns do not include the effect of the sales charges.
F Fees and expenses of any underlying Fidelity Central Funds are not included in the Fund's expense ratio. The Fund indirectly bears its proportionate share of the expenses of any underlying Fidelity Central Funds.
G Expense ratios reflect operating expenses of the class. Expenses before reductions do not reflect amounts reimbursed by the investment adviser or reductions from brokerage service arrangements or reductions from other expense offset arrangements and do not represent the amount paid by the class during periods when reimbursements or reductions occur. Expenses net of fee waivers reflect expenses after reimbursement by the investment adviser but prior to reductions from brokerage service arrangements or other expense offset arrangements. Expenses net of all reductions represent the net expenses paid by the class.
H Annualized
I Amount does not include the portfolio activity of any underlying Fidelity Central Funds.
See accompanying notes which are an integral part of the financial statements.
Fidelity Short Duration High Income Fund Class C
| Six months ended (Unaudited) October 31, | Years endedApril 30, | |||||
| 2019 | 2019 | 2018 | 2017 | 2016 | 2015 | |
| Selected Per–Share Data | ||||||
| Net asset value, beginning of period | $9.44 | $9.42 | $9.57 | $9.15 | $9.86 | $10.10 |
| Income from Investment Operations | ||||||
| Net investment income (loss)A | .151 | .338 | .310 | .325 | .360 | .285 |
| Net realized and unrealized gain (loss) | (.027) | .005B | (.159) | .386 | (.728) | (.247) |
| Total from investment operations | .124 | .343 | .151 | .711 | (.368) | .038 |
| Distributions from net investment income | (.144) | (.323) | (.302) | (.294) | (.343) | (.284) |
| Distributions from net realized gain | – | – | – | – | (.002) | – |
| Total distributions | (.144) | (.323) | (.302) | (.294) | (.345) | (.284) |
| Redemption fees added to paid in capitalA | – | – | .001 | .003 | .003 | .006 |
| Net asset value, end of period | $9.42 | $9.44 | $9.42 | $9.57 | $9.15 | $9.86 |
| Total ReturnC,D,E | 1.33% | 3.74% | 1.59% | 7.92% | (3.68)% | .47% |
| Ratios to Average Net AssetsF,G | ||||||
| Expenses before reductions | 1.97%H | 1.92% | 1.93% | 2.00% | 2.00% | 2.08% |
| Expenses net of fee waivers, if any | 1.80%H | 1.80% | 1.80% | 1.80% | 1.80% | 1.80% |
| Expenses net of all reductions | 1.80%H | 1.80% | 1.80% | 1.80% | 1.80% | 1.80% |
| Net investment income (loss) | 3.19%H | 3.61% | 3.25% | 3.46% | 3.90% | 2.88% |
| Supplemental Data | ||||||
| Net assets, end of period (000 omitted) | $4,368 | $4,541 | $5,146 | $5,387 | $3,827 | $3,465 |
| Portfolio turnover rateI | 82%H | 33% | 65% | 105% | 56% | 84% |
A Calculated based on average shares outstanding during the period.
B The amount shown for a share outstanding does not correspond with the aggregate net gain (loss) on investments for the period due to the timing of sales and repurchases of shares in relation to fluctuating market values of the investments of the Fund.
C Total returns for periods of less than one year are not annualized.
D Total returns would have been lower if certain expenses had not been reduced during the applicable periods shown.
E Total returns do not include the effect of the contingent deferred sales charge.
F Fees and expenses of any underlying Fidelity Central Funds are not included in the Fund's expense ratio. The Fund indirectly bears its proportionate share of the expenses of any underlying Fidelity Central Funds.
G Expense ratios reflect operating expenses of the class. Expenses before reductions do not reflect amounts reimbursed by the investment adviser or reductions from brokerage service arrangements or reductions from other expense offset arrangements and do not represent the amount paid by the class during periods when reimbursements or reductions occur. Expenses net of fee waivers reflect expenses after reimbursement by the investment adviser but prior to reductions from brokerage service arrangements or other expense offset arrangements. Expenses net of all reductions represent the net expenses paid by the class.
H Annualized
I Amount does not include the portfolio activity of any underlying Fidelity Central Funds.
See accompanying notes which are an integral part of the financial statements.
Fidelity Short Duration High Income Fund
| Six months ended (Unaudited) October 31, | Years endedApril 30, | |||||
| 2019 | 2019 | 2018 | 2017 | 2016 | 2015 | |
| Selected Per–Share Data | ||||||
| Net asset value, beginning of period | $9.44 | $9.42 | $9.57 | $9.15 | $9.86 | $10.10 |
| Income from Investment Operations | ||||||
| Net investment income (loss)A | .198 | .431 | .405 | .420 | .455 | .385 |
| Net realized and unrealized gain (loss) | (.036) | .006B | (.159) | .385 | (.730) | (.248) |
| Total from investment operations | .162 | .437 | .246 | .805 | (.275) | .137 |
| Distributions from net investment income | (.192) | (.417) | (.397) | (.388) | (.436) | (.383) |
| Distributions from net realized gain | – | – | – | – | (.002) | – |
| Total distributions | (.192) | (.417) | (.397) | (.388) | (.438) | (.383) |
| Redemption fees added to paid in capitalA | – | – | .001 | .003 | .003 | .006 |
| Net asset value, end of period | $9.41 | $9.44 | $9.42 | $9.57 | $9.15 | $9.86 |
| Total ReturnC,D | 1.73% | 4.78% | 2.61% | 9.00% | (2.71)% | 1.48% |
| Ratios to Average Net AssetsE,F | ||||||
| Expenses before reductions | .91%G | .86% | .86% | .93% | .96% | 1.00% |
| Expenses net of fee waivers, if any | .80%G | .80% | .80% | .80% | .80% | .80% |
| Expenses net of all reductions | .80%G | .80% | .80% | .80% | .80% | .80% |
| Net investment income (loss) | 4.19%G | 4.61% | 4.25% | 4.46% | 4.90% | 3.88% |
| Supplemental Data | ||||||
| Net assets, end of period (000 omitted) | $91,139 | $88,429 | $83,652 | $68,646 | $47,531 | $45,109 |
| Portfolio turnover rateH | 82%G | 33% | 65% | 105% | 56% | 84% |
A Calculated based on average shares outstanding during the period.
B The amount shown for a share outstanding does not correspond with the aggregate net gain (loss) on investments for the period due to the timing of sales and repurchases of shares in relation to fluctuating market values of the investments of the Fund.
C Total returns for periods of less than one year are not annualized.
D Total returns would have been lower if certain expenses had not been reduced during the applicable periods shown.
E Fees and expenses of any underlying Fidelity Central Funds are not included in the Fund's expense ratio. The Fund indirectly bears its proportionate share of the expenses of any underlying Fidelity Central Funds.
F Expense ratios reflect operating expenses of the class. Expenses before reductions do not reflect amounts reimbursed by the investment adviser or reductions from brokerage service arrangements or reductions from other expense offset arrangements and do not represent the amount paid by the class during periods when reimbursements or reductions occur. Expenses net of fee waivers reflect expenses after reimbursement by the investment adviser but prior to reductions from brokerage service arrangements or other expense offset arrangements. Expenses net of all reductions represent the net expenses paid by the class.
G Annualized
H Amount does not include the portfolio activity of any underlying Fidelity Central Funds.
See accompanying notes which are an integral part of the financial statements.
Fidelity Short Duration High Income Fund Class I
| Six months ended (Unaudited) October 31, | Years endedApril 30, | |||||
| 2019 | 2019 | 2018 | 2017 | 2016 | 2015 | |
| Selected Per–Share Data | ||||||
| Net asset value, beginning of period | $9.44 | $9.42 | $9.57 | $9.15 | $9.86 | $10.10 |
| Income from Investment Operations | ||||||
| Net investment income (loss)A | .198 | .430 | .406 | .420 | .460 | .383 |
| Net realized and unrealized gain (loss) | (.036) | .007B | (.160) | .385 | (.735) | (.246) |
| Total from investment operations | .162 | .437 | .246 | .805 | (.275) | .137 |
| Distributions from net investment income | (.192) | (.417) | (.397) | (.388) | (.436) | (.383) |
| Distributions from net realized gain | – | – | – | – | (.002) | – |
| Total distributions | (.192) | (.417) | (.397) | (.388) | (.438) | (.383) |
| Redemption fees added to paid in capitalA | – | – | .001 | .003 | .003 | .006 |
| Net asset value, end of period | $9.41 | $9.44 | $9.42 | $9.57 | $9.15 | $9.86 |
| Total ReturnC,D | 1.73% | 4.78% | 2.61% | 8.99% | (2.71)% | 1.48% |
| Ratios to Average Net AssetsE,F | ||||||
| Expenses before reductions | .93%G | .89% | .91% | .96% | .99% | 1.04% |
| Expenses net of fee waivers, if any | .80%G | .80% | .80% | .80% | .80% | .80% |
| Expenses net of all reductions | .80%G | .80% | .80% | .80% | .80% | .80% |
| Net investment income (loss) | 4.19%G | 4.60% | 4.25% | 4.46% | 4.90% | 3.88% |
| Supplemental Data | ||||||
| Net assets, end of period (000 omitted) | $4,632 | $4,060 | $4,686 | $10,122 | $2,856 | $5,932 |
| Portfolio turnover rateH | 82%G | 33% | 65% | 105% | 56% | 84% |
A Calculated based on average shares outstanding during the period.
B The amount shown for a share outstanding does not correspond with the aggregate net gain (loss) on investments for the period due to the timing of sales and repurchases of shares in relation to fluctuating market values of the investments of the Fund.
C Total returns for periods of less than one year are not annualized.
D Total returns would have been lower if certain expenses had not been reduced during the applicable periods shown.
E Fees and expenses of any underlying Fidelity Central Funds are not included in the Fund's expense ratio. The Fund indirectly bears its proportionate share of the expenses of any underlying Fidelity Central Funds.
F Expense ratios reflect operating expenses of the class. Expenses before reductions do not reflect amounts reimbursed by the investment adviser or reductions from brokerage service arrangements or reductions from other expense offset arrangements and do not represent the amount paid by the class during periods when reimbursements or reductions occur. Expenses net of fee waivers reflect expenses after reimbursement by the investment adviser but prior to reductions from brokerage service arrangements or other expense offset arrangements. Expenses net of all reductions represent the net expenses paid by the class.
G Annualized
H Amount does not include the portfolio activity of any underlying Fidelity Central Funds.
See accompanying notes which are an integral part of the financial statements.
Fidelity Short Duration High Income Fund Class Z
| Six months ended (Unaudited) October 31, | Years endedApril 30, | |
| 2019 | 2019 A | |
| Selected Per–Share Data | ||
| Net asset value, beginning of period | $9.45 | $9.46 |
| Income from Investment Operations | ||
| Net investment income (loss)B | .198 | .261 |
| Net realized and unrealized gain (loss) | (.032) | (.016) |
| Total from investment operations | .166 | .245 |
| Distributions from net investment income | (.196) | (.255) |
| Distributions from net realized gain | – | – |
| Total distributions | (.196) | (.255) |
| Net asset value, end of period | $9.42 | $9.45 |
| Total ReturnC,D | 1.78% | 2.67% |
| Ratios to Average Net AssetsE,F | ||
| Expenses before reductions | .90%G | .82%G |
| Expenses net of fee waivers, if any | .71%G | .71%G |
| Expenses net of all reductions | .71%G | .71%G |
| Net investment income (loss) | 4.28%G | 4.86%G |
| Supplemental Data | ||
| Net assets, end of period (000 omitted) | $2,323 | $425 |
| Portfolio turnover rateH | 82%G | 33% |
A For the period October 2, 2018 (commencement of sale of shares) to April 30, 2019.
B Calculated based on average shares outstanding during the period.
C Total returns for periods of less than one year are not annualized.
D Total returns would have been lower if certain expenses had not been reduced during the applicable periods shown.
E Fees and expenses of any underlying Fidelity Central Funds are not included in the Fund's expense ratio. The Fund indirectly bears its proportionate share of the expenses of any underlying Fidelity Central Funds.
F Expense ratios reflect operating expenses of the class. Expenses before reductions do not reflect amounts reimbursed by the investment adviser or reductions from brokerage service arrangements or reductions from other expense offset arrangements and do not represent the amount paid by the class during periods when reimbursements or reductions occur. Expense ratios before reductions for start-up periods may not be representative of longer-term operating periods. Expenses net of fee waivers reflect expenses after reimbursement by the investment adviser but prior to reductions from brokerage service arrangements or other expense offset arrangements. Expenses net of all reductions represent the net expenses paid by the class.
G Annualized
H Amount does not include the portfolio activity of any underlying Fidelity Central Funds.
See accompanying notes which are an integral part of the financial statements.
Notes to Financial Statements (Unaudited)
For the period ended October 31, 2019
1. Organization.
Fidelity Short Duration High Income Fund (the Fund) is a fund of Fidelity Summer Street Trust (the Trust) and is authorized to issue an unlimited number of shares. The Trust is registered under the Investment Company Act of 1940, as amended (the 1940 Act), as an open-end management investment company organized as a Massachusetts business trust. The Fund offers Class A, Class M, Class C, Short Duration High Income, Class I and Class Z shares, each of which has equal rights as to assets and voting privileges. Each class has exclusive voting rights with respect to matters that affect that class. Effective March 1, 2019, Class C shares will automatically convert to Class A shares after a holding period of ten years from the initial date of purchase, with certain exceptions.
2. Investments in Fidelity Central Funds.
The Fund invests in Fidelity Central Funds, which are open-end investment companies generally available only to other investment companies and accounts managed by the investment adviser and its affiliates. The Fund's Schedule of Investments lists each of the Fidelity Central Funds held as of period end, if any, as an investment of the Fund, but does not include the underlying holdings of each Fidelity Central Fund. As an Investing Fund, the Fund indirectly bears its proportionate share of the expenses of the underlying Fidelity Central Funds.
The Money Market Central Funds seek preservation of capital and current income and are managed by Fidelity Investments Money Management, Inc. (FIMM), an affiliate of the investment adviser. Annualized expenses of the Money Market Central Funds as of their most recent shareholder report date ranged from less than .005% to .01%.
A complete unaudited list of holdings for each Fidelity Central Fund is available upon request or at the Securities and Exchange Commission (the SEC) website at www.sec.gov. In addition, the financial statements of the Fidelity Central Funds are available on the SEC website or upon request.
3. Significant Accounting Policies.
The Fund is an investment company and applies the accounting and reporting guidance of the Financial Accounting Standards Board (FASB) Accounting Standards Codification Topic 946 Financial Services – Investments Companies. The financial statements have been prepared in conformity with accounting principles generally accepted in the United States of America (GAAP), which require management to make certain estimates and assumptions at the date of the financial statements. Actual results could differ from those estimates. Subsequent events, if any, through the date that the financial statements were issued have been evaluated in the preparation of the financial statements. The following summarizes the significant accounting policies of the Fund:
Investment Valuation. Investments are valued as of 4:00 p.m. Eastern time on the last calendar day of the period. The Board of Trustees (the Board) has delegated the day to day responsibility for the valuation of the Fund's investments to the Fair Value Committee (the Committee) established by the Fund's investment adviser. In accordance with valuation policies and procedures approved by the Board, the Fund attempts to obtain prices from one or more third party pricing vendors or brokers to value its investments. When current market prices, quotations or currency exchange rates are not readily available or reliable, investments will be fair valued in good faith by the Committee, in accordance with procedures adopted by the Board. Factors used in determining fair value vary by investment type and may include market or investment specific events, changes in interest rates and credit quality. The frequency with which these procedures are used cannot be predicted and they may be utilized to a significant extent. The Committee oversees the Fund's valuation policies and procedures and reports to the Board on the Committee's activities and fair value determinations. The Board monitors the appropriateness of the procedures used in valuing the Fund's investments and ratifies the fair value determinations of the Committee.
The Fund categorizes the inputs to valuation techniques used to value its investments into a disclosure hierarchy consisting of three levels as shown below:
- Level 1 – quoted prices in active markets for identical investments
- Level 2 – other significant observable inputs (including quoted prices for similar investments, interest rates, prepayment speeds, etc.)
- Level 3 – unobservable inputs (including the Fund's own assumptions based on the best information available)
Valuation techniques used to value the Fund's investments by major category are as follows:
Debt securities, including restricted securities, are valued based on evaluated prices received from third party pricing vendors or from brokers who make markets in such securities. Corporate bonds, bank loan obligations and preferred securities are valued by pricing vendors who utilize matrix pricing which considers yield or price of bonds of comparable quality, coupon, maturity and type or by broker-supplied prices. When independent prices are unavailable or unreliable, debt securities may be valued utilizing pricing methodologies which consider similar factors that would be used by third party pricing vendors. Debt securities are generally categorized as Level 2 in the hierarchy but may be Level 3 depending on the circumstances. The Fund invests a significant portion of its assets in below investment grade securities. The value of these securities can be more volatile due to changes in the credit quality of the issuer and is sensitive to changes in economic, market and regulatory conditions.
Equity securities, including restricted securities, for which market quotations are readily available, are valued at the last reported sale price or official closing price as reported by a third party pricing vendor on the primary market or exchange on which they are traded and are categorized as Level 1 in the hierarchy. In the event there were no sales during the day or closing prices are not available, securities are valued at the last quoted bid price or may be valued using the last available price and are generally categorized as Level 2 in the hierarchy. For equity securities, including restricted securities, where observable inputs are limited, assumptions about market activity and risk are used and these securities may be categorized as Level 3 in the hierarchy.
Investments in open-end mutual funds, including the Fidelity Central Funds, are valued at their closing net asset value (NAV) each business day and are categorized as Level 1 in the hierarchy.
Changes in valuation techniques may result in transfers in or out of an assigned level within the disclosure hierarchy. The aggregate value of investments by input level as of October 31, 2019 is included at the end of the Fund's Schedule of Investments.
Investment Transactions and Income. For financial reporting purposes, the Fund's investment holdings and NAV include trades executed through the end of the last business day of the period. The NAV per share for processing shareholder transactions is calculated as of the close of business of the New York Stock Exchange (NYSE), normally 4:00 p.m. Eastern time and includes trades executed through the end of the prior business day. Gains and losses on securities sold are determined on the basis of identified cost. Dividend income is recorded on the ex-dividend date. Income and capital gain distributions from Fidelity Central Funds, if any, are recorded on the ex-dividend date. Interest income is accrued as earned and includes coupon interest and amortization of premium and accretion of discount on debt securities as applicable. Paid in Kind (PIK) income is recorded at the fair market value of the securities received. Debt obligations may be placed on non-accrual status and related interest income may be reduced by ceasing current accruals and writing off interest receivables when the collection of all or a portion of interest has become doubtful based on consistently applied procedures. A debt obligation is removed from non-accrual status when the issuer resumes interest payments or when collectability of interest is reasonably assured.
Class Allocations and Expenses. Investment income, realized and unrealized capital gains and losses, common expenses of the Fund, and certain fund-level expense reductions, if any, are allocated daily on a pro-rata basis to each class based on the relative net assets of each class to the total net assets of the Fund. Each class differs with respect to transfer agent and distribution and service plan fees incurred. Certain expense reductions may also differ by class. For the reporting period, the allocated portion of income and expenses to each class as a percent of its average net assets may vary due to the timing of recording these transactions in relation to fluctuating net assets of the classes. Expenses directly attributable to a fund are charged to that fund. Expenses attributable to more than one fund are allocated among the respective funds on the basis of relative net assets or other appropriate methods. Expense estimates are accrued in the period to which they relate and adjustments are made when actual amounts are known.
Income Tax Information and Distributions to Shareholders. Each year, the Fund intends to qualify as a regulated investment company under Subchapter M of the Internal Revenue Code, including distributing substantially all of its taxable income and realized gains. As a result, no provision for U.S. Federal income taxes is required. The Fund files a U.S. federal tax return, in addition to state and local tax returns as required. The Fund's federal income tax returns are subject to examination by the Internal Revenue Service (IRS) for a period of three fiscal years after they are filed. State and local tax returns may be subject to examination for an additional fiscal year depending on the jurisdiction.
Distributions are declared and recorded daily and paid monthly from net investment income. Distributions from realized gains, if any, are declared and recorded on the ex-dividend date. Income and capital gain distributions are declared separately for each class. Income and capital gain distributions are determined in accordance with income tax regulations, which may differ from GAAP.
Capital accounts within the financial statements are adjusted for permanent book-tax differences. These adjustments have no impact on net assets or the results of operations. Capital accounts are not adjusted for temporary book-tax differences which will reverse in a subsequent period.
Book-tax differences are primarily due to market discount, partnerships, capital loss carryforwards and losses deferred due to wash sales.
As of period end, the cost and unrealized appreciation (depreciation) in securities, and derivatives if applicable, for federal income tax purposes were as follows:
| Gross unrealized appreciation | $2,137,595 |
| Gross unrealized depreciation | (2,022,707) |
| Net unrealized appreciation (depreciation) | $114,888 |
| Tax cost | $117,897,378 |
Capital loss carryforwards are only available to offset future capital gains of the Fund to the extent provided by regulations and may be limited. Under the Regulated Investment Company Modernization Act of 2010 (the Act), the Fund is permitted to carry forward capital losses incurred in taxable years beginning after December 22, 2010 for an unlimited period and such capital losses are required to be used prior to any losses that expire. The capital loss carryforward information presented below, including any applicable limitation, is estimated as of prior fiscal period end and is subject to adjustment.
| No expiration | |
| Short-term | $(2,701,192) |
| Long-term | (1,760,771) |
| Total no expiration | $(4,461,963) |
Restricted Securities. The Fund may invest in securities that are subject to legal or contractual restrictions on resale. These securities generally may be resold in transactions exempt from registration or to the public if the securities are registered. Disposal of these securities may involve time-consuming negotiations and expense, and prompt sale at an acceptable price may be difficult. Information regarding restricted securities is included at the end of the Fund's Schedule of Investments.
Loans and Other Direct Debt Instruments. The Fund invests in direct debt instruments which are interests in amounts owed to lenders by corporate or other borrowers. These instruments may be in the form of loans, trade claims or other receivables and may include standby financing commitments such as revolving credit facilities that obligate the Fund to supply additional cash to the borrower on demand. Loans may be acquired through assignment or participation. The Fund also invests in unfunded loan commitments, which are contractual obligations for future funding. Information regarding unfunded commitments is included at the end of the Fund's Schedule of Investments.
4. Purchases and Sales of Investments.
Purchases and sales of securities, other than short-term securities, aggregated $47,785,261 and $44,114,123, respectively.
5. Fees and Other Transactions with Affiliates.
Management Fee. Fidelity Management & Research Company (the investment adviser) and its affiliates provide the Fund with investment management related services for which the Fund pays a monthly management fee. The management fee is the sum of an individual fund fee rate that is based on an annual rate of .45% of the Fund's average net assets and an annualized group fee rate that averaged .10% during the period. The group fee rate is based upon the average net assets of all the mutual funds advised by the investment adviser, including any mutual funds previously advised by the investment adviser that are currently advised by Fidelity SelectCo, LLC, an affiliate of the investment adviser. The group fee rate decreases as assets under management increase and increases as assets under management decrease. For the reporting period, the total annualized management fee rate was .55% of the Fund's average net assets.
Distribution and Service Plan Fees. In accordance with Rule 12b-1 of the 1940 Act, the Fund has adopted separate Distribution and Service Plans for each class of shares. Certain classes pay Fidelity Distributors Corporation (FDC), an affiliate of the investment adviser, separate Distribution and Service Fees, each of which is based on an annual percentage of each class' average net assets. In addition, FDC may pay financial intermediaries for selling shares of the Fund and providing shareholder support services. For the period, the Distribution and Service Fee rates, total fees and amounts retained by FDC were as follows:
| Distribution Fee | Service Fee | Total Fees | Retained by FDC | |
| Class A | -% | .25% | $18,838 | $1,419 |
| Class M | -% | .25% | 3,102 | – |
| Class C | .75% | .25% | 22,074 | 2,398 |
| $44,014 | $ 3,817 |
Sales Load. FDC may receive a front-end sales charge of up to 4.00% for selling Class A shares and Class M shares, some of which is paid to financial intermediaries for selling shares of the Fund. Depending on the holding period, FDC may receive contingent deferred sales charges levied on Class A, Class M and Class C redemptions. The deferred sales charges are 1.00% for Class C shares, 1.00% for certain purchases of Class A shares and .25% for certain purchases of Class M shares.
For the period, sales charge amounts retained by FDC were as follows:
| Retained by FDC | |
| Class A | $2,367 |
| Class M | 25 |
| Class C(a) | 309 |
| $2,701 |
(a) When Class C shares are initially sold, FDC pays commissions from its own resources to financial intermediaries through which the sales are made.
Transfer Agent Fees. Fidelity Investments Institutional Operations Company, Inc., (FIIOC), an affiliate of the investment adviser, is the transfer, dividend disbursing and shareholder servicing agent for each class of the Fund. FIIOC receives account fees and asset-based fees that vary according to the account size and type of account of the shareholders of the respective classes of the Fund, except for Class Z. FIIOC receives an asset-based fee of Class Z's average net assets. FIIOC pays for typesetting, printing and mailing of shareholder reports, except proxy statements.
For the period, transfer agent fees for each class were as follows:
| Amount | % of Class-Level Average Net Assets(a) | |
| Class A | $11,440 | .15 |
| Class M | 2,103 | .17 |
| Class C | 3,966 | .18 |
| Short Duration High Income | 51,561 | .11 |
| Class I | 2,972 | .14 |
| Class Z | 310 | .05 |
| $72,352 |
(a) Annualized
Accounting Fees. Fidelity Service Company, Inc. (FSC), an affiliate of the investment adviser, maintains the Fund's accounting records. The fee is based on the level of average net assets for each month. For the period, the fees were equivalent to an annualized rate of .04%.
Interfund Trades. The Fund may purchase from or sell securities to other Fidelity Funds under procedures adopted by the Board. The procedures have been designed to ensure these interfund trades are executed in accordance with Rule 17a-7 of the 1940 Act. Interfund trades are included within the respective purchases and sales amounts shown in the Purchases and Sales of Investments note.
6. Committed Line of Credit.
The Fund participates with other funds managed by the investment adviser or an affiliate in a $4.25 billion credit facility (the "line of credit") to be utilized for temporary or emergency purposes to fund shareholder redemptions or for other short-term liquidity purposes. The Fund has agreed to pay commitment fees on its pro-rata portion of the line of credit, which amounted to $141 and is reflected in Miscellaneous expenses on the Statement of Operations. During the period, the Fund did not borrow on this line of credit.
7. Expense Reductions.
The investment adviser contractually agreed to reimburse each class to the extent annual operating expenses exceeded certain levels of class-level average net assets as noted in the table below. This reimbursement will remain in place through August 31, 2020. Some expenses, for example the compensation of the independent Trustees, and certain miscellaneous expenses such as proxy and shareholder meeting expenses, are excluded from this reimbursement.
The following classes were in reimbursement during the period:
| Expense Limitations | Reimbursement | |
| Class A | 1.05% | $10,937 |
| Class M | 1.05% | 1,997 |
| Class C | 1.80% | 3,744 |
| Short Duration High Income | .80% | 49,485 |
| Class I | .80% | 2,900 |
| Class Z | .71% | 1,134 |
| $70,197 |
Through arrangements with the Fund's custodian, credits realized as a result of certain uninvested cash balances were used to reduce the Fund's expenses. During the period, custodian credits reduced the Fund's expenses by $490.
In addition, during the period the investment adviser reimbursed and/or waived a portion of fund-level operating expenses in the amount of $285.
8. Distributions to Shareholders.
Distributions to shareholders of each class were as follows:
| Six months ended October 31, 2019 | Year ended April 30, 2019(a) |
|
| Distributions to shareholders | ||
| Class A | $288,304 | $570,580 |
| Class M | 47,444 | 92,728 |
| Class C | 67,762 | 169,779 |
| Short Duration High Income | 1,818,081 | 3,978,011 |
| Class I | 87,842 | 186,125 |
| Class Z | 24,042 | 6,698 |
| Total | $2,333,475 | $5,003,921 |
(a) Distributions for Class Z are for the period October 2, 2018 (commencement of sale of shares) to April 30, 2019.
9. Share Transactions.
Share transactions for each class were as follows and may contain automatic conversions between classes or exchanges between affiliated funds:
| Shares | Shares | Dollars | Dollars | |
| Six months ended October 31, 2019 | Year ended April 30, 2019(a) | Six months ended October 31, 2019 | Year ended April 30, 2019(a) | |
| Class A | ||||
| Shares sold | 263,367 | 535,255 | $2,485,779 | $4,993,042 |
| Reinvestment of distributions | 29,548 | 59,316 | 278,175 | 553,118 |
| Shares redeemed | (326,469) | (312,079) | (3,074,635) | (2,908,824) |
| Net increase (decrease) | (33,554) | 282,492 | $(310,681) | $2,637,336 |
| Class M | ||||
| Shares sold | 29,549 | 81,541 | $278,837 | $761,393 |
| Reinvestment of distributions | 4,895 | 9,663 | 46,087 | 90,133 |
| Shares redeemed | (53,599) | (43,489) | (505,247) | (404,012) |
| Net increase (decrease) | (19,155) | 47,715 | $(180,323) | $447,514 |
| Class C | ||||
| Shares sold | 31,825 | 204,330 | $301,088 | $1,900,782 |
| Reinvestment of distributions | 7,163 | 18,015 | 67,448 | 167,975 |
| Shares redeemed | (55,919) | (287,743) | (526,339) | (2,693,623) |
| Net increase (decrease) | (16,931) | (65,398) | $(157,803) | $(624,866) |
| Short Duration High Income | ||||
| Shares sold | 1,988,396 | 5,515,751 | $18,771,334 | $51,682,187 |
| Reinvestment of distributions | 154,254 | 346,618 | 1,452,306 | 3,232,670 |
| Shares redeemed | (1,826,140) | (5,379,470) | (17,179,442) | (50,139,424) |
| Net increase (decrease) | 316,510 | 482,899 | $3,044,198 | $4,775,433 |
| Class I | ||||
| Shares sold | 101,572 | 153,737 | $958,899 | $1,428,982 |
| Reinvestment of distributions | 8,401 | 18,150 | 79,104 | 169,337 |
| Shares redeemed | (47,894) | (239,433) | (451,626) | (2,243,709) |
| Net increase (decrease) | 62,079 | (67,546) | $586,377 | $(645,390) |
| Class Z | ||||
| Shares sold | 227,521 | 45,679 | $2,137,160 | $424,929 |
| Reinvestment of distributions | 2,442 | 648 | 23,023 | 6,031 |
| Shares redeemed | (28,260) | (1,358) | (266,467) | (12,574) |
| Net increase (decrease) | 201,703 | 44,969 | $1,893,716 | $418,386 |
(a) Share transactions for Class Z are for the period October 2, 2018 (commencement of sale of shares) to April 30, 2019.
10. Other.
The Fund's organizational documents provide former and current trustees and officers with a limited indemnification against liabilities arising in connection with the performance of their duties to the Fund. In the normal course of business, the Fund may also enter into contracts that provide general indemnifications. The Fund's maximum exposure under these arrangements is unknown as this would be dependent on future claims that may be made against the Fund. The risk of material loss from such claims is considered remote.
Shareholder Expense Example
As a shareholder of the Fund, you incur two types of costs: (1) transaction costs, including sales charges (loads) on purchase payments or redemption proceeds, and (2) ongoing costs, including management fees, distribution and/or service (12b-1) fees and other Fund expenses. This Example is intended to help you understand your ongoing costs (in dollars) of investing in the Fund and to compare these costs with the ongoing costs of investing in other mutual funds.
The Example is based on an investment of $1,000 invested at the beginning of the period and held for the entire period (May 1, 2019 to October 31, 2019).
Actual Expenses
The first line of the accompanying table for each class of the Fund provides information about actual account values and actual expenses. You may use the information in this line, together with the amount you invested, to estimate the expenses that you paid over the period. Simply divide your account value by $1,000.00 (for example, an $8,600 account value divided by $1,000.00 = 8.6), then multiply the result by the number in the first line for a class of the Fund under the heading entitled "Expenses Paid During Period" to estimate the expenses you paid on your account during this period. In addition, the Fund, as a shareholder in the underlying Fidelity Central Funds, will indirectly bear its pro-rata share of the fees and expenses incurred by the underlying Fidelity Central Funds. These fees and expenses are not included in the Fund's annualized expense ratio used to calculate the expense estimate in the table below.
Hypothetical Example for Comparison Purposes
The second line of the accompanying table for each class of the Fund provides information about hypothetical account values and hypothetical expenses based on a Class' actual expense ratio and an assumed rate of return of 5% per year before expenses, which is not the Class' actual return. The hypothetical account values and expenses may not be used to estimate the actual ending account balance or expenses you paid for the period. You may use this information to compare the ongoing costs of investing in the Fund and other funds. To do so, compare this 5% hypothetical example with the 5% hypothetical examples that appear in the shareholder reports of the other funds. In addition, the Fund, as a shareholder in the underlying Fidelity Central Funds, will indirectly bear its pro-rata share of the fees and expenses incurred by the underlying Fidelity Central Funds. These fees and expenses are not included in the Fund's annualized expense ratio used to calculate the expense estimate in the table below.
Please note that the expenses shown in the table are meant to highlight your ongoing costs only and do not reflect any transaction costs. Therefore, the second line of the table is useful in comparing ongoing costs only, and will not help you determine the relative total costs of owning different funds. In addition, if these transactional costs were included, your costs would have been higher.
| Annualized Expense Ratio-A | Beginning Account Value May 1, 2019 | Ending Account Value October 31, 2019 | Expenses Paid During Period-B May 1, 2019 to October 31, 2019 |
|
| Class A | 1.05% | |||
| Actual | $1,000.00 | $1,016.00 | $5.32 | |
| Hypothetical-C | $1,000.00 | $1,019.86 | $5.33 | |
| Class M | 1.05% | |||
| Actual | $1,000.00 | $1,016.00 | $5.32 | |
| Hypothetical-C | $1,000.00 | $1,019.86 | $5.33 | |
| Class C | 1.80% | |||
| Actual | $1,000.00 | $1,013.30 | $9.11 | |
| Hypothetical-C | $1,000.00 | $1,016.09 | $9.12 | |
| Short Duration High Income | .80% | |||
| Actual | $1,000.00 | $1,017.30 | $4.06 | |
| Hypothetical-C | $1,000.00 | $1,021.11 | $4.06 | |
| Class I | .80% | |||
| Actual | $1,000.00 | $1,017.30 | $4.06 | |
| Hypothetical-C | $1,000.00 | $1,021.11 | $4.06 | |
| Class Z | .71% | |||
| Actual | $1,000.00 | $1,017.80 | $3.60 | |
| Hypothetical-C | $1,000.00 | $1,021.57 | $3.61 |
A Annualized expense ratio reflects expenses net of applicable fee waivers.
B Expenses are equal to each Class' annualized expense ratio, multiplied by the average account value over the period, multiplied by 184/366 (to reflect the one-half year period).
C 5% return per year before expenses
![]()
SDH-SANN-1219
1.969437.105
Fidelity® Women's Leadership Fund
Semi-Annual Report
October 31, 2019
Includes Fidelity and Fidelity Advisor share classes
See the inside front cover for important information about access to your fund’s shareholder reports.
Beginning on January 1, 2021, as permitted by regulations adopted by the Securities and Exchange Commission, paper copies of a fund’s shareholder reports will no longer be sent by mail, unless you specifically request paper copies of the reports from the fund or from your financial intermediary, such as a financial advisor, broker-dealer or bank. Instead, the reports will be made available on a website, and you will be notified by mail each time a report is posted and provided with a website link to access the report.
If you already elected to receive shareholder reports electronically, you will not be affected by this change and you need not take any action. You may elect to receive shareholder reports and other communications from a fund electronically, by contacting your financial intermediary. For Fidelity customers, visit Fidelity's web site or call Fidelity using the contact information listed below.
You may elect to receive all future reports in paper free of charge. If you wish to continue receiving paper copies of your shareholder reports, you may contact your financial intermediary or, if you are a Fidelity customer, visit Fidelity’s website, or call Fidelity at the applicable toll-free number listed below. Your election to receive reports in paper will apply to all funds held with the fund complex/your financial intermediary.
| Account Type | Website | Phone Number |
| Brokerage, Mutual Fund, or Annuity Contracts: | fidelity.com/mailpreferences | 1-800-343-3548 |
| Employer Provided Retirement Accounts: | netbenefits.fidelity.com/preferences (choose 'no' under Required Disclosures to continue to print) | 1-800-343-0860 |
| Advisor Sold Accounts Serviced Through Your Financial Intermediary: | Contact Your Financial Intermediary | Your Financial Intermediary's phone number |
| Advisor Sold Accounts Serviced by Fidelity: | institutional.fidelity.com | 1-877-208-0098 |
Contents
|
Board Approval of Investment Advisory Contracts and Management Fees |
To view a fund's proxy voting guidelines and proxy voting record for the 12-month period ended June 30, visit http://www.fidelity.com/proxyvotingresults or visit the Securities and Exchange Commission's (SEC) web site at http://www.sec.gov.
You may also call 1-800-544-8544 if you’re an individual investing directly with Fidelity, call 1-800-835-5092 if you’re a plan sponsor or participant with Fidelity as your recordkeeper or call 1-877-208-0098 on institutional accounts or if you’re an advisor or invest through one to request a free copy of the proxy voting guidelines.
Standard & Poor's, S&P and S&P 500 are registered service marks of The McGraw-Hill Companies, Inc. and have been licensed for use by Fidelity Distributors Corporation.
Other third-party marks appearing herein are the property of their respective owners.
All other marks appearing herein are registered or unregistered trademarks or service marks of FMR LLC or an affiliated company. © 2019 FMR LLC. All rights reserved.
This report and the financial statements contained herein are submitted for the general information of the shareholders of the Fund. This report is not authorized for distribution to prospective investors in the Fund unless preceded or accompanied by an effective prospectus.
A fund files its complete schedule of portfolio holdings with the SEC for the first and third quarters of each fiscal year on Form N-PORT. Forms N-PORT are available on the SEC’s web site at http://www.sec.gov. A fund's Forms N-PORT may be reviewed and copied at the SEC’s Public Reference Room in Washington, DC. Information regarding the operation of the SEC's Public Reference Room may be obtained by calling 1-800-SEC-0330.
For a complete list of a fund's portfolio holdings, view the most recent holdings listing, semiannual report, or annual report on Fidelity's web site at http://www.fidelity.com, http://www.institutional.fidelity.com, or http://www.401k.com, as applicable.
NOT FDIC INSURED •MAY LOSE VALUE •NO BANK GUARANTEE
Neither the Fund nor Fidelity Distributors Corporation is a bank.
Investment Summary (Unaudited)
Top Five Stocks as of October 31, 2019
| % of fund's net assets | |
| Microsoft Corp. | 3.4 |
| Bank of America Corp. | 2.3 |
| The Walt Disney Co. | 2.1 |
| Anthem, Inc. | 2.1 |
| The NASDAQ OMX Group, Inc. | 1.9 |
| 11.8 |
Top Five Market Sectors as of October 31, 2019
| % of fund's net assets | |
| Information Technology | 24.7 |
| Financials | 14.8 |
| Consumer Discretionary | 14.5 |
| Health Care | 13.6 |
| Industrials | 9.2 |
Asset Allocation (% of fund's net assets)
| As of October 31, 2019 * | ||
| Stocks | 96.3% | |
| Short-Term Investments and Net Other Assets (Liabilities) | 3.7% | |

* Foreign investments - 12.1%
Schedule of Investments October 31, 2019 (Unaudited)
Showing Percentage of Net Assets
| Common Stocks - 96.3% | |||
| Shares | Value | ||
| COMMUNICATION SERVICES - 7.5% | |||
| Entertainment - 3.6% | |||
| Electronic Arts, Inc. (a) | 843 | $81,265 | |
| Netflix, Inc. (a) | 376 | 108,066 | |
| The Walt Disney Co. | 3,208 | 416,783 | |
| Zynga, Inc. (a) | 16,155 | 99,676 | |
| 705,790 | |||
| Interactive Media & Services - 3.5% | |||
| Alphabet, Inc. Class A (a) | 276 | 347,429 | |
| Facebook, Inc. Class A (a) | 1,584 | 303,574 | |
| Match Group, Inc. | 556 | 40,582 | |
| 691,585 | |||
| Media - 0.4% | |||
| The New York Times Co. Class A | 2,195 | 67,826 | |
| TOTAL COMMUNICATION SERVICES | 1,465,201 | ||
| CONSUMER DISCRETIONARY - 14.5% | |||
| Automobiles - 1.2% | |||
| General Motors Co. | 6,574 | 244,290 | |
| Diversified Consumer Services - 1.1% | |||
| Bright Horizons Family Solutions, Inc. (a) | 1,214 | 180,303 | |
| Weight Watchers International, Inc. (a) | 871 | 30,372 | |
| 210,675 | |||
| Hotels, Restaurants & Leisure - 1.4% | |||
| Marriott International, Inc. Class A | 826 | 104,530 | |
| Starbucks Corp. | 1,963 | 165,991 | |
| 270,521 | |||
| Household Durables - 0.9% | |||
| Taylor Morrison Home Corp. (a) | 6,854 | 171,693 | |
| Internet & Direct Marketing Retail - 2.1% | |||
| Amazon.com, Inc. (a) | 95 | 168,783 | |
| Etsy, Inc. (a) | 3,940 | 175,291 | |
| The RealReal, Inc. | 2,429 | 56,134 | |
| Trainline PLC (b) | 700 | 3,777 | |
| 403,985 | |||
| Specialty Retail - 7.2% | |||
| Best Buy Co., Inc. | 4,224 | 303,410 | |
| Burlington Stores, Inc. (a) | 349 | 67,067 | |
| Lowe's Companies, Inc. | 1,868 | 208,487 | |
| Ross Stores, Inc. | 613 | 67,228 | |
| The Home Depot, Inc. | 1,186 | 278,212 | |
| TJX Companies, Inc. | 2,196 | 126,599 | |
| Ulta Beauty, Inc. (a) | 655 | 152,713 | |
| Williams-Sonoma, Inc. | 3,033 | 202,574 | |
| 1,406,290 | |||
| Textiles, Apparel & Luxury Goods - 0.6% | |||
| LVMH Moet Hennessy Louis Vuitton SE | 192 | 81,995 | |
| Tapestry, Inc. | 1,327 | 34,316 | |
| 116,311 | |||
| TOTAL CONSUMER DISCRETIONARY | 2,823,765 | ||
| CONSUMER STAPLES - 2.7% | |||
| Food Products - 1.7% | |||
| Danone SA | 1,918 | 158,890 | |
| The Hershey Co. | 1,212 | 178,006 | |
| 336,896 | |||
| Personal Products - 1.0% | |||
| Shiseido Co. Ltd. | 646 | 53,261 | |
| Unilever NV | 2,510 | 148,228 | |
| 201,489 | |||
| TOTAL CONSUMER STAPLES | 538,385 | ||
| ENERGY - 2.4% | |||
| Energy Equipment & Services - 0.3% | |||
| Baker Hughes, A GE Co. Class A | 2,860 | 61,204 | |
| Nine Energy Service, Inc. (a) | 503 | 2,842 | |
| 64,046 | |||
| Oil, Gas & Consumable Fuels - 2.1% | |||
| Chevron Corp. | 1,921 | 223,105 | |
| Occidental Petroleum Corp. | 2,514 | 101,817 | |
| Valero Energy Corp. | 737 | 71,474 | |
| 396,396 | |||
| TOTAL ENERGY | 460,442 | ||
| FINANCIALS - 14.8% | |||
| Banks - 5.6% | |||
| Bank of America Corp. | 14,239 | 445,254 | |
| Citigroup, Inc. | 3,871 | 278,170 | |
| First Horizon National Corp. | 6,330 | 101,090 | |
| JPMorgan Chase & Co. | 2,125 | 265,455 | |
| 1,089,969 | |||
| Capital Markets - 5.1% | |||
| Macquarie Group Ltd. | 1,522 | 140,538 | |
| Morgan Stanley | 2,358 | 108,586 | |
| Morningstar, Inc. | 1,291 | 208,935 | |
| MSCI, Inc. | 712 | 167,007 | |
| The NASDAQ OMX Group, Inc. | 3,784 | 377,530 | |
| 1,002,596 | |||
| Consumer Finance - 1.7% | |||
| Synchrony Financial | 9,441 | 333,928 | |
| Diversified Financial Services - 0.3% | |||
| Voya Financial, Inc. | 958 | 51,694 | |
| Insurance - 2.1% | |||
| Amerisafe, Inc. | 2,384 | 151,456 | |
| Primerica, Inc. | 389 | 49,084 | |
| Progressive Corp. | 2,978 | 207,567 | |
| 408,107 | |||
| TOTAL FINANCIALS | 2,886,294 | ||
| HEALTH CARE - 13.6% | |||
| Biotechnology - 1.0% | |||
| Vertex Pharmaceuticals, Inc. (a) | 1,037 | 202,713 | |
| Health Care Equipment & Supplies - 4.7% | |||
| Becton, Dickinson & Co. | 591 | 151,296 | |
| Hologic, Inc. (a) | 5,581 | 269,618 | |
| Insulet Corp. (a) | 437 | 63,505 | |
| Medtronic PLC | 2,160 | 235,224 | |
| Stryker Corp. | 891 | 192,697 | |
| 912,340 | |||
| Health Care Providers & Services - 4.0% | |||
| AMN Healthcare Services, Inc. (a) | 1,757 | 103,241 | |
| Anthem, Inc. | 1,488 | 400,391 | |
| CVS Health Corp. | 2,339 | 155,286 | |
| Progyny, Inc. (a) | 7,105 | 116,735 | |
| 775,653 | |||
| Pharmaceuticals - 3.9% | |||
| AstraZeneca PLC sponsored ADR | 7,279 | 356,889 | |
| GlaxoSmithKline PLC | 11,533 | 264,163 | |
| Zoetis, Inc. Class A | 1,122 | 143,526 | |
| 764,578 | |||
| TOTAL HEALTH CARE | 2,655,284 | ||
| INDUSTRIALS - 9.2% | |||
| Aerospace & Defense - 2.8% | |||
| Lockheed Martin Corp. | 723 | 272,340 | |
| Northrop Grumman Corp. | 761 | 268,237 | |
| 540,577 | |||
| Commercial Services & Supplies - 1.9% | |||
| Stericycle, Inc. (a) | 1,710 | 98,496 | |
| Waste Connection, Inc. (United States) | 576 | 53,222 | |
| Waste Management, Inc. | 1,934 | 217,014 | |
| 368,732 | |||
| Electrical Equipment - 2.4% | |||
| AMETEK, Inc. | 1,056 | 96,782 | |
| nVent Electric PLC | 527 | 12,153 | |
| Sensata Technologies, Inc. PLC (a) | 3,747 | 191,809 | |
| Sunrun, Inc. (a) | 10,993 | 170,831 | |
| 471,575 | |||
| Machinery - 1.6% | |||
| Federal Signal Corp. | 7,313 | 237,234 | |
| Gardner Denver Holdings, Inc. (a) | 2,354 | 74,928 | |
| 312,162 | |||
| Professional Services - 0.5% | |||
| Verisk Analytics, Inc. | 724 | 104,763 | |
| TOTAL INDUSTRIALS | 1,797,809 | ||
| INFORMATION TECHNOLOGY - 24.7% | |||
| Communications Equipment - 2.6% | |||
| Arista Networks, Inc. (a) | 986 | 241,146 | |
| Cisco Systems, Inc. | 5,376 | 255,414 | |
| 496,560 | |||
| Electronic Equipment & Components - 0.4% | |||
| CDW Corp. | 659 | 84,293 | |
| IT Services - 10.0% | |||
| Accenture PLC Class A | 1,775 | 329,121 | |
| Automatic Data Processing, Inc. | 598 | 97,014 | |
| Capgemini SA | 1,617 | 182,057 | |
| GoDaddy, Inc. (a) | 2,871 | 186,701 | |
| IBM Corp. | 856 | 114,473 | |
| Leidos Holdings, Inc. | 1,938 | 167,114 | |
| MasterCard, Inc. Class A | 905 | 250,513 | |
| PayPal Holdings, Inc. (a) | 1,439 | 149,800 | |
| Visa, Inc. Class A | 1,023 | 182,974 | |
| WEX, Inc. (a) | 1,568 | 296,634 | |
| 1,956,401 | |||
| Semiconductors & Semiconductor Equipment - 1.6% | |||
| Advanced Micro Devices, Inc. (a) | 2,256 | 76,546 | |
| Marvell Technology Group Ltd. | 2,138 | 52,146 | |
| NVIDIA Corp. | 872 | 175,289 | |
| 303,981 | |||
| Software - 8.3% | |||
| Adobe, Inc. (a) | 930 | 258,475 | |
| HubSpot, Inc. (a) | 684 | 106,088 | |
| Intuit, Inc. | 917 | 236,128 | |
| Microsoft Corp. | 4,615 | 661,651 | |
| Pagerduty, Inc. | 1,400 | 32,186 | |
| Salesforce.com, Inc. (a) | 2,068 | 323,621 | |
| 1,618,149 | |||
| Technology Hardware, Storage & Peripherals - 1.8% | |||
| Apple, Inc. | 1,439 | 357,966 | |
| TOTAL INFORMATION TECHNOLOGY | 4,817,350 | ||
| MATERIALS - 1.5% | |||
| Metals & Mining - 1.5% | |||
| Commercial Metals Co. | 4,641 | 89,711 | |
| Newmont Goldcorp Corp. | 5,209 | 206,954 | |
| 296,665 | |||
| REAL ESTATE - 2.7% | |||
| Equity Real Estate Investment Trusts (REITs) - 2.7% | |||
| Equity Lifestyle Properties, Inc. | 2,748 | 192,195 | |
| Store Capital Corp. | 6,804 | 275,562 | |
| Ventas, Inc. | 1,028 | 66,923 | |
| 534,680 | |||
| UTILITIES - 2.7% | |||
| Electric Utilities - 1.4% | |||
| Duke Energy Corp. | 1,055 | 99,444 | |
| Hawaiian Electric Industries, Inc. | 1,251 | 56,483 | |
| ORSTED A/S (b) | 1,344 | 117,892 | |
| 273,819 | |||
| Multi-Utilities - 0.6% | |||
| CMS Energy Corp. | 1,887 | 120,617 | |
| Water Utilities - 0.7% | |||
| American Water Works Co., Inc. | 1,075 | 132,515 | |
| TOTAL UTILITIES | 526,951 | ||
| TOTAL COMMON STOCKS | |||
| (Cost $18,274,048) | 18,802,826 | ||
| Money Market Funds - 2.6% | |||
| Fidelity Cash Central Fund 1.83% (c) | |||
| (Cost $502,377) | 502,277 | 502,377 | |
| TOTAL INVESTMENT IN SECURITIES - 98.9% | |||
| (Cost $18,776,425) | 19,305,203 | ||
| NET OTHER ASSETS (LIABILITIES) - 1.1% | 206,089 | ||
| NET ASSETS - 100% | $19,511,292 |
Legend
(a) Non-income producing
(b) Security exempt from registration under Rule 144A of the Securities Act of 1933. These securities may be resold in transactions exempt from registration, normally to qualified institutional buyers. At the end of the period, the value of these securities amounted to $121,669 or 0.6% of net assets.
(c) Affiliated fund that is generally available only to investment companies and other accounts managed by Fidelity Investments. The rate quoted is the annualized seven-day yield of the fund at period end. A complete unaudited listing of the fund's holdings as of its most recent quarter end is available upon request. In addition, each Fidelity Central Fund's financial statements are available on the SEC's website or upon request.
Affiliated Central Funds
Information regarding fiscal year to date income earned by the Fund from investments in Fidelity Central Funds is as follows:
| Fund | Income earned |
| Fidelity Cash Central Fund | $5,854 |
| Total | $5,854 |
Amounts in the income column in the above table include any capital gain distributions from underlying funds, which are presented in the corresponding line-item in the Statement of Operations, if applicable.
Investment Valuation
The following is a summary of the inputs used, as of October 31, 2019, involving the Fund's assets and liabilities carried at fair value. The inputs or methodology used for valuing securities may not be an indication of the risk associated with investing in those securities. For more information on valuation inputs, and their aggregation into the levels used below, please refer to the Investment Valuation section in the accompanying Notes to Financial Statements.
| Valuation Inputs at Reporting Date: | ||||
| Description | Total | Level 1 | Level 2 | Level 3 |
| Investments in Securities: | ||||
| Equities: | ||||
| Communication Services | $1,465,201 | $1,465,201 | $-- | $-- |
| Consumer Discretionary | 2,823,765 | 2,741,770 | 81,995 | -- |
| Consumer Staples | 538,385 | 326,234 | 212,151 | -- |
| Energy | 460,442 | 460,442 | -- | -- |
| Financials | 2,886,294 | 2,745,756 | 140,538 | -- |
| Health Care | 2,655,284 | 2,391,121 | 264,163 | -- |
| Industrials | 1,797,809 | 1,797,809 | -- | -- |
| Information Technology | 4,817,350 | 4,817,350 | -- | -- |
| Materials | 296,665 | 296,665 | -- | -- |
| Real Estate | 534,680 | 534,680 | -- | -- |
| Utilities | 526,951 | 526,951 | -- | -- |
| Money Market Funds | 502,377 | 502,377 | -- | -- |
| Total Investments in Securities: | $19,305,203 | $18,606,356 | $698,847 | $-- |
Other Information
Distribution of investments by country or territory of incorporation, as a percentage of Total Net Assets, is as follows (Unaudited):
| United States of America | 87.9% |
| United Kingdom | 4.2% |
| Ireland | 2.9% |
| France | 2.1% |
| Others (Individually Less Than 1%) | 2.9% |
| 100.0% |
See accompanying notes which are an integral part of the financial statements.
Financial Statements
Statement of Assets and Liabilities
| October 31, 2019 (Unaudited) | ||
| Assets | ||
| Investment in securities, at value — See accompanying schedule: Unaffiliated issuers (cost $18,274,048) | $18,802,826 | |
| Fidelity Central Funds (cost $502,377) | 502,377 | |
| Total Investment in Securities (cost $18,776,425) | $19,305,203 | |
| Receivable for investments sold | 246,721 | |
| Receivable for fund shares sold | 96,492 | |
| Dividends receivable | 8,000 | |
| Distributions receivable from Fidelity Central Funds | 1,174 | |
| Prepaid expenses | 53,083 | |
| Receivable from investment adviser for expense reductions | 19,571 | |
| Other receivables | 146 | |
| Total assets | 19,730,390 | |
| Liabilities | ||
| Payable for investments purchased | $165,858 | |
| Payable for fund shares redeemed | 1,959 | |
| Accrued management fee | 8,085 | |
| Audit fees payable | 19,853 | |
| Distribution and service plan fees payable | 356 | |
| Other affiliated payables | 4,087 | |
| Other payables and accrued expenses | 18,900 | |
| Total liabilities | 219,098 | |
| Net Assets | $19,511,292 | |
| Net Assets consist of: | ||
| Paid in capital | $19,118,849 | |
| Total accumulated earnings (loss) | 392,443 | |
| Net Assets | $19,511,292 | |
| Net Asset Value and Maximum Offering Price | ||
| Class A: | ||
| Net Asset Value and redemption price per share ($539,786 ÷ 52,488 shares)(a) | $10.28 | |
| Maximum offering price per share (100/94.25 of $10.28) | $10.91 | |
| Class M: | ||
| Net Asset Value and redemption price per share ($207,825 ÷ 20,236 shares)(a) | $10.27 | |
| Maximum offering price per share (100/96.50 of $10.27) | $10.64 | |
| Class C: | ||
| Net Asset Value and offering price per share ($210,211 ÷ 20,519 shares)(a) | $10.24 | |
| Fidelity Women's Leadership Fund: | ||
| Net Asset Value, offering price and redemption price per share ($16,268,711 ÷ 1,579,798 shares) | $10.30 | |
| Class I: | ||
| Net Asset Value, offering price and redemption price per share ($442,686 ÷ 42,992 shares) | $10.30 | |
| Class Z: | ||
| Net Asset Value, offering price and redemption price per share ($1,842,073 ÷ 178,754 shares) | $10.31 |
(a) Redemption price per share is equal to net asset value less any applicable contingent deferred sales charge.
See accompanying notes which are an integral part of the financial statements.
Statement of Operations
| For the period May 1, 2019 (commencement of operations) to October 31, 2019 (Unaudited) | ||
| Investment Income | ||
| Dividends | $73,601 | |
| Income from Fidelity Central Funds | 5,854 | |
| Total income | 79,455 | |
| Expenses | ||
| Management fee | $29,227 | |
| Transfer agent fees | 13,721 | |
| Distribution and service plan fees | 1,888 | |
| Accounting fees | 2,123 | |
| Custodian fees and expenses | 18,902 | |
| Independent trustees' fees and expenses | 19 | |
| Registration fees | 55,842 | |
| Audit | 21,954 | |
| Legal | 3 | |
| Miscellaneous | 577 | |
| Total expenses before reductions | 144,256 | |
| Expense reductions | (88,699) | |
| Total expenses after reductions | 55,557 | |
| Net investment income (loss) | 23,898 | |
| Realized and Unrealized Gain (Loss) | ||
| Net realized gain (loss) on: | ||
| Investment securities: | ||
| Unaffiliated issuers | (160,422) | |
| Foreign currency transactions | 358 | |
| Total net realized gain (loss) | (160,064) | |
| Change in net unrealized appreciation (depreciation) on: | ||
| Investment securities: | ||
| Unaffiliated issuers | 528,778 | |
| Assets and liabilities in foreign currencies | (169) | |
| Total change in net unrealized appreciation (depreciation) | 528,609 | |
| Net gain (loss) | 368,545 | |
| Net increase (decrease) in net assets resulting from operations | $392,443 |
See accompanying notes which are an integral part of the financial statements.
Statement of Changes in Net Assets
| For the period May 1, 2019 (commencement of operations) to October 31, 2019 (Unaudited) | |
| Increase (Decrease) in Net Assets | |
| Operations | |
| Net investment income (loss) | $23,898 |
| Net realized gain (loss) | (160,064) |
| Change in net unrealized appreciation (depreciation) | 528,609 |
| Net increase (decrease) in net assets resulting from operations | 392,443 |
| Share transactions - net increase (decrease) | 19,118,849 |
| Total increase (decrease) in net assets | 19,511,292 |
| Net Assets | |
| Beginning of period | – |
| End of period | $19,511,292 |
See accompanying notes which are an integral part of the financial statements.
Financial Highlights
Fidelity Women's Leadership Fund Class A
| Six months ended (Unaudited) October 31, | |
| 2019A | |
| Selected Per–Share Data | |
| Net asset value, beginning of period | $10.00 |
| Income from Investment Operations | |
| Net investment income (loss)B | .01 |
| Net realized and unrealized gain (loss) | .27 |
| Total from investment operations | .28 |
| Net asset value, end of period | $10.28 |
| Total ReturnC,D,E | 2.80% |
| Ratios to Average Net AssetsF,G | |
| Expenses before reductions | 3.06%H |
| Expenses net of fee waivers, if any | 1.25%H |
| Expenses net of all reductions | 1.24%H |
| Net investment income (loss) | .21%H |
| Supplemental Data | |
| Net assets, end of period (000 omitted) | $540 |
| Portfolio turnover rateI | 39%H |
A For the period May 1, 2019 (commencement of operations) to October 31, 2019.
B Calculated based on average shares outstanding during the period.
C Total returns for periods of less than one year are not annualized.
D Total returns would have been lower if certain expenses had not been reduced during the applicable periods shown.
E Total returns do not include the effect of the sales charges.
F Fees and expenses of any underlying Fidelity Central Funds are not included in the Fund's expense ratio. The Fund indirectly bears its proportionate share of the expenses of any underlying Fidelity Central Funds.
G Expense ratios reflect operating expenses of the class. Expenses before reductions do not reflect amounts reimbursed by the investment adviser or reductions from brokerage service arrangements or reductions from other expense offset arrangements and do not represent the amount paid by the class during periods when reimbursements or reductions occur. Expense ratios before reductions for start-up periods may not be representative of longer-term operating periods. Expenses net of fee waivers reflect expenses after reimbursement by the investment adviser but prior to reductions from brokerage service arrangements or other expense offset arrangements. Expenses net of all reductions represent the net expenses paid by the class.
H Annualized
I Amount does not include the portfolio activity of any underlying Fidelity Central Funds.
See accompanying notes which are an integral part of the financial statements.
Fidelity Women's Leadership Fund Class M
| Six months ended (Unaudited) October 31, | |
| 2019A | |
| Selected Per–Share Data | |
| Net asset value, beginning of period | $10.00 |
| Income from Investment Operations | |
| Net investment income (loss)B | –C |
| Net realized and unrealized gain (loss) | .27 |
| Total from investment operations | .27 |
| Net asset value, end of period | $10.27 |
| Total ReturnD,E,F | 2.70% |
| Ratios to Average Net AssetsG,H | |
| Expenses before reductions | 3.75%I |
| Expenses net of fee waivers, if any | 1.50%I |
| Expenses net of all reductions | 1.49%I |
| Net investment income (loss) | (.05)%I |
| Supplemental Data | |
| Net assets, end of period (000 omitted) | $208 |
| Portfolio turnover rateJ | 39%I |
A For the period May 1, 2019 (commencement of operations) to October 31, 2019.
B Calculated based on average shares outstanding during the period.
C Amount represents less than $.005 per share.
D Total returns for periods of less than one year are not annualized.
E Total returns would have been lower if certain expenses had not been reduced during the applicable periods shown.
F Total returns do not include the effect of the sales charges.
G Fees and expenses of any underlying Fidelity Central Funds are not included in the Fund's expense ratio. The Fund indirectly bears its proportionate share of the expenses of any underlying Fidelity Central Funds.
H Expense ratios reflect operating expenses of the class. Expenses before reductions do not reflect amounts reimbursed by the investment adviser or reductions from brokerage service arrangements or reductions from other expense offset arrangements and do not represent the amount paid by the class during periods when reimbursements or reductions occur. Expense ratios before reductions for start-up periods may not be representative of longer-term operating periods. Expenses net of fee waivers reflect expenses after reimbursement by the investment adviser but prior to reductions from brokerage service arrangements or other expense offset arrangements. Expenses net of all reductions represent the net expenses paid by the class.
I Annualized
J Amount does not include the portfolio activity of any underlying Fidelity Central Funds.
See accompanying notes which are an integral part of the financial statements.
Fidelity Women's Leadership Fund Class C
| Six months ended (Unaudited) October 31, | |
| 2019A | |
| Selected Per–Share Data | |
| Net asset value, beginning of period | $10.00 |
| Income from Investment Operations | |
| Net investment income (loss)B | (.03) |
| Net realized and unrealized gain (loss) | .27 |
| Total from investment operations | .24 |
| Net asset value, end of period | $10.24 |
| Total ReturnC,D,E | 2.40% |
| Ratios to Average Net AssetsF,G | |
| Expenses before reductions | 4.26%H |
| Expenses net of fee waivers, if any | 2.00%H |
| Expenses net of all reductions | 1.99%H |
| Net investment income (loss) | (.54)%H |
| Supplemental Data | |
| Net assets, end of period (000 omitted) | $210 |
| Portfolio turnover rateI | 39%H |
A For the period May 1, 2019 (commencement of operations) to October 31, 2019.
B Calculated based on average shares outstanding during the period.
C Total returns for periods of less than one year are not annualized.
D Total returns would have been lower if certain expenses had not been reduced during the applicable periods shown.
E Total returns do not include the effect of the contingent deferred sales charge.
F Fees and expenses of any underlying Fidelity Central Funds are not included in the Fund's expense ratio. The Fund indirectly bears its proportionate share of the expenses of any underlying Fidelity Central Funds.
G Expense ratios reflect operating expenses of the class. Expenses before reductions do not reflect amounts reimbursed by the investment adviser or reductions from brokerage service arrangements or reductions from other expense offset arrangements and do not represent the amount paid by the class during periods when reimbursements or reductions occur. Expense ratios before reductions for start-up periods may not be representative of longer-term operating periods. Expenses net of fee waivers reflect expenses after reimbursement by the investment adviser but prior to reductions from brokerage service arrangements or other expense offset arrangements. Expenses net of all reductions represent the net expenses paid by the class.
H Annualized
I Amount does not include the portfolio activity of any underlying Fidelity Central Funds.
See accompanying notes which are an integral part of the financial statements.
Fidelity Women's Leadership Fund
| Six months ended (Unaudited) October 31, | |
| 2019A | |
| Selected Per–Share Data | |
| Net asset value, beginning of period | $10.00 |
| Income from Investment Operations | |
| Net investment income (loss)B | .02 |
| Net realized and unrealized gain (loss) | .28 |
| Total from investment operations | .30 |
| Net asset value, end of period | $10.30 |
| Total ReturnC,D | 3.00% |
| Ratios to Average Net AssetsE,F | |
| Expenses before reductions | 2.57%G |
| Expenses net of fee waivers, if any | .99%G,H |
| Expenses net of all reductions | .99%G |
| Net investment income (loss) | .46%G |
| Supplemental Data | |
| Net assets, end of period (000 omitted) | $16,269 |
| Portfolio turnover rateI | 39%G |
A For the period May 1, 2019 (commencement of operations) to October 31, 2019.
B Calculated based on average shares outstanding during the period.
C Total returns for periods of less than one year are not annualized.
D Total returns would have been lower if certain expenses had not been reduced during the applicable periods shown.
E Fees and expenses of any underlying Fidelity Central Funds are not included in the Fund's expense ratio. The Fund indirectly bears its proportionate share of the expenses of any underlying Fidelity Central Funds.
F Expense ratios reflect operating expenses of the class. Expenses before reductions do not reflect amounts reimbursed by the investment adviser or reductions from brokerage service arrangements or reductions from other expense offset arrangements and do not represent the amount paid by the class during periods when reimbursements or reductions occur. Expense ratios before reductions for start-up periods may not be representative of longer-term operating periods. Expenses net of fee waivers reflect expenses after reimbursement by the investment adviser but prior to reductions from brokerage service arrangements or other expense offset arrangements. Expenses net of all reductions represent the net expenses paid by the class.
G Annualized
H On certain classes, the size and fluctuation of net assets and expense amounts may cause ratios to differ from contractual rates.
I Amount does not include the portfolio activity of any underlying Fidelity Central Funds.
See accompanying notes which are an integral part of the financial statements.
Fidelity Women's Leadership Fund Class I
| Six months ended (Unaudited) October 31, | |
| 2019A | |
| Selected Per–Share Data | |
| Net asset value, beginning of period | $10.00 |
| Income from Investment Operations | |
| Net investment income (loss)B | .02 |
| Net realized and unrealized gain (loss) | .28 |
| Total from investment operations | .30 |
| Net asset value, end of period | $10.30 |
| Total ReturnC,D | 3.00% |
| Ratios to Average Net AssetsE,F | |
| Expenses before reductions | 2.97%G |
| Expenses net of fee waivers, if any | 1.00%G |
| Expenses net of all reductions | .99%G |
| Net investment income (loss) | .46%G |
| Supplemental Data | |
| Net assets, end of period (000 omitted) | $443 |
| Portfolio turnover rateH | 39%G |
A For the period May 1, 2019 (commencement of operations) to October 31, 2019.
B Calculated based on average shares outstanding during the period.
C Total returns for periods of less than one year are not annualized.
D Total returns would have been lower if certain expenses had not been reduced during the applicable periods shown.
E Fees and expenses of any underlying Fidelity Central Funds are not included in the Fund's expense ratio. The Fund indirectly bears its proportionate share of the expenses of any underlying Fidelity Central Funds.
F Expense ratios reflect operating expenses of the class. Expenses before reductions do not reflect amounts reimbursed by the investment adviser or reductions from brokerage service arrangements or reductions from other expense offset arrangements and do not represent the amount paid by the class during periods when reimbursements or reductions occur. Expense ratios before reductions for start-up periods may not be representative of longer-term operating periods. Expenses net of fee waivers reflect expenses after reimbursement by the investment adviser but prior to reductions from brokerage service arrangements or other expense offset arrangements. Expenses net of all reductions represent the net expenses paid by the class.
G Annualized
H Amount does not include the portfolio activity of any underlying Fidelity Central Funds.
See accompanying notes which are an integral part of the financial statements.
Fidelity Women's Leadership Fund Class Z
| Six months ended (Unaudited) October 31, | |
| 2019A | |
| Selected Per–Share Data | |
| Net asset value, beginning of period | $10.00 |
| Income from Investment Operations | |
| Net investment income (loss)B | .03 |
| Net realized and unrealized gain (loss) | .28 |
| Total from investment operations | .31 |
| Net asset value, end of period | $10.31 |
| Total ReturnC,D | 3.10% |
| Ratios to Average Net AssetsE,F | |
| Expenses before reductions | 2.37%G |
| Expenses net of fee waivers, if any | .84%G,H |
| Expenses net of all reductions | .84%G |
| Net investment income (loss) | .61%G |
| Supplemental Data | |
| Net assets, end of period (000 omitted) | $1,842 |
| Portfolio turnover rateI | 39%G |
A For the period May 1, 2019 (commencement of operations) to October 31, 2019.
B Calculated based on average shares outstanding during the period.
C Total returns for periods of less than one year are not annualized.
D Total returns would have been lower if certain expenses had not been reduced during the applicable periods shown.
E Fees and expenses of any underlying Fidelity Central Funds are not included in the Fund's expense ratio. The Fund indirectly bears its proportionate share of the expenses of any underlying Fidelity Central Funds.
F Expense ratios reflect operating expenses of the class. Expenses before reductions do not reflect amounts reimbursed by the investment adviser or reductions from brokerage service arrangements or reductions from other expense offset arrangements and do not represent the amount paid by the class during periods when reimbursements or reductions occur. Expense ratios before reductions for start-up periods may not be representative of longer-term operating periods. Expenses net of fee waivers reflect expenses after reimbursement by the investment adviser but prior to reductions from brokerage service arrangements or other expense offset arrangements. Expenses net of all reductions represent the net expenses paid by the class.
G Annualized
H On certain classes, the size and fluctuation of net assets and expense amounts may cause ratios to differ from contractual rates.
I Amount does not include the portfolio activity of any underlying Fidelity Central Funds.
See accompanying notes which are an integral part of the financial statements.
Notes to Financial Statements (Unaudited)
For the period ended October 31, 2019
1. Organization.
Fidelity Women's Leadership Fund (the Fund) is a fund of Fidelity Summer Street Trust (the Trust) and is authorized to issue an unlimited number of shares. The Trust is registered under the Investment Company Act of 1940, as amended (the 1940 Act), as an open-end management investment company organized as a Massachusetts business trust. The Fund offers Class A, Class M, Class C, Fidelity Women's Leadership Fund, Class I and Class Z shares, each of which has equal rights as to assets and voting privileges. Each class has exclusive voting rights with respect to matters that affect that class. Effective March 1, 2019, Class C shares will automatically convert to Class A shares after a holding period of ten years from the initial date of purchase, with certain exceptions.
2. Investments in Fidelity Central Funds.
The Fund invests in Fidelity Central Funds, which are open-end investment companies generally available only to other investment companies and accounts managed by the investment adviser and its affiliates. The Fund's Schedule of Investments lists each of the Fidelity Central Funds held as of period end, if any, as an investment of the Fund, but does not include the underlying holdings of each Fidelity Central Fund. As an Investing Fund, the Fund indirectly bears its proportionate share of the expenses of the underlying Fidelity Central Funds.
The Money Market Central Funds seek preservation of capital and current income and are managed by Fidelity Investments Money Management, Inc. (FIMM), an affiliate of the investment adviser. Annualized expenses of the Money Market Central Funds as of their most recent shareholder report date ranged from less than .005% to .01%.
A complete unaudited list of holdings for each Fidelity Central Fund is available upon request or at the Securities and Exchange Commission (the SEC) website at www.sec.gov. In addition, the financial statements of the Fidelity Central Funds are available on the SEC website or upon request.
3. Significant Accounting Policies.
The Fund is an investment company and applies the accounting and reporting guidance of the Financial Accounting Standards Board (FASB) Accounting Standards Codification Topic 946 Financial Services – Investments Companies. The financial statements have been prepared in conformity with accounting principles generally accepted in the United States of America (GAAP), which require management to make certain estimates and assumptions at the date of the financial statements. Actual results could differ from those estimates. Subsequent events, if any, through the date that the financial statements were issued have been evaluated in the preparation of the financial statements. The following summarizes the significant accounting policies of the Fund:
Investment Valuation. Investments are valued as of 4:00 p.m. Eastern time on the last calendar day of the period. The Board of Trustees (the Board) has delegated the day to day responsibility for the valuation of the Fund's investments to the Fair Value Committee (the Committee) established by the Fund's investment adviser. In accordance with valuation policies and procedures approved by the Board, the Fund attempts to obtain prices from one or more third party pricing vendors or brokers to value its investments. When current market prices, quotations or currency exchange rates are not readily available or reliable, investments will be fair valued in good faith by the Committee, in accordance with procedures adopted by the Board. Factors used in determining fair value vary by investment type and may include market or investment specific events. The frequency with which these procedures are used cannot be predicted and they may be utilized to a significant extent. The Committee oversees the Fund's valuation policies and procedures and reports to the Board on the Committee's activities and fair value determinations. The Board monitors the appropriateness of the procedures used in valuing the Fund's investments and ratifies the fair value determinations of the Committee.
The Fund categorizes the inputs to valuation techniques used to value its investments into a disclosure hierarchy consisting of three levels as shown below:
- Level 1 – quoted prices in active markets for identical investments
- Level 2 – other significant observable inputs (including quoted prices for similar investments, interest rates, prepayment speeds, etc.)
- Level 3 – unobservable inputs (including the Fund's own assumptions based on the best information available)
Valuation techniques used to value the Fund's investments by major category are as follows:
Equity securities, including restricted securities, for which market quotations are readily available, are valued at the last reported sale price or official closing price as reported by a third party pricing vendor on the primary market or exchange on which they are traded and are categorized as Level 1 in the hierarchy. In the event there were no sales during the day or closing prices are not available, securities are valued at the last quoted bid price or may be valued using the last available price and are generally categorized as Level 2 in the hierarchy. For foreign equity securities, when market or security specific events arise, comparisons to the valuation of American Depositary Receipts (ADRs), futures contracts, Exchange-Traded Funds (ETFs) and certain indexes as well as quoted prices for similar securities may be used and would be categorized as Level 2 in the hierarchy. For equity securities, including restricted securities, where observable inputs are limited, assumptions about market activity and risk are used and these securities may be categorized as Level 3 in the hierarchy.
Investments in open-end mutual funds, including the Fidelity Central Funds, are valued at their closing net asset value (NAV) each business day and are categorized as Level 1 in the hierarchy.
Changes in valuation techniques may result in transfers in or out of an assigned level within the disclosure hierarchy. The aggregate value of investments by input level as of October 31, 2019 is included at the end of the Fund's Schedule of Investments.
Foreign Currency. The Fund may use foreign currency contracts to facilitate transactions in foreign-denominated securities. Gains and losses from these transactions may arise from changes in the value of the foreign currency or if the counterparties do not perform under the contracts' terms.
Foreign-denominated assets, including investment securities, and liabilities are translated into U.S. dollars at the exchange rates at period end. Purchases and sales of investment securities, income and dividends received and expenses denominated in foreign currencies are translated into U.S. dollars at the exchange rate in effect on the transaction date.
The effects of exchange rate fluctuations on investments are included with the net realized and unrealized gain (loss) on investment securities. Other foreign currency transactions resulting in realized and unrealized gain (loss) are disclosed separately.
Investment Transactions and Income. For financial reporting purposes, the Fund's investment holdings and NAV include trades executed through the end of the last business day of the period. The NAV per share for processing shareholder transactions is calculated as of the close of business of the New York Stock Exchange (NYSE), normally 4:00 p.m. Eastern time and includes trades executed through the end of the prior business day. Gains and losses on securities sold are determined on the basis of identified cost. Dividend income is recorded on the ex-dividend date, except for certain dividends from foreign securities where the ex-dividend date may have passed, which are recorded as soon as the Fund is informed of the ex-dividend date. Non-cash dividends included in dividend income, if any, are recorded at the fair market value of the securities received. Income and capital gain distributions from Fidelity Central Funds, if any, are recorded on the ex-dividend date. Investment income is recorded net of foreign taxes withheld where recovery of such taxes is uncertain.
Class Allocations and Expenses. Investment income, realized and unrealized capital gains and losses, common expenses of the Fund, and certain fund-level expense reductions, if any, are allocated daily on a pro-rata basis to each class based on the relative net assets of each class to the total net assets of the Fund. Each class differs with respect to transfer agent and distribution and service plan fees incurred. Certain expense reductions may also differ by class. For the reporting period, the allocated portion of income and expenses to each class as a percent of its average net assets may vary due to the timing of recording these transactions in relation to fluctuating net assets of the classes. Expenses directly attributable to a fund are charged to that fund. Expenses attributable to more than one fund are allocated among the respective funds on the basis of relative net assets or other appropriate methods. Expense estimates are accrued in the period to which they relate and adjustments are made when actual amounts are known.
Income Tax Information and Distributions to Shareholders. Each year, the Fund intends to qualify as a regulated investment company under Subchapter M of the Internal Revenue Code, including distributing substantially all of its taxable income and realized gains. As a result, no provision for U.S. Federal income taxes is required. The Fund files a U.S. federal tax return, in addition to state and local tax returns as required. The Fund's federal income tax returns are subject to examination by the Internal Revenue Service (IRS) for a period of three fiscal years after they are filed. State and local tax returns may be subject to examination for an additional fiscal year depending on the jurisdiction. Foreign taxes are provided for based on the Fund's understanding of the tax rules and rates that exist in the foreign markets in which it invests.
Distributions are declared and recorded on the ex-dividend date. Income and capital gain distributions are declared separately for each class. Income and capital gain distributions are determined in accordance with income tax regulations, which may differ from GAAP.
Capital accounts within the financial statements are adjusted for permanent book-tax differences. These adjustments have no impact on net assets or the results of operations. Capital accounts are not adjusted for temporary book-tax differences which will reverse in a subsequent period.
As of period end, the cost and unrealized appreciation (depreciation) in securities, and derivatives if applicable, for federal income tax purposes were as follows:
| Gross unrealized appreciation | $963,337 |
| Gross unrealized depreciation | (507,446) |
| Net unrealized appreciation (depreciation) | $455,891 |
| Tax cost | $18,849,312 |
Restricted Securities. The Fund may invest in securities that are subject to legal or contractual restrictions on resale. These securities generally may be resold in transactions exempt from registration or to the public if the securities are registered. Disposal of these securities may involve time-consuming negotiations and expense, and prompt sale at an acceptable price may be difficult. Information regarding restricted securities is included at the end of the Fund's Schedule of Investments.
4. Purchases and Sales of Investments.
Purchases and sales of securities, other than short-term securities, aggregated $20,765,232 and $2,330,764, respectively.
5. Fees and Other Transactions with Affiliates.
Management Fee. Fidelity Management & Research Company (the investment adviser) and its affiliates provide the Fund with investment management related services for which the Fund pays a monthly management fee. The management fee is the sum of an individual fund fee rate that is based on an annual rate of .30% of the Fund's average net assets and an annualized group fee rate that averaged .24% during the period. The group fee rate is based upon the average net assets of all the mutual funds advised by the investment adviser, including any mutual funds previously advised by the investment adviser that are currently advised by Fidelity SelectCo, LLC, an affiliate of the investment adviser. The group fee rate decreases as assets under management increase and increases as assets under management decrease. For the reporting period, the total annualized management fee rate was .53% of the Fund's average net assets.
Distribution and Service Plan Fees. In accordance with Rule 12b-1 of the 1940 Act, the Fund has adopted separate Distribution and Service Plans for each class of shares. Certain classes pay Fidelity Distributors Corporation (FDC), an affiliate of the investment adviser, separate Distribution and Service Fees, each of which is based on an annual percentage of each class' average net assets. In addition, FDC may pay financial intermediaries for selling shares of the Fund and providing shareholder support services. For the period, the Distribution and Service Fee rates, total fees and amounts retained by FDC were as follows:
| Distribution Fee | Service Fee | Total Fees | Retained by FDC | |
| Class A | -% | .25% | $514 | $210 |
| Class M | .25% | .25% | 462 | 403 |
| Class C | .75% | .25% | 912 | 912 |
| $1,888 | $1,525 |
Sales Load. FDC may receive a front-end sales charge of up to 5.75% for selling Class A shares and 3.50% for selling Class M shares, some of which is paid to financial intermediaries for selling shares of the Fund. Depending on the holding period, FDC may receive contingent deferred sales charges levied on Class A, Class M and Class C redemptions. The deferred sales charges are 1.00% for Class C shares, 1.00% for certain purchases of Class A shares and .25% for certain purchases of Class M shares.
For the period, sales charge amounts retained by FDC were as follows:
| Retained by FDC | |
| Class A | $459 |
| Class M | 89 |
| Class C(a) | 19 |
| $567 |
(a) When Class C shares are initially sold, FDC pays commissions from its own resources to financial intermediaries through which the sales are made.
Transfer Agent Fees. Fidelity Investments Institutional Operations Company, Inc., (FIIOC), an affiliate of the investment adviser, is the transfer, dividend disbursing and shareholder servicing agent for each class of the Fund. FIIOC receives account fees and asset-based fees that vary according to the account size and type of account of the shareholders of the respective classes of the Fund, except for Class Z. FIIOC receives an asset-based fee of Class Z's average net assets. FIIOC pays for typesetting, printing and mailing of shareholder reports, except proxy statements.
For the period, transfer agent fees for each class were as follows:
| Amount | % of Class-Level Average Net Assets(a) | |
| Class A | $289 | .14 |
| Class M | 110 | .12 |
| Class C | 108 | .12 |
| Fidelity Women's Leadership Fund | 12,761 | .28 |
| Class I | 263 | .17 |
| Class Z | 190 | .04 |
| $13,721 |
(a) Annualized
Accounting Fees. Fidelity Service Company, Inc. (FSC), an affiliate of the investment adviser, maintains the Fund's accounting records. The fee is based on the level of average net assets for each month. For the period, the fees were equivalent to an annualized rate of .04%.
Brokerage Commissions. The Fund placed a portion of its portfolio transactions with brokerage firms which are affiliates of the investment adviser. Brokerage commissions are included in net realized gain (loss) and change in net unrealized appreciation (depreciation) in the Statement of Operations. The commissions paid to these affiliated firms were $172 for the period.
Interfund Trades. The Fund may purchase from or sell securities to other Fidelity Funds under procedures adopted by the Board. The procedures have been designed to ensure these interfund trades are executed in accordance with Rule 17a-7 of the 1940 Act. Interfund trades are included within the respective purchases and sales amounts shown in the Purchases and Sales of Investments note.
6. Expense Reductions.
The investment adviser contractually agreed to reimburse each class to the extent annual operating expenses exceeded certain levels of class-level average net assets as noted in the table below. This reimbursement will remain in place through August 31, 2020. Some expenses, for example the compensation of the independent Trustees are excluded from this reimbursement.
The following classes were in reimbursement during the period:
| Expense Limitations | Reimbursement | |
| Class A | 1.25% | $3,739 |
| Class M | 1.50% | 2,083 |
| Class C | 2.00% | 2,065 |
| Fidelity Women's Leadership Fund | 1.00% | 71,014 |
| Class I | 1.00% | 3,079 |
| Class Z | .85% | 6,466 |
| $88,446 |
Commissions paid to certain brokers with whom the investment adviser, or its affiliates, places trades on behalf of the Fund include an amount in addition to trade execution, which may be rebated back to the Fund to offset certain expenses. This amount totaled $253 for the period.
7. Share Transactions.
Share transactions for each class were as follows and may contain automatic conversions between classes or exchanges between affiliated funds:
| Shares | Dollars | |
| Six months ended October 31, 2019 | Six months ended October 31, 2019 | |
| Class A | ||
| Shares sold | 52,488 | $525,552 |
| Net increase (decrease) | 52,488 | $525,552 |
| Class M | ||
| Shares sold | 20,236 | $201,477 |
| Net increase (decrease) | 20,236 | $201,477 |
| Class C | ||
| Shares sold | 20,714 | $207,320 |
| Shares redeemed | (195) | (2,000) |
| Net increase (decrease) | 20,519 | $205,320 |
| Fidelity Women's Leadership Fund | ||
| Shares sold | 1,719,231 | $17,358,655 |
| Shares redeemed | (139,433) | (1,418,304) |
| Net increase (decrease) | 1,579,798 | $15,940,351 |
| Class I | ||
| Shares sold | 45,879 | $458,088 |
| Shares redeemed | (2,887) | (29,486) |
| Net increase (decrease) | 42,992 | $428,602 |
| Class Z | ||
| Shares sold | 200,873 | $2,041,323 |
| Shares redeemed | (22,119) | (223,776) |
| Net increase (decrease) | 178,754 | $1,817,547 |
8. Other.
The Fund's organizational documents provide former and current trustees and officers with a limited indemnification against liabilities arising in connection with the performance of their duties to the Fund. In the normal course of business, the Fund may also enter into contracts that provide general indemnifications. The Fund's maximum exposure under these arrangements is unknown as this would be dependent on future claims that may be made against the Fund. The risk of material loss from such claims is considered remote.
Shareholder Expense Example
As a shareholder of the Fund, you incur two types of costs: (1) transaction costs, including sales charges (loads) on purchase payments or redemption proceeds, and (2) ongoing costs, including management fees, distribution and/or service (12b-1) fees and other Fund expenses. This Example is intended to help you understand your ongoing costs (in dollars) of investing in the Fund and to compare these costs with the ongoing costs of investing in other mutual funds.
The Example is based on an investment of $1,000 invested at the beginning of the period and held for the entire period (May 1, 2019 to October 31, 2019).
Actual Expenses
The first line of the accompanying table for each class of the Fund provides information about actual account values and actual expenses. You may use the information in this line, together with the amount you invested, to estimate the expenses that you paid over the period. Simply divide your account value by $1,000.00 (for example, an $8,600 account value divided by $1,000.00 = 8.6), then multiply the result by the number in the first line for a class of the Fund under the heading entitled "Expenses Paid During Period" to estimate the expenses you paid on your account during this period. In addition, the Fund, as a shareholder in the underlying Fidelity Central Funds, will indirectly bear its pro-rata share of the fees and expenses incurred by the underlying Fidelity Central Funds. These fees and expenses are not included in the Fund's annualized expense ratio used to calculate the expense estimate in the table below.
Hypothetical Example for Comparison Purposes
The second line of the accompanying table for each class of the Fund provides information about hypothetical account values and hypothetical expenses based on a Class' actual expense ratio and an assumed rate of return of 5% per year before expenses, which is not the Class' actual return. The hypothetical account values and expenses may not be used to estimate the actual ending account balance or expenses you paid for the period. You may use this information to compare the ongoing costs of investing in the Fund and other funds. To do so, compare this 5% hypothetical example with the 5% hypothetical examples that appear in the shareholder reports of the other funds. In addition, the Fund, as a shareholder in the underlying Fidelity Central Funds, will indirectly bear its pro-rata share of the fees and expenses incurred by the underlying Fidelity Central Funds. These fees and expenses are not included in the Fund's annualized expense ratio used to calculate the expense estimate in the table below.
Please note that the expenses shown in the table are meant to highlight your ongoing costs only and do not reflect any transaction costs. Therefore, the second line of the table is useful in comparing ongoing costs only, and will not help you determine the relative total costs of owning different funds. In addition, if these transactional costs were included, your costs would have been higher.
| Annualized Expense Ratio-A | Beginning Account Value May 1, 2019 | Ending Account Value October 31, 2019 | Expenses Paid During Period-B May 1, 2019 to October 31, 2019 |
|
| Class A | 1.25% | |||
| Actual | $1,000.00 | $1,028.00 | $6.37 | |
| Hypothetical-C | $1,000.00 | $1,018.85 | $6.34 | |
| Class M | 1.50% | |||
| Actual | $1,000.00 | $1,027.00 | $7.64 | |
| Hypothetical-C | $1,000.00 | $1,017.60 | $7.61 | |
| Class C | 2.00% | |||
| Actual | $1,000.00 | $1,024.00 | $10.18 | |
| Hypothetical-C | $1,000.00 | $1,015.08 | $10.13 | |
| Fidelity Women's Leadership Fund | .99% | |||
| Actual | $1,000.00 | $1,030.00 | $5.05 | |
| Hypothetical-C | $1,000.00 | $1,020.16 | $5.03 | |
| Class I | 1.00% | |||
| Actual | $1,000.00 | $1,030.00 | $5.10 | |
| Hypothetical-C | $1,000.00 | $1,020.11 | $5.08 | |
| Class Z | .84% | |||
| Actual | $1,000.00 | $1,031.00 | $4.29 | |
| Hypothetical-C | $1,000.00 | $1,020.91 | $4.27 |
A Annualized expense ratio reflects expenses net of applicable fee waivers.
B Expenses are equal to each Class' annualized expense ratio, multiplied by the average account value over the period, multiplied by 184/366 (to reflect the one-half year period).
C 5% return per year before expenses
Board Approval of Investment Advisory Contracts and Management Fees
Fidelity Women's Leadership Fund
On January 23, 2019, the Board of Trustees, including the Independent Trustees (together, the Board), voted to approve the management contract with Fidelity Management & Research Company (FMR) and the sub-advisory agreements with affiliates of FMR (together, the Advisory Contracts) for the fund. FMR and the sub-advisers are collectively referred to herein as the Investment Advisers. The Board, assisted by the advice of fund counsel and Independent Trustees' counsel, considered a broad range of information.
Nature, Extent, and Quality of Services Provided. The Board considered Fidelity's staffing as it relates to the fund, including the backgrounds of investment personnel of Fidelity, and also considered the fund's investment objective, strategies, and related investment philosophy. The Board considered the structure of the investment personnel compensation program and whether this structure provides appropriate incentives to act in the best interests of the fund. Resources Dedicated to Investment Management and Support Services. The Board and the Fund Oversight and Research Committees reviewed the general qualifications and capabilities of Fidelity's investment staff, including its size, education, experience, and resources, as well as Fidelity's approach to recruiting,training, managing, and compensating investment personnel. The Board noted that Fidelity has continued to increase the resources devoted to non-U.S. offices, including expansion of Fidelity's global investment organization. The Board also noted that Fidelity's analysts have extensive resources, tools and capabilities that allow them to conduct sophisticated quantitative and fundamental analysis, as well as credit analysis of issuers, counterparties and guarantors. Further, the Board considered that Fidelity's investment professionals have sufficient access to global information and data so as to provide competitive investment results over time, and that those professionals also have access to sophisticated tools that permit them to assess portfolio construction and risk and performance attribution characteristics continuously, as well as to transmit new information and research conclusions rapidly around the world. Additionally, in its deliberations, the Board considered Fidelity's trading, risk management, compliance, and technology and operations capabilities and resources, which are integral parts of the investment management process. Shareholder and Administrative Services. The Board considered the nature, extent, quality, and cost of advisory, administrative, and shareholder services to be performed by the Investment Advisers and their affiliates under the Advisory Contracts and under separate agreements covering transfer agency, pricing and bookkeeping, and securities lending services for the fund. The Board also considered the nature and extent of the supervision of third party service providers, principally custodians, subcustodians, and pricing vendors.The Board noted that the growth of fund assets over time across the complex allows Fidelity to reinvest in the development of services designed to enhance the value and convenience of the Fidelity funds as investment vehicles. These services include 24-hour access to account information and market information through telephone representatives and over the Internet, investor education materials and asset allocation tools, and the expanded availability of Fidelity Investor Centers. Investment Performance. The fund is a new fund and therefore had no historical performance for the Board to review at the time it approved the fund's Advisory Contracts. The Board considered the Investment Advisers' strength in fundamental, research-driven security selection, which the Board is familiar with through its supervision of other Fidelity funds.Based on its review, the Board concluded that the nature, extent, and quality of services to be provided to the fund under the Advisory Contracts should benefit the shareholders of the fund. Competitiveness of Management Fee and Total Expense Ratio ..In reviewing the Advisory Contracts, the Board considered the fund's proposed management fee rate and the projected total expense ratio of each class of the fund. The Board noted that the fund's proposed management fee rate is lower than the median fee rate of funds with similar Lipper investment objective categories and comparable investment mandates, regardless of whether their management fee structures are comparable. The Board also considered that the projected total expense ratio of the retail class and Class Z is below the median of those funds and classes used by the Board for management fee comparisons that have a similar sales load structure. The Board also considered that the projected total expense ratio of each of Class A, Class M, Class C, and Class I is above the median of those funds and classes used by the Board for management fee comparisons that have a similar sales load structure primarily as a result of low estimated asset levels. The Board, recognizing that the fund is a new fund and therefore had no historical performance upon which to evaluate the effect of the performance adjustment, noted that it would be able to evaluate its effects in connection with future renewals of the fund's Advisory Contracts.The Board also noted that FMR has contractually agreed to reimburse each class of the fund to the extent that total operating expenses (excluding interest, certain taxes, fees and expenses of the Independent Trustees, proxy and shareholder meeting expenses, extraordinary expenses, and acquired fund fees and expenses, if any, as well as non-operating expenses such as brokerage commissions and fees and expenses associated with the fund's securities lending program, if any), as a percentage of their respective average net assets exceed a certain limit through August 31, 2020.Based on its review, the Board concluded that the management fee and the projected total expense ratio of each class of the fund were reasonable in light of the services that the fund and its shareholders will receive and the other factors considered. Costs of the Services and Profitability. The fund is a new fund and therefore no revenue, cost, or profitability data was available for the Board to review in respect of the fund at the time it approved the Advisory Contracts. In connection with its future renewal of the fund's Advisory Contracts, the Board will consider the revenues earned and the expenses incurred by Fidelity in conducting the business of developing, marketing, distributing, managing, administering and servicing the fund and servicing the fund's shareholders. Economies of Scale. The Board will consider economies of scale when there is operating experience to permit assessment thereof. It noted that, notwithstanding the entrepreneurial risk associated with a new fund, the management fee was at a level normally associated, by comparison with competitors, with very high fund net assets, and Fidelity asserted to the Board that the level of the fee anticipated economies of scale at lower asset levels even before, if ever, economies of scale are achieved. The Board also noted that the fund and its shareholders would have access to the very considerable number and variety of services available through Fidelity and its affiliates.Based on its evaluation of all of the conclusions noted above, and after considering all factors it believed relevant, the Board concluded that the advisory fee arrangements are fair and reasonable, and that the fund's Advisory Contracts should be approved.
![]()
WLF-SANN-1219
1.9893106.100
Item 2.
Code of Ethics
Not applicable.
Item 3.
Audit Committee Financial Expert
Not applicable.
Item 4.
Principal Accountant Fees and Services
Not applicable.
Item 5.
Audit Committee of Listed Registrants
Not applicable.
Item 6.
Investments
(a)
Not applicable.
(b)
Not applicable
Item 7.
Disclosure of Proxy Voting Policies and Procedures for Closed-End Management Investment Companies
Not applicable.
Item 8.
Portfolio Managers of Closed-End Management Investment Companies
Not applicable.
Item 9.
Purchase of Equity Securities by Closed-End Management Investment Company and Affiliated Purchasers
Not applicable.
Item 10.
Submission of Matters to a Vote of Security Holders
There were no material changes to the procedures by which shareholders may recommend nominees to the Fidelity Summer Street Trust’s Board of Trustees.
Item 11.
Controls and Procedures
(a)(i) The President and Treasurer and the Chief Financial Officer have concluded that the Fidelity Summer Street Trust’s (the “Trust”) disclosure controls and procedures (as
defined in Rule 30a-3(c) under the Investment Company Act) provide reasonable assurances that material information relating to the Trust is made known to them by the appropriate persons, based on their evaluation of these controls and procedures as of a date within 90 days of the filing date of this report.
(a)(ii) There was no change in the Trust’s internal control over financial reporting (as defined in Rule 30a-3(d) under the Investment Company Act) that occurred during the period covered by this report that has materially affected, or is reasonably likely to materially affect, the Trust’s internal control over financial reporting.
Item 12.
Disclosure of Securities Lending Activities for Closed-End Management
Investment Companies
Not applicable.
Item 13.
Exhibits
(a) | (1) | Not applicable. |
(a) | (2) | Certification pursuant to Rule 30a-2(a) under the Investment Company Act of 1940 (17 CFR 270.30a-2(a)) is filed and attached hereto as Exhibit 99.CERT. |
(a) | (3) | Not applicable. |
(b) | Certification pursuant to Rule 30a-2(b) under the Investment Company Act of 1940 (17 CFR 270.30a-2(b)) is furnished and attached hereto as Exhibit 99.906CERT. |
SIGNATURES
Pursuant to the requirements of the Securities Exchange Act of 1934 and the Investment Company Act of 1940, the registrant has duly caused this report to be signed on its behalf by the undersigned, thereunto duly authorized.
Fidelity Summer Street Trust
By: | /s/Stacie M. Smith |
Stacie M. Smith | |
President and Treasurer | |
Date: | December 23, 2019 |
Pursuant to the requirements of the Securities Exchange Act of 1934 and the Investment Company Act of 1940, this report has been signed below by the following persons on behalf of the registrant and in the capacities and on the dates indicated.
By: | /s/Stacie M. Smith |
Stacie M. Smith | |
President and Treasurer | |
Date: | December 23, 2019 |
By: | /s/John J. Burke III |
John J. Burke III | |
Chief Financial Officer | |
Date: | December 23, 2019 |