UNITED STATES
SECURITIES AND EXCHANGE COMMISSION
Washington, D.C. 20549
FORM N-CSR
CERTIFIED SHAREHOLDER REPORT OF REGISTERED
MANAGEMENT INVESTMENT COMPANIES
Investment Company Act file number 811-2737
Fidelity Summer Street Trust
(Exact name of registrant as specified in charter)
245 Summer St., Boston, MA 02210
(Address of principal executive offices) (Zip code)
William C. Coffey, Secretary
245 Summer St.
Boston, Massachusetts 02210
(Name and address of agent for service)
Registrant's telephone number, including area code:
617-563-7000
| Date of fiscal year end: | April 30 |
| | |
| Date of reporting period: | October 31, 2018 |
Item 1.
Reports to Stockholders
|
Fidelity® Capital & Income Fund Semi-Annual Report October 31, 2018 |
 |
Contents
To view a fund's proxy voting guidelines and proxy voting record for the 12-month period ended June 30, visit http://www.fidelity.com/proxyvotingresults or visit the Securities and Exchange Commission's (SEC) web site at http://www.sec.gov.
You may also call 1-800-544-8544 to request a free copy of the proxy voting guidelines.
Standard & Poor's, S&P and S&P 500 are registered service marks of The McGraw-Hill Companies, Inc. and have been licensed for use by Fidelity Distributors Corporation.
Other third-party marks appearing herein are the property of their respective owners.
All other marks appearing herein are registered or unregistered trademarks or service marks of FMR LLC or an affiliated company. © 2018 FMR LLC. All rights reserved.
This report and the financial statements contained herein are submitted for the general information of the shareholders of the Fund. This report is not authorized for distribution to prospective investors in the Fund unless preceded or accompanied by an effective prospectus.
A fund files its complete schedule of portfolio holdings with the SEC for the first and third quarters of each fiscal year on Form N-Q. Forms N-Q are available on the SEC’s web site at http://www.sec.gov. A fund's Forms N-Q may be reviewed and copied at the SEC’s Public Reference Room in Washington, DC. Information regarding the operation of the SEC's Public Reference Room may be obtained by calling 1-800-SEC-0330.
For a complete list of a fund's portfolio holdings, view the most recent holdings listing, semiannual report, or annual report on Fidelity's web site at http://www.fidelity.com, http://www.institutional.fidelity.com, or http://www.401k.com, as applicable.
NOT FDIC INSURED •MAY LOSE VALUE •NO BANK GUARANTEE
Neither the Fund nor Fidelity Distributors Corporation is a bank.
Investment Summary (Unaudited)
Top Five Holdings as of October 31, 2018
| (by issuer, excluding cash equivalents) | % of fund's net assets |
| Ally Financial, Inc. | 3.5 |
| Bank of America Corp. | 2.3 |
| CCO Holdings LLC/CCO Holdings Capital Corp. | 2.1 |
| Valeant Pharmaceuticals International, Inc. | 1.9 |
| SFR Group SA | 1.7 |
| 11.5 |
Top Five Market Sectors as of October 31, 2018
| % of fund's net assets | |
| Energy | 15.0 |
| Banks & Thrifts | 11.8 |
| Technology | 9.9 |
| Telecommunications | 8.0 |
| Healthcare | 7.3 |
Quality Diversification (% of fund's net assets)
| As of October 31, 2018 | ||
| AAA,AA,A | 0.1% | |
| BBB | 3.3% | |
| BB | 29.2% | |
| B | 26.3% | |
| CCC,CC,C | 9.1% | |
| Not Rated | 0.9% | |
| Equities | 20.8% | |
| Short-Term Investments and Net Other Assets | 10.3% | |
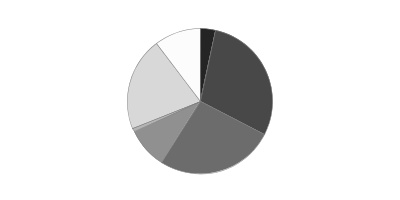
We have used ratings from Moody's Investors Service, Inc. Where Moody's® ratings are not available, we have used S&P® ratings. All ratings are as of the date indicated and do not reflect subsequent changes.
Asset Allocation (% of fund's net assets)
| As of October 31, 2018* | ||
| Nonconvertible Bonds | 56.8% | |
| Common Stocks | 20.8% | |
| Bank Loan Obligations | 3.3% | |
| Other Investments | 8.8% | |
| Short-Term Investments and Net Other Assets (Liabilities) | 10.3% | |

* Foreign investments - 17.9%
Schedule of Investments October 31, 2018 (Unaudited)
Showing Percentage of Net Assets
| Corporate Bonds - 56.8% | |||
| Principal Amount (000s) | Value (000s) | ||
| Convertible Bonds - 0.0% | |||
| Automotive & Auto Parts - 0.0% | |||
| Exide Technologies 7% 4/30/25 pay-in-kind (a) | $2,784 | $1,795 | |
| Nonconvertible Bonds - 56.8% | |||
| Aerospace - 1.1% | |||
| BBA U.S. Holdings, Inc. 5.375% 5/1/26 (b) | 4,405 | 4,355 | |
| BWX Technologies, Inc. 5.375% 7/15/26 (b) | 8,510 | 8,531 | |
| DAE Funding LLC 4% 8/1/20 (b) | 5,145 | 5,094 | |
| TransDigm UK Holdings PLC 6.875% 5/15/26 (b) | 35,725 | 35,636 | |
| TransDigm, Inc.: | |||
| 6.375% 6/15/26 | 55,980 | 54,860 | |
| 6.5% 5/15/25 (Reg. S) | 16,505 | 16,443 | |
| 124,919 | |||
| Air Transportation - 0.3% | |||
| Air Canada 2013-1 Pass Through Trust 5.375% 11/15/22 (b) | 2,254 | 2,296 | |
| Allegiant Travel Co. 5.5% 7/15/19 | 3,350 | 3,367 | |
| Continental Airlines, Inc. pass-thru trust certificates 6.903% 4/19/22 | 639 | 658 | |
| Delta Air Lines, Inc. pass-thru trust certificates 8.021% 2/10/24 | 5,807 | 6,369 | |
| Hawaiian Airlines pass-thru certificates Series 2013-1 Class B, 4.95% 7/15/23 | 3,757 | 3,766 | |
| U.S. Airways pass-thru certificates: | |||
| Series 2011-1 Class A, 7.125% 10/22/23 | 7,769 | 8,507 | |
| Series 2012-2 Class B, 6.75% 6/3/21 | 2,699 | 2,828 | |
| Series 2013-1 Class B, 5.375% 11/15/21 | 3,654 | 3,727 | |
| XPO Logistics, Inc. 6.125% 9/1/23 (b) | 8,900 | 9,115 | |
| 40,633 | |||
| Automotive & Auto Parts - 0.4% | |||
| Allison Transmission, Inc. 5% 10/1/24 (b) | 11,405 | 11,070 | |
| Delphi Technologies PLC 5% 10/1/25 (b) | 13,220 | 11,931 | |
| Exide Technologies 11% 4/30/22 pay-in-kind (a)(b) | 2,725 | 2,412 | |
| LKQ Corp. 4.75% 5/15/23 | 2,190 | 2,113 | |
| Penske Automotive Group, Inc. 5.5% 5/15/26 | 8,565 | 8,137 | |
| Tenneco, Inc. 5% 7/15/26 | 8,345 | 6,926 | |
| 42,589 | |||
| Banks & Thrifts - 3.5% | |||
| Ally Financial, Inc.: | |||
| 4.125% 2/13/22 | 20,550 | 20,242 | |
| 4.625% 3/30/25 | 37,190 | 36,400 | |
| 5.125% 9/30/24 | 85,095 | 86,478 | |
| 8% 11/1/31 | 20,638 | 24,766 | |
| 8% 11/1/31 | 206,609 | 248,441 | |
| 416,327 | |||
| Broadcasting - 0.5% | |||
| iHeartCommunications, Inc. 11.25% 3/1/21 (b)(c) | 11,660 | 8,045 | |
| Sirius XM Radio, Inc.: | |||
| 4.625% 5/15/23 (b) | 4,925 | 4,790 | |
| 5% 8/1/27 (b) | 14,525 | 13,649 | |
| 5.375% 4/15/25 (b) | 12,000 | 11,888 | |
| 5.375% 7/15/26 (b) | 11,315 | 11,066 | |
| Tegna, Inc. 5.5% 9/15/24 (b) | 8,440 | 8,429 | |
| 57,867 | |||
| Building Materials - 0.1% | |||
| Summit Materials LLC/Summit Materials Finance Corp. 5.125% 6/1/25 (b) | 5,095 | 4,560 | |
| U.S. Concrete, Inc. 6.375% 6/1/24 | 5,535 | 5,161 | |
| USG Corp. 4.875% 6/1/27 (b) | 3,170 | 3,177 | |
| 12,898 | |||
| Cable/Satellite TV - 3.6% | |||
| Altice SA 7.625% 2/15/25 (b) | 41,103 | 35,040 | |
| Altice U.S. Finance SA 5.5% 5/15/26 (b) | 50,968 | 49,646 | |
| CCO Holdings LLC/CCO Holdings Capital Corp.: | |||
| 5% 2/1/28 (b) | 54,360 | 50,759 | |
| 5.125% 2/15/23 | 30,665 | 30,512 | |
| 5.125% 5/1/23 (b) | 14,050 | 13,980 | |
| 5.125% 5/1/27 (b) | 69,885 | 65,779 | |
| 5.375% 5/1/25 (b) | 14,050 | 13,751 | |
| 5.5% 5/1/26 (b) | 17,605 | 17,143 | |
| 5.75% 9/1/23 | 9,495 | 9,566 | |
| 5.75% 1/15/24 | 11,275 | 11,388 | |
| 5.75% 2/15/26 (b) | 20,340 | 20,137 | |
| 5.875% 5/1/27 (b) | 17,965 | 17,651 | |
| Cequel Communications Holdings I LLC/Cequel Capital Corp. 7.5% 4/1/28 (b) | 14,375 | 14,899 | |
| CSC Holdings LLC 5.375% 2/1/28 (b) | 23,655 | 22,295 | |
| Videotron Ltd. 5.125% 4/15/27 (b) | 12,060 | 11,427 | |
| Virgin Media Finance PLC 4.875% 2/15/22 | 10,880 | 10,363 | |
| Ziggo Bond Finance BV: | |||
| 5.875% 1/15/25 (b) | 1,175 | 1,075 | |
| 6% 1/15/27 (b) | 11,435 | 10,177 | |
| Ziggo Secured Finance BV 5.5% 1/15/27 (b) | 22,875 | 20,988 | |
| 426,576 | |||
| Capital Goods - 0.1% | |||
| AECOM 5.125% 3/15/27 | 11,885 | 11,053 | |
| Stevens Holding Co., Inc. 6.125% 10/1/26 (b) | 3,245 | 3,233 | |
| 14,286 | |||
| Chemicals - 1.5% | |||
| CF Industries Holdings, Inc.: | |||
| 4.95% 6/1/43 | 12,120 | 10,332 | |
| 5.15% 3/15/34 | 12,120 | 11,120 | |
| 5.375% 3/15/44 | 12,110 | 10,657 | |
| Hexion, Inc. 10.375% 2/1/22 (b) | 4,420 | 3,972 | |
| LSB Industries, Inc. 9.625% 5/1/23 (b) | 6,090 | 6,318 | |
| NOVA Chemicals Corp.: | |||
| 4.875% 6/1/24 (b) | 15,135 | 13,905 | |
| 5.25% 6/1/27 (b) | 12,980 | 11,714 | |
| OCI NV 6.625% 4/15/23 (b) | 5,370 | 5,504 | |
| Platform Specialty Products Corp.: | |||
| 5.875% 12/1/25 (b) | 18,605 | 17,628 | |
| 6.5% 2/1/22 (b) | 10,570 | 10,702 | |
| Starfruit Finco BV / Starfruit U.S. Holdco LLC 8% 10/1/26 (b) | 24,565 | 23,828 | |
| The Chemours Co. LLC 5.375% 5/15/27 | 18,470 | 17,177 | |
| TPC Group, Inc. 8.75% 12/15/20 (b) | 14,165 | 13,882 | |
| Tronox Finance PLC 5.75% 10/1/25 (b) | 5,510 | 4,835 | |
| Valvoline, Inc. 5.5% 7/15/24 | 4,170 | 4,144 | |
| Versum Materials, Inc. 5.5% 9/30/24 (b) | 5,910 | 5,851 | |
| 171,569 | |||
| Consumer Products - 0.1% | |||
| First Quality Finance Co., Inc. 5% 7/1/25 (b) | 9,675 | 8,901 | |
| Containers - 0.4% | |||
| Crown Cork & Seal, Inc.: | |||
| 7.375% 12/15/26 | 4,845 | 5,184 | |
| 7.5% 12/15/96 | 12,871 | 12,903 | |
| Plastipak Holdings, Inc. 6.25% 10/15/25 (b) | 3,540 | 3,239 | |
| Reynolds Group Issuer, Inc./Reynolds Group Issuer LLC/Reynolds Group Issuer (Luxembourg) SA: | |||
| 5.125% 7/15/23 (b) | 22,890 | 22,404 | |
| 7% 7/15/24 (b) | 6,635 | 6,652 | |
| 50,382 | |||
| Diversified Financial Services - 4.0% | |||
| AssuredPartners, Inc. 7% 8/15/25 (b) | 4,865 | 4,786 | |
| CIT Group, Inc. 5% 8/15/22 | 6,971 | 7,023 | |
| FLY Leasing Ltd. 5.25% 10/15/24 | 9,470 | 8,997 | |
| Grinding Media, Inc./MC Grinding Media Canada, Inc. 7.375% 12/15/23 (b) | 7,120 | 7,316 | |
| Icahn Enterprises LP/Icahn Enterprises Finance Corp.: | |||
| 5.875% 2/1/22 | 70,330 | 70,337 | |
| 6% 8/1/20 | 20,090 | 20,266 | |
| 6.25% 2/1/22 | 20,550 | 20,746 | |
| 6.375% 12/15/25 | 54,810 | 54,467 | |
| 6.75% 2/1/24 | 10,075 | 10,151 | |
| James Hardie International Finance Ltd.: | |||
| 4.75% 1/15/25 (b) | 8,815 | 8,187 | |
| 5% 1/15/28 (b) | 8,900 | 8,077 | |
| MSCI, Inc.: | |||
| 5.25% 11/15/24 (b) | 6,725 | 6,775 | |
| 5.75% 8/15/25 (b) | 7,185 | 7,383 | |
| Navient Corp.: | |||
| 5.875% 10/25/24 | 28,294 | 26,667 | |
| 6.5% 6/15/22 | 27,055 | 27,533 | |
| 7.25% 9/25/23 | 5,688 | 5,887 | |
| SLM Corp.: | |||
| 5.5% 1/25/23 | 44,765 | 43,958 | |
| 6.125% 3/25/24 | 15,595 | 15,166 | |
| 7.25% 1/25/22 | 27,370 | 28,465 | |
| Springleaf Financial Corp.: | |||
| 6.875% 3/15/25 | 51,610 | 49,417 | |
| 7.125% 3/15/26 | 38,380 | 35,997 | |
| Venator Finance SARL/Venator Capital Management Ltd. 5.75% 7/15/25 (b) | 10,265 | 8,751 | |
| 476,352 | |||
| Diversified Media - 0.5% | |||
| Block Communications, Inc. 6.875% 2/15/25 (b) | 9,080 | 9,205 | |
| Liberty Media Corp.: | |||
| 8.25% 2/1/30 | 12,298 | 12,851 | |
| 8.5% 7/15/29 | 7,900 | 8,335 | |
| Nielsen Finance LLC/Nielsen Finance Co. 5% 4/15/22 (b) | 6,170 | 6,008 | |
| Quebecor Media, Inc. 5.75% 1/15/23 | 15,820 | 15,860 | |
| WMG Acquisition Corp. 5.625% 4/15/22 (b) | 2,152 | 2,176 | |
| 54,435 | |||
| Energy - 11.4% | |||
| American Energy-Permian Basin LLC/AEPB Finance Corp. 13% 11/30/20 (b) | 18,325 | 19,745 | |
| Antero Midstream Partners LP/Antero Midstream Finance Corp. 5.375% 9/15/24 | 4,420 | 4,310 | |
| Antero Resources Corp.: | |||
| 5.125% 12/1/22 | 840 | 834 | |
| 5.625% 6/1/23 (Reg. S) | 10,850 | 10,850 | |
| Antero Resources Finance Corp. 5.375% 11/1/21 | 5,830 | 5,830 | |
| Callon Petroleum Co. 6.125% 10/1/24 | 4,090 | 3,988 | |
| Carrizo Oil & Gas, Inc. 6.25% 4/15/23 | 7,400 | 7,271 | |
| Cheniere Corpus Christi Holdings LLC: | |||
| 5.125% 6/30/27 | 12,490 | 12,240 | |
| 5.875% 3/31/25 | 14,620 | 15,022 | |
| 7% 6/30/24 | 13,100 | 14,164 | |
| Cheniere Energy Partners LP 5.625% 10/1/26 (b) | 12,250 | 12,066 | |
| Chesapeake Energy Corp.: | |||
| 8% 12/15/22 (b) | 16,717 | 17,427 | |
| 8% 1/15/25 | 6,650 | 6,746 | |
| Citgo Holding, Inc. 10.75% 2/15/20 (b) | 50,085 | 52,088 | |
| CNX Midstream Partners LP 6.5% 3/15/26 (b) | 6,675 | 6,508 | |
| Compressco Partners LP/Compressco Finance, Inc. 7.5% 4/1/25 (b) | 12,190 | 12,220 | |
| Comstock Escrow Corp. 9.75% 8/15/26 (b) | 21,500 | 20,748 | |
| Consolidated Energy Finance SA: | |||
| 3 month U.S. LIBOR + 3.750% 6.0841% 6/15/22 (a)(b)(d) | 3,025 | 3,026 | |
| 6.5% 5/15/26 (b) | 12,170 | 12,109 | |
| 6.875% 6/15/25 (b) | 6,050 | 6,163 | |
| Crestwood Midstream Partners LP/Crestwood Midstream Finance Corp.: | |||
| 5.75% 4/1/25 | 8,985 | 8,963 | |
| 6.25% 4/1/23 | 9,260 | 9,445 | |
| CVR Refining LLC/Coffeyville Finance, Inc. 6.5% 11/1/22 | 20,970 | 21,101 | |
| DCP Midstream LLC 5.85% 5/21/43 (a)(b) | 18,335 | 16,410 | |
| Denbury Resources, Inc.: | |||
| 4.625% 7/15/23 | 13,470 | 11,146 | |
| 5.5% 5/1/22 | 37,342 | 32,301 | |
| 6.375% 8/15/21 | 20,180 | 18,767 | |
| 7.5% 2/15/24 (b) | 20,070 | 19,618 | |
| 9% 5/15/21 (b) | 44,455 | 46,400 | |
| Diamondback Energy, Inc.: | |||
| 4.75% 11/1/24 | 9,930 | 9,657 | |
| 5.375% 5/31/25 | 5,155 | 5,129 | |
| Endeavor Energy Resources LP/EER Finance, Inc.: | |||
| 5.5% 1/30/26 (b) | 5,205 | 5,348 | |
| 5.75% 1/30/28 (b) | 5,235 | 5,405 | |
| Energy Transfer Equity LP 5.5% 6/1/27 | 16,735 | 17,012 | |
| Ensco PLC: | |||
| 4.5% 10/1/24 | 12,210 | 9,921 | |
| 5.2% 3/15/25 | 4,985 | 4,088 | |
| 5.75% 10/1/44 | 10,983 | 7,688 | |
| 7.75% 2/1/26 | 7,360 | 6,863 | |
| EP Energy LLC/Everest Acquisition Finance, Inc.: | |||
| 7.75% 5/15/26 (b) | 52,435 | 52,157 | |
| 8% 11/29/24 (b) | 6,315 | 6,094 | |
| Exterran Energy Solutions LP 8.125% 5/1/25 | 11,280 | 11,365 | |
| Exterran Partners LP/EXLP Finance Corp. 6% 10/1/22 | 8,075 | 7,994 | |
| Extraction Oil & Gas, Inc. 7.375% 5/15/24 (b) | 7,165 | 6,717 | |
| Forum Energy Technologies, Inc. 6.25% 10/1/21 | 13,870 | 13,593 | |
| Genesis Energy LP/Genesis Energy Finance Corp. 6.25% 5/15/26 | 9,130 | 8,240 | |
| Hess Infrastructure Partners LP 5.625% 2/15/26 (b) | 15,535 | 15,574 | |
| Hilcorp Energy I LP/Hilcorp Finance Co.: | |||
| 5% 12/1/24 (b) | 9,920 | 9,350 | |
| 5.75% 10/1/25 (b) | 11,285 | 10,975 | |
| 6.25% 11/1/28 (b) | 12,280 | 11,820 | |
| Holly Energy Partners LP/Holly Finance Corp. 6% 8/1/24 (b) | 7,145 | 7,163 | |
| Indigo Natural Resources LLC 6.875% 2/15/26 (b) | 14,085 | 13,310 | |
| Jonah Energy LLC 7.25% 10/15/25 (b) | 14,145 | 11,245 | |
| Magnolia Oil & Gas Operating LLC 6% 8/1/26 (b) | 6,075 | 5,999 | |
| Murphy Oil U.S.A., Inc. 5.625% 5/1/27 | 6,030 | 5,879 | |
| Newfield Exploration Co.: | |||
| 5.375% 1/1/26 | 9,245 | 9,332 | |
| 5.625% 7/1/24 | 1,550 | 1,597 | |
| NextEra Energy Partners LP: | |||
| 4.25% 9/15/24 (b) | 8,025 | 7,624 | |
| 4.5% 9/15/27 (b) | 5,580 | 5,148 | |
| NGL Energy Partners LP/NGL Energy Finance Corp. 6.125% 3/1/25 | 11,920 | 10,847 | |
| NGPL PipeCo LLC: | |||
| 4.375% 8/15/22 (b) | 2,995 | 2,958 | |
| 4.875% 8/15/27 (b) | 3,000 | 2,888 | |
| Nine Energy Service, Inc. 8.75% 11/1/23 (b) | 6,245 | 6,339 | |
| Noble Holding International Ltd.: | |||
| 6.2% 8/1/40 | 4,305 | 3,132 | |
| 7.875% 2/1/26 (b) | 23,750 | 23,572 | |
| 7.95% 4/1/25 (a) | 9,635 | 8,768 | |
| 8.95% 4/1/45 (a) | 2,130 | 1,997 | |
| Parsley Energy LLC/Parsley: | |||
| 5.25% 8/15/25 (b) | 7,215 | 6,971 | |
| 5.625% 10/15/27 (b) | 5,885 | 5,801 | |
| 6.25% 6/1/24 (b) | 8,115 | 8,338 | |
| PBF Holding Co. LLC/PBF Finance Corp.: | |||
| 7% 11/15/23 | 32,600 | 33,660 | |
| 7.25% 6/15/25 | 22,875 | 23,561 | |
| PBF Logistics LP/PBF Logistics Finance, Inc. 6.875% 5/15/23 | 8,455 | 8,603 | |
| PDC Energy, Inc. 6.125% 9/15/24 | 3,555 | 3,391 | |
| QEP Resources, Inc. 5.25% 5/1/23 | 12,370 | 11,844 | |
| Range Resources Corp. 5% 3/15/23 | 18,145 | 17,555 | |
| Sabine Pass Liquefaction LLC 5% 3/15/27 | 8,570 | 8,611 | |
| Sanchez Energy Corp.: | |||
| 6.125% 1/15/23 | 22,110 | 8,236 | |
| 7.25% 2/15/23 (b) | 14,725 | 13,437 | |
| SemGroup Corp.: | |||
| 6.375% 3/15/25 | 5,990 | 5,795 | |
| 7.25% 3/15/26 | 11,220 | 10,954 | |
| SESI LLC 7.75% 9/15/24 | 7,245 | 7,118 | |
| SM Energy Co.: | |||
| 5.625% 6/1/25 | 5,480 | 5,275 | |
| 6.625% 1/15/27 | 9,590 | 9,638 | |
| 6.75% 9/15/26 | 4,550 | 4,561 | |
| Southern Natural Gas Co.: | |||
| 7.35% 2/15/31 | 23,497 | 27,878 | |
| 8% 3/1/32 | 12,475 | 15,643 | |
| Southern Star Central Corp. 5.125% 7/15/22 (b) | 6,750 | 6,640 | |
| Southwestern Energy Co.: | |||
| 4.1% 3/15/22 | 15,400 | 15,169 | |
| 7.5% 4/1/26 | 9,070 | 9,229 | |
| 7.75% 10/1/27 | 8,135 | 8,298 | |
| SRC Energy, Inc. 6.25% 12/1/25 | 7,435 | 6,924 | |
| Summit Midstream Holdings LLC 5.75% 4/15/25 | 8,365 | 8,009 | |
| Sunoco LP/Sunoco Finance Corp.: | |||
| 4.875% 1/15/23 (b) | 9,145 | 8,813 | |
| 5.5% 2/15/26 (b) | 11,640 | 11,087 | |
| Targa Resources Partners LP/Targa Resources Partners Finance Corp.: | |||
| 5% 1/15/28 | 12,180 | 11,541 | |
| 5.125% 2/1/25 | 5,750 | 5,592 | |
| 5.375% 2/1/27 | 5,750 | 5,592 | |
| 5.875% 4/15/26 (b) | 18,255 | 18,358 | |
| Teine Energy Ltd. 6.875% 9/30/22 (b) | 11,950 | 11,890 | |
| Tennessee Gas Pipeline Co. 7.625% 4/1/37 | 5,445 | 6,600 | |
| TerraForm Power Operating LLC: | |||
| 4.25% 1/31/23 (b) | 6,270 | 5,941 | |
| 5% 1/31/28 (b) | 6,295 | 5,626 | |
| 6.625% 6/15/25 (a)(b) | 7,915 | 8,251 | |
| Tesoro Logistics LP/Tesoro Logistics Finance Corp. 6.375% 5/1/24 | 4,570 | 4,830 | |
| Transocean Guardian Ltd. 5.875% 1/15/24 (b) | 17,430 | 17,256 | |
| Transocean Pontus Ltd. 6.125% 8/1/25 (b) | 10,900 | 10,832 | |
| Transocean, Inc.: | |||
| 7.5% 1/15/26 (b) | 12,910 | 12,684 | |
| 9% 7/15/23 (b) | 26,532 | 27,825 | |
| Trinidad Drilling Ltd. 6.625% 2/15/25 (b) | 4,720 | 4,720 | |
| Ultra Resources, Inc.: | |||
| 6.875% 4/15/22 (b) | 9,060 | 5,210 | |
| 7.125% 4/15/25 (b) | 6,040 | 2,658 | |
| Unit Corp. 6.625% 5/15/21 | 2,202 | 2,185 | |
| W&T Offshore, Inc. 9.75% 11/1/23 (b) | 41,795 | 40,445 | |
| Weatherford International, Inc. 9.875% 3/1/25 (b) | 4,870 | 3,774 | |
| Whiting Petroleum Corp. 6.625% 1/15/26 | 8,380 | 8,401 | |
| WPX Energy, Inc.: | |||
| 5.25% 9/15/24 | 8,725 | 8,616 | |
| 5.75% 6/1/26 | 9,125 | 8,997 | |
| 6% 1/15/22 | 15,850 | 16,207 | |
| 1,345,364 | |||
| Entertainment/Film - 0.2% | |||
| Lions Gate Entertainment Corp. 5.875% 11/1/24 (b) | 3,865 | 3,884 | |
| New Cotai LLC/New Cotai Capital Corp. 10.625% 5/1/19 pay-in-kind (a)(b) | 25,782 | 14,696 | |
| 18,580 | |||
| Environmental - 0.4% | |||
| ADS Waste Holdings, Inc. 5.625% 11/15/24 (b) | 10,140 | 9,887 | |
| CD&R Waterworks Merger Sub LLC 6.125% 8/15/25 (b) | 4,700 | 4,406 | |
| Covanta Holding Corp.: | |||
| 5.875% 3/1/24 | 7,775 | 7,756 | |
| 5.875% 7/1/25 | 3,205 | 3,109 | |
| 6% 1/1/27 | 12,335 | 11,903 | |
| Kissner Holdings LP/Kissner Milling Co. Ltd./BSC Holding, Inc./Kissner U.S.A. 8.375% 12/1/22 (b) | 9,525 | 9,668 | |
| Tervita Escrow Corp. 7.625% 12/1/21 (b) | 5,500 | 5,583 | |
| 52,312 | |||
| Food/Beverage/Tobacco - 1.7% | |||
| B&G Foods, Inc. 4.625% 6/1/21 | 10,575 | 10,509 | |
| ESAL GmbH 6.25% 2/5/23 (b) | 28,980 | 28,437 | |
| JBS Investments GmbH 7.25% 4/3/24 (b) | 37,820 | 38,151 | |
| JBS Investments II GmbH 7% 1/15/26 (b) | 11,630 | 11,485 | |
| JBS U.S.A. LLC/JBS U.S.A. Finance, Inc.: | |||
| 5.75% 6/15/25 (b) | 20,055 | 19,403 | |
| 5.875% 7/15/24 (b) | 6,030 | 5,918 | |
| 6.75% 2/15/28 (b) | 18,350 | 17,891 | |
| Lamb Weston Holdings, Inc.: | |||
| 4.625% 11/1/24 (b) | 7,660 | 7,503 | |
| 4.875% 11/1/26 (b) | 7,740 | 7,469 | |
| Pilgrim's Pride Corp. 5.75% 3/15/25 (b) | 17,930 | 16,720 | |
| Post Holdings, Inc.: | |||
| 5% 8/15/26 (b) | 17,030 | 15,710 | |
| 5.5% 3/1/25 (b) | 10,085 | 9,751 | |
| 5.75% 3/1/27 (b) | 7,710 | 7,363 | |
| 196,310 | |||
| Gaming - 2.4% | |||
| Boyd Gaming Corp.: | |||
| 6% 8/15/26 | 6,435 | 6,218 | |
| 6.375% 4/1/26 | 4,150 | 4,114 | |
| Churchill Downs, Inc. 4.75% 1/15/28 (b) | 9,130 | 8,308 | |
| CRC Escrow Issuer LLC/CRC Finance LLC 5.25% 10/15/25 (b) | 8,185 | 7,617 | |
| Delta Merger Sub, Inc. 6% 9/15/26 (b) | 8,170 | 8,017 | |
| Eldorado Resorts, Inc. 6% 4/1/25 | 22,445 | 22,164 | |
| GLP Capital LP/GLP Financing II, Inc.: | |||
| 5.25% 6/1/25 | 12,085 | 12,146 | |
| 5.75% 6/1/28 | 9,515 | 9,646 | |
| International Game Technology PLC 6.25% 1/15/27 (b) | 17,215 | 17,000 | |
| Jacobs Entertainment, Inc. 7.875% 2/1/24 (b) | 2,820 | 2,972 | |
| LHMC Finco SARL 7.875% 12/20/23 (b) | 12,210 | 12,289 | |
| MCE Finance Ltd. 4.875% 6/6/25 (b) | 30,275 | 27,759 | |
| MGM Growth Properties Operating Partnership LP 5.625% 5/1/24 | 6,770 | 6,778 | |
| MGM Mirage, Inc.: | |||
| 4.625% 9/1/26 | 9,495 | 8,569 | |
| 5.75% 6/15/25 | 20,003 | 19,283 | |
| Penn National Gaming, Inc. 5.625% 1/15/27 (b) | 2,295 | 2,134 | |
| Scientific Games Corp. 5% 10/15/25 (b) | 19,350 | 17,996 | |
| Stars Group Holdings BV 7% 7/15/26 (b) | 16,055 | 16,296 | |
| Station Casinos LLC 5% 10/1/25 (b) | 12,105 | 11,243 | |
| Transocean, Inc. 7.25% 11/1/25 (b) | 12,270 | 11,933 | |
| Wynn Las Vegas LLC/Wynn Las Vegas Capital Corp. 5.25% 5/15/27 (b) | 10,590 | 9,584 | |
| Wynn Macau Ltd.: | |||
| 4.875% 10/1/24 (b) | 15,815 | 14,352 | |
| 5.5% 10/1/27 (b) | 25,605 | 23,109 | |
| 279,527 | |||
| Healthcare - 6.2% | |||
| Catalent Pharma Solutions 4.875% 1/15/26 (b) | 4,000 | 3,750 | |
| Centene Escrow Corp. 5.375% 6/1/26 (b) | 30,420 | 30,876 | |
| Community Health Systems, Inc.: | |||
| 6.875% 2/1/22 | 42,314 | 21,390 | |
| 8.125% 6/30/24 (b) | 46,381 | 36,641 | |
| 8.625% 1/15/24 (b) | 48,790 | 49,339 | |
| 11% 6/30/23 (b)(e) | 21,073 | 17,543 | |
| Enterprise Merger Sub, Inc. 8.75% 10/15/26 (b) | 36,845 | 35,740 | |
| HCA Holdings, Inc.: | |||
| 4.75% 5/1/23 | 12,395 | 12,519 | |
| 5.25% 6/15/26 | 14,055 | 14,301 | |
| 5.375% 2/1/25 | 19,715 | 19,838 | |
| 5.375% 9/1/26 | 13,085 | 12,844 | |
| 5.625% 9/1/28 | 15,990 | 15,688 | |
| 5.875% 5/1/23 | 30,135 | 31,190 | |
| 5.875% 2/15/26 | 26,050 | 26,636 | |
| HealthSouth Corp.: | |||
| 5.125% 3/15/23 | 6,440 | 6,440 | |
| 5.75% 11/1/24 | 22,135 | 22,080 | |
| Hill-Rom Holdings, Inc. 5.75% 9/1/23 (b) | 5,715 | 5,779 | |
| Hologic, Inc.: | |||
| 4.375% 10/15/25 (b) | 6,295 | 5,902 | |
| 4.625% 2/1/28 (b) | 4,255 | 3,888 | |
| Inventiv Group Holdings, Inc. / Investment 7.5% 10/1/24 (b) | 4,033 | 4,245 | |
| MPH Acquisition Holdings LLC 7.125% 6/1/24 (b) | 6,095 | 6,191 | |
| MPT Operating Partnership LP/MPT Finance Corp.: | |||
| 5% 10/15/27 | 25,968 | 24,402 | |
| 5.25% 8/1/26 | 7,453 | 7,192 | |
| 6.375% 3/1/24 | 3,970 | 4,109 | |
| Polaris Intermediate Corp. 8.5% 12/1/22 pay-in-kind (a)(b) | 20,880 | 21,402 | |
| Quintiles Transnational Corp. 4.875% 5/15/23 (b) | 8,705 | 8,607 | |
| Sabra Health Care LP/Sabra Capital Corp. 5.375% 6/1/23 | 4,945 | 4,920 | |
| Teleflex, Inc. 4.625% 11/15/27 | 4,975 | 4,615 | |
| Tenet Healthcare Corp.: | |||
| 4.625% 7/15/24 | 6,055 | 5,836 | |
| 5.125% 5/1/25 | 6,055 | 5,828 | |
| 7.5% 1/1/22 (b) | 6,590 | 6,870 | |
| Valeant Pharmaceuticals International, Inc.: | |||
| 5.5% 11/1/25 (b) | 90,612 | 88,800 | |
| 5.875% 5/15/23 (b) | 42,000 | 40,163 | |
| 6.5% 3/15/22 (b) | 11,985 | 12,404 | |
| 7% 3/15/24 (b) | 17,980 | 18,828 | |
| 8.5% 1/31/27 (b) | 12,280 | 12,495 | |
| 9% 12/15/25 (b) | 47,285 | 49,295 | |
| Vizient, Inc. 10.375% 3/1/24 (b) | 12,515 | 13,641 | |
| Wellcare Health Plans, Inc.: | |||
| 5.25% 4/1/25 | 9,245 | 9,222 | |
| 5.375% 8/15/26 (b) | 7,920 | 7,900 | |
| 729,349 | |||
| Homebuilders/Real Estate - 1.2% | |||
| Howard Hughes Corp. 5.375% 3/15/25 (b) | 12,730 | 12,221 | |
| Lennar Corp. 4.75% 11/29/27 | 12,205 | 11,381 | |
| LGI Homes, Inc. 6.875% 7/15/26 (b) | 12,190 | 11,581 | |
| Mattamy Group Corp. 6.875% 12/15/23 (b) | 8,755 | 8,525 | |
| Odebrecht Finance Ltd.: | |||
| 4.375% 4/25/25 (b) | 12,020 | 1,935 | |
| 5.25% 6/27/29 (b) | 10,987 | 1,758 | |
| 7.125% 6/26/42 (b) | 5,370 | 859 | |
| Shea Homes Ltd. Partnership/Corp.: | |||
| 5.875% 4/1/23 (b) | 3,545 | 3,332 | |
| 6.125% 4/1/25 (b) | 3,545 | 3,297 | |
| Starwood Property Trust, Inc. 4.75% 3/15/25 | 11,625 | 11,073 | |
| Taylor Morrison Communities, Inc./Monarch Communities, Inc.: | |||
| 5.25% 4/15/21 (b) | 14,750 | 14,695 | |
| 5.625% 3/1/24 (b) | 1,312 | 1,273 | |
| 5.875% 4/15/23 (b) | 8,405 | 8,300 | |
| Toll Brothers Finance Corp.: | |||
| 4.375% 4/15/23 | 6,162 | 5,925 | |
| 5.625% 1/15/24 | 3,075 | 3,075 | |
| TRI Pointe Homes, Inc.: | |||
| 4.375% 6/15/19 | 6,675 | 6,675 | |
| 5.875% 6/15/24 | 16,130 | 15,082 | |
| West Street Merger Sub, Inc. 6.375% 9/1/25 (b) | 6,060 | 5,681 | |
| William Lyon Homes, Inc.: | |||
| 5.875% 1/31/25 | 7,125 | 6,279 | |
| 6% 9/1/23 | 7,430 | 6,780 | |
| 139,727 | |||
| Hotels - 0.6% | |||
| Choice Hotels International, Inc. 5.75% 7/1/22 | 3,035 | 3,187 | |
| FelCor Lodging LP 6% 6/1/25 | 10,935 | 11,318 | |
| Hilton Domestic Operating Co., Inc. 5.125% 5/1/26 (b) | 18,255 | 17,844 | |
| Hilton Worldwide Finance LLC/Hilton Worldwide Finance Corp.: | |||
| 4.625% 4/1/25 | 17,975 | 17,436 | |
| 4.875% 4/1/27 | 8,435 | 8,055 | |
| Marriott Ownership Resorts, Inc. 6.5% 9/15/26 (b) | 9,495 | 9,590 | |
| 67,430 | |||
| Insurance - 0.6% | |||
| Acrisure LLC / Acrisure Finance, Inc. 7% 11/15/25 (b) | 17,915 | 15,989 | |
| Alliant Holdings Co.-Issuer, Inc./Wayne Merger Sub LLC 8.25% 8/1/23 (b) | 28,500 | 29,458 | |
| AmWINS Group, Inc. 7.75% 7/1/26 (b) | 6,100 | 6,268 | |
| HUB International Ltd. 7% 5/1/26 (b) | 11,770 | 11,488 | |
| USIS Merger Sub, Inc. 6.875% 5/1/25 (b) | 12,080 | 11,778 | |
| 74,981 | |||
| Leisure - 0.9% | |||
| Cedar Fair LP/Canada's Wonderland Co. 5.375% 4/15/27 | 6,830 | 6,523 | |
| LTF Merger Sub, Inc. 8.5% 6/15/23 (b) | 7,365 | 7,623 | |
| Merlin Entertainments PLC 5.75% 6/15/26 (b) | 12,170 | 12,170 | |
| NVA Holdings, Inc. 6.875% 4/1/26 (b) | 6,560 | 6,478 | |
| Silversea Cruises 7.25% 2/1/25 (b) | 4,765 | 5,134 | |
| Six Flags Entertainment Corp.: | |||
| 4.875% 7/31/24 (b) | 14,040 | 13,268 | |
| 5.5% 4/15/27 (b) | 7,460 | 7,078 | |
| Studio City Co. Ltd.: | |||
| 5.875% 11/30/19 (b) | 7,565 | 7,631 | |
| 7.25% 11/30/21 (b) | 19,685 | 20,252 | |
| Viking Cruises Ltd. 5.875% 9/15/27 (b) | 11,595 | 11,044 | |
| Voc Escrow Ltd. 5% 2/15/28 (b) | 10,755 | 10,110 | |
| 107,311 | |||
| Metals/Mining - 1.2% | |||
| Alcoa Nederland Holding BV: | |||
| 6.125% 5/15/28 (b) | 3,565 | 3,556 | |
| 6.75% 9/30/24 (b) | 7,705 | 8,090 | |
| 7% 9/30/26 (b) | 6,385 | 6,736 | |
| Aleris International, Inc. 6% 6/1/20 (b)(f) | 151 | 151 | |
| Constellium NV 5.875% 2/15/26 (b) | 5,030 | 4,690 | |
| First Quantum Minerals Ltd.: | |||
| 6.5% 3/1/24 (b) | 9,135 | 7,970 | |
| 6.875% 3/1/26 (b) | 9,135 | 7,890 | |
| 7% 2/15/21 (b) | 13,590 | 13,293 | |
| 7.25% 5/15/22 (b) | 7,715 | 7,368 | |
| 7.25% 4/1/23 (b) | 11,390 | 10,522 | |
| 7.5% 4/1/25 (b) | 15,025 | 13,410 | |
| FMG Resources (August 2006) Pty Ltd.: | |||
| 4.75% 5/15/22 (b) | 7,950 | 7,632 | |
| 5.125% 3/15/23 (b) | 12,860 | 12,410 | |
| 5.125% 5/15/24 (b) | 9,780 | 9,291 | |
| Freeport-McMoRan, Inc. 5.45% 3/15/43 | 5,135 | 4,352 | |
| Joseph T Ryerson & Son, Inc. 11% 5/15/22 (b) | 6,445 | 6,896 | |
| Lundin Mining Corp. 7.875% 11/1/22 (b) | 570 | 594 | |
| Murray Energy Corp. 11.25% 4/15/21 (b) | 11,985 | 7,610 | |
| SunCoke Energy Partners LP/SunCoke Energy Partners Finance Corp. 7.5% 6/15/25 (b) | 9,795 | 9,966 | |
| 142,427 | |||
| Paper - 0.1% | |||
| Boise Cascade Co. 5.625% 9/1/24 (b) | 4,105 | 4,023 | |
| Flex Acquisition Co., Inc. 6.875% 1/15/25 (b) | 5,230 | 4,890 | |
| NewPage Corp.: | |||
| 3 month U.S. LIBOR + 6.250% 6.7159% 5/1/12 (a)(c)(d)(f) | 6,337 | 0 | |
| 11.375% 12/31/2014 (c)(f) | 12,582 | 0 | |
| 8,913 | |||
| Restaurants - 1.1% | |||
| 1011778 BC Unlimited Liability Co./New Red Finance, Inc. 5% 10/15/25 (b) | 65,605 | 61,505 | |
| Golden Nugget, Inc.: | |||
| 6.75% 10/15/24 (b) | 22,555 | 22,499 | |
| 8.75% 10/1/25 (b) | 24,245 | 24,912 | |
| KFC Holding Co./Pizza Hut Holding LLC: | |||
| 4.75% 6/1/27 (b) | 9,215 | 8,662 | |
| 5% 6/1/24 (b) | 8,800 | 8,679 | |
| 5.25% 6/1/26 (b) | 8,800 | 8,646 | |
| 134,903 | |||
| Services - 0.7% | |||
| Avantor, Inc. 6% 10/1/24 (b) | 12,090 | 12,060 | |
| Blueline Rental Finance Corp./Blueline Rental LLC 9.25% 3/15/24 (b) | 22,945 | 23,949 | |
| Brand Energy & Infrastructure Services, Inc. 8.5% 7/15/25 (b) | 2,146 | 2,114 | |
| CDK Global, Inc. 5.875% 6/15/26 | 4,545 | 4,579 | |
| IHS Markit Ltd.: | |||
| 4% 3/1/26 (b) | 5,380 | 5,063 | |
| 4.75% 2/15/25 (b) | 4,225 | 4,183 | |
| KAR Auction Services, Inc. 5.125% 6/1/25 (b) | 10,355 | 9,811 | |
| Ritchie Brothers Auctioneers, Inc. 5.375% 1/15/25 (b) | 3,510 | 3,457 | |
| The Brink's Co. 4.625% 10/15/27 (b) | 12,180 | 11,206 | |
| United Rentals North America, Inc. 5.5% 5/15/27 | 7,325 | 6,959 | |
| 83,381 | |||
| Steel - 0.5% | |||
| Big River Steel LLC/BRS Finance Corp. 7.25% 9/1/25 (b) | 9,390 | 9,789 | |
| Cleveland-Cliffs, Inc.: | |||
| 4.875% 1/15/24 (b) | 12,165 | 11,618 | |
| 5.75% 3/1/25 | 12,105 | 11,439 | |
| Commercial Metals Co. 5.75% 4/15/26 (b) | 9,135 | 8,770 | |
| JMC Steel Group, Inc. 9.875% 6/15/23 (b) | 7,500 | 7,988 | |
| United States Steel Corp. 6.25% 3/15/26 | 12,205 | 11,503 | |
| 61,107 | |||
| Super Retail - 1.2% | |||
| Netflix, Inc.: | |||
| 4.375% 11/15/26 | 11,520 | 10,543 | |
| 4.875% 4/15/28 (b) | 28,755 | 26,383 | |
| 5.375% 2/1/21 (b) | 4,255 | 4,335 | |
| 5.75% 3/1/24 | 10,485 | 10,668 | |
| 5.875% 2/15/25 | 27,663 | 28,113 | |
| 5.875% 11/15/28 (b) | 64,825 | 63,691 | |
| Sonic Automotive, Inc. 6.125% 3/15/27 | 3,320 | 3,013 | |
| 146,746 | |||
| Technology - 2.0% | |||
| Ascend Learning LLC 6.875% 8/1/25 (b) | 4,115 | 4,094 | |
| Balboa Merger Sub, Inc. 11.375% 12/1/21 (b) | 23,415 | 24,820 | |
| Banff Merger Sub, Inc. 9.75% 9/1/26 (b) | 30,580 | 29,357 | |
| Camelot Finance SA 7.875% 10/15/24 (b) | 5,065 | 5,014 | |
| CDW LLC/CDW Finance Corp.: | |||
| 5% 9/1/23 | 10,930 | 10,875 | |
| 5% 9/1/25 | 6,380 | 6,221 | |
| Ensemble S Merger Sub, Inc. 9% 9/30/23 (b) | 19,115 | 19,784 | |
| j2 Cloud Services LLC/j2 Global Communications, Inc. 6% 7/15/25 (b) | 8,065 | 7,994 | |
| JDA Escrow LLC/JDA Bond Finance, Inc. 7.375% 10/15/24 (b) | 4,060 | 4,162 | |
| Open Text Corp. 5.875% 6/1/26 (b) | 8,535 | 8,578 | |
| Parametric Technology Corp. 6% 5/15/24 | 3,490 | 3,569 | |
| Qorvo, Inc. 5.5% 7/15/26 (b) | 6,085 | 6,100 | |
| Sensata Technologies BV 5% 10/1/25 (b) | 11,210 | 10,818 | |
| Sensata Technologies UK Financing Co. PLC 6.25% 2/15/26 (b) | 11,535 | 11,737 | |
| Solera LLC/Solera Finance, Inc. 10.5% 3/1/24 (b) | 29,985 | 32,535 | |
| Symantec Corp. 5% 4/15/25 (b) | 10,050 | 9,455 | |
| TTM Technologies, Inc. 5.625% 10/1/25 (b) | 4,060 | 3,959 | |
| Uber Technologies, Inc.: | |||
| 7.5% 11/1/23 (b)(g) | 12,285 | 12,300 | |
| 8% 11/1/26 (b)(g) | 24,575 | 24,698 | |
| 236,070 | |||
| Telecommunications - 6.5% | |||
| Citizens Communications Co.: | |||
| 7.875% 1/15/27 | 9,275 | 5,148 | |
| 9% 8/15/31 | 13,178 | 8,104 | |
| CyrusOne LP/CyrusOne Finance Corp.: | |||
| 5% 3/15/24 | 3,190 | 3,190 | |
| 5.375% 3/15/27 | 2,735 | 2,714 | |
| Equinix, Inc. 5.375% 5/15/27 | 9,265 | 9,172 | |
| Frontier Communications Corp. 8.5% 4/1/26 (b) | 31,445 | 29,205 | |
| GCI, Inc. 6.875% 4/15/25 | 10,905 | 11,253 | |
| GTT Communications, Inc. 7.875% 12/31/24 (b) | 5,565 | 5,231 | |
| Intelsat Jackson Holdings SA: | |||
| 5.5% 8/1/23 | 27,080 | 24,237 | |
| 9.75% 7/15/25 (b) | 15,175 | 15,896 | |
| Level 3 Financing, Inc.: | |||
| 5.125% 5/1/23 | 11,240 | 11,156 | |
| 5.375% 5/1/25 | 11,240 | 10,973 | |
| Sable International Finance Ltd. 6.875% 8/1/22 (b) | 47,295 | 49,364 | |
| SFR Group SA: | |||
| 6.25% 5/15/24 (b) | 7,635 | 7,320 | |
| 7.375% 5/1/26 (b) | 168,925 | 161,693 | |
| 8.125% 2/1/27 (b) | 27,095 | 26,824 | |
| Sprint Capital Corp.: | |||
| 6.875% 11/15/28 | 29,939 | 29,415 | |
| 8.75% 3/15/32 | 37,051 | 40,478 | |
| Sprint Communications, Inc. 6% 11/15/22 | 28,255 | 28,520 | |
| Sprint Corp.: | |||
| 7.125% 6/15/24 | 56,633 | 57,907 | |
| 7.625% 2/15/25 | 32,350 | 33,604 | |
| 7.625% 3/1/26 | 43,440 | 44,988 | |
| 7.875% 9/15/23 | 29,545 | 31,539 | |
| T-Mobile U.S.A., Inc.: | |||
| 6% 4/15/24 | 9,450 | 9,686 | |
| 6.375% 3/1/25 | 25,696 | 26,499 | |
| Telenet Finance Luxembourg Notes SARL 5.5% 3/1/28 (b) | 25,600 | 23,744 | |
| U.S. West Communications 7.25% 9/15/25 | 1,480 | 1,578 | |
| UPCB Finance IV Ltd. 5.375% 1/15/25 (b) | 11,930 | 11,608 | |
| Zayo Group LLC/Zayo Capital, Inc.: | |||
| 5.75% 1/15/27 (b) | 31,195 | 30,577 | |
| 6% 4/1/23 | 11,035 | 11,256 | |
| 6.375% 5/15/25 | 2,440 | 2,495 | |
| 765,374 | |||
| Textiles/Apparel - 0.0% | |||
| Eagle Intermediate Global Holding BV 7.5% 5/1/25 (b) | 4,685 | 4,533 | |
| Transportation Ex Air/Rail - 0.1% | |||
| Navios Maritime Acquisition Corp./Navios Acquisition Finance U.S., Inc. 8.125% 11/15/21 (b) | 2,850 | 2,390 | |
| Navios South American Logistics, Inc./Navios Logistics Finance U.S., Inc. 7.25% 5/1/22 (b) | 10,180 | 9,467 | |
| 11,857 | |||
| Utilities - 1.7% | |||
| Calpine Corp. 5.25% 6/1/26 (b) | 19,080 | 17,530 | |
| Dynegy, Inc. 7.625% 11/1/24 | 40,452 | 42,778 | |
| EnLink Midstream Partners LP: | |||
| 4.15% 6/1/25 | 8,545 | 7,943 | |
| 4.4% 4/1/24 | 8,560 | 8,196 | |
| Global Partners LP/GLP Finance Corp.: | |||
| 6.25% 7/15/22 | 2,720 | 2,672 | |
| 7% 6/15/23 | 11,295 | 11,253 | |
| InterGen NV 7% 6/30/23 (b) | 4,475 | 4,397 | |
| NRG Energy, Inc.: | |||
| 5.75% 1/15/28 | 34,385 | 34,299 | |
| 6.625% 1/15/27 | 26,747 | 27,650 | |
| Pattern Energy Group, Inc. 5.875% 2/1/24 (b) | 5,475 | 5,420 | |
| Talen Energy Supply LLC: | |||
| 6.5% 6/1/25 | 8,945 | 6,664 | |
| 10.5% 1/15/26 (b) | 8,530 | 7,496 | |
| The AES Corp. 4.5% 3/15/23 | 5,175 | 5,104 | |
| Vistra Operations Co. LLC 5.5% 9/1/26 (b) | 16,965 | 16,711 | |
| 198,113 | |||
| TOTAL NONCONVERTIBLE BONDS | 6,702,049 | ||
| TOTAL CORPORATE BONDS | |||
| (Cost $6,741,765) | 6,703,844 | ||
| Shares | Value (000s) | ||
| Common Stocks - 20.8% | |||
| Aerospace - 0.2% | |||
| TransDigm Group, Inc. (h) | 72,100 | 23,811 | |
| Air Transportation - 0.6% | |||
| Air Canada (h) | 3,438,100 | 65,239 | |
| Automotive & Auto Parts - 0.2% | |||
| Allison Transmission Holdings, Inc. | 285,200 | 12,572 | |
| Chassix Holdings, Inc. warrants 7/29/20 (f)(h) | 37,382 | 238 | |
| Exide Technologies (f)(h) | 9,824 | 0 | |
| Exide Technologies (f)(h) | 32,746 | 23 | |
| UC Holdings, Inc. (f) | 677,217 | 14,134 | |
| TOTAL AUTOMOTIVE & AUTO PARTS | 26,967 | ||
| Banks & Thrifts - 0.8% | |||
| Bank of America Corp. | 1,784,015 | 49,060 | |
| Citigroup, Inc. | 275,500 | 18,034 | |
| JPMorgan Chase & Co. | 250,380 | 27,296 | |
| TOTAL BANKS & THRIFTS | 94,390 | ||
| Broadcasting - 0.2% | |||
| Nexstar Broadcasting Group, Inc. Class A | 254,129 | 19,032 | |
| Cable/Satellite TV - 0.8% | |||
| Altice U.S.A., Inc. Class A | 1,233,200 | 20,113 | |
| Comcast Corp. Class A | 688,300 | 26,252 | |
| Naspers Ltd. Class N | 290,300 | 51,019 | |
| TOTAL CABLE/SATELLITE TV | 97,384 | ||
| Chemicals - 0.8% | |||
| DowDuPont, Inc. | 506,200 | 27,294 | |
| LyondellBasell Industries NV Class A | 112,145 | 10,011 | |
| Platform Specialty Products Corp. (h) | 1,629,500 | 17,631 | |
| The Chemours Co. LLC | 987,600 | 32,601 | |
| Westlake Chemical Corp. | 77,113 | 5,498 | |
| TOTAL CHEMICALS | 93,035 | ||
| Consumer Products - 0.0% | |||
| Reddy Ice Holdings, Inc. (h) | 496,439 | 124 | |
| Containers - 0.2% | |||
| Crown Holdings, Inc. (h) | 479,700 | 20,287 | |
| Diversified Financial Services - 0.4% | |||
| OneMain Holdings, Inc. (h) | 1,446,000 | 41,240 | |
| Penson Worldwide, Inc. Class A (f)(h) | 10,322,034 | 0 | |
| PJT Partners, Inc. | 5,092 | 231 | |
| TOTAL DIVERSIFIED FINANCIAL SERVICES | 41,471 | ||
| Energy - 0.9% | |||
| Chaparral Energy, Inc. (f)(h) | 25,896 | 401 | |
| Chaparral Energy, Inc. Class A (h) | 120,910 | 1,833 | |
| Cheniere Energy, Inc. (h) | 294,900 | 17,815 | |
| Diamondback Energy, Inc. | 307,100 | 34,506 | |
| Forbes Energy Services Ltd. (h) | 193,218 | 976 | |
| Goodrich Petroleum Corp. (h) | 129,527 | 1,952 | |
| Harvest Oil & Gas Corp. (h)(i) | 254,828 | 5,912 | |
| Parsley Energy, Inc. Class A (h) | 683,900 | 16,017 | |
| Pioneer Natural Resources Co. | 127,200 | 18,733 | |
| VNR Finance Corp. (h) | 119,961 | 552 | |
| VNR Finance Corp. (b)(h) | 577,714 | 2,657 | |
| TOTAL ENERGY | 101,354 | ||
| Food & Drug Retail - 0.1% | |||
| Southeastern Grocers, Inc. (f)(h) | 321,263 | 13,037 | |
| Food/Beverage/Tobacco - 0.4% | |||
| Darling International, Inc. (h) | 1,254,017 | 25,908 | |
| JBS SA | 9,116,500 | 25,109 | |
| TOTAL FOOD/BEVERAGE/TOBACCO | 51,017 | ||
| Gaming - 1.6% | |||
| Boyd Gaming Corp. | 1,699,600 | 45,141 | |
| Eldorado Resorts, Inc. (h) | 592,736 | 21,635 | |
| Melco Crown Entertainment Ltd. sponsored ADR | 1,610,700 | 26,786 | |
| Penn National Gaming, Inc. (h) | 1,369,900 | 33,261 | |
| Red Rock Resorts, Inc. | 1,079,097 | 24,970 | |
| Scientific Games Corp. Class A (h) | 956,828 | 21,299 | |
| Studio City International Holdings Ltd. ADR | 695,700 | 14,262 | |
| The Stars Group, Inc. (h) | 292,600 | 6,077 | |
| Wynn Resorts Ltd. | 12,101 | 1,217 | |
| TOTAL GAMING | 194,648 | ||
| Healthcare - 1.1% | |||
| HealthSouth Corp. | 34 | 2 | |
| Humana, Inc. | 105,700 | 33,867 | |
| Jazz Pharmaceuticals PLC (h) | 154,600 | 24,554 | |
| Quintiles Transnational Holdings, Inc. (h) | 393,500 | 48,373 | |
| Rotech Healthcare, Inc. (f)(h) | 185,710 | 297 | |
| UnitedHealth Group, Inc. | 101,700 | 26,579 | |
| TOTAL HEALTHCARE | 133,672 | ||
| Homebuilders/Real Estate - 0.3% | |||
| American Tower Corp. | 11,612 | 1,809 | |
| Lennar Corp. Class B | 7,080 | 253 | |
| PulteGroup, Inc. | 405,500 | 9,963 | |
| Starwood Property Trust, Inc. | 831,600 | 18,062 | |
| TOTAL HOMEBUILDERS/REAL ESTATE | 30,087 | ||
| Hotels - 0.1% | |||
| Wyndham Hotels & Resorts, Inc. | 208,200 | 10,262 | |
| Insurance - 0.2% | |||
| Cigna Corp. | 134,900 | 28,843 | |
| Leisure - 0.2% | |||
| Royal Caribbean Cruises Ltd. | 197,700 | 20,705 | |
| Metals/Mining - 0.1% | |||
| Aleris Corp. (f)(h) | 127,520 | 0 | |
| Elah Holdings, Inc. (h) | 906 | 82 | |
| First Quantum Minerals Ltd. | 1,011,900 | 10,100 | |
| TOTAL METALS/MINING | 10,182 | ||
| Publishing/Printing - 0.0% | |||
| Houghton Mifflin Harcourt Co. warrants 6/22/19 (h)(j) | 127,577 | 1 | |
| Services - 2.1% | |||
| HD Supply Holdings, Inc. (h) | 1,088,200 | 40,884 | |
| MasterCard, Inc. Class A | 412,300 | 81,499 | |
| Novus Holdings Ltd. | 100,408 | 30 | |
| Penhall Acquisition Co.: | |||
| Class A (f)(h) | 26,163 | 2,407 | |
| Class B (f)(h) | 8,721 | 802 | |
| United Rentals, Inc. (h) | 524,794 | 63,012 | |
| Visa, Inc. Class A | 442,440 | 60,990 | |
| TOTAL SERVICES | 249,624 | ||
| Super Retail - 0.3% | |||
| Amazon.com, Inc. (h) | 22,800 | 36,435 | |
| Arena Brands Holding Corp. Class B (f)(h)(j) | 659,302 | 2,400 | |
| TOTAL SUPER RETAIL | 38,835 | ||
| Technology - 6.8% | |||
| Activision Blizzard, Inc. | 239,000 | 16,503 | |
| Adobe, Inc. (h) | 256,400 | 63,013 | |
| Alphabet, Inc. Class A (h) | 107,300 | 117,019 | |
| Broadcom, Inc. | 117,500 | 26,260 | |
| CDW Corp. | 247,000 | 22,232 | |
| Electronic Arts, Inc. (h) | 227,300 | 20,680 | |
| EPAM Systems, Inc. (h) | 261,900 | 31,289 | |
| Facebook, Inc. Class A (h) | 231,300 | 35,109 | |
| GDS Holdings Ltd. ADR (h)(i) | 232,572 | 5,458 | |
| Global Payments, Inc. | 456,924 | 52,194 | |
| Microchip Technology, Inc. (i) | 538,000 | 35,390 | |
| Micron Technology, Inc. (h) | 1,377,500 | 51,959 | |
| Microsoft Corp. | 544,300 | 58,137 | |
| NVIDIA Corp. | 226,100 | 47,669 | |
| NXP Semiconductors NV | 236,100 | 17,705 | |
| ON Semiconductor Corp. (h) | 1,863,138 | 31,673 | |
| PayPal Holdings, Inc. (h) | 779,000 | 65,584 | |
| Salesforce.com, Inc. (h) | 202,700 | 27,819 | |
| SS&C Technologies Holdings, Inc. | 919,300 | 47,031 | |
| Take-Two Interactive Software, Inc. (h) | 216,300 | 27,875 | |
| TOTAL TECHNOLOGY | 800,599 | ||
| Telecommunications - 1.5% | |||
| Alibaba Group Holding Ltd. sponsored ADR (h) | 740,200 | 105,316 | |
| T-Mobile U.S., Inc. (h) | 978,600 | 67,083 | |
| TOTAL TELECOMMUNICATIONS | 172,399 | ||
| Textiles/Apparel - 0.3% | |||
| adidas AG | 151,742 | 35,749 | |
| Transportation Ex Air/Rail - 0.0% | |||
| Tricer Holdco SCA: | |||
| Class A1 (f)(j) | 598,287 | 0 | |
| Class A2 (f)(j) | 598,287 | 0 | |
| Class A3 (f)(j) | 598,287 | 0 | |
| Class A4 (f)(j) | 598,287 | 0 | |
| Class A5 (f)(j) | 598,287 | 0 | |
| Class A6 (f)(j) | 598,287 | 0 | |
| Class A7 (f)(j) | 598,287 | 0 | |
| Class A8 (f)(j) | 598,287 | 0 | |
| Class A9 (f)(j) | 598,287 | 0 | |
| U.S. Shipping Partners Corp. (f)(h) | 51,736 | 0 | |
| U.S. Shipping Partners Corp. warrants 12/31/29 (f)(h) | 484,379 | 0 | |
| TOTAL TRANSPORTATION EX AIR/RAIL | 0 | ||
| Utilities - 0.6% | |||
| EQT Corp. | 385,170 | 13,084 | |
| NRG Energy, Inc. | 651,500 | 23,578 | |
| Portland General Electric Co. | 14,817 | 668 | |
| Vistra Energy Corp. (h) | 1,705,900 | 38,605 | |
| TOTAL UTILITIES | 75,935 | ||
| TOTAL COMMON STOCKS | |||
| (Cost $2,159,810) | 2,448,689 | ||
| Preferred Stocks - 0.0% | |||
| Convertible Preferred Stocks - 0.0% | |||
| Consumer Products - 0.0% | |||
| Reddy Ice Holdings, Inc. 7.00% pay-in-kind (f)(h) | 199,717 | 1,456 | |
| Nonconvertible Preferred Stocks - 0.0% | |||
| Transportation Ex Air/Rail - 0.0% | |||
| Tricer Holdco SCA (f)(h)(j) | 287,159,690 | 2,872 | |
| TOTAL PREFERRED STOCKS | |||
| (Cost $11,676) | 4,328 | ||
| Principal Amount (000s) | Value (000s) | ||
| Bank Loan Obligations - 3.3% | |||
| Building Materials - 0.0% | |||
| Traverse Midstream Partners Ll Tranche B, term loan 3 month U.S. LIBOR + 4.000% 6.6% 9/27/24 (a)(d) | 2,980 | 2,997 | |
| Energy - 1.4% | |||
| BCP Raptor II LLC Tranche B, term loan 3 month U.S. LIBOR + 4.750% 10/22/25 (d)(k) | 6,070 | 6,024 | |
| BCP Raptor LLC Tranche B, term loan 3 month U.S. LIBOR + 4.250% 6.6411% 6/22/24 (a)(d) | 8,937 | 8,808 | |
| California Resources Corp.: | |||
| Tranche 1LN, term loan 3 month U.S. LIBOR + 10.375% 12.6699% 12/31/21 (a)(d) | 98,190 | 109,236 | |
| Tranche B, term loan 3 month U.S. LIBOR + 4.750% 7.0365% 12/31/22 (a)(d) | 41,115 | 41,663 | |
| Forbes Energy Services LLC Tranche B, term loan 14% 4/13/21 (a)(f) | 2,060 | 2,075 | |
| TOTAL ENERGY | 167,806 | ||
| Healthcare - 0.0% | |||
| Valeant Pharmaceuticals International, Inc. Tranche B, term loan 3 month U.S. LIBOR + 3.000% 5.2739% 6/1/25 (a)(d) | 2,267 | 2,266 | |
| Insurance - 0.0% | |||
| HUB International Ltd. Tranche B, term loan 3 month U.S. LIBOR + 3.000% 5.4895% 4/25/25 (a)(d) | 5,426 | 5,408 | |
| Metals/Mining - 0.2% | |||
| Murray Energy Corp. Tranche B 2LN, term loan 3 month U.S. LIBOR + 7.250% 9.7766% 10/17/22 (a)(d) | 22,716 | 20,331 | |
| Paper - 0.2% | |||
| Flex Acquisition Co., Inc. Tranche B 1LN, term loan 3 month U.S. LIBOR + 3.250% 5.506% 6/29/25 (a)(d) | 17,426 | 17,436 | |
| Services - 0.3% | |||
| Almonde, Inc.: | |||
| Tranche 2LN, term loan 3 month U.S. LIBOR + 7.250% 9.6361% 6/13/25 (a)(d) | 24,786 | 24,363 | |
| Tranche B 1LN, term loan 3 month U.S. LIBOR + 3.500% 5.8861% 6/13/24 (a)(d) | 5,373 | 5,339 | |
| KUEHG Corp. Tranche B 2LN, term loan 3 month U.S. LIBOR + 8.250% 10.6361% 8/22/25 (a)(d) | 6,055 | 6,131 | |
| TOTAL SERVICES | 35,833 | ||
| Steel - 0.1% | |||
| Essar Steel Algoma, Inc. Tranche B, term loan 3 month U.S. LIBOR + 6.500% 0% 8/16/19 (c)(d) | 5,183 | 6,271 | |
| Technology - 1.1% | |||
| Boxer Parent Co., Inc. Tranche B, term loan 3 month U.S. LIBOR + 4.250% 6.6484% 10/2/25 (a)(d) | 21,035 | 21,085 | |
| Digicert Holdings, Inc. Tranche B, term loan: | |||
| 3 month U.S. LIBOR + 4.000% 10/31/24 (d)(k) | 1,515 | 1,514 | |
| 3 month U.S. LIBOR + 4.000% 6.302% 10/31/24 (a)(d) | 3,875 | 3,874 | |
| 3 month U.S. LIBOR + 8.000% 10.6916% 10/31/25 (a)(d) | 17,055 | 16,938 | |
| Kronos, Inc. 2LN, term loan 3 month U.S. LIBOR + 8.250% 10.5931% 11/1/24 (a)(d) | 19,695 | 19,944 | |
| Landesk Group, Inc. term loan: | |||
| 3 month U.S. LIBOR + 4.250% 6.51% 1/20/24 (a)(d) | 3,115 | 3,110 | |
| 3 month U.S. LIBOR + 9.000% 11.26% 1/20/25 (a)(d) | 10,270 | 9,859 | |
| McAfee LLC Tranche B, term loan: | |||
| 3 month U.S. LIBOR + 4.500% 6.7949% 9/29/24 (a)(d) | 4,698 | 4,708 | |
| 3 month U.S. LIBOR + 8.500% 10.7949% 9/29/25 (a)(d) | 28,185 | 28,626 | |
| Vertafore, Inc. Tranche B 1LN, term loan 3 month U.S. LIBOR + 3.250% 5.552% 7/2/25 (a)(d) | 6,110 | 6,086 | |
| Web.com Group, Inc. 2LN, term loan 3 month U.S. LIBOR + 7.750% 10.1704% 10/11/26 (a)(d) | 10,914 | 10,832 | |
| TOTAL TECHNOLOGY | 126,576 | ||
| TOTAL BANK LOAN OBLIGATIONS | |||
| (Cost $377,491) | 384,924 | ||
| Preferred Securities - 8.8% | |||
| Banks & Thrifts - 7.5% | |||
| Bank of America Corp.: | |||
| 5.125% (a)(l) | 28,140 | 28,609 | |
| 5.2% (a)(l) | 61,440 | 61,240 | |
| 5.875% (a)(l) | 102,630 | 100,334 | |
| 6.25% (a)(l) | 28,555 | 29,693 | |
| Barclays PLC 7.75% (a)(l) | 30,535 | 30,976 | |
| Citigroup, Inc.: | |||
| 5.8% (a)(l) | 41,925 | 43,730 | |
| 5.9% (a)(l) | 27,015 | 27,353 | |
| 5.95% (a)(l) | 51,015 | 51,854 | |
| 6.25% (a)(l) | 17,065 | 17,654 | |
| 6.3% (a)(l) | 5,610 | 5,740 | |
| Credit Agricole SA 7.875% (a)(b)(l) | 8,515 | 8,874 | |
| Credit Suisse Group AG 7.5% (a)(b)(l) | 38,400 | 39,917 | |
| Goldman Sachs Group, Inc.: | |||
| 5% (a)(l) | 54,895 | 51,935 | |
| 5.375% (a)(l) | 31,615 | 32,779 | |
| 5.7% (a)(l) | 35,166 | 36,207 | |
| Huntington Bancshares, Inc. 5.7% (a)(d)(l) | 12,990 | 12,764 | |
| JPMorgan Chase & Co.: | |||
| 5% (a)(l) | 33,640 | 34,202 | |
| 5.3% (a)(l) | 16,855 | 17,554 | |
| 6% (a)(l) | 69,385 | 70,773 | |
| 6.125% (a)(l) | 17,585 | 17,921 | |
| 6.75% (a)(l) | 8,330 | 9,025 | |
| Royal Bank of Scotland Group PLC 8.625% (a)(l) | 41,759 | 44,216 | |
| Wells Fargo & Co.: | |||
| 5.875% (a)(l) | 50,420 | 53,058 | |
| 5.9% (a)(l) | 63,075 | 64,644 | |
| TOTAL BANKS & THRIFTS | 891,052 | ||
| Energy - 1.3% | |||
| Andeavor Logistics LP 6.875% (a)(l) | 30,450 | 30,019 | |
| DCP Midstream Partners LP 7.375% (a)(l) | 15,260 | 15,048 | |
| Energy Transfer Partners LP: | |||
| 6.25% (a)(l) | 65,923 | 62,511 | |
| 6.625% (a)(l) | 27,290 | 25,661 | |
| Summit Midstream Partners LP 9.5% (a)(l) | 15,260 | 15,505 | |
| TOTAL ENERGY | 148,744 | ||
| Homebuilders/Real Estate - 0.0% | |||
| Odebrecht Finance Ltd. 7.5% (b)(l) | 2,940 | 499 | |
| TOTAL PREFERRED SECURITIES | |||
| (Cost $1,041,645) | 1,040,295 | ||
| Shares | Value (000s) | ||
| Money Market Funds - 10.0% | |||
| Fidelity Cash Central Fund, 2.23% (m) | 1,138,855,519 | 1,139,083 | |
| Fidelity Securities Lending Cash Central Fund 2.23% (m)(n) | 36,019,948 | 36,024 | |
| TOTAL MONEY MARKET FUNDS | |||
| (Cost $1,175,063) | 1,175,107 | ||
| TOTAL INVESTMENT IN SECURITIES - 99.7% | |||
| (Cost $11,507,450) | 11,757,187 | ||
| NET OTHER ASSETS (LIABILITIES) - 0.3% | 39,775 | ||
| NET ASSETS - 100% | $11,796,962 |
Values shown as $0 in the Schedule of Investments may reflect amounts less than $500.
Legend
(a) Coupon rates for floating and adjustable rate securities reflect the rates in effect at period end.
(b) Security exempt from registration under Rule 144A of the Securities Act of 1933. These securities may be resold in transactions exempt from registration, normally to qualified institutional buyers. At the end of the period, the value of these securities amounted to $3,807,353,000 or 32.3% of net assets.
(c) Non-income producing - Security is in default.
(d) Coupon is indexed to a floating interest rate which may be multiplied by a specified factor and/or subject to caps or floors.
(e) Security initially issued at one coupon which converts to a higher coupon at a specified date. The rate shown is the rate at period end.
(f) Level 3 security
(g) Security or a portion of the security purchased on a delayed delivery or when-issued basis.
(h) Non-income producing
(i) Security or a portion of the security is on loan at period end.
(j) Restricted securities - Investment in securities not registered under the Securities Act of 1933 (excluding 144A issues). At the end of the period, the value of restricted securities (excluding 144A issues) amounted to $5,272,000 or 0.0% of net assets.
(k) The coupon rate will be determined upon settlement of the loan after period end.
(l) Security is perpetual in nature with no stated maturity date.
(m) Affiliated fund that is generally available only to investment companies and other accounts managed by Fidelity Investments. The rate quoted is the annualized seven-day yield of the fund at period end. A complete unaudited listing of the fund's holdings as of its most recent quarter end is available upon request. In addition, each Fidelity Central Fund's financial statements are available on the SEC's website or upon request.
(n) Investment made with cash collateral received from securities on loan.
Additional information on each restricted holding is as follows:
| Security | Acquisition Date | Acquisition Cost (000s) |
| Arena Brands Holding Corp. Class B | 6/18/97 - 1/12/99 | $21,592 |
| Houghton Mifflin Harcourt Co. warrants 6/22/19 | 6/22/12 | $246 |
| Tricer Holdco SCA | 10/16/09 - 12/30/17 | $10,248 |
| Tricer Holdco SCA Class A1 | 10/16/09 - 10/29/09 | $1,653 |
| Tricer Holdco SCA Class A2 | 10/16/09 - 10/29/09 | $1,653 |
| Tricer Holdco SCA Class A3 | 10/16/09 - 10/29/09 | $1,653 |
| Tricer Holdco SCA Class A4 | 10/16/09 - 10/29/09 | $1,653 |
| Tricer Holdco SCA Class A5 | 10/16/09 - 10/29/09 | $1,653 |
| Tricer Holdco SCA Class A6 | 10/16/09 - 10/29/09 | $1,653 |
| Tricer Holdco SCA Class A7 | 10/16/09 - 10/29/09 | $1,653 |
| Tricer Holdco SCA Class A8 | 10/16/09 - 10/29/09 | $1,653 |
| Tricer Holdco SCA Class A9 | 10/16/09 - 10/29/09 | $1,655 |
Affiliated Central Funds
Information regarding fiscal year to date income earned by the Fund from investments in Fidelity Central Funds is as follows:
| Fund | Income earned |
| (Amounts in thousands) | |
| Fidelity Cash Central Fund | $9,382 |
| Fidelity Securities Lending Cash Central Fund | 94 |
| Total | $9,476 |
Amounts in the income column in the above table include any capital gain distributions from underlying funds, which are presented in the corresponding line-item in the Statement of Operations if applicable.
Investment Valuation
The following is a summary of the inputs used, as of October 31, 2018, involving the Fund's assets and liabilities carried at fair value. The inputs or methodology used for valuing securities may not be an indication of the risk associated with investing in those securities. For more information on valuation inputs, and their aggregation into the levels used below, please refer to the Investment Valuation section in the accompanying Notes to Financial Statements.
| Valuation Inputs at Reporting Date: | ||||
| Description | Total | Level 1 | Level 2 | Level 3 |
| (Amounts in thousands) | ||||
| Investments in Securities: | ||||
| Equities: | ||||
| Communication Services | $380,572 | $380,572 | $-- | $-- |
| Consumer Discretionary | 450,240 | 433,444 | 1 | 16,795 |
| Consumer Staples | 65,634 | 51,141 | -- | 14,493 |
| Energy | 114,438 | 114,037 | -- | 401 |
| Financials | 159,381 | 159,381 | -- | -- |
| Health Care | 162,515 | 162,218 | -- | 297 |
| Industrials | 211,629 | 205,548 | -- | 6,081 |
| Information Technology | 720,444 | 720,444 | -- | -- |
| Materials | 123,504 | 123,504 | -- | -- |
| Real Estate | 1,809 | 1,809 | -- | -- |
| Utilities | 62,851 | 62,851 | -- | -- |
| Corporate Bonds | 6,703,844 | -- | 6,703,693 | 151 |
| Bank Loan Obligations | 384,924 | -- | 382,849 | 2,075 |
| Preferred Securities | 1,040,295 | -- | 1,040,295 | -- |
| Money Market Funds | 1,175,107 | 1,175,107 | -- | -- |
| Total Investments in Securities: | $11,757,187 | $3,590,056 | $8,126,838 | $40,293 |
Other Information
Distribution of investments by country or territory of incorporation, as a percentage of Total Net Assets, is as follows (Unaudited):
| United States of America | 82.1% |
| Canada | 4.6% |
| Cayman Islands | 3.1% |
| France | 1.8% |
| United Kingdom | 1.7% |
| Luxembourg | 1.1% |
| Netherlands | 1.0% |
| Others (Individually Less Than 1%) | 4.6% |
| 100.0% |
See accompanying notes which are an integral part of the financial statements.
Financial Statements
Statement of Assets and Liabilities
| Amounts in thousands (except per-share amount) | October 31, 2018 (Unaudited) | |
| Assets | ||
| Investment in securities, at value (including securities loaned of $35,808) — See accompanying schedule: Unaffiliated issuers (cost $10,332,387) | $10,582,080 | |
| Fidelity Central Funds (cost $1,175,063) | 1,175,107 | |
| Total Investment in Securities (cost $11,507,450) | $11,757,187 | |
| Receivable for investments sold | 46,523 | |
| Receivable for fund shares sold | 6,170 | |
| Dividends receivable | 186 | |
| Interest receivable | 127,150 | |
| Distributions receivable from Fidelity Central Funds | 1,795 | |
| Prepaid expenses | 23 | |
| Other receivables | 703 | |
| Total assets | 11,939,737 | |
| Liabilities | ||
| Payable to custodian bank | $2,628 | |
| Payable for investments purchased | ||
| Regular delivery | 40,818 | |
| Delayed delivery | 36,860 | |
| Payable for fund shares redeemed | 14,259 | |
| Distributions payable | 4,521 | |
| Accrued management fee | 5,577 | |
| Other affiliated payables | 1,302 | |
| Other payables and accrued expenses | 784 | |
| Collateral on securities loaned | 36,026 | |
| Total liabilities | 142,775 | |
| Net Assets | $11,796,962 | |
| Net Assets consist of: | ||
| Paid in capital | $11,367,555 | |
| Total distributable earnings (loss) | 429,407 | |
| Net Assets, for 1,218,989 shares outstanding | $11,796,962 | |
| Net Asset Value, offering price and redemption price per share ($11,796,962 ÷ 1,218,989 shares) | $9.68 |
See accompanying notes which are an integral part of the financial statements.
Statement of Operations
| Amounts in thousands | Six months ended October 31, 2018 (Unaudited) | |
| Investment Income | ||
| Dividends | $38,023 | |
| Interest | 239,348 | |
| Income from Fidelity Central Funds | 9,476 | |
| Total income | 286,847 | |
| Expenses | ||
| Management fee | $33,940 | |
| Transfer agent fees | 7,042 | |
| Accounting and security lending fees | 737 | |
| Custodian fees and expenses | 81 | |
| Independent trustees' fees and expenses | 36 | |
| Registration fees | 111 | |
| Audit | 66 | |
| Legal | 178 | |
| Miscellaneous | 45 | |
| Total expenses before reductions | 42,236 | |
| Expense reductions | (181) | |
| Total expenses after reductions | 42,055 | |
| Net investment income (loss) | 244,792 | |
| Realized and Unrealized Gain (Loss) | ||
| Net realized gain (loss) on: | ||
| Investment securities: | ||
| Unaffiliated issuers | 52,212 | |
| Fidelity Central Funds | 4 | |
| Foreign currency transactions | (22) | |
| Total net realized gain (loss) | 52,194 | |
| Change in net unrealized appreciation (depreciation) on: | ||
| Investment securities: | ||
| Unaffiliated issuers | (418,976) | |
| Fidelity Central Funds | (1) | |
| Assets and liabilities in foreign currencies | (3) | |
| Total change in net unrealized appreciation (depreciation) | (418,980) | |
| Net gain (loss) | (366,786) | |
| Net increase (decrease) in net assets resulting from operations | $(121,994) |
See accompanying notes which are an integral part of the financial statements.
Statement of Changes in Net Assets
| Amounts in thousands | Six months ended October 31, 2018 (Unaudited) | Year ended April 30, 2018 |
| Increase (Decrease) in Net Assets | ||
| Operations | ||
| Net investment income (loss) | $244,792 | $557,270 |
| Net realized gain (loss) | 52,194 | 179,670 |
| Change in net unrealized appreciation (depreciation) | (418,980) | (109,828) |
| Net increase (decrease) in net assets resulting from operations | (121,994) | 627,112 |
| Distributions to shareholders | (426,179) | – |
| Distributions to shareholders from net investment income | – | (475,182) |
| Distributions to shareholders from net realized gain | – | (119,664) |
| Total distributions | (426,179) | (594,846) |
| Share transactions | ||
| Proceeds from sales of shares | 1,223,637 | 2,505,049 |
| Reinvestment of distributions | 381,821 | 531,851 |
| Cost of shares redeemed | (1,313,065) | (2,247,228) |
| Net increase (decrease) in net assets resulting from share transactions | 292,393 | 789,672 |
| Redemption fees | – | 389 |
| Total increase (decrease) in net assets | (255,780) | 822,327 |
| Net Assets | ||
| Beginning of period | 12,052,742 | 11,230,415 |
| End of period | $11,796,962 | $12,052,742 |
| Other Information | ||
| Undistributed net investment income end of period | $127,075 | |
| Shares | ||
| Sold | 121,403 | 244,684 |
| Issued in reinvestment of distributions | 37,869 | 52,177 |
| Redeemed | (130,872) | (219,719) |
| Net increase (decrease) | 28,400 | 77,142 |
See accompanying notes which are an integral part of the financial statements.
Financial Highlights
Fidelity Capital & Income Fund
| Six months ended (Unaudited) October 31, | Years endedApril 30, | |||||
| 2018 | 2018 | 2017 | 2016 | 2015 | 2014 | |
| Selected Per–Share Data | ||||||
| Net asset value, beginning of period | $10.12 | $10.09 | $9.24 | $9.99 | $10.07 | $9.86 |
| Income from Investment Operations | ||||||
| Net investment income (loss)A | .202 | .482 | .430 | .404 | .416 | .472 |
| Net realized and unrealized gain (loss) | (.288) | .065 | .824 | (.710) | .276 | .258 |
| Total from investment operations | (.086) | .547 | 1.254 | (.306) | .692 | .730 |
| Distributions from net investment income | (.198) | (.410) | (.405) | (.387) | (.411) | (.458) |
| Distributions from net realized gain | (.156) | (.107) | – | (.058) | (.362) | (.063) |
| Total distributions | (.354) | (.517) | (.405) | (.445) | (.773) | (.521) |
| Redemption fees added to paid in capitalA | – | –B | .001 | .001 | .001 | .001 |
| Net asset value, end of period | $9.68 | $10.12 | $10.09 | $9.24 | $9.99 | $10.07 |
| Total ReturnC,D | (.95)% | 5.51% | 13.85% | (3.05)% | 7.17% | 7.71% |
| Ratios to Average Net AssetsE,F | ||||||
| Expenses before reductions | .69%G | .67% | .73% | .75% | .72% | .71% |
| Expenses net of fee waivers, if any | .68%G | .67% | .73% | .75% | .72% | .71% |
| Expenses net of all reductions | .68%G | .67% | .73% | .74% | .72% | .71% |
| Net investment income (loss) | 3.97%G | 4.71% | 4.45% | 4.30% | 4.16% | 4.82% |
| Supplemental Data | ||||||
| Net assets, end of period (in millions) | $11,797 | $12,053 | $11,230 | $10,188 | $11,160 | $10,382 |
| Portfolio turnover rateH | 44%G | 39% | 39% | 35% | 41% | 47% |
A Calculated based on average shares outstanding during the period.
B Amount represents less than $.0005 per share.
C Total returns for periods of less than one year are not annualized.
D Total returns would have been lower if certain expenses had not been reduced during the applicable periods shown.
E Fees and expenses of any underlying Fidelity Central Funds are not included in the Fund's expense ratio. The Fund indirectly bears its proportionate share of the expenses of any underlying Fidelity Central Funds.
F Expense ratios reflect operating expenses of the Fund. Expenses before reductions do not reflect amounts reimbursed by the investment adviser or reductions from brokerage service arrangements or reductions from other expense offset arrangements and do not represent the amount paid by the Fund during periods when reimbursements or reductions occur. Expenses net of fee waivers reflect expenses after reimbursement by the investment adviser but prior to reductions from brokerage service arrangements or other expense offset arrangements. Expenses net of all reductions represent the net expenses paid by the Fund.
G Annualized
H Amount does not include the portfolio activity of any underlying Fidelity Central Funds.
See accompanying notes which are an integral part of the financial statements.
Notes to Financial Statements (Unaudited)
For the period ended October 31, 2018
(Amounts in thousands except percentages)
1. Organization.
Fidelity Capital & Income Fund (the Fund) is a fund of Fidelity Summer Street Trust (the Trust) and is authorized to issue an unlimited number of shares. Share transactions on the Statement of Changes in Net Assets may contain exchanges between affiliated funds. The Trust is registered under the Investment Company Act of 1940, as amended (the 1940 Act), as an open-end management investment company organized as a Massachusetts business trust.
2. Investments in Fidelity Central Funds.
The Fund invests in Fidelity Central Funds, which are open-end investment companies generally available only to other investment companies and accounts managed by the investment adviser and its affiliates. The Fund's Schedule of Investments lists each of the Fidelity Central Funds held as of period end, if any, as an investment of the Fund, but does not include the underlying holdings of each Fidelity Central Fund. As an Investing Fund, the Fund indirectly bears its proportionate share of the expenses of the underlying Fidelity Central Funds.
The Money Market Central Funds seek preservation of capital and current income and are managed by Fidelity Investments Money Management, Inc. (FIMM), an affiliate of the investment adviser. Annualized expenses of the Money Market Central Funds as of their most recent shareholder report date are less than .005%.
A complete unaudited list of holdings for each Fidelity Central Fund is available upon request or at the Securities and Exchange Commission (the SEC) website at www.sec.gov. In addition, the financial statements of the Fidelity Central Funds are available on the SEC website or upon request.
3. Significant Accounting Policies.
The Fund is an investment company and applies the accounting and reporting guidance of the Financial Accounting Standards Board (FASB) Accounting Standards Codification Topic 946 Financial Services – Investments Companies. The financial statements have been prepared in conformity with accounting principles generally accepted in the United States of America (GAAP), which require management to make certain estimates and assumptions at the date of the financial statements. Actual results could differ from those estimates. Subsequent events, if any, through the date that the financial statements were issued have been evaluated in the preparation of the financial statements. The following summarizes the significant accounting policies of the Fund:
Investment Valuation. Investments are valued as of 4:00 p.m. Eastern time on the last calendar day of the period. The Board of Trustees (the Board) has delegated the day to day responsibility for the valuation of the Fund's investments to the Fair Value Committee (the Committee) established by the Fund's investment adviser. In accordance with valuation policies and procedures approved by the Board, the Fund attempts to obtain prices from one or more third party pricing vendors or brokers to value its investments. When current market prices, quotations or currency exchange rates are not readily available or reliable, investments will be fair valued in good faith by the Committee, in accordance with procedures adopted by the Board. Factors used in determining fair value vary by investment type and may include market or investment specific events, changes in interest rates and credit quality. The frequency with which these procedures are used cannot be predicted and they may be utilized to a significant extent. The Committee oversees the Fund's valuation policies and procedures and reports to the Board on the Committee's activities and fair value determinations. The Board monitors the appropriateness of the procedures used in valuing the Fund's investments and ratifies the fair value determinations of the Committee.
The Fund categorizes the inputs to valuation techniques used to value its investments into a disclosure hierarchy consisting of three levels as shown below:
- Level 1 – quoted prices in active markets for identical investments
- Level 2 – other significant observable inputs (including quoted prices for similar investments, interest rates, prepayment speeds, etc.)
- Level 3 – unobservable inputs (including the Fund's own assumptions based on the best information available)
Valuation techniques used to value the Fund's investments by major category are as follows:
Debt securities, including restricted securities, are valued based on evaluated prices received from third party pricing vendors or from brokers who make markets in such securities. Corporate bonds, bank loan obligations, and preferred securities are valued by pricing vendors who utilize matrix pricing which considers yield or price of bonds of comparable quality, coupon, maturity and type or by broker-supplied prices. When independent prices are unavailable or unreliable, debt securities may be valued utilizing pricing methodologies which consider similar factors that would be used by third party pricing vendors. Debt securities are generally categorized as Level 2 in the hierarchy but may be Level 3 depending on the circumstances. The Fund invests a significant portion of its assets in below investment grade securities. The value of these securities can be more volatile due to changes in the credit quality of the issuer and is sensitive to changes in economic, market and regulatory conditions.
Equity securities, including restricted securities, for which market quotations are readily available, are valued at the last reported sale price or official closing price as reported by a third party pricing vendor on the primary market or exchange on which they are traded and are categorized as Level 1 in the hierarchy. In the event there were no sales during the day or closing prices are not available, securities are valued at the last quoted bid price or may be valued using the last available price and are generally categorized as Level 2 in the hierarchy. For foreign equity securities, when market or security specific events arise, comparisons to the valuation of American Depositary Receipts (ADRs), futures contracts, Exchange-Traded Funds (ETFs) and certain indexes as well as quoted prices for similar securities may be used and would be categorized as Level 2 in the hierarchy. Utilizing these techniques may result in transfers between Level 1 and Level 2. For equity securities, including restricted securities, where observable inputs are limited, assumptions about market activity and risk are used and these securities may be categorized as Level 3 in the hierarchy.
Investments in open-end mutual funds, including the Fidelity Central Funds, are valued at their closing net asset value (NAV) each business day and are categorized as Level 1 in the hierarchy.
Changes in valuation techniques may result in transfers in or out of an assigned level within the disclosure hierarchy. The aggregate value of investments by input level as of October 31, 2018 is included at the end of the Fund's Schedule of Investments.
Foreign Currency. The Fund may use foreign currency contracts to facilitate transactions in foreign-denominated securities. Gains and losses from these transactions may arise from changes in the value of the foreign currency or if the counterparties do not perform under the contracts' terms.
Foreign-denominated assets, including investment securities, and liabilities are translated into U.S. dollars at the exchange rates at period end. Purchases and sales of investment securities, income and dividends received and expenses denominated in foreign currencies are translated into U.S. dollars at the exchange rate in effect on the transaction date.
The effects of exchange rate fluctuations on investments are included with the net realized and unrealized gain (loss) on investment securities. Other foreign currency transactions resulting in realized and unrealized gain (loss) are disclosed separately.
Investment Transactions and Income. For financial reporting purposes, the Fund's investment holdings and NAV include trades executed through the end of the last business day of the period. The NAV per share for processing shareholder transactions is calculated as of the close of business of the New York Stock Exchange (NYSE), normally 4:00 p.m. Eastern time and includes trades executed through the end of the prior business day. Gains and losses on securities sold are determined on the basis of identified cost and include proceeds received from litigation. Dividend income is recorded on the ex-dividend date, except for certain dividends from foreign securities where the ex-dividend date may have passed, which are recorded as soon as the Fund is informed of the ex-dividend date. Non-cash dividends included in dividend income, if any, are recorded at the fair market value of the securities received. Income and capital gain distributions from Fidelity Central Funds, if any, are recorded on the ex-dividend date. Certain distributions received by the Fund represent a return of capital or capital gain. The Fund determines the components of these distributions subsequent to the ex-dividend date, based upon receipt of tax filings or other correspondence relating to the underlying investment. These distributions are recorded as a reduction of cost of investments and/or as a realized gain. Interest income is accrued as earned and includes coupon interest and amortization of premium and accretion of discount on debt securities as applicable. Paid in Kind (PIK) income is recorded at the fair market value of the securities received. Investment income is recorded net of foreign taxes withheld where recovery of such taxes is uncertain. Debt obligations may be placed on non-accrual status and related interest income may be reduced by ceasing current accruals and writing off interest receivables when the collection of all or a portion of interest has become doubtful based on consistently applied procedures. A debt obligation is removed from non-accrual status when the issuer resumes interest payments or when collectability of interest is reasonably assured.
Expenses. Expenses directly attributable to a fund are charged to that fund. Expenses attributable to more than one fund are allocated among the respective funds on the basis of relative net assets or other appropriate methods. Expense estimates are accrued in the period to which they relate and adjustments are made when actual amounts are known.
Deferred Trustee Compensation. Under a Deferred Compensation Plan (the Plan) for the Fund, certain independent Trustees have elected to defer receipt of a portion of their annual compensation. Deferred amounts are invested in a cross-section of Fidelity funds, are marked-to-market and remain in the Fund until distributed in accordance with the Plan. The investment of deferred amounts and the offsetting payable to the Trustees of $657 are included in the accompanying Statement of Assets and Liabilities in other receivables and other payables and accrued expenses, respectively.
Income Tax Information and Distributions to Shareholders. Each year, the Fund intends to qualify as a regulated investment company under Subchapter M of the Internal Revenue Code, including distributing substantially all of its taxable income and realized gains. As a result, no provision for U.S. Federal income taxes is required. The Fund files a U.S. federal tax return, in addition to state and local tax returns as required. The Fund's federal income tax returns are subject to examination by the Internal Revenue Service (IRS) for a period of three fiscal years after they are filed. State and local tax returns may be subject to examination for an additional fiscal year depending on the jurisdiction. Foreign taxes are provided for based on the Fund's understanding of the tax rules and rates that exist in the foreign markets in which it invests.
Distributions are declared and recorded daily and paid monthly from net investment income. Distributions from realized gains, if any, are declared and recorded on the ex-dividend date. Income and capital gain distributions are determined in accordance with income tax regulations, which may differ from GAAP.
Capital accounts within the financial statements are adjusted for permanent book-tax differences. These adjustments have no impact on net assets or the results of operations. Capital accounts are not adjusted for temporary book-tax differences which will reverse in a subsequent period.
Book-tax differences are primarily due to partnerships, foreign currency transactions, market discount, deferred trustees compensation and losses deferred due to wash sales.
As of period end, the cost and unrealized appreciation (depreciation) in securities, and derivatives if applicable, for federal income tax purposes were as follows:
| Gross unrealized appreciation | $778,968 |
| Gross unrealized depreciation | (485,018) |
| Net unrealized appreciation (depreciation) | $293,950 |
| Tax cost | $11,463,237 |
Delayed Delivery Transactions and When-Issued Securities. During the period, the Fund transacted in securities on a delayed delivery or when-issued basis. Payment and delivery may take place after the customary settlement period for that security. The price of the underlying securities and the date when the securities will be delivered and paid for are fixed at the time the transaction is negotiated. The securities purchased on a delayed delivery or when-issued basis are identified as such in the Fund's Schedule of Investments. The Fund may receive compensation for interest forgone in the purchase of a delayed delivery or when-issued security. With respect to purchase commitments, the Fund identifies securities as segregated in its records with a value at least equal to the amount of the commitment. Losses may arise due to changes in the value of the underlying securities or if the counterparty does not perform under the contract's terms, or if the issuer does not issue the securities due to political, economic, or other factors.
Restricted Securities. The Fund may invest in securities that are subject to legal or contractual restrictions on resale. These securities generally may be resold in transactions exempt from registration or to the public if the securities are registered. Disposal of these securities may involve time-consuming negotiations and expense, and prompt sale at an acceptable price may be difficult. Information regarding restricted securities is included at the end of the Fund's Schedule of Investments.
Loans and Other Direct Debt Instruments. The Fund invests in direct debt instruments which are interests in amounts owed to lenders by corporate or other borrowers. These instruments may be in the form of loans, trade claims or other receivables and may include standby financing commitments such as revolving credit facilities that obligate the Fund to supply additional cash to the borrower on demand. Loans may be acquired through assignment or participation. The Fund did not have any unfunded loan commitments, which are contractual obligations for future funding, at period end.
New Accounting Pronouncement. In March 2017, the Financial Accounting Standards Board (FASB) issued an Accounting Standards Update (ASU), ASU 2017-08, which amends the amortization period for certain callable debt securities that are held at a premium. The amendment requires the premium to be amortized to the earliest call date. The amendments do not require an accounting change for securities held at a discount. The ASU is effective for annual periods beginning after December 15, 2018. Management is currently evaluating the potential impact of these changes to the financial statements.
New Rule Issuance. During August 2018, the U.S. Securities and Exchange Commission issued Final Rule Release No. 33-10532, Disclosure Update and Simplification. This Final Rule includes amendments specific to registered investment companies that are intended to eliminate overlap in disclosure requirements between Regulation S-X and GAAP. In accordance with these amendments, certain line-items in the Fund's financial statements have been combined or removed for the current period as outlined in the table below.
| Financial Statement | Current Line-Item Presentation | Prior Line-Item Presentation |
| Statement of Assets and Liabilities | Total distributable earnings (loss) | Undistributed/Distributions in excess of/Accumulated net investment income (loss) Accumulated/Undistributed net realized gain (loss) Net unrealized appreciation (depreciation) |
| Statement of Changes in Net Assets | N/A – removed | Undistributed/Distributions in excess of/Accumulated net investment income (loss) end of period |
| Statement of Changes in Net Assets | Distributions to shareholders | Distributions to shareholders from net investment income Distributions to shareholders from net realized gain |
4. Purchases and Sales of Investments.
Purchases and sales of securities, other than short-term securities, aggregated $2,699,261 and $2,445,846, respectively.
5. Fees and Other Transactions with Affiliates.
Management Fee. Fidelity Management & Research Company (the investment adviser) and its affiliates provide the Fund with investment management related services for which the Fund pays a monthly management fee. The management fee is the sum of an individual fund fee rate that is based on an annual rate of .45% of the Fund's average net assets and an annualized group fee rate that averaged .11% during the period. The group fee rate is based upon the average net assets of all the mutual funds advised by the investment adviser, including any mutual funds previously advised by the investment adviser that are currently advised by Fidelity SelectCo, LLC, an affiliate of the investment adviser. The group fee rate decreases as assets under management increase and increases as assets under management decrease. For the reporting period, the total annualized management fee rate was .55% of the Fund's average net assets.
Transfer Agent Fees. Fidelity Investments Institutional Operations Company, Inc. (FIIOC), an affiliate of the investment adviser, is the Fund's transfer, dividend disbursing and shareholder servicing agent. FIIOC receives account fees and asset-based fees that vary according to account size and type of account. FIIOC pays for typesetting, printing and mailing of shareholder reports, except proxy statements. For the period, the transfer agent fees were equivalent to an annualized rate of .11% of average net assets.
Accounting and Security Lending Fees. Fidelity Service Company, Inc. (FSC), an affiliate of the investment adviser, maintains the Fund's accounting records. The accounting fee is based on the level of average net assets for each month. Under a separate contract, FSC administers the security lending program. The security lending fee is based on the number and duration of lending transactions. For the period, the fees were equivalent to an annualized rate of .01%.
Brokerage Commissions. The Fund placed a portion of its portfolio transactions with brokerage firms which are affiliates of the investment adviser. Brokerage commissions are included in net realized gain (loss) and change in net unrealized appreciation (depreciation) in the Statement of Operations. The commissions paid to these affiliated firms were $25 for the period.
Interfund Trades. The Fund may purchase from or sell securities to other Fidelity Funds under procedures adopted by the Board. The procedures have been designed to ensure these interfund trades are executed in accordance with Rule 17a-7 of the 1940 Act. Interfund trades are included within the respective purchases and sales amounts shown in the Purchases and Sales of Investments note.
6. Committed Line of Credit.
The Fund participates with other funds managed by the investment adviser or an affiliate in a $4.25 billion credit facility (the "line of credit") to be utilized for temporary or emergency purposes to fund shareholder redemptions or for other short-term liquidity purposes. The Fund has agreed to pay commitment fees on its pro-rata portion of the line of credit, which amounted to $16 and is reflected in Miscellaneous expenses on the Statement of Operations. During the period, the Fund did not borrow on this line of credit.
7. Security Lending.
The Fund lends portfolio securities through a lending agent from time to time in order to earn additional income. For equity securities, a lending agent is used and may loan securities to certain qualified borrowers, including Fidelity Capital Markets (FCM), a broker-dealer affiliated with the Fund. On the settlement date of the loan, the Fund receives collateral (in the form of U.S. Treasury obligations, letters of credit and/or cash) against the loaned securities and maintains collateral in an amount not less than 100% of the market value of the loaned securities during the period of the loan. The market value of the loaned securities is determined at the close of business of the Fund and any additional required collateral is delivered to the Fund on the next business day. The Fund or borrower may terminate the loan at any time, and if the borrower defaults on its obligation to return the securities loaned because of insolvency or other reasons, the Fund may apply collateral received from the borrower against the obligation. The Fund may experience delays and costs in recovering the securities loaned. Any cash collateral received is invested in the Fidelity Securities Lending Cash Central Fund. The value of loaned securities and cash collateral at period end are disclosed on the Fund's Statement of Assets and Liabilities. At period end, there were no security loans outstanding with FCM. Security lending income represents the income earned on investing cash collateral, less rebates paid to borrowers and any lending agent fees associated with the loan, plus any premium payments received for lending certain types of securities. Security lending income is presented in the Statement of Operations as a component of income from Fidelity Central Funds. Total security lending income during the period amounted to $94, including $1 from securities loaned to FCM.
8. Expense Reductions.
Commissions paid to certain brokers with whom the investment adviser, or its affiliates, places trades on behalf of the Fund include an amount in addition to trade execution, which may be rebated back to the Fund to offset certain expenses. This amount totaled $124 for the period. In addition, through arrangements with the Fund's custodian, credits realized as a result of certain uninvested cash balances were used to reduce the Fund's expenses. During the period, these credits reduced the Fund's custody expenses by $21.
In addition, during the period the investment adviser reimbursed and/or waived a portion of operating expenses in the amount of $36.
9. Other.
The Fund's organizational documents provide former and current trustees and officers with a limited indemnification against liabilities arising in connection with the performance of their duties to the Fund. In the normal course of business, the Fund may also enter into contracts that provide general indemnifications. The Fund's maximum exposure under these arrangements is unknown as this would be dependent on future claims that may be made against the Fund. The risk of material loss from such claims is considered remote.
10. Litigation.
The Fund and other entities managed by FMR or its affiliates were named as defendants in a lawsuit filed in the United States Bankruptcy Court for the Southern District of New York in 2009. The lawsuit was brought by creditors of Motors Liquidation Company (f/k/a General Motors), which went through Chapter 11 bankruptcy proceedings in 2009, and is captioned Official Committee of Unsecured Creditors of Motors Liquidation Company v. JPMorgan Chase Bank, N.A., et al., Adversary No. 09-00504 (REG). The plaintiffs are seeking an order that the Fund and other defendants return proceeds received in 2009 in full payment of the principal and interest on General Motors secured debt. The plaintiffs contend that the Fund and the other defendants were not secured creditors at the time of the 2009 payments and, thus, were not entitled to payment in full. In January 2015, the Court of Appeals ruled that JPMorgan, as administrative agent for all of the debtholders, released the security interest on certain collateral securing the debt prior to the 2009 payments. In September 2017, an opinion was issued in a trial intended to help determine the value of any remaining, unreleased collateral. The parties have engaged in mediation but continue to disagree on the value of the unreleased collateral. At this time, Management cannot determine the amount of loss that may be realized, but expects the amount to be less than the $100,876 received in 2009. The Fund is also incurring legal costs in defending the case.
Shareholder Expense Example
As a shareholder of the Fund, you incur two types of costs: (1) transaction costs and (2) ongoing costs, including management fees and other Fund expenses. This Example is intended to help you understand your ongoing costs (in dollars) of investing in the Fund and to compare these costs with the ongoing costs of investing in other mutual funds.
The Example is based on an investment of $1,000 invested at the beginning of the period and held for the entire period (May 1, 2018 to October 31, 2018).
Actual Expenses
The first line of the accompanying table provides information about actual account values and actual expenses. You may use the information in this line, together with the amount you invested, to estimate the expenses that you paid over the period. Simply divide your account value by $1,000.00 (for example, an $8,600 account value divided by $1,000.00 = 8.6), then multiply the result by the number in the first line under the heading entitled "Expenses Paid During Period" to estimate the expenses you paid on your account during this period. A small balance maintenance fee of $12.00 that is charged once a year may apply for certain accounts with a value of less than $2,000. This fee, which was eliminated effective August 1, 2018, is not included in the table below. If it was, the estimate of expenses you paid during the period would be higher, and your ending account value lower, by this amount. In addition, the Fund, as a shareholder in the underlying Fidelity Central Funds, will indirectly bear its pro-rata share of the fees and expenses incurred by the underlying Fidelity Central Funds. These fees and expenses are not included in the Fund's annualized expense ratio used to calculate the expense estimate in the table below.
Hypothetical Example for Comparison Purposes
The second line of the accompanying table provides information about hypothetical account values and hypothetical expenses based on the Fund's actual expense ratio and an assumed rate of return of 5% per year before expenses, which is not the Fund's actual return. The hypothetical account values and expenses may not be used to estimate the actual ending account balance or expenses you paid for the period. You may use this information to compare the ongoing costs of investing in the Fund and other funds. To do so, compare this 5% hypothetical example with the 5% hypothetical examples that appear in the shareholder reports of the other funds. A small balance maintenance fee of $12.00 that is charged once a year may apply for certain accounts with a value of less than $2,000. This fee, which was eliminated effective August 1, 2018, is not included in the table below. If it was, the estimate of expenses you paid during the period would be higher, and your ending account value lower, by this amount. In addition, the Fund, as a shareholder in the underlying Fidelity Central Funds, will indirectly bear its pro-rata share of the fees and expenses incurred by the underlying Fidelity Central Funds. These fees and expenses are not included in the Fund's annualized expense ratio used to calculate the expense estimate in the table below.
Please note that the expenses shown in the table are meant to highlight your ongoing costs only and do not reflect any transaction costs. Therefore, the second line of the table is useful in comparing ongoing costs only, and will not help you determine the relative total costs of owning different funds.
| Annualized Expense Ratio-A | Beginning Account Value May 1, 2018 | Ending Account Value October 31, 2018 | Expenses Paid During Period-B May 1, 2018 to October 31, 2018 |
|
| Actual | .68% | $1,000.00 | $990.50 | $3.41 |
| Hypothetical-C | $1,000.00 | $1,021.78 | $3.47 |
A Annualized expense ratio reflects expenses net of applicable fee waivers.
B Expenses are equal to the Fund's annualized expense ratio, multiplied by the average account value over the period, multiplied by 184/365 (to reflect the one-half year period).
C 5% return per year before expenses
Board Approval of Investment Advisory Contracts
Fidelity Capital & Income Fund
At its July 2018 meeting, the Board of Trustees, including the Independent Trustees (together, the Board), voted to continue the management contract with Fidelity Management & Research Company (FMR) and the sub-advisory agreements (together, the Advisory Contracts) for the fund for six months through January 31, 2019, in connection with the reunification of the Fidelity Equity High Income Funds Board, which oversees the fund, and the Sector Portfolios Board.
The Board considered that the approval of the fund's Advisory Contracts will not result in any changes in (i) the investment process or strategies employed in the management of the fund's assets; (ii) the fees and expenses paid by shareholders; (iii) the nature, extent or quality of services provided under the fund's Advisory Contracts; or (iv) the day-to-day management of the fund or the persons primarily responsible for such management. The Board concluded that the fund's Advisory Contracts are fair and reasonable, and that the fund's Advisory Contracts should be renewed, without modification, through January 31, 2019, with the understanding that the Board will consider the annual renewal for a full one year period in January 2019.
In connection with its consideration of future renewals of the fund's Advisory Contracts, the Board will consider: (i) the nature, extent and quality of services provided to the fund, including shareholder and administrative services and investment performance; (ii) the competitiveness of the management fee and total expenses for the fund; (iii) the costs of the services and profitability, including the revenues earned and the expenses incurred in conducting the business of developing, marketing, distributing, managing, administering, and servicing the fund and its shareholders, to the extent applicable, as well as potential fall-out benefits from Fidelity's non-fund businesses; and (iv) whether there have been economies of scale in respect of the Fidelity funds, whether the Fidelity funds (including the fund) have appropriately benefited from any such economies of scale, and whether there is the potential for realization of any further economies.
Based on its evaluation of all of the conclusions noted above, and after considering all factors it believed relevant, the Board ultimately concluded that the fund's management fee structure is fair and reasonable, and that the continuation of the fund's Advisory Contracts should be approved.
![]()
Corporate Headquarters
245 Summer St.
Boston, MA 02210
www.fidelity.com
CAI-SANN-1218
1.538653.121
|
Fidelity® Focused High Income Fund Semi-Annual Report October 31, 2018 |
|
|
Contents
To view a fund's proxy voting guidelines and proxy voting record for the 12-month period ended June 30, visit http://www.fidelity.com/proxyvotingresults or visit the Securities and Exchange Commission's (SEC) web site at http://www.sec.gov.
You may also call 1-800-544-8544 to request a free copy of the proxy voting guidelines.
Standard & Poor's, S&P and S&P 500 are registered service marks of The McGraw-Hill Companies, Inc. and have been licensed for use by Fidelity Distributors Corporation.
Other third-party marks appearing herein are the property of their respective owners.
All other marks appearing herein are registered or unregistered trademarks or service marks of FMR LLC or an affiliated company. © 2018 FMR LLC. All rights reserved.
This report and the financial statements contained herein are submitted for the general information of the shareholders of the Fund. This report is not authorized for distribution to prospective investors in the Fund unless preceded or accompanied by an effective prospectus.
A fund files its complete schedule of portfolio holdings with the SEC for the first and third quarters of each fiscal year on Form N-Q. Forms N-Q are available on the SEC’s web site at http://www.sec.gov. A fund's Forms N-Q may be reviewed and copied at the SEC’s Public Reference Room in Washington, DC. Information regarding the operation of the SEC's Public Reference Room may be obtained by calling 1-800-SEC-0330.
For a complete list of a fund's portfolio holdings, view the most recent holdings listing, semiannual report, or annual report on Fidelity's web site at http://www.fidelity.com, http://www.institutional.fidelity.com, or http://www.401k.com, as applicable.
NOT FDIC INSURED •MAY LOSE VALUE •NO BANK GUARANTEE
Neither the Fund nor Fidelity Distributors Corporation is a bank.
Investment Summary (Unaudited)
Top Five Holdings as of October 31, 2018
| (by issuer, excluding cash equivalents) | % of fund's net assets |
| CCO Holdings LLC/CCO Holdings Capital Corp. | 4.2 |
| Icahn Enterprises LP/Icahn Enterprises Finance Corp. | 3.2 |
| Bank of America Corp. | 3.2 |
| Ally Financial, Inc. | 2.4 |
| Targa Resources Partners LP/Targa Resources Partners Finance Corp. | 2.1 |
| 15.1 |
Top Five Market Sectors as of October 31, 2018
| % of fund's net assets | |
| Energy | 15.5 |
| Cable/Satellite TV | 9.7 |
| Banks & Thrifts | 9.1 |
| Diversified Financial Services | 8.1 |
| Healthcare | 7.4 |
Quality Diversification (% of fund's net assets)
| As of October 31, 2018 | ||
| BBB | 2.4% | |
| BB | 73.3% | |
| B | 20.7% | |
| Short-Term Investments and Net Other Assets | 3.6% | |
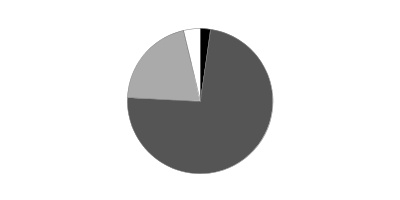
We have used ratings from Moody's Investors Service, Inc. Where Moody's® ratings are not available, we have used S&P® ratings. All ratings are as of the date indicated and do not reflect subsequent changes.
Asset Allocation (% of fund's net assets)
| As of October 31, 2018* | ||
| Nonconvertible Bonds | 87.5% | |
| Convertible Bonds, Preferred Stocks | 0.5% | |
| Bank Loan Obligations | 1.6% | |
| Other Investments | 6.8% | |
| Short-Term Investments and Net Other Assets (Liabilities) | 3.6% | |

* Foreign investments - 19.9%
Schedule of Investments October 31, 2018 (Unaudited)
Showing Percentage of Net Assets
| Corporate Bonds - 88.0% | |||
| Principal Amount | Value | ||
| Convertible Bonds - 0.5% | |||
| Broadcasting - 0.5% | |||
| DISH Network Corp.: | |||
| 2.375% 3/15/24 | $1,230,000 | $1,032,004 | |
| 3.375% 8/15/26 | 680,000 | 605,846 | |
| 1,637,850 | |||
| Nonconvertible Bonds - 87.5% | |||
| Aerospace - 1.0% | |||
| BBA U.S. Holdings, Inc. 5.375% 5/1/26 (a) | 1,620,000 | 1,601,775 | |
| BWX Technologies, Inc. 5.375% 7/15/26 (a) | 1,500,000 | 1,503,750 | |
| 3,105,525 | |||
| Air Transportation - 0.4% | |||
| Aercap Global Aviation Trust 6.5% 6/15/45 (a)(b) | 1,245,000 | 1,276,125 | |
| Banks & Thrifts - 2.9% | |||
| Ally Financial, Inc.: | |||
| 5.125% 9/30/24 | 770,000 | 782,513 | |
| 5.75% 11/20/25 | 4,130,000 | 4,233,250 | |
| 8% 11/1/31 | 1,995,000 | 2,398,988 | |
| Royal Bank of Scotland Group PLC 5.125% 5/28/24 | 1,600,000 | 1,584,001 | |
| 8,998,752 | |||
| Broadcasting - 2.0% | |||
| Sirius XM Radio, Inc.: | |||
| 3.875% 8/1/22 (a) | 1,695,000 | 1,631,438 | |
| 5% 8/1/27 (a) | 2,285,000 | 2,147,192 | |
| 6% 7/15/24 (a) | 2,195,000 | 2,243,949 | |
| 6,022,579 | |||
| Cable/Satellite TV - 9.7% | |||
| Altice U.S. Finance SA 5.375% 7/15/23 (a) | 6,745,000 | 6,743,700 | |
| CCO Holdings LLC/CCO Holdings Capital Corp.: | |||
| 4% 3/1/23 (a) | 1,750,000 | 1,666,875 | |
| 5% 2/1/28 (a) | 3,655,000 | 3,412,856 | |
| 5.125% 5/1/23 (a) | 1,105,000 | 1,099,475 | |
| 5.125% 5/1/27 (a) | 2,110,000 | 1,986,038 | |
| 5.5% 5/1/26 (a) | 3,150,000 | 3,067,313 | |
| 5.875% 5/1/27 (a) | 1,630,000 | 1,601,475 | |
| CSC Holdings LLC: | |||
| 5.375% 2/1/28 (a) | 620,000 | 584,350 | |
| 5.5% 4/15/27 (a) | 1,320,000 | 1,267,200 | |
| DISH DBS Corp.: | |||
| 5.875% 11/15/24 | 1,330,000 | 1,130,500 | |
| 7.75% 7/1/26 | 815,000 | 729,425 | |
| Virgin Media Secured Finance PLC 5.5% 8/15/26 (a) | 1,460,000 | 1,376,050 | |
| Ziggo Secured Finance BV 5.5% 1/15/27 (a) | 5,455,000 | 5,004,963 | |
| 29,670,220 | |||
| Capital Goods - 1.0% | |||
| AECOM: | |||
| 5.125% 3/15/27 | 2,000,000 | 1,860,000 | |
| 5.875% 10/15/24 | 1,155,000 | 1,175,213 | |
| 3,035,213 | |||
| Chemicals - 3.3% | |||
| CF Industries Holdings, Inc.: | |||
| 3.45% 6/1/23 | 1,325,000 | 1,258,750 | |
| 4.5% 12/1/26 (a) | 265,000 | 260,169 | |
| 5.15% 3/15/34 | 80,000 | 73,400 | |
| NOVA Chemicals Corp.: | |||
| 4.875% 6/1/24 (a) | 1,765,000 | 1,621,594 | |
| 5.25% 6/1/27 (a) | 620,000 | 559,550 | |
| OCI NV 6.625% 4/15/23 (a) | 1,270,000 | 1,301,750 | |
| Olin Corp.: | |||
| 5% 2/1/30 | 360,000 | 323,219 | |
| 5.125% 9/15/27 | 1,695,000 | 1,578,469 | |
| The Chemours Co. LLC 5.375% 5/15/27 | 1,000,000 | 930,000 | |
| Valvoline, Inc. 4.375% 8/15/25 | 1,065,000 | 982,463 | |
| W. R. Grace & Co.-Conn. 5.625% 10/1/24 (a) | 1,200,000 | 1,221,000 | |
| 10,110,364 | |||
| Consumer Products - 0.3% | |||
| Coty, Inc. 6.5% 4/15/26 (a) | 930,000 | 867,225 | |
| Containers - 2.0% | |||
| Ardagh Packaging Finance PLC/Ardagh MP Holdings U.S.A., Inc. 4.625% 5/15/23 (a) | 1,590,000 | 1,546,275 | |
| Crown Americas LLC / Crown Americas Capital Corp. IV 4.75% 2/1/26 (a) | 780,000 | 736,125 | |
| Crown Americas LLC/Crown Americas Capital Corp. V 4.25% 9/30/26 | 1,770,000 | 1,606,275 | |
| OI European Group BV 4% 3/15/23 (a) | 1,230,000 | 1,151,588 | |
| Owens-Brockway Glass Container, Inc. 5.375% 1/15/25 (a) | 460,000 | 446,200 | |
| Silgan Holdings, Inc. 4.75% 3/15/25 | 810,000 | 768,488 | |
| 6,254,951 | |||
| Diversified Financial Services - 8.1% | |||
| Aircastle Ltd. 4.125% 5/1/24 | 395,000 | 383,671 | |
| FLY Leasing Ltd. 5.25% 10/15/24 | 1,210,000 | 1,149,500 | |
| Icahn Enterprises LP/Icahn Enterprises Finance Corp.: | |||
| 5.875% 2/1/22 | 4,785,000 | 4,785,479 | |
| 6% 8/1/20 | 2,315,000 | 2,335,256 | |
| 6.25% 2/1/22 | 1,970,000 | 1,988,833 | |
| 6.75% 2/1/24 | 580,000 | 584,350 | |
| MSCI, Inc.: | |||
| 4.75% 8/1/26 (a) | 2,350,000 | 2,267,750 | |
| 5.375% 5/15/27 (a) | 2,545,000 | 2,519,550 | |
| Navient Corp.: | |||
| 6.5% 6/15/22 | 460,000 | 468,133 | |
| 6.625% 7/26/21 | 1,600,000 | 1,646,000 | |
| 7.25% 9/25/23 | 1,395,000 | 1,443,825 | |
| Park Aerospace Holdings Ltd.: | |||
| 4.5% 3/15/23 (a) | 180,000 | 171,248 | |
| 5.25% 8/15/22 (a) | 525,000 | 521,063 | |
| 5.5% 2/15/24 (a) | 1,035,000 | 1,024,909 | |
| Quicken Loans, Inc. 5.25% 1/15/28 (a) | 1,720,000 | 1,526,500 | |
| SLM Corp.: | |||
| 5.5% 1/25/23 | 1,455,000 | 1,428,766 | |
| 6.125% 3/25/24 | 210,000 | 204,225 | |
| 7.25% 1/25/22 | 460,000 | 478,400 | |
| 24,927,458 | |||
| Diversified Media - 0.3% | |||
| Nielsen Co. SARL (Luxembourg): | |||
| 5% 2/1/25 (a) | 90,000 | 87,497 | |
| 5.5% 10/1/21 (a) | 135,000 | 135,675 | |
| Nielsen Finance LLC/Nielsen Finance Co. 5% 4/15/22 (a) | 700,000 | 681,625 | |
| 904,797 | |||
| Energy - 14.1% | |||
| Cheniere Corpus Christi Holdings LLC: | |||
| 5.125% 6/30/27 | 990,000 | 970,200 | |
| 5.875% 3/31/25 | 1,590,000 | 1,633,725 | |
| 7% 6/30/24 | 2,245,000 | 2,427,406 | |
| Cheniere Energy Partners LP: | |||
| 5.25% 10/1/25 | 2,585,000 | 2,536,531 | |
| 5.625% 10/1/26 (a) | 1,155,000 | 1,137,675 | |
| Consolidated Energy Finance SA 3 month U.S. LIBOR + 3.750% 6.0841% 6/15/22 (a)(b)(c) | 3,290,000 | 3,291,449 | |
| Crestwood Midstream Partners LP/Crestwood Midstream Finance Corp. 5.75% 4/1/25 | 2,195,000 | 2,189,513 | |
| CVR Refining LLC/Coffeyville Finance, Inc. 6.5% 11/1/22 | 2,630,000 | 2,646,438 | |
| DCP Midstream Operating LP 5.375% 7/15/25 | 915,000 | 927,856 | |
| Duke Energy Field Services 8.125% 8/16/30 | 315,000 | 366,975 | |
| Endeavor Energy Resources LP/EER Finance, Inc.: | |||
| 5.5% 1/30/26 (a) | 195,000 | 200,363 | |
| 5.75% 1/30/28 (a) | 195,000 | 201,338 | |
| Ensco PLC: | |||
| 4.5% 10/1/24 | 1,150,000 | 934,375 | |
| 7.75% 2/1/26 | 485,000 | 452,263 | |
| Hess Infrastructure Partners LP 5.625% 2/15/26 (a) | 2,090,000 | 2,095,225 | |
| Hilcorp Energy I LP/Hilcorp Finance Co.: | |||
| 5% 12/1/24 (a) | 2,755,000 | 2,596,588 | |
| 5.75% 10/1/25 (a) | 1,294,000 | 1,258,415 | |
| Jonah Energy LLC 7.25% 10/15/25 (a) | 750,000 | 596,250 | |
| Magnolia Oil & Gas Operating LLC 6% 8/1/26 (a) | 740,000 | 730,750 | |
| Nabors Industries, Inc.: | |||
| 5.5% 1/15/23 | 1,490,000 | 1,400,469 | |
| 5.75% 2/1/25 | 515,000 | 475,337 | |
| NextEra Energy Partners LP: | |||
| 4.25% 9/15/24 (a) | 1,760,000 | 1,672,000 | |
| 4.5% 9/15/27 (a) | 255,000 | 235,238 | |
| PBF Holding Co. LLC/PBF Finance Corp. 7% 11/15/23 | 1,200,000 | 1,239,000 | |
| Rose Rock Midstream LP/Rose Rock Finance Corp. 5.625% 11/15/23 | 1,000,000 | 945,000 | |
| Sanchez Energy Corp. 7.25% 2/15/23 (a) | 1,000,000 | 912,500 | |
| Southwestern Energy Co. 4.1% 3/15/22 | 330,000 | 325,050 | |
| Summit Midstream Holdings LLC 5.75% 4/15/25 | 975,000 | 933,563 | |
| Sunoco LP/Sunoco Finance Corp. 5.5% 2/15/26 (a) | 800,000 | 762,000 | |
| Targa Resources Partners LP/Targa Resources Partners Finance Corp.: | |||
| 4.25% 11/15/23 | 2,635,000 | 2,527,097 | |
| 5% 1/15/28 | 1,390,000 | 1,317,025 | |
| 5.125% 2/1/25 | 780,000 | 758,550 | |
| 5.375% 2/1/27 | 390,000 | 379,275 | |
| 5.875% 4/15/26 (a) | 1,840,000 | 1,850,350 | |
| Teine Energy Ltd. 6.875% 9/30/22 (a) | 25,000 | 24,875 | |
| TerraForm Power Operating LLC: | |||
| 4.25% 1/31/23 (a) | 235,000 | 222,663 | |
| 5% 1/31/28 (a) | 235,000 | 210,031 | |
| 43,383,358 | |||
| Food/Beverage/Tobacco - 2.8% | |||
| C&S Group Enterprises LLC 5.375% 7/15/22 (a) | 1,905,000 | 1,838,325 | |
| JBS U.S.A. LLC/JBS U.S.A. Finance, Inc. 5.875% 7/15/24 (a) | 2,030,000 | 1,992,445 | |
| Lamb Weston Holdings, Inc.: | |||
| 4.625% 11/1/24 (a) | 1,375,000 | 1,346,771 | |
| 4.875% 11/1/26 (a) | 1,065,000 | 1,027,725 | |
| Vector Group Ltd. 6.125% 2/1/25 (a) | 2,630,000 | 2,393,300 | |
| 8,598,566 | |||
| Gaming - 4.6% | |||
| GLP Capital LP/GLP Financing II, Inc. 5.25% 6/1/25 | 995,000 | 999,985 | |
| MCE Finance Ltd. 4.875% 6/6/25 (a) | 3,225,000 | 2,956,944 | |
| MGM Growth Properties Operating Partnership LP: | |||
| 4.5% 9/1/26 | 3,300,000 | 2,986,500 | |
| 4.5% 1/15/28 | 1,525,000 | 1,364,875 | |
| MGM Mirage, Inc. 5.75% 6/15/25 | 2,520,000 | 2,429,280 | |
| Scientific Games Corp. 5% 10/15/25 (a) | 700,000 | 651,000 | |
| Wynn Las Vegas LLC/Wynn Las Vegas Capital Corp. 5.25% 5/15/27 (a) | 1,930,000 | 1,746,650 | |
| Wynn Macau Ltd. 4.875% 10/1/24 (a) | 960,000 | 871,200 | |
| 14,006,434 | |||
| Healthcare - 7.4% | |||
| Charles River Laboratories International, Inc. 5.5% 4/1/26 (a) | 295,000 | 294,263 | |
| CTR Partnership LP/CareTrust Capital Corp. 5.25% 6/1/25 | 1,195,000 | 1,165,125 | |
| HCA Holdings, Inc.: | |||
| 5% 3/15/24 | 1,055,000 | 1,067,528 | |
| 5.25% 6/15/26 | 1,545,000 | 1,572,038 | |
| Hologic, Inc.: | |||
| 4.375% 10/15/25 (a) | 780,000 | 731,250 | |
| 4.625% 2/1/28 (a) | 150,000 | 137,063 | |
| IMS Health, Inc. 5% 10/15/26 (a) | 1,000,000 | 962,180 | |
| MPT Operating Partnership LP/MPT Finance Corp.: | |||
| 5% 10/15/27 | 610,000 | 573,217 | |
| 5.25% 8/1/26 | 1,455,000 | 1,404,075 | |
| 6.375% 3/1/24 | 880,000 | 910,800 | |
| Sabra Health Care LP/Sabra Capital Corp. 5.375% 6/1/23 | 995,000 | 990,025 | |
| Service Corp. International 4.625% 12/15/27 | 920,000 | 862,500 | |
| Teleflex, Inc.: | |||
| 4.625% 11/15/27 | 505,000 | 468,489 | |
| 4.875% 6/1/26 | 4,955,000 | 4,831,125 | |
| Tenet Healthcare Corp.: | |||
| 4.375% 10/1/21 | 1,100,000 | 1,087,625 | |
| 4.625% 7/15/24 | 1,520,000 | 1,465,052 | |
| 5.125% 5/1/25 | 1,200,000 | 1,155,000 | |
| Valeant Pharmaceuticals International, Inc. 7% 3/15/24 (a) | 2,540,000 | 2,659,863 | |
| Wellcare Health Plans, Inc. 5.375% 8/15/26 (a) | 205,000 | 204,488 | |
| 22,541,706 | |||
| Homebuilders/Real Estate - 0.6% | |||
| Howard Hughes Corp. 5.375% 3/15/25 (a) | 1,345,000 | 1,291,200 | |
| Starwood Property Trust, Inc. 4.75% 3/15/25 | 440,000 | 419,100 | |
| 1,710,300 | |||
| Hotels - 1.4% | |||
| Hilton Escrow Issuer LLC 4.25% 9/1/24 | 2,345,000 | 2,251,904 | |
| Hilton Worldwide Finance LLC/Hilton Worldwide Finance Corp.: | |||
| 4.625% 4/1/25 | 750,000 | 727,500 | |
| 4.875% 4/1/27 | 445,000 | 424,975 | |
| Wyndham Hotels & Resorts, Inc. 5.375% 4/15/26 (a) | 1,020,000 | 989,400 | |
| 4,393,779 | |||
| Leisure - 0.5% | |||
| Mattel, Inc. 6.75% 12/31/25 (a) | 1,630,000 | 1,556,145 | |
| Metals/Mining - 2.1% | |||
| FMG Resources (August 2006) Pty Ltd.: | |||
| 4.75% 5/15/22 (a) | 1,560,000 | 1,497,600 | |
| 5.125% 3/15/23 (a) | 430,000 | 414,950 | |
| Freeport-McMoRan, Inc.: | |||
| 3.55% 3/1/22 | 3,505,000 | 3,316,606 | |
| 4.55% 11/14/24 | 340,000 | 314,925 | |
| Nufarm Australia Ltd. 5.75% 4/30/26 (a) | 900,000 | 840,375 | |
| 6,384,456 | |||
| Restaurants - 0.9% | |||
| 1011778 BC Unlimited Liability Co./New Red Finance, Inc. 4.25% 5/15/24 (a) | 1,425,000 | 1,335,938 | |
| KFC Holding Co./Pizza Hut Holding LLC 5% 6/1/24 (a) | 1,300,000 | 1,282,125 | |
| 2,618,063 | |||
| Services - 1.4% | |||
| Aramark Services, Inc.: | |||
| 4.75% 6/1/26 | 2,460,000 | 2,343,150 | |
| 5% 2/1/28 (a) | 750,000 | 711,563 | |
| CDK Global, Inc. 4.875% 6/1/27 | 505,000 | 472,806 | |
| Corrections Corp. of America 5% 10/15/22 | 105,000 | 101,456 | |
| Prime Security One MS, Inc. 4.875% 7/15/32 (a) | 695,000 | 547,313 | |
| 4,176,288 | |||
| Steel - 0.2% | |||
| Commercial Metals Co. 5.375% 7/15/27 | 785,000 | 727,106 | |
| Super Retail - 0.2% | |||
| Sally Holdings LLC: | |||
| 5.5% 11/1/23 | 500,000 | 481,250 | |
| 5.625% 12/1/25 | 105,000 | 97,514 | |
| 578,764 | |||
| Technology - 6.9% | |||
| Entegris, Inc. 4.625% 2/10/26 (a) | 1,400,000 | 1,300,684 | |
| Fair Isaac Corp. 5.25% 5/15/26 (a) | 1,305,000 | 1,287,056 | |
| First Data Corp. 5.375% 8/15/23 (a) | 1,255,000 | 1,265,981 | |
| Gartner, Inc. 5.125% 4/1/25 (a) | 390,000 | 387,075 | |
| Micron Technology, Inc. 5.5% 2/1/25 | 1,615,000 | 1,639,225 | |
| Nuance Communications, Inc.: | |||
| 5.375% 8/15/20 (a) | 1,518,000 | 1,518,949 | |
| 5.625% 12/15/26 | 1,495,000 | 1,465,100 | |
| Open Text Corp. 5.875% 6/1/26 (a) | 5,015,000 | 5,040,075 | |
| Qorvo, Inc. 5.5% 7/15/26 (a) | 665,000 | 666,663 | |
| Sensata Technologies BV 5% 10/1/25 (a) | 1,915,000 | 1,847,975 | |
| Sensata Technologies UK Financing Co. PLC 6.25% 2/15/26 (a) | 435,000 | 442,613 | |
| SoftBank Corp. 5.375% 7/30/22 (Reg. S) | 1,000,000 | 1,002,500 | |
| Symantec Corp. 5% 4/15/25 (a) | 2,725,000 | 2,563,644 | |
| TTM Technologies, Inc. 5.625% 10/1/25 (a) | 800,000 | 780,000 | |
| 21,207,540 | |||
| Telecommunications - 6.3% | |||
| Altice Financing SA: | |||
| 6.625% 2/15/23 (a) | 2,240,000 | 2,217,152 | |
| 7.5% 5/15/26 (a) | 433,000 | 407,020 | |
| C&W Senior Financing Designated Activity Co. 7.5% 10/15/26 (a) | 810,000 | 812,025 | |
| Equinix, Inc. 5.875% 1/15/26 | 1,125,000 | 1,144,688 | |
| Level 3 Financing, Inc.: | |||
| 5.25% 3/15/26 | 1,186,000 | 1,138,560 | |
| 5.625% 2/1/23 | 2,000,000 | 2,007,060 | |
| Millicom International Cellular SA 6.625% 10/15/26 (a) | 320,000 | 323,200 | |
| Neptune Finco Corp. 6.625% 10/15/25 (a) | 4,600,000 | 4,818,500 | |
| Qwest Corp. 6.75% 12/1/21 | 510,000 | 532,281 | |
| T-Mobile U.S.A., Inc.: | |||
| 4.5% 2/1/26 | 845,000 | 790,869 | |
| 6.5% 1/15/24 | 2,535,000 | 2,623,725 | |
| Telenet Finance Luxembourg Notes SARL 5.5% 3/1/28 (a) | 2,200,000 | 2,040,500 | |
| U.S. West Communications 7.25% 9/15/25 | 560,000 | 596,995 | |
| 19,452,575 | |||
| Transportation Ex Air/Rail - 0.5% | |||
| Avolon Holdings Funding Ltd.: | |||
| 5.125% 10/1/23 (a) | 1,045,000 | 1,025,406 | |
| 5.5% 1/15/23 (a) | 520,000 | 517,400 | |
| 1,542,806 | |||
| Utilities - 6.6% | |||
| Clearway Energy Operating LLC 5.75% 10/15/25 (a) | 525,000 | 517,125 | |
| Dolphin Subsidiary II, Inc. 7.25% 10/15/21 | 3,140,000 | 3,334,303 | |
| DPL, Inc. 6.75% 10/1/19 | 803,000 | 822,071 | |
| InterGen NV 7% 6/30/23 (a) | 1,635,000 | 1,606,388 | |
| NRG Energy, Inc.: | |||
| 5.75% 1/15/28 | 515,000 | 513,713 | |
| 6.25% 5/1/24 | 360,000 | 367,517 | |
| 6.625% 1/15/27 | 2,390,000 | 2,470,663 | |
| NRG Yield Operating LLC 5% 9/15/26 | 790,000 | 734,700 | |
| NSG Holdings II LLC/NSG Holdings, Inc. 7.75% 12/15/25 (a) | 3,032,132 | 3,274,703 | |
| The AES Corp.: | |||
| 4.5% 3/15/23 | 585,000 | 576,956 | |
| 4.875% 5/15/23 | 3,105,000 | 3,073,950 | |
| 6% 5/15/26 | 1,880,000 | 1,922,300 | |
| Vistra Operations Co. LLC 5.5% 9/1/26 (a) | 1,075,000 | 1,058,875 | |
| 20,273,264 | |||
| TOTAL NONCONVERTIBLE BONDS | 268,324,359 | ||
| TOTAL CORPORATE BONDS | |||
| (Cost $276,377,953) | 269,962,209 | ||
| Bank Loan Obligations - 1.6% | |||
| Energy - 0.8% | |||
| Consolidated Energy Finance SA Tranche B, term loan 3 month U.S. LIBOR + 2.500% 4.7841% 5/7/25 (b)(c) | 2,543,625 | 2,530,907 | |
| Gaming - 0.2% | |||
| Scientific Games Corp. Tranche B 5LN, term loan 3 month U.S. LIBOR + 2.750% 5.0457% 8/14/24 (b)(c) | 446,805 | 442,176 | |
| Telecommunications - 0.6% | |||
| Level 3 Financing, Inc. Tranche B, term loan 3 month U.S. LIBOR + 2.250% 4.5296% 2/22/24 (b)(c) | 1,200,000 | 1,200,564 | |
| Sable International Finance Ltd. Tranche B 4LN, term loan 3 month U.S. LIBOR + 3.250% 5.552% 2/2/26 (b)(c) | 675,000 | 674,244 | |
| TOTAL TELECOMMUNICATIONS | 1,874,808 | ||
| TOTAL BANK LOAN OBLIGATIONS | |||
| (Cost $4,854,507) | 4,847,891 | ||
| Preferred Securities - 6.8% | |||
| Banks & Thrifts - 6.2% | |||
| Bank of America Corp.: | |||
| 6.1% (b)(d) | 2,835,000 | 2,930,916 | |
| 6.25% (b)(d) | 3,180,000 | 3,306,695 | |
| 6.5% (b)(d) | 3,150,000 | 3,345,481 | |
| Barclays PLC 7.875% (Reg. S) (b)(d) | 1,295,000 | 1,347,018 | |
| BNP Paribas SA 7% (a)(b)(d) | 200,000 | 199,929 | |
| Citigroup, Inc. 5.95% (b)(d) | 2,980,000 | 3,018,793 | |
| Credit Agricole SA 6.625% (a)(b)(d) | 2,513,000 | 2,552,947 | |
| Royal Bank of Scotland Group PLC 7.5% (b)(d) | 1,065,000 | 1,089,595 | |
| Wells Fargo & Co. 5.9% (b)(d) | 1,300,000 | 1,332,340 | |
| TOTAL BANKS & THRIFTS | 19,123,714 | ||
| Energy - 0.6% | |||
| Andeavor Logistics LP 6.875% (b)(d) | 1,700,000 | 1,675,965 | |
| TOTAL PREFERRED SECURITIES | |||
| (Cost $20,529,091) | 20,799,679 | ||
| Shares | Value | ||
| Money Market Funds - 1.6% | |||
| Fidelity Cash Central Fund, 2.23% (e) | |||
| (Cost $4,938,269) | 4,937,281 | 4,938,269 | |
| TOTAL INVESTMENT IN SECURITIES - 98.0% | |||
| (Cost $306,699,820) | 300,548,048 | ||
| NET OTHER ASSETS (LIABILITIES) - 2.0% | 5,984,675 | ||
| NET ASSETS - 100% | $306,532,723 |
Legend
(a) Security exempt from registration under Rule 144A of the Securities Act of 1933. These securities may be resold in transactions exempt from registration, normally to qualified institutional buyers. At the end of the period, the value of these securities amounted to $143,611,488 or 46.9% of net assets.
(b) Coupon rates for floating and adjustable rate securities reflect the rates in effect at period end.
(c) Coupon is indexed to a floating interest rate which may be multiplied by a specified factor and/or subject to caps or floors.
(d) Security is perpetual in nature with no stated maturity date.
(e) Affiliated fund that is generally available only to investment companies and other accounts managed by Fidelity Investments. The rate quoted is the annualized seven-day yield of the fund at period end. A complete unaudited listing of the fund's holdings as of its most recent quarter end is available upon request. In addition, each Fidelity Central Fund's financial statements are available on the SEC's website or upon request.
Affiliated Central Funds
Information regarding fiscal year to date income earned by the Fund from investments in Fidelity Central Funds is as follows:
| Fund | Income earned |
| Fidelity Cash Central Fund | $83,266 |
| Total | $83,266 |
Amounts in the income column in the above table include any capital gain distributions from underlying funds, which are presented in the corresponding line-item in the Statement of Operations if applicable.
Investment Valuation
The following is a summary of the inputs used, as of October 31, 2018, involving the Fund's assets and liabilities carried at fair value. The inputs or methodology used for valuing securities may not be an indication of the risk associated with investing in those securities. For more information on valuation inputs, and their aggregation into the levels used below, please refer to the Investment Valuation section in the accompanying Notes to Financial Statements.
| Valuation Inputs at Reporting Date: | ||||
| Description | Total | Level 1 | Level 2 | Level 3 |
| Investments in Securities: | ||||
| Corporate Bonds | $269,962,209 | $-- | $269,962,209 | $-- |
| Bank Loan Obligations | 4,847,891 | -- | 4,847,891 | -- |
| Preferred Securities | 20,799,679 | -- | 20,799,679 | -- |
| Money Market Funds | 4,938,269 | 4,938,269 | -- | -- |
| Total Investments in Securities: | $300,548,048 | $4,938,269 | $295,609,779 | $-- |
Other Information
Distribution of investments by country or territory of incorporation, as a percentage of Total Net Assets, is as follows (Unaudited):
| United States of America | 80.1% |
| Canada | 3.9% |
| Luxembourg | 3.6% |
| Netherlands | 3.5% |
| Cayman Islands | 2.5% |
| United Kingdom | 2.3% |
| Others (Individually Less Than 1%) | 4.1% |
| 100.0% |
See accompanying notes which are an integral part of the financial statements.
Financial Statements
Statement of Assets and Liabilities
| October 31, 2018 (Unaudited) | ||
| Assets | ||
| Investment in securities, at value — See accompanying schedule: Unaffiliated issuers (cost $301,761,551) | $295,609,779 | |
| Fidelity Central Funds (cost $4,938,269) | 4,938,269 | |
| Total Investment in Securities (cost $306,699,820) | $300,548,048 | |
| Cash | 457,078 | |
| Receivable for investments sold | 3,458,844 | |
| Receivable for fund shares sold | 11,731 | |
| Interest receivable | 4,270,746 | |
| Distributions receivable from Fidelity Central Funds | 8,735 | |
| Prepaid expenses | 718 | |
| Total assets | 308,755,900 | |
| Liabilities | ||
| Payable for investments purchased | $1,573,882 | |
| Payable for fund shares redeemed | 122,679 | |
| Distributions payable | 288,855 | |
| Accrued management fee | 143,666 | |
| Other affiliated payables | 50,838 | |
| Other payables and accrued expenses | 43,257 | |
| Total liabilities | 2,223,177 | |
| Net Assets | $306,532,723 | |
| Net Assets consist of: | ||
| Paid in capital | $321,875,949 | |
| Total distributable earnings (loss) | (15,343,226) | |
| Net Assets, for 36,721,158 shares outstanding | $306,532,723 | |
| Net Asset Value, offering price and redemption price per share ($306,532,723 ÷ 36,721,158 shares) | $8.35 |
See accompanying notes which are an integral part of the financial statements.
Statement of Operations
| Six months ended October 31, 2018 (Unaudited) | ||
| Investment Income | ||
| Dividends | $1,053,077 | |
| Interest | 8,290,756 | |
| Income from Fidelity Central Funds | 83,266 | |
| Total income | 9,427,099 | |
| Expenses | ||
| Management fee | $947,210 | |
| Transfer agent fees | 258,832 | |
| Accounting fees and expenses | 70,816 | |
| Custodian fees and expenses | 3,654 | |
| Independent trustees' fees and expenses | 1,099 | |
| Registration fees | 24,290 | |
| Audit | 42,380 | |
| Legal | 340 | |
| Miscellaneous | 1,624 | |
| Total expenses before reductions | 1,350,245 | |
| Expense reductions | (3,874) | |
| Total expenses after reductions | 1,346,371 | |
| Net investment income (loss) | 8,080,728 | |
| Realized and Unrealized Gain (Loss) | ||
| Net realized gain (loss) on: | ||
| Investment securities: | ||
| Unaffiliated issuers | 1,390,685 | |
| Fidelity Central Funds | (177) | |
| Total net realized gain (loss) | 1,390,508 | |
| Change in net unrealized appreciation (depreciation) on investment securities | (6,522,137) | |
| Net gain (loss) | (5,131,629) | |
| Net increase (decrease) in net assets resulting from operations | $2,949,099 |
See accompanying notes which are an integral part of the financial statements.
Statement of Changes in Net Assets
| Six months ended October 31, 2018 (Unaudited) | Year ended April 30, 2018 | |
| Increase (Decrease) in Net Assets | ||
| Operations | ||
| Net investment income (loss) | $8,080,728 | $21,066,675 |
| Net realized gain (loss) | 1,390,508 | 10,037,866 |
| Change in net unrealized appreciation (depreciation) | (6,522,137) | (19,868,398) |
| Net increase (decrease) in net assets resulting from operations | 2,949,099 | 11,236,143 |
| Distributions to shareholders | (7,609,266) | – |
| Distributions to shareholders from net investment income | – | (20,060,899) |
| Total distributions | (7,609,266) | (20,060,899) |
| Share transactions | ||
| Proceeds from sales of shares | 13,659,110 | 89,436,320 |
| Reinvestment of distributions | 5,871,984 | 15,741,265 |
| Cost of shares redeemed | (106,187,817) | (247,556,955) |
| Net increase (decrease) in net assets resulting from share transactions | (86,656,723) | (142,379,370) |
| Redemption fees | – | 83,202 |
| Total increase (decrease) in net assets | (91,316,890) | (151,120,924) |
| Net Assets | ||
| Beginning of period | 397,849,613 | 548,970,537 |
| End of period | $306,532,723 | $397,849,613 |
| Other Information | ||
| Undistributed net investment income end of period | $1,274,871 | |
| Shares | ||
| Sold | 1,615,453 | 10,296,385 |
| Issued in reinvestment of distributions | 695,550 | 1,815,188 |
| Redeemed | (12,576,726) | (28,429,361) |
| Net increase (decrease) | (10,265,723) | (16,317,788) |
See accompanying notes which are an integral part of the financial statements.
Financial Highlights
Fidelity Focused High Income Fund
| Six months ended (Unaudited) October 31, | Years endedApril 30, | |||||
| 2018 | 2018 | 2017 | 2016 | 2015 | 2014 | |
| Selected Per–Share Data | ||||||
| Net asset value, beginning of period | $8.47 | $8.67 | $8.22 | $8.73 | $9.12 | $9.55 |
| Income from Investment Operations | ||||||
| Net investment income (loss)A | .201 | .380 | .397 | .396 | .390 | .444 |
| Net realized and unrealized gain (loss) | (.132) | (.219) | .423 | (.519) | (.116) | (.102) |
| Total from investment operations | .069 | .161 | .820 | (.123) | .274 | .342 |
| Distributions from net investment income | (.189) | (.362) | (.373) | (.389) | (.388) | (.438) |
| Distributions from net realized gain | – | – | – | – | (.278) | (.335) |
| Total distributions | (.189) | (.362) | (.373) | (.389) | (.666) | (.773) |
| Redemption fees added to paid in capitalA | – | .001 | .003 | .002 | .002 | .001 |
| Net asset value, end of period | $8.35 | $8.47 | $8.67 | $8.22 | $8.73 | $9.12 |
| Total ReturnB,C | .81% | 1.86% | 10.22% | (1.30)% | 3.20% | 3.92% |
| Ratios to Average Net AssetsD,E | ||||||
| Expenses before reductions | .78%F | .80% | .83% | .85% | .85% | .83% |
| Expenses net of fee waivers, if any | .78%F | .80% | .83% | .85% | .85% | .83% |
| Expenses net of all reductions | .78%F | .79% | .82% | .85% | .85% | .83% |
| Net investment income (loss) | 4.70%F | 4.38% | 4.70% | 4.80% | 4.40% | 4.86% |
| Supplemental Data | ||||||
| Net assets, end of period (000 omitted) | $306,533 | $397,850 | $548,971 | $769,732 | $625,413 | $754,153 |
| Portfolio turnover rateG | 59%F | 47% | 51% | 47% | 62% | 77% |
A Calculated based on average shares outstanding during the period.
B Total returns for periods of less than one year are not annualized.
C Total returns would have been lower if certain expenses had not been reduced during the applicable periods shown.
D Fees and expenses of any underlying Fidelity Central Funds are not included in the Fund's expense ratio. The Fund indirectly bears its proportionate share of the expenses of any underlying Fidelity Central Funds.
E Expense ratios reflect operating expenses of the Fund. Expenses before reductions do not reflect amounts reimbursed by the investment adviser or reductions from expense offset arrangements and do not represent the amount paid by the Fund during periods when reimbursements or reductions occur. Expenses net of fee waivers reflect expenses after reimbursement by the investment adviser but prior to reductions from expense offset arrangements. Expenses net of all reductions represent the net expenses paid by the Fund.
F Annualized
G Amount does not include the portfolio activity of any underlying Fidelity Central Funds.
See accompanying notes which are an integral part of the financial statements.
Notes to Financial Statements (Unaudited)
For the period ended October 31, 2018
1. Organization.
Fidelity Focused High Income Fund (the Fund) is a fund of Fidelity Summer Street Trust (the Trust) and is authorized to issue an unlimited number of shares. Share transactions on the Statement of Changes in Net Assets may contain exchanges between affiliated funds. The Trust is registered under the Investment Company Act of 1940, as amended (the 1940 Act), as an open-end management investment company organized as a Massachusetts business trust.
2. Investments in Fidelity Central Funds.
The Fund invests in Fidelity Central Funds, which are open-end investment companies generally available only to other investment companies and accounts managed by the investment adviser and its affiliates. The Fund's Schedule of Investments lists each of the Fidelity Central Funds held as of period end, if any, as an investment of the Fund, but does not include the underlying holdings of each Fidelity Central Fund. As an Investing Fund, the Fund indirectly bears its proportionate share of the expenses of the underlying Fidelity Central Funds.
The Money Market Central Funds seek preservation of capital and current income and are managed by Fidelity Investments Money Management, Inc. (FIMM), an affiliate of the investment adviser. Annualized expenses of the Money Market Central Funds as of their most recent shareholder report date are less than .005%.
A complete unaudited list of holdings for each Fidelity Central Fund is available upon request or at the Securities and Exchange Commission (the SEC) website at www.sec.gov. In addition, the financial statements of the Fidelity Central Funds are available on the SEC website or upon request.
3. Significant Accounting Policies.
The Fund is an investment company and applies the accounting and reporting guidance of the Financial Accounting Standards Board (FASB) Accounting Standards Codification Topic 946 Financial Services – Investments Companies. The financial statements have been prepared in conformity with accounting principles generally accepted in the United States of America (GAAP), which require management to make certain estimates and assumptions at the date of the financial statements. Actual results could differ from those estimates. Subsequent events, if any, through the date that the financial statements were issued have been evaluated in the preparation of the financial statements. The following summarizes the significant accounting policies of the Fund:
Investment Valuation. Investments are valued as of 4:00 p.m. Eastern time on the last calendar day of the period. The Board of Trustees (the Board) has delegated the day to day responsibility for the valuation of the Fund's investments to the Fair Value Committee (the Committee) established by the Fund's investment adviser. In accordance with valuation policies and procedures approved by the Board, the Fund attempts to obtain prices from one or more third party pricing vendors or brokers to value its investments. When current market prices, quotations or currency exchange rates are not readily available or reliable, investments will be fair valued in good faith by the Committee, in accordance with procedures adopted by the Board. Factors used in determining fair value vary by investment type and may include market or investment specific events, changes in interest rates and credit quality. The frequency with which these procedures are used cannot be predicted and they may be utilized to a significant extent. The Committee oversees the Fund's valuation policies and procedures and reports to the Board on the Committee's activities and fair value determinations. The Board monitors the appropriateness of the procedures used in valuing the Fund's investments and ratifies the fair value determinations of the Committee.
The Fund categorizes the inputs to valuation techniques used to value its investments into a disclosure hierarchy consisting of three levels as shown below:
- Level 1 – quoted prices in active markets for identical investments
- Level 2 – other significant observable inputs (including quoted prices for similar investments, interest rates, prepayment speeds, etc.)
- Level 3 – unobservable inputs (including the Fund's own assumptions based on the best information available)
Valuation techniques used to value the Fund's investments by major category are as follows:
Debt securities, including restricted securities, are valued based on evaluated prices received from third party pricing vendors or from brokers who make markets in such securities. Corporate bonds, bank loan obligations and preferred securities are valued by pricing vendors who utilize matrix pricing which considers yield or price of bonds of comparable quality, coupon, maturity and type or by broker-supplied prices. When independent prices are unavailable or unreliable, debt securities may be valued utilizing pricing methodologies which consider similar factors that would be used by third party pricing vendors. Debt securities are generally categorized as Level 2 in the hierarchy but may be Level 3 depending on the circumstances. The Fund invests a significant portion of its assets in below investment grade securities. The value of these securities can be more volatile due to changes in the credit quality of the issuer and is sensitive to changes in economic, market and regulatory conditions.
Investments in open-end mutual funds, including the Fidelity Central Funds, are valued at their closing net asset value (NAV) each business day and are categorized as Level 1 in the hierarchy.
Changes in valuation techniques may result in transfers in or out of an assigned level within the disclosure hierarchy. The aggregate value of investments by input level as of October 31, 2018 is included at the end of the Fund's Schedule of Investments.
Investment Transactions and Income. For financial reporting purposes, the Fund's investment holdings and NAV include trades executed through the end of the last business day of the period. The NAV per share for processing shareholder transactions is calculated as of the close of business of the New York Stock Exchange (NYSE), normally 4:00 p.m. Eastern time and includes trades executed through the end of the prior business day. Gains and losses on securities sold are determined on the basis of identified cost and include proceeds received from litigation. Dividend income is recorded on the ex-dividend date. Income and capital gain distributions from Fidelity Central Funds, if any, are recorded on the ex-dividend date. Interest income is accrued as earned and includes coupon interest and amortization of premium and accretion of discount on debt securities as applicable. Debt obligations may be placed on non-accrual status and related interest income may be reduced by ceasing current accruals and writing off interest receivables when the collection of all or a portion of interest has become doubtful based on consistently applied procedures. A debt obligation is removed from non-accrual status when the issuer resumes interest payments or when collectability of interest is reasonably assured.
Expenses. Expenses directly attributable to a fund are charged to that fund. Expenses attributable to more than one fund are allocated among the respective funds on the basis of relative net assets or other appropriate methods. Expense estimates are accrued in the period to which they relate and adjustments are made when actual amounts are known.
Income Tax Information and Distributions to Shareholders. Each year, the Fund intends to qualify as a regulated investment company under Subchapter M of the Internal Revenue Code, including distributing substantially all of its taxable income and realized gains. As a result, no provision for U.S. Federal income taxes is required. The Fund files a U.S. federal tax return, in addition to state and local tax returns as required. The Fund's federal income tax returns are subject to examination by the Internal Revenue Service (IRS) for a period of three fiscal years after they are filed. State and local tax returns may be subject to examination for an additional fiscal year depending on the jurisdiction.
Distributions are declared and recorded daily and paid monthly from net investment income. Distributions from realized gains, if any, are declared and recorded on the ex-dividend date. Income and capital gain distributions are determined in accordance with income tax regulations, which may differ from GAAP.
Capital accounts within the financial statements are adjusted for permanent book-tax differences. These adjustments have no impact on net assets or the results of operations. Capital accounts are not adjusted for temporary book-tax differences which will reverse in a subsequent period.
Book-tax differences are primarily due to market discount, partnerships, capital loss carryforwards and losses deferred due to wash sales.
As of period end, the cost and unrealized appreciation (depreciation) in securities, and derivatives if applicable, for federal income tax purposes were as follows:
| Gross unrealized appreciation | $2,619,115 |
| Gross unrealized depreciation | (8,098,648) |
| Net unrealized appreciation (depreciation) | $(5,479,533) |
| Tax cost | $306,027,581 |
Capital loss carryforwards are only available to offset future capital gains of the Fund to the extent provided by regulations and may be limited. Under the Regulated Investment Company Modernization Act of 2010 (the Act), the Fund is permitted to carry forward capital losses incurred in taxable years beginning after December 22, 2010 for an unlimited period and such capital losses are required to be used prior to any losses that expire. The capital loss carryforward information presented below, including any applicable limitation, is estimated as of prior fiscal period end and is subject to adjustment.
| No expiration | |
| Short-term | $(10,971,259) |
| Long-term | (1,259,059) |
| Total capital loss carryforward | $(12,230,318) |
Restricted Securities. The Fund may invest in securities that are subject to legal or contractual restrictions on resale. These securities generally may be resold in transactions exempt from registration or to the public if the securities are registered. Disposal of these securities may involve time-consuming negotiations and expense, and prompt sale at an acceptable price may be difficult. Information regarding restricted securities is included at the end of the Fund's Schedule of Investments.
Loans and Other Direct Debt Instruments. The Fund invests in direct debt instruments which are interests in amounts owed to lenders by corporate or other borrowers. These instruments may be in the form of loans, trade claims or other receivables and may include standby financing commitments such as revolving credit facilities that obligate the Fund to supply additional cash to the borrower on demand. Loans may be acquired through assignment or participation. The Fund did not have any unfunded loan commitments, which are contractual obligations for future funding, at period end.
New Accounting Pronouncement. In March 2017, the Financial Accounting Standards Board (FASB) issued an Accounting Standards Update (ASU), ASU 2017-08, which amends the amortization period for certain callable debt securities that are held at a premium. The amendment requires the premium to be amortized to the earliest call date. The amendments do not require an accounting change for securities held at a discount. The ASU is effective for annual periods beginning after December 15, 2018. Management is currently evaluating the potential impact of these changes to the financial statements.
New Rule Issuance. During August 2018, the U.S. Securities and Exchange Commission issued Final Rule Release No. 33-10532, Disclosure Update and Simplification. This Final Rule includes amendments specific to registered investment companies that are intended to eliminate overlap in disclosure requirements between Regulation S-X and GAAP. In accordance with these amendments, certain line-items in the Fund's financial statements have been combined or removed for the current period as outlined in the table below.
| Financial Statement | Current Line-Item Presentation | Prior Line-Item Presentation |
| Statement of Assets and Liabilities | Total distributable earnings (loss) | Undistributed/Distributions in excess of/Accumulated net investment income (loss) Accumulated/Undistributed net realized gain (loss) Net unrealized appreciation (depreciation) |
| Statement of Changes in Net Assets | N/A – removed | Undistributed/Distributions in excess of/Accumulated net investment income (loss) end of period |
| Statement of Changes in Net Assets | Distributions to shareholders | Distributions to shareholders from net investment income Distributions to shareholders from net realized gain |
4. Purchases and Sales of Investments.
Purchases and sales of securities, other than short-term securities, aggregated $97,485,284 and $179,557,646, respectively.
5. Fees and Other Transactions with Affiliates.
Management Fee. Fidelity Management & Research Company (the investment adviser) and its affiliates provide the Fund with investment management related services for which the Fund pays a monthly management fee. The management fee is the sum of an individual fund fee rate that is based on an annual rate of .45% of the Fund's average net assets and an annualized group fee rate that averaged .11% during the period. The group fee rate is based upon the average net assets of all the mutual funds advised by the investment adviser, including any mutual funds previously advised by the investment adviser that are currently advised by Fidelity SelectCo, LLC, an affiliate of the investment adviser. The group fee rate decreases as assets under management increase and increases as assets under management decrease. For the reporting period, the total annualized management fee rate was .56% of the Fund's average net assets.
Transfer Agent Fees. Fidelity Investments Institutional Operations Company, Inc. (FIIOC), an affiliate of the investment adviser, is the Fund's transfer, dividend disbursing and shareholder servicing agent. FIIOC receives account fees and asset-based fees that vary according to account size and type of account. FIIOC pays for typesetting, printing and mailing of shareholder reports, except proxy statements. For the period, the transfer agent fees were equivalent to an annualized rate of .15% of average net assets.
Accounting Fees. Fidelity Service Company, Inc. (FSC),an affiliate of the investment adviser, maintains the Fund's accounting records. The fee is based on the level of average net assets for each month. For the period, the fees were equivalent to an annualized rate of .04%.
Interfund Trades. The Fund may purchase from or sell securities to other Fidelity Funds under procedures adopted by the Board. The procedures have been designed to ensure these interfund trades are executed in accordance with Rule 17a-7 of the 1940 Act. Interfund trades are included within the respective purchases and sales amounts shown in the Purchases and Sales of Investments note.
6. Committed Line of Credit.
The Fund participates with other funds managed by the investment adviser or an affiliate in a $4.25 billion credit facility (the "line of credit") to be utilized for temporary or emergency purposes to fund shareholder redemptions or for other short-term liquidity purposes. The Fund has agreed to pay commitment fees on its pro-rata portion of the line of credit, which amounted to $467 and is reflected in Miscellaneous expenses on the Statement of Operations. During the period, the Fund did not borrow on this line of credit.
7. Expense Reductions.
Through arrangements with the Fund's custodian, credits realized as a result of certain uninvested cash balances were used to reduce the Fund's expenses. During the period, these credits reduced the Fund's custody expenses by $2,527.
In addition, during the period the investment adviser reimbursed and/or waived a portion of operating expenses in the amount of $1,347.
8. Other.
The Fund's organizational documents provide former and current trustees and officers with a limited indemnification against liabilities arising in connection with the performance of their duties to the Fund. In the normal course of business, the Fund may also enter into contracts that provide general indemnifications. The Fund's maximum exposure under these arrangements is unknown as this would be dependent on future claims that may be made against the Fund. The risk of material loss from such claims is considered remote.
Shareholder Expense Example
As a shareholder of the Fund, you incur two types of costs: (1) transaction costs and (2) ongoing costs, including management fees and other Fund expenses. This Example is intended to help you understand your ongoing costs (in dollars) of investing in the Fund and to compare these costs with the ongoing costs of investing in other mutual funds.
The Example is based on an investment of $1,000 invested at the beginning of the period and held for the entire period (May 1, 2018 to October 31, 2018).
Actual Expenses
The first line of the accompanying table provides information about actual account values and actual expenses. You may use the information in this line, together with the amount you invested, to estimate the expenses that you paid over the period. Simply divide your account value by $1,000.00 (for example, an $8,600 account value divided by $1,000.00 = 8.6), then multiply the result by the number in the first line under the heading entitled "Expenses Paid During Period" to estimate the expenses you paid on your account during this period. A small balance maintenance fee of $12.00 that is charged once a year may apply for certain accounts with a value of less than $2,000. This fee, which was eliminated effective August 1, 2018, is not included in the table below. If it was, the estimate of expenses you paid during the period would be higher, and your ending account value lower, by this amount. In addition, the Fund, as a shareholder in the underlying Fidelity Central Funds, will indirectly bear its pro-rata share of the fees and expenses incurred by the underlying Fidelity Central Funds. These fees and expenses are not included in the Fund's annualized expense ratio used to calculate the expense estimate in the table below.
Hypothetical Example for Comparison Purposes
The second line of the accompanying table provides information about hypothetical account values and hypothetical expenses based on the Fund's actual expense ratio and an assumed rate of return of 5% per year before expenses, which is not the Fund's actual return. The hypothetical account values and expenses may not be used to estimate the actual ending account balance or expenses you paid for the period. You may use this information to compare the ongoing costs of investing in the Fund and other funds. To do so, compare this 5% hypothetical example with the 5% hypothetical examples that appear in the shareholder reports of the other funds. A small balance maintenance fee of $12.00 that is charged once a year may apply for certain accounts with a value of less than $2,000. This fee, which was eliminated effective August 1, 2018, is not included in the table below. If it was, the estimate of expenses you paid during the period would be higher, and your ending account value lower, by this amount. In addition, the Fund, as a shareholder in the underlying Fidelity Central Funds, will indirectly bear its pro-rata share of the fees and expenses incurred by the underlying Fidelity Central Funds. These fees and expenses are not included in the Fund's annualized expense ratio used to calculate the expense estimate in the table below.
Please note that the expenses shown in the table are meant to highlight your ongoing costs only and do not reflect any transaction costs. Therefore, the second line of the table is useful in comparing ongoing costs only, and will not help you determine the relative total costs of owning different funds.
| Annualized Expense Ratio-A | Beginning Account Value May 1, 2018 | Ending Account Value October 31, 2018 | Expenses Paid During Period-B May 1, 2018 to October 31, 2018 |
|
| Actual | .78% | $1,000.00 | $1,008.10 | $3.95 |
| Hypothetical-C | $1,000.00 | $1,021.27 | $3.97 |
A Annualized expense ratio reflects expenses net of applicable fee waivers.
B Expenses are equal to the Fund's annualized expense ratio, multiplied by the average account value over the period, multiplied by 184/365 (to reflect the one-half year period).
C 5% return per year before expenses
Board Approval of Investment Advisory Contracts
Fidelity Focused High Income Fund
At its July 2018 meeting, the Board of Trustees, including the Independent Trustees (together, the Board), voted to continue the management contract with Fidelity Management & Research Company (FMR) and the sub-advisory agreements (together, the Advisory Contracts) for the fund for six months through January 31, 2019, in connection with the reunification of the Fidelity Equity High Income Funds Board, which oversees the fund, and the Sector Portfolios Board.
The Board considered that the approval of the fund's Advisory Contracts will not result in any changes in (i) the investment process or strategies employed in the management of the fund's assets; (ii) the fees and expenses paid by shareholders; (iii) the nature, extent or quality of services provided under the fund's Advisory Contracts; or (iv) the day-to-day management of the fund or the persons primarily responsible for such management. The Board concluded that the fund's Advisory Contracts are fair and reasonable, and that the fund's Advisory Contracts should be renewed, without modification, through January 31, 2019, with the understanding that the Board will consider the annual renewal for a full one year period in January 2019.
In connection with its consideration of future renewals of the fund's Advisory Contracts, the Board will consider: (i) the nature, extent and quality of services provided to the fund, including shareholder and administrative services and investment performance; (ii) the competitiveness of the management fee and total expenses for the fund; (iii) the costs of the services and profitability, including the revenues earned and the expenses incurred in conducting the business of developing, marketing, distributing, managing, administering, and servicing the fund and its shareholders, to the extent applicable, as well as potential fall-out benefits from Fidelity's non-fund businesses; and (iv) whether there have been economies of scale in respect of the Fidelity funds, whether the Fidelity funds (including the fund) have appropriately benefited from any such economies of scale, and whether there is the potential for realization of any further economies.
Based on its evaluation of all of the conclusions noted above, and after considering all factors it believed relevant, the Board ultimately concluded that the fund's management fee structure is fair and reasonable, and that the continuation of the fund's Advisory Contracts should be approved.
![]()
Corporate Headquarters
245 Summer St.
Boston, MA 02210
www.fidelity.com
FFH-SANN-1218
1.801609.115
|
Fidelity® High Income Fund Semi-Annual Report October 31, 2018 |
|
|
Contents
To view a fund's proxy voting guidelines and proxy voting record for the 12-month period ended June 30, visit http://www.fidelity.com/proxyvotingresults or visit the Securities and Exchange Commission's (SEC) web site at http://www.sec.gov.
You may also call 1-800-544-8544 to request a free copy of the proxy voting guidelines.
Standard & Poor's, S&P and S&P 500 are registered service marks of The McGraw-Hill Companies, Inc. and have been licensed for use by Fidelity Distributors Corporation.
Other third-party marks appearing herein are the property of their respective owners.
All other marks appearing herein are registered or unregistered trademarks or service marks of FMR LLC or an affiliated company. © 2018 FMR LLC. All rights reserved.
This report and the financial statements contained herein are submitted for the general information of the shareholders of the Fund. This report is not authorized for distribution to prospective investors in the Fund unless preceded or accompanied by an effective prospectus.
A fund files its complete schedule of portfolio holdings with the SEC for the first and third quarters of each fiscal year on Form N-Q. Forms N-Q are available on the SEC’s web site at http://www.sec.gov. A fund's Forms N-Q may be reviewed and copied at the SEC’s Public Reference Room in Washington, DC. Information regarding the operation of the SEC's Public Reference Room may be obtained by calling 1-800-SEC-0330.
For a complete list of a fund's portfolio holdings, view the most recent holdings listing, semiannual report, or annual report on Fidelity's web site at http://www.fidelity.com, http://www.institutional.fidelity.com, or http://www.401k.com, as applicable.
NOT FDIC INSURED •MAY LOSE VALUE •NO BANK GUARANTEE
Neither the Fund nor Fidelity Distributors Corporation is a bank.
Investment Summary (Unaudited)
Top Five Holdings as of October 31, 2018
| (by issuer, excluding cash equivalents) | % of fund's net assets |
| CCO Holdings LLC/CCO Holdings Capital Corp. | 3.2 |
| Community Health Systems, Inc. | 2.0 |
| Valeant Pharmaceuticals International, Inc. | 2.2 |
| Altice SA | 1.8 |
| Tenet Healthcare Corp. | 1.7 |
| 10.9 |
Top Five Market Sectors as of October 31, 2018
| % of fund's net assets | |
| Energy | 16.2 |
| Telecommunications | 9.1 |
| Cable/Satellite TV | 8.9 |
| Healthcare | 8.8 |
| Diversified Financial Services | 4.4 |
Quality Diversification (% of fund's net assets)
| As of October 31, 2018 | ||
| BBB | 0.8% | |
| BB | 34.4% | |
| B | 41.8% | |
| CCC,CC,C | 12.5% | |
| Not Rated | 0.2% | |
| Equities | 2.0% | |
| Short-Term Investments and Net Other Assets | 8.3% | |

We have used ratings from Moody's Investors Service, Inc. Where Moody's® ratings are not available, we have used S&P® ratings. All ratings are as of the date indicated and do not reflect subsequent changes.
Asset Allocation (% of fund's net assets)
| As of October 31, 2018* | ||
| Nonconvertible Bonds | 82.1% | |
| Convertible Bonds, Preferred Stocks | 1.3% | |
| Common Stocks | 1.3% | |
| Bank Loan Obligations | 5.2% | |
| Other Investments | 1.8% | |
| Short-Term Investments and Net Other Assets (Liabilities) | 8.3% | |

* Foreign investments - 23.8%
Schedule of Investments October 31, 2018 (Unaudited)
Showing Percentage of Net Assets
| Corporate Bonds - 82.7% | |||
| Principal Amount (000s) | Value (000s) | ||
| Convertible Bonds - 0.6% | |||
| Broadcasting - 0.5% | |||
| DISH Network Corp.: | |||
| 2.375% 3/15/24 | $1,060 | $889 | |
| 3.375% 8/15/26 | 22,750 | 20,269 | |
| 21,158 | |||
| Energy - 0.1% | |||
| Ensco Jersey Finance Ltd. 3% 1/31/24 | 7,690 | 7,022 | |
| TOTAL CONVERTIBLE BONDS | 28,180 | ||
| Nonconvertible Bonds - 82.1% | |||
| Aerospace - 1.7% | |||
| BBA U.S. Holdings, Inc. 5.375% 5/1/26 (a) | 12,550 | 12,409 | |
| Bombardier, Inc.: | |||
| 7.5% 12/1/24 (a) | 15,410 | 15,660 | |
| 7.5% 3/15/25 (a) | 25,710 | 25,702 | |
| BWX Technologies, Inc. 5.375% 7/15/26 (a) | 13,175 | 13,208 | |
| TransDigm UK Holdings PLC 6.875% 5/15/26 (a) | 4,400 | 4,389 | |
| 71,368 | |||
| Air Transportation - 0.4% | |||
| Aercap Global Aviation Trust 6.5% 6/15/45 (a)(b) | 17,421 | 17,857 | |
| Banks & Thrifts - 1.5% | |||
| Ally Financial, Inc.: | |||
| 4.25% 4/15/21 | 2,395 | 2,392 | |
| 5.75% 11/20/25 | 49,425 | 50,662 | |
| 8% 11/1/31 | 8,360 | 10,053 | |
| 63,107 | |||
| Broadcasting - 1.8% | |||
| CBS Radio, Inc. 7.25% 11/1/24 (a) | 5,398 | 5,081 | |
| iHeartCommunications, Inc. 11.25% 3/1/21 (a)(c) | 5,040 | 3,478 | |
| Sirius XM Radio, Inc.: | |||
| 3.875% 8/1/22 (a) | 4,075 | 3,922 | |
| 5% 8/1/27 (a) | 19,090 | 17,939 | |
| 5.375% 4/15/25 (a) | 17,855 | 17,688 | |
| 5.375% 7/15/26 (a) | 18,640 | 18,230 | |
| 6% 7/15/24 (a) | 10,780 | 11,020 | |
| 77,358 | |||
| Building Materials - 0.2% | |||
| Building Materials Corp. of America: | |||
| 5.5% 2/15/23 (a) | 3,595 | 3,523 | |
| 6% 10/15/25 (a) | 6,360 | 6,257 | |
| 9,780 | |||
| Cable/Satellite TV - 8.3% | |||
| Altice SA: | |||
| 7.625% 2/15/25 (a) | 45,195 | 38,529 | |
| 7.75% 5/15/22 (a) | 42,960 | 40,007 | |
| Altice U.S. Finance SA: | |||
| 5.375% 7/15/23 (a) | 12,165 | 12,163 | |
| 5.5% 5/15/26 (a) | 18,505 | 18,025 | |
| CCO Holdings LLC/CCO Holdings Capital Corp.: | |||
| 4% 3/1/23 (a) | 5,310 | 5,058 | |
| 5% 2/1/28 (a) | 5,305 | 4,954 | |
| 5.125% 2/15/23 | 4,795 | 4,771 | |
| 5.125% 5/1/23 (a) | 3,625 | 3,607 | |
| 5.125% 5/1/27 (a) | 14,930 | 14,053 | |
| 5.375% 5/1/25 (a) | 11,975 | 11,721 | |
| 5.5% 5/1/26 (a) | 22,970 | 22,367 | |
| 5.75% 9/1/23 | 6,260 | 6,307 | |
| 5.75% 2/15/26 (a) | 23,160 | 22,928 | |
| 5.875% 4/1/24 (a) | 20,000 | 20,175 | |
| 5.875% 5/1/27 (a) | 20,793 | 20,429 | |
| Cequel Communications Holdings I LLC/Cequel Capital Corp.: | |||
| 5.125% 12/15/21 (a) | 3,060 | 3,052 | |
| 5.125% 12/15/21 (a) | 4,795 | 4,782 | |
| 7.5% 4/1/28 (a) | 2,990 | 3,099 | |
| 7.75% 7/15/25 (a) | 5,975 | 6,304 | |
| CSC Holdings LLC 5.5% 4/15/27 (a) | 11,570 | 11,107 | |
| DISH DBS Corp.: | |||
| 5% 3/15/23 | 5,810 | 5,084 | |
| 5.875% 7/15/22 | 3,210 | 3,033 | |
| 6.75% 6/1/21 | 5,543 | 5,598 | |
| 7.75% 7/1/26 | 14,105 | 12,624 | |
| Virgin Media Finance PLC 4.875% 2/15/22 | 7,525 | 7,168 | |
| Virgin Media Secured Finance PLC: | |||
| 5.25% 1/15/26 (a) | 1,500 | 1,399 | |
| 5.5% 8/15/26 (a) | 11,365 | 10,712 | |
| VTR Finance BV 6.875% 1/15/24 (a) | 5,237 | 5,302 | |
| Ziggo Bond Finance BV 5.875% 1/15/25 (a) | 4,235 | 3,875 | |
| Ziggo Secured Finance BV 5.5% 1/15/27 (a) | 25,555 | 23,447 | |
| 351,680 | |||
| Chemicals - 3.5% | |||
| Blue Cube Spinco, Inc.: | |||
| 9.75% 10/15/23 | 4,075 | 4,533 | |
| 10% 10/15/25 | 5,930 | 6,716 | |
| CF Industries Holdings, Inc.: | |||
| 3.45% 6/1/23 | 3,875 | 3,681 | |
| 5.15% 3/15/34 | 12,530 | 11,496 | |
| 5.375% 3/15/44 | 11,725 | 10,318 | |
| NOVA Chemicals Corp. 4.875% 6/1/24 (a) | 16,705 | 15,348 | |
| OCI NV 6.625% 4/15/23 (a) | 16,855 | 17,276 | |
| Platform Specialty Products Corp. 5.875% 12/1/25 (a) | 7,775 | 7,367 | |
| The Chemours Co. LLC: | |||
| 6.625% 5/15/23 | 5,598 | 5,724 | |
| 7% 5/15/25 | 6,965 | 7,174 | |
| TPC Group, Inc. 8.75% 12/15/20 (a) | 26,585 | 26,053 | |
| Trinseo Materials Operating SCA/Trinseo Materials Finance, Inc. 5.375% 9/1/25 (a) | 2,655 | 2,454 | |
| Tronox Finance PLC 5.75% 10/1/25 (a) | 2,065 | 1,812 | |
| Tronox, Inc. 6.5% 4/15/26 (a) | 24,965 | 22,843 | |
| Valvoline, Inc. 5.5% 7/15/24 | 1,890 | 1,878 | |
| W. R. Grace & Co.-Conn.: | |||
| 5.125% 10/1/21 (a) | 1,855 | 1,869 | |
| 5.625% 10/1/24 (a) | 1,800 | 1,832 | |
| 148,374 | |||
| Containers - 2.4% | |||
| Ard Securities Finance SARL 8.75% 1/31/23 pay-in-kind (a)(b) | 2,687 | 2,580 | |
| Ardagh Packaging Finance PLC/Ardagh MP Holdings U.S.A., Inc.: | |||
| 4.625% 5/15/23 (a) | 23,590 | 22,941 | |
| 6% 2/15/25 (a) | 19,730 | 18,497 | |
| Crown Americas LLC / Crown Americas Capital Corp. IV 4.75% 2/1/26 (a) | 13,115 | 12,377 | |
| Crown Americas LLC/Crown Americas Capital Corp. IV 4.5% 1/15/23 | 1,975 | 1,936 | |
| Crown Americas LLC/Crown Americas Capital Corp. V 4.25% 9/30/26 | 23,730 | 21,535 | |
| OI European Group BV 4% 3/15/23 (a) | 1,055 | 988 | |
| Owens-Brockway Glass Container, Inc.: | |||
| 5% 1/15/22 (a) | 6,190 | 6,113 | |
| 5.375% 1/15/25 (a) | 6,760 | 6,557 | |
| Reynolds Group Issuer, Inc./Reynolds Group Issuer LLC/Reynolds Group Issuer (Luxembourg) SA 5.125% 7/15/23 (a) | 6,995 | 6,846 | |
| 100,370 | |||
| Diversified Financial Services - 4.4% | |||
| FLY Leasing Ltd.: | |||
| 5.25% 10/15/24 | 16,724 | 15,888 | |
| 6.375% 10/15/21 | 8,540 | 8,721 | |
| Icahn Enterprises LP/Icahn Enterprises Finance Corp.: | |||
| 6% 8/1/20 | 3,610 | 3,642 | |
| 6.25% 2/1/22 | 2,435 | 2,458 | |
| 6.375% 12/15/25 | 18,085 | 17,972 | |
| ILFC E-Capital Trust I 3 month U.S. LIBOR + 1.550% 4.78% 12/21/65 (a)(b)(d) | 7,105 | 6,288 | |
| ILFC E-Capital Trust II 3 month U.S. LIBOR + 1.800% 5.03% 12/21/65 (a)(b)(d) | 4,720 | 4,201 | |
| MSCI, Inc.: | |||
| 5.375% 5/15/27 (a) | 5,260 | 5,207 | |
| 5.75% 8/15/25 (a) | 3,285 | 3,375 | |
| Navient Corp.: | |||
| 5% 10/26/20 | 2,165 | 2,177 | |
| 6.625% 7/26/21 | 3,750 | 3,858 | |
| 6.75% 6/25/25 | 10,695 | 10,428 | |
| 6.75% 6/15/26 | 2,645 | 2,544 | |
| 7.25% 9/25/23 | 2,670 | 2,763 | |
| Park Aerospace Holdings Ltd.: | |||
| 4.5% 3/15/23 (a) | 2,530 | 2,407 | |
| 5.25% 8/15/22 (a) | 7,300 | 7,245 | |
| 5.5% 2/15/24 (a) | 13,482 | 13,351 | |
| Quicken Loans, Inc. 5.25% 1/15/28 (a) | 11,965 | 10,619 | |
| Radiate Holdco LLC/Radiate Financial Service Ltd. 6.875% 2/15/23 (a) | 6,790 | 6,518 | |
| SLM Corp.: | |||
| 4.875% 6/17/19 | 10,145 | 10,183 | |
| 6.125% 3/25/24 | 3,190 | 3,102 | |
| 7.25% 1/25/22 | 5,390 | 5,606 | |
| 8% 3/25/20 | 9,007 | 9,401 | |
| Springleaf Financial Corp.: | |||
| 6.125% 5/15/22 | 5,360 | 5,387 | |
| 6.875% 3/15/25 | 2,620 | 2,509 | |
| 7.125% 3/15/26 | 24,790 | 23,251 | |
| 189,101 | |||
| Diversified Media - 1.1% | |||
| E.W. Scripps Co. 5.125% 5/15/25 (a) | 2,010 | 1,889 | |
| MDC Partners, Inc. 6.5% 5/1/24 (a) | 25,547 | 20,949 | |
| Nielsen Co. SARL (Luxembourg) 5% 2/1/25 (a) | 4,540 | 4,414 | |
| Nielsen Finance LLC/Nielsen Finance Co. 5% 4/15/22 (a) | 18,410 | 17,927 | |
| 45,179 | |||
| Energy - 14.9% | |||
| Antero Resources Corp.: | |||
| 5.125% 12/1/22 | 2,440 | 2,423 | |
| 5.625% 6/1/23 (Reg. S) | 3,960 | 3,960 | |
| Antero Resources Finance Corp. 5.375% 11/1/21 | 4,735 | 4,735 | |
| Blue Racer Midstream LLC/Blue Racer Finance Corp. 6.625% 7/15/26 (a) | 5,285 | 5,364 | |
| California Resources Corp. 8% 12/15/22 (a) | 31,310 | 27,866 | |
| Cheniere Corpus Christi Holdings LLC: | |||
| 5.125% 6/30/27 | 2,615 | 2,563 | |
| 7% 6/30/24 | 23,928 | 25,872 | |
| Cheniere Energy Partners LP: | |||
| 5.25% 10/1/25 | 35,880 | 35,207 | |
| 5.625% 10/1/26 (a) | 5,975 | 5,885 | |
| Chesapeake Energy Corp.: | |||
| 4.875% 4/15/22 | 1,957 | 1,859 | |
| 5.375% 6/15/21 | 3,255 | 3,222 | |
| 5.75% 3/15/23 | 3,500 | 3,325 | |
| 8% 1/15/25 | 5,265 | 5,341 | |
| 8% 6/15/27 | 5,730 | 5,694 | |
| Citgo Petroleum Corp. 6.25% 8/15/22 (a) | 17,060 | 16,804 | |
| CNX Midstream Partners LP 6.5% 3/15/26 (a) | 5,085 | 4,958 | |
| Compressco Partners LP/Compressco Finance, Inc. 7.5% 4/1/25 (a) | 2,620 | 2,627 | |
| Comstock Escrow Corp. 9.75% 8/15/26 (a) | 17,115 | 16,516 | |
| Consolidated Energy Finance SA: | |||
| 3 month U.S. LIBOR + 3.750% 6.0841% 6/15/22 (a)(b)(d) | 4,080 | 4,082 | |
| 6.5% 5/15/26 (a) | 10,120 | 10,069 | |
| 6.875% 6/15/25 (a) | 4,850 | 4,941 | |
| CVR Refining LLC/Coffeyville Finance, Inc. 6.5% 11/1/22 | 9,618 | 9,678 | |
| DCP Midstream LLC 5.85% 5/21/43 (a)(b) | 2,655 | 2,376 | |
| DCP Midstream Operating LP 5.375% 7/15/25 | 12,825 | 13,005 | |
| Denbury Resources, Inc.: | |||
| 4.625% 7/15/23 | 14,600 | 12,082 | |
| 7.5% 2/15/24 (a) | 8,530 | 8,338 | |
| 9.25% 3/31/22 (a) | 12,215 | 12,734 | |
| Endeavor Energy Resources LP/EER Finance, Inc.: | |||
| 5.5% 1/30/26 (a) | 1,915 | 1,968 | |
| 5.75% 1/30/28 (a) | 1,925 | 1,988 | |
| Ensco PLC: | |||
| 4.5% 10/1/24 | 4,355 | 3,538 | |
| 5.2% 3/15/25 | 2,345 | 1,923 | |
| 5.75% 10/1/44 | 6,460 | 4,522 | |
| 7.75% 2/1/26 | 2,635 | 2,457 | |
| EP Energy LLC/Everest Acquisition Finance, Inc. 8% 11/29/24 (a) | 15,495 | 14,953 | |
| Exterran Energy Solutions LP 8.125% 5/1/25 | 2,445 | 2,463 | |
| Exterran Partners LP/EXLP Finance Corp. 6% 4/1/21 | 1,970 | 1,950 | |
| Hess Infrastructure Partners LP 5.625% 2/15/26 (a) | 18,845 | 18,892 | |
| Hilcorp Energy I LP/Hilcorp Finance Co.: | |||
| 5% 12/1/24 (a) | 12,190 | 11,489 | |
| 5.75% 10/1/25 (a) | 2,690 | 2,616 | |
| Jonah Energy LLC 7.25% 10/15/25 (a) | 18,858 | 14,992 | |
| MEG Energy Corp. 7% 3/31/24 (a) | 7,635 | 7,501 | |
| Nabors Industries, Inc. 5.75% 2/1/25 | 18,410 | 16,992 | |
| NGL Energy Partners LP/NGL Energy Finance Corp. 6.125% 3/1/25 | 4,545 | 4,136 | |
| Noble Holding International Ltd.: | |||
| 5.25% 3/15/42 | 3,445 | 2,394 | |
| 6.05% 3/1/41 | 4,160 | 3,037 | |
| 7.75% 1/15/24 | 6,385 | 5,962 | |
| 7.875% 2/1/26 (a) | 4,240 | 4,208 | |
| 7.95% 4/1/25 (b) | 5,680 | 5,169 | |
| Parsley Energy LLC/Parsley: | |||
| 5.25% 8/15/25 (a) | 3,100 | 2,995 | |
| 5.625% 10/15/27 (a) | 2,200 | 2,169 | |
| 6.25% 6/1/24 (a) | 925 | 950 | |
| PBF Holding Co. LLC/PBF Finance Corp.: | |||
| 7% 11/15/23 | 16,895 | 17,444 | |
| 7.25% 6/15/25 | 980 | 1,009 | |
| PBF Logistics LP/PBF Logistics Finance, Inc. 6.875% 5/15/23 | 1,900 | 1,933 | |
| Rose Rock Midstream LP/Rose Rock Finance Corp.: | |||
| 5.625% 7/15/22 | 5,885 | 5,650 | |
| 5.625% 11/15/23 | 5,625 | 5,316 | |
| Sanchez Energy Corp. 7.25% 2/15/23 (a) | 39,085 | 35,665 | |
| SemGroup Corp.: | |||
| 6.375% 3/15/25 | 17,134 | 16,577 | |
| 7.25% 3/15/26 | 12,785 | 12,481 | |
| SM Energy Co.: | |||
| 5% 1/15/24 | 7,235 | 6,891 | |
| 5.625% 6/1/25 | 4,280 | 4,120 | |
| 6.125% 11/15/22 | 9,667 | 9,788 | |
| Southwestern Energy Co.: | |||
| 7.5% 4/1/26 | 9,265 | 9,427 | |
| 7.75% 10/1/27 | 4,955 | 5,054 | |
| Summit Midstream Holdings LLC 5.75% 4/15/25 | 13,678 | 13,097 | |
| Sunoco LP/Sunoco Finance Corp.: | |||
| 4.875% 1/15/23 (a) | 6,535 | 6,298 | |
| 5.5% 2/15/26 (a) | 4,690 | 4,467 | |
| Targa Resources Partners LP/Targa Resources Partners Finance Corp.: | |||
| 4.25% 11/15/23 | 6,115 | 5,865 | |
| 5% 1/15/28 | 11,965 | 11,337 | |
| 5.25% 5/1/23 | 2,920 | 2,913 | |
| 5.875% 4/15/26 (a) | 14,190 | 14,270 | |
| 6.75% 3/15/24 | 1,230 | 1,288 | |
| Teine Energy Ltd. 6.875% 9/30/22 (a) | 795 | 791 | |
| TerraForm Power Operating LLC 4.25% 1/31/23 (a) | 4,935 | 4,676 | |
| Transocean, Inc. 9% 7/15/23 (a) | 4,330 | 4,541 | |
| U.S.A. Compression Partners LP 6.875% 4/1/26 (a) | 9,917 | 10,091 | |
| Weatherford International Ltd.: | |||
| 6.5% 8/1/36 | 3,015 | 2,005 | |
| 7% 3/15/38 | 14,605 | 9,858 | |
| 9.875% 2/15/24 | 3,335 | 2,585 | |
| Weatherford International, Inc.: | |||
| 6.8% 6/15/37 | 4,355 | 2,929 | |
| 9.875% 3/1/25 (a) | 19,010 | 14,733 | |
| 633,889 | |||
| Entertainment/Film - 0.3% | |||
| CBS Outdoor Americas Capital LLC/CBS Outdoor Americas Capital Corp.: | |||
| 5.625% 2/15/24 | 2,800 | 2,804 | |
| 5.875% 3/15/25 | 5,245 | 5,265 | |
| New Cotai LLC/New Cotai Capital Corp. 10.625% 5/1/19 pay-in-kind (a)(b) | 7,073 | 4,031 | |
| 12,100 | |||
| Environmental - 1.1% | |||
| Covanta Holding Corp.: | |||
| 5.875% 3/1/24 | 6,641 | 6,624 | |
| 5.875% 7/1/25 | 14,289 | 13,860 | |
| LBC Tank Terminals Holding Netherlands BV 6.875% 5/15/23 (a) | 18,820 | 18,491 | |
| Tervita Escrow Corp. 7.625% 12/1/21 (a) | 9,390 | 9,531 | |
| 48,506 | |||
| Food & Drug Retail - 0.1% | |||
| Performance Food Group, Inc. 5.5% 6/1/24 (a) | 2,765 | 2,654 | |
| Food/Beverage/Tobacco - 3.5% | |||
| C&S Group Enterprises LLC 5.375% 7/15/22 (a) | 28,627 | 27,625 | |
| Cott Holdings, Inc. 5.5% 4/1/25 (a) | 8,265 | 7,872 | |
| ESAL GmbH 6.25% 2/5/23 (a) | 26,230 | 25,738 | |
| JBS Investments GmbH 7.25% 4/3/24 (a) | 14,800 | 14,930 | |
| JBS U.S.A. LLC/JBS U.S.A. Finance, Inc.: | |||
| 5.75% 6/15/25 (a) | 7,855 | 7,600 | |
| 6.75% 2/15/28 (a) | 14,720 | 14,352 | |
| Lamb Weston Holdings, Inc.: | |||
| 4.625% 11/1/24 (a) | 5,230 | 5,123 | |
| 4.875% 11/1/26 (a) | 1,570 | 1,515 | |
| Pilgrim's Pride Corp. 5.75% 3/15/25 (a) | 1,330 | 1,240 | |
| Post Holdings, Inc.: | |||
| 5% 8/15/26 (a) | 6,895 | 6,361 | |
| 5.5% 3/1/25 (a) | 6,025 | 5,825 | |
| 5.625% 1/15/28 (a) | 5,295 | 4,979 | |
| 5.75% 3/1/27 (a) | 4,195 | 4,006 | |
| U.S. Foods, Inc. 5.875% 6/15/24 (a) | 4,305 | 4,262 | |
| Vector Group Ltd. 6.125% 2/1/25 (a) | 21,075 | 19,178 | |
| 150,606 | |||
| Gaming - 3.5% | |||
| Boyd Gaming Corp.: | |||
| 6% 8/15/26 | 3,365 | 3,251 | |
| 6.375% 4/1/26 | 2,050 | 2,032 | |
| CRC Escrow Issuer LLC/CRC Finance LLC 5.25% 10/15/25 (a) | 41,840 | 38,937 | |
| Delta Merger Sub, Inc. 6% 9/15/26 (a) | 2,045 | 2,007 | |
| Downstream Development Authority 10.5% 2/15/23 (a) | 5,285 | 5,377 | |
| Eldorado Resorts, Inc. 6% 4/1/25 | 5,275 | 5,209 | |
| GLP Capital LP/GLP Financing II, Inc. 5.375% 4/15/26 | 1,020 | 1,014 | |
| MCE Finance Ltd. 4.875% 6/6/25 (a) | 6,855 | 6,285 | |
| MGM Growth Properties Operating Partnership LP: | |||
| 4.5% 9/1/26 | 11,250 | 10,181 | |
| 5.625% 5/1/24 | 3,055 | 3,059 | |
| MGM Mirage, Inc. 5.75% 6/15/25 | 7,925 | 7,640 | |
| Scientific Games Corp. 5% 10/15/25 (a) | 9,365 | 8,709 | |
| Stars Group Holdings BV 7% 7/15/26 (a) | 19,930 | 20,229 | |
| Sugarhouse HSP Gaming Prop Mezz LP/Sugarhouse HSP Gaming Finance Corp. 5.875% 5/15/25 (a) | 13,005 | 12,273 | |
| Wynn Las Vegas LLC/Wynn Las Vegas Capital Corp. 5.25% 5/15/27 (a) | 11,655 | 10,548 | |
| Wynn Macau Ltd. 4.875% 10/1/24 (a) | 13,365 | 12,129 | |
| 148,880 | |||
| Healthcare - 8.6% | |||
| Catalent Pharma Solutions 4.875% 1/15/26 (a) | 1,490 | 1,397 | |
| Centene Escrow Corp. 5.375% 6/1/26 (a) | 5,230 | 5,308 | |
| Charles River Laboratories International, Inc. 5.5% 4/1/26 (a) | 4,110 | 4,100 | |
| Community Health Systems, Inc.: | |||
| 5.125% 8/1/21 | 33,970 | 32,187 | |
| 6.25% 3/31/23 | 21,990 | 20,224 | |
| 6.875% 2/1/22 | 46,607 | 23,560 | |
| 8.625% 1/15/24 (a) | 12,460 | 12,600 | |
| CTR Partnership LP/CareTrust Capital Corp. 5.25% 6/1/25 | 7,105 | 6,927 | |
| HCA Holdings, Inc.: | |||
| 5.25% 6/15/26 | 3,320 | 3,378 | |
| 5.375% 9/1/26 | 4,615 | 4,530 | |
| 5.875% 5/1/23 | 12,595 | 13,036 | |
| 6.25% 2/15/21 | 7,735 | 8,035 | |
| HealthSouth Corp. 5.75% 9/15/25 | 5,215 | 5,163 | |
| HLF Financing SARL LLC / Herbalife International, Inc. 7.25% 8/15/26(a) | 1,395 | 1,412 | |
| Hologic, Inc. 4.375% 10/15/25 (a) | 4,405 | 4,130 | |
| IMS Health, Inc. 5% 10/15/26 (a) | 3,785 | 3,642 | |
| MPT Operating Partnership LP/MPT Finance Corp.: | |||
| 5% 10/15/27 | 3,280 | 3,082 | |
| 5.5% 5/1/24 | 4,965 | 5,015 | |
| 6.375% 3/1/24 | 3,810 | 3,943 | |
| Sabra Health Care LP/Sabra Capital Corp.: | |||
| 5.375% 6/1/23 | 15,645 | 15,567 | |
| 5.5% 2/1/21 | 8,215 | 8,323 | |
| Teleflex, Inc. 4.875% 6/1/26 | 9,265 | 9,033 | |
| Tenet Healthcare Corp.: | |||
| 4.375% 10/1/21 | 21,045 | 20,808 | |
| 5.125% 5/1/25 | 10,645 | 10,246 | |
| 6.75% 6/15/23 | 5,185 | 5,170 | |
| 8.125% 4/1/22 | 38,840 | 40,442 | |
| THC Escrow Corp. III 7% 8/1/25 | 9,455 | 9,274 | |
| Valeant Pharmaceuticals International, Inc.: | |||
| 5.5% 11/1/25 (a) | 11,780 | 11,544 | |
| 5.625% 12/1/21 (a) | 3,595 | 3,541 | |
| 5.875% 5/15/23 (a) | 22,540 | 21,554 | |
| 6.125% 4/15/25 (a) | 18,095 | 16,642 | |
| 7.5% 7/15/21 (a) | 4,800 | 4,872 | |
| 8.5% 1/31/27 (a) | 4,360 | 4,436 | |
| 9% 12/15/25 (a) | 6,475 | 6,750 | |
| 9.25% 4/1/26 (a) | 10,470 | 10,980 | |
| Wellcare Health Plans, Inc.: | |||
| 5.25% 4/1/25 | 2,765 | 2,758 | |
| 5.375% 8/15/26 (a) | 2,795 | 2,788 | |
| 366,397 | |||
| Homebuilders/Real Estate - 1.2% | |||
| Beazer Homes U.S.A., Inc. 6.75% 3/15/25 | 4,135 | 3,628 | |
| Howard Hughes Corp. 5.375% 3/15/25 (a) | 18,265 | 17,534 | |
| Mattamy Group Corp. 6.875% 12/15/23 (a) | 1,840 | 1,792 | |
| Starwood Property Trust, Inc.: | |||
| 4.75% 3/15/25 | 9,535 | 9,082 | |
| 5% 12/15/21 | 4,690 | 4,667 | |
| Taylor Morrison Communities, Inc./Monarch Communities, Inc. 5.625% 3/1/24 (a) | 4,782 | 4,639 | |
| TRI Pointe Homes, Inc. 5.25% 6/1/27 | 5,325 | 4,546 | |
| William Lyon Homes, Inc.: | |||
| 5.875% 1/31/25 | 3,095 | 2,727 | |
| 6% 9/1/23 | 2,635 | 2,404 | |
| 51,019 | |||
| Hotels - 1.4% | |||
| ESH Hospitality, Inc. 5.25% 5/1/25 (a) | 23,165 | 21,920 | |
| Hilton Domestic Operating Co., Inc. 5.125% 5/1/26 (a) | 26,180 | 25,591 | |
| Hilton Escrow Issuer LLC 4.25% 9/1/24 | 8,425 | 8,091 | |
| Marriott Ownership Resorts, Inc. 6.5% 9/15/26 (a) | 3,350 | 3,384 | |
| 58,986 | |||
| Insurance - 0.1% | |||
| AmWINS Group, Inc. 7.75% 7/1/26 (a) | 2,645 | 2,718 | |
| Leisure - 1.0% | |||
| Mattel, Inc.: | |||
| 2.35% 8/15/21 | 7,920 | 7,108 | |
| 3.15% 3/15/23 | 2,635 | 2,242 | |
| 6.75% 12/31/25 (a) | 26,175 | 24,989 | |
| Studio City Co. Ltd.: | |||
| 5.875% 11/30/19 (a) | 1,345 | 1,357 | |
| 7.25% 11/30/21 (a) | 7,035 | 7,238 | |
| 42,934 | |||
| Metals/Mining - 2.4% | |||
| Constellium NV 5.875% 2/15/26 (a) | 2,920 | 2,723 | |
| First Quantum Minerals Ltd.: | |||
| 6.5% 3/1/24 (a) | 12,610 | 11,002 | |
| 6.875% 3/1/26 (a) | 12,130 | 10,477 | |
| 7% 2/15/21 (a) | 2,470 | 2,416 | |
| 7.25% 5/15/22 (a) | 1,975 | 1,886 | |
| 7.25% 4/1/23 (a) | 9,505 | 8,780 | |
| 7.5% 4/1/25 (a) | 24,970 | 22,286 | |
| FMG Resources (August 2006) Pty Ltd.: | |||
| 4.75% 5/15/22 (a) | 3,140 | 3,014 | |
| 5.125% 5/15/24 (a) | 3,860 | 3,667 | |
| Freeport-McMoRan, Inc.: | |||
| 3.55% 3/1/22 | 11,010 | 10,418 | |
| 3.875% 3/15/23 | 10,420 | 9,639 | |
| 6.875% 2/15/23 | 4,275 | 4,473 | |
| Nufarm Australia Ltd. 5.75% 4/30/26 (a) | 13,155 | 12,283 | |
| 103,064 | |||
| Paper - 0.0% | |||
| Flex Acquisition Co., Inc. 6.875% 1/15/25 (a) | 1,530 | 1,431 | |
| NewPage Corp. 11.375% 12/31/2014 (c)(e) | 30,721 | 0 | |
| 1,431 | |||
| Restaurants - 0.8% | |||
| 1011778 BC Unlimited Liability Co./New Red Finance, Inc.: | |||
| 4.25% 5/15/24 (a) | 11,765 | 11,030 | |
| 5% 10/15/25 (a) | 2,655 | 2,489 | |
| Golden Nugget, Inc. 6.75% 10/15/24 (a) | 7,965 | 7,945 | |
| KFC Holding Co./Pizza Hut Holding LLC 5% 6/1/24 (a) | 14,865 | 14,661 | |
| 36,125 | |||
| Services - 3.2% | |||
| APX Group, Inc. 7.625% 9/1/23 | 5,605 | 4,988 | |
| Aramark Services, Inc.: | |||
| 4.75% 6/1/26 | 9,515 | 9,063 | |
| 5% 4/1/25 (a) | 6,480 | 6,411 | |
| 5.125% 1/15/24 | 3,350 | 3,333 | |
| Avantor, Inc. 6% 10/1/24 (a) | 20,310 | 20,259 | |
| Brand Energy & Infrastructure Services, Inc. 8.5% 7/15/25 (a) | 11,205 | 11,037 | |
| CDK Global, Inc. 5.875% 6/15/26 | 1,600 | 1,612 | |
| Corrections Corp. of America 5% 10/15/22 | 4,758 | 4,597 | |
| H&E Equipment Services, Inc. 5.625% 9/1/25 | 5,295 | 5,043 | |
| Hertz Corp.: | |||
| 5.5% 10/15/24 (a) | 53,650 | 41,311 | |
| 6.25% 10/15/22 | 7,820 | 6,862 | |
| IHS Markit Ltd.: | |||
| 4% 3/1/26 (a) | 1,980 | 1,863 | |
| 4.75% 2/15/25 (a) | 2,160 | 2,138 | |
| 5% 11/1/22 (a) | 1,360 | 1,388 | |
| KAR Auction Services, Inc. 5.125% 6/1/25 (a) | 4,050 | 3,837 | |
| Laureate Education, Inc. 8.25% 5/1/25 (a) | 10,170 | 10,907 | |
| 134,649 | |||
| Steel - 0.3% | |||
| Big River Steel LLC/BRS Finance Corp. 7.25% 9/1/25 (a) | 3,545 | 3,696 | |
| Commercial Metals Co. 5.75% 4/15/26 (a) | 10,530 | 10,109 | |
| 13,805 | |||
| Super Retail - 0.3% | |||
| Netflix, Inc. 4.375% 11/15/26 | 7,580 | 6,937 | |
| Sally Holdings LLC 5.625% 12/1/25 | 1,455 | 1,351 | |
| Sonic Automotive, Inc. 6.125% 3/15/27 | 6,760 | 6,135 | |
| 14,423 | |||
| Technology - 1.6% | |||
| CDW LLC/CDW Finance Corp. 5.5% 12/1/24 | 3,295 | 3,328 | |
| Fair Isaac Corp. 5.25% 5/15/26 (a) | 2,235 | 2,204 | |
| First Data Corp. 5% 1/15/24 (a) | 5,945 | 5,886 | |
| Itron, Inc. 5% 1/15/26 (a) | 3,675 | 3,422 | |
| Nuance Communications, Inc. 5.625% 12/15/26 | 14,545 | 14,254 | |
| Open Text Corp. 5.875% 6/1/26 (a) | 4,285 | 4,306 | |
| Qorvo, Inc. 5.5% 7/15/26 (a) | 7,700 | 7,719 | |
| Solera LLC/Solera Finance, Inc. 10.5% 3/1/24 (a) | 1,610 | 1,747 | |
| Symantec Corp.: | |||
| 4.2% 9/15/20 | 3,215 | 3,207 | |
| 5% 4/15/25 (a) | 15,629 | 14,704 | |
| TTM Technologies, Inc. 5.625% 10/1/25 (a) | 7,255 | 7,074 | |
| 67,851 | |||
| Telecommunications - 7.9% | |||
| Altice Financing SA: | |||
| 6.625% 2/15/23 (a) | 6,950 | 6,879 | |
| 7.5% 5/15/26 (a) | 17,345 | 16,304 | |
| Altice Finco SA: | |||
| 7.625% 2/15/25 (a) | 18,085 | 16,073 | |
| 8.125% 1/15/24 (a) | 5,140 | 5,050 | |
| C&W Senior Financing Designated Activity Co. 7.5% 10/15/26 (a) | 11,425 | 11,454 | |
| Citizens Utilities Co. 7.05% 10/1/46 | 12,280 | 6,140 | |
| Cogent Communications Group, Inc. 5.375% 3/1/22 (a) | 3,860 | 3,884 | |
| Frontier Communications Corp.: | |||
| 8.5% 4/1/26 (a) | 9,700 | 9,009 | |
| 11% 9/15/25 | 18,635 | 13,650 | |
| GCI, Inc. 6.875% 4/15/25 | 6,590 | 6,800 | |
| Intelsat Jackson Holdings SA: | |||
| 5.5% 8/1/23 | 6,755 | 6,046 | |
| 7.5% 4/1/21 | 770 | 780 | |
| 8% 2/15/24 (a) | 11,680 | 12,220 | |
| 8.5% 10/15/24 (a) | 15,990 | 15,710 | |
| Level 3 Financing, Inc.: | |||
| 5.125% 5/1/23 | 9,175 | 9,106 | |
| 5.375% 1/15/24 | 21,700 | 21,483 | |
| 5.375% 5/1/25 | 2,870 | 2,802 | |
| Millicom International Cellular SA 6.625% 10/15/26 (a) | 4,495 | 4,540 | |
| Neptune Finco Corp.: | |||
| 6.625% 10/15/25 (a) | 7,010 | 7,343 | |
| 10.875% 10/15/25 (a) | 2,345 | 2,706 | |
| Sable International Finance Ltd. 6.875% 8/1/22 (a) | 10,115 | 10,558 | |
| SFR Group SA: | |||
| 6.25% 5/15/24 (a) | 4,450 | 4,266 | |
| 7.375% 5/1/26 (a) | 7,630 | 7,303 | |
| 8.125% 2/1/27 (a) | 2,640 | 2,614 | |
| Sprint Capital Corp. 6.875% 11/15/28 | 7,065 | 6,941 | |
| Sprint Communications, Inc. 6% 11/15/22 | 26,110 | 26,355 | |
| Sprint Corp.: | |||
| 7.125% 6/15/24 | 15,025 | 15,363 | |
| 7.25% 9/15/21 | 10,260 | 10,709 | |
| 7.625% 3/1/26 | 8,365 | 8,663 | |
| 7.875% 9/15/23 | 30,390 | 32,441 | |
| T-Mobile U.S.A., Inc.: | |||
| 6% 3/1/23 | 3,700 | 3,784 | |
| 6% 4/15/24 | 10,590 | 10,855 | |
| Wind Tre SpA 5% 1/20/26 (a) | 6,345 | 5,401 | |
| Zayo Group LLC/Zayo Capital, Inc.: | |||
| 5.75% 1/15/27 (a) | 5,075 | 4,975 | |
| 6.375% 5/15/25 | 6,870 | 7,025 | |
| 335,232 | |||
| Transportation Ex Air/Rail - 1.4% | |||
| Avolon Holdings Funding Ltd.: | |||
| 5.125% 10/1/23 (a) | 3,575 | 3,508 | |
| 5.5% 1/15/23 (a) | 7,345 | 7,308 | |
| Navios Maritime Acquisition Corp./Navios Acquisition Finance U.S., Inc. 8.125% 11/15/21 (a) | 15,555 | 13,047 | |
| Navios Maritime Holdings, Inc.: | |||
| 7.375% 1/15/22 (a) | 40,435 | 30,528 | |
| 11.25% 8/15/22 (a) | 5,310 | 4,620 | |
| Navios South American Logistics, Inc./Navios Logistics Finance U.S., Inc. 7.25% 5/1/22 (a) | 1,575 | 1,465 | |
| 60,476 | |||
| Utilities - 3.2% | |||
| Calpine Corp.: | |||
| 5.25% 6/1/26 (a) | 5,645 | 5,186 | |
| 5.75% 1/15/25 | 10,695 | 9,557 | |
| Dynegy, Inc.: | |||
| 7.375% 11/1/22 | 1,648 | 1,710 | |
| 7.625% 11/1/24 | 9,407 | 9,948 | |
| Global Partners LP/GLP Finance Corp.: | |||
| 6.25% 7/15/22 | 3,480 | 3,419 | |
| 7% 6/15/23 | 11,110 | 11,068 | |
| InterGen NV 7% 6/30/23 (a) | 39,739 | 39,044 | |
| NRG Energy, Inc.: | |||
| 5.75% 1/15/28 | 3,380 | 3,372 | |
| 7.25% 5/15/26 | 1,000 | 1,063 | |
| NRG Yield Operating LLC 5% 9/15/26 | 2,685 | 2,497 | |
| NSG Holdings II LLC/NSG Holdings, Inc. 7.75% 12/15/25 (a) | 1,598 | 1,726 | |
| Talen Energy Supply LLC: | |||
| 6.5% 6/1/25 | 17,760 | 13,231 | |
| 10.5% 1/15/26 (a) | 18,795 | 16,516 | |
| The AES Corp.: | |||
| 5.125% 9/1/27 | 2,655 | 2,622 | |
| 6% 5/15/26 | 8,415 | 8,604 | |
| Vistra Operations Co. LLC 5.5% 9/1/26 (a) | 5,990 | 5,900 | |
| 135,463 | |||
| TOTAL NONCONVERTIBLE BONDS | 3,495,382 | ||
| TOTAL CORPORATE BONDS | |||
| (Cost $3,627,734) | 3,523,562 | ||
| Shares | Value (000s) | ||
| Common Stocks - 1.3% | |||
| Automotive & Auto Parts - 0.1% | |||
| Chassix Holdings, Inc. warrants 7/29/20 (e)(f) | 27,176 | 173 | |
| UC Holdings, Inc. (e) | 103,457 | 2,159 | |
| TOTAL AUTOMOTIVE & AUTO PARTS | 2,332 | ||
| Environmental - 0.3% | |||
| Tervita Corp. (f) | 2,277,751 | 12,959 | |
| Food & Drug Retail - 0.9% | |||
| Southeastern Grocers, Inc. (e)(f) | 979,852 | 39,762 | |
| Healthcare - 0.0% | |||
| HealthSouth Corp. | 22 | 1 | |
| TOTAL COMMON STOCKS | |||
| (Cost $44,910) | 55,054 | ||
| Convertible Preferred Stocks - 0.7% | |||
| Energy - 0.4% | |||
| Chesapeake Energy Corp. Series A, 5.75% | 28,510 | 16,547 | |
| Telecommunications - 0.1% | |||
| Crown Castle International Corp. Series A, 6.875% | 3,294 | 3,441 | |
| Utilities - 0.2% | |||
| Vistra Energy Corp. 7.00% | 105,200 | 9,583 | |
| TOTAL CONVERTIBLE PREFERRED STOCKS | |||
| (Cost $30,660) | 29,571 | ||
| Principal Amount (000s) | Value (000s) | ||
| Bank Loan Obligations - 5.2% | |||
| Broadcasting - 0.1% | |||
| CBS Radio, Inc. Tranche B 1LN, term loan 3 month U.S. LIBOR + 2.750% 5.0365% 11/18/24 (b)(d) | 2,725 | 2,710 | |
| Cable/Satellite TV - 0.6% | |||
| CSC Holdings LLC Tranche B, term loan 3 month U.S. LIBOR + 2.500% 4.7795% 1/25/26 (b)(d) | 4,075 | 4,066 | |
| Numericable LLC Tranche B 13LN, term loan 3 month U.S. LIBOR + 4.000% 6.2795% 8/14/26 (b)(d) | 5,400 | 5,282 | |
| WideOpenWest Finance LLC Tranche B, term loan 3 month U.S. LIBOR + 3.250% 5.5395% 8/19/23 (b)(d) | 18,734 | 18,031 | |
| TOTAL CABLE/SATELLITE TV | 27,379 | ||
| Energy - 0.6% | |||
| California Resources Corp.: | |||
| Tranche 1LN, term loan 3 month U.S. LIBOR + 10.375% 12.6699% 12/31/21 (b)(d) | 4,570 | 5,084 | |
| Tranche B, term loan 3 month U.S. LIBOR + 4.750% 7.0365% 12/31/22 (b)(d) | 6,395 | 6,480 | |
| Citgo Petroleum Corp. Tranche B, term loan 3 month U.S. LIBOR + 3.500% 5.896% 7/29/21 (b)(d) | 12,592 | 12,571 | |
| Consolidated Energy Finance SA Tranche B, term loan 3 month U.S. LIBOR + 2.500% 4.7841% 5/7/25 (b)(d) | 2,668 | 2,655 | |
| TOTAL ENERGY | 26,790 | ||
| Food & Drug Retail - 0.7% | |||
| BI-LO LLC Tranche B, term loan 3 month U.S. LIBOR + 8.000% 10.3645% 5/31/24 (b)(d) | 20,648 | 20,364 | |
| Lannett Co., Inc. Tranche B, term loan 3 month U.S. LIBOR + 5.375% 7.677% 11/25/22 (b)(d) | 9,792 | 7,873 | |
| TOTAL FOOD & DRUG RETAIL | 28,237 | ||
| Gaming - 0.3% | |||
| Caesars Resort Collection LLC Tranche B 1LN, term loan 3 month U.S. LIBOR + 2.750% 5.052% 12/22/24 (b)(d) | 10,480 | 10,478 | |
| Golden Nugget, Inc. Tranche B 1LN, term loan 3 month U.S. LIBOR + 2.750% 5.2299% 10/4/23 (b)(d) | 2,780 | 2,781 | |
| TOTAL GAMING | 13,259 | ||
| Healthcare - 0.2% | |||
| HLF Financing SARL LLC Tranche B 1LN, term loan 3 month U.S. LIBOR + 3.250% 5.552% 8/18/25(b)(d) | 910 | 913 | |
| Valeant Pharmaceuticals International, Inc. Tranche B, term loan 3 month U.S. LIBOR + 3.000% 5.2739% 6/1/25 (b)(d) | 6,074 | 6,073 | |
| TOTAL HEALTHCARE | 6,986 | ||
| Insurance - 0.5% | |||
| AmWINS Group, Inc. Tranche B 1LN, term loan 3 month U.S. LIBOR + 2.750% 5.0471% 1/25/24 (b)(d) | 2,160 | 2,162 | |
| HUB International Ltd. Tranche B, term loan 3 month U.S. LIBOR + 3.000% 5.4895% 4/25/25 (b)(d) | 21,416 | 21,343 | |
| TOTAL INSURANCE | 23,505 | ||
| Paper - 0.1% | |||
| Caraustar Industries, Inc. Tranche B, term loan 3 month U.S. LIBOR + 5.500% 7.8861% 3/14/22 (b)(d) | 6,247 | 6,266 | |
| Restaurants - 0.1% | |||
| Burger King Worldwide, Inc. Tranche B, term loan 3 month U.S. LIBOR + 2.250% 4.552% 2/17/24 (b)(d) | 4,158 | 4,140 | |
| Services - 0.5% | |||
| Almonde, Inc. Tranche B 1LN, term loan 3 month U.S. LIBOR + 3.500% 5.8861% 6/13/24 (b)(d) | 16,501 | 16,395 | |
| Laureate Education, Inc. Tranche B 1LN, term loan 3 month U.S. LIBOR + 3.500% 6.0266% 4/26/24 (b)(d) | 3,389 | 3,391 | |
| TOTAL SERVICES | 19,786 | ||
| Steel - 0.2% | |||
| Big River Steel LLC Tranche B, term loan 3 month U.S. LIBOR + 5.000% 7.3861% 8/23/23 (b)(d) | 6,980 | 7,049 | |
| Technology - 0.2% | |||
| Boxer Parent Co., Inc. Tranche B, term loan 3 month U.S. LIBOR + 4.250% 6.6484% 10/2/25 (b)(d) | 5,410 | 5,423 | |
| First Data Corp. Tranche B, term loan 3 month U.S. LIBOR + 2.000% 4.2865% 4/26/24 (b)(d) | 2,690 | 2,675 | |
| TOTAL TECHNOLOGY | 8,098 | ||
| Telecommunications - 1.1% | |||
| Frontier Communications Corp.: | |||
| Tranche A, term loan 3 month U.S. LIBOR + 2.750% 5.06% 3/31/21 (b)(d) | 21,291 | 20,626 | |
| Tranche B 1LN, term loan 3 month U.S. LIBOR + 3.750% 6.06% 6/15/24 (b)(d) | 1,352 | 1,306 | |
| Intelsat Jackson Holdings SA: | |||
| Tranche B-4, term loan 3 month U.S. LIBOR + 4.500% 6.7949% 1/2/24 (b)(d) | 1,480 | 1,532 | |
| Tranche B-5, term loan 6.625% 1/2/24 | 1,485 | 1,521 | |
| Radiate Holdco LLC Tranche B, term loan 3 month U.S. LIBOR + 3.000% 5.302% 2/1/24 (b)(d) | 18,834 | 18,673 | |
| Sprint Communications, Inc. Tranche B, term loan 3 month U.S. LIBOR + 2.500% 4.8125% 2/3/24 (b)(d) | 3,251 | 3,247 | |
| TOTAL TELECOMMUNICATIONS | 46,905 | ||
| Utilities - 0.0% | |||
| Vistra Operations Co. LLC Tranche B 2LN, term loan 3 month U.S. LIBOR + 2.000% 4.552% 12/14/23 (b)(d) | 1,911 | 1,912 | |
| TOTAL BANK LOAN OBLIGATIONS | |||
| (Cost $224,059) | 223,022 | ||
| Preferred Securities - 1.8% | |||
| Banks & Thrifts - 1.6% | |||
| Bank of America Corp. 5.2% (b)(g) | 12,860 | 12,818 | |
| Barclays PLC: | |||
| 7.75% (b)(g) | 2,655 | 2,693 | |
| 7.875% (Reg. S) (b)(g) | 14,130 | 14,698 | |
| Credit Agricole SA 6.625% (a)(b)(g) | 2,785 | 2,829 | |
| Royal Bank of Scotland Group PLC: | |||
| 7.5% (b)(g) | 14,795 | 15,137 | |
| 8.625% (b)(g) | 2,525 | 2,674 | |
| Wells Fargo & Co. 5.9% (b)(g) | 18,095 | 18,545 | |
| TOTAL BANKS & THRIFTS | 69,394 | ||
| Energy - 0.2% | |||
| DCP Midstream Partners LP 7.375% (b)(g) | 2,715 | 2,677 | |
| Summit Midstream Partners LP 9.5% (b)(g) | 5,320 | 5,406 | |
| TOTAL ENERGY | 8,083 | ||
| TOTAL PREFERRED SECURITIES | |||
| (Cost $77,426) | 77,477 | ||
| Shares | Value (000s) | ||
| Money Market Funds - 5.5% | |||
| Fidelity Cash Central Fund, 2.23% (h) | |||
| (Cost $231,612) | 231,604,390 | 231,651 | |
| TOTAL INVESTMENT IN SECURITIES - 97.2% | |||
| (Cost $4,236,401) | 4,140,337 | ||
| NET OTHER ASSETS (LIABILITIES) - 2.8% | 118,836 | ||
| NET ASSETS - 100% | $4,259,173 |
Values shown as $0 in the Schedule of Investments may reflect amounts less than $500.
Legend
(a) Security exempt from registration under Rule 144A of the Securities Act of 1933. These securities may be resold in transactions exempt from registration, normally to qualified institutional buyers. At the end of the period, the value of these securities amounted to $2,147,153,000 or 50.4% of net assets.
(b) Coupon rates for floating and adjustable rate securities reflect the rates in effect at period end.
(c) Non-income producing - Security is in default.
(d) Coupon is indexed to a floating interest rate which may be multiplied by a specified factor and/or subject to caps or floors.
(e) Level 3 security
(f) Non-income producing
(g) Security is perpetual in nature with no stated maturity date.
(h) Affiliated fund that is generally available only to investment companies and other accounts managed by Fidelity Investments. The rate quoted is the annualized seven-day yield of the fund at period end. A complete unaudited listing of the fund's holdings as of its most recent quarter end is available upon request. In addition, each Fidelity Central Fund's financial statements are available on the SEC's website or upon request.
Affiliated Central Funds
Information regarding fiscal year to date income earned by the Fund from investments in Fidelity Central Funds is as follows:
| Fund | Income earned |
| (Amounts in thousands) | |
| Fidelity Cash Central Fund | $3,059 |
| Total | $3,059 |
Amounts in the income column in the above table include any capital gain distributions from underlying funds, which are presented in the corresponding line-item in the Statement of Operations if applicable.
Investment Valuation
The following is a summary of the inputs used, as of October 31, 2018, involving the Fund's assets and liabilities carried at fair value. The inputs or methodology used for valuing securities may not be an indication of the risk associated with investing in those securities. For more information on valuation inputs, and their aggregation into the levels used below, please refer to the Investment Valuation section in the accompanying Notes to Financial Statements.
| Valuation Inputs at Reporting Date: | ||||
| Description | Total | Level 1 | Level 2 | Level 3 |
| (Amounts in thousands) | ||||
| Investments in Securities: | ||||
| Equities: | ||||
| Consumer Discretionary | $2,332 | $-- | $-- | $2,332 |
| Consumer Staples | 39,762 | -- | -- | 39,762 |
| Energy | 16,547 | -- | 16,547 | -- |
| Health Care | 1 | 1 | -- | -- |
| Industrials | 12,959 | 12,959 | -- | -- |
| Real Estate | 3,441 | -- | 3,441 | -- |
| Utilities | 9,583 | -- | 9,583 | -- |
| Corporate Bonds | 3,523,562 | -- | 3,523,562 | -- |
| Bank Loan Obligations | 223,022 | -- | 223,022 | -- |
| Preferred Securities | 77,477 | -- | 77,477 | -- |
| Money Market Funds | 231,651 | 231,651 | -- | -- |
| Total Investments in Securities: | $4,140,337 | $244,611 | $3,853,632 | $42,094 |
The following is a reconciliation of Investments in Securities and Derivative Instruments for which Level 3 inputs were used in determining value:
| (Amounts in thousands) | |
| Investments in Securities: | |
| Beginning Balance | $2,753 |
| Net Realized Gain (Loss) on Investment Securities | -- |
| Net Unrealized Gain (Loss) on Investment Securities | 9,505 |
| Cost of Purchases | 29,836 |
| Proceeds of Sales | -- |
| Amortization/Accretion | -- |
| Transfers into Level 3 | -- |
| Transfers out of Level 3 | -- |
| Ending Balance | $42,094 |
| The change in unrealized gain (loss) for the period attributable to Level 3 securities held at October 31, 2018 | $9,505 |
The information used in the above reconciliation represents fiscal year to date activity for any Investments in Securities identified as using Level 3 inputs at either the beginning or the end of the current fiscal period. Transfers in or out of Level 3 represent the beginning value of any Security or Instrument where a change in the pricing level occurred from the beginning to the end of the period. The cost of purchases and the proceeds of sales may include securities received or delivered through corporate actions or exchanges. Realized and unrealized gains (losses) disclosed in the reconciliation are included in Net Gain (Loss) on the Fund's Statement of Operations.
Other Information
Distribution of investments by country or territory of incorporation, as a percentage of Total Net Assets, is as follows (Unaudited):
| United States of America | 76.2% |
| Canada | 6.0% |
| Luxembourg | 4.6% |
| Netherlands | 3.1% |
| Cayman Islands | 2.1% |
| Multi-National | 1.7% |
| United Kingdom | 1.7% |
| Ireland | 1.2% |
| Bermuda | 1.0% |
| Austria | 1.0% |
| Others (Individually Less Than 1%) | 1.4% |
| 100.0% |
See accompanying notes which are an integral part of the financial statements.
Financial Statements
Statement of Assets and Liabilities
| Amounts in thousands (except per-share amount) | October 31, 2018 (Unaudited) | |
| Assets | ||
| Investment in securities, at value — See accompanying schedule: Unaffiliated issuers (cost $4,004,789) | $3,908,686 | |
| Fidelity Central Funds (cost $231,612) | 231,651 | |
| Total Investment in Securities (cost $4,236,401) | $4,140,337 | |
| Receivable for investments sold | 103,681 | |
| Receivable for fund shares sold | 2,925 | |
| Dividends receivable | 466 | |
| Interest receivable | 62,165 | |
| Distributions receivable from Fidelity Central Funds | 609 | |
| Prepaid expenses | 8 | |
| Total assets | 4,310,191 | |
| Liabilities | ||
| Payable for investments purchased | $39,178 | |
| Payable for fund shares redeemed | 5,522 | |
| Distributions payable | 3,735 | |
| Accrued management fee | 2,012 | |
| Other affiliated payables | 501 | |
| Other payables and accrued expenses | 70 | |
| Total liabilities | 51,018 | |
| Net Assets | $4,259,173 | |
| Net Assets consist of: | ||
| Paid in capital | $4,478,499 | |
| Total distributable earnings (loss) | (219,326) | |
| Net Assets, for 490,431 shares outstanding | $4,259,173 | |
| Net Asset Value, offering price and redemption price per share ($4,259,173 ÷ 490,431 shares) | $8.68 |
See accompanying notes which are an integral part of the financial statements.
Statement of Operations
| Amounts in thousands | Six months ended October 31, 2018 (Unaudited) | |
| Investment Income | ||
| Dividends | $2,676 | |
| Interest | 132,615 | |
| Income from Fidelity Central Funds | 3,059 | |
| Total income | 138,350 | |
| Expenses | ||
| Management fee | $12,058 | |
| Transfer agent fees | 2,428 | |
| Accounting fees and expenses | 573 | |
| Custodian fees and expenses | 24 | |
| Independent trustees' fees and expenses | 13 | |
| Registration fees | 63 | |
| Audit | 57 | |
| Legal | 25 | |
| Miscellaneous | 16 | |
| Total expenses before reductions | 15,257 | |
| Expense reductions | (27) | |
| Total expenses after reductions | 15,230 | |
| Net investment income (loss) | 123,120 | |
| Realized and Unrealized Gain (Loss) | ||
| Net realized gain (loss) on: | ||
| Investment securities: | ||
| Unaffiliated issuers | (20,608) | |
| Foreign currency transactions | 2 | |
| Total net realized gain (loss) | (20,606) | |
| Change in net unrealized appreciation (depreciation) on: | ||
| Investment securities: | ||
| Unaffiliated issuers | (62,848) | |
| Fidelity Central Funds | 1 | |
| Total change in net unrealized appreciation (depreciation) | (62,847) | |
| Net gain (loss) | (83,453) | |
| Net increase (decrease) in net assets resulting from operations | $39,667 |
See accompanying notes which are an integral part of the financial statements.
Statement of Changes in Net Assets
| Amounts in thousands | Six months ended October 31, 2018 (Unaudited) | Year ended April 30, 2018 |
| Increase (Decrease) in Net Assets | ||
| Operations | ||
| Net investment income (loss) | $123,120 | $250,792 |
| Net realized gain (loss) | (20,606) | 50,496 |
| Change in net unrealized appreciation (depreciation) | (62,847) | (117,644) |
| Net increase (decrease) in net assets resulting from operations | 39,667 | 183,644 |
| Distributions to shareholders | (112,852) | – |
| Distributions to shareholders from net investment income | – | (237,387) |
| Total distributions | (112,852) | (237,387) |
| Share transactions | ||
| Proceeds from sales of shares | 484,095 | 792,990 |
| Reinvestment of distributions | 91,266 | 192,732 |
| Cost of shares redeemed | (567,346) | (1,099,687) |
| Net increase (decrease) in net assets resulting from share transactions | 8,015 | (113,965) |
| Redemption fees | – | 129 |
| Total increase (decrease) in net assets | (65,170) | (167,579) |
| Net Assets | ||
| Beginning of period | 4,324,343 | 4,491,922 |
| End of period | $4,259,173 | $4,324,343 |
| Other Information | ||
| Undistributed net investment income end of period | $40,146 | |
| Shares | ||
| Sold | 54,789 | 88,562 |
| Issued in reinvestment of distributions | 10,358 | 21,532 |
| Redeemed | (64,320) | (122,840) |
| Net increase (decrease) | 827 | (12,746) |
See accompanying notes which are an integral part of the financial statements.
Financial Highlights
Fidelity High Income Fund
| Six months ended (Unaudited) October 31, | Years endedApril 30, | |||||
| 2018 | 2018 | 2017 | 2016 | 2015 | 2014 | |
| Selected Per–Share Data | ||||||
| Net asset value, beginning of period | $8.83 | $8.94 | $8.31 | $9.04 | $9.45 | $9.59 |
| Income from Investment Operations | ||||||
| Net investment income (loss)A | .250 | .513 | .501 | .503 | .495 | .523 |
| Net realized and unrealized gain (loss) | (.171) | (.137) | .597 | (.741) | (.291) | (.091) |
| Total from investment operations | .079 | .376 | 1.098 | (.238) | .204 | .432 |
| Distributions from net investment income | (.229) | (.486) | (.469) | (.493) | (.486) | (.509) |
| Distributions from net realized gain | – | – | – | – | (.129) | (.064) |
| Total distributions | (.229) | (.486) | (.469) | (.493) | (.615) | (.573) |
| Redemption fees added to paid in capitalA | – | –B | .001 | .001 | .001 | .001 |
| Net asset value, end of period | $8.68 | $8.83 | $8.94 | $8.31 | $9.04 | $9.45 |
| Total ReturnC,D | .89% | 4.27% | 13.56% | (2.47)% | 2.29% | 4.74% |
| Ratios to Average Net AssetsE,F | ||||||
| Expenses before reductions | .70%G | .70% | .72% | .73% | .72% | .72% |
| Expenses net of fee waivers, if any | .70%G | .70% | .72% | .73% | .72% | .72% |
| Expenses net of all reductions | .70%G | .70% | .72% | .73% | .72% | .72% |
| Net investment income (loss) | 5.62%G | 5.73% | 5.81% | 6.00% | 5.38% | 5.58% |
| Supplemental Data | ||||||
| Net assets, end of period (in millions) | $4,259 | $4,324 | $4,492 | $4,434 | $5,347 | $6,372 |
| Portfolio turnover rateH | 80%G | 51% | 52% | 33% | 37% | 56% |
A Calculated based on average shares outstanding during the period.
B Amount represents less than $.0005 per share.
C Total returns for periods of less than one year are not annualized.
D Total returns would have been lower if certain expenses had not been reduced during the applicable periods shown.
E Fees and expenses of any underlying Fidelity Central Funds are not included in the Fund's expense ratio. The Fund indirectly bears its proportionate share of the expenses of any underlying Fidelity Central Funds.
F Expense ratios reflect operating expenses of the Fund. Expenses before reductions do not reflect amounts reimbursed by the investment adviser or reductions from brokerage service arrangements or reductions from other expense offset arrangements and do not represent the amount paid by the Fund during periods when reimbursements or reductions occur. Expenses net of fee waivers reflect expenses after reimbursement by the investment adviser but prior to reductions from brokerage service arrangements or other expense offset arrangements. Expenses net of all reductions represent the net expenses paid by the Fund.
G Annualized
H Amount does not include the portfolio activity of any underlying Fidelity Central Funds.
See accompanying notes which are an integral part of the financial statements.
Notes to Financial Statements (Unaudited)
For the period ended October 31, 2018
(Amounts in thousands except percentages)
1. Organization.
Fidelity High Income Fund (the Fund) is a fund of Fidelity Summer Street Trust (the Trust) and is authorized to issue an unlimited number of shares. Share transactions on the Statement of Changes in Net Assets may contain exchanges between affiliated funds. The Trust is registered under the Investment Company Act of 1940, as amended (the 1940 Act), as an open-end management investment company organized as a Massachusetts business trust.
2. Investments in Fidelity Central Funds.
The Fund invests in Fidelity Central Funds, which are open-end investment companies generally available only to other investment companies and accounts managed by the investment adviser and its affiliates. The Fund's Schedule of Investments lists each of the Fidelity Central Funds held as of period end, if any, as an investment of the Fund, but does not include the underlying holdings of each Fidelity Central Fund. As an Investing Fund, the Fund indirectly bears its proportionate share of the expenses of the underlying Fidelity Central Funds.
The Money Market Central Funds seek preservation of capital and current income and are managed by Fidelity Investments Money Management, Inc. (FIMM), an affiliate of the investment adviser. Annualized expenses of the Money Market Central Funds as of their most recent shareholder report date are less than .005%.
A complete unaudited list of holdings for each Fidelity Central Fund is available upon request or at the Securities and Exchange Commission (the SEC) website at www.sec.gov. In addition, the financial statements of the Fidelity Central Funds are available on the SEC website or upon request.
3. Significant Accounting Policies.
The Fund is an investment company and applies the accounting and reporting guidance of the Financial Accounting Standards Board (FASB) Accounting Standards Codification Topic 946 Financial Services – Investments Companies. The financial statements have been prepared in conformity with accounting principles generally accepted in the United States of America (GAAP), which require management to make certain estimates and assumptions at the date of the financial statements. Actual results could differ from those estimates. Subsequent events, if any, through the date that the financial statements were issued have been evaluated in the preparation of the financial statements. The following summarizes the significant accounting policies of the Fund:
Investment Valuation. Investments are valued as of 4:00 p.m. Eastern time on the last calendar day of the period. The Board of Trustees (the Board) has delegated the day to day responsibility for the valuation of the Fund's investments to the Fair Value Committee (the Committee) established by the Fund's investment adviser. In accordance with valuation policies and procedures approved by the Board, the Fund attempts to obtain prices from one or more third party pricing vendors or brokers to value its investments. When current market prices, quotations or currency exchange rates are not readily available or reliable, investments will be fair valued in good faith by the Committee, in accordance with procedures adopted by the Board. Factors used in determining fair value vary by investment type and may include market or investment specific events, changes in interest rates and credit quality. The frequency with which these procedures are used cannot be predicted and they may be utilized to a significant extent. The Committee oversees the Fund's valuation policies and procedures and reports to the Board on the Committee's activities and fair value determinations. The Board monitors the appropriateness of the procedures used in valuing the Fund's investments and ratifies the fair value determinations of the Committee.
The Fund categorizes the inputs to valuation techniques used to value its investments into a disclosure hierarchy consisting of three levels as shown below:
- Level 1 – quoted prices in active markets for identical investments
- Level 2 – other significant observable inputs (including quoted prices for similar investments, interest rates, prepayment speeds, etc.)
- Level 3 – unobservable inputs (including the Fund's own assumptions based on the best information available)
Valuation techniques used to value the Fund's investments by major category are as follows:
Debt securities, including restricted securities, are valued based on evaluated prices received from third party pricing vendors or from brokers who make markets in such securities. Corporate bonds, bank loan obligations and preferred securities are valued by pricing vendors who utilize matrix pricing which considers yield or price of bonds of comparable quality, coupon, maturity and type or by broker-supplied prices. When independent prices are unavailable or unreliable, debt securities may be valued utilizing pricing methodologies which consider similar factors that would be used by third party pricing vendors. Debt securities are generally categorized as Level 2 in the hierarchy but may be Level 3 depending on the circumstances. The Fund invests a significant portion of its assets in below investment grade securities. The value of these securities can be more volatile due to changes in the credit quality of the issuer and is sensitive to changes in economic, market and regulatory conditions.
Equity securities, including restricted securities, for which market quotations are readily available, are valued at the last reported sale price or official closing price as reported by a third party pricing vendor on the primary market or exchange on which they are traded and are categorized as Level 1 in the hierarchy. In the event there were no sales during the day or closing prices are not available, securities are valued at the last quoted bid price or may be valued using the last available price and are generally categorized as Level 2 in the hierarchy. For foreign equity securities, when market or security specific events arise, comparisons to the valuation of American Depositary Receipts (ADRs), futures contracts, Exchange-Traded Funds (ETFs) and certain indexes as well as quoted prices for similar securities may be used and would be categorized as Level 2 in the hierarchy. Utilizing these techniques may result in transfers between Level 1 and Level 2. For equity securities, including restricted securities, where observable inputs are limited, assumptions about market activity and risk are used and these securities may be categorized as Level 3 in the hierarchy. Equity securities, including restricted securities, for which observable inputs are not available are valued using alternate valuation approaches, including the market approach and the income approach and are categorized as Level 3 in the hierarchy. The market approach generally consists of using comparable market transactions while the income approach generally consists of using the net present value of estimated future cash flows, adjusted as appropriate for liquidity, credit, market and/or other risk factors.
Investments in open-end mutual funds, including the Fidelity Central Funds, are valued at their closing net asset value (NAV) each business day and are categorized as Level 1 in the hierarchy.
The following provides information on Level 3 securities held by the Fund that were valued at period end based on unobservable inputs. These amounts exclude valuations provided by a broker.
| Asset Type | Fair Value | Valuation Technique(s) | Unobservable Input | Amount or Range/Weighted Average | Impact to Valuation from an Increase in Input(a) |
| Corporate Bonds | $ 0 | Recovery Value | Recovery Value | 0.0% | Increase |
| Equities | $42,094 | Market comparable | Enterprise value/EBITDA multiple (EV/EBITDA) | 3.5 – 5.7 / 5.6 | Increase |
| Discount rate | 10.0% - 15.0% / 10.3% | Decrease | |||
| Discount for lack of marketability | 10.0% - 15.0% / 10.0% | Decrease | |||
| Strick price | $15.68 | Increase |
(a) Represents the expected directional change in the fair value of the Level 3 investments that would result from an increase in the corresponding input. A decrease to the unobservable input would have the opposite effect. Significant changes in these inputs could result in significantly higher or lower fair value measurements.
Changes in valuation techniques may result in transfers in or out of an assigned level within the disclosure hierarchy. The aggregate value of investments by input level as of October 31, 2018, as well as a roll forward of Level 3 investments, is included at the end of the Fund's Schedule of Investments.
Foreign Currency. The Fund may use foreign currency contracts to facilitate transactions in foreign-denominated securities. Gains and losses from these transactions may arise from changes in the value of the foreign currency or if the counterparties do not perform under the contracts' terms.
Foreign-denominated assets, including investment securities, and liabilities are translated into U.S. dollars at the exchange rates at period end. Purchases and sales of investment securities, income and dividends received and expenses denominated in foreign currencies are translated into U.S. dollars at the exchange rate in effect on the transaction date.
The effects of exchange rate fluctuations on investments are included with the net realized and unrealized gain (loss) on investment securities. Other foreign currency transactions resulting in realized and unrealized gain (loss) are disclosed separately.
Investment Transactions and Income. For financial reporting purposes, the Fund's investment holdings and NAV include trades executed through the end of the last business day of the period. The NAV per share for processing shareholder transactions is calculated as of the close of business of the New York Stock Exchange (NYSE), normally 4:00 p.m. Eastern time and includes trades executed through the end of the prior business day. Gains and losses on securities sold are determined on the basis of identified cost and include proceeds received from litigation. Dividend income is recorded on the ex-dividend date, except for certain dividends from foreign securities where the ex-dividend date may have passed, which are recorded as soon as the Fund is informed of the ex-dividend date. Non-cash dividends included in dividend income, if any, are recorded at the fair market value of the securities received. Income and capital gain distributions from Fidelity Central Funds, if any, are recorded on the ex-dividend date. Certain distributions received by the Fund represent a return of capital or capital gain. The Fund determines the components of these distributions subsequent to the ex-dividend date, based upon receipt of tax filings or other correspondence relating to the underlying investment. These distributions are recorded as a reduction of cost of investments and/or as a realized gain. Interest income is accrued as earned and includes coupon interest and amortization of premium and accretion of discount on debt securities as applicable. Paid in Kind (PIK) income is recorded at the fair market value of the securities received. Investment income is recorded net of foreign taxes withheld where recovery of such taxes is uncertain. Debt obligations may be placed on non-accrual status and related interest income may be reduced by ceasing current accruals and writing off interest receivables when the collection of all or a portion of interest has become doubtful based on consistently applied procedures. A debt obligation is removed from non-accrual status when the issuer resumes interest payments or when collectability of interest is reasonably assured.
Expenses. Expenses directly attributable to a fund are charged to that fund. Expenses attributable to more than one fund are allocated among the respective funds on the basis of relative net assets or other appropriate methods. Expense estimates are accrued in the period to which they relate and adjustments are made when actual amounts are known.
Income Tax Information and Distributions to Shareholders. Each year, the Fund intends to qualify as a regulated investment company under Subchapter M of the Internal Revenue Code, including distributing substantially all of its taxable income and realized gains. As a result, no provision for U.S. Federal income taxes is required. The Fund files a U.S. federal tax return, in addition to state and local tax returns as required. The Fund's federal income tax returns are subject to examination by the Internal Revenue Service (IRS) for a period of three fiscal years after they are filed. State and local tax returns may be subject to examination for an additional fiscal year depending on the jurisdiction. Foreign taxes are provided for based on the Fund's understanding of the tax rules and rates that exist in the foreign markets in which it invests.
Distributions are declared and recorded daily and paid monthly from net investment income. Distributions from realized gains, if any, are declared and recorded on the ex-dividend date. Income and capital gain distributions are determined in accordance with income tax regulations, which may differ from GAAP.
Capital accounts within the financial statements are adjusted for permanent book-tax differences. These adjustments have no impact on net assets or the results of operations. Capital accounts are not adjusted for temporary book-tax differences which will reverse in a subsequent period.
Book-tax differences are primarily due to market discount, certain conversion ratio adjustments, contingent interest, equity-debt classifications, partnerships, deferred trustees compensation, capital loss carryforwards and losses deferred due to wash sales.
As of period end, the cost and unrealized appreciation (depreciation) in securities, and derivatives if applicable, for federal income tax purposes were as follows:
| Gross unrealized appreciation | $70,471 |
| Gross unrealized depreciation | (143,705) |
| Net unrealized appreciation (depreciation) | $(73,234) |
| Tax cost | $4,213,571 |
Capital loss carryforwards are only available to offset future capital gains of the Fund to the extent provided by regulations and may be limited. Under the Regulated Investment Company Modernization Act of 2010 (the Act), the Fund is permitted to carry forward capital losses incurred in taxable years beginning after December 22, 2010 for an unlimited period and such capital losses are required to be used prior to any losses that expire. The capital loss carryforward information presented below, including any applicable limitation, is estimated as of prior fiscal period end and is subject to adjustment.
| No expiration | |
| Short-term | $(11,673) |
| Long-term | (139,595) |
| Total capital loss carryforward | $(151,268) |
Restricted Securities. The Fund may invest in securities that are subject to legal or contractual restrictions on resale. These securities generally may be resold in transactions exempt from registration or to the public if the securities are registered. Disposal of these securities may involve time-consuming negotiations and expense, and prompt sale at an acceptable price may be difficult. Information regarding restricted securities is included at the end of the Fund's Schedule of Investments.
Loans and Other Direct Debt Instruments. The Fund invests in direct debt instruments which are interests in amounts owed to lenders by corporate or other borrowers. These instruments may be in the form of loans, trade claims or other receivables and may include standby financing commitments such as revolving credit facilities that obligate the Fund to supply additional cash to the borrower on demand. Loans may be acquired through assignment or participation. The Fund did not have any unfunded loan commitments, which are contractual obligations for future funding, at period end.
New Accounting Pronouncement. In March 2017, the Financial Accounting Standards Board (FASB) issued an Accounting Standards Update (ASU), ASU 2017-08, which amends the amortization period for certain callable debt securities that are held at a premium. The amendment requires the premium to be amortized to the earliest call date. The amendments do not require an accounting change for securities held at a discount. The ASU is effective for annual periods beginning after December 15, 2018. Management is currently evaluating the potential impact of these changes to the financial statements.
New Rule Issuance. During August 2018, the U.S. Securities and Exchange Commission issued Final Rule Release No. 33-10532, Disclosure Update and Simplification. This Final Rule includes amendments specific to registered investment companies that are intended to eliminate overlap in disclosure requirements between Regulation S-X and GAAP. In accordance with these amendments, certain line-items in the Fund's financial statements have been combined or removed for the current period as outlined in the table below.
| Financial Statement | Current Line-Item Presentation | Prior Line-Item Presentation |
| Statement of Assets and Liabilities | Total distributable earnings (loss) | Undistributed/Distributions in excess of/Accumulated net investment income (loss) Accumulated/Undistributed net realized gain (loss) Net unrealized appreciation (depreciation) |
| Statement of Changes in Net Assets | N/A - removed | Undistributed/Distributions in excess of/Accumulated net investment income (loss) end of period |
| Statement of Changes in Net Assets | Distributions to shareholders | Distributions to shareholders from net investment income Distributions to shareholders from net realized gain |
4. Purchases and Sales of Investments.
Purchases and sales of securities, other than short-term securities, aggregated $1,662,720 and $1,614,133, respectively.
5. Fees and Other Transactions with Affiliates.
Management Fee. Fidelity Management & Research Company (the investment adviser) and its affiliates provide the Fund with investment management related services for which the Fund pays a monthly management fee. The management fee is the sum of an individual fund fee rate that is based on an annual rate of .45% of the Fund's average net assets and an annualized group fee rate that averaged .11% during the period. The group fee rate is based upon the average net assets of all the mutual funds advised by the investment adviser, including any mutual funds previously advised by the investment adviser that are currently advised by Fidelity SelectCo, LLC, an affiliate of the investment adviser. The group fee rate decreases as assets under management increase and increases as assets under management decrease. For the reporting period, the total annualized management fee rate was .56% of the Fund's average net assets.
Transfer Agent Fees. Fidelity Investments Institutional Operations Company, Inc. (FIIOC), an affiliate of the investment adviser, is the Fund's transfer, dividend disbursing and shareholder servicing agent. FIIOC receives account fees and asset-based fees that vary according to account size and type of account. FIIOC pays for typesetting, printing and mailing of shareholder reports, except proxy statements. For the period, the transfer agent fees were equivalent to an annualized rate of .11% of average net assets.
Accounting Fees. Fidelity Service Company, Inc. (FSC), an affiliate of the investment adviser, maintains the Fund's accounting records. The fee is based on the level of average net assets for each month. For the period, the fees were equivalent to an annualized rate of .03%.
Interfund Trades. The Fund may purchase from or sell securities to other Fidelity Funds under procedures adopted by the Board. The procedures have been designed to ensure these interfund trades are executed in accordance with Rule 17a-7 of the 1940 Act. Interfund trades are included within the respective purchases and sales amounts shown in the Purchases and Sales of Investments note.
6. Committed Line of Credit.
The Fund participates with other funds managed by the investment adviser or an affiliate in a $4.25 billion credit facility (the "line of credit") to be utilized for temporary or emergency purposes to fund shareholder redemptions or for other short-term liquidity purposes. The Fund has agreed to pay commitment fees on its pro-rata portion of the line of credit, which amounted to $6 and is reflected in Miscellaneous expenses on the Statement of Operations. During the period, the Fund did not borrow on this line of credit.
7. Expense Reductions.
Through arrangements with the Fund's custodian, credits realized as a result of certain uninvested cash balances were used to reduce the Fund's expenses. During the period, these credits reduced the Fund's custody expenses by $14.
In addition, during the period the investment adviser reimbursed and/or waived a portion of operating expenses in the amount of $13.
8. Other.
The Fund's organizational documents provide former and current trustees and officers with a limited indemnification against liabilities arising in connection with the performance of their duties to the Fund. In the normal course of business, the Fund may also enter into contracts that provide general indemnifications. The Fund's maximum exposure under these arrangements is unknown as this would be dependent on future claims that may be made against the Fund. The risk of material loss from such claims is considered remote.
9. Reorganization.
Subsequent to period end, on December 7, 2018, the Fund acquired all of the assets and assumed all of the liabilities of Fidelity Advisor High Income Fund pursuant to an Agreement and Plan of Reorganization approved by the Board of Trustees ("the Board"). In addition, the Board approved the creation of additional classes of shares that commenced operations on December 4, 2018. The reorganization was accomplished by an exchange of the corresponding classes of the Fund for each class of shares then outstanding of Fidelity Advisor High Income Fund at their net asset value on the reorganization date. The reorganization provides shareholders of Fidelity Advisor High Income Fund access to a larger portfolio with a similar investment objective. The reorganization qualified as a tax-free reorganization for federal income tax purposes with no gain or loss recognized to the funds or their shareholders. Fidelity Advisor High Income Fund's net assets of $693,345, including securities of $686,303 and unrealized depreciation of $(28,031), were combined with the Fund's net assets of $4,115,643 for total net assets after the reorganization of $4,808,988.
10. Litigation.
The Fund and other entities managed by FMR or its affiliates were named as defendants in a lawsuit filed in the United States Bankruptcy Court for the Southern District of New York in 2009. The lawsuit was brought by creditors of Motors Liquidation Company (f/k/a General Motors), which went through Chapter 11 bankruptcy proceedings in 2009, and is captioned Official Committee of Unsecured Creditors of Motors Liquidation Company v. JPMorgan Chase Bank, N.A., et al., Adversary No. 09-00504 (REG). The plaintiffs are seeking an order that the Fund and other defendants return proceeds received in 2009 in full payment of the principal and interest on General Motors secured debt. The plaintiffs contend that the Fund and the other defendants were not secured creditors at the time of the 2009 payments and, thus, were not entitled to payment in full. In January 2015, the Court of Appeals ruled that JPMorgan, as administrative agent for all of the debtholders, released the security interest on certain collateral securing the debt prior to the 2009 payments. In September 2017, an opinion was issued in a trial intended to help determine the value of any remaining, unreleased collateral. The parties have engaged in mediation but continue to disagree on the value of the unreleased collateral. At this time, Management cannot determine the amount of loss that may be realized, but expects the amount to be less than the $13,206 received in 2009. The Fund is also incurring legal costs in defending the case.
Shareholder Expense Example
As a shareholder of the Fund, you incur two types of costs: (1) transaction costs and (2) ongoing costs, including management fees and other Fund expenses. This Example is intended to help you understand your ongoing costs (in dollars) of investing in the Fund and to compare these costs with the ongoing costs of investing in other mutual funds.
The Example is based on an investment of $1,000 invested at the beginning of the period and held for the entire period (May 1, 2018 to October 31, 2018).
Actual Expenses
The first line of the accompanying table provides information about actual account values and actual expenses. You may use the information in this line, together with the amount you invested, to estimate the expenses that you paid over the period. Simply divide your account value by $1,000.00 (for example, an $8,600 account value divided by $1,000.00 = 8.6), then multiply the result by the number in the first line under the heading entitled "Expenses Paid During Period" to estimate the expenses you paid on your account during this period. A small balance maintenance fee of $12.00 that is charged once a year may apply for certain accounts with a value of less than $2,000. This fee, which was eliminated effective August 1, 2018, is not included in the table below. If it was, the estimate of expenses you paid during the period would be higher, and your ending account value lower, by this amount. In addition, the Fund, as a shareholder in the underlying Fidelity Central Funds, will indirectly bear its pro-rata share of the fees and expenses incurred by the underlying Fidelity Central Funds. These fees and expenses are not included in the Fund's annualized expense ratio used to calculate the expense estimate in the table below.
Hypothetical Example for Comparison Purposes
The second line of the accompanying table provides information about hypothetical account values and hypothetical expenses based on the Fund's actual expense ratio and an assumed rate of return of 5% per year before expenses, which is not the Fund's actual return. The hypothetical account values and expenses may not be used to estimate the actual ending account balance or expenses you paid for the period. You may use this information to compare the ongoing costs of investing in the Fund and other funds. To do so, compare this 5% hypothetical example with the 5% hypothetical examples that appear in the shareholder reports of the other funds. A small balance maintenance fee of $12.00 that is charged once a year may apply for certain accounts with a value of less than $2,000. This fee, which was eliminated effective August 1, 2018, is not included in the table below. If it was, the estimate of expenses you paid during the period would be higher, and your ending account value lower, by this amount. In addition, the Fund, as a shareholder in the underlying Fidelity Central Funds, will indirectly bear its pro-rata share of the fees and expenses incurred by the underlying Fidelity Central Funds. These fees and expenses are not included in the Fund's annualized expense ratio used to calculate the expense estimate in the table below.
Please note that the expenses shown in the table are meant to highlight your ongoing costs only and do not reflect any transaction costs. Therefore, the second line of the table is useful in comparing ongoing costs only, and will not help you determine the relative total costs of owning different funds.
| Annualized Expense Ratio-A | Beginning Account Value May 1, 2018 | Ending Account Value October 31, 2018 | Expenses Paid During Period-B May 1, 2018 to October 31, 2018 |
|
| Actual | .70% | $1,000.00 | $1,008.90 | $3.54 |
| Hypothetical-C | $1,000.00 | $1,021.68 | $3.57 |
A Annualized expense ratio reflects expenses net of applicable fee waivers.
B Expenses are equal to the Fund's annualized expense ratio, multiplied by the average account value over the period, multiplied by 184/365 (to reflect the one-half year period).
C 5% return per year before expenses
Board Approval of Investment Advisory Contracts
Fidelity High Income Fund
At its July 2018 meeting, the Board of Trustees, including the Independent Trustees (together, the Board), voted to continue the management contract with Fidelity Management & Research Company (FMR) and the sub-advisory agreements (together, the Advisory Contracts) for the fund for six months through January 31, 2019, in connection with the reunification of the Fidelity Equity High Income Funds Board, which oversees the fund, and the Sector Portfolios Board.
The Board considered that the approval of the fund's Advisory Contracts will not result in any changes in (i) the investment process or strategies employed in the management of the fund's assets; (ii) the fees and expenses paid by shareholders; (iii) the nature, extent or quality of services provided under the fund's Advisory Contracts; or (iv) the day-to-day management of the fund or the persons primarily responsible for such management. The Board concluded that the fund's Advisory Contracts are fair and reasonable, and that the fund's Advisory Contracts should be renewed, without modification, through January 31, 2019, with the understanding that the Board will consider the annual renewal for a full one year period in January 2019.
In connection with its consideration of future renewals of the fund's Advisory Contracts, the Board will consider: (i) the nature, extent and quality of services provided to the fund, including shareholder and administrative services and investment performance; (ii) the competitiveness of the management fee and total expenses for the fund; (iii) the costs of the services and profitability, including the revenues earned and the expenses incurred in conducting the business of developing, marketing, distributing, managing, administering, and servicing the fund and its shareholders, to the extent applicable, as well as potential fall-out benefits from Fidelity's non-fund businesses; and (iv) whether there have been economies of scale in respect of the Fidelity funds, whether the Fidelity funds (including the fund) have appropriately benefited from any such economies of scale, and whether there is the potential for realization of any further economies.
Based on its evaluation of all of the conclusions noted above, and after considering all factors it believed relevant, the Board ultimately concluded that the fund's management fee structure is fair and reasonable, and that the continuation of the fund's Advisory Contracts should be approved.
![]()
Corporate Headquarters
245 Summer St.
Boston, MA 02210
www.fidelity.com
SPH-SANN-1218
1.538299.121
|
Fidelity Advisor® Global High Income Fund - Semi-Annual Report October 31, 2018 Class A, Class M, Class C and Class I are classes of Fidelity® Global High Income Fund |
|
|
Contents
To view a fund's proxy voting guidelines and proxy voting record for the 12-month period ended June 30, visit http://www.fidelity.com/proxyvotingresults or visit the Securities and Exchange Commission's (SEC) web site at http://www.sec.gov.
You may also call 1-877-208-0098 to request a free copy of the proxy voting guidelines.
Standard & Poor's, S&P and S&P 500 are registered service marks of The McGraw-Hill Companies, Inc. and have been licensed for use by Fidelity Distributors Corporation.
Other third-party marks appearing herein are the property of their respective owners.
All other marks appearing herein are registered or unregistered trademarks or service marks of FMR LLC or an affiliated company. © 2018 FMR LLC. All rights reserved.
This report and the financial statements contained herein are submitted for the general information of the shareholders of the Fund. This report is not authorized for distribution to prospective investors in the Fund unless preceded or accompanied by an effective prospectus.
A fund files its complete schedule of portfolio holdings with the SEC for the first and third quarters of each fiscal year on Form N-Q. Forms N-Q are available on the SEC’s web site at http://www.sec.gov. A fund's Forms N-Q may be reviewed and copied at the SEC’s Public Reference Room in Washington, DC. Information regarding the operation of the SEC's Public Reference Room may be obtained by calling 1-800-SEC-0330.
For a complete list of a fund's portfolio holdings, view the most recent holdings listing, semiannual report, or annual report on Fidelity's web site at http://www.fidelity.com, http://www.institutional.fidelity.com, or http://www.401k.com, as applicable.
NOT FDIC INSURED •MAY LOSE VALUE •NO BANK GUARANTEE
Neither the Fund nor Fidelity Distributors Corporation is a bank.
Investment Summary (Unaudited)
Top Five Holdings as of October 31, 2018
| (by issuer, excluding cash equivalents) | % of fund's net assets |
| Ally Financial, Inc. | 1.4 |
| Tenet Healthcare Corp. | 1.3 |
| German Federal Republic | 1.3 |
| Sprint Capital Corp. | 1.2 |
| Valeant Pharmaceuticals International, Inc. | 1.2 |
| 6.4 |
Top Five Countries as of October 31, 2018
| (excluding cash equivalents) | % of fund's net assets |
| United States of America | 43.8 |
| Netherlands | 7.4 |
| Cayman Islands | 6.3 |
| Luxembourg | 5.5 |
| United Kingdom | 2.7 |
Top Five Market Sectors as of October 31, 2018
| % of fund's net assets | |
| Energy | 13.6 |
| Telecommunications | 9.0 |
| Banks & Thrifts | 7.4 |
| Healthcare | 7.1 |
| Utilities | 5.5 |
Quality Diversification (% of fund's net assets)
| As of October 31, 2018 | ||
| AAA,AA,A | 1.3% | |
| BBB | 2.9% | |
| BB | 37.4% | |
| B | 33.8% | |
| CCC,CC,C | 11.1% | |
| Not Rated | 2.8% | |
| Equities | 1.5% | |
| Short-Term Investments and Net Other Assets | 9.2% | |
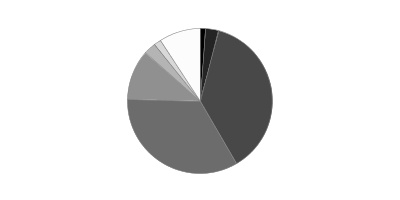
We have used ratings from Moody's Investors Service, Inc. Where Moody's® ratings are not available, we have used S&P® ratings. All ratings are as of the date indicated and do not reflect subsequent changes.
Asset Allocation (% of fund's net assets)
| As of October 31, 2018* | ||
| Corporate Bonds | 79.4% | |
| Government Obligations | 1.3% | |
| Stocks | 1.5% | |
| Preferred Securities | 4.8% | |
| Other Investments | 3.8% | |
| Short-Term Investments and Net Other Assets (Liabilities) | 9.2% | |

* Foreign investments - 47.0%
Schedule of Investments October 31, 2018 (Unaudited)
Showing Percentage of Net Assets
| Nonconvertible Bonds - 79.4% | |||
| Principal Amount(a) | Value | ||
| Aerospace - 0.4% | |||
| BBA U.S. Holdings, Inc. 5.375% 5/1/26 (b) | $30,000 | $29,663 | |
| Bombardier, Inc. 7.5% 12/1/24 (b) | 80,000 | 81,300 | |
| BWX Technologies, Inc. 5.375% 7/15/26 (b) | 65,000 | 65,163 | |
| DAE Funding LLC: | |||
| 4.5% 8/1/22 (b) | 50,000 | 48,750 | |
| 5% 8/1/24 (b) | 65,000 | 63,375 | |
| TransDigm UK Holdings PLC 6.875% 5/15/26 (b) | 200,000 | 199,500 | |
| TOTAL AEROSPACE | 487,751 | ||
| Air Transportation - 1.4% | |||
| Aeropuertos Argentina 2000 SA 6.875% 2/1/27 (b) | 450,000 | 420,755 | |
| Azul Investments LLP 5.875% 10/26/24 (b) | 300,000 | 270,375 | |
| Indira Gandhi International Airport 6.125% 10/31/26 (Reg. S) | 300,000 | 294,000 | |
| Rumo Luxembourg Sarl: | |||
| 5.875% 1/18/25 (b) | 200,000 | 190,252 | |
| 7.375% 2/9/24 (b) | 300,000 | 310,500 | |
| United Continental Holdings, Inc. 4.25% 10/1/22 | 300,000 | 294,375 | |
| TOTAL AIR TRANSPORTATION | 1,780,257 | ||
| Automotive - 0.2% | |||
| Schaeffler Finance BV 3.5% 5/15/22 (Reg. S) | EUR | 200,000 | 228,364 |
| Automotive & Auto Parts - 1.1% | |||
| Allison Transmission, Inc. 4.75% 10/1/27 (b) | 300,000 | 275,625 | |
| Gestamp Funding SA 3.5% 5/15/23 (Reg. S) | EUR | 100,000 | 115,204 |
| Lithia Motors, Inc. 5.25% 8/1/25 (b) | 40,000 | 37,700 | |
| Lkq Euro Holdings BV 3.625% 4/1/26 | EUR | 175,000 | 195,112 |
| Metalsa SA de CV 4.9% 4/24/23 (b) | 350,000 | 332,241 | |
| Samvardhana Motherson Automotive Systems Group BV 1.8% 7/6/24 (Reg. S) | EUR | 200,000 | 199,346 |
| Tenedora Nemak SA de CV 4.75% 1/23/25 (b) | 200,000 | 192,580 | |
| TOTAL AUTOMOTIVE & AUTO PARTS | 1,347,808 | ||
| Banks & Thrifts - 5.0% | |||
| Access Bank PLC 10.5% 10/19/21 (b) | 200,000 | 212,880 | |
| Akbank TAS/Ak Finansal Kiralama A/S 7.2% 3/16/27 (b)(c) | 200,000 | 168,766 | |
| Ally Financial, Inc.: | |||
| 5.75% 11/20/25 | 375,000 | 384,375 | |
| 8% 11/1/31 | 1,115,000 | 1,340,788 | |
| Banco Macro SA 6.75% 11/4/26 (b)(c) | 300,000 | 246,750 | |
| Bank of Ireland 10% 12/19/22 | EUR | 100,000 | 150,221 |
| Bankia SA 3.375% 3/15/27 (Reg. S) (c) | EUR | 200,000 | 231,671 |
| Barclays PLC 2% 2/7/28 (Reg. S) (c) | EUR | 100,000 | 108,021 |
| CaixaBank SA 2.75% 7/14/28 (Reg. S) (c) | EUR | 200,000 | 227,162 |
| Industrial Senior Trust 5.5% 11/1/22 (b) | 200,000 | 195,002 | |
| Intesa Sanpaolo SpA: | |||
| 3.928% 9/15/26 (Reg. S) | EUR | 100,000 | 108,724 |
| 6.625% 9/13/23 (Reg. S) | EUR | 100,000 | 126,162 |
| Itau Unibanco Holding SA 6.2% 12/21/21 (b) | 200,000 | 206,902 | |
| JSC BGEO Group 6% 7/26/23 (b) | 200,000 | 196,092 | |
| Pearl Holding III Ltd. 9.5% 12/11/22 | 200,000 | 172,099 | |
| PT Bukit Makmur Mandiri Utama 7.75% 2/13/22 (b) | 200,000 | 201,977 | |
| Roadster Finance Designated Activity Co. 2.375% 12/8/27 | EUR | 100,000 | 107,397 |
| Royal Bank of Scotland Group PLC: | |||
| 3.625% 3/25/24 (Reg. S) (c) | EUR | 100,000 | 114,531 |
| 5.125% 5/28/24 | 317,000 | 313,830 | |
| Turkiye Garanti Bankasi A/S 6.125% 5/24/27 (b)(c) | 200,000 | 165,494 | |
| Turkiye Is Bankasi A/S 5.5% 4/21/22 (b) | 300,000 | 259,193 | |
| UniCredit SpA 6.95% 10/31/22 (Reg. S) | EUR | 300,000 | 378,070 |
| VimpelCom Holdings BV 4.95% 6/16/24 (b) | 300,000 | 283,971 | |
| Zenith Bank PLC: | |||
| 6.25% 4/22/19 (b) | 200,000 | 200,380 | |
| 7.375% 5/30/22 (b) | 200,000 | 202,346 | |
| TOTAL BANKS & THRIFTS | 6,302,804 | ||
| Broadcasting - 1.0% | |||
| AMC Networks, Inc.: | |||
| 4.75% 12/15/22 | 100,000 | 98,500 | |
| 4.75% 8/1/25 | 125,000 | 116,200 | |
| Sirius XM Radio, Inc.: | |||
| 5% 8/1/27 (b) | 125,000 | 117,461 | |
| 5.375% 7/15/26 (b) | 380,000 | 371,640 | |
| TV Azteca SA de CV 8.25% 8/9/24 (Reg. S) | 600,000 | 592,770 | |
| TOTAL BROADCASTING | 1,296,571 | ||
| Building Materials - 1.6% | |||
| Alam Synergy Pte. Ltd. 6.625% 4/24/22 | 200,000 | 163,394 | |
| American Woodmark Corp. 4.875% 3/15/26 (b) | 335,000 | 311,131 | |
| Builders FirstSource, Inc. 5.625% 9/1/24 (b) | 115,000 | 107,238 | |
| CEMEX Finance LLC: | |||
| 4.625% 6/15/24 | EUR | 200,000 | 237,064 |
| 6% 4/1/24 (Reg. S) | 400,000 | 399,100 | |
| China WindPower Group Ltd. 7.9% 1/23/21 | 200,000 | 188,402 | |
| Elementia S.A.B. de CV 5.5% 1/15/25 (b) | 200,000 | 184,752 | |
| HD Supply, Inc. 5.375% 10/15/26 (b) | 120,000 | 115,050 | |
| HMAN Finance Sub Corp. 6.375% 7/15/22 (b) | 100,000 | 88,000 | |
| Titan Global Finance PLC 2.375% 11/16/24 (Reg. S) | EUR | 100,000 | 107,568 |
| Union Andina de Cementos SAA 5.875% 10/30/21 (Reg. S) | 105,000 | 107,390 | |
| USG Corp. 4.875% 6/1/27 (b) | 15,000 | 15,033 | |
| TOTAL BUILDING MATERIALS | 2,024,122 | ||
| Cable/Satellite TV - 3.9% | |||
| Altice SA: | |||
| 7.625% 2/15/25 (b) | 700,000 | 596,750 | |
| 7.75% 5/15/22 (b) | 235,000 | 218,844 | |
| Cable One, Inc. 5.75% 6/15/22 (b) | 55,000 | 55,825 | |
| Cablevision SA 6.5% 6/15/21 (b) | 500,000 | 488,750 | |
| CCO Holdings LLC/CCO Holdings Capital Corp.: | |||
| 5.125% 5/1/27 (b) | 585,000 | 550,631 | |
| 5.5% 5/1/26 (b) | 110,000 | 107,113 | |
| 5.75% 1/15/24 | 315,000 | 318,150 | |
| 5.75% 2/15/26 (b) | 65,000 | 64,350 | |
| Cequel Communications Holdings I LLC/Cequel Capital Corp.: | |||
| 7.5% 4/1/28 (b) | 230,000 | 238,388 | |
| 7.75% 7/15/25 (b) | 210,000 | 221,550 | |
| CSC Holdings LLC: | |||
| 5.375% 2/1/28 (b) | 200,000 | 188,500 | |
| 5.5% 4/15/27 (b) | 345,000 | 331,200 | |
| DISH DBS Corp. 5% 3/15/23 | 470,000 | 411,250 | |
| UPC Holding BV 3.875% 6/15/29 (Reg. S) | EUR | 100,000 | 108,614 |
| Virgin Media Finance PLC 4.5% 1/15/25 (Reg. S) | EUR | 100,000 | 114,501 |
| VTR Finance BV 6.875% 1/15/24 (b) | 539,000 | 545,738 | |
| Ziggo Bond Finance BV 6% 1/15/27 (b) | 160,000 | 142,400 | |
| Ziggo Secured Finance BV: | |||
| 3.75% 1/15/25 (Reg. S) | EUR | 100,000 | 113,112 |
| 4.25% 1/15/27 (Reg. S) | EUR | 100,000 | 112,128 |
| TOTAL CABLE/SATELLITE TV | 4,927,794 | ||
| Capital Goods - 0.0% | |||
| Apergy Corp. 6.375% 5/1/26 (b) | 30,000 | 30,375 | |
| Chemicals - 2.8% | |||
| Bayer AG 3% 7/1/75 (Reg S.) (c) | EUR | 200,000 | 229,526 |
| CF Industries Holdings, Inc.: | |||
| 4.95% 6/1/43 | 270,000 | 230,175 | |
| 5.15% 3/15/34 | 335,000 | 307,363 | |
| 5.375% 3/15/44 | 105,000 | 92,400 | |
| CTC BondCo GmbH 5.25% 12/15/25 | EUR | 200,000 | 224,274 |
| NOVA Chemicals Corp.: | |||
| 4.875% 6/1/24 (b) | 70,000 | 64,313 | |
| 5.25% 6/1/27 (b) | 70,000 | 63,175 | |
| OCI NV 6.625% 4/15/23 (b) | 325,000 | 333,125 | |
| OCP SA 5.625% 4/25/24 (b) | 200,000 | 203,856 | |
| Petkim Petrokimya Holding A/S 5.875% 1/26/23 (b) | 200,000 | 182,880 | |
| Platform Specialty Products Corp.: | |||
| 5.875% 12/1/25 (b) | 80,000 | 75,800 | |
| 6.5% 2/1/22 (b) | 200,000 | 202,500 | |
| Sasol Financing U.S.A. LLC 5.875% 3/27/24 | 200,000 | 201,500 | |
| Starfruit Finco BV / Starfruit U.S. Holdco LLC 8% 10/1/26 (b) | 150,000 | 145,500 | |
| The Chemours Co. LLC 5.375% 5/15/27 | 25,000 | 23,250 | |
| TPC Group, Inc. 8.75% 12/15/20 (b) | 405,000 | 396,900 | |
| Tronox Finance PLC 5.75% 10/1/25 (b) | 35,000 | 30,713 | |
| Tronox, Inc. 6.5% 4/15/26 (b) | 185,000 | 169,275 | |
| Valvoline, Inc. 4.375% 8/15/25 | 400,000 | 369,000 | |
| TOTAL CHEMICALS | 3,545,525 | ||
| Consumer Products - 0.2% | |||
| Coty, Inc. 6.5% 4/15/26 (b) | 140,000 | 130,550 | |
| Prestige Brands, Inc. 6.375% 3/1/24 (b) | 85,000 | 83,938 | |
| TOTAL CONSUMER PRODUCTS | 214,488 | ||
| Containers - 2.1% | |||
| ARD Finance SA 6.625% 9/15/23 pay-in-kind (c) | EUR | 100,000 | 112,472 |
| Ardagh Packaging Finance PLC/Ardagh MP Holdings U.S.A., Inc.: | |||
| 6% 2/15/25 (b) | 200,000 | 187,500 | |
| 6.75% 5/15/24 (Reg. S) | EUR | 200,000 | 240,133 |
| 7.25% 5/15/24 (b) | 200,000 | 201,000 | |
| Ball Corp. 4.875% 3/15/26 | 205,000 | 202,181 | |
| Berry Global, Inc. 4.5% 2/15/26 (b) | 200,000 | 187,000 | |
| Crown Americas LLC / Crown Americas Capital Corp. IV 4.75% 2/1/26 (b) | 745,000 | 703,094 | |
| Crown Americas LLC/Crown Americas Capital Corp. V 4.25% 9/30/26 | 60,000 | 54,450 | |
| OI European Group BV 6.75% 9/15/20 (Reg. S) | EUR | 150,000 | 188,812 |
| Plastipak Holdings, Inc. 6.25% 10/15/25 (b) | 20,000 | 18,300 | |
| Reynolds Group Issuer, Inc./Reynolds Group Issuer LLC/Reynolds Group Issuer (Luxembourg) SA 5.75% 10/15/20 | 276,196 | 276,196 | |
| Silgan Holdings, Inc. 3.25% 3/15/25 | EUR | 200,000 | 231,337 |
| TOTAL CONTAINERS | 2,602,475 | ||
| Diversified Financial Services - 2.8% | |||
| Arena Lux Finance Sarl 2.875% 11/1/24 (Reg. S) | EUR | 100,000 | 112,704 |
| Chobani LLC/Finance Corp., Inc. 7.5% 4/15/25 (b) | 120,000 | 102,600 | |
| Comcel Trust 6.875% 2/6/24 (b) | 250,000 | 255,719 | |
| FLY Leasing Ltd. 5.25% 10/15/24 | 60,000 | 57,000 | |
| Fortune Star (BVI) Ltd. 5.25% 3/23/22 (Reg. S) | 200,000 | 181,222 | |
| Garfunkelux Holdco 3 SA 7.5% 8/1/22 (Reg. S) | EUR | 100,000 | 110,138 |
| Icahn Enterprises LP/Icahn Enterprises Finance Corp. 6.375% 12/15/25 | 215,000 | 213,656 | |
| International Lease Finance Corp. 5.875% 8/15/22 | 175,000 | 184,311 | |
| International Personal Finance PLC 5.75% 4/7/21 (Reg S.) | EUR | 100,000 | 105,857 |
| James Hardie International Finance Ltd. 4.75% 1/15/25 (b) | 200,000 | 185,750 | |
| MSCI, Inc.: | |||
| 5.375% 5/15/27 (b) | 500,000 | 495,000 | |
| 5.75% 8/15/25 (b) | 50,000 | 51,375 | |
| Navient Corp.: | |||
| 6.75% 6/15/26 | 120,000 | 115,428 | |
| 7.25% 9/25/23 | 55,000 | 56,925 | |
| Park Aerospace Holdings Ltd. 5.5% 2/15/24 (b) | 140,000 | 138,635 | |
| Radiate Holdco LLC/Radiate Financial Service Ltd.: | |||
| 6.625% 2/15/25 (b) | 25,000 | 23,375 | |
| 6.875% 2/15/23 (b) | 30,000 | 28,800 | |
| SLM Corp.: | |||
| 6.125% 3/25/24 | 205,000 | 199,363 | |
| 8% 3/25/20 | 190,000 | 198,313 | |
| Springleaf Financial Corp. 7.125% 3/15/26 | 270,000 | 253,233 | |
| Verisure Holding AB 6% 11/1/22 (Reg. S) | EUR | 234,000 | 272,970 |
| Yihua Overseas Investment Ltd. 8.5% 10/23/20 (Reg. S) | 200,000 | 165,946 | |
| TOTAL DIVERSIFIED FINANCIAL SERVICES | 3,508,320 | ||
| Diversified Media - 0.2% | |||
| E.W. Scripps Co. 5.125% 5/15/25 (b) | 30,000 | 28,200 | |
| Viacom, Inc.: | |||
| 5.875% 2/28/57 (c) | 75,000 | 71,621 | |
| 6.25% 2/28/57 (c) | 90,000 | 86,775 | |
| TOTAL DIVERSIFIED MEDIA | 186,596 | ||
| Energy - 12.6% | |||
| Antero Resources Corp. 5.125% 12/1/22 | 140,000 | 139,038 | |
| Areva SA 4.875% 9/23/24 | EUR | 200,000 | 234,391 |
| California Resources Corp. 8% 12/15/22 (b) | 480,000 | 427,200 | |
| Callon Petroleum Co. 6.125% 10/1/24 | 25,000 | 24,375 | |
| Centennial Resource Prod LLC 5.375% 1/15/26 (b) | 75,000 | 73,313 | |
| Cheniere Corpus Christi Holdings LLC: | |||
| 5.125% 6/30/27 | 195,000 | 191,100 | |
| 5.875% 3/31/25 | 80,000 | 82,200 | |
| Cheniere Energy Partners LP 5.625% 10/1/26 (b) | 90,000 | 88,650 | |
| Chesapeake Energy Corp.: | |||
| 3 month U.S. LIBOR + 3.250% 5.6863% 4/15/19 (c)(d) | 70,000 | 70,175 | |
| 4.875% 4/15/22 | 180,000 | 171,000 | |
| 5.75% 3/15/23 | 65,000 | 61,750 | |
| 8% 12/15/22 (b) | 168,000 | 175,140 | |
| 8% 1/15/25 | 70,000 | 71,006 | |
| 8% 6/15/27 | 375,000 | 372,656 | |
| China Jinjiang Environment Holding Co. Ltd. 6% 7/27/20 (Reg. S) | 200,000 | 180,787 | |
| Citgo Holding, Inc. 10.75% 2/15/20 (b) | 155,000 | 161,200 | |
| Comstock Escrow Corp. 9.75% 8/15/26 (b) | 95,000 | 91,675 | |
| Consolidated Energy Finance SA: | |||
| 3 month U.S. LIBOR + 3.750% 6.0841% 6/15/22 (b)(c)(d) | 520,000 | 520,229 | |
| 6.5% 5/15/26 (b) | 245,000 | 243,775 | |
| 6.875% 6/15/25 (b) | 275,000 | 280,156 | |
| Continental Resources, Inc. 4.375% 1/15/28 | 95,000 | 91,834 | |
| Covey Park Energy LLC 7.5% 5/15/25 (b) | 30,000 | 29,475 | |
| DCP Midstream LLC 5.85% 5/21/43 (b)(c) | 60,000 | 53,700 | |
| DCP Midstream Operating LP 5.375% 7/15/25 | 100,000 | 101,405 | |
| Denbury Resources, Inc.: | |||
| 4.625% 7/15/23 | 10,000 | 8,275 | |
| 5.5% 5/1/22 | 130,000 | 112,450 | |
| 6.375% 8/15/21 | 35,000 | 32,550 | |
| 7.5% 2/15/24 (b) | 125,000 | 122,188 | |
| Drax Finco PLC 6.625% 11/1/25 (b) | 200,000 | 199,500 | |
| Endeavor Energy Resources LP/EER Finance, Inc.: | |||
| 5.5% 1/30/26 (b) | 35,000 | 35,963 | |
| 5.75% 1/30/28 (b) | 35,000 | 36,138 | |
| Ensco PLC: | |||
| 5.2% 3/15/25 | 30,000 | 24,600 | |
| 7.75% 2/1/26 | 85,000 | 79,263 | |
| Envision Energy Overseas Capital Co. Ltd. 7.5% 4/26/21 | 200,000 | 145,500 | |
| EP Energy LLC/Everest Acquisition Finance, Inc.: | |||
| 7.75% 5/15/26 (b) | 325,000 | 323,274 | |
| 8% 11/29/24 (b) | 35,000 | 33,775 | |
| Exterran Partners LP/EXLP Finance Corp.: | |||
| 6% 4/1/21 | 15,000 | 14,850 | |
| 6% 10/1/22 | 200,000 | 198,000 | |
| GCL New Energy Holdings Ltd. 7.1% 1/30/21 | 200,000 | 173,494 | |
| Geo Coal International Pte Ltd. 8% 10/4/22 (Reg. S) | 200,000 | 184,077 | |
| Greenko Dutch BV 5.25% 7/24/24 | 200,000 | 180,880 | |
| Hess Infrastructure Partners LP 5.625% 2/15/26 (b) | 100,000 | 100,250 | |
| Hilcorp Energy I LP/Hilcorp Finance Co.: | |||
| 5% 12/1/24 (b) | 275,000 | 259,188 | |
| 5.75% 10/1/25 (b) | 200,000 | 194,500 | |
| 6.25% 11/1/28 (b) | 80,000 | 77,001 | |
| HPCL-Mittal Energy Ltd. 5.25% 4/28/27 | 200,000 | 175,435 | |
| Indigo Natural Resources LLC 6.875% 2/15/26 (b) | 95,000 | 89,775 | |
| Indika Energy Capital III Pte. Ltd. 5.875% 11/9/24 (b) | 200,000 | 178,366 | |
| Jonah Energy LLC 7.25% 10/15/25 (b) | 160,000 | 127,200 | |
| KLX Energy Services Holdings, Inc. 11.5% 11/1/25 (b) | 80,000 | 80,600 | |
| Kosmos Energy Ltd.: | |||
| 7.875% 8/1/21 (b) | 200,000 | 201,000 | |
| 7.875% 8/1/21 (b) | 100,000 | 101,000 | |
| Magnolia Oil & Gas Operating LLC 6% 8/1/26 (b) | 85,000 | 83,938 | |
| MEG Energy Corp.: | |||
| 6.375% 1/30/23 (b) | 105,000 | 101,194 | |
| 7% 3/31/24 (b) | 240,000 | 235,800 | |
| Neerg Energy Ltd. 6% 2/13/22 (Reg. S) | 200,000 | 187,794 | |
| NextEra Energy Partners LP: | |||
| 4.25% 9/15/24 (b) | 50,000 | 47,500 | |
| 4.5% 9/15/27 (b) | 35,000 | 32,288 | |
| Nine Energy Service, Inc. 8.75% 11/1/23 (b) | 40,000 | 40,600 | |
| Noble Holding International Ltd.: | |||
| 6.05% 3/1/41 | 5,000 | 3,650 | |
| 6.2% 8/1/40 | 85,000 | 61,838 | |
| 7.75% 1/15/24 | 127,000 | 118,586 | |
| 7.875% 2/1/26 (b) | 80,000 | 79,400 | |
| Northern Oil & Gas, Inc. 9.5% 5/15/23 pay-in-kind (b)(c) | 85,000 | 87,444 | |
| Nostrum Oil & Gas Finance BV 8% 7/25/22 (b) | 400,000 | 343,104 | |
| Oasis Petroleum, Inc. 6.875% 3/15/22 | 43,000 | 43,269 | |
| Pacific Drilling V Ltd. 7.25% 12/1/17 (b)(e) | 380,000 | 182,400 | |
| Pan American Energy LLC 7.875% 5/7/21 (b) | 400,000 | 407,520 | |
| Parsley Energy LLC/Parsley: | |||
| 5.625% 10/15/27 (b) | 435,000 | 428,810 | |
| 6.25% 6/1/24 (b) | 10,000 | 10,275 | |
| PBF Holding Co. LLC/PBF Finance Corp. 7.25% 6/15/25 | 70,000 | 72,100 | |
| PBF Logistics LP/PBF Logistics Finance, Inc. 6.875% 5/15/23 | 130,000 | 132,275 | |
| Peabody Securities Finance Corp.: | |||
| 6% 3/31/22 (b) | 20,000 | 19,981 | |
| 6.375% 3/31/25 (b) | 25,000 | 25,000 | |
| Petrobras Global Finance BV 7.375% 1/17/27 | 300,000 | 310,905 | |
| Pride International, Inc. 7.875% 8/15/40 | 95,000 | 85,025 | |
| Puma International Financing SA 5.125% 10/6/24 (Reg. S) | 200,000 | 167,026 | |
| Repsol International Finance BV 4.5% 3/25/75 (Reg. S) (c) | EUR | 200,000 | 240,971 |
| Rose Rock Midstream LP/Rose Rock Finance Corp. 5.625% 7/15/22 | 125,000 | 120,000 | |
| Sabine Pass Liquefaction LLC 5.625% 3/1/25 | 15,000 | 15,661 | |
| SemGroup Corp. 7.25% 3/15/26 | 185,000 | 180,606 | |
| SESI LLC 7.75% 9/15/24 | 40,000 | 39,300 | |
| Sibur Securities Dac 4.125% 10/5/23 (b) | 200,000 | 191,359 | |
| SM Energy Co.: | |||
| 5% 1/15/24 | 65,000 | 61,913 | |
| 5.625% 6/1/25 | 110,000 | 105,875 | |
| 6.625% 1/15/27 | 65,000 | 65,325 | |
| 6.75% 9/15/26 | 25,000 | 25,063 | |
| Southwestern Energy Co.: | |||
| 7.5% 4/1/26 | 65,000 | 66,138 | |
| 7.75% 10/1/27 | 50,000 | 51,000 | |
| Summit Midstream Holdings LLC 5.75% 4/15/25 | 295,000 | 282,463 | |
| Sunoco LP/Sunoco Finance Corp.: | |||
| 4.875% 1/15/23 (b) | 90,000 | 86,738 | |
| 5.5% 2/15/26 (b) | 75,000 | 71,438 | |
| Targa Resources Partners LP/Targa Resources Partners Finance Corp.: | |||
| 5.125% 2/1/25 | 35,000 | 34,038 | |
| 5.375% 2/1/27 | 35,000 | 34,038 | |
| 5.875% 4/15/26 (b) | 70,000 | 70,394 | |
| Teine Energy Ltd. 6.875% 9/30/22 (b) | 85,000 | 84,575 | |
| TerraForm Power Operating LLC: | |||
| 4.25% 1/31/23 (b) | 40,000 | 37,900 | |
| 5% 1/31/28 (b) | 40,000 | 35,750 | |
| 6.625% 6/15/25 (b)(c) | 1,210,000 | 1,261,425 | |
| Tesoro Logistics LP/Tesoro Logistics Finance Corp. 6.375% 5/1/24 | 45,000 | 47,565 | |
| Transocean Pontus Ltd. 6.125% 8/1/25 (b) | 75,000 | 74,531 | |
| Transportadora de Gas del Sur SA 6.75% 5/2/25 (b) | 500,000 | 468,755 | |
| Tupras Turkiye Petrol Rafinerileri A/S 4.5% 10/18/24 (b) | 200,000 | 177,274 | |
| U.S.A. Compression Partners LP 6.875% 4/1/26 (b) | 35,000 | 35,613 | |
| Ultra Resources, Inc.: | |||
| 6.875% 4/15/22 (b) | 50,000 | 28,750 | |
| 7.125% 4/15/25 (b) | 40,000 | 17,600 | |
| W&T Offshore, Inc. 9.75% 11/1/23 (b) | 60,000 | 58,062 | |
| Weatherford International Ltd. 9.875% 2/15/24 | 80,000 | 62,000 | |
| Weatherford International, Inc. 9.875% 3/1/25 (b) | 420,000 | 325,500 | |
| Whiting Petroleum Corp. 6.625% 1/15/26 | 55,000 | 55,138 | |
| WPX Energy, Inc. 8.25% 8/1/23 | 60,000 | 67,425 | |
| YPF SA: | |||
| 8.5% 3/23/21 (b) | 175,000 | 176,663 | |
| 8.5% 7/28/25 (b) | 400,000 | 378,900 | |
| TOTAL ENERGY | 15,868,790 | ||
| Entertainment/Film - 0.4% | |||
| New Cotai LLC/New Cotai Capital Corp. 10.625% 5/1/19 pay-in-kind (b)(c) | 963,594 | 549,249 | |
| Environmental - 0.8% | |||
| CD&R Waterworks Merger Sub LLC 6.125% 8/15/25 (b) | 25,000 | 23,438 | |
| Covanta Holding Corp.: | |||
| 5.875% 3/1/24 | 110,000 | 109,725 | |
| 5.875% 7/1/25 | 15,000 | 14,550 | |
| 6% 1/1/27 | 135,000 | 130,275 | |
| 6.375% 10/1/22 | 95,000 | 97,019 | |
| LBC Tank Terminals Holding Netherlands BV 6.875% 5/15/23 (b) | 445,000 | 437,213 | |
| Paprec Holding 3 month EURIBOR + 3.500% 3.5% 3/31/25 (c)(d) | EUR | 200,000 | 227,776 |
| TOTAL ENVIRONMENTAL | 1,039,996 | ||
| Food & Drug Retail - 0.7% | |||
| Albertsons Companies LLC/Safeway, Inc./New Albertson's, Inc./Albertson's LLC 6.625% 6/15/24 | 35,000 | 33,075 | |
| Albertsons, Inc.: | |||
| 6.625% 6/1/28 | 75,000 | 57,750 | |
| 7.45% 8/1/29 | 5,000 | 4,200 | |
| Casino Guichard Perrachon SA 5.976% 5/26/21 (c) | EUR | 100,000 | 118,220 |
| Cumberland Farms, Inc. 6.75% 5/1/25 (b) | 25,000 | 25,688 | |
| Rite Aid Corp. 6.875% 12/15/28 (b)(c) | 505,000 | 338,350 | |
| Sigma Holdco BV 5.75% 5/15/26 (Reg. S) | EUR | 110,000 | 114,780 |
| Tesco PLC 5.125% 4/10/47 | EUR | 100,000 | 141,168 |
| Tops Holding LLC/Tops Markets II Corp. 8% 6/15/22 (b)(e) | 165,000 | 102,300 | |
| TOTAL FOOD & DRUG RETAIL | 935,531 | ||
| Food/Beverage/Tobacco - 2.2% | |||
| Central American Bottling Corp. 5.75% 1/31/27 (b) | 200,000 | 197,102 | |
| ESAL GmbH 6.25% 2/5/23 (b) | 105,000 | 103,031 | |
| JBS Investments II GmbH 7% 1/15/26 (b) | 400,000 | 395,000 | |
| JBS U.S.A. LLC/JBS U.S.A. Finance, Inc.: | |||
| 5.75% 6/15/25 (b) | 215,000 | 208,013 | |
| 5.875% 7/15/24 (b) | 10,000 | 9,815 | |
| 6.75% 2/15/28 (b) | 185,000 | 180,375 | |
| Lamb Weston Holdings, Inc.: | |||
| 4.625% 11/1/24 (b) | 45,000 | 44,076 | |
| 4.875% 11/1/26 (b) | 45,000 | 43,425 | |
| MHP SA 7.75% 5/10/24 (b) | 300,000 | 295,767 | |
| Pilgrim's Pride Corp.: | |||
| 5.75% 3/15/25 (b) | 225,000 | 209,813 | |
| 5.875% 9/30/27 (b) | 245,000 | 222,338 | |
| Post Holdings, Inc.: | |||
| 5.5% 3/1/25 (b) | 50,000 | 48,344 | |
| 5.625% 1/15/28 (b) | 110,000 | 103,433 | |
| 5.75% 3/1/27 (b) | 160,000 | 152,800 | |
| Tbla International Pte. Ltd. 7% 1/24/23 | 400,000 | 339,156 | |
| U.S. Foods, Inc. 5.875% 6/15/24 (b) | 70,000 | 69,300 | |
| Vector Group Ltd. 6.125% 2/1/25 (b) | 150,000 | 136,500 | |
| TOTAL FOOD/BEVERAGE/TOBACCO | 2,758,288 | ||
| Gaming - 2.1% | |||
| Cleopatra Finance Ltd. 4.75% 2/15/23 (Reg. S) | EUR | 100,000 | 120,936 |
| Codere Finance (Luxembourg) SA 6.75% 11/1/21 (Reg. S) | EUR | 100,000 | 106,756 |
| CRC Escrow Issuer LLC/CRC Finance LLC 5.25% 10/15/25 (b) | 380,000 | 353,638 | |
| Delta Merger Sub, Inc. 6% 9/15/26 (b) | 35,000 | 34,344 | |
| Eldorado Resorts, Inc. 6% 4/1/25 | 70,000 | 69,125 | |
| GLP Capital LP/GLP Financing II, Inc.: | |||
| 5.25% 6/1/25 | 95,000 | 95,476 | |
| 5.375% 4/15/26 | 30,000 | 29,813 | |
| International Game Technology PLC 6.25% 1/15/27 (b) | 50,000 | 49,375 | |
| MGM Growth Properties Operating Partnership LP 4.5% 1/15/28 | 350,000 | 313,250 | |
| MGM Mirage, Inc. 8.625% 2/1/19 | 115,000 | 115,863 | |
| Penn National Gaming, Inc. 5.625% 1/15/27 (b) | 15,000 | 13,950 | |
| Scientific Games Corp.: | |||
| 5% 10/15/25 (b) | 130,000 | 120,900 | |
| 10% 12/1/22 | 270,000 | 282,150 | |
| Station Casinos LLC 5% 10/1/25 (b) | 90,000 | 83,588 | |
| Studio City Finance Ltd. 8.5% 12/1/20 (b) | 200,000 | 200,000 | |
| Transocean, Inc. 7.25% 11/1/25 (b) | 160,000 | 155,600 | |
| Wynn Las Vegas LLC/Wynn Las Vegas Capital Corp. 5.25% 5/15/27 (b) | 85,000 | 76,925 | |
| Wynn Macau Ltd.: | |||
| 4.875% 10/1/24 (b) | 200,000 | 181,500 | |
| 5.5% 10/1/27 (b) | 200,000 | 180,500 | |
| TOTAL GAMING | 2,583,689 | ||
| Healthcare - 6.8% | |||
| Catalent Pharma Solutions 4.875% 1/15/26 (b) | 25,000 | 23,438 | |
| Centene Escrow Corp. 5.375% 6/1/26 (b) | 245,000 | 248,675 | |
| Charles River Laboratories International, Inc. 5.5% 4/1/26 (b) | 65,000 | 64,838 | |
| Community Health Systems, Inc.: | |||
| 5.125% 8/1/21 | 100,000 | 94,750 | |
| 6.25% 3/31/23 | 815,000 | 749,556 | |
| CTR Partnership LP/CareTrust Capital Corp. 5.25% 6/1/25 | 100,000 | 97,500 | |
| DaVita HealthCare Partners, Inc.: | |||
| 5% 5/1/25 | 180,000 | 169,425 | |
| 5.125% 7/15/24 | 215,000 | 205,325 | |
| Eurofins Scientific SA 2.125% 7/25/24 (Reg. S) | EUR | 100,000 | 112,428 |
| HCA Holdings, Inc.: | |||
| 4.5% 2/15/27 | 500,000 | 486,250 | |
| 5.375% 9/1/26 | 85,000 | 83,436 | |
| 5.625% 9/1/28 | 105,000 | 103,016 | |
| 5.875% 3/15/22 | 274,000 | 286,673 | |
| 5.875% 2/15/26 | 85,000 | 86,913 | |
| 7.5% 2/15/22 | 180,000 | 195,300 | |
| HealthSouth Corp. 5.75% 9/15/25 | 15,000 | 14,850 | |
| HLF Financing SARL LLC / Herbalife International, Inc. 7.25% 8/15/26 (b) | 25,000 | 25,313 | |
| Hologic, Inc.: | |||
| 4.375% 10/15/25 (b) | 75,000 | 70,313 | |
| 4.625% 2/1/28 (b) | 30,000 | 27,413 | |
| IMS Health, Inc.: | |||
| 3.25% 3/15/25 (Reg. S) | EUR | 200,000 | 228,888 |
| 5% 10/15/26 (b) | 120,000 | 115,462 | |
| InRetail Pharma SA 5.375% 5/2/23 (b) | 200,000 | 202,300 | |
| MPT Operating Partnership LP/MPT Finance Corp.: | |||
| 5% 10/15/27 | 330,000 | 310,101 | |
| 5.25% 8/1/26 | 100,000 | 96,500 | |
| Polaris Intermediate Corp. 8.5% 12/1/22 pay-in-kind (b)(c) | 145,000 | 148,625 | |
| Sabra Health Care LP/Sabra Capital Corp.: | |||
| 5.375% 6/1/23 | 155,000 | 154,225 | |
| 5.5% 2/1/21 | 120,000 | 121,575 | |
| Teleflex, Inc. 4.625% 11/15/27 | 30,000 | 27,831 | |
| Tenet Healthcare Corp.: | |||
| 4.625% 7/15/24 | 445,000 | 428,913 | |
| 5.125% 5/1/25 | 210,000 | 202,125 | |
| 6.75% 6/15/23 | 470,000 | 468,684 | |
| 8.125% 4/1/22 | 515,000 | 536,244 | |
| Teva Pharmaceutical Finance Netherlands III BV: | |||
| 1.125% 10/15/24 | EUR | 300,000 | 297,844 |
| 2.8% 7/21/23 | 350,000 | 308,767 | |
| Valeant Pharmaceuticals International, Inc.: | |||
| 5.5% 3/1/23 (b) | 115,000 | 108,963 | |
| 5.5% 11/1/25 (b) | 110,000 | 107,800 | |
| 5.875% 5/15/23 (b) | 375,000 | 358,594 | |
| 6.125% 4/15/25 (b) | 155,000 | 142,554 | |
| 6.5% 3/15/22 (b) | 80,000 | 82,800 | |
| 7% 3/15/24 (b) | 160,000 | 167,550 | |
| 7.5% 7/15/21 (b) | 252,000 | 255,780 | |
| 9.25% 4/1/26 (b) | 300,000 | 314,625 | |
| Vizient, Inc. 10.375% 3/1/24 (b) | 80,000 | 87,200 | |
| Wellcare Health Plans, Inc.: | |||
| 5.25% 4/1/25 | 50,000 | 49,875 | |
| 5.375% 8/15/26 (b) | 55,000 | 54,863 | |
| TOTAL HEALTHCARE | 8,524,100 | ||
| Homebuilders/Real Estate - 4.7% | |||
| APL Realty Holdings Pte Ltd. 5.95% 6/2/24 (Reg. S) | 200,000 | 139,278 | |
| Ashton Woods U.S.A. LLC/Ashton Woods Finance Co. 6.875% 2/15/21 (b) | 241,000 | 241,000 | |
| Brookfield Residential Properties, Inc. 6.5% 12/15/20 (b) | 115,000 | 115,000 | |
| Cementos Progreso Trust 7.125% 11/6/23 (b) | 200,000 | 204,752 | |
| Central China Real Estate Ltd. 6.5% 3/5/21 | 300,000 | 281,068 | |
| China Aoyuan Property Group Ltd. 7.95% 9/7/21 (Reg. S) | 200,000 | 193,279 | |
| China SCE Property Holdings Ltd. 7.45% 4/17/21 (Reg. S) | 200,000 | 187,271 | |
| Easy Tactic Ltd. 5.875% 2/13/23 (Reg. S) | 200,000 | 169,093 | |
| Evergrande Real Estate Group Ltd.: | |||
| 8.25% 3/23/22 (Reg. S) | 200,000 | 176,006 | |
| 8.75% 6/28/25 (Reg. S) | 200,000 | 156,750 | |
| Fantasia Holdings Group Co. Ltd. 7.375% 10/4/21 (Reg. S) | 200,000 | 139,104 | |
| Howard Hughes Corp. 5.375% 3/15/25 (b) | 110,000 | 105,600 | |
| IRSA Propiedades Comerciales SA 8.75% 3/23/23 (b) | 150,000 | 149,814 | |
| Jababeka International BV 6.5% 10/5/23 (Reg. S) | 200,000 | 160,105 | |
| Jiayuan International Group Ltd. 8.25% 11/14/18 (Reg. S) | 200,000 | 198,261 | |
| Jingrui Holdings Ltd.: | |||
| 7.75% 4/12/20 | 200,000 | 188,293 | |
| 9.45% 4/23/21 (Reg. S) | 200,000 | 188,179 | |
| Kaisa Group Holdings Ltd. 8.5% 6/30/22 (Reg. S) | 200,000 | 140,990 | |
| KWG Property Holding Ltd.: | |||
| 5.2% 9/21/22 (Reg. S) | 200,000 | 167,279 | |
| 7.875% 8/9/21 (Reg. S) | 200,000 | 191,891 | |
| Lennar Corp. 5.375% 10/1/22 | 55,000 | 55,894 | |
| Lodha Development Intrnl Mauritius Ltd. 12% 3/13/20 (Reg. S) | 200,000 | 178,100 | |
| Mattamy Group Corp. 6.875% 12/15/23 (b) | 25,000 | 24,344 | |
| Modernland Overseas Pte Ltd. 6.95% 4/13/24 | 200,000 | 162,975 | |
| MTN (Mauritius) Investments Ltd. 6.5% 10/13/26 (b) | 300,000 | 289,350 | |
| Redco Group 11% 8/29/20 (Reg. S) | 200,000 | 198,469 | |
| Ronshine China Holdings Ltd. 6.95% 12/8/19 | 200,000 | 198,199 | |
| Shea Homes Ltd. Partnership/Corp.: | |||
| 5.875% 4/1/23 (b) | 30,000 | 28,200 | |
| 6.125% 4/1/25 (b) | 305,000 | 283,650 | |
| Starwood Property Trust, Inc. 4.75% 3/15/25 | 75,000 | 71,438 | |
| Sunac China Holdings Ltd. 7.35% 7/19/21 (Reg. S) | 200,000 | 181,493 | |
| Theta Capital Pte Ltd. 6.75% 10/31/26 (Reg. S) | 200,000 | 131,313 | |
| Times China Holdings Ltd. 7.85% 6/4/21 (Reg. S) | 200,000 | 187,379 | |
| Weekley Homes LLC/Weekley Finance Corp. 6% 2/1/23 | 90,000 | 86,400 | |
| West Street Merger Sub, Inc. 6.375% 9/1/25 (b) | 220,000 | 206,250 | |
| Yida China Holdings 6.95% 4/19/20 (Reg. S) | 200,000 | 154,894 | |
| TOTAL HOMEBUILDERS/REAL ESTATE | 5,931,361 | ||
| Hotels - 0.4% | |||
| Hilton Domestic Operating Co., Inc. 5.125% 5/1/26 (b) | 230,000 | 224,825 | |
| Hilton Worldwide Finance LLC/Hilton Worldwide Finance Corp.: | |||
| 4.625% 4/1/25 | 70,000 | 67,900 | |
| 4.875% 4/1/27 | 40,000 | 38,200 | |
| Marriott Ownership Resorts, Inc. 6.5% 9/15/26 (b) | 65,000 | 65,650 | |
| Wyndham Hotels & Resorts, Inc. 5.375% 4/15/26 (b) | 140,000 | 135,800 | |
| TOTAL HOTELS | 532,375 | ||
| Insurance - 0.5% | |||
| Acrisure LLC / Acrisure Finance, Inc. 7% 11/15/25 (b) | 115,000 | 102,638 | |
| Alliant Holdings Co.-Issuer, Inc./Wayne Merger Sub LLC 8.25% 8/1/23 (b) | 120,000 | 124,036 | |
| Assicurazioni Generali SpA 5.5% 10/27/47 (Reg. S) (c) | EUR | 200,000 | 235,097 |
| HUB International Ltd. 7% 5/1/26 (b) | 90,000 | 87,840 | |
| USIS Merger Sub, Inc. 6.875% 5/1/25 (b) | 75,000 | 73,125 | |
| TOTAL INSURANCE | 622,736 | ||
| Leisure - 1.0% | |||
| Cedar Fair LP/Canada's Wonderland Co. 5.375% 4/15/27 | 35,000 | 33,425 | |
| Mattel, Inc. 6.75% 12/31/25 (b) | 305,000 | 291,180 | |
| NVA Holdings, Inc. 6.875% 4/1/26 (b) | 50,000 | 49,375 | |
| Rivers Pittsburgh Borrower LP 6.125% 8/15/21 (b) | 480,000 | 477,600 | |
| Silversea Cruises 7.25% 2/1/25 (b) | 25,000 | 26,938 | |
| Viking Cruises Ltd. 5.875% 9/15/27 (b) | 370,000 | 352,425 | |
| Voc Escrow Ltd. 5% 2/15/28 (b) | 70,000 | 65,800 | |
| TOTAL LEISURE | 1,296,743 | ||
| Metals/Mining - 3.3% | |||
| Abja Investment Co. Pte Ltd. 5.45% 1/24/28 | 300,000 | 258,490 | |
| ABM Industries, Inc. 7.125% 8/1/22 (Reg. S) | 200,000 | 180,878 | |
| Alcoa Nederland Holding BV 6.125% 5/15/28 (b) | 200,000 | 199,500 | |
| Alpha Natural Resources, Inc. 9.75% 4/15/18 (e)(f) | 210,000 | 0 | |
| Constellium NV 5.875% 2/15/26 (b) | 250,000 | 233,125 | |
| First Quantum Minerals Ltd.: | |||
| 6.5% 3/1/24 (b) | 200,000 | 174,500 | |
| 6.875% 3/1/26 (b) | 200,000 | 172,750 | |
| 7.25% 4/1/23 (b) | 300,000 | 277,125 | |
| 7.5% 4/1/25 (b) | 200,000 | 178,500 | |
| FMG Resources (August 2006) Pty Ltd.: | |||
| 4.75% 5/15/22 (b) | 45,000 | 43,200 | |
| 5.125% 3/15/23 (b) | 95,000 | 91,675 | |
| Freeport-McMoRan, Inc. 6.875% 2/15/23 | 215,000 | 224,944 | |
| Gold Fields Orogen Holding BVI Ltd. 4.875% 10/7/20 (b) | 150,000 | 150,375 | |
| Joseph T Ryerson & Son, Inc. 11% 5/15/22 (b) | 40,000 | 42,800 | |
| Minsur SA 6.25% 2/7/24 (Reg. S) | 200,000 | 203,202 | |
| Murray Energy Corp. 11.25% 4/15/21 (b) | 30,000 | 19,050 | |
| Novelis Corp. 5.875% 9/30/26 (b) | 70,000 | 65,975 | |
| Polyus Finance PLC 5.25% 2/7/23 (b) | 200,000 | 192,848 | |
| PT Bukit Makmur Mandiri Utama 7.75% 2/13/22 (Reg. S) | 200,000 | 201,977 | |
| Qinghai Provincial Investment Group Co. Ltd. 7.875% 3/22/21 (Reg. S) | 200,000 | 152,684 | |
| Stillwater Mining Co. 6.125% 6/27/22 (b) | 200,000 | 190,968 | |
| Vedanta Resources PLC: | |||
| 6.125% 8/9/24 | 200,000 | 176,469 | |
| 6.375% 7/30/22 (b) | 400,000 | 374,200 | |
| VM Holding SA 5.375% 5/4/27 (b) | 200,000 | 194,502 | |
| Zhongrong International Resour 7.25% 10/26/20 (Reg. S) | 200,000 | 131,968 | |
| TOTAL METALS/MINING | 4,131,705 | ||
| Paper - 0.4% | |||
| Progroup AG 3% 3/31/26 (Reg. S) | EUR | 225,000 | 256,495 |
| Smurfit Kappa Acquisitions 3.25% 6/1/21 (Reg. S) | EUR | 200,000 | 240,280 |
| TOTAL PAPER | 496,775 | ||
| Restaurants - 0.5% | |||
| 1011778 BC Unlimited Liability Co./New Red Finance, Inc. 5% 10/15/25 (b) | 140,000 | 131,250 | |
| Golden Nugget, Inc.: | |||
| 6.75% 10/15/24 (b) | 120,000 | 119,700 | |
| 8.75% 10/1/25 (b) | 65,000 | 66,788 | |
| KFC Holding Co./Pizza Hut Holding LLC: | |||
| 4.75% 6/1/27 (b) | 50,000 | 47,000 | |
| 5% 6/1/24 (b) | 195,000 | 192,319 | |
| 5.25% 6/1/26 (b) | 100,000 | 98,250 | |
| TOTAL RESTAURANTS | 655,307 | ||
| Services - 2.4% | |||
| Algeco Scotsman Global Finance PLC: | |||
| 3 month EURIBOR + 6.250% 6.25% 2/15/23 (c)(d) | EUR | 100,000 | 113,831 |
| 6.5% 2/15/23 | EUR | 100,000 | 116,940 |
| APX Group, Inc. 7.625% 9/1/23 | 150,000 | 133,500 | |
| Avantor, Inc. 6% 10/1/24 (b) | 220,000 | 219,450 | |
| Blueline Rental Finance Corp./Blueline Rental LLC 9.25% 3/15/24 (b) | 35,000 | 36,531 | |
| Brand Energy & Infrastructure Services, Inc. 8.5% 7/15/25 (b) | 250,000 | 246,250 | |
| CDK Global, Inc.: | |||
| 4.875% 6/1/27 | 105,000 | 98,306 | |
| 5.875% 6/15/26 | 35,000 | 35,263 | |
| eHi Car Service Co. Ltd. 5.875% 8/14/22 | 200,000 | 173,491 | |
| Elis SA 2.875% 2/15/26 (Reg. S) | EUR | 100,000 | 113,643 |
| FTI Consulting, Inc. 6% 11/15/22 | 175,000 | 178,605 | |
| Global A&T Electronics Ltd. 8.5% 1/12/23 | 200,000 | 189,528 | |
| H&E Equipment Services, Inc. 5.625% 9/1/25 | 180,000 | 171,450 | |
| Herc Rentals, Inc.: | |||
| 7.5% 6/1/22 (b) | 31,000 | 32,240 | |
| 7.75% 6/1/24 (b) | 31,000 | 32,705 | |
| IHS Markit Ltd.: | |||
| 4% 3/1/26 (b) | 35,000 | 32,940 | |
| 4.75% 2/15/25 (b) | 65,000 | 64,349 | |
| Intrum Justitia AB 2.75% 7/15/22 (Reg. S) | EUR | 100,000 | 110,424 |
| IPD BV 4.5% 7/15/22 (Reg. S) | EUR | 200,000 | 231,582 |
| Jurassic Holdings III, Inc. 6.875% 2/15/21 (Reg. S) (b) | 220,000 | 205,700 | |
| Laureate Education, Inc. 8.25% 5/1/25 (b) | 495,000 | 530,888 | |
| TOTAL SERVICES | 3,067,616 | ||
| Steel - 0.8% | |||
| Big River Steel LLC/BRS Finance Corp. 7.25% 9/1/25 (b) | 55,000 | 57,338 | |
| Cleveland-Cliffs, Inc. 5.75% 3/1/25 | 210,000 | 198,450 | |
| CSN Resources SA 6.5% 7/21/20 (b) | 125,000 | 121,524 | |
| EVRAZ Group SA 5.375% 3/20/23 (b) | 200,000 | 196,500 | |
| Metinvest BV 7.75% 4/23/23 (b) | 300,000 | 288,000 | |
| Thyssenkrupp AG 3.125% 10/25/19 (Reg. S) | EUR | 100,000 | 115,263 |
| TOTAL STEEL | 977,075 | ||
| Super Retail - 0.3% | |||
| Netflix, Inc.: | |||
| 4.375% 11/15/26 | 110,000 | 100,672 | |
| 4.875% 4/15/28 (b) | 85,000 | 77,988 | |
| 5.875% 11/15/28 (b) | 140,000 | 137,550 | |
| TOTAL SUPER RETAIL | 316,210 | ||
| Technology - 2.3% | |||
| Balboa Merger Sub, Inc. 11.375% 12/1/21 (b) | 360,000 | 381,600 | |
| Banff Merger Sub, Inc. 9.75% 9/1/26 (b) | 260,000 | 249,600 | |
| CDW LLC/CDW Finance Corp. 5% 9/1/25 | 20,000 | 19,500 | |
| Dr. Peng Holding Hong Kong Ltd. 5.05% 6/1/20 (Reg. S) | 200,000 | 164,292 | |
| Ensemble S Merger Sub, Inc. 9% 9/30/23 (b) | 267,000 | 276,345 | |
| Entegris, Inc. 4.625% 2/10/26 (b) | 85,000 | 78,970 | |
| Fair Isaac Corp. 5.25% 5/15/26 (b) | 50,000 | 49,313 | |
| InterXion Holding N.V. 4.75% 6/15/25 (Reg. S) | EUR | 100,000 | 118,079 |
| Itron, Inc. 5% 1/15/26 (b) | 30,000 | 27,938 | |
| j2 Cloud Services LLC/j2 Global Communications, Inc. 6% 7/15/25 (b) | 45,000 | 44,606 | |
| Jain International Trading BV 7.125% 2/1/22 (Reg. S) | 200,000 | 185,628 | |
| Match Group, Inc. 5% 12/15/27 (b) | 60,000 | 57,150 | |
| Parametric Technology Corp. 6% 5/15/24 | 20,000 | 20,450 | |
| Qorvo, Inc. 5.5% 7/15/26 (b) | 100,000 | 100,250 | |
| Sabre GLBL, Inc. 5.25% 11/15/23 (b) | 85,000 | 83,927 | |
| Sensata Technologies BV 4.875% 10/15/23 (b) | 120,000 | 116,850 | |
| SoftBank Corp. 4.75% 9/19/24 | 35,000 | 33,673 | |
| Solera LLC/Solera Finance, Inc. 10.5% 3/1/24 (b) | 410,000 | 444,862 | |
| TTM Technologies, Inc. 5.625% 10/1/25 (b) | 25,000 | 24,375 | |
| Uber Technologies, Inc. 8% 11/1/26 (b)(g) | 240,000 | 241,200 | |
| Veritas U.S., Inc./Veritas Bermuda Ltd. 10.5% 2/1/24 (b) | 265,000 | 227,900 | |
| TOTAL TECHNOLOGY | 2,946,508 | ||
| Telecommunications - 8.4% | |||
| Altice Finco SA: | |||
| 4.75% 1/15/28 | EUR | 150,000 | 140,736 |
| 7.625% 2/15/25 (b) | 800,000 | 711,000 | |
| Axtel S.A.B. de CV 6.375% 11/14/24 (b) | 300,000 | 286,875 | |
| Banglalink Digital Communications Ltd.: | |||
| 8.625% 5/6/19 (b) | 200,000 | 201,000 | |
| 8.625% 5/6/19 (Reg. S) | 200,000 | 201,000 | |
| C&W Senior Financing Designated Activity Co.: | |||
| 6.875% 9/15/27 (b) | 200,000 | 190,500 | |
| 7.5% 10/15/26 (b) | 200,000 | 200,500 | |
| Cellnex Telecom Sau 2.375% 1/16/24 (Reg. S) | EUR | 200,000 | 228,289 |
| Colombia Telecomunicaciones SA 5.375% 9/27/22 (b) | 200,000 | 198,852 | |
| CyrusOne LP/CyrusOne Finance Corp.: | |||
| 5% 3/15/24 | 45,000 | 45,000 | |
| 5.375% 3/15/27 | 40,000 | 39,700 | |
| Digicel Group Ltd. 6.75% 3/1/23 (b) | 150,000 | 120,375 | |
| Equinix, Inc. 5.375% 5/15/27 | 50,000 | 49,500 | |
| Frontier Communications Corp.: | |||
| 8.5% 4/1/26 (b) | 225,000 | 208,969 | |
| 11% 9/15/25 | 300,000 | 219,750 | |
| GCI, Inc. 6.875% 4/15/25 | 85,000 | 87,709 | |
| Globo Comunicacao e Participacoes SA: | |||
| 4.875% 4/11/22 (Reg. S) | 250,000 | 247,813 | |
| 5.125% 3/31/27 (b) | 200,000 | 185,502 | |
| GTH Finance BV 7.25% 4/26/23 (b) | 200,000 | 207,000 | |
| GTT Communications, Inc. 7.875% 12/31/24 (b) | 180,000 | 169,200 | |
| Intelsat Jackson Holdings SA: | |||
| 8% 2/15/24 (b) | 260,000 | 272,025 | |
| 8.5% 10/15/24 (b) | 385,000 | 378,263 | |
| Millicom International Cellular SA 5.125% 1/15/28 (b) | 200,000 | 181,700 | |
| MTS International Funding Ltd. 5% 5/30/23 (b) | 350,000 | 339,329 | |
| Nokia Corp.: | |||
| 3.375% 6/12/22 | 35,000 | 33,513 | |
| 4.375% 6/12/27 | 45,000 | 42,323 | |
| Sable International Finance Ltd. 6.875% 8/1/22 (b) | 200,000 | 208,750 | |
| SFR Group SA: | |||
| 7.375% 5/1/26 (b) | 150,000 | 143,579 | |
| 8.125% 2/1/27 (b) | 245,000 | 242,550 | |
| Sprint Capital Corp.: | |||
| 6.875% 11/15/28 | 190,000 | 186,675 | |
| 6.9% 5/1/19 | 1,115,000 | 1,129,595 | |
| 8.75% 3/15/32 | 245,000 | 267,663 | |
| Sprint Corp.: | |||
| 7.125% 6/15/24 | 200,000 | 204,500 | |
| 7.625% 3/1/26 | 70,000 | 72,494 | |
| 7.875% 9/15/23 | 540,000 | 576,450 | |
| T-Mobile U.S.A., Inc. 4.5% 2/1/26 | 250,000 | 233,985 | |
| TBG Global Pte. Ltd. 5.25% 2/10/22 (Reg. S) | 400,000 | 389,753 | |
| Telecom Italia SpA 5.25% 3/17/55 | EUR | 300,000 | 332,591 |
| Telefonica Celular del Paraguay SA 6.75% 12/13/22 (b) | 200,000 | 203,018 | |
| Telenet Finance Luxembourg Notes SARL: | |||
| 3.5% 3/1/28 (Reg. S) | EUR | 200,000 | 223,132 |
| 5.5% 3/1/28 (b) | 600,000 | 556,500 | |
| Turkcell Iletisim Hizmet A/S 5.8% 4/11/28 (b) | 200,000 | 172,936 | |
| Wind Tre SpA 5% 1/20/26 (b) | 200,000 | 170,240 | |
| Zayo Group LLC/Zayo Capital, Inc. 5.75% 1/15/27 (b) | 135,000 | 132,327 | |
| TOTAL TELECOMMUNICATIONS | 10,633,161 | ||
| Textiles/Apparel - 0.3% | |||
| CBR Fashion Finance BV 5.125% 10/1/22 (Reg. S) | EUR | 100,000 | 92,360 |
| Eagle Intermediate Global Holding BV 7.5% 5/1/25 (b) | 35,000 | 33,863 | |
| Golden Legacy Pte Ltd. 8.25% 6/7/21 | 200,000 | 205,293 | |
| TOTAL TEXTILES/APPAREL | 331,516 | ||
| Transportation Ex Air/Rail - 0.7% | |||
| Avolon Holdings Funding Ltd.: | |||
| 5.125% 10/1/23 (b) | 265,000 | 260,031 | |
| 5.5% 1/15/23 (b) | 85,000 | 84,575 | |
| Navios Maritime Acquisition Corp./Navios Acquisition Finance U.S., Inc. 8.125% 11/15/21 (b) | 235,000 | 197,106 | |
| Navios Maritime Holdings, Inc.: | |||
| 7.375% 1/15/22 (b) | 90,000 | 67,950 | |
| 11.25% 8/15/22 (b) | 135,000 | 117,450 | |
| Navios South American Logistics, Inc./Navios Logistics Finance U.S., Inc. 7.25% 5/1/22 (b) | 35,000 | 32,550 | |
| Teekay Corp. 8.5% 1/15/20 | 145,000 | 147,175 | |
| TOTAL TRANSPORTATION EX AIR/RAIL | 906,837 | ||
| Utilities - 5.1% | |||
| ContourGlobal Power Holdings SA 4.125% 8/1/25 (Reg. S) | EUR | 125,000 | 138,466 |
| DPL, Inc. 6.75% 10/1/19 | 495,000 | 506,756 | |
| DTEK Finance PLC 10.75% 12/31/24 pay-in-kind (c) | 100,000 | 102,108 | |
| Dynegy, Inc.: | |||
| 5.875% 6/1/23 | 70,000 | 71,050 | |
| 7.375% 11/1/22 | 105,000 | 108,938 | |
| 7.625% 11/1/24 | 239,000 | 252,743 | |
| Greenko Investment Co. 4.875% 8/16/23 (Reg. S) | 200,000 | 178,600 | |
| InterGen NV 7% 6/30/23 (b) | 920,000 | 903,900 | |
| Listrindo Capital BV 4.95% 9/14/26 (b) | 200,000 | 177,800 | |
| NRG Energy, Inc. 5.75% 1/15/28 | 1,345,000 | 1,341,638 | |
| NSG Holdings II LLC/NSG Holdings, Inc. 7.75% 12/15/25 (b) | 298,125 | 321,975 | |
| Pattern Energy Group, Inc. 5.875% 2/1/24 (b) | 30,000 | 29,700 | |
| Petrobras Energia SA 7.375% 7/21/23 (Reg. S) | 200,000 | 184,740 | |
| Petrobras Global Finance BV: | |||
| 4.75% 1/14/25 | EUR | 100,000 | 119,483 |
| 6.25% 3/17/24 | 300,000 | 303,450 | |
| Star Energy Geothermal Wayang Windu Ltd. 6.75% 4/24/33 (Reg. S) | 200,000 | 179,694 | |
| Talen Energy Supply LLC: | |||
| 6.5% 6/1/25 | 215,000 | 160,175 | |
| 10.5% 1/15/26 (b) | 410,000 | 360,288 | |
| TerraForm Global, Inc. 6.125% 3/1/26 (b) | 145,000 | 134,850 | |
| The AES Corp.: | |||
| 4% 3/15/21 | 195,000 | 193,077 | |
| 5.125% 9/1/27 | 55,000 | 54,313 | |
| TVO Power Co.: | |||
| 2.125% 2/4/25 (Reg. S) | EUR | 100,000 | 113,363 |
| 2.5% 3/17/21 (Reg. S) | EUR | 100,000 | 117,835 |
| Vertiv Group Corp. 9.25% 10/15/24 (b) | 60,000 | 59,700 | |
| Vistra Operations Co. LLC 5.5% 9/1/26 (b) | 115,000 | 113,275 | |
| Wind Tre SpA 3.125% 1/20/25 (Reg. S) | EUR | 200,000 | 206,142 |
| TOTAL UTILITIES | 6,434,059 | ||
| TOTAL NONCONVERTIBLE BONDS | |||
| (Cost $104,536,389) | 100,022,877 | ||
| Government Obligations - 1.3% | |||
| Germany - 1.3% | |||
| German Federal Republic: | |||
| 0% 10/13/23 | EUR | 1,200,000 | 1,372,180 |
| 2% 8/15/23 | EUR | 200,000 | 250,978 |
| TOTAL GOVERNMENT OBLIGHTATIONS | |||
| (Cost $1,642,884) | 1,623,158 | ||
| Shares | Value | ||
| Common Stocks - 1.4% | |||
| Automotive & Auto Parts - 0.1% | |||
| General Motors Co. | 2,268 | 82,986 | |
| UC Holdings, Inc. (f) | 3,510 | 73,254 | |
| TOTAL AUTOMOTIVE & AUTO PARTS | 156,240 | ||
| Chemicals - 0.2% | |||
| LyondellBasell Industries NV Class A | 2,100 | 187,467 | |
| Energy - 0.2% | |||
| GulfMark Offshore, Inc.: | |||
| warrants 10/21/42 (f)(h) | 1,897 | 66,395 | |
| warrants 11/14/42 (f)(h) | 5,448 | 190,680 | |
| Riviera Resources, Inc. (h) | 94 | 2,004 | |
| Roan Resources, Inc. (h) | 448 | 7,289 | |
| The Williams Companies, Inc. | 1,900 | 46,227 | |
| TOTAL ENERGY | 312,595 | ||
| Food & Drug Retail - 0.1% | |||
| Southeastern Grocers, Inc. (f)(h) | 1,789 | 72,598 | |
| Gaming - 0.3% | |||
| Boyd Gaming Corp. | 4,800 | 127,488 | |
| Golden Entertainment, Inc. (h) | 8,300 | 150,811 | |
| Penn National Gaming, Inc. (h) | 4,600 | 111,688 | |
| TOTAL GAMING | 389,987 | ||
| Healthcare - 0.2% | |||
| HCA Holdings, Inc. | 1,500 | 200,295 | |
| Hotels - 0.1% | |||
| Extended Stay America, Inc. unit | 5,500 | 89,540 | |
| Metals/Mining - 0.0% | |||
| Warrior Metropolitan Coal, Inc. | 69 | 1,932 | |
| Services - 0.1% | |||
| United Rentals, Inc. (h) | 1,300 | 156,091 | |
| Steel - 0.0% | |||
| ANR, Inc. (h) | 363 | 12,705 | |
| Utilities - 0.1% | |||
| NRG Energy, Inc. | 3,900 | 141,141 | |
| TOTAL COMMON STOCKS | |||
| (Cost $1,792,360) | 1,720,591 | ||
| Convertible Preferred Stocks - 0.1% | |||
| Utilities - 0.1% | |||
| Vistra Energy Corp. 7.00% | |||
| (Cost $133,084) | 1,600 | 145,749 | |
| Principal Amount | Value | ||
| Bank Loan Obligations - 3.8% | |||
| Aerospace - 0.2% | |||
| TransDigm, Inc.: | |||
| Tranche E, term loan 3 month U.S. LIBOR + 2.500% 4.802% 5/30/25 (c)(d) | 19,900 | 19,781 | |
| Tranche F, term loan 3 month U.S. LIBOR + 2.500% 4.802% 6/9/23 (c)(d) | 79,202 | 78,777 | |
| Tranche G, term loan 3 month U.S. LIBOR + 2.500% 4.802% 8/22/24 (c)(d) | 128,380 | 127,708 | |
| TOTAL AEROSPACE | 226,266 | ||
| Cable/Satellite TV - 0.8% | |||
| CSC Holdings LLC Tranche B, term loan 3 month U.S. LIBOR + 2.500% 4.7795% 1/25/26 (c)(d) | 24,875 | 24,821 | |
| Mediacom Illinois LLC Tranche N, term loan 3 month U.S. LIBOR + 1.750% 3.97% 2/15/24 (c)(d) | 129,350 | 128,946 | |
| Numericable LLC Tranche B 12LN, term loan 3 month U.S. LIBOR + 3.688% 5.967% 1/31/26 (c)(d) | 386,596 | 376,529 | |
| WideOpenWest Finance LLC Tranche B, term loan 3 month U.S. LIBOR + 3.250% 5.5395% 8/19/23 (c)(d) | 472,900 | 455,166 | |
| Zayo Group LLC Tranche B 2LN, term loan 3 month U.S. LIBOR + 2.250% 4.552% 1/19/24 (c)(d) | 5,000 | 5,002 | |
| TOTAL CABLE/SATELLITE TV | 990,464 | ||
| Chemicals - 0.4% | |||
| Invictus U.S. Newco LLC Tranche 1LN, term loan 3 month U.S. LIBOR + 3.000% 5.302% 3/28/25 (c)(d) | 4,975 | 4,992 | |
| Oxea Corp. Tranche B2, term loan 3 month U.S. LIBOR + 3.500% 5.9375% 10/11/24 (c)(d) | 9,200 | 9,223 | |
| PQ Corp. Tranche B, term loan 3 month U.S. LIBOR + 2.500% 5.0266% 2/8/25 (c)(d) | 4,785 | 4,776 | |
| Starfruit U.S. Holdco LLC Tranche B, term loan 3 month U.S. LIBOR + 3.250% 5.506% 10/1/25 (c)(d) | 45,000 | 44,831 | |
| The Chemours Co. LLC Tranche B 1LN, term loan 3 month U.S. LIBOR + 1.750% 4.05% 4/3/25 (c)(d) | 378,100 | 376,448 | |
| Tronox Blocked Borrower LLC Tranche B, term loan 3 month U.S. LIBOR + 3.000% 5.302% 9/22/24 (c)(d) | 9,002 | 8,989 | |
| Tronox Finance LLC Tranche B, term loan 3 month U.S. LIBOR + 3.000% 5.302% 9/22/24 (c)(d) | 20,773 | 20,744 | |
| TOTAL CHEMICALS | 470,003 | ||
| Diversified Financial Services - 0.0% | |||
| BCP Renaissance Parent LLC Tranche B, term loan 3 month U.S. LIBOR + 3.500% 6.0266% 10/31/24 (c)(d) | 14,963 | 15,000 | |
| HarbourVest Partners LLC Tranche B 1LN, term loan 3 month U.S. LIBOR + 2.250% 4.5295% 3/1/25 (c)(d) | 18,966 | 18,943 | |
| TOTAL DIVERSIFIED FINANCIAL SERVICES | 33,943 | ||
| Energy - 0.6% | |||
| Arctic LNG Carriers Ltd. Tranche B 1LN, term loan 3 month U.S. LIBOR + 4.500% 6.802% 5/18/23 (c)(d) | 222,188 | 222,188 | |
| BCP Raptor LLC Tranche B, term loan 3 month U.S. LIBOR + 4.250% 6.6411% 6/22/24 (c)(d) | 49,375 | 48,661 | |
| California Resources Corp.: | |||
| Tranche 1LN, term loan 3 month U.S. LIBOR + 10.375% 12.6699% 12/31/21 (c)(d) | 230,000 | 255,875 | |
| Tranche B, term loan 3 month U.S. LIBOR + 4.750% 7.0365% 12/31/22 (c)(d) | 185,000 | 187,466 | |
| Pacific Drilling SA: | |||
| DIP, term loan 3 month U.S. LIBOR + 7.000% 5.8714% 11/30/18 (c)(d)(f)(i) | 31,751 | 31,751 | |
| Tranche B, term loan 3 month U.S. LIBOR + 3.500% 0% 6/3/18 (d)(e) | 47,875 | 21,464 | |
| TOTAL ENERGY | 767,405 | ||
| Entertainment/Film - 0.1% | |||
| Cinemark U.S.A., Inc. Tranche B, term loan 3 month U.S. LIBOR + 1.750% 4.05% 3/29/25 (c)(d) | 163,763 | 163,803 | |
| Food & Drug Retail - 0.6% | |||
| BI-LO LLC Tranche B, term loan 3 month U.S. LIBOR + 8.000% 10.3645% 5/31/24 (c)(d) | 698,250 | 688,649 | |
| Tops Markets LLC term loan 3 month U.S. LIBOR + 9.500% 11.8125% 2/23/19 (c)(d)(f) | 65,045 | 65,208 | |
| TOTAL FOOD & DRUG RETAIL | 753,857 | ||
| Gaming - 0.0% | |||
| Gateway Casinos & Entertainment Ltd. Tranche B 1LN, term loan 3 month U.S. LIBOR + 3.000% 5.3861% 12/1/23 (c)(d) | 19,950 | 19,981 | |
| Healthcare - 0.0% | |||
| U.S. Anesthesia Partners, Inc. Tranche B, term loan 3 month U.S. LIBOR + 3.000% 5.302% 6/23/24 (c)(d) | 4,962 | 4,958 | |
| Insurance - 0.0% | |||
| Alliant Holdings Intermediate LLC Tranche B, term loan 3 month U.S. LIBOR + 3.000% 5.2795% 5/10/25 (c)(d) | 4,937 | 4,930 | |
| USI, Inc. Tranche B, term loan 3 month U.S. LIBOR + 3.000% 5.3861% 5/16/24 (c)(d) | 14,850 | 14,757 | |
| TOTAL INSURANCE | 19,687 | ||
| Leisure - 0.2% | |||
| Alterra Mountain Co. Tranche B 1LN, term loan 3 month U.S. LIBOR + 3.000% 5.302% 7/31/24 (c)(d) | 4,963 | 4,964 | |
| Crown Finance U.S., Inc. Tranche B 1LN, term loan 3 month U.S. LIBOR + 2.500% 4.802% 2/28/25 (c)(d) | 278,600 | 277,235 | |
| TOTAL LEISURE | 282,199 | ||
| Publishing/Printing - 0.1% | |||
| Cengage Learning, Inc. Tranche B, term loan 3 month U.S. LIBOR + 4.250% 6.5296% 6/7/23 (c)(d) | 90,000 | 83,278 | |
| Restaurants - 0.2% | |||
| Burger King Worldwide, Inc. Tranche B, term loan 3 month U.S. LIBOR + 2.250% 4.552% 2/17/24 (c)(d) | 299,801 | 298,526 | |
| Services - 0.1% | |||
| KUEHG Corp. Tranche B 2LN, term loan 3 month U.S. LIBOR + 8.250% 10.6361% 8/22/25 (c)(d) | 95,000 | 96,188 | |
| Technology - 0.4% | |||
| ATS Consolidated, Inc. Tranche B 1LN, term loan 3 month U.S. LIBOR + 3.750% 6.0449% 2/28/25 (c)(d) | 9,950 | 10,004 | |
| Kronos, Inc. 2LN, term loan 3 month U.S. LIBOR + 8.250% 10.5931% 11/1/24 (c)(d) | 115,000 | 116,454 | |
| SS&C Technologies, Inc.: | |||
| Tranche B 3LN, term loan 3 month U.S. LIBOR + 2.250% 4.552% 4/16/25 (c)(d) | 230,706 | 229,423 | |
| Tranche B 4LN, term loan 3 month U.S. LIBOR + 2.250% 4.552% 4/16/25 (c)(d) | 89,422 | 88,924 | |
| TOTAL TECHNOLOGY | 444,805 | ||
| Telecommunications - 0.1% | |||
| Sable International Finance Ltd. Tranche B 4LN, term loan 3 month U.S. LIBOR + 3.250% 5.552% 2/2/26 (c)(d) | 135,000 | 134,849 | |
| TOTAL BANK LOAN OBLIGATIONS | |||
| (Cost $4,796,659) | 4,790,212 | ||
| Preferred Securities - 4.8% | |||
| Automotive & Auto Parts - 0.2% | |||
| Volkswagen International Finance NV 3.875% (Reg. S) (c)(j) | EUR | 200,000 | 217,927 |
| Banks & Thrifts - 2.4% | |||
| Alfa Bond Issuance PLC 8% (Reg. S) (c)(j) | 200,000 | 190,472 | |
| Banco Do Brasil SA 9% (b)(c)(j) | 200,000 | 213,689 | |
| Banco Mercantil del Norte SA 7.625% (b)(c)(j) | 400,000 | 393,159 | |
| Bank of America Corp. 5.875% (c)(j) | 355,000 | 347,058 | |
| Bank of East Asia Ltd. 5.5% (c)(j) | 200,000 | 202,135 | |
| Barclays Bank PLC 7.625% 11/21/22 | 260,000 | 286,385 | |
| Citigroup, Inc. 5.35% (c)(j) | 550,000 | 542,281 | |
| Credit Agricole SA: | |||
| 7.875% (b)(c)(j) | 200,000 | 208,438 | |
| 8.125% (b)(c)(j) | 200,000 | 216,254 | |
| Itau Unibanco Holding SA 6.125% (b)(c)(j) | 200,000 | 197,003 | |
| Standard Chartered PLC 7.5% (b)(c)(j) | 200,000 | 203,486 | |
| TOTAL BANKS & THRIFTS | 3,000,360 | ||
| Consumer Products - 0.6% | |||
| Cosan Overseas Ltd. 8.25% (j) | 700,000 | 722,560 | |
| Energy - 0.2% | |||
| Gas Natural Fenosa Finance BV 4.125% (Reg. S) (c)(j) | EUR | 200,000 | 245,350 |
| Healthcare - 0.1% | |||
| Fullerton Healthcare Corp. Ltd. 7% (Reg. S) (c)(j) | 200,000 | 189,165 | |
| Homebuilders/Real Estate - 0.6% | |||
| Agile Property Holdings Ltd. 6.875% (Reg. S) (c)(j) | 200,000 | 177,166 | |
| CIFI Holdings Group Co. Ltd. 5.375% (Reg. S) (c)(j) | 200,000 | 168,695 | |
| Grand City Properties SA 3.75% (c)(j) | EUR | 100,000 | 119,096 |
| RKI Overseas Finance 2017 (A) 7% (Reg. S) (j) | 200,000 | 157,858 | |
| Yuzhou Properties Co. 5.375% (Reg. S) (c)(j) | 200,000 | 167,459 | |
| TOTAL HOMEBUILDERS/REAL ESTATE | 790,274 | ||
| Telecommunications - 0.5% | |||
| Colombia Telecomunicaciones SA 8.5% (b)(c)(j) | 200,000 | 206,903 | |
| Telefonica Europe BV: | |||
| 3.875% (Reg. S) (c)(j) | EUR | 200,000 | 212,768 |
| 5% (Reg. S) (c)(j) | EUR | 200,000 | 244,528 |
| TOTAL TELECOMMUNICATIONS | 664,199 | ||
| Utilities - 0.2% | |||
| EDF SA 5.375% 12/31/99 (c) | EUR | 200,000 | 250,273 |
| TOTAL PREFERRED SECURITIES | |||
| (Cost $6,306,965) | 6,080,108 | ||
| Shares | Value | ||
| Money Market Funds - 8.1% | |||
| Fidelity Cash Central Fund, 2.23% (k) | |||
| (Cost $10,184,149) | 10,182,363 | 10,184,399 | |
| TOTAL INVESTMENT IN SECURITIES - 98.9% | |||
| (Cost $129,392,490) | 124,567,094 | ||
| NET OTHER ASSETS (LIABILITIES) - 1.1% | 1,337,609 | ||
| NET ASSETS - 100% | $125,904,703 |
Currency Abbreviations
EUR – European Monetary Unit
Legend
(a) Amount is stated in United States dollars unless otherwise noted.
(b) Security exempt from registration under Rule 144A of the Securities Act of 1933. These securities may be resold in transactions exempt from registration, normally to qualified institutional buyers. At the end of the period, the value of these securities amounted to $54,681,998 or 43.4% of net assets.
(c) Coupon rates for floating and adjustable rate securities reflect the rates in effect at period end.
(d) Coupon is indexed to a floating interest rate which may be multiplied by a specified factor and/or subject to caps or floors.
(e) Non-income producing - Security is in default.
(f) Level 3 security
(g) Security or a portion of the security purchased on a delayed delivery or when-issued basis.
(h) Non-income producing
(i) Position or a portion of the position represents an unfunded loan commitment. At period end, the total principal amount and market value of unfunded commitments totaled $13,074 and $13,074, respectively.
(j) Security is perpetual in nature with no stated maturity date.
(k) Affiliated fund that is generally available only to investment companies and other accounts managed by Fidelity Investments. The rate quoted is the annualized seven-day yield of the fund at period end. A complete unaudited listing of the fund's holdings as of its most recent quarter end is available upon request. In addition, each Fidelity Central Fund's financial statements are available on the SEC's website or upon request.
Affiliated Central Funds
Information regarding fiscal year to date income earned by the Fund from investments in Fidelity Central Funds is as follows:
| Fund | Income earned |
| Fidelity Cash Central Fund | $64,567 |
| Total | $64,567 |
Amounts in the income column in the above table include any capital gain distributions from underlying funds, which are presented in the corresponding line-item in the Statement of Operations if applicable.
Investment Valuation
The following is a summary of the inputs used, as of October 31, 2018, involving the Fund's assets and liabilities carried at fair value. The inputs or methodology used for valuing securities may not be an indication of the risk associated with investing in those securities. For more information on valuation inputs, and their aggregation into the levels used below, please refer to the Investment Valuation section in the accompanying Notes to Financial Statements.
| Valuation Inputs at Reporting Date: | ||||
| Description | Total | Level 1 | Level 2 | Level 3 |
| Investments in Securities: | ||||
| Equities: | ||||
| Consumer Discretionary | $635,767 | $562,513 | $-- | $73,254 |
| Consumer Staples | 72,598 | -- | -- | 72,598 |
| Energy | 325,300 | 68,225 | -- | 257,075 |
| Health Care | 200,295 | 200,295 | -- | -- |
| Industrials | 156,091 | 156,091 | -- | -- |
| Materials | 189,399 | 189,399 | -- | -- |
| Utilities | 286,890 | 141,141 | 145,749 | -- |
| Corporate Bonds | 100,022,877 | -- | 100,022,877 | -- |
| Government Obligations | 1,623,158 | -- | 1,623,158 | -- |
| Bank Loan Obligations | 4,790,212 | -- | 4,693,253 | 96,959 |
| Preferred Securities | 6,080,108 | -- | 6,080,108 | -- |
| Money Market Funds | 10,184,399 | 10,184,399 | -- | -- |
| Total Investments in Securities: | $124,567,094 | $11,502,063 | $112,565,145 | $499,886 |
Other Information
Distribution of investments by country or territory of incorporation, as a percentage of Total Net Assets, is as follows (Unaudited):
| United States of America | 53.0% |
| Netherlands | 7.4% |
| Cayman Islands | 6.3% |
| Luxembourg | 5.5% |
| United Kingdom | 2.7% |
| Canada | 2.4% |
| Germany | 2.0% |
| Ireland | 2.0% |
| Argentina | 1.9% |
| Singapore | 1.6% |
| France | 1.5% |
| Mexico | 1.4% |
| British Virgin Islands | 1.3% |
| Italy | 1.3% |
| Bermuda | 1.3% |
| Multi-National | 1.1% |
| Others (Individually Less Than 1%) | 7.3% |
| 100.0% |
See accompanying notes which are an integral part of the financial statements.
Financial Statements
Statement of Assets and Liabilities
| October 31, 2018 (Unaudited) | ||
| Assets | ||
| Investment in securities, at value — See accompanying schedule: Unaffiliated issuers (cost $119,208,341) | $114,382,695 | |
| Fidelity Central Funds (cost $10,184,149) | 10,184,399 | |
| Total Investment in Securities (cost $129,392,490) | $124,567,094 | |
| Foreign currency held at value (cost $27,595) | 27,595 | |
| Receivable for investments sold | 375,954 | |
| Receivable for fund shares sold | 130,484 | |
| Dividends receivable | 13,893 | |
| Interest receivable | 1,751,504 | |
| Distributions receivable from Fidelity Central Funds | 21,047 | |
| Prepaid expenses | 266 | |
| Receivable from investment adviser for expense reductions | 63 | |
| Other receivables | 44 | |
| Total assets | 126,887,944 | |
| Liabilities | ||
| Payable to custodian bank | $44,942 | |
| Payable for investments purchased | ||
| Regular delivery | 51,126 | |
| Delayed delivery | 240,000 | |
| Payable for fund shares redeemed | 436,387 | |
| Distributions payable | 67,106 | |
| Accrued management fee | 75,203 | |
| Distribution and service plan fees payable | 5,724 | |
| Other affiliated payables | 19,499 | |
| Other payables and accrued expenses | 43,254 | |
| Total liabilities | 983,241 | |
| Net Assets | $125,904,703 | |
| Net Assets consist of: | ||
| Paid in capital | $134,068,916 | |
| Total distributable earnings (loss) | (8,164,213) | |
| Net Assets | $125,904,703 | |
| Net Asset Value and Maximum Offering Price | ||
| Class A: | ||
| Net Asset Value and redemption price per share ($6,998,115 ÷ 756,850 shares) | $9.25 | |
| Maximum offering price per share (100/96.00 of $9.25) | $9.64 | |
| Class M: | ||
| Net Asset Value and redemption price per share ($3,976,427 ÷ 430,095 shares) | $9.25 | |
| Maximum offering price per share (100/96.00 of $9.25) | $9.64 | |
| Class C: | ||
| Net Asset Value and offering price per share ($4,083,406 ÷ 441,609 shares)(a) | $9.25 | |
| Global High Income: | ||
| Net Asset Value, offering price and redemption price per share ($105,417,393 ÷ 11,399,871 shares) | $9.25 | |
| Class I: | ||
| Net Asset Value, offering price and redemption price per share ($5,429,362 ÷ 587,142 shares) | $9.25 |
(a) Redemption price per share is equal to net asset value less any applicable contingent deferred sales charge.
See accompanying notes which are an integral part of the financial statements.
Statement of Operations
| Six months ended October 31, 2018 (Unaudited) | ||
| Investment Income | ||
| Dividends | $239,089 | |
| Interest | 3,862,764 | |
| Income from Fidelity Central Funds | 64,567 | |
| Total income | 4,166,420 | |
| Expenses | ||
| Management fee | $481,876 | |
| Transfer agent fees | 95,012 | |
| Distribution and service plan fees | 36,119 | |
| Accounting fees and expenses | 28,363 | |
| Custodian fees and expenses | 10,483 | |
| Independent trustees' fees and expenses | 421 | |
| Registration fees | 26,167 | |
| Audit | 39,647 | |
| Legal | 1,401 | |
| Miscellaneous | 465 | |
| Total expenses before reductions | 719,954 | |
| Expense reductions | (5,549) | |
| Total expenses after reductions | 714,405 | |
| Net investment income (loss) | 3,452,015 | |
| Realized and Unrealized Gain (Loss) | ||
| Net realized gain (loss) on: | ||
| Investment securities: | ||
| Unaffiliated issuers | (933,507) | |
| Fidelity Central Funds | 189 | |
| Foreign currency transactions | (13,366) | |
| Total net realized gain (loss) | (946,684) | |
| Change in net unrealized appreciation (depreciation) on: | ||
| Investment securities: | ||
| Unaffiliated issuers | (4,189,894) | |
| Fidelity Central Funds | (252) | |
| Assets and liabilities in foreign currencies | (5,191) | |
| Total change in net unrealized appreciation (depreciation) | (4,195,337) | |
| Net gain (loss) | (5,142,021) | |
| Net increase (decrease) in net assets resulting from operations | $(1,690,006) |
See accompanying notes which are an integral part of the financial statements.
Statement of Changes in Net Assets
| Six months ended October 31, 2018 (Unaudited) | Year ended April 30, 2018 | |
| Increase (Decrease) in Net Assets | ||
| Operations | ||
| Net investment income (loss) | $3,452,015 | $6,265,299 |
| Net realized gain (loss) | (946,684) | (759,334) |
| Change in net unrealized appreciation (depreciation) | (4,195,337) | (118,096) |
| Net increase (decrease) in net assets resulting from operations | (1,690,006) | 5,387,869 |
| Distributions to shareholders | (3,663,407) | – |
| Distributions to shareholders from net investment income | – | (5,436,985) |
| Total distributions | (3,663,407) | (5,436,985) |
| Share transactions - net increase (decrease) | (21,364,951) | 50,750,887 |
| Redemption fees | – | 9,631 |
| Total increase (decrease) in net assets | (26,718,364) | 50,711,402 |
| Net Assets | ||
| Beginning of period | 152,623,067 | 101,911,665 |
| End of period | $125,904,703 | $152,623,067 |
| Other Information | ||
| Undistributed net investment income end of period | $745,648 |
See accompanying notes which are an integral part of the financial statements.
Financial Highlights
Fidelity Global High Income Fund Class A
| Six months ended (Unaudited) October 31, | Years endedApril 30, | |||||
| 2018 | 2018 | 2017 | 2016 | 2015 | 2014 | |
| Selected Per–Share Data | ||||||
| Net asset value, beginning of period | $9.61 | $9.54 | $9.07 | $9.60 | $10.21 | $10.46 |
| Income from Investment Operations | ||||||
| Net investment income (loss)A | .229 | .462 | .463 | .462 | .476 | .506 |
| Net realized and unrealized gain (loss) | (.347) | .006B | .422 | (.541) | (.293)C | (.036) |
| Total from investment operations | (.118) | .468 | .885 | (.079) | .183 | .470 |
| Distributions from net investment income | (.216) | (.399) | (.418) | (.454) | (.486) | (.483) |
| Distributions from net realized gain | (.026) | – | – | – | (.310) | (.239) |
| Total distributions | (.242) | (.399) | (.418) | (.454) | (.796) | (.722) |
| Redemption fees added to paid in capitalA | – | .001 | .003 | .003 | .003 | .002 |
| Net asset value, end of period | $9.25 | $9.61 | $9.54 | $9.07 | $9.60 | $10.21 |
| Total ReturnD,E,F | (1.25)% | 4.94% | 10.00% | (.65)% | 1.97%C | 4.86% |
| Ratios to Average Net AssetsG,H | ||||||
| Expenses before reductions | 1.29%I | 1.31% | 1.36% | 1.38% | 1.28% | 1.23% |
| Expenses net of fee waivers, if any | 1.25%I | 1.25% | 1.25% | 1.25% | 1.25% | 1.23% |
| Expenses net of all reductions | 1.25%I | 1.25% | 1.25% | 1.25% | 1.25% | 1.23% |
| Net investment income (loss) | 4.80%I | 4.75% | 4.98% | 5.11% | 4.82% | 5.03% |
| Supplemental Data | ||||||
| Net assets, end of period (000 omitted) | $6,998 | $8,712 | $7,102 | $6,187 | $7,036 | $8,000 |
| Portfolio turnover rateJ | 38%I | 48% | 48% | 41% | 44% | 72% |
A Calculated based on average shares outstanding during the period.
B The amount shown for a share outstanding does not correspond with the aggregate net gain (loss) on investments for the period due to the timing of sales and repurchases of shares in relation to fluctuating market values of the investments of the Fund.
C Amount includes a reimbursement from the investment adviser for an operational error which amounted to less than $.01 per share. Excluding this reimbursement, the total return would have been 1.93%.
D Total returns for periods of less than one year are not annualized.
E Total returns would have been lower if certain expenses had not been reduced during the applicable periods shown.
F Total returns do not include the effect of the sales charges.
G Fees and expenses of any underlying Fidelity Central Funds are not included in the Fund's expense ratio. The Fund indirectly bears its proportionate share of the expenses of any underlying Fidelity Central Funds.
H Expense ratios reflect operating expenses of the class. Expenses before reductions do not reflect amounts reimbursed by the investment adviser or reductions from brokerage service arrangements or reductions from other expense offset arrangements and do not represent the amount paid by the class during periods when reimbursements or reductions occur. Expenses net of fee waivers reflect expenses after reimbursement by the investment adviser but prior to reductions from brokerage service arrangements or other expense offset arrangements. Expenses net of all reductions represent the net expenses paid by the class.
I Annualized
J Amount does not include the portfolio activity of any underlying Fidelity Central Funds.
See accompanying notes which are an integral part of the financial statements.
Fidelity Global High Income Fund Class M
| Six months ended (Unaudited) October 31, | Years endedApril 30, | |||||
| 2018 | 2018 | 2017 | 2016 | 2015 | 2014 | |
| Selected Per–Share Data | ||||||
| Net asset value, beginning of period | $9.61 | $9.54 | $9.07 | $9.60 | $10.21 | $10.46 |
| Income from Investment Operations | ||||||
| Net investment income (loss)A | .229 | .462 | .464 | .462 | .474 | .504 |
| Net realized and unrealized gain (loss) | (.347) | .006B | .421 | (.541) | (.291)C | (.036) |
| Total from investment operations | (.118) | .468 | .885 | (.079) | .183 | .468 |
| Distributions from net investment income | (.216) | (.399) | (.418) | (.454) | (.486) | (.481) |
| Distributions from net realized gain | (.026) | – | – | – | (.310) | (.239) |
| Total distributions | (.242) | (.399) | (.418) | (.454) | (.796) | (.720) |
| Redemption fees added to paid in capitalA | – | .001 | .003 | .003 | .003 | .002 |
| Net asset value, end of period | $9.25 | $9.61 | $9.54 | $9.07 | $9.60 | $10.21 |
| Total ReturnD,E,F | (1.25)% | 4.94% | 10.00% | (.65)% | 1.98%C | 4.84% |
| Ratios to Average Net AssetsG,H | ||||||
| Expenses before reductions | 1.36%I | 1.40% | 1.50% | 1.48% | 1.40% | 1.35% |
| Expenses net of fee waivers, if any | 1.25%I | 1.25% | 1.25% | 1.25% | 1.25% | 1.25% |
| Expenses net of all reductions | 1.25%I | 1.25% | 1.25% | 1.25% | 1.25% | 1.25% |
| Net investment income (loss) | 4.80%I | 4.75% | 4.98% | 5.11% | 4.82% | 5.01% |
| Supplemental Data | ||||||
| Net assets, end of period (000 omitted) | $3,976 | $4,301 | $3,029 | $1,436 | $1,745 | $1,595 |
| Portfolio turnover rateJ | 38%I | 48% | 48% | 41% | 44% | 72% |
A Calculated based on average shares outstanding during the period.
B The amount shown for a share outstanding does not correspond with the aggregate net gain (loss) on investments for the period due to the timing of sales and repurchases of shares in relation to fluctuating market values of the investments of the Fund.
C Amount includes a reimbursement from the investment adviser for an operational error which amounted to less than $.01 per share. Excluding this reimbursement, the total return would have been 1.94%.
D Total returns for periods of less than one year are not annualized.
E Total returns would have been lower if certain expenses had not been reduced during the applicable periods shown.
F Total returns do not include the effect of the sales charges.
G Fees and expenses of any underlying Fidelity Central Funds are not included in the Fund's expense ratio. The Fund indirectly bears its proportionate share of the expenses of any underlying Fidelity Central Funds.
H Expense ratios reflect operating expenses of the class. Expenses before reductions do not reflect amounts reimbursed by the investment adviser or reductions from brokerage service arrangements or reductions from other expense offset arrangements and do not represent the amount paid by the class during periods when reimbursements or reductions occur. Expenses net of fee waivers reflect expenses after reimbursement by the investment adviser but prior to reductions from brokerage service arrangements or other expense offset arrangements. Expenses net of all reductions represent the net expenses paid by the class.
I Annualized
J Amount does not include the portfolio activity of any underlying Fidelity Central Funds.
See accompanying notes which are an integral part of the financial statements.
Fidelity Global High Income Fund Class C
| Six months ended (Unaudited) October 31, | Years endedApril 30, | |||||
| 2018 | 2018 | 2017 | 2016 | 2015 | 2014 | |
| Selected Per–Share Data | ||||||
| Net asset value, beginning of period | $9.61 | $9.54 | $9.07 | $9.60 | $10.21 | $10.46 |
| Income from Investment Operations | ||||||
| Net investment income (loss)A | .193 | .390 | .394 | .394 | .401 | .428 |
| Net realized and unrealized gain (loss) | (.347) | .005B | .422 | (.540) | (.292)C | (.035) |
| Total from investment operations | (.154) | .395 | .816 | (.146) | .109 | .393 |
| Distributions from net investment income | (.180) | (.326) | (.349) | (.387) | (.412) | (.406) |
| Distributions from net realized gain | (.026) | – | – | – | (.310) | (.239) |
| Total distributions | (.206) | (.326) | (.349) | (.387) | (.722) | (.645) |
| Redemption fees added to paid in capitalA | – | .001 | .003 | .003 | .003 | .002 |
| Net asset value, end of period | $9.25 | $9.61 | $9.54 | $9.07 | $9.60 | $10.21 |
| Total ReturnD,E,F | (1.62)% | 4.16% | 9.19% | (1.39)% | 1.22%C | 4.05% |
| Ratios to Average Net AssetsG,H | ||||||
| Expenses before reductions | 2.04%I | 2.08% | 2.18% | 2.20% | 2.12% | 2.05% |
| Expenses net of fee waivers, if any | 2.00%I | 2.00% | 2.00% | 2.00% | 2.00% | 2.00% |
| Expenses net of all reductions | 2.00%I | 2.00% | 2.00% | 2.00% | 2.00% | 2.00% |
| Net investment income (loss) | 4.05%I | 4.00% | 4.23% | 4.36% | 4.07% | 4.26% |
| Supplemental Data | ||||||
| Net assets, end of period (000 omitted) | $4,083 | $4,420 | $3,775 | $3,437 | $3,811 | $3,720 |
| Portfolio turnover rateJ | 38%I | 48% | 48% | 41% | 44% | 72% |
A Calculated based on average shares outstanding during the period.
B The amount shown for a share outstanding does not correspond with the aggregate net gain (loss) on investments for the period due to the timing of sales and repurchases of shares in relation to fluctuating market values of the investments of the Fund.
C Amount includes a reimbursement from the investment adviser for an operational error which amounted to less than $.01 per share. Excluding this reimbursement, the total return would have been 1.18%.
D Total returns for periods of less than one year are not annualized.
E Total returns would have been lower if certain expenses had not been reduced during the applicable periods shown.
F Total returns do not include the effect of the contingent deferred sales charge.
G Fees and expenses of any underlying Fidelity Central Funds are not included in the Fund's expense ratio. The Fund indirectly bears its proportionate share of the expenses of any underlying Fidelity Central Funds.
H Expense ratios reflect operating expenses of the class. Expenses before reductions do not reflect amounts reimbursed by the investment adviser or reductions from brokerage service arrangements or reductions from other expense offset arrangements and do not represent the amount paid by the class during periods when reimbursements or reductions occur. Expenses net of fee waivers reflect expenses after reimbursement by the investment adviser but prior to reductions from brokerage service arrangements or other expense offset arrangements. Expenses net of all reductions represent the net expenses paid by the class.
I Annualized
J Amount does not include the portfolio activity of any underlying Fidelity Central Funds.
See accompanying notes which are an integral part of the financial statements.
Fidelity Global High Income Fund
| Six months ended (Unaudited) October 31, | Years endedApril 30, | |||||
| 2018 | 2018 | 2017 | 2016 | 2015 | 2014 | |
| Selected Per–Share Data | ||||||
| Net asset value, beginning of period | $9.62 | $9.54 | $9.07 | $9.60 | $10.21 | $10.47 |
| Income from Investment Operations | ||||||
| Net investment income (loss)A | .242 | .487 | .486 | .486 | .508 | .534 |
| Net realized and unrealized gain (loss) | (.357) | .015B | .423 | (.542) | (.301)C | (.046) |
| Total from investment operations | (.115) | .502 | .909 | (.056) | .207 | .488 |
| Distributions from net investment income | (.229) | (.423) | (.442) | (.477) | (.510) | (.511) |
| Distributions from net realized gain | (.026) | – | – | – | (.310) | (.239) |
| Total distributions | (.255) | (.423) | (.442) | (.477) | (.820) | (.750) |
| Redemption fees added to paid in capitalA | – | .001 | .003 | .003 | .003 | .002 |
| Net asset value, end of period | $9.25 | $9.62 | $9.54 | $9.07 | $9.60 | $10.21 |
| Total ReturnD,E | (1.22)% | 5.31% | 10.28% | (.40)% | 2.23%C | 5.05% |
| Ratios to Average Net AssetsF,G | ||||||
| Expenses before reductions | .98%H | 1.02% | 1.14% | 1.20% | 1.05% | .95% |
| Expenses net of fee waivers, if any | .98%H | 1.00% | 1.00% | 1.00% | 1.00% | .95% |
| Expenses net of all reductions | .98%H | 1.00% | 1.00% | 1.00% | 1.00% | .95% |
| Net investment income (loss) | 5.06%H | 5.00% | 5.23% | 5.35% | 5.07% | 5.30% |
| Supplemental Data | ||||||
| Net assets, end of period (000 omitted) | $105,417 | $125,192 | $85,188 | $93,256 | $119,712 | $344,206 |
| Portfolio turnover rateI | 38%H | 48% | 48% | 41% | 44% | 72% |
A Calculated based on average shares outstanding during the period.
B The amount shown for a share outstanding does not correspond with the aggregate net gain (loss) on investments for the period due to the timing of sales and repurchases of shares in relation to fluctuating market values of the investments of the Fund.
C Amount includes a reimbursement from the investment adviser for an operational error which amounted to less than $.01 per share. Excluding this reimbursement, the total return would have been 2.19%.
D Total returns for periods of less than one year are not annualized.
E Total returns would have been lower if certain expenses had not been reduced during the applicable periods shown.
F Fees and expenses of any underlying Fidelity Central Funds are not included in the Fund's expense ratio. The Fund indirectly bears its proportionate share of the expenses of any underlying Fidelity Central Funds.
G Expense ratios reflect operating expenses of the class. Expenses before reductions do not reflect amounts reimbursed by the investment adviser or reductions from brokerage service arrangements or reductions from other expense offset arrangements and do not represent the amount paid by the class during periods when reimbursements or reductions occur. Expenses net of fee waivers reflect expenses after reimbursement by the investment adviser but prior to reductions from brokerage service arrangements or other expense offset arrangements. Expenses net of all reductions represent the net expenses paid by the class.
H Annualized
I Amount does not include the portfolio activity of any underlying Fidelity Central Funds.
See accompanying notes which are an integral part of the financial statements.
Fidelity Global High Income Fund Class I
| Six months ended (Unaudited) October 31, | Years endedApril 30, | |||||
| 2018 | 2018 | 2017 | 2016 | 2015 | 2014 | |
| Selected Per–Share Data | ||||||
| Net asset value, beginning of period | $9.62 | $9.54 | $9.07 | $9.60 | $10.21 | $10.47 |
| Income from Investment Operations | ||||||
| Net investment income (loss)A | .241 | .485 | .486 | .483 | .501 | .532 |
| Net realized and unrealized gain (loss) | (.357) | .017B | .423 | (.539) | (.293)C | (.046) |
| Total from investment operations | (.116) | .502 | .909 | (.056) | .208 | .486 |
| Distributions from net investment income | (.228) | (.423) | (.442) | (.477) | (.511) | (.509) |
| Distributions from net realized gain | (.026) | – | – | – | (.310) | (.239) |
| Total distributions | (.254) | (.423) | (.442) | (.477) | (.821) | (.748) |
| Redemption fees added to paid in capitalA | – | .001 | .003 | .003 | .003 | .002 |
| Net asset value, end of period | $9.25 | $9.62 | $9.54 | $9.07 | $9.60 | $10.21 |
| Total ReturnD,E | (1.23)% | 5.31% | 10.28% | (.40)% | 2.23%C | 5.03% |
| Ratios to Average Net AssetsF,G | ||||||
| Expenses before reductions | 1.01%H | 1.03% | 1.16% | 1.10% | 1.02% | .97% |
| Expenses net of fee waivers, if any | 1.00%H | 1.00% | 1.00% | 1.00% | 1.00% | .97% |
| Expenses net of all reductions | 1.00%H | 1.00% | 1.00% | 1.00% | 1.00% | .97% |
| Net investment income (loss) | 5.05%H | 5.00% | 5.23% | 5.35% | 5.07% | 5.28% |
| Supplemental Data | ||||||
| Net assets, end of period (000 omitted) | $5,429 | $9,999 | $2,817 | $1,905 | $2,481 | $5,344 |
| Portfolio turnover rateI | 38%H | 48% | 48% | 41% | 44% | 72% |
A Calculated based on average shares outstanding during the period.
B The amount shown for a share outstanding does not correspond with the aggregate net gain (loss) on investments for the period due to the timing of sales and repurchases of shares in relation to fluctuating market values of the investments of the Fund.
C Amount includes a reimbursement from the investment adviser for an operational error which amounted to less than $.01 per share. Excluding this reimbursement, the total return would have been 2.19%.
D Total returns for periods of less than one year are not annualized.
E Total returns would have been lower if certain expenses had not been reduced during the applicable periods shown.
F Fees and expenses of any underlying Fidelity Central Funds are not included in the Fund's expense ratio. The Fund indirectly bears its proportionate share of the expenses of any underlying Fidelity Central Funds.
G Expense ratios reflect operating expenses of the class. Expenses before reductions do not reflect amounts reimbursed by the investment adviser or reductions from brokerage service arrangements or reductions from other expense offset arrangements and do not represent the amount paid by the class during periods when reimbursements or reductions occur. Expenses net of fee waivers reflect expenses after reimbursement by the investment adviser but prior to reductions from brokerage service arrangements or other expense offset arrangements. Expenses net of all reductions represent the net expenses paid by the class.
H Annualized
I Amount does not include the portfolio activity of any underlying Fidelity Central Funds.
See accompanying notes which are an integral part of the financial statements.
Notes to Financial Statements (Unaudited)
For the period ended October 31, 2018
1. Organization.
Fidelity Global High Income Fund (the Fund) is a fund of Fidelity Summer Street Trust (the Trust) and is authorized to issue an unlimited number of shares. The Trust is registered under the Investment Company Act of 1940, as amended (the 1940 Act), as an open-end management investment company organized as a Massachusetts business trust. The Fund offers Class A, Class M, Class C, Global High Income and Class I shares, each of which has equal rights as to assets and voting privileges. Each class has exclusive voting rights with respect to matters that affect that class. The Fund's investments in emerging markets can be subject to social, economic, regulatory, and political uncertainties and can be extremely volatile.
2. Investments in Fidelity Central Funds.
The Fund invests in Fidelity Central Funds, which are open-end investment companies generally available only to other investment companies and accounts managed by the investment adviser and its affiliates. The Fund's Schedule of Investments lists each of the Fidelity Central Funds held as of period end, if any, as an investment of the Fund, but does not include the underlying holdings of each Fidelity Central Fund. As an Investing Fund, the Fund indirectly bears its proportionate share of the expenses of the underlying Fidelity Central Funds.
The Money Market Central Funds seek preservation of capital and current income and are managed by Fidelity Investments Money Management, Inc. (FIMM), an affiliate of the investment adviser. Annualized expenses of the Money Market Central Funds as of their most recent shareholder report date are less than .005%.
A complete unaudited list of holdings for each Fidelity Central Fund is available upon request or at the Securities and Exchange Commission (the SEC) website at www.sec.gov. In addition, the financial statements of the Fidelity Central Funds are available on the SEC website or upon request.
3. Significant Accounting Policies.
The Fund is an investment company and applies the accounting and reporting guidance of the Financial Accounting Standards Board (FASB) Accounting Standards Codification Topic 946 Financial Services – Investments Companies. The financial statements have been prepared in conformity with accounting principles generally accepted in the United States of America (GAAP), which require management to make certain estimates and assumptions at the date of the financial statements. Actual results could differ from those estimates. Subsequent events, if any, through the date that the financial statements were issued have been evaluated in the preparation of the financial statements. The following summarizes the significant accounting policies of the Fund:
Investment Valuation. Investments are valued as of 4:00 p.m. Eastern time on the last calendar day of the period. The Board of Trustees (the Board) has delegated the day to day responsibility for the valuation of the Fund's investments to the Fair Value Committee (the Committee) established by the Fund's investment adviser. In accordance with valuation policies and procedures approved by the Board, the Fund attempts to obtain prices from one or more third party pricing vendors or brokers to value its investments. When current market prices, quotations or currency exchange rates are not readily available or reliable, investments will be fair valued in good faith by the Committee, in accordance with procedures adopted by the Board. Factors used in determining fair value vary by investment type and may include market or investment specific events, changes in interest rates and credit quality. The frequency with which these procedures are used cannot be predicted and they may be utilized to a significant extent. The Committee oversees the Fund's valuation policies and procedures and reports to the Board on the Committee's activities and fair value determinations. The Board monitors the appropriateness of the procedures used in valuing the Fund's investments and ratifies the fair value determinations of the Committee.
The Fund categorizes the inputs to valuation techniques used to value its investments into a disclosure hierarchy consisting of three levels as shown below:
- Level 1 – quoted prices in active markets for identical investments
- Level 2 – other significant observable inputs (including quoted prices for similar investments, interest rates, prepayment speeds, etc.)
- Level 3 – unobservable inputs (including the Fund's own assumptions based on the best information available)
Valuation techniques used to value the Fund's investments by major category are as follows:
Debt securities, including restricted securities, are valued based on evaluated prices received from third party pricing vendors or from brokers who make markets in such securities. Corporate bonds, bank loan obligations, foreign government and government agency obligations and preferred securities are valued by pricing vendors who utilize matrix pricing which considers yield or price of bonds of comparable quality, coupon, maturity and type or by broker-supplied prices. When independent prices are unavailable or unreliable, debt securities may be valued utilizing pricing methodologies which consider similar factors that would be used by third party pricing vendors. For foreign debt securities, when significant market or security specific events arise, valuations may be determined in good faith in accordance with procedures adopted by the Board. Debt securities are generally categorized as Level 2 in the hierarchy but may be Level 3 depending on the circumstances. The Fund invests a significant portion of its assets in below investment grade securities. The value of these securities can be more volatile due to changes in the credit quality of the issuer and is sensitive to changes in economic, market and regulatory conditions.
Equity securities, including restricted securities, for which market quotations are readily available, are valued at the last reported sale price or official closing price as reported by a third party pricing vendor on the primary market or exchange on which they are traded and are categorized as Level 1 in the hierarchy. In the event there were no sales during the day or closing prices are not available, securities are valued at the last quoted bid price or may be valued using the last available price and are generally categorized as Level 2 in the hierarchy. For foreign equity securities, when market or security specific events arise, comparisons to the valuation of American Depositary Receipts (ADRs), futures contracts, Exchange-Traded Funds (ETFs) and certain indexes as well as quoted prices for similar securities may be used and would be categorized as Level 2 in the hierarchy. Utilizing these techniques may result in transfers between Level 1 and Level 2. For equity securities, including restricted securities, where observable inputs are limited, assumptions about market activity and risk are used and these securities may be categorized as Level 3 in the hierarchy.
Investments in open-end mutual funds, including the Fidelity Central Funds, are valued at their closing net asset value (NAV) each business day and are categorized as Level 1 in the hierarchy.
Changes in valuation techniques may result in transfers in or out of an assigned level within the disclosure hierarchy. The aggregate value of investments by input level as of October 31, 2018 is included at the end of the Fund's Schedule of Investments.
Foreign Currency. The Fund may use foreign currency contracts to facilitate transactions in foreign-denominated securities. Gains and losses from these transactions may arise from changes in the value of the foreign currency or if the counterparties do not perform under the contracts' terms.
Foreign-denominated assets, including investment securities, and liabilities are translated into U.S. dollars at the exchange rates at period end. Purchases and sales of investment securities, income and dividends received and expenses denominated in foreign currencies are translated into U.S. dollars at the exchange rate in effect on the transaction date.
The effects of exchange rate fluctuations on investments are included with the net realized and unrealized gain (loss) on investment securities. Other foreign currency transactions resulting in realized and unrealized gain (loss) are disclosed separately.
Investment Transactions and Income. For financial reporting purposes, the Fund's investment holdings and NAV include trades executed through the end of the last business day of the period. The NAV per share for processing shareholder transactions is calculated as of the close of business of the New York Stock Exchange (NYSE), normally 4:00 p.m. Eastern time and includes trades executed through the end of the prior business day. Gains and losses on securities sold are determined on the basis of identified cost and include proceeds received from litigation. Dividend income is recorded on the ex-dividend date, except for certain dividends from foreign securities where the ex-dividend date may have passed, which are recorded as soon as the Fund is informed of the ex-dividend date. Non-cash dividends included in dividend income, if any, are recorded at the fair market value of the securities received. Income and capital gain distributions from Fidelity Central Funds, if any, are recorded on the ex-dividend date. Certain distributions received by the Fund represent a return of capital or capital gain. The Fund determines the components of these distributions subsequent to the ex-dividend date, based upon receipt of tax filings or other correspondence relating to the underlying investment. These distributions are recorded as a reduction of cost of investments and/or as a realized gain. Interest income is accrued as earned and includes coupon interest and amortization of premium and accretion of discount on debt securities as applicable. Paid in Kind (PIK) income is recorded at the fair market value of the securities received. Investment income is recorded net of foreign taxes withheld where recovery of such taxes is uncertain. Debt obligations may be placed on non-accrual status and related interest income may be reduced by ceasing current accruals and writing off interest receivables when the collection of all or a portion of interest has become doubtful based on consistently applied procedures. A debt obligation is removed from non-accrual status when the issuer resumes interest payments or when collectability of interest is reasonably assured.
Class Allocations and Expenses. Investment income, realized and unrealized capital gains and losses, common expenses of the Fund, and certain fund-level expense reductions, if any, are allocated daily on a pro-rata basis to each class based on the relative net assets of each class to the total net assets of the Fund. Each class differs with respect to transfer agent and distribution and service plan fees incurred. Certain expense reductions may also differ by class. For the reporting period, the allocated portion of income and expenses to each class as a percent of its average net assets may vary due to the timing of recording these transactions in relation to fluctuating net assets of the classes. Expenses directly attributable to a fund are charged to that fund. Expenses attributable to more than one fund are allocated among the respective funds on the basis of relative net assets or other appropriate methods. Expense estimates are accrued in the period to which they relate and adjustments are made when actual amounts are known.
Income Tax Information and Distributions to Shareholders. Each year, the Fund intends to qualify as a regulated investment company under Subchapter M of the Internal Revenue Code, including distributing substantially all of its taxable income and realized gains. As a result, no provision for U.S. Federal income taxes is required. The Fund files a U.S. federal tax return, in addition to state and local tax returns as required. The Fund's federal income tax returns are subject to examination by the Internal Revenue Service (IRS) for a period of three fiscal years after they are filed. State and local tax returns may be subject to examination for an additional fiscal year depending on the jurisdiction. Foreign taxes are provided for based on the Fund's understanding of the tax rules and rates that exist in the foreign markets in which it invests.
Distributions are declared and recorded daily and paid monthly from net investment income. Distributions from realized gains, if any, are declared and recorded on the ex-dividend date. Income and capital gain distributions are declared separately for each class. Income and capital gain distributions are determined in accordance with income tax regulations, which may differ from GAAP.
Capital accounts within the financial statements are adjusted for permanent book-tax differences. These adjustments have no impact on net assets or the results of operations. Capital accounts are not adjusted for temporary book-tax differences which will reverse in a subsequent period.
Book-tax differences are primarily due to foreign currency transactions, defaulted bonds, market discount, equity-debt classifications, capital loss carryforwards and losses deferred due to wash sales and excise tax regulations.
As of period end, the cost and unrealized appreciation (depreciation) in securities, and derivatives if applicable, for federal income tax purposes were as follows:
| Gross unrealized appreciation | $1,913,826 |
| Gross unrealized depreciation | (6,159,370) |
| Net unrealized appreciation (depreciation) | $(4,245,544) |
| Tax cost | $128,812,638 |
Capital loss carryforwards are only available to offset future capital gains of the Fund to the extent provided by regulations and may be limited. Under the Regulated Investment Company Modernization Act of 2010 (the Act), the Fund is permitted to carry forward capital losses incurred in taxable years beginning after December 22, 2010 for an unlimited period and such capital losses are required to be used prior to any losses that expire. The capital loss carryforward information presented below, including any applicable limitation, is estimated as of prior fiscal period end and is subject to adjustment.
| No expiration | |
| Short-term | $(549,846) |
| Long-term | (2,729,707) |
| Total capital loss carryforward | $(3,279,553) |
Delayed Delivery Transactions and When-Issued Securities. During the period, the Fund transacted in securities on a delayed delivery or when-issued basis. Payment and delivery may take place after the customary settlement period for that security. The price of the underlying securities and the date when the securities will be delivered and paid for are fixed at the time the transaction is negotiated. The securities purchased on a delayed delivery or when-issued basis are identified as such in the Fund's Schedule of Investments. The Fund may receive compensation for interest forgone in the purchase of a delayed delivery or when-issued security. With respect to purchase commitments, the Fund identifies securities as segregated in its records with a value at least equal to the amount of the commitment. Losses may arise due to changes in the value of the underlying securities or if the counterparty does not perform under the contract's terms, or if the issuer does not issue the securities due to political, economic, or other factors.
Restricted Securities. The Fund may invest in securities that are subject to legal or contractual restrictions on resale. These securities generally may be resold in transactions exempt from registration or to the public if the securities are registered. Disposal of these securities may involve time-consuming negotiations and expense, and prompt sale at an acceptable price may be difficult. Information regarding restricted securities is included at the end of the Fund's Schedule of Investments.
Loans and Other Direct Debt Instruments. The Fund invests in direct debt instruments which are interests in amounts owed to lenders by corporate or other borrowers. These instruments may be in the form of loans, trade claims or other receivables and may include standby financing commitments such as revolving credit facilities that obligate the Fund to supply additional cash to the borrower on demand. Loans may be acquired through assignment or participation. The Fund also invests in unfunded loan commitments, which are contractual obligations for future funding. Information regarding unfunded commitments is included at the end of the Fund's Schedule of Investments.
New Accounting Pronouncement. In March 2017, the Financial Accounting Standards Board (FASB) issued an Accounting Standards Update (ASU), ASU 2017-08, which amends the amortization period for certain callable debt securities that are held at a premium. The amendment requires the premium to be amortized to the earliest call date. The amendments do not require an accounting change for securities held at a discount. The ASU is effective for annual periods beginning after December 15, 2018. Management is currently evaluating the potential impact of these changes to the financial statements.
New Rule Issuance. During August 2018, the U.S. Securities and Exchange Commission issued Final Rule Release No. 33-10532, Disclosure Update and Simplification. This Final Rule includes amendments specific to registered investment companies that are intended to eliminate overlap in disclosure requirements between Regulation S-X and GAAP. In accordance with these amendments, certain line-items in the Fund's financial statements have been combined or removed for the current period as outlined in the table below.
| Financial Statement | Current Line-Item Presentation | Prior Line-Item Presentation |
| Statement of Assets and Liabilities | Total distributable earnings (loss) | Undistributed/Distributions in excess of/Accumulated net investment income (loss) Accumulated/Undistributed net realized gain (loss) Net unrealized appreciation (depreciation) |
| Statement of Changes in Net Assets | N/A - removed | Undistributed/Distributions in excess of/Accumulated net investment income (loss) end of period |
| Statement of Changes in Net Assets | Distributions to shareholders | Distributions to shareholders from net investment income Distributions to shareholders from net realized gain |
| Distributions to Shareholders Note to Financial Statements | Distributions to shareholders | Distributions to shareholders from net investment income Distributions to shareholders from net realized gain |
4. Purchases and Sales of Investments.
Purchases and sales of securities, other than short-term securities, aggregated $24,829,567 and $44,705,578, respectively.
5. Fees and Other Transactions with Affiliates.
Management Fee. Fidelity Management & Research Company (the investment adviser) and its affiliates provide the Fund with investment management related services for which the Fund pays a monthly management fee. The management fee is the sum of an individual fund fee rate that is based on an annual rate of .60% of the Fund's average net assets and an annualized group fee rate that averaged .11% during the period. The group fee rate is based upon the average net assets of all the mutual funds advised by the investment adviser, including any mutual funds previously advised by the investment adviser that are currently advised by Fidelity SelectCo, LLC, an affiliate of the investment adviser. The group fee rate decreases as assets under management increase and increases as assets under management decrease. For the reporting period, the total annualized management fee rate was .71% of the Fund's average net assets.
Distribution and Service Plan Fees. In accordance with Rule 12b-1 of the 1940 Act, the Fund has adopted separate Distribution and Service Plans for each class of shares. Certain classes pay Fidelity Distributors Corporation (FDC), an affiliate of the investment adviser, separate Distribution and Service Fees, each of which is based on an annual percentage of each class' average net assets. In addition, FDC may pay financial intermediaries for selling shares of the Fund and providing shareholder support services. For the period, the Distribution and Service Fee rates, total fees and amounts retained by FDC were as follows:
| Distribution Fee | Service Fee | Total Fees | Retained by FDC | |
| Class A | -% | .25% | $9,944 | $611 |
| Class M | -% | .25% | 5,195 | – |
| Class C | .75% | .25% | 20,980 | 3,363 |
| $36,119 | $3,974 |
Sales Load. FDC may receive a front-end sales charge of up to 4.00% for selling Class A shares and Class M shares, some of which is paid to financial intermediaries for selling shares of the Fund. Depending on the holding period, FDC may receive contingent deferred sales charges levied on Class A, Class M and Class C redemptions. The deferred sales charges are 1.00% for Class C shares, 1.00% for certain purchases of Class A shares and .25% for certain purchases of Class M shares.
For the period, sales charge amounts retained by FDC were as follows:
| Retained by FDC | |
| Class A | $522 |
| Class M | 240 |
| Class C(a) | 675 |
| $1,437 |
(a) When Class C shares are initially sold, FDC pays commissions from its own resources to financial intermediaries through which the sales are made.
Transfer Agent Fees. Fidelity Investments Institutional Operations Company, Inc., (FIIOC), an affiliate of the investment adviser, is the transfer, dividend disbursing and shareholder servicing agent for each class of the Fund. FIIOC receives account fees and asset-based fees that vary according to the account size and type of account of the shareholders of the respective classes of the Fund. FIIOC pays for typesetting, printing and mailing of shareholder reports, except proxy statements.
For the period, transfer agent fees for each class were as follows:
| Amount | % of Class-Level Average Net Assets(a) | |
| Class A | $7,329 | .18 |
| Class M | 5,497 | .26 |
| Class C | 4,152 | .20 |
| Global High Income | 73,070 | .13 |
| Class I | 4,964 | .15 |
| $95,012 |
(a) Annualized
Accounting Fees. Fidelity Service Company, Inc. (FSC), an affiliate of the investment adviser, maintains the Fund's accounting records. The fee is based on the level of average net assets for each month. For the period, the fees were equivalent to an annualized rate of .04%.
Brokerage Commissions. The Fund placed a portion of its portfolio transactions with brokerage firms which are affiliates of the investment adviser. Brokerage commissions are included in net realized gain (loss) and change in net unrealized appreciation (depreciation) in the Statement of Operations. The commissions paid to these affiliated firms were $4 for the period.
Interfund Trades. The Fund may purchase from or sell securities to other Fidelity Funds under procedures adopted by the Board. The procedures have been designed to ensure these interfund trades are executed in accordance with Rule 17a-7 of the 1940 Act. Interfund trades are included within the respective purchases and sales amounts shown in the Purchases and Sales of Investments note.
6. Committed Line of Credit.
The Fund participates with other funds managed by the investment adviser or an affiliate in a $4.25 billion credit facility (the "line of credit") to be utilized for temporary or emergency purposes to fund shareholder redemptions or for other short-term liquidity purposes. The Fund has agreed to pay commitment fees on its pro-rata portion of the line of credit, which amounted to $185 and is reflected in Miscellaneous expenses on the Statement of Operations. During the period, the Fund did not borrow on this line of credit.
7. Expense Reductions.
The investment adviser voluntarily agreed to reimburse each class to the extent annual operating expenses exceeded certain levels of class-level average net assets as noted in the table below. Some expenses, for example the compensation of the independent Trustees, and certain miscellaneous expenses such as proxy and shareholder meeting expenses, are excluded from this reimbursement.
The following classes were in reimbursement during the period:
| Expense Limitations | Reimbursement | |
| Class A | 1.25% | $1,392 |
| Class M | 1.25% | 2,357 |
| Class C | 2.00% | 867 |
| Class I | 1.00% | 406 |
| $5,022 |
Commissions paid to certain brokers with whom the investment adviser, or its affiliates, places trades on behalf of the Fund include an amount in addition to trade execution, which may be rebated back to the Fund to offset certain expenses. This amount totaled $131 for the period.
In addition, during the period the investment adviser reimbursed and/or waived a portion of fund-level operating expenses in the amount of $396.
8. Distributions to Shareholders.
Distributions to shareholders of each class were as follows:
| Six months ended October 31, 2018 | Year ended April 30, 2018 |
|
| Distributions to shareholders | ||
| Class A | $205,519 | $– |
| Class M | 106,426 | – |
| Class C | 91,703 | – |
| Global High Income | 3,086,982 | – |
| Class I | 172,777 | – |
| Total | $3,663,407 | $– |
| From net investment income | ||
| Class A | $– | $310,111 |
| Class M | – | 155,128 |
| Class C | – | 136,286 |
| Global High Income | – | 4,624,133 |
| Class I | – | 211,327 |
| Total | $– | $5,436,985 |
9. Share Transactions.
Share transactions for each class were as follows and may contain automatic conversions between classes or exchanges between affiliated funds:
| Shares | Shares | Dollars | Dollars | |
| Six months ended October 31, 2018 | Year ended April 30, 2018 | Six months ended October 31, 2018 | Year ended April 30, 2018 | |
| Class A | ||||
| Shares sold | 37,029 | 396,196 | $351,636 | $3,854,052 |
| Reinvestment of distributions | 20,873 | 30,483 | 196,966 | 296,845 |
| Shares redeemed | (207,193) | (265,014) | (1,960,431) | (2,572,077) |
| Net increase (decrease) | (149,291) | 161,665 | $(1,411,829) | $1,578,820 |
| Class M | ||||
| Shares sold | 32,963 | 231,508 | $310,789 | $2,248,387 |
| Reinvestment of distributions | 11,048 | 15,505 | 104,209 | 151,013 |
| Shares redeemed | (61,284) | (117,144) | (578,415) | (1,138,519) |
| Net increase (decrease) | (17,273) | 129,869 | $(163,417) | $1,260,881 |
| Class C | ||||
| Shares sold | 38,156 | 138,068 | $359,572 | $1,347,084 |
| Reinvestment of distributions | 9,347 | 13,435 | 88,190 | 130,866 |
| Shares redeemed | (65,583) | (87,540) | (620,722) | (849,876) |
| Net increase (decrease) | (18,080) | 63,963 | $(172,960) | $628,074 |
| Global High Income | ||||
| Shares sold | 1,286,528 | 7,832,164 | $12,187,650 | $76,394,064 |
| Reinvestment of distributions | 281,743 | 403,775 | 2,658,139 | 3,933,620 |
| Shares redeemed | (3,188,572) | (4,144,739) | (30,156,464) | (40,362,765) |
| Net increase (decrease) | (1,620,301) | 4,091,200 | $(15,310,675) | $39,964,919 |
| Class I | ||||
| Shares sold | 112,918 | 1,030,440 | $1,069,340 | $10,103,235 |
| Reinvestment of distributions | 15,319 | 16,949 | 144,587 | 164,696 |
| Shares redeemed | (580,971) | (302,780) | (5,519,997) | (2,949,738) |
| Net increase (decrease) | (452,734) | 744,609 | $(4,306,070) | $7,318,193 |
10. Other.
The Fund's organizational documents provide former and current trustees and officers with a limited indemnification against liabilities arising in connection with the performance of their duties to the Fund. In the normal course of business, the Fund may also enter into contracts that provide general indemnifications. The Fund's maximum exposure under these arrangements is unknown as this would be dependent on future claims that may be made against the Fund. The risk of material loss from such claims is considered remote.
11. Credit Risk.
The Fund's relatively large investment in countries with limited or developing capital markets may involve greater risks than investments in more developed markets and the prices of such investments may be volatile. The yields of emerging market debt obligations reflect, among other things, perceived credit risk. The consequences of political, social or economic changes in these markets may have disruptive effects on the market prices of the Fund's investments and the income they generate, as well as the Fund's ability to repatriate such amounts.
Shareholder Expense Example
As a shareholder of a Fund, you incur two types of costs: (1) transaction costs, including sales charges (loads) on purchase payments or redemption proceeds, and (2) ongoing costs, including management fees, distribution and/or service (12b-1) fees and other Fund expenses. This Example is intended to help you understand your ongoing costs (in dollars) of investing in the Funds and to compare these costs with the ongoing costs of investing in other mutual funds.
The Example is based on an investment of $1,000 invested at the beginning of the period and held for the entire period (May 1, 2018 to October 31, 2018).
Actual Expenses
The first line of the accompanying table for each class of the Fund provides information about actual account values and actual expenses. You may use the information in this line, together with the amount you invested, to estimate the expenses that you paid over the period. Simply divide your account value by $1,000.00 (for example, an $8,600 account value divided by $1,000.00 = 8.6), then multiply the result by the number in the first line for a class of the Fund under the heading entitled "Expenses Paid During Period" to estimate the expenses you paid on your account during this period. A small balance maintenance fee of $12.00 that is charged once a year may apply for certain accounts with a value of less than $2,000. This fee, which was eliminated effective August 1, 2018, is not included in the table below. If it was, the estimate of expenses you paid during the period would be higher, and your ending account value lower, by this amount. In addition, the Fund, as a shareholder in the underlying Fidelity Central Funds, will indirectly bear its pro-rata share of the fees and expenses incurred by the underlying Fidelity Central Funds. These fees and expenses are not included in the Fund's annualized expense ratio used to calculate the expense estimate in the table below.
Hypothetical Example for Comparison Purposes
The second line of the accompanying table for each class of the Fund provides information about hypothetical account values and hypothetical expenses based on a Class' actual expense ratio and an assumed rate of return of 5% per year before expenses, which is not the Class' actual return. The hypothetical account values and expenses may not be used to estimate the actual ending account balance or expenses you paid for the period. You may use this information to compare the ongoing costs of investing in the Fund and other funds. To do so, compare this 5% hypothetical example with the 5% hypothetical examples that appear in the shareholder reports of the other funds. A small balance maintenance fee of $12.00 that is charged once a year may apply for certain accounts with a value of less than $2,000. This fee, which was eliminated effective August 1, 2018, is not included in the table below. If it was, the estimate of expenses you paid during the period would be higher, and your ending account value lower, by this amount. In addition, the Fund, as a shareholder in the underlying Fidelity Central Funds, will indirectly bear its pro-rata share of the fees and expenses incurred by the underlying Fidelity Central Funds. These fees and expenses are not included in the Fund's annualized expense ratio used to calculate the expense estimate in the table below.
Please note that the expenses shown in the table are meant to highlight your ongoing costs only and do not reflect any transaction costs. Therefore, the second line of the table is useful in comparing ongoing costs only, and will not help you determine the relative total costs of owning different funds. In addition, if these transactional costs were included, your costs would have been higher.
| Annualized Expense Ratio-A | Beginning Account Value May 1, 2018 | Ending Account Value October 31, 2018 | Expenses Paid During Period-B May 1, 2018 to October 31, 2018 |
|
| Class A | 1.25% | |||
| Actual | $1,000.00 | $987.50 | $6.26 | |
| Hypothetical-C | $1,000.00 | $1,018.90 | $6.36 | |
| Class M | 1.25% | |||
| Actual | $1,000.00 | $987.50 | $6.26 | |
| Hypothetical-C | $1,000.00 | $1,018.90 | $6.36 | |
| Class C | 2.00% | |||
| Actual | $1,000.00 | $983.80 | $10.00 | |
| Hypothetical-C | $1,000.00 | $1,015.12 | $10.16 | |
| Global High Income | .98% | |||
| Actual | $1,000.00 | $987.80 | $4.91 | |
| Hypothetical-C | $1,000.00 | $1,020.27 | $4.99 | |
| Class I | 1.00% | |||
| Actual | $1,000.00 | $987.70 | $5.01 | |
| Hypothetical-C | $1,000.00 | $1,020.16 | $5.09 |
A Annualized expense ratio reflects expenses net of applicable fee waivers.
B Expenses are equal to each Class' annualized expense ratio, multiplied by the average account value over the period, multiplied by 184/365 (to reflect the one-half year period).
C 5% return per year before expenses
Board Approval of Investment Advisory Contracts
Fidelity Global High Income Fund
At its July 2018 meeting, the Board of Trustees, including the Independent Trustees (together, the Board), voted to continue the management contract with Fidelity Management & Research Company (FMR) and the sub-advisory agreements (together, the Advisory Contracts) for the fund for six months through January 31, 2019, in connection with the reunification of the Fidelity Equity High Income Funds Board, which oversees the fund, and the Sector Portfolios Board.
The Board considered that the approval of the fund's Advisory Contracts will not result in any changes in (i) the investment process or strategies employed in the management of the fund's assets; (ii) the fees and expenses paid by shareholders; (iii) the nature, extent or quality of services provided under the fund's Advisory Contracts; or (iv) the day-to-day management of the fund or the persons primarily responsible for such management. The Board concluded that the fund's Advisory Contracts are fair and reasonable, and that the fund's Advisory Contracts should be renewed, without modification, through January 31, 2019, with the understanding that the Board will consider the annual renewal for a full one year period in January 2019.
In connection with its consideration of future renewals of the fund's Advisory Contracts, the Board will consider: (i) the nature, extent and quality of services provided to the fund, including shareholder and administrative services and investment performance; (ii) the competitiveness of the management fee and total expenses for the fund; (iii) the costs of the services and profitability, including the revenues earned and the expenses incurred in conducting the business of developing, marketing, distributing, managing, administering, and servicing the fund and its shareholders, to the extent applicable, as well as potential fall-out benefits from Fidelity's non-fund businesses; and (iv) whether there have been economies of scale in respect of the Fidelity funds, whether the Fidelity funds (including the fund) have appropriately benefited from any such economies of scale, and whether there is the potential for realization of any further economies.
Based on its evaluation of all of the conclusions noted above, and after considering all factors it believed relevant, the Board ultimately concluded that the fund's management fee structure is fair and reasonable, and that the continuation of the fund's Advisory Contracts should be approved.
![]()
AGHI-SANN-1218
1.926292.107
|
Fidelity® Global High Income Fund Semi-Annual Report October 31, 2018 |
|
|
Contents
To view a fund's proxy voting guidelines and proxy voting record for the 12-month period ended June 30, visit http://www.fidelity.com/proxyvotingresults or visit the Securities and Exchange Commission's (SEC) web site at http://www.sec.gov.
You may also call 1-800-544-8544 to request a free copy of the proxy voting guidelines.
Standard & Poor's, S&P and S&P 500 are registered service marks of The McGraw-Hill Companies, Inc. and have been licensed for use by Fidelity Distributors Corporation.
Other third-party marks appearing herein are the property of their respective owners.
All other marks appearing herein are registered or unregistered trademarks or service marks of FMR LLC or an affiliated company. © 2018 FMR LLC. All rights reserved.
This report and the financial statements contained herein are submitted for the general information of the shareholders of the Fund. This report is not authorized for distribution to prospective investors in the Fund unless preceded or accompanied by an effective prospectus.
A fund files its complete schedule of portfolio holdings with the SEC for the first and third quarters of each fiscal year on Form N-Q. Forms N-Q are available on the SEC’s web site at http://www.sec.gov. A fund's Forms N-Q may be reviewed and copied at the SEC’s Public Reference Room in Washington, DC. Information regarding the operation of the SEC's Public Reference Room may be obtained by calling 1-800-SEC-0330.
For a complete list of a fund's portfolio holdings, view the most recent holdings listing, semiannual report, or annual report on Fidelity's web site at http://www.fidelity.com, http://www.institutional.fidelity.com, or http://www.401k.com, as applicable.
NOT FDIC INSURED •MAY LOSE VALUE •NO BANK GUARANTEE
Neither the Fund nor Fidelity Distributors Corporation is a bank.
Investment Summary (Unaudited)
Top Five Holdings as of October 31, 2018
| (by issuer, excluding cash equivalents) | % of fund's net assets |
| Ally Financial, Inc. | 1.4 |
| Tenet Healthcare Corp. | 1.3 |
| German Federal Republic | 1.3 |
| Sprint Capital Corp. | 1.2 |
| Valeant Pharmaceuticals International, Inc. | 1.2 |
| 6.4 |
Top Five Countries as of October 31, 2018
| (excluding cash equivalents) | % of fund's net assets |
| United States of America | 43.8 |
| Netherlands | 7.4 |
| Cayman Islands | 6.3 |
| Luxembourg | 5.5 |
| United Kingdom | 2.7 |
Top Five Market Sectors as of October 31, 2018
| % of fund's net assets | |
| Energy | 13.6 |
| Telecommunications | 9.0 |
| Banks & Thrifts | 7.4 |
| Healthcare | 7.1 |
| Utilities | 5.5 |
Quality Diversification (% of fund's net assets)
| As of October 31, 2018 | ||
| AAA,AA,A | 1.3% | |
| BBB | 2.9% | |
| BB | 37.4% | |
| B | 33.8% | |
| CCC,CC,C | 11.1% | |
| Not Rated | 2.8% | |
| Equities | 1.5% | |
| Short-Term Investments and Net Other Assets | 9.2% | |

We have used ratings from Moody's Investors Service, Inc. Where Moody's® ratings are not available, we have used S&P® ratings. All ratings are as of the date indicated and do not reflect subsequent changes.
Asset Allocation (% of fund's net assets)
| As of October 31, 2018* | ||
| Corporate Bonds | 79.4% | |
| Government Obligations | 1.3% | |
| Stocks | 1.5% | |
| Preferred Securities | 4.8% | |
| Other Investments | 3.8% | |
| Short-Term Investments and Net Other Assets (Liabilities) | 9.2% | |

* Foreign investments - 47.0%
Schedule of Investments October 31, 2018 (Unaudited)
Showing Percentage of Net Assets
| Nonconvertible Bonds - 79.4% | |||
| Principal Amount(a) | Value | ||
| Aerospace - 0.4% | |||
| BBA U.S. Holdings, Inc. 5.375% 5/1/26 (b) | $30,000 | $29,663 | |
| Bombardier, Inc. 7.5% 12/1/24 (b) | 80,000 | 81,300 | |
| BWX Technologies, Inc. 5.375% 7/15/26 (b) | 65,000 | 65,163 | |
| DAE Funding LLC: | |||
| 4.5% 8/1/22 (b) | 50,000 | 48,750 | |
| 5% 8/1/24 (b) | 65,000 | 63,375 | |
| TransDigm UK Holdings PLC 6.875% 5/15/26 (b) | 200,000 | 199,500 | |
| TOTAL AEROSPACE | 487,751 | ||
| Air Transportation - 1.4% | |||
| Aeropuertos Argentina 2000 SA 6.875% 2/1/27 (b) | 450,000 | 420,755 | |
| Azul Investments LLP 5.875% 10/26/24 (b) | 300,000 | 270,375 | |
| Indira Gandhi International Airport 6.125% 10/31/26 (Reg. S) | 300,000 | 294,000 | |
| Rumo Luxembourg Sarl: | |||
| 5.875% 1/18/25 (b) | 200,000 | 190,252 | |
| 7.375% 2/9/24 (b) | 300,000 | 310,500 | |
| United Continental Holdings, Inc. 4.25% 10/1/22 | 300,000 | 294,375 | |
| TOTAL AIR TRANSPORTATION | 1,780,257 | ||
| Automotive - 0.2% | |||
| Schaeffler Finance BV 3.5% 5/15/22 (Reg. S) | EUR | 200,000 | 228,364 |
| Automotive & Auto Parts - 1.1% | |||
| Allison Transmission, Inc. 4.75% 10/1/27 (b) | 300,000 | 275,625 | |
| Gestamp Funding SA 3.5% 5/15/23 (Reg. S) | EUR | 100,000 | 115,204 |
| Lithia Motors, Inc. 5.25% 8/1/25 (b) | 40,000 | 37,700 | |
| Lkq Euro Holdings BV 3.625% 4/1/26 | EUR | 175,000 | 195,112 |
| Metalsa SA de CV 4.9% 4/24/23 (b) | 350,000 | 332,241 | |
| Samvardhana Motherson Automotive Systems Group BV 1.8% 7/6/24 (Reg. S) | EUR | 200,000 | 199,346 |
| Tenedora Nemak SA de CV 4.75% 1/23/25 (b) | 200,000 | 192,580 | |
| TOTAL AUTOMOTIVE & AUTO PARTS | 1,347,808 | ||
| Banks & Thrifts - 5.0% | |||
| Access Bank PLC 10.5% 10/19/21 (b) | 200,000 | 212,880 | |
| Akbank TAS/Ak Finansal Kiralama A/S 7.2% 3/16/27 (b)(c) | 200,000 | 168,766 | |
| Ally Financial, Inc.: | |||
| 5.75% 11/20/25 | 375,000 | 384,375 | |
| 8% 11/1/31 | 1,115,000 | 1,340,788 | |
| Banco Macro SA 6.75% 11/4/26 (b)(c) | 300,000 | 246,750 | |
| Bank of Ireland 10% 12/19/22 | EUR | 100,000 | 150,221 |
| Bankia SA 3.375% 3/15/27 (Reg. S) (c) | EUR | 200,000 | 231,671 |
| Barclays PLC 2% 2/7/28 (Reg. S) (c) | EUR | 100,000 | 108,021 |
| CaixaBank SA 2.75% 7/14/28 (Reg. S) (c) | EUR | 200,000 | 227,162 |
| Industrial Senior Trust 5.5% 11/1/22 (b) | 200,000 | 195,002 | |
| Intesa Sanpaolo SpA: | |||
| 3.928% 9/15/26 (Reg. S) | EUR | 100,000 | 108,724 |
| 6.625% 9/13/23 (Reg. S) | EUR | 100,000 | 126,162 |
| Itau Unibanco Holding SA 6.2% 12/21/21 (b) | 200,000 | 206,902 | |
| JSC BGEO Group 6% 7/26/23 (b) | 200,000 | 196,092 | |
| Pearl Holding III Ltd. 9.5% 12/11/22 | 200,000 | 172,099 | |
| PT Bukit Makmur Mandiri Utama 7.75% 2/13/22 (b) | 200,000 | 201,977 | |
| Roadster Finance Designated Activity Co. 2.375% 12/8/27 | EUR | 100,000 | 107,397 |
| Royal Bank of Scotland Group PLC: | |||
| 3.625% 3/25/24 (Reg. S) (c) | EUR | 100,000 | 114,531 |
| 5.125% 5/28/24 | 317,000 | 313,830 | |
| Turkiye Garanti Bankasi A/S 6.125% 5/24/27 (b)(c) | 200,000 | 165,494 | |
| Turkiye Is Bankasi A/S 5.5% 4/21/22 (b) | 300,000 | 259,193 | |
| UniCredit SpA 6.95% 10/31/22 (Reg. S) | EUR | 300,000 | 378,070 |
| VimpelCom Holdings BV 4.95% 6/16/24 (b) | 300,000 | 283,971 | |
| Zenith Bank PLC: | |||
| 6.25% 4/22/19 (b) | 200,000 | 200,380 | |
| 7.375% 5/30/22 (b) | 200,000 | 202,346 | |
| TOTAL BANKS & THRIFTS | 6,302,804 | ||
| Broadcasting - 1.0% | |||
| AMC Networks, Inc.: | |||
| 4.75% 12/15/22 | 100,000 | 98,500 | |
| 4.75% 8/1/25 | 125,000 | 116,200 | |
| Sirius XM Radio, Inc.: | |||
| 5% 8/1/27 (b) | 125,000 | 117,461 | |
| 5.375% 7/15/26 (b) | 380,000 | 371,640 | |
| TV Azteca SA de CV 8.25% 8/9/24 (Reg. S) | 600,000 | 592,770 | |
| TOTAL BROADCASTING | 1,296,571 | ||
| Building Materials - 1.6% | |||
| Alam Synergy Pte. Ltd. 6.625% 4/24/22 | 200,000 | 163,394 | |
| American Woodmark Corp. 4.875% 3/15/26 (b) | 335,000 | 311,131 | |
| Builders FirstSource, Inc. 5.625% 9/1/24 (b) | 115,000 | 107,238 | |
| CEMEX Finance LLC: | |||
| 4.625% 6/15/24 | EUR | 200,000 | 237,064 |
| 6% 4/1/24 (Reg. S) | 400,000 | 399,100 | |
| China WindPower Group Ltd. 7.9% 1/23/21 | 200,000 | 188,402 | |
| Elementia S.A.B. de CV 5.5% 1/15/25 (b) | 200,000 | 184,752 | |
| HD Supply, Inc. 5.375% 10/15/26 (b) | 120,000 | 115,050 | |
| HMAN Finance Sub Corp. 6.375% 7/15/22 (b) | 100,000 | 88,000 | |
| Titan Global Finance PLC 2.375% 11/16/24 (Reg. S) | EUR | 100,000 | 107,568 |
| Union Andina de Cementos SAA 5.875% 10/30/21 (Reg. S) | 105,000 | 107,390 | |
| USG Corp. 4.875% 6/1/27 (b) | 15,000 | 15,033 | |
| TOTAL BUILDING MATERIALS | 2,024,122 | ||
| Cable/Satellite TV - 3.9% | |||
| Altice SA: | |||
| 7.625% 2/15/25 (b) | 700,000 | 596,750 | |
| 7.75% 5/15/22 (b) | 235,000 | 218,844 | |
| Cable One, Inc. 5.75% 6/15/22 (b) | 55,000 | 55,825 | |
| Cablevision SA 6.5% 6/15/21 (b) | 500,000 | 488,750 | |
| CCO Holdings LLC/CCO Holdings Capital Corp.: | |||
| 5.125% 5/1/27 (b) | 585,000 | 550,631 | |
| 5.5% 5/1/26 (b) | 110,000 | 107,113 | |
| 5.75% 1/15/24 | 315,000 | 318,150 | |
| 5.75% 2/15/26 (b) | 65,000 | 64,350 | |
| Cequel Communications Holdings I LLC/Cequel Capital Corp.: | |||
| 7.5% 4/1/28 (b) | 230,000 | 238,388 | |
| 7.75% 7/15/25 (b) | 210,000 | 221,550 | |
| CSC Holdings LLC: | |||
| 5.375% 2/1/28 (b) | 200,000 | 188,500 | |
| 5.5% 4/15/27 (b) | 345,000 | 331,200 | |
| DISH DBS Corp. 5% 3/15/23 | 470,000 | 411,250 | |
| UPC Holding BV 3.875% 6/15/29 (Reg. S) | EUR | 100,000 | 108,614 |
| Virgin Media Finance PLC 4.5% 1/15/25 (Reg. S) | EUR | 100,000 | 114,501 |
| VTR Finance BV 6.875% 1/15/24 (b) | 539,000 | 545,738 | |
| Ziggo Bond Finance BV 6% 1/15/27 (b) | 160,000 | 142,400 | |
| Ziggo Secured Finance BV: | |||
| 3.75% 1/15/25 (Reg. S) | EUR | 100,000 | 113,112 |
| 4.25% 1/15/27 (Reg. S) | EUR | 100,000 | 112,128 |
| TOTAL CABLE/SATELLITE TV | 4,927,794 | ||
| Capital Goods - 0.0% | |||
| Apergy Corp. 6.375% 5/1/26 (b) | 30,000 | 30,375 | |
| Chemicals - 2.8% | |||
| Bayer AG 3% 7/1/75 (Reg S.) (c) | EUR | 200,000 | 229,526 |
| CF Industries Holdings, Inc.: | |||
| 4.95% 6/1/43 | 270,000 | 230,175 | |
| 5.15% 3/15/34 | 335,000 | 307,363 | |
| 5.375% 3/15/44 | 105,000 | 92,400 | |
| CTC BondCo GmbH 5.25% 12/15/25 | EUR | 200,000 | 224,274 |
| NOVA Chemicals Corp.: | |||
| 4.875% 6/1/24 (b) | 70,000 | 64,313 | |
| 5.25% 6/1/27 (b) | 70,000 | 63,175 | |
| OCI NV 6.625% 4/15/23 (b) | 325,000 | 333,125 | |
| OCP SA 5.625% 4/25/24 (b) | 200,000 | 203,856 | |
| Petkim Petrokimya Holding A/S 5.875% 1/26/23 (b) | 200,000 | 182,880 | |
| Platform Specialty Products Corp.: | |||
| 5.875% 12/1/25 (b) | 80,000 | 75,800 | |
| 6.5% 2/1/22 (b) | 200,000 | 202,500 | |
| Sasol Financing U.S.A. LLC 5.875% 3/27/24 | 200,000 | 201,500 | |
| Starfruit Finco BV / Starfruit U.S. Holdco LLC 8% 10/1/26 (b) | 150,000 | 145,500 | |
| The Chemours Co. LLC 5.375% 5/15/27 | 25,000 | 23,250 | |
| TPC Group, Inc. 8.75% 12/15/20 (b) | 405,000 | 396,900 | |
| Tronox Finance PLC 5.75% 10/1/25 (b) | 35,000 | 30,713 | |
| Tronox, Inc. 6.5% 4/15/26 (b) | 185,000 | 169,275 | |
| Valvoline, Inc. 4.375% 8/15/25 | 400,000 | 369,000 | |
| TOTAL CHEMICALS | 3,545,525 | ||
| Consumer Products - 0.2% | |||
| Coty, Inc. 6.5% 4/15/26 (b) | 140,000 | 130,550 | |
| Prestige Brands, Inc. 6.375% 3/1/24 (b) | 85,000 | 83,938 | |
| TOTAL CONSUMER PRODUCTS | 214,488 | ||
| Containers - 2.1% | |||
| ARD Finance SA 6.625% 9/15/23 pay-in-kind (c) | EUR | 100,000 | 112,472 |
| Ardagh Packaging Finance PLC/Ardagh MP Holdings U.S.A., Inc.: | |||
| 6% 2/15/25 (b) | 200,000 | 187,500 | |
| 6.75% 5/15/24 (Reg. S) | EUR | 200,000 | 240,133 |
| 7.25% 5/15/24 (b) | 200,000 | 201,000 | |
| Ball Corp. 4.875% 3/15/26 | 205,000 | 202,181 | |
| Berry Global, Inc. 4.5% 2/15/26 (b) | 200,000 | 187,000 | |
| Crown Americas LLC / Crown Americas Capital Corp. IV 4.75% 2/1/26 (b) | 745,000 | 703,094 | |
| Crown Americas LLC/Crown Americas Capital Corp. V 4.25% 9/30/26 | 60,000 | 54,450 | |
| OI European Group BV 6.75% 9/15/20 (Reg. S) | EUR | 150,000 | 188,812 |
| Plastipak Holdings, Inc. 6.25% 10/15/25 (b) | 20,000 | 18,300 | |
| Reynolds Group Issuer, Inc./Reynolds Group Issuer LLC/Reynolds Group Issuer (Luxembourg) SA 5.75% 10/15/20 | 276,196 | 276,196 | |
| Silgan Holdings, Inc. 3.25% 3/15/25 | EUR | 200,000 | 231,337 |
| TOTAL CONTAINERS | 2,602,475 | ||
| Diversified Financial Services - 2.8% | |||
| Arena Lux Finance Sarl 2.875% 11/1/24 (Reg. S) | EUR | 100,000 | 112,704 |
| Chobani LLC/Finance Corp., Inc. 7.5% 4/15/25 (b) | 120,000 | 102,600 | |
| Comcel Trust 6.875% 2/6/24 (b) | 250,000 | 255,719 | |
| FLY Leasing Ltd. 5.25% 10/15/24 | 60,000 | 57,000 | |
| Fortune Star (BVI) Ltd. 5.25% 3/23/22 (Reg. S) | 200,000 | 181,222 | |
| Garfunkelux Holdco 3 SA 7.5% 8/1/22 (Reg. S) | EUR | 100,000 | 110,138 |
| Icahn Enterprises LP/Icahn Enterprises Finance Corp. 6.375% 12/15/25 | 215,000 | 213,656 | |
| International Lease Finance Corp. 5.875% 8/15/22 | 175,000 | 184,311 | |
| International Personal Finance PLC 5.75% 4/7/21 (Reg S.) | EUR | 100,000 | 105,857 |
| James Hardie International Finance Ltd. 4.75% 1/15/25 (b) | 200,000 | 185,750 | |
| MSCI, Inc.: | |||
| 5.375% 5/15/27 (b) | 500,000 | 495,000 | |
| 5.75% 8/15/25 (b) | 50,000 | 51,375 | |
| Navient Corp.: | |||
| 6.75% 6/15/26 | 120,000 | 115,428 | |
| 7.25% 9/25/23 | 55,000 | 56,925 | |
| Park Aerospace Holdings Ltd. 5.5% 2/15/24 (b) | 140,000 | 138,635 | |
| Radiate Holdco LLC/Radiate Financial Service Ltd.: | |||
| 6.625% 2/15/25 (b) | 25,000 | 23,375 | |
| 6.875% 2/15/23 (b) | 30,000 | 28,800 | |
| SLM Corp.: | |||
| 6.125% 3/25/24 | 205,000 | 199,363 | |
| 8% 3/25/20 | 190,000 | 198,313 | |
| Springleaf Financial Corp. 7.125% 3/15/26 | 270,000 | 253,233 | |
| Verisure Holding AB 6% 11/1/22 (Reg. S) | EUR | 234,000 | 272,970 |
| Yihua Overseas Investment Ltd. 8.5% 10/23/20 (Reg. S) | 200,000 | 165,946 | |
| TOTAL DIVERSIFIED FINANCIAL SERVICES | 3,508,320 | ||
| Diversified Media - 0.2% | |||
| E.W. Scripps Co. 5.125% 5/15/25 (b) | 30,000 | 28,200 | |
| Viacom, Inc.: | |||
| 5.875% 2/28/57 (c) | 75,000 | 71,621 | |
| 6.25% 2/28/57 (c) | 90,000 | 86,775 | |
| TOTAL DIVERSIFIED MEDIA | 186,596 | ||
| Energy - 12.6% | |||
| Antero Resources Corp. 5.125% 12/1/22 | 140,000 | 139,038 | |
| Areva SA 4.875% 9/23/24 | EUR | 200,000 | 234,391 |
| California Resources Corp. 8% 12/15/22 (b) | 480,000 | 427,200 | |
| Callon Petroleum Co. 6.125% 10/1/24 | 25,000 | 24,375 | |
| Centennial Resource Prod LLC 5.375% 1/15/26 (b) | 75,000 | 73,313 | |
| Cheniere Corpus Christi Holdings LLC: | |||
| 5.125% 6/30/27 | 195,000 | 191,100 | |
| 5.875% 3/31/25 | 80,000 | 82,200 | |
| Cheniere Energy Partners LP 5.625% 10/1/26 (b) | 90,000 | 88,650 | |
| Chesapeake Energy Corp.: | |||
| 3 month U.S. LIBOR + 3.250% 5.6863% 4/15/19 (c)(d) | 70,000 | 70,175 | |
| 4.875% 4/15/22 | 180,000 | 171,000 | |
| 5.75% 3/15/23 | 65,000 | 61,750 | |
| 8% 12/15/22 (b) | 168,000 | 175,140 | |
| 8% 1/15/25 | 70,000 | 71,006 | |
| 8% 6/15/27 | 375,000 | 372,656 | |
| China Jinjiang Environment Holding Co. Ltd. 6% 7/27/20 (Reg. S) | 200,000 | 180,787 | |
| Citgo Holding, Inc. 10.75% 2/15/20 (b) | 155,000 | 161,200 | |
| Comstock Escrow Corp. 9.75% 8/15/26 (b) | 95,000 | 91,675 | |
| Consolidated Energy Finance SA: | |||
| 3 month U.S. LIBOR + 3.750% 6.0841% 6/15/22 (b)(c)(d) | 520,000 | 520,229 | |
| 6.5% 5/15/26 (b) | 245,000 | 243,775 | |
| 6.875% 6/15/25 (b) | 275,000 | 280,156 | |
| Continental Resources, Inc. 4.375% 1/15/28 | 95,000 | 91,834 | |
| Covey Park Energy LLC 7.5% 5/15/25 (b) | 30,000 | 29,475 | |
| DCP Midstream LLC 5.85% 5/21/43 (b)(c) | 60,000 | 53,700 | |
| DCP Midstream Operating LP 5.375% 7/15/25 | 100,000 | 101,405 | |
| Denbury Resources, Inc.: | |||
| 4.625% 7/15/23 | 10,000 | 8,275 | |
| 5.5% 5/1/22 | 130,000 | 112,450 | |
| 6.375% 8/15/21 | 35,000 | 32,550 | |
| 7.5% 2/15/24 (b) | 125,000 | 122,188 | |
| Drax Finco PLC 6.625% 11/1/25 (b) | 200,000 | 199,500 | |
| Endeavor Energy Resources LP/EER Finance, Inc.: | |||
| 5.5% 1/30/26 (b) | 35,000 | 35,963 | |
| 5.75% 1/30/28 (b) | 35,000 | 36,138 | |
| Ensco PLC: | |||
| 5.2% 3/15/25 | 30,000 | 24,600 | |
| 7.75% 2/1/26 | 85,000 | 79,263 | |
| Envision Energy Overseas Capital Co. Ltd. 7.5% 4/26/21 | 200,000 | 145,500 | |
| EP Energy LLC/Everest Acquisition Finance, Inc.: | |||
| 7.75% 5/15/26 (b) | 325,000 | 323,274 | |
| 8% 11/29/24 (b) | 35,000 | 33,775 | |
| Exterran Partners LP/EXLP Finance Corp.: | |||
| 6% 4/1/21 | 15,000 | 14,850 | |
| 6% 10/1/22 | 200,000 | 198,000 | |
| GCL New Energy Holdings Ltd. 7.1% 1/30/21 | 200,000 | 173,494 | |
| Geo Coal International Pte Ltd. 8% 10/4/22 (Reg. S) | 200,000 | 184,077 | |
| Greenko Dutch BV 5.25% 7/24/24 | 200,000 | 180,880 | |
| Hess Infrastructure Partners LP 5.625% 2/15/26 (b) | 100,000 | 100,250 | |
| Hilcorp Energy I LP/Hilcorp Finance Co.: | |||
| 5% 12/1/24 (b) | 275,000 | 259,188 | |
| 5.75% 10/1/25 (b) | 200,000 | 194,500 | |
| 6.25% 11/1/28 (b) | 80,000 | 77,001 | |
| HPCL-Mittal Energy Ltd. 5.25% 4/28/27 | 200,000 | 175,435 | |
| Indigo Natural Resources LLC 6.875% 2/15/26 (b) | 95,000 | 89,775 | |
| Indika Energy Capital III Pte. Ltd. 5.875% 11/9/24 (b) | 200,000 | 178,366 | |
| Jonah Energy LLC 7.25% 10/15/25 (b) | 160,000 | 127,200 | |
| KLX Energy Services Holdings, Inc. 11.5% 11/1/25 (b) | 80,000 | 80,600 | |
| Kosmos Energy Ltd.: | |||
| 7.875% 8/1/21 (b) | 200,000 | 201,000 | |
| 7.875% 8/1/21 (b) | 100,000 | 101,000 | |
| Magnolia Oil & Gas Operating LLC 6% 8/1/26 (b) | 85,000 | 83,938 | |
| MEG Energy Corp.: | |||
| 6.375% 1/30/23 (b) | 105,000 | 101,194 | |
| 7% 3/31/24 (b) | 240,000 | 235,800 | |
| Neerg Energy Ltd. 6% 2/13/22 (Reg. S) | 200,000 | 187,794 | |
| NextEra Energy Partners LP: | |||
| 4.25% 9/15/24 (b) | 50,000 | 47,500 | |
| 4.5% 9/15/27 (b) | 35,000 | 32,288 | |
| Nine Energy Service, Inc. 8.75% 11/1/23 (b) | 40,000 | 40,600 | |
| Noble Holding International Ltd.: | |||
| 6.05% 3/1/41 | 5,000 | 3,650 | |
| 6.2% 8/1/40 | 85,000 | 61,838 | |
| 7.75% 1/15/24 | 127,000 | 118,586 | |
| 7.875% 2/1/26 (b) | 80,000 | 79,400 | |
| Northern Oil & Gas, Inc. 9.5% 5/15/23 pay-in-kind (b)(c) | 85,000 | 87,444 | |
| Nostrum Oil & Gas Finance BV 8% 7/25/22 (b) | 400,000 | 343,104 | |
| Oasis Petroleum, Inc. 6.875% 3/15/22 | 43,000 | 43,269 | |
| Pacific Drilling V Ltd. 7.25% 12/1/17 (b)(e) | 380,000 | 182,400 | |
| Pan American Energy LLC 7.875% 5/7/21 (b) | 400,000 | 407,520 | |
| Parsley Energy LLC/Parsley: | |||
| 5.625% 10/15/27 (b) | 435,000 | 428,810 | |
| 6.25% 6/1/24 (b) | 10,000 | 10,275 | |
| PBF Holding Co. LLC/PBF Finance Corp. 7.25% 6/15/25 | 70,000 | 72,100 | |
| PBF Logistics LP/PBF Logistics Finance, Inc. 6.875% 5/15/23 | 130,000 | 132,275 | |
| Peabody Securities Finance Corp.: | |||
| 6% 3/31/22 (b) | 20,000 | 19,981 | |
| 6.375% 3/31/25 (b) | 25,000 | 25,000 | |
| Petrobras Global Finance BV 7.375% 1/17/27 | 300,000 | 310,905 | |
| Pride International, Inc. 7.875% 8/15/40 | 95,000 | 85,025 | |
| Puma International Financing SA 5.125% 10/6/24 (Reg. S) | 200,000 | 167,026 | |
| Repsol International Finance BV 4.5% 3/25/75 (Reg. S) (c) | EUR | 200,000 | 240,971 |
| Rose Rock Midstream LP/Rose Rock Finance Corp. 5.625% 7/15/22 | 125,000 | 120,000 | |
| Sabine Pass Liquefaction LLC 5.625% 3/1/25 | 15,000 | 15,661 | |
| SemGroup Corp. 7.25% 3/15/26 | 185,000 | 180,606 | |
| SESI LLC 7.75% 9/15/24 | 40,000 | 39,300 | |
| Sibur Securities Dac 4.125% 10/5/23 (b) | 200,000 | 191,359 | |
| SM Energy Co.: | |||
| 5% 1/15/24 | 65,000 | 61,913 | |
| 5.625% 6/1/25 | 110,000 | 105,875 | |
| 6.625% 1/15/27 | 65,000 | 65,325 | |
| 6.75% 9/15/26 | 25,000 | 25,063 | |
| Southwestern Energy Co.: | |||
| 7.5% 4/1/26 | 65,000 | 66,138 | |
| 7.75% 10/1/27 | 50,000 | 51,000 | |
| Summit Midstream Holdings LLC 5.75% 4/15/25 | 295,000 | 282,463 | |
| Sunoco LP/Sunoco Finance Corp.: | |||
| 4.875% 1/15/23 (b) | 90,000 | 86,738 | |
| 5.5% 2/15/26 (b) | 75,000 | 71,438 | |
| Targa Resources Partners LP/Targa Resources Partners Finance Corp.: | |||
| 5.125% 2/1/25 | 35,000 | 34,038 | |
| 5.375% 2/1/27 | 35,000 | 34,038 | |
| 5.875% 4/15/26 (b) | 70,000 | 70,394 | |
| Teine Energy Ltd. 6.875% 9/30/22 (b) | 85,000 | 84,575 | |
| TerraForm Power Operating LLC: | |||
| 4.25% 1/31/23 (b) | 40,000 | 37,900 | |
| 5% 1/31/28 (b) | 40,000 | 35,750 | |
| 6.625% 6/15/25 (b)(c) | 1,210,000 | 1,261,425 | |
| Tesoro Logistics LP/Tesoro Logistics Finance Corp. 6.375% 5/1/24 | 45,000 | 47,565 | |
| Transocean Pontus Ltd. 6.125% 8/1/25 (b) | 75,000 | 74,531 | |
| Transportadora de Gas del Sur SA 6.75% 5/2/25 (b) | 500,000 | 468,755 | |
| Tupras Turkiye Petrol Rafinerileri A/S 4.5% 10/18/24 (b) | 200,000 | 177,274 | |
| U.S.A. Compression Partners LP 6.875% 4/1/26 (b) | 35,000 | 35,613 | |
| Ultra Resources, Inc.: | |||
| 6.875% 4/15/22 (b) | 50,000 | 28,750 | |
| 7.125% 4/15/25 (b) | 40,000 | 17,600 | |
| W&T Offshore, Inc. 9.75% 11/1/23 (b) | 60,000 | 58,062 | |
| Weatherford International Ltd. 9.875% 2/15/24 | 80,000 | 62,000 | |
| Weatherford International, Inc. 9.875% 3/1/25 (b) | 420,000 | 325,500 | |
| Whiting Petroleum Corp. 6.625% 1/15/26 | 55,000 | 55,138 | |
| WPX Energy, Inc. 8.25% 8/1/23 | 60,000 | 67,425 | |
| YPF SA: | |||
| 8.5% 3/23/21 (b) | 175,000 | 176,663 | |
| 8.5% 7/28/25 (b) | 400,000 | 378,900 | |
| TOTAL ENERGY | 15,868,790 | ||
| Entertainment/Film - 0.4% | |||
| New Cotai LLC/New Cotai Capital Corp. 10.625% 5/1/19 pay-in-kind (b)(c) | 963,594 | 549,249 | |
| Environmental - 0.8% | |||
| CD&R Waterworks Merger Sub LLC 6.125% 8/15/25 (b) | 25,000 | 23,438 | |
| Covanta Holding Corp.: | |||
| 5.875% 3/1/24 | 110,000 | 109,725 | |
| 5.875% 7/1/25 | 15,000 | 14,550 | |
| 6% 1/1/27 | 135,000 | 130,275 | |
| 6.375% 10/1/22 | 95,000 | 97,019 | |
| LBC Tank Terminals Holding Netherlands BV 6.875% 5/15/23 (b) | 445,000 | 437,213 | |
| Paprec Holding 3 month EURIBOR + 3.500% 3.5% 3/31/25 (c)(d) | EUR | 200,000 | 227,776 |
| TOTAL ENVIRONMENTAL | 1,039,996 | ||
| Food & Drug Retail - 0.7% | |||
| Albertsons Companies LLC/Safeway, Inc./New Albertson's, Inc./Albertson's LLC 6.625% 6/15/24 | 35,000 | 33,075 | |
| Albertsons, Inc.: | |||
| 6.625% 6/1/28 | 75,000 | 57,750 | |
| 7.45% 8/1/29 | 5,000 | 4,200 | |
| Casino Guichard Perrachon SA 5.976% 5/26/21 (c) | EUR | 100,000 | 118,220 |
| Cumberland Farms, Inc. 6.75% 5/1/25 (b) | 25,000 | 25,688 | |
| Rite Aid Corp. 6.875% 12/15/28 (b)(c) | 505,000 | 338,350 | |
| Sigma Holdco BV 5.75% 5/15/26 (Reg. S) | EUR | 110,000 | 114,780 |
| Tesco PLC 5.125% 4/10/47 | EUR | 100,000 | 141,168 |
| Tops Holding LLC/Tops Markets II Corp. 8% 6/15/22 (b)(e) | 165,000 | 102,300 | |
| TOTAL FOOD & DRUG RETAIL | 935,531 | ||
| Food/Beverage/Tobacco - 2.2% | |||
| Central American Bottling Corp. 5.75% 1/31/27 (b) | 200,000 | 197,102 | |
| ESAL GmbH 6.25% 2/5/23 (b) | 105,000 | 103,031 | |
| JBS Investments II GmbH 7% 1/15/26 (b) | 400,000 | 395,000 | |
| JBS U.S.A. LLC/JBS U.S.A. Finance, Inc.: | |||
| 5.75% 6/15/25 (b) | 215,000 | 208,013 | |
| 5.875% 7/15/24 (b) | 10,000 | 9,815 | |
| 6.75% 2/15/28 (b) | 185,000 | 180,375 | |
| Lamb Weston Holdings, Inc.: | |||
| 4.625% 11/1/24 (b) | 45,000 | 44,076 | |
| 4.875% 11/1/26 (b) | 45,000 | 43,425 | |
| MHP SA 7.75% 5/10/24 (b) | 300,000 | 295,767 | |
| Pilgrim's Pride Corp.: | |||
| 5.75% 3/15/25 (b) | 225,000 | 209,813 | |
| 5.875% 9/30/27 (b) | 245,000 | 222,338 | |
| Post Holdings, Inc.: | |||
| 5.5% 3/1/25 (b) | 50,000 | 48,344 | |
| 5.625% 1/15/28 (b) | 110,000 | 103,433 | |
| 5.75% 3/1/27 (b) | 160,000 | 152,800 | |
| Tbla International Pte. Ltd. 7% 1/24/23 | 400,000 | 339,156 | |
| U.S. Foods, Inc. 5.875% 6/15/24 (b) | 70,000 | 69,300 | |
| Vector Group Ltd. 6.125% 2/1/25 (b) | 150,000 | 136,500 | |
| TOTAL FOOD/BEVERAGE/TOBACCO | 2,758,288 | ||
| Gaming - 2.1% | |||
| Cleopatra Finance Ltd. 4.75% 2/15/23 (Reg. S) | EUR | 100,000 | 120,936 |
| Codere Finance (Luxembourg) SA 6.75% 11/1/21 (Reg. S) | EUR | 100,000 | 106,756 |
| CRC Escrow Issuer LLC/CRC Finance LLC 5.25% 10/15/25 (b) | 380,000 | 353,638 | |
| Delta Merger Sub, Inc. 6% 9/15/26 (b) | 35,000 | 34,344 | |
| Eldorado Resorts, Inc. 6% 4/1/25 | 70,000 | 69,125 | |
| GLP Capital LP/GLP Financing II, Inc.: | |||
| 5.25% 6/1/25 | 95,000 | 95,476 | |
| 5.375% 4/15/26 | 30,000 | 29,813 | |
| International Game Technology PLC 6.25% 1/15/27 (b) | 50,000 | 49,375 | |
| MGM Growth Properties Operating Partnership LP 4.5% 1/15/28 | 350,000 | 313,250 | |
| MGM Mirage, Inc. 8.625% 2/1/19 | 115,000 | 115,863 | |
| Penn National Gaming, Inc. 5.625% 1/15/27 (b) | 15,000 | 13,950 | |
| Scientific Games Corp.: | |||
| 5% 10/15/25 (b) | 130,000 | 120,900 | |
| 10% 12/1/22 | 270,000 | 282,150 | |
| Station Casinos LLC 5% 10/1/25 (b) | 90,000 | 83,588 | |
| Studio City Finance Ltd. 8.5% 12/1/20 (b) | 200,000 | 200,000 | |
| Transocean, Inc. 7.25% 11/1/25 (b) | 160,000 | 155,600 | |
| Wynn Las Vegas LLC/Wynn Las Vegas Capital Corp. 5.25% 5/15/27 (b) | 85,000 | 76,925 | |
| Wynn Macau Ltd.: | |||
| 4.875% 10/1/24 (b) | 200,000 | 181,500 | |
| 5.5% 10/1/27 (b) | 200,000 | 180,500 | |
| TOTAL GAMING | 2,583,689 | ||
| Healthcare - 6.8% | |||
| Catalent Pharma Solutions 4.875% 1/15/26 (b) | 25,000 | 23,438 | |
| Centene Escrow Corp. 5.375% 6/1/26 (b) | 245,000 | 248,675 | |
| Charles River Laboratories International, Inc. 5.5% 4/1/26 (b) | 65,000 | 64,838 | |
| Community Health Systems, Inc.: | |||
| 5.125% 8/1/21 | 100,000 | 94,750 | |
| 6.25% 3/31/23 | 815,000 | 749,556 | |
| CTR Partnership LP/CareTrust Capital Corp. 5.25% 6/1/25 | 100,000 | 97,500 | |
| DaVita HealthCare Partners, Inc.: | |||
| 5% 5/1/25 | 180,000 | 169,425 | |
| 5.125% 7/15/24 | 215,000 | 205,325 | |
| Eurofins Scientific SA 2.125% 7/25/24 (Reg. S) | EUR | 100,000 | 112,428 |
| HCA Holdings, Inc.: | |||
| 4.5% 2/15/27 | 500,000 | 486,250 | |
| 5.375% 9/1/26 | 85,000 | 83,436 | |
| 5.625% 9/1/28 | 105,000 | 103,016 | |
| 5.875% 3/15/22 | 274,000 | 286,673 | |
| 5.875% 2/15/26 | 85,000 | 86,913 | |
| 7.5% 2/15/22 | 180,000 | 195,300 | |
| HealthSouth Corp. 5.75% 9/15/25 | 15,000 | 14,850 | |
| HLF Financing SARL LLC / Herbalife International, Inc. 7.25% 8/15/26 (b) | 25,000 | 25,313 | |
| Hologic, Inc.: | |||
| 4.375% 10/15/25 (b) | 75,000 | 70,313 | |
| 4.625% 2/1/28 (b) | 30,000 | 27,413 | |
| IMS Health, Inc.: | |||
| 3.25% 3/15/25 (Reg. S) | EUR | 200,000 | 228,888 |
| 5% 10/15/26 (b) | 120,000 | 115,462 | |
| InRetail Pharma SA 5.375% 5/2/23 (b) | 200,000 | 202,300 | |
| MPT Operating Partnership LP/MPT Finance Corp.: | |||
| 5% 10/15/27 | 330,000 | 310,101 | |
| 5.25% 8/1/26 | 100,000 | 96,500 | |
| Polaris Intermediate Corp. 8.5% 12/1/22 pay-in-kind (b)(c) | 145,000 | 148,625 | |
| Sabra Health Care LP/Sabra Capital Corp.: | |||
| 5.375% 6/1/23 | 155,000 | 154,225 | |
| 5.5% 2/1/21 | 120,000 | 121,575 | |
| Teleflex, Inc. 4.625% 11/15/27 | 30,000 | 27,831 | |
| Tenet Healthcare Corp.: | |||
| 4.625% 7/15/24 | 445,000 | 428,913 | |
| 5.125% 5/1/25 | 210,000 | 202,125 | |
| 6.75% 6/15/23 | 470,000 | 468,684 | |
| 8.125% 4/1/22 | 515,000 | 536,244 | |
| Teva Pharmaceutical Finance Netherlands III BV: | |||
| 1.125% 10/15/24 | EUR | 300,000 | 297,844 |
| 2.8% 7/21/23 | 350,000 | 308,767 | |
| Valeant Pharmaceuticals International, Inc.: | |||
| 5.5% 3/1/23 (b) | 115,000 | 108,963 | |
| 5.5% 11/1/25 (b) | 110,000 | 107,800 | |
| 5.875% 5/15/23 (b) | 375,000 | 358,594 | |
| 6.125% 4/15/25 (b) | 155,000 | 142,554 | |
| 6.5% 3/15/22 (b) | 80,000 | 82,800 | |
| 7% 3/15/24 (b) | 160,000 | 167,550 | |
| 7.5% 7/15/21 (b) | 252,000 | 255,780 | |
| 9.25% 4/1/26 (b) | 300,000 | 314,625 | |
| Vizient, Inc. 10.375% 3/1/24 (b) | 80,000 | 87,200 | |
| Wellcare Health Plans, Inc.: | |||
| 5.25% 4/1/25 | 50,000 | 49,875 | |
| 5.375% 8/15/26 (b) | 55,000 | 54,863 | |
| TOTAL HEALTHCARE | 8,524,100 | ||
| Homebuilders/Real Estate - 4.7% | |||
| APL Realty Holdings Pte Ltd. 5.95% 6/2/24 (Reg. S) | 200,000 | 139,278 | |
| Ashton Woods U.S.A. LLC/Ashton Woods Finance Co. 6.875% 2/15/21 (b) | 241,000 | 241,000 | |
| Brookfield Residential Properties, Inc. 6.5% 12/15/20 (b) | 115,000 | 115,000 | |
| Cementos Progreso Trust 7.125% 11/6/23 (b) | 200,000 | 204,752 | |
| Central China Real Estate Ltd. 6.5% 3/5/21 | 300,000 | 281,068 | |
| China Aoyuan Property Group Ltd. 7.95% 9/7/21 (Reg. S) | 200,000 | 193,279 | |
| China SCE Property Holdings Ltd. 7.45% 4/17/21 (Reg. S) | 200,000 | 187,271 | |
| Easy Tactic Ltd. 5.875% 2/13/23 (Reg. S) | 200,000 | 169,093 | |
| Evergrande Real Estate Group Ltd.: | |||
| 8.25% 3/23/22 (Reg. S) | 200,000 | 176,006 | |
| 8.75% 6/28/25 (Reg. S) | 200,000 | 156,750 | |
| Fantasia Holdings Group Co. Ltd. 7.375% 10/4/21 (Reg. S) | 200,000 | 139,104 | |
| Howard Hughes Corp. 5.375% 3/15/25 (b) | 110,000 | 105,600 | |
| IRSA Propiedades Comerciales SA 8.75% 3/23/23 (b) | 150,000 | 149,814 | |
| Jababeka International BV 6.5% 10/5/23 (Reg. S) | 200,000 | 160,105 | |
| Jiayuan International Group Ltd. 8.25% 11/14/18 (Reg. S) | 200,000 | 198,261 | |
| Jingrui Holdings Ltd.: | |||
| 7.75% 4/12/20 | 200,000 | 188,293 | |
| 9.45% 4/23/21 (Reg. S) | 200,000 | 188,179 | |
| Kaisa Group Holdings Ltd. 8.5% 6/30/22 (Reg. S) | 200,000 | 140,990 | |
| KWG Property Holding Ltd.: | |||
| 5.2% 9/21/22 (Reg. S) | 200,000 | 167,279 | |
| 7.875% 8/9/21 (Reg. S) | 200,000 | 191,891 | |
| Lennar Corp. 5.375% 10/1/22 | 55,000 | 55,894 | |
| Lodha Development Intrnl Mauritius Ltd. 12% 3/13/20 (Reg. S) | 200,000 | 178,100 | |
| Mattamy Group Corp. 6.875% 12/15/23 (b) | 25,000 | 24,344 | |
| Modernland Overseas Pte Ltd. 6.95% 4/13/24 | 200,000 | 162,975 | |
| MTN (Mauritius) Investments Ltd. 6.5% 10/13/26 (b) | 300,000 | 289,350 | |
| Redco Group 11% 8/29/20 (Reg. S) | 200,000 | 198,469 | |
| Ronshine China Holdings Ltd. 6.95% 12/8/19 | 200,000 | 198,199 | |
| Shea Homes Ltd. Partnership/Corp.: | |||
| 5.875% 4/1/23 (b) | 30,000 | 28,200 | |
| 6.125% 4/1/25 (b) | 305,000 | 283,650 | |
| Starwood Property Trust, Inc. 4.75% 3/15/25 | 75,000 | 71,438 | |
| Sunac China Holdings Ltd. 7.35% 7/19/21 (Reg. S) | 200,000 | 181,493 | |
| Theta Capital Pte Ltd. 6.75% 10/31/26 (Reg. S) | 200,000 | 131,313 | |
| Times China Holdings Ltd. 7.85% 6/4/21 (Reg. S) | 200,000 | 187,379 | |
| Weekley Homes LLC/Weekley Finance Corp. 6% 2/1/23 | 90,000 | 86,400 | |
| West Street Merger Sub, Inc. 6.375% 9/1/25 (b) | 220,000 | 206,250 | |
| Yida China Holdings 6.95% 4/19/20 (Reg. S) | 200,000 | 154,894 | |
| TOTAL HOMEBUILDERS/REAL ESTATE | 5,931,361 | ||
| Hotels - 0.4% | |||
| Hilton Domestic Operating Co., Inc. 5.125% 5/1/26 (b) | 230,000 | 224,825 | |
| Hilton Worldwide Finance LLC/Hilton Worldwide Finance Corp.: | |||
| 4.625% 4/1/25 | 70,000 | 67,900 | |
| 4.875% 4/1/27 | 40,000 | 38,200 | |
| Marriott Ownership Resorts, Inc. 6.5% 9/15/26 (b) | 65,000 | 65,650 | |
| Wyndham Hotels & Resorts, Inc. 5.375% 4/15/26 (b) | 140,000 | 135,800 | |
| TOTAL HOTELS | 532,375 | ||
| Insurance - 0.5% | |||
| Acrisure LLC / Acrisure Finance, Inc. 7% 11/15/25 (b) | 115,000 | 102,638 | |
| Alliant Holdings Co.-Issuer, Inc./Wayne Merger Sub LLC 8.25% 8/1/23 (b) | 120,000 | 124,036 | |
| Assicurazioni Generali SpA 5.5% 10/27/47 (Reg. S) (c) | EUR | 200,000 | 235,097 |
| HUB International Ltd. 7% 5/1/26 (b) | 90,000 | 87,840 | |
| USIS Merger Sub, Inc. 6.875% 5/1/25 (b) | 75,000 | 73,125 | |
| TOTAL INSURANCE | 622,736 | ||
| Leisure - 1.0% | |||
| Cedar Fair LP/Canada's Wonderland Co. 5.375% 4/15/27 | 35,000 | 33,425 | |
| Mattel, Inc. 6.75% 12/31/25 (b) | 305,000 | 291,180 | |
| NVA Holdings, Inc. 6.875% 4/1/26 (b) | 50,000 | 49,375 | |
| Rivers Pittsburgh Borrower LP 6.125% 8/15/21 (b) | 480,000 | 477,600 | |
| Silversea Cruises 7.25% 2/1/25 (b) | 25,000 | 26,938 | |
| Viking Cruises Ltd. 5.875% 9/15/27 (b) | 370,000 | 352,425 | |
| Voc Escrow Ltd. 5% 2/15/28 (b) | 70,000 | 65,800 | |
| TOTAL LEISURE | 1,296,743 | ||
| Metals/Mining - 3.3% | |||
| Abja Investment Co. Pte Ltd. 5.45% 1/24/28 | 300,000 | 258,490 | |
| ABM Industries, Inc. 7.125% 8/1/22 (Reg. S) | 200,000 | 180,878 | |
| Alcoa Nederland Holding BV 6.125% 5/15/28 (b) | 200,000 | 199,500 | |
| Alpha Natural Resources, Inc. 9.75% 4/15/18 (e)(f) | 210,000 | 0 | |
| Constellium NV 5.875% 2/15/26 (b) | 250,000 | 233,125 | |
| First Quantum Minerals Ltd.: | |||
| 6.5% 3/1/24 (b) | 200,000 | 174,500 | |
| 6.875% 3/1/26 (b) | 200,000 | 172,750 | |
| 7.25% 4/1/23 (b) | 300,000 | 277,125 | |
| 7.5% 4/1/25 (b) | 200,000 | 178,500 | |
| FMG Resources (August 2006) Pty Ltd.: | |||
| 4.75% 5/15/22 (b) | 45,000 | 43,200 | |
| 5.125% 3/15/23 (b) | 95,000 | 91,675 | |
| Freeport-McMoRan, Inc. 6.875% 2/15/23 | 215,000 | 224,944 | |
| Gold Fields Orogen Holding BVI Ltd. 4.875% 10/7/20 (b) | 150,000 | 150,375 | |
| Joseph T Ryerson & Son, Inc. 11% 5/15/22 (b) | 40,000 | 42,800 | |
| Minsur SA 6.25% 2/7/24 (Reg. S) | 200,000 | 203,202 | |
| Murray Energy Corp. 11.25% 4/15/21 (b) | 30,000 | 19,050 | |
| Novelis Corp. 5.875% 9/30/26 (b) | 70,000 | 65,975 | |
| Polyus Finance PLC 5.25% 2/7/23 (b) | 200,000 | 192,848 | |
| PT Bukit Makmur Mandiri Utama 7.75% 2/13/22 (Reg. S) | 200,000 | 201,977 | |
| Qinghai Provincial Investment Group Co. Ltd. 7.875% 3/22/21 (Reg. S) | 200,000 | 152,684 | |
| Stillwater Mining Co. 6.125% 6/27/22 (b) | 200,000 | 190,968 | |
| Vedanta Resources PLC: | |||
| 6.125% 8/9/24 | 200,000 | 176,469 | |
| 6.375% 7/30/22 (b) | 400,000 | 374,200 | |
| VM Holding SA 5.375% 5/4/27 (b) | 200,000 | 194,502 | |
| Zhongrong International Resour 7.25% 10/26/20 (Reg. S) | 200,000 | 131,968 | |
| TOTAL METALS/MINING | 4,131,705 | ||
| Paper - 0.4% | |||
| Progroup AG 3% 3/31/26 (Reg. S) | EUR | 225,000 | 256,495 |
| Smurfit Kappa Acquisitions 3.25% 6/1/21 (Reg. S) | EUR | 200,000 | 240,280 |
| TOTAL PAPER | 496,775 | ||
| Restaurants - 0.5% | |||
| 1011778 BC Unlimited Liability Co./New Red Finance, Inc. 5% 10/15/25 (b) | 140,000 | 131,250 | |
| Golden Nugget, Inc.: | |||
| 6.75% 10/15/24 (b) | 120,000 | 119,700 | |
| 8.75% 10/1/25 (b) | 65,000 | 66,788 | |
| KFC Holding Co./Pizza Hut Holding LLC: | |||
| 4.75% 6/1/27 (b) | 50,000 | 47,000 | |
| 5% 6/1/24 (b) | 195,000 | 192,319 | |
| 5.25% 6/1/26 (b) | 100,000 | 98,250 | |
| TOTAL RESTAURANTS | 655,307 | ||
| Services - 2.4% | |||
| Algeco Scotsman Global Finance PLC: | |||
| 3 month EURIBOR + 6.250% 6.25% 2/15/23 (c)(d) | EUR | 100,000 | 113,831 |
| 6.5% 2/15/23 | EUR | 100,000 | 116,940 |
| APX Group, Inc. 7.625% 9/1/23 | 150,000 | 133,500 | |
| Avantor, Inc. 6% 10/1/24 (b) | 220,000 | 219,450 | |
| Blueline Rental Finance Corp./Blueline Rental LLC 9.25% 3/15/24 (b) | 35,000 | 36,531 | |
| Brand Energy & Infrastructure Services, Inc. 8.5% 7/15/25 (b) | 250,000 | 246,250 | |
| CDK Global, Inc.: | |||
| 4.875% 6/1/27 | 105,000 | 98,306 | |
| 5.875% 6/15/26 | 35,000 | 35,263 | |
| eHi Car Service Co. Ltd. 5.875% 8/14/22 | 200,000 | 173,491 | |
| Elis SA 2.875% 2/15/26 (Reg. S) | EUR | 100,000 | 113,643 |
| FTI Consulting, Inc. 6% 11/15/22 | 175,000 | 178,605 | |
| Global A&T Electronics Ltd. 8.5% 1/12/23 | 200,000 | 189,528 | |
| H&E Equipment Services, Inc. 5.625% 9/1/25 | 180,000 | 171,450 | |
| Herc Rentals, Inc.: | |||
| 7.5% 6/1/22 (b) | 31,000 | 32,240 | |
| 7.75% 6/1/24 (b) | 31,000 | 32,705 | |
| IHS Markit Ltd.: | |||
| 4% 3/1/26 (b) | 35,000 | 32,940 | |
| 4.75% 2/15/25 (b) | 65,000 | 64,349 | |
| Intrum Justitia AB 2.75% 7/15/22 (Reg. S) | EUR | 100,000 | 110,424 |
| IPD BV 4.5% 7/15/22 (Reg. S) | EUR | 200,000 | 231,582 |
| Jurassic Holdings III, Inc. 6.875% 2/15/21 (Reg. S) (b) | 220,000 | 205,700 | |
| Laureate Education, Inc. 8.25% 5/1/25 (b) | 495,000 | 530,888 | |
| TOTAL SERVICES | 3,067,616 | ||
| Steel - 0.8% | |||
| Big River Steel LLC/BRS Finance Corp. 7.25% 9/1/25 (b) | 55,000 | 57,338 | |
| Cleveland-Cliffs, Inc. 5.75% 3/1/25 | 210,000 | 198,450 | |
| CSN Resources SA 6.5% 7/21/20 (b) | 125,000 | 121,524 | |
| EVRAZ Group SA 5.375% 3/20/23 (b) | 200,000 | 196,500 | |
| Metinvest BV 7.75% 4/23/23 (b) | 300,000 | 288,000 | |
| Thyssenkrupp AG 3.125% 10/25/19 (Reg. S) | EUR | 100,000 | 115,263 |
| TOTAL STEEL | 977,075 | ||
| Super Retail - 0.3% | |||
| Netflix, Inc.: | |||
| 4.375% 11/15/26 | 110,000 | 100,672 | |
| 4.875% 4/15/28 (b) | 85,000 | 77,988 | |
| 5.875% 11/15/28 (b) | 140,000 | 137,550 | |
| TOTAL SUPER RETAIL | 316,210 | ||
| Technology - 2.3% | |||
| Balboa Merger Sub, Inc. 11.375% 12/1/21 (b) | 360,000 | 381,600 | |
| Banff Merger Sub, Inc. 9.75% 9/1/26 (b) | 260,000 | 249,600 | |
| CDW LLC/CDW Finance Corp. 5% 9/1/25 | 20,000 | 19,500 | |
| Dr. Peng Holding Hong Kong Ltd. 5.05% 6/1/20 (Reg. S) | 200,000 | 164,292 | |
| Ensemble S Merger Sub, Inc. 9% 9/30/23 (b) | 267,000 | 276,345 | |
| Entegris, Inc. 4.625% 2/10/26 (b) | 85,000 | 78,970 | |
| Fair Isaac Corp. 5.25% 5/15/26 (b) | 50,000 | 49,313 | |
| InterXion Holding N.V. 4.75% 6/15/25 (Reg. S) | EUR | 100,000 | 118,079 |
| Itron, Inc. 5% 1/15/26 (b) | 30,000 | 27,938 | |
| j2 Cloud Services LLC/j2 Global Communications, Inc. 6% 7/15/25 (b) | 45,000 | 44,606 | |
| Jain International Trading BV 7.125% 2/1/22 (Reg. S) | 200,000 | 185,628 | |
| Match Group, Inc. 5% 12/15/27 (b) | 60,000 | 57,150 | |
| Parametric Technology Corp. 6% 5/15/24 | 20,000 | 20,450 | |
| Qorvo, Inc. 5.5% 7/15/26 (b) | 100,000 | 100,250 | |
| Sabre GLBL, Inc. 5.25% 11/15/23 (b) | 85,000 | 83,927 | |
| Sensata Technologies BV 4.875% 10/15/23 (b) | 120,000 | 116,850 | |
| SoftBank Corp. 4.75% 9/19/24 | 35,000 | 33,673 | |
| Solera LLC/Solera Finance, Inc. 10.5% 3/1/24 (b) | 410,000 | 444,862 | |
| TTM Technologies, Inc. 5.625% 10/1/25 (b) | 25,000 | 24,375 | |
| Uber Technologies, Inc. 8% 11/1/26 (b)(g) | 240,000 | 241,200 | |
| Veritas U.S., Inc./Veritas Bermuda Ltd. 10.5% 2/1/24 (b) | 265,000 | 227,900 | |
| TOTAL TECHNOLOGY | 2,946,508 | ||
| Telecommunications - 8.4% | |||
| Altice Finco SA: | |||
| 4.75% 1/15/28 | EUR | 150,000 | 140,736 |
| 7.625% 2/15/25 (b) | 800,000 | 711,000 | |
| Axtel S.A.B. de CV 6.375% 11/14/24 (b) | 300,000 | 286,875 | |
| Banglalink Digital Communications Ltd.: | |||
| 8.625% 5/6/19 (b) | 200,000 | 201,000 | |
| 8.625% 5/6/19 (Reg. S) | 200,000 | 201,000 | |
| C&W Senior Financing Designated Activity Co.: | |||
| 6.875% 9/15/27 (b) | 200,000 | 190,500 | |
| 7.5% 10/15/26 (b) | 200,000 | 200,500 | |
| Cellnex Telecom Sau 2.375% 1/16/24 (Reg. S) | EUR | 200,000 | 228,289 |
| Colombia Telecomunicaciones SA 5.375% 9/27/22 (b) | 200,000 | 198,852 | |
| CyrusOne LP/CyrusOne Finance Corp.: | |||
| 5% 3/15/24 | 45,000 | 45,000 | |
| 5.375% 3/15/27 | 40,000 | 39,700 | |
| Digicel Group Ltd. 6.75% 3/1/23 (b) | 150,000 | 120,375 | |
| Equinix, Inc. 5.375% 5/15/27 | 50,000 | 49,500 | |
| Frontier Communications Corp.: | |||
| 8.5% 4/1/26 (b) | 225,000 | 208,969 | |
| 11% 9/15/25 | 300,000 | 219,750 | |
| GCI, Inc. 6.875% 4/15/25 | 85,000 | 87,709 | |
| Globo Comunicacao e Participacoes SA: | |||
| 4.875% 4/11/22 (Reg. S) | 250,000 | 247,813 | |
| 5.125% 3/31/27 (b) | 200,000 | 185,502 | |
| GTH Finance BV 7.25% 4/26/23 (b) | 200,000 | 207,000 | |
| GTT Communications, Inc. 7.875% 12/31/24 (b) | 180,000 | 169,200 | |
| Intelsat Jackson Holdings SA: | |||
| 8% 2/15/24 (b) | 260,000 | 272,025 | |
| 8.5% 10/15/24 (b) | 385,000 | 378,263 | |
| Millicom International Cellular SA 5.125% 1/15/28 (b) | 200,000 | 181,700 | |
| MTS International Funding Ltd. 5% 5/30/23 (b) | 350,000 | 339,329 | |
| Nokia Corp.: | |||
| 3.375% 6/12/22 | 35,000 | 33,513 | |
| 4.375% 6/12/27 | 45,000 | 42,323 | |
| Sable International Finance Ltd. 6.875% 8/1/22 (b) | 200,000 | 208,750 | |
| SFR Group SA: | |||
| 7.375% 5/1/26 (b) | 150,000 | 143,579 | |
| 8.125% 2/1/27 (b) | 245,000 | 242,550 | |
| Sprint Capital Corp.: | |||
| 6.875% 11/15/28 | 190,000 | 186,675 | |
| 6.9% 5/1/19 | 1,115,000 | 1,129,595 | |
| 8.75% 3/15/32 | 245,000 | 267,663 | |
| Sprint Corp.: | |||
| 7.125% 6/15/24 | 200,000 | 204,500 | |
| 7.625% 3/1/26 | 70,000 | 72,494 | |
| 7.875% 9/15/23 | 540,000 | 576,450 | |
| T-Mobile U.S.A., Inc. 4.5% 2/1/26 | 250,000 | 233,985 | |
| TBG Global Pte. Ltd. 5.25% 2/10/22 (Reg. S) | 400,000 | 389,753 | |
| Telecom Italia SpA 5.25% 3/17/55 | EUR | 300,000 | 332,591 |
| Telefonica Celular del Paraguay SA 6.75% 12/13/22 (b) | 200,000 | 203,018 | |
| Telenet Finance Luxembourg Notes SARL: | |||
| 3.5% 3/1/28 (Reg. S) | EUR | 200,000 | 223,132 |
| 5.5% 3/1/28 (b) | 600,000 | 556,500 | |
| Turkcell Iletisim Hizmet A/S 5.8% 4/11/28 (b) | 200,000 | 172,936 | |
| Wind Tre SpA 5% 1/20/26 (b) | 200,000 | 170,240 | |
| Zayo Group LLC/Zayo Capital, Inc. 5.75% 1/15/27 (b) | 135,000 | 132,327 | |
| TOTAL TELECOMMUNICATIONS | 10,633,161 | ||
| Textiles/Apparel - 0.3% | |||
| CBR Fashion Finance BV 5.125% 10/1/22 (Reg. S) | EUR | 100,000 | 92,360 |
| Eagle Intermediate Global Holding BV 7.5% 5/1/25 (b) | 35,000 | 33,863 | |
| Golden Legacy Pte Ltd. 8.25% 6/7/21 | 200,000 | 205,293 | |
| TOTAL TEXTILES/APPAREL | 331,516 | ||
| Transportation Ex Air/Rail - 0.7% | |||
| Avolon Holdings Funding Ltd.: | |||
| 5.125% 10/1/23 (b) | 265,000 | 260,031 | |
| 5.5% 1/15/23 (b) | 85,000 | 84,575 | |
| Navios Maritime Acquisition Corp./Navios Acquisition Finance U.S., Inc. 8.125% 11/15/21 (b) | 235,000 | 197,106 | |
| Navios Maritime Holdings, Inc.: | |||
| 7.375% 1/15/22 (b) | 90,000 | 67,950 | |
| 11.25% 8/15/22 (b) | 135,000 | 117,450 | |
| Navios South American Logistics, Inc./Navios Logistics Finance U.S., Inc. 7.25% 5/1/22 (b) | 35,000 | 32,550 | |
| Teekay Corp. 8.5% 1/15/20 | 145,000 | 147,175 | |
| TOTAL TRANSPORTATION EX AIR/RAIL | 906,837 | ||
| Utilities - 5.1% | |||
| ContourGlobal Power Holdings SA 4.125% 8/1/25 (Reg. S) | EUR | 125,000 | 138,466 |
| DPL, Inc. 6.75% 10/1/19 | 495,000 | 506,756 | |
| DTEK Finance PLC 10.75% 12/31/24 pay-in-kind (c) | 100,000 | 102,108 | |
| Dynegy, Inc.: | |||
| 5.875% 6/1/23 | 70,000 | 71,050 | |
| 7.375% 11/1/22 | 105,000 | 108,938 | |
| 7.625% 11/1/24 | 239,000 | 252,743 | |
| Greenko Investment Co. 4.875% 8/16/23 (Reg. S) | 200,000 | 178,600 | |
| InterGen NV 7% 6/30/23 (b) | 920,000 | 903,900 | |
| Listrindo Capital BV 4.95% 9/14/26 (b) | 200,000 | 177,800 | |
| NRG Energy, Inc. 5.75% 1/15/28 | 1,345,000 | 1,341,638 | |
| NSG Holdings II LLC/NSG Holdings, Inc. 7.75% 12/15/25 (b) | 298,125 | 321,975 | |
| Pattern Energy Group, Inc. 5.875% 2/1/24 (b) | 30,000 | 29,700 | |
| Petrobras Energia SA 7.375% 7/21/23 (Reg. S) | 200,000 | 184,740 | |
| Petrobras Global Finance BV: | |||
| 4.75% 1/14/25 | EUR | 100,000 | 119,483 |
| 6.25% 3/17/24 | 300,000 | 303,450 | |
| Star Energy Geothermal Wayang Windu Ltd. 6.75% 4/24/33 (Reg. S) | 200,000 | 179,694 | |
| Talen Energy Supply LLC: | |||
| 6.5% 6/1/25 | 215,000 | 160,175 | |
| 10.5% 1/15/26 (b) | 410,000 | 360,288 | |
| TerraForm Global, Inc. 6.125% 3/1/26 (b) | 145,000 | 134,850 | |
| The AES Corp.: | |||
| 4% 3/15/21 | 195,000 | 193,077 | |
| 5.125% 9/1/27 | 55,000 | 54,313 | |
| TVO Power Co.: | |||
| 2.125% 2/4/25 (Reg. S) | EUR | 100,000 | 113,363 |
| 2.5% 3/17/21 (Reg. S) | EUR | 100,000 | 117,835 |
| Vertiv Group Corp. 9.25% 10/15/24 (b) | 60,000 | 59,700 | |
| Vistra Operations Co. LLC 5.5% 9/1/26 (b) | 115,000 | 113,275 | |
| Wind Tre SpA 3.125% 1/20/25 (Reg. S) | EUR | 200,000 | 206,142 |
| TOTAL UTILITIES | 6,434,059 | ||
| TOTAL NONCONVERTIBLE BONDS | |||
| (Cost $104,536,389) | 100,022,877 | ||
| Government Obligations - 1.3% | |||
| Germany - 1.3% | |||
| German Federal Republic: | |||
| 0% 10/13/23 | EUR | 1,200,000 | 1,372,180 |
| 2% 8/15/23 | EUR | 200,000 | 250,978 |
| TOTAL GOVERNMENT OBLIGHTATIONS | |||
| (Cost $1,642,884) | 1,623,158 | ||
| Shares | Value | ||
| Common Stocks - 1.4% | |||
| Automotive & Auto Parts - 0.1% | |||
| General Motors Co. | 2,268 | 82,986 | |
| UC Holdings, Inc. (f) | 3,510 | 73,254 | |
| TOTAL AUTOMOTIVE & AUTO PARTS | 156,240 | ||
| Chemicals - 0.2% | |||
| LyondellBasell Industries NV Class A | 2,100 | 187,467 | |
| Energy - 0.2% | |||
| GulfMark Offshore, Inc.: | |||
| warrants 10/21/42 (f)(h) | 1,897 | 66,395 | |
| warrants 11/14/42 (f)(h) | 5,448 | 190,680 | |
| Riviera Resources, Inc. (h) | 94 | 2,004 | |
| Roan Resources, Inc. (h) | 448 | 7,289 | |
| The Williams Companies, Inc. | 1,900 | 46,227 | |
| TOTAL ENERGY | 312,595 | ||
| Food & Drug Retail - 0.1% | |||
| Southeastern Grocers, Inc. (f)(h) | 1,789 | 72,598 | |
| Gaming - 0.3% | |||
| Boyd Gaming Corp. | 4,800 | 127,488 | |
| Golden Entertainment, Inc. (h) | 8,300 | 150,811 | |
| Penn National Gaming, Inc. (h) | 4,600 | 111,688 | |
| TOTAL GAMING | 389,987 | ||
| Healthcare - 0.2% | |||
| HCA Holdings, Inc. | 1,500 | 200,295 | |
| Hotels - 0.1% | |||
| Extended Stay America, Inc. unit | 5,500 | 89,540 | |
| Metals/Mining - 0.0% | |||
| Warrior Metropolitan Coal, Inc. | 69 | 1,932 | |
| Services - 0.1% | |||
| United Rentals, Inc. (h) | 1,300 | 156,091 | |
| Steel - 0.0% | |||
| ANR, Inc. (h) | 363 | 12,705 | |
| Utilities - 0.1% | |||
| NRG Energy, Inc. | 3,900 | 141,141 | |
| TOTAL COMMON STOCKS | |||
| (Cost $1,792,360) | 1,720,591 | ||
| Convertible Preferred Stocks - 0.1% | |||
| Utilities - 0.1% | |||
| Vistra Energy Corp. 7.00% | |||
| (Cost $133,084) | 1,600 | 145,749 | |
| Principal Amount | Value | ||
| Bank Loan Obligations - 3.8% | |||
| Aerospace - 0.2% | |||
| TransDigm, Inc.: | |||
| Tranche E, term loan 3 month U.S. LIBOR + 2.500% 4.802% 5/30/25 (c)(d) | 19,900 | 19,781 | |
| Tranche F, term loan 3 month U.S. LIBOR + 2.500% 4.802% 6/9/23 (c)(d) | 79,202 | 78,777 | |
| Tranche G, term loan 3 month U.S. LIBOR + 2.500% 4.802% 8/22/24 (c)(d) | 128,380 | 127,708 | |
| TOTAL AEROSPACE | 226,266 | ||
| Cable/Satellite TV - 0.8% | |||
| CSC Holdings LLC Tranche B, term loan 3 month U.S. LIBOR + 2.500% 4.7795% 1/25/26 (c)(d) | 24,875 | 24,821 | |
| Mediacom Illinois LLC Tranche N, term loan 3 month U.S. LIBOR + 1.750% 3.97% 2/15/24 (c)(d) | 129,350 | 128,946 | |
| Numericable LLC Tranche B 12LN, term loan 3 month U.S. LIBOR + 3.688% 5.967% 1/31/26 (c)(d) | 386,596 | 376,529 | |
| WideOpenWest Finance LLC Tranche B, term loan 3 month U.S. LIBOR + 3.250% 5.5395% 8/19/23 (c)(d) | 472,900 | 455,166 | |
| Zayo Group LLC Tranche B 2LN, term loan 3 month U.S. LIBOR + 2.250% 4.552% 1/19/24 (c)(d) | 5,000 | 5,002 | |
| TOTAL CABLE/SATELLITE TV | 990,464 | ||
| Chemicals - 0.4% | |||
| Invictus U.S. Newco LLC Tranche 1LN, term loan 3 month U.S. LIBOR + 3.000% 5.302% 3/28/25 (c)(d) | 4,975 | 4,992 | |
| Oxea Corp. Tranche B2, term loan 3 month U.S. LIBOR + 3.500% 5.9375% 10/11/24 (c)(d) | 9,200 | 9,223 | |
| PQ Corp. Tranche B, term loan 3 month U.S. LIBOR + 2.500% 5.0266% 2/8/25 (c)(d) | 4,785 | 4,776 | |
| Starfruit U.S. Holdco LLC Tranche B, term loan 3 month U.S. LIBOR + 3.250% 5.506% 10/1/25 (c)(d) | 45,000 | 44,831 | |
| The Chemours Co. LLC Tranche B 1LN, term loan 3 month U.S. LIBOR + 1.750% 4.05% 4/3/25 (c)(d) | 378,100 | 376,448 | |
| Tronox Blocked Borrower LLC Tranche B, term loan 3 month U.S. LIBOR + 3.000% 5.302% 9/22/24 (c)(d) | 9,002 | 8,989 | |
| Tronox Finance LLC Tranche B, term loan 3 month U.S. LIBOR + 3.000% 5.302% 9/22/24 (c)(d) | 20,773 | 20,744 | |
| TOTAL CHEMICALS | 470,003 | ||
| Diversified Financial Services - 0.0% | |||
| BCP Renaissance Parent LLC Tranche B, term loan 3 month U.S. LIBOR + 3.500% 6.0266% 10/31/24 (c)(d) | 14,963 | 15,000 | |
| HarbourVest Partners LLC Tranche B 1LN, term loan 3 month U.S. LIBOR + 2.250% 4.5295% 3/1/25 (c)(d) | 18,966 | 18,943 | |
| TOTAL DIVERSIFIED FINANCIAL SERVICES | 33,943 | ||
| Energy - 0.6% | |||
| Arctic LNG Carriers Ltd. Tranche B 1LN, term loan 3 month U.S. LIBOR + 4.500% 6.802% 5/18/23 (c)(d) | 222,188 | 222,188 | |
| BCP Raptor LLC Tranche B, term loan 3 month U.S. LIBOR + 4.250% 6.6411% 6/22/24 (c)(d) | 49,375 | 48,661 | |
| California Resources Corp.: | |||
| Tranche 1LN, term loan 3 month U.S. LIBOR + 10.375% 12.6699% 12/31/21 (c)(d) | 230,000 | 255,875 | |
| Tranche B, term loan 3 month U.S. LIBOR + 4.750% 7.0365% 12/31/22 (c)(d) | 185,000 | 187,466 | |
| Pacific Drilling SA: | |||
| DIP, term loan 3 month U.S. LIBOR + 7.000% 5.8714% 11/30/18 (c)(d)(f)(i) | 31,751 | 31,751 | |
| Tranche B, term loan 3 month U.S. LIBOR + 3.500% 0% 6/3/18 (d)(e) | 47,875 | 21,464 | |
| TOTAL ENERGY | 767,405 | ||
| Entertainment/Film - 0.1% | |||
| Cinemark U.S.A., Inc. Tranche B, term loan 3 month U.S. LIBOR + 1.750% 4.05% 3/29/25 (c)(d) | 163,763 | 163,803 | |
| Food & Drug Retail - 0.6% | |||
| BI-LO LLC Tranche B, term loan 3 month U.S. LIBOR + 8.000% 10.3645% 5/31/24 (c)(d) | 698,250 | 688,649 | |
| Tops Markets LLC term loan 3 month U.S. LIBOR + 9.500% 11.8125% 2/23/19 (c)(d)(f) | 65,045 | 65,208 | |
| TOTAL FOOD & DRUG RETAIL | 753,857 | ||
| Gaming - 0.0% | |||
| Gateway Casinos & Entertainment Ltd. Tranche B 1LN, term loan 3 month U.S. LIBOR + 3.000% 5.3861% 12/1/23 (c)(d) | 19,950 | 19,981 | |
| Healthcare - 0.0% | |||
| U.S. Anesthesia Partners, Inc. Tranche B, term loan 3 month U.S. LIBOR + 3.000% 5.302% 6/23/24 (c)(d) | 4,962 | 4,958 | |
| Insurance - 0.0% | |||
| Alliant Holdings Intermediate LLC Tranche B, term loan 3 month U.S. LIBOR + 3.000% 5.2795% 5/10/25 (c)(d) | 4,937 | 4,930 | |
| USI, Inc. Tranche B, term loan 3 month U.S. LIBOR + 3.000% 5.3861% 5/16/24 (c)(d) | 14,850 | 14,757 | |
| TOTAL INSURANCE | 19,687 | ||
| Leisure - 0.2% | |||
| Alterra Mountain Co. Tranche B 1LN, term loan 3 month U.S. LIBOR + 3.000% 5.302% 7/31/24 (c)(d) | 4,963 | 4,964 | |
| Crown Finance U.S., Inc. Tranche B 1LN, term loan 3 month U.S. LIBOR + 2.500% 4.802% 2/28/25 (c)(d) | 278,600 | 277,235 | |
| TOTAL LEISURE | 282,199 | ||
| Publishing/Printing - 0.1% | |||
| Cengage Learning, Inc. Tranche B, term loan 3 month U.S. LIBOR + 4.250% 6.5296% 6/7/23 (c)(d) | 90,000 | 83,278 | |
| Restaurants - 0.2% | |||
| Burger King Worldwide, Inc. Tranche B, term loan 3 month U.S. LIBOR + 2.250% 4.552% 2/17/24 (c)(d) | 299,801 | 298,526 | |
| Services - 0.1% | |||
| KUEHG Corp. Tranche B 2LN, term loan 3 month U.S. LIBOR + 8.250% 10.6361% 8/22/25 (c)(d) | 95,000 | 96,188 | |
| Technology - 0.4% | |||
| ATS Consolidated, Inc. Tranche B 1LN, term loan 3 month U.S. LIBOR + 3.750% 6.0449% 2/28/25 (c)(d) | 9,950 | 10,004 | |
| Kronos, Inc. 2LN, term loan 3 month U.S. LIBOR + 8.250% 10.5931% 11/1/24 (c)(d) | 115,000 | 116,454 | |
| SS&C Technologies, Inc.: | |||
| Tranche B 3LN, term loan 3 month U.S. LIBOR + 2.250% 4.552% 4/16/25 (c)(d) | 230,706 | 229,423 | |
| Tranche B 4LN, term loan 3 month U.S. LIBOR + 2.250% 4.552% 4/16/25 (c)(d) | 89,422 | 88,924 | |
| TOTAL TECHNOLOGY | 444,805 | ||
| Telecommunications - 0.1% | |||
| Sable International Finance Ltd. Tranche B 4LN, term loan 3 month U.S. LIBOR + 3.250% 5.552% 2/2/26 (c)(d) | 135,000 | 134,849 | |
| TOTAL BANK LOAN OBLIGATIONS | |||
| (Cost $4,796,659) | 4,790,212 | ||
| Preferred Securities - 4.8% | |||
| Automotive & Auto Parts - 0.2% | |||
| Volkswagen International Finance NV 3.875% (Reg. S) (c)(j) | EUR | 200,000 | 217,927 |
| Banks & Thrifts - 2.4% | |||
| Alfa Bond Issuance PLC 8% (Reg. S) (c)(j) | 200,000 | 190,472 | |
| Banco Do Brasil SA 9% (b)(c)(j) | 200,000 | 213,689 | |
| Banco Mercantil del Norte SA 7.625% (b)(c)(j) | 400,000 | 393,159 | |
| Bank of America Corp. 5.875% (c)(j) | 355,000 | 347,058 | |
| Bank of East Asia Ltd. 5.5% (c)(j) | 200,000 | 202,135 | |
| Barclays Bank PLC 7.625% 11/21/22 | 260,000 | 286,385 | |
| Citigroup, Inc. 5.35% (c)(j) | 550,000 | 542,281 | |
| Credit Agricole SA: | |||
| 7.875% (b)(c)(j) | 200,000 | 208,438 | |
| 8.125% (b)(c)(j) | 200,000 | 216,254 | |
| Itau Unibanco Holding SA 6.125% (b)(c)(j) | 200,000 | 197,003 | |
| Standard Chartered PLC 7.5% (b)(c)(j) | 200,000 | 203,486 | |
| TOTAL BANKS & THRIFTS | 3,000,360 | ||
| Consumer Products - 0.6% | |||
| Cosan Overseas Ltd. 8.25% (j) | 700,000 | 722,560 | |
| Energy - 0.2% | |||
| Gas Natural Fenosa Finance BV 4.125% (Reg. S) (c)(j) | EUR | 200,000 | 245,350 |
| Healthcare - 0.1% | |||
| Fullerton Healthcare Corp. Ltd. 7% (Reg. S) (c)(j) | 200,000 | 189,165 | |
| Homebuilders/Real Estate - 0.6% | |||
| Agile Property Holdings Ltd. 6.875% (Reg. S) (c)(j) | 200,000 | 177,166 | |
| CIFI Holdings Group Co. Ltd. 5.375% (Reg. S) (c)(j) | 200,000 | 168,695 | |
| Grand City Properties SA 3.75% (c)(j) | EUR | 100,000 | 119,096 |
| RKI Overseas Finance 2017 (A) 7% (Reg. S) (j) | 200,000 | 157,858 | |
| Yuzhou Properties Co. 5.375% (Reg. S) (c)(j) | 200,000 | 167,459 | |
| TOTAL HOMEBUILDERS/REAL ESTATE | 790,274 | ||
| Telecommunications - 0.5% | |||
| Colombia Telecomunicaciones SA 8.5% (b)(c)(j) | 200,000 | 206,903 | |
| Telefonica Europe BV: | |||
| 3.875% (Reg. S) (c)(j) | EUR | 200,000 | 212,768 |
| 5% (Reg. S) (c)(j) | EUR | 200,000 | 244,528 |
| TOTAL TELECOMMUNICATIONS | 664,199 | ||
| Utilities - 0.2% | |||
| EDF SA 5.375% 12/31/99 (c) | EUR | 200,000 | 250,273 |
| TOTAL PREFERRED SECURITIES | |||
| (Cost $6,306,965) | 6,080,108 | ||
| Shares | Value | ||
| Money Market Funds - 8.1% | |||
| Fidelity Cash Central Fund, 2.23% (k) | |||
| (Cost $10,184,149) | 10,182,363 | 10,184,399 | |
| TOTAL INVESTMENT IN SECURITIES - 98.9% | |||
| (Cost $129,392,490) | 124,567,094 | ||
| NET OTHER ASSETS (LIABILITIES) - 1.1% | 1,337,609 | ||
| NET ASSETS - 100% | $125,904,703 |
Currency Abbreviations
EUR – European Monetary Unit
Legend
(a) Amount is stated in United States dollars unless otherwise noted.
(b) Security exempt from registration under Rule 144A of the Securities Act of 1933. These securities may be resold in transactions exempt from registration, normally to qualified institutional buyers. At the end of the period, the value of these securities amounted to $54,681,998 or 43.4% of net assets.
(c) Coupon rates for floating and adjustable rate securities reflect the rates in effect at period end.
(d) Coupon is indexed to a floating interest rate which may be multiplied by a specified factor and/or subject to caps or floors.
(e) Non-income producing - Security is in default.
(f) Level 3 security
(g) Security or a portion of the security purchased on a delayed delivery or when-issued basis.
(h) Non-income producing
(i) Position or a portion of the position represents an unfunded loan commitment. At period end, the total principal amount and market value of unfunded commitments totaled $13,074 and $13,074, respectively.
(j) Security is perpetual in nature with no stated maturity date.
(k) Affiliated fund that is generally available only to investment companies and other accounts managed by Fidelity Investments. The rate quoted is the annualized seven-day yield of the fund at period end. A complete unaudited listing of the fund's holdings as of its most recent quarter end is available upon request. In addition, each Fidelity Central Fund's financial statements are available on the SEC's website or upon request.
Affiliated Central Funds
Information regarding fiscal year to date income earned by the Fund from investments in Fidelity Central Funds is as follows:
| Fund | Income earned |
| Fidelity Cash Central Fund | $64,567 |
| Total | $64,567 |
Amounts in the income column in the above table include any capital gain distributions from underlying funds, which are presented in the corresponding line-item in the Statement of Operations if applicable.
Investment Valuation
The following is a summary of the inputs used, as of October 31, 2018, involving the Fund's assets and liabilities carried at fair value. The inputs or methodology used for valuing securities may not be an indication of the risk associated with investing in those securities. For more information on valuation inputs, and their aggregation into the levels used below, please refer to the Investment Valuation section in the accompanying Notes to Financial Statements.
| Valuation Inputs at Reporting Date: | ||||
| Description | Total | Level 1 | Level 2 | Level 3 |
| Investments in Securities: | ||||
| Equities: | ||||
| Consumer Discretionary | $635,767 | $562,513 | $-- | $73,254 |
| Consumer Staples | 72,598 | -- | -- | 72,598 |
| Energy | 325,300 | 68,225 | -- | 257,075 |
| Health Care | 200,295 | 200,295 | -- | -- |
| Industrials | 156,091 | 156,091 | -- | -- |
| Materials | 189,399 | 189,399 | -- | -- |
| Utilities | 286,890 | 141,141 | 145,749 | -- |
| Corporate Bonds | 100,022,877 | -- | 100,022,877 | -- |
| Government Obligations | 1,623,158 | -- | 1,623,158 | -- |
| Bank Loan Obligations | 4,790,212 | -- | 4,693,253 | 96,959 |
| Preferred Securities | 6,080,108 | -- | 6,080,108 | -- |
| Money Market Funds | 10,184,399 | 10,184,399 | -- | -- |
| Total Investments in Securities: | $124,567,094 | $11,502,063 | $112,565,145 | $499,886 |
Other Information
Distribution of investments by country or territory of incorporation, as a percentage of Total Net Assets, is as follows (Unaudited):
| United States of America | 53.0% |
| Netherlands | 7.4% |
| Cayman Islands | 6.3% |
| Luxembourg | 5.5% |
| United Kingdom | 2.7% |
| Canada | 2.4% |
| Germany | 2.0% |
| Ireland | 2.0% |
| Argentina | 1.9% |
| Singapore | 1.6% |
| France | 1.5% |
| Mexico | 1.4% |
| British Virgin Islands | 1.3% |
| Italy | 1.3% |
| Bermuda | 1.3% |
| Multi-National | 1.1% |
| Others (Individually Less Than 1%) | 7.3% |
| 100.0% |
See accompanying notes which are an integral part of the financial statements.
Financial Statements
Statement of Assets and Liabilities
| October 31, 2018 (Unaudited) | ||
| Assets | ||
| Investment in securities, at value — See accompanying schedule: Unaffiliated issuers (cost $119,208,341) | $114,382,695 | |
| Fidelity Central Funds (cost $10,184,149) | 10,184,399 | |
| Total Investment in Securities (cost $129,392,490) | $124,567,094 | |
| Foreign currency held at value (cost $27,595) | 27,595 | |
| Receivable for investments sold | 375,954 | |
| Receivable for fund shares sold | 130,484 | |
| Dividends receivable | 13,893 | |
| Interest receivable | 1,751,504 | |
| Distributions receivable from Fidelity Central Funds | 21,047 | |
| Prepaid expenses | 266 | |
| Receivable from investment adviser for expense reductions | 63 | |
| Other receivables | 44 | |
| Total assets | 126,887,944 | |
| Liabilities | ||
| Payable to custodian bank | $44,942 | |
| Payable for investments purchased | ||
| Regular delivery | 51,126 | |
| Delayed delivery | 240,000 | |
| Payable for fund shares redeemed | 436,387 | |
| Distributions payable | 67,106 | |
| Accrued management fee | 75,203 | |
| Distribution and service plan fees payable | 5,724 | |
| Other affiliated payables | 19,499 | |
| Other payables and accrued expenses | 43,254 | |
| Total liabilities | 983,241 | |
| Net Assets | $125,904,703 | |
| Net Assets consist of: | ||
| Paid in capital | $134,068,916 | |
| Total distributable earnings (loss) | (8,164,213) | |
| Net Assets | $125,904,703 | |
| Net Asset Value and Maximum Offering Price | ||
| Class A: | ||
| Net Asset Value and redemption price per share ($6,998,115 ÷ 756,850 shares) | $9.25 | |
| Maximum offering price per share (100/96.00 of $9.25) | $9.64 | |
| Class M: | ||
| Net Asset Value and redemption price per share ($3,976,427 ÷ 430,095 shares) | $9.25 | |
| Maximum offering price per share (100/96.00 of $9.25) | $9.64 | |
| Class C: | ||
| Net Asset Value and offering price per share ($4,083,406 ÷ 441,609 shares)(a) | $9.25 | |
| Global High Income: | ||
| Net Asset Value, offering price and redemption price per share ($105,417,393 ÷ 11,399,871 shares) | $9.25 | |
| Class I: | ||
| Net Asset Value, offering price and redemption price per share ($5,429,362 ÷ 587,142 shares) | $9.25 |
(a) Redemption price per share is equal to net asset value less any applicable contingent deferred sales charge.
See accompanying notes which are an integral part of the financial statements.
Statement of Operations
| Six months ended October 31, 2018 (Unaudited) | ||
| Investment Income | ||
| Dividends | $239,089 | |
| Interest | 3,862,764 | |
| Income from Fidelity Central Funds | 64,567 | |
| Total income | 4,166,420 | |
| Expenses | ||
| Management fee | $481,876 | |
| Transfer agent fees | 95,012 | |
| Distribution and service plan fees | 36,119 | |
| Accounting fees and expenses | 28,363 | |
| Custodian fees and expenses | 10,483 | |
| Independent trustees' fees and expenses | 421 | |
| Registration fees | 26,167 | |
| Audit | 39,647 | |
| Legal | 1,401 | |
| Miscellaneous | 465 | |
| Total expenses before reductions | 719,954 | |
| Expense reductions | (5,549) | |
| Total expenses after reductions | 714,405 | |
| Net investment income (loss) | 3,452,015 | |
| Realized and Unrealized Gain (Loss) | ||
| Net realized gain (loss) on: | ||
| Investment securities: | ||
| Unaffiliated issuers | (933,507) | |
| Fidelity Central Funds | 189 | |
| Foreign currency transactions | (13,366) | |
| Total net realized gain (loss) | (946,684) | |
| Change in net unrealized appreciation (depreciation) on: | ||
| Investment securities: | ||
| Unaffiliated issuers | (4,189,894) | |
| Fidelity Central Funds | (252) | |
| Assets and liabilities in foreign currencies | (5,191) | |
| Total change in net unrealized appreciation (depreciation) | (4,195,337) | |
| Net gain (loss) | (5,142,021) | |
| Net increase (decrease) in net assets resulting from operations | $(1,690,006) |
See accompanying notes which are an integral part of the financial statements.
Statement of Changes in Net Assets
| Six months ended October 31, 2018 (Unaudited) | Year ended April 30, 2018 | |
| Increase (Decrease) in Net Assets | ||
| Operations | ||
| Net investment income (loss) | $3,452,015 | $6,265,299 |
| Net realized gain (loss) | (946,684) | (759,334) |
| Change in net unrealized appreciation (depreciation) | (4,195,337) | (118,096) |
| Net increase (decrease) in net assets resulting from operations | (1,690,006) | 5,387,869 |
| Distributions to shareholders | (3,663,407) | – |
| Distributions to shareholders from net investment income | – | (5,436,985) |
| Total distributions | (3,663,407) | (5,436,985) |
| Share transactions - net increase (decrease) | (21,364,951) | 50,750,887 |
| Redemption fees | – | 9,631 |
| Total increase (decrease) in net assets | (26,718,364) | 50,711,402 |
| Net Assets | ||
| Beginning of period | 152,623,067 | 101,911,665 |
| End of period | $125,904,703 | $152,623,067 |
| Other Information | ||
| Undistributed net investment income end of period | $745,648 |
See accompanying notes which are an integral part of the financial statements.
Financial Highlights
Fidelity Global High Income Fund Class A
| Six months ended (Unaudited) October 31, | Years endedApril 30, | |||||
| 2018 | 2018 | 2017 | 2016 | 2015 | 2014 | |
| Selected Per–Share Data | ||||||
| Net asset value, beginning of period | $9.61 | $9.54 | $9.07 | $9.60 | $10.21 | $10.46 |
| Income from Investment Operations | ||||||
| Net investment income (loss)A | .229 | .462 | .463 | .462 | .476 | .506 |
| Net realized and unrealized gain (loss) | (.347) | .006B | .422 | (.541) | (.293)C | (.036) |
| Total from investment operations | (.118) | .468 | .885 | (.079) | .183 | .470 |
| Distributions from net investment income | (.216) | (.399) | (.418) | (.454) | (.486) | (.483) |
| Distributions from net realized gain | (.026) | – | – | – | (.310) | (.239) |
| Total distributions | (.242) | (.399) | (.418) | (.454) | (.796) | (.722) |
| Redemption fees added to paid in capitalA | – | .001 | .003 | .003 | .003 | .002 |
| Net asset value, end of period | $9.25 | $9.61 | $9.54 | $9.07 | $9.60 | $10.21 |
| Total ReturnD,E,F | (1.25)% | 4.94% | 10.00% | (.65)% | 1.97%C | 4.86% |
| Ratios to Average Net AssetsG,H | ||||||
| Expenses before reductions | 1.29%I | 1.31% | 1.36% | 1.38% | 1.28% | 1.23% |
| Expenses net of fee waivers, if any | 1.25%I | 1.25% | 1.25% | 1.25% | 1.25% | 1.23% |
| Expenses net of all reductions | 1.25%I | 1.25% | 1.25% | 1.25% | 1.25% | 1.23% |
| Net investment income (loss) | 4.80%I | 4.75% | 4.98% | 5.11% | 4.82% | 5.03% |
| Supplemental Data | ||||||
| Net assets, end of period (000 omitted) | $6,998 | $8,712 | $7,102 | $6,187 | $7,036 | $8,000 |
| Portfolio turnover rateJ | 38%I | 48% | 48% | 41% | 44% | 72% |
A Calculated based on average shares outstanding during the period.
B The amount shown for a share outstanding does not correspond with the aggregate net gain (loss) on investments for the period due to the timing of sales and repurchases of shares in relation to fluctuating market values of the investments of the Fund.
C Amount includes a reimbursement from the investment adviser for an operational error which amounted to less than $.01 per share. Excluding this reimbursement, the total return would have been 1.93%.
D Total returns for periods of less than one year are not annualized.
E Total returns would have been lower if certain expenses had not been reduced during the applicable periods shown.
F Total returns do not include the effect of the sales charges.
G Fees and expenses of any underlying Fidelity Central Funds are not included in the Fund's expense ratio. The Fund indirectly bears its proportionate share of the expenses of any underlying Fidelity Central Funds.
H Expense ratios reflect operating expenses of the class. Expenses before reductions do not reflect amounts reimbursed by the investment adviser or reductions from brokerage service arrangements or reductions from other expense offset arrangements and do not represent the amount paid by the class during periods when reimbursements or reductions occur. Expenses net of fee waivers reflect expenses after reimbursement by the investment adviser but prior to reductions from brokerage service arrangements or other expense offset arrangements. Expenses net of all reductions represent the net expenses paid by the class.
I Annualized
J Amount does not include the portfolio activity of any underlying Fidelity Central Funds.
See accompanying notes which are an integral part of the financial statements.
Fidelity Global High Income Fund Class M
| Six months ended (Unaudited) October 31, | Years endedApril 30, | |||||
| 2018 | 2018 | 2017 | 2016 | 2015 | 2014 | |
| Selected Per–Share Data | ||||||
| Net asset value, beginning of period | $9.61 | $9.54 | $9.07 | $9.60 | $10.21 | $10.46 |
| Income from Investment Operations | ||||||
| Net investment income (loss)A | .229 | .462 | .464 | .462 | .474 | .504 |
| Net realized and unrealized gain (loss) | (.347) | .006B | .421 | (.541) | (.291)C | (.036) |
| Total from investment operations | (.118) | .468 | .885 | (.079) | .183 | .468 |
| Distributions from net investment income | (.216) | (.399) | (.418) | (.454) | (.486) | (.481) |
| Distributions from net realized gain | (.026) | – | – | – | (.310) | (.239) |
| Total distributions | (.242) | (.399) | (.418) | (.454) | (.796) | (.720) |
| Redemption fees added to paid in capitalA | – | .001 | .003 | .003 | .003 | .002 |
| Net asset value, end of period | $9.25 | $9.61 | $9.54 | $9.07 | $9.60 | $10.21 |
| Total ReturnD,E,F | (1.25)% | 4.94% | 10.00% | (.65)% | 1.98%C | 4.84% |
| Ratios to Average Net AssetsG,H | ||||||
| Expenses before reductions | 1.36%I | 1.40% | 1.50% | 1.48% | 1.40% | 1.35% |
| Expenses net of fee waivers, if any | 1.25%I | 1.25% | 1.25% | 1.25% | 1.25% | 1.25% |
| Expenses net of all reductions | 1.25%I | 1.25% | 1.25% | 1.25% | 1.25% | 1.25% |
| Net investment income (loss) | 4.80%I | 4.75% | 4.98% | 5.11% | 4.82% | 5.01% |
| Supplemental Data | ||||||
| Net assets, end of period (000 omitted) | $3,976 | $4,301 | $3,029 | $1,436 | $1,745 | $1,595 |
| Portfolio turnover rateJ | 38%I | 48% | 48% | 41% | 44% | 72% |
A Calculated based on average shares outstanding during the period.
B The amount shown for a share outstanding does not correspond with the aggregate net gain (loss) on investments for the period due to the timing of sales and repurchases of shares in relation to fluctuating market values of the investments of the Fund.
C Amount includes a reimbursement from the investment adviser for an operational error which amounted to less than $.01 per share. Excluding this reimbursement, the total return would have been 1.94%.
D Total returns for periods of less than one year are not annualized.
E Total returns would have been lower if certain expenses had not been reduced during the applicable periods shown.
F Total returns do not include the effect of the sales charges.
G Fees and expenses of any underlying Fidelity Central Funds are not included in the Fund's expense ratio. The Fund indirectly bears its proportionate share of the expenses of any underlying Fidelity Central Funds.
H Expense ratios reflect operating expenses of the class. Expenses before reductions do not reflect amounts reimbursed by the investment adviser or reductions from brokerage service arrangements or reductions from other expense offset arrangements and do not represent the amount paid by the class during periods when reimbursements or reductions occur. Expenses net of fee waivers reflect expenses after reimbursement by the investment adviser but prior to reductions from brokerage service arrangements or other expense offset arrangements. Expenses net of all reductions represent the net expenses paid by the class.
I Annualized
J Amount does not include the portfolio activity of any underlying Fidelity Central Funds.
See accompanying notes which are an integral part of the financial statements.
Fidelity Global High Income Fund Class C
| Six months ended (Unaudited) October 31, | Years endedApril 30, | |||||
| 2018 | 2018 | 2017 | 2016 | 2015 | 2014 | |
| Selected Per–Share Data | ||||||
| Net asset value, beginning of period | $9.61 | $9.54 | $9.07 | $9.60 | $10.21 | $10.46 |
| Income from Investment Operations | ||||||
| Net investment income (loss)A | .193 | .390 | .394 | .394 | .401 | .428 |
| Net realized and unrealized gain (loss) | (.347) | .005B | .422 | (.540) | (.292)C | (.035) |
| Total from investment operations | (.154) | .395 | .816 | (.146) | .109 | .393 |
| Distributions from net investment income | (.180) | (.326) | (.349) | (.387) | (.412) | (.406) |
| Distributions from net realized gain | (.026) | – | – | – | (.310) | (.239) |
| Total distributions | (.206) | (.326) | (.349) | (.387) | (.722) | (.645) |
| Redemption fees added to paid in capitalA | – | .001 | .003 | .003 | .003 | .002 |
| Net asset value, end of period | $9.25 | $9.61 | $9.54 | $9.07 | $9.60 | $10.21 |
| Total ReturnD,E,F | (1.62)% | 4.16% | 9.19% | (1.39)% | 1.22%C | 4.05% |
| Ratios to Average Net AssetsG,H | ||||||
| Expenses before reductions | 2.04%I | 2.08% | 2.18% | 2.20% | 2.12% | 2.05% |
| Expenses net of fee waivers, if any | 2.00%I | 2.00% | 2.00% | 2.00% | 2.00% | 2.00% |
| Expenses net of all reductions | 2.00%I | 2.00% | 2.00% | 2.00% | 2.00% | 2.00% |
| Net investment income (loss) | 4.05%I | 4.00% | 4.23% | 4.36% | 4.07% | 4.26% |
| Supplemental Data | ||||||
| Net assets, end of period (000 omitted) | $4,083 | $4,420 | $3,775 | $3,437 | $3,811 | $3,720 |
| Portfolio turnover rateJ | 38%I | 48% | 48% | 41% | 44% | 72% |
A Calculated based on average shares outstanding during the period.
B The amount shown for a share outstanding does not correspond with the aggregate net gain (loss) on investments for the period due to the timing of sales and repurchases of shares in relation to fluctuating market values of the investments of the Fund.
C Amount includes a reimbursement from the investment adviser for an operational error which amounted to less than $.01 per share. Excluding this reimbursement, the total return would have been 1.18%.
D Total returns for periods of less than one year are not annualized.
E Total returns would have been lower if certain expenses had not been reduced during the applicable periods shown.
F Total returns do not include the effect of the contingent deferred sales charge.
G Fees and expenses of any underlying Fidelity Central Funds are not included in the Fund's expense ratio. The Fund indirectly bears its proportionate share of the expenses of any underlying Fidelity Central Funds.
H Expense ratios reflect operating expenses of the class. Expenses before reductions do not reflect amounts reimbursed by the investment adviser or reductions from brokerage service arrangements or reductions from other expense offset arrangements and do not represent the amount paid by the class during periods when reimbursements or reductions occur. Expenses net of fee waivers reflect expenses after reimbursement by the investment adviser but prior to reductions from brokerage service arrangements or other expense offset arrangements. Expenses net of all reductions represent the net expenses paid by the class.
I Annualized
J Amount does not include the portfolio activity of any underlying Fidelity Central Funds.
See accompanying notes which are an integral part of the financial statements.
Fidelity Global High Income Fund
| Six months ended (Unaudited) October 31, | Years endedApril 30, | |||||
| 2018 | 2018 | 2017 | 2016 | 2015 | 2014 | |
| Selected Per–Share Data | ||||||
| Net asset value, beginning of period | $9.62 | $9.54 | $9.07 | $9.60 | $10.21 | $10.47 |
| Income from Investment Operations | ||||||
| Net investment income (loss)A | .242 | .487 | .486 | .486 | .508 | .534 |
| Net realized and unrealized gain (loss) | (.357) | .015B | .423 | (.542) | (.301)C | (.046) |
| Total from investment operations | (.115) | .502 | .909 | (.056) | .207 | .488 |
| Distributions from net investment income | (.229) | (.423) | (.442) | (.477) | (.510) | (.511) |
| Distributions from net realized gain | (.026) | – | – | – | (.310) | (.239) |
| Total distributions | (.255) | (.423) | (.442) | (.477) | (.820) | (.750) |
| Redemption fees added to paid in capitalA | – | .001 | .003 | .003 | .003 | .002 |
| Net asset value, end of period | $9.25 | $9.62 | $9.54 | $9.07 | $9.60 | $10.21 |
| Total ReturnD,E | (1.22)% | 5.31% | 10.28% | (.40)% | 2.23%C | 5.05% |
| Ratios to Average Net AssetsF,G | ||||||
| Expenses before reductions | .98%H | 1.02% | 1.14% | 1.20% | 1.05% | .95% |
| Expenses net of fee waivers, if any | .98%H | 1.00% | 1.00% | 1.00% | 1.00% | .95% |
| Expenses net of all reductions | .98%H | 1.00% | 1.00% | 1.00% | 1.00% | .95% |
| Net investment income (loss) | 5.06%H | 5.00% | 5.23% | 5.35% | 5.07% | 5.30% |
| Supplemental Data | ||||||
| Net assets, end of period (000 omitted) | $105,417 | $125,192 | $85,188 | $93,256 | $119,712 | $344,206 |
| Portfolio turnover rateI | 38%H | 48% | 48% | 41% | 44% | 72% |
A Calculated based on average shares outstanding during the period.
B The amount shown for a share outstanding does not correspond with the aggregate net gain (loss) on investments for the period due to the timing of sales and repurchases of shares in relation to fluctuating market values of the investments of the Fund.
C Amount includes a reimbursement from the investment adviser for an operational error which amounted to less than $.01 per share. Excluding this reimbursement, the total return would have been 2.19%.
D Total returns for periods of less than one year are not annualized.
E Total returns would have been lower if certain expenses had not been reduced during the applicable periods shown.
F Fees and expenses of any underlying Fidelity Central Funds are not included in the Fund's expense ratio. The Fund indirectly bears its proportionate share of the expenses of any underlying Fidelity Central Funds.
G Expense ratios reflect operating expenses of the class. Expenses before reductions do not reflect amounts reimbursed by the investment adviser or reductions from brokerage service arrangements or reductions from other expense offset arrangements and do not represent the amount paid by the class during periods when reimbursements or reductions occur. Expenses net of fee waivers reflect expenses after reimbursement by the investment adviser but prior to reductions from brokerage service arrangements or other expense offset arrangements. Expenses net of all reductions represent the net expenses paid by the class.
H Annualized
I Amount does not include the portfolio activity of any underlying Fidelity Central Funds.
See accompanying notes which are an integral part of the financial statements.
Fidelity Global High Income Fund Class I
| Six months ended (Unaudited) October 31, | Years endedApril 30, | |||||
| 2018 | 2018 | 2017 | 2016 | 2015 | 2014 | |
| Selected Per–Share Data | ||||||
| Net asset value, beginning of period | $9.62 | $9.54 | $9.07 | $9.60 | $10.21 | $10.47 |
| Income from Investment Operations | ||||||
| Net investment income (loss)A | .241 | .485 | .486 | .483 | .501 | .532 |
| Net realized and unrealized gain (loss) | (.357) | .017B | .423 | (.539) | (.293)C | (.046) |
| Total from investment operations | (.116) | .502 | .909 | (.056) | .208 | .486 |
| Distributions from net investment income | (.228) | (.423) | (.442) | (.477) | (.511) | (.509) |
| Distributions from net realized gain | (.026) | – | – | – | (.310) | (.239) |
| Total distributions | (.254) | (.423) | (.442) | (.477) | (.821) | (.748) |
| Redemption fees added to paid in capitalA | – | .001 | .003 | .003 | .003 | .002 |
| Net asset value, end of period | $9.25 | $9.62 | $9.54 | $9.07 | $9.60 | $10.21 |
| Total ReturnD,E | (1.23)% | 5.31% | 10.28% | (.40)% | 2.23%C | 5.03% |
| Ratios to Average Net AssetsF,G | ||||||
| Expenses before reductions | 1.01%H | 1.03% | 1.16% | 1.10% | 1.02% | .97% |
| Expenses net of fee waivers, if any | 1.00%H | 1.00% | 1.00% | 1.00% | 1.00% | .97% |
| Expenses net of all reductions | 1.00%H | 1.00% | 1.00% | 1.00% | 1.00% | .97% |
| Net investment income (loss) | 5.05%H | 5.00% | 5.23% | 5.35% | 5.07% | 5.28% |
| Supplemental Data | ||||||
| Net assets, end of period (000 omitted) | $5,429 | $9,999 | $2,817 | $1,905 | $2,481 | $5,344 |
| Portfolio turnover rateI | 38%H | 48% | 48% | 41% | 44% | 72% |
A Calculated based on average shares outstanding during the period.
B The amount shown for a share outstanding does not correspond with the aggregate net gain (loss) on investments for the period due to the timing of sales and repurchases of shares in relation to fluctuating market values of the investments of the Fund.
C Amount includes a reimbursement from the investment adviser for an operational error which amounted to less than $.01 per share. Excluding this reimbursement, the total return would have been 2.19%.
D Total returns for periods of less than one year are not annualized.
E Total returns would have been lower if certain expenses had not been reduced during the applicable periods shown.
F Fees and expenses of any underlying Fidelity Central Funds are not included in the Fund's expense ratio. The Fund indirectly bears its proportionate share of the expenses of any underlying Fidelity Central Funds.
G Expense ratios reflect operating expenses of the class. Expenses before reductions do not reflect amounts reimbursed by the investment adviser or reductions from brokerage service arrangements or reductions from other expense offset arrangements and do not represent the amount paid by the class during periods when reimbursements or reductions occur. Expenses net of fee waivers reflect expenses after reimbursement by the investment adviser but prior to reductions from brokerage service arrangements or other expense offset arrangements. Expenses net of all reductions represent the net expenses paid by the class.
H Annualized
I Amount does not include the portfolio activity of any underlying Fidelity Central Funds.
See accompanying notes which are an integral part of the financial statements.
Notes to Financial Statements (Unaudited)
For the period ended October 31, 2018
1. Organization.
Fidelity Global High Income Fund (the Fund) is a fund of Fidelity Summer Street Trust (the Trust) and is authorized to issue an unlimited number of shares. The Trust is registered under the Investment Company Act of 1940, as amended (the 1940 Act), as an open-end management investment company organized as a Massachusetts business trust. The Fund offers Class A, Class M, Class C, Global High Income and Class I shares, each of which has equal rights as to assets and voting privileges. Each class has exclusive voting rights with respect to matters that affect that class. The Fund's investments in emerging markets can be subject to social, economic, regulatory, and political uncertainties and can be extremely volatile.
2. Investments in Fidelity Central Funds.
The Fund invests in Fidelity Central Funds, which are open-end investment companies generally available only to other investment companies and accounts managed by the investment adviser and its affiliates. The Fund's Schedule of Investments lists each of the Fidelity Central Funds held as of period end, if any, as an investment of the Fund, but does not include the underlying holdings of each Fidelity Central Fund. As an Investing Fund, the Fund indirectly bears its proportionate share of the expenses of the underlying Fidelity Central Funds.
The Money Market Central Funds seek preservation of capital and current income and are managed by Fidelity Investments Money Management, Inc. (FIMM), an affiliate of the investment adviser. Annualized expenses of the Money Market Central Funds as of their most recent shareholder report date are less than .005%.
A complete unaudited list of holdings for each Fidelity Central Fund is available upon request or at the Securities and Exchange Commission (the SEC) website at www.sec.gov. In addition, the financial statements of the Fidelity Central Funds are available on the SEC website or upon request.
3. Significant Accounting Policies.
The Fund is an investment company and applies the accounting and reporting guidance of the Financial Accounting Standards Board (FASB) Accounting Standards Codification Topic 946 Financial Services – Investments Companies. The financial statements have been prepared in conformity with accounting principles generally accepted in the United States of America (GAAP), which require management to make certain estimates and assumptions at the date of the financial statements. Actual results could differ from those estimates. Subsequent events, if any, through the date that the financial statements were issued have been evaluated in the preparation of the financial statements. The following summarizes the significant accounting policies of the Fund:
Investment Valuation. Investments are valued as of 4:00 p.m. Eastern time on the last calendar day of the period. The Board of Trustees (the Board) has delegated the day to day responsibility for the valuation of the Fund's investments to the Fair Value Committee (the Committee) established by the Fund's investment adviser. In accordance with valuation policies and procedures approved by the Board, the Fund attempts to obtain prices from one or more third party pricing vendors or brokers to value its investments. When current market prices, quotations or currency exchange rates are not readily available or reliable, investments will be fair valued in good faith by the Committee, in accordance with procedures adopted by the Board. Factors used in determining fair value vary by investment type and may include market or investment specific events, changes in interest rates and credit quality. The frequency with which these procedures are used cannot be predicted and they may be utilized to a significant extent. The Committee oversees the Fund's valuation policies and procedures and reports to the Board on the Committee's activities and fair value determinations. The Board monitors the appropriateness of the procedures used in valuing the Fund's investments and ratifies the fair value determinations of the Committee.
The Fund categorizes the inputs to valuation techniques used to value its investments into a disclosure hierarchy consisting of three levels as shown below:
- Level 1 – quoted prices in active markets for identical investments
- Level 2 – other significant observable inputs (including quoted prices for similar investments, interest rates, prepayment speeds, etc.)
- Level 3 – unobservable inputs (including the Fund's own assumptions based on the best information available)
Valuation techniques used to value the Fund's investments by major category are as follows:
Debt securities, including restricted securities, are valued based on evaluated prices received from third party pricing vendors or from brokers who make markets in such securities. Corporate bonds, bank loan obligations, foreign government and government agency obligations and preferred securities are valued by pricing vendors who utilize matrix pricing which considers yield or price of bonds of comparable quality, coupon, maturity and type or by broker-supplied prices. When independent prices are unavailable or unreliable, debt securities may be valued utilizing pricing methodologies which consider similar factors that would be used by third party pricing vendors. For foreign debt securities, when significant market or security specific events arise, valuations may be determined in good faith in accordance with procedures adopted by the Board. Debt securities are generally categorized as Level 2 in the hierarchy but may be Level 3 depending on the circumstances. The Fund invests a significant portion of its assets in below investment grade securities. The value of these securities can be more volatile due to changes in the credit quality of the issuer and is sensitive to changes in economic, market and regulatory conditions.
Equity securities, including restricted securities, for which market quotations are readily available, are valued at the last reported sale price or official closing price as reported by a third party pricing vendor on the primary market or exchange on which they are traded and are categorized as Level 1 in the hierarchy. In the event there were no sales during the day or closing prices are not available, securities are valued at the last quoted bid price or may be valued using the last available price and are generally categorized as Level 2 in the hierarchy. For foreign equity securities, when market or security specific events arise, comparisons to the valuation of American Depositary Receipts (ADRs), futures contracts, Exchange-Traded Funds (ETFs) and certain indexes as well as quoted prices for similar securities may be used and would be categorized as Level 2 in the hierarchy. Utilizing these techniques may result in transfers between Level 1 and Level 2. For equity securities, including restricted securities, where observable inputs are limited, assumptions about market activity and risk are used and these securities may be categorized as Level 3 in the hierarchy.
Investments in open-end mutual funds, including the Fidelity Central Funds, are valued at their closing net asset value (NAV) each business day and are categorized as Level 1 in the hierarchy.
Changes in valuation techniques may result in transfers in or out of an assigned level within the disclosure hierarchy. The aggregate value of investments by input level as of October 31, 2018 is included at the end of the Fund's Schedule of Investments.
Foreign Currency. The Fund may use foreign currency contracts to facilitate transactions in foreign-denominated securities. Gains and losses from these transactions may arise from changes in the value of the foreign currency or if the counterparties do not perform under the contracts' terms.
Foreign-denominated assets, including investment securities, and liabilities are translated into U.S. dollars at the exchange rates at period end. Purchases and sales of investment securities, income and dividends received and expenses denominated in foreign currencies are translated into U.S. dollars at the exchange rate in effect on the transaction date.
The effects of exchange rate fluctuations on investments are included with the net realized and unrealized gain (loss) on investment securities. Other foreign currency transactions resulting in realized and unrealized gain (loss) are disclosed separately.
Investment Transactions and Income. For financial reporting purposes, the Fund's investment holdings and NAV include trades executed through the end of the last business day of the period. The NAV per share for processing shareholder transactions is calculated as of the close of business of the New York Stock Exchange (NYSE), normally 4:00 p.m. Eastern time and includes trades executed through the end of the prior business day. Gains and losses on securities sold are determined on the basis of identified cost and include proceeds received from litigation. Dividend income is recorded on the ex-dividend date, except for certain dividends from foreign securities where the ex-dividend date may have passed, which are recorded as soon as the Fund is informed of the ex-dividend date. Non-cash dividends included in dividend income, if any, are recorded at the fair market value of the securities received. Income and capital gain distributions from Fidelity Central Funds, if any, are recorded on the ex-dividend date. Certain distributions received by the Fund represent a return of capital or capital gain. The Fund determines the components of these distributions subsequent to the ex-dividend date, based upon receipt of tax filings or other correspondence relating to the underlying investment. These distributions are recorded as a reduction of cost of investments and/or as a realized gain. Interest income is accrued as earned and includes coupon interest and amortization of premium and accretion of discount on debt securities as applicable. Paid in Kind (PIK) income is recorded at the fair market value of the securities received. Investment income is recorded net of foreign taxes withheld where recovery of such taxes is uncertain. Debt obligations may be placed on non-accrual status and related interest income may be reduced by ceasing current accruals and writing off interest receivables when the collection of all or a portion of interest has become doubtful based on consistently applied procedures. A debt obligation is removed from non-accrual status when the issuer resumes interest payments or when collectability of interest is reasonably assured.
Class Allocations and Expenses. Investment income, realized and unrealized capital gains and losses, common expenses of the Fund, and certain fund-level expense reductions, if any, are allocated daily on a pro-rata basis to each class based on the relative net assets of each class to the total net assets of the Fund. Each class differs with respect to transfer agent and distribution and service plan fees incurred. Certain expense reductions may also differ by class. For the reporting period, the allocated portion of income and expenses to each class as a percent of its average net assets may vary due to the timing of recording these transactions in relation to fluctuating net assets of the classes. Expenses directly attributable to a fund are charged to that fund. Expenses attributable to more than one fund are allocated among the respective funds on the basis of relative net assets or other appropriate methods. Expense estimates are accrued in the period to which they relate and adjustments are made when actual amounts are known.
Income Tax Information and Distributions to Shareholders. Each year, the Fund intends to qualify as a regulated investment company under Subchapter M of the Internal Revenue Code, including distributing substantially all of its taxable income and realized gains. As a result, no provision for U.S. Federal income taxes is required. The Fund files a U.S. federal tax return, in addition to state and local tax returns as required. The Fund's federal income tax returns are subject to examination by the Internal Revenue Service (IRS) for a period of three fiscal years after they are filed. State and local tax returns may be subject to examination for an additional fiscal year depending on the jurisdiction. Foreign taxes are provided for based on the Fund's understanding of the tax rules and rates that exist in the foreign markets in which it invests.
Distributions are declared and recorded daily and paid monthly from net investment income. Distributions from realized gains, if any, are declared and recorded on the ex-dividend date. Income and capital gain distributions are declared separately for each class. Income and capital gain distributions are determined in accordance with income tax regulations, which may differ from GAAP.
Capital accounts within the financial statements are adjusted for permanent book-tax differences. These adjustments have no impact on net assets or the results of operations. Capital accounts are not adjusted for temporary book-tax differences which will reverse in a subsequent period.
Book-tax differences are primarily due to foreign currency transactions, defaulted bonds, market discount, equity-debt classifications, capital loss carryforwards and losses deferred due to wash sales and excise tax regulations.
As of period end, the cost and unrealized appreciation (depreciation) in securities, and derivatives if applicable, for federal income tax purposes were as follows:
| Gross unrealized appreciation | $1,913,826 |
| Gross unrealized depreciation | (6,159,370) |
| Net unrealized appreciation (depreciation) | $(4,245,544) |
| Tax cost | $128,812,638 |
Capital loss carryforwards are only available to offset future capital gains of the Fund to the extent provided by regulations and may be limited. Under the Regulated Investment Company Modernization Act of 2010 (the Act), the Fund is permitted to carry forward capital losses incurred in taxable years beginning after December 22, 2010 for an unlimited period and such capital losses are required to be used prior to any losses that expire. The capital loss carryforward information presented below, including any applicable limitation, is estimated as of prior fiscal period end and is subject to adjustment.
| No expiration | |
| Short-term | $(549,846) |
| Long-term | (2,729,707) |
| Total capital loss carryforward | $(3,279,553) |
Delayed Delivery Transactions and When-Issued Securities. During the period, the Fund transacted in securities on a delayed delivery or when-issued basis. Payment and delivery may take place after the customary settlement period for that security. The price of the underlying securities and the date when the securities will be delivered and paid for are fixed at the time the transaction is negotiated. The securities purchased on a delayed delivery or when-issued basis are identified as such in the Fund's Schedule of Investments. The Fund may receive compensation for interest forgone in the purchase of a delayed delivery or when-issued security. With respect to purchase commitments, the Fund identifies securities as segregated in its records with a value at least equal to the amount of the commitment. Losses may arise due to changes in the value of the underlying securities or if the counterparty does not perform under the contract's terms, or if the issuer does not issue the securities due to political, economic, or other factors.
Restricted Securities. The Fund may invest in securities that are subject to legal or contractual restrictions on resale. These securities generally may be resold in transactions exempt from registration or to the public if the securities are registered. Disposal of these securities may involve time-consuming negotiations and expense, and prompt sale at an acceptable price may be difficult. Information regarding restricted securities is included at the end of the Fund's Schedule of Investments.
Loans and Other Direct Debt Instruments. The Fund invests in direct debt instruments which are interests in amounts owed to lenders by corporate or other borrowers. These instruments may be in the form of loans, trade claims or other receivables and may include standby financing commitments such as revolving credit facilities that obligate the Fund to supply additional cash to the borrower on demand. Loans may be acquired through assignment or participation. The Fund also invests in unfunded loan commitments, which are contractual obligations for future funding. Information regarding unfunded commitments is included at the end of the Fund's Schedule of Investments.
New Accounting Pronouncement. In March 2017, the Financial Accounting Standards Board (FASB) issued an Accounting Standards Update (ASU), ASU 2017-08, which amends the amortization period for certain callable debt securities that are held at a premium. The amendment requires the premium to be amortized to the earliest call date. The amendments do not require an accounting change for securities held at a discount. The ASU is effective for annual periods beginning after December 15, 2018. Management is currently evaluating the potential impact of these changes to the financial statements.
New Rule Issuance. During August 2018, the U.S. Securities and Exchange Commission issued Final Rule Release No. 33-10532, Disclosure Update and Simplification. This Final Rule includes amendments specific to registered investment companies that are intended to eliminate overlap in disclosure requirements between Regulation S-X and GAAP. In accordance with these amendments, certain line-items in the Fund's financial statements have been combined or removed for the current period as outlined in the table below.
| Financial Statement | Current Line-Item Presentation | Prior Line-Item Presentation |
| Statement of Assets and Liabilities | Total distributable earnings (loss) | Undistributed/Distributions in excess of/Accumulated net investment income (loss) Accumulated/Undistributed net realized gain (loss) Net unrealized appreciation (depreciation) |
| Statement of Changes in Net Assets | N/A - removed | Undistributed/Distributions in excess of/Accumulated net investment income (loss) end of period |
| Statement of Changes in Net Assets | Distributions to shareholders | Distributions to shareholders from net investment income Distributions to shareholders from net realized gain |
| Distributions to Shareholders Note to Financial Statements | Distributions to shareholders | Distributions to shareholders from net investment income Distributions to shareholders from net realized gain |
4. Purchases and Sales of Investments.
Purchases and sales of securities, other than short-term securities, aggregated $24,829,567 and $44,705,578, respectively.
5. Fees and Other Transactions with Affiliates.
Management Fee. Fidelity Management & Research Company (the investment adviser) and its affiliates provide the Fund with investment management related services for which the Fund pays a monthly management fee. The management fee is the sum of an individual fund fee rate that is based on an annual rate of .60% of the Fund's average net assets and an annualized group fee rate that averaged .11% during the period. The group fee rate is based upon the average net assets of all the mutual funds advised by the investment adviser, including any mutual funds previously advised by the investment adviser that are currently advised by Fidelity SelectCo, LLC, an affiliate of the investment adviser. The group fee rate decreases as assets under management increase and increases as assets under management decrease. For the reporting period, the total annualized management fee rate was .71% of the Fund's average net assets.
Distribution and Service Plan Fees. In accordance with Rule 12b-1 of the 1940 Act, the Fund has adopted separate Distribution and Service Plans for each class of shares. Certain classes pay Fidelity Distributors Corporation (FDC), an affiliate of the investment adviser, separate Distribution and Service Fees, each of which is based on an annual percentage of each class' average net assets. In addition, FDC may pay financial intermediaries for selling shares of the Fund and providing shareholder support services. For the period, the Distribution and Service Fee rates, total fees and amounts retained by FDC were as follows:
| Distribution Fee | Service Fee | Total Fees | Retained by FDC | |
| Class A | -% | .25% | $9,944 | $611 |
| Class M | -% | .25% | 5,195 | – |
| Class C | .75% | .25% | 20,980 | 3,363 |
| $36,119 | $3,974 |
Sales Load. FDC may receive a front-end sales charge of up to 4.00% for selling Class A shares and Class M shares, some of which is paid to financial intermediaries for selling shares of the Fund. Depending on the holding period, FDC may receive contingent deferred sales charges levied on Class A, Class M and Class C redemptions. The deferred sales charges are 1.00% for Class C shares, 1.00% for certain purchases of Class A shares and .25% for certain purchases of Class M shares.
For the period, sales charge amounts retained by FDC were as follows:
| Retained by FDC | |
| Class A | $522 |
| Class M | 240 |
| Class C(a) | 675 |
| $1,437 |
(a) When Class C shares are initially sold, FDC pays commissions from its own resources to financial intermediaries through which the sales are made.
Transfer Agent Fees. Fidelity Investments Institutional Operations Company, Inc., (FIIOC), an affiliate of the investment adviser, is the transfer, dividend disbursing and shareholder servicing agent for each class of the Fund. FIIOC receives account fees and asset-based fees that vary according to the account size and type of account of the shareholders of the respective classes of the Fund. FIIOC pays for typesetting, printing and mailing of shareholder reports, except proxy statements.
For the period, transfer agent fees for each class were as follows:
| Amount | % of Class-Level Average Net Assets(a) | |
| Class A | $7,329 | .18 |
| Class M | 5,497 | .26 |
| Class C | 4,152 | .20 |
| Global High Income | 73,070 | .13 |
| Class I | 4,964 | .15 |
| $95,012 |
(a) Annualized
Accounting Fees. Fidelity Service Company, Inc. (FSC), an affiliate of the investment adviser, maintains the Fund's accounting records. The fee is based on the level of average net assets for each month. For the period, the fees were equivalent to an annualized rate of .04%.
Brokerage Commissions. The Fund placed a portion of its portfolio transactions with brokerage firms which are affiliates of the investment adviser. Brokerage commissions are included in net realized gain (loss) and change in net unrealized appreciation (depreciation) in the Statement of Operations. The commissions paid to these affiliated firms were $4 for the period.
Interfund Trades. The Fund may purchase from or sell securities to other Fidelity Funds under procedures adopted by the Board. The procedures have been designed to ensure these interfund trades are executed in accordance with Rule 17a-7 of the 1940 Act. Interfund trades are included within the respective purchases and sales amounts shown in the Purchases and Sales of Investments note.
6. Committed Line of Credit.
The Fund participates with other funds managed by the investment adviser or an affiliate in a $4.25 billion credit facility (the "line of credit") to be utilized for temporary or emergency purposes to fund shareholder redemptions or for other short-term liquidity purposes. The Fund has agreed to pay commitment fees on its pro-rata portion of the line of credit, which amounted to $185 and is reflected in Miscellaneous expenses on the Statement of Operations. During the period, the Fund did not borrow on this line of credit.
7. Expense Reductions.
The investment adviser voluntarily agreed to reimburse each class to the extent annual operating expenses exceeded certain levels of class-level average net assets as noted in the table below. Some expenses, for example the compensation of the independent Trustees, and certain miscellaneous expenses such as proxy and shareholder meeting expenses, are excluded from this reimbursement.
The following classes were in reimbursement during the period:
| Expense Limitations | Reimbursement | |
| Class A | 1.25% | $1,392 |
| Class M | 1.25% | 2,357 |
| Class C | 2.00% | 867 |
| Class I | 1.00% | 406 |
| $5,022 |
Commissions paid to certain brokers with whom the investment adviser, or its affiliates, places trades on behalf of the Fund include an amount in addition to trade execution, which may be rebated back to the Fund to offset certain expenses. This amount totaled $131 for the period.
In addition, during the period the investment adviser reimbursed and/or waived a portion of fund-level operating expenses in the amount of $396.
8. Distributions to Shareholders.
Distributions to shareholders of each class were as follows:
| Six months ended October 31, 2018 | Year ended April 30, 2018 |
|
| Distributions to shareholders | ||
| Class A | $205,519 | $– |
| Class M | 106,426 | – |
| Class C | 91,703 | – |
| Global High Income | 3,086,982 | – |
| Class I | 172,777 | – |
| Total | $3,663,407 | $– |
| From net investment income | ||
| Class A | $– | $310,111 |
| Class M | – | 155,128 |
| Class C | – | 136,286 |
| Global High Income | – | 4,624,133 |
| Class I | – | 211,327 |
| Total | $– | $5,436,985 |
9. Share Transactions.
Share transactions for each class were as follows and may contain automatic conversions between classes or exchanges between affiliated funds:
| Shares | Shares | Dollars | Dollars | |
| Six months ended October 31, 2018 | Year ended April 30, 2018 | Six months ended October 31, 2018 | Year ended April 30, 2018 | |
| Class A | ||||
| Shares sold | 37,029 | 396,196 | $351,636 | $3,854,052 |
| Reinvestment of distributions | 20,873 | 30,483 | 196,966 | 296,845 |
| Shares redeemed | (207,193) | (265,014) | (1,960,431) | (2,572,077) |
| Net increase (decrease) | (149,291) | 161,665 | $(1,411,829) | $1,578,820 |
| Class M | ||||
| Shares sold | 32,963 | 231,508 | $310,789 | $2,248,387 |
| Reinvestment of distributions | 11,048 | 15,505 | 104,209 | 151,013 |
| Shares redeemed | (61,284) | (117,144) | (578,415) | (1,138,519) |
| Net increase (decrease) | (17,273) | 129,869 | $(163,417) | $1,260,881 |
| Class C | ||||
| Shares sold | 38,156 | 138,068 | $359,572 | $1,347,084 |
| Reinvestment of distributions | 9,347 | 13,435 | 88,190 | 130,866 |
| Shares redeemed | (65,583) | (87,540) | (620,722) | (849,876) |
| Net increase (decrease) | (18,080) | 63,963 | $(172,960) | $628,074 |
| Global High Income | ||||
| Shares sold | 1,286,528 | 7,832,164 | $12,187,650 | $76,394,064 |
| Reinvestment of distributions | 281,743 | 403,775 | 2,658,139 | 3,933,620 |
| Shares redeemed | (3,188,572) | (4,144,739) | (30,156,464) | (40,362,765) |
| Net increase (decrease) | (1,620,301) | 4,091,200 | $(15,310,675) | $39,964,919 |
| Class I | ||||
| Shares sold | 112,918 | 1,030,440 | $1,069,340 | $10,103,235 |
| Reinvestment of distributions | 15,319 | 16,949 | 144,587 | 164,696 |
| Shares redeemed | (580,971) | (302,780) | (5,519,997) | (2,949,738) |
| Net increase (decrease) | (452,734) | 744,609 | $(4,306,070) | $7,318,193 |
10. Other.
The Fund's organizational documents provide former and current trustees and officers with a limited indemnification against liabilities arising in connection with the performance of their duties to the Fund. In the normal course of business, the Fund may also enter into contracts that provide general indemnifications. The Fund's maximum exposure under these arrangements is unknown as this would be dependent on future claims that may be made against the Fund. The risk of material loss from such claims is considered remote.
11. Credit Risk.
The Fund's relatively large investment in countries with limited or developing capital markets may involve greater risks than investments in more developed markets and the prices of such investments may be volatile. The yields of emerging market debt obligations reflect, among other things, perceived credit risk. The consequences of political, social or economic changes in these markets may have disruptive effects on the market prices of the Fund's investments and the income they generate, as well as the Fund's ability to repatriate such amounts.
Shareholder Expense Example
As a shareholder of a Fund, you incur two types of costs: (1) transaction costs, including sales charges (loads) on purchase payments or redemption proceeds, and (2) ongoing costs, including management fees, distribution and/or service (12b-1) fees and other Fund expenses. This Example is intended to help you understand your ongoing costs (in dollars) of investing in the Funds and to compare these costs with the ongoing costs of investing in other mutual funds.
The Example is based on an investment of $1,000 invested at the beginning of the period and held for the entire period (May 1, 2018 to October 31, 2018).
Actual Expenses
The first line of the accompanying table for each class of the Fund provides information about actual account values and actual expenses. You may use the information in this line, together with the amount you invested, to estimate the expenses that you paid over the period. Simply divide your account value by $1,000.00 (for example, an $8,600 account value divided by $1,000.00 = 8.6), then multiply the result by the number in the first line for a class of the Fund under the heading entitled "Expenses Paid During Period" to estimate the expenses you paid on your account during this period. A small balance maintenance fee of $12.00 that is charged once a year may apply for certain accounts with a value of less than $2,000. This fee, which was eliminated effective August 1, 2018, is not included in the table below. If it was, the estimate of expenses you paid during the period would be higher, and your ending account value lower, by this amount. In addition, the Fund, as a shareholder in the underlying Fidelity Central Funds, will indirectly bear its pro-rata share of the fees and expenses incurred by the underlying Fidelity Central Funds. These fees and expenses are not included in the Fund's annualized expense ratio used to calculate the expense estimate in the table below.
Hypothetical Example for Comparison Purposes
The second line of the accompanying table for each class of the Fund provides information about hypothetical account values and hypothetical expenses based on a Class' actual expense ratio and an assumed rate of return of 5% per year before expenses, which is not the Class' actual return. The hypothetical account values and expenses may not be used to estimate the actual ending account balance or expenses you paid for the period. You may use this information to compare the ongoing costs of investing in the Fund and other funds. To do so, compare this 5% hypothetical example with the 5% hypothetical examples that appear in the shareholder reports of the other funds. A small balance maintenance fee of $12.00 that is charged once a year may apply for certain accounts with a value of less than $2,000. This fee, which was eliminated effective August 1, 2018, is not included in the table below. If it was, the estimate of expenses you paid during the period would be higher, and your ending account value lower, by this amount. In addition, the Fund, as a shareholder in the underlying Fidelity Central Funds, will indirectly bear its pro-rata share of the fees and expenses incurred by the underlying Fidelity Central Funds. These fees and expenses are not included in the Fund's annualized expense ratio used to calculate the expense estimate in the table below.
Please note that the expenses shown in the table are meant to highlight your ongoing costs only and do not reflect any transaction costs. Therefore, the second line of the table is useful in comparing ongoing costs only, and will not help you determine the relative total costs of owning different funds. In addition, if these transactional costs were included, your costs would have been higher.
| Annualized Expense Ratio-A | Beginning Account Value May 1, 2018 | Ending Account Value October 31, 2018 | Expenses Paid During Period-B May 1, 2018 to October 31, 2018 |
|
| Class A | 1.25% | |||
| Actual | $1,000.00 | $987.50 | $6.26 | |
| Hypothetical-C | $1,000.00 | $1,018.90 | $6.36 | |
| Class M | 1.25% | |||
| Actual | $1,000.00 | $987.50 | $6.26 | |
| Hypothetical-C | $1,000.00 | $1,018.90 | $6.36 | |
| Class C | 2.00% | |||
| Actual | $1,000.00 | $983.80 | $10.00 | |
| Hypothetical-C | $1,000.00 | $1,015.12 | $10.16 | |
| Global High Income | .98% | |||
| Actual | $1,000.00 | $987.80 | $4.91 | |
| Hypothetical-C | $1,000.00 | $1,020.27 | $4.99 | |
| Class I | 1.00% | |||
| Actual | $1,000.00 | $987.70 | $5.01 | |
| Hypothetical-C | $1,000.00 | $1,020.16 | $5.09 |
A Annualized expense ratio reflects expenses net of applicable fee waivers.
B Expenses are equal to each Class' annualized expense ratio, multiplied by the average account value over the period, multiplied by 184/365 (to reflect the one-half year period).
C 5% return per year before expenses
Board Approval of Investment Advisory Contracts
Fidelity Global High Income Fund
At its July 2018 meeting, the Board of Trustees, including the Independent Trustees (together, the Board), voted to continue the management contract with Fidelity Management & Research Company (FMR) and the sub-advisory agreements (together, the Advisory Contracts) for the fund for six months through January 31, 2019, in connection with the reunification of the Fidelity Equity High Income Funds Board, which oversees the fund, and the Sector Portfolios Board.
The Board considered that the approval of the fund's Advisory Contracts will not result in any changes in (i) the investment process or strategies employed in the management of the fund's assets; (ii) the fees and expenses paid by shareholders; (iii) the nature, extent or quality of services provided under the fund's Advisory Contracts; or (iv) the day-to-day management of the fund or the persons primarily responsible for such management. The Board concluded that the fund's Advisory Contracts are fair and reasonable, and that the fund's Advisory Contracts should be renewed, without modification, through January 31, 2019, with the understanding that the Board will consider the annual renewal for a full one year period in January 2019.
In connection with its consideration of future renewals of the fund's Advisory Contracts, the Board will consider: (i) the nature, extent and quality of services provided to the fund, including shareholder and administrative services and investment performance; (ii) the competitiveness of the management fee and total expenses for the fund; (iii) the costs of the services and profitability, including the revenues earned and the expenses incurred in conducting the business of developing, marketing, distributing, managing, administering, and servicing the fund and its shareholders, to the extent applicable, as well as potential fall-out benefits from Fidelity's non-fund businesses; and (iv) whether there have been economies of scale in respect of the Fidelity funds, whether the Fidelity funds (including the fund) have appropriately benefited from any such economies of scale, and whether there is the potential for realization of any further economies.
Based on its evaluation of all of the conclusions noted above, and after considering all factors it believed relevant, the Board ultimately concluded that the fund's management fee structure is fair and reasonable, and that the continuation of the fund's Advisory Contracts should be approved.
![]()
Corporate Headquarters
245 Summer St.
Boston, MA 02210
www.fidelity.com
GHI-SANN-1218
1.926252.107
|
Fidelity® Series High Income Fund Semi-Annual Report October 31, 2018 |
|
|
Contents
To view a fund's proxy voting guidelines and proxy voting record for the 12-month period ended June 30, visit http://www.fidelity.com/proxyvotingresults or visit the Securities and Exchange Commission's (SEC) web site at http://www.sec.gov.
You may also call 1-800-544-8544 to request a free copy of the proxy voting guidelines.
Standard & Poor's, S&P and S&P 500 are registered service marks of The McGraw-Hill Companies, Inc. and have been licensed for use by Fidelity Distributors Corporation.
Other third-party marks appearing herein are the property of their respective owners.
All other marks appearing herein are registered or unregistered trademarks or service marks of FMR LLC or an affiliated company. © 2018 FMR LLC. All rights reserved.
This report and the financial statements contained herein are submitted for the general information of the shareholders of the Fund. This report is not authorized for distribution to prospective investors in the Fund unless preceded or accompanied by an effective prospectus.
A fund files its complete schedule of portfolio holdings with the SEC for the first and third quarters of each fiscal year on Form N-Q. Forms N-Q are available on the SEC’s web site at http://www.sec.gov. A fund's Forms N-Q may be reviewed and copied at the SEC’s Public Reference Room in Washington, DC. Information regarding the operation of the SEC's Public Reference Room may be obtained by calling 1-800-SEC-0330.
For a complete list of a fund's portfolio holdings, view the most recent holdings listing, semiannual report, or annual report on Fidelity's web site at http://www.fidelity.com, http://www.institutional.fidelity.com, or http://www.401k.com, as applicable.
NOT FDIC INSURED •MAY LOSE VALUE •NO BANK GUARANTEE
Neither the Fund nor Fidelity Distributors Corporation is a bank.
Investment Summary (Unaudited)
Top Five Holdings as of October 31, 2018
| (by issuer, excluding cash equivalents) | % of fund's net assets |
| CCO Holdings LLC/CCO Holdings Capital Corp. | 3.4 |
| Community Health Systems, Inc. | 2.3 |
| Valeant Pharmaceuticals International, Inc. | 2.3 |
| Altice SA | 2.0 |
| Tenet Healthcare Corp. | 2.0 |
| 12.0 |
Top Five Market Sectors as of October 31, 2018
| % of fund's net assets | |
| Energy | 16.6 |
| Healthcare | 9.8 |
| Telecommunications | 9.4 |
| Cable/Satellite TV | 9.4 |
| Diversified Financial Services | 4.9 |
Quality Diversification (% of fund's net assets)
| As of October 31, 2018 | ||
| BBB | 0.9% | |
| BB | 35.8% | |
| B | 43.8% | |
| CCC,CC,C | 12.8% | |
| Not Rated | 0.2% | |
| Equities | 2.9% | |
| Short-Term Investments and Net Other Assets | 3.6% | |

We have used ratings from Moody's Investors Service, Inc. Where Moody's® ratings are not available, we have used S&P® ratings. All ratings are as of the date indicated and do not reflect subsequent changes.
Asset Allocation (% of fund's net assets)
| As of October 31, 2018* | ||
| Nonconvertible Bonds | 85.3% | |
| Convertible Bonds, Preferred Stocks | 1.5% | |
| Common Stocks | 2.1% | |
| Bank Loan Obligations | 5.6% | |
| Other Investments | 1.9% | |
| Short-Term Investments and Net Other Assets (Liabilities) | 3.6% | |

* Foreign investments - 25.7%
Schedule of Investments October 31, 2018 (Unaudited)
Showing Percentage of Net Assets
| Corporate Bonds - 86.0% | |||
| Principal Amount | Value | ||
| Convertible Bonds - 0.7% | |||
| Broadcasting - 0.5% | |||
| DISH Network Corp.: | |||
| 2.375% 3/15/24 | $690,000 | $578,929 | |
| 3.375% 8/15/26 | 14,720,000 | 13,114,784 | |
| 13,693,713 | |||
| Energy - 0.2% | |||
| Ensco Jersey Finance Ltd. 3% 1/31/24 | 5,510,000 | 5,031,699 | |
| TOTAL CONVERTIBLE BONDS | 18,725,412 | ||
| Nonconvertible Bonds - 85.3% | |||
| Aerospace - 1.8% | |||
| BBA U.S. Holdings, Inc. 5.375% 5/1/26 (a) | 7,975,000 | 7,885,281 | |
| Bombardier, Inc.: | |||
| 7.5% 12/1/24 (a) | 9,840,000 | 9,999,900 | |
| 7.5% 3/15/25 (a) | 16,540,000 | 16,535,038 | |
| BWX Technologies, Inc. 5.375% 7/15/26 (a) | 8,270,000 | 8,290,675 | |
| TransDigm UK Holdings PLC 6.875% 5/15/26 (a) | 2,935,000 | 2,927,663 | |
| 45,638,557 | |||
| Air Transportation - 0.4% | |||
| Aercap Global Aviation Trust 6.5% 6/15/45 (a)(b) | 10,795,000 | 11,064,875 | |
| Banks & Thrifts - 1.6% | |||
| Ally Financial, Inc.: | |||
| 4.25% 4/15/21 | 1,210,000 | 1,208,488 | |
| 5.75% 11/20/25 | 31,950,000 | 32,748,714 | |
| 8% 11/1/31 | 5,000,000 | 6,012,500 | |
| 39,969,702 | |||
| Broadcasting - 2.0% | |||
| CBS Radio, Inc. 7.25% 11/1/24 (a) | 5,025,000 | 4,729,781 | |
| iHeartCommunications, Inc. 11.25% 3/1/21 (a)(c) | 4,625,000 | 3,191,250 | |
| Sirius XM Radio, Inc.: | |||
| 3.875% 8/1/22 (a) | 2,610,000 | 2,512,125 | |
| 5% 8/1/27 (a) | 12,200,000 | 11,464,218 | |
| 5.375% 4/15/25 (a) | 11,223,960 | 11,118,735 | |
| 5.375% 7/15/26 (a) | 11,393,000 | 11,142,354 | |
| 6% 7/15/24 (a) | 6,770,000 | 6,920,971 | |
| 51,079,434 | |||
| Cable/Satellite TV - 8.7% | |||
| Altice SA: | |||
| 7.625% 2/15/25 (a) | 29,340,000 | 25,012,350 | |
| 7.75% 5/15/22 (a) | 27,945,000 | 26,023,781 | |
| Altice U.S. Finance SA: | |||
| 5.375% 7/15/23 (a) | 5,690,000 | 5,688,919 | |
| 5.5% 5/15/26 (a) | 13,040,000 | 12,701,742 | |
| CCO Holdings LLC/CCO Holdings Capital Corp.: | |||
| 4% 3/1/23 (a) | 3,405,000 | 3,243,263 | |
| 5% 2/1/28 (a) | 3,405,000 | 3,179,419 | |
| 5.125% 2/15/23 | 4,450,000 | 4,427,750 | |
| 5.125% 5/1/23 (a) | 1,730,000 | 1,721,350 | |
| 5.125% 5/1/27 (a) | 8,720,000 | 8,207,700 | |
| 5.375% 5/1/25 (a) | 7,525,000 | 7,365,094 | |
| 5.5% 5/1/26 (a) | 13,025,000 | 12,683,094 | |
| 5.75% 9/1/23 | 4,640,000 | 4,674,800 | |
| 5.75% 2/15/26 (a) | 14,320,000 | 14,176,800 | |
| 5.875% 4/1/24 (a) | 12,805,000 | 12,917,044 | |
| 5.875% 5/1/27 (a) | 13,075,000 | 12,846,188 | |
| Cequel Communications Holdings I LLC/Cequel Capital Corp.: | |||
| 5.125% 12/15/21 (a) | 3,760,000 | 3,749,773 | |
| 7.5% 4/1/28 (a) | 1,885,000 | 1,953,746 | |
| 7.75% 7/15/25 (a) | 3,770,000 | 3,977,350 | |
| CSC Holdings LLC 5.5% 4/15/27 (a) | 5,810,000 | 5,577,600 | |
| DISH DBS Corp.: | |||
| 5.875% 7/15/22 | 4,135,000 | 3,907,575 | |
| 6.75% 6/1/21 | 3,995,000 | 4,034,950 | |
| 7.75% 7/1/26 | 9,935,000 | 8,891,825 | |
| Virgin Media Finance PLC 4.875% 2/15/22 | 8,880,000 | 8,458,200 | |
| Virgin Media Secured Finance PLC: | |||
| 5.25% 1/15/26 (a) | 995,000 | 927,838 | |
| 5.5% 8/15/26 (a) | 4,675,000 | 4,406,188 | |
| VTR Finance BV 6.875% 1/15/24 (a) | 1,800,000 | 1,822,500 | |
| Ziggo Bond Finance BV 5.875% 1/15/25 (a) | 2,550,000 | 2,333,250 | |
| Ziggo Secured Finance BV 5.5% 1/15/27 (a) | 16,790,000 | 15,404,825 | |
| 220,314,914 | |||
| Chemicals - 3.7% | |||
| Blue Cube Spinco, Inc. 10% 10/15/25 | 6,250,000 | 7,078,125 | |
| CF Industries Holdings, Inc.: | |||
| 3.45% 6/1/23 | 2,365,000 | 2,246,750 | |
| 5.15% 3/15/34 | 7,525,000 | 6,904,188 | |
| 5.375% 3/15/44 | 5,675,000 | 4,994,000 | |
| NOVA Chemicals Corp. 4.875% 6/1/24 (a) | 10,550,000 | 9,692,813 | |
| OCI NV 6.625% 4/15/23 (a) | 10,725,000 | 10,993,125 | |
| Platform Specialty Products Corp. 5.875% 12/1/25 (a) | 5,020,000 | 4,756,450 | |
| The Chemours Co. LLC: | |||
| 6.625% 5/15/23 | 3,519,000 | 3,598,178 | |
| 7% 5/15/25 | 4,335,000 | 4,465,050 | |
| TPC Group, Inc. 8.75% 12/15/20 (a) | 17,040,000 | 16,699,200 | |
| Trinseo Materials Operating SCA/Trinseo Materials Finance, Inc. 5.375% 9/1/25 (a) | 1,705,000 | 1,575,932 | |
| Tronox Finance PLC 5.75% 10/1/25 (a) | 1,325,000 | 1,162,688 | |
| Tronox, Inc. 6.5% 4/15/26 (a) | 16,555,000 | 15,147,825 | |
| Valvoline, Inc. 5.5% 7/15/24 | 2,075,000 | 2,062,031 | |
| W. R. Grace & Co.-Conn.: | |||
| 5.125% 10/1/21 (a) | 1,155,000 | 1,163,663 | |
| 5.625% 10/1/24 (a) | 2,475,000 | 2,518,313 | |
| 95,058,331 | |||
| Containers - 2.3% | |||
| Ard Securities Finance SARL 8.75% 1/31/23 pay-in-kind (a)(b) | 1,751,538 | 1,681,476 | |
| Ardagh Packaging Finance PLC/Ardagh MP Holdings U.S.A., Inc.: | |||
| 4.625% 5/15/23 (a) | 13,920,000 | 13,537,200 | |
| 6% 2/15/25 (a) | 12,492,000 | 11,711,250 | |
| Crown Americas LLC / Crown Americas Capital Corp. IV 4.75% 2/1/26 (a) | 8,679,000 | 8,190,806 | |
| Crown Americas LLC/Crown Americas Capital Corp. V 4.25% 9/30/26 | 16,055,000 | 14,569,913 | |
| OI European Group BV 4% 3/15/23 (a) | 685,000 | 641,331 | |
| Owens-Brockway Glass Container, Inc. 5.375% 1/15/25 (a) | 5,860,000 | 5,684,200 | |
| Reynolds Group Issuer, Inc./Reynolds Group Issuer LLC/Reynolds Group Issuer (Luxembourg) SA 5.125% 7/15/23 (a) | 3,320,000 | 3,249,450 | |
| 59,265,626 | |||
| Diversified Financial Services - 4.9% | |||
| FLY Leasing Ltd.: | |||
| 5.25% 10/15/24 | 10,955,000 | 10,407,250 | |
| 6.375% 10/15/21 | 5,167,000 | 5,276,799 | |
| Icahn Enterprises LP/Icahn Enterprises Finance Corp.: | |||
| 6.25% 2/1/22 | 2,180,000 | 2,200,841 | |
| 6.375% 12/15/25 | 11,150,000 | 11,080,313 | |
| ILFC E-Capital Trust I 3 month U.S. LIBOR + 1.550% 4.78% 12/21/65 (a)(b)(d) | 8,630,000 | 7,637,550 | |
| ILFC E-Capital Trust II 3 month U.S. LIBOR + 1.800% 5.03% 12/21/65 (a)(b)(d) | 4,638,000 | 4,127,820 | |
| MSCI, Inc.: | |||
| 5.375% 5/15/27 (a) | 3,450,000 | 3,415,500 | |
| 5.75% 8/15/25 (a) | 1,635,000 | 1,679,963 | |
| Navient Corp.: | |||
| 5% 10/26/20 | 2,425,000 | 2,438,338 | |
| 6.75% 6/25/25 | 6,740,000 | 6,571,500 | |
| 6.75% 6/15/26 | 1,710,000 | 1,644,849 | |
| 7.25% 9/25/23 | 2,695,000 | 2,789,325 | |
| Park Aerospace Holdings Ltd.: | |||
| 4.5% 3/15/23 (a) | 1,570,000 | 1,493,667 | |
| 5.25% 8/15/22 (a) | 4,330,000 | 4,297,525 | |
| 5.5% 2/15/24 (a) | 8,165,000 | 8,085,391 | |
| Quicken Loans, Inc. 5.25% 1/15/28 (a) | 7,535,000 | 6,687,313 | |
| Radiate Holdco LLC/Radiate Financial Service Ltd. 6.875% 2/15/23 (a) | 4,485,000 | 4,305,600 | |
| SLM Corp.: | |||
| 4.875% 6/17/19 | 6,680,000 | 6,705,050 | |
| 6.125% 3/25/24 | 3,555,000 | 3,457,238 | |
| 7.25% 1/25/22 | 2,925,000 | 3,042,000 | |
| 8% 3/25/20 | 6,038,000 | 6,302,163 | |
| Springleaf Financial Corp.: | |||
| 6.125% 5/15/22 | 3,365,000 | 3,381,825 | |
| 6.875% 3/15/25 | 1,735,000 | 1,661,263 | |
| 7.125% 3/15/26 | 15,990,000 | 14,997,021 | |
| 123,686,104 | |||
| Diversified Media - 1.2% | |||
| E.W. Scripps Co. 5.125% 5/15/25 (a) | 1,250,000 | 1,175,000 | |
| MDC Partners, Inc. 6.5% 5/1/24 (a) | 15,938,000 | 13,069,160 | |
| Nielsen Co. SARL (Luxembourg) 5% 2/1/25 (a) | 2,455,000 | 2,386,726 | |
| Nielsen Finance LLC/Nielsen Finance Co. 5% 4/15/22 (a) | 12,945,000 | 12,605,194 | |
| 29,236,080 | |||
| Energy - 15.2% | |||
| Blue Racer Midstream LLC/Blue Racer Finance Corp. 6.625% 7/15/26 (a) | 3,420,000 | 3,471,300 | |
| California Resources Corp. 8% 12/15/22 (a) | 19,870,000 | 17,684,300 | |
| Cheniere Corpus Christi Holdings LLC: | |||
| 5.125% 6/30/27 | 1,745,000 | 1,710,100 | |
| 7% 6/30/24 | 15,065,000 | 16,289,031 | |
| Cheniere Energy Partners LP: | |||
| 5.25% 10/1/25 | 22,610,000 | 22,186,063 | |
| 5.625% 10/1/26 (a) | 3,770,000 | 3,713,450 | |
| Chesapeake Energy Corp.: | |||
| 4.875% 4/15/22 | 1,470,000 | 1,396,500 | |
| 5.375% 6/15/21 | 1,896,000 | 1,877,040 | |
| 8% 1/15/25 | 1,555,000 | 1,577,353 | |
| 8% 6/15/27 | 3,630,000 | 3,607,313 | |
| Citgo Petroleum Corp. 6.25% 8/15/22 (a) | 10,628,000 | 10,468,580 | |
| CNX Midstream Partners LP 6.5% 3/15/26 (a) | 3,280,000 | 3,198,000 | |
| Compressco Partners LP/Compressco Finance, Inc. 7.5% 4/1/25 (a) | 1,735,000 | 1,739,338 | |
| Comstock Escrow Corp. 9.75% 8/15/26 (a) | 10,800,000 | 10,422,000 | |
| Consolidated Energy Finance SA: | |||
| 3 month U.S. LIBOR + 3.750% 6.0841% 6/15/22 (a)(b)(d) | 2,615,000 | 2,616,151 | |
| 6.5% 5/15/26 (a) | 6,685,000 | 6,651,575 | |
| 6.875% 6/15/25 (a) | 3,085,000 | 3,142,844 | |
| CVR Refining LLC/Coffeyville Finance, Inc. 6.5% 11/1/22 | 5,900,000 | 5,936,875 | |
| DCP Midstream LLC 5.85% 5/21/43 (a)(b) | 1,690,000 | 1,512,550 | |
| DCP Midstream Operating LP 5.375% 7/15/25 | 7,625,000 | 7,732,131 | |
| Denbury Resources, Inc.: | |||
| 4.625% 7/15/23 | 10,757,000 | 8,901,418 | |
| 7.5% 2/15/24 (a) | 5,410,000 | 5,288,275 | |
| 9.25% 3/31/22 (a) | 7,257,000 | 7,565,423 | |
| Endeavor Energy Resources LP/EER Finance, Inc.: | |||
| 5.5% 1/30/26 (a) | 1,235,000 | 1,268,963 | |
| 5.75% 1/30/28 (a) | 1,240,000 | 1,280,300 | |
| Ensco PLC: | |||
| 5.2% 3/15/25 | 2,605,000 | 2,136,100 | |
| 5.75% 10/1/44 | 5,160,000 | 3,612,000 | |
| 7.75% 2/1/26 | 1,720,000 | 1,603,900 | |
| EP Energy LLC/Everest Acquisition Finance, Inc. 8% 11/29/24 (a) | 9,975,000 | 9,625,875 | |
| Exterran Energy Solutions LP 8.125% 5/1/25 | 1,465,000 | 1,475,988 | |
| Exterran Partners LP/EXLP Finance Corp. 6% 4/1/21 | 1,770,000 | 1,752,300 | |
| Hess Infrastructure Partners LP 5.625% 2/15/26 (a) | 12,070,000 | 12,100,175 | |
| Hilcorp Energy I LP/Hilcorp Finance Co.: | |||
| 5% 12/1/24 (a) | 5,160,000 | 4,863,300 | |
| 5.75% 10/1/25 (a) | 1,825,000 | 1,774,813 | |
| Jonah Energy LLC 7.25% 10/15/25 (a) | 12,150,000 | 9,659,250 | |
| MEG Energy Corp. 7% 3/31/24 (a) | 4,930,000 | 4,843,725 | |
| Nabors Industries, Inc. 5.75% 2/1/25 | 12,080,000 | 11,149,654 | |
| NGL Energy Partners LP/NGL Energy Finance Corp. 6.125% 3/1/25 | 3,960,000 | 3,603,600 | |
| Noble Holding International Ltd.: | |||
| 5.25% 3/15/42 | 2,815,000 | 1,956,425 | |
| 6.05% 3/1/41 | 2,935,000 | 2,142,550 | |
| 7.75% 1/15/24 | 3,949,000 | 3,687,379 | |
| 7.875% 2/1/26 (a) | 2,770,000 | 2,749,225 | |
| 7.95% 4/1/25 (b) | 3,075,000 | 2,798,250 | |
| Parsley Energy LLC/Parsley: | |||
| 5.625% 10/15/27 (a) | 1,410,000 | 1,389,936 | |
| 6.25% 6/1/24 (a) | 1,030,000 | 1,058,325 | |
| PBF Holding Co. LLC/PBF Finance Corp.: | |||
| 7% 11/15/23 | 10,195,000 | 10,526,338 | |
| 7.25% 6/15/25 | 700,000 | 721,000 | |
| PBF Logistics LP/PBF Logistics Finance, Inc. 6.875% 5/15/23 | 1,685,000 | 1,714,488 | |
| Rose Rock Midstream LP/Rose Rock Finance Corp.: | |||
| 5.625% 7/15/22 | 3,585,000 | 3,441,600 | |
| 5.625% 11/15/23 | 2,860,000 | 2,702,700 | |
| Sanchez Energy Corp. 7.25% 2/15/23 (a) | 25,255,000 | 23,045,188 | |
| SemGroup Corp.: | |||
| 6.375% 3/15/25 | 10,740,000 | 10,390,950 | |
| 7.25% 3/15/26 | 8,215,000 | 8,019,894 | |
| SM Energy Co.: | |||
| 5% 1/15/24 | 6,500,000 | 6,191,250 | |
| 5.625% 6/1/25 | 2,695,000 | 2,593,938 | |
| 6.125% 11/15/22 | 5,471,000 | 5,539,388 | |
| Southwestern Energy Co.: | |||
| 7.5% 4/1/26 | 5,985,000 | 6,089,738 | |
| 7.75% 10/1/27 | 3,213,000 | 3,277,260 | |
| Summit Midstream Holdings LLC 5.75% 4/15/25 | 6,575,000 | 6,295,563 | |
| Sunoco LP/Sunoco Finance Corp.: | |||
| 4.875% 1/15/23 (a) | 3,895,000 | 3,753,806 | |
| 5.5% 2/15/26 (a) | 2,780,000 | 2,647,950 | |
| Targa Resources Partners LP/Targa Resources Partners Finance Corp.: | |||
| 4.25% 11/15/23 | 4,185,000 | 4,013,624 | |
| 5% 1/15/28 | 7,535,000 | 7,139,413 | |
| 5.875% 4/15/26 (a) | 9,140,000 | 9,191,413 | |
| 6.75% 3/15/24 | 1,490,000 | 1,560,775 | |
| Teine Energy Ltd. 6.875% 9/30/22 (a) | 750,000 | 746,250 | |
| TerraForm Power Operating LLC 4.25% 1/31/23 (a) | 3,205,000 | 3,036,738 | |
| Transocean, Inc. 9% 7/15/23 (a) | 3,755,000 | 3,938,056 | |
| U.S.A. Compression Partners LP 6.875% 4/1/26 (a) | 6,310,000 | 6,420,425 | |
| Weatherford International Ltd.: | |||
| 6.5% 8/1/36 | 3,345,000 | 2,224,425 | |
| 7% 3/15/38 | 5,465,000 | 3,688,875 | |
| 9.875% 2/15/24 | 2,095,000 | 1,623,625 | |
| Weatherford International, Inc.: | |||
| 6.8% 6/15/37 | 1,720,000 | 1,156,700 | |
| 9.875% 3/1/25 (a) | 12,130,000 | 9,400,750 | |
| 386,311,763 | |||
| Entertainment/Film - 0.4% | |||
| CBS Outdoor Americas Capital LLC/CBS Outdoor Americas Capital Corp.: | |||
| 5.625% 2/15/24 | 4,285,000 | 4,290,356 | |
| 5.875% 3/15/25 | 1,815,000 | 1,821,806 | |
| New Cotai LLC/New Cotai Capital Corp. 10.625% 5/1/19 pay-in-kind (a)(b) | 5,523,977 | 3,148,667 | |
| 9,260,829 | |||
| Environmental - 1.2% | |||
| Covanta Holding Corp.: | |||
| 5.875% 3/1/24 | 4,960,000 | 4,947,600 | |
| 5.875% 7/1/25 | 8,010,000 | 7,769,700 | |
| LBC Tank Terminals Holding Netherlands BV 6.875% 5/15/23 (a) | 13,015,000 | 12,787,238 | |
| Tervita Escrow Corp. 7.625% 12/1/21 (a) | 5,935,000 | 6,024,025 | |
| 31,528,563 | |||
| Food & Drug Retail - 0.1% | |||
| Performance Food Group, Inc. 5.5% 6/1/24 (a) | 2,110,000 | 2,025,600 | |
| Food/Beverage/Tobacco - 3.5% | |||
| C&S Group Enterprises LLC 5.375% 7/15/22 (a) | 18,710,000 | 18,055,150 | |
| Cott Holdings, Inc. 5.5% 4/1/25 (a) | 4,875,000 | 4,643,438 | |
| ESAL GmbH 6.25% 2/5/23 (a) | 19,645,000 | 19,276,656 | |
| JBS Investments GmbH 7.25% 4/3/24 (a) | 4,035,000 | 4,070,306 | |
| JBS U.S.A. LLC/JBS U.S.A. Finance, Inc.: | |||
| 5.75% 6/15/25 (a) | 6,480,000 | 6,269,400 | |
| 6.75% 2/15/28 (a) | 9,720,000 | 9,477,000 | |
| Lamb Weston Holdings, Inc.: | |||
| 4.625% 11/1/24 (a) | 3,495,000 | 3,423,248 | |
| 4.875% 11/1/26 (a) | 1,045,000 | 1,008,425 | |
| Pilgrim's Pride Corp. 5.75% 3/15/25 (a) | 845,000 | 787,963 | |
| Post Holdings, Inc.: | |||
| 5% 8/15/26 (a) | 4,555,000 | 4,201,988 | |
| 5.625% 1/15/28 (a) | 3,415,000 | 3,211,125 | |
| 5.75% 3/1/27 (a) | 2,255,000 | 2,153,525 | |
| Vector Group Ltd. 6.125% 2/1/25 (a) | 12,975,000 | 11,807,250 | |
| 88,385,474 | |||
| Gaming - 3.5% | |||
| Boyd Gaming Corp. 6% 8/15/26 | 2,160,000 | 2,087,100 | |
| CRC Escrow Issuer LLC/CRC Finance LLC 5.25% 10/15/25 (a) | 27,050,000 | 25,173,406 | |
| Delta Merger Sub, Inc. 6% 9/15/26 (a) | 1,290,000 | 1,265,813 | |
| Downstream Development Authority 10.5% 2/15/23 (a) | 3,415,000 | 3,474,763 | |
| Eldorado Resorts, Inc. 6% 4/1/25 | 750,000 | 740,625 | |
| GLP Capital LP/GLP Financing II, Inc. 5.375% 4/15/26 | 1,200,000 | 1,192,500 | |
| MCE Finance Ltd. 4.875% 6/6/25 (a) | 2,855,000 | 2,617,698 | |
| MGM Growth Properties Operating Partnership LP: | |||
| 4.5% 9/1/26 | 4,590,000 | 4,153,950 | |
| 5.625% 5/1/24 | 1,815,000 | 1,817,269 | |
| MGM Mirage, Inc. 5.75% 6/15/25 | 5,130,000 | 4,945,320 | |
| Scientific Games Corp. 5% 10/15/25 (a) | 6,160,000 | 5,728,800 | |
| Stars Group Holdings BV 7% 7/15/26 (a) | 12,410,000 | 12,596,150 | |
| Sugarhouse HSP Gaming Prop Mezz LP/Sugarhouse HSP Gaming Finance Corp. 5.875% 5/15/25 (a) | 8,340,000 | 7,870,875 | |
| Wynn Las Vegas LLC/Wynn Las Vegas Capital Corp. 5.25% 5/15/27 (a) | 7,485,000 | 6,773,925 | |
| Wynn Macau Ltd. 4.875% 10/1/24 (a) | 8,095,000 | 7,346,213 | |
| 87,784,407 | |||
| Healthcare - 9.6% | |||
| Catalent Pharma Solutions 4.875% 1/15/26 (a) | 955,000 | 895,313 | |
| Centene Escrow Corp. 5.375% 6/1/26 (a) | 3,490,000 | 3,542,350 | |
| Charles River Laboratories International, Inc. 5.5% 4/1/26 (a) | 2,470,000 | 2,463,825 | |
| Community Health Systems, Inc.: | |||
| 5.125% 8/1/21 | 22,950,000 | 21,745,125 | |
| 6.25% 3/31/23 | 13,895,000 | 12,779,232 | |
| 6.875% 2/1/22 | 30,741,000 | 15,539,576 | |
| 8.625% 1/15/24 (a) | 7,940,000 | 8,029,325 | |
| CTR Partnership LP/CareTrust Capital Corp. 5.25% 6/1/25 | 4,465,000 | 4,353,375 | |
| HCA Holdings, Inc.: | |||
| 5.25% 6/15/26 | 2,865,000 | 2,915,138 | |
| 5.375% 9/1/26 | 2,935,000 | 2,880,996 | |
| 5.875% 5/1/23 | 7,350,000 | 7,607,250 | |
| 6.25% 2/15/21 | 5,100,000 | 5,297,625 | |
| HealthSouth Corp. 5.75% 9/15/25 | 3,890,000 | 3,851,100 | |
| HLF Financing SARL LLC / Herbalife International, Inc. 7.25% 8/15/26 (a) | 885,000 | 896,063 | |
| Hologic, Inc. 4.375% 10/15/25 (a) | 2,845,000 | 2,667,188 | |
| IMS Health, Inc. 5% 10/15/26 (a) | 4,190,000 | 4,031,534 | |
| MPT Operating Partnership LP/MPT Finance Corp.: | |||
| 5% 10/15/27 | 2,000,000 | 1,879,400 | |
| 5.5% 5/1/24 | 2,120,000 | 2,141,200 | |
| 6.375% 3/1/24 | 4,595,000 | 4,755,825 | |
| Sabra Health Care LP/Sabra Capital Corp.: | |||
| 5.375% 6/1/23 | 12,260,000 | 12,198,700 | |
| 5.5% 2/1/21 | 5,015,000 | 5,080,822 | |
| Teleflex, Inc. 4.875% 6/1/26 | 5,645,000 | 5,503,875 | |
| Tenet Healthcare Corp.: | |||
| 4.375% 10/1/21 | 14,240,000 | 14,079,800 | |
| 5.125% 5/1/25 | 6,775,000 | 6,520,938 | |
| 6.75% 6/15/23 | 3,260,000 | 3,250,872 | |
| 8.125% 4/1/22 | 24,515,000 | 25,526,244 | |
| THC Escrow Corp. III 7% 8/1/25 | 5,835,000 | 5,723,376 | |
| Valeant Pharmaceuticals International, Inc.: | |||
| 5.5% 11/1/25 (a) | 7,645,000 | 7,492,100 | |
| 5.625% 12/1/21 (a) | 2,495,000 | 2,457,575 | |
| 5.875% 5/15/23 (a) | 15,210,000 | 14,544,563 | |
| 6.125% 4/15/25 (a) | 13,305,000 | 12,236,609 | |
| 7.5% 7/15/21 (a) | 1,315,000 | 1,334,725 | |
| 8.5% 1/31/27 (a) | 2,855,000 | 2,904,963 | |
| 9% 12/15/25 (a) | 4,735,000 | 4,936,238 | |
| 9.25% 4/1/26 (a) | 6,945,000 | 7,283,569 | |
| Wellcare Health Plans, Inc.: | |||
| 5.25% 4/1/25 | 1,800,000 | 1,795,500 | |
| 5.375% 8/15/26 (a) | 1,775,000 | 1,770,563 | |
| 242,912,472 | |||
| Homebuilders/Real Estate - 0.8% | |||
| Beazer Homes U.S.A., Inc. 6.75% 3/15/25 | 1,685,000 | 1,478,588 | |
| Howard Hughes Corp. 5.375% 3/15/25 (a) | 10,535,000 | 10,113,600 | |
| Starwood Property Trust, Inc. 4.75% 3/15/25 | 6,205,000 | 5,910,263 | |
| TRI Pointe Homes, Inc. 5.25% 6/1/27 | 3,385,000 | 2,889,944 | |
| 20,392,395 | |||
| Hotels - 1.4% | |||
| ESH Hospitality, Inc. 5.25% 5/1/25 (a) | 15,059,000 | 14,249,579 | |
| Hilton Domestic Operating Co., Inc. 5.125% 5/1/26 (a) | 17,375,000 | 16,984,063 | |
| Hilton Escrow Issuer LLC 4.25% 9/1/24 | 2,000,000 | 1,920,600 | |
| Marriott Ownership Resorts, Inc. 6.5% 9/15/26 (a) | 2,130,000 | 2,151,300 | |
| 35,305,542 | |||
| Insurance - 0.1% | |||
| AmWINS Group, Inc. 7.75% 7/1/26 (a) | 1,705,000 | 1,751,888 | |
| Leisure - 1.2% | |||
| Mattel, Inc.: | |||
| 2.35% 8/15/21 | 5,150,000 | 4,622,125 | |
| 3.15% 3/15/23 | 1,720,000 | 1,463,720 | |
| 6.75% 12/31/25 (a) | 17,180,000 | 16,401,574 | |
| Studio City Co. Ltd.: | |||
| 5.875% 11/30/19 (a) | 3,055,000 | 3,081,731 | |
| 7.25% 11/30/21 (a) | 4,420,000 | 4,547,340 | |
| 30,116,490 | |||
| Metals/Mining - 2.6% | |||
| Constellium NV 5.875% 2/15/26 (a) | 1,885,000 | 1,757,763 | |
| First Quantum Minerals Ltd.: | |||
| 6.5% 3/1/24 (a) | 8,350,000 | 7,285,375 | |
| 6.875% 3/1/26 (a) | 8,055,000 | 6,957,506 | |
| 7.25% 5/15/22 (a) | 2,480,000 | 2,368,400 | |
| 7.25% 4/1/23 (a) | 6,135,000 | 5,667,206 | |
| 7.5% 4/1/25 (a) | 16,565,000 | 14,784,263 | |
| FMG Resources (August 2006) Pty Ltd.: | |||
| 4.75% 5/15/22 (a) | 1,965,000 | 1,886,400 | |
| 5.125% 5/15/24 (a) | 2,420,000 | 2,299,000 | |
| Freeport-McMoRan, Inc.: | |||
| 3.55% 3/1/22 | 7,255,000 | 6,865,044 | |
| 3.875% 3/15/23 | 1,835,000 | 1,697,375 | |
| 6.875% 2/15/23 | 4,810,000 | 5,032,463 | |
| Nufarm Australia Ltd. 5.75% 4/30/26 (a) | 8,635,000 | 8,062,931 | |
| 64,663,726 | |||
| Paper - 0.0% | |||
| Flex Acquisition Co., Inc. 6.875% 1/15/25 (a) | 920,000 | 860,200 | |
| NewPage Corp. 11.375% 12/31/2014 (c)(e) | 56,458,756 | 6 | |
| 860,206 | |||
| Restaurants - 0.9% | |||
| 1011778 BC Unlimited Liability Co./New Red Finance, Inc.: | |||
| 4.25% 5/15/24 (a) | 7,498,000 | 7,029,375 | |
| 5% 10/15/25 (a) | 1,705,000 | 1,598,438 | |
| Golden Nugget, Inc. 6.75% 10/15/24 (a) | 5,105,000 | 5,092,238 | |
| KFC Holding Co./Pizza Hut Holding LLC 5% 6/1/24 (a) | 9,100,000 | 8,974,875 | |
| 22,694,926 | |||
| Services - 3.4% | |||
| APX Group, Inc. 7.625% 9/1/23 | 3,585,000 | 3,190,650 | |
| Aramark Services, Inc.: | |||
| 4.75% 6/1/26 | 6,285,000 | 5,986,463 | |
| 5% 4/1/25 (a) | 3,880,000 | 3,838,775 | |
| 5.125% 1/15/24 | 2,405,000 | 2,392,975 | |
| Avantor, Inc. 6% 10/1/24 (a) | 13,935,000 | 13,900,163 | |
| Brand Energy & Infrastructure Services, Inc. 8.5% 7/15/25 (a) | 6,785,000 | 6,683,225 | |
| CDK Global, Inc. 5.875% 6/15/26 | 1,055,000 | 1,062,913 | |
| Corrections Corp. of America 5% 10/15/22 | 1,695,000 | 1,637,794 | |
| H&E Equipment Services, Inc. 5.625% 9/1/25 | 3,420,000 | 3,257,550 | |
| Hertz Corp.: | |||
| 5.5% 10/15/24 (a) | 35,200,000 | 27,104,000 | |
| 6.25% 10/15/22 | 4,630,000 | 4,062,825 | |
| IHS Markit Ltd.: | |||
| 4% 3/1/26 (a) | 1,275,000 | 1,199,966 | |
| 4.75% 2/15/25 (a) | 1,375,000 | 1,361,223 | |
| 5% 11/1/22 (a) | 1,370,000 | 1,398,496 | |
| KAR Auction Services, Inc. 5.125% 6/1/25 (a) | 2,555,000 | 2,420,863 | |
| Laureate Education, Inc. 8.25% 5/1/25 (a) | 6,400,000 | 6,864,000 | |
| 86,361,881 | |||
| Steel - 0.4% | |||
| Big River Steel LLC/BRS Finance Corp. 7.25% 9/1/25 (a) | 2,275,000 | 2,371,688 | |
| Commercial Metals Co. 5.75% 4/15/26 (a) | 6,890,000 | 6,614,400 | |
| 8,986,088 | |||
| Super Retail - 0.3% | |||
| Netflix, Inc. 4.375% 11/15/26 | 3,490,000 | 3,194,048 | |
| Sally Holdings LLC 5.625% 12/1/25 | 880,000 | 817,256 | |
| Sonic Automotive, Inc. 6.125% 3/15/27 | 4,225,000 | 3,834,188 | |
| 7,845,492 | |||
| Technology - 1.6% | |||
| Fair Isaac Corp. 5.25% 5/15/26 (a) | 1,490,000 | 1,469,513 | |
| First Data Corp. 5% 1/15/24 (a) | 3,895,000 | 3,856,050 | |
| Itron, Inc. 5% 1/15/26 (a) | 2,400,000 | 2,235,000 | |
| Nuance Communications, Inc. 5.625% 12/15/26 | 8,595,000 | 8,423,100 | |
| Open Text Corp. 5.875% 6/1/26 (a) | 2,800,000 | 2,814,000 | |
| Qorvo, Inc. 5.5% 7/15/26 (a) | 4,950,000 | 4,962,375 | |
| Solera LLC/Solera Finance, Inc. 10.5% 3/1/24 (a) | 955,000 | 1,036,204 | |
| Symantec Corp.: | |||
| 4.2% 9/15/20 | 2,145,000 | 2,139,337 | |
| 5% 4/15/25 (a) | 10,295,000 | 9,685,400 | |
| TTM Technologies, Inc. 5.625% 10/1/25 (a) | 4,490,000 | 4,377,750 | |
| 40,998,729 | |||
| Telecommunications - 8.1% | |||
| Altice Financing SA: | |||
| 6.625% 2/15/23 (a) | 4,450,000 | 4,404,610 | |
| 7.5% 5/15/26 (a) | 13,090,000 | 12,304,600 | |
| Altice Finco SA: | |||
| 7.625% 2/15/25 (a) | 12,260,000 | 10,896,075 | |
| 8.125% 1/15/24 (a) | 3,820,000 | 3,753,150 | |
| C&W Senior Financing Designated Activity Co. 7.5% 10/15/26 (a) | 7,195,000 | 7,212,988 | |
| Citizens Utilities Co. 7.05% 10/1/46 | 7,285,000 | 3,642,500 | |
| Cogent Communications Group, Inc. 5.375% 3/1/22 (a) | 2,450,000 | 2,465,313 | |
| Frontier Communications Corp.: | |||
| 8.5% 4/1/26 (a) | 6,440,000 | 5,981,150 | |
| 11% 9/15/25 | 11,525,000 | 8,442,063 | |
| GCI, Inc. 6.875% 4/15/25 | 3,450,000 | 3,559,952 | |
| Intelsat Jackson Holdings SA: | |||
| 5.5% 8/1/23 | 3,275,000 | 2,931,125 | |
| 7.5% 4/1/21 | 657,000 | 665,213 | |
| 8% 2/15/24 (a) | 8,730,000 | 9,133,763 | |
| 8.5% 10/15/24 (a) | 8,390,000 | 8,243,175 | |
| Level 3 Financing, Inc.: | |||
| 5.125% 5/1/23 | 2,220,000 | 2,203,350 | |
| 5.375% 1/15/24 | 14,510,000 | 14,364,900 | |
| 5.375% 5/1/25 | 120,000 | 117,150 | |
| Millicom International Cellular SA 6.625% 10/15/26 (a) | 2,820,000 | 2,848,200 | |
| Neptune Finco Corp.: | |||
| 6.625% 10/15/25 (a) | 4,865,000 | 5,096,088 | |
| 10.875% 10/15/25 (a) | 1,615,000 | 1,863,306 | |
| Sable International Finance Ltd. 6.875% 8/1/22 (a) | 5,870,000 | 6,126,813 | |
| SFR Group SA: | |||
| 7.375% 5/1/26 (a) | 4,640,000 | 4,441,362 | |
| 8.125% 2/1/27 (a) | 1,710,000 | 1,692,900 | |
| Sprint Capital Corp. 6.875% 11/15/28 | 3,269,000 | 3,211,793 | |
| Sprint Communications, Inc. 6% 11/15/22 | 17,315,000 | 17,477,328 | |
| Sprint Corp.: | |||
| 7.125% 6/15/24 | 7,865,000 | 8,041,963 | |
| 7.25% 9/15/21 | 5,935,000 | 6,194,656 | |
| 7.625% 3/1/26 | 5,285,000 | 5,473,278 | |
| 7.875% 9/15/23 | 21,375,000 | 22,817,813 | |
| T-Mobile U.S.A., Inc. 6% 4/15/24 | 10,105,000 | 10,357,625 | |
| Wind Tre SpA 5% 1/20/26 (a) | 4,060,000 | 3,455,872 | |
| Zayo Group LLC/Zayo Capital, Inc.: | |||
| 5.75% 1/15/27 (a) | 2,915,000 | 2,857,283 | |
| 6.375% 5/15/25 | 4,090,000 | 4,182,025 | |
| 206,459,382 | |||
| Transportation Ex Air/Rail - 1.1% | |||
| Avolon Holdings Funding Ltd.: | |||
| 5.125% 10/1/23 (a) | 2,219,000 | 2,177,394 | |
| 5.5% 1/15/23 (a) | 4,610,000 | 4,586,950 | |
| Navios Maritime Acquisition Corp./Navios Acquisition Finance U.S., Inc. 8.125% 11/15/21 (a) | 10,100,000 | 8,471,375 | |
| Navios Maritime Holdings, Inc. 7.375% 1/15/22 (a) | 15,870,000 | 11,981,850 | |
| Navios South American Logistics, Inc./Navios Logistics Finance U.S., Inc. 7.25% 5/1/22 (a) | 1,175,000 | 1,092,750 | |
| 28,310,319 | |||
| Utilities - 3.3% | |||
| Calpine Corp.: | |||
| 5.25% 6/1/26 (a) | 3,655,000 | 3,358,031 | |
| 5.75% 1/15/25 | 6,750,000 | 6,031,463 | |
| Dynegy, Inc.: | |||
| 7.375% 11/1/22 | 987,000 | 1,024,013 | |
| 7.625% 11/1/24 | 5,926,000 | 6,266,745 | |
| Global Partners LP/GLP Finance Corp.: | |||
| 6.25% 7/15/22 | 2,750,000 | 2,701,875 | |
| 7% 6/15/23 | 6,105,000 | 6,082,106 | |
| InterGen NV 7% 6/30/23 (a) | 26,217,000 | 25,758,203 | |
| NRG Energy, Inc. 5.75% 1/15/28 | 2,180,000 | 2,174,550 | |
| NRG Yield Operating LLC 5% 9/15/26 | 1,735,000 | 1,613,550 | |
| NSG Holdings II LLC/NSG Holdings, Inc. 7.75% 12/15/25 (a) | 946,051 | 1,021,735 | |
| Talen Energy Supply LLC: | |||
| 6.5% 6/1/25 | 10,915,000 | 8,131,675 | |
| 10.5% 1/15/26 (a) | 12,212,000 | 10,731,295 | |
| The AES Corp.: | |||
| 5.125% 9/1/27 | 1,700,000 | 1,678,750 | |
| 6% 5/15/26 | 3,475,000 | 3,553,188 | |
| Vistra Operations Co. LLC 5.5% 9/1/26 (a) | 3,805,000 | 3,747,925 | |
| 83,875,104 | |||
| TOTAL NONCONVERTIBLE BONDS | 2,162,144,899 | ||
| TOTAL CORPORATE BONDS | |||
| (Cost $2,239,680,581) | 2,180,870,311 | ||
| Shares | Value | ||
| Common Stocks - 2.1% | |||
| Automotive & Auto Parts - 0.2% | |||
| Chassix Holdings, Inc. warrants 7/29/20 (e)(f) | 48,708 | 310,757 | |
| UC Holdings, Inc. (e) | 180,386 | 3,764,656 | |
| TOTAL AUTOMOTIVE & AUTO PARTS | 4,075,413 | ||
| Environmental - 0.7% | |||
| Tervita Corp. (f) | 3,013,479 | 17,145,321 | |
| Food & Drug Retail - 1.2% | |||
| Southeastern Grocers, Inc. (e)(f) | 764,631 | 31,028,726 | |
| Metals/Mining - 0.0% | |||
| Aleris Corp. (e)(f) | 46,900 | 0 | |
| Elah Holdings, Inc. (f) | 333 | 30,303 | |
| TOTAL METALS/MINING | 30,303 | ||
| Transportation Ex Air/Rail - 0.0% | |||
| Navios Maritime Holdings, Inc. (f) | 771,100 | 424,105 | |
| Tricer Holdco SCA: | |||
| Class A1 (e)(g) | 220,288 | 2 | |
| Class A2 (e)(g) | 220,288 | 2 | |
| Class A3 (e)(g) | 220,288 | 2 | |
| Class A4 (e)(g) | 220,288 | 2 | |
| Class A5 (e)(g) | 220,288 | 2 | |
| Class A6 (e)(g) | 220,288 | 2 | |
| Class A7 (e)(g) | 220,288 | 2 | |
| Class A8 (e)(g) | 220,288 | 2 | |
| Class A9 (e)(g) | 220,288 | 2 | |
| TOTAL TRANSPORTATION EX AIR/RAIL | 424,123 | ||
| TOTAL COMMON STOCKS | |||
| (Cost $55,853,315) | 52,703,886 | ||
| Preferred Stocks - 0.8% | |||
| Convertible Preferred Stocks - 0.8% | |||
| Energy - 0.5% | |||
| Chesapeake Energy Corp. Series A, 5.75% | 20,537 | 11,919,675 | |
| Telecommunications - 0.1% | |||
| Crown Castle International Corp. Series A, 6.875% | 2,000 | 2,089,028 | |
| Utilities - 0.2% | |||
| Vistra Energy Corp. 7.00% | 69,000 | 6,285,417 | |
| TOTAL CONVERTIBLE PREFERRED STOCKS | 20,294,120 | ||
| Nonconvertible Preferred Stocks - 0.0% | |||
| Transportation Ex Air/Rail - 0.0% | |||
| Tricer Holdco SCA (e)(f)(g) | 105,731,544 | 1,057,315 | |
| TOTAL PREFERRED STOCKS | |||
| (Cost $24,158,444) | 21,351,435 | ||
| Principal Amount | Value | ||
| Bank Loan Obligations - 5.6% | |||
| Broadcasting - 0.1% | |||
| CBS Radio, Inc. Tranche B 1LN, term loan 3 month U.S. LIBOR + 2.750% 5.0365% 11/18/24 (b)(d) | 1,725,000 | 1,715,513 | |
| Cable/Satellite TV - 0.7% | |||
| CSC Holdings LLC Tranche B, term loan 3 month U.S. LIBOR + 2.500% 4.7795% 1/25/26 (b)(d) | 2,646,700 | 2,640,904 | |
| Numericable LLC Tranche B 13LN, term loan 3 month U.S. LIBOR + 4.000% 6.2795% 8/14/26 (b)(d) | 3,500,000 | 3,423,455 | |
| WideOpenWest Finance LLC Tranche B, term loan 3 month U.S. LIBOR + 3.250% 5.5395% 8/19/23 (b)(d) | 12,220,476 | 11,762,208 | |
| TOTAL CABLE/SATELLITE TV | 17,826,567 | ||
| Energy - 0.5% | |||
| California Resources Corp. Tranche B, term loan 3 month U.S. LIBOR + 4.750% 7.0365% 12/31/22 (b)(d) | 4,110,000 | 4,164,786 | |
| Citgo Petroleum Corp. Tranche B, term loan 3 month U.S. LIBOR + 3.500% 5.896% 7/29/21 (b)(d) | 8,154,169 | 8,140,552 | |
| Consolidated Energy Finance SA Tranche B, term loan 3 month U.S. LIBOR + 2.500% 4.7841% 5/7/25 (b)(d) | 1,775,550 | 1,766,672 | |
| TOTAL ENERGY | 14,072,010 | ||
| Food & Drug Retail - 0.7% | |||
| BI-LO LLC Tranche B, term loan 3 month U.S. LIBOR + 8.000% 10.3645% 5/31/24 (b)(d) | 13,765,500 | 13,576,224 | |
| Lannett Co., Inc. Tranche B, term loan 3 month U.S. LIBOR + 5.375% 7.677% 11/25/22 (b)(d) | 6,389,102 | 5,136,838 | |
| TOTAL FOOD & DRUG RETAIL | 18,713,062 | ||
| Gaming - 0.3% | |||
| Caesars Resort Collection LLC Tranche B 1LN, term loan 3 month U.S. LIBOR + 2.750% 5.052% 12/22/24 (b)(d) | 6,718,131 | 6,717,190 | |
| Golden Nugget, Inc. Tranche B 1LN, term loan 3 month U.S. LIBOR + 2.750% 5.2299% 10/4/23 (b)(d) | 1,784,904 | 1,785,743 | |
| TOTAL GAMING | 8,502,933 | ||
| Healthcare - 0.2% | |||
| HLF Financing SARL LLC Tranche B 1LN, term loan 3 month U.S. LIBOR + 3.250% 5.552% 8/18/25 (b)(d) | 580,000 | 582,053 | |
| Valeant Pharmaceuticals International, Inc. Tranche B, term loan 3 month U.S. LIBOR + 3.000% 5.2739% 6/1/25 (b)(d) | 3,939,000 | 3,938,094 | |
| TOTAL HEALTHCARE | 4,520,147 | ||
| Insurance - 0.6% | |||
| AmWINS Group, Inc. Tranche B 1LN, term loan 3 month U.S. LIBOR + 2.750% 5.0471% 1/25/24 (b)(d) | 1,391,459 | 1,392,851 | |
| HUB International Ltd. Tranche B, term loan 3 month U.S. LIBOR + 3.000% 5.4895% 4/25/25 (b)(d) | 12,748,050 | 12,704,197 | |
| TOTAL INSURANCE | 14,097,048 | ||
| Paper - 0.2% | |||
| Caraustar Industries, Inc. Tranche B, term loan 3 month U.S. LIBOR + 5.500% 7.8861% 3/14/22 (b)(d) | 3,968,600 | 3,980,386 | |
| Restaurants - 0.1% | |||
| Burger King Worldwide, Inc. Tranche B, term loan 3 month U.S. LIBOR + 2.250% 4.552% 2/17/24 (b)(d) | 2,589,774 | 2,578,767 | |
| Services - 0.5% | |||
| Almonde, Inc. Tranche B 1LN, term loan 3 month U.S. LIBOR + 3.500% 5.8861% 6/13/24 (b)(d) | 10,609,373 | 10,541,579 | |
| Laureate Education, Inc. Tranche B 1LN, term loan 3 month U.S. LIBOR + 3.500% 6.0266% 4/26/24 (b)(d) | 2,018,050 | 2,019,564 | |
| TOTAL SERVICES | 12,561,143 | ||
| Steel - 0.2% | |||
| Big River Steel LLC Tranche B, term loan 3 month U.S. LIBOR + 5.000% 7.3861% 8/23/23 (b)(d) | 4,479,750 | 4,524,548 | |
| Technology - 0.2% | |||
| Boxer Parent Co., Inc. Tranche B, term loan 3 month U.S. LIBOR + 4.250% 6.6484% 10/2/25 (b)(d) | 3,495,000 | 3,503,388 | |
| First Data Corp. Tranche B, term loan 3 month U.S. LIBOR + 2.000% 4.2865% 4/26/24 (b)(d) | 1,601,285 | 1,591,950 | |
| TOTAL TECHNOLOGY | 5,095,338 | ||
| Telecommunications - 1.2% | |||
| Frontier Communications Corp.: | |||
| Tranche A, term loan 3 month U.S. LIBOR + 2.750% 5.06% 3/31/21 (b)(d) | 13,807,746 | 13,376,254 | |
| Tranche B 1LN, term loan 3 month U.S. LIBOR + 3.750% 6.06% 6/15/24 (b)(d) | 876,588 | 846,784 | |
| Intelsat Jackson Holdings SA: | |||
| Tranche B-4, term loan 3 month U.S. LIBOR + 4.500% 6.7949% 1/2/24 (b)(d) | 960,000 | 993,600 | |
| Tranche B-5, term loan 6.625% 1/2/24 | 965,000 | 988,266 | |
| Radiate Holdco LLC Tranche B, term loan 3 month U.S. LIBOR + 3.000% 5.302% 2/1/24 (b)(d) | 12,065,965 | 11,962,559 | |
| Sprint Communications, Inc. Tranche B, term loan 3 month U.S. LIBOR + 2.500% 4.8125% 2/3/24 (b)(d) | 2,940,225 | 2,937,461 | |
| TOTAL TELECOMMUNICATIONS | 31,104,924 | ||
| Utilities - 0.1% | |||
| Vistra Operations Co. LLC Tranche B 2LN, term loan 3 month U.S. LIBOR + 2.000% 4.552% 12/14/23 (b)(d) | 1,739,025 | 1,739,686 | |
| TOTAL BANK LOAN OBLIGATIONS | |||
| (Cost $142,060,039) | 141,032,072 | ||
| Preferred Securities - 1.9% | |||
| Banks & Thrifts - 1.7% | |||
| Bank of America Corp. 5.2% (b)(h) | 7,680,000 | 7,654,946 | |
| Barclays PLC: | |||
| 7.75% (b)(h) | 1,690,000 | 1,714,387 | |
| 7.875% (Reg. S) (b)(h) | 8,435,000 | 8,773,819 | |
| Credit Agricole SA 6.625% (a)(b)(h) | 1,765,000 | 1,793,057 | |
| Royal Bank of Scotland Group PLC: | |||
| 7.5% (b)(h) | 8,950,000 | 9,156,686 | |
| 8.625% (b)(h) | 2,080,000 | 2,202,371 | |
| Wells Fargo & Co. 5.9% (b)(h) | 10,950,000 | 11,222,404 | |
| TOTAL BANKS & THRIFTS | 42,517,670 | ||
| Energy - 0.2% | |||
| DCP Midstream Partners LP 7.375% (b)(h) | 1,740,000 | 1,715,873 | |
| Summit Midstream Partners LP 9.5% (b)(h) | 3,400,000 | 3,454,669 | |
| TOTAL ENERGY | 5,170,542 | ||
| TOTAL PREFERRED SECURITIES | |||
| (Cost $47,591,858) | 47,688,212 | ||
| Shares | Value | ||
| Money Market Funds - 0.3% | |||
| Fidelity Cash Central Fund, 2.23% (i) | |||
| (Cost $7,829,907) | 7,828,966 | 7,830,531 | |
| TOTAL INVESTMENT IN SECURITIES - 96.7% | |||
| (Cost $2,517,174,144) | 2,451,476,447 | ||
| NET OTHER ASSETS (LIABILITIES) - 3.3% | 82,829,416 | ||
| NET ASSETS - 100% | $2,534,305,863 |
Legend
(a) Security exempt from registration under Rule 144A of the Securities Act of 1933. These securities may be resold in transactions exempt from registration, normally to qualified institutional buyers. At the end of the period, the value of these securities amounted to $1,341,643,559 or 52.9% of net assets.
(b) Coupon rates for floating and adjustable rate securities reflect the rates in effect at period end.
(c) Non-income producing - Security is in default.
(d) Coupon is indexed to a floating interest rate which may be multiplied by a specified factor and/or subject to caps or floors.
(e) Level 3 security
(f) Non-income producing
(g) Restricted securities - Investment in securities not registered under the Securities Act of 1933 (excluding 144A issues). At the end of the period, the value of restricted securities (excluding 144A issues) amounted to $1,057,335 or 0.0% of net assets.
(h) Security is perpetual in nature with no stated maturity date.
(i) Affiliated fund that is generally available only to investment companies and other accounts managed by Fidelity Investments. The rate quoted is the annualized seven-day yield of the fund at period end. A complete unaudited listing of the fund's holdings as of its most recent quarter end is available upon request. In addition, each Fidelity Central Fund's financial statements are available on the SEC's website or upon request.
Additional information on each restricted holding is as follows:
| Security | Acquisition Date | Acquisition Cost |
| Tricer Holdco SCA | 3/11/11 - 12/30/17 | $3,047,870 |
| Tricer Holdco SCA Class A1 | 3/11/11 | $491,406 |
| Tricer Holdco SCA Class A2 | 3/11/11 | $491,406 |
| Tricer Holdco SCA Class A3 | 3/11/11 | $491,406 |
| Tricer Holdco SCA Class A4 | 3/11/11 | $491,406 |
| Tricer Holdco SCA Class A5 | 3/11/11 | $491,406 |
| Tricer Holdco SCA Class A6 | 3/11/11 | $491,406 |
| Tricer Holdco SCA Class A7 | 3/11/11 | $491,406 |
| Tricer Holdco SCA Class A8 | 3/11/11 | $491,406 |
| Tricer Holdco SCA Class A9 | 3/11/11 | $491,848 |
Affiliated Central Funds
Information regarding fiscal year to date income earned by the Fund from investments in Fidelity Central Funds is as follows:
| Fund | Income earned |
| Fidelity Cash Central Fund | $1,811,194 |
| Fidelity Securities Lending Cash Central Fund | 2,077 |
| Total | $1,813,271 |
Amounts in the income column in the above table include any capital gain distributions from underlying funds, which are presented in the corresponding line-item in the Statement of Operations if applicable.
Investment Valuation
The following is a summary of the inputs used, as of October 31, 2018, involving the Fund's assets and liabilities carried at fair value. The inputs or methodology used for valuing securities may not be an indication of the risk associated with investing in those securities. For more information on valuation inputs, and their aggregation into the levels used below, please refer to the Investment Valuation section in the accompanying Notes to Financial Statements.
| Valuation Inputs at Reporting Date: | ||||
| Description | Total | Level 1 | Level 2 | Level 3 |
| Investments in Securities: | ||||
| Equities: | ||||
| Consumer Discretionary | $4,075,413 | $-- | $-- | $4,075,413 |
| Consumer Staples | 31,028,726 | -- | -- | 31,028,726 |
| Energy | 11,919,675 | -- | 11,919,675 | -- |
| Industrials | 18,626,759 | 17,569,426 | -- | 1,057,333 |
| Materials | 30,303 | 30,303 | -- | -- |
| Real Estate | 2,089,028 | -- | 2,089,028 | -- |
| Utilities | 6,285,417 | -- | 6,285,417 | -- |
| Corporate Bonds | 2,180,870,311 | -- | 2,180,870,305 | 6 |
| Bank Loan Obligations | 141,032,072 | -- | 141,032,072 | -- |
| Preferred Securities | 47,688,212 | -- | 47,688,212 | -- |
| Money Market Funds | 7,830,531 | 7,830,531 | -- | -- |
| Total Investments in Securities: | $2,451,476,447 | $25,430,260 | $2,389,884,709 | $36,161,478 |
The following are reconciliations of Investments in Securities and Derivative Instruments for which Level 3 inputs were used in determining value:
| Investments in Securities: | |
| Equities - Consumer Staples | |
| Beginning Balance | $-- |
| Net Realized Gain (Loss) on Investment Securities | -- |
| Net Unrealized Gain (Loss) on Investment Securities | 7,745,712 |
| Cost of Purchases | 23,283,014 |
| Proceeds of Sales | -- |
| Amortization/Accretion | -- |
| Transfers into Level 3 | -- |
| Transfers out of Level 3 | -- |
| Ending Balance | $31,028,726 |
| The change in unrealized gain (loss) for the period attributable to Level 3 securities held at October 31, 2018 | $7,745,712 |
| Other Investments in Securities | |
| Beginning Balance | $7,295,357 |
| Net Realized Gain (Loss) on Investment Securities | (1) |
| Net Unrealized Gain (Loss) on Investment Securities | (2,162,604) |
| Cost of Purchases | -- |
| Proceeds of Sales | -- |
| Amortization/Accretion | -- |
| Transfers into Level 3 | -- |
| Transfers out of Level 3 | -- |
| Ending Balance | $5,132,752 |
| The change in unrealized gain (loss) for the period attributable to Level 3 securities held at October 31, 2018 | $(2,162,602) |
The information used in the above reconciliations represents fiscal year to date activity for any Investments in Securities identified as using Level 3 inputs at either the beginning or the end of the current fiscal period. Transfers in or out of Level 3 represent the beginning value of any Security or Instrument where a change in the pricing level occurred from the beginning to the end of the period. The cost of purchases and the proceeds of sales may include securities received or delivered through corporate actions or exchanges. Realized and unrealized gains (losses) disclosed in the reconciliations are included in Net Gain (Loss) on the Fund's Statement of Operations.
Other Information
Distribution of investments by country or territory of incorporation, as a percentage of Total Net Assets, is as follows (Unaudited):
| United States of America | 74.3% |
| Canada | 6.9% |
| Luxembourg | 5.2% |
| Netherlands | 3.3% |
| Cayman Islands | 2.1% |
| United Kingdom | 1.8% |
| Multi-National | 1.5% |
| Ireland | 1.3% |
| Bermuda | 1.1% |
| Austria | 1.0% |
| Others (Individually Less Than 1%) | 1.5% |
| 100.0% |
See accompanying notes which are an integral part of the financial statements.
Financial Statements
Statement of Assets and Liabilities
| October 31, 2018 (Unaudited) | ||
| Assets | ||
| Investment in securities, at value — See accompanying schedule: Unaffiliated issuers (cost $2,509,344,237) | $2,443,645,916 | |
| Fidelity Central Funds (cost $7,829,907) | 7,830,531 | |
| Total Investment in Securities (cost $2,517,174,144) | $2,451,476,447 | |
| Receivable for investments sold | 68,208,846 | |
| Receivable for fund shares sold | 96,099 | |
| Dividends receivable | 329,594 | |
| Interest receivable | 38,767,751 | |
| Distributions receivable from Fidelity Central Funds | 216,434 | |
| Total assets | 2,559,095,171 | |
| Liabilities | ||
| Payable for investments purchased | $20,469,710 | |
| Payable for fund shares redeemed | 4,308,444 | |
| Other payables and accrued expenses | 11,154 | |
| Total liabilities | 24,789,308 | |
| Net Assets | $2,534,305,863 | |
| Net Assets consist of: | ||
| Paid in capital | $2,830,377,633 | |
| Total distributable earnings (loss) | (296,071,770) | |
| Net Assets | $2,534,305,863 | |
| Net Asset Value and Maximum Offering Price | ||
| Net Asset Value, offering price and redemption price per share ($2,534,305,863 ÷ 270,335,116 shares) | $9.37 |
See accompanying notes which are an integral part of the financial statements.
Statement of Operations
| Six months ended October 31, 2018 (Unaudited) | ||
| Investment Income | ||
| Dividends | $1,787,436 | |
| Interest | 84,735,445 | |
| Income from Fidelity Central Funds | 1,813,271 | |
| Total income | 88,336,152 | |
| Expenses | ||
| Custodian fees and expenses | $17,193 | |
| Independent trustees' fees and expenses | 8,392 | |
| Commitment fees | 3,661 | |
| Total expenses before reductions | 29,246 | |
| Expense reductions | (10,753) | |
| Total expenses after reductions | 18,493 | |
| Net investment income (loss) | 88,317,659 | |
| Realized and Unrealized Gain (Loss) | ||
| Net realized gain (loss) on: | ||
| Investment securities: | ||
| Unaffiliated issuers | (19,828,806) | |
| Fidelity Central Funds | 9,157 | |
| Foreign currency transactions | 2,400 | |
| Total net realized gain (loss) | (19,817,249) | |
| Change in net unrealized appreciation (depreciation) on: | ||
| Investment securities: | ||
| Unaffiliated issuers | (36,654,974) | |
| Fidelity Central Funds | (9,284) | |
| Total change in net unrealized appreciation (depreciation) | (36,664,258) | |
| Net gain (loss) | (56,481,507) | |
| Net increase (decrease) in net assets resulting from operations | $31,836,152 |
See accompanying notes which are an integral part of the financial statements.
Statement of Changes in Net Assets
| Six months ended October 31, 2018 (Unaudited) | Year ended April 30, 2018 | |
| Increase (Decrease) in Net Assets | ||
| Operations | ||
| Net investment income (loss) | $88,317,659 | $182,294,882 |
| Net realized gain (loss) | (19,817,249) | 24,517,266 |
| Change in net unrealized appreciation (depreciation) | (36,664,258) | (67,648,258) |
| Net increase (decrease) in net assets resulting from operations | 31,836,152 | 139,163,890 |
| Distributions to shareholders | (81,399,901) | – |
| Distributions to shareholders from net investment income | – | (176,063,609) |
| Total distributions | (81,399,901) | (176,063,609) |
| Share transactions - net increase (decrease) | (299,935,281) | 141,241,043 |
| Total increase (decrease) in net assets | (349,499,030) | 104,341,324 |
| Net Assets | ||
| Beginning of period | 2,883,804,893 | 2,779,463,569 |
| End of period | $2,534,305,863 | $2,883,804,893 |
| Other Information | ||
| Undistributed net investment income end of period | $28,150,020 |
See accompanying notes which are an integral part of the financial statements.
Financial Highlights
Fidelity Series High Income Fund
| Six months ended (Unaudited) October 31, | Years endedApril 30, | |||||
| 2018 | 2018 | 2017 | 2016 | 2015 | 2014 | |
| Selected Per–Share Data | ||||||
| Net asset value, beginning of period | $9.56 | $9.68 | $8.96 | $9.87 | $10.58 | $10.63 |
| Income from Investment Operations | ||||||
| Net investment income (loss)A | .304 | .623 | .557 | .550 | .565 | .566 |
| Net realized and unrealized gain (loss) | (.214) | (.141) | .687 | (.867) | (.382) | (.033) |
| Total from investment operations | .090 | .482 | 1.244 | (.317) | .183 | .533 |
| Distributions from net investment income | (.280) | (.602) | (.524) | (.546) | (.552) | (.554) |
| Distributions from net realized gain | – | – | – | (.047) | (.341) | (.029) |
| Total distributions | (.280) | (.602) | (.524) | (.593) | (.893) | (.583) |
| Net asset value, end of period | $9.37 | $9.56 | $9.68 | $8.96 | $9.87 | $10.58 |
| Total ReturnB,C | .93% | 5.08% | 14.25% | (3.08)% | 1.86% | 5.23% |
| Ratios to Average Net AssetsD,E | ||||||
| Expenses before reductions | - %F,G | .06% | .69% | .69% | .69% | .70% |
| Expenses net of fee waivers, if any | - %F,G | .05% | .69% | .69% | .69% | .70% |
| Expenses net of all reductions | - %F,G | .05% | .69% | .69% | .69% | .69% |
| Net investment income (loss) | 6.31%F | 6.44% | 6.00% | 6.07% | 5.51% | 5.42% |
| Supplemental Data | ||||||
| Net assets, end of period (000 omitted) | $2,534,306 | $2,883,805 | $1,285,072 | $2,417,317 | $2,835,891 | $5,367,464 |
| Portfolio turnover rateH | 81%F | 49% | 44% | 34% | 31% | 54% |
A Calculated based on average shares outstanding during the period.
B Total returns for periods of less than one year are not annualized.
C Total returns would have been lower if certain expenses had not been reduced during the applicable periods shown.
D Fees and expenses of any underlying Fidelity Central Funds are not included in the Fund's expense ratio. The Fund indirectly bears its proportionate share of the expenses of any underlying Fidelity Central Funds.
E Expense ratios reflect operating expenses of the Fund. Expenses before reductions do not reflect amounts reimbursed by the investment adviser or reductions from brokerage service arrangements or reductions from other expense offset arrangements and do not represent the amount paid by the Fund during periods when reimbursements or reductions occur. Expenses net of fee waivers reflect expenses after reimbursement by the investment adviser but prior to reductions from brokerage service arrangements or other expense offset arrangements. Expenses net of all reductions represent the net expenses paid by the Fund.
F Annualized
G Amount represents less than .005%.
H Amount does not include the portfolio activity of any underlying Fidelity Central Funds.
See accompanying notes which are an integral part of the financial statements.
Notes to Financial Statements (Unaudited)
For the period ended October 31, 2018
1. Organization.
Fidelity Series High Income Fund (the Fund) is a fund of Fidelity Summer Street Trust (the Trust) and is authorized to issue an unlimited number of shares. Shares of the Fund are only available for purchase by mutual funds for which Fidelity Management & Research Company (FMR) or an affiliate serves as an investment manager. The Trust is registered under the Investment Company Act of 1940, as amended (the 1940 Act), as an open-end management investment company organized as a Massachusetts business trust. Effective August 28, 2017, the Fund no longer offered Class F shares, and all outstanding shares of Class F were exchanged for shares of Series High Income.
2. Investments in Fidelity Central Funds.
The Fund invests in Fidelity Central Funds, which are open-end investment companies generally available only to other investment companies and accounts managed by the investment adviser and its affiliates. The Fund's Schedule of Investments lists each of the Fidelity Central Funds held as of period end, if any, as an investment of the Fund, but does not include the underlying holdings of each Fidelity Central Fund. As an Investing Fund, the Fund indirectly bears its proportionate share of the expenses of the underlying Fidelity Central Funds.
The Money Market Central Funds seek preservation of capital and current income and are managed by Fidelity Investments Money Management, Inc. (FIMM), an affiliate of the investment adviser. Annualized expenses of the Money Market Central Funds as of their most recent shareholder report date are less than .005%.
A complete unaudited list of holdings for each Fidelity Central Fund is available upon request or at the Securities and Exchange Commission (the SEC) website at www.sec.gov. In addition, the financial statements of the Fidelity Central Funds are available on the SEC website or upon request.
3. Significant Accounting Policies.
The Fund is an investment company and applies the accounting and reporting guidance of the Financial Accounting Standards Board (FASB) Accounting Standards Codification Topic 946 Financial Services – Investments Companies. The financial statements have been prepared in conformity with accounting principles generally accepted in the United States of America (GAAP), which require management to make certain estimates and assumptions at the date of the financial statements. Actual results could differ from those estimates. Subsequent events, if any, through the date that the financial statements were issued have been evaluated in the preparation of the financial statements. The following summarizes the significant accounting policies of the Fund:
Investment Valuation. Investments are valued as of 4:00 p.m. Eastern time on the last calendar day of the period. The Board of Trustees (the Board) has delegated the day to day responsibility for the valuation of the Fund's investments to the Fair Value Committee (the Committee) established by the Fund's investment adviser. In accordance with valuation policies and procedures approved by the Board, the Fund attempts to obtain prices from one or more third party pricing vendors or brokers to value its investments. When current market prices, quotations or currency exchange rates are not readily available or reliable, investments will be fair valued in good faith by the Committee, in accordance with procedures adopted by the Board. Factors used in determining fair value vary by investment type and may include market or investment specific events, changes in interest rates and credit quality. The frequency with which these procedures are used cannot be predicted and they may be utilized to a significant extent. The Committee oversees the Fund's valuation policies and procedures and reports to the Board on the Committee's activities and fair value determinations. The Board monitors the appropriateness of the procedures used in valuing the Fund's investments and ratifies the fair value determinations of the Committee.
The Fund categorizes the inputs to valuation techniques used to value its investments into a disclosure hierarchy consisting of three levels as shown below:
- Level 1 – quoted prices in active markets for identical investments
- Level 2 – other significant observable inputs (including quoted prices for similar investments, interest rates, prepayment speeds, etc.)
- Level 3 – unobservable inputs (including the Fund's own assumptions based on the best information available)
Valuation techniques used to value the Fund's investments by major category are as follows:
Debt securities, including restricted securities, are valued based on evaluated prices received from third party pricing vendors or from brokers who make markets in such securities. Corporate bonds, bank loan obligations and preferred securities are valued by pricing vendors who utilize matrix pricing which considers yield or price of bonds of comparable quality, coupon, maturity and type or by broker-supplied prices. When independent prices are unavailable or unreliable, debt securities may be valued utilizing pricing methodologies which consider similar factors that would be used by third party pricing vendors. Debt securities are generally categorized as Level 2 in the hierarchy but may be Level 3 depending on the circumstances. The Fund invests a significant portion of its assets in below investment grade securities. The value of these securities can be more volatile due to changes in the credit quality of the issuer and is sensitive to changes in economic, market and regulatory conditions.
Equity securities, including restricted securities, for which market quotations are readily available, are valued at the last reported sale price or official closing price as reported by a third party pricing vendor on the primary market or exchange on which they are traded and are categorized as Level 1 in the hierarchy. In the event there were no sales during the day or closing prices are not available, securities are valued at the last quoted bid price or may be valued using the last available price and are generally categorized as Level 2 in the hierarchy. For foreign equity securities, when market or security specific events arise, comparisons to the valuation of American Depositary Receipts (ADRs), futures contracts, Exchange-Traded Funds (ETFs) and certain indexes as well as quoted prices for similar securities may be used and would be categorized as Level 2 in the hierarchy. Utilizing these techniques may result in transfers between Level 1 and Level 2. For equity securities, including restricted securities, where observable inputs are limited, assumptions about market activity and risk are used and these securities may be categorized as Level 3 in the hierarchy. Equity securities, including restricted securities, for which observable inputs are not available are valued using alternate valuation approaches, including the market approach and the income approach and are categorized as Level 3 in the hierarchy. The market approach generally consists of using comparable market transactions while the income approach generally consists of using the net present value of estimated future cash flows, adjusted as appropriate for liquidity, credit, market and/or other risk factors.
Investments in open-end mutual funds, including the Fidelity Central Funds, are valued at their closing net asset value (NAV) each business day and are categorized as Level 1 in the hierarchy.
The following provides information on Level 3 securities held by the Fund that were valued at period end based on unobservable inputs. These amounts exclude valuations provided by a broker.
| Asset Type | Fair Value | Valuation Technique(s) | Unobservable Input | Amount or Range/Weighted Average | Impact to Valuation from an Increase in Input(a) |
| Corporate Bond | $6 | Recovery value | Recovery value | 0.0% | Increase |
| Equities | $36,161,472 | Market comparable | Enterprise value/EBITDA multiple (EV/EBITDA) | 3.5 - 5.7 / 5.4 | Increase |
| Discount rate | 10.0% - 15.0% / 10.6% | Decrease | |||
| Discount for lack of marketability | 10.0% - 15.0% / 10.0% | Decrease | |||
| Strike price | $15.68 | Increase | |||
| Book value | Book value multiple | 1.0 | Increase | ||
| Recovery value | Recovery value | 0.0% | Increase |
(a) Represents the expected directional change in the fair value of the Level 3 investments that would result from an increase in the corresponding input. A decrease to the unobservable input would have the opposite effect. Significant changes in these inputs could result in significantly higher or lower fair value measurements.
Changes in valuation techniques may result in transfers in or out of an assigned level within the disclosure hierarchy. The aggregate value of investments by input level as of October 31, 2018, as well as a roll forward of Level 3 investments, is included at the end of the Fund's Schedule of Investments.
Foreign Currency. The Fund may use foreign currency contracts to facilitate transactions in foreign-denominated securities. Gains and losses from these transactions may arise from changes in the value of the foreign currency or if the counterparties do not perform under the contracts' terms.
Foreign-denominated assets, including investment securities, and liabilities are translated into U.S. dollars at the exchange rates at period end. Purchases and sales of investment securities, income and dividends received and expenses denominated in foreign currencies are translated into U.S. dollars at the exchange rate in effect on the transaction date.
The effects of exchange rate fluctuations on investments are included with the net realized and unrealized gain (loss) on investment securities. Other foreign currency transactions resulting in realized and unrealized gain (loss) are disclosed separately.
Investment Transactions and Income. For financial reporting purposes, the Fund's investment holdings and NAV include trades executed through the end of the last business day of the period. The NAV per share for processing shareholder transactions is calculated as of the close of business of the New York Stock Exchange (NYSE), normally 4:00 p.m. Eastern time and includes trades executed through the end of the prior business day. Gains and losses on securities sold are determined on the basis of identified cost and include proceeds received from litigation. Dividend income is recorded on the ex-dividend date, except for certain dividends from foreign securities where the ex-dividend date may have passed, which are recorded as soon as the Fund is informed of the ex-dividend date. Non-cash dividends included in dividend income, if any, are recorded at the fair market value of the securities received. Income and capital gain distributions from Fidelity Central Funds, if any, are recorded on the ex-dividend date. Certain distributions received by the Fund represent a return of capital or capital gain. The Fund determines the components of these distributions subsequent to the ex-dividend date, based upon receipt of tax filings or other correspondence relating to the underlying investment. These distributions are recorded as a reduction of cost of investments and/or as a realized gain. Interest income is accrued as earned and includes coupon interest and amortization of premium and accretion of discount on debt securities as applicable. Paid in Kind (PIK) income is recorded at the fair market value of the securities received. Investment income is recorded net of foreign taxes withheld where recovery of such taxes is uncertain. Debt obligations may be placed on non-accrual status and related interest income may be reduced by ceasing current accruals and writing off interest receivables when the collection of all or a portion of interest has become doubtful based on consistently applied procedures. A debt obligation is removed from non-accrual status when the issuer resumes interest payments or when collectability of interest is reasonably assured.
Expenses. Expenses directly attributable to a fund are charged to that fund. Expenses attributable to more than one fund are allocated among the respective funds on the basis of relative net assets or other appropriate methods. Expense estimates are accrued in the period to which they relate and adjustments are made when actual amounts are known.
Income Tax Information and Distributions to Shareholders. Each year, the Fund intends to qualify as a regulated investment company under Subchapter M of the Internal Revenue Code, including distributing substantially all of its taxable income and realized gains. As a result, no provision for U.S. Federal income taxes is required. The Fund files a U.S. federal tax return, in addition to state and local tax returns as required. The Fund's federal income tax returns are subject to examination by the Internal Revenue Service (IRS) for a period of three fiscal years after they are filed. State and local tax returns may be subject to examination for an additional fiscal year depending on the jurisdiction. Foreign taxes are provided for based on the Fund's understanding of the tax rules and rates that exist in the foreign markets in which it invests.
Distributions are declared and recorded daily and paid monthly from net investment income. Distributions from realized gains, if any, are declared and recorded on the ex-dividend date. Income and capital gain distributions are determined in accordance with income tax regulations, which may differ from GAAP.
Capital accounts within the financial statements are adjusted for permanent book-tax differences. These adjustments have no impact on net assets or the results of operations. Capital accounts are not adjusted for temporary book-tax differences which will reverse in a subsequent period.
Book-tax differences are primarily due to foreign currency transactions, market discount, contingent interest, certain conversion ratio adjustments, equity-debt classifications, partnerships, capital loss carryforwards and losses deferred due to wash sales.
As of period end, the cost and unrealized appreciation (depreciation) in securities, and derivatives if applicable, for federal income tax purposes were as follows:
| Gross unrealized appreciation | $51,248,305 |
| Gross unrealized depreciation | (100,970,708) |
| Net unrealized appreciation (depreciation) | $(49,722,403) |
| Tax cost | $2,501,198,850 |
Capital loss carryforwards are only available to offset future capital gains of the Fund to the extent provided by regulations and may be limited. Under the Regulated Investment Company Modernization Act of 2010 (the Act), the Fund is permitted to carry forward capital losses incurred in taxable years beginning after December 22, 2010 for an unlimited period and such capital losses are required to be used prior to any losses that expire. The capital loss carryforward information presented below, including any applicable limitation, is estimated as of prior fiscal period end and is subject to adjustment.
| No expiration | |
| Long-term | $(243,806,924) |
Restricted Securities. The Fund may invest in securities that are subject to legal or contractual restrictions on resale. These securities generally may be resold in transactions exempt from registration or to the public if the securities are registered. Disposal of these securities may involve time-consuming negotiations and expense, and prompt sale at an acceptable price may be difficult. Information regarding restricted securities is included at the end of the Fund's Schedule of Investments.
Loans and Other Direct Debt Instruments. The Fund invests in direct debt instruments which are interests in amounts owed to lenders by corporate or other borrowers. These instruments may be in the form of loans, trade claims or other receivables and may include standby financing commitments such as revolving credit facilities that obligate the Fund to supply additional cash to the borrower on demand. Loans may be acquired through assignment or participation. The Fund did not have any unfunded loan commitments, which are contractual obligations for future funding, at period end.
New Accounting Pronouncement. In March 2017, the Financial Accounting Standards Board (FASB) issued an Accounting Standards Update (ASU), ASU 2017-08, which amends the amortization period for certain callable debt securities that are held at a premium. The amendment requires the premium to be amortized to the earliest call date. The amendments do not require an accounting change for securities held at a discount. The ASU is effective for annual periods beginning after December 15, 2018. Management is currently evaluating the potential impact of these changes to the financial statements.
New Rule Issuance. During August 2018, the U.S. Securities and Exchange Commission issued Final Rule Release No. 33-10532, Disclosure Update and Simplification. This Final Rule includes amendments specific to registered investment companies that are intended to eliminate overlap in disclosure requirements between Regulation S-X and GAAP. In accordance with these amendments, certain line-items in the Fund's financial statements have been combined or removed for the current period as outlined in the table below.
| Financial Statement | Current Line-Item Presentation | Prior Line-Item Presentation |
| Statement of Assets and Liabilities | Total distributable earnings (loss) | Undistributed/Distributions in excess of/Accumulated net investment income (loss) Accumulated/Undistributed net realized gain (loss) Net unrealized appreciation (depreciation) |
| Statement of Changes in Net Assets | N/A – removed | Undistributed/Distributions in excess of/Accumulated net investment income (loss) end of period |
| Distributions to Shareholders Note to Financial Statements | Distributions to shareholders | Distributions to shareholders from net investment income Distributions to shareholders from net realized gain |
4. Purchases and Sales of Investments.
Purchases and sales of securities, other than short-term securities, aggregated $1,047,985,024 and $1,145,040,209, respectively.
5. Fees and Other Transactions with Affiliates.
Management Fee. Fidelity Management & Research Company (the investment adviser) and its affiliates provide the Fund with investment management related services for which the Fund does not pay a management fee. Under the management contract, the investment adviser or an affiliate pays all ordinary operating expenses of the Fund, except custody fees, fees and expenses of the independent Trustees, and certain miscellaneous expenses such as proxy and shareholder meeting expenses.
Interfund Trades. The Fund may purchase from or sell securities to other Fidelity Funds under procedures adopted by the Board. The procedures have been designed to ensure these interfund trades are executed in accordance with Rule 17a-7 of the 1940 Act. Interfund trades are included within the respective purchases and sales amounts shown in the Purchases and Sales of Investments note.
6. Committed Line of Credit.
The Fund participates with other funds managed by the investment adviser or an affiliate in a $4.25 billion credit facility (the "line of credit") to be utilized for temporary or emergency purposes to fund shareholder redemptions or for other short-term liquidity purposes. The Fund has agreed to pay commitment fees on its pro-rata portion of the line of credit, which amounted to $3,661 and is reflected in Commitment fees on the Statement of Operations. During the period, the Fund did not borrow on this line of credit.
7. Security Lending.
The Fund lends portfolio securities through a lending agent from time to time in order to earn additional income. For equity securities, a lending agent is used and may loan securities to certain qualified borrowers, including Fidelity Capital Markets (FCM), a broker-dealer affiliated with the Fund. On the settlement date of the loan, the Fund receives collateral (in the form of U.S. Treasury obligations, letters of credit and/or cash) against the loaned securities and maintains collateral in an amount not less than 100% of the market value of the loaned securities during the period of the loan. The market value of the loaned securities is determined at the close of business of the Fund and any additional required collateral is delivered to the Fund on the next business day. The Fund or borrower may terminate the loan at any time, and if the borrower defaults on its obligation to return the securities loaned because of insolvency or other reasons, the Fund may apply collateral received from the borrower against the obligation. The Fund may experience delays and costs in recovering the securities loaned. Any cash collateral received is invested in the Fidelity Securities Lending Cash Central Fund. At period end, there were no security loans outstanding. Security lending income represents the income earned on investing cash collateral, less rebates paid to borrowers and any lending agent fees associated with the loan, plus any premium payments received for lending certain types of securities. Security lending income is presented in the Statement of Operations as a component of income from Fidelity Central Funds. Total security lending income during the period amounted to $2,077. During the period, there were no securities loaned to FCM.
8. Expense Reductions.
Through arrangements with the Fund's custodian, credits realized as a result of certain uninvested cash balances were used to reduce the Fund's expenses. During the period, these credits reduced the Fund's custody expenses by $10,753.
9. Distributions to Shareholders.
Distributions to shareholders of each class were as follows:
| Six months ended October 31, 2018 | Year ended April 30, 2018 |
|
| Distributions to shareholders | ||
| Series High Income | $81,399,901 | $– |
| Total | $81,399,901 | $– |
| From net investment income | ||
| Series High Income | $– | $149,099,935 |
| Class F | – | 26,963,674 |
| Total | $– | $176,063,609 |
10. Share Transactions.
Transactions for each class of shares were as follows:
| Shares | Shares | Dollars | Dollars | |
| Six months ended October 31, 2018 | Year ended April 30, 2018 | Six months ended October 31, 2018 | Year ended April 30, 2018 | |
| Series High Income | ||||
| Shares sold | 6,491,007 | 176,504,625 | $61,989,730 | $1,705,652,741 |
| Reinvestment of distributions | 8,545,076 | 15,078,574 | 81,399,901 | 145,891,047 |
| Shares redeemed | (46,511,665) | (22,564,457) | (443,324,912) | (218,685,661) |
| Net increase (decrease) | (31,475,582) | 169,018,742 | $(299,935,281) | $1,632,858,127 |
| Class F | ||||
| Shares sold | – | 4,069,818 | $– | $39,433,422 |
| Reinvestment of distributions | – | 2,131,566 | – | 20,689,896 |
| Shares redeemed | – | (160,622,473) | – | (1,551,740,402) |
| Net increase (decrease) | – | (154,421,089) | $– | $(1,491,617,084) |
11. Other.
The Fund's organizational documents provide former and current trustees and officers with a limited indemnification against liabilities arising in connection with the performance of their duties to the Fund. In the normal course of business, the Fund may also enter into contracts that provide general indemnifications. The Fund's maximum exposure under these arrangements is unknown as this would be dependent on future claims that may be made against the Fund. The risk of material loss from such claims is considered remote.
At the end of the period, mutual funds managed by the investment adviser or its affiliates were the owners of record of all of the outstanding shares of the Fund.
Shareholder Expense Example
As a shareholder of the Fund, you incur two types of costs: (1) transaction costs and (2) ongoing costs, including other Fund expenses. This Example is intended to help you understand your ongoing costs (in dollars) of investing in the Fund and to compare these costs with the ongoing costs of investing in other mutual funds.
The Example is based on an investment of $1,000 invested at the beginning of the period and held for the entire period (May 1, 2018 to October 31, 2018).
Actual Expenses
The first line of the accompanying table provides information about actual account values and actual expenses. You may use the information in this line, together with the amount you invested, to estimate the expenses that you paid over the period. Simply divide your account value by $1,000.00 (for example, an $8,600 account value divided by $1,000.00 = 8.6), then multiply the result by the number in the first line under the heading entitled "Expenses Paid During Period" to estimate the expenses you paid on your account during this period. In addition, the Fund, as a shareholder in the underlying Fidelity Central Funds, will indirectly bear its pro-rata share of the fees and expenses incurred by the underlying Fidelity Central Funds. These fees and expenses are not included in the Fund's annualized expense ratio used to calculate the expense estimate in the table below.
Hypothetical Example for Comparison Purposes
The second line of the accompanying table provides information about hypothetical account values and hypothetical expenses based on the Fund's actual expense ratio and an assumed rate of return of 5% per year before expenses, which is not the Fund's actual return. The hypothetical account values and expenses may not be used to estimate the actual ending account balance or expenses you paid for the period. You may use this information to compare the ongoing costs of investing in the Fund and other funds. To do so, compare this 5% hypothetical example with the 5% hypothetical examples that appear in the shareholder reports of the other funds. In addition, the Fund, as a shareholder in the underlying Fidelity Central Funds, will indirectly bear its pro-rata share of the fees and expenses incurred by the underlying Fidelity Central Funds. These fees and expenses are not included in the Fund's annualized expense ratio used to calculate the expense estimate in the table below.
Please note that the expenses shown in the table are meant to highlight your ongoing costs only and do not reflect any transaction costs. Therefore, the second line of the table is useful in comparing ongoing costs only, and will not help you determine the relative total costs of owning different funds.
| Annualized Expense Ratio-A | Beginning Account Value May 1, 2018 | Ending Account Value October 31, 2018 | Expenses Paid During Period-B May 1, 2018 to October 31, 2018 |
|
| Series High Income | - %-C | |||
| Actual | $1,000.00 | $1,009.30 | $--D | |
| Hypothetical-E | $1,000.00 | $1,025.21 | $--D |
A Annualized expense ratio reflects expenses net of applicable fee waivers.
B Expenses are equal to the Fund's annualized expense ratio, multiplied by the average account value over the period, multiplied by 184/365 (to reflect the one-half year period).
C Amount represents less than .005%.
D Amount represents less than $.005.
E 5% return per year before expenses
Board Approval of Investment Advisory Contracts
Fidelity Series High Income Fund
At its July 2018 meeting, the Board of Trustees, including the Independent Trustees (together, the Board), voted to continue the management contract with Fidelity Management & Research Company (FMR) and the sub-advisory agreements (together, the Advisory Contracts) for the fund for six months through January 31, 2019, in connection with the reunification of the Fidelity Equity High Income Funds Board, which oversees the fund, and the Sector Portfolios Board.
The Board considered that the approval of the fund's Advisory Contracts will not result in any changes in (i) the investment process or strategies employed in the management of the fund's assets; (ii) the fees and expenses paid by shareholders, including the expense cap arrangement currently in place for the fund; (iii) the nature, extent or quality of services provided under the fund's Advisory Contracts; or (iv) the day-to-day management of the fund or the persons primarily responsible for such management. The Board concluded that the fund's Advisory Contracts are fair and reasonable, and that the fund's Advisory Contracts should be renewed, without modification, through January 31, 2019, with the understanding that the Board will consider the annual renewal for a full one year period in January 2019.
In connection with its consideration of future renewals of the fund's Advisory Contracts, the Board will consider: (i) the nature, extent and quality of services provided to the fund, including shareholder and administrative services and investment performance; (ii) the competitiveness of the management fee and total expenses for the fund; (iii) the costs of the services and profitability, including the revenues earned and the expenses incurred in conducting the business of developing, marketing, distributing, managing, administering, and servicing the fund and its shareholders, to the extent applicable, as well as potential fall-out benefits from Fidelity's non-fund businesses; and (iv) whether there have been economies of scale in respect of the Fidelity funds, whether the Fidelity funds (including the fund) have appropriately benefited from any such economies of scale, and whether there is the potential for realization of any further economies.
Based on its evaluation of all of the conclusions noted above, and after considering all factors it believed relevant, the Board ultimately concluded that the fund's management fee structure is fair and reasonable, and that the continuation of the fund's Advisory Contracts should be approved.
![]()
Corporate Headquarters
245 Summer St.
Boston, MA 02210
www.fidelity.com
FSH-SANN-1218
1.924273.107
|
Fidelity Advisor® Short Duration High Income Fund - Semi-Annual Report October 31, 2018 Class A, Class M, Class C, Class I and Class Z are classes of Fidelity® Short Duration High Income Fund |
|
|
Contents
To view a fund's proxy voting guidelines and proxy voting record for the 12-month period ended June 30, visit http://www.fidelity.com/proxyvotingresults or visit the Securities and Exchange Commission's (SEC) web site at http://www.sec.gov.
You may also call 1-877-208-0098 to request a free copy of the proxy voting guidelines.
Standard & Poor's, S&P and S&P 500 are registered service marks of The McGraw-Hill Companies, Inc. and have been licensed for use by Fidelity Distributors Corporation.
Other third-party marks appearing herein are the property of their respective owners.
All other marks appearing herein are registered or unregistered trademarks or service marks of FMR LLC or an affiliated company. © 2018 FMR LLC. All rights reserved.
This report and the financial statements contained herein are submitted for the general information of the shareholders of the Fund. This report is not authorized for distribution to prospective investors in the Fund unless preceded or accompanied by an effective prospectus.
A fund files its complete schedule of portfolio holdings with the SEC for the first and third quarters of each fiscal year on Form N-Q. Forms N-Q are available on the SEC’s web site at http://www.sec.gov. A fund's Forms N-Q may be reviewed and copied at the SEC’s Public Reference Room in Washington, DC. Information regarding the operation of the SEC's Public Reference Room may be obtained by calling 1-800-SEC-0330.
For a complete list of a fund's portfolio holdings, view the most recent holdings listing, semiannual report, or annual report on Fidelity's web site at http://www.fidelity.com, http://www.institutional.fidelity.com, or http://www.401k.com, as applicable.
NOT FDIC INSURED •MAY LOSE VALUE •NO BANK GUARANTEE
Neither the Fund nor Fidelity Distributors Corporation is a bank.
Investment Summary (Unaudited)
Top Five Holdings as of October 31, 2018
| (by issuer, excluding cash equivalents) | % of fund's net assets |
| TransDigm, Inc. | 3.3 |
| Icahn Enterprises LP/Icahn Enterprises Finance Corp. | 3.3 |
| CCO Holdings LLC/CCO Holdings Capital Corp. | 3.0 |
| Valeant Pharmaceuticals International, Inc. | 2.9 |
| First Quantum Minerals Ltd. | 2.7 |
| 15.2 |
Top Five Market Sectors as of October 31, 2018
| % of fund's net assets | |
| Energy | 15.1 |
| Healthcare | 8.6 |
| Cable/Satellite TV | 8.0 |
| Utilities | 7.6 |
| Diversified Financial Services | 6.0 |
Quality Diversification (% of fund's net assets)
| As of October 31, 2018 | ||
| AAA,AA,A | 1.3% | |
| BBB | 7.7% | |
| BB | 35.8% | |
| B | 40.2% | |
| CCC,CC,C | 9.7% | |
| Not Rated | 1.3% | |
| Short-Term Investments and Net Other Assets | 4.0% | |
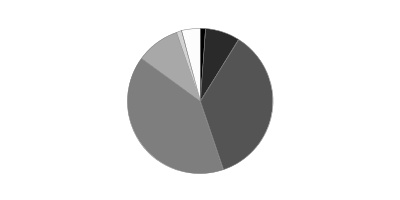
We have used ratings from Moody's Investors Service, Inc. Where Moody's® ratings are not available, we have used S&P® ratings. All ratings are as of the date indicated and do not reflect subsequent changes.
Asset Allocation (% of fund's net assets)
| As of October 31, 2018* | ||
| Nonconvertible Bonds | 78.9% | |
| Convertible Bonds, Preferred Stocks | 0.5% | |
| Bank Loan Obligations | 15.2% | |
| Other Investments | 1.4% | |
| Short-Term Investments and Net Other Assets (Liabilities) | 4.0% | |

* Foreign investments - 23.3%
Schedule of Investments October 31, 2018 (Unaudited)
Showing Percentage of Net Assets
| Corporate Bonds - 79.4% | |||
| Principal Amount | Value | ||
| Convertible Bonds - 0.5% | |||
| Broadcasting - 0.2% | |||
| DISH Network Corp. 2.375% 3/15/24 | $260,000 | $218,147 | |
| Utilities - 0.3% | |||
| SolarCity Corp. 1.625% 11/1/19 | 360,000 | 339,279 | |
| TOTAL CONVERTIBLE BONDS | 557,426 | ||
| Nonconvertible Bonds - 78.9% | |||
| Aerospace - 4.7% | |||
| Bombardier, Inc.: | |||
| 6.125% 1/15/23 (a) | 2,530,000 | 2,498,375 | |
| 7.5% 12/1/24 (a) | 105,000 | 106,706 | |
| TransDigm, Inc. 6% 7/15/22 | 2,810,000 | 2,824,050 | |
| United Technologies Corp. 3.65% 8/16/23 | 250,000 | 247,196 | |
| 5,676,327 | |||
| Air Transportation - 1.3% | |||
| Allegiant Travel Co. 5.5% 7/15/19 | 785,000 | 788,925 | |
| American Airlines Group, Inc. 5.5% 10/1/19 (a) | 485,000 | 489,244 | |
| United Continental Holdings, Inc. 4.25% 10/1/22 | 345,000 | 338,531 | |
| 1,616,700 | |||
| Automotive & Auto Parts - 0.1% | |||
| General Motors Financial Co., Inc. 2.35% 10/4/19 | 100,000 | 99,024 | |
| Banks & Thrifts - 2.3% | |||
| Bank of America Corp. 2.625% 4/19/21 | 250,000 | 245,329 | |
| Citigroup, Inc. 2.9% 12/8/21 | 200,000 | 195,379 | |
| Citizens Bank NA 2.25% 3/2/20 | 250,000 | 246,425 | |
| Credit Suisse Group Funding Guernsey Ltd. 3.45% 4/16/21 | 250,000 | 248,358 | |
| Deutsche Bank AG 2.7% 7/13/20 | 250,000 | 244,271 | |
| Goldman Sachs Group, Inc. 2.876% 10/31/22 (b) | 350,000 | 340,424 | |
| Intesa Sanpaolo SpA 3.375% 1/12/23 (a) | 200,000 | 180,992 | |
| JPMorgan Chase & Co. 2.55% 3/1/21 | 200,000 | 196,012 | |
| Santander Holdings U.S.A., Inc. 3.4% 1/18/23 | 200,000 | 190,920 | |
| SunTrust Banks, Inc. 2.7% 1/27/22 | 200,000 | 193,630 | |
| Synchrony Bank 3% 6/15/22 | 250,000 | 238,460 | |
| Synovus Financial Corp. 3.125% 11/1/22 | 17,000 | 16,171 | |
| UniCredit SpA 3.75% 4/12/22 (a) | 200,000 | 188,982 | |
| 2,725,353 | |||
| Broadcasting - 1.0% | |||
| LIN Television Corp. 5.875% 11/15/22 | 300,000 | 304,560 | |
| Sirius XM Radio, Inc. 3.875% 8/1/22 (a) | 985,000 | 948,063 | |
| 1,252,623 | |||
| Building Materials - 0.0% | |||
| Mississippi Power Co. 3 month U.S. LIBOR + 0.650% 3.031% 3/27/20 (b)(c) | 6,000 | 6,001 | |
| Cable/Satellite TV - 6.3% | |||
| Altice SA 7.75% 5/15/22 (a) | 905,000 | 842,781 | |
| Altice U.S. Finance SA 5.375% 7/15/23 (a) | 500,000 | 499,905 | |
| Cablevision Systems Corp. 5.875% 9/15/22 | 640,000 | 643,200 | |
| CCO Holdings LLC/CCO Holdings Capital Corp.: | |||
| 4% 3/1/23 (a) | 1,115,000 | 1,062,038 | |
| 5.125% 2/15/23 | 1,800,000 | 1,791,000 | |
| 5.125% 5/1/23 (a) | 720,000 | 716,400 | |
| DISH DBS Corp.: | |||
| 5.125% 5/1/20 | 45,000 | 45,113 | |
| 5.875% 7/15/22 | 1,760,000 | 1,663,200 | |
| 5.875% 11/15/24 | 155,000 | 131,750 | |
| 6.75% 6/1/21 | 180,000 | 181,800 | |
| 7,577,187 | |||
| Capital Goods - 0.2% | |||
| Roper Technologies, Inc. 2.8% 12/15/21 | 213,000 | 207,413 | |
| Chemicals - 2.2% | |||
| CF Industries Holdings, Inc.: | |||
| 3.4% 12/1/21 (a) | 60,000 | 58,805 | |
| 3.45% 6/1/23 | 805,000 | 764,750 | |
| LSB Industries, Inc. 9.625% 5/1/23 (a) | 45,000 | 46,688 | |
| OCI NV 6.625% 4/15/23 (a) | 565,000 | 579,125 | |
| Platform Specialty Products Corp. 6.5% 2/1/22 (a) | 500,000 | 506,250 | |
| The Mosaic Co. 3.25% 11/15/22 | 150,000 | 145,564 | |
| TPC Group, Inc. 8.75% 12/15/20 (a) | 525,000 | 514,500 | |
| 2,615,682 | |||
| Consumer Products - 0.1% | |||
| Coty, Inc. 6.5% 4/15/26 (a) | 195,000 | 181,838 | |
| Containers - 3.3% | |||
| Ard Securities Finance SARL 8.75% 1/31/23 pay-in-kind (a)(b) | 26,142 | 25,096 | |
| Ardagh Packaging Finance PLC/Ardagh MP Holdings U.S.A., Inc.: | |||
| 4.25% 9/15/22 (a) | 200,000 | 194,000 | |
| 4.625% 5/15/23 (a) | 400,000 | 389,000 | |
| Ball Corp.: | |||
| 4% 11/15/23 | 300,000 | 291,000 | |
| 5% 3/15/22 | 300,000 | 304,500 | |
| Berry Global, Inc. 5.125% 7/15/23 | 500,000 | 497,500 | |
| OI European Group BV 4% 3/15/23 (a) | 250,000 | 234,063 | |
| Reynolds Group Issuer, Inc./Reynolds Group Issuer LLC/Reynolds Group Issuer (Luxembourg) SA: | |||
| 3 month U.S. LIBOR + 3.500% 5.9363% 7/15/21 (a)(b)(c) | 310,000 | 313,100 | |
| 5.125% 7/15/23 (a) | 1,000,000 | 978,750 | |
| 5.75% 10/15/20 | 726,831 | 726,831 | |
| 3,953,840 | |||
| Diversified Financial Services - 6.0% | |||
| Aircastle Ltd. 4.125% 5/1/24 | 80,000 | 77,706 | |
| Capital One Financial Corp. 2.5% 5/12/20 | 200,000 | 197,152 | |
| Financial & Risk U.S. Holdings, Inc.: | |||
| 6.25% 5/15/26 (a) | 170,000 | 169,150 | |
| 8.25% 11/15/26 (a) | 85,000 | 82,450 | |
| FLY Leasing Ltd. 5.25% 10/15/24 | 790,000 | 750,500 | |
| Hyundai Capital America 2.55% 2/6/19 (a) | 100,000 | 99,843 | |
| Icahn Enterprises LP/Icahn Enterprises Finance Corp.: | |||
| 5.875% 2/1/22 | 770,000 | 770,077 | |
| 6% 8/1/20 | 320,000 | 322,800 | |
| 6.25% 2/1/22 | 2,805,000 | 2,831,804 | |
| ILFC E-Capital Trust I 3 month U.S. LIBOR + 1.550% 4.78% 12/21/65 (a)(b)(c) | 605,000 | 535,425 | |
| ILFC E-Capital Trust II 3 month U.S. LIBOR + 1.800% 5.03% 12/21/65 (a)(b)(c) | 175,000 | 155,750 | |
| Moody's Corp. 5.5% 9/1/20 | 200,000 | 207,292 | |
| Morgan Stanley 2.5% 4/21/21 | 250,000 | 243,593 | |
| Park Aerospace Holdings Ltd. 4.5% 3/15/23 (a) | 51,000 | 48,520 | |
| Prime Securities Services Borrower LLC/Prime Finance, Inc. 9.25% 5/15/23 (a) | 125,000 | 132,088 | |
| SLM Corp. 7.25% 1/25/22 | 500,000 | 520,000 | |
| 7,144,150 | |||
| Diversified Media - 1.0% | |||
| 21st Century Fox America, Inc. 4.5% 2/15/21 | 200,000 | 204,319 | |
| MDC Partners, Inc. 6.5% 5/1/24 (a) | 180,000 | 147,600 | |
| Nielsen Finance LLC/Nielsen Finance Co. 5% 4/15/22 (a) | 815,000 | 793,606 | |
| 1,145,525 | |||
| Energy - 14.0% | |||
| Anadarko Petroleum Corp. 4.85% 3/15/21 | 200,000 | 204,336 | |
| Antero Resources Corp. 5.125% 12/1/22 | 370,000 | 367,456 | |
| Antero Resources Finance Corp. 5.375% 11/1/21 | 60,000 | 60,000 | |
| Boardwalk Pipelines LP 3.375% 2/1/23 | 150,000 | 144,477 | |
| California Resources Corp. 8% 12/15/22 (a) | 655,000 | 582,950 | |
| Cenovus Energy, Inc. 3% 8/15/22 | 250,000 | 238,892 | |
| Cheniere Corpus Christi Holdings LLC 7% 6/30/24 | 350,000 | 378,438 | |
| Chesapeake Energy Corp. 8% 12/15/22 (a) | 876,000 | 913,230 | |
| Citgo Petroleum Corp. 6.25% 8/15/22 (a) | 250,000 | 246,250 | |
| Consolidated Energy Finance SA 3 month U.S. LIBOR + 3.750% 6.0841% 6/15/22 (a)(b)(c) | 525,000 | 525,231 | |
| Continental Resources, Inc. 4.5% 4/15/23 | 500,000 | 501,695 | |
| CVR Refining LLC/Coffeyville Finance, Inc. 6.5% 11/1/22 | 1,085,000 | 1,091,781 | |
| Denbury Resources, Inc.: | |||
| 4.625% 7/15/23 | 10,000 | 8,275 | |
| 5.5% 5/1/22 | 110,000 | 95,150 | |
| 6.375% 8/15/21 | 35,000 | 32,550 | |
| 7.5% 2/15/24 (a) | 80,000 | 78,200 | |
| 9.25% 3/31/22 (a) | 130,000 | 135,525 | |
| Energy Transfer Equity LP: | |||
| 4.25% 3/15/23 | 475,000 | 470,250 | |
| 7.5% 10/15/20 | 105,000 | 111,169 | |
| Ensco PLC: | |||
| 4.5% 10/1/24 | 705,000 | 572,813 | |
| 8% 1/31/24 | 1,132,000 | 1,117,850 | |
| EP Energy LLC/Everest Acquisition Finance, Inc. 8% 11/29/24 (a) | 320,000 | 308,800 | |
| EQT Corp. 2.5% 10/1/20 | 9,000 | 8,776 | |
| Exterran Partners LP/EXLP Finance Corp.: | |||
| 6% 4/1/21 | 830,000 | 821,700 | |
| 6% 10/1/22 | 300,000 | 297,000 | |
| Forum Energy Technologies, Inc. 6.25% 10/1/21 | 30,000 | 29,400 | |
| FTS International, Inc. 6.25% 5/1/22 | 265,000 | 252,744 | |
| MPLX LP 3.375% 3/15/23 | 13,000 | 12,637 | |
| Nabors Industries, Inc. 5.5% 1/15/23 | 143,000 | 134,407 | |
| NextEra Energy Partners LP 4.25% 9/15/24 (a) | 155,000 | 147,250 | |
| Nine Energy Service, Inc. 8.75% 11/1/23 (a) | 445,000 | 451,675 | |
| Noble Holding International Ltd. 7.75% 1/15/24 | 171,000 | 159,671 | |
| PBF Logistics LP/PBF Logistics Finance, Inc. 6.875% 5/15/23 | 150,000 | 152,625 | |
| Plains All American Pipeline LP/PAA Finance Corp.: | |||
| 2.6% 12/15/19 | 100,000 | 99,093 | |
| 3.65% 6/1/22 | 18,000 | 17,643 | |
| 3.85% 10/15/23 | 75,000 | 72,912 | |
| Precision Drilling Corp.: | |||
| 6.5% 12/15/21 | 270,026 | 272,051 | |
| 7.75% 12/15/23 | 235,000 | 244,400 | |
| Range Resources Corp. 5% 8/15/22 | 840,000 | 825,300 | |
| Sanchez Energy Corp. 7.25% 2/15/23 (a) | 150,000 | 136,875 | |
| Southwestern Energy Co. 4.1% 3/15/22 | 300,000 | 295,500 | |
| Summit Midstream Holdings LLC 5.5% 8/15/22 | 90,000 | 89,100 | |
| Targa Resources Partners LP/Targa Resources Partners Finance Corp.: | |||
| 4.125% 11/15/19 | 207,000 | 207,000 | |
| 4.25% 11/15/23 | 625,000 | 599,406 | |
| 5.25% 5/1/23 | 800,000 | 798,000 | |
| TerraForm Power Operating LLC 4.25% 1/31/23 (a) | 350,000 | 331,625 | |
| Tesoro Logistics LP/Tesoro Logistics Finance Corp.: | |||
| 5.5% 10/15/19 | 755,000 | 769,300 | |
| 6.25% 10/15/22 | 135,000 | 139,219 | |
| TransCanada PipeLines Ltd. 2.5% 8/1/22 | 9,000 | 8,601 | |
| Transocean Pontus Ltd. 6.125% 8/1/25 (a) | 75,000 | 74,531 | |
| W&T Offshore, Inc. 9.75% 11/1/23 (a) | 250,000 | 241,925 | |
| Weatherford International Ltd. 9.875% 2/15/24 | 500,000 | 387,500 | |
| Weatherford International, Inc. 9.875% 3/1/25 (a) | 500,000 | 387,500 | |
| Whiting Petroleum Corp. 5.75% 3/15/21 | 165,000 | 166,031 | |
| 16,816,715 | |||
| Entertainment/Film - 0.4% | |||
| AMC Entertainment, Inc. 5.875% 2/15/22 | 300,000 | 299,895 | |
| New Cotai LLC/New Cotai Capital Corp. 10.625% 5/1/19 pay-in-kind (a)(b) | 323,844 | 184,591 | |
| 484,486 | |||
| Environmental - 0.9% | |||
| Clean Harbors, Inc. 5.125% 6/1/21 | 500,000 | 500,000 | |
| LBC Tank Terminals Holding Netherlands BV 6.875% 5/15/23 (a) | 500,000 | 491,250 | |
| Tervita Escrow Corp. 7.625% 12/1/21 (a) | 35,000 | 35,525 | |
| 1,026,775 | |||
| Food & Drug Retail - 0.2% | |||
| CVS Health Corp.: | |||
| 3.35% 3/9/21 | 16,000 | 15,930 | |
| 3.7% 3/9/23 | 176,000 | 173,890 | |
| 189,820 | |||
| Food/Beverage/Tobacco - 2.2% | |||
| Anheuser-Busch InBev Finance, Inc. 2.65% 2/1/21 | 200,000 | 196,058 | |
| Anheuser-Busch InBev Worldwide, Inc. 3.5% 1/12/24 | 250,000 | 243,344 | |
| Bat Capital Corp. 2.764% 8/15/22 (a) | 250,000 | 239,317 | |
| C&S Group Enterprises LLC 5.375% 7/15/22 (a) | 925,000 | 892,625 | |
| Darling International, Inc. 5.375% 1/15/22 | 415,000 | 416,038 | |
| General Mills, Inc. 3.2% 4/16/21 | 4,000 | 3,971 | |
| Imperial Tobacco Finance PLC 2.95% 7/21/20 (a) | 200,000 | 197,422 | |
| Vector Group Ltd. 6.125% 2/1/25 (a) | 500,000 | 455,000 | |
| 2,643,775 | |||
| Gaming - 2.9% | |||
| MGM Mirage, Inc. 6% 3/15/23 | 1,000,000 | 1,015,000 | |
| Scientific Games Corp.: | |||
| 5% 10/15/25 (a) | 115,000 | 106,950 | |
| 6.625% 5/15/21 | 935,000 | 904,613 | |
| 10% 12/1/22 | 500,000 | 522,500 | |
| Wynn Macau Ltd. 4.875% 10/1/24 (a) | 1,000,000 | 907,500 | |
| 3,456,563 | |||
| Healthcare - 8.1% | |||
| AbbVie, Inc. 3.375% 11/14/21 | 200,000 | 198,941 | |
| Becton, Dickinson & Co. 2.894% 6/6/22 | 200,000 | 193,129 | |
| Community Health Systems, Inc. 6.25% 3/31/23 | 585,000 | 538,025 | |
| Elanco Animal Health, Inc. 3.912% 8/27/21 (a) | 2,000 | 2,000 | |
| Forest Laboratories, Inc. 5% 12/15/21 (a) | 200,000 | 206,291 | |
| Halfmoon Parent, Inc.: | |||
| 3.4% 9/17/21 (a) | 18,000 | 17,868 | |
| 3.75% 7/15/23 (a) | 9,000 | 8,927 | |
| HCA Holdings, Inc.: | |||
| 4.75% 5/1/23 | 300,000 | 303,000 | |
| 5% 3/15/24 | 300,000 | 303,563 | |
| 6.25% 2/15/21 | 800,000 | 831,000 | |
| HealthSouth Corp. 5.125% 3/15/23 | 255,000 | 255,000 | |
| Humana, Inc. 2.5% 12/15/20 | 10,000 | 9,803 | |
| Mylan NV 3.15% 6/15/21 | 200,000 | 195,294 | |
| Ortho-Clinical Diagnostics, Inc. 6.625% 5/15/22 (a) | 485,000 | 463,175 | |
| Sabra Health Care LP/Sabra Capital Corp. 5.375% 6/1/23 | 60,000 | 59,700 | |
| Shire Acquisitions Investments Ireland DAC 2.4% 9/23/21 | 200,000 | 192,213 | |
| Tenet Healthcare Corp.: | |||
| 4.375% 10/1/21 | 1,365,000 | 1,349,644 | |
| 4.75% 6/1/20 | 200,000 | 200,500 | |
| 6.75% 6/15/23 | 165,000 | 164,538 | |
| 8.125% 4/1/22 | 485,000 | 505,006 | |
| Teva Pharmaceutical Finance Netherlands III BV 2.2% 7/21/21 | 250,000 | 233,421 | |
| Valeant Pharmaceuticals International, Inc.: | |||
| 5.625% 12/1/21 (a) | 1,500,000 | 1,477,500 | |
| 5.875% 5/15/23 (a) | 850,000 | 812,813 | |
| 6.5% 3/15/22 (a) | 1,135,000 | 1,174,725 | |
| 9,696,076 | |||
| Homebuilders/Real Estate - 0.6% | |||
| Brookfield Residential Properties, Inc. 6.5% 12/15/20 (a) | 300,000 | 300,000 | |
| D.R. Horton, Inc. 2.55% 12/1/20 | 14,000 | 13,673 | |
| DDR Corp. 4.625% 7/15/22 | 200,000 | 203,481 | |
| Healthcare Trust of America Holdings LP 2.95% 7/1/22 | 216,000 | 208,530 | |
| 725,684 | |||
| Insurance - 0.2% | |||
| American International Group, Inc. 3.3% 3/1/21 | 200,000 | 197,975 | |
| Leisure - 1.2% | |||
| Rivers Pittsburgh Borrower LP 6.125% 8/15/21 (a) | 200,000 | 199,000 | |
| Studio City Co. Ltd.: | |||
| 5.875% 11/30/19 (a) | 200,000 | 201,750 | |
| 7.25% 11/30/21 (a) | 1,000,000 | 1,028,810 | |
| 1,429,560 | |||
| Metals/Mining - 3.8% | |||
| First Quantum Minerals Ltd.: | |||
| 6.5% 3/1/24 (a) | 200,000 | 174,500 | |
| 7% 2/15/21 (a) | 1,000,000 | 978,125 | |
| 7.25% 5/15/22 (a) | 1,110,000 | 1,060,050 | |
| 7.25% 4/1/23 (a) | 1,175,000 | 1,085,406 | |
| FMG Resources (August 2006) Pty Ltd.: | |||
| 4.75% 5/15/22 (a) | 300,000 | 288,000 | |
| 5.125% 3/15/23 (a) | 90,000 | 86,850 | |
| Freeport-McMoRan, Inc. 3.55% 3/1/22 | 995,000 | 941,519 | |
| 4,614,450 | |||
| Restaurants - 1.6% | |||
| Golden Nugget, Inc. 6.75% 10/15/24 (a) | 800,000 | 798,000 | |
| Yum! Brands, Inc. 3.875% 11/1/23 | 1,225,000 | 1,157,625 | |
| 1,955,625 | |||
| Services - 0.4% | |||
| Air Lease Corp.: | |||
| 2.125% 1/15/20 | 200,000 | 196,867 | |
| 3.5% 1/15/22 | 150,000 | 148,320 | |
| APX Group, Inc. 8.75% 12/1/20 | 155,000 | 151,125 | |
| Corrections Corp. of America 5% 10/15/22 | 25,000 | 24,156 | |
| 520,468 | |||
| Super Retail - 0.1% | |||
| AutoZone, Inc. 2.5% 4/15/21 | 145,000 | 141,114 | |
| Technology - 2.7% | |||
| Diamond 1 Finance Corp./Diamond 2 Finance Corp. 4.42% 6/15/21 (a) | 200,000 | 201,666 | |
| EMC Corp. 2.65% 6/1/20 | 1,140,000 | 1,110,550 | |
| Microchip Technology, Inc. 3.922% 6/1/21 (a) | 200,000 | 198,557 | |
| Nuance Communications, Inc. 5.375% 8/15/20 (a) | 215,000 | 215,134 | |
| NXP BV/NXP Funding LLC: | |||
| 3.875% 9/1/22 (a) | 415,000 | 400,475 | |
| 4.125% 6/1/21 (a) | 175,000 | 173,906 | |
| Sensata Technologies BV 4.875% 10/15/23 (a) | 155,000 | 150,931 | |
| Symantec Corp. 4.2% 9/15/20 | 500,000 | 498,680 | |
| Uber Technologies, Inc. 7.5% 11/1/23 (a)(d) | 250,000 | 250,313 | |
| 3,200,212 | |||
| Telecommunications - 3.4% | |||
| Altice Financing SA 6.625% 2/15/23 (a) | 500,000 | 494,900 | |
| AT&T, Inc. 2.8% 2/17/21 | 200,000 | 196,538 | |
| Cogent Communications Group, Inc. 5.375% 3/1/22 (a) | 75,000 | 75,469 | |
| Equinix, Inc. 5.375% 4/1/23 | 580,000 | 588,700 | |
| Frontier Communications Corp. 10.5% 9/15/22 | 175,000 | 145,688 | |
| Intelsat Jackson Holdings SA 8.5% 10/15/24 (a) | 200,000 | 196,500 | |
| Qwest Corp. 6.75% 12/1/21 | 100,000 | 104,369 | |
| SBA Communications Corp. 4% 10/1/22 | 500,000 | 478,750 | |
| SFR Group SA 6.25% 5/15/24 (a) | 215,000 | 206,131 | |
| Sprint Communications, Inc.: | |||
| 6% 11/15/22 | 515,000 | 519,828 | |
| 9% 11/15/18 (a) | 115,000 | 115,230 | |
| Sprint Corp. 7.875% 9/15/23 | 700,000 | 747,250 | |
| T-Mobile U.S.A., Inc. 4% 4/15/22 | 225,000 | 222,188 | |
| 4,091,541 | |||
| Transportation Ex Air/Rail - 1.1% | |||
| Avolon Holdings Funding Ltd.: | |||
| 5.125% 10/1/23 (a) | 300,000 | 294,375 | |
| 5.5% 1/15/23 (a) | 155,000 | 154,225 | |
| Navios Maritime Acquisition Corp./Navios Acquisition Finance U.S., Inc. 8.125% 11/15/21 (a) | 875,000 | 733,906 | |
| Navios Maritime Holdings, Inc. 7.375% 1/15/22 (a) | 265,000 | 200,075 | |
| 1,382,581 | |||
| Utilities - 6.6% | |||
| Calpine Corp. 6% 1/15/22 (a) | 1,800,000 | 1,809,000 | |
| Dolphin Subsidiary II, Inc. 7.25% 10/15/21 | 558,000 | 592,529 | |
| Dominion Resources, Inc. 4.104% 4/1/21 | 250,000 | 252,011 | |
| DPL, Inc. 6.75% 10/1/19 | 217,000 | 222,154 | |
| Dynegy, Inc. 5.875% 6/1/23 | 1,300,000 | 1,319,500 | |
| Exelon Corp. 3.497% 6/1/22 (b) | 250,000 | 243,827 | |
| Global Partners LP/GLP Finance Corp. 6.25% 7/15/22 | 885,000 | 869,513 | |
| InterGen NV 7% 6/30/23 (a) | 500,000 | 491,250 | |
| The AES Corp.: | |||
| 4% 3/15/21 | 185,000 | 183,176 | |
| 4.5% 3/15/23 | 120,000 | 118,350 | |
| 4.875% 5/15/23 | 1,615,000 | 1,598,850 | |
| Williams Partners LP 5.25% 3/15/20 | 200,000 | 204,489 | |
| 7,904,649 | |||
| TOTAL NONCONVERTIBLE BONDS | 94,679,732 | ||
| TOTAL CORPORATE BONDS | |||
| (Cost $96,959,527) | 95,237,158 | ||
| Shares | Value | ||
| Common Stocks - 0.0% | |||
| Energy - 0.0% | |||
| Forbes Energy Services Ltd. (e) | |||
| (Cost $301,607) | 6,468 | 32,663 | |
| Principal Amount | Value | ||
| Bank Loan Obligations - 15.2% | |||
| Aerospace - 1.0% | |||
| TransDigm, Inc.: | |||
| Tranche F, term loan 3 month U.S. LIBOR + 2.500% 4.802% 6/9/23 (b)(c) | 866,382 | 861,738 | |
| Tranche G, term loan 3 month U.S. LIBOR + 2.500% 4.802% 8/22/24 (b)(c) | 340,725 | 338,943 | |
| TOTAL AEROSPACE | 1,200,681 | ||
| Air Transportation - 0.3% | |||
| American Airlines, Inc. Tranche B, term loan 3 month U.S. LIBOR + 2.000% 4.2767% 10/10/21 (b)(c) | 342,642 | 342,108 | |
| Cable/Satellite TV - 1.7% | |||
| Altice U.S. Finance SA: | |||
| Tranche B, term loan 3 month U.S. LIBOR + 2.250% 4.552% 7/28/25 (b)(c) | 124,684 | 124,399 | |
| Tranche B3 1LN, term loan 3 month U.S. LIBOR + 2.250% 1/11/26 (c)(f) | 125,000 | 124,649 | |
| CSC Holdings LLC Tranche B, term loan 3 month U.S. LIBOR + 2.500% 4.7795% 1/25/26 (b)(c) | 54,725 | 54,605 | |
| Numericable LLC Tranche B 12LN, term loan 3 month U.S. LIBOR + 3.688% 5.967% 1/31/26 (b)(c) | 301,950 | 294,087 | |
| Unitymedia Finance LLC Tranche B, term loan 3 month U.S. LIBOR + 2.250% 4.5295% 9/30/25 (b)(c) | 365,000 | 364,409 | |
| WideOpenWest Finance LLC Tranche B, term loan 3 month U.S. LIBOR + 3.250% 5.5395% 8/19/23 (b)(c) | 490,050 | 471,673 | |
| Zayo Group LLC Tranche B, term loan 3 month U.S. LIBOR + 2.000% 4.302% 1/19/21 (b)(c) | 142,825 | 142,851 | |
| Ziggo Secured Finance Partnership Tranche E, term loan 3 month U.S. LIBOR + 2.500% 4.7795% 4/15/25 (b)(c) | 530,000 | 519,490 | |
| TOTAL CABLE/SATELLITE TV | 2,096,163 | ||
| Capital Goods - 0.0% | |||
| Apergy Corp. Tranche B, term loan 3 month U.S. LIBOR + 2.500% 4.8125% 5/9/25 (b)(c) | 14,277 | 14,304 | |
| CPM Holdings, Inc. Tranche B 1LN, term loan 3 month U.S. LIBOR + 3.750% 10/24/25 (c)(f) | 20,000 | 20,067 | |
| TOTAL CAPITAL GOODS | 34,371 | ||
| Chemicals - 0.1% | |||
| Tronox Blocked Borrower LLC Tranche B, term loan 3 month U.S. LIBOR + 3.000% 5.302% 9/22/24 (b)(c) | 21,004 | 20,974 | |
| Tronox Finance LLC Tranche B, term loan 3 month U.S. LIBOR + 3.000% 5.302% 9/22/24 (b)(c) | 48,471 | 48,403 | |
| TOTAL CHEMICALS | 69,377 | ||
| Consumer Products - 0.0% | |||
| Owens & Minor Distribution, Inc. Tranche B, term loan 3 month U.S. LIBOR + 4.500% 6.756% 4/30/25 (b)(c) | 49,875 | 45,137 | |
| Containers - 0.4% | |||
| Berlin Packaging, LLC Tranche B 1LN, term loan 3 month U.S. LIBOR + 3.000% 5.2794% 11/7/25 (b)(c) | 64,838 | 64,720 | |
| Charter Nex U.S., Inc. Tranche B 1LN, term loan 3 month U.S. LIBOR + 3.000% 5.052% 5/16/24 (b)(c) | 125,000 | 124,714 | |
| Crown Americas LLC Tranche B 1LN, term loan 3 month U.S. LIBOR + 2.000% 4.2832% 4/3/25 (b)(c) | 28,621 | 28,636 | |
| Reynolds Group Holdings, Inc. Tranche B, term loan 3 month U.S. LIBOR + 2.750% 5.052% 2/5/23 (b)(c) | 303,814 | 303,814 | |
| TOTAL CONTAINERS | 521,884 | ||
| Energy - 0.9% | |||
| Arctic LNG Carriers Ltd. Tranche B 1LN, term loan 3 month U.S. LIBOR + 4.500% 6.802% 5/18/23 (b)(c) | 211,464 | 211,464 | |
| BCP Raptor II LLC Tranche B, term loan 3 month U.S. LIBOR + 4.750% 10/22/25 (c)(f) | 100,000 | 99,250 | |
| BCP Raptor LLC Tranche B, term loan 3 month U.S. LIBOR + 4.250% 6.6411% 6/22/24 (b)(c) | 124,370 | 122,572 | |
| California Resources Corp.: | |||
| Tranche 1LN, term loan 3 month U.S. LIBOR + 10.375% 12.6699% 12/31/21 (b)(c) | 100,000 | 111,250 | |
| Tranche B, term loan 3 month U.S. LIBOR + 4.750% 7.0365% 12/31/22 (b)(c) | 160,000 | 162,133 | |
| Consolidated Energy Finance SA Tranche B, term loan 3 month U.S. LIBOR + 2.500% 4.7841% 5/7/25 (b)(c) | 124,688 | 124,064 | |
| Forbes Energy Services LLC Tranche B, term loan 14% 4/13/21 (b)(g) | 68,952 | 69,470 | |
| Gavilan Resources LLC Tranche 2LN, term loan 3 month U.S. LIBOR + 6.000% 8.2796% 3/1/24 (b)(c) | 100,000 | 93,139 | |
| GIP III Stetson I LP Tranche B, term loan 3 month U.S. LIBOR + 4.250% 6.6946% 7/18/25 (b)(c) | 75,000 | 75,094 | |
| Natgasoline LLC Tranche B, term loan 3 month U.S. LIBOR + 3.500% 5.9446% 10/31/25 (b)(c) | 40,000 | 40,050 | |
| TOTAL ENERGY | 1,108,486 | ||
| Entertainment/Film - 0.2% | |||
| AMC Entertainment, Inc. Tranche B, term loan 3 month U.S. LIBOR + 2.250% 4.5295% 12/15/22 (b)(c) | 276,438 | 276,006 | |
| Food & Drug Retail - 0.2% | |||
| BI-LO LLC Tranche B, term loan 3 month U.S. LIBOR + 8.000% 10.3645% 5/31/24 (b)(c) | 124,688 | 122,973 | |
| JP Intermediate B LLC Tranche B, term loan 3 month U.S. LIBOR + 5.500% 10/18/25 (c)(f) | 15,000 | 15,000 | |
| Tops Markets LLC term loan 3 month U.S. LIBOR + 9.500% 11.8125% 2/23/19 (b)(c)(g) | 78,843 | 79,040 | |
| TOTAL FOOD & DRUG RETAIL | 217,013 | ||
| Food/Beverage/Tobacco - 0.3% | |||
| Chobani LLC Tranche B, term loan 3 month U.S. LIBOR + 3.500% 5.802% 10/7/23 (b)(c) | 124,368 | 121,337 | |
| Post Holdings, Inc. Tranche B, term loan 3 month U.S. LIBOR + 2.000% 4.29% 5/24/24 (b)(c) | 200,179 | 199,857 | |
| TOTAL FOOD/BEVERAGE/TOBACCO | 321,194 | ||
| Gaming - 1.1% | |||
| CityCenter Holdings LLC Tranche B, term loan 3 month U.S. LIBOR + 2.250% 4.552% 4/18/24 (b)(c) | 296,362 | 295,529 | |
| Golden Entertainment, Inc. Tranche B, term loan: | |||
| 3 month U.S. LIBOR + 3.000% 5.3% 10/20/24 (b)(c) | 456,550 | 456,550 | |
| 3 month U.S. LIBOR + 7.000% 9.31% 10/20/25 (b)(c) | 155,000 | 155,775 | |
| Scientific Games Corp. Tranche B 5LN, term loan 3 month U.S. LIBOR + 2.750% 5.0457% 8/14/24 (b)(c) | 158,877 | 157,231 | |
| Stars Group Holdings BV Tranche B, term loan 3 month U.S. LIBOR + 3.500% 5.8861% 7/10/25 (b)(c) | 124,688 | 125,138 | |
| Wynn Resorts Ltd. Tranche B, term loan 3 month U.S. LIBOR + 2.250% 10/22/24 (c)(d)(f) | 125,000 | 124,298 | |
| TOTAL GAMING | 1,314,521 | ||
| Healthcare - 0.5% | |||
| HCA Holdings, Inc. Tranche B 10LN, term loan 3 month U.S. LIBOR + 2.000% 4.302% 3/13/25 (b)(c) | 208,950 | 209,734 | |
| HLF Financing SARL LLC Tranche B 1LN, term loan 3 month U.S. LIBOR + 3.250% 5.552% 8/18/25 (b)(c) | 160,000 | 160,566 | |
| Press Ganey Holdings, Inc. Tranche 1LN, term loan 3 month U.S. LIBOR + 2.750% 5.052% 10/21/23 (b)(c) | 4,975 | 4,976 | |
| Surgery Center Holdings, Inc. Tranche B, term loan 3 month U.S. LIBOR + 3.250% 5.57% 8/31/24 (b)(c) | 30,000 | 29,918 | |
| Valeant Pharmaceuticals International, Inc. Tranche B, term loan 3 month U.S. LIBOR + 3.000% 5.2739% 6/1/25 (b)(c) | 29,250 | 29,243 | |
| VVC Holding Corp. 1LN, term loan 3 month U.S. LIBOR + 4.250% 6.6863% 7/9/25 (b)(c) | 125,000 | 123,750 | |
| TOTAL HEALTHCARE | 558,187 | ||
| Homebuilders/Real Estate - 0.1% | |||
| DTZ U.S. Borrower LLC Tranche B, term loan 3 month U.S. LIBOR + 3.250% 5.552% 8/21/25 (b)(c) | 125,000 | 124,883 | |
| Hotels - 0.0% | |||
| Marriott Ownership Resorts, Inc. Tranche B, term loan 3 month U.S. LIBOR + 2.250% 4.552% 8/31/25 (b)(c) | 20,000 | 20,050 | |
| Insurance - 0.3% | |||
| Asurion LLC: | |||
| Tranche B 7LN, term loan 3 month U.S. LIBOR + 3.000% 5.302% 11/3/24 (b)(c) | 124,688 | 124,755 | |
| Tranche B, term loan 3 month U.S. LIBOR + 6.500% 8.802% 8/4/25 (b)(c) | 125,000 | 128,219 | |
| HUB International Ltd. Tranche B, term loan 3 month U.S. LIBOR + 3.000% 5.4895% 4/25/25 (b)(c) | 74,813 | 74,555 | |
| TOTAL INSURANCE | 327,529 | ||
| Leisure - 0.1% | |||
| Delta 2 SARL Tranche B, term loan 3 month U.S. LIBOR + 2.500% 4.802% 2/1/24 (b)(c) | 125,000 | 123,594 | |
| Paper - 0.1% | |||
| Flex Acquisition Co., Inc. Tranche B 1LN, term loan 3 month U.S. LIBOR + 3.250% 5.506% 6/29/25 (b)(c) | 124,688 | 124,755 | |
| Publishing/Printing - 0.2% | |||
| Springer Science+Business Media Deutschland GmbH Tranche B 13LN, term loan 3 month U.S. LIBOR + 3.500% 5.8861% 8/24/22 (b)(c) | 191,789 | 192,269 | |
| Services - 0.7% | |||
| Almonde, Inc.: | |||
| Tranche 2LN, term loan 3 month U.S. LIBOR + 7.250% 9.6361% 6/13/25 (b)(c) | 20,000 | 19,658 | |
| Tranche B 1LN, term loan 3 month U.S. LIBOR + 3.500% 5.8861% 6/13/24 (b)(c) | 79,989 | 79,478 | |
| Aramark Services, Inc. Tranche B 3LN, term loan 3 month U.S. LIBOR + 1.750% 4.052% 3/11/25 (b)(c) | 125,909 | 125,831 | |
| Brand Energy & Infrastructure Services, Inc. Tranche B, term loan 3 month U.S. LIBOR + 4.250% 6.7321% 6/21/24 (b)(c) | 488,813 | 490,460 | |
| Frontdoor, Inc. Tranche B, term loan 3 month U.S. LIBOR + 2.500% 4.8125% 8/16/25 (b)(c) | 15,000 | 15,000 | |
| Lineage Logistics Holdings, LLC. Tranche B, term loan 3 month U.S. LIBOR + 3.000% 5.302% 2/27/25 (b)(c) | 99,500 | 98,712 | |
| TOTAL SERVICES | 829,139 | ||
| Super Retail - 1.3% | |||
| Bass Pro Shops LLC. Tranche B, term loan 3 month U.S. LIBOR + 5.000% 7.302% 9/25/24 (b)(c)(d) | 1,500,000 | 1,499,460 | |
| Technology - 2.7% | |||
| Anastasia Parent LLC Tranche B, term loan 3 month U.S. LIBOR + 3.750% 6.0267% 8/3/25 (b)(c) | 45,000 | 44,462 | |
| Bracket Intermediate Holding Corp. 1LN, term loan 3 month U.S. LIBOR + 4.250% 6.5708% 9/5/25 (b)(c) | 25,000 | 25,063 | |
| Digicert Holdings, Inc. Tranche B, term loan 3 month U.S. LIBOR + 8.000% 10.6916% 10/31/25 (b)(c) | 100,000 | 99,313 | |
| Dynatrace LLC Tranche B 1LN, term loan 1 month U.S. LIBOR + 3.250% 5.552% 8/23/25 (b)(c) | 30,000 | 30,163 | |
| Epicor Software Corp. Tranche B, term loan 3 month U.S. LIBOR + 3.250% 5.56% 6/1/22 (b)(c) | 298,456 | 298,970 | |
| Go Daddy Operating Co. LLC Tranche B, term loan 3 month U.S. LIBOR + 2.250% 4.552% 2/15/24 (b)(c) | 533,042 | 533,378 | |
| Hyland Software, Inc.: | |||
| Tranche 2LN, term loan 3 month U.S. LIBOR + 7.000% 9.2422% 7/7/25 (b)(c) | 5,000 | 5,008 | |
| Tranche B 1LN, term loan 3 month U.S. LIBOR + 3.500% 5.9252% 7/1/24 (b)(c)(d) | 5,000 | 5,024 | |
| Kronos, Inc. Tranche B 1LN, term loan 3 month U.S. LIBOR + 3.000% 5.3431% 11/1/23 (b)(c) | 389,102 | 389,406 | |
| MA FinanceCo. LLC Tranche B 3LN, term loan: | |||
| 3 month U.S. LIBOR + 2.500% 4.802% 6/21/24 (b)(c) | 86,666 | 86,367 | |
| 3 month U.S. LIBOR + 2.500% 4.802% 6/21/24 (b)(c) | 12,833 | 12,789 | |
| Microchip Technology, Inc. Tranche B, term loan 3 month U.S. LIBOR + 2.000% 4.31% 5/29/25 (b)(c) | 45,217 | 45,036 | |
| Renaissance Holding Corp.: | |||
| Tranche B 1LN, term loan 3 month U.S. LIBOR + 3.250% 5.552% 5/31/25 (b)(c) | 34,913 | 34,729 | |
| Tranche B 2LN, term loan 3 month U.S. LIBOR + 7.000% 9.302% 5/31/26 (b)(c) | 15,000 | 14,888 | |
| Solera LLC Tranche B, term loan 3 month U.S. LIBOR + 2.750% 5.052% 3/3/23 (b)(c) | 104,198 | 103,987 | |
| SS&C Technologies, Inc.: | |||
| Tranche B 3LN, term loan 3 month U.S. LIBOR + 2.250% 4.552% 4/16/25 (b)(c) | 116,614 | 115,966 | |
| Tranche B 4LN, term loan 3 month U.S. LIBOR + 2.250% 4.552% 4/16/25 (b)(c) | 45,200 | 44,948 | |
| Tranche B 5LN, term loan 3 month U.S. LIBOR + 2.500% 4.552% 4/16/25 (b)(c) | 70,000 | 69,575 | |
| Syniverse Holdings, Inc.: | |||
| Tranche B 2LN, term loan 3 month U.S. LIBOR + 9.000% 11.2795% 3/11/24 (b)(c) | 150,000 | 144,500 | |
| Tranche B, term loan 3 month U.S. LIBOR + 5.000% 7.2795% 3/9/23 (b)(c) | 347,000 | 348,735 | |
| Uber Technologies, Inc. Tranche B, term loan: | |||
| 3 month U.S. LIBOR + 3.500% 5.7795% 7/13/23 (b)(c) | 441,000 | 440,727 | |
| 3 month U.S. LIBOR + 4.000% 6.2806% 4/4/25 (b)(c) | 125,000 | 124,896 | |
| Verscend Holding Corp. Tranche B, term loan 3 month U.S. LIBOR + 4.500% 6.802% 8/27/25 (b)(c) | 60,000 | 60,431 | |
| Vertafore, Inc. Tranche B 1LN, term loan 3 month U.S. LIBOR + 3.250% 5.552% 7/2/25 (b)(c) | 75,000 | 74,703 | |
| Web.com Group, Inc. Tranche B 1LN, term loan 3 month U.S. LIBOR + 3.750% 6.1704% 10/11/25 (b)(c) | 35,000 | 34,923 | |
| TOTAL TECHNOLOGY | 3,187,987 | ||
| Telecommunications - 2.3% | |||
| Altice Financing SA Tranche B, term loan 3 month U.S. LIBOR + 2.750% 5.0395% 7/15/25 (b)(c) | 147,750 | 143,920 | |
| Frontier Communications Corp.: | |||
| Tranche A, term loan 3 month U.S. LIBOR + 2.750% 5.06% 3/31/21 (b)(c) | 147,887 | 143,266 | |
| Tranche B 1LN, term loan 3 month U.S. LIBOR + 3.750% 6.06% 6/15/24 (b)(c) | 24,937 | 24,089 | |
| GTT Communications, Inc. Tranche B, term loan 3 month U.S. LIBOR + 2.750% 5.05% 5/31/25 (b)(c) | 24,938 | 24,578 | |
| Intelsat Jackson Holdings SA: | |||
| Tranche B, term loan 3 month U.S. LIBOR + 3.750% 6.0449% 11/27/23 (b)(c) | 125,000 | 125,000 | |
| Tranche B-5, term loan 6.625% 1/2/24 | 500,000 | 512,055 | |
| Level 3 Financing, Inc. Tranche B, term loan 3 month U.S. LIBOR + 2.250% 4.5296% 2/22/24 (b)(c) | 335,000 | 335,157 | |
| Radiate Holdco LLC Tranche B, term loan 3 month U.S. LIBOR + 3.000% 5.302% 2/1/24 (b)(c) | 369,375 | 366,209 | |
| Sable International Finance Ltd. Tranche B 4LN, term loan 3 month U.S. LIBOR + 3.250% 5.552% 2/2/26 (b)(c) | 280,000 | 279,686 | |
| Securus Technologies, Inc. Tranche B, term loan: | |||
| 3 month U.S. LIBOR + 4.500% 6.802% 11/1/24 (b)(c) | 241,288 | 241,690 | |
| 3 month U.S. LIBOR + 8.250% 10.552% 11/1/25 (b)(c) | 165,000 | 164,724 | |
| SFR Group SA Tranche B 11LN, term loan 3 month U.S. LIBOR + 2.750% 5.052% 7/31/25 (b)(c) | 448,175 | 431,790 | |
| TOTAL TELECOMMUNICATIONS | 2,792,164 | ||
| Transportation Ex Air/Rail - 0.0% | |||
| International Seaways Operating Corp. Tranche B, term loan 3 month U.S. LIBOR + 5.500% 8.26% 6/22/22 (b)(c) | 24,521 | 24,460 | |
| Utilities - 0.7% | |||
| Brookfield WEC Holdings, Inc.: | |||
| 2LN, term loan 3 month U.S. LIBOR + 6.750% 9.052% 8/1/26 (b)(c) | 10,000 | 10,135 | |
| Tranche B 1LN, term loan 3 month U.S. LIBOR + 3.750% 6.052% 8/1/25 (b)(c) | 125,000 | 125,660 | |
| Houston Fuel Oil Terminal Co. Tranche B 1LN, term loan 3 month U.S. LIBOR + 2.750% 5.06% 6/26/25 (b)(c) | 84,788 | 84,964 | |
| The AES Corp. Tranche B, term loan 3 month U.S. LIBOR + 1.750% 4.0673% 5/31/22 (b)(c) | 359,543 | 359,274 | |
| Vertiv Group Corp. Tranche B, term loan 3 month U.S. LIBOR + 4.000% 6.3126% 11/30/23 (b)(c) | 125,000 | 123,594 | |
| Vistra Operations Co. LLC Tranche B 3LN, term loan 3 month U.S. LIBOR + 2.000% 4.2928% 12/31/25 (b)(c) | 124,688 | 124,234 | |
| TOTAL UTILITIES | 827,861 | ||
| TOTAL BANK LOAN OBLIGATIONS | |||
| (Cost $18,212,340) | 18,179,279 | ||
| Bank Notes - 0.2% | |||
| Compass Bank 2.875% 6/29/22 | |||
| (Cost $249,715) | 250,000 | 239,575 | |
| Preferred Securities - 1.2% | |||
| Banks & Thrifts - 1.0% | |||
| Bank of America Corp. 5.2% (b)(h) | $300,000 | $299,021 | |
| Citigroup, Inc.: | |||
| 5.95% (b)(h) | 100,000 | 101,311 | |
| 5.95% (b)(h) | 10,000 | 10,289 | |
| Royal Bank of Scotland Group PLC 7.5% (b)(h) | 800,000 | 818,475 | |
| TOTAL BANKS & THRIFTS | 1,229,096 | ||
| Energy - 0.2% | |||
| Energy Transfer Partners LP 6.25% (b)(h) | 265,000 | 251,286 | |
| TOTAL PREFERRED SECURITIES | |||
| (Cost $1,461,006) | 1,480,382 | ||
| Shares | Value | ||
| Money Market Funds - 6.0% | |||
| Fidelity Cash Central Fund, 2.23% (i) | |||
| (Cost $7,236,496) | 7,235,175 | 7,236,622 | |
| TOTAL INVESTMENT IN SECURITIES - 102.0% | |||
| (Cost $124,420,691) | 122,405,679 | ||
| NET OTHER ASSETS (LIABILITIES) - (2.0)% | (2,378,187) | ||
| NET ASSETS - 100% | $120,027,492 |
Legend
(a) Security exempt from registration under Rule 144A of the Securities Act of 1933. These securities may be resold in transactions exempt from registration, normally to qualified institutional buyers. At the end of the period, the value of these securities amounted to $38,516,713 or 32.1% of net assets.
(b) Coupon rates for floating and adjustable rate securities reflect the rates in effect at period end.
(c) Coupon is indexed to a floating interest rate which may be multiplied by a specified factor and/or subject to caps or floors.
(d) Security or a portion of the security purchased on a delayed delivery or when-issued basis.
(e) Non-income producing
(f) The coupon rate will be determined upon settlement of the loan after period end.
(g) Level 3 security
(h) Security is perpetual in nature with no stated maturity date.
(i) Affiliated fund that is generally available only to investment companies and other accounts managed by Fidelity Investments. The rate quoted is the annualized seven-day yield of the fund at period end. A complete unaudited listing of the fund's holdings as of its most recent quarter end is available upon request. In addition, each Fidelity Central Fund's financial statements are available on the SEC's website or upon request.
Affiliated Central Funds
Information regarding fiscal year to date income earned by the Fund from investments in Fidelity Central Funds is as follows:
| Fund | Income earned |
| Fidelity Cash Central Fund | $61,374 |
| Total | $61,374 |
Amounts in the income column in the above table include any capital gain distributions from underlying funds, which are presented in the corresponding line-item in the Statement of Operations if applicable.
Investment Valuation
The following is a summary of the inputs used, as of October 31, 2018, involving the Fund's assets and liabilities carried at fair value. The inputs or methodology used for valuing securities may not be an indication of the risk associated with investing in those securities. For more information on valuation inputs, and their aggregation into the levels used below, please refer to the Investment Valuation section in the accompanying Notes to Financial Statements.
| Valuation Inputs at Reporting Date: | ||||
| Description | Total | Level 1 | Level 2 | Level 3 |
| Investments in Securities: | ||||
| Equities: | ||||
| Energy | $32,663 | $32,663 | $-- | $-- |
| Corporate Bonds | 95,237,158 | -- | 95,237,158 | -- |
| Bank Loan Obligations | 18,179,279 | -- | 18,030,769 | 148,510 |
| Bank Notes | 239,575 | -- | 239,575 | -- |
| Preferred Securities | 1,480,382 | -- | 1,480,382 | -- |
| Money Market Funds | 7,236,622 | 7,236,622 | -- | -- |
| Total Investments in Securities: | $122,405,679 | $7,269,285 | $114,987,884 | $148,510 |
Other Information
Distribution of investments by country or territory of incorporation, as a percentage of Total Net Assets, is as follows (Unaudited):
| United States of America | 76.7% |
| Canada | 8.8% |
| Netherlands | 2.6% |
| Luxembourg | 2.5% |
| United Kingdom | 2.3% |
| Cayman Islands | 1.5% |
| British Virgin Islands | 1.0% |
| Bermuda | 1.0% |
| Multi-National | 1.0% |
| Others (Individually Less Than 1%) | 2.6% |
| 100.0% |
See accompanying notes which are an integral part of the financial statements.
Financial Statements
Statement of Assets and Liabilities
| October 31, 2018 (Unaudited) | ||
| Assets | ||
| Investment in securities, at value — See accompanying schedule: Unaffiliated issuers (cost $117,184,195) | $115,169,057 | |
| Fidelity Central Funds (cost $7,236,496) | 7,236,622 | |
| Total Investment in Securities (cost $124,420,691) | $122,405,679 | |
| Cash | 35,227 | |
| Receivable for investments sold | 252,971 | |
| Receivable for fund shares sold | 333,289 | |
| Interest receivable | 1,537,620 | |
| Distributions receivable from Fidelity Central Funds | 14,680 | |
| Prepaid expenses | 206 | |
| Receivable from investment adviser for expense reductions | 39,007 | |
| Total assets | 124,618,679 | |
| Liabilities | ||
| Payable for investments purchased | $4,105,372 | |
| Payable for fund shares redeemed | 302,744 | |
| Distributions payable | 66,350 | |
| Accrued management fee | 55,498 | |
| Distribution and service plan fees payable | 6,928 | |
| Other affiliated payables | 15,103 | |
| Other payables and accrued expenses | 39,192 | |
| Total liabilities | 4,591,187 | |
| Net Assets | $120,027,492 | |
| Net Assets consist of: | ||
| Paid in capital | $125,950,322 | |
| Total distributable earnings (loss) | (5,922,830) | |
| Net Assets | $120,027,492 | |
| Net Asset Value and Maximum Offering Price | ||
| Class A: | ||
| Net Asset Value and redemption price per share ($13,506,176 ÷ 1,448,736 shares) | $9.32 | |
| Maximum offering price per share (100/96.00 of $9.32) | $9.71 | |
| Class M: | ||
| Net Asset Value and redemption price per share ($2,198,578 ÷ 235,875 shares) | $9.32 | |
| Maximum offering price per share (100/96.00 of $9.32) | $9.71 | |
| Class C: | ||
| Net Asset Value and offering price per share ($4,566,600 ÷ 489,795 shares)(a) | $9.32 | |
| Short Duration High Income: | ||
| Net Asset Value, offering price and redemption price per share ($95,748,390 ÷ 10,270,004 shares) | $9.32 | |
| Class I: | ||
| Net Asset Value, offering price and redemption price per share ($3,908,839 ÷ 419,261 shares) | $9.32 | |
| Class Z: | ||
| Net Asset Value, offering price and redemption price per share ($98,909 ÷ 10,606 shares) | $9.33 |
(a) Redemption price per share is equal to net asset value less any applicable contingent deferred sales charge.
See accompanying notes which are an integral part of the financial statements.
Statement of Operations
| Six months ended October 31, 2018 (Unaudited) | ||
| Investment Income | ||
| Dividends | $41,554 | |
| Interest | 2,902,289 | |
| Income from Fidelity Central Funds | 61,374 | |
| Total income | 3,005,217 | |
| Expenses | ||
| Management fee | $316,679 | |
| Transfer agent fees | 66,191 | |
| Distribution and service plan fees | 43,370 | |
| Accounting fees and expenses | 23,678 | |
| Custodian fees and expenses | 6,433 | |
| Independent trustees' fees and expenses | 334 | |
| Registration fees | 65,748 | |
| Audit | 35,668 | |
| Legal | 91 | |
| Miscellaneous | 401 | |
| Total expenses before reductions | 558,593 | |
| Expense reductions | (54,782) | |
| Total expenses after reductions | 503,811 | |
| Net investment income (loss) | 2,501,406 | |
| Realized and Unrealized Gain (Loss) | ||
| Net realized gain (loss) on: | ||
| Investment securities: | ||
| Unaffiliated issuers | (136,476) | |
| Fidelity Central Funds | 7 | |
| Total net realized gain (loss) | (136,469) | |
| Change in net unrealized appreciation (depreciation) on: | ||
| Investment securities: | ||
| Unaffiliated issuers | (1,260,215) | |
| Fidelity Central Funds | (1) | |
| Total change in net unrealized appreciation (depreciation) | (1,260,216) | |
| Net gain (loss) | (1,396,685) | |
| Net increase (decrease) in net assets resulting from operations | $1,104,721 |
See accompanying notes which are an integral part of the financial statements.
Statement of Changes in Net Assets
| Six months ended October 31, 2018 (Unaudited) | Year ended April 30, 2018 | |
| Increase (Decrease) in Net Assets | ||
| Operations | ||
| Net investment income (loss) | $2,501,406 | $4,799,847 |
| Net realized gain (loss) | (136,469) | (10,805) |
| Change in net unrealized appreciation (depreciation) | (1,260,216) | (1,948,198) |
| Net increase (decrease) in net assets resulting from operations | 1,104,721 | 2,840,844 |
| Distributions to shareholders | (2,339,936) | – |
| Distributions to shareholders from net investment income | – | (4,712,243) |
| Total distributions | (2,339,936) | (4,712,243) |
| Share transactions - net increase (decrease) | 13,347,721 | 13,613,515 |
| Redemption fees | – | 11,820 |
| Total increase (decrease) in net assets | 12,112,506 | 11,753,936 |
| Net Assets | ||
| Beginning of period | 107,914,986 | 96,161,050 |
| End of period | $120,027,492 | $107,914,986 |
| Other Information | ||
| Undistributed net investment income end of period | $360,273 |
See accompanying notes which are an integral part of the financial statements.
Financial Highlights
Fidelity Short Duration High Income Fund Class A
| Six months ended (Unaudited) October 31, | Years endedApril 30, | |||||
| 2018 | 2018 | 2017 | 2016 | 2015 | 2014 A | |
| Selected Per–Share Data | ||||||
| Net asset value, beginning of period | $9.42 | $9.57 | $9.14 | $9.86 | $10.10 | $10.00 |
| Income from Investment Operations | ||||||
| Net investment income (loss)B | .198 | .381 | .395 | .429 | .358 | .132 |
| Net realized and unrealized gain (loss) | (.113) | (.159) | .397 | (.737) | (.246) | .091 |
| Total from investment operations | .085 | .222 | .792 | (.308) | .112 | .223 |
| Distributions from net investment income | (.185) | (.373) | (.365) | (.413) | (.358) | (.124) |
| Distributions from net realized gain | – | – | – | (.002) | – | – |
| Total distributions | (.185) | (.373) | (.365) | (.415) | (.358) | (.124) |
| Redemption fees added to paid in capitalB | – | .001 | .003 | .003 | .006 | .001 |
| Net asset value, end of period | $9.32 | $9.42 | $9.57 | $9.14 | $9.86 | $10.10 |
| Total ReturnC,D,E | .90% | 2.36% | 8.84% | (3.06)% | 1.22% | 2.25% |
| Ratios to Average Net AssetsF,G | ||||||
| Expenses before reductions | 1.18%H | 1.16% | 1.22% | 1.24% | 1.29% | 1.61%H |
| Expenses net of fee waivers, if any | 1.05%H | 1.05% | 1.05% | 1.05% | 1.05% | 1.05%H |
| Expenses net of all reductions | 1.05%H | 1.05% | 1.05% | 1.05% | 1.05% | 1.05%H |
| Net investment income (loss) | 4.17%H | 4.00% | 4.21% | 4.65% | 3.63% | 2.72%H |
| Supplemental Data | ||||||
| Net assets, end of period (000 omitted) | $13,506 | $12,351 | $9,304 | $6,823 | $4,398 | $3,043 |
| Portfolio turnover rateI | 23%H | 65% | 105% | 56% | 84% | 20%J |
A For the period November 5, 2013 (commencement of operations) to April 30, 2014.
B Calculated based on average shares outstanding during the period.
C Total returns for periods of less than one year are not annualized.
D Total returns would have been lower if certain expenses had not been reduced during the applicable periods shown.
E Total returns do not include the effect of the sales charges.
F Fees and expenses of any underlying Fidelity Central Funds are not included in the Fund's expense ratio. The Fund indirectly bears its proportionate share of the expenses of any underlying Fidelity Central Funds.
G Expense ratios reflect operating expenses of the class. Expenses before reductions do not reflect amounts reimbursed by the investment adviser or reductions from brokerage service arrangements or reductions from other expense offset arrangements and do not represent the amount paid by the class during periods when reimbursements or reductions occur. Expense ratios before reductions for start-up periods may not be representative of longer-term operating periods. Expenses net of fee waivers reflect expenses after reimbursement by the investment adviser but prior to reductions from brokerage service arrangements or other expense offset arrangements. Expenses net of all reductions represent the net expenses paid by the class.
H Annualized
I Amount does not include the portfolio activity of any underlying Fidelity Central Funds.
J Amount not annualized.
See accompanying notes which are an integral part of the financial statements.
Fidelity Short Duration High Income Fund Class M
| Six months ended (Unaudited) October 31, | Years endedApril 30, | |||||
| 2018 | 2018 | 2017 | 2016 | 2015 | 2014 A | |
| Selected Per–Share Data | ||||||
| Net asset value, beginning of period | $9.42 | $9.57 | $9.14 | $9.86 | $10.10 | $10.00 |
| Income from Investment Operations | ||||||
| Net investment income (loss)B | .198 | .382 | .395 | .433 | .360 | .132 |
| Net realized and unrealized gain (loss) | (.113) | (.160) | .397 | (.741) | (.247) | .091 |
| Total from investment operations | .085 | .222 | .792 | (.308) | .113 | .223 |
| Distributions from net investment income | (.185) | (.373) | (.365) | (.413) | (.359) | (.124) |
| Distributions from net realized gain | – | – | – | (.002) | – | – |
| Total distributions | (.185) | (.373) | (.365) | (.415) | (.359) | (.124) |
| Redemption fees added to paid in capitalB | – | .001 | .003 | .003 | .006 | .001 |
| Net asset value, end of period | $9.32 | $9.42 | $9.57 | $9.14 | $9.86 | $10.10 |
| Total ReturnC,D,E | .90% | 2.36% | 8.84% | (3.06)% | 1.23% | 2.25% |
| Ratios to Average Net AssetsF,G | ||||||
| Expenses before reductions | 1.18%H | 1.16% | 1.22% | 1.25% | 1.31% | 1.61%H |
| Expenses net of fee waivers, if any | 1.05%H | 1.05% | 1.05% | 1.05% | 1.05% | 1.05%H |
| Expenses net of all reductions | 1.05%H | 1.05% | 1.05% | 1.05% | 1.05% | 1.05%H |
| Net investment income (loss) | 4.17%H | 4.00% | 4.21% | 4.65% | 3.63% | 2.72%H |
| Supplemental Data | ||||||
| Net assets, end of period (000 omitted) | $2,199 | $2,081 | $2,703 | $2,426 | $2,930 | $2,946 |
| Portfolio turnover rateI | 23%H | 65% | 105% | 56% | 84% | 20%J |
A For the period November 5, 2013 (commencement of operations) to April 30, 2014.
B Calculated based on average shares outstanding during the period.
C Total returns for periods of less than one year are not annualized.
D Total returns would have been lower if certain expenses had not been reduced during the applicable periods shown.
E Total returns do not include the effect of the sales charges.
F Fees and expenses of any underlying Fidelity Central Funds are not included in the Fund's expense ratio. The Fund indirectly bears its proportionate share of the expenses of any underlying Fidelity Central Funds.
G Expense ratios reflect operating expenses of the class. Expenses before reductions do not reflect amounts reimbursed by the investment adviser or reductions from brokerage service arrangements or reductions from other expense offset arrangements and do not represent the amount paid by the class during periods when reimbursements or reductions occur. Expense ratios before reductions for start-up periods may not be representative of longer-term operating periods. Expenses net of fee waivers reflect expenses after reimbursement by the investment adviser but prior to reductions from brokerage service arrangements or other expense offset arrangements. Expenses net of all reductions represent the net expenses paid by the class.
H Annualized
I Amount does not include the portfolio activity of any underlying Fidelity Central Funds.
J Amount not annualized.
See accompanying notes which are an integral part of the financial statements.
Fidelity Short Duration High Income Fund Class C
| Six months ended (Unaudited) October 31, | Years endedApril 30, | |||||
| 2018 | 2018 | 2017 | 2016 | 2015 | 2014 A | |
| Selected Per–Share Data | ||||||
| Net asset value, beginning of period | $9.42 | $9.57 | $9.15 | $9.86 | $10.10 | $10.00 |
| Income from Investment Operations | ||||||
| Net investment income (loss)B | .163 | .310 | .325 | .360 | .285 | .096 |
| Net realized and unrealized gain (loss) | (.114) | (.159) | .386 | (.728) | (.247) | .090 |
| Total from investment operations | .049 | .151 | .711 | (.368) | .038 | .186 |
| Distributions from net investment income | (.149) | (.302) | (.294) | (.343) | (.284) | (.087) |
| Distributions from net realized gain | – | – | – | (.002) | – | – |
| Total distributions | (.149) | (.302) | (.294) | (.345) | (.284) | (.087) |
| Redemption fees added to paid in capitalB | – | .001 | .003 | .003 | .006 | .001 |
| Net asset value, end of period | $9.32 | $9.42 | $9.57 | $9.15 | $9.86 | $10.10 |
| Total ReturnC,D,E | .52% | 1.59% | 7.92% | (3.68)% | .47% | 1.88% |
| Ratios to Average Net AssetsF,G | ||||||
| Expenses before reductions | 1.94%H | 1.93% | 2.00% | 2.00% | 2.08% | 2.37%H |
| Expenses net of fee waivers, if any | 1.80%H | 1.80% | 1.80% | 1.80% | 1.80% | 1.80%H |
| Expenses net of all reductions | 1.80%H | 1.80% | 1.80% | 1.80% | 1.80% | 1.80%H |
| Net investment income (loss) | 3.42%H | 3.25% | 3.46% | 3.90% | 2.88% | 1.97%H |
| Supplemental Data | ||||||
| Net assets, end of period (000 omitted) | $4,567 | $5,146 | $5,387 | $3,827 | $3,465 | $3,114 |
| Portfolio turnover rateI | 23%H | 65% | 105% | 56% | 84% | 20%J |
A For the period November 5, 2013 (commencement of operations) to April 30, 2014.
B Calculated based on average shares outstanding during the period.
C Total returns for periods of less than one year are not annualized.
D Total returns would have been lower if certain expenses had not been reduced during the applicable periods shown.
E Total returns do not include the effect of the contingent deferred sales charge.
F Fees and expenses of any underlying Fidelity Central Funds are not included in the Fund's expense ratio. The Fund indirectly bears its proportionate share of the expenses of any underlying Fidelity Central Funds.
G Expense ratios reflect operating expenses of the class. Expenses before reductions do not reflect amounts reimbursed by the investment adviser or reductions from brokerage service arrangements or reductions from other expense offset arrangements and do not represent the amount paid by the class during periods when reimbursements or reductions occur. Expense ratios before reductions for start-up periods may not be representative of longer-term operating periods. Expenses net of fee waivers reflect expenses after reimbursement by the investment adviser but prior to reductions from brokerage service arrangements or other expense offset arrangements. Expenses net of all reductions represent the net expenses paid by the class.
H Annualized
I Amount does not include the portfolio activity of any underlying Fidelity Central Funds.
J Amount not annualized.
See accompanying notes which are an integral part of the financial statements.
Fidelity Short Duration High Income Fund
| Six months ended (Unaudited) October 31, | Years endedApril 30, | |||||
| 2018 | 2018 | 2017 | 2016 | 2015 | 2014 A | |
| Selected Per–Share Data | ||||||
| Net asset value, beginning of period | $9.42 | $9.57 | $9.15 | $9.86 | $10.10 | $10.00 |
| Income from Investment Operations | ||||||
| Net investment income (loss)B | .210 | .405 | .420 | .455 | .385 | .142 |
| Net realized and unrealized gain (loss) | (.113) | (.159) | .385 | (.730) | (.248) | .093 |
| Total from investment operations | .097 | .246 | .805 | (.275) | .137 | .235 |
| Distributions from net investment income | (.197) | (.397) | (.388) | (.436) | (.383) | (.136) |
| Distributions from net realized gain | – | – | – | (.002) | – | – |
| Total distributions | (.197) | (.397) | (.388) | (.438) | (.383) | (.136) |
| Redemption fees added to paid in capitalB | – | .001 | .003 | .003 | .006 | .001 |
| Net asset value, end of period | $9.32 | $9.42 | $9.57 | $9.15 | $9.86 | $10.10 |
| Total ReturnC,D | 1.03% | 2.61% | 9.00% | (2.71)% | 1.48% | 2.37% |
| Ratios to Average Net AssetsE,F | ||||||
| Expenses before reductions | .89%G | .86% | .93% | .96% | 1.00% | 1.24%G |
| Expenses net of fee waivers, if any | .80%G | .80% | .80% | .80% | .80% | .80%G |
| Expenses net of all reductions | .80%G | .80% | .80% | .80% | .80% | .80%G |
| Net investment income (loss) | 4.43%G | 4.25% | 4.46% | 4.90% | 3.88% | 2.96%G |
| Supplemental Data | ||||||
| Net assets, end of period (000 omitted) | $95,748 | $83,652 | $68,646 | $47,531 | $45,109 | $54,547 |
| Portfolio turnover rateH | 23%G | 65% | 105% | 56% | 84% | 20%I |
A For the period November 5, 2013 (commencement of operations) to April 30, 2014.
B Calculated based on average shares outstanding during the period.
C Total returns for periods of less than one year are not annualized.
D Total returns would have been lower if certain expenses had not been reduced during the applicable periods shown.
E Fees and expenses of any underlying Fidelity Central Funds are not included in the Fund's expense ratio. The Fund indirectly bears its proportionate share of the expenses of any underlying Fidelity Central Funds.
F Expense ratios reflect operating expenses of the class. Expenses before reductions do not reflect amounts reimbursed by the investment adviser or reductions from brokerage service arrangements or reductions from other expense offset arrangements and do not represent the amount paid by the class during periods when reimbursements or reductions occur. Expense ratios before reductions for start-up periods may not be representative of longer-term operating periods. Expenses net of fee waivers reflect expenses after reimbursement by the investment adviser but prior to reductions from brokerage service arrangements or other expense offset arrangements. Expenses net of all reductions represent the net expenses paid by the class.
G Annualized
H Amount does not include the portfolio activity of any underlying Fidelity Central Funds.
I Amount not annualized.
See accompanying notes which are an integral part of the financial statements.
Fidelity Short Duration High Income Fund Class I
| Six months ended (Unaudited) October 31, | Years endedApril 30, | |||||
| 2018 | 2018 | 2017 | 2016 | 2015 | 2014 A | |
| Selected Per–Share Data | ||||||
| Net asset value, beginning of period | $9.42 | $9.57 | $9.15 | $9.86 | $10.10 | $10.00 |
| Income from Investment Operations | ||||||
| Net investment income (loss)B | .210 | .406 | .420 | .460 | .383 | .143 |
| Net realized and unrealized gain (loss) | (.113) | (.160) | .385 | (.735) | (.246) | .091 |
| Total from investment operations | .097 | .246 | .805 | (.275) | .137 | .234 |
| Distributions from net investment income | (.197) | (.397) | (.388) | (.436) | (.383) | (.135) |
| Distributions from net realized gain | – | – | – | (.002) | – | – |
| Total distributions | (.197) | (.397) | (.388) | (.438) | (.383) | (.135) |
| Redemption fees added to paid in capitalB | – | .001 | .003 | .003 | .006 | .001 |
| Net asset value, end of period | $9.32 | $9.42 | $9.57 | $9.15 | $9.86 | $10.10 |
| Total ReturnC,D | 1.03% | 2.61% | 8.99% | (2.71)% | 1.48% | 2.37% |
| Ratios to Average Net AssetsE,F | ||||||
| Expenses before reductions | .91%G | .91% | .96% | .99% | 1.04% | 1.34%G |
| Expenses net of fee waivers, if any | .80%G | .80% | .80% | .80% | .80% | .80%G |
| Expenses net of all reductions | .80%G | .80% | .80% | .80% | .80% | .80%G |
| Net investment income (loss) | 4.42%G | 4.25% | 4.46% | 4.90% | 3.88% | 2.97%G |
| Supplemental Data | ||||||
| Net assets, end of period (000 omitted) | $3,909 | $4,686 | $10,122 | $2,856 | $5,932 | $4,419 |
| Portfolio turnover rateH | 23%G | 65% | 105% | 56% | 84% | 20%I |
A For the period November 5, 2013 (commencement of operations) to April 30, 2014.
B Calculated based on average shares outstanding during the period.
C Total returns for periods of less than one year are not annualized.
D Total returns would have been lower if certain expenses had not been reduced during the applicable periods shown.
E Fees and expenses of any underlying Fidelity Central Funds are not included in the Fund's expense ratio. The Fund indirectly bears its proportionate share of the expenses of any underlying Fidelity Central Funds.
F Expense ratios reflect operating expenses of the class. Expenses before reductions do not reflect amounts reimbursed by the investment adviser or reductions from brokerage service arrangements or reductions from other expense offset arrangements and do not represent the amount paid by the class during periods when reimbursements or reductions occur. Expense ratios before reductions for start-up periods may not be representative of longer-term operating periods. Expenses net of fee waivers reflect expenses after reimbursement by the investment adviser but prior to reductions from brokerage service arrangements or other expense offset arrangements. Expenses net of all reductions represent the net expenses paid by the class.
G Annualized
H Amount does not include the portfolio activity of any underlying Fidelity Central Funds.
I Amount not annualized.
See accompanying notes which are an integral part of the financial statements.
Fidelity Short Duration High Income Fund Class Z
| Six months ended (Unaudited) October 31, | |
| 2018 A | |
| Selected Per–Share Data | |
| Net asset value, beginning of period | $9.46 |
| Income from Investment Operations | |
| Net investment income (loss)B | .033 |
| Net realized and unrealized gain (loss) | (.132) |
| Total from investment operations | (.099) |
| Distributions from net investment income | (.031) |
| Distributions from net realized gain | – |
| Total distributions | (.031) |
| Redemption fees added to paid in capitalB | – |
| Net asset value, end of period | $9.33 |
| Total ReturnC,D | (1.05)% |
| Ratios to Average Net AssetsE,F | |
| Expenses before reductions | 1.11%G |
| Expenses net of fee waivers, if any | .71%G |
| Expenses net of all reductions | .71%G |
| Net investment income (loss) | (.14)%G |
| Supplemental Data | |
| Net assets, end of period (000 omitted) | $99 |
| Portfolio turnover rateH | 23%G |
A For the period October 2, 2018 (commencement of sale of shares) to October 31, 2018.
B Calculated based on average shares outstanding during the period.
C Total returns for periods of less than one year are not annualized.
D Total returns would have been lower if certain expenses had not been reduced during the applicable periods shown.
E Fees and expenses of any underlying Fidelity Central Funds are not included in the Fund's expense ratio. The Fund indirectly bears its proportionate share of the expenses of any underlying Fidelity Central Funds.
F Expense ratios reflect operating expenses of the class. Expenses before reductions do not reflect amounts reimbursed by the investment adviser or reductions from brokerage service arrangements or reductions from other expense offset arrangements and do not represent the amount paid by the class during periods when reimbursements or reductions occur. Expense ratios before reductions for start-up periods may not be representative of longer-term operating periods. Expenses net of fee waivers reflect expenses after reimbursement by the investment adviser but prior to reductions from brokerage service arrangements or other expense offset arrangements. Expenses net of all reductions represent the net expenses paid by the class.
G Annualized
H Amount does not include the portfolio activity of any underlying Fidelity Central Funds.
See accompanying notes which are an integral part of the financial statements.
Notes to Financial Statements (Unaudited)
For the period ended October 31, 2018
1. Organization.
Fidelity Short Duration High Income Fund (the Fund) is a fund of Fidelity Summer Street Trust (the Trust) and is authorized to issue an unlimited number of shares. The Trust is registered under the Investment Company Act of 1940, as amended (the 1940 Act), as an open-end management investment company organized as a Massachusetts business trust. The Fund commenced sale of Class Z shares on October 2, 2018. The Fund offers Class A, Class M, Class C, Short Duration High Income, Class I and Class Z shares, each of which has equal rights as to assets and voting privileges. Each class has exclusive voting rights with respect to matters that affect that class.
2. Investments in Fidelity Central Funds.
The Fund invests in Fidelity Central Funds, which are open-end investment companies generally available only to other investment companies and accounts managed by the investment adviser and its affiliates. The Fund's Schedule of Investments lists each of the Fidelity Central Funds held as of period end, if any, as an investment of the Fund, but does not include the underlying holdings of each Fidelity Central Fund. As an Investing Fund, the Fund indirectly bears its proportionate share of the expenses of the underlying Fidelity Central Funds.
The Money Market Central Funds seek preservation of capital and current income and are managed by Fidelity Investments Money Management, Inc. (FIMM), an affiliate of the investment adviser. Annualized expenses of the Money Market Central Funds as of their most recent shareholder report date are less than .005%.
A complete unaudited list of holdings for each Fidelity Central Fund is available upon request or at the Securities and Exchange Commission (the SEC) website at www.sec.gov. In addition, the financial statements of the Fidelity Central Funds are available on the SEC website or upon request.
3. Significant Accounting Policies.
The Fund is an investment company and applies the accounting and reporting guidance of the Financial Accounting Standards Board (FASB) Accounting Standards Codification Topic 946 Financial Services – Investments Companies. The financial statements have been prepared in conformity with accounting principles generally accepted in the United States of America (GAAP), which require management to make certain estimates and assumptions at the date of the financial statements. Actual results could differ from those estimates. Subsequent events, if any, through the date that the financial statements were issued have been evaluated in the preparation of the financial statements. The following summarizes the significant accounting policies of the Fund:
Investment Valuation. Investments are valued as of 4:00 p.m. Eastern time on the last calendar day of the period. The Board of Trustees (the Board) has delegated the day to day responsibility for the valuation of the Fund's investments to the Fair Value Committee (the Committee) established by the Fund's investment adviser. In accordance with valuation policies and procedures approved by the Board, the Fund attempts to obtain prices from one or more third party pricing vendors or brokers to value its investments. When current market prices, quotations or currency exchange rates are not readily available or reliable, investments will be fair valued in good faith by the Committee, in accordance with procedures adopted by the Board. Factors used in determining fair value vary by investment type and may include market or investment specific events, changes in interest rates and credit quality. The frequency with which these procedures are used cannot be predicted and they may be utilized to a significant extent. The Committee oversees the Fund's valuation policies and procedures and reports to the Board on the Committee's activities and fair value determinations. The Board monitors the appropriateness of the procedures used in valuing the Fund's investments and ratifies the fair value determinations of the Committee.
The Fund categorizes the inputs to valuation techniques used to value its investments into a disclosure hierarchy consisting of three levels as shown below:
- Level 1 – quoted prices in active markets for identical investments
- Level 2 – other significant observable inputs (including quoted prices for similar investments, interest rates, prepayment speeds, etc.)
- Level 3 – unobservable inputs (including the Fund's own assumptions based on the best information available)
Valuation techniques used to value the Fund's investments by major category are as follows:
Debt securities, including restricted securities, are valued based on evaluated prices received from third party pricing vendors or from brokers who make markets in such securities. Corporate bonds, bank notes, bank loan obligations and preferred securities are valued by pricing vendors who utilize matrix pricing which considers yield or price of bonds of comparable quality, coupon, maturity and type or by broker-supplied prices. When independent prices are unavailable or unreliable, debt securities may be valued utilizing pricing methodologies which consider similar factors that would be used by third party pricing vendors. Debt securities are generally categorized as Level 2 in the hierarchy but may be Level 3 depending on the circumstances. The Fund invests a significant portion of its assets in below investment grade securities. The value of these securities can be more volatile due to changes in the credit quality of the issuer and is sensitive to changes in economic, market and regulatory conditions.
Equity securities, including restricted securities, for which market quotations are readily available, are valued at the last reported sale price or official closing price as reported by a third party pricing vendor on the primary market or exchange on which they are traded and are categorized as Level 1 in the hierarchy. In the event there were no sales during the day or closing prices are not available, securities are valued at the last quoted bid price or may be valued using the last available price and are generally categorized as Level 2 in the hierarchy. Utilizing these techniques may result in transfers between Level 1 and Level 2. For equity securities, including restricted securities, where observable inputs are limited, assumptions about market activity and risk are used and these securities may be categorized as Level 3 in the hierarchy.
Investments in open-end mutual funds, including the Fidelity Central Funds, are valued at their closing net asset value (NAV) each business day and are categorized as Level 1 in the hierarchy.
Changes in valuation techniques may result in transfers in or out of an assigned level within the disclosure hierarchy. The aggregate value of investments by input level as of October 31, 2018 is included at the end of the Fund's Schedule of Investments.
Investment Transactions and Income. For financial reporting purposes, the Fund's investment holdings and NAV include trades executed through the end of the last business day of the period. The NAV per share for processing shareholder transactions is calculated as of the close of business of the New York Stock Exchange (NYSE), normally 4:00 p.m. Eastern time and includes trades executed through the end of the prior business day. Gains and losses on securities sold are determined on the basis of identified cost and include proceeds received from litigation. Dividend income is recorded on the ex-dividend date, except for certain dividends from foreign securities where the ex-dividend date may have passed, which are recorded as soon as the Fund is informed of the ex-dividend date. Non-cash dividends included in dividend income, if any, are recorded at the fair market value of the securities received. Income and capital gain distributions from Fidelity Central Funds, if any, are recorded on the ex-dividend date. Interest income is accrued as earned and includes coupon interest and amortization of premium and accretion of discount on debt securities as applicable. Paid in Kind (PIK) income is recorded at the fair market value of the securities received. Debt obligations may be placed on non-accrual status and related interest income may be reduced by ceasing current accruals and writing off interest receivables when the collection of all or a portion of interest has become doubtful based on consistently applied procedures. A debt obligation is removed from non-accrual status when the issuer resumes interest payments or when collectability of interest is reasonably assured.
Class Allocations and Expenses. Investment income, realized and unrealized capital gains and losses, common expenses of the Fund, and certain fund-level expense reductions, if any, are allocated daily on a pro-rata basis to each class based on the relative net assets of each class to the total net assets of the Fund. Each class differs with respect to transfer agent and distribution and service plan fees incurred. Certain expense reductions may also differ by class. For the reporting period, the allocated portion of income and expenses to each class as a percent of its average net assets may vary due to the timing of recording these transactions in relation to fluctuating net assets of the classes. Expenses directly attributable to a fund are charged to that fund. Expenses attributable to more than one fund are allocated among the respective funds on the basis of relative net assets or other appropriate methods. Expense estimates are accrued in the period to which they relate and adjustments are made when actual amounts are known.
Income Tax Information and Distributions to Shareholders. Each year, the Fund intends to qualify as a regulated investment company under Subchapter M of the Internal Revenue Code, including distributing substantially all of its taxable income and realized gains. As a result, no provision for U.S. Federal income taxes is required. The Fund files a U.S. federal tax return, in addition to state and local tax returns as required. The Fund's federal income tax returns are subject to examination by the Internal Revenue Service (IRS) for a period of three fiscal years after they are filed. State and local tax returns may be subject to examination for an additional fiscal year depending on the jurisdiction.
Distributions are declared and recorded daily and paid monthly from net investment income. Distributions from realized gains, if any, are declared and recorded on the ex-dividend date. Income and capital gain distributions are declared separately for each class. Income and capital gain distributions are determined in accordance with income tax regulations, which may differ from GAAP.
Capital accounts within the financial statements are adjusted for permanent book-tax differences. These adjustments have no impact on net assets or the results of operations. Capital accounts are not adjusted for temporary book-tax differences which will reverse in a subsequent period.
Book-tax differences are primarily due to market discount, partnerships, capital loss carryforwards and losses deferred due to wash sales.
As of period end, the cost and unrealized appreciation (depreciation) in securities, and derivatives if applicable, for federal income tax purposes were as follows:
| Gross unrealized appreciation | $934,111 |
| Gross unrealized depreciation | (2,541,183) |
| Net unrealized appreciation (depreciation) | $(1,607,072) |
| Tax cost | $124,012,751 |
Capital loss carryforwards are only available to offset future capital gains of the Fund to the extent provided by regulations and may be limited. Under the Regulated Investment Company Modernization Act of 2010 (the Act), the Fund is permitted to carry forward capital losses incurred in taxable years beginning after December 22, 2010 for an unlimited period and such capital losses are required to be used prior to any losses that expire. The capital loss carryforward information presented below, including any applicable limitation, is estimated as of prior fiscal period end and is subject to adjustment.
| No expiration | |
| Short-term | $(2,523,332) |
| Long-term | (1,771,337) |
| Total capital loss carryforward | $(4,294,669) |
Restricted Securities. The Fund may invest in securities that are subject to legal or contractual restrictions on resale. These securities generally may be resold in transactions exempt from registration or to the public if the securities are registered. Disposal of these securities may involve time-consuming negotiations and expense, and prompt sale at an acceptable price may be difficult. Information regarding restricted securities is included at the end of the Fund's Schedule of Investments.
Loans and Other Direct Debt Instruments. The Fund invests in direct debt instruments which are interests in amounts owed to lenders by corporate or other borrowers. These instruments may be in the form of loans, trade claims or other receivables and may include standby financing commitments such as revolving credit facilities that obligate the Fund to supply additional cash to the borrower on demand. Loans may be acquired through assignment or participation. The Fund did not have any unfunded loan commitments, which are contractual obligations for future funding, at period end.
New Accounting Pronouncement. In March 2017, the Financial Accounting Standards Board (FASB) issued an Accounting Standards Update (ASU), ASU 2017-08, which amends the amortization period for certain callable debt securities that are held at a premium. The amendment requires the premium to be amortized to the earliest call date. The amendments do not require an accounting change for securities held at a discount. The ASU is effective for annual periods beginning after December 15, 2018. Management is currently evaluating the potential impact of these changes to the financial statements.
New Rule Issuance. During August 2018, the U.S. Securities and Exchange Commission issued Final Rule Release No. 33-10532, Disclosure Update and Simplification. This Final Rule includes amendments specific to registered investment companies that are intended to eliminate overlap in disclosure requirements between Regulation S-X and GAAP. In accordance with these amendments, certain line-items in the Fund's financial statements have been combined or removed for the current period as outlined in the table below.
| Financial Statement | Current Line-Item Presentation | Prior Line-Item Presentation |
| Statement of Assets and Liabilities | Total distributable earnings (loss) | Undistributed/Distributions in excess of/Accumulated net investment income (loss) Accumulated/Undistributed net realized gain (loss) Net unrealized appreciation (depreciation) |
| Statement of Changes in Net Assets | N/A – removed | Undistributed/Distributions in excess of/Accumulated net investment income (loss) end of period |
| Statement of Changes in Net Assets | Distributions to shareholders | Distributions to shareholders from net investment income Distributions to shareholders from net realized gain |
| Distributions to Shareholders Note to Financial Statements | Distributions to shareholders | Distributions to shareholders from net investment income Distributions to shareholders from net realized gain |
4. Purchases and Sales of Investments.
Purchases and sales of securities, other than short-term securities, aggregated $27,008,950 and $12,344,602, respectively.
5. Fees and Other Transactions with Affiliates.
Management Fee. Fidelity Management & Research Company (the investment adviser) and its affiliates provide the Fund with investment management related services for which the Fund pays a monthly management fee. The management fee is the sum of an individual fund fee rate that is based on an annual rate of .45% of the Fund's average net assets and an annualized group fee rate that averaged .11% during the period. The group fee rate is based upon the average net assets of all the mutual funds advised by the investment adviser, including any mutual funds previously advised by the investment adviser that are currently advised by Fidelity SelectCo, LLC, an affiliate of the investment adviser. The group fee rate decreases as assets under management increase and increases as assets under management decrease. For the reporting period, the total annualized management fee rate was .56% of the Fund's average net assets.
Distribution and Service Plan Fees. In accordance with Rule 12b-1 of the 1940 Act, the Fund has adopted separate Distribution and Service Plans for each class of shares. Certain classes pay Fidelity Distributors Corporation (FDC), an affiliate of the investment adviser, separate Distribution and Service Fees, each of which is based on an annual percentage of each class' average net assets. In addition, FDC may pay financial intermediaries for selling shares of the Fund and providing shareholder support services. For the period, the Distribution and Service Fee rates, total fees and amounts retained by FDC were as follows:
| Distribution Fee | Service Fee | Total Fees | Retained by FDC | |
| Class A | -% | .25% | $15,997 | $1,484 |
| Class M | -% | .25% | 2,641 | – |
| Class C | .75% | .25% | 24,732 | 2,391 |
| $43,370 | $3,875 |
Sales Load. FDC may receive a front-end sales charge of up to 4.00% for selling Class A shares and Class M shares, some of which is paid to financial intermediaries for selling shares of the Fund. Depending on the holding period, FDC may receive contingent deferred sales charges levied on Class A, Class M and Class C redemptions. The deferred sales charges are 1.00% for Class C shares, 1.00% for certain purchases of Class A shares and .25% for certain purchases of Class M shares.
For the period, sales charge amounts retained by FDC were as follows:
| Retained by FDC | |
| Class A | $1,508 |
| Class M | 195 |
| Class C(a) | 250 |
| $1,953 |
(a) When Class C shares are initially sold, FDC pays commissions from its own resources to financial intermediaries through which the sales are made.
Transfer Agent Fees. Fidelity Investments Institutional Operations Company, Inc., (FIIOC), an affiliate of the investment adviser, is the transfer, dividend disbursing and shareholder servicing agent for each class of the Fund. FIIOC receives account fees and asset-based fees that vary according to the account size and type of account of the shareholders of the respective classes of the Fund, except for Class Z. FIIOC receives an asset-based fee of Class Z's average net assets. FIIOC pays for typesetting, printing and mailing of shareholder reports, except proxy statements.
For the period, transfer agent fees for each class were as follows:
| Amount | % of Class-Level Average Net Assets(a) | |
| Class A | $9,605 | .15 |
| Class M | 1,642 | .15 |
| Class C | 4,454 | .18 |
| Short Duration High Income | 47,523 | .10 |
| Class I | 2,963 | .13 |
| Class Z | 4 | .05 |
| $66,191 |
(a) Annualized
Accounting Fees. Fidelity Service Company, Inc. (FSC), an affiliate of the investment adviser, maintains the Fund's accounting records. The fee is based on the level of average net assets for each month. For the period, the fees were equivalent to an annualized rate of .04%.
Interfund Trades. The Fund may purchase from or sell securities to other Fidelity Funds under procedures adopted by the Board. The procedures have been designed to ensure these interfund trades are executed in accordance with Rule 17a-7 of the 1940 Act. Interfund trades are included within the respective purchases and sales amounts shown in the Purchases and Sales of Investments note.
6. Committed Line of Credit.
The Fund participates with other funds managed by the investment adviser or an affiliate in a $4.25 billion credit facility (the "line of credit") to be utilized for temporary or emergency purposes to fund shareholder redemptions or for other short-term liquidity purposes. The Fund has agreed to pay commitment fees on its pro-rata portion of the line of credit, which amounted to $145 and is reflected in Miscellaneous expenses on the Statement of Operations. During the period, the Fund did not borrow on this line of credit.
7. Expense Reductions.
The investment adviser contractually agreed to reimburse each class to the extent annual operating expenses exceeded certain levels of class-level average net assets as noted in the table below. This reimbursement will remain in place through June 30, 2019. Some expenses, for example the compensation of the independent Trustees, and certain miscellaneous expenses such as proxy and shareholder meeting expenses, are excluded from this reimbursement.
The following classes were in reimbursement during the period:
| Expense Limitations | Reimbursement | |
| Class A | 1.05% | $8,162 |
| Class M | 1.05% | 1,393 |
| Class C | 1.80% | 3,535 |
| Short Duration High Income | .80% | 38,743 |
| Class I | .80% | 2,363 |
| Class Z | .71% | 33 |
| $54,229 |
Commissions paid to certain brokers with whom the investment adviser, or its affiliates, places trades on behalf of the Fund include an amount in addition to trade execution, which may be rebated back to the Fund to offset certain expenses. This amount totaled $31 for the period. Through arrangements with the Fund's custodian, credits realized as a result of certain uninvested cash balances were used to reduce the Fund's expenses. During the period, these credits reduced the Fund's custody expenses by $161.
In addition, during the period the investment adviser reimbursed and/or waived a portion of fund-level operating expenses in the amount of $361.
8. Distributions to Shareholders.
Distributions to shareholders of each class were as follows:
| Six months ended October 31, 2018(a) | Year ended April 30, 2018 |
|
| Distributions to shareholders | ||
| Class A | $251,147 | $– |
| Class M | 41,465 | – |
| Class C | 78,432 | – |
| Short Duration High Income | 1,877,261 | – |
| Class I | 91,306 | – |
| Class Z | 325 | – |
| Total | $2,339,936 | $– |
| From net investment income | ||
| Class A | $– | $445,242 |
| Class M | – | 93,305 |
| Class C | – | 176,055 |
| Short Duration High Income | – | 3,580,329 |
| Class I | – | 417,312 |
| Total | $– | $4,712,243 |
(a) Distributions for Class Z are for the period October 2, 2018 (commencement of sale of shares) to October 31, 2018.
9. Share Transactions.
Share transactions for each class were as follows and may contain automatic conversions between classes or exchanges between affiliated funds:
| Shares | Shares | Dollars | Dollars | |
| Six months ended October 31, 2018(a) | Year ended April 30, 2018 | Six months ended October 31, 2018(a) | Year ended April 30, 2018 | |
| Class A | ||||
| Shares sold | 259,285 | 583,861 | $2,439,130 | $5,564,910 |
| Reinvestment of distributions | 25,845 | 44,786 | 243,043 | 426,787 |
| Shares redeemed | (147,746) | (289,548) | (1,390,762) | (2,756,061) |
| Net increase (decrease) | 137,384 | 339,099 | $1,291,411 | $3,235,636 |
| Class M | ||||
| Shares sold | 25,732 | 47,258 | $241,953 | $450,924 |
| Reinvestment of distributions | 4,295 | 9,433 | 40,391 | 89,955 |
| Shares redeemed | (15,111) | (118,183) | (142,136) | (1,126,799) |
| Net increase (decrease) | 14,916 | (61,492) | $140,208 | $(585,920) |
| Class C | ||||
| Shares sold | 77,731 | 203,484 | $729,723 | $1,941,596 |
| Reinvestment of distributions | 8,252 | 18,355 | 77,621 | 175,004 |
| Shares redeemed | (142,461) | (238,426) | (1,342,695) | (2,272,097) |
| Net increase (decrease) | (56,478) | (16,587) | $(535,351) | $(155,497) |
| Short Duration High Income | ||||
| Shares sold | 3,010,643 | 5,767,474 | $28,358,196 | $55,048,153 |
| Reinvestment of distributions | 161,387 | 292,731 | 1,517,639 | 2,790,315 |
| Shares redeemed | (1,783,408) | (4,351,715) | (16,786,324) | (41,381,770) |
| Net increase (decrease) | 1,388,622 | 1,708,490 | $13,089,511 | $16,456,698 |
| Class I | ||||
| Shares sold | 59,092 | 643,223 | $555,967 | $6,143,050 |
| Reinvestment of distributions | 8,651 | 35,107 | 81,364 | 335,181 |
| Shares redeemed | (145,963) | (1,238,488) | (1,375,714) | (11,815,633) |
| Net increase (decrease) | (78,220) | (560,158) | $(738,383) | $(5,337,402) |
| Class Z | ||||
| Shares sold | 10,571 | – | $100,000 | $– |
| Reinvestment of distributions | 35 | – | 325 | – |
| Net increase (decrease) | 10,606 | – | $100,325 | $– |
(a) Share transactions for Class Z are for the period October 2, 2018 (commencement of sale of shares) to October 31, 2018.
10. Other.
The Fund's organizational documents provide former and current trustees and officers with a limited indemnification against liabilities arising in connection with the performance of their duties to the Fund. In the normal course of business, the Fund may also enter into contracts that provide general indemnifications. The Fund's maximum exposure under these arrangements is unknown as this would be dependent on future claims that may be made against the Fund. The risk of material loss from such claims is considered remote.
Shareholder Expense Example
As a shareholder of the Fund, you incur two types of costs: (1) transaction costs, including sales charges (loads) on purchase payments or redemption proceeds, and (2) ongoing costs, including management fees, distribution and/or service (12b-1) fees and other Fund expenses. This Example is intended to help you understand your ongoing costs (in dollars) of investing in the Fund and to compare these costs with the ongoing costs of investing in other mutual funds.
The actual expense Example is based on an investment of $1,000 invested at the beginning of the period and held for the entire period (May 1, 2018 to October 31, 2018) for Class A, Class M, Class C, Short Duration High Income and Class I and for the period (October 2, 2018 to October 31, 2018) for Class Z. The hypothetical expense is based on an investment of $1,000 invested for the one-half year period (May 1, 2018 to October 31, 2018).
Actual Expenses
The first line of the accompanying table for each class of the Fund provides information about actual account values and actual expenses. You may use the information in this line, together with the amount you invested, to estimate the expenses that you paid over the period. Simply divide your account value by $1,000.00 (for example, an $8,600 account value divided by $1,000.00 = 8.6), then multiply the result by the number in the first line for a class of the Fund under the heading entitled "Expenses Paid During Period" to estimate the expenses you paid on your account during this period. A small balance maintenance fee of $12.00 that is charged once a year may apply for certain accounts with a value of less than $2,000. This fee, which was eliminated effective August 1, 2018, is not included in the table below. If it was, the estimate of expenses you paid during the period would be higher, and your ending account value lower, by this amount. In addition, the Fund, as a shareholder in the underlying Fidelity Central Funds, will indirectly bear its pro-rata share of the fees and expenses incurred by the underlying Fidelity Central Funds. These fees and expenses are not included in the Fund's annualized expense ratio used to calculate the expense estimate in the table below.
Hypothetical Example for Comparison Purposes
The second line of the accompanying table for each class of the Fund provides information about hypothetical account values and hypothetical expenses based on a Class' actual expense ratio and an assumed rate of return of 5% per year before expenses, which is not the Class' actual return. The hypothetical account values and expenses may not be used to estimate the actual ending account balance or expenses you paid for the period. You may use this information to compare the ongoing costs of investing in the Fund and other funds. To do so, compare this 5% hypothetical example with the 5% hypothetical examples that appear in the shareholder reports of the other funds. A small balance maintenance fee of $12.00 that is charged once a year may apply for certain accounts with a value of less than $2,000. This fee, which was eliminated effective August 1, 2018, is not included in the table below. If it was, the estimate of expenses you paid during the period would be higher, and your ending account value lower, by this amount. In addition, the Fund, as a shareholder in the underlying Fidelity Central Funds, will indirectly bear its pro-rata share of the fees and expenses incurred by the underlying Fidelity Central Funds. These fees and expenses are not included in the Fund's annualized expense ratio used to calculate the expense estimate in the table below.
Please note that the expenses shown in the table are meant to highlight your ongoing costs only and do not reflect any transaction costs. Therefore, the second line of the table is useful in comparing ongoing costs only, and will not help you determine the relative total costs of owning different funds. In addition, if these transactional costs were included, your costs would have been higher.
| Annualized Expense Ratio-A | Beginning Account Value | Ending Account Value October 31, 2018 | Expenses Paid During Period |
|
| Class A | 1.05% | |||
| Actual | $1,000.00 | $1,009.00 | $5.32-B | |
| Hypothetical-C | $1,000.00 | $1,019.91 | $5.35-D | |
| Class M | 1.05% | |||
| Actual | $1,000.00 | $1,009.00 | $5.32-B | |
| Hypothetical-C | $1,000.00 | $1,019.91 | $5.35-D | |
| Class C | 1.80% | |||
| Actual | $1,000.00 | $1,005.20 | $9.10-B | |
| Hypothetical-C | $1,000.00 | $1,016.13 | $9.15-D | |
| Short Duration High Income | .80% | |||
| Actual | $1,000.00 | $1,010.30 | $4.05-B | |
| Hypothetical-C | $1,000.00 | $1,021.17 | $4.08-D | |
| Class I | .80% | |||
| Actual | $1,000.00 | $1,010.30 | $4.05-B | |
| Hypothetical-C | $1,000.00 | $1,021.17 | $4.08-D | |
| Class Z | .71% | |||
| Actual | $1,000.00 | $989.50 | $.58-B | |
| Hypothetical-C | $1,000.00 | $1,021.63 | $3.62-D |
A Annualized expense ratio reflects expenses net of applicable fee waivers.
B Actual expenses are equal to each Class' annualized expense ratio, multiplied by the average account value over the period, multiplied by 184/365 (to reflect the one-half year period) for Class A, Class M, Class C, Short Duration High Income and Class I, and multiplied by 30/365 (to reflect the period October 2, 2018 to October 31, 2018) for Class Z.
C 5% return per year before expenses
D Hypothetical expenses are equal to each Class' annualized expense ratio, multiplied by the average account value over the period, multiplied by 184/365 (to reflect the one-half year period).
Board Approval of Investment Advisory Contracts
Fidelity Short Duration High Income Fund
At its July 2018 meeting, the Board of Trustees, including the Independent Trustees (together, the Board), voted to continue the management contract with Fidelity Management & Research Company (FMR) and the sub-advisory agreements (together, the Advisory Contracts) for the fund for six months through January 31, 2019, in connection with the reunification of the Fidelity Equity High Income Funds Board, which oversees the fund, and the Sector Portfolios Board.
The Board considered that the approval of the fund's Advisory Contracts will not result in any changes in (i) the investment process or strategies employed in the management of the fund's assets; (ii) the fees and expenses paid by shareholders, including the expense cap arrangement currently in place for the fund; (iii) the nature, extent or quality of services provided under the fund's Advisory Contracts; or (iv) the day-to-day management of the fund or the persons primarily responsible for such management. The Board concluded that the fund's Advisory Contracts are fair and reasonable, and that the fund's Advisory Contracts should be renewed, without modification, through January 31, 2019, with the understanding that the Board will consider the annual renewal for a full one year period in January 2019.
In connection with its consideration of future renewals of the fund's Advisory Contracts, the Board will consider: (i) the nature, extent and quality of services provided to the fund, including shareholder and administrative services and investment performance; (ii) the competitiveness of the management fee and total expenses for the fund; (iii) the costs of the services and profitability, including the revenues earned and the expenses incurred in conducting the business of developing, marketing, distributing, managing, administering, and servicing the fund and its shareholders, to the extent applicable, as well as potential fall-out benefits from Fidelity's non-fund businesses; and (iv) whether there have been economies of scale in respect of the Fidelity funds, whether the Fidelity funds (including the fund) have appropriately benefited from any such economies of scale, and whether there is the potential for realization of any further economies.
Based on its evaluation of all of the conclusions noted above, and after considering all factors it believed relevant, the Board ultimately concluded that the fund's management fee structure is fair and reasonable, and that the continuation of the fund's Advisory Contracts should be approved.
![]()
ASDH-SANN-1218
1.969458.104
|
Fidelity® Short Duration High Income Fund Semi-Annual Report October 31, 2018 |
|
|
Contents
To view a fund's proxy voting guidelines and proxy voting record for the 12-month period ended June 30, visit http://www.fidelity.com/proxyvotingresults or visit the Securities and Exchange Commission's (SEC) web site at http://www.sec.gov.
You may also call 1-800-544-8544 to request a free copy of the proxy voting guidelines.
Standard & Poor's, S&P and S&P 500 are registered service marks of The McGraw-Hill Companies, Inc. and have been licensed for use by Fidelity Distributors Corporation.
Other third-party marks appearing herein are the property of their respective owners.
All other marks appearing herein are registered or unregistered trademarks or service marks of FMR LLC or an affiliated company. © 2018 FMR LLC. All rights reserved.
This report and the financial statements contained herein are submitted for the general information of the shareholders of the Fund. This report is not authorized for distribution to prospective investors in the Fund unless preceded or accompanied by an effective prospectus.
A fund files its complete schedule of portfolio holdings with the SEC for the first and third quarters of each fiscal year on Form N-Q. Forms N-Q are available on the SEC’s web site at http://www.sec.gov. A fund's Forms N-Q may be reviewed and copied at the SEC’s Public Reference Room in Washington, DC. Information regarding the operation of the SEC's Public Reference Room may be obtained by calling 1-800-SEC-0330.
For a complete list of a fund's portfolio holdings, view the most recent holdings listing, semiannual report, or annual report on Fidelity's web site at http://www.fidelity.com, http://www.institutional.fidelity.com, or http://www.401k.com, as applicable.
NOT FDIC INSURED •MAY LOSE VALUE •NO BANK GUARANTEE
Neither the Fund nor Fidelity Distributors Corporation is a bank.
Investment Summary (Unaudited)
Top Five Holdings as of October 31, 2018
| (by issuer, excluding cash equivalents) | % of fund's net assets |
| TransDigm, Inc. | 3.3 |
| Icahn Enterprises LP/Icahn Enterprises Finance Corp. | 3.3 |
| CCO Holdings LLC/CCO Holdings Capital Corp. | 3.0 |
| Valeant Pharmaceuticals International, Inc. | 2.9 |
| First Quantum Minerals Ltd. | 2.7 |
| 15.2 |
Top Five Market Sectors as of October 31, 2018
| % of fund's net assets | |
| Energy | 15.1 |
| Healthcare | 8.6 |
| Cable/Satellite TV | 8.0 |
| Utilities | 7.6 |
| Diversified Financial Services | 6.0 |
Quality Diversification (% of fund's net assets)
| As of October 31, 2018 | ||
| AAA,AA,A | 1.3% | |
| BBB | 7.7% | |
| BB | 35.8% | |
| B | 40.2% | |
| CCC,CC,C | 9.7% | |
| Not Rated | 1.3% | |
| Short-Term Investments and Net Other Assets | 4.0% | |

We have used ratings from Moody's Investors Service, Inc. Where Moody's® ratings are not available, we have used S&P® ratings. All ratings are as of the date indicated and do not reflect subsequent changes.
Asset Allocation (% of fund's net assets)
| As of October 31, 2018* | ||
| Nonconvertible Bonds | 78.9% | |
| Convertible Bonds, Preferred Stocks | 0.5% | |
| Bank Loan Obligations | 15.2% | |
| Other Investments | 1.4% | |
| Short-Term Investments and Net Other Assets (Liabilities) | 4.0% | |

* Foreign investments - 23.3%
Schedule of Investments October 31, 2018 (Unaudited)
Showing Percentage of Net Assets
| Corporate Bonds - 79.4% | |||
| Principal Amount | Value | ||
| Convertible Bonds - 0.5% | |||
| Broadcasting - 0.2% | |||
| DISH Network Corp. 2.375% 3/15/24 | $260,000 | $218,147 | |
| Utilities - 0.3% | |||
| SolarCity Corp. 1.625% 11/1/19 | 360,000 | 339,279 | |
| TOTAL CONVERTIBLE BONDS | 557,426 | ||
| Nonconvertible Bonds - 78.9% | |||
| Aerospace - 4.7% | |||
| Bombardier, Inc.: | |||
| 6.125% 1/15/23 (a) | 2,530,000 | 2,498,375 | |
| 7.5% 12/1/24 (a) | 105,000 | 106,706 | |
| TransDigm, Inc. 6% 7/15/22 | 2,810,000 | 2,824,050 | |
| United Technologies Corp. 3.65% 8/16/23 | 250,000 | 247,196 | |
| 5,676,327 | |||
| Air Transportation - 1.3% | |||
| Allegiant Travel Co. 5.5% 7/15/19 | 785,000 | 788,925 | |
| American Airlines Group, Inc. 5.5% 10/1/19 (a) | 485,000 | 489,244 | |
| United Continental Holdings, Inc. 4.25% 10/1/22 | 345,000 | 338,531 | |
| 1,616,700 | |||
| Automotive & Auto Parts - 0.1% | |||
| General Motors Financial Co., Inc. 2.35% 10/4/19 | 100,000 | 99,024 | |
| Banks & Thrifts - 2.3% | |||
| Bank of America Corp. 2.625% 4/19/21 | 250,000 | 245,329 | |
| Citigroup, Inc. 2.9% 12/8/21 | 200,000 | 195,379 | |
| Citizens Bank NA 2.25% 3/2/20 | 250,000 | 246,425 | |
| Credit Suisse Group Funding Guernsey Ltd. 3.45% 4/16/21 | 250,000 | 248,358 | |
| Deutsche Bank AG 2.7% 7/13/20 | 250,000 | 244,271 | |
| Goldman Sachs Group, Inc. 2.876% 10/31/22 (b) | 350,000 | 340,424 | |
| Intesa Sanpaolo SpA 3.375% 1/12/23 (a) | 200,000 | 180,992 | |
| JPMorgan Chase & Co. 2.55% 3/1/21 | 200,000 | 196,012 | |
| Santander Holdings U.S.A., Inc. 3.4% 1/18/23 | 200,000 | 190,920 | |
| SunTrust Banks, Inc. 2.7% 1/27/22 | 200,000 | 193,630 | |
| Synchrony Bank 3% 6/15/22 | 250,000 | 238,460 | |
| Synovus Financial Corp. 3.125% 11/1/22 | 17,000 | 16,171 | |
| UniCredit SpA 3.75% 4/12/22 (a) | 200,000 | 188,982 | |
| 2,725,353 | |||
| Broadcasting - 1.0% | |||
| LIN Television Corp. 5.875% 11/15/22 | 300,000 | 304,560 | |
| Sirius XM Radio, Inc. 3.875% 8/1/22 (a) | 985,000 | 948,063 | |
| 1,252,623 | |||
| Building Materials - 0.0% | |||
| Mississippi Power Co. 3 month U.S. LIBOR + 0.650% 3.031% 3/27/20 (b)(c) | 6,000 | 6,001 | |
| Cable/Satellite TV - 6.3% | |||
| Altice SA 7.75% 5/15/22 (a) | 905,000 | 842,781 | |
| Altice U.S. Finance SA 5.375% 7/15/23 (a) | 500,000 | 499,905 | |
| Cablevision Systems Corp. 5.875% 9/15/22 | 640,000 | 643,200 | |
| CCO Holdings LLC/CCO Holdings Capital Corp.: | |||
| 4% 3/1/23 (a) | 1,115,000 | 1,062,038 | |
| 5.125% 2/15/23 | 1,800,000 | 1,791,000 | |
| 5.125% 5/1/23 (a) | 720,000 | 716,400 | |
| DISH DBS Corp.: | |||
| 5.125% 5/1/20 | 45,000 | 45,113 | |
| 5.875% 7/15/22 | 1,760,000 | 1,663,200 | |
| 5.875% 11/15/24 | 155,000 | 131,750 | |
| 6.75% 6/1/21 | 180,000 | 181,800 | |
| 7,577,187 | |||
| Capital Goods - 0.2% | |||
| Roper Technologies, Inc. 2.8% 12/15/21 | 213,000 | 207,413 | |
| Chemicals - 2.2% | |||
| CF Industries Holdings, Inc.: | |||
| 3.4% 12/1/21 (a) | 60,000 | 58,805 | |
| 3.45% 6/1/23 | 805,000 | 764,750 | |
| LSB Industries, Inc. 9.625% 5/1/23 (a) | 45,000 | 46,688 | |
| OCI NV 6.625% 4/15/23 (a) | 565,000 | 579,125 | |
| Platform Specialty Products Corp. 6.5% 2/1/22 (a) | 500,000 | 506,250 | |
| The Mosaic Co. 3.25% 11/15/22 | 150,000 | 145,564 | |
| TPC Group, Inc. 8.75% 12/15/20 (a) | 525,000 | 514,500 | |
| 2,615,682 | |||
| Consumer Products - 0.1% | |||
| Coty, Inc. 6.5% 4/15/26 (a) | 195,000 | 181,838 | |
| Containers - 3.3% | |||
| Ard Securities Finance SARL 8.75% 1/31/23 pay-in-kind (a)(b) | 26,142 | 25,096 | |
| Ardagh Packaging Finance PLC/Ardagh MP Holdings U.S.A., Inc.: | |||
| 4.25% 9/15/22 (a) | 200,000 | 194,000 | |
| 4.625% 5/15/23 (a) | 400,000 | 389,000 | |
| Ball Corp.: | |||
| 4% 11/15/23 | 300,000 | 291,000 | |
| 5% 3/15/22 | 300,000 | 304,500 | |
| Berry Global, Inc. 5.125% 7/15/23 | 500,000 | 497,500 | |
| OI European Group BV 4% 3/15/23 (a) | 250,000 | 234,063 | |
| Reynolds Group Issuer, Inc./Reynolds Group Issuer LLC/Reynolds Group Issuer (Luxembourg) SA: | |||
| 3 month U.S. LIBOR + 3.500% 5.9363% 7/15/21 (a)(b)(c) | 310,000 | 313,100 | |
| 5.125% 7/15/23 (a) | 1,000,000 | 978,750 | |
| 5.75% 10/15/20 | 726,831 | 726,831 | |
| 3,953,840 | |||
| Diversified Financial Services - 6.0% | |||
| Aircastle Ltd. 4.125% 5/1/24 | 80,000 | 77,706 | |
| Capital One Financial Corp. 2.5% 5/12/20 | 200,000 | 197,152 | |
| Financial & Risk U.S. Holdings, Inc.: | |||
| 6.25% 5/15/26 (a) | 170,000 | 169,150 | |
| 8.25% 11/15/26 (a) | 85,000 | 82,450 | |
| FLY Leasing Ltd. 5.25% 10/15/24 | 790,000 | 750,500 | |
| Hyundai Capital America 2.55% 2/6/19 (a) | 100,000 | 99,843 | |
| Icahn Enterprises LP/Icahn Enterprises Finance Corp.: | |||
| 5.875% 2/1/22 | 770,000 | 770,077 | |
| 6% 8/1/20 | 320,000 | 322,800 | |
| 6.25% 2/1/22 | 2,805,000 | 2,831,804 | |
| ILFC E-Capital Trust I 3 month U.S. LIBOR + 1.550% 4.78% 12/21/65 (a)(b)(c) | 605,000 | 535,425 | |
| ILFC E-Capital Trust II 3 month U.S. LIBOR + 1.800% 5.03% 12/21/65 (a)(b)(c) | 175,000 | 155,750 | |
| Moody's Corp. 5.5% 9/1/20 | 200,000 | 207,292 | |
| Morgan Stanley 2.5% 4/21/21 | 250,000 | 243,593 | |
| Park Aerospace Holdings Ltd. 4.5% 3/15/23 (a) | 51,000 | 48,520 | |
| Prime Securities Services Borrower LLC/Prime Finance, Inc. 9.25% 5/15/23 (a) | 125,000 | 132,088 | |
| SLM Corp. 7.25% 1/25/22 | 500,000 | 520,000 | |
| 7,144,150 | |||
| Diversified Media - 1.0% | |||
| 21st Century Fox America, Inc. 4.5% 2/15/21 | 200,000 | 204,319 | |
| MDC Partners, Inc. 6.5% 5/1/24 (a) | 180,000 | 147,600 | |
| Nielsen Finance LLC/Nielsen Finance Co. 5% 4/15/22 (a) | 815,000 | 793,606 | |
| 1,145,525 | |||
| Energy - 14.0% | |||
| Anadarko Petroleum Corp. 4.85% 3/15/21 | 200,000 | 204,336 | |
| Antero Resources Corp. 5.125% 12/1/22 | 370,000 | 367,456 | |
| Antero Resources Finance Corp. 5.375% 11/1/21 | 60,000 | 60,000 | |
| Boardwalk Pipelines LP 3.375% 2/1/23 | 150,000 | 144,477 | |
| California Resources Corp. 8% 12/15/22 (a) | 655,000 | 582,950 | |
| Cenovus Energy, Inc. 3% 8/15/22 | 250,000 | 238,892 | |
| Cheniere Corpus Christi Holdings LLC 7% 6/30/24 | 350,000 | 378,438 | |
| Chesapeake Energy Corp. 8% 12/15/22 (a) | 876,000 | 913,230 | |
| Citgo Petroleum Corp. 6.25% 8/15/22 (a) | 250,000 | 246,250 | |
| Consolidated Energy Finance SA 3 month U.S. LIBOR + 3.750% 6.0841% 6/15/22 (a)(b)(c) | 525,000 | 525,231 | |
| Continental Resources, Inc. 4.5% 4/15/23 | 500,000 | 501,695 | |
| CVR Refining LLC/Coffeyville Finance, Inc. 6.5% 11/1/22 | 1,085,000 | 1,091,781 | |
| Denbury Resources, Inc.: | |||
| 4.625% 7/15/23 | 10,000 | 8,275 | |
| 5.5% 5/1/22 | 110,000 | 95,150 | |
| 6.375% 8/15/21 | 35,000 | 32,550 | |
| 7.5% 2/15/24 (a) | 80,000 | 78,200 | |
| 9.25% 3/31/22 (a) | 130,000 | 135,525 | |
| Energy Transfer Equity LP: | |||
| 4.25% 3/15/23 | 475,000 | 470,250 | |
| 7.5% 10/15/20 | 105,000 | 111,169 | |
| Ensco PLC: | |||
| 4.5% 10/1/24 | 705,000 | 572,813 | |
| 8% 1/31/24 | 1,132,000 | 1,117,850 | |
| EP Energy LLC/Everest Acquisition Finance, Inc. 8% 11/29/24 (a) | 320,000 | 308,800 | |
| EQT Corp. 2.5% 10/1/20 | 9,000 | 8,776 | |
| Exterran Partners LP/EXLP Finance Corp.: | |||
| 6% 4/1/21 | 830,000 | 821,700 | |
| 6% 10/1/22 | 300,000 | 297,000 | |
| Forum Energy Technologies, Inc. 6.25% 10/1/21 | 30,000 | 29,400 | |
| FTS International, Inc. 6.25% 5/1/22 | 265,000 | 252,744 | |
| MPLX LP 3.375% 3/15/23 | 13,000 | 12,637 | |
| Nabors Industries, Inc. 5.5% 1/15/23 | 143,000 | 134,407 | |
| NextEra Energy Partners LP 4.25% 9/15/24 (a) | 155,000 | 147,250 | |
| Nine Energy Service, Inc. 8.75% 11/1/23 (a) | 445,000 | 451,675 | |
| Noble Holding International Ltd. 7.75% 1/15/24 | 171,000 | 159,671 | |
| PBF Logistics LP/PBF Logistics Finance, Inc. 6.875% 5/15/23 | 150,000 | 152,625 | |
| Plains All American Pipeline LP/PAA Finance Corp.: | |||
| 2.6% 12/15/19 | 100,000 | 99,093 | |
| 3.65% 6/1/22 | 18,000 | 17,643 | |
| 3.85% 10/15/23 | 75,000 | 72,912 | |
| Precision Drilling Corp.: | |||
| 6.5% 12/15/21 | 270,026 | 272,051 | |
| 7.75% 12/15/23 | 235,000 | 244,400 | |
| Range Resources Corp. 5% 8/15/22 | 840,000 | 825,300 | |
| Sanchez Energy Corp. 7.25% 2/15/23 (a) | 150,000 | 136,875 | |
| Southwestern Energy Co. 4.1% 3/15/22 | 300,000 | 295,500 | |
| Summit Midstream Holdings LLC 5.5% 8/15/22 | 90,000 | 89,100 | |
| Targa Resources Partners LP/Targa Resources Partners Finance Corp.: | |||
| 4.125% 11/15/19 | 207,000 | 207,000 | |
| 4.25% 11/15/23 | 625,000 | 599,406 | |
| 5.25% 5/1/23 | 800,000 | 798,000 | |
| TerraForm Power Operating LLC 4.25% 1/31/23 (a) | 350,000 | 331,625 | |
| Tesoro Logistics LP/Tesoro Logistics Finance Corp.: | |||
| 5.5% 10/15/19 | 755,000 | 769,300 | |
| 6.25% 10/15/22 | 135,000 | 139,219 | |
| TransCanada PipeLines Ltd. 2.5% 8/1/22 | 9,000 | 8,601 | |
| Transocean Pontus Ltd. 6.125% 8/1/25 (a) | 75,000 | 74,531 | |
| W&T Offshore, Inc. 9.75% 11/1/23 (a) | 250,000 | 241,925 | |
| Weatherford International Ltd. 9.875% 2/15/24 | 500,000 | 387,500 | |
| Weatherford International, Inc. 9.875% 3/1/25 (a) | 500,000 | 387,500 | |
| Whiting Petroleum Corp. 5.75% 3/15/21 | 165,000 | 166,031 | |
| 16,816,715 | |||
| Entertainment/Film - 0.4% | |||
| AMC Entertainment, Inc. 5.875% 2/15/22 | 300,000 | 299,895 | |
| New Cotai LLC/New Cotai Capital Corp. 10.625% 5/1/19 pay-in-kind (a)(b) | 323,844 | 184,591 | |
| 484,486 | |||
| Environmental - 0.9% | |||
| Clean Harbors, Inc. 5.125% 6/1/21 | 500,000 | 500,000 | |
| LBC Tank Terminals Holding Netherlands BV 6.875% 5/15/23 (a) | 500,000 | 491,250 | |
| Tervita Escrow Corp. 7.625% 12/1/21 (a) | 35,000 | 35,525 | |
| 1,026,775 | |||
| Food & Drug Retail - 0.2% | |||
| CVS Health Corp.: | |||
| 3.35% 3/9/21 | 16,000 | 15,930 | |
| 3.7% 3/9/23 | 176,000 | 173,890 | |
| 189,820 | |||
| Food/Beverage/Tobacco - 2.2% | |||
| Anheuser-Busch InBev Finance, Inc. 2.65% 2/1/21 | 200,000 | 196,058 | |
| Anheuser-Busch InBev Worldwide, Inc. 3.5% 1/12/24 | 250,000 | 243,344 | |
| Bat Capital Corp. 2.764% 8/15/22 (a) | 250,000 | 239,317 | |
| C&S Group Enterprises LLC 5.375% 7/15/22 (a) | 925,000 | 892,625 | |
| Darling International, Inc. 5.375% 1/15/22 | 415,000 | 416,038 | |
| General Mills, Inc. 3.2% 4/16/21 | 4,000 | 3,971 | |
| Imperial Tobacco Finance PLC 2.95% 7/21/20 (a) | 200,000 | 197,422 | |
| Vector Group Ltd. 6.125% 2/1/25 (a) | 500,000 | 455,000 | |
| 2,643,775 | |||
| Gaming - 2.9% | |||
| MGM Mirage, Inc. 6% 3/15/23 | 1,000,000 | 1,015,000 | |
| Scientific Games Corp.: | |||
| 5% 10/15/25 (a) | 115,000 | 106,950 | |
| 6.625% 5/15/21 | 935,000 | 904,613 | |
| 10% 12/1/22 | 500,000 | 522,500 | |
| Wynn Macau Ltd. 4.875% 10/1/24 (a) | 1,000,000 | 907,500 | |
| 3,456,563 | |||
| Healthcare - 8.1% | |||
| AbbVie, Inc. 3.375% 11/14/21 | 200,000 | 198,941 | |
| Becton, Dickinson & Co. 2.894% 6/6/22 | 200,000 | 193,129 | |
| Community Health Systems, Inc. 6.25% 3/31/23 | 585,000 | 538,025 | |
| Elanco Animal Health, Inc. 3.912% 8/27/21 (a) | 2,000 | 2,000 | |
| Forest Laboratories, Inc. 5% 12/15/21 (a) | 200,000 | 206,291 | |
| Halfmoon Parent, Inc.: | |||
| 3.4% 9/17/21 (a) | 18,000 | 17,868 | |
| 3.75% 7/15/23 (a) | 9,000 | 8,927 | |
| HCA Holdings, Inc.: | |||
| 4.75% 5/1/23 | 300,000 | 303,000 | |
| 5% 3/15/24 | 300,000 | 303,563 | |
| 6.25% 2/15/21 | 800,000 | 831,000 | |
| HealthSouth Corp. 5.125% 3/15/23 | 255,000 | 255,000 | |
| Humana, Inc. 2.5% 12/15/20 | 10,000 | 9,803 | |
| Mylan NV 3.15% 6/15/21 | 200,000 | 195,294 | |
| Ortho-Clinical Diagnostics, Inc. 6.625% 5/15/22 (a) | 485,000 | 463,175 | |
| Sabra Health Care LP/Sabra Capital Corp. 5.375% 6/1/23 | 60,000 | 59,700 | |
| Shire Acquisitions Investments Ireland DAC 2.4% 9/23/21 | 200,000 | 192,213 | |
| Tenet Healthcare Corp.: | |||
| 4.375% 10/1/21 | 1,365,000 | 1,349,644 | |
| 4.75% 6/1/20 | 200,000 | 200,500 | |
| 6.75% 6/15/23 | 165,000 | 164,538 | |
| 8.125% 4/1/22 | 485,000 | 505,006 | |
| Teva Pharmaceutical Finance Netherlands III BV 2.2% 7/21/21 | 250,000 | 233,421 | |
| Valeant Pharmaceuticals International, Inc.: | |||
| 5.625% 12/1/21 (a) | 1,500,000 | 1,477,500 | |
| 5.875% 5/15/23 (a) | 850,000 | 812,813 | |
| 6.5% 3/15/22 (a) | 1,135,000 | 1,174,725 | |
| 9,696,076 | |||
| Homebuilders/Real Estate - 0.6% | |||
| Brookfield Residential Properties, Inc. 6.5% 12/15/20 (a) | 300,000 | 300,000 | |
| D.R. Horton, Inc. 2.55% 12/1/20 | 14,000 | 13,673 | |
| DDR Corp. 4.625% 7/15/22 | 200,000 | 203,481 | |
| Healthcare Trust of America Holdings LP 2.95% 7/1/22 | 216,000 | 208,530 | |
| 725,684 | |||
| Insurance - 0.2% | |||
| American International Group, Inc. 3.3% 3/1/21 | 200,000 | 197,975 | |
| Leisure - 1.2% | |||
| Rivers Pittsburgh Borrower LP 6.125% 8/15/21 (a) | 200,000 | 199,000 | |
| Studio City Co. Ltd.: | |||
| 5.875% 11/30/19 (a) | 200,000 | 201,750 | |
| 7.25% 11/30/21 (a) | 1,000,000 | 1,028,810 | |
| 1,429,560 | |||
| Metals/Mining - 3.8% | |||
| First Quantum Minerals Ltd.: | |||
| 6.5% 3/1/24 (a) | 200,000 | 174,500 | |
| 7% 2/15/21 (a) | 1,000,000 | 978,125 | |
| 7.25% 5/15/22 (a) | 1,110,000 | 1,060,050 | |
| 7.25% 4/1/23 (a) | 1,175,000 | 1,085,406 | |
| FMG Resources (August 2006) Pty Ltd.: | |||
| 4.75% 5/15/22 (a) | 300,000 | 288,000 | |
| 5.125% 3/15/23 (a) | 90,000 | 86,850 | |
| Freeport-McMoRan, Inc. 3.55% 3/1/22 | 995,000 | 941,519 | |
| 4,614,450 | |||
| Restaurants - 1.6% | |||
| Golden Nugget, Inc. 6.75% 10/15/24 (a) | 800,000 | 798,000 | |
| Yum! Brands, Inc. 3.875% 11/1/23 | 1,225,000 | 1,157,625 | |
| 1,955,625 | |||
| Services - 0.4% | |||
| Air Lease Corp.: | |||
| 2.125% 1/15/20 | 200,000 | 196,867 | |
| 3.5% 1/15/22 | 150,000 | 148,320 | |
| APX Group, Inc. 8.75% 12/1/20 | 155,000 | 151,125 | |
| Corrections Corp. of America 5% 10/15/22 | 25,000 | 24,156 | |
| 520,468 | |||
| Super Retail - 0.1% | |||
| AutoZone, Inc. 2.5% 4/15/21 | 145,000 | 141,114 | |
| Technology - 2.7% | |||
| Diamond 1 Finance Corp./Diamond 2 Finance Corp. 4.42% 6/15/21 (a) | 200,000 | 201,666 | |
| EMC Corp. 2.65% 6/1/20 | 1,140,000 | 1,110,550 | |
| Microchip Technology, Inc. 3.922% 6/1/21 (a) | 200,000 | 198,557 | |
| Nuance Communications, Inc. 5.375% 8/15/20 (a) | 215,000 | 215,134 | |
| NXP BV/NXP Funding LLC: | |||
| 3.875% 9/1/22 (a) | 415,000 | 400,475 | |
| 4.125% 6/1/21 (a) | 175,000 | 173,906 | |
| Sensata Technologies BV 4.875% 10/15/23 (a) | 155,000 | 150,931 | |
| Symantec Corp. 4.2% 9/15/20 | 500,000 | 498,680 | |
| Uber Technologies, Inc. 7.5% 11/1/23 (a)(d) | 250,000 | 250,313 | |
| 3,200,212 | |||
| Telecommunications - 3.4% | |||
| Altice Financing SA 6.625% 2/15/23 (a) | 500,000 | 494,900 | |
| AT&T, Inc. 2.8% 2/17/21 | 200,000 | 196,538 | |
| Cogent Communications Group, Inc. 5.375% 3/1/22 (a) | 75,000 | 75,469 | |
| Equinix, Inc. 5.375% 4/1/23 | 580,000 | 588,700 | |
| Frontier Communications Corp. 10.5% 9/15/22 | 175,000 | 145,688 | |
| Intelsat Jackson Holdings SA 8.5% 10/15/24 (a) | 200,000 | 196,500 | |
| Qwest Corp. 6.75% 12/1/21 | 100,000 | 104,369 | |
| SBA Communications Corp. 4% 10/1/22 | 500,000 | 478,750 | |
| SFR Group SA 6.25% 5/15/24 (a) | 215,000 | 206,131 | |
| Sprint Communications, Inc.: | |||
| 6% 11/15/22 | 515,000 | 519,828 | |
| 9% 11/15/18 (a) | 115,000 | 115,230 | |
| Sprint Corp. 7.875% 9/15/23 | 700,000 | 747,250 | |
| T-Mobile U.S.A., Inc. 4% 4/15/22 | 225,000 | 222,188 | |
| 4,091,541 | |||
| Transportation Ex Air/Rail - 1.1% | |||
| Avolon Holdings Funding Ltd.: | |||
| 5.125% 10/1/23 (a) | 300,000 | 294,375 | |
| 5.5% 1/15/23 (a) | 155,000 | 154,225 | |
| Navios Maritime Acquisition Corp./Navios Acquisition Finance U.S., Inc. 8.125% 11/15/21 (a) | 875,000 | 733,906 | |
| Navios Maritime Holdings, Inc. 7.375% 1/15/22 (a) | 265,000 | 200,075 | |
| 1,382,581 | |||
| Utilities - 6.6% | |||
| Calpine Corp. 6% 1/15/22 (a) | 1,800,000 | 1,809,000 | |
| Dolphin Subsidiary II, Inc. 7.25% 10/15/21 | 558,000 | 592,529 | |
| Dominion Resources, Inc. 4.104% 4/1/21 | 250,000 | 252,011 | |
| DPL, Inc. 6.75% 10/1/19 | 217,000 | 222,154 | |
| Dynegy, Inc. 5.875% 6/1/23 | 1,300,000 | 1,319,500 | |
| Exelon Corp. 3.497% 6/1/22 (b) | 250,000 | 243,827 | |
| Global Partners LP/GLP Finance Corp. 6.25% 7/15/22 | 885,000 | 869,513 | |
| InterGen NV 7% 6/30/23 (a) | 500,000 | 491,250 | |
| The AES Corp.: | |||
| 4% 3/15/21 | 185,000 | 183,176 | |
| 4.5% 3/15/23 | 120,000 | 118,350 | |
| 4.875% 5/15/23 | 1,615,000 | 1,598,850 | |
| Williams Partners LP 5.25% 3/15/20 | 200,000 | 204,489 | |
| 7,904,649 | |||
| TOTAL NONCONVERTIBLE BONDS | 94,679,732 | ||
| TOTAL CORPORATE BONDS | |||
| (Cost $96,959,527) | 95,237,158 | ||
| Shares | Value | ||
| Common Stocks - 0.0% | |||
| Energy - 0.0% | |||
| Forbes Energy Services Ltd. (e) | |||
| (Cost $301,607) | 6,468 | 32,663 | |
| Principal Amount | Value | ||
| Bank Loan Obligations - 15.2% | |||
| Aerospace - 1.0% | |||
| TransDigm, Inc.: | |||
| Tranche F, term loan 3 month U.S. LIBOR + 2.500% 4.802% 6/9/23 (b)(c) | 866,382 | 861,738 | |
| Tranche G, term loan 3 month U.S. LIBOR + 2.500% 4.802% 8/22/24 (b)(c) | 340,725 | 338,943 | |
| TOTAL AEROSPACE | 1,200,681 | ||
| Air Transportation - 0.3% | |||
| American Airlines, Inc. Tranche B, term loan 3 month U.S. LIBOR + 2.000% 4.2767% 10/10/21 (b)(c) | 342,642 | 342,108 | |
| Cable/Satellite TV - 1.7% | |||
| Altice U.S. Finance SA: | |||
| Tranche B, term loan 3 month U.S. LIBOR + 2.250% 4.552% 7/28/25 (b)(c) | 124,684 | 124,399 | |
| Tranche B3 1LN, term loan 3 month U.S. LIBOR + 2.250% 1/11/26 (c)(f) | 125,000 | 124,649 | |
| CSC Holdings LLC Tranche B, term loan 3 month U.S. LIBOR + 2.500% 4.7795% 1/25/26 (b)(c) | 54,725 | 54,605 | |
| Numericable LLC Tranche B 12LN, term loan 3 month U.S. LIBOR + 3.688% 5.967% 1/31/26 (b)(c) | 301,950 | 294,087 | |
| Unitymedia Finance LLC Tranche B, term loan 3 month U.S. LIBOR + 2.250% 4.5295% 9/30/25 (b)(c) | 365,000 | 364,409 | |
| WideOpenWest Finance LLC Tranche B, term loan 3 month U.S. LIBOR + 3.250% 5.5395% 8/19/23 (b)(c) | 490,050 | 471,673 | |
| Zayo Group LLC Tranche B, term loan 3 month U.S. LIBOR + 2.000% 4.302% 1/19/21 (b)(c) | 142,825 | 142,851 | |
| Ziggo Secured Finance Partnership Tranche E, term loan 3 month U.S. LIBOR + 2.500% 4.7795% 4/15/25 (b)(c) | 530,000 | 519,490 | |
| TOTAL CABLE/SATELLITE TV | 2,096,163 | ||
| Capital Goods - 0.0% | |||
| Apergy Corp. Tranche B, term loan 3 month U.S. LIBOR + 2.500% 4.8125% 5/9/25 (b)(c) | 14,277 | 14,304 | |
| CPM Holdings, Inc. Tranche B 1LN, term loan 3 month U.S. LIBOR + 3.750% 10/24/25 (c)(f) | 20,000 | 20,067 | |
| TOTAL CAPITAL GOODS | 34,371 | ||
| Chemicals - 0.1% | |||
| Tronox Blocked Borrower LLC Tranche B, term loan 3 month U.S. LIBOR + 3.000% 5.302% 9/22/24 (b)(c) | 21,004 | 20,974 | |
| Tronox Finance LLC Tranche B, term loan 3 month U.S. LIBOR + 3.000% 5.302% 9/22/24 (b)(c) | 48,471 | 48,403 | |
| TOTAL CHEMICALS | 69,377 | ||
| Consumer Products - 0.0% | |||
| Owens & Minor Distribution, Inc. Tranche B, term loan 3 month U.S. LIBOR + 4.500% 6.756% 4/30/25 (b)(c) | 49,875 | 45,137 | |
| Containers - 0.4% | |||
| Berlin Packaging, LLC Tranche B 1LN, term loan 3 month U.S. LIBOR + 3.000% 5.2794% 11/7/25 (b)(c) | 64,838 | 64,720 | |
| Charter Nex U.S., Inc. Tranche B 1LN, term loan 3 month U.S. LIBOR + 3.000% 5.052% 5/16/24 (b)(c) | 125,000 | 124,714 | |
| Crown Americas LLC Tranche B 1LN, term loan 3 month U.S. LIBOR + 2.000% 4.2832% 4/3/25 (b)(c) | 28,621 | 28,636 | |
| Reynolds Group Holdings, Inc. Tranche B, term loan 3 month U.S. LIBOR + 2.750% 5.052% 2/5/23 (b)(c) | 303,814 | 303,814 | |
| TOTAL CONTAINERS | 521,884 | ||
| Energy - 0.9% | |||
| Arctic LNG Carriers Ltd. Tranche B 1LN, term loan 3 month U.S. LIBOR + 4.500% 6.802% 5/18/23 (b)(c) | 211,464 | 211,464 | |
| BCP Raptor II LLC Tranche B, term loan 3 month U.S. LIBOR + 4.750% 10/22/25 (c)(f) | 100,000 | 99,250 | |
| BCP Raptor LLC Tranche B, term loan 3 month U.S. LIBOR + 4.250% 6.6411% 6/22/24 (b)(c) | 124,370 | 122,572 | |
| California Resources Corp.: | |||
| Tranche 1LN, term loan 3 month U.S. LIBOR + 10.375% 12.6699% 12/31/21 (b)(c) | 100,000 | 111,250 | |
| Tranche B, term loan 3 month U.S. LIBOR + 4.750% 7.0365% 12/31/22 (b)(c) | 160,000 | 162,133 | |
| Consolidated Energy Finance SA Tranche B, term loan 3 month U.S. LIBOR + 2.500% 4.7841% 5/7/25 (b)(c) | 124,688 | 124,064 | |
| Forbes Energy Services LLC Tranche B, term loan 14% 4/13/21 (b)(g) | 68,952 | 69,470 | |
| Gavilan Resources LLC Tranche 2LN, term loan 3 month U.S. LIBOR + 6.000% 8.2796% 3/1/24 (b)(c) | 100,000 | 93,139 | |
| GIP III Stetson I LP Tranche B, term loan 3 month U.S. LIBOR + 4.250% 6.6946% 7/18/25 (b)(c) | 75,000 | 75,094 | |
| Natgasoline LLC Tranche B, term loan 3 month U.S. LIBOR + 3.500% 5.9446% 10/31/25 (b)(c) | 40,000 | 40,050 | |
| TOTAL ENERGY | 1,108,486 | ||
| Entertainment/Film - 0.2% | |||
| AMC Entertainment, Inc. Tranche B, term loan 3 month U.S. LIBOR + 2.250% 4.5295% 12/15/22 (b)(c) | 276,438 | 276,006 | |
| Food & Drug Retail - 0.2% | |||
| BI-LO LLC Tranche B, term loan 3 month U.S. LIBOR + 8.000% 10.3645% 5/31/24 (b)(c) | 124,688 | 122,973 | |
| JP Intermediate B LLC Tranche B, term loan 3 month U.S. LIBOR + 5.500% 10/18/25 (c)(f) | 15,000 | 15,000 | |
| Tops Markets LLC term loan 3 month U.S. LIBOR + 9.500% 11.8125% 2/23/19 (b)(c)(g) | 78,843 | 79,040 | |
| TOTAL FOOD & DRUG RETAIL | 217,013 | ||
| Food/Beverage/Tobacco - 0.3% | |||
| Chobani LLC Tranche B, term loan 3 month U.S. LIBOR + 3.500% 5.802% 10/7/23 (b)(c) | 124,368 | 121,337 | |
| Post Holdings, Inc. Tranche B, term loan 3 month U.S. LIBOR + 2.000% 4.29% 5/24/24 (b)(c) | 200,179 | 199,857 | |
| TOTAL FOOD/BEVERAGE/TOBACCO | 321,194 | ||
| Gaming - 1.1% | |||
| CityCenter Holdings LLC Tranche B, term loan 3 month U.S. LIBOR + 2.250% 4.552% 4/18/24 (b)(c) | 296,362 | 295,529 | |
| Golden Entertainment, Inc. Tranche B, term loan: | |||
| 3 month U.S. LIBOR + 3.000% 5.3% 10/20/24 (b)(c) | 456,550 | 456,550 | |
| 3 month U.S. LIBOR + 7.000% 9.31% 10/20/25 (b)(c) | 155,000 | 155,775 | |
| Scientific Games Corp. Tranche B 5LN, term loan 3 month U.S. LIBOR + 2.750% 5.0457% 8/14/24 (b)(c) | 158,877 | 157,231 | |
| Stars Group Holdings BV Tranche B, term loan 3 month U.S. LIBOR + 3.500% 5.8861% 7/10/25 (b)(c) | 124,688 | 125,138 | |
| Wynn Resorts Ltd. Tranche B, term loan 3 month U.S. LIBOR + 2.250% 10/22/24 (c)(d)(f) | 125,000 | 124,298 | |
| TOTAL GAMING | 1,314,521 | ||
| Healthcare - 0.5% | |||
| HCA Holdings, Inc. Tranche B 10LN, term loan 3 month U.S. LIBOR + 2.000% 4.302% 3/13/25 (b)(c) | 208,950 | 209,734 | |
| HLF Financing SARL LLC Tranche B 1LN, term loan 3 month U.S. LIBOR + 3.250% 5.552% 8/18/25 (b)(c) | 160,000 | 160,566 | |
| Press Ganey Holdings, Inc. Tranche 1LN, term loan 3 month U.S. LIBOR + 2.750% 5.052% 10/21/23 (b)(c) | 4,975 | 4,976 | |
| Surgery Center Holdings, Inc. Tranche B, term loan 3 month U.S. LIBOR + 3.250% 5.57% 8/31/24 (b)(c) | 30,000 | 29,918 | |
| Valeant Pharmaceuticals International, Inc. Tranche B, term loan 3 month U.S. LIBOR + 3.000% 5.2739% 6/1/25 (b)(c) | 29,250 | 29,243 | |
| VVC Holding Corp. 1LN, term loan 3 month U.S. LIBOR + 4.250% 6.6863% 7/9/25 (b)(c) | 125,000 | 123,750 | |
| TOTAL HEALTHCARE | 558,187 | ||
| Homebuilders/Real Estate - 0.1% | |||
| DTZ U.S. Borrower LLC Tranche B, term loan 3 month U.S. LIBOR + 3.250% 5.552% 8/21/25 (b)(c) | 125,000 | 124,883 | |
| Hotels - 0.0% | |||
| Marriott Ownership Resorts, Inc. Tranche B, term loan 3 month U.S. LIBOR + 2.250% 4.552% 8/31/25 (b)(c) | 20,000 | 20,050 | |
| Insurance - 0.3% | |||
| Asurion LLC: | |||
| Tranche B 7LN, term loan 3 month U.S. LIBOR + 3.000% 5.302% 11/3/24 (b)(c) | 124,688 | 124,755 | |
| Tranche B, term loan 3 month U.S. LIBOR + 6.500% 8.802% 8/4/25 (b)(c) | 125,000 | 128,219 | |
| HUB International Ltd. Tranche B, term loan 3 month U.S. LIBOR + 3.000% 5.4895% 4/25/25 (b)(c) | 74,813 | 74,555 | |
| TOTAL INSURANCE | 327,529 | ||
| Leisure - 0.1% | |||
| Delta 2 SARL Tranche B, term loan 3 month U.S. LIBOR + 2.500% 4.802% 2/1/24 (b)(c) | 125,000 | 123,594 | |
| Paper - 0.1% | |||
| Flex Acquisition Co., Inc. Tranche B 1LN, term loan 3 month U.S. LIBOR + 3.250% 5.506% 6/29/25 (b)(c) | 124,688 | 124,755 | |
| Publishing/Printing - 0.2% | |||
| Springer Science+Business Media Deutschland GmbH Tranche B 13LN, term loan 3 month U.S. LIBOR + 3.500% 5.8861% 8/24/22 (b)(c) | 191,789 | 192,269 | |
| Services - 0.7% | |||
| Almonde, Inc.: | |||
| Tranche 2LN, term loan 3 month U.S. LIBOR + 7.250% 9.6361% 6/13/25 (b)(c) | 20,000 | 19,658 | |
| Tranche B 1LN, term loan 3 month U.S. LIBOR + 3.500% 5.8861% 6/13/24 (b)(c) | 79,989 | 79,478 | |
| Aramark Services, Inc. Tranche B 3LN, term loan 3 month U.S. LIBOR + 1.750% 4.052% 3/11/25 (b)(c) | 125,909 | 125,831 | |
| Brand Energy & Infrastructure Services, Inc. Tranche B, term loan 3 month U.S. LIBOR + 4.250% 6.7321% 6/21/24 (b)(c) | 488,813 | 490,460 | |
| Frontdoor, Inc. Tranche B, term loan 3 month U.S. LIBOR + 2.500% 4.8125% 8/16/25 (b)(c) | 15,000 | 15,000 | |
| Lineage Logistics Holdings, LLC. Tranche B, term loan 3 month U.S. LIBOR + 3.000% 5.302% 2/27/25 (b)(c) | 99,500 | 98,712 | |
| TOTAL SERVICES | 829,139 | ||
| Super Retail - 1.3% | |||
| Bass Pro Shops LLC. Tranche B, term loan 3 month U.S. LIBOR + 5.000% 7.302% 9/25/24 (b)(c)(d) | 1,500,000 | 1,499,460 | |
| Technology - 2.7% | |||
| Anastasia Parent LLC Tranche B, term loan 3 month U.S. LIBOR + 3.750% 6.0267% 8/3/25 (b)(c) | 45,000 | 44,462 | |
| Bracket Intermediate Holding Corp. 1LN, term loan 3 month U.S. LIBOR + 4.250% 6.5708% 9/5/25 (b)(c) | 25,000 | 25,063 | |
| Digicert Holdings, Inc. Tranche B, term loan 3 month U.S. LIBOR + 8.000% 10.6916% 10/31/25 (b)(c) | 100,000 | 99,313 | |
| Dynatrace LLC Tranche B 1LN, term loan 1 month U.S. LIBOR + 3.250% 5.552% 8/23/25 (b)(c) | 30,000 | 30,163 | |
| Epicor Software Corp. Tranche B, term loan 3 month U.S. LIBOR + 3.250% 5.56% 6/1/22 (b)(c) | 298,456 | 298,970 | |
| Go Daddy Operating Co. LLC Tranche B, term loan 3 month U.S. LIBOR + 2.250% 4.552% 2/15/24 (b)(c) | 533,042 | 533,378 | |
| Hyland Software, Inc.: | |||
| Tranche 2LN, term loan 3 month U.S. LIBOR + 7.000% 9.2422% 7/7/25 (b)(c) | 5,000 | 5,008 | |
| Tranche B 1LN, term loan 3 month U.S. LIBOR + 3.500% 5.9252% 7/1/24 (b)(c)(d) | 5,000 | 5,024 | |
| Kronos, Inc. Tranche B 1LN, term loan 3 month U.S. LIBOR + 3.000% 5.3431% 11/1/23 (b)(c) | 389,102 | 389,406 | |
| MA FinanceCo. LLC Tranche B 3LN, term loan: | |||
| 3 month U.S. LIBOR + 2.500% 4.802% 6/21/24 (b)(c) | 86,666 | 86,367 | |
| 3 month U.S. LIBOR + 2.500% 4.802% 6/21/24 (b)(c) | 12,833 | 12,789 | |
| Microchip Technology, Inc. Tranche B, term loan 3 month U.S. LIBOR + 2.000% 4.31% 5/29/25 (b)(c) | 45,217 | 45,036 | |
| Renaissance Holding Corp.: | |||
| Tranche B 1LN, term loan 3 month U.S. LIBOR + 3.250% 5.552% 5/31/25 (b)(c) | 34,913 | 34,729 | |
| Tranche B 2LN, term loan 3 month U.S. LIBOR + 7.000% 9.302% 5/31/26 (b)(c) | 15,000 | 14,888 | |
| Solera LLC Tranche B, term loan 3 month U.S. LIBOR + 2.750% 5.052% 3/3/23 (b)(c) | 104,198 | 103,987 | |
| SS&C Technologies, Inc.: | |||
| Tranche B 3LN, term loan 3 month U.S. LIBOR + 2.250% 4.552% 4/16/25 (b)(c) | 116,614 | 115,966 | |
| Tranche B 4LN, term loan 3 month U.S. LIBOR + 2.250% 4.552% 4/16/25 (b)(c) | 45,200 | 44,948 | |
| Tranche B 5LN, term loan 3 month U.S. LIBOR + 2.500% 4.552% 4/16/25 (b)(c) | 70,000 | 69,575 | |
| Syniverse Holdings, Inc.: | |||
| Tranche B 2LN, term loan 3 month U.S. LIBOR + 9.000% 11.2795% 3/11/24 (b)(c) | 150,000 | 144,500 | |
| Tranche B, term loan 3 month U.S. LIBOR + 5.000% 7.2795% 3/9/23 (b)(c) | 347,000 | 348,735 | |
| Uber Technologies, Inc. Tranche B, term loan: | |||
| 3 month U.S. LIBOR + 3.500% 5.7795% 7/13/23 (b)(c) | 441,000 | 440,727 | |
| 3 month U.S. LIBOR + 4.000% 6.2806% 4/4/25 (b)(c) | 125,000 | 124,896 | |
| Verscend Holding Corp. Tranche B, term loan 3 month U.S. LIBOR + 4.500% 6.802% 8/27/25 (b)(c) | 60,000 | 60,431 | |
| Vertafore, Inc. Tranche B 1LN, term loan 3 month U.S. LIBOR + 3.250% 5.552% 7/2/25 (b)(c) | 75,000 | 74,703 | |
| Web.com Group, Inc. Tranche B 1LN, term loan 3 month U.S. LIBOR + 3.750% 6.1704% 10/11/25 (b)(c) | 35,000 | 34,923 | |
| TOTAL TECHNOLOGY | 3,187,987 | ||
| Telecommunications - 2.3% | |||
| Altice Financing SA Tranche B, term loan 3 month U.S. LIBOR + 2.750% 5.0395% 7/15/25 (b)(c) | 147,750 | 143,920 | |
| Frontier Communications Corp.: | |||
| Tranche A, term loan 3 month U.S. LIBOR + 2.750% 5.06% 3/31/21 (b)(c) | 147,887 | 143,266 | |
| Tranche B 1LN, term loan 3 month U.S. LIBOR + 3.750% 6.06% 6/15/24 (b)(c) | 24,937 | 24,089 | |
| GTT Communications, Inc. Tranche B, term loan 3 month U.S. LIBOR + 2.750% 5.05% 5/31/25 (b)(c) | 24,938 | 24,578 | |
| Intelsat Jackson Holdings SA: | |||
| Tranche B, term loan 3 month U.S. LIBOR + 3.750% 6.0449% 11/27/23 (b)(c) | 125,000 | 125,000 | |
| Tranche B-5, term loan 6.625% 1/2/24 | 500,000 | 512,055 | |
| Level 3 Financing, Inc. Tranche B, term loan 3 month U.S. LIBOR + 2.250% 4.5296% 2/22/24 (b)(c) | 335,000 | 335,157 | |
| Radiate Holdco LLC Tranche B, term loan 3 month U.S. LIBOR + 3.000% 5.302% 2/1/24 (b)(c) | 369,375 | 366,209 | |
| Sable International Finance Ltd. Tranche B 4LN, term loan 3 month U.S. LIBOR + 3.250% 5.552% 2/2/26 (b)(c) | 280,000 | 279,686 | |
| Securus Technologies, Inc. Tranche B, term loan: | |||
| 3 month U.S. LIBOR + 4.500% 6.802% 11/1/24 (b)(c) | 241,288 | 241,690 | |
| 3 month U.S. LIBOR + 8.250% 10.552% 11/1/25 (b)(c) | 165,000 | 164,724 | |
| SFR Group SA Tranche B 11LN, term loan 3 month U.S. LIBOR + 2.750% 5.052% 7/31/25 (b)(c) | 448,175 | 431,790 | |
| TOTAL TELECOMMUNICATIONS | 2,792,164 | ||
| Transportation Ex Air/Rail - 0.0% | |||
| International Seaways Operating Corp. Tranche B, term loan 3 month U.S. LIBOR + 5.500% 8.26% 6/22/22 (b)(c) | 24,521 | 24,460 | |
| Utilities - 0.7% | |||
| Brookfield WEC Holdings, Inc.: | |||
| 2LN, term loan 3 month U.S. LIBOR + 6.750% 9.052% 8/1/26 (b)(c) | 10,000 | 10,135 | |
| Tranche B 1LN, term loan 3 month U.S. LIBOR + 3.750% 6.052% 8/1/25 (b)(c) | 125,000 | 125,660 | |
| Houston Fuel Oil Terminal Co. Tranche B 1LN, term loan 3 month U.S. LIBOR + 2.750% 5.06% 6/26/25 (b)(c) | 84,788 | 84,964 | |
| The AES Corp. Tranche B, term loan 3 month U.S. LIBOR + 1.750% 4.0673% 5/31/22 (b)(c) | 359,543 | 359,274 | |
| Vertiv Group Corp. Tranche B, term loan 3 month U.S. LIBOR + 4.000% 6.3126% 11/30/23 (b)(c) | 125,000 | 123,594 | |
| Vistra Operations Co. LLC Tranche B 3LN, term loan 3 month U.S. LIBOR + 2.000% 4.2928% 12/31/25 (b)(c) | 124,688 | 124,234 | |
| TOTAL UTILITIES | 827,861 | ||
| TOTAL BANK LOAN OBLIGATIONS | |||
| (Cost $18,212,340) | 18,179,279 | ||
| Bank Notes - 0.2% | |||
| Compass Bank 2.875% 6/29/22 | |||
| (Cost $249,715) | 250,000 | 239,575 | |
| Preferred Securities - 1.2% | |||
| Banks & Thrifts - 1.0% | |||
| Bank of America Corp. 5.2% (b)(h) | $300,000 | $299,021 | |
| Citigroup, Inc.: | |||
| 5.95% (b)(h) | 100,000 | 101,311 | |
| 5.95% (b)(h) | 10,000 | 10,289 | |
| Royal Bank of Scotland Group PLC 7.5% (b)(h) | 800,000 | 818,475 | |
| TOTAL BANKS & THRIFTS | 1,229,096 | ||
| Energy - 0.2% | |||
| Energy Transfer Partners LP 6.25% (b)(h) | 265,000 | 251,286 | |
| TOTAL PREFERRED SECURITIES | |||
| (Cost $1,461,006) | 1,480,382 | ||
| Shares | Value | ||
| Money Market Funds - 6.0% | |||
| Fidelity Cash Central Fund, 2.23% (i) | |||
| (Cost $7,236,496) | 7,235,175 | 7,236,622 | |
| TOTAL INVESTMENT IN SECURITIES - 102.0% | |||
| (Cost $124,420,691) | 122,405,679 | ||
| NET OTHER ASSETS (LIABILITIES) - (2.0)% | (2,378,187) | ||
| NET ASSETS - 100% | $120,027,492 |
Legend
(a) Security exempt from registration under Rule 144A of the Securities Act of 1933. These securities may be resold in transactions exempt from registration, normally to qualified institutional buyers. At the end of the period, the value of these securities amounted to $38,516,713 or 32.1% of net assets.
(b) Coupon rates for floating and adjustable rate securities reflect the rates in effect at period end.
(c) Coupon is indexed to a floating interest rate which may be multiplied by a specified factor and/or subject to caps or floors.
(d) Security or a portion of the security purchased on a delayed delivery or when-issued basis.
(e) Non-income producing
(f) The coupon rate will be determined upon settlement of the loan after period end.
(g) Level 3 security
(h) Security is perpetual in nature with no stated maturity date.
(i) Affiliated fund that is generally available only to investment companies and other accounts managed by Fidelity Investments. The rate quoted is the annualized seven-day yield of the fund at period end. A complete unaudited listing of the fund's holdings as of its most recent quarter end is available upon request. In addition, each Fidelity Central Fund's financial statements are available on the SEC's website or upon request.
Affiliated Central Funds
Information regarding fiscal year to date income earned by the Fund from investments in Fidelity Central Funds is as follows:
| Fund | Income earned |
| Fidelity Cash Central Fund | $61,374 |
| Total | $61,374 |
Amounts in the income column in the above table include any capital gain distributions from underlying funds, which are presented in the corresponding line-item in the Statement of Operations if applicable.
Investment Valuation
The following is a summary of the inputs used, as of October 31, 2018, involving the Fund's assets and liabilities carried at fair value. The inputs or methodology used for valuing securities may not be an indication of the risk associated with investing in those securities. For more information on valuation inputs, and their aggregation into the levels used below, please refer to the Investment Valuation section in the accompanying Notes to Financial Statements.
| Valuation Inputs at Reporting Date: | ||||
| Description | Total | Level 1 | Level 2 | Level 3 |
| Investments in Securities: | ||||
| Equities: | ||||
| Energy | $32,663 | $32,663 | $-- | $-- |
| Corporate Bonds | 95,237,158 | -- | 95,237,158 | -- |
| Bank Loan Obligations | 18,179,279 | -- | 18,030,769 | 148,510 |
| Bank Notes | 239,575 | -- | 239,575 | -- |
| Preferred Securities | 1,480,382 | -- | 1,480,382 | -- |
| Money Market Funds | 7,236,622 | 7,236,622 | -- | -- |
| Total Investments in Securities: | $122,405,679 | $7,269,285 | $114,987,884 | $148,510 |
Other Information
Distribution of investments by country or territory of incorporation, as a percentage of Total Net Assets, is as follows (Unaudited):
| United States of America | 76.7% |
| Canada | 8.8% |
| Netherlands | 2.6% |
| Luxembourg | 2.5% |
| United Kingdom | 2.3% |
| Cayman Islands | 1.5% |
| British Virgin Islands | 1.0% |
| Bermuda | 1.0% |
| Multi-National | 1.0% |
| Others (Individually Less Than 1%) | 2.6% |
| 100.0% |
See accompanying notes which are an integral part of the financial statements.
Financial Statements
Statement of Assets and Liabilities
| October 31, 2018 (Unaudited) | ||
| Assets | ||
| Investment in securities, at value — See accompanying schedule: Unaffiliated issuers (cost $117,184,195) | $115,169,057 | |
| Fidelity Central Funds (cost $7,236,496) | 7,236,622 | |
| Total Investment in Securities (cost $124,420,691) | $122,405,679 | |
| Cash | 35,227 | |
| Receivable for investments sold | 252,971 | |
| Receivable for fund shares sold | 333,289 | |
| Interest receivable | 1,537,620 | |
| Distributions receivable from Fidelity Central Funds | 14,680 | |
| Prepaid expenses | 206 | |
| Receivable from investment adviser for expense reductions | 39,007 | |
| Total assets | 124,618,679 | |
| Liabilities | ||
| Payable for investments purchased | $4,105,372 | |
| Payable for fund shares redeemed | 302,744 | |
| Distributions payable | 66,350 | |
| Accrued management fee | 55,498 | |
| Distribution and service plan fees payable | 6,928 | |
| Other affiliated payables | 15,103 | |
| Other payables and accrued expenses | 39,192 | |
| Total liabilities | 4,591,187 | |
| Net Assets | $120,027,492 | |
| Net Assets consist of: | ||
| Paid in capital | $125,950,322 | |
| Total distributable earnings (loss) | (5,922,830) | |
| Net Assets | $120,027,492 | |
| Net Asset Value and Maximum Offering Price | ||
| Class A: | ||
| Net Asset Value and redemption price per share ($13,506,176 ÷ 1,448,736 shares) | $9.32 | |
| Maximum offering price per share (100/96.00 of $9.32) | $9.71 | |
| Class M: | ||
| Net Asset Value and redemption price per share ($2,198,578 ÷ 235,875 shares) | $9.32 | |
| Maximum offering price per share (100/96.00 of $9.32) | $9.71 | |
| Class C: | ||
| Net Asset Value and offering price per share ($4,566,600 ÷ 489,795 shares)(a) | $9.32 | |
| Short Duration High Income: | ||
| Net Asset Value, offering price and redemption price per share ($95,748,390 ÷ 10,270,004 shares) | $9.32 | |
| Class I: | ||
| Net Asset Value, offering price and redemption price per share ($3,908,839 ÷ 419,261 shares) | $9.32 | |
| Class Z: | ||
| Net Asset Value, offering price and redemption price per share ($98,909 ÷ 10,606 shares) | $9.33 |
(a) Redemption price per share is equal to net asset value less any applicable contingent deferred sales charge.
See accompanying notes which are an integral part of the financial statements.
Statement of Operations
| Six months ended October 31, 2018 (Unaudited) | ||
| Investment Income | ||
| Dividends | $41,554 | |
| Interest | 2,902,289 | |
| Income from Fidelity Central Funds | 61,374 | |
| Total income | 3,005,217 | |
| Expenses | ||
| Management fee | $316,679 | |
| Transfer agent fees | 66,191 | |
| Distribution and service plan fees | 43,370 | |
| Accounting fees and expenses | 23,678 | |
| Custodian fees and expenses | 6,433 | |
| Independent trustees' fees and expenses | 334 | |
| Registration fees | 65,748 | |
| Audit | 35,668 | |
| Legal | 91 | |
| Miscellaneous | 401 | |
| Total expenses before reductions | 558,593 | |
| Expense reductions | (54,782) | |
| Total expenses after reductions | 503,811 | |
| Net investment income (loss) | 2,501,406 | |
| Realized and Unrealized Gain (Loss) | ||
| Net realized gain (loss) on: | ||
| Investment securities: | ||
| Unaffiliated issuers | (136,476) | |
| Fidelity Central Funds | 7 | |
| Total net realized gain (loss) | (136,469) | |
| Change in net unrealized appreciation (depreciation) on: | ||
| Investment securities: | ||
| Unaffiliated issuers | (1,260,215) | |
| Fidelity Central Funds | (1) | |
| Total change in net unrealized appreciation (depreciation) | (1,260,216) | |
| Net gain (loss) | (1,396,685) | |
| Net increase (decrease) in net assets resulting from operations | $1,104,721 |
See accompanying notes which are an integral part of the financial statements.
Statement of Changes in Net Assets
| Six months ended October 31, 2018 (Unaudited) | Year ended April 30, 2018 | |
| Increase (Decrease) in Net Assets | ||
| Operations | ||
| Net investment income (loss) | $2,501,406 | $4,799,847 |
| Net realized gain (loss) | (136,469) | (10,805) |
| Change in net unrealized appreciation (depreciation) | (1,260,216) | (1,948,198) |
| Net increase (decrease) in net assets resulting from operations | 1,104,721 | 2,840,844 |
| Distributions to shareholders | (2,339,936) | – |
| Distributions to shareholders from net investment income | – | (4,712,243) |
| Total distributions | (2,339,936) | (4,712,243) |
| Share transactions - net increase (decrease) | 13,347,721 | 13,613,515 |
| Redemption fees | – | 11,820 |
| Total increase (decrease) in net assets | 12,112,506 | 11,753,936 |
| Net Assets | ||
| Beginning of period | 107,914,986 | 96,161,050 |
| End of period | $120,027,492 | $107,914,986 |
| Other Information | ||
| Undistributed net investment income end of period | $360,273 |
See accompanying notes which are an integral part of the financial statements.
Financial Highlights
Fidelity Short Duration High Income Fund Class A
| Six months ended (Unaudited) October 31, | Years endedApril 30, | |||||
| 2018 | 2018 | 2017 | 2016 | 2015 | 2014 A | |
| Selected Per–Share Data | ||||||
| Net asset value, beginning of period | $9.42 | $9.57 | $9.14 | $9.86 | $10.10 | $10.00 |
| Income from Investment Operations | ||||||
| Net investment income (loss)B | .198 | .381 | .395 | .429 | .358 | .132 |
| Net realized and unrealized gain (loss) | (.113) | (.159) | .397 | (.737) | (.246) | .091 |
| Total from investment operations | .085 | .222 | .792 | (.308) | .112 | .223 |
| Distributions from net investment income | (.185) | (.373) | (.365) | (.413) | (.358) | (.124) |
| Distributions from net realized gain | – | – | – | (.002) | – | – |
| Total distributions | (.185) | (.373) | (.365) | (.415) | (.358) | (.124) |
| Redemption fees added to paid in capitalB | – | .001 | .003 | .003 | .006 | .001 |
| Net asset value, end of period | $9.32 | $9.42 | $9.57 | $9.14 | $9.86 | $10.10 |
| Total ReturnC,D,E | .90% | 2.36% | 8.84% | (3.06)% | 1.22% | 2.25% |
| Ratios to Average Net AssetsF,G | ||||||
| Expenses before reductions | 1.18%H | 1.16% | 1.22% | 1.24% | 1.29% | 1.61%H |
| Expenses net of fee waivers, if any | 1.05%H | 1.05% | 1.05% | 1.05% | 1.05% | 1.05%H |
| Expenses net of all reductions | 1.05%H | 1.05% | 1.05% | 1.05% | 1.05% | 1.05%H |
| Net investment income (loss) | 4.17%H | 4.00% | 4.21% | 4.65% | 3.63% | 2.72%H |
| Supplemental Data | ||||||
| Net assets, end of period (000 omitted) | $13,506 | $12,351 | $9,304 | $6,823 | $4,398 | $3,043 |
| Portfolio turnover rateI | 23%H | 65% | 105% | 56% | 84% | 20%J |
A For the period November 5, 2013 (commencement of operations) to April 30, 2014.
B Calculated based on average shares outstanding during the period.
C Total returns for periods of less than one year are not annualized.
D Total returns would have been lower if certain expenses had not been reduced during the applicable periods shown.
E Total returns do not include the effect of the sales charges.
F Fees and expenses of any underlying Fidelity Central Funds are not included in the Fund's expense ratio. The Fund indirectly bears its proportionate share of the expenses of any underlying Fidelity Central Funds.
G Expense ratios reflect operating expenses of the class. Expenses before reductions do not reflect amounts reimbursed by the investment adviser or reductions from brokerage service arrangements or reductions from other expense offset arrangements and do not represent the amount paid by the class during periods when reimbursements or reductions occur. Expense ratios before reductions for start-up periods may not be representative of longer-term operating periods. Expenses net of fee waivers reflect expenses after reimbursement by the investment adviser but prior to reductions from brokerage service arrangements or other expense offset arrangements. Expenses net of all reductions represent the net expenses paid by the class.
H Annualized
I Amount does not include the portfolio activity of any underlying Fidelity Central Funds.
J Amount not annualized.
See accompanying notes which are an integral part of the financial statements.
Fidelity Short Duration High Income Fund Class M
| Six months ended (Unaudited) October 31, | Years endedApril 30, | |||||
| 2018 | 2018 | 2017 | 2016 | 2015 | 2014 A | |
| Selected Per–Share Data | ||||||
| Net asset value, beginning of period | $9.42 | $9.57 | $9.14 | $9.86 | $10.10 | $10.00 |
| Income from Investment Operations | ||||||
| Net investment income (loss)B | .198 | .382 | .395 | .433 | .360 | .132 |
| Net realized and unrealized gain (loss) | (.113) | (.160) | .397 | (.741) | (.247) | .091 |
| Total from investment operations | .085 | .222 | .792 | (.308) | .113 | .223 |
| Distributions from net investment income | (.185) | (.373) | (.365) | (.413) | (.359) | (.124) |
| Distributions from net realized gain | – | – | – | (.002) | – | – |
| Total distributions | (.185) | (.373) | (.365) | (.415) | (.359) | (.124) |
| Redemption fees added to paid in capitalB | – | .001 | .003 | .003 | .006 | .001 |
| Net asset value, end of period | $9.32 | $9.42 | $9.57 | $9.14 | $9.86 | $10.10 |
| Total ReturnC,D,E | .90% | 2.36% | 8.84% | (3.06)% | 1.23% | 2.25% |
| Ratios to Average Net AssetsF,G | ||||||
| Expenses before reductions | 1.18%H | 1.16% | 1.22% | 1.25% | 1.31% | 1.61%H |
| Expenses net of fee waivers, if any | 1.05%H | 1.05% | 1.05% | 1.05% | 1.05% | 1.05%H |
| Expenses net of all reductions | 1.05%H | 1.05% | 1.05% | 1.05% | 1.05% | 1.05%H |
| Net investment income (loss) | 4.17%H | 4.00% | 4.21% | 4.65% | 3.63% | 2.72%H |
| Supplemental Data | ||||||
| Net assets, end of period (000 omitted) | $2,199 | $2,081 | $2,703 | $2,426 | $2,930 | $2,946 |
| Portfolio turnover rateI | 23%H | 65% | 105% | 56% | 84% | 20%J |
A For the period November 5, 2013 (commencement of operations) to April 30, 2014.
B Calculated based on average shares outstanding during the period.
C Total returns for periods of less than one year are not annualized.
D Total returns would have been lower if certain expenses had not been reduced during the applicable periods shown.
E Total returns do not include the effect of the sales charges.
F Fees and expenses of any underlying Fidelity Central Funds are not included in the Fund's expense ratio. The Fund indirectly bears its proportionate share of the expenses of any underlying Fidelity Central Funds.
G Expense ratios reflect operating expenses of the class. Expenses before reductions do not reflect amounts reimbursed by the investment adviser or reductions from brokerage service arrangements or reductions from other expense offset arrangements and do not represent the amount paid by the class during periods when reimbursements or reductions occur. Expense ratios before reductions for start-up periods may not be representative of longer-term operating periods. Expenses net of fee waivers reflect expenses after reimbursement by the investment adviser but prior to reductions from brokerage service arrangements or other expense offset arrangements. Expenses net of all reductions represent the net expenses paid by the class.
H Annualized
I Amount does not include the portfolio activity of any underlying Fidelity Central Funds.
J Amount not annualized.
See accompanying notes which are an integral part of the financial statements.
Fidelity Short Duration High Income Fund Class C
| Six months ended (Unaudited) October 31, | Years endedApril 30, | |||||
| 2018 | 2018 | 2017 | 2016 | 2015 | 2014 A | |
| Selected Per–Share Data | ||||||
| Net asset value, beginning of period | $9.42 | $9.57 | $9.15 | $9.86 | $10.10 | $10.00 |
| Income from Investment Operations | ||||||
| Net investment income (loss)B | .163 | .310 | .325 | .360 | .285 | .096 |
| Net realized and unrealized gain (loss) | (.114) | (.159) | .386 | (.728) | (.247) | .090 |
| Total from investment operations | .049 | .151 | .711 | (.368) | .038 | .186 |
| Distributions from net investment income | (.149) | (.302) | (.294) | (.343) | (.284) | (.087) |
| Distributions from net realized gain | – | – | – | (.002) | – | – |
| Total distributions | (.149) | (.302) | (.294) | (.345) | (.284) | (.087) |
| Redemption fees added to paid in capitalB | – | .001 | .003 | .003 | .006 | .001 |
| Net asset value, end of period | $9.32 | $9.42 | $9.57 | $9.15 | $9.86 | $10.10 |
| Total ReturnC,D,E | .52% | 1.59% | 7.92% | (3.68)% | .47% | 1.88% |
| Ratios to Average Net AssetsF,G | ||||||
| Expenses before reductions | 1.94%H | 1.93% | 2.00% | 2.00% | 2.08% | 2.37%H |
| Expenses net of fee waivers, if any | 1.80%H | 1.80% | 1.80% | 1.80% | 1.80% | 1.80%H |
| Expenses net of all reductions | 1.80%H | 1.80% | 1.80% | 1.80% | 1.80% | 1.80%H |
| Net investment income (loss) | 3.42%H | 3.25% | 3.46% | 3.90% | 2.88% | 1.97%H |
| Supplemental Data | ||||||
| Net assets, end of period (000 omitted) | $4,567 | $5,146 | $5,387 | $3,827 | $3,465 | $3,114 |
| Portfolio turnover rateI | 23%H | 65% | 105% | 56% | 84% | 20%J |
A For the period November 5, 2013 (commencement of operations) to April 30, 2014.
B Calculated based on average shares outstanding during the period.
C Total returns for periods of less than one year are not annualized.
D Total returns would have been lower if certain expenses had not been reduced during the applicable periods shown.
E Total returns do not include the effect of the contingent deferred sales charge.
F Fees and expenses of any underlying Fidelity Central Funds are not included in the Fund's expense ratio. The Fund indirectly bears its proportionate share of the expenses of any underlying Fidelity Central Funds.
G Expense ratios reflect operating expenses of the class. Expenses before reductions do not reflect amounts reimbursed by the investment adviser or reductions from brokerage service arrangements or reductions from other expense offset arrangements and do not represent the amount paid by the class during periods when reimbursements or reductions occur. Expense ratios before reductions for start-up periods may not be representative of longer-term operating periods. Expenses net of fee waivers reflect expenses after reimbursement by the investment adviser but prior to reductions from brokerage service arrangements or other expense offset arrangements. Expenses net of all reductions represent the net expenses paid by the class.
H Annualized
I Amount does not include the portfolio activity of any underlying Fidelity Central Funds.
J Amount not annualized.
See accompanying notes which are an integral part of the financial statements.
Fidelity Short Duration High Income Fund
| Six months ended (Unaudited) October 31, | Years endedApril 30, | |||||
| 2018 | 2018 | 2017 | 2016 | 2015 | 2014 A | |
| Selected Per–Share Data | ||||||
| Net asset value, beginning of period | $9.42 | $9.57 | $9.15 | $9.86 | $10.10 | $10.00 |
| Income from Investment Operations | ||||||
| Net investment income (loss)B | .210 | .405 | .420 | .455 | .385 | .142 |
| Net realized and unrealized gain (loss) | (.113) | (.159) | .385 | (.730) | (.248) | .093 |
| Total from investment operations | .097 | .246 | .805 | (.275) | .137 | .235 |
| Distributions from net investment income | (.197) | (.397) | (.388) | (.436) | (.383) | (.136) |
| Distributions from net realized gain | – | – | – | (.002) | – | – |
| Total distributions | (.197) | (.397) | (.388) | (.438) | (.383) | (.136) |
| Redemption fees added to paid in capitalB | – | .001 | .003 | .003 | .006 | .001 |
| Net asset value, end of period | $9.32 | $9.42 | $9.57 | $9.15 | $9.86 | $10.10 |
| Total ReturnC,D | 1.03% | 2.61% | 9.00% | (2.71)% | 1.48% | 2.37% |
| Ratios to Average Net AssetsE,F | ||||||
| Expenses before reductions | .89%G | .86% | .93% | .96% | 1.00% | 1.24%G |
| Expenses net of fee waivers, if any | .80%G | .80% | .80% | .80% | .80% | .80%G |
| Expenses net of all reductions | .80%G | .80% | .80% | .80% | .80% | .80%G |
| Net investment income (loss) | 4.43%G | 4.25% | 4.46% | 4.90% | 3.88% | 2.96%G |
| Supplemental Data | ||||||
| Net assets, end of period (000 omitted) | $95,748 | $83,652 | $68,646 | $47,531 | $45,109 | $54,547 |
| Portfolio turnover rateH | 23%G | 65% | 105% | 56% | 84% | 20%I |
A For the period November 5, 2013 (commencement of operations) to April 30, 2014.
B Calculated based on average shares outstanding during the period.
C Total returns for periods of less than one year are not annualized.
D Total returns would have been lower if certain expenses had not been reduced during the applicable periods shown.
E Fees and expenses of any underlying Fidelity Central Funds are not included in the Fund's expense ratio. The Fund indirectly bears its proportionate share of the expenses of any underlying Fidelity Central Funds.
F Expense ratios reflect operating expenses of the class. Expenses before reductions do not reflect amounts reimbursed by the investment adviser or reductions from brokerage service arrangements or reductions from other expense offset arrangements and do not represent the amount paid by the class during periods when reimbursements or reductions occur. Expense ratios before reductions for start-up periods may not be representative of longer-term operating periods. Expenses net of fee waivers reflect expenses after reimbursement by the investment adviser but prior to reductions from brokerage service arrangements or other expense offset arrangements. Expenses net of all reductions represent the net expenses paid by the class.
G Annualized
H Amount does not include the portfolio activity of any underlying Fidelity Central Funds.
I Amount not annualized.
See accompanying notes which are an integral part of the financial statements.
Fidelity Short Duration High Income Fund Class I
| Six months ended (Unaudited) October 31, | Years endedApril 30, | |||||
| 2018 | 2018 | 2017 | 2016 | 2015 | 2014 A | |
| Selected Per–Share Data | ||||||
| Net asset value, beginning of period | $9.42 | $9.57 | $9.15 | $9.86 | $10.10 | $10.00 |
| Income from Investment Operations | ||||||
| Net investment income (loss)B | .210 | .406 | .420 | .460 | .383 | .143 |
| Net realized and unrealized gain (loss) | (.113) | (.160) | .385 | (.735) | (.246) | .091 |
| Total from investment operations | .097 | .246 | .805 | (.275) | .137 | .234 |
| Distributions from net investment income | (.197) | (.397) | (.388) | (.436) | (.383) | (.135) |
| Distributions from net realized gain | – | – | – | (.002) | – | – |
| Total distributions | (.197) | (.397) | (.388) | (.438) | (.383) | (.135) |
| Redemption fees added to paid in capitalB | – | .001 | .003 | .003 | .006 | .001 |
| Net asset value, end of period | $9.32 | $9.42 | $9.57 | $9.15 | $9.86 | $10.10 |
| Total ReturnC,D | 1.03% | 2.61% | 8.99% | (2.71)% | 1.48% | 2.37% |
| Ratios to Average Net AssetsE,F | ||||||
| Expenses before reductions | .91%G | .91% | .96% | .99% | 1.04% | 1.34%G |
| Expenses net of fee waivers, if any | .80%G | .80% | .80% | .80% | .80% | .80%G |
| Expenses net of all reductions | .80%G | .80% | .80% | .80% | .80% | .80%G |
| Net investment income (loss) | 4.42%G | 4.25% | 4.46% | 4.90% | 3.88% | 2.97%G |
| Supplemental Data | ||||||
| Net assets, end of period (000 omitted) | $3,909 | $4,686 | $10,122 | $2,856 | $5,932 | $4,419 |
| Portfolio turnover rateH | 23%G | 65% | 105% | 56% | 84% | 20%I |
A For the period November 5, 2013 (commencement of operations) to April 30, 2014.
B Calculated based on average shares outstanding during the period.
C Total returns for periods of less than one year are not annualized.
D Total returns would have been lower if certain expenses had not been reduced during the applicable periods shown.
E Fees and expenses of any underlying Fidelity Central Funds are not included in the Fund's expense ratio. The Fund indirectly bears its proportionate share of the expenses of any underlying Fidelity Central Funds.
F Expense ratios reflect operating expenses of the class. Expenses before reductions do not reflect amounts reimbursed by the investment adviser or reductions from brokerage service arrangements or reductions from other expense offset arrangements and do not represent the amount paid by the class during periods when reimbursements or reductions occur. Expense ratios before reductions for start-up periods may not be representative of longer-term operating periods. Expenses net of fee waivers reflect expenses after reimbursement by the investment adviser but prior to reductions from brokerage service arrangements or other expense offset arrangements. Expenses net of all reductions represent the net expenses paid by the class.
G Annualized
H Amount does not include the portfolio activity of any underlying Fidelity Central Funds.
I Amount not annualized.
See accompanying notes which are an integral part of the financial statements.
Fidelity Short Duration High Income Fund Class Z
| Six months ended (Unaudited) October 31, | |
| 2018 A | |
| Selected Per–Share Data | |
| Net asset value, beginning of period | $9.46 |
| Income from Investment Operations | |
| Net investment income (loss)B | .033 |
| Net realized and unrealized gain (loss) | (.132) |
| Total from investment operations | (.099) |
| Distributions from net investment income | (.031) |
| Distributions from net realized gain | – |
| Total distributions | (.031) |
| Redemption fees added to paid in capitalB | – |
| Net asset value, end of period | $9.33 |
| Total ReturnC,D | (1.05)% |
| Ratios to Average Net AssetsE,F | |
| Expenses before reductions | 1.11%G |
| Expenses net of fee waivers, if any | .71%G |
| Expenses net of all reductions | .71%G |
| Net investment income (loss) | (.14)%G |
| Supplemental Data | |
| Net assets, end of period (000 omitted) | $99 |
| Portfolio turnover rateH | 23%G |
A For the period October 2, 2018 (commencement of sale of shares) to October 31, 2018.
B Calculated based on average shares outstanding during the period.
C Total returns for periods of less than one year are not annualized.
D Total returns would have been lower if certain expenses had not been reduced during the applicable periods shown.
E Fees and expenses of any underlying Fidelity Central Funds are not included in the Fund's expense ratio. The Fund indirectly bears its proportionate share of the expenses of any underlying Fidelity Central Funds.
F Expense ratios reflect operating expenses of the class. Expenses before reductions do not reflect amounts reimbursed by the investment adviser or reductions from brokerage service arrangements or reductions from other expense offset arrangements and do not represent the amount paid by the class during periods when reimbursements or reductions occur. Expense ratios before reductions for start-up periods may not be representative of longer-term operating periods. Expenses net of fee waivers reflect expenses after reimbursement by the investment adviser but prior to reductions from brokerage service arrangements or other expense offset arrangements. Expenses net of all reductions represent the net expenses paid by the class.
G Annualized
H Amount does not include the portfolio activity of any underlying Fidelity Central Funds.
See accompanying notes which are an integral part of the financial statements.
Notes to Financial Statements (Unaudited)
For the period ended October 31, 2018
1. Organization.
Fidelity Short Duration High Income Fund (the Fund) is a fund of Fidelity Summer Street Trust (the Trust) and is authorized to issue an unlimited number of shares. The Trust is registered under the Investment Company Act of 1940, as amended (the 1940 Act), as an open-end management investment company organized as a Massachusetts business trust. The Fund commenced sale of Class Z shares on October 2, 2018. The Fund offers Class A, Class M, Class C, Short Duration High Income, Class I and Class Z shares, each of which has equal rights as to assets and voting privileges. Each class has exclusive voting rights with respect to matters that affect that class.
2. Investments in Fidelity Central Funds.
The Fund invests in Fidelity Central Funds, which are open-end investment companies generally available only to other investment companies and accounts managed by the investment adviser and its affiliates. The Fund's Schedule of Investments lists each of the Fidelity Central Funds held as of period end, if any, as an investment of the Fund, but does not include the underlying holdings of each Fidelity Central Fund. As an Investing Fund, the Fund indirectly bears its proportionate share of the expenses of the underlying Fidelity Central Funds.
The Money Market Central Funds seek preservation of capital and current income and are managed by Fidelity Investments Money Management, Inc. (FIMM), an affiliate of the investment adviser. Annualized expenses of the Money Market Central Funds as of their most recent shareholder report date are less than .005%.
A complete unaudited list of holdings for each Fidelity Central Fund is available upon request or at the Securities and Exchange Commission (the SEC) website at www.sec.gov. In addition, the financial statements of the Fidelity Central Funds are available on the SEC website or upon request.
3. Significant Accounting Policies.
The Fund is an investment company and applies the accounting and reporting guidance of the Financial Accounting Standards Board (FASB) Accounting Standards Codification Topic 946 Financial Services – Investments Companies. The financial statements have been prepared in conformity with accounting principles generally accepted in the United States of America (GAAP), which require management to make certain estimates and assumptions at the date of the financial statements. Actual results could differ from those estimates. Subsequent events, if any, through the date that the financial statements were issued have been evaluated in the preparation of the financial statements. The following summarizes the significant accounting policies of the Fund:
Investment Valuation. Investments are valued as of 4:00 p.m. Eastern time on the last calendar day of the period. The Board of Trustees (the Board) has delegated the day to day responsibility for the valuation of the Fund's investments to the Fair Value Committee (the Committee) established by the Fund's investment adviser. In accordance with valuation policies and procedures approved by the Board, the Fund attempts to obtain prices from one or more third party pricing vendors or brokers to value its investments. When current market prices, quotations or currency exchange rates are not readily available or reliable, investments will be fair valued in good faith by the Committee, in accordance with procedures adopted by the Board. Factors used in determining fair value vary by investment type and may include market or investment specific events, changes in interest rates and credit quality. The frequency with which these procedures are used cannot be predicted and they may be utilized to a significant extent. The Committee oversees the Fund's valuation policies and procedures and reports to the Board on the Committee's activities and fair value determinations. The Board monitors the appropriateness of the procedures used in valuing the Fund's investments and ratifies the fair value determinations of the Committee.
The Fund categorizes the inputs to valuation techniques used to value its investments into a disclosure hierarchy consisting of three levels as shown below:
- Level 1 – quoted prices in active markets for identical investments
- Level 2 – other significant observable inputs (including quoted prices for similar investments, interest rates, prepayment speeds, etc.)
- Level 3 – unobservable inputs (including the Fund's own assumptions based on the best information available)
Valuation techniques used to value the Fund's investments by major category are as follows:
Debt securities, including restricted securities, are valued based on evaluated prices received from third party pricing vendors or from brokers who make markets in such securities. Corporate bonds, bank notes, bank loan obligations and preferred securities are valued by pricing vendors who utilize matrix pricing which considers yield or price of bonds of comparable quality, coupon, maturity and type or by broker-supplied prices. When independent prices are unavailable or unreliable, debt securities may be valued utilizing pricing methodologies which consider similar factors that would be used by third party pricing vendors. Debt securities are generally categorized as Level 2 in the hierarchy but may be Level 3 depending on the circumstances. The Fund invests a significant portion of its assets in below investment grade securities. The value of these securities can be more volatile due to changes in the credit quality of the issuer and is sensitive to changes in economic, market and regulatory conditions.
Equity securities, including restricted securities, for which market quotations are readily available, are valued at the last reported sale price or official closing price as reported by a third party pricing vendor on the primary market or exchange on which they are traded and are categorized as Level 1 in the hierarchy. In the event there were no sales during the day or closing prices are not available, securities are valued at the last quoted bid price or may be valued using the last available price and are generally categorized as Level 2 in the hierarchy. Utilizing these techniques may result in transfers between Level 1 and Level 2. For equity securities, including restricted securities, where observable inputs are limited, assumptions about market activity and risk are used and these securities may be categorized as Level 3 in the hierarchy.
Investments in open-end mutual funds, including the Fidelity Central Funds, are valued at their closing net asset value (NAV) each business day and are categorized as Level 1 in the hierarchy.
Changes in valuation techniques may result in transfers in or out of an assigned level within the disclosure hierarchy. The aggregate value of investments by input level as of October 31, 2018 is included at the end of the Fund's Schedule of Investments.
Investment Transactions and Income. For financial reporting purposes, the Fund's investment holdings and NAV include trades executed through the end of the last business day of the period. The NAV per share for processing shareholder transactions is calculated as of the close of business of the New York Stock Exchange (NYSE), normally 4:00 p.m. Eastern time and includes trades executed through the end of the prior business day. Gains and losses on securities sold are determined on the basis of identified cost and include proceeds received from litigation. Dividend income is recorded on the ex-dividend date, except for certain dividends from foreign securities where the ex-dividend date may have passed, which are recorded as soon as the Fund is informed of the ex-dividend date. Non-cash dividends included in dividend income, if any, are recorded at the fair market value of the securities received. Income and capital gain distributions from Fidelity Central Funds, if any, are recorded on the ex-dividend date. Interest income is accrued as earned and includes coupon interest and amortization of premium and accretion of discount on debt securities as applicable. Paid in Kind (PIK) income is recorded at the fair market value of the securities received. Debt obligations may be placed on non-accrual status and related interest income may be reduced by ceasing current accruals and writing off interest receivables when the collection of all or a portion of interest has become doubtful based on consistently applied procedures. A debt obligation is removed from non-accrual status when the issuer resumes interest payments or when collectability of interest is reasonably assured.
Class Allocations and Expenses. Investment income, realized and unrealized capital gains and losses, common expenses of the Fund, and certain fund-level expense reductions, if any, are allocated daily on a pro-rata basis to each class based on the relative net assets of each class to the total net assets of the Fund. Each class differs with respect to transfer agent and distribution and service plan fees incurred. Certain expense reductions may also differ by class. For the reporting period, the allocated portion of income and expenses to each class as a percent of its average net assets may vary due to the timing of recording these transactions in relation to fluctuating net assets of the classes. Expenses directly attributable to a fund are charged to that fund. Expenses attributable to more than one fund are allocated among the respective funds on the basis of relative net assets or other appropriate methods. Expense estimates are accrued in the period to which they relate and adjustments are made when actual amounts are known.
Income Tax Information and Distributions to Shareholders. Each year, the Fund intends to qualify as a regulated investment company under Subchapter M of the Internal Revenue Code, including distributing substantially all of its taxable income and realized gains. As a result, no provision for U.S. Federal income taxes is required. The Fund files a U.S. federal tax return, in addition to state and local tax returns as required. The Fund's federal income tax returns are subject to examination by the Internal Revenue Service (IRS) for a period of three fiscal years after they are filed. State and local tax returns may be subject to examination for an additional fiscal year depending on the jurisdiction.
Distributions are declared and recorded daily and paid monthly from net investment income. Distributions from realized gains, if any, are declared and recorded on the ex-dividend date. Income and capital gain distributions are declared separately for each class. Income and capital gain distributions are determined in accordance with income tax regulations, which may differ from GAAP.
Capital accounts within the financial statements are adjusted for permanent book-tax differences. These adjustments have no impact on net assets or the results of operations. Capital accounts are not adjusted for temporary book-tax differences which will reverse in a subsequent period.
Book-tax differences are primarily due to market discount, partnerships, capital loss carryforwards and losses deferred due to wash sales.
As of period end, the cost and unrealized appreciation (depreciation) in securities, and derivatives if applicable, for federal income tax purposes were as follows:
| Gross unrealized appreciation | $934,111 |
| Gross unrealized depreciation | (2,541,183) |
| Net unrealized appreciation (depreciation) | $(1,607,072) |
| Tax cost | $124,012,751 |
Capital loss carryforwards are only available to offset future capital gains of the Fund to the extent provided by regulations and may be limited. Under the Regulated Investment Company Modernization Act of 2010 (the Act), the Fund is permitted to carry forward capital losses incurred in taxable years beginning after December 22, 2010 for an unlimited period and such capital losses are required to be used prior to any losses that expire. The capital loss carryforward information presented below, including any applicable limitation, is estimated as of prior fiscal period end and is subject to adjustment.
| No expiration | |
| Short-term | $(2,523,332) |
| Long-term | (1,771,337) |
| Total capital loss carryforward | $(4,294,669) |
Restricted Securities. The Fund may invest in securities that are subject to legal or contractual restrictions on resale. These securities generally may be resold in transactions exempt from registration or to the public if the securities are registered. Disposal of these securities may involve time-consuming negotiations and expense, and prompt sale at an acceptable price may be difficult. Information regarding restricted securities is included at the end of the Fund's Schedule of Investments.
Loans and Other Direct Debt Instruments. The Fund invests in direct debt instruments which are interests in amounts owed to lenders by corporate or other borrowers. These instruments may be in the form of loans, trade claims or other receivables and may include standby financing commitments such as revolving credit facilities that obligate the Fund to supply additional cash to the borrower on demand. Loans may be acquired through assignment or participation. The Fund did not have any unfunded loan commitments, which are contractual obligations for future funding, at period end.
New Accounting Pronouncement. In March 2017, the Financial Accounting Standards Board (FASB) issued an Accounting Standards Update (ASU), ASU 2017-08, which amends the amortization period for certain callable debt securities that are held at a premium. The amendment requires the premium to be amortized to the earliest call date. The amendments do not require an accounting change for securities held at a discount. The ASU is effective for annual periods beginning after December 15, 2018. Management is currently evaluating the potential impact of these changes to the financial statements.
New Rule Issuance. During August 2018, the U.S. Securities and Exchange Commission issued Final Rule Release No. 33-10532, Disclosure Update and Simplification. This Final Rule includes amendments specific to registered investment companies that are intended to eliminate overlap in disclosure requirements between Regulation S-X and GAAP. In accordance with these amendments, certain line-items in the Fund's financial statements have been combined or removed for the current period as outlined in the table below.
| Financial Statement | Current Line-Item Presentation | Prior Line-Item Presentation |
| Statement of Assets and Liabilities | Total distributable earnings (loss) | Undistributed/Distributions in excess of/Accumulated net investment income (loss) Accumulated/Undistributed net realized gain (loss) Net unrealized appreciation (depreciation) |
| Statement of Changes in Net Assets | N/A – removed | Undistributed/Distributions in excess of/Accumulated net investment income (loss) end of period |
| Statement of Changes in Net Assets | Distributions to shareholders | Distributions to shareholders from net investment income Distributions to shareholders from net realized gain |
| Distributions to Shareholders Note to Financial Statements | Distributions to shareholders | Distributions to shareholders from net investment income Distributions to shareholders from net realized gain |
4. Purchases and Sales of Investments.
Purchases and sales of securities, other than short-term securities, aggregated $27,008,950 and $12,344,602, respectively.
5. Fees and Other Transactions with Affiliates.
Management Fee. Fidelity Management & Research Company (the investment adviser) and its affiliates provide the Fund with investment management related services for which the Fund pays a monthly management fee. The management fee is the sum of an individual fund fee rate that is based on an annual rate of .45% of the Fund's average net assets and an annualized group fee rate that averaged .11% during the period. The group fee rate is based upon the average net assets of all the mutual funds advised by the investment adviser, including any mutual funds previously advised by the investment adviser that are currently advised by Fidelity SelectCo, LLC, an affiliate of the investment adviser. The group fee rate decreases as assets under management increase and increases as assets under management decrease. For the reporting period, the total annualized management fee rate was .56% of the Fund's average net assets.
Distribution and Service Plan Fees. In accordance with Rule 12b-1 of the 1940 Act, the Fund has adopted separate Distribution and Service Plans for each class of shares. Certain classes pay Fidelity Distributors Corporation (FDC), an affiliate of the investment adviser, separate Distribution and Service Fees, each of which is based on an annual percentage of each class' average net assets. In addition, FDC may pay financial intermediaries for selling shares of the Fund and providing shareholder support services. For the period, the Distribution and Service Fee rates, total fees and amounts retained by FDC were as follows:
| Distribution Fee | Service Fee | Total Fees | Retained by FDC | |
| Class A | -% | .25% | $15,997 | $1,484 |
| Class M | -% | .25% | 2,641 | – |
| Class C | .75% | .25% | 24,732 | 2,391 |
| $43,370 | $3,875 |
Sales Load. FDC may receive a front-end sales charge of up to 4.00% for selling Class A shares and Class M shares, some of which is paid to financial intermediaries for selling shares of the Fund. Depending on the holding period, FDC may receive contingent deferred sales charges levied on Class A, Class M and Class C redemptions. The deferred sales charges are 1.00% for Class C shares, 1.00% for certain purchases of Class A shares and .25% for certain purchases of Class M shares.
For the period, sales charge amounts retained by FDC were as follows:
| Retained by FDC | |
| Class A | $1,508 |
| Class M | 195 |
| Class C(a) | 250 |
| $1,953 |
(a) When Class C shares are initially sold, FDC pays commissions from its own resources to financial intermediaries through which the sales are made.
Transfer Agent Fees. Fidelity Investments Institutional Operations Company, Inc., (FIIOC), an affiliate of the investment adviser, is the transfer, dividend disbursing and shareholder servicing agent for each class of the Fund. FIIOC receives account fees and asset-based fees that vary according to the account size and type of account of the shareholders of the respective classes of the Fund, except for Class Z. FIIOC receives an asset-based fee of Class Z's average net assets. FIIOC pays for typesetting, printing and mailing of shareholder reports, except proxy statements.
For the period, transfer agent fees for each class were as follows:
| Amount | % of Class-Level Average Net Assets(a) | |
| Class A | $9,605 | .15 |
| Class M | 1,642 | .15 |
| Class C | 4,454 | .18 |
| Short Duration High Income | 47,523 | .10 |
| Class I | 2,963 | .13 |
| Class Z | 4 | .05 |
| $66,191 |
(a) Annualized
Accounting Fees. Fidelity Service Company, Inc. (FSC), an affiliate of the investment adviser, maintains the Fund's accounting records. The fee is based on the level of average net assets for each month. For the period, the fees were equivalent to an annualized rate of .04%.
Interfund Trades. The Fund may purchase from or sell securities to other Fidelity Funds under procedures adopted by the Board. The procedures have been designed to ensure these interfund trades are executed in accordance with Rule 17a-7 of the 1940 Act. Interfund trades are included within the respective purchases and sales amounts shown in the Purchases and Sales of Investments note.
6. Committed Line of Credit.
The Fund participates with other funds managed by the investment adviser or an affiliate in a $4.25 billion credit facility (the "line of credit") to be utilized for temporary or emergency purposes to fund shareholder redemptions or for other short-term liquidity purposes. The Fund has agreed to pay commitment fees on its pro-rata portion of the line of credit, which amounted to $145 and is reflected in Miscellaneous expenses on the Statement of Operations. During the period, the Fund did not borrow on this line of credit.
7. Expense Reductions.
The investment adviser contractually agreed to reimburse each class to the extent annual operating expenses exceeded certain levels of class-level average net assets as noted in the table below. This reimbursement will remain in place through June 30, 2019. Some expenses, for example the compensation of the independent Trustees, and certain miscellaneous expenses such as proxy and shareholder meeting expenses, are excluded from this reimbursement.
The following classes were in reimbursement during the period:
| Expense Limitations | Reimbursement | |
| Class A | 1.05% | $8,162 |
| Class M | 1.05% | 1,393 |
| Class C | 1.80% | 3,535 |
| Short Duration High Income | .80% | 38,743 |
| Class I | .80% | 2,363 |
| Class Z | .71% | 33 |
| $54,229 |
Commissions paid to certain brokers with whom the investment adviser, or its affiliates, places trades on behalf of the Fund include an amount in addition to trade execution, which may be rebated back to the Fund to offset certain expenses. This amount totaled $31 for the period. Through arrangements with the Fund's custodian, credits realized as a result of certain uninvested cash balances were used to reduce the Fund's expenses. During the period, these credits reduced the Fund's custody expenses by $161.
In addition, during the period the investment adviser reimbursed and/or waived a portion of fund-level operating expenses in the amount of $361.
8. Distributions to Shareholders.
Distributions to shareholders of each class were as follows:
| Six months ended October 31, 2018(a) | Year ended April 30, 2018 |
|
| Distributions to shareholders | ||
| Class A | $251,147 | $– |
| Class M | 41,465 | – |
| Class C | 78,432 | – |
| Short Duration High Income | 1,877,261 | – |
| Class I | 91,306 | – |
| Class Z | 325 | – |
| Total | $2,339,936 | $– |
| From net investment income | ||
| Class A | $– | $445,242 |
| Class M | – | 93,305 |
| Class C | – | 176,055 |
| Short Duration High Income | – | 3,580,329 |
| Class I | – | 417,312 |
| Total | $– | $4,712,243 |
(a) Distributions for Class Z are for the period October 2, 2018 (commencement of sale of shares) to October 31, 2018.
9. Share Transactions.
Share transactions for each class were as follows and may contain automatic conversions between classes or exchanges between affiliated funds:
| Shares | Shares | Dollars | Dollars | |
| Six months ended October 31, 2018(a) | Year ended April 30, 2018 | Six months ended October 31, 2018(a) | Year ended April 30, 2018 | |
| Class A | ||||
| Shares sold | 259,285 | 583,861 | $2,439,130 | $5,564,910 |
| Reinvestment of distributions | 25,845 | 44,786 | 243,043 | 426,787 |
| Shares redeemed | (147,746) | (289,548) | (1,390,762) | (2,756,061) |
| Net increase (decrease) | 137,384 | 339,099 | $1,291,411 | $3,235,636 |
| Class M | ||||
| Shares sold | 25,732 | 47,258 | $241,953 | $450,924 |
| Reinvestment of distributions | 4,295 | 9,433 | 40,391 | 89,955 |
| Shares redeemed | (15,111) | (118,183) | (142,136) | (1,126,799) |
| Net increase (decrease) | 14,916 | (61,492) | $140,208 | $(585,920) |
| Class C | ||||
| Shares sold | 77,731 | 203,484 | $729,723 | $1,941,596 |
| Reinvestment of distributions | 8,252 | 18,355 | 77,621 | 175,004 |
| Shares redeemed | (142,461) | (238,426) | (1,342,695) | (2,272,097) |
| Net increase (decrease) | (56,478) | (16,587) | $(535,351) | $(155,497) |
| Short Duration High Income | ||||
| Shares sold | 3,010,643 | 5,767,474 | $28,358,196 | $55,048,153 |
| Reinvestment of distributions | 161,387 | 292,731 | 1,517,639 | 2,790,315 |
| Shares redeemed | (1,783,408) | (4,351,715) | (16,786,324) | (41,381,770) |
| Net increase (decrease) | 1,388,622 | 1,708,490 | $13,089,511 | $16,456,698 |
| Class I | ||||
| Shares sold | 59,092 | 643,223 | $555,967 | $6,143,050 |
| Reinvestment of distributions | 8,651 | 35,107 | 81,364 | 335,181 |
| Shares redeemed | (145,963) | (1,238,488) | (1,375,714) | (11,815,633) |
| Net increase (decrease) | (78,220) | (560,158) | $(738,383) | $(5,337,402) |
| Class Z | ||||
| Shares sold | 10,571 | – | $100,000 | $– |
| Reinvestment of distributions | 35 | – | 325 | – |
| Net increase (decrease) | 10,606 | – | $100,325 | $– |
(a) Share transactions for Class Z are for the period October 2, 2018 (commencement of sale of shares) to October 31, 2018.
10. Other.
The Fund's organizational documents provide former and current trustees and officers with a limited indemnification against liabilities arising in connection with the performance of their duties to the Fund. In the normal course of business, the Fund may also enter into contracts that provide general indemnifications. The Fund's maximum exposure under these arrangements is unknown as this would be dependent on future claims that may be made against the Fund. The risk of material loss from such claims is considered remote.
Shareholder Expense Example
As a shareholder of the Fund, you incur two types of costs: (1) transaction costs, including sales charges (loads) on purchase payments or redemption proceeds, and (2) ongoing costs, including management fees, distribution and/or service (12b-1) fees and other Fund expenses. This Example is intended to help you understand your ongoing costs (in dollars) of investing in the Fund and to compare these costs with the ongoing costs of investing in other mutual funds.
The actual expense Example is based on an investment of $1,000 invested at the beginning of the period and held for the entire period (May 1, 2018 to October 31, 2018) for Class A, Class M, Class C, Short Duration High Income and Class I and for the period (October 2, 2018 to October 31, 2018) for Class Z. The hypothetical expense is based on an investment of $1,000 invested for the one-half year period (May 1, 2018 to October 31, 2018).
Actual Expenses
The first line of the accompanying table for each class of the Fund provides information about actual account values and actual expenses. You may use the information in this line, together with the amount you invested, to estimate the expenses that you paid over the period. Simply divide your account value by $1,000.00 (for example, an $8,600 account value divided by $1,000.00 = 8.6), then multiply the result by the number in the first line for a class of the Fund under the heading entitled "Expenses Paid During Period" to estimate the expenses you paid on your account during this period. A small balance maintenance fee of $12.00 that is charged once a year may apply for certain accounts with a value of less than $2,000. This fee, which was eliminated effective August 1, 2018, is not included in the table below. If it was, the estimate of expenses you paid during the period would be higher, and your ending account value lower, by this amount. In addition, the Fund, as a shareholder in the underlying Fidelity Central Funds, will indirectly bear its pro-rata share of the fees and expenses incurred by the underlying Fidelity Central Funds. These fees and expenses are not included in the Fund's annualized expense ratio used to calculate the expense estimate in the table below.
Hypothetical Example for Comparison Purposes
The second line of the accompanying table for each class of the Fund provides information about hypothetical account values and hypothetical expenses based on a Class' actual expense ratio and an assumed rate of return of 5% per year before expenses, which is not the Class' actual return. The hypothetical account values and expenses may not be used to estimate the actual ending account balance or expenses you paid for the period. You may use this information to compare the ongoing costs of investing in the Fund and other funds. To do so, compare this 5% hypothetical example with the 5% hypothetical examples that appear in the shareholder reports of the other funds. A small balance maintenance fee of $12.00 that is charged once a year may apply for certain accounts with a value of less than $2,000. This fee, which was eliminated effective August 1, 2018, is not included in the table below. If it was, the estimate of expenses you paid during the period would be higher, and your ending account value lower, by this amount. In addition, the Fund, as a shareholder in the underlying Fidelity Central Funds, will indirectly bear its pro-rata share of the fees and expenses incurred by the underlying Fidelity Central Funds. These fees and expenses are not included in the Fund's annualized expense ratio used to calculate the expense estimate in the table below.
Please note that the expenses shown in the table are meant to highlight your ongoing costs only and do not reflect any transaction costs. Therefore, the second line of the table is useful in comparing ongoing costs only, and will not help you determine the relative total costs of owning different funds. In addition, if these transactional costs were included, your costs would have been higher.
| Annualized Expense Ratio-A | Beginning Account Value | Ending Account Value October 31, 2018 | Expenses Paid During Period |
|
| Class A | 1.05% | |||
| Actual | $1,000.00 | $1,009.00 | $5.32-B | |
| Hypothetical-C | $1,000.00 | $1,019.91 | $5.35-D | |
| Class M | 1.05% | |||
| Actual | $1,000.00 | $1,009.00 | $5.32-B | |
| Hypothetical-C | $1,000.00 | $1,019.91 | $5.35-D | |
| Class C | 1.80% | |||
| Actual | $1,000.00 | $1,005.20 | $9.10-B | |
| Hypothetical-C | $1,000.00 | $1,016.13 | $9.15-D | |
| Short Duration High Income | .80% | |||
| Actual | $1,000.00 | $1,010.30 | $4.05-B | |
| Hypothetical-C | $1,000.00 | $1,021.17 | $4.08-D | |
| Class I | .80% | |||
| Actual | $1,000.00 | $1,010.30 | $4.05-B | |
| Hypothetical-C | $1,000.00 | $1,021.17 | $4.08-D | |
| Class Z | .71% | |||
| Actual | $1,000.00 | $989.50 | $.58-B | |
| Hypothetical-C | $1,000.00 | $1,021.63 | $3.62-D |
A Annualized expense ratio reflects expenses net of applicable fee waivers.
B Actual expenses are equal to each Class' annualized expense ratio, multiplied by the average account value over the period, multiplied by 184/365 (to reflect the one-half year period) for Class A, Class M, Class C, Short Duration High Income and Class I, and multiplied by 30/365 (to reflect the period October 2, 2018 to October 31, 2018) for Class Z.
C 5% return per year before expenses
D Hypothetical expenses are equal to each Class' annualized expense ratio, multiplied by the average account value over the period, multiplied by 184/365 (to reflect the one-half year period).
Board Approval of Investment Advisory Contracts
Fidelity Short Duration High Income Fund
At its July 2018 meeting, the Board of Trustees, including the Independent Trustees (together, the Board), voted to continue the management contract with Fidelity Management & Research Company (FMR) and the sub-advisory agreements (together, the Advisory Contracts) for the fund for six months through January 31, 2019, in connection with the reunification of the Fidelity Equity High Income Funds Board, which oversees the fund, and the Sector Portfolios Board.
The Board considered that the approval of the fund's Advisory Contracts will not result in any changes in (i) the investment process or strategies employed in the management of the fund's assets; (ii) the fees and expenses paid by shareholders, including the expense cap arrangement currently in place for the fund; (iii) the nature, extent or quality of services provided under the fund's Advisory Contracts; or (iv) the day-to-day management of the fund or the persons primarily responsible for such management. The Board concluded that the fund's Advisory Contracts are fair and reasonable, and that the fund's Advisory Contracts should be renewed, without modification, through January 31, 2019, with the understanding that the Board will consider the annual renewal for a full one year period in January 2019.
In connection with its consideration of future renewals of the fund's Advisory Contracts, the Board will consider: (i) the nature, extent and quality of services provided to the fund, including shareholder and administrative services and investment performance; (ii) the competitiveness of the management fee and total expenses for the fund; (iii) the costs of the services and profitability, including the revenues earned and the expenses incurred in conducting the business of developing, marketing, distributing, managing, administering, and servicing the fund and its shareholders, to the extent applicable, as well as potential fall-out benefits from Fidelity's non-fund businesses; and (iv) whether there have been economies of scale in respect of the Fidelity funds, whether the Fidelity funds (including the fund) have appropriately benefited from any such economies of scale, and whether there is the potential for realization of any further economies.
Based on its evaluation of all of the conclusions noted above, and after considering all factors it believed relevant, the Board ultimately concluded that the fund's management fee structure is fair and reasonable, and that the continuation of the fund's Advisory Contracts should be approved.
![]()
Corporate Headquarters
245 Summer St.
Boston, MA 02210
www.fidelity.com
SDH-SANN-1218
1.969437.104
Item 2.
Code of Ethics
Not applicable.
Item 3.
Audit Committee Financial Expert
Not applicable.
Item 4.
Principal Accountant Fees and Services
Not applicable.
Item 5.
Audit Committee of Listed Registrants
Not applicable.
Item 6.
Investments
(a)
Not applicable.
(b)
Not applicable
Item 7.
Disclosure of Proxy Voting Policies and Procedures for Closed-End Management Investment Companies
Not applicable.
Item 8.
Portfolio Managers of Closed-End Management Investment Companies
Not applicable.
Item 9.
Purchase of Equity Securities by Closed-End Management Investment Company and Affiliated Purchasers
Not applicable.
Item 10.
Submission of Matters to a Vote of Security Holders
There were no material changes to the procedures by which shareholders may recommend nominees to the Fidelity Summer Street Trust’s Board of Trustees.
Item 11.
Controls and Procedures
(a)(i) The President and Treasurer and the Chief Financial Officer have concluded that the Fidelity Summer Street Trust’s (the “Trust”) disclosure controls and procedures (as defined in Rule 30a-3(c) under the Investment Company Act) provide reasonable
assurances that material information relating to the Trust is made known to them by the appropriate persons, based on their evaluation of these controls and procedures as of a date within 90 days of the filing date of this report.
(a)(ii) There was no change in the Trust’s internal control over financial reporting (as defined in Rule 30a-3(d) under the Investment Company Act) that occurred during the period covered by this report that has materially affected, or is reasonably likely to materially affect, the Trust’s internal control over financial reporting.
Item 12.
Disclosure of Securities Lending Activities for Closed-End Management
Investment Companies
Not applicable.
Item 13.
Exhibits
(a) | (1) | Not applicable. |
(a) | (2) | Certification pursuant to Rule 30a-2(a) under the Investment Company Act of 1940 (17 CFR 270.30a-2(a)) is filed and attached hereto as Exhibit 99.CERT. |
(a) | (3) | Not applicable. |
(b) | Certification pursuant to Rule 30a-2(b) under the Investment Company Act of 1940 (17 CFR 270.30a-2(b)) is furnished and attached hereto as Exhibit 99.906CERT. |
SIGNATURES
Pursuant to the requirements of the Securities Exchange Act of 1934 and the Investment Company Act of 1940, the registrant has duly caused this report to be signed on its behalf by the undersigned, thereunto duly authorized.
Fidelity Summer Street Trust
By: | /s/Stacie M. Smith |
Stacie M. Smith | |
President and Treasurer | |
Date: | December 26, 2018 |
Pursuant to the requirements of the Securities Exchange Act of 1934 and the Investment Company Act of 1940, this report has been signed below by the following persons on behalf of the registrant and in the capacities and on the dates indicated.
By: | /s/Stacie M. Smith |
Stacie M. Smith | |
President and Treasurer | |
Date: | December 26, 2018 |
By: | /s/John J. Burke III |
John J. Burke III | |
Chief Financial Officer | |
Date: | December 26, 2018 |