COMPETITIVE RETURNS • AFFORDABLE HOUSING

 |
AFL-CIO Housing Investment Trust
|
||
| 2012 ANNUAL REPORT |

To Our Investors
The strong performance of the AFL-CIO Housing Investment Trust in 2012 reflects the significant work the HIT has done over the last 20 years to define and structure its investment strategy and to build its management infrastructure. With the vision of its founders as our compass, the HIT has become a national leader in socially responsible investment, offering investors the “double bottom line” of competitive returns on capital together with the creation of union jobs, affordable housing, and community development. A testament to HIT’s success is the fact that it has outperformed its benchmark every calendar year over the past two decades on a gross basis – a record many fixed-income managers would envy.
HIT’s assets under management have grown almost nine-fold during this time and are now on the threshold of reaching $5 billion. The HIT has kept pace by building the capacity of its staff and systems to source the multifamily investments that are key to its performance, and to manage its growing investment portfolio. Today’s HIT is a state-of-the-art investment program. It is one that meets the highest standards of fund management in an increasingly complex financial marketplace and finances affordable housing and creates union construction jobs in America’s communities.
The HIT’s ability to fund and help structure large and complex housing developments makes it a valued partner in local community development. In the Great Recession and the construction jobs crisis that followed, the HIT mobilized the labor movement’s response through its Construction Jobs Initiative. To date the initiative has helped create over 25,000 jobs including 16,000 union construction jobs. The grassroots labor movement has led the way by investing $1.4 billion of capital in the HIT since the Construction Jobs Initiative began in 2009.
The HIT has grown in size, scope, and capacity, but it remains true to its founders’ vision: to create a socially responsible investment fund that earns competitive returns for its investors while creating union jobs and affordable housing. I look forward to your continued support of that mission as we work together in the period ahead.
 |
|||
| Steve Coyle, Chief Executive Officer | |||
|
|
| MESSAGE FROM RICHARD L. TRUMKA | ||
|
AFL-CIO President
All of us who care deeply about managing workers’ pension capital should read carefully this annual report from the AFL-CIO Housing Investment Trust. The report highlights the HIT’s success in doing what many fixed-income managers cannot: outperforming its industry benchmark year after year and keeping its investors’ capital growing through the ups and downs of our economy. 2012 was the 20th consecutive calendar year in which the HIT beat its benchmark on a gross basis. That is a record few can match. It is responsible investing at its best.
More than that, the HIT generates its strong returns by investing in our communities – investments that are building affordable housing, creating union jobs, improving the quality of life for working people, and supporting economic growth. Those are benefits you cannot get from most Wall Street investments. The HIT – and its Construction Jobs Initiative – are a vital source of financing to meet the urgent needs of our communities at a time when unemployment remains stubbornly high.
The HIT’s Construction Jobs Initiative has been a key part of labor’s response to the unemployment crisis since 2009. In 2012, the initiative exceeded its job-creation goal of 15,000 union jobs and is now working to reach a new target of 20,000 union jobs before the end of 2013. Projects financed through the initiative by the HIT and its subsidiary, Building America, are providing family-supporting wages to thousands of union construction workers, while also generating jobs in other industries.
The HIT’s responsible investment strategy extends to its Green Jobs Initiative, which is doing a great job of seeking out investments in projects that promote environmental sustainability and energy efficiency. The HIT’s financing of energy-saving rehabilitation and retrofit projects supports the AFL-CIO’s broader efforts to promote job-generating investments in the nation’s infrastructure.
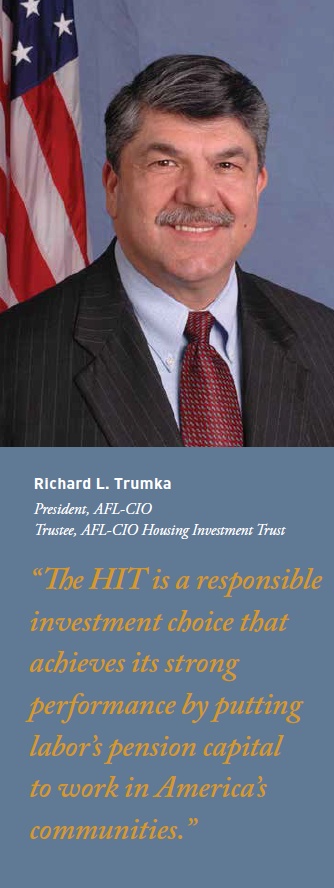
The HIT is a responsible investment choice that achieves its strong performance by putting labor’s pension capital to work in America’s communities. I urge pension investors to consider an investment in the HIT. The HIT’s competitive fixed-income returns, its job creation, and its impact on communities are helping to build our future and demonstrating beyond a doubt that the labor movement remains the leader in socially responsible investing.
 |
 |
A N N U A L R E P O R T 2 0 1 2 1
| MESSAGE FROM JOHN J. SWEENEY | ||
 |
HIT Chairman
As we report on the outstanding financial performance of the AFL-CIO Housing Investment Trust in 2012, it is important to reflect as well on what the Trust’s investments mean to working people and their families. I have had the opportunity to see these effects firsthand as a long-time member of the HIT’s Board of Trustees and for the last four years as its Chairman. It has been a privilege to participate in and support the development of the HIT from a pioneering $104 million start-up to today’s successful $4.6 billion fund. As the labor movement’s premier fixed-income investment vehicle, the HIT has consistently provided competitive returns to its investors while financing more than 105,000 affordable housing units and generating nearly 71,000 family-supporting union jobs in our communities. I am especially proud of what the HIT has done, in the worst economy in a generation, through the Construction Jobs Initiative. Begun in 2009, in a period when construction workers faced Depression-era unemployment rates, the Construction Jobs Initiative has created 16,000 on-site union construction jobs and an additional 11,000 jobs supplying and servicing the projects. Thanks to this job-creating initiative, the HIT’s connection to the grassroots of the American labor movement is stronger than ever. The personal impact of the HIT’s investments is evident every time I visit HIT projects. I will never forget the union worker who spoke up at a groundbreaking event to say “thank you” for calling him back to work. Or the smiles of the union retirees whose renovated co-op apartments will be kept affordable well into the future. Or the excitement of a young girl in a wheelchair anticipating the care she will receive at a new state-of-the-art pediatric center. The HIT touches the lives of people like these every day through its prudent investment of your pension capital.
I want to thank you for your investments that make these important projects and the benefits they create possible. Together, with your support, we are making a difference in the lives of working families across the country, while generating competitive returns for pension beneficiaries.
 |
2 A F L - C I O H O U S I N G I N V E S T M E N T T R U S T
Overview of 2012 Performance
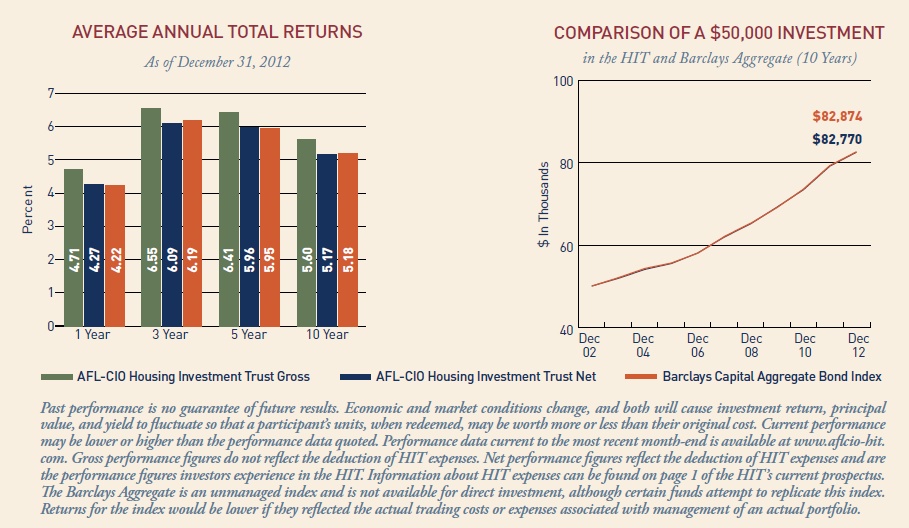
For the 20th consecutive calendar year, the HIT’s gross returns exceeded the Barclays Aggregate.
|
The AFL-CIO Housing Investment Trust has completed another year of strong performance, producing competitive returns for its investors while creating union jobs and affordable housing in communities from coast to coast. The HIT outperformed its benchmark, the Barclays Capital Aggregate Bond Index, on both a gross and net basis for the year ended December 31, 2012. The HIT returned 4.71% gross and 4.27% net against 4.22% for the benchmark. This marked the HIT’s 20th consecutive calendar year of outperforming the benchmark on a gross basis, and the 13th year in that period in which it outperformed on a net basis. The HIT’s overweight in the government-insured multifamily mortgage-backed securities (MBS) in which it specializes contributed to its outperformance of the benchmark in 2012. The HIT achieved superior returns as multifamily spreads tightened as well as earning higher income versus the benchmark.
As U.S. unemployment remained high and the economy weak, the HIT worked to generate much-needed union construction
|
jobs and affordable housing through projects financed under its Construction Jobs Initiative. Since its launch in 2009, this initiative has helped generate 16,000 union construction jobs on projects financed by the HIT and its subsidiary, Building America CDE, Inc. Construction-related investments have contributed substantially to the HIT’s returns while helping put unemployed union members back on the job and assisting communities to meet their development needs.
Net assets grew to nearly $4.6 billion at year-end. In a year of considerable market uncertainty, investors responded to the HIT’s consistent performance, its diversification benefits, and its success in creating jobs by investing $424 million of new capital – the largest annual investment amount since 2003. This new capital included $165 million of earnings reinvested by participants, reflecting a 90% dividend reinvestment rate. The HIT attracted 15 new investors for a total of 368 investors at year-end.
|
|
 |
||
A N N U A L R E P O R T 2 0 1 2 3
Strategy and Performance
Multifamily MBS helped generate higher income without additional credit or interest rate risk.
|
Investors once again benefited from the HIT’s expertise in high credit quality multifamily securities, as the sector performed very well in 2012. Multifamily MBS generated a higher level of income than comparable U.S. Treasuries, and spread tightening on these MBS helped their price performance.
The HIT’s strategy focuses on multifamily MBS that are insured or guaranteed by a U.S. government agency or a government-sponsored enterprise (GSE). It seeks to outperform the Barclays Aggregate by substituting these multifamily assets for corporate debt and some Treasury and GSE debt securities in the benchmark. Multifamily MBS tend to generate higher income than Treasuries while offering similar credit quality. By managing portfolio duration and convexity, the HIT manages its interest rate risk to be similar to the benchmark.
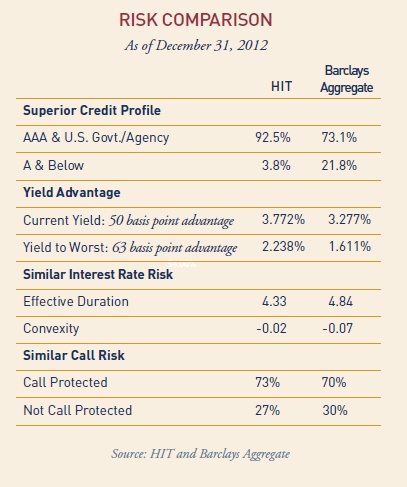
As a result of this strategy, approximately 92% of the HIT’s portfolio at year-end consisted of investments that were U.S. government or agency insured or guaranteed, compared to 72% in the benchmark. The overweight in multifamily MBS contributed to the HIT’s 63 basis point yield advantage over the benchmark at December 31. In addition, the HIT’s performance benefited from the tightening of spreads to Treasuries for these multifamily MBS during 2012. The construction-related multifamily MBS generated by the Construction Jobs Initiative contributed to the HIT’s higher returns in 2012 and are expected to generate future income for the portfolio as construction projects are funded.
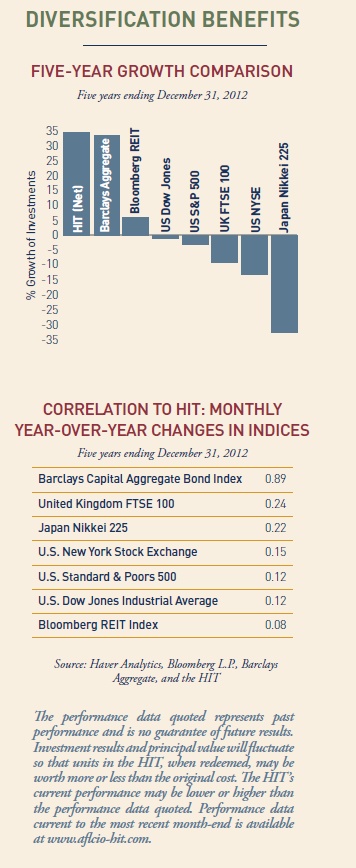
Fixed-income investments such as the HIT can be an important part of a balanced portfolio. The HIT’s returns provide diversification as seen in the growth comparisons and correlations to other major investment classes at right.
|
 |
4 A F L - C I O H O U S I N G I N V E S T M E N T T R U S T
Market Conditions
|
Extremely low interest rates continued to prevail in the U.S. in 2012. Amid concerns over a global economic slowdown, the European sovereign debt crisis, and uncertainty over U.S. fiscal policy, the Federal Reserve and other central banks added monetary stimulus during the year, which kept interest rates low. The Fed’s purchase of Treasuries and MBS via quantitative easing created heightened demand for investments that could provide higher yields.
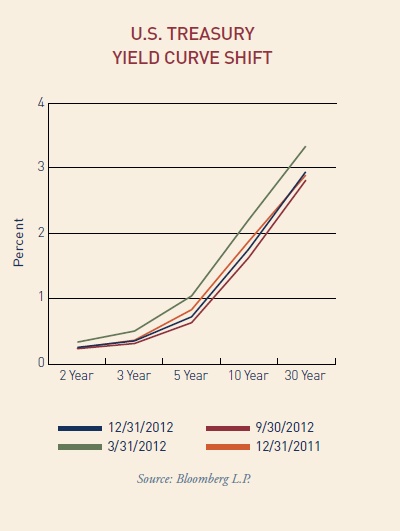
Treasury rates peaked in the first quarter and then fell again, with 2-year and 30-year Treasuries ending the year barely higher than a year earlier and intermediate Treasuries ending marginally lower than the prior year. Lower quality investments outperformed higher quality ones, with AAA, AA, A, and BBB-rated securities showing excess returns to Treasuries of 59, 344, 754, and 875 basis points, respectively, at year-end.
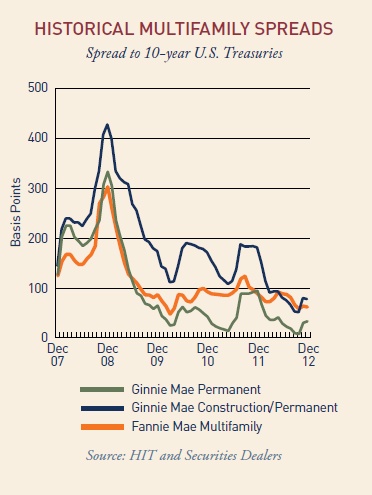
Spreads to Treasuries contracted significantly during the year for multifamily securities, including Ginnie Mae construction/permanent and permanent loan certificates and Fannie Mae multifamily securities. Most of this tightening occurred in the first and third quarters due to strong demand from investors for yield, safety, and prepayment protection.
 |
  |
A N N U A L R E P O R T 2 0 1 2 5
Housing and Jobs
 |
“We are proud of the HIT’s success in investing workers’ pension capital to build retirement security and create good union jobs. Together we are supporting the economic recovery.”
—Sean McGarvey, President
Building and Construction Trades Department, AFL-CIO
Trustee, AFL-CIO Housing Investment Trust
|
|
The HIT made new commitments of $285 million in 2012 to finance 13 projects that should generate more than 1,650 union construction jobs. The investments will help fund the construction or rehabilitation of 3,908 units of multifamily housing, nearly 90% of which will be affordable to low- and middle-income households. Through these investments of union and public employee pension capital, the HIT leveraged $442 million of total development investment in eight cities. In keeping with the HIT’s support of green jobs, many of the financed projects are working to achieve environmental sustainability, ranging from new construction designed to meet LEED standards to energy-saving improvements in older housing undergoing rehabilitation.
The HIT’s Construction Jobs Initiative, established in 2009 to create jobs and promote economic recovery, celebrated the funding of its 15,000th union construction job in October 2012. At the direction of the HIT’s Board of Trustees, the initiative’s job-creation goal was raised to 20,000 jobs, and
|
the HIT is now is working to reach that target before the end of 2013. To date, the Construction Jobs Initiative has created 16,000 union construction jobs on 56 projects in 29 cities through the investment of nearly $1.3 billion of HIT’s capital and $68 million of federal New Markets Tax Credits (NMTCs) from Building America CDE Inc., the HIT’s wholly owned subsidiary.
Building America extended the HIT’s job-creation efforts by investing NMTCs in union-built projects that will enhance the economic base of low-income communities. After successfully allocating the $35 million of NMTCs it received in 2011 to five projects, Building America was selected in 2012 to receive a new allocation of $50 million. By year-end, two-thirds of the new allocation had been invested in four projects representing more than 1,350 union construction jobs, 78 affordable housing units, and 400,000 square feet of commercial development – with the remainder of the allocation on track to be funded in 2013.
|
||
 |
|||
6 A F L - C I O H O U S I N G I N V E S T M E N T T R U S T
 |
|||
|
The 44 projects under construction in 2012 through the Construction Jobs Initiative represented $2.5 billion of development and an estimated 13,450 family-supporting union construction jobs. Some notable new projects include:
Electchester Housing Companies, New York. The HIT made a commitment to directly invest $49 million in this cooperative housing complex in Queens, which was developed 60 years ago by the International Brotherhood of Electrical Workers. The financing is enabling the 2,399-unit co-op to maintain its affordability for working families and make needed capital improvements. The rehab work, creating about 175 union jobs, will update the complex to meet New York City’s Green Building Code. With this project, the HIT has now invested a total of $702 million under its New York City investment initiative, which was begun in early 2002.
The Penfield, St. Paul. This $62.5 million mixed-use project is considered a key step in St. Paul’s downtown revitalization plan. The HIT is providing $40.9 million to help finance the six-story, LEED-designed building, which will have 254 rental units and a grocery store staffed by United Food and Commercial Workers members. The project is expected to create more than 250 union construction jobs while attracting additional downtown investment. The HIT has invested over $400 million in the St. Paul/Minneapolis metro area over the last 10 years.
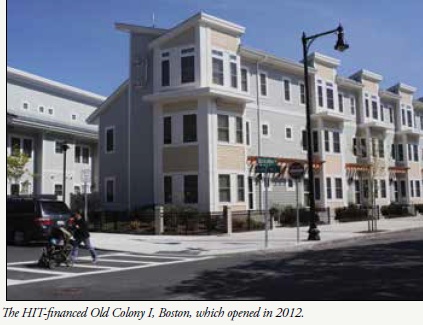
Old Colony II, Boston. The HIT is helping the Boston Housing Authority and MassHousing transform one of Boston’s largest and most distressed public housing properties into a model
|
for affordable urban living. After providing financing for the successful first phase of this redevelopment, which opened in early 2012, the HIT invested an additional $33 million for Phase II. The $61 million second phase, with 129 new apartments, is expected to generate 289 union construction jobs. The project is designed to meet LEED criteria for sustainable development.
Bronzeville Senior Apartments, Chicago. The HIT committed $8.8 million toward the $18.7 million rehabilitation of this high-rise senior residence on Chicago’s South Side. All of the property’s 97 units receive project-based Section 8 rental assistance. The work on the project, which will create over 110 union construction jobs, includes energy efficient improvements to reduce operating costs. The HIT’s investments in Chicago in the past 10 years exceed $256 million.
 |
||
A N N U A L R E P O R T 2 0 1 2 7
Superior portfolio fundamentals and a strong demand for rental housing position the HIT well for 2013.
|
The HIT is well-positioned to meet its objectives in 2013. Its superior portfolio fundamentals should offer higher income, higher credit quality, and similar interest rate risk as compared to the Barclays Aggregate, along with the benefits of liquidity and diversification. The HIT’s pipeline of prospective investments includes additional multifamily projects that are expected to be ready for funding in the coming year. Those that are financed should help the portfolio to maintain its competitive performance while generating union construction jobs and affordable housing.
A robust demand for multifamily rental housing continues to be a bright spot in the economy. For the HIT, with its specialization in this sector, the need to build or rehabilitate multifamily housing should generate favorable investment opportunities in the period ahead. Multifamily demand is projected to exceed supply for a number of years because of the rising rate of household formation, the slow recovery of the single-family housing sector, and the choice many households are making to rent rather than own. Although the single-family market showed signs of improvement in 2012, demand was dampened by a tight credit market for potential homebuyers and lingering weakness in the labor market.
Going forward, with low inflation expectations, the HIT should remain an attractive fixed-income investment. Its core competency in multifamily MBS differentiates it from other fixed-income choices, helps investors achieve diversification from corporate bonds, and provides an opportunity to generate superior returns relative to the benchmark. The construction-related assets that are the focus of the HIT’s Construction Jobs Initiative should continue to benefit the portfolio. The projects built with these construction loans will put more union members to work, increase the nation’s affordable housing stock, and bring economic stimulus to local communities.
|
  |
8 A F L - C I O H O U S I N G I N V E S T M E N T T R U S T
Other Important Information
|
EXPENSE EXAMPLE
Participants in the HIT incur ongoing expenses related to the management and distribution activities of the HIT, as well as certain other expenses. The expense example in the table below is intended to help participants understand the ongoing costs (in dollars) of investing in the HIT and to compare these costs with the ongoing costs of investing in other mutual funds. The example is based on an investment of $1,000 invested at the beginning of the period, July 1, 2012, and held for the entire period ended December 31, 2012.
Actual Expenses: The first line of the table below provides information about actual account values and actual expenses. Participants may use the information in this line, together with the amount they invested, to estimate the expenses that they paid over the period. Simply divide the account value by $1,000 (for example, an $800,000 account value divided by $1,000 = 800), then multiply the result by the number in the first line under the heading entitled “Expenses Paid During Six-Month Period Ended December 31, 2012” to estimate the expenses paid on a particular account during this period.
Hypothetical Expenses (for Comparison Purposes Only):
The second line of the table below provides information about hypothetical account values and hypothetical expenses based on the HIT’s actual expense ratio and an assumed rate of return of 5% per year before expenses, which is not the HIT’s actual return. The hypothetical account values and expenses may not be used to estimate the actual ending account balance or expenses a participant paid for the period. Participants may use this information to compare the ongoing costs of investing in the HIT and other mutual funds. To do so, compare this 5% hypothetical example with the 5% hypothetical examples that appear in the shareholder reports of the other mutual funds.
|
Please note that this example is useful in comparing funds’ ongoing costs only. It does not include any transactional costs, such as sales charges (loads), redemption fees, or exchange fees. The HIT does not have such transactional costs, but many other funds do.
AVAILABILITY OF QUARTERLY
PORTFOLIO SCHEDULES
In addition to disclosure in the Annual and Semi-Annual Reports to Participants, the HIT also files its complete schedule of portfolio holdings with the Securities and Exchange Commission (SEC) for the first and third quarters of each fiscal year on Form N-Q. The HIT’s reports on Form N-Q are made available on the SEC’s website at http://www.sec.gov and may be reviewed and copied at the SEC’s Public Reference Room in Washington, D.C. Information relating to the hours and operation of the SEC’s Public Reference Room may be obtained by calling 800-SEC-0330. Participants may also obtain copies of the HIT’s Form N-Q reports, without charge, upon request, by calling the HIT collect at 202-331-8055.
PROXY VOTING
Except for its shares in its wholly owned subsidiary, Building America CDE, Inc., the HIT invests exclusively in non-voting securities and has not deemed it necessary to adopt policies and procedures for the voting of portfolio securities. The HIT has reported information regarding how it voted in matters related to its subsidiary in its most recent filing with the SEC on Form N-PX. This filing is available on the SEC’s website at http://www.sec.gov. Participants may also obtain a copy of the HIT’s report on Form N-PX, without charge, upon request, by calling the HIT collect at 202-331-8055.
|
|
Beginning
|
Ending
|
Expenses Paid During
|
|
|
Account Value
|
Account Value
|
Six-Month Period Ended
|
|
|
July 1, 2012
|
December 31, 2012
|
December 31, 2012*
|
|
| Actual expenses | $ 1,000 | $ 1,015.90 | $ 2.05 |
| Hypothetical expenses | |||
| (5% annual return before expenses) | $ 1,000 | $ 1,023.10 | $ 2.06 |
*Expenses are equal to the HIT’s annualized expense ratio of 0.40%, as of December 31, 2012, multiplied by the average account value over the period, multiplied by 184/366 (to reflect the one-half year period).
A N N U A L R E P O R T 2 0 1 2 9
|
The 2012 Annual Meeting of Participants was held in Washington, D.C., on Thursday, December 27, 2012. The following matters were put to a vote of the Participants at the meeting through the solicitation of proxies:
John J. Sweeney was elected to chair the Board of Trustees by: votes for 2,427,224.069; votes against 0.000; votes abstaining 2,418.758; votes not cast 1,443,856.738.
|
The following Trustees were not up for reelection and their terms of office continued after the meeting: Richard L. Trumka, Arlene Holt Baker, Jack Quinn, Kenneth E. Rigmaiden, and Tony Stanley.
Ernst & Young LLP was ratified as the HIT’s Independent Registered Public Accounting Firm by: votes for 2,426,182.843; votes against 0.000; votes abstaining 3,459.984; votes not cast 1,443,856.738.
|
|
The table below details votes pertaining to Trustees who were elected at the meeting.
|
Trustee
|
Votes For
|
Votes Against
|
Votes Abstaining
|
|
|
Vincent Alvarez
|
2,429,092.014
|
0
|
550.813
|
|
|
James Boland
|
2,429,092.014
|
0
|
550.813
|
|
|
Sean McGarvey
|
2,429,092.014
|
0
|
550.813
|
|
|
Liz Shuler
|
2,429,092.014
|
0
|
550.813
|
|
|
Stephen Frank
|
2,427,685.673
|
0
|
1,957.154
|
|
|
Richard Ravitch
|
2,427,685.673
|
0
|
1,957.154
|
|
|
Marlyn Spear
|
2,330,163.862
|
97,521.811
|
1,957.154
|
|
| Votes not cast: 1,443,856.738 | ||||
10 A F L - C I O H O U S I N G I N V E S T M E N T T R U S T

Report of Independent Registered Public Accounting Firm
The Board of Trustees and Participants of American Federation of Labor and Congress of
Industrial Organizations Housing Investment Trust:
We have audited the accompanying statement of assets and liabilities of American Federation of Labor and Congress of Industrial Organizations Housing Investment Trust (the Trust), including the schedule of portfolio investments, as of December 31, 2012, and the related statements of operations for the year then ended, the statements of changes in net assets for each of the two years in the period then ended, and the financial highlights for each of the five years in the period then ended. These financial statements and financial highlights are the responsibility of the Trust’s management. Our responsibility is to express an opinion on these financial statements and financial highlights based on our audits.
We conducted our audits in accordance with the standards of the Public Company Accounting Oversight Board (United States). Those standards require that we plan and perform the audit to obtain reasonable assurance about whether the financial statements and financial highlights are free of material misstatement. We were not engaged to perform an audit of the Trust’s internal control over financial reporting. Our audits included consideration of internal control over financial reporting as a basis for designing audit procedures that are appropriate in the circumstances, but not for the purpose of expressing an opinion on the effectiveness of the Trust’s internal control over financial reporting. Accordingly, we express no such opinion. An audit also includes examining, on a test basis, evidence supporting the amounts and disclosures in the financial statements and financial highlights, assessing the accounting principles used and significant estimates made by management, and evaluating the overall financial statement presentation. Our procedures included confirmation of securities owned as of December 31, 2012, by correspondence with the custodian and brokers. We believe that our audits provide a reasonable basis for our opinion.
In our opinion, the financial statements and financial highlights referred to above present fairly, in all material respects, the financial position of American Federation of Labor and Congress of Industrial Organizations Housing Investment Trust as of December 31, 2012, the results of its operations for the year then ended, the changes in its net assets for each of the two years in the period then ended, and the financial highlights for each of the five years in the period then ended, in conformity with U.S. generally accepted accounting principles.
 |
McLean, Virginia
February 22, 2013
12 A F L - C I O H O U S I N G I N V E S T M E N T T R U S T
Statement of Assets and Liabilities
December 31, 2012 (Dollars in thousands, except per share data)
Assets
|
Investments, at value (cost $4,296,995)
|
$
|
4,573,218
|
|
Cash
|
1,005
|
|
|
Accrued interest receivable
|
16,383
|
|
|
Receivables for investments sold
|
31,369
|
|
|
Other assets
|
1,577
|
|
|
Total assets
|
4,623,552
|
|
|
Liabilities
|
||
|
Payables for investments purchased
|
37,212
|
|
|
Redemptions payable
|
1,680
|
|
|
Income distribution and capital gains payable, net of dividends reinvested of $38,636
|
4,168
|
|
|
Refundable deposits
|
574
|
|
|
Accrued salaries and fringe benefits
|
3,740
|
|
|
Accrued expenses
|
543
|
|
|
Total liabilities
|
47,917
|
|
|
Net assets applicable to participants’ equity —
|
||
|
Certificates of participation—authorized unlimited;
|
||
|
Outstanding 3,906,752 units
|
$
|
4,575,635
|
|
Net asset value per unit of participation (in dollars)
|
$
|
1,171.21
|
|
Participants’ equity
|
||
|
Participants’ equity consisted of the following:
|
||
|
Amount invested and reinvested by current participants
|
$
|
4,302,542
|
|
Net unrealized appreciation of investments
|
276,223
|
|
|
Distribution in excess of net investment income
|
(2,828)
|
|
|
Accumulated net realized gains, net of distributions
|
(302)
|
|
|
Total participants’ equity
|
$
|
4,575,635
|
See accompanying Notes to Financial Statements.
A N N U A L R E P O R T 2 0 1 2 13
SCHEDULE OF PORTFOLIO INVESTMENTS December 31, 2012 (dollars in thousands)
FHA Permanent Securities (4.0% of net assets)
|
Interest Rate
|
Maturity Date
|
Face Amount
|
Amortized Cost
|
Value
|
||||
|
Single Family
|
7.75%
|
Jul-2021
|
$
|
17
|
$
|
17
|
$
|
17
|
|
Multifamily1
|
3.75%
|
Aug-2048
|
4,175
|
4,171
|
4,333
|
|||
|
4.00%
|
Dec-2053
|
66,755
|
66,729
|
68,267
|
||||
|
5.35%
|
Mar-2047
|
7,662
|
7,673
|
8,391
|
||||
|
5.55%
|
Aug-2042
|
8,414
|
8,407
|
9,292
|
||||
|
5.60%
|
Jun-2038
|
2,640
|
2,635
|
2,669
|
||||
|
5.62%
|
Jun-2014
|
170
|
170
|
174
|
||||
|
5.65%
|
Oct-2038
|
2,041
|
2,086
|
2,091
|
||||
|
5.80%
|
Jan-2053
|
2,100
|
2,090
|
2,264
|
||||
|
5.87%
|
Jun-2044
|
1,864
|
1,862
|
2,100
|
||||
|
5.89%
|
Apr-2038
|
4,949
|
4,959
|
5,531
|
||||
|
6.02%
|
Jun-2035
|
5,523
|
5,507
|
5,848
|
||||
|
6.20%
|
Apr-2052
|
11,849
|
11,842
|
12,868
|
||||
|
6.40%
|
Jul-2046
|
3,941
|
3,938
|
4,479
|
||||
|
6.60%
|
Jan-2050
|
3,456
|
3,495
|
3,877
|
||||
|
6.66%
|
May-2040
|
5,408
|
5,413
|
5,418
|
||||
|
6.70%
|
Dec-2042
|
5,716
|
5,720
|
5,727
|
||||
|
6.75%
|
Apr-2040 - Jul-2040
|
5,109
|
5,091
|
5,580
|
||||
|
7.05%
|
Jul-2043
|
5,097
|
5,096
|
5,225
|
||||
|
7.13%
|
Mar-2040
|
7,451
|
7,436
|
8,129
|
||||
|
7.20%
|
Dec-2033 - Oct-2039
|
9,270
|
9,263
|
9,757
|
||||
|
7.50%
|
Sep-2032
|
1,467
|
1,462
|
1,693
|
||||
|
7.93%
|
Apr-2042
|
2,779
|
2,779
|
3,226
|
||||
|
8.15%
|
Mar-2037
|
1,123
|
1,215
|
1,126
|
||||
|
8.27%
|
Jun-2042
|
2,440
|
2,440
|
2,448
|
||||
|
8.75%
|
Aug-2036
|
3,496
|
3,500
|
3,509
|
||||
|
174,895
|
174,979
|
184,022
|
||||||
|
Total FHA Permanent Securities
|
$
|
174,912
|
$
|
174,996
|
$
|
184,039
|
||
Ginnie Mae Securities (17.7% of net assets)
|
Interest Rate
|
Maturity Date
|
Face Amount
|
Amortized Cost
|
Value
|
||||
|
Single Family
|
4.00%
|
Feb-2040 - Jun-2040
|
$
|
15,693
|
$
|
15,939
|
$
|
17,254
|
|
4.50%
|
Aug-2040
|
9,545
|
9,815
|
10,508
|
||||
|
5.50%
|
Jan-2033 - Jun-2037
|
10,655
|
10,602
|
11,821
|
||||
|
6.00%
|
Jan-2032 - Aug-2037
|
5,913
|
5,915
|
6,628
|
||||
|
6.50%
|
Jul-2028
|
113
|
113
|
129
|
||||
|
7.00%
|
Nov-2016 - Jan-2030
|
2,530
|
2,546
|
2,895
|
||||
|
7.50%
|
Apr-2013 - Aug-2030
|
1,568
|
1,586
|
1,794
|
||||
|
8.00%
|
Jun-2023 - Nov-2030
|
1,011
|
1,033
|
1,191
|
||||
|
8.50%
|
Jun-2022 - Aug-2027
|
1,025
|
1,038
|
1,192
|
||||
|
9.00%
|
May-2016 - Jun-2025
|
292
|
297
|
332
|
||||
|
9.50%
|
Sep-2021 - Sep-2030
|
106
|
107
|
118
|
||||
|
10.00%
|
Jun-2019
|
1
|
1
|
1
|
||||
|
48,452
|
48,992
|
53,863
|
||||||
|
Multifamily1
|
2.11%
|
Apr-2033
|
23,965
|
24,173
|
24,323
|
|||
|
2.18%
|
May-2039
|
24,366
|
24,635
|
25,068
|
||||
| continued | ||||||||
14 A F L - C I O H O U S I N G I N V E S T M E N T T R U S T
A N N U A L R E P O R T 2 0 1 2 15
SCHEDULE OF PORTFOLIO INVESTMENTS December 31, 2012 (dollars in thousands)
Ginnie Mae Construction Securities (8.3% of net assets)
|
Interest Rates4
|
Commitment
|
||||||||||
|
Permanent
|
Construction
|
Maturity Date
|
Amount
|
Face Amount
|
Amortized Cost
|
Value
|
|||||
|
Multifamily1
|
2.32%
|
2.32%
|
Apr-2054
|
$
|
23,500
|
$
|
1,873
|
$
|
2,578
|
$
|
1,696
|
|
2.35%
|
2.35%
|
Jan-2054
|
15,850
|
1,387
|
1,867
|
1,456
|
|||||
|
2.87%
|
2.87%
|
Mar-2054
|
40,943
|
25
|
1,259
|
1,232
|
|||||
|
3.20%
|
3.20%
|
Oct-2053
|
10,078
|
6,421
|
6,723
|
7,157
|
|||||
|
3.40%
|
3.40%
|
Apr-20172
|
2,250
|
1,975
|
1,974
|
2,080
|
|||||
|
3.95%
|
3.95%
|
Feb-2052 - May-20542
|
12,722
|
9,832
|
9,851
|
10,886
|
|||||
|
4.15%
|
2.00%
|
Apr-2053
|
70,000
|
60,092
|
61,515
|
66,994
|
|||||
|
4.15%
|
4.15%
|
Jul-20532
|
2,274
|
2,274
|
2,307
|
2,481
|
|||||
|
4.75%
|
4.75%
|
Mar-20522
|
32,463
|
31,500
|
31,518
|
35,108
|
|||||
|
4.86%
|
4.86%
|
Jan-2053
|
42,358
|
39,834
|
40,158
|
44,488
|
|||||
|
4.87%
|
4.87%
|
Apr-2042
|
100,000
|
97,448
|
98,327
|
109,690
|
|||||
|
5.10%
|
5.10%
|
Dec-20502
|
15,862
|
15,741
|
15,579
|
17,392
|
|||||
|
5.21%
|
4.95%
|
Mar-20532
|
49,950
|
49,950
|
50,025
|
55,540
|
|||||
|
5.25%
|
5.25%
|
Apr-20372
|
19,750
|
19,750
|
19,742
|
21,971
|
|||||
|
Total Ginnie Mae Construction Securities
|
$
|
438,000
|
$
|
338,102
|
$
|
343,423
|
$
|
378,171
|
|||
Fannie Mae Securities (43.3% of net assets)
|
Interest Rate
|
Maturity Date
|
Face Amount
|
Amortized Cost
|
Value
|
|||||
| Single Family | 0.46% | 5 |
Mar-2037
|
$ |
1,880
|
$ |
1,854
|
$ |
1,877
|
|
0.59%
|
5
|
Nov-2042
|
14,186
|
14,193
|
14,186
|
||||
|
0.61%
|
5
|
Apr-2037 - Oct-2042
|
22,727
|
22,730
|
22,702
|
||||
|
0.67%
|
5
|
Oct-2042
|
11,625
|
11,695
|
11,671
|
||||
|
0.71%
|
5
|
Dec-2040
|
53,433
|
52,962
|
53,635
|
||||
|
0.71%
|
5
|
Feb- 2042 - Jun-2042
|
36,358
|
36,384
|
36,474
|
||||
|
0.76%
|
5
|
Mar-2042
|
23,518
|
23,575
|
23,631
|
||||
|
0.81%
|
5
|
Mar-2042
|
11,224
|
11,223
|
11,325
|
||||
|
2.22%
|
5
|
May-2033
|
1,022
|
1,028
|
1,080
|
||||
|
2.27%
|
5
|
Nov-2033
|
4,925
|
4,929
|
5,173
|
||||
|
2.30%
|
5
|
Sep-2035
|
1,440
|
1,434
|
1,528
|
||||
|
2.32%
|
5
|
Aug-2033
|
3,661
|
3,653
|
3,853
|
||||
|
2.34%
|
5
|
Jul-2033 - Aug-2033
|
5,808
|
5,825
|
6,164
|
||||
|
2.36%
|
5
|
Aug-2033
|
311
|
310
|
328
|
||||
|
2.60%
|
5
|
Jul-2033
|
898
|
892
|
954
|
||||
|
2.63%
|
5
|
Nov-2034
|
3,294
|
3,409
|
3,514
|
||||
|
2.75%
|
5
|
Apr-2034
|
2,607
|
2,698
|
2,778
|
||||
|
3.00%
|
Jun-2042 - Dec-2042
|
53,856
|
55,897
|
56,484
|
|||||
|
3.00%
|
Apr-2042
|
20,137
|
20,733
|
21,120
|
|||||
|
3.00%
|
May-2042
|
23,184
|
23,808
|
24,315
|
|||||
|
3.00%
|
Nov-2042
|
25,000
|
25,804
|
26,220
|
|||||
|
3.50%
|
Jan-2042 - Jun-2042
|
53,110
|
54,850
|
56,618
|
|||||
|
4.00%
|
Jul-2024 - Apr-2041
|
96,332
|
97,717
|
103,447
|
|||||
|
4.50%
|
Jun-2018 - Sep-2040
|
69,278
|
70,594
|
74,980
|
|||||
|
5.00%
|
Jul-2018 - Apr-2041
|
82,830
|
85,533
|
89,822
|
|||||
|
continued
|
|||||||||
16 A F L - C I O H O U S I N G I N V E S T M E N T T R U S T
|
Interest Rate
|
Maturity Date
|
Face Amount
|
Amortized Cost
|
Value
|
||||
|
5.50%
|
Jul-2017 - Jun-2038
|
$
|
46,077
|
$
|
46,224
|
$
|
50,165
|
|
|
6.00%
|
Apr-2016 - Nov-2038
|
40,524
|
40,903
|
44,576
|
||||
|
6.50%
|
Nov-2016 - Jul-2036
|
5,404
|
5,547
|
6,031
|
||||
|
7.00%
|
Nov-2013 - May-2032
|
2,491
|
2,495
|
2,838
|
||||
|
7.50%
|
Nov-2016 - Sep-2031
|
833
|
814
|
961
|
||||
|
8.00%
|
Apr-2030 - May-2031
|
91
|
93
|
106
|
||||
|
8.50%
|
Mar-2015 - Apr-2031
|
215
|
214
|
239
|
||||
|
9.00%
|
Jan-2024 - May-2025
|
123
|
123
|
143
|
||||
|
718,402
|
730,143
|
758,938
|
||||||
|
Multifamily1
|
2.21%
|
Dec-2022
|
25,800
|
25,864
|
26,064
|
|||
|
2.21%
|
Dec-2022
|
33,995
|
34,079
|
34,343
|
||||
|
2.24%
|
Dec-2022
|
33,200
|
33,282
|
33,546
|
||||
|
2.26%
|
Nov-2022
|
6,880
|
6,948
|
6,969
|
||||
|
2.84%
|
Mar-2022
|
3,879
|
3,941
|
4,103
|
||||
|
2.85%
|
Mar-2022
|
33,000
|
33,305
|
34,806
|
||||
|
3.54%
|
Oct-2021
|
7,670
|
7,772
|
8,366
|
||||
|
3.66%
|
Jul-2021
|
128,145
|
128,574
|
140,389
|
||||
|
4.00%
|
Sep-2021
|
16,218
|
16,272
|
17,934
|
||||
|
4.03%
|
Oct-2021
|
7,387
|
7,417
|
8,197
|
||||
|
4.06% 5
|
Jun-2020
|
3,720
|
3,727
|
3,710
|
||||
|
4.06%
|
Oct-2025
|
26,122
|
26,367
|
28,580
|
||||
|
4.15%
|
Jun-2021
|
9,473
|
9,533
|
10,611
|
||||
|
4.22%
|
Jul-2018
|
2,730
|
2,680
|
2,972
|
||||
|
4.25%
|
May-2021
|
4,411
|
4,422
|
4,948
|
||||
|
4.27%
|
Nov-2019
|
6,236
|
6,253
|
7,003
|
||||
|
4.32%
|
Nov-2019
|
3,084
|
3,102
|
3,472
|
||||
|
4.33%
|
Nov-2019 - Mar-2021
|
26,248
|
26,317
|
30,096
|
||||
|
4.38%
|
Apr-2020
|
10,593
|
10,694
|
11,941
|
||||
|
4.44%
|
May-2020
|
6,272
|
6,312
|
7,098
|
||||
|
4.49%
|
Jun-2021
|
1,012
|
1,035
|
1,142
|
||||
|
4.50%
|
Feb-2020
|
4,380
|
4,404
|
4,921
|
||||
|
4.52%
|
Nov-2019 - May-2021
|
7,427
|
7,550
|
8,402
|
||||
|
4.55%
|
Nov-2019
|
2,935
|
2,955
|
3,318
|
||||
|
4.56%
|
Jul-2019 - May-2021
|
8,710
|
8,733
|
9,870
|
||||
|
4.64%
|
Aug-2019
|
18,698
|
18,904
|
21,209
|
||||
|
4.66%
|
Jul-2021 - Sep-2033
|
7,706
|
7,750
|
8,020
|
||||
|
4.67%
|
Aug-2033
|
6,615
|
6,608
|
6,709
|
||||
|
4.68%
|
Jul-2019
|
13,589
|
13,625
|
15,434
|
||||
|
4.69%
|
Jan-2020 - Jun-2035
|
14,514
|
14,548
|
16,456
|
||||
|
4.71%
|
Mar-2021
|
6,069
|
6,221
|
6,903
|
||||
|
4.73%
|
Feb-2021
|
1,588
|
1,623
|
1,808
|
||||
|
4.80%
|
Jun-2019
|
2,224
|
2,233
|
2,538
|
||||
|
4.86%
|
May-2019
|
1,487
|
1,497
|
1,696
|
||||
|
4.89%
|
Nov-2019 - May-2021
|
2,799
|
2,907
|
3,193
|
||||
|
4.93%
|
Nov-2013
|
44,352
|
44,351
|
44,961
|
||||
|
4.94%
|
Apr-2019
|
3,500
|
3,528
|
4,005
|
||||
|
5.00%
|
Jun-2019
|
1,937
|
1,954
|
2,224
|
||||
|
continued
|
||||||||
A N N U A L R E P O R T 2 0 1 2 17
SCHEDULE OF PORTFOLIO INVESTMENTS December 31, 2012 (dollars in thousands)
|
Fannie Mae Securities (43.3% of net assets) continued
|
|||||||
|
Interest Rate
|
Maturity Date
|
Face Amount
|
Amortized Cost
|
Value
|
|||
|
5.02%
|
Jun-2019
|
$
|
841
|
$
|
840
|
$
|
963
|
|
5.04%
|
Jun-2019
|
1,915
|
1,944
|
2,196
|
|||
|
5.05%
|
Jun-2019 - Jul-2019
|
3,259
|
3,305
|
3,738
|
|||
|
5.08%
|
Apr-2021
|
40,000
|
40,003
|
45,304
|
|||
|
5.09%
|
Jun-2018
|
6,501
|
6,658
|
7,407
|
|||
|
5.11%
|
Jul-2019
|
895
|
897
|
1,030
|
|||
|
5.12%
|
Jul-2019
|
8,918
|
8,956
|
10,264
|
|||
|
5.13%
|
Jul-2019
|
910
|
912
|
1,048
|
|||
|
5.15%
|
Oct-2022
|
3,526
|
3,523
|
3,971
|
|||
|
5.16%
|
Jan-2018
|
5,285
|
5,234
|
5,857
|
|||
|
5.25%
|
Jan-2020
|
6,967
|
6,960
|
8,045
|
|||
|
5.29%
|
May-2022
|
5,363
|
5,363
|
6,151
|
|||
|
5.30%
|
Aug-2029
|
7,022
|
6,851
|
7,872
|
|||
|
5.34%
|
Apr-2016
|
6,127
|
6,125
|
6,724
|
|||
|
5.35%
|
Jun-2018
|
1,682
|
1,687
|
1,881
|
|||
|
5.36%
|
Feb-2016
|
2,119
|
2,120
|
2,158
|
|||
|
5.37%
|
Jun-2017
|
1,407
|
1,462
|
1,579
|
|||
|
5.43%
|
Nov-2018
|
344
|
344
|
345
|
|||
|
5.45%
|
May-2033
|
2,919
|
2,937
|
3,308
|
|||
|
5.46%
|
Feb-2017
|
45,741
|
46,118
|
52,053
|
|||
|
5.47%
|
Aug-2024
|
8,460
|
8,550
|
9,691
|
|||
|
5.52%
|
Mar-2018
|
598
|
620
|
687
|
|||
|
5.53%
|
Apr-2017
|
62,880
|
62,878
|
71,875
|
|||
|
5.59%
|
May-2017
|
6,941
|
6,944
|
7,874
|
|||
|
5.60%
|
Feb-2018 - Jan-2024
|
11,475
|
11,477
|
13,246
|
|||
|
5.63%
|
Dec-2019
|
9,185
|
9,233
|
10,380
|
|||
|
5.69%
|
Jun-2041
|
4,941
|
5,107
|
5,555
|
|||
|
5.70%
|
Jun-2016
|
1,368
|
1,366
|
1,539
|
|||
|
5.75%
|
Jun-2041
|
2,394
|
2,486
|
2,688
|
|||
|
5.80%
|
Jun-2018
|
69,248
|
68,889
|
80,763
|
|||
|
5.86%
|
Dec-2016
|
199
|
199
|
219
|
|||
|
5.91%
|
Mar-2037
|
2,025
|
2,076
|
2,326
|
|||
|
5.92%
|
Dec-2016
|
181
|
181
|
200
|
|||
|
5.96%
|
Jan-2029
|
420
|
423
|
485
|
|||
|
6.03%
|
Jun-2017 - Jun-2036
|
5,437
|
5,493
|
6,167
|
|||
|
6.06%
|
Jul-2034
|
9,703
|
9,984
|
11,209
|
|||
|
6.11%
|
Aug-2017
|
6,671
|
6,650
|
7,773
|
|||
|
6.13%
|
Dec-2016
|
3,409
|
3,513
|
3,932
|
|||
|
6.14%
|
Sep-2033
|
298
|
315
|
345
|
|||
|
6.15%
|
Jan-2019
|
33,359
|
33,369
|
39,152
|
|||
|
6.15%
|
Jan-2023- Oct-2032
|
7,219
|
7,273
|
8,221
|
|||
|
6.16%
|
Aug-2013
|
152
|
152
|
153
|
|||
|
6.22%
|
Aug-2032
|
1,727
|
1,764
|
1,989
|
|||
|
6.23%
|
Sep-2034
|
1,415
|
1,475
|
1,648
|
|||
|
continued
|
|||||||
18 A F L - C I O H O U S I N G I N V E S T M E N T T R U S T
|
Fannie Mae Securities (43.3% of net assets) continued
|
|||||||
|
Interest Rate
|
Maturity Date
|
Face Amount
|
Amortized Cost
|
Value
|
|||
|
6.28%
|
Nov-2028
|
$
|
2,967
|
$
|
3,132
|
$
|
3,455
|
|
6.35%
|
Aug-2032
|
10,545
|
10,600
|
12,146
|
|||
|
6.38%
|
Jul-2021
|
5,519
|
5,582
|
6,527
|
|||
|
6.39%
|
Apr-2019
|
934
|
947
|
1,070
|
|||
|
6.44%
|
Apr-2014
|
5,419
|
5,386
|
5,725
|
|||
|
6.44%
|
Dec-2018
|
37,087
|
37,087
|
43,517
|
|||
|
6.52%
|
May-2029
|
5,316
|
5,732
|
6,237
|
|||
|
6.63%
|
Jun-2014 - Apr-2019
|
3,484
|
3,484
|
3,858
|
|||
|
6.80%
|
Jul-2016
|
422
|
422
|
467
|
|||
|
6.85%
|
Aug-2014
|
41,762
|
41,763
|
44,534
|
|||
|
7.01%
|
Apr-2031
|
3,178
|
3,187
|
3,631
|
|||
|
7.07%
|
Feb-2031
|
15,983
|
16,160
|
18,226
|
|||
|
7.18%
|
Aug-2016
|
270
|
270
|
301
|
|||
|
7.20%
|
Aug-2029
|
889
|
873
|
892
|
|||
|
7.26%
|
Dec-2018
|
8,354
|
8,655
|
9,426
|
|||
|
7.50%
|
Dec-2014
|
580
|
580
|
620
|
|||
|
7.75%
|
Dec-2024
|
1,648
|
1,648
|
1,828
|
|||
|
8.40%
|
Jul-2023
|
419
|
411
|
433
|
|||
|
8.50%
|
Nov-2019
|
2,859
|
2,875
|
3,468
|
|||
|
8.63%
|
Sep-2028
|
6,068
|
6,068
|
6,349
|
|||
|
1,099,754
|
1,104,805
|
1,220,678
|
|||||
|
Total Fannie Mae Securities
|
$
|
1,818,156
|
$
|
1,834,948
|
$
|
1,979,616
|
|
Freddie Mac Securities (10.2% of net assets)
|
Interest Rate
|
Maturity Date
|
Commitment Amount
|
Face Amount
|
Amortized Cost
|
Value
|
||||||
| Single Family | 0.51% |
5
|
Feb-2036
|
$ | - | $ |
5,919
|
$ |
5,919
|
$ |
5,935
|
|
0.56%
|
5
|
Apr-2036
|
-
|
3,462
|
3,458
|
3,465
|
|||||
|
0.71%
|
5
|
Nov-2040
|
-
|
10,469
|
10,403
|
10,504
|
|||||
|
0.71%
|
5
|
Nov-2040
|
-
|
24,449
|
24,277
|
24,553
|
|||||
|
2.35%
|
5
|
Jun-2033
|
-
|
920
|
918
|
976
|
|||||
|
2.45%
|
5
|
Oct-2033
|
-
|
2,326
|
2,300
|
2,469
|
|||||
|
2.80%
|
5
|
Jul-2035
|
-
|
676
|
675
|
726
|
|||||
|
3.00%
|
Nov-2042
|
-
|
20,000
|
20,567
|
20,920
|
||||||
|
3.00%
|
Aug-2042
|
-
|
44,226
|
45,264
|
46,261
|
||||||
|
3.00%
|
Sep-2042 - Jan-2043
|
-
|
84,054
|
87,106
|
87,920
|
||||||
|
3.50%
|
Oct-2041 - Feb-2042
|
-
|
37,932
|
38,558
|
40,339
|
||||||
|
4.00%
|
Nov-2013 - Jan-2041
|
-
|
67,003
|
68,476
|
71,373
|
||||||
|
4.50%
|
Aug-2018 - Sep-2040
|
-
|
25,960
|
26,026
|
27,995
|
||||||
|
5.00%
|
Jan-2019 - Mar-2041
|
-
|
35,826
|
35,830
|
38,621
|
||||||
|
continued
|
|||||||||||
A N N U A L R E P O R T 2 0 1 2 19
|
Freddie Mac Securities (10.2% of net assets) continued
|
||||||||||
|
Interest Rate
|
Maturity Date
|
Commitment Amount
|
Face Amount
|
Amortized Cost
|
Value
|
|||||
|
5.50%
|
Oct-2017 - Jul-2038
|
$
|
-
|
$
|
37,975
|
$
|
37,560
|
$
|
41,022
|
|
|
6.00%
|
Mar-2014 - Feb-2038
|
-
|
22,833
|
23,164
|
25,128
|
|||||
|
6.50%
|
Oct-2013 - Nov-2037
|
-
|
7,321
|
7,594
|
8,107
|
|||||
|
7.00%
|
Sep-2013 - Mar-2030
|
-
|
187
|
173
|
210
|
|||||
|
7.50%
|
Aug-2029 - Apr-2031
|
-
|
152
|
145
|
178
|
|||||
|
8.00%
|
Jul-2015 - Feb-2030
|
-
|
67
|
65
|
76
|
|||||
|
8.50%
|
Jun-2015 - Jan-2025
|
-
|
189
|
190
|
224
|
|||||
|
9.00%
|
Mar-2025
|
-
|
101
|
101
|
119
|
|||||
|
-
|
432,047
|
438,769
|
457,121
|
|||||||
|
Multifamily1
|
5.38%
|
Dec-2028
|
-
|
20,000
|
20,004
|
22,629
|
||||
|
5.42%
|
Apr-2016
|
-
|
10,000
|
9,961
|
10,869
|
|||||
|
5.65%
|
Apr-2016
|
-
|
5,689
|
5,682
|
6,303
|
|||||
|
-
|
35,689
|
35,647
|
39,801
|
|||||||
|
Forward Commitments1
|
2.95%
|
Aug-2017
|
2,585
|
-
|
(84)
|
85
|
||||
|
TBA6
|
3.00%
|
Jan-2043
|
-
|
(30,000)
|
(31,298)
|
(31,350)
|
||||
|
Total Freddie Mac Securities
|
$
|
2,585
|
$
|
437,736
|
$
|
443,034
|
$
|
465,657
|
||
Other Multifamily Investments (0.9% of net assets)
|
Interest Rates4
|
Maturity
|
Commitment
|
Face
|
Amortized
|
|||||||
|
Issuer
|
Permanent
|
Construction
|
Date
|
Amount
|
Amount
|
Cost
|
Value
|
||||
|
Direct Loans1
|
|||||||||||
|
First Housing Company, Inc.
|
2.70%
|
-
|
May-2014
|
$
|
8,960
|
$
|
5,953
|
$
|
5,969
|
$
|
5,949
|
|
Second Housing Company, Inc.
|
2.70%
|
-
|
May-2014
|
10,800
|
5,079
|
5,100
|
5,075
|
||||
|
Third Housing Company, Inc.
|
2.70%
|
-
|
May-2014
|
15,110
|
6,687
|
6,715
|
6,680
|
||||
|
Fourth Housing Company, Inc.
|
2.70%
|
-
|
May-2014
|
9,630
|
5,500
|
5,518
|
5,496
|
||||
|
Fifth Housing Company, Inc.
|
2.70%
|
-
|
May-2014
|
4,500
|
2,126
|
2,134
|
2,124
|
||||
|
49,000
|
25,345
|
25,436
|
25,324
|
||||||||
|
Privately Insured Construction/Permanent Mortgages1,7
|
|||||||||||
|
IL Housing Development Authority
|
5.40%
|
5.40%
|
Mar-2047
|
9,000
|
8,572
|
8,577
|
8,153
|
||||
|
IL Housing Development Authority
|
5.73%
|
5.73%
|
Aug-2047
|
5,575
|
5,350
|
5,350
|
5,141
|
||||
|
IL Housing Development Authority
|
6.20%
|
-
|
Dec-2047
|
3,325
|
3,213
|
3,230
|
3,164
|
||||
|
IL Housing Development Authority
|
6.40%
|
6.40%
|
Nov-2048
|
993
|
968
|
982
|
952
|
||||
|
18,893
|
18,103
|
18,139
|
17,410
|
||||||||
|
Total Other Multifamily Investments
|
$
|
67,893
|
$
|
43,448
|
$
|
43,575
|
$
|
42,734
|
|||
20 A F L - C I O H O U S I N G I N V E S T M E N T T R U S T
|
Interest Rates4
|
Commitment
|
Face
|
Amortized
|
|||||||||
|
Issuer
|
Permanent
|
Construction
|
Maturity Date
|
Amount
|
Amount
|
Cost
|
Value
|
|||||
|
Multifamily1
|
IL Housing Development Authority
|
-
|
1.70%
|
Dec-2013
|
$
|
-
|
$
|
2,670
|
$
|
2,670
|
$
|
2,671
|
|
MassHousing
|
-
|
3.05%
|
Dec-20138
|
20,380
|
20,110
|
20,041
|
20,092
|
|||||
|
MassHousing
|
-
|
3.25%
|
Oct-20158
|
21,050
|
50
|
43
|
140
|
|||||
|
MassHousing
|
-
|
3.40%
|
Dec-20138
|
3,000
|
3,000
|
2,997
|
2,997
|
|||||
|
NYC Housing Development Corp
|
-
|
3.45%
|
May-2013
|
9,500
|
5,600
|
5,609
|
5,609
|
|||||
|
MassHousing
|
-
|
3.83%
|
Apr-20158
|
5,000
|
1,495
|
1,476
|
1,504
|
|||||
|
MassHousing
|
-
|
4.15%
|
Dec-20138
|
26,700
|
7,395
|
7,395
|
7,442
|
|||||
|
MassHousing
|
-
|
4.30%
|
Jun-20158
|
34,700
|
10,285
|
10,198
|
10,358
|
|||||
|
MassHousing
|
-
|
4.37%
|
Jun-20148
|
23,500
|
10,230
|
10,171
|
10,260
|
|||||
|
NYC Housing Development Corp
|
2.00%
|
-
|
Sep-2013
|
-
|
7,500
|
7,500
|
7,517
|
|||||
|
NYC Housing Development Corp
|
4.04%
|
-
|
Nov-2032
|
-
|
1,305
|
1,305
|
1,317
|
|||||
|
NYC Housing Development Corp
|
4.25%
|
-
|
Nov-2025
|
-
|
1,150
|
1,150
|
1,220
|
|||||
|
NYC Housing Development Corp
|
4.29%
|
-
|
Nov-2037
|
-
|
1,190
|
1,190
|
1,199
|
|||||
|
NYC Housing Development Corp
|
4.40%
|
-
|
Nov-2024
|
-
|
4,120
|
4,120
|
4,456
|
|||||
|
NYC Housing Development Corp
|
4.44%
|
-
|
Nov-2041
|
-
|
1,120
|
1,120
|
1,129
|
|||||
|
NYC Housing Development Corp
|
4.49%
|
-
|
Nov-2044
|
-
|
1,000
|
1,000
|
1,008
|
|||||
|
NYC Housing Development Corp
|
4.50%
|
-
|
Nov-2030
|
-
|
1,680
|
1,682
|
1,808
|
|||||
|
NYC Housing Development Corp
|
4.60%
|
-
|
Nov-2030
|
-
|
4,665
|
4,665
|
4,945
|
|||||
|
NYC Housing Development Corp
|
4.70%
|
-
|
Nov-2035
|
-
|
1,685
|
1,685
|
1,793
|
|||||
|
NYC Housing Development Corp
|
4.78%
|
-
|
Aug-2026
|
-
|
12,500
|
12,505
|
13,108
|
|||||
|
NYC Housing Development Corp
|
4.80%
|
-
|
Nov-2040
|
-
|
2,860
|
2,863
|
3,060
|
|||||
|
NYC Housing Development Corp
|
4.90%
|
-
|
Nov-2034 - Nov-2041
|
-
|
8,800
|
8,800
|
9,331
|
|||||
|
NYC Housing Development Corp
|
4.95%
|
-
|
Nov-2039 - May-2047
|
-
|
13,680
|
13,682
|
14,368
|
|||||
|
MassHousing
|
5.55%
|
-
|
Nov-2039
|
-
|
5,000
|
4,979
|
5,334
|
|||||
|
MassHousing
|
5.69%
|
-
|
Nov-2018
|
-
|
5,210
|
5,213
|
6,016
|
|||||
|
MassHousing
|
5.70%
|
-
|
Jun-2040
|
-
|
14,190
|
14,192
|
14,900
|
|||||
|
NYC Housing Development Corp
|
5.92%
|
-
|
Dec-2037
|
-
|
6,260
|
6,263
|
6,485
|
|||||
|
MassHousing
|
6.42%
|
-
|
Nov-2039
|
-
|
22,000
|
22,000
|
24,782
|
|||||
|
MassHousing
|
6.50%
|
-
|
Dec-2039
|
-
|
730
|
734
|
797
|
|||||
|
MassHousing
|
6.58%
|
-
|
Dec-2039
|
-
|
11,385
|
11,388
|
11,954
|
|||||
|
MassHousing
|
6.70%
|
-
|
Jun-2040
|
-
|
11,560
|
11,560
|
12,056
|
|||||
|
143,830
|
200,425
|
200,196
|
209,656
|
|||||||||
|
Forward Commitments1
|
MassHousing
|
-
|
3.50%
|
Oct-20158
|
12,435
|
-
|
-
|
(12)
|
||||
|
MassHousing
|
-
|
3.98%
|
Apr-20158
|
4,915
|
-
|
(18)
|
6
|
|||||
|
17,350
|
-
|
(18)
|
(6)
|
|||||||||
|
Total State Housing Finance Agency Securities
|
$
|
161,180
|
$
|
200,425
|
$
|
200,178
|
$
|
209,650
|
||||
Commercial Mortgage-Backed Securities1 (0.7% of net assets)
|
Issuer
|
Interest Rate
|
Maturity Date
|
Face Amount
|
Amortized Cost
|
Value
|
|||
|
JP Morgan
|
3.48%
|
Jun-2045
|
$
|
10,000
|
$
|
10,568
|
$
|
10,896
|
|
Deutsche Bank
|
5.00%
|
Nov-2046
|
18,990
|
19,525
|
22,622
|
|||
|
Total Commercial Mortgage Backed Securities
|
$
|
28,990
|
$
|
30,093
|
$
|
33,518
|
||
A N N U A L R E P O R T 2 0 1 2 21
|
United States Treasury Securities (9.1% of net assets)
|
|||||||
|
Interest Rate
|
Maturity Date
|
Face Amount
|
Amortized Cost
|
Value
|
|||
|
0.63%
|
Nov-2017
|
$
|
20,000
|
$
|
19,946
|
$
|
19,934
|
|
1.63%
|
Nov-2022
|
50,000
|
49,998
|
49,452
|
|||
|
2.00%
|
Nov-2021
|
30,000
|
30,199
|
31,136
|
|||
|
2.13%
|
Aug-2021
|
35,000
|
35,175
|
36,794
|
|||
|
3.00%
|
May-2042
|
10,000
|
10,845
|
10,184
|
|||
|
3.13%
|
May-2021
|
105,000
|
107,469
|
119,070
|
|||
|
3.13%
|
Nov-2041
|
65,000
|
65,521
|
68,014
|
|||
|
3.75%
|
Aug-2041
|
70,000
|
77,497
|
82,239
|
|||
|
Total United States Treasury Securities
|
$
|
385,000
|
$
|
396,650
|
$
|
416,823
|
|
|
Total Fixed-Income Investments
|
$
|
4,194,333
|
$ 4,243,148
|
$ 4,519,439
|
|||
Equity Investment in Wholly Owned Subsidiary (less than 0.1% of net assets)
|
Amount of Dividends
|
||||||||
|
Issuer
|
Number of Shares
|
Face Amount (Cost)
|
or Interest
|
Value
|
||||
|
Building America CDE, Inc.9
|
1,000
|
$
|
1
|
$
|
-
|
$
|
(68)
|
|
|
Total Equity Investment
|
1,000
|
$
|
1
|
$
|
-
|
$
|
(68)
|
|
|
Short-Term Investments (1.2% of net assets)
|
||||||||
|
Issuer
|
Interest Rate
|
Maturity Date
|
Face Amount
|
Amortized Cost
|
Value
|
|||
|
Blackrock Federal Funds 30
|
0.01%
|
January 2, 2013
|
$
|
53,847
|
$
|
53,847
|
$
|
53,847
|
|
Total Short-Term Investments
|
$
|
53,847
|
$
|
53,847
|
$
|
53,847
|
||
|
Total Investments
|
$
|
4,248,181
|
$ 4,296,995
|
$
|
4,573,218
|
|||
|
1
|
Valued by the HIT’s management in accordance with the fair value procedures adopted by the HIT’s Board of Trustees.
|
|
2
|
Tax-exempt bonds collateralized by Ginnie Mae securities.
|
|
3
|
The HIT records when issued securities on the trade date and maintains security positions such that sufficient liquid assets will be available to make payment for the securities purchased. Securities purchased on a when-issued basis are marked to market monthly and begin earning interest on the settlement date. Losses may occur on these transactions due to changes in market conditions or the failure of counterparties to perform under the contract.
|
|
4
|
Construction interest rates are the rates charged to the borrower during the construction phase of the project. The permanent interest rates are charged to the borrower during the amortization period of the loan, unless the U.S. Department of Housing and Urban Development requires that such rates be charged earlier.
|
|
5
|
The coupon rate shown on floating or adjustable rate securities represents the rate at period end.
|
|
6
|
Represents to be announced (TBA) securities: the particular securities to be delivered are not identified at the trade date. However, delivered securities must meet specified terms, including issuer, rate and mortgage term, and be within industry-accepted “good delivery” standards. Until settlement, the HIT maintains cash reserves and liquid assets sufficient to settle its TBA commitments.
|
|
7
|
Loans insured by Ambac Assurance Corporation, which are additionally backed by a repurchase option from the mortgagee for the benefit of the HIT. The repurchase price is defined as the unpaid principal balance of the loan plus all accrued unpaid interest due through the remittance date. The repurchase option can be exercised by the HIT in the event of a payment failure by Ambac Assurance Corporation.
|
|
8
|
Securities exempt from registration under the Securities Act of 1933. The construction notes were privately placed directly by MassHousing (a not-for-profit public agency) with the HIT. The notes are for construction only and will mature on or prior to October 1, 2015. The notes are general obligations of MassHousing and are secured by the full faith and credit of MassHousing. These securities may be resold in transactions exempt from registration, normally to qualified institutional buyers. These securities are considered liquid, under procedures established by and under the general supervision of the HIT’s Board of Trustees.
|
|
9
|
The HIT holds the shares of Building America CDE, Inc. (BACDE), a wholly owned subsidiary of the HIT. BACDE is a Community Development Entity, certified by the Community Development Financial Institutions Fund of the U.S. Department of Treasury, which can facilitate the generation of investments for the HIT or parties other than the HIT. The fair value of the HIT’s investment in BACDE approximates its carrying value.
|
See accompanying Notes to Financial Statements.
22 A F L - C I O H O U S I N G I N V E S T M E N T T R U S T
Statement of Operations
For the Year Ended December 31, 2012 (Dollars in thousands)
|
Investment income
|
$
|
163,880
|
|
Expenses
|
||
|
Non-officer salaries and fringe benefits
|
8,744
|
|
|
Officer salaries and fringe benefits
|
4,201
|
|
|
Investment management
|
849
|
|
|
Marketing and sales promotion (12b-1)
|
665
|
|
|
Consulting fees
|
556
|
|
|
Legal fees
|
452
|
|
|
Auditing, tax and accounting fees
|
412
|
|
|
Insurance
|
342
|
|
|
Trustee expenses
|
36
|
|
|
Rental expenses
|
866
|
|
|
General expenses
|
1,538
|
|
|
Total expenses
|
18,661
|
|
|
Net investment income
|
145,219
|
|
|
Net realized gain on investments
|
38,253
|
|
|
Net change in unrealized appreciation on investments
|
1,570
|
|
|
Net realized and unrealized gain on investments
|
39,823
|
|
|
Net increase in net assets resulting from operations
|
$
|
185,042
|
See accompanying Notes to Financial Statements.
A N N U A L R E P O R T 2 0 1 2 23
|
For the Years Ended December 31, 2012 and 2011 (Dollars in thousands)
|
||||
|
Increase in net assets from operations
|
2012
|
2011
|
||
|
Net investment income
|
$
|
145,219
|
$
|
152,788
|
|
Net realized gain on investments
|
38,253
|
33,589
|
||
|
Net change in unrealized appreciation on investments
|
1,570
|
120,362
|
||
|
Net increase in net assets resulting from operations
|
185,042
|
306,739
|
||
|
Decrease in net assets from distributions
|
||||
|
Distributions to participants or reinvested from:
|
||||
|
Net investment income
|
(153,392)
|
(159,575)
|
||
|
Net realized gains on investments
|
(29,525)
|
(19,721)
|
||
|
Net decrease in net assets from distributions
|
(182,917)
|
(179,296)
|
||
|
Increase (decrease) in net assets from unit transactions
|
||||
|
Proceeds from the sale of units of participation
|
259,267
|
186,650
|
||
|
Dividend reinvestment of units of participation
|
164,956
|
160,096
|
||
|
Payments for redemption of units of participation
|
(113,184)
|
(101,557)
|
||
|
Net increase from unit transactions
|
311,039
|
245,189
|
||
|
Total increase in net assets
|
313,164
|
372,632
|
||
|
Net assets
|
||||
|
Beginning of period
|
$
|
4,262,471
|
$
|
3,889,839
|
|
End of period
|
$
|
4,575,635
|
$
|
4,262,471
|
|
Distribution in excess of net investment income
|
$
|
(2,828)
|
$
|
(2,867)
|
|
Unit information
|
||||
|
Units sold
|
220,270
|
161,499
|
||
|
Distributions reinvested
|
140,088
|
138,701
|
||
|
Units redeemed
|
(96,091)
|
(88,452)
|
||
|
Increase in units outstanding
|
264,267
|
211,748
|
See accompanying Notes to Financial Statements.
24 A F L - C I O H O U S I N G I N V E S T M E N T T R U S T
Notes to Financial Statements
Note 1. Summary of Significant Accounting Policies
The American Federation of Labor and Congress of Industrial Organizations (AFL- CIO) Housing Investment Trust (HIT) is a common law trust created under the laws of the District of Columbia and is registered under the Investment Company Act of 1940, as amended (the Investment Company Act), as a no-load, open-end investment company. The HIT has obtained certain exemptions from the requirements of the Investment Company Act that are described in the HIT’s Prospectus and Statement of Additional Information.
Participation in the HIT is limited to eligible pension plans and labor organizations, including health and welfare, annuity, general, and other funds, that have beneficiaries who are represented by labor organizations.
The following is a summary of significant accounting policies followed by the HIT in the preparation of its financial statements. The policies are in conformity with generally accepted accounting principles (GAAP) in the United States.
INVESTMENT VALUATION
Net asset value per share (NAV) is calculated as of the close of business of the major bond markets in New York City on the last business day of each month. A description of the valuation techniques applied to the HIT’s major categories of assets and liabilities measured at fair value on a recurring basis follows.
Portfolio securities for which market quotations are readily available (U.S. Treasury securities, government-sponsored enterprise debt securities, single family mortgage-backed securities, and state housing finance agency securities) are valued by using independent pricing services, published prices, market quotes, and bids from dealers who make markets in such securities. For U.S. Treasury securities, pricing services generally base prices on actual transactions as well as dealer supplied prices. For government-sponsored enterprise securities and single family mortgage-backed securities, pricing services generally base prices on discounted cash flow models and examine reference data such as issue name, issue size, ratings, maturity, call type, spread/benchmark yields, and conditional prepayment rates, as well as dealer supplied prices. For state housing finance agency securities, pricing services generally base prices on trading spreads, new issue scales, verified bid information, and credit ratings.
Portfolio investments for which market quotations are not readily available (for example, multifamily mortgage-backed securities, and construction mortgage securities and loans) are valued at their fair value determined in good faith under consistently applied procedures adopted by the HIT’s Board of Trustees using dealer quotes and discounted cash flow models. The respective cash flow models utilize inputs from matrix pricing which consider observable market-based discount and prepayment rates, attributes of the collateral, and yield or price of bonds of comparable quality, coupon, maturity, and type. The market-based discount rate is composed of a risk-free yield (i.e., a U.S. Treasury note) adjusted for an appropriate risk premium. The risk premium reflects premiums in the marketplace over the yield on U.S. Treasury securities of comparable risk and average life to the security being valued as adjusted for other market considerations, such as significant market or security specific events, changes in interest rates, and credit quality. On investments for which the HIT finances the construction and permanent securities or participation interests, value is determined based upon the total amount, funded and/or unfunded, of the commitment. The HIT has also retained an independent firm to determine the fair market value of securities for which market quotations are not readily available. In accordance with the procedures adopted by the HIT’s Board of Trustees, the monthly third-party valuation is reviewed by the HIT staff to determine whether valuation adjustments are appropriate based on any material impairments in value arising from specific facts and circumstances of the investment (e.g., prepayment speed). All such adjustments must be reviewed and reconciled with the independent valuation firm prior to incorporation in the NAV.
Commercial mortgage-backed securities are valued using dealer quotes in a discounted cash flow model and/or independent pricing services. Pricing services generally base prices on a single cash flow model, determine a benchmark yield, and utilize available trade information, dealer quotes, and market color.
Real estate mortgage conduits are valued using a dealer quote and/or independent pricing services. Pricing services generally base prices on a single cash flow model or an option-adjusted spread model, determine a benchmark yield, and utilize available trade information, dealer quotes, market color, and prepayment speed.
The HIT holds the shares of Building America CDE, Inc. (BACDE), a wholly owned subsidiary of the HIT. The shares of BACDE are valued at their fair value determined in good faith under consistently applied procedures adopted by the HIT’s Board of Trustees, which approximates BACDE’s carrying value.
Investments in registered open-end investment management companies are valued based upon the NAVs of such investments.
Short-term investments having a maturity of 60 days or less are generally valued at amortized cost which approximates fair market value.
GAAP establishes a disclosure hierarchy that categorizes the inputs to valuation techniques used to value assets and liabilities at measurement date. The HIT classifies its assets and liabilities into three levels based on the method used to value the assets or liabilities. Level 1 values are based on quoted prices in active markets for identical securities. Level 2 values are based on significant observable market inputs, such as quoted prices for similar securities, interest rates, prepayment speeds, credit risk, and quoted prices in inactive markets. Level 3 values are based on significant unobservable inputs that reflect the HIT’s determination of assumptions that market participants might reasonably use in valuing the securities.
The following table presents the HIT’s valuation levels as of December 31, 2012:
Investment Securities ($ in thousands)
|
Level 1
|
Level 2
|
Level 3
|
Total
|
|||||
|
FHA Permanent Securities
|
$
|
-
|
$
|
184,022
|
$
|
17
|
$
|
184,039
|
|
Ginnie Mae Securities
|
-
|
784,266
|
-
|
784,266
|
||||
|
Ginnie Mae Construction Securities
|
-
|
378,171
|
-
|
378,171
|
||||
| Fannie Mae Securities | - |
1,979,616
|
- |
1,979,616
|
||||
|
Freddie Mac Securities
|
-
|
496,922
|
-
|
496,922
|
||||
|
Other Multifamily Investments
|
-
|
42,734
|
-
|
42,734
|
||||
|
State Housing Finance Agency Securities
|
-
|
209,656
|
-
|
209,656
|
||||
|
Commercial Mortgage-Backed Securities
|
-
|
33,518
|
-
|
33,518
|
||||
|
United States Treasury Securities
|
-
|
416,823
|
-
|
416,823
|
||||
|
Equity Investments
|
-
|
-
|
(68)
|
(68)
|
||||
|
Short-Term Investments
|
53,847
|
-
|
-
|
53,847
|
||||
|
Other Financial Instruments*
|
-
|
(6,306)
|
-
|
(6,306)
|
||||
| Total | $ |
53,847
|
$ |
4,519,422
|
$ | (51) | $ | 4,573,218 |
*Other financial instruments include forward commitments, when issued securities, and TBA securities.
A N N U A L R E P O R T 2 0 1 2 25
Notes to Financial Statements
The following table reconciles the valuation of the HIT’s Level 3 investment securities and related transactions for the year ended December 31, 2012.
Investments in Securities ($ in thousands)
|
FHA Permanent
|
Equity Investment
|
Total
|
|||||
| Beginning balance, 12/31/2011 | $ | 19 | $ | (535) | $ |
(516)
|
|
|
Total unrealized gain (loss)*
|
-
|
467
|
$
|
467
|
|||
|
Amortization/accretion
|
(2)
|
-
|
$
|
(2)
|
|||
|
Ending balance, 12/31/2012
|
$
|
17
|
$
|
(68)
|
$
|
(51)
|
|
* Net change in unrealized gain attributable to Level 3 securities held at December 31, 2012, totaled $467,000 and is included on the accompanying Statement of Operations.
Level 3 investments in securities are not considered a significant portion of the HIT’s portfolio. The HIT’s policy is to recognize transfers between levels at the end of the reporting period. For the year ended December 31, 2012, there were no transfers between levels.
USE OF ESTIMATES
The preparation of financial statements in conformity with GAAP requires management to make estimates and assumptions that affect the reported amounts of assets and liabilities at the date of the financial statements and the reported amounts of revenues and expenses during the period. Actual results could differ from those estimates.
FEDERAL INCOME TAXES
The HIT’s policy is to comply with the requirements of the Internal Revenue Code of 1986, as amended (the Internal Revenue Code), that are applicable to regulated investment companies, and to distribute all of its taxable income to its participants. Therefore, no federal income tax provision is required.
Tax positions taken or expected to be taken in the course of preparing the HIT’s tax returns are evaluated to determine whether the tax positions are “more-likely-than-not” of being sustained by the applicable tax authority. Tax positions not deemed to meet the more-likely-than-not threshold would be recorded
as a tax benefit or expense in the current year. Management has analyzed for all open years the HIT’s tax positions taken on federal income tax returns and has concluded that no provision for income tax is required in the HIT’s financial statements.
The HIT files U.S. federal, state, and local tax returns as required. The HIT’s tax returns are subject to examination by the relevant tax authorities until the expiration of the applicable statutes of limitations, which is generally three years after the filing of the tax return but could be longer in certain circumstances.
DISTRIBUTIONS TO PARTICIPANTS
At the end of each calendar month, a pro-rata distribution is made to participants of the net investment income earned during the month. This pro-rata distribution is based on the participant’s number of units held as of the immediately preceding month-end and excludes realized gains (losses) which are distributed at year-end.
Participants redeeming their investments are paid their pro-rata share of undistributed net income accrued through the month-end of the month in which they redeem.
The HIT offers an income reinvestment plan that permits current participants automatically to reinvest their income distributions into HIT units of participation. Total reinvestment was approximately 90% of distributed income for the year ended December 31, 2012.
INVESTMENT TRANSACTIONS AND INCOME
For financial reporting purposes, security transactions are accounted for as of the trade date. Gains and losses on securities sold are determined on the basis of amortized cost. Realized gains (losses) on paydowns of mortgage-and asset-backed securities are classified as interest income. Interest income, which includes amortization of premium and accretion of discount on debt securities, is accrued as earned.
12B-1 PLAN OF DISTRIBUTION
The HIT’s Board of Trustees annually considers a Plan of Distribution under Rule 12b-1 under the Investment Company Act to pay for marketing and sales promotion expenses incurred in connection with the offer and sale of units and related distribution activities (12b-1 expenses). For the year ended December 31, 2012, the HIT was authorized to pay 12b-1 expenses in an amount up to $600,000 or 0.05% of its average monthly net assets on an annualized basis, whichever is greater. During the year ended December 31, 2012, the HIT incurred approximately $665,000 of 12b-1 expenses.
Note 2. Investment Risks
INTEREST RATE RISK
As with any fixed -income investment, the market value of the HIT’s investments will fall below the principal amount of those investments at times when market interest rates rise above the interest rates of the investments. Rising interest rates may also reduce prepayment rates, causing the average life of the HIT’s investments to increase. This could in turn further reduce the value of the HIT’s portfolio.
PREPAYMENT AND EXTENSION RISK
The HIT invests in certain fixed-income securities whose value is derived from an underlying pool of mortgage loans that are subject to prepayment and extension risk.
Prepayment risk is the risk that a security will pay more quickly than its assumed payment rate, shortening its expected average life. In such an event, the HIT may be required to reinvest the proceeds of such prepayments in other investments bearing lower interest rates. The majority of the HIT’s securities backed by loans for multifamily projects include restrictions on prepayments for specified periods to mitigate this risk.
Extension risk is the risk that a security will pay more slowly than its assumed payment rate, extending its expected average life. When this occurs, the HIT’s ability to reinvest principal repayments in higher returning investments may be limited.
These two risks may increase the sensitivity of the HIT’s portfolio to fluctuations in interest rates and negatively affect the value of the HIT’s portfolio.
26 A F L - C I O H O U S I N G I N V E S T M E N T T R U S T
Notes to Financial Statements
Note 3. Transactions with Related Entities
BACDE is a Community Development Entity, certified by the Community Development Financial Institutions Fund (CDFI Fund) of the U.S. Department of the Treasury, which can facilitate the generation of investments for the HIT or parties other than the HIT. BACDE is accounted for as an investment of the HIT.
The New Markets Tax Credit (NMTC) program1, which is run by the CDFI Fund, provides tax credits to equity investors that invest in businesses operating in low-income areas, including those that engage in creation of housing and other construction activities. BACDE received an allocation of $50 million in NMTCs in the 2011 allocation round, which can be committed to qualified transactions. BACDE receives fees for committing NMTCs to such qualified transactions. BACDE committed to or prefunded seven qualified transactions in 2012, none of which obligates the assets of the HIT.
Summarized financial information for the BACDE on a historical cost basis is included in the table below:
|
$ in Thousands
|
||
|
As of December 31, 2012
|
||
|
Assets
|
$
|
639
|
|
Liabilities
|
(708)
|
|
|
Equity
|
$
|
(69)
|
|
For the year ended December 31, 2012
|
||
| Income | $ |
1,696
|
| Expenses |
(1,213)
|
|
|
Income tax expense
|
(210)
|
|
|
Net income
|
$
|
273
|
A rollforward of advances to BACDE by the HIT as of December 31, 2012, is included in the table below:
|
Advances to BACDE by HIT
|
$ in Thousands
|
|
|
Beginning balance, 12/31/2011
|
$
|
763
|
|
Advances in 2012
|
1,066
|
|
| Repayment by BACDE in 2012 |
(1,283)
|
|
|
Ending Balance, 12/31/2012
|
$
|
546
|
1The NMTC Program, enacted by Congress as part of the Community Renewal Tax Relief Act of 2000, is incorporated as section 45D of the Internal Revenue Code.
Note 4. Commitments
The HIT invests in securities originated under forward commitments, in which the HIT agrees to purchase an investment either in or backed by mortgage loans that have not yet closed and will be delivered in the future. The HIT agrees to an interest rate and purchase price for these securities when the commitment to purchase is originated.
Certain assets of the HIT are invested in liquid investments until they are required to fund these purchase commitments. As of December 31, 2012, the HIT had outstanding unfunded purchase commitments of approximately $209.2 million. The HIT maintains a reserve, in the form of securities, of no less than the total of the outstanding unfunded purchase commitments, less short-term investments. As of December 31, 2012, the value of the publicly traded mortgage-backed securities maintained for the reserve in a segregated account was approximately $4.36 billion.
The commitment amounts disclosed on the Schedule of Portfolio Investments represent the original commitment amount, which includes both funded and unfunded commitments.
Note 5. Investment Transactions
Purchases and sales of investments, excluding short-term securities and U.S. Treasury securities, for the year ended December 31, 2012, were $1.2 billion and $396.3 million, respectively.
Note 6. Income Taxes
The RIC Modernization Act of 2010 was signed into law on December 22, 2010, and seeks to simplify some of the tax provisions applicable to regulated investment companies and the tax reporting to their shareholders, and to improve the tax efficiency of certain fund structures. The greatest impact to the disclosure in the financial reports for the HIT will be seen on the treatment of capital loss carryforwards.
The HIT will be permitted to carry forward capital losses incurred in taxable years beginning after December 22, 2010, for an unlimited period. Under pre-enactment law, capital losses could be carried forward for eight years, and carried forward as short-term capital, irrespective of the character of the original loss. Post-enactment capital losses that are carried forward will retain their character as either short-term or long-term capital losses rather than being considered all short-term as under previous law. As of December 31, 2012, the HIT does not have a capital loss carryforward.
No provision for federal income taxes is required since the HIT intends to continue to qualify as a regulated investment company under Subchapter M of the Internal Revenue Code and distribute to shareholders all of its taxable income and gains. Federal income tax regulations differ from GAAP; therefore, distributions determined in accordance with tax regulations may differ in amount or character from net investment income and realized gains for financial reporting purposes. Financial reporting records are adjusted for permanent book/tax differences to reflect tax character.
The tax character of distributions paid during 2012 and 2011 was as follows ($ in thousands):
| 2012 2011 | ||
|
Ordinary investment income
|
$ 174,961
|
$ 163,242
|
|
Long-term capital gain on investments
|
7,956
|
16,054
|
|
Total distributions paid to participants or reinvested
|
$182,917
|
$179,296
|
As of December 31, 2012, the components of accumulated earnings on a tax basis were as follows ($ in thousands):
| 2012 | |
|
Unrealized appreciation
|
$ 275,893
|
|
Undistributed ordinary income
|
1,087
|
|
Undistributed long-term capital gain
|
28
|
|
Other temporary differences
|
(3,916)
|
|
Total accumulated earnings
|
$273,092
|
The differences between book basis and tax basis components of net assets are primarily attributable to tax deferral of losses on wash sales and tax treatment of deferred compensation plans.
For financial reporting purposes, capital accounts are adjusted to reflect the tax character of permanent book/tax differences. These reclassifications are primarily due to the different book and tax treatment of paydowns and distributions. Results of operations and net assets were not affected by these reclassifications.
A N N U A L R E P O R T 2 0 1 2 27
Notes to Financial Statements
For the year ended December 31, 2012, the HIT recorded the following permanent reclassifications ($ in thousands):
| 2012 | |
|
Accumulated net investment income
|
$ 8,212
|
|
Accumulated net realized losses
|
$ (8,170)
|
|
Amount invested and reinvested by current participants
|
$ (42) |
At December 31, 2012, the cost of investments for federal income tax purposes was $4,297,325,000, which approximated book cost at amortized cost adjusted for wash sales. Net unrealized gain aggregated $275,893,000 at period-end, of which $280,933,000 related to appreciated investments and $5,040,000 related to depreciated investments.
Note 7. Retirement and Deferred Compensation Plans
The HIT participates in the AFL-CIO Staff Retirement Plan (Plan), which is a multiemployer defined benefit pension plan, under the terms of a collective-bargaining agreement. The Plan covers substantially all employees, including non-bargaining unit employees. The risks of participating in a multiemployer plan are different from a single-employer plan in the following aspects:
|
a.
|
Assets contributed to a multiemployer plan by one employer may be used to provide benefits to employees of other participating employers.
|
|
b.
|
If a participating employer stops contributing to the plan, the unfunded obligations of the plan may be borne by the remaining participating employers based on their level of contributions to the plan.
|
|
c.
|
If the HIT chooses to stop participating in its multiemployer plan, the HIT may be required to pay the plan an amount based on the HIT’s share of the underfunded status of the plan, referred to as a withdrawal liability.
|
The HIT’s participation in the Plan for the annual period ended December 31, 2012, is outlined in the table below. The “EIN/Pension Plan Number” line provides the Employee Identification Number (EIN) and the three-digit plan number. The most recent Pension Protection Act (PPA) zone status available in 2012 is for the Plan’s year -end at June 30, 2012. The zone status is based on information that the HIT received from the Plan and is certified by the Plan’s actuary. Among other factors, plans in the red zone are generally less than 65% funded, plans in the yellow zone are less than 80% funded, and plans in the green zone are at least 80% funded. The “FIP/RP Status Pending/Implemented” line indicates whether a financial improvement plan (FIP) or a rehabilitation plan (RP) is either pending or has been implemented.
Pension Fund: AFL-CIO Staff Retirement Plan
|
EIN/Pension Plan Number
|
53-0228172 / 001
|
|
2012 PPA Zone Status
|
Green
|
|
FIP/RP Status Pending/ Implemented
|
No
|
|
2012 Contributions
|
$2,004,658
|
|
2012 Contribution Rate
|
26%
|
|
Surcharge Imposed
|
no
|
|
Expiration Date of Collective Bargaining Agreement
|
03/31/2017
|
The Plan utilized three provisions provided by Public Law 111-192, Section 211: (1) to spread investment losses from 2008 and 2009 over a period of 10 years, (2) to amortize 2008 and 2009 losses over a 29- year period, and (3) to temporarily allow actuarial value of assets to be as high as 130% of market value.
The HIT was listed in the Plan’s Form 5500 as providing more than 5% of the total contributions for the following plan year:
|
Years Contributions to Plan Exceeded More
|
|
|
Pension Fund
|
Than 5 Percent of Total Contributions
|
|
AFL-CIO Staff Retirement Plan
|
20101
|
1 The 2010 plan year ended at June 30, 2011.
At the date the financial statements were issued, the Plan’s Form 5500 was not available for the plan year ended June 30, 2012.
The HIT also sponsors a deferred compensation plan, referred to as a 401(k) plan, covering substantially all employees. This plan permits employees to defer the lesser of 100% of their total compensation or the applicable Internal Revenue Service limit. During 2012, the HIT matched dollar for dollar the first $5,000 of each employee’s contributions. The HIT’s 401(k) contribution for the year ended December 31, 2012, was approximately $251,400.
Note 8. Loan Facility
The HIT has a $15 million uncommitted loan facility which expires on June 19, 2013. Under this facility, borrowings bear interest per annum equal to 1.25% plus the highest of (a) the Federal Funds rate, (b) the Overnight Eurodollar Rate, or (c) the one- month LIBOR. The HIT had no outstanding balance under the facility for the year ended December 31, 2012. No compensating balances are required.
Note 9. Contract Obligations
In the ordinary course of business, the HIT enters into contracts that contain a variety of indemnifications. The HIT’s maximum exposure under these arrangements is unknown. However, the HIT has not had any prior claims or losses pursuant to these contracts and expects the risk of loss to be low.
28 A F L - C I O H O U S I N G I N V E S T M E N T T R U S T
|
Financial Highlights
|
||||||||||
|
Selected Per Share Data and Ratios for the Years Ended December 31 (Dollars in thousands)
|
||||||||||
|
Per share data
|
2012
|
2011
|
2010
|
2009
|
2008
|
|||||
|
Net asset value, beginning of period
|
$ 1,170.21
|
$ 1,133.82
|
$ 1,114.72
|
$ 1,098.48
|
$ 1,097.01
|
|||||
|
Income from investment operations:
|
||||||||||
|
Net investment income*
|
38.55
|
43.58
|
47.27
|
50.68
|
53.64
|
|||||
|
Net realized and unrealized gains on investments
|
10.81
|
43.81
|
20.75
|
17.15
|
1.91
|
|||||
|
Total income from investment operations
|
49.36
|
87.39
|
68.02
|
67.83
|
55.55
|
|||||
|
Less distributions from:
|
||||||||||
|
Net investment income
|
(40.74)
|
(45.52)
|
(48.92)
|
(51.59)
|
(54.08)
|
|||||
|
Net realized gains on investments
|
(7.62)
|
(5.48)
|
-
|
-
|
-
|
|||||
|
Total distributions
|
(48.36)
|
(51.00)
|
(48.92)
|
(51.59)
|
(54.08)
|
|||||
|
Net asset value, end of period
|
$ 1,171.21
|
$ 1,170.21
|
$ 1,133.82
|
$ 1,114.72
|
$ 1,098.48
|
|||||
|
Ratios/supplemental data
|
||||||||||
|
Ratio of expenses to average net assets
|
0.42%
|
0.44%
|
0.44%
|
0.43%
|
0.41%
|
|||||
|
Ratio of net investment income to average net assets
|
3.3%
|
3.8%
|
4.1%
|
4.5%
|
5.0%
|
|||||
|
Portfolio turnover rate
|
27.3%
|
33.9%
|
42.2%
|
28.5%
|
23.8%
|
|||||
|
Number of outstanding units at end of period
|
3,906,752
|
3,642,485
|
3,430,737
|
3,250,549
|
3,156,720
|
|||||
|
Net assets, end of period (in thousands)
|
$
|
4,575,635
|
$
|
4,262,471
|
$
|
3,889,839
|
$
|
3,623,437
|
$
|
3,467,603
|
|
Total return
|
4.27%
|
7.86%
|
6.16%
|
6.28%
|
5.25%
|
|||||
*The average shares outstanding method has been applied for this per share information. See accompanying Notes to Financial Statements.
A N N U A L R E P O R T 2 0 1 2 29
Overall responsibility for the management of the HIT, the establishment of policies, and the oversight of activities is vested in its Board of Trustees. The list below provides the following information for each of the Trustees: name, age, address, term of office, length of time served, principal occupations during at least the past five years and other directorships held.* The HIT’s Statement of Additional Information includes additional information about the Trustees and is available without charge, upon request, by placing a collect call to the HIT’s Investor Relations Office at (202) 331-8055, or by viewing the HIT’s website at www.aflcio-hit.com.
|
John J. Sweeney,** age 78; 815 16th Street, NW, Washington, DC 20006; Chairman of the Board; service commenced 1981, expires 2013; President Emeritus, AFL-CIO; formerly President, AFL-CIO; formerly Chairman, AFL-CIO Staff Retirement Plan.
Richard L. Trumka,** age 63; 815 16th Street, NW, Washington, DC 20006; Union Trustee; service commenced 1995, expires 2014; President, AFL-CIO; Chairman, AFL-CIO Staff Retirement Plan; formerly Secretary-Treasurer, AFL-CIO.
Liz Shuler, age 42; 815 16th Street, NW, Washington, DC 20006; Union Trustee; service commenced 2009, expires 2015; Secretary-Treasurer, AFL-CIO; Trustee, AFL-CIO Staff Retirement Plan; formerly Executive Assistant to the President, IBEW.
Arlene Holt Baker, age 62; 815 16th Street, NW, Washington, DC 20006; Union Trustee; service commenced 2008, expires 2014; Executive Vice President, AFL-CIO; Trustee, AFL-CIO Staff Retirement Plan; formerly President, Voices for Working Families and Executive Assistant to the President, AFL-CIO.
Vincent Alvarez, age 44; 275 Seventh Avenue, 18th Floor, New York, NY 10001; Union Trustee; service commenced 2012; expires 2015; President, New York City Central Labor Council (NYCCLC); formerly Assistant Legislative Director, New York State AFL-CIO; formerly NYCCLC Chief of Staff.
|
James Boland, age 62; 620 F Street, NW, Suite 700, Washington, DC 20004; Union Trustee; service commenced 2010, expires 2015; President, International Union of Bricklayers and Allied Craftworkers (BAC); Co-Chair, International Masonry Institute; Co-Chair, International Trowel Trades Pension Fund
and BAC International Health Fund; Executive Member, BAC Staff Health Plan; Trustee, BAC Local Union Officers and Employees Pension Fund and BAC Salaried Employees Pension Fund; formerly Executive Vice President and Secretary Treasurer, BAC.
Stephen Frank, age 72; 8584 Via Avellino, Lake Worth, FL 33467; Management Trustee; service commenced 2003, expires 2015; retired; formerly Vice President and Chief Financial Officer, The Small Business Funding Corporation.
Sean McGarvey, age 50; 815 16th Street, NW, Suite 600, Washington, DC 20006; Union Trustee; service commenced 2012, expires 2015; President, Building and Construction Trades Department, AFL-CIO (BCTD); formerly Secretary-Treasurer, BCTD.
Jack Quinn, age 61; 121 Ellicott Street, Buffalo, NY 14203; Management Trustee; service commenced 2005, expires 2014; President, Erie County Community College; Director, Kaiser Aluminum Corporation; formerly President, Cassidy & Associates; Member of Congress, 27th District, New York.
|
Richard Ravitch,** age 79; 610 5th Avenue, Suite 420, New York, NY 10020; Management Trustee; service commenced 1991, expires 2015; Principal, Ravitch Rice & Co. LLC; formerly Lieutenant Governor, State of New York; Director, Parsons, Brinckerhoff Inc.; Co-Chair, Millennial Housing Commission; President and Chief Executive Officer, Player Relations Committee of Major League Baseball.
Kenneth E. Rigmaiden, age 59; 7234 Parkway Drive, Hanover, MD 21076; Union Trustee; service commenced 2011, expires 2014; Executive General Vice President, International Union of Painters and Allied Trades of the United States and Canada (IUPAT); Director, Coalition of Black Trade Unionists and Board for Partnership for Working Families; Trustee, IUPAT International Pension Fund; formerly Assistant to the General President, IUPAT; National Project Coordinator, IUPAT Job Corps Program; Director, United Way.
Marlyn J. Spear,** CFA, age 59; 500 Elm Grove Road, Elm Grove, WI 53122; Management Trustee; service commenced 1995, expires 2015; Chief Investment Officer, Building Trades United Pension Trust Fund (Milwaukee and Vicinity); Member, Greater Milwaukee Foundation Investment Committee; Director, Baird Funds, Inc.
Tony Stanley,** age 79; 191 SE Bella Strano, Port St. Lucie, FL 34984; Management Trustee; service commenced 1983, expires 2013; Director, TransCon Builders, Inc.; formerly Executive Vice President, TransCon Builders, Inc.
|
|
*
|
Includes any directorships in a corporation or trust having securities registered pursuant to Section 12 of the Securities Exchange Act of 1934, as amended, or subject to the requirements of Section 15(d) of such Act, or a company registered as an investment company under the Investment Company Act of 1940, as amended.
|
|
**
|
Executive Committee member.
|
30 A F L - C I O H O U S I N G I N V E S T M E N T T R U S T
All officers of the HIT are located at 2401 Pennsylvania Avenue, NW, Suite 200, Washington, DC 20037.*
|
Stephen Coyle,† age 67; Chief Executive Officer, AFL-CIO Housing Investment Trust since 1992.
Theodore S. Chandler,† age 53; Chief Operating Officer, AFL-CIO Housing Investment Trust since 2009; formerly Vice President, Fannie Mae.
Erica Khatchadourian,† age 45; Chief Financial Officer, AFL-CIO Housing Investment Trust since 2001; formerly Controller, Chief of Staff and Director of Operations, AFL-CIO Housing Investment Trust; Senior Consultant, Price Waterhouse.
Chang Suh,† CFA, CPA, age 41; Senior Executive Vice President and Chief Portfolio Manager, AFL-CIO Housing Investment Trust since 2005; formerly Chief Portfolio Manager, Assistant Portfolio Manager, and Senior Portfolio Analyst, AFL-CIO Housing Investment Trust; Senior Auditor, Arthur Andersen.
Christopher Kaiser,† age 48; Acting General Counsel (since 2013) and Chief Compliance Officer (since 2007), AFL-CIO Housing Investment Trust; formerly Deputy General
|
Counsel, AFL-CIO Housing Investment Trust; Branch Chief, Division of Investment Management, U.S. Securities and Exchange Commission.
Debbie Cohen,† age 62; Chief Development Officer, AFL-CIO Housing Investment Trust since 2009; formerly Chief Director of Marketing and Investor Relations and Assistant Portfolio Manager, AFL-CIO Housing Investment Trust; Realtor, Coldwell Banker Realty and Weichert Realty; Senior Director of Planning and Research, Federal Home Loan Banks.
Thalia B. Lankin,† age 34; Director of Operations, AFL-CIO Housing Investment Trust since 2012; Chief Operating Officer, Building America CDE, Inc.; formerly Chief of Staff and Special Counsel, AFL-CIO Housing Investment Trust.
Harpreet Singh Peleg,† CPA, age 39; Controller, AFL-CIO Housing Investment Trust since 2005; Chief Financial Officer, Building America CDE, Inc.; formerly Chief Financial Officer, AFL-CIO Investment Trust Corporation; Financial
|
Analyst, Goldman Sachs & Co.; Senior Associate, Pricewaterhouse Coopers.
Eric W. Price,† age 51; Executive Vice President, AFL-CIO Housing Investment Trust since 2010; Chief Executive Officer, Building America CDE, Inc.; formerly Senior Vice President, Abdo Development; Senior Vice President, Local Initiative Support Corporation; Deputy Mayor for Planning and Economic Development, District of Columbia.
Lesyllee White, age 50; Senior Vice President and Managing Director of Marketing, AFL-CIO Housing Investment Trust since 2004; formerly Director of Marketing, Regional Marketing Director and Senior Marketing Associate, AFL-CIO Housing Investment Trust; Vice President, Northern Trust Company.
Stephanie H. Wiggins,† age 47; Executive Vice President and Chief Investment Officer, AFL-CIO Housing Investment Trust since 2001; formerly Director of Fannie Mae Finance, AFL-CIO Housing Investment Trust; Director, Prudential Mortgage Capital Company; Vice President/Multifamily Transaction Manager, WMF Capital Corporation.
|
* No officer of the HIT serves as a trustee or director in any corporation or trust having securities registered pursuant to Section 12 of the Securities Exchange Act of 1934, as amended, or subject to the requirements of Section 15(d) of such Act, or any company registered as an investment company under the Investment Company Act of 1940, as amended.
† Board-appointed officer. These officers are appointed annually, serving for a period of approximately one year or until their respective successors are duly appointed and qualified.
A N N U A L R E P O R T 2 0 1 2 31
|
AFL-CIO Housing
|
Service Providers
|
|
|
Investment Trust
|
|
National Office
2401 Pennsylvania Avenue, N.W.
Suite 200
Washington, D.C. 20037
(202) 331-8055
www.aflcio-hit.com
New York City Office
Carol Nixon, Director
1270 Avenue of the Americas
Suite 210
New York, New York 10020
(212) 554-2750
New England Regional Office
Thomas O’Malley, Senior Vice President
Ten Post Office Square, Suite 800
Boston, Massachusetts 02109
(617) 850-9071
Western Regional Office
Liz Diamond, Director
101 California Street, Suite 2450
San Francisco, California 94111
(415) 433-3044
Southern California Office
155 North Lake Avenue, Suite 800
Pasadena, CA 91101
(626) 993-6676
Gulf Coast Office
935 Gravier Street, Suite 640
New Orleans, Louisiana 70112
(504) 599-8750
|
Independent Registered Public Accounting Firm
Ernst & Young LLP
McLean, Virginia
Corporate Counsel
Bingham McCutchen LLP
Washington, D.C.
Securities Counsel
Perkins Coie LLP
Washington, D.C.
Transfer Agent
BNY Mellon Investment Servicing (US) Inc.
Wilmington, Delaware
Custodian
Bank of New York Mellon
New York, New York
|
Investors should consider the HIT’s investment objectives, risks, and expenses carefully before investing. A prospectus containing more complete information may be obtained from the HIT by calling the Marketing and Investor Relations Department collect at (202) 331-8055 or by viewing the HIT’s website at www.aflcio-hit.com. The prospectus should be read carefully before investing.
32 A F L - C I O H O U S I N G I N V E S T M E N T T R U S T