Table of Contents
UNITED STATES
SECURITIES AND EXCHANGE COMMISSION
Washington, D.C. 20549
FORM 20-F
| (Mark one) | ||
| ☐ | REGISTRATION STATEMENT PURSUANT TO SECTION 12(b) OR (g) OF THE SECURITIES EXCHANGE ACT OF 1934 | |
| OR | ||
| ☒ | ANNUAL REPORT PURSUANT TO SECTION 13 OR 15(d) OF THE SECURITIES EXCHANGE ACT OF 1934 | |
| FOR THE FISCAL YEAR ENDED DECEMBER 31, 2020 | ||
| OR | ||
| ☐ | TRANSITION REPORT PURSUANT TO SECTION 13 OR 15(d) OF THE SECURITIES EXCHANGE ACT OF 1934 | |
| OR | ||
| ☐ | SHELL COMPANY REPORT PURSUANT TO SECTION 13 OR 15(d) OF THE SECURITIES EXCHANGE ACT OF 1934 | |
Date of event requiring this shell company report
For the transition period from to
Commission file number 001-04546
UNILEVER PLC
(Exact name of Registrant as specified in its charter)
ENGLAND
(Jurisdiction of incorporation or organization)
100 Victoria Embankment, London, England
(Address of principal executive offices)
R Sotamaa, Chief Legal Officer and Group Secretary
Tel: +44(0)2078225252, Fax: +44(0)2078225464
100 Victoria Embankment, London EC4Y 0DY, UK
(Name, Telephone Number, E-mail and/or Facsimile number and Address of Company Contact Person)
Securities registered or to be registered pursuant to Section 12(b) of the Act:
| Title of each class |
Trading Symbol(s) |
Name of each exchange on which registered | ||
| Ordinary shares, nominal value of 3 1/9 pence per share | ULVR | New York Stock Exchange* | ||
| American Depositary Shares (evidenced by Depositary Receipts) each representing one ordinary share of the nominal amount of 3 1/9p each | UL | New York Stock Exchange |
*Not for trading, but only in connection with the registration of the American Depositary Shares pursuant to the requirements of the Securities and Exchange Commission.
Securities registered or to be registered pursuant to Section 12(g) of the Act: None
Securities for which there is a reporting obligation pursuant to Section 15(d) of the Act:
| Title of each class |
||
| 2.75% Notes due 2021 3.0% Notes due 2022 2.2% Notes due 2022 0.375% Notes due 2023 3.125% Notes due 2023 3.25% Notes due 2024 2.6% Notes due 2024 3.1% Notes due 2025 3.375% Notes due 2025 2.0% Notes due 2026 2.9% Notes due 2027 3.5% Notes due 2028 2.125% Notes due 2029 1.375% Notes due 2030 5.9% Notes due 2032 |
Indicate the number of outstanding shares of each of the issuer’s classes of capital or common stock as of the close of the period covered by the annual report.
The total number of outstanding shares of the issuer’s capital stock at the close of the period covered by the annual report was: 2,629,243,772 ordinary shares
Indicate by check mark if the registrant is a well-known seasoned issuer, as defined in Rule 405 of the Securities Act:
Yes ☒ No ☐
If this report is an annual or transition report, indicate by check mark if the registrant is not required to file reports pursuant to Section 13 or 15(d) of the Securities Exchange Act of 1934:
Yes ☐ No ☒
Indicate by check mark whether the registrant: (1) has filed all reports required to be filed by Section 13 or 15(d) of the Securities Exchange Act of 1934 during the preceding 12 months (or for such shorter period that the registrant was required to file such reports), and (2) has been subject to such filing requirements for the past 90 days.
Yes ☒ No ☐
Indicate by check mark whether the registrant has submitted electronically every Interactive Data File required to be submitted pursuant to Rule 405 of Regulation S-T (§232.405 of this chapter) during the preceding 12 months (or for such shorter period that the registrant was required to submit such files).
Yes ☒ No ☐
Indicate by check mark whether the registrant is a large accelerated filer, an accelerated filer, a non-accelerated filer, or an emerging growth company. See definition of “large accelerated filer,” accelerated filer,” and “emerging growth company” in Rule 12b-2 of the Exchange Act.
Large Accelerated filer ☒ Accelerated filer ☐ Non-accelerated filer ☐ Emerging Growth Company ☐
If an emerging growth company that prepares its financial statements in accordance with U.S. GAAP, indicate by check mark if the registrant has elected not to use the extended transition period for complying with any new or revised financial accounting standards* provided pursuant to Section 13(a) of the Exchange Act. ☐
*The term ‘‘new or revised financial accounting standard’’ refers to any update issued by the Financial Accounting Standards Board to its Accounting Standards Codification after April 5, 2012.
Indicate by check mark whether the registrant has filed a report on and attestation to its management’s assessment of the effectiveness of its internal control over financial reporting under Section 404(b) of the Sarbanes-Oxley Act (15 U.S.C. 7262(b)) by the registered public accounting firm that prepared or issued its audit report. ☒
Indicate by check mark which basis of accounting the registrant has used to prepare the financial statements included in this filing:
| U.S. GAAP ☐ |
International Financial Reporting Standards as issued by the International Accounting Standards Board ☒ | Other ☐ |
If ‘Other’ has been checked in response to the previous question, indicate by check mark which financial statement item the registrant has elected to follow. Item 17 ☐ Item 18 ☐
If this is an annual report, indicate by check mark whether the registrant is a shell company (as defined in Rule 12b-2 of the Exchange Act):
Yes ☐ No ☒
Table of Contents
CAUTIONARY STATEMENT
This document may contain forward-looking statements, including ‘forward-looking statements’ within the meaning of the United States Private Securities Litigation Reform Act of 1995. Words such as ‘will’, ‘aim’, ‘expects’, ‘anticipates’, ‘intends’, ‘looks’, ‘believes’, ‘vision’, or the negative of these terms and other similar expressions of future performance or results, and their negatives, are intended to identify such forward-looking statements. These forward-looking statements are based upon current expectations and assumptions regarding anticipated developments and other factors affecting the Unilever Group (the ‘Group’). They are not historical facts, nor are they guarantees of future performance.
Because these forward-looking statements involve risks and uncertainties, there are important factors that could cause actual results to differ materially from those expressed or implied by these forward-looking statements. Among other risks and uncertainties, the material or principal factors which could cause actual results to differ materially are: Unilever’s global brands not meeting consumer preferences; Unilever’s ability to innovate and remain competitive; Unilever’s investment choices in its portfolio management; the effect of climate change on Unilever’s business; Unilever’s ability to find sustainable solutions to its plastic packaging; significant changes or deterioration in customer relationships; the recruitment and retention of talented employees; disruptions in our supply chain and distribution; increases or volatility in the cost of raw materials and commodities; the production of safe and high quality products; secure and reliable IT infrastructure; execution of acquisitions, divestitures and business transformation projects; economic, social and political risks and natural disasters; financial risks; failure to meet high and ethical standards; and managing regulatory, tax and legal matters. A number of these risks have increased as a result of the current Covid-19 pandemic.
These forward-looking statements speak only as of the date of this document. Except as required by any applicable law or regulation, the Group expressly disclaims any obligation or undertaking to release publicly any updates or revisions to any forward-looking statements contained herein to reflect any change in the Group’s expectations with regard thereto or any change in events, conditions or circumstances on which any such statement is based.
Further details of potential risks and uncertainties affecting the Group are described in the Group’s filings with the London Stock Exchange, Euronext Amsterdam and the US Securities and Exchange Commission, including in the Annual Report on Form 20-F 2020 and the Unilever Annual Report and Accounts 2020.
Table of Contents

Table of Contents
 www.unilever.com
Table of Contents

The events of 2020 have tested the world in ways few anticipated. They also tested the resilience of our business – our people, our operations, our financial strength. While this has not been an easy year, it’s made us a stronger business, better prepared for a fast-changing world.
We believe that the world needs businesses like Unilever more than ever. We have responded with speed and agility to protect lives and livelihoods, while growing our business. Driving a progressive agenda on issues like climate, social inequality and the future of work. And serving consumers through our purposeful brands, which are more relevant than ever.
Above all, this year has strengthened our commitment to being the global leader in sustainable business, and to showing that our purpose-led, future-fit business model delivers superior performance.
Table of Contents
| 2 | Unilever Annual Report on Form 20-F 2020 |
As one of the world’s largest consumer goods companies, we’re driven by our purpose to make sustainable living commonplace.
| A truly global business | Strong brands with purpose | |
| Our brands are available in over 190 countries | Our 400+ brands help people feel good, look good and get more out of life | |
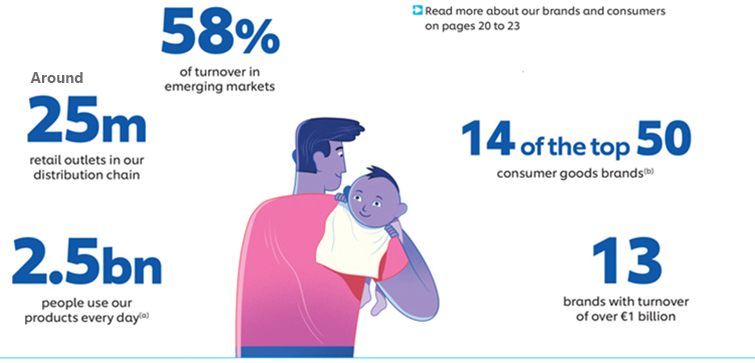
Our financial highlights
| Turnover |
Underlying sales | Dividends paid | ||||||
| growth(c) | ||||||||
| €51bn |
1.9% | €4.3bn | ||||||
| 2019: €52bn |
2019: 2.9% | 2019: €4.2bn | ||||||
| 2018: €51bn |
2018: 3.2% | 2018: €4.1bn | ||||||
|
Underlying operating |
Operating margin |
Free cash flow(c) | ||||||
| margin(c) |
||||||||
| 18.5% |
16.4% | €7.7bn | ||||||
| 2019: 19.1% |
2019: 16.8% | 2019: €6.1bn | ||||||
| 2018: 18.6% |
2018: 24.8% | 2018: €5.4bn | ||||||
| (a) | Based on a detailed study carried out in 2016. |
| (b) | Based on market penetration and consumer interactions (Kantar Brand Footprint report). |
| (c) | Free cash flow, underlying operating margin and underlying sales growth are non-GAAP measures. For further information about these measures, and the reasons why we believe they are important for an understanding of the performance of the business, please refer to our commentary on non-GAAP measures on page 39. |
Table of Contents
| Unilever Annual Report on Form 20-F 2020 | 3 |
 Read more about our people
 Read more about our Divisions


Table of Contents
Table of Contents
| Unilever Annual Report on Form 20-F 2020 | 5 |

Table of Contents
Table of Contents
| Unilever Annual Report on Form 20-F 2020 | 7 |

Table of Contents
| 8 | Unilever Annual Report on Form 20-F 2020 |
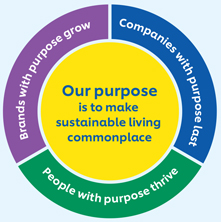
A belief that sustainable business drives superior
performance lies at the heart of the Unilever Compass.
|
||
| Our vision is to be the global leader in sustainable business. We will demonstrate how our purpose-led, future-fit business model drives superior performance, consistently delivering financial results in the top third of our industry. | ||
|
Our strategic choices and actions will help us fulfil our purpose and vision
|
|
Develop our portfolio into high growth spaces
| ||||||||
| Hygiene | Skin care | Prestige beauty | Functional nutrition | Plant-based foods | ||||
|
Win with our brands as a force for good, powered by purpose and innovation
| ||||||
| Improve the health of the planet |
Improve people’s health, confidence and wellbeing |
Contribute to a fairer, more socially inclusive world |
Win with differentiated science and technology | |||
|
Accelerate in USA, India, China and key growth markets
| ||
| Build further scale in USA, India and China |
Leverage emerging market strength | |
|
Lead in the channels of the future
| ||||
| Accelerate pure-play and omnichannel eCommerce |
Develop eB2B business platforms |
Drive category leadership through shopper insight | ||
|
Build a purpose-led, future-fit organisation and growth culture
| ||||
| Unlock capacity through agility and digital transformation |
Be a beacon for diversity, inclusion and values-based leadership |
Build capability through lifelong learning | ||
|
Operational Excellence through the 5 Growth Fundamentals
| ||||||||
| 1 | 2 | 3 | 4 | 5 | ||||
| Purposeful | Improved | Impactful | Design | Fuel | ||||
| brands | penetration | innovation | for channel | for growth | ||||
Table of Contents
| Unilever Annual Report on Form 20-F 2020 | 9 |
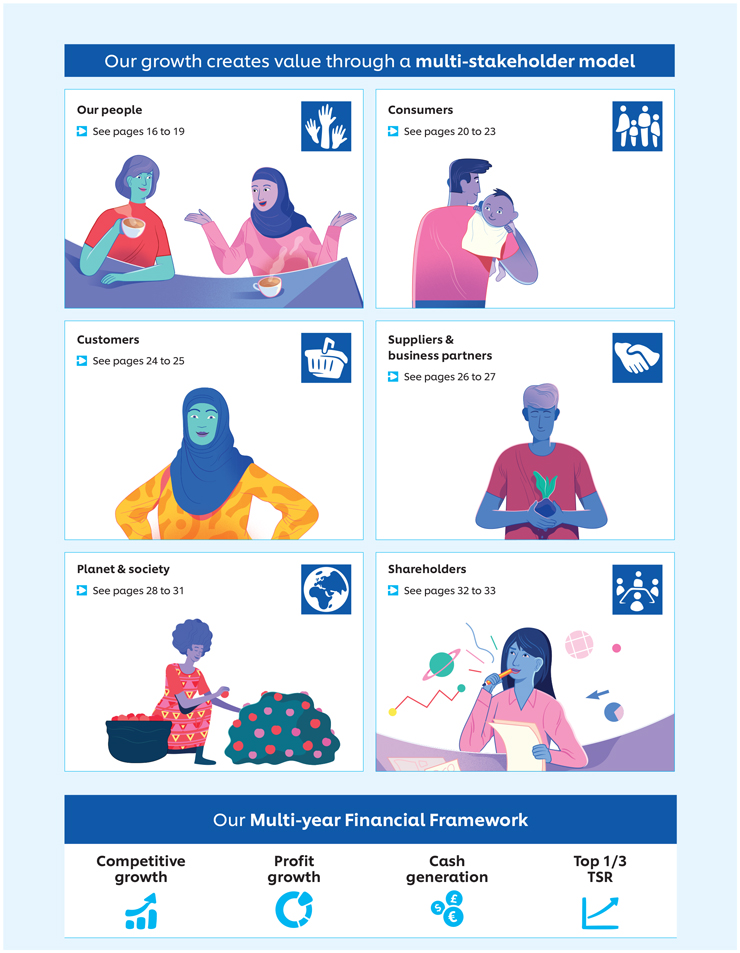
Table of Contents
| 10 | Unilever Annual Report on Form 20-F 2020 |
Our strategy continued
Our Compass sustainability commitments
will help us deliver our purpose and vision.
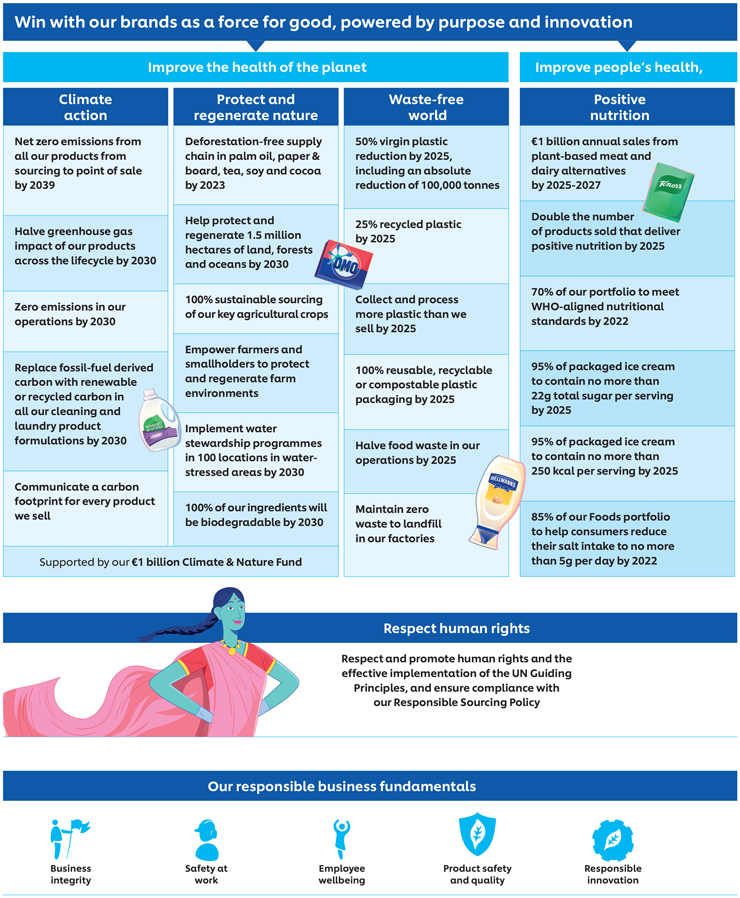
Table of Contents
| Unilever Annual Report on Form 20-F 2020 | 11 |

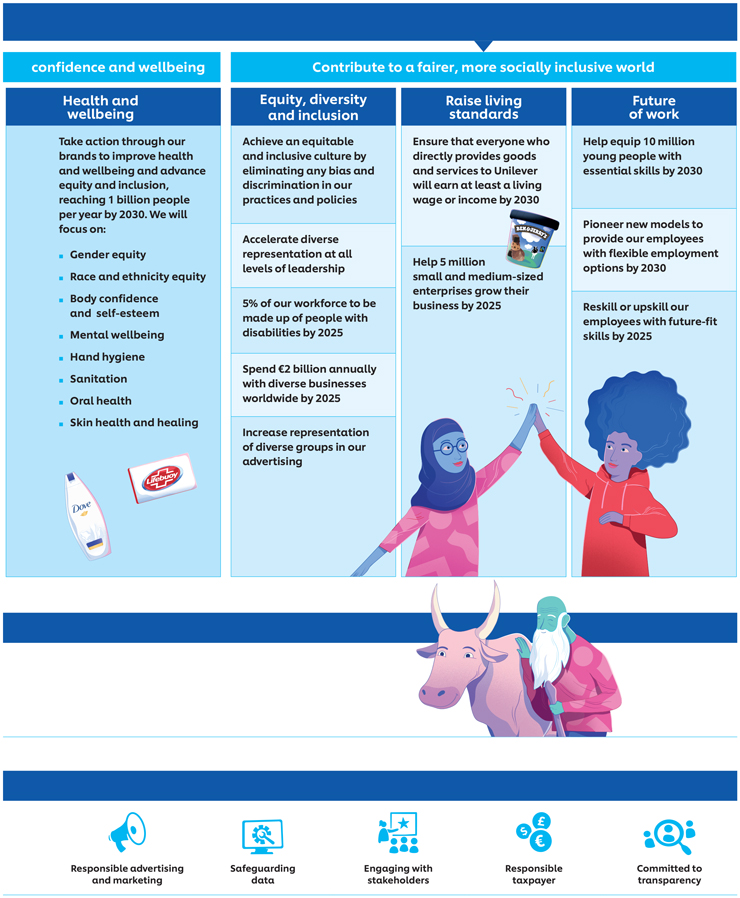
Table of Contents
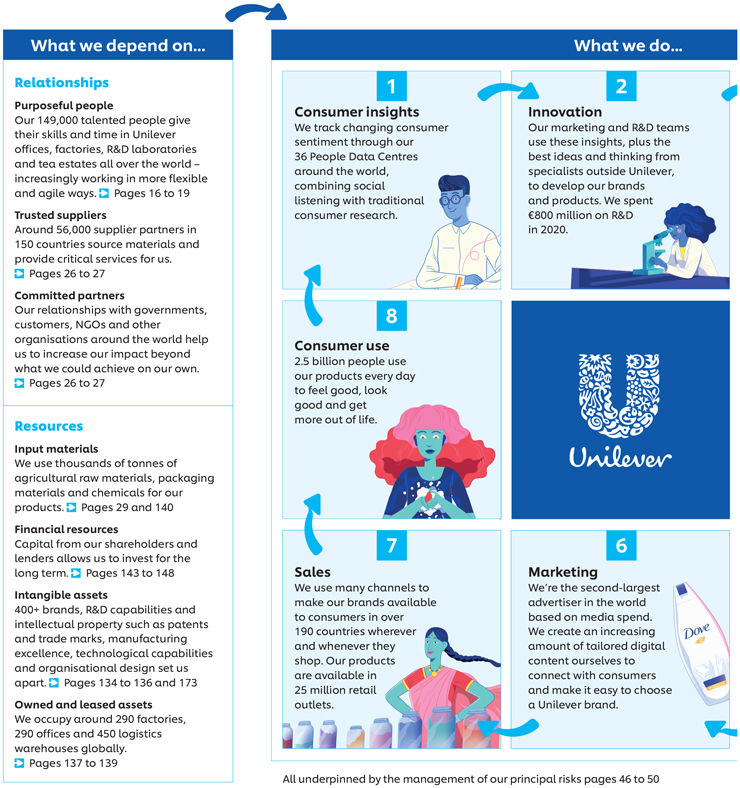
Table of Contents
| Unilever Annual Report on Form 20-F 2020 | 13 |
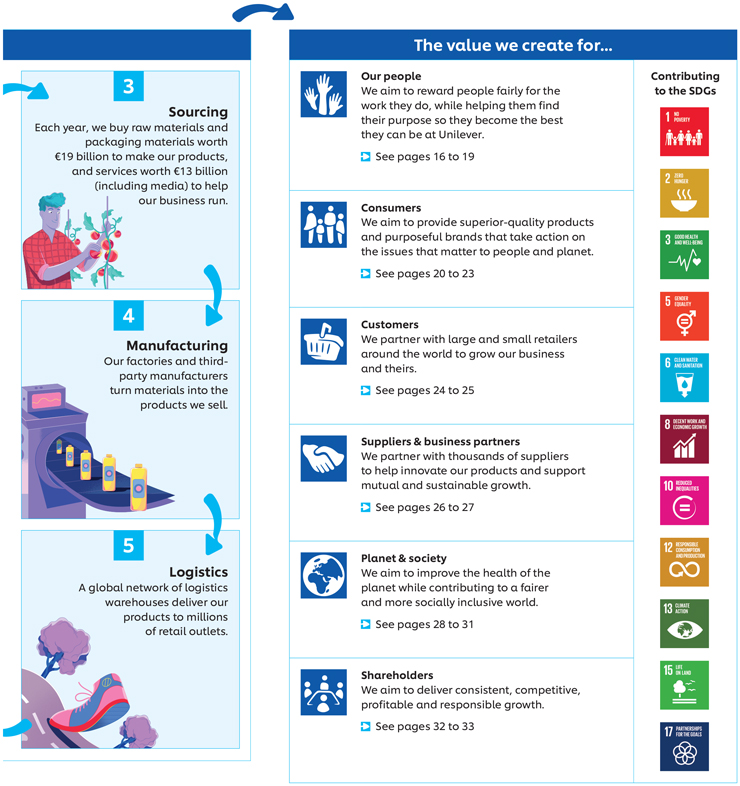
Table of Contents
| 14 | Unilever Annual Report on Form 20-F 2020 |
The Unilever Compass and our business model are designed to
create value for our stakeholders. Understanding their changing
needs helps us to make informed strategic decisions.
Our multi-stakeholder model in action
We’ve identified six stakeholder groups critical to our future success: our people, consumers, customers, suppliers & business partners, planet & society, and shareholders. The stakeholder reviews on pages 14 to 33 explain how we’ve worked to create value for each of our stakeholders in 2020, as well as how our business benefits from these vital relationships.
The Governance of Unilever sets out the roles and responsibilities of the Board and, with the exception of specified Board responsibilities, delegates the running of Unilever to the CEO. The CFO also has certain powers in relation to financial matters set out within the Governance of Unilever. The CEO heads the Unilever Leadership Executive (ULE) which comprises the CFO, the Group Secretary and the most senior management of Unilever as set out on pages 66 to 67. The Board provides guidance and advice to the CEO and the ULE on multiple issues throughout the year. The table below highlights key Board considerations and outcomes and also where relevant the key considerations and outcomes of the ULE in line with their duties and the Board Rules outlined in the Governance of Unilever.
|
Under Section 172 of the UK Companies Act 2006 (‘Section 172’) directors must act in the way that they consider, in good faith, would be most likely to promote the success of their company. In doing so, our Directors must have regard to stakeholders and the other matters set out in Section 172. Pages 14 and 15 comprise our Section 172 statement, which describes how the Directors have had regard to these matters when performing their duty. In light of our purpose to make sustainable living commonplace and the Unilever Compass strategy to drive superior performance as set out on pages 8 to 9, our Directors take steps to understand the needs and priorities of each stakeholder group and do so via a number of mediums, including by direct engagement or via their delegated committees and forums. The relevance of each stakeholder may change depending on the matter at hand. In line with the UK Companies Act 2006, below we provide a high-level summary of the concerns of our stakeholders and how our Directors and ULE engaged with them and had regard to their interests when setting Unilever’s strategy and taking decisions concerning the business.
|
 Section 172
| Stakeholder | Interests and concerns in 2020 |
How we engaged in 2020 | Board and ULE considerations and outcomes in 2020 | |||
|
Our people
We stepped up our engagement with employees significantly to help our people through the pandemic.
pages 16 to 19 |
Covid-19 has been the overriding concern for our people during the year as the pandemic impacted virtually every part of their lives, especially working arrangements. Through our engagement, we also consistently see that concerns such as career opportunities, wellbeing, purpose, sustainability and being a more simple and agile business remain important for our people. | This year our annual UniVoice survey focused on our office-based employees, and more than 42,000 people responded (see pages 16, 17 and 18 for results). We continued to run monthly UniPulse surveys throughout the year for more instant feedback. Covid-19 accelerated a widescale use of new digital platforms. We held a bi-weekly ‘Your Call’ with our CEO and ULE which gave people direct access to our leadership team in rotating guest slots, including our Chairman. We consulted with our people on a new Future Reward Framework through multiple employee focus groups and surveys, as well as consultation with the European Works Council and other local employee representation bodies. |
Our Board engaged directly with employees throughout the year on issues of concern such as working in factories and at home through the pandemic, the new starter onboarding process and learning opportunities. These perspectives were taken into consideration in decision making (see page 63 for more details). The Board’s Corporate Responsibility Committee looked at a range of people-related issues in the year, including safety and our Code of Business Principles (see page 18). As part of the Unification of our legal structure, and after engaging with the Dutch Central Works Council and the European Works Council, the Board agreed to provide a guarantee to Unilever APF, the Dutch Pension Fund, to safeguard the pensions of Dutch employees. | |||
|
Consumers
Changes in consumer behaviour have accelerated, leading to new insights about the ways people shop and buy our products.
pages 20 to 23 |
The pandemic has impacted consumer spending habits, particularly for discretionary purchases. This has led to a back-to-basics approach to consumption, with value for money and quality remaining key concerns, alongside sustainability as consumers have become more mindful of the impact of their spending decisions on the world. Health and wellness concerns also increased as people looked to protect themselves from the physical and mental consequences of the pandemic. | We have many direct and indirect touchpoints with our consumers. Our People Data Centres combine social listening with traditional consumer research while our Consumer Carelines give us rich insights into the experiences of consumers when using our products – during 2020 we had around 2.5 million interactions through calls, emails, letters, social media and webchats. We also consulted with almost 1.8 million consumers this year through regular surveys using partners like Kantar, Nielsen and Ipsos. These insights help to inform our understanding of consumer trends, including those likely to continue in a post- Covid world. |
Our Board and ULE members are regularly informed of consumer trends and consider these when making decisions. For example, during a strategy focused Board meeting in October, the Board discussed how to ensure our divisional portfolios remain attractive and differentiated, the growing importance of eCommerce and large retailer omnichannel partnerships. The ULE considered a range of 3-5 year scenarios in the early months of the pandemic to understand how consumer trends might change, how to best prepare for a global recession, and where growth opportunities might be. The work informed Unilever’s portfolio and investment strategies by helping to identify growth opportunities. | |||

 For more see
Table of Contents
| Unilever Annual Report on Form 20-F 2020 | 15 |

 For more see


Table of Contents


Table of Contents
| Unilever Annual Report on Form 20-F 2020 | 17 |

Table of Contents
| 18 | Unilever Annual Report on Form 20-F 2020 |
Our people continued

 See our website for more on business integrity
Table of Contents
| Unilever Annual Report on Form 20-F 2020 | 19 |
Table of Contents


Table of Contents
| Unilever Annual Report on Form 20-F 2020 | 21 |


Table of Contents
| 22 | Unilever Annual Report on Form 20-F 2020 |
Consumers continued


Table of Contents
| Unilever Annual Report on Form 20-F 2020 | 23 |
Table of Contents


Table of Contents
| Unilever Annual Report on Form 20-F 2020 | 25 |

Table of Contents


Table of Contents
| Unilever Annual Report on Form 20-F 2020 | 27 |
 See our website for more on sustainable sourcing

Table of Contents


Table of Contents
| Unilever Annual Report on Form 20-F 2020 | 29 |
 See our website for more on climate action

Table of Contents
| 30 | Unilever Annual Report on Form 20-F 2020 |
Planet & society continued
Table of Contents
| Unilever Annual Report on Form 20-F 2020 | 31 |


Table of Contents


Table of Contents
| Unilever Annual Report on Form 20-F 2020 | 33 |


Table of Contents
| 34 | Unilever Annual Report on Form 20-F 2020 |
We measure our success by tracking both non-financial
and financial key performance indicators.
Non-financial performance
| Target | 2020 | 2019 | 2018 | |||||
| Improving health & wellbeing |
||||||||
| Health & hygiene Target: By 2020 we will help more than a billion people to improve their health and hygiene. This will help reduce the incidence of life-threatening diseases like diarrhoea(a) |
1 billion | On ground reach: 625 million |
On ground reach: 615 million |
On ground reach: 570 million | ||||
| TV reach: 715 million |
TV reach: 710 million |
TV reach: 670 million | ||||||
| Nutrition Target: By 2020 we will double (i.e. up to 60%) the proportion of our portfolio that meets the Highest Nutritional Standards, based on globally recognised dietary guidelines |
60% | 61%† | 56%à | 48% | ||||
| Reducing environmental impact |
||||||||
| Greenhouse gases Target: Halve the greenhouse gas impact of our products across the lifecycle (from the sourcing of the raw materials to the greenhouse gas emissions linked to people using our products) by 2030 (greenhouse gas impact per consumer use; 2010 baseline)(c)(d) |
(50%) | (10%) | (8%)(b)à | (3%)(b) | ||||
| Target: By 2020 CO2 emissions from energy from our factories will be at or below 2008 levels (£145.92) despite significantly higher volumes (reduction in CO2 from energy in kg per tonne of production since 2008)* |
£145.92 | 36.94† | 50.76à | 70.46D | ||||
| Water Target: Halve the water associated with the consumer use of our products by 2020 (water impact per consumer use; 2010 baseline)(c) |
(50%) | 0% | 1%à | (2%) | ||||
| Target: By 2020 water abstraction by our global factory network will be at or below 2008 levels (£2.97) despite significantly higher volumes (reduction in water abstraction in m³ per tonne of production since 2008)* |
£2.97 | 1.52† | 1.58à | 1.67D | ||||
| Waste Target: Halve the waste associated with the disposal of our products by 2020 (waste impact per consumer use; 2010 baseline)(c) |
(50%) | (34%)† | (32%) | (31%) | ||||
| Target: By 2020 total waste sent for disposal will be at or below 2008 levels (£7.91) despite significantly higher volumes (reduction in total waste in kg per tonne of production since 2008)* |
£7.91 | 0.34† | 0.30à | 0.23(e) | ||||
| Sustainable sourcing Target: By 2020 we will source 100% of our agricultural raw materials sustainably (% of tonnes purchased) |
100% | 67% | 62%à | 56% | ||||
| Enhancing livelihoods |
||||||||
| Fairness in the workplace Target: By 2020 we will advance human rights across our operations and extended supply chain, by: |
||||||||
| • Sourcing 100% of procurement spend from suppliers meeting the mandatory requirements of the Responsible Sourcing Policy (% of spend of suppliers meeting the Policy) |
100% | 83%† | 70% | 61%D | ||||
| • Reducing workplace injuries and accidents by 50%, from 2.10 accidents per 1 million hours worked in 2008 (reduction in Total Recordable Frequency Rate of workplace accidents per million hours worked since 2008)* |
1.05 | 0.63† | 0.76(f)à | 0.69D | ||||
| Opportunities for women Target: By 2020 we will empower 5 million women, by: |
||||||||
| • Promoting safety for women in communities where we operate (number of women) |
||||||||
| • Enhancing access to training and skills (number of women) |
5 million | 2.63 million(g)† | 2.34 million | 1.85 millionD | ||||
| • Expanding opportunities in our value chain (number of women) |
||||||||
| • Building a gender-balanced organisation with a focus on management (% of managers that are women)* |
50% | 50%† | 51% | 49%D | ||||
| Inclusive business Target: By 2020 we will have a positive impact on the lives of 5.5 million people by: |
||||||||
| • Enabling 5 million small-scale retailers to access initiatives aiming to improve their income (number of small-scale retailers since 2015) |
5 million | 1.83 million(g)† | 1.81 millionà | 1.73 million | ||||
| • Enabling 500,000 smallholder farmers to access initiatives aiming to improve their agricultural practices (number of smallholder farmers since 2011) |
0.50 million | 0.83 million(g)† | 0.79 millionà | 0.75 million | ||||
| * | Key Non-Financial Indicators. |
| † | PwC assured in 2020. For details and 2020 basis of preparation see www.unilever.com/investor-relations/annual-report-and-accounts |
| à | PwC assured in 2019. For details and 2019 basis of preparation see www.unilever.com/planet-and-society/sustainability-reporting-centre/reporting-archive |
| D | PwC assured in 2018. For details and 2018 basis of preparation see www.unilever.com/planet-and-society/sustainability-reporting-centre/reporting-archive |
| (a) | The number of people reached through TV advertisements and programmes aimed at encouraging health and hygiene behaviour change (‘TV reach’) includes Signal, Dove and Lifebuoy. |
| (b) | We have restated the change in our GHG emissions ‘per consumer use’ for prior years as a result of incorporating new data relating to the usage of our products, which changed the estimated GHG emissions in our 2010 baseline. See page 56 for more information. |
| (c) | Brackets around our GHG, waste and water footprints indicate that we have reduced our footprints by the numbers quoted. |
| (d) | Target approved by the Science Based Targets initiative. |
| (e) | Restated from 0.20 kg/tonne of production due to a classification error during the data reporting process. |
| (f) | 2019 Total Recordable Frequency Rate (TRFR) included for the first time all acquisitions which operate as decentralised business units, as we now have processes in place to collect the data. Had we included these acquisitions in 2018, our reported TRFR would have been approximately 6% higher. |
| (g) | Around 592,000 women have accessed initiatives under both the Inclusive business and the Opportunities for women pillars in 2020. |
Table of Contents
| Unilever Annual Report on Form 20-F 2020 | 35 |
Table of Contents
| 36 | Unilever Annual Report on Form 20-F 2020 |
| Highlights for the year ended | ||||||||||||||||||||||||||||||||||||||||||||
| Beauty & Personal Care | Foods & Refreshment | Home Care | Group | |||||||||||||||||||||||||||||||||||||||||
| 2020 | 2019 | 2020 | 2019 | 2020 | 2019 | 2020 | 2019 | |||||||||||||||||||||||||||||||||||||
| Turnover (€ million) | 21,124 | 21,868 | 19,140 | 19,287 | 10,460 | 10,825 | 50,724 | 51,980 | ||||||||||||||||||||||||||||||||||||
| Underlying sales growth (%) | 1.2 | 2.6 | 1.3 | 1.5 | 4.5 | 6.1 | 1.9 | 2.9 | ||||||||||||||||||||||||||||||||||||
| Underlying volume growth (%) | 1.2 | 1.7 | 0.1 | (0.2 | ) | 5.1 | 2.9 | 1.6 | 1.2 | |||||||||||||||||||||||||||||||||||
| Underlying price growth (%) | – | 0.9 | 1.1 | 1.7 | (0.6 | ) | 3.1 | 0.3 | 1.6 | |||||||||||||||||||||||||||||||||||
| Operating profit (€ million) | 4,311 | 4,520 | 2,749 | 2,811 | 1,243 | 1,377 | 8,303 | 8,708 | ||||||||||||||||||||||||||||||||||||
| Underlying operating profit (€ million) | 4,591 | 4,960 | 3,257 | 3,382 | 1,519 | 1,605 | 9,367 | 9,947 | ||||||||||||||||||||||||||||||||||||
| Operating margin (%) | 20.4 | 20.7 | 14.4 | 14.6 | 11.9 | 12.7 | 16.4 | 16.8 | ||||||||||||||||||||||||||||||||||||
| Underlying operating margin (%) | 21.7 | 22.7 | 17.0 | 17.5 | 14.5 | 14.8 | 18.5 | 19.1 | ||||||||||||||||||||||||||||||||||||
| Return on assets (%) | 140 | 124 | 69 | 61 | 129 | 99 | 102 | 89 | ||||||||||||||||||||||||||||||||||||
| Free cash flow (€ million) | 7,671 | 6,132 | ||||||||||||||||||||||||||||||||||||||||||
Table of Contents
| Unilever Annual Report on Form 20-F 2020 | 37 |
Table of Contents
| 38 | Unilever Annual Report on Form 20-F 2020 |
Financial review continued
Table of Contents
| Unilever Annual Report on Form 20-F 2020 | 39 |
Table of Contents
| 40 | Unilever Annual Report on Form 20-F 2020 |
Financial review continued
The reconciliation of changes in the GAAP measure of turnover to USG is as follows:
| 2020 vs 2019 (%) | Beauty & Personal Care |
Foods & Refreshment |
Home Care |
Total Group |
||||||||||||
| Turnover growth(a) | (3.4 | ) | (0.8 | ) | (3.4 | ) | (2.4 | ) | ||||||||
| Effect of acquisitions | 0.9 | 2.7 | 0.2 | 1.4 | ||||||||||||
| Effect of disposals | - | (0.4 | ) | (0.2 | ) | (0.2 | ) | |||||||||
| Effect of currency-related items, | (5.4 | ) | (4.2 | ) | (7.5 | ) | (5.4 | ) | ||||||||
| of which: | ||||||||||||||||
| Exchange rate changes |
(5.6 | ) | (4.6 | ) | (7.8 | ) | (5.7 | ) | ||||||||
| Extreme price growth in hyperinflationary markets(b) |
0.2 | 0.5 | 0.3 | 0.3 | ||||||||||||
| Underlying sales growth(b) | 1.2 | 1.3 | 4.5 | 1.9 | ||||||||||||
| 2019 vs 2018 (%) | ||||||||||||||||
| Turnover growth(a) | 6.0 | (4.6 | ) | 6.9 | 2.0 | |||||||||||
| Effect of acquisitions | 0.9 | 0.6 | 0.3 | 0.7 | ||||||||||||
| Effect of disposals | - | (7.5 | ) | - | (3.0 | ) | ||||||||||
| Effect of currency-related items, | 2.4 | 1.0 | 0.4 | 1.5 | ||||||||||||
| of which: | ||||||||||||||||
| Exchange rate changes |
1.7 | (3.5 | ) | (0.3 | ) | (0.7 | ) | |||||||||
| Extreme price growth in hyperinflationary markets(b) |
0.6 | 4.7 | 0.7 | 2.2 | ||||||||||||
| Underlying sales growth(b) | 2.6 | 1.5 | 6.1 | 2.9 | ||||||||||||
| 2018 vs 2017 (%) | ||||||||||||||||
| Turnover growth(a) | (0.3 | ) | (9.9 | ) | (4.2 | ) | (5.1 | ) | ||||||||
| Effect of acquisitions | 3.9 | 0.8 | 0.5 | 2.0 | ||||||||||||
| Effect of disposals | – | (7.2 | ) | (0.2 | ) | (3.0 | ) | |||||||||
| Effect of currency-related items, | (7.2 | ) | (5.8 | ) | (8.8 | ) | (7.0 | ) | ||||||||
| of which: | ||||||||||||||||
| Exchange rate changes |
(8.1 | ) | (47.7 | ) | (9.1 | ) | (29.4 | ) | ||||||||
| Extreme price growth in hyperinflationary markets(b) |
1.0 | 79.1 | 0.4 | 31.7 | ||||||||||||
| Underlying sales growth(b) | 3.4 | 2.2 | 4.7 | 3.2 | ||||||||||||
| (a) | Turnover growth is made up of distinct individual growth components, namely underlying sales, currency impact, acquisitions and disposals. Turnover growth is arrived at by multiplying these individual components on a compounded basis as there is a currency impact on each of the other components. Accordingly, turnover growth is more than just the sum of the individual components. |
| (b) | Underlying price growth in excess of 26% per year in hyperinflationary economies has been excluded when calculating the underlying sales growth in the tables above, and an equal and opposite amount is shown as extreme price growth in hyperinflationary markets. |
Table of Contents
| Unilever Annual Report on Form 20-F 2020 | 41 |
Table of Contents
| 42 | Unilever Annual Report on Form 20-F 2020 |
Financial review continued
Table of Contents
| Unilever Annual Report on Form 20-F 2020 | 43 |
Table of Contents
Table of Contents
| Unilever Annual Report on Form 20-F 2020 | 45 |
Table of Contents
| 46 | Unilever Annual Report on Form 20-F 2020 |
Our risks continued
Principal risk factors
| Risk
|
Risk description
|
Level of risk
| ||||
| Brand preference | Our success depends on the value and relevance of our brands and products to consumers around the world and on our ability to innovate and remain competitive. |
Increase | ||||
|
Consumer tastes, preferences and behaviours are changing more rapidly than ever before. We see a growing trend for consumers preferring brands which both meet their functional needs and have an explicit social purpose. |
||||||
| Technological change is disrupting our traditional brand communication models. Our ability to develop and deploy the right communication, both in terms of messaging content and medium is critical to the continued strength of our brands. | ||||||
| We are dependent on creating innovative products that continue to meet the needs of our consumers and getting these new products to market with speed. | ||||||
| The Covid-19 pandemic has driven significant changes in consumer habits and demand which is requiring a continuing and rapid evolution of our brands.
|
||||||
| Portfolio management | Unilever’s strategic investment choices will affect the long-term growth and profits of our business. |
No change | ||||
|
Unilever’s growth and profitability are determined by our portfolio of divisions, geographies and channels and how these evolve over time. If Unilever does not make optimal strategic investment decisions, then opportunities for growth and improved margin could be missed.
|
||||||


Table of Contents
| Unilever Annual Report on Form 20-F 2020 | 47 |
Table of Contents
| 48 | Unilever Annual Report on Form 20-F 2020 |
Our risks continued
| Risk
|
Risk description
|
Level of risk
| ||||
| Talent | A skilled workforce and agile ways of working are essential for the continued success of our business. |
Increase | ||||
|
With the rapidly changing nature of work and skills, there is a risk that our workforce is not equipped with the skills required for the new environment. |
||||||
| Our ability to attract, develop and retain a diverse range of skilled people is critical if we are to compete and grow effectively. This is especially true in our key emerging markets where there can be a high level of competition for a limited talent pool. | ||||||
| The loss of management or other key personnel or the inability to identify, attract and retain qualified personnel could make it difficult to manage the business and could adversely affect operations and financial results. | ||||||
| The wellbeing of our employees is vital to the success of our business. Covid-19 has had a significant impact on their wellbeing, therefore helping our employees manage the impact of Covid-19 on their lives and their ability to work effectively requires continued focus.
|
||||||
| Supply chain | Our business depends on purchasing materials, efficient manufacturing and the timely distribution of products to our customers. |
Increase | ||||
|
Our supply chain network is exposed to potentially adverse events such as physical disruptions, environmental and industrial accidents, trade restrictions or disruptions at a key supplier, which could impact our ability to deliver orders to our customers. |
||||||
| Covid-19 is an adverse event that has challenged and continues to challenge the continuity of our supply chain. Maintaining manufacturing and logistics operations whilst adhering to changing local regulations and meeting enhanced health and safety standards requires continued focus and flexibility. | ||||||
| The cost of our products can be significantly affected by the cost of the underlying commodities and materials from which they are made. Fluctuations in these costs cannot always be passed on to the consumer through pricing.
|
||||||
| Safe and high-quality products | The quality and safety of our products are of paramount importance for our brands and our reputation. |
No change | ||||
|
The risk that raw materials are accidentally or maliciously contaminated throughout the supply chain or that other product defects occur due to human error, equipment failure or other factors cannot be excluded. |
||||||
| Labelling errors can have potentially serious consequences for both consumer safety and brand reputation. Therefore on-pack labelling needs to provide clear and accurate ingredient information in order that consumers can make informed decisions regarding the products they buy.
|
||||||
Table of Contents
| Unilever Annual Report on Form 20-F 2020 | 49 |
Table of Contents
| 50 | Unilever Annual Report on Form 20-F 2020 |
Our risks continued
| Risk
|
Risk description
|
Level of risk
| ||||
| Treasury and Tax | Unilever is exposed to a variety of external financial risks in relation to Treasury and Tax. |
No change | ||||
|
The relative values of currencies can fluctuate widely and could have a significant impact on business results. Further, because Unilever consolidates its financial statements in euros, it is subject to exchange risks associated with the translation of the underlying net assets and earnings of its foreign subsidiaries. |
||||||
| We are also subject to the imposition of exchange controls by individual countries which could limit our ability to import materials paid in foreign currency or to remit dividends to the parent company. | ||||||
| A material shortfall in our cash flow could undermine Unilever’s credit rating, impair investor confidence and restrict Unilever’s ability to raise funds. In times of financial crisis, there is a further risk that we may not be able to raise funds due to market liquidity. | ||||||
| We are exposed to counter-party risks with banks, suppliers and customers which could result in financial losses. | ||||||
| Tax is a complex and evolving area where laws and their interpretation are changing regularly, leading to the risk of unexpected tax exposures. International tax reform remains a key focus of attention with the OECD’s Base Erosion and Profit Shifting project, and the Digitalising Economy Project, and further potential tax reform in the EU.
|
||||||
| Ethical | Unilever’s brands and reputation are valuable assets and the way in which we operate, contribute to society and engage with the world around us is always under scrutiny both internally and externally. |
No change | ||||
|
Acting in an ethical manner, consistent with the expectations of customers, consumers and other stakeholders, is essential for the protection of the reputation of Unilever and its brands. |
||||||
| A key element of our ethical approach to business is to reduce inequality and promote fairness. Our activities touch the lives of millions of people and it is our responsibility to protect their rights and help them live well. The safety of our employees and the people and communities we work with is critical. Failure to meet these high standards could result in damage to Unilever’s corporate reputation and business results.
|
||||||
| Legal and regulatory | Compliance with laws and regulations is an essential part of Unilever’s business operations. |
No change | ||||
|
Unilever is subject to national and regional laws and regulations in such diverse areas as product safety, product claims, trademarks, copyright, patents, competition, employee health and safety, data privacy, the environment, corporate governance, listing and disclosure, employment and taxes. |
||||||
| Failure to comply with laws and regulations could expose Unilever to civil and/or criminal actions leading to damages, fines and criminal sanctions against us and/or our employees with possible consequences for our corporate reputation. Changes to laws and regulations could have a material impact on the cost of doing business.
|
||||||
Table of Contents
| Unilever Annual Report on Form 20-F 2020 | 51 |
Table of Contents
| 52 | Unilever Annual Report on Form 20-F 2020 |
Sustainability deep-dives continued
Table of Contents
| Unilever Annual Report on Form 20-F 2020 | 53 |
 Palm oil
Table of Contents
| 54 | Unilever Annual Report on Form 20-F 2020 |
Sustainability deep-dives continued
 Soybean oil
 Black tea
Table of Contents
| Unilever Annual Report on Form 20-F 2020 | 55 |
Table of Contents
| 56 | Unilever Annual Report on Form 20-F 2020 |
Sustainability deep-dives continued
Table of Contents
| Unilever Annual Report on Form 20-F 2020 | 57 |

Table of Contents
| 58 | Unilever Annual Report on Form 20-F 2020 |
Sustainability deep-dives continued
Table of Contents
| Unilever Annual Report on Form 20-F 2020 | 59 |
Table of Contents
| 60 | Unilever Annual Report on Form 20-F 2020 |
Sustainability deep-dives continued
 Find out more about our actions on plastic packaging on our website
Non-financial information statement
In accordance with sections 414CA and 414CB of the Companies Act 2006 which outline requirements for non-financial reporting, the table below is intended to provide our stakeholders with the content they need to understand our development, performance, position and the impact of our activities with regards to specified non-financial matters. Further information on these matters can be found on our website and in our Human Rights Report, including relevant policies.
| Non-financial matter and relevant sections of Annual Report
|
Annual Report page reference | |
|
Environmental matters
Relevant sections of Annual Report and Accounts: ◾ Protecting climate and nature ◾ Net zero emissions ◾ A waste-free world ◾ Protecting and regenerating nature ◾ Protecting water ◾ In focus: Climate change ◾ In focus: Plastic packaging
|
◾ Policy: pages 28 to 29 ◾ Position and performance: pages 28 to 29, 34, 56 to 57 and 59 ◾ Risk: pages 47, 55 to 56 and 58 to 59 ◾ Impact: pages 28 to 29 | |
| Social and community matters
Relevant sections of Annual Report and Accounts: ◾ A fairer more socially inclusive world ◾ Better health and hygiene
|
◾ Policy: pages 30 to 31 ◾ Position and performance: pages 30 to 31 and 34 ◾ Risk: page 50 ◾ Impact: pages 30 to 31
| |
| Employee matters
Relevant sections of Annual Report and Accounts: ◾ Making our supply chain more diverse ◾ Protecting wellbeing ◾ Safety at work ◾ A year of learning ◾ Managing talent ◾ A beacon for diversity
|
◾ Policy: pages 16 to 19 ◾ Position and performance: pages 16 to 19 and 34 ◾ Risk: page 48 ◾ Impact: pages 16 to 19 | |
| Human rights matters
Relevant sections of Annual Report and Accounts: ◾ Promoting human rights ◾ Raising living standards
|
◾ Policy: page 30 ◾ Position and performance: page 30 ◾ Risk: pages 50 and 59 ◾ Impact: page 30
| |
| Anti-corruption and bribery matters
Relevant sections of Annual Report and Accounts: ◾ Working with integrity |
◾ Policy: Page 18 ◾ Position and performance: Page 18 ◾ Risk: Page 50 ◾ Impact: Page 18
| |
Table of Contents
| Unilever Annual Report on Form 20-F 2020 | 61 |

Table of Contents
| 62 | Unilever Annual Report on Form 20-F 2020 |
Corporate Governance continued
Table of Contents
| Unilever Annual Report on Form 20-F 2020 | 63 |
Table of Contents
| 64 | Unilever Annual Report on Form 20-F 2020 |
Our Board of Directors
Our Non-Executive Directors bring diverse experience to the Board’s
strategic discussions and decision-making.
|
|
|
| ||||||||||||

|
Nils Andersen Chairman
Nationality Danish Age 62, Male Appointed April 2015
|

|
Youngme Moon Vice-Chairman/Senior Independent Director
Nationality American Age 56, Female Appointed April 2016
|

|
Alan Jope CEO
Nationality British Age 56, Male Appointed CEO January 2019 Appointed Director May 2019 | |||||||||
|
|
|
| ||||||||||||
| Previous experience: BP plc (NED); A.P. Moller – Maersk A/S (Group CEO); Carlsberg A/S and Carlsberg Breweries A/S (CEO); European Round Table of Industrialists (Vice-Chairman); Unifeeder S/A (Chairman).
Current external appointments: AKZO Nobel N.V. (Chairman); Faerch Plast (Chairman); Salling Foundation (NED); Worldwide Flight Services (Chairman). |
Previous experience: Harvard Business School (Chairman and Senior Associate Dean for the MBA Program); Massachusetts Institute of Technology (Professor); Avid Technology (NED); Rakuten Inc (NED).
Current external appointments: Mastercard INC (Board Member); Sweetgreen Inc (Board Member); JAND Inc (Board Member); Harvard Business School (Professor). |
Previous experience: Beauty and Personal Care Division (President); Unilever Russia, Africa and Middle East (President); Unilever North Asia (President); SCC and Dressings (Global Category Leader); Home and Personal Care North America (President).
Current external appointments: Generation Unlimited (Board Member). | ||||||||||||
|
|
|
| ||||||||||||

|
Graeme Pitkethly CFO
Nationality British Age 54, Male Appointed CFO October 2015 Appointed Director April 2016 |

|
Laura Cha Non-Executive Director
Nationality Chinese Age 71, Female Appointed May 2013
|

|
Vittorio Colao Non-Executive Director
Nationality Italian Age 59, Male Appointed July 2015 Stepped down as a director on 18 February 2021
| |||||||||
|
|
|
| ||||||||||||
| Previous experience: Unilever UK and Ireland (EVP and General Manager); Finance Global Markets (EVP); Group Treasurer; Head of M&A; FLAG Telecom (VP Corporate Development); PwC.
Current external appointments: Pearson Plc (NED); Financial Stability Board Task Force on Climate-related Financial Disclosures (Vice Chair); The 100 Group Main Committee (Vice Chair); UN Global Compact CFO Task Force. |
Previous experience: Securities and Futures Commission, Hong Kong (Deputy Chairman); China Securities Regulatory Commission (Vice Chairman); China Telecom Corporation Limited (NED); 12th National People’s Congress of China (Hong Kong Delegate).
Current external appointments: HSBC Holdings plc (NED); Hong Kong Exchanges and Clearing Ltd (Non-Executive Chairman); Foundation Asset Management Sweden AB (Senior International Adviser); Executive Council of the Hong Kong Special Administrative Region (Non-official member); CSRC International Advisory Council (Vice Chairman). |
Previous experience: Vodafone Group plc (CEO); RCS MediaGroup SpA (CEO); McKinsey & Company (Partner); Finmeccanica Group Services SpA (renamed to Leonardo SpA) (NED); RAS Insurance SpA (merged with Allianz AG) (NED).
Current external appointments: Verizon Communications Inc. (NED); General Atlantic (Senior Advisor / Vice Chairman EMEA); Bocconi University Italy (Executive Trustee); Oxford Martin School – UK (Advisor); MedTech-Humanitas / Politecnico – Italy (Advisor). | ||||||||||||
|
|
|
| ||||||||||||

|
Judith Hartmann Non-Executive Director
Nationality Austrian Age 51, Female Appointed April 2015
|

|
Andrea Jung Non-Executive Director
Nationality American/Canadian Age 61, Female Appointed May 2018
|

|
Susan Kilsby Non-Executive Director
Nationality American/British Age 62, Female Appointed August 2019
| |||||||||
|
|
|
| ||||||||||||
| Previous experience: Suez (NED); General Electric (various roles); Bertelsmann SE & Co. KGaA (CFO); RTL Group SA (NED); Penguin Random House LLC (NED).
Current external appointments: ENGIE Group (Deputy CEO). |
Previous experience: Avon Products Inc (CEO); General Electric (Board Member); Daimler AG (Board Member).
Current external appointments: Grameen America Inc (President and CEO); Apple Inc (NED); Wayfair Inc (NED). |
Previous experience: L’Occitane International (NED); Keurig Green Mountain (NED); Coca-Cola HBC AG (NED); Goldman Sachs International (NED); Shire Plc (Chair); Mergers and Acquisitions, EMEA – Credit Suisse (Chair).
Current external appointments: Fortune Brands Home & Security Inc (Chair); Diageo Plc (Senior Independent Director); BHP Plc (NED).
| ||||||||||||
|
|
|
| ||||||||||||


| Committee membership key | ||||||||

|
Audit Committee |

|
Nominating and Corporate Governance Committee | |||||

|
Compensation Committee |

|
Chair | |||||

|
Corporate Responsibility Committee | |||||||
Table of Contents
| Unilever Annual Report on Form 20-F 2020 | 65 |


Table of Contents
| 66 | Unilever Annual Report on Form 20-F 2020 |
Unilever Leadership Executive (ULE)
Our executive management team is responsible for the day-to-day
running of the business and the execution of our strategy.
For Alan Jope and Graeme Pitkethly see page 64


Table of Contents
| Unilever Annual Report on Form 20-F 2020 | 67 |


Table of Contents
| 68 | Unilever Annual Report on Form 20-F 2020 |
Corporate Governance continued
 www.administratiekantoor-unilever.nl/eng/home
Table of Contents
| Unilever Annual Report on Form 20-F 2020 | 69 |
Table of Contents
Table of Contents
| Unilever Annual Report on Form 20-F 2020 | 71 |
Table of Contents
Table of Contents
| Unilever Annual Report on Form 20-F 2020 | 73 |
Table of Contents
 www.unilever.com/corporategovernance
Table of Contents
| Unilever Annual Report on Form 20-F 2020 | 75 |

Table of Contents
Table of Contents
| Unilever Annual Report on Form 20-F 2020 | 77 |
Table of Contents
| 78 | Unilever Annual Report on Form 20-F 2020 |
Directors’ Remuneration Report continued
Table of Contents
| Unilever Annual Report on Form 20-F 2020 | 79 |
Table of Contents
| 80 | Unilever Annual Report on Form 20-F 2020 |
Directors’ Remuneration Report continued
|
Annual bonus
|
||
| Purpose and link to strategy | Performance measures | |
| Incentivises year-on-year delivery of rigorous short-term financial, strategic and operational objectives selected to support our annual business strategy and the ongoing enhancement of shareholder value.
The ability to recognise performance through annual bonus enables us to manage our cost base flexibly and react to events and market circumstances.
Operation
Each year Executive Directors may have the opportunity to participate in the annual bonus plan. Executive Directors are set a target opportunity that is assessed against the business performance multiplier of up to 150% of target opportunity at the end of the year.
Directors are required to defer 50% of their bonus into shares or share awards for three years. Deferred bonus awards can earn dividends or dividend equivalents during the vesting period and may be satisfied in cash and/or shares. Deferral may be effected under the Unilever Share Plan, or by such other method as the Committee determines.
Ultimate remedy/malus and claw-back provisions apply (see details on page 81).
Opportunity
The maximum annual bonus opportunity under this Policy is 225% of fixed pay.
The normal target bonus opportunity for the CEO is 150% of fixed pay, and for the CFO is 120% of fixed pay. This results in normal maximums of 225% and 180% respectively.
Achievement of threshold performance results in a payout of 0% of the maximum opportunity.
|
The business performance multiplier is based on a range of business metrics set by the Committee on an annual basis to ensure that they are appropriately stretching for the delivery of threshold, target and maximum performance. These performance measures may include Underlying Sales Growth (USG), Underlying Operating Margin improvement (UOM) and Free Cash Flow (FCF), along with any other measures chosen by the Committee, as appropriate. The Committee also sets the weightings of the respective metrics on an annual basis.
The Committee has discretion to adjust the formulaic outcome of the business performance multiplier, if it believes this better reflects the underlying performance of Unilever. In any event, the overall business performance multiplier will not exceed 150%. The use of any discretion will be fully disclosed in the directors’ remuneration report for the year to which discretion relates.
The Committee may introduce non-financial measures in the future subject to a minimum of 70% of targets being financial in nature.
Performance is normally measured over the financial year.
Supporting information
There are two changes from the previous policy. The first is the requirement for 50% of bonus to be deferred, rather than voluntarily invested into the Management Co-Investment Plan (the historic long-term incentive plan). The second is that the Committee can now override any formulaic outcome (including to nil), instead of being limited to adjusting by 25%. This is in line with best practice and the UK Corporate Governance Code. Any exercise of discretion will continue to be disclosed in full in the relevant directors’ remuneration report.
The Policy sets out a single maximum opportunity that applies to any potential Executive Director, this is different to the previous policy which sets out different maximum opportunities for each Director. This is intended to simplify the Policy, and provide flexibility if needed over the course of the Policy. If the Committee sought to increase the annual grant for the CFO, it would only do so after engaging with shareholders.
| |
Table of Contents
| Unilever Annual Report on Form 20-F 2020 | 81 |
Table of Contents
| 82 | Unilever Annual Report on Form 20-F 2020 |
Directors’ Remuneration Report continued
Malus: Malus is the adjustment of bonus, unvested deferred bonus awards or unvested LTIP awards (both PSP awards under this Remuneration Policy, and predecessor awards under any previous remuneration policies). The Committee may apply malus to reduce an award or determine that it will not vest or only vest in part. Malus applies to deferred bonus awards during the three-year deferral period and to unvested LTIP awards (PSP awards under this Remuneration Policy and predecessor awards under any previous remuneration policies) during the vesting period and retention period, in the event of:
| ◾ a significant downward restatement of the financial results of Unilever; |
| ◾ gross misconduct or gross negligence; |
| ◾ material breach of Unilever’s Code of Business Principles or any of the Unilever Code Policies; |
| ◾ breach of restrictive covenants by which the individual has agreed to be bound, or conduct by the individual which results in significant losses or serious reputation damage to Unilever; and |
| ◾ for PSP awards and deferred bonus awards, error in calculation or misleading data or corporate failure. |
The annual bonus will also be subject to malus on the same grounds as apply for deferred bonus awards and unvested LTIP awards. This power is an addition to the normal discretion to adjust awards and the additional sustainability test outlined in the policy table.
Ultimate remedy: Awards under the PSP (and predecessor long-term incentives under any previous remuneration policy) are subject to ultimate remedy. Upon vesting of an award, the Committee shall have the discretionary power to adjust the value of the award if the award, in the Committee’s opinion taking all circumstances into account, produces an unfair result. In exercising this discretion, the Committee may take into account Unilever’s performance against non-financial measures.
These powers are in addition to the normal discretion to adjust awards and the additional sustainability test outlined in the policy table.
Ultimate remedy/malus and claw-back will not apply to an award which has been exchanged following a change of control and claw-back will not apply where an award vests on a change of control.
Committee discretion to amend targets/measures: For PSP awards (or MCIP awards under the previous policy) and annual bonus, the Committee may change a performance measure or target (including replacing a measure) in accordance with the award’s terms or if anything happens which causes the Committee reasonably to consider it appropriate to do so. The Committee may also adjust the number or class of shares subject to MCIP, PSP and deferred bonus awards if certain corporate events (e.g. rights issues) occur.
The Committee will continue to review targets on all unvested awards in the event of any material acquisitions or disposals that were not included in the financial plan, or were not anticipated at the time of target setting. The Committee may make adjustments if deemed appropriate to ensure that all targets remain relevant and equally stretching in light of any M&A activity, other corporate events, or any other event that the Committee considers to be material, that was not foreseen at the time of target setting.
Legacy arrangements
For the duration of this Remuneration Policy, entitlements arising before the adoption of this Remuneration Policy will continue to be honoured in line with the approved remuneration policy under which they were granted, or their contractual terms.
The Committee reserves the right to make any remuneration payments and payments for loss of office (including exercising any relevant discretions) notwithstanding that they are not in line with this Remuneration Policy where the terms of the payment were agreed before this Remuneration Policy came into effect or at a time when the relevant individual was not a Director of Unilever and, in the opinion of the Committee, the payment was not in consideration for the individual becoming a Director of Unilever. For these purposes, ‘payments’ includes the Committee satisfying awards of variable remuneration and, in relation to an award over shares, the terms of the payment are ‘agreed’ at the time the award is granted.
Remuneration scenarios: our emphasis on performance-related pay
It is Unilever’s policy that the total remuneration package for Executive Directors should be competitive with other global companies and that a significant proportion should be performance-related.
For the remuneration scenarios below, the maximum and target pay opportunities have been chosen to be consistent with the current levels for Executive Directors. In reviewing the appropriate level of pay opportunity for the Executive Directors, the Committee considers internal and external comparators. Although pay is not driven by benchmarking, the Committee is aware that pay needs to be within a reasonable range of competitive practice. The Committee notes that total target pay is slightly below lower quartile for the CEO and slightly below median for our CFO for the benchmark group used by the Committee.
The Committee typically reviews, on at least an annual basis, the impact of different performance scenarios on the potential reward opportunity and payouts to be received by Executive Directors and the alignment of these with the returns that might be received by shareholders. The Committee believes that the level of remuneration that can be delivered in the various scenarios is appropriate for the level of performance delivered and the value that would be delivered to shareholders. The charts below show hypothetical values of the remuneration package for Executive Directors in the first full year of the policy under below threshold, target and maximum performance scenarios.
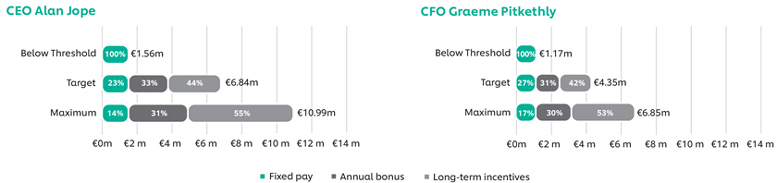
Table of Contents
| Unilever Annual Report on Form 20-F 2020 | 83 |
Table of Contents
| 84 | Unilever Annual Report on Form 20-F 2020 |
Directors’ Remuneration Report continued
Changes in pay policy generally
The key changes in the new Remuneration Policy are to:
| ◾ | replace the current long-term incentive plan, the MCIP with the PSP – a long-term incentive plan that is operated entirely separately from the annual bonus plan; |
| ◾ | replace voluntary investment in the long-term incentive plan with a mandatory deferral of 50% of the annual bonus into shares or share awards, for three years; |
| ◾ | change the performance measures for the long-term incentive plan (to maximise the strategic alignment as outlined above); |
| ◾ | reduce maximum total pay; and |
| ◾ | maintain a five-year period from award to release on PSP by reducing the performance period from four years to three years, and increasing the retention period from one year to two years. |
The Committee wants to increase the impact, traction and resilience of Unilever’s incentives to drive sustainable long-term growth which can be better achieved with distinct short- and long-term incentive plans, enabling the Committee to set stretching but achievable performance targets over realistic timeframes. This change more closely aligns Unilever’s reward structure with standard market practice.
By separating short- and long-term incentive plans the policy will further simplify executive pay. Currently, these are linked by our MCIP as the MCIP opportunity is driven by the outcome of the annual bonus plan. Delinking the two plans will deleverage incentives, reduce maximum pay and make our incentives more resilient and less dependent on the short-term incentive.
Change in target and maximum pay levels
In moving from the current MCIP to the proposed PSP structure, the quantum of the previous annual bonus has been unchanged and the quantum of the PSP has been increased at target and decreased at maximum. The overall result is an increase in target pay of 13%/12% for the CEO/CFO respectively and decrease in maximum pay of 6% for both individuals.
As fixed pay and annual bonus opportunities have been unchanged, this increase in target opportunity will only be realised subject to performance against stretching three-year performance conditions and will be delivered fully in shares which executives will not normally be able to sell until five years after grant. This is to create an even stronger alignment to both the long-term performance of the business and the shareholder experience, and to address shareholder comments on the levels of maximum pay available under the previous structure.
In determining the appropriate quantum, the Committee did consider external benchmarking data against a group of comparable major European companies. Whilst the Committee is not led by benchmarking data, or target a specific benchmark position, this data is used as a reference point to ensure that pay levels are not significantly out of line with the market. Under the proposed changes total target compensation is slightly below lower quartile for our CEO and slightly below median for our CFO. This is despite the fact that Unilever is above the upper quartile of this group by market capitalisation. The Committee believes this data shows that the proposals do not provide excessive levels of remuneration versus the market. In addition, the Committee believes that a lower level of target compensation would create undue risks in terms of retention or any future recruitment.
The Committee was also cognisant of the need to maintain a sufficient pay differential between the Executive Directors and the rest of the ULE and this modest increase at target pay helps the Committee to do this.
Application beyond the Board
Remuneration arrangements are determined throughout the Group based on the same principle: that reward should support our business strategy and should be sufficient to attract and retain high-performing individuals without paying more than is necessary. Unilever is a global organisation with employees at a number of different levels of seniority and in a number of different countries and, while this principle underpins all reward arrangements, the way it is implemented varies by geography and level.
In principle, all our managers participate in the same Unilever annual bonus scheme with the same performance measures based on Unilever’s overall performance and the requirement to defer 50% of bonus also extends to the ULE. The intention is to extend the new policy across all of Unilever’s 14,400+ managers worldwide in 2021. Wherever possible, all other employees have the opportunity to participate in the global ’buy 3 get 1 free’ employee share plan called ‘SHARES’, which is offered in more than 100 countries.
Through these initiatives we continue to encourage all our employees to adopt an owner’s mindset with the goal of achieving our growth ambition, so they can share in the future long-term success of Unilever.
Stakeholders’ considerations:
Guided by our purpose-led and future-fit business model the Committee has applied a multi-stakeholder approach in reviewing the current reward framework in view of the 2021 policy renewal. The Committee has therefore engaged with various stakeholders, both internally and externally as set out below.
Consideration of conditions elsewhere in the Group
When determining the pay of Executive Directors, the Committee considers the pay arrangements for other employees in the Group, including considering the average global pay review budget for the management population, to ensure that remuneration arrangements for Executive Directors remain reasonable. Unilever takes the views of its employees seriously and on an ongoing basis, we conduct the ‘Rate-My-Reward’ survey to gauge the views of employees on the different parts of their reward package.
In establishing the Future Reward Framework, Unilever conducted an employee survey amongst its WL1+ population to seek their views on Unilever’s approach to reward. Interviews and focus groups have also been organised for the management population to receive feedback on the proposed Future Reward Framework. In addition, the company consulted with the European Works Council and employee representation bodies in other relevant jurisdictions. Employees value the mix between fixed and variable pay, and the various benefits (including non-cash benefits), but there is also a desire for more flexibility in reward to fit individual’s different life stages. The Future Reward Framework is well received for its simplicity and market alignment. It is seen as a more competitive, inclusive and fair reward programme. The ability to receive the bonus in cash rather than having to invest it to receive a long-term incentive award is valued in times of uncertainty caused by the Covid-19 pandemic. More senior employees would have preferred the continuation of an attractive opportunity to investment in Unilever shares. Based on feedback from the European Works Council, we will continue to explore opportunities to widen and deepen Unilever’s all-employee share scheme.
Fairness in the workplace is a core pillar of the Compass and incorporates our Framework for Fair Compensation. As part of our Framework’s living wage element, we are committed to pay a living wage to all our direct employees. At the end of 2020, 100% of Unilever’s direct employees globally were paid at or above a certified living wage level. Further detail can be found on page 19. The living wage principle is also endorsed as good practice in Unilever’s Responsible Sourcing Policy. The Committee already upholds its obligation under Section 172 of the UK Companies Act 2006 (see page 14) to consider the impact of what we do on our multiple stakeholders. These considerations shape the way the Committee looks at pay and sets pay rates for our Executive and Non-Executive Directors relative to our wider workforce. We will continue to advance these initiatives over the years ahead to enhance the livelihoods of all our employees.
 www.unilever.com/planet-and-society
Table of Contents
| Unilever Annual Report on Form 20-F 2020 | 85 |
Table of Contents
| 86 | Unilever Annual Report on Form 20-F 2020 |
Directors’ Remuneration Report continued
| Service contracts | ||||
| Policy in relation to Executive Director service contracts and payments in the event of loss of office | ||||
| Service contracts & notice period |
Current Executive Directors’ service contracts are not for a fixed duration but are terminable upon notice (12 months’ notice from Unilever, six months’ notice from the Executive Director), and are available for shareholders to view at the AGM or on request from the Group Secretary. Starting dates of the service contracts for the current CEO and CFO: CEO: 1 January 2019 (signed on 16 December 2020); and CFO: 1 October 2015 (signed on 16 December 2015). | |||
| Termination payments | A payment in lieu of notice can be made, to the value of no more than 12 months’ fixed pay and other benefits (unless dictated by applicable law). | |||
| Other elements | ◾ |
Executive Directors may, at the discretion of the Board, remain eligible to receive an annual bonus for the financial year in which they cease employment. Such annual bonus will be determined by the Committee taking into account time in employment and performance. | ||
| ◾ |
Treatment of share awards is as set out in the section on leaver provisions, below. | |||
| ◾ |
Any outstanding all-employee share arrangements will be treated in accordance with HMRC-approved terms. | |||
| ◾ |
Other payments, such as legal or other professional fees, repatriation or relocation costs and/or outplacement fees, may be paid if it is considered appropriate. Additional payments may be permitted at the proposal of the Committee if the Committee considers not allowing such a payment would be manifestly unreasonable given the circumstances. | |||
| ◾ |
The Committee reserves the discretion to approve gifts to Executive Directors who are retiring or who are considered by the Board to be otherwise leaving in good standing (e.g. those leaving office for any reason other than termination by Unilever or in the context of misconduct). If the value of the gift for any one Executive Director exceeds £5,000 it will be disclosed in the relevant directors’ remuneration report. Where a tax liability is incurred on any such a gift, the Committee has the discretion to approve the payment of such liability on behalf of the Executive Director in addition to the value of the gift. | |||
| Leaver provisions in share plan rules | ||||||
| ‘Good leavers’ as determined by the Committee in accordance with the plan rules*
|
Leavers in other circumstances* |
Change of control | ||||
| Investment shares under the MCIP |
Investment shares are not impacted by termination (although they may be transferred to the personal representative of the Executive Director in the event of his or her death without causing the corresponding matching shares to lapse). | Investment shares are not impacted by termination. | Investment shares may normally be disposed of in connection with a change of control without causing the corresponding matching shares to lapse. Alternatively, Executive Directors may be required to exchange the investment shares for equivalent shares in the acquiring company.
| |||
| PSP awards and awards of matching shares under MCIP | Awards will normally vest following the end of the original performance period, taking into account performance and (unless the Board on the proposal of the Committee determine otherwise) pro-rated for time in employment. Alternatively, the Board may determine that awards shall vest upon termination based on performance at that time and pro-rated for time in employment (unless the Board on the proposal of the Committee determine otherwise). If an Executive Director dies or leaves due to ill health, injury or disability, awards will vest at the time of death or leaving at the target level of vesting (in case of death pro-rated for time in employment if the Director had previously left as a good leaver).
|
Awards will normally lapse upon termination. | Awards will vest based on performance at the time of the change of control and the Board, on the proposal of the Committee, have the discretion to pro-rate for time. Alternatively, Executive Directors may be required to exchange the awards for equivalent awards over shares in the acquiring company.
The retention period of a PSP award will end on a change of control. | |||
|
Deferred bonus awards |
Unvested deferred bonus awards will continue in effect and vest on the normal timescale unless the Executive Director is terminated for misconduct or breach of the terms of their employment, unless the Committee decides otherwise.
|
Unvested deferred bonus awards vest in full. | ||||
| * | An Executive Director will usually be treated as a good leaver if he or she leaves due to ill health, injury or disability, retirement with Unilever’s agreement or redundancy, or death in service. The Board may decide to treat an Executive Director who leaves in other circumstances as a good leaver. An Executive Director will not be treated as a good leaver if he or she chooses to leave for another job elsewhere unless the Board determines otherwise, if he or she is summarily dismissed or leaves because of concerns about performance. In deciding whether or not to treat an Executive Director as a good leaver, the Board will have regard to his or her performance in the role. |
If Unilever is affected by a demerger, special distribution or other transaction which may affect the value of awards, the Committee may allow PSP awards, matching shares under legacy MCIP and/or deferred bonus awards to vest early over such number of shares as it shall determine (to the extent any performance measures have been met) and awards may be pro-rated to reflect the acceleration of vesting at the Committee’s discretion.
Table of Contents
| Unilever Annual Report on Form 20-F 2020 | 87 |
Table of Contents
| 88 | Unilever Annual Report on Form 20-F 2020 |
Directors’ Remuneration Report continued
Annual report on remuneration
This section sets out how Unilever’s remuneration policy (which was approved by shareholders at the May 2018 AGMs and is available on our website) was implemented in 2020. Furthermore, the following sets out how our new Remuneration Policy (as set out on pages 79 to 87) will be implemented if it receives shareholder approval at the 2021 AGM.
www.unilever.com/remuneration-policy
Implementation of the Remuneration Policy for Executive Directors
If approved by shareholders, Unilever’s new Remuneration Policy will be implemented with effect from the 2021 AGM as set out below. If the updated Remuneration Policy is not approved, Unilever’s existing remuneration policy will continue to apply.
| Elements of remuneration | ||
| Fixed Pay | ||
| Purpose and link to strategy | Supports the recruitment and retention of Executive Directors of the calibre required to implement our strategy. Reflects the individual’s skills, experience, performance and role within the Group. Provides a simple competitive alternative to the separate provision of salary, fixed allowance and pension. | |
| At a glance | Details of the rationale for our Executive Directors’ fixed pay amounts can be found on page 78. | |
| Implementation in 2020 | Effective from January 2020: | |
| ◾ CEO: €1,508,000 | ||
| ◾ CFO: € 1,135,960 | ||
| Planned for 2021 | Effective from January 2021: ◾ CEO: €1,508,000 ◾ CFO: € 1,135,960 | |
| Annual Bonus | ||
| Purpose and link to strategy | Incentivises year-on-year delivery of rigorous short-term financial, strategic and operational objectives selected to support our annual business strategy and the ongoing enhancement of shareholder value. | |
| The ability to recognise performance through an annual bonus enables us to manage our cost base flexibly and react to events and market circumstances. | ||
| At a glance | ◾ Target annual bonus of 150% of fixed pay for the CEO and 120% of fixed pay for the CFO. | |
| ◾ Business performance multiplier of between 0% and 150% based on achievement against business targets over the year. | ||
| ◾ Performance target ranges are considered to be commercially sensitive and will be disclosed in full with the corresponding performance outcomes retrospectively following the end of the relevant performance year. | ||
| ◾ Maximum annual bonus is 225% of fixed pay for the CEO and 180% for the CFO. | ||
| ◾ Subject to ultimate remedy/malus and claw-back provisions. | ||
| Implementation in 2020 | Implemented in line with the 2018 remuneration policy; however, the weight attached to each performance measure changed to reflect management’s focus on delivering growth as a key priority for 2020 (pre Covid 19): | |
| ◾ Underlying Sales Growth: 50% | ||
| ◾ Underlying Operating Margin Improvement: 25% | ||
| ◾ Free Cash Flow: 25% | ||
| Planned for 2021 | The performance measures for 2021 will remain the same with performance measures weighted as follows: | |
| ◾ Underlying Sales Growth: 1/3 | ||
| ◾ Underlying Operating Margin Improvement: 1/3 | ||
| ◾ Free Cash Flow: 1/3 | ||
| In 2021 a new requirement is introduced to defer 50% of the bonus into shares or share awards. Details for this rationale can be found on pages 76. | ||
| Long-term Incentive (MCIP)/(PSP) |
||
| Purpose and link to strategy | The MCIP encouraged senior management to invest their own money into Unilever shares, aligning their interests with shareholders by focusing on the sustained delivery of high-performance results over the long term. As from 2021 the PSP replaces the MCIP as the sole long-term incentive plan. | |
| At a glance | ◾ Executive Directors were required to invest a minimum of 33% and a maximum of 67% of their bonus into the legacy MCIP. Investment was made out of after-tax income, so investing 67% of gross bonus would require an investment of more than the total net bonus received. | |
| ◾ Matching shares were awarded based on performance up to a maximum of 3x matching shares. | ||
| ◾ The final MCIP award was made on 24 April 2020, vesting 15 February 2024 (with a requirement to hold vested matching shares for a further one-year retention period). | ||
| ◾ Subject to shareholder approval at the 2021 AGM, the new PSP grants rights to receive free shares on vesting (awards) which normally vest after three years, to the extent performance conditions are achieved. | ||
| ◾ Upon vesting, Executive Directors will have another two-year retention period to ensure there is a five-year duration between the grant of the award and release of the shares. | ||
|
◾ Subject to ultimate remedy/malus and claw-back provisions. | ||
| Implementation in 2020 | Implemented in line with the 2018 remuneration policy. Vesting details of the 2017-2020 MCIP award can be found on page 95. Details of the 2020 MCIP awards can be found on page 94. | |
Table of Contents
| Unilever Annual Report on Form 20-F 2020 | 89 |
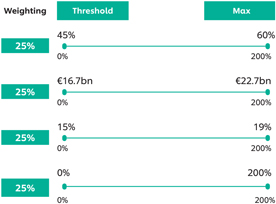

Table of Contents
| 90 | Unilever Annual Report on Form 20-F 2020 |
Directors’ Remuneration Report continued
Single figure of remuneration and implementation of the remuneration policy in 2020
for Executive Directors
The table below shows a single figure of remuneration for each of our Executive Directors for the years 2019 and 2020.
| Alan Jope CEO (€’000) | Graeme Pitkethly CFO (€’000) | |||||||||||||||||||||||||||||||||
| Proportion | Proportion | Proportion | Proportion | |||||||||||||||||||||||||||||||
| 2020 | of Fixed and Variable Rem |
2019 | of Fixed and |
2020 | of Fixed and Variable |
2019 | of Fixed and Variable Rem |
|||||||||||||||||||||||||||
| (A) Fixed pay | 1,508 | 1,450 | 1,136 | 1,103 | ||||||||||||||||||||||||||||||
| Total fixed pay | 1,508 | 1,450 | 1,136 | 1,103 | ||||||||||||||||||||||||||||||
| (B) Other benefits | 56 | 41 | 38 | 27 | ||||||||||||||||||||||||||||||
| Fixed pay & benefits sub total | 1,564 | 45.4 | % | 1,491 | 30.5 | % | 1,174 | 39.7 | % | 1,130 | 26.0 | % | ||||||||||||||||||||||
| (C) STI: Annual bonus | 1,086 | 1,784 | 654 | 1,085 | ||||||||||||||||||||||||||||||
| (D) LTI: GSIP Performance Shares(a) | n/a | 1,619 | 670 | 2,132 | ||||||||||||||||||||||||||||||
| (D) LTI: MCIP Match Shares | 797 | n/a | 463 | n/a | ||||||||||||||||||||||||||||||
| Variable Remuneration sub total | 1,883 | 54.6 | % | 3,403 | 69.5 | % | 1,787 | 60.3 | % | 3,217 | 74.0 | % | ||||||||||||||||||||||
| LTI Sub total | 797 | 1,619 | 1,133 | 2,132 | ||||||||||||||||||||||||||||||
| Total Remuneration (A+B+C+D) | 3,447 | 4,894 | 2,961 | 4,347 | ||||||||||||||||||||||||||||||
| (a) | Alan Jope received his last GSIP award in 2017 that vested on 13 February 2020 as disclosed in the Remuneration Report of the 2019 Annual Report. |
Where relevant, amounts for 2020 have been translated into euros using the average exchange rate over 2020 (€1 = £0.8877), excluding amounts in respect of MCIP and GSIP, which have been translated into euros using the exchange rates on the vesting date at 16 February 2021 (€1 = £0.8711 and €1 = $1.2136) for MCIP and 17 February 2021 (€1 = £0.8703) for GSIP. Amounts for 2019 have been translated into euros using the average exchange rate over 2019 (€1 = £0.8799), excluding amounts in respect of GSIP, which have been translated into euros using the exchange rate at vesting date of 13 February 2020 (€1 = £0.8390).
We do not grant our Executive Directors any personal loans or guarantees.
Elements of single figure remuneration 2020
(A) Fixed pay
Fixed pay set in euros and paid in 2020: CEO – €1,508,000, CFO – €1,135,960
(B) Other benefits
For 2020 this comprises:
|
Alan Jope
2020 |
Graeme Pitkethly
2020 |
|||||||
| Medical insurance cover and actual tax return preparation costs | 40,445 | 26,259 | ||||||
| Provision of death-in-service benefits and administration | 16,000 | 12,000 | ||||||
| Total | 56,445 | 38,259 | ||||||
| (a) | The numbers in this table are translated where necessary using the average exchange rate over 2020 of €1 = £0.8877. |
(C) Annual bonus
Annual bonus 2020 actual outcomes: CEO – €1,085,760 (which is 32% of maximum, 72% of fixed pay). CFO – €654,313 (which is 32% of maximum, 58% of fixed pay).
| Alan Jope | Graeme Pitkethly | |
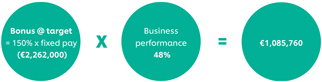
|
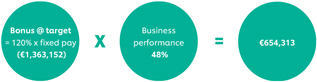
| |
Annual bonus measures are not impacted by share price growth.
50% of the net bonus earned is, subject to shareholder approval, deferred into shares (€287,726 for Alan Jope and €173,393 for Graeme Pitkethly). Shares are deferred for three years, in line with the proposed Remuneration Policy set out on pages 79 to 87. See the opposite page for details.
The annual bonus measures and performance against targets are set out below. All performance ranges are straight-line between threshold and maximum:
Table of Contents
| Unilever Annual Report on Form 20-F 2020 | 91 |
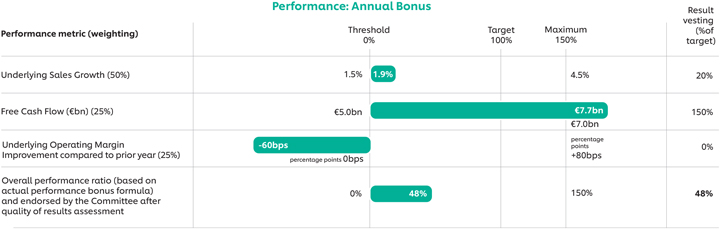
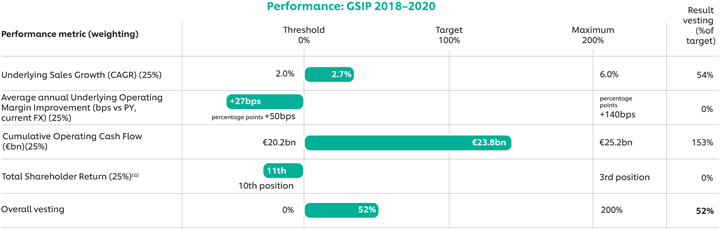
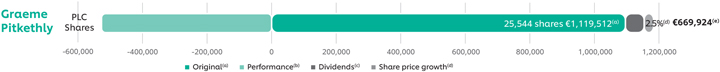
Table of Contents
| 92 | Unilever Annual Report on Form 20-F 2020 |
Directors’ Remuneration Report continued
(D) MCIP – UK law requirement
2020 Outcomes
This includes MCIP match shares (operated under the Unilever Share Plan 2017) granted to Alan Jope and Graeme Pitkethly on 17 May 2017, based on performance in the four- year period to 31 December 2020, which vested on 16 February 2021.
The values included in the single figure table for 2020 are calculated by multiplying the number of shares granted on 17 May 2017 (including additional shares in respect of accrued dividends through to 31 December 2020) by the level of vesting (83% of target award) and the share price on the date of vesting (PLC £40.06 and PLC ADS $55.74). These have been translated into euros using the exchange rates on the date of vesting (€1 = £0.8711 and €1 = $1.2136).
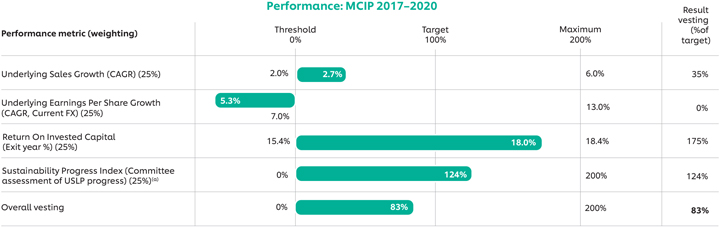
Further details of the MCIP outcome are described in the Committee’s Chair letter on page 76. Further details on the Sustainability Progress Index vesting is set out below. On the basis of this performance the Committee determined that the MCIP awards at the end of 2020 will vest at 83% of initial target award levels (i.e. 42% of maximum for MCIP).
Outcome of Sustainability Progress Index (SPI) for MCIP cycle 2017-2020:
On 16 February 2021 the first MCIP cycle vested with SPI as one of the four performance measures. The SPI is an assessment of the business’s sustainability performance by the Corporate Responsibility Committee and the Compensation Committee that captures quantitative and qualitative elements (see page 73). The Corporate Responsibility Committee and Compensation Committee agreed a framework for SPI assessment that captures the breadth and depth of the USLP in relation to a number of key performance indicators (KPIs). These KPIs illustrate how Unilever aims to address a number of its principal risks such as brand preference, climate change, plastic packaging, supply chain and ethics (see Our risks on page 44). The Committees review qualitative and quantitative progress across each category and delivery against the KPIs. The Committees then agree on a SPI achievement level against the KPI taking into account performance across the entire SPI Category.
In previous directors’ remuneration reports we have described the annual assessments and outcomes for the SPI years 2017, 2018 and 2019 and 2020 SPI performance (based on 2019 USLP performance) is set out on the following page. The SPI index for the four-year MCIP performance period is calculated by taking a simple average and is set out at the bottom of the table for MCIP 2017-2020.
Table of Contents
| Unilever Annual Report on Form 20-F 2020 | 93 |
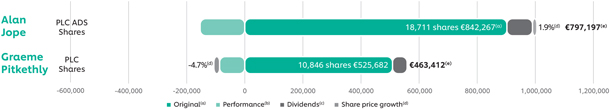
Table of Contents
| 94 | Unilever Annual Report on Form 20-F 2020 |
Directors’ Remuneration Report continued
Scheme interests awarded in the year
| MCIP Plan Conditional matching share award made on 24 April 2020 | ||||
| Basis of award | Based on the level of 2019 annual bonus paid in 2020 invested by the CEO and CFO. The following numbers of matching shares were awarded on 24 April 2020 (vesting on 15 February 2024)(a): | |||
| CEO: | CFO: | |||
| ◾ PLC – 39,594 |
◾ PLC – 23,795 | |||
| Maximum vesting results in 200% of the above awards vesting. Dividend equivalents may be earned (in cash or additional shares) on the award when and to the extent that the award vests. | ||||
| Maximum face value of awards | ◾ CEO: €3,650,301(b) ◾ CFO: €2,193,739(b) | |||
| Threshold vesting (% of target award) |
Four equally weighted long-term performance measures. 0% of the target award vests for threshold performance. | |||
| Performance period | 1 January 2020 – 31 December 2023 (with a requirement to hold vested matching shares for a further one-year retention period). | |||
| Details of performance measures | Performance measures: | |||
|
MCIP 2020 – 2023 awards | ||||
|
Underlying Sales Growth (CAGR)
Underlying EPS Growth (CAGR, Current FX)
Return On Invested Capital (Exit year %)
Sustainability Progress Index (Committee assessment of USLP progress) |
| |||

| (a) | Under the legacy MCIP, Executive Directors invested in Unilever N.V. or Unilever PLC shares, and received a corresponding number of performance-related matching shares. On 24 April 2020, the CEO and the CFO invested the maximum value of their 2019 annual bonus (i.e. 67%) in MCIP investment shares (Alan Jope elected to receive Unilever N.V. shares only and Graeme Pitkethly elected to receive Unilever PLC shares only, in line with the share choice provisions in operation at the time). Upon Unification on 29 November 2020 all Unilever N.V. shares were converted into Unilever PLC shares (on a one-on-one ratio), which is why only Unilever PLC shares are provided in this table. |
| (b) | Face values are calculated by multiplying the number of shares granted on 24 April 2020 (including decimals) by the share price on that day of PLC £40.92, assuming maximum performance and therefore maximum vesting of 200% for MCIP and then translating into euros using an average exchange rate over 2020 of €1 = £0.8877. |
Impact of Covid-19
The MCIP awards were granted, in line with the normal grant timetable, in late April – shortly after the outbreak of Covid-19. No adjustment was made to the level of MCIP awards granted because, in accordance with the applicable remuneration policy, the number of shares subject to each MCIP award was based on the portion of 2019 bonus which executives had already chosen to invest in Unilever shares at the time of award, so the Committee had limited flexibility to adjust grant levels for any element of windfall. Further, at the time of grant, it was too early to tell whether or not there would be windfall gains from the grant of awards because of their four-year time horizon and the fact that the immediate drop in Unilever’s share price from its pre-Covid-19 levels was not as pronounced as that suffered by many other companies (particularly given it was not then clear whether that drop would be sustained over the longer term).
When the MCIP awards vest, the Committee will look again at the question of windfall gains by looking at the following factors:
| ◾ | the level of share price growth delivered over the vesting period, compared to historical and expected norms; |
| ◾ | an assessment of any share price growth that may be attributable to an improvement in Unilever performance, as opposed to general market / sector-specific movements. |
If the Committee concludes that there have been windfall gains, it may use its discretion to adjust the formulaic outcome of the performance conditions to mitigate the impact of any windfall. When determining whether or not there have been windfall gains in relation to the 2020 MCIP awards, the Committee will take into account share price movements over the whole vesting period of the 2020 MCIP awards – with particular focus on the share price and share price volatility over the portion of the vesting period during which the pandemic is determined to impact performance.
Minimum shareholding requirement and Executive Director share interests
The remuneration arrangements applicable to our Executive Directors require them to build and retain a personal shareholding in Unilever within five years of their date of appointment to align their interests with those of Unilever’s shareholders. Incoming Executive Directors will be required to retain all shares vesting from any share awards made since their appointment until their minimum shareholding requirements have been met in full.
The table below shows the Executive Directors’ share ownership against the minimum shareholding requirements as at 31 December 2020 and the interest in PLC ordinary shares of the Executive Directors and their connected persons as at 31 December 2020.
When calculating an Executive Director’s personal shareholding the following methodology is used:
| ◾ | fixed pay at the date of measurement; |
| ◾ | shares in PLC will qualify provided they are personally owned by the Executive Director, by a member of his (immediate) family or by certain corporate bodies, trusts or partnerships as required by law from time to time (each a ‘connected person’); |
Table of Contents
| Unilever Annual Report on Form 20-F 2020 | 95 |
Table of Contents
| 96 | Unilever Annual Report on Form 20-F 2020 |
Directors’ Remuneration Report continued
Global Share Incentive Plan
The following conditional shares vested during 2020 or were outstanding at 31 December 2020 under the GSIP:
| Balance of conditional shares at January 2020(a) |
Balance of conditional shares at 31 December 2020 |
|||||||||||||||||||||||||||||
| Share type |
No. of shares(b) |
Dividend shares accrued during the year(e) |
Vested in 2020(f) |
Price at vesting |
Additional earned in |
No. of shares |
||||||||||||||||||||||||
| Alan Jope | PLC ADS | 11,689(c) | – | 13,910 | $60.53 | 2,221 | – | |||||||||||||||||||||||
| Graeme Pitkethly | PLC | 58,121(d) | 927 | 36,769 | £46.12 | 5,870 | 28,149 | |||||||||||||||||||||||
| (a) In accordance with the remuneration policy adopted by shareholders in May 2018 no GSIP award has been granted after 2018. |
| (b) As per 1 January 2020 Alan Jope held 5,842 Unilever NV NY conditional shares and Graeme Pitkethly held 29,011 Unilever N.V. conditional shares. These Unilever N.V. shares converted into Unilever PLC shares (on a one-on-one ratio) upon Unification on 29 November 2020 which is why only Unilever PLC shares are provided in this table. |
| (c) This includes a grant of 5,370 of each NV NY and PLC ADS shares made on 13 February 2017 (which vested on 13 February 2020), and 472 NV NY and 477 PLC ADS shares from reinvested dividends accrued in prior years in respect of awards. |
| (d) This includes a grant of 14,171 of each NV and PLC shares made on 13 February 2017 (which vested on 13 February 2020), a grant of 12,772 of each NV and PLC shares made on 16 February 2018 (vesting 17 February 2021), and 2,068 NV shares and 2,167 PLC shares from reinvested dividends accrued in prior years in respect of awards. |
| (e) Reflects reinvested dividend equivalents accrued during 2020, subject to the same performance conditions as the underlying GSIP shares. |
| (f) The 13 February 2017 grant vested on 13 February 2020 at 119% for both Alan Jope and Graeme Pitkethly. |
| (g) This includes the additional shares earned and accrued dividends as result of a business performance multiplier on vesting above 100%. |
Executive Directors’ service contracts
| Starting dates of our Executive Directors’ service contracts: |
| ◾ Alan Jope: 1 January 2019 (signed on 16 December 2020); and |
| ◾ Graeme Pitkethly: 1 October 2015 (signed on 16 December 2015). |
Service contracts are available to shareholders to view at the AGMs or on request from the Group Secretary, and can be terminated with 12 months’ notice from Unilever or six months’ notice from the Executive Director. A payment in lieu of notice can be made of no more than one year’s fixed pay and other benefits. Other payments that can be made to Executive Directors in the event of loss of office are disclosed in our remuneration policy which is available on our website.
 www.unilever.com/remuneration-policy
Payments to former Directors
The table below shows the 2020 payments to Paul Polman in accordance with arrangements made with him upon his stepping down as CEO on 31 December 2018 and his retirement from employment with Unilever effective 2 July 2019. These arrangements were disclosed in the directors’ remuneration report in the Unilever Annual Report and Accounts 2018.
| Paul Polman | (€’000) | |||
| Benefits(a) | 655 | |||
| GSIP 2018-2020 (pro-rated)(b) | 631 | |||
| MCIP 2017-2020 (pro-rated)(c) | 673 | |||
| Total Remuneration | 1,959 | |||
| (a) | This includes tax preparation fees and social security. |
| (b) | Actual time pro-rated GSIP vesting (46%) on 17 February 2021 of 6,860 Unilever PLC shares at a closing share price of £39.30 and 6,857 Unilever PLC shares at a closing share price of €45.81. |
| (c) | Actual time pro-rated MCIP vesting (59%) on 16 February 2021 of 14,622 Unilever PLC shares at a closing share price of €46.02. |
There have been no other payments to former Directors nor have there been any payments for loss of office during the year.
Table of Contents
| Unilever Annual Report on Form 20-F 2020 | 97 |
Table of Contents
| 98 | Unilever Annual Report on Form 20-F 2020 |
Directors’ Remuneration Report continued
Percentage change in remuneration of Non-Executive Directors
The table below shows the five-year history year-on-year percentage change for fees and other benefits for the current Non-Executive Directors.
| Total Remuneration(a) | ||||||||||||||||||||||||
| Non-Executive Director | % change from 2019 to 2020 |
% change from |
% change from |
% change from |
% change from |
% change from |
||||||||||||||||||
| Nils Andersen | 253.9 | % | 69.2 | % | 16.1 | % | -12.5 | % | 62.0 | % | – | |||||||||||||
| Laura Cha | 10.8 | % | 5.2 | % | 7.5 | % | -10.1 | % | -2.5 | % | 20.8 | % | ||||||||||||
| Vittorio Colao(b) | -19.9 | % | 35.4 | % | 23.3 | % | -3.7 | % | 87.7 | % | – | |||||||||||||
| Marijn Dekkers | -93.3 | % | -6.5 | % | 2.3 | % | 42.6 | % | – | – | ||||||||||||||
| Judith Hartmann | -11.4 | % | 14.1 | % | 14.3 | % | -8.2 | % | 52.5 | % | – | |||||||||||||
| Andrea Jung | 11.8 | % | 51.3 | % | – | – | – | – | ||||||||||||||||
| Susan Kilsby | 144.0 | % | – | – | – | – | – | |||||||||||||||||
| Strive Masiyiwa | -0.9 | % | 6.1 | % | 18.0 | % | 56.3 | % | – | – | ||||||||||||||
| Youngme Moon | -0.8 | % | 15.0 | % | 42.7 | % | 45.1 | % | – | – | ||||||||||||||
| John Rishton | -10.9 | % | 17.5 | % | 12.6 | % | -9.3 | % | 5.3 | % | 24.3 | % | ||||||||||||
| Feike Sijbesma | -0.9 | % | 3.0 | % | 6.3 | % | -3.8 | % | 3.9 | % | 693.8 | % | ||||||||||||
| (a) | Non-Executive Directors receive an annual fixed fee and do not receive any Company performance-related payment. Therefore, the year-on-year % changes are mainly due to changes in committee chair or memberships, mid-year appointments of Non-Executive Directors, fee increases as disclosed in earlier directors’ remuneration reports and changes in the average sterling: euro exchange rates. Susan Kilsby joined Unilever in August 2019 and therefore her change from 2019 to 2020 shows a larger percentage change than for a usual mid year joiner. Marijn Dekkers stepped down as Chairman in November 2019 and retired in April 2020, and was succeeded by Nils Andersen, hence his larger percentage increase from 2019 to 2020. Feike Sijbesma joined Unilever in November 2014 and therefore his change from 2014 to 2015 shows a larger % change than for a usual mid-year joiner. |
| (b) | Stepped down as Director on 18 February 2021. |
Non-Executive Directors’ interests in shares
Non-Executive Directors are encouraged to build up a personal shareholding of at least 100% of their annual fees over the five years from appointment. The table shows the interests in Unilever N.V. and Unilever PLC ordinary shares as at 1 January 2020 and Unilever PLC ordinary shares as at 31 December 2020, as result of Unification on 29 November 2020, of Non-Executive Directors and their connected persons. This is set against the minimum shareholding recommendation. There has been no change in these interests between 31 December 2020 and 23 February 2021 (other than Susan Kilsby, who bought 1,000 PLC shares on 8 February 2021 at a share price of £40.03 and John Rishton, who bought 1,256 PLC shares on 9 February 2021 at a share price of £39.51).
| Non-Executive Director | Share type | Shares held at 31 December 2020 |
Share type | Shares held at 1 January 2020 |
Actual share ownership as a % of NED fees (as at 31 December 2020) | |||||||
| Nils Andersen | PLC | 21,014 | NV | 21,014 | 131% | |||||||
| Laura Cha | PLC | 3,518 | NV | 2,660 | 128% | |||||||
| PLC | 858 | |||||||||||
| Vittorio Colao(a) | PLC | 5,600 | NV | 5,600 | 198% | |||||||
| Marijn Dekkers(b) | PLC ADS | 20,000 | NV NY | 20,000 | 2,089% | |||||||
| Judith Hartmann | PLC | 2,500 | NV | 2,500 | 94% | |||||||
| Andrea Jung | PLC | 4,576 | NV | 4,576 | 165% | |||||||
| Susan Kilsby | PLC | 1,250 | PLC | – | 47% | |||||||
| Strive Masiyiwa | PLC | 1,130 | PLC | 1,130 | 40% | |||||||
| Youngme Moon | PLC ADS | 3,500 | NV NY | 3,500 | 102% | |||||||
| John Rishton | PLC | 5,340 | NV | 3,340 | 173% | |||||||
| PLC | 2,000 | |||||||||||
| Feike Sijbesma | PLC | 10,000 | NV | 10,000 | 353% | |||||||
| (a) | Stepped down as Director on 18 February 2021. |
| (b) | Shares held at 30 April 2020. |
Table of Contents
| Unilever Annual Report on Form 20-F 2020 | 99 |
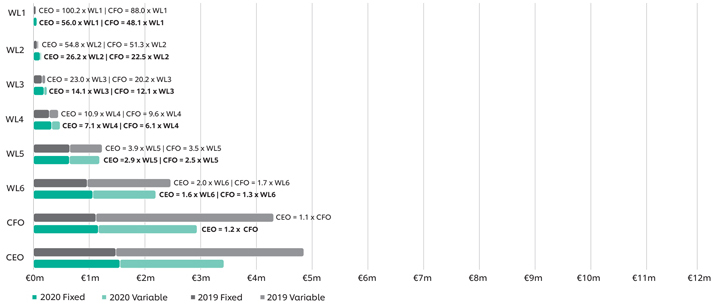
Table of Contents
| 100 | Unilever Annual Report on Form 20-F 2020 |
Directors’ Remuneration Report continued
CEO pay ratio comparison
The table below is included to meet UK requirements and shows how pay for the CEO compares to our UK employees at the 25th percentile, median and 75th percentile.
| Year | 25th Percentile | Median Percentile | 75th Percentile | Mean Pay Ratio | ||||||
| Year ended 31 December 2020 | Salary: | £34,298 | £41,010 | £55,000 | ||||||
|
| ||||||||||
| Pay and benefits: | £45,713 | £55,751 | £80,670 | |||||||
|
| ||||||||||
| Pay ratio (Option A): | 67 | 55 | 38 | 50 | ||||||
| Year ended 31 December 2019 | Salary: | £38,510 | £45,154 | £59,988 | ||||||
|
| ||||||||||
| Pay and benefits (excluding pension): | £50,689 | £61,086 | £87,982 | |||||||
|
| ||||||||||
| Pay ratio (Option A): | 83 | 69 | 48 | 51 | ||||||
Figures for the CEO are calculated using the data from the Executive Directors’ single figure table on page 90 translated into sterling using the average exchange rate over 2020 (€1 = £0.8877).
Option A was used to calculate the pay and benefits (including pension) of the 25th percentile, median and 75th percentile UK employees because the data was readily available for all UK employees of the group and Option A is the most accurate method (as it is based on total full-time equivalent total reward for all UK employees for the relevant financial year). Figures are calculated by reference to 31 December 2020, and the respective salary and pay and benefits figures for each quartile are set out in the table above. Full-time equivalent figures are calculated on a pro-rated basis.
Variable pay figures for the UK employees are calculated on the basis set out in the paragraph for other work levels below the ‘CEO/CFO pay ratio comparison’ table. The reason for this is it would be unduly onerous to recalculate these figures when, based on a sample, the impact of such recalculation is expected to be minimal.
Year-on-year comparisons reflects the lowering incentive performance outcomes in 2020. For the overall UK employee calculation salary has increased by approximately 1.29% (despite the lowering of performance outcomes and changes in FTE’s), which is aligned to our defined peer group at the 50th percentile (market median), that we benchmark against on a yearly basis.
Additionally, in the UK we are required to show additional disclosures on the rates of change in pay year on year. The pay ratios set out above are more meaningful as they compare to the pay of all of our UK employees. By contrast, the UK regulations require us to show the percentages below based on employees of our PLC top company only, which forms a relatively small proportion of our total UK workforce. So, whilst operationally we may pay greater attention to our internal pay ratios (included above in the ‘CEO/CFO pay ratio comparison’ table), these new required figures are as follows:
Percentage change in remuneration of Executive Directors (CEO/CFO)
The table below shows the five-year history year-on-year percentage change for fixed pay, other benefits (excluding pension) and bonus for the CEO, CFO and PLC’s employees (based on total full-time equivalent total reward for the relevant financial year) pursuant to UK requirements. The respective changes in percentages in fees for our Non-Executive Directors are included in the table ‘Percentage change in remuneration of Non-Executive Directors’ on page 98.
| Fixed pay |
Other benefits (not including pension) |
Bonus | ||||||||||
| % change from 2019 to 2020 | CEO(a)(b) | 4.0 | % | 36.6 | % | -39.1% | ||||||
|
| ||||||||||||
| CFO(a)(c) | 3.0 | % | 40.7 | % | -39.7% | |||||||
|
| ||||||||||||
| PLC employees(d) | 1.7 | % | 30.2 | % | -3.0% | |||||||
| % change from 2018 to 2019 | CEO(a)(b) | -9.5 | % | -92.3 | % | -7.4% | ||||||
|
| ||||||||||||
| CFO(a) | 4.2 | % | 4.8 | % | 7.9% | |||||||
|
| ||||||||||||
| PLC employees(d) | 15.0 | % | -5.2 | % | 9.7% | |||||||
| % change from 2017 to 2018 | CEO(a) | 11.3 | % | -19.2 | % | -16.5% | ||||||
|
| ||||||||||||
| CFO(a) | 8.2 | % | 8.3 | % | -10.5% | |||||||
|
| ||||||||||||
| PLC employees(d) | 8.4 | % | -5.0 | % | -3.9% | |||||||
| % change from 2016 to 2017 | CEO(a) | -6.9 | % | 5.0 | % | 0.8% | ||||||
|
| ||||||||||||
| CFO(a) | -2.2 | % | -5.5 | % | 21.1% | |||||||
|
| ||||||||||||
| PLC employees(d) | -6.8 | % | -7.0 | % | 14.5% | |||||||
| % change from 2015 to 2016 | CEO(a) | -11.0 | % | -5.1 | % | -11.0% | ||||||
|
| ||||||||||||
| CFO(a)(c) | -30.8 | % | -32.2 | % | 14.3% | |||||||
|
| ||||||||||||
| PLC employees(d) | 10.1 | % | 19.1 | % | 16.6% | |||||||
| % change from 2014 to 2015 | CEO(a) | 11.3 | % | 14.5 | % | 55.8% | ||||||
|
| ||||||||||||
| CFO(a)(c) | -16.6 | % | -27.6 | % | 4.4% | |||||||
|
| ||||||||||||
| PLC employees(d) | 0.3 | % | 20.7 | % | 79.0% | |||||||
| (a) Calculated using the data from the Executive Directors’ single figure table on page 90 (for information on exchange rates please see the footnotes in that table). |
| (b) As result of a lower differentiation factor for the bonus in 2020, the Bonus from 2019 to 2020 decreased compared to prior years. As at 1 January 2020 the tax gross-up has been added in the cost instead of in base salary and therefore the Other Benefits increased from 2019 to 2020 compared to prior years. As at 1 January 2019 Alan Jope succeeded Paul Polman as CEO and therefore the CEO remuneration from 2018 to 2019 decreased compared to prior years as Alan Jope’s Fixed Pay was set at a level lower than Paul Polman’s. |
| (c) As result of a lower differentiation factor for the bonus in 2020, the Bonus from 2019 to 2020 decreased compared to prior years. As at 1 January 2020 the tax gross-up has been added in the cost instead of in base salary and therefore the Other Benefits increased from 2019 to 2020 compared to prior years. As at October 2015 Jean-Marc Huet stepped down as CFO and therefore the figures only include ten months for 2015. Graeme Pitkethly succeeded Jean-Marc Huet as an Executive Director as per 21 April 2016, although he assumed the role of CFO as from October 2015. As a result the figure for 2016 include payments from May 2016 onwards. The CFO remuneration from 2015 to 2016 therefore decreased, which was also due to Graeme Pitkethly’s Fixed Pay being set at a level lower than Jean-Marc Huet’s. In 2013 the CFO received a one-off payment for the loss and costs on the sale of his house, as agreed upon his recruitment. Consequently, ‘other benefits’ decreased from 2014 to 2013. |
| (d) For the PLC employees, fixed pay numbers have been restated to include cash-related benefits employees receive as part of their total compensation, to ensure we can accurately compare fixed pay for them against that of the CEO and CFO. Figures are also affected by changes in the average sterling: euro exchange rates. |
Table of Contents
| Unilever Annual Report on Form 20-F 2020 | 101 |
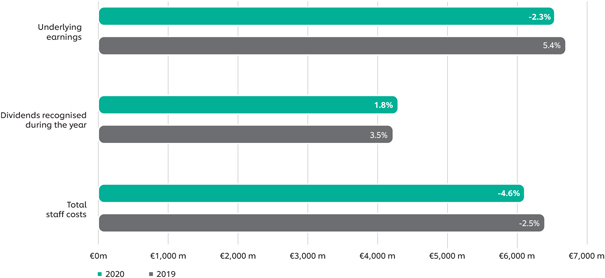
Table of Contents
| 102 | Unilever Annual Report on Form 20-F 2020 |
Directors’ Remuneration Report continued
Ten-year historical Total Shareholder Return (TSR) performance
The graph below includes growth in the value of a hypothetical £100 investment over ten years’ FTSE 100 comparison based on 30-trading-day average values.
The table below shows Unilever’s performance against the FTSE 100 Index, which is the most relevant index in the UK where we have our principal listing. Unilever is a constituent of this index.
Ten-year historical TSR performance
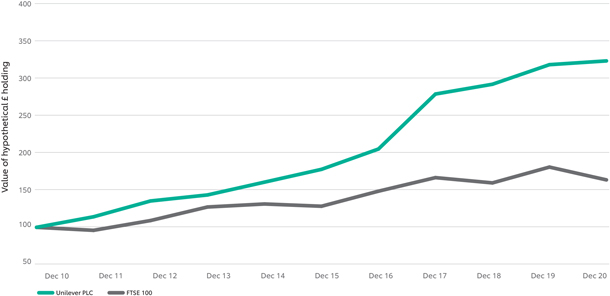
Serving as a non-executive on the board of another company
Unilever recognises the benefit to the individual and the Group of senior executives acting as directors of other companies in terms of broadening Directors’ knowledge and experience, but the number of outside directorships of listed companies is generally limited to one per Executive Director. The remuneration and fees earned from that particular outside listed directorship may be retained (see ‘Independence and Conflicts’ on page 62 for further details).
For the reason above, Graeme Pitkethly is permitted to be a Non-Executive Director of Pearson PLC since 1 May 2019. In 2020 he received an annual fee of €104,014 (£92,333) (2019: €64,969 (£57,166)) (of which 25% was in accordance with Pearson’s remuneration policy delivered in Pearson shares) based on an average exchange rate over 2020 of €1 = £0.8877. Figures for 2019 have been translated in euros based on an average exchange rate over 2019 of €1 = £0.8799.
The Compensation Committee
During 2020, the Committee met seven times and its activities included: determining the 2019 annual bonus outcome; determining vesting of the GSIP awards for the CEO, CFO and the ULE; approving the 2019 directors’ remuneration report; setting the 2020 annual bonus and MCIP 2020-2023 performance measures and targets; reviewing fixed pay for the CEO and CFO and fees for the Non-Executive Directors; tracking external developments and assessing their impact on Unilever’s remuneration policy and its implementation, in particular in Covid-19 context; review of the remuneration policy, underlying reward principles and proposed changes to the Remuneration Policy, including extensive consultation with investors and proxy agencies (see page 77 of the Committee’s Chair letter), workforce pay, including pay philosophy and pay positioning, review of gender pay gap data, and progress on the Fair Compensation Framework.
The Committee operates within its terms of reference which were last updated on 29 November 2020. The Committee’s revised terms of reference are contained within ‘The Governance of Unilever’, and are also set out on our website.
www.unilever.com/investor-relations/agm-and-corporate-governance/
As part of the Board evaluation carried out in 2020, the Boards evaluated the performance of the Committee. The Committee also carried out an assessment of its own performance in 2020. Overall the Committee members concluded that the Committee is performing effectively. The Committee has agreed to further enhance its effectiveness by continuing to closely monitor (regulatory) developments and trends in the executive remuneration landscape to gain insights of stakeholders’ views.
Table of Contents
| Unilever Annual Report on Form 20-F 2020 | 103 |
Table of Contents
| 104 | Unilever Annual Report on Form 20-F 2020 |
Financial Statements
Table of Contents
| Unilever Annual Report on Form 20-F 2020 | 105 |

Table of Contents
| 106 | Unilever Annual Report on Form 20-F 2020 |
Report of Independent Registered Public Accounting Firm continued
Table of Contents
| Unilever Annual Report on Form 20-F 2020 | 107 |
Table of Contents
| 108 | Unilever Annual Report on Form 20-F 2020 |
THIS PAGE INTENTIONALLY LEFT BLANK
Table of Contents
| Unilever Annual Report on Form 20-F 2020 | 109 |
Table of Contents
| 110 | Unilever Annual Report on Form 20-F 2020 |
THIS PAGE INTENTIONALLY LEFT BLANK
Table of Contents
| Unilever Annual Report on Form 20-F 2020 | 111 |
Table of Contents
| 112 | Unilever Annual Report on Form 20-F 2020 |
Consolidated Financial Statements
Unilever Group
Consolidated income statement
for the year ended 31 December
| Notes | € million 2020 |
€ million 2019 |
€ million 2018 |
|||||||||||||
| Turnover | 2 | 50,724 | 51,980 | 50,982 | ||||||||||||
| Operating profit | 2 | 8,303 | 8,708 | 12,639 | ||||||||||||
| Which includes non-underlying item credits/(charges) of |
3 | (1,064 | ) | (1,239 | ) | 3,176 | ||||||||||
| Net finance costs | 5 | (505 | ) | (627 | ) | (608 | ) | |||||||||
| Pensions and similar obligations |
(9 | ) | (30 | ) | (25 | ) | ||||||||||
| Finance income |
232 | 224 | 135 | |||||||||||||
| Finance costs |
(728 | ) | (821 | ) | (718 | ) | ||||||||||
| Which includes non-underlying costs of |
3 | (56 | ) | – | – | |||||||||||
| Non-underlying item net monetary gain/(loss) arising from hyperinflationary economies | 1,3 | 20 | 32 | 122 | ||||||||||||
| Share of net profit/(loss) of joint ventures and associates | 11 | 175 | 176 | 185 | ||||||||||||
| Which includes non-underlying item credits/(charges) of |
3 | – | 3 | 32 | ||||||||||||
| Other income/(loss) from non-current investments and associates | 3 | – | 22 | |||||||||||||
| Profit before taxation | 7,996 | 8,289 | 12,360 | |||||||||||||
| Taxation | 6A | (1,923 | ) | (2,263 | ) | (2,572 | ) | |||||||||
| Which includes tax impact of non-underlying items of |
3 | 126 | 113 | (288 | ) | |||||||||||
| Net profit | 6,073 | 6,026 | 9,788 | |||||||||||||
| Attributable to: | ||||||||||||||||
| Non-controlling interests | 492 | 401 | 419 | |||||||||||||
| Shareholders’ equity | 5,581 | 5,625 | 9,369 | |||||||||||||
| Combined earnings per share | 7 | |||||||||||||||
| Basic earnings per share (€) | 2.13 | 2.15 | 3.49 | |||||||||||||
| Diluted earnings per share (€) | 2.12 | 2.14 | 3.48 | |||||||||||||
| Consolidated statement of comprehensive income
for the year ended 31 December |
||||||||||||||||
| Notes |
€ million 2020 |
€ million 2019 |
€ million 2018 |
|||||||||||||
| Net profit | 6,073 | 6,026 | 9,788 | |||||||||||||
| Other comprehensive income | 6C | |||||||||||||||
| Items that will not be reclassified to profit or loss, net of tax: | ||||||||||||||||
| Gains/(losses) on equity instruments measured at fair value through other comprehensive income |
78 | 29 | 51 | |||||||||||||
| Remeasurement of defined benefit pension plans |
15B | 215 | 353 | (328 | ) | |||||||||||
| Items that may be reclassified subsequently to profit or loss, net of tax: | ||||||||||||||||
| Gains/(losses) on cash flow hedges |
60 | 176 | (55 | ) | ||||||||||||
| Currency retranslation gains/(losses) |
15B | (2,590 | ) | (15 | ) | (839 | ) | |||||||||
| Total comprehensive income | 3,836 | 6,569 | 8,617 | |||||||||||||
| Attributable to: | ||||||||||||||||
| Non-controlling interests | 286 | 407 | 407 | |||||||||||||
| Shareholders’ equity | 3,550 | 6,162 | 8,210 | |||||||||||||
Note references in the consolidated income statement, consolidated statement of comprehensive income, consolidated statement of changes in equity, consolidated balance sheet and consolidated cash flow statement relate to notes on pages 116 to 167, which form an integral part of the consolidated financial statements.
Table of Contents
| Unilever Annual Report on Form 20-F 2020 | 113 |
Table of Contents
| 114 | Unilever Annual Report on Form 20-F 2020 |
Consolidated Financial Statements Unilever Group continued
Consolidated balance sheet
for the year ended 31 December
| Notes | € million 2020 |
€ million 2019 |
||||||||||
| Assets | ||||||||||||
| Non-current assets | ||||||||||||
| Goodwill | 9 | 18,942 | 18,067 | |||||||||
| Intangible assets | 9 | 15,999 | 12,962 | |||||||||
| Property, plant and equipment | 10 | 10,558 | 12,062 | |||||||||
| Pension asset for funded schemes in surplus | 4B | 2,722 | 2,422 | |||||||||
| Deferred tax assets | 6B | 1,474 | 1,336 | |||||||||
| Financial assets | 17A | 876 | 874 | |||||||||
| Other non-current assets | 11 | 931 | 653 | |||||||||
| 51,502 | 48,376 | |||||||||||
| Current assets | ||||||||||||
| Inventories | 12 | 4,462 | 4,164 | |||||||||
| Trade and other current receivables | 13 | 4,939 | 6,695 | |||||||||
| Current tax assets | 372 | 397 | ||||||||||
| Cash and cash equivalents | 17A | 5,548 | 4,185 | |||||||||
| Other financial assets | 17A | 808 | 907 | |||||||||
| Assets held for sale | 22 | 28 | 82 | |||||||||
| 16,157 | 16,430 | |||||||||||
| Total assets | 67,659 | 64,806 | ||||||||||
| Liabilities | ||||||||||||
| Current liabilities | ||||||||||||
| Financial liabilities | 15C | 4,461 | 4,691 | |||||||||
| Trade payables and other current liabilities | 14 | 14,132 | 14,768 | |||||||||
| Current tax liabilities | 1,451 | 898 | ||||||||||
| Provisions | 19 | 547 | 620 | |||||||||
| Liabilities held for sale | 22 | 1 | 1 | |||||||||
| 20,592 | 20,978 | |||||||||||
| Non-current liabilities | ||||||||||||
| Financial liabilities | 15C | 22,844 | 23,566 | |||||||||
| Non-current tax liabilities | 149 | 182 | ||||||||||
| Pensions and post-retirement healthcare liabilities: | ||||||||||||
| Funded schemes in deficit |
4B | 1,109 | 1,157 | |||||||||
| Unfunded schemes |
4B | 1,326 | 1,461 | |||||||||
| Provisions | 19 | 583 | 664 | |||||||||
| Deferred tax liabilities | 6B | 3,166 | 2,573 | |||||||||
| Other non-current liabilities | 14 | 235 | 339 | |||||||||
| 29,412 | 29,942 | |||||||||||
| Total liabilities | 50,004 | 50,920 | ||||||||||
| Equity | ||||||||||||
| Shareholders’ equity | 15,266 | 13,192 | ||||||||||
| Non-controlling interests | 2,389 | 694 | ||||||||||
| Total equity | 17,655 | 13,886 | ||||||||||
| Total liabilities and equity | 67,659 | 64,806 | ||||||||||
Note references in the consolidated income statement, consolidated statement of comprehensive income, consolidated statement of changes in equity, consolidated balance sheet and consolidated cash flow statement relate to notes on pages 116 to 167, which form an integral part of the consolidated financial statements.
These financial statements have been approved by the Directors.
The Board of Directors
3 March 2021
Table of Contents
| Unilever Annual Report on Form 20-F 2020 | 115 |
Table of Contents
Table of Contents
| Unilever Annual Report on Form 20-F 2020 | 117 |
Table of Contents
| 118 | Unilever Annual Report on Form 20-F 2020 |
Notes to the Consolidated Financial Statements Unilever Group continued
New standards, amendments and interpretations of existing standards that are not yet effective and have not been early adopted by the Group
The following new standards have been released but are not yet adopted by the Group. The expected impact and progress is shown below. In addition to the above, based on an initial review the Group does not currently believe adoption of the following standard/amendments will have a material impact on the consolidated results or financial position of the Group.
| Applicable standard | Key requirements or changes in accounting policy | |
| Interest Rate Benchmark Reform (Phase 2)
Amendments to IFRS 9, IAS 39, IFRS 7, IFRS 4 and IFRS 16 |
The amendments are applicable when an existing interest rate benchmark is replaced by another interest rate benchmark. The amendments provide a practical expedient that modifications to asset and liability values as a direct consequence of the interest rate benchmark reform and made on an economically equivalent basis (i.e. where the basis for determining contractual cash flows is the same), can be accounted for by only updating the effective interest rate. | |
| Effective from the year ended 31 December 2021
|
Additionally, hedge accounting is not discontinued solely because of the replacement of another interest rate benchmark. Hedging relationships (and related documentation) must instead be amended to reflect modifications to the hedged item, hedging instrument and hedged risk.
| |
| IFRS 17 ‘Insurance Contracts’
Effective from the year ended 31 December 2023 |
This standard introduces a new model for accounting for insurance contracts. Work continues to review existing arrangements to determine the impact on adoption. | |
All other standards or amendments to standards that have been issued by the IASB and are effective from 1 January 2021 onwards are not applicable or material to Unilever.
2. Segment information
| Segmental reporting |
||||
| Beauty & Personal Care |
◾ |
primarily sales of skin cleansing (soap, shower), hair care (shampoo, conditioner, styling), skin care (face, hand and body moisturisers) and deodorants categories. | ||
| Foods & Refreshment |
◾ |
primarily sales of ice cream, savoury (soups, bouillons, seasoning), dressings (mayonnaise, ketchup) and tea categories. | ||
| Home Care |
◾ |
primarily sales of fabric category (washing powders and liquids, rinse conditioners) and includes a wide range of cleaning products. | ||
|
Revenue
Turnover comprises sales of goods after the deduction of discounts, sales taxes and estimated returns. It does not include sales between group companies. Discounts given by Unilever include rebates, price reductions and incentives given to customers, promotional couponing and trade communication costs and are based on the contractual arrangements with each customer. Discounts can either be immediately deducted from the sales value on the invoice or off-invoice and settled later through credit notes when the precise amounts are known. Rebates are generally off-invoice. Amounts provided for discounts at the end of a period require estimation; historical data and accumulated experience is used to estimate the provision using the most likely amount method and in most instances the discount can be estimated using known facts with a high level of accuracy. Any differences between actual amounts settled and the amounts provided are not material and recognised in the subsequent reporting period.
Customer contracts generally contain a single performance obligation and turnover is recognised when control of the products being sold has transferred to our customer as there are no longer any unfulfilled obligations to the customer. This is generally on delivery to the customer but depending on individual customer terms, this can be at the time of dispatch, delivery or upon formal customer acceptance. This is considered the appropriate point where the performance obligations in our contracts are satisfied as Unilever no longer has control over the inventory.
Our customers have the contractual right to return goods only when authorised by Unilever. At 31 December 2020, an estimate has been made of goods that will be returned and a liability has been recognised for this amount. An asset has also been recorded for the corresponding inventory that is estimated to return to Unilever using a best estimate based on accumulated experience.
Some of our customers are distributors who may be able to return unsold goods in consignment arrangements.
Underlying operating profit
Underlying operating profit means operating profit before the impact of non-underlying items within operating profit (see note 3). Underlying operating profit represents our measure of segment profit or loss as it is the primary measure used for the purpose of making decisions about allocating resources and assessing performance of segments. Underlying operating margin is calculated as underlying operating profit divided by turnover.
| ||||
Table of Contents
| Unilever Annual Report on Form 20-F 2020 | 119 |
Table of Contents
| 120 | Unilever Annual Report on Form 20-F 2020 |
Notes to the Consolidated Financial Statements Unilever Group continued
2. Segment information continued
The Unilever Group is not reliant on turnover from transactions with any single customer and does not receive 10% or more of its turnover from transactions with any single customer.
Segment assets and liabilities are not provided because they are not reported to or reviewed by our chief operating decision-maker, which is the Unilever Leadership Executive (ULE).
As part of Unification, Unilever PLC became the single parent of the Group and the United Kingdom became the country of domicile. Before Unification, the countries of domicile were the United Kingdom and the Netherlands. Turnover and non-current assets for the domicile country, the United States and India (being the two largest country outside the home countries) and for all other countries are:
| € million | € million | € million | € million | € million | ||||||||||||||||
| United | United | |||||||||||||||||||
| Kingdom | States | India | Others(a) | Total | ||||||||||||||||
| 2020 | ||||||||||||||||||||
| Turnover | 2,391 | 9,363 | 4,993 | 33,977 | 50,724 | |||||||||||||||
| Non-current assets(b) | 3,587 | 12,946 | 6,264 | 23,633 | 46,430 | |||||||||||||||
| 2019 | ||||||||||||||||||||
| Turnover | 2,306 | 8,702 | 4,964 | 36,009 | 51,980 | |||||||||||||||
| Non-current assets(b) | 3,891 | 13,326 | 1,137 | 25,391 | 43,744 | |||||||||||||||
| 2018 | ||||||||||||||||||||
| Turnover | 2,385 | 8,305 | 4,565 | 35,727 | 50,982 | |||||||||||||||
| Non-current assets(b) | 3,160 | 12,471 | 1,080 | 25,400 | 42,111 | |||||||||||||||
| (a) | Includes the Netherlands that was presented as country of domicile in prior years. | |
| (b) | For the purpose of this table, non-current assets include goodwill, intangible assets, property, plant and equipment and other non-current assets as shown on the consolidated balance sheet. Goodwill is attributed to countries where acquired business operated at the time of acquisition; all other assets are attributed to the countries where they were acquired. |
No other country had turnover or non-current assets (as shown above) greater than 10% of the Group total.
Additional information by geographies
Although the Group’s operations are managed by product area, we provide additional information based on geographies. The analysis of turnover by geographical area is stated on the basis of origin.
| € million | € million | € million | € million | |||||||||||||
| Asia/ | The | |||||||||||||||
| AMET/RUB(a) | Americas(b) | Europe | Total | |||||||||||||
| 2020 | ||||||||||||||||
| Turnover | 23,440 | 16,080 | 11,204 | 50,724 | ||||||||||||
| Operating profit | 4,137 | 2,723 | 1,443 | 8,303 | ||||||||||||
| Non-underlying items | 409 | 249 | 406 | 1,064 | ||||||||||||
| Underlying operating profit | 4,546 | 2,973 | 1,848 | 9,367 | ||||||||||||
| Share of net profit/(loss) of joint ventures and associates | 8 | 122 | 45 | 175 | ||||||||||||
| 2019 | ||||||||||||||||
| Turnover | 24,129 | 16,482 | 11,369 | 51,980 | ||||||||||||
| Operating profit | 4,418 | 2,683 | 1,607 | 8,708 | ||||||||||||
| Non-underlying items | 439 | 395 | 405 | 1,239 | ||||||||||||
| Underlying operating profit | 4,857 | 3,078 | 2,012 | 9,947 | ||||||||||||
| Share of net profit/(loss) of joint ventures and associates | (5 | ) | 126 | 55 | 176 | |||||||||||
| 2018 | ||||||||||||||||
| Turnover | 22,868 | 16,020 | 12,094 | 50,982 | ||||||||||||
| Operating profit | 4,824 | 3,621 | 4,194 | 12,639 | ||||||||||||
| Non-underlying items | (437 | ) | (892 | ) | (1,847 | ) | (3,176 | ) | ||||||||
| Underlying operating profit | 4,387 | 2,729 | 2,347 | 9,463 | ||||||||||||
| Share of net profit/(loss) of joint ventures and associates | – | 114 | 71 | 185 | ||||||||||||
| (a) | Refers to Asia, Africa, Middle East, Turkey, Russia, Ukraine and Belarus. |
| (b) | Americas sales in North America were €10,117 million (2019: €9,411 million; 2018 €9,041 million) and in Latin America were €5,963 million (2019: €7,071 million; 2018: €6,979 million). |
Disaggregation of sales by markets are:
| € million | € million | € million | ||||||||||
| 2020 | 2019 | 2018 | ||||||||||
| Emerging markets | 29,281 | 31,021 | 29,654 | |||||||||
| Developed markets | 21,443 | 20,959 | 21,328 | |||||||||
Transactions between the Unilever Group’s geographical regions are carried out on an arm’s length basis and their net impact is immaterial.
Table of Contents
| Unilever Annual Report on Form 20-F 2020 | 121 |
Table of Contents
| 122 | Unilever Annual Report on Form 20-F 2020 |
Notes to the Consolidated Financial Statements Unilever Group continued
3. Operating costs and non-underlying items continued
|
€ million 2020 |
€ million 2019 |
€ million 2018 |
||||||||||
| Non-underlying items within operating profit before tax | (1,064 | ) | (1,239 | ) | 3176 | |||||||
| Acquisition and disposal-related costs |
(69 | ) | (132 | ) | 76 | |||||||
| Gain on disposal of group companies(a) |
8 | 70 | 4,331 | |||||||||
| Restructuring costs(b) |
(916 | ) | (1,159 | ) | (914 | ) | ||||||
| Impairments(c) |
– | (18 | ) | (208 | ) | |||||||
| Other(d) |
(87 | ) | – | (109 | ) | |||||||
| Tax on non-underlying items within operating profit | 272 | 309 | (259 | ) | ||||||||
| Non-underlying items within operating profit after tax | (792 | ) | (930 | ) | 2,917 | |||||||
| Non-underlying items not in operating profit but within net profit before tax | (36 | ) | 35 | 154 | ||||||||
| Share of gain on disposal of Spreads business in Portugal JV |
– | 3 | 32 | |||||||||
| Interest related to the UK tax audit of intangible income and centralised services |
(56 | ) | – | – | ||||||||
| Net monetary gain arising from hyperinflationary economies |
20 | 32 | 122 | |||||||||
| Tax impact of non-underlying items not in operating profit but within net profit | (146 | ) | (196 | ) | (29 | ) | ||||||
| Impact of US tax reform |
– | – | (29 | ) | ||||||||
| Taxes related to the reorganisation of our European business |
(58 | ) | (175 | ) | – | |||||||
| Taxes related to share buyback as part of Unification |
(30 | ) | – | – | ||||||||
| Taxes related to the UK tax audit of intangible income and centralised services |
(53 | ) | – | – | ||||||||
| Hyperinflation adjustment for Argentina deferred tax |
(5 | ) | (21 | ) | – | |||||||
| Non-underlying items not in operating profit but within net profit after tax | (182 | ) | (161 | ) | 125 | |||||||
| Non-underlying items after tax(e) | (974 | ) | (1,091 | ) | 3,042 | |||||||
| Attributable to: | ||||||||||||
| Non-controlling interest |
(23 | ) | (28 | ) | 18 | |||||||
| Shareholders’ equity |
(951 | ) | (1,063 | ) | 3,024 | |||||||
| (a) | 2020 gain relates to a laundry bar business disposal. 2019 includes a gain of €57 million relating to the disposal of Alsa. 2018 includes a gain of €4,331 million on disposal of spreads business. |
| (b) | Restructuring costs are comprised of various supply chain optimisation projects and organisational change programmes across markets. |
| (c) | 2019 includes a charge of €18 million relating to an impairment of goodwill for a local business classified to held for sale. |
| (d) | 2020 includes a charge of €87 million for litigation matters in relation to investigations by national competition authorities. |
| (e) | Non-underlying items after tax is calculated as non-underlying items within operating profit after tax plus non-underlying items not in operating profit but within net profit after tax. |
4. Employees
4A. Staff and management costs
| Staff costs |
€ million 2020 |
€ million 2019 |
€ million 2018 |
|||||||||
| Wages and salaries | (5,051 | ) | (5,364 | ) | (5,346 | ) | ||||||
| Social security costs | (519 | ) | (541 | ) | (571 | ) | ||||||
| Other pension costs | (419 | ) | (334 | ) | (439 | ) | ||||||
| Share-based compensation costs | (108 | ) | (151 | ) | (196 | ) | ||||||
| (6,097 | ) | (6,390 | ) | (6,552 | ) | |||||||
| Average number of employees during the year | ‘000 2020 |
‘000 2019 |
‘000 2018 |
|||||||||
| Asia/AMET/RUB | 83 | 84 | 88 | |||||||||
| The Americas | 38 | 40 | 40 | |||||||||
| Europe | 29 | 29 | 30 | |||||||||
| 150 | 153 | 158 | ||||||||||
Table of Contents
| Unilever Annual Report on Form 20-F 2020 | 123 |
4A. Staff and management costs continued
Table of Contents
| 124 | Unilever Annual Report on Form 20-F 2020 |
Notes to the Consolidated Financial Statements Unilever Group continued
4B. Pensions and similar obligations continued
Assumptions
With the objective of presenting the assets and liabilities of the pensions and other post-employment benefit plans at their fair value on the balance sheet, assumptions under IAS 19 are set by reference to market conditions at the valuation date. The actuarial assumptions used to calculate the benefit liabilities vary according to the country in which the plan is situated. The following table shows the assumptions, weighted by liabilities, used to value the principal defined benefit plans (representing approximately 96% of total pension liabilities and other post-employment benefit liabilities).
| 31 December 2020 | 31 December 2019 | |||||||||||||||||||
| Defined benefit pension plans |
Other post- employment benefit plans |
Defined benefit pension plans |
Other
post- employment benefit plans |
|||||||||||||||||
| Discount rate | 1.3% | 3.3% | 1.9% | 3.9% | ||||||||||||||||
| Inflation | 2.2% | n/a | 2.3% | n/a | ||||||||||||||||
| Rate of increase in salaries | 2.9% | 3.0% | 2.9% | 3.0% | ||||||||||||||||
| Rate of increase for pensions in payment (where provided) | 2.1% | n/a | 2.2% | n/a | ||||||||||||||||
| Rate of increase for pensions in deferment (where provided) | 2.3% | n/a | 2.4% | n/a | ||||||||||||||||
| Long-term medical cost inflation | n/a | 5.1% | n/a | 5.4% | ||||||||||||||||
The valuations of other post-employment benefit plans generally assume a higher initial level of medical cost inflation, which falls from 6% to the long-term rate within the next four years. Assumed healthcare cost trend rates have a significant effect on the amounts reported for healthcare plans.
During 2020, refinements were made in assumption setting methodologies to reflect changes being made more generally by corporates and their advisers in setting discount rates and future inflation rates, specifically in the UK, which resulted in a €880 million lower liability.
For the UK and Netherlands pension plans, representing approximately 70% of all defined benefit pension liabilities, the assumptions used at 31 December 2020 and 2019 were:
| United Kingdom | Netherlands | |||||||||||||||||||
| 2020 | 2019 | 2020 | 2019 | |||||||||||||||||
| Discount rate | 1.4% | 2.0 | % | 0.7 | % | 1.1 | % | |||||||||||||
| Inflation | 2.7% | 2.9 | % | 1.5 | % | 1.5 | % | |||||||||||||
| Rate of increase in salaries | 3.3% | 3.2 | % | 2.0 | % | 2.0 | % | |||||||||||||
| Rate of increase for pensions in payment (where provided) | 2.7% | 2.8 | % | 1.5 | % | 1.5 | % | |||||||||||||
| Rate of increase for pensions in deferment (where provided) | 2.7% | 2.8 | % | 1.5 | % | 1.5 | % | |||||||||||||
| Number of years a current pensioner is expected to live beyond age 65: | ||||||||||||||||||||
| Men |
21.7 | 21.6 | 21.5 | 22.6 | ||||||||||||||||
| Women |
23.4 | 23.4 | 23.6 | 24.1 | ||||||||||||||||
| Number of years a future pensioner currently aged 45 is expected to live beyond age 65: | ||||||||||||||||||||
| Men |
22.7 | 22.6 | 23.4 | 24.5 | ||||||||||||||||
| Women |
24.6 | 24.6 | 25.4 | 26.2 | ||||||||||||||||
Demographic assumptions, such as mortality rates, are set with having regard to the latest trends in life expectancy (including expectations of future improvements), plan experience and other relevant data. These assumptions are reviewed and updated as necessary as part of the periodic actuarial valuation of the pension plans. The years of life expectancy for 2020 above have been translated from the following tables:
UK: Standard life expectancy tables Series S3, adjusted to reflect the experience of our plan members analysed as part of the 2019 actuarial valuation. Future improvements in longevity have been allowed for in line with the core CMI 2018 Mortality Projections Model with a 1.0% p.a. long-term improvement rate.
Netherlands: The Dutch Actuarial Society’s AG Prognosetafel 2020 table is used with correction factors (2020) to allow for the typically longer life expectancy for fund members relative to the general population. This table has an in-built allowance for future improvements in longevity.
The remaining defined benefit plans are considered immaterial. Their assumptions vary due to a number of factors including the currency and long-term economic conditions of the countries where they are situated.
Table of Contents
| Unilever Annual Report on Form 20-F 2020 | 125 |
4B. Pensions and similar obligations continued
Table of Contents
| 126 | Unilever Annual Report on Form 20-F 2020 |
Notes to the Consolidated Financial Statements Unilever Group continued
4B. Pensions and similar obligations continued
Reconciliation of change in assets and liabilities
The group of plans within ‘Rest of world’ category in the tables below are not materially different with respect to their risks that would require disaggregated disclosure.
Movements in assets during the year:
| UK | Netherlands |
Rest of world |
€ million 2020 Total |
UK | Netherlands | Rest of world |
€ million 2019 Total |
|||||||||||||||||||||||||
| 1 January | 12,122 | 5,522 | 6,082 | 23,726 | 10,329 | 4,996 | 5,555 | 20,880 | ||||||||||||||||||||||||
| Employee contributions | – | – | 17 | 17 | – | – | 17 | 17 | ||||||||||||||||||||||||
| Settlements | – | – | (67 | ) | (67 | ) | – | – | – | – | ||||||||||||||||||||||
| Actual return on plan assets (excluding amounts in net finance income/charge) | 1,109 | 206 | 179 | 1,494 | 1,233 | 588 | 564 | 2,385 | ||||||||||||||||||||||||
| Change in asset ceiling, excluding amounts included in finance cost | – | – | 2 | 2 | – | – | (37 | ) | (37 | ) | ||||||||||||||||||||||
| Interest income(a) | 230 | 60 | 146 | 436 | 292 | 89 | 192 | 573 | ||||||||||||||||||||||||
| Employer contributions | 104 | 12 | 282 | 398 | 94 | 14 | 293 | 401 | ||||||||||||||||||||||||
| Benefit payments | (467 | ) | (166 | ) | (507 | ) | (1,140 | ) | (455 | ) | (165 | ) | (588 | ) | (1,208 | ) | ||||||||||||||||
| Others | 46 | (47 | ) | 21 | 20 | – | – | 2 | 2 | |||||||||||||||||||||||
| Currency retranslation | (645 | ) | – | (235 | ) | (880 | ) | 629 | – | 84 | 713 | |||||||||||||||||||||
| 31 December | 12,499 | 5,587 | 5,920 | 24,006 | 12,122 | 5,522 | 6,082 | 23,726 | ||||||||||||||||||||||||
| (a) | This includes the impact of interest on asset ceiling. |
Movements in liabilities during the year:
| UK | Netherlands |
Rest of world |
€ million 2020 Total |
UK | Netherlands | Rest of world |
€ million 2019 Total |
|||||||||||||||||||||||||
| 1 January | (11,001 | ) | (5,097 | ) | (7,824 | ) | (23,922 | ) | (9,739 | ) | (4,664 | ) | (7,351 | ) | (21,754 | ) | ||||||||||||||||
| Current service cost | (114 | ) | (3 | ) | (106 | ) | (223 | ) | (104 | ) | (4 | ) | (108 | ) | (216 | ) | ||||||||||||||||
| Special termination benefits | – | – | (37 | ) | (37 | ) | – | – | (5 | ) | (5 | ) | ||||||||||||||||||||
| Past service costs including (losses)/gains on curtailments | 17 | – | 3 | 20 | 56 | – | 9 | 65 | ||||||||||||||||||||||||
| Settlements | – | – | 74 | 74 | – | – | (2 | ) | (2 | ) | ||||||||||||||||||||||
| Interest cost | (208 | ) | (55 | ) | (182 | ) | (445 | ) | (276 | ) | (82 | ) | (245 | ) | (603 | ) | ||||||||||||||||
| Actuarial gain/(loss) arising from changes in demographic assumptions | (1 | ) | 245 | 2 | 246 | 157 | 14 | 12 | 183 | |||||||||||||||||||||||
| Actuarial gain/(loss) arising from changes in financial assumptions | (806 | ) | (354 | ) | (254 | ) | (1,414 | ) | (955 | ) | (511 | ) | (672 | ) | (2,138 | ) | ||||||||||||||||
| Actuarial gain/(loss) arising from experience adjustments | (67 | ) | (6 | ) | (5 | ) | (78 | ) | (44 | ) | (15 | ) | 47 | (12 | ) | |||||||||||||||||
| Benefit payments | 467 | 166 | 507 | 1,140 | 455 | 165 | 588 | 1,208 | ||||||||||||||||||||||||
| Others | (44 | ) | 44 | (38 | ) | (38 | ) | – | – | (20 | ) | (20 | ) | |||||||||||||||||||
| Currency retranslation | 609 | – | 349 | 958 | (551 | ) | – | (77 | ) | (628 | ) | |||||||||||||||||||||
| 31 December | (11,148 | ) | (5,060 | ) | (7,511 | ) | (23,719 | ) | (11,001 | ) | (5,097 | ) | (7,824 | ) | (23,922 | ) | ||||||||||||||||
Table of Contents
| Unilever Annual Report on Form 20-F 2020 | 127 |
4B. Pensions and similar obligations continued
Table of Contents
| 128 | Unilever Annual Report on Form 20-F 2020 |
Notes to the Consolidated Financial Statements Unilever Group continued
4B. Pensions and similar obligations continued
Plan assets
The group of plans within ‘Rest of world’ category in the tables below are not materially different with respect to their risks that would require disaggregated disclosure.
The fair value of plan assets, which are reported net of fund liabilities that are not employee benefits, at the end of the reporting period for each category are as follows:
| € million 31 December 2020 |
€ million 31 December 2019 |
|||||||||||||||||||||||||||||||||||
| UK | Netherlands |
Rest of world |
2020 Total |
UK | Netherlands |
Rest of world |
2019 Total |
|||||||||||||||||||||||||||||
| Total plan assets | 12,499 | 5,587 | 5,937 | 24,023 | 12,122 | 5,522 | 6,105 | 23,749 | ||||||||||||||||||||||||||||
| Assets | ||||||||||||||||||||||||||||||||||||
| Equities total | 4,653 | 1,837 | 1,694 | 8,184 | 4,173 | 1,831 | 1,752 | 7,756 | ||||||||||||||||||||||||||||
| Europe |
921 | 437 | 506 | 1,864 | 930 | 517 | 583 | 2,030 | ||||||||||||||||||||||||||||
| North America |
2,740 | 894 | 747 | 4,381 | 2,312 | 825 | 707 | 3,844 | ||||||||||||||||||||||||||||
| Other |
992 | 506 | 441 | 1,939 | 931 | 489 | 462 | 1,882 | ||||||||||||||||||||||||||||
| Fixed income total | 5,819 | 2,766 | 3,108 | 11,693 | 5,317 | 2,795 | 3,250 | 11,362 | ||||||||||||||||||||||||||||
| Government bonds |
3,292 | 798 | 1,367 | 5,457 | 2,711 | 765 | 1,369 | 4,845 | ||||||||||||||||||||||||||||
| Investment grade corporate bonds |
1,167 | 540 | 1,111 | 2,818 | 1,120 | 542 | 1,272 | 2,934 | ||||||||||||||||||||||||||||
| Other fixed income |
1,360 | 1,428 | 630 | 3,418 | 1,486 | 1,488 | 609 | 3,583 | ||||||||||||||||||||||||||||
| Private equity | 274 | 64 | 9 | 347 | 325 | 65 | 6 | 396 | ||||||||||||||||||||||||||||
| Property and real estate | 835 | 456 | 332 | 1,623 | 916 | 491 | 321 | 1,728 | ||||||||||||||||||||||||||||
| Hedge funds | 318 | – | 62 | 380 | 688 | – | 69 | 757 | ||||||||||||||||||||||||||||
| Other | 470 | 320 | 377 | 1,167 | 454 | 289 | 415 | 1,158 | ||||||||||||||||||||||||||||
| Other plans | – | – | 370 | 370 | – | – | 300 | 300 | ||||||||||||||||||||||||||||
| Assets/fund (liabilities) that are not employee benefits | ||||||||||||||||||||||||||||||||||||
| Derivatives | 130 | 144 | (15 | ) | 259 | 249 | 51 | (8 | ) | 292 | ||||||||||||||||||||||||||
The fair values of the above equity and fixed income instruments are determined based on quoted market prices in active markets. The fair value of private equity, properties, derivatives and hedge funds are not based on quoted market prices in active markets. The Group uses derivatives and other instruments to hedge some of its exposure to inflation and interest rate risk – the degree of this hedging of liabilities was 70% for interest rate and 70% for inflation for the UK plan and 33% for interest rate and 20% for inflation for the Netherlands plan. Foreign currency exposures in part are also hedged by the use of forward foreign exchange contracts. Assets included in the Other category are cash and insurance contracts which are also unquoted assets.
Equity securities include Unilever securities amounting to €9 million (0.04% of total plan assets) and €12 million (0.05% of total plan assets) at 31 December 2020 and 2019 respectively. Property includes property occupied by Unilever amounting to €29 million and €30 million at 31 December 2020 and 2019 respectively.
The pension assets above exclude the assets in a Special Benefits Trust amounting to €44 million (2019: €54 million) to fund pension and similar obligations in the United States (see also note 17A on page 157).
Sensitivities
The sensitivity of the overall pension liabilities to changes in the weighted key assumptions are:
| Change in liabilities | ||||||||||||||||||||
| Change in assumption | UK | Netherlands | Total | |||||||||||||||||
| Discount rate | Increase by 0.5% | -8% | -9% | -8% | ||||||||||||||||
| Inflation rate | Increase by 0.5% | 6% | 9% | 6% | ||||||||||||||||
| Life expectancy | Increase by 1 year | 5% | 5% | 5% | ||||||||||||||||
| Long-term medical cost inflation(a) | Increase by 1.0% | 0% | 0% | 3% | ||||||||||||||||
| (a) | Long-term medical cost inflation only relates to post-retirement medical plans and its impact on these liabilities. |
An equivalent decrease in each assumption would have an equal and opposite impact on liabilities.
The sensitivity analyses above have been determined based on reasonably possible changes of the respective assumptions occurring at the end of the reporting period and may not be representative of the actual change. It is based on a change in the key assumption while holding all other assumptions constant. When calculating the sensitivity to the assumption, the same method used to calculate the liability recognised in the balance sheet has been applied. The methods and types of assumptions used in preparing the sensitivity analysis did not change compared with the previous period.
Table of Contents
| Unilever Annual Report on Form 20-F 2020 | 129 |
4B. Pensions and similar obligations continued
Table of Contents
| 130 | Unilever Annual Report on Form 20-F 2020 |
Notes to the Consolidated Financial Statements Unilever Group continued
4C. Share-based compensation plans continued
| 2020 | 2019 | 2018 | ||||||||||
| Share award value information | ||||||||||||
| Fair value per share award during the year | €43.91 | €48.22 | €42.44 | |||||||||
Additional information
At 31 December 2020 shares in PLC totalling 12,283,872 were outstanding in respect of share-based compensation plans of PLC and its subsidiaries, including North American plans. At 31 December 2019 shares in NV and PLC totalling 11,944,106 were outstanding in respect of share-based compensation plans of NV, PLC and its subsidiaries, including North American plans.
Shortly before Unification, 4,523,367 NV and PLC ordinary shares, 892,155 NV NYRSs and 468,989 PLC ADSs held by NV in connection with share-based compensation plans were transferred to an employee share ownership trust that will satisfy the awards granted. At 31 December 2020 the employee share ownership trust held 5,884,511 PLC shares and PLC and its subsidiaries held 1,382,155 PLC shares which are held as treasury shares. At 31 December 2019 PLC and NV shares totalling 12,419,009 were held by NV as treasury shares. In the future either the employee share ownership trust or subsidiaries of PLC will buy PLC shares in the open market to satisfy share-based payment obligations.
The book value of €483 million of the shares held by the trust and by Unilever PLC and its subsidiaries in respect of share-based compensation plans is eliminated on consolidation by deduction from other reserves (2019: €640 million of shares were held as treasury shares by NV). Their market value at 31 December 2020 was €357 million (2019: €635 million).
Shares held to satisfy awards are accounted for in accordance with IAS 32 ‘Financial Instruments: Presentation’. All differences between the purchase price of the shares held to satisfy awards granted and the proceeds received for the shares, whether on exercise or lapse, are charged to reserves.
Between 31 December 2020 and 23 February 2021 (the latest practicable date for inclusion in this report), nil shares were granted, 2,232,282 shares vested and 43,435 shares were forfeited related to the Performance Share Plans.
5. Net finance costs
| Net finance costs are comprised of finance costs and finance income, including net finance costs in relation to pensions and similar obligations.
Finance income includes income on cash and cash equivalents and income on other financial assets. Finance costs include interest costs in relation to financial liabilities. This includes interest on lease liabilities which represents the unwind of the discount rate applied to lease liabilities.
Borrowing costs are recognised based on the effective interest method. |
| Net finance costs | Notes |
€ million 2020 |
€ million 2019 |
€ million 2018 |
||||||||||||
| Finance costs | (672 | ) | (821 | ) | (718 | ) | ||||||||||
| Bank loans and overdrafts |
(32 | ) | (46 | ) | (44 | ) | ||||||||||
| Interest on bonds and other loans(a) |
(533 | ) | (617 | ) | (560 | ) | ||||||||||
| Interest on lease liabilities |
(82 | ) | (100 | ) | (127 | ) | ||||||||||
| Net gain/(loss) on transactions for which hedge accounting is not applied |
(25 | ) | (58 | ) | 13 | |||||||||||
| On foreign exchange derivatives |
275 | (321 | ) | 144 | ||||||||||||
| Exchange difference on underlying items(b) |
(300 | ) | 263 | (131 | ) | |||||||||||
| Finance income(c) | 232 | 224 | 135 | |||||||||||||
| Pensions and similar obligations | 4B | (9 | ) | (30 | ) | (25 | ) | |||||||||
| Net finance costs before non-underlying items(d) | (449 | ) | (627 | ) | (608 | ) | ||||||||||
| Interest related to the UK tax audit of intangible income and centralised services | 3 | (56 | ) | – | – | |||||||||||
| (505 | ) | (627 | ) | (608 | ) | |||||||||||
| (a) | Interest on bonds and other loans includes the impact of interest rate derivatives that are part of hedge accounting relationships and the related recycling of results from the hedge accounting reserve. Includes an amount of €(21) million (2019: €(6) million) relating to unwinding of discount on deferred consideration for acquisitions. |
| (b) | 2020 includes Nil (2019: €(40) million) finance cost due to change in functional currency in Group’s operating entities in Zimbabwe from US dollar to RTGS dollar. For further details of derivatives for which hedge accounting is not applied, please refer to note 16C. |
| (c) | Includes an amount of €90 million (2019: €70 million) that relates to interest on tax settlement in Brazil and €27 million (2019: Nil) related to interest on corporate income tax refund in India. |
| (d) | See note 3 for explanation of non-underlying items. |
Table of Contents
| Unilever Annual Report on Form 20-F 2020 | 131 |
Table of Contents
| 132 | Unilever Annual Report on Form 20-F 2020 |
Notes to the Consolidated Financial Statements Unilever Group continued
6B. Deferred tax
| Deferred tax is recognised using the liability method on taxable temporary differences between the tax base and the accounting base of items included in the balance sheet of the Group. Certain temporary differences are not provided for as follows:
◾ goodwill not deductible for tax purposes; ◾ the initial recognition of assets or liabilities that affect neither accounting nor taxable profit; and ◾ differences relating to investments in subsidiaries to the extent that it is probable that they will not reverse in the foreseeable future.
The amount of deferred tax provided is based on the expected manner of realisation or settlement of the carrying amount of assets and liabilities, using tax rates enacted, or substantively enacted, at the year end.
A deferred tax asset is recognised only to the extent that it is probable that future taxable profits will be available against which the asset can be utilised. Deferred tax assets are reduced to the extent that it is no longer probable that the related tax benefit will be realised. |
| Movements in 2020 and 2019 | € million As at 1 January 2020 |
€ million
Income statement |
€ million
Other |
€ million As at 31 December 2020 |
€ million As at 1 January 2019 |
€ million
Income statement |
€ million
Other |
€ million As at 31 December 2019 |
||||||||||||||||||||||||
| Pensions and similar obligations | 272 | (97 | ) | (95 | ) | 80 | 404 | (81 | ) | (51 | ) | 272 | ||||||||||||||||||||
| Provisions and accruals | 756 | 38 | (96 | ) | 698 | 821 | (73 | ) | 8 | 756 | ||||||||||||||||||||||
| Goodwill and intangible assets | (2,096 | ) | 23 | (661 | ) | (2,734 | ) | (1,911 | ) | (31 | ) | (154 | ) | (2,096 | ) | |||||||||||||||||
| Accelerated tax depreciation | (685 | ) | 9 | 35 | (641 | ) | (679 | ) | 12 | (18 | ) | (685 | ) | |||||||||||||||||||
| Tax losses | 184 | 32 | (26 | ) | 190 | 130 | 63 | (9 | ) | 184 | ||||||||||||||||||||||
| Fair value gains | (50 | ) | 12 | (14 | ) | (52 | ) | 155 | (200 | ) | (5 | ) | (50 | ) | ||||||||||||||||||
| Fair value losses | 15 | (6 | ) | 36 | 45 | 22 | (2 | ) | (5 | ) | 15 | |||||||||||||||||||||
| Share-based payments | 156 | (30 | ) | 20 | 146 | 175 | (39 | ) | 20 | 156 | ||||||||||||||||||||||
| Lease liability | 319 | 9 | (34 | ) | 294 | 428 | (113 | ) | 4 | 319 | ||||||||||||||||||||||
| Right of use asset | (269 | ) | (4 | ) | 29 | (244 | ) | (370 | ) | 107 | (6 | ) | (269 | ) | ||||||||||||||||||
| Other(a) | 161 | 373 | (8 | ) | 526 | 77 | 73 | 11 | 161 | |||||||||||||||||||||||
| (1,237 | ) | 359 | (814 | ) | (1,692 | ) | (748 | ) | (284 | ) | (205 | ) | (1,237 | ) | ||||||||||||||||||
| (a) | The deferred tax - other includes the recognition of an asset of €345 million relating to the impact of the expected outcome of the Mutual Agreement Procedure which Unilever applied for following the conclusion of the UK tax audit for the tax years 2011-2018. |
At the balance sheet date, the Group had unused tax losses of €4,808 million (2019: €4,790 million) and tax credits amounting to €454 million (2019: €524 million) available for offset against future taxable profits. Deferred tax assets have not been recognised in respect of unused tax losses of €4,246 million (2019: €4,272 million) and tax credits of €429 million (2019: €497 million), as it is not probable that there will be future taxable profits within the entities against which the losses and credits can be utilised. Of these losses €4,195 million (2019: €4,108 million) have expiry dates, the majority being corporate income tax losses in the Netherlands which expire between now and 2027.
Deferred tax assets have not been recognised in respect of other deductible temporary differences of €1,445 million (2019: €48 million) as it is not expected they will be utilised. Of these differences €1,193 million relates to limitation on the deduction of interest expenses. There is no expiry date for these differences.
At the balance sheet date, the aggregate amount of temporary differences associated with undistributed earnings of subsidiaries for which deferred tax liabilities have not been recognised was €2,097 million (2019: €2,476 million). No liability has been recognised in respect of these differences because the Group is in a position to control the timing of the reversal of the temporary differences, and it is probable that such differences will not reverse in the foreseeable future.
Deferred tax assets and liabilities are offset when there is a legally enforceable right to set off current tax assets against current tax liabilities and when the deferred income taxes relate to the same fiscal authority. The following amounts, determined after appropriate offsetting, are shown in the consolidated balance sheet:
| Movements in 2020 and 2019 |
€ million Assets 2020 |
€ million Assets 2019 |
€ million Liabilities 2020 |
€ million Liabilities 2019 |
€ million Total 2020 |
€ million Total 2019 |
||||||||||||||||||
| Pensions and similar obligations | 404 | 402 | (324 | ) | (130 | ) | 80 | 272 | ||||||||||||||||
| Provisions and accruals | 408 | 495 | 290 | 261 | 698 | 756 | ||||||||||||||||||
| Goodwill and intangible assets | 330 | 248 | (3,064 | ) | (2,344 | ) | (2,734 | ) | (2,096 | ) | ||||||||||||||
| Accelerated tax depreciation | (37 | ) | (67 | ) | (604 | ) | (618 | ) | (641 | ) | (685 | ) | ||||||||||||
| Tax losses | 161 | 153 | 29 | 31 | 190 | 184 | ||||||||||||||||||
| Fair value gains | (1 | ) | (14 | ) | (51 | ) | (36 | ) | (52 | ) | (50 | ) | ||||||||||||
| Fair value losses | 27 | – | 18 | 15 | 45 | 15 | ||||||||||||||||||
| Share-based payments | 26 | 31 | 120 | 125 | 146 | 156 | ||||||||||||||||||
| Lease liability | 157 | 170 | 137 | 149 | 294 | 319 | ||||||||||||||||||
| Right of use asset | (128 | ) | (142 | ) | (116 | ) | (127 | ) | (244 | ) | (269 | ) | ||||||||||||
| Other | 127 | 60 | 399 | 101 | 526 | 161 | ||||||||||||||||||
| 1,474 | 1,336 | (3,166 | ) | (2,573 | ) | (1,692 | ) | (1,237 | ) | |||||||||||||||
| Of which deferred tax to be recovered/(settled) after more than 12 months | 1,230 | 1,030 | (3,311 | ) | (2,681 | ) | (2,081 | ) | (1,651 | ) | ||||||||||||||
Table of Contents
| Unilever Annual Report on Form 20-F 2020 | 133 |
Table of Contents
| 134 | Unilever Annual Report on Form 20-F 2020 |
Notes to the Consolidated Financial Statements Unilever Group continued
8. Dividends on ordinary capital
| Dividends are recognised on the date that the shareholder’s right to receive payment is established. This is generally the date when the dividend is declared. |
| Dividends on ordinary capital during the year | € million 2020 |
€
million 2019 |
€
million 2018 |
|||||||||
| PLC dividends | (1,911 | ) | (1,871 | ) | (1,819 | ) | ||||||
| NV dividends(a) | (2,389 | ) | (2,352 | ) | (2,262 | ) | ||||||
| (4,300 | ) | (4,223 | ) | (4,081 | ) | |||||||
| (a) | Amount relates to NV dividends paid prior to Unification. |
Four quarterly interim dividends were declared and paid during 2020 totalling €1.64 (2019: €1.62) per NV ordinary share and £1.45 (2019: £1.42) per PLC ordinary share.
A quarterly dividend of €1,125 million (2019: €1,073 million) was declared on 4 February 2021, to be paid in March 2021; £0.38 per PLC ordinary share (2019: £0.35). Total dividends declared in relation to 2020 were £1.48 (2019: £1.43) per PLC ordinary share.
9. Goodwill and intangible assets
| Goodwill Goodwill is initially recognised based on the accounting policy for business combinations (see note 21). Goodwill is subsequently measured at cost less amounts provided for impairment.
Goodwill acquired in a business combination is assessed to determine whether new cash generating units are created, and if not, is allocated to the Group’s CGUs, or groups of CGUs, that are expected to benefit from the synergies of the combination. These might not always be the same as the CGUs that include the assets and liabilities of the acquired business. Each unit or group of units to which the goodwill is allocated represents the lowest level within the Group at which the goodwill is monitored for internal management purposes, and is not larger than an operating segment.
The Group has ten cash generating units (CGUs) based on the three geographical areas and three divisions as well as a health and wellbeing CGU which was recognised in 2019 following the acquisition of the OLLY business.
Intangible assets Separately purchased intangible assets are initially measured at cost, being the purchase price as at the date of acquisition. On acquisition of new interests in group companies, Unilever recognises any specifically identifiable intangible assets separately from goodwill. These intangible assets are initially measured at fair value as at the date of acquisition.
Expenditure to support development of internally-produced intangible assets is recognised in profit or loss as incurred.
Indefinite-life intangibles mainly comprise trademarks and brands, for which there is no foreseeable limit to the period over which they are expected to generate net cash inflows. These are considered to have an indefinite life, given the strength and durability of our brands and the level of marketing support. These assets are not amortised but are subject to a review for impairment annually, or more frequently if events or circumstances indicate this is necessary. Any impairment is charged to the income statement as it arises.
Finite-life intangible assets mainly comprise software, patented and non-patented technology, know-how and customer lists. These assets are amortised on a straight-line basis in the income statement over the period of their expected useful lives, or the period of legal rights if shorter. None of the amortisation periods exceeds ten years. |
Table of Contents
| Unilever Annual Report on Form 20-F 2020 | 135 |
9. Goodwill and intangible assets continued
Table of Contents
| 136 | Unilever Annual Report on Form 20-F 2020 |
Notes to the Consolidated Financial Statements Unilever Group continued
9. Goodwill and intangible assets continued
Significant CGUs
The goodwill and indefinite-life intangible assets held in the CGUs relating to Foods & Refreshment Europe, Foods & Refreshment The Americas, Foods & Refreshment Asia/AMET/RUB, Beauty & Personal Care The Americas and Beauty & Personal Care Asia/AMET/RUB are considered significant within the total carrying amounts of goodwill and indefinite-life intangible assets at 31 December 2020.
| 2020 CGUs | 2019 CGUs | |||||||||||||||||||||||
| € billion | € billion | € billion | € billion | |||||||||||||||||||||
| Indefinite-life | Indefinite-life | |||||||||||||||||||||||
| Goodwill | intangible assets | Goodwill | intangible assets | |||||||||||||||||||||
| Foods & Refreshment Europe | 4.0 | 1.7 | 4.1 | 1.7 | ||||||||||||||||||||
| Foods & Refreshment The Americas | 3.4 | 1.9 | 4.0 | 2.1 | ||||||||||||||||||||
| Foods & Refreshment Asia/AMET/RUB(a) | 3.7 | 3.7 | 1.9 | 0.5 | ||||||||||||||||||||
| Beauty & Personal Care The Americas | 3.8 | 3.1 | 4.3 | 3.1 | ||||||||||||||||||||
| Beauty & Personal Care Asia/AMET/RUB | 1.6 | 1.9 | 1.7 | 2.0 | ||||||||||||||||||||
| Total significant CGUs | 16.5 | 12.3 | 16.0 | 9.4 | ||||||||||||||||||||
| Others(b) | 2.4 | 2.9 | 2.1 | 2.5 | ||||||||||||||||||||
| Total CGUs | 18.9 | 15.2 | 18.1 | 11.9 | ||||||||||||||||||||
| (a) | The Main Horlicks Acquisition increased goodwill by €2.0 billion and indefinite-life intangible assets by €3.3 billion in 2020. These values are provisional. |
| (b) | Included within Others are individually insignificant amounts of goodwill and intangible assets that have been allocated between multiple cash generating units. |
Key assumptions
The recoverable amount of each CGU has been calculated based on its value in use, estimated as the present value of projected future cash flows.
The growth rates and margins for the significant CGUs are set out below:
| For the year 2020 | Foods & Refreshment Europe |
Foods & Refreshment The Americas |
Foods & Refreshment Asia/AMET/RUB |
Beauty & Personal Care The Americas |
Beauty & Personal Care Asia/AMET/RUB |
|||||||||||||||
| Longer-term sustainable growth rates | 1.1 | % | 1.7 | % | 3.9 | % | 1.7 | % | 3.9 | % | ||||||||||
| Average near-term nominal growth rates | (1.0 | )% | 0.1 | % | 4.9 | % | 2.5 | % | 3.4 | % | ||||||||||
| Average operating margins | 13 | % | 15 | % | 16 | % | 22 | % | 22 | % | ||||||||||
| For the year 2019 | Foods & Refreshment Europe |
Foods & Refreshment The Americas |
Foods & Refreshment Asia/AMET/RUB |
Beauty & Personal Care The Americas |
Beauty & Personal Care Asia/AMET/RUB |
|||||||||||||||
| Longer-term sustainable growth rates | 1.1 | % | 1.7 | % | 3.9 | % | 1.7 | % | 3.9 | % | ||||||||||
| Average near-term nominal growth rates | 1.2 | % | (1.2 | )% | 6.5 | % | 1.6 | % | 5.3 | % | ||||||||||
| Average operating margins | 16 | % | 15 | % | 18 | % | 21 | % | 22 | % | ||||||||||
Projected cash flows include specific estimates for a period of five years. The growth rates and operating margins used to estimate cash flows for the first five years are based on past performance and on the Group’s three-year strategic plan, which includes the impact on our business of climate change and activities we are undertaking to reduce carbon emissions, extended to years four and five.
The estimated cash flows after year five are extrapolated using a longer-term sustainable growth rate, which is determined as the lower of our own three-year average market growth projection and external forecasts for the relevant market.
In 2020, the projected cash flows are discounted using pre-tax discount rates in the range between 6.0%-7.4% (2019: 7.4%). The discount rates are specific to each CGU and are determined based on the weighted average cost of capital, including a market risk premium.
There are no reasonably possible changes in key assumptions that would cause the carrying amount of a CGU to exceed its recoverable amount.
Table of Contents
| Unilever Annual Report on Form 20-F 2020 | 137 |
Table of Contents
| 138 | Unilever Annual Report on Form 20-F 2020 |
Notes to the Consolidated Financial Statements Unilever Group continued
10A. Owned assets continued
| Movements during 2019 | € million Land and buildings |
€ million Plant and equipment |
€ million
Total |
|||||||||
| Cost | ||||||||||||
| 1 January 2019 | 4,386 | 15,216 | 19,602 | |||||||||
| Additions through business combinations | 7 | 28 | 35 | |||||||||
| Additions | 175 | 1,141 | 1,316 | |||||||||
| Disposals and other movements | (72 | ) | (649 | ) | (721 | ) | ||||||
| Hyperinflationary adjustment | (3 | ) | (28 | ) | (31 | ) | ||||||
| Reclassification as held for sale | (63 | ) | (116 | ) | (179 | ) | ||||||
| Currency retranslation | 68 | 252 | 320 | |||||||||
| 31 December 2019 | 4,498 | 15,844 | 20,342 | |||||||||
| Accumulated depreciation | ||||||||||||
| 1 January 2019 | (1,390 | ) | (7,998 | ) | (9,388 | ) | ||||||
| Depreciation charge for the year | (134 | ) | (1,022 | ) | (1,156 | ) | ||||||
| Disposals and other movements | 28 | 456 | 484 | |||||||||
| Hyperinflationary adjustment | 5 | 30 | 35 | |||||||||
| Reclassification as held for sale | 38 | 81 | 119 | |||||||||
| Currency retranslation | (26 | ) | (161 | ) | (187 | ) | ||||||
| 31 December 2019 | (1,479 | ) | (8,614 | ) | (10,093 | ) | ||||||
| Net book value 31 December 2019(a) | 3,019 | 7,230 | 10,249 | |||||||||
| Includes capital expenditures for assets under construction | 78 | 872 | 950 | |||||||||
| (a) | Includes €347 million (2019: €319 million) of freehold land. |
10B. Leased assets
| Movements during 2020 | € million Land and buildings |
€ million Plant and equipment |
€ million
Total |
|||||||||
| Cost | ||||||||||||
| 1 January 2020 | 2,874 | 827 | 3,701 | |||||||||
| Additions through business combinations | 30 | 3 | 33 | |||||||||
| Additions | 390 | 189 | 579 | |||||||||
| Disposals and other movements | (436 | ) | (188 | ) | (624 | ) | ||||||
| Hyperinflationary adjustment | (3 | ) | – | (3 | ) | |||||||
| Currency retranslation | (216 | ) | (63 | ) | (279 | ) | ||||||
| 31 December 2020 | 2,639 | 768 | 3,407 | |||||||||
| Accumulated depreciation | ||||||||||||
| 1 January 2020 | (1,397 | ) | (491 | ) | (1,888 | ) | ||||||
| Depreciation charge for the year | (315 | ) | (142 | ) | (457 | ) | ||||||
| Disposals and other movements | 300 | 150 | 450 | |||||||||
| Currency retranslation | 101 | 36 | 137 | |||||||||
| 31 December 2020 | (1,311 | ) | (447 | ) | (1,758 | ) | ||||||
| Net book value 31 December 2020 | 1,328 | 321 | 1,649 | |||||||||
Table of Contents
| Unilever Annual Report on Form 20-F 2020 | 139 |
10B. Leased assets continued
Table of Contents
| 140 | Unilever Annual Report on Form 20-F 2020 |
Notes to the Consolidated Financial Statements Unilever Group continued
11. Other non-current assets continued
| Movements during 2020 and 2019 | € million 2020 |
€ million 2019 |
||||||
| Joint ventures(a) | ||||||||
| 1 January | 35 | 14 | ||||||
| Additions | 1 | – | ||||||
| Dividends received/reductions | (182 | ) | (158 | ) | ||||
| Share of net profit/(loss) | 177 | 179 | ||||||
| Currency retranslation | (2 | ) | – | |||||
| 31 December | 29 | 35 | ||||||
| Associates(b) | ||||||||
| 1 January | 37 | 40 | ||||||
| Additions | 1 | 1 | ||||||
| Dividend received/reductions | – | – | ||||||
| Share of net profit/(loss) | (2 | ) | (3 | ) | ||||
| Currency retranslation | (2 | ) | (1 | ) | ||||
| 31 December | 34 | 37 | ||||||
| (a) | Our principal joint ventures are Unilever FIMA Lda for Portugal, Binzagr Unilever Distribution and Al Gurg Unilever for Middle East, the Pepsi/Lipton Partnership for the US and Pepsi Lipton International Ltd for the rest of the world. |
| (b) | Associates as at 31 December 2020 primarily comprise our investments in Langholm Capital Partners. |
The joint ventures and associates have no contingent liabilities to which the Group is exposed, and the Group has no contingent liabilities in relation to its interests in the joint ventures and associates.
The Group has no outstanding capital commitments to joint ventures.
Outstanding balances with joint ventures and associates are shown in note 23 on page 166.
12. Inventories
|
Inventories are valued at the lower of weighted average cost and net realisable value. Cost comprises direct costs and, where appropriate, a proportion of attributable production overheads. Net realisable value is the estimated selling price less the estimated costs necessary to make the sale.
|
| Inventories | € million 2020 |
€ million 2019 |
||||||
| Raw materials and consumables | 1,523 | 1,399 | ||||||
| Finished goods and goods for resale | 3,223 | 3,053 | ||||||
| Total inventories | 4,746 | 4,452 | ||||||
| Provision for inventories | (284 | ) | (288 | ) | ||||
| 4,462 | 4,164 | |||||||
| Provisions for inventories | € million 2020 |
€ million 2019 |
||||||
| 1 January | 288 | 205 | ||||||
| Charge to income statement | 116 | 153 | ||||||
| Reduction/releases | (97 | ) | (71 | ) | ||||
| Currency translations | (26 | ) | – | |||||
| Others(a) | 3 | 1 | ||||||
| 31 December | 284 | 288 | ||||||
| (a) Others include the amount relating to the acquisition/disposal of businesses. |
Inventories with a value of €204 million (2019: €159 million) are carried at net realisable value, this being lower than cost. During 2020, a total expense of €381 million (2019: €363 million) was recognised in the income statement for inventory write downs and losses.
Table of Contents
| Unilever Annual Report on Form 20-F 2020 | 141 |
Table of Contents
| 142 | Unilever Annual Report on Form 20-F 2020 |
Notes to the Consolidated Financial Statements Unilever Group continued
14. Trade payables and other liabilities
| Trade payables |
| Trade payables are initially recognised at fair value less any directly attributable transaction costs. Trade payables are subsequently measured at amortised cost, using the effective interest method. |
| Other liabilities |
| Other liabilities are initially recognised at fair value less any directly attributable transaction costs. Subsequent measurement depends on the type of liability: |
| ◾ accruals are subsequently measured at amortised cost, using the effective interest method; |
| ◾ social security and sundry taxes are subsequently measured at amortised cost, using the effective interest method; |
| ◾ deferred consideration is subsequently measured at fair value with changes in the income statement as explained below; and |
| ◾ others are subsequently measured either at amortised cost, using the effective interest method or at fair value, with changes being recognised in the income statement. |
| Deferred Consideration |
| Deferred consideration represents any payments to the sellers of a business that occur after the acquisition date. These typically comprise contingent consideration and fixed deferred consideration: |
| ◾ fixed deferred consideration is a payment with a due date after acquisition that is not dependent on future conditions; and |
| ◾ contingent consideration is a payment which is dependent on certain conditions being met in the future and is often variable. |
| All deferred consideration is initially recognised at fair value as at the acquisition date, which includes a present value discount. Subsequently, deferred consideration is measured to reflect the unwinding of discount on the liability, with changes recognised in finance cost within the income statement. In the balance sheet it is remeasured to reflect the latest estimate of the achievement of the conditions on which the consideration is based; changes in value other than the discount unwind are recognised as acquisition and disposal-related costs within non-underlying items in the income statement. |
We do not consider the fair values of trade payables and other liabilities to be significantly different from their carrying values.
| Trade payables and other liabilities | € million 2020 |
€ million 2019 |
||||||
| Current: due within one year | ||||||||
| Trade payables(a) | 8,375 | 9,190 | ||||||
| Accruals | 4,266 | 4,153 | ||||||
| Social security and sundry taxes | 401 | 507 | ||||||
| Deferred consideration | 43 | 39 | ||||||
| Others | 1,047 | 879 | ||||||
| 14,132 | 14,768 | |||||||
| Non-current: due after more than one year | ||||||||
| Accruals | 81 | 117 | ||||||
| Deferred consideration | 121 | 169 | ||||||
| Others | 33 | 53 | ||||||
| 235 | 339 | |||||||
| Total trade payables and other liabilities | 14,367 | 15,107 | ||||||
| (a) | 2020 includes €5 million (2019: €359 million) due to KKR as a result of an arrangement following the sale of the global spreads business (excluding Southern Africa). Unilever provided services to KKR for two years from completion of the disposal and paid KKR for amounts collected on its behalf. See also trade receivables on page 141. |
Included within trade payables and other liabilities are discounts due to our customers of €1,770 million (2019: €1,053 million). The increase from 2019 is primarily driven by differences in the timing of promotional activities and the settlement of customer invoices compared to last year.
Included within others are IT and consulting services.
Deferred Consideration
At 31 December 2020 the total balance of deferred consideration for acquisitions is €164 million (2019: €208 million), which includes contingent consideration of €140 million (2019: €154 million). These contingent consideration payments are dependent on acquired businesses achieving contractually agreed financial targets (mainly relates to cumulative increases in turnover and profit before tax) and fall due up until 2025, with a maximum contractual amount of €718 million.
Supplier financing arrangements for trade payables
Some of our suppliers elect to factor some of their receivables from the Group with financial institutions. In some instances we provide suppliers and/ or banks with visibility of invoices approved for payment, which helps them receive cash from the bank before the invoice due date, if they choose to do so. Payment dates and terms for Unilever do not vary based on whether the supplier chooses to factor their receivable. If a receivable is purchased by a third party bank, that third party bank does not benefit from additional security when compared to the security originally enjoyed by the supplier. The Group evaluates these arrangements to assess if the payable holds the characteristics of a trade payable or should be classified as a financial liability. At 31 December 2020 and 31 December 2019 all such liabilities were classified as trade payables.
Table of Contents
| Unilever Annual Report on Form 20-F 2020 | 143 |
Table of Contents
| 144 | Unilever Annual Report on Form 20-F 2020 |
Notes to the Consolidated Financial Statements Unilever Group continued
15. Capital and funding continued
15A. Share capital
| Unilever N.V. | Authorised 2020 € million |
Issued, € million |
Authorised 2019 € million |
Issued, 2019 € million |
||||||||||||
| NV ordinary shares of €0.16 each | – | – | 480 | 274 | ||||||||||||
| NV ordinary shares of €428.57 each | ||||||||||||||||
| (shares numbered 1 to 2,400 – ‘Special Shares’) | – | – | 1 | 1 | ||||||||||||
| Internal holdings eliminated on consolidation (€428.57 shares) | – | – | – | (1 | ) | |||||||||||
| Cancellation of treasury shares(b) | – | – | – | (41 | ) | |||||||||||
| – | – | 481 | 233 | |||||||||||||
| Unilever PLC | £ million | £ million | ||||||||||||||
| PLC ordinary shares of 31/9p each | 36.4 | 37.0 | ||||||||||||||
| PLC deferred stock of £1 each | – | 0.1 | ||||||||||||||
| Internal holding eliminated on consolidation (£1 stock) | – | (0.1 | ) | |||||||||||||
| Shares issued to NV shareholders(c) | 45.4 | – | ||||||||||||||
| Cancellation of treasury shares(b) | – | (0.6 | ) | |||||||||||||
| 81.8 | 36.4 | |||||||||||||||
| € million | € million | |||||||||||||||
| Euro equivalent in millions(d) | 92 | 187 | ||||||||||||||
| Unilever Group | € million | € million | ||||||||||||||
| Ordinary share capital of NV(c) | – | 233 | ||||||||||||||
| Ordinary share capital of PLC(c) | 92 | 187 | ||||||||||||||
| 92 | 420 | |||||||||||||||
| (a) | At 31 December 2020, 2,629,243,772 of PLC ordinary shares were in issue, no NV shares were in issue. The NV special ordinary shares and PLC deferred stock were cancelled before Unification. At 31 December 2019, 1,168,530,650 of PLC ordinary shares, 100,000 of PLC deferred stock, 1,460,714,804 of NV ordinary shares and 2,400 of NV special ordinary shares were in issue. |
| (b) | At 31 December 2019, 254,012,896 of NV ordinary shares and 18,660,634 of PLC ordinary shares that were repurchased as part of the share buyback programme in 2018 and prior years were cancelled. |
| (c) | As a result of Unification, the shareholders of NV were issued 1,460,713,122 PLC ordinary shares, and all NV shares in issue were cancelled. |
| (d) | Prior to Unification, a conversion rate of £1 = €5.143 was used in accordance with the Equalisation Agreement, which ceased to exist as a result of Unification. The ordinary share capital of PLC is now translated using the conversion rate at 29 November 2020 of £1 = € 1.121. The difference between the conversion rates was released through Other Reserves as presented in the “Other effects of Unification” line in the Statement of Changes in Equity. |
A nominal dividend of 6% was paid on the PLC deferred stock in 2020.
15B. Equity
Basis of consolidation
Unilever is the majority shareholder of all material subsidiaries and has control in all cases. Information in relation to significant subsidiaries is provided on page 167.
Subsidiaries with significant non-controlling interests
Unilever has one subsidiary company which has a material non-controlling interest, Hindustan Unilever Limited (HUL). Summary financial information in relation to HUL is shown below.
| HUL balance sheet as at 31 December | € million 2020 |
€ million 2019 |
||||||
| Non-current assets | 6,173 | 1,030 | ||||||
| Current assets | 1,258 | 1,438 | ||||||
| Current liabilities | (1,127 | ) | (1,117 | ) | ||||
| Non-current liabilities | (1,139 | ) | (332 | ) | ||||
| HUL comprehensive income for the year ended 31 December | ||||||||
| Turnover | 4,957 | 4,937 | ||||||
| Profit after tax | 866 | 730 | ||||||
| Total comprehensive income | 374 | 740 | ||||||
Table of Contents
| Unilever Annual Report on Form 20-F 2020 | 145 |
15B. Equity continued
Table of Contents
| 146 | Unilever Annual Report on Form 20-F 2020 |
Notes to the Consolidated Financial Statements Unilever Group continued
15B. Equity continued
| Currency retranslation reserve – movements during the year |
€ million 2020 |
€ million 2019 |
||||||
| 1 January | (4,712 | ) | (4,694 | ) | ||||
| Currency retranslation of group companies net assets and liabilities during the year | (1,490 | ) | (341 | ) | ||||
| Movement in net investment hedges and exchange differences in net investments in foreign operations | (866 | ) | 326 | |||||
| Recycled to income statement | – | (3 | ) | |||||
| 31 December | (7,068 | ) | (4,712 | ) | ||||
| Fair value reserves – movements during the year | € million 2020 |
€ million 2019 |
||||||
| 1 January | 110 | (123 | ) | |||||
| Movements in Other comprehensive income, net of tax | ||||||||
| Gains/(losses) on equity instruments |
68 | 25 | ||||||
| Gains/(losses) on cash flow hedges |
62 | 176 | ||||||
| Hedging gains/(losses) transferred to non-financial assets | 10 | 32 | ||||||
| 31 December | 250 | 110 | ||||||
Refer to the consolidated statement of comprehensive income on page 112, the consolidated statement of changes in equity on page 113, and note 6C on page 133.
| Remeasurement of defined benefit pension plans net of tax |
€ million 2020 |
€ million 2019 |
||||||
| 1 January | (1,146 | ) | (1,499 | ) | ||||
| Movement during the year | 215 | 353 | ||||||
| 31 December | (931 | ) | (1,146 | ) | ||||
Refer to the consolidated statement of comprehensive income on page 112, the consolidated statement of changes in equity on page 113, note 4B from pages 123 to 129 and note 6C on page 133.
| Currency retranslation gains/(losses) – movements during the year |
€ million 2020 |
€ million 2019 |
||||||
| 1 January | (5,084 | ) | (5,069 | ) | ||||
| Currency retranslation during the year: | ||||||||
| Other reserves |
(2,356 | ) | (18 | ) | ||||
| Retained profit |
(22 | ) | 2 | |||||
| Non-controlling interest |
(212 | ) | 1 | |||||
| 31 December | (7,674 | ) | (5,084 | ) | ||||
Share premium account
On 29 November 2020 PLC issued 1,460,713,122 PLC ordinary shares to former NV shareholders in return for the assets and liabilities of NV. The fair value of the consideration received has been determined as the NV market capitalisation as at that date and the excess over the nominal value of the shares that were issued is recognised as share premium.
Table of Contents
| Unilever Annual Report on Form 20-F 2020 | 147 |
Table of Contents
| 148 | Unilever Annual Report on Form 20-F 2020 |
Notes to the Consolidated Financial Statements Unilever Group continued
15C. Financial liabilities continued
Analysis of bonds and other loans
| € million Total 2020 |
€ million Total 2019 |
|||||||
| Unilever PLC | ||||||||
| 1.125% Notes 2022 (£) | 387 | 408 | ||||||
| 1.375% Notes 2024 (£) | 276 | 292 | ||||||
| 1.875% Notes 2029 (£) | 274 | 290 | ||||||
| 1.500% Notes 2026 (£) | 550 | 580 | ||||||
| 1.500% Notes 2039 (€) | 646 | 646 | ||||||
| Total PLC | 2,133 | 2,216 | ||||||
| Other group companies | ||||||||
| The Netherlands(a) | ||||||||
| 1.625% Notes 2033 (€) | 793 | 792 | ||||||
| 1.750% Bonds 2020 (€) | – | 750 | ||||||
| 0.500% Notes 2022 (€) | 749 | 747 | ||||||
| 1.375% Notes 2029 (€) | 744 | 743 | ||||||
| 1.125% Bonds 2027 (€) | 697 | 697 | ||||||
| 1.125% Bonds 2028 (€) | 695 | 694 | ||||||
| 0.875% Notes 2025 (€) | 648 | 647 | ||||||
| 0.500% Bonds 2025 (€) | 645 | 644 | ||||||
| 1.375% Notes 2030 (€) | 643 | 642 | ||||||
| 0.375% Notes 2023 (€) | 599 | 599 | ||||||
| 1.000% Notes 2027 (€) | 598 | 598 | ||||||
| 1.000% Notes 2023 (€) | 498 | 498 | ||||||
| 0.000% Notes 2021 (€) | 499 | 498 | ||||||
| 0.500% Notes 2023 (€) | 498 | 498 | ||||||
| 0.500% Notes 2024 (€) | 496 | 495 | ||||||
| 0.000% Notes 2020 (€) | – | 300 | ||||||
| 1.250% Notes 2025 (€) | 999 | – | ||||||
| 1.750% Notes 2030 (€) | 994 | – | ||||||
| Switzerland | ||||||||
| Other | 16 | 24 | ||||||
| United States | ||||||||
| 4.250% Notes 2021 ($) | 812 | 892 | ||||||
| 5.900% Bonds 2032 ($) | 809 | 883 | ||||||
| 2.900% Notes 2027 ($) | 803 | 879 | ||||||
| 2.200% Notes 2022 ($) | 689 | 755 | ||||||
| 1.800% Notes 2020 ($) | – | 714 | ||||||
| 3.500% Notes 2028 ($) | 641 | 703 | ||||||
| 2.000% Notes 2026 ($) | 563 | 616 | ||||||
| 1.375% Notes 2021 ($)(b) | – | 489 | ||||||
| 3.125% Notes 2023 ($) | 445 | 488 | ||||||
| 2.100% Notes 2020 ($) | – | 446 | ||||||
| 3.000% Notes 2022 ($) | 406 | 444 | ||||||
| 3.250% Notes 2024 ($) | 404 | 443 | ||||||
| 3.100% Notes 2025 ($) | 403 | 442 | ||||||
| 2.600% Notes 2024 ($) | 404 | 442 | ||||||
| 3.500% Bonds 2028 ($) | 402 | 441 | ||||||
| 2.750% Bonds 2021 ($) | 324 | 356 | ||||||
| 3.375% Notes 2025 ($) | 283 | 309 | ||||||
| 7.250% Bonds 2026 ($) | 238 | 260 | ||||||
| 6.625% Bonds 2028 ($) | 189 | 206 | ||||||
| 5.150% Notes 2020 ($) | – | 135 | ||||||
| 5.600% Bonds 2097 ($) | 74 | 82 | ||||||
| 2.125% Notes 2029 ($) | 683 | 749 | ||||||
| 2.600% Notes 2024 ($) | 415 | 457 | ||||||
| 1.375% Notes 2030 ($) | 395 | – | ||||||
| 0.375% Notes 2023 ($) | 405 | – | ||||||
| Commercial paper ($) | 1,848 | 1,276 | ||||||
| Other countries | 6 | 43 | ||||||
| Total other group companies | 22,452 | 22,816 | ||||||
| Total bonds and other loans | 24,585 | 25,032 | ||||||
| (a) | As part of Unification, these bonds which were previously issued by Unilever N.V. were transferred to Unilever Finance Netherlands B.V. with effect from 26 November 2020. |
| (b) | Bond repaid (Make-Whole) on 9 October 2020. |
Information in relation to the derivatives used to hedge bonds and other loans within a fair value hedge relationship is shown in note 16.
Table of Contents
| Unilever Annual Report on Form 20-F 2020 | 149 |
Table of Contents
| 150 | Unilever Annual Report on Form 20-F 2020 |
Notes to the Consolidated Financial Statements Unilever Group continued
16A. Management of liquidity risk continued
The following table shows Unilever’s contractually agreed undiscounted cash flows, including expected interest payments, which are payable under financial liabilities at the balance sheet date:
| Undiscounted cash flows |
€ million
Due within 1 year |
€ million
Due between 1 and 2 years |
€ million
Due between 2 and 3 years |
€ million
Due between 3 and 4 years |
€ million
Due between 4 and 5 years |
€ million
Due after 5 years |
€ million
Total |
€ million Net carrying amount as shown in balance sheet |
||||||||||||||||||||||||
| 2020 | ||||||||||||||||||||||||||||||||
| Non-derivative financial liabilities: | ||||||||||||||||||||||||||||||||
| Bank loans and overdrafts | (413 | ) | (2 | ) | (1 | ) | – | – | (1 | ) | (417 | ) | (411 | ) | ||||||||||||||||||
| Bonds and other loans | (3,926 | ) | (2,626 | ) | (2,824 | ) | (2,326 | ) | (3,278 | ) | (13,020 | ) | (28,000 | ) | (24,585 | ) | ||||||||||||||||
| Lease liabilities | (442 | ) | (352 | ) | (292 | ) | (234 | ) | (187 | ) | (591 | ) | (2,098 | ) | (1,771 | ) | ||||||||||||||||
| Other financial liabilities | (117 | ) | (12 | ) | (33 | ) | (23 | ) | (51 | ) | – | (236 | ) | (223 | ) | |||||||||||||||||
| Trade payables, accruals and other liabilities | (13,585 | ) | (46 | ) | (15 | ) | (17 | ) | (4 | ) | (32 | ) | (13,699 | ) | (13,699 | ) | ||||||||||||||||
| Deferred consideration | (60 | ) | (12 | ) | (76 | ) | (35 | ) | (8 | ) | – | (191 | ) | (164 | ) | |||||||||||||||||
| (18,543 | ) | (3,050 | ) | (3,241 | ) | (2,635 | ) | (3,528 | ) | (13,644 | ) | (44,641 | ) | (40,853 | ) | |||||||||||||||||
| Derivative financial liabilities: | ||||||||||||||||||||||||||||||||
| Interest rate derivatives: | (257 | ) | ||||||||||||||||||||||||||||||
| Derivative contracts – receipts |
174 | 1,069 | 40 | 441 | 29 | 877 | 2,630 | |||||||||||||||||||||||||
| Derivative contracts – payments |
(134 | ) | (1,148 | ) | (21 | ) | (479 | ) | (19 | ) | (977 | ) | (2,778 | ) | ||||||||||||||||||
| Foreign exchange derivatives: | (158 | ) | ||||||||||||||||||||||||||||||
| Derivative contracts – receipts |
6,163 | – | – | – | – | – | 6,163 | |||||||||||||||||||||||||
| Derivative contracts – payments |
(6,333 | ) | – | – | – | – | – | (6,333 | ) | |||||||||||||||||||||||
| Commodity derivatives: | (3 | ) | ||||||||||||||||||||||||||||||
| Derivative contracts – receipts |
– | – | – | – | – | – | – | |||||||||||||||||||||||||
| Derivative contracts – payments |
(3 | ) | – | – | – | – | – | (3 | ) | |||||||||||||||||||||||
| (133 | ) | (79 | ) | 19 | (38 | ) | 10 | (100 | ) | (321 | ) | (418 | ) | |||||||||||||||||||
| Total | (18,676 | ) | (3,129 | ) | (3,222 | ) | (2,673 | ) | (3,518 | ) | (13,744 | ) | (44,962 | ) | (41,271 | ) | ||||||||||||||||
| 2019 | ||||||||||||||||||||||||||||||||
| Non-derivative financial liabilities: | ||||||||||||||||||||||||||||||||
| Bank loans and overdrafts | (399 | ) | (9 | ) | (289 | ) | (164 | ) | – | (2 | ) | (863 | ) | (853 | ) | |||||||||||||||||
| Bonds and other loans | (4,169 | ) | (2,661 | ) | (2,745 | ) | (2,449 | ) | (2,454 | ) | (14,431 | ) | (28,909 | ) | (25,032 | ) | ||||||||||||||||
| Lease liabilities | (432 | ) | (392 | ) | (302 | ) | (242 | ) | (191 | ) | (720 | ) | (2,279 | ) | (1,919 | ) | ||||||||||||||||
| Other financial liabilities | (125 | ) | – | (24 | ) | (31 | ) | (26 | ) | – | (206 | ) | (183 | ) | ||||||||||||||||||
| Trade payables, accruals and other liabilities | (14,166 | ) | (93 | ) | (13 | ) | (8 | ) | (14 | ) | (42 | ) | (14,336 | ) | (14,336 | ) | ||||||||||||||||
| Deferred consideration | (39 | ) | (124 | ) | (8 | ) | – | (64 | ) | – | (235 | ) | (208 | ) | ||||||||||||||||||
| (19,330 | ) | (3,279 | ) | (3,381 | ) | (2,894 | ) | (2,749 | ) | (15,195 | ) | (46,828 | ) | (42,531 | ) | |||||||||||||||||
| Derivative financial liabilities: | ||||||||||||||||||||||||||||||||
| Interest rate derivatives: | (154 | ) | ||||||||||||||||||||||||||||||
| Derivative contracts – receipts |
776 | 164 | 805 | 37 | 478 | 957 | 3,217 | |||||||||||||||||||||||||
| Derivative contracts – payments |
(756 | ) | (141 | ) | (797 | ) | (17 | ) | (473 | ) | (949 | ) | (3,133 | ) | ||||||||||||||||||
| Foreign exchange derivatives: | (168 | ) | ||||||||||||||||||||||||||||||
| Derivative contracts – receipts |
8,783 | – | – | – | – | – | 8,783 | |||||||||||||||||||||||||
| Derivative contracts – payments |
(8,952 | ) | – | – | – | – | – | (8,952 | ) | |||||||||||||||||||||||
| Commodity derivatives: | (4 | ) | ||||||||||||||||||||||||||||||
| Derivative contracts – receipts |
– | – | – | – | – | – | – | |||||||||||||||||||||||||
| Derivative contracts – payments |
(4 | ) | – | – | – | – | – | (4 | ) | |||||||||||||||||||||||
| (153 | ) | 23 | 8 | 20 | 5 | 8 | (89 | ) | (326 | ) | ||||||||||||||||||||||
| Total | (19,483 | ) | (3,256 | ) | (3,373 | ) | (2,874 | ) | (2,744 | ) | (15,187 | ) | (46,917 | ) | (42,857 | ) | ||||||||||||||||
The Group has sublet a small proportion of leased properties. Related future minimum sublease payments are €63 million (2019: €21 million).
Table of Contents
| Unilever Annual Report on Form 20-F 2020 | 151 |
Table of Contents
| 152 | Unilever Annual Report on Form 20-F 2020 |
Notes to the Consolidated Financial Statements Unilever Group continued
| Potential impact of risk
|
Management policy and hedging strategy
|
Sensitivity to the risk
| ||||||
| (ii) Currency risk
Currency risk on sales, purchases and borrowings
Because of Unilever’s global reach, it is subject to the risk that changes in foreign currency values impact the Group’s sales, purchases and borrowings.
The Group manages the foreign currency risk by hedging forecasted sales and purchase transactions that are expected to occur within a maximum 12-month period through layered hedging.
At 31 December 2020, the exposure to the Group from companies holding financial assets and liabilities other than in their functional currency amounted to €274 million (2019: €317 million). |
The Group manages currency exposures within prescribed limits, mainly through the use of forward foreign currency exchange contracts.
Operating companies manage foreign exchange exposures within prescribed limits.
The aim of the Group’s approach to management of currency risk is to leave the Group with no material residual risk. This aim has been achieved in all years presented. |
As an estimation of the approximate impact of the residual risk, with respect to financial instruments, the Group has calculated the impact of a 10% change in exchange rates.
Impact on income statement
A 10% strengthening of the respective functional currencies of group companies against the foreign currencies would have led to an additional €27 million gain in the income statement (2019: €32 million gain).
A 10% weakening of the respective functional currencies of group companies against the foreign currencies would have led to an equal but opposite effect.
As at year end, the Group had the below notional amount of currency derivatives outstanding to which cash flow hedge accounting is applied: | ||||||
| Currency | 2020 | 2019 | ||||||
|
| ||||||||
| EUR* | (920) | (743) | ||||||
|
| ||||||||
| GBP | (414) | (325) | ||||||
|
| ||||||||
| USD | 588 | 640 | ||||||
|
| ||||||||
| SEK | (100) | (94) | ||||||
|
| ||||||||
| CAD | (110) | (108) | ||||||
|
| ||||||||
| PLN | (70) | (67) | ||||||
|
| ||||||||
| Others | (176) | (192) | ||||||
|
| ||||||||
| Total | (1,202) | (889) | ||||||
|
| ||||||||
|
* Euro exposure relates to group companies having non-euro functional currencies.
| ||||||||
| Impact on equity – trade-related cash flow hedges | ||||||||
| A 10% strengthening of foreign currencies against the respective functional currencies of group companies hedging future trade cash flows and applying cash flow hedge accounting, would have led to €120 million loss (2019: €89 million loss). | ||||||||
| A 10% weakening of the same would have led to an equal but opposite effect. | ||||||||
| Currency risk on the Group’s net investments
The Group is also subject to currency risk in relation to the translation of the net investments of its foreign operations into euros for inclusion in its consolidated financial statements.
These net investments include Group financial loans, which are monetary items that form part of our net investment in foreign operations, of €9.2 billion (2019: €7.6 billion), of which €5.5 billion (2019: €3.5 billion) is denominated in GBP. In accordance with IAS 21, the exchange differences on these financial loans are booked through reserves.
Part of the currency exposure on the Group’s investments is also managed using US$ net investment hedges with a nominal value of €4.0 billion (2019: €4.0 billion) for US$.
At 31 December 2020, the net exposure of the net investments in foreign currencies amounts to €24.6 billion (2019: €22.0 billion). |
Unilever aims to minimise this currency risk on the Group’s net investment exposure by borrowing in local currency in the operating companies themselves. In some locations, however, the Group’s ability to do this is inhibited by local regulations, lack of local liquidity or by local market conditions.
Where the residual risk from these countries exceeds prescribed limits, Treasury may decide on a case-by-case basis to actively hedge the exposure. This is done either through additional borrowings in the related currency, or through the use of forward foreign exchange contracts.
Where local currency borrowings, or forward contracts, are used to hedge the currency risk in relation to the Group’s net investment in foreign subsidiaries, these relationships are designated as net investment hedges for accounting purposes.
Exchange risk related to the principal amount of the US$ denominated debt either forms part of hedging relationship itself, or is hedged through forward contracts. |
Impact on equity – net investment hedges
A 10% strengthening of the euro against other currencies would have led to a €404 million (2019: €396 million) loss on the net investment hedges used to manage the currency exposure on the Group’s investments.
A 10% weakening of the euro against other currencies would have led to an equal but opposite effect.
Impact on equity – net investments in group companies
A 10% strengthening of the euro against all other currencies would have led to a €2,461 million negative retranslation effect (2019: €2,203 million negative retranslation effect).
A 10% weakening of the euro against all other currencies would have led to an equal but opposite effect. In line with accepted hedge accounting treatment and our accounting policy for financial loans, the retranslation differences would be recognised in equity. | ||||||
Table of Contents
| Unilever Annual Report on Form 20-F 2020 | 153 |
Table of Contents
| 154 | Unilever Annual Report on Form 20-F 2020 |
Notes to the Consolidated Financial Statements Unilever Group continued
16C. Derivatives and hedging
The Group does not use derivative financial instruments for speculative purposes. The uses of derivatives and the related values of derivatives are summarised in the following table. Derivatives used to hedge:
| € million | € million | € million | € million | € million | € million | € million | ||||||||||||||||||||||
| Non- | Trade | Non- | ||||||||||||||||||||||||||
| Trade | Current | current | payables | Current | current | |||||||||||||||||||||||
| and other | financial | financial | and other | financial | financial | |||||||||||||||||||||||
| receivables | assets | assets | liabilities | liabilities | liabilities | Total | ||||||||||||||||||||||
| 31 December 2020 | ||||||||||||||||||||||||||||
| Foreign exchange derivatives | ||||||||||||||||||||||||||||
| Fair value hedges |
– | – | – | – | – | – | – | |||||||||||||||||||||
| Cash flow hedges |
24 | – | – | (74 | ) | – | – | (50 | ) | |||||||||||||||||||
| Hedges of net investments in foreign operations |
– | – | – | – | (149 | )(a) | – | (149 | ) | |||||||||||||||||||
| Hedge accounting not applied |
14 | 54 | (a) | – | (26 | ) | 91 | (a) | – | 133 | ||||||||||||||||||
| Interest rate derivatives | ||||||||||||||||||||||||||||
| Fair value hedges |
– | – | – | – | – | (10 | ) | (10 | ) | |||||||||||||||||||
| Cash flow hedges |
– | 5 | 21 | – | – | (247 | ) | (221 | ) | |||||||||||||||||||
| Hedge accounting not applied |
– | – | – | – | – | – | – | |||||||||||||||||||||
| Commodity contracts | ||||||||||||||||||||||||||||
| Cash flow hedges |
40 | – | – | (3 | ) | – | – | 37 | ||||||||||||||||||||
| Hedge accounting not applied |
– | – | – | – | – | – | – | |||||||||||||||||||||
| 78 | 59 | 21 | (103 | ) | (58 | ) | (257 | ) | (260 | ) | ||||||||||||||||||
| Total assets | 158 | Total liabilities | (418 | ) | (260 | ) | ||||||||||||||||||||||
| 31 December 2019 | ||||||||||||||||||||||||||||
| Foreign exchange derivatives | ||||||||||||||||||||||||||||
| Fair value hedges |
– | – | – | – | – | – | – | |||||||||||||||||||||
| Cash flow hedges |
38 | – | – | (38 | ) | – | – | – | ||||||||||||||||||||
| Hedges of net investments in foreign operations |
– | 30 | (a) | – | – | (14 | )(a) | – | 16 | |||||||||||||||||||
| Hedge accounting not applied |
5 | (10 | )(a) | – | (14 | ) | (102 | )(a) | – | (121 | ) | |||||||||||||||||
| Interest rate derivatives | ||||||||||||||||||||||||||||
| Fair value hedges |
– | – | – | – | – | – | – | |||||||||||||||||||||
| Cash flow hedges |
– | – | 114 | – | – | (143 | ) | (29 | ) | |||||||||||||||||||
| Hedge accounting not applied |
– | – | – | – | – | (11 | ) | (11 | ) | |||||||||||||||||||
| Commodity contracts | ||||||||||||||||||||||||||||
| Cash flow hedges |
31 | – | – | (4 | ) | – | – | 27 | ||||||||||||||||||||
| Hedge accounting not applied |
– | – | – | – | – | – | – | |||||||||||||||||||||
| 74 | 20 | 114 | (56 | ) | (116 | ) | (154 | ) | (118 | ) | ||||||||||||||||||
| Total assets | 208 | Total liabilities | (326 | ) | (118 | ) | ||||||||||||||||||||||
| (a) | Swaps that hedge the currency risk on intra-group loans and offset ‘Hedges of net investments in foreign operations’ are included within ‘Hedge accounting not applied’. See below for further details. |
Table of Contents
| Unilever Annual Report on Form 20-F 2020 | 155 |
16C. Derivatives and hedging continued
Table of Contents
| 156 | Unilever Annual Report on Form 20-F 2020 |
Notes to the Consolidated Financial Statements Unilever Group continued
17. Investment and return
Cash and cash equivalents
Cash and cash equivalents in the balance sheet include deposits, investments in money market funds and highly liquid investments. To be classified as cash and cash equivalents, an asset must:
| ◾ | be readily convertible into cash; |
| ◾ | have an insignificant risk of changes in value; and |
| ◾ | have a maturity period of typically three months or less at acquisition. |
Cash and cash equivalents in the cash flow statement also include bank overdrafts and are recorded at amortised cost.
Other financial assets
The Group classifies its financial assets into the following measurement categories:
| ◾ | those to be measured subsequently at fair value (either through other comprehensive income, or through profit or loss), and |
| ◾ | those to be measured at amortised cost. |
This classification depends on our business model for managing the financial asset and the contractual terms of the cash flows.
At initial recognition, the Group measures a financial asset at its fair value plus, in the case of a financial asset not at fair value through profit or loss, transaction costs that are directly attributable to the acquisition of the financial asset. Transaction costs of financial assets carried at fair value through profit or loss are expensed in profit or loss.
All financial assets are either debt instruments or equity instruments. Debt instruments are those that provide the Group with a contractual right to receive cash or another asset. Equity instruments are those where the Group has no contractual right to receive cash or another asset.
Debt instruments
The subsequent measurement of debt instruments depends on the Group’s business model for managing the asset and the cash flow characteristics of the asset. There are three measurement categories that debt instruments are classified as:
| ◾ | financial assets at amortised cost; |
| ◾ | financial assets at fair value through other comprehensive income; or |
| ◾ | financial assets at fair value through profit or loss. |
(i) Amortised cost
Assets measured at amortised cost are those which are held to collect contractual cash flows on the repayment of principal or interest (SPPI). A gain or loss on a debt investment recognised at amortised cost on de-recognition or impairment is recognised in profit or loss. Interest income is recognised within finance income using the effective interest rate method.
(ii) Fair value through other comprehensive income
Assets that are held at fair value through other comprehensive income are those that are held to collect contractual cash flows on the repayment of principal and interest and which are held to recognise a capital gain through the sale of the asset. Movements in the carrying amount are recognised in other comprehensive income except for the recognition of impairment, interest income and foreign exchange gains or losses which are recognised in profit or loss. On de-recognition, the cumulative gain or loss recognised in other comprehensive income is reclassified from equity to profit or loss. Interest income is included in finance income using the effective interest rate method.
(iii) Fair value through profit or loss
Assets that do not meet the criteria for either amortised cost or fair value through other comprehensive income are measured as fair value through profit or loss. Related transaction costs are expensed as incurred. Unless they form part of a hedging relationship, these assets are held at fair value, with changes being recognised in the income statement. Interest income from these assets is included within finance income.
Equity instruments
The Group subsequently measures all equity instruments at fair value. Where the Group has elected to present fair value gains and losses on equity investments in other comprehensive income, there is no subsequent reclassification of fair value gains or losses to profit or loss. Dividends from these investments continue to be recognised in profit or loss.
Impairment of financial assets
Financial instruments classified as amortised cost and debt instruments classified as fair value through other comprehensive income are assessed for impairment. The Group assesses the probability of default of an asset at initial recognition and then whether there has been a significant increase in credit risk on an ongoing basis.
To assess whether there is a significant increase in credit risk the Group compares the risk of a default occurring on the asset as at the reporting date with the risk of default as at the date of initial recognition. It considers available reasonable and supportive forwarding-looking information. Macroeconomic information (such as market interest rates or growth rates) is also considered.
Financial assets are written off when there is no reasonable expectation of recovery, such as a debtor failing to engage in a repayment plan with the company. Impairment losses on assets classified as amortised cost are recognised in profit or loss. When a later event causes the impairment losses to decrease, the reduction in impairment loss is also recognised in profit or loss. Permanent impairment losses on debt instruments classified as fair value through other comprehensive income are recognised in profit or loss.
Table of Contents
| Unilever Annual Report on Form 20-F 2020 | 157 |
Table of Contents
| 158 | Unilever Annual Report on Form 20-F 2020 |
Notes to the Consolidated Financial Statements Unilever Group continued
Table of Contents
| Unilever Annual Report on Form 20-F 2020 | 159 |
18. Financial instruments fair value risk continued
Table of Contents
| 160 | Unilever Annual Report on Form 20-F 2020 |
Notes to the Consolidated Financial Statements Unilever Group continued
18. Financial instruments fair value risk continued
Other financial assets and liabilities (fair values for disclosure purposes only)
| ◾ | Cash and cash equivalents, trade and other current receivables, bank loans and overdrafts, trade payables and other current liabilities have fair values that approximate to their carrying amounts due to their short-term nature. |
| ◾ | The fair values of listed bonds are based on their market value. |
| ◾ | Non-listed bonds, other loans, bank loans and non-current receivables and payables are based on the net present value of the anticipated future cash flows associated with these instruments using rates currently available for debt on similar terms, credit risk and remaining maturities. |
Policies and processes used in relation to the calculation of level 3 fair values
Assets valued using Level 3 valuation techniques are primarily made up of long-term cash receivables and unlisted investments. Valuation techniques used are specific to the circumstances involved. Unlisted investments include €494 million (2019: €403 million) of investments within Unilever Ventures companies.
19. Provisions
| Provisions are recognised where a legal or constructive obligation exists at the balance sheet date, as a result of a past event, where the amount of the obligation can be reliably estimated and where the outflow of economic benefit is probable. |
| Provisions | €
million 2020 |
€
million 2019 |
||||||
| Due within one year | 547 | 620 | ||||||
| Due after one year | 583 | 664 | ||||||
| Total provisions | 1,130 | 1,284 | ||||||
| Movements during 2020 | € million
Restructuring |
€ million
Legal |
€ million Brazil indirect taxes |
€ million
Other |
€ million
Total |
|||||||||||||||
| 1 January 2020 | 470 | 149 | 128 | 537 | 1,284 | |||||||||||||||
| Additions through business combinations | – | 4 | – | 57 | 61 | |||||||||||||||
| Income Statement: | ||||||||||||||||||||
| Charges |
151 | 129 | 4 | 140 | 424 | |||||||||||||||
| Releases |
(87 | ) | (5 | ) | (20 | ) | (59 | ) | (171 | ) | ||||||||||
| Utilisation | (252 | ) | (27 | ) | (1 | ) | (44 | ) | (324 | ) | ||||||||||
| Currency translation | (18 | ) | (23 | ) | (37 | ) | (66 | ) | (144 | ) | ||||||||||
| 31 December 2020 | 264 | 227 | 74 | 565 | 1,130 | |||||||||||||||
Restructuring provisions primarily include people costs such as redundancy costs and the cost of compensation where manufacturing, distribution, service or selling agreements are to be terminated. The Group expects these provisions to be substantially utilised within the next few years.
The Group is involved from time to time in legal and arbitration proceedings arising in the ordinary course of business. As previously disclosed, along with other consumer products companies and retail customers, Unilever is involved in a number of ongoing investigations by national competition authorities. These proceedings and investigations are at various stages and concern a variety of product markets. Where specific issues arise, provisions are made to the extent appropriate. Due to the nature of the legal cases, the timing of utilisation of these provisions is uncertain.
Provisions for Brazil indirect taxes are comprised of disputes with Brazilian authorities, in particular relating to tax credits that can be taken for the PIS and COFINS indirect taxes. These provisions are separate from the matters listed as contingent liabilities in note 20. Unilever does not have provisions and contingent liabilities for the same matters. Due to the nature of disputed indirect taxes, the timing of utilisation of these provisions is uncertain.
Other includes provisions for indirect taxes in countries other than Brazil, interest on tax provisions and provisions for various other matters. The timing of utilisation of these provisions is uncertain.
Table of Contents
| Unilever Annual Report on Form 20-F 2020 | 161 |
Table of Contents
| 162 | Unilever Annual Report on Form 20-F 2020 |
Notes to the Consolidated Financial Statements Unilever Group continued
21. Acquisitions and disposals
| Business combinations are accounted for using the acquisition accounting method as at the acquisition date, which is the date at which control is transferred to the Group. |
| Goodwill is measured at the acquisition date as the fair value of consideration transferred, plus non-controlling interests and the fair value of any previously held equity interests less the net recognised amount (which is generally fair value) of the identifiable assets and liabilities assumed. Goodwill is subject to an annual review for impairment (or more frequently if necessary) in accordance with our accounting policies. Any impairment is charged to the income statement as it arises. Detailed information relating to goodwill is provided in note 9 on pages 134 to 136. |
| Transaction costs are expensed as incurred, within non-underlying items. |
| Changes in ownership that do not result in a change of control are accounted for as equity transactions and therefore do not have any impact on goodwill. The difference between consideration and the non-controlling share of net assets acquired is recognised within equity. |
2020
In 2020, the Group completed the business acquisitions and disposals as listed below. In each case, 100% of the businesses were acquired unless stated otherwise. Total consideration for 2020 acquisitions is €6,337 million (2019: €1,167 million for acquisitions completed during that year). More information related to the 2020 acquisitions is provided on page 163 to 164.
| Deal completion date | Acquired/disposed business | |
| 1 April 2020 | Acquired the health food drinks business of GlaxoSmithKline plc in India and 20 other predominantly Asian markets (“the Main Horlicks Acquisition”). The acquisition added leading brands such as Horlicks and Boost in certain markets, increasing Unilever’s presence in functional nutrition. As a significant acquisition for the Group, further details are disclosed separately below. | |
| 25 June 2020 | Acquired Vwash, a leading intimate hygiene business in India. The acquisition complements our beauty and personal care portfolio and increase our presence in fast-growing segments in India. | |
| 30 June 2020 | The Group acquired 82% of GlaxoSmithKline Bangladesh Limited, a health food drink business in Bangladesh. The Bangladesh Horlicks Acquisition was a separate transaction to the Main Horlicks Acquisition. | |
| 15 July 2020 | Sold the Ice Cream business in Chile to Carozzi. | |
| 1 October 2020 | Acquired Liquid IV, a US-based health-science nutrition and wellness company, known for its portfolio of electrolyte drink mixes that enhance rapid hydration. This acquisition increases our presence in functional nutrition. | |
| 23 December 2020 | Acquired SmartyPants Vitamins, a vitamin, mineral and supplement company based in the US. The acquisition complements Unilever’s existing portfolio in functional nutrition. | |
Horlicks Acquisitions
The Main Horlicks Acquisition was composed of the following related transactions on 1 April 2020:
| ◾ | Hindustan Unilever Limited (HUL), a subsidiary of the Group, obtained control of the business of GlaxoSmithKline Consumer Healthcare Limited (GSKCH) via an all equity merger under which 4.39 shares of HUL were allotted for every share of GSKCH; |
| ◾ | HUL purchased the Horlicks intellectual property rights, being mainly legal rights to the Horlicks brand (the ‘HFD IP’) for India and Unilever N.V. and Unilever PLC purchased the HFD IP outside of India and Bangladesh (subsequently the Bangladesh HFD IP was acquired by Unilever PLC in a separate transaction); and |
| ◾ | Unilever Foods (Malaysia) Sdn Bhd and Unilever Asia Pacific Limited (Singapore) purchased the Horlicks commercial operations of GSK in 20 other predominantly Asian markets (“Local Distribution Assets”). |
The Bangladesh Horlicks Acquisition is separate to the Main Horlicks Acquisition and completed on 30 June 2020. Unilever Overseas Holding B.V. purchased 82% of GSK Bangladesh Limited and Unilever PLC purchased the HFD IP in Bangladesh. The following disclosures relate only to the Main Horlicks Acquisition.
Main Horlicks Acquisition
The purpose of the acquisition was to add the Horlicks and Boost brands in certain geographical markets to Unilever’s portfolio to increase presence in healthy nutrition and in high-growth emerging markets.
The total consideration paid was €5,294 million comprised of €449 million in cash and €4,845 million in shares of Hindustan Unilever Limited valued based on the share price of HUL on the completion date and the exchange rate on the same date (83.05 INR/€).
The provisional fair value of net assets for the acquisition that is recognised on the balance sheet is €3,204 million. Balances are provisional as we are finalising our review of the asset valuations. The main assets acquired were brands which were valued using an income approach model by estimating future cashflows generated by the brand and discounting them to present value using rates in line with a market participant expectation. The key assumptions in the brand valuations are revenue growth and discount rates. More information related to each major class of assets and liabilities acquired is provided on page 164.
At the date of acquisition we expected around €1.3 billion of the goodwill to be deductible for tax purposes. While we believe there is legal basis to claim the Horlicks goodwill as tax deductible, we note that the Indian Budget on 1 February 2021 includes a proposal to exclude goodwill from the definition of tax depreciable assets effective 1 April 2020. If enacted this would have no material impact on the income statement. Since the acquisition date, foreign exchange has decreased this goodwill in euros by €159 million.
The gross contractual value of trade and other receivables as at the dates of acquisition amounted to €77 million which is expected to be fully recoverable.
Within the acquired net assets, contingent liabilities amounting to €123 million in respect of ongoing litigation against GlaxoSmithKline Consumer Healthcare Limited have been recognised based on management’s estimate of the values of exposures and their assessment of the probability of the related claims being settled by the Group. The contingent liabilities mainly relate to direct and indirect tax disputes with the Indian tax authorities. There are several matters being disputed and in each case we believe that the likelihood that the Indian tax authorities will ultimately prevail is no higher than moderate, however we expect that most of these disputes will not be resolved for several years. Contingent assets of €73 million are also recognised, measured on the same basis, for the Group’s right to future indemnification by GlaxoSmithKline Pte Limited and Horlicks Limited in relation to certain claims.
Table of Contents
| Unilever Annual Report on Form 20-F 2020 | 163 |
21. Acquisitions and disposals continued
Table of Contents
| 164 | Unilever Annual Report on Form 20-F 2020 |
Notes to the Consolidated Financial Statements Unilever Group continued
21. Acquisitions and disposals continued
Effect on consolidated balance sheet
Acquisitions
The following table sets out the overall effect of the Main Horlicks Acquisition and the other acquisitions in 2020, 2019 and 2018 on the consolidated balance sheet. The fair values currently used for opening balances of all acquisitions made in 2020 are provisional. Balances remain provisional due to missing relevant information about facts and circumstances that existed as of the acquisition date and where valuation work is still ongoing.
| € million 2020 |
€ million 2019 |
€ million 2018 |
||||||||||
| Net assets acquired | 3,857 | 771 | 815 | |||||||||
| Non-controlling interest | (27 | ) | (25 | ) | (17 | ) | ||||||
| Goodwill | 2,507 | 421 | 496 | |||||||||
| Total payment for acquisition | 6,337 | 1,167 | 1,294 | |||||||||
| Exchange rate gain/(loss) on cash flow hedge | – | – | (100 | ) | ||||||||
| Total consideration | 6,337 | 1,167 | 1,194 | |||||||||
In 2020 the net assets acquired and total payment for acquisitions consist of:
| Main Horlicks Acquisition |
Other acquisitions |
€ million 2020 |
||||||||||
| Intangible assets | 3,345 | 737 | 4,082 | |||||||||
| Other non-current assets | 249 | 35 | 284 | |||||||||
| Trade and other receivables | 77 | 26 | 103 | |||||||||
| Other current assets(a) | 560 | 95 | 655 | |||||||||
| Non-current liabilities(b) | (905 | ) | (202 | ) | (1,107 | ) | ||||||
| Current liabilities | (122 | ) | (38 | ) | (160 | ) | ||||||
| Net assets acquired | 3,204 | 653 | 3,857 | |||||||||
| Non-controlling interest | – | (27 | ) | (27 | ) | |||||||
| Goodwill | 2,090 | 417 | 2,507 | |||||||||
| Exchange rate gain/(loss) on cash flow hedges | – | – | – | |||||||||
| Total consideration | 5,294 | 1,043 | 6,337 | |||||||||
| Of which | ||||||||||||
| Consideration paid(c) |
5,294 | 1,019 | 6,313 | |||||||||
| Deferred consideration |
– | 24 | 24 | |||||||||
| (a) | Other current assets include financial assets of €463 million and cash of €36 million related to the Main Horlicks Acquisition. |
| (b) | Non-current liabilities include deferred tax of €746 million related to the Main Horlicks Acquisition. |
| (c) | For the Main Horlick Acquisition consideration paid was €449 million in cash and €4,845 million in equity shares. For the other acquisitions all consideration was paid in cash. |
Goodwill represents the future value which the Group believes it will obtain through operational synergies and the application of acquired company ideas to existing Unilever channels and businesses. Detailed information relating to goodwill is provided in note 9 on pages 134 to 136.
No material contingent liabilities were acquired in the other acquisitions described above.
Table of Contents
| Unilever Annual Report on Form 20-F 2020 | 165 |
21. Acquisitions and disposals continued
Table of Contents
| 166 | Unilever Annual Report on Form 20-F 2020 |
Notes to the Consolidated Financial Statements Unilever Group continued
23. Related party transactions
| A related party is a person or entity that is related to the Group. These include both people and entities that have, or are subject to, the influence or control of the Group. |
Joint ventures
The following related party balances existed with associate or joint venture businesses at 31 December:
| Related party balances |
€ million 2020 Total |
€ million 2019 Total |
||||||
| Sales to joint ventures | 1,004 | 839 | ||||||
| Purchases from joint ventures | 118 | 113 | ||||||
| Receivables from joint ventures | 80 | 92 | ||||||
| Payables to joint ventures | 43 | 38 | ||||||
| Loans to joint ventures | 255 | 289 | ||||||
| Royalties and service fees | 21 | 23 | ||||||
Significant joint ventures are Unilever FIMA Lda for Portugal, Binzagr Unilever Distribution and Al Gurg Unilever for Middle East, the Pepsi/Lipton Partnership for the US and Pepsi Lipton International Ltd for the rest of the world.
Associates
There are no trading balances from/to associates.
Langholm Capital II was launched in 2009. Unilever has invested €64 million in Langholm II, with an outstanding commitment at the end of 2020 of €2 million (2019: € 11 million). During 2020, Unilever received €nil (2019: €nil) from its investment in Langholm Capital II.
24. Remuneration of auditors
|
€ million 2020 |
€ million 2019 |
€ million 2018 |
||||||||||
| Fees payable to the Group’s auditors for the audit of the consolidated and parent | ||||||||||||
| Company Accounts of Unilever N.V. and Unilever PLC(a) |
6 | 5 | 6 | |||||||||
| Fees payable to the Group’s auditors for the audit of accounts of subsidiaries of | ||||||||||||
| Unilever N.V. and Unilever PLC pursuant to legislation(b)(c) |
13 | 12 | 10 | |||||||||
| Total statutory audit fees | 19 | 17 | 16 | |||||||||
| Fees payable to the Group’s auditors for the audit of non-statutory | ||||||||||||
| financial statements |
6 | (d) | – | 4 | (d) | |||||||
| Audit-related assurance services | – | (e) | – | (e) | – | (e) | ||||||
| Other taxation advisory services | – | – | – | |||||||||
| Services relating to corporate finance transactions | – | – | – | |||||||||
| Other assurance services | 1 | (f) | – | 1 | (f) | |||||||
| All other non-audit services | – | (e) | – | (e) | – | (e) | ||||||
| Total fees payable | 26 | 17 | 21 | |||||||||
| (a) | Of which €nil million was payable to KPMG Accountants N.V. (2019: €1 million; 2018: €1 million) and €6 million was payable to KPMG LLP (2019: €4 million; 2018: €5 million). |
| (b) | Comprises fees payable to the KPMG network of independent member firms affiliated with KPMG International Cooperative for audit work on statutory financial statements and Group reporting returns of subsidiary companies. |
| (c) | Amount payable to KPMG in respect of services supplied to associated pension schemes was less than €1 million individually and in aggregate (2019: less than €1 million individually and in aggregate; 2018: less than €1 million individually and in aggregate). |
| (d) | 2020 includes €6 million for the audit of carve-out financial statements of the Tea business. 2018 includes €4 million for audits of carve-out financial statements of the Spreads business. |
| (e) | Amounts paid in relation to each type of service are less than €1 million individually and in aggregate (2019: less than €1 million and in aggregate; 2018: less than €1 million). |
| (f) | 2020 includes €1 million for assurance work on Unification. 2018 includes €1 million for assurance work on Simplification. |
25. Events after the balance sheet date
| Where events occurring after the balance sheet date provide evidence of conditions that existed at the end of the reporting period, the impact of these events is adjusted within the financial statements. Otherwise, events after the balance sheet date of a material size or nature are disclosed below. |
Dividend
On 4 February 2021 Unilever announced a quarterly dividend with the 2020 fourth quarter results of £0.3760 per PLC ordinary share. The total value of the announced dividend is €1,125 million.
Table of Contents
| Unilever Annual Report on Form 20-F 2020 | 167 |
Table of Contents
| 168 | Unilever Annual Report on Form 20-F 2020 |
THIS PAGE INTENTIONALLY LEFT BLANK
Table of Contents
| Unilever Annual Report on Form 20-F 2020 | 169 |
Table of Contents
| 170 | Unilever Annual Report on Form 20-F 2020 |
THIS PAGE INTENTIONALLY LEFT BLANK
Table of Contents
| Unilever Annual Report on Form 20-F 2020 | 171 |
Table of Contents
| 172 | Unilever Annual Report on Form 20-F 2020 |
THIS PAGE INTENTIONALLY LEFT BLANK
Table of Contents
| Unilever Annual Report on Form 20-F 2020 | 173 |
Table of Contents
| 174 | Unilever Annual Report on Form 20-F 2020 |
THIS PAGE INTENTIONALLY LEFT BLANK
Table of Contents
| Unilever Annual Report on Form 20-F 2020 | 175 |
Table of Contents
| 176 | Unilever Annual Report on Form 20-F 2020 |
THIS PAGE INTENTIONALLY LEFT BLANK
Table of Contents
| Unilever Annual Report on Form 20-F 2020 | 177 |
Table of Contents
| 178 | Unilever Annual Report on Form 20-F 2020 |
THIS PAGE INTENTIONALLY LEFT BLANK
Table of Contents
| Unilever Annual Report on Form 20-F 2020 | 179 |
Table of Contents
| 180 | Unilever Annual Report on Form 20-F 2020 |
THIS PAGE INTENTIONALLY LEFT BLANK
Table of Contents
| Unilever Annual Report on Form 20-F 2020 | 181 |
Table of Contents
| 182 | Unilever Annual Report on Form 20-F 2020 |
THIS PAGE INTENTIONALLY LEFT BLANK
Table of Contents
| Unilever Annual Report on Form 20-F 2020 | 183 |
Table of Contents
| 184 | Unilever Annual Report on Form 20-F 2020 |
As at 31 December 2020
In accordance with Section 409 of the Companies Act 2006, a list of subsidiaries, partnerships, associates and joint ventures as at 31 December 2020 is set out below. All subsidiary undertakings are subsidiary undertakings of their immediate parent undertaking(s) pursuant to section 1162 (2) (a) of the Companies Act 2006 unless otherwise indicated – see the notes on page 190. All subsidiary undertakings not included in the consolidation are not included because they are not material for such purposes. All associated undertakings are included in the Unilever Group’s financial statements using the equity method of accounting unless otherwise indicated – see the notes on page 190.
See page 167 of the Annual Report and Accounts for a list of the significant subsidiaries.
Companies are listed by country and under their registered office address. The aggregate percentage of capital held by the Unilever Group is shown after the subsidiary company name, except where it is 100%. If the Nominal Value field is blank, then the Share Class Note will identify the type of interest held in the entity.
Subsidiary undertakings included in the consolidation
Table of Contents
| Unilever Annual Report on Form 20-F 2020 | 185 |
Table of Contents
| 186 | Unilever Annual Report on Form 20-F 2020 |
Group Companies continued
Table of Contents
| Unilever Annual Report on Form 20-F 2020 | 187 |
Table of Contents
| 188 | Unilever Annual Report on Form 20-F 2020 |
Group Companies continued
Table of Contents
| Unilever Annual Report on Form 20-F 2020 | 189 |
Table of Contents
| 190 | Unilever Annual Report on Form 20-F 2020 |
Group Companies continued
Notes:
1: Ordinary, 2: Ordinary-A, 3: Ordinary-B, 4: Partnership, 5: Quotas, 6: Class-A Common, 7: Common, 8: Class A, 9: Class B, 10: Class C, 11: Class II Common, 12: Class III Common, 13: Membership Interest, 14: Preference, 15: Redeemable Preference, 16: Limited by Guarantee, 17: C Ordinary Shares, 18: Viscountcy, 19: B3 Ordinary, 20: Series C-1 Pref, 21: Ordinary-C, 22: Preferred, 23: Redeemable Preference Class A, 24: Redeemable Preference Class B, 25: Special, 26: Cumulative Preference, 27: 5% Cumulative Preference, 28: Non-Voting Ordinary B, 29: Common B, 30: Management, 31: Dormant, 32: Series C1 Preference, 33: Series D-2, 34: Cumulative Redeemable Preference, 35: A-Ordinary, 36: Preferred Ordinary, 37: Com, 38: Class Common-B, 39: Series A Participating Preference, 40: H-Ordinary, 41: I-Ordinary, 42: J-Ordinary, 43: Series A Preferred Convertible, 44: A Preferred, 45: Series B1 CPPS, 46: B Preferred, 47: Not In Use, 48: Series C-2 Preferred, 49: A-4 Com, 50: D Preferred, 51: Series A-3 Preferred, 52: C Preferred, 53: E Ordinary, 54: G Preferred, 55: Series Seed, 56: Nominal, 57: Preferred A, 58: Series A Preferred, 59: Series Seed-2 Preferred, 60: Series C-2, 61: Series D, 62: Series A1 Preferred, 63: Series B-2 Preference, 64: Pre Series B CPPS, 65: Series B CPPS, 66: Series C1 CPPS, 67: Series C2, 68: Office Holders, 69: Security, 70: Series B-3 Preference, 71: Series B Preferred, 72: Series Seed B CPPS, 73: Series A CPPS, 74: Series A2 CPPS, 75: Equity, 76: Series B CPPS, 77: Series B Preferred Convertible, 78: Class A Ordinary Redeemable Non Voting Ordinary, 79: B Ordinary, 80: N Ordinary, 81: A-1 Com, 82: A-2 Com, 83: A-3 Com, 84: Series A EIS, 85: Series A Convertible Preferred, 86: Series A Preferred, 87: Series B Preferred, 88: Series C Preferred, 89: Series A1 CPPS, 90: D1 Preferred, 91: Series E, 92: Series C-2 Pref, 93: Series B-1 Preferred, 94: Series B-2 Preferred.
| o | Indicates an undertaking directly held by PLC. All other undertakings are indirectly held. In the case of Hindustan Unilever Limited 47.43% is directly held and the remainder of 14.47% is indirectly held. In the case of Unilever Kenya Limited 39.13% is directly held and the remainder of 60.87% is indirectly held. In the case of Unilever Sri Lanka Limited 5.49% is directly held and the remainder of 94.51% is indirectly held. In the case of Mixhold B.V. 27.71% is directly held and the remainder of 72.29% is indirectly held. In the cases of each of Unilever Gida Sarayi ve Ticaret A.Ş. and Unilever Sarayi ve Ticaret Turk A.Ş. a fractional amount is directly held and the remainder is indirectly held. In the case of Mixhold B.V., 55.37% of the ordinary – A shares are directly held, the remainder of 44.63% are indirectly held and the other share classes are indirectly held. |
| † | Shares the undertaking holds in itself. |
| D | Denotes an undertaking where other classes of shares are held by a third party. |
| X | Binzagr Unilever Limited, Severn Gulf FZCO, Unilever Binzagr Gulf General Trading LLC, Unilever Home and Personal Care Products Manufacturing LLC and UTIC Distribution S.A. are subsidiary undertakings pursuant to section 1162(2)(b) Companies Act 2006. The Unilever Group is entitled to 50% of the profits made by Binzagr Unilever Limited. The Unilever Group is entitled to 80% of the profits made by Unilever Home and Personal Care Products Manufacturing LLC . |
| à | Accounted for as non-current investments within non-current financial assets. |
| ¥ | Exemption pursuant to Section 264b German Commercial Code. |
In addition, we have revenues either from our own operations or otherwise in the following locations: Afghanistan, Albania, Aland Islands, American, Samoa, Andorra, Angola, Antigua, Anguilla, Armenia, Aruba,Azerbaijan, Bahamas, Barbuda, Barbados, Belarus, Belize, Benin, Bhutan, Bosnia and Herzegovina, Botswana, British Virgin Islands, Brunei Darussalam, Burkina Faso, Burundi, Cameroon, Cape Verde, Cayman Islands, Central African Republic, Chad, Comoros, Congo, Cook Islands, Curacao, Democratic Republic of Congo, Dominica, Equatorial Guinea, Eritrea, Fiji, French Guiana, French Polynesia, Gabon, Gambia, Georgia, Gibraltar, Greenland, Grenada, Guam, Guinea, Guinea-Bissau, Guyana, Iceland, Iraq, Kiribati, Kosovo, Kuwait, Kyrgyzstan, Lesotho, Liberia, Libya, Liechtenstein, Luxembourg, Macao, Macedonia, Madagascar, Maldives, Mali, Malta, Martinique, Mauritania, Mauritius, Monaco, Mongolia, Montenegro, Montserrat, Namibia, New Caledonia, Niue, Norfolk Islands, Papua New Guinea, Qatar, Saint Kitts and Nevis, Saint Lucia, Saint Maarten, Saint Vincent and the Grenadines, Samoa, San Marino, Senegal, Seychelles, Sierra Leone, Slovenia, Solomon Islands, Somalia, South Sudan, Sudan, Suriname, Swaziland, Syrian Arab Republic, Tajikistan, Timor Leste, Togo, Tokelau, Tonga, Turkmenistan, Tuvalu, Uzbekistan, Vanuatu, Western Sahara and Yemen.
The Unilever Group has established branches in Azerbaijan, Bosnia-Herzegovina, Cote d’Ivoire, Cuba, Jordan, Kazakhstan, Lebanon, Northern Ireland, the Philippines, Turkey and the UK.
Table of Contents
| Unilever Annual Report on Form 20-F 2020 | 191 |
 www.unilever.com/contact/contact-form
Table of Contents
Table of Contents
| Unilever Annual Report on Form 20-F 2020 | 193 |
Table of Contents
| 194 | Unilever Annual Report on Form 20-F 2020 |
Additional information for US listing purposes continued
| Item 10 | Additional Information | |||||
| A. | Share capital | n/a | ||||
| B. | Articles of association | 61 – 69, 74, 95 | ||||
| C. | Material contracts | 61, 197 | ||||
| D. | Exchange controls | 197 | ||||
| E. | Taxation | 198 – 199 | ||||
| F. | Dividends and paying agents | n/a | ||||
| G. | Statement by experts | n/a | ||||
| H. | Documents on display | 191, 197 | ||||
| I. | Subsidiary information | n/a | ||||
| Item 11 | Quantitative and Qualitative Disclosures About Market Risk | 123 – 129, 141 – 143, 149 – 156, 158 – 160 | ||||
| Item 12 | Description of Securities Other than Equity Securities | |||||
| A. | Description of debt securities | n/a | ||||
| B. | Description of warrants and rights | n/a | ||||
| C. | Description of other securities | n/a | ||||
| D.1 | Name of depositary and address of principal executive | n/a | ||||
| D.2 | Title of ADRS and brief description of provisions | n/a | ||||
| D.3 | Depositary fees and charges | 199 – 200 | ||||
| D.4 | Depositary payments | 199 – 200 | ||||
| Item 13 | Defaults, Dividend Arrearages and Delinquencies | |||||
| A. | Defaults | 200 | ||||
| B. | Dividend arrearages and delinquencies | 200 | ||||
| Item 14 | Material Modifications to the Rights of Security Holders and Use of Proceeds | n/a | ||||
| Item 15 | Controls and Procedures | 44, 69 – 71, 105, 201 | ||||
| Item 16 | Reserved | |||||
| A. | Audit Committee Financial Expert | 70 | ||||
| B. | Code of Ethics | 18, 44, 50, 69, 71 – 72 | ||||
| C. | Principal Accountant Fees and Services | 70 – 71, 201 | ||||
| D. | Exemptions From The Listing Standards For Audit Committees | n/a | ||||
| E. | Purchases Of Equity Securities By The Issuer and Affiliated Purchasers | 68, 201 | ||||
| F. | Change in Registrant’s Certifying Accountant | n/a | ||||
| G. | Corporate Governance | 69 | ||||
| H. | Mine Safety Disclosures | n/a | ||||
| Item 17 | Financial Statements | 104 – 105, 112 – 167 | ||||
| Item 18 | Financial Statements | 104 – 105, 112 – 167 | ||||
| Item 19 | Exhibits | Please refer to the Exhibit list located immediately following the signature page for this document as filed with the SEC. |
||||
Table of Contents
| Unilever Annual Report on Form 20-F 2020 | 195 |
Table of Contents
| 196 | Unilever Annual Report on Form 20-F 2020 |
Additional information for US listing purposes continued
Major shareholders and related party transactions
Major shareholders
The voting rights of the significant shareholders of PLC are the same as for other holders of the class of share held by such significant shareholder.
The principal trading market upon which PLC ordinary shares are listed is the London Stock Exchange. PLC ordinary shares are also listed and traded on Euronext Amsterdam.
In the United States, PLC American Depositary Receipts are traded on the New York Stock Exchange. Deutsche Bank Trust Company Americas (Deutsche Bank) acts for PLC as depositary.
At 23 February 2021 (the latest practicable date for inclusion in this report), there were 2,153 registered holders of PLC American Depositary Receipts in the United States. We estimate that approximately 11% of PLC’s ordinary shares (including shares underlying PLC American Depositary Receipts) were held in the United States (approximately 11% in 2019).
If you are a shareholder of PLC, your interest is in a UK legal entity, your dividends will be paid in pound sterling (converted into US dollars if you have American Depositary Receipts) and you may be subject to UK tax.
To Unilever’s knowledge, PLC is not owned or controlled, directly or indirectly, by another corporation, any foreign government or by any other legal or natural person, severally or jointly. PLC is not aware of any arrangements the operation of which may at any subsequent date result in a change of control of PLC.
Related party transactions
Transactions with related parties are conducted in accordance with agreed transfer pricing policies and include sales to joint ventures and associates. Other than those disclosed in note 23 to the consolidated financial statements (and incorporated herein as above), there were no related party transactions that were material to the Group or to the related parties concerned that are required to be reported in 2020 up to 23 February 2021 (the latest practicable date for inclusion in this report).
Dividend record
The following tables show the dividends declared and dividends paid by PLC for the last five years, expressed in terms of the revised share denominations which became effective from 22 May 2006.
| 2020 | 2019 | 2018 | 2017 | 2016 | ||||||||||||||||
| Dividends declared for the year | ||||||||||||||||||||
| PLC dividends | ||||||||||||||||||||
| Dividend per 31/9p | £1.48 | £1.43 | £1.35 | £1.26 | £1.09 | |||||||||||||||
| Dividend per 31/9p (US Registry) | $1.91 | $1.83 | $1.82 | $1.66 | $1.42 | |||||||||||||||
| Dividends paid during the year | ||||||||||||||||||||
| PLC dividends | ||||||||||||||||||||
| Dividend per 31/9p | £1.45 | £1.42 | £1.33 | £1.22 | £1.04 | |||||||||||||||
| Dividend per 31/9p (US Registry) | $1.85 | $1.82 | $1.83 | $1.56 | $1.40 | |||||||||||||||
Table of Contents
| Unilever Annual Report on Form 20-F 2020 | 197 |
Table of Contents
| 198 | Unilever Annual Report on Form 20-F 2020 |
Additional information for US listing purposes continued
Table of Contents
| Unilever Annual Report on Form 20-F 2020 | 199 |
Table of Contents
| 200 | Unilever Annual Report on Form 20-F 2020 |
Additional information for US listing purposes continued
Table of Contents
| Unilever Annual Report on Form 20-F 2020 | 201 |
Table of Contents
| 202 | Unilever Annual Report on Form 20-F 2020 |
Selected financial data
The schedules below provide the Group’s selected financial data for the five most recent financial years. 2016 numbers are not comparable as the Group adopted IFRS 16 in 2019 and restated only 2018 and 2017.
| Consolidated income statement |
€ million 2020 |
€ million 2019 |
€ million 2018 |
€ million 2017 |
€ million 2016 |
|||||||||||||||
| Turnover | 50,724 | 51,980 | 50,982 | 53,715 | 52,713 | |||||||||||||||
| Operating profit | 8,303 | 8,708 | 12,639 | 8,957 | 7,801 | |||||||||||||||
| Net finance costs | (505 | ) | (627 | ) | (608 | ) | (1,004 | ) | (563 | ) | ||||||||||
| Net monetary gain arising from hyperinflationary economies | 20 | 32 | 122 | – | – | |||||||||||||||
| Share of net profit/(loss) of joint ventures and associates and other income/(loss) from non-current investments | 178 | 176 | 207 | 173 | 231 | |||||||||||||||
| Profit before taxation | 7,996 | 8,289 | 12,360 | 8,126 | 7,469 | |||||||||||||||
| Taxation | (1,923 | ) | (2,263 | ) | (2,572 | ) | (1,670 | ) | (1,922 | ) | ||||||||||
| Net profit | 6,073 | 6,026 | 9,788 | 6,456 | 5,547 | |||||||||||||||
| Attributable to: | ||||||||||||||||||||
| Non-controlling interests | 492 | 401 | 419 | 433 | 363 | |||||||||||||||
| Shareholders’ equity | 5,581 | 5,625 | 9,369 | 6,023 | 5,184 | |||||||||||||||
| Combined earnings per share | € million 2020 |
€ million 2019 |
€ million 2018 |
€ million 2017 |
€ million 2016 |
|||||||||||||||
| Basic earnings per share | 2.13 | 2.15 | 3.49 | 2.15 | 1.83 | |||||||||||||||
| Diluted earnings per share | 2.12 | 2.14 | 3.48 | 2.14 | 1.82 | |||||||||||||||
| For the basis of the calculations of combined earnings per share see note 7 ‘Combined earnings per share’ on page 133. |
|
|||||||||||||||||||
| Consolidated balance sheet | € million 2020 |
€ million 2019 |
€ million 2018 |
€ million 2017 |
€ million 2016 |
|||||||||||||||
| Non-current assets | 51,502 | 48,376 | 45,633 | 45,078 | 42,545 | |||||||||||||||
| Current assets | 16,157 | 16,430 | 15,478 | 16,980 | 13,884 | |||||||||||||||
| Total assets | 67,659 | 64,806 | 61,111 | 62,058 | 56,429 | |||||||||||||||
| Current liabilities | 20,592 | 20,978 | 20,150 | 23,587 | 20,556 | |||||||||||||||
| Non-current liabilities | 29,412 | 29,942 | 28,844 | 24,273 | 18,893 | |||||||||||||||
| Total liabilities | 50,004 | 50,920 | 48,994 | 47,860 | 39,449 | |||||||||||||||
| Share Capital | 92 | 420 | 464 | 484 | 484 | |||||||||||||||
| Reserves | 15,174 | 12,772 | 10,933 | 12,956 | 15,870 | |||||||||||||||
| Non-controlling interests | 2,389 | 694 | 720 | 758 | 626 | |||||||||||||||
| Total equity | 17,655 | 13,886 | 12,117 | 14,198 | 16,980 | |||||||||||||||
| Total liabilities and equity | 67,659 | 64,806 | 61,111 | 62,058 | 56,429 | |||||||||||||||
Table of Contents
| Unilever Annual Report on Form 20-F 2020 | 203 |
Additional information for US listing purposes continued
Table of Contents
| 204 | Unilever Annual Report on Form 20-F 2020 |
Cautionary Statement
This document may contain forward-looking statements, including ‘forward-looking statements’ within the meaning of the United States Private Securities Litigation Reform Act of 1995. Words such as ‘will’, ‘aim’, ‘expects’, ‘anticipates’, ‘intends’, ‘looks’, ‘believes’, ‘vision’, or the negative of these terms and other similar expressions of future performance or results, and their negatives, are intended to identify such forward-looking statements. These forward-looking statements are based upon current expectations and assumptions regarding anticipated developments and other factors affecting the Unilever Group (the ‘Group’). They are not historical facts, nor are they guarantees of future performance.
Because these forward-looking statements involve risks and uncertainties, there are important factors that could cause actual results to differ materially from those expressed or implied by these forward-looking statements. Among other risks and uncertainties, the material or principal factors which could cause actual results to differ materially are: Unilever’s global brands not meeting consumer preferences; Unilever’s ability to innovate and remain competitive; Unilever’s investment choices in its portfolio management; the effect of climate change on Unilever’s business; Unilever’s ability to find sustainable solutions to its plastic packaging; significant changes or deterioration in customer relationships; the recruitment and retention of talented employees; disruptions in our supply chain and distribution; increases or volatility in the cost of raw materials and commodities; the production of safe and high quality products; secure and reliable IT infrastructure; execution of acquisitions, divestitures and business transformation projects; economic, social and political risks and natural disasters; financial risks; failure to meet high and ethical standards; and managing regulatory, tax and legal matters. A number of these risks have increased as a result of the current Covid-19 pandemic.
These forward-looking statements speak only as of the date of this document. Except as required by any applicable law or regulation, the Group expressly disclaims any obligation or undertaking to release publicly any updates or revisions to any forward-looking statements contained herein to reflect any change in the Group’s expectations with regard thereto or any change in events, conditions or circumstances on which any such statement is based.
Further details of potential risks and uncertainties affecting the Group are described in the Group’s filings with the London Stock Exchange, Euronext Amsterdam and the US Securities and Exchange Commission, including in the Unilever Annual Report and Accounts 2020.
This document is not prepared in accordance with US GAAP and should not therefore be relied upon by readers as such.
In addition, a printed copy of the Annual Report on Form 20-F 2020 is available, free of charge, upon request to Unilever, Investor Relations Department, 100 Victoria Embankment, London EC4Y 0DY, United Kingdom.
This document comprises regulated information within the meaning of Sections 1:1 and 5:25c of the Act on Financial Supervision (‘Wet op het financieel toezicht (Wft)’) in the Netherlands.
The brand names shown in this report are trademarks owned by or licensed to companies within the Group.
References in this document to information on websites (and/or social media sites) are included as an aid to their location and such information is not incorporated in, and does not form part of, the Annual Report on Form 20-F 2020.
Table of Contents
| Designed and produced by Unilever Communications.
Printed at Pureprint Group, ISO 14001. FSC® certified and CarbonNeutral®.
This document is printed on Revive 100% Recycled Silk. These papers have been exclusively supplied by Denmaur Independent Papers which has offset the carbon produced by the production and delivery of them to the printer.
These papers are 100% recycled and manufactured using de-inked post-consumer waste. All the pulp is bleached using an elemental chlorine free process (ECF). Printed in the UK by Pureprint using its pureprint® environmental printing technology. Vegetable inks were used throughout. Pureprint is a CarbonNeutral® company. Both the manufacturing mill and the printer are registered to the Environmental Management System ISO 14001 and are Forest Stewardship Council® (FSC®) chain-of-custody certified.
If you have finished with this document and no longer wish to retain it, please pass it on to other interested readers or dispose of it in your recycled paper waste. Thank you. |

| |
Table of Contents
For further information about
Unilever please visit our website:
www.unilever.com
Unilever PLC
Head Office
100 Victoria Embankment
London EC4Y 0DY
United Kingdom
T +44 (0)20 7822 5252
Registered Office
Unilever PLC
Port Sunlight
Wirral
Merseyside CH62 4ZD
United Kingdom
Registered in England and Wales
Company Number: 41424
Table of Contents
UNILEVER PLC — 20-F EXHIBIT LIST
Table of Contents
Certain instruments which define rights of holders of long-term debt of the Company and its subsidiaries are not being filed because the total amount of securities authorized under each such instrument does not exceed 10% of the total consolidated assets of the Company and its subsidiaries. The Company and its subsidiaries hereby agree to furnish a copy of each such instrument to the Securities and Exchange Commission upon request.
| 1 | Incorporated by reference to Exhibit 2.2 of Form 20-F (File No: 001-04546) filed with the SEC on March 28, 2002. |
| 2 | Incorporated by reference to Exhibit 99.1 of post-effective amendment to Form F-3 (File No: 333-245589) filed with the SEC on November 30, 2020. |
| 3 | Incorporated by reference to Exhibit 99(A) of Form F-6 (File No: 333-196985) filed with the SEC on June 24, 2014. |
| 4 | Incorporated by reference to Exhibit 2.5 of Form 20-F (File No: 001-04546) filed with the SEC on March 9, 2020. |
| 5 | Incorporated by reference to Exhibit 99.1 of Form S-8 (File No: 333-185299) filed with the SEC on December 6, 2012. |
| 6 | Incorporated by reference to Exhibit 4.5 of Form 20-F (File No: 001-04546) filed with the SEC on March 28, 2002. |
| 7 | Incorporated by reference to Exhibit 4.7 of Form 20-F (File No: 001-04546) filed with the SEC on March 28, 2002. |
| 8 | Incorporated by reference to Exhibit 4.7 of Form 20-F (File No: 001-04546) filed with the SEC on March 26, 2008. |
| 9 | Incorporated by reference to Exhibit 4.8 of Form 20-F (File No: 001-04546) filed with the SEC on March 4, 2011. |
| 10 | Incorporated by reference to Exhibit 4.9 of Form 20-F (File No: 001-04546) filed with the SEC on February 28, 2018. |
| 11 | The required information is set forth on pages 167 and 184 to 190 of the Annual Report on Form 20-F 2020. |
Table of Contents
SIGNATURES
The registrant hereby certifies that it meets all of the requirements for filing on Form 20-F and that it has duly caused and authorised the undersigned to sign this Annual Report on its behalf.
Unilever PLC.
(Registrant)
| /s/ R.Sotamaa |
| R. SOTAMAA, |
| Chief Legal Officer and Group Secretary |
Date: 10 March 2021