UNITED STATES
SECURITIES AND EXCHANGE COMMISSION
Washington, D.C. 20549
FORM N-CSR
CERTIFIED SHAREHOLDER REPORT OF REGISTERED MANAGEMENT INVESTMENT COMPANIES
Investment Company Act file number 811-01829
Columbia Acorn Trust
(Exact name of registrant as specified in charter)
71 S Wacker Dr.
Suite 2500
Chicago, IL 60606,USA
(Address of principal executive offices) (Zip code)
Ryan C. Larrenaga
c/o Columbia Management Investment Advisers, LLC
290 Congress Street
Boston, Massachusetts 02210
Daniel J. Beckman
c/o Columbia Management Investment Advisers, LLC
290 Congress Street
Boston, Massachusetts 02210
Mary C. Moynihan
Perkins Coie LLP
700 13th Street, NW
Suite 800
Washington, DC 20005
(Name and address of agent for service)
Registrant's telephone number, including area code: (312) 634-9200
Date of fiscal year end: December 31
Date of reporting period: December 31, 2023
Form N-CSR is to be used by management investment companies to file reports with the Commission not later than 10 days after the transmission to stockholders of any report that is required to be transmitted to stockholders under Rule 30e-1 under the Investment Company Act of 1940 (17 CFR 270.30e-1). The Commission may use the information provided on Form N-CSR in its regulatory, disclosure review, inspection, and policymaking roles.
A registrant is required to disclose the information specified by Form N-CSR, and the Commission will make this information public. A registrant is not required to respond to the collection of information contained in Form N-CSR unless the Form displays a currently valid Office of Management and Budget ("OMB") control number. Please direct comments concerning the accuracy of the information collection burden estimate and any suggestions for reducing the burden to Secretary, Securities and Exchange Commission, 100 F Street, NE, Washington, DC 20549. The OMB has reviewed this collection of information under the clearance requirements of 44 U.S.C. § 3507.
Item 1. Reports to Stockholders.


|
3
|
|
|
5
|
|
|
8
|
|
|
10
|
|
|
12
|
|
|
14
|
|
|
16
|
|
|
18
|
|
|
20
|
|
|
22
|
|
|
24
|
|
|
26
|
|
|
44
|
|
|
48
|
|
|
51
|
|
|
58
|
|
|
78
|
|
|
98
|
|
|
99
|
|
|
100
|
|
|
103
|
Portfolio management
|
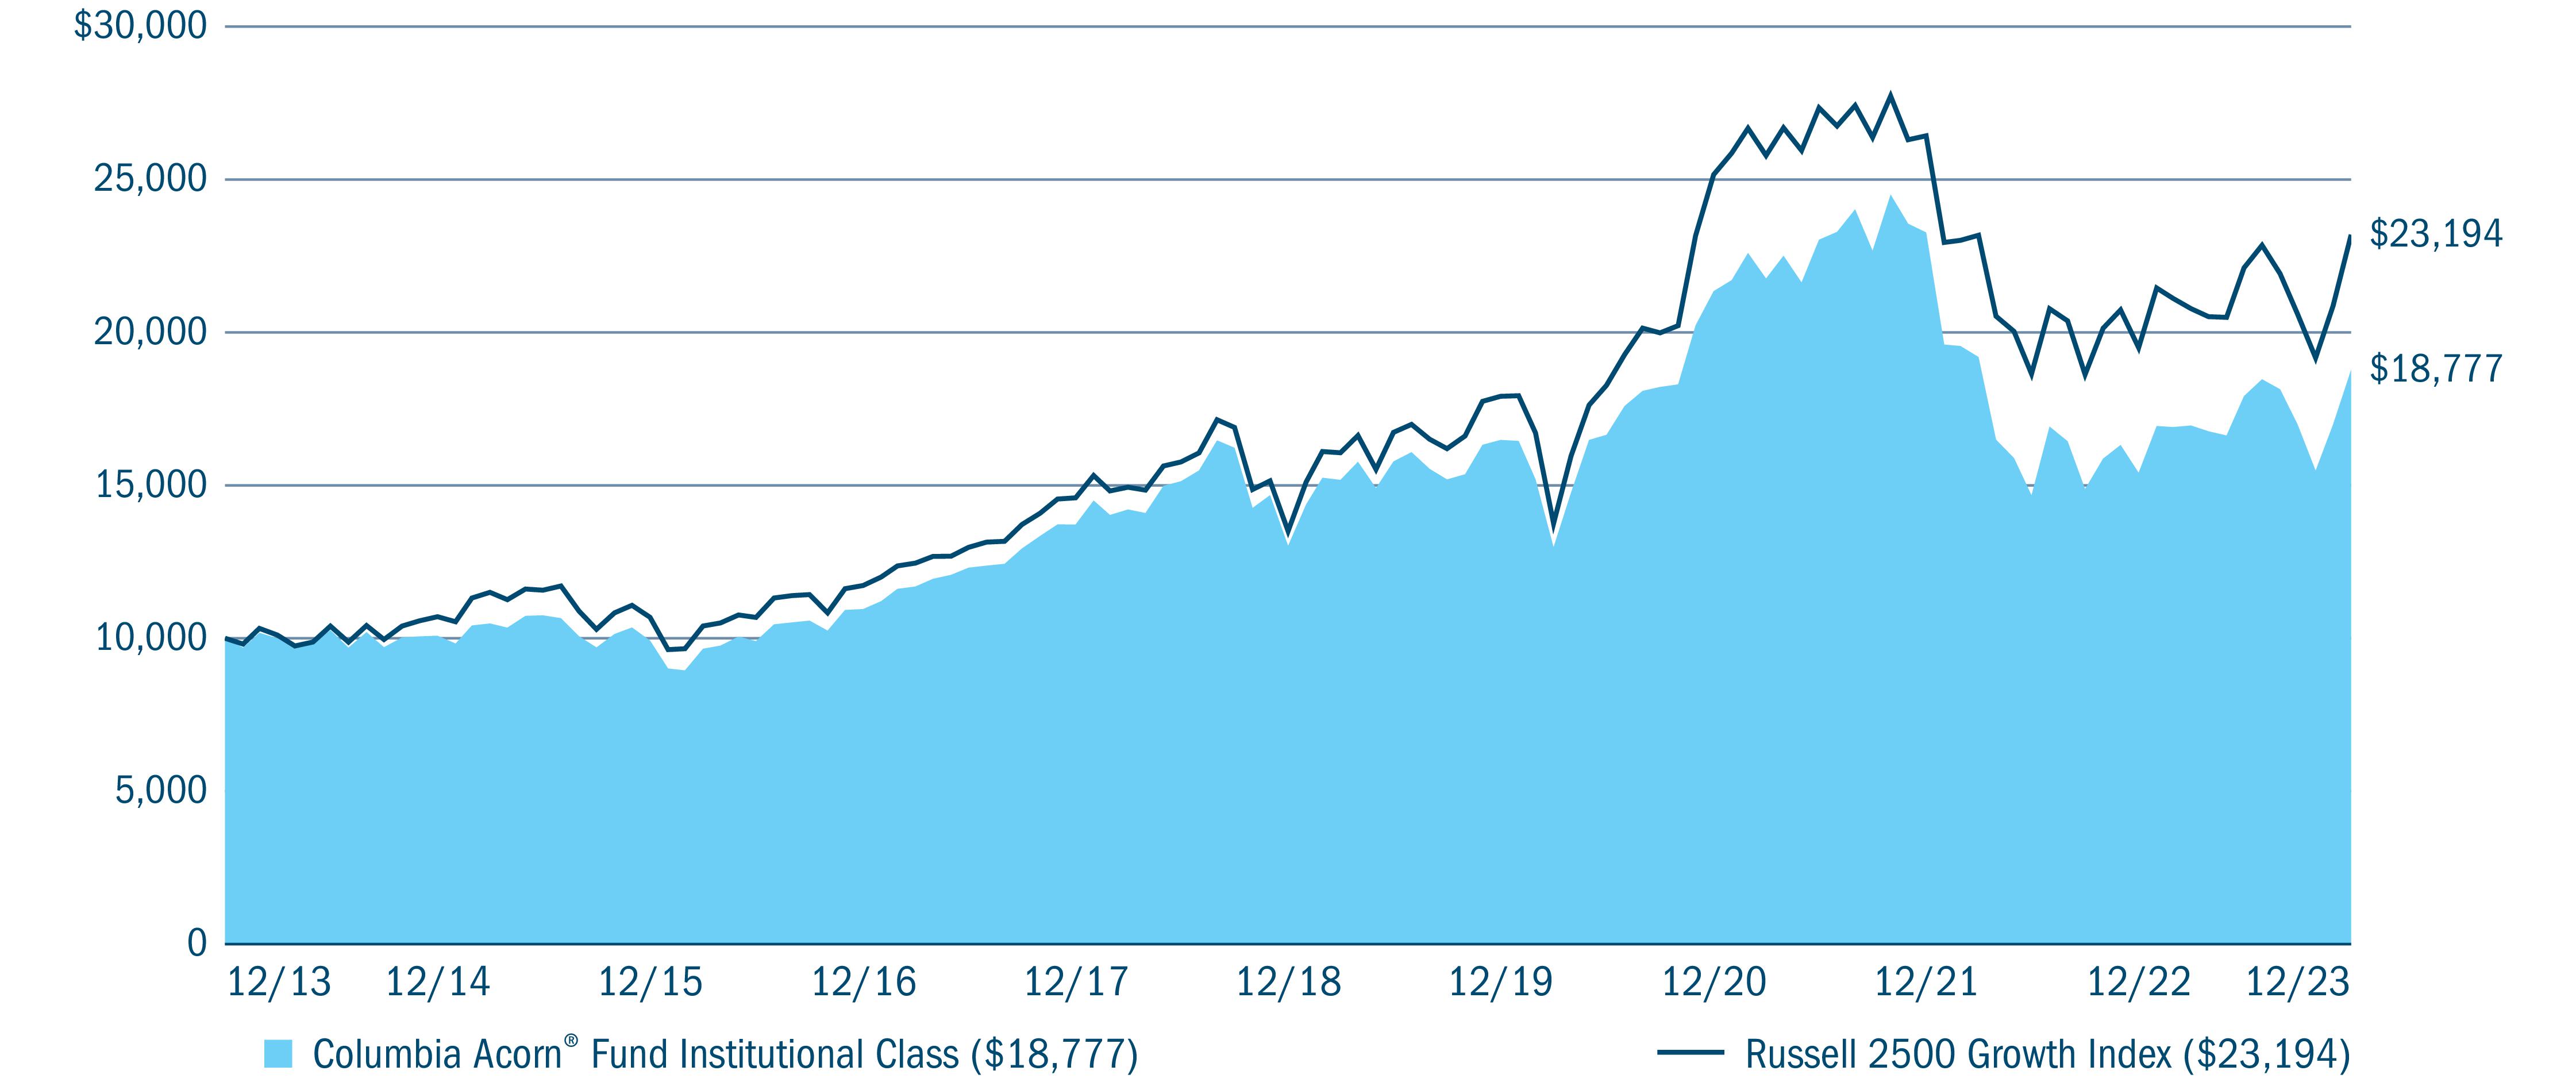
Average annual total returns (%) (for the period ended December 31, 2023)
|
||||||
|
|
|
Inception
|
1 Year
|
5 Years
|
10 Years
|
Life of Fund
|
|
Class A
|
Excluding sales charges
|
10/16/00
|
21.59
|
7.32
|
6.23
|
12.95
|
|
|
Including sales charges
|
|
14.53
|
6.05
|
5.60
|
12.83
|
|
Advisor Class
|
11/08/12
|
21.89
|
7.59
|
6.48
|
13.30
|
|
|
Class C
|
Excluding sales charges
|
10/16/00
|
20.67
|
6.50
|
5.44
|
12.10
|
|
|
Including sales charges
|
|
19.67
|
6.50
|
5.44
|
12.10
|
|
Institutional Class
|
06/10/70
|
21.85
|
7.60
|
6.50
|
13.31
|
|
|
Institutional 2 Class
|
11/08/12
|
21.94
|
7.62
|
6.53
|
13.31
|
|
|
Institutional 3 Class
|
11/08/12
|
21.95
|
7.68
|
6.59
|
13.32
|
|
|
Russell 2500 Growth Index
|
|
18.93
|
11.43
|
8.78
|
-
|
|
|
Portfolio breakdown (%) (at December 31, 2023)
|
|
|
Common Stocks
|
97.5
|
|
Money Market Funds
|
2.5
|
|
Securities Lending Collateral
|
0.0
(a)
|
|
Total
|
100.0
|
|
(a)
|
Rounds to zero.
|
|
Equity sector breakdown (%) (at December 31, 2023)
|
|
|
Communication Services
|
2.2
|
|
Consumer Discretionary
|
19.9
|
|
Consumer Staples
|
3.1
|
|
Energy
|
2.8
|
|
Financials
|
7.0
|
|
Health Care
|
19.9
|
|
Industrials
|
20.0
|
|
Information Technology
|
19.3
|
|
Materials
|
3.2
|
|
Real Estate
|
2.6
|
|
Total
|
100.0
|
Portfolio management
|
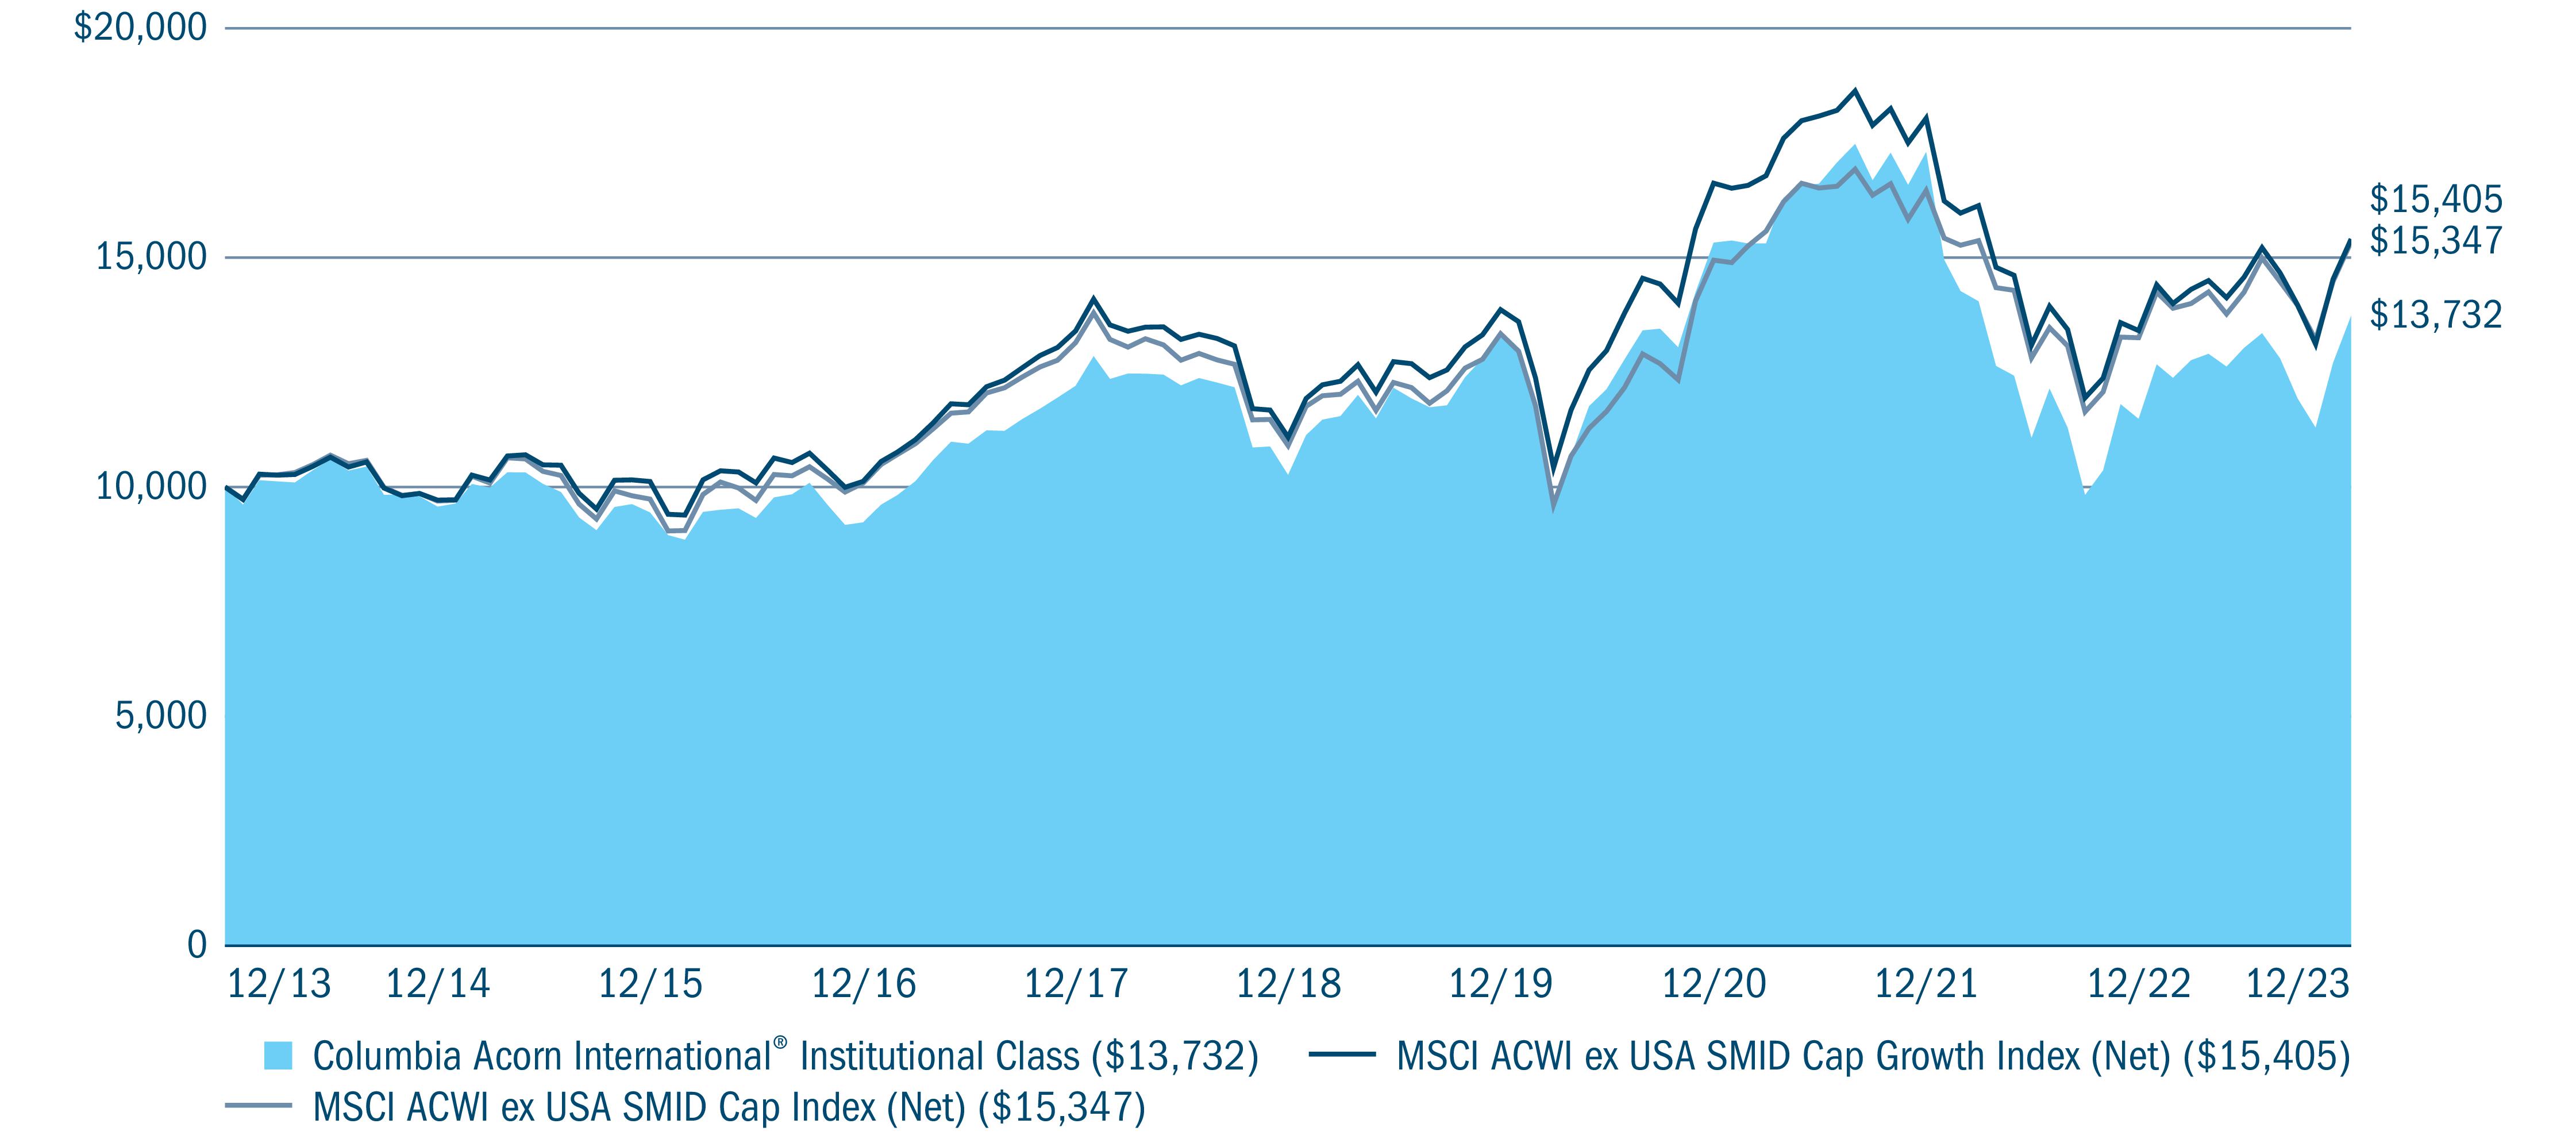
Average annual total returns (%) (for the period ended December 31, 2023)
|
||||||
|
|
|
Inception
|
1 Year
|
5 Years
|
10 Years
|
Life of Fund
|
|
Class A
|
Excluding sales charges
|
10/16/00
|
19.31
|
5.73
|
2.96
|
8.51
|
|
|
Including sales charges
|
|
12.46
|
4.49
|
2.35
|
8.30
|
|
Advisor Class
|
11/08/12
|
19.57
|
5.99
|
3.20
|
8.87
|
|
|
Class C
|
Excluding sales charges
|
10/16/00
|
18.35
|
4.93
|
2.18
|
7.70
|
|
|
Including sales charges
|
|
17.35
|
4.93
|
2.18
|
7.70
|
|
Institutional Class
|
09/23/92
|
19.57
|
6.00
|
3.22
|
8.88
|
|
|
Institutional 2 Class
|
08/02/11
|
19.63
|
6.06
|
3.27
|
8.89
|
|
|
Institutional 3 Class
|
11/08/12
|
19.73
|
6.11
|
3.32
|
8.92
|
|
|
Class R
|
08/02/11
|
18.98
|
5.46
|
2.66
|
8.23
|
|
|
MSCI ACWI ex USA SMID Cap
Growth Index (Net)
|
|
14.88
|
6.80
|
4.42
|
-
|
|
|
MSCI ACWI ex USA SMID Cap
Index (Net)
|
|
15.79
|
7.07
|
4.38
|
-
|
|
|
Equity sector breakdown (%) (at December 31, 2023)
|
|
|
Communication Services
|
6.9
|
|
Consumer Discretionary
|
4.0
|
|
Consumer Staples
|
4.7
|
|
Energy
|
2.2
|
|
Financials
|
8.5
|
|
Health Care
|
8.9
|
|
Industrials
|
31.4
|
|
Information Technology
|
22.1
|
|
Materials
|
6.1
|
|
Real Estate
|
5.2
|
|
Total
|
100.0
|
|
Country breakdown (%) (at December 31, 2023)
|
|
|
Australia
|
4.7
|
|
Brazil
|
1.6
|
|
Canada
|
7.8
|
|
China
|
3.5
|
|
Finland
|
2.1
|
|
France
|
2.0
|
|
Country breakdown (%) (at December 31, 2023)
|
|
|
Germany
|
6.5
|
|
India
|
1.6
|
|
Ireland
|
1.5
|
|
Italy
|
2.1
|
|
Japan
|
17.4
|
|
Mexico
|
4.9
|
|
Netherlands
|
4.8
|
|
New Zealand
|
1.5
|
|
Norway
|
0.8
|
|
South Korea
|
1.0
|
|
Sweden
|
6.9
|
|
Switzerland
|
5.7
|
|
Taiwan
|
4.0
|
|
United Kingdom
|
15.0
|
|
United States(a)
|
3.0
|
|
Vietnam
|
1.6
|
|
Total
|
100.0
|
|
(a)
|
Includes investments in Money Market Funds.
|
Portfolio management
|
Average annual total returns (%) (for the period ended December 31, 2023)
|
||||||
|
|
|
Inception
|
1 Year
|
5 Years
|
10 Years
|
Life of Fund
|
|
Class A
|
Excluding sales charges
|
10/16/00
|
18.13
|
5.40
|
3.61
|
7.15
|
|
|
Including sales charges
|
|
11.31
|
4.16
|
3.00
|
6.89
|
|
Advisor Class
|
11/08/12
|
18.37
|
5.66
|
3.87
|
7.46
|
|
|
Class C
|
Excluding sales charges
|
10/16/00
|
17.22
|
4.60
|
2.83
|
6.34
|
|
|
Including sales charges
|
|
16.22
|
4.60
|
2.83
|
6.34
|
|
Institutional Class
|
11/23/98
|
18.42
|
5.66
|
3.88
|
7.47
|
|
|
Institutional 2 Class
|
11/08/12
|
18.54
|
5.76
|
3.96
|
7.50
|
|
|
Institutional 3 Class
|
11/08/12
|
18.64
|
5.82
|
4.02
|
7.53
|
|
|
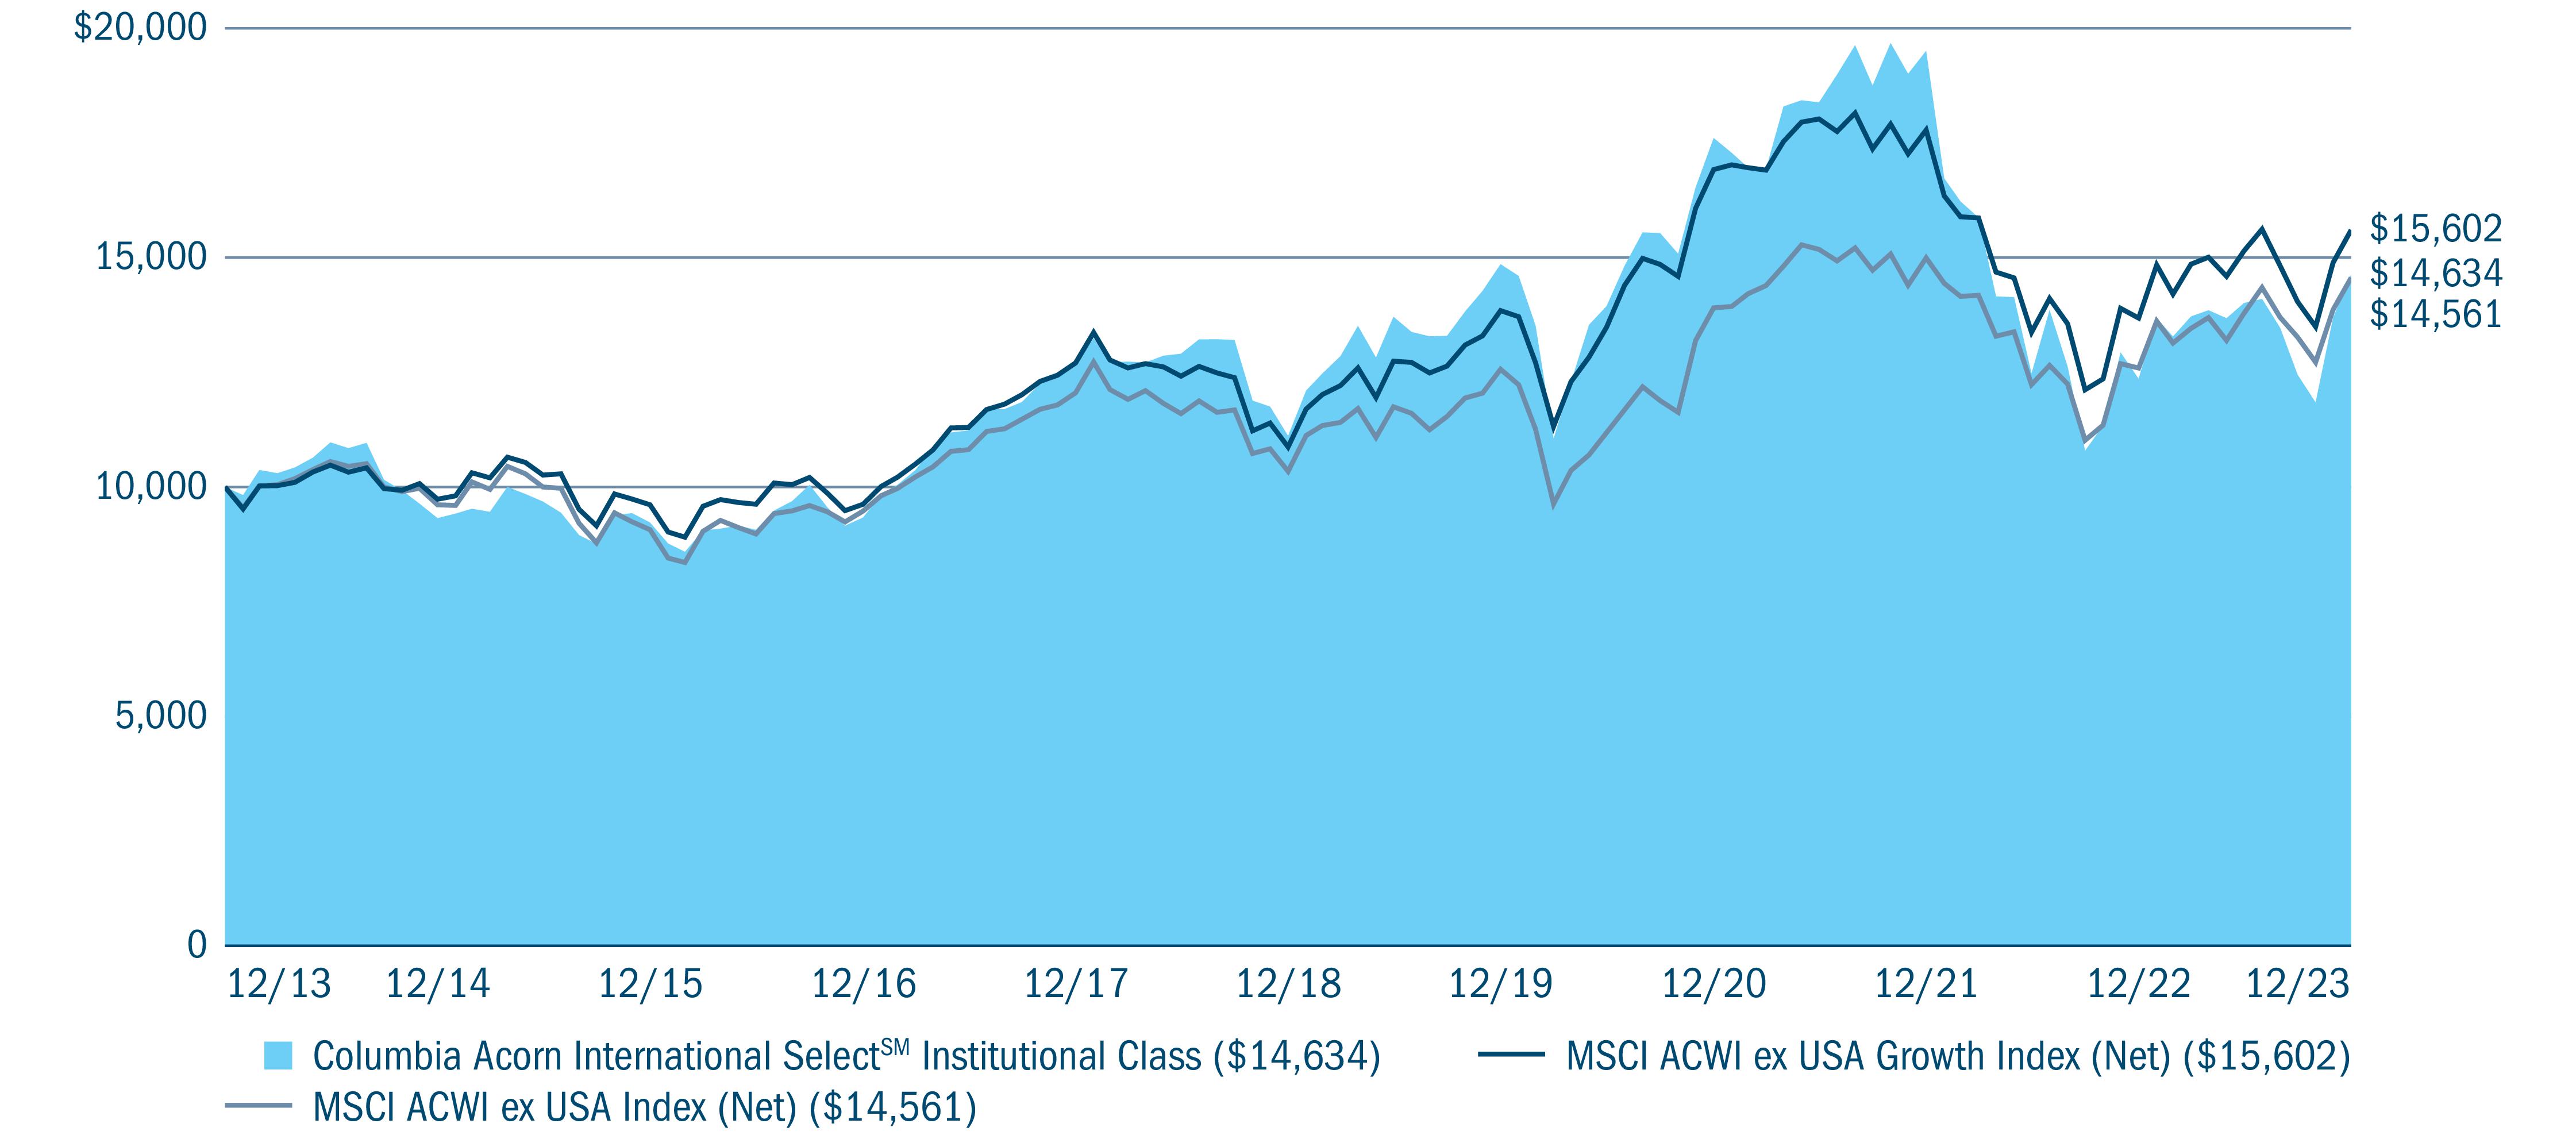
MSCI ACWI ex USA Growth
Index (Net)
|
|
14.03
|
7.49
|
4.55
|
-
|
|
|
MSCI ACWI ex USA Index (Net)
|
|
15.62
|
7.08
|
3.83
|
-
|
|
|
Equity sector breakdown (%) (at December 31, 2023)
|
|
|
Communication Services
|
9.9
|
|
Consumer Discretionary
|
5.7
|
|
Consumer Staples
|
7.2
|
|
Energy
|
1.1
|
|
Financials
|
6.5
|
|
Health Care
|
9.6
|
|
Industrials
|
28.5
|
|
Information Technology
|
27.9
|
|
Materials
|
1.1
|
|
Real Estate
|
2.5
|
|
Total
|
100.0
|
|
Country breakdown (%) (at December 31, 2023)
|
|
|
Australia
|
2.4
|
|
Brazil
|
2.3
|
|
Canada
|
1.1
|
|
China
|
7.1
|
|
Finland
|
2.4
|
|
France
|
4.0
|
|
Germany
|
3.5
|
|
Ireland
|
2.0
|
|
Italy
|
2.4
|
|
Japan
|
20.7
|
|
Mexico
|
2.5
|
|
Netherlands
|
4.5
|
|
New Zealand
|
3.1
|
|
Sweden
|
5.9
|
|
Switzerland
|
10.9
|
|
Taiwan
|
6.5
|
|
United Kingdom
|
13.9
|
|
United States(a)
|
4.8
|
|
Total
|
100.0
|
|
(a)
|
Includes investments in Money Market Funds.
|
Portfolio management
|
Average annual total returns (%) (for the period ended December 31, 2023)
|
||||||
|
|
|
Inception
|
1 Year
|
5 Years
|
10 Years
|
Life of Fund
|
|
Class A
|
Excluding sales charges
|
03/03/03
|
11.38
|
8.82
|
5.85
|
6.95
|
|
|
Including sales charges
|
|
4.95
|
7.55
|
5.22
|
6.65
|
|
Advisor Class
|
11/08/12
|
11.64
|
9.09
|
6.12
|
7.22
|
|
|
Class C
|
Excluding sales charges
|
03/03/03
|
10.52
|
8.00
|
5.06
|
6.15
|
|
|
Including sales charges
|
|
9.52
|
8.00
|
5.06
|
6.15
|
|
Institutional Class
|
09/25/02
|
11.66
|
9.08
|
6.11
|
7.22
|
|
|
Institutional 2 Class
|
11/08/12
|
11.67
|
9.13
|
6.15
|
7.23
|
|
|
Institutional 3 Class
|
11/08/12
|
11.73
|
9.17
|
6.19
|
7.26
|
|
|
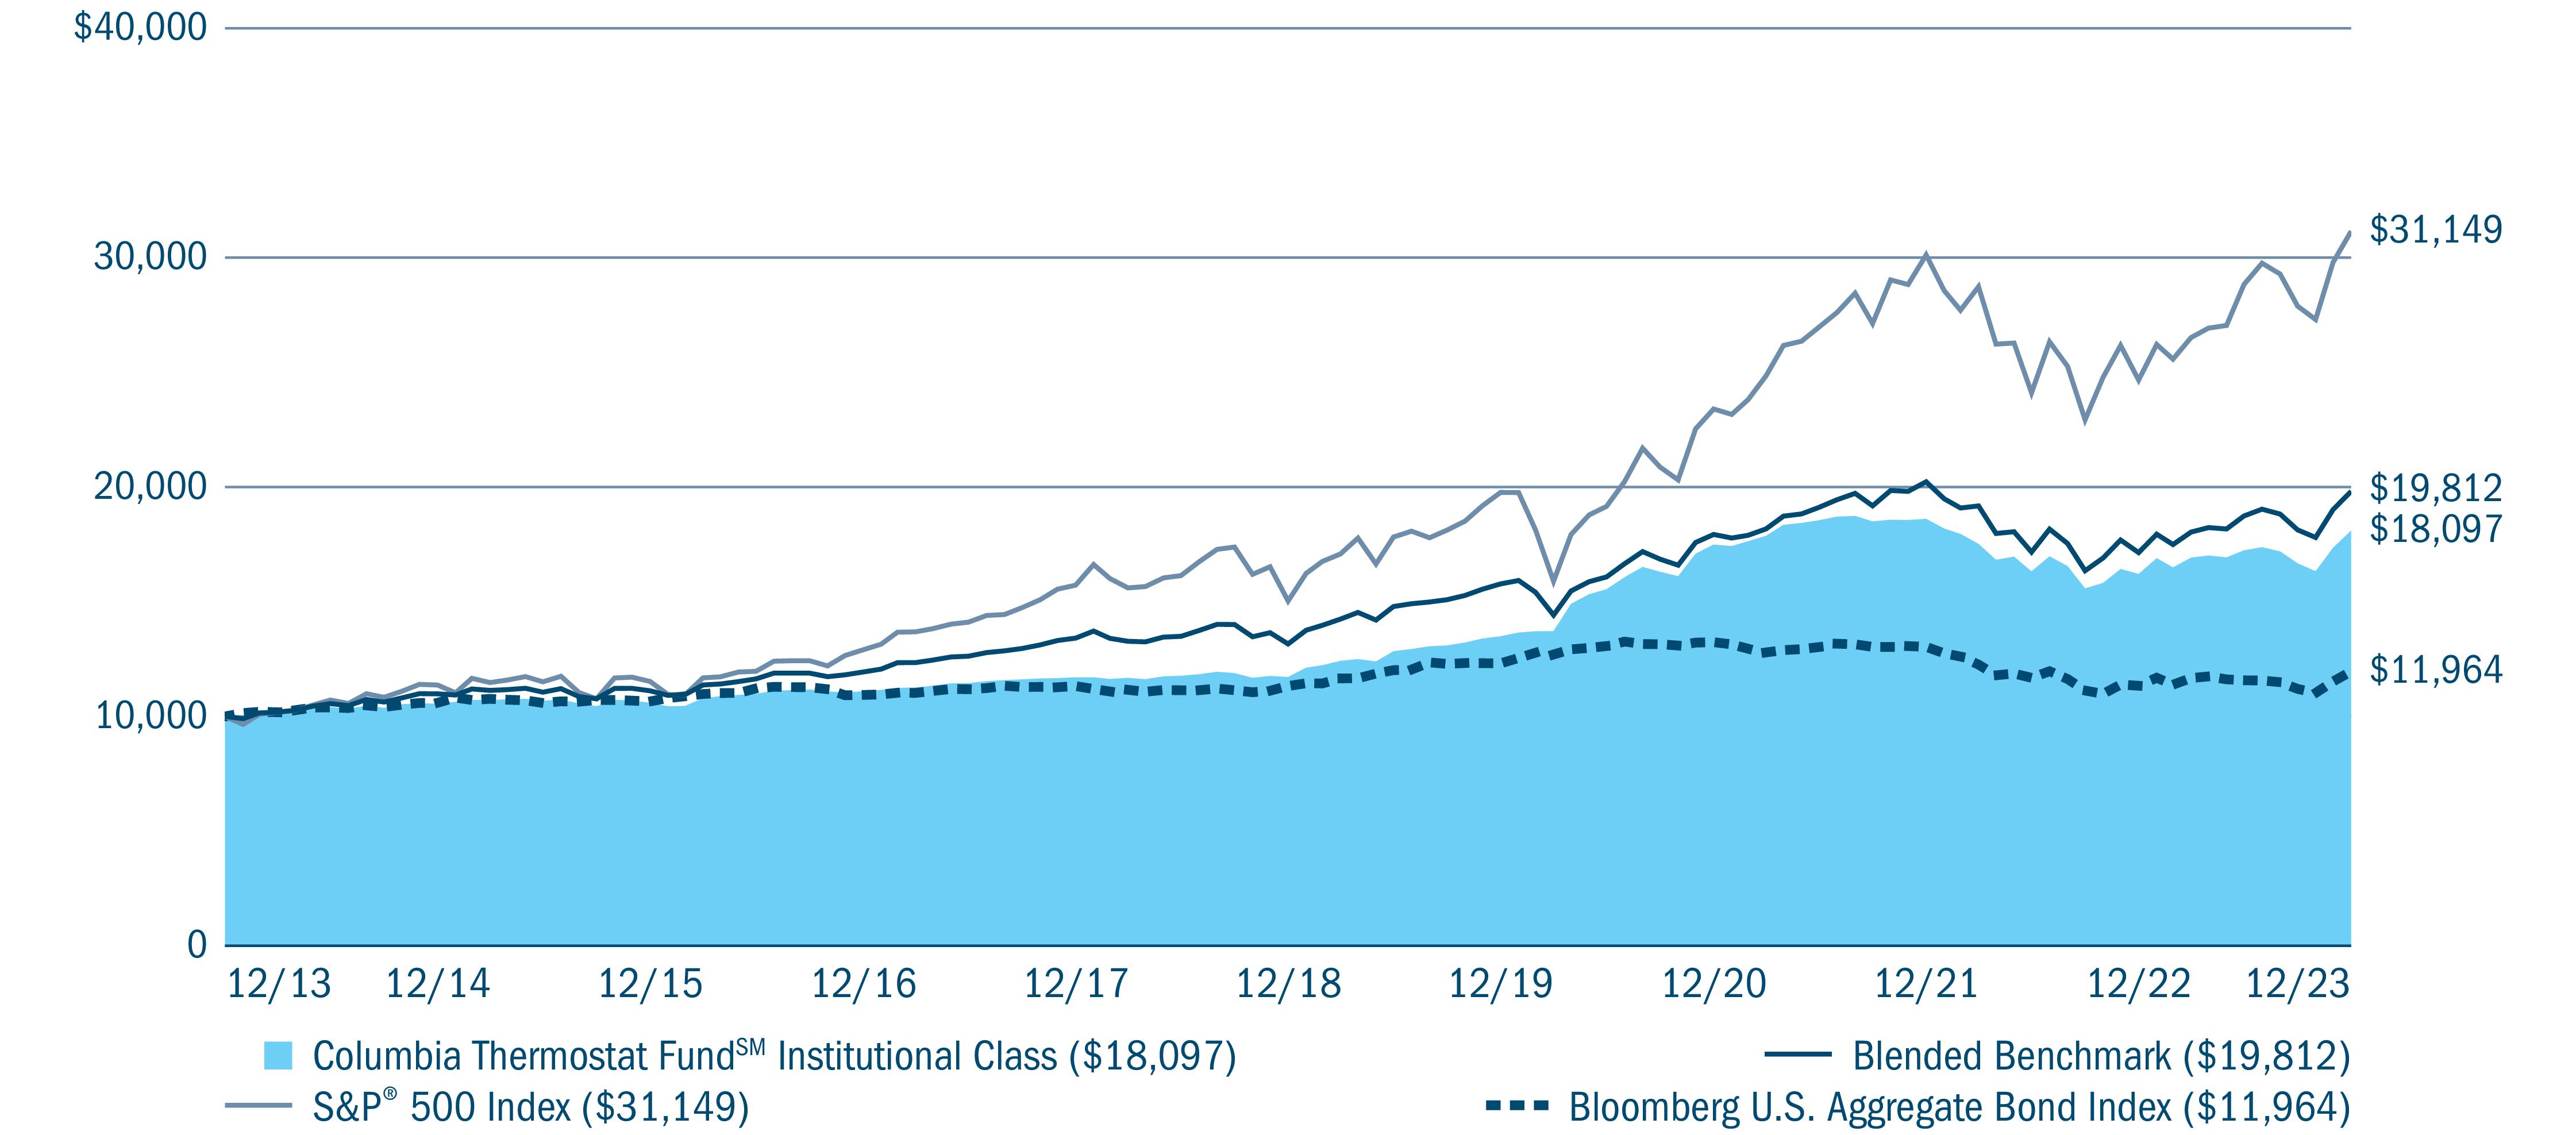
Blended Benchmark
|
|
15.58
|
8.53
|
7.08
|
-
|
|
|
S&P 500® Index
|
|
26.29
|
15.69
|
12.03
|
-
|
|
|
Bloomberg U.S. Aggregate
Bond Index
|
|
5.53
|
1.10
|
1.81
|
-
|
|
|
Portfolio breakdown (%) (at December 31, 2023)
|
|
|
Equity Funds
|
13.4
|
|
Exchange-Traded Equity Funds
|
1.5
|
|
Exchange-Traded Fixed Income Funds
|
8.4
|
|
Fixed Income Funds
|
76.3
|
|
Money Market Funds
|
0.4
|
|
Total
|
100.0
|
Portfolio management
|
Average annual total returns (%) (for the period ended December 31, 2023)
|
||||||
|
|
|
Inception
|
1 Year
|
5 Years
|
10 Years
|
Life of Fund
|
|
Class A
|
Excluding sales charges
|
08/19/11
|
24.76
|
10.93
|
5.72
|
8.62
|
|
|
Including sales charges
|
|
17.57
|
9.62
|
5.10
|
8.10
|
|
Advisor Class
|
06/25/14
|
25.11
|
11.20
|
6.00
|
8.90
|
|
|
Class C
|
Excluding sales charges
|
08/19/11
|
23.83
|
10.08
|
4.94
|
7.81
|
|
|
Including sales charges
|
|
22.83
|
10.08
|
4.94
|
7.81
|
|
Institutional Class
|
08/19/11
|
25.09
|
11.20
|
5.99
|
8.89
|
|
|
Institutional 2 Class
|
11/08/12
|
25.17
|
11.26
|
6.04
|
8.94
|
|
|
Institutional 3 Class
|
03/01/17
|
25.21
|
11.30
|
6.05
|
8.94
|
|
|
MSCI AC Europe Small Cap
Index (Net)
|
|
16.54
|
7.65
|
4.70
|
-
|
|

|
Equity sector breakdown (%) (at December 31, 2023)
|
|
|
Communication Services
|
8.2
|
|
Consumer Staples
|
4.1
|
|
Financials
|
6.8
|
|
Health Care
|
12.5
|
|
Industrials
|
42.9
|
|
Information Technology
|
19.7
|
|
Materials
|
3.3
|
|
Real Estate
|
2.5
|
|
Total
|
100.0
|
|
Equity sub-industry breakdown (%) (at December 31, 2023)
|
|
|
Industrials
|
|
|
Building Products
|
13.2
|
|
Construction & Engineering
|
2.7
|
|
Construction Machinery & Heavy Trucks
|
0.5
|
|
Environmental & Facilities Services
|
1.8
|
|
Heavy Electrical Equipment
|
1.1
|
|
Industrial Machinery & Supplies & Components
|
9.9
|
|
Trading Companies & Distributors
|
13.7
|
|
Total
|
42.9
|
|
Country breakdown (%) (at December 31, 2023)
|
|
|
Belgium
|
1.0
|
|
Finland
|
2.3
|
|
France
|
4.6
|
|
Germany
|
9.1
|
|
Italy
|
7.9
|
|
Netherlands
|
7.8
|
|
Norway
|
1.4
|
|
Sweden
|
21.4
|
|
Switzerland
|
10.3
|
|
United Kingdom
|
28.9
|
|
United States(a)
|
5.3
|
|
Total
|
100.0
|
|
(a)
|
Includes investments in Money Market Funds.
|
|
July 1, 2023 — December 31, 2023
|
|||||||
|
|
Account value at the
beginning of the
period ($)
|
Account value at the
end of the
period ($)
|
Expenses paid during
the period ($)
|
Fund’s annualized
expense ratio (%)
|
|||
|
|
Actual
|
Hypothetical
|
Actual
|
Hypothetical
|
Actual
|
Hypothetical
|
Actual
|
|
Columbia Acorn® Fund
|
|||||||
|
Class A
|
1,000.00
|
1,000.00
|
1,047.60
|
1,019.60
|
5.46
|
5.39
|
1.07
|
|
Advisor Class
|
1,000.00
|
1,000.00
|
1,048.60
|
1,020.84
|
4.19
|
4.13
|
0.82
|
|
Class C
|
1,000.00
|
1,000.00
|
1,043.20
|
1,015.86
|
9.27
|
9.15
|
1.82
|
|
Institutional Class
|
1,000.00
|
1,000.00
|
1,047.90
|
1,020.84
|
4.19
|
4.13
|
0.82
|
|
Institutional 2 Class
|
1,000.00
|
1,000.00
|
1,047.80
|
1,020.99
|
4.03
|
3.98
|
0.79
|
|
Institutional 3 Class
|
1,000.00
|
1,000.00
|
1,048.70
|
1,021.19
|
3.83
|
3.78
|
0.75
|
|
July 1, 2023 — December 31, 2023
|
|||||||
|
|
Account value at the
beginning of the
period ($)
|
Account value at the
end of the
period ($)
|
Expenses paid during
the period ($)
|
Fund’s annualized
expense ratio (%)
|
|||
|
|
Actual
|
Hypothetical
|
Actual
|
Hypothetical
|
Actual
|
Hypothetical
|
Actual
|
|
Columbia Acorn International®
|
|||||||
|
Class A
|
1,000.00
|
1,000.00
|
1,052.50
|
1,018.70
|
6.40
|
6.29
|
1.25
|
|
Advisor Class
|
1,000.00
|
1,000.00
|
1,053.70
|
1,019.95
|
5.12
|
5.04
|
1.00
|
|
Class C
|
1,000.00
|
1,000.00
|
1,048.10
|
1,014.96
|
10.21
|
10.05
|
2.00
|
|
Institutional Class
|
1,000.00
|
1,000.00
|
1,053.80
|
1,019.95
|
5.12
|
5.04
|
1.00
|
|
Institutional 2 Class
|
1,000.00
|
1,000.00
|
1,053.80
|
1,020.29
|
4.76
|
4.68
|
0.93
|
|
Institutional 3 Class
|
1,000.00
|
1,000.00
|
1,054.40
|
1,020.44
|
4.61
|
4.53
|
0.90
|
|
Class R
|
1,000.00
|
1,000.00
|
1,051.00
|
1,017.45
|
7.67
|
7.54
|
1.50
|
|
Columbia Acorn International SelectSM
|
|||||||
|
Class A
|
1,000.00
|
1,000.00
|
1,043.40
|
1,018.80
|
6.27
|
6.19
|
1.23
|
|
Advisor Class
|
1,000.00
|
1,000.00
|
1,044.50
|
1,020.04
|
5.00
|
4.94
|
0.98
|
|
Class C
|
1,000.00
|
1,000.00
|
1,039.30
|
1,015.06
|
10.07
|
9.95
|
1.98
|
|
Institutional Class
|
1,000.00
|
1,000.00
|
1,044.50
|
1,020.04
|
5.00
|
4.94
|
0.98
|
|
Institutional 2 Class
|
1,000.00
|
1,000.00
|
1,045.20
|
1,020.74
|
4.28
|
4.23
|
0.84
|
|
Institutional 3 Class
|
1,000.00
|
1,000.00
|
1,045.60
|
1,020.99
|
4.03
|
3.98
|
0.79
|
|
Columbia Acorn European FundSM
|
|||||||
|
Class A
|
1,000.00
|
1,000.00
|
1,070.90
|
1,017.70
|
7.49
|
7.29
|
1.45
|
|
Advisor Class
|
1,000.00
|
1,000.00
|
1,072.30
|
1,018.95
|
6.20
|
6.04
|
1.20
|
|
Class C
|
1,000.00
|
1,000.00
|
1,066.80
|
1,013.96
|
11.34
|
11.05
|
2.20
|
|
Institutional Class
|
1,000.00
|
1,000.00
|
1,072.30
|
1,018.95
|
6.20
|
6.04
|
1.20
|
|
Institutional 2 Class
|
1,000.00
|
1,000.00
|
1,072.70
|
1,019.25
|
5.89
|
5.74
|
1.14
|
|
Institutional 3 Class
|
1,000.00
|
1,000.00
|
1,072.90
|
1,019.40
|
5.74
|
5.59
|
1.11
|
|
July 1, 2023 — December 31, 2023
|
||||||||||
|
|
Account value at the
beginning of the
period ($)
|
Account value at the
end of the
period ($)
|
Expenses paid during
the period ($)
|
Fund’s annualized
expense ratio (%)
|
Effective expenses
paid during the
period ($)
|
Fund’s effective
annualized
expense ratio (%)
|
||||
|
|
Actual
|
Hypothetical
|
Actual
|
Hypothetical
|
Actual
|
Hypothetical
|
Actual
|
Actual
|
Hypothetical
|
Actual
|
|
Class A
|
1,000.00
|
1,000.00
|
1,048.40
|
1,022.49
|
2.50
|
2.47
|
0.49
|
4.34
|
4.29
|
0.85
|
|
Advisor Class
|
1,000.00
|
1,000.00
|
1,049.40
|
1,023.73
|
1.23
|
1.21
|
0.24
|
3.07
|
3.03
|
0.60
|
|
Class C
|
1,000.00
|
1,000.00
|
1,044.90
|
1,018.75
|
6.32
|
6.24
|
1.24
|
8.16
|
8.05
|
1.60
|
|
Institutional Class
|
1,000.00
|
1,000.00
|
1,049.80
|
1,023.73
|
1.23
|
1.21
|
0.24
|
3.07
|
3.03
|
0.60
|
|
Institutional 2 Class
|
1,000.00
|
1,000.00
|
1,049.70
|
1,023.93
|
1.02
|
1.01
|
0.20
|
2.86
|
2.83
|
0.56
|
|
Institutional 3 Class
|
1,000.00
|
1,000.00
|
1,050.20
|
1,024.13
|
0.82
|
0.81
|
0.16
|
2.66
|
2.62
|
0.52
|
|
Common Stocks 97.7%
|
||
|
Issuer
|
Shares
|
Value ($)
|
|
Communication Services 2.1%
|
||
|
Entertainment 1.4%
|
||
|
Take-Two Interactive Software, Inc.(a)
|
245,137
|
39,454,800
|
|
Media 0.7%
|
||
|
Trade Desk, Inc. (The), Class A(a)
|
276,581
|
19,902,769
|
|
Total Communication Services
|
59,357,569
|
|
|
Consumer Discretionary 19.5%
|
||
|
Automobile Components 1.0%
|
||
|
Dorman Products, Inc.(a)
|
324,095
|
27,032,764
|
|
Broadline Retail 0.7%
|
||
|
Etsy, Inc.(a)
|
219,325
|
17,776,291
|
|
Distributors 2.0%
|
||
|
Pool Corp.
|
141,732
|
56,509,966
|
|
Diversified Consumer Services 1.9%
|
||
|
Bright Horizons Family Solutions, Inc.(a)
|
569,228
|
53,644,047
|
|
Hotels, Restaurants & Leisure 5.9%
|
||
|
Churchill Downs, Inc.
|
503,526
|
67,940,763
|
|
Planet Fitness, Inc., Class A(a)
|
459,659
|
33,555,107
|
|
Portillo’s, Inc., Class A(a)
|
1,030,678
|
16,418,701
|
|
Wingstop, Inc.
|
134,730
|
34,569,023
|
|
Xponential Fitness, Inc., Class A(a)
|
867,523
|
11,182,372
|
|
Total
|
|
163,665,966
|
|
Household Durables 3.3%
|
||
|
Skyline Champion Corp.(a)
|
720,249
|
53,485,691
|
|
TopBuild Corp.(a)
|
102,501
|
38,362,024
|
|
Total
|
|
91,847,715
|
|
Specialty Retail 4.7%
|
||
|
Boot Barn Holdings, Inc.(a)
|
328,219
|
25,194,090
|
|
Five Below, Inc.(a)
|
291,196
|
62,071,339
|
|
Williams-Sonoma, Inc.
|
217,247
|
43,836,100
|
|
Total
|
|
131,101,529
|
|
Total Consumer Discretionary
|
541,578,278
|
|
|
Consumer Staples 3.1%
|
||
|
Beverages 0.6%
|
||
|
Celsius Holdings, Inc.(a)
|
305,364
|
16,648,445
|
|
Common Stocks (continued)
|
||
|
Issuer
|
Shares
|
Value ($)
|
|
Consumer Staples Distribution & Retail 2.1%
|
||
|
BJ’s Wholesale Club Holdings, Inc.(a)
|
852,605
|
56,834,650
|
|
Household Products 0.4%
|
||
|
WD-40 Co.
|
49,600
|
11,857,872
|
|
Total Consumer Staples
|
85,340,967
|
|
|
Energy 2.7%
|
||
|
Energy Equipment & Services 0.9%
|
||
|
ChampionX Corp.
|
351,933
|
10,279,963
|
|
Helix Energy Solutions Group, Inc.(a)
|
1,466,254
|
15,073,091
|
|
Total
|
|
25,353,054
|
|
Oil, Gas & Consumable Fuels 1.8%
|
||
|
Antero Resources Corp.(a)
|
569,198
|
12,909,411
|
|
APA Corp.
|
622,715
|
22,343,014
|
|
Diamondback Energy, Inc.
|
98,067
|
15,208,230
|
|
Total
|
|
50,460,655
|
|
Total Energy
|
75,813,709
|
|
|
Financials 6.9%
|
||
|
Banks 1.7%
|
||
|
Lakeland Financial Corp.
|
232,728
|
15,164,556
|
|
Pinnacle Financial Partners, Inc.
|
177,859
|
15,512,862
|
|
Western Alliance Bancorp
|
258,245
|
16,989,939
|
|
Total
|
|
47,667,357
|
|
Capital Markets 3.4%
|
||
|
Ares Management Corp., Class A
|
172,656
|
20,532,252
|
|
GCM Grosvenor, Inc., Class A(b)
|
4,025,082
|
36,064,735
|
|
Houlihan Lokey, Inc., Class A
|
304,761
|
36,543,891
|
|
Total
|
|
93,140,878
|
|
Insurance 1.8%
|
||
|
Ryan Specialty Holdings, Inc., Class A(a)
|
1,162,550
|
50,012,901
|
|
Total Financials
|
190,821,136
|
|
|
Health Care 19.4%
|
||
|
Biotechnology 5.9%
|
||
|
Apellis Pharmaceuticals, Inc.(a)
|
64,012
|
3,831,758
|
|
Arrowhead Pharmaceuticals, Inc.(a)
|
214,574
|
6,565,964
|
|
bluebird bio, Inc.(a)
|
2,315,637
|
3,195,579
|
|
Exact Sciences Corp.(a)
|
760,406
|
56,254,836
|
|
Common Stocks (continued)
|
||
|
Issuer
|
Shares
|
Value ($)
|
|
Exelixis, Inc.(a)
|
377,951
|
9,067,045
|
|
Insmed, Inc.(a)
|
311,042
|
9,639,192
|
|
Karuna Therapeutics, Inc.(a)
|
26,208
|
8,295,094
|
|
Natera, Inc.(a)
|
725,792
|
45,463,611
|
|
Revolution Medicines, Inc.(a)
|
258,724
|
7,420,204
|
|
Sarepta Therapeutics, Inc.(a)
|
144,489
|
13,933,074
|
|
Total
|
|
163,666,357
|
|
Health Care Equipment & Supplies 3.4%
|
||
|
Glaukos Corp.(a)
|
293,065
|
23,295,737
|
|
Inspire Medical Systems, Inc.(a)
|
171,499
|
34,888,042
|
|
Insulet Corp.(a)
|
112,827
|
24,481,202
|
|
Outset Medical, Inc.(a)
|
2,267,323
|
12,266,217
|
|
Total
|
|
94,931,198
|
|
Health Care Providers & Services 0.8%
|
||
|
Chemed Corp.
|
25,960
|
15,180,110
|
|
P3 Health Partners, Inc., Class A(a),(b),(c)
|
4,567,474
|
6,440,139
|
|
Total
|
|
21,620,249
|
|
Life Sciences Tools & Services 7.8%
|
||
|
BioLife Solutions, Inc.(a)
|
735,657
|
11,954,426
|
|
Bio-Techne Corp.
|
907,134
|
69,994,460
|
|
DNA Script(a),(d),(e),(f)
|
1,139
|
236,944
|
|
Maravai LifeSciences Holdings, Inc., Class A(a)
|
1,831,822
|
11,998,434
|
|
Repligen Corp.(a)
|
357,889
|
64,348,442
|
|
Stevanato Group SpA
|
505,518
|
13,795,586
|
|
West Pharmaceutical Services, Inc.
|
127,190
|
44,786,143
|
|
Total
|
|
217,114,435
|
|
Pharmaceuticals 1.5%
|
||
|
Catalent, Inc.(a)
|
851,230
|
38,245,764
|
|
Pliant Therapeutics, Inc.(a)
|
310,308
|
5,619,678
|
|
Total
|
|
43,865,442
|
|
Total Health Care
|
541,197,681
|
|
|
Industrials 19.5%
|
||
|
Aerospace & Defense 3.2%
|
||
|
Axon Enterprise, Inc.(a)
|
148,799
|
38,439,246
|
|
Curtiss-Wright Corp.
|
221,354
|
49,315,457
|
|
Total
|
|
87,754,703
|
|
Commercial Services & Supplies 1.5%
|
||
|
Casella Waste Systems, Inc., Class A(a)
|
497,768
|
42,539,253
|
|
Common Stocks (continued)
|
||
|
Issuer
|
Shares
|
Value ($)
|
|
Construction & Engineering 2.5%
|
||
|
WillScot Mobile Mini Holdings Corp.(a)
|
1,580,275
|
70,322,238
|
|
Electrical Equipment 2.0%
|
||
|
Atkore, Inc.(a)
|
296,052
|
47,368,320
|
|
Vertiv Holdings Co.
|
178,924
|
8,593,720
|
|
Total
|
|
55,962,040
|
|
Machinery 3.6%
|
||
|
IDEX Corp.
|
118,263
|
25,676,080
|
|
Middleby Corp. (The)(a)
|
134,019
|
19,723,576
|
|
SPX Technologies, Inc.(a)
|
552,533
|
55,811,358
|
|
Total
|
|
101,211,014
|
|
Professional Services 5.3%
|
||
|
Exponent, Inc.
|
313,757
|
27,623,166
|
|
ICF International, Inc.
|
178,809
|
23,976,499
|
|
KBR, Inc.
|
799,028
|
44,274,142
|
|
Parsons Corp.(a)
|
275,361
|
17,267,888
|
|
Paycom Software, Inc.
|
114,284
|
23,624,788
|
|
Paylocity Holding Corp.(a)
|
59,486
|
9,806,267
|
|
Total
|
|
146,572,750
|
|
Trading Companies & Distributors 1.4%
|
||
|
SiteOne Landscape Supply, Inc.(a)
|
236,875
|
38,492,188
|
|
Total Industrials
|
542,854,186
|
|
|
Information Technology 18.9%
|
||
|
Communications Equipment 0.6%
|
||
|
Calix, Inc.(a)
|
349,608
|
15,274,373
|
|
IT Services 4.0%
|
||
|
Endava PLC, ADR(a)
|
287,381
|
22,372,611
|
|
Globant SA(a)
|
205,822
|
48,981,520
|
|
MongoDB, Inc.(a)
|
56,474
|
23,089,395
|
|
VeriSign, Inc.(a)
|
75,113
|
15,470,273
|
|
Total
|
|
109,913,799
|
|
Semiconductors & Semiconductor Equipment 3.3%
|
||
|
Aehr Test Systems(a)
|
269,973
|
7,162,384
|
|
Axcelis Technologies, Inc.(a)
|
29,398
|
3,812,627
|
|
Lattice Semiconductor Corp.(a)
|
393,200
|
27,126,868
|
|
Monolithic Power Systems, Inc.
|
33,743
|
21,284,410
|
|
Common Stocks (continued)
|
||
|
Issuer
|
Shares
|
Value ($)
|
|
Onto Innovation, Inc.(a)
|
116,556
|
17,821,412
|
|
Rambus, Inc.(a)
|
218,086
|
14,884,369
|
|
Total
|
|
92,092,070
|
|
Software 9.8%
|
||
|
Bentley Systems, Inc., Class B
|
850,346
|
44,371,054
|
|
Crowdstrike Holdings, Inc., Class A(a)
|
61,126
|
15,606,690
|
|
DoubleVerify Holdings, Inc.(a)
|
845,621
|
31,101,940
|
|
HubSpot, Inc.(a)
|
73,825
|
42,858,366
|
|
Sprout Social, Inc., Class A(a)
|
856,799
|
52,641,731
|
|
Workiva, Inc., Class A(a)
|
385,014
|
39,090,471
|
|
Zeta Global Holdings Corp., Class A(a)
|
1,283,941
|
11,324,360
|
|
Zscaler, Inc.(a)
|
167,210
|
37,047,048
|
|
Total
|
|
274,041,660
|
|
Technology Hardware, Storage & Peripherals 1.2%
|
||
|
Super Micro Computer, Inc.(a)
|
119,709
|
34,028,480
|
|
Total Information Technology
|
525,350,382
|
|
|
Materials 3.1%
|
||
|
Chemicals 1.4%
|
||
|
Albemarle Corp.
|
110,523
|
15,968,363
|
|
Avient Corp.
|
538,224
|
22,373,972
|
|
Total
|
|
38,342,335
|
|
Containers & Packaging 1.7%
|
||
|
Avery Dennison Corp.
|
241,249
|
48,770,898
|
|
Total Materials
|
87,113,233
|
|
|
Common Stocks (continued)
|
||
|
Issuer
|
Shares
|
Value ($)
|
|
Real Estate 2.5%
|
||
|
Real Estate Management & Development 2.5%
|
||
|
Colliers International Group, Inc.
|
557,637
|
70,552,233
|
|
Total Real Estate
|
70,552,233
|
|
|
Total Common Stocks
(Cost $2,246,522,283)
|
2,719,979,374
|
|
|
|
||
|
Securities Lending Collateral 0.0%
|
||
|
|
|
|
|
Dreyfus Government Cash Management Fund,
Institutional Shares, 5.250%(g),(h)
|
192,150
|
192,150
|
|
Total Securities Lending Collateral
(Cost $192,150)
|
192,150
|
|
|
|
||
|
Money Market Funds 2.5%
|
||
|
|
Shares
|
Value ($)
|
|
Columbia Short-Term Cash Fund, 5.569%(b),(g)
|
68,973,211
|
68,959,416
|
|
Total Money Market Funds
(Cost $68,937,559)
|
68,959,416
|
|
|
Total Investments in Securities
(Cost: $2,315,651,992)
|
2,789,130,940
|
|
|
Obligation to Return Collateral for Securities
Loaned
|
|
(192,150
)
|
|
Other Assets & Liabilities, Net
|
|
(6,175,860
)
|
|
Net Assets
|
2,782,762,930
|
|
|
(a)
|
Non-income producing investment.
|
|
(b)
|
As defined in the Investment Company Act of 1940, as amended, an affiliated company is one in which the Fund owns 5% or more of the company’s outstanding voting securities, or a company which is under common ownership or control with the Fund. The value of the holdings and transactions in these
affiliated companies during the year ended December 31, 2023 are as follows:
|
|
Affiliated issuers
|
Beginning
of period($)
|
Purchases($)
|
Sales($)
|
Net change in
unrealized
appreciation
(depreciation)($)
|
End of
period($)
|
Realized gain
(loss)($)
|
Dividends($)
|
End of
period shares
|
|
Columbia Short-Term Cash Fund, 5.569%
|
||||||||
|
|
75,773,186
|
654,407,612
*
|
(661,238,155
)
|
16,773
|
68,959,416
|
(19,389
)
|
4,550,766
|
68,973,211
|
|
GCM Grosvenor, Inc., Class A
|
||||||||
|
|
24,820,677
|
6,150,535
*
|
—
|
5,093,523
|
36,064,735
|
—
|
1,606,054
|
4,025,082
|
|
Affiliated issuers
|
Beginning
of period($)
|
Purchases($)
|
Sales($)
|
Net change in
unrealized
appreciation
(depreciation)($)
|
End of
period($)
|
Realized gain
(loss)($)
|
Dividends($)
|
End of
period shares
|
|
P3 Health Partners, Inc., Class A†
|
||||||||
|
|
4,600,000
|
5,225,718
*
|
(4,288,225
)
|
20,400,000
|
—
|
(2,434,850
)
|
—
|
—
|
|
Total
|
105,193,863
|
|
|
25,510,296
|
105,024,151
|
(2,454,239
)
|
6,156,820
|
|
|
*
|
Includes the effect of affiliated issuers acquired in the fund reorganization.
|
|
†
|
Issuer was not an affiliate at the end of period.
|
|
(c)
|
All or a portion of this security was on loan at December 31, 2023. The total market value of securities on loan at December
31, 2023 was $154,818.
|
|
(d)
|
Represents fair value as determined in good faith under procedures approved by the Board of Trustees. At December 31, 2023,
the total value of these securities amounted to $236,944, which represents 0.01% of total net assets.
|
|
(e)
|
Denotes a restricted security, which is subject to legal or contractual restrictions on resale under federal securities laws.
Disposal of a restricted investment may involve time-consuming negotiations and expenses, and prompt sale at an acceptable price may be difficult to achieve. Private placement
securities are generally considered to be restricted, although certain of those securities may be traded between qualified institutional investors under the provisions
of Section 4(a)(2) and Rule 144A. The Fund will not incur any registration costs upon such a trade. These securities are valued at fair value determined in good faith under consistently applied procedures approved by the Fund’s Board of Trustees. At December 31, 2023, the total market value of these securities amounted to $236,944, which represents
0.01% of total net assets. Additional information on these securities is as follows:
|
|
Security
|
Acquisition
Dates
|
Shares
|
Cost ($)
|
Value ($)
|
|
DNA Script
|
10/01/2021
|
1,139
|
993,179
|
236,944
|
|
(f)
|
Valuation based on significant unobservable inputs.
|
|
(g)
|
The rate shown is the seven-day current annualized yield at December 31, 2023.
|
|
(h)
|
Investment made with cash collateral received from securities lending activity.
|
|
ADR
|
American Depositary Receipt
|
|
|
Level 1 ($)
|
Level 2 ($)
|
Level 3 ($)
|
Total ($)
|
|
Investments in Securities
|
|
|
|
|
|
Common Stocks
|
|
|
|
|
|
Communication Services
|
59,357,569
|
—
|
—
|
59,357,569
|
|
Consumer Discretionary
|
541,578,278
|
—
|
—
|
541,578,278
|
|
Consumer Staples
|
85,340,967
|
—
|
—
|
85,340,967
|
|
Energy
|
75,813,709
|
—
|
—
|
75,813,709
|
|
Financials
|
190,821,136
|
—
|
—
|
190,821,136
|
|
Health Care
|
540,960,737
|
—
|
236,944
|
541,197,681
|
|
Industrials
|
542,854,186
|
—
|
—
|
542,854,186
|
|
Information Technology
|
525,350,382
|
—
|
—
|
525,350,382
|
|
Materials
|
87,113,233
|
—
|
—
|
87,113,233
|
|
Real Estate
|
70,552,233
|
—
|
—
|
70,552,233
|
|
Total Common Stocks
|
2,719,742,430
|
—
|
236,944
|
2,719,979,374
|
|
Securities Lending Collateral
|
192,150
|
—
|
—
|
192,150
|
|
Money Market Funds
|
68,959,416
|
—
|
—
|
68,959,416
|
|
Total Investments in Securities
|
2,788,893,996
|
—
|
236,944
|
2,789,130,940
|
|
Common Stocks 97.9%
|
||
|
Issuer
|
Shares
|
Value ($)
|
|
Australia 4.7%
|
||
|
CAR Group Ltd.
|
872,591
|
18,491,323
|
|
IDP Education Ltd.
|
1,432,359
|
19,539,028
|
|
Pro Medicus Ltd.
|
252,698
|
16,489,543
|
|
Total
|
54,519,894
|
|
|
Brazil 1.6%
|
||
|
TOTVS SA
|
2,641,793
|
18,322,218
|
|
Canada 7.8%
|
||
|
Agnico Eagle Mines Ltd.
|
97,083
|
5,322,878
|
|
Altus Group Ltd.
|
377,811
|
12,015,362
|
|
ARC Resources Ltd.
|
957,042
|
14,207,023
|
|
CCL Industries, Inc., Class B
|
416,811
|
18,744,778
|
|
Richelieu Hardware Ltd.
|
446,976
|
16,184,981
|
|
Wheaton Precious Metals Corp.
|
258,225
|
12,739,269
|
|
Whitecap Resources, Inc.
|
1,643,356
|
11,000,768
|
|
Total
|
90,215,059
|
|
|
China 3.4%
|
||
|
China Meidong Auto Holdings Ltd.
|
13,676,000
|
8,329,390
|
|
Proya Cosmetics Co., Ltd., Class A
|
407,064
|
5,705,420
|
|
Shenzhou International Group Holdings Ltd.
|
576,800
|
5,917,310
|
|
Silergy Corp.
|
1,236,000
|
20,061,409
|
|
Total
|
40,013,529
|
|
|
Finland 2.1%
|
||
|
Valmet OYJ
|
842,416
|
24,360,595
|
|
France 2.0%
|
||
|
Edenred SE
|
292,710
|
17,517,150
|
|
Robertet SA
|
5,829
|
5,340,987
|
|
Total
|
22,858,137
|
|
|
Germany 6.5%
|
||
|
Amadeus Fire AG
|
70,766
|
9,607,465
|
|
Eckert & Ziegler Strahlen- und Medizintechnik AG
|
162,989
|
7,423,115
|
|
Hypoport SE(a)
|
112,891
|
22,034,087
|
|
Jenoptik AG
|
679,887
|
21,323,318
|
|
Nemetschek SE
|
175,954
|
15,190,935
|
|
Total
|
75,578,920
|
|
|
Common Stocks (continued)
|
||
|
Issuer
|
Shares
|
Value ($)
|
|
India 1.6%
|
||
|
Astral Ltd.
|
155,692
|
3,567,029
|
|
Cholamandalam Investment and Finance Co., Ltd.
|
400,065
|
6,051,155
|
|
ICICI Prudential Life Insurance Co., Ltd.
|
1,394,459
|
8,954,334
|
|
Total
|
18,572,518
|
|
|
Ireland 1.5%
|
||
|
Bank of Ireland Group PLC
|
577,511
|
5,242,908
|
|
CRH PLC
|
169,949
|
11,695,767
|
|
Total
|
16,938,675
|
|
|
Italy 2.1%
|
||
|
Amplifon SpA
|
521,666
|
18,076,052
|
|
Carel Industries SpA
|
249,562
|
6,835,305
|
|
Total
|
24,911,357
|
|
|
Japan 17.3%
|
||
|
Capcom Co., Ltd.
|
244,400
|
7,886,965
|
|
Daiseki Co., Ltd.
|
844,119
|
23,388,417
|
|
Disco Corp.
|
87,400
|
21,584,900
|
|
Fuso Chemical Co., Ltd.
|
507,100
|
14,977,472
|
|
Gunma Bank Ltd. (The)
|
1,063,900
|
5,194,402
|
|
Hoshizaki Corp.
|
330,800
|
12,084,243
|
|
Insource Co., Ltd.
|
189,000
|
1,182,270
|
|
Macnica Holdings, Inc.
|
112,000
|
5,883,831
|
|
NGK Spark Plug Co., Ltd.
|
473,300
|
11,209,587
|
|
Obic Co., Ltd.
|
85,600
|
14,727,914
|
|
Recruit Holdings Co., Ltd.
|
738,300
|
30,869,161
|
|
Simplex Holdings, Inc.
|
727,400
|
14,114,445
|
|
Solasto Corp.
|
1,887,300
|
8,229,541
|
|
Suntory Beverage & Food Ltd.
|
614,500
|
20,204,694
|
|
Yaskawa Electric Corp.
|
218,100
|
9,077,731
|
|
Total
|
200,615,573
|
|
|
Mexico 4.8%
|
||
|
Corporación Inmobiliaria Vesta SAB de CV
|
7,007,664
|
27,789,653
|
|
Grupo Aeroportuario del Centro Norte SAB de CV
|
1,373,218
|
14,523,068
|
|
La Comer SAB de CV
|
5,357,945
|
13,820,034
|
|
Total
|
56,132,755
|
|
|
Common Stocks (continued)
|
||
|
Issuer
|
Shares
|
Value ($)
|
|
Netherlands 4.8%
|
||
|
BE Semiconductor Industries NV
|
112,247
|
16,946,602
|
|
IMCD NV
|
222,507
|
38,752,613
|
|
Total
|
55,699,215
|
|
|
New Zealand 1.5%
|
||
|
Fisher & Paykel Healthcare Corp., Ltd.
|
1,137,570
|
16,965,076
|
|
Norway 0.8%
|
||
|
AutoStore Holdings Ltd.(a),(b)
|
4,699,040
|
9,232,391
|
|
South Korea 1.0%
|
||
|
Jeisys Medical, Inc.(a)
|
196,103
|
1,591,589
|
|
KEPCO Plant Service & Engineering Co., Ltd.(a)
|
362,319
|
9,563,552
|
|
Total
|
11,155,141
|
|
|
Sweden 6.9%
|
||
|
AddTech AB, B Shares
|
648,070
|
14,259,210
|
|
Hexagon AB, Class B
|
2,259,128
|
27,135,079
|
|
Munters Group AB
|
1,405,706
|
22,922,242
|
|
Sweco AB, Class B
|
1,130,393
|
15,170,853
|
|
Total
|
79,487,384
|
|
|
Switzerland 5.7%
|
||
|
Belimo Holding AG, Registered Shares
|
60,139
|
33,194,054
|
|
Inficon Holding AG
|
12,163
|
17,440,792
|
|
Tecan Group AG, Registered Shares
|
21,728
|
8,889,084
|
|
VAT Group AG
|
12,809
|
6,433,422
|
|
Total
|
65,957,352
|
|
|
Taiwan 4.0%
|
||
|
Parade Technologies Ltd.
|
198,000
|
7,718,087
|
|
Sinbon Electronics Co., Ltd.
|
1,658,000
|
16,137,383
|
|
Universal Vision Biotechnology Co., Ltd.
|
571,883
|
5,157,104
|
|
Voltronic Power Technology Corp.
|
317,408
|
17,651,957
|
|
Total
|
46,664,531
|
|
|
Common Stocks (continued)
|
||
|
Issuer
|
Shares
|
Value ($)
|
|
United Kingdom 15.0%
|
||
|
Ashtead Group PLC
|
136,138
|
9,462,568
|
|
Auto Trader Group PLC
|
2,439,267
|
22,408,692
|
|
Diploma PLC
|
172,747
|
7,889,654
|
|
Genus PLC
|
658,912
|
18,225,443
|
|
Halma PLC
|
783,051
|
22,767,920
|
|
Howden Joinery Group PLC
|
590,796
|
6,116,373
|
|
Intermediate Capital Group PLC
|
1,150,586
|
24,580,494
|
|
Rentokil Initial PLC
|
2,515,836
|
14,179,919
|
|
Rightmove PLC
|
4,007,531
|
29,459,313
|
|
Safestore Holdings PLC
|
1,672,397
|
18,834,547
|
|
Total
|
173,924,923
|
|
|
United States 1.2%
|
||
|
Inter Parfums, Inc.
|
93,531
|
13,469,399
|
|
Vietnam 1.6%
|
||
|
Asia Commercial Bank JSC
|
7,113,224
|
7,003,946
|
|
FPT Corp.
|
2,870,489
|
11,360,703
|
|
Total
|
18,364,649
|
|
|
Total Common Stocks
(Cost $838,290,321)
|
1,133,959,291
|
|
|
|
||
|
Money Market Funds 1.8%
|
||
|
|
Shares
|
Value ($)
|
|
Columbia Short-Term Cash Fund, 5.569%(c),(d)
|
21,223,835
|
21,219,590
|
|
Total Money Market Funds
(Cost $21,219,547)
|
21,219,590
|
|
|
Total Investments in Securities
(Cost $859,509,868)
|
1,155,178,881
|
|
|
Other Assets & Liabilities, Net
|
|
3,008,089
|
|
Net Assets
|
$1,158,186,970
|
|
|
(a)
|
Non-income producing investment.
|
|
(b)
|
Represents privately placed and other securities and instruments exempt from Securities and Exchange Commission registration
(collectively, private placements), such as Section 4(a)(2) and Rule 144A eligible securities, which are often sold only to qualified institutional buyers. At December
31, 2023, the total value of these securities amounted to $9,232,391, which represents 0.80% of total net assets.
|
|
(c)
|
The rate shown is the seven-day current annualized yield at December 31, 2023.
|
|
(d)
|
As defined in the Investment Company Act of 1940, as amended, an affiliated company is one in which the Fund owns 5% or more of the company’s outstanding voting securities, or a company which is under common ownership or control with the Fund. The value of the holdings and transactions in these
affiliated companies during the year ended December 31, 2023 are as follows:
|
|
Affiliated issuers
|
Beginning
of period($)
|
Purchases($)
|
Sales($)
|
Net change in
unrealized
appreciation
(depreciation)($)
|
End of
period($)
|
Realized gain
(loss)($)
|
Dividends($)
|
End of
period shares
|
|
Columbia Short-Term Cash Fund, 5.569%
|
||||||||
|
|
10,828,339
|
384,248,858
|
(373,856,589
)
|
(1,018
)
|
21,219,590
|
(4,697
)
|
1,718,285
|
21,223,835
|
|
|
Level 1 ($)
|
Level 2 ($)
|
Level 3 ($)
|
Total ($)
|
|
Investments in Securities
|
|
|
|
|
|
Common Stocks
|
|
|
|
|
|
Australia
|
—
|
54,519,894
|
—
|
54,519,894
|
|
Brazil
|
18,322,218
|
—
|
—
|
18,322,218
|
|
Canada
|
90,215,059
|
—
|
—
|
90,215,059
|
|
China
|
—
|
40,013,529
|
—
|
40,013,529
|
|
Finland
|
—
|
24,360,595
|
—
|
24,360,595
|
|
France
|
—
|
22,858,137
|
—
|
22,858,137
|
|
Germany
|
—
|
75,578,920
|
—
|
75,578,920
|
|
India
|
—
|
18,572,518
|
—
|
18,572,518
|
|
Ireland
|
—
|
16,938,675
|
—
|
16,938,675
|
|
Italy
|
—
|
24,911,357
|
—
|
24,911,357
|
|
Japan
|
—
|
200,615,573
|
—
|
200,615,573
|
|
Mexico
|
56,132,755
|
—
|
—
|
56,132,755
|
|
Netherlands
|
—
|
55,699,215
|
—
|
55,699,215
|
|
New Zealand
|
—
|
16,965,076
|
—
|
16,965,076
|
|
Norway
|
—
|
9,232,391
|
—
|
9,232,391
|
|
South Korea
|
—
|
11,155,141
|
—
|
11,155,141
|
|
Sweden
|
—
|
79,487,384
|
—
|
79,487,384
|
|
Switzerland
|
—
|
65,957,352
|
—
|
65,957,352
|
|
|
Level 1 ($)
|
Level 2 ($)
|
Level 3 ($)
|
Total ($)
|
|
Taiwan
|
—
|
46,664,531
|
—
|
46,664,531
|
|
United Kingdom
|
—
|
173,924,923
|
—
|
173,924,923
|
|
United States
|
13,469,399
|
—
|
—
|
13,469,399
|
|
Vietnam
|
—
|
18,364,649
|
—
|
18,364,649
|
|
Total Common Stocks
|
178,139,431
|
955,819,860
|
—
|
1,133,959,291
|
|
Money Market Funds
|
21,219,590
|
—
|
—
|
21,219,590
|
|
Total Investments in Securities
|
199,359,021
|
955,819,860
|
—
|
1,155,178,881
|
|
Common Stocks 97.3%
|
||
|
Issuer
|
Shares
|
Value ($)
|
|
Australia 2.4%
|
||
|
IDP Education Ltd.
|
394,639
|
5,383,331
|
|
Brazil 2.3%
|
||
|
TOTVS SA
|
755,891
|
5,242,500
|
|
Canada 1.1%
|
||
|
ARC Resources Ltd.
|
89,570
|
1,329,642
|
|
Whitecap Resources, Inc.
|
175,605
|
1,175,515
|
|
Total
|
2,505,157
|
|
|
China 7.1%
|
||
|
NetEase, Inc., ADR
|
49,089
|
4,573,131
|
|
Shenzhou International Group Holdings Ltd.
|
477,800
|
4,901,683
|
|
Silergy Corp.
|
400,000
|
6,492,365
|
|
Total
|
15,967,179
|
|
|
Finland 2.3%
|
||
|
Valmet OYJ
|
183,305
|
5,300,729
|
|
France 4.0%
|
||
|
Edenred SE
|
73,162
|
4,378,360
|
|
Publicis Groupe SA
|
24,987
|
2,321,588
|
|
Schneider Electric SE
|
11,451
|
2,305,157
|
|
Total
|
9,005,105
|
|
|
Germany 3.5%
|
||
|
Deutsche Telekom AG, Registered Shares
|
87,321
|
2,099,485
|
|
Nemetschek SE
|
66,312
|
5,725,026
|
|
Total
|
7,824,511
|
|
|
Ireland 2.0%
|
||
|
Bank of Ireland Group PLC
|
243,834
|
2,213,636
|
|
CRH PLC
|
33,438
|
2,301,179
|
|
Total
|
4,514,815
|
|
|
Italy 2.4%
|
||
|
Amplifon SpA
|
155,081
|
5,373,653
|
|
Japan 20.7%
|
||
|
Capcom Co., Ltd.
|
80,300
|
2,591,339
|
|
Disco Corp.
|
27,700
|
6,840,981
|
|
Gunma Bank Ltd. (The)
|
208,200
|
1,016,519
|
|
Hoshizaki Corp.
|
58,900
|
2,151,638
|
|
Common Stocks (continued)
|
||
|
Issuer
|
Shares
|
Value ($)
|
|
Keyence Corp.
|
10,100
|
4,437,500
|
|
Macnica Holdings, Inc.
|
34,400
|
1,807,177
|
|
NGK Spark Plug Co., Ltd.
|
92,400
|
2,188,392
|
|
Obic Co., Ltd.
|
32,800
|
5,643,406
|
|
Recruit Holdings Co., Ltd.
|
213,100
|
8,909,953
|
|
Renesas Electronics Corp.(a)
|
95,800
|
1,712,996
|
|
Suntory Beverage & Food Ltd.
|
226,200
|
7,437,432
|
|
Yaskawa Electric Corp.
|
42,700
|
1,777,254
|
|
Total
|
46,514,587
|
|
|
Mexico 2.5%
|
||
|
Corporación Inmobiliaria Vesta SAB de CV
|
1,407,086
|
5,579,952
|
|
Netherlands 4.5%
|
||
|
ASML Holding NV
|
3,045
|
2,298,632
|
|
IMCD NV
|
44,580
|
7,764,212
|
|
Total
|
10,062,844
|
|
|
New Zealand 3.1%
|
||
|
Fisher & Paykel Healthcare Corp., Ltd.
|
473,981
|
7,068,685
|
|
Sweden 5.9%
|
||
|
AddTech AB, B Shares
|
113,582
|
2,499,097
|
|
Hexagon AB, Class B
|
575,681
|
6,914,681
|
|
Sweco AB, Class B
|
290,265
|
3,895,608
|
|
Total
|
13,309,386
|
|
|
Switzerland 10.9%
|
||
|
Belimo Holding AG, Registered Shares
|
20,465
|
11,295,770
|
|
Lonza Group AG, Registered Shares
|
16,451
|
6,935,519
|
|
Nestlé SA, Registered Shares
|
28,835
|
3,342,550
|
|
Tecan Group AG, Registered Shares
|
4,252
|
1,739,524
|
|
VAT Group AG
|
2,507
|
1,259,161
|
|
Total
|
24,572,524
|
|
|
Taiwan 6.5%
|
||
|
Parade Technologies Ltd.
|
185,000
|
7,211,344
|
|
Voltronic Power Technology Corp.
|
131,852
|
7,332,663
|
|
Total
|
14,544,007
|
|
|
Common Stocks (continued)
|
||
|
Issuer
|
Shares
|
Value ($)
|
|
United Kingdom 13.8%
|
||
|
3i Group PLC
|
50,505
|
1,554,520
|
|
Ashtead Group PLC
|
26,643
|
1,851,880
|
|
Auto Trader Group PLC
|
316,123
|
2,904,111
|
|
Diploma PLC
|
104,080
|
4,753,513
|
|
Halma PLC
|
233,697
|
6,794,953
|
|
Howden Joinery Group PLC
|
115,622
|
1,197,008
|
|
Intermediate Capital Group PLC
|
232,697
|
4,971,212
|
|
Rightmove PLC
|
962,872
|
7,078,061
|
|
Total
|
31,105,258
|
|
|
United States 2.3%
|
||
|
Inter Parfums, Inc.
|
35,268
|
5,078,945
|
|
Total Common Stocks
(Cost $180,882,300)
|
218,953,168
|
|
|
|
||
|
Money Market Funds 2.5%
|
||
|
|
Shares
|
Value ($)
|
|
Columbia Short-Term Cash Fund, 5.569%(b),(c)
|
5,680,939
|
5,679,803
|
|
Total Money Market Funds
(Cost $5,679,624)
|
5,679,803
|
|
|
Total Investments in Securities
(Cost $186,561,924)
|
224,632,971
|
|
|
Other Assets & Liabilities, Net
|
|
433,237
|
|
Net Assets
|
$225,066,208
|
|
|
(a)
|
Non-income producing investment.
|
|
(b)
|
The rate shown is the seven-day current annualized yield at December 31, 2023.
|
|
(c)
|
As defined in the Investment Company Act of 1940, as amended, an affiliated company is one in which the Fund owns 5% or more of the company’s outstanding voting securities, or a company which is under common ownership or control with the Fund. The value of the holdings and transactions in these
affiliated companies during the year ended December 31, 2023 are as follows:
|
|
Affiliated issuers
|
Beginning
of period($)
|
Purchases($)
|
Sales($)
|
Net change in
unrealized
appreciation
(depreciation)($)
|
End of
period($)
|
Realized gain
(loss)($)
|
Dividends($)
|
End of
period shares
|
|
Columbia Short-Term Cash Fund, 5.569%
|
||||||||
|
|
2,143,192
|
75,258,944
|
(71,722,495
)
|
162
|
5,679,803
|
358
|
189,866
|
5,680,939
|
|
ADR
|
American Depositary Receipt
|
|
|
Level 1 ($)
|
Level 2 ($)
|
Level 3 ($)
|
Total ($)
|
|
Investments in Securities
|
|
|
|
|
|
Common Stocks
|
|
|
|
|
|
Australia
|
—
|
5,383,331
|
—
|
5,383,331
|
|
Brazil
|
5,242,500
|
—
|
—
|
5,242,500
|
|
Canada
|
2,505,157
|
—
|
—
|
2,505,157
|
|
China
|
4,573,131
|
11,394,048
|
—
|
15,967,179
|
|
Finland
|
—
|
5,300,729
|
—
|
5,300,729
|
|
France
|
—
|
9,005,105
|
—
|
9,005,105
|
|
Germany
|
—
|
7,824,511
|
—
|
7,824,511
|
|
Ireland
|
—
|
4,514,815
|
—
|
4,514,815
|
|
Italy
|
—
|
5,373,653
|
—
|
5,373,653
|
|
Japan
|
—
|
46,514,587
|
—
|
46,514,587
|
|
Mexico
|
5,579,952
|
—
|
—
|
5,579,952
|
|
Netherlands
|
—
|
10,062,844
|
—
|
10,062,844
|
|
New Zealand
|
—
|
7,068,685
|
—
|
7,068,685
|
|
Sweden
|
—
|
13,309,386
|
—
|
13,309,386
|
|
Switzerland
|
—
|
24,572,524
|
—
|
24,572,524
|
|
Taiwan
|
—
|
14,544,007
|
—
|
14,544,007
|
|
United Kingdom
|
—
|
31,105,258
|
—
|
31,105,258
|
|
United States
|
5,078,945
|
—
|
—
|
5,078,945
|
|
Total Common Stocks
|
22,979,685
|
195,973,483
|
—
|
218,953,168
|
|
Money Market Funds
|
5,679,803
|
—
|
—
|
5,679,803
|
|
Total Investments in Securities
|
28,659,488
|
195,973,483
|
—
|
224,632,971
|
|
Equity Funds 13.3%
|
||
|
|
Shares
|
Value ($)
|
|
International 1.5%
|
||
|
Columbia Emerging Markets Fund, Institutional 3
Class(a),(b)
|
1,594,816
|
20,222,272
|
|
U.S. Large Cap 10.4%
|
||
|
Columbia Contrarian Core Fund, Institutional 3
Class(a)
|
1,544,080
|
49,842,893
|
|
Columbia Large Cap Enhanced Core Fund,
Institutional 3 Class(a)
|
1,992,531
|
49,793,350
|
|
Columbia Large Cap Index Fund, Institutional 3
Class(a)
|
794,961
|
39,867,291
|
|
Total
|
139,503,534
|
|
|
U.S. Small Cap 1.4%
|
||
|
Columbia Small Cap Index Fund, Institutional 3
Class(a)
|
838,047
|
19,727,625
|
|
Total Equity Funds
(Cost $147,701,578)
|
179,453,431
|
|
|
|
||
|
Exchange-Traded Equity Funds 1.5%
|
||
|
|
|
|
|
U.S. Large Cap 1.5%
|
||
|
Columbia Research Enhanced Core ETF(a)
|
720,180
|
19,956,188
|
|
Total Exchange-Traded Equity Funds
(Cost $16,740,379)
|
19,956,188
|
|
|
|
||
|
Exchange-Traded Fixed Income Funds 8.4%
|
||
|
|
|
|
|
Multisector 8.4%
|
||
|
Columbia Diversified Fixed Income Allocation ETF(a)
|
6,270,633
|
113,184,926
|
|
Total Exchange-Traded Fixed Income Funds
(Cost $120,106,028)
|
113,184,926
|
|
|
|
||
|
Fixed Income Funds 76.2%
|
||
|
|
Shares
|
Value ($)
|
|
Investment Grade 76.2%
|
||
|
Columbia Corporate Income Fund, Institutional 3
Class(a)
|
12,386,539
|
113,832,291
|
|
Columbia Quality Income Fund, Institutional 3
Class(a)
|
12,754,894
|
227,547,307
|
|
Columbia Total Return Bond Fund, Institutional 3
Class(a)
|
9,289,675
|
284,542,729
|
|
Columbia U.S. Treasury Index Fund, Institutional 3
Class(a)
|
39,310,795
|
397,039,033
|
|
Total
|
1,022,961,360
|
|
|
Total Fixed Income Funds
(Cost $1,059,381,752)
|
1,022,961,360
|
|
|
|
||
|
Money Market Funds 0.4%
|
||
|
|
|
|
|
Columbia Short-Term Cash Fund, 5.569%(a),(c)
|
5,041,874
|
5,040,866
|
|
Total Money Market Funds
(Cost $5,040,361)
|
5,040,866
|
|
|
Total Investments in Securities
(Cost: $1,348,970,098)
|
1,340,596,771
|
|
|
Other Assets & Liabilities, Net
|
|
2,447,253
|
|
Net Assets
|
1,343,044,024
|
|
|
(a)
|
As defined in the Investment Company Act of 1940, as amended, an affiliated company is one in which the Fund owns 5% or more of the company’s outstanding voting securities, or a company which is under common ownership or control with the Fund. The value of the holdings and transactions in these
affiliated companies during the year ended December 31, 2023 are as follows:
|
|
Affiliated issuers
|
Beginning
of period($)
|
Purchases($)
|
Sales($)
|
Net change in
unrealized
appreciation
(depreciation)($)
|
End of
period($)
|
Capital gain
distributions($)
|
Realized gain
(loss)($)
|
Dividends —
affiliated
issuers ($)
|
End of
period shares
|
|
Columbia Acorn® Fund, Institutional 3 Class
|
|||||||||
|
|
20,526,610
|
28,341,323
|
(47,869,698
)
|
(998,235
)
|
—
|
—
|
4,610,957
|
—
|
—
|
|
Columbia Contrarian Core Fund, Institutional 3 Class
|
|||||||||
|
|
30,404,160
|
201,738,717
|
(193,569,261
)
|
11,269,277
|
49,842,893
|
1,573,588
|
11,974,943
|
434,131
|
1,544,080
|
|
Affiliated issuers
|
Beginning
of period($)
|
Purchases($)
|
Sales($)
|
Net change in
unrealized
appreciation
(depreciation)($)
|
End of
period($)
|
Capital gain
distributions($)
|
Realized gain
(loss)($)
|
Dividends —
affiliated
issuers ($)
|
End of
period shares
|
|
Columbia Corporate Income Fund, Institutional 3 Class
|
|||||||||
|
|
114,873,896
|
88,091,242
|
(100,032,938
)
|
10,900,091
|
113,832,291
|
—
|
(7,000,418
)
|
4,446,110
|
12,386,539
|
|
Columbia Diversified Fixed Income Allocation ETF
|
|||||||||
|
|
115,127,713
|
85,619,129
|
(97,908,029
)
|
10,346,113
|
113,184,926
|
—
|
(7,380,059
)
|
3,995,718
|
6,270,633
|
|
Columbia Emerging Markets Fund, Institutional 3 Class
|
|||||||||
|
|
20,889,634
|
84,826,647
|
(86,552,747
)
|
1,058,738
|
20,222,272
|
—
|
5,318,108
|
—
|
1,594,816
|
|
Columbia Large Cap Enhanced Core Fund, Institutional 3 Class
|
|||||||||
|
|
30,435,205
|
203,830,940
|
(189,510,538
)
|
5,037,743
|
49,793,350
|
2,707,504
|
13,131,285
|
908,735
|
1,992,531
|
|
Columbia Large Cap Index Fund, Institutional 3 Class
|
|||||||||
|
|
61,073,643
|
198,896,430
|
(227,624,148
)
|
7,521,366
|
39,867,291
|
4,411,231
|
11,072,432
|
787,273
|
794,961
|
|
Columbia Quality Income Fund, Institutional 3 Class
|
|||||||||
|
|
230,219,391
|
184,142,371
|
(212,790,977
)
|
25,976,522
|
227,547,307
|
—
|
(27,054,835
)
|
8,340,048
|
12,754,894
|
|
Columbia Research Enhanced Core ETF
|
|||||||||
|
|
20,231,103
|
82,611,994
|
(84,970,363
)
|
2,083,454
|
19,956,188
|
—
|
6,173,268
|
199,974
|
720,180
|
|
Columbia Select Mid Cap Value Fund, Institutional 3 Class
|
|||||||||
|
|
20,582,824
|
29,766,266
|
(45,987,280
)
|
(4,361,810
)
|
—
|
—
|
5,564,361
|
95,470
|
—
|
|
Columbia Short Term Bond Fund, Institutional 3 Class
|
|||||||||
|
|
172,099,694
|
50,641,529
|
(228,529,199
)
|
5,787,976
|
—
|
—
|
(4,228,570
)
|
2,342,611
|
—
|
|
Columbia Short-Term Cash Fund, 5.569%
|
|||||||||
|
|
3,993,005
|
208,140,733
|
(207,093,376
)
|
504
|
5,040,866
|
—
|
(1,099
)
|
267,814
|
5,041,874
|
|
Columbia Small Cap Index Fund, Institutional 3 Class
|
|||||||||
|
|
—
|
78,552,375
|
(61,556,928
)
|
2,732,178
|
19,727,625
|
1,299,359
|
2,588,930
|
427,003
|
838,047
|
|
Columbia Total Return Bond Fund, Institutional 3 Class
|
|||||||||
|
|
114,885,482
|
358,982,154
|
(217,285,704
)
|
27,960,797
|
284,542,729
|
—
|
(24,752,047
)
|
9,883,559
|
9,289,675
|
|
Columbia U.S. Treasury Index Fund, Institutional 3 Class
|
|||||||||
|
|
401,455,944
|
324,074,491
|
(357,006,704
)
|
28,515,302
|
397,039,033
|
—
|
(26,224,001
)
|
9,643,552
|
39,310,795
|
|
Total
|
1,356,798,304
|
|
|
133,830,016
|
1,340,596,771
|
9,991,682
|
(36,206,745
)
|
41,771,998
|
|
|
(b)
|
Non-income producing investment.
|
|
(c)
|
The rate shown is the seven-day current annualized yield at December 31, 2023.
|
|
|
Level 1 ($)
|
Level 2 ($)
|
Level 3 ($)
|
Total ($)
|
|
Investments in Securities
|
|
|
|
|
|
Equity Funds
|
179,453,431
|
—
|
—
|
179,453,431
|
|
Exchange-Traded Equity Funds
|
19,956,188
|
—
|
—
|
19,956,188
|
|
Exchange-Traded Fixed Income Funds
|
113,184,926
|
—
|
—
|
113,184,926
|
|
Fixed Income Funds
|
1,022,961,360
|
—
|
—
|
1,022,961,360
|
|
Money Market Funds
|
5,040,866
|
—
|
—
|
5,040,866
|
|
Total Investments in Securities
|
1,340,596,771
|
—
|
—
|
1,340,596,771
|
|
Common Stocks 96.7%
|
||
|
Issuer
|
Shares
|
Value ($)
|
|
Belgium 1.0%
|
||
|
Melexis NV
|
6,076
|
612,387
|
|
Finland 2.2%
|
||
|
Metso Outotec OYJ
|
28,390
|
288,212
|
|
Valmet OYJ
|
36,896
|
1,066,942
|
|
Total
|
1,355,154
|
|
|
France 4.6%
|
||
|
Edenred SE
|
24,163
|
1,446,028
|
|
Robertet SA
|
1,434
|
1,313,943
|
|
Total
|
2,759,971
|
|
|
Germany 8.9%
|
||
|
Eckert & Ziegler Strahlen- und Medizintechnik AG
|
8,500
|
387,121
|
|
Gerresheimer AG
|
5,738
|
596,956
|
|
Hypoport SE(a)
|
2,963
|
578,319
|
|
Jenoptik AG
|
39,253
|
1,231,093
|
|
Nemetschek SE
|
16,873
|
1,456,725
|
|
Rational AG
|
431
|
332,584
|
|
Washtec AG
|
23,164
|
818,301
|
|
Total
|
5,401,099
|
|
|
Italy 7.8%
|
||
|
Amplifon SpA
|
60,995
|
2,113,515
|
|
Carel Industries SpA
|
94,492
|
2,588,061
|
|
Total
|
4,701,576
|
|
|
Netherlands 7.6%
|
||
|
BE Semiconductor Industries NV
|
13,249
|
2,000,281
|
|
IMCD NV
|
15,083
|
2,626,909
|
|
Total
|
4,627,190
|
|
|
Norway 1.3%
|
||
|
AutoStore Holdings Ltd.(a),(b),(c)
|
408,366
|
802,333
|
|
Sweden 21.0%
|
||
|
AddTech AB, B Shares
|
120,654
|
2,654,699
|
|
Hexagon AB, Class B
|
205,301
|
2,465,934
|
|
Hexpol AB
|
51,007
|
617,985
|
|
Munters Group AB
|
174,213
|
2,840,816
|
|
Sectra AB, Class B(a)
|
144,012
|
2,571,192
|
|
Common Stocks (continued)
|
||
|
Issuer
|
Shares
|
Value ($)
|
|
Sweco AB, Class B
|
117,123
|
1,571,892
|
|
Total
|
12,722,518
|
|
|
Switzerland 10.1%
|
||
|
Accelleron Industries AG
|
20,479
|
640,487
|
|
Belimo Holding AG, Registered Shares
|
4,227
|
2,333,116
|
|
Inficon Holding AG
|
1,044
|
1,497,015
|
|
Kardex Holding AG
|
5,100
|
1,323,251
|
|
Tecan Group AG, Registered Shares
|
814
|
333,013
|
|
Total
|
6,126,882
|
|
|
United Kingdom 28.3%
|
||
|
Auto Trader Group PLC
|
269,761
|
2,478,200
|
|
Diploma PLC
|
53,122
|
2,426,173
|
|
Genus PLC
|
47,570
|
1,315,782
|
|
Halma PLC
|
79,593
|
2,314,239
|
|
Howden Joinery Group PLC
|
30,515
|
315,915
|
|
Intermediate Capital Group PLC
|
92,143
|
1,968,493
|
|
Rentokil Initial PLC
|
184,750
|
1,041,300
|
|
Rightmove PLC
|
314,993
|
2,315,510
|
|
Safestore Holdings PLC
|
133,777
|
1,506,597
|
|
Spirax-Sarco Engineering PLC
|
11,050
|
1,478,442
|
|
Total
|
17,160,651
|
|
|
United States 3.9%
|
||
|
Inter Parfums, Inc.
|
16,573
|
2,386,678
|
|
Total Common Stocks
(Cost $34,465,116)
|
58,656,439
|
|
|
|
||
|
Securities Lending Collateral 0.4%
|
||
|
|
|
|
|
Dreyfus Government Cash Management Fund, Institutional
Shares, 5.250%(d),(e)
|
225,086
|
225,086
|
|
Total Securities Lending Collateral
(Cost $225,086)
|
225,086
|
|
|
|
||
|
Money Market Funds 0.9%
|
||
|
|
Shares
|
Value ($)
|
|
Columbia Short-Term Cash Fund, 5.569%(d),(f)
|
549,089
|
548,979
|
|
Total Money Market Funds
(Cost $548,924)
|
548,979
|
|
|
Total Investments in Securities
(Cost $35,239,126)
|
59,430,504
|
|
|
Obligation to Return Collateral for Securities Loaned
|
|
(225,086
)
|
|
Other Assets & Liabilities, Net
|
|
1,438,274
|
|
Net Assets
|
$60,643,692
|
|
|
(a)
|
Non-income producing investment.
|
|
(b)
|
Represents privately placed and other securities and instruments exempt from Securities and Exchange Commission registration
(collectively, private placements), such as Section 4(a)(2) and Rule 144A eligible securities, which are often sold only to qualified institutional buyers. At December
31, 2023, the total value of these securities amounted to $802,333, which represents 1.32% of total net assets.
|
|
(c)
|
All or a portion of this security was on loan at December 31, 2023. The total market value of securities on loan at December
31, 2023 was $210,870.
|
|
(d)
|
The rate shown is the seven-day current annualized yield at December 31, 2023.
|
|
(e)
|
Investment made with cash collateral received from securities lending activity.
|
|
(f)
|
As defined in the Investment Company Act of 1940, as amended, an affiliated company is one in which the Fund owns 5% or more of the company’s outstanding voting securities, or a company which is under common ownership or control with the Fund. The value of the holdings and transactions in these
affiliated companies during the year ended December 31, 2023 are as follows:
|
|
Affiliated issuers
|
Beginning
of period($)
|
Purchases($)
|
Sales($)
|
Net change in
unrealized
appreciation
(depreciation)($)
|
End of
period($)
|
Realized gain
(loss)($)
|
Dividends($)
|
End of
period shares
|
|
Columbia Short-Term Cash Fund, 5.569%
|
||||||||
|
|
1,602,880
|
21,933,837
|
(22,987,759
)
|
21
|
548,979
|
93
|
74,337
|
549,089
|
|
|
Level 1 ($)
|
Level 2 ($)
|
Level 3 ($)
|
Total ($)
|
|
Investments in Securities
|
|
|
|
|
|
Common Stocks
|
|
|
|
|
|
Belgium
|
—
|
612,387
|
—
|
612,387
|
|
Finland
|
—
|
1,355,154
|
—
|
1,355,154
|
|
France
|
—
|
2,759,971
|
—
|
2,759,971
|
|
Germany
|
—
|
5,401,099
|
—
|
5,401,099
|
|
Italy
|
—
|
4,701,576
|
—
|
4,701,576
|
|
Netherlands
|
—
|
4,627,190
|
—
|
4,627,190
|
|
Norway
|
—
|
802,333
|
—
|
802,333
|
|
Sweden
|
—
|
12,722,518
|
—
|
12,722,518
|
|
Switzerland
|
—
|
6,126,882
|
—
|
6,126,882
|
|
United Kingdom
|
—
|
17,160,651
|
—
|
17,160,651
|
|
United States
|
2,386,678
|
—
|
—
|
2,386,678
|
|
Total Common Stocks
|
2,386,678
|
56,269,761
|
—
|
58,656,439
|
|
Securities Lending Collateral
|
225,086
|
—
|
—
|
225,086
|
|
Money Market Funds
|
548,979
|
—
|
—
|
548,979
|
|
Total Investments in Securities
|
3,160,743
|
56,269,761
|
—
|
59,430,504
|
|
|
Columbia
Acorn®
Fund
|
Columbia
Acorn
International®
|
Columbia
Acorn
International
SelectSM
|
|
Assets
|
|
|
|
|
Investments in securities, at value*
|
|
|
|
|
Unaffiliated issuers (cost $2,208,479,482, $838,290,321, $180,882,300, respectively)
|
$2,684,106,789
|
$1,133,959,291
|
$218,953,168
|
|
Affiliated issuers (cost $107,172,510, $21,219,547, $5,679,624, respectively)
|
105,024,151
|
21,219,590
|
5,679,803
|
|
Foreign currency (cost $—, $37,531, $6, respectively)
|
—
|
37,640
|
6
|
|
Receivable for:
|
|
|
|
|
Investments sold
|
—
|
2,265,982
|
—
|
|
Capital shares sold
|
501,456
|
1,452,325
|
105,829
|
|
Dividends
|
947,250
|
1,381,481
|
240,818
|
|
Securities lending income
|
865
|
5,289
|
—
|
|
Foreign tax reclaims
|
8,364
|
1,860,184
|
588,333
|
|
Expense reimbursement due from Investment Manager
|
3,623
|
3,777
|
1,072
|
|
Prepaid expenses
|
71,549
|
34,646
|
5,645
|
|
Total assets
|
2,790,664,047
|
1,162,220,205
|
225,574,674
|
|
Liabilities
|
|
|
|
|
Due to custodian
|
—
|
39,608
|
—
|
|
Due upon return of securities on loan
|
192,150
|
—
|
—
|
|
Payable for:
|
|
|
|
|
Capital shares redeemed
|
3,604,966
|
2,049,738
|
249,724
|
|
Investment advisory fee
|
53,128
|
26,964
|
5,488
|
|
Distribution and/or service fees
|
4,204
|
1,190
|
907
|
|
Transfer agent fees
|
171,254
|
72,618
|
22,834
|
|
Administration fees
|
3,862
|
1,591
|
308
|
|
Compensation of chief compliance officer
|
8,395
|
4,030
|
657
|
|
Accounting services fees
|
25,706
|
26,090
|
26,090
|
|
Compensation of board members
|
14,712
|
6,856
|
1,220
|
|
Other expenses
|
180,970
|
161,995
|
42,153
|
|
Deferred compensation of board members
|
3,641,770
|
1,642,555
|
159,085
|
|
Total liabilities
|
7,901,117
|
4,033,235
|
508,466
|
|
Net assets applicable to outstanding capital stock
|
$2,782,762,930
|
$1,158,186,970
|
$225,066,208
|
|
Represented by
|
|
|
|
|
Paid in capital
|
2,860,237,923
|
912,827,742
|
212,519,427
|
|
Total distributable earnings (loss)
|
(77,474,993
)
|
245,359,228
|
12,546,781
|
|
Total - representing net assets applicable to outstanding capital stock
|
$2,782,762,930
|
$1,158,186,970
|
$225,066,208
|
|
* Includes the value of securities on loan
|
154,818
|
—
|
—
|
|
|
Columbia
Acorn®
Fund
|
Columbia
Acorn
International®
|
Columbia
Acorn
International
SelectSM
|
|
Class A
|
|
|
|
|
Net assets
|
$570,240,032
|
$155,876,644
|
$128,075,509
|
|
Shares outstanding
|
76,128,092
|
6,122,630
|
5,026,996
|
|
Net asset value per share(a)
|
$7.49
|
$25.46
|
$25.48
|
|
Maximum sales charge
|
5.75%
|
5.75%
|
5.75%
|
|
Maximum offering price per share(b) (calculated by dividing the net asset value per share by 1.0 minus the maximum
sales charge for Class A shares)
|
$7.95
|
$27.01
|
$27.03
|
|
Advisor Class
|
|
|
|
|
Net assets
|
$36,286,980
|
$5,688,857
|
$932,101
|
|
Shares outstanding
|
3,060,725
|
218,031
|
35,449
|
|
Net asset value per share(c)
|
$11.86
|
$26.09
|
$26.29
|
|
Class C
|
|
|
|
|
Net assets
|
$8,990,740
|
$3,320,521
|
$1,080,000
|
|
Shares outstanding
|
865,138
|
146,635
|
48,082
|
|
Net asset value per share(a)
|
$10.39
|
$22.64
|
$22.46
|
|
Institutional Class
|
|
|
|
|
Net assets
|
$2,110,299,397
|
$837,217,349
|
$79,764,733
|
|
Shares outstanding
|
193,073,221
|
32,626,036
|
3,063,175
|
|
Net asset value per share(c)
|
$10.93
|
$25.66
|
$26.04
|
|
Institutional 2 Class
|
|
|
|
|
Net assets
|
$28,764,672
|
$22,936,971
|
$5,810,042
|
|
Shares outstanding
|
2,384,686
|
893,762
|
220,562
|
|
Net asset value per share(c)
|
$12.06
|
$25.66
|
$26.34
|
|
Institutional 3 Class
|
|
|
|
|
Net assets
|
$28,181,109
|
$131,038,064
|
$9,403,823
|
|
Shares outstanding
|
2,295,542
|
5,011,324
|
356,915
|
|
Net asset value per share(c)
|
$12.28
|
$26.15
|
$26.35
|
|
Class R
|
|
|
|
|
Net assets
|
$—
|
$2,108,564
|
$—
|
|
Shares outstanding
|
—
|
83,230
|
—
|
|
Net asset value per share(c)
|
$—
|
$25.33
|
$—
|
|
(a)
|
Redemption price per share is equal to net asset value less any applicable contingent deferred sales charge.
|
|
(b)
|
On sales of $50,000 or more the offering price is reduced.
|
|
(c)
|
Redemption price per share is equal to net asset value.
|
|
|
Columbia
Thermostat
FundSM
|
Columbia
Acorn
European
FundSM
|
|
Assets
|
|
|
|
Investments in securities, at value*
|
|
|
|
Unaffiliated issuers (cost $—, $34,690,202, respectively)
|
$—
|
$58,881,525
|
|
Affiliated issuers (cost $1,348,970,098, $548,924, respectively)
|
1,340,596,771
|
548,979
|
|
Receivable for:
|
|
|
|
Investments sold
|
—
|
1,186,678
|
|
Capital shares sold
|
4,173,010
|
341,581
|
|
Dividends
|
3,645,609
|
54,274
|
|
Securities lending income
|
—
|
106
|
|
Foreign tax reclaims
|
—
|
241,338
|
|
Expense reimbursement due from Investment Manager
|
1,924
|
462
|
|
Prepaid expenses
|
34,627
|
1,554
|
|
Total assets
|
1,348,451,941
|
61,256,497
|
|
Liabilities
|
|
|
|
Due upon return of securities on loan
|
—
|
225,086
|
|
Payable for:
|
|
|
|
Investments purchased
|
3,625,038
|
193,204
|
|
Capital shares redeemed
|
1,125,358
|
119,362
|
|
Investment advisory fee
|
3,684
|
1,977
|
|
Distribution and/or service fees
|
6,001
|
257
|
|
Transfer agent fees
|
108,433
|
6,195
|
|
Administration fees
|
1,842
|
83
|
|
Compensation of chief compliance officer
|
4,220
|
178
|
|
Compensation of board members
|
7,530
|
327
|
|
Other expenses
|
108,645
|
37,917
|
|
Deferred compensation of board members
|
417,166
|
28,219
|
|
Total liabilities
|
5,407,917
|
612,805
|
|
Net assets applicable to outstanding capital stock
|
$1,343,044,024
|
$60,643,692
|
|
Represented by
|
|
|
|
Paid in capital
|
1,497,333,440
|
54,901,658
|
|
Total distributable earnings (loss)
|
(154,289,416
)
|
5,742,034
|
|
Total - representing net assets applicable to outstanding capital stock
|
$1,343,044,024
|
$60,643,692
|
|
* Includes the value of securities on loan
|
—
|
210,870
|
|
|
Columbia
Thermostat
FundSM
|
Columbia
Acorn
European
FundSM
|
|
Class A
|
|
|
|
Net assets
|
$428,092,394
|
$30,487,196
|
|
Shares outstanding
|
27,423,708
|
1,193,148
|
|
Net asset value per share(a)
|
$15.61
|
$25.55
|
|
Maximum sales charge
|
5.75%
|
5.75%
|
|
Maximum offering price per share(b) (calculated by dividing the net asset value per share by 1.0 minus the maximum sales charge for Class A
shares)
|
$16.56
|
$27.11
|
|
Advisor Class
|
|
|
|
Net assets
|
$69,278,192
|
$1,857,146
|
|
Shares outstanding
|
4,492,620
|
71,725
|
|
Net asset value per share(c)
|
$15.42
|
$25.89
|
|
Class C
|
|
|
|
Net assets
|
$111,123,244
|
$1,787,042
|
|
Shares outstanding
|
7,064,470
|
72,692
|
|
Net asset value per share(a)
|
$15.73
|
$24.58
|
|
Institutional Class
|
|
|
|
Net assets
|
$636,586,597
|
$23,802,136
|
|
Shares outstanding
|
41,602,332
|
924,110
|
|
Net asset value per share(c)
|
$15.30
|
$25.76
|
|
Institutional 2 Class
|
|
|
|
Net assets
|
$86,925,460
|
$2,661,479
|
|
Shares outstanding
|
5,628,418
|
101,988
|
|
Net asset value per share(c)
|
$15.44
|
$26.10
|
|
Institutional 3 Class
|
|
|
|
Net assets
|
$11,038,137
|
$48,693
|
|
Shares outstanding
|
716,250
|
1,895
|
|
Net asset value per share(c)
|
$15.41
|
$25.69
(d)
|
|
(a)
|
Redemption price per share is equal to net asset value less any applicable contingent deferred sales charge.
|
|
(b)
|
On sales of $50,000 or more the offering price is reduced.
|
|
(c)
|
Redemption price per share is equal to net asset value.
|
|
(d)
|
Net asset value per share rounds to this amount due to fractional shares outstanding.
|
|
|
Columbia
Acorn®
Fund
|
Columbia
Acorn
International®
|
Columbia
Acorn
International
SelectSM
|
|
Net investment income
|
|
|
|
|
Income:
|
|
|
|
|
Dividends — unaffiliated issuers
|
$10,461,081
|
$22,227,384
|
$3,540,299
|
|
Dividends — affiliated issuers
|
6,156,820
|
1,718,285
|
189,866
|
|
Income from securities lending — net
|
83,457
|
109,267
|
4,856
|
|
European Union tax reclaim
|
—
|
7,139
|
—
|
|
Foreign taxes withheld
|
(36,426
)
|
(2,167,943
)
|
(254,308
)
|
|
Total income
|
16,664,932
|
21,894,132
|
3,480,713
|
|
Expenses:
|
|
|
|
|
Investment advisory fee
|
18,446,916
|
11,053,432
|
2,030,153
|
|
Distribution and/or service fees
|
|
|
|
|
Class A
|
1,382,604
|
386,599
|
318,266
|
|
Class C
|
93,139
|
38,610
|
10,888
|
|
Class R
|
—
|
10,056
|
—
|
|
Transfer agent fees
|
|
|
|
|
Class A
|
456,132
|
165,606
|
254,541
|
|
Advisor Class
|
26,494
|
7,302
|
1,915
|
|
Class C
|
7,681
|
4,125
|
2,178
|
|
Institutional Class
|
1,659,258
|
986,258
|
163,839
|
|
Institutional 2 Class
|
14,626
|
43,909
|
3,987
|
|
Institutional 3 Class
|
2,339
|
8,634
|
572
|
|
Class R
|
—
|
2,154
|
—
|
|
Administration fees
|
1,335,986
|
662,625
|
114,054
|
|
Custodian fees
|
17,696
|
211,601
|
37,064
|
|
Printing and postage fees
|
112,777
|
119,089
|
55,852
|
|
Registration fees
|
78,867
|
98,333
|
83,818
|
|
Accounting services fees
|
19,940
|
143,351
|
34,948
|
|
Legal fees
|
878,969
|
435,128
|
75,122
|
|
Line of credit interest
|
—
|
121,022
|
305
|
|
Interest on collateral
|
—
|
45
|
—
|
|
Compensation of chief compliance officer
|
15,937
|
8,340
|
1,399
|
|
Compensation of board members
|
382,470
|
193,912
|
33,160
|
|
Deferred compensation of board members
|
360,902
|
194,201
|
28,110
|
|
Other
|
192,580
|
114,608
|
25,609
|
|
Total expenses
|
25,485,313
|
15,008,940
|
3,275,780
|
|
Fees waived or expenses reimbursed by Investment Manager and its affiliates
|
(1,781,144
)
|
(1,654,568
)
|
(730,898
)
|
|
Fees waived by transfer agent
|
|
|
|
|
Institutional 2 Class
|
—
|
(7,221
)
|
—
|
|
Institutional 3 Class
|
—
|
(3,128
)
|
—
|
|
Expense reduction
|
(6,849
)
|
(5,627
)
|
(8,963
)
|
|
Total net expenses
|
23,697,320
|
13,338,396
|
2,535,919
|
|
Net investment income (loss)
|
(7,032,388
)
|
8,555,736
|
944,794
|
|
|
Columbia
Acorn®
Fund
|
Columbia
Acorn
International®
|
Columbia
Acorn
International
SelectSM
|
|
Realized and unrealized gain (loss) — net
|
|
|
|
|
Net realized gain (loss) on:
|
|
|
|
|
Investments — unaffiliated issuers
|
$53,076,598
|
$97,166,667
|
$1,421,555
|
|
Investments — affiliated issuers
|
(2,454,239
)
|
(4,697
)
|
358
|
|
Foreign currency translations
|
—
|
(439,920
)
|
(45,052
)
|
|
Forward foreign currency exchange contracts
|
—
|
—
|
(302,480
)
|
|
Futures contracts
|
—
|
(918,878
)
|
—
|
|
Net realized gain
|
50,622,359
|
95,803,172
|
1,074,381
|
|
Net change in unrealized appreciation (depreciation) on:
|
|
|
|
|
Investments — unaffiliated issuers
|
455,581,606
|
113,580,795
|
35,911,500
|
|
Investments — affiliated issuers
|
25,510,296
|
(1,018
)
|
162
|
|
Foreign currency translations
|
—
|
85,684
|
46,457
|
|
Net change in unrealized appreciation (depreciation)
|
481,091,902
|
113,665,461
|
35,958,119
|
|
Net realized and unrealized gain
|
531,714,261
|
209,468,633
|
37,032,500
|
|
Net increase in net assets resulting from operations
|
$524,681,873
|
$218,024,369
|
$37,977,294
|
|
|
Columbia
Thermostat
FundSM
|
Columbia
Acorn
European
FundSM
|
|
Net investment income
|
|
|
|
Income:
|
|
|
|
Dividends — unaffiliated issuers
|
$—
|
$1,094,167
|
|
Dividends — affiliated issuers
|
41,771,998
|
74,337
|
|
Income from securities lending — net
|
—
|
4,557
|
|
Foreign taxes withheld
|
—
|
(82,483
)
|
|
Total income
|
41,771,998
|
1,090,578
|
|
Expenses:
|
|
|
|
Investment advisory fee
|
1,353,487
|
769,255
|
|
Distribution and/or service fees
|
|
|
|
Class A
|
1,102,425
|
75,132
|
|
Class C
|
1,193,964
|
21,860
|
|
Transfer agent fees
|
|
|
|
Class A
|
407,785
|
35,913
|
|
Advisor Class
|
64,611
|
1,779
|
|
Class C
|
110,457
|
2,605
|
|
Institutional Class
|
576,249
|
33,424
|
|
Institutional 2 Class
|
44,970
|
1,688
|
|
Institutional 3 Class
|
1,218
|
9
|
|
Administration fees
|
676,743
|
32,322
|
|
Custodian fees
|
2,309
|
13,229
|
|
Printing and postage fees
|
87,339
|
20,462
|
|
Registration fees
|
112,292
|
84,188
|
|
Accounting services fees
|
8,665
|
27,534
|
|
Legal fees
|
443,475
|
21,225
|
|
Line of credit interest
|
2,027
|
2,895
|
|
Compensation of chief compliance officer
|
8,349
|
424
|
|
Compensation of board members
|
195,634
|
9,552
|
|
Deferred compensation of board members
|
132,776
|
7,817
|
|
Other
|
106,588
|
14,582
|
|
Total expenses
|
6,631,363
|
1,175,895
|
|
Fees waived or expenses reimbursed by Investment Manager and its affiliates
|
(1,097,936
)
|
(301,421
)
|
|
Fees waived by transfer agent
|
|
|
|
Institutional 2 Class
|
—
|
(474
)
|
|
Institutional 3 Class
|
—
|
(3
)
|
|
Expense reduction
|
(200
)
|
(120
)
|
|
Total net expenses
|
5,533,227
|
873,877
|
|
Net investment income
|
36,238,771
|
216,701
|
|
Realized and unrealized gain (loss) — net
|
|
|
|
Net realized gain (loss) on:
|
|
|
|
Investments — unaffiliated issuers
|
—
|
910,065
|
|
Investments — affiliated issuers
|
(36,206,745
)
|
93
|
|
Capital gain distributions from underlying affiliated funds
|
9,991,682
|
—
|
|
Foreign currency translations
|
—
|
(36,828
)
|
|
Net realized gain (loss)
|
(26,215,063
)
|
873,330
|
|
Net change in unrealized appreciation (depreciation) on:
|
|
|
|
Investments — unaffiliated issuers
|
—
|
13,395,710
|
|
Investments — affiliated issuers
|
133,830,016
|
21
|
|
Foreign currency translations
|
—
|
18,092
|
|
Net change in unrealized appreciation (depreciation)
|
133,830,016
|
13,413,823
|
|
Net realized and unrealized gain
|
107,614,953
|
14,287,153
|
|
Net increase in net assets resulting from operations
|
$143,853,724
|
$14,503,854
|
|
|
Columbia
Acorn® Fund
|
Columbia Acorn
International®
|
||
|
|
Year Ended
December 31, 2023
|
Year Ended
December 31, 2022
|
Year Ended
December 31, 2023
|
Year Ended
December 31, 2022
|
|
Operations
|
|
|
|
|
|
Net investment income (loss)
|
$(7,032,388
)
|
$(10,216,388
)
|
$8,555,736
|
$14,743,604
|
|
Net realized gain (loss)
|
50,622,359
|
(553,193,202
)
|
95,803,172
|
(58,190,952
)
|
|
Net change in unrealized appreciation (depreciation)
|
481,091,902
|
(912,966,508
)
|
113,665,461
|
(733,741,487
)
|
|
Net increase (decrease) in net assets resulting from operations
|
524,681,873
|
(1,476,376,098
)
|
218,024,369
|
(777,188,835
)
|
|
Distributions to shareholders
|
|
|
|
|
|
Net investment income and net realized gains
|
|
|
|
|
|
Class A
|
—
|
(41,011,712
)
|
—
|
(5,361,144
)
|
|
Advisor Class
|
—
|
(1,229,726
)
|
—
|
(168,978
)
|
|
Class C
|
—
|
(608,986
)
|
—
|
(185,732
)
|
|
Institutional Class
|
—
|
(106,713,651
)
|
—
|
(31,799,977
)
|
|
Institutional 2 Class
|
—
|
(1,365,961
)
|
—
|
(2,796,677
)
|
|
Institutional 3 Class
|
—
|
(3,270,753
)
|
—
|
(4,521,218
)
|
|
Class R
|
—
|
—
|
—
|
(65,963
)
|
|
Total distributions to shareholders
|
—
|
(154,200,789
)
|
—
|
(44,899,689
)
|
|
Decrease in net assets from capital stock activity
|
(231,168,063
)
|
(408,797,663
)
|
(344,563,812
)
|
(232,973,136
)
|
|
Total increase (decrease) in net assets
|
293,513,810
|
(2,039,374,550
)
|
(126,539,443
)
|
(1,055,061,660
)
|
|
Net assets at beginning of year
|
2,489,249,120
|
4,528,623,670
|
1,284,726,413
|
2,339,788,073
|
|
Net assets at end of year
|
$2,782,762,930
|
$2,489,249,120
|
$1,158,186,970
|
$1,284,726,413
|
|
|
Columbia Acorn
International SelectSM
|
Columbia
Thermostat FundSM
|
||
|
|
Year Ended
December 31, 2023
|
Year Ended
December 31, 2022
|
Year Ended
December 31, 2023
|
Year Ended
December 31, 2022
|
|
Operations
|
|
|
|
|
|
Net investment income
|
$944,794
|
$1,822,552
|
$36,238,771
|
$29,395,963
|
|
Net realized gain (loss)
|
1,074,381
|
(26,914,409
)
|
(26,215,063
)
|
(119,348,015
)
|
|
Net change in unrealized appreciation (depreciation)
|
35,958,119
|
(143,819,490
)
|
133,830,016
|
(168,613,098
)
|
|
Net increase (decrease) in net assets resulting from operations
|
37,977,294
|
(168,911,347
)
|
143,853,724
|
(258,565,150
)
|
|
Distributions to shareholders
|
|
|
|
|
|
Net investment income and net realized gains
|
|
|
|
|
|
Class A
|
—
|
(5,779,291
)
|
(10,410,932
)
|
(13,588,692
)
|
|
Advisor Class
|
—
|
(51,312
)
|
(1,865,308
)
|
(3,137,330
)
|
|
Class C
|
—
|
(57,732
)
|
(1,924,350
)
|
(2,912,905
)
|
|
Institutional Class
|
—
|
(3,890,418
)
|
(17,128,093
)
|
(20,546,977
)
|
|
Institutional 2 Class
|
—
|
(975,433
)
|
(2,375,641
)
|
(3,327,846
)
|
|
Institutional 3 Class
|
—
|
(506,064
)
|
(305,428
)
|
(337,655
)
|
|
Total distributions to shareholders
|
—
|
(11,260,250
)
|
(34,009,752
)
|
(43,851,405
)
|
|
Decrease in net assets from capital stock activity
|
(40,124,570
)
|
(72,701,020
)
|
(121,785,211
)
|
(416,791,137
)
|
|
Total decrease in net assets
|
(2,147,276
)
|
(252,872,617
)
|
(11,941,239
)
|
(719,207,692
)
|
|
Net assets at beginning of year
|
227,213,484
|
480,086,101
|
1,354,985,263
|
2,074,192,955
|
|
Net assets at end of year
|
$225,066,208
|
$227,213,484
|
$1,343,044,024
|
$1,354,985,263
|
|
|
Columbia Acorn
European FundSM
|
|
|
|
Year Ended
December 31, 2023
|
Year Ended
December 31, 2022
|
|
Operations
|
|
|
|
Net investment income
|
$216,701
|
$390,348
|
|
Net realized gain (loss)
|
873,330
|
(15,549,185
)
|
|
Net change in unrealized appreciation (depreciation)
|
13,413,823
|
(60,748,194
)
|
|
Net increase (decrease) in net assets resulting from operations
|
14,503,854
|
(75,907,031
)
|
|
Distributions to shareholders
|
|
|
|
Net investment income and net realized gains
|
|
|
|
Class A
|
(189,692
)
|
—
|
|
Advisor Class
|
(15,444
)
|
—
|
|
Institutional Class
|
(202,770
)
|
—
|
|
Institutional 2 Class
|
(23,692
)
|
—
|
|
Institutional 3 Class
|
(446
)
|
—
|
|
Total distributions to shareholders
|
(432,044
)
|
—
|
|
Decrease in net assets from capital stock activity
|
(27,064,875
)
|
(64,395,632
)
|
|
Total decrease in net assets
|
(12,993,065
)
|
(140,302,663
)
|
|
Net assets at beginning of year
|
73,636,757
|
213,939,420
|
|
Net assets at end of year
|
$60,643,692
|
$73,636,757
|
|
|
Columbia
Acorn® Fund
|
Columbia Acorn
International®
|
||||||
|
|
Year Ended
|
Year Ended
|
Year Ended
|
Year Ended
|
||||
|
|
December 31, 2023
|
December 31, 2022
|
December 31, 2023
|
December 31, 2022
|
||||
|
|
Shares
|
Dollars ($)
|
Shares
|
Dollars ($)
|
Shares
|
Dollars ($)
|
Shares
|
Dollars ($)
|
|
Capital stock activity
|
||||||||
|
Class A
|
|
|
|
|
|
|
|
|
|
Shares sold
|
1,718,572
|
11,792,823
|
3,841,202
|
27,530,049
|
269,136
|
6,402,067
|
417,699
|
10,032,981
|
|
Fund reorganization
|
4,316,137
|
29,090,226
|
—
|
—
|
—
|
—
|
—
|
—
|
|
Distributions reinvested
|
—
|
—
|
5,676,330
|
37,236,731
|
—
|
—
|
226,394
|
5,150,468
|
|
Shares redeemed
|
(14,502,727
)
|
(99,134,411
)
|
(16,825,830
)
|
(118,360,587
)
|
(1,255,306
)
|
(29,462,523
)
|
(2,035,521
)
|
(46,371,623
)
|
|
Net decrease
|
(8,468,018
)
|
(58,251,362
)
|
(7,308,298
)
|
(53,593,807
)
|
(986,170
)
|
(23,060,456
)
|
(1,391,428
)
|
(31,188,174
)
|
|
Advisor Class
|
|
|
|
|
|
|
|
|
|
Shares sold
|
385,527
|
4,136,070
|
521,853
|
5,802,489
|
178,621
|
4,242,540
|
133,125
|
2,888,745
|
|
Fund reorganization
|
1,525,071
|
16,226,961
|
—
|
—
|
—
|
—
|
—
|
—
|
|
Distributions reinvested
|
—
|
—
|
101,973
|
1,054,403
|
—
|
—
|
7,277
|
168,978
|
|
Shares redeemed
|
(1,105,381
)
|
(12,117,272
)
|
(949,277
)
|
(10,134,232
)
|
(265,087
)
|
(6,561,156
)
|
(110,258
)
|
(2,607,879
)
|
|
Net increase (decrease)
|
805,217
|
8,245,759
|
(325,451
)
|
(3,277,340
)
|
(86,466
)
|
(2,318,616
)
|
30,144
|
449,844
|
|
Class C
|
|
|
|
|
|
|
|
|
|
Shares sold
|
115,650
|
1,100,064
|
130,090
|
1,338,904
|
100,899
|
2,107,289
|
24,534
|
566,274
|
|
Fund reorganization
|
74,005
|
694,892
|
—
|
—
|
—
|
—
|
—
|
—
|
|
Distributions reinvested
|
—
|
—
|
64,371
|
592,861
|
—
|
—
|
9,069
|
185,720
|
|
Shares redeemed
|
(387,124
)
|
(3,667,127
)
|
(920,653
)
|
(8,750,945
)
|
(167,007
)
|
(3,495,357
)
|
(176,264
)
|
(3,789,782
)
|
|
Net decrease
|
(197,469
)
|
(1,872,171
)
|
(726,192
)
|
(6,819,180
)
|
(66,108
)
|
(1,388,068
)
|
(142,661
)
|
(3,037,788
)
|
|
Institutional Class
|
|
|
|
|
|
|
|
|
|
Shares sold
|
2,223,043
|
22,078,082
|
3,404,616
|
34,714,184
|
842,430
|
19,759,167
|
2,161,892
|
49,621,347
|
|
Fund reorganization
|
10,743,676
|
105,395,547
|
—
|
—
|
—
|
—
|
—
|
—
|
|
Distributions reinvested
|
—
|
—
|
10,327,259
|
98,418,808
|
—
|
—
|
1,159,396
|
26,480,610
|
|
Shares redeemed
|
(27,891,526
)
|
(278,094,447
)
|
(45,679,386
)
|
(461,943,597
)
|
(10,456,754
)
|
(243,769,961
)
|
(12,972,429
)
|
(296,525,222
)
|
|
Net decrease
|
(14,924,807
)
|
(150,620,818
)
|
(31,947,511
)
|
(328,810,605
)
|
(9,614,324
)
|
(224,010,794
)
|
(9,651,141
)
|
(220,423,265
)
|
|
Institutional 2 Class
|
|
|
|
|
|
|
|
|
|
Shares sold
|
384,493
|
4,317,101
|
543,152
|
6,139,315
|
250,115
|
5,926,433
|
925,676
|
22,125,006
|
|
Fund reorganization
|
378,826
|
4,102,688
|
—
|
—
|
—
|
—
|
—
|
—
|
|
Distributions reinvested
|
—
|
—
|
129,844
|
1,365,961
|
—
|
—
|
48,905
|
1,116,012
|
|
Shares redeemed
|
(748,162
)
|
(8,093,416
)
|
(1,684,638
)
|
(18,199,954
)
|
(3,088,794
)
|
(71,486,687
)
|
(1,060,983
)
|
(24,110,868
)
|
|
Net increase (decrease)
|
15,157
|
326,373
|
(1,011,642
)
|
(10,694,678
)
|
(2,838,679
)
|
(65,560,254
)
|
(86,402
)
|
(869,850
)
|
|
Institutional 3 Class
|
|
|
|
|
|
|
|
|
|
Shares sold
|
2,965,464
|
31,156,695
|
8,597,429
|
90,011,192
|
1,511,702
|
34,457,382
|
3,157,192
|
74,140,786
|
|
Fund reorganization
|
756,498
|
8,336,673
|
—
|
—
|
—
|
—
|
—
|
—
|
|
Distributions reinvested
|
—
|
—
|
304,164
|
3,254,550
|
—
|
—
|
151,936
|
3,530,989
|
|
Shares redeemed
|
(6,188,692
)
|
(68,489,212
)
|
(9,111,813
)
|
(98,867,795
)
|
(2,622,553
)
|
(62,356,458
)
|
(2,507,211
)
|
(55,246,843
)
|
|
Net increase (decrease)
|
(2,466,730
)
|
(28,995,844
)
|
(210,220
)
|
(5,602,053
)
|
(1,110,851
)
|
(27,899,076
)
|
801,917
|
22,424,932
|
|
Class R
|
|
|
|
|
|
|
|
|
|
Shares sold
|
—
|
—
|
—
|
—
|
18,418
|
427,735
|
13,918
|
319,569
|
|
Distributions reinvested
|
—
|
—
|
—
|
—
|
—
|
—
|
2,902
|
65,963
|
|
Shares redeemed
|
—
|
—
|
—
|
—
|
(32,719
)
|
(754,283
)
|
(30,471
)
|
(714,367
)
|
|
Net decrease
|
—
|
—
|
—
|
—
|
(14,301
)
|
(326,548
)
|
(13,651
)
|
(328,835
)
|
|
Total net decrease
|
(25,236,650
)
|
(231,168,063
)
|
(41,529,314
)
|
(408,797,663
)
|
(14,716,899
)
|
(344,563,812
)
|
(10,453,222
)
|
(232,973,136
)
|
|
|
Columbia Acorn
International SelectSM
|
Columbia
Thermostat FundSM
|
||||||
|
|
Year Ended
|
Year Ended
|
Year Ended
|
Year Ended
|
||||
|
|
December 31, 2023
|
December 31, 2022
|
December 31, 2023
|
December 31, 2022
|
||||
|
|
Shares
|
Dollars ($)
|
Shares
|
Dollars ($)
|
Shares
|
Dollars ($)
|
Shares
|
Dollars ($)
|
|
Capital stock activity
|
||||||||
|
Class A
|
|
|
|
|
|
|
|
|
|
Shares sold
|
87,531
|
2,068,096
|
164,236
|
4,018,820
|
2,523,091
|
37,941,700
|
4,779,635
|
74,320,265
|
|
Distributions reinvested
|
—
|
—
|
221,041
|
5,355,805
|
620,763
|
9,640,277
|
854,305
|
12,622,769
|
|
Shares redeemed
|
(854,161
)
|
(20,033,727
)
|
(1,227,506
)
|
(29,435,787
)
|
(7,091,812
)
|
(106,349,866
)
|
(10,973,721
)
|
(168,238,979
)
|
|
Net decrease
|
(766,630
)
|
(17,965,631
)
|
(842,229
)
|
(20,061,162
)
|
(3,947,958
)
|
(58,767,889
)
|
(5,339,781
)
|
(81,295,945
)
|
|
Advisor Class
|
|
|
|
|
|
|
|
|
|
Shares sold
|
4,126
|
103,379
|
2,601
|
75,193
|
1,811,816
|
26,827,579
|
2,848,884
|
43,186,337
|
|
Distributions reinvested
|
—
|
—
|
2,056
|
51,217
|
121,102
|
1,858,320
|
213,969
|
3,128,499
|
|
Shares redeemed
|
(10,296
)
|
(253,224
)
|
(30,779
)
|
(738,678
)
|
(2,829,609
)
|
(41,872,074
)
|
(7,914,592
)
|
(119,461,531
)
|
|
Net decrease
|
(6,170
)
|
(149,845
)
|
(26,122
)
|
(612,268
)
|
(896,691
)
|
(13,186,175
)
|
(4,851,739
)
|
(73,146,695
)
|
|
Class C
|
|
|
|
|
|
|
|
|
|
Shares sold
|
4,285
|
88,478
|
5,905
|
133,531
|
985,503
|
14,870,755
|
1,908,866
|
30,241,005
|
|
Distributions reinvested
|
—
|
—
|
2,663
|
57,570
|
115,178
|
1,800,278
|
182,360
|
2,729,808
|
|
Shares redeemed
|
(12,861
)
|
(263,154
)
|
(19,273
)
|
(417,002
)
|
(2,794,882
)
|
(42,122,296
)
|
(4,418,887
)
|
(67,545,215
)
|
|
Net decrease
|
(8,576
)
|
(174,676
)
|
(10,705
)
|
(225,901
)
|
(1,694,201
)
|
(25,451,263
)
|
(2,327,661
)
|
(34,574,402
)
|
|
Institutional Class
|
|
|
|
|
|
|
|
|
|
Shares sold
|
127,544
|
3,066,026
|
249,962
|
6,149,181
|
12,766,485
|
188,930,142
|
13,490,772
|
206,555,299
|
|
Distributions reinvested
|
—
|
—
|
140,836
|
3,474,436
|
909,591
|
13,848,552
|
1,162,441
|
16,843,875
|
|
Shares redeemed
|
(694,588
)
|
(16,604,009
)
|
(1,200,621
)
|
(28,390,658
)
|
(14,724,786
)
|
(216,507,923
)
|
(26,101,191
)
|
(392,930,550
)
|
|
Net decrease
|
(567,044
)
|
(13,537,983
)
|
(809,823
)
|
(18,767,041
)
|
(1,048,710
)
|
(13,729,229
)
|
(11,447,978
)
|
(169,531,376
)
|
|
Institutional 2 Class
|
|
|
|
|
|
|
|
|
|
Shares sold
|
34,157
|
830,932
|
57,386
|
1,552,892
|
1,788,145
|
26,584,807
|
2,306,144
|
35,639,654
|
|
Distributions reinvested
|
—
|
—
|
39,142
|
975,433
|
154,614
|
2,375,641
|
227,328
|
3,327,846
|
|
Shares redeemed
|
(228,779
)
|
(5,524,052
)
|
(1,107,129
)
|
(27,154,884
)
|
(2,668,374
)
|
(39,543,933
)
|
(6,232,497
)
|
(93,772,730
)
|
|
Net decrease
|
(194,622
)
|
(4,693,120
)
|
(1,010,601
)
|
(24,626,559
)
|
(725,615
)
|
(10,583,485
)
|
(3,699,025
)
|
(54,805,230
)
|
|
Institutional 3 Class
|
|
|
|
|
|
|
|
|
|
Shares sold
|
30,431
|
736,978
|
81,296
|
2,018,245
|
409,536
|
6,061,906
|
241,620
|
3,652,789
|
|
Distributions reinvested
|
—
|
—
|
20,303
|
505,535
|
19,834
|
304,149
|
23,163
|
336,817
|
|
Shares redeemed
|
(177,200
)
|
(4,340,293
)
|
(388,252
)
|
(10,931,869
)
|
(431,303
)
|
(6,433,225
)
|
(473,981
)
|
(7,427,095
)
|
|
Net decrease
|
(146,769
)
|
(3,603,315
)
|
(286,653
)
|
(8,408,089
)
|
(1,933
)
|
(67,170
)
|
(209,198
)
|
(3,437,489
)
|
|
Total net decrease
|
(1,689,811
)
|
(40,124,570
)
|
(2,986,133
)
|
(72,701,020
)
|
(8,315,108
)
|
(121,785,211
)
|
(27,875,382
)
|
(416,791,137
)
|
|
|
Columbia Acorn
European FundSM
|
|||
|
|
Year Ended
|
Year Ended
|
||
|
|
December 31, 2023
|
December 31, 2022
|
||
|
|
Shares
|
Dollars ($)
|
Shares
|
Dollars ($)
|
|
Capital stock activity
|
||||
|
Class A
|
|
|
|
|
|
Shares sold
|
365,289
|
8,256,089
|
499,655
|
12,080,215
|
|
Distributions reinvested
|
7,554
|
189,613
|
—
|
—
|
|
Shares redeemed
|
(581,752
)
|
(13,156,697
)
|
(1,088,987
)
|
(24,655,242
)
|
|
Net decrease
|
(208,909
)
|
(4,710,995
)
|
(589,332
)
|
(12,575,027
)
|
|
Advisor Class
|
|
|
|
|
|
Shares sold
|
43,377
|
1,026,335
|
25,378
|
563,008
|
|
Distributions reinvested
|
606
|
15,410
|
—
|
—
|
|
Shares redeemed
|
(27,888
)
|
(662,745
)
|
(61,288
)
|
(1,400,836
)
|
|
Net increase (decrease)
|
16,095
|
379,000
|
(35,910
)
|
(837,828
)
|
|
Class C
|
|
|
|
|
|
Shares sold
|
12,836
|
282,031
|
14,975
|
413,475
|
|
Shares redeemed
|
(59,666
)
|
(1,312,778
)
|
(114,266
)
|
(2,516,468
)
|
|
Net decrease
|
(46,830
)
|
(1,030,747
)
|
(99,291
)
|
(2,102,993
)
|
|
Institutional Class
|
|
|
|
|
|
Shares sold
|
108,834
|
2,527,044
|
620,948
|
15,491,624
|
|
Distributions reinvested
|
7,970
|
201,731
|
—
|
—
|
|
Shares redeemed
|
(1,037,033
)
|
(23,633,681
)
|
(2,102,704
)
|
(51,583,730
)
|
|
Net decrease
|
(920,229
)
|
(20,904,906
)
|
(1,481,756
)
|
(36,092,106
)
|
|
Institutional 2 Class
|
|
|
|
|
|
Shares sold
|
11,404
|
272,527
|
783,511
|
22,322,468
|
|
Distributions reinvested
|
923
|
23,655
|
—
|
—
|
|
Shares redeemed
|
(46,437
)
|
(1,091,575
)
|
(1,410,448
)
|
(35,115,863
)
|
|
Net decrease
|
(34,110
)
|
(795,393
)
|
(626,937
)
|
(12,793,395
)
|
|
Institutional 3 Class
|
|
|
|
|
|
Shares sold
|
234
|
5,416
|
189
|
5,717
|
|
Distributions reinvested
|
16
|
406
|
—
|
—
|
|
Shares redeemed
|
(351
)
|
(7,656
)
|
—
|
—
|
|
Net increase (decrease)
|
(101
)
|
(1,834
)
|
189
|
5,717
|
|
Total net decrease
|
(1,194,084
)
|
(27,064,875
)
|
(2,833,037
)
|
(64,395,632
)
|
|
|
Net asset value,
beginning of
period
|
Net
investment
income
(loss)
|
Net
realized
and
unrealized
gain (loss)
|
Total from
investment
operations
|
Distributions
from net
investment
income
|
Distributions
from net
realized
gains
|
Total
distributions to
shareholders
|
|
Class A
|
|||||||
|
Year Ended 12/31/2023
|
$6.16
|
(0.03
)
|
1.36
|
1.33
|
—
|
—
|
—
|
|
Year Ended 12/31/2022
|
$10.01
|
(0.04
)
|
(3.34
)
|
(3.38
)
|
—
|
(0.47
)
|
(0.47
)
|
|
Year Ended 12/31/2021
|
$12.69
|
(0.10
)
|
1.07
|
0.97
|
(0.14
)
|
(3.51
)
|
(3.65
)
|
|
Year Ended 12/31/2020
|
$11.71
|
(0.06
)
|
3.24
|
3.18
|
—
|
(2.20
)
|
(2.20
)
|
|
Year Ended 12/31/2019
|
$10.65
|
(0.04
)
|
2.78
|
2.74
|
—
|
(1.68
)
|
(1.68
)
|
|
Advisor Class
|
|||||||
|
Year Ended 12/31/2023
|
$9.73
|
(0.02
)
|
2.15
|
2.13
|
—
|
—
|
—
|
|
Year Ended 12/31/2022
|
$15.37
|
(0.03
)
|
(5.14
)
|
(5.17
)
|
—
|
(0.47
)
|
(0.47
)
|
|
Year Ended 12/31/2021
|
$17.65
|
(0.10
)
|
1.54
|
1.44
|
(0.13
)
|
(3.59
)
|
(3.72
)
|
|
Year Ended 12/31/2020
|
$15.52
|
(0.05
)
|
4.38
|
4.33
|
—
|
(2.20
)
|
(2.20
)
|
|
Year Ended 12/31/2019
|
$13.63
|
(0.01
)
|
3.58
|
3.57
|
—
|
(1.68
)
|
(1.68
)
|
|
Class C
|
|||||||
|
Year Ended 12/31/2023
|
$8.61
|
(0.11
)
|
1.89
|
1.78
|
—
|
—
|
—
|
|
Year Ended 12/31/2022
|
$13.72
|
(0.13
)
|
(4.57
)
|
(4.70
)
|
—
|
(0.41
)
|
(0.41
)
|
|
Year Ended 12/31/2021
|
$16.14
|
(0.26
)
|
1.40
|
1.14
|
(0.13
)
|
(3.43
)
|
(3.56
)
|
|
Year Ended 12/31/2020(e)
|
$16.57
|
(0.20
)
|
4.08
|
3.88
|
—
|
(4.31
)
|
(4.31
)
|
|
Year Ended 12/31/2019(e)
|
$18.75
|
(0.20
)
|
4.74
|
4.54
|
—
|
(6.72
)
|
(6.72
)
|
|
Institutional Class
|
|||||||
|
Year Ended 12/31/2023
|
$8.97
|
(0.02
)
|
1.98
|
1.96
|
—
|
—
|
—
|
|
Year Ended 12/31/2022
|
$14.22
|
(0.03
)
|
(4.75
)
|
(4.78
)
|
—
|
(0.47
)
|
(0.47
)
|
|
Year Ended 12/31/2021
|
$16.60
|
(0.09
)
|
1.43
|
1.34
|
(0.13
)
|
(3.59
)
|
(3.72
)
|
|
Year Ended 12/31/2020
|
$14.70
|
(0.04
)
|
4.14
|
4.10
|
—
|
(2.20
)
|
(2.20
)
|
|
Year Ended 12/31/2019
|
$12.98
|
(0.01
)
|
3.41
|
3.40
|
—
|
(1.68
)
|
(1.68
)
|
|
Institutional 2 Class
|
|||||||
|
Year Ended 12/31/2023
|
$9.89
|
(0.02
)
|
2.19
|
2.17
|
—
|
—
|
—
|
|
Year Ended 12/31/2022
|
$15.62
|
(0.03
)
|
(5.23
)
|
(5.26
)
|
—
|
(0.47
)
|
(0.47
)
|
|
Year Ended 12/31/2021
|
$17.88
|
(0.10
)
|
1.57
|
1.47
|
(0.13
)
|
(3.60
)
|
(3.73
)
|
|
Year Ended 12/31/2020
|
$15.69
|
(0.04
)
|
4.43
|
4.39
|
—
|
(2.20
)
|
(2.20
)
|
|
Year Ended 12/31/2019
|
$13.76
|
(0.00
)(f)
|
3.61
|
3.61
|
—
|
(1.68
)
|
(1.68
)
|
|
|
Net
asset
value,
end of
period
|
Total
return
|
Total gross
expense
ratio to
average
net assets(a)
|
Total net
expense
ratio to
average
net assets(a)
|
Net investment
income (loss)
ratio to
average
net assets
|
Portfolio
turnover
|
Net
assets,
end of
period
(000’s)
|
|
Class A
|
|||||||
|
Year Ended 12/31/2023
|
$7.49
|
21.59%
(b)
|
1.15%
|
1.08%
(c)
|
(0.46%
)
|
64%
|
$570,240
|
|
Year Ended 12/31/2022
|
$6.16
|
(34.01%
)
|
1.08%
(d)
|
1.08%
(c),(d)
|
(0.53%
)
|
64%
|
$521,243
|
|
Year Ended 12/31/2021
|
$10.01
|
8.79%
|
1.08%
|
1.08%
(c)
|
(0.80%
)
|
75%
|
$919,643
|
|
Year Ended 12/31/2020
|
$12.69
|
29.18%
(b)
|
1.11%
|
1.11%
(c)
|
(0.56%
)
|
86%
|
$983,709
|
|
Year Ended 12/31/2019
|
$11.71
|
26.21%
(b)
|
1.11%
|
1.10%
(c)
|
(0.30%
)
|
101%
|
$810,966
|
|
Advisor Class
|
|||||||
|
Year Ended 12/31/2023
|
$11.86
|
21.89%
(b)
|
0.90%
|
0.83%
(c)
|
(0.20%
)
|
64%
|
$36,287
|
|
Year Ended 12/31/2022
|
$9.73
|
(33.79%
)
|
0.83%
(d)
|
0.83%
(c),(d)
|
(0.27%
)
|
64%
|
$21,946
|
|
Year Ended 12/31/2021
|
$15.37
|
9.03%
|
0.83%
|
0.83%
(c)
|
(0.55%
)
|
75%
|
$39,676
|
|
Year Ended 12/31/2020
|
$17.65
|
29.44%
(b)
|
0.86%
|
0.86%
(c)
|
(0.30%
)
|
86%
|
$44,139
|
|
Year Ended 12/31/2019
|
$15.52
|
26.58%
(b)
|
0.86%
|
0.85%
(c)
|
(0.05%
)
|
101%
|
$44,248
|
|
Class C
|
|||||||
|
Year Ended 12/31/2023
|
$10.39
|
20.67%
(b)
|
1.90%
|
1.83%
(c)
|
(1.21%
)
|
64%
|
$8,991
|
|
Year Ended 12/31/2022
|
$8.61
|
(34.48%
)
|
1.83%
(d)
|
1.83%
(c),(d)
|
(1.29%
)
|
64%
|
$9,153
|
|
Year Ended 12/31/2021
|
$13.72
|
7.95%
|
1.83%
|
1.83%
(c)
|
(1.54%
)
|
75%
|
$24,546
|
|
Year Ended 12/31/2020(e)
|
$16.14
|
28.27%
(b)
|
1.86%
|
1.86%
(c)
|
(1.30%
)
|
86%
|
$55,861
|
|
Year Ended 12/31/2019(e)
|
$16.57
|
25.12%
(b)
|
1.86%
|
1.85%
(c)
|
(1.05%
)
|
101%
|
$69,471
|
|
Institutional Class
|
|||||||
|
Year Ended 12/31/2023
|
$10.93
|
21.85%
(b)
|
0.90%
|
0.83%
(c)
|
(0.21%
)
|
64%
|
$2,110,299
|
|
Year Ended 12/31/2022
|
$8.97
|
(33.78%
)
|
0.83%
(d)
|
0.83%
(c),(d)
|
(0.28%
)
|
64%
|
$1,865,518
|
|
Year Ended 12/31/2021
|
$14.22
|
8.99%
|
0.83%
|
0.83%
(c)
|
(0.55%
)
|
75%
|
$3,413,006
|
|
Year Ended 12/31/2020
|
$16.60
|
29.51%
(b)
|
0.86%
|
0.86%
(c)
|
(0.30%
)
|
86%
|
$3,569,794
|
|
Year Ended 12/31/2019
|
$14.70
|
26.60%
(b)
|
0.86%
|
0.85%
(c)
|
(0.05%
)
|
101%
|
$3,117,486
|
|
Institutional 2 Class
|
|||||||
|
Year Ended 12/31/2023
|
$12.06
|
21.94%
(b)
|
0.87%
|
0.81%
|
(0.18%
)
|
64%
|
$28,765
|
|
Year Ended 12/31/2022
|
$9.89
|
(33.83%
)(b)
|
0.81%
(d)
|
0.80%
(d)
|
(0.26%
)
|
64%
|
$23,445
|
|
Year Ended 12/31/2021
|
$15.62
|
9.09%
(b)
|
0.80%
|
0.80%
|
(0.52%
)
|
75%
|
$52,797
|
|
Year Ended 12/31/2020
|
$17.88
|
29.50%
(b)
|
0.83%
|
0.82%
|
(0.27%
)
|
86%
|
$61,000
|
|
Year Ended 12/31/2019
|
$15.69
|
26.63%
(b)
|
0.83%
|
0.82%
|
(0.02%
)
|
101%
|
$51,584
|
|
|
Net asset value,
beginning of
period
|
Net
investment
income
(loss)
|
Net
realized
and
unrealized
gain (loss)
|
Total from
investment
operations
|
Distributions
from net
investment
income
|
Distributions
from net
realized
gains
|
Total
distributions to
shareholders
|
|
Institutional 3 Class
|
|||||||
|
Year Ended 12/31/2023
|
$10.07
|
(0.02
)
|
2.23
|
2.21
|
—
|
—
|
—
|
|
Year Ended 12/31/2022
|
$15.88
|
(0.02
)
|
(5.32
)
|
(5.34
)
|
—
|
(0.47
)
|
(0.47
)
|
|
Year Ended 12/31/2021
|
$18.12
|
(0.09
)
|
1.60
|
1.51
|
(0.14
)
|
(3.61
)
|
(3.75
)
|
|
Year Ended 12/31/2020
|
$15.87
|
(0.04
)
|
4.49
|
4.45
|
—
|
(2.20
)
|
(2.20
)
|
|
Year Ended 12/31/2019
|
$13.89
|
0.00
(f)
|
3.66
|
3.66
|
—
|
(1.68
)
|
(1.68
)
|
|
Notes to Financial Highlights
|
|
|
(a)
|
In addition to the fees and expenses that the Fund bears directly, the Fund indirectly bears a pro rata share of the fees
and expenses of any other funds in which it invests, if any. Such indirect expenses are not included in the Fund’s reported expense ratios.
|
|
(b)
|
Had the Investment Manager and/or Transfer Agent not waived fees and/or reimbursed a portion of expenses, total return would
have been reduced.
|
|
(c)
|
The benefits derived from expense reductions had an impact of less than 0.01%.
|
|
(d)
|
Ratios include Trustees’ fees deferred during the current period as well as any gains or losses on the Trustees’ deferred compensation balances as a result of market fluctuations. If these had been excluded, expenses would have been higher by 0.03%.
|
|
(e)
|
Per share amounts have been adjusted on a retroactive basis to reflect a 4 to 1 reverse stock split completed after the close
of business on September 11, 2020.
|
|
(f)
|
Rounds to zero.
|
|
|
Net
asset
value,
end of
period
|
Total
return
|
Total gross
expense
ratio to
average
net assets(a)
|
Total net
expense
ratio to
average
net assets(a)
|
Net investment
income (loss)
ratio to
average
net assets
|
Portfolio
turnover
|
Net
assets,
end of
period
(000’s)
|
|
Institutional 3 Class
|
|||||||
|
Year Ended 12/31/2023
|
$12.28
|
21.95%
(b)
|
0.83%
|
0.76%
|
(0.17%
)
|
64%
|
$28,181
|
|
Year Ended 12/31/2022
|
$10.07
|
(33.77%
)
|
0.77%
(d)
|
0.77%
(d)
|
(0.23%
)
|
64%
|
$47,945
|
|
Year Ended 12/31/2021
|
$15.88
|
9.16%
|
0.75%
|
0.75%
|
(0.46%
)
|
75%
|
$78,955
|
|
Year Ended 12/31/2020
|
$18.12
|
29.54%
(b)
|
0.78%
|
0.78%
|
(0.25%
)
|
86%
|
$155,338
|
|
Year Ended 12/31/2019
|
$15.87
|
26.74%
(b)
|
0.78%
|
0.77%
|
0.03%
|
101%
|
$65,408
|
|
|
Net asset value,
beginning of
period
|
Net
investment
income
(loss)
|
Net
realized
and
unrealized
gain (loss)
|
Total from
investment
operations
|
Distributions
from net
investment
income
|
Distributions
from net
realized
gains
|
Total
distributions to
shareholders
|
|
Class A
|
|||||||
|
Year Ended 12/31/2023
|
$21.34
|
0.09
|
4.03
|
4.12
|
—
|
—
|
—
|
|
Year Ended 12/31/2022
|
$33.19
|
0.17
(f)
|
(11.35
)
|
(11.18
)
|
—
|
(0.67
)
|
(0.67
)
|
|
Year Ended 12/31/2021
|
$34.31
|
0.01
|
4.08
|
4.09
|
(0.38
)
|
(4.83
)
|
(5.21
)
|
|
Year Ended 12/31/2020
|
$34.20
|
0.06
|
4.51
|
4.57
|
(0.20
)
|
(4.26
)
|
(4.46
)
|
|
Year Ended 12/31/2019
|
$29.48
|
0.25
|
8.19
|
8.44
|
(0.65
)
|
(3.07
)
|
(3.72
)
|
|
Advisor Class
|
|||||||
|
Year Ended 12/31/2023
|
$21.82
|
0.18
|
4.09
|
4.27
|
—
|
—
|
—
|
|
Year Ended 12/31/2022
|
$33.82
|
0.22
(f)
|
(11.55
)
|
(11.33
)
|
—
|
(0.67
)
|
(0.67
)
|
|
Year Ended 12/31/2021
|
$34.95
|
0.05
|
4.20
|
4.25
|
(0.55
)
|
(4.83
)
|
(5.38
)
|
|
Year Ended 12/31/2020
|
$34.67
|
0.16
|
4.58
|
4.74
|
(0.20
)
|
(4.26
)
|
(4.46
)
|
|
Year Ended 12/31/2019
|
$29.84
|
0.33
|
8.30
|
8.63
|
(0.73
)
|
(3.07
)
|
(3.80
)
|
|
Class C
|
|||||||
|
Year Ended 12/31/2023
|
$19.13
|
(0.07
)
|
3.58
|
3.51
|
—
|
—
|
—
|
|
Year Ended 12/31/2022
|
$30.07
|
(0.02
)(f)
|
(10.25
)
|
(10.27
)
|
—
|
(0.67
)
|
(0.67
)
|
|
Year Ended 12/31/2021
|
$31.43
|
(0.24
)
|
3.72
|
3.48
|
(0.01
)
|
(4.83
)
|
(4.84
)
|
|
Year Ended 12/31/2020
|
$31.92
|
(0.17
)
|
4.14
|
3.97
|
(0.20
)
|
(4.26
)
|
(4.46
)
|
|
Year Ended 12/31/2019
|
$27.63
|
0.00
(h)
|
7.65
|
7.65
|
(0.29
)
|
(3.07
)
|
(3.36
)
|
|
Institutional Class
|
|||||||
|
Year Ended 12/31/2023
|
$21.46
|
0.15
|
4.05
|
4.20
|
—
|
—
|
—
|
|
Year Ended 12/31/2022
|
$33.28
|
0.23
(f)
|
(11.38
)
|
(11.15
)
|
—
|
(0.67
)
|
(0.67
)
|
|
Year Ended 12/31/2021
|
$34.47
|
0.10
|
4.09
|
4.19
|
(0.55
)
|
(4.83
)
|
(5.38
)
|
|
Year Ended 12/31/2020
|
$34.25
|
0.14
|
4.54
|
4.68
|
(0.20
)
|
(4.26
)
|
(4.46
)
|
|
Year Ended 12/31/2019
|
$29.51
|
0.33
|
8.21
|
8.54
|
(0.73
)
|
(3.07
)
|
(3.80
)
|
|
Institutional 2 Class
|
|||||||
|
Year Ended 12/31/2023
|
$21.45
|
0.17
|
4.04
|
4.21
|
—
|
—
|
—
|
|
Year Ended 12/31/2022
|
$33.25
|
0.24
(f)
|
(11.37
)
|
(11.13
)
|
—
|
(0.67
)
|
(0.67
)
|
|
Year Ended 12/31/2021
|
$34.46
|
0.12
|
4.09
|
4.21
|
(0.59
)
|
(4.83
)
|
(5.42
)
|
|
Year Ended 12/31/2020
|
$34.22
|
0.16
|
4.54
|
4.70
|
(0.20
)
|
(4.26
)
|
(4.46
)
|
|
Year Ended 12/31/2019
|
$29.49
|
0.35
|
8.20
|
8.55
|
(0.75
)
|
(3.07
)
|
(3.82
)
|
|
Institutional 3 Class
|
|||||||
|
Year Ended 12/31/2023
|
$21.84
|
0.18
|
4.13
|
4.31
|
—
|
—
|
—
|
|
Year Ended 12/31/2022
|
$33.83
|
0.26
(f)
|
(11.58
)
|
(11.32
)
|
—
|
(0.67
)
|
(0.67
)
|
|
Year Ended 12/31/2021
|
$34.99
|
0.15
|
4.14
|
4.29
|
(0.62
)
|
(4.83
)
|
(5.45
)
|
|
Year Ended 12/31/2020
|
$34.67
|
0.19
|
4.59
|
4.78
|
(0.20
)
|
(4.26
)
|
(4.46
)
|
|
Year Ended 12/31/2019
|
$29.83
|
0.37
|
8.30
|
8.67
|
(0.76
)
|
(3.07
)
|
(3.83
)
|
|
|
Net
asset
value,
end of
period
|
Total
return(a)
|
Total gross
expense
ratio to
average
net assets(b)
|
Total net
expense
ratio to
average
net assets(b)
|
Net investment
income (loss)
ratio to
average
net assets
|
Portfolio
turnover
|
Net
assets,
end of
period
(000’s)
|
|
Class A
|
|||||||
|
Year Ended 12/31/2023
|
$25.46
|
19.31%
|
1.37%
(c),(d)
|
1.24%
(c),(d),(e)
|
0.41%
|
46%
|
$155,877
|
|
Year Ended 12/31/2022
|
$21.34
|
(33.81%
)
|
1.27%
(c),(d),(g)
|
1.23%
(c),(d),(e),(g)
|
0.71%
|
29%
|
$151,725
|
|
Year Ended 12/31/2021
|
$33.19
|
12.63%
|
1.24%
(d)
|
1.23%
(d),(e)
|
0.03%
|
27%
|
$282,125
|
|
Year Ended 12/31/2020
|
$34.31
|
14.68%
|
1.28%
(d)
|
1.24%
(d),(e)
|
0.21%
|
55%
|
$283,478
|
|
Year Ended 12/31/2019
|
$34.20
|
29.56%
|
1.27%
(d)
|
1.24%
(d),(e)
|
0.76%
|
32%
|
$307,872
|
|
Advisor Class
|
|||||||
|
Year Ended 12/31/2023
|
$26.09
|
19.57%
|
1.11%
(c),(d)
|
0.99%
(c),(d),(e)
|
0.77%
|
46%
|
$5,689
|
|
Year Ended 12/31/2022
|
$21.82
|
(33.62%
)
|
1.04%
(c),(d),(g)
|
0.98%
(c),(d),(e),(g)
|
0.96%
|
29%
|
$6,644
|
|
Year Ended 12/31/2021
|
$33.82
|
12.88%
|
0.99%
(d)
|
0.98%
(d),(e)
|
0.14%
|
27%
|
$9,279
|
|
Year Ended 12/31/2020
|
$34.95
|
14.98%
|
1.03%
(d)
|
0.99%
(d),(e)
|
0.52%
|
55%
|
$22,549
|
|
Year Ended 12/31/2019
|
$34.67
|
29.86%
|
1.02%
(d)
|
0.99%
(d),(e)
|
1.00%
|
32%
|
$12,733
|
|
Class C
|
|||||||
|
Year Ended 12/31/2023
|
$22.64
|
18.35%
|
2.11%
(c),(d)
|
1.99%
(c),(d),(e)
|
(0.33%
)
|
46%
|
$3,321
|
|
Year Ended 12/31/2022
|
$19.13
|
(34.30%
)
|
2.02%
(c),(d),(g)
|
1.98%
(c),(d),(e),(g)
|
(0.07%
)
|
29%
|
$4,070
|
|
Year Ended 12/31/2021
|
$30.07
|
11.76%
|
1.99%
(d)
|
1.98%
(d),(e)
|
(0.74%
)
|
27%
|
$10,687
|
|
Year Ended 12/31/2020
|
$31.43
|
13.82%
|
2.02%
(d)
|
1.99%
(d),(e)
|
(0.57%
)
|
55%
|
$19,998
|
|
Year Ended 12/31/2019
|
$31.92
|
28.61%
|
2.02%
(d)
|
2.00%
(d),(e)
|
0.01%
|
32%
|
$18,749
|
|
Institutional Class
|
|||||||
|
Year Ended 12/31/2023
|
$25.66
|
19.57%
|
1.12%
(c),(d)
|
0.99%
(c),(d),(e)
|
0.66%
|
46%
|
$837,217
|
|
Year Ended 12/31/2022
|
$21.46
|
(33.63%
)
|
1.03%
(c),(d),(g)
|
0.98%
(c),(d),(e),(g)
|
0.96%
|
29%
|
$906,415
|
|
Year Ended 12/31/2021
|
$33.28
|
12.89%
|
0.99%
(d)
|
0.98%
(d),(e)
|
0.28%
|
27%
|
$1,727,042
|
|
Year Ended 12/31/2020
|
$34.47
|
14.99%
|
1.03%
(d)
|
0.99%
(d),(e)
|
0.46%
|
55%
|
$1,760,927
|
|
Year Ended 12/31/2019
|
$34.25
|
29.89%
|
1.02%
(d)
|
0.99%
(d),(e)
|
1.01%
|
32%
|
$1,947,995
|
|
Institutional 2 Class
|
|||||||
|
Year Ended 12/31/2023
|
$25.66
|
19.63%
|
1.05%
(c),(d)
|
0.92%
(c),(d)
|
0.75%
|
46%
|
$22,937
|
|
Year Ended 12/31/2022
|
$21.45
|
(33.60%
)
|
0.97%
(c),(d),(g)
|
0.92%
(c),(d),(g)
|
1.04%
|
29%
|
$80,059
|
|
Year Ended 12/31/2021
|
$33.25
|
12.97%
|
0.95%
(d)
|
0.92%
(d)
|
0.34%
|
27%
|
$126,973
|
|
Year Ended 12/31/2020
|
$34.46
|
15.06%
|
0.97%
(d)
|
0.92%
(d)
|
0.53%
|
55%
|
$129,576
|
|
Year Ended 12/31/2019
|
$34.22
|
29.95%
|
0.97%
(d)
|
0.93%
(d)
|
1.06%
|
32%
|
$183,763
|
|
Institutional 3 Class
|
|||||||
|
Year Ended 12/31/2023
|
$26.15
|
19.73%
|
1.01%
(c),(d)
|
0.89%
(c),(d)
|
0.77%
|
46%
|
$131,038
|
|
Year Ended 12/31/2022
|
$21.84
|
(33.58%
)
|
0.92%
(c),(d),(g)
|
0.88%
(c),(d),(g)
|
1.10%
|
29%
|
$133,738
|
|
Year Ended 12/31/2021
|
$33.83
|
13.00%
|
0.90%
(d)
|
0.88%
(d)
|
0.40%
|
27%
|
$179,991
|
|
Year Ended 12/31/2020
|
$34.99
|
15.10%
|
0.93%
(d)
|
0.88%
(d)
|
0.60%
|
55%
|
$277,614
|
|
Year Ended 12/31/2019
|
$34.67
|
30.04%
|
0.92%
(d)
|
0.89%
(d)
|
1.12%
|
32%
|
$239,441
|
|
|
Net asset value,
beginning of
period
|
Net
investment
income
(loss)
|
Net
realized
and
unrealized
gain (loss)
|
Total from
investment
operations
|
Distributions
from net
investment
income
|
Distributions
from net
realized
gains
|
Total
distributions to
shareholders
|
|
Class R
|
|||||||
|
Year Ended 12/31/2023
|
$21.29
|
0.04
|
4.00
|
4.04
|
—
|
—
|
—
|
|
Year Ended 12/31/2022
|
$33.19
|
0.11
(f)
|
(11.34
)
|
(11.23
)
|
—
|
(0.67
)
|
(0.67
)
|
|
Year Ended 12/31/2021
|
$34.24
|
(0.08
)
|
4.07
|
3.99
|
(0.21
)
|
(4.83
)
|
(5.04
)
|
|
Year Ended 12/31/2020
|
$34.22
|
(0.01
)
|
4.49
|
4.48
|
(0.20
)
|
(4.26
)
|
(4.46
)
|
|
Year Ended 12/31/2019
|
$29.44
|
0.06
|
8.27
|
8.33
|
(0.48
)
|
(3.07
)
|
(3.55
)
|
|
Notes to Financial Highlights
|
|
|
(a)
|
Had the Investment Manager and/or Transfer Agent not waived fees and/or reimbursed a portion of expenses, total return would
have been reduced.
|
|
(b)
|
In addition to the fees and expenses that the Fund bears directly, the Fund indirectly bears a pro rata share of the fees
and expenses of any other funds in which it invests, if any. Such indirect expenses are not included in the Fund’s reported expense ratios.
|
|
(c)
|
Ratios include interest on collateral expense which is less than 0.01%.
|
|
(d)
|
Ratios include line of credit interest expense. For the periods indicated below, if line of credit interest expense had been
excluded, expenses would have been lower by:
|
|
Class
|
12/31/2023
|
12/31/2022
|
12/31/2021
|
12/31/2020
|
12/31/2019
|
|
Class A
|
0.01%
|
less than 0.01%
|
—%
|
less than 0.01%
|
less than 0.01%
|
|
Advisor Class
|
0.01%
|
less than 0.01%
|
—%
|
less than 0.01%
|
less than 0.01%
|
|
Class C
|
0.01%
|
less than 0.01%
|
—%
|
less than 0.01%
|
less than 0.01%
|
|
Institutional Class
|
0.01%
|
less than 0.01%
|
—%
|
less than 0.01%
|
less than 0.01%
|
|
Institutional 2 Class
|
less than 0.01%
|
less than 0.01%
|
—%
|
less than 0.01%
|
less than 0.01%
|
|
Institutional 3 Class
|
0.01%
|
less than 0.01%
|
—%
|
less than 0.01%
|
less than 0.01%
|
|
Class R
|
0.01%
|
less than 0.01%
|
—%
|
less than 0.01%
|
less than 0.01%
|
|
(e)
|
The benefits derived from expense reductions had an impact of less than 0.01%.
|
|
(f)
|
Net investment income per share includes European Union tax reclaims. The effect of these reclaims amounted to $0.02 per share.
|
|
(g)
|
Ratios include Trustees’ fees deferred during the current period as well as any gains or losses on the Trustees’ deferred compensation balances as a result of market fluctuations. If these had been excluded, expenses would have been higher by 0.03%.
|
|
(h)
|
Rounds to zero.
|
|
|
Net
asset
value,
end of
period
|
Total
return(a)
|
Total gross
expense
ratio to
average
net assets(b)
|
Total net
expense
ratio to
average
net assets(b)
|
Net investment
income (loss)
ratio to
average
net assets
|
Portfolio
turnover
|
Net
assets,
end of
period
(000’s)
|
|
Class R
|
|||||||
|
Year Ended 12/31/2023
|
$25.33
|
18.98%
|
1.62%
(c),(d)
|
1.49%
(c),(d),(e)
|
0.16%
|
46%
|
$2,109
|
|
Year Ended 12/31/2022
|
$21.29
|
(33.96%
)
|
1.52%
(c),(d),(g)
|
1.48%
(c),(d),(e),(g)
|
0.47%
|
29%
|
$2,077
|
|
Year Ended 12/31/2021
|
$33.19
|
12.34%
|
1.49%
(d)
|
1.48%
(d),(e)
|
(0.22%
)
|
27%
|
$3,691
|
|
Year Ended 12/31/2020
|
$34.24
|
14.40%
|
1.53%
(d)
|
1.49%
(d),(e)
|
(0.04%
)
|
55%
|
$3,398
|
|
Year Ended 12/31/2019
|
$34.22
|
29.21%
|
1.52%
(d)
|
1.50%
(d),(e)
|
0.19%
|
32%
|
$3,696
|
|
|
Net asset value,
beginning of
period
|
Net
investment
income
(loss)
|
Net
realized
and
unrealized
gain (loss)
|
Total from
investment
operations
|
Distributions
from net
investment
income
|
Distributions
from net
realized
gains
|
Total
distributions to
shareholders
|
|
Class A
|
|||||||
|
Year Ended 12/31/2023
|
$21.57
|
0.07
|
3.84
|
3.91
|
—
|
—
|
—
|
|
Year Ended 12/31/2022
|
$35.43
|
0.12
(e)
|
(13.06
)
|
(12.94
)
|
—
|
(0.92
)
|
(0.92
)
|
|
Year Ended 12/31/2021
|
$33.67
|
(0.05
)
|
3.50
|
3.45
|
(0.28
)
|
(1.41
)
|
(1.69
)
|
|
Year Ended 12/31/2020
|
$28.58
|
(0.03
)
|
5.21
|
5.18
|
(0.09
)
|
—
|
(0.09
)
|
|
Year Ended 12/31/2019
|
$23.44
|
0.09
|
7.67
|
7.76
|
(0.28
)
|
(2.34
)
|
(2.62
)
|
|
Advisor Class
|
|||||||
|
Year Ended 12/31/2023
|
$22.21
|
0.13
|
3.95
|
4.08
|
—
|
—
|
—
|
|
Year Ended 12/31/2022
|
$36.35
|
0.18
(e)
|
(13.40
)
|
(13.22
)
|
—
|
(0.92
)
|
(0.92
)
|
|
Year Ended 12/31/2021
|
$34.56
|
0.04
|
3.59
|
3.63
|
(0.43
)
|
(1.41
)
|
(1.84
)
|
|
Year Ended 12/31/2020
|
$29.26
|
0.04
|
5.35
|
5.39
|
(0.09
)
|
—
|
(0.09
)
|
|
Year Ended 12/31/2019
|
$24.00
|
0.18
|
7.84
|
8.02
|
(0.42
)
|
(2.34
)
|
(2.76
)
|
|
Class C
|
|||||||
|
Year Ended 12/31/2023
|
$19.16
|
(0.09
)
|
3.39
|
3.30
|
—
|
—
|
—
|
|
Year Ended 12/31/2022
|
$31.86
|
(0.06
)(e)
|
(11.72
)
|
(11.78
)
|
—
|
(0.92
)
|
(0.92
)
|
|
Year Ended 12/31/2021
|
$30.40
|
(0.30
)
|
3.17
|
2.87
|
—
|
(1.41
)
|
(1.41
)
|
|
Year Ended 12/31/2020
|
$26.00
|
(0.23
)
|
4.72
|
4.49
|
(0.09
)
|
—
|
(0.09
)
|
|
Year Ended 12/31/2019
|
$21.48
|
(0.10
)
|
6.99
|
6.89
|
(0.03
)
|
(2.34
)
|
(2.37
)
|
|
Institutional Class
|
|||||||
|
Year Ended 12/31/2023
|
$21.99
|
0.13
|
3.92
|
4.05
|
—
|
—
|
—
|
|
Year Ended 12/31/2022
|
$36.01
|
0.18
(e)
|
(13.28
)
|
(13.10
)
|
—
|
(0.92
)
|
(0.92
)
|
|
Year Ended 12/31/2021
|
$34.25
|
0.04
|
3.56
|
3.60
|
(0.43
)
|
(1.41
)
|
(1.84
)
|
|
Year Ended 12/31/2020
|
$29.00
|
0.03
|
5.31
|
5.34
|
(0.09
)
|
—
|
(0.09
)
|
|
Year Ended 12/31/2019
|
$23.81
|
0.17
|
7.78
|
7.95
|
(0.42
)
|
(2.34
)
|
(2.76
)
|
|
Institutional 2 Class
|
|||||||
|
Year Ended 12/31/2023
|
$22.22
|
0.15
|
3.97
|
4.12
|
—
|
—
|
—
|
|
Year Ended 12/31/2022
|
$36.33
|
0.20
(e)
|
(13.39
)
|
(13.19
)
|
—
|
(0.92
)
|
(0.92
)
|
|
Year Ended 12/31/2021
|
$34.57
|
0.06
|
3.60
|
3.66
|
(0.49
)
|
(1.41
)
|
(1.90
)
|
|
Year Ended 12/31/2020
|
$29.24
|
0.08
|
5.34
|
5.42
|
(0.09
)
|
—
|
(0.09
)
|
|
Year Ended 12/31/2019
|
$24.01
|
0.18
|
7.86
|
8.04
|
(0.47
)
|
(2.34
)
|
(2.81
)
|
|
|
Net
asset
value,
end of
period
|
Total
return(a)
|
Total gross
expense
ratio to
average
net assets(b)
|
Total net
expense
ratio to
average
net assets(b)
|
Net investment
income (loss)
ratio to
average
net assets
|
Portfolio
turnover
|
Net
assets,
end of
period
(000’s)
|
|
Class A
|
|||||||
|
Year Ended 12/31/2023
|
$25.48
|
18.13%
|
1.55%
(c)
|
1.23%
(c),(d)
|
0.30%
|
43%
|
$128,076
|
|
Year Ended 12/31/2022
|
$21.57
|
(36.80%
)
|
1.50%
(c),(f)
|
1.24%
(c),(d),(f)
|
0.48%
|
21%
|
$124,963
|
|
Year Ended 12/31/2021
|
$35.43
|
10.49%
|
1.44%
(c)
|
1.23%
(c),(d)
|
(0.15%
)
|
27%
|
$235,103
|
|
Year Ended 12/31/2020
|
$33.67
|
18.21%
|
1.48%
|
1.26%
(d)
|
(0.10%
)
|
68%
|
$230,519
|
|
Year Ended 12/31/2019
|
$28.58
|
33.37%
|
1.54%
(c)
|
1.35%
(c),(d)
|
0.34%
|
46%
|
$37,461
|
|
Advisor Class
|
|||||||
|
Year Ended 12/31/2023
|
$26.29
|
18.37%
|
1.30%
(c)
|
0.98%
(c),(d)
|
0.54%
|
43%
|
$932
|
|
Year Ended 12/31/2022
|
$22.21
|
(36.63%
)
|
1.24%
(c),(f)
|
0.99%
(c),(d),(f)
|
0.71%
|
21%
|
$924
|
|
Year Ended 12/31/2021
|
$36.35
|
10.78%
|
1.19%
(c)
|
0.98%
(c),(d)
|
0.11%
|
27%
|
$2,462
|
|
Year Ended 12/31/2020
|
$34.56
|
18.51%
|
1.23%
|
1.02%
(d)
|
0.12%
|
68%
|
$2,748
|
|
Year Ended 12/31/2019
|
$29.26
|
33.73%
|
1.29%
(c)
|
1.10%
(c),(d)
|
0.63%
|
46%
|
$2,030
|
|
Class C
|
|||||||
|
Year Ended 12/31/2023
|
$22.46
|
17.22%
|
2.31%
(c)
|
1.98%
(c),(d)
|
(0.46%
)
|
43%
|
$1,080
|
|
Year Ended 12/31/2022
|
$19.16
|
(37.29%
)
|
2.25%
(c),(f)
|
1.99%
(c),(d),(f)
|
(0.27%
)
|
21%
|
$1,085
|
|
Year Ended 12/31/2021
|
$31.86
|
9.68%
|
2.19%
(c)
|
1.98%
(c),(d)
|
(0.93%
)
|
27%
|
$2,146
|
|
Year Ended 12/31/2020
|
$30.40
|
17.37%
|
2.23%
|
2.02%
(d)
|
(0.88%
)
|
68%
|
$3,251
|
|
Year Ended 12/31/2019
|
$26.00
|
32.31%
|
2.29%
(c)
|
2.10%
(c),(d)
|
(0.42%
)
|
46%
|
$2,493
|
|
Institutional Class
|
|||||||
|
Year Ended 12/31/2023
|
$26.04
|
18.42%
|
1.30%
(c)
|
0.98%
(c),(d)
|
0.55%
|
43%
|
$79,765
|
|
Year Ended 12/31/2022
|
$21.99
|
(36.65%
)
|
1.25%
(c),(f)
|
0.99%
(c),(d),(f)
|
0.73%
|
21%
|
$79,829
|
|
Year Ended 12/31/2021
|
$36.01
|
10.79%
|
1.19%
(c)
|
0.98%
(c),(d)
|
0.10%
|
27%
|
$159,876
|
|
Year Ended 12/31/2020
|
$34.25
|
18.50%
|
1.23%
|
1.02%
(d)
|
0.12%
|
68%
|
$155,133
|
|
Year Ended 12/31/2019
|
$29.00
|
33.71%
|
1.29%
(c)
|
1.10%
(c),(d)
|
0.59%
|
46%
|
$88,922
|
|
Institutional 2 Class
|
|||||||
|
Year Ended 12/31/2023
|
$26.34
|
18.54%
|
1.16%
(c)
|
0.86%
(c)
|
0.64%
|
43%
|
$5,810
|
|
Year Ended 12/31/2022
|
$22.22
|
(36.57%
)
|
1.11%
(c),(f)
|
0.89%
(c),(f)
|
0.78%
|
21%
|
$9,225
|
|
Year Ended 12/31/2021
|
$36.33
|
10.87%
|
1.10%
(c)
|
0.89%
(c)
|
0.17%
|
27%
|
$51,805
|
|
Year Ended 12/31/2020
|
$34.57
|
18.63%
|
1.15%
|
0.93%
|
0.27%
|
68%
|
$77,420
|
|
Year Ended 12/31/2019
|
$29.24
|
33.82%
|
1.22%
(c)
|
1.00%
(c)
|
0.65%
|
46%
|
$3,392
|
|
|
Net asset value,
beginning of
period
|
Net
investment
income
(loss)
|
Net
realized
and
unrealized
gain (loss)
|
Total from
investment
operations
|
Distributions
from net
investment
income
|
Distributions
from net
realized
gains
|
Total
distributions to
shareholders
|
|
Institutional 3 Class
|
|||||||
|
Year Ended 12/31/2023
|
$22.21
|
0.17
|
3.97
|
4.14
|
—
|
—
|
—
|
|
Year Ended 12/31/2022
|
$36.31
|
0.21
(e)
|
(13.39
)
|
(13.18
)
|
—
|
(0.92
)
|
(0.92
)
|
|
Year Ended 12/31/2021
|
$34.56
|
0.09
|
3.59
|
3.68
|
(0.52
)
|
(1.41
)
|
(1.93
)
|
|
Year Ended 12/31/2020
|
$29.22
|
0.07
|
5.36
|
5.43
|
(0.09
)
|
—
|
(0.09
)
|
|
Year Ended 12/31/2019
|
$24.00
|
0.20
|
7.86
|
8.06
|
(0.50
)
|
(2.34
)
|
(2.84
)
|
|
Notes to Financial Highlights
|
|
|
(a)
|
Had the Investment Manager and/or Transfer Agent not waived fees and/or reimbursed a portion of expenses, total return would
have been reduced.
|
|
(b)
|
In addition to the fees and expenses that the Fund bears directly, the Fund indirectly bears a pro rata share of the fees
and expenses of any other funds in which it invests, if any. Such indirect expenses are not included in the Fund’s reported expense ratios.
|
|
(c)
|
Ratios include line of credit interest expense which is less than 0.01%.
|
|
(d)
|
The benefits derived from expense reductions had an impact of less than 0.01%.
|
|
(e)
|
Net investment income per share includes European Union tax reclaims. The effect of these reclaims amounted to $0.02 per share.
|
|
(f)
|
Ratios include Trustees’ fees deferred during the current period as well as any gains or losses on the Trustees’ deferred compensation balances as a result of market fluctuations. If these had been excluded, expenses would have been higher by 0.02%.
|
|
|
Net
asset
value,
end of
period
|
Total
return(a)
|
Total gross
expense
ratio to
average
net assets(b)
|
Total net
expense
ratio to
average
net assets(b)
|
Net investment
income (loss)
ratio to
average
net assets
|
Portfolio
turnover
|
Net
assets,
end of
period
(000’s)
|
|
Institutional 3 Class
|
|||||||
|
Year Ended 12/31/2023
|
$26.35
|
18.64%
|
1.11%
(c)
|
0.81%
(c)
|
0.70%
|
43%
|
$9,404
|
|
Year Ended 12/31/2022
|
$22.21
|
(36.56%
)
|
1.06%
(c),(f)
|
0.84%
(c),(f)
|
0.81%
|
21%
|
$11,188
|
|
Year Ended 12/31/2021
|
$36.31
|
10.93%
|
1.05%
(c)
|
0.84%
(c)
|
0.24%
|
27%
|
$28,694
|
|
Year Ended 12/31/2020
|
$34.56
|
18.67%
|
1.09%
|
0.89%
|
0.24%
|
68%
|
$27,064
|
|
Year Ended 12/31/2019
|
$29.22
|
33.90%
|
1.16%
(c)
|
0.96%
(c)
|
0.72%
|
46%
|
$13,861
|
|
|
Net asset value,
beginning of
period
|
Net
investment
income
|
Net
realized
and
unrealized
gain (loss)
|
Total from
investment
operations
|
Distributions
from net
investment
income
|
Distributions
from net
realized
gains
|
Total
distributions to
shareholders
|
|
Class A
|
|||||||
|
Year Ended 12/31/2023
|
$14.36
|
0.39
|
1.24
|
1.63
|
(0.38
)
|
—
|
(0.38
)
|
|
Year Ended 12/31/2022
|
$17.01
|
0.26
|
(2.49
)
|
(2.23
)
|
(0.28
)
|
(0.14
)
|
(0.42
)
|
|
Year Ended 12/31/2021
|
$18.31
|
0.24
|
0.89
|
1.13
|
(0.26
)
|
(2.17
)
|
(2.43
)
|
|
Year Ended 12/31/2020
|
$15.12
|
0.26
|
4.13
|
4.39
|
(0.27
)
|
(0.93
)
|
(1.20
)
|
|
Year Ended 12/31/2019
|
$13.85
|
0.27
|
1.79
|
2.06
|
(0.26
)
|
(0.53
)
|
(0.79
)
|
|
Advisor Class
|
|||||||
|
Year Ended 12/31/2023
|
$14.19
|
0.42
|
1.23
|
1.65
|
(0.42
)
|
—
|
(0.42
)
|
|
Year Ended 12/31/2022
|
$16.81
|
0.29
|
(2.45
)
|
(2.16
)
|
(0.32
)
|
(0.14
)
|
(0.46
)
|
|
Year Ended 12/31/2021
|
$18.12
|
0.28
|
0.88
|
1.16
|
(0.30
)
|
(2.17
)
|
(2.47
)
|
|
Year Ended 12/31/2020
|
$14.97
|
0.36
|
4.04
|
4.40
|
(0.32
)
|
(0.93
)
|
(1.25
)
|
|
Year Ended 12/31/2019
|
$13.72
|
0.31
|
1.77
|
2.08
|
(0.30
)
|
(0.53
)
|
(0.83
)
|
|
Class C
|
|||||||
|
Year Ended 12/31/2023
|
$14.48
|
0.27
|
1.25
|
1.52
|
(0.27
)
|
—
|
(0.27
)
|
|
Year Ended 12/31/2022
|
$17.14
|
0.14
|
(2.49
)
|
(2.35
)
|
(0.17
)
|
(0.14
)
|
(0.31
)
|
|
Year Ended 12/31/2021
|
$18.43
|
0.09
|
0.90
|
0.99
|
(0.11
)
|
(2.17
)
|
(2.28
)
|
|
Year Ended 12/31/2020
|
$15.23
|
0.12
|
4.16
|
4.28
|
(0.15
)
|
(0.93
)
|
(1.08
)
|
|
Year Ended 12/31/2019
|
$13.96
|
0.16
|
1.79
|
1.95
|
(0.15
)
|
(0.53
)
|
(0.68
)
|
|
Institutional Class
|
|||||||
|
Year Ended 12/31/2023
|
$14.08
|
0.42
|
1.22
|
1.64
|
(0.42
)
|
—
|
(0.42
)
|
|
Year Ended 12/31/2022
|
$16.69
|
0.29
|
(2.44
)
|
(2.15
)
|
(0.32
)
|
(0.14
)
|
(0.46
)
|
|
Year Ended 12/31/2021
|
$18.01
|
0.28
|
0.87
|
1.15
|
(0.30
)
|
(2.17
)
|
(2.47
)
|
|
Year Ended 12/31/2020
|
$14.88
|
0.31
|
4.07
|
4.38
|
(0.32
)
|
(0.93
)
|
(1.25
)
|
|
Year Ended 12/31/2019
|
$13.65
|
0.30
|
1.76
|
2.06
|
(0.30
)
|
(0.53
)
|
(0.83
)
|
|
Institutional 2 Class
|
|||||||
|
Year Ended 12/31/2023
|
$14.21
|
0.43
|
1.22
|
1.65
|
(0.42
)
|
—
|
(0.42
)
|
|
Year Ended 12/31/2022
|
$16.84
|
0.29
|
(2.45
)
|
(2.16
)
|
(0.33
)
|
(0.14
)
|
(0.47
)
|
|
Year Ended 12/31/2021
|
$18.14
|
0.29
|
0.89
|
1.18
|
(0.31
)
|
(2.17
)
|
(2.48
)
|
|
Year Ended 12/31/2020
|
$14.99
|
0.31
|
4.09
|
4.40
|
(0.32
)
|
(0.93
)
|
(1.25
)
|
|
Year Ended 12/31/2019
|
$13.74
|
0.32
|
1.77
|
2.09
|
(0.31
)
|
(0.53
)
|
(0.84
)
|
|
|
Net
asset
value,
end of
period
|
Total
return(a)
|
Total gross
expense
ratio to
average
net assets(b)
|
Total net
expense
ratio to
average
net assets(b)
|
Net investment
income
ratio to
average
net assets
|
Portfolio
turnover
|
Net
assets,
end of
period
(000’s)
|
|
Class A
|
|||||||
|
Year Ended 12/31/2023
|
$15.61
|
11.38%
|
0.57%
(c)
|
0.49%
(c),(d)
|
2.59%
|
148%
|
$428,092
|
|
Year Ended 12/31/2022
|
$14.36
|
(13.14%
)
|
0.54%
(c),(e)
|
0.50%
(c),(d),(e)
|
1.70%
|
88%
|
$450,566
|
|
Year Ended 12/31/2021
|
$17.01
|
6.16%
|
0.54%
(c)
|
0.50%
(c),(d)
|
1.26%
|
49%
|
$624,373
|
|
Year Ended 12/31/2020
|
$18.31
|
29.27%
|
0.56%
(c)
|
0.50%
(c),(d)
|
1.53%
|
97%
|
$505,238
|
|
Year Ended 12/31/2019
|
$15.12
|
14.94%
|
0.58%
(c)
|
0.50%
(c),(d)
|
1.81%
|
158%
|
$225,113
|
|
Advisor Class
|
|||||||
|
Year Ended 12/31/2023
|
$15.42
|
11.64%
|
0.32%
(c)
|
0.24%
(c),(d)
|
2.84%
|
148%
|
$69,278
|
|
Year Ended 12/31/2022
|
$14.19
|
(12.89%
)
|
0.29%
(c),(e)
|
0.25%
(c),(d),(e)
|
1.88%
|
88%
|
$76,472
|
|
Year Ended 12/31/2021
|
$16.81
|
6.43%
|
0.29%
(c)
|
0.25%
(c),(d)
|
1.51%
|
49%
|
$172,162
|
|
Year Ended 12/31/2020
|
$18.12
|
29.58%
|
0.32%
(c)
|
0.25%
(c),(d)
|
2.04%
|
97%
|
$130,921
|
|
Year Ended 12/31/2019
|
$14.97
|
15.21%
|
0.33%
(c)
|
0.25%
(c),(d)
|
2.08%
|
158%
|
$16,208
|
|
Class C
|
|||||||
|
Year Ended 12/31/2023
|
$15.73
|
10.52%
|
1.32%
(c)
|
1.24%
(c),(d)
|
1.82%
|
148%
|
$111,123
|
|
Year Ended 12/31/2022
|
$14.48
|
(13.75%
)
|
1.29%
(c),(e)
|
1.25%
(c),(d),(e)
|
0.93%
|
88%
|
$126,802
|
|
Year Ended 12/31/2021
|
$17.14
|
5.40%
|
1.29%
(c)
|
1.25%
(c),(d)
|
0.48%
|
49%
|
$189,990
|
|
Year Ended 12/31/2020
|
$18.43
|
28.28%
|
1.31%
(c)
|
1.25%
(c),(d)
|
0.72%
|
97%
|
$208,937
|
|
Year Ended 12/31/2019
|
$15.23
|
14.02%
|
1.33%
(c)
|
1.25%
(c),(d)
|
1.05%
|
158%
|
$156,027
|
|
Institutional Class
|
|||||||
|
Year Ended 12/31/2023
|
$15.30
|
11.66%
|
0.32%
(c)
|
0.24%
(c),(d)
|
2.85%
|
148%
|
$636,587
|
|
Year Ended 12/31/2022
|
$14.08
|
(12.92%
)
|
0.29%
(c),(e)
|
0.25%
(c),(d),(e)
|
1.93%
|
88%
|
$600,671
|
|
Year Ended 12/31/2021
|
$16.69
|
6.42%
|
0.29%
(c)
|
0.25%
(c),(d)
|
1.52%
|
49%
|
$902,841
|
|
Year Ended 12/31/2020
|
$18.01
|
29.63%
|
0.31%
(c)
|
0.25%
(c),(d)
|
1.80%
|
97%
|
$729,119
|
|
Year Ended 12/31/2019
|
$14.88
|
15.14%
|
0.33%
(c)
|
0.25%
(c),(d)
|
2.06%
|
158%
|
$285,444
|
|
Institutional 2 Class
|
|||||||
|
Year Ended 12/31/2023
|
$15.44
|
11.67%
|
0.28%
(c)
|
0.20%
(c)
|
2.88%
|
148%
|
$86,925
|
|
Year Ended 12/31/2022
|
$14.21
|
(12.88%
)
|
0.25%
(c),(e)
|
0.20%
(c),(e)
|
1.94%
|
88%
|
$90,290
|
|
Year Ended 12/31/2021
|
$16.84
|
6.53%
|
0.25%
(c)
|
0.20%
(c)
|
1.53%
|
49%
|
$169,246
|
|
Year Ended 12/31/2020
|
$18.14
|
29.59%
|
0.27%
(c)
|
0.21%
(c)
|
1.82%
|
97%
|
$129,197
|
|
Year Ended 12/31/2019
|
$14.99
|
15.25%
|
0.28%
(c)
|
0.21%
(c)
|
2.16%
|
158%
|
$40,759
|
|
|
Net asset value,
beginning of
period
|
Net
investment
income
|
Net
realized
and
unrealized
gain (loss)
|
Total from
investment
operations
|
Distributions
from net
investment
income
|
Distributions
from net
realized
gains
|
Total
distributions to
shareholders
|
|
Institutional 3 Class
|
|||||||
|
Year Ended 12/31/2023
|
$14.18
|
0.44
|
1.22
|
1.66
|
(0.43
)
|
—
|
(0.43
)
|
|
Year Ended 12/31/2022
|
$16.80
|
0.31
|
(2.45
)
|
(2.14
)
|
(0.34
)
|
(0.14
)
|
(0.48
)
|
|
Year Ended 12/31/2021
|
$18.11
|
0.36
|
0.82
|
1.18
|
(0.32
)
|
(2.17
)
|
(2.49
)
|
|
Year Ended 12/31/2020
|
$14.96
|
0.33
|
4.08
|
4.41
|
(0.33
)
|
(0.93
)
|
(1.26
)
|
|
Year Ended 12/31/2019
|
$13.72
|
0.32
|
1.76
|
2.08
|
(0.31
)
|
(0.53
)
|
(0.84
)
|
|
Notes to Financial Highlights
|
|
|
(a)
|
Had the Investment Manager and/or Transfer Agent not waived fees and/or reimbursed a portion of expenses, total return would
have been reduced.
|
|
(b)
|
In addition to the fees and expenses that the Fund bears directly, the Fund indirectly bears a pro rata share of the fees
and expenses of any other funds in which it invests, if any. Such indirect expenses are not included in the Fund’s reported expense ratios.
|
|
(c)
|
Ratios include line of credit interest expense which is less than 0.01%.
|
|
(d)
|
The benefits derived from expense reductions had an impact of less than 0.01%.
|
|
(e)
|
Ratios include Trustees’ fees deferred during the current period as well as any gains or losses on the Trustees’ deferred compensation balances as a result of market fluctuations. If these had been excluded, expenses would have been higher by 0.01%.
|
|
|
Net
asset
value,
end of
period
|
Total
return(a)
|
Total gross
expense
ratio to
average
net assets(b)
|
Total net
expense
ratio to
average
net assets(b)
|
Net investment
income
ratio to
average
net assets
|
Portfolio
turnover
|
Net
assets,
end of
period
(000’s)
|
|
Institutional 3 Class
|
|||||||
|
Year Ended 12/31/2023
|
$15.41
|
11.73%
|
0.24%
(c)
|
0.16%
(c)
|
2.96%
|
148%
|
$11,038
|
|
Year Ended 12/31/2022
|
$14.18
|
(12.82%
)
|
0.21%
(c),(e)
|
0.16%
(c),(e)
|
2.04%
|
88%
|
$10,184
|
|
Year Ended 12/31/2021
|
$16.80
|
6.52%
|
0.21%
(c)
|
0.17%
(c)
|
1.94%
|
49%
|
$15,581
|
|
Year Ended 12/31/2020
|
$18.11
|
29.69%
|
0.24%
(c)
|
0.17%
(c)
|
1.89%
|
97%
|
$2,862
|
|
Year Ended 12/31/2019
|
$14.96
|
15.24%
|
0.25%
(c)
|
0.16%
(c)
|
2.13%
|
158%
|
$837
|
|
|
Net asset value,
beginning of
period
|
Net
investment
income
(loss)
|
Net
realized
and
unrealized
gain (loss)
|
Total from
investment
operations
|
Distributions
from net
investment
income
|
Total
distributions to
shareholders
|
|
Class A
|
||||||
|
Year Ended 12/31/2023
|
$20.61
|
0.06
|
5.04
|
5.10
|
(0.16
)
|
(0.16
)
|
|
Year Ended 12/31/2022
|
$33.33
|
0.06
(e)
|
(12.78
)
|
(12.72
)
|
—
|
—
|
|
Year Ended 12/31/2021
|
$27.49
|
(0.14
)
|
6.04
|
5.90
|
(0.06
)
|
(0.06
)
|
|
Year Ended 12/31/2020
|
$22.52
|
(0.12
)
|
5.22
|
5.10
|
(0.13
)
|
(0.13
)
|
|
Year Ended 12/31/2019
|
$15.56
|
0.06
|
7.09
|
7.15
|
(0.19
)
|
(0.19
)
|
|
Advisor Class
|
||||||
|
Year Ended 12/31/2023
|
$20.87
|
0.10
|
5.14
|
5.24
|
(0.22
)
|
(0.22
)
|
|
Year Ended 12/31/2022
|
$33.68
|
0.11
(e)
|
(12.92
)
|
(12.81
)
|
—
|
—
|
|
Year Ended 12/31/2021
|
$27.78
|
(0.10
)
|
6.13
|
6.03
|
(0.13
)
|
(0.13
)
|
|
Year Ended 12/31/2020
|
$22.70
|
(0.06
)
|
5.27
|
5.21
|
(0.13
)
|
(0.13
)
|
|
Year Ended 12/31/2019
|
$15.68
|
0.12
|
7.13
|
7.25
|
(0.23
)
|
(0.23
)
|
|
Class C
|
||||||
|
Year Ended 12/31/2023
|
$19.85
|
(0.10
)
|
4.83
|
4.73
|
—
|
—
|
|
Year Ended 12/31/2022
|
$32.35
|
(0.10
)(e)
|
(12.40
)
|
(12.50
)
|
—
|
—
|
|
Year Ended 12/31/2021
|
$26.83
|
(0.36
)
|
5.88
|
5.52
|
—
|
—
|
|
Year Ended 12/31/2020
|
$22.15
|
(0.27
)
|
5.08
|
4.81
|
(0.13
)
|
(0.13
)
|
|
Year Ended 12/31/2019
|
$15.33
|
(0.06
)
|
6.93
|
6.87
|
(0.05
)
|
(0.05
)
|
|
Institutional Class
|
||||||
|
Year Ended 12/31/2023
|
$20.77
|
0.11
|
5.10
|
5.21
|
(0.22
)
|
(0.22
)
|
|
Year Ended 12/31/2022
|
$33.51
|
0.11
(e)
|
(12.85
)
|
(12.74
)
|
—
|
—
|
|
Year Ended 12/31/2021
|
$27.64
|
(0.06
)
|
6.06
|
6.00
|
(0.13
)
|
(0.13
)
|
|
Year Ended 12/31/2020
|
$22.59
|
(0.06
)
|
5.24
|
5.18
|
(0.13
)
|
(0.13
)
|
|
Year Ended 12/31/2019
|
$15.60
|
0.12
|
7.10
|
7.22
|
(0.23
)
|
(0.23
)
|
|
Institutional 2 Class
|
||||||
|
Year Ended 12/31/2023
|
$21.04
|
0.13
|
5.16
|
5.29
|
(0.23
)
|
(0.23
)
|
|
Year Ended 12/31/2022
|
$33.92
|
0.12
(e)
|
(13.00
)
|
(12.88
)
|
—
|
—
|
|
Year Ended 12/31/2021
|
$27.98
|
(0.12
)
|
6.21
|
6.09
|
(0.15
)
|
(0.15
)
|
|
Year Ended 12/31/2020
|
$22.84
|
(0.05
)
|
5.32
|
5.27
|
(0.13
)
|
(0.13
)
|
|
Year Ended 12/31/2019
|
$15.78
|
0.14
|
7.17
|
7.31
|
(0.25
)
|
(0.25
)
|
|
|
Net
asset
value,
end of
period
|
Total
return(a)
|
Total gross
expense
ratio to
average
net assets(b)
|
Total net
expense
ratio to
average
net assets(b)
|
Net investment
income (loss)
ratio to
average
net assets
|
Portfolio
turnover
|
Net
assets,
end of
period
(000’s)
|
|
Class A
|
|||||||
|
Year Ended 12/31/2023
|
$25.55
|
24.76%
|
1.92%
(c)
|
1.45%
(c),(d)
|
0.24%
|
23%
|
$30,487
|
|
Year Ended 12/31/2022
|
$20.61
|
(38.16%
)
|
1.80%
(c),(f)
|
1.45%
(c),(d),(f)
|
0.25%
|
31%
|
$28,892
|
|
Year Ended 12/31/2021
|
$33.33
|
21.47%
|
1.63%
(c)
|
1.44%
(c),(d)
|
(0.45%
)
|
21%
|
$66,374
|
|
Year Ended 12/31/2020
|
$27.49
|
22.80%
|
1.86%
(c)
|
1.45%
(c)
|
(0.54%
)
|
45%
|
$42,059
|
|
Year Ended 12/31/2019
|
$22.52
|
45.96%
|
1.88%
|
1.44%
|
0.33%
|
30%
|
$33,361
|
|
Advisor Class
|
|||||||
|
Year Ended 12/31/2023
|
$25.89
|
25.11%
|
1.67%
(c)
|
1.20%
(c),(d)
|
0.44%
|
23%
|
$1,857
|
|
Year Ended 12/31/2022
|
$20.87
|
(38.03%
)
|
1.55%
(c),(f)
|
1.20%
(c),(d),(f)
|
0.47%
|
31%
|
$1,161
|
|
Year Ended 12/31/2021
|
$33.68
|
21.75%
|
1.37%
(c)
|
1.19%
(c),(d)
|
(0.32%
)
|
21%
|
$3,083
|
|
Year Ended 12/31/2020
|
$27.78
|
23.10%
|
1.61%
(c)
|
1.20%
(c)
|
(0.29%
)
|
45%
|
$1,781
|
|
Year Ended 12/31/2019
|
$22.70
|
46.30%
|
1.63%
|
1.19%
|
0.60%
|
30%
|
$1,906
|
|
Class C
|
|||||||
|
Year Ended 12/31/2023
|
$24.58
|
23.83%
|
2.67%
(c)
|
2.20%
(c),(d)
|
(0.46%
)
|
23%
|
$1,787
|
|
Year Ended 12/31/2022
|
$19.85
|
(38.64%
)
|
2.54%
(c),(f)
|
2.20%
(c),(d),(f)
|
(0.47%
)
|
31%
|
$2,372
|
|
Year Ended 12/31/2021
|
$32.35
|
20.57%
|
2.39%
(c)
|
2.19%
(c),(d)
|
(1.20%
)
|
21%
|
$7,078
|
|
Year Ended 12/31/2020
|
$26.83
|
21.87%
|
2.61%
(c)
|
2.20%
(c)
|
(1.27%
)
|
45%
|
$5,705
|
|
Year Ended 12/31/2019
|
$22.15
|
44.79%
|
2.64%
|
2.19%
|
(0.30%
)
|
30%
|
$6,186
|
|
Institutional Class
|
|||||||
|
Year Ended 12/31/2023
|
$25.76
|
25.09%
|
1.67%
(c)
|
1.20%
(c),(d)
|
0.47%
|
23%
|
$23,802
|
|
Year Ended 12/31/2022
|
$20.77
|
(38.02%
)
|
1.54%
(c),(f)
|
1.20%
(c),(d),(f)
|
0.46%
|
31%
|
$38,307
|
|
Year Ended 12/31/2021
|
$33.51
|
21.76%
|
1.38%
(c)
|
1.19%
(c),(d)
|
(0.21%
)
|
21%
|
$111,462
|
|
Year Ended 12/31/2020
|
$27.64
|
23.08%
|
1.61%
(c)
|
1.20%
(c)
|
(0.29%
)
|
45%
|
$55,171
|
|
Year Ended 12/31/2019
|
$22.59
|
46.35%
|
1.63%
|
1.19%
|
0.64%
|
30%
|
$49,616
|
|
Institutional 2 Class
|
|||||||
|
Year Ended 12/31/2023
|
$26.10
|
25.17%
|
1.61%
(c)
|
1.14%
(c)
|
0.55%
|
23%
|
$2,661
|
|
Year Ended 12/31/2022
|
$21.04
|
(37.97%
)
|
1.40%
(c),(f)
|
1.14%
(c),(f)
|
0.48%
|
31%
|
$2,863
|
|
Year Ended 12/31/2021
|
$33.92
|
21.80%
|
1.32%
(c)
|
1.14%
(c)
|
(0.38%
)
|
21%
|
$25,882
|
|
Year Ended 12/31/2020
|
$27.98
|
23.23%
|
1.58%
(c)
|
1.14%
(c)
|
(0.24%
)
|
45%
|
$3,855
|
|
Year Ended 12/31/2019
|
$22.84
|
46.33%
|
1.60%
|
1.13%
|
0.73%
|
30%
|
$2,175
|
|
|
Net asset value,
beginning of
period
|
Net
investment
income
(loss)
|
Net
realized
and
unrealized
gain (loss)
|
Total from
investment
operations
|
Distributions
from net
investment
income
|
Total
distributions to
shareholders
|
|
Institutional 3 Class
|
||||||
|
Year Ended 12/31/2023
|
$20.71
|
0.13
|
5.09
|
5.22
|
(0.24
)
|
(0.24
)
|
|
Year Ended 12/31/2022
|
$33.38
|
0.13
(e)
|
(12.80
)
|
(12.67
)
|
—
|
—
|
|
Year Ended 12/31/2021
|
$27.54
|
(0.05
)
|
6.05
|
6.00
|
(0.16
)
|
(0.16
)
|
|
Year Ended 12/31/2020
|
$22.48
|
(0.02
)
|
5.21
|
5.19
|
(0.13
)
|
(0.13
)
|
|
Year Ended 12/31/2019
|
$15.53
|
0.14
|
7.06
|
7.20
|
(0.25
)
|
(0.25
)
|
|
Notes to Financial Highlights
|
|
|
(a)
|
Had the Investment Manager and/or Transfer Agent not waived fees and/or reimbursed a portion of expenses, total return would
have been reduced.
|
|
(b)
|
In addition to the fees and expenses that the Fund bears directly, the Fund indirectly bears a pro rata share of the fees
and expenses of any other funds in which it invests, if any. Such indirect expenses are not included in the Fund’s reported expense ratios.
|
|
(c)
|
Ratios include line of credit interest expense which is less than 0.01%.
|
|
(d)
|
The benefits derived from expense reductions had an impact of less than 0.01%.
|
|
(e)
|
Net investment income per share includes special dividends. The effect of these dividends amounted to $0.01 per share.
|
|
(f)
|
Ratios include Trustees’ fees deferred during the current period as well as any gains or losses on the Trustees’ deferred compensation balances as a result of market fluctuations. If these had been excluded, expenses would have been higher by 0.01%.
|
|
|
Net
asset
value,
end of
period
|
Total
return(a)
|
Total gross
expense
ratio to
average
net assets(b)
|
Total net
expense
ratio to
average
net assets(b)
|
Net investment
income (loss)
ratio to
average
net assets
|
Portfolio
turnover
|
Net
assets,
end of
period
(000’s)
|
|
Institutional 3 Class
|
|||||||
|
Year Ended 12/31/2023
|
$25.69
|
25.21%
|
1.57%
(c)
|
1.11%
(c)
|
0.56%
|
23%
|
$49
|
|
Year Ended 12/31/2022
|
$20.71
|
(37.96%
)
|
1.47%
(c),(f)
|
1.11%
(c),(f)
|
0.56%
|
31%
|
$41
|
|
Year Ended 12/31/2021
|
$33.38
|
21.83%
|
1.32%
(c)
|
1.10%
(c)
|
(0.15%
)
|
21%
|
$60
|
|
Year Ended 12/31/2020
|
$27.54
|
23.24%
|
1.52%
(c)
|
1.10%
(c)
|
(0.08%
)
|
45%
|
$69
|
|
Year Ended 12/31/2019
|
$22.48
|
46.42%
|
1.54%
|
1.09%
|
0.74%
|
30%
|
$19
|
|
Amount of realized gain (loss) on derivatives recognized in income
|
|
|
Risk exposure category
|
Futures
contracts
($)
|
|
Equity risk
|
(918,878
)
|
|
Derivative instrument
|
Average notional
amounts ($)
|
|
Futures contracts — long
|
13,030,441
|
|
Amount of realized gain (loss) on derivatives recognized in income
|
|
|
Risk exposure category
|
Forward
foreign
currency
exchange
contracts
($)
|
|
Foreign exchange risk
|
(302,480
)
|
|
Derivative instrument
|
Average unrealized
appreciation ($)
|
Average unrealized
depreciation ($)
|
|
Forward foreign currency exchange contracts
|
1,512
|
(13,616
)
|
|
|
Columbia
Acorn® Fund
|
Columbia Acorn
European FundSM
|
|
|
Goldman
Sachs ($)
|
Goldman
Sachs ($)
|
|
Liabilities
|
|
|
|
Collateral on Securities Loaned
|
192,150
|
225,086
|
|
Total Liabilities
|
192,150
|
225,086
|
|
Total Financial and Derivative Net Assets
|
(192,150
)
|
(225,086
)
|
|
Financial Instruments
|
154,818
|
210,870
|
|
Net Amount (a)
|
(37,332
)
|
(14,216
)
|
|
(a)
|
Represents the net amount due from/(to) counterparties in the event of default.
|
|
|
Overnight and
continuous
|
Up to
30 days
|
30-90
days
|
Greater than
90 days
|
Total
|
|
Columbia Acorn® Fund
|
|
|
|
|
|
|
Securities lending transactions
|
|
|
|
|
|
|
Equity securities
|
$154,818
|
$—
|
$—
|
$—
|
$154,818
|
|
Gross amount of recognized liabilities for securities lending (collateral received)
|
|
|
|
|
192,150
|
|
Amounts due to counterparty in the event of default
|
|
|
|
|
$37,332
|
|
Columbia Acorn European FundSM
|
|
|
|
|
|
|
Securities lending transactions
|
|
|
|
|
|
|
Equity securities
|
$210,870
|
$—
|
$—
|
$—
|
$210,870
|
|
Gross amount of recognized liabilities for securities lending (collateral received)
|
|
|
|
|
225,086
|
|
Amounts due to counterparty in the event of default
|
|
|
|
|
$14,216
|
|
Columbia Acorn® Fund
|
|
|
Average daily net assets
|
Annual
fee rate
|
|
Up to $700 million
|
0.74%
|
|
$700 million to $2 billion
|
0.69%
|
|
$2 billion to $6 billion
|
0.64%
|
|
$6 billion and over
|
0.63%
|
|
Columbia Acorn International®
|
|
|
Average daily net assets
|
Annual
fee rate
|
|
Up to $100 million
|
1.19%
|
|
$100 million to $500 million
|
0.94%
|
|
$500 million and over
|
0.74%
|
|
Columbia Acorn International SelectSM
|
|
|
Average daily net assets
|
Annual
fee rate
|
|
Up to $500 million
|
0.89%
|
|
$500 million and over
|
0.85%
|
|
Columbia Thermostat FundSM
|
|
|
|
Annual
fee rate
|
|
All average daily net assets
|
0.10%
|
|
Columbia Acorn European FundSM
|
|
|
Average daily net assets
|
Annual
fee rate
|
|
Up to $100 million
|
1.19%
|
|
$100 million to $500 million
|
0.94%
|
|
$500 million and over
|
0.74%
|
|
Fund
|
Effective investment advisory fee rate (%)
|
|
Columbia Acorn® Fund
|
0.69
|
|
Columbia Acorn International®
|
0.83
|
|
Columbia Acorn International SelectSM
|
0.89
|
|
Columbia Thermostat FundSM
|
0.10
|
|
Columbia Acorn European FundSM
|
1.19
|
|
Columbia Acorn Trust
|
|
|
Aggregate average daily
net assets of the trust
|
Annual
fee rate
|
|
Up to $8 billion
|
0.050%
|
|
$8 billion to $16 billion
|
0.040%
|
|
$16 billion to $35 billion
|
0.030%
|
|
$35 billion to $45 billion
|
0.025%
|
|
$45 billion and over
|
0.015%
|
|
Fund
|
Class A
(%)
|
Advisor
Class (%)
|
Class C
(%)
|
Institutional
Class (%)
|
Institutional 2
Class (%)
|
Institutional 3
Class (%)
|
Class R
(%)
|
|
Columbia Acorn® Fund
|
0.08
|
0.08
|
0.08
|
0.08
|
0.05
|
0.01
|
—
|
|
Columbia Acorn International®
|
0.11
|
0.11
|
0.11
|
0.11
|
0.05
|
0.00
|
0.11
|
|
Columbia Acorn International SelectSM
|
0.20
|
0.20
|
0.20
|
0.20
|
0.06
|
0.01
|
—
|
|
Columbia Thermostat FundSM
|
0.09
|
0.09
|
0.09
|
0.09
|
0.05
|
0.01
|
—
|
|
Columbia Acorn European FundSM
|
0.12
|
0.12
|
0.12
|
0.12
|
0.04
|
0.01
|
—
|
|
Fund
|
Amount ($)
|
|
Columbia Acorn® Fund
|
6,849
|
|
Columbia Acorn International®
|
5,627
|
|
Columbia Acorn International SelectSM
|
8,963
|
|
Columbia Thermostat FundSM
|
200
|
|
Columbia Acorn European FundSM
|
120
|
|
|
Front End (%)
|
CDSC (%)
|
Amount ($)
|
|||
|
Fund
|
Class A
|
Class C
|
Class A
|
Class C
|
Class A
|
Class C
|
|
Columbia Acorn® Fund
|
5.75
|
—
|
0.50 - 1.00(a)
|
1.00
(b)
|
67,628
|
920
|
|
Columbia Acorn International®
|
5.75
|
—
|
0.50 - 1.00(a)
|
1.00
(b)
|
28,806
|
420
|
|
Columbia Acorn International SelectSM
|
5.75
|
—
|
0.50 - 1.00(a)
|
1.00
(b)
|
12,885
|
33
|
|
Columbia Thermostat FundSM
|
5.75
|
—
|
0.50 - 1.00(a)
|
1.00
(b)
|
278,667
|
5,423
|
|
Columbia Acorn European FundSM
|
5.75
|
—
|
0.50 - 1.00(a)
|
1.00
(b)
|
17,328
|
175
|
|
(a)
|
This charge is imposed on certain investments of between $1 million and $50 million redeemed within 18 months after purchase,
as follows: 1.00% if redeemed within 12 months after purchase, and 0.50% if redeemed more than 12, but less than 18, months after purchase, with certain limited exceptions.
|
|
(b)
|
This charge applies to redemptions within 12 months after purchase, with certain limited exceptions.
|
|
Fund
|
Class A
|
Advisor
Class
|
Class C
|
Institutional
Class
|
Institutional 2
Class
|
Institutional 3
Class
|
|
|
Columbia Acorn®Fund
|
1.08%
|
0.83%
|
1.83%
|
0.83%
|
0.80%
|
0.75%
|
|
|
Fund
|
Class A
|
Advisor
Class
|
Class C
|
Institutional
Class
|
Institutional 2
Class
|
Institutional 3
Class
|
Class R
|
|
Columbia Acorn International®
|
1.23%
|
0.98%
|
1.98%
|
0.98%
|
0.92%
|
0.88%
|
1.48%
|
|
Fund
|
Class A
|
Advisor
Class
|
Class C
|
Institutional
Class
|
Institutional 2
Class
|
Institutional 3
Class
|
|
|
Columbia Acorn International SelectSM
|
1.24%
|
0.99%
|
1.99%
|
0.99%
|
0.84%
|
0.79%
|
|
|
Fund
|
Class A
|
Advisor
Class
|
Class C
|
Institutional
Class
|
Institutional 2
Class
|
Institutional 3
Class
|
|
|
Columbia Thermostat FundSM
|
0.50%
|
0.25%
|
1.25%
|
0.25%
|
0.20%
|
0.16%
|
|
|
Fund
|
Class A
|
Advisor
Class
|
Class C
|
Institutional
Class
|
Institutional 2
Class
|
Institutional 3
Class
|
|
|
Columbia Acorn European FundSM
|
1.45%
|
1.20%
|
2.20%
|
1.20%
|
1.14%
|
1.11%
|
|
|
Fund
|
Undistributed
(excess of distributions over)
net investment income ($)
|
Accumulated
net realized
gain (loss) ($)
|
Paid in capital
increase ($)
|
|
Columbia Acorn® Fund
|
6,467,362
|
(39,185,241
)
|
32,717,879
|
|
Columbia Acorn International®
|
15,348,015
|
(15,348,015
)
|
—
|
|
Columbia Acorn International SelectSM
|
(55,996
)
|
55,995
|
1
|
|
Columbia Thermostat FundSM
|
217,634
|
(217,634
)
|
—
|
|
Columbia Acorn European FundSM
|
(15,833
)
|
15,833
|
—
|
|
|
Year Ended December 31, 2023
|
Year Ended December 31, 2022
|
||||
|
Fund
|
Ordinary
income ($)
|
Long-term
capital gains ($)
|
Total ($)
|
Ordinary
income ($)
|
Long-term
capital gains ($)
|
Total ($)
|
|
Columbia Acorn® Fund
|
—
|
—
|
—
|
22,200,389
|
132,000,400
|
154,200,789
|
|
Columbia Acorn International®
|
—
|
—
|
—
|
—
|
44,899,689
|
44,899,689
|
|
Columbia Acorn International SelectSM
|
—
|
—
|
—
|
—
|
11,260,250
|
11,260,250
|
|
Columbia Thermostat FundSM
|
34,009,752
|
—
|
34,009,752
|
31,126,013
|
12,725,392
|
43,851,405
|
|
Columbia Acorn European FundSM
|
432,044
|
—
|
432,044
|
—
|
—
|
—
|
|
Fund
|
Undistributed
ordinary
income ($)
|
Undistributed
long-term
capital gains ($)
|
Capital loss
carryforwards ($)
|
Net unrealized
appreciation
(depreciation) ($)
|
|
Columbia Acorn® Fund
|
—
|
—
|
(543,406,547
)
|
469,573,506
|
|
Columbia Acorn International®
|
20,830,895
|
17,693,097
|
(73,169,404
)
|
281,627,311
|
|
Columbia Acorn International SelectSM
|
2,127,677
|
—
|
(25,417,284
)
|
35,954,749
|
|
Columbia Thermostat FundSM
|
4,689,184
|
—
|
(121,337,356
)
|
(37,224,078
)
|
|
Columbia Acorn European FundSM
|
458,983
|
—
|
(17,510,722
)
|
22,812,218
|
|
Fund
|
Tax cost ($)
|
Gross
unrealized
appreciation ($)
|
Gross
unrealized
(depreciation) ($)
|
Net unrealized
appreciation
(depreciation) ($)
|
|
Columbia Acorn® Fund
|
2,319,365,284
|
626,508,758
|
(156,935,252
)
|
469,573,506
|
|
Columbia Acorn International®
|
873,551,570
|
336,755,691
|
(55,128,380
)
|
281,627,311
|
|
Columbia Acorn International SelectSM
|
188,678,222
|
48,620,239
|
(12,665,490
)
|
35,954,749
|
|
Columbia Thermostat FundSM
|
1,377,820,849
|
12,093,161
|
(49,317,239
)
|
(37,224,078
)
|
|
Columbia Acorn European FundSM
|
36,618,286
|
24,457,477
|
(1,645,259
)
|
22,812,218
|
|
Fund
|
No expiration
short-term ($)
|
No expiration
long-term ($)
|
Total ($)
|
Utilized ($)
|
|
Columbia Acorn® Fund
|
(542,202,704
)
|
(1,203,843
)
|
(543,406,547
)
|
47,596,272
|
|
Columbia Acorn International®
|
(46,900,305
)
|
(26,269,099
)
|
(73,169,404
)
|
41,460,070
|
|
Columbia Acorn International SelectSM
|
(9,293,151
)
|
(16,124,133
)
|
(25,417,284
)
|
772,120
|
|
Columbia Thermostat FundSM
|
(19,207,077
)
|
(102,130,279
)
|
(121,337,356
)
|
—
|
|
Columbia Acorn European FundSM
|
(17,510,722
)
|
—
|
(17,510,722
)
|
301,927
|
|
|
Purchases
($)
|
Proceeds
from sales
($)
|
|
Columbia Acorn® Fund
|
1,653,123,427
|
2,045,469,679
|
|
Columbia Acorn International®
|
591,928,274
|
938,433,312
|
|
Columbia Acorn International SelectSM
|
96,502,953
|
139,356,470
|
|
Columbia Thermostat FundSM
|
2,000,115,607
|
2,114,988,867
|
|
Columbia Acorn European FundSM
|
14,841,626
|
42,411,350
|
|
Fund
|
Average loan
balance ($)
|
Weighted average
interest rate (%)
|
Days
outstanding
|
|
Columbia Acorn International®
|
75,422,222
|
6.42
|
9
|
|
Columbia Acorn International SelectSM
|
340,000
|
6.47
|
5
|
|
Columbia Thermostat FundSM
|
2,950,000
|
6.03
|
4
|
|
Columbia Acorn European FundSM
|
4,775,000
|
5.72
|
4
|
|
Fund
|
Percentage of
shares
outstanding
held —
affiliated (%)
|
|
Columbia Acorn® Fund
|
—
|
|
Columbia Acorn International®
|
—
|
|
Columbia Acorn International SelectSM
|
26.9
|
|
Columbia Thermostat FundSM
|
24.5
|
|
Columbia Acorn European FundSM
|
31.2
|
|
|
Shares
|
|
Class A
|
4,316,137
|
|
Advisor Class
|
1,525,071
|
|
Class C
|
74,005
|
|
Institutional Class
|
10,743,676
|
|
Institutional 2 Class
|
378,826
|
|
Institutional 3 Class
|
756,498
|
|
|
($)
|
|
Net investment loss
|
(5,593,000
)
|
|
Net realized gain
|
43,510,000
|
|
Net change in unrealized appreciation/(depreciation)
|
501,725,000
|
|
Net increase in net assets from operations
|
539,642,000
|
|
|
Qualified
dividend
income
|
Dividends
received
deduction
|
Capital
gain
dividend
|
Foreign
taxes paid
to foreign
countries
|
Foreign
taxes paid
per share
to foreign
countries
|
Foreign
source
income
|
Foreign
source
income
per share
|
|
Columbia Acorn® Fund
|
0.00%
|
0.00%
|
$0
|
$0
|
$0.0000
|
$0
|
$0.0000
|
|
Columbia Acorn International®
|
100.00%
|
0.00%
|
$18,577,752
|
$1,828,040
|
$0.0405
|
$21,749,553
|
$0.4822
|
|
Columbia Acorn International SelectSM
|
100.00%
|
0.00%
|
$0
|
$206,779
|
$0.0236
|
$3,473,839
|
$0.3970
|
|
Columbia Thermostat FundSM
|
7.87%
|
7.55%
|
$0
|
$137,276
|
$0.0016
|
$515,409
|
$0.0059
|
|
Columbia Acorn European FundSM
|
100.00%
|
0.00%
|
$0
|
$63,739
|
$0.0269
|
$1,047,151
|
$0.4427
|
Shareholder Services Group
71 S Wacker Drive, 25th Floor
Chicago, IL 60606
800.922.6769
|
Name and age at
December 31, 2023
|
Year first
appointed or
elected to a Board
in the Columbia
Funds Complex
|
Principal occupation(s)
during the past five years
|
Number of
Funds in the
Columbia
Funds
Complex
overseen (1)
|
Other directorships
held by the Trustee
during the past five years
in addition to
Columbia Acorn Trust
and
Wanger Advisors Trust
|
|
Margaret M. Eisen, 70
|
2002
|
Trustee, Smith College, 2012-2016; Chief Investment
Officer, EAM International LLC (corporate finance and
asset management), 2003-2013; Managing Director,
CFA Institute, 2005-2008.
|
7
|
Chair, RMB Investors Trust (6
series).
|
|
John C. Heaton, 64
|
2010
|
Joseph L. Gidwitz Professor of Finance, University of
Chicago Booth School of Business since 2000;
Deputy Dean for Faculty, University of Chicago Booth
School of Business, 2012-2019.
|
7
|
None.
|
|
Dianne F. Lob, 69
|
2021
|
Retired. Formerly, Senior Vice President and Senior
Managing Director, Global Head of Business and
Product Development, AllianceBernstein Holding L.P.
(asset management), 2014-2020; Chairman, Private
Client Investment Policy Group, Alliance Bernstein
Holding L.P., 2005-2014.
|
7
|
None.
|
|
Charles R. Phillips, 67
|
2015
|
Retired. Formerly, Vice Chairman, J.P. Morgan Private
Bank, 2011-2014; Managing Director, J.P. Morgan
Private Bank, 2001-2011.
|
7
|
None.
|
|
David J. Rudis, 70,
Chair
|
2010
|
Chief Executive Officer, Finger Rock, LLC (strategic
consulting business). Formerly, National Checking and
Debit Executive, and Illinois President, Bank of
America, 2007-2009; President, Consumer Banking
Group, LaSalle National Bank, 2004-2007.
|
7
|
None.
|
|
Name and age at
December 31, 2023
|
Year first
appointed or
elected to a
Board in the
Columbia
Funds
Complex
|
Principal occupation(s)
during the past five years
|
Number of
Funds in the
Columbia
Funds
Complex
overseen (1)
|
Other directorships
held by the Trustee
during the past five years
in addition to
Columbia Acorn Trust
and
Wanger Advisors Trust
|
|
Ralph Wanger, 89 (2)
|
1970 (3)
|
Founder, CWAM. Formerly, President, Chief Investment
Officer and portfolio manager, CWAM or its
predecessors, July 1992-September 2003; Director,
Wanger Investment Company PLC; Consultant, CWAM
or its predecessors, September 2003-September
2005.
|
7
|
None.
|
|
Name and age at
December 31, 2023
|
Position
held with
Columbia
Acorn
Trust and
Wanger
Advisors Trust
|
Year first
appointed
or elected
to office
|
Principal occupation(s) during
the past five years
|
|
Daniel Beckman, 61
|
President and Principal
Executive Officer
|
2021
|
Trustee, President and Principal Executive Officer of the Columbia Funds since
June 2021; Vice President, Columbia Management, since April 2015; formerly,
Vice President – Head of North America Product, Columbia Management, April
2015 – December 2023; Board of Governors, CWAM since January 2022;
Director, Ameriprise Trust Company since October 2016; Director, Columbia
Management Investment Distributors, Inc. since November 2018.
|
|
Joseph Beranek, 59
|
Assistant Treasurer
|
2022
|
Vice President - Mutual Fund Accounting and Financial Reporting, Columbia
Management, since December 2018 and March 2017, respectively (previously
Vice President - Pricing and Corporate Actions, May 2010-March 2017);
Treasurer and Chief Accounting Officer of Columbia Funds since 2019.
|
|
Michael G. Clarke, 53
|
Treasurer and Principal
Accounting and Financial
Officer
|
2004
|
Senior Vice President and North America Head of Operations & Investor Services,
Columbia Management, since June 2023 (previously Senior Vice President and
Head of Global Operations & Investor Services, March 2022 - June 2023, Vice
President, Head of North America Operations, and Co-Head of Global Operations,
June 2019 - February 2022 and Vice President – Accounting and Tax, May 2010
- May 2019); Assistant Treasurer, Columbia Acorn Trust and Wanger Advisors
Trust from 2004 to 2021; senior officer of Columbia Funds and affiliated funds
since 2002; Director, Ameriprise Trust Company, since June 2023.
|
|
John L. Emerson, 49
|
Vice President
|
2020
|
Portfolio manager and/or analyst, CWAM since 2003.
|
|
Ryan C. Larrenaga, 52
|
Assistant Secretary and Chief
Legal Officer
|
2015
|
Vice President and Chief Counsel, Ameriprise Financial, Inc. since August 2018
(previously, Vice President and Group Counsel, August 2011-August 2018);
Senior Vice President and Chief Legal Officer since 2017, and Secretary,
Columbia Funds since 2015; officer of Columbia Funds and affiliated funds since
2005.
|
|
Erika K. Maschmeyer, 42
|
Vice President
|
2020
|
Director of Research (U.S.), CWAM since April 2021; portfolio manager and/or
analyst, CWAM since 2016.
|
|
Name and age at
December 31, 2023
|
Position
held with
Columbia
Acorn
Trust and
Wanger
Advisors Trust
|
Year first
appointed
or elected
to office
|
Principal occupation(s) during
the past five years
|
|
Thomas P. McGuire, 50
|
Chief Compliance Officer
|
2015
|
Senior Vice President and Chief Compliance Officer of the Columbia Funds since
2012; Vice President – Asset Management Compliance, Ameriprise Financial,
Inc., since May 2010; Chief Compliance Officer, Ameriprise Certificate Company,
September 2010-September 2020.
|
|
Marybeth Pilat, 54
|
Assistant Treasurer
|
2022
|
Vice President - Product Pricing and Administration, Columbia Management since
May 2017.
|
|
Julian Quero, 56
|
Assistant Treasurer
|
2015
|
Vice President – Tax, Columbia Management Investment Advisers, LLC since
2009.
|
|
Martha A. Skinner, 48
|
Assistant Treasurer
|
2016
|
Vice President of Financial Reporting and Administration, Columbia Management
since November 2015.
|
|
Linda Roth, 53
|
Secretary
|
2006
|
Business support analyst, CWAM since April 2007; Assistant Secretary, Columbia
Acorn Trust and Wanger Advisors Trust, 2011-2020.
|
Item 2. Code of Ethics.
The registrant has adopted a code of ethics (the “Code”) that applies to the registrant’s principal executive officer, principal financial officer, principal accounting officer or controller, or persons performing similar functions, regardless of whether these individuals are employed by the registrant or a third party. During the period covered by this report, there were not any amendments to a provision of the Code that relates to any element of the code of ethics definition enumerated in paragraph (b) of Item 2 of Form N-CSR. During the period covered by this report, there were no waivers, including any implicit waivers, from a provision of the Code that relates to one or more of the items set forth in paragraph (b) of Item 2 of Form N-CSR. A copy of the Code is attached hereto.
Item 3. Audit Committee Financial Expert.
The registrant’s Board of Trustees has determined that Dianne Lob, a member of the registrant’s Board of Trustees and Audit Committee, qualifies as an audit committee financial expert. Ms. Lob is an independent trustee, as defined in paragraph (a)(2) of this item’s instructions.
Item 4. Principal Accountant Fees and Services.
Fee information below is disclosed for the series of the relevant registrant whose reports to shareholders are included in this annual filing.
(a) Audit Fees. Aggregate Audit Fees billed by the principal accountant for professional services rendered during the fiscal years ended December 31, 2023 and December 31, 2022 are approximately as follows:
|
2023 |
2022 |
|
$111,600 |
$158,500 |
Audit Fees include amounts related to the audit of the registrant’s annual financial statements or services that are normally provided by the accountant in connection with statutory and regulatory filings or engagements for those fiscal years.
(b) Audit-Related Fees. Aggregate Audit-Related Fees billed to the registrant by the principal accountant for professional services rendered during the fiscal years ended December 31, 2023 and December 31, 2022 are approximately as follows:
|
2023 |
2022 |
|
$0 |
$0 |
Audit-Related Fees, if any, include amounts for assurance and related services by the principal accountant that are reasonably related to the performance of the audit of the registrant’s financial statements and are not reported in Audit Fees above. In both fiscal years 2023 and 2022, Audit-Related Fees consist of agreed-upon procedures performed for other audit-related additional testing.
During the fiscal years ended December 31, 2023 and December 31, 2022, there were no Audit-Related Fees billed by the registrant’s principal accountant to the registrant’s investment adviser (not including any sub-adviser whose role is primarily portfolio management and is subcontracted with or overseen by another investment adviser) and any entity controlling, controlled by, or under common control with the adviser that provides ongoing services to the registrant for an engagement that related directly to the operations and financial reporting of the registrant.
(c) Tax Fees. Aggregate Tax Fees billed by the principal accountant to the registrant for professional services rendered during the fiscal years ended December 31, 2023 and December 31, 2022 are approximately as follows:
|
2023 |
2022 |
|
$79,800 |
$108,800 |
Tax Fees incurred in both fiscal years 2023 and 2022 relate to the review of annual tax returns, the review of required shareholder distribution calculations and include amounts for professional services by the principal accountant for tax compliance, tax advice and tax planning. Fiscal year 2022 also includes tax fees for foreign tax filings.
During the fiscal years ended December 31, 2023 and December 31, 2022, there were no Tax Fees billed by the registrant’s principal accountant to the registrant’s investment adviser (not including any sub-adviser whose role is primarily portfolio management and is subcontracted with or overseen by another investment adviser) and any entity controlling, controlled by, or under common control with the adviser that provides ongoing services to the registrant for an engagement that related directly to the operations and financial reporting of the registrant.
(d) All Other Fees. Aggregate All Other Fees billed by the principal accountant to the registrant for professional services rendered during the fiscal years ended December 31, 2023 and December 31, 2022 are as follows:
|
2023 |
2022 |
|
$0 |
$0 |
All Other Fees, if any, include amounts for products and services provided by the principal accountant, other than the services reported in paragraphs (a) through (c) above. Aggregate All Other Fees billed by the registrant’s principal accountant to the registrant’s investment adviser (not including any sub-adviser whose role is primarily portfolio management and is subcontracted with or overseen by another investment adviser) and any entity controlling, controlled by, or under common control with the adviser that provides ongoing services to the registrant for an engagement that related directly to the operations and financial reporting of the registrant during the fiscal years ended December 31, 2023 and December 31, 2022 are approximately as follows:
|
2023 |
2022 |
|
$566,000 |
$535,000 |
In both fiscal years 2023 and 2022, All Other Fees primarily consist of professional services rendered for internal control reviews.
(e)(1) Audit Committee Pre-Approval Policies and Procedures
The policy of the registrant’s Audit Committee is to specifically pre-approve (i) all audit and non-audit (including audit related, tax and all other) services provided by the registrant’s independent auditor to the registrant and individual funds (collectively “Fund Services”) and (ii) all non-audit services provided by the registrant’s independent auditor to the funds’ adviser or a control affiliate of the adviser, that relate directly to the funds’ operations and financial reporting (collectively “Fund-related Adviser Services”). A “control affiliate” is an entity controlling, controlled by, or under common control with the adviser that provides ongoing services to the funds, and the term “adviser” is deemed to exclude any unaffiliated sub-adviser whose role is primarily portfolio management and is sub-contracted or overseen by another investment adviser.
If such Fund Services or Fund-related Adviser Services are required during the period between the Audit Committee’s regularly scheduled meetings, the Chairman of the Audit Committee has the authority to pre-approve the service, with reporting to the full Audit Committee at the next regularly scheduled meeting.
The Audit Committee will waive pre-approval of Fund Services or Fund-related Adviser Services provided that the requirements under paragraph (c)(7)(i)(C) of Rule 2-01 of Regulation S-X are met.
(e)(2) None, or 0%, of the Audit-Related Fees, Tax Fees and All Other Fees paid by the Fund or affiliated entities relating directly to the operations and financial reporting of the Registrant disclosed above were approved by the audit committee pursuant to paragraphs (c)(7)(i)(C) of Rule 2-01 of Regulation S-X (which permits audit committee approval after the start of the engagement with respect to services other than audit, review or attest services, if certain conditions are satisfied).
(f) Not applicable.
(g) The aggregate non-audit fees billed by the registrant’s accountant for services rendered to the registrant, and rendered to the registrant’s investment adviser (not including any sub-adviser whose role is primarily portfolio management and is subcontracted with or overseen by another investment adviser), and any entity controlling, controlled by, or under common control with the adviser that provides ongoing services to the registrant for the fiscal years ended December 31, 2023 and December 31, 2022 are approximately as follows:
|
2023 |
2022 |
|
$645,800 |
$643,800 |
(h) The registrant’s Audit Committee of the Board of Directors has considered whether the provision of non-audit services that were rendered to the registrant’s adviser (not including any sub-adviser whose role is primarily portfolio management and is subcontracted with or overseen by another investment adviser), and any entity controlling, controlled by, or under common control with the investment adviser that provides ongoing services to the registrant that were not pre-approved pursuant to paragraph (c)(7)(ii) of Rule 2-01 of Regulation S-X, is compatible with maintaining the principal accountant’s independence.
(i) Not applicable.
(j) Not applicable.
Item 5. Audit Committee of Listed Registrants.
Not applicable.
Item 6. Investments
|
(a) |
The registrant’s “Schedule I – Investments in securities of unaffiliated issuers” (as set forth in 17 CFR 210.12-12) is included in Item 1 of this Form N-CSR. |
|
(b) |
Not applicable |
Item 7. Disclosure of Proxy Voting Policies and Procedures for Closed-End Management Investment Companies.
Not applicable.
Item 8. Portfolio Managers of Closed-End Management Investment Companies.
Not applicable.
Item 9. Purchases of Equity Securities by Closed-End Management Investment Company and Affiliated Purchasers.
Not applicable.
Item 10. Submission of Matters to a Vote of Security Holders.
There were no material changes to the procedures by which shareholders may recommend nominees to the registrant's board of directors.
Item 11. Controls and Procedures.
|
(a) |
The registrant’s principal executive officer and principal financial officer, based on their evaluation of the registrant’s disclosure controls and procedures as of a date within 90 days of the filing of this report, have concluded that such controls and procedures are adequately designed to ensure that information required to be disclosed by the registrant in Form N-CSR is accumulated and communicated to the registrant’s management, including the principal executive officer and principal financial officer, or persons performing similar functions, as appropriate to allow timely decisions regarding required disclosure. |
|
(b) |
There was no change in the registrant’s internal control over financial reporting that occurred during the period covered by this report that has materially affected, or is reasonably likely to materially affect, the registrant’s internal control over financial reporting. |
Item 12. Disclosure of Securities Lending Activities for Closed-End Management Investment Companies
Not applicable.
Item 13. Exhibits.
SIGNATURES
Pursuant to the requirements of the Securities Exchange Act of 1934 and the Investment Company Act of 1940, the registrant has duly caused this report to be signed on its behalf by the undersigned, thereunto duly authorized.
|
(registrant) |
Columbia Acorn Trust |
|
|
|
|
By (Signature and Title) |
/s/ Daniel J. Beckman |
|
|
Daniel J. Beckman, President and Principal Executive Officer |
|
|
|
|
Date |
February 22, 2024 |
|
|
|
|
|
|
Pursuant to the requirements of the Securities Exchange Act of 1934 and the Investment Company Act of 1940, this report has been signed below by the following persons on behalf of the registrant and in the capacities and on the dates indicated.
|
By (Signature and Title) |
/s/ Daniel J. Beckman |
|
|
Daniel J. Beckman, President and Principal Executive Officer |
|
|
|
|
Date |
February 22, 2024 |
|
By (Signature and Title) |
/s/ Michael G. Clarke |
|
|
Michael G. Clarke, Treasurer and Principal Accounting |
|
|
and Financial Officer |
|
|
|
|
Date |
February 22, 2024 |