
FIRST QUARTER REPORT
March 31, 2015


COLUMBIA ACORN FAMILY OF FUNDS
Class A, B, C, I, R, R4, R5, Y and Z Shares
Managed by Columbia Wanger Asset Management, LLC
Columbia Acorn® Fund
Columbia Acorn International®
Columbia Acorn USA®
Columbia Acorn International SelectSM
Columbia Acorn SelectSM
Columbia Thermostat FundSM
Columbia Acorn Emerging Markets FundSM
Columbia Acorn European FundSM

COLUMBIA ACORN FAMILY OF FUNDS
OUR NEW LOOK
On March 30, 2015, Columbia Management (an affiliate of Columbia Wanger) and its U.K.-based affiliate, Threadneedle Investments, rebranded to Columbia Threadneedle Investments. The new global brand represents the combined capabilities, resources and reach of the global group and offers investors the best of both firms. As a result of this new brand, we have adopted a new logo and colors, which are reflected in this report. To learn more, we encourage you to visit our website at our new address: columbiathreadneedle.com/us.
NET ASSET VALUE PER SHARE as of 3/31/15
|
Columbia Acorn® Fund |
Columbia Acorn International® |
Columbia Acorn USA® |
Columbia Acorn International SelectSM |
Columbia Acorn SelectSM |
Columbia Thermostat FundSM |
Columbia Acorn Emerging Markets FundSM |
Columbia Acorn European FundSM |
||||||||||||||||||||||||||||
|
Class A |
$ |
31.48 |
$ |
43.46 |
$ |
30.61 |
$ |
22.35 |
$ |
21.61 |
$ |
15.07 |
$ |
12.61 |
$ |
14.96 |
|||||||||||||||||||
|
Class B |
$ |
27.51 |
$ |
42.02 |
$ |
26.47 |
$ |
20.95 |
$ |
18.49 |
$ |
15.16 |
N/A |
N/A |
|||||||||||||||||||||
|
Class C |
$ |
26.88 |
$ |
41.84 |
$ |
26.20 |
$ |
20.80 |
$ |
18.15 |
$ |
15.15 |
$ |
12.52 |
$ |
14.75 |
|||||||||||||||||||
|
Class I |
$ |
33.31 |
$ |
43.59 |
$ |
32.80 |
$ |
22.62 |
$ |
23.03 |
N/A |
$ |
12.65 |
$ |
14.96 |
||||||||||||||||||||
|
Class R |
N/A |
$ |
43.41 |
N/A |
N/A |
N/A |
N/A |
N/A |
N/A |
||||||||||||||||||||||||||
|
Class R4 |
$ |
33.80 |
$ |
43.84 |
$ |
33.33 |
$ |
22.79 |
$ |
23.39 |
$ |
14.96 |
$ |
12.72 |
$ |
15.03 |
|||||||||||||||||||
|
Class R5 |
$ |
33.84 |
$ |
43.52 |
$ |
33.35 |
$ |
22.77 |
$ |
23.43 |
$ |
14.97 |
$ |
12.71 |
$ |
15.11 |
|||||||||||||||||||
|
Class Y |
$ |
33.91 |
$ |
43.86 |
$ |
33.44 |
$ |
22.76 |
$ |
23.52 |
$ |
14.96 |
$ |
12.60 |
N/A |
||||||||||||||||||||
|
Class Z |
$ |
33.22 |
$ |
43.54 |
$ |
32.62 |
$ |
22.63 |
$ |
22.91 |
$ |
14.89 |
$ |
12.64 |
$ |
14.97 |
|||||||||||||||||||
Class I shares are available only to the Columbia funds, such as Columbia Thermostat Fund, and are not available to individual investors. Class R, R4, R5, Y and Z shares are sold at net asset value and have limited eligibility. Please see the Funds' prospectuses for details. The Columbia Acorn Family of Funds offer multiple share classes, not all necessarily available through all firms, and the share class ratings may vary. Contact us for details.
The views expressed in the report commentaries reflect the current views of the respective authors. These views are not guarantees of future performance and involve certain risks, uncertainties and assumptions that are difficult to predict, so actual outcomes and results may differ significantly from the views expressed. These views are subject to change at any time based upon economic, market or other conditions and the respective authors disclaim any responsibility to update such views. These views may not be relied upon as investment advice and, because investment decisions for a Columbia Acorn Fund are based on numerous factors, may not be relied upon as an indication of trading intent on behalf of any particular Columbia Acorn Fund. References to a specific company's securities should not be construed as a recommendation or investment advice and there can be no assurance that as of the date of publication of this report, the securities mentioned in each Fund's portfolio are still held or that the securities sold have not been repurchased.
Acorn®, Acorn USA® and Acorn International® are service marks owned and registered by Columbia Acorn Trust.
PRESIDENT'S MESSAGE

April 1, 2015 marked my one-year anniversary as head of Columbia Wanger Asset Management, LLC (Columbia Wanger). I have spent this year focused on our investment operations and processes, building on my 15 years as an international analyst and portfolio manager with the firm. In particular, I have spent considerable time analyzing the investment processes followed by our domestic Acorn Funds. As shareholders are doubtless aware, our domestic products have generated strong absolute returns over the last three years, benefiting from buoyant U.S. markets, but returns relative to benchmarks and peers have been unsatisfactory.
This has led to important enhancements to portfolio management. Effective May 1, 2015, we have added portfolio managers to several of our Funds. Most notably, Fritz Kaegi and I have become portfolio managers of Columbia Acorn Fund and, initially, we will work alongside current managers, David Frank and Robert Mohn. After 23 years at Columbia Wanger, Rob has announced his plans to retire in the fourth quarter of this year. Rob was among the first analysts Ralph Wanger hired after founding the firm in 1992, and we thank him for his years of outstanding service to Columbia Wanger and Fund shareholders. After Rob's departure, David, Fritz and I will continue to co-manage Columbia Acorn Fund. Fritz and David have long tenures at Columbia Wanger, with excellent track records as investment professionals. We are also taking steps to improve our investment process, outlined in a discussion of Columbia Acorn Fund's performance that follows (see Page 3). We believe these steps will bring performance more in line with our own high standards and historical record of performance, to the benefit of Fund shareholders. With respect to our other Funds, Matt Szafranski has been named a co-portfolio manager of Columbia Acorn Select; Andreas Waldburg-Wolfegg has become a co-portfolio manager of Columbia Acorn International Select; and Satoshi Matsunaga has been added as a co-portfolio manager of Columbia Acorn Emerging Markets Fund. These individuals will work with the current managers of the Funds. Also effective May 1, 2015, I am no longer involved in the day-to-day management of Columbia Acorn Emerging Markets Fund.
We at Columbia Wanger believe that we have an investment strategy and process capable of generating excess returns versus benchmarks and peers. This approach, initially pioneered by Ralph Wanger and Chuck McQuaid in the 1970s, puts an emphasis on: (1) identifying and investing in quality business models at reasonable prices; (2) seizing
upon long-term changes in society and specific industries that portend above-average prospects for growth; and (3) recognizing when one is "paid to take risk," while limiting the impact of that risk on the overall portfolio through careful consideration of position size. A central element of this process has been lively internal debate about the characteristics and merits of individual investments, emphasizing the logic behind the discrete components of the investment case. This scrutinizing of business models as well as the likely effects of industry trends sometimes requires thick skin among participants, but generally leads to better decision-making.
My highest priority as a leader of this organization is to build on our culture of active debate in the investment process in order to foster high conviction in all of our portfolios. The aforementioned personnel changes are designed to help achieve this. In the case of Columbia Acorn Fund, we have added experienced international portfolio managers to a domestic fund that is increasingly being shaped by global trends, and where we believe there is an opportunity to improve both stock selection and portfolio construction. With Columbia Acorn Select and Columbia Acorn International Select, we expect that increased debate between two portfolio managers, who have together agreed and articulated the specific investment strategies these concentrated portfolios will execute, will drive a more consistent outcome. This change will also support Columbia Acorn International Select's ongoing repositioning as a more mid-cap oriented strategy that generally invests in businesses with market capitalizations higher than those appropriate for Columbia Acorn International. To promote more effective portfolio monitoring, and to provide managers with more quantitative clarity about style biases and other risks embedded in portfolios constructed on a bottom-up basis, we have also introduced a new Head of Investment Performance and Risk position.
The portfolio managers and analysts at Columbia Wanger are invested with you in the Columbia Acorn Funds. This, and the excitement of working within a tradition that achieved legendary results over more than four decades, are powerful motivators for extending that track record. Thank you for your investment in the Columbia Acorn Funds.

P. Zachary Egan
President and International Chief Investment Officer
Columbia Wanger Asset Management, LLC
There is no guarantee that investment objectives will be achieved or that any particular investment will be profitable.
1
COLUMBIA ACORN FAMILY OF FUNDS
TABLE OF CONTENTS
|
Addressing Columbia Acorn Fund Performance and Process |
3 |
||||||
|
Descriptions of Indexes |
5 |
||||||
|
Share Class Performance |
6 |
||||||
|
Fund Performance vs. Benchmarks |
7 |
||||||
|
Columbia Acorn® Fund |
|||||||
|
In a Nutshell |
8 |
||||||
|
At a Glance |
9 |
||||||
|
Major Portfolio Changes |
24 |
||||||
|
Statement of Investments |
27 |
||||||
|
Columbia Acorn International® |
|||||||
|
In a Nutshell |
10 |
||||||
|
At a Glance |
11 |
||||||
|
Major Portfolio Changes |
36 |
||||||
|
Statement of Investments |
39 |
||||||
|
Portfolio Diversification |
47 |
||||||
|
Columbia Acorn USA® |
|||||||
|
In a Nutshell |
12 |
||||||
|
At a Glance |
13 |
||||||
|
Major Portfolio Changes |
48 |
||||||
|
Statement of Investments |
50 |
||||||
|
Columbia Acorn International SelectSM |
|||||||
|
In a Nutshell |
14 |
||||||
|
At a Glance |
15 |
||||||
|
Major Portfolio Changes |
55 |
||||||
|
Statement of Investments |
56 |
||||||
|
Portfolio Diversification |
60 |
||||||
|
Columbia Acorn SelectSM |
|||||||
|
In a Nutshell |
16 |
||||||
|
At a Glance |
17 |
||||||
|
Major Portfolio Changes |
61 |
||||||
|
Statement of Investments |
62 |
||||||
|
Columbia Thermostat FundSM |
|||||||
|
In a Nutshell |
18 |
||||||
|
At a Glance |
19 |
||||||
|
Statement of Investments |
67 |
||||||
|
Columbia Acorn Emerging Markets FundSM |
|||||||
|
In a Nutshell |
20 |
||||||
|
At a Glance |
21 |
||||||
|
Major Portfolio Changes |
69 |
||||||
|
Statement of Investments |
70 |
||||||
|
Portfolio Diversification |
75 |
||||||
|
Columbia Acorn European FundSM |
|||||||
|
In a Nutshell |
22 |
||||||
|
At a Glance |
23 |
||||||
|
Major Portfolio Changes |
76 |
||||||
|
Statement of Investments |
78 |
||||||
|
Portfolio Diversification |
82 |
||||||
|
Columbia Acorn Family of FundsSM |
|||||||
|
Expense Information |
83 |
||||||
A COMMENT ON TRADING VOLUMES
Market conditions are always changing and vary by country and industry sector, and investing in international markets involves unique risks. In the wake of the 2007-2009 financial crisis, trading volumes in both emerging and developed international markets declined significantly and have stayed at generally reduced levels since then. Although it is difficult to accurately assess trends in trading volumes in foreign markets, because some amount of activity has migrated to alternative trading venues, a reduction in trading volumes poses challenges to the Funds. This is particularly so because the Funds focus on small- and mid-cap companies that usually have lower trading volumes and often take sizeable positions in portfolio companies. As a result of lower trading volumes, it may take longer to buy or sell securities, which can exacerbate a Fund's exposure to volatile markets. A Fund may also be limited in its ability to execute favorable trades in portfolio securities in response to changes in company prices and fundamentals. If a Fund is forced to sell securities to meet redemption requests or other cash needs, or in the case of an event affecting liquidity in a particular market or markets, it may be forced to dispose of those securities under disadvantageous circumstances and at a loss. As a Fund grows in size, these considerations take on increasing significance and may adversely impact performance.
2
ADDRESSING COLUMBIA ACORN FUND PERFORMANCE
AND PROCESS
|
|
|
||||||
|
Robert A. Mohn Co-Portfolio Manager |
P. Zachary Egan Co-Portfolio Manager |
||||||
|
|
|
||||||
|
Fritz Kaegi Co-Portfolio Manager |
David L. Frank Co-Portfolio Manager |
||||||


After decades of outperformance, Columbia Acorn Fund has more recently joined the ranks of actively-managed mutual funds struggling to beat their benchmarks. We are not happy about it and are determined to reverse this course. As described in detail below, after a process of intense review, we have decisively addressed certain key practices in order to reinvigorate the Columbia Wanger process, which has served the Funds well for many years. The steps we have taken include: reducing the number of stocks in the portfolio, instituting minimum position sizes, modestly increasing concentration within our top holdings and reducing macroeconomic exposure where possible. We have also reinforced our investment and support teams.
Columbia Acorn Fund has historically driven investment results predominantly through stock selection, consistent with our investment style of growth-at-a-reasonable-price (GARP). GARP has been out of style in prior performance periods, which hurt the Fund's relative investment performance, but it has become apparent from ongoing results that this was only part of the Fund's underperformance story. As we evaluated Columbia Acorn Fund's shortfall versus its benchmark, the Russell 2500 Index, in the buoyant market environment of the last three years, we could see that underperformance has been significantly driven by stock selection. Stock selection is about identifying individual stocks whose fundamental characteristics or attractive valuations suggest they are poised to outperform related peers within an industry group or some other category. Stock selection also involves allocating capital proportionate to anticipated risk-adjusted returns. Successful stock selection requires getting three things right: (1) picking more winners than losers (a good "hit rate"); (2) sizing the positions correctly so that the most promising ideas garner the most capital; and (3) monitoring macroeconomic exposures so that good stock selection is not canceled out by unexpected economic or market shifts.
High hit rates and correct position-sizing require in-depth, fundamental understanding of individual companies. This in turn requires significant analyst resources and time. While we believe we operate with unrivalled analyst resources, in hindsight these analyst resources may have been spread across too many individual holdings and often were narrowly focused on sub-industry groups. At times, this undermined the formation of the scarcest factor in investment management—conviction—and made capital allocation difficult, as it is hard to assess relative value across a portfolio with a great number of positions, some very small, spread across a wide range of sub-industry groups.
We believe we can improve the performance of Columbia Acorn Fund going forward and have taken the following steps relating to stock selection and portfolio construction:
• Number of positions in portfolio. The number of portfolio positions has been reduced significantly in the first quarter from 277 to 205, with most of the smaller positions having been sold or, where our level of conviction is high, increased. After quarter end, the Fund held fewer than 200 positions. By contrast, in the 2010-2012 period, the Fund closed each year with over 360 positions.
• Position sizes. We are instituting minimum position sizes (with carefully delineated exceptions) and more aggressively aligning position sizes with our analysts' expected returns. As an outcome of the more tightly constructed portfolio, we expect a higher portfolio turnover (albeit one that is still substantially below industry averages).
• Concentration. We are modestly increasing concentration within our top 10 holdings. This measure stood at 18.3% at quarter end, the highest it has been since 2002. We are now at a level of concentration comparable to the years when the Fund posted strong outperformance.
• Reinforcing our investment and support teams. In addition to the portfolio manager changes outlined in Zach Egan's letter on Page 1, we are adding analysts to our coverage of domestic stocks. We have also created a Head of Investment Performance and Risk position and hired a new Chief Operating Officer, which gives us enhanced analytical and oversight resources and
3
increases the investment team's ability to focus on stock picking and improving performance.
In terms of macroeconomic exposures, we have made one major change to Columbia Acorn Fund's asset allocation: going forward we expect to hold a much more modest stake in non-U.S. equities. At the end of the quarter, the foreign weight was 2.2%, whereas one year earlier it was 7.0%. In the past, foreign stock exposure has been as high as 15%. This practice has introduced a level of uncertainty into Fund performance, since variables beyond company fundamentals, such as unhedged currency exposure or central bank policies, inevitably entered the equation. While this exposure has resulted in meaningful positive contributions to performance in the past, the Fund's foreign weight can explain over one-quarter of underperformance versus benchmark in the three-year period ended March 31, 2015. We are also mindful that the investment industry has evolved since Columbia Acorn Fund first adopted this practice, and now generally prefers more focused and predictable strategies. The reduced foreign exposure going forward should also make it easier for shareholders to assess their economic exposure to foreign markets and currency moves.
Generally, Columbia Acorn Fund portfolio managers will not make top-down "macro" calls. The times when we feel like we have a special, contrarian perspective on a significant opportunity and make such calls will be infrequent. While not central to our process, the monitoring of macroeconomic exposure does occasionally yield insights that shape Columbia Acorn Fund's portfolio construction. For example, in the past the monitoring of credit spreads helped us recognize "paid to take risk" market environments when we would orient the portfolio toward companies with balance sheet risk, which would outperform during the subsequent mean reversion of credit spreads.
This brings us to the Fund's current positioning. Our largest sector deviation from the benchmark is in industrials. U.S. industrial companies offer a wide choice of potential investments, many of which have the attractive ability to not only reinvest in their businesses at good rates of return, but also to sell their products to the entire world. We believe these sorts of companies play to our analytical strengths. On the other hand, in certain pockets of the market, we perceive an extreme valuation environment where investors are "not paid to take risk." Specifically, unprecedentedly low interest rates have greatly aided industries where we have traditionally placed less capital, most
notably high-yielding utilities and real estate investment trusts (REITs). We expect to continue this underweight. The critical characteristic of REITs is that they pay out nearly all of the cash flows generated by their assets, and therefore have little ability to reinvest in their business without raising new capital. The bottom-up, company-by-company work done by our analysts indicates that real estate securities at today's prices offer little compensation for the benefits and risks they bring.
We think the Fund's current sector positioning is appropriate for an environment where interest rates are very low and earnings multiples are generally high. In an environment like this, companies that have the ability to re-invest in their businesses at good rates of return deserve some premium, while the market already has priced in most of the value for companies with little ability to re-invest, such as REITs and utilities. We expect these sector weightings, along with the recent changes relating to stock selection and portfolio construction discussed above, will lift Fund performance over the medium and long term.
We look forward to continuing this conversation with you in coming quarters. Thank you for your support and investment in Columbia Acorn Fund.

Robert A. Mohn

P. Zachary Egan

Fritz Kaegi

David L. Frank
4
COLUMBIA ACORN FAMILY OF FUNDS
DESCRIPTIONS OF INDEXES INCLUDED IN THIS REPORT
• 50/50 Blended Benchmark, established by the Fund's investment manager, is an equally weighted custom composite of Columbia Thermostat Fund's primary equity and primary debt benchmarks, the S&P 500® Index and the Barclays U.S. Aggregate Bond Index, respectively. The percentage of the Fund's assets allocated to underlying stock and bond portfolio funds will vary, and accordingly the composition of the Fund's portfolio will not always reflect the composition of the 50/50 Blended Benchmark.
• Barclays U.S. Aggregate Bond Index is a market value-weighted index that tracks the daily price, coupon, pay-downs and total return performance of fixed-rate, publicly placed, dollar-denominated and non-convertible investment grade debt issues with at least $250 million par amount outstanding and with at least one year to final maturity.
• Euromoney Smaller European Companies (inc. UK) Index is an index of smaller companies in Europe including the UK market. The Euromoney Smaller European Companies Index covers companies of small- and mid-cap market capitalization in Europe's developed markets. The index is rebalanced on a quarterly basis.
• Lipper Indexes are composed of the 10 or 30 largest funds in the Lipper investment objective grouping. Lipper Mid-Cap Growth Funds Index, 30 largest mid-cap growth funds, including Columbia Acorn Fund; Lipper International Small/Mid Growth Funds Index, 10 largest non-U.S. small/mid growth funds, including Columbia Acorn International and Columbia Acorn International Select; Lipper Small-Cap Growth Funds Index, 30 largest small-cap growth funds, including Columbia Acorn USA; Lipper Mid-Cap Core Funds Index, 30 largest mid-cap core funds; Lipper Flexible Portfolio Funds Index, an equal-weighted index of the 30 largest mutual funds within the Flexible Portfolio fund classification, as defined by Lipper; Lipper Emerging Markets Index, 30 largest emerging markets funds; Lipper European Region Index, 10 largest European funds.
• MSCI Europe, Australasia and Far East (EAFE) Index (Net) is a capitalization-weighted index that tracks the total return of common stocks in 22 developed-market countries within Europe, Australasia and the Far East. The returns of the MSCI EAFE Index (Net) are presented net of the withholding tax rate applicable to foreign non-resident institutional investors in the foreign companies included in the index who do not benefit from double taxation treaties.
• MSCI Emerging Markets Small Cap Index (Net), a widely recognized international benchmark, is a free float-adjusted market capitalization index that is designed to measure small-cap emerging market equity performance in 23 emerging market countries (as of December 31, 2014), as determined by MSCI. The MSCI Emerging Markets Small Cap Index (Net) currently consists of the following emerging market country indexes: Brazil, Chile, China, Colombia, Czech Republic, Egypt, Hungary, India, Indonesia, Korea, Malaysia, Mexico, Morocco, Peru, Philippines, Poland, Qatar, Russia, South Africa, Taiwan, Thailand, Turkey and United Arab Emirates.
• Russell 2000 Index measures the performance of the 2,000 smallest companies in the Russell 3000 Index, which represents approximately 10% of the total market capitalization of the Russell 3000 Index.
• Russell 2500 Index measures the performance of the 2,500 smallest companies in the Russell 3000 Index, which represents approximately 17% of the total market capitalization of the Russell 3000 Index.
• Standard & Poor's (S&P) 500® Index tracks the performance of 500 widely held, large-capitalization U.S. stocks.
• S&P MidCap 400® Index is a market value-weighted index that tracks the performance of 400 mid-cap U.S. companies.
• S&P Developed Ex-U.S. Between $2B and $10B® Index is a subset of the broad market selected by the index sponsor that represents the mid-cap developed market, excluding the United States.
• S&P Emerging Markets Between $500M and $5B® Index represents the institutionally investable capital of 20 emerging market countries (as of December 31, 2014), as determined by S&P, with market caps ranging between $500 million to $5 billion. The index currently consists of the following emerging market country indexes: Brazil, Chile, China, Colombia, Czech Republic, Egypt, Hungary, India, Indonesia, Malaysia, Mexico, Morocco, Peru, Philippines, Poland, Russia, South Africa, Taiwan, Thailand and Turkey.
• S&P Europe Between $500M and $5B® Index represents the institutionally investable capital of 17 European countries (as of December 31, 2014), as determined by S&P, with market caps ranging between $500 million to $5 billion. The index consists of the following European countries: Austria, Belgium, Denmark, Finland, France, Germany, Greece, Ireland, Italy, Luxembourg, the Netherlands, Norway, Portugal, Spain, Sweden, Switzerland and the United Kingdom.
• S&P Global Ex-U.S. SmallCap® Index consists of the bottom 20% of institutionally investable capital of developed and emerging countries, excluding the United States.
• S&P Global Ex-U.S. Between $500M and $5B® Index is a subset of the broad market selected by the index sponsor that represents the mid- and small-cap developed and emerging markets, excluding the United States.
Unlike mutual funds, indexes are not managed and do not incur fees or expenses. It is not possible to invest directly in an index.
5
COLUMBIA ACORN FAMILY OF FUNDS
SHARE CLASS PERFORMANCE Average Annual Total Returns through 3/31/15
|
Class A |
Class B |
Class C |
Class I |
Class R |
Class R4 |
Class R5 |
Class Y |
Class Z |
|||||||||||||||||||||||||||||||||||||||||||
|
Without Sales Charge |
With Sales Charge |
Without Sales Charge |
With Sales Charge |
Without Sales Charge |
With Sales Charge |
||||||||||||||||||||||||||||||||||||||||||||||
|
Columbia Acorn® Fund |
|||||||||||||||||||||||||||||||||||||||||||||||||||
|
Year to date* |
3.89 |
% |
-2.08 |
% |
3.69 |
% |
-1.31 |
% |
3.70 |
% |
2.70 |
% |
4.00 |
% |
N/A |
3.97 |
% |
3.96 |
% |
3.99 |
% |
3.97 |
% |
||||||||||||||||||||||||||||
| 1 year |
4.55 |
% |
-1.46 |
% |
3.79 |
% |
-0.49 |
% |
3.80 |
% |
2.95 |
% |
4.94 |
% |
N/A |
4.81 |
% |
4.89 |
% |
4.94 |
% |
4.86 |
% |
||||||||||||||||||||||||||||
| 5 years |
12.31 |
% |
10.98 |
% |
11.63 |
% |
11.37 |
% |
11.49 |
% |
11.49 |
% |
12.71 |
% |
N/A |
12.62 |
% |
12.66 |
% |
12.69 |
% |
12.64 |
% |
||||||||||||||||||||||||||||
| 10 years |
8.64 |
% |
8.00 |
% |
7.97 |
% |
7.97 |
% |
7.81 |
% |
7.81 |
% |
8.99 |
% |
N/A |
8.94 |
% |
8.96 |
% |
8.97 |
% |
8.95 |
% |
||||||||||||||||||||||||||||
|
Columbia Acorn International® |
|||||||||||||||||||||||||||||||||||||||||||||||||||
|
Year to date* |
4.27 |
% |
-1.72 |
% |
4.06 |
% |
-0.94 |
% |
4.08 |
% |
3.08 |
% |
4.38 |
% |
4.18 |
% |
4.33 |
% |
4.34 |
% |
4.38 |
% |
4.34 |
% |
|||||||||||||||||||||||||||
| 1 year |
-1.62 |
% |
-7.28 |
% |
-2.37 |
% |
-6.97 |
% |
-2.33 |
% |
-3.26 |
% |
-1.21 |
% |
-2.01 |
% |
-1.41 |
% |
-1.30 |
% |
-1.24 |
% |
-1.33 |
% |
|||||||||||||||||||||||||||
| 5 years |
8.29 |
% |
7.02 |
% |
7.53 |
% |
7.23 |
% |
7.48 |
% |
7.48 |
% |
8.72 |
% |
7.93 |
% |
8.61 |
% |
8.66 |
% |
8.68 |
% |
8.64 |
% |
|||||||||||||||||||||||||||
| 10 years |
8.71 |
% |
8.07 |
% |
7.98 |
% |
7.98 |
% |
7.88 |
% |
7.88 |
% |
9.11 |
% |
8.37 |
% |
9.05 |
% |
9.07 |
% |
9.09 |
% |
9.07 |
% |
|||||||||||||||||||||||||||
|
Columbia Acorn USA® |
|||||||||||||||||||||||||||||||||||||||||||||||||||
|
Year to date* |
5.08 |
% |
-0.97 |
% |
4.75 |
% |
-0.25 |
% |
4.88 |
% |
3.88 |
% |
5.16 |
% |
N/A |
5.14 |
% |
5.17 |
% |
5.16 |
% |
5.12 |
% |
||||||||||||||||||||||||||||
| 1 year |
7.97 |
% |
1.75 |
% |
6.85 |
% |
2.55 |
% |
7.23 |
% |
6.37 |
% |
8.40 |
% |
N/A |
8.24 |
% |
8.33 |
% |
8.37 |
% |
8.22 |
% |
||||||||||||||||||||||||||||
| 5 years |
13.24 |
% |
11.91 |
% |
12.40 |
% |
12.15 |
% |
12.44 |
% |
12.44 |
% |
13.67 |
% |
N/A |
13.56 |
% |
13.59 |
% |
13.61 |
% |
13.54 |
% |
||||||||||||||||||||||||||||
| 10 years |
7.86 |
% |
7.23 |
% |
7.11 |
% |
7.11 |
% |
7.06 |
% |
7.06 |
% |
8.22 |
% |
N/A |
8.17 |
% |
8.18 |
% |
8.19 |
% |
8.16 |
% |
||||||||||||||||||||||||||||
|
Columbia Acorn International SelectSM |
|||||||||||||||||||||||||||||||||||||||||||||||||||
|
Year to date* |
1.41 |
% |
-4.41 |
% |
1.26 |
% |
-3.74 |
% |
1.27 |
% |
0.27 |
% |
1.48 |
% |
N/A |
1.51 |
% |
1.52 |
% |
1.52 |
% |
1.48 |
% |
||||||||||||||||||||||||||||
| 1 year |
-8.44 |
% |
-13.70 |
% |
-9.05 |
% |
-13.04 |
% |
-9.14 |
% |
-9.93 |
% |
-8.15 |
% |
N/A |
-8.17 |
% |
-8.12 |
% |
-8.09 |
% |
-8.18 |
% |
||||||||||||||||||||||||||||
| 5 years |
7.13 |
% |
5.87 |
% |
6.45 |
% |
6.16 |
% |
6.30 |
% |
6.30 |
% |
7.55 |
% |
N/A |
7.47 |
% |
7.50 |
% |
7.52 |
% |
7.49 |
% |
||||||||||||||||||||||||||||
| 10 years |
7.41 |
% |
6.78 |
% |
6.72 |
% |
6.72 |
% |
6.57 |
% |
6.57 |
% |
7.79 |
% |
N/A |
7.75 |
% |
7.76 |
% |
7.77 |
% |
7.75 |
% |
||||||||||||||||||||||||||||
|
Columbia Acorn SelectSM |
|||||||||||||||||||||||||||||||||||||||||||||||||||
|
Year to date* |
2.76 |
% |
-3.14 |
% |
2.55 |
% |
-2.45 |
% |
2.60 |
% |
1.60 |
% |
2.90 |
% |
N/A |
2.81 |
% |
2.85 |
% |
2.89 |
% |
2.83 |
% |
||||||||||||||||||||||||||||
| 1 year |
5.40 |
% |
-0.64 |
% |
4.58 |
% |
0.50 |
% |
4.71 |
% |
3.90 |
% |
5.82 |
% |
N/A |
5.66 |
% |
5.77 |
% |
5.84 |
% |
5.72 |
% |
||||||||||||||||||||||||||||
| 5 years |
9.06 |
% |
7.78 |
% |
8.33 |
% |
8.09 |
% |
8.26 |
% |
8.26 |
% |
9.49 |
% |
N/A |
9.36 |
% |
9.40 |
% |
9.43 |
% |
9.38 |
% |
||||||||||||||||||||||||||||
| 10 years |
7.91 |
% |
7.27 |
% |
7.18 |
% |
7.18 |
% |
7.08 |
% |
7.08 |
% |
8.27 |
% |
N/A |
8.21 |
% |
8.23 |
% |
8.24 |
% |
8.22 |
% |
||||||||||||||||||||||||||||
|
Columbia Thermostat FundSM |
|||||||||||||||||||||||||||||||||||||||||||||||||||
|
Year to date* |
1.41 |
% |
-4.44 |
% |
1.27 |
% |
-3.73 |
% |
1.27 |
% |
0.27 |
% |
N/A |
N/A |
1.49 |
% |
1.49 |
% |
1.49 |
% |
1.50 |
% |
|||||||||||||||||||||||||||||
| 1 year |
4.85 |
% |
-1.20 |
% |
4.31 |
% |
-0.69 |
% |
4.06 |
% |
3.06 |
% |
N/A |
N/A |
5.08 |
% |
5.09 |
% |
5.15 |
% |
5.11 |
% |
|||||||||||||||||||||||||||||
| 5 years |
9.05 |
% |
7.76 |
% |
8.51 |
% |
8.22 |
% |
8.25 |
% |
8.25 |
% |
N/A |
N/A |
9.33 |
% |
9.34 |
% |
9.37 |
% |
9.33 |
% |
|||||||||||||||||||||||||||||
| 10 years |
6.56 |
% |
5.93 |
% |
6.01 |
% |
6.01 |
% |
5.77 |
% |
5.77 |
% |
N/A |
N/A |
6.83 |
% |
6.84 |
% |
6.85 |
% |
6.83 |
% |
|||||||||||||||||||||||||||||
|
Columbia Acorn Emerging Markets FundSM |
|||||||||||||||||||||||||||||||||||||||||||||||||||
|
Year to date* |
-0.86 |
% |
-6.59 |
% |
N/A |
N/A |
-1.03 |
% |
-2.02 |
% |
-0.78 |
% |
N/A |
-0.86 |
% |
-0.86 |
% |
-0.87 |
% |
-0.78 |
% |
||||||||||||||||||||||||||||||
| 1 year |
-4.17 |
% |
-9.70 |
% |
N/A |
N/A |
-4.94 |
% |
-5.89 |
% |
-3.90 |
% |
N/A |
-3.93 |
% |
-3.91 |
% |
-3.92 |
% |
-3.94 |
% |
||||||||||||||||||||||||||||||
|
Life of Fund |
7.17 |
% |
5.43 |
% |
N/A |
N/A |
6.41 |
% |
6.41 |
% |
7.58 |
% |
N/A |
7.52 |
% |
7.53 |
% |
7.54 |
% |
7.47 |
% |
||||||||||||||||||||||||||||||
|
Columbia Acorn European FundSM |
|||||||||||||||||||||||||||||||||||||||||||||||||||
|
Year to date* |
4.32 |
% |
-1.64 |
% |
N/A |
N/A |
4.17 |
% |
3.17 |
% |
4.40 |
% |
N/A |
4.37 |
% |
4.42 |
% |
N/A |
4.39 |
% |
|||||||||||||||||||||||||||||||
| 1 year |
-5.23 |
% |
-10.67 |
% |
N/A |
N/A |
-5.96 |
% |
-6.90 |
% |
-5.00 |
% |
N/A |
-4.96 |
% |
-5.01 |
% |
N/A |
-4.98 |
% |
|||||||||||||||||||||||||||||||
|
Life of Fund |
12.53 |
% |
10.71 |
% |
N/A |
N/A |
11.72 |
% |
11.72 |
% |
12.86 |
% |
N/A |
12.83 |
% |
12.83 |
% |
N/A |
12.83 |
% |
|||||||||||||||||||||||||||||||
*Not annualized.
Returns for Class A shares are shown with and without the maximum initial sales charge of 5.75%. Returns for Class B shares are shown with and without the applicable contingent deferred sales charge (CDSC) of 5.00% in the first year, declining to 1.00% in the sixth year and eliminated thereafter. Returns for Class C shares are shown with and without the maximum CDSC of 1.00% for the first year after purchase. The Funds' other classes are not subject to sales charges and have limited eligibility. Please see the Funds' prospectuses for details. Performance for different share classes will vary based on differences in sales charges and certain fees associated with each class.
All results shown assume reinvestment of distributions during the period. Returns do not reflect the deduction of taxes that a shareholder may pay on Fund distributions or on the redemption of Fund shares. Performance results may reflect the effect of any fee waivers or reimbursements of Fund expenses by the investment manager and/or any of its affiliates. Absent these fee waivers and/or expense reimbursement arrangements, performance results may have been lower. Please see Page 83 of this report for information on contractual fee waiver and expense reimbursement agreements in place on March 31, 2015, for Columbia Thermostat Fund, Columbia Acorn Emerging Markets Fund and Columbia Acorn European Fund and voluntary fee waiver and expense reimbursement arrangements in place for Columbia Acorn International, Columbia Acorn International Select and Columbia Acorn Select.
The performance information shown represents past performance and is not a guarantee of future results. The investment return and principal value of your investment will fluctuate so that shares, when redeemed, may be worth more or less than their original cost. Current performance may be lower or higher than the performance data shown. You may obtain performance information current to the most recent month-end by contacting your financial intermediary, visiting columbiathreadneedle.com/us or calling 800.922.6769.
The returns shown include the returns of each Fund's Class Z shares, each Fund's oldest share class, in cases where the inception date of the Fund is earlier than the inception date of the particular share class or where a period shown dates to before the inception date of the share class. These returns are adjusted to reflect any higher class-related operating expenses of the newer share classes, as applicable. Please visit columbiathreadneedleus.com/investment-products/mutual-funds/appended-performance for more information.
Continued on Page 7.
6
FUND PERFORMANCE VS. BENCHMARKS Class Z Average Annual Total Returns through 3/31/15
|
Class Z Shares |
1st quarter* |
1 year |
5 years |
10 years |
Life of Fund |
||||||||||||||||||
| Columbia Acorn® Fund (ACRNX) (6/10/70) |
3.97 |
% |
4.86 |
% |
12.64 |
% |
8.95 |
% |
14.60 |
% |
|||||||||||||
|
Russell 2500 Index |
5.17 |
% |
10.07 |
% |
15.48 |
% |
9.62 |
% |
N/A |
||||||||||||||
|
S&P 500 Index** |
0.95 |
% |
12.73 |
% |
14.47 |
% |
8.01 |
% |
11.01 |
% |
|||||||||||||
|
Russell 2000 Index |
4.32 |
% |
8.21 |
% |
14.57 |
% |
8.82 |
% |
N/A |
||||||||||||||
|
Lipper Mid-Cap Growth Funds Index |
5.07 |
% |
11.85 |
% |
14.26 |
% |
9.86 |
% |
N/A |
||||||||||||||
| Columbia Acorn International® (ACINX) (9/23/92) |
4.34 |
% |
-1.33 |
% |
8.64 |
% |
9.07 |
% |
10.96 |
% |
|||||||||||||
|
S&P Global Ex-U.S. Between $500M and $5B Index |
4.92 |
% |
0.85 |
% |
7.21 |
% |
7.93 |
% |
8.44 |
% |
|||||||||||||
|
S&P Global Ex-U.S. SmallCap Index |
3.70 |
% |
-2.69 |
% |
7.27 |
% |
7.32 |
% |
7.84 |
% |
|||||||||||||
|
MSCI EAFE Index (Net) |
4.88 |
% |
-0.92 |
% |
6.16 |
% |
4.95 |
% |
6.13 |
% |
|||||||||||||
|
Lipper International Small/Mid Growth Funds Index |
5.58 |
% |
-2.54 |
% |
9.99 |
% |
8.52 |
% |
N/A |
||||||||||||||
| Columbia Acorn USA® (AUSAX) (9/4/96) |
5.12 |
% |
8.22 |
% |
13.54 |
% |
8.16 |
% |
10.96 |
% |
|||||||||||||
|
Russell 2000 Index |
4.32 |
% |
8.21 |
% |
14.57 |
% |
8.82 |
% |
8.82 |
% |
|||||||||||||
|
Lipper Small-Cap Growth Funds Index |
5.74 |
% |
8.34 |
% |
14.73 |
% |
8.55 |
% |
7.44 |
% |
|||||||||||||
| Columbia Acorn Int'l SelectSM (ACFFX) (11/23/98) |
1.48 |
% |
-8.18 |
% |
7.49 |
% |
7.75 |
% |
8.75 |
% |
|||||||||||||
|
S&P Developed Ex-U.S. Between $2B and $10B Index |
5.61 |
% |
1.12 |
% |
7.85 |
% |
6.72 |
% |
7.66 |
% |
|||||||||||||
|
MSCI EAFE Index (Net) |
4.88 |
% |
-0.92 |
% |
6.16 |
% |
4.95 |
% |
4.39 |
% |
|||||||||||||
|
Lipper International Small/Mid Growth Funds Index |
5.58 |
% |
-2.54 |
% |
9.99 |
% |
8.52 |
% |
10.23 |
% |
|||||||||||||
| Columbia Acorn SelectSM (ACTWX) (11/23/98) |
2.83 |
% |
5.72 |
% |
9.38 |
% |
8.22 |
% |
10.31 |
% |
|||||||||||||
|
S&P MidCap 400 Index |
5.31 |
% |
12.19 |
% |
15.72 |
% |
10.32 |
% |
10.79 |
% |
|||||||||||||
|
S&P 500 Index** |
0.95 |
% |
12.73 |
% |
14.47 |
% |
8.01 |
% |
5.53 |
% |
|||||||||||||
|
Lipper Mid-Cap Core Funds Index |
4.03 |
% |
10.12 |
% |
14.02 |
% |
9.06 |
% |
9.33 |
% |
|||||||||||||
| Columbia Thermostat FundSM (COTZX) (9/25/02) |
1.50 |
% |
5.11 |
% |
9.33 |
% |
6.83 |
% |
7.95 |
% |
|||||||||||||
|
S&P 500 Index |
0.95 |
% |
12.73 |
% |
14.47 |
% |
8.01 |
% |
9.90 |
% |
|||||||||||||
|
Barclays U.S. Aggregate Bond Index |
1.61 |
% |
5.72 |
% |
4.41 |
% |
4.93 |
% |
4.71 |
% |
|||||||||||||
|
Lipper Flexible Portfolio Funds Index |
1.48 |
% |
3.83 |
% |
8.28 |
% |
6.43 |
% |
7.99 |
% |
|||||||||||||
|
50/50 Blended Benchmark |
1.37 |
% |
9.30 |
% |
9.60 |
% |
6.76 |
% |
7.57 |
% |
|||||||||||||
| Columbia Acorn Emerging Markets FundSM (CEFZX) (8/19/11) |
-0.78 |
% |
-3.94 |
% |
— |
— |
7.47 |
% |
|||||||||||||||
|
S&P Emerging Markets Between $500M and $5B Index |
1.86 |
% |
3.07 |
% |
— |
— |
3.61 |
% |
|||||||||||||||
|
MSCI Emerging Markets Small Cap Index (Net) |
3.59 |
% |
1.06 |
% |
— |
— |
2.07 |
% |
|||||||||||||||
|
Lipper Emerging Markets Index |
1.05 |
% |
-1.21 |
% |
— |
— |
2.32 |
% |
|||||||||||||||
| Columbia Acorn European FundSM (CAEZX) (8/19/11) |
4.39 |
% |
-4.98 |
% |
— |
— |
12.83 |
% |
|||||||||||||||
|
S&P Europe Between $500M and $5B Index |
5.32 |
% |
-6.11 |
% |
— |
— |
14.42 |
% |
|||||||||||||||
|
Euromoney Smaller European Companies (inc. UK) Index |
4.42 |
% |
-10.35 |
% |
— |
— |
12.20 |
% |
|||||||||||||||
|
Lipper European Region Index |
4.45 |
% |
-4.15 |
% |
— |
— |
12.58 |
% |
|||||||||||||||
The inception dates for Class A, B and C shares (if offered) are as follows: Columbia Acorn Fund, Columbia Acorn International, Columbia Acorn USA, Columbia Acorn International Select and Columbia Acorn Select, 10/16/00; Columbia Thermostat Fund, 3/3/03; Columbia Acorn Emerging Markets Fund and Columbia Acorn European Fund, 8/19/11. The inception dates for Class I shares are as follows: Columbia Acorn Fund, Columbia Acorn International, Columbia Acorn USA, Columbia Acorn International Select and Columbia Acorn Select, 9/27/10; Columbia Acorn Emerging Markets Fund and Columbia Acorn European Fund, 8/19/11. The inception date for Class R shares for Columbia Acorn International is 8/2/11. The inception date for Class R4, R5 and Y shares (if offered) is as follows: Columbia Acorn Fund, Columbia Acorn USA, Columbia Acorn International Select, Columbia Acorn Select, Columbia Thermostat Fund, Columbia Acorn Emerging Markets Fund and Columbia Acorn European Fund, 11/8/12, except that Class Y shares of Columbia Acorn Emerging Markets Fund commenced operations on 6/13/13 and Class R4 shares of Columbia Acorn European Fund commenced operations on 6/25/14. The inception date for Class R5 shares of Columbia Acorn International is 8/2/11. The inception date for Class R4 and Y shares of Columbia Acorn International is 11/8/12. The inception date for Class Z shares is as follows: Columbia Acorn Fund, 6/10/70; Columbia Acorn International, 9/23/92; Columbia Acorn USA, 9/4/96; Columbia Acorn International Select and Columbia Acorn Select, 11/23/98; Columbia Thermostat Fund, 9/25/02; Columbia Acorn Emerging Markets Fund and Columbia Acorn European Fund, 8/19/11.
*Not annualized.
**Although the Fund typically invests in small- and mid-sized companies, the comparison to the S&P 500® Index is presented to show performance against a widely recognized market index over the life of the Fund.
Please see Page 5 for a description of the indexes listed above.
7
COLUMBIA ACORN® FUND
IN A NUTSHELL
|
|
|
||||||
|
Robert A. Mohn Lead Portfolio Manager |
David L. Frank Co-Portfolio Manager |
||||||


Performance data shown represents past performance and is not a guarantee of future results. The investment return and principal value will fluctuate so that shares, when redeemed, may be worth more or less than the original cost. Current performance may be lower or higher than the performance data shown. Please visit columbiathreadneedle.com/us for daily and most recent month-end performance updates.
Market risk may affect a single issuer, sector of the economy, industry or the market as a whole. Investments in small- and mid-cap companies involve risks and volatility and possible illiquidity greater than investments in larger, more established companies. Foreign investments subject the Fund to political, economic, market, social and other risks within a particular country, as well as to potential currency instabilities and less stringent financial and accounting standards generally applicable to U.S. issuers. Risks are enhanced for emerging market issuers. The Fund may invest significantly in issuers within a particular sector, which may be negatively affected by market, economic or other conditions, making the Fund more vulnerable to unfavorable developments in the sector.
Columbia Acorn Fund Class Z shares gained 3.97% in the first quarter of 2015. This compares to a 5.17% gain for the Fund's primary benchmark, the Russell 2500 Index. Relative returns were dampened by the weaker-than-benchmark performance of some of the Fund's industrial and consumer stocks.
Looking first at what assisted returns, Fund holdings in the biotechnology and pharmaceutical industries were strong absolute contributors for the quarter. Akorn, a manufacturer and distributor of specialty generic drugs, gained 29% as revenue jumped 168% over the prior year, aided by some significant generic drug price hikes. Biotech company Intercept Pharmaceuticals gained 82% in the first quarter on news that its drug to treat liver disease received a "breakthrough" designation, indicating that the FDA will work closely with the company to expedite the drug's approval. Orphan drug developer Ultragenyx Pharmaceutical gained 42% on continued steady progress in advancing its drug pipeline. Celldex Therapeutics, a biotech focusing on cancer drug development, gained 54% in the quarter following news of favorable data from a study for its brain cancer drug, Rintega.
Other winners in the quarter included SEI Investments, a mutual fund administrator and investment manager that enjoyed strong cash inflows into its actively managed strategies. Its stock was up 10% for the quarter. IPG Photonics, a manufacturer of fiber lasers, gained 24% on solid year-over-year revenue growth.
Weaker prices hurt energy service providers in the quarter. ShawCor, a Canadian provider of oil and gas pipeline products, declined 24%. Chicago Bridge & Iron, an engineering and construction services provider for liquefied natural gas and petrochemicals companies, and Hornbeck Offshore, a supply vessel operator in the Gulf of Mexico, were also down more than 20%. We opted to sell the Fund's position in Chicago Bridge & Iron. Down 15%, truck dealership Rush Enterprises (Class A) was also impacted by weaker energy prices, as 10% of its truck sales are to energy supply chain customers.
Additional losses resulted from the Fund's investments in car rental companies Avis Budget Group and Hertz, which fell 11% and 12%, respectively, on concerns over weaker than expected pricing. Hardwood flooring retailer Lumber Liquidators fell 56% in the quarter after the company received negative publicity. We opted to sell the Fund's position in the stock.
Small caps offered strong performance in the first quarter of the year, outpacing the 0.95% gain of the large-cap oriented S&P 500® Index. Ever mindful of valuation, we continue to seek what we believe to be well-run smaller companies that have the potential to thrive in the current economic environment and grow faster than their peers. We are also making adjustments to the Fund's portfolio to concentrate its holdings in our highest-conviction names. We believe these steps should improve the Fund's performance relative to the benchmark. For additional information on the steps that we are taking to address the relative underperformance of the Fund, please turn to Page 3 of this report.
Fund's Positions in Mentioned Holdings
As a percentage of net assets, as of 3/31/15
|
SEI Investments |
2.3 |
% |
|||||
|
Akorn |
1.0 |
||||||
|
Avis Budget Group |
1.0 |
||||||
|
IPG Photonics |
0.9 |
||||||
|
Ultragenyx Pharmaceutical |
0.7 |
||||||
|
Rush Enterprises* |
0.6 |
||||||
|
Intercept Pharmaceuticals |
0.5 |
||||||
|
Celldex Therapeutics |
0.4 |
||||||
|
Hertz |
0.4 |
||||||
|
ShawCor |
0.4 |
||||||
|
Hornbeck Offshore |
0.2 |
||||||
Fund holdings are as of the date given, are subject to change at any time, and are not recommendations to buy or sell any security. Top holdings exclude short-term holdings and cash, if applicable.
*The Fund is invested in Class A and Class B shares of this company.
8
COLUMBIA ACORN® FUND
AT A GLANCE
Total Net Assets of the Fund:
$14.1 billion
Performance data shown below represents past performance, does not guarantee future results, assumes reinvestment of dividends and distributions and does not reflect the deduction of taxes that a shareholder may pay on Fund distributions or the redemption of Fund shares. The investment return and principal value of an investment will fluctuate so that shares, when redeemed, may be worth more or less than their original cost. Current performance may be lower or higher than the performance data shown. Performance data reflects fee waivers or reimbursements of Fund expenses, if any; in their absence, performance results would have been lower. Indexes are unmanaged; their results do not reflect the effect of expenses or sales charges. Securities in the Fund may not match those in an index. Please visit columbiathreadneedle.com/us for performance data current to the most recent month-end.
The Growth of a $10,000 Investment in Columbia Acorn® Fund Class Z Shares
June 10, 1970 (Fund inception) through March 31, 2015
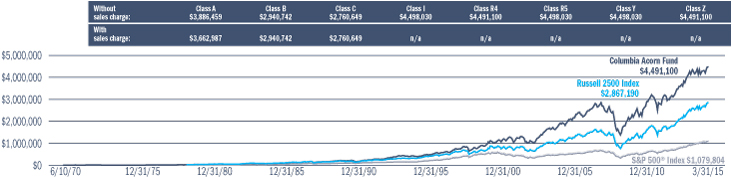
This chart shows the change in value of a hypothetical $10,000 investment in Class Z shares of the Fund during the stated time period. A $10,000 investment in Columbia Acorn Fund at inception appreciated to $31,777 on December 31, 1978, the inception date of the Russell 2500 Index. For comparison with the Russell 2500 Index, we assigned the index the same value as the Fund at index inception. Although the Fund typically invests in small- and mid-sized companies, the comparison to the S&P 500 Index is presented to show performance against a widely recognized market index over the life of the Fund.
Average Annual Total Returns for period ended March 31, 2015
|
1st quarter |
1 year |
5 years |
10 years |
Life of Fund |
|||||||||||||||||||
| Class Z (6/10/70 inception) |
3.97 |
% |
4.86 |
% |
12.64 |
% |
8.95 |
% |
14.60 |
% |
|||||||||||||
| Class A (10/16/00 inception) | |||||||||||||||||||||||
|
without sales charge |
3.89 |
4.55 |
12.31 |
8.64 |
14.23 |
||||||||||||||||||
|
with sales charge |
-2.08 |
-1.46 |
10.98 |
8.00 |
14.08 |
||||||||||||||||||
|
Russell 2500 Index* |
5.17 |
10.07 |
15.48 |
9.62 |
N/A |
||||||||||||||||||
Results for other share classes can be found on Page 6.
*The Fund's primary benchmark. Please see Page 5 for index descriptions.
Returns for Class A shown with and without the maximum initial sales charge of 5.75%. As stated in the May 1, 2014, prospectus, the Fund's annual operating expense ratio is 0.79% for Class Z shares and 1.08% for Class A shares. The returns shown for periods prior to the inception of the Fund's Class A shares append the returns of the Fund's Class Z shares, the Fund's oldest share class. These returns are adjusted to reflect any higher class-related operating expenses of the newer share classes, as applicable. Please visit columbiathreadneedleus.com/investment-products/mutual-funds/appended-performance for more information.
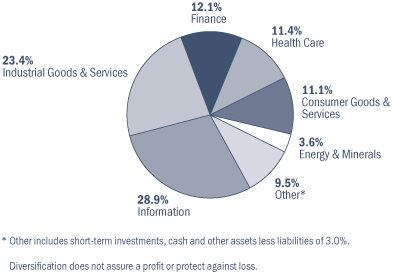
Portfolio Diversification
as a percentage of net assets, as of 3/31/15
Top 10 Holdings
as a percentage of net assets, as of 3/31/15
|
1. |
Ametek Aerospace/Industrial Instruments |
2.6 |
% |
||||||||
|
2. |
SEI Investments Mutual Fund Administration & Investment Management |
2.3 |
% |
||||||||
|
3. |
Donaldson Industrial Air Filtration |
2.1 |
% |
||||||||
|
4. |
Mettler-Toledo International Laboratory Equipment |
2.1 |
% |
||||||||
|
5. |
Cepheid Molecular Diagnostics |
2.0 |
% |
||||||||
|
6. |
Nordson Dispensing Systems for Adhesives & Coatings |
1.7 |
% |
||||||||
|
7. |
Amphenol Electronic Connectors |
1.7 |
% |
||||||||
| 8. |
LKQ Alternative Auto Parts Distribution |
1.3 |
% |
||||||||
| 9. |
Synageva BioPharma Biotech Focused on Orphan Diseases |
1.3 |
% | ||||||||
|
10. |
Associated Banc-Corp Midwest Bank |
1.2 |
% |
||||||||
The Fund's top 10 holdings and portfolio diversification vary with changes in portfolio investments. See the Statement of Investments for a complete list of the Fund's holdings.
9
COLUMBIA ACORN INTERNATIONAL®
IN A NUTSHELL
|
|
|
||||||
|
P. Zachary Egan Co-Portfolio Manager |
Louis J. Mendes III Co-Portfolio Manager |
||||||


Performance data shown represents past performance and is not a guarantee of future results. The investment return and principal value will fluctuate so that shares, when redeemed, may be worth more or less than the original cost. Current performance may be lower or higher than the performance data shown. Please visit columbiathreadneedle.com/us for daily and most recent month-end performance updates.
Market risk may affect a single issuer, sector of the economy, industry or the market as a whole. International investing involves certain risks and volatility due to potential political, economic or currency instabilities and different, potentially less stringent, financial and accounting standards than those generally applicable to U.S. issuers. Risks are enhanced for emerging market issuers. Investments in small- and mid-cap companies involve risks and volatility and possible illiquidity greater than investments in larger, more established companies. Please also see "A Comment on Trading Volumes" on Page 2 of this report.
Columbia Acorn International Class Z shares returned 4.34% in the first quarter of 2015, 0.58% below its primary benchmark, the S&P Global Ex-U.S. Between $500M and $5B® Index. For comparison, the large-cap, developed market MSCI EAFE Index (Net) rose 4.88% during the quarter.
Japan generated the strongest U.S. dollar returns with the Fund's holdings rising over 15% in both local currency and U.S. dollars, as the currency stabilized after a weak 2014. In the quarter, seven of the top 15 performing investments, based on contributions to returns, were domiciled in Japan. In prior reviews, we have noted the strong positive sentiment in Japanese markets stemming from Prime Minister Abe's reform agenda, which was introduced in December 2012. The first two "arrows" of the "Abenomics" agenda, fiscal stimulus and monetary easing, have been successful in generating domestic market optimism, albeit without marked improvement in underlying economic fundamentals. In the first quarter of this year, Japanese regulators proposed a Corporate Governance Code, which constitutes the long-awaited and critical "third arrow" designed to promote improving shareholder returns. As a result, in anticipation of better balance sheet management, many companies that have held large excess cash balances for years showed strong stock price performance. This positive sentiment spilled over into the general market, with domestic-demand oriented companies exhibiting particular buoyancy.
Among the Fund's top performing Japanese positions were Japan Airport Terminal, an airport terminal operator at Haneda that is benefiting from strong inbound Asian tourism, and Ariake Japan, a maker of commercial soup and sauce extracts that has been able to raise prices. Their stocks rose 53% and 42%, respectively, in the quarter. The Japanese market has been characterized for many years by false starts and disappointments. However, we regard government policy moves made in the last two years as among the most aggressive in decades for the world's third largest economy. Representing over 20% of Fund assets, Japan is an important component of the Fund's portfolio.
Europe remains the other large economy seeking to jumpstart economic growth via aggressive monetary easing. Local markets were strong with Fund holdings rising over 17% in local currency. Unfortunately, currency weakness reduced this to roughly 6% in U.S. dollar terms. The fall in European currencies has helped a number of industrial exporters, such as long-time holding Hexagon, a Swedish designer of measurement and visualization software and equipment. Its stock rose over 15% in U.S. dollar terms. Despite ongoing negative headlines over Greek insolvency, European markets appear sanguine about a possible exit scenario.
Many of the Fund's laggards continue to come from Asia ex-Japan, where Hong Kong-listed casinos and retailers struggled on the back of declining Macau gaming and tourist spending in Hong Kong. Casino operator Melco Crown Entertainment and cosmetics retailer Sa Sa International fell 15% and 29%, respectively, while department store operator Lifestyle International fell over 15%. Weak currencies have made Japan and Europe increasingly affordable to mainland Chinese tourists, who seem to be deterred by perceived hostility in Hong Kong and are opting to spend their vacations elsewhere. As the Chinese economy slows and is subject to new anti-corruption policies, the central bank has eased credit in order to backstop declining demand. Whether China will follow the lead of Europe and Japan by launching its own easy money policy remains to be seen, but the trend appears to signal a turnaround in credit availability for the remainder of the year. Latin America was also a laggard, with holdings in Brazil, Mexico, Chile and Guatemala all down over 10% in U.S. dollar terms on weak local economies and a continued bleak outlook for commodity prices.
As we enter the second quarter, there is a clear bifurcation in monetary policy among the world's major economies: Japan, Europe and China combat slowing growth with monetary easing, while the United States is poised to move in the opposite direction. Thus far, the economic impact is most salient in currency moves. While U.S. dollar strength has reduced returns to Fund shareholders, the Fund has not engaged in currency hedging to buoy U.S. dollar returns. Currencies are volatile, their direction difficult to reliably predict, and we believe an unhedged portfolio provides shareholders with the benefit of currency diversification.
Fund's Positions in Mentioned Holdings
As a percentage of net assets, as of 3/31/15
|
Hexagon |
0.8 |
% |
|||||
| Melco Crown Entertainment—ADR* |
0.5 |
||||||
|
Japan Airport Terminal |
0.5 |
||||||
|
Ariake Japan |
0.4 |
||||||
|
Lifestyle International |
0.3 |
||||||
|
Sa Sa International |
0.2 |
||||||
Fund holdings are as of the date given, are subject to change at any time, and are not recommendations to buy or sell any security. Top holdings exclude short-term holdings and cash, if applicable.
*ADR - American Depository Receipts
10
COLUMBIA ACORN INTERNATIONAL®
AT A GLANCE
Total Net Assets of the Fund:
$7.9 billion
Performance data shown below represents past performance, does not guarantee future results, assumes reinvestment of dividends and distributions and does not reflect the deduction of taxes that a shareholder may pay on Fund distributions or the redemption of Fund shares. The investment return and principal value of an investment will fluctuate so that shares, when redeemed, may be worth more or less than their original cost. Current performance may be lower or higher than the performance data shown. Performance data reflects fee waivers or reimbursements of Fund expenses, if any; in their absence, performance results would have been lower. Indexes are unmanaged; their results do not reflect the effect of expenses or sales charges. Securities in the Fund may not match those in an index. Please visit columbiathreadneedle.com/us for performance data current to the most recent month-end.
The Growth of a $10,000 Investment in Columbia Acorn International® Class Z Shares
September 23, 1992 (Fund inception) through March 31, 2015
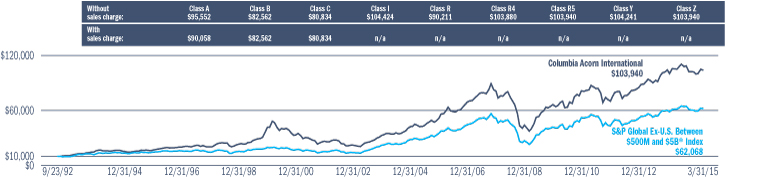
This chart shows the change in value of a hypothetical $10,000 investment in Class Z shares of the Fund during the stated time period.
Average Annual Total Returns for period ended March 31, 2015
|
1st quarter |
1 year |
5 years |
10 years |
Life of Fund |
|||||||||||||||||||
| Class Z (9/23/92 inception) |
4.34 |
% |
-1.33 |
% |
8.64 |
% |
9.07 |
% |
10.96 |
% |
|||||||||||||
| Class A (10/16/00 inception) | |||||||||||||||||||||||
|
without sales charge |
4.27 |
-1.62 |
8.29 |
8.71 |
10.54 |
||||||||||||||||||
|
with sales charge |
-1.72 |
-7.28 |
7.02 |
8.07 |
10.25 |
||||||||||||||||||
|
S&P Global Ex-U.S. Between $500M® and $5B* |
4.92 |
0.85 |
7.21 |
7.93 |
8.44 |
||||||||||||||||||
Results for other share classes can be found on Page 6.
*The Fund's primary benchmark. Please see Page 5 for index descriptions.
Returns for Class A shown with and without the maximum initial sales charge of 5.75%. As stated in the May 1, 2014, prospectus, the Fund's annual operating expense ratio is 0.94% for Class Z shares and 1.29% for Class A shares. The returns shown for periods prior to the inception of the Fund's Class A shares append the returns of the Fund's Class Z shares, the Fund's oldest share class. These returns are adjusted to reflect any higher class-related operating expenses of the newer share classes, as applicable. Please visit columbiathreadneedleus.com/investment-products/mutual-funds/appended-performance for more information.
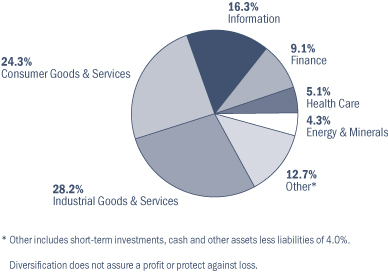
Portfolio Diversification
as a percentage of net assets, as of 3/31/15
Top 10 Holdings
as a percentage of net assets, as of 3/31/15
|
1. |
Coronation Fund Managers (South Africa) South African Fund Manager |
1.4 |
% |
||||||||
| 2. |
CCL Industries (Canada) Global Label Converter |
1.1 |
% |
||||||||
| 3. |
Spotless (Australia) Facility Management & Catering Company |
1.0 |
% |
||||||||
| 4. |
Distribuidora Internacional de Alimentación (Spain) Discount Retailer in Spain & Latin America |
1.0 |
% |
||||||||
| 5. |
Naspers (South Africa) Media in Africa, China, Russia & other Emerging Markets |
1.0 |
% | ||||||||
|
6. |
Neopost (France) Postage Meter Machines |
0.9 |
% |
||||||||
|
7. |
Zee Entertainment Enterprises (India) Indian Programmer of Pay Television Content |
0.9 |
% |
||||||||
| 8. |
Rand Merchant Insurance (South Africa) Directly Sold Property & Casualty Insurance; Holdings in other Insurers |
0.9 |
% |
||||||||
| 9. |
Domino's Pizza Enterprises (Australia) Domino's Pizza Operator in Australia & New Zealand |
0.9 |
% | ||||||||
| 10. |
President Chain Store (Taiwan) Convenience Chain Store Operator in Taiwan |
0.9 |
% |
||||||||
The Fund's top 10 holdings and portfolio diversification vary with changes in portfolio investments. See the Statement of Investments for a complete list of the Fund's holdings.
11
COLUMBIA ACORN USA®
IN A NUTSHELL
|
|
|
||||||
|
Robert A. Mohn Lead Portfolio Manager |
William J. Doyle Co-Portfolio Manager |
||||||


Performance data shown represents past performance and is not a guarantee of future results. The investment return and principal value will fluctuate so that shares, when redeemed, may be worth more or less than the original cost. Current performance may be lower or higher than the performance data shown. Please visit columbiathreadneedle.com/us for daily and most recent month-end performance updates.
Market risk may affect a single issuer, sector of the economy, industry or the market as a whole. Investments in small- and mid-cap companies involve risks and volatility and possible illiquidity greater than investments in larger, more established companies. The Fund may invest significantly in issuers within a particular sector, which may be negatively affected by market, economic or other conditions, making the Fund more vulnerable to unfavorable developments in the sector.
Columbia Acorn USA Class Z shares ended the first quarter of 2015 up 5.12%, outperforming the 4.32% gain of its primary benchmark, the Russell 2000 Index. Outperformance in the quarter was driven by favorable stock selection in the information technology (IT) and consumer discretionary sectors.
IT stock IPG Photonics, a maker of fiber lasers, was the top contributor to gains in the quarter, increasing 23% on solid year-over-year revenue growth. Other winners in the sector included Infinera, a maker of optical networking equipment, whose stock rose 33%. Infinera reported strong fourth quarter growth on robust demand for its long haul optical products. ExlService Holdings, a business process outsourcing company, gained 30% by adding enough new business to grow through the loss of a large insurance client. SPS Commerce, a developer of supply chain management software delivered via the web, gained 19% on solid revenue growth and particularly strong gains in a new analytics offering for retailing suppliers. Informatica, a developer of enterprise data integration software, gained 15% in the quarter, as its stock price began to incorporate a take-out premium based on multiple media reports indicating a sale of the company was near. Just following the quarter end on April 7, Informatica agreed to be acquired for an 11% premium to their closing price on March 31.
Other winners in the period included self-storage facilities owner Extra Space Storage, up 16%. The company has benefited from strong same-store operating income growth of 10%, along with a spate of accretive acquisitions. Akorn, a manufacturer and distributor of specialty generic drugs, gained 30% in the quarter. Its revenue jumped 168% over the prior year, aided by some significant generic drug price hikes.
Drew Industries, a maker of RV and manufactured home components, gained 24% on solid revenue growth. The company has been increasing market share in the fast-growing towable RV end market. Drew Industries' strong quarter helped drive the Fund's relative outperformance in the consumer discretionary sector.
The Fund's investments in car rental companies Avis Budget Group and Hertz detracted from gains during the quarter. Down 12% and 13%, respectively, the stocks fell on concerns over weaker-than-expected pricing. Hardwood flooring retailer Lumber Liquidators fell 48% after the company received negative publicity. We opted to sell the Fund's position in the stock. Down 15%, truck dealership Rush Enterprises (Class A) was impacted by weaker energy prices, as 10% of its truck sales are to energy supply chain customers. NetSuite, a developer of
end-to-end IT systems solutions delivered via the web, fell 15%. The company had good revenue growth of 37% but suffered from lower margins.
We are pleased with the Fund's first quarter performance. We believe the outlook is favorable for the majority of the stocks that the Fund owns given domestic economic growth. We also believe Fund positions with some exposure to growing emerging market populations and incomes should be beneficial going forward.
Fund's Positions in Mentioned Holdings
As a percentage of net assets, as of 3/31/15
|
Extra Space Storage |
3.1 |
% |
|||||
|
IPG Photonics |
2.6 |
||||||
|
Drew Industries |
2.5 |
||||||
|
Avis Budget Group |
1.9 |
||||||
|
Akorn |
1.6 |
||||||
|
ExlService Holdings |
1.4 |
||||||
|
SPS Commerce |
1.2 |
||||||
|
Rush Enterprises* |
1.1 |
||||||
|
NetSuite |
0.8 |
||||||
|
Infinera |
0.7 |
||||||
|
Informatica |
0.7 |
||||||
|
Hertz |
0.6 |
||||||
Fund holdings are as of the date given, are subject to change at any time, and are not recommendations to buy or sell any security. Top holdings exclude short-term holdings and cash, if applicable.
*The Fund is invested in Class A and Class B shares of this company.
12
COLUMBIA ACORN USA®
AT A GLANCE
Total Net Assets of the Fund:
$1.3 billion
Performance data shown below represents past performance, does not guarantee future results, assumes reinvestment of dividends and distributions and does not reflect the deduction of taxes that a shareholder may pay on Fund distributions or the redemption of Fund shares. The investment return and principal value of an investment will fluctuate so that shares, when redeemed, may be worth more or less than their original cost. Current performance may be lower or higher than the performance data shown. Performance data reflects fee waivers or reimbursements of Fund expenses, if any; in their absence, performance results would have been lower. Indexes are unmanaged; their results do not reflect the effect of expenses or sales charges. Securities in the Fund may not match those in an index. Please visit columbiathreadneedle.com/us for performance data current to the most recent month-end.
The Growth of a $10,000 Investment in Columbia Acorn USA® Class Z Shares
September 4, 1996 (Fund inception) through March 31, 2015
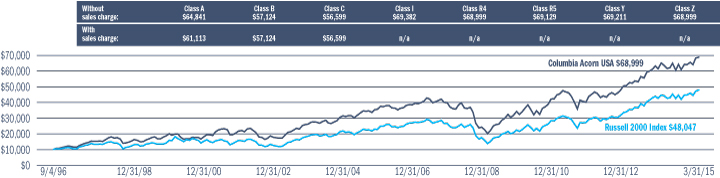
This chart shows the change in value of a hypothetical $10,000 investment in Class Z shares of the Fund during the stated time period.
Average Annual Total Returns for period ended March 31, 2015
|
1st quarter |
1 year |
5 years |
10 years |
Life of Fund |
|||||||||||||||||||
| Class Z (9/4/96 inception) |
5.12 |
% |
8.22 |
% |
13.54 |
% |
8.16 |
% |
10.96 |
% |
|||||||||||||
| Class A (10/16/00 inception) | |||||||||||||||||||||||
|
without sales charge |
5.08 |
7.97 |
13.24 |
7.86 |
10.59 |
||||||||||||||||||
|
with sales charge |
-0.97 |
1.75 |
11.91 |
7.23 |
10.24 |
||||||||||||||||||
|
Russell 2000 Index* |
4.32 |
8.21 |
14.57 |
8.82 |
8.82 |
||||||||||||||||||
Results for other share classes can be found on Page 6.
*The Fund's primary benchmark. Please see Page 5 for index descriptions.
Returns for Class A shown with and without the maximum initial sales charge of 5.75%. As stated in the May 1, 2014, prospectus, the Fund's annual operating expense ratio is 1.07% for Class Z shares and 1.33% for Class A shares. The returns shown for periods prior to the inception of the Fund's Class A shares append the returns of the Fund's Class Z shares, the Fund's oldest share class. These returns are adjusted to reflect any higher class-related operating expenses of the newer share classes, as applicable. Please visit columbiathreadneedleus.com/investment-products/mutual-funds/appended-performance for more information.
Portfolio Diversification
as a percentage of net assets, as of 3/31/15
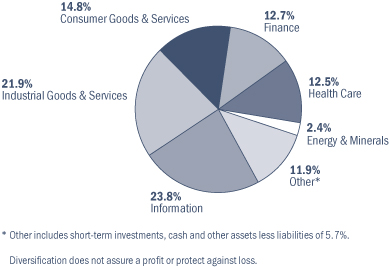
Top 10 Holdings
as a percentage of net assets, as of 3/31/15
|
1. |
Mettler-Toledo International Laboratory Equipment |
3.4 |
% |
||||||||
|
2. |
Ametek Aerospace/Industrial Instruments |
3.1 |
% |
||||||||
|
3. |
Extra Space Storage Self Storage Facilities |
3.1 |
% |
||||||||
|
4. |
Nordson Dispensing Systems for Adhesives & Coatings |
3.0 |
% |
||||||||
|
5. |
HEICO FAA-approved Aircraft Replacement Parts |
2.7 |
% |
||||||||
|
6. |
IPG Photonics Fiber Lasers |
2.6 |
% |
||||||||
|
7. |
Drew Industries RV & Manufactured Home Components |
2.5 |
% |
||||||||
|
8. |
Donaldson Industrial Air Filtration |
2.4 |
% |
||||||||
|
9. |
Cepheid Molecular Diagnostics |
2.1 |
% |
||||||||
|
10. |
Synageva BioPharma Biotech Focused on Orphan Diseases |
2.0 |
% |
||||||||
The Fund's top 10 holdings and portfolio diversification vary with changes in portfolio investments. See the Statement of Investments for a complete list of the Fund's holdings.
13
COLUMBIA ACORN INTERNATIONAL SELECTSM
IN A NUTSHELL
|
|
|||
|
Christopher J. Olson Portfolio Manager |
|||

Performance data shown represents past performance and is not a guarantee of future results. The investment return and principal value will fluctuate so that shares, when redeemed, may be worth more or less than the original cost. Current performance may be lower or higher than the performance data shown. Please visit columbiathreadneedle.com/us for daily and most recent month-end performance updates.
Market risk may affect a single issuer, sector of the economy, industry or the market as a whole. Foreign investments subject the Fund to political, economic, market, social and other risks within a particular country, as well as to potential currency instabilities and less stringent financial and accounting standards generally applicable to U.S. issuers. Risks are enhanced for emerging market issuers. Investments in small- and mid-cap companies involve risks and volatility and possible illiquidity greater than investments in larger, more established companies. The Fund may invest significantly in issuers within a particular sector, which may be negatively affected by market, economic or other conditions, making the Fund more vulnerable to unfavorable developments in the sector. Please also see "A Comment on Trading Volumes" on Page 2 of this report.
Columbia Acorn International Select Class Z shares ended the first quarter of 2015 up 1.48%. This compares to a 5.61% gain for the Fund's primary benchmark, the S&P Developed Ex-U.S. Between $2B and $10B® Index. On a regional basis, a large part of the Fund's relative underperformance was tied to exposure in Asia (excluding Japan), Latin America and other emerging markets. On a sector basis, materials stocks and financials were the biggest relative detractors.
Six of the Fund's top 10 contributors in the quarter were Japanese companies and included Secom, a provider of security services. The company's stock gained 17% as investors sold export stocks on yen strength and moved into stable domestic businesses like Secom. Park24, a parking lot operator in Japan, gained 39%, benefiting from the same trend. Japan Tobacco, a maker of cigarettes, had a 15% gain as investors became more comfortable with the outlook for its Russian operations and management undertook a stock buyback. Recruit Holdings, a provider of recruitment and media services, gained 10% on the back of improved labor conditions, which drove better-than-expected earnings. Abroad, its recent acquisitions, such as indeed.com, an employment-related search engine, continued to grow strongly.
Outside Japan, Naspers, a South African provider of media to emerging markets, gained 18%. Chinese Internet company Tencent is Naspers' primary investment and it continued to report robust revenue and earnings gains. CJ Corp, a holding company of a Korean consumer conglomerate, had a strong quarter, gaining 12% as new management continued to successfully implement restructuring programs.
Laggards in the quarter included Tahoe Resources, a silver miner operating in Guatemala. Its stock fell 21% as investors worried about political risk in Guatemala and responded negatively to the company's proposed merger with Peru-based miner Rio Alto Mining. Babcock International, a UK public sector outsourcer, fell 11% as investors took profits in the stock in anticipation of a volatile election season. Canadian oil and gas producer Baytex fell 16% with the drop in oil prices. We opted to sell the Fund's position during the quarter. Coronation Fund Managers, a South African fund manager, fell 19% in the quarter on profit taking after a strong 2014. Japanese auto parts manufacturer NGK Spark Plug also changed direction in the quarter, declining 11% as export stocks were sold on the back of the stronger yen.
Global liquidity remains supportive to most equity markets. As a result, stock valuations have risen. In addition to paying careful attention to the valuations of our holdings, we strive to be mindful about the impact of monetary policy on the underlying businesses. As easy liquidity is likely to be only a temporary benefit, we will endeavor to be certain that the businesses we invest in can stand on their own once policy support is withdrawn.
Fund's Positions in Mentioned Holdings
As a percentage of net assets, as of 3/31/15
|
Recruit Holdings |
3.8 |
% |
|||||
|
Secom |
3.6 |
||||||
|
Tahoe Resources |
2.7 |
||||||
|
Japan Tobacco |
2.5 |
||||||
|
CJ Corp |
2.4 |
||||||
|
NGK Spark Plug |
2.3 |
||||||
|
Naspers |
2.1 |
||||||
|
Babcock International |
2.0 |
||||||
|
Coronation Fund Managers |
1.9 |
||||||
|
Park24 |
1.5 |
||||||
Fund holdings are as of the date given, are subject to change at any time, and are not recommendations to buy or sell any security. Top holdings exclude short-term holdings and cash, if applicable.
The Fund's concentrated investments in a limited number of stocks will cause the Fund to diverge significantly from benchmark weightings and may subject the Fund to greater risk and volatility than its benchmark and the other Columbia Acorn Funds.
14
COLUMBIA ACORN INTERNATIONAL SELECTSM
AT A GLANCE
Total Net Assets of the Fund:
$241.9 million
Performance data shown below represents past performance, does not guarantee future results, assumes reinvestment of dividends and distributions and does not reflect the deduction of taxes that a shareholder may pay on Fund distributions or the redemption of Fund shares. The investment return and principal value of an investment will fluctuate so that shares, when redeemed, may be worth more or less than their original cost. Current performance may be lower or higher than the performance data shown. Performance data reflects fee waivers or reimbursements of Fund expenses, if any; in their absence, performance results would have been lower. Indexes are unmanaged; their results do not reflect the effect of expenses or sales charges. Securities in the Fund may not match those in an index. Please visit columbiathreadneedle.com/us for performance data current to the most recent month-end.
The Growth of a $10,000 Investment in Columbia Acorn International SelectSM Class Z Shares
November 23, 1998 (Fund inception) through March 31, 2015
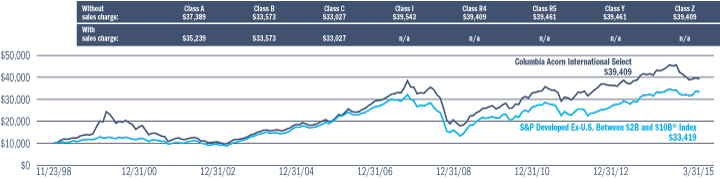
This chart shows the change in value of a hypothetical $10,000 investment in Class Z shares of the Fund during the stated time period.
Average Annual Total Returns for period ended March 31, 2015
|
1st quarter |
1 year |
5 years |
10 years |
Life of Fund |
|||||||||||||||||||
| Class Z (11/23/98 inception) |
1.48 |
% |
-8.18 |
% |
7.49 |
% |
7.75 |
% |
8.75 |
% |
|||||||||||||
| Class A (10/16/00 inception) | |||||||||||||||||||||||
|
without sales charge |
1.41 |
-8.44 |
7.13 |
7.41 |
8.40 |
||||||||||||||||||
|
with sales charge |
-4.41 |
-13.70 |
5.87 |
6.78 |
8.01 |
||||||||||||||||||
|
S&P Developed Ex-U.S. Between $2B and $10B® Index* |
5.61 |
1.12 |
7.85 |
6.72 |
7.66 |
||||||||||||||||||
Results for other share classes can be found on Page 6.
*The Fund's primary benchmark. Please see Page 5 for index descriptions.
Returns for Class A shown with and without the maximum initial sales charge of 5.75%. As stated in the May 1, 2014, prospectus, the Fund's annual operating expense ratio is 1.21% for Class Z shares and 1.49% for Class A shares. The returns shown for periods prior to the inception of the Fund's Class A shares append the returns of the Fund's Class Z shares, the Fund's oldest share class. These returns are adjusted to reflect any higher class-related operating expenses of the newer share classes, as applicable. Please visit columbiathreadneedleus.com/investment-products/mutual-funds/appended-performance for more information.
Portfolio Diversification
as a percentage of net assets, as of 3/31/15

Top 10 Holdings
as a percentage of net assets, as of 3/31/15
|
1. |
Singapore Exchange (Singapore) Singapore Equity & Derivatives Market Operator |
5.0 |
% |
||||||||
| 2. |
Challenger Financial (Australia) Annuity Provider in Australia |
4.6 |
% |
||||||||
|
3. |
CapitaMall Trust (Singapore) Singapore Commercial Property Real Estate Investment Trust |
4.3 |
% |
||||||||
|
4. |
Recruit Holdings (Japan) Recruitment & Media Services |
3.8 |
% |
||||||||
|
5. |
KDDI (Japan) Mobile & Fixed Line Communication Service Provider in Japan |
3.7 |
% |
||||||||
|
6. |
Secom (Japan) Security Services |
3.6 |
% |
||||||||
|
7. |
CCL Industries (Canada) Global Label Converter |
3.1 |
% |
||||||||
|
8. |
Telefonica Deutschland (Germany) Mobile & Fixed-line Communications in Germany |
3.1 |
% |
||||||||
|
9. |
Tahoe Resources (Guatemala) Silver Project in Guatemala |
2.7 |
% |
||||||||
|
10. |
Partners Group (Switzerland) Private Markets Asset Management |
2.6 |
% |
||||||||
The Fund's top 10 holdings and portfolio diversification vary with changes in portfolio investments. See the Statement of Investments for a complete list of the Fund's holdings.
15
COLUMBIA ACORN SELECTSM
IN A NUTSHELL
|
|
|||
|
Robert A. Chalupnik Portfolio Manager |
|||

Performance data shown represents past performance and is not a guarantee of future results. The investment return and principal value will fluctuate so that shares, when redeemed, may be worth more or less than the original cost. Current performance may be lower or higher than the performance data shown. Please visit columbiathreadneedle.com/us for daily and most recent month-end performance updates.
Market risk may affect a single issuer, sector of the economy, industry or the market as a whole. Investments in small- and mid-cap companies involve risks and volatility and possible illiquidity greater than investments in larger, more established companies. Foreign investments subject the Fund to risks, including political, economic, market, social and other risks, within a particular country, as well as to potential currency instabilities and less stringent financial and accounting standards generally applicable to U.S. issuers. Risks are enhanced for emerging market issuers. The Fund may invest significantly in issuers within a particular sector, which may be negatively affected by market, economic or other conditions, making the Fund more vulnerable to unfavorable developments in the sector.
Columbia Acorn Select Class Z shares ended the first quarter of 2015 up 2.83%, underperforming the 5.31% gain of its primary benchmark, the S&P MidCap 400® Index. Industrial stocks were the largest detractors from relative performance in the period, accounting for over half of the Fund's underperformance versus the benchmark.
Top contributors in the quarter came from a variety of sectors. WNS, a provider of offshore business process outsourcing services, gained 17%. The company benefited from better-than-expected earnings driven by a new CEO who has been successful in improving company growth. We trimmed the position during the quarter to manage its size and risk. Amphenol, a manufacturer of electronic connectors, gained 10% on strong earnings and despite reducing the company's outlook for 2015. Mutual fund administrator and investment manager SEI Investments also gained 10% for the three-month period. SEI has had strong cash inflows into its actively managed strategies. Intercept Pharmaceuticals, a biotech developing drugs for several diseases, had an impressive 74% gain in the quarter. Its drug OCA, which is being developed to treat severe liver disease, received "breakthrough" designation from the FDA. This designation is given to drugs that show early promise in treating a poorly managed disease and indicates that the FDA will work closely with the company to expedite approval. We opted to sell the Fund's position in Intercept to capture the strong gains in the quarter.
Turning to underperformers, the biggest detractor from performance in the industrial sector was air filtration company Donaldson, which fell 2%. As the third largest position in the Fund, this relatively small drop had a significant impact. Donaldson reported disappointing earnings due to weaker filter sales to its agriculture end market, and the company also faced a currency headwind due to the strong U.S. dollar. Although Donaldson's results were disappointing, we continue to like the stock and its long-term prospects. Donaldson should benefit from demand for replacement filters and its worldwide presence gives the company the ability to move manufacturing to better compensate for currency headwinds.
Outside the industrial sector, other large detractors in the quarter included F5 Networks, a provider of Internet traffic management equipment that fell 12%. F5's earnings missed expectations due to reduced demand from its end markets, which include the U.S. Government as well as large corporate enterprises. PVH, an apparel wholesaler and retailer, fell 20% on weaker-than-expected results and reduced guidance for 2016. While sales in the company's core brands grew, they were below management's targets and, with a large portion of its sales outside of the United States, the currency headwind was also a problem. We opted to sell out of the position during the quarter. LKQ, a distributor of alternative auto parts for the collision
industry, fell 9% in the quarter on an earnings miss and lower-than-expected guidance for 2015. The strong dollar and falling commodity prices, mainly in scrap steel, hurt the company. We believe the long-term prospects for LKQ are strong, however, and took advantage of the downturn to add to the position.
The Fund's first quarter and 2014 year-end relative performance were disappointing. Although our principal investment strategy has not changed, we continue to look for ways to improve the performance of the Fund's portfolio. One notable change during the quarter was the reduction in exposure to small energy exploration and production companies that have operations outside the United States. With oil prices down, we believe the prospects for these smaller companies operating in emerging markets have been greatly reduced. We sold out of four energy positions and added three new energy ideas to the portfolio, resulting in an increased exposure to the U.S. shale energy market. Although low oil prices have curtailed drilling in this area, the energy companies held by the Fund have proven reserves and have been profitable at lower oil and gas prices. Another notable change to the portfolio was the increase in turnover of individual securities. We added eight new positions to the Fund and sold out of 11 during the quarter. This amount of portfolio turnover is higher than the Fund has experienced in the recent past and reflects our ongoing effort to focus the Fund on our team's favorite ideas. We believe these changes should benefit patient investors.
Fund's Positions in Mentioned Holdings
As a percentage of net assets, as of 3/31/15
|
Amphenol |
4.7 |
% |
|||||
|
Donaldson |
4.6 |
||||||
|
SEI Investments |
4.3 |
||||||
|
LKQ |
4.3 |
||||||
| WNS—ADR* |
3.5 |
||||||
|
F5 Networks |
3.3 |
||||||
Fund holdings are as of the date given, are subject to change at any time, and are not recommendations to buy or sell any security. Top holdings exclude short-term holdings and cash, if applicable.
The Fund's concentrated investments in a limited number of stocks will cause the Fund to diverge significantly from benchmark weightings and may subject the Fund to greater risk and volatility than its benchmark and the other Columbia Acorn Funds.
*ADR - American Depository Receipts
16
COLUMBIA ACORN SELECTSM
AT A GLANCE
Total Net Assets of the Fund:
$623.4 million
Performance data shown below represents past performance, does not guarantee future results, assumes reinvestment of dividends and distributions and does not reflect the deduction of taxes that a shareholder may pay on Fund distributions or the redemption of Fund shares. The investment return and principal value of an investment will fluctuate so that shares, when redeemed, may be worth more or less than their original cost. Current performance may be lower or higher than the performance data shown. Performance data reflects fee waivers or reimbursements of Fund expenses, if any; in their absence, performance results would have been lower. Indexes are unmanaged; their results do not reflect the effect of expenses or sales charges. Securities in the Fund may not match those in an index. Please visit columbiathreadneedle.com/us for performance data current to the most recent month-end.
The Growth of a $10,000 Investment in Columbia Acorn SelectSM Class Z Shares
November 23, 1998 (Fund inception) through March 31, 2015
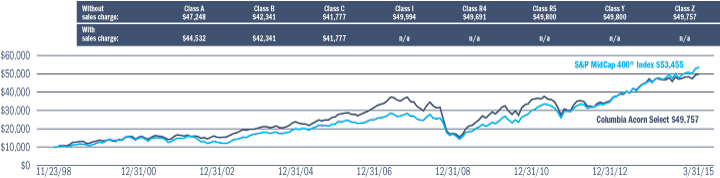
This chart shows the change in value of a hypothetical $10,000 investment in Class Z shares of the Fund during the stated time period.
Average Annual Total Returns for period ended March 31, 2015
|
1st quarter |
1 year |
5 years |
10 years |
Life of Fund |
|||||||||||||||||||
| Class Z (11/23/98 inception) |
2.83 |
% |
5.72 |
% |
9.38 |
% |
8.22 |
% |
10.31 |
% |
|||||||||||||
| Class A (10/16/00 inception) | |||||||||||||||||||||||
|
without sales charge |
2.76 |
5.40 |
9.06 |
7.91 |
9.96 |
||||||||||||||||||
|
with sales charge |
-3.14 |
-0.64 |
7.78 |
7.27 |
9.56 |
||||||||||||||||||
|
S&P MidCap 400® Index* |
5.31 |
12.19 |
15.72 |
10.32 |
10.79 |
||||||||||||||||||
Results for other share classes can be found on Page 6.
*The Fund's primary benchmark. Please see Page 5 for index descriptions.
Returns for Class A shown with and without the maximum initial sales charge of 5.75%. As stated in the May 1, 2014, prospectus, the Fund's annual operating expense ratio is 1.03% for Class Z shares and 1.31% for Class A shares. The returns shown for periods prior to the inception of the Fund's Class A shares append the returns of the Fund's Class Z shares, the Fund's oldest share class. These returns are adjusted to reflect any higher class-related operating expenses of the newer share classes, as applicable. Please visit columbiathreadneedleus.com/investment-products/mutual-funds/appended-performance for more information.
Portfolio Diversification
as a percentage of net assets, as of 3/31/15
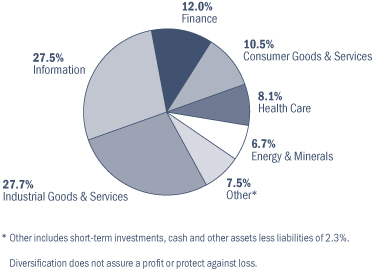
Top 10 Holdings
as a percentage of net assets, as of 3/31/15
|
1. |
Ametek Aerospace/Industrial Instruments |
6.4 |
% |
||||||||
|
2. |
Amphenol Electronic Connectors |
4.7 |
% |
||||||||
|
3. |
Donaldson Industrial Air Filtration |
4.6 |
% |
||||||||
|
4. |
SEI Investments Mutual Fund Administration & Investment Management |
4.3 |
% |
||||||||
|
5. |
LKQ Alternative Auto Parts Distribution |
4.3 |
% |
||||||||
|
6. |
WNS—ADR Offshore Business Process Outsourcing Services |
3.5 |
% |
||||||||
|
7. |
F5 Networks Internet Traffic Management Equipment |
3.3 |
% |
||||||||
|
8. |
Nordson Dispensing Systems for Adhesives & Coatings |
3.3 |
% |
||||||||
| 9. |
Solera Holdings Software for Automotive Insurance Claims Processing |
3.2 |
% |
||||||||
| 10. |
Mettler-Toledo International Laboratory Equipment |
3.1 |
% | ||||||||
The Fund's top 10 holdings and portfolio diversification vary with changes in portfolio investments. See the Statement of Investments for a complete list of the Fund's holdings.
17
COLUMBIA THERMOSTAT FUNDSM
IN A NUTSHELL
|
|
|
||||||
|
Charles P. McQuaid Lead Portfolio Manager |
Christopher J. Olson Co-Portfolio Manager |
||||||


Performance data shown represents past performance and is not a guarantee of future results. The investment return and principal value will fluctuate so that shares, when redeemed, may be worth more or less than the original cost. Current performance may be lower or higher than the performance data shown. Please visit columbiathreadneedle.com/us for daily and most recent month-end performance updates.
A "fund of fund" bears its allocable share of the costs and expenses of the underlying funds in which it invests. Such funds are thus subject to two levels of fees and potentially higher expense ratios than would be associated with a fund that invests and trades directly in financial instruments under the direction of a single manager.
The value of an investment in the Fund is based primarily on the performance of the underlying funds in which it invests. The Fund is subject to the risk that the Investment Manager's decisions regarding asset classes and underlying funds will not anticipate market trends successfully, resulting in a failure to preserve capital or lower total return. The Investment Manager may prefer an underlying fund in the Columbia Acorn Family of Funds over alternative investments. There can be no assurance that the Columbia Acorn Funds will outperform similar funds managed by the Investment Manager's affiliates. This is not an offer of the shares of any other mutual fund mentioned herein.
Columbia Thermostat Fund Class Z shares ended the first quarter of 2015 up 1.50%. This compares to a 0.95% quarterly gain of the Fund's primary equity benchmark, the S&P 500® Index. The Fund's primary debt benchmark, the Barclays U.S. Aggregate Bond Index, rose 1.61% in the quarter, and the 50/50 Blended Benchmark gained 1.37% for the same period. Relative performance for the Fund improved in the first quarter, topping the equity index and the blended benchmark (defined on Page 5).
The weighted average gain for the Fund's equity portfolio was 2.60% for the first quarter, led by the performance of Columbia Select Large Cap Growth Fund, up 5.73%. The bond portion of the Fund had a weighted average gain of 1.49% for the first quarter. Columbia Income Opportunities Fund led bond performance, increasing 2.92%.
The Fund hit one reallocation trigger in the first quarter, reducing stock exposure to 10% after the S&P 500® surpassed the 2,020 level.
During the first quarter of 2015, we conducted the periodic review of underlying funds called for by Columbia Thermostat Fund's prospectus. As a result, we expect to make the following changes during the second quarter:*
• Columbia Acorn Fund's weighting will decrease from 15% to 10% of the equity portfolio.
• Columbia Contrarian Core Fund's weighting will increase from 15% to 20% of the equity portfolio.
• Columbia Intermediate Bond Fund will decrease from 25% to 20% of the bond portfolio.
• Columbia U.S. Government Mortgage Fund will increase from 15% to 20% of the bond portfolio.
• The stock/bond allocation table levels will be revised. The Fund will move to 10% stocks at an S&P 500® level over 2,225, up from 2,020. The Fund will move to 90% stocks at a level of 1,100 or less, up from 970. In between, a 75 point move in the S&P 500® will trigger a 5% point change in allocation of stock and bond funds.
This year's changes in stock weightings resulted in Columbia Thermostat Fund having closer to a market weight in larger cap stocks. We believe the changes in bond weightings will modestly boost the yield of Thermostat's bond portfolio. In 2014, we made changes to the Fund's
allocation table, recognizing that we can no longer assume that price-to-earnings (PE) ratios will compress but, instead, the S&P 500® will trade within its broad historical PE ratio range on normalized (long-term moving average) earnings. This year, we refined our methodology to account for normalized earnings likely rising during the year, as low earnings spool off the moving average.
*These changes were implemented with the Fund's May 1, 2015 prospectus.
Results of the Funds Owned in Columbia Thermostat Fund
as of March 31, 2015
Stock Funds
|
Fund |
Weightings in category |
1st quarter performance |
|||||||||
|
Columbia Acorn International, Class I |
20 |
% |
4.38 |
% |
|||||||
|
Columbia Dividend Income Fund, Class I |
20 |
% |
-0.33 |
% |
|||||||
|
Columbia Acorn Fund, Class I |
15 |
% |
4.00 |
% |
|||||||
|
Columbia Contrarian Core Fund, Class I |
15 |
% |
1.25 |
% |
|||||||
|
Columbia Acorn Select, Class I |
10 |
% |
2.90 |
% |
|||||||
|
Columbia Large Cap Enhanced Core Fund, Class I |
10 |
% |
1.31 |
% |
|||||||
|
Columbia Select Large Cap Growth Fund, Class I |
10 |
% |
5.73 |
% |
|||||||
|
Weighted Average Equity Gain |
100 |
% |
2.60 |
% |
|||||||
Bond Funds
|
Fund |
Weightings in category |
1st quarter performance |
|||||||||
|
Columbia Short Term Bond Fund, Class I |
40 |
% |
0.58 |
% |
|||||||
|
Columbia Intermediate Bond Fund, Class I |
25 |
% |
1.93 |
% |
|||||||
|
Columbia Income Opportunities Fund, Class I |
20 |
% |
2.92 |
% |
|||||||
|
Columbia U.S. Government Mortgage Fund, Class I |
15 |
% |
1.27 |
% |
|||||||
|
Weighted Average Income Gain |
100 |
% |
1.49 |
% |
|||||||
Columbia Thermostat Fund Rebalancing in the First Quarter
|
January 21, 2015 |
10% stocks, 90% bonds |
||||||
The Fund's investments in the underlying funds may present certain risks, including the following. Market risk may affect a single issuer, sector of the economy, industry or the market as a whole. The Fund's investment in other funds subjects it to the investment performance (positive or negative), risks and expenses of these underlying funds. Investments in small- and mid-cap companies involve risks and volatility and possible illiquidity greater than in investments in larger, more established companies. There are risks associated with fixed income investments, including credit risk, market risk, interest rate risk and prepayment and extension risk. In general, bond prices fall when interest rates rise and vice versa. This effect is more pronounced for longer-term securities. Non-investment-grade (high-yield or junk) securities present greater price volatility and more risk to principal and income than higher rated securities. Foreign investments subject the Fund to political, economic, market, social and other risks within a particular country, as well as to potential currency instabilities and less stringent financial and accounting standards generally applicable to U.S. issuers. Risks are enhanced for emerging market issuers.
18
COLUMBIA THERMOSTAT FUNDSM
AT A GLANCE
Total Net Assets of the Fund:
$1.2 billion
Performance data shown below represents past performance, does not guarantee future results, assumes reinvestment of dividends and distributions and does not reflect the deduction of taxes that a shareholder may pay on Fund distributions or the redemption of Fund shares. The investment return and principal value of an investment will fluctuate so that shares, when redeemed, may be worth more or less than their original cost. Current performance may be lower or higher than the performance data shown. Performance data reflects fee waivers or reimbursements of Fund expenses, if any; in their absence, performance results would have been lower. Indexes are unmanaged; their results do not reflect the effect of expenses or sales charges. Securities in the Fund may not match those in an index. Please visit columbiathreadneedle.com/us for performance data current to the most recent month-end.
The Growth of a $10,000 Investment in Columbia Thermostat FundSM Class Z Shares
September 25, 2002 (Fund inception) through March 31, 2015
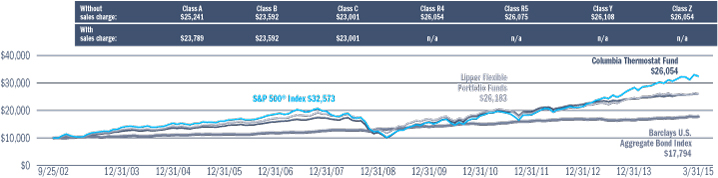
This chart shows the change in value of a hypothetical $10,000 investment in Class Z shares of the Fund during the stated time period.
Average Annual Total Returns for period ended March 31, 2015
|
1st quarter |
1 year |
5 years |
10 years |
Life of Fund |
|||||||||||||||||||
| Class Z (9/25/02 inception) |
1.50 |
% |
5.11 |
% |
9.33 |
% |
6.83 |
% |
7.95 |
% |
|||||||||||||
| Class A (3/3/03 inception) | |||||||||||||||||||||||
|
without sales charge |
1.41 |
4.85 |
9.05 |
6.56 |
7.68 |
||||||||||||||||||
|
with sales charge |
-4.44 |
-1.20 |
7.76 |
5.93 |
7.17 |
||||||||||||||||||
|
S&P 500® Index* |
0.95 |
12.73 |
14.47 |
8.01 |
9.90 |
||||||||||||||||||
|
Barclays U.S. Aggregate Bond Index* |
1.61 |
5.72 |
4.41 |
4.93 |
4.71 |
||||||||||||||||||
Results for other share classes can be found on Page 6.
*The Fund's primary benchmarks. Please see Page 5 for index descriptions.
Returns for Class A shown with and without the maximum initial sales charge of 5.75%. As stated in the May 1, 2014, prospectus, the Fund's annual operating expense ratio is 0.80% for Class Z shares and 1.05% for Class A shares. The returns shown for periods prior to the inception of the Fund's Class A shares append the returns of the Fund's Class Z shares, the Fund's oldest share class. These returns are adjusted to reflect any higher class-related operating expenses of the newer share classes, as applicable. Please visit columbiathreadneedleus.com/investment-products/mutual-funds/appended-performance for more information.
Asset Allocation
as a percentage of net assets, as of 3/31/15
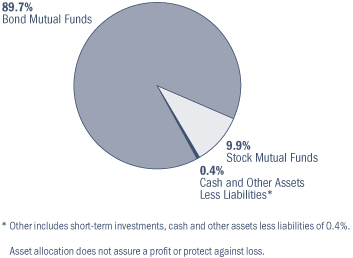
Portfolio Weightings
as a percentage of assets in each investment category, as of 3/31/15
Stock Mutual Funds
|
Columbia Acorn International, Class I |
20 |
% |
|||||
|
Columbia Dividend Income Fund, Class I |
20 |
% |
|||||
|
Columbia Acorn Fund, Class I |
15 |
% |
|||||
|
Columbia Contrarian Core Fund, Class I |
15 |
% |
|||||
|
Columbia Acorn Select, Class I |
10 |
% |
|||||
|
Columbia Large Cap Enhanced Core Fund, Class I |
10 |
% |
|||||
|
Columbia Select Large Cap Growth Fund, Class I |
10 |
% |
|||||
Bond Mutual Funds
|
Columbia Short Term Bond Fund, Class I |
40 |
% |
|||||
|
Columbia Intermediate Bond Fund, Class I |
25 |
% |
|||||
|
Columbia Income Opportunities Fund, Class I |
20 |
% |
|||||
|
Columbia U.S. Government Fund, Class I |
15 |
% |
|||||
19
COLUMBIA ACORN EMERGING MARKETS FUNDSM
IN A NUTSHELL
|
|
|
||||||
|
Fritz Kaegi Lead Portfolio Manager |
Stephen Kusmierczak Lead Portfolio Manager |
||||||
|
|
|
||||||
|
P. Zachary Egan Co-Portfolio Manager |
Louis J. Mendes III Co-Portfolio Manager |
||||||


Performance data shown represents past performance and is not a guarantee of future results. The investment return and principal value will fluctuate so that shares, when redeemed, may be worth more or less than the original cost. Current performance may be lower or higher than the performance data shown. Please visit columbiathreadneedle.com/us for daily and most recent month-end performance updates.
Market risk may affect a single issuer, sector of the economy, industry or the market as a whole. International investing involves certain risks and volatility due to potential political, economic or currency instabilities and different, potentially less stringent, financial and accounting standards than those generally applicable to U.S. issuers. Risks are enhanced for emerging and frontier market issuers. Investments in small- and mid-cap companies involve risks and volatility and possible illiquidity greater than investments in larger, more established companies. Please also see "A Comment on Trading Volumes" on Page 2 of this report.
During the first quarter of 2015, Columbia Acorn Emerging Markets Fund Class Z shares fell 0.78%, while its benchmark, the S&P Emerging Markets Between $500M and $5B® Index, rose 1.86%. Since inception through March 31, 2015, the Fund has returned 7.47%, while the benchmark has had an annualized return of 3.61%.
During the quarter, the Fund's main positional bets underperformed. The Fund's largest regional overweight versus the benchmark is Southeast Asia, where we have a 22.5% weight, or 7.4 percentage points over the benchmark. The Fund's main underweight is Greater China, where the Fund has a 26.7% weight but is 14.6 percentage points below the benchmark. The largest sector overweight continues to be in the consumer discretionary sector, where the Fund's 28.2% weight is 13.6 percentage points above benchmark. In financials, the Fund's 12.1% weight is 11.3 percentage points under benchmark. In each of these four main bets, we had subpar stock selection, which explains most of the Fund's underperformance.
The one positional bright spot was that Fund holdings of companies listed outside emerging markets (but with substantial emerging markets economic exposure) performed strongly across the board. These included Italian tire supplier Pirelli (up 23%), UK-listed but Latin America-exposed telecom service provider Cable and Wireless (up 17%), Swedish metrology specialist Hexagon (up 15%), and paint producers Kansai Paint in Japan (up 18%) and Tikkurila in Finland (up 14%).
The largest single regional detractor was Greater China, representing most of the Fund's underperformance. Within the region, the largest detractors were Chinese auto information website BitAuto, down 27%, and Macau-driven casino operator Melco International, down 23%. The market reacted negatively to BitAuto's initiative with JD.com to push further into online auto markets, as the deal's heavy investment in development spending may depress short-term earnings growth. Melco International continues to be hit by unfavorable revenue growth trends in Macau, and general fears that the Chinese anti-corruption drive will continue to depress casino revenues. In Southeast Asia, casino operators Melco Crown (Philippines) Resorts (down 32% for the quarter) and Nagacorp (down 19%) represented nearly all of the underperformance in that region. Both holdings were hit by falling valuations for Asian casino operators and by a general fear that the fundamental causes of negative gaming revenue trends in Macau will extend into the rest of Asia. These two holdings offset the fine performances of two of our Indonesian holdings, consumer-branded food manufacturer Mayora Indah (up 31%) and retailer
Matahari Department Store (up 26%). Both are in strong fundamental health, including reporting better margins, in spite of a difficult economic environment.
Within consumer discretionary, the three casino operators mentioned above were the largest detractors. Indian pay TV programmer Zee Entertainment Enterprises, down 9%, also hurt performance because it is a large holding. Investors are still skeptical that digitalization of the Indian cable TV market will translate into sustainably higher revenues for owners of content, especially in the short term. This weakness offset the 32% gain posted by auto part maker Bosch (India), which has been carried upward by the Indian auto industry's return to growth. Within financials, the 18% decline in the Fund's largest holding, Coronation Fund Managers, was the most important detractor. With inflows continuing and South African financial markets posting good returns, its stock fell on profit taking after a strong 2014.
How are we responding to this underperformance? First, we have further scrutinized Fund casino holdings and cut weightings, especially since these stocks seem to be more highly correlated than their geographic dispersion would suggest. We still believe they are excellent business franchises, but we are more cautious about the impact of Chinese state policy on the industry. Second, we are making a push to refresh the portfolio with new holdings. We added eight new holdings during the quarter and added several more after quarter's end. All of these were fruits of an intensive period of travel and investigation by our analysts.
Fund's Positions in Mentioned Holdings
As a percentage of net assets, as of 3/31/15
|
Coronation Fund Managers |
3.5 |
% |
|||||
|
Zee Entertainment Enterprises |
2.9 |
||||||
|
Melco International |
2.2 |
||||||
|
Cable and Wireless |
2.0 |
||||||
|
Melco Crown (Philippines) Resorts |
1.9 |
||||||
|
Nagacorp |
1.7 |
||||||
|
Hexagon |
1.6 |
||||||
|
Bosch |
1.6 |
||||||
|
Matahari Department Store |
1.4 |
||||||
| BitAuto—ADR* |
1.4 |
||||||
|
Kansai Paint |
1.3 |
||||||
|
Tikkurila |
1.2 |
||||||
|
Mayora Indah |
1.1 |
||||||
|
Pirelli |
1.0 |
||||||
Fund holdings are as of the date given, are subject to change at any time, and are not recommendations to buy or sell any security. Top holdings exclude short-term holdings and cash, if applicable.
Columbia Acorn Emerging Markets Fund is closed to most new investors and new accounts with certain exceptions. Refer to the Fund's prospectus for details.
*ADR - American Depository Receipts
20
COLUMBIA ACORN EMERGING MARKETS FUNDSM
AT A GLANCE
Total Net Assets of the Fund:
$449.3 million
Performance data shown below represents past performance, does not guarantee future results, assumes reinvestment of dividends and distributions and does not reflect the deduction of taxes that a shareholder may pay on Fund distributions or the redemption of Fund shares. The investment return and principal value of an investment will fluctuate so that shares, when redeemed, may be worth more or less than their original cost. Current performance may be lower or higher than the performance data shown. Performance data reflects fee waivers or reimbursements of Fund expenses, if any; in their absence, performance results would have been lower. Indexes are unmanaged; their results do not reflect the effect of expenses or sales charges. Securities in the Fund may not match those in an index. Please visit columbiathreadneedle.com/us for performance data current to the most recent month-end.
The Growth of a $10,000 Investment in Columbia Acorn Emerging Markets FundSM Class Z Shares
August 19, 2011 (Fund inception) through March 31, 2015
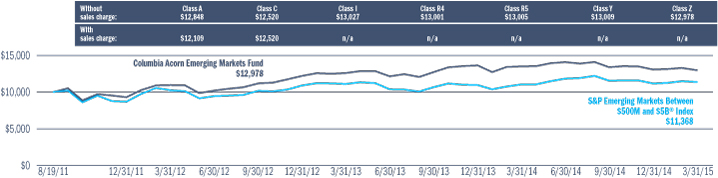
This chart shows the change in value of a hypothetical $10,000 investment in Class Z shares of the Fund during the stated time period.
Average Annual Total Returns for period ended March 31, 2015
|
1st quarter |
1 year |
Life of Fund |
|||||||||||||
| Class Z (8/19/11 inception) |
-0.78 |
% |
-3.94 |
% |
7.47 |
% |
|||||||||
| Class A (8/19/11 inception) | |||||||||||||||
|
without sales charge |
-0.86 |
-4.17 |
7.17 |
||||||||||||
|
with sales charge |
-6.59 |
-9.70 |
5.43 |
||||||||||||
|
S&P Emerging Markets Between $500M and $5B® Index* |
1.86 |
3.07 |
3.61 |
||||||||||||
Results for other share classes can be found on Page 6.
*The Fund's primary benchmark. Please see Page 5 for index descriptions.
Returns for Class A shown with and without the maximum initial sales charge of 5.75%. As stated in the May 1, 2014, prospectus, the Fund's annual operating expense ratio is 1.59% for Class Z shares and 1.81% for Class A shares.
Portfolio Diversification
as a percentage of net assets, as of 3/31/15
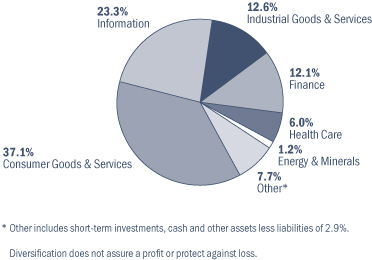
Top 10 Holdings
as a percentage of net assets, as of 3/31/15
|
1. |
Coronation Fund Managers (South Africa) South African Fund Manager |
3.5 |
% |
||||||||
|
2. |
AMVIG Holdings (China) Chinese Tobacco Packaging Material Supplier |
3.1 |
% |
||||||||
| 3. |
Zee Entertainment Enterprises (India) Indian Programmer of Pay Television Content |
2.9 |
% |
||||||||
|
4. |
Koh Young Technology (South Korea) Inspection Systems for Printed Circuit Boards |
2.3 |
% |
||||||||
|
5. |
Rand Merchant Insurance (South Africa) Directly Sold Property & Casualty Insurance; Holdings in other Insurers |
2.2 |
% |
||||||||
|
6. |
Melco International (Hong Kong) Macau Casino Operator |
2.2 |
% |
||||||||
| 7. |
Halyk Savings Bank of Kazakhstan—GDR (Kazakhstan) Retail Bank & Insurer in Kazakhstan |
2.1 |
% |
||||||||
|
8. |
President Chain Store (Taiwan) Convenience Chain Store Operator in Taiwan |
2.1 |
% |
||||||||
|
9. |
Cable and Wireless (United Kingdom) Telecommunications Service Provider in the Caribbean |
2.0 |
% |
||||||||
|
10. |
Adani Ports & Special Economic Zone (India) Indian West Coast Shipping Port |
1.9 |
% |
||||||||
The Fund's top 10 holdings and portfolio diversification vary with changes in portfolio investments. See the Statement of Investments for a complete list of the Fund's holdings.
21
COLUMBIA ACORN EUROPEAN FUNDSM
IN A NUTSHELL
|
|
|
||||||
|
Andreas Waldburg-Wolfegg Lead Portfolio Manager |
Stephen Kusmierczak Co-Portfolio Manager |
||||||


Performance data shown represents past performance and is not a guarantee of future results. The investment return and principal value will fluctuate so that shares, when redeemed, may be worth more or less than the original cost. Current performance may be lower or higher than the performance data shown. Please visit columbiathreadneedle.com/us for daily and most recent month-end performance updates.
Market risk may affect a single issuer, sector of the economy, industry or the market as a whole. International investing involves certain risks and volatility due to potential political, economic or currency instabilities and different, potentially less stringent, financial and accounting standards than those generally applicable to U.S. issuers. Risks are enhanced for emerging market issuers. Investments in small- and mid-cap companies involve risks and volatility and possible illiquidity greater than investments in larger, more established companies. Please also see "A Comment on Trading Volumes" on Page 2 of this report.
Columbia Acorn European Fund Class Z shares gained 4.39% in the first quarter of 2015, underperforming the 5.32% gain of its primary benchmark, the S&P Europe Between $500M and $5B® Index. For the trailing 12 months, the Fund lost 4.98%, less than the benchmark's decline of 6.11%. Over three years, the Fund has returned 11.36% on an annualized basis versus the benchmark's annualized gain of 14.19%. While we are disappointed in the Fund's underperformance versus the benchmark, it should be pointed out that the Fund appears to be less risky than its benchmark, and outperforms it on a risk-adjusted basis.*
In the first quarter, the largest performance detractors versus the benchmark by region were holdings in the Mediterranean. Italy was among the best performing markets in the Fund's benchmark in the quarter. Italian tire supplier Pirelli gained 23%, outpacing the benchmark return of 18% in Italy, but our approximately 60% underweight cost the Fund 51 basis points** of equity performance. Positively in Spain, three out of four Fund holdings gained over 14% in U.S. dollar terms versus the country return of 8% in the benchmark, contributing 33 basis points to performance. Yet this gain was offset by weakness in our French holdings. Following a year marked by significant asset sales, French online advertising company Hi-Media reported disappointing operating earnings and the stock declined 21%. This explains over half of the Fund's 34 basis point equity loss in France.
The Nordic region was the largest contributor to Fund performance versus the benchmark in the quarter. Fund holdings in Norway, Finland and Denmark all beat their country benchmarks by 11%, 3% and 2%, respectively. The largest performance contributor for Norway was consumer company Orkla, up 11%. The company continues to divest non-core assets, and reported a return to growth across all its food and consumer care businesses. IT hardware and services company Atea (up 9%) is a long-term holding and has benefited from a recovery in hardware sales in this highly cash-generative business. Together, both holdings added 36 basis points to Fund performance.
Looking ahead, what do we perceive as the key risks and opportunities for the Fund? European equities have rallied sharply in the first quarter. While evidence is building that muted recoveries are underway in core Europe, as well as the lagging Mediterranean countries, most of the recent gains reflect mark ups in valuation multiples. The market appears to be anticipating a stronger recovery in Europe following the European Central Bank's implementation of quantitative easing. In the United States, a much larger bond-buying program started in 2009 that has fueled a multi-year boom in equities. Also, in light of bond yields,
which have declined to near zero or even turned negative, as in Switzerland and Denmark, equity multiples and dividend yields look attractive in a relative context.
Current momentum and liquidity-driven markets are challenging for bottom-up stock pickers like us who focus on company fundamentals and attempt to have a more informed view of the intrinsic value of the businesses we own. There is a risk that as market sentiment improves in countries like Italy, where we are underweight because we haven't found companies we want to invest in at a reasonable price, we will continue to underperform. We intend to maintain our focus on owning quality franchises with higher returns on capital and solid balance sheets. We believe that if European equity markets do reverse, investors will benefit from the Fund's defensive characteristics.
Fund's Positions in Mentioned Holdings
As a percentage of net assets, as of 3/31/15
|
Orkla |
1.3 |
% |
|||||
|
Pirelli |
1.0 |
||||||
|
Hi-Media |
1.0 |
||||||
|
Atea |
1.0 |
||||||
Fund holdings are as of the date given, are subject to change at any time, and are not recommendations to buy or sell any security. Top holdings exclude short-term holdings and cash, if applicable.
* Based on a three-year 0.78% beta and 2.93% alpha.
** A basis point is 1/100 of a percent.
22
COLUMBIA ACORN EUROPEAN FUNDSM
AT A GLANCE
Total Net Assets of the Fund:
$42.4 million
Performance data shown below represents past performance, does not guarantee future results, assumes reinvestment of dividends and distributions and does not reflect the deduction of taxes that a shareholder may pay on Fund distributions or the redemption of Fund shares. The investment return and principal value of an investment will fluctuate so that shares, when redeemed, may be worth more or less than their original cost. Current performance may be lower or higher than the performance data shown. Performance data reflects fee waivers or reimbursements of Fund expenses, if any; in their absence, performance results would have been lower. Indexes are unmanaged; their results do not reflect the effect of expenses or sales charges. Securities in the Fund may not match those in an index. Please visit columbiathreadneedle.com/us for performance data current to the most recent month-end.
The Growth of a $10,000 Investment in Columbia Acorn European FundSM Class Z Shares
August 19, 2011 (Fund inception) through March 31, 2015
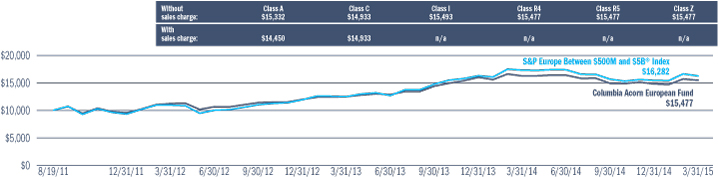
This chart shows the change in value of a hypothetical $10,000 investment in Class Z shares of the Fund during the stated time period.
Average Annual Total Returns for period ended March 31, 2015
|
1st quarter |
1 year |
Life of Fund |
|||||||||||||
| Class Z (8/19/11 inception) |
4.39 |
% |
-4.98 |
% |
12.83 |
% |
|||||||||
| Class A (8/19/11 inception) | |||||||||||||||
|
without sales charge |
4.32 |
-5.23 |
12.53 |
||||||||||||
|
with sales charge |
-1.64 |
-10.67 |
10.71 |
||||||||||||
|
S&P Europe Between $500M and $5B® Index* |
5.32 |
-6.11 |
14.42 |
||||||||||||
Results for other share classes can be found on Page 6.
*The Fund's primary benchmark. Please see Page 5 for index descriptions.
Returns for Class A shown with and without the maximum initial sales charge of 5.75%. As stated in the May 1, 2014, prospectus, the Fund's annual operating expense ratio is 1.51% for Class Z shares and 1.76% for Class A shares.
Portfolio Diversification
as a percentage of net assets, as of 3/31/15
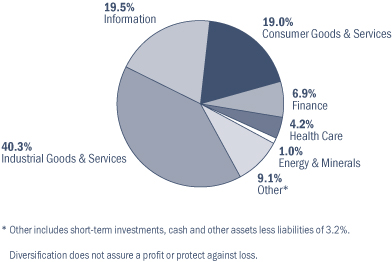
Top 10 Holdings
as a percentage of net assets, as of 3/31/15
|
1. |
Assura (United Kingdom) UK Primary Health Care Property Developer |
3.6 |
% |
||||||||
|
2. |
Distribuidora Internacional de Alimentación (Spain) Discount Retailer in Spain & Latin America |
3.1 |
% |
||||||||
| 3. |
Spirax Sarco (United Kingdom) Steam Systems for Manufacturing & Process Industries |
2.4 |
% |
||||||||
| 4. |
Geberit (Switzerland) Plumbing Supplies |
2.4 |
% | ||||||||
|
5. |
Aurelius (Germany) European Turnaround Investor |
2.3 |
% |
||||||||
|
6. |
Partners Group (Switzerland) Private Markets Asset Management |
2.3 |
% |
||||||||
|
7. |
Neopost (France) Postage Meter Machines |
2.2 |
% |
||||||||
|
8. |
Cable and Wireless (United Kingdom) Telecommunications Service Provider in the Caribbean |
2.0 |
% |
||||||||
|
9. |
Babcock International (United Kingdom) Public Sector Outsourcer |
2.0 |
% |
||||||||
| 10. |
Aalberts Industries (Netherlands) Flow Control & Heat Treatment |
2.0 |
% |
||||||||
The Fund's top 10 holdings and portfolio diversification vary with changes in portfolio investments. See the Statement of Investments for a complete list of the Fund's holdings.
23
COLUMBIA ACORN® FUND
MAJOR PORTFOLIO CHANGES IN THE FIRST QUARTER (UNAUDITED)
|
Number of Shares |
|||||||||||
|
12/31/14 |
3/31/15 |
||||||||||
|
Purchases |
|||||||||||
|
Information |
|||||||||||
|
Bankrate |
6,300,300 |
7,250,000 |
|||||||||
|
Cadence Design Systems |
2,000,000 |
4,155,000 |
|||||||||
|
CalAmp |
1,118,000 |
1,619,000 |
|||||||||
|
Discovery Communications Series C |
670,000 |
1,154,000 |
|||||||||
|
F5 Networks |
582,000 |
629,000 |
|||||||||
|
FLIR Systems |
1,383,000 |
1,895,000 |
|||||||||
|
Genpact |
1,405,000 |
1,531,000 |
|||||||||
|
Global Eagle Entertainment |
1,000,000 |
2,001,000 |
|||||||||
|
Globalstar |
31,000,000 |
34,500,000 |
|||||||||
|
Gogo |
2,000,000 |
3,458,800 |
|||||||||
|
GTT Communications |
1,950,000 |
2,601,000 |
|||||||||
|
IGATE |
3,600,000 |
3,650,000 |
|||||||||
|
RetailMeNot |
1,112,930 |
1,830,000 |
|||||||||
|
Solera Holdings |
989,000 |
1,668,000 |
|||||||||
|
Stratasys |
371,000 |
504,000 |
|||||||||
|
Textura |
800,283 |
1,134,283 |
|||||||||
|
Ultimate Software |
450,000 |
554,000 |
|||||||||
|
VeriFone Holdings |
849,000 |
1,250,000 |
|||||||||
|
Verint Systems |
365,000 |
1,306,000 |
|||||||||
|
Verisign |
350,000 |
1,210,000 |
|||||||||
|
Vonage |
14,044,775 |
14,500,000 |
|||||||||
|
Zayo Group Holdings |
925,000 |
1,150,000 |
|||||||||
|
Industrial Goods & Services |
|||||||||||
|
Allegion |
188,400 |
626,000 |
|||||||||
|
Dorman Products |
867,721 |
957,721 |
|||||||||
|
LKQ |
5,423,000 |
7,481,000 |
|||||||||
|
Quanta Services |
3,309,894 |
3,400,000 |
|||||||||
|
Finance |
|||||||||||
|
Associated Banc-Corp |
9,000,000 |
9,414,000 |
|||||||||
|
BOK Financial |
1,800,000 |
2,027,000 |
|||||||||
|
Eaton Vance |
3,283,508 |
3,463,508 |
|||||||||
|
Leucadia National |
3,552,000 |
3,875,000 |
|||||||||
|
MSCI |
0 |
195,201 |
|||||||||
|
TrustCo Bank |
2,136,500 |
3,136,500 |
|||||||||
|
WEX |
720,000 |
863,000 |
|||||||||
|
Health Care |
|||||||||||
|
Agios Pharmaceuticals |
0 |
275,000 |
|||||||||
|
Align Technology |
448,000 |
513,000 |
|||||||||
|
Ultragenyx Pharmaceutical |
1,164,974 |
1,704,000 |
|||||||||
|
Wright Medical Group |
1,255,500 |
1,729,500 |
|||||||||
|
Number of Shares |
|||||||||||
|
12/31/14 |
3/31/15 |
||||||||||
|
Consumer Goods & Services |
|||||||||||
|
Blackhawk Network |
700,000 |
994,000 |
|||||||||
|
Fossil |
362,145 |
880,145 |
|||||||||
|
Gentex |
1,826,000 |
2,732,952 |
|||||||||
|
Papa John's International |
478,000 |
950,000 |
|||||||||
|
Select Comfort |
1,900,000 |
2,224,284 |
|||||||||
|
Other Industries |
|||||||||||
|
Amerco |
170,000 |
190,000 |
|||||||||
|
Heartland Express |
496,024 |
1,800,000 |
|||||||||
|
Wisconsin Energy |
500,000 |
577,000 |
|||||||||
|
Energy & Minerals |
|||||||||||
|
Carrizo Oil & Gas |
926,000 |
1,037,000 |
|||||||||
|
Cimarex Energy |
0 |
420,000 |
|||||||||
|
Energen Corporation |
717,000 |
732,000 |
|||||||||
|
Kirkland Lake Gold (Canada) |
6,347,100 |
6,697,200 |
|||||||||
|
ShaMaran Petroleum (Iraq) |
28,962,000 |
107,561,000 |
|||||||||
24
|
Number of Shares |
|||||||||||
|
12/31/14 |
3/31/15 |
||||||||||
|
Sales |
|||||||||||
|
Information |
|||||||||||
|
Amber Road |
2,000,000 |
0 |
|||||||||
|
Amphenol |
5,416,000 |
4,010,000 |
|||||||||
|
Ansys |
2,500,000 |
1,806,000 |
|||||||||
|
Atmel |
4,717,000 |
4,467,000 |
|||||||||
|
Audience |
2,150,000 |
1,644,000 |
|||||||||
|
Avnet |
1,887,000 |
1,621,000 |
|||||||||
|
Belden |
475,000 |
450,000 |
|||||||||
|
Cogent Communications |
2,200,000 |
1,572,000 |
|||||||||
|
Covisint |
540,000 |
0 |
|||||||||
|
DemandWare |
1,152,000 |
561,300 |
|||||||||
|
E2Open |
2,575,000 |
0 |
|||||||||
|
Exa |
554,391 |
0 |
|||||||||
|
ExlService Holdings |
1,407,000 |
1,333,000 |
|||||||||
|
Five9 |
1,728,000 |
0 |
|||||||||
|
Global Payments |
1,700,000 |
1,261,000 |
|||||||||
|
Hackett Group |
2,903,719 |
2,700,000 |
|||||||||
|
Hexagon (Sweden) |
1,622,000 |
0 |
|||||||||
|
Infinera |
2,711,000 |
2,568,000 |
|||||||||
|
Informatica |
5,200,000 |
2,080,000 |
|||||||||
|
IPG Photonics |
1,504,000 |
1,399,000 |
|||||||||
|
Ixia |
1,006,000 |
0 |
|||||||||
|
Kinaxis (Canada) |
708,300 |
0 |
|||||||||
|
Lamar Advertising |
1,000,000 |
725,000 |
|||||||||
|
Liberty Global Series C |
800,000 |
366,000 |
|||||||||
|
Mettler-Toledo International |
1,162,000 |
911,000 |
|||||||||
|
Navigant Consulting |
4,128,523 |
3,100,000 |
|||||||||
|
NetSuite |
640,000 |
570,149 |
|||||||||
|
Pandora Media |
2,843,000 |
0 |
|||||||||
|
Plexus |
451,458 |
0 |
|||||||||
|
Rightmove (United Kingdom) |
155,205 |
0 |
|||||||||
|
Rogers |
569,000 |
539,000 |
|||||||||
|
SBA Communications |
1,600,000 |
1,300,000 |
|||||||||
|
SPS Commerce |
1,330,000 |
1,076,000 |
|||||||||
|
Syntel |
497,000 |
0 |
|||||||||
|
Tangoe |
641,952 |
0 |
|||||||||
|
Trimble Navigation |
3,651,000 |
3,458,000 |
|||||||||
|
Tyler Technologies |
470,000 |
220,000 |
|||||||||
|
Verisk Analytics |
1,900,000 |
1,429,000 |
|||||||||
|
Virtusa |
1,658,000 |
1,570,000 |
|||||||||
|
Workiva |
826,390 |
0 |
|||||||||
|
Zebra Technologies |
501,000 |
474,000 |
|||||||||
|
Industrial Goods & Services |
|||||||||||
|
Aalberts Industries (Netherlands) |
2,189,385 |
0 |
|||||||||
|
Acuity Brands |
960,000 |
726,000 |
|||||||||
|
Airgas |
880,000 |
853,000 |
|||||||||
|
Ametek |
7,130,000 |
6,910,000 |
|||||||||
|
Boise Cascade |
600,000 |
0 |
|||||||||
|
Chicago Bridge & Iron |
1,299,000 |
0 |
|||||||||
|
Number of Shares |
|||||||||||
|
12/31/14 |
3/31/15 |
||||||||||
|
ESCO Technologies |
1,948,000 |
1,489,000 |
|||||||||
|
Fortune Brands Home & Security |
1,050,000 |
660,000 |
|||||||||
|
Generac |
3,632,000 |
2,982,000 |
|||||||||
|
HEICO |
3,626,750 |
3,514,750 |
|||||||||
|
Insperity |
715,000 |
0 |
|||||||||
|
KAR Auction Services |
1,316,000 |
0 |
|||||||||
|
Kennametal |
2,674,000 |
2,592,000 |
|||||||||
|
Lindsay |
93,147 |
0 |
|||||||||
|
Lumber Liquidators |
500,000 |
0 |
|||||||||
|
Middleby |
1,050,200 |
968,200 |
|||||||||
|
Mobile Mini |
900,000 |
0 |
|||||||||
|
Moog |
2,456,000 |
2,027,000 |
|||||||||
|
MRC Global |
1,545,000 |
0 |
|||||||||
|
Neopost (France) |
664,400 |
0 |
|||||||||
|
Nordson |
3,130,000 |
3,034,000 |
|||||||||
|
Novozymes (Denmark) |
907,458 |
0 |
|||||||||
|
Pall |
1,100,000 |
846,000 |
|||||||||
|
PGT |
3,592,200 |
2,865,200 |
|||||||||
|
Rexnord |
705,000 |
0 |
|||||||||
|
WABCO Holdings |
1,176,000 |
946,000 |
|||||||||
|
Wabtec |
1,053,000 |
1,021,000 |
|||||||||
|
Waste Connections |
1,100,000 |
0 |
|||||||||
|
Finance |
|||||||||||
|
Alliance Data Systems |
360,000 |
0 |
|||||||||
|
Allied World Assurance Company Holdings |
2,275,000 |
2,000,000 |
|||||||||
|
CAI International |
1,500,000 |
839,000 |
|||||||||
|
Cascade Bancorp |
2,004,600 |
0 |
|||||||||
|
City National |
940,000 |
0 |
|||||||||
|
CNO Financial Group |
7,600,000 |
7,300,000 |
|||||||||
|
Coronation Fund Managers (South Africa) |
1,356,758 |
0 |
|||||||||
|
Enstar Group |
185,000 |
0 |
|||||||||
|
Hancock Holding |
1,900,000 |
1,730,000 |
|||||||||
|
HCC Insurance Holdings |
1,100,000 |
910,000 |
|||||||||
|
Liberty Tax |
472,000 |
0 |
|||||||||
|
Marlin Business Services |
902,210 |
0 |
|||||||||
|
MB Financial |
2,580,000 |
2,420,000 |
|||||||||
|
McGrath Rentcorp |
1,580,000 |
1,345,000 |
|||||||||
|
Rand Merchant Insurance |
8,658,000 |
0 |
|||||||||
|
Selective Insurance Group |
714,574 |
0 |
|||||||||
|
Valley National Bancorp |
1,573,000 |
0 |
|||||||||
|
Wisdom Tree |
500,000 |
0 |
|||||||||
|
World Acceptance |
808,343 |
787,422 |
|||||||||
|
Heath Care |
|||||||||||
|
Abaxis |
752,000 |
595,000 |
|||||||||
|
Akorn |
4,845,000 |
3,048,000 |
|||||||||
|
Alnylam Pharmaceuticals |
362,300 |
302,300 |
|||||||||
|
BioMarin Pharmaceutical |
320,200 |
0 |
|||||||||
25
COLUMBIA ACORN® FUND
MAJOR PORTFOLIO CHANGES IN THE FIRST QUARTER (UNAUDITED), CONTINUED
|
Number of Shares |
|||||||||||
|
12/31/14 |
3/31/15 |
||||||||||
|
Sales (continued) |
|||||||||||
|
Heath Care—continued |
|||||||||||
|
Castlight Health |
863,500 |
487,818 |
|||||||||
|
Celldex Therapeutics |
2,401,400 |
2,140,400 |
|||||||||
|
Cepheid |
5,350,800 |
4,909,800 |
|||||||||
|
HealthSouth |
1,666,323 |
1,647,700 |
|||||||||
|
Intercept Pharmaceuticals |
319,200 |
269,200 |
|||||||||
|
NPS Pharmaceuticals |
934,400 |
0 |
|||||||||
|
Seattle Genetics |
3,398,400 |
2,548,000 |
|||||||||
|
Synageva BioPharma |
2,419,209 |
1,950,318 |
|||||||||
|
Consumer Goods & Services |
|||||||||||
|
Avis Budget Group |
3,700,000 |
2,450,000 |
|||||||||
|
B&G Foods |
591,000 |
0 |
|||||||||
|
Boulder Brands |
3,484,000 |
0 |
|||||||||
|
Buffalo Wild Wings |
157,000 |
0 |
|||||||||
|
Caesarstone (Israel) |
630,000 |
540,000 |
|||||||||
|
Casey's General Stores |
1,027,709 |
791,839 |
|||||||||
|
Choice Hotels |
754,483 |
729,483 |
|||||||||
|
DeVry |
800,000 |
0 |
|||||||||
|
Distribuidora Internacional de Alimentación (Spain) |
837,052 |
0 |
|||||||||
|
Domino's Pizza |
489,000 |
403,000 |
|||||||||
|
Fiesta Restaurant Group |
878,000 |
858,000 |
|||||||||
|
Fox Factory Holding |
537,804 |
0 |
|||||||||
|
Freshpet |
243,000 |
0 |
|||||||||
|
GNC Holdings |
478,000 |
0 |
|||||||||
|
Groupon |
2,010,000 |
0 |
|||||||||
|
Hertz |
3,300,000 |
2,531,000 |
|||||||||
|
Interface |
2,758,000 |
0 |
|||||||||
|
Kate Spade & Company |
1,796,000 |
0 |
|||||||||
|
Knoll |
3,366,000 |
2,836,000 |
|||||||||
|
La-Z-Boy |
700,000 |
0 |
|||||||||
|
Michaels Stores |
1,162,000 |
642,492 |
|||||||||
|
Performance Sports Group |
641,000 |
0 |
|||||||||
|
Pool |
1,565,000 |
1,444,000 |
|||||||||
|
Prestige Brands Holdings |
611,000 |
0 |
|||||||||
|
Shutterfly |
970,000 |
771,056 |
|||||||||
|
ULTA |
613,000 |
0 |
|||||||||
|
United Natural Foods |
1,303,000 |
1,286,000 |
|||||||||
|
Vail Resorts |
1,268,600 |
895,600 |
|||||||||
|
Wayfair |
433,000 |
0 |
|||||||||
|
Williams-Sonoma |
874,200 |
595,200 |
|||||||||
|
Zulily |
1,350,000 |
425,245 |
|||||||||
|
Other Industries |
|||||||||||
|
DCT Industrial Trust |
1,293,750 |
0 |
|||||||||
|
Deltic Timber |
39,381 |
0 |
|||||||||
|
Extra Space Storage |
2,000,000 |
1,467,000 |
|||||||||
|
Federal Realty |
750,000 |
717,000 |
|||||||||
|
JB Hunt Transport Services |
940,000 |
669,000 |
|||||||||
|
Kirby |
730,000 |
720,000 |
|||||||||
|
St. Joe |
872,926 |
0 |
|||||||||
|
Number of Shares |
|||||||||||
|
12/31/14 |
3/31/15 |
||||||||||
|
Energy & Minerals |
|||||||||||
|
Alexco Resource |
2,800,000 |
0 |
|||||||||
|
Allied Nevada Gold |
7,103,513 |
0 |
|||||||||
|
Black Diamond Group |
214,100 |
0 |
|||||||||
|
Bonanza Creek Energy |
203,000 |
0 |
|||||||||
|
Chart Industries |
964,000 |
0 |
|||||||||
|
Core Labs (Netherlands) |
505,000 |
423,000 |
|||||||||
|
DeeThree Exploration (Canada) |
1,400,000 |
0 |
|||||||||
|
FMC Technologies |
370,000 |
0 |
|||||||||
|
Horizon North Logistics (Canada) |
2,601,900 |
0 |
|||||||||
|
Hornbeck Offshore |
1,613,000 |
1,470,000 |
|||||||||
|
Pacific Rubiales Energy (Colombia) |
1,800,000 |
0 |
|||||||||
|
Petroamerica Oil (Colombia) |
42,000,000 |
0 |
|||||||||
|
Range Resources |
632,000 |
0 |
|||||||||
|
RGS Energy |
5,000,000 |
0 |
|||||||||
|
Rosetta Resources |
1,849,600 |
1,550,000 |
|||||||||
|
Rowan |
289,000 |
0 |
|||||||||
|
US Silica |
599,000 |
0 |
|||||||||
|
WPX Energy |
1,210,000 |
0 |
|||||||||
26
COLUMBIA ACORN® FUND
STATEMENT OF INVESTMENTS (UNAUDITED), MARCH 31, 2015
|
Number of Shares |
Value |
||||||||||
|
Equities: 97.0% |
|||||||||||
|
Information 28.9% |
|||||||||||
| > Business Software 6.4% | |||||||||||
|
1,806,000 |
Ansys (a) |
$ |
159,271,140 |
||||||||
|
Simulation Software for Engineers & Designers |
|||||||||||
|
554,000 |
Ultimate Software (a) |
94,155,070 |
|||||||||
|
Human Capital Management Systems |
|||||||||||
|
2,080,000 |
Informatica (a) |
91,218,400 |
|||||||||
|
Enterprise Data Integration Software |
|||||||||||
|
1,668,000 |
Solera Holdings |
86,168,880 |
|||||||||
|
Software for Automotive Insurance Claims Processing |
|||||||||||
|
1,306,000 |
Verint Systems (a) |
80,880,580 |
|||||||||
|
Contact Center & Security Software |
|||||||||||
|
4,155,000 |
Cadence Design Systems (a) |
76,618,200 |
|||||||||
|
Electronic Design Automation Software |
|||||||||||
|
1,076,000 |
SPS Commerce (a)(b) |
72,199,600 |
|||||||||
|
Supply Chain Management Software Delivered via the Web |
|||||||||||
|
570,149 |
NetSuite (a) |
52,887,021 |
|||||||||
|
End-to-end IT Systems Solution Delivered via the Web |
|||||||||||
|
3,741,000 |
inContact (a)(b) |
40,776,900 |
|||||||||
|
Call Center Systems Delivered via the Web & Telco Services |
|||||||||||
|
610,000 |
Envestnet (a) |
34,208,800 |
|||||||||
|
Technology Platform for Investment Advisors |
|||||||||||
|
561,300 |
DemandWare (a) |
34,183,170 |
|||||||||
|
E-Commerce Website Platform for Retailers & Apparel Manufacturers |
|||||||||||
|
699,000 |
Fleetmatics (a) |
31,350,150 |
|||||||||
|
Fleet Management Software |
|||||||||||
|
1,134,283 |
Textura (a) |
30,829,812 |
|||||||||
|
Construction Vendor Management Software |
|||||||||||
|
220,000 |
Tyler Technologies (a) |
26,516,600 |
|||||||||
|
Financial, Tax, Court & Document Management Systems for Local Governments |
|||||||||||
|
911,264,323 |
|||||||||||
| > Instrumentation 4.1% | |||||||||||
|
911,000 |
Mettler-Toledo International (a) |
299,400,150 |
|||||||||
|
Laboratory Equipment |
|||||||||||
|
1,399,000 |
IPG Photonics (a) |
129,687,300 |
|||||||||
|
Fiber Lasers |
|||||||||||
|
3,458,000 |
Trimble Navigation (a) |
87,141,600 |
|||||||||
|
GPS-based Instruments |
|||||||||||
|
1,895,000 |
FLIR Systems |
59,275,600 |
|||||||||
|
Infrared Cameras |
|||||||||||
|
575,504,650 |
|||||||||||
|
> Computer Hardware & Related Equipment 3.1% |
|||||||||||
|
4,010,000 |
Amphenol |
236,309,300 |
|||||||||
|
Electronic Connectors |
|||||||||||
|
539,000 |
Rogers (a) |
44,311,190 |
|||||||||
|
Printed Circuit Materials & High Performance Foams |
|||||||||||
|
Number of Shares |
Value |
||||||||||
|
1,250,000 |
VeriFone Holdings (a) |
$ |
43,612,500 |
||||||||
|
Point of Sale Systems |
|||||||||||
|
474,000 |
Zebra Technologies (a) |
42,998,910 |
|||||||||
|
Bar Code Printers |
|||||||||||
|
450,000 |
Belden |
42,102,000 |
|||||||||
|
Specialty Cable |
|||||||||||
|
504,000 |
Stratasys (a)(c) |
26,601,120 |
|||||||||
|
Rapid Prototyping & Direct Digital Manufacturing Systems |
|||||||||||
|
435,935,020 |
|||||||||||
| > Mobile Communications 3.1% | |||||||||||
|
1,300,000 |
SBA Communications (a) |
152,230,000 |
|||||||||
|
Communications Towers |
|||||||||||
|
34,500,000 |
Globalstar (a) |
114,885,000 |
|||||||||
|
Satellite Mobile Voice & Data Carrier |
|||||||||||
|
800,000 |
Crown Castle International |
66,032,000 |
|||||||||
|
Communications Towers |
|||||||||||
|
3,458,800 |
Gogo (a)(c) |
65,924,728 |
|||||||||
|
Provider of Wi-Fi on Airplanes |
|||||||||||
|
2,001,000 |
Global Eagle Entertainment (a)(c) |
26,633,310 |
|||||||||
|
Provider of Entertainment & Wi-Fi on Airplanes |
|||||||||||
|
1,644,000 |
Audience (a)(b)(c) |
7,463,760 |
|||||||||
|
Improving Voice Quality for Mobile Devices |
|||||||||||
|
433,168,798 |
|||||||||||
| > Computer Services 2.7% | |||||||||||
|
3,650,000 |
IGATE (a) |
155,709,000 |
|||||||||
|
IT & Business Process Outsourcing Services |
|||||||||||
|
1,570,000 |
Virtusa (a)(b) |
64,966,600 |
|||||||||
|
Offshore IT Outsourcing |
|||||||||||
|
1,333,000 |
ExlService Holdings (a) |
49,587,600 |
|||||||||
|
Business Process Outsourcing |
|||||||||||
|
2,025,000 |
WNS - ADR (a) |
49,248,000 |
|||||||||
|
Offshore Business Process Outsourcing Services |
|||||||||||
|
1,531,000 |
Genpact (a) |
35,595,750 |
|||||||||
|
Business Process Outsourcing |
|||||||||||
|
2,700,000 |
Hackett Group (b) |
24,138,000 |
|||||||||
|
IT Integration & Best Practice Research |
|||||||||||
|
379,244,950 |
|||||||||||
|
> Business Information & Marketing Services 1.8% |
|||||||||||
|
1,429,000 |
Verisk Analytics (a) |
102,030,600 |
|||||||||
|
Risk & Decision Analytics |
|||||||||||
|
7,250,000 |
Bankrate (a)(b) |
82,215,000 |
|||||||||
|
Internet Advertising for the Insurance, Credit Card & Banking Markets |
|||||||||||
|
3,100,000 |
Navigant Consulting (a)(b) |
40,176,000 |
|||||||||
|
Financial Consulting Firm |
|||||||||||
|
2,570,000 |
RPX (a) |
36,982,300 |
|||||||||
|
Patent Aggregation & Defensive Patent Consulting |
|||||||||||
|
261,403,900 |
|||||||||||
27
COLUMBIA ACORN® FUND
STATEMENT OF INVESTMENTS (UNAUDITED), CONTINUED
|
Number of Shares |
Value |
||||||||||
| > Internet Related 1.3% | |||||||||||
|
1,210,000 |
Verisign (a) |
$ |
81,033,700 |
||||||||
|
Internet Domain Registry for .com/.net (Approximately 50% of World Domains) |
|||||||||||
|
14,500,000 |
Vonage (a)(b) |
71,195,000 |
|||||||||
|
Business & Consumer Internet Telephony |
|||||||||||
|
1,830,000 |
RetailMeNot (a)(c) |
32,958,300 |
|||||||||
|
Digital Coupon Marketplace |
|||||||||||
|
185,187,000 |
|||||||||||
| > Telephone & Data Services 1.2% | |||||||||||
|
1,572,000 |
Cogent Communications |
55,538,760 |
|||||||||
|
Internet Data Pipelines |
|||||||||||
|
2,601,000 |
GTT Communications (a)(b) |
49,106,880 |
|||||||||
|
Provider of High Capacity Data Transit |
|||||||||||
|
1,150,000 |
Zayo Group Holdings (a)(c) |
32,154,000 |
|||||||||
|
Fiber Optic Data Communications |
|||||||||||
|
2,900,000 |
Boingo Wireless (a)(b) |
21,866,000 |
|||||||||
|
Wi-Fi & Cellular Communications Networks |
|||||||||||
|
4,000,000 |
Towerstream (a)(b)(c) |
8,640,000 |
|||||||||
|
High Speed Wireless, Rooftop Antenna Space & Wi-Fi Offload |
|||||||||||
|
167,305,640 |
|||||||||||
| > Telecommunications Equipment 1.1% | |||||||||||
|
629,000 |
F5 Networks (a) |
72,297,260 |
|||||||||
|
Internet Traffic Management Equipment |
|||||||||||
|
2,568,000 |
Infinera (a) |
50,512,560 |
|||||||||
|
Optical Networking Equipment |
|||||||||||
|
1,619,000 |
CalAmp (a) |
26,211,610 |
|||||||||
|
Machine-to-machine Communications |
|||||||||||
|
149,021,430 |
|||||||||||
| > Financial Processors 0.9% | |||||||||||
|
1,261,000 |
Global Payments |
115,608,480 |
|||||||||
|
Credit Card Processor |
|||||||||||
|
1,600,000 |
Liquidity Services (a)(b) |
15,808,000 |
|||||||||
|
E-Auctions for Surplus & Salvage Goods |
|||||||||||
|
131,416,480 |
|||||||||||
|
> Semiconductors & Related Equipment 0.7% |
|||||||||||
|
4,467,000 |
Atmel |
36,763,410 |
|||||||||
|
Microcontrollers, Radio Frequency & Memory Semiconductors |
|||||||||||
|
367,000 |
Littelfuse |
36,476,130 |
|||||||||
|
Little Fuses |
|||||||||||
|
427,000 |
Monolithic Power Systems |
22,481,550 |
|||||||||
|
High Performance Analog & Mixed Signal Integrated Circuits |
|||||||||||
|
2,500,000 |
Rubicon Technology (a)(b)(c) |
9,850,000 |
|||||||||
|
Producer of Sapphire for the Lighting, Electronics & Automotive Industries |
|||||||||||
|
105,571,090 |
|||||||||||
| > Cable TV 0.7% | |||||||||||
|
800,000 |
Liberty Global Series A (a) |
41,176,000 |
|||||||||
|
Number of Shares |
Value |
||||||||||
| 366,000 |
Liberty Global Series C (a) |
$ |
18,230,460 |
||||||||
|
Cable TV Franchises Outside of the United States |
|||||||||||
|
1,154,000 |
Discovery Communications Series C (a) |
34,014,150 |
|||||||||
|
Cable TV Programming |
|||||||||||
|
93,420,610 |
|||||||||||
| > Contract Manufacturing 0.5% | |||||||||||
|
3,100,000 |
Sanmina (a) |
74,989,000 |
|||||||||
|
Electronic Manufacturing Services |
|||||||||||
| > Entertainment Programming 0.5% | |||||||||||
|
1,250,000 |
IMAX (Canada) (a) |
42,137,500 |
|||||||||
|
IMAX Movies, Theater Equipment & Theater Joint Ventures |
|||||||||||
|
5,500,000 |
Zee Entertainment Enterprises (India) |
30,033,135 |
|||||||||
|
Indian Programmer of Pay Television Content |
|||||||||||
|
72,170,635 |
|||||||||||
| > Electronics Distribution 0.5% | |||||||||||
|
1,621,000 |
Avnet |
72,134,500 |
|||||||||
|
Electronic Components Distribution |
|||||||||||
| > Advertising 0.3% | |||||||||||
|
725,000 |
Lamar Advertising |
42,970,750 |
|||||||||
|
Outdoor Advertising |
|||||||||||
|
Information: Total |
4,090,708,776 |
||||||||||
|
Industrial Goods & Services 23.4% |
|||||||||||
| > Machinery 15.3% | |||||||||||
|
6,910,000 |
Ametek |
363,051,400 |
|||||||||
|
Aerospace/Industrial Instruments |
|||||||||||
|
7,952,000 |
Donaldson (b) |
299,869,920 |
|||||||||
|
Industrial Air Filtration |
|||||||||||
|
3,034,000 |
Nordson |
237,683,560 |
|||||||||
|
Dispensing Systems for Adhesives & Coatings |
|||||||||||
|
3,514,750 |
HEICO (b) |
174,120,715 |
|||||||||
|
FAA-approved Aircraft Replacement Parts |
|||||||||||
|
2,027,000 |
Moog (a)(b) |
152,126,350 |
|||||||||
|
Motion Control Products for Aerospace, Defense & Industrial Markets |
|||||||||||
|
2,982,000 |
Generac (a) |
145,193,580 |
|||||||||
|
Standby Power Generators |
|||||||||||
|
946,000 |
WABCO Holdings (a) |
116,244,480 |
|||||||||
|
Truck & Bus Component Supplier |
|||||||||||
|
1,486,000 |
Toro |
104,198,320 |
|||||||||
|
Turf Maintenance Equipment |
|||||||||||
|
2,100,000 |
Oshkosh Corporation |
102,459,000 |
|||||||||
|
Specialty Truck Manufacturer |
|||||||||||
|
968,200 |
Middleby (a) |
99,385,730 |
|||||||||
|
Manufacturer of Cooking Equipment |
|||||||||||
|
1,021,000 |
Wabtec |
97,005,210 |
|||||||||
|
Freight & Transit Component Supplier |
|||||||||||
|
2,592,000 |
Kennametal |
87,324,480 |
|||||||||
|
Consumable Cutting Tools |
|||||||||||
28
|
Number of Shares |
Value |
||||||||||
| > Machinery—continued | |||||||||||
|
846,000 |
Pall |
$ |
84,929,940 |
||||||||
|
Life Science, Water & Industrial Filtration |
|||||||||||
|
1,489,000 |
ESCO Technologies (b) |
58,041,220 |
|||||||||
|
Industrial Filtration & Advanced Measurement Equipment |
|||||||||||
|
957,721 |
Dorman Products (a)(c) |
47,646,620 |
|||||||||
|
Aftermarket Auto Parts Distributor |
|||||||||||
|
2,169,280,525 |
|||||||||||
| > Other Industrial Services 2.5% | |||||||||||
|
7,481,000 |
LKQ (a) |
191,214,360 |
|||||||||
|
Alternative Auto Parts Distribution |
|||||||||||
|
1,800,000 |
Expeditors International of Washington |
86,724,000 |
|||||||||
|
International Freight Forwarder |
|||||||||||
|
1,500,000 |
Forward Air |
81,450,000 |
|||||||||
|
Freight Transportation Between Airports |
|||||||||||
|
359,388,360 |
|||||||||||
| > Construction 1.6% | |||||||||||
|
96,000 |
NVR (a) |
127,551,360 |
|||||||||
|
Homebuilder |
|||||||||||
|
626,000 |
Allegion |
38,292,420 |
|||||||||
|
Mechanical & Electronic Security Systems |
|||||||||||
|
2,865,200 |
PGT (a)(b) |
32,018,610 |
|||||||||
|
Wind Resistant Windows & Doors |
|||||||||||
|
660,000 |
Fortune Brands Home & Security |
31,336,800 |
|||||||||
|
Home Building Supplies & Small Locks |
|||||||||||
|
229,199,190 |
|||||||||||
| > Industrial Distribution 1.4% | |||||||||||
|
1,553,000 |
WESCO International (a) |
108,539,170 |
|||||||||
|
Industrial Distributor |
|||||||||||
|
853,000 |
Airgas |
90,511,830 |
|||||||||
|
Industrial Gas Distributor |
|||||||||||
|
199,051,000 |
|||||||||||
| > Electrical Components 1.2% | |||||||||||
|
726,000 |
Acuity Brands |
122,084,160 |
|||||||||
|
Commercial Lighting Fixtures |
|||||||||||
|
1,983,829 |
Thermon (a)(b) |
47,750,764 |
|||||||||
|
Global Engineered Thermal Solutions |
|||||||||||
|
169,834,924 |
|||||||||||
|
> Industrial Materials & Specialty Chemicals 0.7% |
|||||||||||
|
1,610,000 |
Drew Industries (b) |
99,079,400 |
|||||||||
|
RV & Manufactured Home Components |
|||||||||||
| > Outsourcing Services 0.7% | |||||||||||
|
3,400,000 |
Quanta Services (a) |
97,002,000 |
|||||||||
|
Electrical Transmission & Pipeline Contracting Services |
|||||||||||
|
Industrial Goods & Services: Total |
3,322,835,399 |
||||||||||
|
Number of Shares |
Value |
||||||||||
|
Finance 12.1% |
|||||||||||
| > Banks 4.3% | |||||||||||
|
9,414,000 |
Associated Banc-Corp (b) |
$ |
175,100,400 |
||||||||
|
Midwest Bank |
|||||||||||
|
2,027,000 |
BOK Financial (c) |
124,092,940 |
|||||||||
|
Tulsa-based Southwest Bank |
|||||||||||
|
840,000 |
SVB Financial Group (a) |
106,713,600 |
|||||||||
|
Bank to Venture Capitalists |
|||||||||||
|
2,420,000 |
MB Financial |
75,770,200 |
|||||||||
|
Chicago Bank |
|||||||||||
|
1,730,000 |
Hancock Holding |
51,657,800 |
|||||||||
|
Gulf Coast Bank |
|||||||||||
|
1,163,480 |
Sandy Spring Bancorp |
30,518,081 |
|||||||||
|
Baltimore & Washington, D.C. Bank |
|||||||||||
|
4,296,286 |
First Busey |
28,742,153 |
|||||||||
|
Illinois Bank |
|||||||||||
|
3,136,500 |
TrustCo Bank |
21,579,120 |
|||||||||
|
New York State Bank |
|||||||||||
|
614,174,294 |
|||||||||||
|
> Brokerage & Money Management 3.5% |
|||||||||||
|
7,368,774 |
SEI Investments |
324,889,246 |
|||||||||
|
Mutual Fund Administration & Investment Management |
|||||||||||
|
3,463,508 |
Eaton Vance |
144,220,473 |
|||||||||
|
Specialty Mutual Funds |
|||||||||||
|
11,000,000 |
Sprott (Canada) (c) |
23,449,528 |
|||||||||
|
Asset Manager Focused on Resources, Particularly Gold & Silver |
|||||||||||
|
492,559,247 |
|||||||||||
| > Insurance 2.1% | |||||||||||
|
7,300,000 |
CNO Financial Group |
125,706,000 |
|||||||||
|
Life, Long-term Care & Medical Supplement Insurance |
|||||||||||
|
2,000,000 |
Allied World Assurance Company Holdings |
80,800,000 |
|||||||||
|
Commercial Lines Insurance/Reinsurance |
|||||||||||
|
910,000 |
HCC Insurance Holdings |
51,569,700 |
|||||||||
|
Specialty Insurance |
|||||||||||
|
800,000 |
RLI |
41,928,000 |
|||||||||
|
Specialty Insurance |
|||||||||||
|
300,003,700 |
|||||||||||
| > Finance Companies 0.9% | |||||||||||
|
787,422 |
World Acceptance (a)(b)(c) |
57,418,812 |
|||||||||
|
Personal Loans |
|||||||||||
|
1,345,000 |
McGrath Rentcorp (b) |
44,263,950 |
|||||||||
|
Mini-rental Conglomerate |
|||||||||||
|
839,000 |
CAI International (a) |
20,614,230 |
|||||||||
|
International Container Leasing |
|||||||||||
|
122,296,992 |
|||||||||||
| > Credit Cards 0.6% | |||||||||||
|
863,000 |
WEX (a) |
92,651,680 |
|||||||||
|
Card Processor |
|||||||||||
|
> Diversified Financial Companies 0.6% |
|||||||||||
|
3,875,000 |
Leucadia National |
86,373,750 |
|||||||||
|
Holding Company |
|||||||||||
29
COLUMBIA ACORN® FUND
STATEMENT OF INVESTMENTS (UNAUDITED), CONTINUED
|
Number of Shares |
Value |
||||||||||
| > Specialized Finance 0.1% | |||||||||||
|
195,201 |
MSCI |
$ |
11,967,773 |
||||||||
|
Investment Decision Support Tools |
|||||||||||
|
Finance: Total |
1,720,027,436 |
||||||||||
|
Health Care 11.4% |
|||||||||||
| > Biotechnology & Drug Delivery 4.3% | |||||||||||
|
1,950,318 |
Synageva BioPharma (a)(b)(c) |
190,214,515 |
|||||||||
|
Biotech Focused on Orphan Diseases |
|||||||||||
|
1,704,000 |
Ultragenyx Pharmaceutical (a) |
105,801,360 |
|||||||||
|
Biotech Focused on "Ultra-Orphan" Drugs |
|||||||||||
|
2,548,000 |
Seattle Genetics (a) |
90,071,800 |
|||||||||
|
Antibody-based Therapies for Cancer |
|||||||||||
|
269,200 |
Intercept Pharmaceuticals (a)(c) |
75,919,784 |
|||||||||
|
Biotech Developing Drugs for Several Diseases |
|||||||||||
|
2,140,400 |
Celldex Therapeutics (a)(c) |
59,652,948 |
|||||||||
|
Biotech Developing Drugs for Cancer |
|||||||||||
|
2,523,900 |
Sarepta Therapeutics (a)(b)(c) |
33,517,392 |
|||||||||
|
Biotech Focused on Rare Diseases |
|||||||||||
|
302,300 |
Alnylam Pharmaceuticals (a) |
31,566,166 |
|||||||||
|
Biotech Developing Drugs Primarily for Rare Diseases |
|||||||||||
|
275,000 |
Agios Pharmaceuticals (a)(c) |
25,932,500 |
|||||||||
|
Biotech Focused on Cancer & Orphan Diseases |
|||||||||||
|
359,944 |
MicroDose Therapeutx Contingent Value Rights (a)(d)(e) |
395,938 |
|||||||||
|
Drug Inhaler Development |
|||||||||||
|
613,072,403 |
|||||||||||
| > Medical Supplies 3.3% | |||||||||||
|
4,909,800 |
Cepheid (a)(b) |
279,367,620 |
|||||||||
|
Molecular Diagnostics |
|||||||||||
|
1,169,200 |
Bio-Techne |
117,259,068 |
|||||||||
|
Maker of Consumables & Systems for the Life Science Market |
|||||||||||
|
291,100 |
Henry Schein (a) |
40,643,382 |
|||||||||
|
Distributor of Dental, Vet & Medical Products |
|||||||||||
|
1,375,400 |
VWR (a) |
35,746,646 |
|||||||||
|
Distributor of Lab Supplies |
|||||||||||
|
473,016,716 |
|||||||||||
| > Health Care Services 1.7% | |||||||||||
|
1,549,500 |
Medidata Solutions (a) |
75,987,480 |
|||||||||
|
Cloud-based Software for Drug Studies |
|||||||||||
|
1,647,700 |
HealthSouth |
73,091,972 |
|||||||||
|
Inpatient Rehabilitation Facilities & Home Health Care |
|||||||||||
|
1,239,000 |
Envision Healthcare Holdings (a) |
47,515,650 |
|||||||||
|
Provider of Health Care Outsourcing Services |
|||||||||||
|
2,746,200 |
Allscripts Healthcare Solutions (a) |
32,844,552 |
|||||||||
|
Health Care IT |
|||||||||||
|
487,818 |
Castlight Health (a) |
3,785,467 |
|||||||||
|
Provider of Cloud-based Software for Managing Health Care Costs |
|||||||||||
|
233,225,121 |
|||||||||||
|
Number of Shares |
Value |
||||||||||
| > Medical Equipment & Devices 1.1% | |||||||||||
|
1,729,500 |
Wright Medical Group (a) |
$ |
44,621,100 |
||||||||
|
Foot & Ankle Replacement |
|||||||||||
|
460,900 |
Sirona Dental Systems (a) |
41,476,391 |
|||||||||
|
Manufacturer of Dental Equipment |
|||||||||||
|
595,000 |
Abaxis |
38,145,450 |
|||||||||
|
Instruments & Tests for Vet & Medical Markets |
|||||||||||
|
513,000 |
Align Technology (a) |
27,591,705 |
|||||||||
|
Invisalign System to Correct Malocclusion (Crooked Teeth) |
|||||||||||
|
151,834,646 |
|||||||||||
| > Pharmaceuticals 1.0% | |||||||||||
|
3,048,000 |
Akorn (a) |
144,810,480 |
|||||||||
|
Developer, Manufacturer & Distributor of Specialty Generic Drugs |
|||||||||||
|
Health Care: Total |
1,615,959,366 |
||||||||||
|
Consumer Goods & Services 11.1% |
|||||||||||
| > Retail 2.9% | |||||||||||
|
880,145 |
Fossil (a) |
72,567,955 |
|||||||||
|
Watch Designer & Retailer |
|||||||||||
|
791,839 |
Casey's General Stores |
71,344,694 |
|||||||||
|
Owner/Operator of Convenience Stores |
|||||||||||
|
1,492,000 |
The Fresh Market (a) |
60,634,880 |
|||||||||
|
Specialty Food Retailer |
|||||||||||
|
595,200 |
Williams-Sonoma |
47,443,392 |
|||||||||
|
Home Goods & Furnishing Retailer |
|||||||||||
|
786,900 |
Burlington Stores (a) |
46,757,598 |
|||||||||
|
Off-price Apparel Retailer |
|||||||||||
|
771,056 |
Shutterfly (a) |
34,882,573 |
|||||||||
|
Internet Photo-centric Retailer |
|||||||||||
|
508,000 |
Urban Outfitters (a) |
23,190,200 |
|||||||||
|
Multi-channel Apparel & Accessory Retailer |
|||||||||||
|
533,500 |
DSW |
19,675,480 |
|||||||||
|
Branded Footwear Retailer |
|||||||||||
|
642,492 |
Michaels Stores (a) |
17,385,834 |
|||||||||
|
Craft & Hobby Specialty Retailer |
|||||||||||
|
2,100,000 |
Gaiam (a)(b) |
15,309,000 |
|||||||||
|
Promoter of Healthy Living through Catalogs, E-Commerce & Gaiam TV |
|||||||||||
|
425,245 |
Zulily (a)(c) |
5,523,933 |
|||||||||
|
E-Commerce Retailer Offering Flash Sale Events |
|||||||||||
|
414,715,539 |
|||||||||||
| > Travel 2.8% | |||||||||||
|
2,450,000 |
Avis Budget Group (a) |
144,586,750 |
|||||||||
|
Car Rental Company |
|||||||||||
|
895,600 |
Vail Resorts |
92,622,952 |
|||||||||
|
Ski Resort Operator & Developer |
|||||||||||
|
2,142,000 |
HomeAway (a) |
64,624,140 |
|||||||||
|
Vacation Rental Online Marketplace |
|||||||||||
|
2,531,000 |
Hertz (a) |
54,872,080 |
|||||||||
|
U.S. Rental Car Operator |
|||||||||||
|
729,483 |
Choice Hotels |
46,737,976 |
|||||||||
|
Franchisor of Budget Hotel Brands |
|||||||||||
|
403,443,898 |
|||||||||||
30
|
Number of Shares |
Value |
||||||||||
| > Consumer Goods Distribution 1.6% | |||||||||||
|
1,444,000 |
Pool |
$ |
100,733,440 |
||||||||
|
Swimming Pool Supplies & Equipment Distributor |
|||||||||||
|
1,286,000 |
United Natural Foods (a) |
99,073,440 |
|||||||||
|
Distributor of Natural/Organic Foods to Grocery Stores |
|||||||||||
|
863,000 |
The Chefs' Warehouse (a) |
19,357,090 |
|||||||||
|
Distributor of Specialty Foods to Fine Dining Restaurants |
|||||||||||
|
219,163,970 |
|||||||||||
| > Restaurants 1.3% | |||||||||||
|
950,000 |
Papa John's International |
58,719,500 |
|||||||||
|
Franchisor of Pizza Restaurants |
|||||||||||
|
858,000 |
Fiesta Restaurant Group (a) |
52,338,000 |
|||||||||
|
Owner/Operator of Two Restaurant Chains: Pollo Tropical & Taco Cabana |
|||||||||||
|
403,000 |
Domino's Pizza |
40,521,650 |
|||||||||
|
Franchisor of Pizza Restaurants |
|||||||||||
|
650,000 |
Popeyes Louisiana Kitchen (a) |
38,883,000 |
|||||||||
|
Popeyes Restaurants |
|||||||||||
|
190,462,150 |
|||||||||||
| > Other Durable Goods 1.2% | |||||||||||
|
2,224,284 |
Select Comfort (a) |
76,671,069 |
|||||||||
|
Specialty Mattresses |
|||||||||||
|
2,732,952 |
Gentex |
50,013,022 |
|||||||||
|
Manufacturer of Auto Parts |
|||||||||||
|
500,000 |
Cavco Industries (a)(b) |
37,530,000 |
|||||||||
|
Manufactured Homes |
|||||||||||
|
164,214,091 |
|||||||||||
| > Furniture & Textiles 0.7% | |||||||||||
|
2,836,000 |
Knoll (b) |
66,447,480 |
|||||||||
|
Office Furniture |
|||||||||||
|
540,000 |
Caesarstone (Israel) |
32,783,400 |
|||||||||
|
Quartz Countertops |
|||||||||||
|
99,230,880 |
|||||||||||
| > Apparel 0.3% | |||||||||||
|
456,000 |
PVH |
48,591,360 |
|||||||||
|
Apparel Wholesaler & Retailer |
|||||||||||
| > Other Consumer Services 0.3% | |||||||||||
|
994,000 |
Blackhawk Network (a) |
35,336,700 |
|||||||||
|
Third-party Distributor of Prepaid Content, Mostly Gift Cards |
|||||||||||
| > Food & Beverage —% | |||||||||||
|
1,493,770 |
GLG Life Tech (Canada) (a) |
371,511 |
|||||||||
|
Producer of an All-natural Sweetener Extracted from the Stevia Plant |
|||||||||||
|
Consumer Goods & Services: Total |
1,575,530,099 |
||||||||||
|
Other Industries 6.5% |
|||||||||||
| > Real Estate 3.8% | |||||||||||
|
717,000 |
Federal Realty |
105,549,570 |
|||||||||
|
Shopping Centers & Mixed Use Projects |
|||||||||||
|
1,467,000 |
Extra Space Storage |
99,125,190 |
|||||||||
|
Self Storage Facilities |
|||||||||||
|
Number of Shares |
Value |
||||||||||
|
2,450,000 |
EdR (b) |
$ |
86,681,000 |
||||||||
|
Student Housing |
|||||||||||
|
1,320,000 |
Post Properties |
75,147,600 |
|||||||||
|
Multifamily Properties |
|||||||||||
|
190,000 |
Amerco |
62,776,000 |
|||||||||
|
North American Moving & Storage King |
|||||||||||
|
325,000 |
Jones Lang LaSalle |
55,380,000 |
|||||||||
|
Real Estate Services |
|||||||||||
|
2,150,000 |
Terreno Realty (b) |
49,020,000 |
|||||||||
|
Industrial Properties |
|||||||||||
|
533,679,360 |
|||||||||||
| > Transportation 1.9% | |||||||||||
|
2,650,000 |
Rush Enterprises, Class A (a)(b) |
72,504,000 |
|||||||||
| 550,000 |
Rush Enterprises, Class B (a)(b) |
13,596,000 |
|||||||||
|
Truck Sales & Service |
|||||||||||
|
669,000 |
JB Hunt Transport Services |
57,129,255 |
|||||||||
|
Truck & Intermodal Carrier |
|||||||||||
|
720,000 |
Kirby (a) |
54,036,000 |
|||||||||
|
Operator of U.S. (Jones Act) Liquid Tank Barges |
|||||||||||
|
1,800,000 |
Heartland Express |
42,768,000 |
|||||||||
|
Regional Trucker |
|||||||||||
|
380,000 |
Genesee & Wyoming (a) |
36,647,200 |
|||||||||
|
Short-line Operator |
|||||||||||
|
276,680,455 |
|||||||||||
| > Regulated Utilities 0.8% | |||||||||||
|
1,600,000 |
Eversource Energy |
80,832,000 |
|||||||||
|
Regulated Electric Utility |
|||||||||||
|
577,000 |
Wisconsin Energy |
28,561,500 |
|||||||||
|
Wisconsin Utility |
|||||||||||
|
109,393,500 |
|||||||||||
|
Other Industries: Total |
919,753,315 |
||||||||||
|
Energy & Minerals 3.6% |
|||||||||||
| > Oil & Gas Producers 1.9% | |||||||||||
|
1,037,000 |
Carrizo Oil & Gas (a) |
51,487,050 |
|||||||||
|
Oil & Gas Producer |
|||||||||||
|
420,000 |
Cimarex Energy |
48,337,800 |
|||||||||
|
Oil & Gas Producer in Texas, New Mexico & Oklahoma |
|||||||||||
|
732,000 |
Energen Corporation |
48,312,000 |
|||||||||
|
Oil & Gas Producer with Natural Gas Utility |
|||||||||||
|
778,000 |
SM Energy |
40,207,040 |
|||||||||
|
Oil & Gas Producer |
|||||||||||
|
501,000 |
PDC Energy (a) |
27,074,040 |
|||||||||
|
Oil & Gas Producer in the United States |
|||||||||||
|
1,550,000 |
Rosetta Resources (a) |
26,381,000 |
|||||||||
|
Oil & Gas Producer Exploring in Texas |
|||||||||||
|
281,000 |
Clayton Williams (a) |
14,227,030 |
|||||||||
|
Oil & Gas Producer |
|||||||||||
|
107,561,000 |
ShaMaran Petroleum (Iraq) (a)(b) |
7,643,196 |
|||||||||
|
Oil Exploration & Production in Kurdistan |
|||||||||||
31
COLUMBIA ACORN® FUND
STATEMENT OF INVESTMENTS (UNAUDITED), CONTINUED
|
Number of Shares |
Value |
||||||||||
| > Oil & Gas Producers—continued | |||||||||||
|
67,500,000 |
Petromanas (Canada) (a)(b)(c) |
$ |
2,664,719 |
||||||||
|
Exploring for Oil in Albania |
|||||||||||
|
24,115,500 |
Canadian Overseas Petroleum (Canada) (a)(b) |
1,570,825 |
|||||||||
| 8,400,000 |
Canadian Overseas Petroleum (Canada) (a)(b)(d) |
519,798 |
|||||||||
|
Oil & Gas Exploration Offshore West Africa |
|||||||||||
|
2,600,000 |
Petrodorado Energy (Colombia) (a)(b) |
205,282 |
|||||||||
|
Oil & Gas Exploration & Production in Colombia, Peru & Paraguay |
|||||||||||
|
268,629,780 |
|||||||||||
| > Oil Services 0.8% | |||||||||||
|
1,797,579 |
ShawCor (Canada) |
49,958,376 |
|||||||||
|
Oil & Gas Pipeline Products |
|||||||||||
|
780,000 |
Gulfport Energy (a) |
35,809,800 |
|||||||||
|
Oil & Gas Producer Focused on Utica Shale in Ohio |
|||||||||||
|
1,470,000 |
Hornbeck Offshore (a) |
27,650,700 |
|||||||||
|
Supply Vessel Operator in Gulf of Mexico |
|||||||||||
|
113,418,876 |
|||||||||||
| > Mining 0.8% | |||||||||||
|
423,000 |
Core Labs (Netherlands) (c) |
44,199,270 |
|||||||||
|
Oil & Gas Reservoir Consulting |
|||||||||||
|
6,697,200 |
Kirkland Lake Gold (Canada) (a)(b)(c) |
28,765,361 |
|||||||||
|
Gold Mining |
|||||||||||
|
3,500,000 |
Alamos Gold (Canada) |
20,504,520 |
|||||||||
|
Gold Mining |
|||||||||||
|
9,014,700 |
Argonaut Gold (Canada) (a)(b) |
12,526,842 |
|||||||||
|
Gold & Silver Mining |
|||||||||||
|
3,412,300 |
Silvercrest Mines (a) |
3,744,895 |
|||||||||
|
Gold & Silver Mining |
|||||||||||
|
3,000,000 |
Kaminak Gold (a)(c) |
2,131,776 |
|||||||||
|
Exploration Stage Canadian Gold Miner |
|||||||||||
|
111,872,664 |
|||||||||||
|
Number of Shares |
Value |
||||||||||
| > Agricultural Commodities 0.1% | |||||||||||
|
1,306,818 |
Union Agriculture Group (Uruguay) (a)(d)(e) |
$ |
14,231,248 |
||||||||
|
Farmland Operator in Uruguay |
|||||||||||
|
Energy & Minerals: Total |
508,152,568 |
||||||||||
|
Total Equities: 97.0% (Cost: $7,228,403,959) |
13,752,966,959 |
(f) |
|||||||||
|
Short-Term Investments 3.2% |
|||||||||||
|
280,000,000 |
JPMorgan U.S. Government Money Market Fund, IM Shares (7 day yield of 0.01%) |
280,000,000 |
|||||||||
|
177,215,101 |
JPMorgan U.S. Government Money Market Fund, Agency Shares (7 day yield of 0.01%) |
177,215,101 |
|||||||||
|
Total Short-Term Investments: 3.2% (Cost: $457,215,101) |
457,215,101 |
||||||||||
|
Securities Lending Collateral 1.7% |
|||||||||||
|
236,439,798 |
Dreyfus Government Cash Management Fund, Institutional Shares (7 day yield of 0.01%) (g) |
236,439,798 |
|||||||||
|
Total Securities Lending Collateral: 1.7% (Cost: $236,439,798) |
236,439,798 |
||||||||||
|
Total Investments: 101.9% (Cost: $7,922,058,858)(h) |
14,446,621,858 |
(i) |
|||||||||
|
Obligation to Return Collateral for Securities Loaned: (1.7)% |
(236,439,798 |
) |
|||||||||
|
Cash and Other Assets Less Liabilities: (0.2)% |
(27,973,810 |
) |
|||||||||
|
Net Assets: 100.0% |
$ |
14,182,208,250 |
|||||||||
ADR - American Depositary Receipts
> Notes to Statement of Investments
(a) Non-income producing security.
(b) An affiliated person of the Fund, as defined in the Investment Company Act of 1940, may include any company in which the Fund owns five percent or more of its outstanding voting shares. Holdings and transactions in these affiliated companies during the period ended March 31, 2015, are as follows:
|
Security |
Balance of Shares Held 12/31/14 |
Purchases/ Additions |
Sales/ Reductions |
Balance of Shares Held 3/31/15 |
Value |
Dividend |
|||||||||||||||||||||
|
Donaldson |
7,952,000 |
- |
- |
7,952,000 |
$ |
299,869,920 |
$ |
1,312,080 |
|||||||||||||||||||
|
Cepheid |
5,350,800 |
- |
441,000 |
4,909,800 |
279,367,620 |
- |
|||||||||||||||||||||
|
Nordson (1) |
3,130,000 |
- |
96,000 |
3,034,000 |
237,683,560 |
667,480 |
|||||||||||||||||||||
|
Synageva BioPharma |
2,419,209 |
- |
468,891 |
1,950,318 |
190,214,515 |
- |
|||||||||||||||||||||
|
Associated Banc-Corp |
9,000,000 |
414,000 |
- |
9,414,000 |
175,100,400 |
941,400 |
|||||||||||||||||||||
|
HEICO |
3,626,750 |
- |
112,000 |
3,514,750 |
174,120,715 |
- |
|||||||||||||||||||||
|
Moog |
2,456,000 |
- |
429,000 |
2,027,000 |
152,126,350 |
- |
|||||||||||||||||||||
32
> Notes to Statement of Investments
|
Security |
Balance of Shares Held 12/31/14 |
Purchases/ Additions |
Sales/ Reductions |
Balance of Shares Held 3/31/15 |
Value |
Dividend |
|||||||||||||||||||||
|
Generac (1) |
3,632,000 |
- |
650,000 |
2,982,000 |
$ |
145,193,580 |
$ |
- |
|||||||||||||||||||
|
Drew Industries |
1,610,000 |
- |
- |
1,610,000 |
99,079,400 |
3,220,000 |
|||||||||||||||||||||
|
EdR |
2,450,000 |
- |
- |
2,450,000 |
86,681,000 |
882,000 |
|||||||||||||||||||||
|
Rush Enterprises |
3,200,000 |
- |
- |
3,200,000 |
86,100,000 |
- |
|||||||||||||||||||||
|
Bankrate |
6,300,300 |
949,700 |
- |
7,250,000 |
82,215,000 |
- |
|||||||||||||||||||||
|
SPS Commerce |
1,330,000 |
- |
254,000 |
1,076,000 |
72,199,600 |
- |
|||||||||||||||||||||
|
Vonage |
14,044,775 |
455,225 |
- |
14,500,000 |
71,195,000 |
- |
|||||||||||||||||||||
|
Knoll |
3,366,000 |
- |
530,000 |
2,836,000 |
66,447,480 |
361,264 |
|||||||||||||||||||||
|
Virtusa |
1,658,000 |
- |
88,000 |
1,570,000 |
64,966,600 |
- |
|||||||||||||||||||||
|
ESCO Technologies |
1,948,000 |
- |
459,000 |
1,489,000 |
58,041,220 |
119,120 |
|||||||||||||||||||||
|
World Acceptance |
808,343 |
- |
20,921 |
787,422 |
57,418,812 |
- |
|||||||||||||||||||||
|
GTT Communications |
1,950,000 |
651,000 |
- |
2,601,000 |
49,106,880 |
- |
|||||||||||||||||||||
|
Terreno Realty |
2,150,000 |
- |
- |
2,150,000 |
49,020,000 |
- |
|||||||||||||||||||||
|
Thermon |
1,940,094 |
43,735 |
- |
1,983,829 |
47,750,764 |
- |
|||||||||||||||||||||
|
McGrath Rentcorp |
1,580,000 |
- |
235,000 |
1,345,000 |
44,263,950 |
387,100 |
|||||||||||||||||||||
|
inContact |
3,741,000 |
- |
- |
3,741,000 |
40,776,900 |
- |
|||||||||||||||||||||
|
Navigant Consulting |
4,128,523 |
- |
1,028,523 |
3,100,000 |
40,176,000 |
- |
|||||||||||||||||||||
|
Cavco Industries |
500,000 |
- |
- |
500,000 |
37,530,000 |
- |
|||||||||||||||||||||
|
Sarepta Therapeutics |
2,523,900 |
- |
- |
2,523,900 |
33,517,392 |
- |
|||||||||||||||||||||
|
PGT |
3,592,200 |
- |
727,000 |
2,865,200 |
32,018,610 |
- |
|||||||||||||||||||||
|
Kirkland Lake Gold |
6,347,100 |
350,100 |
- |
6,697,200 |
28,765,361 |
- |
|||||||||||||||||||||
|
Hackett Group |
2,903,719 |
- |
203,719 |
2,700,000 |
24,138,000 |
- |
|||||||||||||||||||||
|
Boingo Wireless |
2,800,000 |
100,000 |
- |
2,900,000 |
21,866,000 |
- |
|||||||||||||||||||||
|
CAI International (1) |
1,500,000 |
- |
661,000 |
839,000 |
20,614,230 |
- |
|||||||||||||||||||||
|
Liquidity Services |
1,600,000 |
- |
- |
1,600,000 |
15,808,000 |
- |
|||||||||||||||||||||
|
Gaiam |
2,100,000 |
- |
- |
2,100,000 |
15,309,000 |
- |
|||||||||||||||||||||
|
Argonaut Gold |
9,014,700 |
- |
- |
9,014,700 |
12,526,842 |
- |
|||||||||||||||||||||
|
Rubicon Technology |
2,500,000 |
- |
- |
2,500,000 |
9,850,000 |
- |
|||||||||||||||||||||
|
Towerstream |
4,000,000 |
- |
- |
4,000,000 |
8,640,000 |
- |
|||||||||||||||||||||
|
ShaMaran Petroleum |
28,962,000 |
78,599,000 |
107,561,000 |
7,643,196 |
- |
||||||||||||||||||||||
|
Audience |
2,150,000 |
- |
506,000 |
1,644,000 |
7,463,760 |
- |
|||||||||||||||||||||
|
Petromanas |
67,500,000 |
- |
- |
67,500,000 |
2,664,719 |
- |
|||||||||||||||||||||
|
Canadian Overseas Petroleum |
32,515,500 |
- |
- |
32,515,500 |
2,090,623 |
- |
|||||||||||||||||||||
|
Petrodorado Energy |
2,600,000 |
- |
- |
2,600,000 |
205,282 |
- |
|||||||||||||||||||||
|
Allied Nevada Gold (1) |
7,103,513 |
- |
7,103,513 |
- |
- |
- |
|||||||||||||||||||||
|
Amber Road (1) |
2,000,000 |
- |
2,000,000 |
- |
- |
- |
|||||||||||||||||||||
|
Boulder Brands (1) |
3,484,000 |
- |
3,484,000 |
- |
- |
- |
|||||||||||||||||||||
|
E2Open (1) |
2,575,000 |
- |
2,575,000 |
- |
- |
- |
|||||||||||||||||||||
|
Marlin Business Services (1) |
902,210 |
- |
902,210 |
- |
- |
- |
|||||||||||||||||||||
|
RGS Energy (1) |
5,000,000 |
- |
5,000,000 |
- |
- |
- |
|||||||||||||||||||||
|
Total of Affiliated Transactions |
283,945,636 |
81,562,760 |
27,974,777 |
337,533,619 |
$ |
2,949,766,281 |
$ |
7,890,444 |
|||||||||||||||||||
(1) At March 31, 2015, the Fund owned less than five percent of the company's outstanding voting shares.
The aggregate cost and value of these companies at March 31, 2015, was $1,518,703,816 and $2,546,274,911, respectively. Investments in affiliated companies represented 17.95% of the Fund's total net assets at March 31, 2015.
(c) All or a portion of this security was on loan at March 31, 2015. The total market value of securities on loan at March 31, 2015 was $226,593,324.
(d) Denotes a restricted security, which is subject to restrictions on resale under federal securities laws. These securities are valued at fair value determined in good faith under consistently applied procedures established by the Fund's Board of Trustees. At March 31, 2015, the market value of these securities amounted to $15,146,984, which represented 0.11% of total net assets. Additional information on these securities is as follows:
|
Security |
Acquisition Dates |
Shares/Units |
Cost |
Value |
|||||||||||||||
|
Union Agriculture Group |
12/8/10-6/27/12 |
1,306,818 |
$ |
15,000,000 |
$ |
14,231,248 |
|||||||||||||
|
Canadian Overseas Petroleum |
11/24/10 |
8,400,000 |
3,591,152 |
519,798 |
|||||||||||||||
|
MicroDose Therapeutx Contingent Value Rights |
8/14/13 |
359,944 |
- |
395,938 |
|||||||||||||||
|
$ |
18,591,152 |
$ |
15,146,984 |
||||||||||||||||
(e) Illiquid security.
33
COLUMBIA ACORN® FUND
STATEMENT OF INVESTMENTS (UNAUDITED), CONTINUED
> Notes to Statement of Investments
(f) On March 31, 2015, the market value of foreign securities represented 2.20% of total net assets. The Fund's foreign portfolio was diversified as follows:
|
Country |
Value |
Percentage of Net Assets |
|||||||||
|
Canada |
$ |
182,468,980 |
1.30 |
||||||||
|
Netherlands |
44,199,270 |
0.31 |
|||||||||
|
Israel |
32,783,400 |
0.23 |
|||||||||
|
India |
30,033,135 |
0.21 |
|||||||||
|
Uruguay |
14,231,248 |
0.10 |
|||||||||
|
Iraq |
7,643,196 |
0.05 |
|||||||||
|
Colombia |
205,282 |
0.00 |
* |
||||||||
|
Total Foreign Portfolio |
$ |
311,564,511 |
2.20 |
||||||||
* Rounds to zero.
(g) Investment made with cash collateral received from securities lending activity.
(h) At March 31, 2015, for federal income tax purposes, the cost of investments was approximately $7,922,058,858 and net unrealized appreciation was $6,524,563,000 consisting of gross unrealized appreciation of $6,888,584,428 and gross unrealized depreciation of $364,021,428.
(i) Securities are valued using policies described in the Notes to Financial Statements in the shareholder report dated December 31, 2014.
Fair Value Measurements
Various inputs are used in determining the value of the Fund's investments, following the input prioritization hierarchy established by accounting principles generally accepted in the United States of America (GAAP). These inputs are summarized in the three broad levels listed below:
• Level 1 – quoted prices in active markets for identical securities
• Level 2 – prices determined using other significant observable inputs (including quoted prices for similar securities, interest rates, prepayment speeds, credit risk and others)
• Level 3 – prices determined using significant unobservable inputs where quoted prices or observable inputs are unavailable or less reliable (including management's own assumptions about the factors market participants would use in pricing an investment)
The inputs or methodology used for valuing securities are not necessarily an indication of the risk associated with investing in those securities.
Examples of the types of securities in which the Fund would typically invest and how they are classified within this hierarchy are as follows. Typical Level 1 securities include exchange traded domestic equities, mutual funds whose NAVs are published each day and exchange traded foreign equities that are not statistically fair valued. Typical Level 2 securities include exchange traded foreign equities that are statistically fair valued, forward foreign currency exchange contracts and short-term investments valued at amortized cost. Additionally, securities fair valued by the Valuation Committee (the Committee) of the Fund's Board of Trustees (the Board) that rely on significant observable inputs are also included in Level 2. Typical Level 3 securities include any security fair valued by the Committee that relies on significant unobservable inputs.
Under the direction of the Board, the Committee is responsible for overseeing the valuation procedures approved by the Board.
The Committee meets as necessary, and no less frequently than quarterly, to determine fair values for securities for which market quotations are not readily available or for which the investment manager believes that available market quotations are unreliable, to review the appropriateness of the Trust's Portfolio Pricing Policy and the pricing procedures of the investment manager (the Policies), and to review the continuing appropriateness of the current value of any security subject to the Policies. The Policies address, among other things: circumstances under which market quotations will be deemed readily available; selection of third party pricing vendors; appropriate pricing methodologies; events that require fair valuation and fair value techniques; circumstances under which securities will be deemed to pose a potential for stale pricing, including when securities are illiquid, restricted, or in default; and certain delegations of authority to determine fair values to the Fund's investment manager. The Committee may also meet to discuss additional valuation matters, which may include review of back-testing results, review of time-sensitive information or approval of other valuation related actions, and to review the appropriateness of the Policies.
For investments categorized as Level 3, the significant unobservable inputs used in the fair value measurement of the Funds' securities may include: (i) data specific to the issuer or comparable issuers, (ii) general market or specific sector news and (iii) quoted prices and specific or similar security transactions. The Committee considers this data and any changes from prior periods in order to assess the reasonableness of observable and unobservable inputs, any assumptions or internal models used to value those securities and changes in fair value. Significant changes in any of these factors could result in lower or higher fair value measurements. Various factors impact the frequency of monitoring (which may occur as often as daily), however the Committee may determine that changes to inputs, assumptions and models are not required with the same frequency.
34
> Notes to Statement of Investments
The following table summarizes the inputs used, as of March 31, 2015, in valuing the Fund's assets:
|
Investment Type |
Quoted Prices (Level 1) |
Other Significant Observable Inputs (Level 2) |
Significant Unobservable Inputs (Level 3) |
Total |
|||||||||||||||
|
Equities |
|||||||||||||||||||
|
Information |
$ |
4,060,675,641 |
$ |
30,033,135 |
$ |
— |
$ |
4,090,708,776 |
|||||||||||
|
Industrial Goods & Services |
3,322,835,399 |
— |
— |
3,322,835,399 |
|||||||||||||||
|
Finance |
1,720,027,436 |
— |
— |
1,720,027,436 |
|||||||||||||||
|
Health Care |
1,615,563,428 |
— |
395,938 |
1,615,959,366 |
|||||||||||||||
|
Consumer Goods & Services |
1,575,530,099 |
— |
— |
1,575,530,099 |
|||||||||||||||
|
Other Industries |
919,753,315 |
— |
— |
919,753,315 |
|||||||||||||||
|
Energy & Minerals |
493,401,522 |
519,798 |
14,231,248 |
508,152,568 |
|||||||||||||||
|
Total Equities |
13,707,786,840 |
30,552,933 |
14,627,186 |
13,752,966,959 |
|||||||||||||||
|
Total Short-Term Investments |
457,215,101 |
— |
— |
457,215,101 |
|||||||||||||||
|
Total Securities Lending Collateral |
236,439,798 |
— |
— |
236,439,798 |
|||||||||||||||
|
Total Investments |
$ |
14,401,441,739 |
$ |
30,552,933 |
$ |
14,627,186 |
$ |
14,446,621,858 |
|||||||||||
The Fund's assets assigned to the Level 2 input category are generally valued using a market approach, in which a security's value is determined through its correlation to prices and information from observable market transactions for similar or identical assets. Foreign equities are generally valued at the last sale price on the foreign exchange or market on which they trade. The Fund may use a statistical fair valuation model, in accordance with the policy adopted by the Board, provided by an independent third party to value securities principally traded in foreign markets in order to adjust for possible stale pricing that may occur between the close of the foreign exchanges and the time for valuation. These models take into account available market data including intraday index, ADR, and ETF movements. Securities acquired via private placement that have a holding period or an extended settlement period are valued at a discount to the same shares that are trading freely on the market. These discounts are determined by the investment manager's experience with similar securities or situations. Factors may include, but are not limited to, trade volume, shares outstanding and stock price.
There were no transfers of financial assets between levels during the period.
The Fund does not hold any significant investments (greater than one percent of net assets) categorized as Level 3.
Certain securities classified as Level 3 are valued at fair value, using a market approach, as determined in good faith under consistently applied procedures established by and under the general supervision of the Board. To determine fair value for these securities, for which no market exists, the Committee utilizes the valuation technique it deems most appropriate in the circumstances, using some unobservable inputs, which may include, but are not limited to estimated earnings of the company and the position of the security within the company's capital structure. The Committee also may use some observable inputs, which may include, but are not limited to, trades of similar securities and market multiples derived from a set of comparable companies. Significant increases or decreases to any of these inputs could result in a significantly lower or higher fair value measurement.
35
COLUMBIA ACORN INTERNATIONAL®
MAJOR PORTFOLIO CHANGES IN THE FIRST QUARTER (UNAUDITED)
|
Number of Shares |
|||||||||||
|
12/31/14 |
3/31/15 |
||||||||||
|
Purchases |
|||||||||||
|
Asia |
|||||||||||
| > Japan | |||||||||||
|
Aeon Financial Service |
1,205,000 |
1,600,000 |
|||||||||
|
Aeon Mall |
2,004,900 |
2,710,000 |
|||||||||
|
Glory |
1,430,000 |
1,798,600 |
|||||||||
|
Hikari Tsushin |
255,800 |
313,200 |
|||||||||
|
IHI |
0 |
4,235,000 |
|||||||||
|
Kaken Pharmaceutical |
0 |
686,800 |
|||||||||
|
Milbon |
571,080 |
698,480 |
|||||||||
|
NGK Insulators |
1,600,000 |
2,700,000 |
|||||||||
|
NGK Spark Plug |
1,170,000 |
1,440,000 |
|||||||||
|
Nippon Shokubai |
0 |
2,066,000 |
|||||||||
|
NOF |
4,872,000 |
5,311,000 |
|||||||||
|
OBIC |
688,000 |
772,000 |
|||||||||
|
Omron |
462,000 |
512,000 |
|||||||||
|
Otsuka |
419,300 |
629,900 |
|||||||||
|
Recruit Holdings |
0 |
1,225,000 |
|||||||||
| > Taiwan | |||||||||||
|
Chroma Ate |
6,427,000 |
7,611,000 |
|||||||||
|
Far EasTone Telecom |
12,570,000 |
14,140,000 |
|||||||||
|
Hermes Microvision |
174,750 |
211,750 |
|||||||||
|
Lite-On Technology |
5,594,881 |
10,016,881 |
|||||||||
|
President Chain Store |
7,306,000 |
9,100,000 |
|||||||||
|
Voltronic Power |
0 |
1,000,000 |
|||||||||
| > India | |||||||||||
|
Bharti Infratel |
0 |
6,229,667 |
|||||||||
|
Container Corporation of India |
0 |
1,204,602 |
|||||||||
| > Singapore | |||||||||||
|
Mapletree Commercial Trust |
53,724,268 |
55,000,000 |
|||||||||
|
Singapore Exchange |
6,596,000 |
11,000,000 |
|||||||||
| > Korea | |||||||||||
|
CJ Hellovision |
0 |
578,438 |
|||||||||
|
KT&G |
349,317 |
536,317 |
|||||||||
|
LF Corp |
758,028 |
1,119,428 |
|||||||||
|
Nongshim |
94,000 |
145,900 |
|||||||||
| > China | |||||||||||
|
AMVIG Holdings |
35,119,000 |
47,500,000 |
|||||||||
|
China Everbright International |
0 |
28,645,000 |
|||||||||
|
Sihuan Pharmaceuticals |
83,100,000 |
90,360,000 |
|||||||||
|
Sino Biopharmaceutical |
0 |
23,671,000 |
|||||||||
| > Hong Kong | |||||||||||
|
Vitasoy International |
5,818,000 |
9,347,000 |
|||||||||
| > Indonesia | |||||||||||
|
Link Net |
37,000,000 |
43,000,000 |
|||||||||
|
Mayora Indah |
5,600,000 |
6,000,000 |
|||||||||
|
Number of Shares |
|||||||||||
|
12/31/14 |
3/31/15 |
||||||||||
| > Philippines | |||||||||||
|
Melco Crown (Philippines) Resorts |
78,170,000 |
90,000,000 |
|||||||||
|
Universal Robina |
2,114,550 |
3,106,980 |
|||||||||
|
Europe |
|||||||||||
| > United Kingdom | |||||||||||
|
Abcam |
4,550,000 |
4,800,000 |
|||||||||
|
Aggreko |
1,300,000 |
1,980,000 |
|||||||||
|
Cable and Wireless |
35,245,747 |
45,000,000 |
|||||||||
|
Halfords |
3,277,885 |
4,372,390 |
|||||||||
|
Polypipe |
6,534,800 |
7,430,000 |
|||||||||
| > Sweden | |||||||||||
|
Modern Times Group |
0 |
1,137,000 |
|||||||||
|
Recipharm |
0 |
979,403 |
|||||||||
| > Germany | |||||||||||
|
MTU Aero Engines |
465,000 |
608,000 |
|||||||||
| > Spain | |||||||||||
|
Distribuidora Internacional de Alimentación |
7,828,000 |
10,110,000 |
|||||||||
| > France | |||||||||||
|
Eutelsat |
798,001 |
1,110,000 |
|||||||||
| > Netherlands | |||||||||||
|
Brunel |
1,140,000 |
1,201,000 |
|||||||||
|
Gemalto |
237,700 |
324,700 |
|||||||||
|
Vopak |
404,124 |
718,124 |
|||||||||
| > Italy | |||||||||||
|
Industria Macchine Automatiche |
0 |
385,950 |
|||||||||
|
Other Countries |
|||||||||||
| > Canada | |||||||||||
|
Baytex |
1,108,857 |
1,358,857 |
|||||||||
|
DeeThree Exploration |
3,298,377 |
4,490,105 |
|||||||||
|
Keyera |
0 |
363,000 |
|||||||||
|
Prairie Sky Royalty |
0 |
1,010,000 |
|||||||||
|
Vermilion Energy |
0 |
898,000 |
|||||||||
| > Australia | |||||||||||
|
Spotless |
42,700,000 |
46,578,144 |
|||||||||
| > United States | |||||||||||
|
Cimarex Energy |
0 |
350,000 |
|||||||||
| > Egypt | |||||||||||
|
Commercial International Bank of Egypt |
0 |
3,119,000 |
|||||||||
|
Latin America |
|||||||||||
| > Brazil | |||||||||||
|
Linx |
1,184,000 |
1,400,000 |
|||||||||
|
Localiza Rent A Car |
2,802,000 |
3,500,000 |
|||||||||
36
|
Number of Shares |
|||||||||||
|
12/31/14 |
3/31/15 |
||||||||||
|
Sales |
|||||||||||
|
Asia |
|||||||||||
| > Japan | |||||||||||
|
Aica Kogyo |
1,246,000 |
1,012,000 |
|||||||||
|
Ariake Japan |
1,129,000 |
876,300 |
|||||||||
|
Disco |
434,400 |
292,400 |
|||||||||
|
Hoshizaki Electric |
420,000 |
390,000 |
|||||||||
|
Japan Airport Terminal |
960,000 |
600,000 |
|||||||||
|
Lifenet Insurance |
488,700 |
0 |
|||||||||
|
Makita |
600,000 |
258,000 |
|||||||||
|
Misumi Group |
960,000 |
650,000 |
|||||||||
|
MonotaRO |
575,600 |
352,600 |
|||||||||
|
Nabtesco |
1,110,000 |
886,900 |
|||||||||
|
Nippon Kayaku |
3,260,000 |
3,143,000 |
|||||||||
|
Nippon Paint Holdings |
970,000 |
624,000 |
|||||||||
|
Park24 |
2,150,000 |
1,960,000 |
|||||||||
|
Shimano |
208,000 |
0 |
|||||||||
|
Toyo Suisan Kaisha |
792,900 |
370,900 |
|||||||||
| > Taiwan | |||||||||||
|
Largan Precision |
364,000 |
293,000 |
|||||||||
| > India | |||||||||||
|
United Breweries |
2,085,000 |
1,850,000 |
|||||||||
| > Korea | |||||||||||
|
Cheil Industries |
122,726 |
0 |
|||||||||
|
Coway |
295,580 |
0 |
|||||||||
|
Grand Korea Leisure |
591,876 |
475,576 |
|||||||||
|
Paradise |
974,261 |
0 |
|||||||||
|
Soulbrain |
86,274 |
0 |
|||||||||
| > China | |||||||||||
|
CIMC Enric |
17,890,000 |
0 |
|||||||||
|
WuXi PharmaTech - ADR |
2,500,000 |
850,000 |
|||||||||
| > Hong Kong | |||||||||||
|
MGM China Holdings |
7,247,000 |
0 |
|||||||||
|
Sa Sa International |
33,757,000 |
25,223,000 |
|||||||||
| > Indonesia | |||||||||||
|
Surya Citra Media |
54,535,800 |
11,854,300 |
|||||||||
| > Philippines | |||||||||||
|
Puregold Price Club |
35,000,000 |
31,000,000 |
|||||||||
|
Robinsons Retail Holdings |
17,000,000 |
16,000,000 |
|||||||||
|
Security Bank |
5,000,000 |
0 |
|||||||||
| > Malaysia | |||||||||||
|
7-Eleven Malaysia Holdings |
46,980,000 |
43,839,000 |
|||||||||
|
Aeon |
22,609,800 |
17,441,500 |
|||||||||
|
Europe |
|||||||||||
| > United Kingdom | |||||||||||
|
Babcock International |
4,000,000 |
3,300,000 |
|||||||||
|
Jardine Lloyd Thompson Group |
3,950,000 |
2,630,000 |
|||||||||
|
Number of Shares |
|||||||||||
|
12/31/14 |
3/31/15 |
||||||||||
|
Rightmove |
1,338,000 |
872,000 |
|||||||||
|
Smith & Nephew |
1,510,000 |
1,280,000 |
|||||||||
| > Sweden | |||||||||||
|
Hexagon |
2,168,522 |
1,723,394 |
|||||||||
|
Swedish Match |
1,580,000 |
856,000 |
|||||||||
| > Germany | |||||||||||
|
Rational |
130,000 |
117,000 |
|||||||||
|
Wirecard |
1,663,000 |
1,350,000 |
|||||||||
| > Spain | |||||||||||
|
Viscofan |
794,000 |
671,000 |
|||||||||
| > France | |||||||||||
|
Eurofins Scientific |
146,000 |
90,000 |
|||||||||
| > Netherlands | |||||||||||
|
Aalberts Industries |
2,491,770 |
2,103,770 |
|||||||||
| > Switzerland | |||||||||||
|
Partners Group |
263,500 |
213,500 |
|||||||||
| > Denmark | |||||||||||
|
Jyske Bank |
709,000 |
0 |
|||||||||
| > Norway | |||||||||||
|
Subsea 7 |
1,321,000 |
0 |
|||||||||
| > Italy | |||||||||||
|
Pirelli |
2,787,000 |
1,909,000 |
|||||||||
|
Other Countries |
|||||||||||
| > Canada | |||||||||||
|
Black Diamond Group |
551,976 |
0 |
|||||||||
|
Canadian Energy Services & Technology |
3,622,000 |
0 |
|||||||||
|
CCL Industries |
862,772 |
800,772 |
|||||||||
|
Horizon North Logistics |
1,901,514 |
0 |
|||||||||
|
Trilogy Energy |
766,000 |
0 |
|||||||||
| > South Africa | |||||||||||
|
Coronation Fund Managers |
13,858,792 |
13,683,594 |
|||||||||
|
Naspers |
777,188 |
493,188 |
|||||||||
|
Rand Merchant Insurance |
20,179,300 |
19,045,300 |
|||||||||
| > Australia | |||||||||||
|
Amcor |
6,725,000 |
4,270,000 |
|||||||||
|
Austbrokers |
2,196,850 |
1,217,356 |
|||||||||
|
Domino's Pizza Enterprises |
2,978,993 |
2,428,257 |
|||||||||
|
IAG |
10,600,000 |
5,260,000 |
|||||||||
|
MMA Offshore |
10,912,000 |
0 |
|||||||||
| > United States | |||||||||||
|
Chart Industries |
225,000 |
0 |
|||||||||
|
FMC Technologies |
168,213 |
0 |
|||||||||
|
Rowan |
685,900 |
0 |
|||||||||
|
Textainer Group Holdings |
1,272,297 |
933,297 |
|||||||||
37
COLUMBIA ACORN INTERNATIONAL®
MAJOR PORTFOLIO CHANGES IN THE FIRST QUARTER (UNAUDITED), CONTINUED
|
Number of Shares |
|||||||||||
|
12/31/14 |
3/31/15 |
||||||||||
|
Sales (continued) |
|||||||||||
|
Latin America |
|||||||||||
| > Brazil | |||||||||||
|
Beadell Resources |
37,336,982 |
3,421,215 |
|||||||||
| > Mexico | |||||||||||
|
Genomma Lab International |
10,184,000 |
0 |
|||||||||
|
Gruma |
2,200,000 |
0 |
|||||||||
38
COLUMBIA ACORN INTERNATIONAL®
STATEMENT OF INVESTMENTS (UNAUDITED), MARCH 31, 2015
|
Number of Shares |
Value |
||||||||||
|
Equities: 96.0% |
|||||||||||
|
Asia 46.2% |
|||||||||||
| > Japan 22.1% | |||||||||||
|
2,700,000 |
NGK Insulators |
$ |
57,527,649 |
||||||||
|
Ceramic Products for Auto, Power & Electronics |
|||||||||||
|
2,978,600 |
Kansai Paint |
54,209,818 |
|||||||||
|
Paint Producer in Japan, India, China & Southeast Asia |
|||||||||||
|
2,710,000 |
Aeon Mall |
53,666,439 |
|||||||||
|
Suburban Shopping Mall Developer, Owner & Operator |
|||||||||||
|
1,798,600 |
Glory |
50,087,269 |
|||||||||
|
Currency Handling Systems & Related Equipment |
|||||||||||
|
3,850,800 |
Ushio |
47,732,799 |
|||||||||
|
Industrial Light Sources |
|||||||||||
|
1,050,000 |
FamilyMart |
43,993,378 |
|||||||||
|
Convenience Store Operator |
|||||||||||
|
1,301,200 |
Benesse |
40,933,231 |
|||||||||
|
Education Service Provider |
|||||||||||
|
1,600,000 |
Aeon Financial Service |
40,361,893 |
|||||||||
|
Diversified Consumer-related Finance Company in Japan |
|||||||||||
|
28,000 |
Orix JREIT |
40,103,071 |
|||||||||
|
Diversified REIT |
|||||||||||
|
1,960,000 |
Park24 |
40,101,097 |
|||||||||
|
Parking Lot Operator |
|||||||||||
|
2,728,000 |
Santen Pharmaceutical |
39,790,123 |
|||||||||
|
Specialty Pharma (Ophthalmic Medicine) |
|||||||||||
|
5,311,000 |
NOF |
39,397,331 |
|||||||||
|
Specialty Chemicals, Life Science & Rocket Fuels |
|||||||||||
|
3,143,000 |
Nippon Kayaku |
39,352,399 |
|||||||||
|
Functional Chemicals, Pharmaceuticals & Auto Safety Systems |
|||||||||||
|
1,440,000 |
NGK Spark Plug |
38,655,375 |
|||||||||
|
Automobile Parts |
|||||||||||
|
1,225,000 |
Recruit Holdings |
38,221,789 |
|||||||||
|
Recruitment & Media Services |
|||||||||||
|
600,000 |
Japan Airport Terminal |
36,285,663 |
|||||||||
|
Airport Terminal Operator at Haneda |
|||||||||||
|
277,620 |
Hirose Electric |
35,743,745 |
|||||||||
|
Electrical Connectors |
|||||||||||
|
752,800 |
Kintetsu World Express |
33,836,654 |
|||||||||
|
Airfreight Logistics |
|||||||||||
|
6,149 |
Kenedix Office Investment |
33,739,618 |
|||||||||
|
Tokyo Mid-size Office REIT |
|||||||||||
|
772,000 |
OBIC |
32,736,918 |
|||||||||
|
Computer Software |
|||||||||||
|
930,000 |
JIN (a) |
32,205,104 |
|||||||||
|
Eyeglasses Retailer |
|||||||||||
|
1,600,000 |
OSG |
31,115,701 |
|||||||||
|
Consumable Cutting Tools |
|||||||||||
|
1,470,000 |
Suruga Bank |
30,527,007 |
|||||||||
|
Regional Bank |
|||||||||||
|
Number of Shares |
Value |
||||||||||
|
2,066,000 |
Nippon Shokubai |
$ |
30,240,518 |
||||||||
|
Producer of Acrylic Acid & Super Absorbent Polymers used in Disposable Diapers |
|||||||||||
|
746,500 |
Ezaki Glico |
30,178,682 |
|||||||||
|
Confectionary, Ice Cream & Dairy Products |
|||||||||||
|
1,402,000 |
Tamron (b) |
30,165,507 |
|||||||||
|
Camera Lenses |
|||||||||||
|
876,300 |
Ariake Japan |
30,082,564 |
|||||||||
|
Commercial Soup & Sauce Extracts |
|||||||||||
|
2,736,000 |
Moshi Moshi Hotline |
29,853,954 |
|||||||||
|
Call Center Operator |
|||||||||||
|
292,400 |
Disco |
29,833,863 |
|||||||||
|
Semiconductor Dicing & Grinding Equipment |
|||||||||||
|
2,000,000 |
Toto |
29,697,920 |
|||||||||
|
Toilets & Bathroom Fittings |
|||||||||||
|
8,340,000 |
Aozora Bank |
29,561,634 |
|||||||||
|
Commercial Bank |
|||||||||||
|
1,580,000 |
Daiseki |
28,490,844 |
|||||||||
|
Waste Disposal & Recycling |
|||||||||||
|
629,900 |
Otsuka |
26,843,300 |
|||||||||
|
One-stop IT Services & Office Supplies Provider |
|||||||||||
|
650,000 |
Misumi Group |
26,195,854 |
|||||||||
|
Industrial Components Distributor |
|||||||||||
|
886,900 |
Nabtesco |
25,621,857 |
|||||||||
|
Machinery Components |
|||||||||||
|
390,000 |
Hoshizaki Electric |
25,326,120 |
|||||||||
|
Commercial Kitchen Equipment |
|||||||||||
|
643,000 |
Nakanishi |
25,092,395 |
|||||||||
|
Dental Tools & Machinery |
|||||||||||
|
1,107,000 |
Stanley Electric |
24,987,566 |
|||||||||
|
Automobile Lighting & LED Equipment |
|||||||||||
|
1,600,000 |
Doshisha |
24,833,045 |
|||||||||
|
Consumer Goods Wholesaler |
|||||||||||
|
12,050 |
Japan Retail Fund |
23,944,337 |
|||||||||
|
Largest Retail REIT in Japan |
|||||||||||
|
1,676,000 |
Rohto Pharmaceutical |
23,822,025 |
|||||||||
|
Pharmaceutical, Health & Beauty Products |
|||||||||||
|
5,092 |
Industrial & Infrastructure Fund |
23,700,366 |
|||||||||
|
Industrial REIT in Japan |
|||||||||||
|
783,600 |
Hamamatsu Photonics |
23,619,405 |
|||||||||
|
Optical Sensors for Medical & Industrial Applications |
|||||||||||
|
1,012,000 |
Aica Kogyo |
23,564,882 |
|||||||||
|
Laminated Sheets, Building Materials & Chemical Adhesives |
|||||||||||
|
512,000 |
Omron |
23,065,167 |
|||||||||
|
Electric Components for Factory Automation |
|||||||||||
|
309,000 |
Rinnai |
22,900,276 |
|||||||||
|
Gas Appliances for Home & Commercial Use |
|||||||||||
|
624,000 |
Nippon Paint Holdings |
22,811,414 |
|||||||||
|
Paints for Automotive, Decorative & Industrial Usage |
|||||||||||
|
698,480 |
Milbon |
22,418,639 |
|||||||||
|
Hair Products for Salons |
|||||||||||
39
COLUMBIA ACORN INTERNATIONAL®
STATEMENT OF INVESTMENTS (UNAUDITED), CONTINUED
|
Number of Shares |
Value |
||||||||||
| > Japan—continued | |||||||||||
|
1,914,500 |
Asahi Diamond Industrial |
$ |
21,850,149 |
||||||||
|
Consumable Diamond Tools |
|||||||||||
|
1,753,060 |
Nihon Parkerizing |
21,205,884 |
|||||||||
|
Metal Surface Treatment Chemicals & Processing Service |
|||||||||||
|
313,200 |
Hikari Tsushin |
20,284,592 |
|||||||||
|
Office IT/Mobiles/Insurance Distribution |
|||||||||||
|
835,000 |
Icom (b) |
20,067,394 |
|||||||||
|
Two Way Radio Communication Equipment |
|||||||||||
|
686,800 |
Kaken Pharmaceutical |
19,855,165 |
|||||||||
|
Pharmaceutical & Agrochemical Producer |
|||||||||||
|
4,235,000 |
IHI |
19,801,717 |
|||||||||
|
Industrial Conglomerates |
|||||||||||
|
258,000 |
Makita |
13,369,642 |
|||||||||
|
Power Tools |
|||||||||||
|
370,900 |
Toyo Suisan Kaisha |
13,049,133 |
|||||||||
|
Instant Noodles & Processed Foods |
|||||||||||
|
352,600 |
MonotaRO (a) |
12,770,515 |
|||||||||
|
Online Maintenance, Repair & Operations Goods Distributor in Japan |
|||||||||||
|
1,496 |
Kenedix Retail REIT |
3,471,354 |
|||||||||
|
Retail REIT in Japan |
|||||||||||
|
1,752,901,750 |
|||||||||||
| > Taiwan 4.6% | |||||||||||
|
9,100,000 |
President Chain Store |
68,396,889 |
|||||||||
|
Convenience Chain Store Operator in Taiwan |
|||||||||||
|
14,140,000 |
Far EasTone Telecom |
34,111,990 |
|||||||||
|
Mobile Operator in Taiwan |
|||||||||||
|
2,081,000 |
St. Shine Optical |
33,498,260 |
|||||||||
|
Disposable Contact Lens Original Equipment Manufacturer |
|||||||||||
|
5,871,000 |
Novatek Microelectronics |
30,299,818 |
|||||||||
|
Display Related Integrated Circuit Designer |
|||||||||||
|
2,300,000 |
PChome Online |
29,871,567 |
|||||||||
|
Taiwanese Internet Retail Company |
|||||||||||
|
293,000 |
Largan Precision |
25,188,620 |
|||||||||
|
Mobile Device Camera Lenses & Modules |
|||||||||||
|
3,761,000 |
Delta Electronics |
23,699,715 |
|||||||||
|
Industrial Automation, Switching Power Supplies & Passive Components |
|||||||||||
|
3,034,686 |
Advantech |
23,075,971 |
|||||||||
|
Industrial PC & Components |
|||||||||||
|
13,516,000 |
Vanguard International Semiconductor |
22,943,033 |
|||||||||
|
Semiconductor Foundry |
|||||||||||
|
1,925,000 |
Ginko International |
22,115,216 |
|||||||||
|
Contact Lens Maker in China |
|||||||||||
|
7,611,000 |
Chroma Ate |
18,886,325 |
|||||||||
|
Automatic Test Systems, Testing & Measurement Instruments |
|||||||||||
|
10,016,881 |
Lite-On Technology |
12,957,953 |
|||||||||
|
Mobile Device, LED & PC Server Component Supplier |
|||||||||||
|
Number of Shares |
Value |
||||||||||
|
211,750 |
Hermes Microvision |
$ |
12,182,406 |
||||||||
|
E-Beam Inspection Systems for Semiconductor Integrated Circuits |
|||||||||||
|
1,000,000 |
Voltronic Power |
9,900,562 |
|||||||||
|
Uninterruptible Power Supply Products |
|||||||||||
|
367,128,325 |
|||||||||||
| > India 4.0% | |||||||||||
|
13,478,000 |
Zee Entertainment Enterprises |
73,597,561 |
|||||||||
|
Indian Programmer of Pay Television Content |
|||||||||||
|
3,423,265 |
Asian Paints |
44,411,409 |
|||||||||
|
Indian Paint Company |
|||||||||||
|
6,229,667 |
Bharti Infratel |
38,324,926 |
|||||||||
|
Communications Towers |
|||||||||||
|
90,000 |
Bosch |
36,559,217 |
|||||||||
|
Automotive Parts |
|||||||||||
|
1,204,602 |
Container Corporation of India |
30,474,445 |
|||||||||
|
Railway Cargo Services |
|||||||||||
|
6,095,000 |
Adani Ports & Special Economic Zone |
30,011,065 |
|||||||||
|
Indian West Coast Shipping Port |
|||||||||||
|
920,000 |
Colgate Palmolive India |
29,600,896 |
|||||||||
|
Consumer Products in Oral Care |
|||||||||||
|
1,850,000 |
United Breweries |
29,564,791 |
|||||||||
|
Indian Brewer |
|||||||||||
|
312,544,310 |
|||||||||||
| > Singapore 3.0% | |||||||||||
|
11,000,000 |
Singapore Exchange |
65,223,007 |
|||||||||
|
Singapore Equity & Derivatives Market Operator |
|||||||||||
|
55,000,000 |
Mapletree Commercial Trust |
64,124,626 |
|||||||||
|
Retail & Office Property Landlord |
|||||||||||
|
13,500,000 |
Ascendas REIT |
25,464,137 |
|||||||||
|
Industrial Property Landlord |
|||||||||||
|
8,500,000 |
Petra Foods |
23,654,304 |
|||||||||
|
Chocolate Manufacturer in Southeast Asia |
|||||||||||
|
17,742,000 |
CDL Hospitality Trust |
22,688,971 |
|||||||||
|
Hotel Owner Operator |
|||||||||||
|
20,865,750 |
Mapletree Logistics Trust |
18,929,470 |
|||||||||
|
Industrial Property Landlord |
|||||||||||
|
15,000,000 |
Mapletree Industrial Trust |
17,254,695 |
|||||||||
|
Industrial Property Landlord |
|||||||||||
|
237,339,210 |
|||||||||||
| > Korea 2.9% | |||||||||||
|
536,317 |
KT&G |
42,878,289 |
|||||||||
|
Tobacco & Ginseng Products |
|||||||||||
|
249,671 |
CJ Corp |
39,562,070 |
|||||||||
|
Holding Company of Korean Consumer Conglomerate |
|||||||||||
|
631,865 |
LS Industrial Systems |
36,302,491 |
|||||||||
|
Electrical & Automation Equipment |
|||||||||||
|
145,900 |
Nongshim |
32,000,598 |
|||||||||
|
Instant Noodles, Snacks & Bottled Water |
|||||||||||
|
1,119,428 |
LF Corp |
31,943,755 |
|||||||||
|
Apparel Design & Retail |
|||||||||||
|
1,187,900 |
Cheil Worldwide (c) |
25,734,223 |
|||||||||
|
Advertising |
|||||||||||
|
475,576 |
Grand Korea Leisure (a) |
16,189,361 |
|||||||||
|
'Foreigner Only' Casino Group in Korea |
|||||||||||
40
|
Number of Shares |
Value |
||||||||||
| > Korea—continued | |||||||||||
|
578,438 |
CJ Hellovision |
$ |
6,430,412 |
||||||||
|
Cable TV, Broadband & Mobile Virtual Network Operator |
|||||||||||
|
231,041,199 |
|||||||||||
| > China 2.8% | |||||||||||
|
28,645,000 |
China Everbright International |
48,043,333 |
|||||||||
|
Private Municipal Waste Operator |
|||||||||||
|
90,360,000 |
Sihuan Pharmaceuticals (d) |
47,915,014 |
|||||||||
|
Chinese Generic Drug Manufacturer |
|||||||||||
|
850,000 |
WuXi PharmaTech - ADR (c) |
32,963,000 |
|||||||||
|
Contract Research Organization in China |
|||||||||||
|
560,250 |
BitAuto - ADR (a)(c) |
28,505,520 |
|||||||||
|
Automotive Information Website for Buyers & Dealers |
|||||||||||
|
23,671,000 |
Sino Biopharmaceutical |
23,947,553 |
|||||||||
|
Pharmaceutical Developer |
|||||||||||
|
47,500,000 |
AMVIG Holdings (b) |
21,199,203 |
|||||||||
|
Chinese Tobacco Packaging Material Supplier |
|||||||||||
|
32,790,000 |
NewOcean Energy (a) |
16,214,941 |
|||||||||
|
Southern China Liquefied Petroleum Gas Distributor |
|||||||||||
|
218,788,564 |
|||||||||||
| > Hong Kong 2.0% | |||||||||||
|
52,849,000 |
Mapletree Greater China Commercial Trust |
40,044,589 |
|||||||||
|
Retail & Office Property Landlord |
|||||||||||
|
1,800,000 |
Melco Crown Entertainment - ADR |
38,628,000 |
|||||||||
|
Macau Casino Operator |
|||||||||||
|
15,000,000 |
Melco International |
25,241,556 |
|||||||||
|
Macau Casino Operator |
|||||||||||
|
13,120,000 |
Lifestyle International |
23,387,925 |
|||||||||
|
Mid- to High-end Department Store Operator in Hong Kong & China |
|||||||||||
|
9,347,000 |
Vitasoy International |
14,612,505 |
|||||||||
|
Hong Kong Soy Food Brand |
|||||||||||
|
25,223,000 |
Sa Sa International (a) |
12,331,562 |
|||||||||
|
Cosmetics Retailer |
|||||||||||
|
4,358,000 |
Kingboard Chemicals |
6,896,783 |
|||||||||
|
Paper & Glass Laminates, PCB, Specialty Chemicals & Properties |
|||||||||||
|
161,142,920 |
|||||||||||
| > Indonesia 1.6% | |||||||||||
|
19,000,000 |
Matahari Department Store |
28,572,485 |
|||||||||
|
Department Store Chain in Indonesia |
|||||||||||
|
33,000,000 |
Tower Bersama Infrastructure |
23,913,958 |
|||||||||
|
Communications Towers |
|||||||||||
|
43,000,000 |
Link Net (c) |
19,650,096 |
|||||||||
|
Fixed Broadband & CATV Service Provider |
|||||||||||
|
324,290,000 |
Ace Indonesia |
18,222,015 |
|||||||||
|
Home Improvement Retailer |
|||||||||||
|
220,150,800 |
Arwana Citramulia |
13,638,405 |
|||||||||
|
Ceramic Tiles for Home Decoration |
|||||||||||
|
6,000,000 |
Mayora Indah |
13,247,935 |
|||||||||
|
Consumer Branded Food Manufacturer |
|||||||||||
|
Number of Shares |
Value |
||||||||||
|
54,460,800 |
MNC Sky Vision |
$ |
6,872,682 |
||||||||
|
Satellite Pay TV Operator in Indonesia |
|||||||||||
|
11,854,300 |
Surya Citra Media |
3,075,780 |
|||||||||
|
Free to Air TV Station in Indonesia |
|||||||||||
|
127,193,356 |
|||||||||||
| > Philippines 1.2% | |||||||||||
|
16,000,000 |
Robinsons Retail Holdings |
30,067,114 |
|||||||||
|
Multi-format Retailer in the Philippines |
|||||||||||
|
31,000,000 |
Puregold Price Club |
28,802,453 |
|||||||||
|
Supermarket Operator in the Philippines |
|||||||||||
|
90,000,000 |
Melco Crown (Philippines) Resorts |
18,437,287 |
|||||||||
|
Integrated Resort Operator in Manila |
|||||||||||
|
3,106,980 |
Universal Robina |
15,694,116 |
|||||||||
|
Branded Consumer Food Manufacturer in the Philippines |
|||||||||||
|
93,000,970 |
|||||||||||
| > Thailand 1.1% | |||||||||||
|
4,360,000 |
Airports of Thailand |
37,468,787 |
|||||||||
|
Airport Operator of Thailand |
|||||||||||
|
107,731,500 |
Home Product Center |
26,982,536 |
|||||||||
|
Home Improvement Retailer |
|||||||||||
|
14,485,000 |
Robinson Department Store |
21,137,451 |
|||||||||
|
Department Store Operator in Thailand |
|||||||||||
|
85,588,774 |
|||||||||||
| > Cambodia 0.5% | |||||||||||
|
60,000,000 |
Nagacorp |
39,837,465 |
|||||||||
|
Casino & Entertainment Complex in Cambodia |
|||||||||||
| > Malaysia 0.4% | |||||||||||
|
43,839,000 |
7-Eleven Malaysia Holdings |
18,939,490 |
|||||||||
|
Exclusive 7-Eleven Franchisor for Malaysia |
|||||||||||
|
17,441,500 |
Aeon |
13,924,175 |
|||||||||
|
Shopping Center & Department Store Operator |
|||||||||||
|
410,300 |
Astro Malaysia Holdings |
353,945 |
|||||||||
|
Largest Pay TV Operator in Malaysia |
|||||||||||
|
33,217,610 |
|||||||||||
|
Asia: Total |
3,659,724,453 |
||||||||||
|
Europe 30.3% |
|||||||||||
| > United Kingdom 9.7% | |||||||||||
|
1,300,000 |
Spirax Sarco |
65,733,891 |
|||||||||
|
Steam Systems for Manufacturing & Process Industries |
|||||||||||
|
3,300,000 |
Babcock International |
48,139,956 |
|||||||||
|
Public Sector Outsourcer |
|||||||||||
|
2,430,000 |
WH Smith |
46,690,913 |
|||||||||
|
Newsprint, Books & General Stationery Retailer |
|||||||||||
|
1,980,000 |
Aggreko |
44,788,588 |
|||||||||
|
Temporary Power & Temperature Control Services |
|||||||||||
41
COLUMBIA ACORN INTERNATIONAL®
STATEMENT OF INVESTMENTS (UNAUDITED), CONTINUED
|
Number of Shares |
Value |
||||||||||
| > United Kingdom—continued | |||||||||||
|
2,630,000 |
Jardine Lloyd Thompson Group |
$ |
40,847,051 |
||||||||
|
International Business Insurance Broker |
|||||||||||
|
45,000,000 |
Cable and Wireless |
40,580,484 |
|||||||||
|
Telecommunications Service Provider in the Caribbean |
|||||||||||
|
872,000 |
Rightmove |
38,685,198 |
|||||||||
|
Internet Real Estate Listings |
|||||||||||
|
473,398 |
Whitbread |
36,759,324 |
|||||||||
|
UK Hotelier & Coffee Shop |
|||||||||||
|
39,805,000 |
Assura |
36,756,594 |
|||||||||
|
UK Primary Health Care Property Developer |
|||||||||||
|
4,800,000 |
Abcam |
34,478,114 |
|||||||||
|
Online Sales of Antibodies |
|||||||||||
|
14,379,428 |
Connect Group (b) |
32,902,209 |
|||||||||
|
Newspaper & Magazine Distributor |
|||||||||||
|
958,646 |
Fidessa Group |
31,370,544 |
|||||||||
|
Software for Financial Trading Systems |
|||||||||||
|
2,660,000 |
Domino's Pizza UK & Ireland |
30,584,995 |
|||||||||
|
Pizza Delivery in the UK, Ireland & Germany |
|||||||||||
|
7,430,000 |
Polypipe |
30,361,802 |
|||||||||
|
Manufacturer of Plastic Piping & Fittings |
|||||||||||
|
4,372,390 |
Halfords |
29,768,064 |
|||||||||
|
UK Retailer of Leisure Goods & Auto Parts |
|||||||||||
|
2,725,000 |
Halma |
28,155,791 |
|||||||||
|
Health & Safety Sensor Technology |
|||||||||||
|
4,712,000 |
Ocado (c) |
24,555,590 |
|||||||||
|
Online Grocery Retailer |
|||||||||||
|
5,650,001 |
Elementis |
24,268,770 |
|||||||||
|
Specialty Chemicals |
|||||||||||
|
3,075,000 |
PureCircle (c) |
23,605,530 |
|||||||||
|
Natural Sweeteners |
|||||||||||
|
1,280,000 |
Smith & Nephew |
21,826,005 |
|||||||||
|
Medical Equipment & Supplies |
|||||||||||
|
908,500 |
AVEVA |
19,859,269 |
|||||||||
|
Engineering Software |
|||||||||||
|
5,800,000 |
RPS Group |
19,384,181 |
|||||||||
|
Consultant Specializing in Energy, Water, Urban Planning, Health & Safety |
|||||||||||
|
1,480,000 |
Shaftesbury |
18,204,048 |
|||||||||
|
London Prime Retail REIT |
|||||||||||
|
768,306,911 |
|||||||||||
| > Sweden 3.3% | |||||||||||
|
1,723,394 |
Hexagon |
61,189,258 |
|||||||||
|
Design, Measurement & Visualization Software & Equipment |
|||||||||||
|
948,422 |
Unibet |
52,034,555 |
|||||||||
|
European Online Gaming Operator |
|||||||||||
|
3,255,024 |
Sweco |
41,767,331 |
|||||||||
|
Engineering Consultants |
|||||||||||
|
1,137,000 |
Modern Times Group |
34,819,232 |
|||||||||
|
Leading Nordic TV Broadcaster |
|||||||||||
|
Number of Shares |
Value |
||||||||||
|
1,044,000 |
Mekonomen |
$ |
27,578,479 |
||||||||
|
Nordic Integrated Wholesaler/Retailer of Automotive Parts & Service |
|||||||||||
|
856,000 |
Swedish Match |
25,168,699 |
|||||||||
|
Swedish Snus |
|||||||||||
|
979,403 |
Recipharm |
20,868,244 |
|||||||||
|
Contract Development Manufacturing Organization |
|||||||||||
|
263,425,798 |
|||||||||||
| > Germany 3.2% | |||||||||||
|
608,000 |
MTU Aero Engines |
59,565,285 |
|||||||||
|
Airplane Engine Components & Services |
|||||||||||
|
1,350,000 |
Wirecard |
56,896,015 |
|||||||||
|
Online Payment Processing & Risk Management |
|||||||||||
|
795,000 |
NORMA Group |
39,914,542 |
|||||||||
|
Clamps for Automotive & Industrial Applications |
|||||||||||
|
117,000 |
Rational |
39,108,699 |
|||||||||
|
Commercial Ovens |
|||||||||||
|
795,000 |
Aurelius |
33,200,743 |
|||||||||
|
European Turnaround Investor |
|||||||||||
|
745,000 |
Elringklinger |
22,335,498 |
|||||||||
|
Automobile Components |
|||||||||||
|
251,020,782 |
|||||||||||
| > Spain 2.5% | |||||||||||
|
10,110,000 |
Distribuidora Internacional de Alimentación |
78,898,061 |
|||||||||
|
Discount Retailer in Spain & Latin America |
|||||||||||
|
671,000 |
Viscofan |
40,997,093 |
|||||||||
|
Sausage Casings Maker |
|||||||||||
|
6,564,000 |
Prosegur |
37,381,026 |
|||||||||
|
Security Guards |
|||||||||||
|
830,000 |
Bolsas y Mercados Españoles |
36,962,561 |
|||||||||
|
Spanish Stock Markets |
|||||||||||
|
194,238,741 |
|||||||||||
| > France 2.5% | |||||||||||
|
1,350,000 |
Neopost |
74,248,723 |
|||||||||
|
Postage Meter Machines |
|||||||||||
|
1,110,000 |
Eutelsat |
36,820,093 |
|||||||||
|
Fixed Satellite Services |
|||||||||||
|
163,400 |
Norbert Dentressangle |
27,653,030 |
|||||||||
|
European Logistics & Transport Group |
|||||||||||
|
729,096 |
Saft |
26,646,043 |
|||||||||
|
Niche Battery Manufacturer |
|||||||||||
|
90,000 |
Eurofins Scientific |
24,223,322 |
|||||||||
|
Food, Pharmaceuticals & Materials Screening & Testing |
|||||||||||
|
1,831,204 |
Hi-Media (a)(c) |
4,331,806 |
|||||||||
|
Online Advertiser in Europe |
|||||||||||
|
193,923,017 |
|||||||||||
| > Netherlands 2.4% | |||||||||||
|
2,103,770 |
Aalberts Industries |
66,210,805 |
|||||||||
|
Flow Control & Heat Treatment |
|||||||||||
|
718,124 |
Vopak |
39,631,057 |
|||||||||
|
Operator of Petroleum & Chemical Storage Terminals |
|||||||||||
|
324,700 |
Gemalto |
25,871,571 |
|||||||||
|
Digital Security Solutions |
|||||||||||
42
|
Number of Shares |
Value |
||||||||||
| > Netherlands—continued | |||||||||||
|
790,670 |
Arcadis |
$ |
25,392,286 |
||||||||
|
Engineering Consultants |
|||||||||||
|
1,201,000 |
Brunel |
22,973,243 |
|||||||||
|
Temporary Specialist & Energy Staffing |
|||||||||||
|
114,395 |
Core Labs (a) |
11,953,133 |
|||||||||
|
Oil & Gas Reservoir Consulting |
|||||||||||
|
192,032,095 |
|||||||||||
| > Switzerland 2.0% | |||||||||||
|
179,000 |
Geberit |
66,984,611 |
|||||||||
|
Plumbing Supplies |
|||||||||||
|
213,500 |
Partners Group |
63,650,182 |
|||||||||
|
Private Markets Asset Management |
|||||||||||
|
72,500 |
INFICON |
25,906,179 |
|||||||||
|
Gas Detection Instruments |
|||||||||||
|
156,540,972 |
|||||||||||
| > Denmark 1.6% | |||||||||||
|
1,932,063 |
SimCorp |
63,395,100 |
|||||||||
|
Software for Investment Managers |
|||||||||||
|
1,315,800 |
Novozymes |
60,064,949 |
|||||||||
|
Industrial Enzymes |
|||||||||||
|
123,460,049 |
|||||||||||
| > Finland 1.1% | |||||||||||
|
7,766,000 |
Sponda |
33,325,704 |
|||||||||
|
Office, Retail & Logistics Properties |
|||||||||||
|
1,669,000 |
Tikkurila |
31,826,484 |
|||||||||
|
Decorative & Industrial Paint in Scandinavia, Central & Eastern Europe |
|||||||||||
|
711,000 |
Konecranes |
22,404,346 |
|||||||||
|
Manufacture & Service of Industrial Cranes & Port Handling Equipment |
|||||||||||
|
87,556,534 |
|||||||||||
| > Norway 0.7% | |||||||||||
|
2,613,864 |
Atea |
29,446,002 |
|||||||||
|
Nordic IT Hardware/Software Reseller & Integrator |
|||||||||||
|
3,784,000 |
Orkla |
28,559,071 |
|||||||||
|
Food & Brands, Aluminum, Chemicals Conglomerate |
|||||||||||
|
58,005,073 |
|||||||||||
| > Italy 0.6% | |||||||||||
|
1,909,000 |
Pirelli |
31,599,156 |
|||||||||
|
Global Tire Supplier |
|||||||||||
|
385,950 |
Industria Macchine Automatiche |
18,158,768 |
|||||||||
|
Food & Drugs Packaging & Machinery |
|||||||||||
|
49,757,924 |
|||||||||||
| > Kazakhstan 0.5% | |||||||||||
|
5,143,000 |
Halyk Savings Bank of Kazakhstan - GDR |
38,006,770 |
|||||||||
|
Retail Bank & Insurer in Kazakhstan |
|||||||||||
| > Belgium 0.2% | |||||||||||
|
516,965 |
EVS Broadcast Equipment |
19,241,329 |
|||||||||
|
Digital Live Mobile Production Software & Systems |
|||||||||||
|
Europe: Total |
2,395,515,995 |
||||||||||
|
Number of Shares |
Value |
||||||||||
|
Other Countries 16.8% |
|||||||||||
| > Canada 4.6% | |||||||||||
|
800,772 |
CCL Industries |
$ |
90,095,148 |
||||||||
|
Global Label Converter |
|||||||||||
|
898,000 |
Vermilion Energy (a) |
37,754,925 |
|||||||||
|
Canadian Exploration & Production Company |
|||||||||||
|
3,188,000 |
CAE |
37,202,353 |
|||||||||
|
Flight Simulator Equipment & Training Centers |
|||||||||||
|
1,067,730 |
ShawCor |
29,674,388 |
|||||||||
|
Oil & Gas Pipeline Products |
|||||||||||
|
490,200 |
Onex Capital |
28,466,472 |
|||||||||
|
Private Equity |
|||||||||||
|
2,115,898 |
Rona |
27,063,714 |
|||||||||
|
Canadian Home Improvement Retailer |
|||||||||||
|
363,000 |
Keyera |
24,146,500 |
|||||||||
|
Integrated Supply of Hydrocarbon Processing, Transport & Storage |
|||||||||||
|
1,010,000 |
Prairie Sky Royalty |
23,827,563 |
|||||||||
|
Canadian Owner of Oil & Gas Mineral Interests |
|||||||||||
| 3,360,105 |
DeeThree Exploration (b)(c) |
16,899,348 |
|||||||||
| 1,130,000 |
DeeThree Exploration (b)(c)(e) |
5,569,569 |
|||||||||
|
Canadian Oil & Gas Producer |
|||||||||||
|
531,286 |
Ag Growth |
21,586,181 |
|||||||||
|
Manufacturer of Augers & Grain Handling Equipment |
|||||||||||
|
1,358,857 |
Baytex |
21,489,800 |
|||||||||
|
Oil & Gas Producer in Canada |
|||||||||||
|
363,775,961 |
|||||||||||
| > South Africa 4.4% | |||||||||||
|
13,683,594 |
Coronation Fund Managers |
110,604,076 |
|||||||||
|
South African Fund Manager |
|||||||||||
|
493,188 |
Naspers |
75,650,609 |
|||||||||
|
Media in Africa, China, Russia & other Emerging Markets |
|||||||||||
|
19,045,300 |
Rand Merchant Insurance |
72,523,066 |
|||||||||
|
Directly Sold Property & Casualty Insurance; Holdings in other Insurers |
|||||||||||
|
2,644,083 |
Mr. Price |
56,551,952 |
|||||||||
|
South African Retailer of Apparel, Household & Sporting Goods |
|||||||||||
|
8,679,940 |
Northam Platinum (c) |
32,809,939 |
|||||||||
|
Platinum Mining in South Africa |
|||||||||||
|
348,139,642 |
|||||||||||
| > Australia 4.0% | |||||||||||
|
46,578,144 |
Spotless |
80,341,311 |
|||||||||
|
Facility Management & Catering Company |
|||||||||||
|
2,428,257 |
Domino's Pizza Enterprises |
68,488,949 |
|||||||||
|
Domino's Pizza Operator in Australia & New Zealand |
|||||||||||
|
12,550,000 |
Challenger Financial |
68,127,203 |
|||||||||
|
Annuity Provider in Australia |
|||||||||||
|
4,270,000 |
Amcor |
45,496,668 |
|||||||||
|
Global Leader in Flexible & Rigid Packaging |
|||||||||||
|
5,260,000 |
IAG |
24,348,489 |
|||||||||
|
General Insurance Provider |
|||||||||||
43
COLUMBIA ACORN INTERNATIONAL®
STATEMENT OF INVESTMENTS (UNAUDITED), CONTINUED
|
Number of Shares |
Value |
||||||||||
| > Australia—continued | |||||||||||
|
5,000,000 |
Estia Health (c) |
$ |
23,344,573 |
||||||||
|
Residential Aged Care Operator |
|||||||||||
|
1,217,356 |
Austbrokers |
8,025,667 |
|||||||||
|
Local Australian Small Business Insurance Broker |
|||||||||||
|
318,172,860 |
|||||||||||
| > United States 1.8% | |||||||||||
|
350,000 |
Cimarex Energy |
40,281,500 |
|||||||||
|
Oil & Gas Producer in Texas, New Mexico & Oklahoma |
|||||||||||
|
350,000 |
Synageva BioPharma (a)(c) |
34,135,500 |
|||||||||
|
Biotech Focused on Orphan Diseases |
|||||||||||
|
912,000 |
Bladex |
29,904,480 |
|||||||||
|
Latin American Trade Financing House |
|||||||||||
|
933,297 |
Textainer Group Holdings |
27,989,577 |
|||||||||
|
Top International Container Leasor |
|||||||||||
|
634,500 |
Hornbeck Offshore (c) |
11,934,945 |
|||||||||
|
Supply Vessel Operator in Gulf of Mexico |
|||||||||||
|
144,246,002 |
|||||||||||
| > New Zealand 1.1% | |||||||||||
|
10,800,000 |
Auckland International Airport |
36,276,163 |
|||||||||
|
Auckland Airport Operator |
|||||||||||
|
8,000,000 |
Sky City Entertainment |
24,485,318 |
|||||||||
|
Casino & Entertainment Complex |
|||||||||||
|
4,011,000 |
Ryman Healthcare |
23,473,337 |
|||||||||
|
Retirement Village Operator |
|||||||||||
|
84,234,818 |
|||||||||||
| > Israel 0.6% | |||||||||||
|
791,000 |
Caesarstone |
48,021,610 |
|||||||||
|
Quartz Countertops |
|||||||||||
| > Egypt 0.3% | |||||||||||
|
3,119,000 |
Commercial International Bank of Egypt |
22,992,074 |
|||||||||
|
Leading Private Universal Bank in Egypt |
|||||||||||
|
Other Countries: Total |
1,329,582,967 |
||||||||||
|
Latin America 2.7% |
|||||||||||
| > Brazil 1.1% | |||||||||||
|
3,500,000 |
Localiza Rent A Car |
40,115,305 |
|||||||||
|
Car Rental |
|||||||||||
|
6,487,000 |
Odontoprev |
22,256,474 |
|||||||||
|
Dental Insurance |
|||||||||||
|
1,400,000 |
Linx |
20,423,932 |
|||||||||
|
Retail Management Software in Brazil |
|||||||||||
|
3,421,215 |
Beadell Resources |
668,635 |
|||||||||
|
Gold Mining in Brazil |
|||||||||||
|
83,464,346 |
|||||||||||
| > Mexico 0.7% | |||||||||||
|
252,000 |
Grupo Aeroportuario del Sureste - ADR (c) |
33,873,840 |
|||||||||
|
Mexican Airport Operator |
|||||||||||
|
12,339,000 |
Qualitas |
22,326,443 |
|||||||||
|
Auto Insurer in Mexico & Central America |
|||||||||||
|
56,200,283 |
|||||||||||
|
Number of Shares |
Value |
||||||||||
| > Colombia 0.3% | |||||||||||
|
23,377,000 |
Isagen |
$ |
27,423,019 |
||||||||
|
Colombian Electricity Provider |
|||||||||||
| > Guatemala 0.2% | |||||||||||
|
1,626,600 |
Tahoe Resources |
17,825,753 |
|||||||||
|
Silver Project in Guatemala |
|||||||||||
| > Chile 0.2% | |||||||||||
|
921,000 |
Sociedad Quimica y Minera de Chile - ADR |
16,808,250 |
|||||||||
|
Producer of Specialty Fertilizers, Lithium & Iodine |
|||||||||||
| > Uruguay 0.2% | |||||||||||
|
1,306,818 |
Union Agriculture Group (c)(d)(e) |
14,231,248 |
|||||||||
|
Farmland Operator in Uruguay |
|||||||||||
|
Latin America: Total |
215,952,899 |
||||||||||
|
Total Equities: 96.0% (Cost: $5,887,120,937) |
7,600,776,314 |
(f) |
|||||||||
|
Short-Term Investments 3.0% |
|||||||||||
|
220,000,000 |
JPMorgan U.S. Government Money Market Fund, IM Shares (7 day yield of 0.01%) |
220,000,000 |
|||||||||
|
18,955,990 |
JPMorgan U.S. Government Money Market Fund, Agency Shares (7 day yield of 0.01%) |
18,955,990 |
|||||||||
|
Total Short-Term Investments: 3.0% (Cost: $238,955,990) |
238,955,990 |
||||||||||
|
Securities Lending Collateral 0.8% |
|||||||||||
|
64,494,251 |
Dreyfus Government Cash Management Fund, Institutional Shares (7 day yield of 0.01%) (g) |
64,494,251 |
|||||||||
|
Total Securities Lending Collateral: 0.8% (Cost: $64,494,251) |
64,494,251 |
||||||||||
|
Total Investments: 99.8% (Cost: $6,190,571,178)(h) |
7,904,226,555 |
(i) |
|||||||||
|
Obligation to Return Collateral for Securities Loaned: (0.8)% |
(64,494,251 |
) |
|||||||||
|
Cash and Other Assets Less Liabilities: 1.0% |
76,968,177 |
||||||||||
|
Net Assets: 100.0% |
$ |
7,916,700,481 |
|||||||||
ADR - American Depositary Receipts
GDR - Global Depositary Receipts
REIT - Real Estate Investment Trust
44
> Notes to Statement of Investments
(a) All or a portion of this security was on loan at March 31, 2015. The total market value of securities on loan at March 31, 2015 was $61,874,636.
(b) An affiliated person of the Fund, as defined in the Investment Company Act of 1940, may include any company in which the Fund owns five percent or more of its outstanding voting shares. Holdings and transactions in these affiliated companies during the period ended March 31, 2015, are as follows:
|
Security |
Balance of Shares Held 12/31/14 |
Purchases/ Additions |
Sales/ Reductions |
Balance of Shares Held 3/31/15 |
Value |
Dividend |
|||||||||||||||||||||
|
Connect Group |
14,379,428 |
— |
— |
14,379,428 |
$ |
32,902,209 |
$ |
1,445,996 |
|||||||||||||||||||
|
Tamron |
1,402,000 |
— |
— |
1,402,000 |
30,165,507 |
— |
|||||||||||||||||||||
|
DeeThree Exploration |
3,298,377 |
1,191,728 |
— |
4,490,105 |
22,468,917 |
— |
|||||||||||||||||||||
|
AMVIG Holdings |
35,119,000 |
12,381,000 |
— |
47,500,000 |
21,199,203 |
1,771,515 |
|||||||||||||||||||||
|
Icom |
835,000 |
— |
— |
835,000 |
20,067,394 |
105,159 |
|||||||||||||||||||||
|
Total of Affiliated Transactions |
55,033,805 |
13,572,728 |
— |
68,606,533 |
$ |
126,803,230 |
$ |
3,322,670 |
|||||||||||||||||||
The aggregate cost and value of these companies at March 31, 2015, was $135,989,948 and $126,803,230, respectively. Investments in affiliated companies represented 1.60% of the Fund's total net assets at March 31, 2015.
(c) Non-income producing security.
(d) Illiquid security.
(e) Denotes a restricted security, which is subject to restrictions on resale under federal securities laws. These securities are valued at fair value determined in good faith under consistently applied procedures established by the Fund's Board of Trustees. At March 31, 2015, the market value of these securities amounted to $19,800,817, which represented 0.25% of total net assets. Additional information on these securities is as follows:
|
Security |
Acquisition Dates |
Shares/Units |
Cost |
Value |
|||||||||||||||
|
Union Agriculture Group |
12/8/10-6/27/12 |
1,306,818 |
$ |
15,000,000 |
$ |
14,231,248 |
|||||||||||||
|
DeeThree Exploration |
9/7/10 |
1,130,000 |
2,950,812 |
5,569,569 |
|||||||||||||||
|
$ |
17,950,812 |
$ |
19,800,817 |
||||||||||||||||
(f) On March 31, 2015, the Fund's total equity investments were denominated in currencies as follows:
|
Currency |
Value |
Percentage of Net Assets |
|||||||||
|
Japanese Yen |
$ |
1,752,901,750 |
22.1 |
||||||||
|
Euro |
975,817,289 |
12.3 |
|||||||||
|
British Pound |
768,306,911 |
9.7 |
|||||||||
|
U.S. Dollar |
407,237,374 |
5.2 |
|||||||||
|
Other currencies less than 5% of total net assets |
3,696,512,990 |
46.7 |
|||||||||
|
Total Equities |
$ |
7,600,776,314 |
96.0 |
||||||||
(g) Investment made with cash collateral received from securities lending activity.
(h) At March 31, 2015, for federal income tax purposes, the cost of investments was approximately $6,190,571,178 and net unrealized appreciation was $1,713,655,377 consisting of gross unrealized appreciation of $2,053,936,632 and gross unrealized depreciation of $340,281,255.
(i) Securities are valued using policies described in the Notes to Financial Statements in the shareholder report dated December 31, 2014.
Fair Value Measurements
Various inputs are used in determining the value of the Fund's investments, following the input prioritization hierarchy established by accounting principles generally accepted in the United States of America (GAAP). These inputs are summarized in the three broad levels listed below:
• Level 1 – quoted prices in active markets for identical securities
• Level 2 – prices determined using other significant observable inputs (including quoted prices for similar securities, interest rates, prepayment speeds, credit risk and others)
• Level 3 – prices determined using significant unobservable inputs where quoted prices or observable inputs are unavailable or less reliable (including management's own assumptions about the factors market participants would use in pricing an investment)
The inputs or methodology used for valuing securities are not necessarily an indication of the risk associated with investing in those securities.
Examples of the types of securities in which the Fund would typically invest and how they are classified within this hierarchy are as follows. Typical Level 1 securities include exchange traded domestic equities, mutual funds whose NAVs are published each day and exchange traded foreign equities that are not statistically fair valued. Typical Level 2 securities include exchange traded foreign equities that are statistically fair valued, forward foreign currency exchange contracts and short-term investments valued at
45
COLUMBIA ACORN INTERNATIONAL®
STATEMENT OF INVESTMENTS (UNAUDITED), CONTINUED
> Notes to Statement of Investments
amortized cost. Additionally, securities fair valued by the Valuation Committee (the Committee) of the Fund's Board of Trustees (the Board) that rely on significant observable inputs are also included in Level 2. Typical Level 3 securities include any security fair valued by the Committee that relies on significant unobservable inputs.
Under the direction of the Board, the Committee is responsible for overseeing the valuation procedures approved by the Board.
The Committee meets as necessary, and no less frequently than quarterly, to determine fair values for securities for which market quotations are not readily available or for which the investment manager believes that available market quotations are unreliable, to review the appropriateness of the Trust's Portfolio Pricing Policy and the pricing procedures of the investment manager (the Policies), and to review the continuing appropriateness of the current value of any security subject to the Policies. The Policies address, among other things: circumstances under which market quotations will be deemed readily available; selection of third party pricing vendors; appropriate pricing methodologies; events that require fair valuation and fair value techniques; circumstances under which securities will be deemed to pose a potential for stale pricing, including when securities are illiquid, restricted, or in default; and certain delegations of authority to determine fair values to the Fund's investment manager. The Committee may also meet to discuss additional valuation matters, which may include review of back-testing results, review of time-sensitive information or approval of other valuation related actions, and to review the appropriateness of the Policies.
For investments categorized as Level 3, the significant unobservable inputs used in the fair value measurement of the Funds' securities may include: (i) data specific to the issuer or comparable issuers, (ii) general market or specific sector news and (iii) quoted prices and specific or similar security transactions. The Committee considers this data and any changes from prior periods in order to assess the reasonableness of observable and unobservable inputs, any assumptions or internal models used to value those securities and changes in fair value. Significant changes in any of these factors could result in lower or higher fair value measurements. Various factors impact the frequency of monitoring (which may occur as often as daily), however the Committee may determine that changes to inputs, assumptions and models are not required with the same frequency.
The following table summarizes the inputs used, as of March 31, 2015, in valuing the Fund's assets:
|
Investment Type |
Quoted Prices (Level 1) |
Other Significant Observable Inputs (Level 2) |
Significant Unobservable Inputs (Level 3) |
Total |
|||||||||||||||
|
Equities |
|||||||||||||||||||
|
Asia |
$ |
100,096,520 |
$ |
3,511,712,919 |
$ |
47,915,014 |
$ |
3,659,724,453 |
|||||||||||
|
Europe |
11,953,133 |
2,383,562,862 |
- |
2,395,515,995 |
|||||||||||||||
|
Other Countries |
550,474,004 |
779,108,963 |
- |
1,329,582,967 |
|||||||||||||||
|
Latin America |
201,053,016 |
668,635 |
14,231,248 |
215,952,899 |
|||||||||||||||
|
Total Equities |
863,576,673 |
6,675,053,379 |
62,146,262 |
7,600,776,314 |
|||||||||||||||
|
Total Short-Term Investments |
238,955,990 |
- |
- |
238,955,990 |
|||||||||||||||
|
Total Securities Lending Collateral |
64,494,251 |
- |
- |
64,494,251 |
|||||||||||||||
|
Total Investments |
$ |
1,167,026,914 |
$ |
6,675,053,379 |
$ |
62,146,262 |
$ |
7,904,226,555 |
|||||||||||
The Fund's assets assigned to the Level 2 input category are generally valued using a market approach, in which a security's value is determined through its correlation to prices and information from observable market transactions for similar or identical assets. Foreign equities are generally valued at the last sale price on the foreign exchange or market on which they trade. The Fund may use a statistical fair valuation model, in accordance with the policy adopted by the Board, provided by an independent third party to value securities principally traded in foreign markets in order to adjust for possible stale pricing that may occur between the close of the foreign exchanges and the time for valuation. These models take into account available market data including intraday index, ADR, and ETF movements. Securities acquired via private placement that have a holding period or an extended settlement period are valued at a discount to the same shares that are trading freely on the market. These discounts are determined by the investment manager's experience with similar securities or situations. Factors may include, but are not limited to, trade volume, shares outstanding and stock price.
The following table shows transfers between Level 2 and Level 3 of the fair value hierarchy:
|
Transfers In |
Transfers Out |
||||||||||||||
| Level 2 |
Level 3 |
Level 2 |
Level 3 |
||||||||||||
| $ |
- |
$ |
55,274,689 |
$ |
55,274,689 |
$ |
- |
||||||||
There were no transfers of financial assets between levels 1 and 2 during the period. Transfers in and/or out of Level 3 are determined based on the fair value at the beginning of the period for security positions held throughout the period.
The Fund does not hold any significant investments (greater than one percent of net assets) categorized as Level 3.
Certain securities classified as Level 3 are valued at fair value, using a market approach, as determined in good faith under consistently applied procedures established by and under the general supervision of the Board. To determine fair value for these securities, for which no market exists, the Committee utilizes the valuation technique it deems most appropriate in the circumstances, using some unobservable inputs, which may include, but are not limited to estimated earnings of the company and the position of the security within the company's capital structure. The Committee also may use some observable inputs, which may include, but are not limited to, trades of similar securities and market multiples derived from a set of comparable companies. Significant increases or decreases to any of these inputs could result in a significantly lower or higher fair value measurement.
46
COLUMBIA ACORN INTERNATIONAL®
PORTFOLIO DIVERSIFICATION (UNAUDITED)
At March 31, 2015, the Fund's portfolio investments as a percentage of net assets were diversified as follows:
|
Value |
Percentage of Net Assets |
||||||||||
| > Industrial Goods & Services | |||||||||||
|
Machinery |
$ |
530,793,001 |
6.7 |
||||||||
|
Industrial Materials & Specialty Chemicals |
517,728,665 |
6.5 |
|||||||||
|
Other Industrial Services |
440,656,780 |
5.6 |
|||||||||
|
Electrical Components |
227,017,895 |
2.9 |
|||||||||
|
Outsourcing Services |
188,835,536 |
2.4 |
|||||||||
|
Conglomerates |
167,532,689 |
2.1 |
|||||||||
|
Construction |
97,346,414 |
1.2 |
|||||||||
|
Waste Management |
48,043,333 |
0.6 |
|||||||||
|
Industrial Distribution |
12,770,515 |
0.2 |
|||||||||
|
2,230,724,828 |
28.2 |
||||||||||
| > Consumer Goods & Services | |||||||||||
|
Retail |
664,552,991 |
8.4 |
|||||||||
|
Food & Beverage |
291,855,950 |
3.7 |
|||||||||
|
Casinos & Gaming |
214,853,543 |
2.7 |
|||||||||
|
Nondurables |
179,214,101 |
2.3 |
|||||||||
|
Restaurants |
135,833,268 |
1.7 |
|||||||||
|
Other Durable Goods |
118,142,373 |
1.5 |
|||||||||
|
Consumer Goods Distribution |
107,620,742 |
1.3 |
|||||||||
|
Furniture & Textiles |
48,021,610 |
0.6 |
|||||||||
|
Educational Services |
40,933,231 |
0.5 |
|||||||||
|
Travel |
40,115,304 |
0.5 |
|||||||||
|
Apparel |
31,943,755 |
0.4 |
|||||||||
|
Consumer Electronics |
30,165,507 |
0.4 |
|||||||||
|
Other Consumer Services |
23,387,925 |
0.3 |
|||||||||
|
1,926,640,300 |
24.3 |
||||||||||
| > Information | |||||||||||
|
Business Software |
228,975,021 |
2.9 |
|||||||||
|
Internet Related |
142,841,327 |
1.8 |
|||||||||
|
Financial Processors |
122,119,022 |
1.5 |
|||||||||
|
Mobile Communications |
116,418,269 |
1.5 |
|||||||||
|
Computer Hardware & Related Equipment |
114,747,101 |
1.4 |
|||||||||
|
Semiconductors & Related Equipment |
95,259,120 |
1.2 |
|||||||||
|
Entertainment Programming |
73,597,561 |
0.9 |
|||||||||
|
Instrumentation |
70,661,521 |
0.9 |
|||||||||
|
Advertising |
68,287,818 |
0.9 |
|||||||||
|
Computer Services |
56,289,302 |
0.7 |
|||||||||
|
Satellite Broadcasting & Services |
44,046,720 |
0.6 |
|||||||||
|
Telephone & Data Services |
40,580,484 |
0.5 |
|||||||||
|
TV Broadcasting |
37,895,011 |
0.5 |
|||||||||
|
Business Information & Marketing Services |
29,853,954 |
0.4 |
|||||||||
|
Cable TV |
26,080,507 |
0.3 |
|||||||||
|
Telecommunications Equipment |
25,188,620 |
0.3 |
|||||||||
|
1,292,841,358 |
16.3 |
||||||||||
|
Value |
Percentage of Net Assets |
||||||||||
| > Finance | |||||||||||
|
Insurance |
$ |
258,454,394 |
3.3 |
||||||||
|
Banks |
191,353,858 |
2.4 |
|||||||||
|
Brokerage & Money Management |
174,254,258 |
2.2 |
|||||||||
|
Finance Companies |
56,456,049 |
0.7 |
|||||||||
|
Financial Processors |
36,962,561 |
0.5 |
|||||||||
|
717,481,120 |
9.1 |
||||||||||
| > Other Industries | |||||||||||
|
Real Estate |
455,418,019 |
5.8 |
|||||||||
|
Transportation |
202,031,927 |
2.6 |
|||||||||
|
Regulated Utilities |
27,423,019 |
0.3 |
|||||||||
|
684,872,965 |
8.7 |
||||||||||
| > Health Care | |||||||||||
|
Pharmaceuticals |
185,339,101 |
2.4 |
|||||||||
|
Medical Supplies |
90,091,589 |
1.1 |
|||||||||
|
Medical Equipment & Devices |
46,918,399 |
0.6 |
|||||||||
|
Health Care Services |
46,817,909 |
0.5 |
|||||||||
|
Biotechnology & Drug Delivery |
34,135,501 |
0.5 |
|||||||||
|
403,302,499 |
5.1 |
||||||||||
| > Energy & Minerals | |||||||||||
|
Oil & Gas Producers |
145,822,704 |
1.9 |
|||||||||
|
Mining |
63,257,461 |
0.8 |
|||||||||
|
Oil Refining, Marketing & Distribution |
79,992,498 |
1.0 |
|||||||||
|
Oil Services |
41,609,333 |
0.5 |
|||||||||
|
Agricultural Commodities |
14,231,248 |
0.1 |
|||||||||
|
344,913,244 |
4.3 |
||||||||||
|
Total Equities: |
7,600,776,314 |
96.0 |
|||||||||
|
Short-Term Investments: |
238,955,990 |
3.0 |
|||||||||
|
Securities Lending Collateral: |
64,494,251 |
0.8 |
|||||||||
|
Total Investments: |
7,904,226,555 |
99.8 |
|||||||||
|
Obligation to Return Collateral for Securities Loaned: |
(64,494,251 |
) |
(0.8 |
) |
|||||||
|
Cash and Other Assets Less Liabilities: |
76,968,177 |
1.0 |
|||||||||
|
Net Assets: |
$ |
7,916,700,481 |
100.0 |
||||||||
47
COLUMBIA ACORN USA®
MAJOR PORTFOLIO CHANGES IN THE FIRST QUARTER (UNAUDITED)
|
Number of Shares |
|||||||||||
|
12/31/14 |
3/31/15 |
||||||||||
|
Purchases |
|||||||||||
|
Information |
|||||||||||
|
Amber Road |
0 |
816,768 |
|||||||||
|
DemandWare |
119,000 |
145,000 |
|||||||||
|
Gogo |
0 |
422,081 |
|||||||||
|
Rubicon Technology |
50,657 |
600,000 |
|||||||||
|
Solera Holdings |
0 |
196,000 |
|||||||||
|
Textura |
128,934 |
373,934 |
|||||||||
|
Consumer Goods & Services |
|||||||||||
|
Performance Sports Group |
0 |
359,668 |
|||||||||
|
The Fresh Market |
184,000 |
234,000 |
|||||||||
|
Finance |
|||||||||||
|
Marlin Business Services |
91,000 |
418,543 |
|||||||||
|
Patriot National |
0 |
515,590 |
|||||||||
|
Health Care |
|||||||||||
|
Agios Pharmaceuticals |
0 |
26,000 |
|||||||||
|
HealthSouth |
124,200 |
154,200 |
|||||||||
|
Ultragenyx Pharmaceutical |
60,385 |
154,000 |
|||||||||
|
Other Industries |
|||||||||||
|
Heartland Express |
0 |
414,000 |
|||||||||
|
Energy & Minerals |
|||||||||||
|
Carrizo Oil & Gas |
120,000 |
148,000 |
|||||||||
|
Number of Shares |
|||||||||||
|
12/31/14 |
3/31/15 |
||||||||||
|
Sales |
|||||||||||
|
Information |
|||||||||||
|
Ansys |
330,000 |
230,000 |
|||||||||
|
CalAmp |
281,000 |
0 |
|||||||||
|
E2Open |
196,000 |
0 |
|||||||||
|
Exa |
171,861 |
0 |
|||||||||
|
Five9 |
315,000 |
0 |
|||||||||
|
Informatica |
633,000 |
214,000 |
|||||||||
|
IPG Photonics |
427,000 |
383,000 |
|||||||||
|
Ixia |
369,000 |
0 |
|||||||||
|
Mettler-Toledo International |
157,000 |
141,000 |
|||||||||
|
NetSuite |
134,000 |
116,929 |
|||||||||
|
Industrial Goods & Services |
|||||||||||
|
Acuity Brands |
106,000 |
64,000 |
|||||||||
|
ESCO Technologies |
320,000 |
247,000 |
|||||||||
|
Generac |
317,000 |
276,000 |
|||||||||
|
KAR Auction Services |
151,000 |
0 |
|||||||||
|
Middleby |
129,000 |
91,000 |
|||||||||
|
Moog |
312,000 |
238,000 |
|||||||||
|
Thermon |
312,013 |
260,598 |
|||||||||
|
Consumer Goods & Services |
|||||||||||
|
Avis Budget Group |
791,950 |
425,950 |
|||||||||
|
B&G Foods |
65,000 |
0 |
|||||||||
|
Boulder Brands |
612,705 |
0 |
|||||||||
|
Buffalo Wild Wings |
18,500 |
0 |
|||||||||
|
Caesarstone (Israel) |
225,187 |
189,814 |
|||||||||
|
Casey's General Stores |
130,279 |
73,931 |
|||||||||
|
Fox Factory Holding |
102,184 |
0 |
|||||||||
|
Hertz |
469,000 |
345,000 |
|||||||||
|
Interface |
502,000 |
0 |
|||||||||
|
Kate Spade & Company |
135,000 |
0 |
|||||||||
|
Michaels Stores |
368,564 |
203,784 |
|||||||||
|
Shutterfly |
185,991 |
147,845 |
|||||||||
|
Finance |
|||||||||||
|
Associated Banc-Corp |
993,000 |
930,000 |
|||||||||
|
CAI International |
673,208 |
495,208 |
|||||||||
|
City National |
130,000 |
0 |
|||||||||
|
Enstar Group |
33,728 |
0 |
|||||||||
|
McGrath Rentcorp |
315,000 |
227,000 |
|||||||||
|
Textainer Group Holdings |
83,000 |
0 |
|||||||||
|
Valley National Bancorp |
546,750 |
0 |
|||||||||
|
World Acceptance |
180,689 |
135,125 |
|||||||||
48
|
Number of Shares |
|||||||||||
|
12/31/14 |
3/31/15 |
||||||||||
|
Sales (continued) |
|||||||||||
|
Heath Care |
|||||||||||
|
Akorn |
657,117 |
442,117 |
|||||||||
|
Allscripts Healthcare Solutions |
581,600 |
343,600 |
|||||||||
|
BioMarin Pharmaceutical |
33,600 |
0 |
|||||||||
|
Celldex Therapeutics |
349,300 |
280,300 |
|||||||||
|
Cepheid |
558,500 |
494,500 |
|||||||||
|
NPS Pharmaceuticals |
177,200 |
0 |
|||||||||
|
Seattle Genetics |
380,800 |
286,800 |
|||||||||
|
Synageva BioPharma |
317,200 |
271,469 |
|||||||||
|
Other Industries |
|||||||||||
|
DCT Industrial Trust |
217,750 |
0 |
|||||||||
|
Extra Space Storage |
832,000 |
611,000 |
|||||||||
|
St. Joe |
153,098 |
0 |
|||||||||
|
Energy & Minerals |
|||||||||||
|
Bonanza Creek Energy |
47,000 |
0 |
|||||||||
|
Chart Industries |
84,000 |
0 |
|||||||||
|
Core Labs (Netherlands) |
55,000 |
39,000 |
|||||||||
|
Hornbeck Offshore |
198,000 |
137,000 |
|||||||||
|
US Silica |
49,000 |
0 |
|||||||||
|
WPX Energy |
129,000 |
0 |
|||||||||
49
COLUMBIA ACORN USA®
STATEMENT OF INVESTMENTS (UNAUDITED), MARCH 31, 2015
|
Number of Shares |
Value |
||||||||||
|
Equities: 94.3% |
|||||||||||
|
Information 23.8% |
|||||||||||
| > Business Software 8.0% | |||||||||||
|
230,000 |
Ansys (a) |
$ |
20,283,700 |
||||||||
|
Simulation Software for Engineers & Designers |
|||||||||||
|
249,424 |
SPS Commerce (a) |
16,736,351 |
|||||||||
|
Supply Chain Management Software Delivered via the Web |
|||||||||||
|
116,929 |
NetSuite (a) |
10,846,334 |
|||||||||
|
End-to-end IT Systems Solution Delivered via the Web |
|||||||||||
|
373,934 |
Textura (a) |
10,163,526 |
|||||||||
|
Construction Vendor Management Software |
|||||||||||
|
196,000 |
Solera Holdings |
10,125,360 |
|||||||||
|
Software for Automotive Insurance Claims Processing |
|||||||||||
|
214,000 |
Informatica (a) |
9,384,970 |
|||||||||
|
Enterprise Data Integration Software |
|||||||||||
|
145,000 |
DemandWare (a) |
8,830,500 |
|||||||||
|
E-Commerce Website Platform for Retailers & Apparel Manufacturers |
|||||||||||
|
816,768 |
Amber Road (a) |
7,555,104 |
|||||||||
|
Global Trade Management Software Delivered via the Web |
|||||||||||
|
82,000 |
Envestnet (a) |
4,598,560 |
|||||||||
|
Technology Platform for Investment Advisors |
|||||||||||
|
97,000 |
Fleetmatics (a) |
4,350,450 |
|||||||||
|
Fleet Management Software |
|||||||||||
|
394,187 |
inContact (a) |
4,296,638 |
|||||||||
|
Call Center Systems Delivered via the Web & Telco Services |
|||||||||||
|
107,171,493 |
|||||||||||
| > Instrumentation 6.6% | |||||||||||
|
141,000 |
Mettler-Toledo International (a) |
46,339,650 |
|||||||||
|
Laboratory Equipment |
|||||||||||
|
383,000 |
IPG Photonics (a) |
35,504,100 |
|||||||||
|
Fiber Lasers |
|||||||||||
|
274,000 |
Trimble Navigation (a) |
6,904,800 |
|||||||||
|
GPS-based Instruments |
|||||||||||
|
88,748,550 |
|||||||||||
| > Computer Services 3.1% | |||||||||||
|
506,000 |
ExlService Holdings (a) |
18,823,200 |
|||||||||
|
Business Process Outsourcing |
|||||||||||
|
227,000 |
Virtusa (a) |
9,393,260 |
|||||||||
|
Offshore IT Outsourcing |
|||||||||||
|
327,000 |
WNS - ADR (a) |
7,952,640 |
|||||||||
|
Offshore Business Process Outsourcing Services |
|||||||||||
|
432,000 |
Hackett Group |
3,862,080 |
|||||||||
|
IT Integration & Best Practice Research |
|||||||||||
|
302,000 |
RCM Technologies |
2,023,400 |
|||||||||
|
Technology & Engineering Services |
|||||||||||
|
42,054,580 |
|||||||||||
|
Number of Shares |
Value |
||||||||||
|
> Semiconductors & Related Equipment 1.4% |
|||||||||||
|
152,000 |
Monolithic Power Systems |
$ |
8,002,800 |
||||||||
|
High Performance Analog & Mixed Signal Integrated Circuits |
|||||||||||
|
970,000 |
Atmel |
7,983,100 |
|||||||||
|
Microcontrollers, Radio Frequency & Memory Semiconductors |
|||||||||||
|
600,000 |
Rubicon Technology (a)(b) |
2,364,000 |
|||||||||
|
Producer of Sapphire for the Lighting, Electronics & Automotive Industries |
|||||||||||
|
18,349,900 |
|||||||||||
|
> Computer Hardware & Related Equipment 1.2% |
|||||||||||
|
101,000 |
Rogers (a) |
8,303,210 |
|||||||||
|
Printed Circuit Materials & High Performance Foams |
|||||||||||
|
78,000 |
Belden |
7,297,680 |
|||||||||
|
Specialty Cable |
|||||||||||
|
15,600,890 |
|||||||||||
| > Mobile Communications 0.8% | |||||||||||
|
422,081 |
Gogo (a)(b) |
8,044,864 |
|||||||||
|
Provider of Wi-Fi on Airplanes |
|||||||||||
|
23,000 |
SBA Communications (a) |
2,693,300 |
|||||||||
|
Communications Towers |
|||||||||||
|
10,738,164 |
|||||||||||
| > Internet Related 0.7% | |||||||||||
|
280,831 |
RetailMeNot (a)(b) |
5,057,766 |
|||||||||
|
Digital Coupon Marketplace |
|||||||||||
|
951,000 |
Vonage (a) |
4,669,410 |
|||||||||
|
Business & Consumer Internet Telephony |
|||||||||||
|
9,727,176 |
|||||||||||
| > Telecommunications Equipment 0.7% | |||||||||||
|
484,278 |
Infinera (a) |
9,525,748 |
|||||||||
|
Optical Networking Equipment |
|||||||||||
| > Financial Processors 0.6% | |||||||||||
|
77,000 |
Global Payments |
7,059,360 |
|||||||||
|
Credit Card Processor |
|||||||||||
|
153,000 |
Liquidity Services (a) |
1,511,640 |
|||||||||
|
E-Auctions for Surplus & Salvage Goods |
|||||||||||
|
8,571,000 |
|||||||||||
|
> Business Information & Marketing Services 0.4% |
|||||||||||
|
211,000 |
RPX (a) |
3,036,290 |
|||||||||
|
Patent Aggregation & Defensive Patent Consulting |
|||||||||||
|
218,000 |
Bankrate (a) |
2,472,120 |
|||||||||
|
Internet Advertising for the Insurance, Credit Card & Banking Markets |
|||||||||||
|
5,508,410 |
|||||||||||
| > Telephone & Data Services 0.3% | |||||||||||
|
621,000 |
Boingo Wireless (a) |
4,682,340 |
|||||||||
|
Wi-Fi & Cellular Communications Networks |
|||||||||||
|
Information: Total |
320,678,251 |
||||||||||
50
|
Number of Shares |
Value |
||||||||||
|
Industrial Goods & Services 21.9% |
|||||||||||
| > Machinery 17.3% | |||||||||||
|
793,000 |
Ametek |
$ |
41,664,220 |
||||||||
|
Aerospace/Industrial Instruments |
|||||||||||
|
515,000 |
Nordson |
40,345,100 |
|||||||||
|
Dispensing Systems for Adhesives & Coatings |
|||||||||||
|
725,500 |
HEICO |
35,941,270 |
|||||||||
|
FAA-approved Aircraft Replacement Parts |
|||||||||||
|
855,000 |
Donaldson |
32,242,050 |
|||||||||
|
Industrial Air Filtration |
|||||||||||
|
238,000 |
Moog (a) |
17,861,900 |
|||||||||
|
Motion Control Products for Aerospace, Defense & Industrial Markets |
|||||||||||
|
222,000 |
Toro |
15,566,640 |
|||||||||
|
Turf Maintenance Equipment |
|||||||||||
|
276,000 |
Generac (a) |
13,438,440 |
|||||||||
|
Standby Power Generators |
|||||||||||
|
247,000 |
ESCO Technologies |
9,628,060 |
|||||||||
|
Industrial Filtration & Advanced Measurement Equipment |
|||||||||||
|
91,000 |
Middleby (a) |
9,341,150 |
|||||||||
|
Manufacturer of Cooking Equipment |
|||||||||||
|
239,000 |
Kennametal |
8,051,910 |
|||||||||
|
Consumable Cutting Tools |
|||||||||||
|
149,293 |
Dorman Products (a)(b) |
7,427,327 |
|||||||||
|
Aftermarket Auto Parts Distributor |
|||||||||||
|
64,000 |
Graham |
1,534,080 |
|||||||||
|
Designer & Builder of Vacuum & Heat Transfer Equipment for Process Industries |
|||||||||||
|
233,042,147 |
|||||||||||
|
> Industrial Materials & Specialty Chemicals 2.4% |
|||||||||||
|
539,000 |
Drew Industries |
33,170,060 |
|||||||||
|
RV & Manufactured Home Components |
|||||||||||
| > Electrical Components 1.3% | |||||||||||
|
64,000 |
Acuity Brands |
10,762,240 |
|||||||||
|
Commercial Lighting Fixtures |
|||||||||||
|
260,598 |
Thermon (a) |
6,272,594 |
|||||||||
|
Global Engineered Thermal Solutions |
|||||||||||
|
17,034,834 |
|||||||||||
| > Industrial Distribution 0.5% | |||||||||||
|
90,000 |
WESCO International (a) |
6,290,100 |
|||||||||
|
Industrial Distributor |
|||||||||||
| > Construction 0.4% | |||||||||||
|
449,000 |
PGT (a) |
5,017,575 |
|||||||||
|
Wind Resistant Windows & Doors |
|||||||||||
|
Industrial Goods & Services: Total |
294,554,716 |
||||||||||
|
Consumer Goods & Services 14.8% |
|||||||||||
| > Travel 3.7% | |||||||||||
|
425,950 |
Avis Budget Group (a) |
25,137,439 |
|||||||||
|
Car Rental Company |
|||||||||||
|
281,000 |
HomeAway (a) |
8,477,770 |
|||||||||
|
Vacation Rental Online Marketplace |
|||||||||||
|
Number of Shares |
Value |
||||||||||
|
345,000 |
Hertz (a) |
$ |
7,479,600 |
||||||||
|
U.S. Rental Car Operator |
|||||||||||
|
89,666 |
Choice Hotels |
5,744,901 |
|||||||||
|
Franchisor of Budget Hotel Brands |
|||||||||||
|
29,000 |
Vail Resorts |
2,999,180 |
|||||||||
|
Ski Resort Operator & Developer |
|||||||||||
|
49,838,890 |
|||||||||||
| > Retail 3.0% | |||||||||||
|
207,500 |
Burlington Stores (a) |
12,329,650 |
|||||||||
|
Off-price Apparel Retailer |
|||||||||||
|
234,000 |
The Fresh Market (a) |
9,509,760 |
|||||||||
|
Specialty Food Retailer |
|||||||||||
|
147,845 |
Shutterfly (a) |
6,688,508 |
|||||||||
|
Internet Photo-centric Retailer |
|||||||||||
|
73,931 |
Casey's General Stores |
6,661,183 |
|||||||||
|
Owner/Operator of Convenience Stores |
|||||||||||
|
203,784 |
Michaels Stores (a) |
5,514,395 |
|||||||||
|
Craft & Hobby Specialty Retailer |
|||||||||||
|
40,703,496 |
|||||||||||
| > Consumer Goods Distribution 2.5% | |||||||||||
|
260,000 |
Pool |
18,137,600 |
|||||||||
|
Swimming Pool Supplies & Equipment Distributor |
|||||||||||
|
134,000 |
United Natural Foods (a) |
10,323,360 |
|||||||||
|
Distributor of Natural/Organic Foods to Grocery Stores |
|||||||||||
|
268,276 |
The Chefs' Warehouse (a) |
6,017,431 |
|||||||||
|
Distributor of Specialty Foods to Fine Dining Restaurants |
|||||||||||
|
34,478,391 |
|||||||||||
| > Other Durable Goods 2.2% | |||||||||||
|
187,000 |
Cavco Industries (a) |
14,036,220 |
|||||||||
|
Manufactured Homes |
|||||||||||
|
297,000 |
Select Comfort (a) |
10,237,590 |
|||||||||
|
Specialty Mattresses |
|||||||||||
|
296,000 |
Gentex |
5,416,800 |
|||||||||
|
Manufacturer of Auto Parts |
|||||||||||
|
29,690,610 |
|||||||||||
| > Furniture & Textiles 1.5% | |||||||||||
|
189,814 |
Caesarstone (Israel) |
11,523,608 |
|||||||||
|
Quartz Countertops |
|||||||||||
|
357,000 |
Knoll |
8,364,510 |
|||||||||
|
Office Furniture |
|||||||||||
|
19,888,118 |
|||||||||||
| > Restaurants 0.7% | |||||||||||
|
79,000 |
Papa John's International |
4,882,990 |
|||||||||
|
Franchisor of Pizza Restaurants |
|||||||||||
|
68,000 |
Fiesta Restaurant Group (a) |
4,148,000 |
|||||||||
|
Owner/Operator of Two Restaurant Chains: Pollo Tropical & Taco Cabana |
|||||||||||
|
9,030,990 |
|||||||||||
| > Other Consumer Services 0.7% | |||||||||||
|
252,000 |
Blackhawk Network (a) |
8,958,600 |
|||||||||
|
Third-party Distributor of Prepaid Content, Mostly Gift Cards |
|||||||||||
51
|
COLUMBIA ACORN USA® |
|||
STATEMENT OF INVESTMENTS (UNAUDITED), CONTINUED
|
Number of Shares |
Value |
||||||||||
| > Leisure Products 0.5% | |||||||||||
|
359,668 |
Performance Sports Group (a) |
$ |
7,013,526 |
||||||||
|
Sporting Goods Manufacturer |
|||||||||||
|
Consumer Goods & Services: Total |
199,602,621 |
||||||||||
|
Finance 12.7% |
|||||||||||
| > Banks 7.9% | |||||||||||
|
733,000 |
MB Financial |
22,950,230 |
|||||||||
|
Chicago Bank |
|||||||||||
|
140,000 |
SVB Financial Group (a) |
17,785,600 |
|||||||||
|
Bank to Venture Capitalists |
|||||||||||
|
930,000 |
Associated Banc-Corp |
17,298,000 |
|||||||||
|
Midwest Bank |
|||||||||||
|
392,597 |
Lakeland Financial |
15,931,586 |
|||||||||
|
Indiana Bank |
|||||||||||
|
1,484,641 |
First Busey |
9,932,249 |
|||||||||
|
Illinois Bank |
|||||||||||
|
228,000 |
Hancock Holding |
6,808,080 |
|||||||||
|
Gulf Coast Bank |
|||||||||||
|
695,000 |
TrustCo Bank |
4,781,600 |
|||||||||
|
New York State Bank |
|||||||||||
|
172,101 |
Sandy Spring Bancorp |
4,514,209 |
|||||||||
|
Baltimore & Washington, D.C. Bank |
|||||||||||
|
379,000 |
First Commonwealth |
3,411,000 |
|||||||||
|
Western Pennsylvania Bank |
|||||||||||
|
154,849 |
Guaranty Bancorp |
2,626,239 |
|||||||||
|
Colorado Bank |
|||||||||||
|
106,038,793 |
|||||||||||
| > Finance Companies 2.8% | |||||||||||
|
495,208 |
CAI International (a) |
12,167,261 |
|||||||||
|
International Container Leasing |
|||||||||||
|
135,125 |
World Acceptance (a)(b) |
9,853,315 |
|||||||||
|
Personal Loans |
|||||||||||
|
418,543 |
Marlin Business Services |
8,383,416 |
|||||||||
|
Small Equipment Leasing |
|||||||||||
|
227,000 |
McGrath Rentcorp |
7,470,570 |
|||||||||
|
Mini-rental Conglomerate |
|||||||||||
|
37,874,562 |
|||||||||||
| > Insurance 0.9% | |||||||||||
|
515,590 |
Patriot National (a) |
6,547,993 |
|||||||||
|
Underwriting, Claims Administration & Case Management Outsourcing for Workers Comp Insurers |
|||||||||||
|
135,000 |
Allied World Assurance Company Holdings |
5,454,000 |
|||||||||
|
Commercial Lines Insurance/Reinsurance |
|||||||||||
|
12,001,993 |
|||||||||||
| > Savings & Loans 0.6% | |||||||||||
|
373,487 |
LegacyTexas |
8,489,359 |
|||||||||
|
Texas Thrift |
|||||||||||
| > Brokerage & Money Management 0.5% | |||||||||||
|
139,000 |
SEI Investments |
6,128,510 |
|||||||||
|
Mutual Fund Administration & Investment Management |
|||||||||||
|
Finance: Total |
170,533,217 |
||||||||||
|
Number of Shares |
Value |
||||||||||
|
Health Care 12.5% |
|||||||||||
| > Biotechnology & Drug Delivery 5.2% | |||||||||||
|
271,469 |
Synageva BioPharma (a)(b) |
$ |
26,476,371 |
||||||||
|
Biotech Focused on Orphan Diseases |
|||||||||||
|
286,800 |
Seattle Genetics (a) |
10,138,380 |
|||||||||
|
Antibody-based Therapies for Cancer |
|||||||||||
|
154,000 |
Ultragenyx Pharmaceutical (a) |
9,561,860 |
|||||||||
|
Biotech Focused on "Ultra-Orphan" Drugs |
|||||||||||
|
280,300 |
Celldex Therapeutics (a) |
7,811,961 |
|||||||||
|
Biotech Developing Drugs for Cancer |
|||||||||||
|
17,800 |
Intercept Pharmaceuticals (a)(b) |
5,019,956 |
|||||||||
|
Biotech Developing Drugs for Several Diseases |
|||||||||||
|
338,500 |
Sarepta Therapeutics (a)(b) |
4,495,280 |
|||||||||
|
Biotech Focused on Rare Diseases |
|||||||||||
|
40,100 |
Alnylam Pharmaceuticals (a) |
4,187,242 |
|||||||||
|
Biotech Developing Drugs Primarily for Rare Diseases |
|||||||||||
|
26,000 |
Agios Pharmaceuticals (a)(b) |
2,451,800 |
|||||||||
|
Biotech Focused on Cancer & Orphan Diseases |
|||||||||||
|
70,142,850 |
|||||||||||
| > Medical Supplies 3.3% | |||||||||||
|
494,500 |
Cepheid (a) |
28,137,050 |
|||||||||
|
Molecular Diagnostics |
|||||||||||
|
135,200 |
Bio-Techne |
13,559,208 |
|||||||||
|
Maker of Consumables & Systems for the Life Science Market |
|||||||||||
|
86,300 |
VWR (a) |
2,242,937 |
|||||||||
|
Distributor of Lab Supplies |
|||||||||||
|
43,939,195 |
|||||||||||
| > Health Care Services 1.8% | |||||||||||
|
184,500 |
Medidata Solutions (a) |
9,047,880 |
|||||||||
|
Cloud-based Software for Drug Studies |
|||||||||||
|
154,200 |
HealthSouth |
6,840,312 |
|||||||||
|
Inpatient Rehabilitation Facilities & Home Health Care |
|||||||||||
|
110,500 |
Envision Healthcare Holdings (a) |
4,237,675 |
|||||||||
|
Provider of Health Care Outsourcing Services |
|||||||||||
|
343,600 |
Allscripts Healthcare Solutions (a) |
4,109,456 |
|||||||||
|
Health Care IT |
|||||||||||
|
46,268 |
Castlight Health (a) |
359,040 |
|||||||||
|
Provider of Cloud-based Software for Managing Health Care Costs |
|||||||||||
|
24,594,363 |
|||||||||||
| > Pharmaceuticals 1.5% | |||||||||||
|
442,117 |
Akorn (a) |
21,004,979 |
|||||||||
|
Developer, Manufacturer & Distributor of Specialty Generic Drugs |
|||||||||||
| > Medical Equipment & Devices 0.7% | |||||||||||
|
200,300 |
Wright Medical Group (a) |
5,167,740 |
|||||||||
|
Foot & Ankle Replacement |
|||||||||||
52
|
Number of Shares |
Value |
||||||||||
| > Medical Equipment & Devices—continued | |||||||||||
|
61,200 |
Abaxis |
$ |
3,923,532 |
||||||||
|
Instruments & Tests for Vet & Medical Markets |
|||||||||||
|
9,091,272 |
|||||||||||
|
Health Care: Total |
168,772,659 |
||||||||||
|
Other Industries 6.2% |
|||||||||||
| > Real Estate 4.3% | |||||||||||
|
611,000 |
Extra Space Storage |
41,285,270 |
|||||||||
|
Self Storage Facilities |
|||||||||||
|
328,933 |
EdR |
11,637,649 |
|||||||||
|
Student Housing |
|||||||||||
|
91,000 |
Post Properties |
5,180,630 |
|||||||||
|
Multifamily Properties |
|||||||||||
|
58,103,549 |
|||||||||||
| > Transportation 1.9% | |||||||||||
|
468,091 |
Rush Enterprises, Class A (a) |
12,806,970 |
|||||||||
| 105,000 |
Rush Enterprises, Class B (a) |
2,595,600 |
|||||||||
|
Truck Sales & Service |
|||||||||||
|
414,000 |
Heartland Express |
9,836,640 |
|||||||||
|
Regional Trucker |
|||||||||||
|
25,239,210 |
|||||||||||
|
Other Industries: Total |
83,342,759 |
||||||||||
|
Energy & Minerals 2.4% |
|||||||||||
| > Oil & Gas Producers 1.7% | |||||||||||
|
148,000 |
Carrizo Oil & Gas (a) |
7,348,200 |
|||||||||
|
Oil & Gas Producer |
|||||||||||
|
89,000 |
SM Energy |
4,599,520 |
|||||||||
|
Oil & Gas Producer |
|||||||||||
|
83,000 |
PDC Energy (a) |
4,485,320 |
|||||||||
|
Oil & Gas Producer in the United States |
|||||||||||
|
77,000 |
Clayton Williams (a) |
3,898,510 |
|||||||||
|
Oil & Gas Producer |
|||||||||||
|
159,000 |
Rosetta Resources (a) |
2,706,180 |
|||||||||
|
Oil & Gas Producer Exploring in Texas |
|||||||||||
|
23,037,730 |
|||||||||||
| > Oil Services 0.4% | |||||||||||
|
137,000 |
Hornbeck Offshore (a) |
2,576,970 |
|||||||||
|
Supply Vessel Operator in Gulf of Mexico |
|||||||||||
|
Number of Shares |
Value |
||||||||||
|
51,000 |
Gulfport Energy (a) |
$ |
2,341,410 |
||||||||
|
Oil & Gas Producer Focused on Utica Shale in Ohio |
|||||||||||
|
4,918,380 |
|||||||||||
| > Mining 0.3% | |||||||||||
|
39,000 |
Core Labs (Netherlands) (b) |
4,075,110 |
|||||||||
|
Oil & Gas Reservoir Consulting |
|||||||||||
|
Energy & Minerals: Total |
32,031,220 |
||||||||||
|
Total Equities: 94.3% (Cost: $655,552,202) |
1,269,515,443 |
(c) |
|||||||||
|
Short-Term Investments 4.7% |
|||||||||||
|
64,164,090 |
JPMorgan U.S. Government Money Market Fund, Agency Shares (7 day yield of 0.01%) |
64,164,090 |
|||||||||
|
Total Short-Term Investments: 4.7% (Cost: $64,164,090) |
64,164,090 |
||||||||||
|
Securities Lending Collateral 2.6% |
|||||||||||
|
34,441,850 |
Dreyfus Government Cash Management Fund, Institutional Shares (7 day yield of 0.01%) (d) |
34,441,850 |
|||||||||
|
Total Securities Lending Collateral: 2.6% (Cost: $34,441,850) |
34,441,850 |
||||||||||
|
Total Investments: 101.6% (Cost: $754,158,142)(e) |
1,368,121,383 |
(f) |
|||||||||
|
Obligation to Return Collateral for Securities Loaned: (2.6)% |
(34,441,850 |
) |
|||||||||
|
Cash and Other Assets Less Liabilities: 1.0% |
12,248,583 |
||||||||||
|
Net Assets: 100.0% |
$ |
1,345,928,116 |
|||||||||
ADR - American Depositary Receipts
> Notes to Statement of Investments
(a) Non-income producing security.
(b) All or a portion of this security was on loan at March 31, 2015. The total market value of securities on loan at March 31, 2015 was $33,038,748.
(c) On March 31, 2015, the market value of foreign securities represented 1.16% of total net assets. The Fund's foreign portfolio was diversified as follows:
|
Country |
Value |
Percentage of Net Assets |
|||||||||
|
Israel |
$ |
11,523,608 |
0.86 |
||||||||
|
Netherlands |
4,075,110 |
0.30 |
|||||||||
|
Total Foreign Portfolio |
$ |
15,598,718 |
1.16 |
||||||||
(d) Investment made with cash collateral received from securities lending activity.
53
|
COLUMBIA ACORN USA® |
|||
STATEMENT OF INVESTMENTS (UNAUDITED), CONTINUED
> Notes to Statement of Investments
(e) At March 31, 2015, for federal income tax purposes, the cost of investments was approximately $754,158,142 and net unrealized appreciation was $613,963,241 consisting of gross unrealized appreciation of $641,020,566 and gross unrealized depreciation of $27,057,325.
(f) Securities are valued using policies described in the Notes to Financial Statements in the shareholder report dated December 31, 2014.
Fair Value Measurements
Various inputs are used in determining the value of the Fund's investments, following the input prioritization hierarchy established by accounting principles generally accepted in the United States of America (GAAP). These inputs are summarized in the three broad levels listed below:
• Level 1 – quoted prices in active markets for identical securities
• Level 2 – prices determined using other significant observable inputs (including quoted prices for similar securities, interest rates, prepayment speeds, credit risk and others)
• Level 3 – prices determined using significant unobservable inputs where quoted prices or observable inputs are unavailable or less reliable (including management's own assumptions about the factors market participants would use in pricing an investment)
The inputs or methodology used for valuing securities are not necessarily an indication of the risk associated with investing in those securities.
Examples of the types of securities in which the Fund would typically invest and how they are classified within this hierarchy are as follows. Typical Level 1 securities include exchange traded domestic equities, mutual funds whose NAVs are published each day and exchange traded foreign equities that are not statistically fair valued. Typical Level 2 securities include exchange traded foreign equities that are statistically fair valued, forward foreign currency exchange contracts and short-term investments valued at amortized cost. Additionally, securities fair valued by the Valuation Committee (the Committee) of the Fund's Board of Trustees (the Board) that rely on significant observable inputs are also included in Level 2. Typical Level 3 securities include any security fair valued by the Committee that relies on significant unobservable inputs.
Under the direction of the Board, the Committee is responsible for overseeing the valuation procedures approved by the Board.
The Committee meets as necessary, and no less frequently than quarterly, to determine fair values for securities for which market quotations are not readily available or for which the investment manager believes that available market quotations are unreliable, to review the appropriateness of the Trust's Portfolio Pricing Policy and the pricing procedures of the investment manager (the Policies), and to review the continuing appropriateness of the current value of any security subject to the Policies. The Policies address, among other things: circumstances under which market quotations will be deemed readily available; selection of third party pricing vendors; appropriate pricing methodologies; events that require fair valuation and fair value techniques; circumstances under which securities will be deemed to pose a potential for stale pricing, including when securities are illiquid, restricted, or in default; and certain delegations of authority to determine fair values to the Fund's investment manager. The Committee may also meet to discuss additional valuation matters, which may include review of back-testing results, review of time-sensitive information or approval of other valuation related actions, and to review the appropriateness of the Policies.
For investments categorized as Level 3, the significant unobservable inputs used in the fair value measurement of the Funds' securities may include: (i) data specific to the issuer or comparable issuers, (ii) general market or specific sector news and (iii) quoted prices and specific or similar security transactions. The Committee considers this data and any changes from prior periods in order to assess the reasonableness of observable and unobservable inputs, any assumptions or internal models used to value those securities and changes in fair value. Significant changes in any of these factors could result in lower or higher fair value measurements. Various factors impact the frequency of monitoring (which may occur as often as daily), however the Committee may determine that changes to inputs, assumptions and models are not required with the same frequency.
The following table summarizes the inputs used, as of March 31, 2015, in valuing the Fund's assets:
|
Investment Type |
Quoted Prices (Level 1) |
Other Significant Observable Inputs (Level 2) |
Significant Unobservable Inputs (Level 3) |
Total |
|||||||||||||||
|
Equities |
|||||||||||||||||||
|
Information |
$ |
320,678,251 |
$ |
- |
$ |
- |
$ |
320,678,251 |
|||||||||||
|
Industrial Goods & Services |
294,554,716 |
- |
- |
294,554,716 |
|||||||||||||||
|
Consumer Goods & Services |
199,602,621 |
- |
- |
199,602,621 |
|||||||||||||||
|
Finance |
170,533,217 |
- |
- |
170,533,217 |
|||||||||||||||
|
Health Care |
168,772,659 |
- |
- |
168,772,659 |
|||||||||||||||
|
Other Industries |
83,342,759 |
- |
- |
83,342,759 |
|||||||||||||||
|
Energy & Minerals |
32,031,220 |
- |
- |
32,031,220 |
|||||||||||||||
|
Total Equities |
1,269,515,443 |
- |
- |
1,269,515,443 |
|||||||||||||||
|
Total Short-Term Investments |
64,164,090 |
- |
- |
64,164,090 |
|||||||||||||||
|
Total Securities Lending Collateral |
34,441,850 |
- |
- |
34,441,850 |
|||||||||||||||
|
Total Investments |
$ |
1,368,121,383 |
$ |
- |
$ |
- |
$ |
1,368,121,383 |
|||||||||||
There were no transfers of financial assets between levels during the period.
54
COLUMBIA ACORN INTERNATIONAL SELECTSM
MAJOR PORTFOLIO CHANGES IN THE FIRST QUARTER (UNAUDITED)
|
Number of Shares |
|||||||||||
|
12/31/14 |
3/31/15 |
||||||||||
|
Purchases |
|||||||||||
|
Asia |
|||||||||||
| > Japan | |||||||||||
|
Aeon Mall |
0 |
133,000 |
|||||||||
|
KDDI |
360,000 |
399,000 |
|||||||||
|
Recruit Holdings |
222,500 |
297,400 |
|||||||||
|
Secom |
108,000 |
132,000 |
|||||||||
| > Singapore | |||||||||||
|
CapitaMall Trust |
0 |
6,491,000 |
|||||||||
| > Korea | |||||||||||
|
KT&G |
34,400 |
68,400 |
|||||||||
|
Europe |
|||||||||||
| > United Kingdom | |||||||||||
|
Aggreko |
0 |
97,000 |
|||||||||
|
WH Smith |
0 |
126,000 |
|||||||||
| > Germany | |||||||||||
|
MTU Aero Engines |
0 |
56,000 |
|||||||||
| > Switzerland | |||||||||||
|
Geberit |
0 |
7,300 |
|||||||||
| > Spain | |||||||||||
|
Distribuidora Internacional de Alimentación |
0 |
655,000 |
|||||||||
| > France | |||||||||||
|
Eutelsat |
105,081 |
145,081 |
|||||||||
| > Netherlands | |||||||||||
|
Vopak |
0 |
44,000 |
|||||||||
|
Other Countries |
|||||||||||
| > Canada | |||||||||||
|
Vermilion Energy |
0 |
56,000 |
|||||||||
| > South Africa | |||||||||||
|
Coronation Fund Managers |
390,000 |
569,000 |
|||||||||
|
Number of Shares |
|||||||||||
|
12/31/14 |
3/31/15 |
||||||||||
|
Sales |
|||||||||||
|
Asia |
|||||||||||
| > Japan | |||||||||||
|
NGK Spark Plug |
264,000 |
206,300 |
|||||||||
|
Park24 |
212,000 |
181,000 |
|||||||||
| > Singapore | |||||||||||
|
Ascendas REIT |
7,916,000 |
2,650,000 |
|||||||||
|
Europe |
|||||||||||
| > United Kingdom | |||||||||||
|
Babcock International |
556,000 |
330,000 |
|||||||||
|
Jardine Lloyd Thompson Group |
290,000 |
155,000 |
|||||||||
|
Smith & Nephew |
151,000 |
140,000 |
|||||||||
| > Switzerland | |||||||||||
|
Partners Group |
26,680 |
21,040 |
|||||||||
| > Spain | |||||||||||
|
Viscofan |
66,000 |
44,000 |
|||||||||
| > Sweden | |||||||||||
|
Hexagon |
97,000 |
62,900 |
|||||||||
|
Swedish Match |
248,000 |
120,000 |
|||||||||
| > Denmark | |||||||||||
|
Jyske Bank |
67,300 |
0 |
|||||||||
|
Other Countries |
|||||||||||
| > Australia | |||||||||||
|
Amcor |
470,000 |
350,000 |
|||||||||
|
IAG |
1,300,000 |
514,000 |
|||||||||
| > Canada | |||||||||||
|
Baytex |
370,000 |
0 |
|||||||||
|
CCL Industries |
78,000 |
67,000 |
|||||||||
|
Goldcorp |
295,000 |
258,000 |
|||||||||
| > South Africa | |||||||||||
|
Naspers |
42,000 |
33,000 |
|||||||||
55
COLUMBIA ACORN INTERNATIONAL SELECTSM
STATEMENT OF INVESTMENTS (UNAUDITED), MARCH 31, 2015
|
Number of Shares |
Value |
||||||||||
|
Equities: 95.0% |
|||||||||||
|
Asia 43.5% |
|||||||||||
| > Japan 25.2% | |||||||||||
|
297,400 |
Recruit Holdings |
$ |
9,279,314 |
||||||||
|
Recruitment & Media Services |
|||||||||||
|
399,000 |
KDDI |
9,014,420 |
|||||||||
|
Mobile & Fixed Line Communication Service Provider in Japan |
|||||||||||
|
132,000 |
Secom |
8,804,444 |
|||||||||
|
Security Services |
|||||||||||
|
190,000 |
Japan Tobacco |
6,006,824 |
|||||||||
|
Cigarettes |
|||||||||||
|
206,300 |
NGK Spark Plug |
5,537,919 |
|||||||||
|
Automobile Parts |
|||||||||||
|
777,000 |
Seven Bank |
3,831,182 |
|||||||||
|
ATM Processing Services |
|||||||||||
|
181,000 |
Park24 |
3,703,214 |
|||||||||
|
Parking Lot Operator |
|||||||||||
|
2,560 |
Orix JREIT |
3,666,566 |
|||||||||
|
Diversified REIT |
|||||||||||
|
1,600 |
Nippon Prologis REIT |
3,522,192 |
|||||||||
|
Logistics REIT in Japan |
|||||||||||
|
133,000 |
Aeon Mall |
2,633,814 |
|||||||||
|
Suburban Shopping Mall Developer, Owner & Operator |
|||||||||||
|
1,300 |
Japan Retail Fund |
2,583,207 |
|||||||||
|
Largest Retail REIT in Japan |
|||||||||||
|
32,200 |
Rinnai |
2,386,372 |
|||||||||
|
Gas Appliances for Home & Commercial Use |
|||||||||||
|
60,969,468 |
|||||||||||
| > Singapore 11.3% | |||||||||||
|
2,036,000 |
Singapore Exchange |
12,072,185 |
|||||||||
|
Singapore Equity & Derivatives Market Operator |
|||||||||||
|
6,491,000 |
CapitaMall Trust |
10,391,560 |
|||||||||
|
Singapore Commercial Property Real Estate Investment Trust |
|||||||||||
|
2,650,000 |
Ascendas REIT |
4,998,516 |
|||||||||
|
Industrial Property Landlord |
|||||||||||
|
27,462,261 |
|||||||||||
| > Korea 7.0% | |||||||||||
|
37,194 |
CJ Corp |
5,893,642 |
|||||||||
|
Holding Company of Korean Consumer Conglomerate |
|||||||||||
|
23,200 |
Samsung Fire and Marine |
5,593,763 |
|||||||||
|
Non-life Insurance |
|||||||||||
|
68,400 |
KT&G |
5,468,547 |
|||||||||
|
Tobacco & Ginseng Products |
|||||||||||
|
16,955,952 |
|||||||||||
|
Asia: Total |
105,387,681 |
||||||||||
|
Number of Shares |
Value |
||||||||||
|
Europe 29.8% |
|||||||||||
| > United Kingdom 7.4% | |||||||||||
|
330,000 |
Babcock International |
$ |
4,813,996 |
||||||||
|
Public Sector Outsourcer |
|||||||||||
|
47,689 |
Whitbread |
3,703,048 |
|||||||||
|
UK Hotelier & Coffee Shop |
|||||||||||
|
126,000 |
WH Smith |
2,421,010 |
|||||||||
|
Newsprint, Books & General Stationery Retailer |
|||||||||||
|
155,000 |
Jardine Lloyd Thompson Group |
2,407,336 |
|||||||||
|
International Business Insurance Broker |
|||||||||||
|
140,000 |
Smith & Nephew |
2,387,219 |
|||||||||
|
Medical Equipment & Supplies |
|||||||||||
|
97,000 |
Aggreko |
2,194,188 |
|||||||||
|
Temporary Power & Temperature Control Services |
|||||||||||
|
17,926,797 |
|||||||||||
| > Germany 7.3% | |||||||||||
|
1,305,500 |
Telefonica Deutschland |
7,507,185 |
|||||||||
|
Mobile & Fixed-line Communications in Germany |
|||||||||||
|
56,000 |
MTU Aero Engines |
5,486,277 |
|||||||||
|
Airplane Engine Components & Services |
|||||||||||
|
107,400 |
Wirecard |
4,526,394 |
|||||||||
|
Online Payment Processing & Risk Management |
|||||||||||
|
17,519,856 |
|||||||||||
| > Switzerland 3.7% | |||||||||||
|
21,040 |
Partners Group |
6,272,599 |
|||||||||
|
Private Markets Asset Management |
|||||||||||
|
7,300 |
Geberit |
2,731,774 |
|||||||||
|
Plumbing Supplies |
|||||||||||
|
9,004,373 |
|||||||||||
| > Spain 3.2% | |||||||||||
|
655,000 |
Distribuidora Internacional de Alimentación |
5,111,596 |
|||||||||
|
Discount Retailer in Spain & Latin America |
|||||||||||
|
44,000 |
Viscofan |
2,688,334 |
|||||||||
|
Sausage Casings Maker |
|||||||||||
|
7,799,930 |
|||||||||||
| > Sweden 2.4% | |||||||||||
|
120,000 |
Swedish Match |
3,528,322 |
|||||||||
|
Swedish Snus |
|||||||||||
|
62,900 |
Hexagon |
2,233,270 |
|||||||||
|
Design, Measurement & Visualization Software & Equipment |
|||||||||||
|
5,761,592 |
|||||||||||
| > France 2.0% | |||||||||||
|
145,081 |
Eutelsat |
4,812,519 |
|||||||||
|
Fixed Satellite Services |
|||||||||||
| > Norway 1.6% | |||||||||||
|
511,000 |
Orkla |
3,856,682 |
|||||||||
|
Food & Brands, Aluminum, Chemicals Conglomerate |
|||||||||||
56
|
Number of Shares |
Value |
||||||||||
| > Denmark 1.2% | |||||||||||
|
65,500 |
Novozymes |
$ |
2,990,009 |
||||||||
|
Industrial Enzymes |
|||||||||||
| > Netherlands 1.0% | |||||||||||
|
44,000 |
Vopak |
2,428,225 |
|||||||||
|
Operator of Petroleum & Chemical Storage Terminals |
|||||||||||
|
Europe: Total |
72,099,983 |
||||||||||
|
Other Countries 17.2% |
|||||||||||
| > Australia 7.2% | |||||||||||
|
2,062,000 |
Challenger Financial |
11,193,490 |
|||||||||
|
Annuity Provider in Australia |
|||||||||||
|
350,000 |
Amcor |
3,729,235 |
|||||||||
|
Global Leader in Flexible & Rigid Packaging |
|||||||||||
|
514,000 |
IAG |
2,379,301 |
|||||||||
|
General Insurance Provider |
|||||||||||
|
17,302,026 |
|||||||||||
| > Canada 6.0% | |||||||||||
|
67,000 |
CCL Industries |
7,538,194 |
|||||||||
|
Global Label Converter |
|||||||||||
|
258,000 |
Goldcorp |
4,674,960 |
|||||||||
|
Gold Mining |
|||||||||||
|
56,000 |
Vermilion Energy (a) |
2,354,428 |
|||||||||
|
Canadian Exploration & Production Company |
|||||||||||
|
14,567,582 |
|||||||||||
| > South Africa 4.0% | |||||||||||
|
33,000 |
Naspers |
5,061,903 |
|||||||||
|
Media in Africa, China, Russia & other Emerging Markets |
|||||||||||
|
569,000 |
Coronation Fund Managers |
4,599,210 |
|||||||||
|
South African Fund Manager |
|||||||||||
|
9,661,113 |
|||||||||||
|
Other Countries: Total |
41,530,721 |
||||||||||
|
Number of Shares |
Value |
||||||||||
|
Latin America 4.5% |
|||||||||||
| > Guatemala 2.7% | |||||||||||
|
588,000 |
Tahoe Resources |
$ |
6,443,835 |
||||||||
|
Silver Project in Guatemala |
|||||||||||
| > Brazil 1.0% | |||||||||||
|
12,057,582 |
Beadell Resources |
2,356,508 |
|||||||||
|
Gold Mining in Brazil |
|||||||||||
| > Uruguay 0.8% | |||||||||||
|
191,666 |
Union Agriculture Group (b)(c)(d) |
2,087,243 |
|||||||||
|
Farmland Operator in Uruguay |
|||||||||||
|
Latin America: Total |
10,887,586 |
||||||||||
|
Total Equities: 95.0% (Cost: $202,446,123) |
229,905,971 |
(e) |
|||||||||
|
Securities Lending Collateral 0.5% |
|||||||||||
|
1,257,745 |
Dreyfus Government Cash Management Fund, Institutional Shares (7 day yield of 0.01%) (f) |
1,257,745 |
|||||||||
|
Total Securities Lending Collateral: 0.5% (Cost: $1,257,745) |
1,257,745 |
||||||||||
|
Total Investments: 95.5% (Cost: $203,703,868)(g) |
231,163,716 |
(h) |
|||||||||
|
Obligation to Return Collateral for Securities Loaned: (0.5)% |
(1,257,745 |
) |
|||||||||
|
Cash and Other Assets Less Liabilities: 5.0% |
12,053,755 |
||||||||||
|
Net Assets: 100.0% |
$ |
241,959,726 |
|||||||||
REIT - Real Estate Investment Trust
> Notes to Statement of Investments
(a) All or a portion of this security was on loan at March 31, 2015. The total market value of securities on loan at March 31, 2015 was $1,197,778.
(b) Non-income producing security.
(c) Illiquid security.
(d) Denotes a restricted security, which is subject to restrictions on resale under federal securities laws. This security is valued at fair value determined in good faith under consistently applied procedures established by the Fund's Board of Trustees. At March 31, 2015, the market value of this security amounted to $2,087,243, which represented 0.86% of total net assets. Additional information on this security is as follows:
|
Security |
Acquisition Dates |
Shares/Units |
Cost |
Value |
|||||||||||||||
|
Union Agriculture Group |
12/8/10-6/27/12 |
191,666 |
$ |
2,200,000 |
$ |
2,087,243 |
|||||||||||||
57
COLUMBIA ACORN INTERNATIONAL SELECTSM
STATEMENT OF INVESTMENTS (UNAUDITED), CONTINUED
> Notes to Statement of Investments
(e) On March 31, 2015, the Fund's total equity investments were denominated in currencies as follows:
|
Currency |
Value |
Percentage of Net Assets |
|||||||||
|
Japanese Yen |
$ |
60,969,468 |
25.2 |
||||||||
|
Euro |
32,560,529 |
13.5 |
|||||||||
|
Singapore Dollar |
27,462,261 |
11.3 |
|||||||||
|
Australian Dollar |
19,658,534 |
8.1 |
|||||||||
|
British Pound |
17,926,797 |
7.4 |
|||||||||
|
South Korean Won |
16,955,952 |
7.0 |
|||||||||
|
Canadian Dollar |
16,336,457 |
6.8 |
|||||||||
|
Other currencies less than 5% of total net assets |
38,035,973 |
15.7 |
|||||||||
|
Total Equities |
$ |
229,905,971 |
95.0 |
||||||||
(f) Investment made with cash collateral received from securities lending activity.
(g) At March 31, 2015, for federal income tax purposes, the cost of investments was approximately $203,703,868 and net unrealized appreciation was $27,459,848 consisting of gross unrealized appreciation of $43,885,109 and gross unrealized depreciation of $16,425,261.
(h) Securities are valued using policies described in the Notes to Financial Statements in the shareholder report dated December 31, 2014.
At March 31, 2015, the Fund had entered into the following forward foreign currency exchange contract:
|
Forward Foreign Currency Exchange Contracts to Buy |
Forward Foreign Currency Exchange Contracts to Sell |
Principal Amount in Foreign Currency |
Principal Amount in U.S. Dollar |
Settlement Date |
Unrealized Appreciation (Depreciation) |
||||||||||||||||||
|
USD |
ZAR |
110,534,400 |
$ |
9,000,000 |
4/15/15 |
$ |
(92,633 |
) |
|||||||||||||||
The counterparty for all forward foreign currency exchange contracts is Morgan Stanley.
USD - U.S. Dollar
ZAR - South African Rand
Fair Value Measurements
Various inputs are used in determining the value of the Fund's investments, following the input prioritization hierarchy established by accounting principles generally accepted in the United States of America (GAAP). These inputs are summarized in the three broad levels listed below:
• Level 1 – quoted prices in active markets for identical securities
• Level 2 – prices determined using other significant observable inputs (including quoted prices for similar securities, interest rates, prepayment speeds, credit risk and others)
• Level 3 – prices determined using significant unobservable inputs where quoted prices or observable inputs are unavailable or less reliable (including management's own assumptions about the factors market participants would use in pricing an investment)
The inputs or methodology used for valuing securities are not necessarily an indication of the risk associated with investing in those securities.
Examples of the types of securities in which the Fund would typically invest and how they are classified within this hierarchy are as follows. Typical Level 1 securities include exchange traded domestic equities, mutual funds whose NAVs are published each day and exchange traded foreign equities that are not statistically fair valued. Typical Level 2 securities include exchange traded foreign equities that are statistically fair valued, forward foreign currency exchange contracts and short-term investments valued at amortized cost. Additionally, securities fair valued by the Valuation Committee (the Committee) of the Fund's Board of Trustees (the Board) that rely on significant observable inputs are also included in Level 2. Typical Level 3 securities include any security fair valued by the Committee that relies on significant unobservable inputs.
Under the direction of the Board, the Committee is responsible for overseeing the valuation procedures approved by the Board.
The Committee meets as necessary, and no less frequently than quarterly, to determine fair values for securities for which market quotations are not readily available or for which the investment manager believes that available market quotations are unreliable, to review the appropriateness of the Trust's Portfolio Pricing Policy and the pricing procedures of the investment manager (the Policies), and to review the continuing appropriateness of the current value of any security subject to the Policies. The Policies address, among other things: circumstances under which market quotations will be deemed readily available; selection of third party pricing vendors; appropriate pricing methodologies; events that require fair valuation and fair value techniques; circumstances under which securities will be deemed to pose a potential for stale pricing, including when securities are illiquid, restricted, or in default; and certain delegations of authority to determine fair values to the Fund's investment manager. The Committee may also meet to discuss additional valuation matters, which may include review of back-testing results, review of time-sensitive information or approval of other valuation related actions, and to review the appropriateness of the Policies.
For investments and derivatives categorized as Level 3, the significant unobservable inputs used in the fair value measurement of the Funds' securities may include: (i) data specific to the issuer or comparable issuers, (ii) general market or specific sector news and (iii) quoted prices and specific or similar security transactions. The Committee considers this data and any changes from prior periods in order to assess the reasonableness of observable and unobservable inputs, any assumptions or internal models
58
> Notes to Statement of Investments
used to value those securities and changes in fair value. Significant changes in any of these factors could result in lower or higher fair value measurements. Various factors impact the frequency of monitoring (which may occur as often as daily), however the Committee may determine that changes to inputs, assumptions and models are not required with the same frequency.
The following table summarizes the inputs used, as of March 31, 2015, in valuing the Fund's assets:
|
Investment Type |
Quoted Prices (Level 1) |
Other Significant Observable Inputs (Level 2) |
Significant Unobservable Inputs (Level 3) |
Total |
|||||||||||||||
|
Equities |
|||||||||||||||||||
|
Asia |
$ |
- |
$ |
105,387,681 |
$ |
- |
$ |
105,387,681 |
|||||||||||
|
Europe |
- |
72,099,983 |
- |
72,099,983 |
|||||||||||||||
|
Other Countries |
14,567,582 |
26,963,139 |
- |
41,530,721 |
|||||||||||||||
|
Latin America |
6,443,835 |
2,356,508 |
2,087,243 |
10,887,586 |
|||||||||||||||
|
Total Equities |
21,011,417 |
206,807,311 |
2,087,243 |
229,905,971 |
|||||||||||||||
|
Total Securities Lending Collateral |
1,257,745 |
- |
- |
1,257,745 |
|||||||||||||||
|
Total Investments |
$ |
22,269,162 |
$ |
206,807,311 |
$ |
2,087,243 |
$ |
231,163,716 |
|||||||||||
|
Unrealized Depreciation on: |
|||||||||||||||||||
|
Forward Foreign Currency Exchange Contracts |
- |
(92,633 |
) |
- |
(92,633 |
) |
|||||||||||||
|
Total |
$ |
22,269,162 |
$ |
206,714,678 |
$ |
2,087,243 |
$ |
231,071,083 |
|||||||||||
The Fund's assets assigned to the Level 2 input category are generally valued using a market approach, in which a security's value is determined through its correlation to prices and information from observable market transactions for similar or identical assets. Foreign equities are generally valued at the last sale price on the foreign exchange or market on which they trade. The Fund may use a statistical fair valuation model, in accordance with the policy adopted by the Board, provided by an independent third party to value securities principally traded in foreign markets in order to adjust for possible stale pricing that may occur between the close of the foreign exchanges and the time for valuation. These models take into account available market data including intraday index, ADR, and ETF movements. Forward foreign currency exchange contracts are valued at the prevailing forward exchange rate of the underlying currencies.
There were no transfers of financial assets between levels during the period.
The Fund does not hold any significant investments (greater than one percent of net assets) categorized as Level 3.
Certain securities classified as Level 3 are valued at fair value, using a market approach, as determined in good faith under consistently applied procedures established by and under the general supervision of the Board. To determine fair value for these securities, for which no market exists, the Committee utilizes the valuation technique it deems most appropriate in the circumstances, using some unobservable inputs, which may include, but are not limited to estimated earnings of the company and the position of the security within the company's capital structure. The Committee also may use some observable inputs, which may include, but are not limited to, trades of similar securities and market multiples derived from a set of comparable companies. Significant increases or decreases to any of these inputs could result in a significantly lower or higher fair value measurement.
59
COLUMBIA ACORN INTERNATIONAL SELECTSM
PORTFOLIO DIVERSIFICATION (UNAUDITED)
At March 31, 2015, the Fund's portfolio investments as a percentage of net assets were diversified as follows:
|
Value |
Percentage of Net Assets |
||||||||||
|
> Information |
|||||||||||
|
Financial Processors |
$ |
16,598,580 |
6.9 |
||||||||
|
Advertising |
9,279,314 |
3.8 |
|||||||||
|
Mobile Communications |
9,014,420 |
3.7 |
|||||||||
|
Telephone & Data Services |
7,507,185 |
3.1 |
|||||||||
|
Internet Related |
5,061,903 |
2.1 |
|||||||||
|
Satellite Broadcasting & Services |
4,812,519 |
2.0 |
|||||||||
|
Business Software |
2,233,270 |
0.9 |
|||||||||
|
54,507,191 |
22.5 |
||||||||||
|
> Consumer Goods & Services |
|||||||||||
|
Nondurables |
19,013,566 |
7.8 |
|||||||||
|
Other Durable Goods |
7,924,291 |
3.3 |
|||||||||
|
Retail |
7,532,606 |
3.1 |
|||||||||
|
Food & Beverage |
6,216,656 |
2.6 |
|||||||||
|
Restaurants |
3,703,048 |
1.5 |
|||||||||
|
44,390,167 |
18.3 |
||||||||||
|
> Industrial Goods & Services |
|||||||||||
|
Other Industrial Services |
20,188,122 |
8.4 |
|||||||||
|
Conglomerates |
9,750,325 |
4.0 |
|||||||||
|
Industrial Materials & Specialty Chemicals |
6,719,244 |
2.8 |
|||||||||
|
Outsourcing Services |
4,813,996 |
2.0 |
|||||||||
|
Construction |
2,731,775 |
1.1 |
|||||||||
|
44,203,462 |
18.3 |
||||||||||
|
> Finance |
|||||||||||
|
Insurance |
21,573,889 |
8.9 |
|||||||||
|
Brokerage & Money Management |
10,871,808 |
4.5 |
|||||||||
|
Banks |
3,831,182 |
1.6 |
|||||||||
|
36,276,879 |
15.0 |
||||||||||
|
> Other Industries |
|||||||||||
|
Real Estate |
27,795,854 |
11.5 |
|||||||||
|
27,795,854 |
11.5 |
||||||||||
|
> Energy & Minerals |
|||||||||||
|
Mining |
13,475,304 |
5.6 |
|||||||||
|
Oil Refining, Marketing & Distribution |
2,428,225 |
1.0 |
|||||||||
|
Oil & Gas Producers |
2,354,427 |
1.0 |
|||||||||
|
Agricultural Commodities |
2,087,243 |
0.8 |
|||||||||
|
20,345,199 |
8.4 |
||||||||||
|
Value |
Percentage of Net Assets |
||||||||||
|
> Health Care |
|||||||||||
|
Medical Equipment & Devices |
$ |
2,387,219 |
1.0 |
||||||||
|
2,387,219 |
1.0 |
||||||||||
|
Total Equities: |
229,905,971 |
95.0 |
|||||||||
|
Securities Lending Collateral: |
1,257,745 |
0.5 |
|||||||||
|
Total Investments: |
231,163,716 |
95.5 |
|||||||||
|
Obligation to Return Collateral for Securities Loaned: |
(1,257,745 |
) |
(0.5 |
) |
|||||||
|
Cash and Other Assets Less Liabilities: |
12,053,755 |
5.0 |
|||||||||
|
Net Assets: |
$ |
241,959,726 |
100.0 |
||||||||
60
COLUMBIA ACORN SELECTSM
MAJOR PORTFOLIO CHANGES IN THE FIRST QUARTER (UNAUDITED)
|
Number of Shares |
|||||||||||
|
12/31/14 |
3/31/15 |
||||||||||
|
Purchases |
|||||||||||
|
Industrial Goods & Services |
|||||||||||
|
LKQ |
780,000 |
1,050,000 |
|||||||||
|
Information |
|||||||||||
|
Bankrate |
0 |
595,000 |
|||||||||
|
Solera Holdings |
0 |
390,000 |
|||||||||
|
Finance |
|||||||||||
|
Associated Banc-Corp |
635,000 |
915,000 |
|||||||||
|
Eaton Vance |
0 |
348,000 |
|||||||||
|
Consumer Goods & Services |
|||||||||||
|
Fossil |
0 |
120,000 |
|||||||||
|
Health Care |
|||||||||||
|
Ultragenyx Pharmaceutical |
0 |
91,000 |
|||||||||
|
Energy & Minerals |
|||||||||||
|
Carrizo Oil & Gas |
0 |
106,000 |
|||||||||
|
Cimarex Energy |
0 |
45,000 |
|||||||||
|
Core Labs (Netherlands) |
27,000 |
47,000 |
|||||||||
|
Gulfport Energy |
0 |
109,000 |
|||||||||
|
Number of Shares |
|||||||||||
|
12/31/14 |
3/31/15 |
||||||||||
|
Sales |
|||||||||||
|
Industrial Goods & Services |
|||||||||||
|
Ametek |
779,000 |
754,000 |
|||||||||
|
Kennametal |
280,000 |
260,000 |
|||||||||
|
Pall |
177,000 |
163,000 |
|||||||||
|
Information |
|||||||||||
|
Ansys |
190,000 |
163,000 |
|||||||||
|
Informatica |
241,000 |
147,000 |
|||||||||
|
Mettler-Toledo International |
84,500 |
59,500 |
|||||||||
|
SBA Communications |
83,000 |
60,000 |
|||||||||
|
WNS—ADR |
1,245,493 |
875,000 |
|||||||||
|
Finance |
|||||||||||
|
City National |
200,000 |
0 |
|||||||||
|
CNO Financial Group |
1,270,000 |
960,000 |
|||||||||
|
Discover Financial Services |
319,000 |
0 |
|||||||||
|
Consumer Goods & Services |
|||||||||||
|
Casey's General Stores |
86,875 |
0 |
|||||||||
|
Hertz |
138,000 |
0 |
|||||||||
|
PVH |
83,000 |
0 |
|||||||||
|
ULTA |
109,000 |
0 |
|||||||||
|
Vail Resorts |
210,000 |
157,080 |
|||||||||
|
Heath Care |
|||||||||||
|
Cepheid |
322,500 |
243,000 |
|||||||||
|
Intercept Pharmaceuticals |
18,000 |
0 |
|||||||||
|
Energy & Minerals |
|||||||||||
|
Canacol (Colombia) |
1,654,000 |
0 |
|||||||||
|
Rowan |
173,000 |
0 |
|||||||||
|
ShaMaran Petroleum (Iraq) |
20,290,500 |
0 |
|||||||||
|
Other Industries |
|||||||||||
|
EdR |
341,666 |
275,000 |
|||||||||
|
Extra Space Storage |
230,000 |
166,000 |
|||||||||
|
Post Properties |
355,000 |
197,000 |
|||||||||
61
COLUMBIA ACORN SELECTSM
STATEMENT OF INVESTMENTS (UNAUDITED), MARCH 31, 2015
|
Number of Shares |
Value |
||||||||||
|
Equities: 97.7% |
|||||||||||
|
Industrial Goods & Services 27.7% |
|||||||||||
| > Machinery 18.3% | |||||||||||
|
754,000 |
Ametek |
$ |
39,615,160 |
||||||||
|
Aerospace/Industrial Instruments |
|||||||||||
|
764,000 |
Donaldson |
28,810,440 |
|||||||||
|
Industrial Air Filtration |
|||||||||||
|
264,000 |
Nordson |
20,681,760 |
|||||||||
|
Dispensing Systems for Adhesives & Coatings |
|||||||||||
|
163,000 |
Pall |
16,363,570 |
|||||||||
|
Life Science, Water & Industrial Filtration |
|||||||||||
|
260,000 |
Kennametal |
8,759,400 |
|||||||||
|
Consumable Cutting Tools |
|||||||||||
|
114,230,330 |
|||||||||||
| > Other Industrial Services 4.3% | |||||||||||
|
1,050,000 |
LKQ (a) |
26,838,000 |
|||||||||
|
Alternative Auto Parts Distribution |
|||||||||||
| > Industrial Distribution 2.8% | |||||||||||
|
167,000 |
Airgas |
17,720,370 |
|||||||||
|
Industrial Gas Distributor |
|||||||||||
| > Outsourcing Services 2.3% | |||||||||||
|
500,000 |
Quanta Services (a) |
14,265,000 |
|||||||||
|
Electrical Transmission & Pipeline Contracting Services |
|||||||||||
|
Industrial Goods & Services: Total |
173,053,700 |
||||||||||
|
Information 27.5% |
|||||||||||
| > Business Software 6.6% | |||||||||||
|
390,000 |
Solera Holdings |
20,147,400 |
|||||||||
|
Software for Automotive Insurance Claims Processing |
|||||||||||
|
163,000 |
Ansys (a) |
14,374,970 |
|||||||||
|
Simulation Software for Engineers & Designers |
|||||||||||
|
147,000 |
Informatica (a) |
6,446,685 |
|||||||||
|
Enterprise Data Integration Software |
|||||||||||
|
40,969,055 |
|||||||||||
| > Instrumentation 5.3% | |||||||||||
|
59,500 |
Mettler-Toledo International (a) |
19,554,675 |
|||||||||
|
Laboratory Equipment |
|||||||||||
|
525,000 |
Trimble Navigation (a) |
13,230,000 |
|||||||||
|
GPS-based Instruments |
|||||||||||
|
32,784,675 |
|||||||||||
|
> Computer Hardware & Related Equipment 4.7% |
|||||||||||
|
495,000 |
Amphenol |
29,170,350 |
|||||||||
|
Electronic Connectors |
|||||||||||
| > Computer Services 3.4% | |||||||||||
|
875,000 |
WNS - ADR (a) |
21,280,000 |
|||||||||
|
Offshore Business Process Outsourcing Services |
|||||||||||
| > Telecommunications Equipment 3.3% | |||||||||||
|
181,000 |
F5 Networks (a) |
20,804,140 |
|||||||||
|
Internet Traffic Management Equipment |
|||||||||||
|
Number of Shares |
Value |
||||||||||
| > Internet Related 1.3% | |||||||||||
|
1,635,000 |
Vonage (a) |
$ |
8,027,850 |
||||||||
|
Business & Consumer Internet Telephony |
|||||||||||
| > Mobile Communications 1.1% | |||||||||||
|
60,000 |
SBA Communications (a) |
7,026,000 |
|||||||||
|
Communications Towers |
|||||||||||
|
> Business Information & Marketing Services 1.1% |
|||||||||||
|
595,000 |
Bankrate (a) |
6,747,300 |
|||||||||
|
Internet Advertising for the Insurance, Credit Card & Banking Markets |
|||||||||||
| > Semiconductors & Related Equipment 0.7% | |||||||||||
|
535,000 |
Atmel |
4,403,050 |
|||||||||
|
Microcontrollers, Radio Frequency & Memory Semiconductors |
|||||||||||
|
Information: Total |
171,212,420 |
||||||||||
|
Finance 12.0% |
|||||||||||
| > Brokerage & Money Management 6.6% | |||||||||||
|
610,000 |
SEI Investments |
26,894,900 |
|||||||||
|
Mutual Fund Administration & Investment Management |
|||||||||||
|
348,000 |
Eaton Vance |
14,490,720 |
|||||||||
|
Specialty Mutual Funds |
|||||||||||
|
41,385,620 |
|||||||||||
| > Banks 2.7% | |||||||||||
|
915,000 |
Associated Banc-Corp |
17,019,000 |
|||||||||
|
Midwest Bank |
|||||||||||
| > Insurance 2.7% | |||||||||||
|
960,000 |
CNO Financial Group |
16,531,200 |
|||||||||
|
Life, Long-term Care & Medical Supplement Insurance |
|||||||||||
|
Finance: Total |
74,935,820 |
||||||||||
|
Consumer Goods & Services 10.5% |
|||||||||||
| > Retail 4.5% | |||||||||||
|
444,578 |
The Fresh Market (a) |
18,067,650 |
|||||||||
|
Specialty Food Retailer |
|||||||||||
|
120,000 |
Fossil (a) |
9,894,000 |
|||||||||
|
Watch Designer & Retailer |
|||||||||||
|
27,961,650 |
|||||||||||
| > Travel 2.6% | |||||||||||
|
157,080 |
Vail Resorts |
16,245,213 |
|||||||||
|
Ski Resort Operator & Developer |
|||||||||||
| > Other Consumer Services 1.7% | |||||||||||
|
294,000 |
Blackhawk Network (a) |
10,451,700 |
|||||||||
|
Third-party Distributor of Prepaid Content, Mostly Gift Cards |
|||||||||||
| > Consumer Goods Distribution 1.6% | |||||||||||
|
134,000 |
United Natural Foods (a) |
10,323,360 |
|||||||||
|
Distributor of Natural/Organic Foods to Grocery Stores |
|||||||||||
62
|
Number of Shares |
Value |
||||||||||
| > Food & Beverage 0.1% | |||||||||||
|
1,315,000 |
GLG Life Tech (Canada) (a) |
$ |
327,050 |
||||||||
|
Producer of an All-natural Sweetener Extracted from the Stevia Plant |
|||||||||||
|
Consumer Goods & Services: Total |
65,308,973 |
||||||||||
|
Health Care 8.1% |
|||||||||||
| > Medical Supplies 4.5% | |||||||||||
|
243,000 |
Cepheid (a) |
13,826,700 |
|||||||||
|
Molecular Diagnostics |
|||||||||||
|
325,000 |
VWR (a) |
8,446,750 |
|||||||||
|
Distributor of Lab Supplies |
|||||||||||
|
41,000 |
Henry Schein (a) |
5,724,420 |
|||||||||
|
Distributor of Dental, Vet & Medical Products |
|||||||||||
|
27,997,870 |
|||||||||||
| > Biotechnology & Drug Delivery 3.6% | |||||||||||
|
121,769 |
Synageva BioPharma (a)(b) |
11,876,131 |
|||||||||
|
Biotech Focused on Orphan Diseases |
|||||||||||
|
91,000 |
Ultragenyx Pharmaceutical (a) |
5,650,190 |
|||||||||
|
Biotech Focused on "Ultra-Orphan" Drugs |
|||||||||||
|
148,000 |
Seattle Genetics (a) |
5,231,800 |
|||||||||
|
Antibody-based Therapies for Cancer |
|||||||||||
|
22,758,121 |
|||||||||||
|
Health Care: Total |
50,755,991 |
||||||||||
|
Energy & Minerals 6.7% |
|||||||||||
| > Agricultural Commodities 3.1% | |||||||||||
|
1,742,424 |
Union Agriculture Group (Uruguay) (a)(c)(d) |
18,974,997 |
|||||||||
|
Farmland Operator in Uruguay |
|||||||||||
| > Oil & Gas Producers 2.0% | |||||||||||
|
106,000 |
Carrizo Oil & Gas (a) |
5,262,900 |
|||||||||
|
Oil & Gas Producer |
|||||||||||
|
45,000 |
Cimarex Energy |
5,179,050 |
|||||||||
|
Oil & Gas Producer in Texas, New Mexico & Oklahoma |
|||||||||||
|
22,500,000 |
Canadian Overseas Petroleum (Canada) (a)(d)(e) |
1,392,316 |
|||||||||
|
Oil & Gas Exploration Offshore West Africa |
|||||||||||
|
16,000,000 |
Petromanas (Canada) (a)(b) |
631,637 |
|||||||||
|
Exploring for Oil in Albania |
|||||||||||
|
3,036,000 |
Petrodorado Energy (Colombia) (a)(e) |
239,706 |
|||||||||
|
Oil & Gas Exploration & Production in Colombia, Peru & Paraguay |
|||||||||||
|
12,705,609 |
|||||||||||
| > Oil Services 0.8% | |||||||||||
|
109,000 |
Gulfport Energy (a) |
5,004,190 |
|||||||||
|
Oil & Gas Producer Focused on Utica Shale in Ohio |
|||||||||||
| > Mining 0.8% | |||||||||||
|
47,000 |
Core Labs (Netherlands) (b) |
4,911,030 |
|||||||||
|
Oil & Gas Reservoir Consulting |
|||||||||||
|
Energy & Minerals: Total |
41,595,826 |
||||||||||
|
Number of Shares |
Value |
||||||||||
|
Other Industries 5.2% |
|||||||||||
| > Real Estate 5.2% | |||||||||||
|
166,000 |
Extra Space Storage |
$ |
11,216,620 |
||||||||
|
Self Storage Facilities |
|||||||||||
|
197,000 |
Post Properties |
11,215,210 |
|||||||||
|
Multifamily Properties |
|||||||||||
|
275,000 |
EdR |
9,729,500 |
|||||||||
|
Student Housing |
|||||||||||
|
32,161,330 |
|||||||||||
|
Other Industries: Total |
32,161,330 |
||||||||||
|
Total Equities: 97.7% (Cost: $435,570,795) |
609,024,060 |
(f) |
|||||||||
|
Short-Term Investments 2.6% |
|||||||||||
|
16,316,617 |
JPMorgan U.S. Government Money Market Fund, Agency Shares (7 day yield of 0.01%) |
16,316,617 |
|||||||||
|
Total Short-Term Investments: 2.6% (Cost: $16,316,617) |
16,316,617 |
||||||||||
|
Securities Lending Collateral 1.0% |
|||||||||||
|
6,411,300 |
Dreyfus Government Cash Management Fund, Institutional Shares (7 day yield of 0.01%) (g) |
6,411,300 |
|||||||||
|
Total Securities Lending Collateral: 1.0% (Cost: $6,411,300) |
6,411,300 |
||||||||||
|
Total Investments: 101.3% (Cost: $458,298,712)(h) |
631,751,977 |
(i) |
|||||||||
|
Obligation to Return Collateral for Securities Loaned: (1.0)% |
(6,411,300 |
) |
|||||||||
|
Cash and Other Assets Less Liabilities: (0.3)% |
(1,843,478 |
) |
|||||||||
|
Net Assets: 100.0% |
$ |
623,497,199 |
|||||||||
ADR - American Depositary Receipts
63
COLUMBIA ACORN SELECTSM
STATEMENT OF INVESTMENTS (UNAUDITED), CONTINUED
> Notes to Statement of Investments
(a) Non-income producing security.
(b) All or a portion of this security was on loan at March 31, 2015. The total market value of securities on loan at March 31, 2015 was $6,198,822.
(c) Illiquid security.
(d) Denotes a restricted security, which is subject to restrictions on resale under federal securities laws. These securities are valued at fair value determined in good faith under consistently applied procedures established by the Fund's Board of Trustees. At March 31, 2015, the market value of these securities amounted to $20,367,313, which represented 3.27% of total net assets. Additional information on these securities is as follows:
|
Security |
Acquisition Dates |
Shares/Units |
Cost |
Value |
|||||||||||||||
|
Union Agriculture Group |
12/8/10-6/27/12 |
1,742,424 |
$ |
20,000,000 |
$ |
18,974,997 |
|||||||||||||
|
Canadian Overseas Petroleum |
11/24/10 |
22,500,000 |
9,596,330 |
1,392,316 |
|||||||||||||||
|
$ |
29,596,330 |
$ |
20,367,313 |
||||||||||||||||
(e) An affiliated person of the Fund, as defined in the Investment Company Act of 1940, may include any company in which the Fund owns five percent or more of its outstanding voting shares. Holdings and transactions in these affiliated companies during the period ended March 31, 2015, are as follows:
|
Security |
Balance of Shares Held 12/31/14 |
Purchases/ Additions |
Sales/ Reductions |
Balance of Shares Held 3/31/15 |
Value |
Dividend |
|||||||||||||||||||||
|
Canadian Overseas Petroleum |
22,500,000 |
- |
- |
22,500,000 |
$ |
1,392,316 |
$ |
- |
|||||||||||||||||||
|
Petrodorado Energy |
3,370,000 |
- |
334,000 |
3,036,000 |
239,706 |
- |
|||||||||||||||||||||
|
Total of Affiliated Transactions |
25,870,000 |
- |
334,000 |
25,536,000 |
$ |
1,632,022 |
$ |
- |
|||||||||||||||||||
The aggregate cost and value of these companies at March 31, 2015, was $20,784,680 and $1,632,022, respectively. Investments in affiliated companies represented 0.26% of the Fund's total net assets at March 31, 2015.
(f) On March 31, 2015, the market value of foreign securities represented 4.25% of total net assets. The Fund's foreign portfolio was diversified as follows:
|
Country |
Value |
Percentage of Net Assets |
|||||||||
|
Uruguay |
$ |
18,974,997 |
3.04 |
||||||||
|
Netherlands |
4,911,030 |
0.79 |
|||||||||
|
Canada |
2,351,003 |
0.38 |
|||||||||
|
Colombia |
239,706 |
0.04 |
|||||||||
|
Total Foreign Portfolio |
$ |
26,476,736 |
4.25 |
||||||||
(g) Investment made with cash collateral received from securities lending activity.
(h) At March 31, 2015, for federal income tax purposes, the cost of investments was approximately $458,298,712 and net unrealized appreciation was $173,453,265 consisting of gross unrealized appreciation of $208,526,283 and gross unrealized depreciation of $35,073,018.
(i) Securities are valued using policies described in the Notes to Financial Statements in the shareholder report dated December 31, 2014.
Fair Value Measurements
Various inputs are used in determining the value of the Fund's investments, following the input prioritization hierarchy established by accounting principles generally accepted in the United States of America (GAAP). These inputs are summarized in the three broad levels listed below:
• Level 1 – quoted prices in active markets for identical securities
• Level 2 – prices determined using other significant observable inputs (including quoted prices for similar securities, interest rates, prepayment speeds, credit risk and others)
• Level 3 – prices determined using significant unobservable inputs where quoted prices or observable inputs are unavailable or less reliable (including management's own assumptions about the factors market participants would use in pricing an investment)
The inputs or methodology used for valuing securities are not necessarily an indication of the risk associated with investing in those securities.
Examples of the types of securities in which the Fund would typically invest and how they are classified within this hierarchy are as follows. Typical Level 1 securities include exchange traded domestic equities, mutual funds whose NAVs are published each day and exchange traded foreign equities that are not statistically fair valued. Typical Level 2 securities include exchange traded foreign equities that are statistically fair valued, forward foreign currency exchange contracts and short-term investments valued at amortized cost. Additionally, securities fair valued by the Valuation Committee (the Committee) of the Fund's Board of Trustees (the Board) that rely on significant observable inputs are also included in Level 2. Typical Level 3 securities include any security fair valued by the Committee that relies on significant unobservable inputs.
Under the direction of the Board, the Committee is responsible for overseeing the valuation procedures approved by the Board.
The Committee meets as necessary, and no less frequently than quarterly, to determine fair values for securities for which market quotations are not readily available or for which the investment manager believes that available market quotations are unreliable, to review the appropriateness of the Trust's Portfolio Pricing Policy and the pricing
64
> Notes to Statement of Investments
procedures of the investment manager (the Policies), and to review the continuing appropriateness of the current value of any security subject to the Policies. The Policies address, among other things: circumstances under which market quotations will be deemed readily available; selection of third party pricing vendors; appropriate pricing methodologies; events that require fair valuation and fair value techniques; circumstances under which securities will be deemed to pose a potential for stale pricing, including when securities are illiquid, restricted, or in default; and certain delegations of authority to determine fair values to the Fund's investment manager. The Committee may also meet to discuss additional valuation matters, which may include review of back-testing results, review of time-sensitive information or approval of other valuation related actions, and to review the appropriateness of the Policies.
For investments categorized as Level 3, the significant unobservable inputs used in the fair value measurement of the Funds' securities may include: (i) data specific to the issuer or comparable issuers, (ii) general market or specific sector news and (iii) quoted prices and specific or similar security transactions. The Committee considers this data and any changes from prior periods in order to assess the reasonableness of observable and unobservable inputs, any assumptions or internal models used to value those securities and changes in fair value. Significant changes in any of these factors could result in lower or higher fair value measurements. Various factors impact the frequency of monitoring (which may occur as often as daily), however the Committee may determine that changes to inputs, assumptions and models are not required with the same frequency.
The following table summarizes the inputs used, as of March 31, 2015, in valuing the Fund's assets:
|
Investment Type |
Quoted Prices (Level 1) |
Other Significant Observable Inputs (Level 2) |
Significant Unobservable Inputs (Level 3) |
Total |
|||||||||||||||
|
Equities |
|||||||||||||||||||
|
Industrial Goods & Services |
$ |
173,053,700 |
$ |
- |
$ |
- |
$ |
173,053,700 |
|||||||||||
|
Information |
171,212,420 |
- |
- |
171,212,420 |
|||||||||||||||
|
Finance |
74,935,820 |
- |
- |
74,935,820 |
|||||||||||||||
|
Consumer Goods & Services |
65,308,973 |
- |
- |
65,308,973 |
|||||||||||||||
|
Health Care |
50,755,991 |
- |
- |
50,755,991 |
|||||||||||||||
|
Energy & Minerals |
21,228,513 |
1,392,316 |
18,974,997 |
41,595,826 |
|||||||||||||||
|
Other Industries |
32,161,330 |
- |
- |
32,161,330 |
|||||||||||||||
|
Total Equities |
588,656,747 |
1,392,316 |
18,974,997 |
609,024,060 |
|||||||||||||||
|
Total Short-Term Investments |
16,316,617 |
- |
- |
16,316,617 |
|||||||||||||||
|
Total Securities Lending Collateral |
6,411,300 |
- |
- |
6,411,300 |
|||||||||||||||
|
Total Investments |
$ |
611,384,664 |
$ |
1,392,316 |
$ |
18,974,997 |
$ |
631,751,977 |
|||||||||||
The Fund's assets assigned to the Level 2 input category are generally valued using a market approach, in which a security's value is determined through its correlation to prices and information from observable market transactions for similar or identical assets. Securities acquired via private placement that have a holding period or an extended settlement period are valued at a discount to the same shares that are trading freely on the market. These discounts are determined by the investment manager's experience with similar securities or situations. Factors may include, but are not limited to, trade volume, shares outstanding and stock price.
There were no transfers of financial assets between levels during the period.
The following table reconciles asset balances for the period ending March 31, 2015, in which significant observable and/or unobservable inputs (Level 3) were used in determining value:
|
Investments in Securities |
Balance as of December 31, 2014 |
Realized Gain/(Loss) |
Change in Unrealized Appreciation (Depreciation) |
Purchases |
Sales |
Transfers into Level 3 |
Transfers out of Level 3 |
Balance as of March 31, 2015 |
|||||||||||||||||||||||||||
|
Equities |
|||||||||||||||||||||||||||||||||||
|
Energy & Minerals |
$ |
15,908,331 |
$ |
- |
$ |
3,066,666 |
$ |
- |
$ |
- |
$ |
- |
$ |
- |
$ |
18,974,997 |
|||||||||||||||||||
The information in the above reconciliation table represents fiscal year to date activity for any securities identified as using Level 3 inputs at either the beginning or the end of the current fiscal period.
The change in unrealized appreciation attributed to securities owned at March 31, 2015, which were valued using significant unobservable inputs (Level 3), amounted to $3,066,666.
65
COLUMBIA ACORN SELECTSM
STATEMENT OF INVESTMENTS (UNAUDITED), CONTINUED
> Notes to Statement of Investments
Quantitative information pertaining to Level 3 unobservable fair value measurements
|
Fair Value at March 31, 2015 |
Valuation Technique(s) |
Unobservable Input(s) |
Range (Weighted Average) |
||||||||||||||||
|
Equities |
|||||||||||||||||||
|
Energy & Minerals |
$ |
18,974,997 |
Market comparable companies |
Discount for lack of marketability |
7 |
% to 23% |
|||||||||||||
Certain securities classified as Level 3 are valued at fair value, using a market approach, as determined in good faith under consistently applied procedures established by and under the general supervision of the Board. To determine fair value for these securities, for which no market exists, the Committee utilizes the valuation technique it deems most appropriate in the circumstances, using some unobservable inputs, which may include, but are not limited to estimated earnings of the company and the position of the security within the company's capital structure. The Committee also may use some observable inputs, which may include, but are not limited to, trades of similar securities and market multiples derived from a set of comparable companies. Significant increases or decreases to any of these inputs could result in a significantly lower or higher fair value measurement.
66
COLUMBIA THERMOSTAT FUNDSM
STATEMENT OF INVESTMENTS (UNAUDITED), MARCH 31, 2015
|
Number of Shares |
Value |
||||||||||
| > Affiliated Bond Funds 89.7% | |||||||||||
|
44,390,962 |
Columbia Short Term Bond Fund, Class I (a) |
$ |
442,133,980 |
||||||||
|
29,765,306 |
Columbia Intermediate Bond Fund, Class I (a) |
277,115,001 |
|||||||||
|
21,998,052 |
Columbia Income Opportunities Fund, Class I (a) |
221,740,366 |
|||||||||
|
29,925,334 |
Columbia U.S. Government Mortgage Fund, Class I (a) |
166,085,604 |
|||||||||
|
Total Affiliated Bond Funds: (Cost: $1,092,874,322) |
1,107,074,951 |
||||||||||
| > Affiliated Stock Funds 9.9% | |||||||||||
|
562,762 |
Columbia Acorn International, Class I (a) |
24,530,805 |
|||||||||
|
1,296,966 |
Columbia Dividend Income Fund, Class I (a) |
24,357,023 |
|||||||||
|
551,616 |
Columbia Acorn Fund, Class I (a)(b) |
18,374,326 |
|||||||||
|
831,211 |
Columbia Contrarian Core Fund, Class I (a) |
18,203,519 |
|||||||||
|
533,606 |
Columbia Acorn Select, Class I (a)(b) |
12,288,941 |
|||||||||
|
564,010 |
Columbia Large Cap Enhanced Core Fund, Class I (a) |
12,182,612 |
|||||||||
|
634,659 |
Columbia Select Large Cap Growth Fund, Class I (a)(b) |
12,064,869 |
|||||||||
|
Total Affiliated Stock Funds: (Cost: $88,174,334) |
122,002,095 |
||||||||||
|
Number of Shares |
Value |
||||||||||
| > Short-Term Investments 0.3% | |||||||||||
|
4,155,573 |
JPMorgan U.S. Government Money Market Fund, Agency Shares (7 day yield of 0.01%) |
$ |
4,155,573 |
||||||||
|
Total Short-Term Investments: (Cost: $4,155,573) |
4,155,573 |
||||||||||
|
Total Investments: 99.9% (Cost: $1,185,204,229)(c) |
1,233,232,619 |
(d) |
|||||||||
|
Cash and Other Assets Less Liabilities: 0.1% |
1,228,809 |
||||||||||
|
Net Assets: 100.0% |
$ |
1,234,461,428 |
|||||||||
> Notes to Statement of Investments
(a) An affiliated person of the Fund, as defined in the Investment Company Act of 1940, may include any company in which the Fund owns five percent or more of its outstanding voting shares. Holdings and transactions in these affiliated companies during the period ended March 31, 2015, are as follows:
|
Security |
Balance of Shares Held 12/31/14 |
Purchases/ Additions |
Sales/ Reductions |
Balance of Shares Held 3/31/15 |
Value |
Dividend |
|||||||||||||||||||||
|
Columbia Short Term Bond Fund, Class I |
42,849,246 |
2,448,736 |
907,020 |
44,390,962 |
$ |
442,133,980 |
$ |
1,205,740 |
|||||||||||||||||||
|
Columbia Intermediate Bond Fund, Class I |
28,994,280 |
1,711,274 |
940,248 |
29,765,306 |
277,115,001 |
2,018,327 |
|||||||||||||||||||||
|
Columbia Income Opportunities Fund, Class I |
21,780,174 |
1,364,586 |
1,146,708 |
21,998,052 |
221,740,366 |
2,647,214 |
|||||||||||||||||||||
|
Columbia U.S. Government Mortgage Fund, Class I |
28,883,507 |
1,814,285 |
772,458 |
29,925,334 |
166,085,604 |
1,207,571 |
|||||||||||||||||||||
|
Columbia Acorn International, Class I |
898,450 |
- |
335,688 |
562,762 |
24,530,805 |
- |
|||||||||||||||||||||
|
Columbia Dividend Income Fund, Class I |
1,962,468 |
8,696 |
674,198 |
1,296,966 |
24,357,023 |
166,261 |
|||||||||||||||||||||
|
Columbia Acorn Fund, Class I |
879,308 |
- |
327,692 |
551,616 |
18,374,326 |
- |
|||||||||||||||||||||
|
Columbia Contrarian Core Fund, Class I |
1,291,662 |
- |
460,451 |
831,211 |
18,203,519 |
- |
|||||||||||||||||||||
|
Columbia Acorn Select, Class I |
836,113 |
- |
302,507 |
533,606 |
12,288,941 |
- |
|||||||||||||||||||||
|
Columbia Large Cap Enhanced Core Fund, Class I |
870,296 |
- |
306,286 |
564,010 |
12,182,612 |
- |
|||||||||||||||||||||
|
Columbia Select Large Cap Growth Fund, Class I |
1,023,561 |
- |
388,902 |
634,659 |
12,064,869 |
- |
|||||||||||||||||||||
|
Total of Affiliated Transactions |
130,269,065 |
7,347,577 |
6,562,158 |
131,054,484 |
$ |
1,229,077,046 |
$ |
7,245,113 |
|||||||||||||||||||
The aggregate cost and value of these companies at March 31, 2015, was $1,181,048,656 and $1,229,077,046 respectively. Investments in affiliated companies represented 99.56% of the Fund's total net assets at March 31, 2015.
(b) Non-income producing security.
(c) At March 31, 2015, for federal income tax purposes, the cost of investments was approximately $1,185,204,229 and net unrealized appreciation was $48,028,390 consisting of gross unrealized appreciation of $48,654,804 and gross unrealized depreciation of $626,414.
(d) Securities are valued using policies described in the Notes to Financial Statements in the shareholder report dated December 31, 2014.
67
COLUMBIA THERMOSTAT FUNDSM
STATEMENT OF INVESTMENTS (UNAUDITED), CONTINUED
> Notes to Statement of Investments
Fair Value Measurements
Various inputs are used in determining the value of the Fund's investments, following the input prioritization hierarchy established by accounting principles generally accepted in the United States of America (GAAP). These inputs are summarized in the three broad levels listed below:
• Level 1 – quoted prices in active markets for identical securities
• Level 2 – prices determined using other significant observable inputs (including quoted prices for similar securities, interest rates, prepayment speeds, credit risk and others)
• Level 3 – prices determined using significant unobservable inputs where quoted prices or observable inputs are unavailable or less reliable (including management's own assumptions about the factors market participants would use in pricing an investment)
The inputs or methodology used for valuing securities are not necessarily an indication of the risk associated with investing in those securities.
Examples of the types of securities in which the Fund would typically invest and how they are classified within this hierarchy are as follows. Typical Level 1 securities include mutual funds whose NAVs are published each day.
Under the direction of the Board, the Committee is responsible for overseeing the valuation procedures approved by the Board.
The Committee meets as necessary, and no less frequently than quarterly, to determine fair values for securities for which market quotations are not readily available or for which the investment manager believes that available market quotations are unreliable, to review the appropriateness of the Trust's Portfolio Pricing Policy and the pricing procedures of the investment manager (the Policies), and to review the continuing appropriateness of the current value of any security subject to the Policies. The Policies address, among other things: circumstances under which market quotations will be deemed readily available; selection of third party pricing vendors; appropriate pricing methodologies; events that require fair valuation and fair value techniques; circumstances under which securities will be deemed to pose a potential for stale pricing, including when securities are illiquid, restricted, or in default; and certain delegations of authority to determine fair values to the Fund's investment manager. The Committee may also meet to discuss additional valuation matters, which may include review of back-testing results, review of time-sensitive information or approval of other valuation related actions, and to review the appropriateness of the Policies.
For investments categorized as Level 3, the significant unobservable inputs used in the fair value measurement of the Funds' securities may include: (i) data specific to the issuer or comparable issuers, (ii) general market or specific sector news and (iii) quoted prices and specific or similar security transactions. The Committee considers this data and any changes from prior periods in order to assess the reasonableness of observable and unobservable inputs, any assumptions or internal models used to value those securities and changes in fair value. Significant changes in any of these factors could result in lower or higher fair value measurements. Various factors impact the frequency of monitoring (which may occur as often as daily), however the Committee may determine that changes to inputs, assumptions and models are not required with the same frequency.
The following table summarizes the inputs used, as of March 31, 2015, in valuing the Fund's assets:
|
Investment Type |
Quoted Prices (Level 1) |
Other Significant Observable Inputs (Level 2) |
Significant Unobservable Inputs (Level 3) |
Total |
|||||||||||||||
|
Total Affiliated Bond Funds |
$ |
1,107,074,951 |
$ |
- |
$ |
- |
$ |
1,107,074,951 |
|||||||||||
|
Total Affiliated Stock Funds |
122,002,095 |
- |
- |
122,002,095 |
|||||||||||||||
|
Total Short-Term Investments |
4,155,573 |
- |
- |
4,155,573 |
|||||||||||||||
|
Total Investments |
$ |
1,233,232,619 |
$ |
- |
$ |
- |
$ |
1,233,232,619 |
|||||||||||
There were no transfers of financial assets between levels during the period.
68
COLUMBIA ACORN EMERGING MARKETS FUNDSM
MAJOR PORTFOLIO CHANGES IN THE FIRST QUARTER (UNAUDITED)
|
Number of Shares |
|||||||||||
|
12/31/14 |
3/31/15 |
||||||||||
|
Purchases |
|||||||||||
|
Asia |
|||||||||||
| > Taiwan | |||||||||||
|
President Chain Store |
1,058,000 |
1,240,000 |
|||||||||
|
Voltronic Power |
0 |
404,000 |
|||||||||
| > China | |||||||||||
|
AMVIG Holdings |
30,774,000 |
31,000,000 |
|||||||||
|
BitAuto - ADR |
114,558 |
126,580 |
|||||||||
|
China Everbright International |
0 |
3,128,000 |
|||||||||
|
Sino Biopharmaceutical |
0 |
4,925,000 |
|||||||||
|
Xinhua Winshare Publishing |
0 |
2,146,000 |
|||||||||
| > India | |||||||||||
|
Bharti Infratel |
0 |
730,342 |
|||||||||
|
Container Corporation of India |
0 |
140,070 |
|||||||||
| > Indonesia | |||||||||||
|
Mayora Indah |
2,183,600 |
2,300,000 |
|||||||||
| > Philippines | |||||||||||
|
Melco Crown (Philippines) Resorts |
39,172,300 |
41,313,300 |
|||||||||
| > Korea | |||||||||||
|
The Basic House |
358,365 |
421,000 |
|||||||||
| > Hong Kong | |||||||||||
|
Melco International |
5,181,000 |
5,817,000 |
|||||||||
| > Malaysia | |||||||||||
|
7-Eleven Malaysia Holdings |
10,810,900 |
12,777,900 |
|||||||||
|
Astro Malaysia Holdings |
0 |
114,500 |
|||||||||
|
Europe |
|||||||||||
| > United Kingdom | |||||||||||
|
PureCircle |
544,900 |
580,790 |
|||||||||
| > France | |||||||||||
|
Eutelsat |
161,154 |
200,000 |
|||||||||
|
Latin America |
|||||||||||
| > Brazil | |||||||||||
|
Linx |
255,000 |
280,000 |
|||||||||
|
Localiza Rent A Car |
557,970 |
677,970 |
|||||||||
| > Mexico | |||||||||||
|
Qualitas |
2,069,000 |
2,500,000 |
|||||||||
|
Other Countries |
|||||||||||
| > Egypt | |||||||||||
|
Commercial International Bank of Egypt |
0 |
593,000 |
|||||||||
|
Number of Shares |
|||||||||||
|
12/31/14 |
3/31/15 |
||||||||||
|
Sales |
|||||||||||
|
Asia |
|||||||||||
| > Taiwan | |||||||||||
|
Advantech |
720,988 |
598,988 |
|||||||||
|
Largan Precision |
71,000 |
55,000 |
|||||||||
|
Vanguard International Semiconductor |
3,461,000 |
2,814,000 |
|||||||||
| > China | |||||||||||
|
WuXi PharmaTech - ADR |
307,909 |
121,000 |
|||||||||
| > India | |||||||||||
|
United Breweries |
419,349 |
353,739 |
|||||||||
| > Indonesia | |||||||||||
|
Matahari Department Store |
6,909,600 |
4,248,600 |
|||||||||
|
MNC Sky Vision |
61,966,600 |
61,839,700 |
|||||||||
| > Philippines | |||||||||||
|
Puregold Price Club |
8,198,200 |
5,613,200 |
|||||||||
|
Robinsons Retail Holdings |
3,814,910 |
2,636,090 |
|||||||||
|
Security Bank |
1,601,770 |
0 |
|||||||||
| > Korea | |||||||||||
|
Grand Korea Leisure |
132,149 |
98,149 |
|||||||||
|
Koh Young Technology |
295,533 |
256,088 |
|||||||||
|
Paradise |
121,818 |
0 |
|||||||||
| > Hong Kong | |||||||||||
|
Sa Sa International |
7,471,799 |
5,583,799 |
|||||||||
| > Malaysia | |||||||||||
|
Aeon |
4,592,100 |
4,006,700 |
|||||||||
|
Europe |
|||||||||||
| > Sweden | |||||||||||
|
Hexagon |
288,064 |
207,455 |
|||||||||
| > Italy | |||||||||||
|
Pirelli |
393,882 |
270,882 |
|||||||||
| > Turkey | |||||||||||
|
Aviva |
54,624 |
0 |
|||||||||
|
Latin America |
|||||||||||
| > Brazil | |||||||||||
|
Beadell Resources |
3,663,018 |
335,646 |
|||||||||
| > Mexico | |||||||||||
|
Genomma Lab International |
2,278,100 |
0 |
|||||||||
|
Other Countries |
|||||||||||
| > South Africa | |||||||||||
|
Coronation Fund Managers |
2,003,746 |
1,955,513 |
|||||||||
|
Rand Merchant Insurance |
2,851,148 |
2,599,148 |
|||||||||
| > Morocco | |||||||||||
|
Holcim Maroc |
4,273 |
0 |
|||||||||
69
COLUMBIA ACORN EMERGING MARKETS FUNDSM
STATEMENT OF INVESTMENTS (UNAUDITED), MARCH 31, 2015
|
Number of Shares |
Value |
||||||||||
|
Equities: 97.1% |
|||||||||||
|
Asia 65.6% |
|||||||||||
| > Taiwan 11.3% | |||||||||||
|
1,240,000 |
President Chain Store |
$ |
9,320,016 |
||||||||
|
Convenience Chain Store Operator in Taiwan |
|||||||||||
|
570,000 |
PChome Online |
7,402,954 |
|||||||||
|
Taiwanese Internet Retail Company |
|||||||||||
|
420,000 |
St. Shine Optical |
6,760,821 |
|||||||||
|
Disposable Contact Lens Original Equipment Manufacturer |
|||||||||||
|
2,050,990 |
Chroma Ate |
5,089,432 |
|||||||||
|
Automatic Test Systems, Testing & Measurement Instruments |
|||||||||||
|
2,814,000 |
Vanguard International Semiconductor |
4,776,686 |
|||||||||
|
Semiconductor Foundry |
|||||||||||
|
55,000 |
Largan Precision |
4,728,239 |
|||||||||
|
Mobile Device Camera Lenses & Modules |
|||||||||||
|
598,988 |
Advantech |
4,554,748 |
|||||||||
|
Industrial PC & Components |
|||||||||||
|
360,000 |
Ginko International |
4,135,832 |
|||||||||
|
Contact Lens Maker in China |
|||||||||||
|
404,000 |
Voltronic Power |
3,999,827 |
|||||||||
|
Uninterruptible Power Supply Products |
|||||||||||
|
50,768,555 |
|||||||||||
| > China 11.3% | |||||||||||
|
31,000,000 |
AMVIG Holdings |
13,835,269 |
|||||||||
|
Chinese Tobacco Packaging Material Supplier |
|||||||||||
|
126,580 |
BitAuto - ADR (a) |
6,440,390 |
|||||||||
|
Automotive Information Website for Buyers & Dealers |
|||||||||||
|
11,951,000 |
Sihuan Pharmaceuticals (b) |
6,337,233 |
|||||||||
|
Chinese Generic Drug Manufacturer |
|||||||||||
|
11,330,000 |
NewOcean Energy |
5,602,784 |
|||||||||
|
Southern China Liquefied Petroleum Gas Distributor |
|||||||||||
|
3,128,000 |
China Everbright International |
5,246,275 |
|||||||||
|
Private Municipal Waste Operator |
|||||||||||
|
4,925,000 |
Sino Biopharmaceutical |
4,982,540 |
|||||||||
|
Pharmaceutical Developer |
|||||||||||
|
121,000 |
WuXi PharmaTech - ADR (a) |
4,692,380 |
|||||||||
|
Contract Research Organization in China |
|||||||||||
|
2,146,000 |
Xinhua Winshare Publishing |
2,091,010 |
|||||||||
|
Sichuan Publisher, Distributor & Retailer |
|||||||||||
|
257,000 |
Phoenix New Media - ADR (a) |
1,457,190 |
|||||||||
|
Internet Advertising |
|||||||||||
|
50,685,071 |
|||||||||||
| > India 10.8% | |||||||||||
|
2,422,982 |
Zee Entertainment Enterprises |
13,230,862 |
|||||||||
|
Indian Programmer of Pay Television Content |
|||||||||||
|
1,737,269 |
Adani Ports & Special Economic Zone |
8,554,109 |
|||||||||
|
Indian West Coast Shipping Port |
|||||||||||
|
Number of Shares |
Value |
||||||||||
|
17,632 |
Bosch |
$ |
7,162,357 |
||||||||
|
Automotive Parts |
|||||||||||
|
190,350 |
Colgate Palmolive India |
6,124,490 |
|||||||||
|
Consumer Products in Oral Care |
|||||||||||
|
353,739 |
United Breweries |
5,653,091 |
|||||||||
|
Indian Brewer |
|||||||||||
|
730,342 |
Bharti Infratel |
4,493,066 |
|||||||||
|
Communications Towers |
|||||||||||
|
140,070 |
Container Corporation of India |
3,543,540 |
|||||||||
|
Railway Cargo Services |
|||||||||||
|
48,761,515 |
|||||||||||
| > Indonesia 8.5% | |||||||||||
|
61,839,700 |
MNC Sky Vision (a) |
7,803,863 |
|||||||||
|
Satellite Pay TV Operator in Indonesia |
|||||||||||
|
4,248,600 |
Matahari Department Store |
6,389,108 |
|||||||||
|
Department Store Chain in Indonesia |
|||||||||||
|
11,800,000 |
Link Net (a) |
5,392,352 |
|||||||||
|
Fixed Broadband & CATV Service Provider |
|||||||||||
|
2,300,000 |
Mayora Indah |
5,078,375 |
|||||||||
|
Consumer Branded Food Manufacturer |
|||||||||||
|
6,744,300 |
Tower Bersama Infrastructure |
4,887,361 |
|||||||||
|
Communications Towers |
|||||||||||
|
82,889,190 |
Ace Indonesia |
4,657,585 |
|||||||||
|
Home Improvement Retailer |
|||||||||||
|
66,827,700 |
Arwana Citramulia |
4,139,995 |
|||||||||
|
Ceramic Tiles for Home Decoration |
|||||||||||
|
38,348,639 |
|||||||||||
| > Philippines 5.6% | |||||||||||
|
41,313,300 |
Melco Crown (Philippines) Resorts (a)(c) |
8,463,391 |
|||||||||
|
Integrated Resort Operator in Manila |
|||||||||||
|
56,400,000 |
RFM Corporation |
6,677,236 |
|||||||||
|
Flour, Bread, Pasta & Ice Cream Manufacturer/Distributor in the Philippines |
|||||||||||
|
5,613,200 |
Puregold Price Club |
5,215,288 |
|||||||||
|
Supermarket Operator in the Philippines |
|||||||||||
|
2,636,090 |
Robinsons Retail Holdings |
4,953,726 |
|||||||||
|
Multi-format Retailer in the Philippines |
|||||||||||
|
25,309,641 |
|||||||||||
| > Korea 4.3% | |||||||||||
|
256,088 |
Koh Young Technology |
10,252,917 |
|||||||||
|
Inspection Systems for Printed Circuit Boards |
|||||||||||
|
421,000 |
The Basic House (a) |
5,868,287 |
|||||||||
|
Casual & Formal Apparel in China |
|||||||||||
|
98,149 |
Grand Korea Leisure |
3,341,148 |
|||||||||
|
'Foreigner Only' Casino Group in Korea |
|||||||||||
|
19,462,352 |
|||||||||||
| > Hong Kong 4.1% | |||||||||||
|
5,817,000 |
Melco International |
9,788,675 |
|||||||||
|
Macau Casino Operator |
|||||||||||
|
3,698,000 |
Vitasoy International |
5,781,218 |
|||||||||
|
Hong Kong Soy Food Brand |
|||||||||||
70
|
Number of Shares |
Value |
||||||||||
| > Hong Kong—continued | |||||||||||
|
5,583,799 |
Sa Sa International (c) |
$ |
2,729,928 |
||||||||
|
Cosmetics Retailer |
|||||||||||
|
18,299,821 |
|||||||||||
| > Thailand 3.6% | |||||||||||
|
3,737,700 |
Robinson Department Store |
5,454,294 |
|||||||||
|
Department Store Operator in Thailand |
|||||||||||
|
10,016,800 |
Samui Airport Property Fund |
5,294,682 |
|||||||||
|
Thai Airport Operator |
|||||||||||
|
21,126,235 |
Home Product Center |
5,291,298 |
|||||||||
|
Home Improvement Retailer |
|||||||||||
|
16,040,274 |
|||||||||||
| > Malaysia 2.0% | |||||||||||
|
12,777,900 |
7-Eleven Malaysia Holdings |
5,520,357 |
|||||||||
|
Exclusive 7-Eleven Franchisor for Malaysia |
|||||||||||
|
4,006,700 |
Aeon |
3,198,692 |
|||||||||
|
Shopping Center & Department Store Operator |
|||||||||||
|
114,500 |
Astro Malaysia Holdings |
98,773 |
|||||||||
|
Largest Pay TV Operator in Malaysia |
|||||||||||
|
8,817,822 |
|||||||||||
| > Cambodia 1.7% | |||||||||||
|
11,570,000 |
Nagacorp |
7,681,991 |
|||||||||
|
Casino & Entertainment Complex in Cambodia |
|||||||||||
| > Japan 1.3% | |||||||||||
|
310,760 |
Kansai Paint |
5,655,759 |
|||||||||
|
Paint Producer in Japan, India, China & Southeast Asia |
|||||||||||
| > Singapore 1.1% | |||||||||||
|
1,829,000 |
Petra Foods |
5,089,850 |
|||||||||
|
Chocolate Manufacturer in Southeast Asia |
|||||||||||
|
Asia: Total |
294,921,290 |
||||||||||
|
Europe 11.9% |
|||||||||||
| > United Kingdom 3.0% | |||||||||||
|
10,175,965 |
Cable and Wireless |
9,176,568 |
|||||||||
|
Telecommunications Service Provider in the Caribbean |
|||||||||||
|
580,790 |
PureCircle (a)(c) |
4,458,490 |
|||||||||
|
Natural Sweeteners |
|||||||||||
|
13,635,058 |
|||||||||||
| > Kazakhstan 2.1% | |||||||||||
|
1,268,483 |
Halyk Savings Bank of Kazakhstan - GDR |
9,374,090 |
|||||||||
|
Retail Bank & Insurer in Kazakhstan |
|||||||||||
| > Sweden 1.6% | |||||||||||
|
207,455 |
Hexagon |
7,365,708 |
|||||||||
|
Design, Measurement & Visualization Software & Equipment |
|||||||||||
| > France 1.5% | |||||||||||
|
200,000 |
Eutelsat |
6,634,251 |
|||||||||
|
Fixed Satellite Services |
|||||||||||
|
Number of Shares |
Value |
||||||||||
| > Spain 1.5% | |||||||||||
|
1,148,390 |
Prosegur |
$ |
6,539,914 |
||||||||
|
Security Guards |
|||||||||||
| > Finland 1.2% | |||||||||||
|
290,000 |
Tikkurila |
5,530,066 |
|||||||||
|
Decorative & Industrial Paint in Scandinavia, Central & Eastern Europe |
|||||||||||
| > Italy 1.0% | |||||||||||
|
270,882 |
Pirelli |
4,483,836 |
|||||||||
|
Global Tire Supplier |
|||||||||||
|
Europe: Total |
53,562,923 |
||||||||||
|
Latin America 10.3% |
|||||||||||
| > Brazil 3.7% | |||||||||||
|
677,970 |
Localiza Rent A Car |
7,770,564 |
|||||||||
|
Car Rental |
|||||||||||
|
1,430,100 |
Odontoprev |
4,906,580 |
|||||||||
|
Dental Insurance |
|||||||||||
|
280,000 |
Linx |
4,084,786 |
|||||||||
|
Retail Management Software in Brazil |
|||||||||||
|
335,646 |
Beadell Resources |
65,598 |
|||||||||
|
Gold Mining in Brazil |
|||||||||||
|
16,827,528 |
|||||||||||
| > Mexico 3.2% | |||||||||||
|
40,525 |
Grupo Aeroportuario del Sureste - ADR (a) |
5,447,370 |
|||||||||
|
Mexican Airport Operator |
|||||||||||
|
2,500,000 |
Qualitas (a) |
4,523,552 |
|||||||||
|
Auto Insurer in Mexico & Central America |
|||||||||||
|
2,747,000 |
Hoteles City Express (a) |
4,178,084 |
|||||||||
|
Leading Budget Hotel Operator in Mexico |
|||||||||||
|
14,149,006 |
|||||||||||
| > Chile 1.8% | |||||||||||
|
1,943,078 |
Forus |
8,010,335 |
|||||||||
|
Multi-brand Latin American Wholesaler & Retailer |
|||||||||||
| > Colombia 1.6% | |||||||||||
|
6,047,782 |
Isagen |
7,094,514 |
|||||||||
|
Colombian Electricity Provider |
|||||||||||
|
Latin America: Total |
46,081,383 |
||||||||||
|
Other Countries 9.3% |
|||||||||||
| > South Africa 7.1% | |||||||||||
|
1,955,513 |
Coronation Fund Managers |
15,806,352 |
|||||||||
|
South African Fund Manager |
|||||||||||
|
2,599,148 |
Rand Merchant Insurance |
9,897,360 |
|||||||||
|
Directly Sold Property & Casualty Insurance; Holdings in other Insurers |
|||||||||||
|
288,041 |
Mr. Price |
6,160,654 |
|||||||||
|
South African Retailer of Apparel, Household & Sporting Goods |
|||||||||||
|
31,864,366 |
|||||||||||
| > United States 1.2% | |||||||||||
|
171,094 |
Bladex |
5,610,172 |
|||||||||
|
Latin American Trade Financing House |
|||||||||||
71
COLUMBIA ACORN EMERGING MARKETS FUNDSM
STATEMENT OF INVESTMENTS (UNAUDITED), CONTINUED
|
Number of Shares |
Value |
||||||||||
| > Egypt 1.0% | |||||||||||
|
593,000 |
Commercial International Bank of Egypt |
$ |
4,371,369 |
||||||||
|
Leading Private Universal Bank in Egypt |
|||||||||||
|
Other Countries: Total |
41,845,907 |
||||||||||
|
Total Equities: 97.1% (Cost: $423,179,204) |
436,411,503 |
(d) |
|||||||||
|
Short-Term Investments 2.3% |
|||||||||||
|
10,363,888 |
JPMorgan U.S. Government Money Market Fund, IM Shares (7 day yield of 0.01%) |
10,363,888 |
|||||||||
|
Total Short-Term Investments: 2.3% (Cost: $10,363,888) |
10,363,888 |
||||||||||
|
Number of Shares |
Value |
||||||||||
|
Securities Lending Collateral 0.6% |
|||||||||||
|
2,592,411 |
Dreyfus Government Cash Management Fund, Institutional Shares (7 day yield of 0.01%) (e) |
$ |
2,592,411 |
||||||||
|
Total Securities Lending Collateral: 0.6% (Cost: $2,592,411) |
2,592,411 |
||||||||||
|
Total Investments: 100.0% (Cost: $436,135,503)(f) |
449,367,802 |
(g) |
|||||||||
|
Obligation to Return Collateral for Securities Loaned: (0.6)% |
(2,592,411 |
) |
|||||||||
|
Cash and Other Assets Less Liabilities: 0.6% |
2,533,169 |
||||||||||
|
Net Assets: 100.0% |
$ |
449,308,560 |
|||||||||
ADR - American Depositary Receipts
GDR - Global Depositary Receipts
> Notes to Statement of Investments
(a) Non-income producing security.
(b) Illiquid security.
(c) All or a portion of this security was on loan at March 31, 2015. The total market value of securities on loan at March 31, 2015 was $2,402,594.
(d) On March 31, 2015, the Fund's total equity investments were denominated in currencies as follows:
|
Currency |
Value |
Percentage of Net Assets |
|||||||||
|
Hong Kong Dollar |
$ |
64,076,922 |
14.3 |
||||||||
|
Taiwan Dollar |
50,768,556 |
11.3 |
|||||||||
|
Indian Rupee |
48,761,515 |
10.9 |
|||||||||
|
Indonesian Rupiah |
38,348,639 |
8.5 |
|||||||||
|
U.S. Dollar |
33,021,593 |
7.3 |
|||||||||
|
South African Rand |
31,864,366 |
7.1 |
|||||||||
|
Philippines Peso |
25,309,641 |
5.6 |
|||||||||
|
Euro |
23,188,067 |
5.2 |
|||||||||
|
Other currencies less than 5% of total net assets |
121,072,204 |
26.9 |
|||||||||
|
Total Equities |
$ |
436,411,503 |
97.1 |
||||||||
(e) Investment made with cash collateral received from securities lending activity.
(f) At March 31, 2015, for federal income tax purposes, the cost of investments was approximately $436,135,503 and net unrealized appreciation was $13,232,299 consisting of gross unrealized appreciation of $57,882,801 and gross unrealized depreciation of $44,650,502.
(g) Securities are valued using policies described in the Notes to Financial Statements in the shareholder report dated December 31, 2014.
Fair Value Measurements
Various inputs are used in determining the value of the Fund's investments, following the input prioritization hierarchy established by accounting principles generally accepted in the United States of America (GAAP). These inputs are summarized in the three broad levels listed below:
• Level 1 – quoted prices in active markets for identical securities
• Level 2 – prices determined using other significant observable inputs (including quoted prices for similar securities, interest rates, prepayment speeds, credit risk and others)
• Level 3 – prices determined using significant unobservable inputs where quoted prices or observable inputs are unavailable or less reliable (including management's own assumptions about the factors market participants would use in pricing an investment)
The inputs or methodology used for valuing securities are not necessarily an indication of the risk associated with investing in those securities.
72
> Notes to Statement of Investments
Examples of the types of securities in which the Fund would typically invest and how they are classified within this hierarchy are as follows. Typical Level 1 securities include exchange traded domestic equities, mutual funds whose NAVs are published each day and exchange traded foreign equities that are not statistically fair valued. Typical Level 2 securities include exchange traded foreign equities that are statistically fair valued, forward foreign currency exchange contracts and short-term investments valued at amortized cost. Additionally, securities fair valued by the Valuation Committee (the Committee) of the Fund's Board of Trustees (the Board) that rely on significant observable inputs are also included in Level 2. Typical Level 3 securities include any security fair valued by the Committee that relies on significant unobservable inputs.
Under the direction of the Board, the Committee is responsible for overseeing the valuation procedures approved by the Board.
The Committee meets as necessary, and no less frequently than quarterly, to determine fair values for securities for which market quotations are not readily available or for which the investment manager believes that available market quotations are unreliable, to review the appropriateness of the Trust's Portfolio Pricing Policy and the pricing procedures of the investment manager (the Policies), and to review the continuing appropriateness of the current value of any security subject to the Policies. The Policies address, among other things: circumstances under which market quotations will be deemed readily available; selection of third party pricing vendors; appropriate pricing methodologies; events that require fair valuation and fair value techniques; circumstances under which securities will be deemed to pose a potential for stale pricing, including when securities are illiquid, restricted, or in default; and certain delegations of authority to determine fair values to the Fund's investment manager. The Committee may also meet to discuss additional valuation matters, which may include review of back-testing results, review of time-sensitive information or approval of other valuation related actions, and to review the appropriateness of the Policies.
For investments categorized as Level 3, the significant unobservable inputs used in the fair value measurement of the Funds' securities may include: (i) data specific to the issuer or comparable issuers, (ii) general market or specific sector news and (iii) quoted prices and specific or similar security transactions. The Committee considers this data and any changes from prior periods in order to assess the reasonableness of observable and unobservable inputs, any assumptions or internal models used to value those securities and changes in fair value. Significant changes in any of these factors could result in lower or higher fair value measurements. Various factors impact the frequency of monitoring (which may occur as often as daily), however the Committee may determine that changes to inputs, assumptions and models are not required with the same frequency.
The following table summarizes the inputs used, as of March 31, 2015, in valuing the Fund's assets:
|
Investment Type |
Quoted Prices (Level 1) |
Other Significant Observable Inputs (Level 2) |
Significant Unobservable Inputs (Level 3) |
Total |
|||||||||||||||
|
Equities |
|||||||||||||||||||
|
Asia |
$ |
12,589,960 |
$ |
275,994,097 |
$ |
6,337,233 |
$ |
294,921,290 |
|||||||||||
|
Europe |
- |
53,562,923 |
- |
53,562,923 |
|||||||||||||||
|
Latin America |
46,015,785 |
65,598 |
- |
46,081,383 |
|||||||||||||||
|
Other Countries |
5,610,172 |
36,235,735 |
- |
41,845,907 |
|||||||||||||||
|
Total Equities |
64,215,917 |
365,858,353 |
6,337,233 |
436,411,503 |
|||||||||||||||
|
Total Short-Term Investments |
10,363,888 |
- |
- |
10,363,888 |
|||||||||||||||
|
Total Securities Lending Collateral |
2,592,411 |
- |
- |
2,592,411 |
|||||||||||||||
|
Total Investments |
$ |
77,172,216 |
$ |
365,858,353 |
$ |
6,337,233 |
$ |
449,367,802 |
|||||||||||
The Fund's assets assigned to the Level 2 input category are generally valued using a market approach, in which a security's value is determined through its correlation to prices and information from observable market transactions for similar or identical assets. Foreign equities are generally valued at the last sale price on the foreign exchange or market on which they trade. The Fund may use a statistical fair valuation model, in accordance with the policy adopted by the Board, provided by an independent third party to value securities principally traded in foreign markets in order to adjust for possible stale pricing that may occur between the close of the foreign exchanges and the time for valuation. These models take into account available market data including intraday index, ADR, and ETF movements.
The following table shows transfers between Level 2 and Level 3 of the fair value hierarchy:
|
Transfers In |
Transfers Out |
||||||||||||||
| Level 2 |
Level 3 |
Level 2 |
Level 3 |
||||||||||||
| $ |
- |
$ |
7,949,312 |
$ |
7,949,312 |
$ |
- |
||||||||
There were no transfers of financial assets between levels 1 and 2 during the period. Transfers in and/or out of Level 3 are determined based on the fair value at the beginning of the period for security positions held throughout the period.
73
COLUMBIA ACORN EMERGING MARKETS FUNDSM
STATEMENT OF INVESTMENTS (UNAUDITED), CONTINUED
> Notes to Statement of Investments
The following table reconciles asset balances for the period ending March 31, 2015, in which significant observable and/or unobservable inputs (Level 3) were used in determining value:
|
Investments in Securities |
Balance as of December 31, 2014 |
Realized Gain/(Loss) |
Change in Unrealized Appreciation (Depreciation) |
Purchases |
Sales |
Transfers into Level 3 |
Transfers out of Level 3 |
Balance as of March 31, 2015 |
|||||||||||||||||||||||||||
|
Equities |
|||||||||||||||||||||||||||||||||||
|
Asia |
$ |
- |
$ |
- |
$ |
(1,612,079 |
) |
$ |
- |
$ |
- |
$ |
7,949,312 |
$ |
- |
$ |
6,337,233 |
||||||||||||||||||
The information in the above reconciliation table represents fiscal year to date activity for any securities identified as using Level 3 inputs at either the beginning or the end of the current fiscal period.
The change in unrealized depreciation attributed to securities owned at March 31, 2015, which were valued using significant unobservable inputs (Level 3), amounted to $1,612,079.
Quantitative information pertaining to Level 3 unobservable fair value measurements
|
Fair Value at March 31, 2015 |
Valuation Technique(s) |
Unobservable Input(s) |
Range (Weighted Average) |
||||||||||||||||
|
Equities |
|||||||||||||||||||
|
Asia |
$ |
6,337,233 |
Market comparable companies |
Discount for lack of marketability |
10 |
% |
|||||||||||||
Certain securities classified as Level 3 are valued at fair value, using a market approach, as determined in good faith under consistently applied procedures established by and under the general supervision of the Board. To determine fair value for these securities, for which no market exists, the Committee utilizes the valuation technique it deems most appropriate in the circumstances, using some unobservable inputs, which may include, but are not limited to estimated earnings of the company and the position of the security within the company's capital structure. The Committee also may use some observable inputs, which may include, but are not limited to, trades of similar securities or indicies. Significant increases or decreases to any of these inputs could result in a significantly lower or higher fair value measurement.
74
COLUMBIA ACORN EMERGING MARKETS FUNDSM
PORTFOLIO DIVERSIFICATION (UNAUDITED)
At March 31, 2015, the Fund's portfolio investments as a percentage of net assets were diversified as follows:
|
Value |
Percentage of Net Assets |
||||||||||
| > Consumer Goods & Services | |||||||||||
|
Retail |
$ |
76,395,243 |
17.0 |
||||||||
|
Food & Beverage |
32,738,260 |
7.3 |
|||||||||
|
Casinos & Gaming |
29,275,205 |
6.5 |
|||||||||
|
Travel |
11,948,647 |
2.6 |
|||||||||
|
Consumer Goods Distribution |
6,124,490 |
1.4 |
|||||||||
|
Apparel |
5,868,288 |
1.3 |
|||||||||
|
Other Durable Goods |
4,483,836 |
1.0 |
|||||||||
|
166,833,969 |
37.1 |
||||||||||
| > Information | |||||||||||
|
Instrumentation |
15,342,349 |
3.4 |
|||||||||
|
Satellite Broadcasting & Services |
14,536,887 |
3.2 |
|||||||||
|
Entertainment Programming |
13,230,863 |
3.0 |
|||||||||
|
Business Software |
11,450,495 |
2.5 |
|||||||||
|
Mobile Communications |
9,380,427 |
2.1 |
|||||||||
|
Telephone & Data Services |
9,176,568 |
2.0 |
|||||||||
|
Computer Hardware & Related Equipment |
8,554,575 |
1.9 |
|||||||||
|
Internet Related |
7,897,580 |
1.8 |
|||||||||
|
Cable TV |
5,392,352 |
1.2 |
|||||||||
|
Semiconductors & Related Equipment |
4,776,686 |
1.1 |
|||||||||
|
Telecommunications Equipment |
4,728,239 |
1.1 |
|||||||||
|
104,467,021 |
23.3 |
||||||||||
| > Industrial Goods & Services | |||||||||||
|
Industrial Materials & Specialty Chemicals |
29,161,089 |
6.5 |
|||||||||
|
Other Industrial Services |
8,554,109 |
1.9 |
|||||||||
|
Machinery |
7,162,357 |
1.6 |
|||||||||
|
Outsourcing Services |
6,539,914 |
1.4 |
|||||||||
|
Waste Management |
5,246,275 |
1.2 |
|||||||||
|
56,663,744 |
12.6 |
||||||||||
| > Finance | |||||||||||
|
Banks |
19,355,631 |
4.3 |
|||||||||
|
Insurance |
19,327,491 |
4.3 |
|||||||||
|
Brokerage & Money Management |
15,806,352 |
3.5 |
|||||||||
|
54,489,474 |
12.1 |
||||||||||
| > Health Care | |||||||||||
|
Pharmaceuticals |
16,012,153 |
3.6 |
|||||||||
|
Medical Supplies |
10,896,654 |
2.4 |
|||||||||
|
26,908,807 |
6.0 |
||||||||||
|
Value |
Percentage of Net Assets |
||||||||||
| > Other Industries | |||||||||||
|
Transportation |
$ |
14,285,593 |
3.2 |
||||||||
|
Regulated Utilities |
7,094,513 |
1.6 |
|||||||||
|
21,380,106 |
4.8 |
||||||||||
| > Energy & Minerals | |||||||||||
|
Oil Refining, Marketing & Distribution |
5,602,784 |
1.2 |
|||||||||
|
Mining |
65,598 |
0.0 |
* |
||||||||
|
5,668,382 |
1.2 |
||||||||||
|
Total Equities: |
436,411,503 |
97.1 |
|||||||||
|
Short-Term Investments: |
10,363,888 |
2.3 |
|||||||||
|
Securities Lending Collateral: |
2,592,411 |
0.6 |
|||||||||
|
Total Investments: |
449,367,802 |
100.0 |
|||||||||
|
Obligation to Return Collateral for Securities Loaned: |
(2,592,411 |
) |
(0.6 |
) |
|||||||
|
Cash and Other Assets Less Liabilities: |
2,533,169 |
0.6 |
|||||||||
|
Net Assets: |
$ |
449,308,560 |
100.0 |
||||||||
* Rounds to zero.
75
COLUMBIA ACORN EUROPEAN FUNDSM
MAJOR PORTFOLIO CHANGES IN THE FIRST QUARTER (UNAUDITED)
|
Number of Shares |
|||||||||||
|
12/31/14 |
3/31/15 |
||||||||||
|
Purchases |
|||||||||||
|
Europe |
|||||||||||
| > United Kingdom | |||||||||||
|
Abcam |
61,730 |
63,970 |
|||||||||
|
Aggreko |
16,633 |
26,960 |
|||||||||
|
AVEVA |
16,930 |
18,550 |
|||||||||
|
Babcock International |
45,240 |
56,990 |
|||||||||
|
Cable and Wireless |
505,313 |
950,000 |
|||||||||
|
Cambian |
145,820 |
199,280 |
|||||||||
|
Charles Taylor |
188,030 |
241,240 |
|||||||||
|
Dialight |
31,910 |
55,260 |
|||||||||
|
Elementis |
89,680 |
95,860 |
|||||||||
|
Fidessa Group |
10,300 |
18,470 |
|||||||||
|
Halfords |
49,530 |
76,159 |
|||||||||
|
Polypipe |
100,890 |
101,620 |
|||||||||
|
PureCircle |
42,232 |
53,548 |
|||||||||
| RPS Group |
101,810 |
120,090 |
|||||||||
|
WH Smith |
32,210 |
32,710 |
|||||||||
|
Whitbread |
5,575 |
7,954 |
|||||||||
| > France | |||||||||||
|
Bonduelle |
15,320 |
15,690 |
|||||||||
|
Eutelsat |
12,505 |
18,960 |
|||||||||
|
Hi-Media |
123,020 |
174,500 |
|||||||||
| > Germany | |||||||||||
|
Aurelius |
22,450 |
23,640 |
|||||||||
|
Elringklinger |
12,580 |
13,410 |
|||||||||
|
MTU Aero Engines |
4,410 |
7,000 |
|||||||||
|
Wirecard |
14,240 |
14,360 |
|||||||||
| > Sweden | |||||||||||
|
Hexagon |
18,910 |
21,733 |
|||||||||
|
Mekonomen |
16,400 |
18,960 |
|||||||||
|
Modern Times Group |
0 |
16,160 |
|||||||||
|
Recipharm |
28,950 |
29,580 |
|||||||||
|
Sweco |
31,870 |
41,270 |
|||||||||
|
Unibet |
7,351 |
11,851 |
|||||||||
| > Spain | |||||||||||
|
Distribuidora Internacional de Alimentación |
123,060 |
169,200 |
|||||||||
|
Prosegur |
100,660 |
109,950 |
|||||||||
|
Viscofan |
10,000 |
10,430 |
|||||||||
| > Netherlands | |||||||||||
|
Arcadis |
11,819 |
12,819 |
|||||||||
|
Brunel |
16,071 |
27,271 |
|||||||||
|
Core Labs |
1,960 |
3,920 |
|||||||||
|
Gemalto |
4,760 |
5,490 |
|||||||||
|
Number of Shares |
|||||||||||
|
12/31/14 |
3/31/15 |
||||||||||
| > Finland | |||||||||||
|
Konecranes |
12,580 |
15,240 |
|||||||||
|
Munksjo |
63,850 |
68,380 |
|||||||||
|
Sponda |
101,200 |
123,070 |
|||||||||
|
Tikkurila |
25,341 |
28,801 |
|||||||||
| > Switzerland | |||||||||||
|
Geberit |
2,290 |
2,740 |
|||||||||
| > Norway | |||||||||||
|
Atea |
32,400 |
36,180 |
|||||||||
|
Orkla |
58,530 |
70,370 |
|||||||||
| > Belgium | |||||||||||
|
EVS Broadcast Equipment |
10,920 |
11,070 |
|||||||||
76
|
Number of Shares |
|||||||||||
|
12/31/14 |
3/31/15 |
||||||||||
|
Sales |
|||||||||||
|
Europe |
|||||||||||
| > United Kingdom | |||||||||||
|
Jardine Lloyd Thompson Group |
40,000 |
38,560 |
|||||||||
|
Rightmove |
11,210 |
9,670 |
|||||||||
|
Spirax Sarco |
21,120 |
20,450 |
|||||||||
| > France | |||||||||||
|
Eurofins Scientific |
2,390 |
1,540 |
|||||||||
| > Germany | |||||||||||
|
NORMA Group |
16,790 |
16,360 |
|||||||||
|
Telefonica Deutschland |
80,330 |
70,780 |
|||||||||
| > Sweden | |||||||||||
|
Swedish Match |
19,320 |
17,970 |
|||||||||
| > Netherlands | |||||||||||
|
Aalberts Industries |
26,960 |
26,330 |
|||||||||
| > Switzerland | |||||||||||
|
INFICON |
1,250 |
1,150 |
|||||||||
|
Partners Group |
3,570 |
3,250 |
|||||||||
| > Norway | |||||||||||
|
Subsea 7 |
33,440 |
0 |
|||||||||
| > Italy | |||||||||||
|
Pirelli |
29,520 |
24,990 |
|||||||||
| > Denmark | |||||||||||
|
Jyske Bank |
7,260 |
0 |
|||||||||
77
COLUMBIA ACORN EUROPEAN FUNDSM
STATEMENT OF INVESTMENTS (UNAUDITED), MARCH 31, 2015
|
Number of Shares |
Value |
||||||||||
|
Equities: 96.8% |
|||||||||||
|
Europe 96.8% |
|||||||||||
| > United Kingdom 34.9% | |||||||||||
|
1,667,855 |
Assura |
$ |
1,540,125 |
||||||||
|
UK Primary Health Care Property Developer |
|||||||||||
|
20,450 |
Spirax Sarco |
1,034,045 |
|||||||||
|
Steam Systems for Manufacturing & Process Industries |
|||||||||||
| 241,240 |
Charles Taylor |
797,123 |
|||||||||
| 96,338 |
Charles Taylor - Rights |
95,034 |
|||||||||
|
Insurance Services |
|||||||||||
|
950,000 |
Cable and Wireless |
856,699 |
|||||||||
|
Telecommunications Service Provider in the Caribbean |
|||||||||||
|
56,990 |
Babcock International |
831,362 |
|||||||||
|
Public Sector Outsourcer |
|||||||||||
| 199,280 |
Cambian (a) |
688,776 |
|||||||||
|
Mental Health Facilities & Programs |
|||||||||||
|
32,710 |
WH Smith |
628,502 |
|||||||||
|
Newsprint, Books & General Stationery Retailer |
|||||||||||
|
55,260 |
Dialight |
622,288 |
|||||||||
|
LED Products for Hazardous & Industrial Environments |
|||||||||||
|
7,954 |
Whitbread |
617,627 |
|||||||||
|
UK Hotelier & Coffee Shop |
|||||||||||
|
26,960 |
Aggreko |
609,849 |
|||||||||
|
Temporary Power & Temperature Control Services |
|||||||||||
|
18,470 |
Fidessa Group |
604,409 |
|||||||||
|
Software for Financial Trading Systems |
|||||||||||
|
38,560 |
Jardine Lloyd Thompson Group |
598,883 |
|||||||||
|
International Business Insurance Broker |
|||||||||||
|
76,159 |
Halfords |
518,505 |
|||||||||
|
UK Retailer of Leisure Goods & Auto Parts |
|||||||||||
|
225,231 |
Connect Group |
515,361 |
|||||||||
|
Newspaper & Magazine Distributor |
|||||||||||
|
92,240 |
Ocado (a) |
480,689 |
|||||||||
|
Online Grocery Retailer |
|||||||||||
|
63,970 |
Abcam |
459,493 |
|||||||||
|
Online Sales of Antibodies |
|||||||||||
|
37,830 |
Domino's Pizza UK & Ireland |
434,974 |
|||||||||
|
Pizza Delivery in the UK, Ireland & Germany |
|||||||||||
|
9,670 |
Rightmove |
428,997 |
|||||||||
|
Internet Real Estate Listings |
|||||||||||
|
101,620 |
Polypipe |
415,258 |
|||||||||
|
Manufacturer of Plastic Piping & Fittings |
|||||||||||
|
95,860 |
Elementis |
411,753 |
|||||||||
|
Specialty Chemicals |
|||||||||||
|
53,548 |
PureCircle (a)(b) |
411,066 |
|||||||||
|
Natural Sweeteners |
|||||||||||
|
39,570 |
Halma |
408,853 |
|||||||||
|
Health & Safety Sensor Technology |
|||||||||||
|
18,550 |
AVEVA |
405,492 |
|||||||||
|
Engineering Software |
|||||||||||
|
120,090 |
RPS Group |
401,353 |
|||||||||
|
Consultant Specializing in Energy, Water, Urban Planning, Health & Safety |
|||||||||||
|
14,816,516 |
|||||||||||
|
Number of Shares |
Value |
||||||||||
| > France 10.8% | |||||||||||
|
16,720 |
Neopost |
$ |
919,584 |
||||||||
|
Postage Meter Machines |
|||||||||||
|
18,960 |
Eutelsat |
628,927 |
|||||||||
|
Fixed Satellite Services |
|||||||||||
|
14,480 |
Cegedim (a) |
490,443 |
|||||||||
|
Medical Market Research/IT Services |
|||||||||||
|
12,681 |
Saft |
463,448 |
|||||||||
|
Niche Battery Manufacturer |
|||||||||||
|
2,690 |
Norbert Dentressangle |
455,243 |
|||||||||
|
European Logistics & Transport Group |
|||||||||||
|
1,540 |
Eurofins Scientific |
414,488 |
|||||||||
|
Food, Pharmaceuticals & Materials Screening & Testing |
|||||||||||
|
174,500 |
Hi-Media (a)(b) |
412,789 |
|||||||||
|
Online Advertiser in Europe |
|||||||||||
|
12,613 |
AKKA Technologies |
407,000 |
|||||||||
|
Engineering Consultancy |
|||||||||||
|
15,690 |
Bonduelle |
404,917 |
|||||||||
|
Producer of Canned, Deep-frozen & Fresh Vegetables |
|||||||||||
|
4,596,839 |
|||||||||||
| > Germany 10.2% | |||||||||||
|
23,640 |
Aurelius |
987,252 |
|||||||||
|
European Turnaround Investor |
|||||||||||
|
16,360 |
NORMA Group |
821,386 |
|||||||||
|
Clamps for Automotive & Industrial Applications |
|||||||||||
|
7,000 |
MTU Aero Engines |
685,785 |
|||||||||
|
Airplane Engine Components & Services |
|||||||||||
|
14,360 |
Wirecard |
605,205 |
|||||||||
|
Online Payment Processing & Risk Management |
|||||||||||
|
70,780 |
Telefonica Deutschland |
407,015 |
|||||||||
|
Mobile & Fixed-line Communications in Germany |
|||||||||||
|
13,410 |
Elringklinger |
402,039 |
|||||||||
|
Automobile Components |
|||||||||||
|
1,200 |
Rational |
401,115 |
|||||||||
|
Commercial Ovens |
|||||||||||
|
4,309,797 |
|||||||||||
| > Sweden 9.7% | |||||||||||
|
21,733 |
Hexagon |
771,632 |
|||||||||
|
Design, Measurement & Visualization Software & Equipment |
|||||||||||
|
11,851 |
Unibet |
650,198 |
|||||||||
|
European Online Gaming Operator |
|||||||||||
|
29,580 |
Recipharm (a) |
630,264 |
|||||||||
|
Contract Development Manufacturing Organization |
|||||||||||
|
41,270 |
Sweco |
529,562 |
|||||||||
|
Engineering Consultants |
|||||||||||
|
17,970 |
Swedish Match |
528,366 |
|||||||||
|
Swedish Snus |
|||||||||||
|
18,960 |
Mekonomen |
500,851 |
|||||||||
|
Nordic Integrated Wholesaler/Retailer of Automotive Parts & Service |
|||||||||||
|
16,160 |
Modern Times Group |
494,880 |
|||||||||
|
Leading Nordic TV Broadcaster |
|||||||||||
|
90 |
Trelleborg |
1,780 |
|||||||||
|
Manufacturer of Sealing, Dampening & Protective Solutions for Industry |
|||||||||||
|
4,107,533 |
|||||||||||
78
|
Number of Shares |
Value |
||||||||||
| > Spain 7.2% | |||||||||||
|
169,200 |
Distribuidora Internacional de Alimentación |
$ |
1,320,431 |
||||||||
|
Discount Retailer in Spain & Latin America |
|||||||||||
|
10,430 |
Viscofan |
637,258 |
|||||||||
|
Sausage Casings Maker |
|||||||||||
|
109,950 |
Prosegur |
626,149 |
|||||||||
|
Security Guards |
|||||||||||
|
10,370 |
Bolsas y Mercados Españoles |
461,809 |
|||||||||
|
Spanish Stock Markets |
|||||||||||
|
3,045,647 |
|||||||||||
| > Netherlands 6.1% | |||||||||||
|
26,330 |
Aalberts Industries |
828,670 |
|||||||||
|
Flow Control & Heat Treatment |
|||||||||||
|
27,271 |
Brunel |
521,651 |
|||||||||
|
Temporary Specialist & Energy Staffing |
|||||||||||
|
5,490 |
Gemalto |
437,434 |
|||||||||
|
Digital Security Solutions |
|||||||||||
|
12,819 |
Arcadis |
411,681 |
|||||||||
|
Engineering Consultants |
|||||||||||
|
3,920 |
Core Labs |
409,601 |
|||||||||
|
Oil & Gas Reservoir Consulting |
|||||||||||
|
2,609,037 |
|||||||||||
| > Finland 5.7% | |||||||||||
|
58,000 |
Munksjo (a) |
738,396 |
|||||||||
| 10,380 |
Munksjo (a)(c) |
130,169 |
|||||||||
|
Specialty Paper Maker |
|||||||||||
|
28,801 |
Tikkurila |
549,212 |
|||||||||
|
Decorative & Industrial Paint in Scandinavia, Central & Eastern Europe |
|||||||||||
|
123,070 |
Sponda |
528,122 |
|||||||||
|
Office, Retail & Logistics Properties |
|||||||||||
|
15,240 |
Konecranes |
480,228 |
|||||||||
|
Manufacture & Service of Industrial Cranes & Port Handling Equipment |
|||||||||||
|
2,426,127 |
|||||||||||
| > Switzerland 5.7% | |||||||||||
|
2,740 |
Geberit |
1,025,351 |
|||||||||
|
Plumbing Supplies |
|||||||||||
|
3,250 |
Partners Group |
968,914 |
|||||||||
|
Private Markets Asset Management |
|||||||||||
|
1,150 |
INFICON |
410,925 |
|||||||||
|
Gas Detection Instruments |
|||||||||||
|
2,405,190 |
|||||||||||
| > Norway 2.2% | |||||||||||
|
70,370 |
Orkla |
531,105 |
|||||||||
|
Food & Brands, Aluminum, Chemicals Conglomerate |
|||||||||||
|
36,180 |
Atea |
407,579 |
|||||||||
|
Nordic IT Hardware/Software Reseller & Integrator |
|||||||||||
|
938,684 |
|||||||||||
|
Number of Shares |
Value |
||||||||||
| > Italy 2.1% | |||||||||||
|
10,240 |
Industria Macchine Automatiche |
$ |
481,787 |
||||||||
|
Food & Drugs Packaging & Machinery |
|||||||||||
|
24,990 |
Pirelli |
413,653 |
|||||||||
|
Global Tire Supplier |
|||||||||||
|
895,440 |
|||||||||||
| > Denmark 1.2% | |||||||||||
|
15,490 |
SimCorp |
508,260 |
|||||||||
|
Software for Investment Managers |
|||||||||||
| > Belgium 1.0% | |||||||||||
|
11,070 |
EVS Broadcast Equipment |
412,023 |
|||||||||
|
Digital Live Mobile Production Software & Systems |
|||||||||||
|
Europe: Total |
41,071,093 |
||||||||||
|
Total Equities: 96.8% (Cost: $38,774,821) |
41,071,093 |
(d) |
|||||||||
|
Short-Term Investments 6.9% |
|||||||||||
|
2,906,561 |
JPMorgan U.S. Government Money Market Fund, IM Shares (7 day yield of 0.01%) |
2,906,561 |
|||||||||
|
Total Short-Term Investments: 6.9% (Cost: $2,906,561) |
2,906,561 |
||||||||||
|
Securities Lending Collateral 0.1% |
|||||||||||
|
63,226 |
Dreyfus Government Cash Management Fund, Institutional Shares (7 day yield of 0.01%) (e) |
63,226 |
|||||||||
|
Total Securities Lending Collateral: 0.1% (Cost: $63,226) |
63,226 |
||||||||||
|
Total Investments: 103.8% (Cost: $41,744,608)(f) |
44,040,880 |
(g) |
|||||||||
|
Obligation to Return Collateral for Securities Loaned: (0.1)% |
(63,226 |
) |
|||||||||
|
Cash and Other Assets Less Liabilities: (3.7)% |
(1,540,972 |
) |
|||||||||
|
Net Assets: 100.0% |
$ |
42,436,682 |
|||||||||
79
COLUMBIA ACORN EUROPEAN FUNDSM
STATEMENT OF INVESTMENTS (UNAUDITED), CONTINUED
> Notes to Statement of Investments
(a) Non-income producing security.
(b) All or a portion of this security was on loan at March 31, 2015. The total market value of securities on loan at March 31, 2015 was $59,874.
(c) Security is traded on a Swedish exchange.
(d) On March 31, 2015, the Fund's total equity investments were denominated in currencies as follows:
|
Currency |
Value |
Percentage of Net Assets |
|||||||||
|
Euro |
$ |
17,755,139 |
41.8 |
||||||||
|
British Pound |
14,816,516 |
34.9 |
|||||||||
|
Swedish Krona |
4,237,703 |
10.0 |
|||||||||
|
Swiss Franc |
2,405,190 |
5.7 |
|||||||||
|
Other currencies less than 5% of total net assets |
1,856,545 |
4.4 |
|||||||||
|
Total Equities |
$ |
41,071,093 |
96.8 |
||||||||
(e) Investment made with cash collateral received from securities lending activity.
(f) At March 31, 2015, for federal income tax purposes, the cost of investments was approximately $41,744,608 and net unrealized appreciation was $2,296,272 consisting of gross unrealized appreciation of $4,477,741 and gross unrealized depreciation of $2,181,469.
(g) Securities are valued using policies described in the Notes to Financial Statements in the shareholder report dated December 31, 2014.
Fair Value Measurements
Various inputs are used in determining the value of the Fund's investments, following the input prioritization hierarchy established by accounting principles generally accepted in the United States of America (GAAP). These inputs are summarized in the three broad levels listed below:
• Level 1 – quoted prices in active markets for identical securities
• Level 2 – prices determined using other significant observable inputs (including quoted prices for similar securities, interest rates, prepayment speeds, credit risk and others)
• Level 3 – prices determined using significant unobservable inputs where quoted prices or observable inputs are unavailable or less reliable (including management's own assumptions about the factors market participants would use in pricing an investment)
The inputs or methodology used for valuing securities are not necessarily an indication of the risk associated with investing in those securities.
Examples of the types of securities in which the Fund would typically invest and how they are classified within this hierarchy are as follows. Typical Level 1 securities include exchange traded domestic equities, mutual funds whose NAVs are published each day and exchange traded foreign equities that are not statistically fair valued. Typical Level 2 securities include exchange traded foreign equities that are statistically fair valued, forward foreign currency exchange contracts and short-term investments valued at amortized cost. Additionally, securities fair valued by the Valuation Committee (the Committee) of the Fund's Board of Trustees (the Board) that rely on significant observable inputs are also included in Level 2. Typical Level 3 securities include any security fair valued by the Committee that relies on significant unobservable inputs.
Under the direction of the Board, the Committee is responsible for overseeing the valuation procedures approved by the Board.
The Committee meets as necessary, and no less frequently than quarterly, to determine fair values for securities for which market quotations are not readily available or for which the investment manager believes that available market quotations are unreliable, to review the appropriateness of the Trust's Portfolio Pricing Policy and the pricing procedures of the investment manager (the Policies), and to review the continuing appropriateness of the current value of any security subject to the Policies. The Policies address, among other things: circumstances under which market quotations will be deemed readily available; selection of third party pricing vendors; appropriate pricing methodologies; events that require fair valuation and fair value techniques; circumstances under which securities will be deemed to pose a potential for stale pricing, including when securities are illiquid, restricted, or in default; and certain delegations of authority to determine fair values to the Fund's investment manager. The Committee may also meet to discuss additional valuation matters, which may include review of back-testing results, review of time-sensitive information or approval of other valuation related actions, and to review the appropriateness of the Policies.
For investments categorized as Level 3, the significant unobservable inputs used in the fair value measurement of the Funds' securities may include: (i) data specific to the issuer or comparable issuers, (ii) general market or specific sector news and (iii) quoted prices and specific or similar security transactions. The Committee considers this data and any changes from prior periods in order to assess the reasonableness of observable and unobservable inputs, any assumptions or internal models used to value those securities and changes in fair value. Significant changes in any of these factors could result in lower or higher fair value measurements. Various factors impact the frequency of monitoring (which may occur as often as daily), however the Committee may determine that changes to inputs, assumptions and models are not required with the same frequency.
80
> Notes to Statement of Investments
The following table summarizes the inputs used, as of March 31, 2015, in valuing the Fund's assets:
|
Investment Type |
Quoted Prices (Level 1) |
Other Significant Observable Inputs (Level 2) |
Significant Unobservable Inputs (Level 3) |
Total |
|||||||||||||||
|
Equities |
|||||||||||||||||||
|
Europe |
$ |
409,601 |
$ |
40,661,492 |
$ |
- |
$ |
41,071,093 |
|||||||||||
|
Total Equities |
409,601 |
40,661,492 |
- |
41,071,093 |
|||||||||||||||
|
Total Short-Term Investments |
2,906,561 |
- |
- |
2,906,561 |
|||||||||||||||
|
Total Securities Lending Collateral |
63,226 |
- |
- |
63,226 |
|||||||||||||||
|
Total Investments |
$ |
3,379,388 |
$ |
40,661,492 |
$ |
- |
$ |
44,040,880 |
|||||||||||
The Fund's assets assigned to the Level 2 input category are generally valued using a market approach, in which a security's value is determined through its correlation to prices and information from observable market transactions for similar or identical assets. Foreign equities are generally valued at the last sale price on the foreign exchange or market on which they trade. The Fund may use a statistical fair valuation model, in accordance with the policy adopted by the Board, provided by an independent third party to value securities principally traded in foreign markets in order to adjust for possible stale pricing that may occur between the close of the foreign exchanges and the time for valuation. These models take into account available market data including intraday index, ADR, and ETF movements.
There were no transfers of financial assets between levels during the period.
81
COLUMBIA ACORN EUROPEAN FUNDSM
PORTFOLIO DIVERSIFICATION (UNAUDITED)
At March 31, 2015, the Fund's portfolio investments as a percentage of net assets were diversified as follows:
|
Value |
Percentage of Net Assets |
||||||||||
| > Industrial Goods & Services | |||||||||||
|
Machinery |
$ |
4,549,071 |
10.7 |
||||||||
|
Other Industrial Services |
3,052,717 |
7.2 |
|||||||||
|
Outsourcing Services |
2,386,163 |
5.6 |
|||||||||
|
Conglomerates |
2,347,027 |
5.5 |
|||||||||
|
Industrial Materials & Specialty Chemicals |
2,233,349 |
5.3 |
|||||||||
|
Construction |
1,440,609 |
3.4 |
|||||||||
|
Electrical Components |
1,085,736 |
2.6 |
|||||||||
|
17,094,672 |
40.3 |
||||||||||
| > Information | |||||||||||
|
Business Software |
2,289,793 |
5.4 |
|||||||||
|
Telephone & Data Services |
1,263,714 |
3.0 |
|||||||||
|
Computer Services |
898,022 |
2.1 |
|||||||||
|
Computer Hardware & Related Equipment |
849,457 |
2.0 |
|||||||||
|
Satellite Broadcasting & Services |
628,927 |
1.5 |
|||||||||
|
Financial Processors |
605,205 |
1.4 |
|||||||||
|
TV Broadcasting |
494,880 |
1.2 |
|||||||||
|
Internet Related |
428,998 |
1.0 |
|||||||||
|
Advertising |
412,789 |
1.0 |
|||||||||
|
Instrumentation |
408,853 |
0.9 |
|||||||||
|
8,280,638 |
19.5 |
||||||||||
| > Consumer Goods & Services | |||||||||||
|
Retail |
3,448,977 |
8.1 |
|||||||||
|
Food & Beverage |
1,981,607 |
4.7 |
|||||||||
|
Restaurants |
1,052,601 |
2.5 |
|||||||||
|
Casinos & Gaming |
650,198 |
1.5 |
|||||||||
|
Consumer Goods Distribution |
515,361 |
1.2 |
|||||||||
|
Other Durable Goods |
413,653 |
1.0 |
|||||||||
|
8,062,397 |
19.0 |
||||||||||
| > Finance | |||||||||||
|
Insurance |
1,491,040 |
3.5 |
|||||||||
|
Brokerage & Money Management |
968,914 |
2.3 |
|||||||||
|
Financial Processors |
461,809 |
1.1 |
|||||||||
|
2,921,763 |
6.9 |
||||||||||
| > Other Industries | |||||||||||
|
Real Estate |
2,068,247 |
4.9 |
|||||||||
|
Transportation |
455,242 |
1.0 |
|||||||||
|
2,523,489 |
5.9 |
||||||||||
| > Health Care | |||||||||||
|
Health Care Services |
688,776 |
1.6 |
|||||||||
|
Pharmaceuticals |
630,264 |
1.5 |
|||||||||
|
Medical Supplies |
459,493 |
1.1 |
|||||||||
|
1,778,533 |
4.2 |
||||||||||
|
Value |
Percentage of Net Assets |
||||||||||
| > Energy & Minerals | |||||||||||
|
Mining |
$ |
409,601 |
1.0 |
||||||||
|
409,601 |
1.0 |
||||||||||
|
Total Equities: |
41,071,093 |
96.8 |
|||||||||
|
Short-Term Investments: |
2,906,561 |
6.9 |
|||||||||
|
Securities Lending Collateral: |
63,226 |
0.1 |
|||||||||
|
Total Investments: |
44,040,880 |
103.8 |
|||||||||
|
Obligation to Return Collateral for Securities Loaned: |
(63,226 |
) |
(0.1 |
) |
|||||||
|
Cash and Other Assets Less Liabilities: |
(1,540,972 |
) |
(3.7 |
) |
|||||||
|
Net Assets: |
$ |
42,436,682 |
100.0 |
||||||||
82
COLUMBIA ACORN FAMILY OF FUNDS EXPENSE INFORMATION
as of 3/31/15
|
Columbia Acorn® Fund |
Class A |
Class B(a) |
Class C |
Class I |
Class R |
Class R4 |
Class R5 |
Class Y |
Class Z |
||||||||||||||||||||||||||||||
|
Management Fees |
0.64 |
% |
0.64 |
% |
0.64 |
% |
0.64 |
% |
0.64 |
% |
0.64 |
% |
0.64 |
% |
0.64 |
% |
|||||||||||||||||||||||
|
Distribution and Service (12b-1) Fees |
0.25 |
% |
0.75 |
% |
1.00 |
% |
0.00 |
% |
0.00 |
% |
0.00 |
% |
0.00 |
% |
0.00 |
% |
|||||||||||||||||||||||
|
Other Expenses |
0.19 |
% |
0.47 |
% |
0.15 |
% |
0.07 |
% |
0.18 |
% |
0.12 |
% |
0.07 |
% |
0.16 |
% |
|||||||||||||||||||||||
|
Net Expense Ratio |
1.08 |
% |
1.86 |
% |
1.79 |
% |
0.71 |
% |
0.82 |
% |
0.76 |
% |
0.71 |
% |
0.80 |
% |
|||||||||||||||||||||||
|
Columbia Acorn International® |
|||||||||||||||||||||||||||||||||||||||
|
Management Fees |
0.76 |
% |
0.76 |
% |
0.76 |
% |
0.76 |
% |
0.76 |
% |
0.76 |
% |
0.76 |
% |
0.76 |
% |
0.76 |
% |
|||||||||||||||||||||
|
Distribution and Service (12b-1) Fees |
0.25 |
% |
0.75 |
% |
1.00 |
% |
0.00 |
% |
0.50 |
% |
0.00 |
% |
0.00 |
% |
0.00 |
% |
0.00 |
% |
|||||||||||||||||||||
|
Other Expenses |
0.22 |
% |
0.55 |
% |
0.21 |
% |
0.09 |
% |
0.35 |
% |
0.29 |
% |
0.14 |
% |
0.09 |
% |
0.18 |
% |
|||||||||||||||||||||
|
Net Expense Ratio |
1.23 |
% |
2.06 |
% |
1.97 |
% |
0.85 |
% |
1.61 |
% |
1.05 |
% |
0.90 |
% |
0.85 |
% |
0.94 |
% |
|||||||||||||||||||||
|
Columbia Acorn USA® |
|||||||||||||||||||||||||||||||||||||||
|
Management Fees |
0.87 |
% |
0.87 |
% |
0.87 |
% |
0.87 |
% |
0.87 |
% |
0.87 |
% |
0.87 |
% |
0.87 |
% |
|||||||||||||||||||||||
|
Distribution and Service (12b-1) Fees |
0.25 |
% |
0.75 |
% |
1.00 |
% |
0.00 |
% |
0.00 |
% |
0.00 |
% |
0.00 |
% |
0.00 |
% |
|||||||||||||||||||||||
|
Other Expenses |
0.22 |
% |
0.85 |
% |
0.14 |
% |
0.05 |
% |
0.22 |
% |
0.13 |
% |
0.08 |
% |
0.21 |
% |
|||||||||||||||||||||||
|
Net Expense Ratio |
1.34 |
% |
2.47 |
% |
2.01 |
% |
0.92 |
% |
1.09 |
% |
1.00 |
% |
0.95 |
% |
1.08 |
% |
|||||||||||||||||||||||
|
Columbia Acorn International SelectSM |
|||||||||||||||||||||||||||||||||||||||
|
Management Fees |
0.94 |
% |
0.94 |
% |
0.94 |
% |
0.94 |
% |
0.94 |
% |
0.94 |
% |
0.94 |
% |
0.94 |
% |
|||||||||||||||||||||||
|
Distribution and Service (12b-1) Fees |
0.25 |
% |
0.75 |
% |
1.00 |
% |
0.00 |
% |
0.00 |
% |
0.00 |
% |
0.00 |
% |
0.00 |
% |
|||||||||||||||||||||||
|
Other Expenses |
0.33 |
% |
0.51 |
% |
0.34 |
% |
0.26 |
% |
0.30 |
% |
0.23 |
% |
0.17 |
% |
0.26 |
% |
|||||||||||||||||||||||
|
Net Expense Ratio |
1.52 |
% |
2.20 |
% |
2.28 |
% |
1.20 |
% |
1.24 |
% |
1.17 |
% |
1.11 |
% |
1.20 |
% |
|||||||||||||||||||||||
|
Columbia Acorn SelectSM |
|||||||||||||||||||||||||||||||||||||||
|
Management Fees |
0.85 |
% |
0.85 |
% |
0.85 |
% |
0.85 |
% |
0.85 |
% |
0.85 |
% |
0.85 |
% |
0.85 |
% |
|||||||||||||||||||||||
|
Distribution and Service (12b-1) Fees |
0.25 |
% |
0.75 |
% |
1.00 |
% |
0.00 |
% |
0.00 |
% |
0.00 |
% |
0.00 |
% |
0.00 |
% |
|||||||||||||||||||||||
|
Other Expenses |
0.23 |
% |
0.50 |
% |
0.21 |
% |
0.10 |
% |
0.25 |
% |
0.16 |
% |
0.11 |
% |
0.21 |
% |
|||||||||||||||||||||||
|
Net Expense Ratio |
1.33 |
% |
2.10 |
% |
2.06 |
% |
0.95 |
% |
1.10 |
% |
1.01 |
% |
0.96 |
% |
1.06 |
% |
|||||||||||||||||||||||
|
Columbia Thermostat FundSM |
|||||||||||||||||||||||||||||||||||||||
|
Management Fees |
0.10 |
% |
0.10 |
% |
0.10 |
% |
0.10 |
% |
0.10 |
% |
0.10 |
% |
0.10 |
% |
|||||||||||||||||||||||||
|
Distribution and Service (12b-1) Fees |
0.25 |
% |
0.75 |
% |
1.00 |
% |
0.00 |
% |
0.00 |
% |
0.00 |
% |
0.00 |
% |
|||||||||||||||||||||||||
|
Other Expenses |
0.15 |
% |
0.15 |
% |
0.15 |
% |
0.15 |
% |
0.13 |
% |
0.08 |
% |
0.14 |
% |
|||||||||||||||||||||||||
|
Net Expense Ratio(b) |
0.50 |
% |
1.00 |
% |
1.25 |
% |
0.25 |
% |
0.23 |
% |
0.18 |
% |
0.24 |
% |
|||||||||||||||||||||||||
|
Columbia Acorn Emerging Markets FundSM(c) |
|||||||||||||||||||||||||||||||||||||||
|
Management Fees |
1.05 |
% |
1.05 |
% |
1.05 |
% |
1.05 |
% |
1.05 |
% |
1.05 |
% |
1.05 |
% |
|||||||||||||||||||||||||
|
Distribution and Service (12b-1) Fees |
0.25 |
% |
1.00 |
% |
0.00 |
% |
0.00 |
% |
0.00 |
% |
0.00 |
% |
0.00 |
% |
|||||||||||||||||||||||||
|
Other Expenses |
0.30 |
% |
0.31 |
% |
0.22 |
% |
0.26 |
% |
0.23 |
% |
0.16 |
% |
0.30 |
% |
|||||||||||||||||||||||||
|
Net Expense Ratio |
1.60 |
% |
2.36 |
% |
1.27 |
% |
1.31 |
% |
1.28 |
% |
1.21 |
% |
1.35 |
% |
|||||||||||||||||||||||||
|
Columbia Acorn European FundSM |
|||||||||||||||||||||||||||||||||||||||
|
Management Fees |
1.19 |
% |
1.19 |
% |
1.19 |
% |
1.19 |
% |
1.19 |
% |
1.19 |
% |
|||||||||||||||||||||||||||
|
Distribution and Service (12b-1) Fees |
0.25 |
% |
1.00 |
% |
0.00 |
% |
0.00 |
% |
0.00 |
% |
0.00 |
% |
|||||||||||||||||||||||||||
|
Other Expenses |
0.31 |
% |
0.31 |
% |
0.28 |
% |
0.31 |
% |
0.33 |
% |
0.31 |
% |
|||||||||||||||||||||||||||
|
Net Expense Ratio |
1.75 |
% |
2.50 |
% |
1.47 |
% |
1.50 |
% |
1.52 |
% |
1.50 |
% |
|||||||||||||||||||||||||||
See the Funds' prospectuses for information on minimum initial investment amounts and other details of buying, selling and exchanging shares of the Funds.
Fees and expenses are for the three months ended March 31, 2015. The fees and expenses of Columbia Acorn International Select and Columbia Acorn Select include the effect of the voluntary undertaking by Columbia Wanger Asset Management, LLC (CWAM) to reimburse each Fund so that the ordinary operating expenses (excluding transaction costs and certain other investment-related expenses, interest and fees on borrowings and expenses associated with the Fund's investment in other investment companies, if any), after giving effect to any balance credits or overdraft charges from the Fund's custodian, do not exceed annually each class' average daily net assets as follows:
|
Fund |
Class A |
Class B |
Class C |
Class I |
Class R4 |
Class R5 |
Class Y |
Class Z |
|||||||||||||||||||||||||||
|
Columbia Acorn International Select |
1.70 |
% |
2.20 |
% |
2.45 |
% |
1.37 |
% |
1.45 |
% |
1.42 |
% |
1.37 |
% |
1.45 |
% |
|||||||||||||||||||
|
Columbia Acorn Select |
1.60 |
% |
2.10 |
% |
2.35 |
% |
1.22 |
% |
1.35 |
% |
1.27 |
% |
1.22 |
% |
1.35 |
% |
|||||||||||||||||||
These arrangements may be modified or terminated by either the Funds or CWAM on 30 days' notice.
The fees and expenses of Columbia Thermostat Fund include the effect of CWAM's contractual undertaking to waive fees and/or reimburse expenses of the Fund so that the ordinary operating expenses (excluding transaction costs and certain other investment-related expenses, interest and fees on borrowings and expenses associated with the Fund's investment in underlying portfolio funds), do not exceed annually the rates of 0.50%, 1.00%, 1.25%, 0.25%, 0.23%, 0.18% and 0.25% of the Fund's average daily net assets attributable to Class A, Class B, Class C, Class R4, Class R5, Class Y and Class Z shares, respectively, through April 30, 2015. There is no guarantee that this agreement will continue thereafter.
The fees and expenses of Columbia Acorn Emerging Markets Fund and Columbia Acorn European Fund include the effect of CWAM's contractual undertaking to waive fees and/or reimburse expenses of each Fund so that the ordinary operating expenses (excluding transaction costs and certain other investment-related expenses, interest and fees on borrowings and expenses associated with the Fund's investment in other investment companies, if any), of each Fund's Class A, Class C, Class I, Class R4, Class R5, Class Y (if offered) and Class Z shares through April 30, 2015, do not exceed annually each class' average daily net assets as follows:
|
Fund |
Class A |
Class C |
Class I |
Class R4 |
Class R5 |
Class Y |
Class Z |
||||||||||||||||||||||||
|
Columbia Acorn Emerging Markets Fund |
1.85 |
% |
2.60 |
% |
1.46 |
% |
1.60 |
% |
1.51 |
% |
1.46 |
% |
1.60 |
% |
|||||||||||||||||
|
Columbia Acorn European Fund |
1.75 |
% |
2.50 |
% |
1.47 |
% |
1.50 |
% |
1.52 |
% |
— |
1.50 |
% |
||||||||||||||||||
There is no guarantee that these arrangements will continue thereafter.
The fees and expenses of Columbia Acorn International include the effect of the voluntary undertaking by CMIS to waive a portion of total annual Fund operating expenses attributable to transfer agency expenses incurred by Class A, Class B and Class C shares of Columbia Acorn International such that the Fund's total annual Fund operating expenses will be reduced by 0.04%, 0.03% and 0.02% for Class A, Class B and Class C shares of the Fund, respectively.
(a) The Funds generally no longer accept investments by new or existing investors in Class B shares, except in connection with the reinvestment of any dividend and/or capital gain distributions in Class B shares of the Funds and exchanges by existing Class B shareholders of certain other funds within the Columbia Acorn Family of Funds.
(b) Does not include estimated fees and expenses of 0.51% incurred by the Fund from the underlying portfolio funds in which it invests.
(c) Effective July 11, 2014, Columbia Acorn Emerging Markets Fund is closed to most new investors and new accounts, except as described in the Fund's prospectus, dated May 1, 2014, as supplemented June 12, 2014.
83
COLUMBIA ACORN FAMILY OF FUNDS
Trustees
Laura M. Born
Chair of the Board
Steven N. Kaplan
Vice Chair of the Board
Maureen M. Culhane
P. Zachary Egan
Margaret M. Eisen
Thomas M. Goldstein
John C. Heaton
Charles R. Phillips
David J. Rudis
Ralph Wanger (Trustee Emeritus)
Officers
P. Zachary Egan
President
Robert A. Chalupnik
Vice President
Michael G. Clarke
Assistant Treasurer
Joseph F. DiMaria
Assistant Treasurer
William J. Doyle
Vice President
David L. Frank
Vice President
Fritz Kaegi
Vice President
John M. Kunka
Treasurer and Principal Accounting and Financial Officer
Stephen Kusmierczak
Vice President
Joseph C. LaPalm
Vice President
Charles P. McQuaid
Vice President
Louis J. Mendes III
Vice President
Robert A. Mohn
Vice President
Christopher J. Olson
Vice President
Christopher O. Petersen
Assistant Secretary
Scott R. Plummer
Assistant Secretary
Robert P. Scales
Chief Compliance Officer, Chief Legal Officer,
Senior Vice President and General Counsel
Andreas Waldburg-Wolfegg
Vice President
Linda K. Roth-Wiszowaty
Secretary
Investment Manager
Columbia Wanger Asset Management, LLC
227 West Monroe Street, Suite 3000
Chicago, Illinois 60606
1-800-922-6769
Distributor
Columbia Management Investment Distributors, Inc.
225 Franklin Street
Boston, Massachusetts 02110
Transfer Agent, Dividend Disbursing Agent
Columbia Management Investment Services Corp.
P. O. Box 8081
Boston, Massachusetts 02266-8081
1-800-345-6611
Legal Counsel to the Funds
Perkins Coie LLP
Washington, DC
Legal Counsel to the Independent Trustees
Drinker Biddle & Reath LLP
Philadelphia, Pennsylvania
Independent Registered Public Accounting Firm
PricewaterhouseCoopers LLP
Chicago, Illinois
This report, including the schedules of investments, is submitted for the general information of the shareholders of Columbia Acorn Trust.
A description of the policies and procedures that the Funds use to determine how to vote proxies and a copy of the Funds' voting record are available (i) without charge, upon request, by calling 800-922-6769 and (ii) on the Securities and Exchange Commission's website at www.sec.gov. Information regarding how the Funds voted proxies relating to portfolio securities during the 12-month period ended June 30, is available from the SEC's website. Information regarding how the Funds voted proxies relating to portfolio securities is also available at columbiathreadneedle.com/us under "About Us." From there, click on "Disclosures."
The Funds file a complete schedule of portfolio holdings with the SEC for the first and third quarters of each fiscal year on Form N-Q. The Funds' Form N-Q is available on the SEC's website at www.sec.gov and may be reviewed and copied at the SEC's Public Reference Room in Washington, D.C. Information on the operation of the Public Reference Room may be obtained by calling 1-800-SEC-0330. The Funds' complete portfolio holdings are disclosed at columbiathreadneedle.com/us approximately 30 to 40 days after each month-end.
Investors should consider the investment objectives, risks, charges and expenses of a mutual fund carefully before investing. For a free prospectus and, if available, a summary prospectus, which contains this and other important information about the funds, visit columbiathreadneedle.com/us. Read the prospectus carefully before investing.
Columbia Acorn Family of Funds are distributed by Columbia Management Investment Distributors, Inc., member FINRA and managed by Columbia Wanger Asset Management, LLC.
Find out what's new – visit our website at:
columbiathreadneedle.com/us
Our e-mail address is:
serviceinquiries@columbiathreadneedle.com
Shareholders should not include personal information such as account numbers, Social Security numbers or taxpayer identification numbers in e-mail. We are unable to accept account transactions sent via e-mail.
84
This document contains Global Industry Classification Standard data. The Global Industry Classification Standard ("GICS") was developed by and is the exclusive property and a service mark of MSCI Inc. ("MSCI") and Standard & Poor's Financial Services LLC ("S&P") and is licensed for use by Columbia Wanger Asset Management, LLC. Neither MSCI, S&P, nor any other party involved in making or compiling the GICS or any GICS classifications makes any express or implied warranties or representations with respect to such standard or classification (or the results to be obtained by the use thereof), and all such parties hereby expressly disclaim all warranties of originality, accuracy, completeness, merchantability and fitness for a particular purpose with respect to any of such standard or classification. Without limiting any of the foregoing, in no event shall MSCI, S&P, any of their affiliates or any third party involved in making or compiling the GICS or any GICS classifications have any liability for any direct, indirect, special, punitive, consequential or any other damages (including lost profits) even if notified of the possibility of such damages.
Columbia Acorn Family of Funds
Class A, B, C, I, R, R4, R5, Y and Z Shares
First Quarter Report, March 31, 2015
225 Franklin Street, Boston, MA 02110
For More Information
You'll find more information about the Columbia Acorn Family of Funds in the documents described below. Contact Columbia Funds as follows to obtain these documents free of charge:
By Mail: Columbia Funds
c/o Columbia Management Investment Services Corp.
P.O. Box 8081
Boston, MA 02266-8081
By Telephone: 800.345.6611
Online: columbiathreadneedle.com/us
Shareholder Communications with the Board
The Funds' Board of Trustees has adopted procedures by which shareholders may communicate with the Board. Shareholders who wish to communicate with the Board should send their written communications to the Board by mail, c/o Columbia Wanger Asset Management, LLC, 227 West Monroe Street, Suite 3000, Chicago, Illinois 60606, Attention: Secretary. Shareholder communications must (i) be in writing, (ii) identify the Columbia Acorn Fund to which the communication relates and (iii) state the particular class of shares and number of shares held by the communicating shareholder.
Prospectuses and the Statement of Additional Information (SAI)
The prospectuses and the SAI provide more detailed information about the Funds and their policies. The SAI is legally part of each prospectus (it's incorporated by reference). A copy of each has been filed with the SEC.
Information Provided by the SEC
You can review and copy information about the Funds (including their prospectuses, the SAI and shareholder reports) at the SEC's Public Reference Room in Washington, DC. To find out more about the operation of the Public Reference Room, call the SEC at 202.551.8090. Reports and other information about the Fund are also available in the EDGAR Database on the SEC's website at http://www.sec.gov, or you can receive copies of this information, for a fee, by electronic request at the following e-mail address: publicinfo@sec.gov. You can also obtain copies of this information by writing the Public Reference Section, Securities and Exchange Commission, Washington, DC 20549-0102.
The investment company registration number of Columbia Acorn Trust, of which each of these Funds is a series, is 811-01829.
© 2015 Columbia Management Investment Advisers, LLC. All rights reserved.
800.345.6611 columbiathreadneedle.com/us
QTR110_12_E01_(05/15) 1193568
