Q3 2012
Columbia Acorn Family of Funds
Class Z Shares
Managed by Columbia Wanger Asset Management, LLC

Third Quarter Report
September 30, 2012
n Columbia
Acorn® Fund
n Columbia
Acorn International®
n Columbia
Acorn USA®
n Columbia
Acorn International SelectSM
n Columbia
Acorn SelectSM
n Columbia
Thermostat FundSM
n Columbia
Acorn Emerging Markets FundSM
n Columbia
Acorn European FundSM
Not FDIC insured • No bank guarantee • May lose value
Columbia Acorn Family of Funds
Descriptions of Indexes Included in this Report
• 50/50 Blended Benchmark, established by the Fund's investment manager, is an equally weighted custom composite of Columbia Thermostat Fund's primary equity and primary debt benchmarks, the S&P 500 Index and the Barclays Capital U.S. Aggregate Bond Index, respectively. The percentage of the Fund's assets allocated to underlying stock and bond portfolio funds will vary, and accordingly the composition of the Fund's portfolio will not always reflect the composition of the 50/50 Blended Benchmark.
• Barclays U.S. Aggregate Bond Index is a market value-weighted index that tracks the daily price, coupon, pay-downs and total return performance of fixed-rate, publicly placed, dollar-denominated and non-convertible investment grade debt issues with at least $250 million par amount outstanding and with at least one year to final maturity.
• HSBC Smaller European Companies (inc UK) Index is a weighted combination of two indexes: the HSBC Smaller Europe (ex UK) Index and the HSBC Smaller UK Index. The index is rebalanced on a quarterly basis.
• Lipper Indexes include the largest funds tracked by Lipper, Inc. in the named category. Lipper Mid-Cap Growth Funds Index, 30 largest mid-cap growth funds, including Columbia Acorn Fund and Columbia Acorn Select; Lipper International Small/Mid Growth Funds Index, 10 largest non-U.S. small/mid growth funds, including Columbia Acorn International; Lipper Small-Cap Growth Funds Index, 30 largest small-cap growth funds, including Columbia Acorn USA; Lipper Flexible Portfolio Funds Index, an equal-weighted index of the 30 largest mutual funds within the Flexible Portfolio fund classification, as defined by Lipper. Lipper Emerging Markets Index, 30 largest emerging markets funds; Lipper European Region Index, 10 largest European funds.
• MSCI Europe, Australasia, Far East (EAFE) Index (Net) is a capitalization-weighted index that tracks the total return of common stocks in 22 developed-market countries within Europe, Australasia and the Far East. The returns of the MSCI EAFE Index (Net) are presented net of the withholding tax rate applicable to foreign non-resident institutional investors in the foreign companies included in the index who do not benefit from double taxation treaties.
• MSCI Emerging Markets Small Cap Index, a widely recognized international benchmark, is a free float-adjusted market capitalization index that is designed to measure small-cap emerging market equity performance. The MSCI Emerging Markets Small Cap Index currently consists of the following 21 emerging market country indexes: Brazil, Chile, China, Colombia, Czech Republic, Egypt, Hungary, India, Indonesia, Korea, Malaysia, Mexico, Morocco, Peru, Philippines, Poland, Russia, South Africa, Taiwan, Thailand and Turkey.
• Russell 2000 Index measures the performance of the 2,000 smallest companies in the Russell 3000 Index, which represents approximately 10% of the total market capitalization of the Russell 3000 Index.
• Russell 2500 Index measures the performance of the 2,500 smallest companies in the Russell 3000 Index, which represents approximately 17% of the total market capitalization of the Russell 3000 Index.
• Standard & Poor's (S&P) 500 Index tracks the performance of 500 widely held, large-capitalization U.S. stocks.
• Standard & Poor's (S&P) MidCap 400 Index is a market value-weighted index that tracks the performance of 400 mid-cap U.S. companies.
• S&P Developed Ex-U.S. Between $2B and $10B Index is a subset of the broad market selected by the index sponsor representing the mid-cap developed market, excluding the United States.
• S&P Emerging Markets Between $500M and $5B Index represents the institutionally investable capital of emerging market countries with market caps ranging between $500 million to $5 billion, as selected by S&P. The index currently consists of the following 21 emerging market country indexes: Brazil, Chile, China, Colombia, Czech Republic, Egypt, Hungary, India, Indonesia, Korea, Malaysia, Mexico, Morocco, Peru, Philippines, Poland, Russia, South Africa, Taiwan, Thailand and Turkey.
• S&P Europe Between $500M and $5B Index represents the institutionally investable capital of European countries with market caps ranging between $500 million to $5 billion, as selected by S&P. The index currently consists of the following 17 developed market country indexes: Austria, Belgium, Denmark, Finland, France, Germany, Greece, Ireland, Italy, Luxembourg, the Netherlands, Norway, Portugal, Spain, Sweden, Switzerland and the United Kingdom.
• S&P Global Ex-U.S. SmallCap Index consists of the bottom 20% of institutionally investable capital of developed and emerging countries, excluding the United States.
• S&P Global Ex-U.S. Between $500M and $5B Index is a subset of the broad market selected by the index sponsor representing the mid- and small-cap developed and emerging markets, excluding the United States.
Unlike mutual funds, indexes are not managed and do not incur fees or expenses. It is not possible to invest directly in an index.
The views expressed in the "Chattering Squirrels" and "In a Nutshell" commentaries reflect the current views of the respective authors. These views are not guarantees of future performance and involve certain risks, uncertainties and assumptions that are difficult to predict so actual outcomes and results may differ significantly from the views expressed. These views are subject to change at any time based upon economic, market or other conditions and the respective authors disclaim any responsibility to update such views. These views may not be relied upon as investment advice and, because investment decisions for a Columbia Acorn Fund are based on numerous factors, may not be relied upon as an indication of trading intent on behalf of any particular Columbia Acorn Fund. References to specific company's securities should not be construed as a recommendation or investment advice and there can be no assurance that as of the date of publication of this report, the securities mentioned in each Fund's portfolio are still held or that the securities sold have not been repurchased.
Acorn®, Acorn USA® and Acorn International® are service marks owned and registered by Columbia Acorn Trust. ColumbiaSM, Columbia Management®, and the Columbia Management Logo® are service marks owned and/or registered by Ameriprise Financial, Inc.
Columbia Acorn Family of Funds
Table of Contents
|
Performance At A Glance |
2 | ||||||
|
Chattering Squirrels |
|||||||
|
Columbia Acorn International Turns 20 |
3 |
||||||
|
2012 Shareholder Information Meeting Recap |
6 |
||||||
|
Columbia Acorn Fund |
|||||||
|
In a Nutshell |
14 |
||||||
|
At a Glance |
15 |
||||||
|
Major Portfolio Changes |
30 |
||||||
|
Statement of Investments |
32 |
||||||
|
Columbia Acorn International |
|||||||
|
In a Nutshell |
16 |
||||||
|
At a Glance |
17 |
||||||
|
Major Portfolio Changes |
45 |
||||||
|
Statement of Investments |
48 |
||||||
|
Portfolio Diversification |
57 |
||||||
|
Columbia Acorn USA |
|||||||
|
In a Nutshell |
18 |
||||||
|
At a Glance |
19 |
||||||
|
Major Portfolio Changes |
58 |
||||||
|
Statement of Investments |
59 |
||||||
|
Columbia Acorn International Select |
|||||||
|
In a Nutshell |
20 |
||||||
|
At a Glance |
21 |
||||||
|
Major Portfolio Changes |
66 |
||||||
|
Statement of Investments |
67 |
||||||
|
Portfolio Diversification |
71 |
||||||
|
Columbia Acorn Select |
|||||||
|
In a Nutshell |
22 |
||||||
|
At a Glance |
23 |
||||||
|
Major Portfolio Changes |
72 |
||||||
|
Statement of Investments |
73 |
||||||
|
Columbia Thermostat Fund |
|||||||
|
In a Nutshell |
24 |
||||||
|
At a Glance |
25 |
||||||
|
Statement of Investments |
79 |
||||||
|
Columbia Acorn Emerging Markets Fund |
|||||||
|
In a Nutshell |
26 |
||||||
|
At a Glance |
27 |
||||||
|
Major Portfolio Changes |
80 |
||||||
|
Statement of Investments |
82 |
||||||
|
Portfolio Diversification |
86 |
||||||
|
Columbia Acorn European Fund |
|||||||
|
In a Nutshell |
28 |
||||||
|
At a Glance |
29 |
||||||
|
Major Portfolio Changes |
87 |
||||||
|
Statement of Investments |
88 |
||||||
|
Portfolio Diversification |
92 |
||||||
|
Columbia Acorn Family of Funds |
|||||||
|
Columbia Acorn Family of Funds Information |
93 |
||||||
Estimated Year-End Distributions
To help with your tax planning, following are the estimated year-end capital gain distributions for the Columbia Acorn Funds. With the exception of Columbia Thermostat Fund, the expected record date is December 5, 2012, the ex-dividend date is December 6, 2012, and the payable date is December 6, 2012. For Columbia Thermostat Fund, the expected record date is December 20, 2012, the ex-dividend date is December 21, 2012, and the payable date is December 21, 2012. Distribution information is not final and should not be considered final until after the record date. The board of trustees will determine the actual distributions the Funds will pay.
|
Short-term Capital Gains |
Long-term Capital Gains |
||||||||||
|
Columbia Acorn Fund |
None |
$ |
1.25 - $1.50 |
||||||||
|
Columbia Acorn International |
None |
None |
|||||||||
|
Columbia Acorn USA |
None |
$ |
2.20 - $2.45 |
||||||||
|
Columbia Acorn International Select |
None |
$ |
1.95 - $2.20 |
||||||||
|
Columbia Acorn Select |
None |
$ |
1.35 - $1.60 |
||||||||
|
Columbia Thermostat Fund |
None |
None |
|||||||||
|
Columbia Acorn Emerging Markets Fund |
None |
None |
|||||||||
|
Columbia Acorn European Fund |
None |
None |
|||||||||
1
Columbia Acorn Family of Funds
Performance At A Glance Class Z Average Annual Total Returns through 9/30/12
|
NAV on 9/30/12 |
3rd quarter* |
Year to date* |
1 year |
5 years |
10 years |
Life of Fund |
|||||||||||||||||||||||||
| Columbia Acorn Fund (ACRNX) (6/10/70) |
$ |
31.17 |
4.81 |
% |
14.49 |
% |
26.82 |
% |
2.71 |
% |
12.09 |
% |
14.59 |
% |
|||||||||||||||||
|
Russell 2500 Index |
5.57 |
% |
14.33 |
% |
30.93 |
% |
2.80 |
% |
10.86 |
% |
NA |
||||||||||||||||||||
|
S&P 500 Index** |
6.35 |
% |
16.44 |
% |
30.20 |
% |
1.05 |
% |
8.01 |
% |
10.64 |
% |
|||||||||||||||||||
|
Russell 2000 Index |
5.25 |
% |
14.23 |
% |
31.91 |
% |
2.21 |
% |
10.17 |
% |
NA |
||||||||||||||||||||
|
Lipper Mid-Cap Growth Funds Index |
4.40 |
% |
12.46 |
% |
24.04 |
% |
1.33 |
% |
9.82 |
% |
NA |
||||||||||||||||||||
| Columbia Acorn International (ACINX) (9/23/92) |
$ |
39.81 |
7.30 |
% |
16.66 |
% |
19.02 |
% |
-0.31 |
% |
14.33 |
% |
11.06 |
% |
|||||||||||||||||
|
S&P Global Ex-U.S. Between $500M and $5B Index |
7.59 |
% |
12.78 |
% |
13.63 |
% |
-1.68 |
% |
13.77 |
% |
8.24 |
% |
|||||||||||||||||||
|
S&P Global Ex-U.S. SmallCap Index |
8.36 |
% |
13.73 |
% |
15.04 |
% |
-2.57 |
% |
13.09 |
% |
7.52 |
% |
|||||||||||||||||||
|
MSCI EAFE Index |
6.92 |
% |
10.08 |
% |
13.75 |
% |
-5.24 |
% |
8.20 |
% |
5.51 |
% |
|||||||||||||||||||
|
Lipper International Small/Mid Growth Funds Index |
8.92 |
% |
17.29 |
% |
20.67 |
% |
-1.73 |
% |
12.89 |
% |
NA |
||||||||||||||||||||
| Columbia Acorn USA (AUSAX) (9/4/96) |
$ |
31.06 |
4.51 |
% |
15.33 |
% |
29.10 |
% |
2.35 |
% |
10.94 |
% |
10.00 |
% |
|||||||||||||||||
|
Russell 2000 Index |
5.25 |
% |
14.23 |
% |
31.91 |
% |
2.21 |
% |
10.17 |
% |
7.30 |
% |
|||||||||||||||||||
|
Lipper Small-Cap Growth Funds Index |
5.39 |
% |
14.82 |
% |
29.61 |
% |
1.54 |
% |
9.13 |
% |
5.87 |
% |
|||||||||||||||||||
| Columbia Acorn Int'l Select (ACFFX) (11/23/98) |
$ |
30.26 |
12.57 |
% |
24.28 |
% |
26.68 |
% |
0.97 |
% |
13.77 |
% |
9.88 |
% |
|||||||||||||||||
|
S&P Developed Ex-U.S. Between $2B and $10B Index |
7.13 |
% |
10.85 |
% |
11.95 |
% |
-3.73 |
% |
11.02 |
% |
6.90 |
% |
|||||||||||||||||||
|
MSCI EAFE Index |
6.92 |
% |
10.08 |
% |
13.75 |
% |
-5.24 |
% |
8.20 |
% |
3.21 |
% |
|||||||||||||||||||
|
Lipper International Small/Mid Growth Funds Index |
8.92 |
% |
17.29 |
% |
20.67 |
% |
-1.73 |
% |
12.89 |
% |
9.90 |
% |
|||||||||||||||||||
| Columbia Acorn Select (ACTWX) (11/23/98) |
$ |
26.55 |
6.54 |
% |
14.81 |
% |
25.54 |
% |
-1.14 |
% |
9.04 |
% |
9.35 |
% |
|||||||||||||||||
|
S&P MidCap 400 Index |
5.44 |
% |
13.77 |
% |
28.54 |
% |
3.83 |
% |
10.77 |
% |
9.10 |
% |
|||||||||||||||||||
|
S&P 500 Index** |
6.35 |
% |
16.44 |
% |
30.20 |
% |
1.05 |
% |
8.01 |
% |
3.42 |
% |
|||||||||||||||||||
|
Lipper Mid-Cap Growth Funds Index |
4.40 |
% |
12.46 |
% |
24.04 |
% |
1.33 |
% |
9.82 |
% |
6.14 |
% |
|||||||||||||||||||
| Columbia Thermostat Fund (COTZX) (9/25/02)† |
$ |
14.17 |
4.89 |
% |
11.99 |
% |
20.54 |
% |
4.95 |
% |
8.33 |
% |
8.15 |
% |
|||||||||||||||||
|
S&P 500 Index |
6.35 |
% |
16.44 |
% |
30.20 |
% |
1.05 |
% |
8.01 |
% |
7.95 |
% |
|||||||||||||||||||
|
Barclays U.S. Aggregate Bond Index |
1.59 |
% |
3.99 |
% |
5.16 |
% |
6.53 |
% |
5.32 |
% |
5.34 |
% |
|||||||||||||||||||
|
Lipper Flexible Portfolio Funds Index |
5.55 |
% |
11.62 |
% |
18.63 |
% |
2.36 |
% |
7.74 |
% |
7.73 |
% |
|||||||||||||||||||
|
50/50 Blended Benchmark |
3.96 |
% |
10.21 |
% |
17.35 |
% |
4.24 |
% |
6.99 |
% |
6.97 |
% |
|||||||||||||||||||
|
Columbia Acorn Emerging Markets Fund (CEFZX) (8/19/11) |
$ |
11.17 |
9.62 |
% |
20.42 |
% |
26.41 |
% |
— |
— |
10.45 |
% |
|||||||||||||||||||
|
S&P Emerging Markets Between $500M and $5B Index |
7.83 |
% |
17.41 |
% |
18.53 |
% |
— |
— |
1.44 |
% |
|||||||||||||||||||||
|
MSCI Emering Markets Small Cap Index |
8.41 |
% |
16.29 |
% |
15.52 |
% |
— |
— |
-2.76 |
% |
|||||||||||||||||||||
|
Lipper Emerging Markets Index |
7.02 |
% |
12.98 |
% |
18.73 |
% |
— |
— |
4.71 |
% |
|||||||||||||||||||||
| Columbia Acorn European Fund (CAEZX) (8/19/11) |
$ |
11.27 |
7.13 |
% |
19.58 |
% |
21.00 |
% |
— |
— |
12.32 |
% |
|||||||||||||||||||
|
S&P Europe Between $500M and $5B Index |
10.30 |
% |
18.73 |
% |
19.21 |
% |
— |
— |
9.09 |
% |
|||||||||||||||||||||
|
HSBC Smaller European Companies Index |
9.92 |
% |
16.00 |
% |
14.91 |
% |
— |
— |
4.40 |
% |
|||||||||||||||||||||
|
Lipper European Region Index |
8.43 |
% |
13.91 |
% |
20.61 |
% |
— |
— |
11.11 |
% |
|||||||||||||||||||||
*Not annualized.
**Although the Fund typically invests in small- and mid-sized companies, the comparison to the S&P 500 Index is presented to show performance against a widely recognized market index over the life of the Fund.
Performance data shown represents past performance and is not a guarantee of future results. The investment return and principal value of an investment will fluctuate so that shares, when redeemed, may be worth more or less than their original cost. Performance results reflect any fee waivers or reimbursements of Fund expenses by the investment manager (Columbia Wanger Asset Management, LLC ("CWAM")) and/or any of its affiliates. Absent these fee waivers or expense reimbursement arrangements, performance results would have been lower. Current performance may be lower or higher than the performance data shown. Please visit columbiamanagement.com for daily and most recent month-end updates.
Net asset value (NAV) returns do not include sales charges or contingent deferred sales charges (CDSC). If they were included, returns would have been lower. Class Z shares are sold only at NAV with no distribution and service (Rule 12b-1) fees. Only eligible investors may purchase Class Z shares of the Funds, directly or by exchange. Please see each Fund's prospectus for eligibility and other details. Class Z shares have limited eligibility and the investment minimum requirement may vary.
Annual operating expense ratios are stated as of each Fund's prospectus dated May 1, 2012, and differences in expense ratios disclosed elsewhere in this report may result from including fee waivers and expense reimbursements as well as different
time periods used in calculating the ratios for Class Z shares. Columbia Acorn Fund: 0.77%. Columbia Acorn International: 0.98%. Columbia Acorn USA: 1.05%. Columbia Acorn International Select: 1.25%. Columbia Acorn Select: 1.00%. Columbia Thermostat Fund has a contractual fee waiver and expense reimbursement agreement with CWAM that expires on April 30, 2013; expense ratios without and with the contractual waiver/reimbursement, including fees and expenses associated with the Fund's investments in other investment companies (underlying funds), are 1.03% and 0.90%, respectively. Columbia Acorn Emerging Markets Fund and Columbia Acorn European Fund have a contractual fee waiver and expense reimbursement agreement with CWAM that also expires on April 30, 2013; expense ratios without and with the contractual waiver/reimbursement for Columbia Acorn Emerging Markets Fund are 13.35% and 1.60%, respectively, and for Columbia Acorn European Fund are 19.02% and 1.50%, respectively. See Page 93 for more information about the Funds' fees and expenses.
†A "fund of funds" bears its allocable share of the costs and expenses of the underlying funds in which it invests. Such funds are thus subject to two levels of fees and potentially higher expense ratios than would be associated with an investment in a fund that invests and trades directly in financial instruments under the direction of a single manager.
All results shown assume reinvestment of distributions and do not reflect the deduction of taxes that a shareholder would pay on fund distributions or on the redemption of fund shares. Unlike mutual funds, indexes are not actively managed and do not incur fees or expenses. It is not possible to invest directly in an index.
2
Chattering Squirrels
Columbia Acorn International Turns 20
|
|
|
||||||
|
P. Zachary Egan |
Louis J. Mendes III |
||||||
|
Co-Portfolio Manager |
Co-Portfolio Manager |
||||||


On September 23, Columbia Acorn International celebrated its 20-year anniversary. The timing of the Fund's launch was auspicious: after posting a 6.9% return through December 31, 1992, even as international markets were generally down, the Fund went on in its first calendar year of operation in 1993 to return over 49%, with assets under management rising from $29 million to $906 million. By all accounts, the Fund has had a successful run. As of September 30, 2012, Columbia Acorn International was ranked the best performing (1 out of 53) equity mutual fund over 20 years in the "Global ex-USA" investment area as defined by Morningstar.1 However, past performance does not guarantee future results. Today the Fund has about $6.4 billion in assets under management.
As one of the largest dedicated international small-cap funds, the Fund enjoys certain advantages. One important advantage that scale provides is the ability to maintain a large and specialized analyst team. Our current 10-person team has the necessary language and other skills, time and financial resources to ferret out investment ideas wherever they might be. In the course of the last year alone, our analysts have met with over a thousand companies and spent time on the ground in dozens of countries. Our size and research firepower also allow us to construct a broad portfolio containing lots of stocks and consequently myriad data points on industry and other developments. Combined with an investment holding period comparatively long for the industry (as reflected in the Fund's historically low portfolio turnover), our size facilitates patient analysis and thoughtful decision making. Scale also confers an ability to vote large numbers of shares of our portfolio companies in the interests of our clients, and to engage in a dialogue with portfolio companies regarding the issues that matter most to us as long-term shareholders.
An annualized 11.06% return from Fund inception through September 30, 2012, equates to an eight-times multiple of investment. At the 1992 launch, the Fund used
the MSCI EAFE Index as its benchmark, which was the most widely recognized international benchmark at the time. This index returned a comparatively lower 5.51% annualized gain over this same time period. While that is still nicely ahead of inflation and therefore confers a pleasing increase in purchasing power, it equates to a multiple of merely three-times an initial investment made at the Fund's launch, reflecting how, when compounded over a long period, a spread over a benchmark makes a big difference. Today the Fund uses the S&P Global Ex-U.S. Between $500M and $5B Index as its benchmark, which better captures our small-cap orientation and inclusion of emerging market stocks. This index has returned 8.24% per annum since the Fund's inception, which equates to a multiple on invested capital from Fund launch through September 30, 2012, of about 4.9 times. A $1,000 investment in Columbia Acorn International at inception would be worth about $8,000 today, but worth only about $4,900 had one obtained instead merely the benchmark return. For this reason, we at CWAM are hyper attentive to how we do versus benchmarks. We track the returns on actual dollars that individual analysts generate, and have structured incentives so that analysts and portfolio managers are rewarded if shareholders enjoy returns net of fees that are meaningfully better than the benchmark return.
Consistency of process has also been a hallmark of the Fund over its 20-year history. While we have tried to learn from our mistakes and worked to improve our processes over the years, seeking to pay reasonable prices for growing businesses with better-than-average economics has remained a constant. By better-than-average economics, we mean high profits relative to the capital that must be tied up in the business in the form of assets, inventories and receivables. A good measure of the quality of a business can be its return on equity ("ROE"), defined as net income divided by accounting book value. The Fund's quality bias is reflected in the average ROEs of the companies that comprise it. The following table shows how, over the last 15 years (we couldn't get primary benchmark data going back 20 years), the weighted average ROE of the companies in the Fund has been substantially higher (61% on average) than that of companies
3
in the benchmark. Identifying high-quality businesses, however, is not enough to generate competitive returns. It is also important to buy them at the right price. The two right-hand columns in the table below demonstrate that, while we generally have had to pay a premium to the market as
measured by the price-to-earnings multiple, that premium has on average been modest (13%). Given the higher growth and quality we expect from these companies, that premium strikes us as reasonable.
|
September 30: |
ROE Columbia Acorn International (%) |
ROE benchmark (%) |
P/E Columbia Acorn International (multiple) |
P/E benchmark (multiple) |
|||||||||||||||
|
1998 |
* |
22.4 |
12.7 |
33.3 |
25.9 |
||||||||||||||
|
1999 |
* |
11.9 |
10.7 |
49.4 |
34.8 |
||||||||||||||
|
2000 |
* |
17.1 |
9.4 |
60.0 |
36.8 |
||||||||||||||
|
2001 |
* |
18.2 |
10.1 |
26.1 |
24.1 |
||||||||||||||
|
2002 |
* |
15.0 |
7.9 |
19.1 |
21.1 |
||||||||||||||
|
2003 |
* |
13.7 |
6.7 |
20.8 |
24.5 |
||||||||||||||
|
2004 |
* |
15.7 |
9.9 |
23.9 |
25.0 |
||||||||||||||
|
2005 |
* |
18.5 |
11.3 |
23.6 |
26.6 |
||||||||||||||
|
2006 |
* |
18.9 |
12.9 |
24.1 |
25.0 |
||||||||||||||
|
2007 |
* |
20.3 |
15.3 |
31.1 |
26.7 |
||||||||||||||
|
2008 |
** |
20.9 |
15.9 |
18.6 |
20.1 |
||||||||||||||
|
2009 |
** |
18.6 |
8.1 |
23.4 |
23.0 |
||||||||||||||
|
2010 |
** |
16.7 |
9.8 |
28.7 |
24.9 |
||||||||||||||
|
2011 |
** |
18.3 |
12.9 |
20.3 |
18.1 |
||||||||||||||
|
2012 |
** |
19.9 |
12.0 |
22.9 |
20.3 |
||||||||||||||
|
Average over 15 years |
17.7 |
11.0 |
28.4 |
25.1 |
|||||||||||||||
|
Premium (multiple) |
1.61 |
1.13 |
|||||||||||||||||
These are weighted average, trailing 12-month figures.
*The primary benchmark for Columbia Acorn International was the Citigroup EMI Global ex-U.S. Index ("EMI"). EMI was added as a benchmark for Columbia Acorn International on September 30, 1997.
**The primary benchmark for Columbia Acorn International was the S&P Global Ex-U.S. Between $500M and $5B Index.
We attribute much of the Fund's success over the last 20 years to generally getting the relationship between growth, quality and cost right. We did let valuations get away from us in the 1999-2000 period, which we don't intend to repeat. High ROE businesses generally have more of their earnings available to return to shareholders as dividends or share buybacks, or to reinvest in growth, as opposed to simply maintaining their asset base.
The international investment landscape is considerably changed from what it looked like in 1992. This is particularly salient when one considers Asia. While the "Asian Tiger" economies of Hong Kong, Singapore, Taiwan and Korea attracted a great deal of attention when the Fund was launched—the Fund roughly had as much weight in Asia ex-Japan as it does now—important markets today,
such as China and India, were essentially not investable. Throughout emerging markets,2 the opportunity set was also comparatively narrow in 1992, and heavily skewed towards unexciting banks and construction companies. We have a lot more entrepreneurial companies from which to choose today, companies that enjoy leadership positions in profitable niche areas, and therefore conform more closely to the high quality, Acorn-style businesses discussed above. The next 20 years could very well be as volatile and exciting as the last 20 years. We will remain steadfast in our process, and seek to be able to report at that time an even better record of stewardship of your money.
1 Morningstar Percentile Rankings are based on the average annual total returns of the funds in the category for the periods stated and do not include any sales charges or redemption fees, but do include 12b-1 fees and the reinvestment of
4
dividends and capital gains distributions. The highest (or most favorable) percentile rank is 1 and the lowest (or least favorable) percentile rank is 100. Rankings for each share class will vary due to different expenses. Had sales charges or redemption fees been included, total returns would be lower. Columbia Acorn International was ranked as follows. Rankings are based on funds that have an inception date of September 23, 1992, Columbia Acorn International's inception date, or older and reflect performance of the oldest share class.
As of September 30, 2012
|
Morningstar Category: Global ex USA |
1-year |
3-year |
5-year |
10-year |
20-year | ||||||||||||||||||
|
Columbia Acorn International, Class Z |
20 |
2 |
1 |
2 |
1 |
||||||||||||||||||
|
Number of funds in category |
53 |
53 |
53 |
53 |
53 |
||||||||||||||||||
©2012 Morningstar, Inc. All rights reserved. The information contained herein: (1) is proprietary to Morningstar and/or its content providers; (2) may not be copied or distributed; and (3) is not warranted to be accurate, complete or timely. Neither Morningstar nor its content providers are responsible for any damages or losses arising from any use of this information.
2 Emerging markets today represent about a quarter of the Fund's investment universe and a quarter of the stocks in the Fund. Emerging market countries include Brazil, Chile, China, Colombia, Czech Republic, Egypt, Hungary, India, Indonesia, Korea, Malaysia, Mexico, Morocco, Peru, Philippines, Poland, Russia, South Africa, Taiwan, Thailand and Turkey.
5
2012 Shareholder Information Meeting Recap
On September 19, 2012, we held our annual Shareholder Information Meeting in Chicago. Following are highlights from your portfolio managers' presentations. While they did not present at this year's meeting, the portfolio managers of Columbia Acorn Emerging Markets Fund, Columbia Acorn European Fund and Columbia Acorn Select have provided comments to include in this recap. Data used in the presentations has been updated through September 30, 2012.
Charles P. McQuaid, Chief Investment Officer and Lead Portfolio Manager, Columbia Acorn Fund and Columbia Thermostat Fund
Columbia Acorn Fund's performance fell short of its benchmark, the Russell 2500 Index, for the 1-year period ended September 30, 2012. Fund foreign stock holdings hurt performance by 0.8% during the period, as did domestic consumer discretionary holdings, which cost the Fund nearly 1.5%. Domestic industrials were about neutral for performance this year, while telecom services stocks helped.
Looking at largest positions in the Fund, industrial stocks Ametek, Donaldson and Mettler-Toledo International occupy important niches, and all have shown excellent profitability and continue to do well fundamentally. Premium active apparel retailer lululemon athletica has generally been strong but on a roller coaster ride over the last year. It was a standout on the negative side in the second quarter, then a top contributor in the third. Due to valuation concerns and our desire to control risk, we sold about 40% of the Fund's position in lululemon athletica over the last year.
The communications tower industry is a prime example of our "downstream from technology" theme. Technology is a tough sector with lots of competition and fast product cycles. Think of cell phones. First Motorola dominated the industry, then Nokia, then Blackberry-RIM, and now Apple and Samsung. Instead of investing in these companies, we've invested downstream. Most recently, we've focused on communications towers companies, which are often local monopolies because zoning keeps out additional towers. Big wireless companies are leasing additional tower space for antennas as consumers demand more data. Crown Castle International was on the Fund's top-10 list
last year and SBA Communications has joined the list this year. Due to size and valuation, we trimmed about a quarter of the Fund's Crown Castle position over the last year but we thought SBA Communications had more upside so we added to it.
Looking at weightings by industry, the Fund continues to have its largest overweight in industrials, where we've found stocks representing what we think are good businesses at reasonable valuations. Furthermore, we've added a new theme that we call, "The Resurgence of American Manufacturing." Manufacturing unit labor costs have remained steady in the United States for a few decades, while unit labor costs are rising rapidly in many developing countries. In addition, natural gas prices are much cheaper in the United States than in most of the industrialized world, and that reduces costs for many manufacturers. We've seen examples of companies moving manufacturing to the United States, and with that manufacturing comes demand for equipment and components.
Though down from last year, Columbia Acorn Fund's next largest overweight is in consumer discretionary. While we still believe in the affordable luxury of American brands, economic problems overseas have slowed progress in several countries and some of the stocks are down as a result. We also felt that some stocks in this sector were getting expensive, so we trimmed.
The largest underweight continues to be in financials, due largely to the Fund having relatively little exposure to Real Estate Investment Trusts (REITs). REIT growth has generally been slower than other industries, and we don't think many of the stocks are cheap. We did make some purchases of insurance stocks because we believed valuations were reasonable and the insurance cycle was turning positive, but returns on capital are generally uninspiring.
Turning our attention to Columbia Thermostat Fund, we celebrated the Fund's 10-year anniversary in September. From inception through the end of September, the Fund's Class Z share performance edged out its equity benchmark, despite having lower volatility, and beat its debt benchmark.
A decade ago, firm and Fund founder Ralph Wanger noted that, historically, there have been two long-term
6
market phases: one he called "exponential growth," where stocks generally rise for many years, and the other he called "sine wave," where stocks are stuck in a trading range. These sine wave phases had lasted as long as 25 years. Ralph designed Columbia Thermostat Fund for a sine wave market cycle, and that is indeed what we've experienced since the Fund's inception.
Columbia Thermostat Fund buys stock funds when the market drops and sells them when the market goes up. Except for a little cash, the dollars come from, or go to, the bond funds. Thermostat's percentage of stocks has faithfully moved in the opposite direction of the market. Buying low and selling high has been effective so far in this sine wave market.
Robert A. Mohn, Director of Domestic Research, Lead Portfolio Manager, Columbia Acorn USA and Co-portfolio Manager, Columbia Acorn Fund
Columbia Acorn USA fell short of its small-cap benchmark, the Russell 2000 Index, for the one-year period ended September 30, 2012. Most of that shortfall occurred as the market surged during the fourth quarter of last year and the Fund failed to keep up. In 2012, Columbia Acorn USA's relative performance began to bounce back, and the Fund led its benchmark year-to-date through the end of September.
The Fund's best-performing sectors over the past 12 months were telecommunications and industrials. In telecom, the Fund benefitted from a heavy weight in cellular tower stocks and companies providing fiber optic connections to businesses. In industrials, the Fund had strong performers ranging from companies that manufacture dispensing systems for adhesives to companies that sell commercial lighting fixtures. The poorest-performing sectors over the past 12 months were: retailers, where too many of the Fund's larger holdings announced disappointing same-store sales results; financials, hurt by a group of our smaller, regional banks whose margins are getting squeezed by the Fed's zero interest rate policy; and health care equipment, with companies suffering from crimped capital expenditure budgets at hospitals.
I want to discuss two aspects of our research process: our team approach and our theme approach. Our domestic
research team is made up of 15 analysts organized along industry lines, each with a specialized area of expertise. What is rather unique to us is how deeply the team is involved in directly managing our flagship Columbia Acorn Fund. We think of Columbia Acorn Fund as being divided into smaller industry sector funds, each managed by one of our analysts. We internally track the performance of each analyst's sector funds and tie his or her compensation to the return the analyst achieves relative to an industry-specific benchmark. Furthermore, roughly half of our analysts are able to directly input trades for the Fund. This is why we often refer to our investment management style as a team approach. Less seasoned analysts are required to run their trading ideas by the portfolio managers, who are also responsible for industry weighting decisions and risk management.
Next, I want to elaborate on our theme approach to investing by discussing three of our current investment themes.
Orphan Drugs/Breakthrough Therapies
Our biotech analyst, Rich Watson, has concentrated his biotech holdings in a group of companies developing what are called orphan drugs. These drugs treat life-threatening diseases that only affect a small number of patients.
Why are we focused on orphans? First, they have an easier regulatory pathway through the U.S. Food and Drug Administration (FDA). Given their tiny patient populations, the FDA acknowledges that large trials are not feasible for orphan drugs and, since they treat extremely severe and unmet medical needs, the FDA is more tolerant of any side effects identified during the trial process. Second, orphan drugs have superior pricing power. Though orphan drugs are often quite expensive on an individual dosage basis, any one payor typically insures only a handful of patients with a given orphan disease so the cost is relatively small. Finally, orphan drugs have stronger patent protection, less risk of generic competition and stickier market share than traditional pharmaceuticals.
The Cloud
Traditionally, computers have operated in an on-site environment, where programs, databases and storage capacity are physically located on your site. Cloud computing takes that stuff and centralizes it, usually on a large cluster of off-site servers, where you can access your applications and
7
computing power through the internet. The cloud offers many benefits to computer users: it's cheaper, it's more scalable, more flexible and allows users to access huge amounts of computing power on an as-needed, pay-as-you-go basis.
Our software analyst, John Emerson, has built up investments in companies that own and manage the data centers that house the Cloud infrastructure, as well as in software companies that deliver their applications via the Cloud. These are called "software as a service" companies. Software delivered over the Cloud doesn't require on-site installation, which significantly reduces set-up costs. The time and effort required for ongoing management and maintenance of the software is also reduced, allowing companies to cut expenses and slim down their internal technology departments. Despite the obvious advantages, at the end of 2011 spending on software as a service was estimated to comprise less than 11% of the total software application market. We believe this powerful theme has a long way to go.
The Clean Theme
We began investing in our "clean theme" over 10 years ago, when our industrials analyst, Rob Chalupnik, recognized increasing global demand for cleaner inputs. These could be inputs for people, such as the air that we breathe or the water that we drink, as well as inputs for manufactured products and systems, such as engine air intakes or pharmaceutical reagents. Governmental regulation reinforces this theme, as regulatory mandates for a cleaner environment, safer food and more stringent quality control increase.
Most of our clean theme investments are in the filtration business, which has many appealing qualities. For example, a good portion of profits of these companies come from sales of replacement filters, which need to be replaced on a regular basis, in good times and in bad. Filtration companies also tend to have admirable pricing power. Another clean theme play is product inspection companies that inspect food items for contamination or test manufactured products for quality specifications.
Lead Portfolio Manager Ben Andrews and Co-portfolio Manager Robert A. Chalupnik, Columbia Acorn Select
Though we did not present at this year's Shareholder Information Meeting, we did attend and listened to what shareholders had to say. Many were concerned about U.S. deficit spending and whether it will cause high inflation in the future. The value of the dollar and the future for interest rates were also concerns.
While we consider these broader, economic problems, they reflect top-down issues that are difficult to decipher and predict. At CWAM, our analysts are what Chuck McQuaid likes to call "stock nuts." Stock nuts enjoy and get excited about analyzing and investing in companies. This is defined as bottom-up investing, an investment approach that de-emphasizes the significance of economic and market cycles and focuses on the analysis of individual stocks. As bottom-up investors, we focus our attention on a specific company rather than on the industry in which that company operates or on the economy as a whole. The bottom-up approach assumes that fundamentally strong companies can do well even in an industry that is struggling. This is the opposite of top-down investing. Top-down investing looks at the "big picture" in the economy and financial world and then breaks those components down into finer details. The top-down approach can be useful in determining the most promising sectors in a given market, but we have found that with top-down analysis, the bigger the picture you're trying to analyze, the more complicated it gets. Interest rates or inflation trends are huge, dynamic problems that are extremely difficult to predict with any sort of accuracy.
But investors are right to question the impact big-picture problems may have on their investment in the Funds. Long-term deficit spending has made the economic equation much more complicated now than in years past. Consider the U.S. Federal Reserve's quantitative easing programs. The Fed has bought $3 trillion of U.S. treasuries and mortgages, which amounts to more than 20% of the United States' debt obligations.1 What could be the repercussions of this move? Most would think that such excess government borrowing and market manipulation will raise interest rates and inflation. But if we look at Japan, which
8
has arguably been in one of these balance sheet recessions2 for many years now, there is little evidence of inflation. Japan's government debt is more than two-times its GDP, and they are experiencing more of a deflationary spiral. In the United States, the inflationary path seems more likely, though deflationary signs are present as well. It's also possible the United States won't experience either of these if solid growth of 3%-plus per year can be restored to the economy.
If the United States experiences inflation, precious metals, farmland, timberland, some real estate, and solid growth stocks may hold up in that environment. If the United States experiences deflation, cash, debt instruments (if the borrowers remain solvent), foreign investments in more stable markets and solid growth stocks, especially ones that pay a dividend (the stock's valuation multiple will initially contract, but it should rebound over time), could perform okay. Common to both of these scenarios is solid growth stocks, which is what CWAM analysts look for as bottom-up investors.
P. Zachary Egan, Director of International Research, Co-portfolio Manager, Columbia Acorn International and Columbia Acorn Emerging Markets Fund
September 23, 2012, marked the 20th anniversary of the launch of Columbia Acorn International. It is hard to exaggerate how much has changed in international politics and economics over the last 20 years. Curious about what the Fund looked like in the early days, I pulled some of the early annual reports and ran some performance comparisons. I discovered the following:
• Many of the companies that were held at Fund inception, particularly in Europe, are no longer publicly traded. Many were either acquired or merged. Some are now large-cap companies.
• The best performing stock in the Fund's history has been UK energy company Tullow Oil, up 20-times. We bought it almost 11 years ago and still hold it today.
• The worst performing stock was Fu Ji Food and Catering Services, a Chinese outsourced office canteen operator that ended in an accounting scandal and was a complete loss.
• And, while we hate losing money, the disparate outcomes of these two investments highlights one of the attractions of investing in growth companies: you can make 20-times your money, but only lose 1-time your money.
• Japan was the worst performing market over the Fund's history. At the outset of the Fund, Japan was massively over-valued and then suffered an unwinding of a property bubble.
• Scandinavian markets, which are mature economies with aging populations, were the best-performing markets for the Fund, underscoring that high GDP growth is less correlated with stock market returns than one might expect, though these markets had suffered through a banking crisis in the early '90s.
While doing my research, I was most struck by Ralph Wanger's commentary in the Fund's 1993 annual report. Investment commentary seldom holds up for even a few years, let alone 19, and it makes his words particularly noteworthy:
"Amazing things have been happening in the world. Over only a five-year time period, a majority of the world's population has gone from some form of socialism or state control toward free markets."
While that was not news to anybody at the time, succinctly identifying the single thing that will matter most to investors over a long period of time is not easy to do. When I consider how our Fund is positioned today, at a high level, it is this very same political/economic transformation, with origins in the late '80s and early '90s, that grounds many of the investment themes and ideas in the Fund.
This transformation is behind the integration of China, Central and Eastern Europe, and, to a lesser extent, India into the global production system. China's subsequent demand for resources brought a three-decade bear market in commodities to an end, which had huge repercussions for resource-based economies in Latin America and elsewhere. In India, after the dissolution of the Soviet Union took the shine off that economic model, economic liberalization, which started in 1992, removed constraints behind the 3% "Hindu rate of growth," in what used to be a highly insular economy. Finally, across much of Asia, this transformation
9
ultimately drove a marked increase in disposable incomes, resulting in the emergence of an entire continent of new consumers hungry for Western brands.
From a 40,000 foot view, this geopolitical change is still one of the biggest engines of growth in the global economy. Much of the Fund's investments ultimately tie to the movement of goods, capital, labor or ideas between high-income societies in the West and Japan on the one hand, and low cost, industrializing, urbanizing societies on the other. The uneven development of capitalism and free markets in the 20th century resulted in highly dissimilar levels of productivity and, with it, wages and living standards. As firms now invest to take advantage of these dissimilarities, they grow, as do the economies in which they operate, which makes everybody on average richer.
This gradual convergence in productivity levels between "the West" and the rest, referred to as the "Great Convergence" by Financial Times journalist Martin Wolf, is making emerging societies richer. But the magnitude of these changes is not always fully appreciated. This change has expanded the ranks of consumers to whom packaged foods, leisure activities and luxury goods are affordable.
Another group of clear beneficiaries, however, are Western industrial companies that are facilitating the convergence by supplying sophisticated factory automation to Asian producers or complex logistics systems that tie producers into global supply chains. These companies control innovative products and processes not easily replicated by the Chinese and Indians. Western companies have an advantage in the form of a highly educated workforce, but also in the form of high production, and high environmental and safety standards that are eventually sought by emerging market customers. Industrial companies represent about a quarter of the Fund's assets, and many of them—largely from Europe and Japan—fit into this bucket.
In short, the big geopolitical change, which Ralph emphasized almost 20 years ago, arguably remains the most important feature of our investment landscape, and it's likely that capital will continue to flow into developing regions, driving productivity convergence with already industrialized economies, and generating a lot of opportunity for investors along the way.
Christopher J. Olson, Lead Portfolio Manager, Columbia Acorn International Select
Columbia Acorn International Select performance for the one-year period through September 30, 2012, more than doubled that of its benchmark, the S&P Developed Ex-U.S. Between $2B and $10B. Though up only slightly, the Fund's positive gain for the five-year period also outpaced the benchmark. The past one- and five-year periods have been characterized by a tremendous amount of volatility and economic uncertainty and I do not expect these influences to diminish in the near future.
With volatility expected to continue, you may wonder what is in store for the Fund. We closely consider the risks we are taking in the Fund's individual investments and in the portfolio as a whole. We believe that holding a portfolio of carefully researched and considered stocks should give the Fund good returns with a reasonable risk profile. It is important to manage that risk/reward balance over time to determine how long to hold a given stock.
Given the concentrated nature of the Fund, it is also important to carefully consider the larger risks that may be inherent in the portfolio, such as economic, political, country, industry, balance sheet and beta risks. While an investment may make sense on an individual level, the portfolio as a whole can take on different risk characteristics as a result of one investment.
In recent years, I've taken the view that there is much more risk inherent in the global financial system than the market believes. As a result, I've had a bias toward companies with high cash flow and dividend yields, visible earnings streams, solid and less complicated balance sheets, and businesses with good competitive positions. At the same time, I've also had a bias for regions with stronger government finances, less public debt and healthier banking systems.
The Fund's top 10 holdings reflect these themes. Taiwanese mobile telecom operators, Far EasTone and Taiwan Mobile are benefiting from the strong move to smartphones and the increasing data usage that accompanies such a transition. The mobile telecom market in Taiwan has only a few significant players, limiting competition. These are also cash-rich businesses with little debt. When purchased for the Fund in the second half of 2011,
10
these stocks yielded about 6% to 7% and currently yield in the 5% to 6% range. From a bottom-up perspective, these are attractive investments. From a macro perspective, they are located in an attractive environment. While Taiwan is susceptible to a slowdown in exports, its government is constitutionally limited to 40% government debt as a percent of GDP, the political situation looks stable for now, and the financial system is well regulated and relatively strong, after Taiwan learned its lesson during the Asian Crisis of the 1990s.
Another area represented in the Fund's largest holdings is Singapore REITs as highlighted by investments in Ascendas REIT, which was first added to the portfolio in May 2009, and Mapletree Industrial Trust, which was added in May of 2011. When bought, these stocks had dividend yields over 7% and are still currently around 6%, which, in a low interest rate world, is remarkable. And, they aren't the most risky businesses. During the 2008 financial crisis, occupancy rates for properties held by the REITs barely went down and the REITs were easily able to fund their debt when the markets were closed to many other participants. Singapore has a very pro-business environment with low tax rates, minimal regulations, a budget surplus, no net government debt, and a well-run banking system. It is no wonder that multinational companies are increasingly moving there, driving strong demand for property.
If we step back and look at the overall portfolio, where are the major risks to performance? The main one is possibly its more defensive nature. If real and/or nominal economic growth takes off and the markets rally, there is a risk that the Fund will lag its benchmark and competition. However, looking around the world, most data shows poor economic trends. I believe that we are unlikely to see a strong increase in growth. In fact, in many cases, the trends are worsening.
Central bank intervention could fuel a recovery and dampen the Fund's relative performance. At any sign of weakness over the past four years, central banks have stepped in to print money in an attempt to restart the financial markets and economies. In order to hedge fiscal policy risks to Fund performance, I greatly increased the Fund's weight in gold and silver mining stocks. These companies had languished for quite some time and had been trading at multiples far below
historical averages. We found a number of companies that made sense to invest in from the bottom up even if precious metal prices didn't rise. Goldcorp and Fresnillo, which show up in the top 10 holdings, are two of those.
Lead Portfolio Managers Fritz Kaegi and Stephen Kusmierczak, Co-portfolio Managers P. Zachary Egan and Louis J. Mendes, Columbia Acorn Emerging Markets Fund
A year ago, we described our investment process. With the Fund now over a year old, let's review its current positioning.
We have a team of 10 international analysts, each with a regional or sector coverage area. The analyst drives stock selection in the coverage area. We evaluate each analyst's performance by comparing the returns of the stocks selected versus the performance of all the stocks in his or her coverage area. Six of these analysts are also portfolio managers of a Columbia Acorn Fund.
Analysts' bottom-up stock selection drives the Fund's sector and regional weights—portfolio managers do not make a top-down sector or region tilt. The portfolio managers do track whether the Fund is leaning in one direction, or unintentionally making repeated bets on the same factor. We work together to appropriately size positions and triage ideas, generally (but not always) aiming for a minimum position size of 1% of the Fund for each holding.
The Fund's key tilt is toward consumer discretionary, with a sizable underweight in financials. Since September 2011, consumer discretionary has increased from 21% of the Fund to 30% as of September 30, 2012, while the benchmark weight has remained at about 15%. The Fund's consumer discretionary holdings are mostly retailers, casino operators and media stocks. In emerging markets, these companies can benefit from powerful competitive advantages, attractive incremental economics and growth drivers that are largely local, rather than global.
Growth is particularly important in valuing these companies, so they tend to trade at higher earnings multiples. In 2012, our holdings performed well but most are trading at higher earnings multiples than a year ago. These valuations get close scrutiny from us; we are spending a lot of time tracking growth trends, sustainable growth rates and
11
competitive conditions to make sure prices do not get ahead of reasonable expectations for growth.
In financials, the Fund's underweight relative to the benchmark is up from 9% last year to 13% at September 30, 2012. We are not making a top-down call on financials. Rather, our analysts individually see businesses—mostly banks—with little sustainable competitive advantage and transparency, and with much risk. Note that three financials (Rand Merchant Insurance, Coronation Fund Managers, and Halyk Savings Bank of Kazakhstan) are in our top 10 holdings because we like their competitive advantages. The Fund's financial holdings delivered a 37% return for the one-year period ended September 30, 2012, while financials in the benchmark rose 24% (against a rise in the benchmark itself of 18.53%). This demonstrates why we don't want top-down calls by portfolio managers to override our analysts' bottom-up assessments.
In regional terms, the Fund is 7% overweight in Southeast Asia and 10% underweight in Latin America.3 We like the local demand drivers and macro fundamentals in Southeast Asia, but our holdings' management teams and powerful business models were decisive to our positioning. In the case of Latin America, the Fund's underweight does not result from a negative opinion on the region. We do have three analysts that look closely at the area; we just haven't found enough good companies selling at attractive valuations in that region.
Lead Portfolio Manager Andreas Waldburg-Wolfegg and Co-portfolio Manager Stephen Kusmierczak, Columbia Acorn European Fund
We noted last year that launching the new Columbia Acorn European Fund in the middle of the ongoing European economic crisis seemed an odd proposition, yet we also maintained that there were good opportunities for stock picking in the region. We are pleased to report that Columbia Acorn European Fund outperformed its benchmark, the S&P Europe Between $500M and $5B Index, by 179 basis points over the last 12 months, gaining 21.00% versus the benchmark's 19.21% increase. Since inception on August 19, 2011, the Fund was up 12.32% against a benchmark gain of 9.09%. Despite an environment of substantial macroeconomic uncertainty, this performance
has been achieved by focusing on companies and their businesses, not by trying to out-guess the political and economic strategists on the likelihood of a Greek exit from the Eurozone.
The European investment team, like the larger international team at Columbia Wanger Asset Management (CWAM) of which it is a part, is mostly composed of generalist investors. This means that CWAM's international analyst responsibilities are largely apportioned by geography. We are not committed or required to maintain the same sector or country weights as our benchmark and instead construct the portfolio stock by stock, from the bottom up. Our decision to invest in a certain company and determining its proper weighting in the portfolio are the result of fundamental analysis. We believe we can gain an edge by organizing and analyzing information about small companies, rather than trying to decipher the intricacies of Europe's complex and diversified economy.
The result of this stock-picking strategy is a European portfolio that is overweight companies listed in France and Germany. We admittedly do not know what policies the new Hollande government will implement in France, yet our two largest holdings in the Fund are French-listed companies incorporated in the Netherlands and in Luxembourg. Gemalto is a leader in smart chip technology used in pin-chip credit cards and mobile phone electronic payments, while Eurofins Scientific is a supplier of food, pharmaceuticals and materials testing services. If we had steered the portfolio based on a perceived negative election result in France, we would have missed the over 85% return in our two biggest names. Instead, our analyst determined that these companies should benefit from trends that are easier to identify and measure, such as the growth in electronic payments and the increasing focus on food and product safety. Similarly, our fifth largest holding, Wirecard, is a provider of online payment processing and risk management. Our investment is not intended as a bet on German GDP growth. Rather, our analyst believes that Wirecard should be a major beneficiary of the growth in e-commerce. The stock gained over 50% in the 12 months ended September 30, 2012.
While the macroeconomic situation is still highly uncertain, we continue to believe that there are great
12
opportunities to invest in European companies by following CWAM's careful and disciplined investment approach.
The information and data provided in this analysis are derived from sources that we deem to be reliable and accurate. These views are not guarantees of future performance and involve certain risks, uncertainties and assumptions that are difficult to predict so actual outcomes and results may differ significantly from the views expressed. The views/opinions expressed in "Chattering Squirrels" are those of the authors and not of the Columbia Acorn Trust Board, are subject to change at any time based upon economic, market or other conditions, may differ from views expressed by other Columbia Management associates and the respective parties disclaim any responsibility to update such views. These views may not be relied on as investment advice and, because investment decisions for a Columbia Acorn Fund are based on numerous factors, may not be relied on as an indication of trading intent on behalf of any particular Columbia Acorn Fund.
Stocks of small- and mid-cap companies pose special risks, including possible illiquidity and greater price volatility than stocks of larger, more established companies. International investing involves special risks, including foreign taxation, currency risks, risks associated with possible differences in financial standards and other risks associated with future political and economic developments. Investing in emerging markets may involve greater risks than investing in more developed countries. In addition, concentration of investments in a single region may result in greater volatility. A fund that maintains a relatively concentrated portfolio may be subject to greater risk than a fund that is more fully diversified.
1 Additional data available on the Federal Reserve Bank of St. Louis website at http://research.stlouisfed.org/publications/usfd/20121005/usfd.pdf.
2 Koo, Richard C., The Holy Grail of Macroeconomics: Lessons from Japan's Great Recession, (Singapore, John Wiley & Sons (Asia) Pte. Ltd., 2008).
3 Country weights can be found on Pages 82 and 83.
13
Columbia Acorn Fund
In a Nutshell
|
|
|
||||||
|
Charles P. McQuaid |
Robert A. Mohn |
||||||
|
Lead Portfolio Manager |
Co-Portfolio Manager |
||||||


Performance data shown represents past performance and is not a guarantee of future results. The investment return and principal value will fluctuate so that shares, when redeemed, may be worth more or less than the original cost. Current performance may be lower or higher than the performance data shown. Please visit columbiamanagement.com for daily and most recent month-end performance updates.
Fund Positions
in Mentioned Holdings
As a percentage of net assets, as of 9/30/12
|
lululemon athletica |
1.9 |
% | |||||
|
FMC Technologies |
1.4 |
% | |||||
|
Ansys |
1.1 |
% | |||||
|
Informatica |
1.0 |
% | |||||
|
Cepheid |
1.0 |
% | |||||
|
IPG Photonics |
0.9 |
% | |||||
|
Hexagon |
0.7 |
% | |||||
|
ARIAD Pharmaceuticals |
0.5 |
% | |||||
|
Atwood Oceanics |
0.5 |
% | |||||
|
ShawCor |
0.4 |
% | |||||
|
Atmel |
0.3 |
% | |||||
|
Rosetta Resources |
0.3 |
% | |||||
|
Quality Systems |
0.2 |
% | |||||
|
Kenexa |
0.2 |
% | |||||
|
InterMune |
0.1 |
% |
|||||
Columbia Acorn Fund rose 4.81% in the third quarter of 2012, somewhat less than the 5.57% gain of the Russell 2500 Index, its primary benchmark. As shown on Page 2, the Fund edged out the Lipper Mid-Cap Growth Index but rose less than the large-cap S&P 500 Index.
Energy stocks were strong in the quarter. Oil service company FMC Technologies rose 18% on stronger demand, pricing and margins for its subsea production systems. Offshore driller Atwood Oceanics and Canada-based oil and gas pipeline products manufacturer ShawCor each gained 20%. Atwood booked contracts at higher rates while ShawCor put itself up for sale. Oil and gas exploration company Rosetta Resources jumped 31% on rising production and improved prices for natural gas liquids from its Eagle Ford shale wells in South Texas.
Technology stocks were mixed during the quarter. Winners included fiber laser producer IPG Photonics and engineering software company Ansys, up 31% and 16%, respectively, on better than expected earnings. Workforce management software provider Kenexa jumped 57% as it agreed to be purchased by IBM; this was the Fund's eleventh takeover announced in 2012. On the downside, data integration software company Informatica fell 18% on disappointing earnings, and semiconductor producer Atmel dropped 21% on a loss of market share.
Health care stocks generally lagged in the third quarter. Cepheid, a producer of molecular diagnostic instruments and supplies, had disappointing orders and then a manufacturing problem, and fell 23% during the quarter. Health care
information systems provider Quality Systems dropped 32% on a delay in orders pending the release of updated government standards. InterMune's stock was down 25% on a disappointing rollout of the drug manufacturer's pulmonary fibrosis drug in Europe. On the plus side, ARIAD Pharmaceuticals surged 41% on promising data from a study of its lung cancer drug.
Premium active apparel retailer lululemon athletica remained volatile, but in a good way this quarter. The stock was up 24% and was the Fund's largest dollar winner. Net sales increased 33%, driven by 15% same-store sales gains, additional stores, and e-commerce sales, which were up 91% from the prior year. Earnings guidance was boosted somewhat.
After several quarters of relative weakness, Columbia Acorn Fund's international stocks outperformed, rising 11.25%* in the quarter. Swedish measurement equipment and software provider Hexagon rose 25% on nice organic growth and improving margins. A handful of small Canada-listed energy stocks jumped over 30% on higher oil prices, while ShawCor, mentioned above, gained 20%. Columbia Acorn Fund's international stocks accounted for 8.7% of the Fund's assets at quarter end, up from 8.3% at the beginning of the quarter.
While the economic outlook remains uncertain, we are happy with the fundamental progress achieved by many of the portfolio holdings. This quarter's "Chattering Squirrels" section mentions several companies and themes that shareholders should find interesting.
*These returns are not comparable to mutual fund returns, as they are gross of fees and other expenses and do not portray the cash effects incurred by actual mutual funds. Columbia Acorn Fund's foreign stockholdings were not purchased as a balanced, stand-alone portfolio.
Stocks of small- and mid-cap companies pose special risks, including possible illiquidity and greater price volatility than stocks of larger, more established companies. International investing involves special risks, including foreign taxation, currency risks, risks associated with possible differences in financial standards, operational and settlement risks and other risks associated with future political and economic developments.
Portfolio holdings are subject to change periodically and may not be representative of current holdings.
14
Columbia Acorn Fund (ACRNX)
At a Glance
Performance data shown represents past performance and is not a guarantee of future results. The investment return and principal value of an investment will fluctuate so that shares, when redeemed, may be worth more or less than their original cost. Current performance may be lower or higher than the performance data shown. Performance results reflect any fee waivers or reimbursements of Fund expenses by the investment manager and/or any of its affiliates. Absent these fee waivers and/or expense reimbursement arrangements, performance results would have been lower. Please visit columbiamanagement.com for daily and most recent month-end updates.
Pretax and After-tax Average Annual Total Returns (Class Z)
through September 30, 2012
|
Inception 6/10/70 |
Year to date* |
1 year |
5 years |
10 years |
|||||||||||||||
|
Returns before taxes |
14.49 |
% |
26.82 |
% |
2.71 |
% |
12.09 |
% |
|||||||||||
|
Returns after taxes on distributions |
14.28 |
26.01 |
2.16 |
11.47 |
|||||||||||||||
|
Returns after taxes on distributions and sale of fund shares |
9.67 |
18.36 |
2.25 |
10.75 |
|||||||||||||||
|
Russell 2500 Index (pretax)** |
14.33 |
30.93 |
2.80 |
10.86 |
|||||||||||||||
All results shown assume reinvestment of distributions.
*Year to date data is not annualized.
**The Fund's primary benchmark.
After-tax returns are calculated using the highest historical individual federal marginal income tax rates, and do not reflect the impact of state and local taxes. Returns after taxes on distributions and sale of Fund shares reflect the additional tax impact of long-term gains or losses realized when Fund shares are sold. The returns are taxed at the maximum rate and assume shares were purchased at the beginning of the period. Actual after-tax returns depend on the investor's tax situation and may differ from those shown. After-tax returns are not relevant to investors who hold their Fund shares through tax-deferred arrangements such as 401(k) plans or individual retirement accounts. After-tax returns are shown for Class Z shares only; after-tax returns for other share classes will vary. Indexes do not reflect any deduction for fees, expenses or taxes.
The Fund's Class Z annual operating expense ratio, as stated in the May 1, 2012, prospectus, is 0.77%.
Columbia Acorn Fund Portfolio Diversification
as a percentage of net assets, as of 9/30/12

Columbia Acorn Fund Top 10 Holdings
as a percentage of net assets, as of 9/30/12
| 1. |
Ametek Aerospace/Industrial Instruments |
2.0 |
% | ||||||||
| 2. |
lululemon athletica Premium Active Apparel Retailer |
1.9 |
% | ||||||||
| 3. |
Donaldson Industrial Air Filtration |
1.7 |
% | ||||||||
| 4. |
Crown Castle International Communications Towers |
1.6 |
% | ||||||||
| 5. |
Mettler-Toledo International Laboratory Equipment |
1.6 |
% | ||||||||
| 6. |
tw telecom Fiber Optic Telephone/Data Services |
1.4 |
% | ||||||||
| 7. |
FMC Technologies Oil & Gas Wellhead Manufacturer |
1.4 |
% | ||||||||
| 8. |
SBA Communications Communications Towers |
1.2 |
% | ||||||||
| 9. |
Amphenol Electronic Connectors |
1.1 |
% | ||||||||
| 10. |
Ansys Simulation Software for Engineers & Designers |
1.1 |
% | ||||||||
The Fund's top 10 holdings and portfolio diversification vary with changes in portfolio investments. See the Statement of Investments for a complete list of the Fund's holdings.
The Growth of a $10,000 Investment in Columbia Acorn Fund (Class Z)
June 10, 1970 through September 30, 2012
This graph compares the results of $10,000 invested in Columbia Acorn Fund at inception on June 10, 1970 to the S&P 500 Index and to an initial $31,777 investment in the Russell 2500 Index on the index's December 31, 1978 inception date. Although the indexes are provided for use in assessing the Fund's performance, the Fund's holdings may differ significantly from those in the indexes. The indexes are unmanaged and returns for both the indexes and the Fund include reinvested dividends and capital gains. It is not possible to invest directly in an index. The graph does not reflect taxes that a shareholder would pay on Fund distributions or on a sale of Fund shares.
Total Net Assets of the Fund: $17.5 billion
* A $10,000 investment in Columbia Acorn Fund at inception appreciated to $31,777 on December 31, 1978, the inception date of the Russell 2500 Index. For comparison with the Russell 2500 Index, we assigned the index the same value as the Fund at index inception.
**Although the Fund typically invests in small- and mid-sized companies, the comparison to the S&P 500 Index is presented to show performance against a widely recognized market index over the life of the Fund.
15
Columbia Acorn International
In a Nutshell
|
|
|
||||||
|
P. Zachary Egan |
Louis J. Mendes III |
||||||
|
Co-Portfolio Manager |
Co-Portfolio Manager |
||||||


Performance data shown represents past performance and is not a guarantee of future results. The investment return and principal value will fluctuate so that shares, when redeemed, may be worth more or less than the original cost. Current performance may be lower or higher than the performance data shown. Please visit columbiamanagement.com for daily and most recent month-end performance updates.
Fund's Positions
in Mentioned Holdings
As a percentage of net assets, as of 9/30/12
|
Nagacorp |
0.5 |
% | |||||
|
Tahoe Resources |
0.5 |
% | |||||
|
Mongolian Mining |
0.5 |
% | |||||
|
United Breweries |
0.4 |
% | |||||
|
New Oriental Education & Technology |
0.3 |
% | |||||
|
Zhaojin Mining Industry |
0.3 |
% | |||||
|
Sintokogi |
0.2 |
% | |||||
|
PureCircle |
0.2 |
% | |||||
|
Torishima Pump Manufacturing |
0.1 |
% |
|||||
Columbia Acorn International returned 7.30% in the third quarter of 2012, 29 basis points behind its primary benchmark, the S&P Global Ex-U.S. between $500M and $5B Index. Year to date, the Fund's total return of 16.66% is 388 basis points ahead of its benchmark. International small-cap stocks have outperformed larger cap stocks so far this year, with the large-cap developed market MSCI EAFE Index rising 10.08% year to date.
Concerns regarding a global economic slowdown and credit crises in Europe and the United States have cast a net of nervousness over most equity markets globally. Grim sentiment on the macroeconomic picture persisted in the third quarter, as did the outlook for interest rates, already at historical lows. A slow-growth, low interest rate environment is challenging for investors, whether value-focused or searching for growth. Normally defensive, high dividend-paying, steady cash generators, such as real estate investment trusts, have been among the best performers, as investors have apparently settled in for what they expect to be a long period of bad economic news. With growth a scarce phenomenon in the world, emerging market consumer stocks were buoyant, as investors pushed into some of the only growth around, sometimes regardless of price. Cambodian-based gaming company Nagacorp rose 29% and India's leading brewer, United Breweries, was up 27%. Meanwhile most industrial and financial stocks have continued to struggle. Within the Fund, Japanese cyclical industrial companies led the quarter's decline with Sintokogi off 31%, Torishima Pump Manufacturing down 28%, and Shimadzu falling 18% on the back of weak quarterly earnings reports and concerns about overall global economic growth. We sold the Fund's position in Shimadzu.
The Fund's top percentage gains came from PureCircle, a small London-listed company involved in the refining and marketing of stevia, a zero calorie, all-natural alternative to sugar. This is a risky
company and a commensurately small position in the Fund. While there is considerable uncertainty about how stevia might ultimately be used, the product has won regulatory approvals in the United States and Europe, and more general adoption by food and beverage companies could eventually drive large volumes. Concerns over accounting treatment of U.S.-listed Chinese companies with complicated "variable interest equity structures" sent Chinese education service provider New Oriental Education & Technology down over 30%.
Gold and gold miners were up on concerns that money printing would eventually cause inflation. Guatemalan gold and silver miner Tahoe Resources, for example, rose 47% and China-based gold miner Zhaojin ("find gold" in Chinese) Mining Industry increased over 34% on a U.S. dollar gold bullion price, which was up almost 11% in the quarter. Not all commodity companies performed well in the quarter, especially those with disappointing execution and stretched balance sheets. Petropavlovsk, fell 20% as disappointing cash flows caused concerns that the company would need to raise new capital. We sold this position in the quarter. Mongolian coking coal miner Mongolian Mining was down 20% on anxiety over slowing Chinese demand for coking coal as steel output slowed.
Markets have a lot of news to process in the fourth quarter. The United States will have an important election, and China will undergo a change of government. Europe will continue to negotiate a delicate balance between sustainable public finances and economic security demanded by its citizens on the one hand, and between the sovereignty of individual EU member states and the necessity of effective governance required by a single currency, on the other. Equity prices are highly sensitive to discount rates, which themselves are now strongly influenced by monetary policy interventions, and therefore difficult to forecast. All of this suggests that continued high volatility is likely.
International investing involves special risks, including foreign taxation, currency risks, risks associated with possible differences in financial standards, operational and settlement risks and other risks associated with future political and economic developments. Stocks of small- and mid-cap companies pose special risks, including possible illiquidity and greater price volatility than stocks of larger, more established companies. Investing in emerging markets may involve greater risks than investing in more developed countries. In addition, concentration of investments in a single region may result in greater volatility.
Portfolio holdings are subject to change periodically and may not be representative of current holdings.
16
Columbia Acorn International (ACINX)
At a Glance
Performance data shown represents past performance and is not a guarantee of future results. The investment return and principal value of an investment will fluctuate so that shares, when redeemed, may be worth more or less than their original cost. Current performance may be lower or higher than the performance data shown. Performance results reflect any fee waivers or reimbursements of Fund expenses by the investment manager and/or any of its affiliates. Absent these fee waivers and/or expense reimbursement arrangements, performance results would have been lower. Please visit columbiamanagement.com for daily and most recent month-end updates.
Pretax and After-tax Average Annual Total Returns (Class Z)
through September 30, 2012
|
Inception 9/23/92 |
Year to date* |
1 year |
5 years |
10 years |
|||||||||||||||
|
Returns before taxes |
16.66 |
% |
19.02 |
% |
-0.31 |
% |
14.33 |
% |
|||||||||||
|
Returns after taxes on distributions |
16.44 |
18.94 |
-0.85 |
13.75 |
|||||||||||||||
|
Returns after taxes on distributions and sale of fund shares |
10.82 |
12.49 |
-0.33 |
12.91 |
|||||||||||||||
|
S&P Global Ex-U.S. Between $500M and $5B Index** |
12.78 |
13.63 |
-1.68 |
13.77 |
|||||||||||||||
All results shown assume reinvestment of distributions.
*Year to date data is not annualized.
**The Fund's primary benchmark.
After-tax returns are calculated using the highest historical individual federal marginal income tax rates, and do not reflect the impact of state and local taxes. Returns after taxes on distributions and sale of Fund shares reflect the additional tax impact of long-term gains or losses realized when Fund shares are sold. The returns are taxed at the maximum rate and assume shares were purchased at the beginning of the period. Actual after-tax returns depend on the investor's tax situation and may differ from those shown. After-tax returns are not relevant to investors who hold their Fund shares through tax-deferred arrangements such as 401(k) plans or individual retirement accounts. After-tax returns are shown for Class Z shares only; after-tax returns for other share classes will vary. Indexes do not reflect any deduction for fees, expenses or taxes.
The Fund's Class Z shares annual operating expense ratio, as stated in the May 1, 2012, prospectus, is 0.98%.
Columbia Acorn International Portfolio Diversification
as a percentage of net assets, as of 9/30/12
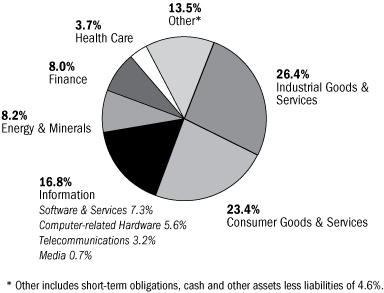
Columbia Acorn International Top 10 Holdings
as a percentage of net assets, as of 9/30/12
| 1. |
Far EasTone Telecom (Taiwan) Taiwan's Third Largest Mobile Operator |
1.4 |
% | ||||||||
| 2. |
Melco Crown Entertainment - ADR (Hong Kong) Macau Casino Operator |
1.4 |
% | ||||||||
| 3. |
Hexagon (Sweden) Measurement Equipment |
1.3 |
% | ||||||||
| 4. |
Eurofins Scientific (France) Food, Pharmaceuticals and Materials Screening and Testing |
1.2 |
% | ||||||||
| 5. |
Naspers (South Africa) Media in Africa and other Emerging Markets |
1.1 |
% | ||||||||
| 6. |
Gemalto (France) Digital Security Solutions |
1.0 |
% | ||||||||
| 7. |
Localiza Rent A Car (Brazil) Car Rental |
1.0 |
% | ||||||||
| 8. |
Kansai Paint (Japan) Paint Producer in Japan, India, China & Southeast Asia |
1.0 |
% | ||||||||
| 9. |
Seven Bank (Japan) ATM Processing Services |
1.0 |
% | ||||||||
| 10. |
Taiwan Mobile (Taiwan) Taiwan's Second Largest Mobile Operator |
0.9 |
% | ||||||||
The Fund's top 10 holdings and portfolio diversification vary with changes in portfolio investments. See the Statement of Investments for a complete list of the Fund's holdings.
The Growth of a $10,000 Investment in Columbia Acorn International (Class Z)
September 23, 1992 through September 30, 2012
This graph compares the results of $10,000 invested in Columbia Acorn International at inception on September 23, 1992 to the S&P Global Ex-U.S. Between $500M and $5B Index. Although the index is provided for use in assessing the Fund's performance, the Fund's holdings may differ significantly from those in the index. The index is unmanaged and returns for both the index and Fund include reinvested dividends and capital gains. It is not possible to invest directly in an index. The graph does not reflect taxes that a shareholder would pay on Fund distributions or on a sale of Fund shares.
Total Net Assets of the Fund: $6.4 billion
17
Columbia Acorn USA
In a Nutshell
|
|
|||||||||||
|
Robert A. Mohn |
|||||||||||
|
Lead Portfolio Manager |
|||||||||||

Performance data shown represents past performance and is not a guarantee of future results. The investment return and principal value will fluctuate so that shares, when redeemed, may be worth more or less than the original cost. Current performance may be lower or higher than the performance data shown. Please visit columbiamanagement.com for daily and most recent month-end performance updates.
Fund's Positions
in Mentioned Holdings
As a percentage of net assets, as of 9/30/12
|
lululemon athletica |
2.6 |
% | |||||
|
Atwood Oceanics |
2.1 |
% | |||||
|
Informatica |
2.0 |
% | |||||
|
IPG Photonics |
1.9 |
% | |||||
|
Cepheid |
1.3 |
% | |||||
|
Acuity Brands |
0.9 |
% | |||||
|
Ixia |
0.8 |
% | |||||
|
Textainer Group Holdings |
0.7 |
% | |||||
|
Atmel |
0.6 |
% | |||||
|
Akorn |
0.5 |
% |
|||||
Columbia Acorn USA ended the third quarter of 2012 up 4.51%, underperforming the 5.25% gain of its primary benchmark, the Russell 2000 Index. Relative to the benchmark, industrial stocks were the largest positive contributors for the quarter, while financial and materials stocks detracted most from performance.
On the upside, premium active apparel retailer lululemon athletica bounced back from last quarter's drop, gaining 24% after announcing revenue growth up over 30% versus the prior year. IPG Photonics, a manufacturer of fiber lasers, rose 31% in the quarter following the release of better-than-expected earnings. Interestingly, the company enjoyed a 26% growth in sales from its business in Asia, a region that has been the focus of growing economic concern.
Offshore drilling contractor Atwood Oceanics rose 20% in the quarter. Rental rates rose for Atwood's ultra-deep-water oil drilling rigs, alleviating concerns that weak oil prices might force the company to rein in rates. Acuity Brands, a provider of commercial lighting fixtures, rose 25% in the quarter as the company continued to gain market share. Ixia, a provider of telecommunication network test equipment, gained 34% after announcing better-than-expected quarterly results driven by strength in LTE (Long Term Evolution) and Wi-Fi products, as well as optimism regarding two promising acquisitions.
On the downside, Informatica, a developer of enterprise data integration software, pre-announced a revenue drop that was primarily caused by weakness in the company's European division. Its stock fell 18% on the news. Cepheid, a producer of molecular diagnostic instruments and supplies, saw its orders decline and had a manufacturing problem. Its stock fell 23% during the quarter.
Still reeling from the loss of a large contract for its touchscreen microcontrollers, semiconductor manufacturer Atmel fell 21% in the quarter. Textainer Group Holdings, an international freight container leasor, fell 16% following a secondary offering of shares. Akorn, a provider of specialty generic drugs, was also off 16% in the quarter as its stock price pulled back following a period of strong growth.
Think for a moment about all the economic disappointments plaguing our country: the weak recovery from the Great Recession, elevated unemployment, housing prices wallowing well below peak values, the economic woes facing our major trading partners in Europe and Asia. Then reflect on this fact: on September 14, 2012, Columbia Acorn USA closed at $32.40, its all-time record high price. The resiliency of U.S. small-cap companies can be remarkable.
Stocks of small- and mid-cap companies pose special risks, including possible illiquidity and greater price volatility than stocks of larger, more established companies.
Portfolio holdings are subject to change periodically and may not be representative of current holdings.
18
Columbia Acorn USA (AUSAX)
At a Glance
Performance data shown represents past performance and is not a guarantee of future results. The investment return and principal value of an investment will fluctuate so that shares, when redeemed, may be worth more or less than their original cost. Current performance may be lower or higher than the performance data shown. Performance results reflect any fee waivers or reimbursements of Fund expenses by the investment manager and/or any of its affiliates. Absent these fee waivers and/or expense reimbursement arrangements, performance results would have been lower. Please visit columbiamanagement.com for daily and most recent month-end updates.
Pretax and After-tax Average Annual Total Returns (Class Z)
through September 30, 2012
|
Inception 9/4/96 |
Year to date* |
1 year |
5 years |
10 years |
|||||||||||||||
|
Returns before taxes |
15.33 |
% |
29.10 |
% |
2.35 |
% |
10.94 |
% |
|||||||||||
|
Returns after taxes on distributions |
15.30 |
28.95 |
2.07 |
10.64 |
|||||||||||||||
|
Returns after taxes on distributions and sale of fund shares |
10.00 |
19.08 |
1.97 |
9.76 |
|||||||||||||||
|
Russell 2000 Index (pretax)** |
14.23 |
31.91 |
2.21 |
10.17 |
|||||||||||||||
All results shown assume reinvestment of distributions.
*Year to date data is not annualized.
**The Fund's primary benchmark.
After-tax returns are calculated using the highest historical individual federal marginal income tax rates, and do not reflect the impact of state and local taxes. Returns after taxes on distributions and sale of Fund shares reflect the additional tax impact of long-term gains or losses realized when Fund shares are sold. The returns are taxed at the maximum rate and assume shares were purchased at the beginning of the period. Actual after-tax returns depend on the investor's tax situation and may differ from those shown. After-tax returns are not relevant to investors who hold their Fund shares through tax-deferred arrangements such as 401(k) plans or individual retirement accounts. After-tax returns are shown for Class Z shares only; after-tax returns for other share classes will vary. Indexes do not reflect any deduction for fees, expenses or taxes.
The Fund's Class Z shares annual operating expense ratio, as stated in the May 1, 2012, prospectus, is 1.05%.
Columbia Acorn USA Portfolio Diversification
as a percentage of net assets, as of 9/30/12

Columbia Acorn USA Top 10 Holdings
as a percentage of net assets, as of 9/30/12
| 1. |
Ametek Aerospace/Industrial Instruments |
2.8 |
% | ||||||||
| 2. |
Nordson Dispensing Systems for Adhesives & Coatings |
2.7 |
% | ||||||||
| 3. |
lululemon athletica Premium Active Apparel Retailer |
2.6 |
% | ||||||||
| 4. |
tw telecom Fiber Optic Telephone/Data Services |
2.4 |
% | ||||||||
| 5. |
Micros Systems Information Systems for Restaurants & Hotels |
2.1 |
% | ||||||||
| 6. |
Ryman Hospitality Properties Convention Hotels |
2.1 |
% | ||||||||
| 7. |
Atwood Oceanics Offshore Drilling Contractor |
2.1 |
% | ||||||||
| 8. |
Bally Technologies Slot Machines & Software |
2.0 |
% | ||||||||
| 9. |
ESCO Technologies Automatic Electric Meter Readers |
2.0 |
% | ||||||||
| 10. |
Informatica Enterprise Data Integration Software |
2.0 |
% | ||||||||
The Fund's top 10 holdings and portfolio diversification vary with changes in portfolio investments. See the Statement of Investments for a complete list of the Fund's holdings.
The Growth of a $10,000 Investment in Columbia Acorn USA (Class Z)
September 4, 1996 through September 30, 2012
This graph compares the results of $10,000 invested in Columbia Acorn USA at inception on September 4, 1996 to the Russell 2000 Index. Although the index is provided for use in assessing the Fund's performance, the Fund's holdings may differ significantly from those in the index. The index is unmanaged and returns for both the index and the Fund include reinvested dividends and capital gains. It is not possible to invest directly in an index. The graph does not reflect taxes that a shareholder would pay on Fund distributions or on a sale of Fund shares.
Total Net Assets of the Fund: $1.5 billion
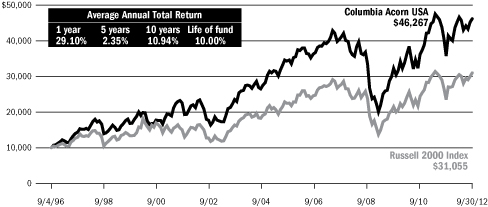
19
Columbia Acorn International Select
In a Nutshell

Christopher J. Olson
Lead Portfolio Manager
Performance data shown represents past performance and is not a guarantee of future results. The investment return and principal value will fluctuate so that shares, when redeemed, may be worth more or less than the original cost. Current performance may be lower or higher than the performance data shown. Please visit columbiamanagement.com for daily and most recent month-end performance updates.
Fund's Positions
in Mentioned Holdings
As a percentage of net assets, as of 9/30/12
|
Ascendas REIT |
6.3 |
% | |||||
|
Mapletree Industrial Trust |
5.8 |
% | |||||
|
Fresnillo |
5.5 |
% | |||||
|
Goldcorp |
5.2 |
% | |||||
|
Seven Bank |
4.3 |
% | |||||
|
Rand Merchant Insurance |
3.1 |
% | |||||
|
UGL |
2.8 |
% | |||||
|
Archipelago Resources |
2.7 |
% | |||||
|
Mapletree Logistics Trust |
2.5 |
% | |||||
|
Tahoe Resources |
2.0 |
% | |||||
|
IAG |
1.8 |
% | |||||
|
Zhaojin Mining Industry |
1.3 |
% | |||||
|
Marel |
1.1 |
% | |||||
|
Santa Maria Petroleum |
0.1 |
% | |||||
Columbia Acorn International Select ended the third quarter of 2012 up 12.57%, well ahead of the 7.13% gain of its primary benchmark, the S&P Developed Ex-U.S. Between $2B and $10B Index. Global economic growth remains weak and many indicators point to a deteriorating situation. In response, governments have continued to rely on massive fiscal deficits and extremely loose monetary policies, which, ironically, helped contribute to the economic problems in the first place. Will this time be any different?
The Fund enjoyed strong performance from its holdings in the materials and financials sectors during the quarter. The Fund is overweight relative to the benchmark in both sectors, and exposure within these areas is geared to stocks that may do well in an environment characterized by continued monetary stimulus. Within the materials sector, the Fund's exposure is mainly to gold and silver miners, which rallied significantly on the back of further European bailout measures and the U.S. Federal Reserve's move to a policy of quantitative easing. Fresnillo, a silver and gold miner in Mexico, gained 32% in the quarter. Goldcorp, a Canadian gold mining company, rose 23%. Archipelago Resources, an Indonesian gold miner operating throughout Asia, gained 21%. Tahoe Resources, a Guatemalan silver miner, rose 51%. Finally, Chinese gold miner Zhaojin Mining Industry gained 36%.
Within the financials sector, Singaporean industrial property landlords Mapletree Industrial Trust, Ascendas REIT and
Mapletree Logistics Trust had gains ranging from 16% to 22% as these companies continued to benefit from a resilient economic outlook in Singapore and from investor interest in their high dividend yields. The objective of easy monetary policy is to lower interest rates, which makes high yields increasingly scarce. Japan's Seven Bank, a provider of ATM processing services, rose 20% in the quarter as its ATM expansion within Japan continued to boost profits. Rand Merchant Insurance, a South African insurance company, came back strong in the third quarter, gaining 21% on continued strong results. Finally, Australian insurance provider IAG rose 29% in the quarter as policy price increases continued to boost the bottom line.
There were just 11 stocks in the Fund's portfolio of over 40 names that fell during the quarter, and only three of that group that were down more than 10%. UGL, an engineering and facilities management company in Australia, fell 12% on the back of a slowdown in the mining services industry in Australia. Icelandic manufacturer of poultry and fish processing equipment Marel fell 11% due to falling margins from a poorer mix of product sales and higher costs from a number of fish project customizations. Santa Maria Petroleum, a Colombian oil and gas explorer, had the largest percentage loss in the quarter, falling 55% due to poor drilling results.
International investing involves special risks, including foreign taxation, currency risks, risks associated with possible differences in financial standards, operational and settlement risks and other risks associated with future political and economic developments. Stocks of small- and mid-cap companies pose special risks, including possible illiquidity and greater price volatility than stocks of larger, more established companies. Investing in emerging markets may involve greater risks than investing in more developed countries.
Portfolio holdings are subject to change periodically and may not be representative of current holdings.
20
Columbia Acorn International Select (ACFFX)
At a Glance
Performance data shown represents past performance and is not a guarantee of future results. The investment return and principal value of an investment will fluctuate so that shares, when redeemed, may be worth more or less than their original cost. Current performance may be lower or higher than the performance data shown. Performance results reflect any fee waivers or reimbursements of Fund expenses by the investment manager and/or any of its affiliates. Absent these fee waivers and/or expense reimbursement arrangements, performance results would have been lower. Please visit columbiamanagement.com for daily and most recent month-end updates.
Pretax and After-tax Average Annual Total Returns (Class Z)
through September 30, 2012
|
Inception 11/23/98 |
Year to date* |
1 year |
5 years |
10 years |
|||||||||||||||
|
Returns before taxes |
24.28 |
% |
26.68 |
% |
0.97 |
% |
13.77 |
% |
|||||||||||
|
Returns after taxes on distributions |
24.19 |
26.18 |
0.56 |
13.55 |
|||||||||||||||
|
Returns after taxes on distributions and sale of fund shares |
15.87 |
18.14 |
0.83 |
12.49 |
|||||||||||||||
|
S&P Developed Ex-U.S. Between $2B and $10B Index (pretax)** |
10.85 |
11.95 |
-3.73 |
11.02 |
|||||||||||||||
All results shown assume reinvestment of distributions.
*Year to date data is not annualized.
**The Fund's primary benchmark.
After-tax returns are calculated using the highest historical individual federal marginal income tax rates, and do not reflect the impact of state and local taxes. Returns after taxes on distributions and sale of Fund shares reflect the additional tax impact of long-term gains or losses realized when Fund shares are sold. The returns are taxed at the maximum rate and assume shares were purchased at the beginning of the period. Actual after-tax returns depend on the investor's tax situation and may differ from those shown. After-tax returns are not relevant to investors who hold their Fund shares through tax-deferred arrangements such as 401(k) plans or individual retirement accounts. After-tax returns are shown for Class Z shares only; after-tax returns for other share classes will vary. Indexes do not reflect any deduction for fees, expenses or taxes.
The Fund's Class Z shares annual operating expense ratio, as stated in the May 1, 2012, prospectus, is 1.25%.
Columbia Acorn International Select Portfolio Diversification
as a percentage of net assets, as of 9/30/12
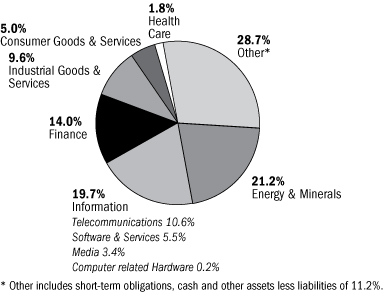
Columbia Acorn International Select
Top 10 Holdings
as a percentage of net assets, as of 9/30/12
| 1. |
Far EasTone Telecom (Taiwan) Taiwan's Third Largest Mobile Operator |
6.7 |
% | ||||||||
| 2. |
Ascendas REIT (Singapore) Industrial Property Landlord |
6.3 |
% | ||||||||
| 3. |
Mapletree Industrial Trust (Singapore) Industrial Property Landlord |
5.8 |
% | ||||||||
| 4. |
Fresnillo (Mexico) Silver and Metal Byproduct Mining in Mexico |
5.5 |
% | ||||||||
| 5. |
Goldcorp (Canada) Gold Mining |
5.2 |
% | ||||||||
| 6. |
Seven Bank (Japan) ATM Processing Services |
4.3 |
% | ||||||||
| 7. |
Jupiter Telecommunications (Japan) Largest Cable Service Provider in Japan |
3.5 |
% | ||||||||
| 8. |
Taiwan Mobile (Taiwan) Taiwan's Second Largest Mobile Operator |
3.4 |
% | ||||||||
| 9. |
Start Today (Japan) Online Japanese Apparel Retailer |
3.1 |
% | ||||||||
| 10. |
Rand Merchant Insurance (South Africa) Directly Sold Property & Casualty Insurance; Holdings in Other Insurers |
3.1 |
% | ||||||||
The Fund's top 10 holdings and portfolio diversification vary with changes in portfolio investments. See the Statement of Investments for a complete list of the Fund's holdings.
The Growth of a $10,000 Investment in Columbia Acorn International Select (Class Z)
November 23, 1998 through September 30, 2012
This graph compares the results of $10,000 invested in Columbia Acorn International Select at inception on November 23, 1998 to the S&P Developed Ex-U.S. Between $2B and $10B Index. Although the index is provided for use in assessing the Fund's performance, the Fund's holdings may differ significantly from those in the index. The index and Fund returns include reinvested dividends and capital gains. It is not possible to invest directly in an index. The graph does not reflect taxes that a shareholder would pay on Fund distributions or on a sale of Fund shares.
Total Net Assets of the Fund: $406.1 million
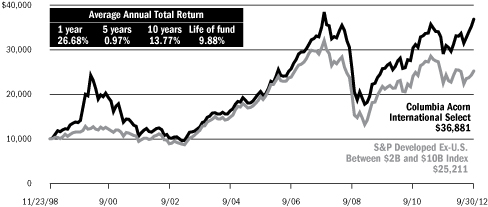
21
Columbia Acorn Select
In a Nutshell
|
|
|
||||||
|
Ben Andrews |
Robert A. Chalupnik |
||||||
|
Lead Portfolio Manager |
Co-Portfolio Manager |
||||||


Performance data shown represents past performance and is not a guarantee of future results. The investment return and principal value will fluctuate so that shares, when redeemed, may be worth more or less than the original cost. Current performance may be lower or higher than the performance data shown. Please visit columbiamanagement.com for daily and most recent month-end performance updates.
Fund's Positions
in Mentioned Holdings
As a percentage of net assets, as of 9/30/12
|
Discover Financial Services |
6.2 |
% | |||||
|
Ametek |
6.0 |
% | |||||
|
CNO Financial Group |
5.6 |
% | |||||
|
Donaldson |
3.5 |
% | |||||
|
Ryman Hospitality Properties |
3.2 |
% | |||||
|
Abercrombie & Fitch |
1.4 |
% | |||||
|
Canacol |
1.3 |
% | |||||
|
Shamaran Petroleum |
1.1 |
% | |||||
|
Cepheid |
1.0 |
% | |||||
|
F5 Networks |
0.8 |
% | |||||
|
ITT Educational Services |
0.7 |
% | |||||
|
Ansys |
0.6 |
% | |||||
|
Houston American Energy |
0.1 |
% |
|||||
Columbia Acorn Select gained 6.54% in the third quarter of 2012, outperforming the S&P MidCap 400 Index, the Fund's primary benchmark, which was up 5.44%. The large-cap S&P 500 Index gained 6.35% in the third quarter. Year to date, Columbia Acorn Select was up 14.81%, the S&P MidCap 400 Index gained 13.77%, and the S&P 500 Index was up 16.44%.
We have seen the larger cap stock index, the S&P 500, perform better than many of the small- to mid-cap indexes in 2011 and year to date in 2012. Why is this? One reason might be dividend yield; as interest rates hit historic lows, some investors are reaching for yield. But another reason might be franchises. The S&P 500 Index is full of household names like Coca-Cola and Home Depot. Franchises often have the heft to gain market share against their rivals in a very slow-growing economy. We've seen this in many of the solid franchises within the mid- and small-cap universe. For example, several of the Fund's industrial companies, such as Ametek and Donaldson, are growing sales faster than their market is growing, thus picking up market share. These companies aren't household names but they are the 800-pound gorilla in their arena and we believe they can use this slow-growth environment to their advantage. This is one of the reasons Columbia Acorn Select has recently been buying more solid growth franchises, or what we like to call core holdings, and leaning away somewhat from turnarounds or opportunistic holdings.
Three stocks were the big performance drivers during the third quarter, contributing about half of the overall performance. CNO Financial Group, an insurance provider, added 1.22%; credit card company Discover Financial Services added 0.95%; and Shamaran Petroleum, an oil explorer in Kurdistan, added 0.73% to overall portfolio gains. The laggard in the quarter was ITT Educational Services, a postsecondary degree services provider that cost the portfolio 0.67%. ITT has been forced to realign course offerings due to proposed regulatory changes from the Department of Education. This realignment has caused some programs to be changed or discontinued, which has led to a drop in enrollment.
Year to date through the end of September, the Fund's strongest
contributors to performance were, again, Discover Financial Services, adding 3.14% to overall portfolio performance, and CNO Financial Group, which added 2.31% to performance. Large detractors during the first three quarters of the year were two Colombian oil exploration companies, Canacol and Houston American Energy, which each lost around 0.70% as they both had disappointing exploration results. Teen apparel retailer Abercrombie & Fitch also subtracted about 0.70% from overall portfolio performance due, in part, to weaker sales in European stores.
During the third quarter, we added three new companies to the portfolio and sold out of three others. We also had one company change its name. We purchased Ansys, a maker of simulation software for engineers, F5 Networks, a provider of technology that optimizes the delivery of information between computers, and Cepheid, a molecular diagnostics services provider. We sold out of niche drug provider Akorn, as we believed the company was too pricey for its fundamentals. Eacom Timber was also sold in the quarter. Following the financial crisis, our original thesis was to purchase lumber assets cheaply and, in time, enjoy the benefits of higher lumber prices driven by the pine beetle epidemic, the U.S. housing recovery, and a growing need from Japan and China for lumber, which performs better in earthquakes than other materials. This thesis is starting to play out, but more slowly than we originally thought. Eacom, however, had to do continued financings during the Fund's period of ownership to stay in business. These financings diluted the share holdings to such an extent that we could see little upside in the stock. This serves as another good example of why we have moved to more solid growth franchises in the portfolio (core holdings). An underlying thesis can be right eventually, but if a company needs too much interim financing, its stock won't be successful. We also sold out of VisionChina Media, a digital advertiser in China's mass transit system, as our reasons for owning the stock did not prove out. Gaylord Entertainment was renamed Ryman Hospitality Properties during the quarter as it prepared to change into a REIT.
Risks include stock market fluctuations due to economic and business developments. The Fund also has potentially greater price volatility due to the Fund's concentration in a limited number of stocks of mid-size companies. International investing involves special risks, including foreign taxation, currency risks, risks associated with possible differences in financial standards, operational and settlement risks and other risks associated with future political and economic developments.
Portfolio holdings are subject to change periodically and may not be representative of current holdings.
22
Columbia Acorn Select (ACTWX)
At a Glance
Performance data shown represents past performance and is not a guarantee of future results. The investment return and principal value of an investment will fluctuate so that shares, when redeemed, may be worth more or less than their original cost. Current performance may be lower or higher than the performance data shown. Performance results reflect any fee waivers or reimbursements of Fund expenses by the investment manager and/or any of its affiliates. Absent these fee waivers and/or expense reimbursement arrangements, performance results would have been lower. Please visit columbiamanagement.com for daily and most recent month-end updates.
Pretax and After-tax Average Annual Total Returns (Class Z)
through September 30, 2012
|
Inception 11/23/98 |
Year to date* |
1 year |
5 years |
10 years |
|||||||||||||||
|
Returns before taxes |
14.81 |
% |
25.54 |
% |
-1.14 |
% |
9.04 |
% |
|||||||||||
|
Returns after taxes on distributions |
14.45 |
25.15 |
-1.45 |
8.72 |
|||||||||||||||
|
Returns after taxes on distributions and sale of fund shares |
10.06 |
17.08 |
-1.04 |
7.97 |
|||||||||||||||
|
S&P MidCap 400 Index (pretax)** |
13.77 |
28.54 |
3.83 |
10.77 |
|||||||||||||||
All results shown assume reinvestment of distributions.
*Year to date data is not annualized.
**The Fund's primary benchmark.
After-tax returns are calculated using the highest historical individual federal marginal income tax rates, and do not reflect the impact of state and local taxes. Returns after taxes on distributions and sale of Fund shares reflect the additional tax impact of long-term gains or losses realized when Fund shares are sold. The returns are taxed at the maximum rate and assume shares were purchased at the beginning of the period. Actual after-tax returns depend on the investor's tax situation and may differ from those shown. After-tax returns are not relevant to investors who hold their Fund shares through tax-deferred arrangements such as 401(k) plans or individual retirement accounts. After-tax returns are shown for Class Z shares only; after-tax returns for other share classes will vary. Indexes do not reflect any deduction for fees, expenses or taxes.
The Fund's Class Z shares annual operating expense ratio, as stated in the May 1, 2012, prospectus, is 1.00%.
Columbia Acorn Select Portfolio Diversification
as a percentage of net assets, as of 9/30/12
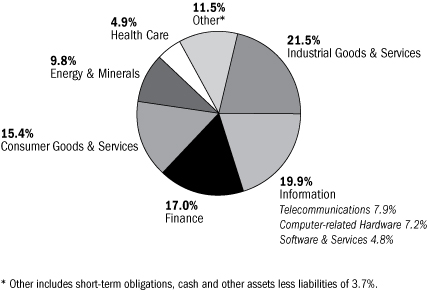
Columbia Acorn Select Top 10 Holdings
as a percentage of net assets, as of 9/30/12
| 1. |
Discover Financial Services Credit Card Company |
6.2 |
% | ||||||||
| 2. |
Ametek Aerospace/Industrial Instruments |
6.0 |
% | ||||||||
| 3. |
CNO Financial Group Life, Long-term Care & Medical Supplement Insurance |
5.6 |
% | ||||||||
| 4. |
Hertz Largest U.S. Rental Car Operator |
5.0 |
% | ||||||||
| 5. |
Crown Castle International Communications Towers |
4.0 |
% | ||||||||
| 6. |
Donaldson Industrial Air Filtration |
3.5 |
% | ||||||||
| 7. |
Pall Filtration & Fluids Clarification |
3.5 |
% | ||||||||
| 8. |
Ryman Hospitality Properties Convention Hotels |
3.2 |
% | ||||||||
| 9. |
WNS - ADR (India) Offshore Business Process Outsourcing Services |
3.1 |
% | ||||||||
| 10. |
Amphenol Electronic Connectors |
2.9 |
% | ||||||||
The Fund's top 10 holdings and portfolio diversification vary with changes in portfolio investments. See the Statement of Investments for a complete list of the Fund's holdings.
The Growth of a $10,000 Investment in Columbia Acorn Select (Class Z)
November 23, 1998 through September 30, 2012
This graph compares the results of $10,000 invested in Columbia Acorn Select at inception on November 23, 1998 to the S&P MidCap 400 Index. Although the index is provided for use in assessing the Fund's performance, the Fund's holdings differ significantly from those in the index. The index is unmanaged and returns for both the index and the Fund include reinvested dividends and capital gains. It is not possible to invest directly in an index. The graph does not reflect taxes that a shareholder would pay on Fund distributions or on a sale of Fund shares.
Total Net Assets of the Fund: $1.0 billion
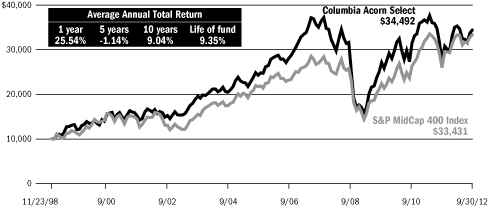
23
Columbia Thermostat Fund
In a Nutshell

|
Charles P. McQuaid |
|||
Lead Portfolio Manager
Performance data shown represents past performance and is not a guarantee of future results. The investment return and principal value will fluctuate so that shares, when redeemed, may be worth more or less than the original cost. Current performance may be lower or higher than the performance data shown. Please visit columbiamanagement.com for daily and most recent month-end performance updates.
A "fund of fund" bears its allocable share of the costs and expenses of the underlying funds in which it invests. Such funds are thus subject to two levels of fees and potentially higher expense ratios than would be associated with a fund that invests and trades directly in financial instruments under the direction of a single manager.
Columbia Thermostat Fund gained 4.89% in the third quarter of 2012. The Fund's primary equity benchmark, the S&P 500 Index, rose 6.35% for the same period while its primary debt benchmark, the Barclays U.S. Aggregate Bond Index, increased 1.59%.
The Fund hit three reallocation triggers during the period, increasing stock exposure in July and reducing it in August and September. At the end of the third quarter, the Fund had a 40% weighting in its underlying stock funds and a 60% weighting in its bond funds.
The weighted average return of the equity portion of the portfolio for the quarter was 6.65%. Columbia Select Large Cap Growth Fund provided top equity gains with a 9.76% return for the third quarter. The bond component of the Fund had a 2.76% weighted average gain. Columbia Income Opportunities Fund led bond fund returns, up 4.32% for the quarter.
Columbia Thermostat Fund reached its 10-year anniversary on September 25, 2012. From inception through the end of the third quarter, the Fund was up 8.15%, topping the 7.95% gain of the S&P 500 Index and the 5.34% return of the Barclays U.S. Aggregate Bond Index. We are pleased with this long-term result and with the Fund's ability to provide you, our shareholders, with a solid gain in a volatile market environment.
Results of the Funds Owned in
Columbia Thermostat Fund as of
September 30, 2012
|
Stock Funds |
Weightings |
3rd |
Year to |
||||||||||||
|
Fund |
in category |
quarter |
date |
||||||||||||
|
Columbia Acorn International, Class I |
20 |
% |
7.30 |
% |
16.73 |
% |
|||||||||
|
Columbia Dividend Income Fund, Class I |
20 |
% |
4.68 |
% |
12.84 |
% |
|||||||||
|
Columbia Acorn Fund, Class I |
15 |
% |
4.84 |
% |
14.55 |
% |
|||||||||
|
Columbia Contrarian Core Fund, Class I |
15 |
% |
7.89 |
% |
18.31 |
% |
|||||||||
|
Columbia Acorn Select, Class I |
10 |
% |
6.57 |
% |
14.87 |
% |
|||||||||
|
Columbia Large Cap Enhanced Core Fund, Class I |
10 |
% |
6.93 |
% |
17.68 |
% |
|||||||||
|
Columbia Select Large Cap Growth Fund, Class I |
10 |
% |
9.76 |
% |
16.58 |
% |
|||||||||
|
Weighted Average Equity Gain |
100 |
% |
6.65 |
% |
15.88 |
% |
|||||||||
|
Bond Funds |
Weightings |
3rd |
Year to |
||||||||||||
|
Fund |
in category |
quarter |
date |
||||||||||||
|
Columbia Intermediate Bond Fund, Class I |
50 |
% |
2.72 |
% |
6.44 |
% |
|||||||||
|
Columbia Income Opportunities Fund, Class I |
30 |
% |
4.32 |
% |
10.93 |
% |
|||||||||
|
Columbia U.S. Treasury Index Fund, Class I |
20 |
% |
0.52 |
% |
1.93 |
% |
|||||||||
|
Weighted Average Income Gain |
100 |
% |
2.76 |
% |
6.87 |
% |
|||||||||
Columbia Thermostat Fund
Rebalancing in the Third Quarter
|
July 25, 2012 |
55% stocks, 45% bonds |
||||||
|
August 27, 2012 |
45% stocks, 55% bonds |
||||||
|
September 14, 2012 |
40% stocks, 60% bonds |
||||||
The value of an investment in the Fund is based primarily on the performance of the underlying portfolio funds and the allocation of the Fund's assets among them. An investment in the underlying portfolio funds may present certain risks, including stock market fluctuations that occur in response to economic and business developments; and a greater degree of social, political and economic volatility associated with international investing. Stocks of small- and mid-cap companies pose special risks, including possible illiquidity and greater price volatility than stocks of larger, more established companies. Value stocks may also be subject to specific business risks that have caused the stocks to be out of favor. Lower-rated and medium quality debt securities are more speculative and incur more risk. International investing involves special risks, including foreign taxation, currency risks, risks associated with possible differences in financial standards and other risks associated with future political and economic developments. Changes in interest rates and changes in the financial strength of issuers of lower-rated bonds may also affect underlying fund performance. The Fund is also subject to the risk that the investment advisor's decisions regarding asset classes and underlying portfolio funds will not anticipate market trends successfully, resulting in a failure to preserve capital or lower total return. In addition, the Fund may buy and sell shares of the portfolio funds frequently. This may result in higher transaction costs and additional tax liability. This is not an offer of the shares of any other mutual fund mentioned herein.
24
Columbia Thermostat Fund (COTZX)
At a Glance
Performance data shown represents past performance and is not a guarantee of future results. The investment return and principal value of an investment will fluctuate so that shares, when redeemed, may be worth more or less than their original cost. Current performance may be lower or higher than the performance data shown. Performance results reflect any fee waivers or reimbursements of Fund expenses by the investment manager and/or any of its affiliates. Absent these fee waivers and/or expense reimbursement arrangements, performance results would have been lower. Please visit columbiamanagement.com for daily and most recent month-end updates.
Pretax and After-tax Average Annual Total Returns (Class Z)
through September 30, 2012
|
Inception 9/25/02 |
Year to date* |
1 year |
5 years |
10 years |
|||||||||||||||
|
Returns before taxes |
11.99 |
% |
20.54 |
% |
4.95 |
% |
8.33 |
% |
|||||||||||
|
Returns after taxes on distributions |
11.93 |
19.96 |
4.01 |
7.18 |
|||||||||||||||
|
Returns after taxes on distributions and sale of fund shares |
7.79 |
13.47 |
3.74 |
6.75 |
|||||||||||||||
|
S&P 500 Index (pretax)** |
16.44 |
30.20 |
1.05 |
8.01 |
|||||||||||||||
|
Barclays U.S. Aggregate Bond Index (pretax)** |
3.99 |
5.16 |
6.53 |
5.32 |
|||||||||||||||
|
Lipper Flexible Portfolio Funds Index (pretax) |
11.62 |
18.63 |
2.36 |
7.74 |
|||||||||||||||
All results shown assume reinvestment of distributions.
*Year to date data is not annualized.
**The Fund's primary stock and bond benchmarks, respectively.
After-tax returns are calculated using the highest historical individual federal marginal income tax rates, and do not reflect the impact of state and local taxes. Returns after taxes on distributions and sale of Fund shares reflect the additional tax impact of long-term gains or losses realized when Fund shares are sold. The returns are taxed at the maximum rate and assume shares were purchased at the beginning of the period. Actual after-tax returns depend on the investor's tax situation and may differ from those shown. After-tax returns are not relevant to investors who hold their Fund shares through tax-deferred arrangements such as 401(k) plans or individual retirement accounts. After-tax returns are shown for Class Z shares only; after-tax returns for other share classes will vary. Indexes do not reflect any deduction for fees, expenses or taxes.
The Fund's Class Z annual operating expense ratio, as stated in the May 1, 2012, prospectus, is 0.90%. Columbia Thermostat Fund has a contractual fee waiver and expense reimbursement with CWAM that expires April 30, 2013; expense ratios without and with the contractual waiver/reimbursement, including fees and expenses associated with the Fund's investment in other investment companies (underlying funds), are 1.03% and 0.90%, respectively. Absent the waiver or reimbursement, performance results would have been lower.
Columbia Thermostat Fund Asset Allocation
as a percentage of net assets, as of 9/30/12
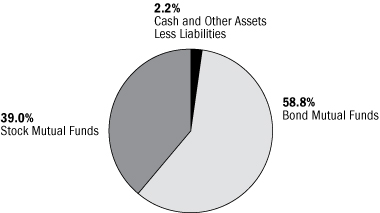
Columbia Thermostat Fund Portfolio Weightings
as a percentage of assets in each investment category, as of 9/30/12
Stock Mutual Funds
|
Columbia Acorn International, Class I |
20 |
% | |||||
|
Columbia Dividend Income Fund, Class I |
20 |
% | |||||
|
Columbia Acorn Fund, Class I |
15 |
% | |||||
|
Columbia Contrarian Core Fund, Class I |
15 |
% | |||||
|
Columbia Acorn Select, Class I |
10 |
% | |||||
|
Columbia Large Cap Enhanced Core Fund, Class I |
10 |
% | |||||
|
Columbia Select Large Cap Growth Fund, Class I |
10 |
% | |||||
Bond Mutual Funds
|
Columbia Intermediate Bond Fund, Class I |
50 |
% | |||||
|
Columbia Income Opportunities Fund, Class I |
30 |
% | |||||
|
Columbia U.S. Treasury Index Fund, Class I |
20 |
% |
|||||
The Growth of a $10,000 Investment in Columbia Thermostat Fund (Class Z)
September 25, 2002 through September 30, 2012
This graph compares the results of $10,000 invested in Columbia Thermostat Fund at inception on September 25, 2002 to the S&P 500 Index, the Barclays U.S. Aggregate Bond Index and the Lipper Flexible Portfolio Funds Index. Although the indexes are provided for use in assessing the Fund's performance, the Fund's holdings differ significantly from those in the indexes. The Indexes are unmanaged and returns for the indexes and the Fund include reinvested dividends and capital gains. It is not possible to invest directly in an index. The graph does not reflect taxes that a shareholder would pay on Fund distributions or on a sale of Fund shares.
Total Net Assets of the Fund: $657.1 million
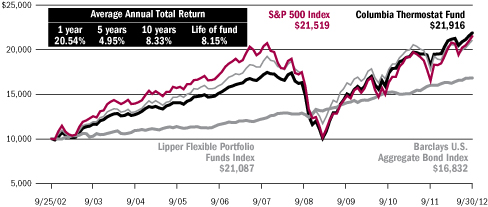
25
Columbia Acorn Emerging Markets Fund
In a Nutshell
|
|
|
||||||
|
Fritz Kaegi |
Stephen Kusmierczak |
||||||
|
Lead Portfolio Manager |
Lead Portfolio Manager |
||||||
|
|
|
||||||
|
P. Zachary Egan |
Louis J. Mendes |
||||||
|
Co-Portfolio Manager |
Co-Portfolio Manager |
||||||


Performance data shown represents past performance and is not a guarantee of future results. The investment return and principal value will fluctuate so that shares, when redeemed, may be worth more or less than the original cost. Current performance may be lower or higher than the performance data shown. Please visit columbiamanagement.com for daily and most recent month-end performance updates.
Fund's Positions
in Mentioned Holdings
As a percentage of net assets, as of 9/30/12
|
Tower Bersama Infrastructure |
3.5 |
% | |||||
|
Ace Indonesia |
3.3 |
% | |||||
|
Nagacorp |
3.3 |
% | |||||
|
Halyk Savings Bank of Kazakhstan |
2.3 |
% | |||||
|
Textainer Group Holdings |
1.9 |
% | |||||
|
Mongolian Mining |
1.6 |
% | |||||
|
Multiplus |
1.2 |
% | |||||
Columbia Acorn Emerging Markets Fund rose 9.62% in the third quarter of 2012 versus a 7.83% rise in the Fund's primary benchmark, the S&P Emerging Markets Between $500M and $5B Index. Year to date through September 30, the Fund was up 20.42% versus 17.41% for the benchmark. From the Fund's launch on August 19, 2011, to September 30, 2012, the Fund has returned an annualized 10.45% versus 1.44% for the benchmark.
The Fund's largest position was Tower Bersama Infrastructure, which owns communications towers in Indonesia and leases antenna space to wireless telephone operators. Its stock was up 33% for the quarter. Growing data volumes, 3G rollout, and the coverage needs of multiple operators continue to boost returns. Rising gaming volumes, tourist arrivals, and investor recognition boosted Nagacorp, owner of a casino complex in Cambodia, by 29%. Halyk Savings Bank of Kazakhstan's repurchase of preferred shares from the Kazakhstan state bailout agency signaled the resumption of a dividend and raised guidance for earnings and loan growth. Thanks to ample access to funding and a robust retail banking franchise, Halyk is earning good returns on equity even with a conservative capital structure. Its stock rose 39% during the quarter.
Mongolian Mining was down 22% as it continued to suffer from declining coking coal prices driven by stagnant Chinese steel production. We believe Mongolian Mining's low-cost position will allow it to make money even with low prices. International freight container leasor Textainer Group Holdings' secondary share offering helped send the stock down 17% for the quarter, giving back some gains made earlier in 2012. Multiplus, a Brazilian operator of airline loyalty programs, fell 15% as a member of
the Brazilian Congress proposed a law to eliminate expiration dates for frequent flier miles (known as "breakage"). While breakage is an important source of profits, we doubt the law will pass.
As we mark the Fund's one-year anniversary, we are pleased with its performance thus far. We believe the 10 analysts selecting stocks for the Columbia Acorn Emerging Markets Fund did a notably good job sizing investments appropriately. Some of the stocks with the largest position sizes—Nagacorp, Tower Bersama Infrastructure and Ace Indonesia—have been among the best performers, especially since March.
There was a common thread among ideas that have not worked out well during the year. Even though some of the largest "losers" were a very diverse group—a coal mining operation, a pulp and paper maker, a lentil and pulse processor, an irrigation equipment manufacturer and three oil exploration plays—one common thing that hurt them was capital intensivity. For some it was capital tied up in inventories and receivables (that is, sales where they are awaiting payment), for others it was capital investment in producing assets. Even though many (but not all) of these companies were profitable, growth sucked up cash and could not be generated internally, leaving them at the mercy of capital and commodity market conditions to fund growth.
This does not mean we should always avoid capital intensive businesses. After all, some of the Fund's biggest winners have also had periods requiring large amounts of capital. Still, with this experience in mind, we have (re)learned that capital intensive companies require extra scrutiny and better returns to compensate for their risks.
International investing involves special risks, including foreign taxation, currency risks, risks associated with possible differences in financial standards, operational and settlement risks and other risks associated with future political and economic developments. Stocks of small- and mid-cap companies pose special risks, including possible illiquidity and greater price volatility than stocks of larger, more established companies. Investing in emerging markets may involve greater risks than investing in more developed countries.
Portfolio holdings are subject to change periodically and may not be representative of current holdings.
26
Columbia Acorn Emerging
Markets Fund (CEFZX)
At a Glance
Pretax and After-tax Total Returns (Class Z)
through September 30, 2012
Performance data shown represents past performance and is not a guarantee of future results. The investment return and principal value of an investment will fluctuate so that shares, when redeemed, may be worth more or less than their original cost. Current performance may be lower or higher than the performance data shown. Performance results reflect any fee waivers or reimbursements of Fund expenses by the investment manager and/or any of its affiliates. Absent these fee waivers and/or expense reimbursement arrangements, performance results would have been lower. Please visit columbiamanagement.com for daily and most recent month-end updates.
|
Inception 8/19/11 |
Year to date* |
1 year |
Life of fund |
||||||||||||
|
Returns before taxes |
20.42 |
% |
26.41 |
% |
10.45 |
% |
|||||||||
|
Returns after taxes on distributions |
20.40 |
26.40 |
10.44 |
||||||||||||
|
Returns after taxes on distributions and sale of fund shares |
13.27 |
17.18 |
8.89 |
||||||||||||
|
S&P Emerging Markets Between $500M and $5B Index (pretax)** |
17.41 |
18.53 |
1.44 |
||||||||||||
All results shown assume reinvestment of distributions.
*Year to date data is not annualized.
**The Fund's primary benchmark.
After-tax returns are calculated using the highest historical individual federal marginal income tax rates, and do not reflect the impact of state and local taxes. Returns after taxes on distributions and sale of Fund shares reflect the additional tax impact of long-term gains or losses realized when Fund shares are sold. The returns are taxed at the maximum rate and assume shares were purchased at the beginning of the period. Actual after-tax returns depend on the investor's tax situation and may differ from those shown. After-tax returns are not relevant to investors who hold their Fund shares through tax-deferred arrangements such as 401(k) plans or individual retirement accounts. After-tax returns are shown for Class Z shares only; after-tax returns for other share classes will vary. Indexes do not reflect any deduction for fees, expenses or taxes.
The Fund's Class Z annual operating expense ratio, as stated in the May 1, 2012 prospectus, is 1.60%. Columbia Acorn Emerging Markets Fund has a contractual fee waiver and expense reimbursement agreement with CWAM that expires April 30, 2013; expense ratios without and with the contractual waiver/reimbursement are 13.35% and 1.60%, respectively. Absent the waiver or reimbursement, performance results would have been lower.
Columbia Acorn Emerging Markets Fund Portfolio Diversification
as a percentage of net assets, as of 9/30/12
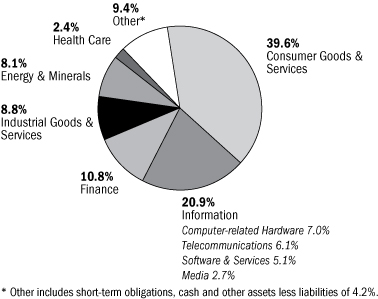
Columbia Acorn Emerging Markets Fund
Top 10 Holdings
as a percentage of net assets, as of 9/30/12
| 1. |
Tower Bersama Infrastructure (Indonesia) Communications Towers |
3.5 |
% | ||||||||
| 2. |
Ace Indonesia (Indonesia) Home Improvement Retailer |
3.3 |
% | ||||||||
| 3. |
Nagacorp (Cambodia) Casino/Entertainment Complex in Cambodia |
3.3 |
% | ||||||||
| 4. |
Rand Merchant Insurance (South Africa) Directly Sold Property & Casualty Insurance; Holdings in Other Insurers |
2.7 |
% | ||||||||
| 5. |
Hexagon (Sweden) Design, Measurement & Visualization Software &Equipment |
2.6 |
% | ||||||||
| 6. |
CTCI Corp (Taiwan) International Engineering Firm |
2.6 |
% | ||||||||
| 7. |
Archipelago Resources (Indonesia) Gold Mining Projects in Indonesia, Vietnam & the Philippines |
2.6 |
% | ||||||||
| 8. |
Far EasTone Telecom (Taiwan) Taiwan's Third Largest Mobile Operator |
2.5 |
% | ||||||||
| 9. |
Coronation Fund Managers (South Africa) South African Fund Manager |
2.4 |
% | ||||||||
| 10. |
Halyk Savings Bank of Kazakhstan - GDR (Kazakhstan) Largest Retail Bank & Insurer in Kazakhstan |
2.3 |
% | ||||||||
The Fund's top 10 holdings and portfolio diversification vary with changes in portfolio investments. See the Statement of Investments for a complete list of the Fund's holdings.
The Growth of a $10,000 Investment in Columbia Acorn Emerging Markets Fund (Class Z)
August 19, 2011 through September 30, 2012
This graph compares the results of $10,000 invested in Columbia Acorn Emerging Markets Fund at inception on August 19, 2011 to the S&P Emerging Markets Between $500M and $5B Index. Although the index is provided for use in assessing the Fund's performance, the Fund's holdings may differ significantly from those in the index. The index and Fund returns include reinvested dividends and capital gains. It is not possible to invest directly in an index. The graph does not reflect taxes that a shareholder would pay on Fund distributions or on a sale of Fund shares.
Total Net Assets of the Fund:
$7.2 million
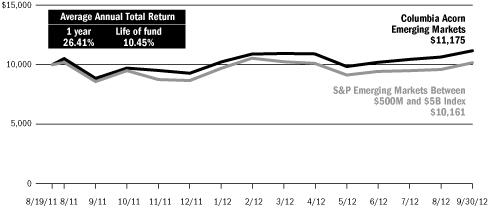
27
Columbia Acorn European Fund
In a Nutshell
|
|
|
||||||
|
Andreas Waldburg-Wolfegg |
Stephen Kusmierczak |
||||||
|
Lead Portfolio Manager |
Co-Portfolio Manager |
||||||


Performance data shown represents past performance and is not a guarantee of future results. The investment return and principal value will fluctuate so that shares, when redeemed, may be worth more or less than the original cost. Current performance may be lower or higher than the performance data shown. Please visit columbiamanagement.com for daily and most recent month-end performance updates.
Fund's Positions
in Mentioned Holdings
As a percentage of net assets, as of 9/30/12
|
Gemalto |
3.0 |
% | |||||
|
Hexagon |
2.8 |
% | |||||
|
Marel |
1.8 |
% | |||||
|
FX Energy |
1.2 |
% | |||||
|
Ocado |
1.0 |
% | |||||
|
Yandex |
0.9 |
% | |||||
|
Koninklijke TenCate |
0.8 |
% |
|||||
Columbia Acorn European Fund was up 7.13% in the third quarter of 2012, underperforming the 10.30% gain of its primary benchmark, the S&P Europe Between $500M and $5B Index, by 3.17%. For the first nine months of the year, the Fund gained 19.58%, somewhat better than the 18.73% gain of the benchmark. From the Fund's inception on August 19, 2011, through the third quarter end, the Fund was up 12.32% versus a 9.09% gain of its benchmark.
The largest detractors to performance relative to the benchmark in the third quarter were the Fund's holdings in the consumer discretionary and industrial sectors. The Fund maintained overweight positions in these sectors, compounding the effect of poor stock selection. The biggest underperformer was Koninklijke TenCate, a Dutch manufacturer of advanced composites and textiles, which fell 14% as orders from the U.S. Army declined faster than the company had forecast. Another consumer discretionary stock, Ocado, was the Fund's third worst performer, dropping 9%. Ocado is a UK internet grocer with nearly $1 billion in revenues and significant operational advantages compared to traditional retailers. The stock weakened after it announced lower sales growth during the Olympics and the Queen's Jubilee.
In industrials, the biggest performance detractor was Marel, an Icelandic manufacturer of poultry and fish processing equipment. While management has repaired the balance sheet and strongly grown revenues over the last several years, operating margins are lagging company targets. The stock declined nearly 11% in the quarter.
The Fund's overweight in information technology benefited from solid stock
selection, and three of the top four performing stocks were in this sector. Yandex is the largest internet search engine in Russia, and continues to maintain above 60% market share against Google's push into the market. This relatively new holding for the Fund jumped 25% after results beat expectations. Sweden's Hexagon, a leading provider of measurement equipment for manufacturing and construction, gained 25% after realizing a record quarterly profit while maintaining a confident outlook for the second half of 2012. Based in France, Gemalto is a leader in smart chip technology used in pin-chip credit cards and mobile phones. The stock has been a consistent outperformer in the Fund and climbed 22% in the quarter.
Another top performer in the Fund was FX Energy, which explores for and produces oil and gas in Poland. The stock gained 25% after the energy company restored full production at one of its wells and successfully resolved some pipeline issues. We believe the company should also benefit if its Polish shale gas explorations are successful.
The volatility in Europe continues, and as we have written before, the repair path will likely not be smooth or continuous. Yet despite the abundant gloom reported by the press, we continue to focus on trying to understand the opportunities, operations and threats facing individual companies. We don't mislead ourselves into believing that we have better insights into how the macro-economy will develop, but rather we maintain and build a portfolio of companies, one investment at a time. This process has been proven for decades in other Acorn Funds and the process continues to be applied in Columbia Acorn European Fund.
International investing involves special risks, including foreign taxation, currency risks, risks associated with possible differences in financial standards, operational and settlement risks and other risks associated with future political and economic developments. Stocks of small- and mid-cap companies pose special risks, including possible illiquidity and greater price volatility than stocks of larger, more established companies. Investing in emerging markets may involve greater risks than investing in more developed countries.
Portfolio holdings are subject to change periodically and may not be representative of current holdings.
28
Columbia Acorn
European Fund (CAEZX)
At a Glance
Pretax and After-tax Total Returns (Class Z)
through September 30, 2012
Performance data shown represents past performance and is not a guarantee of future results. The investment return and principal value of an investment will fluctuate so that shares, when redeemed, may be worth more or less than their original cost. Current performance may be lower or higher than the performance data shown. Performance results reflect any fee waivers or reimbursements of Fund expenses by the investment manager and/or any of its affiliates. Absent these fee waivers and/or expense reimbursement arrangements, performance results would have been lower. Please visit columbiamanagement.com for daily and most recent month-end updates.
|
Inception 8/19/11 |
Year to date* |
1 year |
Life of fund |
||||||||||||
|
Returns before taxes |
19.58 |
% |
21.00 |
% |
12.32 |
% |
|||||||||
|
Returns after taxes on distributions |
19.51 |
20.66 |
12.03 |
||||||||||||
|
Returns after taxes on distributions and sale of fund shares |
12.72 |
13.70 |
10.32 |
||||||||||||
|
S&P Europe Between $500M and $5B Index (pretax)** |
18.73 |
19.21 |
9.09 |
||||||||||||
All results shown assume reinvestment of distributions.
*Year to date data is not annualized.
**The Fund's primary benchmark.
After-tax returns are calculated using the highest historical individual federal marginal income tax rates, and do not reflect the impact of state and local taxes. Returns after taxes on distributions and sale of Fund shares reflect the additional tax impact of long-term gains or losses realized when Fund shares are sold. The returns are taxed at the maximum rate and assume shares were purchased at the beginning of the period. Actual after-tax returns depend on the investor's tax situation and may differ from those shown. After-tax returns are not relevant to investors who hold their Fund shares through tax-deferred arrangements such as 401(k) plans or individual retirement accounts. After-tax returns are shown for Class Z shares only; after-tax returns for other share classes will vary. Indexes do not reflect any deduction for fees, expenses or taxes.
The Fund's Class Z annual operating expense ratio, as stated in the May 1, 2012 prospectus, is 1.50%. Columbia Acorn European Fund has a contractual fee waiver and expense reimbursement agreement with CWAM that expires April 30, 2013; expense ratios without and with the contractual waiver/reimbursement are 19.02% and 1.50%, respectively. Absent the waiver or reimbursement, performance results would have been lower.
Columbia Acorn European Fund Portfolio Diversification
as a percentage of net assets, as of 9/30/12
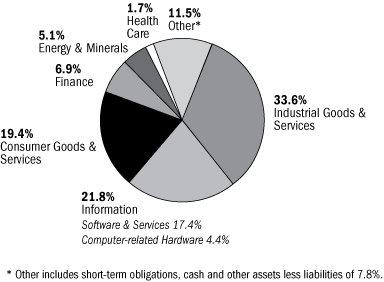
Columbia Acorn European Fund Top 10 Holdings
as a percentage of net assets, as of 9/30/12
| 1. |
Eurofins Scientific (France) Food, Pharmaceuticals & Materials Screening & Testing |
3.1 |
% |
||||||||
| 2. |
Gemalto (France) Smart Card Products & Solutions |
3.0 |
% | ||||||||
| 3. |
1000 Interactive Advertising and Marketingmercis (France) |
3.0 |
% | ||||||||
| 4. |
Geberit (Switzerland) Plumbing Supplies |
2.9 |
% | ||||||||
| 5. |
Wirecard (Germany) Online Payment Processing & Risk Management |
2.9 |
% | ||||||||
| 6. |
Hexagon (Sweden) Design, Measurement & Visualization Software & Equipment |
2.8 |
% | ||||||||
| 7. |
Charles Taylor (United Kingdom) Insurance Services |
2.5 |
% | ||||||||
| 8. |
Aalberts Industries (Netherlands) Flow Control & Heat Treatment |
2.4 |
% | ||||||||
| 9. |
Partners Group (Switzerland) Private Markets Asset Management |
2.3 |
% | ||||||||
| 10. |
Domino's Pizza UK & Ireland Pizza Delivery in the UK, Ireland & Germany |
2.3 |
% | ||||||||
The Fund's top 10 holdings and portfolio diversification vary with changes in portfolio investments. See the Statement of Investments for a complete list of the Fund's holdings.
The Growth of a $10,000 Investment in Columbia Acorn European Fund (Class Z)
August 19, 2011 through September 30, 2012
This graph compares the results of $10,000 invested in Columbia Acorn European Fund at inception on August 19, 2011 to the S&P Europe Between $500M and $5B Index. Although the index is provided for use in assessing the Fund's performance, the Fund's holdings may differ significantly from those in the index. The index and Fund returns include reinvested dividends and capital gains. It is not possible to invest directly in an index. The graph does not reflect taxes that a shareholder would pay on Fund distributions or on a sale of Fund shares.
Total Net Assets of the Fund:
$2.5 million
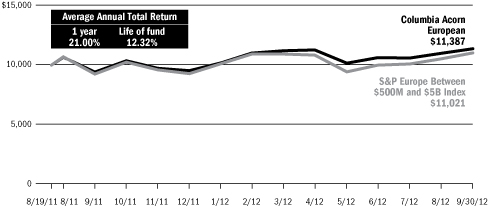
29
Columbia Acorn Fund
Major Portfolio Changes in the Third Quarter (Unaudited)
|
Number of Shares |
|||||||||||
|
6/30/12 |
9/30/12 |
||||||||||
|
Purchases |
|||||||||||
|
Information |
|||||||||||
|
Angie's List |
231,700 |
900,000 |
|||||||||
|
BazaarVoice |
0 |
141,923 |
|||||||||
|
Boingo Wireless |
1,650,000 |
1,860,682 |
|||||||||
|
DemandWare |
0 |
414,204 |
|||||||||
|
Eloqua |
0 |
130,881 |
|||||||||
|
Exa |
0 |
102,593 |
|||||||||
|
Finisar |
1,345,000 |
1,675,000 |
|||||||||
|
Gemalto (France) |
207,000 |
250,000 |
|||||||||
|
InContact |
1,000,000 |
2,110,000 |
|||||||||
|
Liquidity Services |
0 |
100,000 |
|||||||||
|
Trulia |
0 |
106,700 |
|||||||||
|
WNS - ADR (India) |
1,091,353 |
1,491,353 |
|||||||||
|
Yandex (Russia) |
700,100 |
727,000 |
|||||||||
|
Industrial Goods & Services |
|||||||||||
|
Aalberts Industries (Netherlands) |
2,324,833 |
2,472,255 |
|||||||||
|
Generac |
2,350,000 |
2,725,000 |
|||||||||
|
Insperity |
1,359,200 |
1,546,000 |
|||||||||
|
Neopost (France) |
350,000 |
400,000 |
|||||||||
|
Polypore International |
1,325,000 |
1,557,553 |
|||||||||
|
WESCO International |
0 |
157,843 |
|||||||||
|
Consumer Goods & Services |
|||||||||||
|
American Eagle Outfitters |
1,075,000 |
1,575,000 |
|||||||||
|
Choice Hotels |
970,000 |
1,100,000 |
|||||||||
|
DeVry |
0 |
600,000 |
|||||||||
|
Interface |
2,038,555 |
2,325,000 |
|||||||||
|
ITT Educational Services |
300,000 |
500,000 |
|||||||||
|
Lifestyle International (Hong Kong) |
16,857,500 |
17,000,000 |
|||||||||
|
Massmart Holdings (South Africa) |
0 |
388,220 |
|||||||||
|
Tesla Motors |
400,000 |
850,000 |
|||||||||
|
Williams-Sonoma |
0 |
415,000 |
|||||||||
|
Finance |
|||||||||||
|
Textainer Group Holdings |
78,500 |
228,500 |
|||||||||
|
Wright Express |
275,000 |
350,000 |
|||||||||
|
Health Care |
|||||||||||
|
ARIAD Pharmaceuticals |
2,568,248 |
3,600,000 |
|||||||||
|
Cepheid |
4,600,000 |
4,970,000 |
|||||||||
|
Onyx Pharmaceuticals |
750,000 |
870,000 |
|||||||||
|
Sirona Dental Systems |
675,000 |
1,024,683 |
|||||||||
|
Synageva Biopharma |
569,898 |
735,000 |
|||||||||
|
Energy & Minerals |
|||||||||||
|
Kaminak Gold |
0 |
2,518,600 |
|||||||||
|
Regis Resources (Australia) |
0 |
217,283 |
|||||||||
|
Silver Wheaton (Canada) |
550,000 |
1,000,000 |
|||||||||
|
Number of Shares |
|||||||||||
|
6/30/12 |
9/30/12 |
||||||||||
|
Other Industries |
|||||||||||
|
Ascendas REIT (Singapore) |
15,000,000 |
22,000,000 |
|||||||||
|
Kirby |
0 |
350,000 |
|||||||||
|
Mapletree Commercial Trust (Singapore) |
0 |
8,845,000 |
|||||||||
|
Mapletree Industrial Trust (Singapore) |
0 |
10,000,000 |
|||||||||
|
Mapletree Logistics Trust (Singapore) |
43,000,000 |
50,000,000 |
|||||||||
|
Rush Enterprises, Class A |
2,937,175 |
3,100,000 |
|||||||||
|
Summit Hotel Properties |
2,000,031 |
2,476,000 |
|||||||||
30
|
Number of Shares |
|||||||||||
|
6/30/12 |
9/30/12 |
||||||||||
|
Sales |
|||||||||||
|
Information |
|||||||||||
|
AboveNet |
1,400,000 |
0 |
|||||||||
|
Advent Software |
690,000 |
0 |
|||||||||
|
Ariba |
900,000 |
300,000 |
|||||||||
|
Blackbaud |
960,329 |
368,889 |
|||||||||
|
Constant Contact |
2,000,000 |
1,200,000 |
|||||||||
|
FTI Consulting |
234,615 |
0 |
|||||||||
|
General Communications |
2,000,000 |
1,500,000 |
|||||||||
|
Kenexa |
1,173,100 |
925,000 |
|||||||||
|
Lamar Advertising |
1,725,000 |
1,700,000 |
|||||||||
|
Liberty Global Series A |
900,000 |
800,000 |
|||||||||
|
Mail.ru - GDR (Russia) |
234,168 |
0 |
|||||||||
|
NetEase.com - ADR (China) |
304,000 |
222,400 |
|||||||||
|
Saga Communications |
145,271 |
0 |
|||||||||
|
Stratasys |
605,000 |
480,000 |
|||||||||
|
TripAdvisor |
1,450,000 |
1,325,000 |
|||||||||
|
VisionChina Media - ADR (China) |
1,500,000 |
0 |
|||||||||
|
Industrial Goods & Services |
|||||||||||
|
Albemarle |
1,750,000 |
1,580,000 |
|||||||||
|
Clarcor |
2,325,000 |
2,213,551 |
|||||||||
|
Expeditors International of Washington |
3,050,000 |
2,900,000 |
|||||||||
|
GrafTech International |
2,800,000 |
2,221,812 |
|||||||||
|
Imtech (Netherlands) |
1,491,313 |
1,300,000 |
|||||||||
|
Interline Brands |
1,400,000 |
0 |
|||||||||
|
Mersen (France) |
92,046 |
0 |
|||||||||
|
Pentair |
1,890,000 |
1,250,000 |
|||||||||
|
UTI Worldwide |
750,000 |
500,000 |
|||||||||
|
Consumer Goods & Services |
|||||||||||
|
Abercrombie & Fitch |
3,040,000 |
2,601,000 |
|||||||||
|
Expedia |
1,450,000 |
1,225,000 |
|||||||||
|
Shutterfly |
3,370,000 |
2,835,000 |
|||||||||
|
True Religion Apparel |
231,452 |
182,866 |
|||||||||
|
Finance |
|||||||||||
|
FX Alliance |
300,000 |
0 |
|||||||||
|
Pacific Continental Bank |
241,405 |
104,023 |
|||||||||
|
Regional Management |
422,500 |
333,191 |
|||||||||
|
Wintrust Financial |
700,000 |
550,000 |
|||||||||
|
World Acceptance |
1,425,202 |
1,285,000 |
|||||||||
|
Health Care |
|||||||||||
|
Adcock Ingram Holdings (South Africa) |
3,388,000 |
2,606,333 |
|||||||||
|
Alexion Pharmaceuticals |
1,476,000 |
1,215,000 |
|||||||||
|
Anthera Pharmaceuticals |
2,990,000 |
0 |
|||||||||
|
BioMarin Pharmaceutical |
4,315,000 |
3,875,000 |
|||||||||
|
Number of Shares |
|||||||||||
|
6/30/12 |
9/30/12 |
||||||||||
|
Chelsea Therapeutics International |
5,750,000 |
4,949,000 |
|||||||||
|
eResearch Technology |
4,900,000 |
0 |
|||||||||
|
Hill-Rom Holdings |
1,275,000 |
925,000 |
|||||||||
|
InterMune |
3,850,000 |
2,025,000 |
|||||||||
|
Raptor Pharmaceutical |
3,609,594 |
3,000,000 |
|||||||||
|
Energy & Minerals |
|||||||||||
|
Fugro (Netherlands) |
1,289,106 |
1,031,106 |
|||||||||
|
Hornbeck Offshore |
1,000,000 |
884,000 |
|||||||||
|
Pacific Rubiales Energy (Colombia) |
3,700,000 |
3,500,000 |
|||||||||
|
PetroMagdalena Energy (Colombia) |
7,582,928 |
0 |
|||||||||
|
Swift Energy |
550,000 |
0 |
|||||||||
|
Zhaojin Mining Industry (China) |
15,000,000 |
0 |
|||||||||
|
Other Industries |
|||||||||||
|
Red Eléctrica de España (Spain) |
200,000 |
0 |
|||||||||
|
World Fuel Services |
1,260,000 |
704,000 |
|||||||||
31
Columbia Acorn Fund
Statement of Investments (Unaudited), September 30, 2012
|
Number of Shares |
Value (000) |
||||||||||
|
Equities: 96.2% |
|||||||||||
|
Information 26.7% |
|||||||||||
| > Business Software 6.6% | |||||||||||
|
2,550,000 |
Ansys (a) |
$ |
187,170 |
||||||||
|
Simulation Software for Engineers & Designers |
|||||||||||
|
5,000,000 |
Informatica (a) |
174,050 |
|||||||||
|
Enterprise Data Integration Software |
|||||||||||
|
2,700,000 |
Micros Systems (a) |
132,624 |
|||||||||
|
Information Systems for Hotels, Restaurants & Retailers |
|||||||||||
|
5,450,000 |
Hexagon (Sweden) |
116,819 |
|||||||||
|
Design, Measurement & Visualization Software & Equipment |
|||||||||||
|
1,400,000 |
Concur Technologies (a) |
103,222 |
|||||||||
|
Web-enabled Cost & Expense Management Software |
|||||||||||
|
700,000 |
NetSuite (a) |
44,660 |
|||||||||
|
End-to-end IT Systems Solutions Delivered Over the Web |
|||||||||||
|
1,450,000 |
TIBCO (a) |
43,833 |
|||||||||
|
Datacenter Software |
|||||||||||
|
2,350,000 |
Quality Systems |
43,593 |
|||||||||
|
IT Systems for Medical Groups & Ambulatory Care Centers |
|||||||||||
|
925,000 |
Kenexa (a) |
42,393 |
|||||||||
|
Recruiting & Workforce Management Solutions |
|||||||||||
|
700,000 |
Red Hat (a) |
39,858 |
|||||||||
|
Maintenance & Support for Opensource Operating System & Middleware |
|||||||||||
|
900,000 |
Tyler Technologies (a) |
39,618 |
|||||||||
|
Financial, Tax, Court & Document Management Systems for Local Governments |
|||||||||||
|
900,000 |
SPS Commerce (a)(b) |
34,623 |
|||||||||
|
Supply Chain Management Software Delivered via the Web |
|||||||||||
|
750,000 |
Jack Henry & Associates |
28,425 |
|||||||||
|
IT Systems & Outsourced IT Solutions for Financial Institutions |
|||||||||||
|
2,700,000 |
Velti (a)(c) |
22,599 |
|||||||||
|
Mobile Marketing Software Platform |
|||||||||||
|
1,200,000 |
Constant Contact (a) |
20,880 |
|||||||||
|
Email & Other Marketing Campaign Management Systems Delivered Over Web |
|||||||||||
|
2,000,000 |
SABA (a)(b) |
19,980 |
|||||||||
|
Learning Management Systems |
|||||||||||
|
2,110,000 |
InContact (a) |
13,757 |
|||||||||
|
Call Center Systems Delivered Via the Web & Telco Services |
|||||||||||
|
300,000 |
Ariba (a) |
13,440 |
|||||||||
|
Cost Management Software |
|||||||||||
|
414,204 |
DemandWare (a)(c) |
13,151 |
|||||||||
|
eCommerce Website Solutions for Retailers & Apparel Manufacturers |
|||||||||||
|
900,000 |
Active Network (a) |
11,277 |
|||||||||
|
Web-delivered Software Solution for Managing Events & Activities |
|||||||||||
|
368,889 |
Blackbaud |
8,824 |
|||||||||
|
Software & Services for Non-profits |
|||||||||||
|
130,881 |
Eloqua (a) |
2,585 |
|||||||||
|
Marketing Automation Software |
|||||||||||
|
Number of Shares |
Value (000) |
||||||||||
|
55,000 |
Solera Holdings |
$ |
2,413 |
||||||||
|
Software for Automotive Insurance Claims Processing |
|||||||||||
|
141,923 |
BazaarVoice (a) |
2,150 |
|||||||||
|
Platform for Managing Consumer Interaction Via the Web |
|||||||||||
|
102,593 |
Exa (a) |
1,113 |
|||||||||
|
Simulation Software |
|||||||||||
|
1,163,057 |
|||||||||||
| > Instrumentation 3.0% | |||||||||||
|
1,600,000 |
Mettler-Toledo International (a)(b) |
273,184 |
|||||||||
|
Laboratory Equipment |
|||||||||||
|
2,780,000 |
IPG Photonics (a)(b)(c) |
159,294 |
|||||||||
|
Fiber Lasers |
|||||||||||
|
2,035,000 |
Trimble Navigation (a) |
96,988 |
|||||||||
|
GPS-based Instruments |
|||||||||||
|
529,466 |
|||||||||||
| > Mobile Communications 2.9% | |||||||||||
|
4,465,000 |
Crown Castle International (a) |
286,206 |
|||||||||
|
Communications Towers |
|||||||||||
|
3,400,000 |
SBA Communications (a) |
213,860 |
|||||||||
|
Communications Towers |
|||||||||||
|
1,200,000 |
Globalstar (a) |
552 |
|||||||||
|
Satellite Mobile Voice & Data Carrier |
|||||||||||
|
500,618 |
|||||||||||
|
> Computer Hardware & Related Equipment 2.6% |
|||||||||||
|
3,415,000 |
Amphenol |
201,075 |
|||||||||
|
Electronic Connectors |
|||||||||||
|
4,550,000 |
II-VI (a)(b) |
86,541 |
|||||||||
|
Laser Optics & Specialty Materials |
|||||||||||
|
1,365,000 |
Zebra Technologies (a) |
51,242 |
|||||||||
|
Bar Code Printers |
|||||||||||
|
900,000 |
Netgear (a) |
34,326 |
|||||||||
|
Networking Products for Small Business & Home |
|||||||||||
|
800,000 |
NICE Systems - ADR (Israel) (a) |
26,576 |
|||||||||
|
Audio & Video Recording Solutions |
|||||||||||
|
480,000 |
Stratasys (a)(c) |
26,112 |
|||||||||
|
Rapid Prototyping Systems |
|||||||||||
|
250,000 |
Gemalto (France) |
21,991 |
|||||||||
|
Digital Security Solutions |
|||||||||||
|
447,863 |
|||||||||||
|
> Semiconductors & Related Equipment 1.9% |
|||||||||||
|
11,562,000 |
Atmel (a) |
60,816 |
|||||||||
|
Microcontrollers, Radio Frequency & Memory Semiconductors |
|||||||||||
|
7,932,000 |
ON Semiconductor (a) |
48,940 |
|||||||||
|
Mixed Signal & Power Management Semiconductors |
|||||||||||
|
2,160,000 |
Microsemi (a) |
43,351 |
|||||||||
|
Analog/Mixed Signal Semiconductors |
|||||||||||
|
5,000,000 |
Entegris (a) |
40,650 |
|||||||||
|
Semiconductor Materials Management Products |
|||||||||||
|
420,000 |
Littelfuse |
23,747 |
|||||||||
|
Little Fuses |
|||||||||||
32
|
Number of Shares |
Value (000) |
||||||||||
|
> Semiconductors & Related Equipment—continued |
|||||||||||
|
1,165,000 |
Monolithic Power Systems (a) |
$ |
23,009 |
||||||||
|
High Performance Analog & Mixed Signal Integrated Circuits |
|||||||||||
|
400,000 |
Hittite Microwave (a) |
22,188 |
|||||||||
|
Radio Frequency, Microwave & Millimeterwave Semiconductors |
|||||||||||
|
615,000 |
Ultratech (a) |
19,299 |
|||||||||
|
Semiconductor Equipment |
|||||||||||
|
1,900,000 |
IXYS (a)(b) |
18,848 |
|||||||||
|
Power Semiconductors |
|||||||||||
|
1,765,000 |
Pericom Semiconductor (a)(b) |
15,329 |
|||||||||
|
Interface Integrated Circuits & Frequency Control Products |
|||||||||||
|
560,000 |
Cree (a)(c) |
14,297 |
|||||||||
|
LED Lighting, Components & Chips |
|||||||||||
|
2,290,000 |
TriQuint Semiconductor (a) |
11,564 |
|||||||||
|
Radio Frequency Semiconductors |
|||||||||||
|
342,038 |
|||||||||||
| > Telephone & Data Services 1.9% | |||||||||||
|
9,500,000 |
tw telecom (a)(b) |
247,665 |
|||||||||
|
Fiber Optic Telephone/Data Services |
|||||||||||
|
2,200,000 |
Cogent Communications |
50,578 |
|||||||||
|
Internet Data Pipelines |
|||||||||||
|
1,860,682 |
Boingo Wireless (a)(b) |
14,774 |
|||||||||
|
Wholesale & Retail WiFi Networks |
|||||||||||
|
1,500,000 |
General Communications (a) |
14,700 |
|||||||||
|
Commercial Communications & Consumer Cable TV, Web & Phone in Alaska |
|||||||||||
|
327,717 |
|||||||||||
| > Computer Services 1.4% | |||||||||||
|
3,400,000 |
iGATE (a)(b) |
61,778 |
|||||||||
|
IT & Business Process Outsourcing Services |
|||||||||||
|
1,618,000 |
ExlService Holdings (a)(b) |
47,731 |
|||||||||
|
Business Process Outsourcing |
|||||||||||
|
680,000 |
Syntel |
42,439 |
|||||||||
|
Offshore IT Services |
|||||||||||
|
2,125,000 |
Virtusa (a)(b) |
37,761 |
|||||||||
|
Offshore IT Outsourcing |
|||||||||||
|
1,705,000 |
Genpact |
28,439 |
|||||||||
|
Business Process Outsourcing |
|||||||||||
|
3,849,207 |
Hackett Group (a)(b) |
16,090 |
|||||||||
|
IT Integration & Best Practice Research |
|||||||||||
|
1,491,353 |
WNS - ADR (India) (a) |
15,272 |
|||||||||
|
Offshore BPO (Business Process Outsourcing) Services |
|||||||||||
|
249,510 |
|||||||||||
| > Gaming Equipment & Services 1.2% | |||||||||||
|
3,725,000 |
Bally Technologies (a)(b) |
183,978 |
|||||||||
|
Slot Machines & Software |
|||||||||||
|
1,530,000 |
WMS Industries (a) |
25,061 |
|||||||||
|
Slot Machine Provider |
|||||||||||
|
209,039 |
|||||||||||
| > Internet Related 1.0% | |||||||||||
|
450,000 |
Equinix (a) |
92,722 |
|||||||||
|
Network Neutral Data Centers |
|||||||||||
|
Number of Shares |
Value (000) |
||||||||||
|
1,325,000 |
TripAdvisor (a) |
$ |
43,632 |
||||||||
|
Online Travel Research |
|||||||||||
|
727,000 |
Yandex (Russia) (a) |
17,528 |
|||||||||
|
Search Engine for Russian & Turkish Languages |
|||||||||||
|
222,400 |
NetEase.com - ADR (China) (a) |
12,486 |
|||||||||
|
Chinese Online Gaming Services |
|||||||||||
|
900,000 |
Angie's List (a)(c) |
9,522 |
|||||||||
|
Consumer Subscription & Internet Advertising |
|||||||||||
|
106,700 |
Trulia (a) |
2,286 |
|||||||||
|
Real Estate Broker Subscription & Advertising |
|||||||||||
|
178,176 |
|||||||||||
|
> Business Information & Marketing Services 0.8% |
|||||||||||
|
1,900,000 |
Verisk Analytics (a) |
90,459 |
|||||||||
|
Risk & Decision Analytics |
|||||||||||
|
3,500,000 |
Navigant Consulting (a)(b) |
38,675 |
|||||||||
|
Financial Consulting Firm |
|||||||||||
|
505,000 |
RPX (a) |
5,661 |
|||||||||
|
Patent Aggregation & Defensive Patent Consulting |
|||||||||||
|
134,795 |
|||||||||||
| > Telecommunications Equipment 0.7% | |||||||||||
|
640,000 |
F5 Networks (a) |
67,008 |
|||||||||
|
Internet Traffic Management Equipment |
|||||||||||
|
1,730,000 |
Ixia (a) |
27,801 |
|||||||||
|
Telecom Network Test Equipment |
|||||||||||
|
1,675,000 |
Finisar (a) |
23,953 |
|||||||||
|
Optical Subsystems & Components |
|||||||||||
|
1,925,000 |
Infinera (a)(c) |
10,549 |
|||||||||
|
Optical Networking Equipment |
|||||||||||
|
129,311 |
|||||||||||
| > CATV 0.7% | |||||||||||
|
900,000 |
Discovery Series C (a) |
50,436 |
|||||||||
|
Cable TV Programming |
|||||||||||
|
800,000 |
Liberty Global Series A (a) |
48,600 |
|||||||||
|
Cable TV Franchises Outside the U.S. |
|||||||||||
|
18,000 |
Jupiter Telecommunications (Japan) |
18,268 |
|||||||||
|
Largest Cable Service Provider in Japan |
|||||||||||
|
117,304 |
|||||||||||
| > Financial Processors 0.6% | |||||||||||
|
1,700,000 |
Global Payments |
71,111 |
|||||||||
|
Credit Card Processor |
|||||||||||
|
5,000,000 |
Singapore Exchange (Singapore) |
28,418 |
|||||||||
|
Singapore Equity & Derivatives Market Operator |
|||||||||||
|
100,000 |
Liquidity Services (a) |
5,021 |
|||||||||
|
E-auctions for Surplus & Salvage Goods |
|||||||||||
|
104,550 |
|||||||||||
| > Electronics Distribution 0.5% | |||||||||||
|
3,125,000 |
Avnet (a) |
90,906 |
|||||||||
|
Electronic Components Distribution |
|||||||||||
|
90,906 |
|||||||||||
33
Columbia Acorn Fund
Statement of Investments (Unaudited), continued
|
Number of Shares |
Value (000) |
||||||||||
| > Advertising 0.4% | |||||||||||
|
1,700,000 |
Lamar Advertising (a) |
$ |
63,002 |
||||||||
|
Outdoor Advertising |
|||||||||||
|
63,002 |
|||||||||||
| > Contract Manufacturing 0.4% | |||||||||||
|
3,800,000 |
Sanmina-SCI (a) |
32,262 |
|||||||||
|
Electronic Manufacturing Services |
|||||||||||
|
960,000 |
Plexus (a) |
29,078 |
|||||||||
|
Electronic Manufacturing Services |
|||||||||||
|
61,340 |
|||||||||||
| > Entertainment Programming 0.1% | |||||||||||
|
1,100,000 |
IMAX (Canada) (a)(c) |
21,901 |
|||||||||
|
IMAX Movies, Theatre Equipment & Theatre Joint Ventures |
|||||||||||
|
21,901 |
|||||||||||
| > TV Broadcasting —% | |||||||||||
|
1,750,000 |
Gray Television (a) |
3,990 |
|||||||||
|
Mid-market Affiliated TV Stations |
|||||||||||
|
2,500,000 |
Entravision Communications |
3,350 |
|||||||||
|
Spanish Language TV & Radio Stations |
|||||||||||
|
7,340 |
|||||||||||
| > Consumer Software —% | |||||||||||
|
273,500 |
Carbonite (a)(c) |
1,917 |
|||||||||
|
Online Data Storage |
|||||||||||
|
1,917 |
|||||||||||
|
Information: Total |
4,679,850 |
||||||||||
|
Industrial Goods & Services 19.0% |
|||||||||||
| > Machinery 11.4% | |||||||||||
|
10,125,000 |
Ametek |
358,931 |
|||||||||
|
Aerospace/Industrial Instruments |
|||||||||||
|
8,400,000 |
Donaldson (b) |
291,564 |
|||||||||
|
Industrial Air Filtration |
|||||||||||
|
3,125,000 |
Nordson |
183,187 |
|||||||||
|
Dispensing Systems for Adhesives & Coatings |
|||||||||||
|
3,725,000 |
Kennametal |
138,123 |
|||||||||
|
Consumable Cutting Tools |
|||||||||||
|
1,800,000 |
Pall |
114,282 |
|||||||||
|
Life Science, Water & Industrial Filtration |
|||||||||||
|
3,000,000 |
Moog (a)(b) |
113,610 |
|||||||||
|
Motion Control Products for Aerospace, Defense & Industrial Markets |
|||||||||||
|
2,213,551 |
Clarcor |
98,791 |
|||||||||
|
Mobile Equipment & Industrial Filters |
|||||||||||
|
3,063,000 |
HEICO (b) |
93,452 |
|||||||||
|
FAA Approved Aircraft Replacement Parts |
|||||||||||
|
2,200,000 |
ESCO Technologies (b) |
85,470 |
|||||||||
|
Automatic Electric Meter Readers |
|||||||||||
|
2,675,000 |
Oshkosh Corporation (a) |
73,375 |
|||||||||
|
Specialty Truck Manufacturer |
|||||||||||
|
1,610,000 |
Toro |
64,046 |
|||||||||
|
Turf Maintenance Equipment |
|||||||||||
|
2,725,000 |
Generac |
62,375 |
|||||||||
|
Standby Power Generators |
|||||||||||
|
435,000 |
Valmont Industries |
57,203 |
|||||||||
|
Center Pivot Irrigation Systems & Utility Poles |
|||||||||||
|
Number of Shares |
Value (000) |
||||||||||
|
1,250,000 |
Pentair (c) |
$ |
55,638 |
||||||||
|
Pumps & Water Treatment |
|||||||||||
|
1,557,553 |
Polypore International (a)(c) |
55,059 |
|||||||||
|
Battery Separators & Filtration Media |
|||||||||||
|
950,000 |
WABCO Holdings (a) |
54,787 |
|||||||||
|
Truck & Bus Component Supplier |
|||||||||||
|
600,000 |
Wabtec |
48,174 |
|||||||||
|
Freight & Transit Component Supplier |
|||||||||||
|
400,000 |
Neopost (France) |
22,087 |
|||||||||
|
Postage Meter Machines |
|||||||||||
|
170,000 |
Middleby (a) |
19,659 |
|||||||||
|
Manufacturer of Cooking Equipment |
|||||||||||
|
10,000,000 |
Marel (Iceland) |
10,863 |
|||||||||
|
Largest Manufacturer of Poultry & Fish Processing Equipment |
|||||||||||
|
1,000,000 |
Spartan Motors |
5,000 |
|||||||||
|
Specialty Truck & Chassis Manufacturer |
|||||||||||
|
2,005,676 |
|||||||||||
|
> Industrial Materials & Specialty Chemicals 2.3% |
|||||||||||
|
1,520,000 |
FMC Corporation |
84,177 |
|||||||||
|
Niche Specialty Chemicals |
|||||||||||
|
1,580,000 |
Albemarle |
83,234 |
|||||||||
|
Refinery Catalysts & Other Specialty Chemicals |
|||||||||||
|
800,000 |
Ashland |
57,280 |
|||||||||
|
Diversified Chemicals Company |
|||||||||||
|
1,880,000 |
Drew Industries (a)(b) |
56,795 |
|||||||||
|
RV & Manufactured Home Components |
|||||||||||
|
1,525,000 |
Novozymes (Denmark) |
42,032 |
|||||||||
|
Industrial Enzymes |
|||||||||||
|
673,000 |
Sociedad Quimica y Minera de Chile - ADR (Chile) |
41,484 |
|||||||||
|
Producer of Specialty Fertilizers, Lithium & Iodine |
|||||||||||
|
2,218,700 |
Kansai Paint (Japan) (c) |
24,590 |
|||||||||
|
Paint Producer in Japan, India, China & Southeast Asia |
|||||||||||
|
600,000 |
Albany International |
13,182 |
|||||||||
|
Paper Machine Clothing & Composites for Aerospace |
|||||||||||
|
200,000 |
Silgan Holdings |
8,702 |
|||||||||
|
Metal & Plastic Packaging |
|||||||||||
|
411,476 |
|||||||||||
| > Other Industrial Services 1.6% | |||||||||||
|
2,900,000 |
Expeditors International of Washington |
105,444 |
|||||||||
|
International Freight Forwarder |
|||||||||||
|
2,700,000 |
LKQ (a) |
49,950 |
|||||||||
|
Alternative Auto Parts Distribution |
|||||||||||
|
1,400,000 |
Forward Air |
42,574 |
|||||||||
|
Freight Transportation Between Airports |
|||||||||||
|
1,300,000 |
Imtech (Netherlands) |
34,313 |
|||||||||
|
Electromechanical & Information Communications Technology Installation & Maintenance |
|||||||||||
|
1,600,000 |
Mobile Mini (a) |
26,736 |
|||||||||
|
Portable Storage Units Leasing |
|||||||||||
|
1,505,246 |
Acorn Energy (b)(c) |
13,427 |
|||||||||
|
Frac Well Exploration/Monitoring Device, Sonar Security, Electric Grid Monitoring |
|||||||||||
34
|
Number of Shares |
Value (000) |
||||||||||
| > Other Industrial Services—continued | |||||||||||
|
500,000 |
UTI Worldwide |
$ |
6,735 |
||||||||
|
Freight Forwarding & Logistics |
|||||||||||
|
279,179 |
|||||||||||
| > Construction 1.3% | |||||||||||
|
2,850,000 |
Chicago Bridge & Iron |
108,556 |
|||||||||
|
Engineering & Construction for Liquefied Natural Gas & Petrochemicals |
|||||||||||
|
66,000 |
NVR (a) |
55,737 |
|||||||||
|
D.C. Homebuilder |
|||||||||||
|
1,350,000 |
Fortune Brands Home & Security (a) |
36,464 |
|||||||||
|
Home Building Supplies & Small Locks |
|||||||||||
|
1,800,000 |
Mills Estruturas e Servicos de Engenharia (Brazil) |
25,820 |
|||||||||
|
Civil Engineering & Construction |
|||||||||||
|
226,577 |
|||||||||||
| > Electrical Components 0.8% | |||||||||||
|
1,765,000 |
Acuity Brands |
111,707 |
|||||||||
|
Commercial Lighting Fixtures |
|||||||||||
|
1,500,000 |
Ushio (Japan) |
17,993 |
|||||||||
|
Industrial Light Sources |
|||||||||||
|
351,000 |
Saft (France) |
8,130 |
|||||||||
|
Niche Battery Manufacturer |
|||||||||||
|
137,830 |
|||||||||||
| > Outsourcing Services 0.7% | |||||||||||
|
2,800,000 |
Quanta Services (a) |
69,160 |
|||||||||
|
Electrical & Telecom Construction Services |
|||||||||||
|
1,546,000 |
Insperity (b) |
39,006 |
|||||||||
|
Professional Employer Organization |
|||||||||||
|
600,000 |
GP Strategies (a) |
11,592 |
|||||||||
|
Outsourced Training Services |
|||||||||||
|
119,758 |
|||||||||||
| > Waste Management 0.5% | |||||||||||
|
2,050,000 |
Waste Connections |
62,013 |
|||||||||
|
Solid Waste Management |
|||||||||||
|
560,000 |
Clean Harbors (a) |
27,356 |
|||||||||
|
Hazardous Waste Services & Disposal |
|||||||||||
|
89,369 |
|||||||||||
| > Conglomerates 0.2% | |||||||||||
|
2,472,255 |
Aalberts Industries (Netherlands) |
44,382 |
|||||||||
|
Flow Control & Heat Treatment |
|||||||||||
|
44,382 |
|||||||||||
| > Steel 0.1% | |||||||||||
|
2,221,812 |
GrafTech International (a) |
19,974 |
|||||||||
|
Industrial Graphite Materials Producer |
|||||||||||
|
19,974 |
|||||||||||
| > Industrial Distribution 0.1% | |||||||||||
|
157,843 |
WESCO International (a) |
9,029 |
|||||||||
|
Industrial Distribution |
|||||||||||
|
9,029 |
|||||||||||
|
Industrial Goods & Services: Total |
3,343,250 |
||||||||||
|
Consumer Goods & Services 15.7% |
|||||||||||
| > Retail 4.8% | |||||||||||
|
4,505,000 |
lululemon athletica (a) |
333,100 |
|||||||||
|
Premium Active Apparel Retailer |
|||||||||||
|
Number of Shares |
Value (000) |
||||||||||
|
6,600,000 |
Pier 1 Imports (b) |
$ |
123,684 |
||||||||
|
Home Furnishing Retailer |
|||||||||||
|
2,601,000 |
Abercrombie & Fitch |
88,226 |
|||||||||
|
Teen Apparel Retailer |
|||||||||||
|
2,835,000 |
Shutterfly (a)(b) |
88,225 |
|||||||||
|
Internet Photo-centric Retailer |
|||||||||||
|
4,425,000 |
Saks (a)(c) |
45,622 |
|||||||||
|
Luxury Department Store Retailer |
|||||||||||
|
527,845 |
Fossil (a) |
44,708 |
|||||||||
|
Watch Designer & Retailer |
|||||||||||
|
525,000 |
DSW |
35,028 |
|||||||||
|
Branded Footwear Retailer |
|||||||||||
|
1,575,000 |
American Eagle Outfitters |
33,201 |
|||||||||
|
Teen Apparel Retailer |
|||||||||||
|
415,000 |
Williams-Sonoma |
18,248 |
|||||||||
|
Home Goods & Furnishing Retailer |
|||||||||||
|
971,500 |
Teavana (a)(c) |
12,668 |
|||||||||
|
Specialty Tea Retailer |
|||||||||||
|
388,220 |
Massmart Holdings (South Africa) |
7,785 |
|||||||||
|
General Merchandise, Food & Home Improvement Stores; Wal-Mart Subsidiary |
|||||||||||
|
1,371,366 |
Gaiam (a)(b) |
4,786 |
|||||||||
|
Healthy Living Catalogs & E-Commerce, Non-theatrical Media |
|||||||||||
|
66,000 |
The Fresh Market (a) |
3,959 |
|||||||||
|
Specialty Food Retailer |
|||||||||||
|
839,240 |
|||||||||||
| > Apparel 2.4% | |||||||||||
|
1,660,000 |
PVH |
155,575 |
|||||||||
|
Apparel Wholesaler & Retailer |
|||||||||||
|
2,100,000 |
Coach |
117,642 |
|||||||||
|
Designer & Retailer of Branded Leather Accessories |
|||||||||||
|
1,460,000 |
Warnaco Group (a) |
75,774 |
|||||||||
|
Global Branded Apparel Manufacturer |
|||||||||||
|
1,310,000 |
Deckers Outdoor (a)(c) |
47,998 |
|||||||||
|
Fashion Footwear Wholesaler |
|||||||||||
|
600,000 |
Steven Madden (a) |
26,232 |
|||||||||
|
Wholesaler/Retailer of Fashion Footwear |
|||||||||||
|
182,866 |
True Religion Apparel |
3,901 |
|||||||||
|
Premium Denim |
|||||||||||
|
427,122 |
|||||||||||
| > Travel 2.2% | |||||||||||
|
1,430,000 |
Vail Resorts |
82,439 |
|||||||||
|
Ski Resort Operator & Developer |
|||||||||||
|
1,225,000 |
Expedia |
70,854 |
|||||||||
|
Online Travel Services Company |
|||||||||||
|
4,400,000 |
Avis Budget Group (a) |
67,672 |
|||||||||
|
Second Largest Car Rental Company |
|||||||||||
|
3,750,000 |
Hertz (a) |
51,488 |
|||||||||
|
Largest U.S. Rental Car Operator |
|||||||||||
|
1,600,000 |
HomeAway (a)(c) |
37,520 |
|||||||||
|
Vacation Rental Online Marketplace |
|||||||||||
|
1,100,000 |
Choice Hotels |
35,189 |
|||||||||
|
Franchisor of Budget Hotel Brands |
|||||||||||
|
2,000,000 |
Localiza Rent A Car (Brazil) |
34,648 |
|||||||||
|
Car Rental |
|||||||||||
|
379,810 |
|||||||||||
35
Columbia Acorn Fund
Statement of Investments (Unaudited), continued
|
Number of Shares |
Value (000) |
||||||||||
| > Consumer Goods Distribution 1.1% | |||||||||||
|
2,305,000 |
GNC Holdings |
$ |
89,826 |
||||||||
|
Specialty Retailer of Health & Wellness Products |
|||||||||||
|
2,015,000 |
Pool |
83,784 |
|||||||||
|
Distributor of Swimming Pool Supplies & Equipment |
|||||||||||
|
625,000 |
United Stationers |
16,262 |
|||||||||
|
Wholesale Distributor of Business Products |
|||||||||||
|
189,872 |
|||||||||||
| > Food & Beverage 1.0% | |||||||||||
|
1,700,000 |
Monster Beverage (a) |
92,072 |
|||||||||
|
Alternative Beverages |
|||||||||||
|
32,000,000 |
Olam International (Singapore) |
53,083 |
|||||||||
|
Agriculture Supply Chain Manager |
|||||||||||
|
1,800,000 |
Arcos Dorados (Brazil) |
27,774 |
|||||||||
|
McDonald's Master Franchise for Latin America |
|||||||||||
|
45,500 |
Annie's (a)(c) |
2,040 |
|||||||||
|
Developer & Marketer of Natural & Organic Food |
|||||||||||
|
1,665,270 |
GLG Life Tech (Canada) (a)(b)(d) |
227 |
|||||||||
|
Produce an All-natural Sweetener Extracted from the Stevia Plant |
|||||||||||
|
175,196 |
|||||||||||
| > Casinos & Gaming 0.8% | |||||||||||
|
3,950,000 |
Pinnacle Entertainment (a)(b) |
48,388 |
|||||||||
|
Regional Casino Operator |
|||||||||||
|
3,000,000 |
Melco Crown Entertainment - ADR (Hong Kong) (a) |
40,440 |
|||||||||
|
Macau Casino Operator |
|||||||||||
|
850,000 |
Penn National Gaming (a) |
36,635 |
|||||||||
|
Regional Casino Operator |
|||||||||||
|
12,000,000 |
MGM China Holdings (Hong Kong) |
20,611 |
|||||||||
|
Macau Casino Operator |
|||||||||||
|
146,074 |
|||||||||||
| > Other Consumer Services 0.8% | |||||||||||
|
2,190,000 |
Lifetime Fitness (a)(b) |
100,171 |
|||||||||
|
Sport & Fitness Club Operator |
|||||||||||
|
17,000,000 |
Lifestyle International (Hong Kong) |
35,041 |
|||||||||
|
Mid- to High-end Department Store Operator in Hong Kong & China |
|||||||||||
|
1,062,500 |
Move (a) |
9,159 |
|||||||||
|
Real Estate Internet Websites |
|||||||||||
|
450,000 |
IFM Investments (Century 21 China RE) - ADR (China) (a) |
832 |
|||||||||
|
Provide Real Estate Services in China |
|||||||||||
|
145,203 |
|||||||||||
| > Furniture & Textiles 0.8% | |||||||||||
|
4,200,000 |
Knoll (b) |
58,590 |
|||||||||
|
Office Furniture |
|||||||||||
|
2,250,000 |
Herman Miller |
43,740 |
|||||||||
|
Office Furniture |
|||||||||||
|
2,325,000 |
Interface |
30,713 |
|||||||||
|
Modular Carpet |
|||||||||||
|
215,000 |
Caesarstone (Israel) (a) |
3,032 |
|||||||||
|
Quartz Countertops |
|||||||||||
|
136,075 |
|||||||||||
|
Number of Shares |
Value (000) |
||||||||||
| > Other Durable Goods 0.7% | |||||||||||
|
1,500,000 |
Jarden |
$ |
79,260 |
||||||||
|
Branded Household Products |
|||||||||||
|
850,000 |
Tesla Motors (a)(c) |
24,888 |
|||||||||
|
Design, Manufacture & Sell High Performance Electric Vehicles |
|||||||||||
|
460,000 |
Cavco Industries (a)(b) |
21,109 |
|||||||||
|
Manufactured Homes |
|||||||||||
|
125,257 |
|||||||||||
| > Restaurants 0.4% | |||||||||||
|
2,000,000 |
AFC Enterprises (a)(b) |
49,200 |
|||||||||
|
Popeye's Restaurants |
|||||||||||
|
450,000 |
Cheesecake Factory |
16,088 |
|||||||||
|
Casual Dining Restaurants |
|||||||||||
|
675,000 |
Bravo Brio Restaurant Group (a) |
9,821 |
|||||||||
|
Upscale Casual Italian Restaurants |
|||||||||||
|
75,109 |
|||||||||||
| > Nondurables 0.3% | |||||||||||
|
1,600,000 |
Helen of Troy (a)(b) |
50,928 |
|||||||||
|
Personal Care, Housewares, Healthcare & Home Environment Products |
|||||||||||
|
50,928 |
|||||||||||
| > Educational Services 0.3% | |||||||||||
|
500,000 |
ITT Educational Services (a)(c) |
16,115 |
|||||||||
|
Post-secondary Degree Services |
|||||||||||
|
600,000 |
DeVry (c) |
13,656 |
|||||||||
|
Post-secondary Degree Services |
|||||||||||
|
800,000 |
New Oriental Education & Technology - ADR (China) (c) |
13,336 |
|||||||||
|
Education Service Provider |
|||||||||||
|
2,000,000 |
Voyager Learning - Contingent Value Rights (a)(d)(e) |
220 |
|||||||||
|
Education Services for the K-12 Market |
|||||||||||
|
43,327 |
|||||||||||
| > Leisure Products 0.1% | |||||||||||
|
1,290,000 |
Skullcandy (a)(c) |
17,738 |
|||||||||
|
Lifestyle Branded Headphones |
|||||||||||
|
17,738 |
|||||||||||
| > Other Entertainment —% | |||||||||||
|
265,000 |
CTS Eventim (Germany) |
7,878 |
|||||||||
|
Event Ticket Sales |
|||||||||||
|
7,878 |
|||||||||||
|
Consumer Goods & Services: Total |
2,758,829 |
||||||||||
|
Finance 10.9% |
|||||||||||
| > Banks 4.3% | |||||||||||
|
2,638,000 |
BOK Financial |
155,906 |
|||||||||
|
Tulsa-based Southwest Bank |
|||||||||||
|
6,956,800 |
Associated Banc-Corp |
91,621 |
|||||||||
|
Midwest Bank |
|||||||||||
|
2,337,313 |
Hancock Holding |
72,340 |
|||||||||
|
Gulf Coast Bank |
|||||||||||
|
1,348,000 |
City National |
69,435 |
|||||||||
|
Bank & Asset Manager |
|||||||||||
|
985,000 |
SVB Financial Group (a) |
59,553 |
|||||||||
|
Bank to Venture Capitalists |
|||||||||||
36
|
Number of Shares |
Value (000) |
||||||||||
| > Banks—continued | |||||||||||
|
2,860,000 |
MB Financial (b) |
$ |
56,485 |
||||||||
|
Chicago Bank |
|||||||||||
|
5,323,500 |
Valley National Bancorp |
53,341 |
|||||||||
|
New Jersey/New York Bank |
|||||||||||
|
3,000,000 |
CVB Financial |
35,820 |
|||||||||
|
Inland Empire Business Bank |
|||||||||||
|
2,200,000 |
TCF Financial |
26,268 |
|||||||||
|
Great Lakes Bank |
|||||||||||
|
1,350,000 |
TriCo Bancshares (b) |
22,315 |
|||||||||
|
California Central Valley Bank |
|||||||||||
|
1,121,188 |
Sandy Spring Bancorp |
21,583 |
|||||||||
|
Baltimore, D.C. Bank |
|||||||||||
|
4,299,507 |
First Busey |
20,982 |
|||||||||
|
Illinois Bank |
|||||||||||
|
550,000 |
Wintrust Financial |
20,663 |
|||||||||
|
Chicago & Milwaukee Full Service Bank |
|||||||||||
|
2,500,000 |
First Commonwealth |
17,625 |
|||||||||
|
Western Pennsylvania Bank |
|||||||||||
|
811,295 |
Hudson Valley |
13,833 |
|||||||||
|
Metro New York City Bank |
|||||||||||
|
2,136,500 |
TrustCo Bank |
12,221 |
|||||||||
|
New York State Bank |
|||||||||||
|
705,072 |
Eagle Bancorp (a) |
11,789 |
|||||||||
|
Metro D.C. Bank |
|||||||||||
|
104,023 |
Pacific Continental Bank |
929 |
|||||||||
|
Pacific Northwest Bank |
|||||||||||
|
762,709 |
|||||||||||
| > Insurance 2.4% | |||||||||||
|
8,900,000 |
CNO Financial Group |
85,885 |
|||||||||
|
Life, Long-term Care & Medical Supplement Insurance |
|||||||||||
|
833,000 |
Allied World Holdings |
64,349 |
|||||||||
|
Commerical Lines Insurance/Reinsurance |
|||||||||||
|
2,764,000 |
Tower Group (b) |
53,594 |
|||||||||
|
Commercial & Personal Lines Insurance |
|||||||||||
|
1,120,000 |
The Hanover Insurance Group |
41,731 |
|||||||||
|
Commercial & Personal Lines Insurance |
|||||||||||
|
2,050,000 |
Selective Insurance Group |
38,930 |
|||||||||
|
Commercial & Personal Lines Insurance |
|||||||||||
|
1,100,000 |
HCC Insurance Holdings |
37,279 |
|||||||||
|
Specialty Insurance |
|||||||||||
|
832,000 |
Willis Group |
30,717 |
|||||||||
|
Insurance Broker |
|||||||||||
|
925,000 |
Kemper |
28,407 |
|||||||||
|
Multi-line Insurance |
|||||||||||
|
250,000 |
Enstar Group (a) |
24,913 |
|||||||||
|
Insurance/Reinsurance & Related Services |
|||||||||||
|
900,000 |
Brown & Brown |
23,463 |
|||||||||
|
Insurance Broker |
|||||||||||
|
429,268 |
|||||||||||
| > Brokerage & Money Management 1.5% | |||||||||||
|
6,654,000 |
SEI Investments |
142,728 |
|||||||||
|
Mutual Fund Administration & Investment Management |
|||||||||||
|
4,036,000 |
Eaton Vance |
116,883 |
|||||||||
|
Specialty Mutual Funds |
|||||||||||
|
1,000,000 |
Artio Global Investors (c) |
2,980 |
|||||||||
|
International Asset Manager |
|||||||||||
|
262,591 |
|||||||||||
|
Number of Shares |
Value (000) |
||||||||||
| > Finance Companies 1.5% | |||||||||||
|
1,285,000 |
World Acceptance (a)(b) |
$ |
86,673 |
||||||||
|
Personal Loans |
|||||||||||
|
2,150,000 |
McGrath Rentcorp (b) |
56,093 |
|||||||||
|
Temporary Space & IT Rentals |
|||||||||||
|
3,400,000 |
H & E Equipment Services (b) |
41,208 |
|||||||||
|
Heavy Equipment Leasing |
|||||||||||
|
1,091,000 |
Marlin Business Services (b) |
23,140 |
|||||||||
|
Small Equipment Leasing |
|||||||||||
|
1,123,400 |
CAI International (a)(b) |
23,052 |
|||||||||
|
International Container Leasing |
|||||||||||
|
450,000 |
Onex Capital (Canada) |
17,760 |
|||||||||
|
Private Equity |
|||||||||||
|
228,500 |
Textainer Group Holdings |
6,981 |
|||||||||
|
Top International Container Leasor |
|||||||||||
|
333,191 |
Regional Management (a) |
5,748 |
|||||||||
|
Consumer Loans |
|||||||||||
|
260,655 |
|||||||||||
| > Credit Cards 0.6% | |||||||||||
|
550,000 |
Alliance Data Systems (a) |
78,072 |
|||||||||
|
Diversified Credit Card Provider |
|||||||||||
|
350,000 |
Wright Express (a) |
24,402 |
|||||||||
|
Pay Card Processor |
|||||||||||
|
102,474 |
|||||||||||
| > Diversified Financial Companies 0.4% | |||||||||||
|
2,820,000 |
Leucadia National |
64,155 |
|||||||||
|
Holding Company |
|||||||||||
|
64,155 |
|||||||||||
| > Savings & Loans 0.2% | |||||||||||
|
400,000 |
Financial Engines (a) |
9,532 |
|||||||||
|
Asset Management for 401k Plans |
|||||||||||
|
1,010,000 |
Provident New York Bancorp |
9,504 |
|||||||||
|
New York State Thrift |
|||||||||||
|
470,000 |
ViewPoint Financial |
9,010 |
|||||||||
|
Texas Thrift |
|||||||||||
|
452,146 |
Kaiser Federal (b) |
6,823 |
|||||||||
|
Los Angeles Savings & Loan |
|||||||||||
|
65,991 |
Berkshire Hills Bancorp |
1,510 |
|||||||||
|
Northeast Thrift |
|||||||||||
|
36,379 |
|||||||||||
|
Finance: Total |
1,918,231 |
||||||||||
|
Health Care 9.3% |
|||||||||||
| > Biotechnology & Drug Delivery 5.0% | |||||||||||
|
6,153,000 |
Seattle Genetics (a)(b)(c) |
165,823 |
|||||||||
|
Antibody-based Therapies for Cancer |
|||||||||||
|
3,875,000 |
BioMarin Pharmaceutical (a) |
156,046 |
|||||||||
|
Biotech Focused on Orphan Diseases |
|||||||||||
|
1,215,000 |
Alexion Pharmaceuticals (a) |
138,996 |
|||||||||
|
Biotech Focused on Orphan Diseases |
|||||||||||
|
3,600,000 |
ARIAD Pharmaceuticals (a) |
87,210 |
|||||||||
|
Biotech Focused on Cancer |
|||||||||||
|
3,250,000 |
Auxilium Pharmaceuticals (a)(b) |
79,495 |
|||||||||
|
Biotech Focused on Niche Disease Areas |
|||||||||||
|
870,000 |
Onyx Pharmaceuticals (a) |
73,515 |
|||||||||
|
Commercial-stage Biotech Focused on Cancer |
|||||||||||
37
Columbia Acorn Fund
Statement of Investments (Unaudited), continued
|
Number of Shares |
Value (000) |
||||||||||
| > Biotechnology & Drug Delivery—continued | |||||||||||
|
6,000,000 |
NPS Pharmaceuticals (a)(b) |
$ |
55,500 |
||||||||
|
Orphan Drugs & Healthy Royalties |
|||||||||||
|
3,430,000 |
Isis Pharmaceuticals (a)(c) |
48,260 |
|||||||||
|
Biotech Pioneer in Antisense Drugs |
|||||||||||
|
735,000 |
Synageva Biopharma (a) |
39,271 |
|||||||||
|
Biotech Focused on Orphan Diseases |
|||||||||||
|
2,025,000 |
InterMune (a) |
18,164 |
|||||||||
|
Drugs for Pulmonary Fibrosis & Hepatitis C |
|||||||||||
|
3,000,000 |
Raptor Pharmaceutical (a)(b)(c) |
16,680 |
|||||||||
|
Orphan Drug Company |
|||||||||||
|
4,949,000 |
Chelsea Therapeutics International (a)(b)(c) |
5,939 |
|||||||||
|
Biotech Focused on Rare Diseases |
|||||||||||
|
359,944 |
MicroDose Therapeutx (a)(d)(e) |
238 |
|||||||||
|
Drug Inhaler Development |
|||||||||||
|
885,137 |
|||||||||||
| > Medical Supplies 2.3% | |||||||||||
|
4,970,000 |
Cepheid (a)(b) |
171,515 |
|||||||||
|
Molecular Diagnostics |
|||||||||||
|
950,000 |
Henry Schein (a) |
75,306 |
|||||||||
|
Largest Distributor of Healthcare Products |
|||||||||||
|
2,126,000 |
Patterson Companies |
72,794 |
|||||||||
|
Dental/Vet/Med Distributor |
|||||||||||
|
1,550,000 |
DENTSPLY International |
59,117 |
|||||||||
|
Leading Dental Supplies Manufacturer |
|||||||||||
|
375,000 |
Techne |
26,978 |
|||||||||
|
Cytokines, Antibodies & Other Reagents for Life Science |
|||||||||||
|
405,710 |
|||||||||||
| > Medical Equipment & Devices 1.0% | |||||||||||
|
1,024,683 |
Sirona Dental Systems (a) |
58,366 |
|||||||||
|
Manufacturer of Dental Equipment |
|||||||||||
|
550,000 |
Haemonetics (a) |
44,110 |
|||||||||
|
Blood & Plasma Collection Equipment |
|||||||||||
|
950,000 |
PerkinElmer Inc. |
27,996 |
|||||||||
|
Analytical Instruments for Life Sciences |
|||||||||||
|
925,000 |
Hill-Rom Holdings |
26,880 |
|||||||||
|
Hospital Beds/Patient Handling |
|||||||||||
|
570,000 |
Orthofix International (a) |
25,508 |
|||||||||
|
Bone Fixation & Stimulation Devices |
|||||||||||
|
182,860 |
|||||||||||
| > Health Care Services 0.5% | |||||||||||
|
665,000 |
Mednax (a) |
49,509 |
|||||||||
|
Physician Management for Pediatric & Anesthesia Practices |
|||||||||||
|
825,000 |
HealthSouth (a) |
19,850 |
|||||||||
|
Inpatient Rehabalitation Facilities |
|||||||||||
|
1,875,000 |
Health Management Associates (a) |
15,731 |
|||||||||
|
Non-urban Hospitals |
|||||||||||
|
85,090 |
|||||||||||
| > Pharmaceuticals 0.5% | |||||||||||
|
4,000,000 |
Akorn (a) |
52,880 |
|||||||||
|
Develops, Manufactures & Sells Specialty Generic Drugs |
|||||||||||
|
2,606,333 |
Adcock Ingram Holdings (South Africa) |
18,598 |
|||||||||
|
Manufacturer of Pharmaceuticals & Medical Supplies |
|||||||||||
|
Number of Shares |
Value (000) |
||||||||||
|
2,040,000 |
Alimera Sciences (a)(b)(c) |
$ |
5,263 |
||||||||
|
Ophthalmology-focused Pharmaceutical Company |
|||||||||||
|
1,095,000 |
Horizon Pharma (a) |
3,800 |
|||||||||
|
Specialty Pharmaceutical Company |
|||||||||||
|
80,541 |
|||||||||||
|
Health Care: Total |
1,639,338 |
||||||||||
|
Energy & Minerals 7.3% |
|||||||||||
| > Oil Services 3.5% | |||||||||||
|
5,150,000 |
FMC Technologies (a) |
238,445 |
|||||||||
|
Oil & Gas Well Head Manufacturer |
|||||||||||
|
2,114,000 |
Atwood Oceanics (a) |
96,081 |
|||||||||
|
Offshore Drilling Contractor |
|||||||||||
|
1,670,000 |
ShawCor (Canada) |
72,501 |
|||||||||
|
Oil & Gas Pipeline Products |
|||||||||||
|
1,031,106 |
Fugro (Netherlands) |
70,120 |
|||||||||
|
Subsea Oilfield Services |
|||||||||||
|
513,000 |
Oil States International (a) |
40,763 |
|||||||||
|
Diversified North American Oil Service Provider |
|||||||||||
|
884,000 |
Hornbeck Offshore (a) |
32,399 |
|||||||||
|
Supply Vessel Operator in U.S. Gulf of Mexico |
|||||||||||
|
2,890,900 |
Horizon North Logistics (Canada) |
23,436 |
|||||||||
|
Provides Diversified Oil Service Offering in Northern Canada |
|||||||||||
|
893,600 |
Black Diamond Group (Canada) (c) |
20,379 |
|||||||||
|
Provides Accommodations/Equipment for Oil Sands Development |
|||||||||||
|
585,000 |
Rowan (a) |
19,755 |
|||||||||
|
Contract Offshore Driller |
|||||||||||
|
4,025,000 |
Tuscany International Drilling (Colombia) (a) |
942 |
|||||||||
|
South America Based Drilling Rig Contractor |
|||||||||||
|
614,821 |
|||||||||||
| > Oil & Gas Producers 2.5% | |||||||||||
|
3,500,000 |
Pacific Rubiales Energy (Colombia) |
83,628 |
|||||||||
|
Oil Production & Exploration in Colombia |
|||||||||||
|
695,000 |
Range Resources |
48,560 |
|||||||||
|
Oil & Gas Producer |
|||||||||||
|
974,000 |
Rosetta Resources (a) |
46,655 |
|||||||||
|
Oil & Gas Producer Exploring in South Texas & Montana |
|||||||||||
|
2,700,000 |
Denbury Resources (a) |
43,632 |
|||||||||
|
Oil Producer Using Co2 Injection |
|||||||||||
|
703,000 |
SM Energy |
38,039 |
|||||||||
|
Oil & Gas Producer |
|||||||||||
|
1,159,000 |
Laredo Petroleum (a)(c) |
25,475 |
|||||||||
|
Permian Basin Oil Producer |
|||||||||||
|
1,050,000 |
Tullow Oil (United Kingdom) |
23,229 |
|||||||||
|
Oil & Gas Producer |
|||||||||||
|
500,000 |
Cabot Oil and Gas |
22,450 |
|||||||||
|
Large Natural Gas Producer in Appalachia & Gulf Coast |
|||||||||||
|
361,000 |
Baytex (Canada) (c) |
17,156 |
|||||||||
|
Oil & Gas Producer in Canada |
|||||||||||
|
718,000 |
Celtic Exploration (Canada) (a) |
13,351 |
|||||||||
|
Canadian Oil & Gas Producer |
|||||||||||
|
27,000,000 |
Shamaran Petroleum (Iraq) (a) |
11,947 |
|||||||||
|
Oil Exploration in Kurdistan |
|||||||||||
38
|
Number of Shares |
Value (000) |
||||||||||
| > Oil & Gas Producers—continued | |||||||||||
|
340,000 |
PDC Energy (a) |
$ |
10,754 |
||||||||
|
Oil & Gas Producer in the U.S. |
|||||||||||
|
1,100,000 |
Kodiak Oil and Gas (a) |
10,296 |
|||||||||
|
Bakken Oil & Gas Producer |
|||||||||||
|
750,000 |
Athabasca Oil Sands (Canada) (a) |
10,055 |
|||||||||
|
Oil Sands & Unconventional Oil Development |
|||||||||||
|
37,500,000 |
Petromanas (Canada) (a)(b) |
7,629 |
|||||||||
|
Exploring for Oil in Albania |
|||||||||||
|
200,000 |
Approach Resources (a) |
6,026 |
|||||||||
|
Oil & Gas Producer in West Texas Permian |
|||||||||||
|
25,000,000 |
Petroamerica Oil (Colombia) (a) |
5,340 |
|||||||||
|
Oil Exploration & Production in Colombia |
|||||||||||
|
26,000,000 |
Petrodorado Energy (Colombia) (a)(b) |
4,760 |
|||||||||
| 24,000,000 |
Petrodorado Energy - Warrants (Colombia) (a)(e) |
117 |
|||||||||
|
Oil & Gas Exploration & Production in Colombia, Peru & Paraguay |
|||||||||||
|
493,000 |
Crew Energy (Canada) (a) |
3,631 |
|||||||||
|
Canadian Oil & Gas Producer |
|||||||||||
|
1,198,100 |
Pan Orient (Canada) |
3,449 |
|||||||||
|
Asian Oil & Gas Explorer |
|||||||||||
|
50,000,000 |
Gulf United Energy (Colombia) (a)(b) |
3,000 |
|||||||||
|
Prospecting for Oil Alongside Large Producers in Colombia |
|||||||||||
|
5,116,000 |
Canacol (Colombia) (a) |
2,498 |
|||||||||
|
Oil Producer in South America |
|||||||||||
|
8,400,000 |
Canadian Overseas Petroleum (United Kingdom) (a)(e) |
1,722 |
|||||||||
| 4,200,000 |
Canadian Overseas Petroleum - Warrants (United Kingdom) (a)(d)(e) |
110 |
|||||||||
|
Oil & Gas Exploration/Production in the North Sea |
|||||||||||
|
4,110,000 |
Santa Maria Petroleum (Colombia) (a)(b)(e) |
562 |
|||||||||
| 890,000 |
Santa Maria Petroleum (Colombia) (a)(b) |
127 |
|||||||||
|
Explores for Oil & Gas in Latin America |
|||||||||||
| 393,600 |
Houston American Energy (a)(c) |
354 |
|||||||||
|
Oil & Gas Exploration/Production in Colombia |
|||||||||||
|
444,552 |
|||||||||||
| > Mining 1.0% | |||||||||||
|
387,000 |
Core Labs (Netherlands) |
47,013 |
|||||||||
|
Oil & Gas Reservoir Consulting |
|||||||||||
|
1,000,000 |
Silver Wheaton (Canada) |
39,710 |
|||||||||
|
Silver Mining Royalty Company |
|||||||||||
|
7,500,000 |
Duluth Metals (Canada) (a)(b) |
17,928 |
|||||||||
|
Copper & Nickel Miner |
|||||||||||
|
1,400,000 |
Kirkland Lake Gold (Canada) (a) |
16,975 |
|||||||||
|
Gold Mining |
|||||||||||
|
4,432,000 |
Northam Platinum (South Africa) |
15,985 |
|||||||||
|
Platinum Mining in South Africa |
|||||||||||
|
1,150,000 |
Turquoise Hill Resources (Mongolia) (a)(c) |
9,791 |
|||||||||
|
Copper Mine Project in Mongolia |
|||||||||||
|
2,050,000 |
Alexco Resource (a) |
8,897 |
|||||||||
|
Mining, Exploration & Environmental Services |
|||||||||||
|
16,000,000 |
Mongolian Mining (Mongolia) (a) |
7,284 |
|||||||||
|
Coking Coal Mining in Mongolia |
|||||||||||
|
Number of Shares |
Value (000) |
||||||||||
|
2,518,600 |
Kaminak Gold (a)(c) |
$ |
5,969 |
||||||||
|
Exploration Stage Canadian Gold Miner |
|||||||||||
|
800,000 |
Augusta Resource (a)(c) |
2,160 |
|||||||||
|
US Copper/Moly Mine |
|||||||||||
|
217,283 |
Regis Resources (Australia) (a) |
1,278 |
|||||||||
|
Gold Mining in Australia |
|||||||||||
|
4,000,000 |
Wolverine Minerals (Canada) (a)(e) |
176 |
|||||||||
| 2,000,000 |
Wolverine Minerals - Warrants (Canada) (a)(d)(e) |
— |
|||||||||
|
Gold Mining |
|||||||||||
|
500,000 |
Duluth Exploration - Special Warrants (Canada) (a)(d)(e) |
46 |
|||||||||
|
Copper & Nickel Miner |
|||||||||||
|
173,212 |
|||||||||||
| > Oil Refining, Marketing & Distribution 0.1% | |||||||||||
|
218,000 |
Vopak (Netherlands) |
15,307 |
|||||||||
|
World's Largest Operator of Petroleum & Chemical Storage Terminals |
|||||||||||
|
15,307 |
|||||||||||
| > Agricultural Commodities 0.1% | |||||||||||
|
1,306,818 |
Union Agriculture Group (Uruguay) (a)(d)(e) |
13,552 |
|||||||||
|
Farmland Operator in Uruguay |
|||||||||||
|
13,552 |
|||||||||||
| > Alternative Energy 0.1% | |||||||||||
|
2,000,000 |
GT Advanced Technologies (a)(c) |
10,900 |
|||||||||
|
Largest Manufacturer of Furnaces & Reactors to Produce & Cast Polysilicon |
|||||||||||
|
1,210,300 |
Synthesis Energy Systems (China) (a) |
1,598 |
|||||||||
|
Owner/Operator of Gasification Plants |
|||||||||||
|
12,498 |
|||||||||||
|
Energy & Minerals: Total |
1,273,942 |
||||||||||
|
Other Industries 7.3% |
|||||||||||
| > Real Estate 5.1% | |||||||||||
|
3,850,000 |
Ryman Hospitality Properties (a)(b) |
152,190 |
|||||||||
|
Convention Hotels |
|||||||||||
|
3,700,000 |
DuPont Fabros Technology (b) |
93,425 |
|||||||||
|
Technology-focused Office Buildings |
|||||||||||
|
750,000 |
Federal Realty |
78,975 |
|||||||||
|
Shopping Centers |
|||||||||||
|
1,850,000 |
Extra Space Storage |
61,513 |
|||||||||
|
Self Storage Facilities |
|||||||||||
|
3,700,000 |
Associated Estates Realty (b) |
56,092 |
|||||||||
|
Multifamily Properties |
|||||||||||
|
720,000 |
Digital Realty Trust |
50,292 |
|||||||||
|
Technology-focused Office Buildings |
|||||||||||
|
975,000 |
Post Properties |
46,761 |
|||||||||
|
Multi-family Properties |
|||||||||||
|
2,450,000 |
Biomed Realty Trust |
45,864 |
|||||||||
|
Life Science-focused Office Buildings |
|||||||||||
|
50,000,000 |
Mapletree Logistics Trust (Singapore) |
45,723 |
|||||||||
|
Industrial Property Landlord |
|||||||||||
|
22,000,000 |
Ascendas REIT (Singapore) |
43,091 |
|||||||||
|
Industrial Property Landlord |
|||||||||||
|
770,000 |
Kilroy Realty |
34,481 |
|||||||||
|
West Coast Office Buildings |
|||||||||||
39
Columbia Acorn Fund
Statement of Investments (Unaudited), continued
|
Number of Shares |
Value (000) |
||||||||||
| > Real Estate—continued | |||||||||||
|
3,000,000 |
Education Realty Trust |
$ |
32,700 |
||||||||
|
Student Housing |
|||||||||||
|
1,300,000 |
St. Joe (a)(c) |
25,350 |
|||||||||
|
Florida Panhandle Landowner |
|||||||||||
|
325,000 |
Jones Lang LaSalle |
24,814 |
|||||||||
|
Real Estate Services |
|||||||||||
|
3,750,000 |
DCT Industrial Trust |
24,263 |
|||||||||
|
Industrial Properties |
|||||||||||
|
2,476,000 |
Summit Hotel Properties (b) |
21,145 |
|||||||||
|
Owner of Select Service Hotels |
|||||||||||
|
3,500,000 |
Kite Realty Group (b) |
17,850 |
|||||||||
|
Community Shopping Centers |
|||||||||||
|
2,800 |
Orix JREIT (Japan) |
13,676 |
|||||||||
|
Diversified REIT |
|||||||||||
|
10,000,000 |
Mapletree Industrial Trust (Singapore) |
11,476 |
|||||||||
|
Industrial Property Landlord |
|||||||||||
|
8,845,000 |
Mapletree Commercial Trust (Singapore) |
8,426 |
|||||||||
|
Retail & Office Property Landlord |
|||||||||||
|
888,107 |
|||||||||||
| > Transportation 1.3% | |||||||||||
| 3,100,000 |
Rush Enterprises, Class A (a)(b) |
59,706 |
|||||||||
| 550,000 |
Rush Enterprises, Class B (a)(b) |
9,246 |
|||||||||
|
Truck Sales & Service |
|||||||||||
| 1,155,000 |
JB Hunt Transport Services |
60,106 |
|||||||||
|
Truck & Intermodal Carrier |
|||||||||||
|
2,400,000 |
Heartland Express |
32,064 |
|||||||||
|
Regional Trucker |
|||||||||||
|
704,000 |
World Fuel Services |
25,069 |
|||||||||
|
Global Fuel Broker |
|||||||||||
|
300,000 |
Genesee & Wyoming (a) |
20,058 |
|||||||||
|
Short-line Operator |
|||||||||||
|
350,000 |
Kirby (a) |
19,348 |
|||||||||
|
Largest Operator of U.S. (Jones Act) Liquid Tank Barges |
|||||||||||
|
225,597 |
|||||||||||
| > Regulated Utilities 0.9% | |||||||||||
|
2,000,000 |
Northeast Utilities |
76,460 |
|||||||||
|
Regulated Electric Utility |
|||||||||||
|
1,660,000 |
Wisconsin Energy |
62,532 |
|||||||||
|
Wisconsin Utility |
|||||||||||
|
500,000 |
Allete |
20,870 |
|||||||||
|
Minnesota Regulated Electric Utility |
|||||||||||
|
159,862 |
|||||||||||
|
Other Industries: Total |
1,273,566 |
||||||||||
|
Total Equities: 96.2% (Cost: $10,403,931) |
16,887,006 |
||||||||||
|
Number of Shares |
Value (000) |
||||||||||
|
Securities Lending Collateral 2.4% |
|||||||||||
|
418,965,955 |
Dreyfus Government Cash Management Fund (7 day yield of 0.01%) (f) |
$ |
418,966 |
||||||||
|
Total Securities Lending Collateral: (Cost: $418,966) |
418,966 |
||||||||||
|
Total Investments: 98.6% (Cost: $10,822,897)(g)(h) |
17,305,972 |
(i) |
|||||||||
|
Obligation to Return Collateral for Securities Loaned: (2.4)% |
(418,966 |
) |
|||||||||
|
Cash and Other Assets Less Liabilities: 3.8% |
664,276 |
||||||||||
|
Total Net Assets: 100.0% |
$ |
17,551,282 |
|||||||||
ADR - American Depositary Receipts
REIT - Real Estate Investment Trust
40
> Notes to Statement of Investments (dollar values in thousands)
(a) Non-income producing security.
(b) An affiliated person of the Fund may include any company in which the Fund owns five percent or more of its outstanding voting shares. Holdings and transactions in these affiliated companies during the period ended September 30, 2012, are as follows:
|
Security |
Balance of Shares Held 12/31/11 |
Purchases/ Additions |
Sales/ Reductions |
Balance of Shares Held 9/30/12 |
Value |
Dividend |
|||||||||||||||||||||
|
AboveNet* |
1,400,000 |
- |
1,400,000 |
- |
$ |
- |
$ |
- |
|||||||||||||||||||
|
Acorn Energy |
1,500,000 |
5,246 |
- |
1,505,246 |
13,427 |
190 |
|||||||||||||||||||||
|
AFC Enterprises |
2,000,000 |
- |
- |
2,000,000 |
49,200 |
- |
|||||||||||||||||||||
|
Alimera Sciences |
2,040,000 |
- |
- |
2,040,000 |
5,263 |
- |
|||||||||||||||||||||
|
Associated Estates Realty |
3,700,000 |
- |
- |
3,700,000 |
56,092 |
1,961 |
|||||||||||||||||||||
|
Auxilium Pharmaceuticals |
3,033,715 |
216,285 |
- |
3,250,000 |
79,495 |
- |
|||||||||||||||||||||
|
Bally Technologies |
3,725,000 |
- |
- |
3,725,000 |
183,978 |
- |
|||||||||||||||||||||
|
Boingo Wireless |
1,500,000 |
360,682 |
- |
1,860,682 |
14,774 |
- |
|||||||||||||||||||||
|
CAI International |
1,123,400 |
- |
- |
1,123,400 |
23,052 |
- |
|||||||||||||||||||||
|
Cavco Industries |
460,000 |
- |
- |
460,000 |
21,109 |
- |
|||||||||||||||||||||
|
Cepheid |
3,200,000 |
1,770,000 |
- |
4,970,000 |
171,515 |
- |
|||||||||||||||||||||
|
Chelsea Therapeutics International |
4,550,000 |
1,200,000 |
801,000 |
4,949,000 |
5,939 |
- |
|||||||||||||||||||||
|
Cogent Communications* |
2,520,000 |
- |
320,000 |
2,200,000 |
50,578 |
220 |
|||||||||||||||||||||
|
Constant Contact* |
2,350,000 |
- |
1,150,000 |
1,200,000 |
20,880 |
- |
|||||||||||||||||||||
|
Donaldson** |
4,200,000 |
4,200,000 |
- |
8,400,000 |
291,564 |
2,184 |
|||||||||||||||||||||
|
Drew Industries |
1,500,000 |
380,000 |
- |
1,880,000 |
56,795 |
- |
|||||||||||||||||||||
|
Duluth Metals |
7,500,000 |
- |
- |
7,500,000 |
17,928 |
- |
|||||||||||||||||||||
|
DuPont Fabros Technology |
3,350,000 |
350,000 |
- |
3,700,000 |
93,425 |
1,377 |
|||||||||||||||||||||
|
eResearch Technology* |
4,900,000 |
- |
4,900,000 |
- |
- |
- |
|||||||||||||||||||||
|
ESCO Technologies |
2,200,000 |
- |
- |
2,200,000 |
85,470 |
528 |
|||||||||||||||||||||
|
ExlService Holdings |
1,145,000 |
473,000 |
- |
1,618,000 |
47,731 |
- |
|||||||||||||||||||||
|
Gaiam |
1,371,366 |
- |
- |
1,371,366 |
4,786 |
- |
|||||||||||||||||||||
|
General Communications* |
2,000,000 |
- |
500,000 |
1,500,000 |
14,700 |
- |
|||||||||||||||||||||
|
GLG Life Tech |
1,750,000 |
- |
84,730 |
1,665,270 |
227 |
- |
|||||||||||||||||||||
|
Gulf United Energy |
- |
50,000,000 |
- |
50,000,000 |
3,000 |
- |
|||||||||||||||||||||
|
H & E Equipment Services |
3,400,000 |
- |
- |
3,400,000 |
41,208 |
23,800 |
|||||||||||||||||||||
|
Hackett Group+ |
4,500,000 |
- |
650,793 |
3,849,207 |
16,090 |
- |
|||||||||||||||||||||
|
HEICO*** |
2,250,000 |
813,000 |
- |
3,063,000 |
93,452 |
319 |
|||||||||||||||||||||
|
Helen of Troy |
1,600,000 |
- |
- |
1,600,000 |
50,928 |
- |
|||||||||||||||||||||
|
Horizon Pharma* |
1,095,000 |
- |
- |
1,095,000 |
3,800 |
- |
|||||||||||||||||||||
|
iGATE |
3,400,000 |
- |
- |
3,400,000 |
61,778 |
- |
|||||||||||||||||||||
|
II-VI |
4,550,000 |
- |
- |
4,550,000 |
86,541 |
- |
|||||||||||||||||||||
|
Insperity |
1,210,000 |
336,000 |
- |
1,546,000 |
39,006 |
650 |
|||||||||||||||||||||
|
Interline Brands* |
2,600,000 |
- |
2,600,000 |
- |
- |
- |
|||||||||||||||||||||
|
InterMune* |
2,950,000 |
900,000 |
1,825,000 |
2,025,000 |
18,164 |
- |
|||||||||||||||||||||
|
IPG Photonics |
2,780,000 |
- |
- |
2,780,000 |
159,294 |
- |
|||||||||||||||||||||
|
IXYS |
1,900,000 |
- |
- |
1,900,000 |
18,848 |
- |
|||||||||||||||||||||
|
Kaiser Federal |
452,146 |
- |
- |
452,146 |
6,823 |
99 |
|||||||||||||||||||||
|
Kenexa* |
1,700,000 |
- |
775,000 |
925,000 |
42,393 |
- |
|||||||||||||||||||||
|
Kite Realty Group |
3,500,000 |
- |
- |
3,500,000 |
17,850 |
630 |
|||||||||||||||||||||
|
Knoll |
4,200,000 |
- |
- |
4,200,000 |
58,590 |
1,344 |
|||||||||||||||||||||
|
Lifetime Fitness |
2,190,000 |
- |
- |
2,190,000 |
100,171 |
- |
|||||||||||||||||||||
|
lululemon athletica* |
5,740,000 |
- |
1,235,000 |
4,505,000 |
333,100 |
- |
|||||||||||||||||||||
|
Marlin Business Services |
1,091,000 |
- |
- |
1,091,000 |
23,140 |
218 |
|||||||||||||||||||||
|
MB Financial |
2,360,000 |
500,000 |
- |
2,860,000 |
56,485 |
83 |
|||||||||||||||||||||
|
McGrath Rentcorp |
2,150,000 |
- |
- |
2,150,000 |
56,093 |
1,505 |
|||||||||||||||||||||
|
Mettler-Toledo International |
1,600,000 |
- |
- |
1,600,000 |
273,184 |
- |
|||||||||||||||||||||
|
Micromet* |
6,702,347 |
64,547 |
6,766,894 |
- |
- |
- |
|||||||||||||||||||||
|
Moog |
2,775,000 |
225,000 |
- |
3,000,000 |
113,610 |
- |
|||||||||||||||||||||
|
Navigant Consulting |
2,800,000 |
700,000 |
- |
3,500,000 |
38,675 |
- |
|||||||||||||||||||||
|
NPS Pharmaceuticals |
6,000,000 |
- |
- |
6,000,000 |
55,500 |
- |
|||||||||||||||||||||
|
Pericom Semiconductor |
1,765,000 |
- |
- |
1,765,000 |
15,329 |
- |
|||||||||||||||||||||
|
Petroamerica Oil* |
30,275,000 |
- |
5,275,000 |
25,000,000 |
5,340 |
- |
|||||||||||||||||||||
|
Petrodorado Energy |
26,000,000 |
- |
- |
26,000,000 |
4,760 |
- |
|||||||||||||||||||||
|
PetroMagdalena Energy* |
7,582,928 |
- |
7,582,928 |
- |
- |
- |
|||||||||||||||||||||
|
Petromanas |
37,500,000 |
- |
- |
37,500,000 |
7,629 |
- |
|||||||||||||||||||||
|
Pier 1 Imports |
5,600,000 |
1,000,000 |
- |
6,600,000 |
123,684 |
488 |
|||||||||||||||||||||
|
Pinnacle Entertainment |
3,950,000 |
- |
- |
3,950,000 |
48,388 |
- |
|||||||||||||||||||||
41
Columbia Acorn Fund
Statement of Investments (Unaudited), continued
> Notes to Statement of Investments (dollar values in thousands)
|
Security |
Balance of Shares Held 12/31/11 |
Purchases/ Additions |
Sales/ Reductions |
Balance of Shares Held 9/30/12 |
Value |
Dividend |
|||||||||||||||||||||
|
Raptor Pharmaceutical |
3,455,000 |
745,000 |
1,200,000 |
3,000,000 |
$ |
16,680 |
$ |
- |
|||||||||||||||||||
|
Rush Enterprises |
3,350,000 |
300,000 |
- |
3,650,000 |
68,952 |
- |
|||||||||||||||||||||
|
Ryman Hospitality Properties |
3,850,000 |
- |
- |
3,850,000 |
152,190 |
- |
|||||||||||||||||||||
|
SABA |
- |
2,000,000 |
- |
2,000,000 |
19,980 |
- |
|||||||||||||||||||||
|
Salem Communications* |
1,527,700 |
- |
1,527,700 |
- |
- |
- |
|||||||||||||||||||||
|
Santa Maria Petroleum**** |
50,000,000 |
- |
45,000,000 |
5,000,000 |
689 |
- |
|||||||||||||||||||||
|
Seattle Genetics |
6,153,000 |
- |
- |
6,153,000 |
165,823 |
- |
|||||||||||||||||||||
|
Shutterfly |
3,070,000 |
300,000 |
535,000 |
2,835,000 |
88,225 |
- |
|||||||||||||||||||||
|
SPS Commerce |
900,000 |
- |
- |
900,000 |
34,623 |
- |
|||||||||||||||||||||
|
Summit Hotel Properties |
1,500,000 |
976,000 |
- |
2,476,000 |
21,145 |
638 |
|||||||||||||||||||||
|
Tower Group |
1,675,000 |
1,089,000 |
- |
2,764,000 |
53,594 |
1,555 |
|||||||||||||||||||||
|
TriCo Bancshares |
1,350,000 |
- |
- |
1,350,000 |
22,315 |
365 |
|||||||||||||||||||||
|
True Religion Apparel* |
1,507,000 |
- |
1,324,134 |
182,866 |
3,901 |
93 |
|||||||||||||||||||||
|
tw telecom |
9,500,000 |
- |
- |
9,500,000 |
247,665 |
- |
|||||||||||||||||||||
|
Tyler Technologies* |
1,700,000 |
- |
800,000 |
900,000 |
39,618 |
- |
|||||||||||||||||||||
|
Virtusa |
2,125,000 |
- |
- |
2,125,000 |
37,761 |
- |
|||||||||||||||||||||
|
Warnaco Group* |
2,190,000 |
- |
730,000 |
1,460,000 |
75,774 |
- |
|||||||||||||||||||||
|
Wolverine Minerals* |
4,000,000 |
- |
- |
4,000,000 |
176 |
- |
|||||||||||||||||||||
|
World Acceptance |
1,505,202 |
- |
220,202 |
1,285,000 |
86,673 |
- |
|||||||||||||||||||||
|
Total of Affiliated Transactions |
350,544,804 |
68,903,760 |
87,203,381 |
332,245,183 |
$ |
4,416,565 |
$ |
38,247 |
|||||||||||||||||||
* At September 30, 2012, the Fund owned less than five percent of the company's outstanding voting shares.
** Includes the effects of a 2:1 stock split.
*** Includes the effects of a 5:4 stock split.
**** Includes the effects of a 1:10 reverse stock split.
+ Includes the effects of a corporate action.
The aggregate cost and value of these companies at September 30, 2012, were $2,434,032 and $3,808,141, respectively. Investments in affiliated companies represented 21.70% of the Fund's total net assets at September 30, 2012.
(c) All or a portion of this security was on loan at September 30, 2012. The total market value of securities on loan at September 30, 2012 was $409,637.
(d) Illiquid security.
(e) Denotes a restricted security, which is subject to restrictions on resale under federal securities laws. These securities are valued at fair value determined in good faith under consistently applied procedures established by the Board of Trustees. At September 30, 2012, the market value of these securities amounted to $16,743, which represented 0.10% of total net assets. Additional information on these securities is as follows:
|
Security |
Acquisition Dates |
Shares |
Cost |
Value |
|||||||||||||||
|
Union Agriculture Group |
12/8/10-6/27/12 |
1,306,818 |
$ |
15,000 |
$ |
13,552 |
|||||||||||||
|
Canadian Overseas Petroleum |
11/24/10 |
8,400,000 |
3,591 |
1,722 |
|||||||||||||||
|
Santa Maria Petroleum |
1/14/11 |
4,110,000 |
5,193 |
562 |
|||||||||||||||
|
MicroDose Therapeutx |
11/24/00 |
359,944 |
2,005 |
238 |
|||||||||||||||
|
Voyager Learning - Contingent Value Rights |
12/24/09 |
2,000,000 |
- |
220 |
|||||||||||||||
|
Wolverine Minerals |
6/3/11 |
4,000,000 |
2,005 |
176 |
|||||||||||||||
|
Petrodorado Energy - Warrants |
11/20/09 |
24,000,000 |
2,965 |
117 |
|||||||||||||||
|
Canadian Overseas Petroleum - Warrants |
11/24/10 |
4,200,000 |
526 |
110 |
|||||||||||||||
|
Duluth Exploration - Special Warrants |
8/19/11 |
500,000 |
- |
46 |
|||||||||||||||
|
Wolverine Minerals - Warrants |
6/3/11 |
2,000,000 |
243 |
- |
|||||||||||||||
|
$ |
31,528 |
$ |
16,743 |
||||||||||||||||
(f) Investment made with cash collateral received from securities lending activity.
(g) At September 30, 2012, for federal income tax purposes, the cost of investments was $10,822,897 and net unrealized appreciation was $6,483,075 consisting of gross unrealized appreciation of $7,200,375 and gross unrealized depreciation of $717,300.
42
> Notes to Statement of Investments (dollar values in thousands)
(h) On September 30, 2012, the market value of foreign securities represented 8.66% of total net assets. The Fund's foreign portfolio was diversified as follows:
|
Country |
Value |
Percentage of Net Assets |
|||||||||
|
Canada |
$ |
286,310 |
1.63 |
||||||||
|
Netherlands |
211,135 |
1.20 |
|||||||||
|
Singapore |
190,217 |
1.08 |
|||||||||
|
Sweden |
116,819 |
0.67 |
|||||||||
|
Colombia |
100,974 |
0.57 |
|||||||||
|
Hong Kong |
96,092 |
0.55 |
|||||||||
|
Brazil |
88,242 |
0.50 |
|||||||||
|
Japan |
74,527 |
0.42 |
|||||||||
|
France |
52,208 |
0.30 |
|||||||||
|
South Africa |
42,368 |
0.24 |
|||||||||
|
Denmark |
42,032 |
0.24 |
|||||||||
|
Chile |
41,484 |
0.24 |
|||||||||
|
Israel |
29,608 |
0.17 |
|||||||||
|
Country |
Value |
Percentage of Net Assets |
|||||||||
|
China |
$ |
28,252 |
0.16 |
||||||||
|
United Kingdom |
25,061 |
0.14 |
|||||||||
|
Russia |
17,528 |
0.10 |
|||||||||
|
Mongolia |
17,075 |
0.10 |
|||||||||
|
India |
15,272 |
0.09 |
|||||||||
|
Uruguay |
13,552 |
0.08 |
|||||||||
|
Iraq |
11,947 |
0.07 |
|||||||||
|
Iceland |
10,863 |
0.06 |
|||||||||
|
Germany |
7,878 |
0.04 |
|||||||||
|
Australia |
1,278 |
0.01 |
|||||||||
|
Total Foreign Portfolio |
$ |
1,520,722 |
8.66 |
||||||||
(i) Securities are valued using policies described in the Notes to Financial Statements in the most recent shareholder report.
Fair Value Measurements
Various inputs are used in determining the value of the Fund's investments, following the input prioritization hierarchy established by GAAP. These inputs are summarized in the three broad levels listed below:
• Level 1 – quoted prices in active markets for identical securities
• Level 2 – prices determined using other significant observable inputs (including quoted prices for similar securities, interest rates, prepayment speeds, credit risk and others)
• Level 3 – prices determined using significant unobservable inputs where quoted prices or observable inputs are unavailable or less reliable (including management's own assumptions about the factors market participants would use in pricing an investment)
The inputs or methodology used for valuing securities are not necessarily an indication of the risk associated with investing in those securities.
Examples of the types of securities in which the Fund would typically invest and how they are classified within this hierarchy are as follows. Typical Level 1 securities include exchange traded domestic equities, mutual funds whose NAVs are published each day and exchange traded foreign equities that are not statistically fair valued. Typical Level 2 securities include exchange traded foreign equities that are statistically fair valued, forward foreign currency exchange contracts and short-term investments valued at amortized cost. Additionally, securities fair valued by the Valuation Committee (the Committee) of the Fund's Board of Trustees (the Board) that rely on significant observable inputs are also included in Level 2. Typical Level 3 securities include any security fair valued by the Committee that relies on significant unobservable inputs.
Under the direction of the Board, the Committee is responsible for carrying out the valuation procedures approved by the Board.
The Committee meets as necessary, and no less frequently than quarterly, to determine fair values for securities for which market quotations are not readily available or for which the investment manager believes that available market quotations are unreliable, and to review the continuing appropriateness of the current value of any security subject to the Trust's Portfolio Pricing Policy and the pricing procedures of the investment manager (the Policies). The Policies address, among other things: circumstances under which market quotations will be deemed readily available; selection of third party pricing vendors; appropriate pricing methodologies; events that require fair valuation and fair value techniques; and circumstances under which securities will be deemed to pose a potential for stale pricing, including when securities are illiquid, restricted, or in default. The Committee may also meet to discuss additional valuation matters, which may include review of back-testing results, review of time-sensitive information or approval of other valuation related actions, and to review the appropriateness of the Policies.
For investments categorized as Level 3, the significant unobservable inputs used in the fair value measurement of the Funds' securities may include: (i) data specific to the issuer or comparable issuers, (ii) general market or specific sector news and (iii) quoted prices and specific or similar security transactions. The Committee considers this data and any changes from prior periods in order to assess the reasonableness of observable and unobservable inputs, any assumptions or internal models used to value those securities and changes in fair value. Significant changes in any of these factors could result in lower or higher fair value measurements. Various factors impact the frequency of monitoring (which may occur as often as daily), however the Committee may determine that changes to inputs, assumptions and models are not required with the same frequency.
43
Columbia Acorn Fund
Statement of Investments (Unaudited), continued
> Notes to Statement of Investments (dollar values in thousands)
The following table summarizes the inputs used, as of September 30, 2012, in valuing the Fund's assets:
|
Investment Type |
Quoted Prices (Level 1) |
Other Significant Observable Inputs (Level 2) |
Significant Unobservable Inputs (Level 3) |
Total |
|||||||||||||||
|
Equities |
|||||||||||||||||||
|
Information |
$ |
4,494,354 |
$ |
185,496 |
$ |
- |
$ |
4,679,850 |
|||||||||||
|
Industrial Goods & Services |
3,138,860 |
204,390 |
- |
3,343,250 |
|||||||||||||||
|
Consumer Goods & Services |
2,633,984 |
124,625 |
220 |
2,758,829 |
|||||||||||||||
|
Finance |
1,918,231 |
- |
- |
1,918,231 |
|||||||||||||||
|
Health Care |
1,620,502 |
18,598 |
238 |
1,639,338 |
|||||||||||||||
|
Energy & Minerals |
1,124,454 |
135,890 |
13,598 |
1,273,942 |
|||||||||||||||
|
Other Industries |
1,151,174 |
122,392 |
- |
1,273,566 |
|||||||||||||||
|
Total Equities |
16,081,559 |
791,391 |
14,056 |
16,887,006 |
|||||||||||||||
|
Total Securities Lending Collateral |
418,966 |
- |
- |
418,966 |
|||||||||||||||
|
Total Investments |
$ |
16,500,525 |
$ |
791,391 |
$ |
14,056 |
$ |
17,305,972 |
|||||||||||
The Fund's assets assigned to the Level 2 input category are generally valued using a market approach, in which a security's value is determined through its correlation to prices and information from observable market transactions for similar or identical assets. Foreign equities are generally valued at the last sale price on the foreign exchange or market on which they trade. The Fund may use a statistical fair valuation model, in accordance with the policy adopted by the Board, provided by an independent third party to value securities principally traded in foreign markets in order to adjust for possible stale pricing that may occur between the close of the foreign exchanges and the time for valuation. These models take into account available market data including intraday index, ADR, and ETF movements. Securities acquired via private placement that have a holding period or an extended settlement period are valued at a discount to the same shares that are trading freely on the market. These discounts are determined by the investment manager's experience with similar securities or situations. Factors may include, but are not limited to, trade volume, shares outstanding and stock price. Warrants which do not trade are valued as a percentage of the actively trading common stock using a model, based on Black Scholes. Securities which have halted or temporarily stopped trading are valued at the last sale and adjusted by a premium or a discount to account for the anticipated re-opening price. These adjustments are determined by the investment manager's experience with similar securities or situations.
The following table shows transfers between Level 1 and Level 2 of the fair value hierarchy:
|
Transfers In |
Transfers Out |
||||||||||||||
| Level 1 |
Level 2 |
Level 1 |
Level 2 |
||||||||||||
| $ |
- |
$ |
1,575 |
$ |
1,575 |
$ |
- |
||||||||
Financial assets were transferred from Level 1 to Level 2 as trading halted during the period.
The following table reconciles asset balances for the period ending September 30, 2012, in which significant observable and/or unobservable inputs (Level 3) were used in determining value:
|
Investments in Securities |
Balance as of December 31, 2011 |
Realized Gain/(Loss) |
Change in Unrealized Appreciation (Depreciation) |
Purchases |
Sales |
Transfers into Level 3 |
Transfers out of Level 3 |
Balance as of September 30, 2012 |
|||||||||||||||||||||||||||
|
Equities |
|||||||||||||||||||||||||||||||||||
|
Consumer Goods & Services |
$ |
180 |
$ |
- |
$ |
40 |
$ |
- |
$ |
- |
$ |
- |
$ |
- |
$ |
220 |
|||||||||||||||||||
|
Health Care |
270 |
- |
(32 |
) |
- |
- |
- |
- |
238 |
||||||||||||||||||||||||||
|
Energy & Minerals |
12,507 |
- |
1,091 |
- |
- |
- |
- |
13,598 |
|||||||||||||||||||||||||||
|
$ |
12,957 |
$ |
- |
$ |
1,099 |
$ |
- |
$ |
- |
$ |
- |
$ |
- |
$ |
14,056 |
||||||||||||||||||||
The information in the above reconciliation table represents fiscal year to date activity for any securities identified as using Level 3 inputs at either the beginning or the end of the current fiscal period.
The change in unrealized appreciation attributed to securities owned at September 30, 2012, which were valued using significant unobservable inputs (Level 3), amounted to $1,099.
The Fund does not hold any significant investments categorized as Level 3.
Certain common stock classified as Level 3 are valued at fair value, using a market approach, as determined in good faith under consistently applied procedures established by and under the general supervision of the Board. To determine fair value for these securities, for which no market exists, the Committee utilizes the valuation technique it deems most appropriate in the circumstances, using some unobservable inputs, which may include but are not limited to trades of similar securities, estimated earnings of the company, market multiples derived from a set of comparable companies, and the position of the security within the company's capital structure. Significant increases or decreases to any of these inputs could result in a significantly lower or higher fair value measurement. Generally, a change in estimated earnings of a company may result in a change to the comparable companies and market multiples utilized.
44
Columbia Acorn International
Major Portfolio Changes in the Third Quarter (Unaudited)
|
Number of Shares |
|||||||||||
|
6/30/12 |
9/30/12 |
||||||||||
|
Purchases |
|||||||||||
|
Asia |
|||||||||||
| > Japan | |||||||||||
|
Doshisha |
828,000 |
838,000 |
|||||||||
|
Glory |
1,694,562 |
1,817,562 |
|||||||||
|
Hamamatsu Photonics |
0 |
423,900 |
|||||||||
|
Horiba |
424,000 |
711,100 |
|||||||||
|
Itochu Techno-Science |
0 |
249,100 |
|||||||||
|
Lifenet Insurance |
0 |
813,400 |
|||||||||
|
Miraca Holdings |
659,500 |
816,456 |
|||||||||
|
Nabtesco |
0 |
672,000 |
|||||||||
|
Nihon Parkerizing |
756,900 |
1,169,080 |
|||||||||
|
Sanrio |
865,800 |
960,000 |
|||||||||
|
Start Today |
2,572,724 |
2,892,724 |
|||||||||
| > Taiwan | |||||||||||
|
Lung Yen |
2,469,000 |
3,835,000 |
|||||||||
|
Simplo Technology |
5,564,713 |
6,334,713 |
|||||||||
| > Singapore | |||||||||||
|
Ascendas REIT |
20,000,000 |
22,000,000 |
|||||||||
|
Mapletree Commercial Trust |
35,000,000 |
39,467,000 |
|||||||||
|
Mapletree Industrial Trust |
28,000,000 |
33,000,000 |
|||||||||
|
Mapletree Logistics Trust |
35,000,000 |
40,000,000 |
|||||||||
|
Petra Foods |
3,071,300 |
4,772,000 |
|||||||||
| > Hong Kong | |||||||||||
|
AAC Technologies |
8,475,000 |
10,038,000 |
|||||||||
|
Lifestyle International |
21,845,000 |
22,000,000 |
|||||||||
|
Vitasoy International |
4,495,200 |
9,557,900 |
|||||||||
| > China | |||||||||||
| 51job - ADR |
326,700 |
427,814 |
|||||||||
|
Digital China |
18,000,300 |
22,168,300 |
|||||||||
|
NetEase.com - ADR |
381,300 |
419,323 |
|||||||||
|
New Oriental Education & Technology - ADR |
1,100,000 |
1,200,000 |
|||||||||
| > India | |||||||||||
|
Adani Ports & Special Economic Zone |
8,052,053 |
8,945,000 |
|||||||||
|
TTK Prestige |
0 |
63,000 |
|||||||||
| > Korea | |||||||||||
|
BS Financial Group |
0 |
1,208,000 |
|||||||||
|
Handsome |
474,441 |
624,441 |
|||||||||
|
Hite Jinro |
0 |
138,990 |
|||||||||
|
iMarketKorea |
580,000 |
724,727 |
|||||||||
|
Kepco Plant Service & Engineering |
244,530 |
305,540 |
|||||||||
|
Samsung Engineering |
0 |
57,000 |
|||||||||
| > Indonesia | |||||||||||
|
Ace Indonesia |
15,000,000 |
25,000,000 |
|||||||||
|
Archipelago Resources |
29,063,787 |
31,764,600 |
|||||||||
|
Mayora Indah |
2,176,600 |
4,275,800 |
|||||||||
|
Number of Shares |
|||||||||||
|
6/30/12 |
9/30/12 |
||||||||||
|
MNC Skyvision |
32,766,000 |
40,047,000 |
|||||||||
|
Surya Citra Media |
0 |
7,613,000 |
|||||||||
|
Tower Bersama Infrastructure |
51,767,300 |
60,516,300 |
|||||||||
| > Thailand | |||||||||||
|
Home Product Center |
110,000,000 |
125,000,000 |
|||||||||
|
Europe |
|||||||||||
| > United Kingdom | |||||||||||
|
Aggreko |
596,100 |
875,000 |
|||||||||
|
Asos |
0 |
646,000 |
|||||||||
|
Domino's Pizza UK & Ireland |
3,107,000 |
3,789,000 |
|||||||||
|
Elementis |
0 |
4,999,847 |
|||||||||
|
Rightmove |
822,000 |
998,000 |
|||||||||
|
Spirax Sarco |
256,202 |
655,000 |
|||||||||
|
WH Smith |
1,555,000 |
2,321,211 |
|||||||||
| > Netherlands | |||||||||||
|
Aalberts Industries |
2,546,126 |
2,742,165 |
|||||||||
|
BinckBank |
0 |
449,113 |
|||||||||
|
TKH Group |
850,468 |
1,112,468 |
|||||||||
| > France | |||||||||||
|
Compagnie Française de l'Afrique Occidentale |
134,254 |
377,000 |
|||||||||
|
Neopost |
675,000 |
770,000 |
|||||||||
|
Norbert Dentressangle |
232,400 |
285,704 |
|||||||||
| > Switzerland | |||||||||||
|
Dufry Group |
330,000 |
375,000 |
|||||||||
|
Zehnder |
280,000 |
330,000 |
|||||||||
| > Germany | |||||||||||
|
NORMA Group |
690,000 |
1,050,000 |
|||||||||
|
Pfeiffer Vacuum |
0 |
130,050 |
|||||||||
| > Italy | |||||||||||
|
Fiat |
0 |
3,791,000 |
|||||||||
|
Geox |
7,000,000 |
7,706,873 |
|||||||||
|
Pirelli |
2,661,000 |
3,245,000 |
|||||||||
|
Tod's |
166,200 |
224,200 |
|||||||||
| > Denmark | |||||||||||
|
Solar |
166,013 |
207,968 |
|||||||||
| > Norway | |||||||||||
|
Atea |
2,403,664 |
3,281,864 |
|||||||||
| > Kazakhstan | |||||||||||
|
Halyk Savings Bank of Kazakhstan - GDR |
3,319,000 |
4,506,259 |
|||||||||
| > Russia | |||||||||||
|
Yandex |
1,123,695 |
1,167,000 |
|||||||||
| > Finland | |||||||||||
|
Stockmann |
1,039,429 |
1,430,429 |
|||||||||
45
Columbia Acorn International
Major Portfolio Changes in the Third Quarter (Unaudited), continued
|
Number of Shares |
|||||||||||
|
6/30/12 |
9/30/12 |
||||||||||
|
Purchases (continued) |
|||||||||||
|
Other Countries |
|||||||||||
| > South Africa | |||||||||||
|
Massmart Holdings |
1,025,504 |
1,574,575 |
|||||||||
| > Canada | |||||||||||
|
CAE |
0 |
3,047,000 |
|||||||||
| > Australia | |||||||||||
|
Challenger Financial |
11,936,400 |
14,652,712 |
|||||||||
|
Commonwealth Property Office Fund |
48,533,075 |
49,017,000 |
|||||||||
|
Domino's Pizza Enterprises |
1,576,290 |
2,500,000 |
|||||||||
|
Regis Resources |
0 |
311,805 |
|||||||||
|
SAI Global |
0 |
3,338,561 |
|||||||||
| > United States | |||||||||||
|
FMC Technologies |
407,213 |
669,213 |
|||||||||
|
Textainer Group Holdings |
965,297 |
1,103,297 |
|||||||||
| > New Zealand | |||||||||||
|
Telecom NZ |
0 |
3,598,749 |
|||||||||
|
Latin America |
|||||||||||
| > Brazil | |||||||||||
|
Arcos Dorados |
1,300,000 |
1,730,000 |
|||||||||
|
Odontoprev |
4,500,000 |
5,000,000 |
|||||||||
| > Mexico | |||||||||||
|
Genomma Lab International |
0 |
11,945,000 |
|||||||||
|
Herdez |
0 |
1,728,500 |
|||||||||
| > Guatemala | |||||||||||
|
Tahoe Resources |
1,403,049 |
1,434,600 |
|||||||||
| > Chile | |||||||||||
|
Viña Concha y Toro |
5,640,000 |
10,115,274 |
|||||||||
|
Number of Shares |
|||||||||||
|
6/30/12 |
9/30/12 |
||||||||||
|
Sales |
|||||||||||
|
Asia |
|||||||||||
| > Japan | |||||||||||
|
Aeon Delight |
1,417,438 |
1,221,938 |
|||||||||
|
Aeon Mall |
880,474 |
830,474 |
|||||||||
|
Ibiden |
857,144 |
0 |
|||||||||
|
Miura |
407,050 |
202,150 |
|||||||||
|
Shimadzu |
2,600,000 |
0 |
|||||||||
|
Shinsei Bank |
15,024,649 |
0 |
|||||||||
|
Torishima Pump Manufacturing |
1,346,963 |
1,069,963 |
|||||||||
| > Taiwan | |||||||||||
|
MStar Semiconductor |
3,661,100 |
0 |
|||||||||
|
Radiant Opto-Electronics |
6,087,300 |
4,564,960 |
|||||||||
|
St. Shine Optical |
2,492,300 |
2,035,000 |
|||||||||
|
Tripod Technologies |
12,218,270 |
8,012,470 |
|||||||||
| > China | |||||||||||
|
Want Want |
26,565,000 |
24,290,000 |
|||||||||
|
Zhaojin Mining Industry |
18,920,554 |
9,306,554 |
|||||||||
| > India | |||||||||||
|
Jain Irrigation Systems |
11,163,303 |
1,426,549 |
|||||||||
|
S. Kumars Nationwide |
10,249,300 |
0 |
|||||||||
| > Korea | |||||||||||
|
Grand Korea Leisure |
1,134,000 |
852,150 |
|||||||||
|
Hyundai Home Shopping |
55,000 |
0 |
|||||||||
|
NHN |
101,150 |
0 |
|||||||||
|
Europe |
|||||||||||
| > United Kingdom | |||||||||||
|
Chemring |
2,303,000 |
0 |
|||||||||
|
Next |
262,300 |
0 |
|||||||||
|
Serco |
3,375,000 |
0 |
|||||||||
| > Netherlands | |||||||||||
|
Fugro |
460,000 |
368,000 |
|||||||||
|
Koninklijke TenCate |
1,234,758 |
821,137 |
|||||||||
|
UNIT4 |
1,591,702 |
1,574,145 |
|||||||||
| > France | |||||||||||
|
Mersen |
162,844 |
0 |
|||||||||
| > Switzerland | |||||||||||
|
Bank Sarasin & Cie |
580,000 |
0 |
|||||||||
|
Partners Group |
310,000 |
260,000 |
|||||||||
| > Germany | |||||||||||
|
Dürr |
500,000 |
440,000 |
|||||||||
|
Rheinmetall |
405,000 |
0 |
|||||||||
|
Wirecard |
2,500,000 |
2,160,000 |
|||||||||
| > Sweden | |||||||||||
|
East Capital Explorer |
419,877 |
0 |
|||||||||
|
Hexagon |
4,056,007 |
3,957,522 |
|||||||||
46
|
Number of Shares |
|||||||||||
|
6/30/12 |
9/30/12 |
||||||||||
|
Sales (continued) |
|||||||||||
|
Europe—continued |
|||||||||||
| > Russia | |||||||||||
|
Mail.ru - GDR |
368,493 |
0 |
|||||||||
|
Petropavlovsk |
2,109,700 |
0 |
|||||||||
| > Ireland | |||||||||||
|
Paddy Power |
263,400 |
74,637 |
|||||||||
|
United Drug |
4,237,000 |
0 |
|||||||||
| > Greece | |||||||||||
|
Intralot |
4,384,185 |
0 |
|||||||||
| > Spain | |||||||||||
|
Red Eléctrica de España |
618,320 |
0 |
|||||||||
|
Other Countries |
|||||||||||
| > South Africa | |||||||||||
|
Adcock Ingram Holdings |
4,992,200 |
3,938,965 |
|||||||||
|
Mr. Price |
3,175,083 |
2,644,083 |
|||||||||
| > Canada | |||||||||||
|
DeeThree Exploration |
2,919,000 |
1,130,000 |
|||||||||
| > United States | |||||||||||
|
BioMarin Pharmaceutical |
1,229,871 |
1,044,000 |
|||||||||
|
Hornbeck Offshore |
555,500 |
439,500 |
|||||||||
|
World Fuel Services |
763,228 |
428,228 |
|||||||||
| > Israel | |||||||||||
|
Israel Chemicals |
4,706,527 |
3,145,527 |
|||||||||
| > Senegal | |||||||||||
|
Sonatel |
42,360 |
31,200 |
|||||||||
47
Columbia Acorn International
Statement of Investments (Unaudited), September 30, 2012
|
Number of Shares |
Value (000) |
||||||||||
|
Equities: 95.4% |
|||||||||||
|
Asia 43.2% |
|||||||||||
| > Japan 16.7% | |||||||||||
|
5,582,600 |
Kansai Paint |
$ |
61,872 |
||||||||
|
Paint Producer in Japan, India, China & Southeast Asia |
|||||||||||
|
20,227,000 |
Seven Bank |
61,718 |
|||||||||
|
ATM Processing Services |
|||||||||||
|
20,096 |
Wacom |
48,628 |
|||||||||
|
Computer Graphic Illustration Devices |
|||||||||||
|
1,582,200 |
Hoshizaki Electric |
45,949 |
|||||||||
|
Commercial Kitchen Equipment |
|||||||||||
|
2,719,900 |
Park24 |
44,443 |
|||||||||
|
Parking Lot Operator |
|||||||||||
|
1,817,562 |
Glory |
42,593 |
|||||||||
|
Currency Handling Systems & Related Equipment |
|||||||||||
|
2,892,724 |
Start Today (a) |
41,323 |
|||||||||
|
Online Japanese Apparel Retailer |
|||||||||||
|
7,780 |
Orix JREIT |
38,001 |
|||||||||
|
Diversified REIT |
|||||||||||
|
816,456 |
Miraca Holdings |
36,666 |
|||||||||
|
Outsourced Lab Testing, Diagnostic Equipment & Reagents |
|||||||||||
|
960,000 |
Sanrio (a) |
34,336 |
|||||||||
|
Character Goods & Licensing |
|||||||||||
|
2,981,100 |
Kuraray (a) |
33,854 |
|||||||||
|
Special Resin, Fine Chemical, Fibers & Textures |
|||||||||||
|
295,762 |
Nakanishi |
31,759 |
|||||||||
|
Dental Tools & Machinery |
|||||||||||
|
30,500 |
Jupiter Telecommunications |
30,953 |
|||||||||
|
Largest Cable Service Provider in Japan |
|||||||||||
|
2,552,000 |
NGK Insulators (a) |
30,534 |
|||||||||
|
Ceramic Products for Auto, Power & Electronics |
|||||||||||
|
937,651 |
Kintetsu World Express |
30,010 |
|||||||||
|
Airfreight Logistics |
|||||||||||
|
7,620 |
Kenedix Realty Investment |
27,401 |
|||||||||
|
Tokyo Midsize Office REIT |
|||||||||||
|
345,000 |
FP Corporation |
27,155 |
|||||||||
|
Disposable Food Trays & Containers |
|||||||||||
|
5,540 |
Mori Hills REIT Investment |
26,982 |
|||||||||
|
Tokyo Centric Diversified REIT |
|||||||||||
|
1,221,938 |
Aeon Delight |
26,918 |
|||||||||
|
Facility Maintenance & Management |
|||||||||||
|
2,137,272 |
Japan Airport Terminal |
25,363 |
|||||||||
|
Airport Terminal Operator at Haneda |
|||||||||||
|
1,613,429 |
Daiseki |
24,997 |
|||||||||
|
Waste Disposal & Recycling |
|||||||||||
|
838,000 |
Doshisha |
24,286 |
|||||||||
|
Wholesaler |
|||||||||||
|
480,000 |
Disco (a) |
23,083 |
|||||||||
|
Semiconductor Dicing & Grinding Equipment |
|||||||||||
|
10,360 |
Advance Residence Investment |
21,801 |
|||||||||
|
Residential REIT |
|||||||||||
|
300,792 |
Ain Pharmaciez |
21,485 |
|||||||||
|
Dispensing Pharmacy/Drugstore Operator |
|||||||||||
|
Number of Shares |
Value (000) |
||||||||||
|
1,885,600 |
Asahi Diamond Industrial |
$ |
21,143 |
||||||||
|
Consumable Diamond Tools |
|||||||||||
|
711,100 |
Horiba |
20,963 |
|||||||||
|
Measuring Instruments & Analyzers |
|||||||||||
|
830,474 |
Aeon Mall |
20,278 |
|||||||||
|
Suburban Shopping Mall Developer, Owner & Operator |
|||||||||||
|
772,000 |
Misumi Group |
19,140 |
|||||||||
|
Industrial Components Distributor |
|||||||||||
|
1,169,080 |
Nihon Parkerizing |
17,770 |
|||||||||
|
Metal Surface Treatment Agents & Processing |
|||||||||||
|
732,108 |
Icom |
17,668 |
|||||||||
|
Two Way Radio Communication Equipment |
|||||||||||
|
1,405,739 |
Ushio |
16,862 |
|||||||||
|
Industrial Light Sources |
|||||||||||
|
423,900 |
Hamamatsu Photonics |
14,564 |
|||||||||
|
Optical Sensors for Medical & Industrial Applications |
|||||||||||
|
1,940,200 |
Sintokogio |
13,325 |
|||||||||
|
Automated Casting Machines, Surface Treatment System & Consumables |
|||||||||||
|
249,100 |
Itochu Techno-Science |
12,947 |
|||||||||
|
IT Network Sales & Services |
|||||||||||
|
672,000 |
Nabtesco (a) |
12,371 |
|||||||||
|
Machinery Components |
|||||||||||
|
813,400 |
Lifenet Insurance (a)(b) |
10,734 |
|||||||||
|
Online Life Insurance Company in Japan |
|||||||||||
|
1,295 |
Global One Real Estate |
7,863 |
|||||||||
|
Office REIT |
|||||||||||
|
1,069,963 |
Torishima Pump Manufacturing |
7,608 |
|||||||||
|
Industrial Pump for Power Generation & Water Supply Systems |
|||||||||||
|
202,150 |
Miura |
4,887 |
|||||||||
|
Industrial Boiler |
|||||||||||
|
24 |
Fukuoka REIT |
175 |
|||||||||
|
Diversified REIT in Fukuoka |
|||||||||||
|
1,080,408 |
|||||||||||
| > Taiwan 6.5% | |||||||||||
|
36,606,000 |
Far EasTone Telecom |
90,333 |
|||||||||
|
Taiwan's Third Largest Mobile Operator |
|||||||||||
|
16,410,000 |
Taiwan Mobile |
59,843 |
|||||||||
|
Taiwan's Second Largest Mobile Operator |
|||||||||||
|
20,120,000 |
CTCI Corp |
45,962 |
|||||||||
|
International Engineering Firm |
|||||||||||
|
6,334,713 |
Simplo Technology |
37,810 |
|||||||||
|
Battery Packs for Notebook & Tablet PCs |
|||||||||||
|
2,035,000 |
St. Shine Optical |
26,117 |
|||||||||
|
World's Leading Disposable Contact Lens Original Equipment Manufacturer (OEM) |
|||||||||||
|
11,794,000 |
Chroma Ate |
24,777 |
|||||||||
|
Automatic Test Systems, Testing & Measurement Instruments |
|||||||||||
|
11,200,000 |
Taiwan Hon Chuan |
24,476 |
|||||||||
|
Beverage Packaging (Bottles, Caps, Labels) Manufacturer |
|||||||||||
|
6,603,000 |
Advantech |
24,062 |
|||||||||
|
Industrial PC & Components |
|||||||||||
|
4,564,960 |
Radiant Opto-Electronics |
19,730 |
|||||||||
|
LCD Back Light Units & Modules |
|||||||||||
48
|
Number of Shares |
Value (000) |
||||||||||
| > Taiwan—continued | |||||||||||
|
8,012,470 |
Tripod Technologies |
$ |
19,595 |
||||||||
|
Printed Circuit Boards (PCB) |
|||||||||||
|
3,181,000 |
President Chain Store |
16,980 |
|||||||||
|
Taiwan's Number One Convenience Chain Store Operator |
|||||||||||
|
3,000,141 |
PC Home |
16,960 |
|||||||||
|
Taiwanese Internet Retail Company |
|||||||||||
|
3,835,000 |
Lung Yen |
13,174 |
|||||||||
|
Funeral Services & Columbaria |
|||||||||||
|
37,000 |
Chipbond |
59 |
|||||||||
|
Semiconductor Back-end Packaging Services |
|||||||||||
|
419,878 |
|||||||||||
| > Singapore 4.4% | |||||||||||
|
22,000,000 |
Ascendas REIT |
43,091 |
|||||||||
|
Industrial Property Landlord |
|||||||||||
|
25,000,000 |
Olam International |
41,471 |
|||||||||
|
Agriculture Supply Chain Manager |
|||||||||||
|
33,000,000 |
Mapletree Industrial Trust |
37,871 |
|||||||||
|
Industrial Property Landlord |
|||||||||||
|
39,467,000 |
Mapletree Commercial Trust |
37,597 |
|||||||||
|
Retail & Office Property Landlord |
|||||||||||
|
40,000,000 |
Mapletree Logistics Trust |
36,578 |
|||||||||
|
Industrial Property Landlord |
|||||||||||
|
20,000,000 |
CDL Hospitality Trust |
33,061 |
|||||||||
|
Hotel Owner/Operator |
|||||||||||
|
15,000,000 |
Goodpack Limited |
22,626 |
|||||||||
|
International Bulk Container Leasing |
|||||||||||
|
3,500,000 |
Singapore Exchange |
19,893 |
|||||||||
|
Singapore Equity & Derivatives Market Operator |
|||||||||||
|
4,772,000 |
Petra Foods |
9,527 |
|||||||||
|
Cocoa Processor & Chocolate Manufacturer |
|||||||||||
|
281,715 |
|||||||||||
| > Hong Kong 4.1% | |||||||||||
|
6,500,000 |
Melco Crown Entertainment - ADR (a)(b) |
87,620 |
|||||||||
|
Macau Casino Operator |
|||||||||||
|
22,000,000 |
Lifestyle International |
45,348 |
|||||||||
|
Mid- to High-end Department Store Operator in Hong Kong & China |
|||||||||||
|
15,625,000 |
L'Occitane International |
41,196 |
|||||||||
|
Skin Care & Cosmetics Producer |
|||||||||||
|
10,038,000 |
AAC Technologies |
36,092 |
|||||||||
|
Miniature Acoustic Components |
|||||||||||
|
30,000,000 |
Sasa International |
20,455 |
|||||||||
|
Cosmetics Retailer |
|||||||||||
|
10,000,000 |
MGM China Holdings |
17,176 |
|||||||||
|
Macau Casino Operator |
|||||||||||
|
9,557,900 |
Vitasoy International |
8,339 |
|||||||||
|
Hong Kong Soy Food Brand |
|||||||||||
|
8,000,000 |
Melco International |
7,101 |
|||||||||
|
Macau Casino Operator |
|||||||||||
|
263,327 |
|||||||||||
| > China 2.7% | |||||||||||
|
22,168,300 |
Digital China |
35,181 |
|||||||||
|
IT Distribution & Systems Integration Services |
|||||||||||
|
Number of Shares |
Value (000) |
||||||||||
|
24,290,000 |
Want Want |
$ |
30,920 |
||||||||
|
Chinese Branded Consumer Food Company |
|||||||||||
|
419,323 |
NetEase.com - ADR (b) |
23,541 |
|||||||||
|
Chinese Online Gaming Services |
|||||||||||
|
1,200,000 |
New Oriental Education & Technology - ADR (a) |
20,004 |
|||||||||
|
Education Service Provider |
|||||||||||
|
260,000,000 |
RexLot Holdings |
19,714 |
|||||||||
|
Lottery Equipment Supplier in China |
|||||||||||
|
427,814 |
51 |
job - ADR (b) |
19,166 |
||||||||
|
Integrated Human Resource Services |
|||||||||||
|
9,306,554 |
Zhaojin Mining Industry |
16,856 |
|||||||||
|
Gold Mining & Refining in China |
|||||||||||
|
30,000,000 |
AMVIG Holdings |
8,931 |
|||||||||
|
Chinese Tobacco Packaging Material Supplier |
|||||||||||
|
174,313 |
|||||||||||
| > India 2.3% | |||||||||||
|
2,262,300 |
United Breweries |
28,031 |
|||||||||
|
India's Largest Brewer |
|||||||||||
|
341,652 |
Asian Paints |
25,464 |
|||||||||
|
India's Largest Paint Company |
|||||||||||
|
8,945,000 |
Adani Ports & Special Economic Zone |
21,559 |
|||||||||
|
Indian West Coast Shipping Port |
|||||||||||
|
13,195,000 |
Redington India |
19,537 |
|||||||||
|
Supply Chain Solutions for IT & Mobile Handsets in Emerging Markets |
|||||||||||
|
1,550,000 |
Shriram Transport Finance |
18,172 |
|||||||||
|
Used Truck Finance |
|||||||||||
|
545,000 |
Colgate Palmolive India (b) |
12,488 |
|||||||||
|
Consumer Products in Oral Care |
|||||||||||
|
1,600,000 |
Titan Industries |
7,910 |
|||||||||
|
Jewlery, Watches, Eyeglasses |
|||||||||||
|
27,212,878 |
REI Agro |
5,469 |
|||||||||
|
Basmati Rice Processing |
|||||||||||
|
63,000 |
TTK Prestige (b) |
4,441 |
|||||||||
|
Branded Cooking Equipment |
|||||||||||
|
1,650,000 |
SKIL Ports and Logistics (b) |
2,851 |
|||||||||
|
Indian Container Port Project |
|||||||||||
|
1,426,549 |
Jain Irrigation Systems |
1,881 |
|||||||||
|
Agricultural Micro-irrigation Systems & Food Processing |
|||||||||||
|
147,803 |
|||||||||||
| > Korea 1.9% | |||||||||||
|
852,150 |
Grand Korea Leisure |
22,420 |
|||||||||
|
'Foreigner Only' Casino Group in Korea |
|||||||||||
|
724,727 |
iMarketKorea |
18,468 |
|||||||||
|
Procurement, Distribution of MRO (Maintenance Repair Operations) Goods |
|||||||||||
|
623,120 |
Woongjin Coway |
17,240 |
|||||||||
|
Korean Household Appliance Rental Service Provider |
|||||||||||
|
624,441 |
Handsome |
15,710 |
|||||||||
|
Korea's Leading High-end Apparel Company |
|||||||||||
|
305,540 |
Kepco Plant Service & Engineering |
13,848 |
|||||||||
|
Power Plant & Grid Maintenance |
|||||||||||
|
1,208,000 |
BS Financial Group |
12,976 |
|||||||||
|
Regional Bank in Busan |
|||||||||||
49
Columbia Acorn International
Statement of Investments (Unaudited), continued
|
Number of Shares |
Value (000) |
||||||||||
| > Korea—continued | |||||||||||
|
182,000 |
Hana Tour Service |
$ |
9,906 |
||||||||
|
Korea's Largest Wholesale Tour Provider |
|||||||||||
|
57,000 |
Samsung Engineering |
9,780 |
|||||||||
|
Global Engineering, Procurement, Construction (EPC) Firm |
|||||||||||
|
138,990 |
Hite Jinro (b) |
3,041 |
|||||||||
|
Leading Beer & Spirits Manufacturer |
|||||||||||
|
123,389 |
|||||||||||
| > Indonesia 1.7% | |||||||||||
|
31,764,600 |
Archipelago Resources (b)(c) |
30,776 |
|||||||||
|
Gold Mining Projects in Indonesia, Vietnam & the Philippines |
|||||||||||
|
60,516,300 |
Tower Bersama Infrastructure (b) |
28,103 |
|||||||||
|
Communications Towers |
|||||||||||
|
25,000,000 |
Ace Indonesia |
16,035 |
|||||||||
|
Home Improvement Retailer |
|||||||||||
|
4,275,800 |
Mayora Indah |
9,985 |
|||||||||
|
Consumer Branded Food Manufacturer |
|||||||||||
|
7,613,000 |
Surya Citra Media |
8,751 |
|||||||||
|
Free to Air TV in Indonesia |
|||||||||||
|
40,047,000 |
MNC Skyvision (b) |
8,683 |
|||||||||
|
Largest Satellite Pay TV Operator in Indonesia |
|||||||||||
|
12,488,000 |
Mitra Adiperkasa |
8,316 |
|||||||||
|
Operator of Department Store & Specialty Retail Stores |
|||||||||||
|
6,217,500 |
Southern Arc Minerals (b)(c) |
2,214 |
|||||||||
|
Gold & Copper Exploration in Indonesia |
|||||||||||
|
112,863 |
|||||||||||
| > Thailand 0.8% | |||||||||||
|
125,000,000 |
Home Product Center |
53,061 |
|||||||||
|
Home Improvement Retailer |
|||||||||||
|
699,700 |
Samui Airport Property Fund (b) |
327 |
|||||||||
|
Thai Airport Operator |
|||||||||||
|
53,388 |
|||||||||||
| > Philippines 0.8% | |||||||||||
|
73,221,250 |
SM Prime Holdings |
24,880 |
|||||||||
|
Shopping Mall Operator |
|||||||||||
|
7,931,700 |
Int'l Container Terminal |
13,369 |
|||||||||
|
Container Handling Terminals & Port Management |
|||||||||||
|
19,454,700 |
Manila Water Company |
12,605 |
|||||||||
|
Water Utility Company in Philippines |
|||||||||||
|
50,854 |
|||||||||||
| > Mongolia 0.8% | |||||||||||
|
74,865,700 |
Mongolian Mining (b) |
34,085 |
|||||||||
|
Coking Coal Mining in Mongolia |
|||||||||||
|
1,049,943 |
Turquoise Hill Resources (a)(b) |
8,939 |
|||||||||
| 914,678 |
Turquoise Hill Resources (a)(b)(d) |
7,756 |
|||||||||
|
Copper Mine Project in Mongolia |
|||||||||||
|
50,780 |
|||||||||||
| > Cambodia 0.5% | |||||||||||
|
60,000,000 |
Nagacorp |
33,622 |
|||||||||
|
Casino/Entertainment Complex in Cambodia |
|||||||||||
|
33,622 |
|||||||||||
|
Asia: Total |
2,792,340 |
||||||||||
|
Number of Shares |
Value (000) |
||||||||||
|
Europe 29.9% |
|||||||||||
| > United Kingdom 6.2% | |||||||||||
|
935,500 |
Intertek Group |
$ |
41,392 |
||||||||
|
Testing, Inspection, Certification Services |
|||||||||||
|
875,000 |
Aggreko |
32,682 |
|||||||||
|
Temporary Power & Temperature Control Services |
|||||||||||
|
3,789,000 |
Domino's Pizza UK & Ireland |
32,489 |
|||||||||
|
Pizza Delivery in the UK, Ireland & Germany |
|||||||||||
|
2,281,600 |
JLT Group |
28,204 |
|||||||||
|
International Business Insurance Broker |
|||||||||||
|
8,785,000 |
BBA Aviation |
28,017 |
|||||||||
|
Aviation Support Services |
|||||||||||
|
998,000 |
Rightmove |
25,269 |
|||||||||
|
Internet Real Estate Listings |
|||||||||||
|
2,321,211 |
WH Smith |
24,233 |
|||||||||
|
Newsprint, Books & General Stationery Retailer |
|||||||||||
|
646,000 |
Asos (a)(b) |
22,918 |
|||||||||
|
Internet-based Retailer to Hipsters Up to Age 35 |
|||||||||||
|
655,000 |
Spirax Sarco |
22,116 |
|||||||||
|
Steam Systems for Manufacturing & Process Industries |
|||||||||||
|
1,761,742 |
Smith and Nephew |
19,445 |
|||||||||
|
Medical Equipment & Supplies |
|||||||||||
|
517,000 |
Rotork |
18,893 |
|||||||||
|
Valve Actuators for Oil & Water Pipelines |
|||||||||||
|
4,999,847 |
Elementis |
18,731 |
|||||||||
|
Clay-based Additives |
|||||||||||
|
2,300,000 |
Greggs |
18,644 |
|||||||||
|
Bakery |
|||||||||||
|
2,855,000 |
Abcam |
18,522 |
|||||||||
|
Online Sales of Antibodies |
|||||||||||
|
1,773,408 |
Shaftesbury |
15,120 |
|||||||||
|
London Prime Retail REIT |
|||||||||||
|
4,163,948 |
PureCircle (a)(b) |
14,120 |
|||||||||
|
Natural Sweeteners |
|||||||||||
|
1,907,154 |
Premier Oil (b) |
11,053 |
|||||||||
|
Oil & Gas Producer in Europe, Pakistan & Asia |
|||||||||||
|
382,581 |
Tullow Oil |
8,464 |
|||||||||
|
Oil & Gas Producer |
|||||||||||
|
2,272,000 |
Sterling Resources (a)(b) |
3,097 |
|||||||||
|
Oil & Gas Exploration - Europe |
|||||||||||
|
403,409 |
|||||||||||
| > Netherlands 4.2% | |||||||||||
|
2,742,165 |
Aalberts Industries |
49,228 |
|||||||||
|
Flow Control & Heat Treatment |
|||||||||||
|
1,574,145 |
UNIT4 (c) |
42,449 |
|||||||||
|
Business Software Development |
|||||||||||
|
1,515,723 |
Imtech |
40,007 |
|||||||||
|
Electromechanical & Information Communications Technology Installation & Maintenance |
|||||||||||
|
1,252,514 |
Arcadis |
26,509 |
|||||||||
|
Engineering Consultants |
|||||||||||
|
368,000 |
Fugro |
25,026 |
|||||||||
|
Subsea Oilfield Services |
|||||||||||
50
|
Number of Shares |
Value (000) |
||||||||||
| > Netherlands—continued | |||||||||||
|
1,112,468 |
TKH Group |
$ |
23,231 |
||||||||
|
Dutch Industrial Conglomerate |
|||||||||||
|
317,424 |
Vopak |
22,288 |
|||||||||
|
World's Largest Operator of Petroleum & Chemical Storage Terminals |
|||||||||||
|
821,137 |
Koninklijke TenCate |
18,904 |
|||||||||
|
Advanced Textiles & Industrial Fabrics |
|||||||||||
|
143,395 |
Core Labs |
17,420 |
|||||||||
|
Oil & Gas Reservoir Consulting |
|||||||||||
|
449,113 |
BinckBank |
3,304 |
|||||||||
|
Discount Brokerage & Asset Management |
|||||||||||
|
268,366 |
|||||||||||
| > France 3.9% | |||||||||||
|
553,000 |
Eurofins Scientific |
78,454 |
|||||||||
|
Food, Pharmaceuticals & Materials Screening & Testing |
|||||||||||
|
729,700 |
Gemalto |
64,185 |
|||||||||
|
Digital Security Solutions |
|||||||||||
|
770,000 |
Neopost |
42,518 |
|||||||||
|
Postage Meter Machines |
|||||||||||
|
971,800 |
Saft |
22,510 |
|||||||||
|
Niche Battery Manufacturer |
|||||||||||
|
285,704 |
Norbert Dentressangle |
19,202 |
|||||||||
|
Leading European Logistics & Transport Group |
|||||||||||
|
377,000 |
Compagnie Française de l'Afrique Occidentale |
18,056 |
|||||||||
|
African Wholesaler & Distributor |
|||||||||||
|
1,831,204 |
Hi-Media (a)(b) |
4,683 |
|||||||||
|
Online Advertiser in Europe |
|||||||||||
|
249,608 |
|||||||||||
| > Switzerland 3.5% | |||||||||||
|
255,000 |
Geberit |
55,447 |
|||||||||
|
Plumbing Supplies |
|||||||||||
|
260,000 |
Partners Group |
54,101 |
|||||||||
|
Private Markets Asset Management |
|||||||||||
|
375,000 |
Dufry Group (b) |
44,936 |
|||||||||
|
Operates Airport Duty Free & Duty Paid Shops |
|||||||||||
|
15,500 |
Sika |
31,610 |
|||||||||
|
Chemicals for Construction & Industrial Applications |
|||||||||||
|
330,000 |
Zehnder |
19,579 |
|||||||||
|
Radiators & Heat Recovery Ventilation Systems |
|||||||||||
|
170,000 |
Kuehne & Nagel |
19,196 |
|||||||||
|
Freight Forwarding/Logistics |
|||||||||||
|
224,869 |
|||||||||||
| > Germany 3.2% | |||||||||||
|
2,160,000 |
Wirecard |
49,602 |
|||||||||
|
Online Payment Processing & Risk Management |
|||||||||||
|
148,295 |
Rational |
37,170 |
|||||||||
|
Commercial Ovens |
|||||||||||
|
440,000 |
Dürr |
29,306 |
|||||||||
|
Automotive Plant Engineering & Associated Capital Equipment |
|||||||||||
|
1,050,000 |
NORMA Group |
28,335 |
|||||||||
|
Clamps for Automotive & Industrial Applications |
|||||||||||
|
Number of Shares |
Value (000) |
||||||||||
|
625,000 |
CTS Eventim |
$ |
18,581 |
||||||||
|
Event Ticket Sales |
|||||||||||
|
130,050 |
Pfeiffer Vacuum |
13,889 |
|||||||||
|
Vacuum Pumps |
|||||||||||
|
165,400 |
Bertrandt |
12,221 |
|||||||||
|
Outsourced Engineering |
|||||||||||
|
333,000 |
Elringklinger |
8,811 |
|||||||||
|
Automobile Components |
|||||||||||
|
338,886 |
Deutsche Beteiligungs |
8,427 |
|||||||||
|
Private Equity Investment Management |
|||||||||||
|
206,342 |
|||||||||||
| > Sweden 2.3% | |||||||||||
|
3,957,522 |
Hexagon |
84,828 |
|||||||||
|
Design, Measurement & Visualization Software & Equipment |
|||||||||||
|
4,150,024 |
Sweco (c) |
43,751 |
|||||||||
|
Engineering Consultants |
|||||||||||
|
658,700 |
Unibet |
18,451 |
|||||||||
|
European Online Gaming Operator |
|||||||||||
|
147,030 |
|||||||||||
| > Italy 1.7% | |||||||||||
|
3,245,000 |
Pirelli (a) |
34,945 |
|||||||||
|
Global Tire Supplier |
|||||||||||
|
224,200 |
Tod's (a) |
24,230 |
|||||||||
|
Leather Shoes & Bags |
|||||||||||
|
7,706,873 |
Geox (a) |
20,362 |
|||||||||
|
Apparel & Shoe Maker |
|||||||||||
|
3,791,000 |
Fiat (b) |
20,227 |
|||||||||
|
Leading Automotive Manufacturer in the U.S., Latin America & Italy |
|||||||||||
|
7,248,893 |
CIR |
8,197 |
|||||||||
|
Italian Holding Company |
|||||||||||
|
107,961 |
|||||||||||
| > Denmark 1.4% | |||||||||||
|
1,648,800 |
Novozymes |
45,444 |
|||||||||
|
Industrial Enzymes |
|||||||||||
|
168,042 |
SimCorp |
35,888 |
|||||||||
|
Software for Investment Managers |
|||||||||||
|
207,968 |
Solar |
11,471 |
|||||||||
|
Technical Wholesaler of Electrical, Plumbing & HVAC Equipment |
|||||||||||
|
92,803 |
|||||||||||
| > Norway 0.5% | |||||||||||
|
3,281,864 |
Atea |
32,223 |
|||||||||
|
Leading Nordic IT Hardware/Software Reseller & Installation Company |
|||||||||||
|
32,223 |
|||||||||||
| > Iceland 0.5% | |||||||||||
| 35,982,499 |
Marel |
31,954 |
|||||||||
|
Largest Manufacturer of Poultry & Fish Processing Equipment |
|||||||||||
|
31,954 |
|||||||||||
51
Columbia Acorn International
Statement of Investments (Unaudited), continued
|
Number of Shares |
Value (000) |
||||||||||
| > Kazakhstan 0.5% | |||||||||||
|
4,506,259 |
Halyk Savings Bank of Kazakhstan - GDR (b) |
$ |
31,544 |
||||||||
|
Largest Retail Bank & Insurer in Kazakhstan |
|||||||||||
|
31,544 |
|||||||||||
| > Russia 0.4% | |||||||||||
|
1,167,000 |
Yandex (b) |
28,136 |
|||||||||
|
Search Engine for Russian & Turkish Languages |
|||||||||||
|
28,136 |
|||||||||||
| > Finland 0.4% | |||||||||||
|
1,430,429 |
Stockmann (a) |
27,260 |
|||||||||
|
Department Store & Fashion Retailer in Scandinavia & Russia |
|||||||||||
|
27,260 |
|||||||||||
| > Czech Republic 0.4% | |||||||||||
|
130,682 |
Komercni Banka |
25,941 |
|||||||||
|
Leading Czech Universal Bank |
|||||||||||
|
25,941 |
|||||||||||
| > Belgium 0.4% | |||||||||||
|
438,880 |
EVS Broadcast Equipment |
24,234 |
|||||||||
|
Digital Live Mobile Production Software & Systems |
|||||||||||
|
24,234 |
|||||||||||
| > Portugal 0.3% | |||||||||||
|
8,635,000 |
Redes Energéticas Nacionais |
22,293 |
|||||||||
|
Portuguese Power Transmission & Gas Transportation |
|||||||||||
|
22,293 |
|||||||||||
| > Ireland 0.1% | |||||||||||
|
74,637 |
Paddy Power |
5,537 |
|||||||||
|
Irish Betting Services |
|||||||||||
|
5,537 |
|||||||||||
|
Europe: Total |
1,929,510 |
||||||||||
|
Other Countries 17.0% |
|||||||||||
| > South Africa 4.6% | |||||||||||
|
1,170,188 |
Naspers |
72,403 |
|||||||||
|
Media in Africa, China, Russia & Other Emerging Markets |
|||||||||||
|
19,098,300 |
Rand Merchant Insurance |
49,404 |
|||||||||
|
Directly Sold Property & Casualty Insurance; Holdings in Other Insurers |
|||||||||||
|
11,763,907 |
Coronation Fund Managers |
43,816 |
|||||||||
|
South African Fund Manager |
|||||||||||
|
2,644,083 |
Mr. Price |
40,025 |
|||||||||
|
South African Retailer of Apparel, Household & Sporting Goods |
|||||||||||
|
1,574,575 |
Massmart Holdings |
31,577 |
|||||||||
|
General Merchandise, Food & Home Improvement Stores; Wal-Mart Subsidiary |
|||||||||||
|
8,679,940 |
Northam Platinum |
31,307 |
|||||||||
|
Platinum Mining in South Africa |
|||||||||||
|
3,938,965 |
Adcock Ingram Holdings |
28,107 |
|||||||||
|
Manufacturer of Pharmaceuticals & Medical Supplies |
|||||||||||
|
296,639 |
|||||||||||
|
Number of Shares |
Value (000) |
||||||||||
| > Canada 4.4% | |||||||||||
|
1,212,597 |
ShawCor |
$ |
52,643 |
||||||||
|
Oil & Gas Pipeline Products |
|||||||||||
|
1,403,772 |
CCL Industries |
51,861 |
|||||||||
|
Leading Global Label Manufacturer |
|||||||||||
|
3,047,000 |
CAE |
32,636 |
|||||||||
|
Flight Simulator Equipment & Training Centers |
|||||||||||
|
653,200 |
Onex Capital |
25,780 |
|||||||||
|
Private Equity |
|||||||||||
|
582,942 |
AG Growth (a) |
19,117 |
|||||||||
|
Leading Manufacturer of Augers & Grain Handling Equipment |
|||||||||||
|
770,576 |
Black Diamond Group (a) |
17,573 |
|||||||||
|
Provides Accommodations/Equipment for Oil Sands Development |
|||||||||||
|
2,096,514 |
Horizon North Logistics |
16,996 |
|||||||||
|
Provides Diversified Oil Service Offering in Northern Canada |
|||||||||||
|
984,500 |
Alliance Grain Traders (a) |
14,481 |
|||||||||
|
Global Leader in Pulse Processing & Distribution |
|||||||||||
| 1,142,377 |
DeeThree Exploration (b) |
6,531 |
|||||||||
| 1,130,000 |
DeeThree Exploration (b)(e) |
6,428 |
|||||||||
|
Canadian Oil & Gas Producer |
|||||||||||
|
263,857 |
Baytex (a) |
12,539 |
|||||||||
|
Oil & Gas Producer in Canada |
|||||||||||
|
454,000 |
Celtic Exploration (b) |
8,442 |
|||||||||
|
Canadian Oil & Gas Producer |
|||||||||||
| 450,000 |
Athabasca Oil Sands (b) |
6,033 |
|||||||||
|
Oil Sands & Unconventional Oil Development |
|||||||||||
|
1,607,306 |
Pan Orient |
4,627 |
|||||||||
|
Asian Oil & Gas Explorer |
|||||||||||
|
1,611,000 |
Americas Petrogas (a)(b) |
3,032 |
|||||||||
|
Oil & Gas Exploration in Argentina, Potash in Peru |
|||||||||||
|
332,700 |
Crew Energy (b) |
2,450 |
|||||||||
|
Canadian Oil & Gas Producer |
|||||||||||
|
281,169 |
|||||||||||
| > Australia 4.0% | |||||||||||
|
49,017,000 |
Commonwealth Property Office Fund |
52,513 |
|||||||||
|
Australia Prime Office REIT |
|||||||||||
|
14,652,712 |
Challenger Financial |
49,317 |
|||||||||
|
Largest Annuity Provider |
|||||||||||
|
3,973,200 |
UGL |
42,984 |
|||||||||
|
Engineering & Facilities Management |
|||||||||||
|
498,560 |
Cochlear |
34,588 |
|||||||||
|
Cochlear Implants |
|||||||||||
|
7,595,003 |
IAG |
34,255 |
|||||||||
|
General Insurance Provider |
|||||||||||
|
2,500,000 |
Domino's Pizza Enterprises |
27,016 |
|||||||||
|
Domino's Pizza Operator in AU/NZ & France/Benelux |
|||||||||||
|
3,338,561 |
SAI Global |
14,635 |
|||||||||
|
Publishing, Certification, Compliance Services |
|||||||||||
|
311,805 |
Regis Resources (b) |
1,834 |
|||||||||
|
Gold Mining in Australia |
|||||||||||
|
257,142 |
|||||||||||
52
|
Number of Shares |
Value (000) |
||||||||||
| > United States 3.1% | |||||||||||
|
952,080 |
Atwood Oceanics (b) |
$ |
43,272 |
||||||||
|
Offshore Drilling Contractor |
|||||||||||
|
1,044,000 |
BioMarin Pharmaceutical (b) |
42,042 |
|||||||||
|
Biotech Focused on Orphan Diseases |
|||||||||||
|
1,103,297 |
Textainer Group Holdings (a) |
33,706 |
|||||||||
|
Top International Container Leasor |
|||||||||||
|
669,213 |
FMC Technologies (b) |
30,985 |
|||||||||
|
Oil & Gas Well Head Manufacturer |
|||||||||||
|
548,900 |
Rowan (b) |
18,536 |
|||||||||
|
Contract Offshore Driller |
|||||||||||
|
439,500 |
Hornbeck Offshore (b) |
16,108 |
|||||||||
|
Supply Vessel Operator in U.S. Gulf of Mexico |
|||||||||||
|
428,228 |
World Fuel Services |
15,249 |
|||||||||
|
Global Fuel Broker |
|||||||||||
|
199,898 |
|||||||||||
| > Israel 0.7% | |||||||||||
|
3,145,527 |
Israel Chemicals |
38,205 |
|||||||||
|
Producer of Potash, Phosphates, Bromine & Specialty Chemicals |
|||||||||||
|
625,000 |
Caesarstone (b) |
8,812 |
|||||||||
|
Quartz Countertops |
|||||||||||
|
47,017 |
|||||||||||
| > New Zealand 0.1% | |||||||||||
|
3,598,749 |
Telecom NZ |
7,085 |
|||||||||
|
Primary Telecom Operator |
|||||||||||
|
7,085 |
|||||||||||
| > Senegal 0.1% | |||||||||||
|
31,200 |
Sonatel |
7,029 |
|||||||||
|
Leading Telecoms Operator in Western Africa |
|||||||||||
|
7,029 |
|||||||||||
|
Other Countries: Total |
1,095,979 |
||||||||||
|
Latin America 5.3% |
|||||||||||
| > Brazil 3.0% | |||||||||||
|
3,700,000 |
Localiza Rent A Car |
64,099 |
|||||||||
|
Car Rental |
|||||||||||
|
5,000,000 |
Odontoprev |
27,870 |
|||||||||
|
Dental Insurance |
|||||||||||
|
1,880,200 |
Mills Estruturas e Servicos de Engenharia |
26,971 |
|||||||||
|
Civil Engineering & Construction |
|||||||||||
|
1,730,000 |
Arcos Dorados (a) |
26,694 |
|||||||||
|
McDonald's Master Franchise for Latin America |
|||||||||||
|
1,200,000 |
Multiplus |
24,429 |
|||||||||
|
Loyalty Program Operator in Brazil |
|||||||||||
|
3,577,000 |
MRV Engenharia |
21,191 |
|||||||||
|
Brazilan Property Developer |
|||||||||||
|
191,254 |
|||||||||||
| > Mexico 1.2% | |||||||||||
|
600,000 |
Grupo Aeroportuario del Sureste - ADR |
53,160 |
|||||||||
|
Mexican Airport Operator |
|||||||||||
|
11,945,000 |
Genomma Lab International (b) |
23,117 |
|||||||||
|
Develops, Markets & Distributes Consumer Products |
|||||||||||
|
Number of Shares |
Value (000) |
||||||||||
|
1,728,500 |
Herdez (b) |
$ |
4,450 |
||||||||
|
Processed Foods Producer & Distributor |
|||||||||||
|
80,727 |
|||||||||||
| > Guatemala 0.5% | |||||||||||
|
1,434,600 |
Tahoe Resources (b) |
29,214 |
|||||||||
|
Silver Project in Guatemala |
|||||||||||
|
29,214 |
|||||||||||
| > Chile 0.3% | |||||||||||
|
10,115,274 |
Viña Concha y Toro |
21,131 |
|||||||||
|
Global Branded Wine Manufacturer |
|||||||||||
|
21,131 |
|||||||||||
| > Uruguay 0.2% | |||||||||||
|
1,306,818 |
Union Agriculture Group (b)(e)(f) |
13,552 |
|||||||||
|
Farmland Operator in Uruguay |
|||||||||||
|
13,552 |
|||||||||||
| > Colombia 0.1% | |||||||||||
|
7,850,769 |
Canacol (b) |
3,833 |
|||||||||
|
Oil Producer in South America |
|||||||||||
|
22,525,000 |
Gulf United Energy (b) |
1,352 |
|||||||||
|
Prospecting for Oil Alongside Large Producers in Colombia |
|||||||||||
|
5,185 |
|||||||||||
| > Argentina —% | |||||||||||
|
7,425,000 |
Madalena Ventures (b) |
1,812 |
|||||||||
|
Oil & Gas Exploration in Argentina |
|||||||||||
|
1,812 |
|||||||||||
|
Latin America: Total |
342,875 |
||||||||||
|
Total Equities: 95.4% (Cost: $4,781,451) |
6,160,704 |
||||||||||
|
Securities Lending Collateral 3.2% |
|||||||||||
|
209,235,253 |
Dreyfus Government Cash Management Fund (7 day yield of 0.01%) (g) |
209,235 |
|||||||||
|
Total Securities Lending Collateral: (Cost: $209,235) |
209,235 |
||||||||||
|
Total Investments: 98.6% (Cost: $4,990,686)(h)(i) |
6,369,939 |
(j) |
|||||||||
|
Obligation to Return Collateral for Securities Loaned: (3.2)% |
(209,235 |
) |
|||||||||
|
Cash and Other Assets Less Liabilities: 4.6% |
301,639 |
||||||||||
|
Total Net Assets: 100.0% |
$ |
6,462,343 |
|||||||||
ADR - American Depositary Receipts
GDR - Global Depositary Receipts
REIT - Real Estate Investment Trust
53
Columbia Acorn International
Statement of Investments (Unaudited), continued
> Notes to Statement of Investments (dollar values in thousands)
(a) All or a portion of this security was on loan at September 30, 2012. The total market value of securities on loan at September 30, 2012 was $200,170.
(b) Non-income producing security.
(c) An affiliated person of the Fund may include any company in which the Fund owns five percent or more of its outstanding voting shares. Holdings and transactions in these affiliated companies during the period ended September 30, 2012, are as follows:
|
Security |
Balance of Shares Held 12/31/11 |
Purchases/ Additions |
Sales/ Reductions |
Balance of Shares Held 9/30/12 |
Value |
Dividend |
|||||||||||||||||||||
|
Archipelago Resources |
29,063,787 |
2,700,813 |
- |
31,764,600 |
$ |
30,776 |
$ |
- |
|||||||||||||||||||
|
DeeThree Exploration* |
4,061,377 |
- |
1,789,000 |
2,272,377 |
12,959 |
- |
|||||||||||||||||||||
|
Koninklijke TenCate* |
1,371,573 |
53,685 |
604,121 |
821,137 |
18,904 |
- |
|||||||||||||||||||||
|
Southern Arc Minerals |
6,217,500 |
- |
- |
6,217,500 |
2,214 |
- |
|||||||||||||||||||||
|
Sweco |
4,150,024 |
- |
- |
4,150,024 |
43,751 |
1,574 |
|||||||||||||||||||||
|
UNIT4 |
1,591,702 |
- |
17,557 |
1,574,145 |
42,449 |
677 |
|||||||||||||||||||||
|
Wacom* |
23,790 |
- |
3,694 |
20,096 |
48,628 |
794 |
|||||||||||||||||||||
|
Workspace Group* |
8,000,000 |
- |
8,000,000 |
- |
- |
298 |
|||||||||||||||||||||
|
Total of Affiliated Transactions |
54,479,753 |
2,754,498 |
10,414,372 |
46,819,879 |
$ |
199,681 |
$ |
3,343 |
|||||||||||||||||||
* At September 30, 2012, the Fund owned less than five percent of the company's outstanding voting shares.
The aggregate cost and value of these companies at September 30, 2012, were $80,395 and $119,190, respectively. Investments in affiliated companies represented 1.84% of the Fund's total net assets at September 30, 2012.
(d) Security is traded on a U.S. exchange.
(e) Denotes a restricted security, which is subject to restrictions on resale under federal securities laws. These securities are valued at fair value determined in good faith under consistently applied procedures established by the Board of Trustees. At September 30, 2012, the market value of these securities amounted to $19,980, which represented 0.31% of total net assets. Additional information on these securities is as follows:
|
Security |
Acquisition Dates |
Shares |
Cost |
Value |
|||||||||||||||
|
Union Agriculture Group |
12/8/10-6/27/12 |
1,306,818 |
$ |
15,000 |
$ |
13,552 |
|||||||||||||
|
DeeThree Exploration |
9/7/10 |
1,130,000 |
2,951 |
6,428 |
|||||||||||||||
|
$ |
17,951 |
$ |
19,980 |
||||||||||||||||
(f) Illiquid security.
(g) Investment made with cash collateral received from securities lending activity.
(h) At September 30, 2012, for federal income tax purposes, the cost of investments was $4,990,686 and net unrealized appreciation was $1,379,253 consisting of gross unrealized appreciation of $1,671,351 and gross unrealized depreciation of $292,098.
(i) On September 30, 2012, the Fund's total investments were denominated in currencies as follows:
|
Currency |
Value |
Percentage of Net Assets |
|||||||||
|
Japanese Yen |
$ |
1,080,408 |
16.7 |
||||||||
|
Euro |
894,182 |
13.9 |
|||||||||
|
United States Dollar |
538,654 |
8.4 |
|||||||||
|
British Pound |
433,939 |
6.7 |
|||||||||
|
Taiwan Dollar |
419,878 |
6.5 |
|||||||||
|
Hong Kong Dollar |
355,016 |
5.5 |
|||||||||
|
Canadian Dollar |
330,279 |
5.1 |
|||||||||
|
Other currencies less than 5% of total net assets |
2,108,348 |
32.6 |
|||||||||
|
Total Portfolio |
$ |
6,160,704 |
95.4 |
||||||||
(j) Securities are valued using policies described in the Notes to Financial Statements in the most recent shareholder report.
54
> Notes to Statement of Investments (dollar values in thousands)
Fair Value Measurements
Various inputs are used in determining the value of the Fund's investments, following the input prioritization hierarchy established by GAAP. These inputs are summarized in the three broad levels listed below:
• Level 1 – quoted prices in active markets for identical securities
• Level 2 – prices determined using other significant observable inputs (including quoted prices for similar securities, interest rates, prepayment speeds, credit risk and others)
• Level 3 – prices determined using significant unobservable inputs where quoted prices or observable inputs are unavailable or less reliable (including management's own assumptions about the factors market participants would use in pricing an investment)
The inputs or methodology used for valuing securities are not necessarily an indication of the risk associated with investing in those securities.
Examples of the types of securities in which the Fund would typically invest and how they are classified within this hierarchy are as follows. Typical Level 1 securities include exchange traded domestic equities, mutual funds whose NAVs are published each day and exchange traded foreign equities that are not statistically fair valued. Typical Level 2 securities include exchange traded foreign equities that are statistically fair valued, forward foreign currency exchange contracts and short-term investments valued at amortized cost. Additionally, securities fair valued by the Valuation Committee (the Committee) of the Fund's Board of Trustees (the Board) that rely on significant observable inputs are also included in Level 2. Typical Level 3 securities include any security fair valued by the Committee that relies on significant unobservable inputs.
Under the direction of the Board, the Committee is responsible for carrying out the valuation procedures approved by the Board.
The Committee meets as necessary, and no less frequently than quarterly, to determine fair values for securities for which market quotations are not readily available or for which the investment manager believes that available market quotations are unreliable, and to review the continuing appropriateness of the current value of any security subject to the Trust's Portfolio Pricing Policy and the pricing procedures of the investment manager (the Policies). The Policies address, among other things: circumstances under which market quotations will be deemed readily available; selection of third party pricing vendors; appropriate pricing methodologies; events that require fair valuation and fair value techniques; and circumstances under which securities will be deemed to pose a potential for stale pricing, including when securities are illiquid, restricted, or in default. The Committee may also meet to discuss additional valuation matters, which may include review of back-testing results, review of time-sensitive information or approval of other valuation related actions, and to review the appropriateness of the Policies.
For investments categorized as Level 3, the significant unobservable inputs used in the fair value measurement of the Funds' securities may include: (i) data specific to the issuer or comparable issuers, (ii) general market or specific sector news and (iii) quoted prices and specific or similar security transactions. The Committee considers this data and any changes from prior periods in order to assess the reasonableness of observable and unobservable inputs, any assumptions or internal models used to value those securities and changes in fair value. Significant changes in any of these factors could result in lower or higher fair value measurements. Various factors impact the frequency of monitoring (which may occur as often as daily), however the Committee may determine that changes to inputs, assumptions and models are not required with the same frequency.
The following table summarizes the inputs used, as of September 30, 2012, in valuing the Fund's assets:
|
Investment Type |
Quoted Prices (Level 1) |
Other Significant Observable Inputs (Level 2) |
Significant Unobservable Inputs (Level 3) |
Total |
|||||||||||||||
|
Equities |
|||||||||||||||||||
|
Asia |
$ |
169,240 |
$ |
2,623,100 |
$ |
- |
$ |
2,792,340 |
|||||||||||
|
Europe |
48,653 |
1,880,857 |
- |
1,929,510 |
|||||||||||||||
|
Other Countries |
483,451 |
612,528 |
- |
1,095,979 |
|||||||||||||||
|
Latin America |
329,323 |
- |
13,552 |
342,875 |
|||||||||||||||
|
Total Equities |
1,030,667 |
5,116,485 |
13,552 |
6,160,704 |
|||||||||||||||
|
Total Securities Lending Collateral |
209,235 |
- |
- |
209,235 |
|||||||||||||||
|
Total Investments |
$ |
1,239,902 |
$ |
5,116,485 |
$ |
13,552 |
$ |
6,369,939 |
|||||||||||
The Fund's assets assigned to the Level 2 input category are generally valued using a market approach, in which a security's value is determined through its correlation to prices and information from observable market transactions for similar or identical assets. Foreign equities are generally valued at the last sale price on the foreign exchange or market on which they trade. The Fund may use a statistical fair valuation model, in accordance with the policy adopted by the Board, provided by an independent third party to value securities principally traded in foreign markets in order to adjust for possible stale pricing that may occur between the close of the foreign exchanges and the time for valuation. These models take into account available market data including intraday index, ADR, and ETF movements. Securities acquired via private placement that have a holding period or an extended settlement period are valued at a discount to the same shares that are trading freely on the market. These discounts are determined by the investment manager's experience with similar securities or situations. Factors may include, but are not limited to, trade volume, shares outstanding and stock price.
The following table shows transfers between Level 1 and Level 2 of the fair value hierarchy:
| Transfers In |
Transfers Out |
||||||||||||||
| Level 1 |
Level 2 |
Level 1 |
Level 2 |
||||||||||||
| $ |
15,784 |
$ |
- |
$ |
- |
$ |
15,784 |
||||||||
Financial assets were transferred from Level 2 to Level 1 as resale restrictions no longer apply.
55
Columbia Acorn International
Statement of Investments (Unaudited), continued
> Notes to Statement of Investments (dollar values in thousands)
The following table reconciles asset balances for the period ending September 30, 2012, in which significant observable and/or unobservable inputs (Level 3) were used in determining value:
|
Investments in Securities |
Balance as of December 31, 2011 |
Realized Gain/(Loss) |
Change in Unrealized Appreciation (Depreciation) |
Purchases |
Sales |
Transfers into Level 3 |
Transfers out of Level 3 |
Balance as of September 30, 2012 |
|||||||||||||||||||||||||||
|
Equities |
|||||||||||||||||||||||||||||||||||
|
Latin America |
$ |
12,462 |
$ |
- |
$ |
1,090 |
$ |
- |
$ |
- |
$ |
- |
$ |
- |
$ |
13,552 |
|||||||||||||||||||
|
$ |
12,462 |
$ |
- |
$ |
1,090 |
$ |
- |
$ |
- |
$ |
- |
$ |
- |
$ |
13,552 |
||||||||||||||||||||
The information in the above reconciliation table represents fiscal year to date activity for any securities identified as using Level 3 inputs at either the beginning or the end of the current fiscal period.
The change in unrealized appreciation attributed to securities owned at September 30, 2012, which were valued using significant unobservable inputs (Level 3), amounted to $1,090.
The Fund does not hold any significant investments categorized as Level 3.
Certain common stock classified as Level 3 are valued at fair value, using a market approach, as determined in good faith under consistently applied procedures established by and under the general supervision of the Board. To determine fair value for these securities, for which no market exists, the Committee utilizes the valuation technique it deems most appropriate in the circumstances, using some unobservable inputs, which may include but are not limited to trades of similar securities, estimated earnings of the company, market multiples derived from a set of comparable companies, and the position of the security within the company's capital structure. Significant increases or decreases to any of these inputs could result in a significantly lower or higher fair value measurement. Generally, a change in estimated earnings of a company may result in a change to the comparable companies and market multiples utilized.
56
Columbia Acorn International
Portfolio Diversification (Unaudited)
At September 30, 2012, the Fund's portfolio investments as a percentage of net assets were diversified as follows:
|
Value (000) |
Percentage of Net Assets |
||||||||||
| > Industrial Goods & Services | |||||||||||
|
Other Industrial Services |
$ |
583,550 |
9.0 |
||||||||
|
Machinery |
393,057 |
6.1 |
|||||||||
|
Industrial Materials & Specialty Chemicals |
361,226 |
5.6 |
|||||||||
|
Construction |
138,160 |
2.1 |
|||||||||
|
Conglomerates |
80,656 |
1.2 |
|||||||||
|
Electrical Components |
69,906 |
1.1 |
|||||||||
|
Industrial Distribution |
52,565 |
0.9 |
|||||||||
|
Outsourcing Services |
26,070 |
0.4 |
|||||||||
|
1,705,190 |
26.4 |
||||||||||
| > Consumer Goods & Services | |||||||||||
|
Retail |
397,910 |
6.2 |
|||||||||
|
Food & Beverage |
264,309 |
4.1 |
|||||||||
|
Casinos & Gaming |
211,640 |
3.3 |
|||||||||
|
Nondurables |
140,404 |
2.2 |
|||||||||
|
Other Consumer Services |
94,928 |
1.5 |
|||||||||
|
Consumer Goods Distribution |
79,229 |
1.2 |
|||||||||
|
Other Durable Goods |
79,191 |
1.2 |
|||||||||
|
Travel |
74,005 |
1.1 |
|||||||||
|
Apparel |
63,332 |
1.0 |
|||||||||
|
Restaurants |
59,505 |
0.9 |
|||||||||
|
Educational Services |
20,004 |
0.3 |
|||||||||
|
Other Entertainment |
18,581 |
0.3 |
|||||||||
|
Furniture & Textiles |
8,813 |
0.1 |
|||||||||
|
1,511,851 |
23.4 |
||||||||||
| > Information | |||||||||||
|
Computer Hardware & Related Equipment |
274,337 |
4.3 |
|||||||||
|
Mobile Communications |
195,948 |
3.0 |
|||||||||
|
Business Software |
163,166 |
2.5 |
|||||||||
|
Internet Related |
149,350 |
2.3 |
|||||||||
|
Financial Processors |
69,495 |
1.1 |
|||||||||
|
Instrumentation |
60,304 |
0.9 |
|||||||||
|
Computer Services |
45,170 |
0.7 |
|||||||||
|
Electronics Distribution |
35,181 |
0.6 |
|||||||||
|
CATV |
30,953 |
0.5 |
|||||||||
|
Semiconductors & Related Equipment |
23,142 |
0.4 |
|||||||||
|
Telephone & Data Services |
14,114 |
0.2 |
|||||||||
|
TV Broadcasting |
8,751 |
0.1 |
|||||||||
|
Satellite Broadcasting & Services |
8,683 |
0.1 |
|||||||||
|
Advertising |
4,683 |
0.1 |
|||||||||
|
1,083,277 |
16.8 |
||||||||||
| > Other Industries | |||||||||||
|
Real Estate |
424,126 |
6.6 |
|||||||||
|
Transportation |
113,301 |
1.8 |
|||||||||
|
Regulated Utilities |
34,897 |
0.5 |
|||||||||
|
572,324 |
8.9 |
||||||||||
|
Value (000) |
Percentage of Net Assets |
||||||||||
| > Energy & Minerals | |||||||||||
|
Oil Services |
$ |
221,139 |
3.4 |
||||||||
|
Mining |
180,401 |
2.8 |
|||||||||
|
Oil & Gas Producers |
79,691 |
1.2 |
|||||||||
|
Agricultural Commodities |
28,032 |
0.4 |
|||||||||
|
Oil Refining, Marketing & Distribution |
22,288 |
0.4 |
|||||||||
|
531,551 |
8.2 |
||||||||||
| > Finance | |||||||||||
|
Insurance |
199,782 |
3.1 |
|||||||||
|
Banks |
132,179 |
2.0 |
|||||||||
|
Brokerage & Money Management |
109,648 |
1.7 |
|||||||||
|
Finance Companies |
77,657 |
1.2 |
|||||||||
|
519,266 |
8.0 |
||||||||||
| > Health Care | |||||||||||
|
Medical Equipment & Devices |
85,791 |
1.3 |
|||||||||
|
Medical Supplies |
44,639 |
0.7 |
|||||||||
|
Biotechnology & Drug Delivery |
42,042 |
0.7 |
|||||||||
|
Health Care Services |
36,666 |
0.6 |
|||||||||
|
Pharmaceuticals |
28,107 |
0.4 |
|||||||||
|
237,245 |
3.7 |
||||||||||
|
Total Equities: |
6,160,704 |
95.4 |
|||||||||
|
Security Lending Collateral: |
209,235 |
3.2 |
|||||||||
|
Total Investments: |
6,369,939 |
98.6 |
|||||||||
|
Obligation to Return Collateral for Securities Loaned: |
(209,235 |
) |
(3.2 |
) |
|||||||
|
Cash and Other Assets Less Liabilities: |
301,639 |
4.6 |
|||||||||
|
Net Assets: |
$ |
6,462,343 |
100.0 |
||||||||
57
Columbia Acorn USA
Major Portfolio Changes in the Third Quarter (Unaudited)
|
Number of Shares |
|||||||||||
|
6/30/12 |
9/30/12 |
||||||||||
|
Purchases |
|||||||||||
|
Information |
|||||||||||
|
Virtusa |
0 |
192,000 |
|||||||||
|
Industrial Goods & Services |
|||||||||||
|
Generac |
0 |
155,000 |
|||||||||
|
Consumer Goods & Services |
|||||||||||
|
Choice Hotels |
0 |
75,000 |
|||||||||
|
Interface |
621,500 |
756,000 |
|||||||||
|
Finance |
|||||||||||
|
CAI International |
376,000 |
415,208 |
|||||||||
|
Health Care |
|||||||||||
|
ARIAD Pharmaceuticals |
379,040 |
466,000 |
|||||||||
|
Cepheid |
551,600 |
587,600 |
|||||||||
|
NPS Pharmaceuticals |
1,163,600 |
1,275,000 |
|||||||||
|
Sirona Dental Systems |
202,000 |
246,012 |
|||||||||
|
Synageva Biopharma |
129,002 |
177,000 |
|||||||||
|
Energy & Minerals |
|||||||||||
|
PDC Energy |
170,000 |
182,000 |
|||||||||
|
Number of Shares |
|||||||||||
|
6/30/12 |
9/30/12 |
||||||||||
|
Sales |
|||||||||||
|
Information |
|||||||||||
|
Advent Software |
198,000 |
0 |
|||||||||
|
Blackbaud |
67,869 |
0 |
|||||||||
|
Infinera |
752,000 |
323,278 |
|||||||||
|
Monolithic Power Systems |
426,000 |
366,000 |
|||||||||
|
NetSuite |
211,000 |
197,000 |
|||||||||
|
SBA Communications |
529,000 |
300,000 |
|||||||||
|
WMS Industries |
235,000 |
167,000 |
|||||||||
|
Zebra Technologies |
292,000 |
0 |
|||||||||
|
Industrial Goods & Services |
|||||||||||
|
Albany International |
170,000 |
0 |
|||||||||
|
Ametek |
1,314,450 |
1,264,000 |
|||||||||
|
Clean Harbors |
65,000 |
50,000 |
|||||||||
|
GrafTech International |
616,000 |
413,634 |
|||||||||
|
Consumer Goods & Services |
|||||||||||
|
Jarden |
126,000 |
0 |
|||||||||
|
lululemon athletica |
583,000 |
565,000 |
|||||||||
|
Pool |
472,000 |
429,000 |
|||||||||
|
Finance |
|||||||||||
|
Pacific Continental Bank |
503,426 |
217,117 |
|||||||||
|
World Acceptance |
345,000 |
315,000 |
|||||||||
|
Health Care |
|||||||||||
|
BioMarin Pharmaceutical |
520,000 |
415,000 |
|||||||||
|
Other Industries |
|||||||||||
|
Kilroy Realty |
77,000 |
0 |
|||||||||
|
World Fuel Services |
230,000 |
128,000 |
|||||||||
|
Energy & Minerals |
|||||||||||
|
Swift Energy |
168,000 |
0 |
|||||||||
58
Columbia Acorn USA
Statement of Investments (Unaudited), September 30, 2012
|
Number of Shares |
Value (000) |
||||||||||
|
Equities: 99.4% |
|||||||||||
|
Information 29.6% |
|||||||||||
| > Business Software 8.9% | |||||||||||
|
698,000 |
Micros Systems (a) |
$ |
34,286 |
||||||||
|
Information Systems for Hotels, Restaurants & Retailers |
|||||||||||
|
910,000 |
Informatica (a) |
31,677 |
|||||||||
|
Enterprise Data Integration Software |
|||||||||||
|
375,000 |
Ansys (a) |
27,525 |
|||||||||
|
Simulation Software for Engineers & Designers |
|||||||||||
|
243,000 |
Concur Technologies (a) |
17,916 |
|||||||||
|
Web-enabled Cost & Expense Management Software |
|||||||||||
|
197,000 |
NetSuite (a) |
12,569 |
|||||||||
|
End-to-end IT Systems Solutions Delivered Over the Web |
|||||||||||
|
290,000 |
SPS Commerce (a) |
11,156 |
|||||||||
|
Supply Chain Management Software Delivered via the Web |
|||||||||||
|
337,000 |
SABA (a) |
3,367 |
|||||||||
|
Learning Management Systems |
|||||||||||
|
400,000 |
Velti (a)(b) |
3,348 |
|||||||||
|
Mobile Marketing Software Platform |
|||||||||||
|
19,305 |
Eloqua (a) |
381 |
|||||||||
|
Marketing Automation Software |
|||||||||||
|
31,804 |
Exa (a) |
345 |
|||||||||
|
Simulation Software |
|||||||||||
|
142,570 |
|||||||||||
| > Instrumentation 4.2% | |||||||||||
|
180,000 |
Mettler-Toledo International (a) |
30,733 |
|||||||||
|
Laboratory Equipment |
|||||||||||
|
525,000 |
IPG Photonics (a)(b) |
30,082 |
|||||||||
|
Fiber Lasers |
|||||||||||
|
151,000 |
Trimble Navigation (a) |
7,197 |
|||||||||
|
GPS-based Instruments |
|||||||||||
|
68,012 |
|||||||||||
|
> Semiconductors & Related Equipment 3.6% |
|||||||||||
|
690,000 |
Microsemi (a) |
13,848 |
|||||||||
|
Analog/Mixed Signal Semiconductors |
|||||||||||
|
1,958,000 |
Atmel (a) |
10,299 |
|||||||||
|
Microcontrollers, Radio Frequency & Memory Semiconductors |
|||||||||||
|
262,000 |
Ultratech (a) |
8,222 |
|||||||||
|
Semiconductor Equipment |
|||||||||||
|
366,000 |
Monolithic Power Systems (a) |
7,228 |
|||||||||
|
High Performance Analog & Mixed Signal Integrated Circuits |
|||||||||||
|
961,000 |
ON Semiconductor (a) |
5,929 |
|||||||||
|
Mixed Signal & Power Management Semiconductors |
|||||||||||
|
1,075,000 |
TriQuint Semiconductor (a) |
5,429 |
|||||||||
|
Radio Frequency Semiconductors |
|||||||||||
|
390,000 |
Pericom Semiconductor (a) |
3,387 |
|||||||||
|
Interface Integrated Circuits & Frequency Control Products |
|||||||||||
|
50,000 |
Hittite Microwave (a) |
2,774 |
|||||||||
|
Radio Frequency, Microwave & Millimeterwave Semiconductors |
|||||||||||
|
57,116 |
|||||||||||
|
Number of Shares |
Value (000) |
||||||||||
| > Telephone & Data Services 2.6% | |||||||||||
|
1,457,000 |
tw telecom (a) |
$ |
37,984 |
||||||||
|
Fiber Optic Telephone/Data Services |
|||||||||||
|
400,000 |
Boingo Wireless (a)(b) |
3,176 |
|||||||||
|
Wholesale & Retail WiFi Networks |
|||||||||||
|
41,160 |
|||||||||||
| > Computer Services 2.3% | |||||||||||
|
556,000 |
ExlService Holdings (a) |
16,402 |
|||||||||
|
Business Process Outsourcing |
|||||||||||
|
97,000 |
Syntel |
6,054 |
|||||||||
|
Offshore IT Services |
|||||||||||
|
359,000 |
WNS - ADR (India) (a) |
3,676 |
|||||||||
|
Offshore BPO (Business Process Outsourcing) Services |
|||||||||||
|
640,000 |
RCM Technologies (a)(c) |
3,481 |
|||||||||
|
Technology & Engineering Services |
|||||||||||
|
192,000 |
Virtusa (a) |
3,412 |
|||||||||
|
Offshore IT Outsourcing |
|||||||||||
|
776,766 |
Hackett Group (a) |
3,247 |
|||||||||
|
IT Integration & Best Practice Research |
|||||||||||
|
36,272 |
|||||||||||
| > Gaming Equipment & Services 2.2% | |||||||||||
|
660,000 |
Bally Technologies (a) |
32,597 |
|||||||||
|
Slot Machines & Software |
|||||||||||
|
167,000 |
WMS Industries (a) |
2,736 |
|||||||||
|
Slot Machine Provider |
|||||||||||
|
35,333 |
|||||||||||
|
> Computer Hardware & Related Equipment 2.1% |
|||||||||||
|
1,317,000 |
II-VI (a) |
25,049 |
|||||||||
|
Laser Optics & Specialty Materials |
|||||||||||
|
160,000 |
NICE Systems - ADR (Israel) (a) |
5,315 |
|||||||||
|
Audio & Video Recording Solutions |
|||||||||||
|
97,000 |
Netgear (a) |
3,700 |
|||||||||
|
Networking Products for Small Business & Home |
|||||||||||
|
34,064 |
|||||||||||
| > Telecommunications Equipment 1.6% | |||||||||||
|
813,000 |
Ixia (a) |
13,065 |
|||||||||
|
Telecom Network Test Equipment |
|||||||||||
|
732,000 |
Finisar (a) |
10,468 |
|||||||||
|
Optical Subsystems & Components |
|||||||||||
|
323,278 |
Infinera (a)(b) |
1,771 |
|||||||||
|
Optical Networking Equipment |
|||||||||||
|
25,304 |
|||||||||||
| > Mobile Communications 1.2% | |||||||||||
|
300,000 |
SBA Communications (a) |
18,870 |
|||||||||
|
Communications Towers |
|||||||||||
|
18,870 |
|||||||||||
| > Contract Manufacturing 0.4% | |||||||||||
|
236,000 |
Plexus (a) |
7,149 |
|||||||||
|
Electronic Manufacturing Services |
|||||||||||
|
7,149 |
|||||||||||
| > Financial Processors 0.4% | |||||||||||
|
153,000 |
Global Payments |
6,400 |
|||||||||
|
Credit Card Processor |
|||||||||||
|
6,400 |
|||||||||||
59
Columbia Acorn USA
Statement of Investments (Unaudited), continued
|
Number of Shares |
Value (000) |
||||||||||
| > TV Broadcasting 0.1% | |||||||||||
|
875,000 |
Entravision Communications |
$ |
1,173 |
||||||||
|
Spanish Language TV & Radio Stations |
|||||||||||
|
1,173 |
|||||||||||
|
Information: Total |
473,423 |
||||||||||
|
Industrial Goods & Services 17.5% |
|||||||||||
| > Machinery 14.0% | |||||||||||
|
1,264,000 |
Ametek |
44,809 |
|||||||||
|
Aerospace/Industrial Instruments |
|||||||||||
|
747,200 |
Nordson |
43,801 |
|||||||||
|
Dispensing Systems for Adhesives & Coatings |
|||||||||||
|
835,000 |
ESCO Technologies |
32,440 |
|||||||||
|
Automatic Electric Meter Readers |
|||||||||||
|
890,000 |
Donaldson |
30,892 |
|||||||||
|
Industrial Air Filtration |
|||||||||||
|
631,000 |
HEICO |
19,252 |
|||||||||
|
FAA Approved Aircraft Replacement Parts |
|||||||||||
|
436,000 |
Moog (a) |
16,511 |
|||||||||
|
Motion Control Products for Aerospace, Defense & Industrial Markets |
|||||||||||
|
260,000 |
Toro |
10,343 |
|||||||||
|
Turf Maintenance Equipment |
|||||||||||
|
222,833 |
Polypore International (a)(b) |
7,877 |
|||||||||
|
Battery Separators & Filtration Media |
|||||||||||
|
204,000 |
Kennametal |
7,564 |
|||||||||
|
Consumable Cutting Tools |
|||||||||||
|
146,000 |
Oshkosh Corporation (a) |
4,005 |
|||||||||
|
Specialty Truck Manufacturer |
|||||||||||
|
155,000 |
Generac |
3,548 |
|||||||||
|
Standby Power Generators |
|||||||||||
|
26,000 |
Middleby (a) |
3,006 |
|||||||||
|
Manufacturer of Cooking Equipment |
|||||||||||
|
224,048 |
|||||||||||
|
> Industrial Materials & Specialty Chemicals 0.9% |
|||||||||||
|
496,000 |
Drew Industries (a) |
14,984 |
|||||||||
|
RV & Manufactured Home Components |
|||||||||||
|
14,984 |
|||||||||||
| > Electrical Components 0.9% | |||||||||||
|
232,000 |
Acuity Brands |
14,683 |
|||||||||
|
Commercial Lighting Fixtures |
|||||||||||
|
14,683 |
|||||||||||
| > Other Industrial Services 0.8% | |||||||||||
|
600,919 |
Acorn Energy (b) |
5,360 |
|||||||||
|
Frac Well Exploration/Monitoring Device, Sonar Security, Electric Grid Monitoring |
|||||||||||
|
240,000 |
TrueBlue (a) |
3,773 |
|||||||||
|
Temporary Manual Labor |
|||||||||||
|
109,000 |
Forward Air |
3,315 |
|||||||||
|
Freight Transportation Between Airports |
|||||||||||
|
12,448 |
|||||||||||
| > Construction 0.4% | |||||||||||
|
200,000 |
Fortune Brands Home & Security (a) |
5,402 |
|||||||||
|
Home Building Supplies & Small Locks |
|||||||||||
|
5,402 |
|||||||||||
|
Number of Shares |
Value (000) |
||||||||||
| > Waste Management 0.3% | |||||||||||
|
90,000 |
Waste Connections |
$ |
2,722 |
||||||||
|
Solid Waste Management |
|||||||||||
|
50,000 |
Clean Harbors (a) |
2,443 |
|||||||||
|
Hazardous Waste Services & Disposal |
|||||||||||
|
5,165 |
|||||||||||
| > Steel 0.2% | |||||||||||
|
413,634 |
GrafTech International (a) |
3,719 |
|||||||||
|
Industrial Graphite Materials Producer |
|||||||||||
|
3,719 |
|||||||||||
|
Industrial Goods & Services: Total |
280,449 |
||||||||||
|
Consumer Goods & Services 14.6% |
|||||||||||
| > Retail 5.8% | |||||||||||
|
565,000 |
lululemon athletica (a) |
41,776 |
|||||||||
|
Premium Active Apparel Retailer |
|||||||||||
|
468,500 |
Abercrombie & Fitch |
15,891 |
|||||||||
|
Teen Apparel Retailer |
|||||||||||
|
805,000 |
Pier 1 Imports |
15,086 |
|||||||||
|
Home Furnishing Retailer |
|||||||||||
|
356,000 |
Shutterfly (a) |
11,079 |
|||||||||
|
Internet Photo-centric Retailer |
|||||||||||
|
715,000 |
Saks (a)(b) |
7,371 |
|||||||||
|
Luxury Department Store Retailer |
|||||||||||
|
120,000 |
Teavana (a)(b) |
1,565 |
|||||||||
|
Specialty Tea Retailer |
|||||||||||
|
9,000 |
The Fresh Market (a) |
540 |
|||||||||
|
Specialty Food Retailer |
|||||||||||
|
93,308 |
|||||||||||
| > Travel 2.4% | |||||||||||
|
1,300,950 |
Avis Budget Group (a) |
20,009 |
|||||||||
|
Second Largest Car Rental Company |
|||||||||||
|
675,000 |
Hertz (a) |
9,268 |
|||||||||
|
Largest U.S. Rental Car Operator |
|||||||||||
|
64,000 |
Vail Resorts |
3,689 |
|||||||||
|
Ski Resort Operator & Developer |
|||||||||||
|
140,000 |
HomeAway (a)(b) |
3,283 |
|||||||||
|
Vacation Rental Online Marketplace |
|||||||||||
|
75,000 |
Choice Hotels |
2,399 |
|||||||||
|
Franchisor of Budget Hotel Brands |
|||||||||||
|
38,648 |
|||||||||||
| > Furniture & Textiles 1.8% | |||||||||||
|
880,000 |
Knoll |
12,276 |
|||||||||
|
Office Furniture |
|||||||||||
|
756,000 |
Interface |
9,987 |
|||||||||
|
Modular Carpet |
|||||||||||
|
148,000 |
Herman Miller |
2,877 |
|||||||||
|
Office Furniture |
|||||||||||
|
200,000 |
Caesarstone (Israel) (a) |
2,820 |
|||||||||
|
Quartz Countertops |
|||||||||||
|
27,960 |
|||||||||||
| > Consumer Goods Distribution 1.1% | |||||||||||
|
429,000 |
Pool |
17,838 |
|||||||||
|
Distributor of Swimming Pool Supplies & Equipment |
|||||||||||
|
17,838 |
|||||||||||
60
|
Number of Shares |
Value (000) |
||||||||||
| > Apparel 0.9% | |||||||||||
|
222,000 |
Warnaco Group (a) |
$ |
11,522 |
||||||||
|
Global Branded Apparel Manufacturer |
|||||||||||
|
73,000 |
Deckers Outdoor (a)(b) |
2,675 |
|||||||||
|
Fashion Footwear Wholesaler |
|||||||||||
|
14,197 |
|||||||||||
| > Other Consumer Services 0.7% | |||||||||||
|
233,000 |
Lifetime Fitness (a) |
10,657 |
|||||||||
|
Sport & Fitness Club Operator |
|||||||||||
|
10,657 |
|||||||||||
| > Other Durable Goods 0.6% | |||||||||||
|
206,000 |
Cavco Industries (a) |
9,453 |
|||||||||
|
Manufactured Homes |
|||||||||||
|
9,453 |
|||||||||||
| > Casinos & Gaming 0.5% | |||||||||||
|
698,000 |
Pinnacle Entertainment (a) |
8,550 |
|||||||||
|
Regional Casino Operator |
|||||||||||
|
8,550 |
|||||||||||
| > Nondurables 0.5% | |||||||||||
|
262,000 |
Helen of Troy (a) |
8,339 |
|||||||||
|
Personal Care, Housewares, Healthcare & Home Environment Products |
|||||||||||
|
8,339 |
|||||||||||
| > Leisure Products 0.2% | |||||||||||
|
230,000 |
Skullcandy (a)(b) |
3,163 |
|||||||||
|
Lifestyle Branded Headphones |
|||||||||||
|
3,163 |
|||||||||||
| > Educational Services 0.1% | |||||||||||
|
37,350 |
ITT Educational Services (a)(b) |
1,204 |
|||||||||
|
Post-secondary Degree Services |
|||||||||||
|
1,204 |
|||||||||||
| > Food & Beverage —% | |||||||||||
|
4,900 |
Annie's (a)(b) |
220 |
|||||||||
|
Developer & Marketer of Natural & Organic Food |
|||||||||||
|
220 |
|||||||||||
|
Consumer Goods & Services: Total |
233,537 |
||||||||||
|
Finance 13.2% |
|||||||||||
| > Banks 7.5% | |||||||||||
|
833,000 |
MB Financial |
16,452 |
|||||||||
|
Chicago Bank |
|||||||||||
|
1,053,000 |
Associated Banc-Corp |
13,868 |
|||||||||
|
Midwest Bank |
|||||||||||
|
431,597 |
Lakeland Financial |
11,912 |
|||||||||
|
Indiana Bank |
|||||||||||
|
211,000 |
City National |
10,869 |
|||||||||
|
Bank & Asset Manager |
|||||||||||
|
170,000 |
SVB Financial Group (a) |
10,278 |
|||||||||
|
Bank to Venture Capitalists |
|||||||||||
|
251,000 |
Hancock Holding |
7,768 |
|||||||||
|
Gulf Coast Bank |
|||||||||||
|
1,478,200 |
First Busey |
7,214 |
|||||||||
|
Illinois Bank |
|||||||||||
|
641,750 |
Valley National Bancorp (b) |
6,430 |
|||||||||
|
New Jersey/New York Bank |
|||||||||||
|
Number of Shares |
Value (000) |
||||||||||
|
535,000 |
TCF Financial |
$ |
6,388 |
||||||||
|
Great Lakes Bank |
|||||||||||
|
834,000 |
First Commonwealth |
5,880 |
|||||||||
|
Western Pennsylvania Bank |
|||||||||||
|
844,000 |
TrustCo Bank |
4,828 |
|||||||||
|
New York State Bank |
|||||||||||
|
269,087 |
Eagle Bancorp (a) |
4,499 |
|||||||||
|
Metro D.C. Bank |
|||||||||||
|
178,826 |
Sandy Spring Bancorp |
3,442 |
|||||||||
|
Baltimore, D.C. Bank |
|||||||||||
|
210,000 |
CVB Financial |
2,507 |
|||||||||
|
Inland Empire Business Bank |
|||||||||||
|
217,117 |
Pacific Continental Bank |
1,939 |
|||||||||
|
Pacific Northwest Bank |
|||||||||||
|
105,700 |
Hudson Valley |
1,802 |
|||||||||
|
Metro New York City Bank |
|||||||||||
|
851,247 |
Guaranty Bancorp (a) |
1,720 |
|||||||||
|
Colorado Bank |
|||||||||||
|
90,000 |
TriCo Bancshares |
1,488 |
|||||||||
|
California Central Valley Bank |
|||||||||||
|
119,284 |
|||||||||||
| > Finance Companies 3.6% | |||||||||||
|
315,000 |
World Acceptance (a) |
21,247 |
|||||||||
|
Personal Loans |
|||||||||||
|
389,000 |
Textainer Group Holdings (b) |
11,884 |
|||||||||
|
Top International Container Leasor |
|||||||||||
|
346,000 |
McGrath Rentcorp |
9,027 |
|||||||||
|
Temporary Space & IT Rentals |
|||||||||||
|
415,208 |
CAI International (a) |
8,520 |
|||||||||
|
International Container Leasing |
|||||||||||
|
397,172 |
H & E Equipment Services |
4,814 |
|||||||||
|
Heavy Equipment Leasing |
|||||||||||
|
100,000 |
Marlin Business Services |
2,121 |
|||||||||
|
Small Equipment Leasing |
|||||||||||
|
36,318 |
Regional Management (a) |
626 |
|||||||||
|
Consumer Loans |
|||||||||||
|
58,239 |
|||||||||||
| > Savings & Loans 1.1% | |||||||||||
|
602,487 |
ViewPoint Financial |
11,550 |
|||||||||
|
Texas Thrift |
|||||||||||
|
144,000 |
Berkshire Hills Bancorp |
3,295 |
|||||||||
|
Northeast Thrift |
|||||||||||
|
173,073 |
Kaiser Federal |
2,611 |
|||||||||
|
Los Angeles Savings & Loan |
|||||||||||
|
17,456 |
|||||||||||
| > Brokerage & Money Management 0.5% | |||||||||||
|
306,500 |
Eaton Vance |
8,876 |
|||||||||
|
Specialty Mutual Funds |
|||||||||||
|
8,876 |
|||||||||||
| > Insurance 0.5% | |||||||||||
|
55,000 |
Allied World Holdings |
4,249 |
|||||||||
|
Commerical Lines Insurance/Reinsurance |
|||||||||||
|
39,000 |
Enstar Group (a) |
3,886 |
|||||||||
|
Insurance/Reinsurance & Related Services |
|||||||||||
|
8,135 |
|||||||||||
|
Finance: Total |
211,990 |
||||||||||
61
Columbia Acorn USA
Statement of Investments (Unaudited), continued
|
Number of Shares |
Value (000) |
||||||||||
|
Health Care 10.6% |
|||||||||||
| > Biotechnology & Drug Delivery 6.8% | |||||||||||
|
415,000 |
BioMarin Pharmaceutical (a) |
$ |
16,712 |
||||||||
|
Biotech Focused on Orphan Diseases |
|||||||||||
|
614,000 |
Seattle Genetics (a)(b) |
16,547 |
|||||||||
|
Antibody-based Therapies for Cancer |
|||||||||||
|
1,275,000 |
NPS Pharmaceuticals (a) |
11,794 |
|||||||||
|
Orphan Drugs & Healthy Royalties |
|||||||||||
|
466,000 |
ARIAD Pharmaceuticals (a) |
11,289 |
|||||||||
|
Biotech Focused on Cancer |
|||||||||||
|
421,000 |
Auxilium Pharmaceuticals (a) |
10,298 |
|||||||||
|
Biotech Focused on Niche Disease Areas |
|||||||||||
|
177,000 |
Synageva Biopharma (a) |
9,457 |
|||||||||
|
Biotech Focused on Orphan Diseases |
|||||||||||
|
643,000 |
Isis Pharmaceuticals (a) |
9,047 |
|||||||||
|
Biotech Pioneer in Antisense Drugs |
|||||||||||
|
75,000 |
Alexion Pharmaceuticals (a) |
8,580 |
|||||||||
|
Biotech Focused on Orphan Diseases |
|||||||||||
|
100,000 |
Onyx Pharmaceuticals (a) |
8,450 |
|||||||||
|
Commercial-stage Biotech Focused on Cancer |
|||||||||||
|
400,000 |
InterMune (a) |
3,588 |
|||||||||
|
Drugs for Pulmonary Fibrosis & Hepatitis C |
|||||||||||
|
259,000 |
Raptor Pharmaceutical (a)(b) |
1,440 |
|||||||||
|
Orphan Drug Company |
|||||||||||
|
815,900 |
Chelsea Therapeutics International (a)(b) |
979 |
|||||||||
|
Biotech Focused on Rare Diseases |
|||||||||||
|
18,181 |
Metabolex (a)(d)(e) |
6 |
|||||||||
|
Diabetes Drug Development |
|||||||||||
|
108,187 |
|||||||||||
| > Medical Supplies 1.5% | |||||||||||
|
587,600 |
Cepheid (a) |
20,278 |
|||||||||
|
Molecular Diagnostics |
|||||||||||
|
53,000 |
Techne |
3,813 |
|||||||||
|
Cytokines, Antibodies & Other Reagents for Life Science |
|||||||||||
|
24,091 |
|||||||||||
| > Medical Equipment & Devices 1.4% | |||||||||||
|
246,012 |
Sirona Dental Systems (a) |
14,013 |
|||||||||
|
Manufacturer of Dental Equipment |
|||||||||||
|
268,000 |
Hill-Rom Holdings |
7,788 |
|||||||||
|
Hospital Beds/Patient Handling |
|||||||||||
|
21,801 |
|||||||||||
| > Pharmaceuticals 0.6% | |||||||||||
|
642,000 |
Akorn (a) |
8,487 |
|||||||||
|
Develops, Manufactures & Sells Specialty Generic Drugs |
|||||||||||
|
150,000 |
Horizon Pharma (a) |
520 |
|||||||||
|
Specialty Pharmaceutical Company |
|||||||||||
|
133,180 |
Alimera Sciences (a)(b) |
344 |
|||||||||
|
Ophthalmology-focused Pharmaceutical Company |
|||||||||||
|
9,351 |
|||||||||||
|
Number of Shares |
Value (000) |
||||||||||
| > Health Care Services 0.3% | |||||||||||
|
664,900 |
Health Management Associates (a) |
$ |
5,579 |
||||||||
|
Non-urban Hospitals |
|||||||||||
|
5,579 |
|||||||||||
|
Health Care: Total |
169,009 |
||||||||||
|
Other Industries 9.1% |
|||||||||||
| > Real Estate 8.1% | |||||||||||
|
849,700 |
Ryman Hospitality Properties (a) |
33,589 |
|||||||||
|
Convention Hotels |
|||||||||||
|
915,000 |
Extra Space Storage |
30,424 |
|||||||||
|
Self Storage Facilities |
|||||||||||
|
625,000 |
DuPont Fabros Technology |
15,781 |
|||||||||
|
Technology-focused Office Buildings |
|||||||||||
|
561,200 |
Biomed Realty Trust |
10,506 |
|||||||||
|
Life Science-focused Office Buildings |
|||||||||||
|
783,000 |
Education Realty Trust |
8,535 |
|||||||||
|
Student Housing |
|||||||||||
|
540,000 |
Associated Estates Realty |
8,186 |
|||||||||
|
Multifamily Properties |
|||||||||||
|
1,380,000 |
Kite Realty Group |
7,038 |
|||||||||
|
Community Shopping Centers |
|||||||||||
|
958,000 |
DCT Industrial Trust |
6,198 |
|||||||||
|
Industrial Properties |
|||||||||||
|
100,000 |
Post Properties |
4,796 |
|||||||||
|
Multi-family Properties |
|||||||||||
|
200,000 |
St. Joe (a)(b) |
3,900 |
|||||||||
|
Florida Panhandle Landowner |
|||||||||||
|
128,953 |
|||||||||||
| > Transportation 1.0% | |||||||||||
|
515,091 |
Rush Enterprises, Class A (a) |
9,921 |
|||||||||
| 115,000 |
Rush Enterprises, Class B (a) |
1,933 |
|||||||||
|
Truck Sales & Service |
|||||||||||
|
128,000 |
World Fuel Services |
4,558 |
|||||||||
|
Global Fuel Broker |
|||||||||||
|
16,412 |
|||||||||||
|
Other Industries: Total |
145,365 |
||||||||||
|
Energy & Minerals 4.8% |
|||||||||||
| > Oil Services 2.3% | |||||||||||
|
725,000 |
Atwood Oceanics (a) |
32,951 |
|||||||||
|
Offshore Drilling Contractor |
|||||||||||
|
125,000 |
Hornbeck Offshore (a) |
4,581 |
|||||||||
|
Supply Vessel Operator in U.S. Gulf of Mexico |
|||||||||||
|
37,532 |
|||||||||||
| > Oil & Gas Producers 1.7% | |||||||||||
|
133,000 |
SM Energy |
7,197 |
|||||||||
|
Oil & Gas Producer |
|||||||||||
|
129,000 |
Rosetta Resources (a) |
6,179 |
|||||||||
|
Oil & Gas Producer Exploring in South Texas & Montana |
|||||||||||
|
182,000 |
PDC Energy (a) |
5,757 |
|||||||||
|
Oil & Gas Producer in the U.S. |
|||||||||||
|
174,000 |
Approach Resources (a) |
5,242 |
|||||||||
|
Oil & Gas Producer in West Texas Permian |
|||||||||||
62
|
Number of Shares |
Value (000) |
||||||||||
| > Oil & Gas Producers—continued | |||||||||||
|
510,000 |
Quicksilver Resources (a)(b) |
$ |
2,086 |
||||||||
|
Natural Gas & Coal Seam Gas Producer |
|||||||||||
|
262,200 |
Houston American Energy (a)(b) |
236 |
|||||||||
|
Oil & Gas Exploration/Production in Colombia |
|||||||||||
|
26,697 |
|||||||||||
| > Mining 0.8% | |||||||||||
|
77,000 |
Core Labs (Netherlands) |
9,354 |
|||||||||
|
Oil & Gas Reservoir Consulting |
|||||||||||
|
600,000 |
Alexco Resource (a) |
2,604 |
|||||||||
|
Mining, Exploration & Environmental Services |
|||||||||||
|
180,000 |
Augusta Resource (a)(b) |
486 |
|||||||||
|
US Copper/Moly Mine |
|||||||||||
|
12,444 |
|||||||||||
|
Energy & Minerals: Total |
76,673 |
||||||||||
|
Total Equities: 99.4% (Cost: $1,076,499) |
1,590,446 |
||||||||||
|
Number of Shares |
Value (000) |
||||||||||
|
Securities Lending Collateral 3.8% |
|||||||||||
|
60,481,550 |
Dreyfus Government Cash Management Fund (7 day yield of 0.01%) (f) |
$ |
60,482 |
||||||||
|
Total Securities Lending Collateral: (Cost: $60,482) |
60,482 |
||||||||||
|
Total Investments: 103.2% (Cost: $1,136,981)(g)(h) |
1,650,928 |
(i) |
|||||||||
|
Obligation to Return Collateral for Securities Loaned: (3.8)% |
(60,482 |
) |
|||||||||
|
Cash and Other Assets Less Liabilities: 0.6% |
9,482 |
||||||||||
|
Total Net Assets: 100.0% |
$ |
1,599,928 |
|||||||||
ADR - American Depositary Receipts
> Notes to Statement of Investments (dollar values in thousands)
(a) Non-income producing security.
(b) All or a portion of this security was on loan at September 30, 2012. The total market value of securities on loan at September 30, 2012 was $58,671.
(c) An affiliated person of the Fund may include any company in which the Fund owns five percent or more of its outstanding voting shares. Holdings and transactions in these affiliated companies during the period ended September 30, 2012, are as follows:
|
Security |
Balance of Shares Held 12/31/11 |
Purchases/ Additions |
Sales/ Reductions |
Balance of Shares Held 9/30/12 |
Value |
Dividend |
|||||||||||||||||||||
|
RCM Technologies |
640,000 |
- |
- |
640,000 |
$ |
3,481 |
$ |
- |
|||||||||||||||||||
|
Total of Affiliated Transactions |
640,000 |
- |
- |
640,000 |
$ |
3,481 |
$ |
- |
|||||||||||||||||||
The aggregate cost and value of these companies at September 30, 2012 were $3,624 and $3,481 respectively. Investments in affiliated companies represented 0.22% of the Funds total net assets at September 30, 2012.
(d) Denotes a restricted security, which is subject to restrictions on resale under federal securities laws. This security is valued at fair value determined in good faith under consistently applied procedures established by the Board of Trustees. At September 30, 2012, the market value of this security amounted to $6, which represented less than 0.01% of total net assets. Additional information on this security is as follows:
|
Security |
Acquisition Dates |
Shares |
Cost |
Value |
|||||||||||||||
|
Metabolex |
2/11/00 |
18,181 |
$ |
2,000 |
$ |
6 |
|||||||||||||
|
$ |
2,000 |
$ |
6 |
||||||||||||||||
(e) Illiquid security.
(f) Investment made with cash collateral received from securities lending activity.
(g) At September 30, 2012, for federal income tax purposes, the cost of investments was $1,136,981 and net unrealized appreciation was $513,947 consisting of gross unrealized appreciation of $604,573 and gross unrealized depreciation of $90,626.
(h) On September 30, 2012, the market value of foreign securities represented 1.32% of total net assets. The Fund's foreign portfolio was diversified as follows:
|
Country |
Value |
Percentage of Net Assets |
|||||||||
|
Netherlands |
$ |
9,354 |
0.58 |
||||||||
|
Israel |
8,135 |
0.51 |
|||||||||
|
India |
3,676 |
0.23 |
|||||||||
|
Total Foreign Portfolio |
$ |
21,165 |
1.32 |
||||||||
(i) Securities are valued using policies described in the Notes to Financial Statements in the most recent shareholder report.
63
Columbia Acorn USA
Statement of Investments (Unaudited), continued
> Notes to Statement of Investments (dollar values in thousands)
Fair Value Measurements
Various inputs are used in determining the value of the Fund's investments, following the input prioritization hierarchy established by GAAP. These inputs are summarized in the three broad levels listed below:
• Level 1 – quoted prices in active markets for identical securities
• Level 2 – prices determined using other significant observable inputs (including quoted prices for similar securities, interest rates, prepayment speeds, credit risk and others)
• Level 3 – prices determined using significant unobservable inputs where quoted prices or observable inputs are unavailable or less reliable (including management's own assumptions about the factors market participants would use in pricing an investment)
The inputs or methodology used for valuing securities are not necessarily an indication of the risk associated with investing in those securities.
Examples of the types of securities in which the Fund would typically invest and how they are classified within this hierarchy are as follows. Typical Level 1 securities include exchange traded domestic equities, mutual funds whose NAVs are published each day and exchange traded foreign equities that are not statistically fair valued. Typical Level 2 securities include exchange traded foreign equities that are statistically fair valued, forward foreign currency exchange contracts and short-term investments valued at amortized cost. Additionally, securities fair valued by the Valuation Committee (the Committee) of the Fund's Board of Trustees (the Board) that rely on significant observable inputs are also included in Level 2. Typical Level 3 securities include any security fair valued by the Committee that relies on significant unobservable inputs.
Under the direction of the Board, the Committee is responsible for carrying out the valuation procedures approved by the Board.
The Committee meets as necessary, and no less frequently than quarterly, to determine fair values for securities for which market quotations are not readily available or for which the investment manager believes that available market quotations are unreliable, and to review the continuing appropriateness of the current value of any security subject to the Trust's Portfolio Pricing Policy and the pricing procedures of the investment manager (the Policies). The Policies address, among other things: circumstances under which market quotations will be deemed readily available; selection of third party pricing vendors; appropriate pricing methodologies; events that require fair valuation and fair value techniques; and circumstances under which securities will be deemed to pose a potential for stale pricing, including when securities are illiquid, restricted, or in default. The Committee may also meet to discuss additional valuation matters, which may include review of back-testing results, review of time-sensitive information or approval of other valuation related actions, and to review the appropriateness of the Policies.
For investments categorized as Level 3, the significant unobservable inputs used in the fair value measurement of the Funds' securities may include: (i) data specific to the issuer or comparable issuers, (ii) general market or specific sector news and (iii) quoted prices and specific or similar security transactions. The Committee considers this data and any changes from prior periods in order to assess the reasonableness of observable and unobservable inputs, any assumptions or internal models used to value those securities and changes in fair value. Significant changes in any of these factors could result in lower or higher fair value measurements. Various factors impact the frequency of monitoring (which may occur as often as daily), however the Committee may determine that changes to inputs, assumptions and models are not required with the same frequency.
The following table summarizes the inputs used, as of September 30, 2012, in valuing the Fund's assets:
|
Investment Type |
Quoted Prices (Level 1) |
Other Significant Observable Inputs (Level 2) |
Significant Unobservable Inputs (Level 3) |
Total |
|||||||||||||||
|
Equities |
|||||||||||||||||||
|
Information |
$ |
473,423 |
$ |
- |
$ |
- |
$ |
473,423 |
|||||||||||
|
Industrial Goods & Services |
280,449 |
- |
- |
280,449 |
|||||||||||||||
|
Consumer Goods & Services |
233,537 |
- |
- |
233,537 |
|||||||||||||||
|
Finance |
211,990 |
- |
- |
211,990 |
|||||||||||||||
|
Health Care |
169,003 |
- |
6 |
169,009 |
|||||||||||||||
|
Other Industries |
145,365 |
- |
- |
145,365 |
|||||||||||||||
|
Energy & Minerals |
76,673 |
- |
- |
76,673 |
|||||||||||||||
|
Total Equities |
1,590,440 |
- |
6 |
1,590,446 |
|||||||||||||||
|
Total Securities Lending Collateral |
60,482 |
- |
- |
60,482 |
|||||||||||||||
|
Total Investments |
$ |
1,650,922 |
$ |
- |
$ |
6 |
$ |
1,650,928 |
|||||||||||
There were no transfers of financial assets between levels 1 and 2 during the period.
64
> Notes to Statement of Investments (dollar values in thousands)
The following table reconciles asset balances for the period ending September 30, 2012, in which significant observable and/or unobservable inputs (Level 3) were used in determining value:
|
Investments in Securities |
Balance as of December 31, 2011 |
Realized Gain/(Loss) |
Change in Unrealized Appreciation (Depreciation) |
Purchases |
Sales |
Transfers into Level 3 |
Transfers out of Level 3 |
Balance as of September 30, 2012 |
|||||||||||||||||||||||||||
|
Equities |
|||||||||||||||||||||||||||||||||||
|
Health Care |
$ |
27 |
$ |
- |
$ |
(21 |
) |
$ |
- |
$ |
- |
$ |
- |
$ |
- |
$ |
6 |
||||||||||||||||||
|
$ |
27 |
$ |
- |
$ |
(21 |
) |
$ |
- |
$ |
- |
$ |
- |
$ |
- |
$ |
6 |
|||||||||||||||||||
The information in the above reconciliation table represents fiscal year to date activity for any securities identified as using Level 3 inputs at either the beginning or the end of the current fiscal period.
The change in unrealized depreciation attributed to securities owned at September 30, 2012, which were valued using significant unobservable inputs (Level 3), amounted to $21.
The Fund does not hold any significant investments categorized as Level 3.
Certain common stock classified as Level 3 are valued at fair value, using a market approach, as determined in good faith under consistently applied procedures established by and under the general supervision of the Board. To determine fair value for these securities, for which no market exists, the Committee utilizes the valuation technique it deems most appropriate in the circumstances, using some unobservable inputs, which may include but are not limited to trades of similar securities, estimated earnings of the company, market multiples derived from a set of comparable companies, and the position of the security within the company's capital structure. Significant increases or decreases to any of these inputs could result in a significantly lower or higher fair value measurement. Generally, a change in estimated earnings of a company may result in a change to the comparable companies and market multiples utilized.
65
Columbia Acorn International Select
Major Portfolio Changes in the Third Quarter (Unaudited)
|
Number of Shares |
|||||||||||
|
6/30/12 |
9/30/12 |
||||||||||
|
Purchases |
|||||||||||
|
Asia |
|||||||||||
| > Taiwan | |||||||||||
|
CTCI Corp |
3,508,400 |
3,920,000 |
|||||||||
|
Taiwan Mobile |
3,133,800 |
3,810,000 |
|||||||||
| > Japan | |||||||||||
|
Jupiter Telecommunications |
8,970 |
13,964 |
|||||||||
|
Start Today |
496,000 |
869,000 |
|||||||||
| > Indonesia | |||||||||||
|
Archipelago Resources |
9,272,000 |
11,136,600 |
|||||||||
| > Korea | |||||||||||
|
Hite Jinro |
0 |
28,690 |
|||||||||
|
Other Countries |
|||||||||||
| > Australia | |||||||||||
|
Challenger Financial |
2,809,800 |
3,461,296 |
|||||||||
|
Commonwealth Property Office Fund |
10,466,968 |
11,089,000 |
|||||||||
|
Regis Resources |
0 |
95,201 |
|||||||||
|
UGL |
1,000,050 |
1,058,050 |
|||||||||
| > Canada | |||||||||||
|
Central Fund of Canada |
0 |
213,503 |
|||||||||
|
Goldcorp |
344,400 |
464,000 |
|||||||||
|
Kirkland Lake Gold |
0 |
290,000 |
|||||||||
| > New Zealand | |||||||||||
|
Telecom NZ |
0 |
744,857 |
|||||||||
|
Europe |
|||||||||||
| > France | |||||||||||
|
Gemalto |
0 |
7,031 |
|||||||||
|
Latin America |
|||||||||||
| > Mexico | |||||||||||
|
Fresnillo |
597,400 |
745,000 |
|||||||||
| > Guatemala | |||||||||||
|
Tahoe Resources |
196,800 |
401,000 |
|||||||||
|
Number of Shares |
|||||||||||
|
6/30/12 |
9/30/12 |
||||||||||
|
Sales |
|||||||||||
|
Asia |
|||||||||||
| > Japan | |||||||||||
|
Kansai Paint |
319,000 |
0 |
|||||||||
|
Seven Bank |
5,753,734 |
5,750,000 |
|||||||||
| > China | |||||||||||
|
Zhaojin Mining Industry |
4,146,000 |
2,839,000 |
|||||||||
| > Korea | |||||||||||
|
NHN |
32,830 |
0 |
|||||||||
|
Other Countries |
|||||||||||
| > Canada | |||||||||||
|
CCL Industries |
106,400 |
91,400 |
|||||||||
| > South Africa | |||||||||||
|
Adcock Ingram Holdings |
1,317,200 |
1,001,517 |
|||||||||
|
Rand Merchant Insurance |
6,483,015 |
4,798,015 |
|||||||||
| > Israel | |||||||||||
|
Israel Chemicals |
460,000 |
349,000 |
|||||||||
|
Europe |
|||||||||||
| > United Kingdom | |||||||||||
|
Serco |
583,000 |
0 |
|||||||||
| > Iceland | |||||||||||
|
Marel |
4,800,000 |
3,958,835 |
|||||||||
| > Sweden | |||||||||||
|
Hexagon |
595,666 |
192,000 |
|||||||||
| > Netherlands | |||||||||||
|
Imtech |
190,916 |
123,416 |
|||||||||
| > Belgium | |||||||||||
|
EVS Broadcast Equipment |
74,000 |
0 |
|||||||||
66
Columbia Acorn International Select
Statement of Investments (Unaudited), September 30, 2012
|
Number of Shares |
Value (000) |
||||||||||
|
Equities: 88.8% |
|||||||||||
|
Asia 42.9% |
|||||||||||
| > Singapore 14.6% | |||||||||||
|
13,130,000 |
Ascendas REIT |
$ |
25,718 |
||||||||
|
Industrial Property Landlord |
|||||||||||
|
20,395,000 |
Mapletree Industrial Trust |
23,405 |
|||||||||
|
Industrial Property Landlord |
|||||||||||
|
11,142,000 |
Mapletree Logistics Trust |
10,189 |
|||||||||
|
Industrial Property Landlord |
|||||||||||
|
59,312 |
|||||||||||
| > Taiwan 12.4% | |||||||||||
|
11,103,000 |
Far EasTone Telecom |
27,399 |
|||||||||
|
Taiwan's Third Largest Mobile Operator |
|||||||||||
|
3,810,000 |
Taiwan Mobile |
13,894 |
|||||||||
|
Taiwan's Second Largest Mobile Operator |
|||||||||||
|
3,920,000 |
CTCI Corp |
8,955 |
|||||||||
|
International Engineering Firm |
|||||||||||
|
50,248 |
|||||||||||
| > Japan 10.9% | |||||||||||
|
5,750,000 |
Seven Bank |
17,545 |
|||||||||
|
ATM Processing Services |
|||||||||||
|
13,964 |
Jupiter Telecommunications |
14,171 |
|||||||||
|
Largest Cable Service Provider in Japan |
|||||||||||
|
869,000 |
Start Today (a) |
12,414 |
|||||||||
|
Online Japanese Apparel Retailer |
|||||||||||
|
44,130 |
|||||||||||
| > Indonesia 2.7% | |||||||||||
|
11,136,600 |
Archipelago Resources (b) |
10,790 |
|||||||||
|
Gold Mining Projects in Indonesia, Vietnam & the Philippines |
|||||||||||
|
10,790 |
|||||||||||
| > China 2.2% | |||||||||||
|
2,839,000 |
Zhaojin Mining Industry |
5,142 |
|||||||||
|
Gold Mining & Refining in China |
|||||||||||
|
2,956,000 |
Want Want |
3,763 |
|||||||||
|
Chinese Branded Consumer Food Company |
|||||||||||
|
1,000 |
NetEase.com - ADR (b) |
56 |
|||||||||
|
Chinese Online Gaming Services |
|||||||||||
|
8,961 |
|||||||||||
| > Korea 0.1% | |||||||||||
|
28,690 |
Hite Jinro |
628 |
|||||||||
|
Leading Beer & Spirits Manufacturer |
|||||||||||
|
628 |
|||||||||||
|
Asia: Total |
174,069 |
||||||||||
|
Other Countries 28.2% |
|||||||||||
| > Australia 10.6% | |||||||||||
|
11,089,000 |
Commonwealth Property Office Fund |
11,880 |
|||||||||
|
Australia Prime Office REIT |
|||||||||||
|
3,461,296 |
Challenger Financial |
11,650 |
|||||||||
|
Largest Annuity Provider |
|||||||||||
|
1,058,050 |
UGL (a) |
11,446 |
|||||||||
|
Engineering & Facilities Management |
|||||||||||
|
Number of Shares |
Value (000) |
||||||||||
|
1,652,046 |
IAG |
$ |
7,451 |
||||||||
|
General Insurance Provider |
|||||||||||
|
95,201 |
Regis Resources |
560 |
|||||||||
|
Gold Mining in Australia |
|||||||||||
|
42,987 |
|||||||||||
| > Canada 8.2% | |||||||||||
|
464,000 |
Goldcorp |
21,274 |
|||||||||
|
Gold Mining |
|||||||||||
|
213,503 |
Central Fund of Canada |
5,084 |
|||||||||
|
Allocated Gold & Silver Closed-end Fund |
|||||||||||
|
290,000 |
Kirkland Lake Gold |
3,516 |
|||||||||
|
Gold Mining |
|||||||||||
|
91,400 |
CCL Industries |
3,377 |
|||||||||
|
Leading Global Label Manufacturer |
|||||||||||
|
33,251 |
|||||||||||
| > South Africa 6.3% | |||||||||||
|
4,798,015 |
Rand Merchant Insurance |
12,412 |
|||||||||
|
Directly Sold Property & Casualty Insurance; Holdings in Other Insurers |
|||||||||||
|
1,001,517 |
Adcock Ingram Holdings |
7,146 |
|||||||||
|
Manufacturer of Pharmaceuticals & Medical Supplies |
|||||||||||
|
95,700 |
Naspers |
5,921 |
|||||||||
|
Media in Africa, China, Russia & Other Emerging Markets |
|||||||||||
|
25,479 |
|||||||||||
| > United States 1.7% | |||||||||||
|
94,000 |
Atwood Oceanics (b) |
4,272 |
|||||||||
|
Offshore Drilling Contractor |
|||||||||||
|
52,000 |
SM Energy |
2,814 |
|||||||||
|
Oil & Gas Producer |
|||||||||||
|
7,086 |
|||||||||||
| > Israel 1.0% | |||||||||||
|
349,000 |
Israel Chemicals |
4,239 |
|||||||||
|
Producer of Potash, Phosphates, Bromine & Specialty Chemicals |
|||||||||||
|
4,239 |
|||||||||||
| > New Zealand 0.4% | |||||||||||
|
744,857 |
Telecom NZ |
1,466 |
|||||||||
|
Primary Telecom Operator |
|||||||||||
|
1,466 |
|||||||||||
|
Other Countries: Total |
114,508 |
||||||||||
|
Europe 9.7% |
|||||||||||
| > Germany 3.0% | |||||||||||
|
538,000 |
Wirecard |
12,355 |
|||||||||
|
Online Payment Processing & Risk Management |
|||||||||||
|
12,355 |
|||||||||||
| > United Kingdom 1.8% | |||||||||||
|
296,000 |
JLT Group |
3,659 |
|||||||||
|
International Business Insurance Broker |
|||||||||||
|
79,000 |
Intertek Group |
3,495 |
|||||||||
|
Testing, Inspection, Certification Services |
|||||||||||
|
7,154 |
|||||||||||
67
Columbia Acorn International Select
Statement of Investments (Unaudited), continued
|
Number of Shares |
Value (000) |
||||||||||
| > Iceland 1.1% | |||||||||||
|
3,958,835 |
Marel |
$ |
4,301 |
||||||||
|
Largest Manufacturer of Poultry & Fish Processing Equipment |
|||||||||||
|
4,301 |
|||||||||||
| > Switzerland 1.0% | |||||||||||
|
19,800 |
Partners Group |
4,120 |
|||||||||
|
Private Markets Asset Management |
|||||||||||
|
4,120 |
|||||||||||
| > Sweden 1.0% | |||||||||||
|
192,000 |
Hexagon |
4,115 |
|||||||||
|
Design, Measurement & Visualization Software & Equipment |
|||||||||||
|
4,115 |
|||||||||||
| > Denmark 0.8% | |||||||||||
|
125,000 |
Novozymes |
3,445 |
|||||||||
|
Industrial Enzymes |
|||||||||||
|
3,445 |
|||||||||||
| > Netherlands 0.8% | |||||||||||
|
123,416 |
Imtech |
3,258 |
|||||||||
|
Electromechanical & Information Communications Technology Installation & Maintenance |
|||||||||||
|
3,258 |
|||||||||||
| > France 0.2% | |||||||||||
|
7,031 |
Gemalto |
618 |
|||||||||
|
Digital Security Solutions |
|||||||||||
|
618 |
|||||||||||
|
Europe: Total |
39,366 |
||||||||||
|
Latin America 8.0% |
|||||||||||
| > Mexico 5.4% | |||||||||||
|
745,000 |
Fresnillo |
22,292 |
|||||||||
|
Silver & Metal Byproduct Mining in Mexico |
|||||||||||
|
22,292 |
|||||||||||
| > Guatemala 2.0% | |||||||||||
|
401,000 |
Tahoe Resources (b) |
8,166 |
|||||||||
|
Silver Project in Guatemala |
|||||||||||
|
8,166 |
|||||||||||
|
Number of Shares |
Value (000) |
||||||||||
| > Uruguay 0.5% | |||||||||||
|
191,666 |
Union Agriculture Group (b)(c)(d) |
$ |
1,988 |
||||||||
|
Farmland Operator in Uruguay |
|||||||||||
|
1,988 |
|||||||||||
| > Colombia 0.1% | |||||||||||
|
1,880,000 |
Santa Maria Petroleum (b)(c) |
257 |
|||||||||
|
Explores for Oil & Gas in Latin America |
|||||||||||
|
257 |
|||||||||||
|
Latin America: Total |
32,703 |
||||||||||
|
Total Equities: 88.8% (Cost: $284,437) |
360,646 |
||||||||||
|
Securities Lending Collateral 3.0% |
|||||||||||
|
12,212,336 |
Dreyfus Government Cash Management Fund (7 day yield of 0.01%) (e) |
12,212 |
|||||||||
|
Total Securities Lending Collateral: (Cost: $12,212) |
12,212 |
||||||||||
|
Total Investments: 91.8% (Cost: $296,649)(f)(g) |
372,858 |
(h) |
|||||||||
|
Obligation to Return Collateral for Securities Loaned: (3.0)% |
(12,212 |
) |
|||||||||
|
Cash and Other Assets Less Liabilities: 11.2% |
45,468 |
||||||||||
|
Total Net Assets: 100.0% |
$ |
406,114 |
|||||||||
ADR - American Depositary Receipts
REIT - Real Estate Investment Trust
> Notes to Statement of Investments (dollar values in thousands)
(a) All or a portion of this security was on loan at September 30, 2012. The total market value of securities on loan at September 30, 2012 was $11,576.
(b) Non-income producing security.
(c) Denotes a restricted security, which is subject to restrictions on resale under federal securities laws. These securities are valued at fair value determined in good faith under consistently applied procedures established by the Board of Trustees. At September 30, 2012, the market value of these securities amounted to $2,245, which represented 0.55% of total net assets. Additional information on these securities is as follows:
|
Security |
Acquisition Dates |
Shares |
Cost |
Value |
|||||||||||||||
|
Union Agriculture Group |
12/8/10-6/27/12 |
191,666 |
$ |
2,200 |
$ |
1,988 |
|||||||||||||
|
Santa Maria Petroleum |
1/14/11 |
1,880,000 |
2,376 |
257 |
|||||||||||||||
|
$ |
4,576 |
$ |
2,245 |
||||||||||||||||
68
> Notes to Statement of Investments (dollar values in thousands)
(d) Illiquid security.
(e) Investment made with cash collateral received from securities lending activity.
(f) At September 30, 2012, for federal income tax purposes, the cost of investments was $296,649 and net unrealized appreciation was $76,209 consisting of gross unrealized appreciation of $84,702 and gross unrealized depreciation of $8,493.
(g) On September 30, 2012, the Fund's total investments were denominated in currencies as follows:
|
Currency |
Value |
Percentage of Net Assets |
|||||||||
|
Singapore Dollar |
$ |
59,312 |
14.6 |
||||||||
|
Taiwan Dollar |
50,248 |
12.4 |
|||||||||
|
Japanese Yen |
44,130 |
10.9 |
|||||||||
|
Australian Dollar |
42,987 |
10.6 |
|||||||||
|
British Pound |
40,236 |
9.9 |
|||||||||
|
United States Dollar |
35,488 |
8.7 |
|||||||||
|
South African Rand |
25,479 |
6.3 |
|||||||||
|
Other currencies less than 5% of total net assets |
62,766 |
15.4 |
|||||||||
|
Total Portfolio |
$ |
360,646 |
88.8 |
||||||||
(h) Securities are valued using policies described in the Notes to Financial Statements in the most recent shareholder report.
At September 30, 2012, the Fund had entered into the following forward foreign currency exchange contracts:
|
Forward Foreign Currency Exchange Contracts to Buy |
Forward Foreign Currency Exchange Contracts to Sell |
Principal Amount in Foreign Currency |
Principal Amount in U.S. Dollar |
Unrealized Settlement Date |
Appreciation/ (Depreciation) |
||||||||||||||||||
|
USD |
ZAR |
165,352 |
$ |
20,000 |
10/15/12 |
$ |
170 |
||||||||||||||||
The counterparty for all forward foreign currency exchange contracts is State Street Bank and Trust Company.
USD - United States Dollar
ZAR - South African Rand
Fair Value Measurements
Various inputs are used in determining the value of the Fund's investments, following the input prioritization hierarchy established by GAAP. These inputs are summarized in the three broad levels listed below:
• Level 1 – quoted prices in active markets for identical securities
• Level 2 – prices determined using other significant observable inputs (including quoted prices for similar securities, interest rates, prepayment speeds, credit risk and others)
• Level 3 – prices determined using significant unobservable inputs where quoted prices or observable inputs are unavailable or less reliable (including management's own assumptions about the factors market participants would use in pricing an investment)
The inputs or methodology used for valuing securities are not necessarily an indication of the risk associated with investing in those securities.
Examples of the types of securities in which the Fund would typically invest and how they are classified within this hierarchy are as follows. Typical Level 1 securities include exchange traded domestic equities, mutual funds whose NAVs are published each day and exchange traded foreign equities that are not statistically fair valued. Typical Level 2 securities include exchange traded foreign equities that are statistically fair valued, forward foreign currency exchange contracts and short-term investments valued at amortized cost. Additionally, securities fair valued by the Valuation Committee (the Committee) of the Fund's Board of Trustees (the Board) that rely on significant observable inputs are also included in Level 2. Typical Level 3 securities include any security fair valued by the Committee that relies on significant unobservable inputs.
Under the direction of the Board, the Committee is responsible for carrying out the valuation procedures approved by the Board.
The Committee meets as necessary, and no less frequently than quarterly, to determine fair values for securities for which market quotations are not readily available or for which the investment manager believes that available market quotations are unreliable, and to review the continuing appropriateness of the current value of any security subject to the Trust's Portfolio Pricing Policy and the pricing procedures of the investment manager (the Policies). The Policies address, among other things: circumstances under which market quotations will be deemed readily available; selection of third party pricing vendors; appropriate pricing methodologies; events that require fair valuation and fair value techniques; and circumstances under which securities will be deemed to pose a potential for stale pricing, including when securities are illiquid, restricted, or in default. The Committee may also meet to discuss additional valuation matters, which may include review of back-testing results, review of time-sensitive information or approval of other valuation related actions, and to review the appropriateness of the Policies.
For investments categorized as Level 3, the significant unobservable inputs used in the fair value measurement of the Funds' securities may include: (i) data specific to the issuer or comparable issuers, (ii) general market or specific sector news and (iii) quoted prices and specific or similar security transactions. The Committee considers this data and any changes from prior periods in order to assess the reasonableness of observable and unobservable inputs, any assumptions or internal models used to value those securities and changes in fair value. Significant changes in any of these factors could result in lower or higher fair value measurements. Various factors impact the frequency of monitoring (which may occur as often as daily), however the Committee may determine that changes to inputs, assumptions and models are not required with the same frequency.
69
Columbia Acorn International Select
Statement of Investments (Unaudited), continued
> Notes to Statement of Investments (dollar values in thousands)
The following table summarizes the inputs used, as of September 30, 2012, in valuing the Fund's assets:
|
Investment Type |
Quoted Prices (Level 1) |
Other Significant Observable Inputs (Level 2) |
Significant Unobservable Inputs (Level 3) |
Total |
|||||||||||||||
|
Equities |
|||||||||||||||||||
|
Asia |
$ |
56 |
$ |
174,013 |
$ |
- |
$ |
174,069 |
|||||||||||
|
Other Countries |
40,337 |
74,171 |
- |
114,508 |
|||||||||||||||
|
Europe |
- |
39,366 |
- |
39,366 |
|||||||||||||||
|
Latin America |
8,166 |
22,549 |
1,988 |
32,703 |
|||||||||||||||
|
Total Equities |
48,559 |
310,099 |
1,988 |
360,646 |
|||||||||||||||
|
Total Securities Lending Collateral |
12,212 |
- |
- |
12,212 |
|||||||||||||||
|
Total Investments |
$ |
60,771 |
$ |
310,099 |
$ |
1,988 |
$ |
372,858 |
|||||||||||
|
Unrealized Appreciation on Forward Foreign Currency Exchange Contracts |
- |
170 |
- |
170 |
|||||||||||||||
|
Total Investments |
$ |
60,771 |
$ |
310,269 |
$ |
1,988 |
$ |
373,028 |
|||||||||||
The Fund's assets assigned to the Level 2 input category are generally valued using a market approach, in which a security's value is determined through its correlation to prices and information from observable market transactions for similar or identical assets. Foreign equities are generally valued at the last sale price on the foreign exchange or market on which they trade. The Fund may use a statistical fair valuation model, in accordance with the policy adopted by the Board, provided by an independent third party to value securities principally traded in foreign markets in order to adjust for possible stale pricing that may occur between the close of the foreign exchanges and the time for valuation. These models take into account available market data including intraday index, ADR, and ETF movements. Forward foreign currency exchange contracts are valued at the prevailing forward exchange rate of the underlying currencies. Securities acquired via private placement that have a holding period or an extended settlement period are valued at a discount to the same shares that are trading freely on the market. These discounts are determined by the investment manager's experience with similar securities or situations. Factors may include, but are not limited to, trade volume, shares outstanding and stock price.
There were no transfers of financial assets between levels 1 and 2 during the period.
The following table reconciles asset balances for the period ending September 30, 2012, in which significant observable and/or unobservable inputs (Level 3) were used in determining value:
|
Investments in Securities |
Balance as of December 31, 2011 |
Realized Gain/(Loss) |
Change in Unrealized Appreciation (Depreciation) |
Purchases |
Sales |
Transfers into Level 3 |
Transfers out of Level 3 |
Balance as of September 30, 2012 |
|||||||||||||||||||||||||||
|
Equities |
|||||||||||||||||||||||||||||||||||
|
Latin America |
$ |
1,828 |
$ |
- |
$ |
160 |
$ |
- |
$ |
- |
$ |
- |
$ |
- |
$ |
1,988 |
|||||||||||||||||||
|
$ |
1,828 |
$ |
- |
$ |
160 |
$ |
- |
$ |
- |
$ |
- |
$ |
- |
$ |
1,988 |
||||||||||||||||||||
The information in the above reconciliation table represents fiscal year to date activity for any securities identified as using Level 3 inputs at either the beginning or the end of the current fiscal period.
The change in unrealized appreciation attributed to securities owned at September 30, 2012, which were valued using significant unobservable inputs (Level 3), amounted to $160.
The Fund does not hold any significant investments categorized as Level 3.
Certain common stock classified as Level 3 are valued at fair value, using a market approach, as determined in good faith under consistently applied procedures established by and under the general supervision of the Board. To determine fair value for these securities, for which no market exists, the Committee utilizes the valuation technique it deems most appropriate in the circumstances, using some unobservable inputs, which may include but are not limited to trades of similar securities, estimated earnings of the company, market multiples derived from a set of comparable companies, and the position of the security within the company's capital structure. Significant increases or decreases to any of these inputs could result in a significantly lower or higher fair value measurement. Generally, a change in estimated earnings of a company may result in a change to the comparable companies and market multiples utilized.
70
Columbia Acorn International Select
Portfolio Diversification (Unaudited)
At September 30, 2012, the Fund's portfolio investments as a percentage of net assets were diversified as follows:
|
Value (000) |
Percentage of Net Assets |
||||||||||
| > Energy & Minerals | |||||||||||
|
Mining |
$ |
71,741 |
17.7 |
||||||||
|
Non-Ferrous Metals |
5,083 |
1.2 |
|||||||||
|
Oil Services |
4,272 |
1.0 |
|||||||||
|
Oil & Gas Producers |
3,071 |
0.8 |
|||||||||
|
Agricultural Commodities |
1,988 |
0.5 |
|||||||||
|
86,155 |
21.2 |
||||||||||
| > Information | |||||||||||
|
Mobile Communications |
41,293 |
10.2 |
|||||||||
|
CATV |
14,172 |
3.5 |
|||||||||
|
Financial Processors |
12,355 |
3.0 |
|||||||||
|
Internet Related |
5,977 |
1.4 |
|||||||||
|
Business Software |
4,115 |
1.0 |
|||||||||
|
Telephone & Data Services |
1,467 |
0.4 |
|||||||||
|
Computer Hardware & Related Equipment |
618 |
0.2 |
|||||||||
|
79,997 |
19.7 |
||||||||||
| > Other Industries | |||||||||||
|
Real Estate |
71,192 |
17.5 |
|||||||||
| > Finance | |||||||||||
|
Insurance |
35,171 |
8.7 |
|||||||||
|
Banks |
17,545 |
4.3 |
|||||||||
|
Brokerage & Money Management |
4,120 |
1.0 |
|||||||||
|
56,836 |
14.0 |
||||||||||
| > Industrial Goods & Services | |||||||||||
|
Other Industrial Services |
18,199 |
4.5 |
|||||||||
|
Construction |
8,955 |
2.2 |
|||||||||
|
Industrial Materials & Specialty Chemicals |
7,684 |
1.9 |
|||||||||
|
Machinery |
4,301 |
1.0 |
|||||||||
|
39,139 |
9.6 |
||||||||||
|
Value (000) |
Percentage of Net Assets |
||||||||||
| > Consumer Goods & Services | |||||||||||
|
Retail |
$ |
12,414 |
3.1 |
||||||||
|
Food & Beverage |
4,390 |
1.1 |
|||||||||
|
Nondurables |
3,377 |
0.8 |
|||||||||
|
20,181 |
5.0 |
||||||||||
| > Health Care | |||||||||||
|
Pharmaceuticals |
7,146 |
1.8 |
|||||||||
|
Total Equities: |
360,646 |
88.8 |
|||||||||
|
Security Lending Collateral: |
12,212 |
3.0 |
|||||||||
|
Total Investments: |
372,858 |
91.8 |
|||||||||
|
Obligation to Return Collateral for Securities Loaned: |
(12,212 |
) |
(3.0 |
) |
|||||||
|
Cash and Other Assets Less Liabilities: |
45,468 |
11.2 |
|||||||||
|
Net Assets: |
$ |
406,114 |
100.0 |
||||||||
71
Columbia Acorn Select
Major Portfolio Changes in the Third Quarter (Unaudited)
|
Number of Shares |
|||||||||||
|
6/30/12 |
9/30/12 |
||||||||||
|
Purchases |
|||||||||||
|
Information |
|||||||||||
|
Ansys |
0 |
95,000 |
|||||||||
|
F5 Networks |
0 |
80,000 |
|||||||||
|
Consumer Goods & Services |
|||||||||||
|
IFM Investments (Century 21 China RE) - ADR (China) |
998,000 |
1,300,000 |
|||||||||
|
Energy & Minerals |
|||||||||||
|
Kirkland Lake Gold (Canada) |
835,000 |
925,000 |
|||||||||
|
Health Care |
|||||||||||
|
Cepheid |
0 |
320,000 |
|||||||||
|
Number of Shares |
|||||||||||
|
6/30/12 |
9/30/12 |
||||||||||
|
Sales |
|||||||||||
|
Industrial Goods & Services |
|||||||||||
|
Ametek |
2,037,000 |
1,860,000 |
|||||||||
|
Expeditors International of Washington |
475,000 |
230,000 |
|||||||||
|
Kennametal |
865,000 |
835,000 |
|||||||||
|
Pall |
625,000 |
605,000 |
|||||||||
|
Information |
|||||||||||
|
Amphenol |
560,000 |
540,000 |
|||||||||
|
Crown Castle International |
700,000 |
680,000 |
|||||||||
|
Sanmina-SCI |
3,026,600 |
2,415,000 |
|||||||||
|
SBA Communications |
735,000 |
455,000 |
|||||||||
|
VisionChina Media - ADR (China) |
5,427,200 |
0 |
|||||||||
|
Finance |
|||||||||||
|
CNO Financial Group |
7,140,000 |
6,315,000 |
|||||||||
|
Consumer Goods & Services |
|||||||||||
|
Coach |
555,000 |
515,000 |
|||||||||
|
Hertz |
4,495,000 |
4,020,000 |
|||||||||
|
lululemon athletica |
305,000 |
288,000 |
|||||||||
|
Energy & Minerals |
|||||||||||
|
Canadian Solar (China) |
3,301,200 |
1,774,561 |
|||||||||
|
Eacom Timber (Canada) |
8,440,000 |
0 |
|||||||||
|
Shamaran Petroleum (Iraq) |
30,473,500 |
27,100,000 |
|||||||||
|
Tuscany International Drilling (Colombia) |
13,613,200 |
11,705,300 |
|||||||||
|
Other Industries |
|||||||||||
|
Biomed Realty Trust |
1,435,000 |
1,375,000 |
|||||||||
|
Ryman Hospitality Properties |
930,000 |
900,000 |
|||||||||
|
Wisconsin Energy |
403,000 |
316,000 |
|||||||||
|
Health Care |
|||||||||||
|
Akorn |
1,310,000 |
0 |
|||||||||
|
NPS Pharmaceuticals |
2,340,000 |
1,875,000 |
|||||||||
72
Columbia Acorn Select
Statement of Investments (Unaudited), September 30, 2012
|
Number of Shares |
Value (000) |
||||||||||
|
Equities: 96.3% |
|||||||||||
|
Industrial Goods & Services 21.5% |
|||||||||||
| > Machinery 17.0% | |||||||||||
|
1,860,000 |
Ametek |
$ |
65,937 |
||||||||
|
Aerospace/Industrial Instruments |
|||||||||||
|
1,110,000 |
Donaldson |
38,528 |
|||||||||
|
Industrial Air Filtration |
|||||||||||
|
605,000 |
Pall |
38,412 |
|||||||||
|
Life Science, Water & Industrial Filtration |
|||||||||||
|
835,000 |
Kennametal |
30,962 |
|||||||||
|
Consumable Cutting Tools |
|||||||||||
|
220,000 |
Nordson |
12,896 |
|||||||||
|
Dispensing Systems for Adhesives & Coatings |
|||||||||||
|
186,735 |
|||||||||||
| > Outsourcing Services 2.2% | |||||||||||
|
955,000 |
Quanta Services (a) |
23,588 |
|||||||||
|
Electrical & Telecom Construction Services |
|||||||||||
|
23,588 |
|||||||||||
|
> Industrial Materials & Specialty Chemicals 1.5% |
|||||||||||
|
300,000 |
FMC Corporation |
16,614 |
|||||||||
|
Niche Specialty Chemicals |
|||||||||||
|
16,614 |
|||||||||||
| > Other Industrial Services 0.8% | |||||||||||
|
230,000 |
Expeditors International of Washington |
8,363 |
|||||||||
|
International Freight Forwarder |
|||||||||||
|
8,363 |
|||||||||||
|
Industrial Goods & Services: Total |
235,300 |
||||||||||
|
Information 19.9% |
|||||||||||
| > Mobile Communications 7.1% | |||||||||||
|
680,000 |
Crown Castle International (a) |
43,588 |
|||||||||
|
Communications Towers |
|||||||||||
|
455,000 |
SBA Communications (a) |
28,620 |
|||||||||
|
Communications Towers |
|||||||||||
|
12,000,000 |
Globalstar (a) |
5,520 |
|||||||||
|
Satellite Mobile Voice & Data Carrier |
|||||||||||
|
77,728 |
|||||||||||
| > Computer Services 3.1% | |||||||||||
|
3,300,000 |
WNS - ADR (India) (a)(b) |
33,792 |
|||||||||
|
Offshore BPO (Business Process Outsourcing) Services |
|||||||||||
|
33,792 |
|||||||||||
|
> Computer Hardware & Related Equipment 2.9% |
|||||||||||
|
540,000 |
Amphenol |
31,795 |
|||||||||
|
Electronic Connectors |
|||||||||||
|
31,795 |
|||||||||||
| > Contract Manufacturing 1.9% | |||||||||||
|
2,415,000 |
Sanmina-SCI (a) |
20,503 |
|||||||||
|
Electronic Manufacturing Services |
|||||||||||
|
20,503 |
|||||||||||
|
Number of Shares |
Value (000) |
||||||||||
| > Instrumentation 1.9% | |||||||||||
|
120,000 |
Mettler-Toledo International (a) |
$ |
20,489 |
||||||||
|
Laboratory Equipment |
|||||||||||
|
20,489 |
|||||||||||
| > Business Software 1.7% | |||||||||||
|
167,000 |
Concur Technologies (a) |
12,313 |
|||||||||
|
Web-enabled Cost & Expense Management Software |
|||||||||||
|
95,000 |
Ansys (a) |
6,973 |
|||||||||
|
Simulation Software for Engineers & Designers |
|||||||||||
|
19,286 |
|||||||||||
|
> Telecommunications Equipment 0.8% |
|||||||||||
|
80,000 |
F5 Networks (a) |
8,376 |
|||||||||
|
Internet Traffic Management Equipment |
|||||||||||
|
8,376 |
|||||||||||
|
> Semiconductors & Related Equipment 0.5% |
|||||||||||
|
1,140,000 |
Atmel (a) |
5,996 |
|||||||||
|
Microcontrollers, Radio Frequency & Memory Semiconductors |
|||||||||||
|
5,996 |
|||||||||||
|
Information: Total |
217,965 |
||||||||||
|
Finance 17.0% |
|||||||||||
| > Credit Cards 6.2% | |||||||||||
|
1,700,000 |
Discover Financial Services |
67,541 |
|||||||||
|
Credit Card Company |
|||||||||||
|
67,541 |
|||||||||||
| > Insurance 5.6% | |||||||||||
|
6,315,000 |
CNO Financial Group |
60,939 |
|||||||||
|
Life, Long-term Care & Medical Supplement Insurance |
|||||||||||
|
60,939 |
|||||||||||
| > Banks 3.7% | |||||||||||
|
520,000 |
City National |
26,785 |
|||||||||
|
Bank & Asset Manager |
|||||||||||
|
1,075,000 |
Associated Banc-Corp |
14,158 |
|||||||||
|
Midwest Bank |
|||||||||||
|
40,943 |
|||||||||||
|
> Brokerage & Money Management 1.5% |
|||||||||||
|
775,000 |
SEI Investments |
16,624 |
|||||||||
|
Mutual Fund Administration & Investment Management |
|||||||||||
|
16,624 |
|||||||||||
|
Finance: Total |
186,047 |
||||||||||
|
Consumer Goods & Services 15.4% |
|||||||||||
| > Travel 6.3% | |||||||||||
|
4,020,000 |
Hertz (a) |
55,194 |
|||||||||
|
Largest U.S. Rental Car Operator |
|||||||||||
|
235,000 |
Vail Resorts |
13,548 |
|||||||||
|
Ski Resort Operator & Developer |
|||||||||||
|
68,742 |
|||||||||||
73
Columbia Acorn Select
Statement of Investments (Unaudited), continued
|
Number of Shares |
Value (000) |
||||||||||
| > Retail 4.2% | |||||||||||
|
288,000 |
lululemon athletica (a) |
$ |
21,295 |
||||||||
|
Premium Active Apparel Retailer |
|||||||||||
|
455,000 |
Abercrombie & Fitch |
15,434 |
|||||||||
|
Teen Apparel Retailer |
|||||||||||
|
149,000 |
Tiffany & Co. |
9,220 |
|||||||||
|
Luxury Good Retailer |
|||||||||||
|
45,949 |
|||||||||||
| > Apparel 2.6% | |||||||||||
|
515,000 |
Coach |
28,850 |
|||||||||
|
Designer & Retailer of Branded Leather Accessories |
|||||||||||
|
28,850 |
|||||||||||
| > Casinos & Gaming 1.4% | |||||||||||
|
208,000,000 |
RexLot Holdings (China) |
15,771 |
|||||||||
|
Lottery Equipment Supplier in China |
|||||||||||
|
15,771 |
|||||||||||
| > Educational Services 0.7% | |||||||||||
|
223,000 |
ITT Educational Services (a)(c) |
7,187 |
|||||||||
|
Post-secondary Degree Services |
|||||||||||
|
7,187 |
|||||||||||
| > Other Consumer Services 0.2% | |||||||||||
|
1,300,000 |
IFM Investments (Century 21 China RE) - ADR (China) (a)(b) |
2,405 |
|||||||||
|
Provide Real Estate Services in China |
|||||||||||
|
2,405 |
|||||||||||
| > Food & Beverage —% | |||||||||||
|
1,500,000 |
GLG Life Tech (Canada) (a)(d) |
204 |
|||||||||
|
Produce an All-natural Sweetener Extracted from the Stevia Plant |
|||||||||||
|
204 |
|||||||||||
|
Consumer Goods & Services: Total |
169,108 |
||||||||||
|
Energy & Minerals 9.8% |
|||||||||||
| > Oil & Gas Producers 6.1% | |||||||||||
|
1,035,000 |
Pacific Rubiales Energy (Colombia) (c) |
24,730 |
|||||||||
|
Oil Production & Exploration in Colombia |
|||||||||||
|
29,187,400 |
Canacol (Colombia) (a) |
14,251 |
|||||||||
|
Oil Producer in South America |
|||||||||||
|
27,100,000 |
Shamaran Petroleum (Iraq) (a) |
11,991 |
|||||||||
|
Oil Exploration in Kurdistan |
|||||||||||
|
33,700,000 |
Petrodorado Energy (Colombia) (a)(b) |
6,170 |
|||||||||
| 17,144,000 |
Petrodorado Energy - Warrants (Colombia) (a)(e) |
84 |
|||||||||
|
Oil & Gas Exploration & Production in Colombia, Peru & Paraguay |
|||||||||||
|
24,000,000 |
Canadian Overseas Petroleum (United Kingdom) (a)(e) |
4,922 |
|||||||||
| 12,000,000 |
Canadian Overseas Petroleum - Warrants (United Kingdom) (a)(d)(e) |
314 |
|||||||||
|
Oil & Gas Exploration/Production in the North Sea |
|||||||||||
|
17,575,000 |
Petromanas (Canada) (a) |
3,575 |
|||||||||
|
Exploring for Oil in Albania |
|||||||||||
|
Number of Shares |
Value (000) |
||||||||||
|
1,455,000 |
Houston American Energy (a)(c) |
$ |
1,309 |
||||||||
|
Oil & Gas Exploration/Production in Colombia |
|||||||||||
|
67,346 |
|||||||||||
| > Agricultural Commodities 1.6% | |||||||||||
|
1,742,424 |
Union Agriculture Group (Uruguay) (a)(d)(e) |
18,069 |
|||||||||
|
Farmland Operator in Uruguay |
|||||||||||
|
18,069 |
|||||||||||
| > Mining 1.0% | |||||||||||
|
925,000 |
Kirkland Lake Gold (Canada) (a) |
11,216 |
|||||||||
|
Gold Mining |
|||||||||||
|
11,216 |
|||||||||||
| > Alternative Energy 0.8% | |||||||||||
|
1,774,561 |
Canadian Solar (China) (a)(c) |
4,951 |
|||||||||
|
Solar Cell & Module Manufacturer |
|||||||||||
|
2,200,000 |
Synthesis Energy Systems (China) (a) |
2,904 |
|||||||||
|
Owner/Operator of Gasification Plants |
|||||||||||
|
1,165,000 |
Real Goods Solar (a) |
816 |
|||||||||
|
Residential Solar Energy Installer |
|||||||||||
|
8,671 |
|||||||||||
| > Oil Services 0.3% | |||||||||||
|
11,705,300 |
Tuscany International Drilling (Colombia) (a) |
2,738 |
|||||||||
|
South America Based Drilling Rig Contractor |
|||||||||||
|
2,738 |
|||||||||||
|
Energy & Minerals: Total |
108,040 |
||||||||||
|
Other Industries 7.8% |
|||||||||||
| > Real Estate 6.7% | |||||||||||
|
900,000 |
Ryman Hospitality Properties |
35,577 |
|||||||||
|
Convention Hotels |
|||||||||||
|
1,375,000 |
Biomed Realty Trust |
25,740 |
|||||||||
|
Life Science-focused Office Buildings |
|||||||||||
|
475,000 |
DuPont Fabros Technology |
11,994 |
|||||||||
|
Technology-focused Office Buildings |
|||||||||||
|
73,311 |
|||||||||||
| > Regulated Utilities 1.1% | |||||||||||
|
316,000 |
Wisconsin Energy |
11,904 |
|||||||||
|
Wisconsin Utility |
|||||||||||
|
11,904 |
|||||||||||
|
Other Industries: Total |
85,215 |
||||||||||
|
Health Care 4.9% |
|||||||||||
| > Biotechnology & Drug Delivery 2.5% | |||||||||||
|
1,875,000 |
NPS Pharmaceuticals (a) |
17,344 |
|||||||||
|
Orphan Drugs & Healthy Royalties |
|||||||||||
|
383,000 |
Seattle Genetics (a)(c) |
10,322 |
|||||||||
|
Antibody-based Therapies for Cancer |
|||||||||||
|
27,666 |
|||||||||||
74
|
Number of Shares |
Value (000) |
||||||||||
| > Medical Supplies 2.4% | |||||||||||
|
190,000 |
Henry Schein (a) |
$ |
15,061 |
||||||||
|
Largest Distributor of Healthcare Products |
|||||||||||
|
320,000 |
Cepheid (a) |
11,043 |
|||||||||
|
Molecular Diagnostics |
|||||||||||
|
26,104 |
|||||||||||
|
Health Care: Total |
53,770 |
||||||||||
|
Total Equities: 96.3% (Cost: $735,905) |
1,055,445 |
||||||||||
|
Securities Lending Collateral 1.7% |
|||||||||||
|
18,753,371 |
Dreyfus Government Cash Management Fund (7 day yield of 0.01%) (f) |
18,753 |
|||||||||
|
Total Securities Lending Collateral: (Cost: $18,753) |
18,753 |
||||||||||
|
Total Investments: 98.0% (Cost: $754,658)(g)(h) |
1,074,198 |
(i) |
|||||||||
|
Obligation to Return Collateral for Securities Loaned: (1.7)% |
(18,753 |
) |
|||||||||
|
Cash and Other Assets Less Liabilities: 3.7% |
40,526 |
||||||||||
|
Total Net Assets: 100.0% |
$ |
1,095,971 |
|||||||||
ADR - American Depositary Receipts
> Notes to Statement of Investments (dollar values in thousands)
(a) Non-income producing security.
(b) An affiliated person of the Fund may include any company in which the Fund owns five percent or more of its outstanding voting shares. Holdings and transactions in these affiliated companies during the period ended September 30, 2012, are as follows:
|
Security |
Balance of Shares Held 12/31/11 |
Purchases/ Additions |
Sales/ Reductions |
Balance of Shares Held 9/30/12 |
Value |
Dividend |
|||||||||||||||||||||
|
Canacol* |
31,372,300 |
- |
2,184,900 |
29,187,400 |
$ |
14,251 |
$ |
- |
|||||||||||||||||||
|
Canadian Overseas Petroleum* |
24,000,000 |
- |
- |
24,000,000 |
4,922 |
- |
|||||||||||||||||||||
|
Canadian Solar* |
2,700,000 |
601,200 |
1,526,639 |
1,774,561 |
4,951 |
- |
|||||||||||||||||||||
|
Eacom Timber* |
36,000,000 |
- |
36,000,000 |
- |
- |
- |
|||||||||||||||||||||
|
GLG Life Tech* |
1,850,000 |
- |
350,000 |
1,500,000 |
204 |
- |
|||||||||||||||||||||
|
IFM Investments (Century 21 China RE) - ADR** |
3,430,000 |
302,000 |
2,432,000 |
1,300,000 |
2,405 |
- |
|||||||||||||||||||||
|
Petrodorado Energy |
34,700,000 |
- |
1,000,000 |
33,700,000 |
6,170 |
- |
|||||||||||||||||||||
|
Real Goods Solar* |
1,500,000 |
- |
335,000 |
1,165,000 |
816 |
- |
|||||||||||||||||||||
|
Sanmina-SCI* |
6,100,000 |
- |
3,685,000 |
2,415,000 |
20,503 |
- |
|||||||||||||||||||||
|
Synthesis Energy Systems* |
2,950,372 |
- |
750,372 |
2,200,000 |
2,904 |
- |
|||||||||||||||||||||
|
VisionChina Media - ADR* |
7,000,000 |
- |
7,000,000 |
- |
- |
- |
|||||||||||||||||||||
|
WNS - ADR |
4,254,230 |
- |
954,230 |
3,300,000 |
33,792 |
- |
|||||||||||||||||||||
|
Total of Affiliated Transactions |
155,856,902 |
903,200 |
56,218,141 |
100,541,961 |
$ |
90,918 |
$ |
- |
|||||||||||||||||||
* At September 30, 2012, the Fund owned less than five percent of the company's outstanding voting shares.
** Includes the effects of a 1:3 reverse stock split.
75
Columbia Acorn Select
Statement of Investments (Unaudited), continued
> Notes to Statement of Investments (dollar values in thousands)
The aggregate cost and value of these companies at September 30, 2012, were $60,067 and $42,367, respectively. Investments in affiliated companies represented 3.87% of the Fund's total net assets at September 30, 2012.
(c) All or a portion of this security was on loan at September 30, 2012. The total market value of securities on loan at September 30, 2012 was $17,719.
(d) Illiquid security.
(e) Denotes a restricted security, which is subject to restrictions on resale under federal securities laws. These securities are valued at fair value determined in good faith under consistently applied procedures established by the Board of Trustees. At September 30, 2012, the market value of these securities amounted to $23,389, which represented 2.13% of total net assets. Additional information on these securities is as follows:
|
Security |
Acquisition Dates |
Shares |
Cost |
Value |
|||||||||||||||
|
Union Agriculture Group |
12/8/10-6/27/12 |
1,742,424 |
$ |
20,000 |
$ |
18,069 |
|||||||||||||
|
Canadian Overseas Petroleum |
11/24/10 |
24,000,000 |
10,260 |
4,922 |
|||||||||||||||
|
Canadian Overseas Petroleum - Warrants |
11/24/10 |
12,000,000 |
1,502 |
314 |
|||||||||||||||
|
Petrodorado Energy - Warrants |
11/20/09 |
17,144,000 |
2,118 |
84 |
|||||||||||||||
|
$ |
33,880 |
$ |
23,389 |
||||||||||||||||
(f) Investment made with cash collateral received from securities lending activity.
(g) At September 30, 2012, for federal income tax purposes, the cost of investments was $754,658 and net unrealized appreciation was $319,540 consisting of gross unrealized appreciation of $407,538 and gross unrealized depreciation of $87,998.
(h) On September 30, 2012, the market value of foreign securities represented 14.42% of total net assets. The Fund's foreign portfolio was diversified as follows:
|
Country |
Value |
Percentage of Net Assets |
|||||||||
|
Colombia |
$ |
47,973 |
4.38 |
||||||||
|
India |
33,792 |
3.08 |
|||||||||
|
China |
26,031 |
2.37 |
|||||||||
|
Uruguay |
18,069 |
1.65 |
|||||||||
|
Canada |
14,995 |
1.37 |
|||||||||
|
Iraq |
11,991 |
1.09 |
|||||||||
|
United Kingdom |
5,236 |
0.48 |
|||||||||
|
Total Foreign Portfolio |
$ |
158,087 |
14.42 |
||||||||
(i) Securities are valued using policies described in the Notes to Financial Statements in the most recent shareholder report.
Fair Value Measurements
Various inputs are used in determining the value of the Fund's investments, following the input prioritization hierarchy established by GAAP. These inputs are summarized in the three broad levels listed below:
• Level 1 – quoted prices in active markets for identical securities
• Level 2 – prices determined using other significant observable inputs (including quoted prices for similar securities, interest rates, prepayment speeds, credit risk and others)
• Level 3 – prices determined using significant unobservable inputs where quoted prices or observable inputs are unavailable or less reliable (including management's own assumptions about the factors market participants would use in pricing an investment)
The inputs or methodology used for valuing securities are not necessarily an indication of the risk associated with investing in those securities.
Examples of the types of securities in which the Fund would typically invest and how they are classified within this hierarchy are as follows. Typical Level 1 securities include exchange traded domestic equities, mutual funds whose NAVs are published each day and exchange traded foreign equities that are not statistically fair valued. Typical Level 2 securities include exchange traded foreign equities that are statistically fair valued, forward foreign currency exchange contracts and short-term investments valued at amortized cost. Additionally, securities fair valued by the Valuation Committee (the Committee) of the Fund's Board of Trustees (the Board) that rely on significant observable inputs are also included in Level 2. Typical Level 3 securities include any security fair valued by the Committee that relies on significant unobservable inputs.
Under the direction of the Board, the Committee is responsible for carrying out the valuation procedures approved by the Board.
The Committee meets as necessary, and no less frequently than quarterly, to determine fair values for securities for which market quotations are not readily available or for which the investment manager believes that available market quotations are unreliable, and to review the continuing appropriateness of the current value of any security subject to the Trust's Portfolio Pricing Policy and the pricing procedures of the investment manager (the Policies). The Policies address, among other things: circumstances under which market quotations will be deemed readily available; selection of third party pricing vendors; appropriate pricing methodologies; events that require fair valuation and fair value techniques; and circumstances under which securities will be deemed to pose a potential for stale pricing, including when securities are illiquid, restricted, or in default. The Committee may also meet to discuss additional valuation matters, which may include review of back-testing results, review of time-sensitive information or approval of other valuation related actions, and to review the appropriateness of the Policies.
76
> Notes to Statement of Investments (dollar values in thousands)
For investments categorized as Level 3, the significant unobservable inputs used in the fair value measurement of the Funds' securities may include: (i) data specific to the issuer or comparable issuers, (ii) general market or specific sector news and (iii) quoted prices and specific or similar security transactions. The Committee considers this data and any changes from prior periods in order to assess the reasonableness of observable and unobservable inputs, any assumptions or internal models used to value those securities and changes in fair value. Significant changes in any of these factors could result in lower or higher fair value measurements. Various factors impact the frequency of monitoring (which may occur as often as daily), however the Committee may determine that changes to inputs, assumptions and models are not required with the same frequency.
The following table summarizes the inputs used, as of September 30, 2012, in valuing the Fund's assets:
|
Investment Type |
Quoted Prices (Level 1) |
Other Significant Observable Inputs (Level 2) |
Significant Unobservable Inputs (Level 3) |
Total |
|||||||||||||||
|
Equities |
|||||||||||||||||||
|
Industrial Goods & Services |
$ |
235,300 |
$ |
- |
$ |
- |
$ |
235,300 |
|||||||||||
|
Information |
217,965 |
- |
- |
217,965 |
|||||||||||||||
|
Finance |
186,047 |
- |
- |
186,047 |
|||||||||||||||
|
Consumer Goods & Services |
153,133 |
15,975 |
- |
169,108 |
|||||||||||||||
|
Energy & Minerals |
84,651 |
5,320 |
18,069 |
108,040 |
|||||||||||||||
|
Other Industries |
85,215 |
- |
- |
85,215 |
|||||||||||||||
|
Health Care |
53,770 |
- |
- |
53,770 |
|||||||||||||||
|
Total Equities |
1,016,081 |
21,295 |
18,069 |
1,055,445 |
|||||||||||||||
|
Total Securities Lending Collateral |
18,753 |
- |
- |
18,753 |
|||||||||||||||
|
Total Investments |
$ |
1,034,834 |
$ |
21,295 |
$ |
18,069 |
$ |
1,074,198 |
|||||||||||
The Fund's assets assigned to the Level 2 input category are generally valued using a market approach, in which a security's value is determined through its correlation to prices and information from observable market transactions for similar or identical assets. Foreign equities are generally valued at the last sale price on the foreign exchange or market on which they trade. The Fund may use a statistical fair valuation model, in accordance with the policy adopted by the Board, provided by an independent third party to value securities principally traded in foreign markets in order to adjust for possible stale pricing that may occur between the close of the foreign exchanges and the time for valuation. These models take into account available market data including intraday index, ADR, and ETF movements. Securities acquired via private placement that have a holding period or an extended settlement period are valued at a discount to the same shares that are trading freely on the market. These discounts are determined by the investment manager's experience with similar securities or situations. Factors may include, but are not limited to, trade volume, shares outstanding and stock price. Warrants which do not trade are valued as a percentage of the actively trading common stock using a model, based on Black Scholes. Securities which have halted or temporarily stopped trading are valued at the last sale and adjusted by a premium or a discount to account for the anticipated re-opening price. These adjustments are determined by the investment manager's experience with similar securities or situations.
The following table shows transfers between Level 1 and Level 2 of the fair value hierarchy:
|
Transfers In |
Transfers Out |
||||||||||||||
| Level 1 |
Level 2 |
Level 1 |
Level 2 |
||||||||||||
| $ |
- |
$ |
1,665 |
$ |
1,665 |
$ |
- |
||||||||
Financial assets were transferred from Level 1 to Level 2 as trading halted during the period.
The following table reconciles asset balances for the period ending September 30, 2012, in which significant observable and/or unobservable inputs (Level 3) were used in determining value:
|
Investments in Securities |
Balance as of December 31, 2011 |
Realized Gain/(Loss) |
Change in Unrealized Appreciation (Depreciation) |
Purchases |
Sales |
Transfers into Level 3 |
Transfers out of Level 3 |
Balance as of September 30, 2012 |
|||||||||||||||||||||||||||
|
Equities |
|||||||||||||||||||||||||||||||||||
|
Energy & Materials |
$ |
16,617 |
$ |
- |
$ |
1,452 |
$ |
- |
$ |
- |
$ |
- |
$ |
- |
$ |
18,069 |
|||||||||||||||||||
|
$ |
16,617 |
$ |
- |
$ |
1,452 |
$ |
- |
$ |
- |
$ |
- |
$ |
- |
$ |
18,069 |
||||||||||||||||||||
The information in the above reconciliation table represents fiscal year to date activity for any securities identified as using Level 3 inputs at either the beginning or the end of the current fiscal period.
The change in unrealized appreciation attributed to securities owned at September 30, 2012, which were valued using significant unobservable inputs (Level 3), amounted to $1,452.
77
Columbia Acorn Select
Statement of Investments (Unaudited), continued
> Notes to Statement of Investments (dollar values in thousands)
Quantitative information pertaining to Level 3 unobservable fair value measurements
|
Fair Value at 9/30/12 |
Valuation Technique(s) |
Unobservable Input(s) |
Range (Weighted Average) |
||||||||||||||||
|
Equities |
18,069 |
Market comparable companies |
Discount for lack of marketability |
-3 |
% to -18% (-8%) |
||||||||||||||
Certain common stock classified as Level 3 are valued at fair value, using a market approach, as determined in good faith under consistently applied procedures established by and under the general supervision of the Board. To determine fair value for these securities, for which no market exists, the Committee utilizes the valuation technique it deems most appropriate in the circumstances, using some unobservable inputs, which may include but are not limited to trades of similar securities, estimated earnings of the company, market multiples derived from a set of comparable companies, and the position of the security within the company's capital structure. Significant increases or decreases to any of these inputs could result in a significantly lower or higher fair value measurement. Generally, a change in estimated earnings of a company may result in a change to the comparable companies and market multiples utilized.
78
Columbia Thermostat Fund
Statement of Investments (Unaudited), September 30, 2012
|
Number of Shares |
Value (000) |
||||||||||
| > Affiliated Bond Funds: 58.8% | |||||||||||
|
20,114,242 |
Columbia Intermediate Bond Fund, Class I |
$ |
193,097 |
||||||||
|
11,739,324 |
Columbia Income Opportunities Fund, Class I |
116,102 |
|||||||||
|
6,599,493 |
Columbia U.S. Treasury Index Fund, Class I |
77,148 |
|||||||||
|
Total Bond Funds: (Cost: $378,305) |
386,347 |
||||||||||
| > Affiliated Stock Funds: 39.0% | |||||||||||
|
1,287,341 |
Columbia Acorn International, Class I |
51,288 |
|||||||||
|
3,391,313 |
Columbia Dividend Income Fund, Class I |
51,107 |
|||||||||
|
1,234,663 |
Columbia Acorn Fund, Class I (a) |
38,521 |
|||||||||
|
2,360,991 |
Columbia Contrarian Core Fund, Class I |
38,437 |
|||||||||
|
Number of Shares |
Value (000) |
||||||||||
|
969,968 |
Columbia Acorn Select, Class I (a) |
$ |
25,801 |
||||||||
|
1,827,988 |
Columbia Select Large Cap Growth Fund, Class I (a) |
25,701 |
|||||||||
|
1,768,460 |
Columbia Large Cap Enhanced Core Fund, Class I |
25,643 |
|||||||||
|
Total Stock Funds: (Cost: $219,359) |
256,498 |
||||||||||
|
Total Investments: 97.8% (Cost: $597,664)(b) |
642,845 |
(c) |
|||||||||
|
Cash and Other Assets Less Liabilities: 2.2% |
14,281 |
||||||||||
|
Total Net Assets: 100.0% |
$ |
657,126 |
|||||||||
> Notes to Statement of Investments (dollar values in thousands)
(a) Non-income producing security.
(b) At September 30, 2012, for federal income tax purposes, the cost of investments was $597,664 and net unrealized appreciation was $45,181 consisting of gross unrealized appreciation of $45,181 and gross unrealized depreciation of $0.
(c) Securities are valued using policies described in the Notes to Financial Statements in the most recent shareholder report.
Fair Value Measurements
Various inputs are used in determining the value of the Fund's investments, following the input prioritization hierarchy established by GAAP. These inputs are summarized in the three broad levels listed below:
• Level 1 – quoted prices in active markets for identical securities
• Level 2 – prices determined using other significant observable inputs (including quoted prices for similar securities, interest rates, prepayment speeds, credit risk and others)
• Level 3 – prices determined using significant unobservable inputs where quoted prices or observable inputs are unavailable or less reliable (including management's own assumptions about the factors market participants would use in pricing an investment)
The inputs or methodology used for valuing securities are not necessarily an indication of the risk associated with investing in those securities.
Examples of the types of securities in which the Fund would typically invest and how they are classified within this hierarchy are as follows. Typical Level 1 securities include mutual funds whose NAVs are published each day. Typical Level 2 securities include short-term investments valued at amortized cost.
Under the direction of the Board, the Committee is responsible for carrying out the valuation procedures approved by the Board.
The Committee meets as necessary, and no less frequently than quarterly, to determine fair values for securities for which market quotations are not readily available or for which the investment manager believes that available market quotations are unreliable, and to review the continuing appropriateness of the current value of any security subject to the Trust's Portfolio Pricing Policy and the pricing procedures of the investment manager (the Policies). The Policies address, among other things: circumstances under which market quotations will be deemed readily available; selection of third party pricing vendors; appropriate pricing methodologies; events that require fair valuation and fair value techniques; and circumstances under which securities will be deemed to pose a potential for stale pricing, including when securities are illiquid, restricted, or in default. The Committee may also meet to discuss additional valuation matters, which may include review of back-testing results, review of time-sensitive information or approval of other valuation related actions, and to review the appropriateness of the Policies.
The following table summarizes the inputs used, as of September 30, 2012, in valuing the Fund's assets:
|
Investment Type |
Quoted Prices (Level 1) |
Other Significant Observable Inputs (Level 2) |
Significant Unobservable Inputs (Level 3) |
Total |
|||||||||||||||
|
Total Bond Funds |
$ |
386,347 |
$ |
- |
$ |
- |
$ |
386,347 |
|||||||||||
|
Total Stock Funds |
256,498 |
- |
- |
256,498 |
|||||||||||||||
|
Total Investments |
$ |
642,845 |
$ |
- |
$ |
- |
$ |
642,845 |
|||||||||||
There were no transfers of financial assets between levels 1 and 2 during the period.
79
Columbia Acorn Emerging Markets Fund
Major Portfolio Changes in the Third Quarter (Unaudited)
|
Number of Shares |
|||||||||||
|
6/30/12 |
9/30/12 |
||||||||||
|
Purchases |
|||||||||||
|
Asia |
|||||||||||
| > Taiwan | |||||||||||
|
Advantech |
21,169 |
22,169 |
|||||||||
|
CTCI Corp |
73,762 |
81,762 |
|||||||||
|
Lung Yen |
18,500 |
20,500 |
|||||||||
|
PC Home |
18,151 |
19,307 |
|||||||||
|
Taiwan Hon Chuan |
23,689 |
29,689 |
|||||||||
| > Indonesia | |||||||||||
|
Archipelago Resources |
150,100 |
191,539 |
|||||||||
|
Mayora Indah |
13,600 |
28,000 |
|||||||||
|
MNC Skyvision |
0 |
364,000 |
|||||||||
| > Hong Kong | |||||||||||
|
AAC Technologies |
21,027 |
31,027 |
|||||||||
|
Melco Crown Entertainment - ADR |
5,650 |
8,650 |
|||||||||
| > India | |||||||||||
|
Adani Ports & Special Economic Zone |
24,700 |
46,045 |
|||||||||
|
Redington India |
37,794 |
61,400 |
|||||||||
|
Titan Industries |
14,240 |
16,080 |
|||||||||
|
TTK Prestige |
0 |
1,005 |
|||||||||
|
United Breweries |
8,635 |
12,216 |
|||||||||
| > China | |||||||||||
|
AMVIG Holdings |
111,475 |
212,000 |
|||||||||
|
NetEase.com - ADR |
977 |
1,549 |
|||||||||
|
RexLot Holdings |
1,196,000 |
1,575,000 |
|||||||||
| > Philippines | |||||||||||
|
SM Prime Holdings |
176,818 |
195,818 |
|||||||||
| > Thailand | |||||||||||
|
Home Product Center |
272,518 |
310,000 |
|||||||||
| > Mongolia | |||||||||||
|
Mongolian Mining |
140,500 |
255,100 |
|||||||||
| > Singapore | |||||||||||
|
Petra Foods |
19,900 |
32,000 |
|||||||||
|
Other Countries |
|||||||||||
| > South Africa | |||||||||||
|
Coronation Fund Managers |
45,226 |
47,172 |
|||||||||
|
Massmart Holdings |
3,497 |
5,847 |
|||||||||
| > Canada | |||||||||||
|
Americas Petrogas |
19,000 |
36,607 |
|||||||||
| > United States | |||||||||||
|
Textainer Group Holdings |
2,404 |
4,404 |
|||||||||
|
Number of Shares |
|||||||||||
|
6/30/12 |
9/30/12 |
||||||||||
|
Europe |
|||||||||||
| > Sweden | |||||||||||
|
Hexagon |
7,231 |
8,731 |
|||||||||
| > Kazakhstan | |||||||||||
|
Halyk Savings Bank of Kazakhstan - GDR |
19,400 |
23,202 |
|||||||||
| > Switzerland | |||||||||||
|
Dufry Group |
1,178 |
1,320 |
|||||||||
| > Czech Republic | |||||||||||
|
Komercni Banka |
474 |
574 |
|||||||||
| > France | |||||||||||
|
Compagnie Française de l'Afrique Occidentale |
325 |
1,333 |
|||||||||
|
Latin America |
|||||||||||
| > Brazil | |||||||||||
|
Arcos Dorados |
4,000 |
4,622 |
|||||||||
|
Localiza Rent A Car |
6,090 |
8,000 |
|||||||||
| > Mexico | |||||||||||
|
Genomma Lab International |
0 |
38,000 |
|||||||||
| > Chile | |||||||||||
|
Viña Concha y Toro |
18,900 |
34,333 |
|||||||||
80
|
Number of Shares |
|||||||||||
|
6/30/12 |
9/30/12 |
||||||||||
|
Sales |
|||||||||||
|
Asia |
|||||||||||
| > Taiwan | |||||||||||
|
MStar Semiconductor |
13,500 |
0 |
|||||||||
|
Tripod Technologies |
33,000 |
28,300 |
|||||||||
| > India | |||||||||||
|
Jain Irrigation Systems |
33,749 |
5,328 |
|||||||||
|
Other Countries |
|||||||||||
| > South Africa | |||||||||||
|
Adcock Ingram Holdings |
16,350 |
10,076 |
|||||||||
| > United States | |||||||||||
|
Hornbeck Offshore |
1,709 |
0 |
|||||||||
|
Europe |
|||||||||||
| > Sweden | |||||||||||
|
East Capital Explorer |
4,006 |
0 |
|||||||||
81
Columbia Acorn Emerging Markets Fund
Statement of Investments (Unaudited), September 30, 2012
|
Number of Shares |
Value (000) |
||||||||||
|
Equities: 95.8% |
|||||||||||
|
Asia 60.1% |
|||||||||||
| > Taiwan 15.5% | |||||||||||
|
81,762 |
CTCI Corp |
$ |
187 |
||||||||
|
International Engineering Firm |
|||||||||||
|
74,126 |
Far EasTone Telecom |
183 |
|||||||||
|
Taiwan's Third Largest Mobile Operator |
|||||||||||
|
19,307 |
PC Home |
109 |
|||||||||
|
Taiwanese Internet Retail Company |
|||||||||||
|
8,000 |
St. Shine Optical |
103 |
|||||||||
|
World's Leading Disposable Contact Lens Original Equipment Manufacturer (OEM) |
|||||||||||
|
15,576 |
Simplo Technology |
93 |
|||||||||
|
Battery Packs for Notebook & Tablet PCs |
|||||||||||
|
42,990 |
Chroma Ate |
90 |
|||||||||
|
Automatic Test Systems, Testing & Measurement Instruments |
|||||||||||
|
22,169 |
Advantech |
81 |
|||||||||
|
Industrial PC & Components |
|||||||||||
|
20,500 |
Lung Yen |
70 |
|||||||||
|
Funeral Services & Columbaria |
|||||||||||
|
28,300 |
Tripod Technologies |
69 |
|||||||||
|
Printed Circuit Boards (PCB) |
|||||||||||
|
15,735 |
Radiant Opto-Electronics |
68 |
|||||||||
|
LCD Back Light Units & Modules |
|||||||||||
|
29,689 |
Taiwan Hon Chuan |
65 |
|||||||||
|
Beverage Packaging (Bottles, Caps, Labels) Manufacturer |
|||||||||||
|
1,118 |
|||||||||||
| > Indonesia 12.9% | |||||||||||
|
537,609 |
Tower Bersama Infrastructure (a) |
250 |
|||||||||
|
Communications Towers |
|||||||||||
|
369,019 |
Ace Indonesia |
237 |
|||||||||
|
Home Improvement Retailer |
|||||||||||
|
191,539 |
Archipelago Resources (a) |
185 |
|||||||||
|
Gold Mining Projects in Indonesia, Vietnam & the Philippines |
|||||||||||
|
102,764 |
Surya Citra Media |
118 |
|||||||||
|
Free to Air TV in Indonesia |
|||||||||||
|
364,000 |
MNC Skyvision (a) |
79 |
|||||||||
|
Largest Satellite Pay TV Operator in Indonesia |
|||||||||||
|
28,000 |
Mayora Indah |
65 |
|||||||||
|
Consumer Branded Food Manufacturer |
|||||||||||
|
934 |
|||||||||||
| > Hong Kong 7.3% | |||||||||||
|
56,589 |
Lifestyle International |
117 |
|||||||||
|
Mid- to High-end Department Store Operator in Hong Kong & China |
|||||||||||
|
8,650 |
Melco Crown Entertainment - ADR (a) |
117 |
|||||||||
|
Macau Casino Operator |
|||||||||||
|
128,862 |
Melco International |
114 |
|||||||||
|
Macau Casino Operator |
|||||||||||
|
31,027 |
AAC Technologies |
111 |
|||||||||
|
Miniature Acoustic Components |
|||||||||||
|
99,799 |
Sasa International |
68 |
|||||||||
|
Cosmetics Retailer |
|||||||||||
|
527 |
|||||||||||
|
Number of Shares |
Value (000) |
||||||||||
| > India 7.1% | |||||||||||
|
12,216 |
United Breweries |
$ |
151 |
||||||||
|
India's Largest Brewer |
|||||||||||
|
46,045 |
Adani Ports & Special Economic Zone |
111 |
|||||||||
|
Indian West Coast Shipping Port |
|||||||||||
|
61,400 |
Redington India |
91 |
|||||||||
|
Supply Chain Solutions for IT & Mobile Handsets in Emerging Markets |
|||||||||||
|
16,080 |
Titan Industries |
80 |
|||||||||
|
Jewlery, Watches, Eyeglasses |
|||||||||||
|
1,005 |
TTK Prestige (a) |
71 |
|||||||||
|
Branded Cooking Equipment |
|||||||||||
|
5,328 |
Jain Irrigation Systems |
7 |
|||||||||
|
Agricultural Micro-irrigation Systems & Food Processing |
|||||||||||
|
511 |
|||||||||||
| > China 5.8% | |||||||||||
|
1,575,000 |
RexLot Holdings |
120 |
|||||||||
|
Lottery Equipment Supplier in China |
|||||||||||
|
61,151 |
Digital China |
97 |
|||||||||
|
IT Distribution & Systems Integration Services |
|||||||||||
|
1,549 |
NetEase.com - ADR (a) |
87 |
|||||||||
|
Chinese Online Gaming Services |
|||||||||||
|
212,000 |
AMVIG Holdings |
63 |
|||||||||
|
Chinese Tobacco Packaging Material Supplier |
|||||||||||
|
1,254 |
51job - ADR (a) |
56 |
|||||||||
|
Integrated Human Resource Services |
|||||||||||
|
423 |
|||||||||||
| > Cambodia 3.3% | |||||||||||
|
420,000 |
Nagacorp |
235 |
|||||||||
|
Casino/Entertainment Complex in Cambodia |
|||||||||||
|
235 |
|||||||||||
| > Philippines 2.9% | |||||||||||
|
44,487 |
Int'l Container Terminal |
75 |
|||||||||
|
Container Handling Terminals & Port Management |
|||||||||||
|
109,465 |
Manila Water Company |
71 |
|||||||||
|
Water Utility Company in Philippines |
|||||||||||
|
195,818 |
SM Prime Holdings |
67 |
|||||||||
|
Shopping Mall Operator |
|||||||||||
|
213 |
|||||||||||
| > Thailand 1.9% | |||||||||||
|
310,000 |
Home Product Center |
131 |
|||||||||
|
Home Improvement Retailer |
|||||||||||
|
7,700 |
Samui Airport Property Fund (a) |
4 |
|||||||||
|
Thai Airport Operator |
|||||||||||
|
135 |
|||||||||||
| > Mongolia 1.6% | |||||||||||
|
255,100 |
Mongolian Mining (a) |
116 |
|||||||||
|
Coking Coal Mining in Mongolia |
|||||||||||
|
116 |
|||||||||||
| > Singapore 0.9% | |||||||||||
|
32,000 |
Petra Foods |
64 |
|||||||||
|
Cocoa Processor & Chocolate Manufacturer |
|||||||||||
|
64 |
|||||||||||
82
|
Number of Shares |
Value (000) |
||||||||||
| > Japan 0.9% | |||||||||||
|
5,760 |
Kansai Paint |
$ |
64 |
||||||||
|
Paint Producer in Japan, India, China & Southeast Asia |
|||||||||||
|
64 |
|||||||||||
|
Asia: Total |
4,340 |
||||||||||
|
Other Countries 14.6% |
|||||||||||
| > South Africa 9.5% | |||||||||||
|
75,000 |
Rand Merchant Insurance |
194 |
|||||||||
|
Directly Sold Property & Casualty Insurance; Holdings in Other Insurers |
|||||||||||
|
47,172 |
Coronation Fund Managers |
176 |
|||||||||
|
South African Fund Manager |
|||||||||||
|
5,847 |
Massmart Holdings |
117 |
|||||||||
|
General Merchandise, Food & Home Improvement Stores; Wal-Mart Subsidiary |
|||||||||||
|
5,897 |
Mr. Price |
89 |
|||||||||
|
South African Retailer of Apparel, Household & Sporting Goods |
|||||||||||
|
10,076 |
Adcock Ingram Holdings |
72 |
|||||||||
|
Manufacturer of Pharmaceuticals & Medical Supplies |
|||||||||||
|
10,854 |
Northam Platinum |
39 |
|||||||||
|
Platinum Mining in South Africa |
|||||||||||
|
687 |
|||||||||||
| > Canada 2.6% | |||||||||||
|
7,801 |
Alliance Grain Traders |
114 |
|||||||||
|
Global Leader in Pulse Processing & Distribution |
|||||||||||
|
36,607 |
Americas Petrogas (a) |
69 |
|||||||||
|
Oil & Gas Exploration in Argentina, Potash in Peru |
|||||||||||
|
183 |
|||||||||||
| > United States 2.5% | |||||||||||
|
4,404 |
Textainer Group Holdings |
135 |
|||||||||
|
Top International Container Leasor |
|||||||||||
|
952 |
Atwood Oceanics (a) |
43 |
|||||||||
|
Offshore Drilling Contractor |
|||||||||||
|
178 |
|||||||||||
|
Other Countries: Total |
1,048 |
||||||||||
|
Europe 11.5% |
|||||||||||
| > Sweden 2.6% | |||||||||||
|
8,731 |
Hexagon |
187 |
|||||||||
|
Design, Measurement & Visualization Software & Equipment |
|||||||||||
|
187 |
|||||||||||
| > Kazakhstan 2.2% | |||||||||||
|
23,202 |
Halyk Savings Bank of Kazakhstan - GDR (a) |
163 |
|||||||||
|
Largest Retail Bank & Insurer in Kazakhstan |
|||||||||||
|
163 |
|||||||||||
| > Switzerland 2.2% | |||||||||||
|
1,320 |
Dufry Group (a) |
158 |
|||||||||
|
Operates Airport Duty Free & Duty Paid Shops |
|||||||||||
|
158 |
|||||||||||
|
Number of Shares |
Value (000) |
||||||||||
| > Czech Republic 1.6% | |||||||||||
|
574 |
Komercni Banka |
$ |
114 |
||||||||
|
Leading Czech Universal Bank |
|||||||||||
|
114 |
|||||||||||
| > Italy 1.1% | |||||||||||
|
7,631 |
Pirelli |
82 |
|||||||||
|
Global Tire Supplier |
|||||||||||
|
82 |
|||||||||||
| > Germany 0.9% | |||||||||||
|
962 |
Dürr |
64 |
|||||||||
|
Automotive Plant Engineering & Associated Capital Equipment |
|||||||||||
|
64 |
|||||||||||
| > France 0.9% | |||||||||||
|
1,333 |
Compagnie Française de l'Afrique Occidentale |
64 |
|||||||||
|
African Wholesaler & Distributor |
|||||||||||
|
64 |
|||||||||||
|
Europe: Total |
832 |
||||||||||
|
Latin America 9.6% |
|||||||||||
| > Brazil 5.1% | |||||||||||
|
8,000 |
Localiza Rent A Car |
139 |
|||||||||
|
Car Rental |
|||||||||||
|
4,200 |
Multiplus |
85 |
|||||||||
|
Loyalty Program Operator in Brazil |
|||||||||||
|
12,425 |
MRV Engenharia |
74 |
|||||||||
|
Brazilan Property Developer |
|||||||||||
|
4,622 |
Arcos Dorados (b) |
71 |
|||||||||
|
McDonald's Master Franchise for Latin America |
|||||||||||
|
369 |
|||||||||||
| > Mexico 3.2% | |||||||||||
|
1,808 |
Grupo Aeroportuario del Sureste - ADR |
160 |
|||||||||
|
Mexican Airport Operator |
|||||||||||
|
38,000 |
Genomma Lab International (a) |
74 |
|||||||||
|
Develops, Markets & Distributes Consumer Products |
|||||||||||
|
234 |
|||||||||||
| > Chile 1.0% | |||||||||||
|
34,333 |
Viña Concha y Toro |
71 |
|||||||||
|
Global Branded Wine Manufacturer |
|||||||||||
|
71 |
|||||||||||
| > Argentina 0.3% | |||||||||||
|
81,500 |
Madalena Ventures (a) |
20 |
|||||||||
|
Oil & Gas Exploration in Argentina |
|||||||||||
|
20 |
|||||||||||
|
Latin America: Total |
694 |
||||||||||
|
Total Equities: 95.8% (Cost: $6,241) |
6,914 |
||||||||||
83
Columbia Acorn Emerging Markets Fund
Statement of Investments (Unaudited), continued
|
Number of Shares |
Value (000) |
||||||||||
|
Securities Lending Collateral 0.7% |
|||||||||||
|
53,550 |
Dreyfus Government Cash Management Fund (7 day yield of 0.01%) (c) |
$ |
54 |
||||||||
|
Total Securities Lending Collateral: (Cost: $54) |
54 |
||||||||||
|
Total Investments: 96.5% (Cost: $6,295)(d)(e) |
6,968 |
(f) |
|||||||||
|
Obligation to Return Collateral for Securities Loaned: (0.7)% |
(54 |
) |
|||||||||
|
Cash and Other Assets Less Liabilities: 4.2% |
305 |
||||||||||
|
Total Net Assets: 100.0% |
$ |
7,219 |
|||||||||
ADR - American Depositary Receipts
GDR - Global Depositary Receipts
> Notes to Statement of Investments (dollar values in thousands)
(a) Non-income producing security.
(b) All or a portion of this security was on loan at September 30, 2012. The total market value of securities on loan at September 30, 2012 was $52.
(c) Investment made with cash collateral received from securities lending activity.
(d) At September 30, 2012, for federal income tax purposes, the cost of investments was $6,295 and net unrealized appreciation was $673 consisting of gross unrealized appreciation of $1,034 and gross unrealized depreciation of $361.
(e) On September 30, 2012, the Fund's total investments were denominated in currencies as follows:
|
Country |
Value |
Percentage of Net Assets |
|||||||||
|
Taiwan Dollar |
$ |
1,118 |
15.5 |
||||||||
|
Hong Kong Dollar |
1,042 |
14.4 |
|||||||||
|
United States Dollar |
831 |
11.5 |
|||||||||
|
Indonesian Rupiah |
749 |
10.4 |
|||||||||
|
South African Rand |
687 |
9.5 |
|||||||||
|
Indian Rupee |
511 |
7.1 |
|||||||||
|
Other currencies less |
|||||||||||
|
than 5% of total net assets |
1,976 |
27.4 |
|||||||||
|
Total Portfolio |
$ |
6,914 |
95.8 |
||||||||
(f) Securities are valued using policies described in the Notes to Financial Statements in the most recent shareholder report.
Fair Value Measurements
Various inputs are used in determining the value of the Fund's investments, following the input prioritization hierarchy established by GAAP. These inputs are summarized in the three broad levels listed below:
• Level 1 – quoted prices in active markets for identical securities
• Level 2 – prices determined using other significant observable inputs (including quoted prices for similar securities, interest rates, prepayment speeds, credit risk and others)
• Level 3 – prices determined using significant unobservable inputs where quoted prices or observable inputs are unavailable or less reliable (including management's own assumptions about the factors market participants would use in pricing an investment)
The inputs or methodology used for valuing securities are not necessarily an indication of the risk associated with investing in those securities.
Examples of the types of securities in which the Fund would typically invest and how they are classified within this hierarchy are as follows. Typical Level 1 securities include exchange traded domestic equities, mutual funds whose NAVs are published each day and exchange traded foreign equities that are not statistically fair valued. Typical Level 2 securities include exchange traded foreign equities that are statistically fair valued, forward foreign currency exchange contracts and short-term investments valued at amortized cost. Additionally, securities fair valued by the Valuation Committee (the Committee) of the Fund's Board of Trustees (the Board) that rely on significant observable inputs are also included in Level 2. Typical Level 3 securities include any security fair valued by the Committee that relies on significant unobservable inputs.
84
> Notes to Statement of Investments (dollar values in thousands)
Under the direction of the Board, the Committee is responsible for carrying out the valuation procedures approved by the Board.
The Committee meets as necessary, and no less frequently than quarterly, to determine fair values for securities for which market quotations are not readily available or for which the investment manager believes that available market quotations are unreliable, and to review the continuing appropriateness of the current value of any security subject to the Trust's Portfolio Pricing Policy and the pricing procedures of the investment manager (the Policies). The Policies address, among other things: circumstances under which market quotations will be deemed readily available; selection of third party pricing vendors; appropriate pricing methodologies; events that require fair valuation and fair value techniques; and circumstances under which securities will be deemed to pose a potential for stale pricing, including when securities are illiquid, restricted, or in default. The Committee may also meet to discuss additional valuation matters, which may include review of back-testing results, review of time-sensitive information or approval of other valuation related actions, and to review the appropriateness of the Policies.
For investments categorized as Level 3, the significant unobservable inputs used in the fair value measurement of the Funds' securities may include: (i) data specific to the issuer or comparable issuers, (ii) general market or specific sector news and (iii) quoted prices and specific or similar security transactions. The Committee considers this data and any changes from prior periods in order to assess the reasonableness of observable and unobservable inputs, any assumptions or internal models used to value those securities and changes in fair value. Significant changes in any of these factors could result in lower or higher fair value measurements. Various factors impact the frequency of monitoring (which may occur as often as daily), however the Committee may determine that changes to inputs, assumptions and models are not required with the same frequency.
The following table summarizes the inputs used, as of September 30, 2012, in valuing the Fund's assets:
|
Investment Type |
Quoted Prices (Level 1) |
Other Significant Observable Inputs (Level 2) |
Significant Unobservable Inputs (Level 3) |
Total |
|||||||||||||||
|
Equities |
|||||||||||||||||||
|
Asia |
$ |
260 |
$ |
4,080 |
$ |
- |
$ |
4,340 |
|||||||||||
|
Other Countries |
361 |
687 |
- |
1,048 |
|||||||||||||||
|
Europe |
- |
832 |
- |
832 |
|||||||||||||||
|
Latin America |
694 |
- |
- |
694 |
|||||||||||||||
|
Total Equities |
1,315 |
5,599 |
- |
6,914 |
|||||||||||||||
|
Total Securities Lending Collateral |
54 |
- |
- |
54 |
|||||||||||||||
|
Total Investments |
$ |
1,369 |
$ |
5,599 |
$ |
- |
$ |
6,968 |
|||||||||||
The Fund's assets assigned to the Level 2 input category are generally valued using a market approach, in which a security's value is determined through its correlation to prices and information from observable market transactions for similar or identical assets. Foreign equities are generally valued at the last sale price on the foreign exchange or market on which they trade. The Fund may use a statistical fair valuation model, in accordance with the policy adopted by the Board, provided by an independent third party to value securities principally traded in foreign markets in order to adjust for possible stale pricing that may occur between the close of the foreign exchanges and the time for valuation. These models take into account available market data including intraday index, ADR, and ETF movements.
There were no transfers of financial assets between levels 1 and 2 during the period.
85
Columbia Acorn Emerging Markets Fund
Portfolio Diversification (Unaudited)
At September 30, 2012, the Fund's portfolio investments as a percentage of net assets were diversified as follows:
|
Value (000) |
Percentage of Net Assets |
||||||||||
| > Consumer Goods & Services | |||||||||||
|
Retail |
$ |
990 |
13.8 |
||||||||
|
Casinos & Gaming |
586 |
8.1 |
|||||||||
|
Food & Beverage |
573 |
8.0 |
|||||||||
|
Other Consumer Services |
243 |
3.4 |
|||||||||
|
Other Durable Goods |
153 |
2.1 |
|||||||||
|
Travel |
139 |
1.9 |
|||||||||
|
Consumer Goods Distribution |
91 |
1.3 |
|||||||||
|
Nondurables |
73 |
1.0 |
|||||||||
|
2,848 |
39.6 |
||||||||||
| > Information | |||||||||||
|
Mobile Communications |
432 |
6.1 |
|||||||||
|
Computer Hardware & Related Equipment |
422 |
5.8 |
|||||||||
|
Business Software |
187 |
2.6 |
|||||||||
|
TV Broadcasting |
118 |
1.6 |
|||||||||
|
Electronics Distribution |
97 |
1.3 |
|||||||||
|
Instrumentation |
90 |
1.2 |
|||||||||
|
Internet Related |
87 |
1.2 |
|||||||||
|
Satellite Broadcasting & Services |
79 |
1.1 |
|||||||||
|
1,512 |
20.9 |
||||||||||
| > Finance | |||||||||||
|
Banks |
276 |
3.8 |
|||||||||
|
Insurance |
194 |
2.7 |
|||||||||
|
Brokerage & Money Management |
176 |
2.4 |
|||||||||
|
Finance Companies |
134 |
1.9 |
|||||||||
|
780 |
10.8 |
||||||||||
| > Industrial Goods & Services | |||||||||||
|
Industrial Materials & Specialty Chemicals |
192 |
2.6 |
|||||||||
|
Construction |
187 |
2.6 |
|||||||||
|
Other Industrial Services |
186 |
2.6 |
|||||||||
|
Machinery |
71 |
1.0 |
|||||||||
|
636 |
8.8 |
||||||||||
| > Energy & Minerals | |||||||||||
|
Mining |
341 |
4.7 |
|||||||||
|
Agricultural Commodities |
115 |
1.6 |
|||||||||
|
Oil & Gas Producers |
89 |
1.2 |
|||||||||
|
Oil Services |
43 |
0.6 |
|||||||||
|
588 |
8.1 |
||||||||||
| > Other Industries | |||||||||||
|
Transportation |
164 |
2.3 |
|||||||||
|
Real Estate |
140 |
1.9 |
|||||||||
|
Regulated Utilities |
71 |
1.0 |
|||||||||
|
375 |
5.2 |
||||||||||
|
Value (000) |
Percentage of Net Assets |
||||||||||
| > Health Care | |||||||||||
|
Medical Supplies |
$ |
103 |
1.4 |
||||||||
|
Pharmaceuticals |
72 |
1.0 |
|||||||||
|
175 |
2.4 |
||||||||||
|
Total Equities: |
6,914 |
95.8 |
|||||||||
|
Security Lending Collateral: |
54 |
0.7 |
|||||||||
|
Total Investments: |
6,968 |
96.5 |
|||||||||
|
Obligation to Return Collateral for Securities Loaned: |
(54 |
) |
(0.7 |
) |
|||||||
|
Cash and Other Assets Less Liabilities: |
305 |
4.2 |
|||||||||
|
Net Assets: |
$ |
7,219 |
100.0 |
||||||||
86
Columbia Acorn European Fund
Major Portfolio Changes in the Third Quarter (Unaudited)
|
Number of Shares |
|||||||||||
|
6/30/12 |
9/30/12 |
||||||||||
|
Purchases |
|||||||||||
|
Europe |
|||||||||||
| > United Kingdom | |||||||||||
|
Asos |
0 |
1,100 |
|||||||||
|
Domino's Pizza UK & Ireland |
5,090 |
6,990 |
|||||||||
|
Elementis |
0 |
5,768 |
|||||||||
|
Ocado |
0 |
25,000 |
|||||||||
|
Rightmove |
1,400 |
2,000 |
|||||||||
|
Spirax Sarco |
71 |
700 |
|||||||||
|
WH Smith |
2,000 |
3,500 |
|||||||||
| > France | |||||||||||
| 1000 mercis |
1,200 |
1,600 |
|||||||||
|
Neopost |
400 |
600 |
|||||||||
|
Norbert Dentressangle |
360 |
516 |
|||||||||
| > Netherlands | |||||||||||
|
Aalberts Industries |
2,785 |
3,400 |
|||||||||
|
TKH Group |
917 |
1,517 |
|||||||||
|
UNIT4 |
1,730 |
2,011 |
|||||||||
| > Germany | |||||||||||
|
NORMA Group |
0 |
980 |
|||||||||
|
Pfeiffer Vacuum |
0 |
147 |
|||||||||
| > Switzerland | |||||||||||
|
Dufry Group |
310 |
480 |
|||||||||
| > Sweden | |||||||||||
|
Hexagon |
3,070 |
3,370 |
|||||||||
| > Italy | |||||||||||
|
Fiat |
0 |
4,400 |
|||||||||
|
Geox |
11,000 |
13,500 |
|||||||||
| > Norway | |||||||||||
|
Atea |
3,710 |
5,310 |
|||||||||
| > Finland | |||||||||||
|
Stockmann |
0 |
1,000 |
|||||||||
|
Other Countries |
|||||||||||
| > United States | |||||||||||
|
Velti |
1,300 |
2,550 |
|||||||||
|
Number of Shares |
|||||||||||
|
6/30/12 |
9/30/12 |
||||||||||
|
Sales |
|||||||||||
|
Europe |
|||||||||||
| > United Kingdom | |||||||||||
|
Serco |
3,480 |
0 |
|||||||||
| > Netherlands | |||||||||||
|
Koninklijke TenCate |
1,412 |
975 |
|||||||||
| > Germany | |||||||||||
|
Rheinmetall |
360 |
0 |
|||||||||
| > Russia | |||||||||||
|
Yandex |
1,900 |
1,000 |
|||||||||
|
Mail.ru - GDR |
600 |
0 |
|||||||||
| > Ireland | |||||||||||
|
Paddy Power |
300 |
85 |
|||||||||
|
United Drug |
7,300 |
0 |
|||||||||
| > Greece | |||||||||||
|
Intralot |
13,330 |
0 |
|||||||||
87
Columbia Acorn European Fund
Statement of Investments (Unaudited), September 30, 2012
|
Number of Shares |
Value (000) |
||||||||||
|
Equities: 92.2% |
|||||||||||
|
Europe 88.8% |
|||||||||||
| > United Kingdom 20.4% | |||||||||||
|
22,220 |
Charles Taylor |
$ |
65 |
||||||||
|
Insurance Services |
|||||||||||
|
6,990 |
Domino's Pizza UK & Ireland |
60 |
|||||||||
|
Pizza Delivery in the UK, Ireland & Germany |
|||||||||||
|
2,000 |
Rightmove |
51 |
|||||||||
|
Internet Real Estate Listings |
|||||||||||
|
1,100 |
Asos |
39 |
|||||||||
|
Internet-based Retailer to Hipsters Up to Age 35 |
|||||||||||
|
3,500 |
WH Smith |
36 |
|||||||||
|
Newsprint, Books & General Stationery Retailer |
|||||||||||
|
3,180 |
Shaftesbury |
27 |
|||||||||
|
London Prime Retail REIT |
|||||||||||
|
700 |
Aggreko |
26 |
|||||||||
|
Temporary Power & Temperature Control Services |
|||||||||||
|
25,000 |
Ocado |
26 |
|||||||||
|
Leading Online Grocery Retailer |
|||||||||||
|
3,200 |
Greggs |
26 |
|||||||||
|
Bakery |
|||||||||||
|
660 |
Rotork |
24 |
|||||||||
|
Valve Actuators for Oil & Water Pipelines |
|||||||||||
|
7,480 |
BBA Aviation |
24 |
|||||||||
|
Aviation Support Services |
|||||||||||
|
700 |
Spirax Sarco |
24 |
|||||||||
|
Steam Systems for Manufacturing & Process Industries |
|||||||||||
|
1,827 |
JLT Group |
22 |
|||||||||
|
International Business Insurance Broker |
|||||||||||
|
500 |
Intertek Group |
22 |
|||||||||
|
Testing, Inspection, Certification Services |
|||||||||||
|
5,768 |
Elementis |
22 |
|||||||||
|
Clay-based Additives |
|||||||||||
|
3,190 |
Abcam |
21 |
|||||||||
|
Online Sales of Antibodies |
|||||||||||
|
2,315 |
Premier Oil (a) |
13 |
|||||||||
|
Oil & Gas Producer in Europe, Pakistan & Asia |
|||||||||||
|
528 |
|||||||||||
| > France 13.9% | |||||||||||
|
570 |
Eurofins Scientific |
81 |
|||||||||
|
Food, Pharmaceuticals & Materials Screening & Testing |
|||||||||||
|
900 |
Gemalto |
79 |
|||||||||
|
Digital Security Solutions |
|||||||||||
|
1,600 |
1000 mercis |
77 |
|||||||||
|
Interactive Advertising & Marketing |
|||||||||||
|
516 |
Norbert Dentressangle |
35 |
|||||||||
|
Leading European Logistics & Transport Group |
|||||||||||
|
600 |
Neopost |
33 |
|||||||||
|
Postage Meter Machines |
|||||||||||
|
1,300 |
Saft |
30 |
|||||||||
|
Niche Battery Manufacturer |
|||||||||||
|
9,900 |
Hi-Media (a) |
25 |
|||||||||
|
Online Advertiser in Europe |
|||||||||||
|
360 |
|||||||||||
|
Number of Shares |
Value (000) |
||||||||||
| > Netherlands 11.8% | |||||||||||
|
3,400 |
Aalberts Industries |
$ |
61 |
||||||||
|
Flow Control & Heat Treatment |
|||||||||||
|
2,011 |
UNIT4 |
54 |
|||||||||
|
Business Software Development |
|||||||||||
|
1,499 |
Imtech |
40 |
|||||||||
|
Electromechanical & Information Communications Technology Installation & Maintenance |
|||||||||||
|
1,680 |
Arcadis |
36 |
|||||||||
|
Engineering Consultants |
|||||||||||
|
1,517 |
TKH Group |
32 |
|||||||||
|
Dutch Industrial Conglomerate |
|||||||||||
|
400 |
Vopak |
28 |
|||||||||
|
World's Largest Operator of Petroleum & Chemical Storage Terminals |
|||||||||||
|
230 |
Core Labs |
28 |
|||||||||
|
Oil & Gas Reservoir Consulting |
|||||||||||
|
975 |
Koninklijke TenCate |
22 |
|||||||||
|
Advanced Textiles & Industrial Fabrics |
|||||||||||
|
568 |
BinckBank |
4 |
|||||||||
|
Discount Brokerage & Asset Management |
|||||||||||
|
305 |
|||||||||||
| > Germany 10.3% | |||||||||||
|
3,250 |
Wirecard |
75 |
|||||||||
|
Online Payment Processing & Risk Management |
|||||||||||
|
170 |
Rational |
43 |
|||||||||
|
Commercial Ovens |
|||||||||||
|
575 |
Dürr |
38 |
|||||||||
|
Automotive Plant Engineering & Associated Capital Equipment |
|||||||||||
|
375 |
Bertrandt |
28 |
|||||||||
|
Outsourced Engineering |
|||||||||||
|
980 |
NORMA Group |
26 |
|||||||||
|
Clamps for Automotive & Industrial Applications |
|||||||||||
|
500 |
Stratec Biomedical Systems |
23 |
|||||||||
|
Diagnostic Instrumentation |
|||||||||||
|
590 |
CTS Eventim |
17 |
|||||||||
|
Event Ticket Sales |
|||||||||||
|
147 |
Pfeiffer Vacuum |
16 |
|||||||||
|
Vacuum Pumps |
|||||||||||
|
266 |
|||||||||||
| > Switzerland 10.0% | |||||||||||
|
345 |
Geberit |
75 |
|||||||||
|
Plumbing Supplies |
|||||||||||
|
290 |
Partners Group |
60 |
|||||||||
|
Private Markets Asset Management |
|||||||||||
|
480 |
Dufry Group (a) |
57 |
|||||||||
|
Operates Airport Duty Free & Duty Paid Shops |
|||||||||||
|
21 |
Sika |
43 |
|||||||||
|
Chemicals for Construction & Industrial Applications |
|||||||||||
|
420 |
Zehnder |
25 |
|||||||||
|
Radiators & Heat Recovery Ventilation Systems |
|||||||||||
|
260 |
|||||||||||
88
|
Number of Shares |
Value (000) |
||||||||||
| > Sweden 5.9% | |||||||||||
|
3,370 |
Hexagon |
$ |
72 |
||||||||
|
Design, Measurement & Visualization Software & Equipment |
|||||||||||
|
4,570 |
Sweco |
48 |
|||||||||
|
Engineering Consultants |
|||||||||||
|
1,200 |
Unibet |
34 |
|||||||||
|
European Online Gaming Operator |
|||||||||||
|
154 |
|||||||||||
| > Italy 5.0% | |||||||||||
|
13,500 |
Geox |
36 |
|||||||||
|
Apparel & Shoe Maker |
|||||||||||
|
300 |
Tod's |
32 |
|||||||||
|
Leather Shoes & Bags |
|||||||||||
|
2,800 |
Pirelli |
30 |
|||||||||
|
Global Tire Supplier |
|||||||||||
|
4,400 |
Fiat |
24 |
|||||||||
|
Leading Automotive Manufacturer in the U.S., Latin America & Italy |
|||||||||||
|
8,066 |
CIR |
9 |
|||||||||
|
Italian Holding Company |
|||||||||||
|
131 |
|||||||||||
| > Norway 2.0% | |||||||||||
|
5,310 |
Atea |
52 |
|||||||||
|
Leading Nordic IT Hardware/Software Reseller & Installation Company |
|||||||||||
|
52 |
|||||||||||
| > Iceland 1.8% | |||||||||||
|
43,750 |
Marel |
47 |
|||||||||
|
Largest Manufacturer of Poultry & Fish Processing Equipment |
|||||||||||
|
47 |
|||||||||||
| > Portugal 1.4% | |||||||||||
|
13,480 |
Redes Energéticas Nacionais |
35 |
|||||||||
|
Portuguese Power Transmission & Gas Transportation |
|||||||||||
|
35 |
|||||||||||
| > Belgium 1.4% | |||||||||||
|
630 |
EVS Broadcast Equipment |
35 |
|||||||||
|
Digital Live Mobile Production Software & Systems |
|||||||||||
|
35 |
|||||||||||
| > Poland 1.2% | |||||||||||
|
4,000 |
FX Energy (a) |
30 |
|||||||||
|
Oil & Gas Producer in Poland |
|||||||||||
|
30 |
|||||||||||
| > Czech Republic 1.1% | |||||||||||
|
140 |
Komercni Banka |
28 |
|||||||||
|
Leading Czech Universal Bank |
|||||||||||
|
28 |
|||||||||||
| > Russia 0.9% | |||||||||||
|
1,000 |
Yandex (a) |
24 |
|||||||||
|
Search Engine for Russian & Turkish Languages |
|||||||||||
|
24 |
|||||||||||
|
Number of Shares |
Value (000) |
||||||||||
| > Denmark 0.8% | |||||||||||
|
400 |
Solar |
$ |
22 |
||||||||
|
Technical Wholesaler of Electrical, Plumbing & HVAC Equipment |
|||||||||||
|
22 |
|||||||||||
| > Finland 0.7% | |||||||||||
|
1,000 |
Stockmann |
19 |
|||||||||
|
Department Store & Fashion Retailer in Scandinavia & Russia |
|||||||||||
|
19 |
|||||||||||
| > Ireland 0.2% | |||||||||||
|
85 |
Paddy Power |
6 |
|||||||||
|
Irish Betting Services |
|||||||||||
|
6 |
|||||||||||
|
Europe: Total |
2,302 |
||||||||||
|
Other Countries 2.1% |
|||||||||||
| > Canada 1.3% | |||||||||||
|
2,270 |
Alliance Grain Traders |
34 |
|||||||||
|
Global Leader in Pulse Processing & Distribution |
|||||||||||
|
34 |
|||||||||||
| > United States 0.8% | |||||||||||
|
2,550 |
Velti (a) |
21 |
|||||||||
|
Mobile Marketing Software Platform |
|||||||||||
|
21 |
|||||||||||
|
Other Countries: Total |
55 |
||||||||||
|
Asia 1.3% |
|||||||||||
| > Hong Kong 1.3% | |||||||||||
|
13,000 |
L'Occitane International |
34 |
|||||||||
|
Skin Care & Cosmetics Producer |
|||||||||||
|
34 |
|||||||||||
|
Asia: Total |
34 |
||||||||||
|
Total Equities: 92.2% (Cost: $2,157) |
2,391 |
||||||||||
|
Total Investments: 92.2% (Cost: $2,157)(b)(c) |
2,391 |
(d) |
|||||||||
|
Cash and Other Assets Less Liabilities: 7.8% |
201 |
||||||||||
|
Total Net Assets: 100.0% |
$ |
2,592 |
|||||||||
REIT - Real Estate Investment Trust
89
Columbia Acorn European Fund
Statement of Investments (Unaudited), continued
> Notes to Statement of Investments (dollar values in thousands)
(a) Non-income producing security.
(b) At September 30, 2012, for federal income tax purposes, the cost of investments was $2,157 and net unrealized appreciation was $234 consisting of gross unrealized appreciation of $306 and gross unrealized depreciation of $72.
(c) On September 30, 2012, the Fund's total investments were denominated in currencies as follows:
|
Country |
Value |
Percentage of Net Assets |
|||||||||
|
Euro |
$ |
1,128 |
43.5 |
||||||||
|
British Pound |
528 |
20.4 |
|||||||||
|
Swiss Franc |
261 |
10.1 |
|||||||||
|
Swedish Krona |
154 |
5.9 |
|||||||||
|
Other currencies less than 5% of total net assets |
320 |
12.3 |
|||||||||
|
Total Portfolio |
$ |
2,391 |
92.2 |
||||||||
(d) Securities are valued using policies described in the Notes to Financial Statements in the most recent shareholder report.
Fair Value Measurements
Various inputs are used in determining the value of the Fund's investments, following the input prioritization hierarchy established by GAAP. These inputs are summarized in the three broad levels listed below:
• Level 1 – quoted prices in active markets for identical securities
• Level 2 – prices determined using other significant observable inputs (including quoted prices for similar securities, interest rates, prepayment speeds, credit risk and others)
• Level 3 – prices determined using significant unobservable inputs where quoted prices or observable inputs are unavailable or less reliable (including management's own assumptions about the factors market participants would use in pricing an investment)
The inputs or methodology used for valuing securities are not necessarily an indication of the risk associated with investing in those securities.
Examples of the types of securities in which the Fund would typically invest and how they are classified within this hierarchy are as follows. Typical Level 1 securities include exchange traded domestic equities, mutual funds whose NAVs are published each day and exchange traded foreign equities that are not statistically fair valued. Typical Level 2 securities include exchange traded foreign equities that are statistically fair valued, forward foreign currency exchange contracts and short-term investments valued at amortized cost. Additionally, securities fair valued by the Valuation Committee (the Committee) of the Fund's Board of Trustees (the Board) that rely on significant observable inputs are also included in Level 2. Typical Level 3 securities include any security fair valued by the Committee that relies on significant unobservable inputs.
Under the direction of the Board, the Committee is responsible for carrying out the valuation procedures approved by the Board.
The Committee meets as necessary, and no less frequently than quarterly, to determine fair values for securities for which market quotations are not readily available or for which the investment manager believes that available market quotations are unreliable, and to review the continuing appropriateness of the current value of any security subject to the Trust's Portfolio Pricing Policy and the pricing procedures of the investment manager (the Policies). The Policies address, among other things: circumstances under which market quotations will be deemed readily available; selection of third party pricing vendors; appropriate pricing methodologies; events that require fair valuation and fair value techniques; and circumstances under which securities will be deemed to pose a potential for stale pricing, including when securities are illiquid, restricted, or in default. The Committee may also meet to discuss additional valuation matters, which may include review of back-testing results, review of time-sensitive information or approval of other valuation related actions, and to review the appropriateness of the Policies.
For investments categorized as Level 3, the significant unobservable inputs used in the fair value measurement of the Funds' securities may include: (i) data specific to the issuer or comparable issuers, (ii) general market or specific sector news and (iii) quoted prices and specific or similar security transactions. The Committee considers this data and any changes from prior periods in order to assess the reasonableness of observable and unobservable inputs, any assumptions or internal models used to value those securities and changes in fair value. Significant changes in any of these factors could result in lower or higher fair value measurements. Various factors impact the frequency of monitoring (which may occur as often as daily), however the Committee may determine that changes to inputs, assumptions and models are not required with the same frequency.
90
> Notes to Statement of Investments (dollar values in thousands)
The following table summarizes the inputs used, as of September 30, 2012, in valuing the Fund's assets:
|
Investment Type |
Quoted Prices (Level 1) |
Other Significant Observable Inputs (Level 2) |
Significant Unobservable Inputs (Level 3) |
Total |
|||||||||||||||
|
Equities |
|||||||||||||||||||
|
Europe |
$ |
82 |
$ |
2,220 |
$ |
- |
$ |
2,302 |
|||||||||||
|
Other Countries |
55 |
- |
- |
55 |
|||||||||||||||
|
Asia |
- |
34 |
- |
34 |
|||||||||||||||
|
Total Equities |
137 |
2,254 |
- |
2,391 |
|||||||||||||||
|
Total Investments |
$ |
137 |
$ |
2,254 |
$ |
- |
$ |
2,391 |
|||||||||||
The Fund's assets assigned to the Level 2 input category are generally valued using a market approach, in which a security's value is determined through its correlation to prices and information from observable market transactions for similar or identical assets. Foreign equities are generally valued at the last sale price on the foreign exchange or market on which they trade. The Fund may use a statistical fair valuation model, in accordance with the policy adopted by the Board, provided by an independent third party to value securities principally traded in foreign markets in order to adjust for possible stale pricing that may occur between the close of the foreign exchanges and the time for valuation. These models take into account available market data including intraday index, ADR, and ETF movements.
There were no transfers of financial assets between levels 1 and 2 during the period.
91
Columbia Acorn European Fund
Portfolio Diversification (Unaudited)
At September 30, 2012, the Fund's portfolio investments as a percentage of net assets were diversified as follows:
|
Value (000) |
Percentage of Net Assets |
||||||||||
| > Industrial Goods & Services | |||||||||||
|
Other Industrial Services |
$ |
276 |
10.6 |
||||||||
|
Machinery |
251 |
9.7 |
|||||||||
|
Conglomerates |
102 |
3.9 |
|||||||||
|
Industrial Materials & Specialty Chemicals |
87 |
3.4 |
|||||||||
|
Construction |
75 |
2.9 |
|||||||||
|
Electrical Components |
30 |
1.2 |
|||||||||
|
Outsourcing Services |
28 |
1.1 |
|||||||||
|
Industrial Distribution |
22 |
0.8 |
|||||||||
|
871 |
33.6 |
||||||||||
| > Information | |||||||||||
|
Business Software |
148 |
5.7 |
|||||||||
|
Computer Hardware & Related Equipment |
114 |
4.4 |
|||||||||
|
Business Information & Marketing Services |
76 |
2.9 |
|||||||||
|
Financial Processors |
75 |
2.9 |
|||||||||
|
Internet Related |
75 |
2.9 |
|||||||||
|
Computer Services |
52 |
2.0 |
|||||||||
|
Advertising |
25 |
1.0 |
|||||||||
|
565 |
21.8 |
||||||||||
| > Consumer Goods & Services | |||||||||||
|
Retail |
120 |
4.6 |
|||||||||
|
Other Durable Goods |
78 |
3.0 |
|||||||||
|
Nondurables |
67 |
2.6 |
|||||||||
|
Restaurants |
60 |
2.3 |
|||||||||
|
Apparel |
55 |
2.1 |
|||||||||
|
Casinos & Gaming |
40 |
1.6 |
|||||||||
|
Consumer Goods Distribution |
39 |
1.5 |
|||||||||
|
Food & Beverage |
26 |
1.0 |
|||||||||
|
Other Entertainment |
17 |
0.7 |
|||||||||
|
502 |
19.4 |
||||||||||
| > Finance | |||||||||||
|
Insurance |
87 |
3.3 |
|||||||||
|
Brokerage & Money Management |
64 |
2.5 |
|||||||||
|
Banks |
28 |
1.1 |
|||||||||
|
179 |
6.9 |
||||||||||
| > Energy & Minerals | |||||||||||
|
Oil & Gas Producers |
43 |
1.6 |
|||||||||
|
Agricultural Commodities |
34 |
1.3 |
|||||||||
|
Mining |
28 |
1.1 |
|||||||||
|
Oil Refining, Marketing & Distribution |
28 |
1.1 |
|||||||||
|
133 |
5.1 |
||||||||||
|
Value (000) |
Percentage of Net Assets |
||||||||||
| > Other Industries | |||||||||||
|
Regulated Utilities |
$ |
35 |
1.3 |
||||||||
|
Transportation |
35 |
1.3 |
|||||||||
|
Real Estate |
27 |
1.1 |
|||||||||
|
97 |
3.7 |
||||||||||
| > Health Care | |||||||||||
|
Medical Equipment & Devices |
23 |
0.9 |
|||||||||
|
Medical Supplies |
21 |
0.8 |
|||||||||
|
44 |
1.7 |
||||||||||
|
Total Equities: |
2,391 |
92.2 |
|||||||||
|
Total Investments: |
2,391 |
92.2 |
|||||||||
|
Cash and Other Assets Less Liabilities: |
201 |
7.8 |
|||||||||
|
Net Assets: |
$ |
2,592 |
100.0 |
||||||||
92
Columbia Acorn Family of Funds
Third Quarter Class Z Share Information (Unaudited)
|
Minimum Initial Investment in all Funds: |
$0 to $2,000, available only to certain eligible investors |
||||||
|
Exchange Fee: |
None |
||||||
|
Columbia Acorn Fund |
ACRNX |
||||||
|
Management Fee |
0.64 |
% |
|||||
|
12 |
b-1 Fee |
0.00 |
% |
||||
|
Other Expenses |
0.13 |
% |
|||||
|
Net Expense Ratio |
0.77 |
% |
|||||
|
Columbia Acorn International |
ACINX |
||||||
|
Management Fee |
0.76 |
% |
|||||
|
12 |
b-1 Fee |
0.00 |
% |
||||
|
Other Expenses |
0.16 |
% |
|||||
|
Net Expense Ratio |
0.92 |
% |
|||||
|
Columbia Acorn USA |
AUSAX |
||||||
|
Management Fee |
0.86 |
% |
|||||
|
12 |
b-1 Fee |
0.00 |
% |
||||
|
Other Expenses |
0.20 |
% |
|||||
|
Net Expense Ratio |
1.06 |
% |
|||||
|
Columbia Acorn International Select |
ACFFX |
||||||
|
Management Fee |
0.94 |
% |
|||||
|
12 |
b-1 Fee |
0.00 |
% |
||||
|
Other Expenses |
0.24 |
% |
|||||
|
Net Expense Ratio |
1.18 |
% |
|||||
|
Columbia Acorn Select |
ACTWX |
||||||
|
Management Fee |
0.83 |
% |
|||||
|
12 |
b-1 Fee |
0.00 |
% |
||||
|
Other Expenses |
0.20 |
% |
|||||
|
Net Expense Ratio |
1.03 |
% |
|||||
|
Columbia Thermostat Fund |
COTZX |
||||||
|
Management Fee |
0.10 |
% |
|||||
|
12 |
b-1 Fee |
0.00 |
% |
||||
|
Other Expenses |
0.15 |
%* |
|||||
|
Net Expense Ratio |
0.25 |
%* |
|||||
|
Columbia Acorn Emerging Markets Fund |
CEFZX |
||||||
|
Management Fee |
1.25 |
% |
|||||
|
12 |
b-1 Fee |
0.00 |
% |
||||
|
Other Expenses |
0.19 |
% |
|||||
|
Net Expense Ratio |
1.44 |
% |
|||||
|
Columbia Acorn European Fund |
CAEZX |
||||||
|
Management Fee |
1.19 |
% |
|||||
|
12 |
b-1 Fee |
0.00 |
% |
||||
|
Other Expenses |
0.14 |
% |
|||||
|
Net Expense Ratio |
1.33 |
% |
|||||
Fees and expenses are for the nine months ended September 30, 2012.
The fees and expenses of Columbia Acorn Select and Columbia Acorn International Select include the effect of the voluntary undertaking by Columbia Wanger Asset Management, LLC (CWAM) to waive fees and/or reimburse the Funds for any ordinary operating expenses (exclusive of brokerage commissions, interest, taxes and extraordinary expenses, but inclusive of custodian charges relating to overdrafts, if any), after giving effect to any balance credits from the Funds' custodian, in excess of the following annual rates:
|
Fund |
Class Z |
||||||
|
Columbia Acorn International Select |
1.45 |
% |
|||||
|
Columbia Acorn Select |
1.35 |
% |
|||||
These arrangements may be modified or terminated by either the Funds or CWAM upon 30 days notice.
Columbia Thermostat Fund's fees and expenses include the effect of CWAM's contractual undertaking to waive fees and/or reimburse the Fund for any ordinary operating expenses (exclusive of distribution and service fees, interest and fees on borrowings and expenses associated with the Fund's investments in other investment companies, but including custodian charges relating to overdrafts, if any), after giving effect to any balance credits from the Fund's custodian, in excess of the annual rate of 0.25% of the average daily net assets. Columbia Thermostat Fund's waiver/reimbursement arrangement is contractual through April 30, 2013. There is no guarantee that this arrangement will continue thereafter.
The fees and expenses of Columbia Acorn Emerging Markets Fund and Columbia Acorn European Fund also include the effect of fee waivers/reimbursements. CWAM has contractually undertaken to waive fees and/or reimburse Columbia Acorn Emerging Markets Fund so that the Fund's ordinary operating expenses (excluding interest and fees on borrowings and expenses associated with the Fund's investment in other investment companies, if any) do not exceed the annual rate of 1.60% of the Fund's average daily net assets attributable to Class Z shares, through April 30, 2013. There is no guarantee that this arrangement will continue thereafter. CWAM has contractually undertaken to waive fees and/or reimburse Columbia Acorn European Fund so that its ordinary operating expenses (excluding interest and fees on borrowings and expenses associated with the Fund's investment in other investment companies, if any) do not exceed the annual rate of 1.50% of the Fund's average daily net assets attributable to Class Z shares, through April 30, 2013. There is no guarantee that this arrangement will continue thereafter.
* Does not include estimated fees and expenses of 0.61% incurred by the Fund from the underlying portfolio funds in which it invests.
93
This page intentionally left blank.
94
This page intentionally left blank.
95
Columbia Acorn Family of Funds
Trustees
Laura M. Born
Chair of the Board
Steven N. Kaplan
Vice Chair of the Board
Michelle L. Collins
Maureen M. Culhane
Margaret M. Eisen
John C. Heaton
Charles P. McQuaid
David J. Rudis
David B. Small
Ralph Wanger (Trustee Emeritus)
Officers
Charles P. McQuaid
President
Ben Andrews
Vice President
Robert A. Chalupnik
Vice President
Michael G. Clarke
Assistant Treasurer
Joseph F. DiMaria
Assistant Treasurer
P. Zachary Egan
Vice President
Fritz Kaegi
Vice President
John M. Kunka
Assistant Treasurer
Stephen Kusmierczak
Vice President
Joseph C. LaPalm
Vice President
Bruce H. Lauer
Vice President, Secretary and Treasurer
Louis J. Mendes III
Vice President
Robert A. Mohn
Vice President
Christopher J. Olson
Vice President
Christopher O. Petersen
Assistant Secretary
Scott R. Plummer
Assistant Secretary
Andreas Waldburg-Wolfegg
Vice President
Linda K. Roth-Wiszowaty
Assistant Secretary
Robert P. Scales
Chief Compliance Officer, Chief Legal Officer,
Senior Vice President and General Counsel
Investment Manager
Columbia Wanger Asset Management, LLC
227 West Monroe Street, Suite 3000
Chicago, Illinois 60606
1-800-922-6769
Distributor
Columbia Management Investment Distributors, Inc.
225 Franklin Street
Boston, Massachusetts 02110
Transfer Agent, Dividend Disbursing Agent
Columbia Management Investment Services Corp.
P. O. Box 8081
Boston, Massachusetts 02266-8081
1-800-345-6611
Legal Counsel to the Funds
Perkins Coie LLP
Washington, DC
Legal Counsel to the Independent Trustees
Drinker Biddle & Reath LLP
Philadelphia, Pennsylvania
Independent Registered Public Accounting Firm
PricewaterhouseCoopers LLP
Chicago, Illinois
This report, including the schedules of investments, is submitted for the general information of the shareholders of Columbia Acorn Trust.
A description of the policies and procedures that the Funds use to determine how to vote proxies and a copy of the Funds' voting record are available (i) without charge, upon request, by calling 800-922-6769 and (ii) on the Securities and Exchange Commission's website at www.sec.gov. Information regarding how the Funds voted proxies relating to portfolio securities during the 12-month period ended June 30, is available from the SEC's website. Information regarding how the Funds voted proxies relating to portfolio securities is also available at www.columbiamanagement.com under "About Us." From there, click on "Disclosures."
The Funds file a complete schedule of portfolio holdings with the SEC for the first and third quarters of each fiscal year on Form N-Q. The Funds' Form N-Q is available on the SEC's website at www.sec.gov and may be reviewed and copied at the SEC's Public Reference Room in Washington, D.C. Information on the operation of the Public Reference Room may be obtained by calling 1-800-SEC-0330. The Funds' complete portfolio holdings are disclosed at www.columbiamanagement.com approximately 30 to 40 days after each month-end.
Investors should consider the investment objectives, risks, charges and expenses of a mutual fund carefully before investing. For a free prospectus, which contains this and other important information about the funds, visit www.columbiamanagement.com. Read the prospectus carefully before investing.
Columbia Acorn Funds are distributed by Columbia Management Investment Distributors, Inc., member FINRA and managed by Columbia Wanger Asset Management, LLC.
Find out what's new – visit our web site at:
www.columbiamanagement.com
Our e-mail address is:
ServiceInquiries@ColumbiaManagement.com
Shareholders should not include personal information such as account numbers, Social Security numbers or taxpayer identification numbers in e-mail. We are unable to accept account transactions sent via e-mail.
96
This document contains Global Industry Classification Standard data. The Global Industry Classification Standard ("GICS") was developed by and is the exclusive property and a service mark of MSCI Inc. ("MSCI") and Standard & Poor's Financial Services LLC ("S&P") and is licensed for use by Columbia Wanger Asset Management, LLC. Neither MSCI, S&P, nor any other party involved in making or compiling the GICS or any GICS classifications makes any express or implied warranties or representations with respect to such standard or classification (or the results to be obtained by the use thereof), and all such parties hereby expressly disclaim all warranties of originality, accuracy, completeness, merchantability and fitness for a particular purpose with respect to any of such standard or classification. Without limiting any of the foregoing, in no event shall MSCI, S&P, any of their affiliates or any third party involved in making or compiling the GICS or any GICS classifications have any liability for any direct, indirect, special, punitive, consequential or any other damages (including lost profits) even if notified of the possibility of such damages.
Columbia Management®
Columbia Acorn Family of Funds
Class Z Shares
Third Quarter Report, September 30, 2012
For More Information
You'll find more information about the Columbia Acorn Family of Funds in the documents described below. Contact Columbia Funds as follows to obtain these documents free of charge:
By Mail: Columbia Funds
c/o Columbia Management Investment Services Corp.
P. O. Box 8081 Boston, MA 02266-8081
By Telephone: 800.345.6611
Online: www.columbiamanagement.com
Shareholder Communications with the Board
The Funds' Board of Trustees has adopted procedures by which shareholders may communicate with the Board. Shareholders who wish to communicate with the Board should send their written communications to the Board by mail, c/o Columbia Wanger Asset Management, LLC, 227 West Monroe Street, Suite 3000, Chicago, Illinois 60606, Attention: Secretary. Shareholder communications must (i) be in writing, (ii) identify the Columbia Acorn Fund to which the communication relates and (iii) state the particular class of shares and number of shares held by the communicating shareholder.
Prospectuses and the Statement of Additional Information (SAI)
The prospectuses and the SAI provide more detailed information about the Funds and their policies. The SAI is legally part of each prospectus (it's incorporated by reference). A copy of each has been filed with the SEC.
Information Provided by the SEC
You can review and copy information about the Funds (including their prospectuses, the SAI and shareholder reports) at the SEC's Public Reference Room in Washington, DC. To find out more about the operation of the Public Reference Room, call the SEC at 202.551.8090. Reports and other information about the Fund are also available in the EDGAR Database on the SEC's website at http://www.sec.gov, or you can receive copies of this information, for a fee, by electronic request at the following e-mail address: publicinfo@sec.gov. You can also obtain copies of this information by writing the Public Reference Section, Securities and Exchange Commission, Washington, DC 20549-0102.
The investment company registration number of Columbia Acorn Trust, of which each of these Funds is a series, is 811-01829.
© 2012 Columbia Management Investment Advisers, LLC. All rights reserved.
225 Franklin Street, Boston, MA 02110
800.345.6611 www.columbiamanagement.com
C-1562 C (11/12) 147065
Q3 2012
Columbia Acorn Family of Funds
Class A, B, C, I, R and R5 Shares
Managed by Columbia Wanger Asset Management, LLC


Third Quarter Report
September 30, 2012
n Columbia
Acorn® Fund
n Columbia
Acorn International®
n Columbia
Acorn USA®
n Columbia
Acorn International SelectSM
n Columbia
Acorn SelectSM
n Columbia
Thermostat FundSM
n Columbia
Acorn Emerging Markets FundSM
n Columbia
Acorn European FundSM
Not FDIC insured • No bank guarantee • May lose value
The views expressed in the "Chattering Squirrels" and "In a Nutshell" commentaries reflect the current views of the respective authors. These views are not guarantees of future performance and involve certain risks, uncertainties and assumptions that are difficult to predict so actual outcomes and results may differ significantly from the views expressed. These views are subject to change at any time based upon economic, market or other conditions and the respective authors disclaim any responsibility to update such views. These views may not be relied upon as investment advice and, because investment decisions for a Columbia Acorn Fund are based on numerous factors, may not be relied upon as an indication of trading intent on behalf of any particular Columbia Acorn Fund. References to specific company's securities should not be construed as a recommendation or investment advice and there can be no assurance that as of the date of publication of this report, the securities mentioned in each Fund's portfolio are still held or that the securities sold have not been repurchased.
Acorn®, Acorn USA® and Acorn International® are service marks owned and registered by Columbia Acorn Trust. ColumbiaSM, Columbia Management®, and the Columbia Management Logo® are service marks owned and/or registered by Ameriprise Financial, Inc.
Columbia Acorn Family of Funds
Table of Contents
|
Share Class Performance |
2 |
||||||
|
Fund Performance vs. Benchmarks |
4 |
||||||
|
Descriptions of Indexes |
5 |
||||||
|
Estimated Year-End Distributions |
6 |
||||||
|
Fund Net Asset Values |
6 |
||||||
|
Chattering Squirrels |
|||||||
|
Columbia Acorn International Turns 20 |
7 |
||||||
|
2012 Shareholder Information Meeting Recap |
10 |
||||||
|
Columbia Acorn Fund |
|||||||
|
In a Nutshell |
18 |
||||||
|
At a Glance |
19 |
||||||
|
Major Portfolio Changes |
34 |
||||||
|
Statement of Investments |
36 |
||||||
|
Columbia Acorn International |
|||||||
|
In a Nutshell |
20 |
||||||
|
At a Glance |
21 |
||||||
|
Major Portfolio Changes |
49 |
||||||
|
Statement of Investments |
52 |
||||||
|
Portfolio Diversification |
61 |
||||||
|
Columbia Acorn USA |
|||||||
|
In a Nutshell |
22 |
||||||
|
At a Glance |
23 |
||||||
|
Major Portfolio Changes |
62 |
||||||
|
Statement of Investments |
63 |
||||||
|
Columbia Acorn International Select |
|||||||
|
In a Nutshell |
24 |
||||||
|
At a Glance |
25 |
||||||
|
Major Portfolio Changes |
70 |
||||||
|
Statement of Investments |
71 |
||||||
|
Portfolio Diversification |
75 |
||||||
|
Columbia Acorn Select |
|||||||
|
In a Nutshell |
26 |
||||||
|
At a Glance |
27 |
||||||
|
Major Portfolio Changes |
76 |
||||||
|
Statement of Investments |
77 |
||||||
|
Columbia Thermostat Fund |
|||||||
|
In a Nutshell |
28 |
||||||
|
At a Glance |
29 |
||||||
|
Statement of Investments |
83 |
||||||
|
Columbia Acorn Emerging Markets Fund |
|||||||
|
In a Nutshell |
30 |
||||||
|
At a Glance |
31 |
||||||
|
Major Portfolio Changes |
84 |
||||||
|
Statement of Investments |
86 |
||||||
|
Portfolio Diversification |
90 |
||||||
|
Columbia Acorn European Fund |
|||||||
|
In a Nutshell |
32 |
||||||
|
At a Glance |
33 |
||||||
|
Major Portfolio Changes |
91 |
||||||
|
Statement of Investments |
92 |
||||||
|
Portfolio Diversification |
96 |
||||||
|
Columbia Acorn Family of Funds |
|||||||
|
Columbia Acorn Family of Funds Information |
97 |
||||||
1
Columbia Acorn Family of Funds
Share Class Performance Average Annual Total Returns through 9/30/12
|
Class A |
Class B* |
Class C |
Class I |
Class R |
Class R5 |
||||||||||||||||||||||||||||||||||
|
Without Sales Charge |
With Sales Charge |
Without Sales Charge |
With Sales Charge |
Without Sales Charge |
With Sales Charge |
Without Sales Charge |
Without Sales Charge |
Without Sales Charge |
|||||||||||||||||||||||||||||||
|
Columbia Acorn Fund |
|||||||||||||||||||||||||||||||||||||||
| 3 months** |
4.74 |
% |
–1.28 |
% |
4.60 |
% |
–0.40 |
% |
4.55 |
% |
3.55 |
% |
4.84 |
% |
NA |
NA |
|||||||||||||||||||||||
|
Year to date** |
14.28 |
% |
7.72 |
% |
13.78 |
% |
8.78 |
% |
13.65 |
% |
12.65 |
% |
14.55 |
% |
NA |
NA |
|||||||||||||||||||||||
| 1 year |
26.44 |
% |
19.16 |
% |
26.03 |
% |
21.03 |
% |
25.56 |
% |
24.56 |
% |
26.89 |
% |
NA |
NA |
|||||||||||||||||||||||
| 5 years |
2.41 |
% |
1.20 |
% |
1.81 |
% |
1.47 |
% |
1.61 |
% |
1.61 |
% |
2.74 |
% |
NA |
NA |
|||||||||||||||||||||||
| 10 years |
11.72 |
% |
11.07 |
% |
11.02 |
% |
11.02 |
% |
10.87 |
% |
10.87 |
% |
12.10 |
% |
NA |
NA |
|||||||||||||||||||||||
|
Life of Fund |
14.22 |
% |
14.06 |
% |
13.51 |
% |
13.51 |
% |
13.34 |
% |
13.34 |
% |
14.59 |
% |
NA |
NA |
|||||||||||||||||||||||
|
Columbia Acorn International |
|||||||||||||||||||||||||||||||||||||||
| 3 months** |
7.21 |
% |
1.04 |
% |
7.00 |
% |
2.00 |
% |
7.00 |
% |
6.00 |
% |
7.30 |
% |
7.14 |
% |
7.28 |
% |
|||||||||||||||||||||
|
Year to date** |
16.39 |
% |
9.70 |
% |
15.74 |
% |
10.74 |
% |
15.74 |
% |
14.74 |
% |
16.73 |
% |
16.12 |
% |
16.68 |
% |
|||||||||||||||||||||
| 1 year |
18.61 |
% |
11.80 |
% |
17.76 |
% |
12.76 |
% |
17.70 |
% |
16.70 |
% |
19.06 |
% |
18.24 |
% |
19.04 |
% |
|||||||||||||||||||||
| 5 years |
–0.67 |
% |
–1.84 |
% |
–1.31 |
% |
–1.66 |
% |
–1.43 |
% |
–1.43 |
% |
–0.28 |
% |
–0.93 |
% |
–0.31 |
% |
|||||||||||||||||||||
| 10 years |
13.95 |
% |
13.28 |
% |
13.19 |
% |
13.19 |
% |
13.08 |
% |
13.08 |
% |
14.35 |
% |
13.62 |
% |
14.33 |
% |
|||||||||||||||||||||
|
Life of Fund |
10.63 |
% |
10.30 |
% |
9.93 |
% |
9.93 |
% |
9.81 |
% |
9.81 |
% |
11.07 |
% |
10.37 |
% |
11.05 |
% |
|||||||||||||||||||||
|
Columbia Acorn USA |
|||||||||||||||||||||||||||||||||||||||
| 3 months** |
4.49 |
% |
–1.52 |
% |
4.30 |
% |
–0.70 |
% |
4.27 |
% |
3.27 |
% |
4.57 |
% |
NA |
NA |
|||||||||||||||||||||||
|
Year to date** |
15.09 |
% |
8.48 |
% |
14.49 |
% |
9.49 |
% |
14.48 |
% |
13.48 |
% |
15.43 |
% |
NA |
NA |
|||||||||||||||||||||||
| 1 year |
28.79 |
% |
21.40 |
% |
28.16 |
% |
23.16 |
% |
27.84 |
% |
26.84 |
% |
29.25 |
% |
NA |
NA |
|||||||||||||||||||||||
| 5 years |
2.07 |
% |
0.87 |
% |
1.43 |
% |
1.06 |
% |
1.29 |
% |
1.29 |
% |
2.38 |
% |
NA |
NA |
|||||||||||||||||||||||
| 10 years |
10.57 |
% |
9.92 |
% |
9.86 |
% |
9.86 |
% |
9.75 |
% |
9.75 |
% |
10.95 |
% |
NA |
NA |
|||||||||||||||||||||||
|
Life of Fund |
9.62 |
% |
9.21 |
% |
8.91 |
% |
8.91 |
% |
8.81 |
% |
8.81 |
% |
10.01 |
% |
NA |
NA |
|||||||||||||||||||||||
|
Columbia Acorn International Select |
|||||||||||||||||||||||||||||||||||||||
| 3 months** |
12.47 |
% |
6.02 |
% |
12.30 |
% |
7.30 |
% |
12.24 |
% |
11.24 |
% |
12.57 |
% |
NA |
NA |
|||||||||||||||||||||||
|
Year to date** |
23.98 |
% |
16.85 |
% |
23.41 |
% |
18.41 |
% |
23.25 |
% |
22.25 |
% |
24.33 |
% |
NA |
NA |
|||||||||||||||||||||||
| 1 year |
26.25 |
% |
19.00 |
% |
25.53 |
% |
20.53 |
% |
25.28 |
% |
24.28 |
% |
26.72 |
% |
NA |
NA |
|||||||||||||||||||||||
| 5 years |
0.60 |
% |
–0.58 |
% |
–0.03 |
% |
–0.39 |
% |
–0.20 |
% |
–0.20 |
% |
0.99 |
% |
NA |
NA |
|||||||||||||||||||||||
| 10 years |
13.38 |
% |
12.71 |
% |
12.65 |
% |
12.65 |
% |
12.52 |
% |
12.52 |
% |
13.79 |
% |
NA |
NA |
|||||||||||||||||||||||
|
Life of Fund |
9.51 |
% |
9.05 |
% |
8.80 |
% |
8.80 |
% |
8.69 |
% |
8.69 |
% |
9.89 |
% |
NA |
NA |
|||||||||||||||||||||||
|
Columbia Acorn Select |
|||||||||||||||||||||||||||||||||||||||
| 3 months** |
6.45 |
% |
0.35 |
% |
6.29 |
% |
1.29 |
% |
6.26 |
% |
5.26 |
% |
6.57 |
% |
NA |
NA |
|||||||||||||||||||||||
|
Year to date** |
14.58 |
% |
8.00 |
% |
14.05 |
% |
9.05 |
% |
13.94 |
% |
12.94 |
% |
14.87 |
% |
NA |
NA |
|||||||||||||||||||||||
| 1 year |
25.16 |
% |
17.98 |
% |
24.46 |
% |
19.46 |
% |
24.26 |
% |
23.26 |
% |
25.60 |
% |
NA |
NA |
|||||||||||||||||||||||
| 5 years |
–1.44 |
% |
–2.60 |
% |
–2.06 |
% |
–2.43 |
% |
–2.21 |
% |
–2.21 |
% |
–1.10 |
% |
NA |
NA |
|||||||||||||||||||||||
| 10 years |
8.69 |
% |
8.05 |
% |
7.98 |
% |
7.98 |
% |
7.85 |
% |
7.85 |
% |
9.06 |
% |
NA |
NA |
|||||||||||||||||||||||
|
Life of Fund |
9.00 |
% |
8.53 |
% |
8.29 |
% |
8.29 |
% |
8.17 |
% |
8.17 |
% |
9.37 |
% |
NA |
NA |
|||||||||||||||||||||||
|
Columbia Thermostat Fund† |
|||||||||||||||||||||||||||||||||||||||
| 3 months** |
4.76 |
% |
–1.24 |
% |
4.67 |
% |
–0.33 |
% |
4.60 |
% |
3.60 |
% |
NA |
NA |
NA |
||||||||||||||||||||||||
|
Year to date** |
11.69 |
% |
5.28 |
% |
11.30 |
% |
6.30 |
% |
11.07 |
% |
10.07 |
% |
NA |
NA |
NA |
||||||||||||||||||||||||
| 1 year |
20.22 |
% |
13.28 |
% |
19.64 |
% |
14.64 |
% |
19.29 |
% |
18.29 |
% |
NA |
NA |
NA |
||||||||||||||||||||||||
| 5 years |
4.68 |
% |
3.45 |
% |
4.18 |
% |
3.83 |
% |
3.90 |
% |
3.90 |
% |
NA |
NA |
NA |
||||||||||||||||||||||||
| 10 years |
8.05 |
% |
7.41 |
% |
7.46 |
% |
7.46 |
% |
7.25 |
% |
7.25 |
% |
NA |
NA |
NA |
||||||||||||||||||||||||
|
Life of Fund |
7.87 |
% |
7.23 |
% |
7.28 |
% |
7.28 |
% |
7.07 |
% |
7.07 |
% |
NA |
NA |
NA |
||||||||||||||||||||||||
2
|
Class A |
Class B* |
Class C |
Class I |
Class R |
Class R5 |
||||||||||||||||||||||||||||||||||
|
Without Sales Charge |
With Sales Charge |
Without Sales Charge |
With Sales Charge |
Without Sales Charge |
With Sales Charge |
Without Sales Charge |
Without Sales Charge |
Without Sales Charge |
|||||||||||||||||||||||||||||||
|
Columbia Acorn Emerging Markets Fund |
|||||||||||||||||||||||||||||||||||||||
| 3 months** |
9.66 |
% |
3.34 |
% |
NA |
NA |
9.41 |
% |
8.41 |
% |
9.72 |
% |
NA |
NA |
|||||||||||||||||||||||||
|
Year to date** |
20.19 |
% |
13.34 |
% |
NA |
NA |
19.59 |
% |
18.59 |
% |
20.42 |
% |
NA |
NA |
|||||||||||||||||||||||||
| 1 year |
25.90 |
% |
18.66 |
% |
NA |
NA |
25.14 |
% |
24.14 |
% |
26.55 |
% |
NA |
NA |
|||||||||||||||||||||||||
|
Life of Fund |
10.05 |
% |
4.37 |
% |
NA |
NA |
9.34 |
% |
9.34 |
% |
10.55 |
% |
NA |
NA |
|||||||||||||||||||||||||
|
Columbia Acorn European Fund |
|||||||||||||||||||||||||||||||||||||||
| 3 months** |
7.14 |
% |
0.99 |
% |
NA |
NA |
7.07 |
% |
6.07 |
% |
7.23 |
% |
NA |
NA |
|||||||||||||||||||||||||
|
Year to date** |
19.50 |
% |
12.57 |
% |
NA |
NA |
18.84 |
% |
17.84 |
% |
19.71 |
% |
NA |
NA |
|||||||||||||||||||||||||
| 1 year |
20.68 |
% |
13.78 |
% |
NA |
NA |
19.92 |
% |
18.92 |
% |
21.09 |
% |
NA |
NA |
|||||||||||||||||||||||||
|
Life of Fund |
12.04 |
% |
6.26 |
% |
NA |
NA |
11.31 |
% |
11.31 |
% |
12.39 |
% |
NA |
NA |
|||||||||||||||||||||||||
The inception date for Class A, B and C shares is 10/16/00 for all Funds except Columbia Thermostat Fund, Columbia Acorn Emerging Markets Fund and Columbia Acorn European Fund. The inception date for Class A, B and C shares of Columbia Thermostat Fund is 3/03/03. The inception date for Class I shares is 9/27/10 for all Funds. The inception date for all share classes of Columbia Acorn Emerging Markets Fund and Columbia Acorn European Fund is 8/19/11. The inception date for Class R and R5 shares of Columbia Acorn International is 8/2/11.
The returns shown for "Life of Fund" are calculated from the inception date of the Fund. In cases where the inception date of the Fund is earlier than the inception date of a share class, or where a period shown dates to before the inception date of a share class, the returns shown may append the returns of the Fund's Class Z shares, the Fund's oldest share class. These returns are adjusted to reflect any higher class-related operating expenses of the newer share classes, as applicable. Please visit columbiamanagement.com/mutual-funds/appended-performance for more information.
All results shown assume reinvestment of distributions and do not reflect the deduction of taxes that a shareholder would pay on fund distributions or on the redemption of fund shares.
*The Funds generally no longer accept investments by new or existing investors in Class B shares, except in connection with the reinvestment of any dividend and/or capital gain distributions in Class B shares of the Funds and exchanges by existing Class B shareholders of certain other funds within the Columbia Family of Funds.
**Not annualized.
Performance data shown represents past performance and is not a guarantee of future results. The investment return and principal value of an investment will fluctuate so that shares, when redeemed, may be worth more or less than their original cost.
Performance results reflect any fee waivers or reimbursements of Fund expenses by the investment manager and/or any of its affiliates. Absent these fee waivers and/or expense reimbursement arrangements, performance results would have been lower.
Current performance may be lower or higher than the performance data shown. Please visit columbiamanagement.com for daily and most recent month-end updates.
The "with sales charge" returns include the maximum initial sales charge of 5.75% for Class A shares, the applicable contingent deferred sales charge (CDSC) for Class B shares (5%, 4%, 3%, 3%, 2%, 1%, 0% for the first through seventh years after purchase, respectively), and the maximum CDSC of 1.00% of Class C shares during the first year after purchase.
Please see Page 97 of this report for each Fund's operating expense ratio as of the end of the third quarter. On this page, you will find information on fee waiver/expense reimbursement arrangements in place for Columbia Acorn International, Columbia Thermostat Fund, Columbia Acorn Emerging Markets Fund and Columbia Acorn European Fund.
†A "fund of funds" bears its allocable share of the costs and expenses of the underlying funds in which it invests. Such funds are thus subject to two levels of fees and potentially higher expense ratios than would be associated with an investment in a fund that invests and trades directly in financial instruments under the direction of a single manager.
3
Columbia Acorn Family of Funds
Fund Performance vs. Benchmarks Average Annual Total Returns through 9/30/12
| Class A Shares, without sales charge |
3rd quarter* |
Year to date* |
1 year |
5 years |
10 years |
Life of Fund |
|||||||||||||||||||||
| Columbia Acorn Fund (LACAX) (10/16/00) |
4.74 |
% |
14.28 |
% |
26.44 |
% |
2.41 |
% |
11.72 |
% |
14.22 |
% |
|||||||||||||||
|
Russell 2500 Index |
5.57 |
% |
14.33 |
% |
30.93 |
% |
2.80 |
% |
10.86 |
% |
NA |
||||||||||||||||
|
S&P 500 Index** |
6.35 |
% |
16.44 |
% |
30.20 |
% |
1.05 |
% |
8.01 |
% |
10.64 |
% |
|||||||||||||||
|
Russell 2000 Index |
5.25 |
% |
14.23 |
% |
31.91 |
% |
2.21 |
% |
10.17 |
% |
NA |
||||||||||||||||
|
Lipper Mid-Cap Growth Funds Index |
4.40 |
% |
12.46 |
% |
24.04 |
% |
1.33 |
% |
9.82 |
% |
NA |
||||||||||||||||
| Columbia Acorn International (LAIAX) (10/16/00) |
7.21 |
% |
16.39 |
% |
18.61 |
% |
-0.67 |
% |
13.95 |
% |
10.63 |
% |
|||||||||||||||
|
S&P Global Ex-U.S. Between $500M and $5B Index |
7.59 |
% |
12.78 |
% |
13.63 |
% |
-1.68 |
% |
13.77 |
% |
8.24 |
% |
|||||||||||||||
|
S&P Global Ex-U.S. SmallCap Index |
8.36 |
% |
13.73 |
% |
15.04 |
% |
-2.57 |
% |
13.09 |
% |
7.52 |
% |
|||||||||||||||
|
MSCI EAFE Index |
6.92 |
% |
10.08 |
% |
13.75 |
% |
-5.24 |
% |
8.20 |
% |
5.51 |
% |
|||||||||||||||
|
Lipper International Small/Mid Growth Funds Index |
8.92 |
% |
17.29 |
% |
20.67 |
% |
-1.73 |
% |
12.89 |
% |
NA |
||||||||||||||||
| Columbia Acorn USA (LAUAX) (10/16/00) |
4.49 |
% |
15.09 |
% |
28.79 |
% |
2.07 |
% |
10.57 |
% |
9.62 |
% |
|||||||||||||||
|
Russell 2000 Index |
5.25 |
% |
14.23 |
% |
31.91 |
% |
2.21 |
% |
10.17 |
% |
7.30 |
% |
|||||||||||||||
|
Lipper Small-Cap Growth Funds Index |
5.39 |
% |
14.82 |
% |
29.61 |
% |
1.54 |
% |
9.13 |
% |
5.87 |
% |
|||||||||||||||
| Columbia Acorn Int'l Select (LAFAX) (10/16/00) |
12.47 |
% |
23.98 |
% |
26.25 |
% |
0.60 |
% |
13.38 |
% |
9.51 |
% |
|||||||||||||||
|
S&P Developed Ex-U.S. Between $2B and $10B Index |
7.13 |
% |
10.85 |
% |
11.95 |
% |
-3.73 |
% |
11.02 |
% |
6.90 |
% |
|||||||||||||||
|
MSCI EAFE Index |
6.92 |
% |
10.08 |
% |
13.75 |
% |
-5.24 |
% |
8.20 |
% |
3.21 |
% |
|||||||||||||||
|
Lipper International Small/Mid Growth Funds Index |
8.92 |
% |
17.29 |
% |
20.67 |
% |
-1.73 |
% |
12.89 |
% |
9.90 |
% |
|||||||||||||||
| Columbia Acorn Select (LTFAX) (10/16/00) |
6.45 |
% |
14.58 |
% |
25.16 |
% |
-1.44 |
% |
8.69 |
% |
9.00 |
% |
|||||||||||||||
|
S&P MidCap 400 Index |
5.44 |
% |
13.77 |
% |
28.54 |
% |
3.83 |
% |
10.77 |
% |
9.10 |
% |
|||||||||||||||
|
S&P 500 Index** |
6.35 |
% |
16.44 |
% |
30.20 |
% |
1.05 |
% |
8.01 |
% |
3.42 |
% |
|||||||||||||||
|
Lipper Mid-Cap Growth Funds Index |
4.40 |
% |
12.46 |
% |
24.04 |
% |
1.33 |
% |
9.82 |
% |
6.14 |
% |
|||||||||||||||
| Columbia Thermostat Fund (CTFAX) (3/3/03)† |
4.76 |
% |
11.69 |
% |
20.22 |
% |
4.68 |
% |
8.05 |
% |
7.87 |
% |
|||||||||||||||
|
S&P 500 Index |
6.35 |
% |
16.44 |
% |
30.20 |
% |
1.05 |
% |
8.01 |
% |
7.95 |
% |
|||||||||||||||
|
Barclays U.S. Aggregate Bond Index |
1.59 |
% |
3.99 |
% |
5.16 |
% |
6.53 |
% |
5.32 |
% |
5.34 |
% |
|||||||||||||||
|
Lipper Flexible Portfolio Funds Index |
5.55 |
% |
11.62 |
% |
18.63 |
% |
2.36 |
% |
7.74 |
% |
7.73 |
% |
|||||||||||||||
|
50/50 Blended Benchmark |
3.96 |
% |
10.21 |
% |
17.35 |
% |
4.24 |
% |
6.99 |
% |
6.97 |
% |
|||||||||||||||
| Columbia Acorn Emerging Markets Fund (CAGAX) (8/19/11) |
9.66 |
% |
20.19 |
% |
25.90 |
% |
— |
— |
10.05 |
% |
|||||||||||||||||
|
S&P Emerging Markets Between $500M and $5B Index |
7.83 |
% |
17.41 |
% |
18.53 |
% |
— |
— |
1.44 |
% |
|||||||||||||||||
|
MSCI Emering Markets Small Cap Index |
8.41 |
% |
16.29 |
% |
15.52 |
% |
— |
— |
-2.76 |
% |
|||||||||||||||||
|
Lipper Emerging Markets Index |
7.02 |
% |
12.98 |
% |
18.73 |
% |
— |
— |
4.71 |
% |
|||||||||||||||||
| Columbia Acorn European Fund (CAEAX) (8/19/11) |
7.14 |
% |
19.50 |
% |
20.68 |
% |
— |
— |
12.04 |
% |
|||||||||||||||||
|
S&P Europe Between $500M and $5B Index |
10.30 |
% |
18.73 |
% |
19.21 |
% |
— |
— |
9.09 |
% |
|||||||||||||||||
|
HSBC Smaller European Companies Index |
9.92 |
% |
16.00 |
% |
14.91 |
% |
— |
— |
4.40 |
% |
|||||||||||||||||
|
Lipper European Region Index |
8.43 |
% |
13.91 |
% |
20.61 |
% |
— |
— |
11.11 |
% |
|||||||||||||||||
*Not annualized.
**Although the Fund typically invests in small- and mid-sized companies, the comparison to the S&P 500 Index is presented to show performance against a widely recognized market index over the life of the Fund.
Performance data shown represents past performance and is not a guarantee of future results. The investment return and principal value of an investment will fluctuate so that shares, when redeemed, may be worth more or less than their original cost. Current performance may be lower or higher than the performance data shown. Please visit columbiamanagement.com for daily and most recent month-end updates.
Performance results reflect any fee waivers or reimbursements of Fund expenses by the investment manager and/or its affiliates. Please see Page 97 of this report for information on contractual fee waiver/expense reimbursement arrangements in place for Columbia Acorn International, Columbia Thermostat Fund, Columbia Acorn Emerging Markets Fund and Columbia Acorn European Fund. Absent these fee waivers/expense reimbursement arrangements, performance results would have been lower. Annual operating expense ratios are stated as of each Fund's current prospectus dated May 1, 2012, and differences in expense ratios disclosed elsewhere in this report may result from application of any fee waivers/expense reimbursements as well as different time periods used in calculating the ratios. Columbia Acorn Fund: Class A: 1.11%; Class B: 1.81%; Class C: 1.94%; Class I: 0.71%. Columbia Acorn International: Class A: 1.35%; Class B: 2.08%; Class C: 2.14%; Class I: 0.86%; Class R: 1.42%; Class R5: 0.87%. Columbia Acorn USA: Class A: 1.33%; Class B: 2.10%; Class C: 2.18%;
Class I: 0.95%. Columbia Acorn International Select: Class A: 1.62%; Class B: 2.32%; Class C: 2.44%; Class I: 1.08%. Columbia Acorn Select: Class A: 1.35%; Class B: 2.05%; Class C: 2.17%; Class I: 0.91%. Columbia Thermostat Fund: Class A: 1.15%; Class B: 1.65%; Class C: 1.90%. Columbia Acorn Emerging Markets Fund Class A: 1.85%; Class C: 2.60%; Class I: 1.41%. Columbia Acorn European Fund Class A: 1.75%; Class C: 2.50%; Class I: 1.31%.
†A "fund of funds" bears its allocable share of the costs and expenses of the underlying funds in which it invests. Such funds are thus subject to two levels of fees and potentially higher expense ratios than would be associated with an investment in a fund that invests and trades directly in financial instruments under the direction of a single manager.
The returns shown for "Life of Fund" are calculated from the inception date of the Fund. The returns shown for periods prior to inception of a Fund's Class A shares may append the returns of the Fund's Class Z shares, the Fund's oldest share class. These returns are adjusted to reflect any higher class-related operating expenses of the newer share classes, as applicable. Please visit columbiamanagement.com/mutual-funds/appended-performance for more information.
All results shown assume reinvestment of distributions and do not reflect the deduction of taxes that a shareholder would pay on fund distributions or on the redemption of Fund shares. Unlike mutual funds, indexes are not actively managed and do not incur fees or expenses. It is not possible to invest directly in an index.
4
Columbia Acorn Family of Funds
Descriptions of Indexes Included in this Report
• 50/50 Blended Benchmark, established by the Fund's investment manager, is an equally weighted custom composite of Columbia Thermostat Fund's primary equity and primary debt benchmarks, the S&P 500 Index and the Barclays U.S. Aggregate Bond Index, respectively. The percentage of the Fund's assets allocated to underlying stock and bond portfolio funds will vary, and accordingly the composition of the Fund's portfolio will not always reflect the composition of the 50/50 Blended Benchmark.
• Barclays U.S. Aggregate Bond Index is a market value-weighted index that tracks the daily price, coupon, pay-downs and total return performance of fixed-rate, publicly placed, dollar-denominated and non-convertible investment grade debt issues with at least $250 million par amount outstanding and with at least one year to final maturity.
• HSBC Smaller European Companies (inc UK) Index is a weighted combination of two indexes: the HSBC Smaller Europe (ex UK) Index and the HSBC Smaller UK Index. The index is rebalanced on a quarterly basis.
• Lipper Indexes include the largest funds tracked by Lipper, Inc. in the named category. Lipper Mid-Cap Growth Funds Index, 30 largest mid-cap growth funds, including Columbia Acorn Fund and Columbia Acorn Select; Lipper International Small/Mid Growth Funds Index, 10 largest non-U.S. small/mid growth funds, including Columbia Acorn International; Lipper Small-Cap Growth Funds Index, 30 largest small-cap growth funds, including Columbia Acorn USA; Lipper Flexible Portfolio Funds Index, an equal-weighted index of the 30 largest mutual funds within the Flexible Portfolio fund classification, as defined by Lipper. Lipper Emerging Markets Index, 30 largest emerging markets funds; Lipper European Region Index, 10 largest European funds.
• MSCI Europe, Australasia, Far East (EAFE) Index (Net) is a capitalization-weighted index that tracks the total return of common stocks in 22 developed-market countries within Europe, Australasia and the Far East. The returns of the MSCI EAFE Index (Net) are presented net of the withholding tax rate applicable to foreign non-resident institutional investors in the foreign companies included in the index who do not benefit from double taxation treaties.
• MSCI Emerging Markets Small Cap Index, a widely recognized international benchmark, is a free float-adjusted market capitalization index that is designed to measure small-cap emerging market equity performance. The MSCI Emerging Markets Small Cap Index currently consists of the following 21 emerging market country indexes: Brazil, Chile, China, Colombia, Czech Republic, Egypt, Hungary, India, Indonesia, Korea, Malaysia, Mexico, Morocco, Peru, Philippines, Poland, Russia, South Africa, Taiwan, Thailand and Turkey.
• Russell 2000 Index measures the performance of the 2,000 smallest companies in the Russell 3000 Index, which represents approximately 10% of the total market capitalization of the Russell 3000 Index.
• Russell 2500 Index measures the performance of the 2,500 smallest companies in the Russell 3000 Index, which represents approximately 17% of the total market capitalization of the Russell 3000 Index.
• Standard & Poor's (S&P) 500 Index tracks the performance of 500 widely held, large-capitalization U.S. stocks.
• Standard & Poor's (S&P) MidCap 400 Index is a market value-weighted index that tracks the performance of 400 mid-cap U.S. companies.
• S&P Developed Ex-U.S. Between $2B and $10B Index is a subset of the broad market selected by the index sponsor representing the mid-cap developed market, excluding the United States.
• S&P Emerging Markets Between $500M and $5B Index represents the institutionally investable capital of emerging market countries with market caps ranging between $500 million to $5 billion, as selected by S&P. The index currently consists of the following 21 emerging market country indexes: Brazil, Chile, China, Colombia, Czech Republic, Egypt, Hungary, India, Indonesia, Korea, Malaysia, Mexico, Morocco, Peru, Philippines, Poland, Russia, South Africa, Taiwan, Thailand and Turkey.
• S&P Europe Between $500M and $5B Index represents the institutionally investable capital of European countries with market caps ranging between $500 million to $5 billion, as selected by S&P. The index currently consists of the following 17 developed market country indexes: Austria, Belgium, Denmark, Finland, France, Germany, Greece, Ireland, Italy, Luxembourg, the Netherlands, Norway, Portugal, Spain, Sweden, Switzerland and the United Kingdom.
• S&P Global Ex-U.S. SmallCap Index consists of the bottom 20% of institutionally investable capital of developed and emerging countries, excluding the United States.
• S&P Global Ex-U.S. Between $500M and $5B Index is a subset of the broad market selected by the index sponsor representing the mid- and small-cap developed and emerging markets, excluding the United States.
Unlike mutual funds, indexes are not managed and do not incur fees or expenses. It is not possible to invest directly in an index.
5
Columbia Acorn Family of Funds
Estimated Year-End Distributions
To help with your tax planning, following are the estimated year-end capital gain distributions for the Columbia Acorn Funds. With the exception of Columbia Thermostat Fund, the expected record date is December 5, 2012, the ex-dividend date is December 6, 2012, and the payable date is December 6, 2012. For Columbia Thermostat Fund, the expected record date is December 20, 2012, the ex-dividend date is December 21, 2012, and the payable date is December 21, 2012. Distribution information is not final and should not be considered final until after the record date. The board of trustees will determine the actual distributions the Funds will pay.
|
Short-term Capital Gains |
Long-term Capital Gains |
||||||||||
|
Columbia Acorn Fund |
None |
$ |
1.25 - $1.50 |
||||||||
|
Columbia Acorn International |
None |
None |
|||||||||
|
Columbia Acorn USA |
None |
$ |
2.20 - $2.45 |
||||||||
|
Columbia Acorn International Select |
None |
$ |
1.95 - $2.20 |
||||||||
|
Columbia Acorn Select |
None |
$ |
1.35 - $1.60 |
||||||||
|
Columbia Thermostat Fund |
None |
None |
|||||||||
|
Columbia Acorn Emerging Markets Fund |
None |
None |
|||||||||
|
Columbia Acorn European Fund |
None |
None |
|||||||||
Net Asset Value Per Share as of 9/30/12
|
Columbia Acorn Fund |
Columbia Acorn International |
Columbia Acorn USA |
Columbia Acorn International Select |
Columbia Acorn Select |
Columbia Thermostat Fund |
Columbia Acorn Emerging Markets Fund |
Columbia Acorn European Fund |
||||||||||||||||||||||||||||
|
Class A |
$ |
30.05 |
$ |
39.68 |
$ |
29.80 |
$ |
29.94 |
$ |
25.73 |
$ |
14.30 |
$ |
11.13 |
$ |
11.25 |
|||||||||||||||||||
|
Class B |
$ |
27.53 |
$ |
38.39 |
$ |
27.40 |
$ |
28.58 |
$ |
23.84 |
$ |
14.35 |
NA |
NA |
|||||||||||||||||||||
|
Class C |
$ |
27.10 |
$ |
38.23 |
$ |
27.10 |
$ |
28.42 |
$ |
23.59 |
$ |
14.32 |
$ |
11.05 |
$ |
11.20 |
|||||||||||||||||||
|
Class I |
$ |
31.20 |
$ |
39.84 |
$ |
31.11 |
$ |
30.26 |
$ |
26.60 |
NA |
$ |
11.18 |
$ |
11.27 |
||||||||||||||||||||
|
Class R |
NA |
$ |
39.61 |
NA |
NA |
NA |
NA |
NA |
NA |
||||||||||||||||||||||||||
|
Class R5 |
NA |
$ |
39.80 |
NA |
NA |
NA |
NA |
NA |
NA |
||||||||||||||||||||||||||
6
Chattering Squirrels
Columbia Acorn International Turns 20
|
|
|
||||||
|
P. Zachary Egan |
Louis J. Mendes III |
||||||
|
Co-Portfolio Manager |
Co-Portfolio Manager |
||||||


On September 23, Columbia Acorn International celebrated its 20-year anniversary. The timing of the Fund's launch was auspicious: after posting a 6.9% return through December 31, 1992 (returns based on Class Z shares, the Fund's oldest share class), even as international markets were generally down, the Fund went on in its first calendar year of operation in 1993 to return over 49%, with assets under management rising from $29 million to $906 million. By all accounts, the Fund has had a successful run. As of September 30, 2012, Columbia Acorn International Class Z was ranked the best performing (1 out of 53) equity mutual fund over 20 years in the "Global ex-USA" investment area as defined by Morningstar.1 However, past performance does not guarantee future results. Today the Fund has about $6.4 billion in assets under management.
As one of the largest dedicated international small-cap funds, the Fund enjoys certain advantages. One important advantage that scale provides is the ability to maintain a large and specialized analyst team. Our current 10-person team has the necessary language and other skills, time and financial resources to ferret out investment ideas wherever they might be. In the course of the last year alone, our analysts have met with over a thousand companies and spent time on the ground in dozens of countries. Our size and research firepower also allow us to construct a broad portfolio containing lots of stocks and consequently myriad data points on industry and other developments. Combined with an investment holding period comparatively long for the industry (as reflected in the Fund's historically low portfolio turnover), our size facilitates patient analysis and thoughtful decision making. Scale also confers an ability to vote large numbers of shares of our portfolio companies in the interests of our clients, and to engage in a dialogue with portfolio companies regarding the issues that matter most to us as long-term shareholders.
An annualized 10.63% (Class A shares, without sales charge) return from Fund inception through September 30,
2012, equates to a 7.6-times multiple of investment. At the 1992 launch, the Fund used the MSCI EAFE Index as its benchmark, which was the most widely recognized international benchmark at the time. This index returned a comparatively lower 5.51% annualized gain over this same time period. While that is still nicely ahead of inflation and therefore confers a pleasing increase in purchasing power, it equates to a multiple of merely three-times an initial investment made at the Fund's launch, reflecting how, when compounded over a long period, a spread over a benchmark makes a big difference. Today the Fund uses the S&P Global Ex-U.S. Between $500M and $5B Index as its benchmark, which better captures our small-cap orientation and inclusion of emerging market stocks. This index has returned 8.24% per annum since the Fund's inception, which equates to a multiple on invested capital from Fund launch through September 30, 2012, of about 4.9 times. A $1,000 investment in Columbia Acorn International at inception would be worth about $7,600 today, but worth only about $4,900 had one obtained instead merely the benchmark return. For this reason, we at Columbia Wanger Asset Management (CWAM) are hyper attentive to how we do versus benchmarks. We track the returns on actual dollars that individual analysts generate, and have structured incentives so that analysts and portfolio managers are rewarded if shareholders enjoy returns net of fees that are meaningfully better than the benchmark return.
Consistency of process has also been a hallmark of the Fund over its 20-year history. While we have tried to learn from our mistakes and worked to improve our processes over the years, seeking to pay reasonable prices for growing businesses with better-than-average economics has remained a constant. By better-than-average economics, we mean high profits relative to the capital that must be tied up in the business in the form of assets, inventories and receivables. A good measure of the quality of a business can be its return on equity ("ROE"), defined as net income divided by accounting book value. The Fund's quality bias is reflected in the average ROEs of the companies that comprise it. The following table shows how, over the last 15 years (we couldn't get primary benchmark data going back 20 years), the weighted
7
average ROE of the companies in the Fund has been substantially higher (61% on average) than that of companies in the benchmark. Identifying high-quality businesses, however, is not enough to generate competitive returns. It is also important to buy them at the right price. The two right-hand columns in the table below demonstrate that, while we
generally have had to pay a premium to the market as measured by the price-to-earnings multiple, that premium has on average been modest (13%). Given the higher growth and quality we expect from these companies, that premium strikes us as reasonable.
|
September 30: |
ROE Columbia Acorn International (%) |
ROE benchmark (%) |
P/E Columbia Acorn International (multiple) |
P/E benchmark (multiple) |
|||||||||||||||
|
1998 |
* |
22.4 |
12.7 |
33.3 |
25.9 |
||||||||||||||
|
1999 |
* |
11.9 |
10.7 |
49.4 |
34.8 |
||||||||||||||
|
2000 |
* |
17.1 |
9.4 |
60.0 |
36.8 |
||||||||||||||
|
2001 |
* |
18.2 |
10.1 |
26.1 |
24.1 |
||||||||||||||
|
2002 |
* |
15.0 |
7.9 |
19.1 |
21.1 |
||||||||||||||
|
2003 |
* |
13.7 |
6.7 |
20.8 |
24.5 |
||||||||||||||
|
2004 |
* |
15.7 |
9.9 |
23.9 |
25.0 |
||||||||||||||
|
2005 |
* |
18.5 |
11.3 |
23.6 |
26.6 |
||||||||||||||
|
2006 |
* |
18.9 |
12.9 |
24.1 |
25.0 |
||||||||||||||
|
2007 |
* |
20.3 |
15.3 |
31.1 |
26.7 |
||||||||||||||
|
2008 |
** |
20.9 |
15.9 |
18.6 |
20.1 |
||||||||||||||
|
2009 |
** |
18.6 |
8.1 |
23.4 |
23.0 |
||||||||||||||
|
2010 |
** |
16.7 |
9.8 |
28.7 |
24.9 |
||||||||||||||
|
2011 |
** |
18.3 |
12.9 |
20.3 |
18.1 |
||||||||||||||
|
2012 |
** |
19.9 |
12.0 |
22.9 |
20.3 |
||||||||||||||
|
Average over 15 years |
17.7 |
11.0 |
28.4 |
25.1 |
|||||||||||||||
|
Premium (multiple) |
1.61 |
1.13 |
|||||||||||||||||
These are weighted average, trailing 12-month figures.
*The primary benchmark for Columbia Acorn International was the Citigroup EMI Global ex-U.S. Index ("EMI"). EMI was added as a benchmark for Columbia Acorn International on September 30, 1997.
**The primary benchmark for Columbia Acorn International was the S&P Global Ex-U.S. Between $500M and $5B Index.
We attribute much of the Fund's success over the last 20 years to generally getting the relationship between growth, quality and cost right. We did let valuations get away from us in the 1999-2000 period, which we don't intend to repeat. High ROE businesses generally have more of their earnings available to return to shareholders as dividends or share buybacks, or to reinvest in growth, as opposed to simply maintaining their asset base.
The international investment landscape is considerably changed from what it looked like in 1992. This is particularly salient when one considers Asia. While the "Asian Tiger" economies of Hong Kong, Singapore, Taiwan and Korea attracted a great deal of attention when the Fund was launched—the Fund roughly had as much weight in Asia ex-Japan as it does now—important markets today,
such as China and India, were essentially not investable. Throughout emerging markets,2 the opportunity set was also comparatively narrow in 1992, and heavily skewed towards unexciting banks and construction companies. We have a lot more entrepreneurial companies from which to choose today, companies that enjoy leadership positions in profitable niche areas, and therefore conform more closely to the high quality, Acorn-style businesses discussed above. The next 20 years could very well be as volatile and exciting as the last 20 years. We will remain steadfast in our process, and seek to be able to report at that time an even better record of stewardship of your money.
1 Morningstar Percentile Rankings are based on the average annual total returns of the funds in the category for the periods stated and do not include any sales charges or redemption fees, but do include 12b-1 fees and the reinvestment of
8
dividends and capital gains distributions. The highest (or most favorable) percentile rank is 1 and the lowest (or least favorable) percentile rank is 100. Rankings for each share class will vary due to different expenses. Had sales charges or redemption fees been included, total returns would be lower. Columbia Acorn International was ranked as follows. Rankings are based on funds that have an inception date of September 23, 1992, Columbia Acorn International's inception date, or older and reflect performance of the oldest share class.
As of September 30, 2012
|
Morningstar Category: Global ex USA |
1-year |
3-year |
5-year |
10-year |
20-year |
||||||||||||||||||
|
Columbia Acorn International, Class Z |
20 |
2 |
1 |
2 |
1 |
||||||||||||||||||
|
Number of funds in category |
53 |
53 |
53 |
53 |
53 |
||||||||||||||||||
©2012 Morningstar, Inc. All rights reserved. The information contained herein: (1) is proprietary to Morningstar and/or its content providers; (2) may not be copied or distributed; and (3) is not warranted to be accurate, complete or timely. Neither Morningstar nor its content providers are responsible for any damages or losses arising from any use of this information.
2 Emerging markets today represent about a quarter of the Fund's investment universe and a quarter of the stocks in the Fund. Emerging market countries include Brazil, Chile, China, Colombia, Czech Republic, Egypt, Hungary, India, Indonesia, Korea, Malaysia, Mexico, Morocco, Peru, Philippines, Poland, Russia, South Africa, Taiwan, Thailand and Turkey.
9
2012 Shareholder Information Meeting Recap
On September 19, 2012, we held our annual Shareholder Information Meeting in Chicago. Following are highlights from your portfolio managers' presentations. While they did not present at this year's meeting, the portfolio managers of Columbia Acorn Emerging Markets Fund, Columbia Acorn European Fund and Columbia Acorn Select have provided comments to include in this recap. Data used in the presentations has been updated through September 30, 2012.
Charles P. McQuaid, Chief Investment Officer and Lead Portfolio Manager, Columbia Acorn Fund and Columbia Thermostat Fund
Columbia Acorn Fund's performance fell short of its benchmark, the Russell 2500 Index, for the 1-year period ended September 30, 2012. Fund foreign stock holdings hurt performance by 0.8% during the period, as did domestic consumer discretionary holdings, which cost the Fund nearly 1.5%. Domestic industrials were about neutral for performance this year, while telecom services stocks helped.
Looking at largest positions in the Fund, industrial stocks Ametek, Donaldson and Mettler-Toledo International occupy important niches, and all have shown excellent profitability and continue to do well fundamentally. Premium active apparel retailer lululemon athletica has generally been strong but on a roller coaster ride over the last year. It was a standout on the negative side in the second quarter, then a top contributor in the third. Due to valuation concerns and our desire to control risk, we sold about 40% of the Fund's position in lululemon athletica over the last year.
The communications tower industry is a prime example of our "downstream from technology" theme. Technology is a tough sector with lots of competition and fast product cycles. Think of cell phones. First Motorola dominated the industry, then Nokia, then Blackberry-RIM, and now Apple and Samsung. Instead of investing in these companies, we've invested downstream. Most recently, we've focused on communications towers companies, which are often local monopolies because zoning keeps out additional towers. Big wireless companies are leasing additional tower space for antennas as consumers demand more data. Crown Castle International was on the Fund's top-10 list
last year and SBA Communications has joined the list this year. Due to size and valuation, we trimmed about a quarter of the Fund's Crown Castle position over the last year but we thought SBA Communications had more upside so we added to it.
Looking at weightings by industry, the Fund continues to have its largest overweight in industrials, where we've found stocks representing what we think are good businesses at reasonable valuations. Furthermore, we've added a new theme that we call, "The Resurgence of American Manufacturing." Manufacturing unit labor costs have remained steady in the United States for a few decades, while unit labor costs are rising rapidly in many developing countries. In addition, natural gas prices are much cheaper in the United States than in most of the industrialized world, and that reduces costs for many manufacturers. We've seen examples of companies moving manufacturing to the United States, and with that manufacturing comes demand for equipment and components.
Though down from last year, Columbia Acorn Fund's next largest overweight is in consumer discretionary. While we still believe in the affordable luxury of American brands, economic problems overseas have slowed progress in several countries and some of the stocks are down as a result. We also felt that some stocks in this sector were getting expensive, so we trimmed.
The largest underweight continues to be in financials, due largely to the Fund having relatively little exposure to Real Estate Investment Trusts (REITs). REIT growth has generally been slower than other industries, and we don't think many of the stocks are cheap. We did make some purchases of insurance stocks because we believed valuations were reasonable and the insurance cycle was turning positive, but returns on capital are generally uninspiring.
Turning our attention to Columbia Thermostat Fund, we celebrated the Fund's 10-year anniversary in September. From inception through the end of September, the Fund's Class A share performance, without sales charge, was in line with its equity benchmark, despite having lower volatility, and beat its debt benchmark.
10
A decade ago, firm and Fund founder Ralph Wanger noted that, historically, there have been two long-term market phases: one he called "exponential growth," where stocks generally rise for many years, and the other he called "sine wave," where stocks are stuck in a trading range. These sine wave phases had lasted as long as 25 years. Ralph designed Columbia Thermostat Fund for a sine wave market cycle, and that is indeed what we've experienced since the Fund's inception.
Columbia Thermostat Fund buys stock funds when the market drops and sells them when the market goes up. Except for a little cash, the dollars come from, or go to, the bond funds. Thermostat's percentage of stocks has faithfully moved in the opposite direction of the market. Buying low and selling high has been effective so far in this sine wave market.
Robert A. Mohn, Director of Domestic Research, Lead Portfolio Manager, Columbia Acorn USA and Co-portfolio Manager, Columbia Acorn Fund
Columbia Acorn USA fell short of its small-cap benchmark, the Russell 2000 Index, for the one-year period ended September 30, 2012. Most of that shortfall occurred as the market surged during the fourth quarter of last year and the Fund failed to keep up. In 2012, Columbia Acorn USA's relative performance began to bounce back, and the Fund led its benchmark year-to-date through the end of September.
The Fund's best-performing sectors over the past 12 months were telecommunications and industrials. In telecom, the Fund benefitted from a heavy weight in cellular tower stocks and companies providing fiber optic connections to businesses. In industrials, the Fund had strong performers ranging from companies that manufacture dispensing systems for adhesives to companies that sell commercial lighting fixtures. The poorest-performing sectors over the past 12 months were: retailers, where too many of the Fund's larger holdings announced disappointing same-store sales results; financials, hurt by a group of our smaller, regional banks whose margins are getting squeezed by the Fed's zero interest rate policy; and health care equipment, with companies suffering from crimped capital expenditure budgets at hospitals.
I want to discuss two aspects of our research process: our team approach and our theme approach. Our domestic research team is made up of 15 analysts organized along industry lines, each with a specialized area of expertise. What is rather unique to us is how deeply the team is involved in directly managing our flagship Columbia Acorn Fund. We think of Columbia Acorn Fund as being divided into smaller industry sector funds, each managed by one of our analysts. We internally track the performance of each analyst's sector funds and tie his or her compensation to the return the analyst achieves relative to an industry-specific benchmark. Furthermore, roughly half of our analysts are able to directly input trades for the Fund. This is why we often refer to our investment management style as a team approach. Less seasoned analysts are required to run their trading ideas by the portfolio managers, who are also responsible for industry weighting decisions and risk management.
Next, I want to elaborate on our theme approach to investing by discussing three of our current investment themes.
Orphan Drugs/Breakthrough Therapies
Our biotech analyst, Rich Watson, has concentrated his biotech holdings in a group of companies developing what are called orphan drugs. These drugs treat life-threatening diseases that only affect a small number of patients.
Why are we focused on orphans? First, they have an easier regulatory pathway through the U.S. Food and Drug Administration (FDA). Given their tiny patient populations, the FDA acknowledges that large trials are not feasible for orphan drugs and, since they treat extremely severe and unmet medical needs, the FDA is more tolerant of any side effects identified during the trial process. Second, orphan drugs have superior pricing power. Though orphan drugs are often quite expensive on an individual dosage basis, any one payor typically insures only a handful of patients with a given orphan disease so the cost is relatively small. Finally, orphan drugs have stronger patent protection, less risk of generic competition and stickier market share than traditional pharmaceuticals.
The Cloud
Traditionally, computers have operated in an on-site environment, where programs, databases and storage capacity are physically located on your site. Cloud computing takes that
11
stuff and centralizes it, usually on a large cluster of off-site servers, where you can access your applications and computing power through the internet. The Cloud offers many benefits to computer users: it's cheaper, it's more scalable, more flexible and allows users to access huge amounts of computing power on an as-needed, pay-as-you-go basis.
Our software analyst, John Emerson, has built up investments in companies that own and manage the data centers that house the Cloud infrastructure, as well as in software companies that deliver their applications via the Cloud. These are called "software as a service" companies. Software delivered over the Cloud doesn't require on-site installation, which significantly reduces set-up costs. The time and effort required for ongoing management and maintenance of the software is also reduced, allowing companies to cut expenses and slim down their internal technology departments. Despite the obvious advantages, at the end of 2011 spending on software as a service was estimated to comprise less than 11% of the total software application market. We believe this powerful theme has a long way to go.
The Clean Theme
We began investing in our "clean theme" over 10 years ago, when our industrials analyst, Rob Chalupnik, recognized increasing global demand for cleaner inputs. These could be inputs for people, such as the air that we breathe or the water that we drink, as well as inputs for manufactured products and systems, such as engine air intakes or pharmaceutical reagents. Governmental regulation reinforces this theme, as regulatory mandates for a cleaner environment, safer food and more stringent quality control increase.
Most of our clean theme investments are in the filtration business, which has many appealing qualities. For example, a good portion of profits of these companies come from sales of replacement filters, which need to be replaced on a regular basis, in good times and in bad. Filtration companies also tend to have admirable pricing power. Another clean theme play is product inspection companies that inspect food items for contamination or test manufactured products for quality specifications.
Lead Portfolio Manager Ben Andrews and Co-portfolio Manager Robert A. Chalupnik, Columbia Acorn Select
Though we did not present at this year's Shareholder Information Meeting, we did attend and listened to what shareholders had to say. Many were concerned about U.S. deficit spending and whether it will cause high inflation in the future. The value of the dollar and the future for interest rates were also concerns.
While we consider these broader, economic problems, they reflect top-down issues that are difficult to decipher and predict. At CWAM, our analysts are what Chuck McQuaid likes to call "stock nuts." Stock nuts enjoy and get excited about analyzing and investing in companies. This is defined as bottom-up investing, an investment approach that de-emphasizes the significance of economic and market cycles and focuses on the analysis of individual stocks. As bottom-up investors, we focus our attention on a specific company rather than on the industry in which that company operates or on the economy as a whole. The bottom-up approach assumes that fundamentally strong companies can do well even in an industry that is struggling. This is the opposite of top-down investing. Top-down investing looks at the "big picture" in the economy and financial world and then breaks those components down into finer details. The top-down approach can be useful in determining the most promising sectors in a given market, but we have found that with top-down analysis, the bigger the picture you're trying to analyze, the more complicated it gets. Interest rates or inflation trends are huge, dynamic problems that are extremely difficult to predict with any sort of accuracy.
But investors are right to question the impact big-picture problems may have on their investment in the Funds. Long-term deficit spending has made the economic equation much more complicated now than in years past. Consider the U.S. Federal Reserve's quantitative easing programs. The Fed has bought $3 trillion of U.S. treasuries and mortgages, which amounts to more than 20% of the United States' debt obligations.1 What could be the repercussions of this move? Most would think that such excess government borrowing and market manipulation will raise interest rates and inflation. But if we look at Japan, which
12
has arguably been in one of these balance sheet recessions2 for many years now, there is little evidence of inflation. Japan's government debt is more than two-times its GDP, and they are experiencing more of a deflationary spiral. In the United States, the inflationary path seems more likely, though deflationary signs are present as well. It's also possible the United States won't experience either of these if solid growth of 3%-plus per year can be restored to the economy.
If the United States experiences inflation, precious metals, farmland, timberland, some real estate, and solid growth stocks may hold up in that environment. If the United States experiences deflation, cash, debt instruments (if the borrowers remain solvent), foreign investments in more stable markets and solid growth stocks, especially ones that pay a dividend (the stock's valuation multiple will contract, but it should rebound over time), could perform okay. Common to both of these scenarios is solid growth stocks, which is what CWAM analysts look for as bottom-up investors.
P. Zachary Egan, Director of International Research, Co-portfolio Manager, Columbia Acorn International and Columbia Acorn Emerging Markets Fund
September 23, 2012, marked the 20th anniversary of the launch of Columbia Acorn International. It is hard to exaggerate how much has changed in international politics and economics over the last 20 years. Curious about what the Fund looked like in the early days, I pulled some of the early annual reports and ran some performance comparisons. I discovered the following:
• Many of the companies that were held at Fund inception, particularly in Europe, are no longer publicly traded. Many were either acquired or merged. Some are now large-cap companies.
• The best performing stock in the Fund's history has been UK energy company Tullow Oil, up 20-times. We bought it almost 11 years ago and still hold it today.
• The worst performing stock was Fu Ji Food and Catering Services, a Chinese outsourced office canteen operator that ended in an accounting scandal and was a complete loss.
• And, while we hate losing money, the disparate outcomes of these two investments highlights one of the attractions of investing in growth companies: you can make 20-times your money, but only lose 1-time your money.
• Japan was the worst performing market over the Fund's history. At the outset of the Fund, Japan was massively over-valued and then suffered an unwinding of a property bubble.
• Scandinavian markets, which are mature economies with aging populations, were the best-performing markets for the Fund, underscoring that high GDP growth is less correlated with stock market returns than one might expect, though these markets had suffered through a banking crisis in the early '90s.
While doing my research, I was most struck by Ralph Wanger's commentary in the Fund's 1993 annual report. Investment commentary seldom holds up for even a few years, let alone 19, and it makes his words particularly noteworthy:
"Amazing things have been happening in the world. Over only a five-year time period, a majority of the world's population has gone from some form of socialism or state control toward free markets."
While that was not news to anybody at the time, succinctly identifying the single thing that will matter most to investors over a long period of time is not easy to do. When I consider how our Fund is positioned today, at a high level, it is this very same political/economic transformation, with origins in the late '80s and early '90s, that grounds many of the investment themes and ideas in the Fund.
This transformation is behind the integration of China, Central and Eastern Europe, and, to a lesser extent, India into the global production system. China's subsequent demand for resources brought a three-decade bear market in commodities to an end, which had huge repercussions for resource-based economies in Latin America and elsewhere. In India, after the dissolution of the Soviet Union took the shine off that economic model, economic liberalization, which started in 1992, removed constraints behind the 3% "Hindu rate of growth," in what used to be a highly insular economy. Finally, across much of Asia, this
13
transformation ultimately drove a marked increase in disposable incomes, resulting in the emergence of an entire continent of new consumers hungry for Western brands.
From a 40,000 foot view, this geopolitical change is still one of the biggest engines of growth in the global economy. Much of the Fund's investments ultimately tie to the movement of goods, capital, labor or ideas between high-income societies in the West and Japan on the one hand, and low cost, industrializing, urbanizing societies on the other. The uneven development of capitalism and free markets in the 20th century resulted in highly dissimilar levels of productivity and, with it, wages and living standards. As firms now invest to take advantage of these dissimilarities, they grow, as do the economies in which they operate, which makes everybody on average richer.
This gradual convergence in productivity levels between "the West" and the rest, referred to as the "Great Convergence" by Financial Times journalist Martin Wolf, is making emerging societies richer. But the magnitude of these changes is not always fully appreciated. This change has expanded the ranks of consumers to whom packaged foods, leisure activities and luxury goods are affordable.
Another group of clear beneficiaries, however, are Western industrial companies that are facilitating the convergence by supplying sophisticated factory automation to Asian producers or complex logistics systems that tie producers into global supply chains. These companies control innovative products and processes not easily replicated by the Chinese and Indians. Western companies have an advantage in the form of a highly educated workforce, but also in the form of high production, and high environmental and safety standards that are eventually sought by emerging market customers. Industrial companies represent about a quarter of the Fund's assets, and many of them—largely from Europe and Japan—fit into this bucket.
In short, the big geopolitical change, which Ralph emphasized almost 20 years ago, arguably remains the most important feature of our investment landscape, and it's likely that capital will continue to flow into developing regions, driving productivity convergence with already industrialized economies, and generating a lot of opportunity for investors along the way.
Christopher J. Olson, Lead Portfolio Manager, Columbia Acorn International Select
Columbia Acorn International Select performance for the one-year period through September 30, 2012, more than doubled that of its benchmark, the S&P Developed Ex-U.S. Between $2B and $10B. Though up only slightly, the Fund's positive gain for the five-year period also outpaced the benchmark. The past one- and five-year periods have been characterized by a tremendous amount of volatility and economic uncertainty and I do not expect these influences to diminish in the near future.
With volatility expected to continue, you may wonder what is in store for the Fund. We closely consider the risks we are taking in the Fund's individual investments and in the portfolio as a whole. We believe that holding a portfolio of carefully researched and considered stocks should give the Fund good returns with a reasonable risk profile. It is important to manage that risk/reward balance over time to determine how long to hold a given stock.
Given the concentrated nature of the Fund, it is also important to carefully consider the larger risks that may be inherent in the portfolio, such as economic, political, country, industry, balance sheet and beta risks. While an investment may make sense on an individual level, the portfolio as a whole can take on different risk characteristics as a result of one investment.
In recent years, I've taken the view that there is much more risk inherent in the global financial system than the market believes. As a result, I've had a bias toward companies with high cash flow and dividend yields, visible earnings streams, solid and less complicated balance sheets, and businesses with good competitive positions. At the same time, I've also had a bias for regions with stronger government finances, less public debt and healthier banking systems.
The Fund's top 10 holdings reflect these themes. Taiwanese mobile telecom operators, Far EasTone and Taiwan Mobile are benefiting from the strong move to smartphones and the increasing data usage that accompanies such a transition. The mobile telecom market in Taiwan has only a few significant players, limiting competition. These are also cash-rich businesses with little debt. When purchased for the Fund in the second half of 2011,
14
these stocks yielded about 6% to 7% and currently yield in the 5% to 6% range. From a bottom-up perspective, these are attractive investments. From a macro perspective, they are located in an attractive environment. While Taiwan is susceptible to a slowdown in exports, its government is constitutionally limited to 40% government debt as a percent of GDP, the political situation looks stable for now, and the financial system is well regulated and relatively strong, after Taiwan learned its lesson during the Asian Crisis of the 1990s.
Another area represented in the Fund's largest holdings is Singapore REITs as highlighted by investments in Ascendas REIT, which was first added to the portfolio in May 2009, and Mapletree Industrial Trust, which was added in May of 2011. When bought, these stocks had dividend yields over 7% and are still currently around 6%, which, in a low interest rate world, is remarkable. And, they aren't the most risky businesses. During the 2008 financial crisis, occupancy rates for properties held by the REITs barely went down and the REITs were easily able to fund their debt when the markets were closed to many other participants. Singapore has a very pro-business environment with low tax rates, minimal regulations, a budget surplus, no net government debt, and a well-run banking system. It is no wonder that multinational companies are increasingly moving there, driving strong demand for property.
If we step back and look at the overall portfolio, where are the major risks to performance? The main one is possibly its more defensive nature. If real and/or nominal economic growth takes off and the markets rally, there is a risk that the Fund will lag its benchmark and competition. However, looking around the world, most data shows poor economic trends. I believe that we are unlikely to see a strong increase in growth. In fact, in many cases, the trends are worsening.
Central bank intervention could fuel a recovery and dampen the Fund's relative performance. At any sign of weakness over the past four years, central banks have stepped in to print money in an attempt to restart the financial markets and economies. In order to hedge fiscal policy risks to Fund performance, I greatly increased the Fund's weight in gold and silver mining stocks. These companies had languished for quite some time and had been trading at multiples far below
historical averages. We found a number of companies that made sense to invest in from the bottom up even if precious metal prices didn't rise. Goldcorp and Fresnillo, which show up in the top 10 holdings, are two of those.
Lead Portfolio Managers Fritz Kaegi and Stephen Kusmierczak, Co-portfolio Managers P. Zachary Egan and Louis J. Mendes, Columbia Acorn Emerging Markets Fund
A year ago, we described our investment process. With Columbia Acorn Emerging Markets Fund now over a year old, let's review its current positioning.
We have a team of 10 international analysts, each with a regional or sector coverage area. The analyst drives stock selection in the coverage area. We evaluate each analyst's performance by comparing the returns of the stocks selected versus the performance of all the stocks in his or her coverage area. Six of these analysts are also portfolio managers of a Columbia Acorn Fund.
Analysts' bottom-up stock selection drives the Fund's sector and regional weights—portfolio managers do not make a top-down sector or region tilt. The portfolio managers do track whether the Fund is leaning in one direction, or unintentionally making repeated bets on the same factor. We work together to appropriately size positions and triage ideas, generally (but not always) aiming for a minimum position size of 1% of the Fund for each holding.
The Fund's key tilt is toward consumer discretionary, with a sizable underweight in financials. Since September 2011, consumer discretionary has increased from 21% of the Fund to 30% as of September 30, 2012, while the benchmark weight has remained at about 15%. The Fund's consumer discretionary holdings are mostly retailers, casino operators and media stocks. In emerging markets, these companies can benefit from powerful competitive advantages, attractive incremental economics and growth drivers that are largely local, rather than global.
Growth is particularly important in valuing these companies, so they tend to trade at higher earnings multiples. In 2012, our holdings performed well but most are trading at higher earnings multiples than a year ago. These valuations get close scrutiny from us; we are spending a lot of time tracking growth trends, sustainable growth rates and
15
competitive conditions to make sure prices do not get ahead of reasonable expectations for growth.
In financials, the Fund's underweight relative to the benchmark is up from 9% last year to 13% at September 30, 2012. We are not making a top-down call on financials. Rather, our analysts individually see businesses—mostly banks—with little sustainable competitive advantage and transparency, and with much risk. Note that three financials (Rand Merchant Insurance, Coronation Fund Managers, and Halyk Savings Bank of Kazakhstan) are in our top 10 holdings because we like their competitive advantages. The Fund's financial holdings delivered a 37% return for the one-year period ended September 30, 2012, while financials in the benchmark rose 24% (against a rise in the benchmark itself of 18.53%). This demonstrates why we don't want top-down calls by portfolio managers to override our analysts' bottom-up assessments.
In regional terms, the Fund is 7% overweight in Southeast Asia and 10% underweight in Latin America.3 We like the local demand drivers and macro fundamentals in Southeast Asia, but our holdings' management teams and powerful business models were decisive to our positioning. In the case of Latin America, the Fund's underweight does not result from a negative opinion on the region. We do have three analysts that look closely at the area; we just haven't found enough good companies selling at attractive valuations in that region.
Lead Portfolio Manager Andreas Waldburg-Wolfegg and Co-portfolio Manager Stephen Kusmierczak, Columbia Acorn European Fund
We noted last year that launching the new Columbia Acorn European Fund in the middle of the ongoing European economic crisis seemed an odd proposition, yet we also maintained that there were good opportunities for stock picking in the region. We are pleased to report that Columbia Acorn European Fund outperformed its benchmark, the S&P Europe Between $500M and $5B Index, by 147 basis points over the last 12 months, gaining 20.68% (Class A shares, without sales charge) versus the benchmark's 19.21% increase. Since inception on August 19, 2011, the Fund was up 12.04% against a benchmark gain of 9.09%. Despite an environment of substantial
macroeconomic uncertainty, this performance has been achieved by focusing on companies and their businesses, not by trying to out-guess the political and economic strategists on the likelihood of a Greek exit from the Eurozone.
The European investment team, like the larger international team at CWAM of which it is a part, is mostly composed of generalist investors. This means that CWAM's international analyst responsibilities are largely apportioned by geography. We are not committed or required to maintain the same sector or country weights as our benchmark and instead construct the portfolio stock by stock, from the bottom up. Our decision to invest in a certain company and determining its proper weighting in the portfolio are the result of fundamental analysis. We believe we can gain an edge by organizing and analyzing information about small companies, rather than trying to decipher the intricacies of Europe's complex and diversified economy.
The result of this stock-picking strategy is a European portfolio that is overweight companies listed in France and Germany. We admittedly do not know what policies the new Hollande government will implement in France, yet our two largest holdings in the Fund are French-listed companies incorporated in the Netherlands and in Luxembourg. Gemalto is a leader in smart chip technology used in pin-chip credit cards and mobile phone electronic payments, while Eurofins Scientific is a supplier of food, pharmaceuticals and materials testing services. If we had steered the portfolio based on a perceived negative election result in France, we would have missed the over 85% return in our two biggest names. Instead, our analyst determined that these companies should benefit from trends that are easier to identify and measure, such as the growth in electronic payments and the increasing focus on food and product safety. Similarly, our fifth largest holding, Wirecard, is a provider of online payment processing and risk management. Our investment is not intended as a bet on German GDP growth. Rather, our analyst believes that Wirecard should be a major beneficiary of the growth in e-commerce. The stock gained over 50% in the 12 months ended September 30, 2012.
While the macroeconomic situation is still highly uncertain, we continue to believe that there are great
16
opportunities to invest in European companies by following CWAM's careful and disciplined investment approach.
The information and data provided in this analysis are derived from sources that we deem to be reliable and accurate. These views are not guarantees of future performance and involve certain risks, uncertainties and assumptions that are difficult to predict so actual outcomes and results may differ significantly from the views expressed. The views/opinions expressed in "Chattering Squirrels" are those of the authors and not of the Columbia Acorn Trust Board, are subject to change at any time based upon economic, market or other conditions, may differ from views expressed by other Columbia Management associates and the respective parties disclaim any responsibility to update such views. These views may not be relied on as investment advice and, because investment decisions for a Columbia Acorn Fund are based on numerous factors, may not be relied on as an indication of trading intent on behalf of any particular Columbia Acorn Fund.
Stocks of small- and mid-cap companies pose special risks, including possible illiquidity and greater price volatility than stocks of larger, more established companies. International investing involves special risks, including foreign taxation, currency risks, risks associated with possible differences in financial standards and other risks associated with future political and economic developments. Investing in emerging markets may involve greater risks than investing in more developed countries. In addition, concentration of investments in a single region may result in greater volatility. A fund that maintains a relatively concentrated portfolio may be subject to greater risk than a fund that is more fully diversified.
1 Additional data available on the Federal Reserve Bank of St. Louis website at http://research.stlouisfed.org/publications/usfd/20121005/usfd.pdf.
2 Koo, Richard C., The Holy Grail of Macroeconomics: Lessons from Japan's Great Recession, (Singapore, John Wiley & Sons (Asia) Pte. Ltd., 2008).
3 Country weights can be found on Pages 86 and 87.
17
Columbia Acorn Fund
In a Nutshell
|
|
|
||||||
|
Charles P. McQuaid |
Robert A. Mohn |
||||||
|
Lead Portfolio Manager |
Co-Portfolio Manager |
||||||


Performance data shown represents past performance and is not a guarantee of future results. The investment return and principal value will fluctuate so that shares, when redeemed, may be worth more or less than the original cost. Current performance may be lower or higher than the performance data shown. Please visit columbiamanagement.com for daily and most recent month-end performance updates.
Fund Positions
in Mentioned Holdings
As a percentage of net assets, as of 9/30/12
|
lululemon athletica |
1.9 |
% |
|||||
|
FMC Technologies |
1.4 |
% |
|||||
|
Ansys |
1.1 |
% |
|||||
|
Informatica |
1.0 |
% |
|||||
|
Cepheid |
1.0 |
% |
|||||
|
IPG Photonics |
0.9 |
% |
|||||
|
Hexagon |
0.7 |
% |
|||||
|
ARIAD Pharmaceuticals |
0.5 |
% |
|||||
|
Atwood Oceanics |
0.5 |
% |
|||||
|
ShawCor |
0.4 |
% |
|||||
|
Atmel |
0.3 |
% |
|||||
|
Rosetta Resources |
0.3 |
% |
|||||
|
Quality Systems |
0.2 |
% |
|||||
|
Kenexa |
0.2 |
% |
|||||
|
InterMune |
0.1 |
% |
|||||
Columbia Acorn Fund rose 4.74% (Class A shares, without sales charge) in the third quarter of 2012, somewhat less than the 5.57% gain of the Russell 2500 Index, its primary benchmark. As shown on Page 4, the Fund edged out the Lipper Mid-Cap Growth Index but rose less than the large-cap S&P 500 Index during this period.
Energy stocks were strong in the quarter. Oil service company FMC Technologies rose 18% on stronger demand, pricing and margins for its subsea production systems. Offshore driller Atwood Oceanics and Canada-based oil and gas pipeline products manufacturer ShawCor each gained 20%. Atwood booked contracts at higher rates while ShawCor put itself up for sale. Oil and gas exploration company Rosetta Resources jumped 31% on rising production and improved prices for natural gas liquids from its Eagle Ford shale wells in South Texas.
Technology stocks were mixed during the quarter. Winners included fiber laser producer IPG Photonics and engineering software company Ansys, up 31% and 16%, respectively, on better than expected earnings. Workforce management software provider Kenexa jumped 57% as it agreed to be purchased by IBM; this was the Fund's eleventh takeover announced in 2012. On the downside, data integration software company Informatica fell 18% on disappointing earnings, and semiconductor producer Atmel dropped 21% on a loss of market share.
Health care stocks generally lagged in the third quarter. Cepheid, a producer of molecular diagnostic instruments and supplies, had disappointing orders and then a manufacturing problem, and fell 23% during the quarter. Health care
information systems provider Quality Systems dropped 32% on a delay in orders pending the release of updated government standards. InterMune's stock was down 25% on a disappointing rollout of the drug manufacturer's pulmonary fibrosis drug in Europe. On the plus side, ARIAD Pharmaceuticals surged 41% on promising data from a study of its lung cancer drug.
Premium active apparel retailer lululemon athletica remained volatile, but in a good way this quarter. The stock was up 24% and was the Fund's largest dollar winner. Net sales increased 33%, driven by 15% same-store sales gains, additional stores, and e-commerce sales, which were up 91% from the prior year. Earnings guidance was boosted somewhat.
After several quarters of relative weakness, Columbia Acorn Fund's international stocks outperformed, rising 11.25%* in the quarter. Swedish measurement equipment and software provider Hexagon rose 25% on nice organic growth and improving margins. A handful of small Canada-listed energy stocks jumped over 30% on higher oil prices, while ShawCor, mentioned above, gained 20%. Columbia Acorn Fund's international stocks accounted for 8.7% of the Fund's assets at quarter end, up from 8.3% at the beginning of the quarter.
While the economic outlook remains uncertain, we are happy with the fundamental progress achieved by many of the portfolio holdings. This quarter's "Chattering Squirrels" section mentions several companies and themes that shareholders should find interesting.
*These returns are not comparable to mutual fund returns, as they are gross of fees and other expenses and do not portray the cash effects incurred by actual mutual funds. Columbia Acorn Fund's foreign stockholdings were not purchased as a balanced, stand-alone portfolio.
Stocks of small- and mid-cap companies pose special risks, including possible illiquidity and greater price volatility than stocks of larger, more established companies. International investing involves special risks, including foreign taxation, currency risks, risks associated with possible differences in financial standards, operational and settlement risks and other risks associated with future political and economic developments.
Portfolio holdings are subject to change periodically and may not be representative of current holdings.
18
Columbia Acorn Fund
At a Glance (Class A Shares - LACAX)
Performance data shown represents past performance and is not a guarantee of future results. The investment return and principal value of an investment will fluctuate so that shares, when redeemed, may be worth more or less than their original cost. Current performance may be lower or higher than the performance data shown. Performance results reflect any fee waivers or reimbursements of Fund expenses by the investment manager and/or any of its affiliates. Absent these fee waivers and/or expense reimbursement arrangements, performance results would have been lower. Please visit columbiamanagement.com for daily and most recent month-end updates.
Pretax and After-tax Average Annual Total Returns (Based on Class A Share Returns, inception 10/16/00)
through September 30, 2012
|
Year to date* |
1 year |
5 years |
10 years |
||||||||||||||||||||
|
Returns before taxes |
NAV POP |
14.28 7.72 |
% |
26.44 19.16 |
% |
2.41 1.20 |
% |
11.72 11.07 |
% |
||||||||||||||
|
Returns after taxes on distributions |
NAV POP |
14.06 7.52 |
25.60 18.36 |
1.87 0.67 |
11.12 10.47 |
||||||||||||||||||
|
Returns after taxes on distributions and sale of fund shares |
NAV POP |
9.54 5.26 |
18.14 13.35 |
2.00 0.96 |
10.42 9.81 |
||||||||||||||||||
|
Russell 2500 Index** (pretax) |
14.33 |
30.93 |
2.80 |
10.86 |
|||||||||||||||||||
All results shown assume reinvestment of distributions.
*Year to date data is not annualized.
**The Fund's primary benchmark.
After-tax returns are calculated using the highest historical individual federal marginal income tax rates, and do not reflect the impact of state and local taxes. Returns after taxes on distributions and sale of Fund shares reflect the additional tax impact of long-term gains or losses realized when Fund shares are sold. The returns are taxed at the maximum rate and assume shares were purchased at the beginning of the period. Actual after-tax returns depend on the investor's tax situation and may differ from those shown. After-tax returns are not relevant to investors who hold their Fund shares through tax-deferred arrangements such as 401(k) plans or individual retirement accounts. After-tax returns are shown for Class A shares only; after-tax returns for other share classes will vary. Indexes do not reflect any deduction for fees, expenses or taxes.
Public offering price (POP) returns include the maximum sales charge of 5.75% for Class A shares. Net asset value (NAV) returns do not include sales charges or contingent deferred sales charges (CDSC).
The Fund's Class A shares annual operating expense ratio, as stated in the May 1, 2012, prospectus, is 1.11%.
Columbia Acorn Fund Portfolio Diversification
as a percentage of net assets, as of 9/30/12
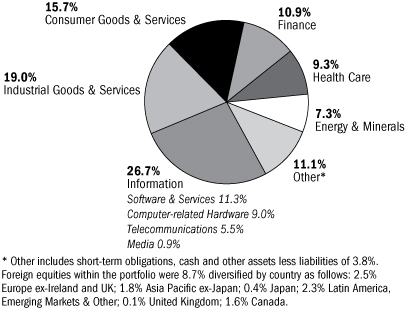
Columbia Acorn Fund Top 10 Holdings
as a percentage of net assets, as of 9/30/12
| 1. |
Ametek Aerospace/Industrial Instruments |
2.0 |
% | ||||||||
| 2. |
lululemon athletica Premium Active Apparel Retailer |
1.9 |
% | ||||||||
| 3. |
Donaldson Industrial Air Filtration |
1.7 |
% | ||||||||
| 4. |
Crown Castle International Communications Towers |
1.6 |
% | ||||||||
| 5. |
Mettler-Toledo International Laboratory Equipment |
1.6 |
% | ||||||||
| 6. |
tw telecom Fiber Optic Telephone/Data Services |
1.4 |
% | ||||||||
| 7. |
FMC Technologies Oil & Gas Wellhead Manufacturer |
1.4 |
% | ||||||||
| 8. |
SBA Communications Communications Towers |
1.2 |
% | ||||||||
| 9. |
Amphenol Electronic Connectors |
1.1 |
% | ||||||||
| 10. |
Ansys Simulation Software for Engineers & Designers |
1.1 |
% | ||||||||
The Fund's top 10 holdings and portfolio diversification vary with changes in portfolio investments. See the Statement of Investments for a complete list of the Fund's holdings.
The Growth of a $10,000 Investment in Columbia Acorn Fund (Class A)
June 10, 1970 (Fund inception) through September 30, 2012
The chart shows the change in value of a hypothetical $10,000 investment in Class A shares of the Fund during the stated time period. Although the indexes are provided for use in assessing the Fund's performance, the Fund's holdings may differ significantly from those in the index. It is not possible to invest directly in an index. The graph does not reflect taxes that a shareholder may pay on Fund distributions or on a sale of Fund shares.
The returns shown for periods prior to the inception date of the Fund's Class A shares are calculated from the inception date of the Fund and append the returns of the Fund's Class Z shares, the Fund's oldest share class. These returns are adjusted to reflect any higher class-related operating expenses of the newer share classes, as applicable. Please visit columbiamanagement.com/mutual-funds/appended-performance for more information.
Total Net Assets of the Fund: $17.5 billion
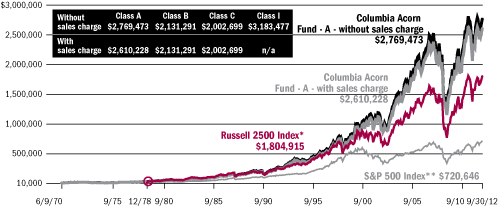
* A $10,000 investment in Columbia Acorn Fund at inception appreciated to $31,777 on December 31, 1978, the inception date of the Russell 2500 Index. For comparison with the Russell 2500 Index, we assigned the index the same value as the Fund at index inception.
**Although the Fund typically invests in small- and mid-sized companies, the comparison to the S&P 500 Index is presented to show performance against a widely recognized market index over the life of the Fund.
19
Columbia Acorn International
In a Nutshell
|
|
|
||||||
|
P. Zachary Egan |
Louis J. Mendes III |
||||||
|
Co-Portfolio Manager |
Co-Portfolio Manager |
||||||


Performance data shown represents past performance and is not a guarantee of future results. The investment return and principal value will fluctuate so that shares, when redeemed, may be worth more or less than the original cost. Current performance may be lower or higher than the performance data shown. Please visit columbiamanagement.com for daily and most recent month-end performance updates.
Fund's Positions
in Mentioned Holdings
As a percentage of net assets, as of 9/30/12
|
Nagacorp |
0.5 |
% |
|||||
|
Tahoe Resources |
0.5 |
% |
|||||
|
Mongolian Mining |
0.5 |
% |
|||||
|
United Breweries |
0.4 |
% |
|||||
|
New Oriental Education & Technology |
0.3 |
% |
|||||
|
Zhaojin Mining Industry |
0.3 |
% |
|||||
|
Sintokogi |
0.2 |
% |
|||||
|
PureCircle |
0.2 |
% |
|||||
|
Torishima Pump Manufacturing |
0.1 |
% |
|||||
Columbia Acorn International returned 7.21% (Class A shares, without sales charge) in the third quarter of 2012, 38 basis points behind its primary benchmark, the S&P Global Ex-U.S. between $500M and $5B Index. Year to date, the Fund's total return of 16.39% is 361 basis points ahead of its benchmark. International small-cap stocks have outperformed larger cap stocks so far this year, with the large-cap developed market MSCI EAFE Index rising 10.08% year to date.
Concerns regarding a global economic slowdown and credit crises in Europe and the United States have cast a net of nervousness over most equity markets globally. Grim sentiment on the macroeconomic picture persisted in the third quarter, as did the outlook for interest rates, already at historical lows. A slow-growth, low interest rate environment is challenging for investors, whether value-focused or searching for growth. Normally defensive, high dividend-paying, steady cash generators, such as real estate investment trusts, have been among the best performers, as investors have apparently settled in for what they expect to be a long period of bad economic news. With growth a scarce phenomenon in the world, emerging market consumer stocks were buoyant, as investors pushed into some of the only growth around, sometimes regardless of price. Cambodian-based gaming company Nagacorp rose 29% and India's leading brewer, United Breweries, was up 27%. Meanwhile most industrial and financial stocks have continued to struggle. Within the Fund, Japanese cyclical industrial companies led the quarter's decline with Sintokogi off 31%, Torishima Pump Manufacturing down 28%, and Shimadzu falling 18% on the back of weak quarterly earnings reports and concerns about overall global economic growth. We sold the Fund's position in Shimadzu.
The Fund's top percentage gains came from PureCircle, a small London-listed company involved in the refining and marketing of stevia, a zero calorie, all-natural alternative to sugar. This is a risky
company and a commensurately small position in the Fund. While there is considerable uncertainty about how stevia might ultimately be used, the product has won regulatory approvals in the United States and Europe, and more general adoption by food and beverage companies could eventually drive large volumes. Concerns over accounting treatment of U.S.-listed Chinese companies with complicated "variable interest equity structures" sent Chinese education service provider New Oriental Education & Technology down over 30%.
Gold and gold miners were up on concerns that money printing would eventually cause inflation. Guatemalan gold and silver miner Tahoe Resources, for example, rose 47% and China-based gold miner Zhaojin ("find gold" in Chinese) Mining Industry increased over 34% on a U.S. dollar gold bullion price, which was up almost 11% in the quarter. Not all commodity companies performed well in the quarter, especially those with disappointing execution and stretched balance sheets. Petropavlovsk fell 20% as disappointing cash flows caused concerns that the company would need to raise new capital. We sold this position in the quarter. Mongolian coking coal miner Mongolian Mining was down 20% on anxiety over slowing Chinese demand for coking coal as steel output slowed.
Markets have a lot of news to process in the fourth quarter. The United States will have an important election, and China will undergo a change of government. Europe will continue to negotiate a delicate balance between sustainable public finances and economic security demanded by its citizens on the one hand, and between the sovereignty of individual EU member states and the necessity of effective governance required by a single currency, on the other. Equity prices are highly sensitive to discount rates, which themselves are now strongly influenced by monetary policy interventions, and therefore difficult to forecast. All of this suggests that continued high volatility is likely.
International investing involves special risks, including foreign taxation, currency risks, risks associated with possible differences in financial standards, operational and settlement risks and other risks associated with future political and economic developments. Stocks of small- and mid-cap companies pose special risks, including possible illiquidity and greater price volatility than stocks of larger, more established companies. Investing in emerging markets may involve greater risks than investing in more developed countries. In addition, concentration of investments in a single region may result in greater volatility.
Portfolio holdings are subject to change periodically and may not be representative of current holdings.
20
Columbia Acorn International
At a Glance (Class A Shares - LAIAX)
Performance data shown represents past performance and is not a guarantee of future results. The investment return and principal value of an investment will fluctuate so that shares, when redeemed, may be worth more or less than their original cost. Current performance may be lower or higher than the performance data shown. Performance results reflect any fee waivers or reimbursements of Fund expenses by the investment manager and/or any of its affiliates. Absent these fee waivers and/or expense reimbursement arrangements, performance results would have been lower. Please visit columbiamanagement.com for daily and most recent month-end updates.
Pretax and After-tax Average Annual Total Returns (Based on Class A Share Returns, inception 10/16/00)
through September 30, 2012
|
Year to date* |
1 year |
5 years |
10 years |
||||||||||||||||||||
|
Returns before taxes |
NAV POP |
16.39 9.70 |
% |
18.61 11.80 |
% |
-0.67 -1.84 |
% |
13.95 13.28 |
% |
||||||||||||||
|
Returns after taxes on distributions |
NAV POP |
16.32 9.64 |
18.69 11.88 |
-1.13 -2.29 |
13.46 12.79 |
||||||||||||||||||
|
Returns after taxes on distributions and sale of fund shares |
NAV POP |
10.65 6.30 |
12.23 7.80 |
-0.61 -1.59 |
12.60 11.97 |
||||||||||||||||||
|
S&P Global Ex-US Between $500M and $5B Index** (pretax) |
12.78 |
13.63 |
-1.68 |
13.77 |
|||||||||||||||||||
All results shown assume reinvestment of distributions.
*Year to date data is not annualized.
**The Fund's primary benchmark.
After-tax returns are calculated using the highest historical individual federal marginal income tax rates, and do not reflect the impact of state and local taxes. Returns after taxes on distributions and sale of Fund shares reflect the additional tax impact of long-term gains or losses realized when Fund shares are sold. The returns are taxed at the maximum rate and assume shares were purchased at the beginning of the period. Actual after-tax returns depend on the investor's tax situation and may differ from those shown. After-tax returns are not relevant to investors who hold their Fund shares through tax-deferred arrangements such as 401(k) plans or individual retirement accounts. After-tax returns are shown for Class A shares only; after-tax returns for other share classes will vary. Indexes do not reflect any deduction for fees, expenses or taxes.
Public offering price (POP) returns include the maximum sales charge of 5.75% for Class A shares. Net asset value (NAV) returns do not include sales charges or contingent deferred sales charges (CDSC).
The Fund's Class A shares annual operating expense ratio, as stated in the May 1, 2012, prospectus, is 1.35%.
Columbia Acorn International Portfolio Diversification
as a percentage of net assets, as of 9/30/12

Columbia Acorn International Top 10 Holdings
as a percentage of net assets, as of 9/30/12
| 1. |
Far EasTone Telecom (Taiwan) Taiwan's Third Largest Mobile Operator |
1.4 |
% | ||||||||
| 2. |
Melco Crown Entertainment - ADR (Hong Kong) Macau Casino Operator |
1.4 |
% | ||||||||
| 3. |
Hexagon (Sweden) Measurement Equipment |
1.3 |
% | ||||||||
| 4. |
Eurofins Scientific (France) Food, Pharmaceuticals and Materials Screening and Testing |
1.2 |
% | ||||||||
| 5. |
Naspers (South Africa) Media in Africa and other Emerging Markets |
1.1 |
% | ||||||||
| 6. |
Gemalto (France) Digital Security Solutions |
1.0 |
% | ||||||||
| 7. |
Localiza Rent A Car (Brazil) Car Rental |
1.0 |
% | ||||||||
| 8. |
Kansai Paint (Japan) Paint Producer in Japan, India, China & Southeast Asia |
1.0 |
% | ||||||||
| 9. |
Seven Bank (Japan) ATM Processing Services |
1.0 |
% | ||||||||
| 10. |
Taiwan Mobile (Taiwan) Taiwan's Second Largest Mobile Operator |
0.9 |
% | ||||||||
The Fund's top 10 holdings and portfolio diversification vary with changes in portfolio investments. See the Statement of Investments for a complete list of the Fund's holdings.
The Growth of a $10,000 Investment in Columbia Acorn International (Class A)
September 23, 1992 (Fund inception) through September 30, 2012
The chart shows the change in value of a hypothetical $10,000 investment in Class A shares of the Fund during the stated time period. Although the index is provided for use in assessing the Fund's performance, the Fund's holdings may differ significantly from those in the index. It is not possible to invest directly in an index. The graph does not reflect taxes that a shareholder may pay on Fund distributions or on a sale of Fund shares.
The returns shown for periods prior to the inception date of the Fund's Class A shares are calculated from the inception date of the Fund and append the returns of the Fund's Class Z shares, the Fund's oldest share class. These returns are adjusted to reflect any higher class-related operating expenses of the newer share classes, as applicable. Please visit columbiamanagement.com/mutual-funds/appended-performance for more information.
Total Net Assets of the Fund: $6.4 billion
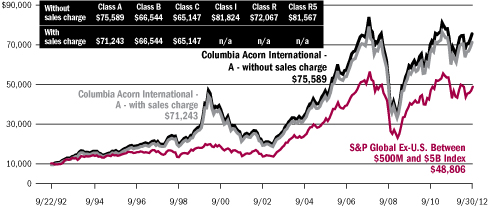
21
Columbia Acorn USA
In a Nutshell
|
|
|||||||||||
|
Robert A. Mohn |
|||||||||||
|
Lead Portfolio Manager |
|||||||||||

Performance data shown represents past performance and is not a guarantee of future results. The investment return and principal value will fluctuate so that shares, when redeemed, may be worth more or less than the original cost. Current performance may be lower or higher than the performance data shown. Please visit columbiamanagement.com for daily and most recent month-end performance updates.
Fund's Positions
in Mentioned Holdings
As a percentage of net assets, as of 9/30/12
|
lululemon athletica |
2.6 |
% |
|||||
|
Atwood Oceanics |
2.1 |
% |
|||||
|
Informatica |
2.0 |
% |
|||||
|
IPG Photonics |
1.9 |
% |
|||||
|
Cepheid |
1.3 |
% |
|||||
|
Acuity Brands |
0.9 |
% |
|||||
|
Ixia |
0.8 |
% |
|||||
|
Textainer Group Holdings |
0.7 |
% |
|||||
|
Atmel |
0.6 |
% |
|||||
|
Akorn |
0.5 |
% |
|||||
Columbia Acorn USA ended the third quarter of 2012 up 4.49% (Class A shares, without sales charge), underperforming the 5.25% gain of its primary benchmark, the Russell 2000 Index. Relative to the benchmark, industrial stocks were the largest positive contributors for the quarter, while financial and materials stocks detracted most from performance.
On the upside, premium active apparel retailer lululemon athletica bounced back from last quarter's drop, gaining 24% after announcing revenue growth up over 30% versus the prior year. IPG Photonics, a manufacturer of fiber lasers, rose 31% in the quarter following the release of better-than-expected earnings. Interestingly, the company enjoyed a 26% growth in sales from its business in Asia, a region that has been the focus of growing economic concern.
Offshore drilling contractor Atwood Oceanics rose 20% in the quarter. Rental rates rose for Atwood's ultra-deep-water oil drilling rigs, alleviating concerns that weak oil prices might force the company to rein in rates. Acuity Brands, a provider of commercial lighting fixtures, rose 25% in the quarter as the company continued to gain market share. Ixia, a provider of telecommunication network test equipment, gained 34% after announcing better-than-expected quarterly results driven by strength in LTE (Long Term Evolution) and Wi-Fi products, as well as
optimism regarding two promising acquisitions.
On the downside, Informatica, a developer of enterprise data integration software, pre-announced a revenue drop that was primarily caused by weakness in the company's European division. Its stock fell 18% on the news. Cepheid, a producer of molecular diagnostic instruments and supplies, saw its orders decline and had a manufacturing problem. Its stock fell 23% during the quarter.
Still reeling from the loss of a large contract for its touchscreen microcontrollers, semiconductor manufacturer Atmel fell 21% in the quarter. Textainer Group Holdings, an international freight container leasor, fell 16% following a secondary offering of shares. Akorn, a provider of specialty generic drugs, was also off 16% in the quarter as its stock price pulled back following a period of strong growth.
Think for a moment about all the economic disappointments plaguing our country: the weak recovery from the Great Recession, elevated unemployment, housing prices wallowing well below peak values, the economic woes facing our major trading partners in Europe and Asia. Then reflect on this fact: on September 14, 2012, Columbia Acorn USA closed at $32.40, its all-time record high price. We believe the resiliency of U.S. small-cap companies can be remarkable.
Stocks of small- and mid-cap companies pose special risks, including possible illiquidity and greater price volatility than stocks of larger, more established companies.
Portfolio holdings are subject to change periodically and may not be representative of current holdings.
22
Columbia Acorn USA
At a Glance (Class A Shares - LAUAX)
Performance data shown represents past performance and is not a guarantee of future results. The investment return and principal value of an investment will fluctuate so that shares, when redeemed, may be worth more or less than their original cost. Current performance may be lower or higher than the performance data shown. Performance results reflect any fee waivers or reimbursements of Fund expenses by the investment manager and/or any of its affiliates. Absent these fee waivers and/or expense reimbursement arrangements, performance results would have been lower. Please visit columbiamanagement.com for daily and most recent month-end updates.
Pretax and After-tax Average Annual Total Returns (Based on Class A Share Returns, inception 10/16/00)
through September 30, 2012
|
Year to date* |
1 year |
5 years |
10 years |
||||||||||||||||||||
|
Returns before taxes |
NAV POP |
15.09 8.48 |
% |
28.79 21.40 |
% |
2.07 0.87 |
% |
10.57 9.92 |
% |
||||||||||||||
|
Returns after taxes on distributions |
NAV POP |
15.06 8.45 |
28.63 21.25 |
1.78 0.58 |
10.27 9.62 |
||||||||||||||||||
|
Returns after taxes on distributions and sale of fund shares |
NAV POP |
9.85 5.55 |
18.89 14.08 |
1.73 0.70 |
9.43 8.82 |
||||||||||||||||||
|
Russell 2000 Index**(pretax) |
14.23 |
31.91 |
2.21 |
10.17 |
|||||||||||||||||||
All results shown assume reinvestment of distributions.
*Year to date data is not annualized.
**The Fund's primary benchmark.
After-tax returns are calculated using the highest historical individual federal marginal income tax rates, and do not reflect the impact of state and local taxes. Returns after taxes on distributions and sale of Fund shares reflect the additional tax impact of long-term gains or losses realized when Fund shares are sold. The returns are taxed at the maximum rate and assume shares were purchased at the beginning of the period. Actual after-tax returns depend on the investor's tax situation and may differ from those shown. After-tax returns are not relevant to investors who hold their Fund shares through tax-deferred arrangements such as 401(k) plans or individual retirement accounts. After-tax returns are shown for Class A shares only; after-tax returns for other share classes will vary. Indexes do not reflect any deduction for fees, expenses or taxes.
Public offering price (POP) returns include the maximum sales charge of 5.75% for Class A shares. Net asset value (NAV) returns do not include sales charges or contingent deferred sales charges (CDSC).
The Fund's Class A shares annual operating expense ratio, as stated in the May 1, 2012, prospectus, is 1.33%.
Columbia Acorn USA Portfolio Diversification
as a percentage of net assets, as of 9/30/12
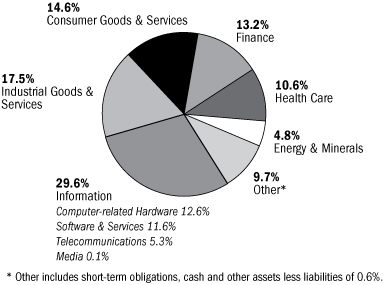
Columbia Acorn USA Top 10 Holdings
as a percentage of net assets, as of 9/30/12
| 1. |
Ametek Aerospace/Industrial Instruments |
2.8 |
% | ||||||||
| 2. |
Nordson Dispensing Systems for Adhesives & Coatings |
2.7 |
% | ||||||||
| 3. |
lululemon athletica Premium Active Apparel Retailer |
2.6 |
% | ||||||||
| 4. |
tw telecom Fiber Optic Telephone/Data Services |
2.4 |
% | ||||||||
| 5. |
Micros Systems Information Systems for Restaurants & Hotels |
2.1 |
% | ||||||||
| 6. |
Ryman Hospitality Properties Convention Hotels |
2.1 |
% | ||||||||
| 7. |
Atwood Oceanics Offshore Drilling Contractor |
2.1 |
% | ||||||||
| 8. |
Bally Technologies Slot Machines & Software |
2.0 |
% | ||||||||
| 9. |
ESCO Technologies Automatic Electric Meter Readers |
2.0 |
% | ||||||||
| 10. |
Informatica Enterprise Data Integration Software |
2.0 |
% | ||||||||
The Fund's top 10 holdings and portfolio diversification vary with changes in portfolio investments. See the Statement of Investments for a complete list of the Fund's holdings.
The Growth of a $10,000 Investment in Columbia Acorn USA (Class A)
September 4, 1996 (Fund inception) through September 30, 2012
The chart shows the change in value of a hypothetical $10,000 investment in Class A shares of the Fund during the stated time period. Although the index is provided for use in assessing the Fund's performance, the Fund's holdings may differ significantly from those in the index. It is not possible to invest directly in an index. The graph does not reflect taxes that a shareholder may pay on Fund distributions or on a sale of Fund shares.
The returns shown for periods prior to the inception date of the Fund's Class A shares are calculated from the inception date of the Fund and append the returns of the Fund's Class Z shares, the Fund's oldest share class. These returns are adjusted to reflect any higher class-related operating expenses of the newer share classes, as applicable. Please visit columbiamanagement.com/mutual-funds/appended-performance for more information.
Total Net Assets of the Fund: $1.5 billion
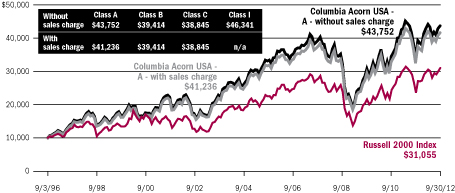
23
Columbia Acorn International Select
In a Nutshell

Christopher J. Olson
Lead Portfolio Manager
Performance data shown represents past performance and is not a guarantee of future results. The investment return and principal value will fluctuate so that shares, when redeemed, may be worth more or less than the original cost. Current performance may be lower or higher than the performance data shown. Please visit columbiamanagement.com for daily and most recent month-end performance updates.
Fund's Positions
in Mentioned Holdings
As a percentage of net assets, as of 9/30/12
|
Ascendas REIT |
6.3 |
% |
|||||
|
Mapletree Industrial Trust |
5.8 |
% |
|||||
|
Fresnillo |
5.5 |
% |
|||||
|
Goldcorp |
5.2 |
% |
|||||
|
Seven Bank |
4.3 |
% |
|||||
|
Rand Merchant Insurance |
3.1 |
% |
|||||
|
UGL |
2.8 |
% |
|||||
|
Archipelago Resources |
2.7 |
% |
|||||
|
Mapletree Logistics Trust |
2.5 |
% |
|||||
|
Tahoe Resources |
2.0 |
% |
|||||
|
IAG |
1.8 |
% |
|||||
|
Zhaojin Mining Industry |
1.3 |
% |
|||||
|
Marel |
1.1 |
% |
|||||
|
Santa Maria Petroleum |
0.1 |
% |
|||||
Columbia Acorn International Select ended the third quarter of 2012 up 12.47% (Class A shares, without sales charge), well ahead of the 7.13% gain of its primary benchmark, the S&P Developed Ex-U.S. Between $2B and $10B Index. Global economic growth remains weak and many indicators point to a deteriorating situation. In response, governments have continued to rely on massive fiscal deficits and extremely loose monetary policies, which, ironically, helped contribute to the economic problems in the first place. Will this time be any different?
The Fund enjoyed strong performance from its holdings in the materials and financials sectors during the quarter. The Fund is overweight relative to the benchmark in both sectors, and exposure within these areas is geared to stocks that may do well in an environment characterized by continued monetary stimulus. Within the materials sector, the Fund's exposure is mainly to gold and silver miners, which rallied significantly on the back of further European bailout measures and the U.S. Federal Reserve's move to a policy of quantitative easing. Fresnillo, a silver and gold miner in Mexico, gained 32% in the quarter. Goldcorp, a Canadian gold mining company, rose 23%. Archipelago Resources, an Indonesian gold miner operating throughout Asia, gained 21%. Tahoe Resources, a Guatemalan silver miner, rose 51%. Finally, Chinese gold miner Zhaojin Mining Industry gained 36%.
Within the financials sector, Singaporean industrial property landlords Mapletree Industrial Trust, Ascendas REIT and Mapletree Logistics Trust had gains ranging from 16% to 22% as these companies continued to benefit from a resilient economic outlook in Singapore and from investor interest in their high dividend yields. The objective of easy monetary policy is to lower interest rates, which makes high yields increasingly scarce. Japan's Seven Bank, a provider of ATM processing services, rose 20% in the quarter as its ATM expansion within Japan continued to boost profits. Rand Merchant Insurance, a South African insurance company, came back strong in the third quarter, gaining 21% on continued strong results. Finally, Australian insurance provider IAG rose 29% in the quarter as policy price increases continued to boost the bottom line.
There were just 11 stocks in the Fund's portfolio of over 40 names that fell during the quarter, and only three of that group that were down more than 10%. UGL, an engineering and facilities management company in Australia, fell 12% on the back of a slowdown in the mining services industry in Australia. Icelandic manufacturer of poultry and fish processing equipment Marel fell 11% due to falling margins from a poorer mix of product sales and higher costs from a number of fish project customizations. Santa Maria Petroleum, a Colombian oil and gas explorer, had the largest percentage loss in the quarter, falling 55% due to poor drilling results.
International investing involves special risks, including foreign taxation, currency risks, risks associated with possible differences in financial standards, operational and settlement risks and other risks associated with future political and economic developments. Stocks of small- and mid-cap companies pose special risks, including possible illiquidity and greater price volatility than stocks of larger, more established companies. Investing in emerging markets may involve greater risks than investing in more developed countries.
Portfolio holdings are subject to change periodically and may not be representative of current holdings.
24
Columbia Acorn International Select
At a Glance (Class A Shares - LAFAX)
Performance data shown represents past performance and is not a guarantee of future results. The investment return and principal value of an investment will fluctuate so that shares, when redeemed, may be worth more or less than their original cost. Current performance may be lower or higher than the performance data shown. Performance results reflect any fee waivers or reimbursements of Fund expenses by the investment manager and/or any of its affiliates. Absent these fee waivers and/or expense reimbursement arrangements, performance results would have been lower. Please visit columbiamanagement.com for daily and most recent month-end updates.
Pretax and After-tax Average Annual Total Returns (Based on Class A Share Returns, inception 10/16/00)
through September 30, 2012
|
Year to date* |
1 year |
5 years |
10 years |
||||||||||||||||||||
|
Returns before taxes |
NAV POP |
23.98 16.85 |
% |
26.25 19.00 |
% |
0.60 -0.58 |
% |
13.38 12.71 |
% |
||||||||||||||
|
Returns after taxes on distributions |
NAV POP |
23.89 16.77 |
25.83 18.60 |
0.25 -0.92 |
13.21 12.53 |
||||||||||||||||||
|
Returns after taxes on distributions and sale of fund shares |
NAV POP |
15.68 11.04 |
17.79 13.04 |
0.53 -0.48 |
12.14 11.51 |
||||||||||||||||||
|
S&P Developed Ex-US Between $2B and $10B Index** (pretax) |
10.85 |
11.95 |
-3.73 |
11.02 |
|||||||||||||||||||
All results shown assume reinvestment of distributions.
*Year to date data is not annualized.
**The Fund's primary benchmark.
After-tax returns are calculated using the highest historical individual federal marginal income tax rates, and do not reflect the impact of state and local taxes. Returns after taxes on distributions and sale of Fund shares reflect the additional tax impact of long-term gains or losses realized when Fund shares are sold. The returns are taxed at the maximum rate and assume shares were purchased at the beginning of the period. Actual after-tax returns depend on the investor's tax situation and may differ from those shown. After-tax returns are not relevant to investors who hold their Fund shares through tax-deferred arrangements such as 401(k) plans or individual retirement accounts. After-tax returns are shown for Class A shares only; after-tax returns for other share classes will vary. Indexes do not reflect any deduction for fees, expenses or taxes.
Public offering price (POP) returns include the maximum sales charge of 5.75% for Class A shares. Net asset value (NAV) returns do not include sales charges or contingent deferred sales charges (CDSC).
The Fund's Class A shares annual operating expense ratio, as stated in the May 1, 2012, prospectus, is 1.62%.
Columbia Acorn International Select Portfolio Diversification
as a percentage of net assets, as of 9/30/12

Columbia Acorn International Select
Top 10 Holdings
as a percentage of net assets, as of 9/30/12
| 1. |
Far EasTone Telecom (Taiwan) Taiwan's Third Largest Mobile Operator |
6.7 |
% | ||||||||
| 2. |
Ascendas REIT (Singapore) Industrial Property Landlord |
6.3 |
% | ||||||||
| 3. |
Mapletree Industrial Trust (Singapore) Industrial Property Landlord |
5.8 |
% | ||||||||
| 4. |
Fresnillo (Mexico) Silver and Metal Byproduct Mining in Mexico |
5.5 |
% | ||||||||
| 5. |
Goldcorp (Canada) Gold Mining |
5.2 |
% | ||||||||
| 6. |
Seven Bank (Japan) ATM Processing Services |
4.3 |
% | ||||||||
| 7. |
Jupiter Telecommunications (Japan) Largest Cable Service Provider in Japan |
3.5 |
% | ||||||||
| 8. |
Taiwan Mobile (Taiwan) Taiwan's Second Largest Mobile Operator |
3.4 |
% | ||||||||
| 9. |
Start Today (Japan) Online Japanese Apparel Retailer |
3.1 |
% | ||||||||
| 10. |
Rand Merchant Insurance (South Africa) Directly Sold Property & Casualty Insurance; Holdings in Other Insurers |
3.1 |
% | ||||||||
The Fund's top 10 holdings and portfolio diversification vary with changes in portfolio investments. See the Statement of Investments for a complete list of the Fund's holdings.
The Growth of a $10,000 Investment in Columbia Acorn International Select (Class A)
November 23, 1998 (Fund inception) through September 30, 2012
The chart shows the change in value of a hypothetical $10,000 investment in Class A shares of the Fund during the stated time period. Although the index is provided for use in assessing the Fund's performance, the Fund's holdings may differ significantly from those in the index. It is not possible to invest directly in an index. The graph does not reflect taxes that a shareholder may pay on Fund distributions or on a sale of Fund shares.
The returns shown for periods prior to the inception date of the Fund's Class A shares are calculated from the inception date of the Fund and append the returns of the Fund's Class Z shares, the Fund's oldest share class. These returns are adjusted to reflect any higher class-related operating expenses of the newer share classes, as applicable. Please visit columbiamanagement.com/mutual-funds/appended-performance for more information.
Total Net Assets of the Fund: $406.1 million
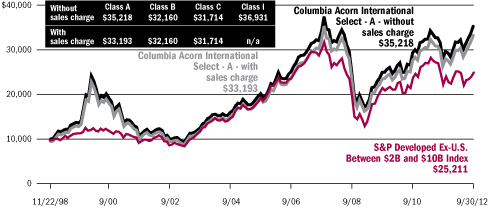
25
Columbia Acorn Select
In a Nutshell
|
|
|
||||||
|
Ben Andrews |
Robert A. Chalupnik |
||||||
|
Lead Portfolio Manager |
Co-Portfolio Manager |
||||||


Performance data shown represents past performance and is not a guarantee of future results. The investment return and principal value will fluctuate so that shares, when redeemed, may be worth more or less than the original cost. Current performance may be lower or higher than the performance data shown. Please visit columbiamanagement.com for daily and most recent month-end performance updates.
Fund's Positions
in Mentioned Holdings
As a percentage of net assets, as of 9/30/12
|
Discover Financial Services |
6.2 |
% |
|||||
|
Ametek |
6.0 |
% |
|||||
|
CNO Financial Group |
5.6 |
% |
|||||
|
Donaldson |
3.5 |
% |
|||||
|
Ryman Hospitality Properties |
3.2 |
% |
|||||
|
Abercrombie & Fitch |
1.4 |
% |
|||||
|
Canacol |
1.3 |
% |
|||||
|
Shamaran Petroleum |
1.1 |
% |
|||||
|
Cepheid |
1.0 |
% |
|||||
|
F5 Networks |
0.8 |
% |
|||||
|
ITT Educational Services |
0.7 |
% |
|||||
|
Ansys |
0.6 |
% |
|||||
|
Houston American Energy |
0.1 |
% |
|||||
Columbia Acorn Select gained 6.45% (Class A shares, without sales charge) in the third quarter of 2012, outperforming the S&P MidCap 400 Index, the Fund's primary benchmark, which was up 5.44%. The large-cap S&P 500 Index gained 6.35% in the third quarter. Year to date, Columbia Acorn Select was up 14.58%, the S&P MidCap 400 Index gained 13.77%, and the S&P 500 Index was up 16.44%.
We have seen the larger cap stock index, the S&P 500, perform better than many of the small- to mid-cap indexes in 2011 and year to date in 2012. Why is this? One reason might be dividend yield; as interest rates hit historic lows, some investors are reaching for yield. But another reason might be franchises. The S&P 500 Index is full of household names like Coca-Cola and Home Depot. Franchises often have the heft to gain market share against their rivals in a very slow-growing economy. We've seen this trend in many of the solid franchises within the mid- and small-cap universe. For example, several of the Fund's industrial companies, such as Ametek and Donaldson, are growing sales faster than their market is growing, thus picking up market share. These companies aren't household names but they are the 800-pound gorillas in their arena and we believe they can use this slow-growth environment to their advantage. This is one of the reasons Columbia Acorn Select has recently been buying more solid growth franchises, or what we like to call core holdings, and leaning away somewhat from turnarounds or opportunistic holdings.
Three stocks were the big performance drivers during the third quarter, contributing about half of the overall performance. CNO Financial Group, an insurance provider, added 1.22%; credit card company Discover Financial Services added 0.95%; and Shamaran Petroleum, an oil explorer in Kurdistan, added 0.73% to overall portfolio gains. The laggard in the quarter was ITT Educational Services, a postsecondary degree services provider that cost the portfolio 0.67%. ITT has been forced to realign course offerings due to proposed regulatory changes from the U.S. Department of Education. This realignment has caused some programs to be changed or discontinued, which has led to a drop in enrollment.
Year to date through the end of September, the Fund's strongest
contributors to performance were, again, Discover Financial Services, adding 3.14% to overall portfolio performance, and CNO Financial Group, which added 2.31% to performance. Large detractors during the first three quarters of the year were two Colombian oil exploration companies, Canacol and Houston American Energy, which each lost around 0.70% as they both had disappointing exploration results. Teen apparel retailer Abercrombie & Fitch also subtracted about 0.70% from overall portfolio performance due, in part, to weaker sales in European stores.
During the third quarter, we added three new companies to the portfolio and sold out of three others. We also had one company change its name. We purchased Ansys, a maker of simulation software for engineers, F5 Networks, a provider of technology that optimizes the delivery of information between computers, and Cepheid, a molecular diagnostics services provider. We sold out of niche drug provider Akorn, as we believed the company was too pricey for its fundamentals. Eacom Timber was also sold in the quarter. Following the financial crisis, our original thesis was to purchase lumber assets cheaply and, in time, enjoy the benefits of higher lumber prices driven by the pine beetle epidemic, the U.S. housing recovery, and a growing need from Japan and China for lumber, which performs better in earthquakes than other materials. This thesis is starting to play out, but more slowly than we originally thought. Eacom, however, had to do continued financings during the Fund's period of ownership to stay in business. These financings diluted the share holdings to such an extent that we could see little upside in the stock. This serves as another good example of why we have moved to more solid growth (core holdings) franchises in the portfolio. An underlying thesis can be right eventually, but if a company needs too much interim financing, its stock won't be successful. We also sold out of VisionChina Media, a digital advertiser in China's mass transit system. Gaylord Entertainment was renamed Ryman Hospitality Properties during the quarter as it prepared to change into a REIT.
Risks include stock market fluctuations due to economic and business developments. The Fund also has potentially greater price volatility due to the Fund's concentration in a limited number of stocks of mid-size companies. International investing involves special risks, including foreign taxation, currency risks, risks associated with possible differences in financial standards, operational and settlement risks and other risks associated with future political and economic developments.
Portfolio holdings are subject to change periodically and may not be representative of current holdings.
26
Columbia Acorn Select
At a Glance (Class A Shares - LTFAX)
Performance data shown represents past performance and is not a guarantee of future results. The investment return and principal value of an investment will fluctuate so that shares, when redeemed, may be worth more or less than their original cost. Current performance may be lower or higher than the performance data shown. Performance results reflect any fee waivers or reimbursements of Fund expenses by the investment manager and/or any of its affiliates. Absent these fee waivers and/or expense reimbursement arrangements, performance results would have been lower. Please visit columbiamanagement.com for daily and most recent month-end updates.
Pretax and After-tax Average Annual Total Returns (Based on Class A Share Returns, inception 10/16/00)
through September 30, 2012
|
Year to date* |
1 year |
5 years |
10 years |
||||||||||||||||||||
|
Returns before taxes |
NAV POP |
14.58 8.00 |
% |
25.16 17.98 |
% |
-1.44 -2.60 |
% |
8.69 8.05 |
% |
||||||||||||||
|
Returns after taxes on distributions |
NAV POP |
14.21 7.65 |
24.76 17.60 |
-1.73 -2.89 |
8.39 7.75 |
||||||||||||||||||
|
Returns after taxes on distributions and sale of fund shares |
NAV POP |
9.93 5.62 |
16.85 12.15 |
-1.28 -2.26 |
7.66 7.07 |
||||||||||||||||||
|
S&P MidCap 400 Index** (pretax) |
13.77 |
28.54 |
3.83 |
10.77 |
|||||||||||||||||||
All results shown assume reinvestment of distributions.
*Year to date data is not annualized.
**The Fund's primary benchmark.
After-tax returns are calculated using the highest historical individual federal marginal income tax rates, and do not reflect the impact of state and local taxes. Returns after taxes on distributions and sale of Fund shares reflect the additional tax impact of long-term gains or losses realized when Fund shares are sold. The returns are taxed at the maximum rate and assume shares were purchased at the beginning of the period. Actual after-tax returns depend on the investor's tax situation and may differ from those shown. After-tax returns are not relevant to investors who hold their Fund shares through tax-deferred arrangements such as 401(k) plans or individual retirement accounts. After-tax returns are shown for Class A shares only; after-tax returns for other share classes will vary. Indexes do not reflect any deduction for fees, expenses or taxes.
Public offering price (POP) returns include the maximum sales charge of 5.75% for Class A shares. Net asset value (NAV) returns do not include sales charges or contingent deferred sales charges (CDSC).
The Fund's Class A shares annual operating expense ratio, as stated in the May 1, 2012, prospectus, is 1.35%.
Columbia Acorn Select Portfolio Diversification
as a percentage of net assets, as of 9/30/12

Columbia Acorn Select Top 10 Holdings
as a percentage of net assets, as of 9/30/12
| 1. |
Discover Financial Services Credit Card Company |
6.2 |
% | ||||||||
| 2. |
Ametek Aerospace/Industrial Instruments |
6.0 |
% | ||||||||
| 3. |
CNO Financial Group Life, Long-term Care & Medical Supplement Insurance |
5.6 |
% | ||||||||
| 4. |
Hertz Largest U.S. Rental Car Operator |
5.0 |
% | ||||||||
| 5. |
Crown Castle International Communications Towers |
4.0 |
% | ||||||||
| 6. |
Donaldson Industrial Air Filtration |
3.5 |
% | ||||||||
| 7. |
Pall Filtration & Fluids Clarification |
3.5 |
% | ||||||||
| 8. |
Ryman Hospitality Properties Convention Hotels |
3.2 |
% | ||||||||
| 9. |
WNS - ADR (India) Offshore Business Process Outsourcing Services |
3.1 |
% | ||||||||
| 10. |
Amphenol Electronic Connectors |
2.9 |
% | ||||||||
The Fund's top 10 holdings and portfolio diversification vary with changes in portfolio investments. See the Statement of Investments for a complete list of the Fund's holdings.
The Growth of a $10,000 Investment in Columbia Acorn Select (Class A)
November 23, 1998 (Fund inception) through September 30, 2012
The chart shows the change in value of a hypothetical $10,000 investment in Class A shares of the Fund during the stated time period. Although the index is provided for use in assessing the Fund's performance, the Fund's holdings may differ significantly from those in the index. It is not possible to invest directly in an index. The graph does not reflect taxes that a shareholder may pay on Fund distributions or on a sale of Fund shares.
The returns shown for periods prior to the inception date of the Fund's Class A shares are calculated from the inception date of the Fund and append the returns of the Fund's Class Z shares, the Fund's oldest share class. These returns are adjusted to reflect any higher class-related operating expenses of the newer share classes, as applicable. Please visit columbiamanagement.com/mutual-funds/appended-performance for more information.
Total Net Assets of the Fund: $1.0 billion
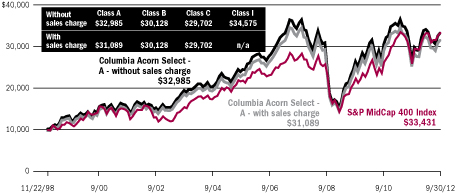
27
Columbia Thermostat Fund
In a Nutshell

|
Charles P. McQuaid |
|||
Lead Portfolio Manager
Performance data shown represents past performance and is not a guarantee of future results. The investment return and principal value will fluctuate so that shares, when redeemed, may be worth more or less than the original cost. Current performance may be lower or higher than the performance data shown. Please visit columbiamanagement.com for daily and most recent month-end performance updates.
A "fund of fund" bears its allocable share of the costs and expenses of the underlying funds in which it invests. Such funds are thus subject to two levels of fees and potentially higher expense ratios than would be associated with a fund that invests and trades directly in financial instruments under the direction of a single manager.
Columbia Thermostat Fund gained 4.76% (Class A shares, without sales charge) in the third quarter of 2012. The Fund's primary equity benchmark, the S&P 500 Index, rose 6.35% for the same period while its primary debt benchmark, the Barclays U.S. Aggregate Bond Index, increased 1.59%.
The Fund hit three reallocation triggers during the period, increasing stock exposure in July and reducing it in August and September. At the end of the third quarter, the Fund had a 40% weighting in its underlying stock funds and a 60% weighting in its bond funds.
The weighted average return of the equity portion of the portfolio for the quarter was 6.65%. Columbia Select Large Cap Growth Fund provided top equity gains with a 9.76% return for the third quarter. The bond component of the Fund had a 2.76% weighted average gain. Columbia Income Opportunities Fund led bond fund returns, up 4.32% for the quarter.
Columbia Thermostat Fund reached its 10-year anniversary on September 25, 2012. From inception through the end of the third quarter, the Fund was up 7.87%, in line with the 7.95% gain of the S&P 500 Index and ahead of the 5.34% return of the Barclays U.S. Aggregate Bond Index. We are pleased with this long-term result and with the Fund's ability to provide you, our shareholders, with a solid gain in a volatile market environment.
Results of the Funds Owned in
Columbia Thermostat Fund as of
September 30, 2012
|
Stock Funds |
Weightings |
3rd |
Year to |
||||||||||||
|
Fund |
in category |
quarter |
date |
||||||||||||
|
Columbia Acorn International, Class I |
20 |
% |
7.30 |
% |
16.73 |
% |
|||||||||
|
Columbia Dividend Income Fund, Class I |
20 |
% |
4.68 |
% |
12.84 |
% |
|||||||||
|
Columbia Acorn Fund, Class I |
15 |
% |
4.84 |
% |
14.55 |
% |
|||||||||
|
Columbia Contrarian Core Fund, Class I |
15 |
% |
7.89 |
% |
18.31 |
% |
|||||||||
|
Columbia Acorn Select, Class I |
10 |
% |
6.57 |
% |
14.87 |
% |
|||||||||
|
Columbia Large Cap Enhanced Core Fund, Class I |
10 |
% |
6.93 |
% |
17.68 |
% |
|||||||||
|
Columbia Select Large Cap Growth Fund, Class I |
10 |
% |
9.76 |
% |
16.58 |
% |
|||||||||
|
Weighted Average Equity Gain |
100 |
% |
6.65 |
% |
15.88 |
% |
|||||||||
|
Bond Funds |
Weightings |
3rd |
Year to |
||||||||||||
|
Fund |
in category |
quarter |
date |
||||||||||||
|
Columbia Intermediate Bond Fund, Class I |
50 |
% |
2.72 |
% |
6.44 |
% |
|||||||||
|
Columbia Income Opportunities Fund, Class I |
30 |
% |
4.32 |
% |
10.93 |
% |
|||||||||
|
Columbia U.S. Treasury Index Fund, Class I |
20 |
% |
0.52 |
% |
1.93 |
% |
|||||||||
|
Weighted Average Income Gain |
100 |
% |
2.76 |
% |
6.87 |
% |
|||||||||
Columbia Thermostat Fund
Rebalancing in the Third Quarter
|
July 25, 2012 |
55% stocks, 45% bonds |
||||||
|
August 27, 2012 |
45% stocks, 55% bonds |
||||||
|
September 14, 2012 |
40% stocks, 60% bonds |
||||||
The value of an investment in the Fund is based primarily on the performance of the underlying portfolio funds and the allocation of the Fund's assets among them. An investment in the underlying portfolio funds may present certain risks, including stock market fluctuations that occur in response to economic and business developments; and a greater degree of social, political and economic volatility associated with international investing. Stocks of small- and mid-cap companies pose special risks, including possible illiquidity and greater price volatility than stocks of larger, more established companies. Value stocks may also be subject to specific business risks that have caused the stocks to be out of favor. Lower-rated and medium quality debt securities are more speculative and incur more risk. International investing involves special risks, including foreign taxation, currency risks, risks associated with possible differences in financial standards and other risks associated with future political and economic developments. Changes in interest rates and changes in the financial strength of issuers of lower-rated bonds may also affect underlying fund performance. The Fund is also subject to the risk that the investment advisor's decisions regarding asset classes and underlying portfolio funds will not anticipate market trends successfully, resulting in a failure to preserve capital or lower total return. In addition, the Fund may buy and sell shares of the portfolio funds frequently. This may result in higher transaction costs and additional tax liability. This is not an offer of the shares of any other mutual fund mentioned herein.
28
Columbia Thermostat Fund
At a Glance (Class A Shares - CTFAX)
Performance data shown represents past performance and is not a guarantee of future results. The investment return and principal value of an investment will fluctuate so that shares, when redeemed, may be worth more or less than their original cost. Current performance may be lower or higher than the performance data shown. Performance results reflect any fee waivers or reimbursements of Fund expenses by the investment manager and/or any of its affiliates. Absent these fee waivers and/or expense reimbursement arrangements, performance results would have been lower. Please visit columbiamanagement.com for daily and most recent month-end updates.
Pretax and After-tax Average Annual Total Returns (Based on Class A Share Returns, inception 3/3/03)
through September 30, 2012
|
Year to date* |
1 year |
5 years |
10 years |
||||||||||||||||||||
|
Returns before taxes |
NAV POP |
11.69 5.28 |
% |
20.22 13.28 |
% |
4.68 3.45 |
% |
8.05 7.41 |
% |
||||||||||||||
|
Returns after taxes on distributions |
NAV POP |
11.64 5.24 |
19.72 12.81 |
3.83 2.61 |
7.00 6.37 |
||||||||||||||||||
|
Returns after taxes on distributions and sale of fund shares |
NAV POP |
7.60 3.43 |
13.24 8.73 |
3.55 2.49 |
6.56 5.98 |
||||||||||||||||||
|
S&P 500 Index** (pretax) |
16.44 |
30.20 |
1.05 |
8.01 |
|||||||||||||||||||
|
Barclays U.S. Aggregate Bond Index** (pretax) |
3.99 |
5.16 |
6.53 |
5.32 |
|||||||||||||||||||
|
Lipper Flexible Portfolio Funds Index (pretax) |
11.62 |
18.63 |
2.36 |
7.74 |
|||||||||||||||||||
All results shown assume reinvestment of distributions.
*Year to date data is not annualized.
**The Fund's primary stock and bond benchmarks.
After-tax returns are calculated using the highest historical individual federal marginal income tax rates, and do not reflect the impact of state and local taxes. Returns after taxes on distributions and sale of Fund shares reflect the additional tax impact of long-term gains or losses realized when Fund shares are sold. The returns are taxed at the maximum rate and assume shares were purchased at the beginning of the period. Actual after-tax returns depend on the investor's tax situation and may differ from those shown. After-tax returns are not relevant to investors who hold their Fund shares through tax-deferred arrangements such as 401(k) plans or individual retirement accounts. After-tax returns are shown for Class A shares only; after-tax returns for other share classes will vary. Indexes do not reflect any deduction for fees, expenses or taxes.
Public offering price (POP) returns include the maximum sales charge of 5.75% for Class A shares. Net asset value (NAV) returns do not include sales charges or contingent deferred sales charges (CDSC).
The Fund's annual operating expense ratio, as stated in the May 1, 2012, prospectus, reflects a contractual fee waiver and expense reimbursement with CWAM that expires April 30, 2013. Class A expense ratios without and with the contractual waiver/reimbursement, including fees and expenses associated with the Fund's investment in other investment companies, are 1.46% and 1.15%, respectively. Absent the waiver or reimbursement, performance results would have been lower.
Columbia Thermostat Fund Asset Allocation
as a percentage of net assets, as of 9/30/12

Columbia Thermostat Fund Portfolio Weightings
as a percentage of assets in each investment category, as of 9/30/12
Stock Mutual Funds
|
Columbia Acorn International, Class I |
20 |
% | |||||
|
Columbia Dividend Income Fund, Class I |
20 |
% | |||||
|
Columbia Acorn Fund, Class I |
15 |
% | |||||
|
Columbia Contrarian Core Fund, Class I |
15 |
% | |||||
|
Columbia Acorn Select, Class I |
10 |
% | |||||
|
Columbia Large Cap Enhanced Core Fund, Class I |
10 |
% | |||||
|
Columbia Select Large Cap Growth Fund, Class I |
10 |
% | |||||
Bond Mutual Funds
|
Columbia Intermediate Bond Fund, Class I |
50 |
% | |||||
|
Columbia Income Opportunities Fund, Class I |
30 |
% | |||||
|
Columbia U.S. Treasury Index Fund, Class I |
20 |
% |
|||||
The Growth of a $10,000 Investment in Columbia Thermostat Fund (Class A)
September 25, 2002 (Fund inception) through September 30, 2012
The chart shows the change in value of a hypothetical $10,000 investment in Class A shares of the Fund during the stated time period. Although the indexes are provided for use in assessing the Fund's performance, the Fund's holdings may differ significantly from those in the index. It is not possible to invest directly in an index. The graph does not reflect taxes that a shareholder may pay on Fund distributions or on a sale of Fund shares.
The returns shown for periods prior to the inception date of the Fund's Class A shares are calculated from the inception date of the Fund and append the returns of the Fund's Class Z shares, the Fund's oldest share class. These returns are adjusted to reflect any higher class-related operating expenses of the newer share classes, as applicable. Please visit columbiamanagement.com/mutual-funds/appended-performance for more information.
Total Net Assets of the Fund: $657.1 million
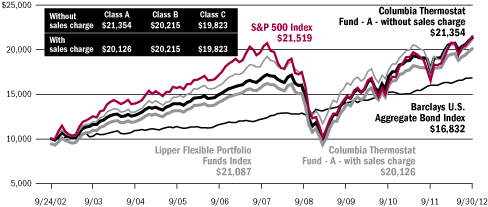
29
Columbia Acorn Emerging Markets Fund
In a Nutshell
|
|
|
||||||
|
Fritz Kaegi |
Stephen Kusmierczak |
||||||
|
Lead Portfolio Manager |
Lead Portfolio Manager |
||||||
|
|
|
||||||
|
P. Zachary Egan |
Louis J. Mendes |
||||||
|
Co-Portfolio Manager |
Co-Portfolio Manager |
||||||


Performance data shown represents past performance and is not a guarantee of future results. The investment return and principal value will fluctuate so that shares, when redeemed, may be worth more or less than the original cost. Current performance may be lower or higher than the performance data shown. Please visit columbiamanagement.com for daily and most recent month-end performance updates.
Fund's Positions
in Mentioned Holdings
As a percentage of net assets, as of 9/30/12
|
Tower Bersama Infrastructure |
3.5 |
% |
|||||
|
Ace Indonesia |
3.3 |
% |
|||||
|
Nagacorp |
3.3 |
% |
|||||
|
Halyk Savings Bank of Kazakhstan |
2.3 |
% |
|||||
|
Textainer Group Holdings |
1.9 |
% |
|||||
|
Mongolian Mining |
1.6 |
% |
|||||
|
Multiplus |
1.2 |
% |
|||||
Columbia Acorn Emerging Markets Fund rose 9.66% (Class A shares, without sales charge) in the third quarter of 2012 versus a 7.83% rise in the Fund's primary benchmark, the S&P Emerging Markets Between $500M and $5B Index. Year to date through September 30, the Fund was up 20.19% versus 17.41% for the benchmark. From the Fund's launch on August 19, 2011, to September 30, 2012, the Fund has returned an annualized 10.05% versus 1.44% for the benchmark.
The Fund's largest position was Tower Bersama Infrastructure, which owns communications towers in Indonesia and leases antenna space to wireless telephone operators. Its stock was up 33% for the quarter. Growing data volumes, 3G rollout, and the coverage needs of multiple operators continue to boost its returns. Rising gaming volumes, tourist arrivals, and investor recognition boosted Nagacorp, owner of a casino complex in Cambodia, by 29%. Halyk Savings Bank of Kazakhstan's repurchase of preferred shares from the Kazakhstan state bailout agency signaled the resumption of a dividend and raised guidance for earnings and loan growth. Thanks to ample access to funding and a robust retail banking franchise, Halyk is earning good returns on equity even with a conservative capital structure. Its stock rose 39% during the quarter.
Mongolian Mining was down 22% as it continued to suffer from declining coking coal prices driven by stagnant Chinese steel production. We believe Mongolian Mining's low-cost position will allow it to make money even with low prices. International freight container leasor Textainer Group Holdings' secondary share offering helped send the stock down 17% for the quarter, giving back some gains made earlier in 2012. Multiplus, a Brazilian operator of airline
loyalty programs, fell 15% as a member of the Brazilian Congress proposed a law to eliminate expiration dates for frequent flier miles (known as "breakage"). While breakage is an important source of profits, we doubt the law will pass.
As we mark the Fund's one-year anniversary, we are pleased with its performance thus far. We believe the 10 analysts selecting stocks for the Columbia Acorn Emerging Markets Fund did a notably good job sizing investments appropriately. Some of the stocks with the largest position sizes—Nagacorp, Tower Bersama Infrastructure and Ace Indonesia—have been among the best performers, especially since March.
There was a common thread among ideas that have not worked out well during the year. Even though some of the largest "losers" were a very diverse group—a coal mining operation, a pulp and paper maker, a lentil and pulse processor, an irrigation equipment manufacturer and three oil exploration plays—one common thing that hurt them was capital intensivity. For some it was capital tied up in inventories and receivables (that is, sales where they are awaiting payment), for others it was capital investment in producing assets. Even though many (but not all) of these companies were profitable, growth sucked up cash and could not be generated internally, leaving them at the mercy of capital and commodity market conditions to fund growth.
This does not mean we should always avoid capital intensive businesses. After all, some of the Fund's biggest winners have also had periods requiring large amounts of capital. Still, with this experience in mind, we have (re)learned that capital intensive companies require extra scrutiny and better returns to compensate for their risks.
International investing involves special risks, including foreign taxation, currency risks, risks associated with possible differences in financial standards, operational and settlement risks and other risks associated with future political and economic developments. Stocks of small- and mid-cap companies pose special risks, including possible illiquidity and greater price volatility than stocks of larger, more established companies. Investing in emerging markets may involve greater risks than investing in more developed countries.
Portfolio holdings are subject to change periodically and may not be representative of current holdings.
30
Columbia Acorn Emerging
Markets Fund
At a Glance (Class A Shares - CAGAX)
Performance data shown represents past performance and is not a guarantee of future results. The investment return and principal value of an investment will fluctuate so that shares, when redeemed, may be worth more or less than their original cost. Current performance may be lower or higher than the performance data shown. Performance results reflect any fee waivers or reimbursements of Fund expenses by the investment manager and/or any of its affiliates. Absent these fee waivers and/or expense reimbursement arrangements, performance results would have been lower. Please visit columbiamanagement.com for daily and most recent month-end updates.
Pretax and After-tax Average Annual Total Returns (Based on Class A Share Returns, inception 8/19/11)
through September 30, 2012
|
Year to date* |
1 year |
Life of fund |
|||||||||||||||||
|
Returns before taxes |
NAV POP |
20.19 13.34 |
% |
25.90 18.66 |
% |
10.05 4.37 |
% |
||||||||||||
|
Returns after taxes on distributions |
NAV POP |
20.19 13.34 |
25.91 18.67 |
10.06 4.38 |
|||||||||||||||
|
Returns after taxes on distributions and sale of fund shares |
NAV POP |
13.13 8.67 |
16.85 12.14 |
8.56 3.73 |
|||||||||||||||
|
S&P Emerging Markets Between $500M and $5B Index (pretax)** |
17.41 |
18.53 |
1.44 |
||||||||||||||||
All results shown assume reinvestment of distributions.
*Year to date data is not annualized.
**The Fund's primary benchmark.
After-tax returns are calculated using the highest historical individual federal marginal income tax rates, and do not reflect the impact of state and local taxes. Returns after taxes on distributions and sale of Fund shares reflect the additional tax impact of long-term gains or losses realized when Fund shares are sold. The returns are taxed at the maximum rate and assume shares were purchased at the beginning of the period. Actual after-tax returns depend on the investor's tax situation and may differ from those shown. After-tax returns are not relevant to investors who hold their Fund shares through tax-deferred arrangements such as 401(k) plans or individual retirement accounts. After-tax returns are shown for Class A shares only; after-tax returns for other share classes will vary. Indexes do not reflect any deduction for fees, expenses or taxes.
Public offering price (POP) returns include the maximum sales charge of 5.75% for Class A shares. Net asset value (NAV) returns do not include sales charges or contingent deferred sales charges (CDSC).
The Fund's annual operating expense ratio, as stated in the May 1, 2012, prospectus, reflects a contractual fee waiver and expense reimbursement agreement with CWAM that expires April 30, 2013; Class A share expense ratios without and with the contractual fee waiver/reimbursement are 14.22% and 1.85%, respectively.
Columbia Acorn Emerging Markets Fund Portfolio Diversification
as a percentage of net assets, as of 9/30/12

Columbia Acorn Emerging Markets Fund
Top 10 Holdings
as a percentage of net assets, as of 9/30/12
| 1. |
Tower Bersama Infrastructure (Indonesia) Communications Towers |
3.5 |
% | ||||||||
| 2. |
Ace Indonesia (Indonesia) Home Improvement Retailer |
3.3 |
% | ||||||||
| 3. |
Nagacorp (Cambodia) Casino/Entertainment Complex in Cambodia |
3.3 |
% | ||||||||
| 4. |
Rand Merchant Insurance (South Africa) Directly Sold Property & Casualty Insurance; Holdings in Other Insurers |
2.7 |
% | ||||||||
| 5. |
Hexagon (Sweden) Design, Measurement & Visualization Software &Equipment |
2.6 |
% | ||||||||
| 6. |
CTCI Corp (Taiwan) International Engineering Firm |
2.6 |
% | ||||||||
| 7. |
Archipelago Resources (Indonesia) Gold Mining Projects in Indonesia, Vietnam & the Philippines |
2.6 |
% | ||||||||
| 8. |
Far EasTone Telecom (Taiwan) Taiwan's Third Largest Mobile Operator |
2.5 |
% | ||||||||
| 9. |
Coronation Fund Managers (South Africa) South African Fund Manager |
2.4 |
% | ||||||||
| 10. |
Halyk Savings Bank of Kazakhstan - GDR (Kazakhstan) Largest Retail Bank & Insurer in Kazakhstan |
2.3 |
% | ||||||||
The Fund's top 10 holdings and portfolio diversification vary with changes in portfolio investments. See the Statement of Investments for a complete list of the Fund's holdings.
The Growth of a $10,000 Investment in Columbia Acorn Emerging Markets Fund (Class A)
August 19, 2011 (Fund inception) through September 30, 2012
The chart shows the change in value of a hypothetical $10,000 investment in Class A shares of the Fund during the stated time period. Although the index is provided for use in assessing the Fund's performance, the Fund's holdings may differ significantly from those in the index. It is not possible to invest directly in an index. The graph does not reflect taxes that a shareholder may pay on Fund distributions or on a sale of Fund shares.
Total Net Assets of the Fund:
$7.2 million
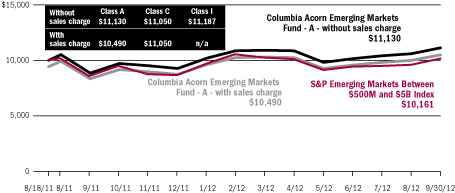
31
Columbia Acorn European Fund
In a Nutshell
|
|
|
||||||
|
Andreas Waldburg-Wolfegg |
Stephen Kusmierczak |
||||||
|
Lead Portfolio Manager |
Co-Portfolio Manager |
||||||


Performance data shown represents past performance and is not a guarantee of future results. The investment return and principal value will fluctuate so that shares, when redeemed, may be worth more or less than the original cost. Current performance may be lower or higher than the performance data shown. Please visit columbiamanagement.com for daily and most recent month-end performance updates.
Fund's Positions
in Mentioned Holdings
As a percentage of net assets, as of 9/30/12
|
Gemalto |
3.0 |
% |
|||||
|
Hexagon |
2.8 |
% |
|||||
|
Marel |
1.8 |
% |
|||||
|
FX Energy |
1.2 |
% |
|||||
|
Ocado |
1.0 |
% |
|||||
|
Yandex |
0.9 |
% |
|||||
|
Koninklijke TenCate |
0.8 |
% |
|||||
Columbia Acorn European Fund was up 7.14% (Class A shares, without sales charge) in the third quarter of 2012, underperforming the 10.30% gain of its primary benchmark, the S&P Europe Between $500M and $5B Index, by 3.16%. For the first nine months of the year, the Fund gained 19.50%, somewhat better than the 18.73% gain of the benchmark. From the Fund's inception on August 19, 2011, through the third quarter end, the Fund was up 12.04% versus a 9.09% gain of its benchmark.
The largest detractors to performance relative to the benchmark in the third quarter were the Fund's holdings in the consumer discretionary and industrial sectors. The Fund maintained overweight positions in these sectors, compounding the effect of poor stock selection. The biggest underperformer was Koninklijke TenCate, a Dutch manufacturer of advanced composites and textiles, which fell 14% as orders from the U.S. Army declined faster than the company had forecast. Another consumer discretionary stock, Ocado, was the Fund's third worst performer, dropping 9%. Ocado is a UK internet grocer with nearly $1 billion in revenues and significant operational advantages compared to traditional retailers. The stock weakened after it announced lower sales growth during the Olympics and the Queen's Jubilee.
In industrials, the biggest performance detractor was Marel, an Icelandic manufacturer of poultry and fish processing equipment. While management has repaired the balance sheet and strongly grown revenues over the last several years, operating margins are lagging company targets. The stock declined nearly 11% in the quarter.
The Fund's overweight in information technology benefited from solid stock
selection, and three of the top four performing stocks were in this sector. Yandex is the largest internet search engine in Russia, and continues to maintain above 60% market share against Google's push into the market. This relatively new holding for the Fund jumped 25% after results beat expectations. Sweden's Hexagon, a leading provider of measurement equipment for manufacturing and construction, gained 25% after realizing a record quarterly profit while maintaining a confident outlook for the second half of 2012. Based in France, Gemalto is a leader in smart chip technology used in pin-chip credit cards and mobile phones. The stock has been a consistent outperformer in the Fund and climbed 22% in the quarter.
Another top performer in the Fund was FX Energy, which explores for and produces oil and gas in Poland. The stock gained 25% after the energy company restored full production at one of its wells and successfully resolved some pipeline issues. We believe the company should also benefit if its Polish shale gas explorations are successful.
The volatility in Europe continues, and as we have written before, the repair path will likely not be smooth or continuous. Yet despite the abundant gloom reported by the press, we continue to focus on trying to understand the opportunities, operations and threats facing individual companies. We don't mislead ourselves into believing that we have better insights into how the macro-economy will develop, but rather we maintain and build a portfolio of companies, one investment at a time. This process has proven successful for decades in other Acorn Funds and the process continues to be applied in Columbia Acorn European Fund.
International investing involves special risks, including foreign taxation, currency risks, risks associated with possible differences in financial standards, operational and settlement risks and other risks associated with future political and economic developments. Stocks of small- and mid-cap companies pose special risks, including possible illiquidity and greater price volatility than stocks of larger, more established companies. Investing in emerging markets may involve greater risks than investing in more developed countries.
Portfolio holdings are subject to change periodically and may not be representative of current holdings.
32
Columbia Acorn
European Fund
At a Glance (Class A Shares - CAEAX)
Performance data shown represents past performance and is not a guarantee of future results. The investment return and principal value of an investment will fluctuate so that shares, when redeemed, may be worth more or less than their original cost. Current performance may be lower or higher than the performance data shown. Performance results reflect any fee waivers or reimbursements of Fund expenses by the investment manager and/or any of its affiliates. Absent these fee waivers and/or expense reimbursement arrangements, performance results would have been lower. Please visit columbiamanagement.com for daily and most recent month-end updates.
Pretax and After-tax Average Annual Total Returns (Based on Class A Share Returns, inception 8/19/11)
through September 30, 2012
|
Year to date* |
1 year |
Life of fund |
|||||||||||||||||
|
Returns before taxes |
NAV POP |
19.50 12.57 |
% |
20.68 13.78 |
% |
12.04 6.26 |
% |
||||||||||||
|
Returns after taxes on distributions |
NAV POP |
19.43 12.51 |
20.37 13.49 |
11.79 6.02 |
|||||||||||||||
|
Returns after taxes on distributions and sale of fund shares |
NAV POP |
12.67 8.17 |
13.48 9.00 |
10.10 5.19 |
|||||||||||||||
|
S&P Europe Between $500M and $5B Index (pretax)** |
18.73 |
19.21 |
9.09 |
||||||||||||||||
All results shown assume reinvestment of distributions.
*Year to date data is not annualized.
**The Fund's primary benchmark.
After-tax returns are calculated using the highest historical individual federal marginal income tax rates, and do not reflect the impact of state and local taxes. Returns after taxes on distributions and sale of Fund shares reflect the additional tax impact of long-term gains or losses realized when Fund shares are sold. The returns are taxed at the maximum rate and assume shares were purchased at the beginning of the period. Actual after-tax returns depend on the investor's tax situation and may differ from those shown. After-tax returns are not relevant to investors who hold their Fund shares through tax-deferred arrangements such as 401(k) plans or individual retirement accounts. After-tax returns are shown for Class A shares only; after-tax returns for other share classes will vary. Indexes do not reflect any deduction for fees, expenses or taxes.
Public offering price (POP) returns include the maximum sales charge of 5.75% for Class A shares. Net asset value (NAV) returns do not include sales charges or contingent deferred sales charges (CDSC).
The Fund's annual operating expense ratio, as stated in the May 1, 2012, prospectus, reflects a contractual fee waiver and expense reimbursement agreement with CWAM that expires April 30, 2013; Class A share expense ratios without and with the contractual fee waiver/reimbursement are 19.73% and 1.75%, respectively.
Columbia Acorn European Fund Portfolio Diversification
as a percentage of net assets, as of 9/30/12

Columbia Acorn European Fund Top 10 Holdings
as a percentage of net assets, as of 9/30/12
| 1. |
Eurofins Scientific (France) Food, Pharmaceuticals & Materials Screening & Testing |
3.1 |
% | ||||||||
| 2. |
Gemalto (France) Smart Card Products & Solutions |
3.0 |
% | ||||||||
| 3. |
1000 mercis (France) Interactive Advertising and Marketing |
3.0 |
% | ||||||||
| 4. |
Geberit (Switzerland) Plumbing Supplies |
2.9 |
% | ||||||||
| 5. |
Wirecard (Germany) Online Payment Processing & Risk Management |
2.9 |
% | ||||||||
| 6. |
Hexagon (Sweden) Design, Measurement & Visualization Software & Equipment |
2.8 |
% | ||||||||
| 7. |
Charles Taylor (United Kingdom) Insurance Services |
2.5 |
% | ||||||||
| 8. |
Aalberts Industries (Netherlands) Flow Control & Heat Treatment |
2.4 |
% | ||||||||
| 9. |
Partners Group (Switzerland) Private Markets Asset Management |
2.3 |
% | ||||||||
| 10. |
Domino's Pizza UK & Ireland Pizza Delivery in the UK, Ireland & Germany |
2.3 |
% | ||||||||
The Fund's top 10 holdings and portfolio diversification vary with changes in portfolio investments. See the Statement of Investments for a complete list of the Fund's holdings.
The Growth of a $10,000 Investment in Columbia Acorn European Fund (Class A)
August 19, 2011 (Fund inception) through September 30, 2012
The chart shows the change in value of a hypothetical $10,000 investment in Class A shares of the Fund during the stated time period. Although the index is provided for use in assessing the Fund's performance, the Fund's holdings may differ significantly from those in the index. It is not possible to invest directly in an index. The graph does not reflect taxes that a shareholder may pay on Fund distributions or on a sale of Fund shares.
Total Net Assets of the Fund:
$2.5 million
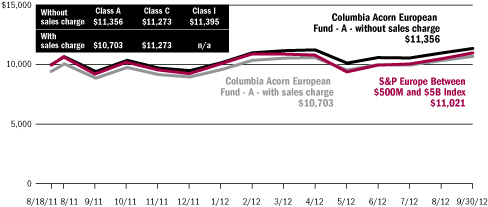
33
Columbia Acorn Fund
Major Portfolio Changes in the Third Quarter (Unaudited)
|
Number of Shares |
|||||||||||
|
6/30/12 |
9/30/12 |
||||||||||
|
Purchases |
|||||||||||
|
Information |
|||||||||||
|
Angie's List |
231,700 |
900,000 |
|||||||||
|
BazaarVoice |
0 |
141,923 |
|||||||||
|
Boingo Wireless |
1,650,000 |
1,860,682 |
|||||||||
|
DemandWare |
0 |
414,204 |
|||||||||
|
Eloqua |
0 |
130,881 |
|||||||||
|
Exa |
0 |
102,593 |
|||||||||
|
Finisar |
1,345,000 |
1,675,000 |
|||||||||
|
Gemalto (France) |
207,000 |
250,000 |
|||||||||
|
InContact |
1,000,000 |
2,110,000 |
|||||||||
|
Liquidity Services |
0 |
100,000 |
|||||||||
|
Trulia |
0 |
106,700 |
|||||||||
|
WNS - ADR (India) |
1,091,353 |
1,491,353 |
|||||||||
|
Yandex (Russia) |
700,100 |
727,000 |
|||||||||
|
Industrial Goods & Services |
|||||||||||
|
Aalberts Industries (Netherlands) |
2,324,833 |
2,472,255 |
|||||||||
|
Generac |
2,350,000 |
2,725,000 |
|||||||||
|
Insperity |
1,359,200 |
1,546,000 |
|||||||||
|
Neopost (France) |
350,000 |
400,000 |
|||||||||
|
Polypore International |
1,325,000 |
1,557,553 |
|||||||||
|
WESCO International |
0 |
157,843 |
|||||||||
|
Consumer Goods & Services |
|||||||||||
|
American Eagle Outfitters |
1,075,000 |
1,575,000 |
|||||||||
|
Choice Hotels |
970,000 |
1,100,000 |
|||||||||
|
DeVry |
0 |
600,000 |
|||||||||
|
Interface |
2,038,555 |
2,325,000 |
|||||||||
|
ITT Educational Services |
300,000 |
500,000 |
|||||||||
|
Lifestyle International (Hong Kong) |
16,857,500 |
17,000,000 |
|||||||||
|
Massmart Holdings (South Africa) |
0 |
388,220 |
|||||||||
|
Tesla Motors |
400,000 |
850,000 |
|||||||||
|
Williams-Sonoma |
0 |
415,000 |
|||||||||
|
Finance |
|||||||||||
|
Textainer Group Holdings |
78,500 |
228,500 |
|||||||||
|
Wright Express |
275,000 |
350,000 |
|||||||||
|
Health Care |
|||||||||||
|
ARIAD Pharmaceuticals |
2,568,248 |
3,600,000 |
|||||||||
|
Cepheid |
4,600,000 |
4,970,000 |
|||||||||
|
Onyx Pharmaceuticals |
750,000 |
870,000 |
|||||||||
|
Sirona Dental Systems |
675,000 |
1,024,683 |
|||||||||
|
Synageva Biopharma |
569,898 |
735,000 |
|||||||||
|
Energy & Minerals |
|||||||||||
|
Kaminak Gold |
0 |
2,518,600 |
|||||||||
|
Regis Resources (Australia) |
0 |
217,283 |
|||||||||
|
Silver Wheaton (Canada) |
550,000 |
1,000,000 |
|||||||||
|
Number of Shares |
|||||||||||
|
6/30/12 |
9/30/12 |
||||||||||
|
Other Industries |
|||||||||||
|
Ascendas REIT (Singapore) |
15,000,000 |
22,000,000 |
|||||||||
|
Kirby |
0 |
350,000 |
|||||||||
|
Mapletree Commercial Trust (Singapore) |
0 |
8,845,000 |
|||||||||
|
Mapletree Industrial Trust (Singapore) |
0 |
10,000,000 |
|||||||||
|
Mapletree Logistics Trust (Singapore) |
43,000,000 |
50,000,000 |
|||||||||
|
Rush Enterprises, Class A |
2,937,175 |
3,100,000 |
|||||||||
|
Summit Hotel Properties |
2,000,031 |
2,476,000 |
|||||||||
34
|
Number of Shares |
|||||||||||
|
6/30/12 |
9/30/12 |
||||||||||
|
Sales |
|||||||||||
|
Information |
|||||||||||
|
AboveNet |
1,400,000 |
0 |
|||||||||
|
Advent Software |
690,000 |
0 |
|||||||||
|
Ariba |
900,000 |
300,000 |
|||||||||
|
Blackbaud |
960,329 |
368,889 |
|||||||||
|
Constant Contact |
2,000,000 |
1,200,000 |
|||||||||
|
FTI Consulting |
234,615 |
0 |
|||||||||
|
General Communications |
2,000,000 |
1,500,000 |
|||||||||
|
Kenexa |
1,173,100 |
925,000 |
|||||||||
|
Lamar Advertising |
1,725,000 |
1,700,000 |
|||||||||
|
Liberty Global Series A |
900,000 |
800,000 |
|||||||||
|
Mail.ru - GDR (Russia) |
234,168 |
0 |
|||||||||
|
NetEase.com - ADR (China) |
304,000 |
222,400 |
|||||||||
|
Saga Communications |
145,271 |
0 |
|||||||||
|
Stratasys |
605,000 |
480,000 |
|||||||||
|
TripAdvisor |
1,450,000 |
1,325,000 |
|||||||||
|
VisionChina Media - ADR (China) |
1,500,000 |
0 |
|||||||||
|
Industrial Goods & Services |
|||||||||||
|
Albemarle |
1,750,000 |
1,580,000 |
|||||||||
|
Clarcor |
2,325,000 |
2,213,551 |
|||||||||
|
Expeditors International of Washington |
3,050,000 |
2,900,000 |
|||||||||
|
GrafTech International |
2,800,000 |
2,221,812 |
|||||||||
|
Imtech (Netherlands) |
1,491,313 |
1,300,000 |
|||||||||
|
Interline Brands |
1,400,000 |
0 |
|||||||||
|
Mersen (France) |
92,046 |
0 |
|||||||||
|
Pentair |
1,890,000 |
1,250,000 |
|||||||||
|
UTI Worldwide |
750,000 |
500,000 |
|||||||||
|
Consumer Goods & Services |
|||||||||||
|
Abercrombie & Fitch |
3,040,000 |
2,601,000 |
|||||||||
|
Expedia |
1,450,000 |
1,225,000 |
|||||||||
|
Shutterfly |
3,370,000 |
2,835,000 |
|||||||||
|
True Religion Apparel |
231,452 |
182,866 |
|||||||||
|
Finance |
|||||||||||
|
FX Alliance |
300,000 |
0 |
|||||||||
|
Pacific Continental Bank |
241,405 |
104,023 |
|||||||||
|
Regional Management |
422,500 |
333,191 |
|||||||||
|
Wintrust Financial |
700,000 |
550,000 |
|||||||||
|
World Acceptance |
1,425,202 |
1,285,000 |
|||||||||
|
Health Care |
|||||||||||
|
Adcock Ingram Holdings (South Africa) |
3,388,000 |
2,606,333 |
|||||||||
|
Alexion Pharmaceuticals |
1,476,000 |
1,215,000 |
|||||||||
|
Anthera Pharmaceuticals |
2,990,000 |
0 |
|||||||||
|
BioMarin Pharmaceutical |
4,315,000 |
3,875,000 |
|||||||||
|
Number of Shares |
|||||||||||
|
6/30/12 |
9/30/12 |
||||||||||
|
Chelsea Therapeutics International |
5,750,000 |
4,949,000 |
|||||||||
|
eResearch Technology |
4,900,000 |
0 |
|||||||||
|
Hill-Rom Holdings |
1,275,000 |
925,000 |
|||||||||
|
InterMune |
3,850,000 |
2,025,000 |
|||||||||
|
Raptor Pharmaceutical |
3,609,594 |
3,000,000 |
|||||||||
|
Energy & Minerals |
|||||||||||
|
Fugro (Netherlands) |
1,289,106 |
1,031,106 |
|||||||||
|
Hornbeck Offshore |
1,000,000 |
884,000 |
|||||||||
|
Pacific Rubiales Energy (Colombia) |
3,700,000 |
3,500,000 |
|||||||||
|
PetroMagdalena Energy (Colombia) |
7,582,928 |
0 |
|||||||||
|
Swift Energy |
550,000 |
0 |
|||||||||
|
Zhaojin Mining Industry (China) |
15,000,000 |
0 |
|||||||||
|
Other Industries |
|||||||||||
|
Red Eléctrica de España (Spain) |
200,000 |
0 |
|||||||||
|
World Fuel Services |
1,260,000 |
704,000 |
|||||||||
35
Columbia Acorn Fund
Statement of Investments (Unaudited), September 30, 2012
|
Number of Shares |
Value (000) |
||||||||||
|
Equities: 96.2% |
|||||||||||
|
Information 26.7% |
|||||||||||
| > Business Software 6.6% | |||||||||||
|
2,550,000 |
Ansys (a) |
$ |
187,170 |
||||||||
|
Simulation Software for Engineers & Designers |
|||||||||||
|
5,000,000 |
Informatica (a) |
174,050 |
|||||||||
|
Enterprise Data Integration Software |
|||||||||||
|
2,700,000 |
Micros Systems (a) |
132,624 |
|||||||||
|
Information Systems for Hotels, Restaurants & Retailers |
|||||||||||
|
5,450,000 |
Hexagon (Sweden) |
116,819 |
|||||||||
|
Design, Measurement & Visualization Software & Equipment |
|||||||||||
|
1,400,000 |
Concur Technologies (a) |
103,222 |
|||||||||
|
Web-enabled Cost & Expense Management Software |
|||||||||||
|
700,000 |
NetSuite (a) |
44,660 |
|||||||||
|
End-to-end IT Systems Solutions Delivered Over the Web |
|||||||||||
|
1,450,000 |
TIBCO (a) |
43,833 |
|||||||||
|
Datacenter Software |
|||||||||||
|
2,350,000 |
Quality Systems |
43,593 |
|||||||||
|
IT Systems for Medical Groups & Ambulatory Care Centers |
|||||||||||
|
925,000 |
Kenexa (a) |
42,393 |
|||||||||
|
Recruiting & Workforce Management Solutions |
|||||||||||
|
700,000 |
Red Hat (a) |
39,858 |
|||||||||
|
Maintenance & Support for Opensource Operating System & Middleware |
|||||||||||
|
900,000 |
Tyler Technologies (a) |
39,618 |
|||||||||
|
Financial, Tax, Court & Document Management Systems for Local Governments |
|||||||||||
|
900,000 |
SPS Commerce (a)(b) |
34,623 |
|||||||||
|
Supply Chain Management Software Delivered via the Web |
|||||||||||
|
750,000 |
Jack Henry & Associates |
28,425 |
|||||||||
|
IT Systems & Outsourced IT Solutions for Financial Institutions |
|||||||||||
|
2,700,000 |
Velti (a)(c) |
22,599 |
|||||||||
|
Mobile Marketing Software Platform |
|||||||||||
|
1,200,000 |
Constant Contact (a) |
20,880 |
|||||||||
|
Email & Other Marketing Campaign Management Systems Delivered Over Web |
|||||||||||
|
2,000,000 |
SABA (a)(b) |
19,980 |
|||||||||
|
Learning Management Systems |
|||||||||||
|
2,110,000 |
InContact (a) |
13,757 |
|||||||||
|
Call Center Systems Delivered Via the Web & Telco Services |
|||||||||||
|
300,000 |
Ariba (a) |
13,440 |
|||||||||
|
Cost Management Software |
|||||||||||
|
414,204 |
DemandWare (a)(c) |
13,151 |
|||||||||
|
eCommerce Website Solutions for Retailers & Apparel Manufacturers |
|||||||||||
|
900,000 |
Active Network (a) |
11,277 |
|||||||||
|
Web-delivered Software Solution for Managing Events & Activities |
|||||||||||
|
368,889 |
Blackbaud |
8,824 |
|||||||||
|
Software & Services for Non-profits |
|||||||||||
|
130,881 |
Eloqua (a) |
2,585 |
|||||||||
|
Marketing Automation Software |
|||||||||||
|
Number of Shares |
Value (000) |
||||||||||
|
55,000 |
Solera Holdings |
$ |
2,413 |
||||||||
|
Software for Automotive Insurance Claims Processing |
|||||||||||
|
141,923 |
BazaarVoice (a) |
2,150 |
|||||||||
|
Platform for Managing Consumer Interaction Via the Web |
|||||||||||
|
102,593 |
Exa (a) |
1,113 |
|||||||||
|
Simulation Software |
|||||||||||
|
1,163,057 |
|||||||||||
| > Instrumentation 3.0% | |||||||||||
|
1,600,000 |
Mettler-Toledo International (a)(b) |
273,184 |
|||||||||
|
Laboratory Equipment |
|||||||||||
|
2,780,000 |
IPG Photonics (a)(b)(c) |
159,294 |
|||||||||
|
Fiber Lasers |
|||||||||||
|
2,035,000 |
Trimble Navigation (a) |
96,988 |
|||||||||
|
GPS-based Instruments |
|||||||||||
|
529,466 |
|||||||||||
| > Mobile Communications 2.9% | |||||||||||
|
4,465,000 |
Crown Castle International (a) |
286,206 |
|||||||||
|
Communications Towers |
|||||||||||
|
3,400,000 |
SBA Communications (a) |
213,860 |
|||||||||
|
Communications Towers |
|||||||||||
|
1,200,000 |
Globalstar (a) |
552 |
|||||||||
|
Satellite Mobile Voice & Data Carrier |
|||||||||||
|
500,618 |
|||||||||||
|
> Computer Hardware & Related Equipment 2.6% |
|||||||||||
|
3,415,000 |
Amphenol |
201,075 |
|||||||||
|
Electronic Connectors |
|||||||||||
|
4,550,000 |
II-VI (a)(b) |
86,541 |
|||||||||
|
Laser Optics & Specialty Materials |
|||||||||||
|
1,365,000 |
Zebra Technologies (a) |
51,242 |
|||||||||
|
Bar Code Printers |
|||||||||||
|
900,000 |
Netgear (a) |
34,326 |
|||||||||
|
Networking Products for Small Business & Home |
|||||||||||
|
800,000 |
NICE Systems - ADR (Israel) (a) |
26,576 |
|||||||||
|
Audio & Video Recording Solutions |
|||||||||||
|
480,000 |
Stratasys (a)(c) |
26,112 |
|||||||||
|
Rapid Prototyping Systems |
|||||||||||
|
250,000 |
Gemalto (France) |
21,991 |
|||||||||
|
Digital Security Solutions |
|||||||||||
|
447,863 |
|||||||||||
|
> Semiconductors & Related Equipment 1.9% |
|||||||||||
|
11,562,000 |
Atmel (a) |
60,816 |
|||||||||
|
Microcontrollers, Radio Frequency & Memory Semiconductors |
|||||||||||
|
7,932,000 |
ON Semiconductor (a) |
48,940 |
|||||||||
|
Mixed Signal & Power Management Semiconductors |
|||||||||||
|
2,160,000 |
Microsemi (a) |
43,351 |
|||||||||
|
Analog/Mixed Signal Semiconductors |
|||||||||||
|
5,000,000 |
Entegris (a) |
40,650 |
|||||||||
|
Semiconductor Materials Management Products |
|||||||||||
|
420,000 |
Littelfuse |
23,747 |
|||||||||
|
Little Fuses |
|||||||||||
36
|
Number of Shares |
Value (000) |
||||||||||
|
> Semiconductors & Related Equipment—continued |
|||||||||||
|
1,165,000 |
Monolithic Power Systems (a) |
$ |
23,009 |
||||||||
|
High Performance Analog & Mixed Signal Integrated Circuits |
|||||||||||
|
400,000 |
Hittite Microwave (a) |
22,188 |
|||||||||
|
Radio Frequency, Microwave & Millimeterwave Semiconductors |
|||||||||||
|
615,000 |
Ultratech (a) |
19,299 |
|||||||||
|
Semiconductor Equipment |
|||||||||||
|
1,900,000 |
IXYS (a)(b) |
18,848 |
|||||||||
|
Power Semiconductors |
|||||||||||
|
1,765,000 |
Pericom Semiconductor (a)(b) |
15,329 |
|||||||||
|
Interface Integrated Circuits & Frequency Control Products |
|||||||||||
|
560,000 |
Cree (a)(c) |
14,297 |
|||||||||
|
LED Lighting, Components & Chips |
|||||||||||
|
2,290,000 |
TriQuint Semiconductor (a) |
11,564 |
|||||||||
|
Radio Frequency Semiconductors |
|||||||||||
|
342,038 |
|||||||||||
| > Telephone & Data Services 1.9% | |||||||||||
|
9,500,000 |
tw telecom (a)(b) |
247,665 |
|||||||||
|
Fiber Optic Telephone/Data Services |
|||||||||||
|
2,200,000 |
Cogent Communications |
50,578 |
|||||||||
|
Internet Data Pipelines |
|||||||||||
|
1,860,682 |
Boingo Wireless (a)(b) |
14,774 |
|||||||||
|
Wholesale & Retail WiFi Networks |
|||||||||||
|
1,500,000 |
General Communications (a) |
14,700 |
|||||||||
|
Commercial Communications & Consumer Cable TV, Web & Phone in Alaska |
|||||||||||
|
327,717 |
|||||||||||
| > Computer Services 1.4% | |||||||||||
|
3,400,000 |
iGATE (a)(b) |
61,778 |
|||||||||
|
IT & Business Process Outsourcing Services |
|||||||||||
|
1,618,000 |
ExlService Holdings (a)(b) |
47,731 |
|||||||||
|
Business Process Outsourcing |
|||||||||||
|
680,000 |
Syntel |
42,439 |
|||||||||
|
Offshore IT Services |
|||||||||||
|
2,125,000 |
Virtusa (a)(b) |
37,761 |
|||||||||
|
Offshore IT Outsourcing |
|||||||||||
|
1,705,000 |
Genpact |
28,439 |
|||||||||
|
Business Process Outsourcing |
|||||||||||
|
3,849,207 |
Hackett Group (a)(b) |
16,090 |
|||||||||
|
IT Integration & Best Practice Research |
|||||||||||
|
1,491,353 |
WNS - ADR (India) (a) |
15,272 |
|||||||||
|
Offshore BPO (Business Process Outsourcing) Services |
|||||||||||
|
249,510 |
|||||||||||
| > Gaming Equipment & Services 1.2% | |||||||||||
|
3,725,000 |
Bally Technologies (a)(b) |
183,978 |
|||||||||
|
Slot Machines & Software |
|||||||||||
|
1,530,000 |
WMS Industries (a) |
25,061 |
|||||||||
|
Slot Machine Provider |
|||||||||||
|
209,039 |
|||||||||||
| > Internet Related 1.0% | |||||||||||
|
450,000 |
Equinix (a) |
92,722 |
|||||||||
|
Network Neutral Data Centers |
|||||||||||
|
Number of Shares |
Value (000) |
||||||||||
|
1,325,000 |
TripAdvisor (a) |
$ |
43,632 |
||||||||
|
Online Travel Research |
|||||||||||
|
727,000 |
Yandex (Russia) (a) |
17,528 |
|||||||||
|
Search Engine for Russian & Turkish Languages |
|||||||||||
|
222,400 |
NetEase.com - ADR (China) (a) |
12,486 |
|||||||||
|
Chinese Online Gaming Services |
|||||||||||
|
900,000 |
Angie's List (a)(c) |
9,522 |
|||||||||
|
Consumer Subscription & Internet Advertising |
|||||||||||
|
106,700 |
Trulia (a) |
2,286 |
|||||||||
|
Real Estate Broker Subscription & Advertising |
|||||||||||
|
178,176 |
|||||||||||
|
> Business Information & Marketing Services 0.8% |
|||||||||||
|
1,900,000 |
Verisk Analytics (a) |
90,459 |
|||||||||
|
Risk & Decision Analytics |
|||||||||||
|
3,500,000 |
Navigant Consulting (a)(b) |
38,675 |
|||||||||
|
Financial Consulting Firm |
|||||||||||
|
505,000 |
RPX (a) |
5,661 |
|||||||||
|
Patent Aggregation & Defensive Patent Consulting |
|||||||||||
|
134,795 |
|||||||||||
| > Telecommunications Equipment 0.7% | |||||||||||
|
640,000 |
F5 Networks (a) |
67,008 |
|||||||||
|
Internet Traffic Management Equipment |
|||||||||||
|
1,730,000 |
Ixia (a) |
27,801 |
|||||||||
|
Telecom Network Test Equipment |
|||||||||||
|
1,675,000 |
Finisar (a) |
23,953 |
|||||||||
|
Optical Subsystems & Components |
|||||||||||
|
1,925,000 |
Infinera (a)(c) |
10,549 |
|||||||||
|
Optical Networking Equipment |
|||||||||||
|
129,311 |
|||||||||||
| > CATV 0.7% | |||||||||||
|
900,000 |
Discovery Series C (a) |
50,436 |
|||||||||
|
Cable TV Programming |
|||||||||||
|
800,000 |
Liberty Global Series A (a) |
48,600 |
|||||||||
|
Cable TV Franchises Outside the U.S. |
|||||||||||
|
18,000 |
Jupiter Telecommunications (Japan) |
18,268 |
|||||||||
|
Largest Cable Service Provider in Japan |
|||||||||||
|
117,304 |
|||||||||||
| > Financial Processors 0.6% | |||||||||||
|
1,700,000 |
Global Payments |
71,111 |
|||||||||
|
Credit Card Processor |
|||||||||||
|
5,000,000 |
Singapore Exchange (Singapore) |
28,418 |
|||||||||
|
Singapore Equity & Derivatives Market Operator |
|||||||||||
|
100,000 |
Liquidity Services (a) |
5,021 |
|||||||||
|
E-auctions for Surplus & Salvage Goods |
|||||||||||
|
104,550 |
|||||||||||
| > Electronics Distribution 0.5% | |||||||||||
|
3,125,000 |
Avnet (a) |
90,906 |
|||||||||
|
Electronic Components Distribution |
|||||||||||
|
90,906 |
|||||||||||
37
Columbia Acorn Fund
Statement of Investments (Unaudited), continued
|
Number of Shares |
Value (000) |
||||||||||
| > Advertising 0.4% | |||||||||||
|
1,700,000 |
Lamar Advertising (a) |
$ |
63,002 |
||||||||
|
Outdoor Advertising |
|||||||||||
|
63,002 |
|||||||||||
| > Contract Manufacturing 0.4% | |||||||||||
|
3,800,000 |
Sanmina-SCI (a) |
32,262 |
|||||||||
|
Electronic Manufacturing Services |
|||||||||||
|
960,000 |
Plexus (a) |
29,078 |
|||||||||
|
Electronic Manufacturing Services |
|||||||||||
|
61,340 |
|||||||||||
| > Entertainment Programming 0.1% | |||||||||||
|
1,100,000 |
IMAX (Canada) (a)(c) |
21,901 |
|||||||||
|
IMAX Movies, Theatre Equipment & Theatre Joint Ventures |
|||||||||||
|
21,901 |
|||||||||||
| > TV Broadcasting —% | |||||||||||
|
1,750,000 |
Gray Television (a) |
3,990 |
|||||||||
|
Mid-market Affiliated TV Stations |
|||||||||||
|
2,500,000 |
Entravision Communications |
3,350 |
|||||||||
|
Spanish Language TV & Radio Stations |
|||||||||||
|
7,340 |
|||||||||||
| > Consumer Software —% | |||||||||||
|
273,500 |
Carbonite (a)(c) |
1,917 |
|||||||||
|
Online Data Storage |
|||||||||||
|
1,917 |
|||||||||||
|
Information: Total |
4,679,850 |
||||||||||
|
Industrial Goods & Services 19.0% |
|||||||||||
| > Machinery 11.4% | |||||||||||
|
10,125,000 |
Ametek |
358,931 |
|||||||||
|
Aerospace/Industrial Instruments |
|||||||||||
|
8,400,000 |
Donaldson (b) |
291,564 |
|||||||||
|
Industrial Air Filtration |
|||||||||||
|
3,125,000 |
Nordson |
183,187 |
|||||||||
|
Dispensing Systems for Adhesives & Coatings |
|||||||||||
|
3,725,000 |
Kennametal |
138,123 |
|||||||||
|
Consumable Cutting Tools |
|||||||||||
|
1,800,000 |
Pall |
114,282 |
|||||||||
|
Life Science, Water & Industrial Filtration |
|||||||||||
|
3,000,000 |
Moog (a)(b) |
113,610 |
|||||||||
|
Motion Control Products for Aerospace, Defense & Industrial Markets |
|||||||||||
|
2,213,551 |
Clarcor |
98,791 |
|||||||||
|
Mobile Equipment & Industrial Filters |
|||||||||||
|
3,063,000 |
HEICO (b) |
93,452 |
|||||||||
|
FAA Approved Aircraft Replacement Parts |
|||||||||||
|
2,200,000 |
ESCO Technologies (b) |
85,470 |
|||||||||
|
Automatic Electric Meter Readers |
|||||||||||
|
2,675,000 |
Oshkosh Corporation (a) |
73,375 |
|||||||||
|
Specialty Truck Manufacturer |
|||||||||||
|
1,610,000 |
Toro |
64,046 |
|||||||||
|
Turf Maintenance Equipment |
|||||||||||
|
2,725,000 |
Generac |
62,375 |
|||||||||
|
Standby Power Generators |
|||||||||||
|
435,000 |
Valmont Industries |
57,203 |
|||||||||
|
Center Pivot Irrigation Systems & Utility Poles |
|||||||||||
|
Number of Shares |
Value (000) |
||||||||||
|
1,250,000 |
Pentair (c) |
$ |
55,638 |
||||||||
|
Pumps & Water Treatment |
|||||||||||
|
1,557,553 |
Polypore International (a)(c) |
55,059 |
|||||||||
|
Battery Separators & Filtration Media |
|||||||||||
|
950,000 |
WABCO Holdings (a) |
54,787 |
|||||||||
|
Truck & Bus Component Supplier |
|||||||||||
|
600,000 |
Wabtec |
48,174 |
|||||||||
|
Freight & Transit Component Supplier |
|||||||||||
|
400,000 |
Neopost (France) |
22,087 |
|||||||||
|
Postage Meter Machines |
|||||||||||
|
170,000 |
Middleby (a) |
19,659 |
|||||||||
|
Manufacturer of Cooking Equipment |
|||||||||||
|
10,000,000 |
Marel (Iceland) |
10,863 |
|||||||||
|
Largest Manufacturer of Poultry & Fish Processing Equipment |
|||||||||||
|
1,000,000 |
Spartan Motors |
5,000 |
|||||||||
|
Specialty Truck & Chassis Manufacturer |
|||||||||||
|
2,005,676 |
|||||||||||
|
> Industrial Materials & Specialty Chemicals 2.3% |
|||||||||||
|
1,520,000 |
FMC Corporation |
84,177 |
|||||||||
|
Niche Specialty Chemicals |
|||||||||||
|
1,580,000 |
Albemarle |
83,234 |
|||||||||
|
Refinery Catalysts & Other Specialty Chemicals |
|||||||||||
|
800,000 |
Ashland |
57,280 |
|||||||||
|
Diversified Chemicals Company |
|||||||||||
|
1,880,000 |
Drew Industries (a)(b) |
56,795 |
|||||||||
|
RV & Manufactured Home Components |
|||||||||||
|
1,525,000 |
Novozymes (Denmark) |
42,032 |
|||||||||
|
Industrial Enzymes |
|||||||||||
|
673,000 |
Sociedad Quimica y Minera de Chile - ADR (Chile) |
41,484 |
|||||||||
|
Producer of Specialty Fertilizers, Lithium & Iodine |
|||||||||||
|
2,218,700 |
Kansai Paint (Japan) (c) |
24,590 |
|||||||||
|
Paint Producer in Japan, India, China & Southeast Asia |
|||||||||||
|
600,000 |
Albany International |
13,182 |
|||||||||
|
Paper Machine Clothing & Composites for Aerospace |
|||||||||||
|
200,000 |
Silgan Holdings |
8,702 |
|||||||||
|
Metal & Plastic Packaging |
|||||||||||
|
411,476 |
|||||||||||
| > Other Industrial Services 1.6% | |||||||||||
|
2,900,000 |
Expeditors International of Washington |
105,444 |
|||||||||
|
International Freight Forwarder |
|||||||||||
|
2,700,000 |
LKQ (a) |
49,950 |
|||||||||
|
Alternative Auto Parts Distribution |
|||||||||||
|
1,400,000 |
Forward Air |
42,574 |
|||||||||
|
Freight Transportation Between Airports |
|||||||||||
|
1,300,000 |
Imtech (Netherlands) |
34,313 |
|||||||||
|
Electromechanical & Information Communications Technology Installation & Maintenance |
|||||||||||
|
1,600,000 |
Mobile Mini (a) |
26,736 |
|||||||||
|
Portable Storage Units Leasing |
|||||||||||
|
1,505,246 |
Acorn Energy (b)(c) |
13,427 |
|||||||||
|
Frac Well Exploration/Monitoring Device, Sonar Security, Electric Grid Monitoring |
|||||||||||
38
|
Number of Shares |
Value (000) |
||||||||||
| > Other Industrial Services—continued | |||||||||||
|
500,000 |
UTI Worldwide |
$ |
6,735 |
||||||||
|
Freight Forwarding & Logistics |
|||||||||||
|
279,179 |
|||||||||||
| > Construction 1.3% | |||||||||||
|
2,850,000 |
Chicago Bridge & Iron |
108,556 |
|||||||||
|
Engineering & Construction for Liquefied Natural Gas & Petrochemicals |
|||||||||||
|
66,000 |
NVR (a) |
55,737 |
|||||||||
|
D.C. Homebuilder |
|||||||||||
|
1,350,000 |
Fortune Brands Home & Security (a) |
36,464 |
|||||||||
|
Home Building Supplies & Small Locks |
|||||||||||
|
1,800,000 |
Mills Estruturas e Servicos de Engenharia (Brazil) |
25,820 |
|||||||||
|
Civil Engineering & Construction |
|||||||||||
|
226,577 |
|||||||||||
| > Electrical Components 0.8% | |||||||||||
|
1,765,000 |
Acuity Brands |
111,707 |
|||||||||
|
Commercial Lighting Fixtures |
|||||||||||
|
1,500,000 |
Ushio (Japan) |
17,993 |
|||||||||
|
Industrial Light Sources |
|||||||||||
|
351,000 |
Saft (France) |
8,130 |
|||||||||
|
Niche Battery Manufacturer |
|||||||||||
|
137,830 |
|||||||||||
| > Outsourcing Services 0.7% | |||||||||||
|
2,800,000 |
Quanta Services (a) |
69,160 |
|||||||||
|
Electrical & Telecom Construction Services |
|||||||||||
|
1,546,000 |
Insperity (b) |
39,006 |
|||||||||
|
Professional Employer Organization |
|||||||||||
|
600,000 |
GP Strategies (a) |
11,592 |
|||||||||
|
Outsourced Training Services |
|||||||||||
|
119,758 |
|||||||||||
| > Waste Management 0.5% | |||||||||||
|
2,050,000 |
Waste Connections |
62,013 |
|||||||||
|
Solid Waste Management |
|||||||||||
|
560,000 |
Clean Harbors (a) |
27,356 |
|||||||||
|
Hazardous Waste Services & Disposal |
|||||||||||
|
89,369 |
|||||||||||
| > Conglomerates 0.2% | |||||||||||
|
2,472,255 |
Aalberts Industries (Netherlands) |
44,382 |
|||||||||
|
Flow Control & Heat Treatment |
|||||||||||
|
44,382 |
|||||||||||
| > Steel 0.1% | |||||||||||
|
2,221,812 |
GrafTech International (a) |
19,974 |
|||||||||
|
Industrial Graphite Materials Producer |
|||||||||||
|
19,974 |
|||||||||||
| > Industrial Distribution 0.1% | |||||||||||
|
157,843 |
WESCO International (a) |
9,029 |
|||||||||
|
Industrial Distribution |
|||||||||||
|
9,029 |
|||||||||||
|
Industrial Goods & Services: Total |
3,343,250 |
||||||||||
|
Consumer Goods & Services 15.7% |
|||||||||||
| > Retail 4.8% | |||||||||||
|
4,505,000 |
lululemon athletica (a) |
333,100 |
|||||||||
|
Premium Active Apparel Retailer |
|||||||||||
|
Number of Shares |
Value (000) |
||||||||||
|
6,600,000 |
Pier 1 Imports (b) |
$ |
123,684 |
||||||||
|
Home Furnishing Retailer |
|||||||||||
|
2,601,000 |
Abercrombie & Fitch |
88,226 |
|||||||||
|
Teen Apparel Retailer |
|||||||||||
|
2,835,000 |
Shutterfly (a)(b) |
88,225 |
|||||||||
|
Internet Photo-centric Retailer |
|||||||||||
|
4,425,000 |
Saks (a)(c) |
45,622 |
|||||||||
|
Luxury Department Store Retailer |
|||||||||||
|
527,845 |
Fossil (a) |
44,708 |
|||||||||
|
Watch Designer & Retailer |
|||||||||||
|
525,000 |
DSW |
35,028 |
|||||||||
|
Branded Footwear Retailer |
|||||||||||
|
1,575,000 |
American Eagle Outfitters |
33,201 |
|||||||||
|
Teen Apparel Retailer |
|||||||||||
|
415,000 |
Williams-Sonoma |
18,248 |
|||||||||
|
Home Goods & Furnishing Retailer |
|||||||||||
|
971,500 |
Teavana (a)(c) |
12,668 |
|||||||||
|
Specialty Tea Retailer |
|||||||||||
|
388,220 |
Massmart Holdings (South Africa) |
7,785 |
|||||||||
|
General Merchandise, Food & Home Improvement Stores; Wal-Mart Subsidiary |
|||||||||||
|
1,371,366 |
Gaiam (a)(b) |
4,786 |
|||||||||
|
Healthy Living Catalogs & E-Commerce, Non-theatrical Media |
|||||||||||
|
66,000 |
The Fresh Market (a) |
3,959 |
|||||||||
|
Specialty Food Retailer |
|||||||||||
|
839,240 |
|||||||||||
| > Apparel 2.4% | |||||||||||
|
1,660,000 |
PVH |
155,575 |
|||||||||
|
Apparel Wholesaler & Retailer |
|||||||||||
|
2,100,000 |
Coach |
117,642 |
|||||||||
|
Designer & Retailer of Branded Leather Accessories |
|||||||||||
|
1,460,000 |
Warnaco Group (a) |
75,774 |
|||||||||
|
Global Branded Apparel Manufacturer |
|||||||||||
|
1,310,000 |
Deckers Outdoor (a)(c) |
47,998 |
|||||||||
|
Fashion Footwear Wholesaler |
|||||||||||
|
600,000 |
Steven Madden (a) |
26,232 |
|||||||||
|
Wholesaler/Retailer of Fashion Footwear |
|||||||||||
|
182,866 |
True Religion Apparel |
3,901 |
|||||||||
|
Premium Denim |
|||||||||||
|
427,122 |
|||||||||||
| > Travel 2.2% | |||||||||||
|
1,430,000 |
Vail Resorts |
82,439 |
|||||||||
|
Ski Resort Operator & Developer |
|||||||||||
|
1,225,000 |
Expedia |
70,854 |
|||||||||
|
Online Travel Services Company |
|||||||||||
|
4,400,000 |
Avis Budget Group (a) |
67,672 |
|||||||||
|
Second Largest Car Rental Company |
|||||||||||
|
3,750,000 |
Hertz (a) |
51,488 |
|||||||||
|
Largest U.S. Rental Car Operator |
|||||||||||
|
1,600,000 |
HomeAway (a)(c) |
37,520 |
|||||||||
|
Vacation Rental Online Marketplace |
|||||||||||
|
1,100,000 |
Choice Hotels |
35,189 |
|||||||||
|
Franchisor of Budget Hotel Brands |
|||||||||||
|
2,000,000 |
Localiza Rent A Car (Brazil) |
34,648 |
|||||||||
|
Car Rental |
|||||||||||
|
379,810 |
|||||||||||
39
Columbia Acorn Fund
Statement of Investments (Unaudited), continued
|
Number of Shares |
Value (000) |
||||||||||
| > Consumer Goods Distribution 1.1% | |||||||||||
|
2,305,000 |
GNC Holdings |
$ |
89,826 |
||||||||
|
Specialty Retailer of Health & Wellness Products |
|||||||||||
|
2,015,000 |
Pool |
83,784 |
|||||||||
|
Distributor of Swimming Pool Supplies & Equipment |
|||||||||||
|
625,000 |
United Stationers |
16,262 |
|||||||||
|
Wholesale Distributor of Business Products |
|||||||||||
|
189,872 |
|||||||||||
| > Food & Beverage 1.0% | |||||||||||
|
1,700,000 |
Monster Beverage (a) |
92,072 |
|||||||||
|
Alternative Beverages |
|||||||||||
|
32,000,000 |
Olam International (Singapore) |
53,083 |
|||||||||
|
Agriculture Supply Chain Manager |
|||||||||||
|
1,800,000 |
Arcos Dorados (Brazil) |
27,774 |
|||||||||
|
McDonald's Master Franchise for Latin America |
|||||||||||
|
45,500 |
Annie's (a)(c) |
2,040 |
|||||||||
|
Developer & Marketer of Natural & Organic Food |
|||||||||||
|
1,665,270 |
GLG Life Tech (Canada) (a)(b)(d) |
227 |
|||||||||
|
Produce an All-natural Sweetener Extracted from the Stevia Plant |
|||||||||||
|
175,196 |
|||||||||||
| > Casinos & Gaming 0.8% | |||||||||||
|
3,950,000 |
Pinnacle Entertainment (a)(b) |
48,388 |
|||||||||
|
Regional Casino Operator |
|||||||||||
|
3,000,000 |
Melco Crown Entertainment - ADR (Hong Kong) (a) |
40,440 |
|||||||||
|
Macau Casino Operator |
|||||||||||
|
850,000 |
Penn National Gaming (a) |
36,635 |
|||||||||
|
Regional Casino Operator |
|||||||||||
|
12,000,000 |
MGM China Holdings (Hong Kong) |
20,611 |
|||||||||
|
Macau Casino Operator |
|||||||||||
|
146,074 |
|||||||||||
| > Other Consumer Services 0.8% | |||||||||||
|
2,190,000 |
Lifetime Fitness (a)(b) |
100,171 |
|||||||||
|
Sport & Fitness Club Operator |
|||||||||||
|
17,000,000 |
Lifestyle International (Hong Kong) |
35,041 |
|||||||||
|
Mid- to High-end Department Store Operator in Hong Kong & China |
|||||||||||
|
1,062,500 |
Move (a) |
9,159 |
|||||||||
|
Real Estate Internet Websites |
|||||||||||
|
450,000 |
IFM Investments (Century 21 China RE) - ADR (China) (a) |
832 |
|||||||||
|
Provide Real Estate Services in China |
|||||||||||
|
145,203 |
|||||||||||
| > Furniture & Textiles 0.8% | |||||||||||
|
4,200,000 |
Knoll (b) |
58,590 |
|||||||||
|
Office Furniture |
|||||||||||
|
2,250,000 |
Herman Miller |
43,740 |
|||||||||
|
Office Furniture |
|||||||||||
|
2,325,000 |
Interface |
30,713 |
|||||||||
|
Modular Carpet |
|||||||||||
|
215,000 |
Caesarstone (Israel) (a) |
3,032 |
|||||||||
|
Quartz Countertops |
|||||||||||
|
136,075 |
|||||||||||
|
Number of Shares |
Value (000) |
||||||||||
| > Other Durable Goods 0.7% | |||||||||||
|
1,500,000 |
Jarden |
$ |
79,260 |
||||||||
|
Branded Household Products |
|||||||||||
|
850,000 |
Tesla Motors (a)(c) |
24,888 |
|||||||||
|
Design, Manufacture & Sell High Performance Electric Vehicles |
|||||||||||
|
460,000 |
Cavco Industries (a)(b) |
21,109 |
|||||||||
|
Manufactured Homes |
|||||||||||
|
125,257 |
|||||||||||
| > Restaurants 0.4% | |||||||||||
|
2,000,000 |
AFC Enterprises (a)(b) |
49,200 |
|||||||||
|
Popeye's Restaurants |
|||||||||||
|
450,000 |
Cheesecake Factory |
16,088 |
|||||||||
|
Casual Dining Restaurants |
|||||||||||
|
675,000 |
Bravo Brio Restaurant Group (a) |
9,821 |
|||||||||
|
Upscale Casual Italian Restaurants |
|||||||||||
|
75,109 |
|||||||||||
| > Nondurables 0.3% | |||||||||||
|
1,600,000 |
Helen of Troy (a)(b) |
50,928 |
|||||||||
|
Personal Care, Housewares, Healthcare & Home Environment Products |
|||||||||||
|
50,928 |
|||||||||||
| > Educational Services 0.3% | |||||||||||
|
500,000 |
ITT Educational Services (a)(c) |
16,115 |
|||||||||
|
Post-secondary Degree Services |
|||||||||||
|
600,000 |
DeVry (c) |
13,656 |
|||||||||
|
Post-secondary Degree Services |
|||||||||||
|
800,000 |
New Oriental Education & Technology - ADR (China) (c) |
13,336 |
|||||||||
|
Education Service Provider |
|||||||||||
|
2,000,000 |
Voyager Learning - Contingent Value Rights (a)(d)(e) |
220 |
|||||||||
|
Education Services for the K-12 Market |
|||||||||||
|
43,327 |
|||||||||||
| > Leisure Products 0.1% | |||||||||||
|
1,290,000 |
Skullcandy (a)(c) |
17,738 |
|||||||||
|
Lifestyle Branded Headphones |
|||||||||||
|
17,738 |
|||||||||||
| > Other Entertainment —% | |||||||||||
|
265,000 |
CTS Eventim (Germany) |
7,878 |
|||||||||
|
Event Ticket Sales |
|||||||||||
|
7,878 |
|||||||||||
|
Consumer Goods & Services: Total |
2,758,829 |
||||||||||
|
Finance 10.9% |
|||||||||||
| > Banks 4.3% | |||||||||||
|
2,638,000 |
BOK Financial |
155,906 |
|||||||||
|
Tulsa-based Southwest Bank |
|||||||||||
|
6,956,800 |
Associated Banc-Corp |
91,621 |
|||||||||
|
Midwest Bank |
|||||||||||
|
2,337,313 |
Hancock Holding |
72,340 |
|||||||||
|
Gulf Coast Bank |
|||||||||||
|
1,348,000 |
City National |
69,435 |
|||||||||
|
Bank & Asset Manager |
|||||||||||
|
985,000 |
SVB Financial Group (a) |
59,553 |
|||||||||
|
Bank to Venture Capitalists |
|||||||||||
40
|
Number of Shares |
Value (000) |
||||||||||
| > Banks—continued | |||||||||||
|
2,860,000 |
MB Financial (b) |
$ |
56,485 |
||||||||
|
Chicago Bank |
|||||||||||
|
5,323,500 |
Valley National Bancorp |
53,341 |
|||||||||
|
New Jersey/New York Bank |
|||||||||||
|
3,000,000 |
CVB Financial |
35,820 |
|||||||||
|
Inland Empire Business Bank |
|||||||||||
|
2,200,000 |
TCF Financial |
26,268 |
|||||||||
|
Great Lakes Bank |
|||||||||||
|
1,350,000 |
TriCo Bancshares (b) |
22,315 |
|||||||||
|
California Central Valley Bank |
|||||||||||
|
1,121,188 |
Sandy Spring Bancorp |
21,583 |
|||||||||
|
Baltimore, D.C. Bank |
|||||||||||
|
4,299,507 |
First Busey |
20,982 |
|||||||||
|
Illinois Bank |
|||||||||||
|
550,000 |
Wintrust Financial |
20,663 |
|||||||||
|
Chicago & Milwaukee Full Service Bank |
|||||||||||
|
2,500,000 |
First Commonwealth |
17,625 |
|||||||||
|
Western Pennsylvania Bank |
|||||||||||
|
811,295 |
Hudson Valley |
13,833 |
|||||||||
|
Metro New York City Bank |
|||||||||||
|
2,136,500 |
TrustCo Bank |
12,221 |
|||||||||
|
New York State Bank |
|||||||||||
|
705,072 |
Eagle Bancorp (a) |
11,789 |
|||||||||
|
Metro D.C. Bank |
|||||||||||
|
104,023 |
Pacific Continental Bank |
929 |
|||||||||
|
Pacific Northwest Bank |
|||||||||||
|
762,709 |
|||||||||||
| > Insurance 2.4% | |||||||||||
|
8,900,000 |
CNO Financial Group |
85,885 |
|||||||||
|
Life, Long-term Care & Medical Supplement Insurance |
|||||||||||
|
833,000 |
Allied World Holdings |
64,349 |
|||||||||
|
Commerical Lines Insurance/Reinsurance |
|||||||||||
|
2,764,000 |
Tower Group (b) |
53,594 |
|||||||||
|
Commercial & Personal Lines Insurance |
|||||||||||
|
1,120,000 |
The Hanover Insurance Group |
41,731 |
|||||||||
|
Commercial & Personal Lines Insurance |
|||||||||||
|
2,050,000 |
Selective Insurance Group |
38,930 |
|||||||||
|
Commercial & Personal Lines Insurance |
|||||||||||
|
1,100,000 |
HCC Insurance Holdings |
37,279 |
|||||||||
|
Specialty Insurance |
|||||||||||
|
832,000 |
Willis Group |
30,717 |
|||||||||
|
Insurance Broker |
|||||||||||
|
925,000 |
Kemper |
28,407 |
|||||||||
|
Multi-line Insurance |
|||||||||||
|
250,000 |
Enstar Group (a) |
24,913 |
|||||||||
|
Insurance/Reinsurance & Related Services |
|||||||||||
|
900,000 |
Brown & Brown |
23,463 |
|||||||||
|
Insurance Broker |
|||||||||||
|
429,268 |
|||||||||||
| > Brokerage & Money Management 1.5% | |||||||||||
|
6,654,000 |
SEI Investments |
142,728 |
|||||||||
|
Mutual Fund Administration & Investment Management |
|||||||||||
|
4,036,000 |
Eaton Vance |
116,883 |
|||||||||
|
Specialty Mutual Funds |
|||||||||||
|
1,000,000 |
Artio Global Investors (c) |
2,980 |
|||||||||
|
International Asset Manager |
|||||||||||
|
262,591 |
|||||||||||
|
Number of Shares |
Value (000) |
||||||||||
| > Finance Companies 1.5% | |||||||||||
|
1,285,000 |
World Acceptance (a)(b) |
$ |
86,673 |
||||||||
|
Personal Loans |
|||||||||||
|
2,150,000 |
McGrath Rentcorp (b) |
56,093 |
|||||||||
|
Temporary Space & IT Rentals |
|||||||||||
|
3,400,000 |
H & E Equipment Services (b) |
41,208 |
|||||||||
|
Heavy Equipment Leasing |
|||||||||||
|
1,091,000 |
Marlin Business Services (b) |
23,140 |
|||||||||
|
Small Equipment Leasing |
|||||||||||
|
1,123,400 |
CAI International (a)(b) |
23,052 |
|||||||||
|
International Container Leasing |
|||||||||||
|
450,000 |
Onex Capital (Canada) |
17,760 |
|||||||||
|
Private Equity |
|||||||||||
|
228,500 |
Textainer Group Holdings |
6,981 |
|||||||||
|
Top International Container Leasor |
|||||||||||
|
333,191 |
Regional Management (a) |
5,748 |
|||||||||
|
Consumer Loans |
|||||||||||
|
260,655 |
|||||||||||
| > Credit Cards 0.6% | |||||||||||
|
550,000 |
Alliance Data Systems (a) |
78,072 |
|||||||||
|
Diversified Credit Card Provider |
|||||||||||
|
350,000 |
Wright Express (a) |
24,402 |
|||||||||
|
Pay Card Processor |
|||||||||||
|
102,474 |
|||||||||||
| > Diversified Financial Companies 0.4% | |||||||||||
|
2,820,000 |
Leucadia National |
64,155 |
|||||||||
|
Holding Company |
|||||||||||
|
64,155 |
|||||||||||
| > Savings & Loans 0.2% | |||||||||||
|
400,000 |
Financial Engines (a) |
9,532 |
|||||||||
|
Asset Management for 401k Plans |
|||||||||||
|
1,010,000 |
Provident New York Bancorp |
9,504 |
|||||||||
|
New York State Thrift |
|||||||||||
|
470,000 |
ViewPoint Financial |
9,010 |
|||||||||
|
Texas Thrift |
|||||||||||
|
452,146 |
Kaiser Federal (b) |
6,823 |
|||||||||
|
Los Angeles Savings & Loan |
|||||||||||
|
65,991 |
Berkshire Hills Bancorp |
1,510 |
|||||||||
|
Northeast Thrift |
|||||||||||
|
36,379 |
|||||||||||
|
Finance: Total |
1,918,231 |
||||||||||
|
Health Care 9.3% |
|||||||||||
| > Biotechnology & Drug Delivery 5.0% | |||||||||||
|
6,153,000 |
Seattle Genetics (a)(b)(c) |
165,823 |
|||||||||
|
Antibody-based Therapies for Cancer |
|||||||||||
|
3,875,000 |
BioMarin Pharmaceutical (a) |
156,046 |
|||||||||
|
Biotech Focused on Orphan Diseases |
|||||||||||
|
1,215,000 |
Alexion Pharmaceuticals (a) |
138,996 |
|||||||||
|
Biotech Focused on Orphan Diseases |
|||||||||||
|
3,600,000 |
ARIAD Pharmaceuticals (a) |
87,210 |
|||||||||
|
Biotech Focused on Cancer |
|||||||||||
|
3,250,000 |
Auxilium Pharmaceuticals (a)(b) |
79,495 |
|||||||||
|
Biotech Focused on Niche Disease Areas |
|||||||||||
|
870,000 |
Onyx Pharmaceuticals (a) |
73,515 |
|||||||||
|
Commercial-stage Biotech Focused on Cancer |
|||||||||||
41
Columbia Acorn Fund
Statement of Investments (Unaudited), continued
|
Number of Shares |
Value (000) |
||||||||||
| > Biotechnology & Drug Delivery—continued | |||||||||||
|
6,000,000 |
NPS Pharmaceuticals (a)(b) |
$ |
55,500 |
||||||||
|
Orphan Drugs & Healthy Royalties |
|||||||||||
|
3,430,000 |
Isis Pharmaceuticals (a)(c) |
48,260 |
|||||||||
|
Biotech Pioneer in Antisense Drugs |
|||||||||||
|
735,000 |
Synageva Biopharma (a) |
39,271 |
|||||||||
|
Biotech Focused on Orphan Diseases |
|||||||||||
|
2,025,000 |
InterMune (a) |
18,164 |
|||||||||
|
Drugs for Pulmonary Fibrosis & Hepatitis C |
|||||||||||
|
3,000,000 |
Raptor Pharmaceutical (a)(b)(c) |
16,680 |
|||||||||
|
Orphan Drug Company |
|||||||||||
|
4,949,000 |
Chelsea Therapeutics International (a)(b)(c) |
5,939 |
|||||||||
|
Biotech Focused on Rare Diseases |
|||||||||||
|
359,944 |
MicroDose Therapeutx (a)(d)(e) |
238 |
|||||||||
|
Drug Inhaler Development |
|||||||||||
|
885,137 |
|||||||||||
| > Medical Supplies 2.3% | |||||||||||
|
4,970,000 |
Cepheid (a)(b) |
171,515 |
|||||||||
|
Molecular Diagnostics |
|||||||||||
|
950,000 |
Henry Schein (a) |
75,306 |
|||||||||
|
Largest Distributor of Healthcare Products |
|||||||||||
|
2,126,000 |
Patterson Companies |
72,794 |
|||||||||
|
Dental/Vet/Med Distributor |
|||||||||||
|
1,550,000 |
DENTSPLY International |
59,117 |
|||||||||
|
Leading Dental Supplies Manufacturer |
|||||||||||
|
375,000 |
Techne |
26,978 |
|||||||||
|
Cytokines, Antibodies & Other Reagents for Life Science |
|||||||||||
|
405,710 |
|||||||||||
| > Medical Equipment & Devices 1.0% | |||||||||||
|
1,024,683 |
Sirona Dental Systems (a) |
58,366 |
|||||||||
|
Manufacturer of Dental Equipment |
|||||||||||
|
550,000 |
Haemonetics (a) |
44,110 |
|||||||||
|
Blood & Plasma Collection Equipment |
|||||||||||
|
950,000 |
PerkinElmer Inc. |
27,996 |
|||||||||
|
Analytical Instruments for Life Sciences |
|||||||||||
|
925,000 |
Hill-Rom Holdings |
26,880 |
|||||||||
|
Hospital Beds/Patient Handling |
|||||||||||
|
570,000 |
Orthofix International (a) |
25,508 |
|||||||||
|
Bone Fixation & Stimulation Devices |
|||||||||||
|
182,860 |
|||||||||||
| > Health Care Services 0.5% | |||||||||||
|
665,000 |
Mednax (a) |
49,509 |
|||||||||
|
Physician Management for Pediatric & Anesthesia Practices |
|||||||||||
|
825,000 |
HealthSouth (a) |
19,850 |
|||||||||
|
Inpatient Rehabalitation Facilities |
|||||||||||
|
1,875,000 |
Health Management Associates (a) |
15,731 |
|||||||||
|
Non-urban Hospitals |
|||||||||||
|
85,090 |
|||||||||||
| > Pharmaceuticals 0.5% | |||||||||||
|
4,000,000 |
Akorn (a) |
52,880 |
|||||||||
|
Develops, Manufactures & Sells Specialty Generic Drugs |
|||||||||||
|
2,606,333 |
Adcock Ingram Holdings (South Africa) |
18,598 |
|||||||||
|
Manufacturer of Pharmaceuticals & Medical Supplies |
|||||||||||
|
Number of Shares |
Value (000) |
||||||||||
|
2,040,000 |
Alimera Sciences (a)(b)(c) |
$ |
5,263 |
||||||||
|
Ophthalmology-focused Pharmaceutical Company |
|||||||||||
|
1,095,000 |
Horizon Pharma (a) |
3,800 |
|||||||||
|
Specialty Pharmaceutical Company |
|||||||||||
|
80,541 |
|||||||||||
|
Health Care: Total |
1,639,338 |
||||||||||
|
Energy & Minerals 7.3% |
|||||||||||
| > Oil Services 3.5% | |||||||||||
|
5,150,000 |
FMC Technologies (a) |
238,445 |
|||||||||
|
Oil & Gas Well Head Manufacturer |
|||||||||||
|
2,114,000 |
Atwood Oceanics (a) |
96,081 |
|||||||||
|
Offshore Drilling Contractor |
|||||||||||
|
1,670,000 |
ShawCor (Canada) |
72,501 |
|||||||||
|
Oil & Gas Pipeline Products |
|||||||||||
|
1,031,106 |
Fugro (Netherlands) |
70,120 |
|||||||||
|
Subsea Oilfield Services |
|||||||||||
|
513,000 |
Oil States International (a) |
40,763 |
|||||||||
|
Diversified North American Oil Service Provider |
|||||||||||
|
884,000 |
Hornbeck Offshore (a) |
32,399 |
|||||||||
|
Supply Vessel Operator in U.S. Gulf of Mexico |
|||||||||||
|
2,890,900 |
Horizon North Logistics (Canada) |
23,436 |
|||||||||
|
Provides Diversified Oil Service Offering in Northern Canada |
|||||||||||
|
893,600 |
Black Diamond Group (Canada) (c) |
20,379 |
|||||||||
|
Provides Accommodations/Equipment for Oil Sands Development |
|||||||||||
|
585,000 |
Rowan (a) |
19,755 |
|||||||||
|
Contract Offshore Driller |
|||||||||||
|
4,025,000 |
Tuscany International Drilling (Colombia) (a) |
942 |
|||||||||
|
South America Based Drilling Rig Contractor |
|||||||||||
|
614,821 |
|||||||||||
| > Oil & Gas Producers 2.5% | |||||||||||
|
3,500,000 |
Pacific Rubiales Energy (Colombia) |
83,628 |
|||||||||
|
Oil Production & Exploration in Colombia |
|||||||||||
|
695,000 |
Range Resources |
48,560 |
|||||||||
|
Oil & Gas Producer |
|||||||||||
|
974,000 |
Rosetta Resources (a) |
46,655 |
|||||||||
|
Oil & Gas Producer Exploring in South Texas & Montana |
|||||||||||
|
2,700,000 |
Denbury Resources (a) |
43,632 |
|||||||||
|
Oil Producer Using Co2 Injection |
|||||||||||
|
703,000 |
SM Energy |
38,039 |
|||||||||
|
Oil & Gas Producer |
|||||||||||
|
1,159,000 |
Laredo Petroleum (a)(c) |
25,475 |
|||||||||
|
Permian Basin Oil Producer |
|||||||||||
|
1,050,000 |
Tullow Oil (United Kingdom) |
23,229 |
|||||||||
|
Oil & Gas Producer |
|||||||||||
|
500,000 |
Cabot Oil and Gas |
22,450 |
|||||||||
|
Large Natural Gas Producer in Appalachia & Gulf Coast |
|||||||||||
|
361,000 |
Baytex (Canada) (c) |
17,156 |
|||||||||
|
Oil & Gas Producer in Canada |
|||||||||||
|
718,000 |
Celtic Exploration (Canada) (a) |
13,351 |
|||||||||
|
Canadian Oil & Gas Producer |
|||||||||||
|
27,000,000 |
Shamaran Petroleum (Iraq) (a) |
11,947 |
|||||||||
|
Oil Exploration in Kurdistan |
|||||||||||
42
|
Number of Shares |
Value (000) |
||||||||||
| > Oil & Gas Producers—continued | |||||||||||
|
340,000 |
PDC Energy (a) |
$ |
10,754 |
||||||||
|
Oil & Gas Producer in the U.S. |
|||||||||||
|
1,100,000 |
Kodiak Oil and Gas (a) |
10,296 |
|||||||||
|
Bakken Oil & Gas Producer |
|||||||||||
|
750,000 |
Athabasca Oil Sands (Canada) (a) |
10,055 |
|||||||||
|
Oil Sands & Unconventional Oil Development |
|||||||||||
|
37,500,000 |
Petromanas (Canada) (a)(b) |
7,629 |
|||||||||
|
Exploring for Oil in Albania |
|||||||||||
|
200,000 |
Approach Resources (a) |
6,026 |
|||||||||
|
Oil & Gas Producer in West Texas Permian |
|||||||||||
|
25,000,000 |
Petroamerica Oil (Colombia) (a) |
5,340 |
|||||||||
|
Oil Exploration & Production in Colombia |
|||||||||||
|
26,000,000 |
Petrodorado Energy (Colombia) (a)(b) |
4,760 |
|||||||||
|
24,000,000 |
Petrodorado Energy - Warrants (Colombia) (a)(e) |
117 |
|||||||||
|
Oil & Gas Exploration & Production in Colombia, Peru & Paraguay |
|||||||||||
|
493,000 |
Crew Energy (Canada) (a) |
3,631 |
|||||||||
|
Canadian Oil & Gas Producer |
|||||||||||
|
1,198,100 |
Pan Orient (Canada) |
3,449 |
|||||||||
|
Asian Oil & Gas Explorer |
|||||||||||
|
50,000,000 |
Gulf United Energy (Colombia) (a)(b) |
3,000 |
|||||||||
|
Prospecting for Oil Alongside Large Producers in Colombia |
|||||||||||
|
5,116,000 |
Canacol (Colombia) (a) |
2,498 |
|||||||||
|
Oil Producer in South America |
|||||||||||
|
8,400,000 |
Canadian Overseas Petroleum (United Kingdom) (a)(e) |
1,722 |
|||||||||
|
4,200,000 |
Canadian Overseas Petroleum - Warrants (United Kingdom) (a)(d)(e) |
110 |
|||||||||
|
Oil & Gas Exploration/Production in the North Sea |
|||||||||||
|
4,110,000 |
Santa Maria Petroleum (Colombia) (a)(b)(e) |
562 |
|||||||||
|
890,000 |
Santa Maria Petroleum (Colombia) (a)(b) |
127 |
|||||||||
|
Explores for Oil & Gas in Latin America |
|||||||||||
|
393,600 |
Houston American Energy (a)(c) |
354 |
|||||||||
|
Oil & Gas Exploration/Production in Colombia |
|||||||||||
|
444,552 |
|||||||||||
| > Mining 1.0% | |||||||||||
|
387,000 |
Core Labs (Netherlands) |
47,013 |
|||||||||
|
Oil & Gas Reservoir Consulting |
|||||||||||
|
1,000,000 |
Silver Wheaton (Canada) |
39,710 |
|||||||||
|
Silver Mining Royalty Company |
|||||||||||
|
7,500,000 |
Duluth Metals (Canada) (a)(b) |
17,928 |
|||||||||
|
Copper & Nickel Miner |
|||||||||||
|
1,400,000 |
Kirkland Lake Gold (Canada) (a) |
16,975 |
|||||||||
|
Gold Mining |
|||||||||||
|
4,432,000 |
Northam Platinum (South Africa) |
15,985 |
|||||||||
|
Platinum Mining in South Africa |
|||||||||||
|
1,150,000 |
Turquoise Hill Resources (Mongolia) (a)(c) |
9,791 |
|||||||||
|
Copper Mine Project in Mongolia |
|||||||||||
|
2,050,000 |
Alexco Resource (a) |
8,897 |
|||||||||
|
Mining, Exploration & Environmental Services |
|||||||||||
|
16,000,000 |
Mongolian Mining (Mongolia) (a) |
7,284 |
|||||||||
|
Coking Coal Mining in Mongolia |
|||||||||||
|
Number of Shares |
Value (000) |
||||||||||
|
2,518,600 |
Kaminak Gold (a)(c) |
$ |
5,969 |
||||||||
|
Exploration Stage Canadian Gold Miner |
|||||||||||
|
800,000 |
Augusta Resource (a)(c) |
2,160 |
|||||||||
|
US Copper/Moly Mine |
|||||||||||
|
217,283 |
Regis Resources (Australia) (a) |
1,278 |
|||||||||
|
Gold Mining in Australia |
|||||||||||
|
4,000,000 |
Wolverine Minerals (Canada) (a)(e) |
176 |
|||||||||
|
2,000,000 |
Wolverine Minerals - Warrants (Canada) (a)(d)(e) |
— |
|||||||||
|
Gold Mining |
|||||||||||
|
500,000 |
Duluth Exploration - Special Warrants (Canada) (a)(d)(e) |
46 |
|||||||||
|
Copper & Nickel Miner |
|||||||||||
|
173,212 |
|||||||||||
| > Oil Refining, Marketing & Distribution 0.1% | |||||||||||
|
218,000 |
Vopak (Netherlands) |
15,307 |
|||||||||
|
World's Largest Operator of Petroleum & Chemical Storage Terminals |
|||||||||||
|
15,307 |
|||||||||||
| > Agricultural Commodities 0.1% | |||||||||||
|
1,306,818 |
Union Agriculture Group (Uruguay) (a)(d)(e) |
13,552 |
|||||||||
|
Farmland Operator in Uruguay |
|||||||||||
|
13,552 |
|||||||||||
| > Alternative Energy 0.1% | |||||||||||
|
2,000,000 |
GT Advanced Technologies (a)(c) |
10,900 |
|||||||||
|
Largest Manufacturer of Furnaces & Reactors to Produce & Cast Polysilicon |
|||||||||||
|
1,210,300 |
Synthesis Energy Systems (China) (a) |
1,598 |
|||||||||
|
Owner/Operator of Gasification Plants |
|||||||||||
|
12,498 |
|||||||||||
|
Energy & Minerals: Total |
1,273,942 |
||||||||||
|
Other Industries 7.3% |
|||||||||||
| > Real Estate 5.1% | |||||||||||
|
3,850,000 |
Ryman Hospitality Properties (a)(b) |
152,190 |
|||||||||
|
Convention Hotels |
|||||||||||
|
3,700,000 |
DuPont Fabros Technology (b) |
93,425 |
|||||||||
|
Technology-focused Office Buildings |
|||||||||||
|
750,000 |
Federal Realty |
78,975 |
|||||||||
|
Shopping Centers |
|||||||||||
|
1,850,000 |
Extra Space Storage |
61,513 |
|||||||||
|
Self Storage Facilities |
|||||||||||
|
3,700,000 |
Associated Estates Realty (b) |
56,092 |
|||||||||
|
Multifamily Properties |
|||||||||||
|
720,000 |
Digital Realty Trust |
50,292 |
|||||||||
|
Technology-focused Office Buildings |
|||||||||||
|
975,000 |
Post Properties |
46,761 |
|||||||||
|
Multi-family Properties |
|||||||||||
|
2,450,000 |
Biomed Realty Trust |
45,864 |
|||||||||
|
Life Science-focused Office Buildings |
|||||||||||
|
50,000,000 |
Mapletree Logistics Trust (Singapore) |
45,723 |
|||||||||
|
Industrial Property Landlord |
|||||||||||
|
22,000,000 |
Ascendas REIT (Singapore) |
43,091 |
|||||||||
|
Industrial Property Landlord |
|||||||||||
|
770,000 |
Kilroy Realty |
34,481 |
|||||||||
|
West Coast Office Buildings |
|||||||||||
43
Columbia Acorn Fund
Statement of Investments (Unaudited), continued
|
Number of Shares |
Value (000) |
||||||||||
| > Real Estate—continued | |||||||||||
|
3,000,000 |
Education Realty Trust |
$ |
32,700 |
||||||||
|
Student Housing |
|||||||||||
|
1,300,000 |
St. Joe (a)(c) |
25,350 |
|||||||||
|
Florida Panhandle Landowner |
|||||||||||
|
325,000 |
Jones Lang LaSalle |
24,814 |
|||||||||
|
Real Estate Services |
|||||||||||
|
3,750,000 |
DCT Industrial Trust |
24,263 |
|||||||||
|
Industrial Properties |
|||||||||||
|
2,476,000 |
Summit Hotel Properties (b) |
21,145 |
|||||||||
|
Owner of Select Service Hotels |
|||||||||||
|
3,500,000 |
Kite Realty Group (b) |
17,850 |
|||||||||
|
Community Shopping Centers |
|||||||||||
|
2,800 |
Orix JREIT (Japan) |
13,676 |
|||||||||
|
Diversified REIT |
|||||||||||
|
10,000,000 |
Mapletree Industrial Trust (Singapore) |
11,476 |
|||||||||
|
Industrial Property Landlord |
|||||||||||
|
8,845,000 |
Mapletree Commercial Trust (Singapore) |
8,426 |
|||||||||
|
Retail & Office Property Landlord |
|||||||||||
|
888,107 |
|||||||||||
| > Transportation 1.3% | |||||||||||
|
3,100,000 |
Rush Enterprises, Class A (a)(b) |
59,706 |
|||||||||
|
550,000 |
Rush Enterprises, Class B (a)(b) |
9,246 |
|||||||||
|
Truck Sales & Service |
|||||||||||
|
1,155,000 |
JB Hunt Transport Services |
60,106 |
|||||||||
|
Truck & Intermodal Carrier |
|||||||||||
|
2,400,000 |
Heartland Express |
32,064 |
|||||||||
|
Regional Trucker |
|||||||||||
|
704,000 |
World Fuel Services |
25,069 |
|||||||||
|
Global Fuel Broker |
|||||||||||
|
300,000 |
Genesee & Wyoming (a) |
20,058 |
|||||||||
|
Short-line Operator |
|||||||||||
|
350,000 |
Kirby (a) |
19,348 |
|||||||||
|
Largest Operator of U.S. (Jones Act) Liquid Tank Barges |
|||||||||||
|
225,597 |
|||||||||||
| > Regulated Utilities 0.9% | |||||||||||
|
2,000,000 |
Northeast Utilities |
76,460 |
|||||||||
|
Regulated Electric Utility |
|||||||||||
|
1,660,000 |
Wisconsin Energy |
62,532 |
|||||||||
|
Wisconsin Utility |
|||||||||||
|
500,000 |
Allete |
20,870 |
|||||||||
|
Minnesota Regulated Electric Utility |
|||||||||||
|
159,862 |
|||||||||||
|
Other Industries: Total |
1,273,566 |
||||||||||
|
Total Equities: 96.2% (Cost: $10,403,931) |
16,887,006 |
||||||||||
|
Number of Shares |
Value (000) |
||||||||||
|
Securities Lending Collateral 2.4% |
|||||||||||
|
418,965,955 |
Dreyfus Government Cash Management Fund (7 day yield of 0.01%) (f) |
$ |
418,966 |
||||||||
|
Total Securities Lending Collateral: (Cost: $418,966) |
418,966 |
||||||||||
|
Total Investments: 98.6% (Cost: $10,822,897)(g)(h) |
17,305,972 |
(i) |
|||||||||
|
Obligation to Return Collateral for Securities Loaned: (2.4)% |
(418,966 |
) |
|||||||||
|
Cash and Other Assets Less Liabilities: 3.8% |
664,276 |
||||||||||
|
Total Net Assets: 100.0% |
$ |
17,551,282 |
|||||||||
ADR - American Depositary Receipts
REIT - Real Estate Investment Trust
44
> Notes to Statement of Investments (dollar values in thousands)
(a) Non-income producing security.
(b) An affiliated person of the Fund may include any company in which the Fund owns five percent or more of its outstanding voting shares. Holdings and transactions in these affiliated companies during the period ended September 30, 2012, are as follows:
|
Security |
Balance of Shares Held 12/31/11 |
Purchases/ Additions |
Sales/ Reductions |
Balance of Shares Held 9/30/12 |
Value |
Dividend |
|||||||||||||||||||||
|
AboveNet* |
1,400,000 |
- |
1,400,000 |
- |
$ |
- |
$ |
- |
|||||||||||||||||||
|
Acorn Energy |
1,500,000 |
5,246 |
- |
1,505,246 |
13,427 |
190 |
|||||||||||||||||||||
|
AFC Enterprises |
2,000,000 |
- |
- |
2,000,000 |
49,200 |
- |
|||||||||||||||||||||
|
Alimera Sciences |
2,040,000 |
- |
- |
2,040,000 |
5,263 |
- |
|||||||||||||||||||||
|
Associated Estates Realty |
3,700,000 |
- |
- |
3,700,000 |
56,092 |
1,961 |
|||||||||||||||||||||
|
Auxilium Pharmaceuticals |
3,033,715 |
216,285 |
- |
3,250,000 |
79,495 |
- |
|||||||||||||||||||||
|
Bally Technologies |
3,725,000 |
- |
- |
3,725,000 |
183,978 |
- |
|||||||||||||||||||||
|
Boingo Wireless |
1,500,000 |
360,682 |
- |
1,860,682 |
14,774 |
- |
|||||||||||||||||||||
|
CAI International |
1,123,400 |
- |
- |
1,123,400 |
23,052 |
- |
|||||||||||||||||||||
|
Cavco Industries |
460,000 |
- |
- |
460,000 |
21,109 |
- |
|||||||||||||||||||||
|
Cepheid |
3,200,000 |
1,770,000 |
- |
4,970,000 |
171,515 |
- |
|||||||||||||||||||||
|
Chelsea Therapeutics International |
4,550,000 |
1,200,000 |
801,000 |
4,949,000 |
5,939 |
- |
|||||||||||||||||||||
|
Cogent Communications* |
2,520,000 |
- |
320,000 |
2,200,000 |
50,578 |
220 |
|||||||||||||||||||||
|
Constant Contact* |
2,350,000 |
- |
1,150,000 |
1,200,000 |
20,880 |
- |
|||||||||||||||||||||
|
Donaldson** |
4,200,000 |
4,200,000 |
- |
8,400,000 |
291,564 |
2,184 |
|||||||||||||||||||||
|
Drew Industries |
1,500,000 |
380,000 |
- |
1,880,000 |
56,795 |
- |
|||||||||||||||||||||
|
Duluth Metals |
7,500,000 |
- |
- |
7,500,000 |
17,928 |
- |
|||||||||||||||||||||
|
DuPont Fabros Technology |
3,350,000 |
350,000 |
- |
3,700,000 |
93,425 |
1,377 |
|||||||||||||||||||||
|
eResearch Technology* |
4,900,000 |
- |
4,900,000 |
- |
- |
- |
|||||||||||||||||||||
|
ESCO Technologies |
2,200,000 |
- |
- |
2,200,000 |
85,470 |
528 |
|||||||||||||||||||||
|
ExlService Holdings |
1,145,000 |
473,000 |
- |
1,618,000 |
47,731 |
- |
|||||||||||||||||||||
|
Gaiam |
1,371,366 |
- |
- |
1,371,366 |
4,786 |
- |
|||||||||||||||||||||
|
General Communications* |
2,000,000 |
- |
500,000 |
1,500,000 |
14,700 |
- |
|||||||||||||||||||||
|
GLG Life Tech |
1,750,000 |
- |
84,730 |
1,665,270 |
227 |
- |
|||||||||||||||||||||
|
Gulf United Energy |
- |
50,000,000 |
- |
50,000,000 |
3,000 |
- |
|||||||||||||||||||||
|
H & E Equipment Services |
3,400,000 |
- |
- |
3,400,000 |
41,208 |
23,800 |
|||||||||||||||||||||
|
Hackett Group+ |
4,500,000 |
- |
650,793 |
3,849,207 |
16,090 |
- |
|||||||||||||||||||||
|
HEICO*** |
2,250,000 |
813,000 |
- |
3,063,000 |
93,452 |
319 |
|||||||||||||||||||||
|
Helen of Troy |
1,600,000 |
- |
- |
1,600,000 |
50,928 |
- |
|||||||||||||||||||||
|
Horizon Pharma* |
1,095,000 |
- |
- |
1,095,000 |
3,800 |
- |
|||||||||||||||||||||
|
iGATE |
3,400,000 |
- |
- |
3,400,000 |
61,778 |
- |
|||||||||||||||||||||
|
II-VI |
4,550,000 |
- |
- |
4,550,000 |
86,541 |
- |
|||||||||||||||||||||
|
Insperity |
1,210,000 |
336,000 |
- |
1,546,000 |
39,006 |
650 |
|||||||||||||||||||||
|
Interline Brands* |
2,600,000 |
- |
2,600,000 |
- |
- |
- |
|||||||||||||||||||||
|
InterMune* |
2,950,000 |
900,000 |
1,825,000 |
2,025,000 |
18,164 |
- |
|||||||||||||||||||||
|
IPG Photonics |
2,780,000 |
- |
- |
2,780,000 |
159,294 |
- |
|||||||||||||||||||||
|
IXYS |
1,900,000 |
- |
- |
1,900,000 |
18,848 |
- |
|||||||||||||||||||||
|
Kaiser Federal |
452,146 |
- |
- |
452,146 |
6,823 |
99 |
|||||||||||||||||||||
|
Kenexa* |
1,700,000 |
- |
775,000 |
925,000 |
42,393 |
- |
|||||||||||||||||||||
|
Kite Realty Group |
3,500,000 |
- |
- |
3,500,000 |
17,850 |
630 |
|||||||||||||||||||||
|
Knoll |
4,200,000 |
- |
- |
4,200,000 |
58,590 |
1,344 |
|||||||||||||||||||||
|
Lifetime Fitness |
2,190,000 |
- |
- |
2,190,000 |
100,171 |
- |
|||||||||||||||||||||
|
lululemon athletica* |
5,740,000 |
- |
1,235,000 |
4,505,000 |
333,100 |
- |
|||||||||||||||||||||
|
Marlin Business Services |
1,091,000 |
- |
- |
1,091,000 |
23,140 |
218 |
|||||||||||||||||||||
|
MB Financial |
2,360,000 |
500,000 |
- |
2,860,000 |
56,485 |
83 |
|||||||||||||||||||||
|
McGrath Rentcorp |
2,150,000 |
- |
- |
2,150,000 |
56,093 |
1,505 |
|||||||||||||||||||||
|
Mettler-Toledo International |
1,600,000 |
- |
- |
1,600,000 |
273,184 |
- |
|||||||||||||||||||||
|
Micromet* |
6,702,347 |
64,547 |
6,766,894 |
- |
- |
- |
|||||||||||||||||||||
|
Moog |
2,775,000 |
225,000 |
- |
3,000,000 |
113,610 |
- |
|||||||||||||||||||||
|
Navigant Consulting |
2,800,000 |
700,000 |
- |
3,500,000 |
38,675 |
- |
|||||||||||||||||||||
|
NPS Pharmaceuticals |
6,000,000 |
- |
- |
6,000,000 |
55,500 |
- |
|||||||||||||||||||||
|
Pericom Semiconductor |
1,765,000 |
- |
- |
1,765,000 |
15,329 |
- |
|||||||||||||||||||||
|
Petroamerica Oil* |
30,275,000 |
- |
5,275,000 |
25,000,000 |
5,340 |
- |
|||||||||||||||||||||
|
Petrodorado Energy |
26,000,000 |
- |
- |
26,000,000 |
4,760 |
- |
|||||||||||||||||||||
|
PetroMagdalena Energy* |
7,582,928 |
- |
7,582,928 |
- |
- |
- |
|||||||||||||||||||||
|
Petromanas |
37,500,000 |
- |
- |
37,500,000 |
7,629 |
- |
|||||||||||||||||||||
|
Pier 1 Imports |
5,600,000 |
1,000,000 |
- |
6,600,000 |
123,684 |
488 |
|||||||||||||||||||||
|
Pinnacle Entertainment |
3,950,000 |
- |
- |
3,950,000 |
48,388 |
- |
|||||||||||||||||||||
45
Columbia Acorn Fund
Statement of Investments (Unaudited), continued
> Notes to Statement of Investments (dollar values in thousands)
|
Security |
Balance of Shares Held 12/31/11 |
Purchases/ Additions |
Sales/ Reductions |
Balance of Shares Held 9/30/12 |
Value |
Dividend |
|||||||||||||||||||||
|
Raptor Pharmaceutical |
3,455,000 |
745,000 |
1,200,000 |
3,000,000 |
$ |
16,680 |
$ |
- |
|||||||||||||||||||
|
Rush Enterprises |
3,350,000 |
300,000 |
- |
3,650,000 |
68,952 |
- |
|||||||||||||||||||||
|
Ryman Hospitality Properties |
3,850,000 |
- |
- |
3,850,000 |
152,190 |
- |
|||||||||||||||||||||
|
SABA |
- |
2,000,000 |
- |
2,000,000 |
19,980 |
- |
|||||||||||||||||||||
|
Salem Communications* |
1,527,700 |
- |
1,527,700 |
- |
- |
- |
|||||||||||||||||||||
|
Santa Maria Petroleum**** |
50,000,000 |
- |
45,000,000 |
5,000,000 |
689 |
- |
|||||||||||||||||||||
|
Seattle Genetics |
6,153,000 |
- |
- |
6,153,000 |
165,823 |
- |
|||||||||||||||||||||
|
Shutterfly |
3,070,000 |
300,000 |
535,000 |
2,835,000 |
88,225 |
- |
|||||||||||||||||||||
|
SPS Commerce |
900,000 |
- |
- |
900,000 |
34,623 |
- |
|||||||||||||||||||||
|
Summit Hotel Properties |
1,500,000 |
976,000 |
- |
2,476,000 |
21,145 |
638 |
|||||||||||||||||||||
|
Tower Group |
1,675,000 |
1,089,000 |
- |
2,764,000 |
53,594 |
1,555 |
|||||||||||||||||||||
|
TriCo Bancshares |
1,350,000 |
- |
- |
1,350,000 |
22,315 |
365 |
|||||||||||||||||||||
|
True Religion Apparel* |
1,507,000 |
- |
1,324,134 |
182,866 |
3,901 |
93 |
|||||||||||||||||||||
|
tw telecom |
9,500,000 |
- |
- |
9,500,000 |
247,665 |
- |
|||||||||||||||||||||
|
Tyler Technologies* |
1,700,000 |
- |
800,000 |
900,000 |
39,618 |
- |
|||||||||||||||||||||
|
Virtusa |
2,125,000 |
- |
- |
2,125,000 |
37,761 |
- |
|||||||||||||||||||||
|
Warnaco Group* |
2,190,000 |
- |
730,000 |
1,460,000 |
75,774 |
- |
|||||||||||||||||||||
|
Wolverine Minerals* |
4,000,000 |
- |
- |
4,000,000 |
176 |
- |
|||||||||||||||||||||
|
World Acceptance |
1,505,202 |
- |
220,202 |
1,285,000 |
86,673 |
- |
|||||||||||||||||||||
|
Total of Affiliated Transactions |
350,544,804 |
68,903,760 |
87,203,381 |
332,245,183 |
$ |
4,416,565 |
$ |
38,247 |
|||||||||||||||||||
* At September 30, 2012, the Fund owned less than five percent of the company's outstanding voting shares.
** Includes the effects of a 2:1 stock split.
*** Includes the effects of a 5:4 stock split.
**** Includes the effects of a 1:10 reverse stock split.
+ Includes the effects of a corporate action.
The aggregate cost and value of these companies at September 30, 2012, were $2,434,032 and $3,808,141, respectively. Investments in affiliated companies represented 21.70% of the Fund's total net assets at September 30, 2012.
(c) All or a portion of this security was on loan at September 30, 2012. The total market value of securities on loan at September 30, 2012 was $409,637.
(d) Illiquid security.
(e) Denotes a restricted security, which is subject to restrictions on resale under federal securities laws. These securities are valued at fair value determined in good faith under consistently applied procedures established by the Board of Trustees. At September 30, 2012, the market value of these securities amounted to $16,743, which represented 0.10% of total net assets. Additional information on these securities is as follows:
|
Security |
Acquisition Dates |
Shares |
Cost |
Value |
|||||||||||||||
|
Union Agriculture Group |
12/8/10-6/27/12 |
1,306,818 |
$ |
15,000 |
$ |
13,552 |
|||||||||||||
|
Canadian Overseas Petroleum |
11/24/10 |
8,400,000 |
3,591 |
1,722 |
|||||||||||||||
|
Santa Maria Petroleum |
1/14/11 |
4,110,000 |
5,193 |
562 |
|||||||||||||||
|
MicroDose Therapeutx |
11/24/00 |
359,944 |
2,005 |
238 |
|||||||||||||||
|
Voyager Learning - Contingent Value Rights |
12/24/09 |
2,000,000 |
- |
220 |
|||||||||||||||
|
Wolverine Minerals |
6/3/11 |
4,000,000 |
2,005 |
176 |
|||||||||||||||
|
Petrodorado Energy - Warrants |
11/20/09 |
24,000,000 |
2,965 |
117 |
|||||||||||||||
|
Canadian Overseas Petroleum - Warrants |
11/24/10 |
4,200,000 |
526 |
110 |
|||||||||||||||
|
Duluth Exploration - Special Warrants |
8/19/11 |
500,000 |
- |
46 |
|||||||||||||||
|
Wolverine Minerals - Warrants |
6/3/11 |
2,000,000 |
243 |
- |
|||||||||||||||
|
$ |
31,528 |
$ |
16,743 |
||||||||||||||||
(f) Investment made with cash collateral received from securities lending activity.
(g) At September 30, 2012, for federal income tax purposes, the cost of investments was $10,822,897 and net unrealized appreciation was $6,483,075 consisting of gross unrealized appreciation of $7,200,375 and gross unrealized depreciation of $717,300.
46
> Notes to Statement of Investments (dollar values in thousands)
(h) On September 30, 2012, the market value of foreign securities represented 8.66% of total net assets. The Fund's foreign portfolio was diversified as follows:
|
Country |
Value |
Percentage of Net Assets |
|||||||||
|
Canada |
$ |
286,310 |
1.63 |
||||||||
|
Netherlands |
211,135 |
1.20 |
|||||||||
|
Singapore |
190,217 |
1.08 |
|||||||||
|
Sweden |
116,819 |
0.67 |
|||||||||
|
Colombia |
100,974 |
0.57 |
|||||||||
|
Hong Kong |
96,092 |
0.55 |
|||||||||
|
Brazil |
88,242 |
0.50 |
|||||||||
|
Japan |
74,527 |
0.42 |
|||||||||
|
France |
52,208 |
0.30 |
|||||||||
|
South Africa |
42,368 |
0.24 |
|||||||||
|
Denmark |
42,032 |
0.24 |
|||||||||
|
Chile |
41,484 |
0.24 |
|||||||||
|
Israel |
29,608 |
0.17 |
|||||||||
|
Country |
Value |
Percentage of Net Assets |
|||||||||
|
China |
$ |
28,252 |
0.16 |
||||||||
|
United Kingdom |
25,061 |
0.14 |
|||||||||
|
Russia |
17,528 |
0.10 |
|||||||||
|
Mongolia |
17,075 |
0.10 |
|||||||||
|
India |
15,272 |
0.09 |
|||||||||
|
Uruguay |
13,552 |
0.08 |
|||||||||
|
Iraq |
11,947 |
0.07 |
|||||||||
|
Iceland |
10,863 |
0.06 |
|||||||||
|
Germany |
7,878 |
0.04 |
|||||||||
|
Australia |
1,278 |
0.01 |
|||||||||
|
Total Foreign Portfolio |
$ |
1,520,722 |
8.66 |
||||||||
(i) Securities are valued using policies described in the Notes to Financial Statements in the most recent shareholder report.
Fair Value Measurements
Various inputs are used in determining the value of the Fund's investments, following the input prioritization hierarchy established by GAAP. These inputs are summarized in the three broad levels listed below:
• Level 1 – quoted prices in active markets for identical securities
• Level 2 – prices determined using other significant observable inputs (including quoted prices for similar securities, interest rates, prepayment speeds, credit risk and others)
• Level 3 – prices determined using significant unobservable inputs where quoted prices or observable inputs are unavailable or less reliable (including management's own assumptions about the factors market participants would use in pricing an investment)
The inputs or methodology used for valuing securities are not necessarily an indication of the risk associated with investing in those securities.
Examples of the types of securities in which the Fund would typically invest and how they are classified within this hierarchy are as follows. Typical Level 1 securities include exchange traded domestic equities, mutual funds whose NAVs are published each day and exchange traded foreign equities that are not statistically fair valued. Typical Level 2 securities include exchange traded foreign equities that are statistically fair valued, forward foreign currency exchange contracts and short-term investments valued at amortized cost. Additionally, securities fair valued by the Valuation Committee (the Committee) of the Fund's Board of Trustees (the Board) that rely on significant observable inputs are also included in Level 2. Typical Level 3 securities include any security fair valued by the Committee that relies on significant unobservable inputs.
Under the direction of the Board, the Committee is responsible for carrying out the valuation procedures approved by the Board.
The Committee meets as necessary, and no less frequently than quarterly, to determine fair values for securities for which market quotations are not readily available or for which the investment manager believes that available market quotations are unreliable, and to review the continuing appropriateness of the current value of any security subject to the Trust's Portfolio Pricing Policy and the pricing procedures of the investment manager (the Policies). The Policies address, among other things: circumstances under which market quotations will be deemed readily available; selection of third party pricing vendors; appropriate pricing methodologies; events that require fair valuation and fair value techniques; and circumstances under which securities will be deemed to pose a potential for stale pricing, including when securities are illiquid, restricted, or in default. The Committee may also meet to discuss additional valuation matters, which may include review of back-testing results, review of time-sensitive information or approval of other valuation related actions, and to review the appropriateness of the Policies.
For investments categorized as Level 3, the significant unobservable inputs used in the fair value measurement of the Funds' securities may include: (i) data specific to the issuer or comparable issuers, (ii) general market or specific sector news and (iii) quoted prices and specific or similar security transactions. The Committee considers this data and any changes from prior periods in order to assess the reasonableness of observable and unobservable inputs, any assumptions or internal models used to value those securities and changes in fair value. Significant changes in any of these factors could result in lower or higher fair value measurements. Various factors impact the frequency of monitoring (which may occur as often as daily), however the Committee may determine that changes to inputs, assumptions and models are not required with the same frequency.
47
Columbia Acorn Fund
Statement of Investments (Unaudited), continued
> Notes to Statement of Investments (dollar values in thousands)
The following table summarizes the inputs used, as of September 30, 2012, in valuing the Fund's assets:
|
Investment Type |
Quoted Prices (Level 1) |
Other Significant Observable Inputs (Level 2) |
Significant Unobservable Inputs (Level 3) |
Total |
|||||||||||||||
|
Equities |
|||||||||||||||||||
|
Information |
$ |
4,494,354 |
$ |
185,496 |
$ |
- |
$ |
4,679,850 |
|||||||||||
|
Industrial Goods & Services |
3,138,860 |
204,390 |
- |
3,343,250 |
|||||||||||||||
|
Consumer Goods & Services |
2,633,984 |
124,625 |
220 |
2,758,829 |
|||||||||||||||
|
Finance |
1,918,231 |
- |
- |
1,918,231 |
|||||||||||||||
|
Health Care |
1,620,502 |
18,598 |
238 |
1,639,338 |
|||||||||||||||
|
Energy & Minerals |
1,124,454 |
135,890 |
13,598 |
1,273,942 |
|||||||||||||||
|
Other Industries |
1,151,174 |
122,392 |
- |
1,273,566 |
|||||||||||||||
|
Total Equities |
16,081,559 |
791,391 |
14,056 |
16,887,006 |
|||||||||||||||
|
Total Securities Lending Collateral |
418,966 |
- |
- |
418,966 |
|||||||||||||||
|
Total Investments |
$ |
16,500,525 |
$ |
791,391 |
$ |
14,056 |
$ |
17,305,972 |
|||||||||||
The Fund's assets assigned to the Level 2 input category are generally valued using a market approach, in which a security's value is determined through its correlation to prices and information from observable market transactions for similar or identical assets. Foreign equities are generally valued at the last sale price on the foreign exchange or market on which they trade. The Fund may use a statistical fair valuation model, in accordance with the policy adopted by the Board, provided by an independent third party to value securities principally traded in foreign markets in order to adjust for possible stale pricing that may occur between the close of the foreign exchanges and the time for valuation. These models take into account available market data including intraday index, ADR, and ETF movements. Securities acquired via private placement that have a holding period or an extended settlement period are valued at a discount to the same shares that are trading freely on the market. These discounts are determined by the investment manager's experience with similar securities or situations. Factors may include, but are not limited to, trade volume, shares outstanding and stock price. Warrants which do not trade are valued as a percentage of the actively trading common stock using a model, based on Black Scholes. Securities which have halted or temporarily stopped trading are valued at the last sale and adjusted by a premium or a discount to account for the anticipated re-opening price. These adjustments are determined by the investment manager's experience with similar securities or situations.
The following table shows transfers between Level 1 and Level 2 of the fair value hierarchy:
|
Transfers In |
Transfers Out |
||||||||||||||
| Level 1 |
Level 2 |
Level 1 |
Level 2 |
||||||||||||
| $ |
- |
$ |
1,575 |
$ |
1,575 |
$ |
- |
||||||||
Financial assets were transferred from Level 1 to Level 2 as trading halted during the period.
The following table reconciles asset balances for the period ending September 30, 2012, in which significant observable and/or unobservable inputs (Level 3) were used in determining value:
|
Investments in Securities |
Balance as of December 31, 2011 |
Realized Gain/(Loss) |
Change in Unrealized Appreciation (Depreciation) |
Purchases |
Sales |
Transfers into Level 3 |
Transfers out of Level 3 |
Balance as of September 30, 2012 |
|||||||||||||||||||||||||||
|
Equities |
|||||||||||||||||||||||||||||||||||
|
Consumer Goods & Services |
$ |
180 |
$ |
- |
$ |
40 |
$ |
- |
$ |
- |
$ |
- |
$ |
- |
$ |
220 |
|||||||||||||||||||
|
Health Care |
270 |
- |
(32 |
) |
- |
- |
- |
- |
238 |
||||||||||||||||||||||||||
|
Energy & Minerals |
12,507 |
- |
1,091 |
- |
- |
- |
- |
13,598 |
|||||||||||||||||||||||||||
|
$ |
12,957 |
$ |
- |
$ |
1,099 |
$ |
- |
$ |
- |
$ |
- |
$ |
- |
$ |
14,056 |
||||||||||||||||||||
The information in the above reconciliation table represents fiscal year to date activity for any securities identified as using Level 3 inputs at either the beginning or the end of the current fiscal period.
The change in unrealized appreciation attributed to securities owned at September 30, 2012, which were valued using significant unobservable inputs (Level 3), amounted to $1,099.
The Fund does not hold any significant investments categorized as Level 3.
Certain common stock classified as Level 3 are valued at fair value, using a market approach, as determined in good faith under consistently applied procedures established by and under the general supervision of the Board. To determine fair value for these securities, for which no market exists, the Committee utilizes the valuation technique it deems most appropriate in the circumstances, using some unobservable inputs, which may include but are not limited to trades of similar securities, estimated earnings of the company, market multiples derived from a set of comparable companies, and the position of the security within the company's capital structure. Significant increases or decreases to any of these inputs could result in a significantly lower or higher fair value measurement. Generally, a change in estimated earnings of a company may result in a change to the comparable companies and market multiples utilized.
48
Columbia Acorn International
Major Portfolio Changes in the Third Quarter (Unaudited)
|
Number of Shares |
|||||||||||
|
6/30/12 |
9/30/12 |
||||||||||
|
Purchases |
|||||||||||
|
Asia |
|||||||||||
| > Japan | |||||||||||
|
Doshisha |
828,000 |
838,000 |
|||||||||
|
Glory |
1,694,562 |
1,817,562 |
|||||||||
|
Hamamatsu Photonics |
0 |
423,900 |
|||||||||
|
Horiba |
424,000 |
711,100 |
|||||||||
|
Itochu Techno-Science |
0 |
249,100 |
|||||||||
|
Lifenet Insurance |
0 |
813,400 |
|||||||||
|
Miraca Holdings |
659,500 |
816,456 |
|||||||||
|
Nabtesco |
0 |
672,000 |
|||||||||
|
Nihon Parkerizing |
756,900 |
1,169,080 |
|||||||||
|
Sanrio |
865,800 |
960,000 |
|||||||||
|
Start Today |
2,572,724 |
2,892,724 |
|||||||||
| > Taiwan | |||||||||||
|
Lung Yen |
2,469,000 |
3,835,000 |
|||||||||
|
Simplo Technology |
5,564,713 |
6,334,713 |
|||||||||
| > Singapore | |||||||||||
|
Ascendas REIT |
20,000,000 |
22,000,000 |
|||||||||
|
Mapletree Commercial Trust |
35,000,000 |
39,467,000 |
|||||||||
|
Mapletree Industrial Trust |
28,000,000 |
33,000,000 |
|||||||||
|
Mapletree Logistics Trust |
35,000,000 |
40,000,000 |
|||||||||
|
Petra Foods |
3,071,300 |
4,772,000 |
|||||||||
| > Hong Kong | |||||||||||
|
AAC Technologies |
8,475,000 |
10,038,000 |
|||||||||
|
Lifestyle International |
21,845,000 |
22,000,000 |
|||||||||
|
Vitasoy International |
4,495,200 |
9,557,900 |
|||||||||
| > China | |||||||||||
| 51job - ADR |
326,700 |
427,814 |
|||||||||
|
Digital China |
18,000,300 |
22,168,300 |
|||||||||
|
NetEase.com - ADR |
381,300 |
419,323 |
|||||||||
|
New Oriental Education & Technology - ADR |
1,100,000 |
1,200,000 |
|||||||||
| > India | |||||||||||
|
Adani Ports & Special Economic Zone |
8,052,053 |
8,945,000 |
|||||||||
|
TTK Prestige |
0 |
63,000 |
|||||||||
| > Korea | |||||||||||
|
BS Financial Group |
0 |
1,208,000 |
|||||||||
|
Handsome |
474,441 |
624,441 |
|||||||||
|
Hite Jinro |
0 |
138,990 |
|||||||||
|
iMarketKorea |
580,000 |
724,727 |
|||||||||
|
Kepco Plant Service & Engineering |
244,530 |
305,540 |
|||||||||
|
Samsung Engineering |
0 |
57,000 |
|||||||||
| > Indonesia | |||||||||||
|
Ace Indonesia |
15,000,000 |
25,000,000 |
|||||||||
|
Archipelago Resources |
29,063,787 |
31,764,600 |
|||||||||
|
Mayora Indah |
2,176,600 |
4,275,800 |
|||||||||
|
Number of Shares |
|||||||||||
|
6/30/12 |
9/30/12 |
||||||||||
|
MNC Skyvision |
32,766,000 |
40,047,000 |
|||||||||
|
Surya Citra Media |
0 |
7,613,000 |
|||||||||
|
Tower Bersama Infrastructure |
51,767,300 |
60,516,300 |
|||||||||
| > Thailand | |||||||||||
|
Home Product Center |
110,000,000 |
125,000,000 |
|||||||||
|
Europe |
|||||||||||
| > United Kingdom | |||||||||||
|
Aggreko |
596,100 |
875,000 |
|||||||||
|
Asos |
0 |
646,000 |
|||||||||
|
Domino's Pizza UK & Ireland |
3,107,000 |
3,789,000 |
|||||||||
|
Elementis |
0 |
4,999,847 |
|||||||||
|
Rightmove |
822,000 |
998,000 |
|||||||||
|
Spirax Sarco |
256,202 |
655,000 |
|||||||||
|
WH Smith |
1,555,000 |
2,321,211 |
|||||||||
| > Netherlands | |||||||||||
|
Aalberts Industries |
2,546,126 |
2,742,165 |
|||||||||
|
BinckBank |
0 |
449,113 |
|||||||||
|
TKH Group |
850,468 |
1,112,468 |
|||||||||
| > France | |||||||||||
|
Compagnie Française de l'Afrique Occidentale |
134,254 |
377,000 |
|||||||||
|
Neopost |
675,000 |
770,000 |
|||||||||
|
Norbert Dentressangle |
232,400 |
285,704 |
|||||||||
| > Switzerland | |||||||||||
|
Dufry Group |
330,000 |
375,000 |
|||||||||
|
Zehnder |
280,000 |
330,000 |
|||||||||
| > Germany | |||||||||||
|
NORMA Group |
690,000 |
1,050,000 |
|||||||||
|
Pfeiffer Vacuum |
0 |
130,050 |
|||||||||
| > Italy | |||||||||||
|
Fiat |
0 |
3,791,000 |
|||||||||
|
Geox |
7,000,000 |
7,706,873 |
|||||||||
|
Pirelli |
2,661,000 |
3,245,000 |
|||||||||
|
Tod's |
166,200 |
224,200 |
|||||||||
| > Denmark | |||||||||||
|
Solar |
166,013 |
207,968 |
|||||||||
| > Norway | |||||||||||
|
Atea |
2,403,664 |
3,281,864 |
|||||||||
| > Kazakhstan | |||||||||||
|
Halyk Savings Bank of Kazakhstan - GDR |
3,319,000 |
4,506,259 |
|||||||||
| > Russia | |||||||||||
|
Yandex |
1,123,695 |
1,167,000 |
|||||||||
| > Finland | |||||||||||
|
Stockmann |
1,039,429 |
1,430,429 |
|||||||||
49
Columbia Acorn International
Major Portfolio Changes in the Third Quarter (Unaudited), continued
|
Number of Shares |
|||||||||||
|
6/30/12 |
9/30/12 |
||||||||||
|
Purchases (continued) |
|||||||||||
|
Other Countries |
|||||||||||
| > South Africa | |||||||||||
|
Massmart Holdings |
1,025,504 |
1,574,575 |
|||||||||
| > Canada | |||||||||||
|
CAE |
0 |
3,047,000 |
|||||||||
| > Australia | |||||||||||
|
Challenger Financial |
11,936,400 |
14,652,712 |
|||||||||
|
Commonwealth Property Office Fund |
48,533,075 |
49,017,000 |
|||||||||
|
Domino's Pizza Enterprises |
1,576,290 |
2,500,000 |
|||||||||
|
Regis Resources |
0 |
311,805 |
|||||||||
|
SAI Global |
0 |
3,338,561 |
|||||||||
| > United States | |||||||||||
|
FMC Technologies |
407,213 |
669,213 |
|||||||||
|
Textainer Group Holdings |
965,297 |
1,103,297 |
|||||||||
| > New Zealand | |||||||||||
|
Telecom NZ |
0 |
3,598,749 |
|||||||||
|
Latin America |
|||||||||||
| > Brazil | |||||||||||
|
Arcos Dorados |
1,300,000 |
1,730,000 |
|||||||||
|
Odontoprev |
4,500,000 |
5,000,000 |
|||||||||
| > Mexico | |||||||||||
|
Genomma Lab International |
0 |
11,945,000 |
|||||||||
|
Herdez |
0 |
1,728,500 |
|||||||||
| > Guatemala | |||||||||||
|
Tahoe Resources |
1,403,049 |
1,434,600 |
|||||||||
| > Chile | |||||||||||
|
Viña Concha y Toro |
5,640,000 |
10,115,274 |
|||||||||
|
Number of Shares |
|||||||||||
|
6/30/12 |
9/30/12 |
||||||||||
|
Sales |
|||||||||||
|
Asia |
|||||||||||
| > Japan | |||||||||||
|
Aeon Delight |
1,417,438 |
1,221,938 |
|||||||||
|
Aeon Mall |
880,474 |
830,474 |
|||||||||
|
Ibiden |
857,144 |
0 |
|||||||||
|
Miura |
407,050 |
202,150 |
|||||||||
|
Shimadzu |
2,600,000 |
0 |
|||||||||
|
Shinsei Bank |
15,024,649 |
0 |
|||||||||
|
Torishima Pump Manufacturing |
1,346,963 |
1,069,963 |
|||||||||
| > Taiwan | |||||||||||
|
MStar Semiconductor |
3,661,100 |
0 |
|||||||||
|
Radiant Opto-Electronics |
6,087,300 |
4,564,960 |
|||||||||
|
St. Shine Optical |
2,492,300 |
2,035,000 |
|||||||||
|
Tripod Technologies |
12,218,270 |
8,012,470 |
|||||||||
| > China | |||||||||||
|
Want Want |
26,565,000 |
24,290,000 |
|||||||||
|
Zhaojin Mining Industry |
18,920,554 |
9,306,554 |
|||||||||
| > India | |||||||||||
|
Jain Irrigation Systems |
11,163,303 |
1,426,549 |
|||||||||
|
S. Kumars Nationwide |
10,249,300 |
0 |
|||||||||
| > Korea | |||||||||||
|
Grand Korea Leisure |
1,134,000 |
852,150 |
|||||||||
|
Hyundai Home Shopping |
55,000 |
0 |
|||||||||
|
NHN |
101,150 |
0 |
|||||||||
|
Europe |
|||||||||||
| > United Kingdom | |||||||||||
|
Chemring |
2,303,000 |
0 |
|||||||||
|
Next |
262,300 |
0 |
|||||||||
|
Serco |
3,375,000 |
0 |
|||||||||
| > Netherlands | |||||||||||
|
Fugro |
460,000 |
368,000 |
|||||||||
|
Koninklijke TenCate |
1,234,758 |
821,137 |
|||||||||
|
UNIT4 |
1,591,702 |
1,574,145 |
|||||||||
| > France | |||||||||||
|
Mersen |
162,844 |
0 |
|||||||||
| > Switzerland | |||||||||||
|
Bank Sarasin & Cie |
580,000 |
0 |
|||||||||
|
Partners Group |
310,000 |
260,000 |
|||||||||
| > Germany | |||||||||||
|
Dürr |
500,000 |
440,000 |
|||||||||
|
Rheinmetall |
405,000 |
0 |
|||||||||
|
Wirecard |
2,500,000 |
2,160,000 |
|||||||||
| > Sweden | |||||||||||
|
East Capital Explorer |
419,877 |
0 |
|||||||||
|
Hexagon |
4,056,007 |
3,957,522 |
|||||||||
50
|
Number of Shares |
|||||||||||
|
6/30/12 |
9/30/12 |
||||||||||
|
Sales (continued) |
|||||||||||
|
Europe—continued |
|||||||||||
| > Russia | |||||||||||
|
Mail.ru - GDR |
368,493 |
0 |
|||||||||
|
Petropavlovsk |
2,109,700 |
0 |
|||||||||
| > Ireland | |||||||||||
|
Paddy Power |
263,400 |
74,637 |
|||||||||
|
United Drug |
4,237,000 |
0 |
|||||||||
| > Greece | |||||||||||
|
Intralot |
4,384,185 |
0 |
|||||||||
| > Spain | |||||||||||
|
Red Eléctrica de España |
618,320 |
0 |
|||||||||
|
Other Countries |
|||||||||||
| > South Africa | |||||||||||
|
Adcock Ingram Holdings |
4,992,200 |
3,938,965 |
|||||||||
|
Mr. Price |
3,175,083 |
2,644,083 |
|||||||||
| > Canada | |||||||||||
|
DeeThree Exploration |
2,919,000 |
1,130,000 |
|||||||||
| > United States | |||||||||||
|
BioMarin Pharmaceutical |
1,229,871 |
1,044,000 |
|||||||||
|
Hornbeck Offshore |
555,500 |
439,500 |
|||||||||
|
World Fuel Services |
763,228 |
428,228 |
|||||||||
| > Israel | |||||||||||
|
Israel Chemicals |
4,706,527 |
3,145,527 |
|||||||||
| > Senegal | |||||||||||
|
Sonatel |
42,360 |
31,200 |
|||||||||
51
Columbia Acorn International
Statement of Investments (Unaudited), September 30, 2012
|
Number of Shares |
Value (000) |
||||||||||
|
Equities: 95.4% |
|||||||||||
|
Asia 43.2% |
|||||||||||
| > Japan 16.7% | |||||||||||
|
5,582,600 |
Kansai Paint |
$ |
61,872 |
||||||||
|
Paint Producer in Japan, India, China & Southeast Asia |
|||||||||||
|
20,227,000 |
Seven Bank |
61,718 |
|||||||||
|
ATM Processing Services |
|||||||||||
|
20,096 |
Wacom |
48,628 |
|||||||||
|
Computer Graphic Illustration Devices |
|||||||||||
|
1,582,200 |
Hoshizaki Electric |
45,949 |
|||||||||
|
Commercial Kitchen Equipment |
|||||||||||
|
2,719,900 |
Park24 |
44,443 |
|||||||||
|
Parking Lot Operator |
|||||||||||
|
1,817,562 |
Glory |
42,593 |
|||||||||
|
Currency Handling Systems & Related Equipment |
|||||||||||
|
2,892,724 |
Start Today (a) |
41,323 |
|||||||||
|
Online Japanese Apparel Retailer |
|||||||||||
|
7,780 |
Orix JREIT |
38,001 |
|||||||||
|
Diversified REIT |
|||||||||||
|
816,456 |
Miraca Holdings |
36,666 |
|||||||||
|
Outsourced Lab Testing, Diagnostic Equipment & Reagents |
|||||||||||
|
960,000 |
Sanrio (a) |
34,336 |
|||||||||
|
Character Goods & Licensing |
|||||||||||
|
2,981,100 |
Kuraray (a) |
33,854 |
|||||||||
|
Special Resin, Fine Chemical, Fibers & Textures |
|||||||||||
|
295,762 |
Nakanishi |
31,759 |
|||||||||
|
Dental Tools & Machinery |
|||||||||||
|
30,500 |
Jupiter Telecommunications |
30,953 |
|||||||||
|
Largest Cable Service Provider in Japan |
|||||||||||
|
2,552,000 |
NGK Insulators (a) |
30,534 |
|||||||||
|
Ceramic Products for Auto, Power & Electronics |
|||||||||||
|
937,651 |
Kintetsu World Express |
30,010 |
|||||||||
|
Airfreight Logistics |
|||||||||||
|
7,620 |
Kenedix Realty Investment |
27,401 |
|||||||||
|
Tokyo Midsize Office REIT |
|||||||||||
|
345,000 |
FP Corporation |
27,155 |
|||||||||
|
Disposable Food Trays & Containers |
|||||||||||
|
5,540 |
Mori Hills REIT Investment |
26,982 |
|||||||||
|
Tokyo Centric Diversified REIT |
|||||||||||
|
1,221,938 |
Aeon Delight |
26,918 |
|||||||||
|
Facility Maintenance & Management |
|||||||||||
|
2,137,272 |
Japan Airport Terminal |
25,363 |
|||||||||
|
Airport Terminal Operator at Haneda |
|||||||||||
|
1,613,429 |
Daiseki |
24,997 |
|||||||||
|
Waste Disposal & Recycling |
|||||||||||
|
838,000 |
Doshisha |
24,286 |
|||||||||
|
Wholesaler |
|||||||||||
|
480,000 |
Disco (a) |
23,083 |
|||||||||
|
Semiconductor Dicing & Grinding Equipment |
|||||||||||
|
10,360 |
Advance Residence Investment |
21,801 |
|||||||||
|
Residential REIT |
|||||||||||
|
300,792 |
Ain Pharmaciez |
21,485 |
|||||||||
|
Dispensing Pharmacy/Drugstore Operator |
|||||||||||
|
Number of Shares |
Value (000) |
||||||||||
|
1,885,600 |
Asahi Diamond Industrial |
$ |
21,143 |
||||||||
|
Consumable Diamond Tools |
|||||||||||
|
711,100 |
Horiba |
20,963 |
|||||||||
|
Measuring Instruments & Analyzers |
|||||||||||
|
830,474 |
Aeon Mall |
20,278 |
|||||||||
|
Suburban Shopping Mall Developer, Owner & Operator |
|||||||||||
|
772,000 |
Misumi Group |
19,140 |
|||||||||
|
Industrial Components Distributor |
|||||||||||
|
1,169,080 |
Nihon Parkerizing |
17,770 |
|||||||||
|
Metal Surface Treatment Agents & Processing |
|||||||||||
|
732,108 |
Icom |
17,668 |
|||||||||
|
Two Way Radio Communication Equipment |
|||||||||||
|
1,405,739 |
Ushio |
16,862 |
|||||||||
|
Industrial Light Sources |
|||||||||||
|
423,900 |
Hamamatsu Photonics |
14,564 |
|||||||||
|
Optical Sensors for Medical & Industrial Applications |
|||||||||||
|
1,940,200 |
Sintokogio |
13,325 |
|||||||||
|
Automated Casting Machines, Surface Treatment System & Consumables |
|||||||||||
|
249,100 |
Itochu Techno-Science |
12,947 |
|||||||||
|
IT Network Sales & Services |
|||||||||||
|
672,000 |
Nabtesco (a) |
12,371 |
|||||||||
|
Machinery Components |
|||||||||||
|
813,400 |
Lifenet Insurance (a)(b) |
10,734 |
|||||||||
|
Online Life Insurance Company in Japan |
|||||||||||
|
1,295 |
Global One Real Estate |
7,863 |
|||||||||
|
Office REIT |
|||||||||||
|
1,069,963 |
Torishima Pump Manufacturing |
7,608 |
|||||||||
|
Industrial Pump for Power Generation & Water Supply Systems |
|||||||||||
|
202,150 |
Miura |
4,887 |
|||||||||
|
Industrial Boiler |
|||||||||||
|
24 |
Fukuoka REIT |
175 |
|||||||||
|
Diversified REIT in Fukuoka |
|||||||||||
|
1,080,408 |
|||||||||||
| > Taiwan 6.5% | |||||||||||
|
36,606,000 |
Far EasTone Telecom |
90,333 |
|||||||||
|
Taiwan's Third Largest Mobile Operator |
|||||||||||
|
16,410,000 |
Taiwan Mobile |
59,843 |
|||||||||
|
Taiwan's Second Largest Mobile Operator |
|||||||||||
|
20,120,000 |
CTCI Corp |
45,962 |
|||||||||
|
International Engineering Firm |
|||||||||||
|
6,334,713 |
Simplo Technology |
37,810 |
|||||||||
|
Battery Packs for Notebook & Tablet PCs |
|||||||||||
|
2,035,000 |
St. Shine Optical |
26,117 |
|||||||||
|
World's Leading Disposable Contact Lens Original Equipment Manufacturer (OEM) |
|||||||||||
|
11,794,000 |
Chroma Ate |
24,777 |
|||||||||
|
Automatic Test Systems, Testing & Measurement Instruments |
|||||||||||
|
11,200,000 |
Taiwan Hon Chuan |
24,476 |
|||||||||
|
Beverage Packaging (Bottles, Caps, Labels) Manufacturer |
|||||||||||
|
6,603,000 |
Advantech |
24,062 |
|||||||||
|
Industrial PC & Components |
|||||||||||
|
4,564,960 |
Radiant Opto-Electronics |
19,730 |
|||||||||
|
LCD Back Light Units & Modules |
|||||||||||
52
|
Number of Shares |
Value (000) |
||||||||||
| > Taiwan—continued | |||||||||||
|
8,012,470 |
Tripod Technologies |
$ |
19,595 |
||||||||
|
Printed Circuit Boards (PCB) |
|||||||||||
|
3,181,000 |
President Chain Store |
16,980 |
|||||||||
|
Taiwan's Number One Convenience Chain Store Operator |
|||||||||||
|
3,000,141 |
PC Home |
16,960 |
|||||||||
|
Taiwanese Internet Retail Company |
|||||||||||
|
3,835,000 |
Lung Yen |
13,174 |
|||||||||
|
Funeral Services & Columbaria |
|||||||||||
|
37,000 |
Chipbond |
59 |
|||||||||
|
Semiconductor Back-end Packaging Services |
|||||||||||
|
419,878 |
|||||||||||
| > Singapore 4.4% | |||||||||||
|
22,000,000 |
Ascendas REIT |
43,091 |
|||||||||
|
Industrial Property Landlord |
|||||||||||
|
25,000,000 |
Olam International |
41,471 |
|||||||||
|
Agriculture Supply Chain Manager |
|||||||||||
|
33,000,000 |
Mapletree Industrial Trust |
37,871 |
|||||||||
|
Industrial Property Landlord |
|||||||||||
|
39,467,000 |
Mapletree Commercial Trust |
37,597 |
|||||||||
|
Retail & Office Property Landlord |
|||||||||||
|
40,000,000 |
Mapletree Logistics Trust |
36,578 |
|||||||||
|
Industrial Property Landlord |
|||||||||||
|
20,000,000 |
CDL Hospitality Trust |
33,061 |
|||||||||
|
Hotel Owner/Operator |
|||||||||||
|
15,000,000 |
Goodpack Limited |
22,626 |
|||||||||
|
International Bulk Container Leasing |
|||||||||||
|
3,500,000 |
Singapore Exchange |
19,893 |
|||||||||
|
Singapore Equity & Derivatives Market Operator |
|||||||||||
|
4,772,000 |
Petra Foods |
9,527 |
|||||||||
|
Cocoa Processor & Chocolate Manufacturer |
|||||||||||
|
281,715 |
|||||||||||
| > Hong Kong 4.1% | |||||||||||
|
6,500,000 |
Melco Crown Entertainment - ADR (a)(b) |
87,620 |
|||||||||
|
Macau Casino Operator |
|||||||||||
|
22,000,000 |
Lifestyle International |
45,348 |
|||||||||
|
Mid- to High-end Department Store Operator in Hong Kong & China |
|||||||||||
|
15,625,000 |
L'Occitane International |
41,196 |
|||||||||
|
Skin Care & Cosmetics Producer |
|||||||||||
|
10,038,000 |
AAC Technologies |
36,092 |
|||||||||
|
Miniature Acoustic Components |
|||||||||||
|
30,000,000 |
Sasa International |
20,455 |
|||||||||
|
Cosmetics Retailer |
|||||||||||
|
10,000,000 |
MGM China Holdings |
17,176 |
|||||||||
|
Macau Casino Operator |
|||||||||||
|
9,557,900 |
Vitasoy International |
8,339 |
|||||||||
|
Hong Kong Soy Food Brand |
|||||||||||
|
8,000,000 |
Melco International |
7,101 |
|||||||||
|
Macau Casino Operator |
|||||||||||
|
263,327 |
|||||||||||
| > China 2.7% | |||||||||||
|
22,168,300 |
Digital China |
35,181 |
|||||||||
|
IT Distribution & Systems Integration Services |
|||||||||||
|
Number of Shares |
Value (000) |
||||||||||
|
24,290,000 |
Want Want |
$ |
30,920 |
||||||||
|
Chinese Branded Consumer Food Company |
|||||||||||
|
419,323 |
NetEase.com - ADR (b) |
23,541 |
|||||||||
|
Chinese Online Gaming Services |
|||||||||||
|
1,200,000 |
New Oriental Education & Technology - ADR (a) |
20,004 |
|||||||||
|
Education Service Provider |
|||||||||||
|
260,000,000 |
RexLot Holdings |
19,714 |
|||||||||
|
Lottery Equipment Supplier in China |
|||||||||||
|
427,814 |
51job - ADR (b) |
19,166 |
|||||||||
|
Integrated Human Resource Services |
|||||||||||
|
9,306,554 |
Zhaojin Mining Industry |
16,856 |
|||||||||
|
Gold Mining & Refining in China |
|||||||||||
|
30,000,000 |
AMVIG Holdings |
8,931 |
|||||||||
|
Chinese Tobacco Packaging Material Supplier |
|||||||||||
|
174,313 |
|||||||||||
| > India 2.3% | |||||||||||
|
2,262,300 |
United Breweries |
28,031 |
|||||||||
|
India's Largest Brewer |
|||||||||||
|
341,652 |
Asian Paints |
25,464 |
|||||||||
|
India's Largest Paint Company |
|||||||||||
|
8,945,000 |
Adani Ports & Special Economic Zone |
21,559 |
|||||||||
|
Indian West Coast Shipping Port |
|||||||||||
|
13,195,000 |
Redington India |
19,537 |
|||||||||
|
Supply Chain Solutions for IT & Mobile Handsets in Emerging Markets |
|||||||||||
|
1,550,000 |
Shriram Transport Finance |
18,172 |
|||||||||
|
Used Truck Finance |
|||||||||||
|
545,000 |
Colgate Palmolive India (b) |
12,488 |
|||||||||
|
Consumer Products in Oral Care |
|||||||||||
|
1,600,000 |
Titan Industries |
7,910 |
|||||||||
|
Jewlery, Watches, Eyeglasses |
|||||||||||
|
27,212,878 |
REI Agro |
5,469 |
|||||||||
|
Basmati Rice Processing |
|||||||||||
|
63,000 |
TTK Prestige (b) |
4,441 |
|||||||||
|
Branded Cooking Equipment |
|||||||||||
|
1,650,000 |
SKIL Ports and Logistics (b) |
2,851 |
|||||||||
|
Indian Container Port Project |
|||||||||||
|
1,426,549 |
Jain Irrigation Systems |
1,881 |
|||||||||
|
Agricultural Micro-irrigation Systems & Food Processing |
|||||||||||
|
147,803 |
|||||||||||
| > Korea 1.9% | |||||||||||
|
852,150 |
Grand Korea Leisure |
22,420 |
|||||||||
|
'Foreigner Only' Casino Group in Korea |
|||||||||||
|
724,727 |
iMarketKorea |
18,468 |
|||||||||
|
Procurement, Distribution of MRO (Maintenance Repair Operations) Goods |
|||||||||||
|
623,120 |
Woongjin Coway |
17,240 |
|||||||||
|
Korean Household Appliance Rental Service Provider |
|||||||||||
|
624,441 |
Handsome |
15,710 |
|||||||||
|
Korea's Leading High-end Apparel Company |
|||||||||||
|
305,540 |
Kepco Plant Service & Engineering |
13,848 |
|||||||||
|
Power Plant & Grid Maintenance |
|||||||||||
|
1,208,000 |
BS Financial Group |
12,976 |
|||||||||
|
Regional Bank in Busan |
|||||||||||
53
Columbia Acorn International
Statement of Investments (Unaudited), continued
|
Number of Shares |
Value (000) |
||||||||||
| > Korea—continued | |||||||||||
|
182,000 |
Hana Tour Service |
$ |
9,906 |
||||||||
|
Korea's Largest Wholesale Tour Provider |
|||||||||||
|
57,000 |
Samsung Engineering |
9,780 |
|||||||||
|
Global Engineering, Procurement, Construction (EPC) Firm |
|||||||||||
|
138,990 |
Hite Jinro (b) |
3,041 |
|||||||||
|
Leading Beer & Spirits Manufacturer |
|||||||||||
|
123,389 |
|||||||||||
| > Indonesia 1.7% | |||||||||||
|
31,764,600 |
Archipelago Resources (b)(c) |
30,776 |
|||||||||
|
Gold Mining Projects in Indonesia, Vietnam & the Philippines |
|||||||||||
|
60,516,300 |
Tower Bersama Infrastructure (b) |
28,103 |
|||||||||
|
Communications Towers |
|||||||||||
|
25,000,000 |
Ace Indonesia |
16,035 |
|||||||||
|
Home Improvement Retailer |
|||||||||||
|
4,275,800 |
Mayora Indah |
9,985 |
|||||||||
|
Consumer Branded Food Manufacturer |
|||||||||||
|
7,613,000 |
Surya Citra Media |
8,751 |
|||||||||
|
Free to Air TV in Indonesia |
|||||||||||
|
40,047,000 |
MNC Skyvision (b) |
8,683 |
|||||||||
|
Largest Satellite Pay TV Operator in Indonesia |
|||||||||||
|
12,488,000 |
Mitra Adiperkasa |
8,316 |
|||||||||
|
Operator of Department Store & Specialty Retail Stores |
|||||||||||
|
6,217,500 |
Southern Arc Minerals (b)(c) |
2,214 |
|||||||||
|
Gold & Copper Exploration in Indonesia |
|||||||||||
|
112,863 |
|||||||||||
| > Thailand 0.8% | |||||||||||
|
125,000,000 |
Home Product Center |
53,061 |
|||||||||
|
Home Improvement Retailer |
|||||||||||
|
699,700 |
Samui Airport Property Fund (b) |
327 |
|||||||||
|
Thai Airport Operator |
|||||||||||
|
53,388 |
|||||||||||
| > Philippines 0.8% | |||||||||||
|
73,221,250 |
SM Prime Holdings |
24,880 |
|||||||||
|
Shopping Mall Operator |
|||||||||||
|
7,931,700 |
Int'l Container Terminal |
13,369 |
|||||||||
|
Container Handling Terminals & Port Management |
|||||||||||
|
19,454,700 |
Manila Water Company |
12,605 |
|||||||||
|
Water Utility Company in Philippines |
|||||||||||
|
50,854 |
|||||||||||
| > Mongolia 0.8% | |||||||||||
|
74,865,700 |
Mongolian Mining (b) |
34,085 |
|||||||||
|
Coking Coal Mining in Mongolia |
|||||||||||
|
1,049,943 |
Turquoise Hill Resources (a)(b) |
8,939 |
|||||||||
|
914,678 |
Turquoise Hill Resources (a)(b)(d) |
7,756 |
|||||||||
|
Copper Mine Project in Mongolia |
|||||||||||
|
50,780 |
|||||||||||
| > Cambodia 0.5% | |||||||||||
|
60,000,000 |
Nagacorp |
33,622 |
|||||||||
|
Casino/Entertainment Complex in Cambodia |
|||||||||||
|
33,622 |
|||||||||||
|
Asia: Total |
2,792,340 |
||||||||||
|
Number of Shares |
Value (000) |
||||||||||
|
Europe 29.9% |
|||||||||||
| > United Kingdom 6.2% | |||||||||||
|
935,500 |
Intertek Group |
$ |
41,392 |
||||||||
|
Testing, Inspection, Certification Services |
|||||||||||
|
875,000 |
Aggreko |
32,682 |
|||||||||
|
Temporary Power & Temperature Control Services |
|||||||||||
|
3,789,000 |
Domino's Pizza UK & Ireland |
32,489 |
|||||||||
|
Pizza Delivery in the UK, Ireland & Germany |
|||||||||||
|
2,281,600 |
JLT Group |
28,204 |
|||||||||
|
International Business Insurance Broker |
|||||||||||
|
8,785,000 |
BBA Aviation |
28,017 |
|||||||||
|
Aviation Support Services |
|||||||||||
|
998,000 |
Rightmove |
25,269 |
|||||||||
|
Internet Real Estate Listings |
|||||||||||
|
2,321,211 |
WH Smith |
24,233 |
|||||||||
|
Newsprint, Books & General Stationery Retailer |
|||||||||||
|
646,000 |
Asos (a)(b) |
22,918 |
|||||||||
|
Internet-based Retailer to Hipsters Up to Age 35 |
|||||||||||
|
655,000 |
Spirax Sarco |
22,116 |
|||||||||
|
Steam Systems for Manufacturing & Process Industries |
|||||||||||
|
1,761,742 |
Smith and Nephew |
19,445 |
|||||||||
|
Medical Equipment & Supplies |
|||||||||||
|
517,000 |
Rotork |
18,893 |
|||||||||
|
Valve Actuators for Oil & Water Pipelines |
|||||||||||
|
4,999,847 |
Elementis |
18,731 |
|||||||||
|
Clay-based Additives |
|||||||||||
|
2,300,000 |
Greggs |
18,644 |
|||||||||
|
Bakery |
|||||||||||
|
2,855,000 |
Abcam |
18,522 |
|||||||||
|
Online Sales of Antibodies |
|||||||||||
|
1,773,408 |
Shaftesbury |
15,120 |
|||||||||
|
London Prime Retail REIT |
|||||||||||
|
4,163,948 |
PureCircle (a)(b) |
14,120 |
|||||||||
|
Natural Sweeteners |
|||||||||||
|
1,907,154 |
Premier Oil (b) |
11,053 |
|||||||||
|
Oil & Gas Producer in Europe, Pakistan & Asia |
|||||||||||
|
382,581 |
Tullow Oil |
8,464 |
|||||||||
|
Oil & Gas Producer |
|||||||||||
|
2,272,000 |
Sterling Resources (a)(b) |
3,097 |
|||||||||
|
Oil & Gas Exploration - Europe |
|||||||||||
|
403,409 |
|||||||||||
| > Netherlands 4.2% | |||||||||||
|
2,742,165 |
Aalberts Industries |
49,228 |
|||||||||
|
Flow Control & Heat Treatment |
|||||||||||
|
1,574,145 |
UNIT4 (c) |
42,449 |
|||||||||
|
Business Software Development |
|||||||||||
|
1,515,723 |
Imtech |
40,007 |
|||||||||
|
Electromechanical & Information Communications Technology Installation & Maintenance |
|||||||||||
|
1,252,514 |
Arcadis |
26,509 |
|||||||||
|
Engineering Consultants |
|||||||||||
|
368,000 |
Fugro |
25,026 |
|||||||||
|
Subsea Oilfield Services |
|||||||||||
54
|
Number of Shares |
Value (000) |
||||||||||
| > Netherlands—continued | |||||||||||
|
1,112,468 |
TKH Group |
$ |
23,231 |
||||||||
|
Dutch Industrial Conglomerate |
|||||||||||
|
317,424 |
Vopak |
22,288 |
|||||||||
|
World's Largest Operator of Petroleum & Chemical Storage Terminals |
|||||||||||
|
821,137 |
Koninklijke TenCate |
18,904 |
|||||||||
|
Advanced Textiles & Industrial Fabrics |
|||||||||||
|
143,395 |
Core Labs |
17,420 |
|||||||||
|
Oil & Gas Reservoir Consulting |
|||||||||||
|
449,113 |
BinckBank |
3,304 |
|||||||||
|
Discount Brokerage & Asset Management |
|||||||||||
|
268,366 |
|||||||||||
| > France 3.9% | |||||||||||
|
553,000 |
Eurofins Scientific |
78,454 |
|||||||||
|
Food, Pharmaceuticals & Materials Screening & Testing |
|||||||||||
|
729,700 |
Gemalto |
64,185 |
|||||||||
|
Digital Security Solutions |
|||||||||||
|
770,000 |
Neopost |
42,518 |
|||||||||
|
Postage Meter Machines |
|||||||||||
|
971,800 |
Saft |
22,510 |
|||||||||
|
Niche Battery Manufacturer |
|||||||||||
|
285,704 |
Norbert Dentressangle |
19,202 |
|||||||||
|
Leading European Logistics & Transport Group |
|||||||||||
|
377,000 |
Compagnie Française de l'Afrique Occidentale |
18,056 |
|||||||||
|
African Wholesaler & Distributor |
|||||||||||
|
1,831,204 |
Hi-Media (a)(b) |
4,683 |
|||||||||
|
Online Advertiser in Europe |
|||||||||||
|
249,608 |
|||||||||||
| > Switzerland 3.5% | |||||||||||
|
255,000 |
Geberit |
55,447 |
|||||||||
|
Plumbing Supplies |
|||||||||||
|
260,000 |
Partners Group |
54,101 |
|||||||||
|
Private Markets Asset Management |
|||||||||||
|
375,000 |
Dufry Group (b) |
44,936 |
|||||||||
|
Operates Airport Duty Free & Duty Paid Shops |
|||||||||||
|
15,500 |
Sika |
31,610 |
|||||||||
|
Chemicals for Construction & Industrial Applications |
|||||||||||
|
330,000 |
Zehnder |
19,579 |
|||||||||
|
Radiators & Heat Recovery Ventilation Systems |
|||||||||||
|
170,000 |
Kuehne & Nagel |
19,196 |
|||||||||
|
Freight Forwarding/Logistics |
|||||||||||
|
224,869 |
|||||||||||
| > Germany 3.2% | |||||||||||
|
2,160,000 |
Wirecard |
49,602 |
|||||||||
|
Online Payment Processing & Risk Management |
|||||||||||
|
148,295 |
Rational |
37,170 |
|||||||||
|
Commercial Ovens |
|||||||||||
|
440,000 |
Dürr |
29,306 |
|||||||||
|
Automotive Plant Engineering & Associated Capital Equipment |
|||||||||||
|
1,050,000 |
NORMA Group |
28,335 |
|||||||||
|
Clamps for Automotive & Industrial Applications |
|||||||||||
|
Number of Shares |
Value (000) |
||||||||||
|
625,000 |
CTS Eventim |
$ |
18,581 |
||||||||
|
Event Ticket Sales |
|||||||||||
|
130,050 |
Pfeiffer Vacuum |
13,889 |
|||||||||
|
Vacuum Pumps |
|||||||||||
|
165,400 |
Bertrandt |
12,221 |
|||||||||
|
Outsourced Engineering |
|||||||||||
|
333,000 |
Elringklinger |
8,811 |
|||||||||
|
Automobile Components |
|||||||||||
|
338,886 |
Deutsche Beteiligungs |
8,427 |
|||||||||
|
Private Equity Investment Management |
|||||||||||
|
206,342 |
|||||||||||
| > Sweden 2.3% | |||||||||||
|
3,957,522 |
Hexagon |
84,828 |
|||||||||
|
Design, Measurement & Visualization Software & Equipment |
|||||||||||
|
4,150,024 |
Sweco (c) |
43,751 |
|||||||||
|
Engineering Consultants |
|||||||||||
|
658,700 |
Unibet |
18,451 |
|||||||||
|
European Online Gaming Operator |
|||||||||||
|
147,030 |
|||||||||||
| > Italy 1.7% | |||||||||||
|
3,245,000 |
Pirelli (a) |
34,945 |
|||||||||
|
Global Tire Supplier |
|||||||||||
|
224,200 |
Tod's (a) |
24,230 |
|||||||||
|
Leather Shoes & Bags |
|||||||||||
|
7,706,873 |
Geox (a) |
20,362 |
|||||||||
|
Apparel & Shoe Maker |
|||||||||||
|
3,791,000 |
Fiat (b) |
20,227 |
|||||||||
|
Leading Automotive Manufacturer in the U.S., Latin America & Italy |
|||||||||||
|
7,248,893 |
CIR |
8,197 |
|||||||||
|
Italian Holding Company |
|||||||||||
|
107,961 |
|||||||||||
| > Denmark 1.4% | |||||||||||
|
1,648,800 |
Novozymes |
45,444 |
|||||||||
|
Industrial Enzymes |
|||||||||||
|
168,042 |
SimCorp |
35,888 |
|||||||||
|
Software for Investment Managers |
|||||||||||
|
207,968 |
Solar |
11,471 |
|||||||||
|
Technical Wholesaler of Electrical, Plumbing & HVAC Equipment |
|||||||||||
|
92,803 |
|||||||||||
| > Norway 0.5% | |||||||||||
|
3,281,864 |
Atea |
32,223 |
|||||||||
|
Leading Nordic IT Hardware/Software Reseller & Installation Company |
|||||||||||
|
32,223 |
|||||||||||
| > Iceland 0.5% | |||||||||||
|
35,982,499 |
Marel |
31,954 |
|||||||||
|
Largest Manufacturer of Poultry & Fish Processing Equipment |
|||||||||||
|
31,954 |
|||||||||||
55
Columbia Acorn International
Statement of Investments (Unaudited), continued
|
Number of Shares |
Value (000) |
||||||||||
| > Kazakhstan 0.5% | |||||||||||
|
4,506,259 |
Halyk Savings Bank of Kazakhstan - GDR (b) |
$ |
31,544 |
||||||||
|
Largest Retail Bank & Insurer in Kazakhstan |
|||||||||||
|
31,544 |
|||||||||||
| > Russia 0.4% | |||||||||||
|
1,167,000 |
Yandex (b) |
28,136 |
|||||||||
|
Search Engine for Russian & Turkish Languages |
|||||||||||
|
28,136 |
|||||||||||
| > Finland 0.4% | |||||||||||
|
1,430,429 |
Stockmann (a) |
27,260 |
|||||||||
|
Department Store & Fashion Retailer in Scandinavia & Russia |
|||||||||||
|
27,260 |
|||||||||||
| > Czech Republic 0.4% | |||||||||||
|
130,682 |
Komercni Banka |
25,941 |
|||||||||
|
Leading Czech Universal Bank |
|||||||||||
|
25,941 |
|||||||||||
| > Belgium 0.4% | |||||||||||
|
438,880 |
EVS Broadcast Equipment |
24,234 |
|||||||||
|
Digital Live Mobile Production Software & Systems |
|||||||||||
|
24,234 |
|||||||||||
| > Portugal 0.3% | |||||||||||
|
8,635,000 |
Redes Energéticas Nacionais |
22,293 |
|||||||||
|
Portuguese Power Transmission & Gas Transportation |
|||||||||||
|
22,293 |
|||||||||||
| > Ireland 0.1% | |||||||||||
|
74,637 |
Paddy Power |
5,537 |
|||||||||
|
Irish Betting Services |
|||||||||||
|
5,537 |
|||||||||||
|
Europe: Total |
1,929,510 |
||||||||||
|
Other Countries 17.0% |
|||||||||||
| > South Africa 4.6% | |||||||||||
|
1,170,188 |
Naspers |
72,403 |
|||||||||
|
Media in Africa, China, Russia & Other Emerging Markets |
|||||||||||
|
19,098,300 |
Rand Merchant Insurance |
49,404 |
|||||||||
|
Directly Sold Property & Casualty Insurance; Holdings in Other Insurers |
|||||||||||
|
11,763,907 |
Coronation Fund Managers |
43,816 |
|||||||||
|
South African Fund Manager |
|||||||||||
|
2,644,083 |
Mr. Price |
40,025 |
|||||||||
|
South African Retailer of Apparel, Household & Sporting Goods |
|||||||||||
|
1,574,575 |
Massmart Holdings |
31,577 |
|||||||||
|
General Merchandise, Food & Home Improvement Stores; Wal-Mart Subsidiary |
|||||||||||
|
8,679,940 |
Northam Platinum |
31,307 |
|||||||||
|
Platinum Mining in South Africa |
|||||||||||
|
3,938,965 |
Adcock Ingram Holdings |
28,107 |
|||||||||
|
Manufacturer of Pharmaceuticals & Medical Supplies |
|||||||||||
|
296,639 |
|||||||||||
|
Number of Shares |
Value (000) |
||||||||||
| > Canada 4.4% | |||||||||||
|
1,212,597 |
ShawCor |
$ |
52,643 |
||||||||
|
Oil & Gas Pipeline Products |
|||||||||||
|
1,403,772 |
CCL Industries |
51,861 |
|||||||||
|
Leading Global Label Manufacturer |
|||||||||||
|
3,047,000 |
CAE |
32,636 |
|||||||||
|
Flight Simulator Equipment & Training Centers |
|||||||||||
|
653,200 |
Onex Capital |
25,780 |
|||||||||
|
Private Equity |
|||||||||||
|
582,942 |
AG Growth (a) |
19,117 |
|||||||||
|
Leading Manufacturer of Augers & Grain Handling Equipment |
|||||||||||
|
770,576 |
Black Diamond Group (a) |
17,573 |
|||||||||
|
Provides Accommodations/Equipment for Oil Sands Development |
|||||||||||
|
2,096,514 |
Horizon North Logistics |
16,996 |
|||||||||
|
Provides Diversified Oil Service Offering in Northern Canada |
|||||||||||
|
984,500 |
Alliance Grain Traders (a) |
14,481 |
|||||||||
|
Global Leader in Pulse Processing & Distribution |
|||||||||||
|
1,142,377 |
DeeThree Exploration (b) |
6,531 |
|||||||||
|
1,130,000 |
DeeThree Exploration (b)(e) |
6,428 |
|||||||||
|
Canadian Oil & Gas Producer |
|||||||||||
|
263,857 |
Baytex (a) |
12,539 |
|||||||||
|
Oil & Gas Producer in Canada |
|||||||||||
|
454,000 |
Celtic Exploration (b) |
8,442 |
|||||||||
|
Canadian Oil & Gas Producer |
|||||||||||
|
450,000 |
Athabasca Oil Sands (b) |
6,033 |
|||||||||
|
Oil Sands & Unconventional Oil Development |
|||||||||||
|
1,607,306 |
Pan Orient |
4,627 |
|||||||||
|
Asian Oil & Gas Explorer |
|||||||||||
|
1,611,000 |
Americas Petrogas (a)(b) |
3,032 |
|||||||||
|
Oil & Gas Exploration in Argentina, Potash in Peru |
|||||||||||
|
332,700 |
Crew Energy (b) |
2,450 |
|||||||||
|
Canadian Oil & Gas Producer |
|||||||||||
|
281,169 |
|||||||||||
| > Australia 4.0% | |||||||||||
|
49,017,000 |
Commonwealth Property Office Fund |
52,513 |
|||||||||
|
Australia Prime Office REIT |
|||||||||||
|
14,652,712 |
Challenger Financial |
49,317 |
|||||||||
|
Largest Annuity Provider |
|||||||||||
|
3,973,200 |
UGL |
42,984 |
|||||||||
|
Engineering & Facilities Management |
|||||||||||
|
498,560 |
Cochlear |
34,588 |
|||||||||
|
Cochlear Implants |
|||||||||||
|
7,595,003 |
IAG |
34,255 |
|||||||||
|
General Insurance Provider |
|||||||||||
|
2,500,000 |
Domino's Pizza Enterprises |
27,016 |
|||||||||
|
Domino's Pizza Operator in AU/NZ & France/Benelux |
|||||||||||
|
3,338,561 |
SAI Global |
14,635 |
|||||||||
|
Publishing, Certification, Compliance Services |
|||||||||||
|
311,805 |
Regis Resources (b) |
1,834 |
|||||||||
|
Gold Mining in Australia |
|||||||||||
|
257,142 |
|||||||||||
56
|
Number of Shares |
Value (000) |
||||||||||
| > United States 3.1% | |||||||||||
|
952,080 |
Atwood Oceanics (b) |
$ |
43,272 |
||||||||
|
Offshore Drilling Contractor |
|||||||||||
|
1,044,000 |
BioMarin Pharmaceutical (b) |
42,042 |
|||||||||
|
Biotech Focused on Orphan Diseases |
|||||||||||
|
1,103,297 |
Textainer Group Holdings (a) |
33,706 |
|||||||||
|
Top International Container Leasor |
|||||||||||
|
669,213 |
FMC Technologies (b) |
30,985 |
|||||||||
|
Oil & Gas Well Head Manufacturer |
|||||||||||
|
548,900 |
Rowan (b) |
18,536 |
|||||||||
|
Contract Offshore Driller |
|||||||||||
|
439,500 |
Hornbeck Offshore (b) |
16,108 |
|||||||||
|
Supply Vessel Operator in U.S. Gulf of Mexico |
|||||||||||
|
428,228 |
World Fuel Services |
15,249 |
|||||||||
|
Global Fuel Broker |
|||||||||||
|
199,898 |
|||||||||||
| > Israel 0.7% | |||||||||||
|
3,145,527 |
Israel Chemicals |
38,205 |
|||||||||
|
Producer of Potash, Phosphates, Bromine & Specialty Chemicals |
|||||||||||
|
625,000 |
Caesarstone (b) |
8,812 |
|||||||||
|
Quartz Countertops |
|||||||||||
|
47,017 |
|||||||||||
| > New Zealand 0.1% | |||||||||||
|
3,598,749 |
Telecom NZ |
7,085 |
|||||||||
|
Primary Telecom Operator |
|||||||||||
|
7,085 |
|||||||||||
| > Senegal 0.1% | |||||||||||
|
31,200 |
Sonatel |
7,029 |
|||||||||
|
Leading Telecoms Operator in Western Africa |
|||||||||||
|
7,029 |
|||||||||||
|
Other Countries: Total |
1,095,979 |
||||||||||
|
Latin America 5.3% |
|||||||||||
| > Brazil 3.0% | |||||||||||
|
3,700,000 |
Localiza Rent A Car |
64,099 |
|||||||||
|
Car Rental |
|||||||||||
|
5,000,000 |
Odontoprev |
27,870 |
|||||||||
|
Dental Insurance |
|||||||||||
|
1,880,200 |
Mills Estruturas e Servicos de Engenharia |
26,971 |
|||||||||
|
Civil Engineering & Construction |
|||||||||||
|
1,730,000 |
Arcos Dorados (a) |
26,694 |
|||||||||
|
McDonald's Master Franchise for Latin America |
|||||||||||
|
1,200,000 |
Multiplus |
24,429 |
|||||||||
|
Loyalty Program Operator in Brazil |
|||||||||||
|
3,577,000 |
MRV Engenharia |
21,191 |
|||||||||
|
Brazilan Property Developer |
|||||||||||
|
191,254 |
|||||||||||
| > Mexico 1.2% | |||||||||||
|
600,000 |
Grupo Aeroportuario del Sureste - ADR |
53,160 |
|||||||||
|
Mexican Airport Operator |
|||||||||||
|
11,945,000 |
Genomma Lab International (b) |
23,117 |
|||||||||
|
Develops, Markets & Distributes Consumer Products |
|||||||||||
|
Number of Shares |
Value (000) |
||||||||||
|
1,728,500 |
Herdez (b) |
$ |
4,450 |
||||||||
|
Processed Foods Producer & Distributor |
|||||||||||
|
80,727 |
|||||||||||
| > Guatemala 0.5% | |||||||||||
|
1,434,600 |
Tahoe Resources (b) |
29,214 |
|||||||||
|
Silver Project in Guatemala |
|||||||||||
|
29,214 |
|||||||||||
| > Chile 0.3% | |||||||||||
|
10,115,274 |
Viña Concha y Toro |
21,131 |
|||||||||
|
Global Branded Wine Manufacturer |
|||||||||||
|
21,131 |
|||||||||||
| > Uruguay 0.2% | |||||||||||
|
1,306,818 |
Union Agriculture Group (b)(e)(f) |
13,552 |
|||||||||
|
Farmland Operator in Uruguay |
|||||||||||
|
13,552 |
|||||||||||
| > Colombia 0.1% | |||||||||||
|
7,850,769 |
Canacol (b) |
3,833 |
|||||||||
|
Oil Producer in South America |
|||||||||||
|
22,525,000 |
Gulf United Energy (b) |
1,352 |
|||||||||
|
Prospecting for Oil Alongside Large Producers in Colombia |
|||||||||||
|
5,185 |
|||||||||||
| > Argentina —% | |||||||||||
|
7,425,000 |
Madalena Ventures (b) |
1,812 |
|||||||||
|
Oil & Gas Exploration in Argentina |
|||||||||||
|
1,812 |
|||||||||||
|
Latin America: Total |
342,875 |
||||||||||
|
Total Equities: 95.4% (Cost: $4,781,451) |
6,160,704 |
||||||||||
|
Securities Lending Collateral 3.2% |
|||||||||||
|
209,235,253 |
Dreyfus Government Cash Management Fund (7 day yield of 0.01%) (g) |
209,235 |
|||||||||
|
Total Securities Lending Collateral: (Cost: $209,235) |
209,235 |
||||||||||
|
Total Investments: 98.6% (Cost: $4,990,686)(h)(i) |
6,369,939 |
(j) |
|||||||||
|
Obligation to Return Collateral for Securities Loaned: (3.2)% |
(209,235 |
) |
|||||||||
|
Cash and Other Assets Less Liabilities: 4.6% |
301,639 |
||||||||||
|
Total Net Assets: 100.0% |
$ |
6,462,343 |
|||||||||
ADR - American Depositary Receipts
GDR - Global Depositary Receipts
REIT - Real Estate Investment Trust
57
Columbia Acorn International
Statement of Investments (Unaudited), continued
> Notes to Statement of Investments (dollar values in thousands)
(a) All or a portion of this security was on loan at September 30, 2012. The total market value of securities on loan at September 30, 2012 was $200,170.
(b) Non-income producing security.
(c) An affiliated person of the Fund may include any company in which the Fund owns five percent or more of its outstanding voting shares. Holdings and transactions in these affiliated companies during the period ended September 30, 2012, are as follows:
|
Security |
Balance of Shares Held 12/31/11 |
Purchases/ Additions |
Sales/ Reductions |
Balance of Shares Held 9/30/12 |
Value |
Dividend |
|||||||||||||||||||||
|
Archipelago Resources |
29,063,787 |
2,700,813 |
- |
31,764,600 |
$ |
30,776 |
$ |
- |
|||||||||||||||||||
|
DeeThree Exploration* |
4,061,377 |
- |
1,789,000 |
2,272,377 |
12,959 |
- |
|||||||||||||||||||||
|
Koninklijke TenCate* |
1,371,573 |
53,685 |
604,121 |
821,137 |
18,904 |
- |
|||||||||||||||||||||
|
Southern Arc Minerals |
6,217,500 |
- |
- |
6,217,500 |
2,214 |
- |
|||||||||||||||||||||
|
Sweco |
4,150,024 |
- |
- |
4,150,024 |
43,751 |
1,574 |
|||||||||||||||||||||
|
UNIT4 |
1,591,702 |
- |
17,557 |
1,574,145 |
42,449 |
677 |
|||||||||||||||||||||
|
Wacom* |
23,790 |
- |
3,694 |
20,096 |
48,628 |
794 |
|||||||||||||||||||||
|
Workspace Group* |
8,000,000 |
- |
8,000,000 |
- |
- |
298 |
|||||||||||||||||||||
|
Total of Affiliated Transactions |
54,479,753 |
2,754,498 |
10,414,372 |
46,819,879 |
$ |
199,681 |
$ |
3,343 |
|||||||||||||||||||
* At September 30, 2012, the Fund owned less than five percent of the company's outstanding voting shares.
The aggregate cost and value of these companies at September 30, 2012, were $80,395 and $119,190, respectively. Investments in affiliated companies represented 1.84% of the Fund's total net assets at September 30, 2012.
(d) Security is traded on a U.S. exchange.
(e) Denotes a restricted security, which is subject to restrictions on resale under federal securities laws. These securities are valued at fair value determined in good faith under consistently applied procedures established by the Board of Trustees. At September 30, 2012, the market value of these securities amounted to $19,980, which represented 0.31% of total net assets. Additional information on these securities is as follows:
|
Security |
Acquisition Dates |
Shares |
Cost |
Value |
|||||||||||||||
|
Union Agriculture Group |
12/8/10-6/27/12 |
1,306,818 |
$ |
15,000 |
$ |
13,552 |
|||||||||||||
|
DeeThree Exploration |
9/7/10 |
1,130,000 |
2,951 |
6,428 |
|||||||||||||||
|
$ |
17,951 |
$ |
19,980 |
||||||||||||||||
(f) Illiquid security.
(g) Investment made with cash collateral received from securities lending activity.
(h) At September 30, 2012, for federal income tax purposes, the cost of investments was $4,990,686 and net unrealized appreciation was $1,379,253 consisting of gross unrealized appreciation of $1,671,351 and gross unrealized depreciation of $292,098.
(i) On September 30, 2012, the Fund's total investments were denominated in currencies as follows:
|
Currency |
Value |
Percentage of Net Assets |
|||||||||
|
Japanese Yen |
$ |
1,080,408 |
16.7 |
||||||||
|
Euro |
894,182 |
13.9 |
|||||||||
|
United States Dollar |
538,654 |
8.4 |
|||||||||
|
British Pound |
433,939 |
6.7 |
|||||||||
|
Taiwan Dollar |
419,878 |
6.5 |
|||||||||
|
Hong Kong Dollar |
355,016 |
5.5 |
|||||||||
|
Canadian Dollar |
330,279 |
5.1 |
|||||||||
|
Other currencies less than 5% of total net assets |
2,108,348 |
32.6 |
|||||||||
|
Total Portfolio |
$ |
6,160,704 |
95.4 |
||||||||
(j) Securities are valued using policies described in the Notes to Financial Statements in the most recent shareholder report.
58
> Notes to Statement of Investments (dollar values in thousands)
Fair Value Measurements
Various inputs are used in determining the value of the Fund's investments, following the input prioritization hierarchy established by GAAP. These inputs are summarized in the three broad levels listed below:
• Level 1 – quoted prices in active markets for identical securities
• Level 2 – prices determined using other significant observable inputs (including quoted prices for similar securities, interest rates, prepayment speeds, credit risk and others)
• Level 3 – prices determined using significant unobservable inputs where quoted prices or observable inputs are unavailable or less reliable (including management's own assumptions about the factors market participants would use in pricing an investment)
The inputs or methodology used for valuing securities are not necessarily an indication of the risk associated with investing in those securities.
Examples of the types of securities in which the Fund would typically invest and how they are classified within this hierarchy are as follows. Typical Level 1 securities include exchange traded domestic equities, mutual funds whose NAVs are published each day and exchange traded foreign equities that are not statistically fair valued. Typical Level 2 securities include exchange traded foreign equities that are statistically fair valued, forward foreign currency exchange contracts and short-term investments valued at amortized cost. Additionally, securities fair valued by the Valuation Committee (the Committee) of the Fund's Board of Trustees (the Board) that rely on significant observable inputs are also included in Level 2. Typical Level 3 securities include any security fair valued by the Committee that relies on significant unobservable inputs.
Under the direction of the Board, the Committee is responsible for carrying out the valuation procedures approved by the Board.
The Committee meets as necessary, and no less frequently than quarterly, to determine fair values for securities for which market quotations are not readily available or for which the investment manager believes that available market quotations are unreliable, and to review the continuing appropriateness of the current value of any security subject to the Trust's Portfolio Pricing Policy and the pricing procedures of the investment manager (the Policies). The Policies address, among other things: circumstances under which market quotations will be deemed readily available; selection of third party pricing vendors; appropriate pricing methodologies; events that require fair valuation and fair value techniques; and circumstances under which securities will be deemed to pose a potential for stale pricing, including when securities are illiquid, restricted, or in default. The Committee may also meet to discuss additional valuation matters, which may include review of back-testing results, review of time-sensitive information or approval of other valuation related actions, and to review the appropriateness of the Policies.
For investments categorized as Level 3, the significant unobservable inputs used in the fair value measurement of the Funds' securities may include: (i) data specific to the issuer or comparable issuers, (ii) general market or specific sector news and (iii) quoted prices and specific or similar security transactions. The Committee considers this data and any changes from prior periods in order to assess the reasonableness of observable and unobservable inputs, any assumptions or internal models used to value those securities and changes in fair value. Significant changes in any of these factors could result in lower or higher fair value measurements. Various factors impact the frequency of monitoring (which may occur as often as daily), however the Committee may determine that changes to inputs, assumptions and models are not required with the same frequency.
The following table summarizes the inputs used, as of September 30, 2012, in valuing the Fund's assets:
|
Investment Type |
Quoted Prices (Level 1) |
Other Significant Observable Inputs (Level 2) |
Significant Unobservable Inputs (Level 3) |
Total |
|||||||||||||||
|
Equities |
|||||||||||||||||||
|
Asia |
$ |
169,240 |
$ |
2,623,100 |
$ |
- |
$ |
2,792,340 |
|||||||||||
|
Europe |
48,653 |
1,880,857 |
- |
1,929,510 |
|||||||||||||||
|
Other Countries |
483,451 |
612,528 |
- |
1,095,979 |
|||||||||||||||
|
Latin America |
329,323 |
- |
13,552 |
342,875 |
|||||||||||||||
|
Total Equities |
1,030,667 |
5,116,485 |
13,552 |
6,160,704 |
|||||||||||||||
|
Total Securities Lending Collateral |
209,235 |
- |
- |
209,235 |
|||||||||||||||
|
Total Investments |
$ |
1,239,902 |
$ |
5,116,485 |
$ |
13,552 |
$ |
6,369,939 |
|||||||||||
The Fund's assets assigned to the Level 2 input category are generally valued using a market approach, in which a security's value is determined through its correlation to prices and information from observable market transactions for similar or identical assets. Foreign equities are generally valued at the last sale price on the foreign exchange or market on which they trade. The Fund may use a statistical fair valuation model, in accordance with the policy adopted by the Board, provided by an independent third party to value securities principally traded in foreign markets in order to adjust for possible stale pricing that may occur between the close of the foreign exchanges and the time for valuation. These models take into account available market data including intraday index, ADR, and ETF movements. Securities acquired via private placement that have a holding period or an extended settlement period are valued at a discount to the same shares that are trading freely on the market. These discounts are determined by the investment manager's experience with similar securities or situations. Factors may include, but are not limited to, trade volume, shares outstanding and stock price.
The following table shows transfers between Level 1 and Level 2 of the fair value hierarchy:
|
Transfers In |
Transfers Out |
||||||||||||||
| Level 1 |
Level 2 |
Level 1 |
Level 2 |
||||||||||||
| $ |
15,784 |
$ |
- |
$ |
- |
$ |
15,784 |
||||||||
Financial assets were transferred from Level 2 to Level 1 as resale restrictions no longer apply.
59
Columbia Acorn International
Statement of Investments (Unaudited), continued
> Notes to Statement of Investments (dollar values in thousands)
The following table reconciles asset balances for the period ending September 30, 2012, in which significant observable and/or unobservable inputs (Level 3) were used in determining value:
|
Investments in Securities |
Balance as of December 31, 2011 |
Realized Gain/(Loss) |
Change in Unrealized Appreciation (Depreciation) |
Purchases |
Sales |
Transfers into Level 3 |
Transfers out of Level 3 |
Balance as of September 30, 2012 |
|||||||||||||||||||||||||||
|
Equities |
|||||||||||||||||||||||||||||||||||
|
Latin America |
$ |
12,462 |
$ |
- |
$ |
1,090 |
$ |
- |
$ |
- |
$ |
- |
$ |
- |
$ |
13,552 |
|||||||||||||||||||
|
$ |
12,462 |
$ |
- |
$ |
1,090 |
$ |
- |
$ |
- |
$ |
- |
$ |
- |
$ |
13,552 |
||||||||||||||||||||
The information in the above reconciliation table represents fiscal year to date activity for any securities identified as using Level 3 inputs at either the beginning or the end of the current fiscal period.
The change in unrealized appreciation attributed to securities owned at September 30, 2012, which were valued using significant unobservable inputs (Level 3), amounted to $1,090.
The Fund does not hold any significant investments categorized as Level 3.
Certain common stock classified as Level 3 are valued at fair value, using a market approach, as determined in good faith under consistently applied procedures established by and under the general supervision of the Board. To determine fair value for these securities, for which no market exists, the Committee utilizes the valuation technique it deems most appropriate in the circumstances, using some unobservable inputs, which may include but are not limited to trades of similar securities, estimated earnings of the company, market multiples derived from a set of comparable companies, and the position of the security within the company's capital structure. Significant increases or decreases to any of these inputs could result in a significantly lower or higher fair value measurement. Generally, a change in estimated earnings of a company may result in a change to the comparable companies and market multiples utilized.
60
Columbia Acorn International
Portfolio Diversification (Unaudited)
At September 30, 2012, the Fund's portfolio investments as a percentage of net assets were diversified as follows:
|
Value (000) |
Percentage of Net Assets |
||||||||||
| > Industrial Goods & Services | |||||||||||
|
Other Industrial Services |
$ |
583,550 |
9.0 |
||||||||
|
Machinery |
393,057 |
6.1 |
|||||||||
|
Industrial Materials & Specialty Chemicals |
361,226 |
5.6 |
|||||||||
|
Construction |
138,160 |
2.1 |
|||||||||
|
Conglomerates |
80,656 |
1.2 |
|||||||||
|
Electrical Components |
69,906 |
1.1 |
|||||||||
|
Industrial Distribution |
52,565 |
0.9 |
|||||||||
|
Outsourcing Services |
26,070 |
0.4 |
|||||||||
|
1,705,190 |
26.4 |
||||||||||
| > Consumer Goods & Services | |||||||||||
|
Retail |
397,910 |
6.2 |
|||||||||
|
Food & Beverage |
264,309 |
4.1 |
|||||||||
|
Casinos & Gaming |
211,640 |
3.3 |
|||||||||
|
Nondurables |
140,404 |
2.2 |
|||||||||
|
Other Consumer Services |
94,928 |
1.5 |
|||||||||
|
Consumer Goods Distribution |
79,229 |
1.2 |
|||||||||
|
Other Durable Goods |
79,191 |
1.2 |
|||||||||
|
Travel |
74,005 |
1.1 |
|||||||||
|
Apparel |
63,332 |
1.0 |
|||||||||
|
Restaurants |
59,505 |
0.9 |
|||||||||
|
Educational Services |
20,004 |
0.3 |
|||||||||
|
Other Entertainment |
18,581 |
0.3 |
|||||||||
|
Furniture & Textiles |
8,813 |
0.1 |
|||||||||
|
1,511,851 |
23.4 |
||||||||||
| > Information | |||||||||||
|
Computer Hardware & Related Equipment |
274,337 |
4.3 |
|||||||||
|
Mobile Communications |
195,948 |
3.0 |
|||||||||
|
Business Software |
163,166 |
2.5 |
|||||||||
|
Internet Related |
149,350 |
2.3 |
|||||||||
|
Financial Processors |
69,495 |
1.1 |
|||||||||
|
Instrumentation |
60,304 |
0.9 |
|||||||||
|
Computer Services |
45,170 |
0.7 |
|||||||||
|
Electronics Distribution |
35,181 |
0.6 |
|||||||||
|
CATV |
30,953 |
0.5 |
|||||||||
|
Semiconductors & Related Equipment |
23,142 |
0.4 |
|||||||||
|
Telephone & Data Services |
14,114 |
0.2 |
|||||||||
|
TV Broadcasting |
8,751 |
0.1 |
|||||||||
|
Satellite Broadcasting & Services |
8,683 |
0.1 |
|||||||||
|
Advertising |
4,683 |
0.1 |
|||||||||
|
1,083,277 |
16.8 |
||||||||||
| > Other Industries | |||||||||||
|
Real Estate |
424,126 |
6.6 |
|||||||||
|
Transportation |
113,301 |
1.8 |
|||||||||
|
Regulated Utilities |
34,897 |
0.5 |
|||||||||
|
572,324 |
8.9 |
||||||||||
|
Value (000) |
Percentage of Net Assets |
||||||||||
| > Energy & Minerals | |||||||||||
|
Oil Services |
$ |
221,139 |
3.4 |
||||||||
|
Mining |
180,401 |
2.8 |
|||||||||
|
Oil & Gas Producers |
79,691 |
1.2 |
|||||||||
|
Agricultural Commodities |
28,032 |
0.4 |
|||||||||
|
Oil Refining, Marketing & Distribution |
22,288 |
0.4 |
|||||||||
|
531,551 |
8.2 |
||||||||||
| > Finance | |||||||||||
|
Insurance |
199,782 |
3.1 |
|||||||||
|
Banks |
132,179 |
2.0 |
|||||||||
|
Brokerage & Money Management |
109,648 |
1.7 |
|||||||||
|
Finance Companies |
77,657 |
1.2 |
|||||||||
|
519,266 |
8.0 |
||||||||||
| > Health Care | |||||||||||
|
Medical Equipment & Devices |
85,791 |
1.3 |
|||||||||
|
Medical Supplies |
44,639 |
0.7 |
|||||||||
|
Biotechnology & Drug Delivery |
42,042 |
0.7 |
|||||||||
|
Health Care Services |
36,666 |
0.6 |
|||||||||
|
Pharmaceuticals |
28,107 |
0.4 |
|||||||||
|
237,245 |
3.7 |
||||||||||
|
Total Equities: |
6,160,704 |
95.4 |
|||||||||
|
Security Lending Collateral: |
209,235 |
3.2 |
|||||||||
|
Total Investments: |
6,369,939 |
98.6 |
|||||||||
|
Obligation to Return Collateral for Securities Loaned: |
(209,235 |
) |
(3.2 |
) |
|||||||
|
Cash and Other Assets Less Liabilities: |
301,639 |
4.6 |
|||||||||
|
Net Assets: |
$ |
6,462,343 |
100.0 |
||||||||
61
Columbia Acorn USA
Major Portfolio Changes in the Third Quarter (Unaudited)
|
Number of Shares |
|||||||||||
|
6/30/12 |
9/30/12 |
||||||||||
|
Purchases |
|||||||||||
|
Information |
|||||||||||
|
Virtusa |
0 |
192,000 |
|||||||||
|
Industrial Goods & Services |
|||||||||||
|
Generac |
0 |
155,000 |
|||||||||
|
Consumer Goods & Services |
|||||||||||
|
Choice Hotels |
0 |
75,000 |
|||||||||
|
Interface |
621,500 |
756,000 |
|||||||||
|
Finance |
|||||||||||
|
CAI International |
376,000 |
415,208 |
|||||||||
|
Health Care |
|||||||||||
|
ARIAD Pharmaceuticals |
379,040 |
466,000 |
|||||||||
|
Cepheid |
551,600 |
587,600 |
|||||||||
|
NPS Pharmaceuticals |
1,163,600 |
1,275,000 |
|||||||||
|
Sirona Dental Systems |
202,000 |
246,012 |
|||||||||
|
Synageva Biopharma |
129,002 |
177,000 |
|||||||||
|
Energy & Minerals |
|||||||||||
|
PDC Energy |
170,000 |
182,000 |
|||||||||
|
Number of Shares |
|||||||||||
|
6/30/12 |
9/30/12 |
||||||||||
|
Sales |
|||||||||||
|
Information |
|||||||||||
|
Advent Software |
198,000 |
0 |
|||||||||
|
Blackbaud |
67,869 |
0 |
|||||||||
|
Infinera |
752,000 |
323,278 |
|||||||||
|
Monolithic Power Systems |
426,000 |
366,000 |
|||||||||
|
NetSuite |
211,000 |
197,000 |
|||||||||
|
SBA Communications |
529,000 |
300,000 |
|||||||||
|
WMS Industries |
235,000 |
167,000 |
|||||||||
|
Zebra Technologies |
292,000 |
0 |
|||||||||
|
Industrial Goods & Services |
|||||||||||
|
Albany International |
170,000 |
0 |
|||||||||
|
Ametek |
1,314,450 |
1,264,000 |
|||||||||
|
Clean Harbors |
65,000 |
50,000 |
|||||||||
|
GrafTech International |
616,000 |
413,634 |
|||||||||
|
Consumer Goods & Services |
|||||||||||
|
Jarden |
126,000 |
0 |
|||||||||
|
lululemon athletica |
583,000 |
565,000 |
|||||||||
|
Pool |
472,000 |
429,000 |
|||||||||
|
Finance |
|||||||||||
|
Pacific Continental Bank |
503,426 |
217,117 |
|||||||||
|
World Acceptance |
345,000 |
315,000 |
|||||||||
|
Health Care |
|||||||||||
|
BioMarin Pharmaceutical |
520,000 |
415,000 |
|||||||||
|
Other Industries |
|||||||||||
|
Kilroy Realty |
77,000 |
0 |
|||||||||
|
World Fuel Services |
230,000 |
128,000 |
|||||||||
|
Energy & Minerals |
|||||||||||
|
Swift Energy |
168,000 |
0 |
|||||||||
62
Columbia Acorn USA
Statement of Investments (Unaudited), September 30, 2012
|
Number of Shares |
Value (000) |
||||||||||
|
Equities: 99.4% |
|||||||||||
|
Information 29.6% |
|||||||||||
| > Business Software 8.9% | |||||||||||
|
698,000 |
Micros Systems (a) |
$ |
34,286 |
||||||||
|
Information Systems for Hotels, Restaurants & Retailers |
|||||||||||
|
910,000 |
Informatica (a) |
31,677 |
|||||||||
|
Enterprise Data Integration Software |
|||||||||||
|
375,000 |
Ansys (a) |
27,525 |
|||||||||
|
Simulation Software for Engineers & Designers |
|||||||||||
|
243,000 |
Concur Technologies (a) |
17,916 |
|||||||||
|
Web-enabled Cost & Expense Management Software |
|||||||||||
|
197,000 |
NetSuite (a) |
12,569 |
|||||||||
|
End-to-end IT Systems Solutions Delivered Over the Web |
|||||||||||
|
290,000 |
SPS Commerce (a) |
11,156 |
|||||||||
|
Supply Chain Management Software Delivered via the Web |
|||||||||||
|
337,000 |
SABA (a) |
3,367 |
|||||||||
|
Learning Management Systems |
|||||||||||
|
400,000 |
Velti (a)(b) |
3,348 |
|||||||||
|
Mobile Marketing Software Platform |
|||||||||||
|
19,305 |
Eloqua (a) |
381 |
|||||||||
|
Marketing Automation Software |
|||||||||||
|
31,804 |
Exa (a) |
345 |
|||||||||
|
Simulation Software |
|||||||||||
|
142,570 |
|||||||||||
| > Instrumentation 4.2% | |||||||||||
|
180,000 |
Mettler-Toledo International (a) |
30,733 |
|||||||||
|
Laboratory Equipment |
|||||||||||
|
525,000 |
IPG Photonics (a)(b) |
30,082 |
|||||||||
|
Fiber Lasers |
|||||||||||
|
151,000 |
Trimble Navigation (a) |
7,197 |
|||||||||
|
GPS-based Instruments |
|||||||||||
|
68,012 |
|||||||||||
|
> Semiconductors & Related Equipment 3.6% |
|||||||||||
|
690,000 |
Microsemi (a) |
13,848 |
|||||||||
|
Analog/Mixed Signal Semiconductors |
|||||||||||
|
1,958,000 |
Atmel (a) |
10,299 |
|||||||||
|
Microcontrollers, Radio Frequency & Memory Semiconductors |
|||||||||||
|
262,000 |
Ultratech (a) |
8,222 |
|||||||||
|
Semiconductor Equipment |
|||||||||||
|
366,000 |
Monolithic Power Systems (a) |
7,228 |
|||||||||
|
High Performance Analog & Mixed Signal Integrated Circuits |
|||||||||||
|
961,000 |
ON Semiconductor (a) |
5,929 |
|||||||||
|
Mixed Signal & Power Management Semiconductors |
|||||||||||
|
1,075,000 |
TriQuint Semiconductor (a) |
5,429 |
|||||||||
|
Radio Frequency Semiconductors |
|||||||||||
|
390,000 |
Pericom Semiconductor (a) |
3,387 |
|||||||||
|
Interface Integrated Circuits & Frequency Control Products |
|||||||||||
|
50,000 |
Hittite Microwave (a) |
2,774 |
|||||||||
|
Radio Frequency, Microwave & Millimeterwave Semiconductors |
|||||||||||
|
57,116 |
|||||||||||
|
Number of Shares |
Value (000) |
||||||||||
| > Telephone & Data Services 2.6% | |||||||||||
|
1,457,000 |
tw telecom (a) |
$ |
37,984 |
||||||||
|
Fiber Optic Telephone/Data Services |
|||||||||||
|
400,000 |
Boingo Wireless (a)(b) |
3,176 |
|||||||||
|
Wholesale & Retail WiFi Networks |
|||||||||||
|
41,160 |
|||||||||||
| > Computer Services 2.3% | |||||||||||
|
556,000 |
ExlService Holdings (a) |
16,402 |
|||||||||
|
Business Process Outsourcing |
|||||||||||
|
97,000 |
Syntel |
6,054 |
|||||||||
|
Offshore IT Services |
|||||||||||
|
359,000 |
WNS - ADR (India) (a) |
3,676 |
|||||||||
|
Offshore BPO (Business Process Outsourcing) Services |
|||||||||||
|
640,000 |
RCM Technologies (a)(c) |
3,481 |
|||||||||
|
Technology & Engineering Services |
|||||||||||
|
192,000 |
Virtusa (a) |
3,412 |
|||||||||
|
Offshore IT Outsourcing |
|||||||||||
|
776,766 |
Hackett Group (a) |
3,247 |
|||||||||
|
IT Integration & Best Practice Research |
|||||||||||
|
36,272 |
|||||||||||
| > Gaming Equipment & Services 2.2% | |||||||||||
|
660,000 |
Bally Technologies (a) |
32,597 |
|||||||||
|
Slot Machines & Software |
|||||||||||
|
167,000 |
WMS Industries (a) |
2,736 |
|||||||||
|
Slot Machine Provider |
|||||||||||
|
35,333 |
|||||||||||
|
> Computer Hardware & Related Equipment 2.1% |
|||||||||||
|
1,317,000 |
II-VI (a) |
25,049 |
|||||||||
|
Laser Optics & Specialty Materials |
|||||||||||
|
160,000 |
NICE Systems - ADR (Israel) (a) |
5,315 |
|||||||||
|
Audio & Video Recording Solutions |
|||||||||||
|
97,000 |
Netgear (a) |
3,700 |
|||||||||
|
Networking Products for Small Business & Home |
|||||||||||
|
34,064 |
|||||||||||
| > Telecommunications Equipment 1.6% | |||||||||||
|
813,000 |
Ixia (a) |
13,065 |
|||||||||
|
Telecom Network Test Equipment |
|||||||||||
|
732,000 |
Finisar (a) |
10,468 |
|||||||||
|
Optical Subsystems & Components |
|||||||||||
|
323,278 |
Infinera (a)(b) |
1,771 |
|||||||||
|
Optical Networking Equipment |
|||||||||||
|
25,304 |
|||||||||||
| > Mobile Communications 1.2% | |||||||||||
|
300,000 |
SBA Communications (a) |
18,870 |
|||||||||
|
Communications Towers |
|||||||||||
|
18,870 |
|||||||||||
| > Contract Manufacturing 0.4% | |||||||||||
|
236,000 |
Plexus (a) |
7,149 |
|||||||||
|
Electronic Manufacturing Services |
|||||||||||
|
7,149 |
|||||||||||
| > Financial Processors 0.4% | |||||||||||
|
153,000 |
Global Payments |
6,400 |
|||||||||
|
Credit Card Processor |
|||||||||||
|
6,400 |
|||||||||||
63
Columbia Acorn USA
Statement of Investments (Unaudited), continued
|
Number of Shares |
Value (000) |
||||||||||
| > TV Broadcasting 0.1% | |||||||||||
|
875,000 |
Entravision Communications |
$ |
1,173 |
||||||||
|
Spanish Language TV & Radio Stations |
|||||||||||
|
1,173 |
|||||||||||
|
Information: Total |
473,423 |
||||||||||
|
Industrial Goods & Services 17.5% |
|||||||||||
| > Machinery 14.0% | |||||||||||
|
1,264,000 |
Ametek |
44,809 |
|||||||||
|
Aerospace/Industrial Instruments |
|||||||||||
|
747,200 |
Nordson |
43,801 |
|||||||||
|
Dispensing Systems for Adhesives & Coatings |
|||||||||||
|
835,000 |
ESCO Technologies |
32,440 |
|||||||||
|
Automatic Electric Meter Readers |
|||||||||||
|
890,000 |
Donaldson |
30,892 |
|||||||||
|
Industrial Air Filtration |
|||||||||||
|
631,000 |
HEICO |
19,252 |
|||||||||
|
FAA Approved Aircraft Replacement Parts |
|||||||||||
|
436,000 |
Moog (a) |
16,511 |
|||||||||
|
Motion Control Products for Aerospace, Defense & Industrial Markets |
|||||||||||
|
260,000 |
Toro |
10,343 |
|||||||||
|
Turf Maintenance Equipment |
|||||||||||
|
222,833 |
Polypore International (a)(b) |
7,877 |
|||||||||
|
Battery Separators & Filtration Media |
|||||||||||
|
204,000 |
Kennametal |
7,564 |
|||||||||
|
Consumable Cutting Tools |
|||||||||||
|
146,000 |
Oshkosh Corporation (a) |
4,005 |
|||||||||
|
Specialty Truck Manufacturer |
|||||||||||
|
155,000 |
Generac |
3,548 |
|||||||||
|
Standby Power Generators |
|||||||||||
|
26,000 |
Middleby (a) |
3,006 |
|||||||||
|
Manufacturer of Cooking Equipment |
|||||||||||
|
224,048 |
|||||||||||
|
> Industrial Materials & Specialty Chemicals 0.9% |
|||||||||||
|
496,000 |
Drew Industries (a) |
14,984 |
|||||||||
|
RV & Manufactured Home Components |
|||||||||||
|
14,984 |
|||||||||||
| > Electrical Components 0.9% | |||||||||||
|
232,000 |
Acuity Brands |
14,683 |
|||||||||
|
Commercial Lighting Fixtures |
|||||||||||
|
14,683 |
|||||||||||
| > Other Industrial Services 0.8% | |||||||||||
|
600,919 |
Acorn Energy (b) |
5,360 |
|||||||||
|
Frac Well Exploration/Monitoring Device, Sonar Security, Electric Grid Monitoring |
|||||||||||
|
240,000 |
TrueBlue (a) |
3,773 |
|||||||||
|
Temporary Manual Labor |
|||||||||||
|
109,000 |
Forward Air |
3,315 |
|||||||||
|
Freight Transportation Between Airports |
|||||||||||
|
12,448 |
|||||||||||
| > Construction 0.4% | |||||||||||
|
200,000 |
Fortune Brands Home & Security (a) |
5,402 |
|||||||||
|
Home Building Supplies & Small Locks |
|||||||||||
|
5,402 |
|||||||||||
|
Number of Shares |
Value (000) |
||||||||||
| > Waste Management 0.3% | |||||||||||
|
90,000 |
Waste Connections |
$ |
2,722 |
||||||||
|
Solid Waste Management |
|||||||||||
|
50,000 |
Clean Harbors (a) |
2,443 |
|||||||||
|
Hazardous Waste Services & Disposal |
|||||||||||
|
5,165 |
|||||||||||
| > Steel 0.2% | |||||||||||
|
413,634 |
GrafTech International (a) |
3,719 |
|||||||||
|
Industrial Graphite Materials Producer |
|||||||||||
|
3,719 |
|||||||||||
|
Industrial Goods & Services: Total |
280,449 |
||||||||||
|
Consumer Goods & Services 14.6% |
|||||||||||
| > Retail 5.8% | |||||||||||
|
565,000 |
lululemon athletica (a) |
41,776 |
|||||||||
|
Premium Active Apparel Retailer |
|||||||||||
|
468,500 |
Abercrombie & Fitch |
15,891 |
|||||||||
|
Teen Apparel Retailer |
|||||||||||
|
805,000 |
Pier 1 Imports |
15,086 |
|||||||||
|
Home Furnishing Retailer |
|||||||||||
|
356,000 |
Shutterfly (a) |
11,079 |
|||||||||
|
Internet Photo-centric Retailer |
|||||||||||
|
715,000 |
Saks (a)(b) |
7,371 |
|||||||||
|
Luxury Department Store Retailer |
|||||||||||
|
120,000 |
Teavana (a)(b) |
1,565 |
|||||||||
|
Specialty Tea Retailer |
|||||||||||
|
9,000 |
The Fresh Market (a) |
540 |
|||||||||
|
Specialty Food Retailer |
|||||||||||
|
93,308 |
|||||||||||
| > Travel 2.4% | |||||||||||
|
1,300,950 |
Avis Budget Group (a) |
20,009 |
|||||||||
|
Second Largest Car Rental Company |
|||||||||||
|
675,000 |
Hertz (a) |
9,268 |
|||||||||
|
Largest U.S. Rental Car Operator |
|||||||||||
|
64,000 |
Vail Resorts |
3,689 |
|||||||||
|
Ski Resort Operator & Developer |
|||||||||||
|
140,000 |
HomeAway (a)(b) |
3,283 |
|||||||||
|
Vacation Rental Online Marketplace |
|||||||||||
|
75,000 |
Choice Hotels |
2,399 |
|||||||||
|
Franchisor of Budget Hotel Brands |
|||||||||||
|
38,648 |
|||||||||||
| > Furniture & Textiles 1.8% | |||||||||||
|
880,000 |
Knoll |
12,276 |
|||||||||
|
Office Furniture |
|||||||||||
|
756,000 |
Interface |
9,987 |
|||||||||
|
Modular Carpet |
|||||||||||
|
148,000 |
Herman Miller |
2,877 |
|||||||||
|
Office Furniture |
|||||||||||
|
200,000 |
Caesarstone (Israel) (a) |
2,820 |
|||||||||
|
Quartz Countertops |
|||||||||||
|
27,960 |
|||||||||||
| > Consumer Goods Distribution 1.1% | |||||||||||
|
429,000 |
Pool |
17,838 |
|||||||||
|
Distributor of Swimming Pool Supplies & Equipment |
|||||||||||
|
17,838 |
|||||||||||
64
|
Number of Shares |
Value (000) |
||||||||||
| > Apparel 0.9% | |||||||||||
|
222,000 |
Warnaco Group (a) |
$ |
11,522 |
||||||||
|
Global Branded Apparel Manufacturer |
|||||||||||
|
73,000 |
Deckers Outdoor (a)(b) |
2,675 |
|||||||||
|
Fashion Footwear Wholesaler |
|||||||||||
|
14,197 |
|||||||||||
| > Other Consumer Services 0.7% | |||||||||||
|
233,000 |
Lifetime Fitness (a) |
10,657 |
|||||||||
|
Sport & Fitness Club Operator |
|||||||||||
|
10,657 |
|||||||||||
| > Other Durable Goods 0.6% | |||||||||||
|
206,000 |
Cavco Industries (a) |
9,453 |
|||||||||
|
Manufactured Homes |
|||||||||||
|
9,453 |
|||||||||||
| > Casinos & Gaming 0.5% | |||||||||||
|
698,000 |
Pinnacle Entertainment (a) |
8,550 |
|||||||||
|
Regional Casino Operator |
|||||||||||
|
8,550 |
|||||||||||
| > Nondurables 0.5% | |||||||||||
|
262,000 |
Helen of Troy (a) |
8,339 |
|||||||||
|
Personal Care, Housewares, Healthcare & Home Environment Products |
|||||||||||
|
8,339 |
|||||||||||
| > Leisure Products 0.2% | |||||||||||
|
230,000 |
Skullcandy (a)(b) |
3,163 |
|||||||||
|
Lifestyle Branded Headphones |
|||||||||||
|
3,163 |
|||||||||||
| > Educational Services 0.1% | |||||||||||
|
37,350 |
ITT Educational Services (a)(b) |
1,204 |
|||||||||
|
Post-secondary Degree Services |
|||||||||||
|
1,204 |
|||||||||||
| > Food & Beverage —% | |||||||||||
|
4,900 |
Annie's (a)(b) |
220 |
|||||||||
|
Developer & Marketer of Natural & Organic Food |
|||||||||||
|
220 |
|||||||||||
|
Consumer Goods & Services: Total |
233,537 |
||||||||||
|
Finance 13.2% |
|||||||||||
| > Banks 7.5% | |||||||||||
|
833,000 |
MB Financial |
16,452 |
|||||||||
|
Chicago Bank |
|||||||||||
|
1,053,000 |
Associated Banc-Corp |
13,868 |
|||||||||
|
Midwest Bank |
|||||||||||
|
431,597 |
Lakeland Financial |
11,912 |
|||||||||
|
Indiana Bank |
|||||||||||
|
211,000 |
City National |
10,869 |
|||||||||
|
Bank & Asset Manager |
|||||||||||
|
170,000 |
SVB Financial Group (a) |
10,278 |
|||||||||
|
Bank to Venture Capitalists |
|||||||||||
|
251,000 |
Hancock Holding |
7,768 |
|||||||||
|
Gulf Coast Bank |
|||||||||||
|
1,478,200 |
First Busey |
7,214 |
|||||||||
|
Illinois Bank |
|||||||||||
|
641,750 |
Valley National Bancorp (b) |
6,430 |
|||||||||
|
New Jersey/New York Bank |
|||||||||||
|
Number of Shares |
Value (000) |
||||||||||
|
535,000 |
TCF Financial |
$ |
6,388 |
||||||||
|
Great Lakes Bank |
|||||||||||
|
834,000 |
First Commonwealth |
5,880 |
|||||||||
|
Western Pennsylvania Bank |
|||||||||||
|
844,000 |
TrustCo Bank |
4,828 |
|||||||||
|
New York State Bank |
|||||||||||
|
269,087 |
Eagle Bancorp (a) |
4,499 |
|||||||||
|
Metro D.C. Bank |
|||||||||||
|
178,826 |
Sandy Spring Bancorp |
3,442 |
|||||||||
|
Baltimore, D.C. Bank |
|||||||||||
|
210,000 |
CVB Financial |
2,507 |
|||||||||
|
Inland Empire Business Bank |
|||||||||||
|
217,117 |
Pacific Continental Bank |
1,939 |
|||||||||
|
Pacific Northwest Bank |
|||||||||||
|
105,700 |
Hudson Valley |
1,802 |
|||||||||
|
Metro New York City Bank |
|||||||||||
|
851,247 |
Guaranty Bancorp (a) |
1,720 |
|||||||||
|
Colorado Bank |
|||||||||||
|
90,000 |
TriCo Bancshares |
1,488 |
|||||||||
|
California Central Valley Bank |
|||||||||||
|
119,284 |
|||||||||||
| > Finance Companies 3.6% | |||||||||||
|
315,000 |
World Acceptance (a) |
21,247 |
|||||||||
|
Personal Loans |
|||||||||||
|
389,000 |
Textainer Group Holdings (b) |
11,884 |
|||||||||
|
Top International Container Leasor |
|||||||||||
|
346,000 |
McGrath Rentcorp |
9,027 |
|||||||||
|
Temporary Space & IT Rentals |
|||||||||||
|
415,208 |
CAI International (a) |
8,520 |
|||||||||
|
International Container Leasing |
|||||||||||
|
397,172 |
H & E Equipment Services |
4,814 |
|||||||||
|
Heavy Equipment Leasing |
|||||||||||
|
100,000 |
Marlin Business Services |
2,121 |
|||||||||
|
Small Equipment Leasing |
|||||||||||
|
36,318 |
Regional Management (a) |
626 |
|||||||||
|
Consumer Loans |
|||||||||||
|
58,239 |
|||||||||||
| > Savings & Loans 1.1% | |||||||||||
|
602,487 |
ViewPoint Financial |
11,550 |
|||||||||
|
Texas Thrift |
|||||||||||
|
144,000 |
Berkshire Hills Bancorp |
3,295 |
|||||||||
|
Northeast Thrift |
|||||||||||
|
173,073 |
Kaiser Federal |
2,611 |
|||||||||
|
Los Angeles Savings & Loan |
|||||||||||
|
17,456 |
|||||||||||
| > Brokerage & Money Management 0.5% | |||||||||||
|
306,500 |
Eaton Vance |
8,876 |
|||||||||
|
Specialty Mutual Funds |
|||||||||||
|
8,876 |
|||||||||||
| > Insurance 0.5% | |||||||||||
|
55,000 |
Allied World Holdings |
4,249 |
|||||||||
|
Commerical Lines Insurance/Reinsurance |
|||||||||||
|
39,000 |
Enstar Group (a) |
3,886 |
|||||||||
|
Insurance/Reinsurance & Related Services |
|||||||||||
|
8,135 |
|||||||||||
|
Finance: Total |
211,990 |
||||||||||
65
Columbia Acorn USA
Statement of Investments (Unaudited), continued
|
Number of Shares |
Value (000) |
||||||||||
|
Health Care 10.6% |
|||||||||||
| > Biotechnology & Drug Delivery 6.8% | |||||||||||
|
415,000 |
BioMarin Pharmaceutical (a) |
$ |
16,712 |
||||||||
|
Biotech Focused on Orphan Diseases |
|||||||||||
|
614,000 |
Seattle Genetics (a)(b) |
16,547 |
|||||||||
|
Antibody-based Therapies for Cancer |
|||||||||||
|
1,275,000 |
NPS Pharmaceuticals (a) |
11,794 |
|||||||||
|
Orphan Drugs & Healthy Royalties |
|||||||||||
|
466,000 |
ARIAD Pharmaceuticals (a) |
11,289 |
|||||||||
|
Biotech Focused on Cancer |
|||||||||||
|
421,000 |
Auxilium Pharmaceuticals (a) |
10,298 |
|||||||||
|
Biotech Focused on Niche Disease Areas |
|||||||||||
|
177,000 |
Synageva Biopharma (a) |
9,457 |
|||||||||
|
Biotech Focused on Orphan Diseases |
|||||||||||
|
643,000 |
Isis Pharmaceuticals (a) |
9,047 |
|||||||||
|
Biotech Pioneer in Antisense Drugs |
|||||||||||
|
75,000 |
Alexion Pharmaceuticals (a) |
8,580 |
|||||||||
|
Biotech Focused on Orphan Diseases |
|||||||||||
|
100,000 |
Onyx Pharmaceuticals (a) |
8,450 |
|||||||||
|
Commercial-stage Biotech Focused on Cancer |
|||||||||||
|
400,000 |
InterMune (a) |
3,588 |
|||||||||
|
Drugs for Pulmonary Fibrosis & Hepatitis C |
|||||||||||
|
259,000 |
Raptor Pharmaceutical (a)(b) |
1,440 |
|||||||||
|
Orphan Drug Company |
|||||||||||
|
815,900 |
Chelsea Therapeutics International (a)(b) |
979 |
|||||||||
|
Biotech Focused on Rare Diseases |
|||||||||||
|
18,181 |
Metabolex (a)(d)(e) |
6 |
|||||||||
|
Diabetes Drug Development |
|||||||||||
|
108,187 |
|||||||||||
| > Medical Supplies 1.5% | |||||||||||
|
587,600 |
Cepheid (a) |
20,278 |
|||||||||
|
Molecular Diagnostics |
|||||||||||
|
53,000 |
Techne |
3,813 |
|||||||||
|
Cytokines, Antibodies & Other Reagents for Life Science |
|||||||||||
|
24,091 |
|||||||||||
| > Medical Equipment & Devices 1.4% | |||||||||||
|
246,012 |
Sirona Dental Systems (a) |
14,013 |
|||||||||
|
Manufacturer of Dental Equipment |
|||||||||||
|
268,000 |
Hill-Rom Holdings |
7,788 |
|||||||||
|
Hospital Beds/Patient Handling |
|||||||||||
|
21,801 |
|||||||||||
| > Pharmaceuticals 0.6% | |||||||||||
|
642,000 |
Akorn (a) |
8,487 |
|||||||||
|
Develops, Manufactures & Sells Specialty Generic Drugs |
|||||||||||
|
150,000 |
Horizon Pharma (a) |
520 |
|||||||||
|
Specialty Pharmaceutical Company |
|||||||||||
|
133,180 |
Alimera Sciences (a)(b) |
344 |
|||||||||
|
Ophthalmology-focused Pharmaceutical Company |
|||||||||||
|
9,351 |
|||||||||||
|
Number of Shares |
Value (000) |
||||||||||
| > Health Care Services 0.3% | |||||||||||
|
664,900 |
Health Management Associates (a) |
$ |
5,579 |
||||||||
|
Non-urban Hospitals |
|||||||||||
|
5,579 |
|||||||||||
|
Health Care: Total |
169,009 |
||||||||||
|
Other Industries 9.1% |
|||||||||||
| > Real Estate 8.1% | |||||||||||
|
849,700 |
Ryman Hospitality Properties (a) |
33,589 |
|||||||||
|
Convention Hotels |
|||||||||||
|
915,000 |
Extra Space Storage |
30,424 |
|||||||||
|
Self Storage Facilities |
|||||||||||
|
625,000 |
DuPont Fabros Technology |
15,781 |
|||||||||
|
Technology-focused Office Buildings |
|||||||||||
|
561,200 |
Biomed Realty Trust |
10,506 |
|||||||||
|
Life Science-focused Office Buildings |
|||||||||||
|
783,000 |
Education Realty Trust |
8,535 |
|||||||||
|
Student Housing |
|||||||||||
|
540,000 |
Associated Estates Realty |
8,186 |
|||||||||
|
Multifamily Properties |
|||||||||||
|
1,380,000 |
Kite Realty Group |
7,038 |
|||||||||
|
Community Shopping Centers |
|||||||||||
|
958,000 |
DCT Industrial Trust |
6,198 |
|||||||||
|
Industrial Properties |
|||||||||||
|
100,000 |
Post Properties |
4,796 |
|||||||||
|
Multi-family Properties |
|||||||||||
|
200,000 |
St. Joe (a)(b) |
3,900 |
|||||||||
|
Florida Panhandle Landowner |
|||||||||||
|
128,953 |
|||||||||||
| > Transportation 1.0% | |||||||||||
|
515,091 |
Rush Enterprises, Class A (a) |
9,921 |
|||||||||
|
115,000 |
Rush Enterprises, Class B (a) |
1,933 |
|||||||||
|
Truck Sales & Service |
|||||||||||
|
128,000 |
World Fuel Services |
4,558 |
|||||||||
|
Global Fuel Broker |
|||||||||||
|
16,412 |
|||||||||||
|
Other Industries: Total |
145,365 |
||||||||||
|
Energy & Minerals 4.8% |
|||||||||||
| > Oil Services 2.3% | |||||||||||
|
725,000 |
Atwood Oceanics (a) |
32,951 |
|||||||||
|
Offshore Drilling Contractor |
|||||||||||
|
125,000 |
Hornbeck Offshore (a) |
4,581 |
|||||||||
|
Supply Vessel Operator in U.S. Gulf of Mexico |
|||||||||||
|
37,532 |
|||||||||||
| > Oil & Gas Producers 1.7% | |||||||||||
|
133,000 |
SM Energy |
7,197 |
|||||||||
|
Oil & Gas Producer |
|||||||||||
|
129,000 |
Rosetta Resources (a) |
6,179 |
|||||||||
|
Oil & Gas Producer Exploring in South Texas & Montana |
|||||||||||
|
182,000 |
PDC Energy (a) |
5,757 |
|||||||||
|
Oil & Gas Producer in the U.S. |
|||||||||||
|
174,000 |
Approach Resources (a) |
5,242 |
|||||||||
|
Oil & Gas Producer in West Texas Permian |
|||||||||||
66
|
Number of Shares |
Value (000) |
||||||||||
| > Oil & Gas Producers—continued | |||||||||||
|
510,000 |
Quicksilver Resources (a)(b) |
$ |
2,086 |
||||||||
|
Natural Gas & Coal Seam Gas Producer |
|||||||||||
|
262,200 |
Houston American Energy (a)(b) |
236 |
|||||||||
|
Oil & Gas Exploration/Production in Colombia |
|||||||||||
|
26,697 |
|||||||||||
| > Mining 0.8% | |||||||||||
|
77,000 |
Core Labs (Netherlands) |
9,354 |
|||||||||
|
Oil & Gas Reservoir Consulting |
|||||||||||
|
600,000 |
Alexco Resource (a) |
2,604 |
|||||||||
|
Mining, Exploration & Environmental Services |
|||||||||||
|
180,000 |
Augusta Resource (a)(b) |
486 |
|||||||||
|
US Copper/Moly Mine |
|||||||||||
|
12,444 |
|||||||||||
|
Energy & Minerals: Total |
76,673 |
||||||||||
|
Total Equities: 99.4% (Cost: $1,076,499) |
1,590,446 |
||||||||||
|
Number of Shares |
Value (000) |
||||||||||
|
Securities Lending Collateral 3.8% |
|||||||||||
|
60,481,550 |
Dreyfus Government Cash Management Fund (7 day yield of 0.01%) (f) |
$ |
60,482 |
||||||||
|
Total Securities Lending Collateral: (Cost: $60,482) |
60,482 |
||||||||||
|
Total Investments: 103.2% (Cost: $1,136,981)(g)(h) |
1,650,928 |
(i) |
|||||||||
|
Obligation to Return Collateral for Securities Loaned: (3.8)% |
(60,482 |
) |
|||||||||
|
Cash and Other Assets Less Liabilities: 0.6% |
9,482 |
||||||||||
|
Total Net Assets: 100.0% |
$ |
1,599,928 |
|||||||||
ADR - American Depositary Receipts
> Notes to Statement of Investments (dollar values in thousands)
(a) Non-income producing security.
(b) All or a portion of this security was on loan at September 30, 2012. The total market value of securities on loan at September 30, 2012 was $58,671.
(c) An affiliated person of the Fund may include any company in which the Fund owns five percent or more of its outstanding voting shares. Holdings and transactions in these affiliated companies during the period ended September 30, 2012, are as follows:
|
Security |
Balance of Shares Held 12/31/11 |
Purchases/ Additions |
Sales/ Reductions |
Balance of Shares Held 9/30/12 |
Value |
Dividend |
|||||||||||||||||||||
|
RCM Technologies |
640,000 |
- |
- |
640,000 |
$ |
3,481 |
$ |
- |
|||||||||||||||||||
|
Total of Affiliated Transactions |
640,000 |
- |
- |
640,000 |
$ |
3,481 |
$ |
- |
|||||||||||||||||||
The aggregate cost and value of these companies at September 30, 2012 were $3,624 and $3,481 respectively. Investments in affiliated companies represented 0.22% of the Funds total net assets at September 30, 2012.
(d) Denotes a restricted security, which is subject to restrictions on resale under federal securities laws. This security is valued at fair value determined in good faith under consistently applied procedures established by the Board of Trustees. At September 30, 2012, the market value of this security amounted to $6, which represented less than 0.01% of total net assets. Additional information on this security is as follows:
|
Security |
Acquisition Dates |
Shares |
Cost |
Value |
|||||||||||||||
|
Metabolex |
2/11/00 |
18,181 |
$ |
2,000 |
$ |
6 |
|||||||||||||
|
$ |
2,000 |
$ |
6 |
||||||||||||||||
(e) Illiquid security.
(f) Investment made with cash collateral received from securities lending activity.
(g) At September 30, 2012, for federal income tax purposes, the cost of investments was $1,136,981 and net unrealized appreciation was $513,947 consisting of gross unrealized appreciation of $604,573 and gross unrealized depreciation of $90,626.
(h) On September 30, 2012, the market value of foreign securities represented 1.32% of total net assets. The Fund's foreign portfolio was diversified as follows:
|
Country |
Value |
Percentage of Net Assets |
|||||||||
|
Netherlands |
$ |
9,354 |
0.58 |
||||||||
|
Israel |
8,135 |
0.51 |
|||||||||
|
India |
3,676 |
0.23 |
|||||||||
|
Total Foreign Portfolio |
$ |
21,165 |
1.32 |
||||||||
(i) Securities are valued using policies described in the Notes to Financial Statements in the most recent shareholder report.
67
Columbia Acorn USA
Statement of Investments (Unaudited), continued
> Notes to Statement of Investments (dollar values in thousands)
Fair Value Measurements
Various inputs are used in determining the value of the Fund's investments, following the input prioritization hierarchy established by GAAP. These inputs are summarized in the three broad levels listed below:
• Level 1 – quoted prices in active markets for identical securities
• Level 2 – prices determined using other significant observable inputs (including quoted prices for similar securities, interest rates, prepayment speeds, credit risk and others)
• Level 3 – prices determined using significant unobservable inputs where quoted prices or observable inputs are unavailable or less reliable (including management's own assumptions about the factors market participants would use in pricing an investment)
The inputs or methodology used for valuing securities are not necessarily an indication of the risk associated with investing in those securities.
Examples of the types of securities in which the Fund would typically invest and how they are classified within this hierarchy are as follows. Typical Level 1 securities include exchange traded domestic equities, mutual funds whose NAVs are published each day and exchange traded foreign equities that are not statistically fair valued. Typical Level 2 securities include exchange traded foreign equities that are statistically fair valued, forward foreign currency exchange contracts and short-term investments valued at amortized cost. Additionally, securities fair valued by the Valuation Committee (the Committee) of the Fund's Board of Trustees (the Board) that rely on significant observable inputs are also included in Level 2. Typical Level 3 securities include any security fair valued by the Committee that relies on significant unobservable inputs.
Under the direction of the Board, the Committee is responsible for carrying out the valuation procedures approved by the Board.
The Committee meets as necessary, and no less frequently than quarterly, to determine fair values for securities for which market quotations are not readily available or for which the investment manager believes that available market quotations are unreliable, and to review the continuing appropriateness of the current value of any security subject to the Trust's Portfolio Pricing Policy and the pricing procedures of the investment manager (the Policies). The Policies address, among other things: circumstances under which market quotations will be deemed readily available; selection of third party pricing vendors; appropriate pricing methodologies; events that require fair valuation and fair value techniques; and circumstances under which securities will be deemed to pose a potential for stale pricing, including when securities are illiquid, restricted, or in default. The Committee may also meet to discuss additional valuation matters, which may include review of back-testing results, review of time-sensitive information or approval of other valuation related actions, and to review the appropriateness of the Policies.
For investments categorized as Level 3, the significant unobservable inputs used in the fair value measurement of the Funds' securities may include: (i) data specific to the issuer or comparable issuers, (ii) general market or specific sector news and (iii) quoted prices and specific or similar security transactions. The Committee considers this data and any changes from prior periods in order to assess the reasonableness of observable and unobservable inputs, any assumptions or internal models used to value those securities and changes in fair value. Significant changes in any of these factors could result in lower or higher fair value measurements. Various factors impact the frequency of monitoring (which may occur as often as daily), however the Committee may determine that changes to inputs, assumptions and models are not required with the same frequency.
The following table summarizes the inputs used, as of September 30, 2012, in valuing the Fund's assets:
|
Investment Type |
Quoted Prices (Level 1) |
Other Significant Observable Inputs (Level 2) |
Significant Unobservable Inputs (Level 3) |
Total |
|||||||||||||||
|
Equities |
|||||||||||||||||||
|
Information |
$ |
473,423 |
$ |
- |
$ |
- |
$ |
473,423 |
|||||||||||
|
Industrial Goods & Services |
280,449 |
- |
- |
280,449 |
|||||||||||||||
|
Consumer Goods & Services |
233,537 |
- |
- |
233,537 |
|||||||||||||||
|
Finance |
211,990 |
- |
- |
211,990 |
|||||||||||||||
|
Health Care |
169,003 |
- |
6 |
169,009 |
|||||||||||||||
|
Other Industries |
145,365 |
- |
- |
145,365 |
|||||||||||||||
|
Energy & Minerals |
76,673 |
- |
- |
76,673 |
|||||||||||||||
|
Total Equities |
1,590,440 |
- |
6 |
1,590,446 |
|||||||||||||||
|
Total Securities Lending Collateral |
60,482 |
- |
- |
60,482 |
|||||||||||||||
|
Total Investments |
$ |
1,650,922 |
$ |
- |
$ |
6 |
$ |
1,650,928 |
|||||||||||
There were no transfers of financial assets between levels 1 and 2 during the period.
68
> Notes to Statement of Investments (dollar values in thousands)
The following table reconciles asset balances for the period ending September 30, 2012, in which significant observable and/or unobservable inputs (Level 3) were used in determining value:
|
Investments in Securities |
Balance as of December 31, 2011 |
Realized Gain/(Loss) |
Change in Unrealized Appreciation (Depreciation) |
Purchases |
Sales |
Transfers into Level 3 |
Transfers out of Level 3 |
Balance as of September 30, 2012 |
|||||||||||||||||||||||||||
|
Equities |
|||||||||||||||||||||||||||||||||||
|
Health Care |
$ |
27 |
$ |
- |
$ |
(21 |
) |
$ |
- |
$ |
- |
$ |
- |
$ |
- |
$ |
6 |
||||||||||||||||||
|
$ |
27 |
$ |
- |
$ |
(21 |
) |
$ |
- |
$ |
- |
$ |
- |
$ |
- |
$ |
6 |
|||||||||||||||||||
The information in the above reconciliation table represents fiscal year to date activity for any securities identified as using Level 3 inputs at either the beginning or the end of the current fiscal period.
The change in unrealized depreciation attributed to securities owned at September 30, 2012, which were valued using significant unobservable inputs (Level 3), amounted to $21.
The Fund does not hold any significant investments categorized as Level 3.
Certain common stock classified as Level 3 are valued at fair value, using a market approach, as determined in good faith under consistently applied procedures established by and under the general supervision of the Board. To determine fair value for these securities, for which no market exists, the Committee utilizes the valuation technique it deems most appropriate in the circumstances, using some unobservable inputs, which may include but are not limited to trades of similar securities, estimated earnings of the company, market multiples derived from a set of comparable companies, and the position of the security within the company's capital structure. Significant increases or decreases to any of these inputs could result in a significantly lower or higher fair value measurement. Generally, a change in estimated earnings of a company may result in a change to the comparable companies and market multiples utilized.
69
Columbia Acorn International Select
Major Portfolio Changes in the Third Quarter (Unaudited)
|
Number of Shares |
|||||||||||
|
6/30/12 |
9/30/12 |
||||||||||
|
Purchases |
|||||||||||
|
Asia |
|||||||||||
| > Taiwan | |||||||||||
|
CTCI Corp |
3,508,400 |
3,920,000 |
|||||||||
|
Taiwan Mobile |
3,133,800 |
3,810,000 |
|||||||||
| > Japan | |||||||||||
|
Jupiter Telecommunications |
8,970 |
13,964 |
|||||||||
|
Start Today |
496,000 |
869,000 |
|||||||||
| > Indonesia | |||||||||||
|
Archipelago Resources |
9,272,000 |
11,136,600 |
|||||||||
| > Korea | |||||||||||
|
Hite Jinro |
0 |
28,690 |
|||||||||
|
Other Countries |
|||||||||||
| > Australia | |||||||||||
|
Challenger Financial |
2,809,800 |
3,461,296 |
|||||||||
|
Commonwealth Property Office Fund |
10,466,968 |
11,089,000 |
|||||||||
|
Regis Resources |
0 |
95,201 |
|||||||||
|
UGL |
1,000,050 |
1,058,050 |
|||||||||
| > Canada | |||||||||||
|
Central Fund of Canada |
0 |
213,503 |
|||||||||
|
Goldcorp |
344,400 |
464,000 |
|||||||||
|
Kirkland Lake Gold |
0 |
290,000 |
|||||||||
| > New Zealand | |||||||||||
|
Telecom NZ |
0 |
744,857 |
|||||||||
|
Europe |
|||||||||||
| > France | |||||||||||
|
Gemalto |
0 |
7,031 |
|||||||||
|
Latin America |
|||||||||||
| > Mexico | |||||||||||
|
Fresnillo |
597,400 |
745,000 |
|||||||||
| > Guatemala | |||||||||||
|
Tahoe Resources |
196,800 |
401,000 |
|||||||||
|
Number of Shares |
|||||||||||
|
6/30/12 |
9/30/12 |
||||||||||
|
Sales |
|||||||||||
|
Asia |
|||||||||||
| > Japan | |||||||||||
|
Kansai Paint |
319,000 |
0 |
|||||||||
|
Seven Bank |
5,753,734 |
5,750,000 |
|||||||||
| > China | |||||||||||
|
Zhaojin Mining Industry |
4,146,000 |
2,839,000 |
|||||||||
| > Korea | |||||||||||
|
NHN |
32,830 |
0 |
|||||||||
|
Other Countries |
|||||||||||
| > Canada | |||||||||||
|
CCL Industries |
106,400 |
91,400 |
|||||||||
| > South Africa | |||||||||||
|
Adcock Ingram Holdings |
1,317,200 |
1,001,517 |
|||||||||
|
Rand Merchant Insurance |
6,483,015 |
4,798,015 |
|||||||||
| > Israel | |||||||||||
|
Israel Chemicals |
460,000 |
349,000 |
|||||||||
|
Europe |
|||||||||||
| > United Kingdom | |||||||||||
|
Serco |
583,000 |
0 |
|||||||||
| > Iceland | |||||||||||
|
Marel |
4,800,000 |
3,958,835 |
|||||||||
| > Sweden | |||||||||||
|
Hexagon |
595,666 |
192,000 |
|||||||||
| > Netherlands | |||||||||||
|
Imtech |
190,916 |
123,416 |
|||||||||
| > Belgium | |||||||||||
|
EVS Broadcast Equipment |
74,000 |
0 |
|||||||||
70
Columbia Acorn International Select
Statement of Investments (Unaudited), September 30, 2012
|
Number of Shares |
Value (000) |
||||||||||
|
Equities: 88.8% |
|||||||||||
|
Asia 42.9% |
|||||||||||
| > Singapore 14.6% | |||||||||||
|
13,130,000 |
Ascendas REIT |
$ |
25,718 |
||||||||
|
Industrial Property Landlord |
|||||||||||
|
20,395,000 |
Mapletree Industrial Trust |
23,405 |
|||||||||
|
Industrial Property Landlord |
|||||||||||
|
11,142,000 |
Mapletree Logistics Trust |
10,189 |
|||||||||
|
Industrial Property Landlord |
|||||||||||
|
59,312 |
|||||||||||
| > Taiwan 12.4% | |||||||||||
|
11,103,000 |
Far EasTone Telecom |
27,399 |
|||||||||
|
Taiwan's Third Largest Mobile Operator |
|||||||||||
|
3,810,000 |
Taiwan Mobile |
13,894 |
|||||||||
|
Taiwan's Second Largest Mobile Operator |
|||||||||||
|
3,920,000 |
CTCI Corp |
8,955 |
|||||||||
|
International Engineering Firm |
|||||||||||
|
50,248 |
|||||||||||
| > Japan 10.9% | |||||||||||
|
5,750,000 |
Seven Bank |
17,545 |
|||||||||
|
ATM Processing Services |
|||||||||||
|
13,964 |
Jupiter Telecommunications |
14,171 |
|||||||||
|
Largest Cable Service Provider in Japan |
|||||||||||
|
869,000 |
Start Today (a) |
12,414 |
|||||||||
|
Online Japanese Apparel Retailer |
|||||||||||
|
44,130 |
|||||||||||
| > Indonesia 2.7% | |||||||||||
|
11,136,600 |
Archipelago Resources (b) |
10,790 |
|||||||||
|
Gold Mining Projects in Indonesia, Vietnam & the Philippines |
|||||||||||
|
10,790 |
|||||||||||
| > China 2.2% | |||||||||||
|
2,839,000 |
Zhaojin Mining Industry |
5,142 |
|||||||||
|
Gold Mining & Refining in China |
|||||||||||
|
2,956,000 |
Want Want |
3,763 |
|||||||||
|
Chinese Branded Consumer Food Company |
|||||||||||
|
1,000 |
NetEase.com - ADR (b) |
56 |
|||||||||
|
Chinese Online Gaming Services |
|||||||||||
|
8,961 |
|||||||||||
| > Korea 0.1% | |||||||||||
|
28,690 |
Hite Jinro |
628 |
|||||||||
|
Leading Beer & Spirits Manufacturer |
|||||||||||
|
628 |
|||||||||||
|
Asia: Total |
174,069 |
||||||||||
|
Other Countries 28.2% |
|||||||||||
| > Australia 10.6% | |||||||||||
|
11,089,000 |
Commonwealth Property Office Fund |
11,880 |
|||||||||
|
Australia Prime Office REIT |
|||||||||||
|
3,461,296 |
Challenger Financial |
11,650 |
|||||||||
|
Largest Annuity Provider |
|||||||||||
|
1,058,050 |
UGL (a) |
11,446 |
|||||||||
|
Engineering & Facilities Management |
|||||||||||
|
Number of Shares |
Value (000) |
||||||||||
|
1,652,046 |
IAG |
$ |
7,451 |
||||||||
|
General Insurance Provider |
|||||||||||
|
95,201 |
Regis Resources |
560 |
|||||||||
|
Gold Mining in Australia |
|||||||||||
|
42,987 |
|||||||||||
| > Canada 8.2% | |||||||||||
|
464,000 |
Goldcorp |
21,274 |
|||||||||
|
Gold Mining |
|||||||||||
|
213,503 |
Central Fund of Canada |
5,084 |
|||||||||
|
Allocated Gold & Silver Closed-end Fund |
|||||||||||
|
290,000 |
Kirkland Lake Gold |
3,516 |
|||||||||
|
Gold Mining |
|||||||||||
|
91,400 |
CCL Industries |
3,377 |
|||||||||
|
Leading Global Label Manufacturer |
|||||||||||
|
33,251 |
|||||||||||
| > South Africa 6.3% | |||||||||||
|
4,798,015 |
Rand Merchant Insurance |
12,412 |
|||||||||
|
Directly Sold Property & Casualty Insurance; Holdings in Other Insurers |
|||||||||||
|
1,001,517 |
Adcock Ingram Holdings |
7,146 |
|||||||||
|
Manufacturer of Pharmaceuticals & Medical Supplies |
|||||||||||
|
95,700 |
Naspers |
5,921 |
|||||||||
|
Media in Africa, China, Russia & Other Emerging Markets |
|||||||||||
|
25,479 |
|||||||||||
| > United States 1.7% | |||||||||||
|
94,000 |
Atwood Oceanics (b) |
4,272 |
|||||||||
|
Offshore Drilling Contractor |
|||||||||||
|
52,000 |
SM Energy |
2,814 |
|||||||||
|
Oil & Gas Producer |
|||||||||||
|
7,086 |
|||||||||||
| > Israel 1.0% | |||||||||||
|
349,000 |
Israel Chemicals |
4,239 |
|||||||||
|
Producer of Potash, Phosphates, Bromine & Specialty Chemicals |
|||||||||||
|
4,239 |
|||||||||||
| > New Zealand 0.4% | |||||||||||
|
744,857 |
Telecom NZ |
1,466 |
|||||||||
|
Primary Telecom Operator |
|||||||||||
|
1,466 |
|||||||||||
|
Other Countries: Total |
114,508 |
||||||||||
|
Europe 9.7% |
|||||||||||
| > Germany 3.0% | |||||||||||
|
538,000 |
Wirecard |
12,355 |
|||||||||
|
Online Payment Processing & Risk Management |
|||||||||||
|
12,355 |
|||||||||||
| > United Kingdom 1.8% | |||||||||||
|
296,000 |
JLT Group |
3,659 |
|||||||||
|
International Business Insurance Broker |
|||||||||||
|
79,000 |
Intertek Group |
3,495 |
|||||||||
|
Testing, Inspection, Certification Services |
|||||||||||
|
7,154 |
|||||||||||
71
Columbia Acorn International Select
Statement of Investments (Unaudited), continued
|
Number of Shares |
Value (000) |
||||||||||
| > Iceland 1.1% | |||||||||||
|
3,958,835 |
Marel |
$ |
4,301 |
||||||||
|
Largest Manufacturer of Poultry & Fish Processing Equipment |
|||||||||||
|
4,301 |
|||||||||||
| > Switzerland 1.0% | |||||||||||
|
19,800 |
Partners Group |
4,120 |
|||||||||
|
Private Markets Asset Management |
|||||||||||
|
4,120 |
|||||||||||
| > Sweden 1.0% | |||||||||||
|
192,000 |
Hexagon |
4,115 |
|||||||||
|
Design, Measurement & Visualization Software & Equipment |
|||||||||||
|
4,115 |
|||||||||||
| > Denmark 0.8% | |||||||||||
|
125,000 |
Novozymes |
3,445 |
|||||||||
|
Industrial Enzymes |
|||||||||||
|
3,445 |
|||||||||||
| > Netherlands 0.8% | |||||||||||
|
123,416 |
Imtech |
3,258 |
|||||||||
|
Electromechanical & Information Communications Technology Installation & Maintenance |
|||||||||||
|
3,258 |
|||||||||||
| > France 0.2% | |||||||||||
|
7,031 |
Gemalto |
618 |
|||||||||
|
Digital Security Solutions |
|||||||||||
|
618 |
|||||||||||
|
Europe: Total |
39,366 |
||||||||||
|
Latin America 8.0% |
|||||||||||
| > Mexico 5.4% | |||||||||||
|
745,000 |
Fresnillo |
22,292 |
|||||||||
|
Silver & Metal Byproduct Mining in Mexico |
|||||||||||
|
22,292 |
|||||||||||
| > Guatemala 2.0% | |||||||||||
|
401,000 |
Tahoe Resources (b) |
8,166 |
|||||||||
|
Silver Project in Guatemala |
|||||||||||
|
8,166 |
|||||||||||
|
Number of Shares |
Value (000) |
||||||||||
| > Uruguay 0.5% | |||||||||||
|
191,666 |
Union Agriculture Group (b)(c)(d) |
$ |
1,988 |
||||||||
|
Farmland Operator in Uruguay |
|||||||||||
|
1,988 |
|||||||||||
| > Colombia 0.1% | |||||||||||
|
1,880,000 |
Santa Maria Petroleum (b)(c) |
257 |
|||||||||
|
Explores for Oil & Gas in Latin America |
|||||||||||
|
257 |
|||||||||||
|
Latin America: Total |
32,703 |
||||||||||
|
Total Equities: 88.8% (Cost: $284,437) |
360,646 |
||||||||||
|
Securities Lending Collateral 3.0% |
|||||||||||
|
12,212,336 |
Dreyfus Government Cash Management Fund (7 day yield of 0.01%) (e) |
12,212 |
|||||||||
|
Total Securities Lending Collateral: (Cost: $12,212) |
12,212 |
||||||||||
|
Total Investments: 91.8% (Cost: $296,649)(f)(g) |
372,858 |
(h) |
|||||||||
|
Obligation to Return Collateral for Securities Loaned: (3.0)% |
(12,212 |
) |
|||||||||
|
Cash and Other Assets Less Liabilities: 11.2% |
45,468 |
||||||||||
|
Total Net Assets: 100.0% |
$ |
406,114 |
|||||||||
ADR - American Depositary Receipts
REIT - Real Estate Investment Trust
> Notes to Statement of Investments (dollar values in thousands)
(a) All or a portion of this security was on loan at September 30, 2012. The total market value of securities on loan at September 30, 2012 was $11,576.
(b) Non-income producing security.
(c) Denotes a restricted security, which is subject to restrictions on resale under federal securities laws. These securities are valued at fair value determined in good faith under consistently applied procedures established by the Board of Trustees. At September 30, 2012, the market value of these securities amounted to $2,245, which represented 0.55% of total net assets. Additional information on these securities is as follows:
|
Security |
Acquisition Dates |
Shares |
Cost |
Value |
|||||||||||||||
|
Union Agriculture Group |
12/8/10-6/27/12 |
191,666 |
$ |
2,200 |
$ |
1,988 |
|||||||||||||
|
Santa Maria Petroleum |
1/14/11 |
1,880,000 |
2,376 |
257 |
|||||||||||||||
|
$ |
4,576 |
$ |
2,245 |
||||||||||||||||
72
> Notes to Statement of Investments (dollar values in thousands)
(d) Illiquid security.
(e) Investment made with cash collateral received from securities lending activity.
(f) At September 30, 2012, for federal income tax purposes, the cost of investments was $296,649 and net unrealized appreciation was $76,209 consisting of gross unrealized appreciation of $84,702 and gross unrealized depreciation of $8,493.
(g) On September 30, 2012, the Fund's total investments were denominated in currencies as follows:
|
Currency |
Value |
Percentage of Net Assets |
|||||||||
|
Singapore Dollar |
$ |
59,312 |
14.6 |
||||||||
|
Taiwan Dollar |
50,248 |
12.4 |
|||||||||
|
Japanese Yen |
44,130 |
10.9 |
|||||||||
|
Australian Dollar |
42,987 |
10.6 |
|||||||||
|
British Pound |
40,236 |
9.9 |
|||||||||
|
United States Dollar |
35,488 |
8.7 |
|||||||||
|
South African Rand |
25,479 |
6.3 |
|||||||||
|
Other currencies less than 5% of total net assets |
62,766 |
15.4 |
|||||||||
|
Total Portfolio |
$ |
360,646 |
88.8 |
||||||||
(h) Securities are valued using policies described in the Notes to Financial Statements in the most recent shareholder report.
At September 30, 2012, the Fund had entered into the following forward foreign currency exchange contracts:
|
Forward Foreign Currency Exchange Contracts to Buy |
Forward Foreign Currency Exchange Contracts to Sell |
Principal Amount in Foreign Currency |
Principal Amount in U.S. Dollar |
Unrealized Settlement Date |
Appreciation/ (Depreciation) |
||||||||||||||||||
|
USD |
ZAR |
165,352 |
$ |
20,000 |
10/15/12 |
$ |
170 |
||||||||||||||||
The counterparty for all forward foreign currency exchange contracts is State Street Bank and Trust Company.
USD - United States Dollar
ZAR - South African Rand
Fair Value Measurements
Various inputs are used in determining the value of the Fund's investments, following the input prioritization hierarchy established by GAAP. These inputs are summarized in the three broad levels listed below:
• Level 1 – quoted prices in active markets for identical securities
• Level 2 – prices determined using other significant observable inputs (including quoted prices for similar securities, interest rates, prepayment speeds, credit risk and others)
• Level 3 – prices determined using significant unobservable inputs where quoted prices or observable inputs are unavailable or less reliable (including management's own assumptions about the factors market participants would use in pricing an investment)
The inputs or methodology used for valuing securities are not necessarily an indication of the risk associated with investing in those securities.
Examples of the types of securities in which the Fund would typically invest and how they are classified within this hierarchy are as follows. Typical Level 1 securities include exchange traded domestic equities, mutual funds whose NAVs are published each day and exchange traded foreign equities that are not statistically fair valued. Typical Level 2 securities include exchange traded foreign equities that are statistically fair valued, forward foreign currency exchange contracts and short-term investments valued at amortized cost. Additionally, securities fair valued by the Valuation Committee (the Committee) of the Fund's Board of Trustees (the Board) that rely on significant observable inputs are also included in Level 2. Typical Level 3 securities include any security fair valued by the Committee that relies on significant unobservable inputs.
Under the direction of the Board, the Committee is responsible for carrying out the valuation procedures approved by the Board.
The Committee meets as necessary, and no less frequently than quarterly, to determine fair values for securities for which market quotations are not readily available or for which the investment manager believes that available market quotations are unreliable, and to review the continuing appropriateness of the current value of any security subject to the Trust's Portfolio Pricing Policy and the pricing procedures of the investment manager (the Policies). The Policies address, among other things: circumstances under which market quotations will be deemed readily available; selection of third party pricing vendors; appropriate pricing methodologies; events that require fair valuation and fair value techniques; and circumstances under which securities will be deemed to pose a potential for stale pricing, including when securities are illiquid, restricted, or in default. The Committee may also meet to discuss additional valuation matters, which may include review of back-testing results, review of time-sensitive information or approval of other valuation related actions, and to review the appropriateness of the Policies.
For investments categorized as Level 3, the significant unobservable inputs used in the fair value measurement of the Funds' securities may include: (i) data specific to the issuer or comparable issuers, (ii) general market or specific sector news and (iii) quoted prices and specific or similar security transactions. The Committee considers this data and any changes from prior periods in order to assess the reasonableness of observable and unobservable inputs, any assumptions or internal models used to value those securities and changes in fair value. Significant changes in any of these factors could result in lower or higher fair value measurements. Various factors impact the frequency of monitoring (which may occur as often as daily), however the Committee may determine that changes to inputs, assumptions and models are not required with the same frequency.
73
Columbia Acorn International Select
Statement of Investments (Unaudited), continued
> Notes to Statement of Investments (dollar values in thousands)
The following table summarizes the inputs used, as of September 30, 2012, in valuing the Fund's assets:
|
Investment Type |
Quoted Prices (Level 1) |
Other Significant Observable Inputs (Level 2) |
Significant Unobservable Inputs (Level 3) |
Total |
|||||||||||||||
|
Equities |
|||||||||||||||||||
|
Asia |
$ |
56 |
$ |
174,013 |
$ |
- |
$ |
174,069 |
|||||||||||
|
Other Countries |
40,337 |
74,171 |
- |
114,508 |
|||||||||||||||
|
Europe |
- |
39,366 |
- |
39,366 |
|||||||||||||||
|
Latin America |
8,166 |
22,549 |
1,988 |
32,703 |
|||||||||||||||
|
Total Equities |
48,559 |
310,099 |
1,988 |
360,646 |
|||||||||||||||
|
Total Securities Lending Collateral |
12,212 |
- |
- |
12,212 |
|||||||||||||||
|
Total Investments |
$ |
60,771 |
$ |
310,099 |
$ |
1,988 |
$ |
372,858 |
|||||||||||
|
Unrealized Appreciation on Forward Foreign Currency Exchange Contracts |
- |
170 |
- |
170 |
|||||||||||||||
|
Total Investments |
$ |
60,771 |
$ |
310,269 |
$ |
1,988 |
$ |
373,028 |
|||||||||||
The Fund's assets assigned to the Level 2 input category are generally valued using a market approach, in which a security's value is determined through its correlation to prices and information from observable market transactions for similar or identical assets. Foreign equities are generally valued at the last sale price on the foreign exchange or market on which they trade. The Fund may use a statistical fair valuation model, in accordance with the policy adopted by the Board, provided by an independent third party to value securities principally traded in foreign markets in order to adjust for possible stale pricing that may occur between the close of the foreign exchanges and the time for valuation. These models take into account available market data including intraday index, ADR, and ETF movements. Forward foreign currency exchange contracts are valued at the prevailing forward exchange rate of the underlying currencies. Securities acquired via private placement that have a holding period or an extended settlement period are valued at a discount to the same shares that are trading freely on the market. These discounts are determined by the investment manager's experience with similar securities or situations. Factors may include, but are not limited to, trade volume, shares outstanding and stock price.
There were no transfers of financial assets between levels 1 and 2 during the period.
The following table reconciles asset balances for the period ending September 30, 2012, in which significant observable and/or unobservable inputs (Level 3) were used in determining value:
|
Investments in Securities |
Balance as of December 31, 2011 |
Realized Gain/(Loss) |
Change in Unrealized Appreciation (Depreciation) |
Purchases |
Sales |
Transfers into Level 3 |
Transfers out of Level 3 |
Balance as of September 30, 2012 |
|||||||||||||||||||||||||||
|
Equities |
|||||||||||||||||||||||||||||||||||
|
Latin America |
$ |
1,828 |
$ |
- |
$ |
160 |
$ |
- |
$ |
- |
$ |
- |
$ |
- |
$ |
1,988 |
|||||||||||||||||||
|
$ |
1,828 |
$ |
- |
$ |
160 |
$ |
- |
$ |
- |
$ |
- |
$ |
- |
$ |
1,988 |
||||||||||||||||||||
The information in the above reconciliation table represents fiscal year to date activity for any securities identified as using Level 3 inputs at either the beginning or the end of the current fiscal period.
The change in unrealized appreciation attributed to securities owned at September 30, 2012, which were valued using significant unobservable inputs (Level 3), amounted to $160.
The Fund does not hold any significant investments categorized as Level 3.
Certain common stock classified as Level 3 are valued at fair value, using a market approach, as determined in good faith under consistently applied procedures established by and under the general supervision of the Board. To determine fair value for these securities, for which no market exists, the Committee utilizes the valuation technique it deems most appropriate in the circumstances, using some unobservable inputs, which may include but are not limited to trades of similar securities, estimated earnings of the company, market multiples derived from a set of comparable companies, and the position of the security within the company's capital structure. Significant increases or decreases to any of these inputs could result in a significantly lower or higher fair value measurement. Generally, a change in estimated earnings of a company may result in a change to the comparable companies and market multiples utilized.
74
Columbia Acorn International Select
Portfolio Diversification (Unaudited)
At September 30, 2012, the Fund's portfolio investments as a percentage of net assets were diversified as follows:
|
Value (000) |
Percentage of Net Assets |
||||||||||
| > Energy & Minerals | |||||||||||
|
Mining |
$ |
71,741 |
17.7 |
||||||||
|
Non-Ferrous Metals |
5,083 |
1.2 |
|||||||||
|
Oil Services |
4,272 |
1.0 |
|||||||||
|
Oil & Gas Producers |
3,071 |
0.8 |
|||||||||
|
Agricultural Commodities |
1,988 |
0.5 |
|||||||||
|
86,155 |
21.2 |
||||||||||
| > Information | |||||||||||
|
Mobile Communications |
41,293 |
10.2 |
|||||||||
|
CATV |
14,172 |
3.5 |
|||||||||
|
Financial Processors |
12,355 |
3.0 |
|||||||||
|
Internet Related |
5,977 |
1.4 |
|||||||||
|
Business Software |
4,115 |
1.0 |
|||||||||
|
Telephone & Data Services |
1,467 |
0.4 |
|||||||||
|
Computer Hardware & Related Equipment |
618 |
0.2 |
|||||||||
|
79,997 |
19.7 |
||||||||||
| > Other Industries | |||||||||||
|
Real Estate |
71,192 |
17.5 |
|||||||||
| > Finance | |||||||||||
|
Insurance |
35,171 |
8.7 |
|||||||||
|
Banks |
17,545 |
4.3 |
|||||||||
|
Brokerage & Money Management |
4,120 |
1.0 |
|||||||||
|
56,836 |
14.0 |
||||||||||
| > Industrial Goods & Services | |||||||||||
|
Other Industrial Services |
18,199 |
4.5 |
|||||||||
|
Construction |
8,955 |
2.2 |
|||||||||
|
Industrial Materials & Specialty Chemicals |
7,684 |
1.9 |
|||||||||
|
Machinery |
4,301 |
1.0 |
|||||||||
|
39,139 |
9.6 |
||||||||||
|
Value (000) |
Percentage of Net Assets |
||||||||||
| > Consumer Goods & Services | |||||||||||
|
Retail |
$ |
12,414 |
3.1 |
||||||||
|
Food & Beverage |
4,390 |
1.1 |
|||||||||
|
Nondurables |
3,377 |
0.8 |
|||||||||
|
20,181 |
5.0 |
||||||||||
| > Health Care | |||||||||||
|
Pharmaceuticals |
7,146 |
1.8 |
|||||||||
|
Total Equities: |
360,646 |
88.8 |
|||||||||
|
Security Lending Collateral: |
12,212 |
3.0 |
|||||||||
|
Total Investments: |
372,858 |
91.8 |
|||||||||
|
Obligation to Return Collateral for Securities Loaned: |
(12,212 |
) |
(3.0 |
) |
|||||||
|
Cash and Other Assets Less Liabilities: |
45,468 |
11.2 |
|||||||||
|
Net Assets: |
$ |
406,114 |
100.0 |
||||||||
75
Columbia Acorn Select
Major Portfolio Changes in the Third Quarter (Unaudited)
|
Number of Shares |
|||||||||||
|
6/30/12 |
9/30/12 |
||||||||||
|
Purchases |
|||||||||||
|
Information |
|||||||||||
|
Ansys |
0 |
95,000 |
|||||||||
|
F5 Networks |
0 |
80,000 |
|||||||||
|
Consumer Goods & Services |
|||||||||||
|
IFM Investments (Century 21 China RE) - ADR (China) |
998,000 |
1,300,000 |
|||||||||
|
Energy & Minerals |
|||||||||||
|
Kirkland Lake Gold (Canada) |
835,000 |
925,000 |
|||||||||
|
Health Care |
|||||||||||
|
Cepheid |
0 |
320,000 |
|||||||||
|
Number of Shares |
|||||||||||
|
6/30/12 |
9/30/12 |
||||||||||
|
Sales |
|||||||||||
|
Industrial Goods & Services |
|||||||||||
|
Ametek |
2,037,000 |
1,860,000 |
|||||||||
|
Expeditors International of Washington |
475,000 |
230,000 |
|||||||||
|
Kennametal |
865,000 |
835,000 |
|||||||||
|
Pall |
625,000 |
605,000 |
|||||||||
|
Information |
|||||||||||
|
Amphenol |
560,000 |
540,000 |
|||||||||
|
Crown Castle International |
700,000 |
680,000 |
|||||||||
|
Sanmina-SCI |
3,026,600 |
2,415,000 |
|||||||||
|
SBA Communications |
735,000 |
455,000 |
|||||||||
|
VisionChina Media - ADR (China) |
5,427,200 |
0 |
|||||||||
|
Finance |
|||||||||||
|
CNO Financial Group |
7,140,000 |
6,315,000 |
|||||||||
|
Consumer Goods & Services |
|||||||||||
|
Coach |
555,000 |
515,000 |
|||||||||
|
Hertz |
4,495,000 |
4,020,000 |
|||||||||
|
lululemon athletica |
305,000 |
288,000 |
|||||||||
|
Energy & Minerals |
|||||||||||
|
Canadian Solar (China) |
3,301,200 |
1,774,561 |
|||||||||
|
Eacom Timber (Canada) |
8,440,000 |
0 |
|||||||||
|
Shamaran Petroleum (Iraq) |
30,473,500 |
27,100,000 |
|||||||||
|
Tuscany International Drilling (Colombia) |
13,613,200 |
11,705,300 |
|||||||||
|
Other Industries |
|||||||||||
|
Biomed Realty Trust |
1,435,000 |
1,375,000 |
|||||||||
|
Ryman Hospitality Properties |
930,000 |
900,000 |
|||||||||
|
Wisconsin Energy |
403,000 |
316,000 |
|||||||||
|
Health Care |
|||||||||||
|
Akorn |
1,310,000 |
0 |
|||||||||
|
NPS Pharmaceuticals |
2,340,000 |
1,875,000 |
|||||||||
76
Columbia Acorn Select
Statement of Investments (Unaudited), September 30, 2012
|
Number of Shares |
Value (000) |
||||||||||
|
Equities: 96.3% |
|||||||||||
|
Industrial Goods & Services 21.5% |
|||||||||||
| > Machinery 17.0% | |||||||||||
|
1,860,000 |
Ametek |
$ |
65,937 |
||||||||
|
Aerospace/Industrial Instruments |
|||||||||||
|
1,110,000 |
Donaldson |
38,528 |
|||||||||
|
Industrial Air Filtration |
|||||||||||
|
605,000 |
Pall |
38,412 |
|||||||||
|
Life Science, Water & Industrial Filtration |
|||||||||||
|
835,000 |
Kennametal |
30,962 |
|||||||||
|
Consumable Cutting Tools |
|||||||||||
|
220,000 |
Nordson |
12,896 |
|||||||||
|
Dispensing Systems for Adhesives & Coatings |
|||||||||||
|
186,735 |
|||||||||||
| > Outsourcing Services 2.2% | |||||||||||
|
955,000 |
Quanta Services (a) |
23,588 |
|||||||||
|
Electrical & Telecom Construction Services |
|||||||||||
|
23,588 |
|||||||||||
|
> Industrial Materials & Specialty Chemicals 1.5% |
|||||||||||
|
300,000 |
FMC Corporation |
16,614 |
|||||||||
|
Niche Specialty Chemicals |
|||||||||||
|
16,614 |
|||||||||||
| > Other Industrial Services 0.8% | |||||||||||
|
230,000 |
Expeditors International of Washington |
8,363 |
|||||||||
|
International Freight Forwarder |
|||||||||||
|
8,363 |
|||||||||||
|
Industrial Goods & Services: Total |
235,300 |
||||||||||
|
Information 19.9% |
|||||||||||
| > Mobile Communications 7.1% | |||||||||||
|
680,000 |
Crown Castle International (a) |
43,588 |
|||||||||
|
Communications Towers |
|||||||||||
|
455,000 |
SBA Communications (a) |
28,620 |
|||||||||
|
Communications Towers |
|||||||||||
|
12,000,000 |
Globalstar (a) |
5,520 |
|||||||||
|
Satellite Mobile Voice & Data Carrier |
|||||||||||
|
77,728 |
|||||||||||
| > Computer Services 3.1% | |||||||||||
|
3,300,000 |
WNS - ADR (India) (a)(b) |
33,792 |
|||||||||
|
Offshore BPO (Business Process Outsourcing) Services |
|||||||||||
|
33,792 |
|||||||||||
|
> Computer Hardware & Related Equipment 2.9% |
|||||||||||
|
540,000 |
Amphenol |
31,795 |
|||||||||
|
Electronic Connectors |
|||||||||||
|
31,795 |
|||||||||||
| > Contract Manufacturing 1.9% | |||||||||||
|
2,415,000 |
Sanmina-SCI (a) |
20,503 |
|||||||||
|
Electronic Manufacturing Services |
|||||||||||
|
20,503 |
|||||||||||
|
Number of Shares |
Value (000) |
||||||||||
| > Instrumentation 1.9% | |||||||||||
|
120,000 |
Mettler-Toledo International (a) |
$ |
20,489 |
||||||||
|
Laboratory Equipment |
|||||||||||
|
20,489 |
|||||||||||
| > Business Software 1.7% | |||||||||||
|
167,000 |
Concur Technologies (a) |
12,313 |
|||||||||
|
Web-enabled Cost & Expense Management Software |
|||||||||||
|
95,000 |
Ansys (a) |
6,973 |
|||||||||
|
Simulation Software for Engineers & Designers |
|||||||||||
|
19,286 |
|||||||||||
|
> Telecommunications Equipment 0.8% |
|||||||||||
|
80,000 |
F5 Networks (a) |
8,376 |
|||||||||
|
Internet Traffic Management Equipment |
|||||||||||
|
8,376 |
|||||||||||
|
> Semiconductors & Related Equipment 0.5% |
|||||||||||
|
1,140,000 |
Atmel (a) |
5,996 |
|||||||||
|
Microcontrollers, Radio Frequency & Memory Semiconductors |
|||||||||||
|
5,996 |
|||||||||||
|
Information: Total |
217,965 |
||||||||||
|
Finance 17.0% |
|||||||||||
| > Credit Cards 6.2% | |||||||||||
|
1,700,000 |
Discover Financial Services |
67,541 |
|||||||||
|
Credit Card Company |
|||||||||||
|
67,541 |
|||||||||||
| > Insurance 5.6% | |||||||||||
|
6,315,000 |
CNO Financial Group |
60,939 |
|||||||||
|
Life, Long-term Care & Medical Supplement Insurance |
|||||||||||
|
60,939 |
|||||||||||
| > Banks 3.7% | |||||||||||
|
520,000 |
City National |
26,785 |
|||||||||
|
Bank & Asset Manager |
|||||||||||
|
1,075,000 |
Associated Banc-Corp |
14,158 |
|||||||||
|
Midwest Bank |
|||||||||||
|
40,943 |
|||||||||||
|
> Brokerage & Money Management 1.5% |
|||||||||||
|
775,000 |
SEI Investments |
16,624 |
|||||||||
|
Mutual Fund Administration & Investment Management |
|||||||||||
|
16,624 |
|||||||||||
|
Finance: Total |
186,047 |
||||||||||
|
Consumer Goods & Services 15.4% |
|||||||||||
| > Travel 6.3% | |||||||||||
|
4,020,000 |
Hertz (a) |
55,194 |
|||||||||
|
Largest U.S. Rental Car Operator |
|||||||||||
|
235,000 |
Vail Resorts |
13,548 |
|||||||||
|
Ski Resort Operator & Developer |
|||||||||||
|
68,742 |
|||||||||||
77
Columbia Acorn Select
Statement of Investments (Unaudited), continued
|
Number of Shares |
Value (000) |
||||||||||
| > Retail 4.2% | |||||||||||
|
288,000 |
lululemon athletica (a) |
$ |
21,295 |
||||||||
|
Premium Active Apparel Retailer |
|||||||||||
|
455,000 |
Abercrombie & Fitch |
15,434 |
|||||||||
|
Teen Apparel Retailer |
|||||||||||
|
149,000 |
Tiffany & Co. |
9,220 |
|||||||||
|
Luxury Good Retailer |
|||||||||||
|
45,949 |
|||||||||||
| > Apparel 2.6% | |||||||||||
|
515,000 |
Coach |
28,850 |
|||||||||
|
Designer & Retailer of Branded Leather Accessories |
|||||||||||
|
28,850 |
|||||||||||
| > Casinos & Gaming 1.4% | |||||||||||
|
208,000,000 |
RexLot Holdings (China) |
15,771 |
|||||||||
|
Lottery Equipment Supplier in China |
|||||||||||
|
15,771 |
|||||||||||
| > Educational Services 0.7% | |||||||||||
|
223,000 |
ITT Educational Services (a)(c) |
7,187 |
|||||||||
|
Post-secondary Degree Services |
|||||||||||
|
7,187 |
|||||||||||
| > Other Consumer Services 0.2% | |||||||||||
|
1,300,000 |
IFM Investments (Century 21 China RE) - ADR (China) (a)(b) |
2,405 |
|||||||||
|
Provide Real Estate Services in China |
|||||||||||
|
2,405 |
|||||||||||
| > Food & Beverage —% | |||||||||||
|
1,500,000 |
GLG Life Tech (Canada) (a)(d) |
204 |
|||||||||
|
Produce an All-natural Sweetener Extracted from the Stevia Plant |
|||||||||||
|
204 |
|||||||||||
|
Consumer Goods & Services: Total |
169,108 |
||||||||||
|
Energy & Minerals 9.8% |
|||||||||||
| > Oil & Gas Producers 6.1% | |||||||||||
|
1,035,000 |
Pacific Rubiales Energy (Colombia) (c) |
24,730 |
|||||||||
|
Oil Production & Exploration in Colombia |
|||||||||||
|
29,187,400 |
Canacol (Colombia) (a) |
14,251 |
|||||||||
|
Oil Producer in South America |
|||||||||||
|
27,100,000 |
Shamaran Petroleum (Iraq) (a) |
11,991 |
|||||||||
|
Oil Exploration in Kurdistan |
|||||||||||
|
33,700,000 |
Petrodorado Energy (Colombia) (a)(b) |
6,170 |
|||||||||
|
17,144,000 |
Petrodorado Energy - Warrants (Colombia) (a)(e) |
84 |
|||||||||
|
Oil & Gas Exploration & Production in Colombia, Peru & Paraguay |
|||||||||||
|
24,000,000 |
Canadian Overseas Petroleum (United Kingdom) (a)(e) |
4,922 |
|||||||||
|
12,000,000 |
Canadian Overseas Petroleum - Warrants (United Kingdom) (a)(d)(e) |
314 |
|||||||||
|
Oil & Gas Exploration/Production in the North Sea |
|||||||||||
|
17,575,000 |
Petromanas (Canada) (a) |
3,575 |
|||||||||
|
Exploring for Oil in Albania |
|||||||||||
|
Number of Shares |
Value (000) |
||||||||||
|
1,455,000 |
Houston American Energy (a)(c) |
$ |
1,309 |
||||||||
|
Oil & Gas Exploration/Production in Colombia |
|||||||||||
|
67,346 |
|||||||||||
| > Agricultural Commodities 1.6% | |||||||||||
|
1,742,424 |
Union Agriculture Group (Uruguay) (a)(d)(e) |
18,069 |
|||||||||
|
Farmland Operator in Uruguay |
|||||||||||
|
18,069 |
|||||||||||
| > Mining 1.0% | |||||||||||
|
925,000 |
Kirkland Lake Gold (Canada) (a) |
11,216 |
|||||||||
|
Gold Mining |
|||||||||||
|
11,216 |
|||||||||||
| > Alternative Energy 0.8% | |||||||||||
|
1,774,561 |
Canadian Solar (China) (a)(c) |
4,951 |
|||||||||
|
Solar Cell & Module Manufacturer |
|||||||||||
|
2,200,000 |
Synthesis Energy Systems (China) (a) |
2,904 |
|||||||||
|
Owner/Operator of Gasification Plants |
|||||||||||
|
1,165,000 |
Real Goods Solar (a) |
816 |
|||||||||
|
Residential Solar Energy Installer |
|||||||||||
|
8,671 |
|||||||||||
| > Oil Services 0.3% | |||||||||||
|
11,705,300 |
Tuscany International Drilling (Colombia) (a) |
2,738 |
|||||||||
|
South America Based Drilling Rig Contractor |
|||||||||||
|
2,738 |
|||||||||||
|
Energy & Minerals: Total |
108,040 |
||||||||||
|
Other Industries 7.8% |
|||||||||||
| > Real Estate 6.7% | |||||||||||
|
900,000 |
Ryman Hospitality Properties |
35,577 |
|||||||||
|
Convention Hotels |
|||||||||||
|
1,375,000 |
Biomed Realty Trust |
25,740 |
|||||||||
|
Life Science-focused Office Buildings |
|||||||||||
|
475,000 |
DuPont Fabros Technology |
11,994 |
|||||||||
|
Technology-focused Office Buildings |
|||||||||||
|
73,311 |
|||||||||||
| > Regulated Utilities 1.1% | |||||||||||
|
316,000 |
Wisconsin Energy |
11,904 |
|||||||||
|
Wisconsin Utility |
|||||||||||
|
11,904 |
|||||||||||
|
Other Industries: Total |
85,215 |
||||||||||
|
Health Care 4.9% |
|||||||||||
| > Biotechnology & Drug Delivery 2.5% | |||||||||||
|
1,875,000 |
NPS Pharmaceuticals (a) |
17,344 |
|||||||||
|
Orphan Drugs & Healthy Royalties |
|||||||||||
|
383,000 |
Seattle Genetics (a)(c) |
10,322 |
|||||||||
|
Antibody-based Therapies for Cancer |
|||||||||||
|
27,666 |
|||||||||||
78
|
Number of Shares |
Value (000) |
||||||||||
| > Medical Supplies 2.4% | |||||||||||
|
190,000 |
Henry Schein (a) |
$ |
15,061 |
||||||||
|
Largest Distributor of Healthcare Products |
|||||||||||
|
320,000 |
Cepheid (a) |
11,043 |
|||||||||
|
Molecular Diagnostics |
|||||||||||
|
26,104 |
|||||||||||
|
Health Care: Total |
53,770 |
||||||||||
|
Total Equities: 96.3% (Cost: $735,905) |
1,055,445 |
||||||||||
|
Securities Lending Collateral 1.7% |
|||||||||||
|
18,753,371 |
Dreyfus Government Cash Management Fund (7 day yield of 0.01%) (f) |
18,753 |
|||||||||
|
Total Securities Lending Collateral: (Cost: $18,753) |
18,753 |
||||||||||
|
Total Investments: 98.0% (Cost: $754,658)(g)(h) |
1,074,198 |
(i) |
|||||||||
|
Obligation to Return Collateral for Securities Loaned: (1.7)% |
(18,753 |
) |
|||||||||
|
Cash and Other Assets Less Liabilities: 3.7% |
40,526 |
||||||||||
|
Total Net Assets: 100.0% |
$ |
1,095,971 |
|||||||||
ADR - American Depositary Receipts
> Notes to Statement of Investments (dollar values in thousands)
(a) Non-income producing security.
(b) An affiliated person of the Fund may include any company in which the Fund owns five percent or more of its outstanding voting shares. Holdings and transactions in these affiliated companies during the period ended September 30, 2012, are as follows:
|
Security |
Balance of Shares Held 12/31/11 |
Purchases/ Additions |
Sales/ Reductions |
Balance of Shares Held 9/30/12 |
Value |
Dividend |
|||||||||||||||||||||
|
Canacol* |
31,372,300 |
- |
2,184,900 |
29,187,400 |
$ |
14,251 |
$ |
- |
|||||||||||||||||||
|
Canadian Overseas Petroleum* |
24,000,000 |
- |
- |
24,000,000 |
4,922 |
- |
|||||||||||||||||||||
|
Canadian Solar* |
2,700,000 |
601,200 |
1,526,639 |
1,774,561 |
4,951 |
- |
|||||||||||||||||||||
|
Eacom Timber* |
36,000,000 |
- |
36,000,000 |
- |
- |
- |
|||||||||||||||||||||
|
GLG Life Tech* |
1,850,000 |
- |
350,000 |
1,500,000 |
204 |
- |
|||||||||||||||||||||
|
IFM Investments (Century 21 China RE) - ADR** |
3,430,000 |
302,000 |
2,432,000 |
1,300,000 |
2,405 |
- |
|||||||||||||||||||||
|
Petrodorado Energy |
34,700,000 |
- |
1,000,000 |
33,700,000 |
6,170 |
- |
|||||||||||||||||||||
|
Real Goods Solar* |
1,500,000 |
- |
335,000 |
1,165,000 |
816 |
- |
|||||||||||||||||||||
|
Sanmina-SCI* |
6,100,000 |
- |
3,685,000 |
2,415,000 |
20,503 |
- |
|||||||||||||||||||||
|
Synthesis Energy Systems* |
2,950,372 |
- |
750,372 |
2,200,000 |
2,904 |
- |
|||||||||||||||||||||
|
VisionChina Media - ADR* |
7,000,000 |
- |
7,000,000 |
- |
- |
- |
|||||||||||||||||||||
|
WNS - ADR |
4,254,230 |
- |
954,230 |
3,300,000 |
33,792 |
- |
|||||||||||||||||||||
|
Total of Affiliated Transactions |
155,856,902 |
903,200 |
56,218,141 |
100,541,961 |
$ |
90,918 |
$ |
- |
|||||||||||||||||||
* At September 30, 2012, the Fund owned less than five percent of the company's outstanding voting shares.
** Includes the effects of a 1:3 reverse stock split.
79
Columbia Acorn Select
Statement of Investments (Unaudited), continued
> Notes to Statement of Investments (dollar values in thousands)
The aggregate cost and value of these companies at September 30, 2012, were $60,067 and $42,367, respectively. Investments in affiliated companies represented 3.87% of the Fund's total net assets at September 30, 2012.
(c) All or a portion of this security was on loan at September 30, 2012. The total market value of securities on loan at September 30, 2012 was $17,719.
(d) Illiquid security.
(e) Denotes a restricted security, which is subject to restrictions on resale under federal securities laws. These securities are valued at fair value determined in good faith under consistently applied procedures established by the Board of Trustees. At September 30, 2012, the market value of these securities amounted to $23,389, which represented 2.13% of total net assets. Additional information on these securities is as follows:
|
Security |
Acquisition Dates |
Shares |
Cost |
Value |
|||||||||||||||
|
Union Agriculture Group |
12/8/10-6/27/12 |
1,742,424 |
$ |
20,000 |
$ |
18,069 |
|||||||||||||
|
Canadian Overseas Petroleum |
11/24/10 |
24,000,000 |
10,260 |
4,922 |
|||||||||||||||
|
Canadian Overseas Petroleum - Warrants |
11/24/10 |
12,000,000 |
1,502 |
314 |
|||||||||||||||
|
Petrodorado Energy - Warrants |
11/20/09 |
17,144,000 |
2,118 |
84 |
|||||||||||||||
|
$ |
33,880 |
$ |
23,389 |
||||||||||||||||
(f) Investment made with cash collateral received from securities lending activity.
(g) At September 30, 2012, for federal income tax purposes, the cost of investments was $754,658 and net unrealized appreciation was $319,540 consisting of gross unrealized appreciation of $407,538 and gross unrealized depreciation of $87,998.
(h) On September 30, 2012, the market value of foreign securities represented 14.42% of total net assets. The Fund's foreign portfolio was diversified as follows:
|
Country |
Value |
Percentage of Net Assets |
|||||||||
|
Colombia |
$ |
47,973 |
4.38 |
||||||||
|
India |
33,792 |
3.08 |
|||||||||
|
China |
26,031 |
2.37 |
|||||||||
|
Uruguay |
18,069 |
1.65 |
|||||||||
|
Canada |
14,995 |
1.37 |
|||||||||
|
Iraq |
11,991 |
1.09 |
|||||||||
|
United Kingdom |
5,236 |
0.48 |
|||||||||
|
Total Foreign Portfolio |
$ |
158,087 |
14.42 |
||||||||
(i) Securities are valued using policies described in the Notes to Financial Statements in the most recent shareholder report.
Fair Value Measurements
Various inputs are used in determining the value of the Fund's investments, following the input prioritization hierarchy established by GAAP. These inputs are summarized in the three broad levels listed below:
• Level 1 – quoted prices in active markets for identical securities
• Level 2 – prices determined using other significant observable inputs (including quoted prices for similar securities, interest rates, prepayment speeds, credit risk and others)
• Level 3 – prices determined using significant unobservable inputs where quoted prices or observable inputs are unavailable or less reliable (including management's own assumptions about the factors market participants would use in pricing an investment)
The inputs or methodology used for valuing securities are not necessarily an indication of the risk associated with investing in those securities.
Examples of the types of securities in which the Fund would typically invest and how they are classified within this hierarchy are as follows. Typical Level 1 securities include exchange traded domestic equities, mutual funds whose NAVs are published each day and exchange traded foreign equities that are not statistically fair valued. Typical Level 2 securities include exchange traded foreign equities that are statistically fair valued, forward foreign currency exchange contracts and short-term investments valued at amortized cost. Additionally, securities fair valued by the Valuation Committee (the Committee) of the Fund's Board of Trustees (the Board) that rely on significant observable inputs are also included in Level 2. Typical Level 3 securities include any security fair valued by the Committee that relies on significant unobservable inputs.
Under the direction of the Board, the Committee is responsible for carrying out the valuation procedures approved by the Board.
The Committee meets as necessary, and no less frequently than quarterly, to determine fair values for securities for which market quotations are not readily available or for which the investment manager believes that available market quotations are unreliable, and to review the continuing appropriateness of the current value of any security subject to the Trust's Portfolio Pricing Policy and the pricing procedures of the investment manager (the Policies). The Policies address, among other things: circumstances under which market quotations will be deemed readily available; selection of third party pricing vendors; appropriate pricing methodologies; events that require fair valuation and fair value techniques; and circumstances under which securities will be deemed to pose a potential for stale pricing, including when securities are illiquid, restricted, or in default. The Committee may also meet to discuss additional valuation matters, which may include review of back-testing results, review of time-sensitive information or approval of other valuation related actions, and to review the appropriateness of the Policies.
80
> Notes to Statement of Investments (dollar values in thousands)
For investments categorized as Level 3, the significant unobservable inputs used in the fair value measurement of the Funds' securities may include: (i) data specific to the issuer or comparable issuers, (ii) general market or specific sector news and (iii) quoted prices and specific or similar security transactions. The Committee considers this data and any changes from prior periods in order to assess the reasonableness of observable and unobservable inputs, any assumptions or internal models used to value those securities and changes in fair value. Significant changes in any of these factors could result in lower or higher fair value measurements. Various factors impact the frequency of monitoring (which may occur as often as daily), however the Committee may determine that changes to inputs, assumptions and models are not required with the same frequency.
The following table summarizes the inputs used, as of September 30, 2012, in valuing the Fund's assets:
|
Investment Type |
Quoted Prices (Level 1) |
Other Significant Observable Inputs (Level 2) |
Significant Unobservable Inputs (Level 3) |
Total |
|||||||||||||||
|
Equities |
|||||||||||||||||||
|
Industrial Goods & Services |
$ |
235,300 |
$ |
- |
$ |
- |
$ |
235,300 |
|||||||||||
|
Information |
217,965 |
- |
- |
217,965 |
|||||||||||||||
|
Finance |
186,047 |
- |
- |
186,047 |
|||||||||||||||
|
Consumer Goods & Services |
153,133 |
15,975 |
- |
169,108 |
|||||||||||||||
|
Energy & Minerals |
84,651 |
5,320 |
18,069 |
108,040 |
|||||||||||||||
|
Other Industries |
85,215 |
- |
- |
85,215 |
|||||||||||||||
|
Health Care |
53,770 |
- |
- |
53,770 |
|||||||||||||||
|
Total Equities |
1,016,081 |
21,295 |
18,069 |
1,055,445 |
|||||||||||||||
|
Total Securities Lending Collateral |
18,753 |
- |
- |
18,753 |
|||||||||||||||
|
Total Investments |
$ |
1,034,834 |
$ |
21,295 |
$ |
18,069 |
$ |
1,074,198 |
|||||||||||
The Fund's assets assigned to the Level 2 input category are generally valued using a market approach, in which a security's value is determined through its correlation to prices and information from observable market transactions for similar or identical assets. Foreign equities are generally valued at the last sale price on the foreign exchange or market on which they trade. The Fund may use a statistical fair valuation model, in accordance with the policy adopted by the Board, provided by an independent third party to value securities principally traded in foreign markets in order to adjust for possible stale pricing that may occur between the close of the foreign exchanges and the time for valuation. These models take into account available market data including intraday index, ADR, and ETF movements. Securities acquired via private placement that have a holding period or an extended settlement period are valued at a discount to the same shares that are trading freely on the market. These discounts are determined by the investment manager's experience with similar securities or situations. Factors may include, but are not limited to, trade volume, shares outstanding and stock price. Warrants which do not trade are valued as a percentage of the actively trading common stock using a model, based on Black Scholes. Securities which have halted or temporarily stopped trading are valued at the last sale and adjusted by a premium or a discount to account for the anticipated re-opening price. These adjustments are determined by the investment manager's experience with similar securities or situations.
The following table shows transfers between Level 1 and Level 2 of the fair value hierarchy:
|
Transfers In |
Transfers Out |
||||||||||||||
| Level 1 |
Level 2 |
Level 1 |
Level 2 |
||||||||||||
| $ |
- |
$ |
1,665 |
$ |
1,665 |
$ |
- |
||||||||
Financial assets were transferred from Level 1 to Level 2 as trading halted during the period.
The following table reconciles asset balances for the period ending September 30, 2012, in which significant observable and/or unobservable inputs (Level 3) were used in determining value:
|
Investments in Securities |
Balance as of December 31, 2011 |
Realized Gain/(Loss) |
Change in Unrealized Appreciation (Depreciation) |
Purchases |
Sales |
Transfers into Level 3 |
Transfers out of Level 3 |
Balance as of September 30, 2012 |
|||||||||||||||||||||||||||
|
Equities |
|||||||||||||||||||||||||||||||||||
|
Energy & Materials |
$ |
16,617 |
$ |
- |
$ |
1,452 |
$ |
- |
$ |
- |
$ |
- |
$ |
- |
$ |
18,069 |
|||||||||||||||||||
|
$ |
16,617 |
$ |
- |
$ |
1,452 |
$ |
- |
$ |
- |
$ |
- |
$ |
- |
$ |
18,069 |
||||||||||||||||||||
The information in the above reconciliation table represents fiscal year to date activity for any securities identified as using Level 3 inputs at either the beginning or the end of the current fiscal period.
The change in unrealized appreciation attributed to securities owned at September 30, 2012, which were valued using significant unobservable inputs (Level 3), amounted to $1,452.
81
Columbia Acorn Select
Statement of Investments (Unaudited), continued
> Notes to Statement of Investments (dollar values in thousands)
Quantitative information pertaining to Level 3 unobservable fair value measurements
|
Fair Value at 9/30/12 |
Valuation Technique(s) |
Unobservable Input(s) |
Range (Weighted Average) |
||||||||||||||||
|
Equities |
18,069 |
Market comparable companies |
Discount for lack of marketability |
-3 |
% to -18% (-8%) |
||||||||||||||
Certain common stock classified as Level 3 are valued at fair value, using a market approach, as determined in good faith under consistently applied procedures established by and under the general supervision of the Board. To determine fair value for these securities, for which no market exists, the Committee utilizes the valuation technique it deems most appropriate in the circumstances, using some unobservable inputs, which may include but are not limited to trades of similar securities, estimated earnings of the company, market multiples derived from a set of comparable companies, and the position of the security within the company's capital structure. Significant increases or decreases to any of these inputs could result in a significantly lower or higher fair value measurement. Generally, a change in estimated earnings of a company may result in a change to the comparable companies and market multiples utilized.
82
Columbia Thermostat Fund
Statement of Investments (Unaudited), September 30, 2012
|
Number of Shares |
Value (000) |
||||||||||
| > Affiliated Bond Funds: 58.8% | |||||||||||
|
20,114,242 |
Columbia Intermediate Bond Fund, Class I |
$ |
193,097 |
||||||||
|
11,739,324 |
Columbia Income Opportunities Fund, Class I |
116,102 |
|||||||||
|
6,599,493 |
Columbia U.S. Treasury Index Fund, Class I |
77,148 |
|||||||||
|
Total Bond Funds: (Cost: $378,305) |
386,347 |
||||||||||
| > Affiliated Stock Funds: 39.0% | |||||||||||
|
1,287,341 |
Columbia Acorn International, Class I |
51,288 |
|||||||||
|
3,391,313 |
Columbia Dividend Income Fund, Class I |
51,107 |
|||||||||
|
1,234,663 |
Columbia Acorn Fund, Class I (a) |
38,521 |
|||||||||
|
2,360,991 |
Columbia Contrarian Core Fund, Class I |
38,437 |
|||||||||
|
Number of Shares |
Value (000) |
||||||||||
|
969,968 |
Columbia Acorn Select, Class I (a) |
$ |
25,801 |
||||||||
|
1,827,988 |
Columbia Select Large Cap Growth Fund, Class I (a) |
25,701 |
|||||||||
|
1,768,460 |
Columbia Large Cap Enhanced Core Fund, Class I |
25,643 |
|||||||||
|
Total Stock Funds: (Cost: $219,359) |
256,498 |
||||||||||
|
Total Investments: 97.8% (Cost: $597,664)(b) |
642,845 |
(c) |
|||||||||
|
Cash and Other Assets Less Liabilities: 2.2% |
14,281 |
||||||||||
|
Total Net Assets: 100.0% |
$ |
657,126 |
|||||||||
> Notes to Statement of Investments (dollar values in thousands)
(a) Non-income producing security.
(b) At September 30, 2012, for federal income tax purposes, the cost of investments was $597,664 and net unrealized appreciation was $45,181 consisting of gross unrealized appreciation of $45,181 and gross unrealized depreciation of $0.
(c) Securities are valued using policies described in the Notes to Financial Statements in the most recent shareholder report.
Fair Value Measurements
Various inputs are used in determining the value of the Fund's investments, following the input prioritization hierarchy established by GAAP. These inputs are summarized in the three broad levels listed below:
• Level 1 – quoted prices in active markets for identical securities
• Level 2 – prices determined using other significant observable inputs (including quoted prices for similar securities, interest rates, prepayment speeds, credit risk and others)
• Level 3 – prices determined using significant unobservable inputs where quoted prices or observable inputs are unavailable or less reliable (including management's own assumptions about the factors market participants would use in pricing an investment)
The inputs or methodology used for valuing securities are not necessarily an indication of the risk associated with investing in those securities.
Examples of the types of securities in which the Fund would typically invest and how they are classified within this hierarchy are as follows. Typical Level 1 securities include mutual funds whose NAVs are published each day. Typical Level 2 securities include short-term investments valued at amortized cost.
Under the direction of the Board, the Committee is responsible for carrying out the valuation procedures approved by the Board.
The Committee meets as necessary, and no less frequently than quarterly, to determine fair values for securities for which market quotations are not readily available or for which the investment manager believes that available market quotations are unreliable, and to review the continuing appropriateness of the current value of any security subject to the Trust's Portfolio Pricing Policy and the pricing procedures of the investment manager (the Policies). The Policies address, among other things: circumstances under which market quotations will be deemed readily available; selection of third party pricing vendors; appropriate pricing methodologies; events that require fair valuation and fair value techniques; and circumstances under which securities will be deemed to pose a potential for stale pricing, including when securities are illiquid, restricted, or in default. The Committee may also meet to discuss additional valuation matters, which may include review of back-testing results, review of time-sensitive information or approval of other valuation related actions, and to review the appropriateness of the Policies.
The following table summarizes the inputs used, as of September 30, 2012, in valuing the Fund's assets:
|
Investment Type |
Quoted Prices (Level 1) |
Other Significant Observable Inputs (Level 2) |
Significant Unobservable Inputs (Level 3) |
Total |
|||||||||||||||
|
Total Bond Funds |
$ |
386,347 |
$ |
- |
$ |
- |
$ |
386,347 |
|||||||||||
|
Total Stock Funds |
256,498 |
- |
- |
256,498 |
|||||||||||||||
|
Total Investments |
$ |
642,845 |
$ |
- |
$ |
- |
$ |
642,845 |
|||||||||||
There were no transfers of financial assets between levels 1 and 2 during the period.
83
Columbia Acorn Emerging Markets Fund
Major Portfolio Changes in the Third Quarter (Unaudited)
|
Number of Shares |
|||||||||||
|
6/30/12 |
9/30/12 |
||||||||||
|
Purchases |
|||||||||||
|
Asia |
|||||||||||
| > Taiwan | |||||||||||
|
Advantech |
21,169 |
22,169 |
|||||||||
|
CTCI Corp |
73,762 |
81,762 |
|||||||||
|
Lung Yen |
18,500 |
20,500 |
|||||||||
|
PC Home |
18,151 |
19,307 |
|||||||||
|
Taiwan Hon Chuan |
23,689 |
29,689 |
|||||||||
| > Indonesia | |||||||||||
|
Archipelago Resources |
150,100 |
191,539 |
|||||||||
|
Mayora Indah |
13,600 |
28,000 |
|||||||||
|
MNC Skyvision |
0 |
364,000 |
|||||||||
| > Hong Kong | |||||||||||
|
AAC Technologies |
21,027 |
31,027 |
|||||||||
|
Melco Crown Entertainment - ADR |
5,650 |
8,650 |
|||||||||
| > India | |||||||||||
|
Adani Ports & Special Economic Zone |
24,700 |
46,045 |
|||||||||
|
Redington India |
37,794 |
61,400 |
|||||||||
|
Titan Industries |
14,240 |
16,080 |
|||||||||
|
TTK Prestige |
0 |
1,005 |
|||||||||
|
United Breweries |
8,635 |
12,216 |
|||||||||
| > China | |||||||||||
|
AMVIG Holdings |
111,475 |
212,000 |
|||||||||
|
NetEase.com - ADR |
977 |
1,549 |
|||||||||
|
RexLot Holdings |
1,196,000 |
1,575,000 |
|||||||||
| > Philippines | |||||||||||
|
SM Prime Holdings |
176,818 |
195,818 |
|||||||||
| > Thailand | |||||||||||
|
Home Product Center |
272,518 |
310,000 |
|||||||||
| > Mongolia | |||||||||||
|
Mongolian Mining |
140,500 |
255,100 |
|||||||||
| > Singapore | |||||||||||
|
Petra Foods |
19,900 |
32,000 |
|||||||||
|
Other Countries |
|||||||||||
| > South Africa | |||||||||||
|
Coronation Fund Managers |
45,226 |
47,172 |
|||||||||
|
Massmart Holdings |
3,497 |
5,847 |
|||||||||
| > Canada | |||||||||||
|
Americas Petrogas |
19,000 |
36,607 |
|||||||||
| > United States | |||||||||||
|
Textainer Group Holdings |
2,404 |
4,404 |
|||||||||
|
Number of Shares |
|||||||||||
|
6/30/12 |
9/30/12 |
||||||||||
|
Europe |
|||||||||||
| > Sweden | |||||||||||
|
Hexagon |
7,231 |
8,731 |
|||||||||
| > Kazakhstan | |||||||||||
|
Halyk Savings Bank of Kazakhstan - GDR |
19,400 |
23,202 |
|||||||||
| > Switzerland | |||||||||||
|
Dufry Group |
1,178 |
1,320 |
|||||||||
| > Czech Republic | |||||||||||
|
Komercni Banka |
474 |
574 |
|||||||||
| > France | |||||||||||
|
Compagnie Française de l'Afrique Occidentale |
325 |
1,333 |
|||||||||
|
Latin America |
|||||||||||
| > Brazil | |||||||||||
|
Arcos Dorados |
4,000 |
4,622 |
|||||||||
|
Localiza Rent A Car |
6,090 |
8,000 |
|||||||||
| > Mexico | |||||||||||
|
Genomma Lab International |
0 |
38,000 |
|||||||||
| > Chile | |||||||||||
|
Viña Concha y Toro |
18,900 |
34,333 |
|||||||||
84
|
Number of Shares |
|||||||||||
|
6/30/12 |
9/30/12 |
||||||||||
|
Sales |
|||||||||||
|
Asia |
|||||||||||
| > Taiwan | |||||||||||
|
MStar Semiconductor |
13,500 |
0 |
|||||||||
|
Tripod Technologies |
33,000 |
28,300 |
|||||||||
| > India | |||||||||||
|
Jain Irrigation Systems |
33,749 |
5,328 |
|||||||||
|
Other Countries |
|||||||||||
| > South Africa | |||||||||||
|
Adcock Ingram Holdings |
16,350 |
10,076 |
|||||||||
| > United States | |||||||||||
|
Hornbeck Offshore |
1,709 |
0 |
|||||||||
|
Europe |
|||||||||||
| > Sweden | |||||||||||
|
East Capital Explorer |
4,006 |
0 |
|||||||||
85
Columbia Acorn Emerging Markets Fund
Statement of Investments (Unaudited), September 30, 2012
|
Number of Shares |
Value (000) |
||||||||||
|
Equities: 95.8% |
|||||||||||
|
Asia 60.1% |
|||||||||||
| > Taiwan 15.5% | |||||||||||
|
81,762 |
CTCI Corp |
$ |
187 |
||||||||
|
International Engineering Firm |
|||||||||||
|
74,126 |
Far EasTone Telecom |
183 |
|||||||||
|
Taiwan's Third Largest Mobile Operator |
|||||||||||
|
19,307 |
PC Home |
109 |
|||||||||
|
Taiwanese Internet Retail Company |
|||||||||||
|
8,000 |
St. Shine Optical |
103 |
|||||||||
|
World's Leading Disposable Contact Lens Original Equipment Manufacturer (OEM) |
|||||||||||
|
15,576 |
Simplo Technology |
93 |
|||||||||
|
Battery Packs for Notebook & Tablet PCs |
|||||||||||
|
42,990 |
Chroma Ate |
90 |
|||||||||
|
Automatic Test Systems, Testing & Measurement Instruments |
|||||||||||
|
22,169 |
Advantech |
81 |
|||||||||
|
Industrial PC & Components |
|||||||||||
|
20,500 |
Lung Yen |
70 |
|||||||||
|
Funeral Services & Columbaria |
|||||||||||
|
28,300 |
Tripod Technologies |
69 |
|||||||||
|
Printed Circuit Boards (PCB) |
|||||||||||
|
15,735 |
Radiant Opto-Electronics |
68 |
|||||||||
|
LCD Back Light Units & Modules |
|||||||||||
|
29,689 |
Taiwan Hon Chuan |
65 |
|||||||||
|
Beverage Packaging (Bottles, Caps, Labels) Manufacturer |
|||||||||||
|
1,118 |
|||||||||||
| > Indonesia 12.9% | |||||||||||
|
537,609 |
Tower Bersama Infrastructure (a) |
250 |
|||||||||
|
Communications Towers |
|||||||||||
|
369,019 |
Ace Indonesia |
237 |
|||||||||
|
Home Improvement Retailer |
|||||||||||
|
191,539 |
Archipelago Resources (a) |
185 |
|||||||||
|
Gold Mining Projects in Indonesia, Vietnam & the Philippines |
|||||||||||
|
102,764 |
Surya Citra Media |
118 |
|||||||||
|
Free to Air TV in Indonesia |
|||||||||||
|
364,000 |
MNC Skyvision (a) |
79 |
|||||||||
|
Largest Satellite Pay TV Operator in Indonesia |
|||||||||||
|
28,000 |
Mayora Indah |
65 |
|||||||||
|
Consumer Branded Food Manufacturer |
|||||||||||
|
934 |
|||||||||||
| > Hong Kong 7.3% | |||||||||||
|
56,589 |
Lifestyle International |
117 |
|||||||||
|
Mid- to High-end Department Store Operator in Hong Kong & China |
|||||||||||
|
8,650 |
Melco Crown Entertainment - ADR (a) |
117 |
|||||||||
|
Macau Casino Operator |
|||||||||||
|
128,862 |
Melco International |
114 |
|||||||||
|
Macau Casino Operator |
|||||||||||
|
31,027 |
AAC Technologies |
111 |
|||||||||
|
Miniature Acoustic Components |
|||||||||||
|
99,799 |
Sasa International |
68 |
|||||||||
|
Cosmetics Retailer |
|||||||||||
|
527 |
|||||||||||
|
Number of Shares |
Value (000) |
||||||||||
| > India 7.1% | |||||||||||
|
12,216 |
United Breweries |
$ |
151 |
||||||||
|
India's Largest Brewer |
|||||||||||
|
46,045 |
Adani Ports & Special Economic Zone |
111 |
|||||||||
|
Indian West Coast Shipping Port |
|||||||||||
|
61,400 |
Redington India |
91 |
|||||||||
|
Supply Chain Solutions for IT & Mobile Handsets in Emerging Markets |
|||||||||||
|
16,080 |
Titan Industries |
80 |
|||||||||
|
Jewlery, Watches, Eyeglasses |
|||||||||||
|
1,005 |
TTK Prestige (a) |
71 |
|||||||||
|
Branded Cooking Equipment |
|||||||||||
|
5,328 |
Jain Irrigation Systems |
7 |
|||||||||
|
Agricultural Micro-irrigation Systems & Food Processing |
|||||||||||
|
511 |
|||||||||||
| > China 5.8% | |||||||||||
|
1,575,000 |
RexLot Holdings |
120 |
|||||||||
|
Lottery Equipment Supplier in China |
|||||||||||
|
61,151 |
Digital China |
97 |
|||||||||
|
IT Distribution & Systems Integration Services |
|||||||||||
|
1,549 |
NetEase.com - ADR (a) |
87 |
|||||||||
|
Chinese Online Gaming Services |
|||||||||||
|
212,000 |
AMVIG Holdings |
63 |
|||||||||
|
Chinese Tobacco Packaging Material Supplier |
|||||||||||
|
1,254 |
51job - ADR (a) |
56 |
|||||||||
|
Integrated Human Resource Services |
|||||||||||
|
423 |
|||||||||||
| > Cambodia 3.3% | |||||||||||
|
420,000 |
Nagacorp |
235 |
|||||||||
|
Casino/Entertainment Complex in Cambodia |
|||||||||||
|
235 |
|||||||||||
| > Philippines 2.9% | |||||||||||
|
44,487 |
Int'l Container Terminal |
75 |
|||||||||
|
Container Handling Terminals & Port Management |
|||||||||||
|
109,465 |
Manila Water Company |
71 |
|||||||||
|
Water Utility Company in Philippines |
|||||||||||
|
195,818 |
SM Prime Holdings |
67 |
|||||||||
|
Shopping Mall Operator |
|||||||||||
|
213 |
|||||||||||
| > Thailand 1.9% | |||||||||||
|
310,000 |
Home Product Center |
131 |
|||||||||
|
Home Improvement Retailer |
|||||||||||
|
7,700 |
Samui Airport Property Fund (a) |
4 |
|||||||||
|
Thai Airport Operator |
|||||||||||
|
135 |
|||||||||||
| > Mongolia 1.6% | |||||||||||
|
255,100 |
Mongolian Mining (a) |
116 |
|||||||||
|
Coking Coal Mining in Mongolia |
|||||||||||
|
116 |
|||||||||||
| > Singapore 0.9% | |||||||||||
|
32,000 |
Petra Foods |
64 |
|||||||||
|
Cocoa Processor & Chocolate Manufacturer |
|||||||||||
|
64 |
|||||||||||
86
|
Number of Shares |
Value (000) |
||||||||||
| > Japan 0.9% | |||||||||||
|
5,760 |
Kansai Paint |
$ |
64 |
||||||||
|
Paint Producer in Japan, India, China & Southeast Asia |
|||||||||||
|
64 |
|||||||||||
|
Asia: Total |
4,340 |
||||||||||
|
Other Countries 14.6% |
|||||||||||
| > South Africa 9.5% | |||||||||||
|
75,000 |
Rand Merchant Insurance |
194 |
|||||||||
|
Directly Sold Property & Casualty Insurance; Holdings in Other Insurers |
|||||||||||
|
47,172 |
Coronation Fund Managers |
176 |
|||||||||
|
South African Fund Manager |
|||||||||||
|
5,847 |
Massmart Holdings |
117 |
|||||||||
|
General Merchandise, Food & Home Improvement Stores; Wal-Mart Subsidiary |
|||||||||||
|
5,897 |
Mr. Price |
89 |
|||||||||
|
South African Retailer of Apparel, Household & Sporting Goods |
|||||||||||
|
10,076 |
Adcock Ingram Holdings |
72 |
|||||||||
|
Manufacturer of Pharmaceuticals & Medical Supplies |
|||||||||||
|
10,854 |
Northam Platinum |
39 |
|||||||||
|
Platinum Mining in South Africa |
|||||||||||
|
687 |
|||||||||||
| > Canada 2.6% | |||||||||||
|
7,801 |
Alliance Grain Traders |
114 |
|||||||||
|
Global Leader in Pulse Processing & Distribution |
|||||||||||
|
36,607 |
Americas Petrogas (a) |
69 |
|||||||||
|
Oil & Gas Exploration in Argentina, Potash in Peru |
|||||||||||
|
183 |
|||||||||||
| > United States 2.5% | |||||||||||
|
4,404 |
Textainer Group Holdings |
135 |
|||||||||
|
Top International Container Leasor |
|||||||||||
|
952 |
Atwood Oceanics (a) |
43 |
|||||||||
|
Offshore Drilling Contractor |
|||||||||||
|
178 |
|||||||||||
|
Other Countries: Total |
1,048 |
||||||||||
|
Europe 11.5% |
|||||||||||
| > Sweden 2.6% | |||||||||||
|
8,731 |
Hexagon |
187 |
|||||||||
|
Design, Measurement & Visualization Software & Equipment |
|||||||||||
|
187 |
|||||||||||
| > Kazakhstan 2.2% | |||||||||||
|
23,202 |
Halyk Savings Bank of Kazakhstan - GDR (a) |
163 |
|||||||||
|
Largest Retail Bank & Insurer in Kazakhstan |
|||||||||||
|
163 |
|||||||||||
| > Switzerland 2.2% | |||||||||||
|
1,320 |
Dufry Group (a) |
158 |
|||||||||
|
Operates Airport Duty Free & Duty Paid Shops |
|||||||||||
|
158 |
|||||||||||
|
Number of Shares |
Value (000) |
||||||||||
| > Czech Republic 1.6% | |||||||||||
|
574 |
Komercni Banka |
$ |
114 |
||||||||
|
Leading Czech Universal Bank |
|||||||||||
|
114 |
|||||||||||
| > Italy 1.1% | |||||||||||
|
7,631 |
Pirelli |
82 |
|||||||||
|
Global Tire Supplier |
|||||||||||
|
82 |
|||||||||||
| > Germany 0.9% | |||||||||||
|
962 |
Dürr |
64 |
|||||||||
|
Automotive Plant Engineering & Associated Capital Equipment |
|||||||||||
|
64 |
|||||||||||
| > France 0.9% | |||||||||||
|
1,333 |
Compagnie Française de l'Afrique Occidentale |
64 |
|||||||||
|
African Wholesaler & Distributor |
|||||||||||
|
64 |
|||||||||||
|
Europe: Total |
832 |
||||||||||
|
Latin America 9.6% |
|||||||||||
| > Brazil 5.1% | |||||||||||
|
8,000 |
Localiza Rent A Car |
139 |
|||||||||
|
Car Rental |
|||||||||||
|
4,200 |
Multiplus |
85 |
|||||||||
|
Loyalty Program Operator in Brazil |
|||||||||||
|
12,425 |
MRV Engenharia |
74 |
|||||||||
|
Brazilan Property Developer |
|||||||||||
|
4,622 |
Arcos Dorados (b) |
71 |
|||||||||
|
McDonald's Master Franchise for Latin America |
|||||||||||
|
369 |
|||||||||||
| > Mexico 3.2% | |||||||||||
|
1,808 |
Grupo Aeroportuario del Sureste - ADR |
160 |
|||||||||
|
Mexican Airport Operator |
|||||||||||
|
38,000 |
Genomma Lab International (a) |
74 |
|||||||||
|
Develops, Markets & Distributes Consumer Products |
|||||||||||
|
234 |
|||||||||||
| > Chile 1.0% | |||||||||||
|
34,333 |
Viña Concha y Toro |
71 |
|||||||||
|
Global Branded Wine Manufacturer |
|||||||||||
|
71 |
|||||||||||
| > Argentina 0.3% | |||||||||||
|
81,500 |
Madalena Ventures (a) |
20 |
|||||||||
|
Oil & Gas Exploration in Argentina |
|||||||||||
|
20 |
|||||||||||
|
Latin America: Total |
694 |
||||||||||
|
Total Equities: 95.8% (Cost: $6,241) |
6,914 |
||||||||||
87
Columbia Acorn Emerging Markets Fund
Statement of Investments (Unaudited), continued
|
Number of Shares |
Value (000) |
||||||||||
|
Securities Lending Collateral 0.7% |
|||||||||||
|
53,550 |
Dreyfus Government Cash Management Fund (7 day yield of 0.01%) (c) |
$ |
54 |
||||||||
|
Total Securities Lending Collateral: (Cost: $54) |
54 |
||||||||||
|
Total Investments: 96.5% (Cost: $6,295)(d)(e) |
6,968 |
(f) |
|||||||||
|
Obligation to Return Collateral for Securities Loaned: (0.7)% |
(54 |
) |
|||||||||
|
Cash and Other Assets Less Liabilities: 4.2% |
305 |
||||||||||
|
Total Net Assets: 100.0% |
$ |
7,219 |
|||||||||
ADR - American Depositary Receipts
GDR - Global Depositary Receipts
> Notes to Statement of Investments (dollar values in thousands)
(a) Non-income producing security.
(b) All or a portion of this security was on loan at September 30, 2012. The total market value of securities on loan at September 30, 2012 was $52.
(c) Investment made with cash collateral received from securities lending activity.
(d) At September 30, 2012, for federal income tax purposes, the cost of investments was $6,295 and net unrealized appreciation was $673 consisting of gross unrealized appreciation of $1,034 and gross unrealized depreciation of $361.
(e) On September 30, 2012, the Fund's total investments were denominated in currencies as follows:
|
Country |
Value |
Percentage of Net Assets |
|||||||||
|
Taiwan Dollar |
$ |
1,118 |
15.5 |
||||||||
|
Hong Kong Dollar |
1,042 |
14.4 |
|||||||||
|
United States Dollar |
831 |
11.5 |
|||||||||
|
Indonesian Rupiah |
749 |
10.4 |
|||||||||
|
South African Rand |
687 |
9.5 |
|||||||||
|
Indian Rupee |
511 |
7.1 |
|||||||||
|
Other currencies less |
|||||||||||
|
than 5% of total net assets |
1,976 |
27.4 |
|||||||||
|
Total Portfolio |
$ |
6,914 |
95.8 |
||||||||
(f) Securities are valued using policies described in the Notes to Financial Statements in the most recent shareholder report.
Fair Value Measurements
Various inputs are used in determining the value of the Fund's investments, following the input prioritization hierarchy established by GAAP. These inputs are summarized in the three broad levels listed below:
• Level 1 – quoted prices in active markets for identical securities
• Level 2 – prices determined using other significant observable inputs (including quoted prices for similar securities, interest rates, prepayment speeds, credit risk and others)
• Level 3 – prices determined using significant unobservable inputs where quoted prices or observable inputs are unavailable or less reliable (including management's own assumptions about the factors market participants would use in pricing an investment)
The inputs or methodology used for valuing securities are not necessarily an indication of the risk associated with investing in those securities.
Examples of the types of securities in which the Fund would typically invest and how they are classified within this hierarchy are as follows. Typical Level 1 securities include exchange traded domestic equities, mutual funds whose NAVs are published each day and exchange traded foreign equities that are not statistically fair valued. Typical Level 2 securities include exchange traded foreign equities that are statistically fair valued, forward foreign currency exchange contracts and short-term investments valued at amortized cost. Additionally, securities fair valued by the Valuation Committee (the Committee) of the Fund's Board of Trustees (the Board) that rely on significant observable inputs are also included in Level 2. Typical Level 3 securities include any security fair valued by the Committee that relies on significant unobservable inputs.
88
> Notes to Statement of Investments (dollar values in thousands)
Under the direction of the Board, the Committee is responsible for carrying out the valuation procedures approved by the Board.
The Committee meets as necessary, and no less frequently than quarterly, to determine fair values for securities for which market quotations are not readily available or for which the investment manager believes that available market quotations are unreliable, and to review the continuing appropriateness of the current value of any security subject to the Trust's Portfolio Pricing Policy and the pricing procedures of the investment manager (the Policies). The Policies address, among other things: circumstances under which market quotations will be deemed readily available; selection of third party pricing vendors; appropriate pricing methodologies; events that require fair valuation and fair value techniques; and circumstances under which securities will be deemed to pose a potential for stale pricing, including when securities are illiquid, restricted, or in default. The Committee may also meet to discuss additional valuation matters, which may include review of back-testing results, review of time-sensitive information or approval of other valuation related actions, and to review the appropriateness of the Policies.
For investments categorized as Level 3, the significant unobservable inputs used in the fair value measurement of the Funds' securities may include: (i) data specific to the issuer or comparable issuers, (ii) general market or specific sector news and (iii) quoted prices and specific or similar security transactions. The Committee considers this data and any changes from prior periods in order to assess the reasonableness of observable and unobservable inputs, any assumptions or internal models used to value those securities and changes in fair value. Significant changes in any of these factors could result in lower or higher fair value measurements. Various factors impact the frequency of monitoring (which may occur as often as daily), however the Committee may determine that changes to inputs, assumptions and models are not required with the same frequency.
The following table summarizes the inputs used, as of September 30, 2012, in valuing the Fund's assets:
|
Investment Type |
Quoted Prices (Level 1) |
Other Significant Observable Inputs (Level 2) |
Significant Unobservable Inputs (Level 3) |
Total |
|||||||||||||||
|
Equities |
|||||||||||||||||||
|
Asia |
$ |
260 |
$ |
4,080 |
$ |
- |
$ |
4,340 |
|||||||||||
|
Other Countries |
361 |
687 |
- |
1,048 |
|||||||||||||||
|
Europe |
- |
832 |
- |
832 |
|||||||||||||||
|
Latin America |
694 |
- |
- |
694 |
|||||||||||||||
|
Total Equities |
1,315 |
5,599 |
- |
6,914 |
|||||||||||||||
|
Total Securities Lending Collateral |
54 |
- |
- |
54 |
|||||||||||||||
|
Total Investments |
$ |
1,369 |
$ |
5,599 |
$ |
- |
$ |
6,968 |
|||||||||||
The Fund's assets assigned to the Level 2 input category are generally valued using a market approach, in which a security's value is determined through its correlation to prices and information from observable market transactions for similar or identical assets. Foreign equities are generally valued at the last sale price on the foreign exchange or market on which they trade. The Fund may use a statistical fair valuation model, in accordance with the policy adopted by the Board, provided by an independent third party to value securities principally traded in foreign markets in order to adjust for possible stale pricing that may occur between the close of the foreign exchanges and the time for valuation. These models take into account available market data including intraday index, ADR, and ETF movements.
There were no transfers of financial assets between levels 1 and 2 during the period.
89
Columbia Acorn Emerging Markets Fund
Portfolio Diversification (Unaudited)
At September 30, 2012, the Fund's portfolio investments as a percentage of net assets were diversified as follows:
|
Value (000) |
Percentage of Net Assets |
||||||||||
| > Consumer Goods & Services | |||||||||||
|
Retail |
$ |
990 |
13.8 |
||||||||
|
Casinos & Gaming |
586 |
8.1 |
|||||||||
|
Food & Beverage |
573 |
8.0 |
|||||||||
|
Other Consumer Services |
243 |
3.4 |
|||||||||
|
Other Durable Goods |
153 |
2.1 |
|||||||||
|
Travel |
139 |
1.9 |
|||||||||
|
Consumer Goods Distribution |
91 |
1.3 |
|||||||||
|
Nondurables |
73 |
1.0 |
|||||||||
|
2,848 |
39.6 |
||||||||||
| > Information | |||||||||||
|
Mobile Communications |
432 |
6.1 |
|||||||||
|
Computer Hardware & Related Equipment |
422 |
5.8 |
|||||||||
|
Business Software |
187 |
2.6 |
|||||||||
|
TV Broadcasting |
118 |
1.6 |
|||||||||
|
Electronics Distribution |
97 |
1.3 |
|||||||||
|
Instrumentation |
90 |
1.2 |
|||||||||
|
Internet Related |
87 |
1.2 |
|||||||||
|
Satellite Broadcasting & Services |
79 |
1.1 |
|||||||||
|
1,512 |
20.9 |
||||||||||
| > Finance | |||||||||||
|
Banks |
276 |
3.8 |
|||||||||
|
Insurance |
194 |
2.7 |
|||||||||
|
Brokerage & Money Management |
176 |
2.4 |
|||||||||
|
Finance Companies |
134 |
1.9 |
|||||||||
|
780 |
10.8 |
||||||||||
| > Industrial Goods & Services | |||||||||||
|
Industrial Materials & Specialty Chemicals |
192 |
2.6 |
|||||||||
|
Construction |
187 |
2.6 |
|||||||||
|
Other Industrial Services |
186 |
2.6 |
|||||||||
|
Machinery |
71 |
1.0 |
|||||||||
|
636 |
8.8 |
||||||||||
| > Energy & Minerals | |||||||||||
|
Mining |
341 |
4.7 |
|||||||||
|
Agricultural Commodities |
115 |
1.6 |
|||||||||
|
Oil & Gas Producers |
89 |
1.2 |
|||||||||
|
Oil Services |
43 |
0.6 |
|||||||||
|
588 |
8.1 |
||||||||||
| > Other Industries | |||||||||||
|
Transportation |
164 |
2.3 |
|||||||||
|
Real Estate |
140 |
1.9 |
|||||||||
|
Regulated Utilities |
71 |
1.0 |
|||||||||
|
375 |
5.2 |
||||||||||
|
Value (000) |
Percentage of Net Assets |
||||||||||
| > Health Care | |||||||||||
|
Medical Supplies |
$ |
103 |
1.4 |
||||||||
|
Pharmaceuticals |
72 |
1.0 |
|||||||||
|
175 |
2.4 |
||||||||||
|
Total Equities: |
6,914 |
95.8 |
|||||||||
|
Security Lending Collateral: |
54 |
0.7 |
|||||||||
|
Total Investments: |
6,968 |
96.5 |
|||||||||
|
Obligation to Return Collateral for Securities Loaned: |
(54 |
) |
(0.7 |
) |
|||||||
|
Cash and Other Assets Less Liabilities: |
305 |
4.2 |
|||||||||
|
Net Assets: |
$ |
7,219 |
100.0 |
||||||||
90
Columbia Acorn European Fund
Major Portfolio Changes in the Third Quarter (Unaudited)
|
Number of Shares |
|||||||||||
|
6/30/12 |
9/30/12 |
||||||||||
|
Purchases |
|||||||||||
|
Europe |
|||||||||||
| > United Kingdom | |||||||||||
|
Asos |
0 |
1,100 |
|||||||||
|
Domino's Pizza UK & Ireland |
5,090 |
6,990 |
|||||||||
|
Elementis |
0 |
5,768 |
|||||||||
|
Ocado |
0 |
25,000 |
|||||||||
|
Rightmove |
1,400 |
2,000 |
|||||||||
|
Spirax Sarco |
71 |
700 |
|||||||||
|
WH Smith |
2,000 |
3,500 |
|||||||||
| > France | |||||||||||
| 1000 mercis |
1,200 |
1,600 |
|||||||||
|
Neopost |
400 |
600 |
|||||||||
|
Norbert Dentressangle |
360 |
516 |
|||||||||
| > Netherlands | |||||||||||
|
Aalberts Industries |
2,785 |
3,400 |
|||||||||
|
TKH Group |
917 |
1,517 |
|||||||||
|
UNIT4 |
1,730 |
2,011 |
|||||||||
| > Germany | |||||||||||
|
NORMA Group |
0 |
980 |
|||||||||
|
Pfeiffer Vacuum |
0 |
147 |
|||||||||
| > Switzerland | |||||||||||
|
Dufry Group |
310 |
480 |
|||||||||
| > Sweden | |||||||||||
|
Hexagon |
3,070 |
3,370 |
|||||||||
| > Italy | |||||||||||
|
Fiat |
0 |
4,400 |
|||||||||
|
Geox |
11,000 |
13,500 |
|||||||||
| > Norway | |||||||||||
|
Atea |
3,710 |
5,310 |
|||||||||
| > Finland | |||||||||||
|
Stockmann |
0 |
1,000 |
|||||||||
|
Other Countries |
|||||||||||
| > United States | |||||||||||
|
Velti |
1,300 |
2,550 |
|||||||||
|
Number of Shares |
|||||||||||
|
6/30/12 |
9/30/12 |
||||||||||
|
Sales |
|||||||||||
|
Europe |
|||||||||||
| > United Kingdom | |||||||||||
|
Serco |
3,480 |
0 |
|||||||||
| > Netherlands | |||||||||||
|
Koninklijke TenCate |
1,412 |
975 |
|||||||||
| > Germany | |||||||||||
|
Rheinmetall |
360 |
0 |
|||||||||
| > Russia | |||||||||||
|
Yandex |
1,900 |
1,000 |
|||||||||
|
Mail.ru - GDR |
600 |
0 |
|||||||||
| > Ireland | |||||||||||
|
Paddy Power |
300 |
85 |
|||||||||
|
United Drug |
7,300 |
0 |
|||||||||
| > Greece | |||||||||||
|
Intralot |
13,330 |
0 |
|||||||||
91
Columbia Acorn European Fund
Statement of Investments (Unaudited), September 30, 2012
|
Number of Shares |
Value (000) |
||||||||||
|
Equities: 92.2% |
|||||||||||
|
Europe 88.8% |
|||||||||||
| > United Kingdom 20.4% | |||||||||||
|
22,220 |
Charles Taylor |
$ |
65 |
||||||||
|
Insurance Services |
|||||||||||
|
6,990 |
Domino's Pizza UK & Ireland |
60 |
|||||||||
|
Pizza Delivery in the UK, Ireland & Germany |
|||||||||||
|
2,000 |
Rightmove |
51 |
|||||||||
|
Internet Real Estate Listings |
|||||||||||
|
1,100 |
Asos |
39 |
|||||||||
|
Internet-based Retailer to Hipsters Up to Age 35 |
|||||||||||
|
3,500 |
WH Smith |
36 |
|||||||||
|
Newsprint, Books & General Stationery Retailer |
|||||||||||
|
3,180 |
Shaftesbury |
27 |
|||||||||
|
London Prime Retail REIT |
|||||||||||
|
700 |
Aggreko |
26 |
|||||||||
|
Temporary Power & Temperature Control Services |
|||||||||||
|
25,000 |
Ocado |
26 |
|||||||||
|
Leading Online Grocery Retailer |
|||||||||||
|
3,200 |
Greggs |
26 |
|||||||||
|
Bakery |
|||||||||||
|
660 |
Rotork |
24 |
|||||||||
|
Valve Actuators for Oil & Water Pipelines |
|||||||||||
|
7,480 |
BBA Aviation |
24 |
|||||||||
|
Aviation Support Services |
|||||||||||
|
700 |
Spirax Sarco |
24 |
|||||||||
|
Steam Systems for Manufacturing & Process Industries |
|||||||||||
|
1,827 |
JLT Group |
22 |
|||||||||
|
International Business Insurance Broker |
|||||||||||
|
500 |
Intertek Group |
22 |
|||||||||
|
Testing, Inspection, Certification Services |
|||||||||||
|
5,768 |
Elementis |
22 |
|||||||||
|
Clay-based Additives |
|||||||||||
|
3,190 |
Abcam |
21 |
|||||||||
|
Online Sales of Antibodies |
|||||||||||
|
2,315 |
Premier Oil (a) |
13 |
|||||||||
|
Oil & Gas Producer in Europe, Pakistan & Asia |
|||||||||||
|
528 |
|||||||||||
| > France 13.9% | |||||||||||
|
570 |
Eurofins Scientific |
81 |
|||||||||
|
Food, Pharmaceuticals & Materials Screening & Testing |
|||||||||||
|
900 |
Gemalto |
79 |
|||||||||
|
Digital Security Solutions |
|||||||||||
|
1,600 |
1000 mercis |
77 |
|||||||||
|
Interactive Advertising & Marketing |
|||||||||||
|
516 |
Norbert Dentressangle |
35 |
|||||||||
|
Leading European Logistics & Transport Group |
|||||||||||
|
600 |
Neopost |
33 |
|||||||||
|
Postage Meter Machines |
|||||||||||
|
1,300 |
Saft |
30 |
|||||||||
|
Niche Battery Manufacturer |
|||||||||||
|
9,900 |
Hi-Media (a) |
25 |
|||||||||
|
Online Advertiser in Europe |
|||||||||||
|
360 |
|||||||||||
|
Number of Shares |
Value (000) |
||||||||||
| > Netherlands 11.8% | |||||||||||
|
3,400 |
Aalberts Industries |
$ |
61 |
||||||||
|
Flow Control & Heat Treatment |
|||||||||||
|
2,011 |
UNIT4 |
54 |
|||||||||
|
Business Software Development |
|||||||||||
|
1,499 |
Imtech |
40 |
|||||||||
|
Electromechanical & Information Communications Technology Installation & Maintenance |
|||||||||||
|
1,680 |
Arcadis |
36 |
|||||||||
|
Engineering Consultants |
|||||||||||
|
1,517 |
TKH Group |
32 |
|||||||||
|
Dutch Industrial Conglomerate |
|||||||||||
|
400 |
Vopak |
28 |
|||||||||
|
World's Largest Operator of Petroleum & Chemical Storage Terminals |
|||||||||||
|
230 |
Core Labs |
28 |
|||||||||
|
Oil & Gas Reservoir Consulting |
|||||||||||
|
975 |
Koninklijke TenCate |
22 |
|||||||||
|
Advanced Textiles & Industrial Fabrics |
|||||||||||
|
568 |
BinckBank |
4 |
|||||||||
|
Discount Brokerage & Asset Management |
|||||||||||
|
305 |
|||||||||||
| > Germany 10.3% | |||||||||||
|
3,250 |
Wirecard |
75 |
|||||||||
|
Online Payment Processing & Risk Management |
|||||||||||
|
170 |
Rational |
43 |
|||||||||
|
Commercial Ovens |
|||||||||||
|
575 |
Dürr |
38 |
|||||||||
|
Automotive Plant Engineering & Associated Capital Equipment |
|||||||||||
|
375 |
Bertrandt |
28 |
|||||||||
|
Outsourced Engineering |
|||||||||||
|
980 |
NORMA Group |
26 |
|||||||||
|
Clamps for Automotive & Industrial Applications |
|||||||||||
|
500 |
Stratec Biomedical Systems |
23 |
|||||||||
|
Diagnostic Instrumentation |
|||||||||||
|
590 |
CTS Eventim |
17 |
|||||||||
|
Event Ticket Sales |
|||||||||||
|
147 |
Pfeiffer Vacuum |
16 |
|||||||||
|
Vacuum Pumps |
|||||||||||
|
266 |
|||||||||||
| > Switzerland 10.0% | |||||||||||
|
345 |
Geberit |
75 |
|||||||||
|
Plumbing Supplies |
|||||||||||
|
290 |
Partners Group |
60 |
|||||||||
|
Private Markets Asset Management |
|||||||||||
|
480 |
Dufry Group (a) |
57 |
|||||||||
|
Operates Airport Duty Free & Duty Paid Shops |
|||||||||||
|
21 |
Sika |
43 |
|||||||||
|
Chemicals for Construction & Industrial Applications |
|||||||||||
|
420 |
Zehnder |
25 |
|||||||||
|
Radiators & Heat Recovery Ventilation Systems |
|||||||||||
|
260 |
|||||||||||
92
|
Number of Shares |
Value (000) |
||||||||||
| > Sweden 5.9% | |||||||||||
|
3,370 |
Hexagon |
$ |
72 |
||||||||
|
Design, Measurement & Visualization Software & Equipment |
|||||||||||
|
4,570 |
Sweco |
48 |
|||||||||
|
Engineering Consultants |
|||||||||||
|
1,200 |
Unibet |
34 |
|||||||||
|
European Online Gaming Operator |
|||||||||||
|
154 |
|||||||||||
| > Italy 5.0% | |||||||||||
|
13,500 |
Geox |
36 |
|||||||||
|
Apparel & Shoe Maker |
|||||||||||
|
300 |
Tod's |
32 |
|||||||||
|
Leather Shoes & Bags |
|||||||||||
|
2,800 |
Pirelli |
30 |
|||||||||
|
Global Tire Supplier |
|||||||||||
|
4,400 |
Fiat |
24 |
|||||||||
|
Leading Automotive Manufacturer in the U.S., Latin America & Italy |
|||||||||||
|
8,066 |
CIR |
9 |
|||||||||
|
Italian Holding Company |
|||||||||||
|
131 |
|||||||||||
| > Norway 2.0% | |||||||||||
|
5,310 |
Atea |
52 |
|||||||||
|
Leading Nordic IT Hardware/Software Reseller & Installation Company |
|||||||||||
|
52 |
|||||||||||
| > Iceland 1.8% | |||||||||||
|
43,750 |
Marel |
47 |
|||||||||
|
Largest Manufacturer of Poultry & Fish Processing Equipment |
|||||||||||
|
47 |
|||||||||||
| > Portugal 1.4% | |||||||||||
|
13,480 |
Redes Energéticas Nacionais |
35 |
|||||||||
|
Portuguese Power Transmission & Gas Transportation |
|||||||||||
|
35 |
|||||||||||
| > Belgium 1.4% | |||||||||||
|
630 |
EVS Broadcast Equipment |
35 |
|||||||||
|
Digital Live Mobile Production Software & Systems |
|||||||||||
|
35 |
|||||||||||
| > Poland 1.2% | |||||||||||
|
4,000 |
FX Energy (a) |
30 |
|||||||||
|
Oil & Gas Producer in Poland |
|||||||||||
|
30 |
|||||||||||
| > Czech Republic 1.1% | |||||||||||
|
140 |
Komercni Banka |
28 |
|||||||||
|
Leading Czech Universal Bank |
|||||||||||
|
28 |
|||||||||||
| > Russia 0.9% | |||||||||||
|
1,000 |
Yandex (a) |
24 |
|||||||||
|
Search Engine for Russian & Turkish Languages |
|||||||||||
|
24 |
|||||||||||
|
Number of Shares |
Value (000) |
||||||||||
| > Denmark 0.8% | |||||||||||
|
400 |
Solar |
$ |
22 |
||||||||
|
Technical Wholesaler of Electrical, Plumbing & HVAC Equipment |
|||||||||||
|
22 |
|||||||||||
| > Finland 0.7% | |||||||||||
|
1,000 |
Stockmann |
19 |
|||||||||
|
Department Store & Fashion Retailer in Scandinavia & Russia |
|||||||||||
|
19 |
|||||||||||
| > Ireland 0.2% | |||||||||||
|
85 |
Paddy Power |
6 |
|||||||||
|
Irish Betting Services |
|||||||||||
|
6 |
|||||||||||
|
Europe: Total |
2,302 |
||||||||||
|
Other Countries 2.1% |
|||||||||||
| > Canada 1.3% | |||||||||||
|
2,270 |
Alliance Grain Traders |
34 |
|||||||||
|
Global Leader in Pulse Processing & Distribution |
|||||||||||
|
34 |
|||||||||||
| > United States 0.8% | |||||||||||
|
2,550 |
Velti (a) |
21 |
|||||||||
|
Mobile Marketing Software Platform |
|||||||||||
|
21 |
|||||||||||
|
Other Countries: Total |
55 |
||||||||||
|
Asia 1.3% |
|||||||||||
| > Hong Kong 1.3% | |||||||||||
|
13,000 |
L'Occitane International |
34 |
|||||||||
|
Skin Care & Cosmetics Producer |
|||||||||||
|
34 |
|||||||||||
|
Asia: Total |
34 |
||||||||||
|
Total Equities: 92.2% (Cost: $2,157) |
2,391 |
||||||||||
|
Total Investments: 92.2% (Cost: $2,157)(b)(c) |
2,391 |
(d) |
|||||||||
|
Cash and Other Assets Less Liabilities: 7.8% |
201 |
||||||||||
|
Total Net Assets: 100.0% |
$ |
2,592 |
|||||||||
REIT - Real Estate Investment Trust
93
Columbia Acorn European Fund
Statement of Investments (Unaudited), continued
> Notes to Statement of Investments (dollar values in thousands)
(a) Non-income producing security.
(b) At September 30, 2012, for federal income tax purposes, the cost of investments was $2,157 and net unrealized appreciation was $234 consisting of gross unrealized appreciation of $306 and gross unrealized depreciation of $72.
(c) On September 30, 2012, the Fund's total investments were denominated in currencies as follows:
|
Country |
Value |
Percentage of Net Assets |
|||||||||
|
Euro |
$ |
1,128 |
43.5 |
||||||||
|
British Pound |
528 |
20.4 |
|||||||||
|
Swiss Franc |
261 |
10.1 |
|||||||||
|
Swedish Krona |
154 |
5.9 |
|||||||||
|
Other currencies less than 5% of total net assets |
320 |
12.3 |
|||||||||
|
Total Portfolio |
$ |
2,391 |
92.2 |
||||||||
(d) Securities are valued using policies described in the Notes to Financial Statements in the most recent shareholder report.
Fair Value Measurements
Various inputs are used in determining the value of the Fund's investments, following the input prioritization hierarchy established by GAAP. These inputs are summarized in the three broad levels listed below:
• Level 1 – quoted prices in active markets for identical securities
• Level 2 – prices determined using other significant observable inputs (including quoted prices for similar securities, interest rates, prepayment speeds, credit risk and others)
• Level 3 – prices determined using significant unobservable inputs where quoted prices or observable inputs are unavailable or less reliable (including management's own assumptions about the factors market participants would use in pricing an investment)
The inputs or methodology used for valuing securities are not necessarily an indication of the risk associated with investing in those securities.
Examples of the types of securities in which the Fund would typically invest and how they are classified within this hierarchy are as follows. Typical Level 1 securities include exchange traded domestic equities, mutual funds whose NAVs are published each day and exchange traded foreign equities that are not statistically fair valued. Typical Level 2 securities include exchange traded foreign equities that are statistically fair valued, forward foreign currency exchange contracts and short-term investments valued at amortized cost. Additionally, securities fair valued by the Valuation Committee (the Committee) of the Fund's Board of Trustees (the Board) that rely on significant observable inputs are also included in Level 2. Typical Level 3 securities include any security fair valued by the Committee that relies on significant unobservable inputs.
Under the direction of the Board, the Committee is responsible for carrying out the valuation procedures approved by the Board.
The Committee meets as necessary, and no less frequently than quarterly, to determine fair values for securities for which market quotations are not readily available or for which the investment manager believes that available market quotations are unreliable, and to review the continuing appropriateness of the current value of any security subject to the Trust's Portfolio Pricing Policy and the pricing procedures of the investment manager (the Policies). The Policies address, among other things: circumstances under which market quotations will be deemed readily available; selection of third party pricing vendors; appropriate pricing methodologies; events that require fair valuation and fair value techniques; and circumstances under which securities will be deemed to pose a potential for stale pricing, including when securities are illiquid, restricted, or in default. The Committee may also meet to discuss additional valuation matters, which may include review of back-testing results, review of time-sensitive information or approval of other valuation related actions, and to review the appropriateness of the Policies.
For investments categorized as Level 3, the significant unobservable inputs used in the fair value measurement of the Funds' securities may include: (i) data specific to the issuer or comparable issuers, (ii) general market or specific sector news and (iii) quoted prices and specific or similar security transactions. The Committee considers this data and any changes from prior periods in order to assess the reasonableness of observable and unobservable inputs, any assumptions or internal models used to value those securities and changes in fair value. Significant changes in any of these factors could result in lower or higher fair value measurements. Various factors impact the frequency of monitoring (which may occur as often as daily), however the Committee may determine that changes to inputs, assumptions and models are not required with the same frequency.
94
> Notes to Statement of Investments (dollar values in thousands)
The following table summarizes the inputs used, as of September 30, 2012, in valuing the Fund's assets:
|
Investment Type |
Quoted Prices (Level 1) |
Other Significant Observable Inputs (Level 2) |
Significant Unobservable Inputs (Level 3) |
Total |
|||||||||||||||
|
Equities |
|||||||||||||||||||
|
Europe |
$ |
82 |
$ |
2,220 |
$ |
- |
$ |
2,302 |
|||||||||||
|
Other Countries |
55 |
- |
- |
55 |
|||||||||||||||
|
Asia |
- |
34 |
- |
34 |
|||||||||||||||
|
Total Equities |
137 |
2,254 |
- |
2,391 |
|||||||||||||||
|
Total Investments |
$ |
137 |
$ |
2,254 |
$ |
- |
$ |
2,391 |
|||||||||||
The Fund's assets assigned to the Level 2 input category are generally valued using a market approach, in which a security's value is determined through its correlation to prices and information from observable market transactions for similar or identical assets. Foreign equities are generally valued at the last sale price on the foreign exchange or market on which they trade. The Fund may use a statistical fair valuation model, in accordance with the policy adopted by the Board, provided by an independent third party to value securities principally traded in foreign markets in order to adjust for possible stale pricing that may occur between the close of the foreign exchanges and the time for valuation. These models take into account available market data including intraday index, ADR, and ETF movements.
There were no transfers of financial assets between levels 1 and 2 during the period.
95
Columbia Acorn European Fund
Portfolio Diversification (Unaudited)
At September 30, 2012, the Fund's portfolio investments as a percentage of net assets were diversified as follows:
|
Value (000) |
Percentage of Net Assets |
||||||||||
| > Industrial Goods & Services | |||||||||||
|
Other Industrial Services |
$ |
276 |
10.6 |
||||||||
|
Machinery |
251 |
9.7 |
|||||||||
|
Conglomerates |
102 |
3.9 |
|||||||||
|
Industrial Materials & Specialty Chemicals |
87 |
3.4 |
|||||||||
|
Construction |
75 |
2.9 |
|||||||||
|
Electrical Components |
30 |
1.2 |
|||||||||
|
Outsourcing Services |
28 |
1.1 |
|||||||||
|
Industrial Distribution |
22 |
0.8 |
|||||||||
|
871 |
33.6 |
||||||||||
| > Information | |||||||||||
|
Business Software |
148 |
5.7 |
|||||||||
|
Computer Hardware & Related Equipment |
114 |
4.4 |
|||||||||
|
Business Information & Marketing Services |
76 |
2.9 |
|||||||||
|
Financial Processors |
75 |
2.9 |
|||||||||
|
Internet Related |
75 |
2.9 |
|||||||||
|
Computer Services |
52 |
2.0 |
|||||||||
|
Advertising |
25 |
1.0 |
|||||||||
|
565 |
21.8 |
||||||||||
| > Consumer Goods & Services | |||||||||||
|
Retail |
120 |
4.6 |
|||||||||
|
Other Durable Goods |
78 |
3.0 |
|||||||||
|
Nondurables |
67 |
2.6 |
|||||||||
|
Restaurants |
60 |
2.3 |
|||||||||
|
Apparel |
55 |
2.1 |
|||||||||
|
Casinos & Gaming |
40 |
1.6 |
|||||||||
|
Consumer Goods Distribution |
39 |
1.5 |
|||||||||
|
Food & Beverage |
26 |
1.0 |
|||||||||
|
Other Entertainment |
17 |
0.7 |
|||||||||
|
502 |
19.4 |
||||||||||
| > Finance | |||||||||||
|
Insurance |
87 |
3.3 |
|||||||||
|
Brokerage & Money Management |
64 |
2.5 |
|||||||||
|
Banks |
28 |
1.1 |
|||||||||
|
179 |
6.9 |
||||||||||
| > Energy & Minerals | |||||||||||
|
Oil & Gas Producers |
43 |
1.6 |
|||||||||
|
Agricultural Commodities |
34 |
1.3 |
|||||||||
|
Mining |
28 |
1.1 |
|||||||||
|
Oil Refining, Marketing & Distribution |
28 |
1.1 |
|||||||||
|
133 |
5.1 |
||||||||||
|
Value (000) |
Percentage of Net Assets |
||||||||||
| > Other Industries | |||||||||||
|
Regulated Utilities |
$ |
35 |
1.3 |
||||||||
|
Transportation |
35 |
1.3 |
|||||||||
|
Real Estate |
27 |
1.1 |
|||||||||
|
97 |
3.7 |
||||||||||
| > Health Care | |||||||||||
|
Medical Equipment & Devices |
23 |
0.9 |
|||||||||
|
Medical Supplies |
21 |
0.8 |
|||||||||
|
44 |
1.7 |
||||||||||
|
Total Equities: |
2,391 |
92.2 |
|||||||||
|
Total Investments: |
2,391 |
92.2 |
|||||||||
|
Cash and Other Assets Less Liabilities: |
201 |
7.8 |
|||||||||
|
Net Assets: |
$ |
2,592 |
100.0 |
||||||||
96
Columbia Acorn Family of Funds
Third Quarter Class A, B, C, I, R and R5 Expense Information (Unaudited)
|
Columbia Acorn Fund |
Class A |
Class B* |
Class C |
Class I |
|||||||||||||||||||||||
|
Management Fees |
0.64 |
% |
0.64 |
% |
0.64 |
% |
0.64 |
% |
|||||||||||||||||||
|
Distribution and Services (12b-1) Fees |
0.25 |
% |
0.75 |
% |
1.00 |
% |
0.00 |
% |
|||||||||||||||||||
|
Other Expenses |
0.17 |
% |
0.27 |
% |
0.17 |
% |
0.08 |
% |
|||||||||||||||||||
|
Net Expense Ratio |
1.06 |
% |
1.66 |
% |
1.81 |
% |
0.72 |
% |
|||||||||||||||||||
|
Columbia Acorn International |
Class A |
Class B* |
Class C |
Class I |
Class R |
Class R5 |
|||||||||||||||||||||
|
Management Fees |
0.76 |
% |
0.76 |
% |
0.76 |
% |
0.76 |
% |
0.76 |
% |
0.76 |
% |
|||||||||||||||
|
Distribution and Services (12b-1) Fees |
0.25 |
% |
0.75 |
% |
1.00 |
% |
0.00 |
% |
0.50 |
% |
0.00 |
% |
|||||||||||||||
|
Other Expenses |
0.23 |
% |
0.48 |
% |
0.24 |
% |
0.11 |
% |
0.21 |
% |
0.12 |
% |
|||||||||||||||
|
Net Expense Ratio |
1.24 |
% |
1.99 |
% |
2.00 |
% |
0.87 |
% |
1.47 |
% |
0.88 |
% |
|||||||||||||||
|
Columbia Acorn USA |
Class A |
Class B* |
Class C |
Class I |
|||||||||||||||||||||||
|
Management Fees |
0.86 |
% |
0.86 |
% |
0.86 |
% |
0.86 |
% |
|||||||||||||||||||
|
Distribution and Services (12b-1) Fees |
0.25 |
% |
0.75 |
% |
1.00 |
% |
0.00 |
% |
|||||||||||||||||||
|
Other Expenses |
0.21 |
% |
0.41 |
% |
0.19 |
% |
0.10 |
% |
|||||||||||||||||||
|
Net Expense Ratio |
1.32 |
% |
2.02 |
% |
2.05 |
% |
0.96 |
% |
|||||||||||||||||||
|
Columbia Acorn International Select |
Class A |
Class B* |
Class C |
Class I |
|||||||||||||||||||||||
|
Management Fees |
0.94 |
% |
0.94 |
% |
0.94 |
% |
0.94 |
% |
|||||||||||||||||||
|
Distribution and Services (12b-1) Fees |
0.25 |
% |
0.75 |
% |
1.00 |
% |
0.00 |
% |
|||||||||||||||||||
|
Other Expenses |
0.30 |
% |
0.42 |
% |
0.34 |
% |
0.19 |
% |
|||||||||||||||||||
|
Net Expense Ratio |
1.49 |
% |
2.11 |
% |
2.28 |
% |
1.13 |
% |
|||||||||||||||||||
|
Columbia Acorn Select |
Class A |
Class B* |
Class C |
Class I |
|||||||||||||||||||||||
|
Management Fees |
0.83 |
% |
0.83 |
% |
0.83 |
% |
0.83 |
% |
|||||||||||||||||||
|
Distribution and Services (12b-1) Fees |
0.25 |
% |
0.75 |
% |
1.00 |
% |
0.00 |
% |
|||||||||||||||||||
|
Other Expenses |
0.24 |
% |
0.33 |
% |
0.24 |
% |
0.13 |
% |
|||||||||||||||||||
|
Net Expense Ratio |
1.32 |
% |
1.91 |
% |
2.07 |
% |
0.96 |
% |
|||||||||||||||||||
|
Columbia Thermostat Fund |
Class A |
Class B* |
Class C |
||||||||||||||||||||||||
|
Management Fees |
0.10 |
% |
0.10 |
% |
0.10 |
% |
|||||||||||||||||||||
|
Distribution and Services (12b-1) Fees |
0.25 |
% |
0.75 |
% |
1.00 |
% |
|||||||||||||||||||||
|
Other Expenses** |
0.15 |
% |
0.15 |
% |
0.15 |
% |
|||||||||||||||||||||
|
Net Expense Ratio** |
0.50 |
% |
1.00 |
% |
1.25 |
% |
|||||||||||||||||||||
|
Columbia Acorn Emerging Markets Fund |
Class A |
Class C |
Class I |
||||||||||||||||||||||||
|
Management Fees |
1.25 |
% |
1.25 |
% |
1.25 |
% |
|||||||||||||||||||||
|
Distribution and Services (12b-1) Fees |
0.25 |
% |
1.00 |
% |
0.00 |
% |
|||||||||||||||||||||
|
Other Expenses |
0.28 |
% |
0.30 |
% |
0.16 |
% |
|||||||||||||||||||||
|
Net Expense Ratio |
1.78 |
% |
2.55 |
% |
1.41 |
% |
|||||||||||||||||||||
|
Columbia Acorn European Fund |
Class A |
Class C |
Class I |
||||||||||||||||||||||||
|
Management Fees |
1.19 |
% |
1.19 |
% |
1.19 |
% |
|||||||||||||||||||||
|
Distribution and Services (12b-1) Fees |
0.25 |
% |
1.00 |
% |
0.00 |
% |
|||||||||||||||||||||
|
Other Expenses |
0.16 |
% |
-0.09 |
% |
0.12 |
% |
|||||||||||||||||||||
|
Net Expense Ratio |
1.60 |
% |
2.10 |
% |
1.31 |
% |
|||||||||||||||||||||
See the Funds' prospectuses for information on minimum initial investment amounts and other details of buying, selling and exchanging shares of the Funds.
Fees and expenses are for the nine months ended September 30, 2012. The fees and expenses of Columbia Acorn Select and Columbia Acorn International Select include the effect of the voluntary undertaking by Columbia Wanger Asset Management, LLC (CWAM) to waive fees and/or reimburse the Funds for any ordinary operating expenses (exclusive of brokerage commissions, interest, taxes and extraordinary expenses, but inclusive of custodian charges relating to overdrafts, if any), after giving effect to any balance credits from the Funds' custodian, in excess of the following annual rates:
|
Fund |
Class A |
Class B |
Class C |
Class I |
|||||||||||||||
|
Columbia Acorn International Select |
1.70 |
% |
2.20 |
% |
2.45 |
% |
1.28 |
% |
|||||||||||
|
Columbia Acorn Select |
1.60 |
% |
2.10 |
% |
2.35 |
% |
1.25 |
% |
|||||||||||
These arrangements may be modified or terminated by either the Funds or CWAM upon 30 days notice.
Columbia Thermostat Fund's fees and expenses include the effect of CWAM's contractual undertaking to waive fees and/or reimburse the Fund for any ordinary operating expenses (exclusive of distribution and service fees, interest and fees on borrowings and expenses associated with the Fund's investments in other investment companies, but including custodian charges relating to overdrafts, if any), after giving effect to any balance credits from the Fund's custodian, in excess of the annual rate of 0.25% of the average daily net assets. Columbia Thermostat Fund's waiver/reimbursement arrangement is contractual through April 30, 2013. There is no guarantee that this arrangement will continue thereafter.
The fees and expenses of Columbia Acorn Emerging Markets Fund and Columbia Acorn European Fund also include the effect of fee waivers/reimbursement. CWAM has contractually undertaken to waive fees and/or reimburse Columbia Acorn Emerging Markets Fund so that the Fund's ordinary operating expenses (excluding interest and fees on borrowings and expenses associated with the Fund's investment in other investment companies, if any) do not exceed the annual rates of 1.85%, 2.60% and 1.41% of the Fund's average daily net assets attributable to Class A, Class C and Class I shares, respectively, through April 30, 2013. There is no guarantee that this arrangement will continue thereafter. CWAM has contractually undertaken to waive fees and/or reimburse Columbia Acorn European Fund so that the Fund's ordinary operating expenses (excluding interest and fees on borrowings and expenses associated with the Fund's investment in other investment companies, if any) do not exceed the annual rates of 1.75%, 2.50% and 1.31% of the Fund's average daily net assets attributable to Class A, Class C and Class I shares, respectively, through April 30, 2013. There is no guarantee that this arrangement will continue thereafter.
Columbia Acorn International's fees and expenses include the effect of the contractual undertaking by CWAM and its affiliates, effective August 15, 2011, to waive a portion of total annual Fund operating expenses incurred by Class A, Class B and Class C shares of Columbia Acorn International such that the Fund's total annual Fund operating expenses will be reduced by 0.04%, 0.03% and 0.02% for Class A, Class B and Class C shares of the Fund, respectively, through August 14, 2013. There is no guarantee that this arrangement will continue thereafter.
* The Funds generally no longer accept investments by new or existing investors in Class B shares, except in connection with the reinvestment of any dividend and/or capital gain distributions in Class B shares of the Funds and exchanges by existing Class B shareholders of certain other funds within the Columbia Family of Funds.
** Does not include estimated fees and expenses of 0.61% incurred by the Fund from the underlying portfolio funds in which it invests.
97
This page intentionally left blank.
98
This page intentionally left blank.
99
Columbia Acorn Family of Funds
Trustees
Laura M. Born
Chair of the Board
Steven N. Kaplan
Vice Chair of the Board
Michelle L. Collins
Maureen M. Culhane
Margaret M. Eisen
John C. Heaton
Charles P. McQuaid
David J. Rudis
David B. Small
Ralph Wanger (Trustee Emeritus)
Officers
Charles P. McQuaid
President
Ben Andrews
Vice President
Robert A. Chalupnik
Vice President
Michael G. Clarke
Assistant Treasurer
Joseph F. DiMaria
Assistant Treasurer
P. Zachary Egan
Vice President
Fritz Kaegi
Vice President
John M. Kunka
Assistant Treasurer
Stephen Kusmierczak
Vice President
Joseph C. LaPalm
Vice President
Bruce H. Lauer
Vice President, Secretary and Treasurer
Louis J. Mendes III
Vice President
Robert A. Mohn
Vice President
Christopher J. Olson
Vice President
Christopher O. Petersen
Assistant Secretary
Scott R. Plummer
Assistant Secretary
Andreas Waldburg-Wolfegg
Vice President
Linda K. Roth-Wiszowaty
Assistant Secretary
Robert P. Scales
Chief Compliance Officer, Chief Legal Officer,
Senior Vice President and General Counsel
Investment Manager
Columbia Wanger Asset Management, LLC
227 West Monroe Street, Suite 3000
Chicago, Illinois 60606
1-800-922-6769
Distributor
Columbia Management Investment Distributors, Inc.
225 Franklin Street
Boston, Massachusetts 02110
Transfer Agent, Dividend Disbursing Agent
Columbia Management Investment Services Corp.
P. O. Box 8081
Boston, Massachusetts 02266-8081
1-800-345-6611
Legal Counsel to the Funds
Perkins Coie LLP
Washington, DC
Legal Counsel to the Independent Trustees
Drinker Biddle & Reath LLP
Philadelphia, Pennsylvania
Independent Registered Public Accounting Firm
PricewaterhouseCoopers LLP
Chicago, Illinois
This report, including the schedules of investments, is submitted for the general information of the shareholders of Columbia Acorn Trust.
A description of the policies and procedures that the Funds use to determine how to vote proxies and a copy of the Funds' voting record are available (i) without charge, upon request, by calling 800-922-6769 and (ii) on the Securities and Exchange Commission's website at www.sec.gov. Information regarding how the Funds voted proxies relating to portfolio securities during the 12-month period ended June 30, is available from the SEC's website. Information regarding how the Funds voted proxies relating to portfolio securities is also available at www.columbiamanagement.com under "About Us." From there, click on "Disclosures."
The Funds file a complete schedule of portfolio holdings with the SEC for the first and third quarters of each fiscal year on Form N-Q. The Funds' Form N-Q is available on the SEC's website at www.sec.gov and may be reviewed and copied at the SEC's Public Reference Room in Washington, D.C. Information on the operation of the Public Reference Room may be obtained by calling 1-800-SEC-0330. The Funds' complete portfolio holdings are disclosed at www.columbiamanagement.com approximately 30 to 40 days after each month-end.
Investors should consider the investment objectives, risks, charges and expenses of a mutual fund carefully before investing. For a free prospectus, which contains this and other important information about the funds, visit www.columbiamanagement.com. Read the prospectus carefully before investing.
Columbia Acorn Funds are distributed by Columbia Management Investment Distributors, Inc., member FINRA and managed by Columbia Wanger Asset Management, LLC.
Find out what's new – visit our web site at:
www.columbiamanagement.com
Our e-mail address is:
ServiceInquiries@ColumbiaManagement.com
Shareholders should not include personal information such as account numbers, Social Security numbers or taxpayer identification numbers in e-mail. We are unable to accept account transactions sent via e-mail.
100
This document contains Global Industry Classification Standard data. The Global Industry Classification Standard ("GICS") was developed by and is the exclusive property and a service mark of MSCI Inc. ("MSCI") and Standard & Poor's Financial Services LLC ("S&P") and is licensed for use by Columbia Wanger Asset Management, LLC. Neither MSCI, S&P, nor any other party involved in making or compiling the GICS or any GICS classifications makes any express or implied warranties or representations with respect to such standard or classification (or the results to be obtained by the use thereof), and all such parties hereby expressly disclaim all warranties of originality, accuracy, completeness, merchantability and fitness for a particular purpose with respect to any of such standard or classification. Without limiting any of the foregoing, in no event shall MSCI, S&P, any of their affiliates or any third party involved in making or compiling the GICS or any GICS classifications have any liability for any direct, indirect, special, punitive, consequential or any other damages (including lost profits) even if notified of the possibility of such damages.
Columbia Management®
Columbia Acorn Family of Funds
Class A, B, C, I, R and R5 Shares
Third Quarter Report, September 30, 2012
For More Information
You'll find more information about the Columbia Acorn Family of Funds in the documents described below. Contact Columbia Funds as follows to obtain these documents free of charge:
By Mail: Columbia Funds
c/o Columbia Management Investment Services Corp.
P.O. Box 8081
Boston, MA 02266-8081
By Telephone: 800.345.6611
Online: www.columbiamanagement.com
Shareholder Communications with the Board
The Funds' Board of Trustees has adopted procedures by which shareholders may communicate with the Board. Shareholders who wish to communicate with the Board should send their written communications to the Board by mail, c/o Columbia Wanger Asset Management, LLC, 227 West Monroe Street, Suite 3000, Chicago, Illinois 60606, Attention: Secretary. Shareholder communications must (i) be in writing, (ii) identify the Columbia Acorn Fund to which the communication relates and (iii) state the particular class of shares and number of shares held by the communicating shareholder.
Prospectuses and the Statement of Additional Information (SAI)
The prospectuses and the SAI provide more detailed information about the Funds and their policies. The SAI is legally part of each prospectus (it's incorporated by reference). A copy of each has been filed with the SEC.
Information Provided by the SEC
You can review and copy information about the Funds (including their prospectuses, the SAI and shareholder reports) at the SEC's Public Reference Room in Washington, DC. To find out more about the operation of the Public Reference Room, call the SEC at 202.551.8090. Reports and other information about the Fund are also available in the EDGAR Database on the SEC's website at http://www.sec.gov, or you can receive copies of this information, for a fee, by electronic request at the following e-mail address: publicinfo@sec.gov. You can also obtain copies of this information by writing the Public Reference Section, Securities and Exchange Commission, Washington, DC 20549-0102.
The investment company registration number of Columbia Acorn Trust, of which each of these Funds is a series, is 811-01829.
© 2012 Columbia Management Investment Advisers, LLC. All rights reserved.
225 Franklin Street, Boston, MA 02110
800.345.6611 www.columbiamanagement.com
C-1564 C (11/12) 147959