| Exhibit 99.1 | |
|
Frontier Communications
|
|
|
3 High Ridge Park
|
|
|
Stamford, CT 06905
|
|
|
203.614.5600
|
|
|
www.frontier.com
|
|
• Continued improvement in revenue and customer metrics
|
|
|
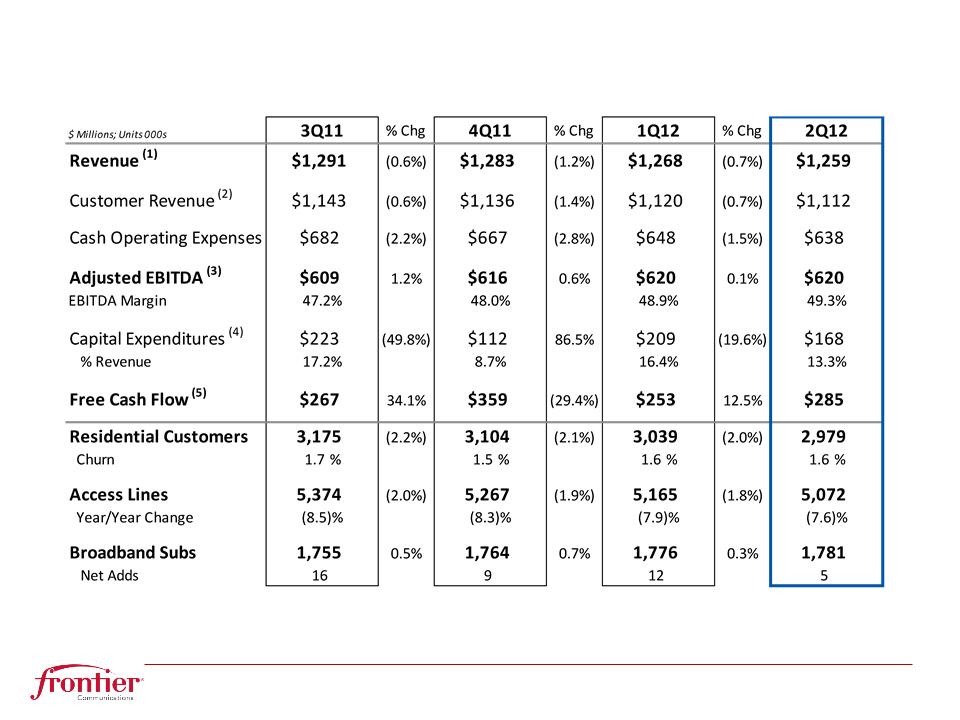
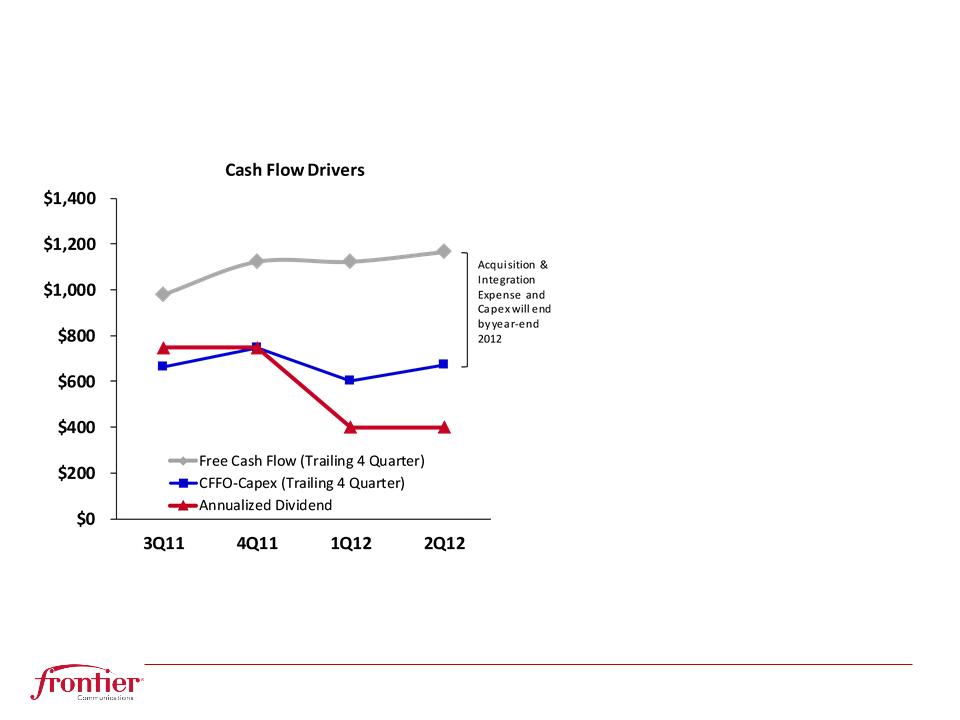
• Second quarter free cash flow of $285 million
|
|
|
• Second quarter operating cash flow margin of 49%, as adjusted
|
|
|
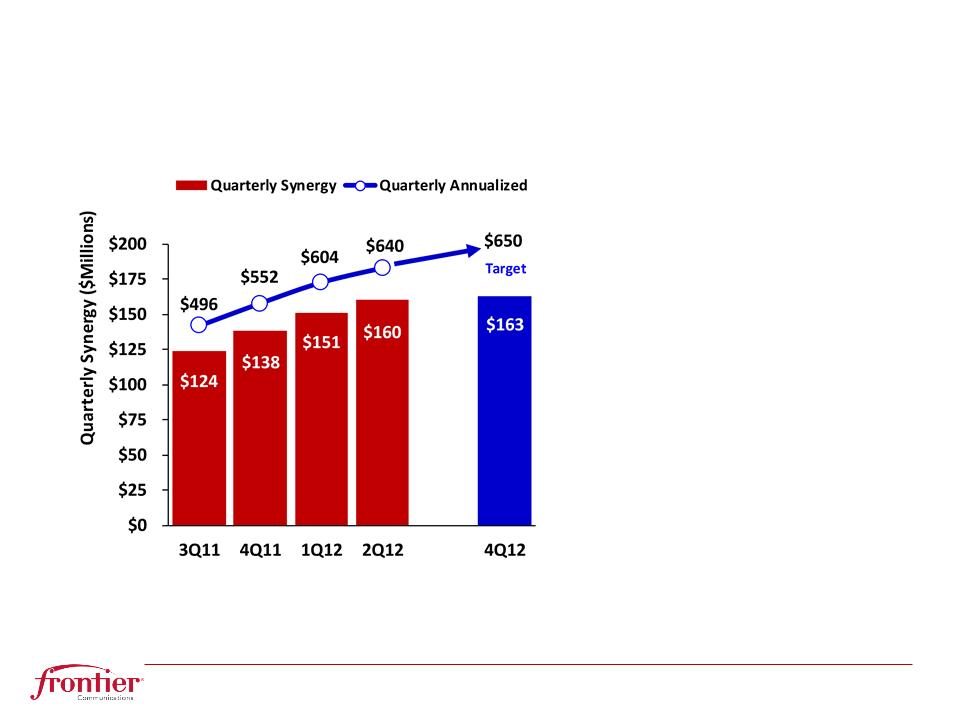
• Second quarter synergy cost savings of $9 million and $640 million since closing
|
|
|
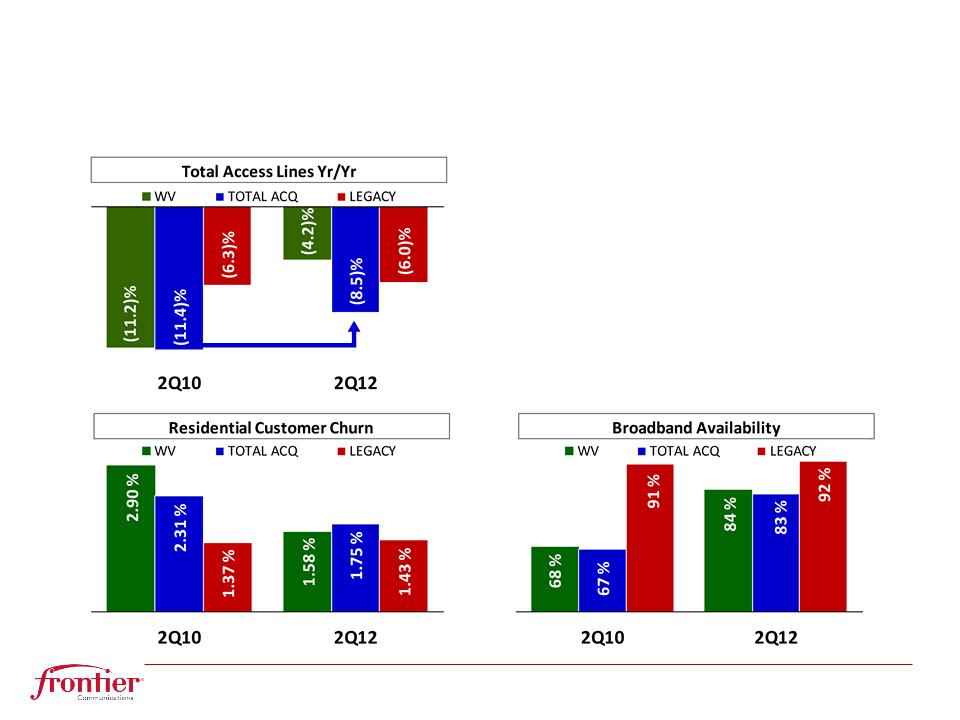
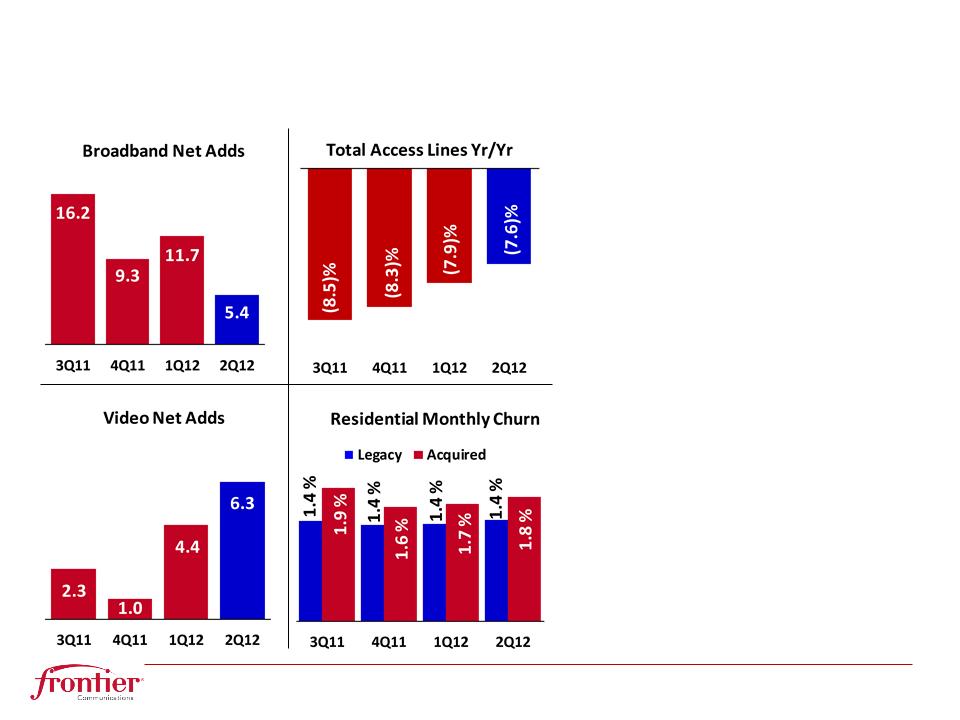
• Access line annual loss rate improved to 7.6%
|
|
|
• Dividend payout ratio of 37% for the first 6 months of 2012
|
|
|
INVESTOR CONTACT:
|
MEDIA CONTACT:
|
|||
|
Gregory Lundberg
|
Brigid Smith
|
|||
|
VP, Investor Relations & Assistant Treasurer
|
AVP Corporate Communications
|
|||
|
(203) 614-5044
|
(203) 614-5042
|
|||
|
greg.lundberg@FTR.com
|
brigid.smith@FTR.com
|
|||
|
Frontier Communications Corporation
|
|||||||||||||||||||||||
|
Consolidated Financial Data
|
|||||||||||||||||||||||
|
For the quarter ended
|
For the six months ended
|
||||||||||||||||||||||
|
June 30,
|
March 31,
|
June 30,
|
June 30,
|
||||||||||||||||||||
|
(Amounts in thousands, except per share amounts)
|
2012
|
2012
|
2011
|
2012
|
2011
|
||||||||||||||||||
|
Income Statement Data
|
|||||||||||||||||||||||
|
Revenue
|
$ | 1,258,777 | $ | 1,268,054 | $ | 1,322,255 | $ | 2,526,831 | $ | 2,668,952 | |||||||||||||
|
Network access expenses
|
115,433 | 115,569 | 126,629 | 231,002 | 277,913 | ||||||||||||||||||
|
Other operating expenses (1)
|
539,911 | 551,583 | 578,096 | 1,091,494 | 1,158,436 | ||||||||||||||||||
|
Depreciation and amortization
|
307,047 | 357,300 | 358,986 | 664,347 | 710,243 | ||||||||||||||||||
|
Integration costs (2)
|
28,602 | 35,144 | 20,264 | 63,746 | 33,487 | ||||||||||||||||||
|
Total operating expenses
|
990,993 | 1,059,596 | 1,083,975 | 2,050,589 | 2,180,079 | ||||||||||||||||||
|
Operating income
|
267,784 | 208,458 | 238,280 | 476,242 | 488,873 | ||||||||||||||||||
|
Losses on early extinguishment of debt
|
(70,818 | ) | - | - | (70,818 | ) | - | ||||||||||||||||
|
Investment and other income (loss), net
|
8,804 | 5,588 | (382 | ) | 14,392 | 9,203 | |||||||||||||||||
|
Interest expense
|
172,054 | 164,862 | 166,864 | 336,916 | 334,279 | ||||||||||||||||||
|
Income before income taxes
|
33,716 | 49,184 | 71,034 | 82,900 | 163,797 | ||||||||||||||||||
|
Income tax expense
|
11,717 | 18,694 | 37,190 | 30,411 | 73,757 | ||||||||||||||||||
|
Net income (2)
|
21,999 | 30,490 | 33,844 | 52,489 | 90,040 | ||||||||||||||||||
|
Less: Income attributable to the noncontrolling interest in
|
|||||||||||||||||||||||
|
a partnership
|
4,010 | 3,722 | 1,583 | 7,732 | 3,068 | ||||||||||||||||||
|
Net income attributable to common shareholders of Frontier
|
$ | 17,989 | $ | 26,768 | $ | 32,261 | $ | 44,757 | $ | 86,972 | |||||||||||||
|
Weighted average shares outstanding
|
991,183 | 988,873 | 989,357 | 989,869 | 989,480 | ||||||||||||||||||
|
Basic net income per share attributable to
|
|||||||||||||||||||||||
|
common shareholders of Frontier (3)
|
$ | 0.02 | $ | 0.03 | $ | 0.03 | $ | 0.04 | $ | 0.09 | |||||||||||||
|
Non-GAAP adjusted net income per share attributable
|
|||||||||||||||||||||||
|
to common shareholders of Frontier (3) (4)
|
$ | 0.08 | $ | 0.05 | $ | 0.06 | $ | 0.13 | $ | 0.12 | |||||||||||||
|
Other Financial Data
|
|||||||||||||||||||||||
|
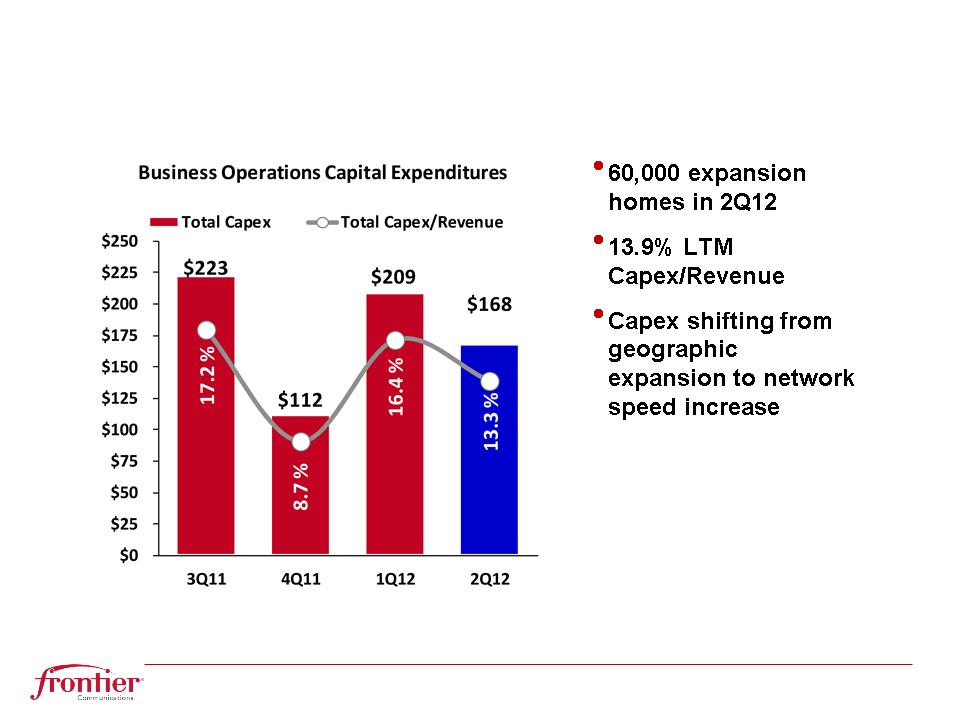
Capital expenditures - Business operations
|
$ | 167,551 | $ | 208,522 | $ | 210,505 | $ | 376,073 | $ | 414,039 | |||||||||||||
|
Capital expenditures - Integration activities
|
12,209 | 15,731 | 13,408 | 27,940 | 18,986 | ||||||||||||||||||
|
Operating cash flow, as adjusted (4)
|
620,363 | 619,834 | 633,770 | 1,240,197 | 1,260,207 | ||||||||||||||||||
|
Free cash flow (4)
|
284,867 | 253,160 | 242,390 | 538,027 | 495,247 | ||||||||||||||||||
|
Dividends paid
|
99,851 | 99,851 | 186,610 | 199,702 | 373,215 | ||||||||||||||||||
|
Dividend payout ratio (5)
|
35 | % | 39 | % | 77 | % | 37 | % | 75 | % | |||||||||||||
| (1) |
Includes severance and early retirement costs of $1.5 million, $6.5 million and $11.0 million for the quarters ended June 30, 2012, March 31, 2012 and June 30, 2011, respectively, and $8.0 million and $11.0 million for the six months ended June 30, 2012 and 2011, respectively.
|
||||||||||||||||||||||
| (2) |
Reflects integration costs of $28.6 million ($18.1 million or $0.02 per share after tax), $35.1 million ($21.7 million or $0.02 per share after tax) and $20.3 million ($12.5 million or $0.01 per share after tax) for the quarters ended June 30, 2012, March 31, 2012 and June 30, 2011, respectively. Reflects integration costs of $63.7 million ($39.8 million or $0.04 per share after tax) and $33.5 million ($20.7 million or $0.02 per share after tax) for the six months ended June 30, 2012 and 2011, respectively.
|
||||||||||||||||||||||
| (3) |
Calculated based on weighted average shares outstanding.
|
||||||||||||||||||||||
| (4) |
Reconciliations to the most comparable GAAP measures are presented in Schedules A, B and C at the end of these tables.
|
||||||||||||||||||||||
| (5) |
Represents dividends paid divided by free cash flow, as defined in Schedule A.
|
||||||||||||||||||||||
|
Frontier Communications Corporation
|
|||||||||||||
|
Consolidated Financial and Operating Data
|
|||||||||||||
| For the quarter ended |
For the six months ended
|
||||||||||||
|
June 30,
|
March 31,
|
June 30,
|
June 30,
|
||||||||||
|
(Amounts in thousands, except operating data)
|
2012
|
2012
|
2011
|
2012
|
2011
|
||||||||
|
Selected Income Statement Data
|
|||||||||||||
|
Revenue:
|
|||||||||||||
|
Local and long distance services
|
$ |
559,837
|
$ 572,162
|
$ 617,744
|
$ 1,131,999
|
$ 1,252,858
|
|||||||
|
Data and internet services
|
454,706
|
450,670
|
461,599
|
905,376
|
920,126
|
||||||||
|
Other
|
97,337
|
96,877
|
85,067
|
194,214
|
171,902
|
||||||||
|
Customer revenue
|
1,111,880
|
1,119,709
|
1,164,410
|
2,231,589
|
2,344,886
|
||||||||
|
Switched access and subsidy
|
146,897
|
148,345
|
157,845
|
295,242
|
324,066
|
||||||||
|
Total revenue
|
$ |
1,258,777
|
$ 1,268,054
|
$ 1,322,255
|
$ 2,526,831
|
$ 2,668,952
|
|||||||
|
Other Financial and Operating Data
|
|||||||||||||
|
Revenue:
|
|||||||||||||
|
Residential
|
$ |
535,089
|
$ 534,836
|
$ 576,304
|
$ 1,069,925
|
$ 1,165,470
|
|||||||
|
Business
|
576,791
|
584,873
|
588,106
|
1,161,664
|
1,179,416
|
||||||||
|
Customer revenue
|
1,111,880
|
1,119,709
|
1,164,410
|
2,231,589
|
2,344,886
|
||||||||
|
Switched access and subsidy
|
146,897
|
148,345
|
157,845
|
295,242
|
324,066
|
||||||||
|
Total revenue
|
$ |
1,258,777
|
$ 1,268,054
|
$ 1,322,255
|
$ 2,526,831
|
$ 2,668,952
|
|||||||
|
Residential customer metrics:
|
|||||||||||||
|
Customers - Legacy Frontier
|
1,047,036
|
1,066,537
|
1,123,506
|
1,047,036
|
1,123,506
|
||||||||
|
- Acquired properties
|
1,931,860
|
1,972,381
|
2,128,453
|
1,931,860
|
2,128,453
|
||||||||
|
Total residential customers
|
2,978,896
|
3,038,918
|
3,251,959
|
2,978,896
|
3,251,959
|
||||||||
|
Revenue
|
$ |
535,089
|
$ 534,836
|
$ 576,304
|
$ 1,069,925
|
$ 1,165,470
|
|||||||
|
Products per residential customer (1)
|
2.51
|
2.50
|
2.40
|
2.51
|
2.40
|
||||||||
|
Average monthly residential revenue per customer (2)
|
$ |
58.19
|
$ 57.06
|
$ 57.71
|
$ 57.61
|
$ 57.51
|
|||||||
|
Customer monthly churn - Legacy Frontier
|
1.43%
|
1.38%
|
1.34%
|
1.41%
|
1.34%
|
||||||||
|
- Acquired properties
|
1.75%
|
1.66%
|
1.83%
|
1.70%
|
1.92%
|
||||||||
|
Total residential customer monthly churn
|
1.63%
|
1.56%
|
1.66%
|
1.60%
|
1.73%
|
||||||||
|
Business customer metrics:
|
|||||||||||||
|
Customers
|
296,458
|
302,142
|
326,763
|
296,458
|
326,763
|
||||||||
|
Revenue
|
$ |
576,791
|
$ 584,873
|
$ 588,106
|
$ 1,161,664
|
$ 1,179,416
|
|||||||
|
Average monthly business revenue per customer
|
$ |
642.38
|
$ 637.07
|
$ 593.90
|
$ 639.33
|
$ 587.37
|
|||||||
|
Access line metrics:
|
|||||||||||||
|
Residential
|
3,130,090
|
3,196,951
|
3,428,911
|
3,130,090
|
3,428,911
|
||||||||
|
Business
|
1,942,013
|
1,967,877
|
2,060,951
|
1,942,013
|
2,060,951
|
||||||||
|
Total access lines
|
5,072,103
|
5,164,828
|
5,489,862
|
5,072,103
|
5,489,862
|
||||||||
|
Legacy Frontier
|
1,814,061
|
1,844,010
|
1,930,838
|
1,814,061
|
1,930,838
|
||||||||
|
Acquired properties
|
3,258,042
|
3,320,818
|
3,559,024
|
3,258,042
|
3,559,024
|
||||||||
|
Total access lines
|
5,072,103
|
5,164,828
|
5,489,862
|
5,072,103
|
5,489,862
|
||||||||
|
Average monthly total revenue per access line
|
$ |
81.98
|
$ 81.04
|
$ 79.42
|
$ 81.49
|
$ 79.22
|
|||||||
|
Average monthly customer revenue per access line
|
$ |
72.41
|
$ 71.56
|
$ 69.94
|
$ 71.97
|
$ 69.60
|
|||||||
|
Employees
|
15,332
|
15,479
|
14,930
|
15,332
|
14,930
|
||||||||
|
Broadband subscribers
|
1,781,295
|
1,775,853
|
1,738,670
|
1,781,295
|
1,738,670
|
||||||||
|
Video subscribers
|
568,154
|
561,878
|
554,218
|
568,154
|
554,218
|
||||||||
|
Switched access minutes of use (in millions)
|
4,771
|
4,517
|
4,785
|
9,288
|
9,785
|
||||||||
|
(1)
|
Products per residential customer: primary residential voice line, broadband and video products have a value of 1. Long distance, Frontier Secure, second lines, feature packages and dial-up have a value of 0.5.
|
||||||||||||
|
(2)
|
Calculation excludes the Mohave Cellular Limited Partnership.
|
||||||||||||
|
Frontier Communications Corporation
|
||||||||
|
Condensed Consolidated Balance Sheet Data
|
||||||||
|
(Amounts in thousands)
|
||||||||
|
June 30, 2012
|
December 31, 2011
|
|||||||
|
ASSETS
|
||||||||
|
Current assets:
|
||||||||
|
Cash and cash equivalents
|
$ | 410,014 | $ | 326,094 | ||||
|
Accounts receivable, net
|
545,818 | 585,157 | ||||||
|
Other current assets
|
342,947 | 327,779 | ||||||
|
Total current assets
|
1,298,779 | 1,239,030 | ||||||
|
Restricted cash
|
105,591 | 144,680 | ||||||
|
Property, plant and equipment, net
|
7,481,896 | 7,547,523 | ||||||
|
Other assets - principally goodwill
|
8,259,329 | 8,498,535 | ||||||
|
Total assets
|
$ | 17,145,595 | $ | 17,429,768 | ||||
|
LIABILITIES AND EQUITY
|
||||||||
|
Current liabilities:
|
||||||||
|
Long-term debt due within one year
|
$ | 616,575 | $ | 94,016 | ||||
|
Accounts payable and other current liabilities
|
922,977 | 1,058,200 | ||||||
|
Total current liabilities
|
1,539,552 | 1,152,216 | ||||||
|
Deferred income taxes and other liabilities
|
3,603,902 | 3,602,577 | ||||||
|
Long-term debt
|
7,670,517 | 8,205,841 | ||||||
|
Equity
|
4,331,624 | 4,469,134 | ||||||
|
Total liabilities and equity
|
$ | 17,145,595 | $ | 17,429,768 | ||||
|
Frontier Communications Corporation
|
||||||||
|
Consolidated Cash Flow Data
|
||||||||
|
(Amounts in thousands)
|
||||||||
|
For the six months ended June 30,
|
||||||||
|
2012
|
2011
|
|||||||
|
Cash flows provided by (used in) operating activities:
|
||||||||
|
Net income
|
$ | 52,489 | $ | 90,040 | ||||
|
Adjustments to reconcile net income to net cash provided
|
||||||||
|
by operating activities:
|
||||||||
|
Depreciation and amortization expense
|
664,347 | 710,243 | ||||||
|
Stock based compensation expense
|
7,775 | 7,677 | ||||||
|
Pension/OPEB costs
|
27,853 | 16,560 | ||||||
|
Losses on early extinguishment of debt
|
70,818 | - | ||||||
|
Other non-cash adjustments
|
8,386 | (6,735 | ) | |||||
|
Deferred income taxes
|
27,158 | 51,133 | ||||||
|
Change in accounts receivable
|
31,696 | 29,705 | ||||||
|
Change in accounts payable and other liabilities
|
(136,003 | ) | (49,414 | ) | ||||
|
Change in other current assets
|
3,274 | 15,022 | ||||||
|
Net cash provided by operating activities
|
757,793 | 864,231 | ||||||
|
Cash flows provided from (used by) investing activities:
|
||||||||
|
Capital expenditures - Business operations
|
(376,073 | ) | (414,039 | ) | ||||
|
Capital expenditures - Integration activities
|
(27,940 | ) | (18,986 | ) | ||||
|
Cash transferred from escrow
|
39,089 | 12,364 | ||||||
|
Other assets purchased and distributions received, net
|
(12,085 | ) | (7,289 | ) | ||||
|
Net cash used by investing activities
|
(377,009 | ) | (427,950 | ) | ||||
|
Cash flows provided from (used by) financing activities:
|
||||||||
|
Long-term debt borrowings
|
500,000 | - | ||||||
|
Financing costs paid
|
(10,288 | ) | - | |||||
|
Long-term debt payments
|
(536,968 | ) | (78,024 | ) | ||||
|
Premium paid to retire debt
|
(52,078 | ) | - | |||||
|
Dividends paid
|
(199,702 | ) | (373,215 | ) | ||||
|
Repayment of customer advances for construction,
|
||||||||
|
distributions to noncontrolling interests and other
|
2,172 | (3,633 | ) | |||||
|
Net cash used by financing activities
|
(296,864 | ) | (454,872 | ) | ||||
|
Increase/(Decrease) in cash and cash equivalents
|
83,920 | (18,591 | ) | |||||
|
Cash and cash equivalents at January 1,
|
326,094 | 251,263 | ||||||
|
Cash and cash equivalents at June 30,
|
$ | 410,014 | $ | 232,672 | ||||
|
Cash paid (received) during the period for:
|
||||||||
|
Interest
|
$ | 328,771 | $ | 328,728 | ||||
|
Income taxes (refunds)
|
$ | (208 | ) | $ | 27,203 | |||
|
Schedule A
|
|||||||||||||||||||||
|
Frontier Communications Corporation
|
|||||||||||||||||||||
|
Reconciliation of Non-GAAP Financial Measures
|
|||||||||||||||||||||
|
For the quarter ended
|
For the six months ended
|
||||||||||||||||||||
|
June 30,
|
March 31,
|
June 30,
|
June 30,
|
||||||||||||||||||
|
(Amounts in thousands)
|
2012
|
2012
|
2011
|
2012
|
2011
|
||||||||||||||||
|
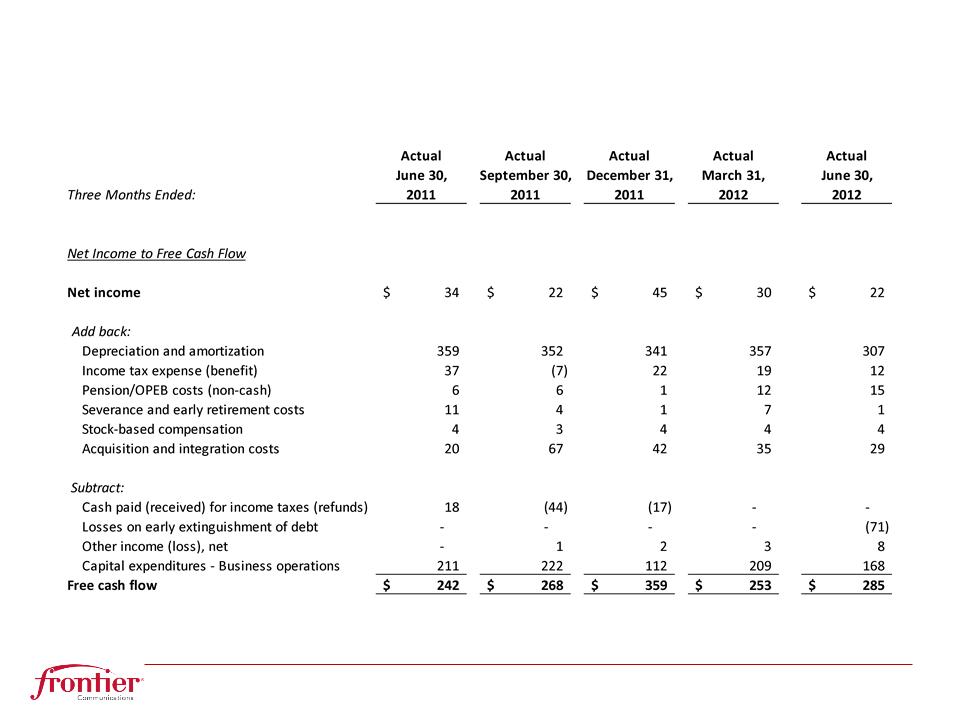
Net Income to Free Cash Flow;
|
|||||||||||||||||||||
|
Net Cash Provided by Operating Activities
|
|||||||||||||||||||||
|
Net income
|
$ | 21,999 | $ | 30,490 | $ | 33,844 | $ | 52,489 | $ | 90,040 | |||||||||||
|
Add back:
|
|||||||||||||||||||||
|
Depreciation and amortization
|
307,047 | 357,300 | 358,986 | 664,347 | 710,243 | ||||||||||||||||
|
Income tax expense
|
11,717 | 18,694 | 37,190 | 30,411 | 73,757 | ||||||||||||||||
|
Integration costs
|
28,602 | 35,144 | 20,264 | 63,746 | 33,487 | ||||||||||||||||
|
Pension/OPEB costs (non-cash) (1)
|
15,450 | 12,403 | 5,281 | 27,853 | 16,560 | ||||||||||||||||
|
Severance and early retirement costs (2)
|
1,480 | 6,529 | 10,959 | 8,009 | 11,044 | ||||||||||||||||
|
Stock based compensation
|
4,057 | 3,718 | 4,093 | 7,775 | 7,677 | ||||||||||||||||
|
Subtract:
|
|||||||||||||||||||||
|
Cash paid (refunded) for income taxes
|
161 | (369 | ) | 18,257 | (208 | ) | 27,203 | ||||||||||||||
|
Losses on early extinguishment of debt
|
(70,818 | ) | - | - | (70,818 | ) | - | ||||||||||||||
|
Other income (loss), net
|
8,591 | 2,965 | (535 | ) | 11,556 | 6,319 | |||||||||||||||
|
Capital expenditures - Business operations (3)
|
167,551 | 208,522 | 210,505 | 376,073 | 414,039 | ||||||||||||||||
|
Free cash flow (2)
|
284,867 | 253,160 | 242,390 | 538,027 | 495,247 | ||||||||||||||||
|
Add back:
|
|||||||||||||||||||||
|
Deferred income taxes
|
11,394 | 15,764 | 23,389 | 27,158 | 51,133 | ||||||||||||||||
|
Non-cash (gains)/losses, net
|
26,356 | 17,658 | 5,638 | 44,014 | 17,502 | ||||||||||||||||
|
Other income (loss), net
|
8,591 | 2,965 | (535 | ) | 11,556 | 6,319 | |||||||||||||||
|
Cash paid (refunded) for income taxes
|
161 | (369 | ) | 18,257 | (208 | ) | 27,203 | ||||||||||||||
|
Capital expenditures - Business operations (3)
|
167,551 | 208,522 | 210,505 | 376,073 | 414,039 | ||||||||||||||||
|
Subtract:
|
|||||||||||||||||||||
|
Changes in current assets and liabilities
|
62,334 | 38,699 | 71,740 | 101,033 | 4,687 | ||||||||||||||||
|
Income tax expense
|
11,717 | 18,694 | 37,190 | 30,411 | 73,757 | ||||||||||||||||
|
Integration costs
|
28,602 | 35,144 | 20,264 | 63,746 | 33,487 | ||||||||||||||||
|
Pension/OPEB costs (non-cash) (1)
|
15,450 | 12,403 | 5,281 | 27,853 | 16,560 | ||||||||||||||||
|
Severance and early retirement costs (2)
|
1,480 | 6,529 | 10,959 | 8,009 | 11,044 | ||||||||||||||||
|
Stock based compensation
|
4,057 | 3,718 | 4,093 | 7,775 | 7,677 | ||||||||||||||||
|
Net cash provided by operating activities
|
$ | 375,280 | $ | 382,513 | $ | 350,117 | $ | 757,793 | $ | 864,231 | |||||||||||
|
(1)
|
Reflects pension and other postretirement benefit (OPEB) expense, net of capitalized amounts, of $16.5 million, $15.8 million and $15.3 million for the quarters ended June 30, 2012, March 31, 2012 and June 30, 2011, respectively, less cash pension contributions and certain OPEB costs/payments of $1.0 million, $3.4 million and $10.0 million for the quarters ended June 30, 2012, March 31, 2012 and June 30, 2011, respectively. Reflects pension and other postretirement benefit (OPEB) expense, net of capitalized amounts, of $32.3 million and $31.2 million for the six months ended June 30, 2012 and 2011, respectively, less cash pension contributions and certain OPEB costs/payments of $4.4 million and $14.6 million for the six months ended June 30, 2012 and 2011, respectively.
|
||||||||||||||||||||
|
(2)
|
The definition of free cash flow has been revised as of January 1, 2012 to add back severance and early retirement costs, with all prior periods conformed to the current calculation.
|
||||||||||||||||||||
|
(3)
|
Excludes capital expenditures for integration activities.
|
||||||||||||||||||||
|
Schedule B
|
|||||||||||||||||||||||||||||||||||||||||
|
Frontier Communications Corporation
|
|||||||||||||||||||||||||||||||||||||||||
|
Reconciliation of Non-GAAP Financial Measures
|
|||||||||||||||||||||||||||||||||||||||||
|
For the quarter ended June 30, 2012
|
For the quarter ended June 30, 2011
|
||||||||||||||||||||||||||||||||||||||||
|
(Amounts in thousands)
|
|||||||||||||||||||||||||||||||||||||||||
|
Severance
|
Severance
|
||||||||||||||||||||||||||||||||||||||||
|
Non-cash
|
and Early
|
Non-cash
|
and Early
|
||||||||||||||||||||||||||||||||||||||
|
Operating Cash Flow and
|
As
|
Integration
|
Pension/OPEB
|
Retirement
|
As
|
As
|
Integration
|
Pension/OPEB
|
Retirement
|
As
|
|||||||||||||||||||||||||||||||
|
Operating Cash Flow Margin
|
Reported
|
Costs
|
Costs (1)
|
Costs
|
Adjusted
|
Reported
|
Costs
|
Costs (1)
|
Costs
|
Adjusted
|
|||||||||||||||||||||||||||||||
|
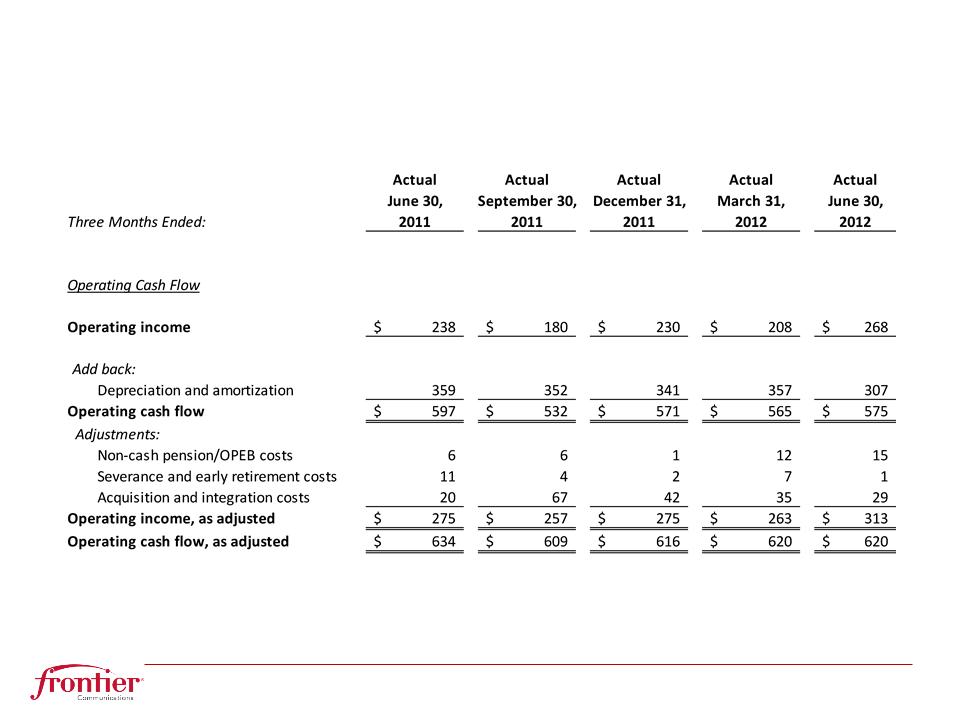
Operating Income
|
$ | 267,784 | $ | 28,602 | $ | 15,450 | $ | 1,480 | $ | 313,316 | $ | 238,280 | $ | 20,264 | $ | 5,281 | $ | 10,959 | $ | 274,784 | |||||||||||||||||||||
|
Add back:
|
|||||||||||||||||||||||||||||||||||||||||
|
Depreciation and
|
|||||||||||||||||||||||||||||||||||||||||
|
amortization
|
307,047 | - | - | - | 307,047 | 358,986 | - | - | - | 358,986 | |||||||||||||||||||||||||||||||
|
Operating cash flow
|
$ | 574,831 | $ | 28,602 | $ | 15,450 | $ | 1,480 | $ | 620,363 | $ | 597,266 | $ | 20,264 | $ | 5,281 | $ | 10,959 | $ | 633,770 | |||||||||||||||||||||
|
Revenue
|
$ | 1,258,777 | $ | 1,258,777 | $ | 1,322,255 | $ | 1,322,255 | |||||||||||||||||||||||||||||||||
|
Operating income margin
|
|||||||||||||||||||||||||||||||||||||||||
|
(Operating income divided
|
|||||||||||||||||||||||||||||||||||||||||
|
by revenue)
|
21.3 | % | 24.9 | % | 18.0 | % | 20.8 | % | |||||||||||||||||||||||||||||||||
|
Operating cash flow margin
|
|||||||||||||||||||||||||||||||||||||||||
|
(Operating cash flow divided
|
|||||||||||||||||||||||||||||||||||||||||
|
by revenue)
|
45.7 | % | 49.3 | % | 45.2 | % | 47.9 | % | |||||||||||||||||||||||||||||||||
|
For the quarter ended March 31, 2012
|
|||||||||||||||||||||||||||||||||||||||||
|
Severance
|
|||||||||||||||||||||||||||||||||||||||||
|
Non-cash
|
and Early
|
||||||||||||||||||||||||||||||||||||||||
|
Operating Cash Flow and
|
As
|
Integration
|
Pension/OPEB
|
Retirement
|
As
|
||||||||||||||||||||||||||||||||||||
|
Operating Cash Flow Margin
|
Reported
|
Costs
|
Costs (1)
|
Costs
|
Adjusted
|
||||||||||||||||||||||||||||||||||||
|
Operating Income
|
$ | 208,458 | $ | 35,144 | $ | 12,403 | $ | 6,529 | $ | 262,534 | |||||||||||||||||||||||||||||||
|
Add back:
|
|||||||||||||||||||||||||||||||||||||||||
|
Depreciation and
|
|||||||||||||||||||||||||||||||||||||||||
|
amortization
|
357,300 | - | - | - | 357,300 | ||||||||||||||||||||||||||||||||||||
|
Operating cash flow
|
$ | 565,758 | $ | 35,144 | $ | 12,403 | $ | 6,529 | $ | 619,834 | |||||||||||||||||||||||||||||||
|
Revenue
|
$ | 1,268,054 | $ | 1,268,054 | |||||||||||||||||||||||||||||||||||||
|
Operating income margin
|
|||||||||||||||||||||||||||||||||||||||||
|
(Operating income divided
|
|||||||||||||||||||||||||||||||||||||||||
|
by revenue)
|
16.4 | % | 20.7 | % | |||||||||||||||||||||||||||||||||||||
|
Operating cash flow margin
|
|||||||||||||||||||||||||||||||||||||||||
|
(Operating cash flow divided
|
|||||||||||||||||||||||||||||||||||||||||
|
by revenue)
|
44.6 | % | 48.9 | % | |||||||||||||||||||||||||||||||||||||
|
(1)
|
Reflects pension and other postretirement benefit (OPEB) expense, net of capitalized amounts, of $16.5 million, $15.8 million and $15.3 million for the quarters ended June 30, 2012, March 31, 2012 and June 30, 2011, respectively, less cash pension contributions and certain OPEB costs/payments of $1.0 million, $3.4 million and $10.0 million for the quarters ended June 30, 2012, March 31 2012 and June 30, 2011, respectively.
|
||||||||||||||||||||||||||||||||||||||||
|
Schedule B
|
|||||||||||||||||||||||||||||||||||||||||
|
(continued)
|
|||||||||||||||||||||||||||||||||||||||||
|
Frontier Communications Corporation
|
|||||||||||||||||||||||||||||||||||||||||
|
Reconciliation of Non-GAAP Financial Measures
|
|||||||||||||||||||||||||||||||||||||||||
|
For the six months ended June 30, 2012
|
For the six months ended June 30, 2011
|
||||||||||||||||||||||||||||||||||||||||
|
(Amounts in thousands)
|
|||||||||||||||||||||||||||||||||||||||||
|
Severance
|
Severance
|
||||||||||||||||||||||||||||||||||||||||
|
Non-cash
|
and Early
|
Non-cash
|
and Early
|
||||||||||||||||||||||||||||||||||||||
|
Operating Cash Flow and
|
As
|
Integration
|
Pension/OPEB
|
Retirement
|
As
|
As
|
Integration
|
Pension/OPEB
|
Retirement
|
As
|
|||||||||||||||||||||||||||||||
|
Operating Cash Flow Margin
|
Reported
|
Costs
|
Costs (1)
|
Costs
|
Adjusted
|
Reported
|
Costs
|
Costs (1)
|
Costs
|
Adjusted
|
|||||||||||||||||||||||||||||||
|
Operating Income
|
$ | 476,242 | $ | 63,746 | $ | 27,853 | $ | 8,009 | $ | 575,850 | $ | 488,873 | $ | 33,487 | $ | 16,560 | $ | 11,044 | $ | 549,964 | |||||||||||||||||||||
|
Add back:
|
|||||||||||||||||||||||||||||||||||||||||
|
Depreciation and
|
|||||||||||||||||||||||||||||||||||||||||
|
amortization
|
664,347 | - | - | - | 664,347 | 710,243 | - | - | - | 710,243 | |||||||||||||||||||||||||||||||
|
Operating cash flow
|
$ | 1,140,589 | $ | 63,746 | $ | 27,853 | $ | 8,009 | $ | 1,240,197 | $ | 1,199,116 | $ | 33,487 | $ | 16,560 | $ | 11,044 | $ | 1,260,207 | |||||||||||||||||||||
|
Revenue
|
$ | 2,526,831 | $ | 2,526,831 | $ | 2,668,952 | $ | 2,668,952 | |||||||||||||||||||||||||||||||||
|
Operating income margin
|
|||||||||||||||||||||||||||||||||||||||||
|
(Operating income divided
|
|||||||||||||||||||||||||||||||||||||||||
|
by revenue)
|
18.8 | % | 22.8 | % | 18.3 | % | 20.6 | % | |||||||||||||||||||||||||||||||||
|
Operating cash flow margin
|
|||||||||||||||||||||||||||||||||||||||||
|
(Operating cash flow divided
|
|||||||||||||||||||||||||||||||||||||||||
|
by revenue)
|
45.1 | % | 49.1 | % | 44.9 | % | 47.2 | % | |||||||||||||||||||||||||||||||||
|
(1)
|
Reflects pension and other postretirement benefit (OPEB) expense, net of capitalized amounts, of $32.3 million and $31.2 million for the six months ended June 30, 2012 and 2011, respectively, less cash pension contributions and certain OPEB costs/payments of $4.4 million and $14.6 million for the six months ended June 30, 2012 and 2011, respectively.
|
||||||||||||||||||||||||||||||||||||||||
|
Schedule C
|
||||||||||||||||||||||||
|
Frontier Communications Corporation
|
||||||||||||||||||||||||
|
Reconciliation of Non-GAAP Financial Measures
|
||||||||||||||||||||||||
| (Amount in thousands, except per share amounts) | ||||||||||||||||||||||||
|
For the quarter ended
|
||||||||||||||||||||||||
|
June 30, 2012
|
March 31, 2012
|
June 30, 2011
|
||||||||||||||||||||||
| Net income attributable to common |
Earnings
|
Earnings
|
Earnings
|
|||||||||||||||||||||
| shareholders of Frontier |
Net Income
|
Per Share
|
Net Income
|
Per Share
|
Net Income
|
Per Share
|
||||||||||||||||||
|
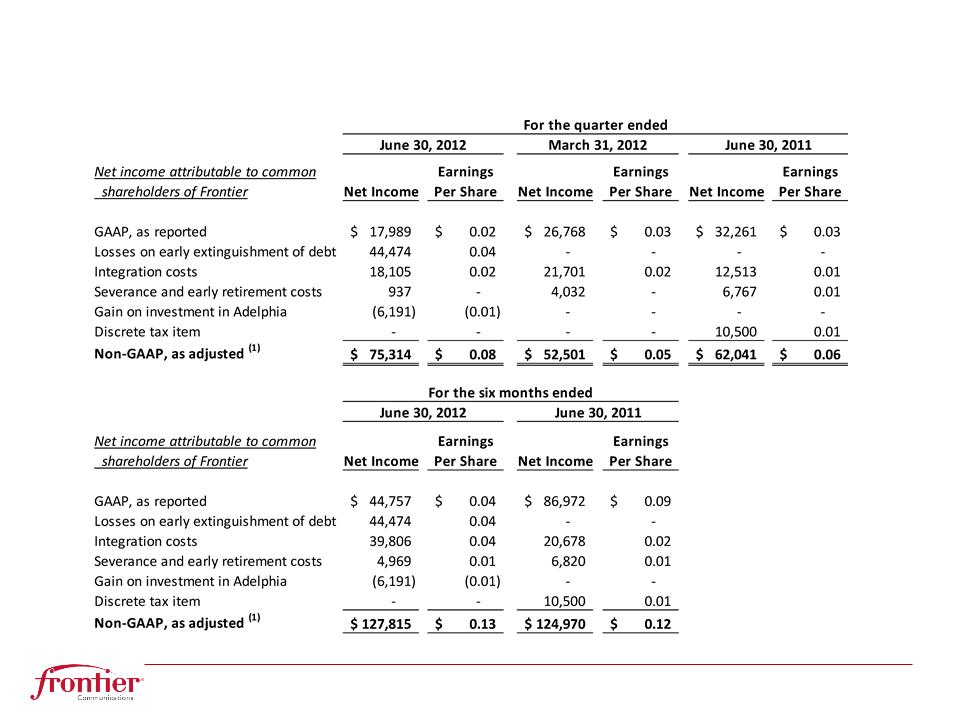
GAAP, as reported
|
$ | 17,989 | $ | 0.02 | $ | 26,768 | $ | 0.03 | $ | 32,261 | $ | 0.03 | ||||||||||||
|
Losses on early extinguishment of debt
|
44,474 | 0.04 | - | - | - | - | ||||||||||||||||||
|
Integration costs
|
18,105 | 0.02 | 21,701 | 0.02 | 12,513 | 0.01 | ||||||||||||||||||
|
Severance and early retirement costs
|
937 | - | 4,032 | - | 6,767 | 0.01 | ||||||||||||||||||
|
Gain on investment in Adelphia
|
(6,191 | ) | (0.01 | ) | - | - | - | - | ||||||||||||||||
|
Discrete tax item
|
- | - | - | - | 10,500 | 0.01 | ||||||||||||||||||
|
Non-GAAP, as adjusted (1)
|
$ | 75,314 | $ | 0.08 | $ | 52,501 | $ | 0.05 | $ | 62,041 | $ | 0.06 | ||||||||||||
|
For the six months ended
|
||||||||||||||||||||||||
|
June 30, 2012
|
June 30, 2011
|
|||||||||||||||||||||||
| Net income attributable to common |
Earnings
|
Earnings
|
||||||||||||||||||||||
| shareholders of Frontier |
Net Income
|
Per Share
|
Net Income
|
Per Share
|
||||||||||||||||||||
|
GAAP, as reported
|
$ | 44,757 | $ | 0.04 | $ | 86,972 | $ | 0.09 | ||||||||||||||||
|
Losses on early extinguishment of debt
|
44,474 | 0.04 | - | - | ||||||||||||||||||||
|
Integration costs
|
39,806 | 0.04 | 20,678 | 0.02 | ||||||||||||||||||||
|
Severance and early retirement costs
|
4,969 | 0.01 | 6,820 | 0.01 | ||||||||||||||||||||
|
Gain on investment in Adelphia
|
(6,191 | ) | (0.01 | ) | - | - | ||||||||||||||||||
|
Discrete tax item
|
- | - | 10,500 | 0.01 | ||||||||||||||||||||
|
Non-GAAP, as adjusted (1)
|
$ | 127,815 | $ | 0.13 | $ | 124,970 | $ | 0.12 | ||||||||||||||||
|
(1) Non-GAAP, as adjusted may not sum due to rounding.
|
||||||||||||||||||||||||
