  Fourth largest in the world #1 LDC in gas storage #2 in renewable sales in the Great Lakes area Cross Winds Energy Park Ludington Pumped Storage Ray Compressor Station Investor Meetings July 9 & 10, 2015 Exhibit 99.1 |
 This presentation is made as of the date hereof and contains “forward-looking statements” as defined in Rule
3b-6 of the Securities
Exchange
Act of 1934, Rule 175 of the Securities Act of 1933, and relevant legal decisions. The forward-looking statements are subject to risks and uncertainties. All forward-looking statements should be considered in the context of the risk
and other factors detailed from time to time in CMS Energy’s and Consumers Energy’s Securities and Exchange Commission filings. Forward-looking statements should be read in conjunction with “FORWARD-LOOKING STATEMENTS AND
INFORMATION” and “RISK FACTORS” sections of CMS
Energy’s and Consumers Energy’s Form 10-K for the year ended December 31, 2014 and as updated in subsequent 10-Qs. CMS Energy’s and Consumers Energy’s
“FORWARD-LOOKING STATEMENTS AND INFORMATION”
and “RISK FACTORS” sections are incorporated herein by reference and discuss important factors that could cause CMS Energy’s and Consumers Energy’s results to differ materially from those
anticipated in such statements.
CMS Energy and Consumers Energy undertake no obligation to update any
of the information presented herein to reflect facts,
events or circumstances after the date hereof. The
presentation also includes non-GAAP measures when describing CMS Energy’s results of operations and financial performance. A reconciliation of each of these measures to the most directly comparable GAAP measure is included in the
appendix
and posted on our website at www.cmsenergy.com. CMS Energy provides historical financial results on both a reported (Generally Accepted Accounting Principles) and adjusted
(non-GAAP) basis and provides forward-looking
guidance on an adjusted basis. Management views adjusted earnings as a key measure of the company’s present operating financial performance, unaffected by discontinued operations, asset sales,
impairments, regulatory items from prior years, or other
items. These items have the potential to impact, favorably or unfavorably, the company's reported earnings in future periods. Investors and others should note that CMS Energy and Consumers Energy post important financial information using the
investor
relations
section
of the CMS Energy website, www.cmsenergy.com and Securities and Exchange Commission filings. 1 |
 . . . . business model is delivering results. 2 • Senator Nofs introduced energy bill – Improvement to 2008 Law • PA 169 (cost of service) approved – Improves industrial rate competitiveness by 4% • MISO Zone 7 capacity shortfall 1,300 MW – More upside to ten-year $15.5 billion capital investment plan • Representative Nesbitt introduced energy bill – Restores full regulatory model |
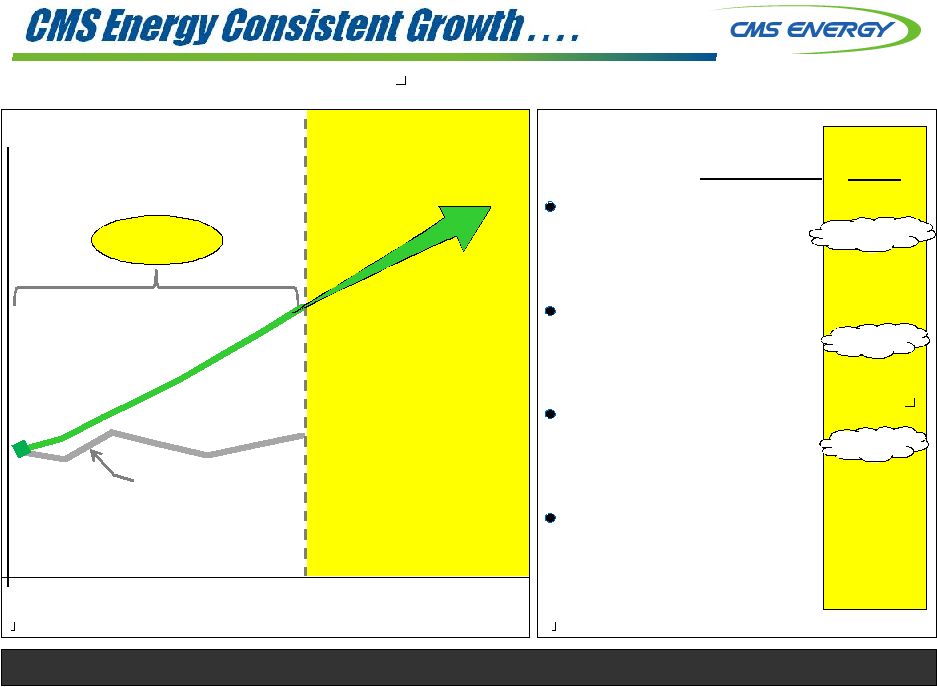
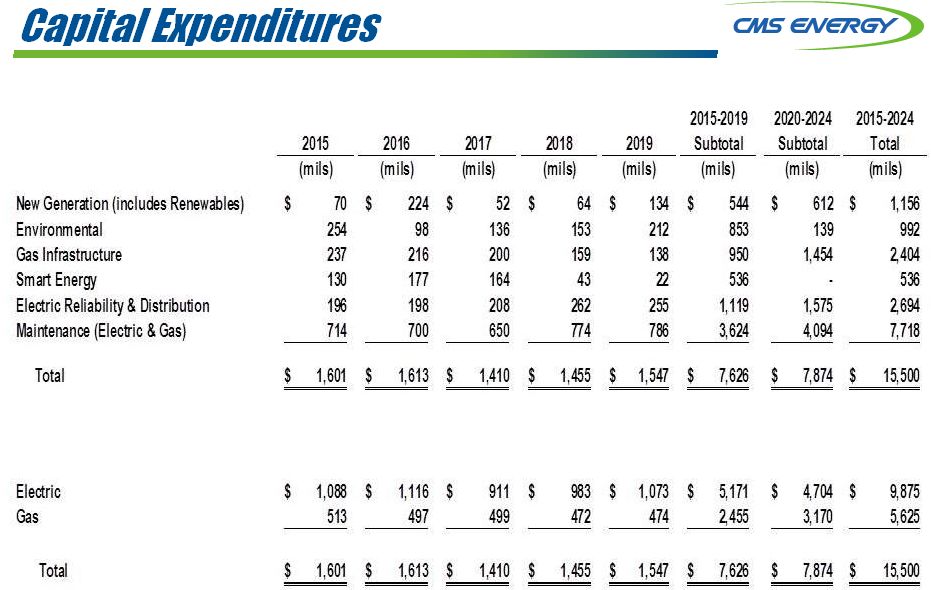
 . . . . next 10 years even brighter than last 10 year record! Supported By UPSIDES create headroom PARTNERS in progress PASSION to improve for customers AND owners SELF-FUNDED! Our Growth Engine Billion $15.5 More “upside” $5 bil NOT yet in Plan! (2015-2024 Capex) (Investment, Sales, Cost, & DIG) (Customers, Regulators, & Policy Makers) (Value, Reliability, & Environment) 3 |
 4 . . . . contains necessary improvements for Michigan Energy Law. • “Fair Choice,” no subsidies • 10% cap and queue remain • Minimum of three years firm capacity requirement • One-time election, “one-way door” • Integrated Resource Plan (IRP) replaces Certificate of Necessity • 270 day approval process • Renewable standard repealed, to be handled in IRP • Energy efficiency 1% per year through 2018 • Net metering – wholesale prices, “no subsidies” • Rate cases completed in ten months (vs twelve) • No self-implementation • Decoupling for gas AND electric |
 5 . . . . provide stability. John Quackenbush (R), Chairman Term Ends: July 2, 2017 Greg White (I) Term Ended: July 2, 2015 Sally Talberg (I) Term Ends: July 2, 2019 Commission Powering Michigan’s Comeback Governor Rick Snyder Energy Committee Chairs Senator Mike Nofs House Rep. Aric Nesbitt Consistent Leadership! |
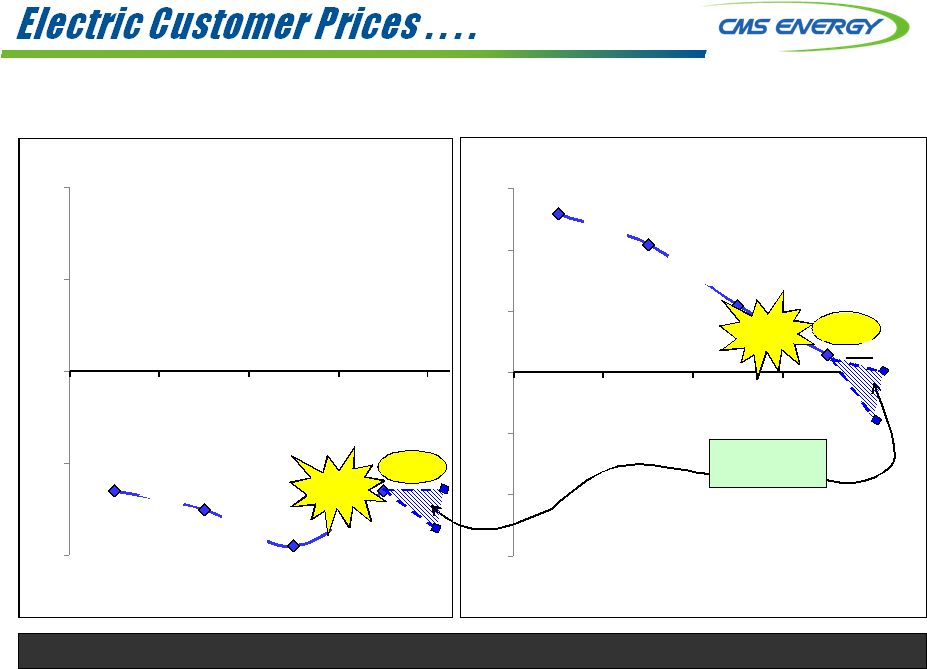 6 -20 -10 0 10 20 2013 2014 2015 2016 Residential Bills Industrial Rates (13)% (15)% (19)% (13)% National Avg % Better Worse Rates Rates & Fuel -30 -20 -10 0 10 20 30 2013 2014 2015 2016 26% 21% 11% Midwest Avg % 4% Better Worse Rates & Fuel Flat (8)% Plus . . . . affordable for residential and improving for industrial customers. Plus (17)% Policy could eliminate gap Rates & Act 169 Rates & Act 169 Rates |
 2003 2004 2005 2006 2007 2008 2009 2010 2011 2012 2013 2014 2015 2016 2017 2018 2019 2020 2021 2022 2023 2024 . . . . creating an opportunity for the next ten years. Amount (billions) $1.8 CMS Peers _ _ _ _ _ a Based on December 31, 2014 information percent of market cap Source: 10K; actual amounts through 2014 smoothed for illustration
7 14% 15% 16% 12% 20% 15% Capex Liquidity Cash Flow (oper) Consumers Energy Peer Average Peer Performance a |
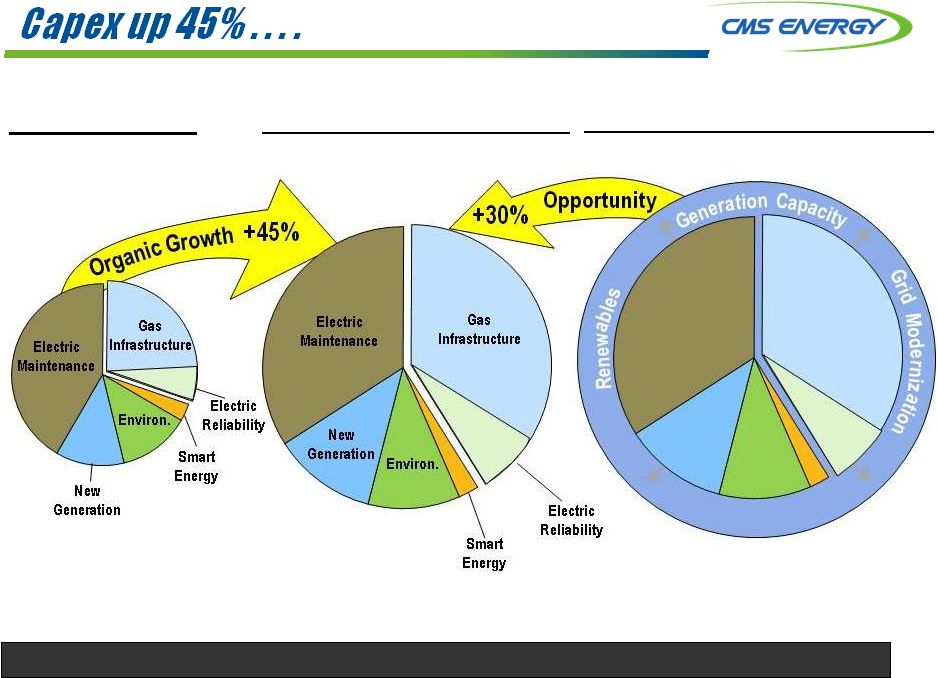 . . . . opportunity for another 30%, with no “big bets” over ten years! 2015-2024 8 2005-2014 $10.7 bil $15.5 bil Opportunity $20 + bil |
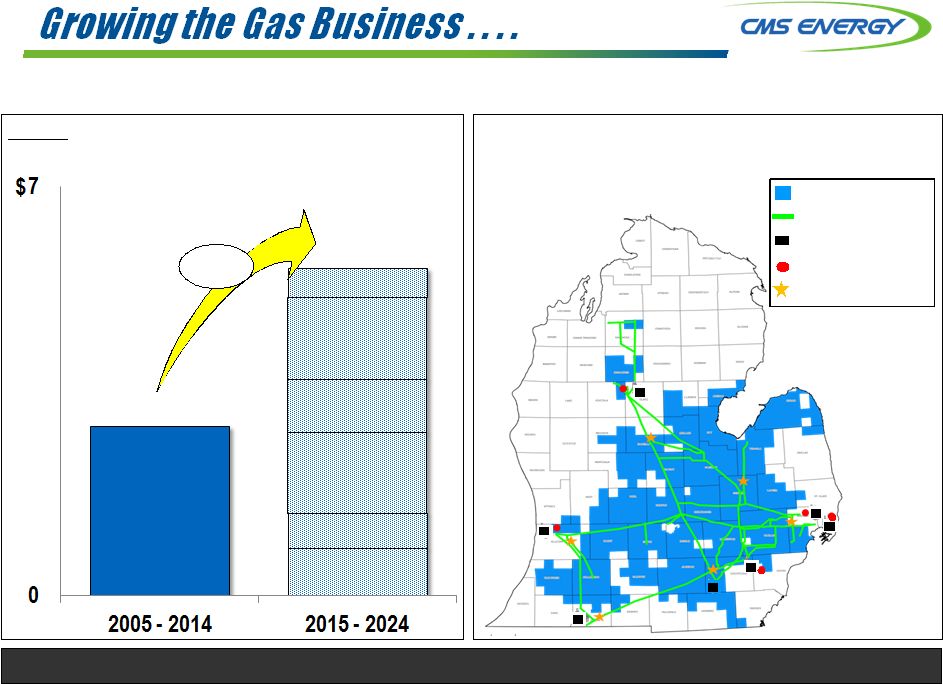 9 . . . . expanding one of the largest systems in the country. $2.9 Amount (bils) $5.6 Capital Investment +93% Pipeline Integrity Civic Improvement Capacity & Deliverability Compression & Other Infrastructure New Customers Gas service area Transmission line Compressor stations Storage fields Interconnects Gas Service Territory - 1.7 million customers - 28,854 miles of distribution and transmission - 309 Bcf gas storage capacity |
 10 . . . . investing $5.6 billion over the next 10 years. Main Replacements 800 miles $1 billion Modernization 6 city gates, 7 regulation stations, 24 relief valves New Connections 100,000 customers $550 million Replace Transmission Mains 275 miles More Conversions 70,000 customers Compression 35,000 hp $300 million |
 . . . . emerging incrementally with replacements not yet in plan! ~800 MW 1,240 MW MW PPA 2,600 capacity ~30% ~8,600 MW 540 MW 410 MW Shortfall Owned 6,000 780 MW ~9,400 MW 11,000 Owned 8,820 PPA 580 Capacity Growth Over Next Ten Years 11 PPA’s Expire Lower customer bills 2015 2022 2025 201X Today Future |
 . . . . adding value to our “DIG” plant. $0.50 $2.00 $4.50 $7.50 Capacity price ($ kW per month) Was (mils) Upside Scenarios (mils) $55 $35 New Business •Long-term
Energy • 250 MW at $4.00 per kWm (6/14) • 250 MW at $6.02 per kWm (4/15) •Recent
Capacity
• Long-term > $3.30 • Near-term $4.50 Upside: Capacity and energy contracts layered in over time 12 (CONE) Now (mils) $15 $5 (Forecast) (Prior) Capacity Energy $65 $40 + $25 – $50 more $0.50 < |
  Electric Gas Combination Betz MSU FRIB Durolast Roofing GM Assembly Examples of New Business Denso North America • Hub for all thermal production in N. America • 100 new jobs • $53.6 million investment • Investments thru 2015 Announcement Enbridge MACI Dart Brembo Denso WKW Post Magna-Cosma 13 Dicastal Plasan Continental Dairy Auto 50 Food 7 Manufacturing 21 Metal 20 Petroleum 19 Plastics 19 Others 19 Industries MW Total Up 155
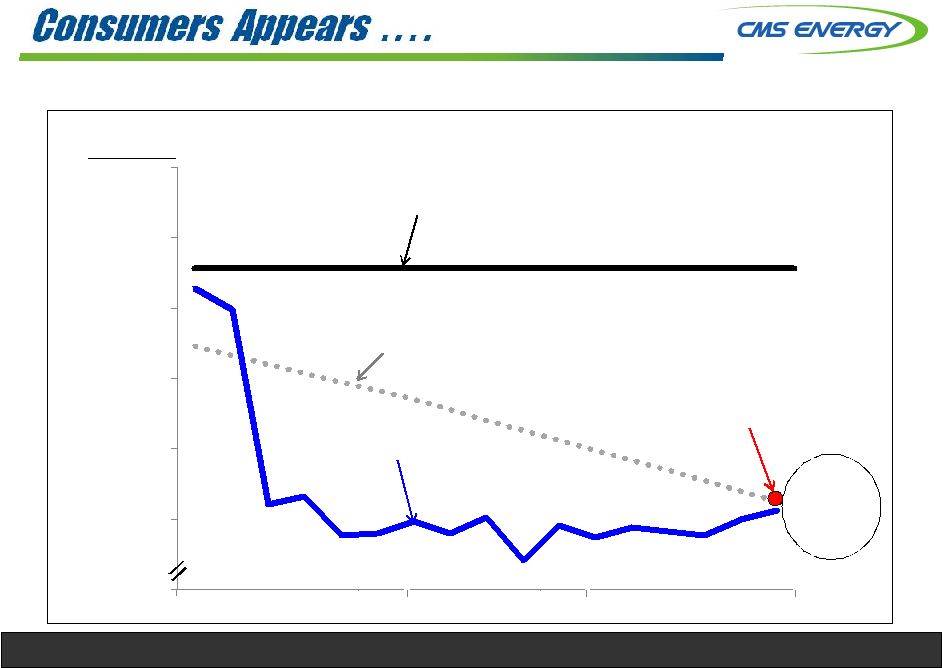
. . . . another 2½% of sales growth. |
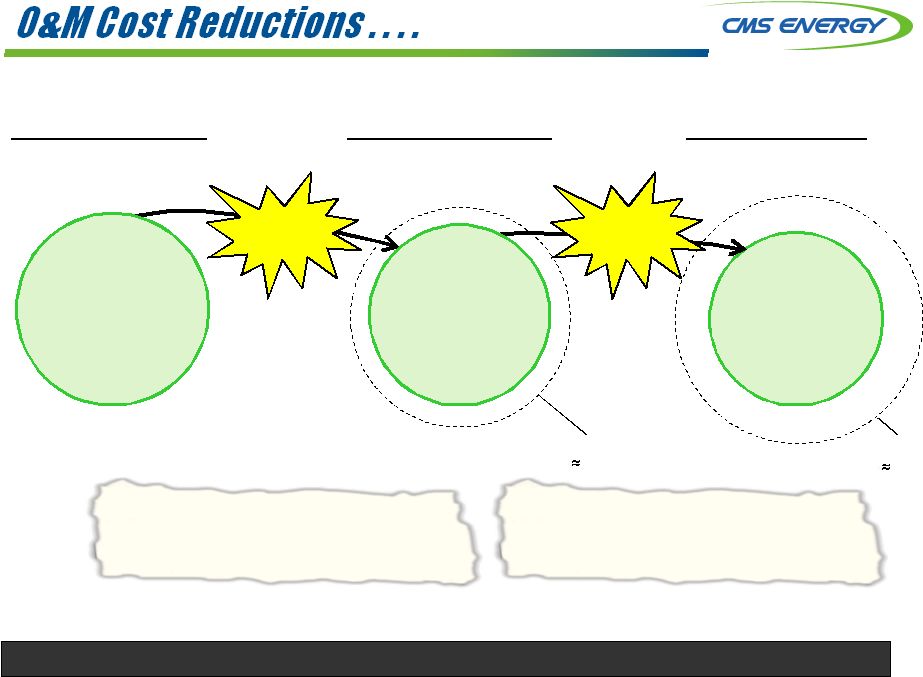 . . . . provide more headroom for more capital investment. 14 Down 10% $1.1 bil $0.9 bil 2006 2014 2019 $1.0 bil • Coal to Gas Switching (Zeeland) • Smarter Benefit Plans • Productivity/Attrition • Coal to Gas Switching (Jackson) • “Pole Top” Hardening • Productivity/Smart Energy Down 7% Inflation 2% Inflation 2% |
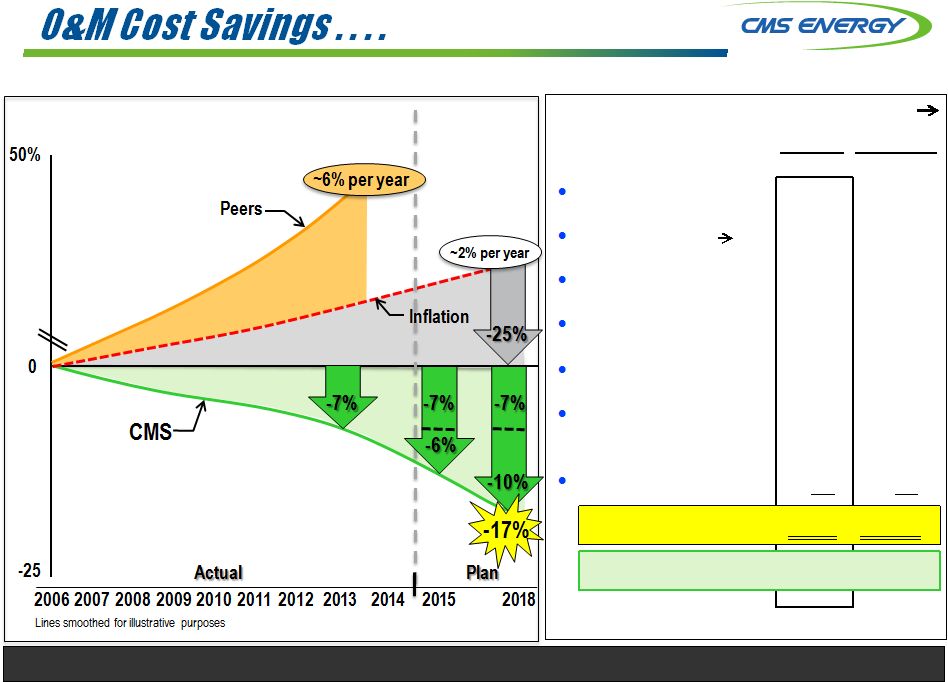 15 . . . . accelerated; funding investment and reducing risk. O&M Trend vs Peers O&M Cost Savings FAST START! Attrition $ - 35 $ - 75 Productivity (Coal Gas) - 35 - 50 “Pole Top” Hardening - 30 - 30 Smart Meters - 5 - 25 Eliminate Waste (UA’s) - 15 - 20 Mortality Tables & Discount Rates +50 + 50 Service Upgrades +10 + 50 Net Savings $ - 60 $ - 100 Percent Savings - 6% - 10% 2014 & 2015 2014 2018 (mils) (mils) |
 16 . . . . even easier, with lots of upsides. Sustainable Future Growth Investment (bils) O&M Reductions Sales Growth Energy Policy Future Shines Bright $6.4 (10)% +1% $7.6 (7)% +½ % Past Performance Next 5 Years Improved Law (2010-2014) (2006-2014) (2010-2014) 2008 Law Last 7 Years Next 5 Years +7% /year _ _ _ _ _ a Adjusted EPS (non-GAAP) $3.50 Conservative Conservative Capacity Op! a Peers = 3% /year b _ _ _ _ _ a As of March 31 |
|
Appendix * * * * * * * * * * * * * * * * * * * * * * **************************************************** |
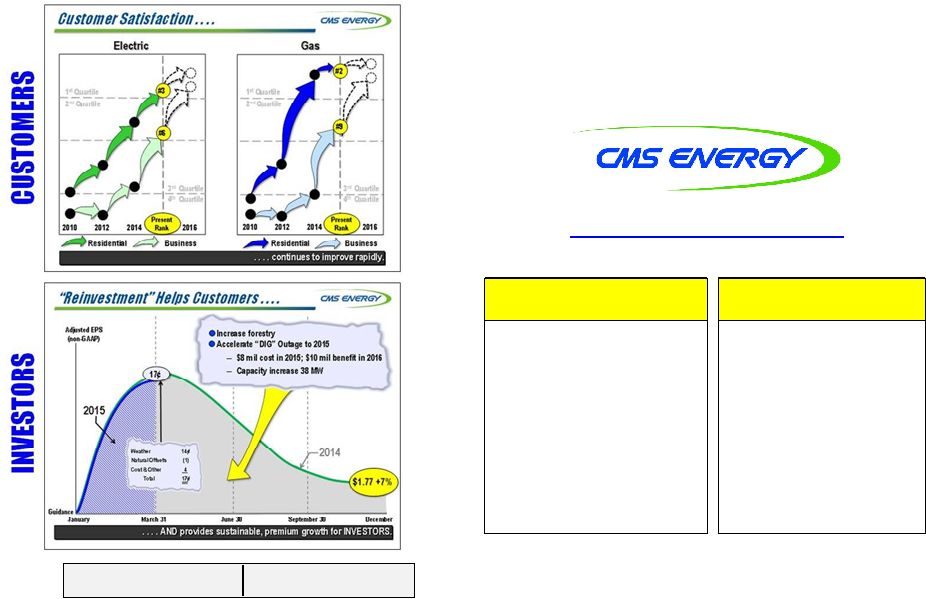
 Electric 1 st Quartile 2 nd Quartile 4 th Quartile 2010 2012
2014 2016 3 rd Quartile . . . . continues to improve rapidly. Gas 1 st Quartile 2 nd Quartile 4 th Quartile 3 rd Quartile 2010 2012
2014 2016 Present Rank Present Rank Residential Business Residential Business #6 #3 #2 18 #9 |
 2020 2025 2030 . . . . to be in a good carbon position. Carbon Tonnage Reduction (Preliminary) 13 15 17 19 21 23 25 2005 Baseline Million Tons of CO 2 Consumers Energy 2014 Clean Power Plan Projected emission level “Implied” EPA Target 19 |
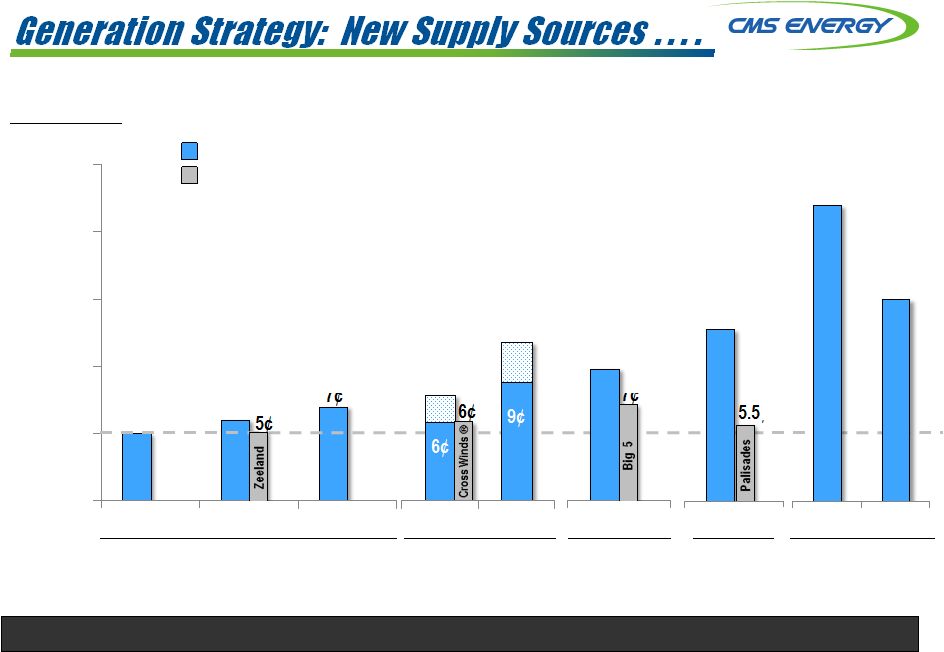 0 5 10 15 20 25 Coal Nuclear . . . . combined cycle gas is the most attractive new source of supply. Levelized cost of new build (¢/kWh) Gas price= $3.00
$4.50 $6.00 W/ tax credit W/o tax credit W/ emission controls Today $3.00 per watt 5¢ 6¢ 7¢ 9¢ 10¢ 12¢ 22¢ 8¢ 11¢ Back -up 6¢ Wind Combined Cycle Gas Plant Residential Solar 15¢ Future $2.00 per watt? Consumers Energy Sources 5¢ 7¢ 5.5¢ New Build 6¢ 20 Back -up |
 21 |
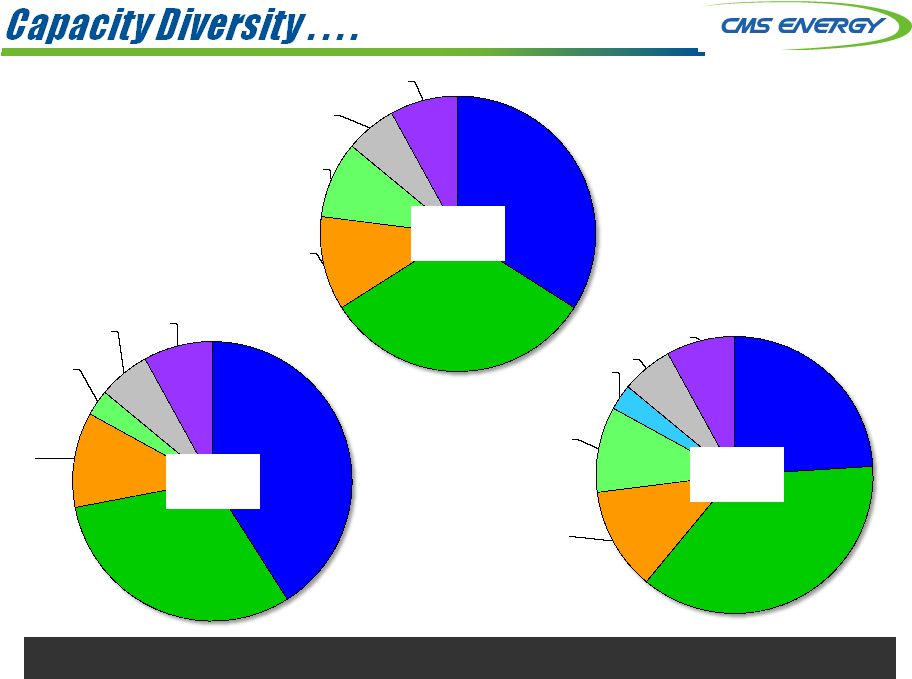 Coal 34% Gas 32% Pumped Storage 11% Renewables 9% Oil 6% Nuclear 8% Coal 24% Gas 37% Pumped Storage 12% Renewables 10% Purchases 3% Oil 6% Nuclear 8% . . . . evolving to cleaner generation while becoming more cost competitive.
Coal 41% Gas 31% Pumped Storage 11% Renewables 3% Oil 6% Nuclear 8% 2005 2017 2014 22 |
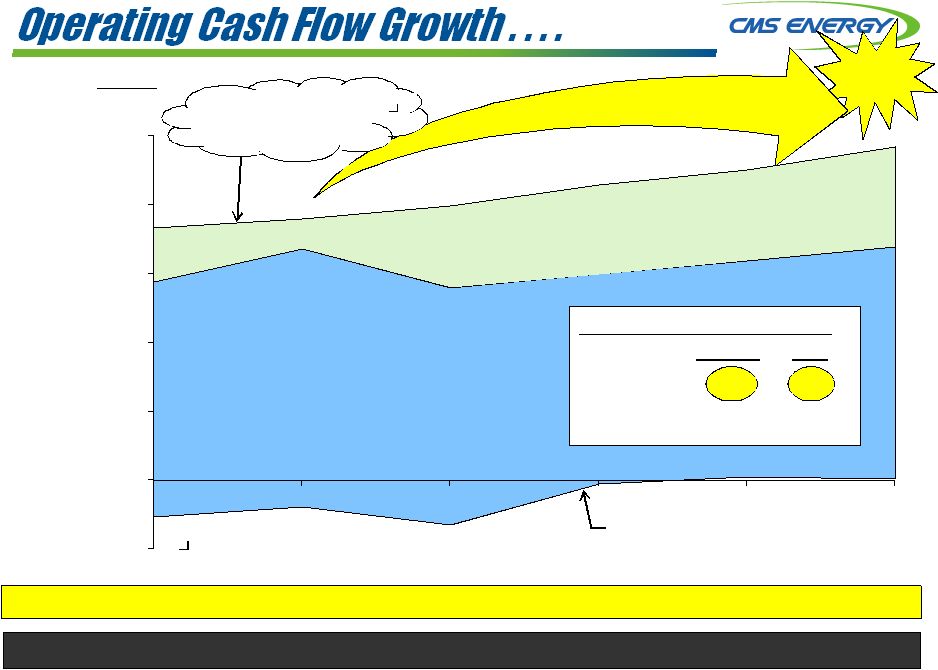 23 (0.5) 0.0 0.5 1.0 1.5 2.0 2.5 2014 2015 2016 2017 2018 2019 Amount (bils) $ Investment Cash flow before dividend _ _ _ _ _ a Non-GAAP NOLs & Credits $0.7 $0.7 $0.5 $0.4 $0.3
$0.2 . . . . up $½
billion or 30% over five years! $2.2
Interest, working
capital and taxes
$1.8 $2.4 $1.68 Pct of Market Cap (as of Dec. 2014) Cap Inv OCF CMS 15% Peers 14 12
Up $0.5 Billion $2.0 $2.1 $1.9 Gross operating cash flow a up $0.1 billion per year 16% 15% |
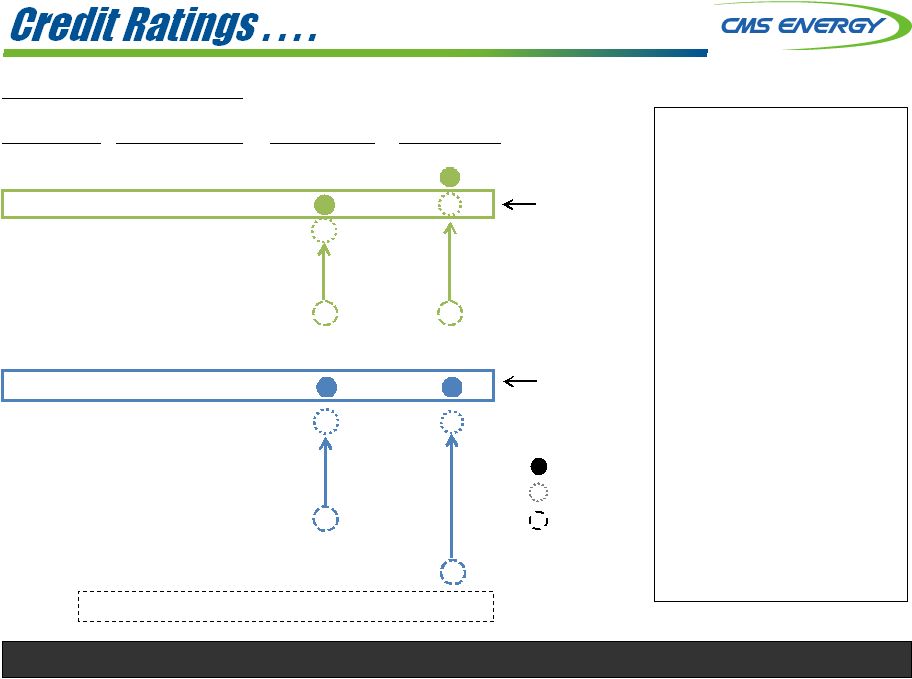 24 . . . . show continuous improvement. • Consistent Performance • Less Risk • Customer Focus • Constructive Regulation • Good Energy Policy Reflects Present Prior 2002 Scale S&P Moody’s S&P (Dec. ‘14) Moody’s (Mar. ‘15) A+ A1 A A2 A- A3 BBB+ Baa1 BBB Baa2 BBB- Baa3 BB+ Ba1 BBB Baa2 BBB- Baa3 BB+ Ba1 BB Ba2 BB- Ba3 B+ B1 B B2 B- B3 Outlook Stable Stable Consumers Secured CMS Unsecured |
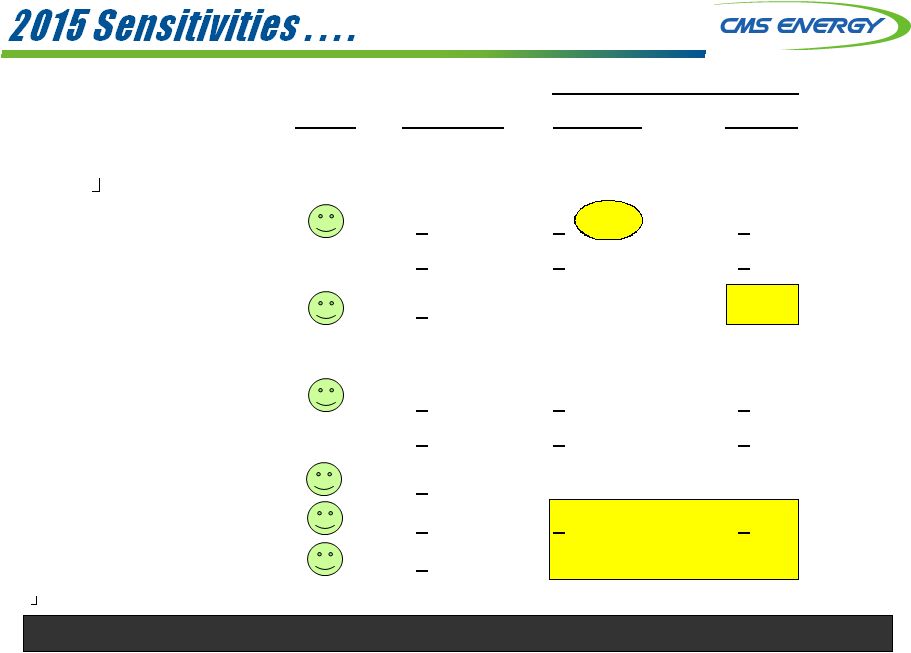 25 _ _ _ _ _ a Reflect 2015 sales forecast; weather adjusted 2015 Impact Status Sensitivity EPS OCF Sales a • Electric (38,093 GWh) • Gas (302.6 Bcf) + 1% + 5 + $0.05 + 0.07 + $ 20 + 30 Gas prices (NYMEX) + 50¢ 0 55 ROE (authorized) • Electric (10.3%) • Gas (10.3%) + 10 bps + 20 + 0.01 + 0.01 + 5 + 4 Interest Rates Capital Investment O&M Cost +100 bps +$100 mil + 2% < 0.01 + 0.01 0.04 0 + 10 20 – + . . . . reflect strong risk mitigation. – + – + – + (mils) – + – + |
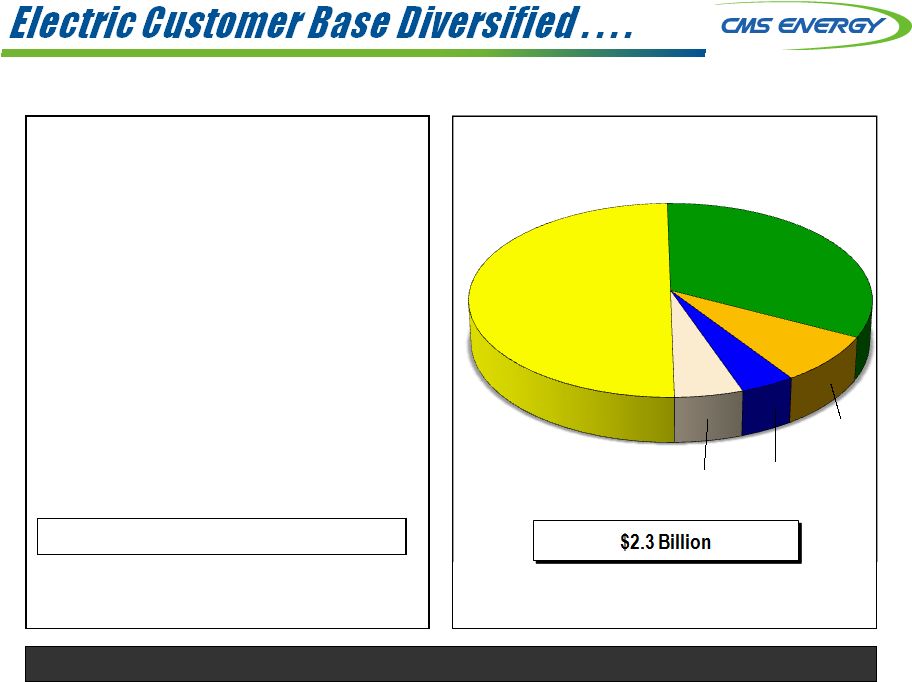 26 . . . . “autos” only 5% of gross margin. • Hemlock Semiconductor • General Motors • Nexteer Automotive Corporation • Gerdau MacSteel • Denso International • Packaging Corporation of America • Meijer • State of Michigan • Spectrum Health • AT&T Percentage of electric gross margin is 2.4% Top Ten Customers 2014 Electric Gross Margin Other 4% Industrial 8% Commercial 33% Residential 50% (2014 Ranked by Deliveries) Auto 5% |
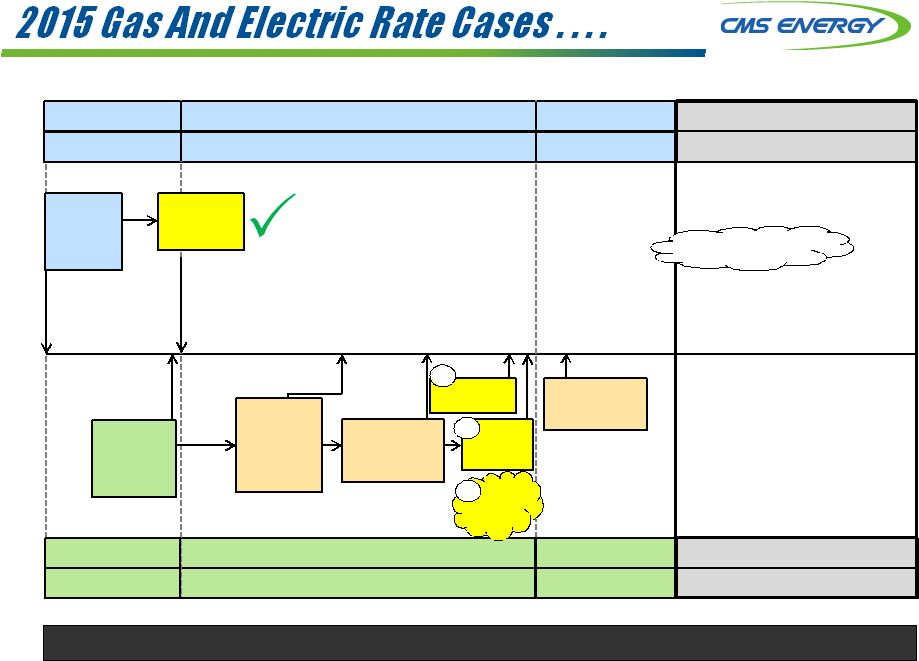          27 2016 2015 2014 Filed $88 M 7/01 . . . . primarily for customer improvement with large O&M offsets. ELECTRIC GAS Our View Our View Filed $163 M 12/05 Securitization Surcharge Ends $80 M 2016 2015 2014 Jackson Plant in rate base Investment recovery and cost reductions New Rate Design A) B) C) Settled $45 M Final Order New Rate Design Jackson Plant Classic 7 Decommissioned Self- implement $110 M 6/4 B) C) A) Settled $45 million 10.3% ROE A) B) |
| GAAP
Reconciliation *
* * * * * * * * * * * * * * * * * * * * * **************************************** |
 29 2003 2004 2005 2006 2007 2008 2009 2010 2011 2012 2013 2014 Reported earnings (loss) per share - GAAP ($0.30) $0.64 ($0.44) ($0.41) ($1.02) $1.20 $0.91 $1.28 $1.58 $1.42 $1.66 $1.74 After-tax items: Electric and gas utility 0.21 (0.39) - -
(0.07)
0.05
0.33
0.03
-
0.17
-
-
Enterprises
0.74
0.62
0.04
(0.02)
1.25
(0.02)
0.09
(0.03)
(0.11)
(0.01)
*
0.03
Corporate interest and other
0.16
(0.03)
0.04
0.27
(0.32)
(0.02)
0.01
*
(0.01)
*
*
*
Discontinued operations (income) loss
(0.16)
0.02
(0.07)
(0.03)
0.40
(*)
(0.08)
0.08
(0.01)
(0.03)
*
(*)
Asset impairment charges, net
-
-
1.82
0.76
0.60
-
-
-
-
-
-
-
Cumulative
accounting changes 0.16
0.01
-
-
-
-
-
-
-
-
-
-
Adjusted
earnings per share, including MTM - non-GAAP $0.81 $0.87 $1.39 $0.57 $0.84 $1.21 (a) $1.26 $1.36 $1.45 $1.55 $1.66 $1.77 Mark-to-market impacts 0.03 (0.43) 0.51 Adjusted earnings per share, excluding MTM - non-GAAP
NA
$0.90
$0.96
$1.08
NA
NA
NA
NA
NA
NA
NA
NA
*
Less than $500 thousand or $0.01 per share.
(a)
$1.25 excluding discontinued Exeter operations and
accounting changes related to convertible debt and restricted stock. CMS ENERGY CORPORATION Earnings Per Share By Year GAAP Reconciliation (Unaudited) |
 30 2014 2015 2016 2017 2018 2019 Consumers Operating Income + Depreciation & Amortization 1,813 $ 1,940 $ 1,955 $ 2,081 $ 2,194 $ 2,358 $ Enterprises Project Cash Flows 20 20 28 50 52 55 Gross Operating Cash Flow 1,833 $ 1,960 $ 1,983 $ 2,131 $ 2,246 $ 2,413 $ (386) (280) (583) (631) (646) (713) Net cash provided by operating activities 1,447 $ 1,680 $ 1,400 $ 1,500 $ 1,600 $ 1,700 $ CMS Energy Reconciliation of Gross Operating Cash Flow to GAAP Operating Activities (unaudited) (mils) Other operating activities including taxes, interest payments and working capital |
 July 2015 OUR MODEL; OUR PLAN INVESTOR INFORMATION CMS Energy
Corporation
Phil McAndrews (517)
788-1464 Investor Relations
Department
Travis Uphaus (517) 768-3114
One Energy Plaza, Jackson, MI
49201
www.cmsenergy.com • 12 year track record (EPS and dividend growth) • Capex -- 100% organic (no “big bets”) • Self-funded -- No block equity dilution! (5 years!) • World-class cost performance • Conservative sales planning (under promise/over deliver) • World-class regulation and law OUTPERFORMED FOR A DECADE: NEXT DECADE EVEN BRIGHTER • Improvement to 2008 Energy Law - Senator Nofs’ bill (July) - Rep. Nesbitt’s bill w/ full reg. (March) • PA 169 (cost of service) approved (Improves industrial rate competitiveness by 4%) • MISO Zone 7 Capacity Shortfall 1,300 MW (More upside to ten-year $15.5 billion capital investment plan) Top of Mind |
 Adjusted EPS Gross OCF Dividend CapEx CMS O&M Cost Electric Sales (Ind. /Total ) Energy Policy 10% 11 16% 15 21% • Energy efficiency standards • File and implement • 10% renewables by 2015 • 10% ROA cap • Adaptability • Reliability • Affordability • Environmentally protective 2015 Update 2008 Law 2009 2010 2011 2012 2013 2014 2015 2016 2017 2018 2019 2008 - 2009 Recession 2010 - 2013 Recovery 2014 2015 2016 - 2019 Future $1 bil capex = +1% sales = $20 mil OCF = 5¢ EPS Self-funded (No block equity dilution) + $0.6 $1.8 $2.4 Base Rates < 2% 2005 - 2014 $10.7 B 2015 - 2024 $15.5 B Opportunity $16.5 + B +30% +45% Down 10% Down 7% -5% -2.5% 5% 1% 3% 1% 2% ½% $1.1 $0.9 $1.3 > 2% < 2% $1.77 Conservative Opportunity • Generation capacity • Gas infrastructure • Grid modernization No “Big Bets” Gas Infrastructure Electric Reliability Smart Energy Environmental New Generation Electric Maintenance 2006 2014 2019 Residential Bills Industrial Rates (bils) (bils) % of Mkt Cap Peers • New capacity • Gas combined cycle -- $700 million • Renewables -- $1 billion • New Energy Efficiency • Incentive/ rate base • Decoupling • Eliminate ROA subsidy = $150 million $20 + B Upside Peers up 42% Actual Plan Upsides NOT in Plan Int’l Sale $1.0 2.8% 8.7% 7% /year + $0.5 This placemat contains “forward-looking statements”; please refer to our SEC filings for information regarding the
risks and uncertainties that could cause our results to differ materially. It also contains non-GAAP measures. Reconciliations to most directly comparable GAAP measures are found in the accompanying handout or on our website at
www.cmsenergy.com a
a a Non-GAAP As of March 31, 2015
b b b 20¢ 36¢ 50¢ 66¢ 84¢ 96¢ $1.02 $1.08 $0.81 $0.90 $0.96 $1.08 $0.84 $1.21 $1.26 $1.36 $1.45 $1.55 $1.66 2003 2004 2005 2006 2007 2008 2009 2010 2011 2012 2013 2014 Future |