Exhibit 99.1
Exhibit 99.1
Investor Meetings
June 13, 2013
Cross Winds® Energy Park
Consumers Smart Energy Program
Gas Combined Cycle Plant
This presentation is made as of the date hereof and contains “forward-looking statements” as defined in Rule 3b-6 of the Securities Exchange Act of 1934, as amended, Rule 175 of the Securities Act of 1933, as amended, and relevant legal decisions. The forward-looking statements are subject to risks and uncertainties. They should be read in conjunction with “FORWARD-LOOKING STATEMENTS AND INFORMATION” and “RISK FACTORS” sections of CMS Energy’s and Consumers Energy’s Form 10-K for the year ended December 31 and as updated in subsequent 10-Qs. CMS Energy’s and Consumers Energy’s “FORWARD-LOOKING STATEMENTS AND INFORMATION” and “RISK FACTORS” sections are incorporated herein by reference and discuss important factors that could cause CMS Energy’s and Consumers Energy’s results to differ materially from those anticipated in such statements. CMS Energy and Consumers Energy undertake no obligation to update any of the information presented herein to reflect facts, events or circumstances after the date hereof.
The presentation also includes non-GAAP measures when describing CMS Energy’s results of operations and financial performance. A reconciliation of each of these measures to the most directly comparable GAAP measure is included in the appendix and posted on our website at www.cmsenergy.com.
CMS Energy provides financial results on both a reported (Generally Accepted Accounting Principles) and adjusted (non-GAAP) basis. Management views adjusted earnings as a key measure of the company’s present operating financial performance, unaffected by discontinued operations, asset sales, impairments, regulatory items from prior years, or other items. Certain of these items have the potential to impact, favorably or unfavorably, the company’s reported earnings in 2013. The company is not able to estimate the impact of these matters and is not providing reported earnings guidance.
1
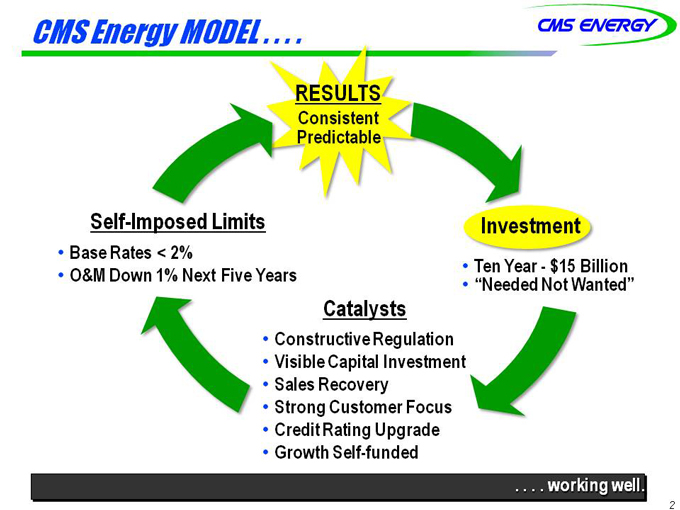
CMS Energy MODEL . . . .
RESULTS
Consistent
Predictable
Self-Imposed Limits
Base Rates < 2%
O&M Down 1% Next Five Years
Investment
Ten Year - $15 Billion
“Needed Not Wanted”
Catalysts
Constructive Regulation
Visible Capital Investment
Sales Recovery
Strong Customer Focus
Credit Rating Upgrade
Growth Self-funded
. . . . working well.
2
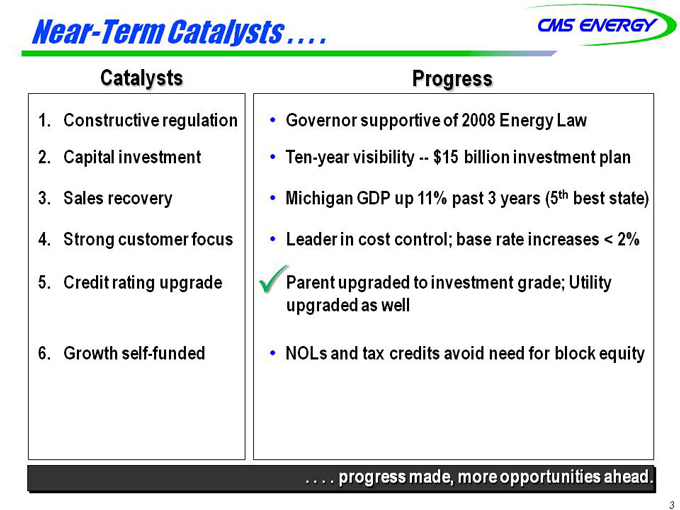
Near-Term Catalysts . . . .
Catalysts Progress
1. Constructive regulation Governor supportive of 2008 Energy Law
2. Capital investment Ten-year visibility -- $15 billion investment plan
3. Sales recovery Michigan GDP up 11% past 3 years (5thbest state)
4.Strong customer focus Leader in cost control; base rate increases < 2%
5. Credit rating upgrade Parent upgraded to investment grade; Utility
upgraded as well
6. Growth self-funded NOLs and tax credits avoid need for block equity
. . . . progress made, more opportunities ahead.
3
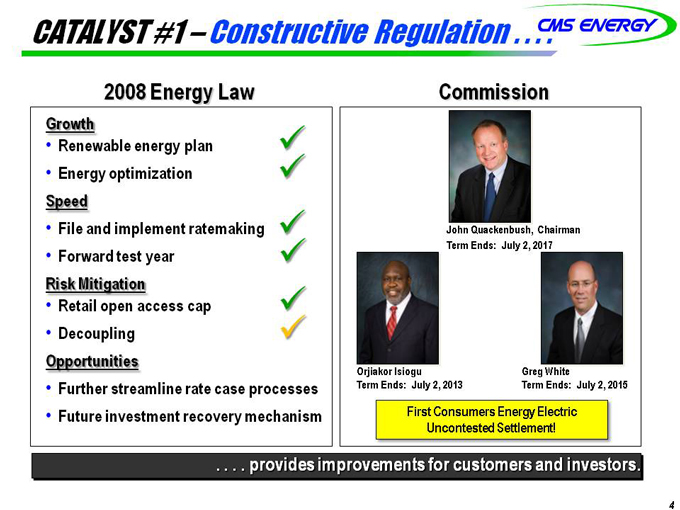
CATALYST #1 –Constructive Regulation . . . .
2008 Energy Law Commission
Growth
Renewable energy plan
Energy optimization
Speed
File and implement ratemaking John Quackenbush, Chairman
Term Ends: July 2 2017 F d t t 2, Forward test year
Risk Mitigation
Retail open access cap
Decoupling
Opportunities Orjiakor Isiogu Greg White
Further streamline rate case processes Term Ends: July 2, 2013 Term Ends: July 2, 2015
Future investment recovery mechanism First Consumers Energy Electric
U t td Sttl t! y Uncontested Settlement!
. . . . provides improvements for customers and investors.
4
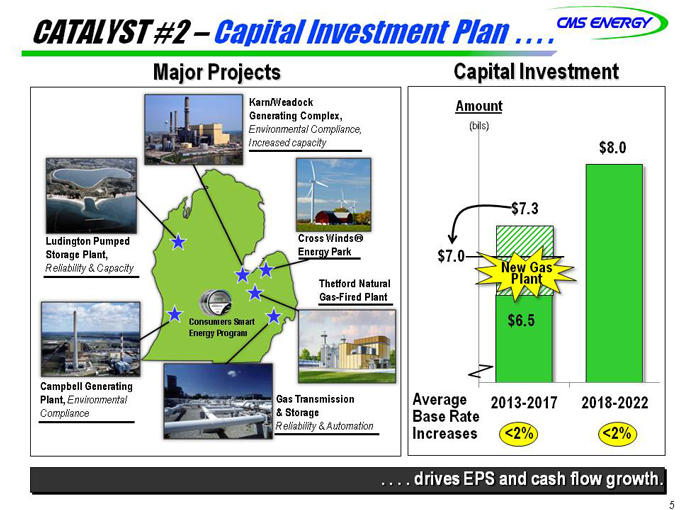
CATALYST #Capital Investment Plan . . . .
Major Projects Capital Investment
Karn/Weadock Amount Generating Complex,
(bils)
Environmental Compliance, Increased capacity $8.0
$7.3
Ludington Pumped Cross Winds®
$7 0
g p
Storage Plant, Energy Park 7.0 New Gas
Sto age a t,
Reliability & Capacity Plant
Thetford Natural Gas-Fired Plant
Consumers Smart $6.5
Energy Program
Campbell Generating
Gas Transmission Average 2013 2017 2018 2022
p g
Plant, Environmental 2013-2018-& Storage B R t
,
Compliance
Base Rate
Reliabilit A tomation
Reliability & Automation Increases <2% <2%
. . . . drives EPS and cash flow growth.
5
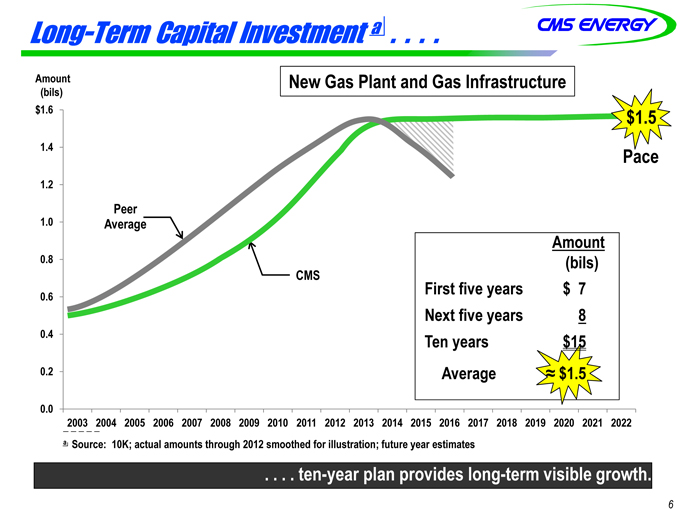
Long-Term Capital Investment a . . . .
Amount New Gas Plant and Gas Infrastructure (bils)
$1.6 $1.5
1.4 Pace
1.2
Peer
1 0
1.0 Average
Amount
0.8 ( bils)
CMS
)
First five years $ 7 0 6 0.6 y
Next five years 8
0 4
y
0.4 Ten years $15
0.2 Average ~ $1.5
0.0
2 _0 0_3 _ _2004 2005 2006 2007 2008 2009 2010 2011 2012 2013 2014 2015 2016 2017 2018 2019 2020 2021 2022
a Source: 10K; actual amounts through 2012 smoothed for illustration; future year estimates
. . . . ten-year plan provides long-term visible growth.
6
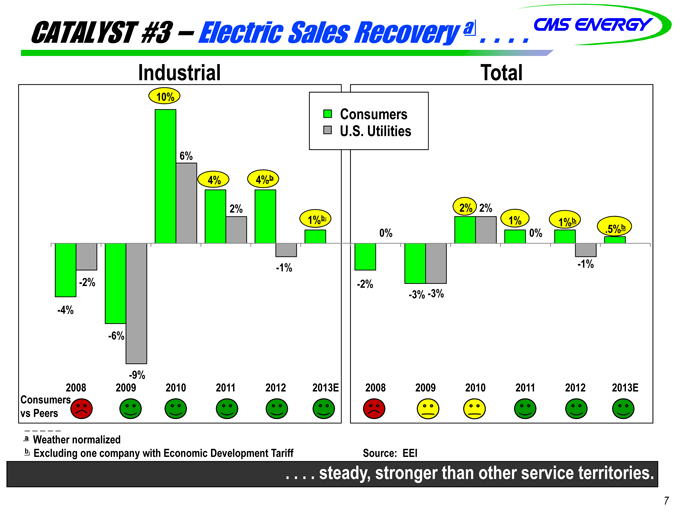
CATALYST # Electric Sales Recovery a . . . .
Industrial Total
10%
Consumers
U.S. Utilities
6%
4% 4%b
2% 2%
2%
1%b
1%
1%b 5%b 0% 0% .5%
-1% -1%
-2% -2%
-3% -3%
-4%
-6%
-9%
2008 2009 2010 2011 2012 2013E 2008 2009 2010 2011 2012 2013E
Consumers
vs Peers
a Weather normalized
b Excluding one company with Economic Development Tariff Source: EEI
. . . . steady, stronger than other service territories.
7
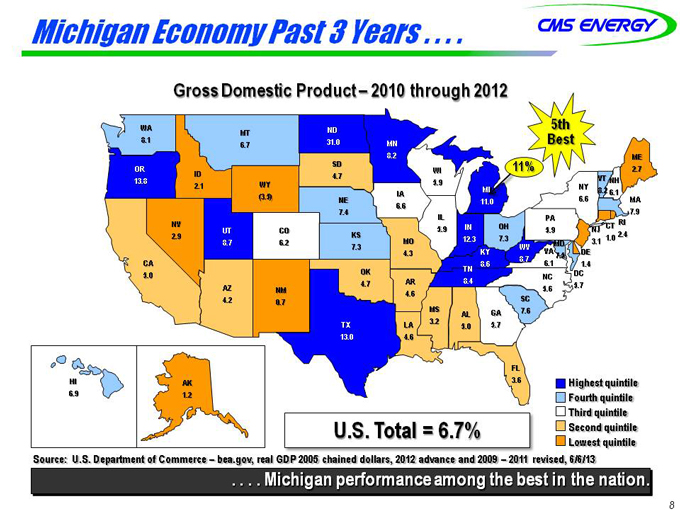
Michigan Economy Past 3 Years . . . .
Gross Domestic Product – 2010 through 2012
5th
WA MT ND
8 1
8.1 6 7 31.0 MN
Best 6.7 8.2 ME SD
11%
OR ID WI
2.7
13 8
4.7 13.8 2 1 WY
5.9 NY VT NH
2.1 IA
5 9
MI
8.2
6 1
(3.5) NE
6 6
6.1
MA
6 6 11.0 6.6 7 4
6.6
7.4 IL
PA
7 9
7.9
NV
IN OH
CT
RI
UT CO 5.9 5 9 NJ
2.9 KS 2 4
5 9
12 3 7 3
5.9 1 0 2.4
8.7 6.2 7 3
MO 12.3 7.3
7.3 WV MD
3.1 1.0
4 3 KY VA 4.3 DE
8 7 7.5
CA 8 6 8.7 6.1 1 4
OK TN 8.6 1.4
5.0 NC
DC
4 7 AR 8.4 5 7
AZ NM
4.7
4 6
5.6 5.7
4 2
4.6 SC
5 6
4.2 0.7 MS AL GA 7.6
TX LA 3.2 5.0 5.7
13.0 4.6
FL
HI AK 3.6 Highest quintile
6.9 1.2 Fourth quintile
Third quintile
U.S. Total = 6.7% Second quintile Lowest quintile
Source: U.S. Department of Commerce – bea.gov, real GDP 2005 chained dollars, 2012 advance and 2009 – 2011 revised, 6/6/13
. . . . Michigan performance among the best in the nation.
8
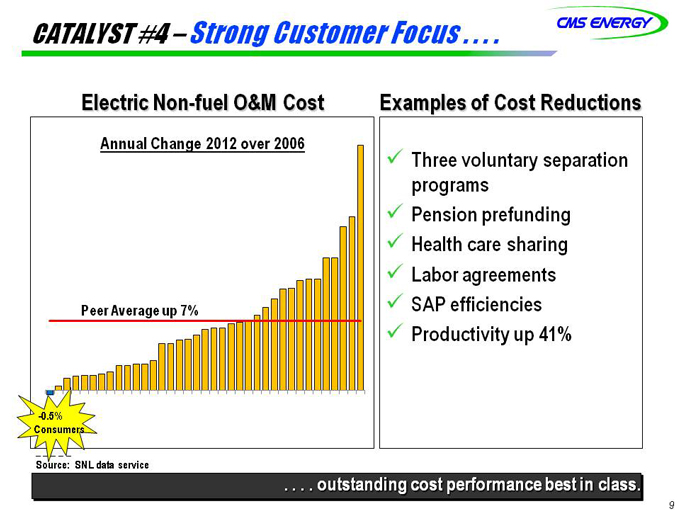
#4 CATALYST – Strong Customer Focus . . . .
Electric Non-fuel O&M Cost Examples of Cost Reductions
Annual Change 2012 over 2006
?? Th l t ti
Three voluntary separation
g
programs
?? Pension prefunding
??Health care sharing
?? Labor agreements
Peer Average up 7% ?? SAP efficiencies
??
g p
Productivity up 41%
-0.5%
Consumers
Source: SNL data service
. . . . outstanding cost performance best in class.
9
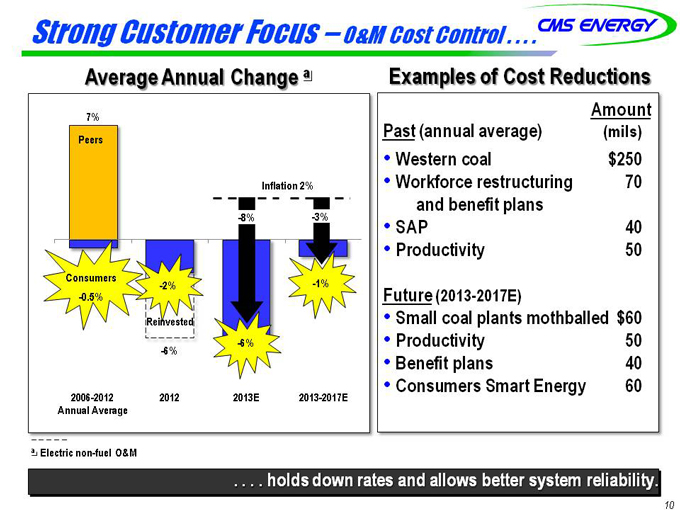
Strong Customer Focus – O&M Cost Control . . . .
Average Annual Change a Examples of Cost Reductions
Amount 7% P t( l ) ( il Past ( annual average) mils) Peers
g) )
Western coal $250
Inflation 2% Workforce restructuring 70
and benefit plans
-8% -3% SAP 40
Productivity 50
Consumers
2%
2% -1% --22%% F t (2013 Future 2013--0.5% 2017E)
Reinvested Small coal plants mothballed $60
-6%
Productivity 50 -6% B fit l 40
Benefit plans Consumers Smart Energy 60 2006-2012 2012 2013E 2013-2017E
Annual Average
a Electric non-fuel O&M
. . . . holds down rates and allows better system reliability.
10
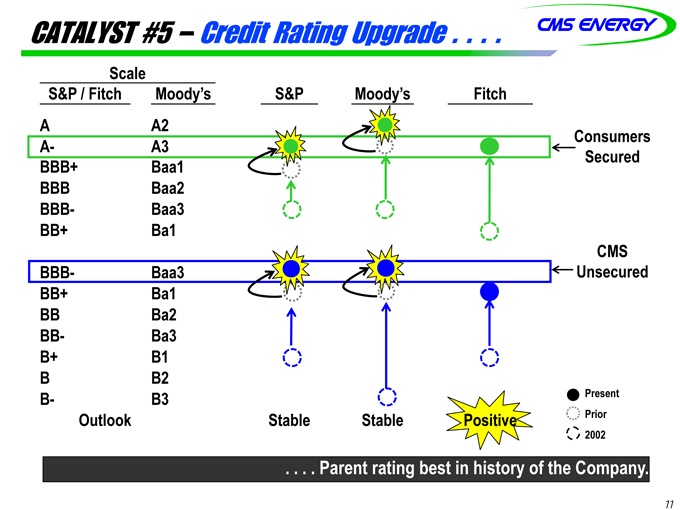
CATALYST #5 – Credit Rating Upgrade . . . .
Scale
S&P / Fitch Moody’s S&P Moody’s Fitch
AABB- B+ AABa23a1 CoSnescuumreedrs
BBB Baa2
BBB- Baa3
BB+ Ba1
CMS
BBB- Baa3 Unsecured
BB+ Ba1
BB Ba2
BB- Ba3
B+ B1
B B2
P t
B- B3
Present
P i
B Outlook Stable Stable Positive Prior
2002
. . . . Parent rating best in history of the Company.
11
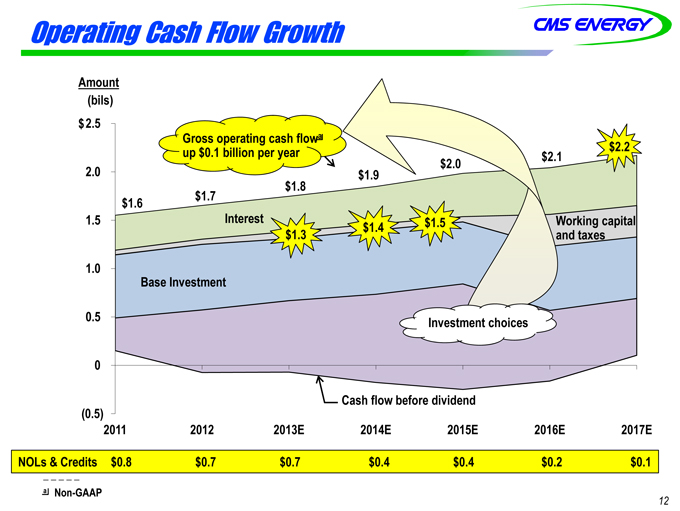
Operating Cash Flow Growth
Amount
(bils)
$2.5
Gross operating cash flowa
$2 2
$
p g 2.2
up $ 0 1 per year 2 1
0.1 billion $2 0 2.1 p p y
2 0 $1 9
2.0 1.9 2.0
$1 8
$
1.8
1 7
$1.6 1.7
1.5 Interest $1 4 $1 5 Working capital
$1 3 1.5
1.3 1.4 and taxes
1.0
Base Investment
0.5 Investment choices
0.0
Cash flow before dividend
(0.5)
2011 2012 2013E 2014E 2015E 2016E 2017E
NOLs & Credits $0.8 $0.7 $0.7 $0.4 $0.4 $0.2 $0.1
a Non GAAP
12
Non
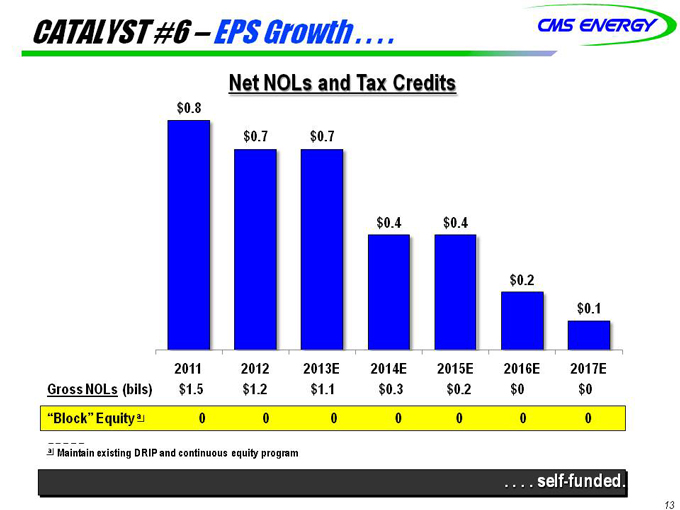
CATALYST #6 –EPS Growth . . . .
Net NOLs and Tax Credits
$0.8
$0.7 $0.7
$0.4 $0.4
$0.2
$0.1
2011 2012 2013E 2014E 2015E 2016E 2017E
Gross NOLs (bils) $1.5 $1.2 $1.1 $0.3 $0.2 $0 $0
“Block” Equity a 0 0 0 0 0 0 0
a Maintain existing DRIP and continuous equity program
. . . . self-funded.
13
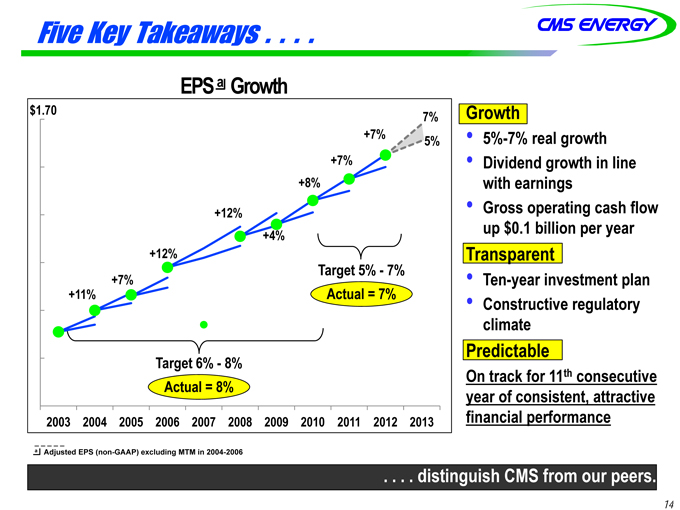
Five Key Takeaways . . . .
EPS aGrowth
$1.70 7% Growth
+7% 5% 5%-7% real growth
+7% Dividend growth in line
+8% with earnings
+12% Gross operating cash flow
+4% up $0.1 billion per year
+12% Transparent
T % %
Target 5% - 7% +7% Ten year investment plan
g Ten-+%
A t l Actual = 7%
C i l 11%
Constructive regulatory
climate
Predictable % % Target 6% - 8%
ed ctab e O t k f 11th ti
g
On track for consecutive A t l 11 Actual = 8% year of consistent, attractive
2003 2004 2005 2006 2007 2008 2009 2010 2011 2012 2013 financial performance
a Adjusted EPS (non-GAAP) excluding MTM in 2004-2006
. . . . distinguish CMS from our peers.
14
APPENDIX
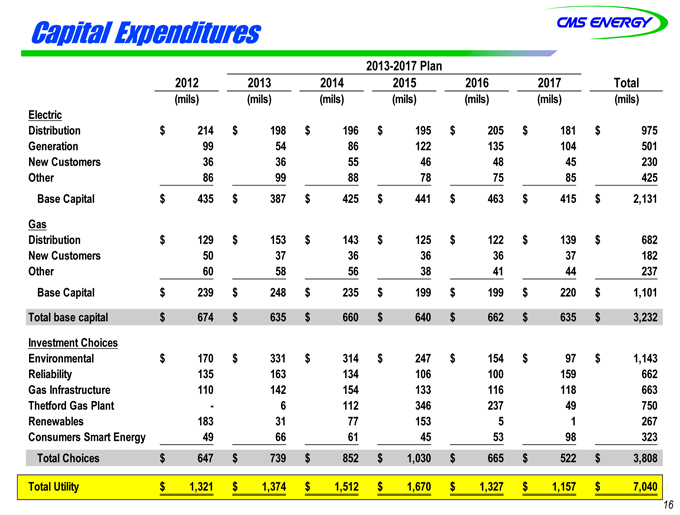
Capital Expenditures
2013-2017 Plan
2012 2013 2014 2015 2016 2017 Total
(mils) (mils) (mils) (mils) (mils) (mils) (mils)
Electric
Distribution $ 2 14 $ 1 98 $ 1 96 $ 1 95 $ 2 05 $ 1 81 $ 9 75
Generation 99 54 86 122 135 104 501
New Customers 36 36 55 46 48 45 230
Other 86 99 88 78 75 85 425
Base Capital $ 4 35 $ 3 87 $ 4 25 $ 4 41 $ 4 63 $ 4 15 $ 2,131
Gas
Distribution $ 1 29 $ 1 53 $ 1 43 $ 1 25 $ 1 22 $ 1 39 $ 6 82
New Customers 50 37 36 36 36 37 182
Other 60 58 56 38 41 44 237
Base Capital $ 2 39 $ 2 48 $ 2 35 $ 1 99 $ 1 99 $ 2 20 $ 1,101
Total base capital $ 6 74 $ 6 35 $ 6 60 $ 6 40 $ 6 62 $ 6 35 $ 3,232
Investment Choices
Environmental $ 1 70 $ 3 31 $ 3 14 $ 2 47 $ 1 54 $ 97 $ 1,143
Reliability 135 163 134 106 100 159 662
Gas Infrastructure 110 142 154 133 116 118 663
Thetford Gas Plant - 6 112 346 237 49 750
Renewables 183 31 77 153 5 1 267
Consumers Smart Energy 49 66 61 45 53 98 323
Total Choices $ 6 47 $ 7 39 $ 8 52 $ 1,030 $ 6 65 $ 5 22 $ 3,808
Total Utility $ 1,321 $ 1,374 $ 1,512 $ 1,670 $ 1,327 $ 1,157 $ 7,040
16
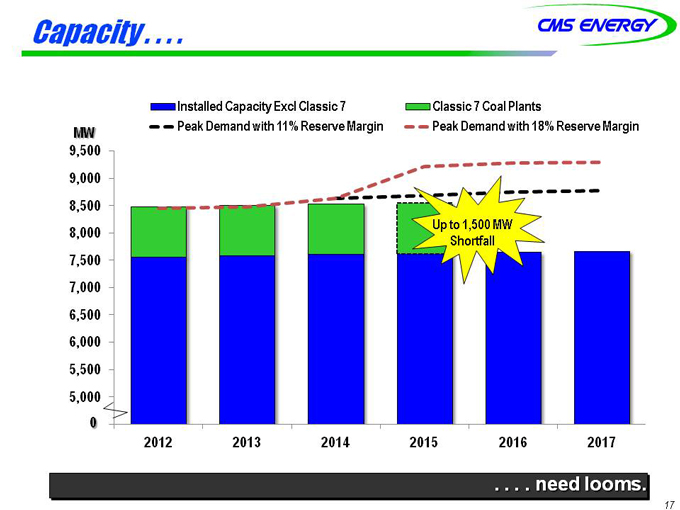
Capacity . .. . .
Installed Capacity Excl Classic 7 Classic 7 Coal Plants
MW Peak Demand with 11% Reserve Margin Peak Demand with 18% Reserve Margin
9,500
9,000
8,500
8,000 Up tSoh 1o,r5t0fa0l lMW
7,500
7,000
6,500
6,000
5,500
5,000
4,5000
2012 2013 2014 2015 2016 2017
. . . . need looms.
17
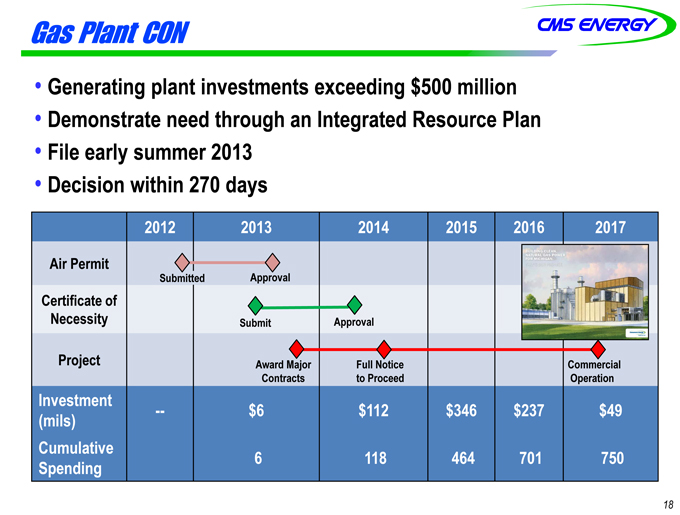
Gas Plant CON
Generating plant investments exceeding $500 million
Demonstrate need through an Integrated Resource Plan
File early summer 2013
Decision within 270 days
2012 2013 2014 2015 2016 2017
Air Permit
Submitted Approval
Certificate of
Necessity Submit Approval
Project Award Major Full Notice Commercial
to Proceed Operation
j
Contracts I(nmvielss)tment -- $6 $112 $346 $237 $49
CSpuemnudliantgive 6 118 464 701 750
18
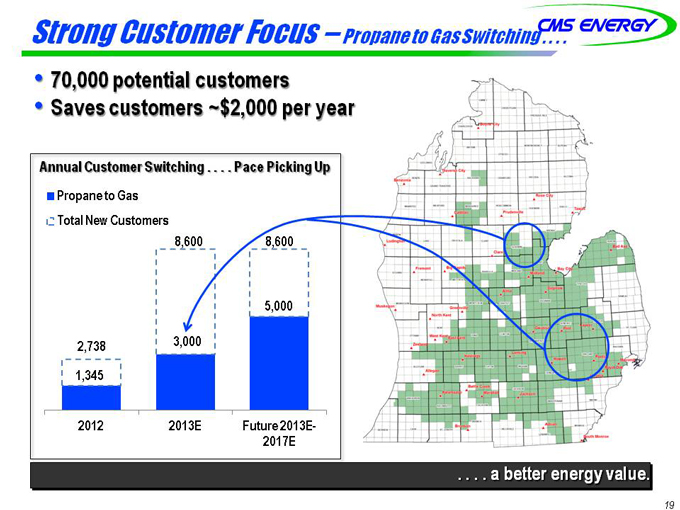
Strong Customer Focus – Propane to Gas Switching . . . .
70,000 potential customers
Saves customers ~$2,000 per year
Annual Customer Switching . . . . Pace Picking Up
Propane to Gas
Total New Customers
8,600 8,600
5,000
2,738 3,000
1,345
2012 2013E Future 2013E-
2017E
. . . . a better energy value.
19
GAAP R Reconciliation
CMS ENERGY CORPORATION
Earnings Per Share By Year GAAP Reconciliation
(Unaudited)
| 2003 |
2004 |
2005 |
2006 |
2007 |
2008 |
2009 |
2010 |
2011 |
2012 |
|||||||||||||||||||||||||||||||
| Reported earnings (loss) per |
($ | 0.30 | ) | $ | 0.64 | ($ | 0.44 | ) | ($ | 0.41 | ) | ($ | 1.02 | ) | $ | 1.20 | $ | 0.91 | $ | 1.28 | $ | 1.58 | $ | 1.42 | ||||||||||||||||
| After-tax items: |
||||||||||||||||||||||||||||||||||||||||
| Electric and gas utility |
0.21 | (0.39 | ) | — | — | (0.07 | ) | 0.05 | 0.33 | 0.03 | 0.00 | 0.17 | ||||||||||||||||||||||||||||
| Enterprises |
0.74 | 0.62 | 0.04 | (0.02 | ) | 1.25 | (0.02 | ) | 0.09 | (0.03 | ) | (0.11 | ) | (0.01 | ) | |||||||||||||||||||||||||
| Corporate interest and other |
0.16 | (0.03 | ) | 0.04 | 0.27 | (0.32 | ) | (0.02 | ) | 0.01 | * | (0.01 | ) | * | ||||||||||||||||||||||||||
| Discontinued operations (income) loss |
(0.16 | ) | 0.02 | (0.07 | ) | (0.03 | ) | 0.40 | ( | *) | (0.08 | ) | 0.08 | (0.01 | ) | (0.03 | ) | |||||||||||||||||||||||
| Asset impairment charges, net |
— | — | 1.82 | 0.76 | 0.60 | — | — | — | — | — | ||||||||||||||||||||||||||||||
| Cumulative accounting changes |
0.16 | 0.01 | — | — | — | — | — | — | — | — | ||||||||||||||||||||||||||||||
| Adjusted earnings per share, including MTM - non-GAAP |
$ | 0.81 | $ | 0.87 | $ | 1.39 | $ | 0.57 | $ | 0.84 | $ | 1.21 | (a) | $ | 1.26 | $ | 1.36 | $ | 1.45 | $ | 1.55 | |||||||||||||||||||
| Mark-to-market impacts |
0.03 | (0.43 | ) | 0.51 | ||||||||||||||||||||||||||||||||||||
| Adjusted earnings per share, excluding MTM - non-GAAP |
NA | $ | 0.90 | $ | 0.96 | $ | 1.08 | NA | NA | NA | NA | NA | NA | |||||||||||||||||||||||||||
| * | Less than $500 thousand or $0.01 per share. |
| (a) | $1.25 excluding discontinued Exeter operations and accounting changes related to convertible debt and restricted stock. |
2003-12 EPS
CMS Energy
Reconciliation of Gross Operating Cash Flow to GAAP Operating Activities
(unaudited)
(mils)
| 2011 |
2012 |
2013 |
2014 |
2015 |
2016 |
2017 |
||||||||||||||||||||||
| Consumers Operating Income + Depreciation & Amortization |
$ | 1,527 | $ | 1,635 | $ | 1,735 | $ | 1,821 | $ | 1,948 | $ | 2,011 | $ | 2,113 | ||||||||||||||
| Enterprises Project Cash Flows |
24 | 17 | 20 | 29 | 37 | 44 | 56 | |||||||||||||||||||||
| Gross Operating Cash Flow |
$ | 1,551 | $ | 1,652 | $ | 1,755 | $ | 1,850 | $ | 1,985 | $ | 2,055 | $ | 2,169 | ||||||||||||||
| Other operating activities including taxes, interest payments and working capital |
(382 | ) | (411 | ) | (405 | ) | (400 | ) | (435 | ) | (805 | ) | (819 | ) | ||||||||||||||
| Net cash provided by operating activities |
$ | 1,169 | $ | 1,241 | $ | 1,350 | $ | 1,450 | $ | 1,550 | $ | 1,250 | $ | 1,350 | ||||||||||||||
2011-17 OCF