2
Statement from the CEO
At the mid-point of 2024, this is proving to be a year of strong recovery. Projects that were postponed during the uncertainty of 2023 are now coming back online. Our long-term confidence in the market continues to shape our ambitious growth strategy, and during the first half of 2024, we have strengthened our position at the forefront of transportation and installation of offshore wind turbines and foundations. We have done this by adding to our fleet, extending our customer and contract base, and focusing on execution.
We have seen positive progress in the ongoing integration of the Eneti business, which we acquired at the end of 2023. To date, synergies are in line with expectations, and we are learning from each other and aligning behind a shared culture. The merger has strengthened Cadeler’s capabilities in geographies beyond our core European market, with projects in Asia and the US added to our order book.
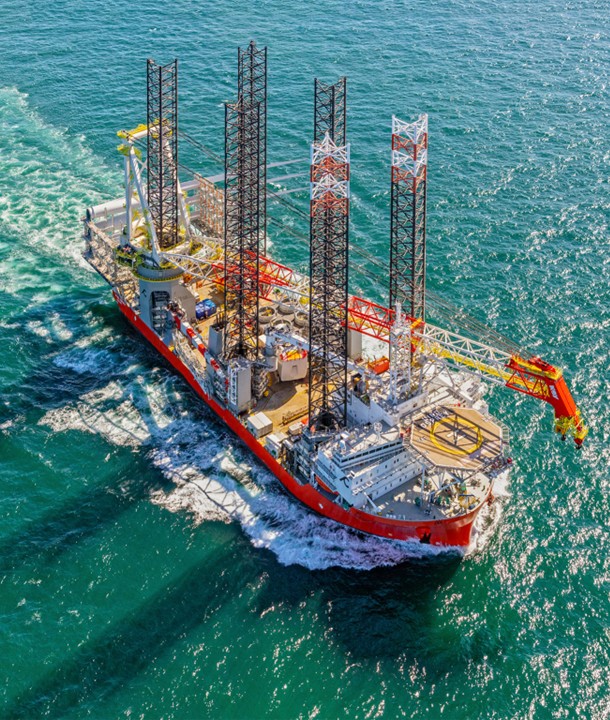
Including new builds, the merger means that Cadeler now represents the industry’s largest jack-up offshore wind installation fleet. After a successful capital raising exercise, we executed the order for a new A-class vessel, our seventh build. Wind Apex, scheduled for delivery in H1 2027, is a hybrid design that converts from a foundation installation unit to a wind turbine generator installation vessel. She joins the two further A Class, two P Class and two M Class vessels currently under construction.
We have successfully replaced the cranes on our two O Class vessels, Wind Orca and Wind Osprey, with the upgraded vessels departing from the yard on time and on budget, and both vessels now up and working on projects. We have also completed significant maintenance scopes on the Wind Scylla and Wind Zaratan, with the Wind Scylla now at work on Cadeler’s first project in US waters. Alongside cutting-edge design, we consider it a primary responsibility to ensure our vessels are converted for compatibility with greener fuel options, which we will begin trialling in H2 2024. Cadeler’s 11-strong fleet allows us to offer clients greater redundancy and versatile solutions. After an extended period of supply chain disruption, clients are responding positively to the assurance of improved access to resources to complete their projects. The resulting demand for our services saw our order book grow to EUR 1.9 billion as of 30 June 2024.
Not included in our backlog is a significant vessel reservation agreement with an undisclosed client, covering transport and installation for both foundations and wind turbine generators, should the client succeed in a forthcoming auction round. Worth up to EUR 700 million, if all options are exercised over the four years of the agreement, it will be the largest deal in Cadeler’s history.
Other major contract wins include an agreement to install 72 wind turbines at the Inch Cape Offshore Wind Farm on the east coast of Scotland. Our position in the Polish offshore wind market has also been strengthened through vessel reservation agreements with two Equinor and Polenergia joint ventures. The transition of the Polish market towards sustainable energy represents great potential for Cadeler, with this contract setting the stage for future partnerships.
We are pleased to have added Alexander Simmonds to Cadeler’s Executive Leadership Team as Chief Legal Officer and Executive Vice President. A graduate of Harvard Law School and joining us from Davis Polk, Alexander brings extensive capital markets and M&A experience.
The acceleration of the offshore wind market underlines the growing importance of renewable energy initiatives in the transition to a low carbon future. We’re proud of the pivotal role Cadeler is playing in some of the most ambitious and impactful projects around the globe, and our role in driving down emissions across the turbine installation supply chain. We have prioritized energy efficiency on our vessels by pushing both operational and technical efficiencies. We recently signed an agreement to develop energy efficiency dashboards onboard our fleet. This will enable us to monitor our vessels’ real-time energy consumption, providing actionable insight for our crews to optimize our carbon footprint during operations and for our clients as they assess emissions across the supply chain.
We thank all our customers, shareholders, financiers and other stakeholders for their ongoing confidence in the company, and for supporting our ambitions as a high-growth global business.
Mikkel Gleerup,
CEO
3
Management review
Business review
Cadeler A/S (“Cadeler” or the “Company” and, together with its subsidiaries, the “Cadeler Group” or the “Group”) is a global leader in offshore wind farm construction, maintenance and decommissioning. Cadeler’s experience as a provider of high-quality offshore wind support services, combined with innovative vessel designs, positions the company to deliver exceptional services to the industry.
The Group, headquartered in Copenhagen, Denmark, has offices in Vejle (Denmark), Great Yarmouth (United Kingdom), Taipei (Taiwan), Tokyo (Japan) and Virginia (United States).
On 28 June 2024, the company announced it is considering a re-domiciliation of its parent company to the United Kingdom. A detailed feasibility analysis, including review of legal, tax and other considerations, is ongoing and no final decision with respect to such a re-domiciliation has been made at this time. It is anticipated that, if Cadeler determines to proceed with a re-domiciliation to the United Kingdom, it would maintain its current stock exchange listings on the Oslo Stock Exchange and the NYSE.
The Company has made the preliminary assessment that a re-domiciliation to the United Kingdom would improve the marketability of the Group and encourage a broader and more diversified international investor base. In addition, it is the Company’s expectation that such a re-domiciliation would support its business strategy generally, including by facilitating the greater physical presence of its Executive Management in the United Kingdom and elsewhere in the markets in which the Group operates.
Recently, the Company entered into a binding contract for the manufacture and delivery of its third A-class vessel – Wind Apex, making Cadeler the owner of the industry’s largest, most advanced and most flexible fleet of jack-up offshore wind installation vessels, with four vessels in operation and seven new builds on the way.
Wind Peak has join our operational fleet in August this year. The P-Class vessel is designed to operate at difficult sites and with what the Group believes to be some of the most advanced equipment in the industry. Wind Peak has already been contracted for the Sofia Project for the transportation and installation of 100 14-megawatt wind turbines. As a result, the Company is ensuring utilisation compliance for the P-Class facility ahead of the expected drawing of funds to make the completion payment to the construction yard. With the completion of the main crane upgrades on Wind Orca and Wind Osprey and the ongoing renewal and expansion of its fleet, Cadeler is ready to meet the growing market demand.
6
Management review
Continued from previous page
Financial highlights
Key figures |
| H1 2024 |
| H1 20231 |
EUR’000 | ||||
Revenue | 82,218 | 67,773 | ||
Gross profit | 24,820 | 42,551 | ||
Operating (loss)/profit | (1,363) | 29,439 | ||
Net financials | 2,633 | 150 | ||
Profit for the period | 153 | 29,589 | ||
| ||||
Cash flow from operating activities | 17,300 | 18,380 | ||
Cash flow (used in) investing activities | (295,987) | (15,574) | ||
Of which investment in property, plant and equipment | (296,152) | (14,564) | ||
Cash flow from/(used in) financing activities | 274,375 | (2,766) | ||
Net (decrease)/increase in cash and cash equivalents | (4,312) | 40 | ||
Share related key figures | ||||
Earnings per share (EPS), EUR | 0.00 | 0.15 | ||
Diluted earnings per share (diluted EPS), EUR |
| 0.00 | 0.15 |
1 Consolidated figures for the six months period ended 30 June 2023 comprised the Parent Company, Cadeler A/S, Wind Osprey Ltd and Wind Orca Ltd.
7
Management review
Continued from previous page
Key figures |
| 30 June 2024 |
| 31 December 2023 |
EUR’000 |
|
| ||
Total assets | 1,589,528 | 1,252,560 | ||
Non-current asset | 1,413,721 | 1,105,110 | ||
Total liabilities | 438,213 | 293,519 | ||
Equity | 1,151,315 | 959,041 | ||
Cash and cash equivalents | 93,050 | 96,608 | ||
Financial ratios and operational metrics |
|
| ||
Return on assets (%) | (0.1%) | 1.6% | ||
Return on equity (%) | 0.1% | 1.6% | ||
Equity ratio (%) | 72.4% | 76.6% | ||
Contracted days (no. of days) | 344 | 568 | ||
Utilisation (%) | 47.2% | 75.4% | ||
Average number of employees2 |
|
| ||
Onshore | 230 | 113 | ||
Offshore |
| 343 |
| 182 |
The financial ratios and operational metrics are calculated in accordance with the terms and definitions set out in the Annual Report 2023 and in the Alternative Performance Measures section of this interim financial report.
Financial review
For the first half year of 2024, the Group result is a profit of EUR 153 thousand, which is a decrease of EUR 29 million from the EUR 30 million profit earned in the comparative period in 2023. The Group’s result was principally driven by lower gross profit, with a decrease in vessel utilisation in the first quarter and an increase in headcount and vessel depreciation.
The Group’s revenue in the first half year of 2024 was EUR 82 million, which is an increase of EUR 14 million compared to revenue of EUR 68 million in H1 2023. This performance aligns with the revenue range projected for the fiscal year 2024, as disclosed in the Group’s Annual Report 2023. Each of the Group’s vessels on water, other than the Wind Peak (delivery of which was taken on schedule on 16 August 2024), are expected to be on hire for the remainder of 2024.
Cost of sales, amounting to EUR 57 million, was EUR 32 million higher than the EUR 25 million cost of sales for the first six months of 2023, mainly driven by Wind Scylla and Wind Zaratan becoming part of the Group’s fleet.
The gross margin in H1 2024 was 30%, a decrease of 33% compared to the gross margin of 63% in H1 2023, mainly due to three of the Group’s four operating vessels undergoing scheduled drydock and crane upgrades during the first quarter of 2024. The Group’s four operating vessels achieved a combined 47% utilisation rate for the first six months of 2024 compared to 75% in the comparative period. Both Wind Orca and Wind Osprey underwent main crane upgrades in Q1 2024, while Wind Zaratan underwent scheduled maintenance.
2 Average number of full-time equivalent Cadeler employees for the reporting period. Figures do not include consultants or contractors. Eneti employees, both onshore and offshore, were incorporated into the Company at the end of December 2023. Thus, average number of full-time employees as of 2023 reflects the number of employees divided by 12 months. Eneti had 99 onshore full-time employees and 176 seafarers by the end of 2023.
8
Management review
Continued from previous page
Administrative costs rose by EUR 14 million, from EUR 13 million in H1 2023 to EUR 27 million in H1 2024, mainly driven by the Group’s increasing headcount, which encompasses the strategic recruitment of key personnel to ensure an elevated level of support for ongoing operations, significant new projects and the business combination with Eneti.
In H1 2024, the Group’s EBITDA reflected a EUR 22 million profit, a decrease of EUR 20 million compared to a result of EUR 42 million for the same period in 2023, as disclosed in the Alternative Performance Measures (APM) section. Adjusted EBITDA, which excludes transactional costs related to the Business Combination, was EUR 44 million in H1 2023, as disclosed in the APM section.
Net cash flow from operating activities of EUR 17 million in H1 2024 was EUR 1 million lower than the EUR 18 million recorded for H1 2023 due to a positive development in working capital offset by a decrease in profits in H1 2024.
Net cash outflow from investing activities in H1 2024 was EUR 296 million, an increase of EUR 280 million compared to EUR 16 million in H1 2023. The increase was driven by crane upgrades and instalment payments for certain of the Group’s vessels under construction.
Net cash inflow from financing activities was EUR 274 million, an increase of EUR 277 million compared to a EUR 3 million outflow in H1 2023. This was a result of the capital raised by the Group’s February 2024 private placement of EUR 152 million (after transactional costs) and proceeds from borrowings of EUR 128 million net of bank fees.
The Group’s equity closed at EUR 1,151 million in H1 2024, an increase of EUR 192 million from the opening balance of EUR 959 million. Developments in the Group’s equity were driven by a net capital increase of EUR 152 million after transactional costs, EUR 23 million in value gained from hedging activity adjustments, EUR 16 million gain from foreign currency translation adjustments, and profit of EUR 153 thousand in H1 2024.
The Company completed a successful private placement on 15 February 2024, resulting in the issuance of 39.5 million shares at a price of NOK 44.50 per share. Overall, the Company raised EUR 153 million after transactional costs. The proceeds from the private placement were substantially allocated to the financing of the intended equity portion of the contract value of the order placed on 22 May 2024 to build the Company’s third A-Class vessel. The remaining funds will be allocated towards acquiring mission equipment and building working capital. Additionally, on 26 June 2024, the Company increased its share capital by EUR 88 thousand, issuing 27,715 new shares with a nominal value of DKK 1.00 each in connection with the exercise of options under its employee equity incentive programme. The new shares issued in June represent an increase of less than 0.01% of Cadeler’s registered share capital.
As of 30 June 2024, total assets amounted to EUR 1,590 million, a 27% increase for the reporting period, driven principally by an increase in property, plant and equipment of EUR 295 million (of which EUR 226 million relates to the Group’s newbuild programmes, EUR 51 million to the main crane upgrades for the Group’s O-class vessels and EUR 10 million to other projects).
On 3 April 2024, the Group utilised the remaining EUR 50 million of the EUR 100 million term loan available under the New Debt Facility for the Wind Osprey main crane upgrade. Further, on 28 June 2024, the Group utilised the remaining EUR 30 million of the Holdco Facility. The proceeds from the Holdco Facility are intended for general corporate purposes. As of 30 June 2024, the full funding available under the Holdco Facility had been utilised.
The Company had significant headroom to comply with its debt covenants. As of 30 June 2024, the Company had liquidity of EUR 361 million available from cash at hand and committed facilities, including the New Debt facility and the Holdco Facility.
Further financing will be required from Q4 2025 for milestone payments for the A-Class newbuilds. The Company is currently exploring numerous options for securing funds, including export credit agencies support. The Cadeler Group’s management expects to require EUR 782 million of additional funding for the A-Class newbuilds, including the third vessel ordered on 22 May 2024. For further information, refer to Note 7.
9
Management review
Continued from previous page
Related party transactions
Related party transactions over the reporting period are limited to guarantee fees issued by BW Group Limited, administrative support provided by Scorpio Services Holding and training courses provided by BW Maritime, see Note 10 for further details. On 27 May 2024, Cadeler’s largest shareholder, BW Group, provided COSCO SHIPPING Heavy Industry CO. Ltd. (“COSCO”) with guarantees in respect of the sums owed by Cadeler pursuant to the recently ordered third A-class vessel. Similar guarantees have been in place since 2021 for the construction of the two P-class and two A-class vessels.
Impact on the external environment
There have been no significant changes to our sustainability strategy since the publication of the 2023 Annual Report.
Sustainability remains a crucial strategic objective for the Company and fundamental to creating enduring shareholder value. Sustainability serves as a platform for innovation, heightened efficiency and for fostering growth. The Company is actively pursuing long-term objectives, focusing on decarbonisation and optimising energy efficiency, as detailed in the 2023 Annual Report, which integrates the Sustainable Development Report.
Order backlog
Cadeler’s order book for 2024 is substantially filled. As of 27 August 2024, notable contracts signed during 2024 include:
| ● | On 20 February 2024, Cadeler signed a contract with Ørsted and PGE Polska Grupa Energetyczna for the transport and installation of 14MW wind turbines supplied by Siemens Gamesa. Baltica 2 is one of two stages of the Baltica Offshore Wind Farm. PGE and Ørsted plan to deliver Baltica 2 with 1.5 GW capacity by the end of 2027. The contract underlines Cadeler’s entry into the Polish market. |
| ● | On 27 March 2024, Cadeler signed a contract with a value between USD 75 million and USD 150 million for offshore wind turbine installation using its vessel, Wind Scylla, with an undisclosed client. The stated contract value includes both the firm period and potential options thereunder. |
| ● | On 8 April 2024, Ørsted and Cadeler signed a firm long-term lease agreement for a new-built Wind Farm Installation Vessel. With the agreement, Ørsted has secured installation vessel capacity from Q1 2027 to the end of 2030 for upcoming construction projects. |
| ● | On 24 June 2024, Cadeler signed a contract with a value between EUR 114 million and EUR 130 million for offshore wind turbine installation using one of its state-of-the-art newbuild M-class installation vessels, with Inch Cape Offshore Limited. |
Vessel Reservation Agreements (VRAs) are not included in the contract backlog. Since 31 December 2023, VRAs have been signed with:
| ● | MFW Bałtyk II Sp. z.o.o. and MFW Bałtyk III Sp. Z.o.o., each a joint venture project owned 50% by Equinor and 50% by Polenergia. The aggregate potential value of the contracts to be negotiated during the pendency of the vessel reservation agreements is anticipated to fall within the range of EUR 110-130 million. |
| ● | An undisclosed customer, for a term of up to four years. The aggregate potential value of the projects to be executed under this vessel reservation agreement is anticipated to fall within the range of EUR 400-700 million. |
| ● | An undisclosed customer, for offshore wind turbine installation to commence in 2029, with undisclosed value. |
10
Management review
Continued from previous page
The following table provides information about new contracts entered in the period 1 July 2024 to 27 August 2024:
EUR million |
| Within 1 year |
| After 1 year |
| Total |
Contract backlog as of 30 June 2024 | 326 | 1,589 | 1,915 | |||
Additions in the period 1 July 2024 to 27 August 2024: | ||||||
Firm | - | 15 | 15 | |||
Subject to exercise of counterparty options | (6) | 1 | (5) | |||
Contract backlog as of 27 August 20241 | 320 | 1,605 | 1,925 |
Refer to Note 3 for further information regarding the total contract backlog.
1 As of the interim report released date, 86% of the contract backlog (an aggregate of EUR 1.652m) relates to projects for which the relevant counterparty has taken a positive final investment decision (FID), and an aggregate of EUR 273 remains subject to counterparty FID.
11
2024 Outlook
Guidance for the financial year 2024
In the 2023 Annual Report published on 26 March 2024, Cadeler provided guidance for the financial year ending 31 December 2024 that revenue was expected to be in the range between EUR 225 to 245 million while EBITDA was expected to be in the range EUR 105 to 125 million. As of June 30 2024, the expectation for both revenue and EBITDA remains unchanged for 2024.
Throughout 2024, the outlook for the offshore wind energy sector and Cadeler remain positive due to favourable macroeconomic trends and unprecedented policy momentum globally. Policies such as the EU Strategy on Offshore Renewable Energy and increased effort by governments will accelerate wind energy deployment to meet climate goals. Especially Europe will remain the driver of offshore wind and is anticipated to experience substantial growth, while new regions are also poised for market expansion. Despite the ongoing volatility in inflation and interest costs, the 2024 outlook for Cadeler is anticipated to remain unaffected, highlighting the Company’s resilience.
Cadeler’s guidance for 2024 is, however, subject to risks and uncertainties, many of which are beyond Cadeler’s control. One-off market-shaping events such as economic turbulence, shortage of workers, supply chain constraints, strikes, embargoes, political instability or adverse weather conditions could have a substantial impact on the business. There could also be off-hire periods as a consequence of accidents, technical breakdown and non-performance. The cancellation or postponement of projects, delays in execution, changes to coverage of one or more vessel employment contracts or changes to crewing costs or administrative and employee costs could have a material adverse impact on the earnings of the Company.
12
Interim condensed consolidated statement of profit or loss and other comprehensive income
EUR’000 |
| Note | H1 2024 | H1 2023 | ||
Revenue |
| 3 | | | ||
Cost of sales |
|
| ( | ( | ||
Gross profit |
|
| | | ||
Other operating income and expenses |
| | - | |||
Administrative expenses |
|
| ( | ( | ||
Operating (loss)/profit |
|
| ( | | ||
|
|
| ||||
Finance income |
|
| | | ||
Finance costs |
|
| ( | ( | ||
Profit before income tax |
|
| | | ||
|
|
| ||||
Income tax expense |
|
| ( | - | ||
Profit for the period |
|
| | | ||
Profit for the period attributable to: |
|
|
| |||
Equity holders of the parent |
| 4 | | | ||
| ||||||
Earnings per share |
|
|
| |||
Basic, profit for the period attributable to ordinary equity holders of the parent (EUR per share) |
| 4 | | |||
Diluted, profit for the period attributable to ordinary equity holders of the parent (EUR per share) |
| 4 | | |||
Other comprehensive income |
|
|
| |||
Items that may be reclassified to profit or loss |
|
|
| |||
Exchange differences on translation of foreign operations |
| | - | |||
Cash flow hedges - changes in fair value |
| 7 | | ( | ||
Cash flow hedges - interest recycled | 7 | ( | ( | |||
Cash flow hedges - cost of hedging | 7 | | ( | |||
Other comprehensive income after tax |
|
| | ( | ||
Total comprehensive income for the period, net of tax |
|
| | | ||
Total comprehensive income attributable to: |
|
|
| |||
Equity holders of the parent |
| 4 | | |
15
Interim condensed consolidated balance sheet
EUR’000 |
| Note | 30 June 2024 | 31 December 2023 | ||
Intangible assets | 6 | | | |||
Property, plant and equipment |
| 5 | | | ||
Right-of-use assets |
| 11 | | | ||
Leasehold deposits |
|
| | | ||
Derivative assets |
| 7 | | | ||
Total non-current assets |
|
| | | ||
Inventories |
|
| | | ||
Trade receivables |
|
| | | ||
Contract assets |
| | | |||
Prepayments |
|
| | | ||
Current derivative assets |
| 7 | | - | ||
Current income tax receivable |
|
| - | | ||
Cash and cash equivalents |
|
| | | ||
Total current assets |
|
| | | ||
Total assets |
| | | |||
Share capital |
| 8 | | | ||
Share premium |
|
| | | ||
Reserves |
| | ( | |||
Retained earnings / (accumulated losses) |
|
| ( | ( | ||
Total equity |
|
| | | ||
Provisions |
| - | | |||
Lease liabilities |
| 11 | | | ||
Deferred tax liabilities |
| | | |||
Deferred charter hire income |
| 3 | | | ||
Debt to credit institutions |
| 7 | | | ||
Derivative liabilities |
| 7 | | | ||
Total non-current liabilities |
|
| | | ||
Trade and other payables |
|
| | | ||
Current provisions |
| | | |||
Payables to related parties |
|
| | | ||
Current deferred charter hire income |
| 3 | | | ||
Current lease liabilities |
| 11 | | | ||
Current income tax liabilities |
|
| | | ||
Current debt to credit institutions |
| 7 | | | ||
Current derivative liabilities | 7 | | | |||
Total current liabilities |
|
| | | ||
Total liabilities |
|
| | | ||
Total equity and liabilities |
|
| | |
16
Interim condensed consolidated statement of changes in equity
Reserves | ||||||||||||||
(Accumulated | ||||||||||||||
Hedging | Cost of hedging | Foreign currency | losses)/ retained | |||||||||||
EUR’000 |
| Share capital |
| Share premium |
| reserves |
| reserves |
| translation reserve |
| earnings |
| Total |
2024 |
| |||||||||||||
1 January 2024 | | | ( | ( | ( | ( | | |||||||
Profit for the period | - | - | - | - | - | | | |||||||
Other comprehensive income for the period | - | - | | | | - | | |||||||
Total comprehensive profit for the period | - | - | | | | | | |||||||
Capital increase February 2024 | | |
|
|
|
| | |||||||
Costs incurred in connection with February 2024 capital increase | - | ( |
|
|
|
| ( | |||||||
Capital increase June 2024 | | |
|
|
|
| | |||||||
Share-based payments | - | - | - | - |
| | | |||||||
30 June 2024 | | | ( | | | ( | | |||||||
2023 |
| |||||||||||||
1 January 2023 |
| | | | - | - | | | ||||||
Profit for the period |
| - | - | - | - | - | | | ||||||
Other comprehensive income for the period |
| - | - | ( | ( | - | - | ( | ||||||
Total comprehensive profit for the period |
| - | - | ( | ( | - | | | ||||||
Share-based payments |
| - | - | - | - |
| | | ||||||
30 June 2023 |
| | | ( | ( | - | | | ||||||
17
Interim condensed consolidated statement of cash flows
EUR’000 |
| Note |
| H1 2024 |
| H1 2023 |
Cash flow from operating activities |
|
|
|
| ||
Profit for the period | | | ||||
Adjustments for: |
|
|
| |||
Depreciation and amortisation |
|
| | | ||
Finance income | ( | - | ||||
Interest expenses |
| | | |||
Income tax expense | | - | ||||
Fair value change of derivative instruments through profit or loss |
| 7 | ( | - | ||
Share-based payment expenses |
| | | |||
|
| | | |||
Changes in working capital: |
|
|
|
| ||
Inventories |
|
| | | ||
Trade receivables and contract assets |
|
| ( | ( | ||
Trade and other payables |
|
| | ( | ||
Provisions |
|
| ( | - | ||
Receivables from related parties |
|
| | - | ||
Payables to related parties |
|
| ( | | ||
Deferred charter hire income |
|
| | ( | ||
Net change in working capital |
|
| ( | ( | ||
Income tax paid |
|
| ( | - | ||
Interest received | | - | ||||
Net cash provided by operating activities |
|
| | | ||
Cash flow from investing activities |
|
|
|
| ||
Additions to property, plant and equipment |
| ( | ( | |||
Additions to intangible assets |
|
| ( | ( | ||
Leasehold deposits |
| | ( | |||
Net cash (used in) investing activities |
|
| ( | ( | ||
|
|
| ||||
Cash flow from financing activities |
|
|
|
| ||
Principal repayment of lease liabilities |
|
| ( | ( | ||
Interest paid |
|
| ( | ( | ||
Proceeds from issue of share capital |
| | - | |||
Transactional costs on issues of shares |
|
| ( | - | ||
Proceeds from borrowing net of bank fees (of EUR |
| 7 | | - | ||
Net cash provided by/(used in) financing activities |
|
| | ( | ||
|
|
|
|
| ||
Net (decrease)/increase in cash and cash equivalents |
|
| ( | | ||
Cash and cash equivalents at beginning of the period |
|
| | | ||
Net foreign exchange difference |
|
| | - | ||
Cash and cash equivalents at end of the period |
|
| | |
18
Notes to the interim condensed consolidated financial statements
21 | ||
23 | ||
26 | ||
29 | ||
30 | ||
31 | ||
31 | ||
35 | ||
35 | ||
35 | ||
36 | ||
37 |
20
Note 1
General information
Corporate information
Cadeler A/S (the “Company”, “Parent Company” or the “Group”) is incorporated and domiciled in Denmark. The address of its registered office is Kalvebod Brygge 43, DK-1560 Copenhagen, Denmark. The Company is listed on the Oslo Stock Exchange (ticker code: CADLR) and on the New York Stock Exchange (ticker code: CDLR).
The Group is a leading offshore wind farm transportation and installation (T&I) contractor headquartered in Copenhagen, Denmark. The Group owns and operates
The interim condensed consolidated financial statements of the Group are composed of the financial statements of Cadeler A/S and its subsidiaries (which are all wholly owned by the Parent Company Cadeler A/S). For more information on the subsidiaries of Cadeler A/S please refer to Note 28 to the consolidated financial statements for 2023.
The interim condensed consolidated financial statements for the six months ended 30 June 2024 are unaudited.
21
Note 2
Significant accounting policies
2.1. Basis for preparation
The interim condensed consolidated financial statements for the six months ended 30 June 2024 have been prepared in accordance with IAS 34 Interim Financial Reporting as issued by the International Accounting Standards Board (IASB) and as endorsed by the EU and additional Danish disclosure requirements for interim reports of listed companies.
The interim condensed consolidated financial statements do not include all the information and disclosures required in the annual consolidated financial statements and should be read in conjunction with the Group’s annual consolidated financial statements as of 31 December 2023.
The accounting policies, judgements and estimates are consistent with those applied in the annual report for 2023. For a complete description of accounting policies, see Note 2 to the consolidated financial statements for 2023.
The interim condensed consolidated financial statements are presented in euros and all values are rounded to the nearest thousand (€000), except when otherwise indicated.
Comparative figures
Consolidated figures for the six months ended 30 June 2023 comprised the Parent Company, Cadeler A/S, Wind Osprey Ltd. and Wind Orca Ltd. In December 2023, Cadeler and Eneti merged, and from this point in time the consolidated figures comprised the Parent Company, Cadeler A/S and its subsidiaries (which are wholly owned by the Group). Therefore the activity of the Group is not fully comparable between H1 2024 and H1 2023. There have been no changes to the subsidiaries of Cadeler A/S in 2024 to date. For more information, please refer to Note 28 to the consolidated financial statements in the Annual Report 2023.
Going concern assessment
The interim condensed consolidated financial statements for the six months ended 30 June 2024 have been prepared in accordance with IAS 34 Interim Financial Reporting. The Group has prepared the financial statements on the basis that it will continue to operate as a going concern. The Board of Directors, the Audit Committee and the Executive Management consider that there are no material uncertainties that may cast significant doubt over this assumption. They have formed a judgement that there is a reasonable expectation that the Group has adequate resources to continue in operational existence for the foreseeable future, and not less than 12 months from the end of the reporting period.
2.2. New standards and interpretations
The Group has adopted standards and interpretations effective as of 1 January 2024. Adoption of new and amended standards and interpretations had no material impact on the interim condensed consolidated financial statements.
IASB has issued a number of amended accounting standards (IFRS) and interpretations (IFRIC). The Group has assessed these accounting standards and interpretations, and does not anticipate the amended standards to have any material impact on either the Group’s figures or disclosures.
IFRS 18 Presentation and Disclosure in Financial Statements, which was issued in April 2024, becomes effective for reporting periods beginning on or after 1 January 2027 and thus has no impact on the Group’s interim condensed consolidated financial statements. The Group will assess the impact of these accounting standards on the Group’s figures and disclosures.
The Group has not early adopted any standard, interpretation or amendments that have been issued but are not yet effective.
2.3. Material accounting judgements, estimates and assumptions
The key assumptions concerning the future and other key sources of estimation uncertainty at the reporting date that involve a significant risk of causing a material adjustment to the carrying amounts of assets and liabilities within the next financial year are described below.
23
Note 2
Significant accounting policies
Continued from previous page
Income tax
As of the reporting date, no changes have been identified to the estimates since the release of the Annual Report 2023. Refer to Note 2.10 to the consolidated financial statements for 2023. Due to uncertainty with respect to future utilization of tax loss carry-forward, deferred tax assets have not been recognized.
As part of the Pillar Two Model Rules, the assessment remains unchanged from year-end 2023. The Group does not anticipate the new standards to have any material impact on either the Group’s figures or disclosures in 2024.
Purchase price allocation
As of the reporting date, no changes have been identified to the estimates and recognition since the release of Annual Report 2023. Adjustments may be applied to these amounts for a period of up to twelve months from the acquisition date in accordance with IFRS 3 (revised).
The following accounting judgements, estimates and assumptions, which Management deems to be material to the preparation of the interim condensed consolidated financial statements, are unchanged from year-end 2023:
| ● | Useful life of vessels |
| ● | Impairment of non-financial assets |
| ● | Identification of CGU for the purpose of goodwill impairment |
| ● | Revenue recognition |
| ● | Macroeconomic factors and climate risks |
Refer to Note 2.26 to the consolidated financial statements for 2023.
24
Note 3
Revenue
Disaggregation of revenue from contracts with customers by activity
The following table provides information about disaggregated revenue.
EUR’000 |
| H1 2024 |
| H1 2023 |
Revenue disaggregation |
|
| ||
Time charter services and transportation and installation services | | | ||
Other revenue, including fees earned for early termination of contracts by customers | | | ||
Total revenue |
| | |
For the six months ended 30 June 2024, the lease component, included within time charter services and transportation and installation, amounts to EUR
Time charter and time charter related revenue
Revenues are recognised over time. Revenue from time charter hire services derives from contracts with customers where the Group utilises its vessels, equipment and crew to deliver a service to the customer based on either a fixed day rate or milestone deliverables. Contracts may also include other obligations such as mobilisation and demobilisation, catering and accommodation.
Transportation and installation revenue
Revenue from transportation and installation (T&I) derives from contracts with customers where the Group utilises its vessels, equipment and crew to perform the transportation and installation of offshore wind turbine foundations as well as heavy lifting operations, decommissioning and planning and engineering.
Revenue from transportation and installation activities may, depending on the contract, represent one or more performance obligations.
Usually, a fixed price milestone payment schedule will be agreed upon. The transaction price may include variable components, such as related to fuel, commodities, etc. Payment terms with customers are considered industry standard and do not include a significant financing component. To the extent possible we obtain payment guarantees to minimise the credit risk during the contract term.
Refer to Note 2.3 to the consolidated financial statements for 2023 for further information regarding the Group’s accounting policies for each revenue stream.
Lease and non-lease components of revenue
Revenue from time charter and T&I services include both a lease component (use of the vessels) and a service component. These components are not treated or priced separately in the contracts, nor does the Group offer either of the services separately.
The service component of time charter contracts is primarily derived from crewing costs with a markup, where the residual is deemed to be the lease component.
Contract assets and liabilities
Customers are typically invoiced on a monthly basis, when the vessels are on contract. Sometimes contracts will accrue revenue for work performed and it will be reported as a contract asset until it is invoiced.
26
Note 3
Revenue
Continued from previous page
The contract liabilities relate to consideration received from customers for the unsatisfied performance obligation in the charter contracts. Revenue will be recognised when the related services are provided to the customers.
EUR’000 |
| H1 2024 |
| H1 2023 |
Liabilities at 1 January | | | ||
Deferred during the period | | | ||
Recognised as revenue during the period | ( | ( | ||
Total liabilities at 30 June | | | ||
Current deferred charter hire income | | | ||
Non-current deferred charter hire income |
| | |
Major customers
For the six months ended 30 June 2024, revenue with three customers each exceeded 10% of total revenue. The revenue derived from these three customers was EUR
For the six months ended 30 June 2023, revenue with two customers each exceeded 10% of total revenue. The revenue derived from these two customers was EUR
Operating segments and geographical information
The Group operates four windfarm installation vessels, which are viewed as one segment. The vessels operate in a global market and are often redeployed to different regions due to changing customers or contracts. Accordingly, we report our operations as a single reportable segment.
Contract backlog
The Group’s order backlog as of the reporting date amounted to EUR
EUR million |
| Within 1 year |
| After 1 year |
| Total |
Contract backlog as of 30 June 2024 |
|
|
| |||
Firm | | | | |||
Subject to exercise of counterparty options | | | | |||
Total¹ | | | | |||
Contract backlog as of 30 June 2023 |
|
|
| |||
Firm |
| | | | ||
Subject to exercise of counterparty options |
| | | | ||
Total¹ |
| | | |
As of 1 January 2024, Cadeler changed the definition of contract backlog and decided to present options measured at
27
Note 4
Earnings Per Share (EPS)
Basic EPS is calculated by dividing the profit for the period attributable to ordinary equity holders of the parent by the weighted average number of ordinary shares outstanding during the period.
Diluted EPS is calculated by dividing the profit attributable to ordinary equity holders of the parent by the weighted average number of ordinary shares outstanding during the period plus the weighted average number of ordinary shares that would be issued on conversion of all the dilutive potential ordinary shares into ordinary shares.
The following table reflects the income and share data used in the basic and diluted EPS calculations:
EUR’000 |
| H1 2024 |
| H1 2023 |
Profit attributable to ordinary equity holders of the parent for basic earnings | | | ||
Profit attributable to ordinary equity holders of the parent adjusted for the effect of dilution | | |
Thousands |
| H1 2024 |
| H1 2023 |
Weighted average number of ordinary shares for basic EPS¹ | | | ||
Effect of dilution from share-based payments programme | | | ||
Weighted average number of ordinary shares adjusted for the effect of dilution¹ |
| | |
| H1 2024 |
| H1 2023 | |
Basic, (loss)/profit for the period attributable to ordinary equity holders of the parent (EUR per share) |
| | | |
Diluted, (loss)/profit for the period attributable to ordinary equity holders of the parent (EUR per share) |
| | |
There have been no other transactions involving ordinary shares or potential ordinary shares between the reporting date and the date of authorisation of these financial statements.
1 The weighted average number of shares takes into account the weighted average effect of share-based payments during the period.
29
Note 5
Property, plant and equipment
Other fixtures and | Assets under | |||||||||
EUR’000 |
| Vessels |
| Dry dock |
| fittings |
| construction |
| Total |
Cost 2024 |
|
|
|
|
| |||||
1 January 2024 | | | | | | |||||
Additions | | | | | | |||||
Transfer from assets under construction | | - | | ( | - | |||||
Disposals | - | - | ( | - | ( | |||||
Exchange differences | | | | | | |||||
30 June 2024 | | | | | | |||||
Accumulated depreciation and impairment |
|
|
|
|
| |||||
1 January 2024 | | | | - | | |||||
Depreciation charge | | | | - | | |||||
Disposals | ( | - | ( | |||||||
Exchange differences | | | | - | | |||||
30 June 2024 | | | | - | | |||||
Net book value, 30 June 2024 | | | | | |
Additions during the first half of 2024 amounted to EUR
In addition, assets under construction contains EUR
Borrowing costs for H1 2024 have been capitalised in the total amount of EUR
Impairment test of vessels (excluding goodwill)
For its assessment of the value of the vessels, the Company has considered impairment indicators and revised the considered most significant assumptions used in the fair value and value in use assessment in Annual Report 2023. Cadeler has assessed there were no significant changes to the value in use assumptions. The Company has identified neither internal nor external impairment indicators. Therefore, Management has not performed an impairment test of the value of the vessels as of 30 June 2024.
For information on goodwill impairment, refer to Note 6.
30
Note 6
Goodwill
At 30 June 2024, Management has concluded on the allocation of goodwill arising from the acquisition of Eneti to a single cash generating unit (CGU), being the transport and installation of offshore wind turbine generators and foundation installation vessels (WTGFIV) as it is from this CGU that the synergies are expected to arise.
The WTGFIV CGU is comprised of Cadeler’s O-class vessels and Scylla. The recoverable amount of the WTGFIV CGU is determined based on the value of the vessels included in the CGU, which showed no indication of impairment.
For assessment of the value of the vessels, the Company has considered impairment indicators and revised the considered most significant assumptions used in the fair value and value in use assessment in the Annual Report 2023. Cadeler has assessed there were no significant changes to the value in use assumptions. The Company has identified neither internal nor external impairment indicators. Therefore, as of 30 June 2024 Management has not performed an impairment test of neither the value of the vessels nor of goodwill.
Note 7
Financial risk management
Financial risk factors
The Group’s activities expose the Group to market risk, including currency risk and interest rate risk, credit risk, and liquidity risk.
The financial risk management of the Group is performed by the Management of Cadeler and overseen by the Board of Directors and Audit Committee. The fair value of the Group’s financial assets and liabilities as of 30 June 2024 does not deviate materially from the carrying amounts as of 30 June 2024.
Financial risks and how the Group manages its risks, are addressed in Note 24 to the consolidated financial statements in Annual Report 2023. The risks in 2024 remain similar in nature.
Quantitative and qualitative disclosures about market risk
Currency risk
The largest currency exposure of the Group is the future instalments for the new P, A and M-class vessels in USD (USD
Interest rate risk
The Group’s current exposure to the risk of changes in market interest rates relates primarily to the New Debt facility, the P-Class facility, M-Class facility and Holdco facility. More details can be found in Note 25 to the consolidated financial statements in Annual Report 2023 with regard to the hedging instruments used to mitigate this risk.
The New Debt facility and Holdco facility are based on a EURIBOR 3M interest rate plus a margin. The EURIBOR interest rate has a floor of
Liquidity risk
The Group manages liquidity risk by maintaining sufficient cash and available funding through committed credit facilities and guarantees to enable it to meet its operational requirements and instalments for the newbuild vessels signed. On 22 May 2024, the Group placed a new order for the third A-Class WFIV, Wind Apex. The intended equity portion of the contract value will be fully financed with a portion of the proceeds from the private placement completed on 15 February 2024. Please refer to Note 11 for a detailed disclosure of the contract obligation for the construction of the newbuild vessels.
31
Note 7
Financial risk management
Continued from previous page
The following table shows a detailed disclosure of the Group’s current facilities:
As of 30 June 2024 |
| |||
EUR Millions | Utilised |
| Unused | |
Secured |
|
| ||
New Debt Facility (RCF + term loan) | | | ||
New Debt Facility - Guarantee | | | ||
Total New Debt Facility | | | ||
P-Class Facility | - | | ||
M-Class Facility (USD | - | | ||
Unsecured |
|
|
| |
HoldCo Facility | | - | ||
Total (excluding Guarantee facility) | | |
Change in debt to credit institutions during the period:
EUR’000 |
| 30 June 2024 |
| 30 June 2023 |
Debt to credit institutions at 1 January |
| ( | ( | |
New loan |
| ( | - | |
Loan fees | | - | ||
Interest expense (non-cash) | ( | ( | ||
Debt to credit institutions at 30 June |
| ( | ( |
32
Note 7
Financial risk management
Continued from previous page
Total fees paid in H1 2024 as per Consolidated Statement of Cash Flows amounts to EUR
On 7 February 2024, the Group secured additional capital, increasing the Holdco Facility from EUR
On 22 March 2024, the Group utilised EUR
Fair value measurement
The Group measures certain financial instruments at fair value at each balance sheet date. Currently, the Company has derivatives measured at fair value. Fair value is the price that would be received to sell an asset or paid to transfer a liability in an orderly transaction between market participants at the balance sheet date.
There are no significant changes in the methods and assumptions used in determining the fair value of the financial instruments. Please refer to note 25 to the consolidated financial statements in Annual Report 2023 for a detailed description of the derivative financial instruments of the Group.
The table below shows the fair value of derivatives:
EUR’000 |
| 30 June 2024 |
| 31 December 2023 |
Derivative assets measured at fair value |
|
|
| |
Interest rate swap - recycled through OCI |
| | | |
Interest rate swap |
| | - | |
FX forward contracts |
| | - | |
Time value through OCI |
| | - | |
Total derivative assets |
| | | |
Derivative liabilities measured at fair value |
|
| ||
Interest rate swap | | | ||
FX forward contracts | - | | ||
Option collars | - | | ||
Time value through OCI | | | ||
Derivatives ineffective hedges |
| - | | |
Total derivative liabilities |
| | |
As of 30 June 2024, the fair value of the derivative assets amounted to EUR
As of June 30, 2024, derivatives liabilities measured at fair value through profit or loss amounted to EUR
The fair value hierarchy for the above derivative financial instruments is Level 2.
33
Note 8
Issued share capital
No. of shares (in | |||||||
EUR’000 | thousands) |
|
| H1 2024 |
| H1 2023 | |
Ordinary shares at 1 January |
| | | | |||
Issued in February 2024 for capital increase |
| | | | |||
Issued in June 2024 for capital increase |
| | | - | |||
Ordinary shares at 30 June |
| | | |
As of 1 January 2024, the Group had share capital amounting to DKK
On 15 February 2024, the Company completed a private placement, resulting in the issuance of
On 26 June 2024, the Company completed a capital increase of EUR
All shares have equal rights.
Note 9
Business combination
The business combination with Eneti, for which the closing date of acquisition was 19 December 2023, and how the Group accounted for the transaction is addressed in Note 6 to the consolidated financial statements in Annual Report 2023. Adjustments may be applied to these amounts for a period of up to twelve months from the acquisition date in accordance with IFRS 3 (revised).
As of the reporting date, no changes have been identified to the estimates and recognition since the release of Annual Report 2023.
Note 10
Related party transactions
The following significant transactions took place between the Company and related parties within the BW Group and Scorpio Holdings at terms agreed between the parties:
EUR’000 |
| H1 2024 |
| H1 2023 |
Purchases of services from related parties | ( | ( | ||
BW Group Limited (including subsidiaries) |
| ( | ( | |
Scorpio Holdings Limited (including subsidiaries) |
| ( | - |
35
Note 10
Related party transactions
Continued from previous page
EUR’000 |
| 30 June 2024 |
| 31 December 2023 |
Receivables from related parties at reported period |
| | | |
Scorpio Holdings Limited (including subsidiaries) |
| | | |
Payables to related parties at reported period |
| | | |
BW Group Limited (including subsidiaries) |
| - | | |
Scorpio Holdings Limited (including subsidiaries) |
| | |
Related party transactions over the reporting period are primarily linked to guarantee fees issued by the BW Group Limited, costs related to training expenses by BW Maritime and administrative expenses to Scorpio Services Holding.
The BW Group has provided COSCO with a guarantee in respect of the sums payable by Cadeler in accordance with new contract signed for the construction of the third A-Class. Under this guarantee arrangement, certain fees are payable by the Group to BW Group until the guarantees are discharged in full. Aside from this, Cadeler has not had significant transactions with the members of its Board of Directors or Executive Management, apart from remuneration. Cadeler has not provided or granted any loans or guarantees to its directors or Executive Management members.
Note 11
Commitments and pledges
The Group’s commitments are related to the future lease payments and instalments for the new P, A and M-class vessels.
Lease commitments
The future minimum lease payables under non-cancellable low value and short-term leases contracted for at the balance sheet date but not recognised as liabilities are as follows:
EUR’000 |
| 30 June 2024 |
| 31 December 2023 |
Not later than one year | | | ||
Between one and five years | | | ||
| | |
As of 31 December 2023, the Company’s lease commitments included tenure of the new headquarters. These commitments were reflected on the balance sheet starting in Q1 2024 as ‘Right of Use Assets’ and ‘Lease Liabilities’ in accordance with IFRS 16.
As of 30 June 2024, Right of use assets amount to EUR
The table below shows the remaining instalments for the newbuild vessels:
As of 30 June 2024 | ||||||||
Millions |
| P-Class |
| M-Class |
| A-Class |
| Total |
Contract amount in EUR | | - | | | ||||
Contract amount in USD | | | | | ||||
Total contract amount translated to EUR | | | | | ||||
Commitment amount in EUR | | - | | | ||||
Commitment amount in USD | | | | | ||||
Commitment amount translated to EUR | | | | |
36
Note 11
Commitments and pledges
Continued from previous page
Wind Osprey & Wind Orca new crane contract
In April 2024, the remaining payments were made upon completion of the upgrade project for the new cranes, while EUR
P-Class vessels
In April 2024, EUR
M-Class vessels
In March 2024, EUR
A-Class vessels
In May 2024, the Company signed an additional contract with COSCO Shipping Shipyard (Nantong) Co., LTD (“COSCO”) to build the third A-Class Wind Foundation Installation Vessel (WFIV). The total sum of the contract for the new vessel is approximately EUR
Note 12
Events after reporting period
Amendment of New Debt Facility
On 6 August 2024, the Group requested the extension and increase of its New Debt Facility (RCF-B) and uncommitted guarantee lines. The extension of the RCF-B facility by 12 months, will provide the Company with additional financial flexibility to seize market opportunities, including by funding the purchase of mission equipment and increased working capital. Further, the uncommitted guarantee lines has been increased from EUR
Delivery of P-Class vessel
On 16 August 2024, the Company took delivery of the fifth vessel in its fleet, Wind Peak, which was delivered in Qidong, China. Additionally, on 12 August 2024, the Company requested the utilisation of half of the P-Class Facility to pay the last instalment amounted to approximately EUR
Refinancing of M-Class Facility
On 16 August 2024, the Company has successfully renegotiated and replaced the USD
The replacement facilities – one for each M-Class vessel – have been entered into on materially improved terms, reflecting Cadeler’s strong credit story and strengthened market position. This refinancing, supported by a broad banking group as well as several export credit agencies, secures an aggregate of up to EUR
Additional capacity under unsecured HoldCo Facility
On 26 August 2024, the Company has further increased the capacity available to it under its unsecured corporate term loan facility, with the lender commitments thereunder increased by EUR
With this upsizing, the Group has increased its financial flexibility and ability to seize market opportunities as they rise. This increase in unsecured, committed funds further strengthens Cadeler's financial position and growth prospects and will enable it to fund a variety of wind turbine installation activities.
37
Statement by Management
The Board of Directors and the Executive Board have today discussed and approved the interim condensed consolidated financial statements of Cadeler A/S for the period 1 January to 30 June 2024.
The interim condensed consolidated financial statements have been prepared in accordance with IAS 34 Interim Financial Reporting as issued by the International Accounting Standards Board (IASB) and as adopted by the EU and additional Danish disclosure requirements of the Danish Financial Statements Act for interim reports of listed companies.
In our opinion, the interim condensed consolidated financial statements give a true and fair view of the financial position of the Group at 30 June 2024 and of the results of its operations and cash flows for the six month period ended 30 June 2024.
Further, in our opinion, the Managements review gives a fair review of the development in the Group’s operations and financial matters, results for the period and financial position as well as a description of material risks and uncertainties that the Group faces.
Copenhagen, 27 August 2024
Executive Management
Mikkel Gleerup CEO | Peter Brogaard Hansen CFO |
Board of Directors
Andreas Sohmen-Pao
Emanuele Lauro
Andrea Abt
Colette Cohen
James B. Nish
Ditlev Wedell-Wedellsborg
39
Forward-Looking statements
The Annual Report and the Interim Financial Report contain certain forward-looking statements relating to the business, financial performance and results of the Company and/or the industry in which it operates.
Forward-looking statements concern future circumstances and results and other statements that are not historical facts, sometimes identified by the words “believes”, expects”, “predicts”, “intends”, “projects”, “plans”, “estimates”, “aims”, “foresees”, “anticipates”, “targets”, and similar expressions. The forward-looking statements contained in the Annual Report and the Interim Financial Report, including assumptions, opinions and views of the Company or cited from third party sources are solely opinions and forecasts which are subject to risks, uncertainties and other factors that may cause actual events to differ materially from any anticipated development. Such factors may for example include a change in the price of raw materials.
None of the Company or any of its parent or subsidiaries undertakings or any such person’s officers or employees provides any assurance that the assumptions underlying such forward-looking statements are free from errors nor does any of them accept any responsibility for the future accuracy of the opinions expressed in the Annual Report and the Interim Financial Report or the actual occurrence of the forecasted developments.
The Company assumes no obligation, except as required by law, to update any forward-looking statements or to conform these forward-looking statements to its actual results.
The Annual Report and the Interim Financial Report contain information obtained from third parties. You are advised that such third-party information has not been prepared specifically for inclusion in the Annual Report and the Interim Financial Report and the Company has not undertaken any independent investigation to confirm the accuracy or completeness of such information.
Several other factors could cause the actual results, performance or achievements of the Company to be materially different from any future results, performance or achievements that may be expressed or implied by statements and information in the Annual Report and the Interim Financial Report.
Should any risks or uncertainties materialise, or should underlying assumptions prove incorrect, actual results may vary materially from those described in the Annual Report and the Interim Financial Report.
No representation or warranty (express or implied) is made as to, and no reliance should be placed on, any information, including projections, estimates, targets and opinions, contained herein, and no liability whatsoever is accepted as to any errors, omissions or misstatements contained herein, and, accordingly, neither the Company nor any of its subsidiaries or shareholders or any officers, directors, board members or employees accept any liability whatsoever arising directly or indirectly from the use of the Annual Report and the Interim Financial Report.
41
Alternative performance measures
Non-IFRS financial measures
To supplement its financial information presented in accordance with IFRS, the Group uses certain non-IFRS metrics, including EBITDA, when measuring performance, including when measuring current period results against prior periods. Because of its non-standardised definition, these non-IFRS measures (unlike IFRS measures) may not be comparable to the calculation of similar measures of other companies. These supplemental non-IFRS measures are presented solely to permit investors to more fully understand how the Group Management assesses underlying performance.
These supplemental non-IFRS measures are not, and should not, be viewed as a substitute for IFRS measures. Management believes the presentation of these non-IFRS measures provides investors with greater transparency and supplemental data relating to the Group’s financial condition and results of operations, and therefore a more complete understanding of factors affecting its business and the Group’s operating performance. In addition, Management believes the presentation of these non-IFRS measures is useful to investors for period-to-period comparison of results as the items may reflect certain unique and/or non-operating items such as asset sales, write-offs, contract termination costs or items outside of Management’s control.
As a performance measure, the Group uses EBITDA: Earnings before interest, tax, depreciation, amortisation, and foreign exchange gains/losses.
EBITDA is calculated as shown below:
EUR’000 |
| H1 2024 |
| H1 2023 |
Operating profit or loss as reported in the statement of profit | (1,363) | 29,439 | ||
Right-of-use asset amortisation | 657 | 262 | ||
Depreciation and amortisation | 22,433 | 11,803 | ||
EBITDA | 21,727 | 41,504 | ||
Transactional costs | - | 2,583 | ||
Adjusted EBITDA | 21,727 | 44,087 |
The Company defines adjusted EBITDA as EBITDA net of transactional costs. Transactional costs comprise significant unusual and/or infrequently occurring items that are not attributable to Cadeler’s normal operations.
As of 30 June 2023, transactional costs include all costs related to the business combination with Eneti closed on 19 December 2023, such as advisory, legal and consulting fees.
42
Alternative performance measures
Continued from previous page
Financial ratios and operational metrics
Return on assets |
| Profit/loss from operating activities Average assets |
Return on equity | Profit/loss for the year Average equity | |
Equity ratio | Equity, year-end Total equity and liabilities, year-end | |
Contracted days | Number of on hire days in the fiscal year (in total for all vessels) | |
Utilisation | Contracted days Days in the year (365*all vessels) | |
Contract backlog (As of reporting date) | The total value of all customer contracts, both firm and options, that are not yet recognised as revenue as of the reporting date, and includes all new contracts signed until the same reporting date of the annual or interim report. Firm days are counted at full committed amounts. Contract backlog in 2024 assumes 100% of counterparty options are exercised (comparative data presented in the disclosure have been restated). The definition also includes any contracts where revenue recognition has started but not yet completed as of the reporting date. Contract backlog excludes vessel reservation agreements. | |
Contract backlog (As of report release date) | The total value of all customer contracts, both firm and options, that are not yet recognised as revenue as of the reporting date, but includes all new contracts signed until the release date of the annual or interim report. Firm days are counted at full committed amounts. Contract backlog in 2024 assumes 100% of counterparty options are exercised. The definition also includes any contracts where revenue recognition has started but not yet completed as of the reporting date. Contract backlog excludes vessel reservation agreements. | |
Non-financial definitions | ||
Vessel reservation agreements (VRA) | A time-limited agreement with a third party to secure the availability of one or more of Cadeler’s vessels for a fixed period in the future, pending the negotiation of full contractual terms. Cadeler is generally entitled to receive a fee in the event that a VRA is cancelled or permitted to expire without full contractual terms having been entered into with the relevant counterpart. | |
Final Investment Decision (FID) | Where a project remains subject to counterparty FID, the relevant counterpart has not yet publicly announced its final decision to commit to the development and operation of the project. |
43