UNITED
STATES
SECURITIES AND EXCHANGE COMMISSION
Washington, D.C. 20549
Form
For the fiscal year ending
For the transition period from __________ to __________.
Commission
file number:
(Exact name of registrant as specified in its charter)
(State or Other Jurisdiction of Incorporation or Organization) |
(I.R.S. Employer Identification No.) |
(Address of principal executive offices, including ZIP Code)
(Registrant’s telephone number, including area code)
Securities registered pursuant to Section 12(b) of the Act:
| Title of Each Class | Trading Symbol(s) | Name of each exchange on which registered | ||
| The
|
Securities registered pursuant to Section 12(g) of the Act: None
Indicate
by check mark if the registrant is a well-known seasoned issuer, as defined in Rule 405 of the Securities Act. Yes ☐
Indicate
by check mark if the registrant is not required to file reports pursuant to Section 13 or Section 15(d) of the Act. Yes ☐
Indicate
by check mark whether the registrant (1) has filed all reports required to be filed by Section 13 or 15(d) of the Securities Exchange
Act of 1934 during the preceding 12 months (or for such shorter period that the issuer was required to file such reports), and (2) has
been subject to such filing requirements for the past 90 days.
Indicate
by check mark whether the registrant has submitted electronically every Interactive Data File required to be submitted pursuant to Rule
405 of Regulation S-T (§ 232.405 of this chapter) during the preceding 12 months (or for such shorter period that the registrant
was required to submit such files).
Indicate by check mark whether the registrant is a large accelerated filer, an accelerated filer, a non-accelerated filer, a smaller reporting company, or an emerging growth company. See the definitions of “large accelerated filer,” “accelerated filer,” “smaller reporting company,” and “emerging growth company” in Rule 12b-2 of the Exchange Act.
| Large accelerated filer ☐ | Accelerated filer ☐ | |
| Smaller
reporting company | ||
| Emerging
growth company |
If
an emerging growth company, indicate by check mark if the registrant has elected not to use the extended transition period for complying
with any new or revised financial accounting standards provided pursuant to Section 13(a) of the Exchange Act.
Indicate
by check mark whether the registrant has filed a report on and attestation to its management’s assessment of the effectiveness
of its internal control over financial reporting under Section 404(b) of the Sarbanes-Oxley Act (15 U.S.C. 7262(b)) by the registered
public accounting firm that prepared or issued its audit report.
If
securities are registered pursuant to Section 12(b) of the Act, indicate by check mark whether the financial statements of the registrant
included in the filing reflect the correction of an error to previously issued financial statements.
Indicate by check mark whether any of those error corrections are restatements that required a recovery analysis of incentive-based compensation received by any of the registrant’s executive officers during the relevant recovery period pursuant to §240.10D-1(b). ☐
Indicate
by check mark whether the registrant is a shell company (as defined in Rule 12b-2 of the Exchange Act). Yes ☐
The registrant was not a public company as of the last business day of its most recently completed second fiscal quarter and, therefore, cannot calculate the aggregate market value of its voting and non-voting common equity held by non-affiliates as of such date.
As of January 16, 2024, there were shares of common stock, no par value, issued and outstanding.
Table of Contents
| Page | ||
| PART I | ||
| ITEM 1: | BUSINESS | 1 |
| ITEM 2: | PROPERTIES | 19 |
| ITEM 3: | LEGAL PROCEEDINGS | 19 |
| PART II | ||
| ITEM 5: | MARKET FOR COMMON EQUITY, RELATED STOCKHOLDER MATTERS AND PURCHASES OF EQUITY SECURITIES | 20 |
| ITEM 6: | [RESERVED] | 22 |
| ITEM 7: | MANAGEMENT’S DISCUSSION AND ANALYSIS OF FINANCIAL CONDITION AND RESULTS OF OPERATION | 22 |
| ITEM 8: | FINANCIAL STATEMENTS | F-1 |
| ITEM 9A. | CONTROLS AND PROCEDURES | 35 |
| PART III | ||
| ITEM 10: | DIRECTORS, EXECUTIVE OFFICERS, AND CORPORATE GOVERNANCE | 36 |
| ITEM 11: | EXECUTIVE COMPENSATION | 42 |
| ITEM 12: | SECURITY OWNERSHIP OF CERTAIN BENEFICIAL OWNERS AND MANAGEMENT AND RELATED STOCKHOLDER MATTERS | 45 |
| ITEM 13: | CERTAIN RELATIONSHIPS AND RELATED TRANSACTIONS, AND DIRECTOR INDEPENDENCE | 46 |
| ITEM 14: | PRINCIPAL ACCOUNTING FEES AND SERVICES | 48 |
| PART IV | ||
| ITEM 15: | EXHIBITS AND FINANCIAL STATEMENT SCHEDULES | 49 |
| SIGNATURES | 50 | |
| i |
SPECIAL NOTE REGARDING FORWARD-LOOKING STATEMENTS
This annual report contains “forward-looking statements” within the meaning of the Private Securities Litigation Reform Act of 1995, Section 27A of the Securities Act of 1933, and Section 21E of the Securities Exchange Act of 1934. Forward-looking statements may appear throughout this annual report, including in the following sections: “Business” and “Management’s Discussion and Analysis of Financial Condition and Results of Operations.” Forward-looking statements are based on current expectations and assumptions that are subject to risks and uncertainties that may cause actual results to differ materially. When used in this annual report, the words “anticipate,” “believe,” “estimate,” “expect,” “future,” “intend,” “plan,” or the negative of these terms and similar expressions, as they relate to us or our management, identify forward-looking statements. Such statements include, but are not limited to, statements contained in this annual report relating to our business strategy, our future operating results, and our liquidity and capital-resources outlook. Forward-looking statements are based on our current expectations and assumptions regarding our business, the economy, and other future conditions. Because forward-looking statements relate to the future, they are subject to inherent uncertainties, risks, and changes in circumstances that are difficult to predict. Our actual results may differ materially from those contemplated by the forward-looking statements. They are neither statements of historical fact nor guarantees of assurance of future performance. We caution you, therefore, against relying on any of these forward-looking statements. Important factors that could cause actual results to differ materially from those in the forward-looking statements include, without limitation:
| ● | our ability to effectively operate our business segments; |
| ● | our ability to manage our research, development, expansion, growth, and operating expenses; |
| ● | our ability to evaluate and measure our business, prospects, and performance metrics; |
| ● | our ability to compete, directly and indirectly, and succeed in a highly competitive and evolving industry; |
| ● | our ability to respond and adapt to changes in technology and customer behavior; |
| ● | our ability to protect our intellectual property and to develop, maintain, and enhance a strong brand; and |
| ● | other factors relating to our industry, our operations, and results of operations. |
Should one or more of these risks or uncertainties materialize, or should the underlying assumptions prove incorrect, actual results may differ significantly from those anticipated, believed, estimated, expected, intended or planned.
Factors or events that could cause our actual results to differ may emerge from time to time, and it is not possible for us to predict all of them. We cannot guarantee future results, levels of activity, performance, or achievements. Except as required by applicable law, including the securities laws of the United States, we do not intend to update any of the forward-looking statements to conform these statements to actual results.
USE OF CERTAIN DEFINED TERMS
Unless the context otherwise requires, in this annual report on Form 10-K references to:
| ● | the “Company,” “INNO,” the “registrant,” “we,” “our,” or “us” mean INNO HOLDINGS INC. and its subsidiaries; | |
| ● | “year” or “fiscal year” means the year ending September 30; | |
| ● | all dollar or $ references, when used in this prospectus, refer to United States dollars; | |
| ● | “framing” means the process of connecting building materials together to create a structure; | |
| ● | “stud” means a vertical framing member which forms part of a wall or partition, also known as a wall stud, a fundamental component of frame construction; | |
| ● | “truss” means a web-like roof design that uses tension and compression to create strong, light components that can span a long distance; | |
| ● | “joist” means a horizontal structural member used in framing to span an open space, often between beams that subsequently transfer loads to vertical members; | |
| ● | “cold-formed steel” or “CFS” or “light-gauge steel” or “LGS” means steel products shaped by cold-working processes carried out near room temperature, such as rolling, pressing, stamping, bending, etc.; | |
| ● | “turnkey cost” is the total cost that must be covered before a product or service is ready to be sold and used by consumers; | |
| ● | “prefab” means a building manufactured in sections to enable assembly on site. |
| ii |
PART I
ITEM 1. BUSINESS
Overview
INNO HOLDINGS INC. (“INNO,” “we,” “us,” or “Company”) is an innovative building-technology company with a mission to transform the construction industry with our proprietary cold-formed steel-framing technology and other building innovations. INNO recognized the inherent inefficiency and waste in traditional lumber-based construction techniques and sought to develop steel-based construction technologies to solve the problems. INNO takes its name from “innovation” and is committed to the research and development of steel studs/tracks/headers, providing higher performance and greater efficiencies in all aspects of construction, making better structural solutions for both commercial and residential buildings, resulting in substantial labor cost savings, in our view. The Company’s products are created using a combination of intelligent machines and cutting-edge techniques to provide an optimal design solution of framing for engineers, builders, and construction companies. We are currently a manufacturer of cold-formed-steel members and we offer a full range of services required to transform raw materials into precise steel framing products and prefabricated homes. We sell these finished products either to businesses or directly to customers. The finished products and cold-formed-steel members are used in a variety of building types, including residential, commercial, industrial, and infrastructure. We hope to transform the building industry by reducing construction times while providing more affordable, environmentally sustainable, and durable solutions compared to traditional construction materials and methods. We believe we are also well positioned to disrupt the construction industry, which now accounts for $10 trillion of the global economy.
We work with our customers to manufacture products in accordance with the customers’ drawings and specifications. Our work complies with specific national and international codes and standards applicable to the construction industry. We believe that we have earned our reputation through outstanding technical expertise, attention to detail, and a total commitment to excellence in customer service.
Our primary manufacturing operations are located on approximately five acres in Brookshire, Texas. Our facility houses state-of-the-art equipment that gives us the capability to manufacture 15,000 linear feet of product per day. We offer a full range of services such as structural designs, metal stud production, and preassembly of metal studs into steel wall panels, which are required to transform raw materials into finished products that are compliant with local building codes. Our manufacturing capabilities include fabrication operations, such as cutting, punching, forming and assembling, and machine operations, which includes computer numerical controlled (“CNC”) machine operations. We also provide support services for our manufacturing capabilities: manufacturing engineering (planning, fixture and tooling development, and manufacturing), quality control (inspection and testing), materials procurement, production control (scheduling, project management, and expediting), and final assembly.
All manufacturing at our facility is done in accordance with our written quality assurance program, which meets specific national codes as well as international codes, standards, and specifications. For example, we have ICC-ES evaluation reports (ESR-4641) that show that our cold-formed steel-framing members are compliant with the 2018 and 2015 International Building Code (“IBC”), 2019 California Building Code (“CBC”), and 2020 Florida Building Code. The standards used for each customer project are specific to each customer’s needs, and we have implemented those standards into our manufacturing operations.
Major Drivers of Our Business Opportunity
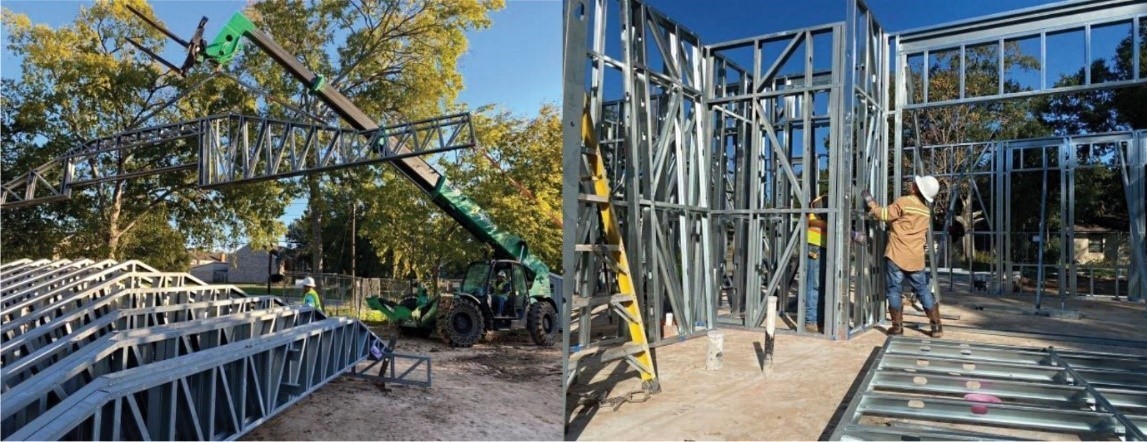
The traditional construction industry is labor intensive and suffers from a skilled labor shortage, which increases overall labor costs and contributes to inefficiencies in the construction process. Our steel-framing technology can decrease construction times by 50% or more by prefabricating panels and can reduce labor costs proportionately due to reduced construction timelines. Our intelligent CNC cold-formed roller machine automatically punches the holes for Mechanical, Electrical and Plumbing (MEP) channels eliminating many steps at the job site, compared to traditional onsite manual measurement and cutting procedures. INNO is dedicated to bringing automation to the construction industry to solve the overreliance on a declining supply of expensive, skilled labor.
Construction Site
Source: INNO
| 1 |
Reducing the need for on-site customization found in traditional construction processes is not only more profitable, it can decrease the risks associated with an inherently dangerous workplace. According to Frommer D’Amico, “10 Top Hazards In a Building Site”, nearly 6.5 million people go to work at approximately 252,000 construction sites across the U.S each day. On the job, these construction workers face a wide range of occupational safety hazards. Heavy equipment, bad weather and chaotic job site conditions can create dangerous situations. INNO typically manufactures metal studs and prefab wall panels, joists, and trusses within our indoor facility, unaffected by weather. The final products delivered to the jobsite are assembled wall panels, joists and trusses, which means almost 70% of structure framing work has been completed before it gets to the construction site where the remaining tasks are to erect and connect the pieces. A construction jobsite using INNO framing products is typically very clean and organized due to a lack of cuttings and debris, which reduces the risk of safety hazards. We anticipate that cold-formed steel-framing technology will ultimately replace wooden and traditional steel structures and we believe it is a big step forward in construction industry.
Construction site
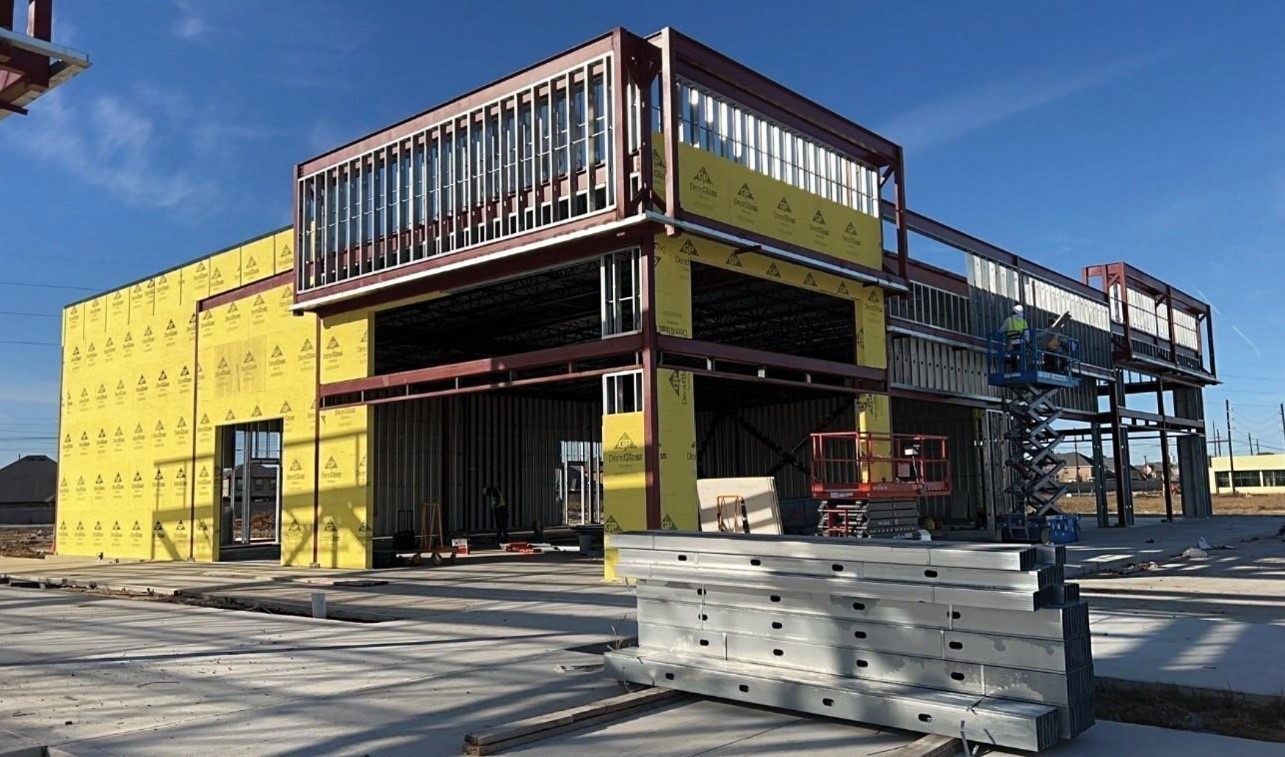
Source: INNO
We are bringing sustainability to the market by replacing traditional wooden structures with cold-formed steel framing, allowing for the reduction of material waste — an average of 2% of steel scrap versus ~20% for wood waste. All steel scrap is 100% recyclable, which we support through our recycling operations. Many businesses are seeking actions that demonstrate sustainability, and steel is uniquely environmental-friendly in its reuse, giving us an edge in Leadership in Energy and Environmental Design (“LEED”) certifiable products and projects.
Scrap Metal Recycling Bin
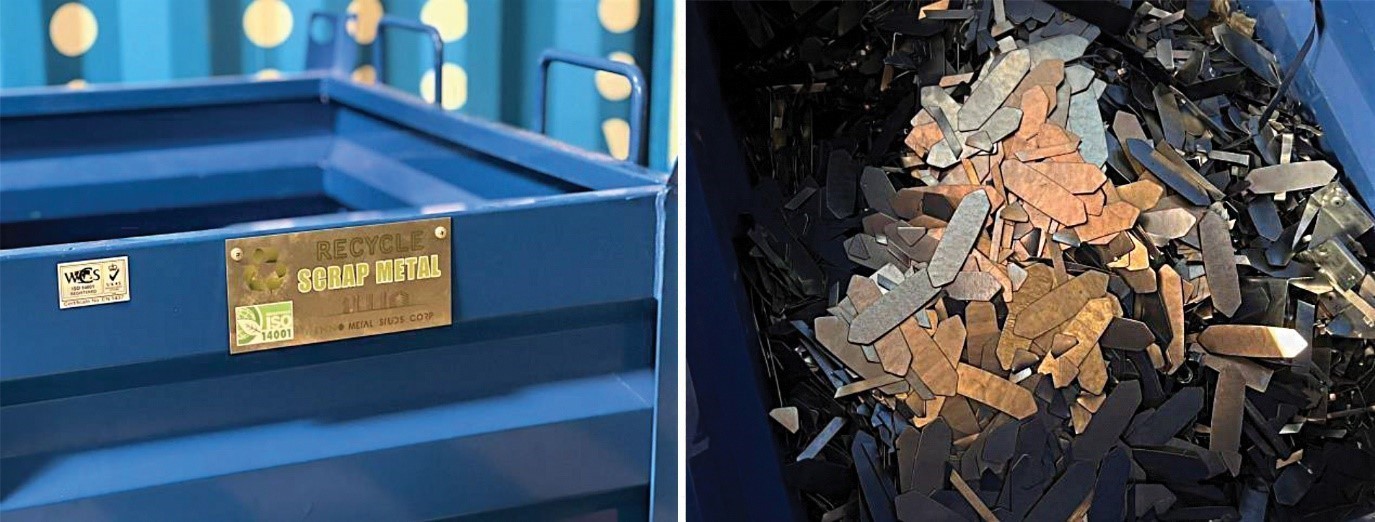
Source: INNO
| 2 |
We are constantly striving to produce lasting results within the building technology sector. With increasingly evolving technological advancements in the industry, our objective is to continue staying ahead of the curve by focusing our ongoing research and development on cold-formed steel framing with an emphasis on architectural and engineering technologies. Our cold-formed steel-framing system increases building and labor savings by integrating each stage of the construction process with Building Information Modeling (“BIM”), which is a highly collaborative process that allows architects, engineers, real estate developers, contractors, manufacturers, and other construction professionals to plan, design, and construct a structure or building within one 3D model, to establish a common data environment, ensuring INNO delivers the final products with the minimum amount of rework needed.
BIM Model
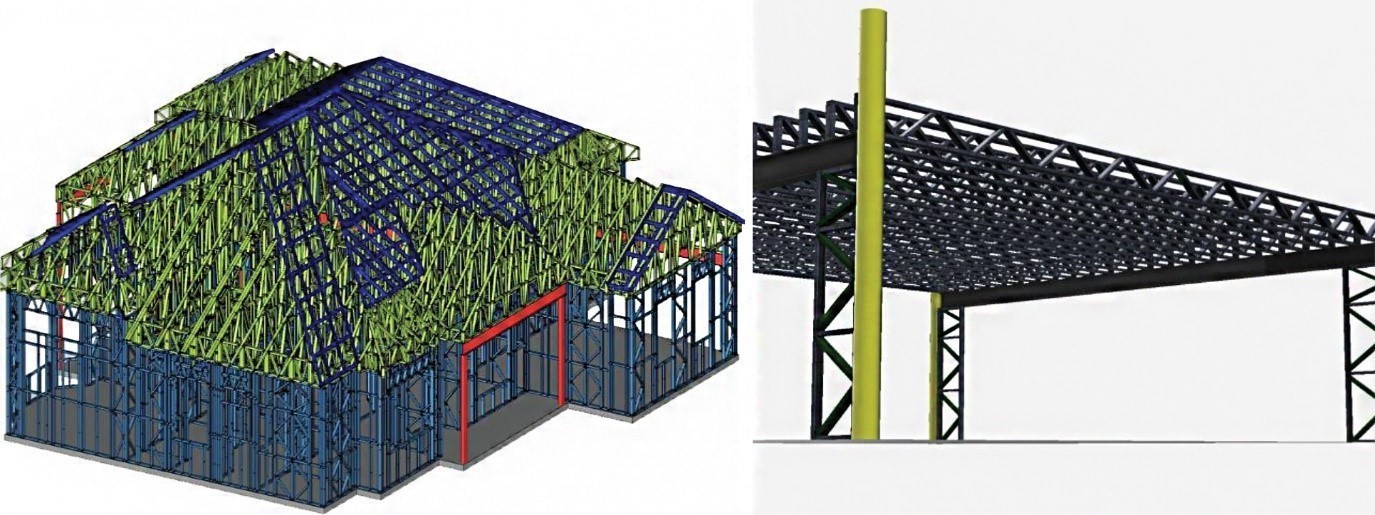
Source: INNO
Off-site building is a technique in which a building or an infrastructure is planned and designed in a modular format. Those modules are fabricated offsite in a factory. Once fabricated, those modules are transported to the site and are installed together to finalize the structure. According to the Allied Market Research published report, titled “Offsite Construction Market by Material (Steel, Wood, Concrete, and Others) and Application (Residential, Commercial, and Industrial): Global Opportunity Analysis and Industry Forecast, 2021-2030”, the global Offsite Construction industry generated $130.4 billion in 2020, and is anticipated to generate $235.4 billion by 2030, representing a CAGR of 5.9% from 2021 to 2030. The rapid rise in urbanization and industrialization, increase in the pace of construction, high efficiency of offsite building is driving the growth of this market. The North America off-site construction market size was valued at $49.5 billion in 2021, and is projected to reach $80.9 billion by 2031, representing a CAGR of 4.9% from 2022 to 2031.
In its 2016 article titled, “Imagining Construction’s Digital Future,” McKinsey & Company noted that large construction projects typically take 20% longer to complete than projected and are up to 80% over budget. The article noted that developers are searching for “… off-site approaches that help them improve predictability, consistency, and repeatability.” The article also highlighted that developers can leverage off-site capabilities “… to transform the construction site into a manufacturing system. The result: greater efficiency, less waste, and improved safety.” Off-site construction is one of the five key trends discussed in the article in which we believe INNO participates, Due to our efficient production model, environmentally sustainable solutions, and superior product quality, believe we also participate the other four trends discussed, including green construction; cost efficiency; supply chain agility; and improved durability and strength).
We are leveraging the trend toward off-site and modular building techniques to increase productivity, reduce errors on-site, and decrease construction costs. As the market continues to move toward panelized building, we anticipate having an edge in the industry as a large-scale pioneer and building industry leader with our cost-reducing, time-saving, and quality solutions.
| 3 |
Our Products
Cold-Formed Steel Framing
Cold-formed steel is the material of choice to lower building costs and adapt to modular or off-site building. It is consistent in quality and form, and it can be shipped preassembled or it can be assembled on-site by workers with little training. Our steel roof trusses, wall panels, and joist systems are a cost-effective noncombustible alternative to
traditional building materials. They are now commonly used to build apartments, hotels, temporary housing, nursing homes, commercial buildings, industrial buildings, and single-family detached homes. These types of structures are expected to be the targets of our Company’s sales and marketing team.
Our proprietary cold-formed roller machines are equipped with proprietary software, which optimizes production efficiency and supports individual part customization to ensure each cold-formed-steel member is produced to the exact specifications of the plans. Our intelligent machines can precisely cut and punch out steel studs, leaving channels for the mechanical, electrical, and plumbing designs. We arrive at an accurate, comprehensive, and information-rich design model with the utilization of light-gauge steel-framing engineering software, which creates a digital model of the project that includes all functional systems, geometric features, and aesthetics, such as electrical wiring, air conditioning, doors, and windows. The light-gauge steel-framing engineering software is a shared multidisciplinary resource that allows collaborators to achieve maximum efficiency and effectiveness by compressing design lead time. We have created a full BIM solution that instructs our advanced cold-formed roller machines to produce each steel-framing piece to certain specifications.
After the design phase, our top-quality raw materials are processed on several production lines, each with made-to-order specific dimensions, screw holes, and cross-cut stitching. These customizations reduce the need for on-site manual calculations and simplify the assembling steps, both of which increase construction efficiency and reduce labor costs. All steel-framing products produced by our Company are International Code Council (ICC) certified. The International Code Council is the leading global source of model codes and standards and building safety solutions that include product evaluation, accreditation, technology, training, and certification. The Code Council’s codes, standards, and solutions are used to ensure safe, affordable, and sustainable communities and buildings worldwide.
Our modular steel building framing systems avoid construction delays caused by partial or unsynchronized delivery of different building components. By breaking away from the methods of traditional stick-built building, our customers report that their construction timelines have been reduced at least by 20%.
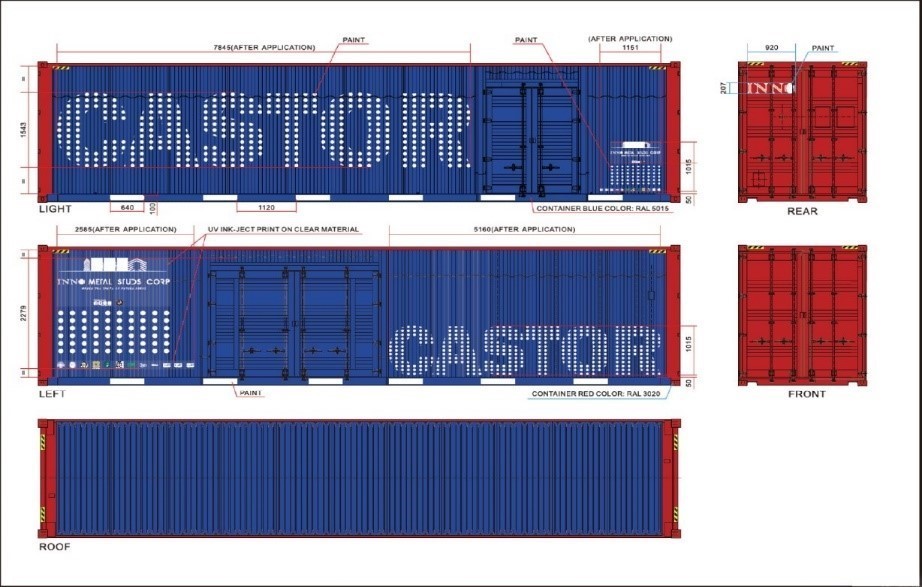
Castor Cube
Due to high housing prices, some are having difficulties purchasing a home. Housing market trends have shown a gradual preference for modular homes, which is a prefabricated building that consists of repeated sections called modules, and involves constructing sections away from the building site, then delivering them to the intended site where the installation is completed. We believe demand for prefab homes is on an upward growth trend in the United States. According to the Straits Research Institute, North America’s share of the global modular building market was valued at $28 billion in 2021 and is expected to grow to $53 billion by 2030, representing a CAGR of 7%. According to the summary of an IBISWorld report titled, “Prefabricated Home Manufacturing in the US — Market Size 2002-2029,” the prefabricated home manufacturing market size in the U.S. is expected to be $9.1 billion in 2023. We expect to capitalize on this trend by providing high-quality and affordable modular homes.
Most consumers are drawn to prefab homes because of their cost-effectiveness, efficiency, and permanent property characteristics. Castor Cube is a low-maintenance, single-story, 743-square-foot manufactured home with 4 color options that can resist earthquakes, withstand winds, and prevent pests. It is a cold-formed-steel building system equipped with honeycomb panels, and it is designed to maximize the strength-to-weight value. As a result, it yields high structural stability. Castor Cube can be built on a foundation or used as a mobile home.
The Castor Cube can be built on a foundation steel chassis, which can be single or used as a mobile multi-sectioned. We anticipate that this modular home product will be completely constructed within our facilities starting in the fourth quarter of 2023. Once built, it will be transported to permanent locations for installation. The timeline for product delivery is not affected by weather since it will be manufactured in our 100% climate-controlled factory. Furthermore, we expect that streamlined building process will shorten the completion time. We anticipate being able to produce up to one Castor Cube per day beginning in the year of 2024. We believe the Castor Cube demonstrates the effectiveness of our Company’s modular technique.
Castor Cube Rendering

Source: INNO
| 4 |
Mobile Factory: Off-site Equipment Rental, Sales, Service, and Support
We believe innovative technology can increase productivity in the building sector. Research and development of more efficient methods in the manufacturing and building space is at the forefront of our business model.
Our Mobile Factory is an all-in-one, secured production facility that will produce steel-framing members onsite. It can print wall panel, floor truss, and roof truss components. The size is customized for a trailer, which enables it to be transported anywhere, ranging from metropolitan suburbs to remote areas with little to no infrastructure. It is designed to enable immediate stud production on any site.
Our Mobile Factory is complete with metal stud production equipment and a diesel generator. This generator can supply continuous power to our cold-formed roller machine. The production capacity of our Mobile Factory is at least 1,000 linear feet per day. We believe this innovation is the good solution for urgent deployment in disaster areas or remote areas. It is designed to reduce the cost and time of transportation of metal studs, which we believe can drive a lower carbon footprint for larger projects.
Mobile Factory Illustration
Source: INNO
The Mobile Factory is operated and managed by Internet of Things (“IoT”) technology, a network of physical objects that are embedded with sensors, software and other technologies for the purpose of connecting and exchanging data with other devices and systems over the internet. INNO developed its proprietary IoT production management system independently. The system controls equipment and manages the Mobile Factory via a dashboard, allowing the user to gain a comparative understanding of production parameters, such as operation data, machinery breakdown data, uptime data and production efficiency.
IoT Production Management System
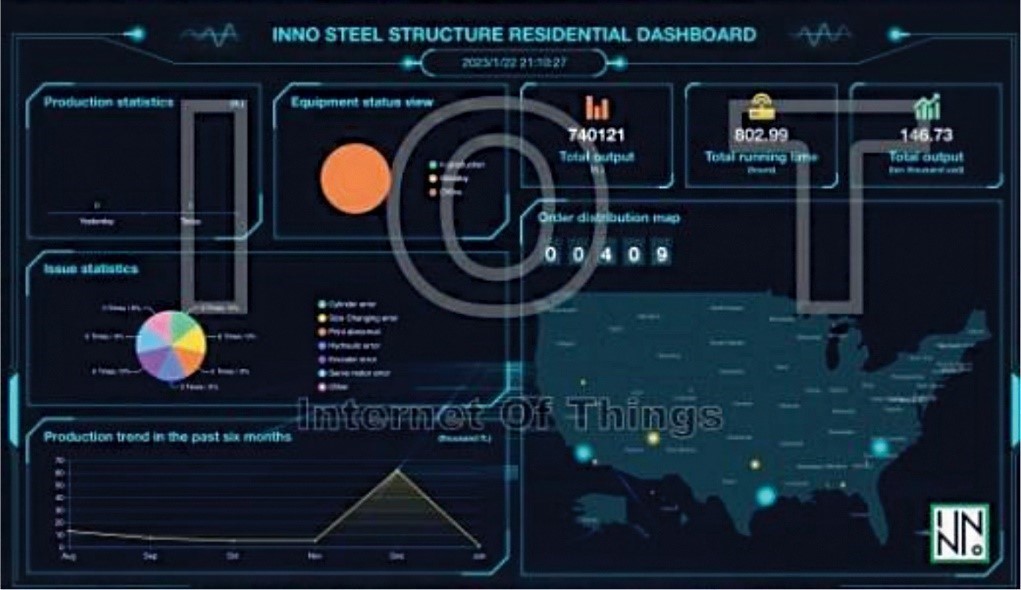
Source: INNO
| 5 |
Related Services
We may from time to time participate in land development and contractor services if an opportunity exists to leverage our products. Specifically, we have evaluated the development of apartment complexes, retirement communities, and remodels for projects that would incorporate our metal framing studs. For example, we have agreed to provide project development services for our contract with Vision Opportunity Fund LP, partially owned by a minority shareholder of the Company, related to the development of an approximately 110,000 sqft retirement community.
Our Customers
We can serve commercial, residential, and industrial projects. For the cold-formed steel-framing business, the sales model is business-to-business because the main customers are developers, builders, and contractors. For the Castor Cube prefab home products, the sales model is expected to be either business-to-business or business-to-customer.
On a year-to-year basis we are generally dependent on a small number of major customers that change year to year. Our written agreements with major customers normally terminate upon completion, and our major customers change from year to year. For fiscal year 2023, we had 24 customers, and for fiscal year 2022 we had 46 customers, of which only 10 were customers the prior fiscal year. For the years ended September 30, 2023 and 2022, three customers accounted for 53% and one customer accounted for 15% of the Company’s total revenues, respectively. As of September 30, 2023 and 2022, accounts receivable from one customer accounted for 100% and five customers accounted for 80% of the Company’s total accounts receivable, respectively.
These agreements contain standard construction and supplier agreement terms including payment schedules, performance schedules, the ability to subcontract, insurance obligations and indemnification provisions, and confidentiality provisions. Our written agreements with these customers generally terminate upon completion of the project or early terminate upon mutual agreement of the parties and contain provisions restricting our right to assign the agreement.
Our Suppliers
Historically we rely on a limited number of suppliers. For the years ended September 30, 2023 and 2022, three suppliers accounted for 57% and three suppliers accounted for 75% of the Company’s total purchases, respectively. As of September 30, 2023 and 2022, accounts payable to two suppliers accounted for 55% and three suppliers accounted for 94% of the Company’s total accounts payable, respectively. We currently do not have written agreements with these suppliers or, generally, with any of our suppliers. All of our purchases from these suppliers are made by way of individual orders.
Our Competitive Strengths
Technology Innovations
INNO recognizes that no technology or product is completely immune to being copied, and therefore the company is committed to being a pioneer in the industry by constantly researching and developing new technologies, and being ahead in various aspects of the industry such as regulations, equipment autonomy, design technology, production efficiency, new product birth, orderly management, coordinated transportation, remote production, etc. In this way, INNO aims to have the most advanced and comprehensive technology in the industry and be the true technological barrier for competitors to overcome.
A significant competitive strength in our research and development capability is the Inno Research Institute, LLC, a subsidiary of INNO (“IRI”). IRI focuses on patentable innovative products and commercializing research discoveries in the cold-formed steel industry in the U.S. and committed to bringing innovation in the field of thin-walled structures, cold-formed steel building technology, and design methodology for resilient buildings.
| 6 |
Fully Integrated Manufacturing Process
Compared to other traditional metal stud manufacturers, INNO differentiates itself by integrating services from design to metal stud production to prefabrication, utilizing off-site building technology to reduce the need for on-site framing labor. This approach allows INNO to streamline the production process, increase efficiency, and reduce dependency on labor. By implementing off-site building technologies, INNO is able to prefabricate and assemble many components of the building in a factory setting, which can lead to improved quality control, faster construction times and reduced on-site labor costs. This approach allows INNO to be a leader in the metal studs manufacturing industry in the U.S. and set a new standard for the building industry.
Compared to other prefab home companies, INNO sets itself apart by making an innovation in the overall structure system and developing our own patent pending panel material for faster installation. Unlike other prefab home competitors who still use traditional wood-stick building methods or other unique liquid material (required by 3D printing), which are not as efficient and may not be able to guarantee delivery times, INNO’s patent pending panel material and overall structure system allows for faster installation, improved efficiency and guaranteed delivery times. This allows INNO to offer a more efficient and cost-effective solution for prefab home building and maintain a competitive edge in the market. Additionally, INNO’s patent pending material and system can guarantee the quality and safety of the building, which is a significant advantage over the other prefab home companies.
Rising Cost of Traditional Wood Construction Favors Transition to Steel
Utilizing INNO’s off-site building technology can significantly reduce overall construction costs, even when compared to wood building. The past several years of western wildfires in the United States have had a significant impact on lumber stocks and mills, leading to disruptions in supply and fluctuations in lumber prices. A study by the Steel Framing Industry Association (SFIA) indicates that the cost to build with cold-formed steel is relatively the same as building with wood when the cost comparison includes the construction insurance premiums associated with using the materials. As the price of wood no longer provides a cost advantage, alternative building materials like steel have become increasingly popular in the market. By leveraging its off-site building technology, INNO is able to offer a cost-effective solution that takes advantage of the cost benefits of steel building while also providing faster and more efficient construction.
We are keeping our prices at a competitive level with traditional wood framing solutions. In a recent internal case study, we found that INNO’s products delivered real-world cost-savings of 8-16% compared to wood framing. This study compared our solution against wood for a 2,2663 sqft. home built in 2022, for which we supplied materials. Based on fully quoted materials and estimated labor and insurance costs, we estimate the contractor saved 16% by using INNO products compared to wood framing. For the “low” scenario, we recently requested updated wood bids and used the lowest one; in this case, we estimate that INNO products would have provided the contractor with 8% savings.
Market Opportunity
We believe we compete in a $40 billion+ U.S.-based market opportunity in 2023.
Light-Gauge Steel-Framing Market
In concept, cold-formed-steel building structures are very similar to wooden structures. In steel buildings, the wooden structural elements are replaced by thin-walled steel components. The cold-forming process is the core technology used. By our estimates, the U.S. light-gauge steel framing market should be roughly $6 billion in 2023.
According to the report released by Grand View Research in 2020, titled “Light Gauge Steel Framing Market Size, Share & Trends Analysis Report By Type, By End-use, By Region, and Segment Forecasts, 2021-2028”, the global light-gauge steel-framing market was valued at $33.89 billion in 2020 and is expected to reach $48.21 billion by 2028, growing at a CAGR of 4.6% from 2021 to 2028. The substantial rise in construction spending and a shift in trend toward sustainable materials have contributed to higher energy efficiency at a lower cost, in turn driving the market demand for light-gauge steel frames. According to KBV Research’s report released in February 2022, titled “North America Light Gauge Steel Framing Market Size, Share and Industry Trend Analysis Report By Type, By End Use, By Country, Historical Data and Growth Forecast, 2021-2027,” the U. S. market has dominated the North American cold-formed steel-framing market, and it is expected to continue to be a dominant market player until 2027; thereby, achieving a market value of $7.2 billion by 2027.
| 7 |
According to the summary of an IBISWorld report titled, “Wood Framing in the US — Market Size 2005-2029,” the wood framing market size in the U.S. is expected to be $24.9 billion in 2023. Since the wood structures could be replaced by cold-formed-steel structures, INNO’s target market size includes the wood-framing market. If we combined the US light gauge steel (which we estimate to be currently at approximately $6 billion based on the projected market value of $7.2 billion by 2027) and wood framing market ($24.9 billion) opportunities in 2023, we estimate it would amount to a $29.9B market opportunity in which INNO competes.
Prefabricated Building Market
According to the summary of an IBISWorld report titled, “Prefabricated Home Manufacturing in the US — Market Size 2002-2029,” the prefabricated home manufacturing market size in the U.S. is expected to be $9.1 billion in 2023. According to the report released by Global Industry Analysts, Inc, titled “Prefabricated Building Global Market Trajectory & Analytics”, the global prefabricated building market, estimated at $106.1 billion in the year 2020, is projected to reach a revised size of $164.1 billion by 2027, growing at a CAGR of 6.4% over the analysis period of 2020 through 2027. According to Straits Research Institute, the U.S. modular home market is projected to be valued at $53 billion in 2030.
Prefabricated houses are those that are built with the help of prefabricated building materials. These building materials are prefabricated in an off-site facility and then transported to the desired location for assembly. The building materials used to develop prefabricated houses are divided into concrete-based and metal-based materials. The market is being driven by factors such as shorter construction times and cost savings. The market is also benefiting from increased customer interest in reducing CO2 emissions, green building, and waste reduction.
Due to the rise in labor wages and material costs, operators want to unlock greater efficiencies, reduce project costs and increase labor productivity in the face of a skilled labor shortage and low profit margin. Modeling technologies are impacting all aspects of the design and building industry. Studies from Dodge Data & Analytics report reveal a strong correlation between companies’ BIM use and the degree to which they enjoy improved schedule and budget performance from using prefabrication or modular building. The modular building market is gaining popularity among the construction giants owing to the various benefits that it possesses, including reduced waste, speedy building, cost-effectiveness, eco-friendliness, and flexibility. According to experts, modular building projects can be completed 30% to 50% more quickly than traditional building. Modular buildings are extremely flexible, owing to the custom-made fit that are created according to the specific requirements of customers.
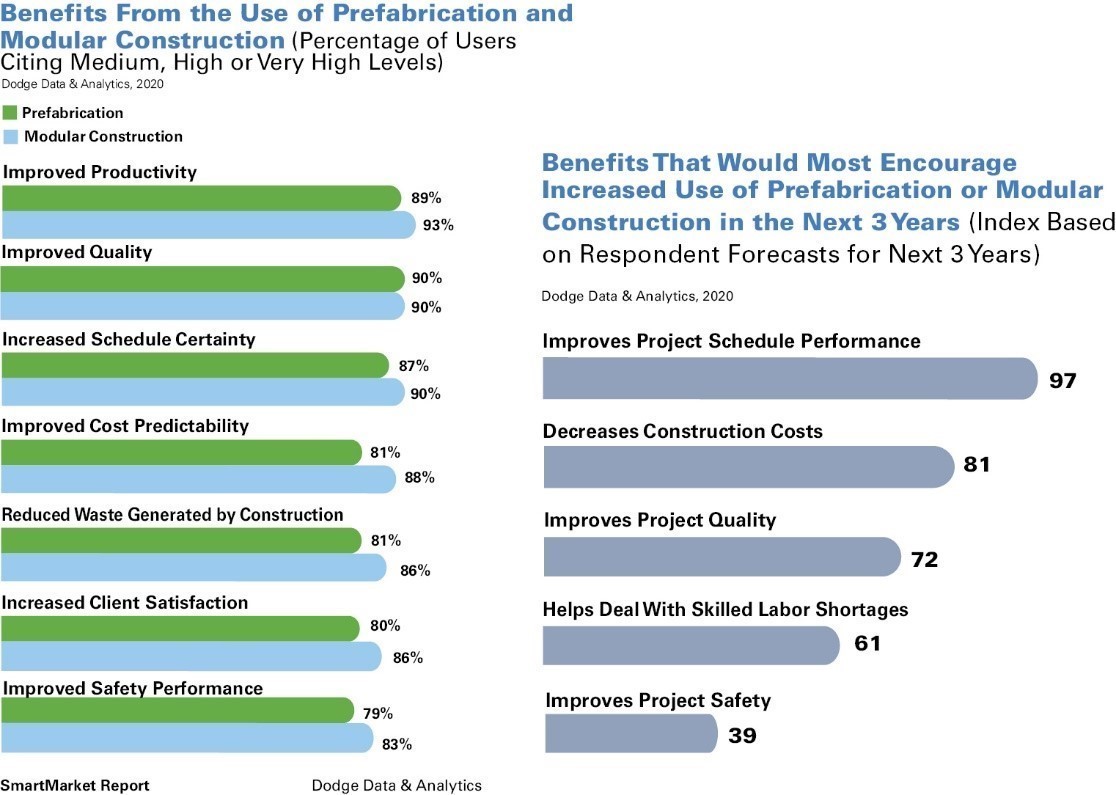
Source: DDA’s new SmartMarket report, “Prefabrication and Modular Construction 2020.”
Design firms and contractors alike agree that both prefabrication and modular building are providing significant improvements to cost, schedule, quality and safety performance, productivity, client satisfaction and their ability to reduce waste. According to the McKinsey Global Institute (MGI’s) Reinventing construction: A route to higher productivity report, released in February 2017, parts of the construction industry are moving toward a manufacturing-like system of mass production, relying on prefabricated, standardized components that are produced off-site. Such system would include applications such as fully automated prefabrication processes that turn a 2D drawings or 3D model into a prefabricated building component, or fabrication directly off a 3D model or shop drawings, enabling the production of high-performing components and, ultimately, more efficient parts.
| 8 |
Regulatory and Governmental Pressures for Change
President Biden’s Executive Order 14057 on the adoption of the federal Sustainable Development Catalyst for America’s Clean Energy Industry and Jobs and the accompanying federal Sustainable Development Plan establish the ambitious goal of achieving zero emissions from building by 2045. The federal government will work on new construction, major renovations, and existing real estate to achieve linked electrification, reduced energy use, lower water consumption and waste reduction. The federal government will develop data-driven targets and annual indicators for energy and water reduction by 2030 based on leading performance benchmarks for building type categories and the composition of institutional building portfolios. As part of this journey, the federal government will use performance contracts to reduce emissions, improve efficiency, and modernize facilities while providing financial savings.
In 2021, the Los Angeles City Council Public Safety Committee approved a proposal to expand Fire District I, an anachronistic planning overlay that would effectively ban wood-frame building in much of the city. The motion currently winding its way through City Council would expand Fire District I to neighborhoods with a population density of 5,000 residents per square mile, among other areas. With nearly all of Los Angeles comfortably above 5,000 residents per square mile, this expansion would effectively ban timber and wood-frame building in much of the city, including many rapidly growing neighborhoods near transit.
Sustainability and Green Building
Manufacturing of materials for buildings and construction accounted for approximately 11% of global energy-related CO2 emissions in 2017 according to the Global Status Report 2018, Global Alliance for Buildings and Construction & International Energy Agency. Increased global awareness of green building has driven efforts among all levels of government. For example, local governments are beginning to regulate in favor of using alternatives to wood in building projects. To reduce the city’s vulnerability to wildfires, the Los Angeles City Council voted in early 2021 to explore a proposal that could prohibit the use of wood-frame building for larger developments in some of its most densely populated neighborhoods. Similarly, the Los Angeles City Council Public Safety Committee approval of a proposal in 2021 to expand Fire District 1, an anachronistic planning overlay that would effectively ban wood-frame building in much of the city. In most U.S. cities, fire safety is ensured by the International Building Code (IBC), which sets strict rules on allowable building materials and methods.
Cold-formed steel framing (“CFS”) is a highly sustainable, green building solution. Through technological advances and processing changes, steel has drastically reduced its carbon footprint. CFS boasts a high level of recyclability, energy savings and greenhouses gas reduction. Due to its inherent advantages such as fire-resistance, termite resistance, consistent material quality and sustainability, we believe cold-formed steel will be the optimal alternative building material.
Macroeconomic Factors
The past several years of western wildfires have had a devastating impact on lumber stock and mills that were in the path of these fires, plus the disruption of supply chain due to the COVID-19 pandemic, has resulted in rising lumber prices. The net result of the fall in steel prices and rise in lumber costs is a much stronger case for parity between the two raw materials.
A new study conducted by R.A Smith, Inc., Brookfield, WI, and the SFIA addresses framing costs on behalf of architects, building owners, and general contractors. The study, “Costs to Build with Cold-formed Steel Versus a Wood-Framed Building,” established that CFS framing and wood framing cost relatively the same when the cost comparison included the construction insurance premiums associated with using the selected material. CFS is noncombustible, which reduces the risk of property loss during construction and over the life of the structure. It reduces the risk of property loss leads to lower insurance premiums for builders and owners. The true cost of CFS over wood is less than 1% when insurance is included in the comparison.
| 9 |
Marketing
We are an innovative building-technology company with a mission to transform the construction industry with our proprietary cold-formed steel-framing technology and other innovations. While we have significant customer concentrations, we endeavor to broaden our customer base as well as the industries we serve. Our marketing strategy is a long-term plan to achieve our Company’s mission by understanding the needs of customers and creating a distinct and sustainable competitive advantage. We position ourselves as the leader in intelligent steel-framing building systems. We intend to leverage our marketing and sales efforts to establish new potential customers. We also intend to leverage customer referrals, which in the past have been a source of new business. A significant portion of our business is the result of competitive bidding processes, and a significant portion of our business is from contract negotiation. We believe that the reputation we have developed with our current customers represents an important part of our marketing effort.
Quotation requests from customers are reviewed to determine the specific requirements and our ability to meet such requirements. Quotations are prepared by estimating the material and labor costs and assessing our current production schedule to determine our delivery commitments. Competitive bid quotations are submitted to the customer for review and award of the contract.
We have several strategic partners, including real estate companies, general contractors, builders and developers. Our strategic partners connect our Company with potential customers who are either potential homeowners or developers.
Through the several architecture, builder and contractor associations that we have joined, we share the advantages of cold-formed steel framing with others, and we educate and encourage construction industry practitioners to move out of their wood-framing comfort zone to embrace steel-framing technology.
We have a digital market channel and a social media presence. Also, we are actively conducting market research to determine the viability of our new products and new patents. We have increased our marketing budget and formed a professional sales team to increase our online marketing, which we believe can help us grow our revenue.
Research and Product Development/Innovations
We are a building technology company that is dedicated to research and product development innovation. Our scientists and engineers are committed to developing sturdier steel studs, tracks, headers, and other components, resulting in superior strength while maintaining the lowest costs possible. Our cold-formed roller machine is acquired from an original equipment manufacturer with certain modifications to the standard version of the machine that are unique and proprietary to INNO. When we refer to our “proprietary” cold-formed roller machines, we are referring to the modified machine with the intellectual property and process techniques we have developed. INNO uses CAD (Computer Aided Design) technology to arrive at the most accurate, comprehensive and information-rich design model within its parameters with the utilization of Vertex to ensure each member is produced to the exact specifications of called for in the design. The digital model of the project includes all functional systems and aesthetics, such as electrical wiring, air conditioning, doors, windows etc., as well as geometric features. It is a shared multi-disciplinary resource allowing all those working on a project to share information and working processes in order to achieve maximum efficiency and effectiveness, thus reducing all phases — design, pre-construction and construction — of the construction timeline. The platform gives us open communication, true collaboration, and aligned understanding. Taken all together, INNO has created a full BIM solution that works together to inform our state of the art light-gauge roll forming machines the instructions to automatically produce each steel framing member to exact specification.
We have continued making improvements to our cold-formed roller machines to optimally increase the printing speed. We are actively working on a list of 100 potential patentable products. Our goal is to commercialize patents and technologies that we own.
For example, the CFS portal frame system invented by our CEO could replace current shear wall systems to provide adequate lateral resistance against strong winds and severe earthquakes. The standard lateral force resisting systems in light frame cold-formed steel building are shear walls either sheathed by structural panels such as OSB, Plywood, and steel sheets or braced by steel straps. These systems require a large amount interior walls to be load bearing walls which limits flexibility for room layout and may not support large openings for windows and doors. The steel portal frame system is a novel long span framing system to replace the traditional hot-rolled structural steel frame. The new technologies in the portal frame system include optimized stiffened holes on cold-formed steel frame members to increase structural stability and span capacity and special moment joint technology using adhesive and rivet connections which enable superior energy dissipation capacity and fast fabrication.
| 10 |
This new CFS moment frame does not require any interior shear walls for the Castor Cube, our modular home product. It will allow the Cube to have various room layouts. The homeowners will also be able to change the room layout in the future. The new CFS moment frame can also be used for long-span residential and mid-rise commercial buildings. The new technology should improve the structural integrity of building structures, increase the lateral resistance, and lower the overall costs.
Another innovation, the cold-formed steel truss system, utilizes a strong axis of cold-formed steel stud members for both chords and webs which allow longer spans and lighter weight than the conventional type trusses. The steel truss system has wide applications in storage and education buildings.
We believe the steel truss system and steel portal framing system will also allow INNO to enter the high-rise commercial and large span industrial building markets (Type I and Type II buildings) and deliver more competitive and cost-effective building structures than the traditional structural steel frame and concrete masonry systems.
Honeycomb aluminum panel is a metal composite panel product series developed in combination with the composite honeycomb panel technology developed by the aviation industry. The panel is a box-type structure with surrounding edges, which has good airtightness and improves the safety and service life of the panel. The product adopts a “honeycomb sandwich” structure, that is, a composite plate made of high-strength alloy aluminum plate coated with a decorative coating with excellent weather resistance as the surface, bottom plate and aluminum honeycomb core through high temperature and high pressure. This product series has the advantages of excellent material selection, advanced technology, and reasonable structure. It not only has excellent performance in large scale and flatness, but also has many choices in terms of shape, surface treatment, color and installation system. This advanced technology enables the Company to manufacture high-strength and light-weight wall panel products. These siding products have very flat surfaces and tightly controlled seam widths, which allow architects to design very straight and beautiful walls with large panels. Except for certain technical restrictions, there is no standard size for honeycomb aluminum panels, and all wall panels are factory-made according to design drawings. Our production method allows the panels to be highly flexible in size and shape, such as curved panels and folded panels. This flexibility creates a complete and multi-functional highly competitive wall panel system that can be installed on almost any joist and are extremely simple to install.
Revenue Model
Our revenue model currently consists of sales of the following:
| ● | Light-gauged studs and tracks; | |
| ● | Prefabricated wall panels and trusses; | |
| ● | Structure framing work on site; | |
| ● | Engineering services; | |
| ● | Machine sales; and | |
| ● | Replicable Apartment product. |
Light-gauged studs and tracks
We supply metal studs from 12GA to 24GA depending on the structure engineering requirements and city building codes. The model for selling cold-formed steel studs and tracks is wholesale because it is business-to-business. Given the specific nature of our products, we do not sell retail. Unlike traditional metal stud suppliers, whose products are “made to stock” with no consideration for engineer design, our metal studs are typically made-to-order and customized for each project.
| 11 |
Prefabricated wall panels and trusses
Prefabricated wall panels and trusses are another option for customers. With these products, the customer can either choose to assemble the panels themselves or include this prefab service in their contract with us. Most customers typically choose prefab service because of our skilled team given that most wood framers are not familiar with steel framing.
INNO also has standardized modular wall products which could be used for all residential and commercial buildings. We design modular walls in 20 specifications to cover different building requirements. Modular walls are “made to stock” products and participate in both business-to-business and business-to-customer model channels.
Structure framing work on site
Steel structure installation on site is also an optional service. Depending on the project size and scope, we will provide on-site installation service if customers requested. With our full turnkey solution, all elements of the project construction are included, not just the cold-formed steel. This may include cabinetry and other items. In cases where the customer simply wants the framing, we bring our expertise in working with steel to that portion of the project. We are in the process of reducing our on-site work offerings.
Engineering services
Our engineering services provide stamped and sealed structure design services by our in-house engineer team. Because of the specific nature of our services, the rates vary case by case depending on the square footage and project complexity. Our engineer team will collaborate with customer’s architect, civil engineers, and MEP engineers to make sure the final structure design is city approved. To begin the metal stud production, our engineer team also generates the shop drawings which is a digital file and readable by our intelligent CNC machine. We also have another option where the customer may outsource the engineer service and contact INNO for metal stud production, where we do not provide continuous services until the design is city approved.
Machine sales
We may sell or lease our machines. We provide technical and design support at relatively low costs, including industry compliance license and permits, as well as shop drawings and structural design. We also offer administration, operation, and management consulting support, including directing and assisting factory set-up, operation procedures, equipment installation, machine maintenance, repairs, and efficiency improvement. The training for such operations and installations are also provided. We will recommend, select, and advise pricings for material suppliers and other vendors.
Replicable Apartment Product
Our flagship product within this series is Village 101, a smart senior living apartment comprising 155 units with a floor area of 110,000 square feet. The architectural plan package for Village 101 is complete and ready for implementation. Village 101 serves as a prototype building tech community, showcasing our innovative approach to senior living.
Our pipeline includes various apartment product options with different unit sizes, ranging from 15 to 150 units. These products are under active research and development, with the aim of creating replicable housing complexes across the United States. By leveraging our expertise in building technology and innovative design, we target to provide scalable and high-quality housing solutions that meet the evolving needs of residents including but not limited to senior citizen, college students and Gen Z etc.
Through our revenue model, we anticipate generating sustainable income by catering to the demand for replicable apartment products. By expanding our product line and continually advancing our research and development efforts, we aim to capture a significant market share in the housing industry while delivering superior value to our clients.
| 12 |
Cost of Sales
Cost of Sales primarily consist below components.
| ● | Materials — Rolled steel represents the single largest cost. We manage our relationship with suppliers (primarily US Steel) very adroitly by building in purchase orders and their associated costs to the customer to minimize our exposure to changes in steel prices for any specific project. We manage our purchases and deliveries as close to “just in time” as possible. | |
| ● | Labor — Labor is potentially the most variable component of cost of sales. We have a team of hourly workers who largely work onsite at the factory producing parts from raw steel and assembling them into prefabricated pieces to be delivered to job sites. Contractors are non-employee hourly workers who largely work in our turnkey projects. As-needed hourly labor is largely available in our markets. | |
| ● | Freight and Shipping — Our policy is to include any freight incurred to ship the product from our vendors to warehouses as a part of cost of goods sold. Outbound freight costs related to shipping costs to customers are considered periodic costs and are reflected in selling expenses. |
Other Expenses
Other expenses are typically comprised of payroll of salaried and hourly workers. We pride ourselves on running lean and efficiently. We operate in a business-friendly state with a large and available workforce. Rent, utilities, insurance, consulting service and other normal expenses are all competitive in the commercial area where we are based.
Our Growth Strategy
We seek to leverage the trend toward off-site and modular building techniques to increase productivity, reduce errors on-site, and decrease costs. With both Castor Cube and Mobile Factory as our featured products in the coming years, we seek to become leaders in the industry. As the market continues to move toward panelized construction, we seek to have an edge in the industry as a large-scale pioneer of the overall cost-reducing process.
INNO’s business growth strategy combines the following three parts: revenue growth strategy, profit growth strategy and technology growth strategy.
Revenue Growth Strategy
Our revenue growth strategy is composed of the following.
Capacity expansion and in-house research and development. We plan to expand factory operations and manufacturing capabilities in line with demand. We are also investing in R&D to ensure a pipeline of competitive and innovative building-technology products.
Multiple products. We are in the process of developing the Castor Cube, a 743-square-foot modular house product with the goal of mass producing. We are also working on developing Village 101, a smart senior living apartment comprising 155 units with a floor area of 110,000 square feet. The architectural plan package for Village 101 is complete and ready for implementation. Village 101 serves as a prototype building tech community, showcasing our innovative approach to senior living. Meanwhile, the new products extend to new building material composed of stainless steel, such as stainless-steel roof and panels with the vision of using such materials for seaside buildings.
Marketing investment. We are in the process of optimizing our online sales and marketing efforts by recruiting marketing talent and developing a marketing plan.
Potential Acquisitions. In accordance with our growth strategy, our company intends to pursue vertical integration by acquiring several companies operating within the construction industry in the United States. The objective of this vertical integration is to strengthen our position as a prominent building-technology developer and expand our capabilities within the market. We will position ourselves to offer a comprehensive range of solutions encompassing the entire building. The expanded scope of our offerings includes prefab structure systems, centralized MEP (mechanical, electrical, plumbing) systems, integrated wall systems, integrated floor systems, roofing systems, and prefab cabinets, sinks, and countertops. This integration allows us to deliver a single-cycle turnkey solution, streamlining the traditional linear process employed by traditional developers. To fortify our supply chain and augment our capabilities, we will consider the strategic acquisition of construction vendors/suppliers with the proceeds from IPO to pursue potential acquisitions. The targeted companies would include the ones that enjoy the popularities in the industry, including but not limited to the companies that can supply the interior finish, exterior wall panels, insulation materials and roof system etc. By incorporating the targeted companies into our operations, we will establish a comprehensive one-stop-shop solution for the multi-family apartments, thereby further solidifying our market position and value proposition. Consistent with our growth strategy, we are firmly committed to implementing a robust product life cycle management approach, encompassing all stages from procurement to delivery. Through our pursuit of vertical integration and strategic acquisitions, we are poised for substantial growth to assume a leadership role within the market. By expanding our product offerings, strengthening our supply chain, and cultivating key partnerships, we are well-positioned to provide comprehensive building solutions that effectively meet the evolving needs of our clients while concurrently driving revenue growth and delivering enhanced shareholder value.
| 13 |
Profit Growth Strategy
Our profit growth strategy is composed of the following.
Improving assembly automation. We plan to source and develop production robots and to expand automation where possible, to further increase our production efficiency.
Reducing transportation costs by utilizing Mobile Factory. Our Mobile Factory is equipped with our proprietary machines and can be transported to any jobsite. Mobile Factory utilizes Inno Statlink Data System which is ideal for remote production management. Mobile Factory saves significant transportation costs and as such, our goal is to increase the use of Mobile Factory.
Optimizing artificial intelligence design capabilities. We intend to optimize the artificial intelligence design capabilities by utilizing machine learning to get the wisest structure supporting data and running several models for all types of walls. The model we tested could reduce the raw materials used in different projects.
Technology Growth Strategy
Our technology growth strategy is composed of the following.
Develop EQ products to replace existing building materials with thinner and lighter products. We are developing technology in an effort to replace existing building materials with thinner materials. Once this technology matures, it is expected to save approximately 10% in raw materials.
Develop stainless steel as a building material for the high-end building market. We are developing technology to replace the current galvanized steel sheets with stainless steel. The new patent pending material could be used in extreme climate conditions for high-end customers.
Leverage module wall technology to increase the range of applications. We are in the process of developing different types of module wall products to expand our customer reach.
Strategic Partnerships
We have partnerships with at least 10 regional and national developers and builders. INNO’s customers include national real-estate developers and some local builders in both Texas and California. The regional/national developers and builders have a strong pipeline of projects coming each year. Their project types cover residential, commercial, and industrial. They either intend to use steel framing for structure or to develop land with Castor Cube and Village 101 projects, as their strategic partners, INNO will provide customized offer and have higher probability to bid and win projects. The cold-formed steel framing business is categorized as business-to-business model, and the Castor Cube as well as Village 101 projects will be either to business or to customers.
Competitive Outlook
Lumber-Based vs. Cold-Formed Steel
Our primary competitors (or segment with which we are most often compared) are traditional lumber-based building products solutions in certain categories, particularly buildings below six floors and residential. The accessibility and proficiency in assembling lumber-based structures can make practitioners in construction industry unwilling to move out of the wood framing comfort zone. Further, lumber prices were generally lower than the price of metal studs before the COVID-19 pandemic. The switch to cold-formed Steel is being driven by materials price and several market-based advantages of steel. Steel is strong, safe, durable, versatile, and cost-effective. Steel has the exceptional environmental advantage of being highly recycled and infinitely recyclable. Steel is tough and does not rot, spawl, split, or absorb moisture, and it is resistant to pests, unlike wood building materials.
| 14 |
Inherent Benefits of Steel Framing
| ● | Steel has the highest strength-to-weight ratio of any framing material. | |
| ● | Non-combustible. Steel will not contribute fuel to the spread of fire. | |
| ● | Steel is termite and rodent resistant. | |
| ● | Steel ensures dimensional stability. Will not rot, warp, crack or shrink. | |
| ● | Lower builder’s risk insurance. | |
| ● | Permanently straight walls. No call backs for nail pops. | |
| ● | No toxicity contribution. Free of resins, adhesives, and chemicals normally present in other framing material. | |
| ● | Consistent material quality. No regional variation. | |
| ● | Grounded against electrical storms. | |
| ● | Steel is inorganic. Unlike traditional framing products, steel is not vulnerable to mold. | |
| ● | Steel is the most recycled product in the world. Optimum sustainability. |
The SFIA has conducted studies of construction costs in two different locations using two identical buildings — one designed with wood and the other with cold-formed steel (CFS) framing. The mixed-use, 49,900 square foot building used in the studies is representative of many residential buildings constructed in the mid-rise market today and includes:
| ● | A first floor non-combustible (concrete) podium with parking and retail space | |
| ● | Residential dwellings on levels 2-5 | |
| ● | Roof-top/penthouse space atop level 5 housing building services. |
The first location for the study was a building constructed in Chicago in late 2017. Results include hard construction costs only. In this case, cold-formed steel cost 2.6% more than traditional wood construction.
SFIA Cost Analysis: Wood vs. Cold-Formed Steel, Location 1
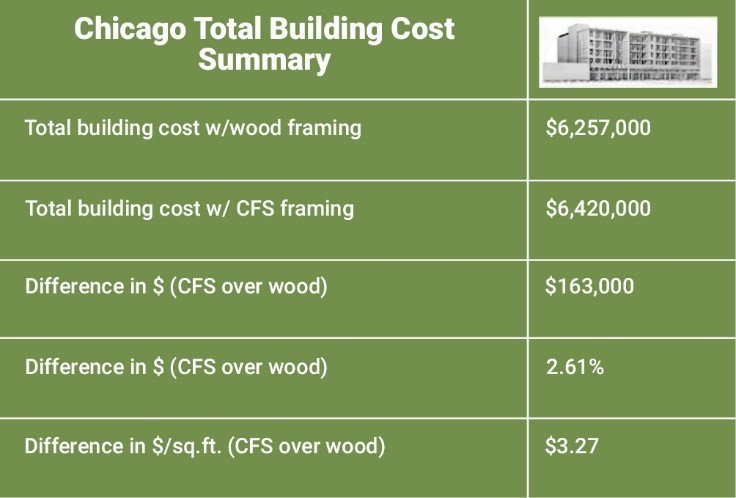
Source: SFIA
| 15 |
The second location was in Morristown, New Jersey. It takes a deeper look at costs by including the impact of lower insurance premiums available for CFS construction compared to combustible framing (wood). The insurance costs from major insurers operating in New Jersey were converted to a cost per square foot and evaluated in terms of their impact on the overall building costs. In this case, cold-formed steel cost 0.9% more than traditional wood construction.
Cost Comparison Case Study 2
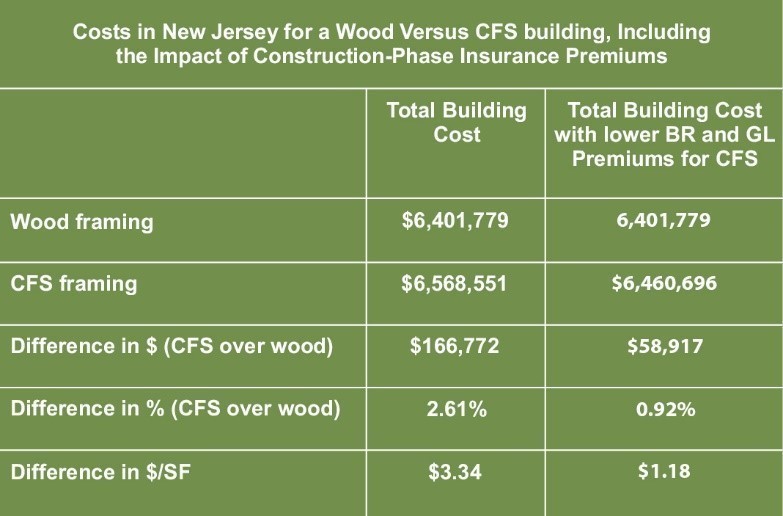
Source: SFIA
The two case studies mentioned above are taken from the official SFIA website. We believe INNO’s product cost is less than that of the preceding case studies, with the overall cost less than that of traditional wood.
Others Participating in Cold-formed Steel
The second category of competitors are divided into two groups: traditional manufacturers of metal studs and suppliers of cold-roller machines. Traditional manufacturers, such as Clark Dietrich and CEMCO, pre-punch their metal studs with punchouts at regular intervals for pipe installation, but the number of punchouts is fixed and not customized for each project. INNO employs proprietary software to calculate the minimum punchouts for MEP pipe installation that are consistent with the architectural plan set to ensure the structure’s load-bearing capability to the greatest extent possible. The load-bearing capability gradually decreases as the number of punchouts increases. Traditional steel framing manufacturers are unable to automatically make punchouts for screw holes, so manual drilling holes at the jobsite for metal stud connections are still required. The screw holes are precisely located and punched by the INNO CNC machines.
Screw hole punchouts are left for panel assembly, and the stud spacing should be building code compliant. The number of screw holes for each panel is calculated systematically, and the screws are included in the product package. We prefabricate the wall panels, joists, and trusses in the factory, eliminating the need for on-site manual labor to measure stud intervals and drill holes for metal stud connection. These two traditional metal studs profile manufacturers have a nationwide retail network that we cannot compete with. We are using the Internet to increase the marginal effect of sales, and our future strategy is to use Internet sales to undermine traditional store-based sales.
In the cold-formed roller machine market, FRAMECAD is a traditional LGS/CFS machine manufacturer. When compared to their LGS equipment, INNO CNC machines manufacturing cost is approximately 50% less, based on our estimates. INNO CNC machines currently have three pending patents, the CUBE 200 (Application number: 63437142), CUBE 300 (Application number: 63427583) and NEW OPTIMIZED DESIGN FOR ROLL FORMER CNC MACHINE (Application number: 63427583). CUBE 200 is able to form C& U type studs and tracks in the thickness of 16 gauge and 6 inches width studs. CUBE 300 is able to form C&U type studs in the thickness of 12 gauge and 12 inches width studs.
In addition, mobile factories are an important countermeasure to traditional equipment. We have developed a mobile factory for offsite production of steel pieces and structures that compete in the traditional prefab and modular building markets. INNO differentiates itself from other steel framing companies and cold-formed roller machine suppliers by integrating services ranging from metal stud manufacturing to prefabrication. In this context, we distinguish ourselves through the technologies and innovations we bring to our process and methods for producing structural components from rolled steel into useful pieces that assemble without error.
| 16 |
3D “Printing” Technology
Currently, 3D printing technology is widely used for prefab homes; however, cooling time is required for formation because the technical principle is to melt the material and then wait for it to cool before settling. In contrast to other prefab home companies, which use 3D printing technology, INNO uses our own cold-formed steel technology to ensure that there is no waiting time for structure formation. 3D printing necessitates the use of unique liquid raw materials such as LAVACRETE and Light Stone Material (LSM), neither of which are easily accessible. This could lead to supply chain disruptions and affect delivery time. Furthermore, the steel is still commonly used to support the structure of prefab homes, regardless of the manufacturing technology used.
Safety is an important factor to consider when choosing a prefab home. Since INNO’s CASTOR CUBE uses steel structure entirely, which has a high strength to weight ratio and good performance to resist disasters such as hurricanes and earthquakes. The foldable prefab home product manufactured by other company may not have the same level of disaster resistance as CASTOR CUBE.
Castor Cube plans to apply a patent for its utility hook-up system, which enable consumers to connect utility within one day. This is a unique feature that can make the process of setting up a prefab home more convenient for consumers. It is also worth noting that according to other prefab companies’ product introduction videos and their social media platforms, they all take around 48 hours to construct a 350 square feet prefab home.
With the usage of INNO’s patent pending honeycomb aluminum panels and Z-shaped pendant designed for replacing manual sheetrock installation, we can significantly reduce the number of manufacturing steps and minimize manual labor. INNO is planning to set up an automatic streamline to produce CASTOR CUBE. This will bring the significant increase in production capacity and it can help INNO to meet the growing demand for prefab homes more efficiently.
Government Regulations
Building Codes
Building codes are laws that set minimum requirements for how structural systems, plumbing, heating, ventilation and air conditioning, natural gas systems and other aspects of residential and commercial buildings should be designed and constructed. In the U.S., building codes mostly fall under the purview of state and local governments. All metal studs used for building structures are required to pass inspections in the jurisdiction they are located. We have ICC-ES evaluation reports (ESR-4641) that show that our cold-formed steel-framing members are compliant with the 2018 and 2015 International Building Code (“IBC”), 2019 California Building Code (“CBC”), and 2020 Florida Building Code (“FBC”). Because of the nature and use of our products, we need to be compliant with quality assurance programs.
Fire safety is one critical area of the building codes. As fire codes become stricter in some geographical areas or specific types of structures, our cold-formed steel materials are inherently non-combustible and therefore are advantaged over combustible alternatives.
Environmental Compliance
We are subject to U.S federal, state, and local environmental laws and regulations that involve the use, disposal and cleanup of substances regulated by those laws and subject to periodic inspections to monitor our compliance. We believe that we are currently in compliance with applicable environmental regulations. Expenditures for environmental compliance purposes during 2023 and 2022 were not material.
We were given awards by the U.S. Green Building Council (“USGBC”) in 2020. Our manufacturing processes minimizes waste, prevents pollution, and recycles wherever possible. Our manufacturing process manufactures special length products for all types of projects, has self-contained building system solutions that do not rely on third-party suppliers, and designs products to fulfill the BCA Energy Efficiency program. This compliance proves that we are a green company that meets basic environmental milestones and legal requirements.
| 17 |
Occupational Health and Safety Laws
Our business and operations are subject to numerous federal, state, and local laws and regulations intended to protect our employees. Due to the nature of manufacturing, we are subject to substantial regulations related to safety in the workplace. In addition to the requirements of local and state governments in Texas, we must comply with federal health and safety regulations, the most significant of which are enforced by the Occupational Safety and Health Administration.
Further, our operations and facilities are subject to additional federal, state, or local laws or regulations, such as the COVID-19 safety and prevention regulations. Our operations are also subject to federal, state, and local labor laws relating to employee privacy, wage and hour matters, overtime pay, discrimination and harassment, equal opportunity and employee leave and benefits.
It is our policy and practice to comply with all legal and regulatory requirements and our procedures and internal controls are designed to promote such compliance. Expenditures for compliance with occupational health and safety laws and regulations during 2023 and 2022 were not material.
Human Capital Resources
The success of our business depends in large part on our ability to attract, retain, and develop a workforce of skilled employees at all levels of our organization. We provide employees with base wages and salaries that we believe are competitive and consistent with each employee’s position. We also work with local, regional, and state-wide agencies to facilitate workforce hiring and development initiatives. We had 11 full-time employees at both of September 30, 2023 and 2022. We also utilize at-will contractors in our business. As of September 30, 2022, we had 10 at-will contractors employed. That number has since grown to 18 contractors as of September 30, 2023.
Intellectual Property Matters
Presently, we have no registered intellectual property rights and trademarks. The trademarks application status of our name and other marketing materials is pending. There are currently five pending patent applications and descriptions of each pending patent are as follows:
| ● | New optimized design for Roll Former CNC machine that efficiently produces C&U type studs and tracks to be used in building high quality, quick erection structures. (Application number: 63427583) | |
| ● | Cube 200, which is a new optimized design for a Roll Former CNC machine that efficiently produces C&U type studs and tracks to be used in building high quality, quick erection structures. (Application number: 63437142) | |
| ● | Z-shaped pendant for castor exterior wall to replace the Z-shaped pendant for sheetrock with honeycomb aluminum plate. (Application number: 63434155) | |
| ● | Cube 300, which is a new optimized design for a Roll Former CNC machine that efficiently produces C&U type studs and tracks to be used in building high quality, quick erection structures. (Application number: 63437143) | |
| ● | Aluminum honeycomb plate for interior wall construction. (Application number: 63367663) |
In the course of our business, we develop expertise in the manufacturing process. Although we have non-disclosure policies in place with respect to our personnel and in our contractual relationships, we cannot assure you that we will be able to protect our intellectual property rights with respect to this expertise.
Corporate Structure
Our Company, INNO HOLDINGS, INC., a Texas corporation (the “Company”), was incorporated on September 8, 2021. The Company is principally engaged in the marketing and sale of construction products along with full-scope construction services in the US. It has three subsidiaries: Inno Metal Studs Corp, Castor Building Tech LLC, and Inno Research Institute LLC.
On January 18, 2022, the Company formed a limited liability company, Castor Building Tech LLC (“CBT”), in California. The Company owned 53% of the equity interest in CBT. On October 16, 2023, the Company and the noncontrolling interest parties reached a new ownership agreement that the Company’s ownership changed to 55%.
| 18 |
Effective January 21, 2022, the Company acquired 100% of the ordinary shares of Inno Metal Studs Corp. (“IMSC”), a Texas corporation incorporated on October 31, 2019. Pursuant to the terms of the Share Purchase Agreement with IMSC’s sole owner, Mr. Dekui Liu, who was also the sole owner and CEO of the Company, the Company issued 15,170,000 shares of its common stock to Mr. Dekui Liu in exchange for his 100% ownership in IMSC. Upon completion of the transaction, IMSC became a 100% owned subsidiary of the Company. See Note 3 below for details.
Inno Research Institute LLC, a Texas limited liability company incorporated on September 8, 2021, is a 65% owned subsidiary of IMSC.
Corporate Information
Our principal executive offices are located at 2465 Farm Market 359 South, Brookshire, TX 77423, and our California office is located at 21660 Copley Drive, Diamond Bar, CA 91765. Our corporate website address is www.innometalstuds.com. Our telephone number is (800) 909-8800. Information contained in, or accessible through, our website does not constitute part of this prospectus and inclusions of our website address in this prospectus are inactive textual references only.
ITEM 2. PROPERTIES
We lease our principal executive offices which are located at 2465 Farm Market 359 South, Brookshire, TX 77423. The lease for the Company’s principal Executive Officer at 2465 Farm Market 359 South, Brookshire, TX 77423 has a 60-month term beginning on December 1, 2019 and ending on December 31, 2024.
We also leased a building at 4225 Prado Road, Suite 101, Corona, California 92880, as our California office. This lease has a five-year term beginning on May 1, 2022 and ending on April 30, 2027. In August 2023, our California office was relocated to 21660 Copley Drive, Diamond Bar, CA 91765. We will continue to be obligated to pay the monthly rent for the office in Corona, California until the landlord finds a new lessee to occupy the facility. The new lease in Diamond Bar, CA 91765 has a 24-month term beginning on August 1, 2023 and ending on July 31, 2025.
These lease agreements contain standard commercial lease terms including but not limited to provisions regarding utilities, alterations, maintenance and repair, insurance and indemnification.
We believe that our current leased property is in good condition and suitable for the conduct of our business.
On January 4, 2024, the Company entered into an agreement to acquire certain real property located at 300 South Park Avenue, Pomona, Los Angeles, California. The property will serve as an office and commercial building.
ITEM 3. LEGAL PROCEEDINGS
From time to time, we may become involved in legal proceedings arising in the ordinary course of our business. We believe that we do not have any pending or threatened litigation which, individually or in the aggregate, would have a material adverse effect on our business, results of operations, financial condition and/or cash flows.
| 19 |
PART II
ITEM 5 - MARKET FOR REGISTRANT’S COMMON EQUITY, RELATED STOCKHOLDER MATTERS AND ISSUER PURCHASES OF EQUITY SECURITIES
Market Information
We have our common stock listed on the Nasdaq Capital Market under the symbol “INHD”.
Holders
As of January 11, 2024, there were approximately 4 stockholders of record of our common stock. The actual number of stockholders is greater than this number of record holders, and includes stockholders who are beneficial owners, but whose shares are held in street name by brokers and other nominees. This number of holders of record also does not include stockholders whose shares may be held in trust by other entities.
Dividend Policy
We have not declared any cash dividends since inception, and we do not anticipate paying any dividends in the foreseeable future. Instead, we anticipate that all of our earnings will be used to provide working capital, to support our operations, and to finance the growth and development of our business. The payment of dividends is within the discretion of the Board and will depend on our earnings; capital requirements; financial condition; prospects; applicable Texas law, which provides that dividends are only payable out of surplus or current net profits; and other factors our Board might deem relevant. There are no restrictions that currently limit our ability to pay dividends on our common stock other than those generally imposed by applicable state law.
Transfer Agent
VStock Transfer, LLC., 18 Lafayette Place, Woodmere, New York 11598.
Recent Sales of Unregistered Securities
During the period from October 1, 2022 to September 30, 2023, we have granted or issued the following securities that were not registered under the Securities Act:
| (a) | Issuance of common stock. |
| ● | On December 3, 2022, the Company issued 142,857 shares of its common stock, on a pre-reverse stock split basis, to an accredited investor at $3.5 per share for $500,000 in cash. |
| ● | On March 13, 2023, the Company issued 27,028 shares of its common stock, on a pre-reverse stock split basis, to an accredited investor at $3.7 per share for $100,000 in cash. |
| ● | On April 25, 2023, The Company issued 78,947 shares of its common stock, on a pre-reverse stock split basis, to an accredited investor at $3.80 per share for $300,000 in cash. |
| ● | On June 20, 2023, the Company issued 13,158 shares of its common stock, on a pre-reverse stock split basis, for a total value of $50,000 for services to be rendered during next twelve months by the immediate relative of the Company’s Chief Financial Officer. |
| ● | On June 20, 2023, the Company issued 19,737 shares of its common stock, on a pre-reverse stock split basis, for a total value of $75,000 for services to be rendered during next twelve months by one nonemployee contractor. These shares were valued at $3.8 per share. |
| 20 |
| ● | On July 24, 2023, the Company issued 13,514 shares of its common stock to an accredited investor for no additional consideration following the Company’s previously disclosed reverse stock split. |
| ● | On July 24, 2023, the Company issued 39,473.50 shares of its common stock to an accredited investor for no additional consideration following the Company’s previously disclosed reverse stock split. |
| ● | On July 24, 2023, the Company issued 6,579 shares of its common stock to an accredited investor for no additional consideration following the Company’s previously disclosed reverse stock split. |
| ● | On July 24, 2023, the Company issued 9,868.50 shares of its common stock to an accredited investor for no additional consideration following the Company’s previously disclosed reverse stock split. |
| ● | On July 24, 2023, the Company issued 71,428.50 shares of its common stock to an accredited investor for no additional consideration following the Company’s previously disclosed reverse stock split. |
The issuance of the common stock in private placements was deemed exempt from registration under Section 4(a)(2) of the Securities Act or Regulation D promulgated thereunder in that the issuance of securities were made to an accredited investor and did not involve a public offering. The recipient of such securities represented its intention to acquire the securities for investment purposes only and not with a view to or for sale in connection with any distribution thereof.
| (b) | Warrants. |
| ● | On December 18, 2023, the Company issued warrants to AC Sunshine Securities LLC, the underwriter of its IPO (as defined below), to purchase up to 201,250 shares of common stock at an exercise price of $4.80 per share. |
Use of Proceeds from our Initial Public Offering of Common Stock
On December 18, 2023, we closed our initial public offering (the “IPO”), in which we sold and issued 2,500,000 shares of our common stock at a price to the public of $4.00 per share. We received approximately $7,859,533 in aggregate net proceeds from our IPO after deducting underwriting discounts and commissions and other offering expenses. AC Sunshine Securities LLC was the underwriter of our IPO.
The offer and sale of all of the shares of our common stock in our IPO were registered under the Securities Act pursuant to a registration statement on Form S-1 (File No. 333-273429), which was declared effective by the SEC on November 9, 2023.
As of January 11, 2023, we have used approximately $0.9 million of the net proceeds from our IPO for working capital and general corporate purposes. There has been no material change in our planned use of the net proceeds from our IPO as described in our final prospectus filed pursuant to Rule 424(b)(4) under the Securities Act with the SEC on December 4, 2023.
Purchases of Equity Securities
Neither we nor any “affiliated purchaser,” as defined in Rule 10b-18(a)(3) of the Exchange Act, purchased any of our equity securities during the period covered by this annual report.
Securities Authorized for Issuance Under Equity Compensation Plans.
The information required by this Item regarding equity compensation plans is incorporated by reference to the information set forth in Item 12 of this Annual Report on Form 10-K.
| 21 |
ITEM 6. [RESERVED]
ITEM 7. - MANAGEMENT’S DISCUSSION AND ANALYSIS OF FINANCIAL CONDITION AND RESULTS OF OPERATIONS
The following discussion and analysis of our financial condition and results of operations should be read in conjunction with our consolidated financial statements and related notes that appear elsewhere in this Annual Report on Form 10-K. In addition to historical consolidated financial information, the following discussion contains forward-looking statements that reflect our plans, estimates and beliefs. Our actual results could differ materially from those discussed in the forward-looking statements as a result of various factors, including those set forth under the heading “Cautionary Note Regarding Forward-Looking Statements” in this Annual Report on Form 10-K.
Overview
We are a building technology company that primarily manufactures cold-formed-steel members and offers a full range of services required to transform raw materials into precise steel framing products and prefabricated homes. We transform raw material (coils of rolled steel of various gauges and other materials) through our proprietary technologies to cut, punch and bend the steel into members or other components. These work-in-process components are further processed into finished products which are used in a variety of building types, including residential, commercial, industrial, and infrastructure. At each stage of the process, we are adding value to the original rolled steel (and other materials) to its final assembled use by businesses or directly to customers.
Our largest commodity expense is our primary raw material — rolled steel in various gauges and widths. Like any commodity, steel is subject to supply/demand-based price fluctuations which can have an impact on the profitability of our business if prices change between the time we enter into a contract with a customer to deliver finished goods and the time the steel is purchased from the mill. We seek to mitigate our exposure to steel price fluctuations in two ways:
| ● | Entering fixed price forward contracts with steel mills/suppliers for delivery in the future so that our bids for customer contracts have known pricing for the steel. This is particularly useful in larger projects that involve delivery of product over many months. | |
| ● | Maintaining an approximately three-month inventory of our most actively used rolled steel coils (defined by width and gauge). This inventory requires an active forward-looking assessment of steel needs to meet expected demand. Maintaining inventory is a real financial exposure especially during periods of pricing volatility. |
Key Performance Indicators (“KPIs”)
In addition to the measures presented in our consolidated financial statements, our management regularly monitors certain KPIs for our business. The KPIs used by the Company include:
The capital turnover rate of raw-material procurement
Our business is reliant on timely delivery of raw materials. At the same time, our primary raw material (steel) is expensive to warehouse. We strive to achieve roughly 1-3 months of raw materials inventory to balance our cost of inventory against the risk of not having raw materials when needed. We do this by setting up long-term cooperative relationship with multiple local and national suppliers, including the mills, so that we will gain a better payment cycle to secure the raw material, to maximize the usage of the funds. At the same time, to match the raw-material usage of the sales order each quarter, we will make the quarterly purchase plans ahead, so that the efficiency of capital turnover is higher.
| 22 |
The collection period of accounts receivable
Timely payments from customers are essential to a successful business. Based on our historical collectability experience, we will seek to gradually eliminate the types of small-size homebuilders and cooperate with large-size and professional companies to strengthen risk control of accounts receivable and shorten the days outstanding for accounts receivable. Eventually, we expect to achieve the goal of receiving 100% of the payment before products leave the shop.
Lead time
Construction requires the coordination of many contractors, subcontractors, permitting, etc. that must be done on very exacting schedules where any delays will have a ripple effect down the chain. While there are many things we cannot control, we strive to communicate with the customers at a high frequency and make the best production arrangement to minimize storage period and shorten the lead time, which is one of the most important operating indicators of INNO.
The growth of total operating income
We maintain internal long-term targets for both gross profit and operating income, based partly on long-term revenue growth targets and partly on execution and internal controls. Ultimately, we strive to deliver profitable long-term growth.
Production capacity improvement
We are committed to investing in the improvement of production capacity and production efficiency in an effort to support larger orders and to meet the goal of increasing total operating income.
Results of Operation
For the years ended September 30, 2023, and 2022
The following table presents certain Consolidated statement-of-operations information and presentation of that data as a percentage of change from year to year.
| For the Years Ended September 30, | ||||||||||||
| 2023 | 2022 | Variance | ||||||||||
| Revenues | $ | 799,747 | $ | 4,252,568 | -81 | % | ||||||
| Revenues– related party | - | 250,000 | -100 | % | ||||||||
| TOTAL REVENUES | 799,747 | 4,502,568 | -82 | % | ||||||||
| Costs of materials and labor | 1,255,315 | 3,031,588 | -59 | % | ||||||||
| Selling, general and administrative expenses (exclusive of depreciation and bad debt expenses shown separately below) | 2,191,043 | 2,247,820 | -3 | % | ||||||||
| Depreciation | 69,437 | 33,138 | 110 | % | ||||||||
| Bad debt expense | 1,267,960 | - | 100 | % | ||||||||
| Operating loss | (3,984,008 | ) | (809,978 | ) | 392 | % | ||||||
| Other income (expenses) | (39,196 | ) | (310,114 | ) | -87 | % | ||||||
| Loss before income taxes | (4,023,204 | ) | (1,120,092 | ) | 259 | % | ||||||
| Income tax expense | - | 9,915 | -100 | % | ||||||||
| Net loss | (4,023,204 | ) | (1,130,007 | ) | 256 | % | ||||||
| Non-controlling interest | (127,426 | ) | (121,345 | ) | 5 | % | ||||||
| Net loss attributable to INNO HOLDINGS INC. | $ | (3,895,778 | ) | $ | (1,008,662 | ) | 286 | % | ||||
| Operating loss % of revenues | (498 | )% | (18 | )% | ||||||||
| Net loss % of revenues | (503 | )% | (25 | )% | ||||||||
| 23 |
Revenues
Revenue for the fiscal year ended September 30, 2023 declined 82% to $799,747 in comparison to $4,502,568 for the fiscal year ended September 30, 2022. The decline in revenue primarily resulted from a decrease in customer construction activity, a decline in the number of customers, to 24 in the fiscal year ended September 30, 2023 from 48 in fiscal year 2022, and a decline in the average size of projects, which resulted in a decline in average revenue per customer to $33,323 in the fiscal year ended September 30, 2023 from $93,804 in the fiscal year ended September 30, 2022. We had nine repeat customers in the year ended September 30, 2023 compared to the year ended September 30, 2022.
Our backlog as of September 30, 2023 was approximately $14,000,000 to $19,000,000. The range of backlog amount is comprised of all remaining payments related to our signed customer contracts and estimation of order adjustments. We expect revenue from these contracts to be realized within next 24 months. These signed contracts included an agreement in the amount of $15,875,800 with Vision Opportunity Fund LP, assigned to Vision 101 LLC (“Vision 101”), which is partially owned by one of our minority shareholders. None of the contract amount has been delivered to Vision 101 or recognized as revenue during the fiscal year ended September 30, 2023.
Our revenues are significantly impacted by demand for residential and commercial buildings, economic conditions including interest rates and costs of labor, materials and other variables that impact the cost of our finished goods. We cannot ensure that growth will continue, and our business may be adversely affected by negative overall economic conditions currently being experienced.
Costs of Materials and Labor
Costs of materials and labor include raw materials (primarily rolled steel) and direct labor in the processing of raw materials through the manufacturing process. Fluctuations in raw materials pricing and production volume can have an impact on our costs as indicated in the table below, with raw steel contributing between approximately 40% of the cost of goods sold and 61% of the cost of goods sold, depending on price and volume.
Costs of materials and labor for the fiscal year ended September 30, 2023, declined 59% to $1,255,315 in comparison to $3,031,588 for the fiscal year ended September 30, 2022. The decrease was primarily due to the sharp year-over-year decline in revenue, as discussed above. The revenue decline exceeded the cost reduction, partly because some fixed costs are not declined along with the revenue and some expenses were incurred for long-term projects that are not eligible for revenue recognition in the current year.
While the Company seeks to minimize the impact of fluctuations of steel prices by advance purchases of steel tied to the price to be paid by customers in their contracts, available capital resources has limited our ability to make advance purchases to about three months of supply, which has left us with some exposure to supply price changes. Among the uses of proceeds from our IPO, the Company intends to extend the number of months of supply to match the expected need for raw materials of purchases under contract.
| Steel Price Sensitivity Analysis | |||||||
| Steel Price | Steel as % of COGS | ||||||
| Variance | Low Volume | High Volume | |||||
| (20)% | 40% | 51% | |||||
| (10)% | 43% | 54% | |||||
| 0 | 45% | 57% | |||||
| 10% | 48% | 59% | |||||
| 20% | 50% | 61% | |||||
Table Notes: “Low Volume” assumes three tons of steel material used per one eight-hour shift; “High Volume” assumes seven tons of steel material used per shift. Steel price variance assumes a baseline price of $1,200 per U.S. ton.
| 24 |
Selling, General and Administrative Expenses
Selling, general and administrative expenses for the fiscal year ended September 30, 2023, decreased 3% to $2,191,043 in comparison to $2,247,820 for the fiscal year ended September 30, 2022. The decrease was primarily due to the decrease of nonemployee commission offset by the increase of overhead to support long-term growth.
Bad debt expense
Bad debt expense increased by $1,267,960 for the fiscal year ended September 30, 2023 compared to the same period in 2022 due to the reserves for doubtful accounts. We estimated the credit losses based on each customer’s financial situation, project status and the outstanding days of the accounts receivable balance. Following table illustrates the allowance for credit losses related to each age group of receivables.
| Aging Category | ||||||||||||
| 1 – 30 days | > 270 days | Total | ||||||||||
| Accounts receivable | $ | — | $ | 1,338,395 | $ | 1,338,395 | ||||||
| Less: allowance for credit losses | — | (1,267,960 | ) | (1,267,960 | ) | |||||||
| Accounts receivable, net | $ | — | $ | 70,435 | $ | 70,435 | ||||||
At the beginning of our 2023 fiscal year, we started to strengthen our risk control of accounts receivable and reduce the days outstanding for accounts receivable by discontinuing business with smaller customers with high credit risk. Most of our current customers adhere to a 30-day payment term. For the current year’s transactions, we have maintained a high collection rate. For aged outstanding balances, we assessed the provision for credit loss based on the aging groups, each customer’s business and project status, contractual term, and financial situation. We reserved 95% of the balance that is aged over nine months. Below, we have summarized the nature of our current collection issues:
| A. | We were notified that the ownership of one of our projects had been transferred in the middle of construction. We had collection issues from the former owner and reserved approximately $0.5 million credit losses accordingly. | |
| B. | As a subcontractor to provide the designing service and prefab products, we recognize the revenue upon completion of our performance obligations. However, there are two projects that had been significantly changed during the later stage of construction, our delivered services and prefab products had been replaced. We are experiencing difficulties in collecting payment for the services rendered and prefab products delivered. The related balance of approximately $0.3 million has been reserved as credit losses. | |
| C. | We were notified that several customers have cash flow issues and are facing challenges in securing loans. We are experiencing difficulties in collecting payment for the services rendered and prefab products delivered. We assessed the customers’ financial situation and reserved approximately $0.4 million as credit losses. |
We continue to monitor our accounts receivable balances and limit small-size homebuilders and cooperate with large-size and professional companies to strengthen risk control of accounts receivable and shorten the days outstanding for accounts receivable.
Operating Loss
Operating loss was $3,984,008 for the fiscal year ended September 30, 2023, in comparison to operating loss of $809,978 for the fiscal year ended September 30, 2022. The increased loss was primarily attributed to lower revenue and increased expenses, as discussed above.
| 25 |
Other Income (Expense)
Other expenses for the fiscal year ended September 30, 2023, were $39,196, in comparison to other expenses of $310,114 for the fiscal year ended September 30, 2022. The decrease in expense was primarily related to stock compensation expense recorded for the fiscal year ended September 30, 2022.
Net Loss
Net loss for the fiscal year ended September 30, 2023 was $4,023,204, in comparison to net loss of $1,130,007 for the fiscal year ended September 30, 2022. The year-over-year increase in net loss was primarily due to changes in revenue, costs and expenses as outlined above, including lower year-over-year revenue, occurred bad debt expenses and higher expenses as a result of the increase of headcounts and our public filing process.
Key Factors That Affect Operating Results
The following are factors that affect our operating results.
| ● | Acquisition of new (large size) builders, developers, and other types of customers and assisting them to complete the structural design and engineering more efficiently. | |
| ● | Consistently providing value-added professional services for our customers, saving costs, and shortening construction periods to win more loyal customers. | |
| ● | Maintaining technological leadership, competitive prices, and other advantages over competitors. | |
| ● | Consistent investment in automation and other systems to improve efficiencies required to improve margins. | |
| ● | Investment in employees in an effort to efficiently manage operations, finances, and other corporate efforts. | |
| ● | Demand for residential and commercial buildings can be substantially impacted by the cost of borrowing money. Recent increases in interest rates and recessionary fears have slowed building activities. However, we believe demand for affordable housing remains stable. Builders in this segment are driven to seek breakthroughs and optimization in terms of cost and lead time, which we believe may benefit INNO. |
Our Ability to Create Value for Our Users and Generate Revenue
Our ability to create value for our users and generate our revenues from merchants is driven by the factors described below:
| ● | Our competitors include traditional wood framing, competing steel framing solutions, and other building techniques, as well as prefab homes and prefabricated building components. With respect to framing solutions, we expect cost savings, quality, and construction efficiency over our competitors to be the main driver of outperformance for INNO. For prefab homes and components, we differentiate through modern design, high quality, technology innovation, and affordability, and we believe our product is differentiated in this large and growing market space. | |
| ● | From applying AI design technology, innovation of new products, and exploration of new materials, to developing a whole new structural system, we provide customers with the most optimized solutions and LGS framing, which can lead to lower costs and construction times. | |
| ● | Our steel framing products are formed by automated CNC production lines. We currently own five automatic production lines that can cover 3 ⅝” to 12” studs/tracks of different thickness ranging from 25 gauge to 12 gauge. We believe our lead time is faster than other traditional suppliers. |
| 26 |
Inflation, Supply Chain Disruption, and Price Fluctuations
Inflationary pressures of the past year, as evidenced by rising interest rates and cost of living indices, have had a direct impact on all aspects of our business from the cost of the raw materials we use to the demand for our finished goods. While we have no control over the decisions our customers make of whether to move forward with construction projects in the face of recessionary fears, we endeavor to limit our exposure by carefully managing our steel purchases to match expected demand and maintaining a flexible as-needed work force.
While steel material remains more expensive than wood on an absolute basis, we believe demand for our steel framing products will continue to grow due to significant advantages, including lower construction times (shorter time to building completion, lower labor costs), higher quality (limited waste, true and straight walls, durability), and insurance savings. We saw evidence of this in the fiscal year ended September 30, 2022, when steel prices increased sharply (price increases peaked at +143% year to year), yet demand remained strong, and our revenue grew approximately 50% year to year. We also note that steel and softwood price changes tend to track reasonably closely over time, which held even through the pandemic (see figure below). We believe this suggests that our steel framing products will likely remain competitive with wood framing, even in periods of high price volatility.
Steel Mill Products and Softwood Pricing Trends, 2018-2022
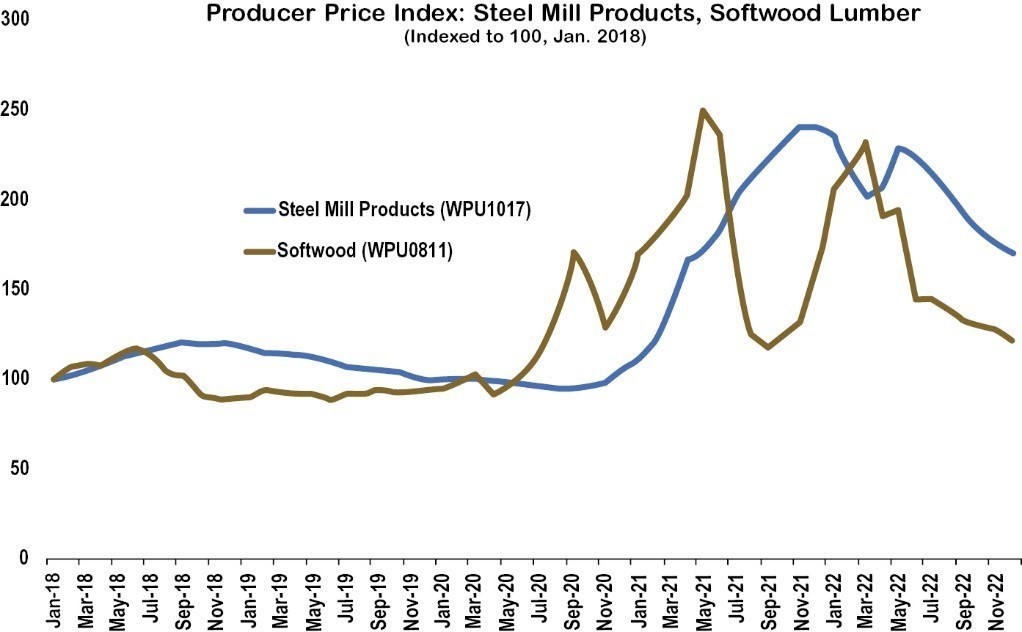
Source: U.S. Bureau of Labor Statistics, Producer Price Index by Commodity: Lumber and Wood Products:
Softwood Lumber [WPS0811], retrieved from FRED, Federal Reserve Bank of St. Louis, and Metals and Metal
Products: Steel Mill Products [WPU1017], retrieved from FRED, Federal Reserve Bank of St. Louis.
The supply chain covers material sourcing, logistics, and macroeconomic factors.
| ● | INNO is a technology-based manufacturing company, with all manufacturing operations currently based in the U.S. We currently source our steel from U.S.-based steel mills, which greatly reduces our exposure to global supply chain concerns; however, we may in the future source steel from other countries. We may also source other materials internationally from time-to-time to ensure we maintain an efficient cost profile. | |
| ● | Timely transportation of our inbound raw materials and outbound finished goods are critical to our operations and meeting our obligations to our customers. We are exposed to the overall shortage in capacity in the transportation industry including the well-publicized driver shortage and volatile fuel price. We have mitigated some of the transportation shortages and maintained high service levels by having one company-owned truck and may add more if demand warrants it. | |
| ● | An additional innovation aiding in our logistics strategy, is our patent-pending Mobile Factory. Our Mobile Factory can be transported to the jobsite for production. Once launched, our Mobile Factory can greatly reduce the logistic costs of all or a portion of finished products produced at the factory. |
| 27 |
Impact of Global Conflicts and Uncertainties
The conflict between Russia and Ukraine continues to affect economic and global financial markets. The effects of the conflict have contributed to other ongoing economic challenges such as global supply-chain disruptions, labor shortages, inflation, and cybersecurity attacks, creating a challenging business environment for all industries. While we have not been materially affected by the conflict or these other economic challenges, future unpredictable and uncertain events and the protentional for future global conflicts could impact the Company. We continue monitor developments in the Russia-Ukraine conflict and evaluate our supply chain to mitigate any effects on our business, which includes currently sourcing all of our steel from the U.S.
We currently source all of our steel within the U.S. and ensure that the steel coils we source meet U.S. standards. We may source steel and other materials internationally to ensure a favorable cost profile. Our robust supply chain efforts help ensure consistent quality standards are met.
Impact of COVID-19 and Any Future Pandemic
At this time the COVID-19 pandemic and shutdowns related to additional outbreaks have not had a material effect on our business. However, the pandemic continues to affect energy prices, inflation, labor supply, the global supply chain and capital resources. Future impacts related the pandemic remain uncertain and could have an adverse effect on our business, including with regard to the Company’s ability to acquire raw materials used in our finished goods at sufficiently low prices, find and hire qualified employees, and access capital.
We’ve taken our previous experiences operating during the pandemic and related shutdowns and used them to implement strategies to ensure our continued success. We have adapted to the ongoing COVID-19 pandemic in order to continue functioning. This has included implementing safety protocols and flexible remote work.
Our supply chain has not been significantly impacted by the recent COVID-19 pandemic since we source raw materials locally which helps reduce lead times and minimize risk of disruptions. We also attempt to keep a safety stock of raw material inventory which can help to ensure that we have enough product on hand to meet urgent demand even if there are unexpected delays or disruptions in supply chain.
Liquidity and Capital Resources
Sources of Liquidity
During the years ended September 30, 2023, and 2022, we primarily funded our operations with cash generated from operations, sale of equity, as well as through borrowing under our revolving line of credit, a long term promissory note, and related parties. See Note 9, Note 10 and Note 12 to the consolidated financial statements for details. We had cash of $4,898 as of September 30, 2023 compared to $50,628 of cash as of September 30, 2022. The cash decrease was primarily the result of the increase in net cash used by operating activities and purchase of equipment in the fiscal year ended September 30, 2023.
The Company has participated in several private-placement offerings. On December 3, 2022, we closed on a private-placement offering pursuant to which we sold to an accredited investor an aggregate of $500,000 in common stock, at a purchase price of $3.50 per share. On March 13, 2023, we closed on a private-placement offering pursuant to which we sold to an accredited investor an aggregate of $100,000 in common stock, at a purchase price of $3.70 per share. On March 29, 2023, we closed on a private-placement offering pursuant to which we sold to an accredited investor an aggregate of $300,000 in common stock, at a purchase price of $3.80 per share. The offerings were completed pursuant to an exemption from registration under Rule 506(b) of the Securities Act of 1933, as amended.
We do not believe the cash and cash equivalents on hand as of September 30, 2023 of $4,898 will be sufficient to fund its operations and capital expenditure requirements for the next twelve months from the date the consolidated financial statements are issued. We will be required to raise additional capital to continue to fund operations and capital expenditures. As previously disclosed, on December 18, 2023, the Company successfully closed the IPO with gross proceeds of $10 million. The management has concluded that substantial doubt is not alleviated regarding the Company’s ability to continue as a going concern for 12 months from the date of issuance of these financial statements. We will be required to raise additional capital to continue to fund operations and capital expenditure. The uncertainties surrounding our ability to access capital when needed creates substantial doubt about our ability to continue as a going concern.
| 28 |
Based on our need to raise additional funds to implement our business plans for the next twelve months, we have included a discussion concerning the presentation of our financial statements on a going concern basis in the notes to our consolidated financial statements and our independent public accountants have included a similar discussion in their opinion on our financial statements through September 30, 2023. We will be required in the near future to issue debt or sell our Company’s equity securities in order to raise additional cash, although there are no firm arrangements in place for any such financing at this time. We cannot provide any assurances as to whether we will be able to secure the necessary financing, or the terms of any such financing transaction if one were to occur. The failure to secure such financing could severely curtail our plans for future growth or in more severe scenarios, the continued operations of our Company.
Working Capital
As of September 30, 2023 and 2022, our working (deficit) capital was $(2,913,827) and $378,782, respectively. The historical seasonality in our business during the year can cause cash and cash equivalents, inventory, and accounts payable to fluctuate, resulting in changes in our working capital.
Cash Flows
Operating Activities
Net cash used in operating activities for the years ended September 30, 2023, and 2022 was $1,225,941 and $1,717,819, respectively. The decrease was mainly due to the combination of an increase in loss of $2.9 million offset by an increase of non-cash reconciling items of $1.1 million and a decrease in working capital consumption of $2.3 million.
For the year ended September 30, 2023, net cash used in operating activities was $1.2 million, primarily driven by the net loss of $4.0 million, partially offset by non-cash items, which mainly included bad debt expense of $1.3 million. Working capital provided cash of $1.4 million, which was primarily driven by a $1.3 million increase in accounts payable, unearned revenue and other current liabilities, a $0.6 million decrease in account receivable and account receivable -related party, a $0.1 million decrease of prepayments and other current assets, and partially offset by a $0.5 million increase in deferred offering costs and a $0.1 million increase in inventories.
For the year ended September 30, 2022, net cash used in operating activities was $1.7 million, primarily driven by the net loss of $1.1 million, partially offset by non-cash items, which mainly included stock compensation expense of $0.3 million. Working capital consumption of $0.9 million, which was primarily driven by a $1.4 million increase in account receivable and account receivable -related party, a $0.2 million increase of prepayments and other current assets, and partially offset by a $0.7 million increase in accounts payable, unearned revenue and other current liabilities.
Investing Activities
For the years ended September 30, 2023, and 2022, net cash used in investing activities was the result of additions to property and equipment of $244,899 and $684,815, respectively, which are mainly related to the purchase of machinery, tools, motor vehicles, and leasehold improvements.
Financing Activities
Net cash provided by financing activities was $1,425,110 and $2,356,401, respectively, for the years ended September 30, 2023, and 2022. The main reason for the decrease in net cash provided was primarily due to decrease in proceeds from shares sold for cash, short term loans and long-term note and offset by the increase in proceeds from related parties during the year ended September 30, 2023.
| 29 |
Critical Accounting Policies and Estimate
We prepare our consolidated financial statements in accordance with accounting principles generally accepted in the United States, or GAAP and pursuant to the rules and regulations of the Securities Exchange Commission (“SEC”). The preparation of consolidated financial statements in conformity with GAAP requires management to make estimates and assumptions that affect the amounts reported in the consolidated financial statements and accompanying notes. Actual results could differ from those estimates. In some cases, changes in the accounting estimates are reasonably likely to occur from period to period. Accordingly, actual results could differ materially from our estimates. To the extent that there are material differences between these estimates and actual results, our financial condition and results of operations will be affected. We base our estimates on experience and other assumptions that we believe are reasonable under the circumstances, and we evaluate these estimates on an ongoing basis. We refer to accounting estimates of this type as critical accounting policies, which we discuss further below. While our significant accounting policies are more fully described in note 2 to our audited consolidated financial statements, we believe that the following accounting policies are critical to the process of making significant judgments and estimates in the preparation of our audited consolidated financial statements.
Principles of consolidation
The consolidated financial statements include the accounts of the Company and its subsidiaries, Inno Metal Studs Corp, Castor Building Tech LLC, and Inno Research Institute LLC. All intercompany balances and transactions have been eliminated.
Going concern
The Company’s continuation as a going concern is dependent on its ability to generate sufficient cash flows from operations to meet its obligations, in which it has not been successful, and/or obtaining additional financing from its shareholders or other sources, as may be required.
Our consolidated financial statements have been prepared assuming that we will continue as a going concern. Such an assumption contemplates the realization of assets and satisfaction of liabilities in the normal course of business. These consolidated financial statements do not include any adjustments to reflect the possible future effects on the recoverability and classification of assets or the amounts and classifications of liabilities that may result should the Company be unable to continue as a going concern.
Management is endeavoring to increase revenue-generating operations. While priority is on generating cash from operations through the sale of the Company’s products and services, management is also seeking to raise additional working capital through various financing sources, including the sale of the Company’s equity and/or debt securities, which may not be available on commercially reasonable terms to our Company, or which may not be available at all. If such financing is not available on satisfactory terms, we may be unable to continue our business as desired and our operating results will be adversely affected. In addition, any financing arrangement may have potentially adverse effects on us and/or our stockholders. Debt financing (if available and undertaken) will increase expenses, must be repaid regardless of operating results and may involve restrictions limiting our operating flexibility. If we issue equity securities to raise additional funds, the percentage ownership of our existing stockholders will be reduced, and the new equity securities may have rights, preferences or privileges senior to those of the current holders of our common stock.
Reverse acquisition under common control
Effective January 21, 2022, the Company acquired 100% of the common stock of Inno Metal Studs Corp (“IMSC”), a Texas corporation incorporated on October 31, 2019. Pursuant to the terms of the Share Purchase Agreement with IMSC’s sole owner, Mr. Dekui Liu, who was also the sole owner and CEO of the Company, the Company issued 15,170,000 shares of its common stock to Mr. Dekui Liu in exchange for his 100% ownership in IMSC. Upon completion of the transaction, IMSC became a 100% owned subsidiary of the Company. As such, Under ASC 805-40 and ASC 805-50, the transaction is a reverse acquisition between entities under common control, in which INNO HOLDINGS INC. is the accounting acquiree and IMSC is the accounting acquirer. The assets, liabilities and operations of the two entities are combined at their historical carrying amounts, with all historical periods adjusted as if the entities had always been combined. The consolidated financial statements represent the continuation of the financial statements of IMSC except for its capital structure.
| 30 |
Accounts receivable
During the ordinary course of business, the Company extends unsecured credit to its customers. Accounts receivable are stated at the amount the Company expects to collect from customers. Management reviews its accounts receivable balances each reporting period to determine if an allowance for credit loss is required.
In October 2020, the Company adopted ASU 2016-13, Topics 326 — Credit Loss, Measurement of Credit Losses on Financial Instruments, which replaces the incurred loss methodology with an expected loss methodology that is referred to as the current expected credit loss (CECL) methodology, for its accounting standard for its trade accounts receivable.
The Company continuously monitors the recoverability of accounts receivable. If there are any indicators that a customer may not make payment, the Company may consider making a provision for non-collectability for that particular customer. At the same time, the Company may cease further sales or services to such a customer. The following are some of the factors that the Company develops allowance for credit losses:
| ● | the customer fails to comply with its payment schedule; | |
| ● | the customer is in serious financial difficulty; | |
| ● | a significant dispute with the customer has occurred regarding job progress or other matters; | |
| ● | the customer breaches any of its contractual obligations; | |
| ● | the customer appears to be financially distressed due to economic or legal factors; | |
| ● | the business between the customer and the Company is not active; and | |
| ● | other objective evidence indicates non-collectability of the accounts receivable. |
The adoption of the credit loss accounting standard has no material impact on the Company’s consolidated financial statements. Accounts receivable are recognized and carried at carrying amount less an allowance for credit losses, if any. The Company maintains an allowance for credit losses resulting from the inability of its customers to make required payments based on contractual terms. The Company reviews the collectability of its receivables on a regular and ongoing basis. The Company has also included in calculation of allowance for credit losses the potential impact of the COVID-19 pandemic on our customers’ businesses and their ability to pay their accounts receivable. After all attempts to collect a receivable have failed, the receivable is written off against the allowance. The Company also considers external factors to the specific customer, including current conditions and forecasts of economic conditions, including the potential impact of the COVID-19 pandemic. In the event we recover amounts previously written off, we will reduce the specific allowance for credit losses.
Revenue recognition
The Company has adopted Accounting Standards Codification (“ASC”) 606 since its inception and recognizes revenue from product and service sales revenues, net of promotional discounts and return allowances, if any, when the following revenue recognition criteria are met: a contract has been identified, separate performance obligations are identified, the transaction price is determined, the transaction price is allocated to separate performance obligations and revenue is recognized upon satisfying each performance obligation. The Company transfers the risk of loss or damage upon shipment, therefore, revenue from product sales is recognized when it is shipped to the customer. Return allowances, which reduce product revenue by the Company’s best estimate of expected product returns, are estimated using historical experience. For services, all sales are recognized upon completion based on terms stated in the sales agreements.
The Company evaluates the criteria of ASC 606 — Revenue Recognition Principal Agent Considerations in determining whether it is appropriate to record the gross amount of product sales and related costs or the net amount earned as commissions. Generally, when the Company is primarily responsible for fulfilling the promise to provide a specified good or service, the Company is subject to inventory risk before the good or service has been transferred to a customer and the Company has discretion in establishing the price, revenue is recorded at gross.
| 31 |
Payments received prior to the delivery of goods to customers are recorded as customer deposits.
Sales discounts are recorded in the period in which the related sale is recognized. Sales return allowances are estimated based on historical amounts and are recorded upon recognizing the related sales. Shipping and handling costs are recorded as selling expenses.
Costs and expenses
Costs and expenses are operating expenses, which consist of costs of material and labor, selling, general and administrative expenses, and depreciation, are expensed as incurred.
Inventory
Inventory consists of material and finished goods ready for sale and is stated at the lower of cost or net realizable value. The Company values its inventory using the FIFO costing method. The Company’s policy is to include as a part of cost of goods sold any freight incurred to ship the product from its vendors to warehouses. Outbound freight costs related to shipping costs to customers are considered periodic costs and are reflected in selling expenses. The Company regularly reviews inventory and considers forecasts of future demand, market conditions and product obsolescence.
If the estimated realizable value of the inventory is less than cost, the Company makes provisions in order to reduce its carrying value to its estimated market value. The Company also reviews inventory for slow moving inventory and obsolescence and records allowance for obsolescence.
Property and equipment
Property and equipment is stated at the historical cost, less accumulated depreciation. Depreciation on property and equipment is provided using the straight-line method over the estimated useful lives of the assets as follows:
| Machinery tools and equipment | 7 years | |
| Office furniture and equipment | 5 years | |
| Motor vehicles | 5 years | |
| Leasehold improvements | the shorter of the lease term or the estimated useful life of the improvements |
Expenditures for renewals and betterments are capitalized while repairs and maintenance costs are normally charged to the statement of operations in the year in which they are incurred. In situations where it can be clearly demonstrated that the expenditure has resulted in an increase in the future economic benefits expected to be obtained from the use of the asset, the expenditure is capitalized as an additional cost of the asset.
Upon sale or disposal of an asset, the historical cost and related accumulated depreciation or amortization of such asset were removed from their respective accounts and any gain or loss is recorded in the statements of income.
The Company reviews the carrying value of property and equipment for impairment whenever events and circumstances indicate that the carrying value of an asset may not be recoverable from the estimated future cash flows expected to result from its use and eventual disposition. In cases where undiscounted expected future cash flows are less than the carrying value, an impairment loss is recognized equal to an amount by which the carrying value exceeds the fair value of assets. The factors considered by management in performing this assessment include current operating results, trends and prospects, the manner in which the property is used, and the effects of obsolescence, demand, competition and other economic factors. Based on this assessment, no impairment expenses for property and equipment were recorded during the years ended September 30, 2023 and 2022.
| 32 |
Leases
On its inception date, the Company adopted ASC 842 — Leases (“ASC 842”), which requires lessees to record right-of-use (“ROU”) assets and related lease obligations on the balance sheet, as well as disclose key information regarding leasing arrangements.
ROU assets represent our right to use an underlying asset for the lease terms and lease liabilities represent our obligation to make lease payments arising from the lease. Operating lease ROU assets and liabilities are recognized at commencement date based on the present value of lease payments over the lease term. As the Company’s leases do not provide an implicit rate, the Company generally uses its incremental borrowing rate based on the estimated rate of interest for collateralized borrowing over a similar term of the lease payments at commencement date. The operating lease ROU asset also includes any lease payments made and excludes lease incentives. Lease expense for lease payments is recognized on a straight-line basis over the lease term.
Stock-based compensation
The Company applies ASC No. 718, “Compensation-Stock Compensation,” which requires that share-based payment transactions with employees and nonemployees upon adoption of ASU 2018-07, be measured based on the grant date fair value of the equity instrument and recognized as compensation expense over the requisite service period, with a corresponding addition to equity. Under this method, compensation cost related to employee share options or similar equity instruments is measured at the grant date based on the fair value of the award and is recognized over the period during which an employee is required to provide service in exchange for the award, which generally is the vesting period. In addition to the requisite service period, the Company also evaluates the performance condition and market condition under ASC 718-10-20. For an award which contains both a performance and a market condition, and where both conditions must be satisfied for the award to vest, the market condition is incorporated into the fair value of the award, and that fair value is recognized over the employee’s requisite service period or nonemployee’s vesting period if it is probable the performance condition will be met. If the performance condition is ultimately not met, compensation cost related to the award should not be recognized (or should be reversed) because the vesting condition in the award has not been satisfied.
The Company will recognize forfeitures of such equity-based compensation as they occur.
Income taxes
The Company accounts for income taxes under the asset and liability method. Deferred tax assets and liabilities are recognized for future tax consequences attributable to differences between the financial statement carrying amounts of existing assets and liabilities and their perspective tax bases. Deferred tax assets and liabilities are measured using enacted tax rates expected to apply to taxable income in the years in which the temporary differences are expected to be recovered or settled. The effect on deferred tax assets and liabilities of a change in tax rates is recognized in income in the period that includes the enactment date. Valuation allowances are recorded, when necessary, to reduce deferred tax assets to the amount expected to be realized.
As a result of the implementation of certain provisions of ASC 740, Income Taxes (“ASC 740”), which clarifies the accounting and disclosure for uncertainty in tax position, as defined, ASC 740 seeks to reduce the diversity in practice associated with certain aspects of the recognition and measurement related to accounting for income taxes. The Company has adopted the provisions of ASC 740 since inception and has analyzed filing positions in each of the federal and state jurisdictions where the Company is required to file income tax returns, as well as open tax years in such jurisdictions. The Company has identified the U.S. federal jurisdiction, and the states of Texas and California, as its “major” tax jurisdictions. However, the Company has certain tax attribute carryforwards which will remain subject to review and adjustment by the relevant tax authorities until the statute of limitations closes with respect to the year in which such attributes are utilized.
The Company believes that its income tax filing positions and deductions will be sustained on audit and do not anticipate any adjustments that will result in a material change to its financial position. Therefore, no reserves for uncertain income tax positions have been recorded pursuant to ASC 740. The Company’s policy for recording interest and penalties associated with income-based tax audits is to record such items as a component of income taxes.
| 33 |
Commitments and contingencies
In the ordinary course of business, the Company is subject to certain contingencies, including legal proceedings and claims arising out of the business that relate to a wide range of matters, such as government investigations and tax matters. The Company recognizes its liability for such contingency if it determines it is probable that a loss has occurred, and a reasonable estimate of the loss can be made. The Company may consider many factors in making these assessments including historical and specific facts and circumstances of each matter.
Earnings per share
Basic earnings per share are computed by dividing net income attributable to holders of common stock by the weighted average number of shares of common stock outstanding during the year. Diluted earnings per share reflect the potential dilution that could occur if securities to issue common stock were exercised.
Recently issued but not yet adopted accounting pronouncements
In June 2022, FASB issued ASU 2022-03, Fair Value Measurement (Topic 820): Fair Value Measurement of Equity Securities Subject to Contractual Sale Restrictions. The amendments in this ASU clarify the guidance in ASC 820 on the fair value measurement of an equity security that is subject to a contractual sale restriction and require specific disclosures related to such an equity security. This standard is effective for fiscal years beginning after December 15, 2024. The Company does not expect the adoption of this standard to have a material impact on the consolidated financial statements.
In October 2021, the FASB issued ASU 2021-08, Business Combinations (Topic 805), Accounting for Contract Assets and Contract Liabilities from Contracts with Customers. This ASU clarifies that an acquirer of a business should recognize and measure contract assets and contract liabilities in a business combination in accordance with ASU 2014-09, Revenue from Contracts with Customers (Topic 606) as if the entity had originated the contracts. The guidance is effective for fiscal years beginning after December 15, 2023, with early application permitted. The Company does not expect the adoption of this standard to have a material impact on the consolidated financial statements.
Recently issued and adopted accounting pronouncements
In January 2020, the FASB issued ASU 2020-01, “Investments — Equity Securities (Topic 321), Investments — Equity Method and Joint Ventures (Topic 323), and Derivatives and Hedging (Topic 815) - Clarifying the Interactions between Topic 321, Topic 323, and Topic 815.” This ASU among other things clarifies that a company should consider observable transactions that require a company to either apply or discontinue the equity method of accounting under Topic 323, Investments — Equity Method and Joint Ventures, for the purposes of applying the measurement alternative in accordance with Topic 321 immediately before applying or upon discontinuing the equity method. The new ASU clarifies that, when determining the accounting for certain forward contracts and purchased options a company should not consider, whether upon settlement or exercise, if the underlying securities would be accounted for under the equity method or fair value option. The Company adopted ASU 2020-01 on October 1, 2022. The adoption did not have a material impact on the Company’s consolidated financial statements.
In December 2019, the FASB issued ASU 2019-12, Income Taxes (Topic 740) — Simplifying the Accounting for Income Taxes. The update is intended to simplify the current rules regarding the accounting for income taxes and addresses several technical topics including accounting for franchise taxes, allocating income taxes between a loss in continuing operations and in other categories such as discontinued operations, reporting income taxes for legal entities that are not subject to income taxes, and interim accounting for enacted changes in tax laws. The Company adopted ASU 2019-12 on October 1, 2022. The adoption did not have a material impact on the Company’s consolidated financial statements.
The Company does not believe other recently issued but not yet effective accounting standards, if currently adopted, would have a material effect on the consolidated financial position, statements of operations and cash flows.
| 34 |
ITEM 8. FINANCIAL STATEMENTS AND SUPPLEMENTARY DATA
INDEX TO FINANCIAL STATEMENTS
| Page | ||
| Financial Statements as of and for the Fiscal Years Ended September 30, 2023 and 2022 | ||
| Report
of Independent Registered Public Accounting Firm PCAOB ID# (0 |
F-2 | |
| Consolidated Balance Sheets as of September 30, 2023 and 2022 | F-3 | |
| Consolidated Statements of Operations for the years ended September 30, 2023 and 2022 | F-5 | |
| Consolidated Statements of Changes in Stockholders’ Equity for the years ended September 30, 2023 and 2022 | F-6 | |
| Consolidated Statements of Cash Flows for the years ended September 30, 2023 and 2022 | F-7 | |
| Notes to Consolidated Financial Statements | F-8 |
| F-1 |
REPORT OF INDEPENDENT REGISTERED PUBLIC ACCOUNTING FIRM
To the shareholders and the board of directors of INNO HOLDINGS INC.
Opinion on the Financial Statements
We have audited the accompanying consolidated balance sheets of INNO HOLDINGS INC. and its subsidiaries (the Company) as of September 30, 2023 and 2022, and the related consolidated statements of operations, stockholders’ equity (deficit), and cash flows for each of the years in the two-year period ended September 30, 2023, and the related notes (collectively referred to as the “consolidated financial statements”). In our opinion, the consolidated financial statements present fairly, in all material respects, the financial position of the Company as of September 30, 2023 and 2022, and the results of its operations and its cash flows for each of the years in the two-year period ended September 30, 2023, in conformity with accounting principles generally accepted in the United States of America.
Going Concern Matter
The accompanying consolidated financial statements have been prepared assuming that the Company will continue as a going concern. As discussed in Note 2 to the consolidated financial statements, the Company has suffered recurring losses from operations that raises substantial doubt about its ability to continue as a going concern. Management’s plans regarding these matters are also described in Note 2 to the consolidated financial statements. The financial statements do not include any adjustments that might result from the outcome of this uncertainty.
Basis for Opinion
These consolidated financial statements are the responsibility of the Company’s management. Our responsibility is to express an opinion on the Company’s consolidated financial statements based on our audits. We are a public accounting firm registered with the Public Company Accounting Oversight Board (United States) (PCAOB) and are required to be independent with respect to the Company in accordance with the U.S. federal securities laws and the applicable rules and regulations of the Securities and Exchange Commission and the PCAOB.
We conducted our audits in accordance with the standards of the PCAOB. Those standards require that we plan and perform the audit to obtain reasonable assurance about whether the consolidated financial statements are free of material misstatement, whether due to error or fraud. The Company is not required to have, nor were we engaged to perform, an audit of its internal control over financial reporting. As part of our audits, we are required to obtain an understanding of internal control over financial reporting, but not for the purpose of expressing an opinion on the effectiveness of the Company’s internal control over financial reporting. Accordingly, we express no such opinion.
Our audits included performing procedures to assess the risks of material misstatement of the consolidated financial statements, whether due to error or fraud, and performing procedures that respond to those risks. Such procedures included examining, on a test basis, evidence regarding the amounts and disclosures in the consolidated financial statements. Our audits also included evaluating the accounting principles used and significant estimates made by management, as well as evaluating the overall presentation of the consolidated financial statements. We believe that our audits provide a reasonable basis for our opinion.
/s/
We have served as the Company’s auditor since 2022.
January 16, 2024
| F-2 |
INNO
HOLDINGS INC. AND SUBSIDIARIES
Consolidated Balance Sheets
As of September 30, 2023 and 2022
| September
30, 2023 | September
30, 2022 | |||||||
| ASSETS | ||||||||
| Current assets | ||||||||
| Cash and cash equivalent | $ | $ | ||||||
| Accounts receivable, net | ||||||||
| Accounts receivable – related party | ||||||||
| Inventories | ||||||||
| Deferred offering costs | ||||||||
| Prepayments and other current assets | ||||||||
| Total current assets | ||||||||
| Non-current assets | ||||||||
| ROU assets | ||||||||
| Property and equipment, net | ||||||||
| Other non-current assets | ||||||||
| Total non-current assets | ||||||||
| Total assets | $ | $ | ||||||
| LIABILITIES AND EQUITY | ||||||||
| Current liabilities | ||||||||
| Accounts payable | ||||||||
| Accounts payable – related party | ||||||||
| Credit cards payable | ||||||||
| Unearned revenue | ||||||||
| Other payables and accrued liabilities | ||||||||
| Other payables – related party | ||||||||
| Short-term loan payable | ||||||||
| Lease liability – current | ||||||||
| Long-term notes payable – current portion | ||||||||
| Total current liabilities | ||||||||
| Non-current liabilities | ||||||||
| Notes payable | ||||||||
| Lease liability – non-current | ||||||||
| Other non-current liabilities | ||||||||
| Total non-current liabilities | ||||||||
| Total liabilities | ||||||||
| Commitments and contingency | ||||||||
| F-3 |
INNO
HOLDINGS INC. AND SUBSIDIARIES
Consolidated Balance Sheets — (Continued)
As of September 30, 2023 and 2022
| September 30, 2023 | September 30, 2022 | |||||||
| Stockholders’ Equity (Deficit) | ||||||||
| Common
stock, | ||||||||
| Additional paid in capital | ||||||||
| Accumulated deficit | ( | ) | ( | ) | ||||
| Non-controlling interest | ( | ) | ( | ) | ||||
| Total stockholders’ equity (deficit) | ( | ) | ||||||
| Total liabilities and stockholders’ equity (deficit) | $ | $ | ||||||
| * | On
November 30, 2022, the Company implemented a 2-for-1 forward split of the issued and outstanding shares of Common Stock of the Company.
Further on July 24, 2023, |
The accompanying notes are an integral part of these Consolidated financial statements
| F-4 |
INNO
HOLDINGS INC. AND SUBSIDIARIES
Consolidated Statements of Operations
For the Years Ended September 30, 2023 and 2022
| For
the Years Ended September 30, | ||||||||
| 2023 | 2022 | |||||||
| REVENUES | $ | $ | ||||||
| REVENUES – related party | ||||||||
| TOTAL REVENUES | ||||||||
| COSTS AND EXPENSES: | ||||||||
| Costs of materials and labor | ||||||||
| Selling, general and administrative expenses (exclusive of depreciation and bad debt expense shown separately below) | ||||||||
| Depreciation | ||||||||
| Bad debt expense | ||||||||
| Total costs and expenses | ||||||||
| LOSS FROM OPERATIONS | ( | ) | ( | ) | ||||
| OTHER INCOME (EXPENSE) | ||||||||
| Interest expenses | ( | ) | ( | ) | ||||
| Stock compensation expense | ( | ) | ||||||
| Other non-operating income (expense) | ||||||||
| Total other income (expenses), net | ( | ) | ( | ) | ||||
| LOSS BEFORE INCOME TAXES | ( | ) | ( | ) | ||||
| PROVISION FOR INCOME TAXES | ||||||||
| NET LOSS | ( | ) | ( | ) | ||||
| Non-controlling interest | ( | ) | ( | ) | ||||
| NET LOSS ATTRIBUTABLE TO INNO HOLDINGS INC. | $ | ( | ) | $ | ( | ) | ||
| WEIGHTED AVERAGE NUMBER OF COMMON STOCK | ||||||||
| Basic | ||||||||
| Diluted | ||||||||
| LOSSES PER SHARE | ||||||||
| Basic | $ | ( | ) | $ | ( | ) | ||
| Diluted | $ | ( | ) | $ | ( | ) | ||
| * | On
November 30, 2022, the Company implemented a 2-for-1 forward split of the issued and outstanding shares of Common Stock of the Company.
Further on July 24, 2023, |
The accompanying notes are an integral part of these Consolidated financial statements
| F-5 |
INNO
HOLDINGS INC. AND SUBSIDIARIES
Consolidated Statements of Changes in Stockholders’ Equity
For the Years Ended September 30, 2023 and 2022
| Common Stock* | Additional Paid in | Retained
Earnings (Accumulated | Non- controlling | |||||||||||||||||||||
| Shares | Amount | Capital | Deficit) | interest | Total | |||||||||||||||||||
| Balance, September 30, 2021 | ||||||||||||||||||||||||
| Net loss | ( | ) | ( | ) | ( | ) | ||||||||||||||||||
| Shares issued for cash | ||||||||||||||||||||||||
| Shares issued for service | ||||||||||||||||||||||||
| Balance, September 30, 2022 | $ | $ | $ | ( | ) | $ | ( | ) | $ | |||||||||||||||
| Net loss | ( | ) | ( | ) | ( | ) | ||||||||||||||||||
| Shares issued for cash | ||||||||||||||||||||||||
| Shares issued for service | ||||||||||||||||||||||||
| Balance, September 30, 2023 | $ | $ | $ | ( | ) | $ | ( | ) | $ | ( | ) | |||||||||||||
| * |
| * |
The accompanying notes are an integral part of these Consolidated financial statements
| F-6 |
INNO
HOLDINGS INC. AND SUBSIDIARIES
Consolidated Statements of Cash Flows
For the Years Ended September 30, 2023 and 2022
| For the Years Ended September 30, | ||||||||
| 2023 | 2022 | |||||||
| CASH FLOWS FROM OPERATING ACTIVITIES: | ||||||||
| Net loss | $ | ( | ) | $ | ( | ) | ||
| Adjustments to reconcile net income to cash used in operating activities: | ||||||||
| Depreciation expense | ||||||||
| Stock-based compensation expense | ||||||||
| Non-cash operating lease expense | ||||||||
| Bad debt expense | ||||||||
| Change in operating assets and liabilities | ||||||||
| Accounts receivable | ( | ) | ||||||
| Accounts receivable – related party | ( | ) | ||||||
| Inventories | ( | ) | ( | ) | ||||
| Deferred offering costs | ( | ) | ||||||
| Prepayments and other current assets | ( | ) | ||||||
| Other non-current assets | ( | ) | ( | ) | ||||
| Accounts payable | ||||||||
| Accounts payable – related party | ||||||||
| Credit cards payable | ( | ) | ||||||
| Unearned revenue | ( | ) | ||||||
| Income tax payable | ( | ) | ||||||
| Other payables and accrued liabilities | ( | ) | ||||||
| Other non-current liabilities | ( | ) | ||||||
| Net cash used in operating activities | ( | ) | ( | ) | ||||
| CASH FLOWS FROM INVESTING ACTIVITIES: | ||||||||
| Purchase of equipment | ( | ) | ( | ) | ||||
| Proceed from sale of truck | ||||||||
| Net cash used in investing activities | ( | ) | ( | ) | ||||
| CASH FLOWS FROM FINANCING ACTIVITIES: | ||||||||
| Proceeds from related parties | ||||||||
| Payments to related parties | ( | ) | ( | ) | ||||
| Proceeds from short-term loans | ||||||||
| Payments to short-term loans | ( | ) | ||||||
| Proceeds from long-term note | ||||||||
| Payment to long-term note | ( | ) | ( | ) | ||||
| Shares issued for cash | ||||||||
| Net cash provided by financing activities | ||||||||
| CHANGES IN CASH | ( | ) | ( | ) | ||||
| CASH AND CASH EQUIVALENT, beginning of year | ||||||||
| CASH AND CASH EQUIVALENT, end of year | $ | $ | ||||||
| SUPPLEMENTAL CASH FLOW INFORMATION: | ||||||||
| Cash paid for income tax | $ | $ | ||||||
| Cash paid for interest | $ | $ | ||||||
| SUPPLEMENTAL DISCLOSURE OF NON-CASH INVESTING AND FINANCING TRANSACTIONS: | ||||||||
| Right of use assets acquired under new operating leases | $ | $ | ||||||
The accompanying notes are an integral part of these Consolidated financial statements
| F-7 |
INNO
HOLDINGS INC. AND SUBSIDIARIES
Notes to Consolidated Financial Statements
As of September 30, 2023 and 2022 and for the years Ended
September 30, 2023 and 2022
Note 1 — Nature of business and organization
INNO HOLDINGS, INC., a Texas corporation (the “Company”), was incorporated on September 8, 2021. The Company is principally engaged in the marketing and sale of construction products along with full-scope construction services in the US.
On
January 18, 2022, the Company formed a limited liability company, Castor Building Tech LLC (“CBT”), in California. The Company
owned
Effective
January 21, 2022, the Company acquired
Inno
Research Institute LLC, a Texas limited liability company incorporated on September 8, 2021, is a
Note 2 — Basis of Presentation and Summary of significant accounting policies
Basis of presentation
The accompanying financial statements have been prepared in accordance with the generally accepted accounting principles in the United States of America (“U.S. GAAP”) and pursuant to the rules and regulations of the Securities Exchange Commission (“SEC”). The Company’s fiscal year end date is September 30.
Consolidated Principles of consolidation
The Consolidated financial statements include the accounts of the Company and its subsidiaries, Inno Metal Studs Corp., Castor Building Tech LLC, and Inno Research Institute LLC. All inter-company balances and transactions have been eliminated.
Reclassification
Reclassification could involve changes in accounting policies, adjustments to prior period amounts, or shifts in the classification of specific items. Certain items in the financial statements of comparative year have been reclassified to conform to the financial statements for the current year because of prior year adjustment as disclosed in Note 16.
Going concern
As
of September 30, 2023, the Company had total cash of $
The Company’s continuation as a going concern is dependent on its ability to generate sufficient cash flows from operations to meet its obligations, in which it has not been successful, and/or obtaining additional financing from its shareholders or other sources, as may be required.
| F-8 |
INNO
HOLDINGS INC. AND SUBSIDIARIES
Notes to Consolidated Financial Statements
As of September 30, 2023 and 2022 and for the years Ended
September 30, 2023 and 2022
Note 2 — Basis of Presentation and Summary of significant accounting policies (cont.)
Management is endeavoring to increase revenue-generating operations. While priority is on generating cash from operations through the sale of the Company’s products, management is also seeking to raise additional working capital through various financing sources, including the sale of the Company’s equity and/or debt securities, which may not be available on commercially reasonable terms to the Company, or which may not be available at all. If such financing is not available on satisfactory terms, the Company may not be able to continue operations or may be required to delay, scale back or eliminate some or all of its ongoing research and development efforts and other operations. The Company’s ability to access capital when needed is not assured and, if not achieved on a timely basis, will materially harm its business, financial condition and results of operations. In addition, any financing arrangement may have potentially adverse effects on us and/or our stockholders. Debt financing (if available and undertaken) will increase expenses, must be repaid regardless of operating results and may involve restrictions limiting our operating flexibility. If we issue equity securities to raise additional funds, the percentage ownership of our existing stockholders will be reduced, and the new equity securities may have rights, preferences or privileges senior to those of the current holders of our common stock. Given the uncertainties associated with the Company’s ability to access capital and its business growth strategy, management has concluded that substantial doubt exists regarding the Company’s ability to continue as a going concern for the next twelve months from the date the condensed consolidated financial statements are issued.
Our Consolidated financial statements have been prepared assuming that we will continue as a going concern. Such assumption contemplates the realization of assets and satisfaction of liabilities in the normal course of business. These Consolidated financial statements do not include any adjustments to reflect the possible future effects on the recoverability and classification of assets or the amounts and classifications of liabilities that may result should the Company be unable to continue as a going concern.
Use of estimates and assumptions
The preparation of financial statements in conformity with U.S. GAAP requires management to make estimates and assumptions that affect the amounts of assets and liabilities reported and disclosures of contingent assets and liabilities as of the date of the financial statements and the reported amounts of revenues and expenses during the periods presented. Actual results could differ from these estimates.
Reverse acquisition under common control
Effective
January 21, 2022, the Company acquired
Cash and cash equivalents
Cash and cash equivalents consist of amounts held as cash on hand and bank deposits.
From
time to time, the Company may maintain bank balances in interest bearing accounts in excess of the $
| F-9 |
INNO
HOLDINGS INC. AND SUBSIDIARIES
Notes to Consolidated Financial Statements
As of September 30, 2023 and 2022 and for the years Ended
September 30, 2023 and 2022
Note 2 — Basis of Presentation and Summary of significant accounting policies (cont.)
Accounts receivable
During the ordinary course of business, the Company extends unsecured credit to its customers. Accounts receivable are stated at the amount the Company expects to collect from customers. Management reviews its accounts receivable balances each reporting period to determine if an allowance for credit loss is required.
In October 2020, the Company adopted ASU 2016-13, Topics 326 — Credit Loss, Measurement of Credit Losses on Financial Instruments, which replaces the incurred loss methodology with an expected loss methodology that is referred to as the current expected credit loss (CECL) methodology, for its accounting standard for its trade accounts receivable.
The Company continuously monitors the recoverability of accounts receivable. If there are any indicators that a customer may not make payment, the Company may consider making provision for non-collectability for that particular customer. At the same time, the Company may cease further sales or services to such customer. The following are some of the factors that the Company develops allowance for credit losses:
| ● | the customer fails to comply with its payment schedule; | |
| ● | the customer is in serious financial difficulty; | |
| ● | a significant dispute with the customer has occurred regarding job progress or other matters; | |
| ● | the customer breaches any of its contractual obligations; | |
| ● | the customer appears to be financially distressed due to economic or legal factors; | |
| ● | the business between the customer and the Company is not active; and | |
| ● | other objective evidence indicates non-collectability of the accounts receivable. |
The adoption of the credit loss accounting standard has no material impact on the Company’s consolidated financial statements. Accounts receivable are recognized and carried at carrying amount less an allowance for credit losses, if any. The Company maintains an allowance for credit losses resulting from the inability of its customers to make required payments based on contractual terms. The Company reviews the collectability of its receivables on a regular and ongoing basis. The Company has also included in the calculation of allowance for credit losses the potential impact of the COVID-19 pandemic on our customers’ businesses and their ability to pay their accounts receivable. After all attempts to collect a receivable have failed, the receivable is written off against the allowance. The Company also considers external factors to the specific customer, including current conditions and forecasts of economic conditions, including the potential impact of the COVID-19 pandemic. In the event we recover amounts previously written off, we will reduce the specific allowance for credit losses.
Fair values of financial instruments
ASC 825, “Disclosures about Fair Value of Financial Instruments,” requires disclosure of fair value information about financial instruments. ASC 820, “Fair Value Measurements” defines fair value, establishes a framework for measuring fair value in generally accepted accounting principles, and expands disclosures about fair value measurements.
The carrying amounts of cash and cash equivalents, accounts receivable, accounts payable and all other current assets and liabilities are approximate fair values due to their short-term nature.
| F-10 |
INNO
HOLDINGS INC. AND SUBSIDIARIES
Notes to Consolidated Financial Statements
As of September 30, 2023 and 2022 and for the years Ended
September 30, 2023 and 2022
Note 2 — Basis of Presentation and Summary of significant accounting policies (cont.)
For other financial instruments to be reported at fair value, the Company utilizes valuation techniques that maximize the use of observable inputs and minimize the use of unobservable inputs to the extent possible. The Company determines the fair value of its financial instruments based on assumptions that market participants would use in pricing an asset or liability in the principal or most advantageous market. When considering market participant assumptions in fair value measurements, the following fair value hierarchy distinguishes between observable and unobservable inputs, which are categorized in one of the following levels:
| Level 1 — | Inputs are unadjusted, quoted prices in active markets for identical assets or liabilities at the measurement date; |
| Level 2 — | Inputs are observable, unadjusted quoted prices in active markets for similar assets or liabilities, unadjusted quoted prices for identical or similar assets or liabilities in markets that are not active, or other inputs that are observable or can be corroborated by observable market data for substantially the full term of the related assets or liabilities; and |
| Level 3 — | Unobservable inputs that are significant to the measurement of the fair value of the assets or liabilities that are supported by little or no market data. |
As of September 30, 2023 and 2022, the Company did not have any other financial instruments reported at fair value.
Revenue recognition
The Company has adopted Accounting Standards Codification (“ASC”) 606 since its inception and recognizes revenue from product and service sales revenues, net of promotional discounts and return allowances, if any, when the following revenue recognition criteria are met: a contract has been identified, separate performance obligations are identified, the transaction price is determined, the transaction price is allocated to separate performance obligations and revenue is recognized upon satisfying each performance obligation. The Company transfers the risk of loss or damage upon delivery, therefore, revenue from product sales is recognized when it is delivered to the customer. For services, all sales are recognized upon completion based on terms stated in the sales agreements.
The Company evaluates the criteria of ASC 606 — Revenue Recognition Principal Agent Considerations in determining whether it is appropriate to record the gross amount of product sales and related costs or the net amount earned as commissions. Generally, when the Company is primarily responsible for fulfilling the promise to provide a specified good or service, the Company is subject to inventory risk before the good or service has been transferred to a customer and the Company has discretion in establishing the price, revenue is recorded at gross.
Payments received prior to the delivery of goods to customers are recorded as customer deposits.
Sales discounts are recorded in the period in which the related sale is recognized. Sales return allowances are estimated based on historical amounts and are recorded upon recognizing the related sales. Shipping and handling costs are recorded as selling expenses.
Costs and expenses
Costs and expenses are operating expenses, which consist of costs of material and labor, selling, general and administrative expenses, and depreciation, are expensed as incurred.
Inventory
Inventory consists of material and finished goods ready for sale and is stated at the lower of cost or net realizable value. The Company values its inventory using the FIFO costing method. The Company’s policy is to include as a part of cost of goods sold any freight incurred to ship the product from its vendors to warehouses. Outbound freight costs related to shipping costs to customers are considered periodic costs and are reflected in selling expenses. The Company regularly reviews inventory and considers forecasts of future demand, market conditions and product obsolescence.
| F-11 |
INNO
HOLDINGS INC. AND SUBSIDIARIES
Notes to Consolidated Financial Statements
As of September 30, 2023 and 2022 and for the years Ended
September 30, 2023 and 2022
Note 2 — Basis of Presentation and Summary of significant accounting policies (cont.)
If the estimated realizable value of the inventory is less than cost, the Company makes provisions in order to reduce its carrying value to its estimated net realizable value. The Company also reviews inventory for slow moving inventory and obsolescence and records allowance for obsolescence.
Deferred offering costs
The Company capitalizes certain legal, accounting and other third-party fees that are directly related to an equity financing that is probable of successful completion until such financing is consummated. After consummation of an equity financing, these costs are recorded as a reduction of the proceeds received as a result of the financing. Should a planned equity financing be abandoned, terminated or significantly delayed, the deferred offering costs are immediately written off to operating expenses in the consolidated statements of operations in the period of determination.
Property and equipment
Property and equipment is stated at the historical cost, less accumulated depreciation. Depreciation on property and equipment is provided using the straight-line method over the estimated useful lives of the assets as follows:
| Machinery and equipment | ||
| Office equipment | ||
| Motor vehicles | ||
| Leasehold improvements |
|
Expenditures for renewals and betterments are capitalized while repairs and maintenance costs are normally charged to the statement of operations in the year in which they are incurred. In situations where it can be clearly demonstrated that the expenditure has resulted in an increase in the future economic benefits expected to be obtained from the use of the asset, the expenditure is capitalized as an additional cost of the asset.
Upon sale or disposal of an asset, the historical cost and related accumulated depreciation or amortization of such asset were removed from their respective accounts and any gain or loss is recorded in the statements of income.
The Company reviews the carrying value of property and equipment for impairment whenever events and circumstances indicate that the carrying value of an asset may not be recoverable from the estimated future cash flows expected to result from its use and eventual disposition. In cases where undiscounted expected future cash flows are less than the carrying value, an impairment loss is recognized equal to an amount by which the carrying value exceeds the fair value of assets. The factors considered by management in performing this assessment include current operating results, trends and prospects, the manner in which the property is used, and the effects of obsolescence, demand, competition and other economic factors. Based on this assessment, no impairment expenses for property and equipment were recorded during the years ended September 30, 2023 and 2022.
Leases
On its inception date, the Company adopted ASC 842 — Leases (“ASC 842”), which requires lessees to record right-of-use (“ROU”) assets and related lease obligations on the balance sheet, as well as disclose key information regarding leasing arrangements.
ROU assets represent our right to use an underlying asset for the lease terms and lease liabilities represent our obligation to make lease payments arising from the lease. Operating lease ROU assets and liabilities are recognized at commencement date based on the present value of lease payments over the lease term. As the Company’s leases do not provide an implicit rate, the Company generally uses its incremental borrowing rate based on the estimated rate of interest for collateralized borrowing over a similar term of the lease payments at commencement date. The operating lease ROU asset also includes any lease payments made and excludes lease incentives. Lease expense for lease payments is recognized on a straight-line basis over the lease term.
| F-12 |
INNO
HOLDINGS INC. AND SUBSIDIARIES
Notes to Consolidated Financial Statements
As of September 30, 2023 and 2022 and for the years Ended
September 30, 2023 and 2022
Note 2 — Basis of Presentation and Summary of significant accounting policies (cont.)
The Company applies ASC No. 718, “Compensation-Stock Compensation,” which requires that share-based payment transactions with employees and nonemployees upon adoption of ASU 2018-07, be measured based on the grant date fair value of the equity instrument and recognized as compensation expense over the requisite service period, with a corresponding addition to equity. Under this method, compensation cost related to employee share options or similar equity instruments is measured at the grant date based on the fair value of the award and is recognized over the period during which an employee is required to provide service in exchange for the award, which generally is the vesting period. In addition to the requisite service period, the Company also evaluates the performance condition and market condition under ASC 718-10-20. For an award which contains both a performance and a market condition, and where both conditions must be satisfied for the award to vest, the market condition is incorporated into the fair value of the award, and that fair value is recognized over the employee’s requisite service period or nonemployee’s vesting period if it is probable the performance condition will be met. If the performance condition is ultimately not met, compensation cost related to the award should not be recognized (or should be reversed) because the vesting condition in the award has not been satisfied.
The Company will recognize forfeitures of such equity-based compensation as they occur.
Income taxes
The Company accounts for income taxes under the asset and liability method. Deferred tax assets and liabilities are recognized for future tax consequences attributable to differences between the financial statement carrying amounts of existing assets and liabilities and their perspective tax bases. Deferred tax assets and liabilities are measured using enacted tax rates expected to apply to taxable income in the years in which the temporary differences are expected to be recovered or settled. The effect on deferred tax assets and liabilities of a change in tax rates is recognized in income in the period that includes the enactment date. Valuation allowances are recorded, when necessary, to reduce deferred tax assets to the amount expected to be realized.
As a result of the implementation of certain provisions of ASC 740, Income Taxes (“ASC 740”), which clarifies the accounting and disclosure for uncertainty in tax position, as defined, ASC 740 seeks to reduce the diversity in practice associated with certain aspects of the recognition and measurement related to accounting for income taxes. The Company has adopted the provisions of ASC 740 since inception and has analyzed filing positions in each of the federal and state jurisdictions where the Company is required to file income tax returns, as well as open tax years in such jurisdictions. The Company has identified the U.S. federal jurisdiction, and the states of Texas and California, as its “major” tax jurisdictions. However, the Company has certain tax attribute carryforwards which will remain subject to review and adjustment by the relevant tax authorities until the statute of limitations closes with respect to the year in which such attributes are utilized.
The Company believes that its income tax filing positions and deductions will be sustained on audit and do not anticipate any adjustments that will result in a material change to its financial position. Therefore, no reserves for uncertain income tax positions have been recorded pursuant to ASC 740. The Company’s policy for recording interest and penalties associated with income-based tax audits is to record such items as a component of income taxes.
Commitments and contingencies
In the ordinary course of business, the Company is subject to certain contingencies, including legal proceedings and claims arising out of the business that relate to a wide range of matters, such as government investigations and tax matters. The Company recognizes its liability for such contingency if it determines it is probable that a loss has occurred and a reasonable estimate of the loss can be made. The Company may consider many factors in making these assessments including historical and specific facts and circumstances of each matter.
| F-13 |
INNO
HOLDINGS INC. AND SUBSIDIARIES
Notes to Consolidated Financial Statements
As of September 30, 2023 and 2022 and for the years Ended
September30, 2023 and 2022
Note 2 — Basis of Presentation and Summary of significant accounting policies (cont.)
Basic earnings (loss) per share are computed by dividing net income (loss) attributable to holders of common stock by the weighted average number of shares of common stock outstanding during the year. Diluted earnings per share reflect the potential dilution that could occur if securities to issue common stock were exercised.
Recently issued but not yet adopted accounting pronouncements
In June 2022, FASB issued ASU 2022-03, Fair Value Measurement (Topic 820): Fair Value Measurement of Equity Securities Subject to Contractual Sale Restrictions. The amendments in this ASU clarify the guidance in ASC 820 on the fair value measurement of an equity security that is subject to a contractual sale restriction and require specific disclosures related to such an equity security. This standard is effective for fiscal years beginning after December 15, 2024. The Company does not expect the adoption of this standard to have a material impact on the consolidated financial statements.
In October 2021, the FASB issued ASU 2021-08, Business Combinations (Topic 805), Accounting for Contract Assets and Contract Liabilities from Contracts with Customers. This ASU clarifies that an acquirer of a business should recognize and measure contract assets and contract liabilities in a business combination in accordance with ASU 2014-09, Revenue from Contracts with Customers (Topic 606) as if the entity had originated the contracts. The guidance is effective for fiscal years beginning after December 15, 2023, with early application permitted. The Company does not expect the adoption of this standard to have a material impact on the consolidated financial statements.
Recently issued and adopted accounting pronouncements
In January 2020, the FASB issued ASU 2020-01, “Investments — Equity Securities (Topic 321), Investments — Equity Method and Joint Ventures (Topic 323), and Derivatives and Hedging (Topic 815) - Clarifying the Interactions between Topic 321, Topic 323, and Topic 815.” This ASU among other things clarifies that a company should consider observable transactions that require a company to either apply or discontinue the equity method of accounting under Topic 323, Investments — Equity Method and Joint Ventures, for the purposes of applying the measurement alternative in accordance with Topic 321 immediately before applying or upon discontinuing the equity method. The new ASU clarifies that, when determining the accounting for certain forward contracts and purchased options a company should not consider, whether upon settlement or exercise, if the underlying securities would be accounted for under the equity method or fair value option. The Company adopted ASU 2020-01 on October 1, 2022. The adoption did not have a material impact on the Company’s consolidated financial statements.
In December 2019, the FASB issued ASU 2019-12, Income Taxes (Topic 740) — Simplifying the Accounting for Income Taxes. The update is intended to simplify the current rules regarding the accounting for income taxes and addresses several technical topics including accounting for franchise taxes, allocating income taxes between a loss in continuing operations and in other categories such as discontinued operations, reporting income taxes for legal entities that are not subject to income taxes, and interim accounting for enacted changes in tax laws. The Company adopted ASU 2019-12 on October 1, 2022. The adoption did not have a material impact on the Company’s consolidated financial statements.
The Company does not believe other recently issued but not yet effective accounting standards, if currently adopted, would have a material effect on the consolidated financial position, statements of operations and cash flows.
| F-14 |
INNO
HOLDINGS INC. AND SUBSIDIARIES
Notes to Consolidated Financial Statements
As of September 30, 2023 and 2022 and for the years Ended
September 30, 2023 and 2022
Note 2 — Basis of Presentation and Summary of significant accounting policies (cont.)
Subsequent events
The Company evaluated subsequent events and transactions that occurred after the balance sheet date through the date that the consolidated financial statements are available to be issued. Material subsequent events that required recognition or additional disclosure in the consolidated financial statements are presented.
Note 3 — Reverse Acquisition under Common Control
On
January 21, 2022, the sole owner of the Company and IMSC, Mr. Dekui Liu, entered into an agreement to sell
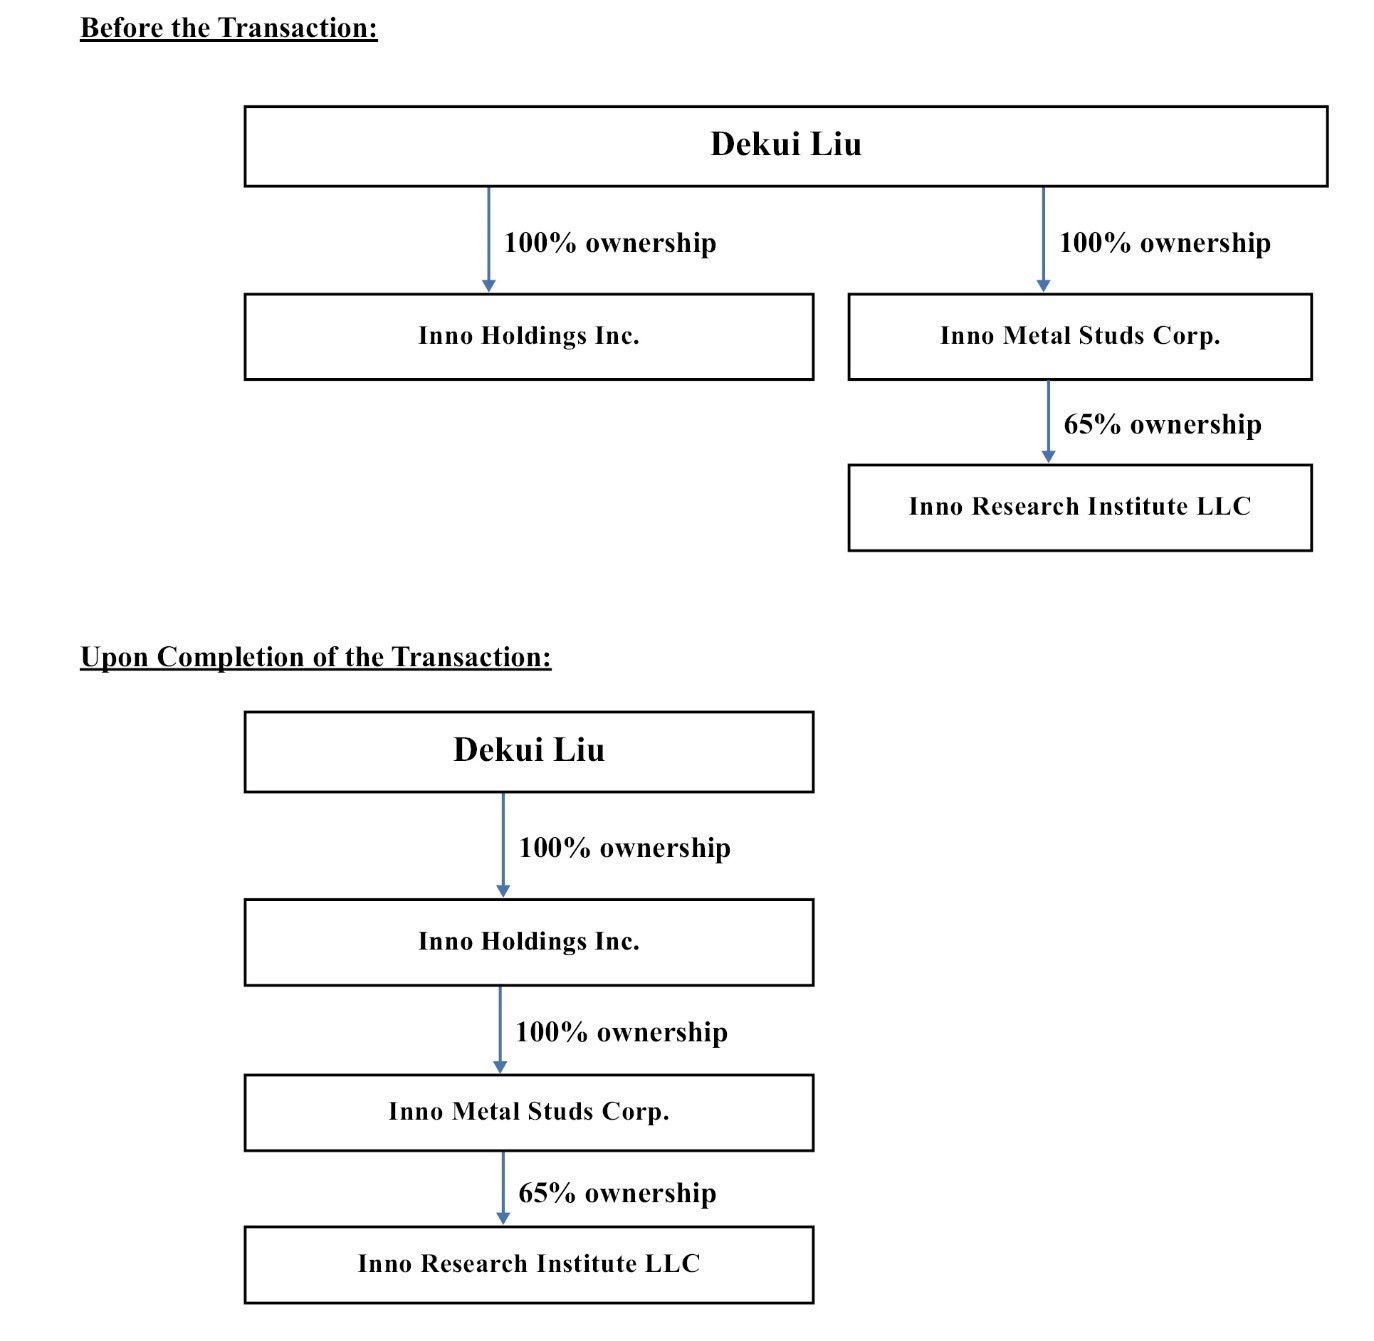
| F-15 |
INNO
HOLDINGS INC. AND SUBSIDIARIES
Notes to Consolidated Financial Statements
As of September 30, 2023 and 2022 and for the years Ended
September 30, 2023 and 2022
Note 3 — Reverse Acquisition under Common Control (cont.)
Under ASC 805, Business Combination, A common-control transaction is typically a transfer of net assets or an exchange of equity interests between entities under the control of the same parent. While a common-control transaction is similar to a business combination for the entity that receives the net assets or equity interests, such a transaction does not meet the definition of a business combination because there is no change in control over the net assets. Therefore, the accounting and reporting for a transaction between entities under common control is outside the scope of the business combinations guidance in ASC 805-10, ASC 805-20, and ASC 805-30 and is addressed in the “Transactions Between Entities Under Common Control” subsections of ASC 805-50.
Note 4 — Accounts Receivable, Net
Accounts receivable for the Company consisted of the following as of the dates indicated below:
| September 30, 2023 | September 30, 2022 | |||||||
| Accounts receivable | $ | $ | ||||||
| Less: allowance for credit losses | ( | ) | ||||||
| Accounts receivable, net | $ | $ | ||||||
| Accounts receivable – related party | $ | $ | ||||||
The
Company recorded credit losses of $
Note 5 — Inventories
As of September 30, 2023 and 2022, inventories consisted of the following:
| September 30, 2023 | September 30, 2022 | |||||||
| Raw material | $ | $ | ||||||
| Production inventory | ||||||||
| Total | $ | $ | ||||||
As
of September 30, 2023 and 2022, there was
Note 6 — Deferred offering costs
Deferred
offering costs consisted of fees and expenses incurred in connection with the sale of the Company’s common stock in the IPO, including
the legal, accounting, printing and other offering related costs. Upon completion of the IPO, these deferred offering costs are to be
reclassified from current assets to stockholders’ equity and recorded against the net proceeds from the offering. As of September
30, 2023 and 2022, deferred offering costs amounted to $
Note 7 — Prepayments and other current assets
As of September 30, 2023 and 2022, prepayments and other current assets consisted of the following:
| September 30, 2023 | September 30, 2022 | |||||||
| Advance to suppliers | $ | $ | ||||||
| Other prepayments and current assets | ||||||||
| Total | $ | $ | ||||||
| F-16 |
INNO
HOLDINGS INC. AND SUBSIDIARIES
Notes to Consolidated Financial Statements
As of September 30, 2023 and 2022 and for the years Ended
September 30, 2023 and 2022
Note 8 — Property and equipment, net
As of September 30, 2023 and 2022, property and equipment consisted of the following:
| September 30, 2023 | September 30, 2022 | |||||||
| Machinery and equipment | $ | $ | ||||||
| Office equipment | ||||||||
| Motor vehicles | ||||||||
| Leasehold improvements | ||||||||
| Total | ||||||||
| Less: accumulated depreciation | ( | ) | ( | ) | ||||
| Property and equipment, net | $ | $ | ||||||
For
the years ended September 30, 2023 and 2022, depreciation expenses amounted to $
Note 9 — Loans payable
Short-term loans
Revolving line of credit
On
September 16, 2022, the Company entered into an agreement with Origin Bank for a revolving line of credit (the “Line of Credit”)
of up to $
Short term loan without interest
From
June 2023 to August 2023, the Company borrowed short-term loans due on demand without interest, amounting to $
Long-term loan
Promissory note payable
On
October 28, 2021, the Company issued to BancorpSouth Bank a five-year unsecured
For
the years ended September 30, 2023 and 2022, the Company recorded interest expense of $
As
of September 30, 2023 and 2022, the total outstanding balance of the Note was $
Note 10 — Related party transactions
The
Company borrows short term loans without interest from its majority shareholder and CEO, Mr. Dekui Liu, for operation and cashflow needs
from time to time. As of September 30, 2023, the amount due to Mr. Liu was $
| F-17 |
INNO
HOLDINGS INC. AND SUBSIDIARIES
Notes to Consolidated Financial Statements
As of September 30, 2023 and 2022 and for the years Ended
September 30, 2023 and 2022
Note 10 — Related party transactions (cont.)
During
the year ended September 30, 2022, the Company engaged Yunited Assets LLC (“Yunited”), a limited liability company owned
by Mr. Cheng Yu, the minority owner of the Company’s subsidiary, Inno Research Institute, for consultation services on a project-by-project
basis. During the years ended September 30, 2023 and 2022, the Company recorded $
During
the year ended September 30, 2022, the Company purchased prefab home and other material and supplies from Baicheng Trading LLC, in which
the father of Mr. Dekui Liu, the Company’s majority shareholder and CEO, is a director. As of September 30, 2023 and 2022, the
outstanding balance of accounts payable-related party was both of $
In
March 2022, the Company entered into an agreement with Wise Hill Inc. (“Wise Hill”), a Florida corporation wholly owned by
a minority shareholder of the Company. Pursuant to the agreement, the Company sold prefab home products of $
In
March 2023, the Company entered into an agreement with Vision Opportunity Fund LP, a Florida limited partnership partially owned by a
minority shareholder of the Company. In August 2023, all rights, obligations and interests under the agreement were subsequently assigned
by Vision Opportunity Fund LP to its general partner, New Vision 101 LLC (“Vision 101”). Pursuant to the agreement, the Company
agreed to provide supplies and act as project developer for an amount equal to $
During
the year ended September 30, 2023, the Company advanced $
The following table sets forth the computation of basic and diluted losses per share for the periods presented:
| For the years ended September 30, | ||||||||
| 2023 | 2022 | |||||||
| Numerator: | ||||||||
| Net loss attributable to INNO HOLDINGS INC. | $ | ( | ) | $ | ( | ) | ||
| Denominator: | ||||||||
| Weighted-average shares used in computing basic and diluted losses per share* | ||||||||
| Losses per share of ordinary shares: – basic and diluted | $ | ) | $ | ) | ||||
| * |
| * |
| F-18 |
INNO
HOLDINGS INC. AND SUBSIDIARIES
Notes to Consolidated Financial Statements
As of September 30, 2023 and 2022 and for the years Ended
September 30, 2023 and 2022
Note 12 — Equity
The Company was incorporated in Texas on September 8, 2021. The total authorized shares of capital stock were shares without par value.
On November 30, 2022, the Company effected a forward stock split (the “Stock Split”) of the Company’s issued and outstanding shares of the common stock at a split ratio of 2-for-1. Further on July 24, 2023, the Company effected a reverse stock split (the “Reverse Stock Split”) of the Company’s issued and outstanding shares of the common stock at a split ratio of 1-for-2 such that every holder of common stock of the Company shall receive one share of common stock for every two shares of common stock held and to reduce the number of authorized shares of common stock from to . Shortly after the Reverse Stock Split, the Board of Directors of the Company approved issuance of additional shares to preserve the original purchase price per share of the shares sold in the period from February 1 to June 30, 2023. All share numbers of the Company’s Common Stock are stated on a post-split basis.
At the inception date, September 8, 2021, the Company issued shares of common stock to its founder, Mr. Dekui Liu.
On
February 2, 2022, the Company issued shares of its common stock to Mr. Dekui Liu in exchange for his
On
January 31, 2022, the Company issued of its series A convertible preferred stock to three accredited investors for $
On January 31 and September 30, 2022, the Company issued a total of shares of common stock to an investor for services. These shares were valued at $ per share, which was the per share price for the most recent sale of the Company’s capital stock to accredited investors. For the year ended September 30, 2022, the Company recorded $ as stock compensation expense.
In
December 2022, The Company issued shares of its common stock at a price of $ per share to an accredited investor for $
In
February 2023, The Company issued shares of its common stock at a price of $ per share to an accredited investor for $
In
March 2023, The Company issued shares of its common stock at a price of $ per share to an accredited investor for $
In
April and May 2023, Mr. Dekui Liu, the Company’s chief executive officer, sold shares of the Company’s common stock
he owned to three investors at $ per share for $
On
June 20, 2023, the Company issued shares of its common stock for a total value of $
As of September 30, 2023 and 2022, after giving effect to the stock splits of the outstanding shares of Common Stock, there were and shares of Common Stock issued and outstanding, respectively. The total authorized number of shares of capital stock was shares without par value.
| F-19 |
INNO
HOLDINGS INC. AND SUBSIDIARIES
Notes to Consolidated Financial Statements
As of September 30, 2023 and 2022 and for the years Ended
September 30, 2023 and 2022
Note 13 — Income taxes
On
December 22, 2017, the President of the United States signed into law H.R.1, formerly known as the Tax Cuts and Jobs Act (the “Tax
Legislation”). The Tax Legislation significantly revised the U.S. tax code by (i) lowering the U.S. federal statutory income tax
rate from
Other provisions of the new legislation include, but are not limited to, limiting deductibility of interest and executive compensation expense. These additional items have been considered in the income tax provision for the years ended September 30, 2023 and 2022.
Texas
imposes a franchise tax that applies to most business entities that are formed or qualified to do business, or which are otherwise doing
business, in Texas. Under the Texas franchise tax, a
The income tax provision for the years ended September 30, 2023 and 2022 consisted of the following:
| September 30, | ||||||||
| 2023 | 2022 | |||||||
| Current: | ||||||||
| Federal | $ | $ | ||||||
| State | ||||||||
| Total current income tax provision | ||||||||
| Deferred: | ||||||||
| Federal | ( | ) | ( | ) | ||||
| State | ||||||||
| Increase/(decrease) in valuation allowance | ||||||||
| Total deferred taxes | ||||||||
| Total provision for income taxes | $ | $ | ||||||
The deferred tax asset as of September 30, 2023 and 2022 consisted of the following:
| September 30, | ||||||||
| 2023 | 2022 | |||||||
| Stock-based compensation | $ | $ | ||||||
| Net operating loss | ||||||||
| Depreciation | ( | ) | ||||||
| Unearned revenue | ||||||||
| Investment in Passthrough Entities | ||||||||
| Allowance for Doubtful Accounts | ||||||||
| Others | ||||||||
| Total deferred tax assets | ||||||||
| Less: valuation allowance | ( | ) | ( | ) | ||||
| $ | $ | |||||||
The
company has net operating loss carry forwards of approximately $
| F-20 |
INNO
HOLDINGS INC. AND SUBSIDIARIES
Notes to Consolidated Financial Statements
As of September 30, 2023 and 2022 and for the years Ended
September 30, 2023 and 2022
Note 13 — Income taxes (cont.)
Valuation Allowance
We periodically assess whether it is more likely than not whether we will generate sufficient taxable income to realize our deferred tax assets and establish a valuation allowance if it’s we deem that will not likely be able to realize the benefit associated with our deferred tax assets. We consider all available positive and negative evidence and make certain assumptions to make this determination. We review our deferred tax liabilities, historical earnings, history of cycles of earnings and losses within our industry, our business environment and the potential to generate current and future earnings. We cannot determine at this time when we will be able to generate sufficient taxable income to realize our deferred tax assets. We therefore have recorded a full valuation allowance against our net deferred tax assets.
The Company is subject to U.S. federal income tax as well as state income tax in certain jurisdictions. The tax years 2020 to 2023 remain open to examination by the major taxing jurisdictions to which the Company is subject. The following is a reconciliation of income tax expenses at the effective rate to income tax at the calculated statutory rates:
| September 30, 2023 | September 30, 2022 | |||||||
| Statutory tax rate | ||||||||
| Federal | % | % | ||||||
| State (net of federal benefit) | % | ( | )% | |||||
| Net effect of state income tax deduction and other permanent differences | ( | )% | ( | )% | ||||
| Effective tax rate | % | ( | )% | |||||
As
of September 30, 2023 and 2022, the outstanding income tax payable was both $
Note 14 — Concentration of risk
Credit risk
Financial instruments that potentially subject the Company to significant concentrations of credit risk consist primarily of cash and cash equivalents and accounts receivable.
As
of September 30, 2023 and 2022, $
Accounts receivable are typically unsecured and derived from revenue earned from customers, thereby exposing the Company to credit risk. The risk is mitigated by the Company’s assessment of its customers’ creditworthiness and its ongoing monitoring of outstanding balances.
Customer and vendor concentration risk
For
the years ended September 30, 2023 and 2022, three customers accounted for
For
the years ended September 30, 2023 and 2022, three suppliers accounted for
| F-21 |
INNO
HOLDINGS INC. AND SUBSIDIARIES
Notes to Consolidated Financial Statements
As of September 30, 2023 and 2022 and for the years Ended
September 30, 2023 and 2022
Note 15 — Commitments and contingencies
Lease commitments
The Company has adopted ASC 842 since its inception date.
The
Company has entered into a lease agreement for office and production space in Texas with a lease period from December 1, 2019 until December
31, 2024 at a rate of $
The
Company has also entered into a lease agreement for office and production space in Corona, California with a lease period from May 1,
2022 until April 30, 2027 at a rate of $
In addition, the Company will be responsible for its pro rata share of certain costs, including utility costs, insurance and common area costs, as further detailed in the lease agreements.
Total
present value of commitment for the full term of these leases is $
The years ended September 30, 2023 and 2022:
| Lease cost | 2023 | 2022 | ||||||
| Operating lease cost (included in G&A in the Company’s statement of operations) | $ | $ | ||||||
| Other information | ||||||||
| Cash paid for amounts included in the measurement of lease liabilities | $ | $ | ||||||
| Remaining term in years | ||||||||
| Average discount rate – operating leases | % | % | ||||||
The supplemental balance sheet information related to leases is as follows:
| Operating leases | September 30, 2023 | September 30, 2022 | ||||||
| Right of use asset – non-current | $ | $ | ||||||
| Lease Liability – current | ||||||||
| Lease Liability – non-current | ||||||||
| Total operating lease liabilities | $ | $ | ||||||
Maturities of the Company’s lease liabilities are as follows:
| Operating Lease | ||||
| For periods subsequent to September 30, 2023: | ||||
| 2024 | $ | |||
| 2025 | ||||
| 2026 | ||||
| 2027 | ||||
| Less: Imputed interest/present value discount | ( | ) | ||
| Present value of lease liabilities | $ | |||
| F-22 |
Contingencies
Except a garnishment order described in Note 17, the Company is not currently a party to any material legal proceedings, investigations or claims. As the Company may, from time to time, be involved in legal matters arising in the ordinary course of its business, there can be no assurance that such matters will not arise in the future or that any such matters in which the Company is involved, or which may arise in the ordinary course of the Company’s business, will not at some point proceed to litigation or that such litigation will not have a material adverse effect on the business, financial condition or results of operations of the Company.
Note 16 — Correction of Immaterial Misstatements in Prior Period Financial Statement
In accordance with Staff Accounting Bulletin (“SAB”) No. 99, Materiality, and SAB No. 108, Considering the Effects of Prior Year Misstatements when Quantifying Misstatements in Current Year Financial Statements, the Company evaluated the errors and determined that the impact was not material to any of our previously issued financial statements.
The Company’s Consolidated Statements of Operations for the year ended September 30, 2022 contained reclassification of Cost of materials and labor to Selling general and administrative expense. The error had no impact on Net income.
| 30-Sep-22 | ||||||||||||
| In USD | As previously reported | Adjustment | As revised | |||||||||
| Consolidated statements of operations | ||||||||||||
| Costs of materials and labor | ( | ) | ||||||||||
| Selling, general and administrative expenses (exclusive of depreciation shown separately below) | ||||||||||||
Note 17 — Subsequent events
The registration statement for
the Company’s Initial Public Offering (“the Offering”) was declared effective on November 9, 2023. The Common Stock commenced
trading on the Nasdaq Capital Market on December 14, 2023, under the symbol “INHD.” The closing of the Offering took place
on December 18, 2023. On December 18, 2023, in connection with the closing of the initial public offering of shares (“the
Shares”) of its common stock, no par value, the Company adopted its Amended and Restated Bylaws, effective the same day. In connection
with the Offering of the Shares at an offering price of $ per share, the Company also granted the underwriters an option exercisable
for 45-days to purchase up to shares of Common Stock as the Public Offering Price, less the underwriting discount to cover-over
allotment. Additionally, the Company also issued warrants to the underwriters to purchase up to
The total gross proceeds from the Offering were
$
On December 27, 2023, a garnishment order resulting from a legal action
initiated by a creditor against the Company was issued by a court in the state of Ohio. The Creditor is seeking a total amount of $
As
disclosed in Note 9, on December 29, 2023, the Company paid $
On
January 4, 2024, the Company entered into an agreement to acquire certain real property located at 300 South Park Avenue, Pomona, Los
Angeles, California, approximately
| F-23 |
ITEM 9A. CONTROLS AND PROCEDURES
This annual report does not include a report of management’s assessment regarding internal control over financial reporting or an attestation report of the company’s registered public accounting firm due to a transition period established by rules of the Securities and Exchange Commission for newly public companies.
Disclosure Controls and Procedures
An evaluation was performed under the supervision of our management, including our Chief Executive Officer and Chief Financial Officer, of the effectiveness of the design and operation of our disclosure controls and procedures (as defined in Rules 13a-15(e) and 15d-15(e) of the Exchange Act) as of the end of the period covered by this Annual Report. Based on that evaluation, our management, including our Chief Executive Officer and Chief Financial Officer, concluded that, as of September 30, 2023, our disclosure controls and procedures were not effective to ensure that information we are required to disclose in reports that we file or submit under the Exchange Act is recorded, processed, summarized and reported within the time periods specified in the SEC’s rules and forms due to material weaknesses in our internal controls described below.
| ● | Lack of sufficient personnel commensurate with our accounting and reporting requirements and insufficient segregation of duties within accounting functions. | |
| ● | Lack of adequate policies and procedures in internal control function to ensure that proper control and procedures have been designed and implemented over key business cycles. |
We plan to hire additional qualified personnel with relevant experience and qualifications to strengthen the financial reporting function and to set up a financial and system control framework. However, we cannot assure you that we will remediate our material weaknesses in a timely manner.
Inherent Limitations Over Internal Controls
Our management, including our Chief Executive Officer and Chief Financial Officer, does not expect that our disclosure controls and procedures or our internal controls will prevent all errors and all fraud. A control system, no matter how well conceived and operated, can provide only reasonable, not absolute, assurance that the objectives of the control system are met. Our control systems are designed to provide such reasonable assurance of achieving their objectives. Further, the design of a control system must reflect the fact that there are resource constraints and the benefits of controls must be considered relative to their costs. Because of the inherent limitations in all control systems, no evaluation of controls can provide absolute assurance that all control issues and instances of fraud, if any, within our Company have been detected. These inherent limitations include, but are not limited to, the realities that judgments in decision-making can be faulty and that breakdowns can occur because of simple error or mistake. Additionally, controls can be circumvented by the individual acts of some persons, by collusion of two or more people, or by management override of the control. The design of any system of controls also is based in part upon certain assumptions about the likelihood of future events and there can be no assurance that any design will succeed in achieving its stated goals under all potential future conditions. Over time, controls may become inadequate because of changes in conditions, or the degree of compliance with the policies or procedures may deteriorate. Because of the inherent limitations in a cost-effective control system, misstatements due to error or fraud may occur and not be detected.
Changes in Internal Control over Financial Reporting
We have made no change in our internal control over financial reporting during the last fiscal year that has materially affected, or is reasonably likely to materially affect, our internal control over financial reporting.
| 35 |
PART III
ITEM 10. DIRECTORS, EXECUTIVE OFFICERS AND CORPORATE GOVERNANCE
Directors and Executive Officers
The following are our executive officers and directors and their respective ages and positions as of the date of this annual report.
| Name | Age | Position | ||
| Dekui Liu | 42 | Chief Executive Officer, Director and Chairman | ||
| Tianwei (Solomon) Li | 35 | Chief Financial Officer | ||
| Dr. Li (Alice) Gong | 38 | Chief Operation Officer | ||
| Ying Liu | 68 | Director | ||
| Xiaogang (John) Zhang | 40 | Independent Director | ||
| Chen Sung | 73 | Independent Director | ||
| Richard B. Haws, PE | 67 | Independent Director |
Dekui (“DK”) Liu — Chief Executive Officer, Director and Chairman
Mr. Liu has over 10 years of ground-up experience within the real estate development industry in the United States. Three generations of his family have been engaged in industrial industry. Having grown up in the entrepreneurial environment, he took his family’s inherited interest in machinery. Practical experience in machinery made him proficient in mechanical principles, electronics principles, and hydraulic transmission principles. Prior to founding INNO, Mr. Liu was the founder and CEO of WBBC Company, engaging in industrial products manufacturing, international trades, and construction from October 2012 to October 2022. Mr. Liu was also the CEO of Hwami Builder LLC from August 2018 to August 2020 and president at the real estate holdings company, Cube Development & Supply LLC from May 2019 to September 2020. Concurrently in October 2019, he founded Inno Metal Studs Corp where he has served as CEO from its inception to the present day. He has also served as the CEO and a Director of INNO from September 2021 to the present day. He is the author of five mechanical-related pending patents in the United States. Mr. Liu obtained his A.S. Degree in 2003 in Dalian, China, with a major in Mechanical and Electrical Engineering.
Tianwei (Solomon) Li — Chief Financial Officer
Mr. Li is a highly accomplished finance professional with a diverse background spanning various prestigious institutions. From November 2021 to the present July 2023, he has served as a licensed banker at both J.P Morgan Securities LLC and JPMorgan Chase Bank, N.A., where he combined his matchless expertise in financial management, venture capital, and financial advisory to create real value for clients. Before joining INNO HOLDINGS INC, Mr. Li worked as an exclusive banker at J.P Morgan Securities LLC. From October 2021 to December 2021, he worked as a registered representative at Sutter Securities Inc, providing investment advice and navigating complex regulatory frameworks. Prior to that, from November 2020 to December 2021, he worked as a registered representative at Boustead Securities, LLC, where he offered investment, management, and consulting services to over 50 portfolio companies. Notably, Mr. Li held leadership positions as Vice President at both Multipoint Resources Management Corp, from April 2019 to December 2019, and CATHY LOGISTICS INC, from February 2019 to August 2019, where he demonstrated exceptional leadership skills and strategic decision-making abilities. With a master’s Mr. Li also worked as an agent at Provident Real Estate from October 2019 to February 2022. With a master’s degree in Business Administration and holding the US Financial Industry Regulatory Agency Series 7 and 63 Securities licenses, Mr. Li exemplifies professionalism and regulatory compliance in his work. Combining his extensive practical experience with his strong academic foundation, Mr. Li is committed to delivering exceptional financial solutions and building long-lasting client relationships.
| 36 |
Dr. Li (Alice) Gong — Chief Operation Officer
Dr. Gong has over 10 years of experience in the field of financial analysis, having collaborated with renowned research organizations including Morningstar China where she was a data analyst from August 2007 to August 2008. Prior to founding INNO, Dr. Gong was a Graduate Research and Teaching Assistant for the Ph.D. Program of Applied Economics, Auburn University, in Alabama from August 2010 until May 2015. She also taught economics as an adjunct instructor at each of Herzing University and North American University from May 2016 to August 2016 and August 2021 to December 2021, respectively. As the COO of INNO beginning in February 2023, and as General Manager of Inno Metal Studs Corp from October 2020 to present, Dr. Gong utilizes her deep understanding of economics to analyze current market trends, finding creative ways to increase INNO’s profits and expand our consumer base. Dr. Gong is responsible for our overall operations, including generating revenue and controlling costs. Her duties at INNO include managing staff, overseeing the budget, employing marketing strategies, and many other facets of the business. Dr. Gong obtained a Ph.D. in Applied Economics from Auburn University in May 2015 and a Master of Science in Finance from Auburn University in May 2010.
Ying Liu — Director
Ms. Liu has more than 25 years of supply chain management experience, specifically in demand planning role. Prior to joining the Board of INNO in September of 2021, she worked at China National Petroleum Corporation, Dalian Branch from 1979-2010. She is skilled at using the analytical, marketing, and sales data of a company to effectively estimate future product demands. She advises to develop effective forecast models based on industry trends and demand patterns and support management with risk assessments and mitigation activities including advising on planning inventory flow, analyzing statistical data, and generating forecasting solutions. She received her A.S. Degree in Mathematics in 1976 in Dalian, China.
Xiaogang (“John”) Zhang — Independent Director
Mr. Zhang has served as a member of the Board since December 18, 2023, the day on which the Company closed its IPO. Mr. Zhang has extensive experience providing professional services for large entities throughout his twelve plus years of public accounting careers. From October 2018 to June 2021, Mr. Zhang served as audit manager and audit senior manager in KPMG’s Atlanta office leading the audit engagements of a number of multi-billion companies in Metro Atlanta. From October 2009 to September 2018, Mr. Zhang served as senior auditor in Pershing Yoakley & Associates, a healthcare accounting and consulting firm. His experience included audit services for large manufacturing companies, SEC filings, multi-hospital health systems, IFRS audits and local statuary audits. Mr. Zhang also currently serves as Director of Corporate Accounting of an industry leading packaging company, Altium Packaging LLC, overseeing the entire Corporate Accounting Team in Atlanta, Georgia, starting from June 2021. He received an MBA from East Tennessee State University in 2009 and a Master of Accountancy from East Tennessee State University in 2008.
Chen Sung — Independent Director
Mr. Sung has served as a member of the Board since December 18, 2023, the day on which the Company closed its IPO. Mr. Sung has over 30 years extensive experience in international trading and the construction industry. In 2018, he founded his own kitchen cabinet company, Bravo Home Products, Inc., and led the entire product development process, including design, manufacturing, and installation. As an engineer, he invented a hand-free classified dustbin device and still owns a patent in China for the device. He is also a community leader actively involved in the Chinese American Construction Professionals (“CACP”) organization where he serves as a communication coordinator. CACP is a non-profit trade organization in Southern California dedicated to enhancing members’ competitive-ness in global and local markets and providing networking opportunities for building and construction professionals. CACP’s corporate members include SOUTHERN CALIFORNIA EDISON, SoCalGas, Cathay Bank and Gensler. He also has served as a Fellow for Chinese American Construction Professionals, in California since 2015. He received an A.A. degree from Cypress College.
| 37 |
Richard B. Haws, PE — Independent Director
Mr. Haws has served as a member of the Board since December 18, 2023, the day on which the Company closed its IPO. Mr. Haws has experience in commercial solutions and construction and building expertise. Starting in August 2004, Mr. Haws held various positions, including most recently senior research engineer and director of commercial solutions, at Nucor Buildings Corp, in Denton, Texas before retiring in August 2021. Mr. Haws is currently the chair of the American Iron and Steel Institute (“AISI”) Committee on Specifications and the AISI Standards Council. He has held both positions since January 2017. In his capacity as chair of the AISI Committee on Specifications and the AISI Standards Council, he leads the effort to integrate building information modeling into the design and detailing process, expands modeling to start at the estimate stage, and develops energy efficient systems to comply with increasingly more stringent energy code requirements. He was also chair of the Metal Building Manufacturers Association (“MBMA”) Energy Committee from April 2017 to May 2021. He received a master’s degree in Civil Engineering from Youngstown State University in 1983.
Family Relationships
The Board of Directors includes the mother of Dekui Liu, our Chief Executive Officer, Director and Chairman, Ying Liu.
Code of Ethics
Our Board has adopted a written code of business conduct and ethics (“Code of Ethics”) that applies to our directors, officers, and employees, including our principal executive officer, principal financial officer and principal accounting officer or controller, or persons performing similar functions. We intend to post on our website a current copy of the Code of Ethics and all disclosures that are required by law regarding any amendments to, or waivers from, any provision of the Code of Ethics. Any person may obtain a copy of our Code of Ethics, without charge, by mailing a request to the Company at the address appearing on the front page of this annual Report on Form 10-K or by viewing it on our website found at https://www.innoholdings.com/code-of-business-conduct-and-ethics.
Board Leadership Structure and Risk Oversight
Our Board has responsibility for the oversight of our risk management processes and, either as a whole or through its committees, regularly discusses with management our major risk exposures, their potential impact on our business and the steps we take to manage them. The risk oversight process includes receiving regular reports from board committees and members of senior management to enable our Board to understand our risk identification, risk management, and risk mitigation strategies with respect to areas of potential material risk, including operations, finance, legal, regulatory, cybersecurity, strategic, and reputational risk. While the Company has not yet experienced a significant impact related to the situation in Ukraine caused by the Russian invasion, the Board will also closely monitor the risks in relation to such developments, including but not limited to risks related to cybersecurity, sanctions, supply chain, suppliers and service providers. Similarly, our board is monitoring US-China relations to monitor risks such as political disruption, supply chain, and foreign exchange.
Board of Directors
Our business and affairs are managed under the direction of our Board. Our Board consists of 5 directors, 3 of whom qualify as “independent” under the listing standards of Nasdaq.
Directors serve until the next annual meeting and until their successors are elected and qualified. Officers are appointed to serve until their successors have been elected and qualified.
Director Independence
Our Board is composed of a majority of “independent directors” as defined under the rules of Nasdaq. Nasdaq Listing Rule 5605(a)(2) provides that an “independent director” is a person other than an officer or employee of the company or any other individual having a relationship which, in the opinion of the Company’s Board, would interfere with the exercise of independent judgment in carrying out the responsibilities of a director.
Under such definition, our Board has undertaken a review of the independence of each director. Based on information provided by each director concerning his or her background, employment and affiliations, our Board has determined that Xiaogang Zhang, Chen Sung and Richard B. Haws are all independent directors of the Company.
| 38 |
Committees of the Board of Directors
Committees of the Board were established and took effect upon the closing of our IPO on December 18, 2023. Our committees include an audit committee and a compensation committee. Each such committee has the composition and responsibilities described below:
Audit Committee
Our audit committee consists of Xiaogang Zhang, Chen Sung and Richard B. Haws. Chen Sung is the chairman of the audit committee. In addition, our Board has determined that Xiaogang Zhang is an audit committee financial expert within the meaning of Item 407(d) of Regulation S-K under the Securities Act of 1933, as amended, or the Securities Act. The audit committee’s duties, which are specified in our Audit Committee Charter, include, but are not limited to:
| (a) | reviewing and discussing with management and the independent auditor the annual audited financial statements, and recommending to the Board whether the audited financial statements should be included in our annual disclosure report; | |
| (b) | discussing with management and the independent auditor significant financial reporting issues and judgments made in connection with the preparation of our financial statements; | |
| (c) | discussing with management major risk assessment and risk management policies; | |
| (d) | monitoring the independence of the independent auditor; | |
| (e) | verifying the rotation of the lead (or coordinating) audit partner having primary responsibility for the audit and the audit partner responsible for reviewing the audit as required by law; | |
| (f) | reviewing and approving all related-party transactions; | |
| (g) | inquiring and discussing with management our compliance with applicable laws and regulations; | |
| (h) | preapproving all audit services and permitted non-audit services to be performed by our independent auditor, including the fees and terms of the services to be performed; | |
| (i) | appointing or replacing the independent auditor; | |
| (j) | determining the compensation and oversight of the work of the independent auditor (including resolution of disagreements between management and the independent auditor regarding financial reporting) for the purpose of preparing or issuing an audit report or related work; | |
| (k) | establishing procedures for the receipt, retention and treatment of complaints received by us regarding accounting, internal accounting controls or reports which raise material issues regarding our financial statements or accounting policies; and | |
| (l) | approving reimbursement of expenses incurred by our management team in identifying potential target businesses. |
The audit committee is composed exclusively of “independent directors” who are “financially literate” as defined under the Nasdaq listing standards. The Nasdaq listing standards define “financially literate” as being able to read and understand fundamental financial statements, including a company’s balance sheet, income statement and cash flow statement.
In addition, the Company has certified to Nasdaq that the committee has, and will continue to have, at least one member who has past employment experience in finance or accounting, requisite professional certification in accounting, or other comparable experience or background that results in the individual’s financial sophistication.
| 39 |
Compensation Committee
Our compensation committee consists of Xiaogang Zhang, Chen Sung and Richard B. Haws, each of whom is an independent director. Each member of our compensation committee is also a non-employee director, as defined under Rule 16b-3 promulgated under the Exchange Act. Chen Sung is the chairman of the compensation committee. The compensation committee’s duties, which are specified in our Compensation Committee Charter, include, but are not limited to:
| (a) | reviews, approves and determines, or makes recommendations to our Board regarding, the compensation of our executive officers; | |
| (b) | administers our equity compensation plans; | |
| (c) | reviews and approves, or makes recommendations to our Board, regarding incentive compensation and equity compensation plans; and | |
| (d) | establishes and reviews general policies relating to compensation and benefits of our employees. |
Involvement in Certain Legal Proceedings
To our knowledge, none of our current directors or executive officers has, during the past ten (10) years:
| (a) | been convicted in a criminal proceeding or been subject to a pending criminal proceeding (excluding traffic violations and other minor offenses); | |
| (b) | had any bankruptcy petition filed by or against the business or property of the person, or of any partnership, corporation or business association of which he was a general partner or executive officer, either at the time of the bankruptcy filing or within two (2) years prior to that time; | |
| (c) | been subject to any order, judgment, or decree, not subsequently reversed, suspended or vacated, of any court of competent jurisdiction or federal or state authority, permanently or temporarily enjoining, barring, suspending or otherwise limiting, his or her involvement in any type of business, securities, futures, commodities, investment, banking, savings and loan, or insurance activities, or to be associated with persons engaged in any such activity; | |
| (d) | been found by a court of competent jurisdiction in a civil action or by the SEC or the Commodity Futures Trading Commission to have violated a federal or state securities or commodities law, and the judgment has not been reversed, suspended, or vacated; | |
| (e) | been the subject of, or a party to, any federal or state judicial or administrative order, judgment, decree, or finding, not subsequently reversed, suspended or vacated (not including any settlement of a civil proceeding among private litigants), relating to an alleged violation of any federal or state securities or commodities law or regulation, any law or regulation respecting financial institutions or insurance companies including, but not limited to, a temporary or permanent injunction, order of disgorgement or restitution, civil money penalty or temporary or permanent cease-and-desist order, or removal or prohibition order, or any law or regulation prohibiting mail or wire fraud or fraud in connection with any business entity; or | |
| (f) | been the subject of, or a party to, any sanction or order, not subsequently reversed, suspended or vacated, of any self-regulatory organization (as defined in section 3(a)(26) of the Exchange Act), any registered entity (as defined in section 1(a)(29) of the Commodity Exchange Act), or any equivalent exchange, association, entity or organization that has disciplinary authority over its members or persons associated with a member. |
| 40 |
Director Qualifications
In accordance with its charter, our nominating and corporate governance committee develops and recommends to our board of directors appropriate criteria, including desired qualifications, expertise, skills and characteristics, for selection of new directors and periodically reviews the criteria adopted by our board of directors and, if appropriate, recommends changes to such criteria.
Board Diversity
Our board of directors desires to seek members from diverse professional backgrounds who combine a strong professional reputation and knowledge of our business and industry with a reputation for integrity. Our board of directors does not have a formal policy with respect to diversity and inclusion but is in process of establishing a policy on diversity. Diversity of experience, expertise and viewpoints is one of many factors the nominating and corporate governance committee considers when recommending director nominees to our board of directors. Further, our board of directors seeks highly qualified women and individuals from minority groups to include in the pool from which new candidates are selected. Our board of directors also seeks members that have experience in positions with a high degree of responsibility or are, or have been, leaders in the companies or institutions with which they are, or were, affiliated, but may seek other members with different backgrounds, based upon the contributions they can make to our company. We believe that our current board composition reflects our commitment to diversity in the areas of professional background.
Delinquent Section 16(a) Reports
Section 16(a) of the Securities Exchange Act of 1934, as amended, requires our directors, executive officers and persons who own more than 10% of our outstanding shares of common stock (“Ten Percent Holders”) to file with the SEC reports of their share ownership and changes in their share ownership of our common stock. Directors, executive officers and Ten Percent Holders are also required to furnish us with copies of all ownership reports they file with the SEC. To our knowledge, based solely on a review of the copies of such reports furnished to us, the following directors, executive officers and Ten Percent Holders did not comply with all Section 16(a) filing requirements as of January 16, 2024 as follows: Messrs. Liu, Li, Sung, Zhang and Haws, and Mses. Gong and Liu, filed their Form 3s late in 2023.
| 41 |
ITEM 11. EXECUTIVE COMPENSATION
Compensation for our Named Executive Officers
As an emerging growth company, we have opted to comply with the executive compensation disclosure rules applicable to “smaller reporting companies,” as such term is defined in the rules promulgated under the Securities Act. This section discusses the material components of the executive compensation program for our named executive officers (“NEOs”) for the fiscal year ending September 30, 2023 (“Fiscal Year 2023”) and the fiscal year ending September 30, 2022 (“Fiscal Year 2022”).
For Fiscal Year 2023, the Company’s NEOs were:
| ● | Dekui Liu, Chief Executive Officer; | |
| ● | Tianwei (Solomon) Li , Chief Financial Officer; and | |
| ● | Dr. Li (Alice) Gong, Chief Operation Officer and General Manager of Inno Metal Studs Corp (a subsidiary of the Company); and | |
| ● | Weston Twigg, former Chief Financial Officer. |
Compensation Program
The objective of the compensation program of the Company and its subsidiaries (the “Company Group”) is to provide a total compensation package to each NEO that will enable the Company Group to attract, motivate and retain outstanding individuals, align the interests of our executive team with those of our shareholders, encourage individual and collective contributions to the successful execution of our short- and long-term business strategies and reward NEOs for performance.
| ● | Base Salary. Each of the NEOs is paid a base salary commensurate with the executive’s skill set, experience, performance, role and responsibilities. For Fiscal Year 2023, the annual base salaries for Mr. Li, Dr. Gong and Mr. Twigg were $180,000, $100,347 and $250,000, respectively. For Fiscal Year 2022, the annual salaries for Mr. Liu and Dr. Gong were $80,000 and $100,347, respectively. Starting at the beginning of Fiscal Year 2023, Mr. Liu agreed to a temporary delay in the payment of his base salary. In June 2023, the Board approved of a temporary reduction in Mr. Liu’s base salary for Fiscal Year 2023, from $80,000 to $11,000. Starting Fiscal Year 2024, Mr. Liu’s base salary returned to $80,000. | |
| ● | Short-Term Cash Incentives. During Fiscal Years 2023 and 2022, the Company Group did not grant any short-term cash bonuses to any of the NEOs. | |
| ● | Long-Term Equity Incentives. During Fiscal Years 2023 and 2022, the Company Group did not grant any incentive equity awards to any of the NEOs. |
Summary Compensation Table
The following table presents information regarding the total compensation awarded to, earned by and paid to the Company’s NEOs for services rendered to the Company Group in all capacities in its Fiscal Years 2023 and 2022.
| Name and Principal Position | Year | Salary
($) | Total
($) | |||||||||
| Dekui Liu | 2023 | 11,000 | (1) | 11,000 | ||||||||
| Chief Executive Officer | 2022 | 80,000 | 80,000 | |||||||||
| Tianwei (Solomon) Li(2) | 2023 | 45,000 | 45,000 | |||||||||
| Chief Financial Officer | ||||||||||||
| Dr. Li (Alice) Gong | 2023 | 100,347 | 100,347 | |||||||||
| Chief Operation Officer and General Manager of Inno Metal Studs Corp | 2022 | 100,347 | 100,347 | |||||||||
| Weston Twigg(2) | 2023 | 104,527 | 104,527 | |||||||||
| Chief Financial Officer (former) | ||||||||||||
| (1) | See above description of Mr. Liu’s base salary reduction for Fiscal Year 2023 above under “Compensation Program – Base Salary.” |
| (2) | Mr. Li was appointed Chief Financial Officer, effective July 17, 2023. Mr. Twigg resigned from the Company, effective July 3, 2023. Since neither individual was a named executive officer before Fiscal Year 2023, only their Fiscal Year 2023 compensation is reported in the table. |
| 42 |
Narrative Disclosure to the Summary Compensation Table
Employee Benefits
The executive officers, including the NEOs, are eligible to receive the same employee benefits that are generally available to all full-time employees, subject to the satisfaction of certain eligibility requirements. In structuring these benefit plans, the Company Group seeks to provide an aggregate level of benefits that are comparable to those provided by similar companies.
Agreements with our NEOs
Other than Mr. Li, our NEOs not currently subject to an employment agreement with the Company Group.
Effective July 17, 2023, Mr. Li was appointed by the Board to serve as the Company Group’s Chief Financial Officer. Pursuant to the terms of his Offer Letter with the Company, dated July 14, 2023 (the “Li Offer Letter”). Mr. Li’s initial employment term will run from July 17, 2023 to July 17, 2024. Starting July 17, 2024, his employment will be at-will. Pursuant to the Offer Letter Mr. Li will receive an annual base salary of $180,000 and be eligible for an annual performance-based bonus of Company options worth $200,000 disbursed proportionally on a monthly basis, subject to the Omnibus Plan. Subject to the consummation of the IPO and pursuant to the Offer Letter, Mr. Li is eligible for a one-time award of $50,000 within one week after consummation of the IPO for pre-IPO consulting services provided. The option awards and the IPO bonus of $50,000 have not been awarded as of the date of this filing. Mr. Li is also will be eligible to participate in all benefit plans generally offered to other senior executives of the Company in similar positions and with similar responsibilities.
2023 Omnibus Incentive Plan
Our Board adopted, and our shareholders approved, the Inno Holdings, Inc. 2023 Omnibus Incentive Plan (the “Omnibus Plan”), effective July 18, 2023. No incentive equity awards have been granted under the Omnibus Plan as of the date hereof.
The purpose of the Omnibus Plan is to: (i) encourage the profitability and growth of the Company through short-term and long-term incentives that are consistent with the Company’s objectives; (ii) give participants an incentive for excellence in individual performance; (iii) promote teamwork among its participants; and (iv) give the Company a significant advantage in attracting and retaining key employees, non-employee directors, and consultants. To accomplish these purposes, the Omnibus Plan provides for the grant of awards in the form of incentive stock options within the meaning of Section 422 of the Code, nonqualified stock options, stock appreciation rights, restricted stock, restricted stock units, performance-based awards (including performance shares, performance units and performance bonus awards), and other stock-based or cash-based awards. A total of 2,013,552 shares of common stock was initially reserved and available for issuance under the Omnibus Plan.
Outstanding Equity Awards at 2023 Fiscal Year-End
None of our NEOs had any outstanding equity awards in the Company as of September 30, 2023.
Potential Payments Upon Termination or Change in Control
Except for Mr. Li, none of our NEOs were eligible for any potential payments upon any form of termination or resignation of employment or a change in control of the Company if such event took place on September 30, 2023 or at any other point during Fiscal Year 2023. Since Li Offer Letter provides for a one-year term, if Mr. Li had been terminated by the Company on September 30, 2023, he would receive the balance of his base salary through the one-year anniversary of his start date. Mr. Twigg did not receive any payments or benefits in connection with his resignation from the Company, effective July 3, 2023.
| 43 |
Director Compensation Table
Shaoren Liu and Ying Liu served as the Company’s non-employee directors during Fiscal Year 2023. Neither of the Company’s non-employee directors received any compensation related to the director’s Board service in Fiscal Year 2023 or had any outstanding equity awards as of September 30, 2023. Mr. Shaoren Liu resigned as a member of the Board, effective December 18, 2023.
Emerging Growth Company Status
We are an “emerging growth company,” as defined in the Jobs Act. We will remain an emerging growth company until the earliest of (i) the last day of the fiscal year following the fifth anniversary of the date of the first sale of our common stock pursuant to an effective registration statement under the Securities Act; (ii) the last day of the fiscal year in which we have total annual gross revenues of $1.235 billion or more; (iii) the date on which we have issued more than $1 billion in nonconvertible debt during the previous three years; and (iv) the date on which we are deemed to be a large accelerated filer under applicable SEC rules. We expect that we will remain an emerging growth company for the foreseeable future, but we cannot retain our emerging growth company status indefinitely and will no longer qualify as an emerging growth company on or before the last day of the fiscal year following the fifth anniversary of the date of the first sale of our common stock pursuant to an effective registration statement under the Securities Act. For so long as we remain an emerging growth company, we are permitted and intend to rely on exemptions from specified disclosure requirements that are applicable to other public companies that are not emerging growth companies.
These exemptions include:
| ● | being permitted to provide only two years of audited financial statements, in addition to any required unaudited interim financial statements, with reduced “Management’s Discussion and Analysis of Financial Condition and Results of Operations” disclosures; | |
| ● | not being required to comply with the requirement of an auditor needing to attest to our internal controls over financial reporting; | |
| ● | not being required to comply with any requirement that may be adopted by the Public Company Accounting Oversight Board regarding mandatory audit firm rotation or providing a supplement to the auditor’s report regarding additional information about the audit and the financial statements; | |
| ● | reduced disclosure obligations regarding executive compensation; and | |
| ● | not being required to hold a nonbinding advisory vote on executive compensation and shareholder approval of any golden parachute payments not previously approved. |
| 44 |
ITEM 12. SECURITY OWNERSHIP OF CERTAIN BENEFICIAL OWNERS AND MANAGEMENT AND RELATED STOCKHOLDER MATTERS
The following table sets forth information with respect to the beneficial ownership, within the meaning of Rule 13d-3 under the Exchange Act, of our Common Stock Shares as of the date of this annual report, with respect to the holdings of (1) each person who is the beneficial owner of more than 5% of Company voting stock, (2) each of our directors, (3) each executive officer, and (4) all of our current directors and executive officers as a group.
Beneficial ownership of the voting stock is determined in accordance with the rules of the SEC and includes any shares of company voting stock over which a person exercises sole or shared voting or investment power, or of which a person has a right to acquire ownership at any time within 60 days of January 16, 2024. Except as otherwise indicated, we believe that the persons named in this table have sole voting and investment power with respect to all shares of voting stock held by them. Applicable percentage ownership in the following table is based on 22,765,278 shares of common stock issued and outstanding and including 2,013,552 shares of common stock reserved for future issuance under the Plan, plus, for each individual, any securities that individual has the right to acquire within 60 days of January 16, 2024.
To the best of our knowledge, except as otherwise indicated, each of the persons named in the table has sole voting and investment power with respect to the shares of our common stock beneficially owned by such person, except to the extent such power may be shared with a spouse. To our knowledge, none of the shares listed below are held under a voting trust or similar agreement, except as noted. To our knowledge, there is no arrangement, including any pledge by any person of securities of the Company, the operation of which may at a subsequent date result in a change in control of the Company.
| Name and Address of Beneficial Owner(1) | Title | Beneficially owned(2) | Percent | |||||||
| Officers and Directors | ||||||||||
| Dekui Liu | Chief Executive Officer, Director and Chairman | 13,837,893 | 60.8 | % | ||||||
| Tianwei Li | Chief Financial Officer | — | — | |||||||
| Dr. Li (Alice) Gong | Chief Operation Officer | — | — | |||||||
| Ying Liu | Director | — | — | |||||||
| Xiaogang (John) Zhang | Independent Director | — | — | |||||||
| Chen Sung | Independent Director | — | — | |||||||
| Richard B. Haws, PE | Independent Director | — | — | |||||||
| Officers and Directors as a Group (total of 7 persons) | 13,837,893 | 60.8 | % | |||||||
| 5% Stockholders | ||||||||||
| Dekui Liu | Chief Executive Officer, Director and Chairman | 13,837,893 | 60.8 | % | ||||||
| Zfounder Organization Inc.(3)(4) | Investor | 3,013,685 | 13.2 | % | ||||||
| * | Less than 1% |
| (1) | Unless otherwise indicated the business address for each of the individuals is 2465 Farm Market 359 South, Brookshire, TX 77423. |
| (2) | Approximate percentage of outstanding common stock includes 2,013,552 shares of common stock reserved for issuance under the Omnibus Plan. |
| (3) | The business address for Zfounder Organization Inc. is 12905 SW 42nd St. Unit 222 Miami, FL 33175. |
| (4) | Beneficially owned by Wen Hua. |
Equity Compensation Plan Information
As of September 30, 2023, there was no awards were issued by the Company under its equity compensation plan.
| 45 |
ITEM 13. CERTAIN RELATIONSHIPS AND RELATED TRANSACTIONS AND DIRECTOR INDEPENDENCE
Unless described below, during the last two fiscal years, there are no transactions or series of similar transactions to which we were a party or will be a party, in which:
| ● | the amounts involved exceed or will exceed $120,000; and | |
| ● | any of our directors, executive officers or holders of more than 5% of our capital stock, or any member of the immediate family of any of the foregoing had, or will have, a direct or indirect material interest. |
The Company borrows short term loans without interest from its majority shareholder and CEO, Mr. Dekui Liu, for operation and cashflow needs from time to time. As of Septembere 30, 2023, the amount due to Mr. Liu was $327,372. As of September 30, 2022, the outstanding balance due to Mr. Liu was $12,233.
During the year ended September 30, 2022, the Company engaged Yunited Assets LLC (“Yunited”), a limited liability company owned by Mr. Cheng Yu, the minority owner of the Company’s subsidiary, Inno Research Institute, for consultation services on a project-by-project basis. During the years ended September 30, 2023 and 2022, the Company recorded $4,375 and $19,950, respectively, of project-based consulting service fees, included in cost of materials and labor. During the years ended September 30, 2023 and 2022, the Company also recorded $110,000 and $80,000 consulting fee to Yunited for Mr. Yu’s daily operating services included in the general and administrative expenses. As of September 30, 2023, the outstanding balance of accounts payable – related party due to Yunited was $50,000. As of September 30, 2022, there were no unpaid balances due to Yunited.
During the year ended September 30, 2022, the Company purchased prefab home and other material and supplies from Baicheng Trading LLC, in which the father of Mr. Dekui Liu, the Company’s majority shareholder and CEO, is a director. As of both September 30, 2023 and 2022, the outstanding balance of accounts payable-related party was $485,595.
In March 2022, the Company entered into an agreement with Wise Hill Inc. (“Wise Hill”), a Florida corporation wholly owned by a minority shareholder of the Company. Pursuant to the agreement, the Company sold prefab home products of $250,000 to Wise Hill. For the year ended September 30, 2022, the Company recorded revenue-related party of $250,000. As of September 30, 2023 and 2022, the outstanding balance of accounts receivable — related party due from Wise Hill was $0 and $100,000, respectively.
In March 2023, the Company entered into an agreement with Vision Opportunity Fund LP, a Florida limited partnership partially owned by a minority shareholder of the Company. In August 2023, all rights, obligations and interests under the agreement were subsequently assigned by Vision Opportunity Fund LP to its general partner, New Vision 101 LLC (“Vision 101”). Pursuant to the agreement, the Company agreed to provide supplies and act as project developer for an amount equal to $15,875,800 plus applicable taxes. During the year ended September 30, 2023, no amount of revenue has been recognized.
During the year ended September 30, 2023, the Company loaned $55,000 without interest from Zfounder Organization Inc., one of the Company’s minority shareholders for operation and cashflow needs. In addition, the Company loaned $222,000 without interest from Wise Hill Inc., a company owned by a minority shareholder of the Company who also serves as the CEO and Board member of Zfounder Organization Inc., for operation and cashflow needs. $100,000 of the advanced amounts have been considered as the payment of accounts receivable due from Wise Hill Inc. As of September 30, 2023, the outstanding balance due to Zfounder Organization Inc. and Wise Hill Inc. was $55,000 and $122,000, respectively.
| 46 |
Policies and Procedures for Related Person Transactions
We have adopted a written related person transaction policy that set forth the following policies and procedures for the review and approval or ratification of related person transactions. A “related person transaction” is a transaction, arrangement or relationship in which INNO or any of its subsidiaries was, is or will be a participant, the amount of which involved exceeds $120,000, and in which any related person had, has or will have a direct or indirect material interest. A “related person” means:
| ● | any person who is, or at any time during the applicable period was, one of INNO’s executive officers or directors; | |
| ● | any person who is known by INNO to be the beneficial owner of more than 5% of INNO’s voting securities; | |
| ● | any immediate family member of any of the foregoing persons, which means any child, stepchild, parent, stepparent, spouse, sibling, mother-in-law, father-in-law, son-in-law, daughter-in-law, brother in-law or sister-in-law of a director, executive officer or a beneficial owner of more than 5% of INNO’s voting securities, and any person (other than a tenant or employee) sharing the household of such director, executive officer or beneficial owner of more than 5% of INNO’s voting securities; and | |
| ● | any firm, corporation or other entity in which any of the foregoing persons is a partner or principal, or in a similar position, or in which such person has a 10% or greater beneficial ownership interest. |
We intend to establish policies and procedures designed to minimize potential conflicts of interest arising from any dealings we may have with our affiliates and to provide appropriate procedures for the disclosure of any real or potential conflicts of interest that may exist from time to time. Specifically, pursuant to its audit committee charter, the audit committee have the responsibility to review related party transactions.
Director Independence
A majority of our Board are independent directors, see the discussion above under the section “Item 10. Directors, Executive Officers and Corporate governance.”
| 47 |
ITEM 14. PRINCIPAL ACCOUNTANT FEES AND SERVICES
Independent Auditor
For the years ended September 30, 2023 and 2022, the Company’s independent public accounting firm was TAAD LLP.
Fees Paid to Principal Independent Registered Public Accounting Firm
The aggregate fees billed by our Independent Registered Public Accounting Firm, for the years ended September 30, 2023 and 2022 are as follows:
| 2023 | 2022 | |||||||
| Audit Fees (1) | $ | 178,383 | $ | 125,842 | ||||
| Audit Related Fees (2) | ||||||||
| Tax Fees (3) | - | - | ||||||
| All other fees (4) | - | - | ||||||
| Total Fees | $ | 178,383 | $ | 125,842 | ||||
| (1) Audit fees represent fees for professional services provided in connection with the audit of our annual financial statements and the review of our quarterly financial statements and those services normally provided in connection with statutory or regulatory filings or engagements including comfort letters, consents and other services related to SEC matters. This information is presented as of the latest practicable date for this annual report. | |
| (2) Audit-related fees represent fees for assurance and related services that are reasonably related to the performance of the audit or review of our financial statements and not reported above under “Audit Fees.” | |
| (3)TAAD did not provide us with tax compliance, tax advice or tax planning services | |
| (4) All other fees include fees billed by our independent auditors for products or services other than as described in the immediately preceding three categories. No such fees were incurred during the fiscal years ended September 30, 2023 and 2022. |
Audit Committee Pre-Approval Policies
The charter of our audit committee provides that the duties and responsibilities of our audit committee include the pre-approval of all audit and non-audit services permitted by law or applicable SEC regulations (including fee and terms of engagement) to be performed by our external auditor.
| 48 |
PART IV
ITEM 15. EXHIBITS AND FINANCIAL STATEMENT SCHEDULES
The following documents are filed as part of this report:
(1) Financial Statements
All financial statements of the Company as set forth under Item 8 of this Annual Report on Form 10-K.
(2) Financial Statement Schedules
All schedules have been omitted because the required information is included in the financial statements or notes thereto or because they are not required.
(3) Exhibits.
The following exhibits are filed, furnished or incorporated by reference as part of this Annual Report on Form 10-K.
EXHIBIT INDEX7
| * | Filed or furnished herewith. |
| ++ | Portions of this exhibit have been redacted in compliance with Regulation S-K Item 601(b)(10). The omitted information is not material and would likely cause competitive harm to the Company if publicly disclosed. The Company agrees to furnish an unredacted copy to the SEC upon its request. |
| # | Certain schedules and exhibits have been omitted in compliance with Regulation S-K Item 601(a)(5). The Company agrees to furnish a copy of any omitted schedule or exhibit to the SEC upon its request. |
7 NTD: Subject to ongoing review.
| 49 |
SIGNATURES
Pursuant to the requirements of Section 13 or 15(d) of the Securities and Exchange Act of 1934, the registrant has duly caused this report to be signed on its behalf by the undersigned, thereunto duly authorized.
| INNO HOLDINGS, INC. | ||
| By: | /s/ Dekui Liu | |
| Dekui Liu | ||
| Chief Executive Officer (Principal Executive Officer) | ||
| Date: | January 16, 2024 | |
Pursuant to the requirements of the Securities Exchange Act of 1934, this report has been signed below by the following persons on behalf of the registrant and in the capacities and on the dates indicated.
| Name | Position | Date | ||
| /s/ Dekui Liu | Chief Executive Officer, Director and Chairman | January 16, 2024 | ||
| Dekui Liu | (Principal Executive Officer) | |||
| /s/ Tianwei Li | Chief Financial Officer | January 16, 2024 | ||
| Tianwei Li | (Principal Financial and Accounting Officer) | |||
| /s/ Ying Liu | Director | January 16, 2024 | ||
| Ying Liu | ||||
| /s/ Xiaogang Zhang | Director | January 16, 2024 | ||
| Xiaogang Zhang | ||||
| /s/ Chen Sung | Director | January 16, 2024 | ||
| Chen Sung | ||||
| /s/ Richard B. Haws | Director | January 16, 2024 | ||
| Richard B. Haws |
| 50 |