Exhibit 99.2


Michigan (State or Other Jurisdiction of Incorporation) | 000-08185 (Commission File Number) | 38-2022454 (IRS Employer Identification No.) | ||
235 E. Main Street Midland, Michigan (Address of Principal Executive Offices) | 48640 (Zip Code) | ||
Item 2.02 | Results of Operations and Financial Condition. |
Item 9.01 | Financial Statements and Exhibits. | ||||
Dated: | October 21, 2015 | CHEMICAL FINANCIAL CORPORATION (Registrant) |
/s/ Lori A. Gwizdala | ||
Lori A. Gwizdala | ||
Executive Vice President, Chief Financial Officer and Treasurer | ||
Exhibit Number | Document | |
99.1 | Press Release dated October 21, 2015. This Exhibit is furnished to, and not filed with, the Commission. |
99.2 | Earnings Presentation Slides. This Exhibit is furnished to, and not filed with, the Commission. |
• | The transaction may be more expensive to complete and the anticipated benefits, including anticipated cost savings and strategic gains, may be significantly harder or take longer to achieve than expected or may not be achieved in their entirety as a result of unexpected factors or events. |
• | The integration of Lake Michigan's business and operations into the Corporation, which will include conversion of operating systems and procedures, may take longer than anticipated or be more costly than anticipated or have unanticipated adverse results relating to Lake Michigan's or the Corporation's existing businesses. |
• | The Corporation's ability to achieve anticipated results from the transaction is dependent on the state of the economic and financial markets going forward. Specifically, the Corporation may incur more credit losses from Lake Michigan's loan portfolio than expected and deposit attrition may be greater than expected. |
September 30, 2015 | June 30, 2015 | December 31, 2014 | September 30, 2014 | |||||||||||||
(In thousands, except per share data) | ||||||||||||||||
Assets | ||||||||||||||||
Cash and cash equivalents: | ||||||||||||||||
Cash and cash due from banks | $ | 151,512 | $ | 167,054 | $ | 144,892 | $ | 134,116 | ||||||||
Interest-bearing deposits with the Federal Reserve Bank and other banks | 140,025 | 47,980 | 38,128 | 248,022 | ||||||||||||
Total cash and cash equivalents | 291,537 | 215,034 | 183,020 | 382,138 | ||||||||||||
Investment securities: | ||||||||||||||||
Available-for-sale | 635,641 | 685,706 | 748,864 | 576,211 | ||||||||||||
Held-to-maturity | 501,083 | 469,837 | 316,413 | 318,562 | ||||||||||||
Total investment securities | 1,136,724 | 1,155,543 | 1,065,277 | 894,773 | ||||||||||||
Loans held-for-sale | 12,319 | 7,798 | 9,128 | 9,347 | ||||||||||||
Loans: | ||||||||||||||||
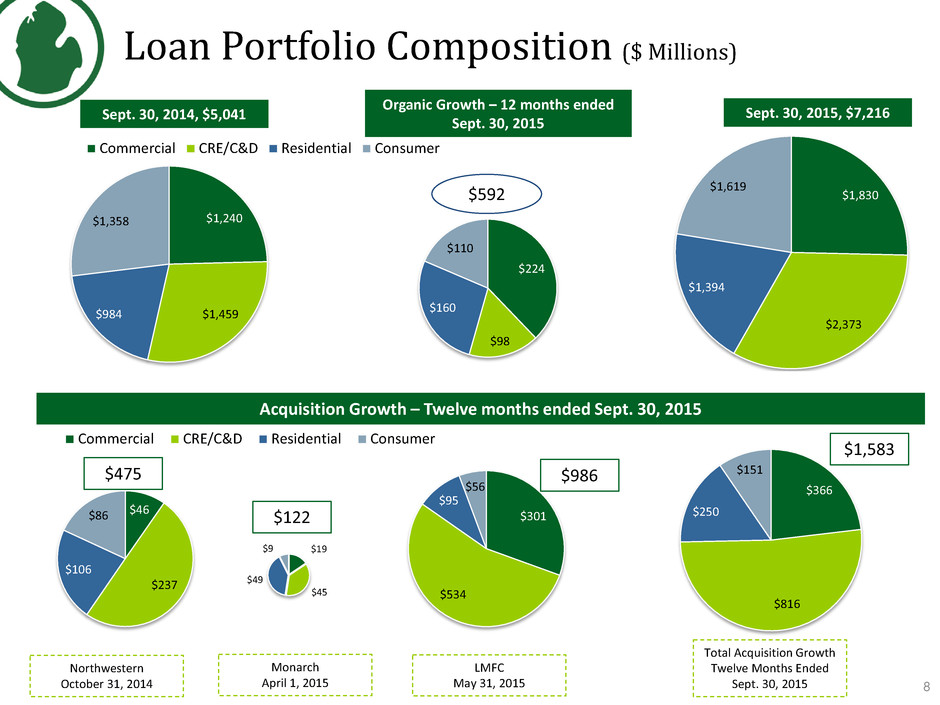
Commercial | 1,829,870 | 1,754,873 | 1,354,881 | 1,239,946 | ||||||||||||
Commercial real estate | 2,227,364 | 2,243,513 | 1,557,648 | 1,322,646 | ||||||||||||
Real estate construction and land development | 145,581 | 112,312 | 171,495 | 136,216 | ||||||||||||
Residential mortgage | 1,394,427 | 1,310,167 | 1,110,390 | 984,049 | ||||||||||||
Consumer installment and home equity | 1,618,953 | 1,613,878 | 1,493,816 | 1,358,063 | ||||||||||||
Total loans | 7,216,195 | 7,034,743 | 5,688,230 | 5,040,920 | ||||||||||||
Allowance for loan losses | (75,626 | ) | (74,941 | ) | (75,683 | ) | (77,006 | ) | ||||||||
Net loans | 7,140,569 | 6,959,802 | 5,612,547 | 4,963,914 | ||||||||||||
Premises and equipment | 110,670 | 111,968 | 97,496 | 80,127 | ||||||||||||
Goodwill | 286,454 | 285,512 | 180,128 | 120,164 | ||||||||||||
Other intangible assets | 39,864 | 41,201 | 33,080 | 11,958 | ||||||||||||
Interest receivable and other assets | 246,417 | 243,867 | 141,467 | 134,564 | ||||||||||||
Total Assets | $ | 9,264,554 | $ | 9,020,725 | $ | 7,322,143 | $ | 6,596,985 | ||||||||
Liabilities | ||||||||||||||||
Deposits: | ||||||||||||||||
Noninterest-bearing | $ | 1,875,636 | $ | 1,860,863 | $ | 1,591,661 | $ | 1,344,716 | ||||||||
Interest-bearing | 5,739,575 | 5,432,116 | 4,487,310 | 4,087,211 | ||||||||||||
Total deposits | 7,615,211 | 7,292,979 | 6,078,971 | 5,431,927 | ||||||||||||
Interest payable and other liabilities | 72,568 | 66,174 | 56,572 | 40,366 | ||||||||||||
Short-term borrowings | 330,016 | 532,291 | 389,467 | 323,086 | ||||||||||||
Other borrowings | 248,396 | 148,490 | — | — | ||||||||||||
Total liabilities | 8,266,191 | 8,039,934 | 6,525,010 | 5,795,379 | ||||||||||||
Shareholders' Equity | ||||||||||||||||
Preferred stock, no par value per share | — | — | — | — | ||||||||||||
Common stock, $1 par value per share | 38,131 | 38,110 | 32,774 | 32,763 | ||||||||||||
Additional paid-in capital | 723,427 | 722,329 | 565,166 | 564,127 | ||||||||||||
Retained earnings | 265,991 | 251,456 | 231,646 | 224,222 | ||||||||||||
Accumulated other comprehensive loss | (29,186 | ) | (31,104 | ) | (32,453 | ) | (19,506 | ) | ||||||||
Total shareholders' equity | 998,363 | 980,791 | 797,133 | 801,606 | ||||||||||||
Total Liabilities and Shareholders' Equity | $ | 9,264,554 | $ | 9,020,725 | $ | 7,322,143 | $ | 6,596,985 | ||||||||
Three Months Ended | Nine Months Ended | |||||||||||||||
September 30, | September 30, | |||||||||||||||
2015 | 2014 | 2015 | 2014 | |||||||||||||
(In thousands, except per share data) | ||||||||||||||||
Interest Income | ||||||||||||||||
Interest and fees on loans | $ | 73,809 | $ | 52,343 | $ | 196,519 | $ | 152,289 | ||||||||
Interest on investment securities: | ||||||||||||||||
Taxable | 2,233 | 2,194 | 6,742 | 6,825 | ||||||||||||
Tax-exempt | 2,399 | 1,838 | 6,490 | 5,213 | ||||||||||||
Dividends on nonmarketable equity securities | 266 | 160 | 1,015 | 809 | ||||||||||||
Interest on deposits with the Federal Reserve Bank and other banks | 144 | 94 | 394 | 318 | ||||||||||||
Total interest income | 78,851 | 56,629 | 211,160 | 165,454 | ||||||||||||
Interest Expense | ||||||||||||||||
Interest on deposits | 4,304 | 3,469 | 11,286 | 10,840 | ||||||||||||
Interest on short-term borrowings | 144 | 92 | 343 | 307 | ||||||||||||
Interest on other borrowings | 786 | — | 999 | — | ||||||||||||
Total interest expense | 5,234 | 3,561 | 12,628 | 11,147 | ||||||||||||
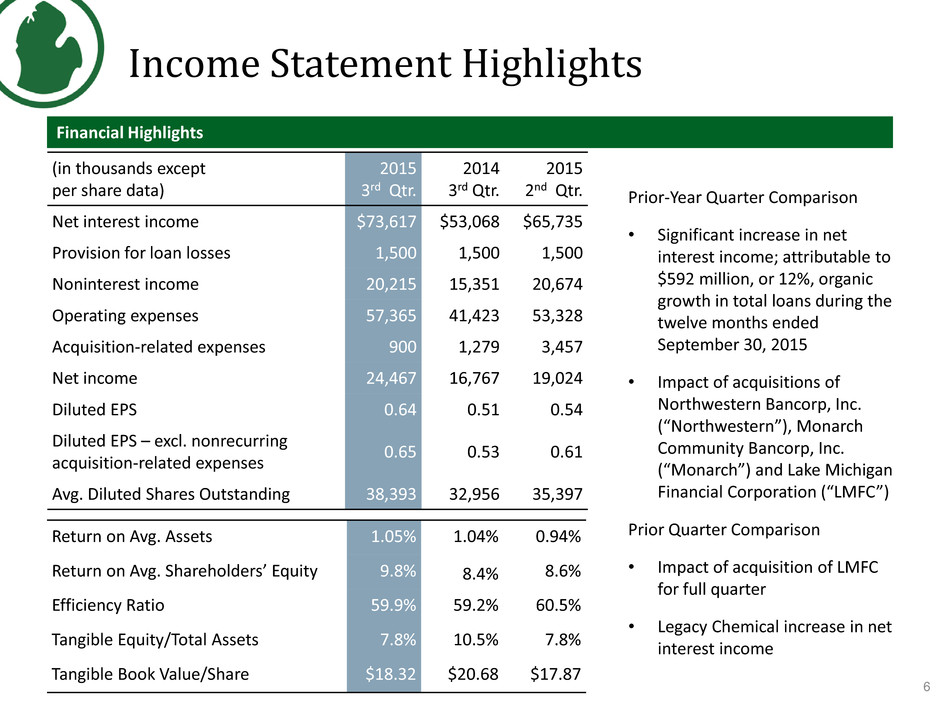
Net Interest Income | 73,617 | 53,068 | 198,532 | 154,307 | ||||||||||||
Provision for loan losses | 1,500 | 1,500 | 4,500 | 4,600 | ||||||||||||
Net interest income after provision for loan losses | 72,117 | 51,568 | 194,032 | 149,707 | ||||||||||||
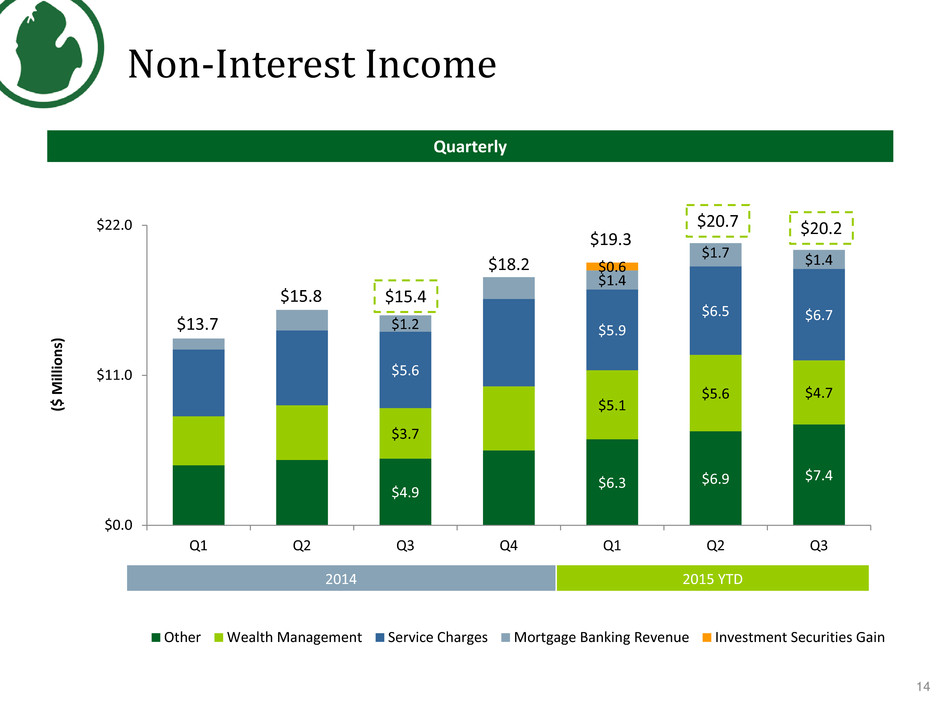
Noninterest Income | ||||||||||||||||
Service charges and fees on deposit accounts | 6,722 | 5,612 | 19,083 | 16,028 | ||||||||||||
Wealth management revenue | 4,725 | 3,730 | 15,401 | 11,319 | ||||||||||||
Other charges and fees for customer services | 6,818 | 4,686 | 19,324 | 13,562 | ||||||||||||
Mortgage banking revenue | 1,436 | 1,166 | 4,527 | 3,451 | ||||||||||||
Gain on sale of investment securities | 5 | — | 612 | — | ||||||||||||
Other | 509 | 157 | 1,217 | 508 | ||||||||||||
Total noninterest income | 20,215 | 15,351 | 60,164 | 44,868 | ||||||||||||
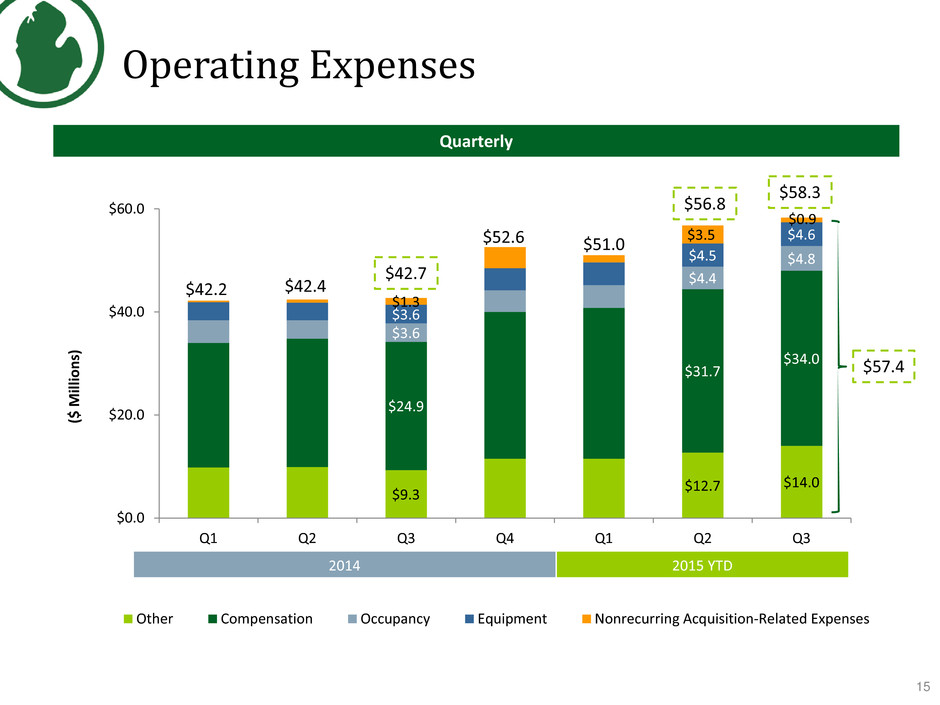
Operating Expenses | ||||||||||||||||
Salaries, wages and employee benefits | 33,985 | 24,885 | 94,949 | 73,929 | ||||||||||||
Occupancy | 4,781 | 3,629 | 13,593 | 11,641 | ||||||||||||
Equipment and software | 4,589 | 3,587 | 13,467 | 10,461 | ||||||||||||
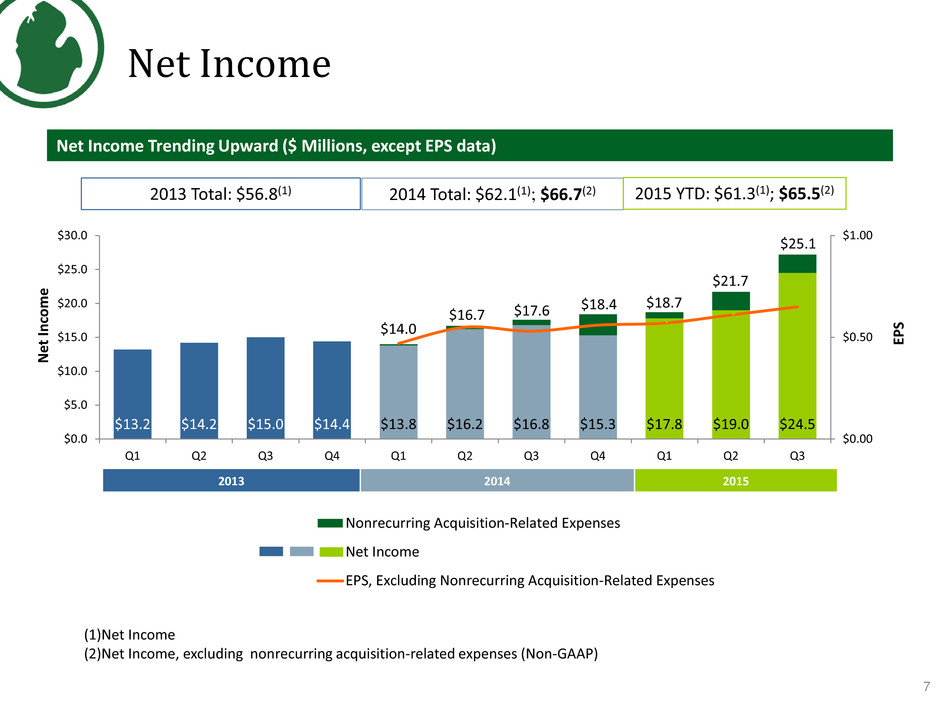
Acquisition-related expenses | 900 | 1,279 | 5,719 | 2,249 | ||||||||||||
Other | 14,010 | 9,322 | 38,342 | 29,029 | ||||||||||||
Total operating expenses | 58,265 | 42,702 | 166,070 | 127,309 | ||||||||||||
Income before income taxes | 34,067 | 24,217 | 88,126 | 67,266 | ||||||||||||
Federal income tax expense | 9,600 | 7,450 | 26,800 | 20,450 | ||||||||||||
Net Income | $ | 24,467 | $ | 16,767 | $ | 61,326 | $ | 46,816 | ||||||||
Earnings Per Common Share: | ||||||||||||||||
Weighted average common shares outstanding for basic earnings per share | 38,123 | 32,762 | 35,384 | 30,896 | ||||||||||||
Weighted average common shares outstanding for diluted earnings per share, including common stock equivalents | 38,393 | 32,956 | 35,630 | 31,101 | ||||||||||||
Basic earnings per share | $ | 0.64 | $ | 0.51 | $ | 1.73 | $ | 1.52 | ||||||||
Diluted earnings per share | 0.64 | 0.51 | 1.72 | 1.51 | ||||||||||||
Cash Dividends Declared Per Common Share | 0.26 | 0.24 | 0.74 | 0.70 | ||||||||||||
Key Ratios (annualized where applicable): | ||||||||||||||||
Return on average assets | 1.05 | % | 1.04 | % | 0.99 | % | 0.99 | % | ||||||||
Return on average shareholders' equity | 9.8 | % | 8.4 | % | 9.2 | % | 8.5 | % | ||||||||
Net interest margin | 3.55 | % | 3.59 | % | 3.56 | % | 3.57 | % | ||||||||
Efficiency ratio | 59.9 | % | 59.2 | % | 60.8 | % | 61.4 | % | ||||||||
3rd Quarter 2015 | 2nd Quarter 2015 | 1st Quarter 2015 | 4th Quarter 2014 | 3rd Quarter 2014 | 2nd Quarter 2014 | 1st Quarter 2014 | ||||||||||||||||||||||
Average Balances | ||||||||||||||||||||||||||||
Total assets | $ | 9,203,856 | $ | 8,117,138 | $ | 7,401,258 | $ | 7,007,879 | $ | 6,412,460 | $ | 6,253,574 | $ | 6,210,569 | ||||||||||||||
Total interest-earning assets | 8,467,939 | 7,534,733 | 6,920,734 | 6,558,147 | 6,046,991 | 5,907,549 | 5,860,429 | |||||||||||||||||||||
Total loans | 7,125,896 | 6,262,072 | 5,696,961 | 5,418,743 | 4,962,948 | 4,824,299 | 4,692,430 | |||||||||||||||||||||
Total deposits | 7,452,556 | 6,709,428 | 6,204,095 | 5,808,187 | 5,249,317 | 5,151,581 | 5,142,276 | |||||||||||||||||||||
Total interest-bearing liabilities | 6,233,944 | 5,442,676 | 4,959,123 | 4,632,769 | 4,237,626 | 4,250,158 | 4,276,677 | |||||||||||||||||||||
Total shareholders' equity | 987,727 | 884,863 | 801,438 | 804,328 | 794,711 | 714,355 | 701,878 | |||||||||||||||||||||
Key Ratios (annualized where applicable) | ||||||||||||||||||||||||||||
Net interest margin (taxable equivalent basis) | 3.55 | % | 3.59 | % | 3.55 | % | 3.62 | % | 3.59 | % | 3.59 | % | 3.53 | % | ||||||||||||||
Efficiency ratio | 59.9 | % | 60.5 | % | 62.4 | % | 62.2 | % | 59.2 | % | 60.9 | % | 64.5 | % | ||||||||||||||
Return on average assets | 1.05 | % | 0.94 | % | 0.98 | % | 0.87 | % | 1.04 | % | 1.04 | % | 0.90 | % | ||||||||||||||
Return on average shareholders' equity | 9.8 | % | 8.6 | % | 9.0 | % | 7.5 | % | 8.4 | % | 9.1 | % | 8.0 | % | ||||||||||||||
Average shareholders' equity as a percent of average assets | 10.7 | % | 10.9 | % | 10.8 | % | 11.5 | % | 12.4 | % | 11.4 | % | 11.3 | % | ||||||||||||||
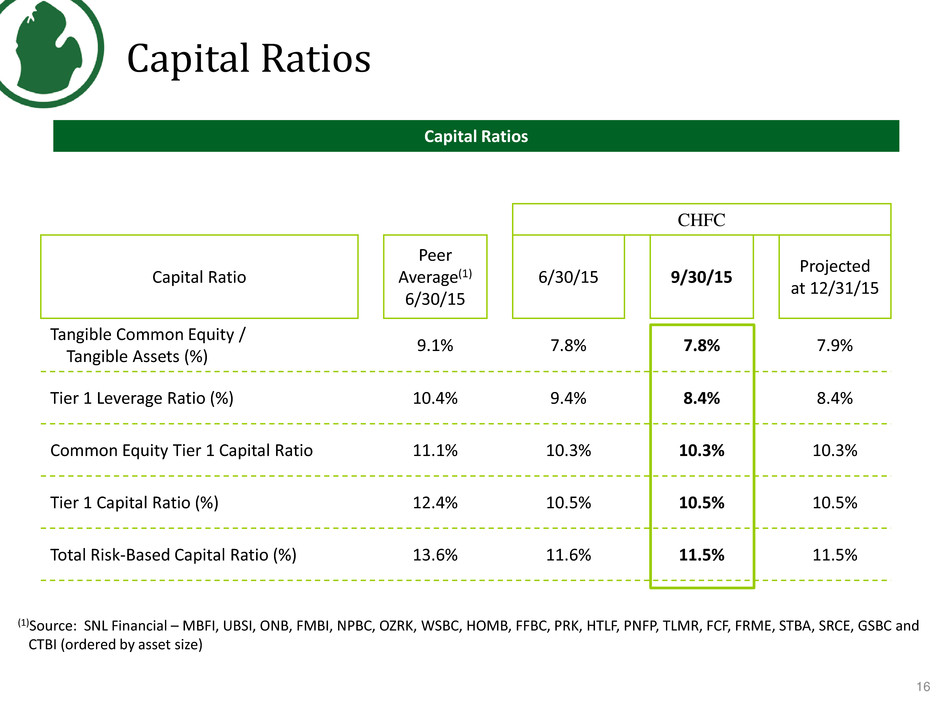
Capital ratios (period end): | ||||||||||||||||||||||||||||
Tangible shareholders' equity as a percent of total assets | 7.8 | % | 7.8 | % | 8.4 | % | 8.4 | % | 10.5 | % | 11.0 | % | 9.3 | % | ||||||||||||||
Total risk-based capital ratio | 11.5 | % | 11.7 | % | 13.0 | % | 12.4 | % | 15.0 | % | 15.3 | % | 13.8 | % | ||||||||||||||
3rd Quarter 2015 | 2nd Quarter 2015 | 1st Quarter 2015 | 4th Quarter 2014 | 3rd Quarter 2014 | 2nd Quarter 2014 | 1st Quarter 2014 | ||||||||||||||||||||||
Credit Quality Statistics | ||||||||||||||||||||||||||||
Originated loans | $ | 5,667,159 | $ | 5,351,011 | $ | 5,048,662 | $ | 4,990,067 | $ | 4,777,614 | $ | 4,624,409 | $ | 4,464,465 | ||||||||||||||
Acquired loans | 1,549,036 | 1,683,732 | 654,212 | 698,163 | 263,306 | 274,395 | 288,824 | |||||||||||||||||||||
Nonperforming assets: | ||||||||||||||||||||||||||||
Nonperforming loans (NPLs) | 81,217 | 70,906 | 72,741 | 71,184 | 70,742 | 73,735 | 76,544 | |||||||||||||||||||||
Other real estate/repossessed assets (ORE) | 11,207 | 14,197 | 14,744 | 14,205 | 10,354 | 10,392 | 10,056 | |||||||||||||||||||||
Total nonperforming assets | 92,424 | 85,103 | 87,485 | 85,389 | 81,096 | 84,127 | 86,600 | |||||||||||||||||||||
Performing troubled debt restructurings | 44,803 | 45,808 | 45,981 | 45,664 | 44,588 | 44,133 | 41,823 | |||||||||||||||||||||
Allowance for loan losses - originated as a percent of: | ||||||||||||||||||||||||||||
Total originated loans | 1.33 | % | 1.40 | % | 1.49 | % | 1.51 | % | 1.60 | % | 1.67 | % | 1.75 | % | ||||||||||||||
Nonperforming loans | 93 | % | 106 | % | 103 | % | 106 | % | 108 | % | 105 | % | 102 | % | ||||||||||||||
NPLs as a percent of total loans | 1.13 | % | 1.01 | % | 1.28 | % | 1.25 | % | 1.40 | % | 1.51 | % | 1.61 | % | ||||||||||||||
Nonperforming assets as a percent of: | ||||||||||||||||||||||||||||
Total loans plus ORE | 1.28 | % | 1.21 | % | 1.53 | % | 1.50 | % | 1.61 | % | 1.71 | % | 1.82 | % | ||||||||||||||
Total assets | 1.00 | % | 0.94 | % | 1.16 | % | 1.17 | % | 1.23 | % | 1.35 | % | 1.37 | % | ||||||||||||||
Net loan charge-offs (year-to-date) | $ | 4,557 | $ | 3,742 | $ | 1,927 | $ | 9,489 | $ | 6,666 | $ | 4,379 | $ | 2,199 | ||||||||||||||
Net loan charge-offs as a percent of average loans (year-to-date, annualized) | 0.10 | % | 0.13 | % | 0.14 | % | 0.19 | % | 0.18 | % | 0.18 | % | 0.19 | % | ||||||||||||||
Sept 30, 2015 | June 30, 2015 | March 31, 2015 | Dec 31, 2014 | Sept 30, 2014 | June 30, 2014 | March 31, 2014 | ||||||||||||||||||||||
Additional Data - Intangibles | ||||||||||||||||||||||||||||
Goodwill | $ | 286,454 | $ | 285,512 | $ | 180,128 | $ | 180,128 | $ | 120,164 | $ | 120,164 | $ | 120,164 | ||||||||||||||
Core deposit intangibles (CDI) | 27,890 | 28,353 | 20,072 | 20,863 | 8,665 | 9,110 | 9,556 | |||||||||||||||||||||
Mortgage servicing rights (MSR) | 11,540 | 12,307 | 11,583 | 12,217 | 3,293 | 3,344 | 3,316 | |||||||||||||||||||||
Noncompete agreements | 434 | 541 | — | — | — | — | — | |||||||||||||||||||||
Amortization of CDI and noncompete agreements (during quarter ended) | 1,270 | 987 | 791 | 693 | 445 | 446 | 445 | |||||||||||||||||||||
Three Months Ended September 30, 2015 | Three Months Ended September 30, 2014 | |||||||||||||||||||||
Average Balance | Interest (FTE) | Effective Yield/Rate* | Average Balance | Interest (FTE) | Effective Yield/Rate* | |||||||||||||||||
Assets | (Dollars in thousands) | |||||||||||||||||||||
Interest-earning assets: | ||||||||||||||||||||||
Loans** | $ | 7,135,013 | $ | 74,549 | 4.15 | % | $ | 4,970,635 | $ | 52,900 | 4.23 | % | ||||||||||
Taxable investment securities | 692,906 | 2,233 | 1.29 | 616,191 | 2,194 | 1.42 | ||||||||||||||||
Tax-exempt investment securities | 448,214 | 3,690 | 3.29 | 300,975 | 2,827 | 3.76 | ||||||||||||||||
Other interest-earning assets | 36,142 | 266 | 2.92 | 25,572 | 160 | 2.48 | ||||||||||||||||
Interest-bearing deposits with the Federal Reserve Bank and other banks | 155,664 | 144 | 0.37 | 133,618 | 94 | 0.28 | ||||||||||||||||
Total interest-earning assets | 8,467,939 | 80,882 | 3.80 | 6,046,991 | 58,175 | 3.82 | ||||||||||||||||
Less: allowance for loan losses | 75,337 | 77,536 | ||||||||||||||||||||
Other assets: | ||||||||||||||||||||||
Cash and cash due from banks | 174,816 | 133,465 | ||||||||||||||||||||
Premises and equipment | 112,252 | 74,738 | ||||||||||||||||||||
Interest receivable and other assets | 524,186 | 234,802 | ||||||||||||||||||||
Total assets | $ | 9,203,856 | $ | 6,412,460 | ||||||||||||||||||
Liabilities and Shareholders' Equity | ||||||||||||||||||||||
Interest-bearing liabilities: | ||||||||||||||||||||||
Interest-bearing demand deposits | $ | 1,778,681 | $ | 436 | 0.10 | % | $ | 1,206,075 | $ | 308 | 0.10 | % | ||||||||||
Savings deposits | 2,033,613 | 389 | 0.08 | 1,441,114 | 327 | 0.09 | ||||||||||||||||
Time deposits | 1,728,725 | 3,479 | 0.80 | 1,264,477 | 2,834 | 0.89 | ||||||||||||||||
Short-term borrowings | 504,252 | 144 | 0.11 | 325,960 | 92 | 0.11 | ||||||||||||||||
Other borrowings | 188,673 | 786 | 1.65 | — | — | — | ||||||||||||||||
Total interest-bearing liabilities | 6,233,944 | 5,234 | 0.33 | 4,237,626 | 3,561 | 0.33 | ||||||||||||||||
Noninterest-bearing deposits | 1,911,537 | — | — | 1,337,651 | — | — | ||||||||||||||||
Total deposits and borrowed funds | 8,145,481 | 5,234 | 0.25 | 5,575,277 | 3,561 | 0.25 | ||||||||||||||||
Interest payable and other liabilities | 70,648 | 42,472 | ||||||||||||||||||||
Shareholders' equity | 987,727 | 794,711 | ||||||||||||||||||||
Total liabilities and shareholders' equity | $ | 9,203,856 | $ | 6,412,460 | ||||||||||||||||||
Net Interest Spread (Average yield earned on interest-earning assets minus average rate paid on interest-bearing liabilities) | 3.47 | % | 3.49 | % | ||||||||||||||||||
Net Interest Income (FTE) | $ | 75,648 | $ | 54,614 | ||||||||||||||||||
Net Interest Margin (Net Interest Income (FTE) divided by total average interest-earning assets) | 3.55 | % | 3.59 | % | ||||||||||||||||||
* | Fully taxable equivalent (FTE) basis using a federal income tax rate of 35%. |
** | Nonaccrual loans and loans held-for-sale are included in average balances reported and are included in the calculation of yields. Also, tax equivalent interest includes net loan fees. |
Nine Months Ended September 30, 2015 | Nine Months Ended September 30, 2014 | |||||||||||||||||||||
Average Balance | Interest (FTE) | Effective Yield/Rate* | Average Balance | Interest (FTE) | Effective Yield/Rate* | |||||||||||||||||
Assets | (Dollars in thousands) | |||||||||||||||||||||
Interest-earning assets: | ||||||||||||||||||||||
Loans** | $ | 6,376,527 | $ | 198,436 | 4.16 | % | $ | 4,833,468 | $ | 153,928 | 4.26 | % | ||||||||||
Taxable investment securities | 708,618 | 6,742 | 1.27 | 652,969 | 6,825 | 1.39 | ||||||||||||||||
Tax-exempt investment securities | 392,555 | 9,983 | 3.39 | 270,699 | 8,018 | 3.95 | ||||||||||||||||
Other interest-earning assets | 33,308 | 1,015 | 4.07 | 25,572 | 809 | 4.23 | ||||||||||||||||
Interest-bearing deposits with the Federal Reserve Bank and other banks | 135,795 | 394 | 0.39 | 156,299 | 318 | 0.27 | ||||||||||||||||
Total interest-earning assets | 7,646,803 | 216,570 | 3.78 | 5,939,007 | 169,898 | 3.82 | ||||||||||||||||
Less: allowance for loan losses | 75,430 | 78,488 | ||||||||||||||||||||
Other assets: | ||||||||||||||||||||||
Cash and cash due from banks | 154,157 | 123,390 | ||||||||||||||||||||
Premises and equipment | 104,477 | 74,618 | ||||||||||||||||||||
Interest receivable and other assets | 417,347 | 234,413 | ||||||||||||||||||||
Total assets | $ | 8,247,354 | $ | 6,292,940 | ||||||||||||||||||
Liabilities and Shareholders' Equity | ||||||||||||||||||||||
Interest-bearing liabilities: | ||||||||||||||||||||||
Interest-bearing demand deposits | $ | 1,609,323 | $ | 1,051 | 0.09 | % | $ | 1,189,200 | $ | 868 | 0.10 | % | ||||||||||
Savings deposits | 1,921,750 | 1,119 | 0.08 | 1,424,494 | 958 | 0.09 | ||||||||||||||||
Time deposits | 1,518,842 | 9,116 | 0.80 | 1,307,174 | 9,014 | 0.92 | ||||||||||||||||
Short-term borrowings | 415,160 | 343 | 0.11 | 333,809 | 307 | 0.12 | ||||||||||||||||
Other borrowings | 84,843 | 999 | 1.57 | — | — | — | ||||||||||||||||
Total interest-bearing liabilities | 5,549,918 | 12,628 | 0.30 | 4,254,677 | 11,147 | 0.35 | ||||||||||||||||
Noninterest-bearing deposits | 1,743,351 | — | — | 1,260,582 | — | — | ||||||||||||||||
Total deposits and borrowed funds | 7,293,269 | 12,628 | 0.23 | 5,515,259 | 11,147 | 0.27 | ||||||||||||||||
Interest payable and other liabilities | 62,060 | 40,360 | ||||||||||||||||||||
Shareholders' equity | 892,025 | 737,321 | ||||||||||||||||||||
Total liabilities and shareholders' equity | $ | 8,247,354 | $ | 6,292,940 | ||||||||||||||||||
Net Interest Spread (Average yield earned on interest-earning assets minus average rate paid on interest-bearing liabilities) | 3.48 | % | 3.47 | % | ||||||||||||||||||
Net Interest Income (FTE) | $ | 203,942 | $ | 158,751 | ||||||||||||||||||
Net Interest Margin (Net Interest Income (FTE) divided by total average interest-earning assets) | 3.56 | % | 3.57 | % | ||||||||||||||||||
* | Fully taxable equivalent (FTE) basis using a federal income tax rate of 35%. |
** | Nonaccrual loans and loans held-for-sale are included in average balances reported and are included in the calculation of yields. Also, tax equivalent interest includes net loan fees. |
Sept 30, 2015 | June 30, 2015 | March 31, 2015 | Dec 31, 2014 | Sept 30, 2014 | June 30, 2014 | March 31, 2014 | ||||||||||||||||||||||
(In thousands) | ||||||||||||||||||||||||||||
Nonperforming Loans: | ||||||||||||||||||||||||||||
Nonaccrual loans: | ||||||||||||||||||||||||||||
Commercial | $ | 26,463 | $ | 17,260 | $ | 18,904 | $ | 16,418 | $ | 18,213 | $ | 18,773 | $ | 18,251 | ||||||||||||||
Commercial real estate | 24,969 | 25,287 | 24,766 | 24,966 | 23,858 | 25,361 | 27,568 | |||||||||||||||||||||
Real estate construction | 247 | 247 | 663 | 162 | 162 | 160 | 160 | |||||||||||||||||||||
Land development | 297 | 255 | 290 | 225 | 1,467 | 2,184 | 2,267 | |||||||||||||||||||||
Residential mortgage | 6,248 | 6,004 | 6,514 | 6,706 | 6,693 | 6,325 | 6,589 | |||||||||||||||||||||
Consumer installment | 536 | 393 | 433 | 500 | 527 | 536 | 806 | |||||||||||||||||||||
Home equity | 1,876 | 1,769 | 1,870 | 1,667 | 2,116 | 2,296 | 2,046 | |||||||||||||||||||||
Total nonaccrual loans | 60,636 | 51,215 | 53,440 | 50,644 | 53,036 | 55,635 | 57,687 | |||||||||||||||||||||
Accruing loans contractually past due 90 days or more as to interest or principal payments: | ||||||||||||||||||||||||||||
Commercial | 122 | 711 | 52 | 170 | 16 | 15 | 43 | |||||||||||||||||||||
Commercial real estate | 216 | 56 | 148 | — | 87 | 69 | 730 | |||||||||||||||||||||
Real estate construction | — | — | — | — | — | — | — | |||||||||||||||||||||
Land development | — | — | — | — | — | — | — | |||||||||||||||||||||
Residential mortgage | 572 | 424 | 172 | 557 | 380 | 376 | — | |||||||||||||||||||||
Consumer installment | — | — | — | — | — | — | — | |||||||||||||||||||||
Home equity | 558 | 588 | 429 | 1,346 | 1,779 | 1,075 | 622 | |||||||||||||||||||||
Total accruing loans contractually past due 90 days or more as to interest or principal payments | 1,468 | 1,779 | 801 | 2,073 | 2,262 | 1,535 | 1,395 | |||||||||||||||||||||
Nonperforming troubled debt restructurings: | ||||||||||||||||||||||||||||
Commercial loan portfolio | 15,559 | 14,547 | 15,810 | 15,271 | 11,797 | 11,049 | 11,218 | |||||||||||||||||||||
Consumer loan portfolio | 3,554 | 3,365 | 2,690 | 3,196 | 3,647 | 5,516 | 6,244 | |||||||||||||||||||||
Total nonperforming troubled debt restructurings | 19,113 | 17,912 | 18,500 | 18,467 | 15,444 | 16,565 | 17,462 | |||||||||||||||||||||
Total nonperforming loans | 81,217 | 70,906 | 72,741 | 71,184 | 70,742 | 73,735 | 76,544 | |||||||||||||||||||||
Other real estate and repossessed assets | 11,207 | 14,197 | 14,744 | 14,205 | 10,354 | 10,392 | 10,056 | |||||||||||||||||||||
Total nonperforming assets | $ | 92,424 | $ | 85,103 | $ | 87,485 | $ | 85,389 | $ | 81,096 | $ | 84,127 | $ | 86,600 | ||||||||||||||
3rd Quarter 2015 | 2nd Quarter 2015 | 1st Quarter 2015 | 4th Quarter 2014 | 3rd Quarter 2014 | 2nd Quarter 2014 | 1st Quarter 2014 | Nine Months Ended | |||||||||||||||||||||||||||||
Sept 30, 2015 | Sept 30, 2014 | |||||||||||||||||||||||||||||||||||
(In thousands) | ||||||||||||||||||||||||||||||||||||
Allowance for loan losses - originated loan portfolio | ||||||||||||||||||||||||||||||||||||
Allowance for loan losses - beginning of period | $ | 74,941 | $ | 75,256 | $ | 75,183 | $ | 76,506 | $ | 77,293 | $ | 77,973 | $ | 78,572 | $ | 75,183 | $ | 78,572 | ||||||||||||||||||
Provision for loan losses | 1,500 | 1,500 | 2,000 | 1,500 | 1,500 | 1,500 | 1,600 | 5,000 | 4,600 | |||||||||||||||||||||||||||
Net loan (charge-offs) recoveries: | ||||||||||||||||||||||||||||||||||||
Commercial | 86 | (36 | ) | (424 | ) | (932 | ) | (535 | ) | (569 | ) | (233 | ) | (374 | ) | (1,337 | ) | |||||||||||||||||||
Commercial real estate | 145 | (581 | ) | (415 | ) | (620 | ) | (412 | ) | (783 | ) | (241 | ) | (851 | ) | (1,436 | ) | |||||||||||||||||||
Real estate construction | — | (49 | ) | (80 | ) | — | (13 | ) | — | (100 | ) | (129 | ) | (113 | ) | |||||||||||||||||||||
Land development | (1 | ) | — | (11 | ) | 363 | 16 | 127 | 142 | (12 | ) | 285 | ||||||||||||||||||||||||
Residential mortgage | (214 | ) | (661 | ) | (492 | ) | (277 | ) | (304 | ) | (341 | ) | (704 | ) | (1,367 | ) | (1,349 | ) | ||||||||||||||||||
Consumer installment | (782 | ) | (590 | ) | (649 | ) | (813 | ) | (689 | ) | (612 | ) | (801 | ) | (2,021 | ) | (2,102 | ) | ||||||||||||||||||
Home equity | (49 | ) | 102 | 144 | (544 | ) | (350 | ) | (2 | ) | (262 | ) | 197 | (614 | ) | |||||||||||||||||||||
Net loan charge-offs | (815 | ) | (1,815 | ) | (1,927 | ) | (2,823 | ) | (2,287 | ) | (2,180 | ) | (2,199 | ) | (4,557 | ) | (6,666 | ) | ||||||||||||||||||
Allowance for loan losses - end of period | 75,626 | 74,941 | 75,256 | 75,183 | 76,506 | 77,293 | 77,973 | 75,626 | 76,506 | |||||||||||||||||||||||||||
Allowance for loan losses - acquired loan portfolio | ||||||||||||||||||||||||||||||||||||
Allowance for loan losses - beginning of period | — | — | 500 | 500 | 500 | 500 | 500 | 500 | 500 | |||||||||||||||||||||||||||
Provision for loan losses | — | — | (500 | ) | — | — | — | — | (500 | ) | — | |||||||||||||||||||||||||
Allowance for loan losses - end of period | — | — | — | 500 | 500 | 500 | 500 | — | 500 | |||||||||||||||||||||||||||
Total allowance for loan losses | $ | 75,626 | $ | 74,941 | $ | 75,256 | $ | 75,683 | $ | 77,006 | $ | 77,793 | $ | 78,473 | $ | 75,626 | $ | 77,006 | ||||||||||||||||||
Net loan charge-offs as a percent of average loans | 0.05% | 0.12% | 0.14% | 0.21% | 0.18% | 0.18% | 0.19% | 0.10% | 0.18% | |||||||||||||||||||||||||||
3rd Quarter 2015 | 2nd Quarter 2015 | 1st Quarter 2015 | 4th Quarter 2014 | 3rd Quarter 2014 | 2nd Quarter 2014 | 1st Quarter 2014 | ||||||||||||||||||||||
(Dollars in thousands, except per share data) | ||||||||||||||||||||||||||||
Summary of Operations | ||||||||||||||||||||||||||||
Interest income | $ | 78,851 | $ | 69,679 | $ | 62,630 | $ | 61,807 | $ | 56,629 | $ | 55,180 | $ | 53,645 | ||||||||||||||
Interest expense | 5,234 | 3,944 | 3,450 | 3,563 | 3,561 | 3,720 | 3,866 | |||||||||||||||||||||
Net interest income | 73,617 | 65,735 | 59,180 | 58,244 | 53,068 | 51,460 | 49,779 | |||||||||||||||||||||
Provision for loan losses | 1,500 | 1,500 | 1,500 | 1,500 | 1,500 | 1,500 | 1,600 | |||||||||||||||||||||
Net interest income after provision for loan losses | 72,117 | 64,235 | 57,680 | 56,744 | 51,568 | 49,960 | 48,179 | |||||||||||||||||||||
Noninterest income | 20,215 | 20,674 | 19,275 | 18,227 | 15,351 | 15,801 | 13,716 | |||||||||||||||||||||
Operating expenses | 57,365 | 53,328 | 49,658 | 48,477 | 41,423 | 41,778 | 41,859 | |||||||||||||||||||||
Acquisition-related expenses | 900 | 3,457 | 1,362 | 4,139 | 1,279 | 647 | 323 | |||||||||||||||||||||
Income before income taxes | 34,067 | 28,124 | 25,935 | 22,355 | 24,217 | 23,336 | 19,713 | |||||||||||||||||||||
Federal income tax expense | 9,600 | 9,100 | 8,100 | 7,050 | 7,450 | 7,100 | 5,900 | |||||||||||||||||||||
Net income | $ | 24,467 | $ | 19,024 | $ | 17,835 | $ | 15,305 | $ | 16,767 | $ | 16,236 | $ | 13,813 | ||||||||||||||
Net interest margin | 3.55 | % | 3.59 | % | 3.55 | % | 3.62 | % | 3.59 | % | 3.59 | % | 3.53 | % | ||||||||||||||
Per Common Share Data | ||||||||||||||||||||||||||||
Net income: | ||||||||||||||||||||||||||||
Basic | $ | 0.64 | $ | 0.54 | $ | 0.54 | $ | 0.47 | $ | 0.51 | $ | 0.54 | $ | 0.46 | ||||||||||||||
Diluted | 0.64 | 0.54 | 0.54 | 0.46 | 0.51 | 0.54 | 0.46 | |||||||||||||||||||||
Diluted, excluding acquisition-related transaction expenses | 0.65 | 0.61 | 0.57 | 0.56 | 0.53 | 0.55 | 0.47 | |||||||||||||||||||||
Cash dividends declared | 0.26 | 0.24 | 0.24 | 0.24 | 0.24 | 0.23 | 0.23 | |||||||||||||||||||||
Book value - period-end | 26.18 | 25.74 | 24.68 | 24.32 | 24.47 | 24.22 | 23.63 | |||||||||||||||||||||
Tangible book value - period-end | 18.32 | 17.87 | 18.95 | 18.57 | 20.68 | 20.42 | 19.44 | |||||||||||||||||||||
Market value - period-end | 32.35 | 33.06 | 31.36 | 30.64 | 26.89 | 28.08 | 32.45 | |||||||||||||||||||||
B"_=AN,K'/<9"UJ@ T..#\E")[(D:<8PC
M& $(R)12>[(QN,YPB:4G8@(M/8+0>J,:C 3L=9KL=0N>9/PYP^J=LKX+K;*>MIJAE33SQB6
M.>(Y;(TC((.EQ