0001951667--12-312023FYfalse82500008250000166660001791600084160009666000P5Y96660000001951667us-gaap:CommonClassAMemberus-gaap:CommonStockMember2023-01-012023-12-310001951667us-gaap:AdditionalPaidInCapitalMember2023-01-012023-12-310001951667ctnt:JuguangZhangMemberctnt:EdwardTransitExpressGroupInc.Memberus-gaap:CommonClassAMemberus-gaap:SubsequentEventMember2024-02-022024-02-020001951667us-gaap:RetainedEarningsMember2023-12-310001951667us-gaap:AdditionalPaidInCapitalMember2023-12-310001951667ctnt:SubscriptionReceivableMember2023-12-310001951667us-gaap:RetainedEarningsMember2022-12-310001951667us-gaap:AdditionalPaidInCapitalMember2022-12-310001951667ctnt:SubscriptionReceivableMember2022-12-310001951667us-gaap:RetainedEarningsMember2021-12-310001951667us-gaap:AdditionalPaidInCapitalMember2021-12-310001951667ctnt:SecondInstallmentDueWithinSixMonthsAfterSettlementMember2023-10-0200019516672023-10-020001951667ctnt:ThreadCapitalIncMember2023-01-012023-12-310001951667ctnt:SmallBusinessAdministrationMember2023-01-012023-12-310001951667us-gaap:NonUsMember2023-01-012023-12-310001951667country:US2023-01-012023-12-310001951667us-gaap:NonUsMember2022-01-012022-12-310001951667country:US2022-01-012022-12-310001951667ctnt:Mr.HuanLiuMemberus-gaap:RelatedPartyMember2023-01-012023-12-310001951667ctnt:Mr.HuanLiuMemberus-gaap:RelatedPartyMember2022-01-012022-12-310001951667ctnt:JuguangZhangMemberctnt:EdwardTransitExpressGroupInc.Memberus-gaap:SubsequentEventMember2024-02-022024-02-020001951667ctnt:Mr.HuanLiuMemberus-gaap:RelatedPartyMember2023-12-310001951667us-gaap:MortgageReceivablesMember2023-12-310001951667us-gaap:LoansReceivableMember2023-12-310001951667us-gaap:RetainedEarningsMember2023-01-012023-12-310001951667us-gaap:RetainedEarningsMember2022-01-012022-12-310001951667ctnt:PacificConsultingLlcMember2023-12-310001951667ctnt:EntourSolutionsLlcMember2023-12-310001951667ctnt:CheetahNetMember2023-12-310001951667ctnt:CheetahNetLogisticsLlcMember2023-12-310001951667ctnt:CanaanLimousineLlcMember2023-12-310001951667ctnt:CanaanInternationalLlcMember2023-12-310001951667ctnt:AllenBoyInternationalLlcMember2023-12-3100019516672023-02-082023-02-080001951667ctnt:MercedesBenzGls450Member2023-02-012023-02-280001951667ctnt:ThreadCapitalIncMember2023-12-310001951667ctnt:SmallBusinessAdministrationMember2023-12-310001951667ctnt:ThreadCapitalIncMember2022-12-310001951667ctnt:SmallBusinessAdministrationMember2022-12-310001951667us-gaap:RevolvingCreditFacilityMember2022-10-050001951667ctnt:RevolvingCreditFacilityTwoMember2022-10-050001951667ctnt:RevolvingCreditFacilityOneMember2022-10-050001951667srt:MinimumMember2023-12-310001951667srt:MaximumMember2023-12-310001951667us-gaap:LoansReceivableMember2023-01-012023-12-310001951667us-gaap:LoansReceivableMember2022-01-012022-12-310001951667us-gaap:AssetPledgedAsCollateralMember2023-12-310001951667us-gaap:AssetPledgedAsCollateralMemberctnt:LoansPayableFromInventoryFinancingMember2022-12-310001951667us-gaap:AssetPledgedAsCollateralMember2022-12-310001951667us-gaap:RevolvingCreditFacilityMember2023-01-012023-12-310001951667ctnt:LoansPayableFromPremiumFinanceMember2023-01-012023-12-310001951667us-gaap:RevolvingCreditFacilityMember2022-01-012022-12-310001951667ctnt:LoansPayableFromPremiumFinanceMember2022-01-012022-12-310001951667ctnt:LoansPayableFromInventoryFinancingMember2022-01-012022-12-310001951667ctnt:LoansPayableFromDealersFinanceMember2022-01-012022-12-310001951667us-gaap:DomesticCountryMember2023-12-310001951667us-gaap:DomesticCountryMember2022-12-310001951667us-gaap:InvestorMember2022-06-270001951667srt:MinimumMemberctnt:LoansPayableFromDealersFinanceMember2023-01-012023-12-310001951667srt:MaximumMemberctnt:LoansPayableFromDealersFinanceMember2023-01-012023-12-310001951667ctnt:ThreadCapitalIncMember2022-12-012022-12-010001951667ctnt:SmallBusinessAdministrationMember2022-03-162022-03-160001951667srt:MinimumMemberctnt:LoanAmountOutstandingForNoMoreThan90DaysMemberctnt:LoansPayableFromInventoryFinancingMember2023-12-310001951667srt:MinimumMemberctnt:LoanAmountOutstandingForMoreThan90DaysMemberctnt:LoansPayableFromInventoryFinancingMember2023-12-310001951667srt:MaximumMemberctnt:LoanAmountOutstandingForNoMoreThan90DaysMemberctnt:LoansPayableFromInventoryFinancingMember2023-12-310001951667srt:MaximumMemberctnt:LoanAmountOutstandingForMoreThan90DaysMemberctnt:LoansPayableFromInventoryFinancingMember2023-12-310001951667srt:MinimumMemberus-gaap:LetterOfCreditMember2023-12-310001951667srt:MinimumMemberctnt:LoansPayableFromDealersFinanceMember2023-12-310001951667srt:MaximumMemberus-gaap:LetterOfCreditMember2023-12-310001951667srt:MaximumMemberctnt:LoansPayableFromDealersFinanceMember2023-12-310001951667ctnt:ThreadCapitalIncMember2022-12-010001951667ctnt:ThreadCapitalIncMember2022-11-300001951667ctnt:LoansPayableFromPremiumFinanceMember2023-07-310001951667srt:MaximumMemberctnt:SmallBusinessAdministrationMember2022-03-160001951667ctnt:SmallBusinessAdministrationMember2022-03-160001951667srt:MaximumMemberctnt:ThreadCapitalIncMember2021-05-180001951667ctnt:ThreadCapitalIncMember2021-05-180001951667ctnt:SmallBusinessAdministrationMember2020-05-240001951667ctnt:ThreadCapitalIncMember2020-05-150001951667ctnt:CustomerTwoMemberus-gaap:SalesRevenueNetMemberus-gaap:CustomerConcentrationRiskMember2023-01-012023-12-310001951667ctnt:CustomerTwoMemberus-gaap:AccountsReceivableMemberus-gaap:CustomerConcentrationRiskMember2023-01-012023-12-310001951667ctnt:CustomerThreeMemberus-gaap:SalesRevenueNetMemberus-gaap:CustomerConcentrationRiskMember2023-01-012023-12-310001951667ctnt:CustomerThreeMemberus-gaap:AccountsReceivableMemberus-gaap:CustomerConcentrationRiskMember2023-01-012023-12-310001951667ctnt:CustomerOneMemberus-gaap:SalesRevenueNetMemberus-gaap:CustomerConcentrationRiskMember2023-01-012023-12-310001951667ctnt:CustomerOneMemberus-gaap:AccountsReceivableMemberus-gaap:CustomerConcentrationRiskMember2023-01-012023-12-310001951667ctnt:CustomerMemberus-gaap:SalesRevenueNetMemberus-gaap:SupplierConcentrationRiskMember2023-01-012023-12-310001951667ctnt:CustomerMemberus-gaap:SalesRevenueNetMemberus-gaap:CustomerConcentrationRiskMember2023-01-012023-12-310001951667ctnt:CustomerMemberus-gaap:AccountsReceivableMemberus-gaap:CustomerConcentrationRiskMember2023-01-012023-12-310001951667ctnt:CustomerTwoMemberus-gaap:SalesRevenueNetMemberus-gaap:CustomerConcentrationRiskMember2022-01-012022-12-310001951667ctnt:CustomerTwoMemberus-gaap:AccountsReceivableMemberus-gaap:CustomerConcentrationRiskMember2022-01-012022-12-310001951667ctnt:CustomerThreeMemberus-gaap:SalesRevenueNetMemberus-gaap:CustomerConcentrationRiskMember2022-01-012022-12-310001951667ctnt:CustomerOneMemberus-gaap:SalesRevenueNetMemberus-gaap:CustomerConcentrationRiskMember2022-01-012022-12-310001951667ctnt:CustomerOneMemberus-gaap:AccountsReceivableMemberus-gaap:CustomerConcentrationRiskMember2022-01-012022-12-310001951667ctnt:CustomerMemberus-gaap:SalesRevenueNetMemberus-gaap:SupplierConcentrationRiskMember2022-01-012022-12-310001951667ctnt:CustomerMemberus-gaap:SalesRevenueNetMemberus-gaap:CustomerConcentrationRiskMember2022-01-012022-12-310001951667ctnt:CustomerMemberus-gaap:AccountsReceivableMemberus-gaap:CustomerConcentrationRiskMember2022-01-012022-12-310001951667us-gaap:CommonClassBMember2022-07-112022-07-110001951667us-gaap:CommonClassAMember2022-07-112022-07-110001951667us-gaap:InvestorMemberus-gaap:CommonClassAMember2023-12-310001951667us-gaap:CommonClassBMemberus-gaap:CommonStockMember2023-12-310001951667us-gaap:CommonClassBMemberus-gaap:CommonStockMember2022-12-310001951667us-gaap:CommonClassAMemberus-gaap:CommonStockMember2022-12-310001951667us-gaap:CommonClassBMemberus-gaap:CommonStockMember2021-12-310001951667us-gaap:CommonClassAMemberus-gaap:CommonStockMember2021-12-310001951667us-gaap:CommonClassBMember2022-07-110001951667us-gaap:CommonClassAMember2022-07-110001951667us-gaap:CommonClassBMember2023-12-310001951667us-gaap:CommonClassAMember2023-12-310001951667us-gaap:CommonClassBMember2022-12-310001951667us-gaap:CommonClassAMember2022-12-3100019516672022-07-110001951667ctnt:MaximGroupLlcMemberus-gaap:CommonClassAMemberus-gaap:SubsequentEventMember2024-03-040001951667ctnt:August2023UnderwriterWarrantsMember2023-12-310001951667us-gaap:CommonClassAMemberus-gaap:IPOMember2023-08-0300019516672021-12-310001951667us-gaap:CustomerConcentrationRiskMember2023-12-310001951667us-gaap:CustomerConcentrationRiskMember2022-12-310001951667ctnt:MaximGroupLlcMemberus-gaap:SubsequentEventMember2024-03-042024-03-040001951667ctnt:CheetahNetLogisticsLlcMember2022-10-192022-10-190001951667ctnt:EntourSolutionsLlcMember2021-04-092021-04-090001951667ctnt:CanaanLimousineLlcMember2021-02-192021-02-190001951667ctnt:PacificConsultingLlcMember2019-02-152019-02-150001951667ctnt:CanaanInternationalLlcMember2019-01-012019-01-010001951667ctnt:AllenBoyInternationalLlcMember2017-01-012017-01-010001951667ctnt:JuguangZhangMemberctnt:EdwardTransitExpressGroupInc.Memberus-gaap:SubsequentEventMember2024-01-240001951667us-gaap:AssetPledgedAsCollateralMemberus-gaap:LetterOfCreditMember2023-12-310001951667ctnt:ThirdPartyMemberctnt:FinancialAssetGreaterThan150DaysPastDueMember2023-12-310001951667ctnt:ThirdPartyMember2023-12-310001951667ctnt:FinancialAssetLessThan150DaysPastDueMember2023-12-310001951667ctnt:FinancialAssetGreaterThan210DaysPastDueMember2023-12-310001951667ctnt:FinancialAsset181To210DaysPastDueMember2023-12-310001951667ctnt:FinancialAsset151To180DaysPastDueMember2023-12-310001951667us-gaap:AssetPledgedAsCollateralMemberus-gaap:LetterOfCreditMember2022-12-3100019516672023-10-012023-12-3100019516672023-06-3000019516672024-03-150001951667us-gaap:CommonClassAMemberus-gaap:CommonStockMember2023-12-310001951667ctnt:RapidProceedLimitedMemberus-gaap:SubsequentEventMember2024-03-130001951667ctnt:RapidProceedLimitedMember2022-06-270001951667us-gaap:LetterOfCreditMember2023-01-012023-12-310001951667us-gaap:LetterOfCreditMember2022-01-012022-12-310001951667ctnt:CanaanLimousineLlcMemberus-gaap:CommonClassAMember2021-02-100001951667ctnt:PacificConsultingLlcMemberus-gaap:CommonClassAMember2019-01-170001951667ctnt:YingchangYuanMemberus-gaap:CommonClassAMember2016-08-310001951667us-gaap:CommonClassAMemberus-gaap:IPOMember2023-08-032023-08-030001951667us-gaap:InvestorMember2023-01-012023-12-310001951667us-gaap:InvestorMember2022-06-272022-06-270001951667us-gaap:InvestorMember2022-01-012022-12-310001951667ctnt:LoansPayableFromPremiumFinanceMember2023-12-310001951667ctnt:LoansPayableFromPremiumFinanceMember2022-12-310001951667ctnt:LoansPayableFromInventoryFinancingMember2022-12-310001951667us-gaap:RevolvingCreditFacilityMember2022-10-052022-10-050001951667ctnt:RevolvingCreditFacilityTwoMember2022-10-052022-10-050001951667ctnt:RevolvingCreditFacilityOneMember2022-10-052022-10-050001951667ctnt:ExtendedMaturityPeriodMemberus-gaap:LoansReceivableMember2024-06-122024-06-120001951667ctnt:OriginalMaturityPeriodMemberus-gaap:LoansReceivableMember2024-02-122024-02-120001951667ctnt:First90DaysMemberus-gaap:MortgageReceivablesMember2023-12-062023-12-060001951667ctnt:Beyond90DaysMemberus-gaap:MortgageReceivablesMember2023-12-062023-12-060001951667ctnt:SmallBusinessAdministrationMember2020-05-242020-05-240001951667ctnt:LoansPayableFromDealersFinanceMember2023-01-012023-12-310001951667ctnt:SubscriptionReceivableMember2023-01-012023-12-3100019516672023-01-012023-12-310001951667us-gaap:CommonClassAMemberus-gaap:CommonStockMember2022-01-012022-12-310001951667us-gaap:AdditionalPaidInCapitalMember2022-01-012022-12-310001951667ctnt:SubscriptionReceivableMember2022-01-012022-12-3100019516672022-01-012022-12-310001951667us-gaap:LoansReceivableMember2023-12-112023-12-110001951667us-gaap:MortgageReceivablesMember2023-12-062023-12-0600019516672023-12-3100019516672022-12-31iso4217:USDxbrli:purectnt:agreementctnt:customerxbrli:sharesctnt:companyiso4217:USDxbrli:sharesctnt:segment

Table of Contents

UNITED STATES

SECURITIES AND EXCHANGE COMMISSION

WASHINGTON, D.C. 20549

FORM 10-K

(Mark One)

 ANNUAL REPORT PURSUANT TO SECTION 13 OR 15(d) OF THE SECURITIES EXCHANGE ACT OF 1934

For the fiscal year ended December 31, 2023

or

 TRANSITION REPORT PURSUANT TO SECTION 13 OR 15(d) OF THE SECURITIES EXCHANGE ACT OF 1934

For the transition period from          to

Commission file number 001-41761

Cheetah Net Supply Chain Service Inc.

(Exact name of registrant as specified in its charter)

North Carolina


81-3509120

(State or other jurisdiction of
incorporation or organization)

(I.R.S. Employer
Identification No.)

6201 Fairview Road, Suite 225

Charlotte, North Carolina 28210

(Address of principal executive offices) (Zip Code)

Registrant’s telephone number, including area code: (704) 972-0209

Securities registered pursuant to Section 12(b) of the Act:

Title of each class


Trading Symbol(s)


Name of each exchange on which registered


Class A common stock, par value $0.0001
per share

CTNT

The Nasdaq Stock Market LLC

Securities registered pursuant to Section 12(g) of the Act: None

Indicate by check mark whether the registrant is a well-known seasoned issuer, as defined in Rule 405 of the Securities Act. Yes  No 

Indicate by check mark whether the registrant is not required to file reports pursuant to Section 13 or 15(d) of the Act. Yes  No 

Indicate by check mark whether the registrant (1) has filed all reports required to be filed by Section 13 or 15(d) of the Securities Exchange Act of 1934 during the preceding 12 months (or for such shorter period that the registrant was required to file such reports), and (2) has been subject to such filing requirements for the past 90 days. Yes  No 

Indicate by check mark whether the registrant has submitted electronically every Interactive Data File required to be submitted pursuant to Rule 405 of Regulation S-T (§232.405 of this chapter) during the preceding 12 months (or for such shorter period that the registrant was required to submit such files). Yes  No 

Indicate by check mark whether the registrant is a large accelerated filer, an accelerated filer, a non-accelerated filer, a smaller reporting company, or an emerging growth company. See the definitions of “large accelerated filer,” “accelerated filer,” “smaller reporting company,” and “emerging growth company” in Rule 12b-2 of the Exchange Act.

Large accelerated filer


Accelerated filer

Non-accelerated filer

Smaller reporting company

Emerging growth company

If an emerging growth company, indicate by check mark if the registrant has elected not to use the extended transition period for complying with any new or revised financial accounting standards provided pursuant to Section 13(a) of the Exchange Act. 

Indicate by check mark whether the registrant has filed a report on and attestation to its management’s assessment of the effectiveness of its internal control over financial reporting under Section 404(b) of the Sarbanes-Oxley Act (15 U.S.C. 7262(b)) by the registered public accounting firm that prepared or issued its audit report.

If securities are registered pursuant to Section 12(b) of the Act, indicate by check mark whether the financial statements of the registrant included in the filing reflect the correction of an error to previously issued financial statements.

Indicate by check mark whether any of those error corrections are restatements that required a recovery analysis of incentive-based compensation received by any of the registrant’s executive officers during the relevant recovery period pursuant to §240.10D-1(b).

Indicate by check mark whether the registrant is a shell company (as defined in Rule 12b-2 of the Act). Yes  No 

The registrant’s Class A common stock commenced trading on the Nasdaq Capital Market on August 1, 2023. As of June 30, 2023, the last business day of the registrant’s most recently completed second fiscal quarter, the registrant’s Class A common stock was not publicly traded. Accordingly, there was no market value for the registrant’s Class A common stock on such date.

The number of the registrant’s shares of Class A common stock, $0.0001 par value per share, outstanding on March 15, 2024 was 10,938,329.

DOCUMENTS INCORPORATED BY REFERENCE

Portions of the registrant’s proxy statement for its 2024 Annual Meeting of Stockholders are incorporated by reference in Part III of this Annual Report on Form 10-K.

Table of Contents

Table of Contents


Page

PART I

1

Item 1.

Business

1

Item 1A.

Risk Factors

16

Item 1B.

Unresolved Staff Comments

16

Item 1C.

Cybersecurity

16

Item 2.

Properties

17

Item 3.

Legal Proceedings

17

Item 4.

Mine Safety Disclosure

17


PART II

18

Item 5.

Market for Registrant’s Common Equity, Related Stockholder Matters and Issuer Purchases of Equity Securities.

18

Item 6.

[Reserved]

19

Item 7.

Management’s Discussion and Analysis of Financial Condition and Results of Operations

19

Item 7A.

Quantitative and Qualitative Disclosures about Market Risk

33

Item 8.

Financial Statements and Supplementary Data

F-1

Item 9.

Changes in and Disagreements with Accountants on Accounting and Financial Disclosure

34

Item 9A.

Controls and Procedures

34

Item 9B.

Other Information

35

Item 9C.

Disclosure Regarding Foreign Jurisdictions that Prevent Inspections

35


PART III

35

Item 10.

Directors, Executive Officers and Corporate Governance

35

Item 11.

Executive Compensation

35

Item 12.

Security Ownership of Certain Beneficial Owners and Management and Related Stockholder Matters

35

Item 13.

Certain Relationships and Related Transactions, and Director Independence

35

Item 14.

Principal Accounting Fees and Services

35


PART IV

36

Item 15.

Exhibit and Financial Statement Schedules

36

Item 16.

Form 10-K Summary

38

Signatures

39

i

Table of Contents

PART I

Item 1. Business.

Overview

We are a supplier of parallel-import vehicles sourced in the U.S. to be sold in the PRC market. In the PRC, parallel-import vehicles refer to those purchased by dealers directly from overseas markets and imported for sale through channels other than brand manufacturers’ official distribution systems. Parallel-import cars have been popular in the PRC because they are generally priced 10% to 15% cheaper than vehicles sold through distribution systems authorized by brand manufacturers and generally offer a wider variety of models and versions with more customization. In addition, some overseas models can only be obtained through this channel rather than through the brand manufacturers’ authorized distribution systems as a result of certain regulations that prohibit their production and sale in the PRC due to environmental protection and emission standards. Customers demand our parallel-import vehicles largely because our selling prices are lower than those offered by other suppliers of parallel-import vehicles to the PRC market, driven by our scalable operations and a systematic approach to procurement. We have available a large number of professional purchasing agents that we believe can supply stable and large quantities of cars at reasonable prices to Chinese parallel-import car dealers and maintain a long-term relationship with them. See “—Our Competitive Strengths—In-depth Industry Insight and Strong Overseas Procurement Capability Enabled by a Large Team of Professional Purchasing Agents.”

In China, sales of parallel-import vehicles have been facilitated by a series of related regulations and policies that have been promulgated by the PRC government since 2016, including “Several Opinions on Promoting Pilot Parallel Import of Automobiles,” “Opinions on Further Promoting the Development of Parallel Import of Automobiles,” and the “Circular on Several Measures for Invigorating Automobile Circulation and Promoting Automobile Consumption.” Such regulations and policies are in compliance with U.S. laws on trade and export. See “—Our Industry and Business Model.” To our knowledge, there are currently no U.S. federal or state laws, regulation, or rules on trade or export that prohibit the export of vehicles that will be parallel imported into foreign countries. We purchase automobiles, primarily luxury brands, such as Mercedes, BMW, Land Rover, Lexus, and Bentley, from the U.S. market and resell them to our customers, including both U.S. and PRC parallel-import car dealers, for sale to the ultimate users. We derive profits primarily from the price difference between our buying and selling prices for parallel-import vehicles.

The primary driver for our industry is the continued growth of high-net-worth individuals in China. The core of our business is the ability to identify the type of parallel-import vehicles that are in high demand and to procure them in a timely manner. We procure our automobiles from U.S. automobile dealers via a network of independent contractors acting as purchasing agents on our behalf. As of December 31, 2023 and 2022, we actively worked with 389 and 342 purchasing agents, respectively.

We believe that our corporate focus and dedication to the market, manifested in the size and sophistication of our purchasing agent team, provides us with a significant marketing advantage and sets us apart from our competitors. Although we compete directly with many other companies that sell parallel-import vehicles to the PRC, most of our competitors are small family businesses that obtain U.S. cars through their family members or friends in the U.S. and therefore cannot guarantee a steady supply. We have developed a standardized system of recruiting, training, and managing a large number of professional purchasing agents, enabling us to sell on a recurring basis a large number of automobiles to the PRC market. We have been currently able to maintain sufficient purchasing agents to meet our purchasing demand, and as a result, we have become a reliable source of parallel-import vehicles and have built long-term relationships with multiple U.S. and PRC parallel-import car dealers. During the years ended December 31, 2023 and 2022, we sold 230 and 434 parallel-import vehicles to Chinese parallel-import car dealers, respectively. During the same years, we sold 73 and 29 parallel-import vehicles to our U.S. customers, respectively.

We experienced significant growth in sales volume, revenue, and gross profit from 2016, when we commenced our operations, to the first half of 2022 due to our core strengths and a favorable economic climate. Our financial results in 2022 were impacted by the COVID-19 pandemic and our financial results continue to be impacted by weak economic conditions in the PRC. We have responded to this weakness by focusing less on unit sales and concentrating more on the sales of those luxury vehicles that provide us with the highest profitability per transaction. Our financial results during 2023 demonstrate the impact of this strategy shift. We sold 303 and 463 vehicles during the years ended December 31, 2023 and 2022, respectively. For the years ended December 31, 2023 and 2022, we had total revenue of $38.3 million and $55.2 million, respectively, representing a decrease of 30.5% from 2022 to 2023. We earned net income of $0.1 million for the year ended December 31, 2023, compared to net income of $0.8 million for the year ended December 31, 2022.

1

Table of Contents

Sales to the PRC market represent a significant part of our revenue. During the years ended December 31, 2023 and 2022, sales to the China market accounted for approximately 78.7% and 93.1% of our revenue, respectively.

Recent Developments

To diversify our revenue and further leverage our in-depth expertise in the parallel-import vehicle industry, we launched our financial services to small- and medium-sized traders in the global supply chain industry (primarily other parallel-import vehicle suppliers) in October 2022. Our financial services are provided in the form of inventory financing, for which customers can use their cars as collateral, which will be stored in our warehouse or other locations designated by us, in exchange for a loan from us. In December 2023, we further advanced such financial services strategy by introducing our vehicle pledge loans, primarily aimed at parallel-import car dealers. We provided $0.7 million in loans to third parties in the fourth quarter of 2023, all of which was outstanding as of December 31, 2023. See “Note 4—Loans Receivable” in the notes to our consolidated financial statements for more details.

Beginning in the second half of 2023, the market for new luxury vehicles in the PRC has been negatively impacted by weak economic conditions and a shift in consumer demand towards electric vehicles (“EVs”), mainly those produced domestically by PRC manufacturers. Luxury import brand manufacturers have responded to these threats by discounting the sale price of their vehicles, which has resulted in a significant challenge to our ability to generate a profit from the sale of parallel-import vehicles generally. Consistent with our strategy to focus only on profitable parallel-import vehicle transactions, our unit sales during the fourth quarter of 2023 fell to 49 vehicles, a 36.4% decrease from the fourth quarter of 2022 and a 38.0% drop from unit sales in the third quarter of 2023, which resulted in our recognition of a net loss during the fourth quarter of 2023. This market dynamic has continued into 2024 and we are unable at this time to predict when the market for luxury vehicles will firm and the price spread between vehicles sourced from brand manufacturers’ official distribution systems and those sourced via the parallel-import market will return.

To diversify our revenue and further leverage our in-depth expertise in the parallel-import vehicle industry, we have embarked on a plan to acquire warehousing and logistics businesses with the goals of reducing our costs of transporting purchased vehicles from the dealer lot to the ultimate point of sale and to more efficiently manage the transaction cycle. We completed the first of such acquisitions in early 2024. On January 24, 2024, we entered into a stock purchase agreement with Edward Transit Express Group Inc. (“Edward”), a California-based common carrier specializing in ocean and air transportation services, and the sole shareholder of Edward. On January 29, 2024, we entered into an amendment to the stock purchase agreement with Edward and the sole shareholder of Edward, modifying certain terms of such agreement. Pursuant to the stock purchase agreement, as amended, we agreed to acquire 100% of the equity interests in Edward from the sole shareholder of Edward, for a cash payment of $300,000 and 1,272,329 shares of our Class A common stock. On February 2, 2024, we closed the acquisition and Edward became a wholly-owned subsidiary of our Company. The acquisition of these capabilities can be further leveraged by offering warehousing and logistics services to third-party parallel-import vehicle and other wholesalers and enhanced by offering financial services that we launched in October 2022. Our long-term ambition is to move beyond the parallel-import vehicle business and become an integrated provider of international trade services for small- and medium-sized traders.

Our Competitive Strengths

We believe the following competitive strengths are essential for our success and differentiate us from our competitors:

In-depth Industry Insight and Strong Overseas Procurement Capability Enabled by a Large Team of Professional Purchasing Agents

We are capable of providing a large and stable source of parallel-import vehicles. With in-depth knowledge of the Chinese luxury car market, we have built a large team of independent contractors, who serve as professional purchasing agents, to facilitate our procurement of vehicles, enabling us to become a growing supplier of parallel-import vehicles. As of December 31, 2023, we had 389 professional purchasing agents who are experts in both luxury cars and negotiation skills. Due to our in-depth industry insight and strong procurement capability enabled by our sizable team of purchasing agents, we have built long-term relationships with five Chinese parallel-import car dealers. We rely on the business relationships we have built over the years while working with those PRC customers, many of which have cooperated with us for over three years. Since our inception in 2016, we have developed a standardized system of recruiting, training, and managing a large number of professional purchasing agents, enabling us to sell on a recurring basis a large number of automobiles to the PRC market. We believe that our corporate focus and dedication to the market, manifested in the size and sophistication of our purchasing agent team and our ability to source and train new purchasing agents, sets us apart from our competitors. Although we compete directly with many other companies that sell parallel-import vehicles to the PRC, most of our competitors are

2

Table of Contents

small family businesses that obtain U.S. cars through their family members or friends in the U.S. and therefore cannot guarantee a steady supply. See “—Our Professional Purchasing Agents.” The standardized system has been tested during the past years and has propelled us into a strong market position in parallel-import car sales. As a result, Chinese parallel-import car dealers with whom we work proactively choose to source luxury vehicles from us.

Scalable Operation with Systematic Approach to Procurement Which Drives Better Pricing for Customers

Customers demand our parallel-import vehicles largely because our selling prices are lower than those offered by other suppliers of parallel-import vehicles to the PRC market, driven by our scalable operation with a systematic approach to procurement. We acquired automobiles from U.S. automobile dealers via our purchasing agents. See “—Sales of Parallel-Import Vehicles—Services and Operational Flow—Procurement.” Since we have a large number of professional purchasing agents with excellent negotiation skills, we believe we are able to supply stable and large quantities of cars at reasonable prices to Chinese parallel-import car dealers and maintain a long-term relationship with them. See “—In-depth Industry Insight and Strong Overseas Procurement Capability Enabled by a Large Team of Professional Purchasing Agents.” We purchased and sold 258 and 303 vehicles, respectively, during the year ended December 31, 2023. We purchased and sold 356 and 463 vehicles, respectively, during the year ended December 31, 2022. As a stable parallel-import vehicle supplier, we are able to offer our customers a lower price than our competitors, which in turn increases our customers’ demand for our automobiles.

A Visionary and Experienced Management Team with Strong Financial and Operational Expertise

Our senior management team has extensive experience in finance and imports and exports of automobiles. Mr. Huan Liu, our Chief Executive Officer, has extensive experience in real estate, private equity, and car imports and exports. As the founder and CEO of Cheetah Net, Mr. Huan Liu has been responsible for the management of day-to-day operations and high-level strategizing and business planning, as well as implementing proposed plans and evaluating the success of our Company in achieving its goals. From 2014 to 2015, Mr. Huan Liu served as the chief executive officer at Beijing Xinyongjia Technology Co., where he was responsible for identifying opportunities for expansion and analyzing operations to identify areas in need of reorganization. From 2012 to 2013, Mr. Huan Liu served as the senior investment manager at Beijing Wanze Investment Management Co. Ltd. and was responsible for developing and implementing risk-based asset allocation models and performance analytics. He received his master’s degree in Finance from the International Business School at Brandeis University in 2012.

Our Growth Strategies

Taking the niche market of parallel-import vehicle trade as an entry point, we intend to continuously consolidate our upstream and downstream customer resources. By leveraging these resources and our industry expertise, we are launching and developing our warehousing and logistics services and providing financial services to the upstream and downstream dealers across the entire parallel-import vehicle trade value chain. Ultimately, we aim to become a global supply chain platform that offers an integrated package of warehousing, logistics, and financial services to small- and medium-sized import and export companies. Specifically, we intend to develop our business and strengthen our brand loyalty by implementing the following strategies:

Launch Additional Warehousing and Logistics Services

We plan to acquire two warehouses, either on the east or west coasts of the United States. As of the date of this annual report, we have already acquired one warehouse through the acquisition of Edward. We have retained Edward’s current manager, who possesses extensive experience in the freight industry, as the CEO of our new wholly-owned subsidiary following the acquisition of Edward, to lead our warehousing and logistics business. Lately, we have transported a majority of the vehicles to the west coast, and while this decision increased our procurement costs, it was offset by a decrease in selling expenses. Additionally, the new strategy also streamlines shipping time and expedites receipt of payment through letters of credit, since it only takes approximately two to three weeks to deliver a purchased vehicle to a customer overseas through the west coast ports (compared with 40 to 60 days if through the east coast ports), resulting in significantly shorter payment cycles. The Edward acquisition provides us with our own warehousing and logistics systems. Thereafter, we expect to build economies of scale by providing these services to small- and medium-sized traders in the global supply chain industry. We expect our first customers will be parallel-import vehicle businesses with whom we have established relationships. Not only can we use our self-operated warehousing and logistics systems to deliver vehicles to the customers of our parallel-import vehicle business, we can also offer such services to other small- and medium-sized suppliers of parallel-import vehicles or those engaged in the import or export of other products between the U.S. and the PRC or other destinations around the world who lack such systems.

3

Table of Contents

In the longer term, we plan to develop an online Service-as-a-Service (“SaaS”) platform to facilitate our warehousing services, logistics services, and financial services, enabling us to automate and digitalize key steps of the supply chain for our customers. The SaaS platform will include a warehouse management system, which monitors the entire flow of inventory, labor force, and information in and out of our warehouse network, resulting in improved operational efficiency by providing real-time inventory visibility. Our warehousing and logistics systems and SaaS platform will enable us to warehouse, manage, and deliver the goods of our customers. In addition, since we hold our customers’ goods in our own warehouses and monitor their inventory, we will be able to access real-time data related to customer’s inventory, purchases, and financial information with their prior consent, allowing us to make efficient decisions as to whether to approve customers’ application for our financial services. See “—Our Growth Strategies—Launch Financial Services to Small- and Medium-Sized Traders in the Global Supply Chain Industry.” Once we have established a relatively mature warehouse and logistical services in the parallel-import vehicle industry, we may expand our SaaS platform to other industries, such as textiles, medical products, and tires.

Moreover, after we obtain access to our warehouses, we plan to provide warehousing and order fulfillment services to small businesses, such as e-commerce merchants, who can send their products/merchandise to our warehouses in advance, and when their customers make a purchase, we will be responsible for picking, packing, and shipping the specific products to the customers based on their order information. By outsourcing their warehousing and order fulfillment functions to us, these small businesses may be relieved of their logistics burdens and have greater flexibility and agility when it comes to marketing and selling practices. We expect to generate revenue and profits by charging those small businesses storage, packing, and shipping service fees. We expect to further develop our SaaS platform with respect to the warehousing and order fulfillment services we plan to launch. Specifically, we plan to utilize our SaaS platform for marketing purposes by advertising small business sellers’ merchandise on our platform to help them promote and gain more exposure to potential or target customers. We expect to generate profits by charging small businesses services fees for our marketing efforts.

Manage the Growth of our Purchasing Agent Team and Maintain an Adequate Customer Base for the Parallel-Import Vehicle Business

We endeavor to continue to expand our parallel-import vehicle business. Retaining quality purchasing agents with excellent negotiation skills is an essential part of our business. To maintain or grow our team of professional purchasing agents, we will devote the necessary resources to personnel recruitment and training. In addition, we will maintain and grow our customer base by identifying and engaging more parallel-import car dealers in China to further increase our sales. Moreover, we will continue to monitor the constantly changing PRC market demand for vehicle models and expand our brand coverage as applicable to strengthen our strong market position as a supplier of luxury automobiles to the parallel-import car dealers in China.

Pursue Additional Strategic and Financially Attractive Acquisitions

We endeavor to identify, acquire, and integrate businesses that will expand our parallel-import vehicle business, warehousing services, and financial services while achieving synergies and generating attractive returns. Using our disciplined approach to screening and evaluating potential opportunities, we intend to seek strategically and financially attractive acquisition targets that provide us with new capabilities. We have significant internal resources dedicated to tracking potential acquisition prospects which are formally reviewed by senior management on a regular basis. Since we are a stable parallel-import vehicle supplier with a wide network of contacts and have been involved in the industry for more than eight years, we believe we will be an acquirer of choice in our industry at attractive valuations. Edward is the first such business that we integrated into our operations.

Organizational Structure

Cheetah Net was originally formed on August 9, 2016 under the laws of the State of North Carolina as a limited liability company known as Yuan Qiu Business Group LLC. On March 1, 2022, we filed articles of incorporation including articles of conversion with the Secretary of State of the State of North Carolina to convert from an LLC to a corporation, and changed our name to Cheetah Net Supply Chain Service Inc. Cheetah Net also conducts business under the marketing name of “Elite Motor Group.” As of the date of this annual report, Cheetah Net holds 100% of the equity interests in the following entities:

(i) Allen-Boy International LLC (“Allen-Boy”), a limited liability company organized on August 31, 2016 under the laws of the State of Delaware, which was acquired by Cheetah Net from Yingchang Yuan, the previous owner of Allen-Boy who beneficially owns 1,200,000 shares of Class A common stock of Cheetah Net, for a total consideration of $100 on January 1,

4

Table of Contents

2017. Allen-Boy did not have any business activities until acquired by Cheetah Net. Currently, Allen-Boy is engaged in the parallel-import vehicle business.
(ii) Canaan International LLC (“Fairview”), a limited liability company organized on December 5, 2018 under the laws of the State of North Carolina, known as Fairview International Business Group, LLC before changing its name by filing articles of amendment on July 21, 2020. Fairview was acquired by Cheetah Net from Yiming Wang, a former employee of Cheetah Net, for a total consideration of $100 on January 1, 2019. Fairview did not have any business activities until acquired by Cheetah Net. Currently, Fairview is engaged in the parallel-import vehicle business.
(iii) Canaan Limousine LLC (“Limousine”), a limited liability company organized on February 10, 2021 under the laws of the State of South Carolina, which was acquired by Cheetah Net from Yingchang Yuan, the previous owner of Limousine who beneficially owns 1,200,000 shares of Class A common stock of Cheetah Net, for a total consideration of $100 on February 19, 2021. Limousine did not have any business activities until acquired by Cheetah Net. Currently, Limousine is engaged in the parallel-import vehicle business.
(iv) Pacific Consulting LLC (“Pacific”), a limited liability company organized on January 17, 2019 under the laws of the State of New York, which was acquired by Cheetah Net from Yingchang Yuan, the previous owner of Pacific who beneficially owns 1,200,000 shares of Class A common stock of Cheetah Net, for a total consideration of $100 on February 15, 2019. Pacific did not have any business activities until acquired by Cheetah Net. Currently, Pacific is engaged in the parallel-import vehicle business and financial services.
(v) Entour Solutions LLC (“Entour”), a limited liability company organized on April 8, 2021 under the laws of the State of New York, which was acquired by Cheetah Net from Daihan Ding, the previous owner of Entour, and a current employee of Cheetah Net, for a total consideration of $100 on April 9, 2021. Entour did not have any business activities until acquired by Cheetah Net. Currently, Entour is engaged in the parallel-import vehicle business.
(vi) Cheetah Net Logistics LLC (“Logistics”), a limited liability company organized on October 12, 2022 under the laws of the State of New York, whose previous sole member and owner, Hanzhang Li, a current employee of Cheetah Net, assigned all his membership interests in Logistics to Cheetah Net for a total consideration of $100 through a membership interest assignment agreement dated October 19, 2022. Currently, Logistics is engaged in the parallel-import vehicle business.
(vii) Edward, a corporation incorporated on July 14, 2010 under the laws of the State of California, whose previous sole shareholder and owner, Juguang Zhang, transferred all his right, title, and interest in and to all of the issued and outstanding equity interests of Edward to Cheetah Net for a total consideration of $1,200,000 in cash and Cheetah Net’s Class A common stock through a stock purchase agreement dated January 24, 2024, as amended. Currently, Edward is engaged in ocean and air transportation services.

On August 3, 2023, we closed our IPO of 1,250,000 shares of Class A common stock at a price of $4.00 per share. In connection with the IPO, the shares of Class A common stock began trading on the Nasdaq Capital Market under the symbol “CTNT” on August 1, 2023.

Our Industry and Business Model

We generate revenue primarily from the sales of parallel-import vehicles. In the PRC, parallel-import vehicles refer to those purchased directly by dealers from overseas markets and imported into the PRC market for sale through channels other than brand manufacturers’ official distribution systems. Models and prices of parallel-import vehicles vary from mid-range to high-end brands, with the manufacturer’s suggested retail price (“MSRP”) typically not less than $40,000. Parallel-import cars are popular in China because they are relatively cheaper and offer a wider variety of models and versions with more customization possibilities than regular imported cars. Specifically, because parallel-import vehicles do not have to pass through multiple levels of distributors, such as China general distributors, regional distributors, and 4S stores, to reach their end consumers, they can generally be priced at least 10% to 15% lower than regular imported cars. Parallel-import cars are popular also because some overseas models cannot be produced and sold in China due to certain regulations concerning environmental protection and emission standards and can only be introduced into the PRC market through parallel imports. As manufacturers frequently arbitrage markets, setting the price according to local market conditions so the same vehicle will have different retail prices in different territories, this enables parallel-import vehicle dealers to utilize a profit

5

Table of Contents

maximization strategy to drive profit from the industry. Currently, there are no U.S. federal or state laws, regulation, or rules on trade or export that prohibit the export of vehicles that will be parallel imported into foreign countries. Nonetheless, manufacturers and their distributors sometimes regard parallel-import vehicles as a competitor to their network of franchised dealerships, and thus may take measures to limit or reduce the opportunities for third parties, such as parallel-import vehicle dealers, to profit through leveraging the manufacturers’ different pricing strategies across the world. For example, they may add provisions in their sales agreements that restrict the export of the purchased automobiles, or they may build and update their Suspect Customer Database and monitor and limit the sales of automobiles to those suspect customers.

Parallel-import vehicles in China are generally divided into three categories based on the original country of procurement, including the U.S. version, the Middle East version, and the European version. All of the cars we sell are of the U.S. version with MSRPs typically not less than $80,000. Suppliers of the U.S. version of parallel-import cars are typically unable to purchase large quantities of vehicles, so most of the industry’s participants are small family businesses who purchase cars from local dealers and resell them to local dealers/exporters in the U.S. or to dealers/importers in China. For U.S. dealers of parallel-import vehicles, vehicle sourcing capabilities are critical.

In order to rein in prices of foreign luxury cars in the PRC market, which are typically higher than elsewhere in the world, the PRC government has issued policies to promote the development of the parallel-import car industry. Since the PRC government issued policies to promote the layout of parallel-import vehicle trials in October 2014, the parallel-import vehicle market began to grow. In 2016, the Ministry of Commerce of the PRC and seven other departments issued “Several Opinions on Promoting Pilot Parallel Import of Automobiles” to speed up the implementation of the pilot policy measures to promote parallel-import cars. China began piloting parallel imports of automobiles in February 2016, where the first cities to pilot parallel imports of cars were Shanghai, Tianjin, Fuzhou, Shenzhen, and Huangpu, followed by Chengdu, Xinjiang Uygur Autonomous Region, Dalian, and Ningbo. As a result of these government policies, more Chinese consumers have access to foreign premium cars, such as Porsche and Land Rover, which have spurred sales despite overall softening sales in the broader market. The market liberalization in 2016 was partly driven by the PRC government’s desire to break up monopolies, benefit consumers, and encourage more cooperation between suppliers and dealers in a fairer and more reasonable environment. In 2017, China’s new “Measures for the Administration of Automobile Sales” (the “Measures”) were released. Article 36 of the Measures provides a regulatory basis for the parallel importation of automobiles. This document contributed to the rapid development of the parallel import model in China. The new regulation defines the supplier of imported cars as “the operator who imports cars from abroad,” and the authorization of the manufacturer is no longer required for importing cars. Under the traditional brand authorization model, the car manufacturer is in control of the product types and specifications of the imported cars. With the development of the parallel import model, however, a growing number of PRC end consumers choose to bypass the brand-authorized dealers in favor of non-authorized dealers for a variety of reasons such as price and special needs. The development of the parallel-import vehicle industry has since grown significantly. Furthermore, in 2019, the Ministry of Commerce of the PRC and six other departments issued the “Opinions on Further Promoting the Development of Parallel Import of Automobiles,” which emphasizes the need to (i) permit and support establishment of compliance and modification sites for parallel-import automobiles to ensure the automobiles meet the national standards; (ii) promote the normalization and institutionalization of the parallel import of automobiles; (iii) further improve trade facilitation for parallel-import automobiles; and (iv) further strengthen the supervision and accountability of parallel-import automobiles. In 2022, the Ministry of Commerce of the PRC and 16 other departments promulgated the “Circular on Several Measures for Invigorating Automobile Circulation and Promoting Automobile Consumption,” which provides that the PRC government will further promote the sustainable and healthy development of parallel import of automobiles by supporting the parallel import of automobiles in ports that permit automobile imports and improving the mandatory product certification and information disclosure system for parallel-import automobiles. Such regulations and policies comply with U.S. laws on trade and exports.

Currently, we are primarily engaged in parallel-import vehicle dealership business, where we purchase automobiles from the U.S. market through our large team of professional purchasing agents, and resell them to our customers, including both U.S.- and PRC-based parallel-import car dealers. We derive profits primarily from the price difference between our buying and selling prices for parallel-import vehicles. Our operating principle is to maximize sales margins rather than volume, so we mainly focus on luxury vehicle brands in large demand because of the strong purchasing power of the end consumers in the PRC and higher markups for pricing. This strategy allows us to maintain efficient operations and effective management by keeping the size and scope of our Company within reasonable limits.

Our Customers

We primarily serve two types of customers: (i) PRC customers and (ii) U.S. domestic customers. Specifically, our PRC customers refer to those Chinese automobile dealers/importers who intend to import automobiles into the PRC market as parallel-import vehicles. Our

6

Table of Contents

U.S. domestic customers are parallel-import car dealers/exporters based in the U.S., which are typically the branches or upstream suppliers of Chinese parallel-import vehicle car dealers, who often lack purchasing capabilities in the U.S. market and need to purchase vehicles from us to transport to their PRC branches or sell to their PRC customers. Our customers are willing to work with us because we are able to provide them with a large number of vehicles having a wide variety of models, thus greatly reducing the difficulty of collecting and managing vehicles for them. Our PRC and U.S. customers generated approximately 78.7% and 21.3% of our revenue, respectively, during the year ended December 31, 2023, and 93.1% and 6.9% of our revenue, respectively, during the year ended December 31, 2022. We had a total of four and 17 customers for the years ended December 31, 2023 and 2022, respectively. For the year ended December 31, 2023, our three largest customers accounted for approximately 98.9% of our total revenue, while for the year ended December 31, 2022, our three largest customers accounted for 65% of our total revenue.

As an example of a typical transaction, under a sales contract entered into by and between our Company and a PRC customers, we are required to (i) load the designated automobiles on a vessel by the time of shipment specified in the contract at a U.S. port of loading; (ii) facilitate export customs clearance; (iii) provide the PRC customer with information about the designated automobiles, quantity, invoice amount, vessel name, and departure date, and provide a bill of lading, packaging list, commercial invoice, and other necessary documents; and (iv) ensure that the sold automobiles are brand new. Pursuant to the sales contract, the PRC customer (i) is responsible for import customs clearance and other relevant import issues; (ii) is required to bear all costs and risks once the designated automobiles arrive at the designated port of destination in the PRC; and (iii) is responsible for arranging payment as specified in the contract. In the event of any dispute, controversy, or claim arising out of or relating to such sales contracts, both parties agree (i) they will first try to resolve such disputes through friendly consultation; and that (ii) the validity, interpretation, and implementation of such contracts shall be governed by the laws of the State of North Carolina in the U.S.

Similarly, our U.S. customers enter into sales agreements for each automobile sold by us. According to a typical sales agreement entered into between our U.S. customers and our Company, we will (i) sell the designated automobile to the U.S. customer for the amount specified in the agreement and certify that all of the information provided therein is true and accurate to the best of our knowledge; (ii) deliver the automobile to the warehouse requested by the U.S. customer; and (iii) provide the automobile title within three weeks of the completion of the transaction. Meanwhile, the U.S. customer acknowledges that the automobile described therein is sold “as is” and that there is no guarantee or warranty either expressed or implied with respect to the automobile.

Our Suppliers

We do not have typical suppliers, because we purchase all of our automobiles via our team of professional purchasing agents from U.S. automobile dealers that have the designated automobile model in stock. The designated brands and models are usually luxury or mid- to high-end vehicles that are in high demand in the PRC market, such as Mercedes GLS450, Mercedes G63, BMW X7, and Lexus 600.

Our Professional Purchasing Agents

As of December 31, 2023, we worked with 389 independent contractors as our professional purchasing agents, responsible for purchasing designated models of vehicles using the knowledge and negotiating skills they have acquired from our training. We have developed a standardized system of recruiting, training, and managing professional purchasing agents. Specifically, we post job listings on various job platforms to attract qualified potential candidates, and assign received resumes to our full-time procurement specialists, who will schedule interviews by telephone or in person. A second interview will be conducted by a procurement manager and/or human resources manager to further review the candidate’s background and qualifications. Upon reviewing the applicant’s experience in the industry, knowledge of our Company, and other qualifications, we will determine whether a candidate is a good fit. In addition, we have designed and developed our own referral program that incentivizes our existing agents to utilize their network to attract additional qualified agents and thus further expand our purchasing agent base. In particular, we encourage our purchasing agents to introduce such positions to their connections and forward their resumes or contact information to our Company if consent is granted. The candidates so referred, if retained, will receive our training and start working as purchasing agents, and the referral agent will earn a $200 commission for each deal the referred agents close. There is no limit or cap on how many referrals can be made in our referral program. In the referral program, existing agents act as mentors to new agents by providing them with initial training and helping them become familiar with our Company.

7

Table of Contents

Since most of the purchasing agents have other part-time employment, training sessions are provided to accommodate their schedules. In a training session, our procurement specialists outline the details, such as models with specifications, buying procedures, commission structure, and agent conduct when visiting a dealership. The agents are trained continuously after each deal is completed to improve their skills and knowledge. To determine whether a new purchasing agent has been fully trained and understands well his or her responsibilities, workflow, and company procedures and policies, a procurement manager will schedule an assessment test or call with the new agent before the agent places his or her first order with a dealership. We manage our purchasing agents through a variety of communication tools including texts, phone calls, emails, and zoom meetings. Each purchasing agent is assigned to a procurement specialist in charge, who leads and trains a group of agents. Depending on the agent’s schedule, the procurement specialists in charge are in direct communication with their agents on a weekly basis for updates on active deals, leads for new potential deals, and scheduling vehicle pick-ups.

As each of our purchasing agents may only be able to perform a limited number of purchases before being recorded in the U.S. dealers’ Suspect Customer Database, we may encounter difficulty maintaining a sufficient number of purchasing agents to meet our purchasing demand. Our newly established referral program helps us maintain sufficient purchasing agents by offering incentives to existing agents in the form of a referral commission on each successfully concluded transaction completed by a new agent whom they referred to us. As a result, agents are more motivated to work and stay with our Company.

In accordance with a typical independent contractor agreement entered between a professional purchasing agent and our Company, the purchasing agent agrees to (i) acquire the automobile identified by our Company and promptly transfer possession of the automobile to us; (ii) diligently execute all documents related to the transfer of title and delivery of the automobile; (iii) deliver the automobile without any physical damage, including all purchasing documents, user manuals, window sticker, keys, spare tires, and interior carpets; and (iv) acknowledge that the automobile is at all times the sole property of our Company insofar as we fulfill our obligation to fund all related costs of purchasing the automobile and to pay/reimburse all fees owed pursuant to the independent contractor agreement. Pursuant to the independent contractor agreement, we are required to pay the purchasing agent a service fee calculated according to an agreed-upon payment structure specified in the agreement, which includes (i) a base fee ranging from $500 to $2,000, depending on the model of the purchased automobile, and (ii) an incentive bonus that amounts to 25% of any further discount achieved by the purchasing agent beyond the pre-determined benchmark discount required for the purchased automobile. Such agreement also includes liability exemption clauses providing that the purchasing agent shall not be liable for any fines or lawsuits imposed by dealerships or manufacturers due to export infractions or infringements and we agree to indemnify, defend, and hold harmless the purchasing agent from and against any liability, losses, claims, costs, interests, penalties, expenses, and damages arising from any non-negligent execution of the role as purchasing agents on behalf of our Company.

Brands We Supply

The brands of automobiles we have procured include Mercedes, BMW, Porsche, Land Rover, Lexus, Bentley, Ram, and Toyota.

8

Table of Contents

The following table sets forth a breakdown of brands purchased during the years ended December 31, 2023 and 2022.


Percentages


Percentages


Number of

of

Number of

of

Automobiles

Total

Automobiles

Total

Purchased

Purchase

Purchased

Purchase

During the

During the

During the

During the

Year

Year


Year


Year

Ended


Ended

Ended

Ended


December 31,

December 31,

December 31,

December 31,

Brands/Models:

2023

2023

2022

2022

Luxury Brands


Mercedes Benz GLS450

156

60.5

%  

153

43.0

%

Mercedes Benz S500

16

4.5

%

Mercedes Benz G63

1

0.4

%  

4

1.1

%

Mercedes Benz G550

7

2.0

%

Mercedes Benz GLS600

12

4.6

%  

1

0.3

%

BMW X7


28


7.9

%

Porsche Cayenne


15


4.2

%

Lexus LX600


58


22.5

%  

83


23.3

%

Bentley


2


0.6

%

Land Rover Range Rover


10


3.9

%  

10


2.8

%

Ram 1500 TRX


1


0.4

%  

20


5.6

%

Toyota Sequoia


20


7.8

%  

14


3.9

%

Subtotal


258


100

%  

353


99.2

%

Mid- to High-End Brands


Sprinter


3


0.8

%

Subtotal


3


0.8

%

Total


258


100

%  

356


100

%

Services and Operational Flow

Procurement

We make procurement decisions based on our extensive experience and insight into the PRC parallel-import vehicle industry. In order to avoid overstocking or understocking inventory, we must forecast inventory needs and expenses through meticulous market analysis and weekly sales department meetings. Specifically, our management estimates, based on the data from the General Administration of Customs of China, that approximately 20,000 parallel-import cars have been exported annually from the U.S. to China in recent years, most of which are of low-end and mid-range brands. Our founding team understands the factors driving the growth of the luxury-car segment in China and the desires of the Chinese consumer. In addition, we have some close business partners in China who are parallel-import car traders or dealers, including some of our PRC customers and some third parties or potential customers. They provide us with timely information on the PRC market and often offer us more favorable terms of settlement. To develop our sales strategy and support our procurement department’s purchasing plans, the sales department meets weekly with our procurement department to discuss the latest market needs and dynamics, including sales prices, brand composition, and inventory changes. Nonetheless, in the event that we overstock or understock our inventory, our business, financial condition, and results of operations may be adversely harmed.

We primarily procure automobiles through our team of professional purchasing agents, who serve as independent contractors, from U.S. automobile dealers that have the designated automobile model in stock. As of December 31, 2023 and 2022, we worked with approximately 389 and 342 professional purchasing agents, respectively. Mr. Walter Folker, who currently serves as our Vice President of Procurement, oversees a full-time procurement manager, who in turn supervise five full-time procurement specialists, as of December 31, 2023. Those full-time procurement specialists are responsible for training our purchasing agents and providing them with timely phone coaching and on-site support. Due to our standardized recruitment, training, and management of professional purchasing agents, we believe our efficient procurement management and organizational skills set us apart from other competitors in the industry. See “—Our Professional Purchasing Agents.” Our purchasing agents negotiate the best price for our designated automobile models using the knowledge and negotiating skills they received from our training. We decide which automobiles to purchase primarily based on the demand and selling price for specific automobile models in the PRC market and their availability in the U.S. market. We regularly issue

9

Table of Contents

instructions about the brands and models of vehicles to be purchased, as well as the maximum acceptable prices and pick-up time limits. Professional purchasing agents can visit dealerships across the U.S. for quotes based on their schedules and convenience, and provide us with the price information they obtain. We then select the lowest prices for models in demand and assist those purchasing agents who provide such quotes in completing the purchases. Once the purchases are completed, the purchasing agents sell automobiles to our Company at their purchase prices and charge us a service fee per automobile based on the model of the vehicle and the discount they obtained from the automobile dealers. See “—Our Professional Purchasing Agents.” A purchasing agent usually pays the deposit to automobile dealers using a Company-issued credit and pays the remaining balance via bank cashier check from our Company’s bank account. The purchasing agents may occasionally advance funds to the automobile dealers, which will be reimbursed once they provide a receipt and other required documents. In addition, we will fund any other costs, fees, and taxes incurred by purchasing agents related to the purchase and transfer of automobiles. Once the purchasing agents receive the titles of the purchased automobiles from the Department of Motor Vehicles, they immediately sign the titles over to Cheetah Net. Automobiles purchased from U.S. automobile dealers are picked up by our purchasing agents and delivered to us at a designated warehouse or other agreed delivery location.

Below is a diagram showing the procurement process:

Graphic

The following chart demonstrates the number of vehicles we acquired each year since 2016. We are able to support an annual purchase volume of 500 to 600 cars with our current team size and working capital reserves. In the future, if our client base expands, we may

10

Table of Contents

adjust the brands of luxury cars we offer. This could result in more cars to be acquired, with a higher or lower average purchase price per vehicle than the current level. Nevertheless, we will primarily focus on vehicles with MSRPs between $80,000 and $130,000.

Graphic

Note: Year 2020 was affected by the COVID-19 pandemic and China’s Implementation of National VI Standards.

We actively monitor our automobile inventory as part of our inventory management process. It is our policy to keep our inventory levels as low as possible while maintaining reasonable levels. The balance of our inventory as of December 31, 2023 and 2022 accounted for approximately 15.4% and 41.2% of our total current assets, respectively. The automobiles are stored in the third-party warehouses until they are shipped to China or delivered to our U.S. customers.

Financing for Procurement

Our business requires a large amount of capital. To maintain our liquidity, we sometimes use the following financing instruments for procurement, including inventory financing, letter of credit financing (“LC financing”), and revolving line of credit:

Inventory Financing: In order to improve our liquidity and retain more cash to buy new cars, we may borrow short-term loans from time to time secured by the vehicles we purchased (namely, our inventory) as collateral. We incur interest expense on such inventory financing, provided by funding companies, which are usually small lenders, generally at a rate of 1.35% to 1.80% per month. In most cases, we first look for inventory financing from a lender who understands our business and the luxury car market, and then negotiate the loan terms with them. Different lenders and funding companies charge different interest rates, fees, and repayment terms for inventory financing. Generally, we receive approximately 70% of the MSRP value of a car if we pledge it in a lender’s warehouse and apply for financing. Interest expense is calculated based on the agreed interest rate and the actual number of days borrowed. We generally need to clear all loans prior to customs clearance to further deliver cars to our PRC customers. For the years ended December 31, 2023 and 2022, our interest expense accrued through inventory financing was approximately $115,000 and $750,000, respectively.
LC Financing: To increase our liquidity, we finance our operations from time to time through short-term loans using letters of credit, typically received from our international customers in overseas sales of parallel-import vehicles, as collateral. Generally, we receive approximately 90% or more of the LC amount with a monthly interest rate of approximately 1.5%. For the years

11

Table of Contents

ended December 31, 2023 and 2022, our interest expense accrued through LC financing was approximately $930,000 and $1,670,000, respectively.
Revolving Lines of Credit: As part of our ongoing efforts to enhance liquidity, on October 5, 2022, we entered into revolving line of credit agreements with two financial support companies, as detailed in “Note 11—Revolving Line of Credit” in the notes to our consolidated financial statements. These agreements enable us to access up to $15.0 million in total, with individual limits of $10.0 million and $5.0 million respectively, for a 12-month period at a fixed interest rate of 1.5% per month. The agreements were amended on December 12, 2022, to extend their maturity dates to April 2024. These revolving lines of credit provide us with a significant buffer to manage cash flow and meet procurement demands effectively. For the years ended December 31, 2023 and 2022, our interest expense accrued through revolving lines of credit was approximately $160,000 and nil, respectively.

Sales and Services

We sell our automobile inventories to our U.S. customers (parallel-import vehicle exporters based in the U.S.) or PRC customers (Chinese parallel-import car dealers who purchase cars from us and import them into the PRC to resell them to other dealers or end consumers). A specific vehicle model’s pricing and profitability vary based on the market demand and supply for that model. We set our selling prices based on multiple factors, including the price of the same model sold by authorized dealers in China, normal commercial terms, market pricing adjustments, customer payment methods, operational efficiency of our Company, and anticipated workload for trading activities. The selling price is finalized as the MSRP plus service fees, which are determined upon comprehensive consideration of the overall market adjustments for vehicles as well as the customer’s payment method. For example, for the year ended December 31, 2023, the total selling price for customers using letters of credit as payment method ranged from 120% to 130% of the MSRP plus a market adjustment of up to $25,000, while the total selling price for customers using telegraphic transfer (wire transfer) as the payment method was the MSRP plus an adjustment price ranging from $4,000 to $37,000 as determined on a case-by-case basis. During the years ended December 31, 2023 and 2022, the sales price of our vehicles ranged between $77,499 and $277,300.

The following table sets forth the breakdown of our sales revenue by brands and models during the years ended December 31, 2023 and 2022.


Sales


Revenue Share


Sales


Revenue Share


Revenue

of Total

Revenue

of Total

During the

Sales for

During the

Sales for

Year

the Year

Year

the Year

Ended

Ended

Ended

Ended

December 31,

December 31,

December 31,

December 31,

Brands/Models:

2023

2023

2022

2022

Luxury Brands


Mercedes Benz GLS450

$

17,634,255

46.0

%  

$

21,690,333

39.3

%

Mercedes Benz S500

$

$

6,976,494

12.6

%

Mercedes Benz G63

$

$

1,917,066

3.5

%

Mercedes Benz G550

$

$

1,538,944

2.8

%

Mercedes Benz GLS600

$

2,877,516

7.5

%  

$

273,603

0.5

%

BMW X7

$

480,210

1.2

%  

$

6,426,881

11.6

%

Porsche Cayenne

$


$

2,405,244


4.4

%

Bentley

$


$

537,448


1.0

%

Lexus LX570

$


$

318,503


0.6

%

Lexus LX 600

$

10,023,386


26.2

%  

$

10,962,014


19.9

%

Land Rover Range Rover

$

2,359,979


6.2

%  

$

800,931


1.4

%

Ram 1500 RTX

$

1,698,061


4.4

%  

$

864,644


1.6

%

Toyota Sequoia

$

3,242,567


8.5

%  

$

202,383


0.4

%

Subtotal

$

38,315,974


100

%  

$

54,914,488


99.6

%

Mid- to High-End Brands


Sprinter

$


$

238,847


0.4

%

Subtotal

$


$

238,847

$

0.4

%

Total

$

38,315,974


100

%  

$

55,153,335


100

%

12

Table of Contents

Typically, we enter into sales contracts with our PRC and U.S. customers. See “—Our Customers.” Our U.S. customers usually pay the full amount to us within two days before or after the automobile is delivered to the appointed warehouse. In most cases, our PRC customers make their payments one or two weeks after we arrange for a freight forwarding company to load the automobile and provide them with the ocean bill of lading and other related documents.

Fulfillment and U.S. Customs Clearance

For our domestic sales, we deliver the purchased vehicles to U.S. customers at their designated warehouses and provide the original copy of the title to them within the agreed timeframe. Our U.S. customers are responsible for export and cross-border transportation matters on their own after purchasing automobiles. In this case, we bear the risk of damage and loss before delivering the automobile to the warehouse designated by the U.S. customer.

For our PRC customers, it is our responsibility to arrange for the ocean freight forwarder to load the automobile to be shipped and provide them with the ocean bill of lading and related documents. As such, we bear the risk of damage and loss prior to arranging for the shipping of automobiles by third-party logistics service providers, but these risks pass to our PRC customers once the automobile is dispatched on board. Our PRC customers, namely, Chinese parallel-import car dealers, will be responsible for after-sale services for the end consumers of those parallel-import vehicles. Prior to shipping the automobiles, we generally require PRC customers to make the majority of the amount owed (typically the MSRP amount) upfront via a letter of credit, where the release of payment is contingent upon our submission of a bill of lading and other required documents to the issuing bank underlying the letter of credit for its review. Once we confirm receipt of the letter of credit, we will settle the loan (if any) and arrange for customs clearance and shipping by third-party logistics service providers. In the event that all customs clearance procedures have been completed with all forms filled out and accepted by U.S. Customs and Border Protection (“Customs”), we will ship the automobiles and provide the issuing bank with the bill of landing and related documents for its review. Upon completion of the review, the issuing bank releases payment to us, and the bill of landing and related documents to PRC customers, which are necessary to obtain the automobiles from the freight forwarder. We cooperate with third-party logistics service providers whose primary responsibility is to provide cross-border logistics services, typically by sea, for the delivery of our automobiles to our PRC customers.

Technology and Intellectual Property

The success of our business depends on our proprietary technologies. We have developed our Office Automation System (the “OA System”), an information technology system we use to track our order status and monitor our business workflow. The OA system facilitates the storage, exchange, and management of order data, thereby increasing our productivity and efficiency. Currently, the OA System has four main modules: Dashboard, Resume, Orders, and Pick-Up.

Dashboard. The Dashboard module is designed for publishing company policies, operational guidelines, and vehicle specifications. Additionally, it can display the daily numbers of new orders so that employees can keep track of trends over time.
Resume. The Human Resources Department of our Company selects resumes from job posting platforms and uploads them to the OA System with scores based on company resume scoring instructions. The scored resumes are assigned to our procurement specialists daily for the purpose of hiring talent purchasing agents on a continuous basis.
Orders. Once the purchasing agents have placed orders with U.S. automobile dealers, our procurement specialist creates a new order in this module and uploads the required documents for back office review. The back office carefully reviews the information and documents and makes notes or comments when further information is needed. As soon as the back office collects and confirms all required information and documents, it will approve or cancel the order in accordance with our order review policy.
Pick-Up. When an approved order is ready for pick-up, procurement specialists submit a Pick-Up Form and upload additional or updated information and documents under this module for final review by the back office. It is the responsibility of the back office to finalize the cost and specifications before approving the order and preparing for pick-up. After the vehicle has been successfully picked up, its relevant information is moved to the next module, Logistics, which is currently under construction.

13

Table of Contents

As of the date of this annual report, we have registered three domain names in the U.S., including (i) Cheetah-net.com, a domain name registered on August 17, 2022 and associated with the Cheetah Net website; (ii) Pacificconsultingusa.com, a domain name registered on January 7, 2019 and associated with the Pacific Consulting LLC website; and (iii) Allen-boy.com, a domain name registered on December 5, 2018 and currently not in use.

Employees

As of December 31, 2023, we had a total of 20 employees, 18 of whom worked as full-time employees, as set forth in the following table:


Number of


Number of

total

full-time

Function:

employees

employees

Procurement

6

6

Customer Services and Operations

5

4

Sales and Marketing


3


3

General and Administration


6


5

Total


20


18

Our employment contracts with full-time employees include a confidentiality clause.

In addition to our employees, we worked with 389 independent contractors as of December 31, 2023. These independent contractors serve as our professional purchasing agents, primarily responsible for visiting the U.S. automobile dealers and negotiating the best vehicle purchase price.

We believe that we maintain a good working relationship with our employees and our independent contractors, and we have not experienced material labor disputes in the past. None of our employees is represented by labor unions.

Competition

The automobile dealership industry in the U.S. is highly competitive and rapidly evolving, with many new companies constantly entering the market. We are committed to the niche market of selling automobiles to U.S. and PRC parallel-import vehicle dealers. We compete with other U.S. companies that sell parallel-import vehicles sourced in the U.S. to be sold in the PRC market. Our ability to compete effectively in the parallel-import vehicle dealership industry depends upon many factors, including our experience and in-depth insight into the industry, as well as the ability to provide vehicles in large quantities to Chinese parallel-import car dealers on a recurring basis. Generally, we do not have major competitors, because most of our competitors are small family businesses that obtain U.S. cars through their family members or friends in the U.S., and thus cannot guarantee recurring large supplies. With a large purchasing agent team responsible for our procurement, we have become a stable supplier for Chinese parallel-import car dealers. Accordingly, we believe we are well-positioned to effectively compete in the parallel-import vehicles dealership industry. It is possible, however, that some of our current or future competitors may have a greater brand recognition, or more financial, technical, or marketing resources. We may lose clients if we fail to compete successfully, which could adversely affect our financial performance and business prospects. We cannot guarantee that our strategies will remain competitive or successful in the future.

Governmental Regulations

Automotive Dealing and Other Laws and Regulations

We operate in the highly regulated automobile dealership and commercial lending industries. A number of U.S. federal, state, and local laws and regulations affect our business. Numerous laws and regulations govern our business, including those relating to our sales, operations, financing, insurance, advertising, transportation of vehicles, and employment practices. The regulatory bodies that regulate our business include the Consumer Financial Protection Bureau, the Federal Trade Commission, the United States Department of Transportation, the Occupational Safety and Health Administration, the Department of Justice, the Federal Communications Commission, various state dealer licensing authorities, various state consumer protection agencies, and various state financial regulatory agencies. We are subject to compliance audits of our operations by many of these authorities. For example, the Federal Trade

14

Table of Contents

Commission has jurisdiction to investigate and enforce our compliance with certain consumer protection laws and has brought enforcement actions against auto dealers relating to a broad range of practices, including the sale and financing of value-added or add-on products and the collection, storage and use of consumer personal information.

Currently, we have a dealer license in North Carolina under Allen-Boy, which allows us to sell vehicles nationwide and export them worldwide. As we expand to other states, we may be subject to applicable vehicle dealer licensing laws in those states. Some states regulate retail installment sales, including setting a maximum interest rate, caps on certain fees, or maximum amounts financed. All domestic vehicle sale transactions and applicable retail installment financings are conducted under our dealer licenses. As we expand to other states, we may be required to obtain additional finance licenses or other licenses, and we may not be able to obtain such licenses within the time frame we expect or at all. We may also be subject to certain states’ laws related to titling and registration and wholesale vehicle sales. These laws can vary from state to state. The applicability of these regulatory and legal compliance obligations to our business depends on evolving interpretations of these laws and regulations and how our operations are, or are not, subject to them, and we may face regulatory action if regulators believe that we are not in compliance with such obligations. In addition to these laws and regulations that apply specifically to the sale and financing of vehicles, our facilities and business operations are subject to laws and regulations relating to environmental protection, occupational health and safety, and other broadly applicable business regulations. We may also be subject to laws and regulations involving taxes, tariffs, pricing, content protection, electronic contracts and communications, mobile communications, consumer protection, and information-reporting requirements, as well as privacy laws, anti-money laundering laws, and federal and state wage-hour, anti-discrimination, and other employment practices laws. For example, under the Immigration and Nationality Act, a foreign national is eligible for employment authorization in the U.S. only with an employment-related green card (permanent residency), an exchange visitor work and study visa, or a temporary (non-immigrant) worker visa, such as an H-1B visa. In particular, the H-1B visa is a nonimmigrant work visa that allows U.S. employers to hire foreign workers for specialty jobs that require a bachelor’s degree or equivalent. H-1B status can be granted initially for up to three years, and can be extended for another three years. H-1B holders who reach that six-year maximum must leave the U.S. and remain outside for at least one year before being eligible for a new six years of H-1B. As of December 31, 2023, we had 18 full-time employees, including seven foreign employees who do not have permanent work permits in the U.S. and currently work under H-1B visas or student visas. We are also subject to laws and regulations affecting public companies, including securities laws and exchange listing rules.

Automobile Exportation Laws and Regulations

The exportation aspect of our business is subject to the U.S. Code of Federal Regulation’s requirements for exportation under 19 CFR § 192.2 and the inspection of Customs. We may be required to present to Customs, at the port of exportation, both the vehicle and the documentation describing the vehicle, including the vehicle identification number (the “VIN”) or the product identification number at least 72 hours prior to export for Customs to determine the authenticity of the documents. Specifically, for exportation of U.S.-titled vehicles, we are required to provide to Customs the vehicle’s original certificate of title. If the vehicle to be exported is leased or has recorded liens in the U.S., separate writing from the third-party-in-interest is also required, which expressly provides that the vehicle may be exported and contains a complete description of the vehicle (including the VIN and the name and contact of the owner or lienholder) and the original signatures.

Regulations Affecting Financial Services

Our financial services are affected by laws and regulations that apply to commercial lending. This includes a range of laws, regulations, and standards that address information security, data protection, privacy, licensing, and interest rates, among other things.

Federal Lending Regulations

Several federal laws and regulations affect our lending operations. These laws include, among others, portions of the Dodd Frank Act, Anti-Money Laundering requirements (Bank Secrecy Act and USA PATRIOT Act), Equal Credit Opportunity Act, Fair Credit Reporting Act, Privacy Regulations (Right to Financial Privacy Act), Telephone Consumer Protection Act, and requirements relating to unfair, deceptive, or abusive acts or practices.

State Lending Regulations

Interest Rate Regulations. Although the federal government does not regulate the maximum interest rates that may be charged on commercial loan transactions, some states have enacted commercial rate laws specifying the maximum legal interest rate at

15

Table of Contents

which loans can be made in the state. We currently originate commercial loans and provide our financial services under the laws of the State of New York. New York Usury Law stipulates two maximum interest rates: 16% per year for civil usury and 25% per year for criminal usury. In other words, borrowers can sue to invalidate a loan or plead usury as a defense to a nonpayment action to loans charging rates above 16% per year. Additionally, lenders who charge interest over 25% per year may be subject to criminal liability. However, loans under $2,500,000 to incorporated entities, such as corporations, limited liability companies, and the like, are typically exempt from the 16% civil usury cap, but are subject to the 25% criminal cap. Accordingly, loans made to those entities can include interest rates up to 25%. In addition, all loans, whether to business entities or to individuals, in a principal amount over $2.5 million are exempt from both the criminal and the civil limits.
Licensing Requirements. Our loans are governed by New York law. Under Article 9 of the New York Banking Law, a person or entity is required to obtain a license in order to engage in the business of making loans in the principal amount of $50,000 or less for business and commercial loans with an interest rate of over 16% per year. As the business and commercial loans in our financial services do not have a principal of $50,000 or less with an interest rate of over 16% per year, we are currently not required to obtain such a license. New York Commercial Finance Disclosure Law also requires commercial finance providers to give standardized consumer disclosures to borrowers in connection with financings in an amount less than or equal to $2,500,000.

Item 1A. Risk Factors.

As a smaller reporting company, we are not required to provide the information required by this item.

Item 1B. Unresolved Staff Comments.

None.

Item 1C. Cybersecurity.

Risk Management and Strategy

We recognize the importance of cybersecurity in our operations. We face diverse cybersecurity threats, ranging from unauthorized individual access attempts to sophisticated disruptions targeting our business and customer data. Our operations involve collecting and storing customer information in cloud systems, such as Google Drive, and we rely on third-party providers, such as Google, whose systems may encounter interruptions and/or cybersecurity incidents.

Our business depends on the continuous functioning of our OA System, which tracks order status and monitors business workflows. The secure handling of information is crucial, particularly for tracking automobile orders. We have implemented various measures, such as access controls, data encryption, and vulnerability assessments, to prevent and mitigate cybersecurity risks and incidents. In particular, we have implemented a cybersecurity risk management program, in accordance with our risk profile and business size, which is designed to detect, identify, assess, and respond to current and emerging cybersecurity threats. We have developed a comprehensive, cross-functional approach to identifying, preventing, and mitigating cybersecurity threats and incidents, while also developing tools and processes that provide for the prompt escalation of certain cybersecurity incidents so that decisions regarding the public disclosure and reporting of such incidents can be made by management in a timely manner. Our cybersecurity risk management program is supported by third-party information technologies and vendors, including Squarespace and Google Workspace, which assist us with information technology system monitoring, detection, and response support services. We also leverage third-party information technology service providers to monitor and evaluate our cybersecurity posture through vulnerability scans, penetration tests, and cybersecurity risk reviews and assessments. We engage in the assessment and testing of our cybersecurity risk management program, policies, standards, processes, and practices that are designed to address cybersecurity threats and incidents. These efforts include a wide range of activities, assessments, vulnerability testing, and other exercises focused on evaluating the effectiveness of our cybersecurity measures and planning. We also have a process to review certain third-party information technology service providers and vendors, including through contractual requirements and proactive threat intelligence monitoring, as appropriate. However, cybersecurity incidents, if they occur, depending on their nature, could lead to the loss, destruction, or unavailability of critical and confidential data, impacting our operations and potentially harming our reputation. This could result in customer distrust, termination of partnerships, significant remediation costs, and legal liabilities.

16

Table of Contents

As of the date of this annual report, we are not aware of any cybersecurity incidents, that have had a materially adverse effect on our operations, business, results of operations, or financial condition.

Governance

Our board of directors considers cybersecurity risk as part of its risk oversight function and has delegated to the Nominating and Corporate Governance Committee (the “Committee”) oversight of cybersecurity and other information technology risks. The Committee receives reports from management on potential cybersecurity risks and threats. Our management plays a key role in assessing and managing our material risks from cybersecurity threats, with designated positions and committees equipped with the necessary expertise. The management team supervises efforts to prevent, detect, mitigate, and remediate cybersecurity risks and incidents through various means, which may include briefings from internal security personnel and threat intelligence and other information obtained from governmental, public, or private sources.

Item 2. Properties.

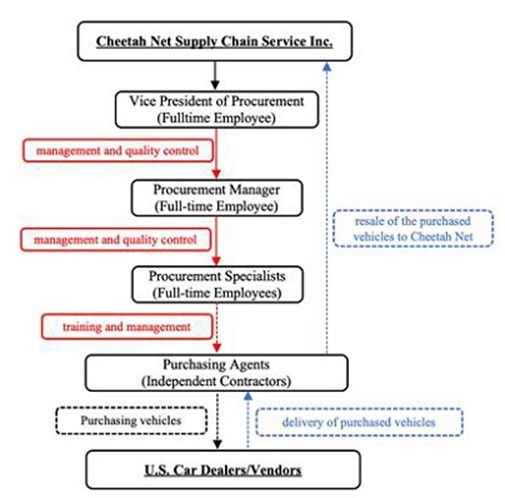
Our principal executive offices are located at 6201 Fairview Road, Suite 225, Charlotte, North Carolina, where we lease office space from an independent third party, GT Real Estate USA, LLC, with an area of approximately 2,514 square feet, a lease term from December 1, 2020 to December 31, 2023 and a monthly rent of approximately $6,354. On April 28, 2023, we entered into an amendment to our current lease, extending its term to February 28, 2027, with a monthly rent of approximately $6,639. On July 25, 2023, GT Real Estate USA, LLC transferred all of its lease rights to two Delaware LLCs, WILVI 6201 SPE LLC and BILA 6201 SPE LLC. This office is used as our corporate headquarter for general business operations and administrative functions.

Allen-Boy, one of our subsidiaries, leases office space for business operations in Charlotte, North Carolina, from an independent third party, Sounder Properties Inc., with an area of approximately 225 square feet, a lease term from October 1, 2022 to September 30, 2023, and a monthly rent of $465. In September 2023, we renewed the lease with a monthly rent of $505, for a term commencing on October 1, 2023 and ending on September 30, 2024. This office is the address for our dealer license.

Pacific, one of our subsidiaries, leases an office in New York City, New York, from an independent third party, Executive Workspace LLC, with an area of approximately 1,692 square feet, a lease term from August 1, 2021 to September 30, 2023, and a monthly rent of approximately $11,174. On September 26, 2023, we amended the lease to include an additional office space of approximately 1,591 square feet and extended its term to February 29, 2024. On February 2, 2024, we further renewed the lease, extending its term to May 31, 2024. This lease currently carries a monthly rent of $9,944. This office is used to support business operations for employees based in New York.

Edward, which became one of our subsidiaries on February 2, 2024, had previously been in a collaborative partnership with us as providers for vehicle storage and logistics services throughout the year ended December 31, 2023. Following our acquisition of Edward in 2024, we assumed responsibility for a lease agreement for its warehousing facility located in Gardena, California, covering approximately 8,800 square feet. This lease agreement, now under our management, has been entered into with an independent third party, SCI Ventures, Inc. The current lease is set to expire on August 31, 2028, with a monthly rent of approximately $13,500. The leased warehousing facility enhances our logistics capabilities and operational efficiency.

We believe that the offices and warehouses we currently lease are adequate to meet our needs for the foreseeable future.

Item 3. Legal Proceedings.

We are not currently involved in any material legal proceedings. From time-to-time we are, and we anticipate that we will be, involved in legal proceedings, claims, and litigation arising in the ordinary course of our business and otherwise. The ultimate costs to resolve any such matters could have a material adverse effect on our financial statements. We could be forced to incur material expenses with respect to these legal proceedings, and in the event that there is an outcome in any that is adverse to us, our financial position and prospects could be harmed.

Item 4. Mine Safety Disclosures

Not applicable.

17

Table of Contents

PART II

Item 5. Market for Registrant’s Common Equity, Related Stockholder Matters and Issuer Purchases of Equity Securities.

Common Stock

Our Class A common stock trades under the symbol “CTNT” on the Nasdaq Capital Market.

Holders of Record

As of March 15, 2024, we had 10,938,329 shares of Class A common stock issued and outstanding held by seven stockholders of record, not including beneficial holders whose shares are held in names other than their own.

Dividend Policy

As of the date of this annual report, we have not paid any cash dividends on our Class A or Class B common stock. We are organized under the North Carolina Business Corporation Act, which prohibits the payment of a dividend if, after giving it effect, we would not be able to pay our debts as they become due in the usual course of business or our total assets would be less than the sum of our total liabilities plus the amount that would be needed, if we were to be dissolved, to satisfy the preferential rights upon dissolution of any preferred stockholders. Our board of directors may decide to pay dividends in the future. Any determination by our board of directors to pay dividends in the future to stockholders will be dependent upon our operational results, financial condition, capital requirements, business projections, general business conditions, statutory and regulatory restrictions, and any other factors deemed appropriate by our board of directors.

Equity Compensation Plans

For information on securities authorized for issuance under our existing equity compensation plan, see Item 12 under the heading “Security Ownership of Certain Beneficial Owners and Management and Related Stockholder Matters.”

Recent Sales of Unregistered Securities

Other than previously disclosed in our quarterly reports on Form 10-Q or current reports on Form 8-K, during the period covered by this annual report, we issued the following securities which were not registered under the Securities Act. We believe that each of the following issuance was exempt from registration under the Securities Act in reliance on Regulation S under the Securities Act regarding sales by an issuer in offshore transactions. No underwriters were involved in these issuances of securities.


Date of


Number of


Securities/Purchaser

Issuance

Securities

Consideration

Class A Common Stock


Rapid Proceed Limited

July 12, 2022


1,000,000

$

1,800,000

Yan Bai

July 12, 2022


666,000

$

1,198,800

Use of Proceeds

The following “Use of Proceeds” information relates to the registration statement on Form S-1, as amended (File Number 333-271185) for our initial public offering (“IPO”), which was declared effective by the SEC on July 31, 2023. In August 2023, we completed our IPO, in which we issued and sold an aggregate of 1,250,000 shares of Class A common stock, at a price of $4.00 per share for $5,000,000. Maxim Group LLC was the representative of the underwriters of our IPO.

We incurred approximately $870,000 in expenses in connection with our IPO, which included approximately $350,000 in underwriting discounts, approximately $100,000 in expenses paid to or for underwriters, and approximately $320,000 in other expenses. None of the transaction expenses included payments to directors or officers of our Company or their associates, persons owning more than 10% or more of our equity securities or our affiliates. None of the net proceeds we received from the IPO were paid, directly or indirectly, to any of our directors or officers or their associates, persons owning 10% or more of our equity securities or our affiliates.

18

Table of Contents

The net proceeds raised from the IPO were $4,230,000 after deducting underwriting discounts and the offering expenses payable by us. As of the date of this annual report, we have used approximately $3,530,000 for working capital and other general corporate purposes in support of our current business. We intend to use the remaining proceeds from our IPO in the manner disclosed in our registration statement on Form S-1, as amended (File Number 333-271185).

Recent Purchases of Equity Securities

None.

Item 6. [Reserved].

Item 7. Management’s Discussion and Analysis of Financial Condition and Results of Operations.

You should read the following discussion and analysis of our financial condition and results of operations together with our consolidated financial statements and related notes appearing elsewhere in this annual report. Some of the information contained in this discussion and analysis or set forth elsewhere in this annual report, including information with respect to our plans and strategy for our business and related financing, includes forward-looking statements that involve risks and uncertainties. As a result of many factors, our actual results could differ materially from the results described in or implied by the forward-looking statements contained in the following discussion and analysis.

Business Overview and Recent Developing Trends

We are a supplier of parallel-import vehicles sourced in the U.S. to be sold in the PRC market. We purchase automobiles, primarily luxury brands such as Mercedes, Lexus, Range Rover, RAM and Toyota, from authorized dealers in the U.S. market and resell them to our customers, including both U.S. and PRC based parallel-import car dealers. We derive profits primarily from the price difference between our buying and selling prices for parallel-import vehicles. Our expertise lies in our ability to identify the type of parallel-import vehicles that are in high demand and to procure them in a timely manner.

The primary driver for our industry is the continuing growth of high-net-worth individuals in the PRC. We are focusing our attention on the most popular of the luxury vehicles that provide us with the best profit opportunity. We provide or utilize third parties in the U.S. to provide logistics and warehousing services and to truck transport our vehicles from an authorized dealer in the U.S. to the ultimate point of sale.

Beginning in the second half of 2023, the market for new luxury vehicles in the PRC has been negatively impacted by weak economic conditions and a shift in consumer demand towards EVs, mainly those produced domestically by PRC manufacturers. Luxury import brand manufacturers have responded to these threats by discounting the sale price of their vehicles, which has resulted in a significant challenge to our ability to generate a profit from the sale of parallel import vehicles generally. Consistent with our strategy to focus only on profitable parallel-import vehicle transactions, our unit sales during the fourth quarter of 2023 fell to 49 vehicles, a 36.4% decrease from the fourth quarter of 2022 and a 38.0% drop from unit sales in the third quarter of 2023, which resulted in our recognition of a net loss during the fourth quarter of 2023. This market dynamic has continued into 2024 and we are unable at this time to predict the point at which the market for luxury vehicles will firm and the positive spread between the price of vehicles sourced from brand manufacturers’ official distribution systems compared with those sourced via the parallel-import market will return.

We are responding to the current softness in luxury vehicle sales in China by reducing our operating costs, maintaining a very low level of inventory, and using our cashflow to strengthen our logistics and warehouse capabilities as well as cover overhead. We have significant flexibility to reduce expenses due to our scalable operations; for example, our procurement agents are paid on a commission basis only so these agents are paid only to the extent they purchase vehicles on our behalf. We are proceeding with our plans to integrate the acquisition of Edward and to acquire additional U.S.-based logistics and warehousing service providers to reduce our reliance on the purchase and sale of luxury vehicles and augment our core operations with service revenue, which we believe will provide the opportunity to generate revenue by selling these services to third-party parallel importers as well as to importers of other goods. We believe we can overlay these services with the financial services plans we launched in October 2022 for inventory financing (see “Item 1. Business—Overview—Recent Development” for more details), such that we can essentially become a one-stop shop for small- and medium-sized traders within the global supply chain sector.

19

Table of Contents

Key Factors Affecting our Results of Operations

We believe the following key factors may affect our financial condition and results of operations:

Changes in consumer demand and consumption power in the PRC market. We primarily generate revenue from the sale of vehicles to parallel-import vehicle dealers in China, directly or through U.S. based exporters. We currently focus on luxury brands and gasoline-powered vehicles. Our industry is primarily driven by the increased number of wealthy consumers in the PRC market. If the consumption and purchasing power of Chinese customers declines, or if they are less inclined to purchase large, expensive vehicles, such as sport utility vehicles or luxury automobiles, and more inclined to purchase smaller, less expensive, and more fuel-efficient vehicles, our business and results of operations could be adversely affected.
Fluctuations in the average selling price per vehicle and the number of vehicles available for sale caused by competition. The parallel-import vehicle dealership industry in the U.S. is relatively competitive and rapidly evolving, with many new companies joining the competition in recent years. We compete directly with other U.S. companies that sell parallel-import vehicles to the PRC, although most of our competitors are small family businesses that obtain U.S. cars through their family members or friends in the U.S. It is expected that competition will intensify in the future, and the increased competition may lead to price reductions for vehicle sales, which may result in reduced margins and a loss of market share. We purchase our inventory of vehicles from U.S. automobile dealers via third-party professional purchasing agents, and each of them can purchase a limited number of vehicles before being placed on the “exporters list.” If these purchasing agents are unable or unwilling to continue in their present positions, or if we fail to recruit new purchasing agents or maintain a sufficient number of purchasing agents to meet our purchasing demand, our business may be severely disrupted. If our procurement capabilities are impacted and we are unable to purchase popular vehicle models at reasonable procurement costs, our business and results of operations could be adversely affected. We may lose customers if we cannot successfully compete, which could adversely affect our financial performance and business prospects.
Our ability to expand markets. During the year ended December 31, 2023, our three largest customers accounted for 53.2%, 25.5%, and 20.2% of our total revenue, respectively. For the year ended December 31, 2022, our three largest customers accounted for approximately 65% of our total revenue, while for the year ended December 31, 2021, our four largest customers accounted for 81.9% of our total revenue. While we have a strong record of performance, we cannot guarantee that we will continue to maintain our business relationships with these major customers at the same level, or at all. In the event that a significant customer terminates its relationship with us, we cannot assure that we will be able to secure an alternative arrangement with another comparable customer in a timely manner, or at all. Losing one or more of these major customers could adversely affect our revenue and profitability.
China’s industrial Policies. Changes in consumer demand in the PRC market for fuel-efficient vehicles and electric vehicles could adversely affect our vehicle sales volumes and results of operations. Furthermore, government policies on the purchase and ownership of automobiles in the PRC, as well as stricter emission standards, may reduce the market demand for the automobiles we sell and thus negatively affect our business and growth prospects.
Macroeconomic conditions. We facilitate the import of automobiles of foreign brands into the PRC market as parallel-import vehicles, and any adverse change in political relations between the PRC and the U.S. or any other country where those brands originate, including the ongoing trade conflicts between the U.S. and the PRC, may negatively affect our business. We are currently operating in a period of economic uncertainty and capital market disruption, which has been significantly impacted by geopolitical instability due to the ongoing military conflicts between Russia and Ukraine and in the Middle East. Our business, financial condition, and results of operations could be materially adversely affected by any negative impact on the global economy and capital markets resulting from the conflict in Ukraine, the Middle East, or any other geopolitical tensions.

Results of Operations

Major Components of Results of Operations

The automobile models we purchase and sell are among the most popular vehicles in the market, which we believe provide lucrative profit opportunities. Our selection of customers and the models we plan to purchase are based on our efforts to maximize the overall profitability of each vehicle sale. We will continue to apply this guiding principle in developing and refining our procurement and sales

20

Table of Contents

strategies. As such, we consider market conditions, capital costs, and other factors when determining the models and categories we purchase and the prices at which we sell them. While the brands, models, and their price ranges at which we sell may be adjusted, we intend to maintain the highest gross profit opportunities to improve the overall efficiency of our capital and maximize our earnings potential.

Revenue

We generate revenue by selling vehicles to U.S. parallel-import vehicle exporters and PRC parallel-import vehicle dealers. A specific vehicle model’s pricing and profitability vary based on the market demand and supply for that model. We set our selling prices based on multiple factors, including the price of the same model sold by authorized dealers in China, the normal commercial terms, customer payment methods, and anticipated workload for trading activities. The selling price is finalized as the MSRP plus adjustments, which are determined upon comprehensive consideration of the overall market conditions for vehicles as well as the customer’s payment method. In addition to those specific factors that impact the parallel-import vehicle market, our revenue may be impacted by global economic factors including the U.S. dollar/RMB exchange rate, overall financial and economic conditions in the PRC, and any significant change in relevant import or export regulations.


2023


2022

No. of Cars  

Ave.  

Total  

No. of Cars  

Ave.  


Total  

Sold


Selling Price


Revenue

Sold


Selling Price


Revenue

Q1

82

$

124,566

$

10,214,442

121

$

105,934

$

12,818,071

Q2


93


131,430


12,223,026


175


118,794


20,788,964

Q3


79


127,066


10,038,246


90


132,351


11,911,614

Q4


49


119,189


5,840,260


77


125,126


9,634,686

Total


303

$

126,455

$

38,315,974


463

$

119,122

$

55,153,335

Our revenue decreased by $16.8 million, or 30.5%, from $55.2 million in 2023 to $38.4 million in 2023. Despite a year-over-year revenue decline in 2023, our average selling price per vehicle increased from 2022. The initial rise was due to our shift towards models with higher profit margins. Starting from the third quarter of 2023, we began adjusting our average selling prices downward in response to short-term market volatility, which continued during the fourth quarter with the onset of price inversion in the Chinese market. These adjustments affected our fourth quarter sales, which resulted in a 39.4% drop in revenue from the same quarter in 2022.

Cost of Revenue

Our cost of revenue mainly comprises (i) the purchase cost of vehicles including dealership service fees and non-refundable taxes incurred during procurement, and (ii) fulfillment expenses, mainly including (a) compensation and bonuses for staff in the purchasing department, (b) commission paid to purchasing agents, (c) transportation and storage costs for vehicles, and (d) consulting fees paid to dealer experts to assist us in making the best purchase decisions. Allowance for slow-moving inventories is also included in the cost of revenue when our cost of inventory is higher than net realizable value.

Our cost of revenue decreased by $16.6 million, or 32.8%, from $50.7 million in 2022 to $34.1 million in 2023, primarily as a result of our decline in sales.

Interest Expense, Net

To improve our cash flow and expand our business, we obtain loans from finance companies through (i) inventory financing by keeping inventories not intended for immediate sale as collateral, (ii) LC financing by using letters of credit received from our international customers in overseas sales of parallel-import vehicles as collateral, and (iii) accessing revolving lines of credit to further support our operations and strategic initiatives. Accrued interest is recorded as interest expense. As of the date of this annual report, our LC financing annual interest rate is 18.0%, and our revolving line of credit interest rate is 18.0%.

Risks and Uncertainties

Our operations are in the U.S. and our primary market is in the PRC. Accordingly, our business, financial condition, and results of operations may be influenced by political, economic, and legal environments in the U.S. and the PRC, as well as by the general state of

21

Table of Contents

the U.S. and the PRC economies. Our results may be adversely affected by changes in the political, regulatory, and social conditions in the U.S. and the PRC.

Risks and uncertainties related to our business include, but are not limited to, the following:

changes in consumer demand in the Chinese market towards fuel-efficient vehicles and electric vehicles could adversely affect our vehicle sales volumes and results of operations;
the PRC government policies on the purchase and ownership of automobiles and stricter emissions standards may reduce the market demand for the automobiles we sell and thus negatively affect our business and growth prospects;
any adverse change in political relations between the PRC and the U.S. or any other country where those brands originate, including the ongoing trade conflicts between the U.S. and the PRC, may negatively affect our business;
the ongoing military conflicts between Russia and Ukraine and between Israel and Hamas could materially and adversely affect the global economy and capital markets, including significant volatility in commodity prices, especially energy prices, credit and capital markets, as well as supply chain interruptions; and
the inflation in the economy may result in higher interest rates and capital costs, shipping costs, supply shortages, and increased costs of labor, and may adversely affect our liquidity, business, financial condition, and results of operations, particularly if we are unable to achieve commensurate increases in the prices we charge our customers.

Our business, financial condition, and results of operations may also be negatively impacted by risks related to natural disasters, extreme weather conditions, health epidemics, and other catastrophic incidents, which could significantly disrupt our operations.

Our operations in 2022 were affected by the COVID-19 pandemic. First, the COVID-19 pandemic restricted our purchasing agents in the U.S. from freely purchasing designated automobiles at U.S. automobile dealerships, either because of the short supply of vehicles or because of store closings or limited opening hours due to the COVID-19 pandemic. Second, the COVID-19 pandemic adversely affected the market demand for our products. Due to the implementation of significant governmental measures in the PRC, including lockdowns, closures, quarantines, and travel bans, intended to control the spread of the virus, parallel-import vehicle consumers were less willing to spend, and their purchasing power declined. Consequently, the market demand for luxury cars, which make up the vast majority of our inventory, has decreased dramatically. As of the date of this annual report, the spread of COVID-19 has been under control, and during the year ended December 31, 2023, the COVID-19 pandemic did not have a material impact on our financial positions and operating results.

22

Table of Contents

Comparison of Results of Operations for the Years Ended December 31, 2023 and 2022


For the Years ended December 31,

Change


2023

2022

Amount

%  


USD


%  


USD


%  


Revenue

$

38,315,974


100.0

%  

$

55,153,335


100.0

%  

$

(16,837,361)


(30.5)

%

Cost of Revenue

Cost of vehicles


32,183,676


84.1

%  


48,534,282


88.0

%  


(16,350,606)


(33.7)

%

Fulfillment expenses


1,885,382


4.9

%  


2,149,672


3.9

%  


(264,290)


(12.3)

%

Total cost of revenue


34,069,058


89.0

%  


50,683,954


91.9

%  


(16,614,896)


(32.8)

%

Gross Profit


4,246,916


11.1

%  


4,469,381


8.1

%  


(222,465)


(5.0)

%

Selling expenses


668,721


1.7

%  


898,852


1.6

%  


(230,680)


(25.7)

%

General and administrative expenses


2,190,513


5.7

%  


1,430,917


2.6

%  


759,596


53.1

%

Total operating expenses


2,858,685


7.4

%  


2,329,769


4.2

%  


528,916


22.7

%

Income from Operations


1,388,231


3.6

%  


2,139,612


3.9

%  


(751,381)


(35.1)

%

Other Income (Expenses)


Interest expenses, net


(1,239,297)


(3.2)

%  


(2,441,443)


(4.4)

%  


1,202,146


(49.2)

%

Other income, net


31,593


0.1

%  


12,974


%  


18,619


143.5

%

Subsidy income from Business Recovery Grant Program


%  


1,340,316


2.4

%  


(1,340,316)


(100.0)

%

Total other expenses, net


(1,207,704)


(3.1)

%  


(1,088,153)


(4.4)

%  


(119,551)


11.0

%

Income before Provision for Income Tax


180,527


0.5

%  


1,051,459


(0.5)

%  


(187,822)


(82.8)

%

Provision for Income Taxes


46,657


0.1

%  


234,479


0.4

%  


(187,822)


(80.1)

%

Net Income

$

133,870

0.4

%

$

816,980

(0.9)

%

$

(683,110)

(83.6)

%

Revenue


Years Ended December 31,


2023

2022

Amount

%

Total

$

38,315,974

$

55,153,335

$

(16,837,361)


(30.5)

%

23

Table of Contents

During the year ended December 31, 2023, our financial performance reflected the consequences of our strategic decisions and external market forces. Our revenue experienced a substantial decline compared to the previous year. Revenue from our operations decreased by $16.8 million, or 30.5%, from approximately $55.2 million in 2022 to $38.4 million in 2023. This decline can be primarily attributed to an intentional pause in vehicle procurement in the fourth quarter of 2023, prompted by price inversion in the Chinese market, as well as a change in our procurement pricing strategy as detailed in our most recent quarterly report. The impact of these factors was particularly pronounced in the fourth quarter of 2023, during which period revenue was $5.8 million, a decrease of 39.4%, or $3.8 million, from the $9.6 million reported in the fourth quarter of the previous year.


Year Ended December 31,

Year Ended December 31,


2023

2022

 Average Selling Price Changes


No.


Sales Amount


Ave Selling Price


No.


Sales Amount


Ave Selling Price


Amount


%  

Bentley


$

$


2

$

537,448

$

268,724

$


%

BMW X7


5


480,210


96,042


72


6,426,881


89,262


6,780


7.6

%

Porsche Cayenne


26


2,405,244


92,509


%

Mercedes G550


8


1,538,944


192,368


%

Mercedes G63


8


1,917,066


239,633


%

Mercedes GLS 450


157


17,634,255


112,320


204


21,690,333


106,325


5,995


5.6

%

Mercedes Benz GLS600


12


2,877,516


239,793


1


273,603


273,603


(33,810)


(12.4)

%

Mercedes Benz S500


51


6,976,494


136,794


%

RAM Trucks


14


1,698,061


121,290


7


864,644


123,521


(2,230)


(1.8)

%

Land Rover Range Rover


15


2,359,979


157,332


5


800,931


160,186


(2,854)


(1.8)

%

Toyota Sequoia


32


3,242,567


101,330


2


202,383


101,192


139


0.1

%

Mercedes-Benz Sprinter


3


238,847


79,616


%

LEXUS LX570


3


318,503


106,168


%

LEXUS LX600


68


10,023,386


147,403


71


10,962,014


154,395


(6,992)


(4.5)

%

Total


303

$

38,315,974

$

126,455


463

$

55,153,335

$

119,122

$

7,334


6.2

%

(i)In 2023, we sold 303 vehicles, a 34.6% decrease from 463 in 2022. The decline was primarily due to market volatility in China, particularly price fluctuations, resulting in a halt in vehicle procurement in the fourth quarter. During this period, 49 vehicles were sold compared to 77 in 2022, representing a 36.4% decrease.
(ii)During the year ended December 31, 2023, we strategically restructured our product portfolio by discontinuing the sale of select luxury car models, such as the Porsche Cayenne, Mercedes G550, and MB S500. This decision was driven by our objective to better align with market demand, streamline resource allocation toward higher-demand models, and improve our inventory cost management.
(iii)Our average selling price per vehicle for the years ended December 31, 2023 and 2022 was $126,455 and $119,122 respectively, representing an increase of $7,334, or 6.2 %, per vehicle. This increase demonstrates our ability to adjust pricing strategies effectively and underscores the positive impact of our portfolio restructuring on our revenue profile. However, this increase was contrasted with a decrease in the volume of vehicles sold, as a result of the strategic pause in procurement in response to the price inversion in the Chinese market, which led to an overall decline in revenue.


Years Ended December 31,


2023


2022


Amount


%

Revenue:

U.S. domestic market

$

8,160,395

$

3,821,261

$

4,339,134


113.6

%

Overseas market


30,155,579


51,332,074


(21,176,495)


(41.3)

%

Total

$

38,315,974

$

55,153,335

$

(16,837,361)


(30.5)

%

(iv)Sales to U.S. market dealers/exporters in 2023 amounted to 73 vehicles, representing 24.1% of total unit sales and 21.3% of total revenue during the year, compared with 29 vehicles sold in 2022 amounting to 6.3% of total unit sales and 6.9% of total revenue in 2022. Sales to overseas markets in 2023, primarily the PRC market, amounted to 230 vehicles, representing 75.9%

24

Table of Contents

of total unit sales and 78.7% of total revenue during the year, compared with 434 vehicles in 2022, representing 93.7% of total unit sales and 93.1% of total revenue.

The size of our procurement group enables us to purchase a large number of vehicles within a short period of time; therefore, many of our U.S.-based peers turn to us for vehicle purchasing. Our cooperation with selected U.S. counterparts generally improves our cash flow without compromising our ability to deliver vehicles to our PRC clients. Recent developments, including the price inversion in the Chinese market, have reinforced the effectiveness of this approach.

Cost of Revenue


Years Ended December 31,


2023

2022

Amount

%

Cost of Revenue

Cost of vehicles

$

32,183,676

$

48,534,282

$

(16,350,606)


(33.7)

%

Fulfillment expenses


1,885,382


2,149,672


(264,290)


(12.3)

%

Total cost of revenue

$

34,069,058

$

50,683,954

$

(16,614,896)


(32.8)

%

Our total cost of revenue decreased by $16.6 million, or 32.8%, from $50.7 million in 2022 to $34.1 million in 2023. For the years ended December 31, 2023 and 2022, our total cost as a percentage of our total revenue was 88.9% and 91.9%, respectively. Our total cost of revenue decreased in line with the reduced revenue, indicating effective cost control measures. The procurement strategy shift, initiated earlier in 2023, was a significant factor in this decrease, allowing us to manage costs more effectively despite external market pressures.

Cost of Vehicles

Total cost of vehicles sold decreased by $16.3 million, or 33.7%, from $48.5 million in 2022 to $32.2 million in 2023. For the years ended December 31, 2023 and 2022, we sold 303 and 463 vehicles, respectively. The average purchase price per vehicle increased from $104,826 in 2022 to $106,217 in 2023.This increase was primarily driven by the increased MSRP of the vehicles we acquired.

The cost of vehicles sold was approximately 84.0% and 88.0% of revenue for the years ended December 31, 2023, and 2022, respectively. This favorable change is primarily attributed to the altered composition of our sales between the U.S. domestic and overseas markets. During this period, we experienced a strategic shift with an increased percentage of sales occurring domestically. Given the lower transportation costs associated with U.S. domestic sales compared to the expenses incurred for overseas delivery, our cost of revenue as a percentage of total revenue improved.

25

Table of Contents

Fulfillment Expenses


Years Ended December 31,


2023

2022

Amount

%

Fulfillment Expenses


Payroll and benefits

$

1,094,296

$

1,300,581

$

(206,286)


(15.9)

%

Buyer commission


289,153


308,948


(19,795)


(6.4)

%

Vehicle storage and towing


298,265


354,683


(56,418)


(15.9)

%

Vehicle insurance expenses


96,024


88,982


7,041


7.9

%

Consulting Fees


75,299


73,619


1,680


2.3

%

Others


32,346


22,860


9,486


41.5

%

Total fulfillment expenses

$

1,885,382

$

2,149,672

$

(264,290)


(12.3)

%

Fulfillment expenses decreased by approximately $0.3 million, or 12.3%, from $2.1 million in 2022, to $1.9 million in 2023. The decrease was mainly attributable to the cost reductions in payroll and benefits as well as the improved management of vehicle storage and towing costs. The decrease was partially offset by an increase in vehicle insurance and other miscellaneous expenses. In 2023, we made a shift in our procurement strategy by transporting a majority of our vehicles to the West Coast. While this decision resulted in an increase in procurement costs, it was offset by a decrease in selling expenses. The new strategy also streamlines shipping time and expedites receipt of payment through letters of credit, since it takes approximately 14 to 21 days to deliver a purchased vehicle to a customer overseas through the West Coast ports (compared with 40 to 60 days if through the East Coast ones), resulting in significantly shorter payment cycles.

Gross Profit

As a result of the foregoing, our gross profit decreased by $0.2 million, or 5.0%, from $4.5 million in 2022 to $4.3 million in 2023. As of percentage of revenue, the gross margin increased 3%, from 8.1% in 2022 to 11.1% in 2023. This positive shift is primarily attributable to our strategic adjustments within our product portfolio. These adjustments, which centered on optimizing the inventory mix towards products with more favorable margins, played a pivotal role in cushioning the revenue downtrend and improving our gross margin ratio.

Operating Expenses

Selling Expenses


Years Ended December 31,


2023

2022

Amount

%

Selling Expenses


Payroll and benefits

$

145,764

$

180,212

$

(34,450)


(19.1)

%

Ocean freight


498,022


710,265


(212,244)


(29.9)

%

Others


24,387


8,375


16,011


191.2

%

Total selling expenses

$

668,172

$

898,852

$

(230,680)


(25.7)

%

In 2023, our total selling expenses decreased by 25.7% to $0.7 million, representing 1.7% of our revenue, a slight increase from 1.6% in 2022. This change is due to a 29.9% reduction in ocean freight expenses and 19.1% decrease in payroll and benefits, despite a 191.2% increase in other expenses. The decrease in selling expenses can be attributed primarily to a reduction in the number of vehicles sold during the fourth quarter.

26

Table of Contents

General and Administrative Expenses


Years Ended December 31,


2023

2022

Amount

%

General and Administrative Expenses


Payroll and benefits

$

692,729

$

418,420

$

274,307


65.6

%

Rental and leases


268,801


218,305


50,495


23.1

%

Travel & entertainment


65,533


32,846


32,687


99.5

%

Legal & accounting fees


764,375


544,863


219,512


40.3

%

Recruiting fees


10,367


30,258


(19,890)


(65.7)

%

Bank charges and fees


50,844


47,915


2,929


6.1

%

Insurance expenses


155,787


15,130


140,658


929.7

%

Others


182,076


123,180


58,896


47.8

%

Total general and administrative expenses

$

2,190,513

$

1,430,917

$

759,596


53.1

%

General and administrative expenses increased by $0.8 million, or 53.1%, to $2.2 million in 2023 from $1.4 million in 2022, primarily due to (i) an increase in personnel-related expenses by approximately $0.3 million, or 65.6%, as a result of the recruitment of additional employees in 2023, (ii) the leasing of an additional office workplace in New York, resulting in increased rental and lease expenses, (iii) an increase in legal and accounting expenses, and (iv) an increase in insurance expenses due to higher costs associated with directors and officers insurance.

Other Income (Expenses)

Interest Expenses, net


Years Ended December 31,


2023

2022

Amount

%

Inventory financing

$

112,769

$

747,298

$

(634,529)


(84.9)

%

Letter of credit financing


925,426


1,669,931


(744,506)


(44.6)

%

Dealers finance charges


3,975


2,332


1,643


70.5

%

Other loan interest


31,197


18,641


12,556


67.4

%

Line of credit interest


155,245


155,245


100.0

%

Credit card interest


4,712


3,242


1,470


45.3

%

Premium finance interest


5,974


5,974


100.0

%

Total

$

1,239,297

$

2,441,443

$

(1,202,146)


(49.2)

%

Interest expenses decreased significantly by approximately $1.2 million, or 49.2%, to $1.2 million for the year ended December 31, 2023, from $2.4 million for the year ended December 31, 2022, primarily due to (i) the significant drop in inventory financing activities and reduced LC financing activities and (ii) the completion of our IPO in the third quarter of 2023, which marked a significant financial milestone and resulted in a substantial capital infusion. This financial event has played a key role in reducing our reliance on external financing and, subsequently, in the reduction of interest expenses.

In order to improve our liquidity and retain more cash to acquire new cars, we may enter into short-term loans from time to time, pledging our inventory as collateral before the vehicles are delivered to our customers. We incur interest expenses on such inventory financing, provided mainly by small lenders, generally at a rate of 1.35% to 1.80% per month. In 2023, the total weighted average balance of funds we obtained through inventory financing was $0.6 million, the interest expenses incurred was $0.1 million, and the weighted average annual interest rate was 17.6%. In 2022, the total weighted average balance of funds we obtained through inventory financing was $4.5 million, the interest expense incurred was $0.7 million, and the weighted average annual interest rate was 16.6%. As we continue to develop our third-party financial services, which are provided in the form of financing for inventory purchase, we intend to minimize our own inventory financing obtained from other parties.

27

Table of Contents

We may also finance our operations from time to time through short-term loans using letters of credit, typically received from our international customers in overseas sales of parallel-import vehicles as collateral. Generally, we borrow approximately 90% or more of the letter of credit amount with a monthly interest rate of approximately 1.5%. In 2023, the total weighted average balance of funds we obtained through LC financing decreased to $4.7 million, the interest expenses incurred was $0.9 million, and the weighted average annual interest rate was 19.5%. In 2022, the total weighted average balance of funds we obtained through LC financing was $9.0 million, the interest expenses incurred was $1.7 million, and the weighted average annual interest rate was 18.5%. The decrease in total weighted average balance of funds through LC financing and the related interest expenses incurred in 2023 reflected a lower volume of vehicles shipped and greater use of our revolving lines of credit.

As of December 31, 2023, the total weighted average balance of funds we obtained through revolving lines of credit was $0.9 million, the interest expenses incurred were $0.2 million for year ended December 31, 2023, and the weighted average annual interest rate was 18.0%.

Provision for Income Taxes

Our provision for income taxes, which consists of U.S. federal and state income taxes, amounted to approximately $50,000 and $0.2 million in 2023 and 2022, respectively.

Liquidity and Capital Resources

Cash Flows and Working Capital

We assess our liquidity in terms of our ability to generate adequate amounts of cash to meet current and future needs. We have relied primarily upon cash provided by operations and financing activities, including as necessary third-party loans and financial support from our founders.

As reflected in the accompanying consolidated financial statements, we reported net income of approximately $135,000 for the year ended December 31, 2023. We also reported cash provided by operating activities of $5.6 million for the year ended December 31, 2023, a positive working capital of $7.5 million and total stockholders’ equity of $6.9 million.

In December 2023, we further advanced our financial services strategy, initially launched in October 2022, with a focus on providing inventory financing services. This strategic progression was marked by the introduction of vehicle pledge loans, primarily aimed at parallel-import car dealers. We provided $0.7 million in loans to third parties in the fourth quarter of 2023, all of which was outstanding as of December 31, 2023. See “Note 4—Loans Receivable” in the notes to our consolidated financial statements for more details.

In August 2023, we completed our IPO of 1.25 million shares of Class A common stock and raised net proceeds of approximately $3.7 million after expenses. We commenced using our revolving lines of credit during the second quarter of 2023, which has reduced our borrowings under our inventory and LC financing and reduce our interest expenses.

We entered into a series of loan agreements with third-party companies for working capital purposes during the year ended December 31, 2023. Pursuant to these agreements, loan payables from LC financing were collateralized by letters of credit from overseas sales of parallel-import vehicles. The accounts receivable in connection with letters of credit with book value of $1,084,775 and $7,502,291 were pledged as collateral to guarantee our borrowings from these third-party companies as of December 31, 2023 and 2022, respectively.

In October 2022, we entered into agreements with two third-party companies that have been providing financial support to us since 2021. Pursuant to the agreements, we can borrow under revolving lines of credit of up to $10.0 million and $5.0 million, respectively, from these two third-party companies for a total of $15.0 million for a period of 12 months at a fixed interest rate of 1.5% per month. In December 2022, we amended the revolving line of credit agreements to extend their maturity dates to April 2024.

In June 2022, we sold 1,666,000 shares of Class A common stock at a purchase price of $1.80 per share. The gross proceeds were approximately $3.0 million, before deducting the offering expenses of approximately $0.3 million. The net proceeds were approximately $2.7 million, of which approximately $0.6 million was received in September 2022, $0.5 million in November 2022, $0.1 million in

28

Table of Contents

December 2022, $0.7 million in March 2023, and $0.5 million in July 2023, for a total receipt of approximately $2.4 million. The balance of $0.6 million is expected to be paid within six months after our IPO.

In March 2022, we entered into an amended agreement with the SBA to borrow an additional $350,000 for 30 years as working capital to alleviate economic injury caused by the COVID-19 pandemic. In aggregate, our SBA borrowings amounted to $500,000 with a maturity date of May 23, 2050. The amended loan bears a fixed interest rate of 3.75% per annum. Beginning from March 2022, 24 months from the date of the original loan agreement, we are required to make a new monthly installment payment of $2,485 within the remaining term of the loan, with the last installment to be paid in May 2050.

In assessing our liquidity, we monitor and analyze our cash on-hand, our ability to generate sufficient revenue, the collection of our accounts receivable, our ability to obtain additional financial support in the future, and our operating and capital expenditure commitments. We reported cash of $0.4 million as of December 31, 2023. As of December 31, 2023, our working capital amounted to approximately $7.5 million (namely, $9.8 million of current assets less $2.3 million of current liabilities), including $1.8 million loans payable. Our solid working capital position is supported additionally by our ability to borrow under our existing credit facilities based on past experience, our good credit history, and well-established relationship with the lenders. We have from time to time in the past several years been supported with loans from our principal stockholder, and we believe such support will be available in the future, if needed.

The completion of the IPO in the third quarter of 2023 provided us with a substantial influx of capital. With improved access to funds as a result of being a public company, we now have the increased financial flexibility to operate without the current need for external debt financing and can manage our operations with a more comfortable cash flow position.

We are working to further improve our liquidity and capital sources primarily by generating cash from operations, debt financing, and, if needed, financial support from our principal stockholder. In order to fully implement our business plan and sustain continued growth, we may also seek additional equity financing from outside investors. Based on the current operating plan, management believes that the above-mentioned measures collectively will provide sufficient liquidity to meet our future liquidity and capital requirements for at least 12 months from the issuance date of the consolidated financial statements.

Cash Flows for the Years Ended December 31, 2023 and 2022

The following table summarizes our cash flow for the years ended December 31, 2023 and 2022:


Years ended December 31,

2023


2022

Net cash provided by operating activities

$

5,610,225

$

2,189,605

Net cash (used in) investing activities


(672,500)


Net cash (used in) financing activities


(4,563,108)


(2,632,201)

Net increase (decrease) in cash

$

374,617

$

(442,596)

Operating Activities

Net cash provided by operating activities was $5.6 million for the year ended December 31, 2023. This was primarily attributable to a collection of $0.6 million in accounts receivable, a $4.5 million decrease in inventory, $0.5 million decrease in other receivables, and other less significant factors.

Net cash provided by operating activities was $2.2 million for the year ended December 31, 2022. This was primarily attributable to a net profit of $0.8 million, adjusted by a $10.5 million reduction in inventory and offset by (i) a $1.8 million decrease in deferred revenue (because customer prepayment and deposit was recognized as revenue during 2022 when revenue recognition criteria were met), (ii) a $7.1 million increase in accounts receivable, and (iii) other factors of less significance.

29

Table of Contents

Investing Activities

Net cash used in investing activities was $0.7 million and nil for the years ended December 31, 2023 and 2022, respectively. The increase of investing activities consisted of (i) $0.5 million in short-term loans lent to third parties, and (ii) $0.2 million in vehicle pledge loans extended to third parties.

Financing Activities

Net cash used in financing activities of $4.6 million for the year ended December 31, 2023, consisted of (i) net repayments of LC financing of $25.5 million; (ii) net repayments of inventory financing of $4.2 million; (iii) net repayments of revolving lines of credit of $2.6 million; and (iv) repayments of dealers financing of $0.4 million; partially offset by (v) proceeds from LC financing of $19.4 million; (vi) proceeds from revolving lines of credit of $3.2 million; (vi) proceeds from dealers financing of $0.4 million; (vii) proceeds from premium finance of $0.2 million; (viii) a reduction in subscriptions receivable of $1.2 million; and (ix) net proceeds from our IPO of $3.7 million.

Net cash used in financing activities of $2.6 million for the year ended December 31, 2022, consisted of (i) net repayment of LC financing of $34.3 million; (ii) net repayment of inventory financing of $26.1 million; (iii) repayment to a founder of $1.4 million; and (iv) repayment of dealers financing of $0.2 million; partially offset by (v) net proceeds from LC financing of $33.3 million, (vi) net proceeds from inventory financing of $24.3 million; (vii)issuance of common stock of $1.2 million; (viii) net financing support from long-term borrowing of $0.4 million; and (ix) financial support of $0.3 million from our founder.

Contractual Obligations

The following table sets forth our contractual obligations as of December 31, 2023:


Less than 1

1 to 5

Above 5

Total

Year


years


years

Lease commitment

$

247,479

$

66,391

$

181,088

$

Long-term borrowings


677,613


32,887


149,356


495,370

Total

$

925,092

$

99,278

$

330,444

$

495,370

Except for those disclosed above, we did not have any significant capital or other commitments, long-term obligations, or guarantees outstanding as of December 31, 2023.

Off-Balance Sheet Arrangements

We did not have during the period presented, and we do not currently have, any off-balance sheet financing arrangements as defined under the rules and regulations of the SEC, or any relationships with unconsolidated entities or financial partnerships, including entities sometimes referred to as structured finance or special purpose entities, that were established for the purpose of facilitating off-balance sheet arrangements or other contractually narrow or limited purposes.

Critical Accounting Estimates

We prepare our financial statements in conformity with the accounting principles generally accepted in the U.S. (“U.S. GAAP”), which require us to make judgments, estimates, and assumptions that affect our reported amount of assets, liabilities, revenue, costs and expenses, and any related disclosures. Although there were no material changes made to the accounting estimates and assumptions in the past three years, we continually evaluate these estimates and assumptions based on the most recently available information, our own historical experience and various other assumptions that we believe to be reasonable under the circumstances. Since the use of estimates is an integral component of the financial reporting process, actual results could differ from our expectations as a result of changes in our estimates.

30

Table of Contents

Estimated allowance for doubtful accounts receivable

Management reviews the accounts receivable on a periodic basis and makes general and specific allowances when there is doubt as to the collectability of individual balances. Our Company determines the adequacy of reserves for doubtful accounts based on individual account analysis and historical collection trend. On March 13, 2024, we received requests for deferred payments from two clients, both supported by third-party guarantors. These accounts have been subject to a heightened review process, with our assessment including an evaluation of the clients’ reasons for deferral and an analysis of the financial standing of the guarantors. Based on this review, as of December 31, 2023, we concluded that these receivables remained fully collectible and, consequently, did not establish an allowance for doubtful accounts. This conclusion is subject to change as future evaluations may indicate a heightened risk of non-collection. For a detailed information on overdue amounts, please refer to “Note 3—Accounts Receivable” in the notes to our consolidated financial statements.

Estimated allowance for inventories obsolescence

Management’s estimated allowance for the inventory obsolescence reserves is based on management’s assessment of realization of inventory. Any excess of the cost over the realizable value of each item of inventories recognized as a provision for diminution in the value of inventories. As of December 31, 2023 and 2022, we recorded no reserves of inventories from the carrying amount to their net realizable values.

Estimate of the valuation allowance of deferred tax assets

Our Company recognizes deferred tax assets to the extent that it believes that these assets are more likely than not to be realized. In making such a determination, our Company considers all available positive and negative evidence, including future reversals of existing taxable temporary differences, projected future taxable income, tax-planning strategies, and results of recent operations. We have not assessed a valuation allowance as we determine it is more likely than not that all deferred tax assets will be realized before expiration.

Revenue Recognition

ASC 606 establishes principles for reporting information about the nature, amount, timing, and uncertainty of revenue and cash flows arising from the entity’s contracts to provide goods or services to customers. The core principle requires an entity to recognize revenue to depict the transfer of goods or services to customers in an amount that reflects the consideration that it expects to be entitled to receive in exchange for those goods or services recognized as performance obligations are satisfied. ASC 606 requires the use of a new five-step model to recognize revenue from customer contracts. The five-step model requires that our Company (i) identify the contract with the customer, (ii) identify the performance obligations in the contract, (iii) determine the transaction price, including variable consideration to the extent that it is probable that a significant future reversal will not occur, (iv) allocate the transaction price to the respective performance obligations in the contract, and (v) recognize revenue when (or as) our Company satisfies the performance obligation. The application of the five-step model to the revenue streams compared to the prior guidance did not result in significant changes in the way our Company records its revenue. Under the new guidance, revenue is recognized when a customer obtains control of promised goods or services and is recognized in an amount that reflects the consideration which the entity expects to receive in exchange for those goods or services. In addition, the new guidance requires disclosure of the nature, amount, timing, and uncertainty of revenue and cash flows arising from contracts with customers.

Our Company is primarily engaged in the parallel-import vehicle dealership business and generates revenue from the sales of parallel-import vehicles to both domestic and oversea parallel-import car dealers. We purchase automobiles from the U.S. market through our large team of professional purchasing agents, and mainly resell them to parallel-import car dealers in the U.S. and PRC. In accordance with ASC 606, our Company recognizes revenue at the point in time when the performance obligation has been satisfied and control of the vehicles has been transferred to the dealers. For sales to U.S. domestic parallel-import car dealers, revenue is recognized when a vehicle is delivered and its title has been transferred to the dealers. For overseas sales, our Company sells vehicles under Cost and Freight (“CFR”) shipping point term, and revenue is recognized when a vehicle is loaded on a cargo ship and its title has been transferred to the dealers. Our Company accounts for the revenue generated from sales of vehicles on a gross basis as our Company is acting as a principal in these transactions, is subject to inventory risk, has latitude in establishing prices, and is responsible for fulfilling the promise to provide customers the specified goods, which our Company has control of the goods and has the ability to direct the use of goods to obtain substantially all the benefits. All of our Company’s contracts have one single performance obligation as the promise is to transfer the individual vehicle to parallel-import car dealers, and there is no separately identifiable other promises in the contracts. Our

31

Table of Contents

Company’s vehicles are sold with no right of return and our Company does not provide other credits or sales incentives to parallel-import car dealers. Historically, no customer returns have occurred. Therefore, our Company did not provide any sales return allowances for the years ended December 31, 2023 and 2022.

Contract balances and remaining performance obligations

Contract balances typically arise when a difference in timing between the transfer of control to the parallel-import car dealers and receipt of consideration occurs. Our Company did not have contract assets nor contract liabilities as of December 31, 2023 and 2022.

Accounts receivable, net

Accounts receivable represent the amounts that our Company has an unconditional right to consideration, which are stated at the original amount less an allowance for doubtful accounts. Our Company reviews the accounts receivable on a periodic basis and makes general and specific allowances when there is doubt as to the collectability of individual balances. Our Company determines the adequacy of reserves for doubtful accounts based on individual account analysis and historical collection trends. Our Company establishes a provision for doubtful receivables when there is objective evidence that our Company may not be able to collect amounts due. The allowance is based on management’s best estimate of specific losses on individual exposures, as well as a provision on historical trends of collections. Actual amounts received may differ from management’s estimate of credit worthiness and the economic environment. Delinquent account balances are written-off against the allowance for doubtful accounts after management has determined that the collection is not probable. As of December 31, 2023 and 2022, there was no allowance for doubtful accounts recorded as we consider all of the outstanding accounts receivable fully collectible.

Loans receivable, net

The Company’s loans receivable are recognized at the point of loan disbursement, initially measured at fair value, primarily reflecting the disbursed amount and associated transaction costs. Both secured and unsecured lending are encompassed in these receivables, with terms including varying interest rates and maturity dates. Subsequently, these receivables are measured at amortized cost using the effective interest method, which ensures the accurate recognition of interest income over the loan period. The interest rates for these loans may be subject to change based on the terms of loan agreements. Periodic reviews of the loan portfolio are conducted to assess for impairment, utilizing the expected credit loss model. This approach considers historical credit loss experience, current conditions, and reasonable forecasts in estimating potential credit losses. As of the date of this annual report, no significant impairment allowance has been recorded for these loans receivable.

Inventories, net

Inventories consist of new vehicles held for sale and are stated at the lower of cost or net realizable value using the specific identification method. The cost of inventory mainly includes the cost of auto vehicles purchased from U.S. automobile dealers, non-refundable sales tax, and dealership service fees. Our Company reviews its inventory periodically if any reserves are necessary for potential shrinkage. We recorded no inventory reserve as of December 31, 2023 and 2022.

Income taxes

Our Company accounts for income taxes under the asset and liability method, which requires the recognition of deferred tax assets and liabilities for the expected future tax consequences of events that have been included in the financial statements. Under this method, our Company determines deferred tax assets and liabilities on the basis of the differences between the financial statement and tax bases of assets and liabilities by using enacted tax rates in effect for the year in which the differences are expected to reverse. The effect of a change in tax rates on deferred tax assets and liabilities is recognized in income in the period that includes the enactment date.

Our Company recognizes deferred tax assets to the extent that it believes that these assets are more likely than not to be realized. In making such a determination, our Company considers all available positive and negative evidence, including future reversals of existing taxable temporary differences, projected future taxable income, tax-planning strategies, and results of recent operations. We have not assessed a valuation allowance as we determine it is more likely than not that all deferred tax assets will be realized before expiration.

32

Table of Contents

Our Company records uncertain tax positions in accordance with ASC 740 (“ASC 740”), Income Taxes, on the basis of a two-step process in which (1) our Company determines whether it is more likely than not that the tax positions will be sustained on the basis of the technical merits of the position and (2) for those tax positions that meet the more-likely-than-not recognition threshold, our Company recognizes the largest amount of tax benefit that is more than 50 percent likely to be realized upon ultimate settlement with the related tax authority. Our Company does not believe that there were any uncertain tax positions as of December 31, 2023 and 2022.

Our Company and its operating subsidiaries in the United States are subject to the tax law of the United States. Our Company elected to file income taxes as a corporation instead of an LLC for the tax years ended December 31, 2020 through December 31, 2023. As of December 31, 2023, the tax years ended December 31, 2020 through December 31, 2022 for our consolidated income tax returns remain open for statutory examination by U.S. tax authorities.

Recent Accounting Pronouncements

See “Note 2—Summary of Significant Accounting Policies—Recent Accounting Pronouncements” in the notes to our consolidated financial statements for a discussion of recent accounting pronouncements.

Item 7A. Quantitative and Qualitative Disclosures About Market Risk.

As a smaller report company, we are not required to provide the information required by this item.

33

Table of Contents

Item 8. Financial Statements and Supplementary Data.

CHEETAH NET SUPPLY CHAIN SERVICE INC.

INDEX TO CONSOLIDATED FINANCIAL STATEMENTS

TABLE OF CONTENTS


Page

Index to Consolidated Financial Statements


Report of Independent Registered Public Accounting Firm (PCAOB ID:6783)

F-2

Report of Independent Registered Public Accounting Firm (PCAOB ID:5395)

F-3

Consolidated Balance Sheets as of December 31, 2023 and 2022

F-4

Consolidated Statements of Income for the Years Ended December 31, 2023 and 2022

F-5

Consolidated Statements of Changes in Stockholders’ Equity (Deficit) for the Years Ended December 31, 2023 and 2022

F-6

Consolidated Statements of Cash Flows for the Years Ended December 31, 2023 and 2022

F-7

Notes to the Consolidated Financial Statements

F-8 – F-24

F-1

Table of Contents

Report of Independent Registered Public Accounting Firm

To the shareholders and the board of directors of Cheetah Net Supply Chain Service Inc.

Opinion on the Financial Statements

We have audited the accompanying consolidated balance sheet of Cheetah Net Supply Chain Service Inc. and its subsidiaries (collectively the “Company”) as of December 31, 2023, the related consolidated statements of income, changes in stockholders’ equity (deficit), and cash flows for the year ended December 31, 2023, and the related notes (collectively referred to as the “financial statements”). In our opinion, the financial statements present fairly, in all material respects, the consolidated financial position of the Company as of December 31, 2023, and the consolidated results of its operations and its cash flows for the year ended December 31, 2023, in conformity with accounting principles generally accepted in the United States of America.

Basis for Opinion

These financial statements are the responsibility of the Company’s management. Our responsibility is to express an opinion on the Company’s financial statements based on our audit. We are a public accounting firm registered with the Public Company Accounting Oversight Board (United States) (the “PCAOB”) and are required to be independent with respect to the Company in accordance with the United States federal securities laws. and the applicable rules and regulations of the Securities and Exchange Commission and the PCAOB.

We conducted our audit in accordance with the standards of the PCAOB. Those standards require that we plan and perform the audits to obtain reasonable assurance about whether the financial statements are free of material misstatement, whether due to error or fraud. The Company is not required to have, nor were we engaged to perform, an audit of its internal control over financial reporting. As part of our audits, we are required to obtain an understanding of internal control over financial reporting, but not for the purpose of expressing an opinion on the effectiveness of the Company’s internal control over financial reporting. Accordingly, we express no such opinion.

Our audit included performing procedures to assess the risks of material misstatement of the financial statements, whether due to error or fraud, and performing procedures that respond to those risks. Such procedures included examining, on a test basis, evidence regarding the amounts and disclosures in the financial statements. Our audits also included evaluating the accounting principles used and significant estimates made by management, as well as evaluating the overall presentation of the financial statements. We believe that our audits provide a reasonable basis for our opinion.

/s/ Assentsure PAC

Singapore

March 18, 2024

PCAOB ID number: 6783

We have served as the Company’s auditor since 2023.

F-2

Table of Contents

Graphic

REPORT OF INDEPENDENT REGISTERED PUBLIC ACCOUNTING FIRM

To the Board of Directors and shareholders of

Cheetah Net Supply Chain Service Inc.

Opinion on the Financial Statements

We have audited the accompanying consolidated balance sheet of Cheetah Net Supply Chain Service Inc. and its subsidiaries (collectively, the “Company”) as of December 31, 2022, and the related consolidated statements of income, changes in shareholders’ equity, and cash flows for the year ended December 31, 2022, and the related notes (collectively referred to as the “consolidated financial statements”). In our opinion, the consolidated financial statements present fairly, in all material respects, the financial position of the Company as of December 31, 2022, and the results of its operations and its cash flows for the year ended December 31, 2022, in conformity with accounting principles generally accepted in the United States of America.

Basis for Opinion

These consolidated financial statements are the responsibility of the Company’s management. Our responsibility is to express an opinion on the Company’s consolidated financial statements based on our audit. We are a public accounting firm registered with the Public Company Accounting Oversight Board (United States) (“PCAOB”) and are required to be independent with respect to the Company in accordance with the U.S. federal securities laws and the applicable rules and regulations of the Securities and Exchange Commission and the PCAOB.

We conducted our audit in accordance with the standards of the PCAOB. Those standards require that we plan and perform the audit to obtain reasonable assurance about whether the consolidated financial statements are free of material misstatement, whether due to error or fraud. The Company is not required to have, nor were we engaged to perform, an audit of its internal control over financial reporting. As part of our audit we are required to obtain an understanding of internal control over financial reporting, but not for the purpose of expressing an opinion on the effectiveness of the Company’s internal control over financial reporting. Accordingly, we express no such opinion.

Our audit included performing procedures to assess the risks of material misstatement of the consolidated financial statements, whether due to error or fraud, and performing procedures that respond to those risks. Such procedures included examining, on a test basis, evidence regarding the amounts and disclosures in the consolidated financial statements. Our audit also included evaluating the accounting principles used and significant estimates made by management, as well as evaluating the overall presentation of the consolidated financial statements. We believe that our audit provides a reasonable basis for our opinion.

/s/ Marcum Asia CPAs LLP

We have served as the Company’s auditor from 2022 (such date takes into account the acquisition of certain assets of Friedman LLP by Marcum Asia CPAs LLP effective September 1, 2022) through October 5, 2023.

New York, New York

April 7, 2023

F-3

Table of Contents

CHEETAH NET SUPPLY CHAIN SERVICE INC.

CONSOLIDATED BALANCE SHEETS


December 31,


December 31,

2023

2022

ASSETS


CURRENT ASSETS:


Cash

$

432,998

$

58,381

Accounts receivable


6,494,695


7,086,651

Loans receivable

672,500

Inventory


1,515,270


5,965,935

Other receivables


410,920


900,730

Prepaid expenses and other current assets


294,154


480,828

TOTAL CURRENT ASSETS


9,820,537


14,492,525

NONCURRENT ASSETS:

Operating lease right-of-use assets


190,823


140,145

Deferred tax assets


47,905


86,734

TOTAL ASSETS

$

10,059,265

$

14,719,404

LIABILITIES AND STOCKHOLDERS’ EQUITY


CURRENT LIABILITIES:


Accounts payable

$

40,430

$

86,285

Current portion of long-term debt


32,887


31,281

Loans payable from inventory financing


4,164,100

Loans payable from letter of credit financing


1,004,565


7,105,873

Loans payable from dealers finance


41,747

Loans payable from line of credit

688,711

Loans payable from premium finance


148,621


Due to a related party


13,423


Operating lease liabilities, current


39,703


149,458

Accrued liabilities and other current liabilities

390,451

616,863

TOTAL CURRENT LIABILITIES

2,358,791

12,195,607

NONCURRENT LIABILITIES:

Long-term debt, net of current portion

644,725

678,442

Operating lease liabilities, net of current portion

151,121

TOTAL LIABILITIES


3,154,637


12,874,049

COMMITMENTS AND CONTINGENCIES


STOCKHOLDERS’ EQUITY


Common stock, $0.0001 par value, 100,000,000 shares authorized; 17,916,000 and 16,666,000 shares issued and outstanding, including:


Class A common stock, $0.0001 par value, 91,750,000 shares authorized, 9,666,000 and 8,416,000 shares issued and outstanding


967


842

Class B common stock, $0.0001 par value, 8,250,000 shares authorized, 8,250,000 shares issued and outstanding


825


825

Additional paid-in capital


6,994,595


3,269,317

Subscription receivable


(600,000)


(1,800,000)

Retained earnings


508,241


374,371

TOTAL STOCKHOLDERS’ EQUITY


6,904,628


1,845,355

TOTAL LIABILITIES AND STOCKHOLDERS’ EQUITY

$

10,059,265

$

14,719,404

The accompanying notes are an integral part of these consolidated financial statements.

F-4

Table of Contents

CHEETAH NET SUPPLY CHAIN SERVICE INC.

CONSOLIDATED STATEMENTS OF INCOME


For the Years Ended December 31,


2023


2022

REVENUE

$

38,315,974

$

55,153,335

COST OF REVENUE


Cost of vehicles


32,183,676


48,534,282

Fulfillment expenses


1,885,382


2,149,672

Total cost of revenue


34,069,058


50,683,954

GROSS PROFIT


4,246,916


4,469,381

OPERATING EXPENSES


Selling expenses


668,172


898,852

General and administrative expenses


2,190,513


1,430,917

Total operating expenses


2,858,685


2,329,769

INCOME FROM OPERATIONS


1,388,231


2,139,612

OTHER INCOME (EXPENSES)


Interest expense, net


(1,239,297)


(2,441,443)

Other income, net


31,593


12,974

Subsidy income from Business Recovery Grant Program


1,340,316

Total other (expenses), net

(1,207,704)

(1,088,153)

INCOME BEFORE PROVISION FOR INCOME TAXES


180,527


1,051,459

Provision for income taxes


46,657


234,479

NET INCOME

$

133,870

$

816,980

Earnings per share - basic and diluted

$

0.01

$

0.05

Weighted average shares - basic and diluted


17,183,123


15,794,203

The accompanying notes are an integral part of these consolidated financial statements.

F-5

Table of Contents

CHEETAH NET SUPPLY CHAIN SERVICE INC.

CONSOLIDATED STATEMENTS OF CHANGES IN STOCKHOLDERS’ EQUITY (DEFICIT)


Common Stock


Class A

Class B

Additional

Total

Common

Common

paid-in

Subscription

Retained

Stockholders’


stock


Amount


stock


Amount


capital


Receivable


Earnings


Equity

Balance, December 31, 2022


8,416,000

$

842

8,250,000

$

825

$

3,269,317

$

(1,800,000)

$

374,371

$

1,845,355

Initial public offering, net of issuance costs

1,250,000

125

3,725,278

3,725,403

Stock issuance


1,200,000

1,200,000

Net income


133,870

133,870

Balance, December 31, 2023

9,666,000

$

967

8,250,000

$

825

$

6,994,595

$

(600,000)

$

508,241

$

6,904,628


Common Stock*


Class A

Class B

Additional

Retained Earnings

Total

Common

Common

paid-in

Subscription

(Accumulated

Stockholders’


stock


Amount


stock


Amount


capital


Receivable


Deficit)


Equity (Deficit)

Balance, December 31, 2021


6,750,000

$

675


8,250,000

$

825

$

270,684


$

$

(442,609)

$

(170,425)

Stock issuance

1,666,000

167

2,998,633

(1,800,000)

1,198,800

Net income

816,980

816,980

Balance, December 31, 2022


8,416,000

$

842


8,250,000

$

825

$

3,269,317


$

(1,800,000)

$

374,371

$

1,845,355

The accompanying notes are an integral part of these consolidated financial statements.

F-6

Table of Contents

CHEETAH NET SUPPLY CHAIN SERVICE INC.

CONSOLIDATED STATEMENTS OF CASH FLOWS


For the Years Ended

December 31,


2023


2022

Cash flows from operating activities:


Net income

$

133,870

$

816,980

Adjustments to reconcile net income to net cash provided by (used in) operating activities:

Amortization of operating lease right-of-use assets

140,145

169,503

Inventory reserve recovery

(92,811)

Deferred tax provision

38,829

158,060

Changes in operating assets and liabilities:

Accounts receivable

591,956

(7,066,535)

Inventory

4,450,665

10,452,396

Other receivables

489,810

220,029

Due from a related party

10,000

Prepaid expenses and other current assets

186,674

(478,828)

Deferred revenue

(1,805,073)

Other payables and other current liabilities

(272,266)

(30,566)

Operating lease liabilities

(149,458)

(163,550)

Net cash provided by operating activities

5,610,225

2,189,605

Cash flows from investing activities:

Loans made to third parties

(672,500)

Net cash (used in) investing activities

(672,500)

Cash flows from financing activities:

Proceeds from initial public offering, net of expenses

3,725,403

Proceeds from issuance of common stock under private placement transaction

1,200,000

1,198,800

Proceeds from inventory financing

24,257,900

Repayments of inventory financing

(4,164,100)

(26,131,700)

Proceeds from letter of credit financing

19,424,370

33,341,191

Repayments of letter of credit financing

(25,525,678)

(34,267,549)

Proceeds from loans from dealers finance

389,296

Repayments of loans from dealers finance

(431,043)

(235,690)

Proceeds from line of credit

3,244,488

Repayment of line of credit

(2,555,777)

Proceeds from premium finance

148,621

Proceeds from long-term borrowings

350,000

Repayments of long-term borrowings

(32,111)

(9,563)

Borrowing from a related party

45,798

313,464

Repayments made to a related party

(32,375)

(1,449,054)

Net cash (used in) financing activities

(4,563,108)

(2,632,201)

Net increase (decrease) in cash

374,617

(442,596)

Cash, beginning of year

58,381

500,977

Cash, end of year

$

432,998

$

58,381

Supplemental cash flow information

Cash paid for income taxes

$

74,533

$

46,196

Cash paid for interest

$

262,661

$

842,228

The accompanying notes are an integral part of these consolidated financial statements.

F-7

Table of Contents

CHEETAH NET SUPPLY CHAIN SERVICE INC.

NOTES TO CONSOLIDATED FINANCIAL STATEMENTS

NOTE 1 — ORGANIZATION AND BUSINESS DESCRIPTION

Cheetah Net Supply Chain Service Inc. (“Cheetah Net” or the “Company”), formerly known as Yuan Qiu Business Group LLC, was established under the laws of the State of North Carolina on August 9, 2016 as a limited liability company (“LLC”). On March 1, 2022, the Company filed articles of incorporation including articles of conversion with the Secretary of State of the State of North Carolina to convert from an LLC to a corporation, and changed its name to Cheetah Net Supply Chain Service Inc. The Company holds 100% of the equity interests in the following entities:

·

(i) Allen-Boy International LLC (“Allen-Boy”), an LLC organized on August 31, 2016 under the laws of the State of Delaware, which was acquired by Cheetah Net from Yingchang Yuan, the previous owner of Allen-Boy who beneficially owns 1,200,000 shares of Class A common stock of Cheetah Net, for a total consideration of $100 on January 1, 2017. Allen-Boy did not have any business activities until acquired by Cheetah Net;

·

(ii) Canaan International LLC (“Fairview”), an LLC organized on December 5, 2018 under the laws of the State of North Carolina, known as Fairview International Business Group, LLC before changing its name by filing articles of amendment on July 21, 2020, which was acquired by Cheetah Net from Yiming Wang, the previous owner of Fairview, for a total consideration of $100 on January 1, 2019. Fairview did not have any business activities until acquired by Cheetah Net;

·

(iii) Pacific Consulting LLC (“Pacific”), an LLC organized on January 17, 2019 under the laws of the State of New York, which was acquired by Cheetah Net from Yingchang Yuan, the previous owner of Pacific who beneficially owns 1,200,000 shares of Class A common stock of Cheetah Net, for a total consideration of $100 on February 15, 2019. Pacific did not have any business activities until acquired by Cheetah Net;

·

(iv) Canaan Limousine LLC (“Limousine”), an LLC organized on February 10, 2021 under the laws of the State of South Carolina, which was acquired by Cheetah Net from Yingchang Yuan, the previous owner of Limousine who beneficially owns 1,200,000 shares of Class A common stock of Cheetah Net, for a total consideration of $100 on February 19, 2021. Limousine did not have any business activities until acquired by Cheetah Net;

·

(v) Entour Solutions LLC (“Entour”), an LLC organized on April 8, 2021 under the laws of the State of New York, which was acquired by Cheetah Net from Daihan Ding, the previous owner of Entour, and a current employee of Cheetah Net, for a total consideration of $100 on April 9, 2021. Entour did not have any business activities until acquired by Cheetah Net; and

·

(vi) Cheetah Net Logistics LLC (“Logistics”), an LLC organized on October 12, 2022 under the laws of the State of New York, whose previous sole member and owner, Hanzhang Li, the previous owner of Logistics, and a current employee of Cheetah Net, for a total consideration of $100, assigned all his membership interests in Logistics to Cheetah Net on October 19, 2022.

The Company and its wholly-owned subsidiaries are primarily engaged in the parallel-import vehicle dealership business. In the People’s Republic of China (the “PRC”), parallel-import vehicles refer to those purchased by dealers directly from overseas markets and imported for sale through channels other than brand manufacturers’ official distribution systems. The Company purchases automobiles from the U.S. market through its large team of professional purchasing agents, and resells the automobiles to parallel-import car dealers in the U.S. and the PRC.

F-8

Table of Contents

Details of the subsidiaries of the Company as of December 31, 2023 are set out below:

Name of Entity


Date of
Incorporation


State of
Incorporation


% of
Ownership


Principal Activities


Cheetah Net

August 9, 2016

North Carolina

Parent, 100%

Parallel-import
vehicle dealership
business

Subsidiaries of the parent:

Allen-Boy

August 31, 2016

Delaware

100%

Parallel-import
vehicle dealership
business

Fairview

December 5, 2018

North Carolina

100%

Parallel-import
vehicle dealership
business

Pacific

January 17, 2019

New York

100%

Parallel-import
vehicle dealership
business

Limousine

February 10, 2021

South Carolina

100%

Parallel-import
vehicle dealership
business

Entour

April 8, 2021

New York

100%

Parallel-import
vehicle dealership
business

Logistics

October 12, 2022

New York

100%

Parallel-import
vehicle dealership
business

On August 3, 2023, the Company completed its initial public offering (“IPO”) of 1,250,000 shares of Class A common stock, par value $0.0001 per share, at a price to the public of $4.00 per share. The Company’s Class A common stock began trading on the Nasdaq Capital Market under the ticker symbol “CTNT” on August 1, 2023. Total net proceeds of approximately $3.7 million were raised from the IPO after deducting the underwriting discounts and the offering expenses, in an aggregate amount of $1.3 million. (see Note 17).

NOTE 2 — SUMMARY OF SIGNIFICANT ACCOUNTING POLICIES

Basis of presentation

The accompanying consolidated financial statements have been prepared in accordance with the accounting principles generally accepted in the U.S. (the “U.S. GAAP”) and pursuant to the rules and regulations of the U.S. Securities and Exchange Commission (the “SEC”). The accompanying consolidated financial statements include the financial statements of the Company and its wholly owned subsidiaries. All inter-company balances and transactions are eliminated upon consolidation. As a U.S.-based company operating exclusively within the domestic market and transacting solely in United States Dollars (USD), both the Company’s presentation and functional currencies are the USD. This uniformity simplifies the Company’s financial reporting process and ensures clarity in its financial transactions. The Company’s financial statements, therefore, are presented in USD, in compliance with U.S. GAAP requirements, and provide transparent and straightforward financial information to the Company’s stakeholders.

F-9

Table of Contents

Uses of estimates

In preparing the consolidated financial statements in conformity with U.S. GAAP, management makes estimates and assumptions that affect the reported amounts of assets and liabilities and disclosure of contingent assets and liabilities at the date of the consolidated financial statements and the reported amounts of revenue and expenses during the reporting period. These estimates are based on information as of the date of the consolidated financial statements. Significant estimates required to be made by management include, but are not limited to, the valuation of accounts receivables, the valuation of inventory, the revenue recognition, and the realization of deferred tax assets. Actual results could differ from those estimates.

Risks and uncertainties

The operations of the Company are located in the U.S. and the Company’s primary market is in the PRC. Accordingly, the Company’s business, financial condition, and results of operations may be influenced by political, economic, and legal environments in the U.S. and the PRC, as well as by the general state of the U.S. and the PRC economies. The Company’s results may be adversely affected by changes in the political, regulatory, and social conditions in the U.S. and the PRC.

Risks and uncertainties related to the Company’s business include, but are not limited to, the following:

Changes in consumer demand in the Chinese market towards fuel-efficient vehicles and electric vehicles, or a general declining purchasing power of PRC consumers, could adversely affect the Company’s vehicle sales volumes and results of operations;
The PRC government policies on the purchase and ownership of automobiles and stricter emissions standards, may reduce the market demand for the automobiles the Company sells and thus negatively affect its business and growth prospects;
Any adverse change in political relations between the PRC and the U.S. or any other country where those brands originate, including the ongoing trade conflicts between the U.S. and the PRC, may negatively affect its business; and
The ongoing military conflict between Russia and Ukraine could materially and adversely affect the global economy and capital markets, including significant volatility in commodity prices, especially energy prices, credit and capital markets, as well as supply chain interruptions.

The Company’s business, financial condition, and results of operations may also be negatively impacted by risks related to natural disasters, extreme weather conditions, health epidemics, and other catastrophic incidents, which could significantly disrupt the Company’s operations.

Cash

Cash includes deposits held by banks that can be added or withdrawn without limitation.

Accounts receivable

Accounts receivable represent the amounts that the Company has an unconditional right to consideration, which are stated at the original amount less an allowance for doubtful accounts. The Company reviews the accounts receivable on a periodic basis and makes general and specific allowances when there is doubt as to the collectability of individual balances. The Company usually determines the adequacy of reserves for doubtful accounts based on individual account analysis and historical collection trends. The Company establishes a provision for doubtful receivables when there is objective evidence that the Company may not be able to collect amounts due. The allowance is based on management’s best estimates of specific losses on individual exposures, as well as a provision on historical trends of collections. The provision is recorded against accounts receivable balances, with a corresponding charge recorded in the consolidated statements of income. Delinquent account balances are written off against the allowance for doubtful accounts after management has determined that the likelihood of collection is remote. In circumstances in which the Company receives payments for accounts receivable that have previously been written off, the Company reverses the allowance and bad debt expenses. As of December 31, 2023 and December 31, 2022, there was no allowance for doubtful accounts recorded as the Company considers all of the outstanding accounts receivable fully collectible.

F-10

Table of Contents

Loans receivable

The Company’s loans receivable are recognized at the point of loan disbursement, initially measured at fair value, primarily reflecting the disbursed amount and associated transaction costs. Both secured and unsecured lending are encompassed in these receivables, with terms including varying interest rates and maturity dates. Subsequently, these receivables are measured at amortized cost using the effective interest method, which ensures the accurate recognition of interest income over the loan period. The interest rates for these loans may be subject to change based on the terms of loan agreements. Periodic reviews of the loan portfolio are conducted to assess for impairment, utilizing the expected credit loss model. This approach considers historical credit loss experience, current conditions, and reasonable forecasts in estimating potential credit losses. As of the end of the reporting periods, no impairment allowance was recorded for these loans receivable.

Inventory

Inventory consists of new vehicles held for sale and is stated at the lower of cost or net realizable value using the specific identification method. The value of inventory mainly includes the cost of auto vehicles purchased from U.S. automobile dealers, non-refundable sales tax, and dealership service fees. The Company reviews its inventory periodically if any reserves are necessary for potential shrinkage. The Company recorded no inventory reserve as of December 31, 2023 and 2022.

Fair value of financial instruments

Fair value is defined as the price that would be received to sell an asset or paid to transfer a liability in an orderly transaction between market participants at the measurement date. A three-level fair value hierarchy prioritizes the inputs used to measure fair value. The hierarchy requires entities to maximize the use of observable inputs and minimize the use of unobservable inputs. The three levels of inputs used to measure fair value are as follows:

Level 1 — inputs to the valuation methodology are quoted prices (unadjusted) for identical assets or liabilities in active markets.
Level 2 — inputs to the valuation methodology include quoted prices for similar assets and liabilities in active markets, quoted market prices for identical or similar assets in markets that are not active, inputs other than quoted prices that are observable and inputs derived from or corroborated by observable market data.
Level 3 — inputs to the valuation methodology are unobservable.

Unless otherwise disclosed, the fair value of the Company’s financial instruments, including cash, accounts receivable, loans receivable, and other current assets, loans payable, deferred revenue and other payables and other current liabilities, approximate the fair value of the respective assets and liabilities as of December 31, 2023 and 2022 based upon the short-term nature of the assets and liabilities.

The Company believes that the carrying amount of long-term loans approximates fair value at December 31, 2023 and 2022 based on the terms of the borrowings and current market rates as the rates of the borrowings are reflective of the current market rates.

Leases

The Company follows Financial Accounting Standards Board (“FASB”) Accounting Standards Codification (“ASC”) No. 842, Leases (“Topic 842”). The Company leases office space, which is classified as operating leases in accordance with Topic 842. Under Topic 842, lessees are required to recognize the following for all leases (with the exception of short-term leases, usually with an initial term of 12 months or less) on the commencement date: (i) lease liability, which is a lessee’s obligation to make lease payments arising from a lease, measured on a discounted basis; and (ii) right-of-use (“ROU”) asset, which is an asset that represents the lessee’s right to use, or control the use of, a specified asset for the lease term.

At the commencement date, the Company recognizes the lease liability at the present value of the lease payments not yet paid, discounted using the interest rate implicit in the lease or, if that rate cannot be readily determined, the Company’s incremental borrowing rate for the same term as the underlying lease. The ROU asset is recognized initially at cost, which primarily comprises the initial amount of the lease liability, plus any initial direct costs incurred, consisting mainly of brokerage commissions, less any lease incentives received. All ROU assets are reviewed for impairment annually. There was no impairment for ROU lease assets as of December 31, 2023 and 2022.

F-11

Table of Contents

Revenue recognition

ASC 606 establishes principles for reporting information about the nature, amount, timing, and uncertainty of revenue and cash flows arising from the entity’s contracts to provide goods or services to customers. The core principle requires an entity to recognize revenue to depict the transfer of goods or services to customers in an amount that reflects the consideration that it expects to be entitled to receive in exchange for those goods or services recognized as performance obligations are satisfied. ASC 606 requires the use of a new five-step model to recognize revenue from customer contracts. The five-step model requires that the Company (i) identify the contract with the customer, (ii) identify the performance obligations in the contract, (iii) determine the transaction price, including variable consideration to the extent that it is probable that a significant future reversal will not occur, (iv) allocate the transaction price to the respective performance obligations in the contract, and (v) recognize revenue when (or as) the Company satisfies the performance obligation. The application of the five-step model to the revenue streams compared to the prior guidance did not result in significant changes in the way the Company records its revenue. Under the new guidance, revenue is recognized when a customer obtains control of promised goods or services and is recognized in an amount that reflects the consideration which the entity expects to receive in exchange for those goods or services. In addition, the new guidance requires disclosure of the nature, amount, timing, and uncertainty of revenue and cash flows arising from contracts with customers.

The Company is primarily engaged in the parallel-import vehicle dealership business and generates its revenue from the sales of parallel-import vehicles to both domestic and overseas parallel-import car dealers. It purchases automobiles from the U.S. market through its large team of professional purchasing agents, and mainly resells them to parallel-import car dealers in the U.S. and the PRC. In accordance with ASC 606, the Company recognizes revenue at the point in time when the performance obligation has been satisfied and control of the vehicles has been transferred to the dealers. For sales to U.S. domestic parallel-import car dealers, revenue is recognized when a vehicle is delivered and its title has been transferred to the dealers. For overseas sales, the Company sells vehicles under Cost and Freight (“CFR”) shipping point terms, and revenue is recognized when a vehicle is loaded on a cargo ship and its title has been transferred to the dealers. The Company accounts for the revenue generated from sales of vehicles on a gross basis as the Company is acting as a principal in these transactions, is subject to inventory risk, has latitude in establishing prices, and is responsible for fulfilling the promise to provide customers the specified goods, which the Company has control of the goods and has the ability to direct the use of goods to obtain substantially all the benefits. All of the Company’s contracts have one single performance obligation as the promise is to transfer the individual vehicle to parallel-import car dealers, and there is no separately identifiable other promise in the contracts. The Company’s vehicles are sold with no right of return and the Company does not provide other credits or sales incentives to parallel-import car dealers. Historically, no customer returns have occurred. Therefore, the Company did not provide any sales return allowances as of December 31,2023 and 2022.

Contract balances and remaining performance obligations

Contract balances typically arise when a difference in timing between the transfer of control to the parallel-import car dealers and receipt of consideration occurs. The Company did not have contract assets as of December 31, 2023 and 2022. The Company did not have contact liabilities as of December 31, 2023 and 2022.

F-12

Table of Contents

Disaggregation of Revenue

The Company disaggregates its revenue by geographic areas, as the Company believes it best depicts how the nature, amount, timing, and uncertainty of the revenue and cash flows are affected by economic factors. The Company’s disaggregation of revenue for the years ended December 31, 2023 and 2022 were as follows:

Geographic information

The summary of the Company’s total revenue by geographic area for the years ended December 31, 2023 and 2022 was as follows:


For the Years Ended

December 31,


2023


2022

U.S. domestic market

$

8,160,395

$

3,821,261

Overseas market


30,155,579


51,332,073

Total revenue

$

38,315,974

$

55,153,335

Cost of revenue

Cost of revenue mainly includes the cost of vehicles purchased from U.S. automobile dealers, non-refundable sales tax, dealership service fees, and other expenses. It also includes fulfillment expenses, which consist primarily of (i) vehicle warehousing and towing fees, (ii) vehicle insurance expenses, (iii) commissions paid to purchasing agents incurred in vehicle pick-up and the vehicle title transfer process, (iv) broker consulting fees incurred to acquire new vehicles, and (v) purchase department labor costs.

Income taxes

The Company accounts for income taxes under the asset and liability method, which requires the recognition of deferred tax assets and liabilities for the expected future tax consequences of events that have been included in the financial statements. Under this method, the Company determines deferred tax assets and liabilities on the basis of differences between the financial statement and tax bases of assets and liabilities by using enacted tax rates in effect for the year in which the differences are expected to reverse. The effect of a change in tax rates on deferred tax assets and liabilities is recognized in income in the period that includes the enactment date.

The Company recognizes deferred tax assets to the extent that it believes that these assets are more likely than not to be realized. In making such a determination, the Company considers all available positive and negative evidence, including future reversals of existing taxable temporary differences, projected future taxable income, tax-planning strategies, and results of recent operations. The Company has not assessed a valuation allowance as it determines it is more likely than not that all deferred tax assets will be realized before expiration.

The Company records uncertain tax positions in accordance with ASC 740, Income Taxes, on the basis of a two-step process in which (1) the Company determines whether it is more likely than not that the tax positions will be sustained on the basis of the technical merits of the position and (2) for those tax positions that meet the more-likely-than-not recognition threshold, the Company recognizes the largest amount of tax benefit that is more than 50 percent likely to be realized upon ultimate settlement with the related tax authority. The Company records interest and penalties related to an uncertain tax position, is and when required, as part of income tax expenses in the consolidated statements of income. The Company does not believe that there were any uncertain tax positions as of December 31, 2023 and 2022.

The Company and its U.S. operating subsidiaries are subject to the U.S. tax law. The Company elected to file income taxes as a corporation instead of an LLC for the tax years ended December 31, 2020 through December 31, 2022. As of December 31, 2023, the Company’s consolidated income tax returns for the tax years ended December 31, 2020 through December 31, 2023, remain open for statutory examination by U.S. tax authorities.

F-13

Table of Contents

Earnings per share

The Company computes earnings per share (“EPS”) in accordance with ASC 260, “Earnings per Share” (“ASC 260”). ASC 260 requires companies with complex capital structures to present basic and diluted EPS. Basic EPS is measured as net income divided by the weighted average common shares outstanding for the period. Diluted EPS presents the dilutive effect on a per share basis of potential common shares (e.g., convertible securities, options and warrants) as if they had been converted at the beginning of the periods presented, or issuance date, if later. Potential common shares that have an anti-dilutive effect (i.e., those that increase income per share or decrease loss per share) are excluded from the calculation of diluted EPS. For the years ended December 31, 2023 and 2022, there were no dilutive shares outstanding.

Related parties and transactions

The Company identifies related parties, and accounts for and discloses related party transactions in accordance with ASC 850, “Related Party Disclosures” and other relevant ASC standards.

Parties, which can be a corporation or individual, are considered to be related if the Company has the ability, directly or indirectly, to control the other party or exercise significant influence over the other party in making financial and operational decisions. Companies are also considered to be related if they are subject to common control or common significant influence.

Transactions between related parties commonly occurring in the normal course of business are considered to be related party transactions. Transactions between related parties are also considered to be related party transactions even though they may not be given accounting recognition.

Shipping and handling costs

Shipping and handling costs, which are associated with shipping and delivery of vehicles to automobile dealers, are expensed as incurred and are included in selling expenses in the consolidated statements of income. Total shipping and handling expenses were $498,022 and $710,265 for the years ended December 31, 2023 and 2022, respectively.

Segment reporting

The Company uses the management approach in determining reportable operating segments. The management approach considers the internal reporting used by the Company’s chief operating decision maker for making operating decisions about the allocation of resources of the segment and the assessment of its performance in determining the Company’s reportable operating segments. Management has determined that the Company has one operating segment.

Recent accounting pronouncements

The Company considers the applicability and impact of all accounting standards updates (“ASUs”). Management periodically reviews new accounting standards that are issued.

In June 2016, the FASB issued ASU 2016-13, Financial Instruments-Credit Losses (Topic 326), which requires entities to measure all expected credit losses for financial assets held at the reporting date based on historical experience, current conditions, and reasonable and supportable forecasts. This replaces the existing incurred loss model and is applicable to the measurement of credit losses on financial assets measured at amortized cost. ASU 2016-13 was subsequently amended by ASU 2018-19, Codification Improvements to Topic 326, Financial Instruments—Credit Losses, ASU 2019-04 Codification Improvements to Topic 326, Financial Instruments—Credit Losses, Topic 815, Derivatives and Hedging, and Topic 825, Financial Instruments, and ASU 2019-05, Targeted Transition Relief. In November 2019, the FASB issued ASU 2019-10, which extends the effective date for the adoption of ASU 2016-13. In November 2019, the FASB issued ASU 2019-11 to clarify its new credit impairment guidance in ASU 326. Accordingly, for public entities that are not smaller reporting entities, ASU 2016-13 and its amendments are effective for fiscal years, and interim periods within those fiscal years, beginning after December 15, 2019. For all other entities, this guidance and its amendments will be effective for fiscal years beginning after December 15, 2022, including interim periods within those fiscal years. As an emerging growth company, the Company adopted this guidance on January 1, 2023 and the adoption of this ASU did not have a material impact on its consolidated financial statements.

F-14

Table of Contents

In August 2018, the FASB issued ASU No. 2018-13, “Fair Value Measurement (Topic 820): Disclosure Framework Changes to the Disclosure Requirements for Fair Value Measurement” (“ASU 2018-13”). ASU 2018-13 modifies the disclosure requirements on fair value measurements. ASU 2018-13 is effective for all entities for fiscal years and interim periods within those fiscal years beginning after December 15, 2019, with early adoption permitted for any removed or modified disclosures. The removed and modified disclosures were adopted on a retrospective basis and the new disclosures were adopted on a prospective basis. The Company adopted this guidance on January 1, 2020 and the adoption of this ASU did not have a material impact on its consolidated financial statements.

In December 2019, the FASB issued ASU No. 2019-12, Income Taxes (Topic 740)—Simplifying the Accounting for Income Taxes. ASU 2019-12 is intended to simplify accounting for income taxes. It removes certain exceptions to the general principles in Topic 740 and amends existing guidance to improve consistent application. ASU 2019-12 is effective for fiscal years beginning after December 15, 2020 and interim periods within those fiscal years, with early adoption permitted. The Company adopted this guidance on January 1, 2021 and the adoption of this ASU did not have a material impact on its consolidated financial statements.

NOTE 3 — ACCOUNTS RECEIVABLE

Accounts receivable consisted of the following:


December 31, 


December 31, 

 2023

2022

Accounts receivable

$

6,494,695

$

7,086,651

Less: allowance for doubtful accounts


Total accounts receivable

$

6,494,695

$

7,086,651

The Company’s accounts receivable primarily include balances generated from selling parallel-import vehicles to both domestic and overseas parallel-import car dealers, which have not been collected as of the balance sheet dates. The Company identified two accounts with deferred payments overdue for over 150 days, totaling approximately $2.6 million of the $5.6 million total deferred payment balances as of December 31, 2023, which were backed by third-party guarantees. After a thorough assessment, these accounts were classified as fully collectible despite the delay.

As of December 31, 2023, the following table summarizes the Company’s accounts receivable aging:


December 31,

2023

Accounts receivable aging:

Less than 150 days

$

3,508,729

151-180 days

861,197

181-210 days

886,845

Over 210 days

1,237,924

Less: allowance for doubtful accounts

Total accounts receivable

$

6,494,695

The accounts receivable transactions in connection with letters of credit with book value of $1,084,775 and $7,502,291 were pledged as collateral to guarantee the Company’s borrowings from four third-party lending companies as of December 31, 2023 and December 31, 2022, respectively (see Note 9).

F-15

Table of Contents

NOTE 4 — LOANS RECEIVABLE

Loans receivable consisted of the following:


December 31,  


December 31, 

2023

2022

Vehicle pledge loan receivable

$

172,500

$

Short-term loan

$

500,000


Total loans receivable

$

672,500

$

On December 6, 2023, the Company entered into two separate vehicle pledge loan agreements with one customer, securing the loans with the customer’s vehicle inventory. The aggregate principal for these loans was set at $172,500, determined as 90% of each pledged vehicles’ MSRP. The initial term of each agreement is 90 days. The loans carry an interest rate of 14.4% annually for the first 90 days, and for any duration beyond that, the rate is 18% annually. As of December 31, 2023, no impairment is required as the loans have been assessed as collectible.

On December 11, 2023, the Company provided an unsecured short-term loan to one of its customers. The principal amount of the loan was $500,000. This loan carried an annual interest rate of 12.0% and was originally set to mature on February 12, 2024. However, on the maturity date, the Company and the borrower agreed to amend the terms of the loan. The amendment extended the maturity date to June 12, 2024, and increased the annual interest rate to 18.0% for the extension period. No impairment is required as the loan has been assessed as collectible. Interest accrued through February 12, 2024, remains at the original rate of 12.0% per annum, and any interest accruing after this date is subject to the new rate of 18.0% per annum. Interest income for the years ended December 31, 2023 and 2022 was $5,423 and nil, respectively, which was accrued and recorded as interest receivable (see Note 6).

NOTE 5 — INVENTORY

Inventory consisted of the following:


December 31, 


December 31,

2023

2022

Vehicles

$

1,515,270

$

5,965,935

Less: inventory valuation allowance


Total inventory

$

1,515,270

$

5,965,935

Changes in inventory valuation allowance were as follows:


December 31,


December 31, 

2023

2022

Beginning balance

$

$

92,811

Sale of previously reserved inventory


(92,811)

Ending balance

$

$

In connection with the Company’s $4,164,100 inventory financing from loans payable as of December 31, 2022, the Company pledged its inventory with book value of $4,095,132 as collateral for these loans, respectively (see Note 8). The Company’s vehicles in inventory with book value totaling $141,557 were pledged as collateral to secure loans payable from dealers finance as of December 31, 2022 (see Note 10).

F-16

Table of Contents

NOTE 6 — OTHER RECEIVABLES

Other receivables consisted of the following:


December 31, 2023


December 31, 2022

Vehicle deposit(1)

$

162,159

$

400,659

Rent deposit


22,095


41,845

Sales tax refundable(2)


217,892


419,886

Interest receivable

5,423

Others


3,351


38,340

Subtotal


410,920


900,730

Less: allowance for doubtful accounts


Total other receivables

$

410,920

$

900,730

(1)

Vehicle deposits represent security deposits paid to U.S. automobile dealers to reserve vehicles.

(2)

Sales tax refundable represents vehicles sales tax exempted in some states and to be refunded by the tax authorities.

NOTE 7 — LEASES

The Company leases office space from various third parties under non-cancelable operating leases, with terms ranging from 12 to 38 months. The Company considers the renewal or termination options that are reasonably certain to be exercised in the determination of the lease term and initial measurement of ROU assets and lease liabilities. Lease expenses are recognized on a straight-line basis over the lease term. Leases with an initial term of 12 months or less are not recorded on the balance sheet.

The Company determines whether a contract is or contains a lease at the inception of the contract and whether that lease meets the classification criteria of a finance or operating lease. When available, the Company uses the rate implicit in the lease to discount lease payments to present value; however, most of the Company’s leases do not provide a readily determinable implicit rate. Therefore, the Company discounts lease payments based on an estimate of its incremental borrowing rate.

The Company’s lease agreements do not contain any material residual value guarantees or material restrictive covenants.

On April 28, 2023, the Company entered a first amendment to lease agreement (the “Amended Lease”) with one of its landlords, which amended a previous lease agreement between the two parties, whereby the Company leases office space from the landlord with an initial lease term from December 1, 2020 to December 31, 2023. Pursuant to the Amended Lease, the initial lease term was extended for a period commencing January 1, 2024 and expiring February 28, 2027, unless sooner terminated as provided in the Amended Lease. The Company was also granted the option to extend the lease term for another three years starting from March 1, 2027 and ending February 28, 2030.

The table below presents the operating lease related assets and liabilities recorded on the balance sheets.


December 31, 2023


December 31, 2022

Right-of-use assets

$

190,823

$

140,145

Operating lease liabilities – current

$

39,703

$

149,458

Operating lease liabilities – non-current


151,121


Total operating lease liabilities

$

190,824

$

149,458

F-17

Table of Contents

The weighted average remaining lease terms and discount rates for all operating leases were as follows as of December 31, 2023 and 2022:


December 31, 2023


December 31, 2022


Remaining lease term and discount rate:


Weighted average remaining lease term (years)


3.17


0.77

Weighted average discount rate *


17.8

%  

17.1

%

*The Company used a weighted average incremental borrowing rate of 17.8% per annum for its lease contracts based on the Company’s current borrowing rates from various financial institutions.

During the years ended December 31, 2023 and 2022, the Company incurred total operating lease expenses of $268,801 and $218,305, respectively.

The following is a schedule, by years, of maturities of lease liabilities as of December 31, 2023:

12 months ending December 31,


Amount

2024

$

66,391

2025


82,059

2026


84,520

2027


14,509

Total lease payments

$

247,479

Less: imputed interest


(56,655)

Present value of lease liabilities

$

190,824

NOTE 8 — INVENTORY FINANCING

There were no inventory financing loan agreements executed during the year ended December 31, 2023. No inventory was being held as collateral, and the balance of inventory financing was nil, as of December 31, 2023.

The Company entered into a series of inventory financing loan agreements with a third party for working capital purposes during the year ended December 31, 2022, pursuant to which the Company pledged a portion of its vehicle inventory as collateral for each of the loan agreements. Interest expenses are calculated based on the actual number of days the loan was outstanding upon settlement of the loan. For the loan amount outstanding for no more than 90 days, the Company is charged an interest rate ranging between 16.2% and 21.6%, per annum, and for the amount outstanding for more than 90 days, the Company is charged an interest rate ranging between 20.7% and 27.6%, per annum. The loans are guaranteed by Huan Liu, the Company’s controlling stockholder, and another stockholder of the Company.

Inventory financing amounted to $4,164,100 as of December 31, 2022. Interest expense for inventory financing was $747,298 for the year ended December 31, 2022. The Company’s vehicles in inventory with book value of $4,095,132 were pledged as collateral to secure the Company’s borrowings from a third party as of December 31, 2022 (see Note 5).

NOTE 9 — LETTER OF CREDIT FINANCING (“LC FINANCING”)

The Company entered into a series of loan agreements with three third-party companies for working capital funding purposes during the years ended December 31, 2023 and 2022. Pursuant to the agreements, loans payable from LC financing were collateralized by letters of credit from overseas sales of parallel-import vehicles. Interest expense is calculated based on the actual number of days the loan was outstanding and payable upon settlement, and the Company is charged at an interest rate ranging between 15.0% and 27.6% per annum.

The LC financing amounted to $1,004,565 and $7,105,873 as of December 31, 2023 and 2022, respectively. Interest expense for LC financing was $925,426 and $1,669,931 for the years ended December 31, 2023 and 2022, respectively. Accounts receivable transactions in connection with letters of credit having book value of $1,084,775 and $7,502,291 were pledged as collateral to guarantee the Company’s borrowings from these three third-party lending companies as of December 31, 2023 and 2022, respectively (see Note 3).

F-18

Table of Contents

NOTE 10 — DEALERS FINANCE

Loans payable from dealers finance reflect amounts borrowed from various automobile dealers to finance the purchased vehicles. The original term of these loans is between five to six years; however, the Company typically repays these loans within two months. The Company is charged an interest rate ranging between 5.09% and 9.84%, per annum.

The dealers finance amounted to nil and $41,747 as of December 31, 2023 and 2022, respectively. Interest expense for dealers finance was $4,123 and $2,332 for the years ended December 31, 2023 and 2022, respectively. The Company’s vehicles in inventory with book value of nil and $141,557 were pledged as collateral to secure the loans payable from dealers finance as of December 31, 2023 and 2022, respectively (see Note 5).

NOTE 11 — REVOLVING LINE OF CREDIT

On October 5, 2022, the Company entered into two revolving line of credit agreements (the “Revolving Line of Credit Agreements”) with two third-party companies that have been providing financial support to the Company since 2021. Pursuant to the Revolving Line of Credit Agreements, the Company can borrow under revolving lines of credit of up to $10.0 million and $5.0 million, respectively, from these two third-party companies with a total of $15.0 million for a period of 12 months at a fixed interest rate of 1.5% per month. On December 12, 2022, the Company amended the Revolving Line of Credit Agreements to extend the maturity date to April 2024.

During the year ended December 31, 2023, the Company borrowed a total of $3,244,488, and paid back $2,555,777. As of December 31, 2023 and 2022, the revolving line of credit balance was $688,711 and nil, respectively. Interest expense for the revolving lines of credit was $155,245 and nil for the years ended December 31, 2023 and 2022, respectively.

NOTE 12 — PREMIUM FINANCE

On July 31, 2023, the Company entered into a premium finance agreement (the “Premium Finance Agreement”) with National Partners PFco, LLC. Pursuant to the Premium Finance Agreement, the Company borrowed $221,139 for the purchase of its directors and officers’ insurance, at an annual interest rate of 7.75%.

The premium finance loan amounted to $148,621 and nil as of December 31, 2023 and 2022, respectively. Interest expense for premium finance loan was $5,974 and nil for the years ended December 31, 2023 and 2022, respectively.

NOTE 13 — LONG-TERM DEBT

Long-term debt consisted of the following:


December 31,


December 31,

2023

2022

Small Business Administration(1)

$

479,124

$

490,130

Thread Capital Inc.(2)


198,488


219,593

Total long-term debt

$

677,612

$

709,723

Current portion of long-term debt

$

32,887

$

31,281

Non-current portion of long-term debt

$

644,725

$

678,442

(1)

On May 24, 2020, the Company entered into a loan agreement with the U.S. Small Business Administration (the “SBA”), an agency of the U.S. Government, to borrow $150,000 for thirty years, with a maturity date of May 23, 2050. Under the terms of the SBA loan, the loan proceeds are used as working capital to alleviate economic injury caused by the COVID-19 pandemic. The loan bears a fixed interest rate of 3.75% per annum. Beginning 12 months from the date of this loan agreement, the Company is required to make a monthly installment payment of $731 within the term of loan, with last installment to be paid in May 2050.

F-19

Table of Contents

On March 16, 2022, the Company entered into an amended agreement with SBA to borrow an additional $350,000 for 30 years as working capital to alleviate economic injury caused by the COVID-19 pandemic. In aggregate, the Company’s borrowings amounted to $500,000 with a maturity date of May 23, 2050. The amended loan bears a fixed interest rate of 3.75% per annum. Beginning from March 2022, twenty - four months from the date of the original loan agreement, the Company is required to make a new monthly installment payment of $2,485 within the remaining term of loan, with the last installment to be paid in May 2050.

The future maturities of the loan from SBA as of December 31, 2023 are as follows:

12 months ending December 31,


Future repayment

2024

$

10,592

2025


11,024

2026


11,474

2027


11,942

2028


12,429

Thereafter


421,663

Total

$

479,124

(2)

On May 15, 2020, the Company entered into a loan agreement with Thread Capital Inc. (“Thread Capital”) to borrow $50,000 as working capital with a maturity date of November 1, 2024. The loan bore a fixed interest rate of 5.50% per annum. This loan agreement was subsequently terminated on May 17, 2021, and the Company entered into a new loan agreement with Thread Capital to borrow an additional $171,300 as working capital. In aggregate, the Company’s borrowings from Thread Capital amounted to $221,300 with a maturity date of May 1, 2031. The interest was charged at a fixed annual interest rate of 0.25% between June 1, 2021 and November 30, 2022. Beginning from December 1, 2022, the loan bears a fixed annual interest rate of 5.5%, and the Company is required to make a monthly installment payment of $2,721 within the remaining term of loan, with the last installment to be paid in May 2031.

The future maturities of the loan from Thread Capital as of December 31, 2023 are as follows:

12 months ending December 31,


Future repayment

2024

$

22,295

2025


23,553

2026


24,881

2027


26,285

2028


27,768

Thereafter


73,706

Total

$

198,488

For the above-mentioned long-term borrowings, the Company recorded interest expense of $31,197 and $18,641 for the years ended December 31, 2023 and 2022, respectively.

NOTE 14 — RELATED PARTY TRANSACTIONS

a. Nature of relationship with a related party

Name


Relationship with Our Company


Mr. Huan Liu

Chief Executive Officer (“CEO”) and Chairman of the Board of Directors

b. Due to a related party

Amount due to a related party represents amounts due to the Company’s CEO and Chairman of the Board of Directors, Mr. Huan Liu, for funds borrowed for working capital purposes during the Company’s normal course of business. These payables are unsecured, non-interest bearing, and due on demand.

F-20

Table of Contents

During the years ended December 31, 2023 and 2022, the Company borrowed an aggregate of $45,798 and $313,464, respectively, from Mr. Huan Liu directly as working capital and used such funds to purchase vehicles. The Company made repayments to Mr. Huan Liu in the amount of $32,375 and $1,449,054 during the years ended December 31, 2023 and 2022, respectively. As a result of these transactions, the balance due to Mr. Huan Liu was $13,423 as of December 31, 2023.

NOTE 15 — INCOME TAXES

The Company and its operating subsidiaries in United States are subject to the tax law of the United States. The Company elected to file income taxes as a corporation instead of an LLC for the tax years ended December 31, 2020 through December 31, 2022.

(i)

The components of the income tax provision were as follows:


For the Years Ended

December 31,

2023


2022

Current:


Federal

$

7,385

$

42,881

State

443

33,538

Total current income tax provision

7,828

76,419

Deferred:


Federal

35,561

178,279

State

3,268

(20,219)

Total deferred income tax provision

38,829

158,060

Total income tax provision

$

46,657

$

234,479

(ii)

Reconciliations of the statutory income tax rate to the effective income tax rate were as follows:


For the Years Ended


December 31,

2023


2022


Federal statutory tax rate

$

21.0

%  

$

21.0

%

State statutory tax rate


1.6

%  

3.7

%

Non-deductible expenses


0.6

%  

0.2

%

Deferred true-up


2.6

%  

(2.6)

%

Effective tax rate

$

25.8

%  

$

22.3

%

(iii)

Deferred tax assets were composed of the following:


December 31,


December 31,

2023

2022

Deferred tax assets:


Net operating loss carry-forwards

$

47,905

$

84,496

Others


2,238

Total deferred tax assets

$

47,905

$

86,734

As of December 31, 2022, the Company had a cumulative U.S. federal net operating loss (“NOL”) of $327,648, which may reduce future federal taxable income. During the year ended December 31, 2023, the Company’s operations utilized NOLs of $163,295, resulting in a cumulative U.S. federal NOL of $164,353 as of December 31, 2023, which is carried forward indefinitely. As of December 31, 2023, the Company also had a cumulative state NOL of $191,759, which may reduce future state taxable income, and the NOL balance as of December 31, 2023 will expire beginning in 2041.

F-21

Table of Contents

The Company was not previously subject to the interest expense limitation under §163(j) of the U.S. Internal Revenue Code, due to the small business exemption. Its average annual gross receipts for the three tax years preceding 2022 did not exceed the relevant threshold amount ($27 million for 2022). The Company no longer met the small business exception in 2023, but it met one of the other exceptions to the §163(j) limitation, “floor plan financing indebtedness” (indebtedness used to finance the acquisition of motor vehicles held for sale or lease or secured by such inventory), and therefore continued to be exempt from the §163(j) interest expenses limitation in 2023.

The Company periodically evaluates the likelihood of the realization of deferred tax assets and reduces the carrying amount of the deferred tax assets by a valuation allowance to the extent it believes a portion will not be realized. Management considers new evidence, both positive and negative, that could affect the Company’s future realization of deferred tax assets including its recent cumulative earnings experience, expectation of future income, the carry forward periods available for tax reporting purposes and other relevant factors. The Company believes that it is more likely than not that its deferred tax assets will be realized before expiration.

NOTE 16 — CONCENTRATIONS

Political and economic risk

The operations of the Company are located in the U.S. and the Company’s primary market is in the PRC. Accordingly, the Company’s business, financial condition, and results of operations may be influenced by political, economic, and legal environments in the U.S. and the PRC, as well as by the general state of the U.S. and the PRC economy. The Company’s results may be adversely affected by changes in the political, regulatory, and social conditions in the U.S. and the PRC. Although the Company has not experienced losses from these situations and believes that it is in compliance with existing laws and regulations, including its organization and structure disclosed in Note 1, such experience may not be indicative of future results.

Credit risk

As of December 31, 2023 and 2022, $432,998 and $58,381 of the Company’s cash was on deposit at financial institutions in the U.S., respectively, which were insured by the Federal Deposit Insurance Corporation subject to certain limitations. The Company has not experienced any losses in such accounts.

Loans receivable may be secured by the vehicles being financed or unsecured based on the creditworthiness of the borrower, thereby exposing the Company to credit risk. This risk is mitigated by the Company’s assessment of its customers’ creditworthiness and its ongoing monitoring of outstanding balances.

Accounts receivable are typically unsecured and derived from revenue earned from parallel-import car dealers, thereby exposing the Company to credit risk. This risk is mitigated by the Company’s assessment of its parallel-import car dealers’ creditworthiness and its ongoing monitoring of outstanding balances.

Concentrations

The Company’s major customers are parallel-import automobile dealers. For the year ended December 31, 2023, three parallel-import car dealers accounted in total for 98.9% (53.2%, 25.5%, and 20.2%, respectively) of the Company’s total revenue. For the year ended December 31, 2022, three parallel-import car dealers accounted for approximately 65.0% (28.4%, 25.7%, and 10.9%, respectively) of the Company’s total revenue.

As of December 31, 2023, three parallel-import car dealers accounted for 98.0% (58.1%, 28.2%, and 11.7%, respectively) of the accounts receivable balance. As of December 31, 2022, two parallel-import car dealers accounted for approximately 88.7% (77.0% and 11.7%, respectively) of the accounts receivable balance.

For the years ended December 31, 2023 and 2022, one U.S.-based automobile dealership accounted for approximately 8.8% and 8.4%, respectively, of the Company’s total purchases.

F-22

Table of Contents

NOTE 17 — STOCKHOLDERS’ EQUITY

Common Stock

Cheetah Net was established under the laws of the State of North Carolina on August 9, 2016. Under the Company’s amended and restated articles of incorporation on July 11, 2022, the total authorized number of common stocks is 100,000,000 with par value of $0.0001 per common stock, which consists of 91,750,000 shares of Class A common stock and 8,250,000 shares of Class B common stock. The total number of shares of common stock outstanding is 15,000,000, which consists of 6,750,000 shares of Class A common stock and 8,250,000 shares of Class B common stock. Holders of Class A common stock and Class B common stock have the same rights except for voting and conversion rights. In respect of matters requiring the votes of stockholders, each share of Class A common stock is entitled to one vote, and each share of Class B common stock is entitled to 15 votes. Class B common stock is convertible into Class A common stock at any time after issuance at the option of the holder on a one-to-one basis. Class A common stock is not convertible into shares of any other class. The numbers of authorized and outstanding common stock were retroactively applied as if the transaction occurred at the beginning of the period presented.

On June 27, 2022, the Company entered into a subscription agreement with a group of investors (the “Investors”) whereby the Company agreed to sell, and the Investors agreed to purchase, up to 1,666,000 shares of Class A common stock at a purchase price of $1.80 per share. These Investors are unrelated parties to the Company. The gross proceeds were approximately $3.0 million, before deducting offering expenses of approximately $0.3 million. The net proceeds were approximately $2.7 million, of which approximately $1.2 million was received in 2022 and $1.2 million in 2023, for a total receipt of approximately $2.4 million. After negotiations between Rapid Proceed Limited (“Rapid”), one of the Investors, and the Company regarding the fund’s release terms, an agreement was reached on November 2, 2023, stipulating that the outstanding $600,000 would be paid by Rapid within six months following the Company’s IPO. On March 13, 2024, considering the impact of market volatility and the long-term benefits of continued cooperation, Rapid requested and the Company agreed to extend the payment due date of the outstanding $600,000 to September 30, 2024.

On August 3, 2023, the Company closed its IPO of 1,250,000 shares of Class A common stock at a public offering price of $4.00 per share, for aggregate gross proceeds of $5.0 million before deducting underwriting discounts, and other offering expenses, including a grant to the underwriter of a warrant to purchase 62,500 shares of Class A common stock (the “Warrant”), with an exercise price of $5.00 per share. The Company’s Class A common stock began trading on the Nasdaq Capital Market under the ticker symbol “CTNT” on August 1, 2023. As of December 31, 2023, there were 9,666,000 shares of Class A common stock issued and outstanding.

Warrants

The Company accounts for stock warrants as either equity instruments or derivative liabilities depending on the specific terms of the warrant agreement. The Warrant is equity-classified as a result of being indexed to the Company’s Class A common stock and meeting certain equity classification criteria, and the instruments will not be remeasured in subsequent periods as long as the instruments continue to meet these accounting criteria. The fair value of the Warrant was recorded to additional paid-in capital within stockholders’ equity.


Total Common

Shares Issuable as of

Exercise

December 31,

Title of Warrant

Date Issued

Expiry Date

Price

2023

Equity-classified warrants


August 2023 – underwriter warrant


8/3/2023


07/31/2026

$

5.00


62,500

F-23

Table of Contents

NOTE 18 — COMMITMENTS AND CONTINGENCIES

On February 8, 2023, ISY1 LLC (the “Plaintiff”) commenced a lawsuit against the Company in the Superior Court of New Jersey. The Plaintiff alleged that the Company offered to pay the Plaintiff to arrange for the transport of certain automobiles for the benefit of the Company, the Plaintiff accepted the Company’s offer and rendered its services by contracting with and paying third parties who transported these automobiles. However, after the Plaintiff submitted the invoices, the Company refused to make the payment on the grounds that the Plaintiff’s services had not met the Company’s expectations. Therefore, the Plaintiff is seeking $86,355 in monetary damages, reimbursement for all costs and attorneys’ fees, and other relief as the Court may deem just and proper. On October 2, 2023, the Company entered into a settlement agreement with the Plaintiff. The Company agreed to deliver payments totaling $55,000, half of which was delivered on December 26, 2023. Pursuant to the terms of the settlement agreement, the remaining $27,500 is scheduled for payment six months following the effective date, with a due date at the end of March 2024.

On February 23, 2023, the Company filed a complaint in the Supreme Court of the State of New York County against Stefanie A. Rehfeld (the “Defendant”), alleging breach of contract as the Defendant had misappropriated an automobile belonging to the Company. Pursuant to an independent contractor agreement dated June 30, 2022 between the Company and the Defendant, the Company hired the Defendant to locate and acquire certain new model luxury vehicles. The Company was obligated to fully fund the purchase of each vehicle, and the Defendant was required to locate and acquire the vehicle and turn over title and possession to the Company in exchange for a commission fee. In February 2023, after the Company fully funded the purchase of a 2023 Mercedes Benz GLS 450 (the “Mercedes”) for a total amount of $102,593.50, the Defendant obtained possession of the Mercedes from a Mercedes Benz dealership and signed a bill of sale with the Company, whereby she agreed to sell, transfer, and convey the title of the Mercedes to the Company. However, the Defendant failed to transfer the title of the Mercedes to the Company as scheduled. Therefore, the Company is seeking to require the Defendant to transfer title and deliver possession of the Mercedes to the Company and recover the costs incurred in retrieving the car, or alternatively, the monetary damages resulting from the Defendant’s misappropriation of the Mercedes, including court costs and attorneys’ fees and expenses. On April 25, 2023, the Supreme Court of the State of New York County granted the Company’s motion for summary judgment on its second and fourth causes of action. Subsequently, an inquest will be conducted to determine the precise amount owed to the Company. Based on the outcome of the current motion and the Company’s overall assessment of the case, the Company believes it will be successful in this litigation. As of the filing date of this report, the Mercedes has been found by the police and returned to the Company.

NOTE 19 — SUBSEQUENT EVENT

On January 24, 2024, the Company entered into a stock purchase agreement with Edward Transit Express Group Inc., a California corporation (“Edward”), and Juguang Zhang, Edward’s sole stockholder (the “Seller”). Pursuant to the Agreement, the Company agreed to acquire 100% of the equity interest in Edward from the Seller (the “Acquisition”). On February 2, 2024, the Corporation closed the Acquisition for a total purchase price that included a cash payment of $300,000 and the issuance of 1,272,329 shares of the Company’s unregistered Class A common stock, valued at $1,200,000.

On March 4, 2024, the Company entered into a warrant termination agreement (the “Agreement”) with Maxim Group LLC (“Maxim”). Pursuant to the terms of the Agreement, the Company agreed to pay Maxim a cash consideration of $78,125 in full settlement for the termination of the Warrant, previously issued to Maxim in connection with the Company’s IPO. The Warrant, originally issued on August 3, 2023, provided Maxim the right to purchase 62,500 shares of the Company’s Class A common stock. According to the Agreement, the Warrant was fully terminated and rendered null and void as of the effective date of the Agreement. This termination extinguishes all past, present, or future obligations of the parties under the Warrant, except as otherwise expressly provided for in the Agreement. The effective date of the Agreement is acknowledged as the date on which the cash consideration of $78,125 was received by Maxim.

F-24

Table of Contents

Item 9. Changes in and Disagreements with Accountants on Accounting and Financial Disclosure.

None.

Item 9A. Controls and Procedures.

Evaluation of Disclosure Controls and Procedures.

Our management, with the participation of our principal executive officer and principal financial officer, conducted an evaluation of the effectiveness of our disclosure controls and procedures (as defined in Rules 13a-15(e) and 15d-15(e) under the Securities Exchange Act of 1934, as amended (the “Exchange Act”)) as of December 31, 2023. Disclosure controls and procedures include, without limitation, controls and procedures designed to ensure that information required to be disclosed by a company in the reports that it files or submits under the Exchange Act is accumulated and communicated to its management, including its principal executive and principal financial officers, or persons performing similar functions, as appropriate to allow timely decisions regarding required disclosure. Management recognizes that any controls and procedures, no matter how well designed and operated, can provide only reasonable assurance of achieving their objectives and management necessarily applies its judgment in evaluating the cost-benefit relationship of possible controls and procedures.

Management did not identify material weaknesses in our internal control over financial reporting, which is an integral component of our disclosure controls and procedures. A material weakness is a deficiency, or a combination of deficiencies, in internal control over financial reporting, such that there is a reasonable possibility that a material misstatement of our annual or interim financial statements will not be prevented or detected on a timely basis. However, we do believe we can design and maintain more effective controls in 2024. These may include additions to personnel and or consultants, and formalizing and improving our accounting policies, procedures, and controls. Based on the evaluation of our disclosure controls and procedures as of December 31, 2023, our principal executive officer and principal financial officer concluded that, as of such date, our disclosure controls and procedures were effective at the reasonable assurance level.

Management’s Responsibility for Financial Statements

Our management is responsible for the integrity and objectivity of all information presented in this Annual Report on Form 10-K. The financial statements were prepared in conformity with the U.S. GAAP and include amounts based on management’s best estimates and judgments. Management believes the financial statements fairly reflect the form and substance of transactions and that the financial statements fairly represent the Company’s financial position and results of operations for the periods and as of the dates stated therein. Our audit committee of the board of directors, which is composed solely of independent directors, meets regularly with our independent registered public accounting firm, Assentsure PAC, and representatives of management to review accounting, financial reporting, internal control, and audit matters, as well as the nature and extent of the audit effort. The audit committee is responsible for the engagement of the independent auditors. The independent auditors have free access to the audit committee.

Changes in Internal Control over Financial Reporting

There were no changes in our internal control over financial reporting identified in connection with the evaluation of such internal control required by Rule 13a-15(d) and 15d-15(d) of the Exchange Act that occurred during the fiscal year ended December 31, 2023 that have materially affected, or are reasonably likely to materially affect, our internal control over financial reporting.

Management’s Annual Report on Internal Control over Financial Reporting

Our management, including the Chief Executive Officer and Chief Financial Officer, is responsible for establishing and maintaining adequate internal control over financial reporting (as defined in Rules 13a-15(f) and 15d-15(f) under the Exchange Act). Our management, including the Chief Executive Officer and Chief Financial Officer, assessed the effectiveness of our internal control over financial reporting as of December 31, 2023. Management based this assessment on criteria for effective internal control over financial reporting described in “Internal Control Integrated Framework 2013” issued by the Committee of Sponsoring Organizations of the Treadway Commission. Based on this assessment, management determined that, as of December 31, 2023, we maintained effective internal control over financial reporting.

34

Table of Contents

Item 9B. Other Information.

None.

Item 9C. Disclosure Regarding Foreign Jurisdictions that Prevent Inspections.

Not Applicable.

PART III

Item 10. Directors, Executive Officers and Corporate Governance.

In response to this Item, the information set forth in our Proxy Statement for our 2024 Annual Meeting of Stockholders (the “2024 Proxy Statement”) to be filed within 120 days following the end of our fiscal year, under the headings “Proposal No. 1—Election of Directors,” “Our Executive Officers,” “Section 16(a) Compliance,” and “Corporate Governance Practices and Policies” is incorporated herein by reference.

Item 11. Executive Compensation.

In response to this Item, the information set forth in the 2024 Proxy Statement under the headings “Executive Compensation” and “Corporate Governance Practices and Policies” is incorporated herein by reference.

Item 12. Security Ownership of Certain Beneficial Owners and Management and Related Stockholder Matters.

In response to this Item, the information set forth in the 2024 Proxy Statement under the headings “Executive Compensation” and “Security Ownership of Certain Beneficial Owners and Management” and is hereby incorporated herein by reference.

Item 13. Certain Relationships and Related Transactions, and Director Independence.

In response to this Item, the information set forth in the 2024 Proxy Statement under the headings “Certain Relationships and Related Party Transactions” and “Corporate Governance Practices and Policies—Board and Committee Independence” is incorporated herein by reference.

Item 14. Principal Accounting Fees and Services.

In response to this Item, the information set forth in the 2024 Proxy Statement under the heading “Matters Relating to the Independent Registered Public Accounting Firm” is incorporated herein by reference.

35

Table of Contents

PART IV

Item 15. Exhibit and Financial Statement Schedules

(a) Financial Statements

We have filed the financial statements in Item 8. Financial Statements and Supplementary Data as a part of this Annual Report on Form 10-K.

(b) Exhibits

The following is a list of all exhibits filed or incorporated by reference as part of this Annual Report on Form 10-K.


Incorporated by Reference
(Unless Otherwise Indicated)

Exhibit
Number

Exhibit Title

Form


File


Exhibit


Filing Date

3.1

Second Amended and Restated Article of Incorporation

S-1

333- 271185

3.1

May 3, 2023

3.2

Bylaws

S-1

001- 271185

3.2

April 7, 2023

4.1

Specimen Stock Certificate

S-1

333- 271185

4.1

April 7, 2023

4.2

Description of Securities

Filed herewith

10.1

Employment Agreement effective as of March 1, 2022 by and between Huan Liu and Cheetah Net

S-1

333- 271185

10.1

April 7, 2023

10.2

Employment Agreement effective as of October 26, 2022 by and between Robert Cook and Cheetah Net

S-1

333- 271185

10.2

April 7, 2023

10.3

Employment Agreement effective as of March 1, 2022 by and between Walter Folker and Cheetah Net

S-1

333- 271185

10.3

April 7, 2023

10.4

Indemnification Agreement dated October 14, 2022 by and between Huan Liu and Cheetah Net

S-1

333- 271185

10.4

April 7, 2023

10.5

Indemnification Agreement dated October 26, 2022 by and between Robert Cook and Cheetah Net

S-1

333- 271185

10.5

April 7, 2023

10.6

Indemnification Agreement dated October 14, 2022 by and between Walter Folker and Cheetah Net

S-1

333- 271185

10.6

April 7, 2023

10.7

Indemnification Agreement dated October 14, 2022 by and between Xianggeng Huang and Cheetah Net

S-1

333- 271185

10.7

April 7, 2023

10.8

Indemnification Agreement dated October 14, 2022 by and between Adam Eilenberg and Cheetah Net

S-1

333- 271185

10.8

April 7, 2023

10.9

Indemnification Agreement dated October 14, 2022 by and between Vladimir Gavrilovic and Cheetah Net

S-1

333- 271185

10.9

April 7, 2023

10.10

Indemnification Agreement dated October 14, 2022 by and between Catherine Chen and Cheetah Net

S-1

333- 271185

10.10

April 7, 2023

36

Table of Contents

10.11

Director Offer Letter, between Xianggeng Huang and Cheetah Net, dated August 31, 2022

S-1

333- 271185

10.11

April 7, 2023

10.12

Director Offer Letter, between Adam Eilenberg and Cheetah Net, dated September 14, 2022

S-1

333- 271185

10.12

April 7, 2023

10.13

Director Offer Letter, between Vladimir Gavrilovic and Cheetah Net, dated October 3, 2022

S-1

333- 271185

10.13

April 7, 2023

10.14

Director Offer Letter, between Catherine Chen and Cheetah Net, dated August 29, 2022

S-1

333- 271185

10.14

April 7, 2023

10.15

Form of Independent Contractor Agreement between a purchasing agent and Cheetah Net

S-1

333- 271185

10.15

April 7, 2023

10.16

Revolving Line of Credit Agreement dated October 5, 2022 (as amended), by and between Cheetah Net and Asia Finance Investment Limited

Filed herewith

10.17

Revolving Line of Credit Agreement dated October 5, 2022 (as amended), by and between Cheetah Net and Hong Kong Sanyou Petroleum Co Limited

Filed herewith

10.18

Form of Sales Contract by and between a PRC customer and Cheetah Net

S-1

333- 271185

10.19

April 7, 2023

10.19

Form of Sales Agreement by and between a U.S. customer and Cheetah Net

S-1

333- 271185

10.20

April 7, 2023

10.20

Stock Purchase Agreement dated January 24, 2024, by and among Edward Transit Express Group, Inc., Juguang Zhang, and Cheetah Net

8-K

0001-41761

10.1

January 30, 2024

10.21

Amendment No.1 to Stock Purchase Agreement dated January 29, 2024 by and among Edward Transit Express Group, Inc., Juguang Zhang, and Cheetah Net

8-K

001-41761

10.2

January 30, 2024

14.1

Code of Business Conduct and Ethics

S-1

001- 271185

14.1

April 7, 2023

19.1

Inside Trading Policy

Filed herewith

21.1

Subsidiaries

Filed herewith

31.1

Certification of Principal Executive Officer pursuant to Section 302 of the Sarbanes-Oxley Act of 2002

Filed herewith

31.2

Certification of Principal Financial Officer pursuant to Section 302 of the Sarbanes-Oxley Act of 2002

Filed herewith

32.1*

Certification of Principal Executive Officer pursuant to 18 U.S.C. 1350, as adopted pursuant to Section 906 of the Sarbanes-Oxley Act of 2002

Furnished herewith

37

Table of Contents

32.2*

Certification of Principal Financial Officer pursuant to 18 U.S.C. 1350, as adopted pursuant to Section 906 of the Sarbanes-Oxley Act of 2002

Furnished herewith

97.1

Compensation Recovery Policy

Filed herewith

101.INS

Inline XBRL Instance Document

Filed herewith

101.SCH

Inline XBRL Taxonomy Extension Schema Document

Filed herewith

101.CAL

Inline XBRL Taxonomy Extension Calculation Linkbase Document

Filed herewith

101.DEF

Inline XBRL Taxonomy Extension Definition Linkbase Document

Filed herewith

101.LAB

Inline XBRL Taxonomy Extension Label Linkbase Document

Filed herewith

101.PRE

Inline XBRL Taxonomy Extension Presentation Linkbase Document

Filed herewith

104

Cover Page Interactive Data File (formatted as Inline XBRL and contained in Exhibit 101)

Filed herewith

*

In accordance with Item 601(b)(32)(ii) of Regulation S-K and SEC Release No. 34-47986, the certifications furnished in Exhibits 32.1 and 32.2 herewith are deemed to accompany this Form 10-K and will not be deemed filed for purposes of Section 18 of the Exchange Act. Such certifications will not be deemed to be incorporated by reference into any filings under the Securities Act or the Exchange Act.

Item 16. Form 10-K Summary.

None.

38

Table of Contents

SIGNATURES

Pursuant to the requirements of Section 13 or 15(d) of the Securities Exchange Act of 1934, the registrant has duly caused this report to be signed on its behalf by the undersigned, thereunto duly authorized.

Cheetah Net Supply Chain Service Inc.

Date: March 18, 2024

By:

/s/ Huan Liu

Name:

Huan Liu

Title:

Chief Executive Officer, Director, and

Chairman of the Board of Directors

(Principal Executive Officer)

Pursuant to the requirements of the Securities Exchange Act of 1934, this report has been signed below by the following persons on behalf of the registrant and in the capacities and on the dates indicated.

Signature


Title


Date

/s/ Huan Liu

Chief Executive Officer, Director, and Chairman of the Board of Directors

March 18, 2024

Name: Huan Liu

(Principal Executive Officer)

/s/ Robert Cook

Chief Financial Officer

March 18, 2024

Name: Robert Cook

(Principal Accounting and Financial Officer)

/s/ Xianggeng Huang

Director

March 18, 2024

Name: Xianggeng Huang

/s/ Catherine Chen

Independent Director

March 18, 2024

Name: Catherine Chen

39