UNITED
STATES
SECURITIES AND EXCHANGE COMMISSION
Washington, D.C. 20549
FORM
CERTIFIED SHAREHOLDER REPORT OF REGISTERED MANAGEMENT INVESTMENT COMPANIES
Investment Company Act file number (811-23793)
(Exact name of registrant as specified in charter)
234 West Florida Street, Suite 203
Milwaukee,
Wisconsin 53204
(Address of principal executive offices) (Zip code)
Eric W. Falkeis
Tidal Trust II
234 West Florida Street, Suite 203
Milwaukee,
Wisconsin 53204
(Name and address of agent for service)
(844) 986-7700
Registrant's telephone number, including area code
Date of fiscal year end: June 30
Date
of reporting period:
Updated June 27, 2024
Item 1. Reports to Stockholders.
Item 2. Code of Ethics.
The registrant has adopted a code of ethics that applies to the registrant’s principal executive officer and principal financial officer. The registrant has not made any substantive amendments to its code of ethics during the period covered by this report. The registrant has not granted any waivers from any provisions of the code of ethics during the period covered by this report.
A copy of the registrant’s Code of Ethics is filed herewith.
Item 3. Audit Committee Financial Expert.
The registrant’s Board of Trustees of the Trust has determined that there is at least one audit committee financial expert serving on its audit committee. Mr. David Norris is the “audit committee financial expert” and is considered to be “independent” as each term is defined in Item 3 of Form N-CSR.
Item 4. Principal Accountant Fees and Services.
The registrant has engaged its principal accountant to perform audit services, audit-related services, tax services and other services during the past two fiscal years. “Audit services” refer to performing an audit of the registrant's annual financial statements or services that are normally provided by the accountant in connection with statutory and regulatory filings or engagements for those fiscal years. “Audit-related services” refer to the assurance and related services by the principal accountant that are reasonably related to the performance of the audit. “Tax services” refer to professional services rendered by the principal accountant for tax compliance, tax advice, and tax planning. There were no “Other services” provided by the principal accountant. The following table details the aggregate fees billed or expected to be billed for each of the last two fiscal years for audit fees, audit-related fees, tax fees and other fees by the principal accountant.
Blueprint Chesapeake Multi-Asset Trend ETF
| FYE 6/30/2024 | FYE 6/30/2023 | |
| ( a ) Audit Fees | $14,500 | N/A |
| ( b ) Audit-Related Fees | N/A | N/A |
| ( c ) Tax Fees | $4,500 | N/A |
| ( d ) All Other Fees | N/A | N/A |
Cambria Chesapeake Pure Trend ETF
| FYE 6/30/2024 | FYE 6/30/2023 | |
| ( a ) Audit Fees | $16,000 | N/A |
| ( b ) Audit-Related Fees | N/A | N/A |
| ( c ) Tax Fees | $6,000 | N/A |
| ( d ) All Other Fees | N/A | N/A |
1
(e)(1) The audit committee has adopted pre-approval policies and procedures that require the audit committee to pre-approve all audit and non-audit services of the registrant, including services provided to any entity affiliated with the registrant.
(e)(2) The percentage of fees billed by Cohen & Company, Ltd. applicable to non-audit services pursuant to waiver of pre-approval requirement were as follows:
| FYE 6/30/2024 | FYE 6/30/2023 | |
| Audit-Related Fees | 0% | N/A |
| Tax Fees | 0% | N/A |
| All Other Fees | 0% | N/A |
(f) All of the principal accountant’s hours spent on auditing the registrant’s financial statements were attributed to work performed by full-time permanent employees of the principal accountant.
(g) The following table indicates the non-audit fees billed or expected to be billed by the registrant’s accountant for services to the registrant and to the registrant’s investment adviser (and any other controlling entity, etc.—not sub-adviser) for the last two years.
| Non-Audit Related Fees | FYE 6/30/2024 | FYE 6/30/2023 |
| Registrant | N/A | N/A |
| Registrant’s Investment Adviser | N/A | N/A |
(h) The audit committee of the board of trustees/directors has considered whether the provision of non-audit services that were rendered to the registrant's investment adviser is compatible with maintaining the principal accountant's independence and has concluded that the provision of such non-audit services by the accountant has not compromised the accountant’s independence.
(i) The registrant has not been identified by the U.S. Securities and Exchange Commission as having filed an annual report issued by a registered public accounting firm branch or office that is located in a foreign jurisdiction where the Public Company Accounting Oversight Board is unable to inspect or completely investigate because of a position taken by an authority in that jurisdiction.
(j) The registrant is not a foreign issuer.
Item 5. Audit Committee of Listed Registrants.
(a) The registrant is an issuer as defined in Rule 10A-3 under the Securities Exchange Act of 1934, (the “Act”) and has a separately-designated standing audit committee established in accordance with Section 3(a)(58)(A) of the Act. The independent members of the committee are as follows: Javier Marquina, Michelle McDonough, and David Norris.
(b) Not applicable
Item 6. Investments.
| (a) | Schedule of Investments is included within the financial statements filed under Item 7 of this Form. |
2
| (b) | Not applicable. |
Item 7. Financial Statements and Financial Highlights for Open-End Investment Companies.
| (a) |

Core
Financial Statements
June 30, 2024
| Tidal Trust II | ||
| •Blueprint Chesapeake Multi-Asset Trend ETF | | TFPN | | NYSE Arca, Inc. |
| •Cambria Chesapeake Pure Trend ETF | | MFUT | | Cboe BZX Exchange, Inc. |
3
| Chesapeake ETFs |
Table of Contents
| Consolidated Schedule of Investments | Blueprint Chesapeake Multi-Asset Trend ETF |
| June 30, 2024 | |
| COMMON STOCKS - 46.5% | Shares | Value | ||||||
| Aerospace & Defense - 2.6% | ||||||||
| AeroVironment, Inc.(a) | 2,197 | $ | 400,206 | |||||
| Barnes Group, Inc. | 9,795 | 405,611 | ||||||
| Bombardier, Inc. - Class B(a) | 9,620 | 616,774 | ||||||
| Embraer SA - ADR(a) | 16,348 | 421,778 | ||||||
| Hexcel Corp. | 1,117 | 69,757 | ||||||
| Kratos Defense & Security Solutions, Inc.(a) | 16,620 | 332,566 | ||||||
| Leonardo DRS, Inc.(a) | 8,150 | 207,906 | ||||||
| Moog, Inc. - Class A(b) | 3,229 | 540,212 | ||||||
| 2,994,810 | ||||||||
| Agriculture - 1.1% | ||||||||
| Andersons, Inc. (b) | 4,762 | 236,195 | ||||||
| Universal Corp. | 4,075 | 196,374 | ||||||
| Vital Farms, Inc.(a) | 16,490 | 771,238 | ||||||
| 1,203,807 | ||||||||
| Auto Parts & Equipment - 0.7% | ||||||||
| Autoliv, Inc. | 2,929 | 313,374 | ||||||
| Gentex Corp. | 14,716 | 496,076 | ||||||
| 809,450 | ||||||||
| Building Materials - 3.4% | ||||||||
| Armstrong World Industries, Inc. | 3,373 | 381,958 | ||||||
| Boise Cascade Co. (b) | 3,086 | 367,913 | ||||||
| Eagle Materials, Inc. (b) | 1,934 | 420,568 | ||||||
| Griffon Corp. | 6,751 | 431,119 | ||||||
| Louisiana-Pacific Corp. | 5,959 | 490,604 | ||||||
| Mohawk Industries, Inc.(a) | 2,580 | 293,062 | ||||||
| Owens Corning(b) | 3,225 | 560,247 | ||||||
| ROCKWOOL A/S - Class B | 1,017 | 413,044 | ||||||
| Summit Materials, Inc. - Class A(a) | 7,131 | 261,066 | ||||||
| Tecnoglass, Inc. | 1,753 | 87,966 | ||||||
| West Fraser Timber Co. Ltd. | 2,012 | 154,662 | ||||||
| 3,862,209 | ||||||||
| Chemicals - 4.4% | ||||||||
| Ashland, Inc. | 5,432 | 513,270 | ||||||
| Avient Corp. | 7,358 | 321,177 | ||||||
| Axalta Coating Systems Ltd.(a) | 17,200 | 587,724 | ||||||
| Balchem Corp. | 2,586 | 398,115 | ||||||
| Cabot Corp. | 3,972 | 364,987 | ||||||
| Element Solutions, Inc. | 16,668 | 452,036 | ||||||
| HB Fuller Co. | 3,800 | 292,448 | ||||||
1
| Consolidated Schedule of Investments | Blueprint Chesapeake Multi-Asset Trend ETF |
| June 30, 2024 | |
| Ingevity Corp.(a) | 6,357 | 277,865 | ||||||
| Mativ Holdings, Inc. | 13,301 | 225,585 | ||||||
| Methanex Corp. | 5,972 | 288,209 | ||||||
| Minerals Technologies, Inc. | 5,202 | 432,598 | ||||||
| Orion SA | 3,462 | 75,956 | ||||||
| Sensient Technologies Corp. | 6,897 | 511,688 | ||||||
| Tronox Holdings PLC | 12,741 | 199,906 | ||||||
| 4,941,564 | ||||||||
| Coal - 0.6% | ||||||||
| Alpha Metallurgical Resources, Inc. (b) | 1,229 | 344,772 | ||||||
| Arch Resources, Inc. - Class A(b) | 1,153 | 175,521 | ||||||
| Peabody Energy Corp. | 4,499 | 99,518 | ||||||
| 619,811 | ||||||||
| Commercial Services - 0.2% | ||||||||
| Block, Inc.(a) | 1,849 | 119,242 | ||||||
| Marqeta, Inc. - Class A(a) | 8,600 | 47,128 | ||||||
| StoneCo Ltd. - Class A(a) | 4,300 | 51,557 | ||||||
| 217,927 | ||||||||
| Computers - 0.3% | ||||||||
| Infosys Ltd. - ADR | 17,200 | 320,264 | ||||||
| Cosmetics & Personal Care - 1.1% | ||||||||
| elf Beauty, Inc.(a) (b) | 5,977 | 1,259,474 | ||||||
| Distribution & Wholesale - 0.5% | ||||||||
| Core & Main, Inc. - Class A(a) | 8,600 | 420,884 | ||||||
| H&E Equipment Services, Inc. | 3,192 | 140,991 | ||||||
| 561,875 | ||||||||
| Diversified Financial Services - 0.4% | ||||||||
| Coinbase Global, Inc. - Class A(a) | 1,794 | 398,681 | ||||||
| Electrical Components & Equipment - 1.0% | ||||||||
| Belden, Inc. | 4,838 | 453,804 | ||||||
| EnerSys | 2,597 | 268,842 | ||||||
| Universal Display Corp. | 1,953 | 410,618 | ||||||
| 1,133,264 | ||||||||
2
| Consolidated Schedule of Investments | Blueprint Chesapeake Multi-Asset Trend ETF |
| June 30, 2024 | |
| Electronics - 2.2% | ||||||||
| Atkore, Inc. | 962 | 129,803 | ||||||
| Badger Meter, Inc. | 2,282 | 425,251 | ||||||
| Brady Corp. - Class A | 7,515 | 496,140 | ||||||
| Coherent Corp.(a) | 3,493 | 253,103 | ||||||
| Enovix Corp.(a) | 10,531 | 162,809 | ||||||
| NEXTracker, Inc. - Class A(a) | 3,023 | 141,718 | ||||||
| nVent Electric PLC | 5,889 | 451,156 | ||||||
| Sensata Technologies Holding PLC | 12,074 | 451,447 | ||||||
| 2,511,427 | ||||||||
| Engineering & Construction - 0.5% | ||||||||
| Granite Construction, Inc. | 4,641 | 287,603 | ||||||
| MasTec, Inc.(a) | 2,820 | 301,712 | ||||||
| 589,315 | ||||||||
| Entertainment - 0.3% | ||||||||
| Light & Wonder, Inc. - Class A(a) | 3,420 | 358,690 | ||||||
| Environmental Control - 0.4% | ||||||||
| Clean Harbors, Inc.(a) (b) | 1,953 | 441,671 | ||||||
| Food - 2.5% | ||||||||
| Cal-Maine Foods, Inc. | 6,046 | 369,471 | ||||||
| Ingredion, Inc. | 4,786 | 548,954 | ||||||
| John B Sanfilippo & Son, Inc. (b) | 2,679 | 260,319 | ||||||
| Mowi ASA | 17,200 | 287,057 | ||||||
| Pilgrim's Pride Corp.(a) | 13,813 | 531,662 | ||||||
| Saputo, Inc. | 34,400 | 772,294 | ||||||
| 2,769,757 | ||||||||
| Forest Products & Paper - 0.6% | ||||||||
| Mercer International, Inc. | 25,800 | 220,332 | ||||||
| Sylvamo Corp. | 7,129 | 489,049 | ||||||
| 709,381 | ||||||||
| Hand & Machine Tools - 0.5% | ||||||||
| Enerpac Tool Group Corp. | 9,299 | 355,036 | ||||||
| Franklin Electric Co., Inc. | 2,564 | 246,964 | ||||||
| 602,000 | ||||||||
| Healthcare - Products - 0.9% | ||||||||
| Twist Bioscience Corp.(a) | 4,829 | 237,973 | ||||||
| UFP Technologies, Inc.(a) | 2,786 | 735,142 | ||||||
| 973,115 |
3
| Consolidated Schedule of Investments | Blueprint Chesapeake Multi-Asset Trend ETF |
| June 30, 2024 | |
| Housewares - 0.2% | ||||||||
| Scotts Miracle-Gro Co. | 3,971 | 258,353 | ||||||
| Insurance - 0.4% | ||||||||
| Arch Capital Group Ltd.(a) (b) | 3,953 | 398,818 | ||||||
| Investment Companies - 0.9% | ||||||||
| Argo Blockchain PLC - ADR(a) | 12,900 | 14,835 | ||||||
| Bitfarms Ltd.(a) | 17,200 | 44,204 | ||||||
| Cipher Mining, Inc.(a) | 17,200 | 71,380 | ||||||
| Cleanspark, Inc.(a) | 17,200 | 274,340 | ||||||
| Galaxy Digital Holdings Ltd.(a) | 17,200 | 200,867 | ||||||
| Iris Energy Ltd.(a) | 13,834 | 156,186 | ||||||
| Marathon Digital Holdings, Inc.(a) | 5,382 | 106,832 | ||||||
| Terawulf, Inc.(a) | 25,800 | 114,810 | ||||||
| 983,454 | ||||||||
| Iron & Steel - 0.6% | ||||||||
| Carpenter Technology Corp. | 4,672 | 511,958 | ||||||
| United States Steel Corp. | 4,066 | 153,695 | ||||||
| 665,653 | ||||||||
| Machinery - Construction & Mining - 1.2% | ||||||||
| BWX Technologies, Inc. (b) | 4,709 | 447,355 | ||||||
| Hyster-Yale, Inc. | 5,148 | 358,970 | ||||||
| Oshkosh Corp. | 3,469 | 375,346 | ||||||
| Terex Corp. | 3,986 | 218,592 | ||||||
| 1,400,263 | ||||||||
| Machinery - Diversified - 1.6% | ||||||||
| Alamo Group, Inc. | 378 | 65,394 | ||||||
| Cactus, Inc. - Class A | 8,418 | 443,965 | ||||||
| Cognex Corp. | 7,699 | 360,005 | ||||||
| Crane Co. | 3,514 | 509,460 | ||||||
| Flowserve Corp. (b) | 9,920 | 477,152 | ||||||
| 1,855,976 | ||||||||
| Media - 0.5% | ||||||||
| Liberty Media Corp.-Liberty Formula One - Class C(a) | 8,371 | 601,373 | ||||||
| Metal Fabricate & Hardware - 2.7% | ||||||||
| Advanced Drainage Systems, Inc. | 2,681 | 430,005 | ||||||
| AZZ, Inc. (b) | 12,931 | 998,920 | ||||||
| RBC Bearings, Inc.(a) | 1,665 | 449,184 | ||||||
| Timken Co. | 5,101 | 408,743 | ||||||
| Valmont Industries, Inc. | 2,805 | 769,832 | ||||||
| 3,056,684 | ||||||||
4
| Consolidated Schedule of Investments | Blueprint Chesapeake Multi-Asset Trend ETF |
| June 30, 2024 | |
| Mining - 2.9% | ||||||||
| Agnico Eagle Mines Ltd. | 6,904 | 451,522 | ||||||
| Alamos Gold, Inc. - Class A | 15,850 | 248,528 | ||||||
| Alcoa Corp. | 8,285 | 329,577 | ||||||
| Anglogold Ashanti PLC | 14,100 | 354,333 | ||||||
| Cameco Corp. | 4,227 | 207,969 | ||||||
| ERO Copper Corp.(a) | 16,405 | 350,739 | ||||||
| Kaiser Aluminum Corp. | 5,059 | 444,686 | ||||||
| Lundin Mining Corp. | 17,200 | 191,439 | ||||||
| NAC Kazatomprom JSC - GDR | 12,696 | 507,840 | ||||||
| NexGen Energy Ltd.(a) | 17,200 | 120,056 | ||||||
| Uranium Energy Corp.(a) | 12,900 | 77,529 | ||||||
| 3,284,218 | ||||||||
| Miscellaneous Manufacturing - 1.4% | ||||||||
| Axon Enterprise, Inc.(a) | 1,339 | 393,987 | ||||||
| ITT, Inc. | 3,491 | 450,967 | ||||||
| Materion Corp. | 999 | 108,022 | ||||||
| Smith & Wesson Brands, Inc. | 16,520 | 236,897 | ||||||
| Trinity Industries, Inc. | 13,730 | 410,802 | ||||||
| 1,600,675 | ||||||||
| Oil & Gas - 0.7% | ||||||||
| Delek US Holdings, Inc. | 8,990 | 222,592 | ||||||
| Seadrill Ltd.(a) | 11,470 | 590,705 | ||||||
| 813,297 | ||||||||
| Oil & Gas Services - 0.3% | ||||||||
| ChampionX Corp. | 2,530 | 84,021 | ||||||
| Oceaneering International, Inc.(a) | 10,124 | 239,534 | ||||||
| 323,555 | ||||||||
| Packaging & Containers - 2.1% | ||||||||
| AptarGroup, Inc. | 2,867 | 403,702 | ||||||
| Berry Global Group, Inc. | 2,174 | 127,940 | ||||||
| Clearwater Paper Corp.(a) | 6,761 | 327,706 | ||||||
| Graphic Packaging Holding Co. | 14,037 | 367,910 | ||||||
| Sealed Air Corp. | 13,837 | 481,389 | ||||||
| Silgan Holdings, Inc. | 8,498 | 359,720 | ||||||
| Sonoco Products Co. | 6,415 | 325,369 | ||||||
| 2,393,736 |
5
| Consolidated Schedule of Investments | Blueprint Chesapeake Multi-Asset Trend ETF |
| June 30, 2024 | |
| Pharmaceuticals - 0.3% | ||||||||
| Canopy Growth Corp.(a) | 5,372 | 34,649 | ||||||
| Green Thumb Industries, Inc.(a) | 14,709 | 177,366 | ||||||
| Trulieve Cannabis Corp.(a) | 15,282 | 142,171 | ||||||
| 354,186 | ||||||||
| Pipelines - 1.5% | ||||||||
| Excelerate Energy, Inc. - Class A | 19,545 | 360,410 | ||||||
| Golar LNG Ltd. | 18,887 | 592,107 | ||||||
| Koninklijke Vopak NV | 19,019 | 790,072 | ||||||
| 1,742,589 | ||||||||
| Semiconductors - 1.0% | ||||||||
| MKS Instruments, Inc. | 2,180 | 284,664 | ||||||
| Rambus, Inc.(a) (b) | 4,846 | 284,751 | ||||||
| Veeco Instruments, Inc.(a) (b) | 12,028 | 561,828 | ||||||
| 1,131,243 | ||||||||
| Shipbuilding - 0.2% | ||||||||
| Huntington Ingalls Industries, Inc. | 892 | 219,726 | ||||||
| Software - 0.6% | ||||||||
| Cloudflare, Inc. - Class A(a) | 1,720 | 142,468 | ||||||
| MicroStrategy, Inc. - Class A(a) | 361 | 497,270 | ||||||
| 639,738 | ||||||||
| Toys, Games & Hobbies - 0.3% | ||||||||
| Funko, Inc. - Class A(a) | 34,400 | 335,744 | ||||||
| Transportation - 2.2% | ||||||||
| ArcBest Corp. | 730 | 78,168 | ||||||
| Danaos Corp. | 4,466 | 412,480 | ||||||
| Frontline PLC(b) | 15,400 | 396,704 | ||||||
| Kirby Corp.(a) | 3,869 | 463,235 | ||||||
| Scorpio Tankers, Inc. | 5,492 | 446,445 | ||||||
| Star Bulk Carriers Corp. | 14,278 | 348,098 | ||||||
| ZIM Integrated Shipping Services Ltd. | 17,149 | 380,193 | ||||||
| 2,525,323 | ||||||||
| Trucking & Leasing - 0.7% | ||||||||
| GATX Corp. | 4,092 | 541,617 | ||||||
| Greenbrier Cos., Inc. | 4,264 | 211,281 | ||||||
| 752,898 | ||||||||
| TOTAL COMMON STOCKS (Cost $47,300,174) | 52,615,994 |
6
| Consolidated Schedule of Investments | Blueprint Chesapeake Multi-Asset Trend ETF |
| June 30, 2024 | |
| EXCHANGE TRADED FUNDS - 16.4% | ||||||||
| Invesco Senior Loan ETF(b) | 49,783 | 1,047,434 | ||||||
| iShares 0-5 Year High Yield Corporate Bond ETF(b) | 26,644 | 1,124,377 | ||||||
| iShares 0-5 Year TIPS Bond ETF | 23,689 | 2,356,819 | ||||||
| iShares Bitcoin Trust(a) | 12,611 | 430,539 | ||||||
| iShares J.P. Morgan USD Emerging Markets Bond ETF | 7,825 | 692,356 | ||||||
| iShares MBS ETF | 10,175 | 934,167 | ||||||
| iShares National Muni Bond ETF | 10,983 | 1,170,239 | ||||||
| iShares Preferred and Income Securities ETF | 27,265 | 860,211 | ||||||
| iShares Short-Term National Muni Bond ETF(b) | 27,742 | 2,900,426 | ||||||
| iShares TIPS Bond ETF | 13,214 | 1,410,991 | ||||||
| SPDR Bloomberg Convertible Securities ETF | 14,478 | 1,043,285 | ||||||
| SPDR Bloomberg High Yield Bond ETF(b) | 12,370 | 1,166,120 | ||||||
| Vanguard Intermediate-Term Corporate Bond ETF | 12,055 | 963,556 | ||||||
| Vanguard Long-Term Corporate Bond ETF | 7,046 | 534,509 | ||||||
| Vanguard Short-Term Corporate Bond ETF(b) | 24,907 | 1,924,688 | ||||||
| TOTAL EXCHANGE TRADED FUNDS (Cost $18,407,880) | 18,559,717 | |||||||
| U.S. TREASURY SECURITIES - 6.6% | Par | |||||||
| United States Treasury Note/Bond | ||||||||
| 1.88%, 08/31/2024 | $ | 3,500,000 | 3,478,792 | |||||
| 3.25%, 08/31/2024 | 2,000,000 | 1,992,399 | ||||||
| 0.38%, 09/15/2024 | 2,000,000 | 1,979,630 | ||||||
| TOTAL U.S. TREASURY SECURITIES (Cost $7,451,638) | 7,450,821 | |||||||
| REAL ESTATE INVESTMENT TRUSTS - 1.0% | Shares | |||||||
| CoreCivic, Inc.(a) | 8,600 | 111,628 | ||||||
| GEO Group, Inc.(a) | 17,200 | 246,992 | ||||||
| Innovative Industrial Properties, Inc. | 2,978 | 325,257 | ||||||
| Rayonier, Inc. | 8,083 | 235,134 | ||||||
| Starwood Property Trust, Inc. | 14,924 | 282,661 | ||||||
| TOTAL REAL ESTATE INVESTMENT TRUSTS (Cost $1,123,340) | 1,201,672 | |||||||
| CLOSED END INVESTMENT TRUSTS - 0.2% | ||||||||
| Sprott Physical Uranium Trust(a) | 12,900 | 239,079 | ||||||
| TOTAL CLOSED END INVESTMENT TRUSTS (Cost $186,681) | 239,079 |
7
| Consolidated Schedule of Investments | Blueprint Chesapeake Multi-Asset Trend ETF |
| June 30, 2024 | |
| SHORT-TERM INVESTMENTS - 17.4% | ||||||||
| Money Market Funds - 2.9% | ||||||||
| First American Government Obligations Fund - Class X, 5.23%(c) | 3,278,251 | 3,278,251 | ||||||
| U.S. Treasury Bills - 14.5% | Par | |||||||
| 5.20%, 07/18/2024(d) | $ | 3,500,000 | 3,491,314 | |||||
| 5.30%, 07/23/2024(d) | 2,000,000 | 1,993,595 | ||||||
| 5.31%, 08/01/2024(d) | 2,000,000 | 1,991,001 | ||||||
| 5.32%, 08/22/2024(d) | 2,000,000 | 1,984,921 | ||||||
| 5.28%, 09/12/2024(d) | 3,500,000 | 3,462,928 | ||||||
| 5.30%, 10/08/2024(d) | 3,500,000 | 3,449,854 | ||||||
| 16,373,613 | ||||||||
| TOTAL SHORT-TERM INVESTMENTS (Cost $19,651,774) | 19,651,864 | |||||||
| TOTAL INVESTMENTS - 88.1% (Cost $94,121,487) | $ | 99,719,147 | ||||||
| Other Assets in Excess of Liabilities - 11.9% | 13,513,165 | |||||||
| TOTAL NET ASSETS - 100.0% | $ | 113,232,312 | ||||||
| Percentages are stated as a percent of net assets. | ||||||||
| ADR - American Depositary Receipt | ||||||||
| AG - Aktiengesellschaft | ||||||||
| ASA - Advanced Subscription Agreement | ||||||||
| GDR - Global Depositary Receipt | ||||||||
| NV - Naamloze Vennootschap | ||||||||
| PLC - Public Limited Company | ||||||||
| SA - Sociedad Anónima | ||||||||
| (a) | Non-income producing security. |
| (b) | All or a portion of the security has been pledged as collateral for securities sold short. Total value of assets committed as collateral as of June 30, 2024 is $7,429,960 or 6.6% of net assets. |
| (c) | The rate shown represents the 7-day effective yield as of June 30, 2024. |
| (d) | The rate shown is the effective yield as of June 30, 2024. |
8
| Consolidated Schedule of Securities Sold Short | Blueprint Chesapeake Multi-Asset Trend ETF |
| June 30, 2024 | |
| COMMON STOCKS - (15.3)% | Shares | Value | ||||||
| Aerospace & Defense - (0.5)% | ||||||||
| Northrop Grumman Corp. | (1,155 | ) | $ | (503,522 | ) | |||
| Apparel - (0.2)% | ||||||||
| Kering SA | (746 | ) | (270,640 | ) | ||||
| Auto Manufacturers - (0.2)% | ||||||||
| Bayerische Motoren Werke AG | (2,758 | ) | (261,242 | ) | ||||
| Banks - (0.6)% | ||||||||
| Bank of Montreal | (2,917 | ) | (244,591 | ) | ||||
| Toronto-Dominion Bank | (7,315 | ) | (402,032 | ) | ||||
| (646,623 | ) | |||||||
| Beverages - (0.7)% | ||||||||
| Diageo PLC | (10,015 | ) | (315,168 | ) | ||||
| Monster Beverage Corp. | (9,186 | ) | (458,841 | ) | ||||
| (774,009 | ) | |||||||
| Biotechnology - (1.0)% | ||||||||
| Gilead Sciences, Inc. | (10,295 | ) | (706,340 | ) | ||||
| Royalty Pharma PLC - Class A | (16,017 | ) | (422,368 | ) | ||||
| (1,128,708 | ) | |||||||
| Chemicals - (0.4)% | ||||||||
| PPG Industries, Inc. | (3,795 | ) | (477,753 | ) | ||||
| Computers - (0.8)% | ||||||||
| Accenture PLC - Class A | (3,150 | ) | (955,742 | ) | ||||
| Diversified Financial Services - (0.4)% | ||||||||
| CME Group, Inc. | (2,512 | ) | (493,859 | ) | ||||
| Electric - (0.3)% | ||||||||
| Eversource Energy | (6,599 | ) | (374,229 | ) | ||||
| Food - (1.5)% | ||||||||
| Conagra Brands, Inc. | (4,034 | ) | (114,646 | ) | ||||
| General Mills, Inc. | (1,634 | ) | (103,367 | ) | ||||
| Hershey Co. | (1,400 | ) | (257,362 | ) | ||||
| Hormel Foods Corp. | (6,376 | ) | (194,404 | ) | ||||
| Kraft Heinz Co. | (10,914 | ) | (351,649 | ) | ||||
| Mondelez International, Inc. - Class A | (6,875 | ) | (449,900 | ) | ||||
9
| Consolidated Schedule of Securities Sold Short | Blueprint Chesapeake Multi-Asset Trend ETF |
| June 30, 2024 | |
| Nestle SA | (2,324 | ) | (237,211 | ) | ||||
| (1,708,539 | ) | |||||||
| Healthcare - Products - (0.4)% | ||||||||
| Abbott Laboratories | (3,418 | ) | (355,164 | ) | ||||
| Medtronic PLC | (1,514 | ) | (119,167 | ) | ||||
| (474,331 | ) | |||||||
| Insurance - (0.5)% | ||||||||
| Aon PLC - Class A | (2,040 | ) | (598,903 | ) | ||||
| Iron & Steel - (0.2)% | ||||||||
| Nucor Corp. | (1,311 | ) | (207,243 | ) | ||||
| Lodging - (0.7)% | ||||||||
| Las Vegas Sands Corp. | (17,686 | ) | (782,606 | ) | ||||
| Media - (1.0)% | ||||||||
| Comcast Corp. - Class A | (27,345 | ) | (1,070,830 | ) | ||||
| Oil & Gas Services - (1.0)% | ||||||||
| Schlumberger NV | (22,792 | ) | (1,075,327 | ) | ||||
| Pharmaceuticals - (1.1)% | ||||||||
| Becton Dickinson & Co. | (2,923 | ) | (683,134 | ) | ||||
| Bristol-Myers Squibb Co. | (6,315 | ) | (262,262 | ) | ||||
| Pfizer, Inc. | (11,361 | ) | (317,881 | ) | ||||
| (1,263,277 | ) | |||||||
| Pipelines - (0.1)% | ||||||||
| Cheniere Energy, Inc. | (640 | ) | (111,891 | ) | ||||
| Real Estate - (0.3)% | ||||||||
| CoStar Group, Inc. | (4,584 | ) | (339,858 | ) | ||||
| Retail - (1.2)% | ||||||||
| Dollar General Corp. | (1,032 | ) | (136,461 | ) | ||||
| McDonald's Corp. | (1,852 | ) | (471,964 | ) | ||||
| Starbucks Corp. | (8,970 | ) | (698,315 | ) | ||||
| (1,306,740 | ) | |||||||
| Software - (0.2)% | ||||||||
| Paycom Software, Inc. | (1,489 | ) | (212,987 | ) |
10
| Consolidated Schedule of Securities Sold Short | Blueprint Chesapeake Multi-Asset Trend ETF |
| June 30, 2024 | |
| Telecommunications - (0.9)% | ||||||||
| Cisco Systems, Inc. | (20,238 | ) | (961,507 | ) | ||||
| Transportation - (1.1)% | ||||||||
| Norfolk Southern Corp. | (998 | ) | (214,261 | ) | ||||
| Old Dominion Freight Line, Inc. | (4,071 | ) | (718,938 | ) | ||||
| United Parcel Service, Inc. - Class B | (2,545 | ) | (348,283 | ) | ||||
| (1,281,482 | ) | |||||||
| TOTAL COMMON STOCKS (Proceeds $17,746,327) | (17,281,848 | ) | ||||||
| REAL ESTATE INVESTMENT TRUSTS - (1.1)% | ||||||||
| Blackstone Mortgage Trust, Inc. - Class A | (46,739 | ) | (814,193 | ) | ||||
| Equinix, Inc. | (238 | ) | (180,071 | ) | ||||
| Realty Income Corp. | (5,178 | ) | (273,502 | ) | ||||
| (1,267,766 | ) | |||||||
| TOTAL REAL ESTATE INVESTMENT TRUSTS (Proceeds $1,251,091) | (1,267,766 | ) | ||||||
| TOTAL SECURITIES SOLD SHORT - (16.4)% (Proceeds $18,997,418) | $ | (18,549,614 | ) |
Percentages are stated as a percent of net assets.
11
| Consolidated Schedule of Futures Contracts | Blueprint Chesapeake Multi-Asset Trend ETF |
| June 30, 2024 | |
| Description | Contracts Purchased | Expiration Date | Notional | Value / Unrealized Appreciation (Depreciation) | |||||||||
| 3 Month Swiss Average Overnight Rate | 63 | 12/17/2024 | $ | 17,345,858 | $ | 25,114 | |||||||
| 3 Month Swiss Average Overnight Rate | 21 | 06/17/2025 | 5,791,300 | 7,546 | |||||||||
| Arabica Coffee(a) | 3 | 09/18/2024 | 255,150 | (2,527 | ) | ||||||||
| Brent Crude Oil(a) | 2 | 08/30/2024 | 168,380 | 552 | |||||||||
| Class III Milk(a) | 14 | 09/04/2024 | 561,120 | (14,272 | ) | ||||||||
| Copper(a) | 8 | 09/26/2024 | 878,300 | (8,550 | ) | ||||||||
| Crude Oil(a) | 3 | 07/22/2024 | 244,620 | 13,926 | |||||||||
| Crude Palm Oil(a) | 31 | 09/13/2024 | 643,328 | (1,911 | ) | ||||||||
| Ether Dollar Reference Rate | 2 | 07/26/2024 | 338,100 | 7,935 | |||||||||
| Euro STOXX 50 Dividend Index | 50 | 12/19/2025 | 861,154 | 20,386 | |||||||||
| Euro STOXX 50 Dividend Index | 51 | 12/18/2026 | 843,942 | 20,681 | |||||||||
| Euro STOXX Select Dividend 30 Index | 79 | 09/20/2024 | 1,361,047 | 15,206 | |||||||||
| Euro-BTP Italian Government Bonds | 6 | 09/06/2024 | 741,375 | (9,869 | ) | ||||||||
| European Rapeseed(a) | 22 | 10/31/2024 | 572,960 | 24,370 | |||||||||
| Frozen Concentrated Orange Juice(a) | 13 | 09/10/2024 | 805,740 | (9,997 | ) | ||||||||
| Gold(a) | 4 | 08/28/2024 | 935,840 | (7,168 | ) | ||||||||
| International Arabica Coffee(a) | 19 | 09/20/2024 | 525,920 | 36,590 | |||||||||
| Live Cattle(a) | 20 | 08/30/2024 | 1,483,400 | 5,288 | |||||||||
| London Cocoa(a) | 24 | 09/13/2024 | 1,930,728 | 45,564 | |||||||||
| London Metals - Aluminum(a)(b) | 15 | 09/18/2024 | 946,335 | (34,190 | ) | ||||||||
| London Metals - Nickel(a)(b) | 2 | 09/18/2024 | 207,273 | (15,068 | ) | ||||||||
| London Metals - Tin(a)(b) | 4 | 09/18/2024 | 654,960 | 12,927 | |||||||||
| London Metals - Zinc(a)(b) | 9 | 09/18/2024 | 660,481 | 11,904 | |||||||||
| Low Sulphur Gas Oil(a) | 3 | 08/12/2024 | 235,200 | 16,688 | |||||||||
| Milling Wheat No. 2(a) | 43 | 12/10/2024 | 533,439 | (39,903 | ) | ||||||||
| Platinum(a) | 15 | 10/29/2024 | 760,575 | 8,781 | |||||||||
| Reformulated Gasoline Blendstock(a) | 3 | 07/31/2024 | 315,189 | 5,430 | |||||||||
| Robusta Coffee(a) | 17 | 09/24/2024 | 681,870 | (43,194 | ) | ||||||||
| Rough Rice(a) | 15 | 09/13/2024 | 461,700 | 14,273 | |||||||||
| SGX Technically Specified Rubber 20(a) | 73 | 08/30/2024 | 618,675 | (31,387 | ) | ||||||||
| SGX TSI Iron Ore(a) | 15 | 08/30/2024 | 159,525 | 4,575 | |||||||||
| Silver(a) | 4 | 09/26/2024 | 591,200 | 7,082 | |||||||||
| Sunflower Seeds(a) | 22 | 12/20/2024 | 543,313 | (2,411 | ) | ||||||||
| UK Emissions Trading Registry Allowance(a) | 4 | 12/16/2024 | 233,908 | (11,609 | ) | ||||||||
| US Cocoa(a) | 19 | 09/13/2024 | 1,468,890 | (350,947 | ) | ||||||||
| Wheat(a) | 69 | 12/20/2024 | 1,157,998 | (59,912 | ) | ||||||||
| White Maize(a) | 11 | 12/20/2024 | 319,096 | 7,695 | |||||||||
| Yellow Maize(a) | 29 | 12/20/2024 | 628,757 | (41,653 | ) | ||||||||
| $ | (372,055 | ) | |||||||||||
12
| Consolidated Schedule of Futures Contracts | Blueprint Chesapeake Multi-Asset Trend ETF |
| June 30, 2024 | |
| Description | Contracts Sold | Expiration Date | Notional | Value / Unrealized Appreciation (Depreciation) | |||||||||
| 10 Year U.S. Ultra Treasury Notes | (9) | 09/19/2024 | $ | 1,021,781 | $ | (6,659 | ) | ||||||
| 3 Month Canadian Overnight Repo Rate Average | (26) | 06/17/2025 | 4,559,762 | (8,947 | ) | ||||||||
| 3 Month Canadian Overnight Repo Rate Average | (12) | 12/16/2025 | 2,113,275 | (254 | ) | ||||||||
| 3 Month Euribor | (65) | 03/17/2025 | 16,877,847 | (27,481 | ) | ||||||||
| 3 Month Euribor | (20) | 03/16/2026 | 5,216,226 | (8,185 | ) | ||||||||
| 3 Month New Zealand Treasury Bill | (41) | 12/11/2024 | 24,660,678 | (2,670 | ) | ||||||||
| 30 Day Federal Funds Rate | (25) | 01/31/2025 | 9,910,168 | 856 | |||||||||
| 3-Month Secured Overnight Financing Rate | (37) | 06/17/2025 | 8,827,738 | (10,770 | ) | ||||||||
| 3-Month Secured Overnight Financing Rate | (39) | 06/16/2026 | 9,373,163 | (13,604 | ) | ||||||||
| Australian Government 10 Year Bonds | (14) | 09/16/2024 | 1,061,963 | 1,007 | |||||||||
| Australian Government 3 Year Bonds | (19) | 09/16/2024 | 1,338,299 | 5,031 | |||||||||
| Australian 90 Day Bank Bills | (36) | 03/13/2025 | 23,782,998 | 19,534 | |||||||||
| Australian 90 Day Bank Bills | (36) | 09/11/2025 | 23,795,171 | 5,868 | |||||||||
| Canadian 10 Year Government Bonds | (10) | 09/18/2024 | 877,480 | (1,739 | ) | ||||||||
| Canadian Canola Oil(a) | (37) | 11/14/2024 | 339,134 | 8,931 | |||||||||
| Corn(a) | (65) | 09/16/2024 | 313,751 | 3,928 | |||||||||
| Corn No. 2 Yellow(a) | (19) | 12/13/2024 | 399,713 | 40,753 | |||||||||
| Crude Soybean Oil(a) | (21) | 12/13/2024 | 551,754 | 402 | |||||||||
| Euro BUXL 30 Year Bonds | (2) | 09/06/2024 | 279,170 | 851 | |||||||||
| Euro-BOBL | (33) | 09/06/2024 | 4,118,236 | (15,873 | ) | ||||||||
| Euro-Bund | (8) | 09/06/2024 | 1,128,514 | (9,361 | ) | ||||||||
| Euro-Schatz | (33) | 09/06/2024 | 3,738,385 | (9,721 | ) | ||||||||
| Feeder Cattle(a) | (2) | 08/29/2024 | 259,300 | (3,648 | ) | ||||||||
| French Government Bonds | (9) | 09/06/2024 | 1,187,589 | 6,894 | |||||||||
| Hard Red Winter Wheat(a) | (5) | 09/13/2024 | 146,563 | 16,924 | |||||||||
| ICE 3 Month SONIA Rate | (19) | 06/17/2025 | 5,733,649 | (9,519 | ) | ||||||||
| ICE European Climate Exchange Emissions(a) | (5) | 12/16/2024 | 361,556 | 54,345 | |||||||||
| International Live Cattle(a) | (29) | 10/31/2024 | 424,878 | (12,813 | ) | ||||||||
| Japanese 10 Year Government Bonds | (1) | 09/12/2024 | 888,101 | (439 | ) | ||||||||
| Lean Hogs(a) | (27) | 08/14/2024 | 966,600 | 19,162 | |||||||||
| London Metals - Nickel(a)(b) | (3) | 09/18/2024 | 310,910 | 3,555 | |||||||||
| Long Gilt | (4) | 09/26/2024 | 493,351 | (5,500 | ) | ||||||||
| Lumber(a) | (57) | 09/13/2024 | 753,968 | 43,008 | |||||||||
| NY Harbor ULSD(a) | (7) | 07/31/2024 | 744,731 | (49,739 | ) | ||||||||
| Palladium(a) | (3) | 09/26/2024 | 293,370 | (9,434 | ) | ||||||||
| Red Spring Wheat(a) | (14) | 09/13/2024 | 429,100 | 42,395 | |||||||||
| Short-term Euro-BTP | (41) | 09/06/2024 | 4,614,340 | (7,283 | ) | ||||||||
| Soybeans(a) | (8) | 11/14/2024 | 441,600 | 17,759 | |||||||||
13
| Consolidated Schedule of Futures Contracts | Blueprint Chesapeake Multi-Asset Trend ETF |
| June 30, 2024 | |
| Soybeans(a) | (4) | 12/20/2024 | 100,252 | 2,396 | |||||||||
| U.S. Treasury 10 Year Notes | (17) | 09/19/2024 | 1,869,734 | (9,268 | ) | ||||||||
| U.S. Treasury 2 Year Notes | (24) | 09/30/2024 | 4,901,250 | (8,869 | ) | ||||||||
| U.S. Treasury 5 Year Note | (25) | 09/30/2024 | 2,664,453 | (11,639 | ) | ||||||||
| U.S. Treasury Long Bonds | (6) | 09/19/2024 | 709,875 | (3,180 | ) | ||||||||
| U.S. Treasury Ultra Bonds | (3) | 09/19/2024 | 376,031 | (1,387 | ) | ||||||||
| US 3 Year Notes | (18) | 09/30/2024 | 3,743,719 | (10,363 | ) | ||||||||
| White Sugar(a) | (27) | 07/16/2024 | 807,840 | (63,177 | ) | ||||||||
| $ | (27,923 | ) | |||||||||||
| Total Unrealized Appreciation (Depreciation) | $ | (399,978 | ) |
| (a) | All or a portion of the investment is a holding of the Blueprint-Chesapeake Cayman Subsidiary. |
| (b) | London Metal Exchange (“LME”) futures contracts settle on their respective maturity date. |
14
| Consolidated Schedule of Forward Currency Contracts | Blueprint Chesapeake Multi-Asset Trend ETF |
| June 30, 2024 | |
| Settlement Date | Currency Purchased | Currency Sold | Counterparty | Unrealized Appreciation (Depreciation) | ||||||||
| 09/18/2024 | AUD | 4,612,000 | CAD | 4,198,000 | StoneX Financial, Inc. | $ | 12,655 | |||||
| 09/18/2024 | AUD | 2,860,000 | CHF | 1,682,898 | StoneX Financial, Inc. | 22,336 | ||||||
| 09/19/2024 | AUD | 932,000 | CNH | 4,474,540 | StoneX Financial, Inc. | 6,857 | ||||||
| 09/18/2024 | AUD | 7,059,468 | EUR | 4,344,000 | StoneX Financial, Inc. | 50,210 | ||||||
| 09/18/2024 | AUD | 1,053,000 | JPY | 108,315,031 | StoneX Financial, Inc. | 22,760 | ||||||
| 09/18/2024 | CAD | 105,000 | CHF | 68,040 | StoneX Financial, Inc. | 402 | ||||||
| 09/19/2024 | CAD | 1,303,184 | CNH | 6,861,000 | StoneX Financial, Inc. | 8,347 | ||||||
| 09/18/2024 | CAD | 1,075,000 | JPY | 121,387,471 | StoneX Financial, Inc. | 22,888 | ||||||
| 09/18/2024 | CHF | 505,082 | CAD | 783,000 | StoneX Financial, Inc. | (5,586 | ) | |||||
| 09/18/2024 | CHF | 1,039,000 | JPY | 181,670,873 | StoneX Financial, Inc. | 24,109 | ||||||
| 09/23/2024 | CLP | 119,179,000 | USD | 129,631 | StoneX Financial, Inc. | (3,453 | ) | |||||
| 09/19/2024 | CNH | 9,640,147 | CHF | 1,184,000 | StoneX Financial, Inc. | (1,998 | ) | |||||
| 09/18/2024 | CNH | 188,000 | EUR | 24,254 | StoneX Financial, Inc. | (181 | ) | |||||
| 09/19/2024 | CNH | 16,001,000 | EUR | 2,052,929 | StoneX Financial, Inc. | (3,117 | ) | |||||
| 09/19/2024 | CNH | 6,530,000 | JPY | 140,527,286 | StoneX Financial, Inc. | 15,380 | ||||||
| 09/18/2024 | CNH | 385,000 | SGD | 71,933 | StoneX Financial, Inc. | (211 | ) | |||||
| 09/19/2024 | CNH | 32,674,000 | SGD | 6,095,401 | StoneX Financial, Inc. | (10,756 | ) | |||||
| 09/18/2024 | COP | 1,766,060,000 | USD | 440,414 | StoneX Financial, Inc. | (19,799 | ) | |||||
| 09/18/2024 | EUR | 580,000 | AUD | 944,397 | StoneX Financial, Inc. | (7,931 | ) | |||||
| 09/18/2024 | EUR | 265,000 | CAD | 392,465 | StoneX Financial, Inc. | (2,225 | ) | |||||
| 09/18/2024 | EUR | 3,245,000 | CHF | 3,111,610 | StoneX Financial, Inc. | (5,946 | ) | |||||
| 09/18/2024 | EUR | 1,326,000 | CZK | 33,312,065 | StoneX Financial, Inc. | (1,300 | ) | |||||
| 09/18/2024 | EUR | 289,000 | GBP | 245,101 | StoneX Financial, Inc. | 960 | ||||||
| 09/18/2024 | EUR | 500,000 | JPY | 83,802,900 | StoneX Financial, Inc. | 10,392 | ||||||
| 09/18/2024 | EUR | 596,000 | NOK | 6,833,780 | StoneX Financial, Inc. | (1,805 | ) | |||||
| 09/18/2024 | GBP | 1,102,000 | AUD | 2,112,582 | StoneX Financial, Inc. | (19,977 | ) | |||||
| 09/18/2024 | GBP | 1,143,000 | CAD | 2,008,041 | StoneX Financial, Inc. | (24,632 | ) | |||||
| 09/18/2024 | GBP | 1,404,000 | CHF | 1,587,516 | StoneX Financial, Inc. | (8,647 | ) | |||||
| 09/19/2024 | GBP | 338,000 | CNH | 3,126,568 | StoneX Financial, Inc. | (3,531 | ) | |||||
| 09/18/2024 | GBP | 1,532,740 | EUR | 1,812,000 | StoneX Financial, Inc. | (11,102 | ) | |||||
| 09/18/2024 | GBP | 471,000 | JPY | 93,189,538 | StoneX Financial, Inc. | 9,017 | ||||||
| 09/18/2024 | GBP | 636,000 | NOK | 8,654,074 | StoneX Financial, Inc. | (9,989 | ) | |||||
| 09/18/2024 | GBP | 1,134,000 | SEK | 15,082,210 | StoneX Financial, Inc. | 4,072 | ||||||
| 09/18/2024 | GBP | 283,000 | USD | 360,938 | StoneX Financial, Inc. | (2,978 | ) | |||||
| 09/18/2024 | HUF | 300,399,637 | EUR | 756,000 | StoneX Financial, Inc. | (613 | ) | |||||
| 09/18/2024 | HUF | 156,482,000 | USD | 427,739 | StoneX Financial, Inc. | (4,293 | ) | |||||
| 09/18/2024 | INR | 71,918,000 | USD | 859,676 | StoneX Financial, Inc. | 523 | ||||||
| 09/18/2024 | JPY | 100,000 | NOK | 6,855 | StoneX Financial, Inc. | (16 | ) | |||||
| 09/18/2024 | NOK | 26,040,865 | CHF | 2,174,000 | StoneX Financial, Inc. | 6,949 | ||||||
15
| Consolidated Schedule of Forward Currency Contracts | Blueprint Chesapeake Multi-Asset Trend ETF |
| June 30, 2024 | |
| 09/18/2024 | NOK | 8,488,000 | JPY | 124,449,955 | StoneX Financial, Inc. | 15,259 | ||||||
| 09/18/2024 | NZD | 5,836,000 | CAD | 4,948,212 | StoneX Financial, Inc. | (67,259 | ) | |||||
| 09/18/2024 | NZD | 605,000 | JPY | 57,898,026 | StoneX Financial, Inc. | 4,108 | ||||||
| 09/18/2024 | PLN | 5,872,000 | EUR | 1,346,840 | StoneX Financial, Inc. | 9,904 | ||||||
| 09/18/2024 | PLN | 3,506,000 | USD | 867,585 | StoneX Financial, Inc. | 3,656 | ||||||
| 09/18/2024 | SEK | 18,435,638 | CHF | 1,568,000 | StoneX Financial, Inc. | (14,281 | ) | |||||
| 09/18/2024 | SEK | 8,392,000 | JPY | 125,744,863 | StoneX Financial, Inc. | 4,128 | ||||||
| 09/18/2024 | SEK | 4,663,272 | NOK | 4,774,000 | StoneX Financial, Inc. | (7,056 | ) | |||||
| 09/18/2024 | USD | 435,156 | AUD | 656,000 | StoneX Financial, Inc. | (3,880 | ) | |||||
| 09/18/2024 | USD | 1,891,001 | BRL | 10,239,000 | StoneX Financial, Inc. | 64,504 | ||||||
| 09/18/2024 | USD | 2,426,881 | CHF | 2,148,000 | StoneX Financial, Inc. | 12,303 | ||||||
| 09/23/2024 | USD | 695,465 | CLP | 642,901,000 | StoneX Financial, Inc. | 14,808 | ||||||
| 09/18/2024 | USD | 15,633 | CNH | 113,000 | StoneX Financial, Inc. | 55 | ||||||
| 09/19/2024 | USD | 1,186,637 | CNH | 8,571,000 | StoneX Financial, Inc. | 4,946 | ||||||
| 09/18/2024 | USD | 861,434 | COP | 3,635,978,000 | StoneX Financial, Inc. | (4,531 | ) | |||||
| 09/18/2024 | USD | 986,910 | CZK | 22,512,000 | StoneX Financial, Inc. | 21,770 | ||||||
| 09/18/2024 | USD | 733,764 | JPY | 113,581,000 | StoneX Financial, Inc. | 18,635 | ||||||
| 09/19/2024 | USD | 1,215,568 | KRW | 1,664,788,000 | StoneX Financial, Inc. | 271 | ||||||
| 09/18/2024 | USD | 131,758 | MXN | 2,537,000 | StoneX Financial, Inc. | (5,197 | ) | |||||
| 09/18/2024 | USD | 444,045 | NOK | 4,684,000 | StoneX Financial, Inc. | 3,225 | ||||||
| 09/18/2024 | USD | 584,058 | NZD | 945,000 | StoneX Financial, Inc. | 8,239 | ||||||
| 09/18/2024 | USD | 2,948,214 | PHP | 173,256,000 | StoneX Financial, Inc. | (6,448 | ) | |||||
| 09/18/2024 | USD | 1,919,960 | SGD | 2,579,000 | StoneX Financial, Inc. | 9,489 | ||||||
| 09/18/2024 | USD | 1,275,356 | THB | 46,497,000 | StoneX Financial, Inc. | (276 | ) | |||||
| 09/18/2024 | USD | 2,630,093 | TWD | 84,730,000 | StoneX Financial, Inc. | (5,554 | ) | |||||
| 09/18/2024 | ZAR | 16,491,233 | EUR | 819,000 | StoneX Financial, Inc. | 16,144 | ||||||
| 09/18/2024 | ZAR | 25,034,000 | USD | 1,341,551 | StoneX Financial, Inc. | 20,782 | ||||||
| Total Unrealized Appreciation (Depreciation) | $ | 185,515 | ||||||||||
| AUD - Australian Dollar |
| BRL - Brazilian Real |
| CAD - Canadian Dollar |
| CHF - Swiss Franc |
| CLP - Chilean Peso |
| CNH - Chinese Offshore Renminbi |
| COP - Colombian Peso |
| CZK - Czech Koruna |
| EUR - Euro |
| GBP - British Pound |
| HUF - Hungarian Forint |
| INR - Indian Rupee |
| JPY - Japanese Yen |
| KRW - South Korean Won |
16
| Consolidated Schedule of Forward Currency Contracts | Blueprint Chesapeake Multi-Asset Trend ETF |
| June 30, 2024 | |
| MXN - Mexican Peso |
| NOK - Norwegian Krone |
| NZD - New Zealand Dollar |
| PHP - Philippine Peso |
| PLN - Polish Zloty |
| SEK - Swedish Krona |
| SGD - Singapore Dollar |
| THB - Thai Baht |
| TWD - New Taiwan Dollar |
| USD - United States Dollar |
| ZAR - South African Rand |
17
| Consolidated Schedule of Investments | Cambria Chesapeake Pure Trend ETF |
| June 30, 2024 | |
| COMMON STOCKS - 44.5% | Shares | Value | ||||||
| Aerospace & Defense - 4.9% | ||||||||
| Lockheed Martin Corp. | 2,320 | $ | 1,083,672 | |||||
| Beverages - 0.9% | ||||||||
| Constellation Brands, Inc. - Class A | 786 | 202,222 | ||||||
| Chemicals - 1.5% | ||||||||
| Air Products and Chemicals, Inc. | 1,308 | 337,529 | ||||||
| Commercial Services - 5.4% | ||||||||
| Automatic Data Processing, Inc. | 5,033 | 1,201,327 | ||||||
| Computers - 3.1% | ||||||||
| Apple, Inc. | 3,276 | 689,991 | ||||||
| Electric - 2.9% | ||||||||
| Sempra | 8,513 | 647,499 | ||||||
| Electronics - 5.7% | ||||||||
| Honeywell International, Inc. | 4,810 | 1,027,127 | ||||||
| NEXTracker, Inc. - Class A(a) | 4,851 | 227,415 | ||||||
| 1,254,542 | ||||||||
| Healthcare - Products - 2.5% | ||||||||
| Edwards Lifesciences Corp.(a) | 6,048 | 558,654 | ||||||
| Machinery - Diversified - 1.8% | ||||||||
| Cactus, Inc. - Class A | 7,538 | 397,554 | ||||||
| Mining - 4.7% | ||||||||
| Newmont Corp. | 9,120 | 381,855 | ||||||
| Rio Tinto PLC - ADR | 9,809 | 646,707 | ||||||
| 1,028,562 | ||||||||
| Oil & Gas - 1.1% | ||||||||
| Chevron Corp. | 1,553 | 242,920 | ||||||
| Pipelines - 1.1% | ||||||||
| Cheniere Energy, Inc. | 1,425 | 249,133 | ||||||
| Retail - 3.5% | ||||||||
| Yum! Brands, Inc. | 5,750 | 761,645 | ||||||
18
| Consolidated Schedule of Investments | Cambria Chesapeake Pure Trend ETF |
| June 30, 2024 | |
| Semiconductors - 2.0% | ||||||||
| Microchip Technology, Inc. | 4,832 | 442,128 | ||||||
| Software - 3.4% | ||||||||
| Paychex, Inc. | 6,262 | 742,423 | ||||||
| TOTAL COMMON STOCKS (Cost $10,012,257) | 9,839,801 | |||||||
| REAL ESTATE INVESTMENT TRUSTS - 2.3% | ||||||||
| Extra Space Storage, Inc. | 3,289 | 511,143 | ||||||
| TOTAL REAL ESTATE INVESTMENT TRUSTS (Cost $522,754) | 511,143 | |||||||
| SHORT-TERM INVESTMENTS - 28.9% | ||||||||
| Money Market Funds - 11.3% | ||||||||
| First American Government Obligations Fund - Class X, 5.23%(b) | 2,494,443 | 2,494,443 | ||||||
| U.S. Treasury Bills - 17.6% | Par | |||||||
| 5.29%, 10/31/2024(c) | $ | 2,000,000 | 1,964,993 | |||||
| 5.17%, 03/20/2025(c) | 2,000,000 | 1,928,127 | ||||||
| 3,893,120 | ||||||||
| TOTAL SHORT-TERM INVESTMENTS (Cost $6,387,172) | 6,387,563 | |||||||
| TOTAL INVESTMENTS - 75.7% (Cost $16,922,183) | $ | 16,738,507 | ||||||
| Other Assets in Excess of Liabilities - 24.3% | 5,387,167 | |||||||
| TOTAL NET ASSETS - 100.0% | $ | 22,125,674 | ||||||
Percentages are stated as a percent of net assets.
ADR - American Depositary Receipt
PLC - Public Limited Company
| (a) | Non-income producing security. |
| (b) | The rate shown represents the 7-day effective yield as of June 30, 2024. |
| (c) | The rate shown is the effective yield as of June 30, 2024. |
19
| Consolidated Schedule of Futures Contracts | Cambria Chesapeake Pure Trend ETF |
| June 30, 2024 | |
| Description | Contracts Purchased | Expiration Date | Notional | Value / Unrealized Appreciation (Depreciation) | ||||||||||
| 3 Month Swiss Average Overnight Rate | 37 | 09/16/2025 | $ | 10,207,837 | $ | 30,655 | ||||||||
| Arabica Coffee(a) | 5 | 09/18/2024 | 425,250 | (7,469 | ) | |||||||||
| Copper(a) | 8 | 09/26/2024 | 878,300 | (14,799 | ) | |||||||||
| Crude Oil(a) | 5 | 07/22/2024 | 407,700 | 14,949 | ||||||||||
| Crude Palm Oil(a) | 34 | 09/13/2024 | 705,586 | (2,411 | ) | |||||||||
| Euro-BTP Italian Government Bonds | 10 | 09/06/2024 | 1,235,625 | (15,723 | ) | |||||||||
| Gold(a) | 6 | 08/28/2024 | 1,403,760 | (16,765 | ) | |||||||||
| Live Cattle(a) | 19 | 08/30/2024 | 1,409,230 | 7,484 | ||||||||||
| London Metals - Aluminum(a)(b) | 17 | 09/18/2024 | 1,072,513 | (24,979 | ) | |||||||||
| London Metals - Nickel(a)(b) | 1 | 09/18/2024 | 103,637 | (7,324 | ) | |||||||||
| London Metals - Tin(a)(b) | 5 | 09/18/2024 | 818,700 | 11,133 | ||||||||||
| London Metals - Zinc(a)(b) | 10 | 09/18/2024 | 733,867 | 12,070 | ||||||||||
| Low Sulphur Gas Oil(a) | 5 | 08/12/2024 | 392,000 | 22,055 | ||||||||||
| Platinum(a) | 12 | 10/29/2024 | 608,460 | 6,964 | ||||||||||
| Reformulated Gasoline Blendstock(a) | 5 | 07/31/2024 | 525,315 | 16,344 | ||||||||||
| Robusta Coffee(a) | 27 | 09/24/2024 | 1,082,970 | (70,833 | ) | |||||||||
| SGX Technically Specified Rubber 20(a) | 117 | 08/30/2024 | 991,575 | (43,541 | ) | |||||||||
| SGX TSI Iron Ore(a) | 24 | 08/30/2024 | 255,240 | 7,320 | ||||||||||
| Silver(a) | 5 | 09/26/2024 | 739,000 | 8,602 | ||||||||||
| UK Emissions Trading Registry Allowance(a) | 3 | 12/16/2024 | 175,431 | (6,027 | ) | |||||||||
| $ | (72,295 | ) | ||||||||||||
20
| Consolidated Schedule of Futures Contracts | Cambria Chesapeake Pure Trend ETF |
| June 30, 2024 | |
| Description | Contracts Sold | Expiration Date | Notional | Value / Unrealized Appreciation (Depreciation) | ||||||||||
| 3 Month Canadian Overnight Repo Rate Average | (19) | 12/16/2025 | $ | 3,346,019 | $ | 1,378 | ||||||||
| 3 Month Euribor | (1) | 03/16/2026 | 260,811 | (539 | ) | |||||||||
| 30 Day Federal Funds Rate | (39) | 01/31/2025 | 15,459,862 | 657 | ||||||||||
| 3-Month Secured Overnight Financing Rate | (74) | 06/16/2026 | 17,784,975 | (15,966 | ) | |||||||||
| Australian Government 10 Year Bonds | (27) | 09/16/2024 | 2,048,074 | 13,325 | ||||||||||
| Australian Government 3 Year Bonds | (30) | 09/16/2024 | 2,113,105 | 9,638 | ||||||||||
| Australian 90 Day Bank Bills | (73) | 09/11/2025 | 48,251,319 | 13,572 | ||||||||||
| Canadian 10 Year Government Bonds | (23) | 09/18/2024 | 2,018,204 | (2,084 | ) | |||||||||
| Corn No. 2 Yellow(a) | (30) | 12/13/2024 | 631,125 | 64,959 | ||||||||||
| Crude Soybean Oil(a) | (23) | 12/13/2024 | 604,302 | 3,932 | ||||||||||
| Euro BUXL 30 Year Bonds | (2) | 09/06/2024 | 279,171 | 2,844 | ||||||||||
| Euro-BOBL | (26) | 09/06/2024 | 3,244,671 | (6,880 | ) | |||||||||
| Euro-Bund | (7) | 09/06/2024 | 987,450 | (4,717 | ) | |||||||||
| Euro-Schatz | (54) | 09/06/2024 | 6,117,357 | (9,626 | ) | |||||||||
| Feeder Cattle(a) | (3) | 08/29/2024 | 388,950 | 11 | ||||||||||
| Hard Red Winter Wheat(a) | (8) | 09/13/2024 | 234,500 | 18,759 | ||||||||||
| ICE European Climate Exchange Emissions(a) | (8) | 12/16/2024 | 578,490 | 42,566 | ||||||||||
| Lean Hogs(a) | (22) | 08/14/2024 | 787,600 | 8,277 | ||||||||||
| London Metals - Nickel(a)(b) | (2) | 09/18/2024 | 207,273 | 3,220 | ||||||||||
| Long Gilt | (4) | 09/26/2024 | 493,351 | (1,708 | ) | |||||||||
| NY Harbor ULSD(a) | (5) | 07/31/2024 | 531,951 | (26,667 | ) | |||||||||
| Palladium(a) | (4) | 09/26/2024 | 391,160 | (16,376 | ) | |||||||||
| Short-term Euro-BTP | (33) | 09/06/2024 | 3,713,981 | (3,549 | ) | |||||||||
| Soybeans(a) | (13) | 11/14/2024 | 717,600 | 20,121 | ||||||||||
| U.S. Treasury 10 Year Notes | (35) | 09/19/2024 | 3,849,453 | (16,834 | ) | |||||||||
| U.S. Treasury 2 Year Notes | (43) | 09/30/2024 | 8,781,406 | (10,283 | ) | |||||||||
| U.S. Treasury 5 Year Note | (49) | 09/30/2024 | 5,222,328 | (17,179 | ) | |||||||||
| U.S. Treasury Long Bonds | (10) | 09/19/2024 | 1,183,125 | (6,283 | ) | |||||||||
| US 3 Year Notes | (32) | 09/30/2024 | 6,655,500 | (12,415 | ) | |||||||||
| White Sugar(a) | (22) | 07/16/2024 | 658,240 | (35,128 | ) | |||||||||
| $ | 17,025 | |||||||||||||
| Total Unrealized Appreciation (Depreciation) | $ | (55,270 | ) | |||||||||||
| (a) | All or a portion of the investment is a holding of the Cambria Chesapeake Cayman Subsidiary. |
| (b) | London Metal Exchange (“LME”) futures contracts settle on their respective maturity date. |
21
| Consolidated Schedule of Forward Currency Contracts | Cambria Chesapeake Pure Trend ETF |
| June 30, 2024 | |
| Settlement Date | Currency Purchased | Currency Sold | Counterparty | Unrealized Appreciation (Depreciation) | ||||||||||||||
| 09/18/2024 | EUR | 10,000 | USD | 10,744 | StoneX Financial, Inc. | $ | 17 | |||||||||||
| 09/18/2024 | GBP | 574,000 | USD | 726,110 | StoneX Financial, Inc. | (70 | ) | |||||||||||
| 09/18/2024 | HUF | 251,100,000 | USD | 675,636 | StoneX Financial, Inc. | 3,850 | ||||||||||||
| 09/18/2024 | INR | 74,230,000 | USD | 886,223 | StoneX Financial, Inc. | 1,631 | ||||||||||||
| 09/18/2024 | MXN | 3,894,000 | USD | 211,089 | StoneX Financial, Inc. | (879 | ) | |||||||||||
| 09/18/2024 | PLN | 5,760,000 | USD | 1,423,663 | StoneX Financial, Inc. | 7,697 | ||||||||||||
| 09/18/2024 | USD | 802,716 | AUD | 1,208,000 | StoneX Financial, Inc. | (5,753 | ) | |||||||||||
| 09/18/2024 | USD | 1,490,701 | BRL | 8,216,000 | StoneX Financial, Inc. | 25,079 | ||||||||||||
| 09/18/2024 | USD | 2,657,027 | CHF | 2,352,000 | StoneX Financial, Inc. | 13,130 | ||||||||||||
| 09/23/2024 | USD | 892,372 | CLP | 840,391,000 | StoneX Financial, Inc. | 2,732 | ||||||||||||
| 09/19/2024 | USD | 2,148,003 | CNH | 15,564,000 | StoneX Financial, Inc. | 2,181 | ||||||||||||
| 09/18/2024 | USD | 147,908 | COP | 622,839,000 | StoneX Financial, Inc. | (479 | ) | |||||||||||
| 09/18/2024 | USD | 1,548,061 | CZK | 36,124,000 | StoneX Financial, Inc. | (656 | ) | |||||||||||
| 09/18/2024 | USD | 10,723 | EUR | 10,000 | StoneX Financial, Inc. | (37 | ) | |||||||||||
| 09/18/2024 | USD | 93,804 | ILS | 352,000 | StoneX Financial, Inc. | 16 | ||||||||||||
| 09/18/2024 | USD | 1,347,244 | JPY | 212,137,000 | StoneX Financial, Inc. | 11,585 | ||||||||||||
| 09/19/2024 | USD | 1,501,544 | KRW | 2,079,638,000 | StoneX Financial, Inc. | (16,595 | ) | |||||||||||
| 09/18/2024 | USD | 965,106 | NOK | 10,192,000 | StoneX Financial, Inc. | 5,917 | ||||||||||||
| 09/18/2024 | USD | 1,092,647 | NZD | 1,788,000 | StoneX Financial, Inc. | 3,160 | ||||||||||||
| 09/18/2024 | USD | 3,066,226 | PHP | 180,846,000 | StoneX Financial, Inc. | (17,875 | ) | |||||||||||
| 09/18/2024 | USD | 3,137,081 | SGD | 4,236,000 | StoneX Financial, Inc. | (861 | ) | |||||||||||
| 09/18/2024 | USD | 1,800,791 | THB | 66,017,000 | StoneX Financial, Inc. | (10,367 | ) | |||||||||||
| 09/18/2024 | USD | 3,504,974 | TWD | 113,088,000 | StoneX Financial, Inc. | (12,789 | ) | |||||||||||
| 09/18/2024 | ZAR | 20,085,000 | USD | 1,112,508 | StoneX Financial, Inc. | (19,496 | ) | |||||||||||
| Total Unrealized Appreciation (Depreciation) | $ | (8,862 | ) | |||||||||||||||
AUD - Australian Dollar
BRL - Brazilian Real
CHF - Swiss Franc
CLP - Chilean Peso
CNH - Chinese Offshore Renminbi
COP - Colombian Peso
CZK - Czech Koruna
EUR - Euro
GBP - British Pound
HUF - Hungarian Forint
ILS - Israeli Shekel
INR - Indian Rupee
JPY - Japanese Yen
KRW - South Korean Won
MXN - Mexican Peso
22
| Consolidated Schedule of Forward Currency Contracts | Cambria Chesapeake Pure Trend ETF |
| June 30, 2024 | |
NOK - Norwegian Krone
NZD - New Zealand Dollar
PHP - Philippine Peso
PLN - Polish Zloty
SGD - Singapore Dollar
THB - Thai Baht
TWD - New Taiwan Dollar
USD - United States Dollar
ZAR - South African Rand
23
| Consolidated Statements of Assets and Liabilities | Chesapeake ETFs |
| June 30, 2024 | |
| Blueprint Chesapeake Multi Asset Trend ETF | Cambria Chesapeake Pure Trend ETF | |||||||
| ASSETS: | ||||||||
| Investments, at value | $ | 99,719,147 | $ | 16,738,507 | ||||
| Deposit at broker for securities sold short | 21,626,500 | — | ||||||
| Deposit at broker for futures contracts | 4,426,047 | 2,186,698 | ||||||
| Deposit at broker for forward currency contracts | 3,470,765 | 3,249,240 | ||||||
| Receivable for investments sold | 3,064,026 | — | ||||||
| Receivable for open forward currency contacts | 450,083 | 76,995 | ||||||
| Dividends and interest receivable | 237,573 | 23,507 | ||||||
| Cash | 12,522 | — | ||||||
| Unrealized appreciation on futures contracts | 606,112 | 340,835 | ||||||
| Total assets | 133,612,775 | 22,615,782 | ||||||
| LIABILITIES: | ||||||||
| Securities sold short, at value | 18,549,614 | — | ||||||
| Payable for open forward currency contacts | 264,568 | 85,857 | ||||||
| Unrealized depreciation on futures contracts | 1,006,090 | 396,105 | ||||||
| Payable to adviser | 83,351 | 8,146 | ||||||
| Payable for investments purchased | 423,991 | — | ||||||
| Dividends payable | 38,405 | — | ||||||
| Interest payable | 14,444 | — | ||||||
| Total liabilities | 20,380,463 | 490,108 | ||||||
| NET ASSETS | $ | 113,232,312 | $ | 22,125,674 | ||||
| NET ASSETS CONSISTS OF: | ||||||||
| Paid-in capital | $ | 112,995,496 | $ | 22,391,681 | ||||
| Total accumulated gain/(loss) | 236,816 | (266,007 | ) | |||||
| Total net assets | $ | 113,232,312 | $ | 22,125,674 | ||||
| Net assets | $ | 113,232,312 | $ | 22,125,674 | ||||
| Shares issued and outstanding(a) | 4,500,000 | 1,150,000 | ||||||
| Net asset value per share | $ | 25.16 | $ | 19.24 | ||||
| COST: | ||||||||
| Investments, at cost | $ | 94,121,487 | $ | 16,922,183 | ||||
| PROCEEDS: | ||||||||
| Securities sold short proceeds | $ | 18,997,418 | $ | — | ||||
| (a) | Unlimited shares authorized without par value. |
The accompanying notes are an integral part of these financial statements.
24
| Consolidated Statements of Operations | Chesapeake ETFs |
| June 30, 2024 | |
| Blueprint Chesapeake Multi Asset Trend ETF(a) | Cambria Chesapeake Pure Trend ETF(b) | |||||||
| INVESTMENT INCOME: | ||||||||
| Dividend income | $ | 736,865 | $ | 5,278 | ||||
| Less: Dividend withholding taxes | (8,030 | ) | — | |||||
| Less: Issuance fees | (55 | ) | — | |||||
| Interest income | 2,021,381 | 41,209 | ||||||
| Other income | 6 | — | ||||||
| Total investment income | 2,750,167 | 46,487 | ||||||
| EXPENSES: | ||||||||
| Investment advisory fee | 624,750 | 8,454 | ||||||
| Dividends expense | 452,409 | — | ||||||
| Interest expense | 179,434 | — | ||||||
| Other expenses and fees | 10,380 | 759 | ||||||
| Total expenses | 1,266,973 | 9,213 | ||||||
| NET INVESTMENT INCOME | 1,483,194 | 37,274 | ||||||
| REALIZED AND UNREALIZED GAIN/(LOSS) | ||||||||
| Net realized gain/(loss) from: | ||||||||
| Investments | (2,611,688 | )(c) | 393 | |||||
| Securities sold short | (3,644,238 | ) | — | |||||
| Futures contracts | 98,008 | (218,365 | ) | |||||
| Forward currency contracts | (264,736 | ) | — | |||||
| Foreign currency transactions | (18,735 | ) | — | |||||
| Net realized loss | (6,441,389 | ) | (217,972 | ) | ||||
| Net change in unrealized appreciation/(depreciation) on: | ||||||||
| Investments | 5,597,660 | (183,676 | ) | |||||
| Securities sold short | 447,804 | — | ||||||
| Future contracts | (399,978 | ) | (55,270 | ) | ||||
| Forward currency contracts | 185,515 | (8,862 | ) | |||||
| Foreign currency translation | 12,391 | (330 | ) | |||||
| Net change in unrealized appreciation/(depreciation) | 5,843,392 | (248,138 | ) | |||||
| Net realized and unrealized loss | (597,997 | ) | (466,110 | ) | ||||
| NET INCREASE/(DECREASE) IN NET ASSETS RESULTING FROM OPERATIONS | $ | 885,197 | $ | (428,836 | ) | |||
| (a) | Inception date of the Fund was July 11, 2023. |
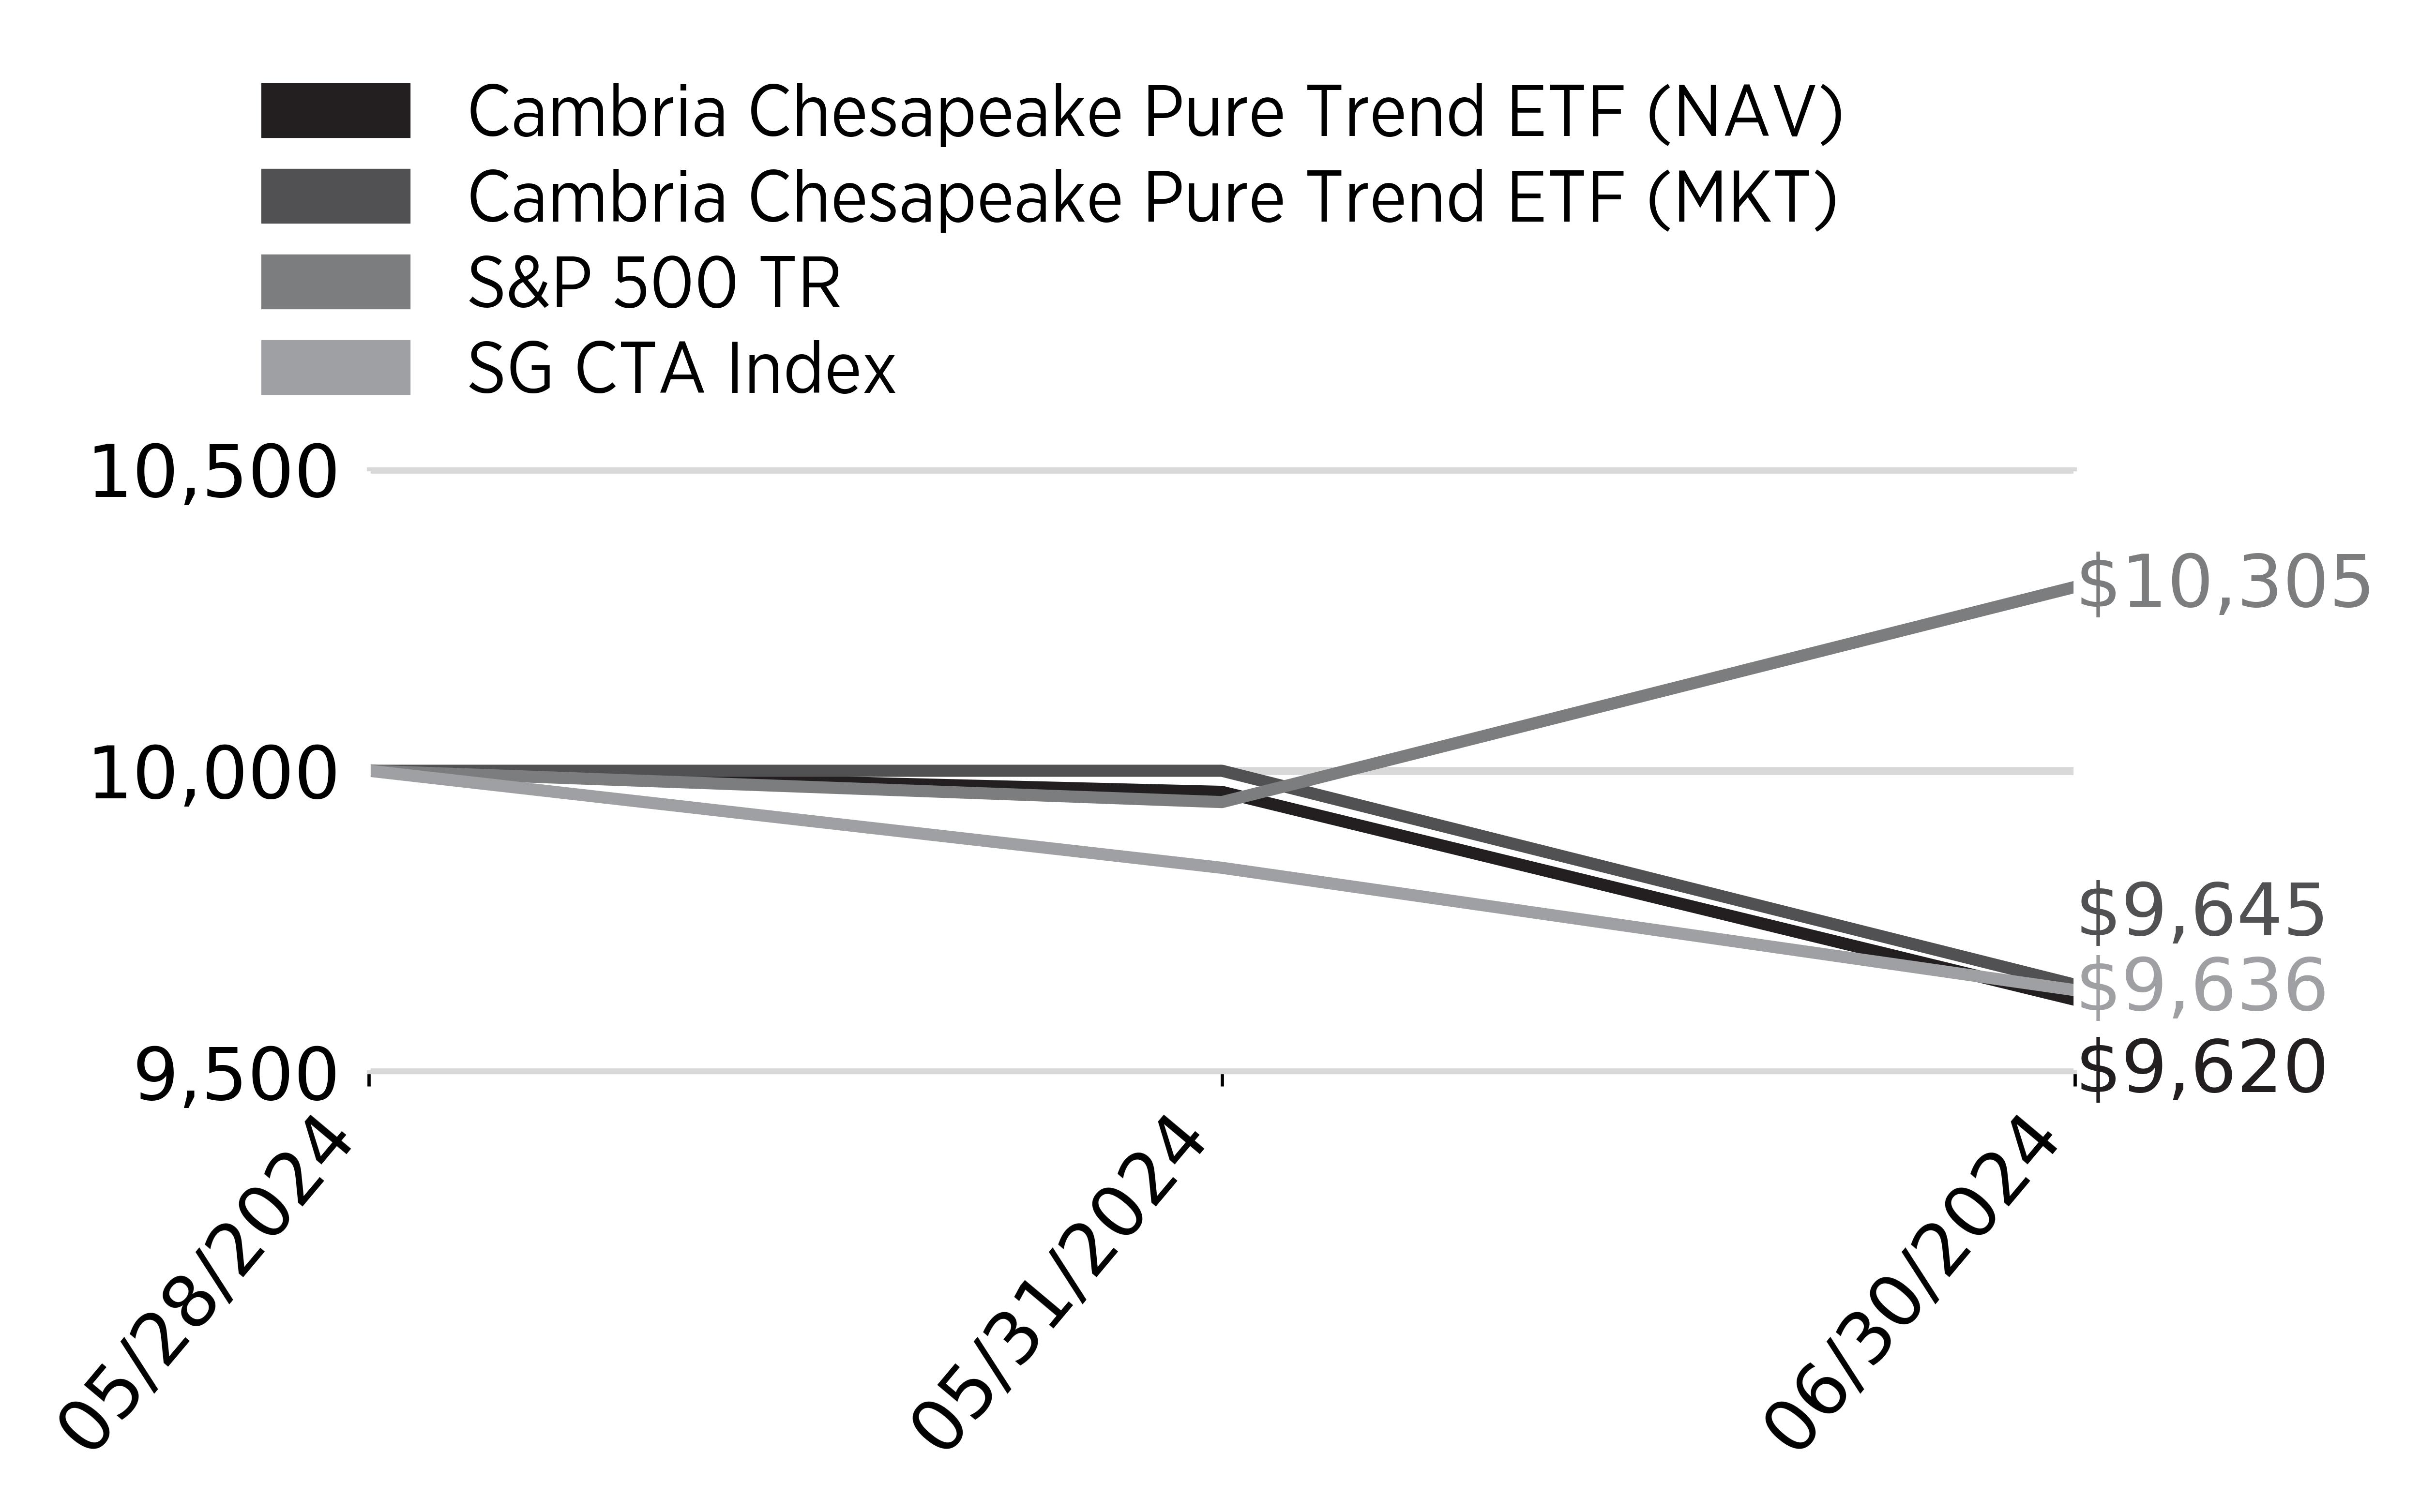
| (b) | Inception date of the Fund was May 28, 2024. |
| (c) | Includes reimbursement from the Adviser (defined in Note 1) for losses on trade errors totaling $14,551. |
The accompanying notes are an integral part of these financial statements.
25
| Consolidated Statements of Changes in Net Assets | Chesapeake ETFs |
| June 30, 2024 | |
| Blueprint Chesapeake Multi Asset Trend ETF | Cambria Chesapeake Pure Trend ETF | |||||||
Period ended | Period ended | |||||||
| OPERATIONS: | ||||||||
| Net investment income | $ | 1,483,194 | $ | 37,274 | ||||
| Net realized loss | (6,441,389 | ) | (217,972 | ) | ||||
| Net change in unrealized appreciation/(depreciation) | 5,843,392 | (248,138 | ) | |||||
| Net increase/(decrease) in net assets from operations | 885,197 | (428,836 | ) | |||||
| DISTRIBUTIONS TO SHAREHOLDERS: | ||||||||
| Distributions to shareholders | (647,460 | ) | — | |||||
| Total distributions to shareholders | (647,460 | ) | — | |||||
| CAPITAL TRANSACTIONS: | ||||||||
| Subscriptions | 115,461,875 | 22,554,510 | ||||||
| Redemptions | (2,467,300 | ) | — | |||||
| Net increase in net assets from capital transactions | 112,994,575 | 22,554,510 | ||||||
| NET INCREASE IN NET ASSETS | 113,232,312 | 22,125,674 | ||||||
| NET ASSETS: | ||||||||
| Beginning of the period | — | — | ||||||
| End of the period | $ | 113,232,312 | $ | 22,125,674 | ||||
| SHARES TRANSACTIONS | ||||||||
| Subscriptions | 4,600,000 | 1,150,000 | ||||||
| Redemptions | 100,000 | — | ||||||
| Total increase in shares outstanding | 4,500,000 | 1,150,000 | ||||||
| (a) | Inception date of the Fund was July 11, 2023. |
| (b) | Inception date of the Fund was May 28, 2024. |
The accompanying notes are an integral part of these financial statements.
26
| Consolidated Financial Highlights | Blueprint Chesapeake Multi-Asset Trend ETF |
| June 30, 2024 | |
| Period ended June 30, 2024(a) | ||||
| PER SHARE DATA: | ||||
| Net asset value, beginning of period | $ | 25.00 | ||
| INVESTMENTS OPERATIONS: | ||||
| Net investment income(b)(c) | 0.57 | |||
| Net realized and unrealized loss on investments(d) | (0.17 | ) | ||
| Total from investment operations | 0.40 | |||
| LESS DISTRIBUTIONS FROM: | ||||
| From net investment income | (0.24 | ) | ||
| Total distributions | (0.24 | ) | ||
| Net asset value, end of period | $ | 25.16 | ||
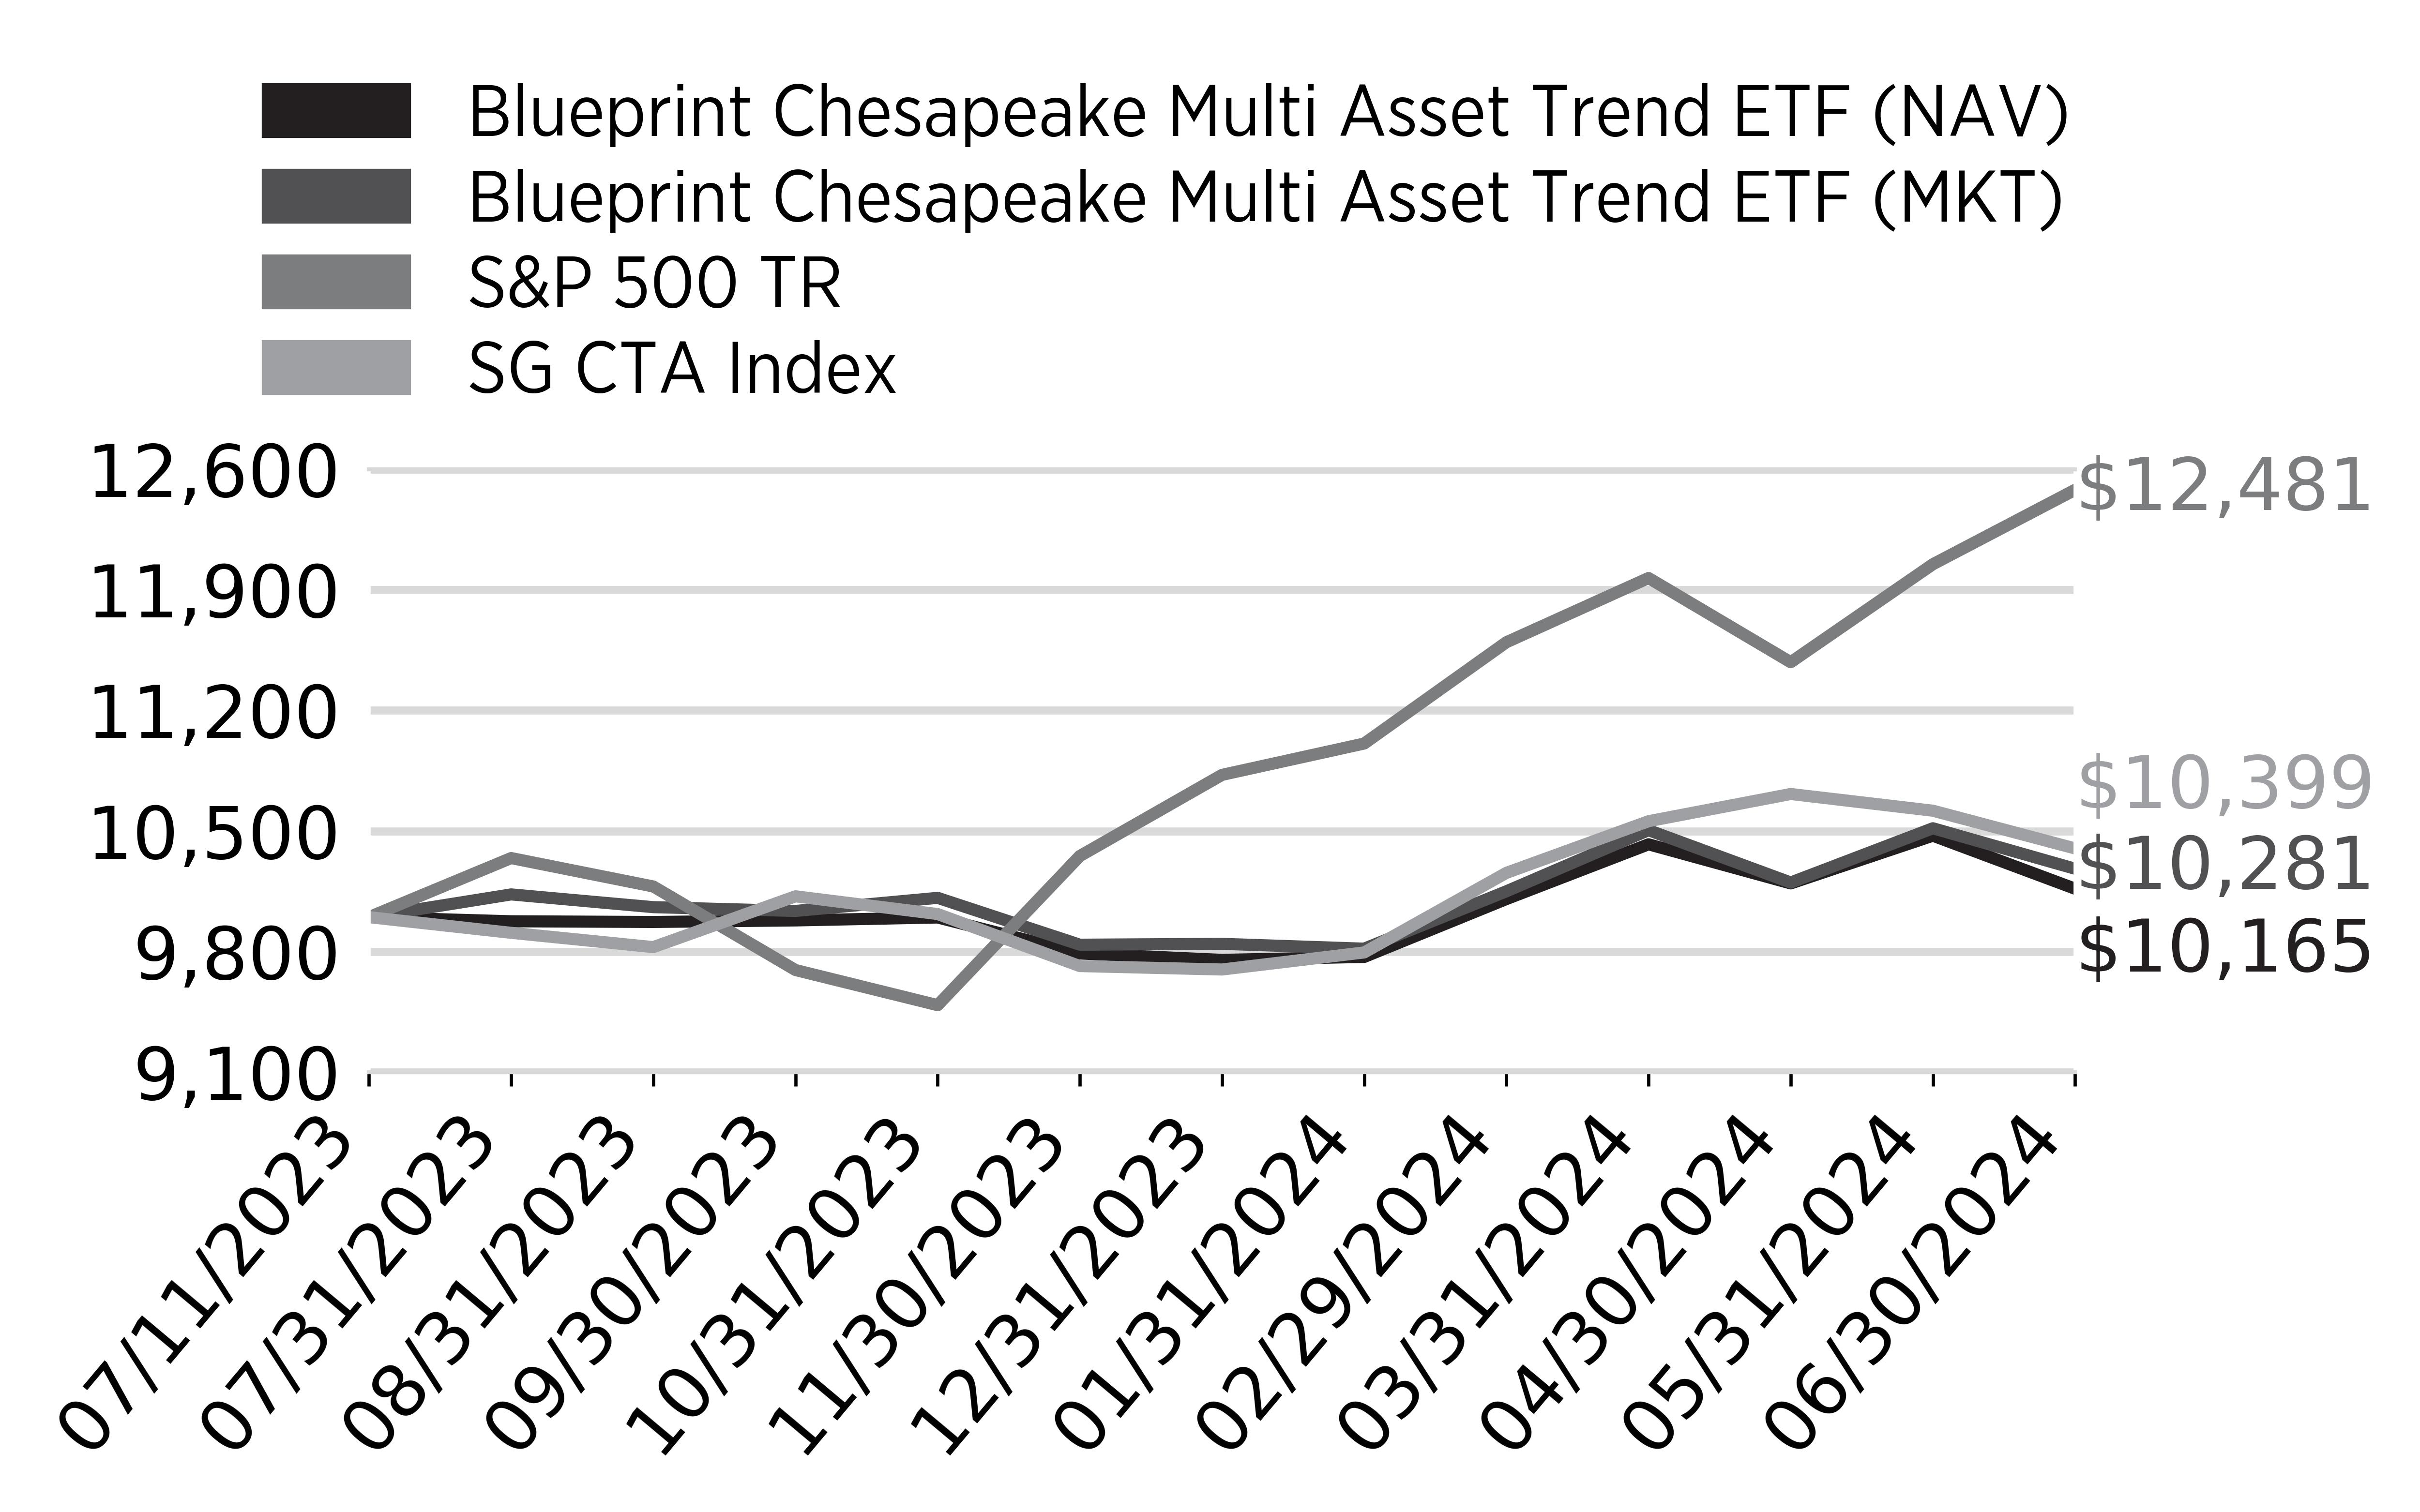
| TOTAL RETURN(e)(i) | 1.65 | % | ||
| SUPPLEMENTAL DATA AND RATIOS: | ||||
| Net assets, end of period (in thousands) | $ | 113,232 | ||
| Ratio of expenses to average net assets(f)(g) | 2.01 | % | ||
| Ratio of dividends, interest and borrowing expense on securities sold short to average net assets(f)(g) | 1.02 | % | ||
| Ratio of operational expenses to average net assets excluding dividends, interest, and borrowing expense on securities sold short(f)(g) | 0.99 | % | ||
| Ratio of net investment income to average net assets(f)(g) | 2.35 | % | ||
| Portfolio turnover rate(e)(h) | 89 | % | ||
| (a) | Inception date of the Fund was July 11, 2023. |
| (b) | Net investment income per share has been calculated based on average shares outstanding during the period. |
| (c) | Recognition of net investment income by the Fund is affected by the timing of the declaration of dividends by the underlying exchange traded funds in which the Fund invests. The ratio does not include net investment income of the exchange traded funds in which the Fund invests. |
| (d) | Realized and unrealized gains and losses per share in the caption are balancing amounts necessary to reconcile the change in net asset value per share for the years, and may not reconcile with the aggregate gains and losses in the Statement of Operations due to share transactions for the year. |
| (e) | Not annualized for periods less than one year. |
| (f) | Annualized for periods less than one year. |
| (g) | These ratios exclude the impact of expenses of the underlying exchange traded funds as represented in the Schedule of Investments. Recognition of net investment income by the Fund is affected by the timing of the underlying exchange traded funds in which the Fund invests. |
| (h) | Portfolio turnover rate excludes in-kind transactions. |
27
| Consolidated Financial Highlights | Blueprint Chesapeake Multi-Asset Trend ETF |
| June 30, 2024 | |
| (i) | As a result of trade errors, the Fund experienced a loss totaling $14,551 for the period ended June 30, 2024, all of which was reimbursed by the Adviser (defined in Note 1). Total return would have been lower, but Management determined that the impact to total return was immaterial. |
The accompanying notes are an integral part of these financial statements.
28
| Consolidated Financial Highlights | Cambria Chesapeake Pure Trend ETF |
| June 30, 2024 | |
| Period ended June 30, 2024(a) | ||||
| PER SHARE DATA: | ||||
| Net asset value, beginning of period | $ | 20.00 | ||
| INVESTMENTS OPERATIONS: | ||||
| Net investment income(b) | 0.06 | |||
| Net realized and unrealized loss on investments(c) | (0.82 | ) | ||
| Total from investment operations | (0.76 | ) | ||
| LESS DISTRIBUTIONS FROM: | ||||
| Total distributions | — | |||
| Net asset value, end of period | $ | 19.24 | ||
| TOTAL RETURN(d) | -3.80 | % | ||
| SUPPLEMENTAL DATA AND RATIOS: | ||||
| Net assets, end of period (in thousands) | $ | 22,126 | ||
| Ratio of expenses to average net assets(e) | 0.82 | % | ||
| Ratio of other expenses and fees to average net assets(e) | 0.07 | % | ||
| Ratio of operational expenses to average net assets excluding other expenses and fees(e) | 0.75 | % | ||
| Ratio of net investment income to average net assets(e) | 3.30 | % | ||
| Portfolio turnover rate(d)(f) | 0 | % | ||
| (a) | Inception date of the Fund was May 28, 2024. |
| (b) | Net investment income per share has been calculated based on average shares outstanding during the period. |
| (c) | Realized and unrealized gains and losses per share in the caption are balancing amounts necessary to reconcile the change in net asset value per share for the years, and may not reconcile with the aggregate gains and losses in the Statement of Operations due to share transactions for the year. |
| (d) | Not annualized for periods less than one year. |
| (e) | Annualized for periods less than one year. |
| (f) | Portfolio turnover rate excludes in-kind transactions. |
The accompanying notes are an integral part of these financial statements.
29
| Notes to the Consolidated Financial Statements | Chesapeake ETFs |
| June 30, 2024 | |
| NOTE 1 – ORGANIZATION |
The Blueprint Chesapeake Multi-Asset Trend ETF (the “Blueprint ETF”) and the Cambria Chesapeake Pure Trend ETF (the “Cambria ETF”) (each a “Fund”, and collectively, the “Funds”) are each a non-diversified series of Tidal Trust II (the “Trust”). The Trust was organized as a Delaware statutory trust on January 13, 2022. The Trust is registered with the Securities and Exchange Commission (“SEC”) under the Investment Company Act of 1940, as amended (the “1940 Act”), as an open-end management investment company and the offering of each Fund’s shares (“Shares”) is registered under the Securities Act of 1933, as amended. The Trust is governed by the Board of Trustees (the “Board”). Tidal Investments LLC (f/k/a Toroso Investments, LLC) (“Tidal Investments” or the “Adviser”), a Tidal Financial Group company, serves as investment adviser to each Fund. The Blueprint Fund Management, LLC serves as investment sub-adviser to the Blueprint ETF, the Cambria Investment Management, L.P. serves as investment sub-adviser to the Cambria ETF, and the Chesapeake Capital Corporation (each a “Sub-Adviser”, and collectively, the “Sub-Advisers”), serves as investment sub-advisers to each Fund. Each Fund is an investment company and accordingly follows the investment company accounting and reporting guidance of the Financial Accounting Standards Board (“FASB”) Accounting Standard Codification Topic 946 “Financial Services – Investment Companies”. The Blueprint ETF commenced operations on July 11, 2023, and the Cambria ETF commenced operations on May 28, 2024.
The investment objective of each Fund is to preserve capital and generate long-term capital appreciation.
| NOTE 2 – SIGNIFICANT ACCOUNTING POLICIES |
The following is a summary of significant accounting policies consistently followed by the Funds. These policies are in conformity with accounting principles generally accepted in the United States of America (“U.S. GAAP”).
| A. | Security Valuation. Equity securities that are listed on a securities exchange, market or automated quotation system for which quotations are readily available (except for securities traded on the NASDAQ), including securities traded over the counter, are valued at the last quoted sale price on the primary exchange or market (foreign or domestic) on which they are traded on the valuation date (or at approximately 4:00 p.m. EST if a security’s primary exchange is normally open at that time), or, if there is no such reported sale on the valuation date, at the most recent quoted bid price or mean between the most recent quoted bid and ask prices for long and short positions. For a security that trades on multiple exchanges, the primary exchange will generally be considered the exchange on which the security is generally most actively traded. For securities traded on NASDAQ, the NASDAQ Official Closing Price will be used. Prices of securities traded on the securities exchange will be obtained from recognized independent pricing agents (“Independent Pricing Agents”) each day that the Funds are open for business. |
Debt securities are valued by using an evaluated mean of the bid and asked prices provided by Independent Pricing Agents. The Independent Pricing Agents may employ methodologies that utilize actual market transactions (if the security is actively traded), broker dealer supplied valuations, or other methodologies designed to identify the market value for such securities. In arriving at valuations, such methodologies generally consider factors such as security prices, yields, maturities, call features, ratings and developments relating to specific securities.
Futures contracts and forward contacts are priced by an approved independent pricing service. Futures contracts are valued at the settlement price on the exchange on which they are principally traded. Foreign currency forward contracts are valued at the current day’s interpolated foreign exchange rate, as calculated using the current day’s spot rate, and the thirty, sixty, ninety and one-hundred eighty day forward rates provided by an independent source.
Under Rule 2a-5 of the 1940 Act, a fair value will be determined for securities for which quotations are not readily available by the Valuation Designee (as defined in Rule 2a-5) in accordance with the Pricing and Valuation Policy and Fair Value Procedures, as applicable, of the Adviser, subject to oversight by the Board. When a security is “fair valued,” consideration is given to the facts and circumstances relevant to the particular situation, including a review of various factors set forth in the Adviser’s Pricing and Valuation Policy and Fair Value Procedures, as applicable. Fair value pricing is an inherently subjective process, and no single standard exists for determining fair value. Different funds could reasonably arrive at different values for the same security. The use of fair value pricing by a fund may cause the net asset value (“NAV”) of its shares to differ significantly from the NAV that would be calculated without regard to such considerations.
30
| Notes to the Consolidated Financial Statements | Chesapeake ETFs |
| June 30, 2024 | |
As described above, the Funds utilize various methods to measure the fair value of its investments on a recurring basis. U.S. GAAP establishes a hierarchy that prioritizes inputs to valuation methods. The three levels of inputs are:
| Level 1 – | Unadjusted quoted prices in active markets for identical assets or liabilities that the Funds have the ability to access. |
| Level 2 – | Observable inputs other than quoted prices included in Level 1 that are observable for the asset or liability, either directly or indirectly. These inputs may include quoted prices for the identical instrument on an inactive market, prices for similar instruments, interest rates, prepayment speeds, credit risk, yield curves, default rates and similar data. |
| Level 3 – | Unobservable inputs for the asset or liability, to the extent relevant observable inputs are not available; representing the Fund’s own assumptions about the assumptions a market participant would use in valuing the asset or liability and would be based on the best information available. |
The availability of observable inputs can vary from security to security and is affected by a wide variety of factors, including, for example, the type of security, whether the security is new and not yet established in the marketplace, the liquidity of markets, and other characteristics particular to the security. To the extent that valuation is based on models or inputs that are less observable or unobservable in the market, the determination of fair value requires more judgment. Accordingly, the degree of judgment exercised in determining fair value is greatest for instruments categorized in Level 3.
The inputs used to measure fair value may fall into different levels of the fair value hierarchy. In such cases, for disclosure purposes, the level in the fair value hierarchy within which the fair value measurement falls in its entirety, is determined based on the lowest level input that is significant to the fair value measurement in its entirety.
The following is a summary of the inputs used to value each Fund’s investments as of June 30, 2024:
Blueprint Chesapeake Multi-Asset Trend ETF
| Level 1 | Level 2 | Level 3 | Total | |||||||||||||
| Assets: | ||||||||||||||||
| Investments: | ||||||||||||||||
| Common Stocks(a) | $ | 52,615,994 | $ | — | $ | — | $ | 52,615,994 | ||||||||
| Exchange Traded Funds | 18,559,717 | — | — | 18,559,717 | ||||||||||||
| U.S. Treasury Securities | — | 7,450,821 | — | 7,450,821 | ||||||||||||
| Real Estate Investment Trusts | 1,201,672 | — | — | 1,201,672 | ||||||||||||
| Closed End Investment Trusts | 239,079 | — | — | 239,079 | ||||||||||||
| Money Market Funds | 3,278,251 | — | — | 3,278,251 | ||||||||||||
| U.S. Treasury Bills | — | 16,373,613 | — | 16,373,613 | ||||||||||||
| Total Investments | $ | 75,894,713 | $ | 23,824,434 | $ | — | $ | 99,719,147 | ||||||||
| Other Financial Instruments:(b) | ||||||||||||||||
| Futures Contracts | $ | 606,112 | $ | — | $ | — | $ | 606,112 | ||||||||
| Forward Currency Contracts | — | 450,083 | — | 450,083 | ||||||||||||
| Total Other Financial Instruments | $ | 606,112 | $ | 450,083 | $ | — | $ | 1,056,195 | ||||||||
| Liabilities: | ||||||||||||||||
| Investments: | ||||||||||||||||
| Common Stocks(a) | $ | (17,281,848 | ) | $ | — | $ | — | $ | (17,281,848 | ) | ||||||
| Real Estate Investment Trusts | (1,267,766 | ) | — | — | (1,267,766 | ) | ||||||||||
| Total Investments | $ | (18,549,614 | ) | $ | — | $ | — | $ | (18,549,614 | ) | ||||||
| Other Financial Instruments:(b) | ||||||||||||||||
| Futures Contracts | $ | (1,006,090 | ) | $ | — | $ | — | $ | (1,006,090 | ) | ||||||
| Forward Currency Contracts | — | (264,568 | ) | — | (264,568 | ) | ||||||||||
| Total Other Financial Instruments | $ | (1,006,090 | ) | $ | (264,568 | ) | $ | — | $ | (1,270,658 | ) | |||||
31
| Notes to the Consolidated Financial Statements | Chesapeake ETFs |
| June 30, 2024 | |
Cambria Chesapeake Pure Trend ETF
| Level 1 | Level 2 | Level 3 | Total | |||||||||||||
| Assets: | ||||||||||||||||
| Investments: | ||||||||||||||||
| Common Stocks(a) | $ | 9,839,801 | $ | — | $ | — | $ | 9,839,801 | ||||||||
| Real Estate Investment Trusts | 511,143 | — | — | 511,143 | ||||||||||||
| Money Market Funds | 2,494,443 | — | — | 2,494,443 | ||||||||||||
| U.S. Treasury Bills | — | 3,893,120 | — | 3,893,120 | ||||||||||||
| Total Investments | $ | 12,845,387 | $ | 3,893,120 | $ | — | $ | 16,738,507 | ||||||||
| Other Financial Instruments:(b) | ||||||||||||||||
| Future Contracts | $ | 340,835 | $ | — | $ | — | $ | 340,835 | ||||||||
| Forward Currency Contracts | — | 76,995 | — | 76,995 | ||||||||||||
| Total Other Financial Instruments | $ | 340,835 | $ | 76,995 | $ | — | $ | 417,830 | ||||||||
| Liabilities: | ||||||||||||||||
| Other Financial Instruments:(b) | ||||||||||||||||
| Future Contracts | $ | (396,105 | ) | $ | — | $ | — | $ | (396,105 | ) | ||||||
| Forward Currency Contracts | — | (85,857 | ) | — | (85,857 | ) | ||||||||||
| Total Other Financial Instruments | $ | (396,105 | ) | $ | (85,857 | ) | $ | — | $ | (481,962 | ) | |||||
| (a) | See Consolidated Schedule of Investments for the industry breakout. |
| (b) | Other Financial Instruments are derivative instruments not reflected on the Consolidated Schedules of Investments, such as futures and forwards contracts, which are presented at the unrealized appreciation/depreciation on the investment. |
| B. | Derivative Investments. The Funds have provided additional disclosures below regarding derivatives and hedging activity intending to improve financial reporting by enabling investors to understand how and why the Funds use futures contracts and forward contracts (both a type of derivative), how they are accounted for and how they affect an entity’s results of operations and financial position. The Funds may use derivatives for risk management purposes or as part of their investment strategies. Derivatives are financial contracts whose values depend on, or are derived from, the value of an underlying asset, reference rate or index. The Funds may use derivatives to earn income and enhance returns, to hedge or adjust the risk profile of its portfolio, to replace more traditional direct investments and to obtain exposure to otherwise inaccessible markets. |
The average notional amount for open futures contracts and forward currency contracts is based on the monthly notional amounts. The notional amount for open futures contracts and forward currency contracts represents the U.S. dollar value of the contract as of the day of opening the transaction or latest contract reset date.
For the period ended June 30, 2024, the average notional value of open long futures contracts was $34,069,292 for the Blueprint ETF, and $10,705,732 for the Cambria ETF. The average notional value of long forward currency contracts outstanding was $42,443,138 for the Blueprint ETF and $31,245,647 for the Cambria ETF. The average notional value of open short futures contracts was $87,253,033 for the Blueprint ETF and $83,826,796 for the Cambria ETF. The average notional value of short forward currency contracts outstanding was $41,290,471 for the Blueprint ETF and $31,254,510 for the Cambria ETF. The following tables show the effects of derivative instruments on the consolidated financial statements.
32
| Notes to the Consolidated Financial Statements | Chesapeake ETFs |
| June 30, 2024 | |
Consolidated Statements of Assets and Liabilities
Fair value of derivative instruments as of June 30, 2024:
| Asset Derivatives | Liability Derivatives | |||||||||||
| Derivative Instruments | Statements of Assets and Liabilities | Fair Value | Statements of Assets and Liabilities | Fair Value | ||||||||
| Blueprint ETF | ||||||||||||
| Futures Contracts | Unrealized appreciation on futures contracts (see Consolidated Statements of Assets and Liabilities) | Unrealized depreciation on futures contracts (see Consolidated Statements of Assets and Liabilities) | ||||||||||
| Commodities Risk | $ | 469,203 | $ | (813,509 | ) | |||||||
| Equities Risk | 56,273 | — | ||||||||||
| Foreign Exchange Currencies Risk | 7,935 | — | ||||||||||
| Interest Rate Risk | 72,701 | (192,581 | ) | |||||||||
| Total Futures Contracts | 606,112 | (1,006,090 | ) | |||||||||
| Forward Currency Contracts | Receivable for open forward currency contracts (see Consolidated Statement of Assets and Liabilities | Payable for open forward currency contracts (see Consolidated Statement of Assets and Liabilities | ||||||||||
| Foreign Exchange Currencies Risk | $ | 450,083 | $ | (264,568 | ) | |||||||
| Cambria ETF | ||||||||||||
| Futures Contracts | Unrealized appreciation on futures contracts (see Consolidated Statements of Assets and Liabilities) | Unrealized depreciation on futures contracts (see Consolidated Statements of Assets and Liabilities) | ||||||||||
| Commodities Risk | $ | 268,764 | $ | (272,318 | ) | |||||||
| Equities Risk | — | — | ||||||||||
| Foreign Exchange Currencies Risk | — | — | ||||||||||
| Interest Rate Risk | 72,071 | (123,787 | ) | |||||||||
| Total Futures Contracts | 340,835 | (396,105 | ) | |||||||||
| Forward Currency Contracts | Receivable for open forward currency contracts (see Consolidated Statements of Assets and Liabilities | Payable for open forward currency contracts (see Consolidated Statements of Assets and Liabilities | ||||||||||
| Foreign Exchange Currencies Risk | $ | 76,995 | $ | (85,857 | ) | |||||||
33
| Notes to the Consolidated Financial Statements | Chesapeake ETFs |
| June 30, 2024 | |
Consolidated Statements of Operations
The effect of derivative instruments on the Consolidated Statements of Operations for the period ended June 30, 2024:
| Instruments | Location of Gain (Loss) on Derivatives Recognized in Income | Realized Gain (Loss) on Derivatives Recognized in Income | Change in Unrealized Appreciation/Depreciation on Derivatives Recognized in Income | ||||||
| Blueprint ETF | |||||||||
| Futures Contracts | Net Realized and Unrealized Gain (Loss) on Futures Contracts | ||||||||
| Commodities Risk | $ | 685,415 | $ | (344,306 | ) | ||||
| Equities Risk | (43,508 | ) | 56,273 | ||||||
| Foreign Exchange Currencies Risk | 3,004 | 7,935 | |||||||
| Interest Rate Risk | (546,903 | ) | (119,880 | ) | |||||
| Total Futures Contracts | 98,008 | (399,978 | ) | ||||||
| Forward Currency Contracts | Net Realized and Unrealized Gain (Loss) on Forward Currency Contracts | ||||||||
| Foreign Exchange Currencies Risk | $ | (264,736 | ) | $ | 185,515 | ||||
| Cambria ETF | |||||||||
| Futures Contracts | Net Realized and Unrealized Gain (Loss) on Futures Contracts | ||||||||
| Commodities Risk | $ | (161,300 | ) | $ | (3,554 | ) | |||
| Interest Rate Risk | (57,065 | ) | (51,716 | ) | |||||
| Total Futures Contracts | (218,365 | ) | (55,270 | ) | |||||
| Forward Currency Contracts | Net Realized and Unrealized Gain (Loss) on Forward Currency Contracts | ||||||||
| Foreign Exchange Currencies Risk | — | $ | (8,862 | ) | |||||
The Funds are not subject to master netting agreements; therefore, no additional disclosures regarding netting agreements are required.
| C. | Federal Income Taxes. The Funds have each elected to be taxed as a “regulated investment company” and intend to distribute substantially all taxable income to their shareholders and otherwise comply with the provisions of the Internal Revenue Code applicable to regulated investment companies. Therefore, no provision for federal income taxes or excise taxes has been made. |
In order to avoid imposition of the excise tax applicable to regulated investment companies, the Funds intend to declare as dividends in each calendar year at least 98.0% of their net investment income (earned during the calendar year) and at least 98.2% of their net realized capital gains (earned during the twelve months ended October 31) plus undistributed amounts, if any, from prior years. As a registered investment company, each Fund is subject to a 4% excise tax that is imposed if a Fund does not distribute by the end of any calendar year at least the sum of (i) 98% of its ordinary income (not taking into account any capital gain or loss) for the calendar year and (ii) 98.2% of its capital gain in excess of its capital loss (adjusted for certain ordinary losses) for a one year period generally ending on October 31 of the calendar year (unless an election is made to use the fund’s fiscal year). The Funds generally intend to distribute income and capital gains in the manner necessary to minimize (but not necessarily eliminate) the imposition of such excise tax. The Funds may retain income or capital gains and pay excise tax when it is determined that doing so is in the best interest of shareholders. Management, in consultation with the Board of Trustees, evaluates the costs of the excise tax relative to the benefits of retaining income and capital gains, including that such undistributed amounts (net of the excise tax paid) remain available for investment by the Funds and are available to supplement future distributions. Tax expense is disclosed in the Consolidated Statements of Operations, if applicable.
34
| Notes to the Consolidated Financial Statements | Chesapeake ETFs |
| June 30, 2024 | |
As of June 30, 2024, the Funds did not have any tax positions that did not meet the threshold of being sustained by the applicable tax authority. Generally, tax authorities can examine all the tax returns filed for the last three years. The Funds identify their major tax jurisdiction as U.S. Federal and the Commonwealth of Delaware; however, the Funds are not aware of any tax positions for which it is reasonably possible that the total amounts of unrecognized tax benefits will change materially. The Funds recognize interest and penalties, if any, related to unrecognized tax benefits on uncertain tax positions as income tax expense in the Consolidated Statement of Operations. The Subsidiaries (defined in Note 2.H.) are exempted Cayman investment companies and as such are not subject to Cayman Island taxes at the present time. For U.S. income tax purposes, the Subsidiaries are controlled foreign corporations not subject to U.S. income taxes. As wholly-owned controlled foreign corporations, the Subsidiaries’ net income and capital gains, if any, will be included each year in the Funds’ investment company taxable income.
| D. | Foreign Currency. Investment securities and other assets and liabilities denominated in foreign currencies are translated into U.S. dollar amounts at the date of valuation. Purchases and sales of investment securities and income and expense items denominated in foreign currencies are translated into U.S. dollar amounts on the respective dates of such transactions. |
The Funds do not isolate that portion of the results of operations resulting from changes in foreign exchange rates on investments from the fluctuations arising from changes in market prices of securities held. Such fluctuations are included with the net realized and unrealized gain or loss from investments.
The Funds report net realized foreign exchange gains or losses that arise from sales of foreign currencies, currency gains or losses realized between the trade and settlement dates on securities transactions, and the difference between the amounts of dividends, interest, and foreign withholding taxes recorded on the Funds' books and the U.S. dollar equivalent of the amounts actually received or paid. Net unrealized foreign exchange gains and losses arise from changes in the fair values of assets and liabilities, other than investments in securities at period end, resulting from changes in exchange rates.
| E. | Securities Transactions and Investment Income. Investment securities transactions are accounted for on the trade date. Gains and losses realized on sales of securities are determined on a specific identification basis. Discounts/premiums on debt securities purchased are accreted/amortized over the life of the respective securities using the effective interest method. Dividend income is recorded on the ex-dividend date. Dividends received from REITs generally are comprised of ordinary income, capital gains, and may include return of capital. Debt income is recorded on an accrual basis. Other non-cash dividends are recognized as investment income at the fair value of the property received. Withholding taxes on foreign dividends have been provided for in accordance with the Fund’s understanding of the applicable country’s tax rules and rates. |
| F. | Futures Contracts. Generally, a futures contract is a standard binding agreement to buy or sell a specified quantity of an underlying reference instrument, such as a specific security, currency or commodity, at a specified price at a specified later date. A “sale” of a futures contract means the acquisition of a contractual obligation to deliver the underlying reference instrument called for by the contract at a specified price on a specified date. A “purchase” of a futures contract means the acquisition of a contractual obligation to acquire the underlying reference instrument called for by the contract at a specified price on a specified date. The purchase or sale of a futures contract will allow the Funds to increase or decrease its exposure to the underlying reference instrument without having to buy the actual instrument. |
The underlying reference instruments to which futures contracts may relate include non-U.S. currencies, commodities, interest rates, stock and bond indices, and debt securities, including U.S. government debt obligations. In certain types of futures contracts, the underlying reference instrument may be a swap agreement. In most cases the contractual obligation under a futures contract may be offset, or “closed out,” before the settlement date so that the parties do not have to make or take delivery. The closing out of a contractual obligation is usually accomplished by buying or selling, as the case may be, an identical, offsetting futures contract. This transaction, which is effected through a member of an exchange, cancels the obligation to make or take delivery of the underlying instrument or asset. Although some futures contracts by their terms require the actual delivery or acquisition of the underlying instrument or asset, some require cash settlement.
35
| Notes to the Consolidated Financial Statements | Chesapeake ETFs |
| June 30, 2024 | |
Futures contracts may be bought and sold on U.S. and non-U.S. exchanges. Futures contracts in the U.S. have been designed by exchanges that have been designated “contract markets” by the CFTC and must be executed through a futures commission merchant (“FCM”), which is a brokerage firm that is a member of the relevant contract market. Each exchange guarantees performance of the contracts as between the clearing members of the exchange, thereby reducing the risk of counterparty default. Futures contracts may also be entered into on certain exempt markets, including exempt boards of trade and electronic trading facilities, available to certain market participants. Because all transactions in the futures market are made, offset or fulfilled by an FCM through a clearinghouse associated with the exchange on which the contracts are traded, the Funds will incur brokerage fees when they buy or sell futures contracts.
To the extent the Funds invest in futures contracts, the Funds will generally buy and sell futures contracts only on contract markets (including exchanges or boards of trade) where there appears to be an active market for the futures contracts, but there is no assurance that an active market will exist for any particular contract or at any particular time. An active market makes it more likely that futures contracts will be liquid and bought and sold at competitive market prices. In addition, many of the futures contracts available may be relatively new instruments without a significant trading history. As a result, there can be no assurance that an active market will develop or continue to exist.
When the Funds enter into a futures contract, they must deliver to an account controlled by the FCM (that has been selected by the Funds), an amount referred to as “initial margin” that is typically calculated as an amount equal to the volatility in market value of a contract over a fixed period. Initial margin requirements are determined by the respective exchanges on which the futures contracts are traded and the FCM. Thereafter, a “variation margin” amount may be required to be paid by the Funds or received by the Funds in accordance with margin controls set for such accounts, depending upon changes in the marked-to market value of the futures contract. The account is marked-to market daily and the variation margin is monitored by the Adviser and Custodian (defined below) on a daily basis. When the futures contract is closed out, if the Funds have a loss equal to or greater than the margin amount, the margin amount is paid to the FCM along with any loss in excess of the margin amount. If the Fund has a loss of less than the margin amount, the excess margin is returned to the Funds. If the Funds have a gain, the full margin amount and the amount of the gain is paid to the Funds.
Some futures contracts provide for the delivery of securities that are different than those that are specified in the contract. For a futures contract for delivery of debt securities, on the settlement date of the contract, adjustments to the contract can be made to recognize differences in value arising from the delivery of debt securities with a different interest rate from that of the particular debt securities that were specified in the contract. In some cases, securities called for by a futures contract may not have been issued when the contract was written.
The Funds had futures contracts activity during the period ended June 30, 2024. Realized and unrealized gains and losses are included in the Consolidated Statements of Operations. The futures contracts held by the Fund are exchange-traded with StoneX Financial Inc. acting as the futures commission merchant.
| G. | Forward Contracts. The Funds may purchase forward currency contracts. A forward currency contract is a negotiated agreement between the contracting parties to exchange a specified amount of currency at a specified future time at a specified rate (e.g., 30, 60, or 90 days). The rate can be higher or lower than the spot rate between the currencies that are the subject of the contract. Realized and unrealized gains and losses are included in the Consolidated Statements of Operations. The forward currency contracts held by the Funds are traded with StoneX Financial Inc. acting as the forward contracts commission merchant. |
| H. | Basis for Consolidation for the Fund. The Funds may invest up to 25% of their total assets in their respective Cayman Subsidiaries. The Blueprint ETF may invest in the Blueprint-Chesapeake Cayman Subsidiary and the Cambria ETF may invest in the Cambria Chesapeake Cayman Subsidiary (collectively the “Subsidiaries”). The Subsidiaries will generally invest in futures contracts that do not generate “qualifying income” under the source of income test required to qualify as a regulated investment company (“RIC”) under Subchapter M of the Internal Revenue Code of 1986, as amended (the “Code”). Unlike the Funds, the Subsidiaries may invest without limitation in futures contracts and other derivative instruments; however, the Subsidiaries will comply with the same 1940 Act requirements that are applicable to the Funds’ transactions in derivatives. In addition, the Subsidiaries will be subject to the same fundamental investment restrictions and will follow the same compliance policies and procedures as the Funds. Unlike the Funds, the Subsidiaries will not seek to qualify as a RIC under the Code. The Funds are the sole investors in the Subsidiaries and do not expect the shares of the Subsidiaries to be offered or sold to other investors. The financial statements of the Subsidiaries are consolidated with the Funds’ financial statements. The Blueprint ETF and Cambria ETF had $2,535,917 or 2.2%, and $1,139,998 or 5.2%, respectively, of their total assets invested in their respective Subsidiaries as of June 30, 2024. |
36
| Notes to the Consolidated Financial Statements | Chesapeake ETFs |
| June 30, 2024 | |
| I. | Derivatives Transactions. Pursuant to Rule 18f-4 under the 1940 Act, the SEC imposes limits on the amount of derivatives a fund can enter into, eliminates the asset segregation and cover framework arising from prior SEC guidance for covering derivatives and certain financial instruments currently used by funds to comply with Section 18 of the 1940 Act and treats derivatives as senior securities. Under Rule 18f-4, a fund’s derivatives exposure is limited through a value-at-risk test. Funds whose use of derivatives is more than a limited specified exposure amount are required to establish and maintain a comprehensive derivatives risk management program, subject to oversight by a fund’s board of trustees, and appoint a derivatives risk manager. The Funds have implemented a Rule 18f-4 Derivative Risk Management Program that complies with Rule 18f-4. |
| J. | Deposits at Brokers. Deposits at brokers for futures contracts, forward currency contracts, and securities sold short represents amounts that are held by third parties under certain of the Funds’ derivative transactions. Such cash is excluded from cash and equivalents in the Consolidated Statements of Assets and Liabilities. Cash and cash equivalents and deposits at broker are subject to credit risk to the extent those balances exceed applicable Securities Investor Protection Corporations (“SIPC”) or Federal Deposit Insurance Corporation (“FDIC”) limitations. |
| K. | Short Sales. The Funds may make short sales as part of their overall portfolio management strategies or to offset a potential decline in value of a security. A short sale involves the sale of a security that is borrowed from a broker or other institution to complete the sale. Each Fund may engage in short sales with respect to securities it owns, as well as securities that it does not own. Short sales expose each Fund to the risk that it will be required to acquire, convert or exchange securities to replace the borrowed security (also known as “covering” the short position) at a time when the security sold short has appreciated in value, thus resulting in a loss to the Fund. Each Fund’s investment performance may also suffer if either Fund is required to close out a short position earlier than they had intended. Each Fund must segregate assets determined to be liquid in accordance with procedures established by the Board, or otherwise cover its positions in a permissible manner. Each Fund will be required to pledge their liquid assets to the broker to secure their performance on short sales. As a result, the assets pledged may not be available to meet the Funds’ needs for immediate cash or other liquidity. Interest income is accrued on cash proceeds held at the broker for short sales. In addition, each Fund may be subject to expenses related to short sales that are not typically associated with investing in securities directly, such as costs of borrowing and margin account maintenance costs associated with each Fund’s open short positions. These types of short sales expenses are sometimes referred to as the “negative cost of carry,” and will tend to cause a Fund to lose money on a short sale even in instances where the price of the security sold short does not change over the duration of the short sale. Dividend expenses on securities sold short will be borne by the shareholders of the Funds. |
| L. | Distributions to Shareholders. Distributions to shareholders from net investment income, if any, for each Fund are declared and paid annually. Distributions to shareholders from net realized gains on securities, if any, for each Fund normally are declared and paid on an annual basis. Distributions are recorded on the ex-dividend date. |
| M. | Use of Estimates. The preparation of consolidated financial statements in conformity with U.S. GAAP requires management to make estimates and assumptions that affect the reported amounts of assets and liabilities and disclosure of contingent assets and liabilities at the date of the consolidated financial statements and the reported amounts of increases and decreases in net assets from operations during the reporting period. Actual results could differ from those estimates. |
| N. | Share Valuation. The NAV per share of each Fund is calculated by dividing the sum of the value of the securities held by each Fund, plus cash or other assets, minus all liabilities by the total number of shares outstanding for each Fund, rounded to the nearest cent. Each Fund’s shares will not be priced on the days on which the New York Stock Exchange (“NYSE”) is closed for trading. |
| O. | Guarantees and Indemnifications. In the normal course of business, each Fund enters into contracts with service providers that contain general indemnification clauses. Each Fund’s maximum exposure under these arrangements is unknown as this would involve future claims that may be made against each Fund that have not yet occurred. However, based on experience, each Fund expects the risk of loss to be remote. |
| P. | Illiquid Securities. Pursuant to Rule 22e-4 under the 1940 Act, the Funds have adopted a Board-approved Liquidity Risk Management Program (the “Program”) that requires, among other things, that the Funds limit its illiquid investments that are assets to no more than 15% of the value of the Fund’s net assets. An illiquid investment is any security that the Funds reasonably expect cannot be sold or disposed of in current market conditions in seven calendar days or less without the sale or disposition significantly changing the market value of the investment. If the Funds should be in a position where the value of illiquid investments held by the Funds exceeds 15% of the Fund’s net assets, the Funds will take such steps as set forth in the Program. |
37
| Notes to the Consolidated Financial Statements | Chesapeake ETFs |
| June 30, 2024 | |
| Q. | Reclassification of Capital Accounts. U.S. GAAP require that certain components of net assets relating to permanent differences be reclassified between financial and tax reporting. These reclassifications are primarily due to activity within the subsidiary and partnership investments. These reclassifications have no effect on net assets or net asset value per share. For the period ended June 30, 2024, the following adjustments were made: |
| Fund | Paid-In Capital | Total Distributed (Accumulated) Earnings (Losses) | ||||||
| Blueprint ETF | $ | 921 | $ | (921 | ) | |||
| Cambria ETF | (162,829 | ) | 162,829 | |||||
| NOTE 3 – PRINCIPAL INVESTMENT RISKS |
Equity Market Risk. By virtue of the Funds’ investments in equity securities, each Fund is exposed to common stocks which subjects the Funds to equity market risk. Common stocks are generally exposed to greater risk than other types of securities, such as preferred stock and debt obligations, because common stockholders generally have inferior rights to receive payment from specific issuers. Equity securities may experience sudden, unpredictable drops in value or long periods of decline in value. This may occur because of factors that affect securities markets generally or factors affecting specific issuers, industries, or sectors in which the Funds invests.
Fixed Income Securities Risk. The prices of fixed income securities respond to economic developments, particularly interest rate changes, as well as to changes in an issuer’s credit rating or market perceptions about the creditworthiness of an issuer. Generally, fixed income securities decrease in value if interest rates rise and increase in value if interest rates fall, and longer-term and lower-rated securities are more volatile than shorter-term and higher-rated securities.
Derivatives Risk. Derivatives are financial instruments that derive value from the underlying reference asset or assets, such as stocks, bonds, commodities, currencies, funds (including ETFs), interest rates or indexes. The Funds’ investments in derivatives may pose risks in addition to, and greater than, those associated with directly investing in securities or other ordinary investments, including risk related to the market, imperfect correlation with underlying investments or the Funds’ other portfolio holdings, higher price volatility, lack of availability, counterparty risk, liquidity, valuation and legal restrictions. The use of derivatives is a highly specialized activity that involves investment techniques and risks different from those associated with ordinary portfolio securities transactions. The use of derivatives may result in larger losses or smaller gains than directly investing in the underlying reference asset(s). Because derivatives often require only a limited initial investment, the use of derivatives may expose each Fund to losses in excess of those amounts initially invested. In addition, the Funds’ investments in derivatives are subject to the following risks:
| ● | Futures Contracts. Risks of futures contracts include: (i) an imperfect correlation between the value of the futures contract and the underlying asset; (ii) possible lack of a liquid secondary market; (iii) the inability to close a futures contract when desired; (iv) losses caused by unanticipated market movements, which may be unlimited; (v) an obligation for the Funds to make daily cash payments to maintain its required margin, particularly at times when the Funds may have insufficient cash; and (vi) unfavorable execution prices from rapid selling. |
| ● | Forward Currency Contracts Risk. The Funds may invest in forward currency contracts. A forward currency contract is a negotiated agreement between the contracting parties to exchange a specified amount of currency at a specified future time at a specified rate. The rate can be higher or lower than the spot rate between the currencies that are the subject of the contract. Forward currency contracts may be used to protect against uncertainty in the level of future foreign currency exchange rates or to gain or modify exposure to a particular currency. Hedging the Funds’ currency risks involves the risk of mismatching the Funds’ objectives under a forward contract with the value of securities denominated in a particular currency. Furthermore, such transactions reduce or preclude the opportunity for gain if the value of the currency should move in the direction opposite to the position taken. There is an additional risk to the effect that currency contracts create exposure to currencies in which the Funds’ securities are not denominated. Unanticipated changes in currency prices may result in poorer overall performance for the Funds than if they had not entered into such contracts. |
38
| Notes to the Consolidated Financial Statements | Chesapeake ETFs |
| June 30, 2024 | |
Short Sales Risk. In connection with a short sale of a security or other instrument, the Funds are subject to the risk that instead of declining, the price of the security or other instrument sold short will rise. If the price of the security or other instrument sold short increases between the date of the short sale and the date on which the Funds replace the security or other instrument borrowed to make the short sale, the Funds will experience a loss, which is theoretically unlimited since there is a theoretically unlimited potential for the market price of a security or other instrument sold short to increase. Shorting options or futures may have an imperfect correlation to the assets held by the Funds and may not adequately protect against losses in or may result in greater losses for the Funds’ portfolios.
Cayman Subsidiary Risk. By investing in the Subsidiaries, the Funds are indirectly exposed to the risks associated with the Subsidiaries’ investments. The futures contracts and other investments held by the Subsidiaries are subject to the same economic risks that apply to similar investments if held directly by the Funds. The Subsidiaries are not registered under the 1940 Act, and, unless otherwise noted in this Prospectus, are not subject to all the investor protections of the 1940 Act. Changes in the laws of the United States and the Cayman Islands could result in the inability of the Funds and/or the Subsidiaries to continue to operate as they do currently and could adversely affect the Funds. For example, the Cayman Islands does not currently impose any income, corporate or capital gains tax or withholding tax on the Subsidiaries. If Cayman Islands law changes such that the Subsidiaries must pay Cayman Islands taxes, the Funds’ shareholders would likely suffer decreased investment returns.
As with any investment, there is a risk that you could lose all or a portion of your principal investment in the Funds. The Funds are subject to principal risks which may adversely affect the Funds’ NAV’s, trading price, yield, total return and/or ability to meet their objective. For more information about the risks of investing in the Funds, see the section in the Funds’ Prospectus titled “Additional Information About the Funds — Principal Risks of Investing in The Funds.”
NOTE 4 – COMMITMENTS AND OTHER RELATED PARTY TRANSACTIONS
The Adviser serves as investment adviser to the Funds pursuant to investment advisory agreements between the Adviser and the Trust, on behalf of the Funds (the “Advisory Agreements”)., and, pursuant to the Advisory Agreements, provides investment advice to the Funds and oversees the day-to-day operations of the Funds, subject to oversight of the Board. The Adviser is also responsible for trading portfolio securities for the Funds, including selecting broker-dealers to execute purchase and sale transactions, subject to the supervision of the Board. The Adviser also serves as adviser to the Subsidiaries pursuant to advisory agreements between the Adviser and the Subsidiaries (the “Subsidiary Advisory Agreements”). The Adviser does not receive any compensation for services rendered by the Adviser as investment adviser to the Subsidiaries and is not entitled to any compensation under the Subsidiary Advisory Agreements.
Pursuant to the Advisory Agreement, each Fund pays the Adviser a unitary management fee (the “Management Fee”) based on the average daily net assets of the Funds as follows:
| Fund | Management Fee |
| Blueprint ETF | 0.99% |
| Cambria ETF | 0.75% |
Out of the Management Fee, the Adviser is obligated to pay or arrange for the payment of substantially all expenses of the Funds, including the cost of transfer agency, custody, fund administration, and all other related services necessary for the Fund to operate. Under the Advisory Agreement, the Adviser has agreed to pay all expenses incurred by the Funds except for interest charges on any borrowings, dividends and other expenses on securities sold short, taxes, brokerage commissions and other expenses incurred in placing orders for the purchase and sale of securities and other investment instruments, acquired fund fees and expenses, accrued deferred tax liability, extraordinary expenses, and distribution fees and expenses paid by the Funds under any distribution plan adopted pursuant to Rule 12b-1 under the 1940 Act (collectively, “Excluded Expenses”), and the Management Fee payable to the Adviser. The Management Fees incurred are paid monthly to the Adviser. Management fees for the period ended June 30, 2024 are disclosed in the Consolidated Statements of Operations.
The Sub-Advisers serve as sub-adviser to the Funds, pursuant to the sub-advisory agreement between the Adviser and the Sub- Advisers with respect to the Funds (the “Sub-Advisory Agreements”). Pursuant to the Sub-Advisory Agreements, the Sub-Advisers are responsible for the day-to-day management of the Funds’ portfolio, including determining the securities purchased and sold by the Funds, subject to the supervision of the Adviser and the Board. For their services, the Sub-Advisers are paid a fee by the Adviser, which fee is calculated daily and paid monthly. For the Blueprint ETF, the Sub-Advisers have agreed to assume the Adviser’s obligation to pay all expenses incurred by the Fund, except for Excluded Expenses. For the Cambria ETF, the Sub-Advisers and Adviser have agreed that each will have a joint obligation to pay all expenses incurred by the Fund, except for Excluded Expenses. For assuming the payment obligation, the Adviser has agreed to pay to the Sub-Advisers the profits, if any, generated by each Fund’s Management Fee, less a contractual fee retained by the Adviser. Expenses incurred by the Funds and paid by the Sub-Advisers include fees charged by Tidal, as defined below.
39
| Notes to the Consolidated Financial Statements | Chesapeake ETFs |
| June 30, 2024 | |
Tidal ETF Services LLC (“Tidal”), a Tidal Financial Group company and an affiliate of the Adviser, serves as each Fund’s administrator and, in that capacity, performs various administrative and management services for the Funds. Tidal coordinates the payment of Fund related expenses and manages the Trust’s relationships with its various service providers.
U.S. Bancorp Fund Services, LLC, doing business as U.S. Bank Global Fund Services (“Fund Services”), serves as each Fund’s sub-administrator, fund accountant and transfer agent. In those capacities Fund Services performs various administrative and accounting services for the Funds. Fund Services prepares various federal and state regulatory filings, reports and returns for the Funds, including regulatory compliance monitoring and financial reporting; prepares reports and materials to be supplied to the Board; and monitors the activities of the Fund’s custodian U.S. Bank N.A. (the “Custodian”), an affiliate of Fund Services, serves as the Funds’ custodian.
Foreside Fund Services, LLC (the “Distributor”) acts as the Funds’ principal underwriter in a continuous public offering of the Fund’s shares.
Certain officers and a trustee of the Trust are affiliated with the Adviser. Neither the affiliated trustee nor the Trust’s officers receive compensation from the Funds.
The Board has adopted a Distribution (Rule 12b-1) Plan (the “Plan”) pursuant to Rule 12b-1 under the 1940 Act. In accordance with the Plan, each Fund is authorized to pay an amount up to 0.25% of its average daily net assets each year to pay distribution fees for the sale and distribution of its Shares. No Rule 12b-1 fees are currently paid by the Funds, and there are no plans to impose these fees. However, in the event Rule 12b-1 fees are charged in the future, because the fees are paid out of Funds assets on an ongoing basis, over time these fees will increase the cost of your investment and may cost you more than certain other types of sales charges.
NOTE 5 – PURCHASES AND SALES OF SECURITIES
For the period ended June 30, 2024, the cost of purchases and proceeds from the sales or maturities of securities, excluding short-term investments, securities sold short, U.S. government securities, in-kind transactions, and purchases and sales of the Subsidiaries, were as follows:
| Fund | Purchases | Sales | ||||||
| Blueprint ETF | $ | 99,101,739 | $ | 31,983,990 | ||||
| Cambria ETF | 10,535,011 | — | ||||||
For the period ended June 30, 2024, there were no purchases and sales of long-term U.S. government securities.
For the period ended June 30, 2024, the in-kind transactions associated with creations and redemptions for the Funds were as follows:
| Fund | Purchases | Sales | ||||||
| Blueprint ETF | $ | 2,507,746 | $ | — | ||||
| Cambria ETF | — | — | ||||||
NOTE 6 – INCOME TAXES AND DISTRIBUTIONS TO SHAREHOLDERS
The tax character of distributions paid during the periods ended June 30, 2024 were as follows:
| Fund | Distributions paid from: | June 30, 2024 | ||||
| Blueprint ETF | Ordinary Income | $ | 647,460 | |||
| Cambria ETF | Ordinary Income | — | ||||
40
| Notes to the Consolidated Financial Statements | Chesapeake ETFs |
| June 30, 2024 | |
As of June 30, 2024, the components of distributable (accumulated) earnings (losses) on a tax basis were as follows:
| Blueprint ETF | Cambria ETF | |||||||
| Cost of investments(1) | $ | 94,706,669 | $ | 16,922,183 | ||||
| Gross tax unrealized appreciation | 8,415,474 | 536,507 | ||||||
| Gross tax unrealized depreciation | (3,007,195 | ) | (728,293 | ) | ||||
| Net tax unrealized appreciation (depreciation) | 5,408,279 | (191,786 | ) | |||||
| Undistributed ordinary income (loss) | 1,337,403 | 70,885 | ||||||
| Undistributed long-term capital gain (loss) | — | — | ||||||
| Total distributable earnings | 1,337,403 | 70,885 | ||||||
| Other accumulated gain (loss) | (6,508,865 | ) | (145,106 | ) | ||||
| Total distributable (accumulated) earnings (losses) | $ | 236,816 | $ | (266,007 | ) | |||
| (1) | The difference between book and tax-basis cost of investments was attributable primarily to the treatment of wash sales, mark-to-market treatment of futures and open forward currency contracts, and PFIC adjustments. |
Net capital losses incurred after October 31 (post-October losses) and net investment losses incurred after December 31 (late-year losses), and within the taxable year, may be elected to be deferred to the first business day of the Funds’ next taxable year. As of the most recent fiscal period ended June 30, 2024, the Funds had not elected to defer any post-October or late year losses.
As of the most recent fiscal period ended June 30, 2024, the Funds had long-term and short-term capital loss carryovers of the following, which do not expire.
| Fund | Short-Term | Long-Term | ||||||
| Blueprint ETF | $ | 6,086,919 | $ | 421,946 | ||||
| Cambria ETF | 71,379 | 73,727 | ||||||
NOTE 7 – SHARE TRANSACTIONS
Shares of the Blueprint ETF are listed and traded on the NYSE Arca, Inc. and shares of the Cambria ETF are listed and traded on the CBOE BZX Exchange, Inc. Market prices for the shares may be different from their NAV. Each Fund issues and redeems shares on a continuous basis at NAV generally in large blocks of shares, called “Creation Units.” Creation Units are issued and redeemed principally in-kind for securities included in a specified universe. Once created, shares generally trade in the secondary market at market prices that change throughout the day. Except when aggregated in Creation Units, shares are not redeemable securities of the Funds. Creation Units may only be purchased or redeemed by Authorized Participants. An Authorized Participant is either (i) a broker-dealer or other participant in the clearing process through the Continuous Net Settlement System of the National Securities Clearing Corporation or (ii) a Depository Trust Company participant and, in each case, must have executed a Participant Agreement with the Distributor. Most retail investors do not qualify as Authorized Participants nor have the resources to buy and sell whole Creation Units. Therefore, they are unable to purchase or redeem the shares directly from the Funds. Rather, most retail investors may purchase shares in the secondary market with the assistance of a broker and are subject to customary brokerage commissions or fees.
Each Fund currently offers one class of shares, which has no front-end sales load, no deferred sales charge, and no redemption fee. A fixed transaction fee is imposed for the transfer and other transaction costs associated with the purchase or sale of Creation Units. The standard fixed transaction fee is $500 for the Blueprint ETF and $300 for the Cambria ETF, payable to the Custodian. The fixed transaction fee may be waived on certain orders if the Funds’ Custodian has determined to waive some or all of the costs associated with the order or another party, such as the Adviser, has agreed to pay such fee. In addition, a variable fee may be charged on all cash transactions or substitutes for Creation Units of up to a maximum of 2% and for Redemption Units of up to a maximum of 2% of the value of the Creation Units and Redemption Units subject to the transaction. Variable fees received by the Funds, if any, are disclosed in the capital shares transactions section of the Statements of Changes in Net Assets. Each Fund may issue an unlimited number of shares of beneficial interest, with no par value. All shares of the Funds have equal rights and privileges.
41
| Notes to the Consolidated Financial Statements | Chesapeake ETFs |
| June 30, 2024 | |
NOTE 8 – RECENT MARKET EVENTS
U.S. and international markets have experienced and may continue to experience significant periods of volatility in recent years and months due to a number of economic, political and global macro factors including rising inflation, uncertainty regarding central banks’ interest rate increases, the possibility of a national or global recession, trade tensions, political events, the war between Russia and Ukraine, significant conflict between Israel and Hamas in the Middle East, and the impact of COVID-19. The global recovery from COVID-19 may last for an extended period of time. As a result of continuing political tensions and armed conflicts, including the war between Ukraine and Russia, the U.S. and the European Union imposed sanctions on certain Russian individuals and companies, including certain financial institutions, and have limited certain exports and imports to and from Russia. The war has contributed to recent market volatility and may continue to do so. The Middle East conflict has led to significant loss of life, damaged infrastructure and escalated tensions both in the region and globally. These developments, as well as other events, could result in further market volatility and negatively affect financial asset prices, the liquidity of certain securities and the normal operations of securities exchanges and other markets, despite government efforts to address market disruptions. As a result, the risk environment remains elevated. The Adviser and Sub-Advisers will monitor developments and seek to manage the Funds in a manner consistent with achieving the Funds’ investment objective, but there can be no assurance that they will be successful in doing so.
NOTE 9 – SUBSEQUENT EVENTS
In preparing these consolidated financial statements, each Fund has evaluated events and transactions for potential recognition or disclosure through the date the consolidated financial statements were issued. Management has determined that there are no subsequent events that would need to be recorded or disclosed in the Funds’ consolidated financial statements.
42
| Report of Independent Registered Public Accounting Firm | Chesapeake ETFs |
| June 30, 2024 | |
To the Shareholders of Chesapeake ETFs and
Board of Trustees of Tidal Trust II
Opinion on the Financial Statements
We have audited the accompanying consolidated statements of assets and liabilities, including the consolidated schedules of investments, securities sold short, futures contracts, and forward currency contracts (as applicable), of Blueprint Chesapeake Multi-Asset Trend ETF and Cambria Chesapeake Pure Trend ETF (the “Funds”), each a series of Tidal Trust II, as of June 30, 2024, the related consolidated statements of operations and changes in net assets, and the consolidated financial highlights for each of the periods indicated below, and the related notes (collectively referred to as the “consolidated financial statements”). In our opinion, the consolidated financial statements present fairly, in all material respects, the financial position of each of the Funds as of June 30, 2024, the results of their operations, the changes in their net assets, and the financial highlights for the periods indicated below, in conformity with accounting principles generally accepted in the United States of America.
| Fund Name | Consolidated
Statements of Operations |
Consolidated
Statements of Changes in Net Assets |
Consolidated
Financial Highlights |
| Blueprint Chesapeake Multi-Asset Trend ETF | For the period from July 11, 2023 (commencement of operations) through June 30, 2024 | ||
| Cambria Chesapeake Pure Trend ETF | For the period from May 28, 2024 (commencement of operations) through June 30, 2024 | ||
Basis for Opinion
These consolidated financial statements are the responsibility of the Funds’ management. Our responsibility is to express an opinion on the Funds’ consolidated financial statements based on our audits. We are a public accounting firm registered with the Public Company Accounting Oversight Board (United States) (“PCAOB”) and are required to be independent with respect to the Funds in accordance with the U.S. federal securities laws and the applicable rules and regulations of the Securities and Exchange Commission and the PCAOB.
We conducted our audits in accordance with the standards of the PCAOB. Those standards require that we plan and perform the audit to obtain reasonable assurance about whether the consolidated financial statements are free of material misstatement whether due to error or fraud.
Our audits included performing procedures to assess the risks of material misstatement of the consolidated financial statements, whether due to error or fraud, and performing procedures that respond to those risks. Such procedures included examining, on a test basis, evidence regarding the amounts and disclosures in the consolidated financial statements. Our procedures included confirmation of securities owned as of June 30, 2024, by correspondence with the custodian and brokers. Our audits also included evaluating the accounting principles used and significant estimates made by management, as well as evaluating the overall presentation of the consolidated financial statements. We believe that our audits provide a reasonable basis for our opinion.
43
| Report of Independent Registered Public Accounting Firm | Chesapeake ETFs |
| June 30, 2024 | |
We have served as the auditor of one or more of Tidal Investment LLC’s Investment companies since 2020.
COHEN & COMPANY, LTD.
Philadelphia, Pennsylvania
August 29, 2024
44
| Other Non-Audited Information (Unaudited) | Chesapeake ETFs |
| June 30, 2024 | |
QUALIFIED DIVIDEND INCOME/DIVIDENDS RECEIVED DEDUCTION
For the period ended June 30, 2024, certain dividends paid by the Funds may be subject to a maximum tax rate of 23.8%, as provided for by the Jobs and Growth Tax Relief Reconciliation Act of 2003 and the Tax Cuts and Jobs Act of 2017. The percentage of dividends declared from ordinary income designated as qualified dividend income was as follows:
| Blueprint Chesapeake Multi-Asset Trend ETF | 14.82% |
| Cambria Chesapeake Pure Trend ETF | 0.00% |
For corporate shareholders, the percent of ordinary income distributions qualifying for the corporate dividends received deduction for the period ended June 30, 2024, was as follows:
| Blueprint Chesapeake Multi-Asset Trend ETF | 10.14% |
| Cambria Chesapeake Pure Trend ETF | 0.00% |
The percentage of taxable ordinary income distributions that are designated as short-term capital gain distribution under Internal Revenue Section 871(k)(2)(c) for the period ended June 30, 2024, was as follows:
| Blueprint Chesapeake Multi-Asset Trend ETF | 0.00% |
| Cambria Chesapeake Pure Trend ETF | 0.00% |
45
| Item 8. Changes in and Disagreements with Accountants for Open- End Management Investment Companies (Unaudited) | Chesapeake ETFs |
| June 30, 2024 | |
An open-end management investment company registered on Form N-1A [17 CFR 239.15A and 17 CFR 274.11A] must disclose the information concerning changes in and disagreements with accountants and on accounting and financial disclosure required by Item 304 of Regulation S-K [17 CFR 229.304].
Response: There have been no changes in or disagreements with the Funds’ accountants.
46
| Item 9. Proxy Disclosures for Open- End Management Investment Companies (Unaudited) | Chesapeake ETFs |
| June 30, 2024 | |
If any matter was submitted during the period covered by the report to a vote of shareholders of an open-end management investment company registered on Form N-1A [17 CFR 239.15A and 17 CFR 274.11A], through the solicitation of proxies or otherwise, the company must furnish the following information:
(1) The date of the meeting and whether it was an annual or special meeting.
(2) If the meeting involved the election of directors, the name of each director elected at the meeting and the name of each other director whose term of office as a director continued after the meeting.
(3) A brief description of each matter voted upon at the meeting and the number of votes cast for, against or withheld, as well as the number of abstentions and broker non-votes as to each such matter, including a separate tabulation with respect to each matter or nominee for office.
Response: There were no matters submitted to a vote of shareholders during the period covered by the report.
47
| Item 10. Remuneration Paid to Directors, Officers, and Others of Open-End Management Investment Companies (Unaudited) | Chesapeake ETFs |
| June 30, 2024 | |
Unless the following information is disclosed as part of the financial statements included in Item 7, an open-end management investment company registered on Form N-1A [17 CFR 239.15A and 17 CFR 274.11A] must disclose the aggregate remuneration paid by the company during the period covered by the report to:
(1) All directors and all members of any advisory board for regular compensation;
(2) Each director and each member of an advisory board for special compensation;
(3) All officers; and
(4) Each person of whom any officer or director of the Funds is an affiliated person
Response: See Item 7(a)
48
| Item 11. Statement Regarding Basis for Approval of Investment Advisory Contract (Unaudited) | Chesapeake ETFs |
| June 30, 2024 | |
Cambria Chesapeake Pure Trend ETF (the “Cambria Chesapeake ETF” or the “Fund”)
APPROVAL OF ADVISORY, SUB-ADVISORY AND FUTURES TRADING ADVISORY AGREEMENTS AND BOARD CONSIDERATIONS
Pursuant to Section 15(c) of the Investment Company Act of 1940 (the “1940 Act”), at a meeting held on May 14, 2024, the Board of Trustees (the “Board”) of Tidal Trust II (the “Trust”) considered the approval of:
● the Investment Advisory Agreement (the “Advisory Agreement”) between Tidal Investments LLC (the “Adviser”) and the Trust, on behalf of the Fund;
● an Investment Sub-Advisory Agreement (a “Sub-Advisory Agreement) between the Adviser and Cambria Investment Management, L.P. (“Cambria”) with respect to the Cambria Chesapeake ETF;
● an Investment Sub-Advisory Agreement (a “Sub-Advisory Agreement) between the Adviser and Chesapeake Capital Corporation (“Chesapeake”) with respect to the Cambria Chesapeake ETF;
● a Futures Trading Advisory Agreement (the “Futures Trading Advisory Agreement”) between the Adviser and Chesapeake (the “Futures Trading Adviser”) with respect to the Cambria Chesapeake ETF;
● an Investment Advisory Agreement between the Cambria Chesapeake Cayman Subsidiary and the Adviser with respect to the Cambria Chesapeake ETF;
● a Subsidiary Futures Trading Advisory Agreement between the Adviser and Chesapeake with respect to the Cambria Chesapeake Cayman Subsidiary Futures;
Pursuant to Section 15 of the 1940 Act, the Agreements must be approved by the vote of a majority of the Trustees who are not parties to the Agreements or “interested persons” of any party thereto, as defined in the 1940 Act (the “Independent Trustees”), cast in person at a meeting called for the purpose of voting on such approval. It is noted that in accordance with the SEC’s temporary exemptive relief for in-person approvals, these approvals shall be ratified at the next in-person Board meeting.
In preparation for such meeting, the Board requested and reviewed a wide variety of information from the Adviser and Sub-Adviser.
In reaching its decision, the Board, including the Independent Trustees, considered all factors it believed relevant, including: (i) the nature, extent and quality of the services to be provided to the Fund’s shareholders by the Adviser, Sub-Advisers and Futures Trading Adviser (with respect to the Cambria Chesapeake ETF and Cambria Chesapeake Cayman Subsidiary); (ii) the costs of the services to be provided and the profits to be realized by the Adviser, Sub-Advisers and Futures Trading Adviser (with respect to the Cambria Chesapeake ETF and Cambria Chesapeake Cayman Subsidiary);) from services to be provided to the Fund, including any fall-out benefits; (iv) comparative fee and expense data for the Fund in relation to other investment companies with similar investment objectives; (v) the extent to which economies of scale would be realized as the Fund grows and whether the advisory fees for the Fund reflects these economies of scale for the benefit of the Fund; and (vi) other financial benefits to the Adviser or Sub-Advisers and Futures Trading Adviser (with respect to the Cambria Chesapeake ETF and Cambria Chesapeake Cayman Subsidiary);) and their affiliates resulting from services rendered to the Fund. The Board’s review included written and oral information furnished to the Board prior to and at the meeting held on May 14, 2024. Among other things, each of the Adviser, Sub-Advisers and Futures Trading Adviser provided responses to a detailed series of questions, which included information about the Adviser’s, Sub-Advisers’ and Future Trading Adviser’s operations, service offerings, personnel, compliance program and financial condition. The Board then discussed the written and oral information that it received before the meeting, and the Adviser’s oral presentations and any other information that the Board received at the meeting and deliberated on the renewal of the Agreements in light of this information.
The Independent Trustees were assisted throughout the contract review process by independent legal counsel. The Independent Trustees relied upon the advice of such counsel and their own business judgment in determining the material factors to be considered in evaluating the renewal of the Agreements, and the weight to be given to each such factor. The conclusions reached with respect to the Agreements were based on a comprehensive evaluation of all the information provided and not any single factor. Moreover, each Trustee may have placed varying emphasis on particular factors in reaching conclusions with respect to the Fund. The Independent Trustees conferred amongst themselves and independent legal counsel in executive sessions both with and without representatives of management.
49
| Item 11. Statement Regarding Basis for Approval of Investment Advisory Contract (Unaudited) | Chesapeake ETFs |
| June 30, 2024 | |
Nature, Extent and Quality of Services to be Provided. The Trustees considered the scope of services to be provided under the Advisory Agreement, Sub-Advisory Agreements and Futures Trading Advisory Agreements. In considering the nature, extent and quality of the services to be provided by the Adviser, Sub-Advisers and Futures Trading Adviser (with respect to the Cambria Chesapeake ETF and Cambria Chesapeake Cayman Subsidiary); the Board reviewed the Adviser’s, Sub-Advisers’ and Futures Trading Adviser’s (with respect to Cambria Chesapeake ETF and Cambria Chesapeake Cayman Subsidiary) compliance infrastructure and its financial strength and resources. The Board also considered the experience of the personnel of the Adviser, Sub-Advisers and Futures Trading Advise (with respect to the Cambria Chesapeake ETF and Cambria Chesapeake Cayman Subsidiary) working with ETFs. The Board also considered other services to be provided to the Fund by the Adviser. Sub-Advisers and Futures Trading Adviser (with respect to the Cambria Chesapeake ETF and Cambria Chesapeake Cayman Subsidiary), such as selecting broker-dealers for executing portfolio transactions, monitoring adherence to the Fund’s investment restrictions, and monitoring compliance with various Fund policies and procedures and with applicable securities regulations. Based on the factors above, as well as those discussed below, the Board concluded that it was satisfied with the nature, extent and quality of the services to be provided to the Fund by the Adviser, Sub-Advisers and Futures Trading Adviser (with respect to the Cambria Chesapeake ETF and Cambria Chesapeake Cayman Subsidiary) based on their experience, personnel, operations and resources.
Historical Performance. The Board noted that the Fund had not yet commenced operations and that therefore there was no prior performance to review.
Cost of Services Provided, Profitability and Economies of Scale. The Board reviewed the proposed advisory fees for the Fund and compared them to the management fees and total operating expenses of its Peer Group. The Board noted that the comparisons to the total expense ratios were the most relevant comparisons, given the fact that the advisory fee for the Fund is a “unified fee.”
The Board noted the importance of the fact that the proposed advisory fee for the Fund is a “unified fee,” meaning that the shareholders of the Fund pay no expenses except for interest charges on any borrowings, dividends and other expenses on securities sold short, taxes, brokerage commissions and other expenses incurred in placing orders for the purchase and sale of securities and other investment instruments, acquired fund fees and expenses, accrued deferred tax liability, distribution fees and expenses paid by the Fund under any distribution plan adopted pursuant to Rule 12b-1 under the Investment Company Act of 1940 Act, as amended (the “1940 Act”), litigation expenses, non-routine or extraordinary expenses, and the unitary management fee payable to the Adviser. The Board also noted that the Adviser was responsible for compensating the Trust’s other service providers and paying the Fund’s other expenses (except as noted above) out of its own fees and resources. The Board further noted that because the Fund is new, it was difficult to estimate the profitability of the Fund to the Adviser. The Board, however, considered collateral or “fall-out” benefits that the Adviser and its affiliates may derive as a result of their relationship with the Fund. The Board did note that the Adviser did not receive any additional compensation for serving as investment adviser to the Cambria Chesapeake Cayman Subsidiary.
The Board noted that because the Fund is new, it also was difficult to estimate whether the Fund would experience economies of scale. The Board noted that the Adviser will review expenses as the Fund’s assets grow. The Board determined to evaluate economies of scale on an ongoing basis if the Fund achieved asset growth.
The Board also reviewed the proposed sub-advisory fee paid to each Sub-Adviser and the Futures Trading Adviser (with respect to the Cambria Chesapeake ETF and Cambria Chesapeake Cayman Subsidiary) for their services. The Board considered each of these fees in light of the services being provided. The Board determined that the proposed fees reflected an appropriate allocation of the advisory fee paid to the Adviser, each Sub-Adviser and Futures Trading Adviser given the work performed by each firm. The Board also noted that, with respect to the Cambria Chesapeake ETF, the Futures Trading Adviser is not receiving any additional compensation for serving as futures trading adviser to the Cambria Chesapeake Cayman Subsidiary. The Board also considered that Cambria and Chesapeake were acting as sponsors for the Cambria Chesapeake ETF, and each had agreed to assume the payment of any fund expenses above the level of the unitary fee. The Board considered that pursuant to these arrangements, if fund expenses, including a payment to the Adviser of a certain amount, fall below the level of the unitary fee, the Adviser would pay any remaining portion of the unitary fee to the respective sponsor out of its profits. The Board concluded that the proposed fees for the Fund were reasonable in light of the services rendered.
50
| Item 11. Statement Regarding Basis for Approval of Investment Advisory Contract (Unaudited) | Chesapeake ETFs |
| June 30, 2024 | |
The Board also considered that the sub-advisory fees and futures trading advisory fee paid to the Sub-Advisers and Futures Trading Adviser (with respect to the Cambria Chesapeake ETF and Cambria Chesapeake Cayman Subsidiary) is paid out of the Adviser’s unified fee and represents an arm’s-length negotiation between the Adviser, the Sub-Advisers and the Futures Trading Adviser. For these reasons, the Trustees determined that the profitability to the Sub-Advisers and Futures Trading Adviser from respective relationships with the respective Fund was not a material factor in their deliberations with respect to consideration of approval of the Sub-Advisory Agreements and
Futures Trading Agreements. The Board considered that, because these fees are paid by the Adviser out of its unified fee, any economies of scale would not benefit shareholders and, thus, were not relevant for the consideration of the approval of the sub-advisory fee.
Conclusion. No single factor was determinative to the decision of the Board. Based on the Board’s deliberations and its evaluation of the information described above and such other matters as were deemed relevant, the Board, including the Independent Trustees, unanimously: (a) concluded that the terms of each Advisory Agreement, Sub-Advisory Agreement and Futures Trading Agreement are fair and reasonable; (b) concluded that each of the Adviser’s Sub-Adviser’s and Futures Trading Adviser’s fees are reasonable in light of the services that the Adviser, Sub-Advisers and Futures Trading Adviser will provide to the Fund; and (c) agreed to approve the Agreement for an initial term of two years.
51
| (b) | Financial Highlights are included within the financial statements filed under Item 7(a) of this Form.” |
Item 8. Changes in and Disagreements with Accountants for Open-End Investment Companies.
See Item 7(a).
There were no changes in or disagreements with accountants during the period covered by this report.
Item 9. Proxy Disclosure for Open-End Investment Companies.
There were no matters submitted to a vote of shareholders during the period covered by this report.
Item 10. Remuneration Paid to Directors, Officers, and Others of Open-End Investment Companies.
The aggregate remuneration paid to the Registrant’s trustees, officers and others, if any, is included in Item 7 of this report.
Item 11. Statement Regarding Basis for Approval of Investment Advisory Contract.
See Item 7(a).
Item 12. Disclosure of Proxy Voting Policies and Procedures for Closed-End Management Investment Companies.
Not applicable to open-end investment companies.
Item 13. Portfolio Managers of Closed-End Management Investment Companies.
Not applicable to open-end investment companies.
Item 14. Purchases of Equity Securities by Closed-End Management Investment Company and Affiliated Purchasers.
Not applicable to open-end investment companies.
Item 15. Submission of Matters to a Vote of Security Holders.
Not Applicable.
4
Item 16. Controls and Procedures.
| (a) | The Registrant’s President/Principal Executive Officer and Treasurer/Principal Financial Officer have reviewed the Registrant's disclosure controls and procedures (as defined in Rule 30a-3(c) under the Investment Company Act of 1940 (the “Act”)) as of a date within 90 days of the filing of this report, as required by Rule 30a-3(b) under the Act and Rules 13a-15(b) or 15d-15(b) under the Securities Exchange Act of 1934. Based on their review, such officers have concluded that the disclosure controls and procedures are effective in ensuring that information required to be disclosed in this report is appropriately recorded, processed, summarized and reported and made known to them by others within the Registrant and by the Registrant’s service provider. |
| (b) | There were no changes in the Registrant's internal control over financial reporting (as defined in Rule 30a-3(d) under the Act) that occurred during the period covered by this report that have materially affected, or are reasonably likely to materially affect, the Registrant's internal control over financial reporting. |
Item 17. Disclosure of Securities Lending Activities for Closed-End Management Investment Companies
Not applicable to open-end investment companies.
Item 18. Recovery of Erroneously Awarded Compensation.
(a) Not Applicable
(b) Not Applicable
Item 19. Exhibits.
| (a) | (1) Any code of ethics or amendment thereto, that is the subject of the disclosure required by Item 2, to the extent that the registrant intends to satisfy Item 2 requirements through filing an exhibit. Filed herewith. |
(2) Any policy required by the listing standards adopted pursuant to Rule 10D-1 under the Exchange Act (17 CFR 240.10D-1) by the registered national securities exchange or registered national securities association upon which the registrant’s securities are listed. Filed herewith.
(3) A separate certification for each principal executive officer and principal financial officer pursuant to Section 302 of the Sarbanes-Oxley Act of 2002. Filed herewith.
(4) Any written solicitation to purchase securities under Rule 23c-1 under the Act sent or given during the period covered by the report by or on behalf of the registrant to 10 or more persons. Not applicable.
(5) Change in the registrant’s independent public accountant. Provide the information called for by Item 4 of Form 8-K under the Exchange Act (17 CFR 249.308). Unless otherwise specified by Item 4, or related to and necessary for a complete understanding of information not previously disclosed, the information should relate to events occurring during the reporting period. Not applicable.
| (b) | Certifications pursuant to Section 906 of the Sarbanes-Oxley Act of 2002. Furnished herewith. |
5
SIGNATURES
Pursuant to the requirements of the Securities Exchange Act of 1934 and the Investment Company Act of 1940, the registrant has duly caused this report to be signed on its behalf by the undersigned, thereunto duly authorized.
| (Registrant) | Tidal Trust II |
| By (Signature and Title)* | /s/ Eric W. Falkeis | ||
| Eric W. Falkeis, President/Principal Executive Officer | |||
| Date | September 6, 2024 |
Pursuant to the requirements of the Securities Exchange Act of 1934 and the Investment Company Act of 1940, this report has been signed below by the following persons on behalf of the registrant and in the capacities and on the dates indicated.
| By (Signature and Title)* | /s/ Eric W. Falkeis | ||
| Eric W. Falkeis, President/Principal Executive Officer | |||
| Date | September 6, 2024 |
| By (Signature and Title)* | /s/ Aaron J. Perkovich | ||
| Aaron J. Perkovich, Treasurer/Principal Financial Officer | |||
| Date | September 6, 2024 |
* Print the name and title of each signing officer under his or her signature.
6