UNITED STATES
SECURITIES AND EXCHANGE COMMISSION
WASHINGTON, D.C. 20549
FORM
OR
For
the fiscal year ended
OR
OR
Date of event requiring this shell company report
For the transition period from to
Commission
file number:
(Exact name of Registrant as specified in its charter)
N/A
(Translation of Registrant’s name into English)
(Jurisdiction of incorporation or organization)
+603 2781 9066
(Address of principal executive offices)
Telephone:
+
Email:
At the address of the Company set forth above
(Name, Telephone, E-mail and/or Facsimile number and Address of Company Contact Person)
Securities registered or to be registered pursuant to Section 12(b) of the Act.
| Title of each class | Trading Symbol(s) | Name of each exchange on which registered | ||
| The
|
Securities registered or to be registered pursuant to Section 12(g) of the Act.
None
(Title of Class)
Securities for which there is a reporting obligation pursuant to Section 15(d) of the Act.
None
(Title of Class)
Indicate the number of outstanding shares of each of the issuer’s classes of capital or common stock as of the close of the period covered by the annual report.
An aggregate of ordinary shares, par value $0.001125 per share, as of September 30, 2022.
Indicate by check mark if the registrant is a well-known seasoned issuer, as defined in Rule 405 of the Securities Act.
Yes
☐
If this report is an annual or transition report, indicate by check mark if the registrant is not required to file reports pursuant to Section 13 or 15(d) of the Securities Exchange Act of 1934.
Yes
☐
Indicate by check mark whether the registrant (1) has filed all reports required to be filed by Section 13 or 15(d) of the Securities Exchange Act of 1934 during the preceding 12 months (or for such shorter period that the registrant was required to file such reports), and (2) has been subject to such filing requirements for the past 90 days.
Indicate by check mark whether the registrant has submitted electronically every Interactive Data File required to be submitted pursuant to Rule 405 of Regulation S-T (§232.405 of this chapter) during the preceding 12 months (or for such shorter period that the registrant was required to submit such files).
Indicate by check mark whether the registrant is a large accelerated filer, an accelerated filer, a non-accelerated filer, or an emerging growth company. See definition of “large accelerated filer,” “accelerated filer,” and “emerging growth company” in Rule 12b-2 of the Exchange Act.
| Large accelerated filer | ☐ | Accelerated filer | ☐ |
| ☒ | Emerging growth company |
If
an emerging growth company that prepares its financial statements in accordance with U.S. GAAP, indicate by check mark if the registrant
has elected not to use the extended transition period for complying with any new or revised financial accounting standards provided pursuant
to Section 13(a) of the Exchange Act.
Indicate
by check mark whether the registrant has filed a report on and attestation to its management’s assessment of the effectiveness
of its internal control over financial reporting under Section 404(b) of the Sarbanes-Oxley Act (15 U.S.C. 7262(b)) by the registered
public accounting firm that prepared or issued its audit report.
Indicate by check mark which basis of accounting the registrant has used to prepare the financial statements included in this filing:
| International Financial Reporting Standards as issued by the International Accounting Standards Board ☐ | Other ☐ |
| * | If “Other” has been checked in response to the previous question, indicate by check mark which financial statement item the registrant has elected to follow. Item 17 ☐ Item 18 ☐ |
If
this is an annual report, indicate by check mark whether the registrant is a shell company (as defined in Rule 12b-2 of the Exchange
Act). Yes ☐
TABLE OF CONTENTS
| 2 |
INTRODUCTION
In this annual report on Form 20-F, unless the context otherwise requires, references to:
| ● | “GETBATS website and mobile app” are to the GETBATS cash rebate website (www.getbats.com) and the GETBATS app operated by StarboxGB (defined below); |
| ● | “Members” are to retail shoppers that have registered as a member on the GETBATS website and mobile app; |
| ● | “Merchants” are to retail merchants (both online and offline) that have registered as a merchant on the GETBATS website and mobile app; |
| ● | “MYR” are to the Malaysian ringgit, the legal currency of Malaysia; |
| ● | “Nasdaq” are to the Nasdaq Stock Market LLC; |
| ● | “Ordinary Shares” are to ordinary shares of Starbox Group (defined below), par value $0.001125 per share; |
| ● | “Preferred Shares” are to preferred shares of Starbox Group, par value $0.001125 per share; |
| ● | “SEC” are to the U.S. Securities and Exchange Commission; |
| ● | “SEEBATS website and mobile app” are to the SEEBATS video streaming website (www.seebats.com) and the SEEBATS app operated by StarboxSB (defined below); |
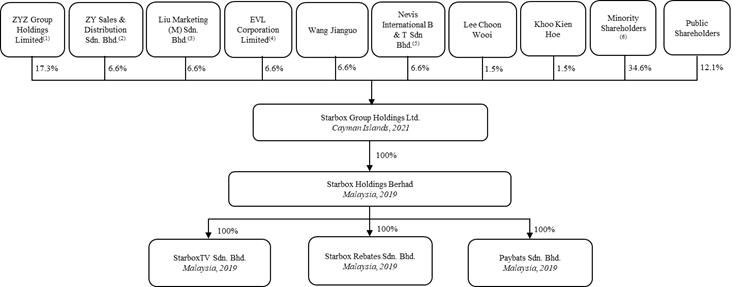
| ● | “Starbox Berhad” are to Starbox Holdings Berhad, a company limited by shares incorporated under the laws of Malaysia and a wholly owned subsidiary of Starbox Group (defined below); |
| ● | “StarboxGB” are to Starbox Rebates Sdn. Bhd., a company limited by shares incorporated under the laws of Malaysia, which is a wholly owned subsidiary of Starbox Berhad; |
| ● | “Starbox Group” are to Starbox Group Holdings Ltd., an exempted company limited by shares incorporated under the laws of the Cayman Islands; |
| ● | “StarboxPB” are to Paybats Sdn. Bhd., a company limited by shares incorporated under the laws of Malaysia, which is a wholly owned subsidiary of Starbox Berhad; |
| ● | “StarboxSB” are to StarboxTV Sdn. Bhd., a company limited by shares incorporated under the laws of Malaysia, which is a wholly owned subsidiary of Starbox Berhad; |
| ● | “U.S. dollars,” “$,” and “dollars” are to the legal currency of the United States; |
| ● | “VE Services” are to VE Services Sdn Bhd, a Malaysian Internet payment gateway company and a related-party entity controlled by one of our beneficial shareholders; and |
| ● | “we,” “us,” “our,” “our Company,” or the “Company” are to one or more of Starbox Group and its subsidiaries, as the case may be. |
This annual report on Form 20-F includes our audited consolidated financial statements for the fiscal years ended September 30, 2022, 2021, and 2020. In this annual report, we refer to assets, obligations, commitments, and liabilities in our consolidated financial statements in United States dollars. These dollar references are based on the exchange rate of MYR to United States dollars, determined as of a specific date or for a specific period. Changes in the exchange rate will affect the amount of our obligations and the value of our assets in terms of United States dollars which may result in an increase or decrease in the amount of our obligations and the value of our assets.
This annual report contains translations of certain MYR amounts into U.S. dollars at specified rates. Unless otherwise stated, the following exchange rates are used in this annual report:
| September 30, | ||||||
| US$ Exchange Rate | 2022 | 2021 | 2020 | |||
| At the end of the year – MYR | MYR4.6359 to $1.00 | MYR4.1869 to $1.00 | MYR4.1576 to $1.00 | |||
| Average rate for the year – MYR | MYR4.3041 to $1.00 | MYR4.1243 to $1.00 | MYR4.2163 to $1.00 | |||
| 3 |
Part I
Item 1. IDENTITY OF DIRECTORS, SENIOR MANAGEMENT AND ADVISERS
Not Applicable.
Item 2. OFFER STATISTICS AND EXPECTED TIMETABLE
Not Applicable.
Item 3. KEY INFORMATION
A. [Reserved]
B. Capitalization and Indebtedness
Not applicable.
C. Reasons for the Offer and Use of Proceeds
Not applicable.
D. Risk Factors
Risks Related to Our Business and Industry
If advertisers stop purchasing digital advertising services from us or decrease the amount they are willing to spend on marketing campaigns and promotional activities, or if we are unable to establish and maintain new relationships with advertisers, our business, financial condition, and results of operations could be materially adversely affected.
A substantial majority of our revenue is derived from providing digital advertising services to retail merchant advertisers. Our digital advertising services are designed to help advertisers drive consumer demand, increase sales, and achieve operating efficiencies. Thus, our relationships with advertisers primarily depend on our ability to deliver quality advertising services at attractive volumes and prices. If advertisers are dissatisfied with the effectiveness of the advertising campaigns run through us, they may stop purchasing our digital advertising services or decrease the amount they are willing to spend on marketing campaigns and promotional activities. Our agreements with advertisers are largely short-term agreements, and advertisers may cease purchasing our digital advertising services at any time with no prior notice.
In addition to the quality of our digital advertising services, the willingness of retail merchant advertisers to spend their digital advertising budget through us, which is critical to our business and our ability to generate our revenue, can be influenced by a variety of factors, including:
| ● | macro-economic and social factors: domestic, regional, and global social, economic, and political conditions; economic and geopolitical challenges; and economic, monetary, and fiscal policies (such as concerns over a severe or prolonged slowdown in Malaysia’s economy and threats of political unrest); |
| ● | industry-related factors: the trends, preferences, and habits of audiences towards digital advertising and the development of varying forms of digital advertising and content; and |
| ● | advertiser-specific factors: an advertiser’s specific development strategies, business performance, financial condition, and sales and marketing plans. |
In view of the above, we cannot assure you that our advertisers will continue to purchase our services or that we will be able to replace, in a timely and effective manner, departing advertisers with potential new and quality advertisers. Neither can we guarantee the amount of digital advertising services our advertisers will purchase from us, or that we will be able to attract new advertisers or increase the amount of revenue we earn from advertisers over time. If we are unable to maintain existing relationships with our advertisers or continue to expand our advertiser base, the demand for our advertising services will not grow and may even decrease, which could materially and adversely affect our revenue and profitability.
| 4 |
If we fail to retain and expand our Merchant and Member bases, our revenue and business will be harmed.
Our revenue is derived largely from the digital advertising services we provided primarily on our websites and mobile apps. The effectiveness of our digital advertising services, in turn, depends on (i) a large repository of Merchant and Member data we have been collecting from the GETBATS website and mobile app, which enables targeted marketing by leveraging our business data analysis technology; and (ii) the Internet traffic on our GETBATS website and mobile app and SEEBATS website and mobile app, where we place our advertisements, which largely decides the number of audiences who may view our advertisements. As such, maintaining and timely updating our composite database of Merchants and Members, and maintaining sufficiently high website traffic on the GETBATS website and mobile app and the SEEBATS website and mobile app are both vital to our business operations.
We must continue to retain and acquire Members on the GETBATS website and mobile app that purchase products or services through cash rebates offered by our Merchants, in order to maintain both the Internet traffic on the website and mobile app and our composite database for direct marketing. If our Members do not perceive the cash rebates offered through the GETBATS website and mobile app to be attractive or if we fail to introduce new and more relevant deals, we may not be able to retain or acquire Members at levels necessary to grow our business, which may not only affect the quality of our digital advertising services, but also comprise the number of audiences who may view our advertisements. This, in turn, may adversely affect the effectiveness of our digital advertising services, reduce our revenue from sales of digital advertising services, and thereby result in a material adverse impact on our financial performance and business prospects.
Moreover, we depend on our ability to attract and retain Merchants that are prepared to offer products or services with compelling cash rebates through our website and mobile app and provide our Members with a great experience. Our GETBATS website and mobile app currently feature cash rebates from retail merchants (both online and offline) in over 20 industries, such as automotive, beauty and health, books and media, electronics, fashion, food and beverages, groceries and pets, home and living, and sports and entertainment. After a merchant fills out an application form and agrees with our Merchant terms and conditions and the rate of blanket cash rebates, it becomes an authorized GETBATS Merchant and remains one indefinitely, unless the status is terminated by us or the Merchant by notice in writing. During the fiscal years ended September 30, 2022, 2021, and 2020, the GETBATS website and mobile app had 820, 723, and 478 Merchants, respectively, and had total transaction amount of $3,568,166, $2,501,913, and $74,867, respectively. If we are unsuccessful in our efforts to introduce services to Merchants as part of our cash rebates operating system, we will not experience a corresponding growth in our Merchant pool that is sufficient to offset the cost of these initiatives. We must continue to attract and retain Merchants to maintain our business ecosystem, where we leverage business data analysis technology to provide targeted advertisements based on our composite database of Merchants and Members on our website and mobile app. If new merchants do not find our marketing and promotional services effective, or if existing Merchants do not believe that utilizing our services provides them with a long-term increase in customers, revenue, or profits, they may stop making offers through our website and mobile app. In addition, we may experience attrition in our Merchants in the ordinary course of business, resulting from several factors, including losses to competitors and Merchant closures or bankruptcies. If we are unable to attract new merchants or if too many Merchants are unwilling to offer products or services with compelling cash rebates through our website and mobile app, we may not be able to retain or acquire Merchants in sufficient numbers to maintain our business ecosystem that relies both on our composite database of consumer spending behaviors and our website traffic. As a result, our business, financial condition, and results of operations may be adversely affected.
Our limited operating history in rapidly evolving industries makes it difficult to accurately forecast our future operating results and evaluate our business prospects.
As we launched our cash rebates and digital advertising services business in 2019, we only have a limited operating history. Members of our management team have been working together only for a short period of time and are still in the running-in period. They may still be in the process of exploring approaches to running our Company and reaching consensus among themselves, which may affect the efficiency and results of our operation. Due to our limited operating history, our historical growth rate may not be indicative of our future performance. Our future performance may be more susceptible to certain risks than a company with a longer operating history in a different industry. Many of the factors discussed below could adversely affect our business and prospects and future performance, including:
| ● | our ability to maintain, expand, and further develop our relationships with advertisers to meet their increasing demand; | |
| ● | our ability to introduce and manage the development of new digital advertising services; |
| 5 |
| ● | the continued growth and development of the cash rebates industry and the digital advertising industry; | |
| ● | our ability to keep up with the technological developments or new business models of the rapidly evolving cash rebates industry and digital advertising industry; | |
| ● | our ability to attract and retain qualified and skilled employees; | |
| ● | our ability to effectively manage our growth; and | |
| ● | our ability to compete effectively with our competitors in the cash rebates industry and the digital advertising industry. |
We may not be successful in addressing the risks and uncertainties listed above, among others, which may materially and adversely affect our business, results of operations, financial condition, and future prospects.
We have significantly unstable operating revenue, anticipate increases in our operating expenses in the future, and may not achieve or sustain profitability on a consistent basis. If we cannot achieve and sustain profitability, our business, financial condition, and operating results may be adversely affected.
We have had significantly unstable and volatile operating revenue since our inception—specifically, our total revenue increased significantly by $4,027,959, or approximately 127.22%, to $7,194,187 for the fiscal year ended September 30, 2022 from $3,166,228 for the fiscal year ended September 30, 2021, primarily due to increased revenue from providing digital advertising services and cash rebate services to customers. As a result, we reported net income of $3,602,365 for the fiscal year ended September 30, 2022, representing a significant increase of $2,154,715 from a net income of $1,447,650 for the fiscal year ended September 30, 2021. Our total revenue increased significantly by $3,012,365, or approximately 1,957.82%, to $3,166,228 for the fiscal year ended September 30, 2021 from $153,863 for the fiscal year ended September 30, 2020, primarily due to increased revenue from providing digital advertising services and cash rebate services to customers. As a result, we reported net income of $1,447,650 for the fiscal year ended September 30, 2021, representing a significant increase of $1,652,804 from a net loss of $205,154 for the fiscal year ended September 30, 2020. However, we cannot assure you that we will achieve or maintain profitability on a consistent basis. Our revenue growth may slow or our revenue may decline for a number of reasons, including reduced demand for our digital marketing services, increased competition, or our failure to capitalize on growth opportunities. Meanwhile, we expect our overall selling, general, and administrative expenses, including marketing expenses, salaries, and professional and business consulting expenses, to continue to increase in the foreseeable future, as we plan to hire additional personnel and incur additional expenses in connection with the expansion of our business operations. In addition, we also expect to incur significant additional legal, accounting, and other expenses as a newly public company. These efforts and additional expenses may be more costly than we currently expect, and there is no assurance that we will be able to maintain sufficient operating revenue to offset our operating expenses. Any failure to increase revenue or to manage our costs as we continue to grow and invest in our business would prevent us from achieving or maintaining profitability or maintaining positive operating cash flow at all, or on a consistent basis, which would cause our business, financial condition, and results of operations to suffer.
The markets in which we operate are highly competitive, and we may not be able to compete successfully against existing or new competitors, which could reduce our market share and adversely affect our competitive position and financial performance.
The cash rebates industry and the digital advertising industry in Malaysia are highly-competitive and rapidly evolving, with many new companies joining the competition in recent years and few leading companies. We compete directly with other cash rebate platforms for members and merchants and other providers of digital advertising services for advertisers and advertising revenue. Competition can be increasingly intensive and is expected to increase significantly in the future. Increased competition may result in price reductions for cash rebate offers and advertising services and thus reduced margins and loss of our market share. We compete for members, merchants, and advertisers on the following bases:
| ● | quality of services; | |
| ● | effectiveness of sales and marketing efforts; | |
| ● | creativity in design and contents of advertisements; | |
| ● | pricing and discount policies; and | |
| ● | hiring and retention of talented staff. |
| 6 |
Our competitors may operate with different business models, have different cost structures, and may ultimately prove to be more successful or more adaptable to new regulatory, technological, and other developments. They may in the future achieve greater market acceptance and recognition and gain a greater market share. It is also possible that potential competitors may emerge and acquire a significant market share. If existing or potential competitors develop or offer services that provide significant performance, price, creative optimization, or other advantages over those offered by us, our business, results of operations, and financial condition would be negatively affected. Our existing and potential competitors may enjoy competitive advantages over us, such as longer operating history, greater brand recognition, larger advertiser base, and significantly greater financial, technical, and marketing resources. In addition, our clients often have a vast array of advertising choices—for example, we compete with traditional forms of media, such as newspapers, magazines, and radio and television broadcast, for advertisers and advertising revenue. If we are unable to sustain sufficient interest in our digital advertising services in comparison to other advertising forms, including new forms of marketing campaigns and promotional activities that may emerge in the future, our business model may no longer be viable.
If we fail to compete successfully, we could lose out in acquiring Members and Merchants or procuring advertisers, which could result in an adverse impact on our financial performance and business prospects. We cannot assure you that our strategies will remain competitive or that they will continue to be successful in the future. Increasing competition may result in pricing pressure and loss of our market share, either of which could have a material adverse effect on our financial condition and results of operations.
Our major clients generate a significant portion of our revenue. Any interruption in operations in such major clients may have an adverse effect on our business, financial condition, and results of operations.
Although for the fiscal year ended September 30, 2022, no single customer accounted for more than 10% of our total revenue, and no single customer accounted for more than 10% of our outstanding accounts receivable as of September 30, 2022, during the fiscal years ended September 30, 2021 and 2020, we derived most of our revenue from a few clients. For the fiscal year ended September 30, 2021, three clients accounted for approximately 21.7%, 10.8%, and 10.8% of our total revenue, respectively. As of September 30, 2021, two clients accounted for approximately 52.6% and 26.3% of our total accounts receivable, respectively. For the fiscal year ended September 30, 2020, one client accounted for approximately 91.6% of our total revenue and approximately 85.4% of our total accounts receivable. All of these significant customers were advertisers who used our digital advertising services during the fiscal years ended September 30, 2021 and 2020. These clients are generally able to reduce or cancel spending on our services on short notice for any reason. There are a number of factors, including our performance, that could cause the loss of, or decrease in the volume of business from, a client. Even though we have a strong record of performance, we cannot assure you that we will continue to maintain the business cooperation with these clients at the same level, or at all. The loss of business from one or more of these significant clients could materially and adversely affect our revenue and profitability. Furthermore, if any significant advertiser terminates its relationship with us, we cannot assure you that we will be able to secure an alternative arrangement with comparable advertiser in a timely manner, or at all.
We have licensed all of the movies and television series on our SEEBATS website and mobile app from a third-party content provider. Any interruption in the operations of the content provider or our licensing partnership may have an adverse effect on our business, financial condition, and results of operations.
Our success will depend, in large part, on the website traffic on our SEEBATS website and mobile app, which in turn depends on our ability to continually provide attractive and entertaining movies and television series across various genres to meet the evolving needs of viewers. Currently, we have licensed all of the movies and television series on our SEEBATS website and mobile app from Shenzhen Yunshidian Information Technology Ltd., a third-party content provider (“Shenzhen Yunshidian”), pursuant to a Service and Licensing Agreement dated November 1, 2021. However, as the license will expire on October 31, 2023, and although we currently expect to renew the license when it expires, we cannot assure you that we will be able to maintain such license partnership at the same level, or at all. Such third-party content provider is subject to its own unique operational and financial risks, which are beyond our control. If the content provider breaches, terminates, or decides to not renew its licensing contract with us or experiences significant disruption to its operations, we will be required to find a substitute content provider for sufficient entertainment offerings in order to continually attract and retain viewers on our SEEBATS website and mobile app. If we are unable to do so in a timely or cost-effective manner, our SEEBATS website and mobile app could lose their appeal to our advertisers as a marketing platform due to the decreased website traffic. As a result, our business, financial condition, and results of operations may be adversely affected.
If the relevant Malaysian regulatory agency were to determine that a Film Distribution License was required for the operations of our SEEBATS website and mobile app prior to April 11, 2022, our business, financial condition, and results of operations could be adversely affected.
Pursuant to Section 22(1) of the Perbadanan Kemajuan Filem Nasional Malaysia Act 1981 (Unofficial Translation: the National Film Development Corporation Malaysia Act 1981) (the “FINAS Act”), “no person shall engage in any of the activities of production, distribution, or exhibition of films or any combination of those activities as specified in subsection 21(1) unless there is in force a license authorizing him to do the same.” Section 2 of the FINAS Act defines film distribution as “including the renting, hiring, and loaning of films for profit or otherwise, the importation and distribution of films produced abroad, and the distribution of films produced locally.” One of our subsidiaries, StarboxSB, operates our SEEBATS website and mobile app, on which viewers may watch movies and television series through over-the-top (“OTT”) streaming, and StarboxSB obtained the Film Distribution License from the National Film Development Corporation Malaysia (the “FINAS”) on April 11, 2022. However, since we conducted our business operations through our SEEBATS website and mobile app without holding the Film Distribution License prior to April 11, 2022, we may be subject to penalty if the FINAS were to determine that a Film Distribution License was required. As of the date of this annual report, we have not received any penalty notice from the relevant Malaysian regulatory agency.
| 7 |
Our Malaysia legal counsel, GLT Law, has advised us that, based on their understanding of the FINAS Act and their discussion with the Director of Licensing and Enforcement of the FINAS, StarboxSB is not required to obtain a Film Distribution License for “film distribution” for the following reasons: (i) as our SEEBATS website and mobile app allow viewers to access movies and television series through the Internet, this online streaming mode does not, at its strict interpretation, fall within the scope of “renting, hiring, and loaning of films” under the FINAS Act, and (ii) no enforcement actions are currently being taken towards online streaming service providers who do not have the Film Distribution License.
There remains uncertainty, however, inherent in relying on an opinion of counsel or the opinion of an officer at the relevant department in connection with whether we would be required to obtain a license under the FINAS Act for the business of StarboxSB. The issue of whether the Film Distribution License is required for the operations of our SEEBATS website and mobile app will be subject to future revisions of the FINAS Act and different interpretations by higher-level officers within FINAS. If FINAS were to determine that a Film Distribution License was required prior to April 11, 2022, FINAS may take enforcement action to collect from us the penalty and late fee charges in respect of unlicensed activities of StarboxSB prior to such date, which could adversely affect our business, financial condition, and results of operations. For details about the penalty for failure to comply with the FINAS Act, see “Item 4. Information on the Company—B. Business Overview—Regulations—Regulations Relating to Film Distribution.”
Our payment solution service business relies on our cooperation with VE Services. Any interruption in the operations of VE Services or its cooperation with us may have an adverse effect on our business, financial condition, and results of operations.
We provide payment solution services to merchants by referring them to VE Services for payment processing. As we merely act as a recruitment and onboarding agent during this type of transaction, our payment solution service business is highly dependent on the quality of the services provided by VE Services, and its ability to comply with the relevant laws and regulations. Since we do not have control over the operations of VE Services, if VE Services breaches the terms of its contracts with the relevant merchants, or the relevant laws and regulations, our payment solution services and our reputation may be severely impacted. In addition, if VE Services breaches or terminates the appointment letter dated October 1, 2020 (the “Appointment Letter”) with us or experiences significant disruption to its operations, we may lose our current payment solution service customers in the event that the customers discontinue the services provided by us, and we will be unable to continue providing payment solution services unless we find substitute payment solution service providers. As a result, our business, financial condition, and results of operations may be adversely affected.
If we fail to improve our services to keep up with the rapidly changing demands, preferences, advertising trends, or technologies in the digital advertising industry, our revenue and growth could be adversely affected.
We consider the digital advertising industry to be dynamic, as we face (i) constant changes in audiences’ interests, preferences, and receptiveness over different advertisement formats, (ii) evolution of the needs of advertisers in response to shifts in their business needs and marketing strategies, and (iii) innovations in the means on digital advertising. As a result, our success depends not only on our ability to offer proper choices of media, deliver effective optimization services, and provide creative advertising ideas, but also on our ability to adapt to rapidly changing online trends and technologies to enhance the quality of existing services and to develop and introduce new services to address advertisers’ changing demands.
We may experience difficulties that could delay or prevent the successful development, introduction, or marketing of our new services. Any new service or enhancement will need to meet the requirements of our existing and potential advertisers and may not achieve significant market acceptance. If we fail to keep pace with changing trends and technologies, continue to offer effective optimization services and creative advertising ideas to the satisfaction of our advertisers, or introduce successful and well-accepted services for our existing and potential advertisers, we may lose our advertisers and our revenue and growth could be adversely affected.
| 8 |
Our failure to anticipate or successfully implement new technologies could render our technologies or advertising services unattractive or obsolete and reduce our revenue and market share.
The majority of our revenue is derived from our digital advertising services, which in turn depend on our advanced business data analysis technology for advertisements. We have built a large repository of data regarding Merchants and Members through the GETBATS website and mobile app, where we facilitate transactions between Merchants and Members, in which Merchants offer certain cash rebates to incentivize or attract Members to shop online or offline. With the data collected through our cash rebate website and mobile app, we have utilized our business data analysis capabilities to better understand and anticipate consumer spending behaviors, which enables targeted advertisement delivery by Merchants.
With our digital advertising services primarily driven by a composite database of consumer spending behaviors, we operate in businesses that require sophisticated data collection, processing, and software for analysis and insights. Some of the digital advertising strategy technologies, which support the industry we serve, are changing rapidly. We will be required to continue to adapt to changing technologies, either by developing new services or by enhancing our existing services, to meet client demand. We need to invest significant resources, including financial resources, in research and development to keep pace with technological advances in order to make our digital advertising services competitive in the market. Our continued success will depend on our ability to anticipate and adapt to changing technologies, manage and process increasing amounts of data and information, and improve the performance, features, and reliability of our existing services in response to changing client and industry demand.
However, development activities are inherently uncertain, and our investment in research and development may not generate corresponding benefits. Given the fast pace with which the online marketing strategy technology has been and will continue to be developed, we may not be able to timely upgrade our business data analysis technology, or the algorithm or engines required thereby, in an efficient and cost-effective manner, or at all. New technologies in programming or operations could render our technologies or products or services that we are developing or expect to develop in the future obsolete or unattractive, thereby limiting our ability to recover the costs relating to the design, development, testing, or marketing of our digital advertising services, and resulting in a decline in our revenue and market share.
If we fail to retain and expand the user base for our payment solution service business or if our partner fails to implement and maintain a reliable and convenient payment solution system, our payment solution service business may not be successful, and our business, financial condition, and results of operations may be adversely affected.
We started to provide payment solution services to merchants in May 2021 by referring them to VE Services for payment processing. Since we have relatively limited operating history and experience regarding our payment solution service business, we may encounter difficulties as we advance our business operations, such as in marketing, selling, and deploying our payment services.
The payments industry is highly competitive. We compete against other payment solution service providers in the market, many of which have greater customer bases, volume, scale, resources, and market share than we do, which may provide significant competitive advantages. Because one of the biggest concerns for the payment solution users, is the system’s security vulnerabilities such as the threat of cyber-attacks and data breaches, users tend to choose an established brand having a relatively large market share and proven reputation. For that reason, we may incur substantial expenses in retaining and expanding our merchant user base through robust marketing campaigns and promotional activities, and we cannot assure you that these promotional efforts will be effective. To be competitive in the constantly evolving payments industry, we must keep pace with rapid technological developments to provide new and innovative payment solution services. Our payment solution service business relies, in large part, on VE Services for access to new or evolving payment technologies, but we cannot assure you that we will continue to maintain the business cooperation with it at the same level, or at all. In addition, we cannot predict the effects of technological changes on our business, which technological developments or innovations will become widely adopted, or how those technologies may be regulated. New services and technologies will continue to emerge and may render the technologies VE Services currently uses in its system obsolete. If we are unable to attract new merchant users in sufficient numbers or if VE Services fails to keep pace with the new payment technology to maintain a reliable and resilient payment system, our payment solutions service business may not be successful, leading to a waste of our substantial investment in promoting our payment solution service business as well as the diversion of management’s attention and resources. As a result, our business, financial condition, and results of operations may be adversely affected.
| 9 |
If we fail to manage our growth or execute our strategies and future plans effectively, we may not be able to take advantage of market opportunities or meet the demand of our advertisers.
Our business has grown substantially since our inception, and we expect it to continue to grow in terms of the scale and diversity of operations. For example, in order to diversify our business and revenue stream for future growth, we have utilized our cash rebate website and mobile app, in addition to our digital advertising service business, to facilitate transactions between Merchants and Members, in which Merchants offer certain cash rebates to incentivize or attract Members to shop online or offline, and we have provided payment solution services to Merchants. This expansion increases the complexity of our operations and may cause strain on our managerial, operational, and financial resources. We must continue to hire, train, and effectively manage new employees. If our new hires perform poorly or if we are unsuccessful in hiring, training, managing, and integrating new employees, our business, financial condition, and results of operations may be materially harmed. Our expansion will also require us to maintain the consistency of our service offerings to ensure that our market reputation does not suffer as a result of any deviations, whether actual or perceived, in the quality of our services.
Our future results of operations also depend largely on our ability to execute our future plans successfully. In particular, our continued growth may subject us to the following additional challenges and constraints:
| ● | we face challenges in recruiting, training, and retaining highly skilled personnel, including areas of sales and marketing, advertising concepts, optimization skills, and information technology for our growing operations; | |
| ● | we face challenges in responding to evolving industry standards and government regulations that impact our business and the cash rebates industry and the digital advertising industry in general, particularly in the areas of content dissemination; | |
| ● | we may have limited experience for certain new service offerings, and our expansion into these new service offerings may not achieve broad acceptance among advertisers; | |
| ● | the execution of our future plans will be subject to the availability of funds to support the relevant capital investment and expenditures; and | |
| ● | the successful execution of our strategies is subject to factors beyond our control, such as general market conditions, economic, and political development in Malaysia and globally. |
All of these endeavors involve risks and will require significant management, financial, and human resources. We cannot assure you that we will be able to effectively manage our growth or will implement our strategies successfully. Besides, there is no assurance that the investment to be made by our Company as contemplated under our future plans will be successful and generate the expected return. If we are not able to manage our growth or execute our strategies effectively, or at all, our business, results of operations, and prospects may be materially and adversely affected.
The ongoing effects of the COVID-19 pandemic in Malaysia may have a material adverse effect on our business.
Our business operations could be materially and adversely affected by the ongoing COVID-19 pandemic. The COVID-19 pandemic has resulted in the implementation of significant governmental measures, including lockdowns, closures, quarantines, and travel bans, intended to control the spread of the virus. Such governmental actions, together with the further development of the COVID-19 pandemic, could materially disrupt our business and operations, slow down the overall economy, curtail consumer spending, and make it difficult to adequately staff our operations.
Specifically, in response to the COVID-19 pandemic and its spread, the Malaysian government has implemented intermittent lockdowns in various stages such as (i) imposing full movement control orders (“MCO”), under which, quarantines, travel restrictions, and the temporary closure of stores and facilities in Malaysia were made mandatory; (ii) easing MCO to a Conditional Movement Control Order (“CMCO”) under which most business sectors were allowed to operate under strict rules and Standard Operating Procedures mandated by the government of Malaysia; and (iii) further easing CMCO to Recovery Movement Control Order. On January 12, 2021, due to a resurgence of COVID-19 cases, the Malaysian government declared a state of emergency nationwide to combat COVID-19. On February 16, 2021, the government announced that a National COVID-19 Immunization Plan will be implemented for one year after February 2021, in which 80% of the Malaysian population will be vaccinated to achieve herd immunity. On March 5, 2021, lockdowns in most parts of the country were eased to a CMCO, however, COVID-19 cases in the country continued to rise. On May 12, 2021, the Malaysian government re-imposed a full lockdown order nationwide, until the earlier of when (i) daily COVID-19 infection cases in the country fall below 4,000; (ii) intensive care unit wards start operating at a moderate level; or (iii) 10% of the Malaysian population is fully vaccinated. The total number of COVID-19 cases in the country surpassed three million on February 13, 2022, and the number of daily cases hit a record high of 33,406 on March 5, 2022.
| 10 |
In response to efforts to contain the spread of COVID-19, we have implemented temporary measures and adjustments of work schemes to allow employees to work from home and collaborate remotely. We have taken measures to reduce the impact of the COVID-19 pandemic, including upgrading our telecommuting system, monitoring employees’ health on a daily basis, and optimizing the technology system to support potential growth in user traffic. The Malaysian government has recently eased its restrictive policies due to a decrease in COVID-19 infection cases. The government ended the nationwide state of emergency on August 1, 2021, and COVID-19 infection cases started to drop below the 10,000 mark daily, beginning October 3, 2021. Interstate and international travel restrictions were lifted, effective October 11, 2021, for residents who had been fully vaccinated against COVID-19, as the country achieved its target of inoculating 90% of its adult population. The government is preparing to shift into an endemic COVID-19 phase, where it will not impose broad lockdowns even if cases rise. As of November 13, 2022, 84.3% of Malaysia’s total population (98.3% of the adult population, 91.9% of the adolescent population, and 43.3% of children) had received their second dose of the COVID-19 vaccine. An estimated 49.8% of the total population had received a third dose as of November 13, 2022.
However, there have been occasional outbreaks of COVID-19 in various cities in Malaysia, and the Malaysian government may again take measures to keep COVID-19 in check. Consumers may have less disposable income and the merchants’ advertising budgets may experience a general decline or fluctuate, depending on factors beyond our control, such as the shelter-in-place restrictions due to the COVID-19 pandemic. Substantially all our revenue is concentrated in Malaysia. Consequently, our results of operations will likely be adversely, and may be materially, affected, to the extent that the COVID-19 pandemic or any other epidemic harms the Malaysia and global economy in general. Specifically, prior to April 1, 2022, significant governmental measures implemented by the Malaysian government, including various stages of lockdowns, closures, quarantines, and travel bans, led to the store closure of some of our offline Merchants. As a result, although business in Malaysia had gradually resumed since April 1, 2022, our cash rebate service business was negatively affected to a certain extent, because the number of offline sales transactions between retail shoppers and retail merchants facilitated by us did not grow as much as we expected, leading to a lower amount of cash rebate service revenue than we expected during the fiscal years ended September 30, 2022, 2021, and 2020. However, our digital advertising service revenue was not significantly affected by the COVID-19 pandemic, because more people have opted to use various online services since the beginning of the COVID-19 pandemic. As more advertisers used our digital advertising services through our websites and mobile apps and third-party social media channels to target their audiences, our revenue from digital advertising services increased significantly from fiscal year 2020 to fiscal year 2021 and to fiscal year 2022. However, any resurgence of the COVID-19 pandemic could negatively affect the execution of customer contracts and the collection of customer payments. The extent to which the COVID-19 pandemic may impact us will depend on future developments, which are highly uncertain and cannot be predicted, including new information on the effectiveness of the mitigation strategies, the duration, spread, severity, and recurrence of COVID-19 and any COVID-19 variants and related travel advisories and restrictions, and the efficacy of COVID-19 vaccines, which may also take an extended period of time to be widely and adequately distributed.
Our business is geographically concentrated, which subjects us to greater risks from changes in local or regional conditions.
Substantially all of our current operations are located in Malaysia. Due to this geographic concentration, our financial condition and operating results are subject to greater risks from changes in general economic and other conditions in Malaysia, than the operations of more geographically diversified competitors. These risks include:
| ● | changes in economic conditions and unemployment rates; | |
| ● | changes in laws and regulations; | |
| ● | changes in the competitive environment; and | |
| ● | adverse weather conditions and natural disasters. |
As a result of the geographic concentration of our business, we face a greater risk of a negative impact on our business, financial condition, results of operations, and prospects in the event that Malaysia is more severely impacted by any such adverse condition, as compared to other countries.
| 11 |
We may be unsuccessful in expanding and operating our business internationally, which could adversely affect our results of operations.
We plan to selectively launch our cash rebate and digital advertising services in other countries in Southeast Asia during the next three years, starting from markets such as the Philippines, Thailand, and Indonesia. For details, see “Item 5. Operating and Financial Review and Prospects—B. Liquidity and Capital Resources” The entry and operation of our business in these markets could cause us to be subject to unexpected, uncontrollable, and rapidly changing events and circumstances outside Malaysia. As we grow our international operations in the future, we may need to recruit and hire new product development, sales, marketing, and support personnel in the countries in which we will launch our services or otherwise have a significant presence. Entry into new international markets typically requires the establishment of new marketing channels. Our ability to continue to expand into international markets involves various risks, including the possibility that our expectations regarding the level of returns we will achieve on such expansion will not be achieved in the near future, or ever, and that competing in markets with which we are unfamiliar may be more difficult than anticipated. If we are less successful than we expect in a new market, we may not be able to realize an adequate return on our initial investment and our operating results could suffer.
Our international operations may also fail due to other risks inherent in foreign operations, including:
| ● | varied, unfamiliar, unclear, and changing legal and regulatory restrictions, including different legal and regulatory standards applicable to digital advertising; | |
| ● | compliance with multiple and potentially conflicting regulations in other countries in Southeast Asia; | |
| ● | difficulties in staffing and managing foreign operations; | |
| ● | longer collection cycles; | |
| ● | different intellectual property laws that may not provide consistent and/or sufficient protections for our intellectual property; | |
| ● | proper compliance with local tax laws, which can be complex and may result in unintended adverse tax consequences; | |
| ● | localized spread of infection resulting from the COVID-19 pandemic, including any economic downturns and other adverse impacts; | |
| ● | difficulties in enforcing agreements through foreign legal systems; | |
| ● | fluctuations in currency exchange rates that may affect service demand and may adversely affect the profitability in MYR of services provided by us in foreign markets where payment for our services is made in the local currency; | |
| ● | changes in general economic, health, and political conditions in countries where our services are provided; | |
| ● | disruptions caused by acts of war; | |
| ● | potential labor strike, lockouts, work slowdowns, and work stoppages; and | |
| ● | different consumer preferences and requirements in specific international markets. |
Our current and any future international expansion plans will require management attention and resources and may be unsuccessful. We may find it impossible or prohibitively expensive to continue expanding internationally or we may be unsuccessful in our attempt to do so, and our results of operations could be adversely impacted.
Any negative publicity about us, our services, and our management may materially and adversely affect our reputation and business.
We may from time to time receive negative publicity about us, our management, or our business. Any such negative publicity may be the result of malicious harassment or unfair competition acts by third parties. We may also be subject to government or regulatory investigations (including investigations relating to advertising materials that are alleged to be illegal) as a result of such third-party conduct and may be required to spend significant time and incur substantial costs to defend ourselves against such third-party conduct, and we may not be able to conclusively refute any such allegations within a reasonable period of time, or at all. Harm to our reputation and confidence of advertisers and media can also arise for other reasons, including misconduct of our employees or any third-party business partners. Our reputation may be materially and adversely affected as a result of any negative publicity, which in turn may cause us to lose market share, advertising customers, industry partners, and other business partnerships.
The proper functioning of our websites and mobile apps is essential to our business. Any disruption to our information technology systems could materially affect our ability to maintain the satisfactory performance of our websites and mobile apps.
The proper functioning of our websites and mobile applications is essential to our business. The satisfactory performance, reliability, and availability of our information technology systems are critical to our ability to drive more Internet traffic to our advertising websites and mobile apps and provide effective digital advertising services for brands and retailers. Our technology or infrastructure, however, may not function properly at all times. Any system interruptions caused by computer viruses, hacking, or other attempts to harm the systems could result in the unavailability or slowdown of our websites or mobile apps and compromise the quality of the digital advertising services provided thereon. Our servers may also be vulnerable to computer viruses, physical or electronic break-ins, and similar disruptions, which could lead to system interruptions, website or mobile application slowdowns or unavailability, or loss of data. Any of such occurrences could cause severe disruption to our daily operations. As such, our reputation may be materially and adversely affected, our market share could decline, and we could be subject to liability claims.
| 12 |
If we sustain cyber-attacks or other privacy or data security incidents that result in security breaches, we could be subject to increased costs, liabilities, reputational harm, or other negative consequences.
Through our business operations, we collect large amounts of data regarding our Merchants and Members on the GETBATS website and mobile app and create a composite database of consumer spending behaviors by leveraging business data analysis technology. We also provide data management for micro, small, and medium-sized online and offline merchants to accurately organize their own customer data and accurate advertising. As such, our systems and the data stored thereon may be subject to security breach incidents. For example, our information technology may be subject to cyber-attacks, viruses, malicious software, break-ins, theft, computer hacking, phishing, employee error or malfeasance, or other security breaches. Hackers and data thieves are increasingly sophisticated and operate large-scale and complex automatic hacks. Experienced computer programmers and hackers may be able to penetrate our security controls, misappropriate or compromise sensitive proprietary or confidential information, or create system disruptions or cause shutdowns. They also may be able to develop and deploy malicious software programs that attack our systems or otherwise exploit any security vulnerabilities. The composite database stored in our systems may be vulnerable to security incidents or security attacks, acts of vandalism or theft, coordinated attacks by activist entities, misplaced or lost data, human errors, or other similar events that could negatively affect our systems and the data stored on or transmitted by those systems, including the data of our Merchants and Members on the GETBATS website and mobile app, as well as the data and information regarding our advertiser clients who have purchased our digital advertising services on the GETBATS website and mobile app and the SEEBATS website and mobile app before, and the participating merchants and consumers who have used our payment solution services.
Although we have taken measures to protect sensitive data from unauthorized access, use, or disclosure, our protective measures may not be effective and our information technology may still be vulnerable to attacks. In the event of such attacks, the costs to eliminate or address the foregoing security threats and vulnerability before or after a cyber-incident could potentially be significant. Our remediation efforts may not be successful and could result in interruptions or delays of services. As threats related to cyber-attacks develop and grow, we may also find it necessary to take further steps to protect our data and infrastructure, which could be costly and therefore impact our results of operations. In the event that we are unable to prevent, detect, and remediate the foregoing security threats and vulnerabilities in a timely manner, our operations could be interrupted, or we could incur financial, legal, or reputational losses arising from misappropriation, misuse, leakage, falsification, or intentional or accidental release or loss of information maintained in our systems. The number and complexity of these threats continue to increase over time. Although we inspect our systems on a regular basis to prevent these events from occurring, the possibility of these events occurring cannot be eliminated entirely.
Compliance with Malaysia’s Personal Data Protection Act 2010, Personal Data Protection Order 2013, and any such existing or future data-privacy related laws, regulations, and governmental orders may entail significant expenses and could materially affect our business.
Our business and operations in Malaysia are subject to laws and regulations regarding data privacy and data protection pursuant to the Personal Data Protection Act 2010 (the “PDPA 2010”). In particular, the PDPA 2010 applies to any person who processes or has control over, or authorizes the processing of, any personal data regarding commercial transactions, except for any personal data processed outside of Malaysia and not intended to be further processed in Malaysia. Under the PDPA 2010, any person engaged in processing personal data shall take measures to protect the personal data from any loss, misuse, modification, unauthorized or accidental access, or disclosure, alteration, or destruction of personal data and to maintain the integrity and competence of the personnel having access to the personal data processed. Such personal data should not be kept longer than necessary for the fulfilment of the purpose for which it was to be processed and shall be destroyed or permanently deleted if it is no longer required. In addition, a data user who belongs to any of the classes of data users prescribed under the Personal Data Protection (Class of Data Users) Order 2013 (the “Order 2013”) shall be registered under the PDPA 2010 in order to process personal data. See “Item 4. Information on the Company—B. Business Overview—Regulations—Regulations Relating to Personal Data Protection.”
| 13 |
Interpretation, application, and enforcement of such laws, rules, regulations, and governmental orders, such as the PDPA 2010 and the Order 2013, evolve from time to time and their scope may continually change, through new legislation, amendments to existing legislation, and changes in enforcement. Compliance with the PDPA 2010 and/or related implementing regulations and governmental orders could significantly increase the cost of providing our service offerings, require significant changes to our operations, or even prevent us from providing certain service offerings in Malaysia. Despite our efforts to comply with applicable laws, regulations, and other obligations relating to privacy, data protection, and information security, it is possible that our practices could fail to meet all of the requirements imposed on us by the PDPA 2010 and/or related implementing regulations and government orders. Any failure on our part to comply with such laws, rules, regulations, governmental orders, or any other obligations relating to privacy, data protection, or information security, or any compromise of security that results in unauthorized access, use or release of personally identifiable information or other data, or the perception or allegation that any of the foregoing types of failure or compromise has occurred, could damage our reputation, discourage new and existing counterparties from contracting with us or result in investigations, fines, suspension, or other penalties by Malaysian government authorities and private claims or litigation, any of which could materially adversely affect our business, financial condition, and results of operations. Even if our practices are not subject to legal challenges, the perception of privacy concerns, whether or not valid, may harm our reputation and brand and adversely affect our business, financial condition, and results of operations. Moreover, the legal uncertainty created by the PDPA 2010 and/or related implementing regulations and governmental orders could materially and adversely affect our ability, on favorable terms, to raise capital, including engaging in offerings of our securities in the U.S. market.
Seasonal fluctuations in advertising activities could have a material impact on our revenue, cash flow, and operating results.
Our revenue, cash flow, operating results, and other key operating and performance metrics may vary from quarter to quarter, due to the seasonal nature of our advertisers’ budgets and spending on advertising campaigns. For example, advertising spending tends to rise in holiday seasons with consumer holiday spending, or closer to end-of-year in fulfilment of their annual advertising budgets, which may lead to an increase in our revenue and cash flow during such periods. Moreover, advertising inventory in holiday seasons may be more expensive, due to increased demand for advertising inventory. While our historical revenue growth may have, to some extent, masked the impact of seasonality, if our growth rate declines or seasonal spending becomes more pronounced, seasonality could have a material impact on our revenue, cash flow, and operating results from period to period.
Unauthorized use of our intellectual property by third parties and expenses incurred in protecting our intellectual property rights may adversely affect our business, reputation, and competitive edge.
We regard our trademarks, domain names, and similar intellectual property as important to our success, and we rely on a combination of intellectual property laws and contractual arrangements, including confidentiality and non-disclosure agreements to protect our proprietary rights. For details, please see “Item 4. Information on the Company—B. Business Overview—Intellectual Property.”
Despite these measures, any of our intellectual property rights could be challenged, invalidated, circumvented, or misappropriated, or such intellectual property may not be sufficient to provide us with competitive advantages. It may be difficult to maintain and enforce intellectual property rights in Malaysia. Statutory laws and regulations are subject to judicial interpretation and enforcement and may not be applied consistently. Confidentiality, invention assignment and non-compete agreements may be breached by counterparties, and there may not be adequate remedies available to us for any such breach. Accordingly, we may not be able to effectively protect our intellectual property rights or to enforce our contractual rights in all jurisdictions.
Policing unauthorized use of our proprietary technology and other intellectual property is difficult and expensive, and litigation may be necessary in the future to enforce their intellectual property rights. Future litigation could result in substantial costs and diversion of our resources and could disrupt our business, as well as materially adversely affect our financial condition and results of operations. Further, despite the potentially substantial costs, we cannot assure you that we will prevail in such litigation.
Third parties may claim that we infringe their proprietary intellectual property rights, which could cause us to incur significant legal expenses and prevent us from promoting our services.
We cannot be certain that our operations or any aspects of our business do not or will not infringe upon or otherwise violate trademarks, patents, copyrights, know-how, or other intellectual property rights held by third parties. We may be from time to time in the future subject to legal proceedings and claims relating to the intellectual property rights of others. For example, we may face intellectual property infringement claims or other allegations by third parties for information or content displayed on, retrieved from or linked to, recorded, stored, or make accessible on our websites and mobile apps—in particular the SEEBATS website and mobile app, which feature movies and television series we have licensed from a third-party content provider, and we are unable to verify if the third-party content provider has lawfully obtained or licensed all movies and television series that it has licensed to us. Otherwise, we may be subject to allegations that we have infringed on the trademarks, copyrights, patents, and other intellectual property rights of third parties, including our competitors, or that we are involved in unfair trade practices. In addition, there may be third-party trademarks, patents, copyrights, know-how, or other intellectual property rights that are infringed by our products, services, or other aspects of our business without our awareness. Holders of such intellectual property rights may seek to enforce such intellectual property rights against us in various jurisdictions.
| 14 |
If any third-party infringement claims are brought against us, we may be forced to divert management’s time and other resources from our business and operations to defend against these claims, regardless of their merits. Additionally, the application and interpretation of intellectual property right laws and the procedures and standards for granting trademarks, patents, copyrights, know-how, or other intellectual property rights are evolving and may be uncertain, and we cannot assure you that courts or regulatory authorities would agree with our analysis. Such claims, even if they do not result in liability, may harm our reputation. If we were found to have violated the intellectual property rights of others, we may be subject to liability for our infringement activities or may be prohibited from using such intellectual property, and we may incur licensing fees or be forced to develop alternatives of our own. As a result, our business and financial performance may be materially and adversely affected.
If we fail to attract, recruit, or retain our key personnel, including our executive officers, senior management, and key employees, our ongoing operations and growth could be affected.
Our success also depends, to a large extent, on the efforts of our key personnel, including our executive officers, senior management, and other key employees who have valuable experience, knowledge, and connection in the cash rebates industry and the digital advertising industry. There is no assurance that these key personnel will not voluntarily terminate their employment with us. We do not carry, and do not intend to procure, key person insurance on any of our senior management team. The loss of any of our key personnel could be detrimental to our ongoing operations. Our success will also depend on our ability to attract and retain qualified personnel to manage our existing operations as well as our future growth. We may not be able to successfully attract, recruit, or retain key personnel, and this could adversely impact our growth. Moreover, we rely on our sales and marketing team to source new advertisers for our business growth. We have four sales and marketing personnel in total, as of the date of this annual report, who are responsible for pitching and soliciting advertisers to purchase our digital advertising services or merchants to join our cash rebate website and mobile app. If we are unable to attract, retain, and motivate our sales and marketing personnel, our business may be adversely affected.
Future acquisitions may have an adverse effect on our ability to manage their business.
We may acquire businesses, technologies, services, or products that are complementary to our digital advertising business. Future acquisitions may expose us to potential risks, including risks associated with the integration of new operations, services, and personnel, unforeseen or hidden liabilities, the diversion of resources from our existing business and technology, our potential inability to generate sufficient revenue to offset new costs, the expenses of acquisitions, or the potential loss of or harm to relationships with both employees and customers resulting from our integration of new businesses.
Any of the potential risks listed above could have a material adverse effect on our ability to manage our business, revenue, and net income. We may need to raise additional debt funding or sell additional equity securities to make such acquisitions. The raising of additional debt funding by our Company, if required, would result in increased debt service obligations and could result in additional operating and financing covenants, or liens on their assets, that would restrict their operations. The sale of additional equity securities could result in additional dilution to our shareholders.
We may from time to time be subject to claims, controversies, lawsuits, and legal proceedings, which could adversely affect our business, prospects, results of operations, and financial condition.
We may from time to time become subject to or involved in various claims, controversies, lawsuits, and legal proceedings. However, claims and threats of lawsuits are subject to inherent uncertainties, and we are uncertain whether any of these claims would develop into a lawsuit. Lawsuits, or any type of legal proceeding, may cause our Company to incur defense costs, utilize a significant portion of our resources, and divert management’s attention from our day-to-day operations, any of which could harm our business. Any settlements or judgments against our Company could have a material adverse impact on our financial condition, results of operations, and cash flows. In addition, negative publicity regarding claims or judgments made against our Company may damage our reputation and may result in a material adverse impact on us.
| 15 |
We may be the subject of allegations, harassment, or other detrimental conduct by third parties, which could harm our reputation and cause us to lose market share, Members, or Merchants.
We may be subject to allegations by third parties or purported former employees, negative Internet postings, and other adverse public exposure on our business, operations, and staff compensation. We may also become the target of harassment or other detrimental conduct by third parties or disgruntled former or current employees. Such conduct may include complaints, anonymous, or otherwise, to regulatory agencies, media, or other organizations. We may be subject to government or regulatory investigation or other proceedings as a result of such third-party conduct and may be required to spend significant time and incur substantial costs to address such third-party conduct, and there is no assurance that we will be able to conclusively refute each of the allegations within a reasonable period of time, or at all. Additionally, allegations, directly or indirectly against our Company, may be posted on the Internet, including social media platforms, by anyone on an anonymous basis. Any negative publicity about our Company or our management can be quickly and widely disseminated. Social media platforms and devices immediately publish the content of their users’ posts, often without filters or checks on the accuracy of the content posted. The information posted may be inaccurate and adverse to our Company, and it may harm our reputation, business, or prospects. The harm may be immediate without affording us an opportunity for redress or correction. Our reputation may be negatively affected as a result of the public dissemination of negative and potentially false information about our business and operations, which in turn may cause us to lose market share, Members, or Merchants.
Our current insurance policies may not provide adequate levels of coverage against all claims and we may incur losses that are not covered by our insurance.
We believe we maintain insurance coverage that is customary for businesses of our size and type. However, we may be unable to insure against certain types of losses or claims, or the cost of such insurance may be prohibitive. Uninsured losses or claims, if they occur, could have a material adverse effect on our reputation, business, results of operations, financial condition, or prospects.
Risks Relating to Our Ordinary Shares and the Trading Market
If we fail to implement and maintain an effective system of internal controls or fail to remediate the material weaknesses in our internal control over financial reporting that have been identified, we may fail to meet our reporting obligations or be unable to accurately report our results of operations or prevent fraud, and investor confidence and the market price of our Ordinary Shares may be materially and adversely affected.
We are subject to reporting obligations under U.S. securities laws. The SEC adopted rules pursuant to Section 404 of the Sarbanes-Oxley Act of 2002 requiring every public company to include a management report on such company’s internal control over financial reporting in its annual report, which contains management’s assessment of the effectiveness of its internal control over financial reporting.
In preparing our consolidated financial statements as of and for the fiscal year ended September 30, 2022, we have identified material weaknesses in our internal control over financial reporting, as defined in the standards established by the Public Company Accounting Oversight Board, and other control deficiencies. The material weaknesses identified included (i) a lack of accounting staff and resources with appropriate knowledge of Generally Accepted Accounting Principles (“U.S. GAAP”) and SEC reporting and compliance requirements; and (ii) certain audit adjustments proposed by the auditor and recorded by our Company into the financial statements. Following the identification of the material weaknesses and control deficiencies, we plan to continue to take remedial measures including (i) hiring more qualified accounting personnel with relevant U.S. GAAP and SEC reporting experience and qualifications to strengthen the financial reporting function and to set up a financial and system control framework; (ii) implementing regular and continuous U.S. GAAP accounting and financial reporting training programs for our accounting and financial reporting personnel; and (iii) engaging an external consulting firm to assist us with assessment of Sarbanes-Oxley compliance requirements and improvement of overall internal control. However, the implementation of these measures may not fully address the material weaknesses in our internal control over financial reporting. Our failure to correct the material weaknesses or our failure to discover and address any other material weaknesses or control deficiencies could result in inaccuracies in our financial statements and could also impair our ability to comply with applicable financial reporting requirements and related regulatory filings on a timely basis. As a result, our business, financial condition, results of operations and prospects, and the trading price of our Ordinary Shares, may be materially and adversely affected. Moreover, ineffective internal control over financial reporting significantly hinders our ability to prevent fraud.
| 16 |
Substantial future sales of our Ordinary Shares or the anticipation of future sales of our Ordinary Shares in the public market could cause the price of our Ordinary Shares to decline.
The market price of our Ordinary Shares could decline as a result of sales of substantial amounts of our Ordinary Shares in the public market, or the perception that these sales could occur. In addition, these factors could make it more difficult for us to raise funds through future offerings of our Ordinary Shares. An aggregate of 54,375,000 Ordinary Shares are issued and outstanding as of the date of this annual report and 6,575,000 are freely tradable. The remaining Ordinary Shares will be “restricted securities” as defined in Rule 144. These Ordinary Shares may be sold without registration under the Securities Act to the extent permitted by Rule 144 or other exemptions under the Securities Act.
We do not intend to pay dividends for the foreseeable future.
We currently intend to retain any future earnings to finance the operation and expansion of our business, and we do not expect to declare or pay any dividends in the foreseeable future. As a result, you may only receive a return on your investment in our Ordinary Shares if the market price of our Ordinary Shares increases.
If securities or industry analysts do not publish research or reports about our business, or if the publish a negative report regarding our Ordinary Shares, the price of our Ordinary Shares and trading volume could decline.
Any trading market for our Ordinary Shares may depend in part on the research and reports that industry or securities analysts publish about us or our business. We do not have any control over these analysts. If one or more of the analysts who cover us downgrade us, the price of our Ordinary Shares would likely decline. If one or more of these analysts cease coverage of our Company or fail to regularly publish reports on us, we could lose visibility in the financial markets, which could cause the price of our Ordinary Shares and the trading volume to decline.
The trading price of our Ordinary Shares is likely to be volatile, which could result in substantial losses to our investors.
From the closing of our initial public offering on August 25, 2022 to the date of this annual report, the trading price of our Ordinary Shares has ranged from $1.37 to $46.21 per Ordinary Share. The trading price of our Ordinary Shares is likely to continue to be volatile and could fluctuate widely due to factors beyond our control. This may happen because of broad market and industry factors, including the performance and fluctuation of the market prices of other companies with business operations overseas that have listed their securities in the United States. The securities of some of these companies have experienced significant volatility since their initial public offerings, including, in some cases, substantial price declines in their trading prices. The trading performances of other companies’ securities after their offerings may affect the attitudes of investors toward companies listed in the United States in general and consequently may impact the trading performance of our Ordinary Shares, regardless of our actual operating performance.
In addition to market and industry factors, the price and trading volume for our Ordinary Shares may be highly volatile for factors specific to our own operations, including the following:
| ● | our operating and financial performance; | |
| ● | quarterly variations in the rate of growth of our financial indicators, such as net income per share, net income, and revenues; | |
| ● | the public reaction to our press releases, our other public announcements, and our filings with the SEC; | |
| ● | strategic actions by our competitors; | |
| ● | changes in revenue or earnings estimates, or changes in recommendations or withdrawal of research coverage, by equity research analysts; | |
| ● | speculation in the press or investment community; | |
| ● | the failure of research analysts to cover our Ordinary Shares; | |
| ● | sales of our Ordinary Shares by us or other shareholders, or the perception that such sales may occur; | |
| ● | changes in accounting principles, policies, guidance, interpretations, or standards; | |
| ● | additions or departures of key management personnel; | |
| ● | actions by our shareholders; | |
| ● | domestic and international economic, legal, and regulatory factors unrelated to our performance; and | |
| ● | the realization of any risks described under this “Risk Factors” section. |
Any of these factors may result in large and sudden changes in the volume and price at which our Ordinary Shares will trade.
| 17 |
In the past, shareholders of public companies have often brought securities class action suits against those companies following periods of instability in the market price of their securities. If we were involved in a class action suit, it could divert a significant amount of our management’s attention and other resources from our business and operations and require us to incur significant expenses to defend the suit, which could harm our results of operations. Any such class action suit, whether or not successful, could harm our reputation and restrict our ability to raise capital in the future. In addition, if a claim is successfully made against us, we may be required to pay significant damages, which could have a material adverse effect on our financial condition and results of operations.
The requirements of being a public company may strain our resources and divert management’s attention.
As a public company, we are subject to the reporting requirements of the Exchange Act, the Sarbanes-Oxley Act of 2002, or the “Sarbanes-Oxley Act,” the Dodd-Frank Wall Street Reform and Consumer Protection Act, the listing requirements of Nasdaq, and other applicable securities rules and regulations. Despite recent reforms made possible by the Jumpstart Our Business Startups Act of 2012, or the “JOBS Act,” compliance with these rules and regulations will nonetheless increase our legal, accounting, and financial compliance costs and investor relations and public relations costs, make some activities more difficult, time-consuming, or costly, and increase demand on our systems and resources, particularly after we are no longer an “emerging growth company.” The Exchange Act requires, among other things, that we file annual and current reports with respect to our business and operating results as well as proxy statements.
As a result of disclosure of information in the Form 20-F and in filings required of a public company, our business and financial condition are more visible, which we believe may result in threatened or actual litigation, including by competitors and other third parties. If such claims are successful, our business and operating results could be harmed, and even if the claims do not result in litigation or are resolved in our favor, these claims, and the time and resources necessary to resolve them, could divert the resources of our management and adversely affect our business, brand and reputation and results of operations.
Being a public company and these new rules and regulations make it more expensive for us to obtain director and officer liability insurance, and we may be required to accept reduced coverage or incur substantially higher costs to obtain coverage. These factors could also make it more difficult for us to attract and retain qualified members of our board of directors, particularly to serve on our audit committee and compensation committee, and qualified executive officers.
If we cease to qualify as a foreign private issuer, we would be required to comply fully with the reporting requirements of the Exchange Act applicable to U.S. domestic issuers, and we would incur significant additional legal, accounting, and other expenses that we would not incur as a foreign private issuer.
As a foreign private issuer, we are exempt from the rules under the Exchange Act prescribing the furnishing and content of proxy statements, and our officers, directors and principal shareholders are exempt from the reporting and short-swing profit recovery provisions contained in Section 16 of the Exchange Act. In addition, we are not required under the Exchange Act to file periodic reports and financial statements with the SEC as frequently or as promptly as United States domestic issuers, and we are not required to disclose in our periodic reports all of the information that United States domestic issuers are required to disclose. While we currently are qualified as a foreign private issuer, we may cease to qualify as a foreign private issuer in the future, in which case we would incur significant additional expenses that could have a material adverse effect on our results of operations.
Because we are a foreign private issuer and are exempt from certain Nasdaq corporate governance standards applicable to U.S. issuers, you will have less protection than you would have if we were a domestic issuer.
Nasdaq listing rules require listed companies to have, among other things, a majority of its board members be independent. As a foreign private issuer, however, we are permitted to, and we may follow home country practice in lieu of the above requirements, or we may choose to comply with the above requirement within one year of listing. The corporate governance practice in our home country, the Cayman Islands, does not require a majority of our board to consist of independent directors. Thus, although a director must act in the best interests of the Company, it is possible that fewer board members will be exercising independent judgment and the level of board oversight on the management of our company may decrease as a result. In addition, Nasdaq listing rules also require U.S. domestic issuers to have a compensation committee, a nominating and corporate governance committee composed entirely of independent directors, and an audit committee with a minimum of three members. We, as a foreign private issuer, are not subject to these requirements. Nasdaq listing rules may require shareholder approval for certain corporate matters, such as requiring that shareholders be given the opportunity to vote on all equity compensation plans and material revisions to those plans, certain ordinary share issuances. We intend to comply with the requirements of Nasdaq listing rules in determining whether shareholder approval is required on such matters and to appoint a nominating and corporate governance committee. We may, however, consider following home country practice in lieu of the requirements under Nasdaq listing rules with respect to certain corporate governance standards which may afford less protection to investors.
| 18 |
If we cannot satisfy, or continue to satisfy, the continued listing requirements and other rules of the Nasdaq Capital Market, our securities may be delisted, which could negatively impact the price of our securities and your ability to sell them.
Our securities are listed on the Nasdaq Capital Market. We cannot assure you that our securities will continue to be listed on the Nasdaq Capital Market. In order to maintain our listing on the Nasdaq Capital Market, we are required to comply with certain rules of the Nasdaq Capital Market, including those regarding minimum stockholders’ equity, minimum share price, minimum market value of publicly held shares, and various additional requirements. Even if we currently meet the listing requirements and other applicable rules of the Nasdaq Capital Market, we may not be able to continue to satisfy these requirements and applicable rules. If we are unable to satisfy the Nasdaq Capital Market criteria for maintaining our listing, our securities could be subject to delisting.
If the Nasdaq Capital Market subsequently delists our securities from trading, we could face significant consequences, including:
| ● | a limited availability for market quotations for our securities; | |
| ● | reduced liquidity with respect to our securities; | |
| ● | a determination that our Ordinary Shares are a “penny stock,” which will require brokers trading in our Ordinary Shares to adhere to more stringent rules and possibly result in a reduced level of trading activity in the secondary trading market for our Ordinary Shares; | |
| ● | limited amount of news and analyst coverage; and | |
| ● | a decreased ability to issue additional securities or obtain additional financing in the future. |
Anti-takeover provisions in our articles of association may discourage, delay, or prevent a change in control.
Some provisions of our articles of association may discourage, delay or prevent a change in control of our Company or management that shareholders may consider favorable, including, among other things, the following:
| ● | provisions that authorize our board of directors to issue shares with preferred, deferred or other special rights or restrictions without any further vote or action by our shareholders; and | |
| ● | provisions that restrict the ability of our shareholders to call shareholder meetings. |
Our board of directors may decline to register transfers of Ordinary Shares in certain circumstances.
Our board of directors may, in its sole discretion, decline to register any transfer of any Ordinary Share which is not fully paid up or on which we have a lien. Our directors may also decline to register any transfer of any Ordinary Share unless (i) the instrument of transfer is lodged with us, accompanied by the certificate for the shares to which it relates and such other evidence as our board of directors may reasonably require to show the right of the transferor to make the transfer; (ii) the instrument of transfer is in respect of only one class of shares; (iii) the instrument of transfer is properly stamped, if required; (iv) in the case of a transfer to joint holders, the number of joint holders to whom the share is to be transferred does not exceed four; (v) the shares transferred are free of any lien in favor of us; or (vi) a fee of such maximum sum as the Nasdaq Capital Market may determine to be payable, or such lesser sum as our board of directors may from time to time require, is paid to us in respect thereof.
If our directors refuse to register a transfer they shall, within three months after the date on which the instrument of transfer was lodged, send to each of the transferor and the transferee notice of such refusal. The registration of transfers may, on 14 days’ notice being given by advertisement in one or more newspapers or by electronic means, be suspended and the register closed at such times and for such periods as our board of directors may from time to time determine, provided, however, that the registration of transfers shall not be suspended nor the register closed for more than 30 days in any year.
This, however, will not affect market transactions of the Ordinary Shares purchased by investors in a public offering. Where the Ordinary Shares are listed on a stock exchange, the Ordinary Shares may be transferred without the need for a written instrument of transfer, if the transfer is carried out in accordance with the rules of the stock exchange and other requirements applicable to the Ordinary Shares listed on the stock exchange.
| 19 |
We are an “emerging growth company” within the meaning of the Securities Act, and if we take advantage of certain exemptions from disclosure requirements available to emerging growth companies, this will make it more difficult to compare our performance with other public companies.
We are an “emerging growth company” within the meaning of the Securities Act, as modified by the JOBS Act. Section 102(b)(1) of the JOBS Act exempts emerging growth companies from being required to comply with new or revised financial accounting standards until private companies (that is, those that have not had a Securities Act registration statement declared effective or do not have a class of securities registered under the Exchange Act) are required to comply with the new or revised financial accounting standards. The JOBS Act provides that a company can elect to opt out of the extended transition period and comply with the requirements that apply to non-emerging growth companies but any such an election to opt out is irrevocable. We have elected not to opt out of such extended transition period, which means that when a standard is issued or revised and it has different application dates for public or private companies, we, as an emerging growth company, can adopt the new or revised standard at the time private companies adopt the new or revised standard. This will make comparison of our financial statements with another public company which is neither an emerging growth company nor an emerging growth company which has opted out of using the extended transition period difficult or impossible because of the potential differences in accounting standards used.
Because we are an “emerging growth company,” we may not be subject to requirements that other public companies are subject to, which could affect investor confidence in us and our Ordinary Shares.
For as long as we remain an “emerging growth company,” as defined in the JOBS Act, we will elect to take advantage of certain exemptions from various reporting requirements that are applicable to other public companies that are not “emerging growth companies,” including not being required to comply with the auditor attestation requirements of Section 404 of the Sarbanes-Oxley Act, reduced disclosure obligations regarding executive compensation in our periodic reports and proxy statements, and exemptions from the requirements of shareholder approval of any golden parachute payments not previously approved. Because of these lessened regulatory requirements, our shareholders would be left without information or rights available to shareholders of more mature companies. If some investors find our Ordinary Shares less attractive as a result, there may be a less active trading market for our Ordinary Shares and our share price may be more volatile.
You may have difficulty enforcing judgments against us.
We are incorporated under the laws of the Cayman Islands as an exempted company limited by shares. Currently, the vast majority of our operations are conducted in Malaysia, and almost all of our assets are and will be located outside of the United States. In addition, almost all of our officers and directors are nationals and residents of a country other than the United States, and almost all of their assets are located outside the United States. As a result, it may be difficult or impossible for you to bring an action against us or against these individuals in the United States in the event that you believe we have violated your rights, either under United States federal or state securities laws or otherwise, or if you have a claim against us. Even if you are successful in bringing an action of this kind, the laws of the Cayman Islands and of Malaysia may not allow you to enforce a judgment against our assets or the assets of our directors and officers.
The laws of the Cayman Islands may not provide our shareholders with benefits comparable to those provided to shareholders of corporations incorporated in the United States.
Our corporate affairs are governed by our memorandum and articles of association, by the Companies Act (as amended) of the Cayman Islands (the “Cayman Companies Act”) and by the common law of the Cayman Islands. The rights of shareholders to take action against our directors, actions by minority shareholders, and the fiduciary responsibilities of our directors to us under Cayman Islands law are to a large extent governed by the common law of the Cayman Islands. The common law in the Cayman Islands is derived in part from comparatively limited judicial precedent in the Cayman Islands and from English common law. Decisions of the Privy Council (which is the final Court of Appeal for British overseas territories such as the Cayman Islands) are binding on a court in the Cayman Islands. Decisions of the English courts, and particularly the Supreme Court and the Court of Appeal are generally of persuasive authority but are not binding in the courts of the Cayman Islands. Decisions of courts in other Commonwealth jurisdictions are similarly of persuasive but not binding authority. The rights of our shareholders and the fiduciary responsibilities of our directors under Cayman Islands law are not as clearly established as they would be under statutes or judicial precedents in the United States. In particular, the Cayman Islands has a less developed body of securities laws relative to the United States. Therefore, our public shareholders may have more difficulty protecting their interests in the face of actions by our management, directors, or controlling shareholders than would shareholders of a corporation incorporated in a jurisdiction in the United States.
| 20 |
You may be unable to present proposals before annual general meetings or extraordinary general meetings not called by shareholders.
Cayman Islands law provides shareholders with only limited rights to requisition a general meeting, and does not provide shareholders with any right to put any proposal before a general meeting. These rights, however, may be provided in a company’s articles of association. Our articles of association allow our shareholders holding shares which carry in aggregate not less than one-third of all votes attaching to all of our issued and outstanding shares, to requisition a general meeting of our shareholders, in which case our chairman or a majority of our directors are obliged to call such meeting. Advance notice of at least seven calendar days is required for the convening of any general meeting of our shareholders. A quorum required for a meeting of shareholders consists of at least one shareholder, present in person or by proxy, holding shares which carry in aggregate not less than one-third of all votes attaching to all of our shares in issue and entitled to vote at such meeting.
If we are classified as a passive foreign investment company, United States taxpayers who own our Ordinary Shares may have adverse United States federal income tax consequences.
A non-U.S. corporation such as ourselves will be classified as a passive foreign investment company, which is known as a PFIC, for any taxable year if, for such year, either:
| ● | at least 75% of our gross income for the year is passive income; or | |
| ● | the average percentage of our assets (determined at the end of each quarter) during the taxable year which produce passive income or which are held for the production of passive income is at least 50%. |
Passive income generally includes dividends, interest, rents and royalties (other than rents or royalties derived from the active conduct of a trade or business), and gains from the disposition of passive assets.
If we are determined to be a PFIC for any taxable year (or portion thereof) that is included in the holding period of a U.S. taxpayer who holds our Ordinary Shares, the U.S. taxpayer may be subject to increased U.S. federal income tax liability and may be subject to additional reporting requirements.
Depending on the amount of assets held for the production of passive income, it is possible that, for our 2023 taxable year or for any subsequent year, more than 50% of our assets may be assets which produce passive income, in which case we would be deemed a PFIC, which could have adverse U.S. federal income tax consequences for U.S. taxpayers who are shareholders. We will make this determination following the end of any particular tax year.
For purposes of the PFIC analysis, in general, a non-U.S. corporation is deemed to own its pro rata share of the gross income and assets of any entity in which it is considered to own at least 25% of the equity by value.
For a more detailed discussion of the application of the PFIC rules to us and the consequences to U.S. taxpayers if we were or are determined to be a PFIC, see “Item 10. Additional Information—E. Taxation—United States Federal Income Taxation—PFIC.”
Our shareholders may be held liable for claims by third parties against us to the extent of distributions received by them upon redemption of their shares.
If we are forced to enter into an insolvency liquidation, any distributions received by shareholders could be viewed as an unlawful payment if it was proved that immediately following the date on which the distribution was made, we were unable to pay our debts as they fall due in the ordinary course of business. As a result, a liquidator could seek to recover some or all amounts received by our shareholders. Furthermore, our directors may be viewed as having breached their fiduciary duties to us or our creditors and/or may have acted in bad faith, thereby exposing themselves and our Company to claims, by paying public shareholders from the trust account prior to addressing the claims of creditors. We cannot assure you that claims will not be brought against us for these reasons. We and our directors and officers who knowingly and willfully authorized or permitted any distribution to be paid out of our share premium account while we were unable to pay our debts as they fall due in the ordinary course of business would be guilty of an offence and may be liable for a fine of $18,292.68 and to imprisonment for five years in the Cayman Islands.
| 21 |
Item 4. INFORMATION ON THE COMPANY
A. History and Development of the Company
Corporate History and Structure
Starbox Berhad was established on July 24, 2019, as a limited liability company organized under the laws of Malaysia. Starbox Berhad holds 100% of the equity interests in the following entities: (i) StarboxSB, which was established in Kuala Lumpur, Malaysia on July 23, 2019; (ii) StarboxGB, which was established in Kuala Lumpur, Malaysia on July 24, 2019; and (iii) StarboxPB, which was formed in Kuala Lumpur, Malaysia, on May 21, 2019.
On September 13, 2021, we incorporated Starbox Group as an exempted company limited by shares under the laws of the Cayman Islands. On November 17, 2021, Starbox Group acquired 100% of the equity interests in Starbox Berhad from its original shareholders. Consequently, Starbox Group, through a restructuring which is accounted for as a reorganization of entities under common control, became the ultimate holding company of all other entities mentioned above. On June 8, 2022, we undertook a series of corporation actions, including a reverse split of our outstanding Ordinary Shares, a reverse split of our authorized and unissued Preferred Shares, and an increase in our authorized share capital.
Completion of the Initial Public Offering (“IPO”)
On August 25, 2022, we closed our IPO of 5,375,000 Ordinary Shares at a public offering price of $4.00 per share, which included 375,000 Ordinary Shares issued pursuant to the partial exercise of the underwriters’ over-allotment option. Gross proceeds of our IPO, including the proceeds from the sale of the over-allotment shares, totaled $21.5 million, before deducting underwriting discounts and other related expenses. The Company received net proceeds of approximately $18.8 million after the deduction of approximately $2.7 million of offering costs. The Ordinary Shares were previously approved for listing on The Nasdaq Capital Market and commenced trading under the ticker symbol “STBX” on August 23, 2022.
Completion of the Private Placement
On November 3, 2022, we closed a private placement pursuant to certain subscription agreements dated October 26, 2022 with four investors (the “Subscribers”). We issued and sold an aggregate of 9,000,000 Ordinary Shares to the Subscribers at a price of $1.40 per share and received gross proceeds, before deducting the placement agent’s fees and other related offering expenses, of $12.60 million.
The following chart illustrates our corporate structure as of the date of this annual report.
| (1) | Represents 9,400,000 Ordinary Shares indirectly held by Choo Teck Hong, the 100% beneficial owner of ZYZ Group Holdings Limited, as of the date of this annual report. |
| (2) | Represents 3,600,000 Ordinary Shares indirectly held by Zhang Yong, the 100% beneficial owner of ZY Sales & Distribution Sdn. Bhd., as of the date of this annual report. |
| 22 |
| (3) | Represents 3,600,000 Ordinary Shares indirectly held by Liu Jun, the 100% beneficial owner of Liu Marketing (M) Sdn. Bhd., as of the date of this annual report. |
| (4) | Represents 3,600,000 Ordinary Shares indirectly held by Chen Han-Chen, the 100% beneficial owner of EVL Corporation Limited, as of the date of this annual report. |
| (5) | Represents 3,600,000 Ordinary Shares indirectly held by Chen Xiaoping, the 100% beneficial owner of Nevis International B & T Sdn Bhd., as of the date of this annual report. |
| (6) | Represents an aggregate of 18,800,000 Ordinary Shares held by 13 shareholders, each one of which holds less than 5% of our Ordinary Shares, as of the date of this annual report. |
For details of our principal shareholders’ ownership, please refer to the beneficial ownership table in “Item 6. Directors, Senior Management and Employees—E. Share Ownership.”
Corporate Information
Our principal executive offices are located at VO2-03-07, Velocity Office 2, Lingkaran SV, Sunway Velocity, 55100 Kuala Lumpur, Malaysia, and our phone number is +603 2781 9066. Our registered office in the Cayman Islands is located at the offices of Gold-In (Cayman) Co., Ltd., whose physical address is Suite 102, Cannon Place, North Sound Rd., George Town, Grand Cayman, Cayman Islands with postal address P.O. Box 712, Grand Cayman, KY1-9006, Cayman Islands, and the phone number of our registered office is +886-2-55820008. We maintain a corporate website at https://www.starboxholdings.com. The information contained in, or accessible from, our website or any other website does not constitute a part of this annual report. Our agent for service of process in the United States is Cogency Global Inc., 122 East 42nd Street, 18th Floor, New York, NY 10168.
The SEC maintains a website at www.sec.gov that contains reports, proxy, and information statements, and other information regarding issuers that file electronically with the SEC using its EDGAR system.
B. Business Overview
Overview
We are building a cash rebate, digital advertising, and payment solution business ecosystem targeting micro, small, and medium enterprises that lack the bandwidth to develop an in-house data management system for effective marketing. Through our subsidiaries in Malaysia, we connect retail merchants with retail shoppers to facilitate transactions through cash rebates offered by retail merchants, provide digital advertising services to advertisers, and provide payment solution services to merchants. Substantially all of our current operations are located in Malaysia.
Our cash rebate business is the foundation of the business ecosystem we are building. We have cooperated with retail merchants, which have registered on the GETBATS website and mobile app as Merchants, to offer cash rebates on their products or services, which have attracted retail shoppers to register on the GETBATS website and mobile app as Members in order to earn cash rebates for shopping online and offline. As the number of Members grows and sales of the existing Merchants increase, more retail merchants are willing to cooperate with us. As of September 30, 2022, 2021, and 2020, the GETBATS website and mobile app had 2,513,658, 514,167, and 66,580 Members, respectively, and 820, 723, and 478 Merchants, respectively. During the fiscal years ended September 30, 2022, 2021, and 2020, we facilitated 338,940, 295,393, and 1,759 transactions through the GETBATS website and mobile app, respectively. We generate revenue by keeping an agreed-upon portion of the cash rebates offered by Merchants on the GETBATS website and mobile app.
Making use of the vast Member and Merchant data we have collected from the GETBATS website and mobile app, we help advertisers design, optimize, and distribute advertisements through online and digital channels. We primarily distribute advertisements through (i) our SEEBATS website and mobile app, on which viewers can watch movies and television series for free through OTT streaming, which is a means of providing television and film content over the Internet at the request and to suit the requirements of the individual consumer, (ii) our GETBATS website and mobile app to its Members, and (iii) social media, mainly consisting of accounts of influencers and bloggers. During the fiscal years ended September 30, 2022, 2021, and 2020, we served 63, 25, and two advertisers, respectively. We generate revenue through service fees charged to the advertisers.
| 23 |
To diversify our revenue sources and supplement our cash rebate and digital advertising service businesses, we started to provide payment solution services to merchants in May 2021 by referring them to VE Services. Pursuant to the Appointment Letter with VE Services, we serve as its independent merchant recruitment and onboarding agent and refer merchants to VE Services for payment processing. We referred 19 and 11 merchants to VE Services during the fiscal years ended September 30, 2022 and 2021, respectively. We generate insignificant revenue through commissions from VE Services for our referrals and such revenue has been reported as revenue from a related party in our consolidated financial statements.
For the fiscal year ended September 30, 2022, we had total revenue of $7,194,187 and net income of $3,602,365. Revenue derived from digital advertising services, cash rebate services, and payment solution services accounted for approximately 99.72%, 0.15%, and 0.13% of our total revenue for the period, respectively.
For the fiscal years ended September 30, 2021 and 2020, we had total revenue of $3,166,228 and $153,863, respectively, and net income of $1,447,650 and a net loss of $205,154, respectively. Revenue derived from digital advertising services accounted for approximately 99.75% and 99.53% of our total revenue for those fiscal years, respectively. Revenue derived from cash rebate services accounted for approximately 0.20% and 0.47% of our total revenue for those fiscal years, respectively. Revenue derived from payment solution services accounted for approximately 0.05% and 0.00% of our total revenue for those fiscal years, respectively.
Competition
The cash rebates industry and the digital advertising industry in Malaysia are highly-competitive and rapidly evolving, with many new companies joining the competition in recent years and few leading companies.
In the cash rebates industry, we compete with other cash rebate platforms and businesses that focus on particular merchant categories and markets. We also compete with traditional offline coupon and discount services, as well as newspapers, magazines, and other traditional media companies that provide coupons and discounts on products and services. We believe the principal competitive factors in this industry include breadth of member and merchant bases, local presence and understanding of local business trends, ability to deliver a high volume of relevant deals to consumers, ability to generate positive return on investment for merchants, and strength and recognition of our brand. We believe that we compete favorably on the factors described above.
In the digital advertising industry, we compete directly with other providers of digital advertising services for advertisers and advertising revenue. In addition, we compete with traditional forms of media, such as newspapers, magazines, and radio and television broadcast, and other providers of offline advertising services. We believe that our ability to compete effectively for advertisers depends upon many factors, including brand recognition, qualify of services, effectiveness of sales and marketing efforts, creativity in design and contents of advertisements, pricing and discount policies, and hiring and retention of talented staff. We believe that we are well-positioned to effectively compete in the digital advertising industry based on the factors listed above.
Some of our current or future competitors, however, may have longer operating histories, greater brand recognition, or greater financial, technical, or marketing resources than we do. For a discussion of risks relating to competition, see “Item 3. Key Information—D. Risk Factors—Risks Related to Our Business and Industry—The markets in which we operate are highly competitive, and we may not be able to compete successfully against existing or new competitors, which could reduce our market share and adversely affect our competitive position and financial performance.”
Our Competitive Strengths
We believe the following competitive strengths are essential for our success and differentiate us from our competitors:
Business Ecosystem Comprising Cash Rebate, Digital Advertising, and Payment Solution Services
We are developing a business ecosystem in Malaysia comprising three lines of business that are complementary to each other, including (i) a cash rebate business connecting Members to Merchants, (ii) a digital advertising business providing targeted digital advertising services to advertisers; and (iii) a payment solution service business, which ecosystem we plan to replicate to other parts of Southeast Asia and eventually globally.
| 24 |
Our business maintains sustainable growth owing to the dynamic and complementary relationships among our GETBATS website and mobile app, our SEEBATS website and mobile app, and our payment solution services. Although currently the revenue from the GETBATS website and mobile app only accounts for a small portion of our overall revenue, they play a crucial and strategic role in our business ecosystem, essentially functioning as a direct database marketing platform that enables us to collect a large amount of data regarding our Merchants and Members and create a composite database of consumer spending behaviors by leveraging our business data analysis system; the SEEBATS website and mobile app, in turn, drive website traffic back to the GETBATS website and mobile app, which have become an increasingly popular cash rebate platform; and our payment solution service business functions as a further supplementary piece to our business ecosystem to ensure the security and convenience of all the transactions conducted therein. As such, we endeavor to provide our advertisers with targeted digital advertising services while ensuring our Merchant and Members can also benefit from the transactions facilitated by us through our cash rebate system in a more secure payment environment.
Capability of Providing Targeted Digital Advertising Services by Leveraging Business Data Analysis Technology Capability of Providing Targeted Digital Advertising Services by Leveraging Business Data Analysis Technology
The ability to understand market traffic and pair potential consumers with suitable advertisements is key to converting the viewer’s interest into a purchase, thus enhancing the return of investment of marketing expenditures in the digital advertising industry. We are devoted to offering targeted digital advertising services for advertisers to help them improve the return of investment of their marketing expenditures by leveraging business data analysis technology and creating and refining marketing campaigns that could better reach the target audience and achieve better results.
Our large repository of Merchant and Member data and strong technological capabilities have enabled us to innovate and optimize our digital advertising services on an ongoing basis. Specifically, we collect and analyze vast Member spending behavioral data by leveraging our large user base on our GETBATS website and mobile app and our business data analysis capabilities. As of September 30, 2022, we had acquired information from 2,513,658 unique Members, including more than 5,488 spending Members, and 820 Merchants, and implemented a business data analysis system to study consumer spending behaviors. The size and number of available data sets have grown rapidly as data has been collected from mobile devices through our mobile app, computer peripherals from web browsers, and progressive web applications. We also collect analytic data from log files. We study our Members’ login patterns (such as time, date, and frequency of login), the deals, promotions, and advertisements they click, and the Merchant links that they share. In addition, we study viewers’ behaviors on our SEEBATS website and mobile app, including the types of movies they view and the time they spend on each movie, so that we can further relate and categorize them into different spending behavior category. In addition, we also help advertisers optimize their marketing campaigns by identifying the objectives and audience, formulating customized digital media strategies, designing brand positioning, and key messages, and improving the artistic value and attractiveness of the ads.
As of the date of this annual report, we have five contracted employees engaging in developing, maintaining business data analysis technology, and advertisement optimization. We believe our optimization capabilities, particularly driven by our advanced business data analysis, are recognized and valued by our advertisers, which has enabled us to obtain and sustain a solid advertiser base.
Solid Advertiser Base Spanning a Wide Range of Industries
Our advertiser base grew substantially during the fiscal years ended September 30, 2022, 2021, and 2020. Our revenue from digital advertising services increased from $3,158,520 for the fiscal year ended September 30, 2021 to $7,174,050 for the fiscal year ended September 30, 2022, while the number of advertisers we served grew from 25 for the fiscal year ended September 30, 2021 to 63 for the fiscal year ended September 30, 2022. Our revenue from digital advertising services increased from $153,145 in fiscal year 2020 to $3,158,520 in fiscal year 2021, while the number of advertisers we served grew from two in fiscal year 2020 to 25 in fiscal year 2021. The industries of our advertiser base include luxury property development, medical services, retail jewelry sales, and real estate agencies, among other.
We believe our diverse advertiser base helps us compete with other digital advertising services providers. Our relationships with advertisers of a broad industry spectrum have also enabled us to understand the demands and requirements of the advertisers and communicate with them in an accurate and efficient manner, which serves as our primary source to stay informed of the trends and evolutions of the digital advertising industry.
| 25 |
We believe our relationships with our advertisers has helped us build a reputation of high service quality, which helps attract and secure potential advertisers, thus creating a virtuous cycle for our growth and furthering our business development. As we continue to build and optimize our advertiser base, we are confident that we will be seen by merchants as the “go-to” place for advertisers who look for digital marketing of their products and services and a valuable source and channel to drive consumer demand, increase sales, and achieve operating efficiencies.
Visionary and Experienced Management Team with Strong Technical and Operational Expertise
Our senior management team has extensive experience in the traditional and mobile Internet, data analysis, and other technologies. Mr. Lee Choon Wooi, our Chief Executive Officer, director, and chairman of the board of directors, has served as the chief executive officer at Starbox Berhad since January 2020, where he is responsible for the management of day-to-day operations and high-level strategizing and business planning. From October 2013 to September 2021, Mr. Lee served as an executive director at Teclutions Sdn. Bhd., a multi-level marketing and e-commerce software system development company, where he was responsible for the company’s overall management. Under the leadership of Mr. Lee, we have successfully identified trends in digital advertising by leveraging our business data analysis technology and timely seized opportunities for growth and innovation.
Growth Strategies
We intend to develop our business and strengthen brand loyalty by implementing the following strategies:
Further Expand Our Business Scale and Secure New Advertisers
The digital advertising market in Southeast Asia has been growing rapidly. According to the industry report of Frost & Sullivan Limited commissioned by us in April 2022, entitled “Digital Advertising, Cashback and Coupon Market Study in Southeast Asia” (the “Frost and Sullivan Report”), the market size of the digital advertising industry in Southeast Asia increased from approximately $5.3 billion in 2016 to approximately $10.0 billion in 2021, and it is expected to further increase to approximately $15.9 billion in 2026; the market size of the digital advertising industry in Malaysia increased from approximately $0.5 billion in 2016 to approximately $0.9 billion in 2021, and it is expected to further increase to approximately $1.5 billion in 2026. We believe the growth of the digital advertising market will fuel the need for digital advertising services as advertisers seek to optimize their online marketing strategies, which will create an enormous opportunity for digital advertising service providers like us for the foreseeable future.
To capture the potential growth of the digital advertising service market, we will continue to actively attract new advertisers to place ads through us and seek to increase the advertising spend of our existing advertisers. We will also seek to include more high-profile and sizeable advertisers from various industries. We believe this will reinforce our reputation as a reliable digital advertising services provider in different industries, which we believe would extend our reach to advertisers in those industries. In particular, we have (i) increased our brand exposure in offline events targeting micro, small, and medium enterprises via brand partnerships, like Grab, iFood, and Tastefully, and various activities at shopping malls; (ii) partnered with influencers or Key Opinion Leaders (“KOLs”) to create content to maximize our social media presence; (iii) created our own referral program to entice brand awareness, through which existing GETBATS Members may invite friends to sign up as Members and earn e-vouchers or gift cards; and (iv) improved our search engine optimization with user intent-related keywords through a digital marketing agency.
We believe that such strategies have contributed to our significant revenue growth in the fiscal years 2020, 2021 and 2022, and will continue to do so in the future. We will keep ourselves abreast of the latest changes in the digital advertising landscape and understand the evolving needs and requirements of our advertisers.
Further Grow Our Merchant and Member Bases on the GETBATS Website and Mobile App
We endeavor to continue to expand our Merchant and Member bases on the GETBATS website and mobile app, since they play a crucial and strategic role in our business ecosystem. As of September 30, 2022, we had 2,513,658 Members on the GETBATS website and mobile app. We have made significant investments to acquire Members through online marketing initiatives, such as search engine marketing, display advertisements, referral programs, and affiliate marketing. During the fiscal years ended September 30, 2022, 2021, and 2020, we spent $188,338, $167,803, and $159,852, respectively, on these initiatives. In addition, our Member base has increased by word-of-mouth. We intend to continue to invest in acquiring Members, for so long as we believe the economics of our business support such investments. Our goal is to retain existing and acquire new Members by providing more targeted cash rebate deals, delivering high-quality customer services, and expanding the number and categories of deals we offer. We intend to continue to invest in the development of increased relevance of our services, as the number and variety of the deals we offer to our Members increase and we gain more information about their interests.
| 26 |
During the fiscal years ended September 30, 2022, 2021, and 2020, we featured more than 40, 60, and 30 Merchants offering cash rebate deals on our GETBATS website and mobile app, respectively. To drive Merchant growth, we have expanded the number of ways in which Members can discover deals through our shop-centric website and mobile app. We have also made investments in our salesforce, which builds merchant relationships and local expertise. Our Merchant retention efforts are focused on providing Merchants with a positive experience by offering targeted placement of their deals to our Member base, high-quality customer services, and tools to manage deals more effectively. We routinely solicit feedback from our Merchants to ensure their objectives are met and they are satisfied with our services. Based on this feedback, we believe our Merchants value the profitability of the immediate deal, potential revenue generated by repeat customers, increased brand awareness, and the resulting revenue stream that brand awareness may generate over time. Some Merchants view our deals as a marketing expense and may be willing to offer deals with little or no immediate profitability in an effort to gain future customers and increased brand awareness, since they only pay the cash rebates to the GETBATS website and mobile app upon each successful transaction.
Continue to Invest in and Develop Technologies Relating to Data Analysis
We consider technological innovations to be a critical component of our strategy, allowing us to provide execution at scale and deliver data-driven insights to grow our clients’ businesses. We will continue developing our technologies, with a focus on data analysis. We have implemented a business data analysis system, which analyzes data collected on our websites and mobile apps to understand consumer spending behaviors. We intend to improve this system by introducing (i) descriptive analysis, which simplifies and summarizes past data into a readable form to provide insights into what has occurred in the past; (ii) predictive analysis, which uses past data and present data to predict future events, and (iii) prescriptive analysis, which explores several possible actions and suggests actions based on the results of descriptive and predictive analysis of a given data set. We also intend to use artificial intelligence technology to improve the natural language processing ability of our websites and mobile apps, with a goal of recognizing voice and text input by Members in multiple languages and dialects and returning search results.
Expand Our Cash Rebate and Digital Advertising Services Internationally
We intend to selectively launch our cash rebate and digital advertising services in other countries in Southeast Asia during the next three years, starting from markets such as the Philippines, Thailand, and Indonesia. We started to expand into the Philippines and Thailand in July 2022 and intend to continue focus on expanding into the Philippines and Thailand until June 2023. Our goal is to become operational in these countries around April to June 2023 and to further expand into Indonesia, Brunei, Singapore, and other countries in Southeast Asia between July 2023 and June 2025. We believe we can expand into these new markets by leveraging our existing business data analysis technology and expect to (i) establish representative offices or appoint local partners; (ii) integrate our websites and mobile apps with the representative offices or local partners to provide our services; (iii) hire key marketing and support employees who are familiar with local languages and cultures to manage our business in these countries, especially Thailand and Indonesia, where local languages are preferred in business activities; and (iv) promote our brands in these countries by investing in marketing activities.
We face financial and logistical challenges associated with our plans for accelerated and geographically expansive growth. See “Item 3. Key Information—D. Risk Factors—Risks Related to Our Business and Industry—If we fail to manage our growth or execute our strategies and future plans effectively, we may not be able to take advantage of market opportunities or meet the demand of our advertisers” and “Item 3. Key Information—D. Risk Factors—Risks Related to Our Business and Industry—We may be unsuccessful in expanding and operating our business internationally, which could adversely affect our results of operations.”
Our Business Model
We currently generate revenue from the following principal sources:
| ● | Cash Rebates. We facilitate online and offline transactions between Merchants and Members of the GETBATS website and mobile app and keep a portion, usually 14%, of the cash rebates offered by Merchants as our revenue. | |
| ● | Digital Advertising Services. We help advertisers design and optimize online advertisements, and distribute advertisements through the SEEBATS website and mobile app, the GETBATS website and mobile app, and social media. We generate revenue through service fees charged to the advertisers. | |
| ● | Payment Solution Services. We refer merchants to VE Services to process payments and receive a portion of the monthly service fees, which range from 0.15% to 0.525% of the total service fees collected by VE Services, as commissions for our referrals. |
| 27 |
The following tables presents our revenue for fiscal years ended September 30, 2022, 2021, and 2020.
| Revenue | ||||||||||||
| Fiscal Year Ended September 30, | ||||||||||||
| 2022 | 2021 | 2020 | ||||||||||
| Cash Rebate Services | $ | 10,562 | $ | 6,214 | $ | 718 | ||||||
| Digital Advertising Services | 7,174,050 | 3,158,520 | 153,145 | |||||||||
| Payment Solution Services – Related Party | 9,575 | 1,494 | - | |||||||||
| Total | $ | 7,194,187 | $ | 3,166,228 | $ | 153,863 | ||||||
Cash Rebates
We operate a cash rebate platform, the GETBATS website and mobile app. Users may sign up for a free membership on our website, www.getbats.com, or on our GETBATS app, which may be downloaded from the App Store and Google Play. Members may then use the GETBATS website or app as their personal shopping portal, and earn cash rebates for online shopping and offline shopping.
| ● | Online. Rather than going directly to a retailer’s website, a Member first logs in on the GETBATS website or app. After searching for and finding a Merchant, the Member clicks the “Shop Now” button for that Merchant. The “Shop Now” button will direct the Member to the respective store or app page for the Merchant, where the Member may shop and pay for products as usual. After the Member makes payment, the GETBATS website/app automatically tracks the transaction(s) and cash rebates. The cash rebates are usually available for the Member to check in his or her account on the GETBATS website and mobile app in one to three days after the purchase. | |
| ● | Offline. A Member may also earn cash rebates when shopping at offline stores of our Merchants, such as restaurants, retail stores, and salons. After making payment, the Member may inform the cashier that he or she is a GETBATS Member and is entitled to cash rebates. The Member may then log in on the GETBATS website or app, select the Merchant, and follow the system guidance to obtain the cash rebate entitlement. Once the Merchant validates the purchase and the amount, which takes a few seconds to several days depending on the Merchant, we will add the cash rebates to the account of the Member. |
One key selling point of the GETBATS website and mobile app is that the cash rebates of a Member do not expire. Members may withdraw their cash rebates via e-wallet transfer when their accumulated rebate balance reaches a minimum of MYR10.00 ($2.38). The withdrawal process typically takes three to five business days. We partner with e-wallet service providers, such as MCash, Boost, Touch ‘n Go, and KA$H.
The GETBATS Website and Mobile App
The GETBATS website and mobile app provide the following functions:
| ● | Search. With the search engine built into the GETBATS website and mobile app, Members can search their favorite Merchants and deals among hundreds of choices. | |
| ● | Location-based Services. Based on Members’ location, nearby offline Merchants and cash rebate deals are selected and displayed on the GETBATS webpage and app for a smooth, user-friendly interaction. | |
| ● | Merchant and Deal Spotlight. Featured Merchants get customized banners on the GETBATS website and mobile app homepage, and the homepage also lists deal highlights, latest rebates, top rebates, and popular rebates, making it easier for Members to discover featured cash rebate deals and purchase from featured Merchants. |
| 28 |
| ● | Smart Categories. Members can easily filter and sort deals and Merchants and narrow down their choices by pre-defined categories and collections. | |
| ● | Member Account Management. Members can check their cash rebate status, cash rebate balance, and purchase history and initiate cash rebate withdrawal in their accounts on the GETBATS website and mobile app. | |
| ● | Merchant Account Management. Stores that have signed up as a Merchant can manage their accounts on the GETBATS website and mobile app, including editing information about their stores and viewing or voiding approved transactions. |
The following are screenshots for our GETBATS website and GETBATS app.
| Screenshot for the GETBATS Website | Screenshot for the GETBATS App |
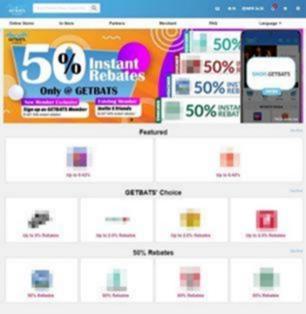 |
 |
The Members
We have grown the Member base of the GETBATS website and mobile app since their official launch in November 2019. The following table sets out the key performance indicators for Members of the GETBATS website and mobile app as of the fiscal years indicated.
| Fiscal Years Ended September 30, | ||||||||||||
| 2022 | 2021 | 2020 | ||||||||||
| Members (#) | 2,513,658 | 514,167 | 66,580 | |||||||||
| Members Who Have Received Rebates (for spending and referral) (#) | 5,488 | 3,418 | 532 | |||||||||
| Cash Rebates Distributed* | $ | 19,907 | $ | 29,873 | $ | 4,761 | ||||||
*These amounts refer to total cash rebates distributed to Members for spending and referrals and include cash rebates that were accrued to be paid in the future.
| 29 |
We grow our Member base through marketing initiatives and word-of-mouth. Our online marketing consists of social media marketing, email marketing, influential marketing, search engine optimization marketing, display advertisements, referral programs, and affiliate marketing. For instance, we have been running a “New Member Exclusive Promo” since June 6, 2021, which is available to new GETBATS Members that have signed up and existing GETBATS Members who have invited at least five friends to sign up as a GETBATS Member during the promotional period. These eligible Members may purchase an e-vouchers or gift card with a 50% instant cash rebates. Our offline marketing consists of traditional printed flyers, billboard, public relations, brand partnerships, and sponsored and corporate social responsibilities events to increase our visibility and build our brands. During the fiscal years ended September 30, 2022, 2021, and 2020, we spent MYR142,833 (approximately $33,186), MYR250,149 (approximately $60,652), and MYR159,788 (approximately $37,897) on Member acquisition, respectively.
The Merchants
Our GETBATS website and mobile app currently feature cash rebates from Merchants in over 20 industries, such as automotive, beauty and health, books and media, electronics, fashion, food and beverages, groceries and pets, home and living, and sports and entertainment. Most of the Merchants are located in Malaysia.
The following table sets out the key performance indicators for Merchants of the GETBATS website and mobile app as of the fiscal years indicated.
| Fiscal Years Ended September 30, | ||||||||||||
| 2022 | 2021 | 2020 | ||||||||||
| Merchants (#) | 820 | 723 | 478 | |||||||||
| Online Merchants (#) | 421 | 337 | 111 | |||||||||
| Offline Merchants (#) | 399 | 386 | 367 | |||||||||
| Transactions (based on rebated sales) (#) | 338,940 | 295,393 | 1,759 | |||||||||
| Total Transaction Amount | $ | 3,568,166 | $ | 2,501,913 | $ | 74,867 | ||||||
Merchant Acquisition Channels
We acquire Merchants through various means, including (i) approaching potential merchants based on market intelligence and our industry insights; (ii) exploiting our industry connections to identify potential merchants; (iii) reaching out to our existing Merchants to explore further business opportunities; (iv) referrals by our existing Merchants; and (v) collaboration with other platforms (such as affiliate marketing platform) to aggregate merchant bases. We also have some Merchants who seek our cash rebate-related services as a result of our marketing efforts.
After identifying a merchant interested in joining the GETBATS website and mobile app, we will negotiate with the merchant to determine the rate of blanket cash rebates it will offer to us. The merchant will then fill out an application form, which specifies the rate of blanket cash rebates and lays out our Merchant terms and conditions, and pay an application fee, which is typically waived, before becoming an authorized GETBATS Merchant. It will remain an authorized Merchant of the GETBATS website and mobile app indefinitely, unless the status is terminated by us or the Merchant by notice in writing.
Digital Advertising Services
Our Advertisers
We have built a diverse advertiser base from a broad range of industries, including luxury property development, medical services, retail jewelry sales, and real estate agencies, among others. During the fiscal years ended September 30, 2022, 2021, and 2020, we served 63, 25, and two advertisers, respectively. For the fiscal year ended September 30, 2022, no single advertiser accounted for more than 10% of our total revenue. For the fiscal year ended September 30, 2021, three advertisers accounted for approximately 21.7%, 10.8%, and 10.8% of our total revenue, respectively. For the fiscal year ended September 30, 2020, one advertiser accounted for approximately 91.6% of our total revenue. See “Item 3. Key Information—D. Risk Factors—Risks Related to Our Business and Industry—Our major clients generate a significant portion of our revenue. Any interruption in operations in such major clients may have an adverse effect on our business, financial condition, and results of operations.”
| 30 |
The following tables summarize our major advertisers for the fiscal years ended September 30, 2021 and 2020:
| For the fiscal year ended September 30, 2021 | ||||||
| Name of advertiser | Revenue and percentage of total revenue | Relationship with our Company | Major contract terms | |||
| Company A | $727,073, 21.70% | Third-party advertiser | (i) Advertising strategy consultation, profile setup, and advertisement and graphic design, (ii) social media channel posting (including through blogger and influencer accounts) in August and September 2021; and (iii) four-week advertisement display on our SEEBATS website and mobile app from September 1, 2021 to September 30, 2021 | |||
| Company B | $363,694, 10.80% | Third-party advertiser | (1) Advertising strategy consultation, profile setup, and advertisement and graphic design; (ii) social media channel posting (including through blogger and influencer accounts) in August and September 2021; and (iii) four-week advertisement display on our SEEBATS website and mobile app from September 1, 2021 to September 30, 2021 | |||
| Company C | $363,537, 10.80% | Third-party advertiser | (i) Advertising strategy consultation, profile setup, and advertisement and graphic design; (ii) social media channel posting (including through blogger and influencer accounts) in August and September 2021; and (iii) four-week advertisement display on our SEEBATS website and mobile app from September 1, 2021 to September 30, 2021 | |||
| For the fiscal year ended September 30, 2020 | ||||||
| Name of advertiser | Revenue and percentage of total revenue | Relationship with our Company | Major contract terms | |||
| Company D | $142,307, 91.6% | Third-party advertiser | A three-month advertisement and promotional activities package running from January 1, 2020 to March 31, 2020 | |||
| 31 |
Ad Distribution Channels
We mainly distribute online advertisements through our SEEBATS website and mobile app, our GETBATS website and mobile app, and social media.
Distribution through Our SEEBATS Website and Mobile App
We currently operate a video streaming platform, the SEEBATS website and mobile app. Viewers may sign up for a free membership and watch movies and television series on our website, www.seebats.com, or our SEEBATS TV mobile app through OTT streaming. The following are screenshots for our SEEBATS website and our SEEBATS TV app.
| Screenshot for Our SEEBATS Website | Screenshot for Our SEEBATS App |
 |
 |
Our SEEBATS website and mobile app offer 579 episodes of licensed movies and television series in various genres, such as action, comedy, fantasy, historical, and romance. We have licensed these movies and television series from Shenzhen Yunshidian, a third-party content provider, pursuant to a Service and Licensing Agreement dated November 1, 2021 (the “Service and Licensing Agreement”). The agreement has a term from November 1, 2021 to October 31, 2023 and may be terminated by either party in the event of a material breach by the other party of the agreement. We have agreed to pay a content and service fee of $120,000 and a content delivery fee based on the amount of content delivered by the content provider, ranging from $1,700 to $660,000 per year under the Service and Licensing Agreement. Pursuant to a letter dated July 15, 2021, Shenzhen Yunshidian also provided our SEEBATS website and mobile app with movies and television series for a free trial run from August 1, 2021 to October 31, 2021 before we entered into the Service and Licensing Agreement.
During the fiscal years ended September 30, 2021 and 2020, we licensed movies and television series from Dooya Media Group (“DMG”), a third-party content provider, pursuant to a Distribution and Ad Sales Deal Agreement dated July 29, 2019, and Super Runway Inc. (“SRI”), a third-party content provider, pursuant to a White-label Video App and Ad Sales Service Agreement dated August 5, 2019. Our agreement with DMG had a term from August 1, 2019 to July 31, 2021, and we agreed to share with DMG 50% of the net revenue generated from advertisements placed on its content, in addition to paying DMG a flat fee of $10,000 and a monthly fee of $2,500 during the term. Our agreement with SRI had a term from August 1, 2019 to July 31, 2021, and we agreed to share with SRI 40% to 60% of the net revenue generated from advertisements placed on its content, in addition to paying SRI a monthly fee of $2,500 during the term. During the terms of the agreements, as we only displayed banner advertisements on the homepage of our SEEBATS website and mobile app and on the video pages, instead of placing advertisements on the movies and television series we licensed from DMG and SRI, we did not share any ad revenue with DMG or SRI and we only paid DMG and SRI flat fees and monthly fees based on contract terms. Total flat fees and monthly fees paid to DMG and SRI amounted to $50,000 and $60,000 for the fiscal years ended September 30, 2021 and 2020, respectively, which were recorded under our operating costs. See “Item 5. Operating and Financial Review and Prospects—A. Operating Results” for details.
On our SEEBATS website and mobile app, we offer eight tiers of digital advertisement distribution packages, which include different timing and duration of advertisement display and different placement formats, including (i) banner advertisements on the homepage of our SEEBATS website and mobile app, (ii) banner advertisements on the video pages, (iii) in-stream video ads played at the beginning or in the middle of videos, and (iv) background advertisements via digital product placements that appear above or below a selected video screen concurrently with a user viewing a video. For the fiscal years ended September 30, 2022, 2021, and 2020, approximately 82%, 93%, and 100% of our advertisement display services revenue was generated from ads distributed on our SEEBATS website and mobile app, respectively.
| 32 |
Distribution through Our GETBATS Website and Mobile App
Taking advantage of the growing GETBATS Member base, we offer the following types of digital advertising services through our GETBATS website and mobile app:
| ● | Peer-to-peer Influencing Tools. We make tools available for GETBATS Members to share advertisers’ advertisements in their own influencing circles through social media platforms, such as WhatsApp, WeChat, Facebook, Instagram, and Telegram, and email. Premium SEEBATS advertisers will be published in GETBATS Member dashboard. GETBATS Members can do targeted Merchant sharing to attract the relevant crowd to view the related sharing. Our Members will be able to share directly the related Merchant instead of general GETBATS promotional link. This enable the viewer of the shared link to be easily captured based on the brands the Member is sharing. | |
| ● | Push Notification and Email Marketing. We send advertisers’ advertisements through mobile app notifications and/or email to our GETBATS Members on a daily basis. As we analyze GETBATS Members’ purchase habits and interests through their activities on our GETBATS website and mobile app, we are able to show advertisements to the right audiences, therefore increasing the conversion rate of these advertisements. | |
| ● | Banner Advertisements. We display banner advertisements on our GETBATS website and mobile app. |
For the fiscal years ended September 30, 2022, 2021, and 2020, approximately 0.1%, 2%, and 0% of our advertisement display services revenue was generated from ads distributed on our GETBATS website and mobile app, respectively.
Distribution through Social Media
With the emergence of popular online social media attracting numerous users, advertisers are increasingly receptive of the idea of identifying social media accounts that have influence over potential customers on these platforms, and orienting marketing activities around KOLs. Our social media marketing services generally involve the design and implementation of creative advertising campaigns carried out on social media platforms through the use of influential social media accounts with suitable target audiences. During the fiscal years ended September 30, 2022, 2021, and 2020, we distributed advertisements for 63, 25, and two advertisers on social media, respectively.
Our social media campaigns generally take the form of coordinated issuances of content on accounts in various popular social media platforms, including popular social networking platforms, video sharing platforms, live streaming platforms, knowledge sharing platforms, and information content platforms, which are intended to reach the readers of the contents of these accounts. Depending on the advertisers’ marketing objectives, various types of social media accounts can be used, such as (i) the accounts of nano-influencers, who are generally non-professional social media influencers with between 1,000 and 10,000 followers; (ii) the accounts of professional influencers; and (iii) the accounts of non-professional and professional bloggers.
To make a post on these social media accounts, we typically collaborate with active GETBATS social media (Facebook and Instagram) fans besides engaging KOLs in public or private influencer groups. We select KOLs by set parameters like minimum numbers of followers in their respective social media sites before engaging with them. We maintain a list of such KOLs, which are reviewed and updated from time to time based on our review of their service quality and their available resources. Generally, we enter into ad-hoc agreements with these KOLs, setting out the major terms and administrative procedures for utilizing their social media accounts for ad deployments, and the respective rights and obligations of the parties.
| 33 |
| Social Media Ads (Example 1) | Social Media Ads (Example 2) |
 |
 |
For the fiscal years ended September 30, 2022, 2021, and 2020, approximately 4%, 5%, and 0% of our advertisement display services revenue was generated from ads distributed on third-party social media channels, respectively.
Services and Operational Flow
Acquiring Advertisers
We acquire advertisers through various means, including (i) approaching potential advertisers based on market intelligence and our industry insights; (ii) exploit our industry connections to identify potential advertisers; (iii) reaching out to our existing advertisers to explore further business opportunities; and (iv) through referrals by our advertisers.
We provide potential advertisers with our quotation for digital advertising services, which lays out the types of digital advertising services we will provide, payment information, and other terms and conditions. After the advertiser accepts our quotation, it becomes a legally-binding contract with us.
Pre-Launch
Before launching an advertising campaign, we usually discuss with the advertiser to understand its products or services to be marketed, marketing budget, and marketing objectives. Depending on the needs of our advertisers, we may provide advice and services on advertising strategies and ad optimization, generally covering:
| Ad Type | Advisory Services | |
| Banner Ads | Time and Place for Ad Deployment: We help our advertisers identify their target audiences (such as their profiles and geographical locations) and target time slots to target the ad displays based on the characteristic of the advertisers’ products and services. By setting these parameters, we aim to target the relevant audiences of the products and services we promote to improve the efficiency of reaching users with higher likelihood to click on the ads.
Ad Presentation: We also provide design optimization on the presentation of banner ads, such as title phrases, picture design, and text descriptions. |
| 34 |
| In-stream Ads on our SEEBATS Website and Mobile App | Time and Place for Ad Deployment: We help our advertisers set parameters, such as geographical regions and time slots for ad displays and profiles of target audiences based on the features of advertisers’ products and services, to increase the likelihood of the ads reaching their target audience.
Ad Presentation: In addition to increasing the precision of the advertisements, we also provide optimization services on the design and format of ads, such as the desired length, content, script, and color tone of short video ads, to make them more receptive to the target audiences. | |
| Push Notification and Email Ads on Our GETBATS Website and Mobile App | Customized Audience: Through direct access to our GETBATS website and mobile app, which provides “tags” based on Member profiles and behaviors, we advise our advertisers on how to use these “tags” to define their target audiences, and assist our advertisers in adjusting the ad-trigger criteria to achieve more precise marketing. | |
| Social Media Ads | We assist our advertisers in the design of advertising strategies, provide advice on choices of ad formats and materials (such as short-videos, images, and text descriptions), and recommend appropriate social media accounts and suitable media channels for implementation and deployment of the advertising campaigns based on the themes and the desired effects of the campaigns. |
We provide these advice and related services on advertising strategies and ad optimization to our advertisers to improve the effectiveness of their ads, which we believe will serve to enhance our advertisers’ satisfaction and improve advertiser retention.
Campaign Launch and Performance Review
We have implemented measures to ensure that our ad content does not violate laws and regulations. Our experienced employees carefully review ad content we receive from our advertisers. If we determine that the ad content does not violate any applicable laws and regulations, we will share the ad content with the relevant media for their internal review. If we determine that the ad content may be in violation of applicable laws or regulations, we will provide suggested edits to the ad content and send it back to the advertisers for revision. After both we and the media have determined that the ad content is in full compliance with applicable laws and regulations on information dissemination, we will confirm with the advertiser on its opinion with respect to the compliance prior to the deployment of the ad.
After we and our advertisers agree upon the advertising strategies and materials, we will be ready to launch the advertising campaigns. Upon receiving our advertisers’ orders, we would proceed to place their ads on our SEEBATS website and mobile app or our GETBATS website and mobile app, push notification or email ads to relevant GETBATS Members, or inform the influencers or bloggers to start posting relevant advertisement materials on their social media. The ads are usually displayed for a fixed period of time, ranging from a few weeks to a few months.
After an ad is launched, we monitor and assess the overall effectiveness of the advertising campaign in various dimensions, such as the ad exposure of in-stream ads and the visibility and degree of customer engagement of social media campaigns. Based on our assessment, we may further advise our advertisers on advertising strategies and optimization to continuously improve the effectiveness of their ad campaigns.
During the fiscal years ended September 30, 2022 and 2021, 22 and 10 advertisers used our advertisement design and consultation services, respectively. For advertisement design and consultation services, our stand-alone selling price ranges from approximately $2,400 to approximately $38,000 for each of the service commitments, including advice on advertising strategies, customization and optimization of the desired content, length, color tone, layout, format, and presentation of the ads. Advertisers may elect to use any agreed-upon combination of services in one package, depending on their specific needs. We generated revenue of $1,575,800 and $384,061 from providing advertisement design and consultation services for the fiscal year ended 2022 and 2021, respectively. There was no such service revenue in fiscal year 2020.
| 35 |
In addition, all 63 advertisers for the fiscal year ended September 30, 2022, 25 advertisers in fiscal year 2021, and two advertisers in fiscal year 2020 used our services for advertisement display on our websites and mobile apps and third-party social media channels. Depending on the distribution channels used and the duration of the advertisement display, we charged advertising service fees in the range of approximately $5,000 to approximately $240,000 for designated services. Our revenue associated with advertisement display services amounted to $5,645,324 for the fiscal year ended September 30, 2022, $2,774,459 in fiscal year 2021, and $153,145 in fiscal year 2020.
Payment Solution Services
To diversify our revenue sources and supplement our cash rebates and digital advertising service businesses, we started to provide payment solution services to merchants in May 2021 by referring them to VE Services. We entered into the Appointment Letter with VE Services on October 1, 2020, which Appointment Letter has a term of one year and is renewed automatically on a yearly basis unless terminated by either party. Pursuant to the Appointment Letter, we serve as its independent merchant recruitment and onboarding agent and refer merchants to VE Services to process payments through multiple payment methods, such as FPX, Alipay, Maybank QR Pay, Boost, Touch ‘n Go, and GrabPay. VE Services charges these merchants a service fee ranging from 1.50% to 2.50% based on the processed payment amount and payment processing methods used, and we are entitled to receive a portion of the monthly service fees as commissions for our referrals. The commission rate ranges from 0.15% to 0.525% based on the total service fees collected by VE Services from merchants referred by us.
We referred 19 and 11 merchants to VE Services during the fiscal years ended September 30, 2022 and 2021, respectively. As of the date of this annual report, we have referred three additional merchants to VE Services since October 1, 2022. As we plan to expand our network with more third-party payment service providers and refer more merchants to them to process the payments, we do not expect to derive a substantial amount of payment solution service revenue from related parties in future periods. Since this is a business we recently started, we cannot guarantee that our payment solution service business will be successful. See “Item 3. Key Information—D. Risk Factors—Risks Related to Our Business and Industry—If we fail to retain and expand the user base for our payment solution services or if we fail to implement and maintain a reliable and convenient payment solution system, our payment solution service business may not be successful, and our business, financial condition, and results of operations may be adversely affected.”
Technology
We apply data science technologies extensively throughout our business ecosystem to support Merchant and Member onboarding and digital advertising. Our proprietary technologies include:
| ● | Merchant and Member Onboarding System. We have developed a system with an innovative business model that incentives both Merchants and Members to onboard our GETBATS website and mobile app, where they both benefit from the transactions facilitated by us via our cash rebate program. We work with both online and offline Merchants, who offer cash rebates to Members based on their spending at the physical store or online via our GETBATS website and mobile app. Through our system, Members receive cash rebates from their spending and Merchants obtain sales from spending Members. In addition, Merchants or Members who have onboarded other Merchants or Members can also receive referral rebates. We have filed a patent application, “System and Method to Seamlessly Onboard Merchants and Members to an Electronic Commerce Website,” for this system in Malaysia, which application is pending approval as of the date of this annual report. | |
| ● | Cash Rebate Calculation and Distribution System. Once a successful transaction has been completed through the GETBATS website and mobile app, our cash rebate calculation processor will transmit the expending data of the spending Member to a rule engine, which loads one or more distribution tables that set forth pre-determined distribution rules. Based on such data, our calculation engine calculates and distributes the total rebates payable to different entities under various circumstances, including but not limited to (i) the spending Member, (ii) referrals (the Member who introduced the spending Member), (iii) agent-merchants (agents who onboards the Merchant), and (iv) agent-customer (agents who onboards a big group of Members), if applicable. We have filed a patent application, “System and Method to Compute Payable Rebates and Distribute the Payable Rebates to Distribution Entities,” for this system in Malaysia, which application is pending approval as of the date of this annual report. |
| 36 |
| ● | Business Data Analysis System. Our analysis engine monitors our Members’ behaviors on the GETBATS website and mobile app and parses all the data properties, including login patterns (such as time, date, and frequency of login), the deals, promotions, and advertisements they click, and the Merchant links that they share. The large repository of Merchant and Member data collected from our GETBATS website and mobile app enables our Merchants to better understand consumers’ preferences and their spending behaviors. In addition, we study viewers’ behaviors on the SEEBATS website and mobile app, where our user profiling engine infers the viewers’ interest, demographic, intent, and other features through dynamic correlation analysis based on the data collected from our SEEBATS website and mobile app, such as the types of movies they view and the time they spend on each movie. In doing so, we relate and categorize the viewers into different spending behavior categories. We also expect to further improve our data analysis capabilities by introducing the descriptive, predictive, and prescriptive features in the future. We have filed a patent application, “System and Method to Analyze Business Data Based on Spending Behavior Data,” for this system in Malaysia, which application is pending approval as of the date of this annual report. |
| ● | Payment Token System. Our payment token module on our payment system tokenizes Members’ sensitive payment data by replacing those key data with unique identification symbols that retain all the essential information about the data without compromising its security. Such payment tokens can be automatically loaded, and payments can be automatically made to the merchants who have appropriately confirmed the payment data and selected a payment option. We utilize such token payment data to facilitate secure and convenient transactions conducted in our business ecosystem. Members need not repeatedly fill in complicated payment information when making payments to Merchants, which greatly enhances user experience in payment transactions. We have filed a patent application, “System and Method to Create a Flexible Payment Token for A Plurality of Merchants, for this system in Malaysia,” which application is pending approval as of the date of this annual report. |
Data Privacy and Security
We collect data solely to analyze consumer behaviors and advertising performance. In order to identify each user profile, we assign a random profile number with each new profile. We then use that number as the anonymous identification for the profile and associate it with all related data. In general, we do not collect personally identifiable information unless a Member consents to it. If such information is inadvertently obtained by us, our policy is to immediately delete such information.
We treat all information we collect as confidential. We do not disclose any information we gather from a Member or Merchant unless such disclosure is approved by it.
We have put in place appropriate physical, electronic, and managerial procedures to safeguard and secure our data assets, including to prevent unauthorized access, to preserve their integrity, and to ensure their appropriate use. On the software level, we encrypt important and sensitive data during their transmission from and to the user end, and only authorized personnel may access the backend of our systems based on their user assigned user groups and user levels. We have central controls to govern user roles and permissions. On the hardware level, only authorized information technology personnel have access to our servers through a virtual private network and data backup is kept inside our company safe box. In addition, we have established a hardware firewall where all traffic is inspected and filtered according to a comprehensive set of rules.
Intellectual Property
We regard our trademarks, service marks, domain names, trade secrets, and similar intellectual property as critical to our success. We rely on a combination of trademark law and confidentiality and non-disclosure agreements to protect our intellectual property rights. We also regularly monitor any infringement or misappropriation of our intellectual property rights.
As of the date of this annual report, we have registered:
| ● | 12 trademarks in Malaysia; and | |
| ● | seven domain names in Malaysia. |
| 37 |
As of the date of this annual report, we have 65 pending trademark applications and 12 pending patent applications in Malaysia, the Philippines, and Indonesia. These pending trademark applications include 23 applications that were objected to on the grounds of similarity in Malaysia and the Philippines (i.e., the trademark applications for “PAYBATS,” “GETBATS,” and “SEEBATS”). All current 65 pending trademark applications, including the applications that were objected to (which have been resubmitted for appeal) and the four patent applications, are all currently under examination. For details of the technologies related to the four patent applications and how our businesses depend on them, see “—Technology” above. Our business does not depend on those patent applications. None of our patent applications have resulted in the granting of a patent and we cannot assure you that we will file for or obtain any patents. In addition, we cannot assure you that:
| ● | any patent which we may obtain will be broad enough to protect our technologies, will provide us with competitive advantages, or will escape challenges or invalidation by third parties; | |
| ● | the patents of others will not have an adverse effect on our ability to do business; or | |
| ● | others will not independently develop similar technologies, duplicate our technologies, or, if patents are issued to us, design around these patents. |
We implement comprehensive measures to protect our intellectual property in addition to making trademark and patent registration applications. Our key measures to protect their intellectual property include: (i) hiring outside legal counsels to assist in the protection of our intellectual property; (ii) trademark searches prior to the launch of our websites and mobile apps; (iii) timely registration and filing with relevant authorities and application of intellectual property rights for our significant technologies and self-developed software; and (iv) reviews of virtual marketing materials, including text, graphics, and videos, to avoid copyright infringement.
Employees
We had 21 and 17 full-time employees as of September 30, 2022 and 2021, respectively. The following table sets forth the number of our full-time employees as of September 30, 2022:
| Function | Number | |||
| Management | 6 | |||
| Customer Services and Operations | 5 | |||
| Sales and Marketing | 5 | |||
| General and Administration | 5 | |||
| Total | 21 | |||
We enter into employment contracts, which contain a confidentiality clause, with our full-time employees.
During the fiscal years ended September 30, 2020 and 2019, because of our limited business operations, we did not hire any full-time employees. Instead, we outsourced four contract workers from Zenapp as of September 30, 2020. In fiscal year 2021, we had 12 full-time employees prior to June 30, 2021 and added another five full-time employees in the fourth quarter. We further hired additional four full-time employees in fiscal year 2022. Most of our employees undertook multiple tasks in a cost-effective manner during the fiscal years ended September 30, 2022, 2021, and 2020.
In addition to our full-time employees, we also employed five and eight contract workers as of September 30, 2022 and 2021, respectively. These contract workers are primarily responsible for providing information and technology support.
We believe that we maintain a good working relationship with our employees and contract workers, and we have not experienced material labor disputes in the past. None of our employees and contract workers are represented by labor unions.
Facilities
Our principal executive offices are located in Kuala Lumpur, Malaysia, where StarboxGB, StarboxPB, and StarboxSB lease offices from two third parties, with an aggregate area of approximately 4,800 square feet, pursuant to three tenancy agreements, each with a lease term from May 1, 2022 to April 30, 2023. The tenancy agreements of StarboxGB and StarboxPB each have monthly rent of MYR6,288 (approximately $1,439) and may be terminated by giving the landlord three months’ advance notice in writing. The tenancy agreement of StarboxSB has monthly rent of MYR6,800 (approximately $1,556) and may be terminated by giving the landlord two months’ advance notice in writing; StarboxSB may extend the agreement for an additional two years upon its expiration.
We believe that the offices that we currently lease are adequate to meet our needs for the immediate future.
| 38 |
Insurance
We do not maintain directors and officers liability insurance, group comprehensive life insurance for employees, property insurance, business interruption insurance, or general third-party liability insurance. We believe the insurance coverage we maintain is in line with the industry. See “Item 3. Key Information—D. Risk Factors—Risks Related to Our Business and Industry—Our current insurance policies may not provide adequate levels of coverage against all claims and we may incur losses that are not covered by our insurance.”
Seasonality
Our revenue, cash flow, operating results, and other key operating and performance metrics may vary from quarter to quarter, due to the seasonal nature of our advertisers’ budgets and spending on advertising campaigns. For example, advertising spending tends to rise in holiday seasons with consumer holiday spending, or closer to end-of-year in fulfilment of their annual advertising budgets, which may lead to an increase in our revenue and cash flow during such periods. Moreover, advertising inventory in holiday seasons may be more expensive, due to increased demand for advertising inventory.
Legal Proceedings
From time to time, we may become a party to various legal or administrative proceedings arising in the ordinary course of our business, including actions with respect to intellectual property infringement, violation of third-party licenses or other rights, breach of contract, and labor and employment claims. We are currently not a party to, and we are not aware of any threat of, any legal or administrative proceedings that, in the opinion of our management, are likely to have any material and adverse effect on our business, financial condition, cash flow, or results of operations.
Regulations
This section sets forth a summary of the principal Malaysian laws, regulations, and rules relevant to our business and operations in Malaysia.
Regulations Relating to Communications and Multimedia
In Malaysia, the communications and multimedia industry and its regulatory licensing framework are regulated by the Malaysian Communications and Multimedia Commission, a regulatory body tasked with overseeing regulatory framework pertaining to the communications and multimedia industry, such as the Communications and Multimedia Act 1998 (the “CMA 1998”), the Malaysian Communications and Multimedia Content Code (the “Content Code”), and other corresponding regulations, guidelines, directions, declarations, and standards.
The CMA 1998 generally provides four categories of licensable activities, which include (i) network facilities provider, (ii) network service provider, (iii) applications service provider, and (iv) content applications service provider. Specifically, content applications services provider generally includes any person who provides television and radio broadcast services, online publishing services, and information services. Nonetheless, any person who provides Internet content applications services—content applications services delivered by means of Internet such as broadcast services via an over-the-top platform—are currently exempt from the licensing requirement pursuant to the Communications and Multimedia (Licensing) (Exemption) Order 2000”). Our Malaysian subsidiary, StarboxSB, provides video streaming services by means of Internet, which is categorized under “Internet content applications services” and is therefore exempted from the licensing requirement.
Similarly, any person who provides electronic transaction services, interactive transaction services, network advertising boards and cineplex, or web hosting or client server under the application service providers category is exempt from this licensing requirement. In the opinion of our Malaysian counsel, GLT Law, the CMA 1998 and the Exemption Order 2000 apply to our Malaysian subsidiaries, StarboxSB and StarboxGB. In particular, StarboxSB has developed a mobile application known as “SEEBATS,” which will be categorized under “networked advertising boards and cineplex,” being the category assigned to an application service for advertising in which content and information is remotely generated and is distributed through a network service, whereas StarboxGB has developed mobile application known as “GETBATS,” which will be categorized under “networked advertising boards and cineplex” and “electronic transaction service,” being the category assigned to an application service which utilizes network services and information processing to conduct and achieve or support end user or third party transactions, both of which are regarded as applications services providers exempted under the Exemption Order 2000.
| 39 |
Nevertheless, StarboxSB and Starbox GB shall comply with all the other applicable provisions under the CMA 1998 and relevant guidelines, such as technical requirements and content prohibitions. While compliance with the Content Code is not compulsory, the adoption of the practice and standards provided are encouraged as it provides a valid legal defense against any legal proceedings that may arise from an alleged violation of the Content Code and maintains a good market practice.
Regulations Relating to Advertising and Marketing
The advertising industry in Malaysia is largely self-regulated. For electronic advertisements, including those communicated through the Internet, the rules and its self-regulatory codes can be found in the Content Code, which provides specific guidelines for online content providers or those who provide access to online content through the present and future technology.
As our business includes digital advertising and marketing, we are required to comply with the Content Code. Amongst the principles provided under the Content Code, it is worth noting that the responsibility for content provided online primarily rests with the creator of the content and users are responsible for their choice and utilization of online content. The Content Code also provides guidelines and procedures in determining whether the content is prohibited under the CMA 1998. Under the general principles that shall apply to all the content displayed or communicated online and subject to the CMA 1998, content shall not be indecent, obscene, false, menacing, or offensive in character with the intent to annoy, abuse, threaten, or harass any person. In addition, the Content Code generally prohibits content that may potentially offend the religious, political, sentimental, or racial susceptibilities of certain communities in Malaysia. Nevertheless, any guidelines that apply to the provisions of online content shall not unduly restrict the growth of the industry but serve to enhance a dynamic environment to encourage and stimulate the development of the Malaysian communications and multimedia industry.
Notwithstanding the above, the Consumer Protection Act 1999 (the “CPA 1999”) and the Trade Descriptions Act 2011 (the “TDA 2011”) further regulate advertising in relation to the supply of goods or services in Malaysia. The CPA 1999 applies to all goods and services that are offered or supplied to one or more consumers in trade, including any trade transaction conducted through electronic means in Malaysia, as well as prohibiting the act of bait advertising. Similarly, the TDA 2011 promotes good trade practices by prohibiting false trade descriptions and false or misleading statements, conduct, and practices. Our Malaysian subsidiaries which provide advertising services to its consumer and users, StarboxGB and StarboxSB, are in compliance with the CPA 1999 and the TDA 2011.
Regulations Relating to Film Distribution
The production, distribution, and exhibition of films in Malaysia are governed by the FINAS Act. Pursuant to Section 22(1) of the FINAS Act, no person (which term includes a body of persons, corporate, or unincorporate) shall engage in any of the activities of production, distribution, or exhibition of films or any combination of the activities specified in Section 21(1) of the FINAS Act (i.e., (a) production and distribution; (b) production and exhibition; or (c) distribution and exhibition, of films), unless such person is authorized by the FINAS to do the same. Section 2 of the FINAS Act defines film distribution as “including the renting, hiring, and loaning of films for profit or otherwise, the importation and distribution of films produced abroad, and the distribution of films produced locally.” Section 25 of the FINAS Act further provides that any person who contravenes Section 22 of the FINAS Act shall be guilty of an offence and shall, on conviction, be liable for a fine not exceeding MYR50,000 (approximately $11,484) or to imprisonment for a term not exceeding two years or for both such fine and imprisonment, and he shall, in the case of a continuing offence, be liable to daily fine not exceeding MYR10,000 (approximately $2,297). Further, Section 26 of the FINAS Act provides that where an offence is committed by a company or a firm, every director, secretary, or manager of the company or, as the case may be, every partner in the firm shall also be deemed to be guilty of the offence, unless he proves that the offence was committed without his knowledge, consent, or connivance and that he exercised all due diligence to prevent the commission of the offence.
Our Malaysian subsidiary, StarboxSB, operates our SEEBATS website and mobile app, on which viewers may watch movies and television series through OTT streaming, which may fall under the scope of film distribution under the FINAS Act. As such, StarboxSB obtained the Film Distribution License (License No. DF 04/09445) on April 11, 2022, which allows it to engage in the distribution of films. The Film Distribution License (License No. DF 04/09445) has a validity period from April 11, 2022 to April 10, 2023. See “Item 3. Key Information—D. Risk Factors—Risks Related to Our Business and Industry—If the relevant Malaysian regulatory agency were to determine that a Film Distribution License was required for the operations of our SEEBATS website and mobile app prior to April 11, 2022, our business, financial condition, and results of operations could be adversely affected.”
| 40 |
Regulations Relating to Direct Selling
Any person who carries on a direct sales business is required to hold a valid license granted under the Direct Sales and Anti-Pyramid Scheme Act 1993 (the “DSAPSA 1993”) and is prohibited from carrying out any pyramid scheme or arrangement, chain distribution scheme or arrangement, or any similar scheme or arrangement within the meaning of the DSAPSA 1993. Such activities are under the purview of the Ministry of Domestic Trade and Consumer Affairs. Direct sale means a door-to-door sale, a mail order sale, or a sale through an electronic transaction within the meaning of the DSAPSA 1993. Other requirements to be complied with in respect of a direct sales business are the requirements for contents of advertisement, direct sales contracts, as well as requirements for a cooling-off period and rescission.
Our Malaysian subsidiary, StarboxGB, undertakes a direct sales business by way of electronic transaction (for the purposes of Section 19A of the DSAPSA 1993), by having a multi-level marketing plan in which individuals who are registered as members will be entitled to four different types of bonuses, which bonus types vary depending on the activities carried out. For illustration purposes, the member will be entitled to a retail profit when they generate a sale with a non-member, a personal sales bonus when a sale is made, a direct sales bonus when its downline members generate sales, and a tier group sales bonus for the sales its group produced. Thus, StarboxGB is required to hold a license under the DSAPSA 1993, which it has obtained and has a validity period from December 22, 2020 to December 21, 2022. Further, it is required to comply with the provisions of the DSAPSA 1993 and the Direct Sales (Scheme and Conduct) Regulations 2001.
Regulations Relating to Anti-Money Laundering and Counter-Terrorism Financing
The Anti-Money Laundering, Anti-Terrorism Financing and Proceeds of Unlawful Activities Act 2001 (the “AMLA 2001”) prohibits money laundering and terrorism financing activities. Any person who (a) engages in a transaction that involves proceeds of unlawful activity; (b) uses proceeds of unlawful activity; (c) removes from or brings into Malaysia proceeds of unlawful activity; or (d) conceals, disguises, or impedes the establishment of the true nature, origin, location, movement, disposition, title of, rights with respect to, or ownership of, proceeds of unlawful activity, commits a money laundering offence under the AMLA 2001.
In addition, a reporting institution under the First Schedule of the AMLA 2001 is obliged to observe the anti-money laundering and counter financing terrorism requirements and standards, which include reporting and record-keeping duties, such as submitting suspicious transaction reports, implementing risk-based application, and conducting customer due diligence. None of our Malaysian subsidiaries is deemed to be a reporting institution. Nevertheless, we are required to comply with the provisions under the AMLA 2001.
Regulations Relating to Foreign Exchange Control
The exchange control regime in Malaysia is regulated by the Financial Services Act 2013 (the “FSA 2013”). The FSA 2013 has prescribed a list of transactions that are prohibited without approval from Bank Negara Malaysia (the Central Bank of Malaysia) (“BNM”) and it regulates the domestic and international transactions involving residents and non-residents of Malaysia. The requirements, restrictions, and conditions of approval in respect of the prohibited transactions and directions of BNM are further set forth in the Foreign Exchange Notices issued by BNM (the “FE Notices”).
Under the FSA 2013, all payments made between the residents of Malaysia must be paid in Malaysian ringgit, subject to limited exceptions and approval under the FE Notices, whereas payment made between resident and non-resident of Malaysia may be made either (i) in Malaysian ringgit, if for the prescribed purposes (for, among others, any purpose between immediate family members, income earned or expenses incurred in Malaysia or settlement of trade in goods or services in Malaysia), or (ii) in foreign currency (except for the currency of Israel), if for any purpose subject to certain prohibition under the FE Notices. On the other hand, non-residents are allowed to make or receive payment in foreign currency (except for the currency of Israel) in Malaysia for any purpose (including capital, divestment proceeds, profits, dividends, rent, fees, and interest arising from any investment in Malaysia, subject to any withholding tax) in accordance with the FE Notices. Unless otherwise restricted by contractual undertakings and subject to applicable laws, our Malaysian subsidiaries are at liberty to distribute dividends to us in foreign currency without having to seek prior approval from BNM.
| 41 |
Regulations Relating to Personal Data Protection
Our business and operations in Malaysia are subject to laws and regulations regarding data privacy and data protection pursuant to the PDPA 2010. In particular, PDPA 2010 applies to any person who processes or has control over, or authorizes the processing of, any personal data in respect of commercial transactions save and except for any personal data processed outside of Malaysia and not intended to be further processed in Malaysia.
On personal data processing, the PDPA 2010 provides key principles that must be adhered to by data users, which are defined as a person who either alone or jointly, or in common with other persons, processes any personal data or has control over, or authorizes the processing of, any personal data but does not include a processor. For example, to process or disclose personal data relating to any individuals would require (i) consent from such individuals, which may be obtained in any form that can be recorded and maintained properly by the data user; and (ii) written notice in the national language of Malaysia (Malay) and/or English to such individuals notifying, among others, (a) the processing of personal data and a description of the data, (b) the purposes for which the personal data is being collected; (c) individual’s right to request access and correction of the personal data, and (d) class of third parties to whom the personal data may be disclosed.
Any person engaged in processing personal data shall take measures to protect the personal data from any loss, misuse, modification, unauthorized or accidental access, or disclosure, alteration, or destruction of personal data and to maintain the integrity of the personal data processed, which should not be kept longer than necessary for the fulfilment of the purpose for which it was to be processed. Such personal data shall be destroyed or permanently deleted if it is no longer required.
In addition, a data user who belongs to any of the classes of data users prescribed under the Order 2013 shall be registered under the PDPA 2010 in order to process personal data. These users include, among others, a licensee under the CMA 1998 and a licensee under the Direct Sales and Anti-Pyramid Scheme Act 1993 (the “DSAPSA 1993”) who undertakes direct sales business. As our Malaysian subsidiaries, StarboxSB and StarboxGB, are exempted from the licensing requirement under the CMA 1998 pursuant to the Exemption Order 2000, they are not required to be registered as a data user under the PDPA 2010. However, StarboxGB is a licensee under the DSAPSA 1993 for direct selling activity and, hence, it is required, and has registered, to be a data user in compliance with the PDPA 2010. Notwithstanding that our other Malaysian subsidiaries are not required to be registered as data users under the PDPA 2010, all such other Malaysian subsidiaries are in compliance with the PDPA 2010 as of the date of this annual report.
Regulations Relating to Labor
The principal law that governs and regulates all labor relations—including contracts of service, payment of wages, employment of women, maternity protection, hours of work, holidays, leave policy, termination, layoff, retirement benefits, and employment of foreign employees—is the Employment Act 1955 (the “EA 1955”). Following the implementation of the Employment (Amendment of First Schedule) Order 2022, which came into force on January 1, 2023, the applicability of the EA 1955 has been expanded to include any person who has entered into a contract of service with an employer, irrespective of their monthly wages, is engaged in manual labor, serves as a supervisor of such manual laborer, serves as a domestic employee, or is engaged in any capacity in any vessel registered in Malaysia subject to certain conditions. Notwithstanding this, pursuant to Paragraph 1A of the First Schedule of the EA 1955, certain provisions in respect of overtime payments and termination benefits will not apply to employees whose wages exceed MYR4,000 a month.
The widening scope of the EA 1955 indicates that all employers should ensure that the terms of their existing contract of employment comply with the minimum standards prescribed under the EA 1955 as well as all other applicable statutory requirements, including the minimum retirement age and statutory contributions such as Social Security and Employees’ Provident Fund.
Other laws and regulations in relation to employment matters include the Industrial Relations Act 1967, Immigration Act 1959/63, Employment (Restriction) Act 1968, Employees Provident Fund Act 1991, Employees’ Social Security Act 1969, Employee Social Security General Rules 1971, Employment Insurance System Act 2017, Minimum Retirement Age Act 2012 and Minimum Wages Order 2020. As of the date of this annual report, our Malaysian subsidiaries are in compliance with all applicable labor regulations.
Regulations Relating to Business Operation
Prior to the commencement of our business operations in Malaysia, we are required to apply for business premises licenses for each operating premises from the relevant local authority under the Local Government Act 1976, which confers power to the local authority to create by-laws providing that no person shall use any premises within the jurisdiction of the respective municipal council without a license issued by the respective municipal council, and any person who fails to exhibit his license at all times in some prominent place on the licensed premises or fails to produce such license when required shall be liable to a fine not exceeding MYR500 and/or to imprisonment for a term not exceeding six months. All of our Malaysian subsidiaries have obtained the business premises license from the local authority (i.e., Kuala Lumpur City Hall (DBKL)) and are in compliance with the Local Government Act 1976. The validity periods of the business premises licenses obtained by our Malaysian subsidiaries are as follows: (i) in respect of the business premises license of Starbox Berhad, from April 30, 2022 to April 29, 2023; (ii) in respect of the business premises license of StarboxSB, from February 25, 2022 to February 24, 2023; (iii) in respect of the business premises license of StarboxGB, from February 26, 2022 to February 25, 2023; and (iv) in respect of the business premises license of StarboxPB, from April 7, 2022 to April 6, 2023.
| 42 |
Regulations Relating to Cybersecurity
Currently, there is no legislation in Malaysia that imposes a blanket requirement for implementing cybersecurity measures, but a number of sporadic laws exist relating to this area and promulgated to counter cybercrimes. The Computer Crimes Act 1997 (the “CCA 1997”) criminalizes abuse of computers and counters cybercrimes, including (i) gaining of unauthorized access to computers or networks with or without the intent to commit other offenses, (ii) spreading of malicious codes such as computer viruses, (iii) unauthorized modification of any program or data on a computer, and (iv) wrongful communication of any means of access to a computer to an unauthorized person. Once convicted, a person who committed such cybercrimes is subject to, depending on the type of the offense committed, a fine ranging from MYR25,000 to MYR150,000 and/or imprisonment of three to 10 years. Where computer or internet-related crime activities are involved, but which do not specifically fall within the ambit of the CCA 1997 (for example, online fraud, cheating, criminal defamation, intimidation, gambling, and pornography), such offenses may be charged under the Penal Code, which is the main statute governing a wide range of criminal offenses and procedures in Malaysia.
As of the date of this annual report, our Malaysian subsidiaries are in compliance with the applicable provisions under CCA 1997 in preventing any activity that will cause unauthorized modification of the contents of any computer and malicious activities.
Regulations Relating to Intellectual Property
Our intellectual property rights are important to our business and operations. We rely primarily on a combination of intellectual property laws, contract provisions, copyrights, trademarks, patents, and domain rights to protect our intellectual property rights.
Copyright
The Copyright Act 1987 (“CA 1987”) is the principal law governing copyright related matters. Unlike trademarks or other intellectual property rights, there is no specific system of registration for copyrights in Malaysia. Nonetheless, the CA 1987 allows copyright owners to protect their copyrights by way of filling with the Intellectual Property Corporation of Malaysia (“MyIPO”) a voluntary notification, which is considered prima facie evidence in cases of copyright infringement.
The Copyright (Amendment) Act 2022 (“Amendment Act 2022”), which was implemented on March 18, 2022, introduced amendments to the CA 1987 and strengthened the enforcement of copyright laws, especially in the digital environment, by, among others, introducing criminal liabilities for copyright infringement relating to streaming technology. Amendment Act 2022 contains provisions that strengthen the enforcement of copyright law in the digital landscape by introducing offences involving streaming technology in line with the development and surge of online content streaming. Pursuant to the new Section 43AA of the CA 1987, it is an offence for a person to commit or facilitate infringement of the copyright in any way by engaging in commercial dealings, such as manufacture for sale or hire, import, sell or let for hire, offer, export or advertise, distribute and offer or provide any related services, with streaming technology. Streaming technology is defined under Amendment Act 2022 to include computer programs, devices, or components which are used in part or in whole that results in an infringement of the copyright in a work.
Trademarks
The Trademarks Act 2019 (“TA 2019”) provides protection against a broad scope of trademark infringement, under which the use of an identical or similar mark in relation to similar goods or services would constitute trademark infringement, whereas the Guidelines of Trademarks 2019 provides for the registration of trademarks.
A registered trademark would permit its registered proprietor, namely, the owner of the registered trademark, to use or authorize other persons to use the trademark. It also grants registered proprietor the right to obtain relief in the case of trademark infringement and the terms of protection for a registered trademark is 10 years from its application. Pursuant to Section 56 of the TA 2019, any person who has infringed the registered trademark may face court proceedings instituted by the registered proprietor.
| 43 |
In order to protect our trademarks in Malaysia, Starbox Berhad has secured registration in respect of the “STARBOX” trademark under several classes, including Class 9, Class 35, and Class 36 of goods and services in Malaysia, where the trademark protection will expire on September 21, 2030. In addition, our other Malaysian subsidiaries, such as StarboxGB, StarboxSB, and StarboxPB, have applications pending registration for the respective trademarks of “GETBATS,” “SEEBATS,” and “PAYBATS” under the relevant Classes in Malaysia, where the registration applications of the three trademarks were submitted to MyIPO on December 26, 2019. The appeals are currently under examination. See “—Intellectual Property.”
Patents
Patents in Malaysia are protected under the Patents Act 1983 (the “PA 1983”) and Patents Regulations 1986. An invention can be patentable if it is new, involves an inventive step, have industrial application, and is not explicitly excluded by the PA 1983. Generally, patents should be filed as soon as possible since most countries including Malaysia award patents to applicants on a first-to-file basis. Hence, it is in the interest of an inventor to make an early decision on whether to file a patent application to preempt another competitor from filing ahead of him.
Pursuant to Section 35 of the PA 1983, once a patent is granted, the duration of validity of a patent shall be 20 years from the filing date of the application, subject to the timely payment of prescribed annual fees.
Patent rights are territorial in nature and, therefore, the rights conferred by a patent granted in Malaysia extend only to Malaysia. Pursuant to Section 36(1) of the PA 1983 and the Patent (Amendment) Act 2022, the exclusive rights of the patent owner are to exploit the patented invention, assign or transmit the patent, conclude license contracts, and utilize the patent as the subject of a security interest.
Patent infringement occurs when a person does any of the acts that are the exclusive rights of the patent owner without his consent, and this gives the patent owner the right to institute infringement proceedings against such person. Where the patent owner provides sufficient evidence demonstrating that an infringement has been committed or is being committed, the court will award damages, grant an injunction to prevent further infringement, and/or award any other legal remedy as the court deemed appropriate.
To safeguard our rights of invention, StarboxGB has filed the following patent applications and its rights to such inventions in Malaysia, the Philippines, and Indonesia, all of which are pending approval as of the date of this annual report:
| (i) | System and Method to Seamlessly Onboard Merchants and Members to an Electronic Commerce Website; | |
| (ii) | System and Method to Compute Payable Rebates and Distribute the Payable Rebates to Distribution Entities; | |
| (iii) | System and Method to Create a Flexible Payment Token for A Plurality of Merchants; and | |
| (iv) | System and Method to Analyze Business Data Based on Spending Behavior Data. |
Domain Names
There is no specific regulation in respect of the licensing of domain names in Malaysia. The right to use the .my domain name is administered solely by the Malaysian Network Information Centre Berhad (the sole administrator for .my web addresses) (“MYNIC”).
Once a specific domain name is registered with MYNIC, no other person can register or use the specific domain name after the date of its registration. However, a domain name registration with the MYNIC does not automatically result in the owner of the domain name obtaining a trademark for the particular domain name. To achieve this, the domain name owner must successfully register the domain name as a trademark with MyIPO.
Notwithstanding the above, we have opted to register our websites under .com domain names, details of which are as follows:
| (i) | www.batsmail.com; | |
| (ii) | www.getbats.com; | |
| (iii) | www.seebats.com; | |
| (iv) | www.starboxrebates.com; | |
| (v) | www.starboxholding.com; | |
| (vi) | www.starboxholdings.com; and | |
| (vii) | www.paybats.com. |
As of the date of this annual report, we have registered the above-mentioned seven domain names relating to our business in Malaysia.
| 44 |
C. Organizational Structure
See “—A. History and Development of the Company.”
D. Property, Plants and Equipment
See “—B. Business Overview—Facilities.”
Item 4A. UNRESOLVED STAFF COMMENTS
Not applicable.
Item 5. OPERATING AND FINANCIAL REVIEW AND PROSPECTS
The following discussion of our financial condition and results of operations is based upon and should be read in conjunction with our consolidated financial statements and their related notes included in this annual report. This annual report contains forward-looking statements. In evaluating our business, you should carefully consider the information provided under the caption “Item 3. Key Information—D. Risk Factors” in this annual report. We caution you that our businesses and financial performance are subject to substantial risks and uncertainties.
A. Operating Results
Comparison of Results of Operations for the Fiscal Years Ended September 30, 2022 and 2021
The following table summarizes our results of operations for the fiscal years ended September 30, 2022 and 2021, respectively, and provides information regarding the dollar and percentage increase or (decrease) during such periods.
| For the fiscal years ended September 30, | ||||||||||||||||||||||||
| 2022 | 2021 | Variances | ||||||||||||||||||||||
| Amount | % of total revenue | Amount | % of total revenue | Amount | % | |||||||||||||||||||
| Revenue | ||||||||||||||||||||||||
| Revenue from digital advertising service | $ | 7,174,050 | 99.72 | % | $ | 3,158,520 | 99.75 | % | $ | 4,015,530 | 127.13 | % | ||||||||||||
| Revenue from cash rebate services | 10,562 | 0.15 | % | 6,214 | 0.20 | % | 4,348 | 69.97 | % | |||||||||||||||
| Revenue from payment solution services – related party | 9,575 | 0.13 | % | 1,494 | 0.05 | % | 8,081 | 540.90 | % | |||||||||||||||
| Total operating revenue | 7,194,187 | 100.00 | % | 3,166,228 | 100.00 | % | 4,027,959 | 127.22 | % | |||||||||||||||
| Operating costs | ||||||||||||||||||||||||
| Cost, selling, general and administrative expenses | 2,243,750 | 31.19 | % | 1,026,339 | 32.42 | % | 1,217,411 | 118.62 | % | |||||||||||||||
| Total operating costs | 2,243,750 | 31.19 | % | 1,026,339 | 32.42 | % | 1,217,411 | 118.62 | % | |||||||||||||||
| Income from operations | 4,950,437 | 68.81 | % | 2,139,889 | 67.58 | % | 2,810,548 | 131.34 | % | |||||||||||||||
| Other income | ||||||||||||||||||||||||
| Other income, net | 59,377 | 0.83 | % | 166 | 0.01 | % | 59,211 | 35669.28 | % | |||||||||||||||
| Total other income, net | 59,377 | 0.83 | % | 166 | 0.01 | % | 59,211 | 35669.28 | % | |||||||||||||||
| Income before income tax | 5,009,814 | 69.64 | % | 2,140,055 | 67.59 | % | 2,869,759 | 134.10 | % | |||||||||||||||
| Provision for income tax expenses | 1,407,449 | 19.56 | % | 692,405 | 21.87 | % | 715,044 | 103.27 | % | |||||||||||||||
| Net income | $ | 3,602,365 | 50.07 | % | $ | 1,447,650 | 45.72 | % | $ | 2,154,715 | 148.84 | % | ||||||||||||
| 45 |
Revenue
Our total revenue increased by $4,027,959, or 127.22%, to $7,194,187 for the fiscal year ended September 30, 2022 from $3,166,228 for the fiscal year ended September 30, 2021. The increase in our revenue was primarily due to increases in the revenue from digital advertising services and from cash rebate services.
Our different revenue sources for fiscal years 2021 and 2020 were as follows:
| For the fiscal years ended September 30, | ||||||||||||||||||||||||
| 2022 | 2021 | Change | ||||||||||||||||||||||
| Amount | % | Amount | % | Amount | % | |||||||||||||||||||
| Revenue by service types: | ||||||||||||||||||||||||
| Revenue from digital advertising services | $ | 7,174,050 | 99.72 | % | $ | 3,158,520 | 99.75 | % | $ | 4,015,530 | 127.13 | % | ||||||||||||
| Revenue from cash rebate services | 10,562 | 0.15 | % | 6,214 | 0.20 | % | 4,348 | 69.97 | % | |||||||||||||||
| Revenue from payment solution services – related party | 9,575 | 0.13 | % | 1,494 | 0.05 | % | 8,081 | 540.90 | % | |||||||||||||||
| Total operating revenue | $ | 7,194,187 | 100.00 | % | $ | 3,166,228 | 100.00 | % | $ | 4,027,959 | 127.22 | % | ||||||||||||
Revenue from Digital Advertising Services
Our revenue from digital advertising services increased significantly by $4,015,530, or approximately 127.13%, from $3,158,520 in the fiscal year ended September 30, 2021 to $7,174,050 in the fiscal year ended September 30, 2022. The significant increase was due to increases in the number of advertisers for our services in fiscal year 2022. The total number of advertisers that used our digital advertising services was 63 in fiscal year 2022 (including 18 repeat advertisers and 45 new advertisers). Among the 63 advertisers, 22 had registered with us as Merchants as of September 30, 2022 and the remaining 41 had not. The total number of advertisers that used our digital advertising services was 25 in fiscal year 2021 (including two repeat advertisers and 23 new advertisers). Among the 25 advertisers, 13 had registered with us as Merchants as of September 30, 2021 and the remaining 12 had not. The average advertising spending per advertiser was $113,874 and $126,341, for the fiscal years ended September 30, 2022 and 2021, respectively.
The following table presents the breakdown of our revenue from digital advertising services for the fiscal years ended September 30, 2022 and 2021:
| For the fiscal years ended September 30, | ||||||||
| 2022 | 2021 | |||||||
| Advertisement design and consultation services | $ | 1,575,800 | $ | 384,061 | ||||
| Advertisement display services, net of discount of $247,060 and $147,478 respectively | 5,598,250 | 2,774,459 | ||||||
| Total revenue from digital advertising services, net | $ | 7,174,050 | $ | 3,158,520 | ||||
During the fiscal year ended September 30, 2022, 22 advertisers used our advertisement design and consultation services and we charged the advertising service fees in the range of approximately $2,400 to $38,000 for designated services. We generated revenue of $1,575,800 from providing advertisement design and consultation services in fiscal year 2022.
In addition, 63 advertisers in fiscal year 2022 further used our services for advertisement display on our websites and mobile apps and third-party social media channels. Depending on the different advertisement distribution channels and the duration of the advertisement display, we charged advertising service fees in the range of approximately $5,000 to approximately $240,000 for designated services. Our revenue associated with advertisement display amounted to $5,645,324 (after deducting discount of $247,060) in fiscal year 2022.
In comparison, during the fiscal year ended September 30, 2021, 11 advertisers used our advertisement design and consultation services and we charged the advertising service fees in the range of approximately $2,400 to $10,000 for designated services. We generated revenue of $384,061 from providing advertisement design and consultation services and $2,774,459 revenue from providing advertisement display services in fiscal year 2021.
| 46 |
Revenue from Cash Rebates Offered by Retail Merchants
Our cash rebate service revenue increased by approximately 69.97% from $6,214 for the fiscal year ended September 30, 2021 to $10,562 for the fiscal year ended September 30, 2022. The cash rebate service revenue increased primarily due to an increase in volume of transactions and average cash rebate commission rate earned by the Company for the fiscal year ended September 30, 2022 as compared to the fiscal year ended September 30, 2021. For the fiscal year ended September 30, 2022, 42 Merchants offered total cash rebates of $30,469 to attract 5,488 Members to purchase products and services from these Merchants, with sales transaction amount of $3,723,699. Total cash rebate of $19,907 to members was approximately 66% of total rebate offered by Merchants. For the fiscal year ended September 30, 2021, 63 Merchants offered total cash rebates of $36,087 to attract 3,418 Members to purchase products and services from these Merchants, with a sales transaction amount of $2,501,913. Total cash rebate of $29,873 to members was approximately 86% of total rebate offered by Merchants.
Revenue from Payment Solution Services – Related Party
We started to provide payment solution services to merchants in May 2021. During the fiscal year ended September 30, 2022, we referred 19 merchants to VE Services for payment processing and earned commission fees of $9,575. Since VE Services is an entity controlled by one of our beneficial shareholders, our revenue of $9,575 from payment solution services in fiscal year 2022 was reported as revenue from a related party.
During the fiscal year ended September 30, 2021, we referred 11 merchants to VE Services for payment processing and earned commission fees of $1,494. Since VE Services is an entity controlled by one of our beneficial shareholders, our revenue of $1,494 from payment solution services in fiscal year 2021 was reported as revenue from a related party.
As we plan to expand our network with more third-party payment service providers and refer more merchants to them to process the payments, we do not expect to derive a substantial amount of payment solution service revenue from related parties in future periods.
Operating Costs
The following table sets forth the breakdown of our operating costs for the fiscal years ended September 30, 2022 and 2021:
| For the fiscal years ended September 30, | ||||||||||||||||||||||||
| 2022 | 2021 | Variances | ||||||||||||||||||||||
| Amount | % | Amount | % | Amount | % | |||||||||||||||||||
| Salary and employee benefit expenses | $ | 429,924 | 19.16 | % | $ | 191,981 | 18.71 | % | $ | 237,943 | 123.94 | % | ||||||||||||
| Professional and consulting service fees | 767,229 | 34.19 | % | 365,774 | 35.64 | % | 401,455 | 109.75 | % | |||||||||||||||
| Marketing and promotional expenses | 188,338 | 8.39 | % | 167,803 | 16.35 | % | 20,535 | 12.24 | % | |||||||||||||||
| License costs | 55,000 | 2.45 | % | 50,000 | 4.87 | % | 5,000 | 10.00 | % | |||||||||||||||
| Website and facility maintenance expenses | 292,579 | 13.04 | % | 185,757 | 18.10 | % | 106,822 | 57.51 | % | |||||||||||||||
| Depreciation | 106,267 | 4.74 | % | 2,568 | 0.25 | % | 103,699 | 4,038.12 | % | |||||||||||||||
| Utility and office expenses | 144,735 | 6.45 | % | 19,185 | 1.87 | % | 125,550 | 654.42 | % | |||||||||||||||
| Business travel and entertainment expenses | 67,836 | 3.02 | % | 6,003 | 0.58 | % | 61,833 | 1030.03 | % | |||||||||||||||
| Others | 191,842 | 8.55 | % | 37,268 | 3.63 | % | 154,574 | 414.76 | % | |||||||||||||||
| Total operating costs | $ | 2,243,750 | 100.00 | % | $ | 1,026,339 | 100.00 | % | $ | 1,217,411 | 118.62 | % | ||||||||||||
Our operating costs accounted for approximately 31.19% and 32.42% of our total revenue for the fiscal years ended September 30, 2022 and 2021, respectively. Although our operating costs as a percentage to our total revenue decreased from 32.42% in fiscal year 2021 to 31.19% in fiscal year 2022, due to increased total revenue, our operating costs increased significantly by $1,217,411, or approximately 118.62%, from $1,026,339 in fiscal year 2021 to $2,243,750 in fiscal year 2022. The increase was due to the following major reasons:
| 47 |
| (1) | For the fiscal year 2022, the salary expense was $429,924, an increase of $237,943 compared with $191,981 in fiscal year 2021, primarily due to an increase in the number of employees from 17 in fiscal year 2021 to 21 in fiscal year 2022 in order to handle increased business activities associated with our digital advertising services and cash rebate services, and increased directors’ remuneration; |
| (2) | Professional and consulting service fees were $767,229 in fiscal year 2022, an increase of $401,455 when compared with $365,774 in fiscal year 2021, primarily due to increased professional expenses we paid to third-party professionals for business strategy and planning purposes and increased audit fees in connection with our IPO; |
| (3) | The marketing and promotional expenses primarily included expenses incurred to develop Members, Merchants, and advertisers, and to broaden our brand awareness. Our marketing and promotional expenses increased by $20,535, from $167,803 in fiscal year 2021 to $188,338 in fiscal year 2022, as a result of our increased marketing efforts to develop new Merchants and advertisers for our services; |
| (4) | License costs represented service fees paid to third-party content providers to license movies and television series and put such licensed movies and television series on our SEEBATS website and mobile app to drive traffic. License costs slightly increased by $5,000, from $50,000 in fiscal year 2021 to $55,000 in fiscal year 2022. On July 29, 2019 and August 5, 2019, we entered into a Distribution and Ad Sales Deal Agreement with third-party content providers, DMG and SRI, respectively, in order to license movies and television series from them and put such licensed movies and television series on our SEEBATS website and mobile app to drive traffic. Pursuant to these agreements, each with effective terms from August 2019 to July 31, 2021, we were required to pay a flat fee of $10,000 and a monthly fee of $2,500 to DMG and a monthly fee of $2,500 to SRI. As a result, we incurred license costs of approximately $50,000 in fiscal year 2021. On November 1, 2021, we entered into a Service and Licensing Agreement with a third-party content provider, Shenzhen Yunshidian, to license movies and television series in various genres, such as action, comedy, fantasy, historical, and romance. The agreement has a term from November 1, 2021 to October 31, 2023 and may be terminated by either party in the event of a material breach by the other party of the agreement. We agreed to pay a content and service fee of $120,000 and a content delivery fee based on the amount of content delivered by the content provider, ranging from $1,700 to $660,000 per year under the Service and Licensing Agreement. Pursuant to a letter agreement dated July 15, 2021, Shenzhen Yunshidian also provided SEEBATS website and mobile app with movies and television series for a free trial run from August 1, 2021 to October 31, 2021, before we entered into the Service and Licensing Agreement. As a result of the Service and Licensing Agreement with Shenzhen Yunshidian, we capitalized content assets as part of our intangible assets and amortize the content assets using the straight-line method over the licensing period from November 1, 2021 to October 31, 2023. For the year ended September 30, 2022, the amortization of intangible assets-content assets amounted to $55,000; |
| (5) | Website and facility maintenance expenses increased by $106,822, from $185,757 in fiscal year 2021 to $292,579 in fiscal year 2022. In order to carry out our businesses, we use (i) the GETBATS website and mobile app to connect our Members and Merchants and (ii) our websites and mobile apps and third-party social media channels to provide digital advertising services to advertisers. The increase was because we incurred higher overhead costs to maintain our websites and mobile apps for stability when our business scale expanded, which required us to process increased merchant and member data. In December 2021, we acquired packaged computer software and applications from a third-party vendor at the cost of MYR2.12 million (equivalent to $504,222) to improve certain functions of our cash rebate and digital advertising operating systems, such as the optimization of the cash rebate calculation and settlement, a more user-friendly shopping cart and eWallet module, a better integration of the SEEBATS website and mobile app with license content provider, and a multilingual interface. In addition, from June 2022 to September 2022, we further purchased from the same third-party vendor the packaged computer software and applications in the aggregate amount of $501,412 (MYR2.32 million) to add imbedded treasure hunt system into our digital advertising operating systems, to improve the coding, rating and comment function and optimize our SEEBATS mobile app. As a result, our website and facility maintenance expenses increased in fiscal year 2022; |
| (6) | Our utility and office expenses increased significantly by $125,550, from $19,185 in fiscal year 2021 to $144,735 in fiscal year 2022, primarily due to increased office lease expenses and increased office supply expenses when we leased a new office in September 2021; |
| (7) | Our depreciation and amortization expense increased significantly by $103,699, from $2,568 in fiscal year 2021 to $106,267 in fiscal year 2022 because of the increased amortization of intangible assets. As discussed above, in December 2021, we acquired packaged computer software and applications from a third-party vendor at the cost of MYR2.12 million (equivalent to $504,222) to improve certain functions of our cash rebate and digital advertising operating systems. In addition, from June 2022 to September 2022, we further purchased from the same third-party vendor the packaged computer software and applications in the aggregate amount of $501,412 (MYR2.32 million) to add imbedded treasure hunt system into our digital advertising operating systems, to improve the coding, rating and comment function and optimize our SEEBATS mobile app. We recorded it as intangible assets and amortize such assets over ten years. As a result, our amortization expenses increased in fiscal year 2022; |
| 48 |
| (8) | Our business travel and entertainment expenses increased by $61,833 from $6,003 in fiscal year 2021 to $67,836 in fiscal year 2022, due to our increased efforts to expand our business operations into local and neighboring countries; and |
| (9) | Others included trademark, employee defined contribution plan, and company’s uniform design and customized-made. Others increased by $154,574 from $37,268 in fiscal year 2021 to $191,842 in fiscal year 2022, mainly due to (i) increased trademark expenses by $54,986, (ii) increased defined contribution plan by $24,251, and (iii) increased uniform cost by $21,656. |
We expect our overall operating costs, including marketing expenses, salaries, and professional and business consulting expenses, to continue to increase in the foreseeable future, as we plan to hire additional personnel and incur additional expenses in connection with the expansion of our business operations.
Provision for Income Taxes
Our provision for income taxes was $1,407,449 in fiscal year ended September 30, 2022, an increase of $715,044 from $692,405 in fiscal year ended September 30, 2021, primarily due to our increased taxable income generated from our digital advertising services. Our subsidiaries Starbox Berhad, StarboxGB, StarboxSB, and StarboxPB are governed by the income tax laws of Malaysia. The income tax provision in respect of operations in Malaysia is calculated at the applicable tax rates on the taxable income for the periods based on existing legislation, interpretations, and practices. Under the Income Tax Act of Malaysia, enterprises incorporated in Malaysia are usually subject to a unified 24% enterprise income tax rate, while preferential tax rates, tax holidays, and tax exemptions may be granted on a case-by-case basis. The tax rate for small and medium sized companies (generally companies incorporated in Malaysia with paid-in capital of MYR2,500,000 or less, and gross income of not more than MYR50 million) is 17% for the first MYR600,000 (or approximately $150,000) taxable income for the fiscal years ended September 30, 2021 and 2020, with the remaining balance being taxed at the 24% rate. For the fiscal years ended September 30, 2022 and 2021, the tax saving as the result of the favorable tax rates and tax exemption amounted to $0 and $10,183 respectively, and per share effect of the favorable tax rate and tax exemption was $0.00 and $0.00, respectively. Other than StarboxSB, which generated taxable income through providing digital advertising services to customers, Starbox Berhad, StarboxGB, and StarboxPB have each reported recurring operating losses since their inception. Management concluded that the chances for these three entities that suffered recurring losses in prior periods to become profitable in the foreseeable future and to utilize their net operating loss carry forwards were remote. Accordingly, we provided valuation allowance of $35,174 and $137,932 for the deferred tax assets of these subsidiaries for the fiscal years ended September 30, 2022 and 2021, respectively.
Net Income
As a result of the foregoing, we reported net income of $3,602,365 for the fiscal year ended September 30, 2022, representing an increase of $2,154,715 from a net income of $1,447,650 for the fiscal year ended September 30, 2021.
| 49 |
Comparison of Results of Operations for the Fiscal Years Ended September 30, 2021 and 2020
The following table summarizes the results of our operations during the fiscal years ended September 30, 2021 and 2020, respectively, and provides information regarding the dollar and percentage increase or (decrease) during such years.
| For the fiscal years ended September 30, | ||||||||||||||||||||||||
| 2021 | 2020 | Variances | ||||||||||||||||||||||
| Amount | % of total revenue | Amount | % of total revenue | Amount | % | |||||||||||||||||||
| Revenue | ||||||||||||||||||||||||
| Revenue from digital advertising service | $ | 3,158,520 | 99.75 | % | $ | 153,145 | 99.53 | % | $ | 3,005,375 | 1962.44 | % | ||||||||||||
| Revenue from cash rebate services | 6,214 | 0.20 | % | 718 | 0.47 | % | 5,496 | 765.46 | % | |||||||||||||||
| Revenue from payment solution services – related party | 1,494 | 0.05 | % | - | 0.00 | % | 1,494 | 100.00 | % | |||||||||||||||
| Total operating revenue | 3,166,228 | 100.00 | % | 153,863 | 100.00 | % | 3,012,365 | 1957.82 | % | |||||||||||||||
| Operating costs | ||||||||||||||||||||||||
| Cost, selling, general and administrative expenses | 1,026,339 | 32.42 | % | 344,026 | 223.59 | % | 682,313 | 198.33 | % | |||||||||||||||
| Total operating costs | 1,026,339 | 32.42 | % | 344,026 | 223.59 | % | 682,313 | 198.33 | % | |||||||||||||||
| Income (loss) from operations | 2,139,889 | 67.58 | % | (190,163 | ) | -123.59 | % | 2,330,052 | -1225.29 | % | ||||||||||||||
| Other income | ||||||||||||||||||||||||
| Other income(expenses), net | 166 | 0.01 | % | - | 0.00 | % | 166 | 100.00 | % | |||||||||||||||
| Total other income, net | 166 | 0.01 | % | - | 0.00 | % | 166 | 100.00 | % | |||||||||||||||
| Income (loss) before income tax | 2,140,055 | 67.59 | % | (190,163 | ) | -123.59 | % | 2,330,218 | -1225.38 | % | ||||||||||||||
| Provision for income tax expenses | 692,405 | 21.87 | % | 14,991 | 9.74 | % | 677,414 | 4518.80 | % | |||||||||||||||
| Net income (loss) | $ | 1,447,650 | 45.72 | % | $ | (205,154 | ) | -133.34 | % | $ | 1,652,804 | -805.64 | % | |||||||||||
Revenue
Our total revenue increased by $3,012,365, or 1,957.82%, to $3,166,228 for the fiscal year ended September 30, 2021 from $153,863 for the fiscal year ended September 30, 2020. The increase in our revenue was primarily due to increases in the revenue from digital advertising services and from cash rebate services.
Our different revenue sources for fiscal years 2021 and 2020 were as follows:
| For the fiscal years ended September 30, | ||||||||||||||||||||||||
| 2021 | 2020 | Change | ||||||||||||||||||||||
| Amount | % | Amount | % | Amount | % | |||||||||||||||||||
| Revenue by service types: | ||||||||||||||||||||||||
| Revenue from digital advertising services | $ | 3,158,520 | 99.75 | % | $ | 153,145 | 99.53 | % | $ | 3,005,375 | 1,962.44 | % | ||||||||||||
| Revenue from cash rebate services | 6,214 | 0.20 | % | 718 | 0.47 | % | 5,496 | 765.46 | % | |||||||||||||||
| Revenue from payment solution services – related party | 1,494 | 0.05 | % | - | 0.00 | % | 1,494 | 100.00 | % | |||||||||||||||
| Total operating revenue | $ | 3,166,228 | 100.00 | % | $ | 153,863 | 100.00 | % | $ | 3,012,365 | 1,957.82 | % | ||||||||||||
Revenue from Digital Advertising Services
Our revenue from digital advertising services increased significantly by $3,005,375, or approximately 1,962.44%, from $153,145 in the fiscal year ended September 30, 2020 to $3,158,520 in the fiscal year ended September 30, 2021. The significant increase was due to increases in the number of advertisers and the average advertising spending per advertiser in fiscal year 2021. The total number of advertisers that used our digital advertising services was 25 in fiscal year 2021 (including two repeat advertisers and 23 new advertisers). Among the 25 advertisers, 13 had registered with us as Merchants as of September 30, 2021 and the remaining 12 had not. The total number of advertisers that used our digital advertising services was two in fiscal year 2020 (including 0 repeat advertiser and two new advertisers, who did not register with us as Merchants). The average advertising spending per advertiser was $126,341 and $76,573, for the fiscal years ended September 30, 2021 and 2020, respectively.
| 50 |
The following table presents the breakdown of our revenue from digital advertising services for the fiscal years ended September 30, 2021 and 2020:
| For the fiscal years ended September 30, | ||||||||
| 2021 | 2020 | |||||||
| Advertisement design and consultation services | $ | 384,061 | $ | - | ||||
| Advertisement display services | 2,774,459 | 153,145 | ||||||
| Total revenue from digital advertising services | $ | 3,158,520 | $ | 153,145 | ||||
During the fiscal year ended September 30, 2021, 11 advertisers used our advertisement design and consultation services and we charged the advertising service fees in the range of approximately $2,400 to $10,000 for designated services. We generated revenue of $384,061 from providing advertisement design and consultation services in fiscal year 2021.
In addition, all 25 advertisers in fiscal year 2021 further used our services for advertisement display on our websites and mobile apps and third-party social media channels. Depending on the different advertisement distribution channels and the duration of the advertisement display, we charged advertising service fees in the range of approximately $5,000 to approximately $240,000 for designated services. Our revenue associated with advertisement display amounted to $2,774,459 in fiscal year 2021.
In comparison, during the fiscal year ended September 30, 2020, no advertiser used our advertisement design and consultation services. The two advertisers only used our services for advertisement display on our websites and mobile apps and third-party social media channels, and we generated advertising service revenue of $153,145 in fiscal year 2020.
Revenue from Cash Rebates Offered by Retail Merchants
Our cash rebate service revenue increased significantly by approximately 765.46% from $718 in the fiscal year ended September 30, 2020 to $6,214 in the fiscal year ended September 30, 2021. The revenue increased due to the increased number of Merchants offering cash rebates to attract our Members to shop online and offline when total sales transactions facilitated through our GETBATS website and mobile app increased in fiscal year 2021 as compared to fiscal year 2020. For the fiscal year ended September 30, 2021, 63 Merchants offered total cash rebates of $36,087 to attract 3,418 Members to purchase products and services from these Merchants, with a sales transaction amount of $2,501,913. For the fiscal year ended September 30, 2020, 32 Merchants offered total cash rebates of $5,479 to attract 532 Members to purchase products and services from Merchants with a sales transaction amount of $74,867. The number of sales transactions facilitated through our GETBATS website and mobile app was 295,393 in fiscal year 2021 and 1,759 in fiscal year 2020. Cash rebates offered by Merchants to Members were $29,873 and $4,761 for the fiscal years ended September 30, 2021 and 2020, respectively.
Revenue from Payment Solution Services – Related Party
We started to provide payment solution services to merchants in May 2021. During the fiscal year ended September 30, 2021, we referred 11 merchants to VE Services for payment processing and earned commission fees of $1,494. Since VE Services is an entity controlled by one of our beneficial shareholders, our revenue of $1,494 from payment solution services in fiscal year 2021 was reported as revenue from a related party. As we plan to expand our network with more third-party payment service providers and refer more merchants to them to process the payments, we do not expect to derive a substantial amount of payment solution service revenue from related parties in future periods.
Operating Costs
The following table sets forth the breakdown of our operating costs for the fiscal years ended September 30, 2021 and 2020:
| For the fiscal years ended September 30, | ||||||||||||||||||||||||
| 2021 | 2020 | Variances | ||||||||||||||||||||||
| Amount | % | Amount | % | Amount | % | |||||||||||||||||||
| Salary and employee benefit expenses | $ | 191,981 | 18.71 | % | $ | 41,988 | 12.21 | % | $ | 149,993 | 357.23 | % | ||||||||||||
| Professional and consulting service fees | 365,774 | 35.64 | % | 5,172 | 1.50 | % | 360,602 | 6972.20 | % | |||||||||||||||
| Marketing and promotional expenses | 167,803 | 16.35 | % | 159,852 | 46.47 | % | 7,951 | 4.97 | % | |||||||||||||||
| License costs | 50,000 | 4.87 | % | 60,000 | 17.44 | % | (10,000 | ) | -16.67 | % | ||||||||||||||
| Website and facility maintenance expenses | 185,757 | 18.10 | % | 43,936 | 12.77 | % | 141,821 | 322.79 | % | |||||||||||||||
| Depreciation | 2,568 | 0.25 | % | 1,948 | 0.57 | % | 620 | 31.83 | % | |||||||||||||||
| Utility and office expenses | 19,185 | 1.87 | % | 3,213 | 0.93 | % | 15,972 | 497.11 | % | |||||||||||||||
| Business travel and entertainment expenses | 6,003 | 0.58 | % | 25 | 0.01 | % | 5,978 | 23,912.00 | % | |||||||||||||||
| Others | 37,268 | 3.63 | % | 27,892 | 8.10 | % | 9,376 | 33.62 | % | |||||||||||||||
| Total operating costs | $ | 1,026,339 | 100.00 | % | $ | 344,026 | 100.00 | % | $ | 682,313 | 198.33 | % | ||||||||||||
| 51 |
Our operating costs accounted for approximately 32.42% and 223.59% of our total revenue for the fiscal years ended September 30, 2021 and 2020, respectively. Although our operating costs as a percentage to our total revenue decreased significantly from 223.59% in fiscal year 2020 to 32.42% in fiscal year 2021 due to significantly increased total revenue, our operating costs increased significantly by $682,313, or approximately 198.33%, from $344,026 in fiscal year 2020 to $1,026,339 in fiscal year 2021. The significant increase was due to the following major reasons:
| (1) | Our salary and employee benefit expenses increased significantly by $149,993, or approximately 357.23%, from $41,988 in fiscal year 2020 to $191,981 in fiscal year 2021, primarily due to an increased number of employees from four in 2020 to 17 in 2021 in order to handle increased business activities associated with our digital advertising services and cash rebate services. |
| (2) | Our professional and consulting service fees increased significantly by $360,602, or approximately 6,972.20%, from $5,172 in fiscal year 2020 to $365,774 in fiscal year 2021, primarily due to increased professional expenses we paid to third-party professionals for business strategy and planning purposes and increased audit fees in connection with our proposed IPO. |
| (3) | Our marketing and promotional expenses primarily included expenses incurred to develop members, merchants, and advertisers, and to broaden our brand awareness. Our marketing and promotional expenses slightly increased by $7,951, or approximately 4.97%, from $159,852 in fiscal year 2020 to $167,803 in fiscal year 2021, the increase was a result of our increased marketing efforts to develop new merchants and advertisers for our services. |
| (4) | License costs represented service fees paid to third-party content providers to license movies and television series and put such licensed movies and television series on our SEEBATS website and mobile app to drive traffic. License costs decreased by $10,000, from $60,000 in fiscal year 2020 to $50,000 in fiscal year 2021, because we paid a higher amount of service fees to third-party content providers in fiscal year 2020 as compared to fiscal year 2021. On July 29, 2019 and August 5, 2019, we entered into a Distribution and Ad Sales Deal Agreement with third-party content providers DMG and SRI, respectively, in order to license movies and television series from them and put such licensed movies and television series on our SEEBATS website and mobile app to drive traffic. Pursuant to these agreements, each with effective terms from August 2019 to July 31, 2021, we were required to pay a flat fee of $10,000 and a monthly fee of $2,500 to DMG and a monthly fee of $2,500 to SRI. See “Item 4. Information on the Company—B. Business Overview—Digital Advertising Services—Ads Distribution Channels—Distribution through Our SEEBATS Website and Mobile App” for more details. |
| (5) | Website and facility maintenance expenses increased significantly by $141,821, or approximately 322.79%, from $43,936 in fiscal year 2020 to $185,757 in fiscal year 2021. In order to carry out businesses, we use (i) the GETBATS website and mobile app to connect our Members and Merchants and (ii) our websites and mobile apps and third-party social media channels to provide digital advertising services to advertisers. As of September 30, 2021 and 2020, there were an aggregate of 514,167 and 66,580 retail shoppers registered with us as Members and 723 and 478 retail merchants registered with us as Merchants, respectively.
Due to the increased number of Members and Merchants registered with us for our cash rebate and digital advertising services during fiscal year 2021, we incurred higher website and facility maintenance expenses to support our expanded business activities.
In order to support our business activities, we also conduct research and development activities to optimize and implement our websites and mobile apps (such as leveraging browser caching, improving server response time, removing render-blocking JavaScript, reducing redirects, and optimizing images), to improve their performance and drive more traffic. Research and development costs are expensed as incurred. Research and development expenses included in website and facility maintenance expenses amounted to $147,296 and $38,925 for the fiscal years ended September 30, 2021 and 2020, respectively. |
| 52 |
| (6) | Utility and office expenses increased significantly by $15,972, or approximately 497.11%, from $3,213 in fiscal year 2020 to $19,185 in fiscal year 2021, primarily due to increased utility and office supply expenses incurred when we leased a new office in fiscal year 2021. |
We expect our overall operating costs, including marketing expenses, salaries, and professional and business consulting expenses, to continue to increase in the foreseeable future, as we plan to hire additional personnel and incur additional expenses in connection with the expansion of our business operations.
Provision for Income Taxes
Our provision for income taxes was $692,405 in fiscal year ended September 30, 2021, a significant increase of $677,414 from $14,991 in fiscal year ended September 30, 2020, primarily due to our increased taxable income generated from our digital advertising services. Our subsidiaries Starbox Berhad, StarboxGB, StarboxSB, and StarboxPB are governed by the income tax laws of Malaysia. The income tax provision in respect of operations in Malaysia is calculated at the applicable tax rates on the taxable income for the periods based on existing legislation, interpretations, and practices. Under the Income Tax Act of Malaysia, enterprises incorporated in Malaysia are usually subject to a unified 24% enterprise income tax rate, while preferential tax rates, tax holidays, and tax exemptions may be granted on a case-by-case basis. The tax rate for small and medium sized companies (generally companies incorporated in Malaysia with paid-in capital of MYR2,500,000 or less, and gross income of not more than MYR50 million) is 17% for the first MYR600,000 (or approximately $150,000) taxable income for the fiscal years ended September 30, 2021 and 2020, with the remaining balance being taxed at the 24% rate. For the fiscal years ended September 30, 2021 and 2020, the tax saving as the result of the favorable tax rates and tax exemption amounted to $10,183 and $(13,311), respectively, and per share effect of the favorable tax rate and tax exemption was $0.00 and $(0.00), respectively. Other than StarboxSB, which generated taxable income through providing digital advertising services to customers, Starbox Berhad, StarboxGB, and StarboxPB have each reported recurring operating losses since their inception. Management concluded that the chances for these three entities that suffered recurring losses in prior periods to become profitable in the foreseeable future and to utilize their net operating loss carry forwards were remote. Accordingly, we provided valuation allowance of $137,932 and $40,949 for the deferred tax assets of these subsidiaries for the fiscal years ended September 30, 2021 and 2020, respectively.
Net Income
As a result of the foregoing, we reported net income of $1,447,650 for the fiscal year ended September 30, 2021, representing a significant increase of $1,652,804 from a net loss of $205,154 for the fiscal year ended September 30, 2020.
B. Liquidity and Capital Resources
Cash Flows for the Fiscal Year Ended September 30, 2022 Compared to the Fiscal Year Ended September 30, 2021
We were incorporated in the Cayman Islands as a holding company and our Cayman Islands holding company did not have active business operations as of September 30, 2022 and as of the date of this annual report. Our consolidated assets and liabilities and consolidated revenue and net income are the operation results of our subsidiaries in Malaysia. Our Malaysian subsidiaries’ ability to transfer funds to us in the form of loans or advances or cash dividends is not materially restricted by regulatory provisions in accordance with laws and regulations in Malaysia. Our subsidiaries in Malaysia are free to remit divestment proceeds, profits, dividends, or any income arising from our investment in Malaysia, as long as the payment is made in foreign currency, instead of Malaysian Ringgit, and in accordance with the Foreign Exchange Notices issued by the Bank Negara Malaysia (the Central Bank of Malaysia). As of September 30, 2022 and 2021, none of the net assets of our consolidated subsidiaries in Malaysia were restricted net assets and there were no funds transferred from our Malaysia subsidiaries to us in the form of loans, advances, or cash dividends during the fiscal years ended September 30, 2022 and 2021.
As of September 30, 2022 and as of the date of this annual report, there were no cash transfers between our Cayman Islands holding company and our subsidiaries in Malaysia, in terms of loans or advances or cash dividends. Funds were transferred among our Malaysian subsidiaries, Starbox Berhad, StarboxGB, StarboxSB, and StarboxPB, as intercompany loans, and used for working capital purposes and amounted to approximately $6.1 million and $0.48 million during the fiscal years ended September 30, 2022 and 2021, respectively. We have not been notified of any restrictions which could limit our Malaysian subsidiaries’ ability to transfer cash among one another.
| 53 |
As of September 30, 2022, we had $17,778,896 in cash and cash on hand as compared to $2,295,277 as of September 30, 2021. We also had $2,032,717 and $1,362,417 in accounts receivable as of September 30, 2022 and September 30, 2021, respectively. Our accounts receivable included balances due from advertisers for digital advertising services rendered, where our performance obligations had been satisfied and our fees had been billed but had not been collected as of the balance sheet date. Accounts receivable balance as of September 30, 2021 has been fully collected. Approximately 65% of the September 30, 2022 accounts receivable balance has been subsequently collected as of the date of this annual report and the remaining balance is expected to be collected by February 2023. The following table summarizes our outstanding accounts receivable and subsequent collection by aging bucket:
| Accounts Receivable by aging bucket | Balance as of September 30, 2022 | Subsequent collection | % of subsequent collection | |||||||||
| Less than 6 months | $ | 2,032,717 | $ | 1,311,268 | 65 | % | ||||||
| From 7 to 9 months | - | - | - | % | ||||||||
| From 10 to 12 months | - | - | - | % | ||||||||
| Over 1 year | - | - | - | % | ||||||||
| Total gross accounts receivable | 2,032,717 | 1,311,268 | 65 | % | ||||||||
| Allowance for doubtful accounts | - | - | - | |||||||||
| Accounts Receivable, net | $ | 2,032,717 | $ | 1,311,268 | 65 | % | ||||||
| Accounts Receivable by aging bucket | Balance as of September 30, 2021 | Subsequent collection | % of subsequent collection | |||||||||
| Less than 6 months | $ | 1,362,342 | $ | 1,362,342 | 100.0 | % | ||||||
| From 7 to 9 months | 12 | 12 | 100.0 | % | ||||||||
| From 10 to 12 months | - | - | 0.0 | % | ||||||||
| Over 1 year | 63 | 63 | 100.0 | % | ||||||||
| Total gross accounts receivable | 1,362,417 | 1,362,417 | 100.0 | % | ||||||||
| Allowance for doubtful accounts | - | - | - | |||||||||
| Accounts Receivable, net | $ | 1,362,417 | $ | 1,362,417 | 100.0 | % | ||||||
As of September 30, 2022, we had prepaid expenses and other current assets balance of approximately $4.3 million, which primarily consisted of prepayments to third-party vendors to help us (i) design, develop, and optimize the Augmented Reality (“AR”) travel guide app with the key commercial objective to provide personalized instant rebates, voucher distribution, and ad placements for merchants and (ii) to conduct software application design, development, conceptualization, and visualization for our Virtual Reality Rebate Mall project, and upgrade our existing software and operating systems to increase the data processing capability, to diversify our business operation model, and to support our future business expansion. There was no allowance for doubtful accounts recorded for such prepayments as we consider all of the prepayments fully realizable.
As of September 30, 2022, we had taxes payable of $1,404,128, due to our increased taxable income. We have made partial payment to settle the September 30, 2022 taxes payable balance during November to December 2022, and we expect to fully settle the remaining tax liabilities before August 31, 2023 when our annual tax returns in Malaysia are filed. We plan to use our cash on hand and cash generated from our operations to settle our current tax liabilities.
The balance due to a related party was $7,361 as of September 30, 2022, representing the fee to be paid for secretarial and tax consulting and filing services received from a company that is owned by the Company’s CFO. Such advance was non-interest bearing and due on demand.
As of September 30, 2022, our working capital balance amounted to approximately $22.1 million. In assessing our liquidity, management monitors and analyzes our cash on-hand, our ability to generate sufficient revenue in the future, and our operating and capital expenditure commitments.
| 54 |
To further grow our advertiser, Member, and Merchant bases and increase our future revenue and cash flows, we plan to selectively launch our cash rebate and digital advertising services in other countries in Southeast Asia during the next three years, starting from markets such as the Philippines, Thailand, and Indonesia. We have been focusing on and intend to continue focusing on expanding into the Philippines and Thailand between July 2022 and June 2023 and become operational in these countries around April to June 2023 and to further expand into Indonesia, Brunei, Singapore, and other countries in Southeast Asia between July 2023 and June 2025. To accomplish such expansion plan, we will need to establish representative offices or appoint local partners, hire new sales, marketing, and support personnel in the countries in which we will launch our services, improve or upgrade our websites and mobile apps to adapt to local languages and cultures, and promote our brands in these countries. In addition to our geographic business expansion, in order to upgrade our existing software and operating systems to increase the data processing capability, to diversify our business operation model and to support our future business growth, we also plan to put a significant amount of investment on our IT system and infrastructure. We will outsource the software and application design and development to third-party vendors for market research, feasibility study, AR app and Virtual Reality Mall Data Management system software conceptualization, visualization, system coding, testing, debugging, and application and server backup supporting services. We believe such IT related investment will help us diversify our future business scope, increase our competitive advantage, and benefit our future long-run growth.
In connection with the above-mentioned business expansion into neighboring countries and investment on our IT infrastructure, we estimate the total related capital investment and expenditures to be approximately $57 million over the next three years, among which approximately $2 million will be required to support our expansion into the Philippines and Thailand and approximately $25 million will be required on IT software related investment within the next 12 months, based on management’s best estimate as of the date of this annual report. We will also need approximately $1.4 million to fully settle our September 30, 2022 tax liabilities, making the total estimated required capital expenditure within the next 12 months to be approximately $29 million. Currently, we plan to use our own cash to support our short-term business growth goal. Our major source of fund includes the following: (i) on August 25, 2022, we closed our IPO of 5,375,000 ordinary shares at a public offering price of $4.00 per ordinary share. We raised approximately $21.5 million in gross proceeds from the IPO and underwriters’ partial exercise of the over-allotment option, before deducting underwriting discounts and other related expenses, (ii) on November 3, 2022, we closed a private placement, in which we issued and sold an aggregate of 9,000,000 ordinary shares to investors at a price of $1.40 per share and received gross proceeds, before deducting the placement agent’s fees and other related offering expenses, of $12.60 million, and (iii) our operating cash flows from existing businesses as well as potentially from our expansion into neighboring countries within the next 12 months. We believe that our current cash and cash flows provided by operating activities will be sufficient to meet our working capital needs in the next 12 months from the date of this annual report.
However, we may incur additional capital needs in the long term. We may also seek additional financing, to the extent required, and there can be no assurance that such financing will be available on favorable terms, or at all. All of our business expansion endeavors involve risks and will require significant management, human resources, and capital expenditure. There is no assurance that the investment to be made by us as contemplated under our future plans will be successful and generate the expected return. If we are not able to manage our growth or execute our strategies effectively, or at all, our business, results of operations, and prospects may be materially and adversely affected. See “Item 3. Key Information—D. Risk Factors—Risks Related to Our Business and Industry—If we fail to manage our growth or execute our strategies and future plans effectively, we may not be able to take advantage of market opportunities or meet the demand of our advertisers” and “Item 3. Key Information—D. Risk Factors—Risks Related to Our Business and Industry—We may be unsuccessful in expanding and operating our business internationally, which could adversely affect our results of operations.”
The following table sets forth summary of our cash flows for the fiscal years indicated:
| For the Fiscal Years Ended September 30, | ||||||||
| 2022 | 2021 | |||||||
| Net cash provided by (used in) operating activities | $ | (1,232,364 | ) | $ | 1,883,895 | |||
| Net cash used in investing activities | (1,135,929 | ) | (5,203 | ) | ||||
| Net cash provided by financing activities | 18,039,805 | 74,125 | ||||||
| Effect of exchange rate change on cash | (187,893 | ) | (28,792 | ) | ||||
| Net increase in cash | 15,483,619 | 1,924,025 | ||||||
| Cash, beginning of year | 2,295,277 | 371,252 | ||||||
| Cash, end of year | $ | 17,778,896 | $ | 2,295,277 | ||||
| 55 |
Operating Activities
Net cash used in operating activities was $1,232,364 for the fiscal year ended September 30, 2022, and primarily consisted of the following:
| ● | net income of $3,602,365 for the year; | |
| ● | an increase in accounts receivable of $864,099. Our accounts receivable included balances due from customers for digital advertising services, cash rebate services, and payment solution services rendered, where our performance obligations had been satisfied, and our fees had been billed but had not been collected as of the balance sheet dates. The September 30, 2022 accounts receivable balance has been substantially collected as of the date of this annual report; | |
| ● | an increase in prepayment and other current assets of approximately $4,754,970. In order to upgrade our existing software and operating systems to increase the data processing capability, to diversify our business operation model and to support our future business expansion, we signed agreements with third-party technological and software development vendors to (i) conduct software application design and development for our develop AR travel guide app with key commercial objective to provide additional digital ads placement for merchants, and to convert online traffic to offline merchants to improve our data processing capacity for instant rebates, and air-drop voucher for merchants; and (ii) to conduct market research, feasibility study, VR Mall Data Management system software conceptualization, visualization, system coding, testing, and debugging for our Virtual Reality Rebate Mall project, to initialize and rollout the application as a progressive web portal, which can be further developed into a mobile app to allow integration to various platforms. As of September 30, 2022, we had prepaid approximately $4.7 million to these vendors and we consider all of the prepayments fully realizable; | |
| ● | an increase in outstanding taxes payable of $661,359 due to our increased taxable income. We plan to fully settle the tax liabilities with local tax authorities before August 31, 2023 when we file our annual tax returns in Malaysia; and | |
| ● | A decrease in deferred revenue of $778,701 because prior period accrued deferred revenue has been recognized as revenue for current year when our services are rendered. Our customers are typically required to make certain prepayments to us before we provide digital advertising services to them. We record such prepayment as deferred revenue when our performance obligations associated with the delivery of digital advertising services to customers had not been satisfied as of the balance sheet date. Due to the generally short-term duration of the contracts, the majority of our unfulfilled performance obligations are satisfied in the following reporting period. |
Net cash provided by operating activities was $1,883,895 for the fiscal year ended September 30, 2021, and primarily consisted of the following:
| ● | net income of $1,447,650 for the year; | |
| ● | an increase in accounts receivable of $1,100,053. Our accounts receivable included balances due from customers for digital advertising services, cash rebate services, and payment solution services rendered, where our performance obligations had been satisfied, and our fees had been billed but had not been collected as of the balance sheet dates. The September 30, 2021 accounts receivable balance has been fully collected as of the date of this annual report; | |
| ● | an increase in outstanding taxes payable of $870,528 due to our increased taxable income. We plan to fully settle the tax liabilities with local tax authorities by early August 2022; and | |
| ● | an increase in deferred revenue of $688,979. Our customers are typically required to make certain prepayments to us before we provide digital advertising services to them. We record such prepayment as deferred revenue when our performance obligations associated with the delivery of digital advertising services to customers had not been satisfied as of the balance sheet date. Due to the generally short-term duration of the contracts, the majority of our unfulfilled performance obligations are satisfied in the following reporting period. |
Investing Activities
Cash used in investing activities was $1,135,929 for the fiscal year ended September 30, 2022, which primarily included purchase of property and equipment of $6,669 and purchase of intangible assets of $1,129,260 during the year.
| 56 |
Cash used in investing activities was $5,203 for the fiscal year ended September 30, 2021, which primarily included purchases of property and equipment of $5,203 and cash advances made to Zenapp Sdn Bhd (“Zenapp”), an entity previously controlled by Choo Keam Hui, our former director and one of the directors of Starbox Berhad, of $387,945, offset by a collection of cash advances to Zenapp of $387,945 during the year.
Financing Activities
Cash provided by financing activities was $18,039,805 for the fiscal year ended September 30, 2022, which consisted of net proceeds from our IPO of $18,769,326 because we completed our IPO in August 2022, offset by repayment of borrowing from related parties in the amount of $727,935.
Cash provided by financing activities was $74,125 for the fiscal year ended September 30, 2021, which consisted of capital contributions from shareholders of $200,000 and repayment of borrowings from Zenapp of $125,875.
Cash Flows for the Fiscal Year Ended September 30, 2021 Compared to the Fiscal Year Ended September 30, 2020
We were incorporated in the Cayman Islands as a holding company and our Cayman Islands holding company did not have active business operations as of September 30, 2021 and as of the date of this annual report. Our consolidated assets and liabilities and consolidated revenue and net income are the operation results of our subsidiaries in Malaysia. Our Malaysian subsidiaries’ ability to transfer funds to us in the form of loans or advances or cash dividends is not materially restricted by regulatory provisions in accordance with laws and regulations in Malaysia. Our subsidiaries in Malaysia are free to remit divestment proceeds, profits, dividends, or any income arising from our investment in Malaysia, as long as the payment is made in foreign currency, instead of Malaysian Ringgit, and in accordance with the Foreign Exchange Notices issued by the Bank Negara Malaysia (the Central Bank of Malaysia). As of September 30, 2021 and 2020, none of the net assets of our consolidated subsidiaries in Malaysia were restricted net assets and there were no funds transferred from our Malaysia subsidiaries to us in the form of loans, advances, or cash dividends during the fiscal years ended September 30, 2021 and 2020.
As of September 30, 2021 and as of the date of this annual report, there were no cash transfers between our Cayman Islands holding company and our subsidiaries in Malaysia, in terms of loans or advances or cash dividends. Funds were transferred among our Malaysian subsidiaries, Starbox Berhad, StarboxGB, StarboxSB, and StarboxPB, as intercompany loans, and used for working capital purposes and amounted to approximately $0.48 million and nil during the fiscal years ended September 30, 2021 and 2020, respectively. We have not been notified of any restrictions which could limit our Malaysian subsidiaries’ ability to transfer cash among one another.
As of September 30, 2021, we had $2,295,277 in cash and cash on hand as compared to $371,252 as of September 30, 2020. We also had $1,362,417 and $281,593 in accounts receivable as of September 30, 2021 and September 30, 2020, respectively. Our accounts receivable included balances due from advertisers for digital advertising services rendered, where our performance obligations had been satisfied and our fees had been billed but had not been collected as of the balance sheet date. Both the September 30, 2021 and 2020 accounts receivable balances have been fully collected as of the date of this annual report. The following table summarizes our outstanding accounts receivable and subsequent collection by aging bucket:
| Accounts Receivable by aging bucket | Balance as of September 30, 2021 | Subsequent collection | % of subsequent collection | |||||||||
| Less than 6 months | $ | 1,362,342 | $ | 1,362,342 | 100.0 | % | ||||||
| From 7 to 9 months | 12 | 12 | 100.0 | % | ||||||||
| From 10 to 12 months | - | - | 0.0 | % | ||||||||
| Over 1 year | 63 | 63 | 100.0 | % | ||||||||
| Total gross accounts receivable | 1,362,417 | 1,362,417 | 100.0 | % | ||||||||
| Allowance for doubtful accounts | - | - | - | |||||||||
| Accounts Receivable, net | $ | 1,362,417 | $ | 1,362,417 | 100.0 | % | ||||||
| 57 |
| Accounts Receivable by aging bucket | Balance as of September 30, 2020 | Subsequent collection | % of subsequent collection | |||||||||
| Less than 6 months | $ | 208,218 | $ | 208,218 | 100.0 | % | ||||||
| From 7 to 9 months | 73,375 | 73,375 | 100.0 | % | ||||||||
| From 10 to 12 months | - | - | - | % | ||||||||
| Over 1 year | - | - | - | % | ||||||||
| Total gross accounts receivable | 281,593 | 281,593 | 100.0 | % | ||||||||
| Allowance for doubtful accounts | - | - | - | |||||||||
| Accounts Receivable, net | $ | 281,593 | $ | 281,593 | 100.0 | % | ||||||
As of September 30, 2021, we had deferred revenue of $800,492, which primarily consisted of digital advertising service fees received from customers before we perform the services. Such balance represented service consideration received in advance for our performance obligations that were not satisfied at the end of the year. Due to the generally short-term duration of the contracts, the majority of our unfulfilled performance obligations are satisfied in the following reporting period.
As of September 30, 2021, we had taxes payable of $874,834, due to our increased taxable income. We have made partial payment to settle the September 30, 2021 taxes payable balance during January to March 2022 and we originally planned to fully settle the remaining tax liabilities with local tax authorities before May 2022 when we file the 2021 annual tax returns. Due to the extension of the 2021 annual tax return filing deadline to August 31, 2022, we now expect to fully settle the remaining tax liabilities by early August 2022. We plan to use our cash on hand and cash generated from our operations to settle our current tax liabilities.
The balance due to a related party was $756,478 as of September 30, 2021, representing a loan advance from Choo Keam Hui, our former director and one of the directors of Starbox Berhad, and was used as working capital during our normal course of business. Such advance was non-interest bearing and due on demand.
As of September 30, 2021, our working capital balance amounted to approximately $1.2 million. In assessing our liquidity, management monitors and analyzes our cash on-hand, our ability to generate sufficient revenue in the future, and our operating and capital expenditure commitments.
To further grow our advertiser, Member, and Merchant bases and increase our future revenue and cash flows, we plan to selectively launch our cash rebate and digital advertising services in other countries in Southeast Asia during the next three years, starting from markets such as the Philippines, Thailand, and Indonesia. We intend to focus on expanding into the Philippines and Thailand between July 2022 and June 2023 and become operational in these countries around April to June 2023 and to further expand into Indonesia, Brunei, Singapore, and other countries in Southeast Asia between July 2023 and June 2025.
To accomplish such expansion plan, we will need to establish representative offices or appoint local partners, hire new sales, marketing, and support personnel in the countries in which we will launch our services, improve or upgrade our websites and mobile apps to adapt to local languages and cultures, and promote our brands in these countries. We estimate the total related capital investment and expenditures to be approximately $12 million, among which approximately $2 million will be required within the next 12 months to support our expansion into the Philippines and Thailand, based on management’s best estimate as of the date of this annual report. We will also need approximately $0.87 million to fully settle our September 30, 2021 tax liabilities, making the total estimated required capital expenditure within the next 12 months to be approximately $3 million. Currently, we plan to use our own cash to support our short-term business growth goal. We believe that our current cash and cash flows provided by operating activities will be sufficient to meet our working capital needs in the next 12 months from the date of this annual report.
However, we may incur additional capital needs in the long term. We may also seek additional financing, to the extent required, and there can be no assurance that such financing will be available on favorable terms, or at all. All of our business expansion endeavors involve risks and will require significant management, human resources, and capital expenditure. There is no assurance that the investment to be made by us as contemplated under our future plans will be successful and generate the expected return. If we are not able to manage our growth or execute our strategies effectively, or at all, our business, results of operations, and prospects may be materially and adversely affected. See “Item 3. Key Information—D. Risk Factors—Risks Related to Our Business and Industry—If we fail to manage our growth or execute our strategies and future plans effectively, we may not be able to take advantage of market opportunities or meet the demand of our advertisers” and “Item 3. Key Information—D. Risk Factors—Risks Related to Our Business and Industry—We may be unsuccessful in expanding and operating our business internationally, which could adversely affect our results of operations.”
| 58 |
The following table sets forth summary of our cash flows for the fiscal years indicated:
| For the Fiscal Years Ended September 30, | ||||||||
| 2021 | 2020 | |||||||
| Net cash provided by (used in) operating activities | $ | 1,883,895 | $ | (342,348 | ) | |||
| Net cash used in investing activities | (5,203 | ) | (8,198 | ) | ||||
| Net cash provided by financing activities | 74,125 | 707,064 | ||||||
| Effect of exchange rate change on cash and restricted cash | (28,792 | ) | 5,102 | |||||
| Net increase in cash | 1,924,025 | 361,620 | ||||||
| Cash, beginning of year | 371,252 | 9,632 | ||||||
| Cash, end of year | $ | 2,295,277 | $ | 371,252 | ||||
Operating Activities
Net cash provided by operating activities was $1,883,895 for the fiscal year ended September 30, 2021, and primarily consisted of the following:
| ● | net income of $1,447,650 for the year; | |
| ● | an increase in accounts receivable of $1,100,053. Our accounts receivable included balances due from customers for digital advertising services, cash rebate services, and payment solution services rendered, where our performance obligations had been satisfied, and our fees had been billed but had not been collected as of the balance sheet dates. The September 30, 2021 accounts receivable balance has been fully collected as of the date of this annual report; | |
| ● | an increase in outstanding taxes payable of $870,528 due to our increased taxable income. We plan to fully settle the tax liabilities with local tax authorities by early August 2022; and | |
| ● | an increase in deferred revenue of $688,979. Our customers are typically required to make certain prepayments to us before we provide digital advertising services to them. We record such prepayment as deferred revenue when our performance obligations associated with the delivery of digital advertising services to customers had not been satisfied as of the balance sheet date. Due to the generally short-term duration of the contracts, the majority of our unfulfilled performance obligations are satisfied in the following reporting period. |
Net cash used in operating activities was $342,348 for the fiscal year ended September 30, 2020, and primarily consisted of:
| ● | a net loss of $205,154 for the year; | |
| ● | an increase in accounts receivable of $277,543. 100% of the September 30, 2020 accounts receivable balance has been collected as of the date of this annual report; and | |
| ● | an increase in deferred revenue of $120,961. |
Investing Activities
Cash used in investing activities was $5,203 for the fiscal year ended September 30, 2021, which primarily included purchases of property and equipment of $5,203 and cash advances made to Zenapp Sdn Bhd (“Zenapp”), an entity previously controlled by Choo Keam Hui, our former director and one of the directors of Starbox Berhad, of $387,945, offset by a collection of cash advances to Zenapp of $387,945 during the year.
Cash used in investing activities was $8,198 for the fiscal year ended September 30, 2020, which was primarily related to purchases of property and equipment in the same amount.
| 59 |
Financing Activities
Cash provided by financing activities was $74,125 for the fiscal year ended September 30, 2021, which consisted of capital contributions from shareholders of $200,000 and repayment of borrowings from Zenapp of $125,875.
Cash provided by financing activities amounted to $707,064 for the fiscal year ended September 30, 2020, which consisted of borrowings from Zenapp of $707,064 to support our working capital needs.
Contractual Obligations
Prior to August 2021, we had not directly entered into any office lease agreements. The lease expenses were paid by Zenapp on behalf of us, with an estimated amount of $4,200 for the fiscal year ended September 30, 2020, and approximately $3,850 for the period from October 2020 to August 2021. On August 20, 2021, our main operating subsidiaries in Malaysia started to lease office spaces from Zenapp, with an aggregate area of approximately 4,800 square feet, pursuant to three sub-tenancy agreements, each with a lease term from September 1, 2021 to August 31, 2023, and monthly rent of MYR10,000 (approximately $2,424). The sub-tenancy agreements may be renewed for successive two-year terms. The operating lease expenses for the fiscal year ended September 30, 2022 and 2021 were $56,690 and $7,274, respectively. However, on April 30, 2022, we early terminated the sub-tenancy agreements with Zenapp and elected to enter into lease agreements directly with the same landlords for a term of one year from May 1, 2022 to April 30, 2023. There was no penalty derived from the early termination of the sub-tenancy agreements.
The following tables summarize our contractual obligations as of September 30, 2022:
| 12 months ending September 30, | Lease Payment | |||
| 2023 | $ | 17,601 | ||
| 2024 | 17,601 | |||
| 2025 | 10,268 | |||
| Total future minimum lease payments | 45,470 | |||
| Less: imputed interest | (2,896 | ) | ||
| Total | $ | 42,574 | ||
Off-Balance Sheet Arrangements
We did not have any off-balance sheet arrangements as of September 30, 2022, 2021, and 2020.
C. Research and Development, Patents and Licenses, etc.
See “Item 4. Information on the Company—B. Business Overview—Intellectual Property.”
D. Trend Information
Other than as disclosed elsewhere in this annual report, we are not aware of any trends, uncertainties, demands, commitments, or events that are reasonably likely to have a material effect on our net revenue, income from continuing operations, profitability, liquidity, or capital resources, or that would cause reported financial information not necessarily to be indicative of future operating results or financial condition.
Factors and Trends Affecting Our Results of Operations
We believe the following key factors may affect our financial condition and results of operations:
| 60 |
Our Ability to Retain and Expand Our Merchant and Member Bases
Our revenue growth largely depends on our ability to retain our current Members and Merchants and attract new Members and Merchants effectively, including our ability to form relationships with and manage an increasing number of Members and Merchants. In order to maintain the high growth momentum of our business, we must continuously dedicate significant resources to our Member and Merchant acquisition efforts. If we are unable to attract new Members and Merchants to register with us or if our current Members and Merchants do not continue to use our services, we may be unable to increase our revenue as we expect, and our business and results of operations may be adversely affected.
Our Ability to Increase Awareness of Our Brands and Develop Customer Loyalty
Our brands are integral to our sales and marketing efforts. We believe that maintaining and enhancing our brand name recognition in a cost-effective manner is critical to achieving widespread acceptance of our current and future service offerings and is an important element in our effort to expand our Member and Merchant bases. Successful promotion of our brand name will depend largely on our marketing efforts and our ability to provide reliable and quality services at competitive prices. Brand promotion activities may not necessarily yield increased revenue, and even if they do, any increased revenue may not offset the expenses we will incur in marketing activities. If we fail to successfully promote and maintain our brands, or if we incur substantial expenses in an unsuccessful attempt to promote and maintain our brands, we may fail to attract new Members and Merchants or retain our existing Members and Merchants, in which case our business, operating results, and financial condition would be materially and adversely affected.
Number of Advertisers for Our Digital Advertising Services and Our Service Fees Charged
Substantially all of our revenue is derived from providing digital advertising services to advertisers. Some of these advertisers have also registered through our GETBATS website and mobile app as Merchants. Our digital advertising services are designed to help advertisers drive consumer demand, increase sales, and achieve operating efficiencies. Thus, our relationships with advertisers primarily depend on our ability to deliver quality digital advertising services at attractive prices. If advertisers are dissatisfied with the effectiveness of the advertising campaigns run through our digital channels, they may stop purchasing our digital advertising services or decrease the amount they are willing to spend on marketing campaigns and promotional activities. For the fiscal year ended September 30, 2022, we provided digital advertising services to 63 advertisers, among which 22 had registered with us as Merchants as of September 30, 2022 and the remaining 41 advertisers did not. For the fiscal year ended September 30, 2021, we provided digital advertising services to 25 advertisers, among which 13 had registered with us as Merchants as of September 30, 2021 and the remaining 12 advertisers did not. For the fiscal year ended September 30, 2020, we provided digital advertising services to two advertisers, none of which registered with us as Merchants. For the fiscal year ended September 30, 2022, no single advertiser accounted for more than 10% of our total revenue. For the fiscal year ended September 30, 2021, three advertisers accounted for approximately 21.7%, 10.8%, and 10.8% of our total revenue, respectively. For the fiscal year ended September 30, 2020, one advertiser accounted for approximately 91.6% of our total revenue. Our dependence on a small number of advertisers for our digital advertising services could expose us to the risk of substantial losses if a single advertiser stops purchasing our digital advertising services, decreases its advertising spending, or goes out of business and we cannot find substitute customers on equivalent terms. If any of our significant customers reduces advertising spending or stops purchasing digital advertising services from us, our net revenue could be materially and adversely affected. However, as we plan to increase our marketing efforts to expand our advertiser network and provide digital advertising services to advertisers in other countries in Southeast Asia, we believe such customer concentration will diminish in the foreseeable future.
In addition, our results of operations are directly affected by the level of service fees we charge to advertisers. We determine the service fees based on services provided to each advertiser to satisfy its needs. Demand for our services is sensitive to prices. Many factors, including our advertisers’ satisfaction or dissatisfaction with our services, the cost of our services and the cost of services offered by our competitors, reductions in our advertisers’ spending levels, or the introduction by competitors of attractive advertising features and functionality, can significantly affect our pricing strategies. There can be no assurance that we will not be forced to engage in price-cutting initiatives, or to increase our advertising and other expenses to attract and retain advertisers in response to competitive pressures, either of which could have a material adverse effect on our revenue, operating results, and resources.
Our Ability to Increase the Transaction Volume under the Cash Rebate Programs Offered by Merchants
We utilize our GETBATS website and mobile app to connect Merchants and Members and facilitate Members to purchase consumer products or services from Merchants online and offline under cash rebate programs offered by Merchants. Our revenue from cash rebate services is largely affected by the volume of transactions facilitated by us between Members and Merchants. The level of our cash rebate service revenue depends upon many factors, including our ability to attract Merchants that are prepared to offer products or services with compelling cash rebates through our website and mobile app, to provide our Members with a great cash rebate experience, and to manage an increasing number of Members and Merchants and optimize our Members and Merchants network. If our marketing efforts fail to convince Members to use the cash rebate programs, or if we are unable to increase the volume of transactions, our net revenue would decline, and our growth prospects would be severely impaired.
| 61 |
Our Ability to Expand our Payment Solution Service Business
We started to generate revenue from our payment solution service business in May 2021. Our revenue growth in this business largely depends on our ability to expand our network with more third-party payment service providers and refer more merchants to them to process the payments and our ability to keep pace with the new technological trends and advances in the payment area. If we are unable to attract new merchant users in sufficient numbers or if we fail to maintain long-term business partnership with third-party payment service providers, our payment solution service business may not be successful. As a result, our business, financial condition, and results of operations may be adversely affected.
Our Ability to Control Costs and Expenses and Improve Our Operating Efficiency
Our business growth is dependent on our ability to improve our operating efficiency, which is determined by our abilities to monitor and adjust costs and expenses. Specifically, we consider our ability to monitor and adjust staffing costs (including payroll and employee benefit expenses) and administrative expenses essential to the success of our business. As our Member and Merchant bases expand, if we enter into more service agreements with customers for our digital advertising services and payment solution services, or if we facilitate more transactions between Members and Merchants under the cash rebate program arrangements, our staffing costs are likely to rise. If our staffing costs and administrative expenses exceed our estimated budget and we are unable to increase our revenue as expected, our operational efficiency might decrease, having an adverse impact on our business, results of operation, and financial condition.
Our Geographic Concentration in Malaysia
Our main operations are located in Malaysia. Accordingly, our business, financial condition, and results of operations may be influenced by changes in political, economic, social, regulatory, and legal environments in Malaysia, as well as by the general state of the economy in Malaysia. Although we have not experienced losses from these situations and believe that we are in compliance with existing laws and regulations, such experience may not be indicative of future results.
Our Ability to Compete Successfully
The cash rebates industry and the digital advertising industry in Malaysia are rapidly evolving and highly competitive, and we expect competition in these industries to persist and intensify. We face competition in each of our service segments. With respect to cash rebate services, we primarily compete with other cash rebate platforms. With respect to digital advertising services, we compete directly with other digital advertising service providers in terms of brand recognition, quality of services, effectiveness of sales and marketing efforts, creativity in design and content of advertisements, pricing and discount policies, and hiring and retention of talented staff. We also face competition from other types of advertising media, such as newspapers, magazines, yellow pages, billboards, television, and radio. Significant competition could reduce our operating margins and profitability and result in a loss of market share. Some of our existing and potential competitors may have competitive advantages, such as significantly greater brand recognition and financial, marketing, or other resources that may be devoted to the development, promotion, sales, and support of their platforms. Significant competition could lead to lower prices and decreased revenue, gross margins, and profits, any of which could have a material and adverse effect on our results of operations.
| 62 |
COVID-19 Pandemic Affecting Our Results of Operations
Our operations may be further affected by the ongoing COVID-19 pandemic. In response to the COVID-19 pandemic, Malaysia has been put through various stages of lockdowns, quarantines, travel restrictions, and the temporary closure of stores and facilities nationwide, and most business sectors were only allowed to operate under strict rules and standard operating procedures mandated by the government of Malaysia. Substantially all of our revenue is concentrated in Malaysia. Consequently, our results of operations may be adversely and materially affected, to the extent that the COVID-19 pandemic or any other epidemic harms the Malaysian economy and global economy in general. The COVID-19 pandemic has adversely affected our business operations. Specifically, significant governmental measures implemented by the Malaysian government, including various stages of lockdowns, closures, quarantines, and travel bans, led to the store closure of some of our offline Merchants. As a result, our cash rebate service business was negatively affected to a certain extent, because the number of offline sales transactions between retail shoppers and retail merchants facilitated by us did not grow as much as we expected, leading to a lower amount of cash rebate service revenue than we expected during the fiscal year ended September 30, 2022, 2021, and 2020. However, our digital advertising service revenue was not significantly affected by the COVID-19 pandemic, because more people have opted to use various online services since the beginning of the COVID-19 pandemic. As more advertisers used our digital advertising services through our websites and mobile apps and third-party social media channels to target their audiences, our revenue from digital advertising services increased significantly from fiscal year 2020 to fiscal year 2021 and to fiscal year 2022. However, any resurgence of the COVID-19 pandemic could negatively affect the execution of customer contracts and the collection of customer payments. The extent of any future impact of the COVID-19 pandemic on our business is still highly uncertain and cannot be predicted as of the date of this annual report. Any potential impact to our operating results will depend, to a large extent, on future developments and new information that may emerge regarding the duration and severity of the COVID-19 pandemic and the actions taken by government authorities to contain the spread of the COVID-19 pandemic, almost all of which are beyond our control.
E. Critical Accounting Estimates
Our discussion and analysis of our financial condition and results of operations are based upon our consolidated financial statements. These financial statements are prepared in accordance with U.S. GAAP, which requires us to make estimates and assumptions that affect the reported amounts of our assets and liabilities and revenue and expenses, to disclose contingent assets and liabilities on the date of the consolidated financial statements, and to disclose the reported amounts of revenue and expenses incurred during the financial reporting period. We continue to evaluate these estimates and assumptions that we believe to be reasonable under the circumstances. We rely on these evaluations as the basis for making judgments about the carrying values of assets and liabilities that are not readily apparent from other sources. Since the use of estimates is an integral component of the financial reporting process, actual results could differ from those estimates. Some of our accounting policies require higher degrees of judgment than others in their application. We believe that the critical accounting policies as disclosed in this annual report reflect the more significant judgments and estimates used in preparation of our consolidated financial statements. Further, we elected to use the extended transition period for complying with new or revised accounting standards that have different effective dates for public and private companies until the earlier of the date that we (i) are no longer an emerging growth company or (ii) affirmatively and irrevocably opt out of the extended transition period provided in the JOBS Act. As a result, these financial statements may not be comparable to companies that comply with the new or revised accounting pronouncements.
The following critical accounting policies rely upon assumptions and estimates and were used in the preparation of our consolidated financial statements:
Uses of Estimates
In preparing the consolidated financial statements in conformity with U.S. GAAP, management makes estimates and assumptions that affect the reported amounts of assets and liabilities and disclosure of contingent assets and liabilities at the date of the financial statements and the reported amounts of revenue and expenses during the reporting period. These estimates are based on information as of the date of the consolidated financial statements. Significant estimates required to be made by management include the valuation of accounts receivable, useful lives of property and equipment and intangible assets, the recoverability of long-lived assets and investments, provision necessary for contingent liabilities and revenue recognition. Actual results could differ from those estimates.
Accounts Receivable, Net
Accounts receivable primarily consist of service fees generated from providing digital advertising services and payment solution services to retail merchants.
Accounts receivable are presented net of allowance for doubtful accounts. We determine the adequacy of allowance for doubtful accounts based on individual account analysis, historical collection trend, and best estimate of specific losses on individual exposures. We establish a provision for doubtful receivables when there is objective evidence that we may not be able to collect the amounts due. Actual amounts received may differ from management’s estimate of credit worthiness and the economic environment. Delinquent account balances are written-off against the allowance for doubtful accounts after management has determined that the likelihood of collection is not probable. As of September 30, 2022, 2021, and 2020, there was no allowance for doubtful accounts recorded, as we consider all of the outstanding accounts receivable fully collectible.
| 63 |
Revenue Recognition
On October 1, 2019, we adopted Accounting Standards Codification (“ASC”) 606 using the modified retrospective approach. The adoption of this standard did not have a material impact on our consolidated financial statements. Therefore, no adjustments to opening retained earnings were necessary.
To determine revenue recognition for contracts with customers, we perform the following five steps: (i) identify the contract(s) with the customer, (ii) identify the performance obligations in the contract, (iii) determine the transaction price, including variable consideration to the extent that it is probable that a significant future reversal will not occur, (iv) allocate the transaction price to the respective performance obligations in the contract, and (v) recognize revenue when (or as) we satisfy the performance obligation.
We currently generate our revenue from the following main sources:
Revenue from Digital Advertising Services
Our digital advertising service revenue is derived principally from advertising contracts with advertisers, which allow customers to place advertisements on our websites and mobile apps and third-party social media channels over a particular period of time. The advertising contracts specify the related fees and payment terms and provide evidence of the arrangements. Our digital advertising services are to (i) provide advertisement design and consultation services to help advertisers precisely shape their digital advertising strategies and optimize the design, content, and layout of their advertisements and (ii) the displaying of advertisers’ advertisement products and services on our websites and mobile apps and third-party social media channels over a particular period of time and in a variety of forms, such as logos, banners, push notification, and posts by accounts of influencers and bloggers, to help promote the sales of their products and services and enhance their brand awareness. Advertisers may elect to engage with us for only advertisement display services or both of our advertisement design and consultation services and advertisement display services.
In connection with these digital advertising services, we charge advertisers nonrefundable digital advertising service fees. For advertisement design and consultation services, our stand-alone selling price ranges from approximately $2,400 to approximately $38,000 for each of the service commitments, including advice on advertising strategies, customization and optimization of the desired content, length, color tone, layout, format, and presentation of the ads. Advertisers may elect to use any agreed-upon combination of services in one package, depending on their specific needs. For advertisement display services, we charge advertisers service fees with a range from approximately $5,000 to approximately $240,000, depending on the distribution channels used and the duration of the advertisement display. We act as a principal in providing digital advertising services to customers, have latitude in establishing prices, and are responsible for fulfilling the promise to provide customers the specified services. We recognize revenue for the amount of fees we receive from advertisers, after deducting discounts and net of service taxes under ASC 606.
We identify advertisement design and consultation services and advertisement display services as two separate performance obligations, as each are services that are capable of being distinct and distinct in the context of advertising contracts. Each of the service commitments in advertisement design and consultation services, including advice on advertising strategies, customization and optimization of the desired content, length, color tone, layout, format, and presentation of the ads, are not distinct in the context of advertising contracts, because they are inputs to deliver the combined output of advertisements to be displayed as specified by the customer. Therefore, advertisement design and consultation services are identified as a single performance obligation. We allocate revenue to each performance obligation based on its stand-alone selling price, which is specified in the contracts.
Our advertisement design and consultation services are normally rendered within a short period of time, ranging from a few days to a month. As all the benefits enjoyed by the advertisers can be substantially realized at the time when such design and consultation services are completed, we recognize revenue at the point when designated services are rendered and accepted by the advertisers. We do not provide rights of return, credits or discounts, price protection, or other similar privileges to advertising customers for such services and, accordingly, no variable consideration are included in such services.
The majority of our digital advertising contracts are for the provision of the advertisement displayed on our websites and mobile apps and third-party social media channels for a fixed period of time (ranging from a few weeks to a few months) without a guaranteed minimum impression level. In instances where certain discounts are provided to advertisers for advertisement displays, such discounts are reported as deduction of revenue. Revenue from advertisement display services is recognized over the period the advertisement is displayed. Advances from customers are deferred first and then recognized as revenue upon the completion of the contract. There are no future obligations after the completion of the contract and no rights of refund related to the impression levels.
| 64 |
Revenue from Cash Rebate Services
We utilize our GETBATS website and mobile app to connect Merchants and Members and facilitate Members to purchase consumer products or services from Merchants online and offline under cash rebate programs offered by Merchants. The total cash rebates offered by Merchants range from 0.25% to 25% based on the sales price of their products or services, among which approximately 86% are awarded to Members, and we are entitled to receive and retain the remaining approximately 14% as rebate revenue for facilitating the sales transactions between Members and Merchants. There is a single performance obligation in the contract, as the performance obligation is to facilitate the sales transaction between Members and Merchants.
We merely act as an agent in this type of transaction. We do not have control of the goods or services facilitated in the sales transaction, have no discretion in establishing prices, and do not have the ability to direct the use of the goods or services to obtain substantially all the benefits. We recognize rebate revenue at the point when Merchants and Members are connected and the sales transactions are facilitated and completed. Revenue is reported net of service taxes.
Revenue from Payment Solution Services – Related Party
In May 2021, we started to provide payment solution services to merchants by referring them to VE Services, an entity controlled by one of our beneficial shareholders, for payment processing. VE Services uses multiple payment methods to process the payments and charges the merchants a service fee ranging from 1.50% to 2.50%, based on the processed payment amount and payment processing methods used, and we are entitled to receive a portion of the service fees as commissions for our referrals. The commission rate ranges from 0.15% to 0.525% based on the total service fees collected by VE Services from the merchants. We merely act as an agent in this type of transaction. We have no discretion in establishing prices and do not have the ability to direct the use of the services to obtain substantially all the benefits. Such revenue is recognized at the point when the payment is processed and our performance obligations are satisfied.
Contract Assets and Liabilities
We did not have contract assets as of September 30, 2022, 2021, and 2020.
A contract liability is our obligation to transfer goods or services to a customer for which we have received consideration from the customers. Receipts in advance and deferred revenue, which relate to unsatisfied performance obligations at the end of the period, primarily consist of digital advertising service fees received from customers. Due to the generally short-term duration of the contracts, the majority of the performance obligations are satisfied in the following reporting period. Contract liabilities presented as deferred revenue in the consolidated balance sheets as of September 30, 2022, 2021, and 2020 amounted to nil, $800,492, and $122,668, respectively. Revenue recognized for the fiscal years ended September 30, 2022, 2021, and 2020 that was included in the contract liabilities balance at the beginning of the period was $800,491, $122,667, and nil, respectively.
We do not disclose information about remaining performance obligations pertaining to service contracts with an original expected term of one year or less.
Disaggregation of Revenue
We disaggregate our revenue from contracts by service types, as we believe it best depicts how the nature, amount, timing, and uncertainty of the revenue and cash flows are affected by economic factors.
The summary of our disaggregation of revenue by service types for the fiscal years ended September 30, 2022, 2021, and 2020 was as follows:
| For the Fiscal Years Ended September 30, | ||||||||||||
| 2022 | 2021 | 2020 | ||||||||||
| Revenue from advertising services: | ||||||||||||
| Advertisement design and consultation services | $ | 1,575,800 | $ | 384,061 | $ | - | ||||||
| Advertisement display services | 5,845,310 | 2,921,937 | 153,145 | |||||||||
| Gross revenue from advertising services | 7,421,110 | 3,305,998 | 153,145 | |||||||||
| Less: discount to customers for advertisement displays | (247,060 | ) | (147,478 | ) | - | |||||||
| Sub-total of net revenue from advertising services | 7,174,050 | 3,158,520 | 153,145 | |||||||||
| Revenue from cash rebate services | 10,562 | 6,214 | 718 | |||||||||
| Revenue from payment solution services – related party | 9,575 | 1,494 | - | |||||||||
| Total operating revenue | $ | 7,194,187 | $ | 3,166,228 | $ | 153,863 | ||||||
| 65 |
Income Tax
We account for current income taxes in accordance with the laws of the relevant tax authorities. Deferred income taxes are recognized when temporary differences exist between the tax bases of assets and liabilities and their reported amounts in the consolidated financial statements. Deferred tax assets and liabilities are measured using enacted tax rates expected to apply to taxable income in the years in which those temporary differences are expected to be recovered or settled. The effect on deferred tax assets and liabilities of a change in tax rates is recognized in income in the period including the enactment date. Valuation allowances are established, when necessary, to reduce deferred tax assets to the amount expected to be realized.
An uncertain tax position is recognized only if it is “more likely than not” that the tax position would be sustained in a tax examination. The amount recognized is the largest amount of tax benefit that is greater than 50% likely of being realized on examination. For tax positions not meeting the “more likely than not” test, no tax benefit is recorded. Penalties and interest incurred related to underpayment of income tax are classified as income tax expense in the period incurred. No significant penalties or interest relating to income taxes were incurred during the fiscal years ended September 30, 2022, 2021, and 2020. We do not believe there was any uncertain tax provision as of September 30, 2022, 2021, and 2020.
Our operating subsidiaries in Malaysia are subject to the income tax laws of Malaysia. No significant income was generated outside Malaysia for the fiscal years ended September 30, 2022, 2021, and 2020. As of September 30, 2022 and 2021, all of the tax returns of our Malaysian subsidiaries remained open for statutory examination by relevant tax authorities.
Recent Accounting Pronouncements
We consider the applicability and impact of all accounting standards updates (“ASUs”). Management periodically reviews new accounting standards that are issued.
In June 2016, the Financial Accounting Standards Board (the “FASB”) issued ASU 2016-13, Financial Instruments-Credit Losses (Topic 326) (“ASU 2016-13”), which requires entities to measure all expected credit losses for financial assets held at the reporting date based on historical experience, current conditions, and reasonable and supportable forecasts. This replaces the existing incurred loss model and is applicable to the measurement of credit losses on financial assets measured at amortized cost. ASU 2016-13 was subsequently amended by ASU 2018-19, Codification Improvements to Topic 326, Financial Instruments—Credit Losses, ASU 2019-04 Codification Improvements to Topic 326, Financial Instruments—Credit Losses, Topic 815, Derivatives and Hedging, and Topic 825, Financial Instruments, and ASU 2019-05, Targeted Transition Relief. In November 2019, the FASB issued ASU 2019-10, which extends the effective date for adoption of ASU 2016-13. In November 2019, the FASB issued ASU 2019-11 to clarify its new credit impairment guidance in ASU 326. Accordingly, for public entities that are not smaller reporting entities, ASU 2016-13 and its amendments are effective for fiscal years, and interim periods within those fiscal years, beginning after December 15, 2019. For all other entities, this guidance and its amendments will be effective for fiscal years beginning after December 15, 2022, including interim periods within those fiscal years. As an emerging growth company, we plan to adopt this guidance effective October 1, 2023. We are currently evaluating the impact of our pending adoption of ASU 2016-13 on our consolidated financial statements.
In December 2020, the FASB issued ASU 2020-12, Income Taxes (Topic 740)—Simplifying the Accounting for Income Taxes (“ASU 2020-12”). ASU 2020-12 is intended to simplify accounting for income taxes. It removes certain exceptions to the general principles in Topic 740 and amends existing guidance to improve consistent application. ASU 2020-12 is effective for fiscal years beginning after December 15, 2021 and interim periods within those fiscal years, with early adoption permitted. We adopted this guidance in fiscal year 2022 and the adoption of the new guidance did not have a significant impact on our consolidated financial statements.
| 66 |
Item 6. DIRECTORS, SENIOR MANAGEMENT AND EMPLOYEES
A. Directors and Senior Management
The following table sets forth information regarding our directors and executive officers as of the date of this annual report.
| Name | Age | Position(s) | ||
| Lee Choon Wooi | 47 | Chief Executive Officer, Director, and Chairman of the Board of Directors | ||
| Khoo Kien Hoe | 52 | Chief Financial Officer and Director | ||
| Lai Kwong Choy | 60 | Independent Director | ||
| Sung Ming-Hsuan | 41 | Independent Director | ||
| Law Peck Woon | 44 | Independent Director |
The following is a brief biography of each of our executive officers and directors:
Mr. Lee Choon Wooi has served as our Chief Executive Officer and chairman of the board of directors since March 2022 and our director since February 2022. Mr. Lee has extensive experience in multi-level computation systems. Since January 2020, Mr. Lee has served as the chief executive officer at Starbox Berhad, where he is responsible for the management of day-to-day operations and high-level strategizing and business planning. From November 2013 to September 2021, Mr. Lee served as an executive director at Teclutions Sdn. Bhd., a multi-level marketing and e-commerce software system development company, where he was responsible for the overall management of the company. Mr. Lee received his bachelor’s degree in Business Computing from the University of Southern Queensland in 1995.
Mr. Khoo Kien Hoe has served as our Chief Financial Officer since March 2022 and our director since February 2022. Mr. Khoo has over 25 years of experience in corporate advisory, auditing, accounting, taxation, and company secretarial matters. Since January 2020, Mr. Khoo has served as the chief financial officer at Starbox Berhad, where he is responsible for the company’s overall financial management and internal control. Mr. Khoo has also served as a non-executive director at Bluetech Consultancy Sdn. Bhd. since June 2022 and served as its managing director between April 2018 and May 2022, where he was responsible for tax compliance and accounting related matters. Mr. Khoo has served as a non-executive director at KH Advisory Sdn. Bhd. and served as its managing director between October 2015 and May 2022 (where he resigned in September 2018 and was re-appointed in December 2020), where he was responsible for tax compliance and accounting related matters. Mr. Khoo is also the founder of Bizguide Corporate Services Sdn. Bhd., a Malaysia-based company specializing in company secretarial, corporate advisory, and accounting related matters, and has served as a non-executive director since June 2022 and served as its managing director between August 2011 and May 2022, where he was responsible for the company’s secretarial matters. Since July 2014, Mr. Khoo has served as an independent non-executive director and the chairman of the audit committee at Sunzen Biotech Berhad (KLSE: SUNZEN), a public listed company in Malaysia. Since November 2021, Mr. Khoo has also served as an independent non-executive director and the chairman of the audit committee at Scanwolf Corporation Berhad (KLSE: SCNWOLF), a public listed company in Malaysia. Mr. Khoo is an ACCA Fellowship (FCCA) and a member of MIA in Malaysia (Chartered Accountant), and received his Certificate in Accounting with Business Computing in 1992 and a diploma in Commerce in 1995 from Tunku Abdul Rahman College (now known as Tunku Abdul Rahman University College).
Dato’ Dr. Lai Kwong Choy has served as our independent director since February 2022. Dr. Lai has over 29 years of management experience in the healthcare industry. Since October 2017, Dr. Lai has served as the medical officer in charge of the Emergency Department at Cengild G.I. Medical Center in Malaysia, a healthcare provider specializing in the diagnosis and treatment of gastrointestinal and liver disease. Since May 1992, Dr. Lai has served as a general practitioner and partner at Klinik Tanming Jaya, a private clinic in Malaysia he co-founded, where he is responsible for treating and managing patients. Dr Lai also co-founded a private pharmacy, Seremban Premier Pharmacy Sdn. Bhd., in September 1997 and has since served as a partner, responsible for the general management and advisory work. From September 2007 to August 2013, Dr. Lai served as a board member at the Malaysia Health Promotion Board under the Ministry of Health, Malaysia, where he was responsible for the yearly financial planning, human resource planning, and project planning of the Malaysia Health Promotion Board. He also served as the head of sub-committee of the Internal Audit of the Malaysia Health Promotion Board from September 2010 to August 2013. From June 2004 to May 2008, Dr. Lai also served as a local councilor at the Kajang Local Municipal Council, responsible for the yearly council planning (which includes approval for social and economically viable projects) and budgetary as well as human resource matters of the local council. Dr. Lai was conferred the “Darjah Indera Mahkota of Pahang” award from the Sultan of Pahang, which carries the title “Dato,” in 2009. Dr. Lai received his M.D. degree in Medicine from the National University of Malaysia in 1988, and subsequently obtained a diploma of Family Medicine in 2014 and participated in the Advanced Training in Family Medicine Program in 2016, both from the Academy of Family Physicians of Malaysia.
| 67 |
Ms. Sung Ming-Hsuan has served as our independent director since February 2022. Ms. Sung has extensive experience in finance and investment and has served as the president at Skyrocket Investments LLC, a California-based investment fund, since December 2011. From September 2007 to July 2016, she also served as a director at Taipro Corporation Ltd., a Taiwan-based company specializing in manufacturing LED lighting products, which are largely exported to the U.S. market. From September 2005 to August 2007, Ms. Sung served as a management consultant at Howard Hotel, the flagship of Taiwan’s largest 5-star hotel group. Ms. Sung received her bachelor’s degree in Hospitality Management from the Collins College of Hospitality Management at California State Polytechnic University, Pomona in 2004.
Ms. Law Peck Woon has served as our independent director since February 2022. Ms. Law has over 20 years of experience in legal practice. Since February 2018, Ms. Law has served as a legal consultant at HZX Global Sdn. Bhd. and Midlands Riverfront Sdn. Bhd., both real estate developers, where she is responsible for providing commercial and legal advice in connection with business operations and providing contract review and risk analysis services in relation to construction and engineering contracts, consultancy services agreements, and material and equipment supply agreements. She has also served as the Deputy Chairperson of the Malaysia Anxi Chamber of Commerce and Industry since February 2020 and acts as a liaison for commerce activities in Malaysia and China. Since April 2007, Ms. Law has served as a legal consultant for several multinational corporations in Malaysia, including Canon Marketing (M) Sdn. Bhd., Flextronics (M) Sdn. Bhd., and Quill Solar Sdn. Bhd. From June 2001 to December 2006, Ms. Law practiced law at Azman Davidson & Co., one of the top legal firms in Malaysia. Ms. Law received her bachelor of law degree from the University of Sheffield, England in 2000.
Board Diversity
The table below provides certain information regarding the diversity of our board of directors as of the date of this annual report.
| Board Diversity Matrix | |||||||
| Country of Principal Executive Offices: | Malaysia | ||||||
| Foreign Private Issuer | Yes | ||||||
| Disclosure Prohibited under Home Country Law | No | ||||||
| Total Number of Directors | 5 | ||||||
| Female | Male | Non- Binary |
Did Not Disclose Gender | ||||
| Part I: Gender Identity | |||||||
| Directors | 2 | 3 | 0 | 0 | |||
| Part II: Demographic Background | |||||||
| Underrepresented Individual in Home Country Jurisdiction | 0 | ||||||
| LGBTQ+ | 0 | ||||||
| Did Not Disclose Demographic Background | 0 | ||||||
Family Relationships
None of our directors or executive officers has a family relationship as defined in Item 401 of Regulation S-K.
B. Compensation
For the fiscal year ended September 30, 2022, we paid an aggregate of MYR268,800 ($62,452) as compensation to our executive officers and directors. None of our non-employee directors have any service contracts with us that provide for benefits upon termination of employment. We have not set aside or accrued any amount to provide pension, retirement, or other similar benefits to our directors and executive officers. Our Malaysian subsidiaries are required by law to make contributions equal to certain percentages of each employee’s salary for his or her statutory benefits.
| 68 |
C. Board Practices
Pursuant to our articles of association, unless otherwise determined by our Company in a general meeting, we are required to have a minimum of three directors and the exact number of directors will be determined from time to time by our board of directors.
Under our articles of association, a director may be appointed by ordinary resolution or by the directors. An appointment of a director may be on terms that the director will automatically retire from office (unless he has sooner vacated office) at the next or a subsequent annual general meeting or upon any specified event or after any specified period in a written agreement between our Company and the director, if any, but no such term will be implied in the absence of express provision. It is expected that, whether by ordinary resolution or by the directors, each director will be appointed on the terms that the director will hold office until the appointment of the director’s successor or the director’s re-appointment at the next annual general meeting, unless the director has sooner vacated office.
Board of Directors
Our board of directors consists of five directors. Our board of directors has determined that our three independent directors, Lai Kwong Choy, Sung Ming-Hsuan, and Law Peck Woon satisfy the “independence” requirements of the Nasdaq corporate governance rules.
Duties of Directors
Under Cayman Islands law, all of our directors owe three types of duties to us: (i) statutory duties, (ii) fiduciary duties, and (iii) common law duties. The Cayman Companies Act imposes a number of statutory duties on a director. Under Cayman Islands law, the fiduciary duties owed by a director include (a) a duty to act in good faith in what the director considers are in the best interests of the company, (b) a duty to exercise their powers in the company’s interests and only for the purposes for which they were given, (c) a duty to avoid improperly fettering the exercise of the director’s future discretion, (d) a duty to avoid any conflict of interest (whether actual or potential) between the director’s duty to the company and the director’s personal interests or a duty owed to a third party, and (e) a duty not to misuse the company’s property (including any confidential information and trade secrets). The common law duties owed by a director are those to exercise appropriate skill and care. The relevant threshold measure for such standard is that of a reasonable diligent person having both the general knowledge, skill, and experience that may reasonably be expected of a person carrying out the same functions as are carried out by that director in relation to the company, and the general knowledge, skill, and experience that that director has. In fulfilling their duty to us, our directors must ensure compliance with our memorandum and articles of association, as amended and restated from time to time, and our shareholder resolutions. We have the right to seek damages where certain duties owed by any of our directors are breached.
The functions and powers of our board of directors include, among others:
| ● | appointing officers and determining the term of office of the officers; | |
| ● | exercising the borrowing powers of the company and mortgaging the property of the company; and | |
| ● | maintaining or registering a register of mortgages, charges, or other encumbrances of the company. |
Terms of Directors and Executive Officers
Under our articles of association, a director may be appointed by ordinary resolution or by the directors. An appointment of a director may be on terms that the director will automatically retire from office (unless he has sooner vacated office) at the next or a subsequent annual general meeting or upon any specified event or after any specified period in a written agreement between our Company and the director, if any, but no such term will be implied in the absence of express provision. It is expected that, whether by ordinary resolution or by the directors, each director will be appointed on the terms that the director will hold office until the appointment of the director’s successor or the director’s re-appointment at the next annual general meeting, unless the director has sooner vacated office.
All of our executive officers are appointed by and serve at the discretion of our board of directors.
Qualification
There is currently no shareholding qualification for directors, although a shareholding qualification for directors may be fixed by our shareholders by ordinary resolution.
| 69 |
Employment Agreements and Indemnification Agreements
We have entered into employment agreements with each of our executive officers. Pursuant to employment agreements, we agree to employ each of our executive officers for a specified time period, which may be renewed upon both parties’ agreement 30 days before the end of the current employment term. We may terminate the employment for cause, at any time, without notice or remuneration, for certain acts of the executive officer, including the commitments of any serious or persistent breach or non-observance of the terms and conditions of the employment, conviction of a criminal offense, willful disobedience of a lawful and reasonable order, fraud or dishonesty, receipt of bribery, or severe neglect of his or her duties. An executive officer may terminate his or her employment at any time with a one-month prior written notice. Each executive officer agrees to hold, both during and after the employment agreement expires, in strict confidence and not to use or disclose to any person, corporation or other entity without written consent, any confidential information.
We have also entered into indemnification agreements with each of our directors and executive officers. Under these agreements, we agree to indemnify our directors and executive officers against certain liabilities and expenses incurred by such persons in connection with claims made by reason of their being a director or officer of our company.
Insider Participation Concerning Executive Compensation
Our former sole director, Choo Keam Hui, was making all determinations regarding executive officer compensation from the inception of our Company to February 2022. Our compensation committee has been making all determinations regarding executive officer compensation since March 2022.
Committees of the Board of Directors
We have established three committees under the board of directors: an audit committee, a compensation committee, and a nominating and corporate governance committee. Our independent directors serve on each of the committees. We have adopted a charter for each of the three committees. Each committee’s members and functions are described below.
Audit Committee. Our audit committee consists of our three independent directors, Lai Kwong Choy, Sung Ming-Hsuan, and Law Peck Woon. Sung Ming-Hsuan is the chairperson of our audit committee. We have determined that each of our independent directors also satisfy the “independence” requirements of Rule 10A-3 under the Securities Exchange Act. Our board also has determined that Sung Ming-Hsuan qualifies as an audit committee financial expert within the meaning of the SEC rules or possesses financial sophistication within the meaning of the Nasdaq listing rules. The audit committee oversees our accounting and financial reporting processes and the audits of the financial statements of our company. The audit committee is responsible for, among other things:
| ● | appointing the independent auditors and pre-approving all auditing and non-auditing services permitted to be performed by the independent auditors; | |
| ● | reviewing with the independent auditors any audit problems or difficulties and management’s response; | |
| ● | discussing the annual audited financial statements with management and the independent auditors; | |
| ● | reviewing the adequacy and effectiveness of our accounting and internal control policies and procedures and any steps taken to monitor and control major financial risk exposures; | |
| ● | reviewing and approving all proposed related party transactions; | |
| ● | meeting separately and periodically with management and the independent auditors; and | |
| ● | monitoring compliance with our code of business conduct and ethics, including reviewing the adequacy and effectiveness of our procedures to ensure proper compliance. |
| 70 |
Compensation Committee. Our compensation committee consists of our three independent directors, Lai Kwong Choy, Sung Ming-Hsuan, and Law Peck Woon. Lai Kwong Choy is the chairperson of our compensation committee. The compensation committee assists the board in reviewing and approving the compensation structure, including all forms of compensation, relating to our directors and executive officers. Our chief executive officer may not be present at any committee meeting during which his compensation is deliberated. The compensation committee is responsible for, among other things:
| ● | reviewing and approving the total compensation package for our most senior executive officers; | |
| ● | approving and overseeing the total compensation package for our executives other than the most senior executive officers; | |
| ● | reviewing periodically and approving any long-term incentive compensation or equity plans; | |
| ● | selecting compensation consultants, legal counsel or other advisors after taking into consideration all factors relevant to that person’s independence from management; and | |
| ● | reviewing programs or similar arrangements, annual bonuses, employee pension and welfare benefit plans. |
Nominating and Corporate Governance Committee. Our nominating and corporate governance committee consists of our three independent directors, Lai Kwong Choy, Sung Ming-Hsuan, and Law Peck Woon. Law Peck Woon is the chairperson of our nominating and corporate governance committee. The nominating and corporate governance committee assists the board of directors in selecting individuals qualified to become our directors and in determining the composition of the board and its committees. The nominating and corporate governance committee is responsible for, among other things:
| ● | identifying and recommending nominees for appointment or re-appointment to our board of directors or for appointment to fill any vacancy; | |
| ● | reviewing annually with our board of directors its current composition in light of the characteristics of independence, age, skills, experience and availability of service to us; | |
| ● | identifying and recommending to our board the directors to serve as members of committees; | |
| ● | advising the board, periodically, with respect to significant developments in the law and practice of corporate governance, as well as our compliance with applicable laws and regulations, and making recommendations to our board of directors on all matters of corporate governance and on any corrective action to be taken; and | |
| ● | monitoring compliance with our code of business conduct and ethics, including reviewing the adequacy and effectiveness of our procedures to ensure proper compliance. |
D. Employees
See “Item 4. Information on the Company—B. Business Overview—Employees.”
E. Share Ownership
The following table sets forth information with respect to the beneficial ownership, within the meaning of Rule 13d-3 under the Exchange Act, of our Ordinary Shares as of the date of this annual report for:
| ● | each of our directors and executive officers; and | |
| ● | each person known to us to own beneficially more than 5% of our Ordinary Shares. |
Beneficial ownership includes voting or investment power with respect to the securities. Except as indicated below, and subject to applicable community property laws, the persons named in the table have sole voting and investment power with respect to all Ordinary Shares shown as beneficially owned by them. Percentage of beneficial ownership of each listed person is based on 54,375,000 Ordinary Shares outstanding as of the date of this annual report.
| 71 |
Information with respect to beneficial ownership has been furnished by each director, officer, or beneficial owner of 5% or more of our Ordinary Shares. Beneficial ownership is determined in accordance with the rules of the SEC and generally requires that such person have voting or investment power with respect to securities. In computing the number of Ordinary Shares beneficially owned by a person listed below and the percentage ownership of such person, Ordinary Shares underlying options, warrants, or convertible securities, including Preferred Shares, held by each such person that are exercisable or convertible within 60 days of the date of this annual report are deemed outstanding, but are not deemed outstanding for computing the percentage ownership of any other person.
| Ordinary Shares Beneficially Owned | ||||||||
| Number | Percent | |||||||
| Directors and Executive Officers(1): | ||||||||
| Lee Choon Wooi | 800,000 | 1.5 | % | |||||
| Khoo Kien Hoe | 800,000 | 1.5 | % | |||||
| Lai Kwong Choy | — | — | ||||||
| Sung Ming-Hsuan | — | — | ||||||
| Law Peck Woon | — | — | ||||||
| All directors and executive officers as a group (five individuals): | 1,600,000 | 3.0 | % | |||||
| 5% Shareholders: | ||||||||
| ZYZ Group Holdings Limited(2) | 9,400,000 | 17.3 | % | |||||
| ZY Sales & Distribution Sdn. Bhd.(3) | 3,600,000 | 6.6 | % | |||||
| Liu Marketing (M) Sdn. Bhd.(4) | 3,600,000 | 6.6 | % | |||||
| EVL Corporation Limited(5) | 3,600,000 | 6.6 | % | |||||
| Wang Jianguo(6) | 3,600,000 | 6.6 | % | |||||
| Nevis International B & T Sdn Bhd.(7) | 3,600,000 | 6.6 | % | |||||
| (1) | Unless otherwise indicated, the business address of each of the individuals is VO2-03-07, Velocity Office 2, Lingkaran SV, Sunway Velocity, 55100, Kuala Lumpur, Malaysia. |
| (2) | Represents 9,400,000 Ordinary Shares held by ZYZ Group Holdings Limited, an Island of Nevis company 100% owned by Choo Teck Hong. The registered address of ZYZ Group Holdings Limited is Hamilton Reserve Plaza, Building #1, Suite 102, P.O. Box 590, Nevis. |
| (3) | Represents 3,600,000 Ordinary Shares held by ZY Sales & Distribution Sdn. Bhd., a Malaysian company 100% owned by Zhang Yong. The registered address of ZY Sales & Distribution Sdn. Bhd. is A-07-3A Ekocheras, No. 693, Batu 5, Jalan Cheras, 56000 Kuala Lumpur, Malaysia. |
| (4) | Represents 3,600,000 Ordinary Shares held by Liu Marketing (M) Sdn. Bhd., a Malaysian company 100% owned by Liu Jun. The registered address of Liu Marketing (M) Sdn. Bhd. is A-07-3A Ekocheras, No. 693, Batu 5, Jalan Cheras, 56000 Kuala Lumpur, Malaysia. |
| (5) | Represents 3,600,000 Ordinary Shares held by EVL Corporation Limited, a British Virgin Island company 100% owned by Chen Han-Chen. The registered address of EVL Corporation Limited is Vistra Corporate Services Centre, Wickhams Cay II, Road Town, Tortola, VG1110, the British Virgin Islands. |
| (6) | Wang Jianguo’s address is Flat B 29/F, the Westminster Terrace, TWTL 367, Yau Kom Yau, Tsuen Wan New Territories, Hong Kong. |
| (7) | Represents 3,600,000 Ordinary Shares held by Nevis International B & T Sdn Bhd., a Malaysian company 100% owned by Chen Xiaoping. The registered address of Nevis International B & T Sdn Bhd. is A-07-3A Ekocheras, No. 693, Batu 5, Jalan Cheras, 56000 Kuala Lumpur, Malaysia. |
As of the date of this annual report, approximately 12.1% of our issued and outstanding Ordinary Shares are held in the United States by one record holder (Cede and Company, as nominee for beneficial shareholders).
We are not aware of any arrangement that may, at a subsequent date, result in a change of control of our Company.
| 72 |
Item 7. MAJOR SHAREHOLDERS AND RELATED PARTY TRANSACTIONS
A. Major Shareholders
See “Item 6. Directors, Senior Management and Employees—E. Share Ownership.”
B. Related Party Transactions
Employment Agreements
See “Item 6. Directors, Senior Management and Employees—C. Board Practices—Employment Agreements and Indemnification Agreements.”
Material Transactions with Related Parties
The relationship and the nature of related party transactions are summarized as follow:
| Name of Related Party | Relationship to Us | |
| Choo Keam Hui | Our former director and one of the directors of Starbox Berhad | |
| Zenapp | An entity controlled by Choo Keam Hui prior to September 20, 2021 | |
| Bizguide Corporate Service Sdn Bhd | An entity controlled by Khoo Kien Hoe, our CFO | |
| KH Advisory Sdn Bhd | An entity controlled by Khoo Kien Hoe, our CFO | |
| VE Services | An entity controlled by Choo Teck Hong, one of our beneficial shareholders, a director of Starbox Berhad, and a sibling of Choo Keam Hui |
| a. | Due from a related party |
As of September 30, 2022, due from a related party balance of $1,473 represents receivable from VE Services when the Company referred merchants to VE Services for processing the payment. The Company expects to receive the payment from VE Services by the end of January 2023.
| b. | Due to related parties |
As of September 30, 2022, the balance due to related parties included due to Bizguide Corporate Service Sdn. Bhd. of $1,763 and due to KH Advisory Sdn. Bhd. of $5,598, which represented the fee to be paid for secretarial and tax consulting and filing services received from the companies. Such advances were non-interest bearing and due on demand. The balances due as of September 30, 2022 were fully repaid on January 16, 2023.
| c. | Sub-tenancy agreements with a related party |
On August 20, 2021, StarboxGB, StarboxSB, and StarboxPB each entered into a sub-tenancy agreement with Zenapp to lease an office in Kuala Lumpur, Malaysia. The sub-tenancy agreements each had a lease term from September 1, 2021 to August 31, 2023 and monthly rent of MYR10,000 (approximately $2,424). The sub-tenancy agreements may be renewed for successive two-year terms. On March 31, 2022, StarboxGB, StarboxSB, and StarboxPB terminated the sub-tenancy agreements with Zenapp, effective on April 30, 2022 and elected to enter into lease agreements directly with the same landlords for a term of one year from May 1, 2022 to April 30, 2023. There was no penalty derived from the early termination of the sub-tenancy agreements.
| d. | Revenue from a related party |
In May 2021, we started to provide payment solution services to merchants by referring them to VE Services. During the fiscal year ended September, 2022, we referred 19 merchants to VE Services for payment processing and earned commission fees of $9,575, which was reported as revenue from payment solution services in our consolidated financial statements.
C. Interests of Experts and Counsel
Not applicable.
| 73 |
Item 8. FINANCIAL INFORMATION
A. Consolidated Statements and Other Financial Information
We have appended consolidated financial statements filed as part of this annual report. See “Item 18. Financial Statements.”
Legal Proceedings
We are currently not a party to any material legal proceeding. From time to time, however, we may be subject to various claims and legal actions arising in the ordinary course of business.
Dividend Policy
Since our inception, we have not declared or paid cash dividends on our Ordinary Shares. Any decision to pay dividends in the future will be subject to a number of factors, including our financial condition, results of operations, the level of our retained earnings, capital demands, general business conditions, and other factors our board of directors may deem relevant. We currently intend to retain most, if not all, of our available funds and any future earnings to fund the operation, development, and growth of our business, and, as a result, we do not expect to pay any dividends in the foreseeable future. Consequently, we cannot give any assurance that any dividends may be declared and paid in the future.
Under Cayman Islands law, a Cayman Islands company may pay a dividend on its shares out of either profit or share premium, provided that in no circumstances may a dividend be paid if this would result in the company being unable to pay its debts due in the ordinary course of business.
If we determine to pay dividends on any of our Ordinary Shares in the future, as a holding company, we will be dependent on receipt of funds from our Malaysia subsidiary, Starbox Berhad. Starbox Berhad will rely on payments made from its subsidiaries, StarboxGB, StarboxSB, and StarboxPB. Under the Malaysian Companies Act 2016, dividends must be paid out of profit and no dividend shall be paid out if the payment will cause the company to be insolvent. As a result, in the event that Starbox Berhad or its subsidiaries incur debt on their own behalves in the future, the instruments governing the debt may restrict any such entity’s ability to pay dividends or make other distributions to us.
Cash dividends, if any, on our Ordinary Shares will be paid in U.S. dollars. Malaysia is under a single-tier tax system. Dividends are exempt from income tax in the hands of shareholders. Our Malaysia subsidiary, Starbox Berhad, is not required to deduct tax from dividends paid to its shareholder, Starbox Group, and no tax credits will be available for offsetting against the recipient’s tax liability. A corporate shareholder, such as Starbox Berhad, receiving exempt single-tier dividends from its subsidiaries, StarboxGB, StarboxSB, and StarboxPB, can, in turn, distribute such dividends to its own shareholder, Starbox Group, who is also exempt on such receipts. Further, Malaysia does not impose any withholding tax (i.e., 0%) on dividends paid by Malaysian companies to non-residents. Hence, Starbox Berhad is not required to withhold any sum from its dividends for tax withholding purposes.
B. Significant Changes
Except as disclosed elsewhere in this annual report, we have not experienced any significant changes since the date of our audited consolidated financial statements included in this annual report.
Item 9. THE OFFER AND LISTING
A. Offer and Listing Details.
Our Ordinary Shares have been listed on the Nasdaq Capital Market since August 23, 2022 under the symbol “STBX.”
B. Plan of Distribution
Not applicable.
| 74 |
C. Markets
Our Ordinary Shares have been listed on the Nasdaq Capital Market since August 23, 2022 under the symbol “STBX.”
D. Selling Shareholders
Not applicable.
E. Dilution
Not applicable.
F. Expenses of the Issue
Not applicable.
Item 10. ADDITIONAL INFORMATION
A. Share Capital
Not applicable.
B. Memorandum and Articles of Association
We incorporate by reference into this annual report the description of our articles of association, Exhibit 3.1, and the description of differences in corporate laws contained in our registration statement on Form F-1 (File No. 333-265635), as amended, initially filed with the SEC on June 15, 2022.
C. Material Contracts
We have not entered into any material contracts other than in the ordinary course of business and other than those described in “Item 4. Information on the Company” or elsewhere in this annual report.
D. Exchange Controls
See “Item 4. Information on the Company—B. Business Overview—Regulations—Regulations Relating to Foreign Exchange Control.”
E. Taxation
| 75 |
Malaysian Enterprise Taxation
The following brief description of Malaysian enterprise income taxation is designed to highlight the enterprise-level taxation on our earnings, which will affect the amount of dividends, if any, we are ultimately able to pay to our shareholders. See “Item 8. Financial information—A. Consolidated Statements and Other Financial Information—Dividend Policy.”
Income Tax in Malaysia
The principal legislation that governs a person’s income tax in Malaysia is the Income Tax Act 1967 (the “ITA”). The regulatory body implementing and enforcing the ITA is the Inland Revenue Board of Malaysia (“IRB”). Pursuant to Section 3 of the ITA, income tax shall be charged for each year of assessment (“YA”) upon the income of any person accruing in or derived from Malaysia or received in Malaysia from outside Malaysia.
Pursuant to Section 8 of the ITA, a company is a tax resident in Malaysia if its management and control are exercised in Malaysia. Management and control are normally considered to be exercised at the place where the directors’ meetings concerning management and control of the company are held. The income tax rate payable by a resident company differs depending on the amount of the company’s paid-up capital and its annual sale in relation to the particular YA. With reference to Appendix 10 (Imposition of Cukai Makmur) of the Budget 2022, a resident company with a paid-up capital not exceeding MYR2.5 million and an annual sale of not more than MYR50 million during YA 2022 is categorized as a Micro, Small, and Medium Enterprise (“MSME”) and is subject to an income tax rate of 17% on chargeable income up to MYR600,000. The remaining chargeable income above MYR600,000 is taxed at 24%. A resident company that is not categorized as an MSME will be taxed at 24% for all its chargeable income. Further, for YA 2022 only, a special one-off tax (Cukai Makmur) will be imposed on companies (other than MSMEs) generating high income during the COVID-19 pandemic period. The one-off tax consists of the following two parts: (i) the chargeable income up to the first MYR100 million is subject to a 24% tax rate; and (ii) the remaining chargeable income above MYR100 million is taxed at 33%.
With reference to Appendix 7 (Review of Income Tax Rate for Micro, Small, and Medium Enterprises) of the Budget Speech 2023, a company that has a paid-up capital of MYR2.5 million and below with an annual sale turnover not exceeding MYR50 million is categorized as an MSME. To increase the competitiveness of MSME and promote economic growth, it is proposed that the tax rate on chargeable income for the first MYR100,000 be reduced by 2% from 17% to 15% and the tax rate for the taxable income of MYR100,001 to MYR600,000 be maintained at 17% and remaining chargeable income above MYR600,000 to be maintained at 24% from YA 2023. However, the Ministry of Finance of Malaysia has confirmed that the Prime Minister and Finance Minister, Datuk Seri Anwar Ibrahim, will table the revised Budget 2023 in the Dewan Rakyat (i.e., House of Representatives) on February 24, 2023. Accordingly, the final income tax rate chargeable on the income of MSME for YA 2023 is subject to the revised Budget 2023.
Pursuant to the ITA, a non-resident company—namely, a company whose management and control are not exercised in Malaysia and thus does not fall under the purview of Section 8 of the ITA—is subject to the following tax rates:
| Types of Income | Rate (%) | ||
| Business income | 24 | ||
| Royalties derived from Malaysia | 10 | ||
| Rental of moveable properties | 10 | ||
| Advice, assistance, or services rendered in Malaysia | 10 | ||
| Interest | 15* | ||
| Dividends | Exempt | ||
| Other income | 10 |
Note: Where the recipient is resident in a country that has a double tax agreement with Malaysia, the tax rates for the specific sources of income may be reduced.
* Interest paid to a non-resident by a bank or a finance company in Malaysia is exempt from tax.
Foreign-Sourced Income
Malaysia adopts a territorial principle of taxation, under which only income accruing in or derived from or received in Malaysia from outside Malaysia is subject to income tax in Malaysia pursuant to Section 3 of the ITA. Previously, “income received in Malaysia from outside Malaysia” or “foreign-sourced income” (“FSI”) received by Malaysian taxpayers is not taxable due to the availability of tax exemption under Paragraph 28, Schedule 6 of the ITA (“Para 28”). This exemption is applicable to any person other than a resident company carrying on the business of banking, insurance, or sea or air transport, in respect of income derived from sources outside Malaysia and received in Malaysia, pursuant to Para 28. On October 29, 2021, however, the Malaysian government announced via the Budget 2022 that the exemption under Para 28 will no longer be applicable to tax residents, effective from January 1, 2022. Therefore, income tax will be imposed on resident persons in Malaysia on income derived from foreign sources and received in Malaysia with effect from January 1, 2022. Such income will be treated equally vis-à-vis income accruing in or derived from Malaysia and taxable under Section 3 of the ITA.
In summary, the tax treatments for the income of a person in Malaysia are depicted as follows:
| Income Derived From | Income Received In | Prior to January 1, 2022 |
Effective from January 1, 2022 | |||
| Malaysia | Malaysia | Taxable | Taxable | |||
| Malaysia | Malaysia from outside Malaysia | Taxable | Taxable | |||
| Overseas | Malaysia from outside Malaysia | Tax Exempted | Taxable | |||
| Overseas | Overseas | Tax Exempted | Tax Exempted |
On November 16, 2021, the IRB announced the Special Income Remittance Program (“SIRP”) for Malaysian tax residents whose income is derived from foreign sources and received in Malaysia. The implementation of taxation on FSI is staggered into the following two timelines, depending on the timing of remittance of FSI into Malaysia: (i) during the period from January 1 to June 30, 2022 (six months) (the “SIRP Period”), FSI remitted shall be taxed at a fixed rate of 3% on the gross amount of income remitted; and (ii) on or after July 1, 2022, FSI remitted shall be taxed at the prevailing tax rate applicable to tax residents on the statutory income, namely, gross FSI less expenses attributable to the FSI. FSI remitted under the SIRP will be accepted in good faith by the IRB as the IRB will not conduct an audit or investigation on the taxpayer. In addition, the IRB will not impose any penalty on FSI remitted during the SIRP Period.
| 76 |
Notwithstanding the implementation of taxation on FSI, the Malaysian Ministry of Finance announced on December 30, 2021 that exemption from income tax would be available for a period of five years commencing from January 1, 2022 to December 31, 2026 on certain categories of FSI received by Malaysian tax residents, when certain qualifying conditions are met. Specifically, (i) for individuals excluding those carrying on business in Malaysia through a partnership, all categories of FSI are exempted; and (ii) for companies and limited liability partnerships, foreign-sourced dividend income is exempted.
The Malaysian Ministry of Finance will enact the above income tax exemption by issuing a Ministerial exemption order in due course. Notably, this income tax exemption will also be subject to a set of eligibility requirements that will be detailed in the guidelines to be issued by the IRB.
Profit Distribution and Withholding Tax
We are a holding company incorporated as an exempted company in the Cayman Islands and we gain substantial income by way of dividends to be paid to us from Starbox Berhad, our direct subsidiary company in Malaysia.
Malaysia is under the single-tier tax system, under which income tax imposed on a company’s chargeable income is a final tax, and dividends distributed are exempt from tax in the hands of the shareholders pursuant to Section 108 of the ITA. As such, companies are not required to deduct tax from dividends paid to shareholders, and no tax credits will be available to offset against the recipient’s tax liability. Corporate shareholders receiving exempt single-tier dividends can, in turn, distribute such dividends to their own shareholders, who are also exempt on such receipts. In addition, while Malaysia imposes withholding tax on certain payments, such as interest, royalties, contract payments, and special classes of income, Malaysia does not do so on dividends in addition to tax on the profits out of which the dividends are declared. Such position aligns with the double taxation agreements (“DTAs”) concluded by Malaysia with an extensive number of countries, including the United States. Pursuant to the DTAs, no withholding tax will be imposed on dividends paid by Malaysian companies to non-residents.
In view of the above, we believe that dividends which will be paid to us from our direct subsidiary in Malaysia will not be subject to any withholding tax.
Cayman Islands Taxation
The Cayman Islands currently levies no taxes on individuals or corporations based upon profits, income, gains, or appreciation and there is no taxation in the nature of inheritance tax or estate duty. There are no other taxes likely to be material to us levied by the Government of the Cayman Islands except for stamp duties which may be applicable on instruments executed in, or, after execution, brought within the jurisdiction of the Cayman Islands. No stamp duty is payable in the Cayman Islands on the issue of shares by, or any transfers of shares of, Cayman Islands companies (except those which hold interests in land in the Cayman Islands). There are no exchange control regulations or currency restrictions in the Cayman Islands.
Payments of dividends and capital in respect of our Ordinary Shares will not be subject to taxation in the Cayman Islands and no withholding will be required on the payment of a dividend or capital to any holder of our Ordinary Shares, as the case may be, nor will gains derived from the disposal of our Ordinary Shares be subject to Cayman Islands income or corporation tax.
| 77 |
United States Federal Income Taxation
The following does not address the tax consequences to any particular investor or to persons in special tax situations, such as:
| ● | banks; | |
| ● | financial institutions; | |
| ● | insurance companies; | |
| ● | regulated investment companies; | |
| ● | real estate investment trusts; | |
| ● | broker-dealers; | |
| ● | persons that elect to mark their securities to market; | |
| ● | U.S. expatriates or former long-term residents of the U.S.; | |
| ● | governments or agencies or instrumentalities thereof; | |
| ● | tax-exempt entities; | |
| ● | persons liable for alternative minimum tax; | |
| ● | persons holding our Ordinary Shares as part of a straddle, hedging, conversion or integrated transaction; | |
| ● | persons that actually or constructively own 10% or more of our voting power or value (including by reason of owning our Ordinary Shares); | |
| ● | persons who acquired our Ordinary Shares pursuant to the exercise of any employee share option or otherwise as compensation; | |
| ● | persons holding our Ordinary Shares through partnerships or other pass-through entities; | |
| ● | beneficiaries of a Trust holding our Ordinary Shares; or | |
| ● | persons holding our Ordinary Shares through a trust. |
The discussion set forth below is addressed only to U.S. Holders that purchase our Ordinary Shares. Prospective purchasers are urged to consult their own tax advisors about the application of the U.S. federal income tax rules to their particular circumstances as well as the state, local, foreign and other tax consequences to them of the purchase, ownership and disposition of our Ordinary Shares.
Material Tax Consequences Applicable to U.S. Holders of Our Ordinary Shares
The following sets forth the material U.S. federal income tax consequences related to the ownership and disposition of our Ordinary Shares. It is directed to U.S. Holders (as defined below) of our Ordinary Shares and is based upon laws and relevant interpretations thereof in effect as of the date of this annual report, all of which are subject to change. This description does not deal with all possible tax consequences relating to ownership and disposition of our Ordinary Shares or U.S. tax laws, other than the U.S. federal income tax laws, such as the tax consequences under non-U.S. tax laws, state, local and other tax laws.
The following brief description applies only to U.S. Holders that hold Ordinary Shares as capital assets and that have the U.S. dollar as their functional currency. This brief description is based on the federal income tax laws of the United States in effect as of the date of this annual report and on U.S. Treasury regulations in effect or, in some cases, proposed, as of the date of this annual report, as well as judicial and administrative interpretations thereof available on or before such date. All of the foregoing authorities are subject to change, which change could apply retroactively and could affect the tax consequences described below.
The brief description below of the U.S. federal income tax consequences to “U.S. Holders” will apply to you if you are a beneficial owner of Ordinary Shares and you are, for U.S. federal income tax purposes,
| ● | an individual who is a citizen or resident of the United States; | |
| ● | a corporation (or other entity taxable as a corporation for U.S. federal income tax purposes) organized under the laws of the United States, any state thereof or the District of Columbia; |
| 78 |
| ● | an estate whose income is subject to U.S. federal income taxation regardless of its source; or | |
| ● | a trust that (1) is subject to the primary supervision of a court within the United States and the control of one or more U.S. persons for all substantial decisions or (2) has a valid election in effect under applicable U.S. Treasury regulations to be treated as a U.S. person. |
If a partnership (or other entities treated as a partnership for United States federal income tax purposes) is a beneficial owner of our Ordinary Shares, the tax treatment of a partner in the partnership will depend upon the status of the partner and the activities of the partnership. Partnerships and partners of a partnership holding our Ordinary Shares are urged to consult their tax advisors regarding an investment in our Ordinary Shares.
Taxation of Dividends and Other Distributions on our Ordinary Shares
Subject to the PFIC rules discussed below, the gross amount of distributions made by us to you with respect to the Ordinary Shares (including the amount of any taxes withheld therefrom) will generally be includable in your gross income as dividend income on the date of receipt by you, but only to the extent that the distribution is paid out of our current or accumulated earnings and profits (as determined under U.S. federal income tax principles). With respect to corporate U.S. Holders, the dividends will not be eligible for the dividends-received deduction allowed to corporations in respect of dividends received from other U.S. corporations.
With respect to non-corporate U.S. Holders, including individual U.S. Holders, dividends will be taxed at the lower capital gains rate applicable to qualified dividend income, provided that (1) the Ordinary Shares are readily tradable on an established securities market in the United States, or we are eligible for the benefits of an approved qualifying income tax treaty with the United States that includes an exchange of information program, (2) we are not a PFIC for either our taxable year in which the dividend is paid or the preceding taxable year, and (3) certain holding period requirements are met. Because there is no income tax treaty between the United States and the Cayman Islands, clause (1) above can be satisfied only if the Ordinary Shares are readily tradable on an established securities market in the United States. Under U.S. Internal Revenue Service authority, Ordinary Shares are considered for purpose of clause (1) above to be readily tradable on an established securities market in the United States if they are listed on certain exchanges, which presently include the NYSE and the Nasdaq Stock Market. You are urged to consult your tax advisors regarding the availability of the lower rate for dividends paid with respect to our Ordinary Shares, including the effects of any change in law after the date of this annual report.
Dividends will constitute foreign source income for foreign tax credit limitation purposes. If the dividends are taxed as qualified dividend income (as discussed above), the amount of the dividend taken into account for purposes of calculating the foreign tax credit limitation will be limited to the gross amount of the dividend, multiplied by the reduced rate divided by the highest rate of tax normally applicable to dividends. The limitation on foreign taxes eligible for credit is calculated separately with respect to specific classes of income. For this purpose, dividends distributed by us with respect to our Ordinary Shares will constitute “passive category income” but could, in the case of certain U.S. Holders, constitute “general category income.”
To the extent that the amount of the distribution exceeds our current and accumulated earnings and profits (as determined under U.S. federal income tax principles), it will be treated first as a tax-free return of your tax basis in your Ordinary Shares, and to the extent the amount of the distribution exceeds your tax basis, the excess will be taxed as capital gain. We do not intend to calculate our earnings and profits under U.S. federal income tax principles. Therefore, a U.S. Holder should expect that a distribution will be treated as a dividend even if that distribution would otherwise be treated as a non-taxable return of capital or as capital gain under the rules described above.
Taxation of Dispositions of Ordinary Shares
Subject to the PFIC rules discussed below, you will recognize taxable gain or loss on any sale, exchange or other taxable disposition of a share equal to the difference between the amount realized (in U.S. dollars) for the share and your tax basis (in U.S. dollars) in the Ordinary Shares. The gain or loss will be capital gain or loss. If you are a non-corporate U.S. Holder, including an individual U.S. Holder, who has held the Ordinary Shares for more than one year, you will generally be eligible for reduced tax rates. The deductibility of capital losses is subject to limitations. Any such gain or loss that you recognize will generally be treated as United States source income or loss for foreign tax credit limitation purposes which will generally limit the availability of foreign tax credits.
| 79 |
PFIC
A non-U.S. corporation is considered a PFIC, as defined in Section 1297(a) of the US Internal Revenue Code, for any taxable year if either:
| ● | at least 75% of its gross income for such taxable year is passive income; or | |
| ● | at least 50% of the value of its assets (based on an average of the quarterly values of the assets during a taxable year) is attributable to assets that produce or are held for the production of passive income (the “asset test”). |
Passive income generally includes dividends, interest, rents and royalties (other than rents or royalties derived from the active conduct of a trade or business), and gains from the disposition of passive assets. We will be treated as owning our proportionate share of the assets and earning our proportionate share of the income of any other corporation in which we own, directly or indirectly, at least 25% (by value) of the stock. In determining the value and composition of our assets for purposes of the PFIC asset test, the value of our assets must be determined based on the market value of our Ordinary Shares from time to time, which could cause the value of our non-passive assets to be less than 50% of the value of all of our assets on any particular quarterly testing date for purposes of the asset test.
Based on our operations and the composition of our assets we do not expect to be treated as a PFIC under the current PFIC rules. We must make a separate determination each year as to whether we are a PFIC, however, and there can be no assurance with respect to our status as a PFIC for our current taxable year or any future taxable year. Depending on the amount of assets held for the production of passive income, it is possible that, for our current taxable year or for any subsequent taxable year, more than 50% of our assets may be assets held for the production of passive income. We will make this determination following the end of any particular tax year. In addition, because the value of our assets for purposes of the asset test will generally be determined based on the market price of our Ordinary Shares, our PFIC status will depend in large part on the market price of our Ordinary Shares. Accordingly, fluctuations in the market price of the Ordinary Shares may cause us to become a PFIC. In addition, the application of the PFIC rules is subject to uncertainty in several respects and the composition of our income and assets will be affected by how, and how quickly, we spend our liquid assets. We are under no obligation to take steps to reduce the risk of our being classified as a PFIC, and as stated above, the determination of the value of our assets will depend upon material facts (including the market price of our Ordinary Shares from time to time) that may not be within our control. If we are a PFIC for any year during which you hold Ordinary Shares, we will continue to be treated as a PFIC for all succeeding years during which you hold Ordinary Shares. If we cease to be a PFIC and you did not previously make a timely “mark-to-market” election as described below, however, you may avoid some of the adverse effects of the PFIC regime by making a “purging election” (as described below) with respect to the Ordinary Shares.
If we are a PFIC for your taxable year(s) during which you hold Ordinary Shares, you will be subject to special tax rules with respect to any “excess distribution” that you receive and any gain you realize from a sale or other disposition (including a pledge) of the Ordinary Shares, unless you make a “mark-to-market” election as discussed below. Distributions you receive in a taxable year that are greater than 125% of the average annual distributions you received during the shorter of the three preceding taxable years or your holding period for the Ordinary Shares will be treated as an excess distribution. Under these special tax rules:
| ● | the excess distribution or gain will be allocated ratably over your holding period for the Ordinary Shares; | |
| ● | the amount allocated to your current taxable year, and any amount allocated to any of your taxable year(s) prior to the first taxable year in which we were a PFIC, will be treated as ordinary income, and | |
| ● | the amount allocated to each of your other taxable year(s) will be subject to the highest tax rate in effect for that year and the interest charge generally applicable to underpayments of tax will be imposed on the resulting tax attributable to each such year. |
The tax liability for amounts allocated to years prior to the year of disposition or “excess distribution” cannot be offset by any net operating losses for such years, and gains (but not losses) realized on the sale of the Ordinary Shares cannot be treated as capital, even if you hold the Ordinary Shares as capital assets.
A U.S. Holder of “marketable stock” (as defined below) in a PFIC may make a mark-to-market election under Section 1296 of the US Internal Revenue Code for such stock to elect out of the tax treatment discussed above. If you make a mark-to-market election for first taxable year which you hold (or are deemed to hold) Ordinary Shares and for which we are determined to be a PFIC, you will include in your income each year an amount equal to the excess, if any, of the fair market value of the Ordinary Shares as of the close of such taxable year over your adjusted basis in such Ordinary Shares, which excess will be treated as ordinary income and not capital gain. You are allowed an ordinary loss for the excess, if any, of the adjusted basis of the Ordinary Shares over their fair market value as of the close of the taxable year. Such ordinary loss, however, is allowable only to the extent of any net mark-to-market gains on the Ordinary Shares included in your income for prior taxable years. Amounts included in your income under a mark-to-market election, as well as gain on the actual sale or other disposition of the Ordinary Shares, are treated as ordinary income. Ordinary loss treatment also applies to any loss realized on the actual sale or disposition of the Ordinary Shares, to the extent that the amount of such loss does not exceed the net mark-to-market gains previously included for such Ordinary Shares. Your basis in the Ordinary Shares will be adjusted to reflect any such income or loss amounts. If you make a valid mark-to-market election, the tax rules that apply to distributions by corporations which are not PFICs would apply to distributions by us, except that the lower applicable capital gains rate for qualified dividend income discussed above under “—Taxation of Dividends and Other Distributions on our Ordinary Shares” generally would not apply.
| 80 |
The mark-to-market election is available only for “marketable stock,” which is stock that is traded in other than de minimis quantities on at least 15 days during each calendar quarter (“regularly traded”) on a qualified exchange or other market (as defined in applicable U.S. Treasury regulations), including the Nasdaq Capital Market. If the Ordinary Shares are regularly traded on the Nasdaq Capital Market and if you are a holder of Ordinary Shares, the mark-to-market election would be available to you were we to be or become a PFIC.
Alternatively, a U.S. Holder of stock in a PFIC may make a “qualified electing fund” election under Section 1295(b) of the US Internal Revenue Code with respect to such PFIC to elect out of the tax treatment discussed above. A U.S. Holder who makes a valid qualified electing fund election with respect to a PFIC will generally include in gross income for a taxable year such holder’s pro rata share of the corporation’s earnings and profits for the taxable year. The qualified electing fund election, however, is available only if such PFIC provides such U.S. Holder with certain information regarding its earnings and profits as required under applicable U.S. Treasury regulations. We do not currently intend to prepare or provide the information that would enable you to make a qualified electing fund election. If you hold Ordinary Shares in any taxable year in which we are a PFIC, you will be required to file U.S. Internal Revenue Service Form 8621 in each such year and provide certain annual information regarding such Ordinary Shares, including regarding distributions received on the Ordinary Shares and any gain realized on the disposition of the Ordinary Shares.
If you do not make a timely “mark-to-market” election (as described above), and if we were a PFIC at any time during the period you hold our Ordinary Shares, then such Ordinary Shares will continue to be treated as stock of a PFIC with respect to you even if we cease to be a PFIC in a future year, unless you make a “purging election” for the year we cease to be a PFIC. A “purging election” creates a deemed sale of such Ordinary Shares at their fair market value on the last day of the last year in which we are treated as a PFIC. The gain recognized by the purging election will be subject to the special tax and interest charge rules treating the gain as an excess distribution, as described above. As a result of the purging election, you will have a new basis (equal to the fair market value of the Ordinary Shares on the last day of the last year in which we are treated as a PFIC) and holding period (which new holding period will begin the day after such last day) in your Ordinary Shares for tax purposes.
IRC Section 1014(a) provides for a step-up in basis to the fair market value for our Ordinary Shares when inherited from a decedent that was previously a holder of our Ordinary Shares. However, if we are determined to be a PFIC and a decedent that was a U.S. Holder did not make either a timely qualified electing fund election for our first taxable year as a PFIC in which the U.S. Holder held (or was deemed to hold) our Ordinary Shares, or a mark-to-market election and ownership of those Ordinary Shares are inherited, a special provision in IRC Section 1291(e) provides that the new U.S. Holder’s basis should be reduced by an amount equal to the Section 1014 basis minus the decedent’s adjusted basis just before death. As such if we are determined to be a PFIC at any time prior to a decedent’s passing, the PFIC rules will cause any new U.S. Holder that inherits our Ordinary Shares from a U.S. Holder to not get a step-up in basis under Section 1014 and instead will receive a carryover basis in those Ordinary Shares.
You are urged to consult your tax advisors regarding the application of the PFIC rules to your investment in our Ordinary Shares and the elections discussed above.
Information Reporting and Backup Withholding
Dividend payments with respect to our Ordinary Shares and proceeds from the sale, exchange or redemption of our Ordinary Shares may be subject to information reporting to the U.S. Internal Revenue Service and possible U.S. backup withholding under Section 3406 of the US Internal Revenue Code with at a current flat rate of 24%. Backup withholding will not apply, however, to a U.S. Holder who furnishes a correct taxpayer identification number and makes any other required certification on U.S. Internal Revenue Service Form W-9 or who is otherwise exempt from backup withholding. U.S. Holders who are required to establish their exempt status generally must provide such certification on U.S. Internal Revenue Service Form W-9. U.S. Holders are urged to consult their tax advisors regarding the application of the U.S. information reporting and backup withholding rules.
| 81 |
Backup withholding is not an additional tax. Amounts withheld as backup withholding may be credited against your U.S. federal income tax liability, and you may obtain a refund of any excess amounts withheld under the backup withholding rules by filing the appropriate claim for refund with the U.S. Internal Revenue Service and furnishing any required information. We do not intend to withhold taxes for individual shareholders. Transactions effected through certain brokers or other intermediaries, however, may be subject to withholding taxes (including backup withholding), and such brokers or intermediaries may be required by law to withhold such taxes.
Under the Hiring Incentives to Restore Employment Act of 2010, certain U.S. Holders are required to report information relating to our Ordinary Shares, subject to certain exceptions (including an exception for Ordinary Shares held in accounts maintained by certain financial institutions), by attaching a complete Internal Revenue Service Form 8938, Statement of Specified Foreign Financial Assets, with their tax return for each year in which they hold Ordinary Shares. Failure to report such information could result in substantial penalties. You should consult your own tax advisor regarding your obligation to file a Form 8938.
F. Dividends and Paying Agents
Not applicable.
G. Statement by Experts
Not applicable.
H. Documents on Display
We have previously filed with the SEC our registration statements on Form F-1 (File No. 333-239659), as amended.
We are subject to the periodic reporting and other informational requirements of the Exchange Act. Under the Exchange Act, we are required to file reports and other information with the SEC. Specifically, we are required to file annually a Form 20-F within four months after the end of each fiscal year. The SEC maintains a website at http://www.sec.gov that contains reports, proxy and information statements, and other information regarding registrants that make electronic filings with the SEC using its EDGAR system. As a foreign private issuer, we are exempt from the rules of the Exchange Act prescribing, among other things, the furnishing and content of proxy statements to shareholders, and our executive officers, directors and principal shareholders are exempt from the reporting and short-swing profit recovery provisions contained in Section 16 of the Exchange Act.
I. Subsidiary Information
For a listing of our subsidiaries, see “Item 4. Information on the Company—A. History and Development of the Company.”
| 82 |
Item 11. QUANTITATIVE AND QUALITATIVE DISCLOSURES ABOUT MARKET RISK
Foreign Exchange Risk
Our business is conducted in Malaysia by our Malaysia subsidiaries, and our Malaysia subsidiaries’ books and records are maintained in MYR. The financial statements that we file with the SEC and provide to our shareholders are presented in U.S. dollars. Changes in the exchange rates between the MYR and U.S. dollar affect the value of our Malaysia subsidiaries’ assets and results of operations, when presented in U.S. dollars.
The value of the MYR against the U.S. dollar and other currencies may fluctuate and is affected by, among other things, changes in Malaysia’s political and economic conditions and perceived changes in the economy of Malaysia and the United States. Any significant revaluation of the MYR may materially and adversely affect our cash flows, revenue, and financial condition. Further, our Ordinary Shares offered in the U.S. are offered in U.S. dollars, we need to convert the net proceeds we receive into MYR in order to use the funds for our Malaysia subsidiaries’ business. Changes in the conversion rate among the U.S. dollar and the MYR will affect the amount of proceeds we will have available for our Malaysia subsidiaries’ business.
Very limited hedging options are available in Malaysia to reduce our exposure to exchange rate fluctuations. To date, we have not entered into any hedging transactions in an effort to reduce our exposure to foreign currency exchange risk. While we may decide to enter into more hedging transactions in the future, the availability and effectiveness of these hedges may be limited and we may not be able to adequately hedge our exposure or at all. In addition, our currency exchange losses may be magnified by Malaysia exchange control regulations that restrict our ability to convert MYR into foreign currency. As a result, fluctuations in exchange rates may have a material adverse effect on your investment.
Credit Risk
Financial instruments that potentially subject us to significant concentrations of credit risk consist primarily of cash. As of September 30, 2022, 2021, and 2020, $17,778,831, $2,295,206, and $371,180 of our cash was on deposit at financial institutions in Malaysia, respectively. The Company has not experienced any losses in such accounts. While management believes that these financial institutions are of high credit quality, it also continually monitors their credit worthiness.
Accounts receivable are typically unsecured and derived from revenue earned from customers, thereby exposed to credit risk. The risk is mitigated by our assessment of our customers’ creditworthiness and our ongoing monitoring of outstanding balances.
Interest Rate Risk
We have not used derivative financial instruments to hedge interest risk. Interest-earning instruments carry a degree of interest rate risk. We have not been exposed, nor do we anticipate being exposed to material risks due to changes in market interest rates. Our future interest income, however, may fall short of expectations due to changes in market interest rates.
Inflation Risk
In recent years, inflation has not had a material impact on our results of operations. According to the Department of Statistics Malaysia Official Portal, the year-over-year percent changes in the consumer price index for 2020 was decrease of 1.2% and for 2021, increase of 2.5%. Although we have not in the past been materially affected by inflation since our inception, we can provide no assurance that we will not be affected in the future by higher rates of inflation in Malaysia. If inflation rises, it may materially and adversely affect our business.
Item 12. DESCRIPTION OF SECURITIES OTHER THAN EQUITY SECURITIES
A. Debt Securities
Not applicable.
B. Warrants and Rights
Not applicable.
C. Other Securities
Not applicable.
D. American Depositary Shares
Not applicable.
| 83 |
Part II
Item 13. DEFAULTS, DIVIDEND ARREARAGES AND DELINQUENCIES
None.
Item 14. MATERIAL MODIFICATIONS TO THE RIGHTS OF SECURITY HOLDERS AND USE OF PROCEEDS
See “Item 10. Additional Information” for a description of the rights of securities holders, which remain unchanged.
Use of Proceeds
The following “Use of Proceeds” information relates to the registration statement on Form F-1, as amended (File Number 333-265635) for our initial public offering, which was declared effective by the SEC on August 19, 2022. In August 2022, we completed our initial public offering in which we issued and sold an aggregate of 5,375,000 Ordinary Shares, at a price of $4.00 per share for $21.5 million. Network 1 Financial Securities, Inc. was the representative of the underwriters of our initial public offering.
We incurred approximately $1,994,664 in expenses in connection with our initial public offering, which included approximately $1,505,000 in underwriting discounts, approximately $240,000 in expenses paid to or for underwriters, and approximately $249,664 in other expenses. None of the transaction expenses included payments to directors or officers of our Company or their associates, persons owning more than 10% or more of our equity securities, or our affiliates. None of the net proceeds we received from the initial public offering were paid, directly or indirectly, to any of our directors or officers or their associates, persons owning 10% or more of our equity securities, or our affiliates.
We received net proceeds of approximately $18.8 million after the deduction of approximately $2.7 million of offering costs. As of the date of this annual report, we have used $66,446, $5,473,716, and $288,683 from the net proceeds for (i) expanding our business into other countries in Southeast Asia; (ii) upgrading our software and systems; and (iii) promoting our brands in Malaysia, respectively. The remaining $13.0 million is deposited in a bank in Malaysia as term deposit. We intend to use the remaining proceeds from our initial public offering in the manner disclosed in our registration statement on Form F-1, as amended (File Number 333-265635).
Item 15. CONTROLS AND PROCEDURES
Disclosure Controls and Procedures
Under the supervision and with the participation of our management, including our chief executive officer and chief financial officer, we carried out an evaluation of the effectiveness of our disclosure controls and procedures, which is defined in Rules 13a-15(e) of the Exchange Act, as of September 30, 2022.
Based on that evaluation, our management has concluded that, due to the material weaknesses described below, as of September 30, 2022, our disclosure controls and procedures were not effective. Our conclusion is based on (i) the fact that we do not have sufficient in-house personnel in our accounting department with sufficient knowledge of the U.S. GAAP and SEC reporting rules and (ii) certain audit adjustments proposed by the auditor and recorded by the Company into the financial statements. Our management is currently in the process of evaluating the steps necessary to remediate the ineffectiveness, such as (i) hiring more qualified accounting personnel with relevant U.S. GAAP and SEC reporting experience and qualifications to strengthen the financial reporting function and to set up a financial and system control framework, (ii) implementing regular and continuous U.S. GAAP accounting and financial reporting training programs for our accounting and financial reporting personnel, and (iii) engaging an external consulting firm to assist us with assessment of Sarbanes-Oxley compliance requirements and improvement of overall internal control.
Management’s Annual Report on Internal Control over Financial Reporting
This annual report does not include a report of management’s assessment regarding internal control over financial reporting or an attestation report of our registered public accounting firm due to a transition period established by rules of the SEC for newly public companies.
| 84 |
Attestation Report of the Registered Public Accounting Firm
This annual report on Form 20-F does not include an attestation report of our registered public accounting firm regarding internal control over financial reporting. Management’s report was not subject to attestation by our registered public accounting firm pursuant to rules of the SEC where domestic and foreign registrants that are non-accelerated filers, which we are, and “emerging growth companies,” which we also are, are not required to provide the auditor attestation report.
Changes in Internal Control over Financial Reporting
There were no changes in our internal controls over financial reporting that occurred during the period covered by this annual report on Form 20-F that have materially affected, or are reasonably likely to materially affect, our internal control over financial reporting.
Item 16. [RESERVED]
Item 16A. AUDIT COMMITTEE FINANCIAL EXPERT
Ms. Sung Ming-Hsuan qualifies as an “audit committee financial expert” as defined in Item 16A of Form 20-F. Ms. Sung Ming-Hsuan satisfies the “independence” requirements of Section 5605(a)(2) of the NASDAQ Listing Rules as well as the independence requirements of Rule 10A-3 under the Exchange Act.
Item 16B. CODE OF ETHICS
Our board of directors has adopted a code of business conduct and ethics, which is applicable to all of our directors, officers, and employees. Our code of business conduct and ethics is publicly available on our website.
Item 16C. PRINCIPAL ACCOUNTANT FEES AND SERVICES
The following table sets forth the aggregate fees by categories specified below in connection with certain professional services rendered and billed by Friedman LLP and YCM CPA INC., our independent registered public accounting firm for the periods indicated.
YCM CPA INC.
| For the Years Ended September 30, | ||||||||||||
| 2022 | 2021 | 2020 | ||||||||||
| Audit fees(1) | $ | 250,000 | $ | - | $ | - | ||||||
| Audit-Related fees | 45,000 | - | - | |||||||||
| Tax fees | - | - | ||||||||||
| All other fees(2) | - | - | ||||||||||
| Total | $ | 295,000 | $ | - | $ | - | ||||||
Friedman LLP
| For the Years Ended September 30, | ||||||||||||
| 2022 | 2021 | 2020 | ||||||||||
| Audit fees(1) | $ | 120,000 | $ | 300,000 | $ | 200,000 | ||||||
| Audit-Related fees | - | - | - | |||||||||
| Tax fees | - | - | - | |||||||||
| All other fees(2) | 50,000 | - | - | |||||||||
| Total | $ | 170,000 | $ | 300,000 | $ | 200,000 | ||||||
| (1) | Audit fees include the aggregate fees billed for each of the fiscal years for professional services rendered by our independent registered public accounting firm for the audit of our annual financial statements or for the audits of our financial statements and review of the interim financial statements in connection with our initial public offering in 2022. |
| (2) | All other fees include the aggregate fees billed in each of the fiscal years for products and services provided by our independent registered public accounting firm, other than the services reported under audit fees, audit-related fees, and tax fees. |
| 85 |
The audit committee of our board of directors has established its pre-approval policies and procedures, pursuant to which the audit committee approved the foregoing audit, tax, and non-audit services provided by YCM CPA INC. and Friedman LLP in the fiscal years as described above. Consistent with our audit committee’s responsibility for engaging our independent auditors, all audit and permitted non-audit services require pre-approval by the audit committee. The full audit committee approves proposed services and fee estimates for these services. One or more independent directors serving on the audit committee may be delegated by the full audit committee to pre-approve any audit and non-audit services. Any such delegation shall be presented to the full audit committee at its next scheduled meeting. Pursuant to these procedures, the audit committee approved the foregoing audit services provided by YCM CPA INC. and Friedman LLP.
Item 16D. EXEMPTIONS FROM THE LISTING STANDARDS FOR AUDIT COMMITTEES
Not applicable.
Item 16E. PURCHASES OF EQUITY SECURITIES BY THE ISSUER AND AFFILIATED PURCHASERS
None.
Item 16F. CHANGE IN REGISTRANT’S CERTIFYING ACCOUNTANT
There has been no change in independent accountants for our Company during the two most recent fiscal years or any subsequent interim period except as previously reported in our Forms 6-K filed with the SEC on October 24, 2022 and November 29, 2022. There have been no disagreements of the type required to be disclosed by Item 16F(b).
Item 16G. CORPORATE GOVERNANCE
As a Cayman Islands company listed on Nasdaq, we are subject to the Nasdaq corporate governance listing standards. However, the Nasdaq Stock Market listing rules permit a foreign private issuer like us to follow the corporate governance practices of its home country. Other than as described in this section, our corporate governance practices do not differ from those followed by domestic companies listed on the Nasdaq Capital Market. Nasdaq Stock Market listing rule 5635 generally provides that shareholder approval is required for U.S. domestic companies listed on the Nasdaq Capital Market prior to issuance (or potential issuance) of securities (i) equaling 20% or more of the company’s common stock or voting power for less than the greater of market or book value (ii) resulting in a change of control of the company; and (iii) which is being issued pursuant to a stock option or purchase plan to be established or materially amended or other equity compensation arrangement made or materially amended. Notwithstanding this general requirement, Nasdaq Stock Market listing rule 5615(a)(3)(A) permits foreign private issuers to follow their home country practice rather than these shareholder approval requirements. The Cayman Islands do not require shareholder approval prior to any of the foregoing types of issuances. Our Company, therefore, is not required to obtain such shareholder approval prior to entering into a transaction with the potential to issue securities as described above. Our board of directors has elected to follow our home country rules as to such issuances and will not be required to seek shareholder approval prior to entering into such a transaction.
Item 16H. MINE SAFETY DISCLOSURE
Not applicable.
Item 16I. DISCLOSURE REGARDING FOREIGN JURISDICTIONS THAT PREVENT INSPECTIONS
Not applicable.
| 86 |
Part III
Item 17. FINANCIAL STATEMENTS
We have elected to provide financial statements pursuant to Item 18.
Item 18. FINANCIAL STATEMENTS
The consolidated financial statements of Starbox Group, and its operating entities are included at the end of this annual report.
Item 19. EXHIBITS
EXHIBIT INDEX
| 87 |
| * | Filed with this annual report on Form 20-F |
| ** | Furnished with this annual report on Form 20-F |
| 88 |
SIGNATURES
The registrant hereby certifies that it meets all of the requirements for filing on Form 20-F and that it has duly caused and authorized the undersigned to sign this annual report on its behalf.
| Starbox Group Holdings Ltd. | ||
| By: | /s/ Lee Choon Wooi | |
| Lee Choon Wooi | ||
| Chief Executive Officer, Director, and | ||
Chairman of the Board of Directors (Principal Executive Officer) | ||
| Date: January 18, 2023 | ||
| 89 |
STARBOX GROUP HOLDINGS LTD.
INDEX TO CONSOLIDATED FINANCIAL STATEMENTS
TABLE OF CONTENTS
| F-1 |

REPORT OF INDEPENDENT REGISTERED PUBLIC ACCOUNTING FIRM
To the Board of Directors and the shareholders of
Starbox Group Holdings Ltd.
Opinion on the Financial Statements
We have audited the accompanying consolidated balance sheet of Starbox Group Holdings Ltd. and subsidiaries (collectively, the “Company”) as of September 30, 2022, and the related consolidated statement of operations and comprehensive income, changes in shareholder’s equity, and cash flows for the year ended September 30, 2022, and the related notes (collectively referred to as the “financial statements”). In our opinion, the financial statements referred to above present fairly, in all material respects, the financial position of the Company as of September 30, 2022, and the results of its operations and its cash flows for the year ended September 30, 2022, in conformity with accounting principles generally accepted in the United States of America.
Basis for Opinion
These consolidated financial statements are the responsibility of the Company’s management. Our responsibility is to express an opinion on the Company’s consolidated financial statements based on our audit. We are a public accounting firm registered with the Public Company Accounting Oversight Board (United States) (“PCAOB”) and are required to be independent with respect to the Company in accordance with the U.S. federal securities laws and the applicable rules and regulations of the Securities and Exchange Commission and the PCAOB.
We conducted our audits in accordance with the standards of the PCAOB. Those standards require that we plan and perform the audits to obtain reasonable assurance about whether the consolidated financial statements are free of material misstatement, whether due to error or fraud. The Company is not required to have, nor were we engaged to perform, an audit of its internal control over financial reporting. As part of our audits, we are required to obtain an understanding of internal control over financial reporting, but not for the purpose of expressing an opinion on the effectiveness of the Company’s internal control over financial reporting. Accordingly, we express no such opinion.
Our audits included performing procedures to assess the risks of material misstatement of the consolidated financial statements, whether due to error or fraud, and performing procedures that respond to those risks. Such procedures included examining, on a test basis, evidence regarding the amounts and disclosures in the consolidated financial statements. Our audits also included evaluating the accounting principles used and significant estimates made by management, as well as evaluating the overall presentation of the consolidated financial statements. We believe that our audits provide a reasonable basis for our opinion.
/s/ YCM CPA, Inc.
We have served as the Company’s auditor since 2022.
PCAOB ID 6781
Irvine, California
January 18, 2023
| F-2 |

REPORT OF INDEPENDENT REGISTERED PUBLIC ACCOUNTING FIRM
To the Board of Directors and Shareholders of
Starbox Group Holdings Ltd.
Opinion on the Financial Statements
We have audited the accompanying consolidated balance sheet of Starbox Group Holdings Ltd. and its subsidiaries (collectively, the “Company”) as of September 30, 2021, and the related consolidated statements of operations and comprehensive income (loss), changes in shareholders’ equity (deficit), and cash flows for each of the years in the two-year period ended September 30, 2021, and the related notes (collectively referred to as the “consolidated financial statements”). In our opinion, the consolidated financial statements present fairly, in all material respects, the financial position of the Company as of September 30, 2021, and the results of its operations and its cash flows for each of the years in the two-year period ended September 30, 2021, in conformity with accounting principles generally accepted in the United States of America.
Basis for Opinion
These consolidated financial statements are the responsibility of the Company’s management. Our responsibility is to express an opinion on the Company’s consolidated financial statements based on our audits. We are a public accounting firm registered with the Public Company Accounting Oversight Board (United States) (the “PCAOB”) and are required to be independent with respect to the Company in accordance with the U.S. federal securities laws and the applicable rules and regulations of the Securities and Exchange Commission and the PCAOB.
We conducted our audits in accordance with the standards of the PCAOB. Those standards require that we plan and perform the audits to obtain reasonable assurance about whether the consolidated financial statements are free of material misstatement, whether due to error or fraud. The Company is not required to have, nor were we engaged to perform, an audit of its internal control over financial reporting. As part of our audit we are required to obtain an understanding of internal control over financial reporting, but not for the purpose of expressing an opinion on the effectiveness of the Company’s internal control over financial reporting. Accordingly, we express no such opinion.
Our audits included performing procedures to assess the risks of material misstatement of the financial statements, whether due to error or fraud, and performing procedures that respond to those risks. Such procedures included examining, on a test basis, evidence regarding the amounts and disclosures in the consolidated financial statements. Our audits also included evaluating the accounting principles used and significant estimates made by management, as well as evaluating the overall presentation of the consolidated financial statement. We believe that our audits provide a reasonable basis for our opinion.
/s/
We have served as the Company’s auditor since 2021 through 2022.
March 22, 2022, except for Note 2, as to which the date is May 18, 2022, and Notes 7 and 12, as to which the date is June 15, 2022
| F-3 |
STARBOX GROUP HOLDINGS LTD. AND SUBSIDIARIES
CONSOLIDATED BALANCE SHEETS
| As of September 30, | ||||||||
| 2022 | 2021 | |||||||
| ASSETS | ||||||||
| CURRENT ASSETS | ||||||||
| Cash | $ | $ | ||||||
| Accounts receivable, net | ||||||||
| Due from related party | ||||||||
| Prepaid expenses and other current assets | ||||||||
| TOTAL CURRENT ASSETS | ||||||||
| Property and equipment, net | ||||||||
| Intangible assets, net | ||||||||
| Right-of-use assets, net | ||||||||
| TOTAL NONCURRENT ASSETS | ||||||||
| TOTAL ASSETS | $ | $ | ||||||
| LIABILITIES AND SHAREHOLDERS’ EQUITY | ||||||||
| CURRENT LIABILITIES | ||||||||
| Deferred revenue | $ | $ | ||||||
| Taxes payable | ||||||||
| Due to related parties | ||||||||
| Operating lease liabilities, current | ||||||||
| Accrued expenses and other current liabilities | ||||||||
| TOTAL CURRENT LIABILITIES | ||||||||
| Operating lease liabilities, non-current | ||||||||
| Total Liabilities | ||||||||
| COMMITMENTS AND CONTINGENCIES | ||||||||
| SHAREHOLDERS’ EQUITY | ||||||||
| Preferred shares, $ par value, shares authorized, issued and outstanding* | ||||||||
| Ordinary common shares, $ par value, shares authorized, shares and shares issued and outstanding as of September 30, 2022 and 2021, respectively* | ||||||||
| Additional paid-in capital | ||||||||
| Retained earnings | ||||||||
| Accumulated other comprehensive loss | ( | ) | ( | ) | ||||
| TOTAL SHAREHOLDERS’ EQUITY | ||||||||
| TOTAL LIABILITIES AND SHAREHOLDERS’ EQUITY | $ | $ | ||||||
| * |
The accompanying notes are an integral part of these consolidated financial statements.
| F-4 |
STARBOX GROUP HOLDINGS LTD. AND SUBSIDIARIES
CONSOLIDATED STATEMENTS OF OPERATIONS AND COMPREHENSIVE INCOME (LOSS)
| For the fiscal years ended September 30, | ||||||||||||
| 2022 | 2021 | 2020 | ||||||||||
| OPERATING REVENUE | ||||||||||||
| Revenue from digital advertising services | $ | $ | $ | |||||||||
| Revenue from cash rebate services | ||||||||||||
| Revenue from payment solution services-related party | ||||||||||||
| Total operating revenue | ||||||||||||
| OPERATING COSTS | ||||||||||||
| Cost, selling, general and administrative expenses | ||||||||||||
| Total operating costs | ||||||||||||
| INCOME (LOSS) FROM OPERATIONS | ( | ) | ||||||||||
| OTHER INCOME | ||||||||||||
| INCOME (LOSS) BEFORE INCOME TAX PROVISION | ( | ) | ||||||||||
| PROVISION FOR INCOME TAXES | ||||||||||||
| NET INCOME (LOSS) | ( | ) | ||||||||||
| OTHER COMPREHENSIVE LOSS | ||||||||||||
| Foreign currency translation adjustment | ( | ) | ( | ) | ( | ) | ||||||
| COMPREHENSIVE INCOME (LOSS) | $ | $ | $ | ( | ) | |||||||
| Earnings(loss) per ordinary common share- basic and diluted | $ | $ | $ | ( | ) | |||||||
| Weighted average number of ordinary common shares- basic and diluted | ||||||||||||
The accompanying notes are an integral part of these consolidated financial statements.
| F-5 |
STARBOX GROUP HOLDINGS LTD. AND SUBSIDIARIES
CONSOLIDATED STATEMENTS OF CHANGES IN SHAREHOLDERS’ EQUITY (DEFICIT)
FOR THE FISCAL YEARS ENDED SEPTEMBER 30, 2022, 2021, AND 2020
| Ordinary shares | Subscription |
paid-in | Retained earnings (accumulated | Accumulated comprehensive | ||||||||||||||||||||||||
| Shares | Amount | receivable | capital | deficit) | loss | Total | ||||||||||||||||||||||
| Balances as of October 1, 2019 | $ | $ | ( | ) | $ | $ | ( | ) | $ | ( | ) | $ | ( | ) | ||||||||||||||
| Net loss for the year | - | ( | ) | ( | ) | |||||||||||||||||||||||
| Conversion of shareholder loan of capital | - | |||||||||||||||||||||||||||
| Foreign currency translation loss | - | ( | ) | ( | ) | |||||||||||||||||||||||
| Balances as of September 30, 2020 | $ | $ | ( | ) | $ | $ | ( | ) | $ | ( | ) | $ | ( | ) | ||||||||||||||
| Capital contribution by shareholders | - | |||||||||||||||||||||||||||
| Net income for the year | - | |||||||||||||||||||||||||||
| Foreign currency translation loss | - | ( | ) | ( | ) | |||||||||||||||||||||||
| Balances as of September 30, 2021 | $ | $ | $ | $ | $ | ( | ) | $ | ||||||||||||||||||||
| Net income for the year | - | |||||||||||||||||||||||||||
| Issuance of common stock in the IPO (net of offering costs of $ | ||||||||||||||||||||||||||||
| Foreign currency translation adjustment | - | ( | ) | ( | ) | |||||||||||||||||||||||
| Balances as of September 30, 2022 | $ | $ | $ | $ | $ | ( | ) | $ | ||||||||||||||||||||
The accompanying notes are an integral part of these consolidated financial statements.
| F-6 |
STARBOX GROUP HOLDINGS LTD. AND SUBSIDIARIES
CONSOLIDATED STATEMENTS OF CASH FLOWS
| For the years ended September 30, | ||||||||||||
| 2022 | 2021 | 2020 | ||||||||||
| Cash flows from operating activities | ||||||||||||
| Net income (loss) | $ | $ | $ | ( | ) | |||||||
| Adjustments to reconcile net income to cash provided by (used in) operating activities: | ||||||||||||
| Depreciation and amortization | ||||||||||||
| Amortization of right-of-use operating lease assets | ||||||||||||
| Changes in operating assets and liabilities: | ||||||||||||
| Accounts receivable | ( | ) | ( | ) | ( | ) | ||||||
| Prepaid expenses and other current assets | ( | ) | ( | ) | ( | ) | ||||||
| Deferred revenue | ( | ) | ||||||||||
| Taxes payable | ||||||||||||
| Operating lease liabilities | ( | ) | ( | ) | ||||||||
| Accrued expenses and other current liabilities | ||||||||||||
| Net cash (used in) provided by used in operating activities | ( | ) | ( | ) | ||||||||
| Cash flows from investing activities | ||||||||||||
| Purchase of fixed assets | ( | ) | ( | ) | ( | ) | ||||||
| Purchase of intangible assets | ( | ) | ||||||||||
| Cash advances to a related party | ( | ) | ||||||||||
| Collection of cash advances from a related party | ||||||||||||
| Net cash used in investing activities | ( | ) | ( | ) | ( | ) | ||||||
| Cash flows from financing activities | ||||||||||||
| Capital contribution by shareholders | ||||||||||||
| Proceeds from issuance of common stock in the IPO, net of offering cost | ||||||||||||
| Proceeds from (repayment to) related party borrowings | ( | ) | ( | ) | ||||||||
| Net cash provided by financing activities | ||||||||||||
| Effect of exchange rate changes on cash | ( | ) | ( | ) | ||||||||
| Net increase in cash | ||||||||||||
| Cash, beginning of year | ||||||||||||
| Cash, end of year | $ | $ | $ | |||||||||
| Supplemental disclosure of cash flow information | ||||||||||||
| Cash paid for income taxes | $ | $ | $ | |||||||||
| Cash paid for interest | $ | $ | $ | |||||||||
| Supplemental disclosure of non-cash investing and financing activities | ||||||||||||
| Right-of-use assets obtained in exchange for operating lease liabilities | $ | $ | $ | |||||||||
| F-7 |
STARBOX GROUP HOLDINGS LTD. AND SUBSIDIARIES
NOTES TO CONSOLIDATED FINANCIAL STATEMENTS
NOTE 1 — ORGANIZATION AND BUSINESS DESCRIPTION
Business
Starbox Group Holdings Ltd. (“Starbox Group” or the “Company”), through its wholly-owned subsidiaries, is engaged in connecting retail merchants with individual online and offline shoppers (“retail shoppers”) to facilitate transactions through cash rebate offered by retail merchants, providing digital advertising services to retail merchants, and providing payment solution services to merchants. The Company’s current principal operations and geographic markets are substantially located in Malaysia.
Organization
Starbox Group was incorporated as an exempted company limited by shares under the laws of the Cayman Islands on September 13, 2021.
Starbox
Group owns
Starbox Group and Starbox Berhad are currently not engaged in any active business operations and are merely acting as holding companies.
Starbox
Berhad owns
Reorganization
A reorganization of the Company’s legal structure (the “Reorganization”) was completed on November 17, 2021. The Reorganization involved the incorporation of Starbox Group, and the transfer of 100% of the equity interests in Starbox Berhad and its subsidiaries from its original shareholders to Starbox Group. Consequently, Starbox Group became the ultimate holding company of all other entities mentioned above.
The Reorganization has been accounted for as a recapitalization among entities under common control since the same controlling shareholders controlled all these entities before and after the Reorganization. The consolidation of the Company and its subsidiaries has been accounted for at historical cost and prepared on the basis as if the aforementioned transactions had become effective as of the beginning of the first period presented in the accompanying consolidated financial statements. Results of operations for the periods presented comprise those of the previously separate entities combined from the beginning of the period to the end of the period, eliminating the effects of intra-entity transactions.
Completion of the Initial Public offerings (“IPO”)
On
August 23, 2022, the Company’s ordinary shares commenced trading on the Nasdaq Capital Market under the symbol “STBX.”
On August 25, 2022, the Company closed its IPO of ordinary shares at a public offering price of
$per ordinary share. The Company raised approximately
$
| F-8 |
The consolidated financial statements of the Company as of September 30, 2022 include the following entities:
| Entity | Date
of Formation |
Place
of Incorporation |
%
of Ownership |
Major business activities | ||||
| Starbox Group | ||||||||
| Starbox Berhad | ||||||||
| StarboxGB | ||||||||
| StarboxSB | ||||||||
| StarboxPB | |
NOTE 2 — SUMMARY OF SIGNIFICANT ACCOUNTING POLICIES
Basis of presentation and principles of consolidation
The accompanying consolidated financial statements have been prepared in accordance with accounting principles generally accepted in the United States of America (“U.S. GAAP”) and pursuant to the rules and regulations of the Securities and Exchange Commission (the “SEC”). The accompanying consolidated financial statements include the financial statements of the Company and its wholly owned subsidiaries. All inter-company balances and transactions are eliminated upon consolidation.
Uses of estimates
In preparing the consolidated financial statements in conformity with U.S. GAAP, management makes estimates and assumptions that affect the reported amounts of assets and liabilities and disclosure of contingent assets and liabilities at the date of the financial statements and the reported amounts of revenue and expenses during the reporting period. These estimates are based on information as of the date of the consolidated financial statements. Significant estimates required to be made by management include the valuation of accounts receivable, useful lives of property and equipment and intangible assets, the recoverability of long-lived assets, realization of deferred tax assets, provision necessary for contingent liabilities, and revenue recognition. Actual results could differ from those estimates.
Risks and uncertainties
The main operations of the Company are located in Malaysia. Accordingly, the Company’s business, financial condition, and results of operations may be influenced by changes in political, economic, social, regulatory, and legal environments in Malaysia, as well as by the general state of the economy in Malaysia. Although the Company has not experienced losses from these situations and believes that it complies with existing laws and regulations, including its organization and structure disclosed in Note 1, this may not be indicative of future results.
The Company’s business, financial condition, and results of operations may also be negatively impacted by risks related to natural disasters, extreme weather conditions, health epidemics, and other catastrophic incidents, which could significantly disrupt the Company’s operations.
The COVID-19 pandemic has adversely affected the Company’s business operations. Specifically, prior to April 1, 2022, significant governmental measures implemented by the Malaysian government, including various stages of lockdowns, closures, quarantines, and travel bans, led to the store closure of some of the Company’s offline merchants. As a result, although business in Malaysia had gradually resumed since April 1, 2022, the Company’s cash rebate service business was negatively affected to a certain extent, because the number of offline sales transactions between retail shoppers and retail merchants facilitated by the Company did not grow as much as the Company expected, leading to a lower amount of cash rebate service revenue than the Company expected during the fiscal years ended September 30, 2022, 2021, and 2020. However, the Company’s digital advertising service revenue was not significantly affected by the COVID-19 pandemic, because more people have opted to use various online services since the beginning of the COVID-19 pandemic. As more advertisers used the Company’s digital advertising services through its websites and mobile apps and third-party social media channels to target their audiences, the Company’s revenue from digital advertising services increased significantly from fiscal year 2021 to fiscal year 2022. However, any resurgence of the COVID-19 pandemic could negatively affect the execution of customer contracts and the collection of customer payments. The extent of any future impact of the COVID-19 pandemic on the Company’s business is still highly uncertain and cannot be predicted as of the financial statement reporting date. Any potential impact to the Company’s operating results will depend, to a large extent, on future developments and new information that may emerge regarding the duration and severity of the COVID-19 pandemic and the actions taken by government authorities to contain the spread of the COVID-19 pandemic, almost all of which are beyond the Company’s control.
| F-9 |
Cash
Cash
includes currency on hand and deposits held by banks that can be added or withdrawn without limitation. The Company maintains all of
its bank accounts in Malaysia. Cash deposit with financial institutions in Malaysia is subject to certain protection under the requirement
of the deposit insurance system. The maximum insurance coverage limit is MYR
Accounts receivable, net
Accounts receivable primarily include service fees generated from providing digital advertising services and payment solution services to retail merchant customers (see Note 3).
Accounts receivable are presented net of allowance for doubtful accounts. The Company determines the adequacy of allowance for doubtful accounts based on individual account analysis, historical collection trend, and the best estimate of specific losses on individual exposures. The Company establishes a provision for doubtful receivables when there is objective evidence that the Company may not be able to collect amounts due. Actual amounts received may differ from management’s estimate of credit worthiness and the economic environment. Delinquent account balances are written off against the allowance for doubtful accounts after management has determined that the likelihood of collection is not probable. As of September 30, 2022 and 2021, there was no allowance for doubtful accounts recorded as the Company considers all of the outstanding accounts receivable fully collectible.
Deferred initial public offering (“IPO”) costs
The
Company complies with the requirement of the Accounting Standards Codification (“ASC”) 340-10-S99-1 and SEC Staff Accounting
Bulletin (“SAB”) Topic 5A—”Expenses of Offering.” Deferred offering costs consist of underwriting, legal,
consulting, and other expenses incurred through the balance sheet date that are directly related to the intended IPO. Deferred offering
costs will be charged to shareholders’ equity upon the completion of the IPO. Should the IPO prove to be unsuccessful, these deferred
costs, as well as additional expenses to be incurred, will be charged to operations. Payment for deferred IPO costs amounted to $
Property and equipment
Property and equipment are stated at cost less accumulated depreciation and amortization. Depreciation and amortization of property and equipment are provided using the straight-line method over their expected useful lives, as follows:
| Useful life | ||||
| Office equipment and furniture | ||||
Expenditures for maintenance and repair, which do not materially extend the useful lives of the assets, are charged to expenses as incurred. Expenditures for major renewals and betterments which substantially extend the useful life of assets are capitalized. The cost and related accumulated depreciation of assets retired or sold are removed from the respective accounts, and any gain or loss is recognized in the consolidated statements of operations and comprehensive income (loss) in other income (expenses).
Intangible assets
The Company’s intangible assets primarily consist of purchased computer software and applications used in conducting the Company’s cash rebate and digital advertising business. Intangible assets also include content assets, which are licensed movies and television series acquired from third-party content providers in order to offer members unlimited viewing of such content to drive traffic on the Company’s SEEBATS website and mobile app. Intangible assets are carried at cost less accumulated amortization and any recorded impairment (see Note 5).
Intangible assets are amortized using the straight-line method with the following estimated useful lives:
| Useful life | ||
| Computer software and applications | ||
| Content assets-licensed movies and television series |
| F-10 |
Impairment of long-lived assets
Long-lived
assets with finite lives, primarily property and equipment, are reviewed for impairment whenever events or changes in circumstances indicate
that the carrying amount of an asset may not be recoverable. If the estimated future undiscounted cash flows from the use of the asset
and its eventual disposition are below the asset’s carrying value, the asset is deemed to be impaired and written down to its fair
value. There were
Fair value of financial instruments
Fair value is defined as the price that would be received to sell an asset or paid to transfer a liability in an orderly transaction between market participants at the measurement date. A three-level fair value hierarchy prioritizes the inputs used to measure fair value. The hierarchy requires entities to maximize the use of observable inputs and minimize the use of unobservable inputs. The three levels of inputs used to measure fair value are as follows:
| ● | Level 1 — inputs to the valuation methodology are quoted prices (unadjusted) for identical assets or liabilities in active markets. |
| ● | Level 2 — inputs to the valuation methodology include quoted prices for similar assets and liabilities in active markets, quoted market prices for identical or similar assets in markets that are not active, inputs other than quoted prices that are observable and inputs derived from or corroborated by observable market data. |
| ● | Level 3 — inputs to the valuation methodology are unobservable. |
Unless otherwise disclosed, the fair value of the Company’s financial instruments, including cash, accounts receivable, prepaid expenses and other current assets, deferred revenue, taxes payable, due to a related party, and accrued expenses and other current liabilities approximate the fair value of the respective assets and liabilities as of September 30, 2022 and 2021 based upon the short-term nature of the assets and liabilities.
Foreign currency translation
The functional currency for Starbox Group is the U.S Dollar (“US$”). Starbox Berhad, StarboxGB, StarboxSB, and StarboxPB use Malaysian Ringgit (“MYR”) as their functional currency. The Company’s consolidated financial statements have been translated into and reported in US$. Assets and liabilities accounts are translated using the exchange rate at each reporting period end date. Equity accounts are translated at historical rates. Income and expense accounts are translated at the average rate of exchange during the reporting period. The resulting translation adjustments are reported under other comprehensive income. Gains and losses resulting from the translations of foreign currency transactions and balances are reflected in the results of operations.
The following table outlines the currency exchange rates that were used in creating the consolidated financial statements in this report:
| September 30, 2022 | September 30, 2021 | September 30, 2020 | ||||
| Year-end spot rate | US$ |
US$ |
US$ |
|||
| Average rate | US$ |
US$ |
US$ |
Comprehensive income (loss)
Comprehensive income (loss) consists of two components, net income (loss) and other comprehensive income (loss). The foreign currency translation gain or loss resulting from the translation of the financial statements expressed in MYR to US$ is reported in other comprehensive income (loss) in the consolidated statements of operations and comprehensive income (loss).
Revenue recognition
To determine revenue recognition for contracts with customers, the Company performs the following five steps: (i) identify the contract(s) with the customer, (ii) identify the performance obligations in the contract, (iii) determine the transaction price, including variable consideration to the extent that it is probable that a significant future reversal will not occur, (iv) allocate the transaction price to the respective performance obligations in the contract, and (v) recognize revenue when (or as) the Company satisfies the performance obligation.
| F-11 |
The Company currently generates its revenue from the following main sources:
Revenue from digital advertising services
The Company’s advertising service revenue is derived principally from advertising contracts with retail merchant customers (the “advertisers”), which allow advertisers to place advertisements on the Company’s websites and mobile apps and third-party social media channels over a particular period of time. The advertising contracts specify the related fees and payment terms and provide evidence of the arrangements. The Company’s digital adverting services are to (i) provide advertisement design and consultation services to help advertisers precisely shape their digital advertising strategies and optimize the design, content, and layout of their advertisements and (ii) the displaying of advertisers’ advertisements of products and services on the Company’s websites and mobile apps and third-party social media channels over a particular period of time and in a variety of forms, such as logos, banners, push notification, and posts by accounts of influencers and bloggers, to help promote advertisers’ products and services and enhance their brand awareness. Advertisers may elect to engage with the Company for only advertisement display services or both advertisement design and consultation services and advertisement display services.
In
connection with these digital advertising
services, the Company charges retail merchant customers nonrefundable digital advertising
service fees. For advertisement design and consultation services, the Company’s stand-alone selling price ranges from approximately
$
The Company identifies advertisement design and consultation services and advertisement display services as two separate performance obligations, as each are services that are capable of being distinct and distinct in the context of advertising contracts. Each of the service commitments in advertisement design and consultation services, including advice on advertising strategies, customization and optimization of the desired content, length, color tone, layout, format, and presentation of the ads, are not distinct in the context of advertising contracts, because they are inputs to deliver the combined output of advertisements to be displayed as specified by the customer. Therefore, advertisement design and consultation services are identified as a single performance obligation. The Company allocates revenue to each performance obligation based on its stand-alone selling price, which is specified in the contracts.
The Company’s advertisement design and consultation services are normally rendered within a short period of time, ranging from a few days to a month. As all the benefits enjoyed by the customers can be substantially realized at the time when the design and consultation services are completed, the Company recognizes revenue at the point when designated services are rendered and accepted by the customers. The Company does not provide rights of return, credits or discounts, price protection, or other similar privileges to customers for such services and accordingly no variable consideration included in such services.
The majority of the Company’s advertising contracts are for the provision of advertisement display on the Company’s websites and mobile apps and social media channels for a fixed period of time (ranging from a few weeks to a few months) without a guaranteed minimum impression level. In instances where certain discounts are provided to customers for advertisement displays, such discounts are reported as deduction of revenue. Revenue from advertisement services is recognized over the period the advertisement is displayed. Advances from customers are deferred first and then recognized as revenue until the completion of the contract. There are no future obligations after the completion of the contract and no rights of refund related to the impression levels.
Revenue from cash rebate services
The
Company also utilizes its websites and mobile apps to connect retail merchants and retail shoppers and facilitate retail shoppers to
purchase consumer products or services from retail merchants online or offline under the cash rebate programs offered by retail merchants.
The cash rebate offered by retail merchants range from
| F-12 |
The
Company merely acts as an agent in this type of transactions. The Company does not have control of the goods or services under the sales
transactions between the retail merchants and retail shoppers, has no discretion in establishing prices, and does not have the ability
to direct the use of the goods or services to obtain substantially all the benefits. The Company recognizes cash rebate revenue at the
point when retail merchants and retail shoppers are connected and the sales transactions are facilitated and completed. Revenue is reported
net of service taxes. For the fiscal years ended September 30, 2022, 2021, and 2020, the Company only reported cash rebate revenue of
$
Revenue from payment solution services
In
May 2021, the Company started to provide payment solution services to retail merchant customers by referring them to VE Services
Sdn Bhd, a Malaysian
Internet payment gateway company and a related-party entity controlled by one of the shareholders of the Company (“VE Services”).
The Company entered into an appointment letter with VE Services and started to refer retail merchant customers to VE Services
to process payments through multiple payment methods, such as FPX, Alipay, Maybank QR Pay, Boost, Touch ‘n Go, and GrabPay. VE
Services first charges retail merchants a service fee ranging from
Disaggregation of revenue
The Company disaggregates its revenue from contracts by service types, as the Company believes it best depicts how the nature, amount, timing, and uncertainty of the revenue and cash flows are affected by economic factors. The summary of the Company’s disaggregation of revenue by service types for the fiscal years ended September 30, 2022, 2021, and 2020 is as follows:
| For the fiscal years ended September 30, | ||||||||||||
| 2022 | 2021 | 2020 | ||||||||||
| Revenue from advertising services: | ||||||||||||
| Advertisement design and consultation services | $ | $ | $ | |||||||||
| Advertisement display services | ||||||||||||
| Gross revenue from advertising services | ||||||||||||
| Less: discount to customers for advertisement displays | ( | ) | ( | ) | ||||||||
| Sub-total of net revenue from advertising services | ||||||||||||
| Revenue from cash rebate services | ||||||||||||
| Revenue from payment solution services-related party | ||||||||||||
| Total operating revenue | $ | $ | $ | |||||||||
Contract Assets and Liabilities
The
Company did
A
contract liability is the Company’s obligation to transfer goods or services to a customer for which it has received consideration
from the customers. Receipts in advance and deferred revenue relate to unsatisfied performance obligations at the end of the period primarily
consist of digital advertising service fees received from customers. Due to the generally short-term duration of the contracts, the majority
of the performance obligations are satisfied in the following reporting period. Contract liabilities presented as deferred revenue in
the consolidated balance sheets as of September 30, 2022 and 2021 amounted to and $
| F-13 |
The Company does not disclose information about remaining performance obligations pertaining to service contracts with an original expected term of one year or less.
Operating leases
On October 1, 2020, the Company adopted Accounting Standards Updates (“ASU”) 2016-02, Leases (Topic 842), as amended (“ASC 842”), which supersedes the lease accounting guidance under Topic 840, and generally requires lessees to recognize operating and finance lease liabilities and corresponding right-of-use assets on the balance sheet and to provide enhanced disclosures surrounding the amount, timing, and uncertainty of cash flows arising from leasing arrangements. The Company elected to apply practical expedients permitted under the transition method that allow the Company to use the beginning of the period of adoption as the date of initial application, to not recognize lease assets and lease liabilities for leases with a term of 12 months or less, to not separate non-lease components from lease components, and to not reassess lease classification, treatment of initial direct costs, or whether an existing or expired contract contains a lease.
The Company used a modified retrospective method and did not adjust the prior comparative periods. Under the new lease standard, the Company determines if an arrangement is or contains a lease at inception. Right-of-use assets and liabilities are recognized at the lease commencement date based on the present value of remaining lease payments over the lease terms. The Company considers only payments that are fixed and determinable at the time of lease commencement.
At the commencement date, the Company recognizes the lease liability at the present value of the lease payments not yet paid, discounted using the interest rate implicit in the lease or, if that rate cannot be readily determined, the Company’s incremental borrowing rate for the same term as the underlying lease. The right-of-use asset is recognized initially at cost, which primarily comprises the initial amount of the lease liability, plus any initial direct costs incurred, consisting mainly of brokerage commissions, less any lease incentives received. All right-of-use assets are reviewed for impairment annually. There was no impairment for right-of-use lease assets as of September 30, 2022 and 2021.
Operating costs
The Company’s operating costs primarily consist of (i) marketing and promotional expenses to develop members, merchants, and advertisers, (ii) website and facility maintenance expenses to upgrade, optimize, and maintain its websites and mobile apps, (iii) employee salary and benefit expenses, (iv) professional and business consulting expenses, and (v) other general office expenses for administrating the Company’s business. Operating costs are expensed as incurred. Judgment is required to determine whether to separately present cost of revenue, selling expenses, and general and administrative expenses. The Company considers materiality, the manner that operating costs can be separately identified, and what is most useful to financial statement users, and elects to present all costs and operating expenses as a single line item “cost, selling, general, and administrative expenses” as reflected in the consolidated statements of operations. Management believes that such presentation is meaningful when considering the nature of the Company’s operations and the manner in which the Company manages its business. The Company’s operating costs for the fiscal years ended September 30, 2022, 2021, and 2020, consisted of the following:
For the fiscal years ended September 30, | ||||||||||||
| 2022 | 2021 | 2020 | ||||||||||
| Salary and employee benefit expenses | $ | $ | $ | |||||||||
| Professional and consulting service fees | ||||||||||||
| Marketing and promotional expenses | ||||||||||||
| License costs | ||||||||||||
| Website and facility maintenance expenses | ||||||||||||
| Depreciation and amortization | ||||||||||||
| Utility and office expenses | ||||||||||||
| Business travel and entertainment expenses | ||||||||||||
| Others | ||||||||||||
| Total operating costs | $ | $ | $ | |||||||||
| F-14 |
Research and development
The
Company’s research and development activities primarily relate to the optimization and implementation of its websites and mobile
apps (such as leveraging browser caching, improving server response time, removing render-blocking JavaScript, reducing redirects, and
optimizing images), to improve their performance and drive more traffic. Research and development costs are expensed as incurred. Research
and development expenses included in cost, selling, general, and administrative expenses amounted to $
Income taxes
The Company accounts for current income taxes in accordance with the laws of the relevant tax authorities. Deferred income taxes are recognized when temporary differences exist between the tax bases of assets and liabilities and their reported amounts in the consolidated financial statements. Deferred tax assets and liabilities are measured using enacted tax rates expected to apply to taxable income in the years in which those temporary differences are expected to be recovered or settled. The effect on deferred tax assets and liabilities of a change in tax rates is recognized in income in the period including the enactment date. Valuation allowances are established, when necessary, to reduce deferred tax assets to the amount expected to be realized.
An uncertain tax position is recognized only if it is “more likely than not” that the tax position would be sustained in a tax examination. The amount recognized is the largest amount of tax benefit that is greater than 50% likely of being realized on examination. For tax positions not meeting the “more likely than not” test, no tax benefit is recorded. Penalties and interest incurred related to underpayment of income tax are classified as income tax expense in the period incurred. No significant penalties or interest relating to income taxes were incurred during the fiscal years ended September 30, 2022, 2021, and 2020. The Company does not believe there was any uncertain tax provision as of September 30, 2022 and 2021.
The Company’s operating subsidiaries in Malaysia are subject to the income tax laws of Malaysia. No significant income was generated outside Malaysia for the fiscal years ended September 30, 2022, 2021, and 2020. As of September 30, 2022, all of the Company’s tax returns of its Malaysian subsidiaries remain open for statutory examination by relevant tax authorities.
Service taxes
Service
tax is a consumption tax levied by Malaysian tax authorities and is charged on any taxable service income (including digital services)
provided in Malaysia by a registered company in carrying on their business. The rate of service tax is 6% ad valorem for all taxable
services and digital services except for the provision of charge or credit card services. A taxable entity is a company that is registered
or liable to be registered for service taxes. A company is liable to be registered if the total value of its taxable services for a 12-month
period exceeds or is expected to exceed the prescribed registration threshold of MYR
The Company computes earnings (loss) per share (“EPS”) in accordance with ASC 260, “Earnings per Share” (“ASC 260”). ASC 260 requires companies with complex capital structures to present basic and diluted EPS. Basic EPS is measured as net income (loss) divided by the weighted average common shares outstanding for the period. Diluted EPS presents the dilutive effect on a per share basis of potential common shares (e.g., convertible securities, options, and warrants) as if they had been converted at the beginning of the periods presented, or issuance date, if later. Potential common shares that have an anti-dilutive effect (i.e., those that increase income per share or decrease loss per share) are excluded from the calculation of diluted EPS. As of September 30, 2022 and 2021, and for the fiscal years ended September 30, 2022, 2021, and 2020, there were no dilutive shares.
Statement of cash flows
In accordance with ASC 230, “Statement of Cash Flows,” cash flows from the Company’s operations are formulated based upon the local currencies using the average exchange rate in the period. As a result, amounts related to assets and liabilities reported on the statements of cash flows will not necessarily agree with changes in the corresponding balances on the balance sheets.
| F-15 |
Related parties and transactions
The Company identifies related parties, and accounts for, discloses related party transactions in accordance with ASC 850, “Related Party Disclosures” and other relevant ASC standards.
Parties, which can be a corporation or individual, are considered to be related if the Company has the ability, directly or indirectly, to control the other party or exercise significant influence over the other party in making financial and operational decisions. Companies are also considered to be related if they are subject to common control or common significant influence. Transactions between related parties commonly occurring in the normal course of business are considered to be related party transactions. Transactions between related parties are also considered to be related party transactions even though they may not be given accounting recognition. While ASC does not provide accounting or measurement guidance for such transactions, it nonetheless requires their disclosure.
Defined contribution plan
The full-time employees of the Company’s subsidiaries in Malaysia are entitled to the government mandated defined contribution plan, such as social security, employee provident fund, employment insurance, and human resource development fund, as required by labor laws in Malaysia. The Company is required to accrue and pay for these benefits based on certain percentages of the employees’ respective salaries, subject to certain ceilings, in accordance with the relevant government regulations, and make cash contributions to the government mandated defined contribution plan.
Employee defined contribution plan expenses amounted to $, $, and $ for the fiscal years ended September 30, 2022, 2021, and 2020, respectively.
Recent accounting pronouncements
The Company considers the applicability and impact of all ASUs. Management periodically reviews new accounting standards that are issued.
Recently adopted accounting pronouncements
In December 2020, the FASB issued ASU 2020-12, Income Taxes (Topic 740): Simplifying the Accounting for Income Taxes (“ASU 2020-12”). ASU 2020-12 is intended to simplify accounting for income taxes. It removes certain exceptions to the general principles in Topic 740 and amends existing guidance to improve consistent application. ASU 2020-12 is effective for fiscal years beginning after December 15, 2021 and interim periods within those fiscal years, with early adoption permitted. The adoption of the new guidance did not have a significant impact on its consolidated financial statements.
Recent accounting pronouncements not yet adopted
In June 2016, the Financial Accounting Standards Board (the “FASB”) issued ASU 2016-13, Financial Instruments – Credit Losses (Topic 326) (“ASU 2016-13”), which requires entities to measure all expected credit losses for financial assets held at the reporting date based on historical experience, current conditions, and reasonable and supportable forecasts. This replaces the existing incurred loss model and is applicable to the measurement of credit losses on financial assets measured at amortized cost. ASU 2016-13 was subsequently amended by ASU 2018-19, Codification Improvements to Topic 326, Financial Instruments – Credit Losses, ASU 2019-04, Codification Improvements to Topic 326, Financial Instruments – Credit Losses, Topic 815, Derivatives and Hedging, and Topic 825, Financial Instruments, and ASU 2019-05, Targeted Transition Relief. In November 2019, the FASB issued ASU 2019-10, which extends the effective date for adoption of ASU 2016-13. In November 2019, the FASB issued ASU 2019-11 to clarify its new credit impairment guidance in ASU 326. Accordingly, for public entities that are not smaller reporting entities, ASU 2016-13 and its amendments are effective for fiscal years, and interim periods within those fiscal years, beginning after December 15, 2019. For all other entities, this guidance and its amendments will be effective for fiscal years beginning after December 15, 2022, including interim periods within those fiscal years. As an emerging growth company, the Company plans to adopt this guidance effective October 1, 2023. The Company is currently evaluating the impact of its pending adoption of ASU 2016-13 on its consolidated financial statements.
| F-16 |
NOTE 3 — ACCOUNTS RECEIVABLE, NET
Accounts receivable, net, consisted of the following:
September 30, 2022 | September 30, 2021 | |||||||
| Accounts receivable associated with digital advertising services | $ | $ | ||||||
| Accounts receivable associated with payment solution services – related party | ||||||||
| Less: allowance for doubtful account | ||||||||
| Accounts receivable, net | $ | $ | ||||||
Accounts
receivable balance as of September 30, 2021 has been fully collected.
Approximately
| Accounts receivable by aging bucket | Balance as of September 30, 2022 | Subsequent collection | % of subsequent collection | |||||||||
| Less than 6 months | $ | $ | % | |||||||||
| From 7 to 9 months | - | % | ||||||||||
| From 10 to 12 months | - | % | ||||||||||
| Over 1 year | - | % | ||||||||||
| Total gross accounts receivable | - | % | ||||||||||
| Allowance for doubtful accounts | - | |||||||||||
| Accounts receivable, net | $ | $ | % | |||||||||
| Accounts receivable by aging bucket | Balance as of September 30, 2021 | Subsequent collection | % of subsequent collection | |||||||||
| Less than 6 months | $ | $ | % | |||||||||
| From 7 to 9 months | % | |||||||||||
| From 10 to 12 months | - | % | ||||||||||
| Over 1 year | % | |||||||||||
| Total gross accounts receivable | % | |||||||||||
| Allowance for doubtful accounts | - | |||||||||||
| Accounts receivable, net | $ | $ | % | |||||||||
NOTE 4—PREPAYMENTS
Prepayments consisted of the following:
September 30, 2022 | September 30, 2021 | |||||||
| Prepayments: | ||||||||
| Speedprop Global Sdn. Bhd. (1) | $ | $ | ||||||
| ARX Media Sdn. Bhd. (2) | ||||||||
| Other third-party vendors (3) | ||||||||
| Less: allowance for doubtful account | ||||||||
| Total prepayments | $ | $ | ||||||
The Company currently operates its business through its GETBATS, SEEBATS, and PAYBATS websites and mobile applications. The satisfactory performance, reliability, and availability of the Company’s information technology systems are critical to its ability to drive more Internet traffic to its advertising websites and mobile apps and provide effective digital advertising services for brands and retailers, especially when the Company starts to expand its business from Malaysia to neighboring countries such as Indonesia, Philippine and Thailand.
| (1) |
| F-17 |
| (2) | |
| (3) |
As of September 30, 2022 and as of the date of this report, there was no allowance for doubtful accounts recorded as the Company considers all of the prepayments fully realizable.
NOTE 5 — PROPERTY AND EQUIPMENT, NET
Property and equipment, net, consisted of the following:
| September 30, 2022 | September 30, 2021 | |||||||
| Office equipment and furniture | $ | $ | ||||||
| Less: accumulated depreciation | ( | ) | ( | ) | ||||
| Property and equipment, net | $ | $ | ||||||
Depreciation
expenses were $
NOTE 6 — INTANGIBLE ASSETS, NET
Intangible assets, net, consisted of the following:
September 30, 2022 | September 30, 2021 | |||||||
| Computer software and applications (1) | $ | $ | ||||||
| Content assets- licensed movies and television series (2) | ||||||||
| Less: accumulated amortization | ( | ) | ||||||
| Intangible asset, net | $ | $ | ||||||
| (1) |
Amortization
of intangible assets – computer and applications amounted to $
| (2) |
| F-18 |
Based on factors including historical and estimated viewing patterns, the Company amortizes the content assets in “operating costs-license costs” on the unaudited condensed consolidated statements of operations on a straight-line basis over its license period or estimated period of use, beginning with the month of first availability.
On
July 29, 2019 and August 5, 2019, the Company entered into a Distribution and Ad Sales Deal Agreement with third-party content providers
Dooya Media Group (“DMG”) and Super Runway Inc. (“SRI”), respectively, in order to license movies and television
series from them and put such licensed movies and television series on the Company’s SEEBATS website and mobile app to drive traffic.
Pursuant to these agreements, each with effective terms from August 2019 to July 31, 2021, the Company was required to pay a flat fee
of $
On
November 1, 2021, the Company entered into a Service and Licensing Agreement with a third-party content provider, Shenzhen Yunshidian
Information Technology Ltd. (“Shenzhen Yunshidian”), to license movies and television series in various genres, such as action,
comedy, fantasy, historical, and romance. The agreement has a term from November 1, 2021 to October 31, 2023 and may be terminated by
either party in the event of a material breach by the other party of the agreement. The Company agreed to pay a content and service fee
of $
The
Company records cost of content that the Company acquired under a license agreement as content assets. Content assets are amortized using
the straight-line method over the licensing period from November 1, 2021 to October 31, 2023. Amortization of content assets amounted
to approximately $
Total
amortization of above-mentioned intangible assets amounted to $
NOTE 7 — TAXES
| a. | Corporate Income Taxes (“CIT”) |
Cayman Islands
Under the current tax laws of the Cayman Islands, the Company is not subject to tax on its income or capital gains. In addition, no Cayman Islands withholding tax will be imposed upon the payment of dividends by the Company to its shareholders.
Malaysia
Starbox
Berhad, StarboxGB, StarboxSB, and StarboxPB are governed by the income tax laws of Malaysia. The income tax provision in respect of operations
in Malaysia is calculated at the applicable tax rates on the taxable income for the periods based on existing legislation, interpretations,
and practices. Under the Income Tax Act of Malaysia, enterprises incorporated in Malaysia are usually subject to a unified
| F-19 |
The components of the income tax provision were as follows:
For the fiscal years ended September 30, | ||||||||||||
| 2022 | 2021 | 2020 | ||||||||||
| Current income tax provision | ||||||||||||
| Cayman Island | $ | $ | $ | |||||||||
| Malaysia | ||||||||||||
| Subtotal | ||||||||||||
| Deferred income tax provision | ||||||||||||
| Cayman Island | ||||||||||||
| Malaysia | ( | ) | ||||||||||
| Total income tax provision | $ | $ | $ | |||||||||
Reconciliation of the differences between the income tax provision computed based on Malaysia unified statutory income tax rate and the Company’s actual income tax provision for the fiscal years ended September 30, 2022, 2021, and 2020, respectively, were as follows:
For the fiscal years ended September 30, | ||||||||||||
| 2022 | 2021 | 2020 | ||||||||||
| Income tax provision computed based on Malaysia unified income tax statutory rate | $ | $ | $ | ( | ) | |||||||
| Effect of tax exemption due to reduced income tax rate for small and medium sized companies | ( | ) | ||||||||||
| Permanent difference | ||||||||||||
| Change in valuation allowance | ( | ) | ||||||||||
| Actual income tax provision | $ | $ | $ | |||||||||
Deferred tax assets
The Company’s deferred tax assets were comprised of the following:
| As of September 30, | ||||||||
| 2022 | 2021 | |||||||
| Deferred tax assets derived from net operating loss carry forwards | $ | $ | ||||||
| Less: valuation allowance | ( | ) | ( | ) | ||||
| Deferred tax assets | $ | $ | ||||||
Movement of valuation allowance:
| As of September 30, | ||||||||
| 2022 | 2021 | |||||||
| Balance at beginning of the year | $ | $ | ||||||
| Current period change | ( | ) | ||||||
| Balance at end of the year | $ | $ | ||||||
The
Company periodically evaluates the likelihood of the realization of deferred tax assets and reduces the carrying amount of the deferred
tax assets by a valuation allowance to the extent it believes a portion will not be realized. Management considers new evidence, both
positive and negative, that could affect the Company’s future realization of deferred tax assets including its recent cumulative
earnings experience, expectation of future income, the carry forward periods available for tax reporting purposes and other relevant
factors. The Company has four subsidiaries in Malaysia, namely Starbox Berhad, StarboxGB, StarboxSB, and StarboxPB. Other than StarboxSB,
which has generated taxable income through providing advertising services to customers, Starbox Berhad, StarboxGB, and StarboxPB have
reported recurring operating losses since their inception. Management concluded that the chances for these three entities that suffered
recurring losses in prior periods to become profitable in the foreseeable near future and to utilize their net operating loss carry forwards
were remote. Accordingly, the Company provided valuation allowance of $
| F-20 |
| b. | Taxes payable |
Taxes payable consisted of the following
September 30, 2022 | September 30, 2021 | |||||||
| Income tax payable | $ | $ | ||||||
| Service tax payable | ||||||||
| Total | $ | $ | ||||||
NOTE 8 — RELATED PARTY TRANSACTIONS
| a. | Name of related parties |
| Name of Related Party | Relationship to the Company | |
| Choo Keam Hui | ||
| Zenapp Sdn Bhd (“Zenapp”) | ||
| Bizguide Corporate Service Sdn Bhd | ||
| KH Advisory Sdn Bhd | ||
| VE Services |
| b. | Due from a related party |
Due from a related party consisted of the following:
| Name | September 30, 2022 | September 30, 2021 | ||||||
| VE Services | $ | $ | ||||||
As of September 30, 2022, the balance of due from VE Services was commission receivable for referring payment solution services to VE Services.
| c. | Due to related parties |
Due to related parties consisted of the following:
| Name | September
30, 2022 | September
30, 2021 | ||||||
| Choo Keam Hui | $ | $ | ||||||
| Bizguide Corporate Service Sdn Bhd | ||||||||
| KH Advisory Sdn Bhd | $ | $ | ||||||
As of September 30, 2022, the balance of due to related parties was the fee to be paid for secretarial and tax consulting services received.
As of September 30, 2021, the balance due to a related party was from loan advances from Choo Keam Hui, and was used as working capital during the Company’s normal course of business. Such advance was non-interest bearing and due on demand. As of September 30, 2022, all of the balance due as of September 30, 2021 had been repaid.
| F-21 |
| d. | Office rental expenses paid by a related party |
Prior
to August 2021, the Company had not directly entered into any office lease agreements. Zenapp leased an office from the landlord and
provided a small part of the office space to the Company to use for free. Based on the square footage allocation of the small office
space used by the Company, the estimated office lease expense paid by Zenapp on behalf of the Company amounted to approximately $
| e. | Sub-tenancy agreements with a related party |
On
August 20, 2021, StarboxGB, StarboxSB, and StarboxPB each entered into a sub-tenancy agreement with Zenapp to lease an office in Kuala
Lumpur, Malaysia. The sub-tenancy agreements each have a
| f. | Revenue from a related party |
In
May 2021, the Company started to provide payment solution services to merchants by referring them to VE Services. During the fiscal year
2022 and 2021, the Company referred 19 and 11 merchants to VE Services for payment processing and earned commission fees of $
| g. | Advance to a related party |
On
September 23, 2020, StarboxGB signed a framework agreement with Zenapp, pursuant to which StarboxGB agreed to provide interest free cash
advance to Zenapp up to a maximum of MYR
The Company does not have the intention to make additional cash advance to related parties going forward.
NOTE 9 — SHAREHOLDERS’ EQUITY
Ordinary Shares
The Company was incorporated under the laws of the Cayman Islands on September 13, 2021. The original authorized share capital of the Company was $ divided into shares comprising of (i) ordinary shares, par value $ per share, and (ii) preferred shares, par value $ per share. The preferred shares have not been issued. The Company issued ordinary shares with par value of $ per share to its shareholders prior to the reverse split as described below.
On
June 8, 2022, the Company’s shareholders approved (i) an increase in the Company’s authorized share capital from $
to $, divided into shares comprising of ordinary shares, par value $ per share, and
preferred shares, par value $ per share, (ii)
As a result of such corporate actions, (i) the number of the Company’s authorized preferred shares has been reduced from the original shares to shares at par value of $ per share, of which preferred shares have been issued and outstanding and (ii) the number of authorized ordinary shares has been increased from shares to shares, and the number of issued and outstanding ordinary shares has been reduced from the original shares to shares at par value of $ per share. Unless otherwise indicated, all references to preferred shares, ordinary shares, options to purchase ordinary shares, share data, per share data, and related information have been retroactively adjusted, where applicable, to reflect the above mentioned reverse split and share capital change as if it had occurred at the beginning of the earlier period presented (see Note 1).
| F-22 |
Initial Public Offering
On
August 23, 2022, the Company’s ordinary shares commenced trading on the Nasdaq Capital Market under the symbol “STBX.”
On August 25, 2022, the Company closed its IPO of ordinary shares at a public offering price of $per ordinary share. The
Company raised approximately $
As of September 30, 2022 and 2021, the Company had total of and shares ordinary shares issued and outstanding, respectively.
Underwriter Representative Warrants
In
connection with the Company’s IPO, the Company also agreed to issue warrants to the underwriter, to purchase
NOTE 10 — CONCENTRATIONS AND CREDIT RISK
As of September 30, 2022 and 2021, the Company’s substantial assets were located in Malaysia and the Company’s substantial revenue was derived from its subsidiaries located in Malaysia.
For
the fiscal year ended September 30, 2022, no customer accounted for more than 10% of the Company’s total revenue. For the fiscal
year ended September 30, 2021, three customers accounted for
As
of September 30, 2021, two customers accounted for
These significant customers were advertisers who used the Company’s digital adverting services during the fiscal years ended September 30, 2022, 2021, and 2020, respectively.
For the fiscal year ended September 30, 2022, 2021, and 2020, no single vendor accounted for more than 10% of the Company’s total purchases.
NOTE 11 — CONTINGENCIES
From time to time, the Company is a party to various legal actions arising in the ordinary course of business. The Company accrues costs associated with these matters when they become probable and the amount can be reasonably estimated. Legal costs incurred in connection with loss contingencies are expensed as incurred. For the fiscal years ended September 30, 2022, 2021, and 2020, the Company did not have any material legal claims or litigation that, individually or in aggregate, could have a material adverse impact on the Company’s consolidated financial position, results of operations, and cash flows.
NOTE 12 — LEASES
Prior
to August 2021, the Company had not directly entered into any office lease agreements. The lease expenses were paid by Zenapp on behalf
of the Company, with an estimated amount of $
| F-23 |
Effective
October 1, 2020, the Company adopted the new lease accounting standard ASC 842 using the optional transition method, which allowed the
Company to continue applying the guidance under the lease standard in effect at the time in the comparative periods presented. In addition,
the Company elected the package of practical expedients, which allowed it to not reassess whether any existing contracts contain a lease,
to not reassess historical lease classification as operating or finance leases, and to not reassess initial direct costs. The Company
has not elected the practical expedient to use hindsight to determine the lease term for its leases at transition. The Company has also
elected the practical expedient allowing it to not separate the lease and non-lease components for all classes of underlying assets.
Adoption of this standard resulted in the recording of operating lease right-of-use assets and corresponding operating lease liabilities
of approximately $
Supplemental balance sheet information related to the Company’s operating leases was as follows:
| September 30, 2022 | September 30, 2021 | |||||||
| Operating lease right-of-use assets | $ | $ | ||||||
| Right-of-use assets - accumulated amortization | ( | ) | ( | ) | ||||
| Right-of-use assets, net | $ | $ | ||||||
| Operating lease liabilities – current | $ | $ | ||||||
| Operating lease liabilities – non-current | ||||||||
| Total operating lease liabilities | $ | $ | ||||||
The weighted average remaining lease terms and discount rates for all of operating leases were as follows as of September 30, 2022 and 2021:
| September 30, 2022 | September 30, 2021 | |||||||
| Remaining lease term and discount rate: | ||||||||
| Weighted average remaining lease term (years) | ||||||||
| Weighted average discount rate * | % | % | ||||||
| * |
During
the fiscal years ended September 30, 2022, 2021, and 2020, the Company incurred total ASC 842 operating lease expenses of $
As of September 30, 2022, the maturities of operating lease liabilities were as follows:
| 12 months ending September 30, | Lease payment | |||
| 2023 | $ | |||
| 2024 | ||||
| 2025 | ||||
| Total future minimum lease payments | ||||
| Less: imputed interest | ||||
| Total | $ | |||
| F-24 |
NOTE 13 — SEGMENT REPORTING
An operating segment is a component of the Company that engages in business activities from which it may earn revenue and incur expenses, and is identified on the basis of the internal financial reports that are provided to and regularly reviewed by the Company’s chief operating decision maker (the “CODM”) in order to allocate resources and assess the performance of the segment.
In accordance with ASC 280, Segment Reporting, operating segments are defined as components of an enterprise about which separate financial information is available that is evaluated regularly by the CODM or decision-making group, in deciding how to allocate resources and in assessing performance. The Company uses the “management approach” in determining reportable operating segments. The management approach considers the internal organization and reporting used by the Company’s CODM for making operating decisions and assessing performance as the source for determining the Company’s reportable segments. Management, including the CODM, reviews operating results by the revenue of different services. Based on management’s assessment, the Company has determined that it has three operating segments as defined by ASC 280, including digital advertising services, cash rebate services, and payment solution services.
Revenue by service categories
The following tables present summary information by segment for the fiscal years ended September 30, 2022, 2021, and 2020, respectively:
For the Fiscal Year Ended September 30, 2022 | ||||||||||||||||
| Cash rebate services | Digital advertising services | Payment solution services | Total | |||||||||||||
| Revenue | $ | $ | $ | $ | ||||||||||||
| Operating costs | ||||||||||||||||
| Income (loss) from operations | ( | ) | ( | ) | ||||||||||||
| Income tax expense | ||||||||||||||||
| Net income (loss) | ( | ) | ( | ) | ||||||||||||
| Capital expenditure | $ | $ | $ | $ | ||||||||||||
| Total assets | $ | $ | $ | $ | ||||||||||||
For the Fiscal Year Ended September 30, 2021 | ||||||||||||||||
| Cash rebate services | Digital advertising services | Payment solution services | Total | |||||||||||||
| Revenue | $ | $ | $ | $ | ||||||||||||
| Operating costs | ||||||||||||||||
| Income (loss) from operations | ( | ) | ( | ) | ||||||||||||
| Income tax expense | ||||||||||||||||
| Net income (loss) | ( | ) | ( | ) | ||||||||||||
| Capital expenditure | $ | $ | $ | $ | ||||||||||||
| Total assets | $ | $ | $ | $ | ||||||||||||
For the Fiscal Year Ended September 30, 2020 | ||||||||||||||||
| Cash rebate services | Digital advertising services | Payment solution services | Total | |||||||||||||
| Revenue | $ | $ | $ | $ | ||||||||||||
| Operating costs | ||||||||||||||||
| Income (loss) from operations | ( | ) | ( | ) | ||||||||||||
| Income tax expense | ||||||||||||||||
| Net income (loss) | ( | ) | ( | ) | ||||||||||||
| Capital expenditure | $ | $ | $ | $ | ||||||||||||
| Total assets | $ | $ | $ | $ | ||||||||||||
| F-25 |
NOTE 14 — SUBSEQUENT EVENTS
Private Placement
On
October 26, 2022, the Company entered into certain subscription agreements (the “Subscription Agreements”) with four investors
(the “Subscribers”). Pursuant to the Subscription Agreements and in reliance on Rule 902 of Regulation S (“Regulation
S”) promulgated under the Securities Act of 1933, as amended, the Company agreed to sell and the Subscribers agreed to purchase
an aggregate of ordinary shares of the Company at a price of $ per share (the “Private Placement”). The Subscribers
represented that they were not residents of the United States and were not “U.S. persons” as defined in Rule 902(k) of Regulation
S and were not acquiring the Shares for the account or benefit of any U.S. person. On November 3, 2022, the Company closed the private
placement and issued and sold an aggregate of ordinary shares to the Subscribers at a price of $ per share for the gross
proceeds of $
Deposit for software development project
In
order to upgrade the Company’s existing software and operating systems to increase the data processing capability, to diversify
the Company’s business operation model and to support its future business expansion, in October 2022, the Company signed a contract
with a third-party, ARX, to conduct software application design and development project. ARX is a full-stacked technology solution company
specializing in design and development of application of AR, Mixed Reality, Virtual Reality (“VR”), Integrated Business Solution,
and Internet of Things to help business entities stand out among the crowd. Total contract price with ARX for Rebates Mall software design
and customization, AR software development, and database processing capacity improvement amounted to MYR
The Company evaluated the subsequent event through January 18, 2023, the date of this report, and concluded that there are no additional material reportable subsequent events that need to be disclosed.
| F-26 |