0000018998302022FYtruefalsefalsefalseP3DP10DP10DP4Y1MP30DP1Y0.500.300.010.010.010.010.010.01false0001899830perf:ForwardPurchaseWarrantsMemberperf:WarrantLiabilitiesMemberperf:ForwardPurchaseAgreementsMember2021-10-272021-10-270001899830perf:PrivatePlacementWarrantsMemberperf:WarrantLiabilitiesMember2021-01-072021-01-070001899830perf:ShareholderEarnoutSharesMember2022-01-012022-12-310001899830perf:PrivatePlacementWarrantsMember2022-01-012022-12-310001899830ifrs-full:PreferenceSharesMember2022-10-282022-10-280001899830ifrs-full:PreferenceSharesMember2021-01-012021-12-310001899830perf:ForwardPurchaseAgreementsMember2022-12-310001899830perf:LaterThanOneYearAndNotLaterThanFourYearsMember2022-01-012022-12-310001899830ifrs-full:NotLaterThanOneYearMember2022-01-012022-12-310001899830perf:ConvertiblePreferredSharesMemberifrs-full:Level3OfFairValueHierarchyMemberperf:DiscountOfLackOfMarketabilityMeasurementInputMemberifrs-full:MarketApproachMember2021-01-012021-12-310001899830perf:ConvertiblePreferredSharesMemberifrs-full:Level3OfFairValueHierarchyMemberifrs-full:WeightedAverageCostOfCapitalMeasurementInputMemberifrs-full:IncomeApproachMember2021-01-012021-12-310001899830perf:ConvertiblePreferredSharesMemberifrs-full:Level3OfFairValueHierarchyMemberifrs-full:WeightedAverageCostOfCapitalMeasurementInputMemberifrs-full:IncomeApproachMember2022-01-012022-12-310001899830perf:ConvertiblePreferredSharesMemberifrs-full:Level3OfFairValueHierarchyMemberifrs-full:MarketApproachMember2022-01-012022-12-310001899830perf:PerfectClassOrdinarySharesMember2022-10-282022-10-280001899830perf:ShareIncentivePlanMemberperf:AfterRecapitalizationMember2022-12-310001899830perf:ShareIncentivePlanMember2021-12-310001899830perf:PerfectOriginalSharesExchangedForPerfectNewClassOrdinarySharesMember2022-12-310001899830perf:PerfectOriginalSharesExchangedForPerfectNewClassBOrdinarySharesMember2022-12-310001899830perf:PerfectOriginalPreferredSharesExchangedForPerfectNewClassOrdinarySharesMember2022-12-310001899830perf:PerfectOriginalPreferredSharesExchangedForPerfectNewClassBOrdinarySharesMember2022-12-310001899830perf:PerfectOriginalCommonSharesExchangedForPerfectNewClassOrdinarySharesMember2022-12-310001899830perf:PerfectOriginalCommonSharesExchangedForPerfectNewClassBOrdinarySharesMember2022-12-310001899830perf:PerfectClassOrdinarySharesIssuedInExchangeForPerfectOriginalPreferredSharesMember2022-12-310001899830perf:PerfectClassOrdinarySharesIssuedInExchangeForPerfectOriginalCommonSharesMember2022-12-310001899830perf:PerfectClassBOrdinarySharesIssuedInExchangeForPerfectOriginalPreferredSharesMember2022-12-310001899830perf:PerfectClassBOrdinarySharesIssuedInExchangeForPerfectOriginalCommonSharesMember2022-12-3100018998302022-01-240001899830perf:ShareholderEarnoutSharesMemberperf:IfDailyVolumeWeightedAveragePriceOfPerfectClassOrdinarySharesIsGreaterThanOrEqualTo14.50Member2022-12-310001899830perf:ShareholderEarnoutSharesMemberperf:IfDailyVolumeWeightedAveragePriceOfPerfectClassOrdinarySharesIsGreaterThanOrEqualTo13.00Member2022-12-310001899830perf:ShareholderEarnoutSharesMemberperf:IfDailyVolumeWeightedAveragePriceOfPerfectClassOrdinarySharesIsGreaterThanOrEqualTo11.50Member2022-12-310001899830perf:WarrantLiabilitiesMemberperf:ForwardPurchaseAgreementsMember2022-12-310001899830perf:SponsorEarnoutSharesMember2022-12-310001899830perf:CyberLinkJapanMemberifrs-full:TopOfRangeMember2022-01-012022-12-310001899830perf:CyberLinkCorpMemberifrs-full:BottomOfRangeMember2022-01-012022-12-310001899830perf:PublicWarrantsMemberperf:WarrantLiabilitiesMember2022-01-012022-12-310001899830perf:PrivatePlacementWarrantsMemberperf:WarrantLiabilitiesMember2022-01-012022-12-310001899830perf:ForwardPurchaseWarrantsMemberperf:WarrantLiabilitiesMember2022-01-012022-12-310001899830perf:SponsorAndThreeDirectorsAndTwoAdvisorsOfProvidentMemberperf:PerfectClassOrdinarySharesMember2022-01-012022-12-310001899830perf:PublicShareholdersWhoDidNotExerciseTheirRightToRedeemAnyProvidentClassOrdinarySharesBeforeClosingMemberperf:PerfectClassOrdinarySharesMember2022-01-012022-12-310001899830perf:PipeInvestorsMemberperf:PerfectClassOrdinarySharesMember2022-01-012022-12-310001899830perf:FpaInvestorsMemberperf:PerfectClassOrdinarySharesMember2022-01-012022-12-310001899830perf:FormerHoldersOfProvidentClassOrdinarySharesAndProvidentClassBOrdinarySharesMemberperf:PerfectClassOrdinarySharesMember2022-01-012022-12-310001899830ifrs-full:PreferenceSharesMember2022-01-012022-12-310001899830ifrs-full:PreferenceSharesMember2018-11-192018-11-190001899830ifrs-full:PreferenceSharesMember2017-07-012017-07-310001899830perf:ForwardPurchaseAgreementsMember2022-10-282022-10-280001899830perf:ShareIncentivePlanMemberperf:ShareBasedPaymentArrangementTrancheTwoMember2022-01-012022-12-310001899830perf:ShareIncentivePlanMemberperf:ShareBasedPaymentArrangementTrancheThreeMember2022-01-012022-12-310001899830perf:ShareIncentivePlanMemberperf:ShareBasedPaymentArrangementTrancheOneMember2022-01-012022-12-310001899830perf:IncentiveStockOptionPlan2018Memberperf:ShareBasedPaymentArrangementTrancheTwoMember2022-01-012022-12-310001899830perf:IncentiveStockOptionPlan2018Memberperf:ShareBasedPaymentArrangementTrancheThreeMember2022-01-012022-12-310001899830perf:IncentiveStockOptionPlan2018Memberperf:ShareBasedPaymentArrangementTrancheOneMember2022-01-012022-12-310001899830perf:IncentiveStockOptionPlan2015Memberperf:ShareBasedPaymentArrangementTrancheTwoMember2022-01-012022-12-310001899830perf:IncentiveStockOptionPlan2015Memberperf:ShareBasedPaymentArrangementTrancheThreeMember2022-01-012022-12-310001899830perf:IncentiveStockOptionPlan2015Memberperf:ShareBasedPaymentArrangementTrancheOneMember2022-01-012022-12-310001899830ifrs-full:TopOfRangeMember2022-01-012022-12-310001899830ifrs-full:BottomOfRangeMember2022-01-012022-12-310001899830perf:PublicWarrantsMemberperf:WarrantLiabilitiesMember2022-12-310001899830perf:PrivatePlacementWarrantsMemberperf:WarrantLiabilitiesMember2022-12-310001899830perf:ForwardPurchaseWarrantsMemberperf:WarrantLiabilitiesMember2022-12-310001899830perf:WarrantLiabilitiesMember2022-12-310001899830perf:PublicWarrantsMemberperf:WarrantLiabilitiesMemberperf:PerfectClassOrdinarySharesMember2022-12-310001899830perf:WarrantLiabilitiesMemberperf:ClassOrdinarySharesMember2022-12-310001899830perf:WarrantLiabilitiesMemberperf:ClassOrdinarySharesMember2022-01-012022-12-310001899830ifrs-full:PreferenceSharesMember2018-11-190001899830perf:UsdDenominatedInRmbMemberifrs-full:CurrencyRiskMember2022-01-012022-12-310001899830perf:UsdDenominatedInJpyMemberifrs-full:CurrencyRiskMember2022-01-012022-12-310001899830perf:UsdDenominatedInRmbMemberifrs-full:CurrencyRiskMember2021-01-012021-12-310001899830perf:UsdDenominatedInJpyMemberifrs-full:CurrencyRiskMember2021-01-012021-12-310001899830perf:UsdDenominatedInNtdMemberifrs-full:CurrencyRiskMember2022-01-012022-12-310001899830perf:JpyDenominatedInNtdMemberifrs-full:CurrencyRiskMember2022-01-012022-12-310001899830perf:EurDenominatedInNtdMemberifrs-full:CurrencyRiskMember2022-01-012022-12-310001899830perf:UsdDenominatedInNtdMemberifrs-full:CurrencyRiskMember2021-01-012021-12-310001899830perf:JpyDenominatedInNtdMemberifrs-full:CurrencyRiskMember2021-01-012021-12-310001899830perf:EurDenominatedInNtdMemberifrs-full:CurrencyRiskMember2021-01-012021-12-310001899830perf:PerfectOrdinarySharesMember2022-01-012022-12-310001899830perf:PerfectCommonShareBeforeClosingMember2022-01-012022-12-310001899830ifrs-full:GrossCarryingAmountMemberifrs-full:BuildingsMember2022-01-012022-12-310001899830ifrs-full:AccumulatedDepreciationAndAmortisationMemberifrs-full:BuildingsMember2022-01-012022-12-310001899830ifrs-full:GrossCarryingAmountMemberifrs-full:BuildingsMember2021-01-012021-12-310001899830ifrs-full:AccumulatedDepreciationAndAmortisationMemberifrs-full:BuildingsMember2021-01-012021-12-310001899830ifrs-full:UnrealisedForeignExchangeGainsLossesMember2022-01-012022-12-310001899830ifrs-full:OtherTemporaryDifferencesMember2022-01-012022-12-310001899830ifrs-full:AllowanceForCreditLossesMember2022-01-012022-12-310001899830ifrs-full:UnusedTaxLossesMember2021-01-012021-12-310001899830ifrs-full:UnrealisedForeignExchangeGainsLossesMember2021-01-012021-12-310001899830ifrs-full:OtherTemporaryDifferencesMember2021-01-012021-12-310001899830ifrs-full:AllowanceForCreditLossesMember2021-01-012021-12-310001899830perf:SponsorEarnoutSharesMemberperf:IfDailyVolumeWeightedAveragePriceOfPerfectClassOrdinarySharesIsGreaterThanOrEqualTo13.00Member2022-01-012022-12-310001899830perf:SponsorEarnoutSharesMemberperf:IfDailyVolumeWeightedAveragePriceOfPerfectClassOrdinarySharesIsGreaterThanOrEqualTo11.50Member2022-01-012022-12-310001899830perf:ShareholderEarnoutSharesMemberperf:IfDailyVolumeWeightedAveragePriceOfPerfectClassOrdinarySharesIsGreaterThanOrEqualTo14.50Member2022-01-012022-12-310001899830perf:ShareholderEarnoutSharesMemberperf:IfDailyVolumeWeightedAveragePriceOfPerfectClassOrdinarySharesIsGreaterThanOrEqualTo13.00Member2022-01-012022-12-310001899830perf:ShareholderEarnoutSharesMemberperf:IfDailyVolumeWeightedAveragePriceOfPerfectClassOrdinarySharesIsGreaterThanOrEqualTo11.50Member2022-01-012022-12-310001899830perf:PerfectClassBOrdinarySharesMember2022-01-012022-12-310001899830perf:ScenarioFor8CompoundInterestAndDividendsMember2022-01-012022-12-310001899830perf:ScenarioFor20InterestAndDividendsMember2022-01-012022-12-310001899830perf:BusinessCooperationAgreementMember2022-01-012022-12-310001899830perf:PublicWarrantsAndForwardPurchaseWarrantsMemberperf:RedemptionOfWarrantsWhenPricePerShareOfPerfectClassOrdinarySharesEqualsOrExceeds18.00Member2022-01-012022-12-310001899830perf:PublicWarrantsAndForwardPurchaseWarrantsMemberperf:RedemptionOfWarrantsWhenPricePerShareOfClassaOrdinarySharesEqualsOrExceeds10.00Member2022-01-012022-12-310001899830perf:PrivatePlacementWarrantsMemberperf:RedemptionOfWarrantsWhenPricePerShareOfPerfectClassOrdinarySharesEqualsOrExceeds18.00Member2022-01-012022-12-310001899830perf:PrivatePlacementWarrantsMemberperf:RedemptionOfWarrantsWhenPricePerShareOfClassaOrdinarySharesEqualsOrExceeds10.00Member2022-01-012022-12-310001899830perf:PublicWarrantsAndForwardPurchaseWarrantsMemberperf:WarrantLiabilitiesMemberperf:RedemptionOfWarrantsWhenPricePerShareOfPerfectClassOrdinarySharesEqualsOrExceeds18.00Member2022-01-012022-12-310001899830perf:PublicWarrantsAndForwardPurchaseWarrantsMemberperf:WarrantLiabilitiesMemberperf:RedemptionOfWarrantsWhenPricePerShareOfClassaOrdinarySharesEqualsOrExceeds10.00Member2022-01-012022-12-310001899830perf:ConvertibleBondsMember2017-07-012017-07-310001899830perf:SubscriptionAgreementsMember2022-01-012022-12-310001899830perf:ForwardPurchaseAgreementsMember2022-01-012022-12-310001899830perf:ForwardPurchaseAgreementsMember2021-10-272021-10-270001899830ifrs-full:TopOfRangeMemberperf:IncentiveStockOptionPlanMember2022-01-012022-12-310001899830ifrs-full:BottomOfRangeMemberperf:IncentiveStockOptionPlanMember2022-01-012022-12-310001899830ifrs-full:TopOfRangeMemberperf:IncentiveStockOptionPlanMember2021-01-012021-12-310001899830ifrs-full:BottomOfRangeMemberperf:IncentiveStockOptionPlanMember2021-01-012021-12-310001899830ifrs-full:TopOfRangeMemberperf:IncentiveStockOptionPlanMember2020-01-012020-12-310001899830ifrs-full:BottomOfRangeMemberperf:IncentiveStockOptionPlanMember2020-01-012020-12-310001899830ifrs-full:LeaseholdImprovementsMemberifrs-full:TopOfRangeMember2022-01-012022-12-310001899830ifrs-full:LeaseholdImprovementsMemberifrs-full:BottomOfRangeMember2022-01-012022-12-310001899830perf:TaxOriginationYear2022Member2022-12-310001899830perf:TaxOriginationYear2021Member2022-12-310001899830perf:TaxOriginationYear2020Member2022-12-310001899830perf:TaxOriginationYear2019Member2022-12-310001899830perf:TaxOriginationYear2018Member2022-12-310001899830perf:TaxOriginationYear2017Member2022-12-310001899830perf:TaxOriginationYear2016Member2022-12-310001899830perf:TaxOriginationYear2015Member2022-12-310001899830perf:TaxOriginationYear2021Member2021-12-310001899830perf:TaxOriginationYear2020Member2021-12-310001899830perf:TaxOriginationYear2019Member2021-12-310001899830perf:TaxOriginationYear2018Member2021-12-310001899830perf:TaxOriginationYear2017Member2021-12-310001899830perf:TaxOriginationYear2016Member2021-12-310001899830perf:TaxOriginationYear2015Member2021-12-310001899830ifrs-full:Level3OfFairValueHierarchyMember2022-01-012022-12-310001899830ifrs-full:Level3OfFairValueHierarchyMember2021-01-012021-12-310001899830perf:PerfectMobileCorp.TaiwanMember2020-01-012020-12-310001899830country:KY2022-01-012022-12-310001899830perf:ConvertiblePreferredSharesMemberifrs-full:Level3OfFairValueHierarchyMemberperf:DiscountOfLackOfMarketabilityMeasurementInputMemberifrs-full:MarketApproachMember2021-12-310001899830ifrs-full:LiquidityRiskMember2022-12-310001899830ifrs-full:LiquidityRiskMember2021-12-310001899830ifrs-full:GrossCarryingAmountMemberifrs-full:VehiclesMember2022-12-310001899830ifrs-full:GrossCarryingAmountMemberifrs-full:BuildingsMember2022-12-310001899830ifrs-full:AccumulatedDepreciationAndAmortisationMemberifrs-full:VehiclesMember2022-12-310001899830ifrs-full:AccumulatedDepreciationAndAmortisationMemberifrs-full:BuildingsMember2022-12-310001899830ifrs-full:VehiclesMember2022-12-310001899830ifrs-full:BuildingsMember2022-12-310001899830ifrs-full:GrossCarryingAmountMemberifrs-full:VehiclesMember2021-12-310001899830ifrs-full:GrossCarryingAmountMemberifrs-full:BuildingsMember2021-12-310001899830ifrs-full:AccumulatedDepreciationAndAmortisationMemberifrs-full:VehiclesMember2021-12-310001899830ifrs-full:AccumulatedDepreciationAndAmortisationMemberifrs-full:BuildingsMember2021-12-310001899830ifrs-full:VehiclesMember2021-12-310001899830ifrs-full:BuildingsMember2021-12-310001899830ifrs-full:GrossCarryingAmountMemberifrs-full:BuildingsMember2020-12-310001899830ifrs-full:AccumulatedDepreciationAndAmortisationMemberifrs-full:BuildingsMember2020-12-310001899830ifrs-full:BuildingsMember2020-12-310001899830perf:OtherCountriesMemberifrs-full:GoodsOrServicesTransferredOverTimeMember2022-01-012022-12-310001899830perf:OtherCountriesMemberifrs-full:GoodsOrServicesTransferredAtPointInTimeMember2022-01-012022-12-310001899830country:USifrs-full:GoodsOrServicesTransferredOverTimeMember2022-01-012022-12-310001899830country:USifrs-full:GoodsOrServicesTransferredAtPointInTimeMember2022-01-012022-12-310001899830country:JPifrs-full:GoodsOrServicesTransferredOverTimeMember2022-01-012022-12-310001899830country:JPifrs-full:GoodsOrServicesTransferredAtPointInTimeMember2022-01-012022-12-310001899830country:FRifrs-full:GoodsOrServicesTransferredOverTimeMember2022-01-012022-12-310001899830country:FRifrs-full:GoodsOrServicesTransferredAtPointInTimeMember2022-01-012022-12-310001899830ifrs-full:GoodsOrServicesTransferredOverTimeMember2022-01-012022-12-310001899830ifrs-full:GoodsOrServicesTransferredAtPointInTimeMember2022-01-012022-12-310001899830perf:OtherCountriesMemberifrs-full:GoodsOrServicesTransferredOverTimeMember2021-01-012021-12-310001899830perf:OtherCountriesMemberifrs-full:GoodsOrServicesTransferredAtPointInTimeMember2021-01-012021-12-310001899830country:USifrs-full:GoodsOrServicesTransferredOverTimeMember2021-01-012021-12-310001899830country:USifrs-full:GoodsOrServicesTransferredAtPointInTimeMember2021-01-012021-12-310001899830country:JPifrs-full:GoodsOrServicesTransferredOverTimeMember2021-01-012021-12-310001899830country:JPifrs-full:GoodsOrServicesTransferredAtPointInTimeMember2021-01-012021-12-310001899830country:FRifrs-full:GoodsOrServicesTransferredOverTimeMember2021-01-012021-12-310001899830country:FRifrs-full:GoodsOrServicesTransferredAtPointInTimeMember2021-01-012021-12-310001899830ifrs-full:GoodsOrServicesTransferredOverTimeMember2021-01-012021-12-310001899830ifrs-full:GoodsOrServicesTransferredAtPointInTimeMember2021-01-012021-12-310001899830perf:OtherCountriesMemberifrs-full:GoodsOrServicesTransferredOverTimeMember2020-01-012020-12-310001899830perf:OtherCountriesMemberifrs-full:GoodsOrServicesTransferredAtPointInTimeMember2020-01-012020-12-310001899830country:USifrs-full:GoodsOrServicesTransferredOverTimeMember2020-01-012020-12-310001899830country:USifrs-full:GoodsOrServicesTransferredAtPointInTimeMember2020-01-012020-12-310001899830country:JPifrs-full:GoodsOrServicesTransferredOverTimeMember2020-01-012020-12-310001899830country:JPifrs-full:GoodsOrServicesTransferredAtPointInTimeMember2020-01-012020-12-310001899830country:FRifrs-full:GoodsOrServicesTransferredOverTimeMember2020-01-012020-12-310001899830country:FRifrs-full:GoodsOrServicesTransferredAtPointInTimeMember2020-01-012020-12-310001899830ifrs-full:GoodsOrServicesTransferredOverTimeMember2020-01-012020-12-310001899830ifrs-full:GoodsOrServicesTransferredAtPointInTimeMember2020-01-012020-12-310001899830perf:OtherCountriesMember2022-01-012022-12-310001899830perf:ClientMember2022-01-012022-12-310001899830country:US2022-01-012022-12-310001899830country:JP2022-01-012022-12-310001899830country:FR2022-01-012022-12-310001899830perf:OtherCountriesMember2021-01-012021-12-310001899830perf:ClientMember2021-01-012021-12-310001899830country:US2021-01-012021-12-310001899830country:JP2021-01-012021-12-310001899830country:FR2021-01-012021-12-310001899830perf:OtherCountriesMember2020-01-012020-12-310001899830perf:ClientMember2020-01-012020-12-310001899830country:US2020-01-012020-12-310001899830country:JP2020-01-012020-12-310001899830country:FR2020-01-012020-12-310001899830perf:CyberLinkJapanMember2022-01-012022-12-310001899830perf:CyberLinkJapanMember2021-01-012021-12-310001899830perf:CyberLinkJapanMember2020-01-012020-12-3100018998302020-12-112020-12-110001899830perf:PerfectMobileLimited.FranceMember2022-01-012022-12-310001899830perf:PerfectMobileCorpB.V.I.Member2022-01-012022-12-310001899830perf:PerfectCorp.UsaMember2022-01-012022-12-310001899830perf:PerfectCorp.ShanghaiMember2022-01-012022-12-310001899830perf:PerfectCorp.JapanMember2022-01-012022-12-310001899830perf:FashionCorp.Member2022-01-012022-12-310001899830perf:PerfectMobileCorpB.V.I.Member2021-01-012021-12-310001899830perf:PerfectCorp.UsaMember2021-01-012021-12-310001899830perf:PerfectCorp.ShanghaiMember2021-01-012021-12-310001899830perf:PerfectCorp.JapanMember2021-01-012021-12-310001899830perf:FashionCorp.Member2021-01-012021-12-310001899830perf:BeautyCorp.Member2021-01-012021-12-310001899830ifrs-full:GrossCarryingAmountMemberifrs-full:OfficeEquipmentMember2022-12-310001899830ifrs-full:GrossCarryingAmountMemberifrs-full:MachineryMember2022-12-310001899830ifrs-full:GrossCarryingAmountMemberifrs-full:LeaseholdImprovementsMember2022-12-310001899830ifrs-full:AccumulatedDepreciationAndAmortisationMemberifrs-full:OfficeEquipmentMember2022-12-310001899830ifrs-full:AccumulatedDepreciationAndAmortisationMemberifrs-full:MachineryMember2022-12-310001899830ifrs-full:AccumulatedDepreciationAndAmortisationMemberifrs-full:LeaseholdImprovementsMember2022-12-310001899830ifrs-full:OfficeEquipmentMember2022-12-310001899830ifrs-full:MachineryMember2022-12-310001899830ifrs-full:LeaseholdImprovementsMember2022-12-310001899830ifrs-full:GrossCarryingAmountMemberifrs-full:OfficeEquipmentMember2021-12-310001899830ifrs-full:GrossCarryingAmountMemberifrs-full:MachineryMember2021-12-310001899830ifrs-full:GrossCarryingAmountMemberifrs-full:LeaseholdImprovementsMember2021-12-310001899830ifrs-full:AccumulatedDepreciationAndAmortisationMemberifrs-full:OfficeEquipmentMember2021-12-310001899830ifrs-full:AccumulatedDepreciationAndAmortisationMemberifrs-full:MachineryMember2021-12-310001899830ifrs-full:AccumulatedDepreciationAndAmortisationMemberifrs-full:LeaseholdImprovementsMember2021-12-310001899830ifrs-full:OfficeEquipmentMember2021-12-310001899830ifrs-full:MachineryMember2021-12-310001899830ifrs-full:LeaseholdImprovementsMember2021-12-310001899830ifrs-full:GrossCarryingAmountMemberifrs-full:OfficeEquipmentMember2020-12-310001899830ifrs-full:GrossCarryingAmountMemberifrs-full:MachineryMember2020-12-310001899830ifrs-full:GrossCarryingAmountMemberifrs-full:LeaseholdImprovementsMember2020-12-310001899830ifrs-full:AccumulatedDepreciationAndAmortisationMemberifrs-full:OfficeEquipmentMember2020-12-310001899830ifrs-full:AccumulatedDepreciationAndAmortisationMemberifrs-full:MachineryMember2020-12-310001899830ifrs-full:AccumulatedDepreciationAndAmortisationMemberifrs-full:LeaseholdImprovementsMember2020-12-310001899830ifrs-full:OfficeEquipmentMember2020-12-310001899830ifrs-full:MachineryMember2020-12-310001899830ifrs-full:LeaseholdImprovementsMember2020-12-310001899830perf:ConvertiblePreferredSharesMemberifrs-full:Level3OfFairValueHierarchyMemberperf:ExitMultipleMeasurementInputMember2021-12-310001899830perf:ConvertiblePreferredSharesMemberifrs-full:Level3OfFairValueHierarchyMemberperf:DiscountOfLackOfMarketabilityMeasurementInputMember2021-12-310001899830perf:ConvertiblePreferredSharesMemberifrs-full:Level3OfFairValueHierarchyMemberifrs-full:WeightedAverageCostOfCapitalMeasurementInputMember2021-12-310001899830ifrs-full:ActuarialAssumptionOfDiscountRatesMemberperf:PerfectMobileCorp.TaiwanMember2022-12-310001899830ifrs-full:ActuarialAssumptionOfDiscountRatesMemberperf:PerfectMobileCorp.TaiwanMember2021-12-310001899830perf:FormerHoldersOfProvidentClassOrdinarySharesAndProvidentClassBOrdinarySharesMemberperf:PerfectClassOrdinarySharesMember2022-12-310001899830perf:ProvidentClassOrdinarySharesMember2022-12-310001899830perf:ProvidentClassBOrdinarySharesMember2022-12-310001899830perf:PerfectClassOrdinarySharesMember2021-12-310001899830perf:PerfectClassBOrdinarySharesMember2021-12-310001899830perf:IncentiveStockOptionPlanMember2021-01-012021-12-310001899830perf:IncentiveStockOptionPlanMember2020-01-012020-12-310001899830perf:IncentiveStockOptionPlanMember2021-12-310001899830perf:IncentiveStockOptionPlanMember2020-12-310001899830perf:IncentiveStockOptionPlanMember2019-12-310001899830perf:OtherPayablesMemberifrs-full:NotLaterThanOneYearMember2022-12-310001899830perf:GuaranteeDepositsReceivedMemberifrs-full:LaterThanOneYearAndNotLaterThanFiveYearsMember2022-12-310001899830ifrs-full:LeaseLiabilitiesMemberifrs-full:NotLaterThanOneYearMember2022-12-310001899830ifrs-full:LeaseLiabilitiesMemberifrs-full:LaterThanOneYearAndNotLaterThanFiveYearsMember2022-12-310001899830ifrs-full:FinancialLiabilitiesAtFairValueMemberifrs-full:LaterThanOneYearAndNotLaterThanFiveYearsMember2022-12-310001899830perf:OtherPayablesMemberifrs-full:NotLaterThanOneYearMember2021-12-310001899830perf:GuaranteeDepositsReceivedMemberifrs-full:LaterThanOneYearAndNotLaterThanFiveYearsMember2021-12-310001899830ifrs-full:LeaseLiabilitiesMemberifrs-full:NotLaterThanOneYearMember2021-12-310001899830ifrs-full:LeaseLiabilitiesMemberifrs-full:LaterThanOneYearAndNotLaterThanFiveYearsMember2021-12-310001899830ifrs-full:FinancialLiabilitiesAtFairValueMemberifrs-full:LaterThanOneYearAndNotLaterThanFiveYearsMember2021-12-310001899830ifrs-full:PreferenceSharesMember2021-12-310001899830perf:PreferenceShareLiabilitiesMember2021-12-310001899830ifrs-full:PresentValueOfDefinedBenefitObligationMemberperf:PerfectMobileCorp.TaiwanMember2022-12-310001899830ifrs-full:PlanAssetsMemberperf:PerfectMobileCorp.TaiwanMember2022-12-310001899830ifrs-full:PresentValueOfDefinedBenefitObligationMemberperf:PerfectMobileCorp.TaiwanMember2021-12-310001899830ifrs-full:PlanAssetsMemberperf:PerfectMobileCorp.TaiwanMember2021-12-310001899830ifrs-full:PresentValueOfDefinedBenefitObligationMemberperf:PerfectMobileCorp.TaiwanMember2020-12-310001899830ifrs-full:PlanAssetsMemberperf:PerfectMobileCorp.TaiwanMember2020-12-310001899830perf:PerfectMobileCorp.TaiwanMember2020-12-310001899830ifrs-full:LeaseLiabilitiesMember2022-12-310001899830ifrs-full:FinancialLiabilitiesAtFairValueThroughProfitOrLossCategoryMember2022-12-310001899830ifrs-full:LeaseLiabilitiesMember2021-12-310001899830ifrs-full:FinancialLiabilitiesAtFairValueThroughProfitOrLossCategoryMember2021-12-310001899830ifrs-full:LeaseLiabilitiesMember2020-12-310001899830ifrs-full:FinancialLiabilitiesAtFairValueThroughProfitOrLossCategoryMember2020-12-310001899830ifrs-full:LeaseLiabilitiesMember2019-12-310001899830ifrs-full:FinancialLiabilitiesAtFairValueThroughProfitOrLossCategoryMember2019-12-310001899830perf:ConvertiblePreferredSharesMember2021-12-310001899830perf:ConvertiblePreferredSharesMember2020-12-310001899830ifrs-full:PreferenceSharesMember2020-12-112020-12-110001899830ifrs-full:PreferenceSharesMember2019-07-082019-07-080001899830ifrs-full:PreferenceSharesMember2017-10-172017-10-170001899830ifrs-full:GrossCarryingAmountMemberifrs-full:OtherIntangibleAssetsMember2022-12-310001899830ifrs-full:GrossCarryingAmountMemberifrs-full:ComputerSoftwareMember2022-12-310001899830ifrs-full:AccumulatedDepreciationAndAmortisationMemberifrs-full:OtherIntangibleAssetsMember2022-12-310001899830ifrs-full:AccumulatedDepreciationAndAmortisationMemberifrs-full:ComputerSoftwareMember2022-12-310001899830ifrs-full:OtherIntangibleAssetsMember2022-12-310001899830ifrs-full:GrossCarryingAmountMember2022-12-310001899830ifrs-full:ComputerSoftwareMember2022-12-310001899830ifrs-full:AccumulatedDepreciationAndAmortisationMember2022-12-310001899830ifrs-full:GrossCarryingAmountMemberifrs-full:OtherIntangibleAssetsMember2021-12-310001899830ifrs-full:GrossCarryingAmountMemberifrs-full:ComputerSoftwareMember2021-12-310001899830ifrs-full:AccumulatedDepreciationAndAmortisationMemberifrs-full:OtherIntangibleAssetsMember2021-12-310001899830ifrs-full:AccumulatedDepreciationAndAmortisationMemberifrs-full:ComputerSoftwareMember2021-12-310001899830ifrs-full:OtherIntangibleAssetsMember2021-12-310001899830ifrs-full:GrossCarryingAmountMember2021-12-310001899830ifrs-full:ComputerSoftwareMember2021-12-310001899830ifrs-full:AccumulatedDepreciationAndAmortisationMember2021-12-310001899830ifrs-full:GrossCarryingAmountMemberifrs-full:OtherIntangibleAssetsMember2020-12-310001899830ifrs-full:GrossCarryingAmountMemberifrs-full:ComputerSoftwareMember2020-12-310001899830ifrs-full:AccumulatedDepreciationAndAmortisationMemberifrs-full:OtherIntangibleAssetsMember2020-12-310001899830ifrs-full:AccumulatedDepreciationAndAmortisationMemberifrs-full:ComputerSoftwareMember2020-12-310001899830ifrs-full:OtherIntangibleAssetsMember2020-12-310001899830ifrs-full:GrossCarryingAmountMember2020-12-310001899830ifrs-full:ComputerSoftwareMember2020-12-310001899830ifrs-full:AccumulatedDepreciationAndAmortisationMember2020-12-310001899830perf:EmployeeStockOptionsMember2022-01-012022-12-310001899830ifrs-full:OrdinarySharesMember2022-01-012022-12-310001899830perf:EmployeeStockOptionsMember2021-01-012021-12-310001899830ifrs-full:OrdinarySharesMember2021-01-012021-12-310001899830ifrs-full:AdditionalPaidinCapitalMember2021-01-012021-12-310001899830perf:EmployeeStockOptionsMember2020-01-012020-12-310001899830ifrs-full:LeaseLiabilitiesMember2022-01-012022-12-310001899830ifrs-full:LeaseLiabilitiesMember2021-01-012021-12-310001899830ifrs-full:LeaseLiabilitiesMember2020-01-012020-12-310001899830ifrs-full:AdditionalPaidinCapitalMember2022-01-012022-12-310001899830ifrs-full:FinancialLiabilitiesAtFairValueThroughProfitOrLossCategoryMember2022-01-012022-12-310001899830ifrs-full:FinancialLiabilitiesAtFairValueThroughProfitOrLossCategoryMember2021-01-012021-12-310001899830ifrs-full:FinancialLiabilitiesAtFairValueThroughProfitOrLossCategoryMember2020-01-012020-12-310001899830ifrs-full:ActuarialAssumptionOfExpectedRatesOfSalaryIncreasesMemberperf:PerfectMobileCorp.TaiwanMember2022-12-310001899830ifrs-full:ActuarialAssumptionOfExpectedRatesOfSalaryIncreasesMemberperf:PerfectMobileCorp.TaiwanMember2021-12-310001899830perf:WarrantLiabilitiesMember2022-01-012022-12-310001899830perf:PreferenceShareLiabilitiesMember2020-01-012020-12-310001899830perf:PreferenceShareLiabilitiesMember2022-01-012022-12-310001899830perf:PreferenceShareLiabilitiesMember2021-01-012021-12-310001899830perf:ConvertiblePreferredSharesMember2022-01-012022-12-310001899830perf:ConvertiblePreferredSharesMember2021-01-012021-12-310001899830ifrs-full:FinancialLiabilitiesAtFairValueThroughProfitOrLossCategoryMemberperf:WarrantLiabilitiesMemberifrs-full:Level2OfFairValueHierarchyMemberifrs-full:RecurringFairValueMeasurementMember2022-12-310001899830ifrs-full:FinancialLiabilitiesAtFairValueThroughProfitOrLossCategoryMemberperf:WarrantLiabilitiesMemberifrs-full:Level1OfFairValueHierarchyMemberifrs-full:RecurringFairValueMeasurementMember2022-12-310001899830ifrs-full:FinancialLiabilitiesAtFairValueThroughProfitOrLossCategoryMemberperf:WarrantLiabilitiesMemberifrs-full:RecurringFairValueMeasurementMember2022-12-310001899830ifrs-full:FinancialLiabilitiesAtFairValueThroughProfitOrLossCategoryMemberperf:WarrantLiabilitiesMember2022-12-310001899830ifrs-full:FinancialLiabilitiesAtAmortisedCostCategoryMemberperf:OtherPayablesMember2022-12-310001899830ifrs-full:FinancialLiabilitiesAtAmortisedCostCategoryMemberperf:GuaranteeDepositsReceivedMember2022-12-310001899830ifrs-full:FinancialLiabilitiesAtFairValueThroughProfitOrLossCategoryMember2022-12-310001899830ifrs-full:FinancialLiabilitiesAtFairValueThroughProfitOrLossCategoryMemberperf:ConvertiblePreferredSharesMemberifrs-full:Level3OfFairValueHierarchyMemberifrs-full:RecurringFairValueMeasurementMember2021-12-310001899830ifrs-full:FinancialLiabilitiesAtFairValueThroughProfitOrLossCategoryMemberperf:ConvertiblePreferredSharesMemberifrs-full:RecurringFairValueMeasurementMember2021-12-310001899830ifrs-full:FinancialLiabilitiesAtFairValueThroughProfitOrLossCategoryMemberifrs-full:FinancialLiabilitiesAtFairValueMember2021-12-310001899830ifrs-full:FinancialLiabilitiesAtAmortisedCostCategoryMemberperf:OtherPayablesMember2021-12-310001899830ifrs-full:FinancialLiabilitiesAtAmortisedCostCategoryMemberperf:GuaranteeDepositsReceivedMember2021-12-310001899830ifrs-full:FinancialLiabilitiesAtFairValueThroughProfitOrLossCategoryMember2021-12-310001899830ifrs-full:FinancialAssetsAtAmortisedCostCategoryMemberperf:OtherReceivablesMember2022-12-310001899830ifrs-full:FinancialAssetsAtAmortisedCostCategoryMemberperf:IfrsCashAndCashEquivalentsMember2022-12-310001899830ifrs-full:FinancialAssetsAtAmortisedCostCategoryMemberperf:GuaranteeDepositsPaidMember2022-12-310001899830ifrs-full:FinancialAssetsAtAmortisedCostCategoryMemberperf:CurrentFinancialAssetsAtAmortisedCostMember2022-12-310001899830ifrs-full:FinancialAssetsAtAmortisedCostCategoryMemberifrs-full:TradeReceivablesMember2022-12-310001899830ifrs-full:FinancialAssetsAtAmortisedCostCategoryMemberperf:OtherReceivablesMember2021-12-310001899830ifrs-full:FinancialAssetsAtAmortisedCostCategoryMemberperf:IfrsCashAndCashEquivalentsMember2021-12-310001899830ifrs-full:FinancialAssetsAtAmortisedCostCategoryMemberperf:GuaranteeDepositsPaidMember2021-12-310001899830ifrs-full:FinancialAssetsAtAmortisedCostCategoryMemberifrs-full:TradeReceivablesMember2021-12-310001899830perf:CyberLinkCorpMember2022-01-012022-12-310001899830perf:CyberLinkCorpMember2021-01-012021-12-310001899830perf:CyberLinkCorpMember2020-01-012020-12-310001899830perf:ServiceAgreementsWithBoardOfDirectorsMember2022-01-012022-12-310001899830perf:ShareIncentivePlanMemberperf:PriorToRecapitalizationMember2022-12-310001899830perf:ShareIncentivePlanMember2022-12-310001899830ifrs-full:TopOfRangeMemberperf:IncentiveStockOptionPlanMember2021-12-310001899830ifrs-full:BottomOfRangeMemberperf:IncentiveStockOptionPlanMember2021-12-310001899830ifrs-full:TopOfRangeMemberperf:IncentiveStockOptionPlanMember2020-12-310001899830ifrs-full:BottomOfRangeMemberperf:IncentiveStockOptionPlanMember2020-12-310001899830ifrs-full:LaterThanFiveYearsMemberperf:PerfectMobileCorp.TaiwanMember2022-01-012022-12-310001899830perf:EmployeeStockOptionsMember2022-12-310001899830ifrs-full:RetainedEarningsMember2022-12-310001899830ifrs-full:ReserveOfExchangeDifferencesOnTranslationMember2022-12-310001899830ifrs-full:OrdinarySharesMember2022-12-310001899830ifrs-full:AdditionalPaidinCapitalMember2022-12-310001899830perf:EmployeeStockOptionsMember2021-12-310001899830ifrs-full:RetainedEarningsMember2021-12-310001899830ifrs-full:ReserveOfExchangeDifferencesOnTranslationMember2021-12-310001899830ifrs-full:ReserveOfChangeInFairValueOfFinancialLiabilityAttributableToChangeInCreditRiskOfLiabilityMember2021-12-310001899830ifrs-full:OrdinarySharesMember2021-12-310001899830ifrs-full:AdditionalPaidinCapitalMember2021-12-310001899830perf:EmployeeStockOptionsMember2020-12-310001899830ifrs-full:RetainedEarningsMember2020-12-310001899830ifrs-full:ReserveOfExchangeDifferencesOnTranslationMember2020-12-310001899830ifrs-full:OrdinarySharesMember2020-12-310001899830ifrs-full:AdditionalPaidinCapitalMember2020-12-310001899830perf:EmployeeStockOptionsMember2019-12-310001899830ifrs-full:RetainedEarningsMember2019-12-310001899830ifrs-full:ReserveOfExchangeDifferencesOnTranslationMember2019-12-310001899830ifrs-full:OrdinarySharesMember2019-12-310001899830ifrs-full:AdditionalPaidinCapitalMember2019-12-310001899830ifrs-full:GrossCarryingAmountMemberifrs-full:MachineryMember2021-01-012021-12-310001899830ifrs-full:GrossCarryingAmountMemberifrs-full:LeaseholdImprovementsMember2021-01-012021-12-310001899830ifrs-full:AccumulatedDepreciationAndAmortisationMemberifrs-full:MachineryMember2021-01-012021-12-310001899830ifrs-full:AccumulatedDepreciationAndAmortisationMemberifrs-full:LeaseholdImprovementsMember2021-01-012021-12-310001899830ifrs-full:GrossCarryingAmountMemberifrs-full:ComputerSoftwareMember2022-01-012022-12-310001899830ifrs-full:AccumulatedDepreciationAndAmortisationMemberifrs-full:ComputerSoftwareMember2022-01-012022-12-310001899830ifrs-full:GrossCarryingAmountMember2022-01-012022-12-310001899830ifrs-full:AccumulatedDepreciationAndAmortisationMember2022-01-012022-12-310001899830ifrs-full:GrossCarryingAmountMemberifrs-full:OtherIntangibleAssetsMember2021-01-012021-12-310001899830ifrs-full:GrossCarryingAmountMemberifrs-full:ComputerSoftwareMember2021-01-012021-12-310001899830ifrs-full:AccumulatedDepreciationAndAmortisationMemberifrs-full:OtherIntangibleAssetsMember2021-01-012021-12-310001899830ifrs-full:AccumulatedDepreciationAndAmortisationMemberifrs-full:ComputerSoftwareMember2021-01-012021-12-310001899830ifrs-full:GrossCarryingAmountMember2021-01-012021-12-310001899830ifrs-full:AccumulatedDepreciationAndAmortisationMember2021-01-012021-12-310001899830perf:IncentiveStockOptionPlanMember2022-01-012022-12-310001899830perf:IncentiveStockOptionPlan2018Member2022-01-012022-12-310001899830perf:IncentiveStockOptionPlan2015Member2022-01-012022-12-310001899830ifrs-full:TopOfRangeMemberperf:IncentiveStockOptionPlan2018Member2022-01-012022-12-310001899830ifrs-full:TopOfRangeMemberperf:IncentiveStockOptionPlan2015Member2022-01-012022-12-310001899830ifrs-full:BottomOfRangeMemberperf:IncentiveStockOptionPlan2018Member2022-01-012022-12-310001899830ifrs-full:BottomOfRangeMemberperf:IncentiveStockOptionPlan2015Member2022-01-012022-12-310001899830perf:SponsorEarnoutSharesMember2022-01-012022-12-310001899830perf:ShareIncentivePlanMember2022-01-012022-12-310001899830ifrs-full:OfficeEquipmentMember2022-01-012022-12-310001899830ifrs-full:OtherTemporaryDifferencesMember2022-12-310001899830ifrs-full:AllowanceForCreditLossesMember2022-12-310001899830ifrs-full:UnusedTaxLossesMember2020-12-310001899830ifrs-full:UnrealisedForeignExchangeGainsLossesMember2020-12-310001899830ifrs-full:OtherTemporaryDifferencesMember2020-12-310001899830ifrs-full:AllowanceForCreditLossesMember2020-12-310001899830ifrs-full:UnrealisedForeignExchangeGainsLossesMember2021-12-310001899830ifrs-full:OtherTemporaryDifferencesMember2021-12-310001899830ifrs-full:AllowanceForCreditLossesMember2021-12-310001899830perf:ConvertiblePreferredSharesMemberifrs-full:Level3OfFairValueHierarchyMemberperf:ExitMultipleMeasurementInputMember2021-01-012021-12-310001899830perf:ConvertiblePreferredSharesMemberifrs-full:Level3OfFairValueHierarchyMemberperf:DiscountOfLackOfMarketabilityMeasurementInputMember2021-01-012021-12-310001899830perf:ConvertiblePreferredSharesMemberifrs-full:Level3OfFairValueHierarchyMemberifrs-full:WeightedAverageCostOfCapitalMeasurementInputMember2021-01-012021-12-310001899830ifrs-full:OnDemandMember2022-12-310001899830ifrs-full:NotLaterThanOneMonthMember2022-12-310001899830ifrs-full:LaterThanThreeMonthsAndNotLaterThanSixMonthsMember2022-12-310001899830ifrs-full:LaterThanSixMonthsMember2022-12-310001899830ifrs-full:LaterThanOneMonthAndNotLaterThanThreeMonthsMember2022-12-310001899830ifrs-full:OnDemandMember2021-12-310001899830ifrs-full:NotLaterThanOneMonthMember2021-12-310001899830ifrs-full:LaterThanThreeMonthsAndNotLaterThanSixMonthsMember2021-12-310001899830ifrs-full:LaterThanSixMonthsMember2021-12-310001899830ifrs-full:LaterThanOneMonthAndNotLaterThanThreeMonthsMember2021-12-3100018998302020-01-010001899830country:TW2022-12-310001899830ifrs-full:PlanAssetsMemberperf:PerfectMobileCorp.TaiwanMember2022-01-012022-12-310001899830ifrs-full:PlanAssetsMemberperf:PerfectMobileCorp.TaiwanMember2021-01-012021-12-310001899830ifrs-full:RetainedEarningsMember2022-01-012022-12-310001899830ifrs-full:ReserveOfExchangeDifferencesOnTranslationMember2022-01-012022-12-310001899830ifrs-full:ReserveOfChangeInFairValueOfFinancialLiabilityAttributableToChangeInCreditRiskOfLiabilityMember2022-01-012022-12-310001899830ifrs-full:RetainedEarningsMember2021-01-012021-12-310001899830ifrs-full:ReserveOfExchangeDifferencesOnTranslationMember2021-01-012021-12-310001899830ifrs-full:ReserveOfChangeInFairValueOfFinancialLiabilityAttributableToChangeInCreditRiskOfLiabilityMember2021-01-012021-12-310001899830ifrs-full:ReserveOfExchangeDifferencesOnTranslationMember2020-01-012020-12-310001899830perf:UsdDenominatedInRmbMemberifrs-full:CurrencyRiskMember2022-12-310001899830perf:UsdDenominatedInNtdMemberifrs-full:CurrencyRiskMember2022-12-310001899830perf:UsdDenominatedInJpyMemberifrs-full:CurrencyRiskMember2022-12-310001899830perf:JpyDenominatedInNtdMemberifrs-full:CurrencyRiskMember2022-12-310001899830perf:EurDenominatedInNtdMemberifrs-full:CurrencyRiskMember2022-12-310001899830perf:UsdDenominatedInRmbMemberifrs-full:CurrencyRiskMember2021-12-310001899830perf:UsdDenominatedInNtdMemberifrs-full:CurrencyRiskMember2021-12-310001899830perf:UsdDenominatedInJpyMemberifrs-full:CurrencyRiskMember2021-12-310001899830perf:JpyDenominatedInNtdMemberifrs-full:CurrencyRiskMember2021-12-310001899830perf:EurDenominatedInNtdMemberifrs-full:CurrencyRiskMember2021-12-3100018998302020-12-3100018998302019-12-310001899830ifrs-full:TreasurySharesMember2020-01-012020-12-310001899830ifrs-full:RetainedEarningsMember2020-01-012020-12-310001899830ifrs-full:OrdinarySharesMember2020-01-012020-12-310001899830ifrs-full:AdditionalPaidinCapitalMember2020-01-012020-12-310001899830perf:ConvertibleBondsMember2017-07-310001899830country:US2022-01-012022-12-310001899830country:TW2022-01-012022-12-310001899830country:JP2022-01-012022-12-310001899830country:US2021-01-012021-12-310001899830country:TW2021-01-012021-12-310001899830country:JP2021-01-012021-12-310001899830country:US2020-01-012020-12-310001899830country:TW2020-01-012020-12-310001899830country:JP2020-01-012020-12-310001899830perf:CyberLinkJapanMember2022-12-310001899830perf:CyberLinkCorpMember2022-12-310001899830perf:CyberLinkJapanMember2021-12-310001899830perf:CyberLinkCorpMember2021-12-310001899830perf:IfrsResearchAndDevelopmentExpenseMember2022-01-012022-12-310001899830perf:IfrsResearchAndDevelopmentExpenseMember2021-01-012021-12-310001899830ifrs-full:OtherIntangibleAssetsMember2021-01-012021-12-310001899830perf:IfrsResearchAndDevelopmentExpenseMember2020-01-012020-12-3100018998302020-01-012020-12-310001899830ifrs-full:VehiclesMember2022-01-012022-12-310001899830ifrs-full:BuildingsMember2022-01-012022-12-310001899830ifrs-full:VehiclesMember2021-01-012021-12-310001899830ifrs-full:BuildingsMember2021-01-012021-12-310001899830ifrs-full:MachineryMember2022-01-012022-12-310001899830ifrs-full:LeaseholdImprovementsMember2022-01-012022-12-310001899830ifrs-full:OfficeEquipmentMember2021-01-012021-12-310001899830ifrs-full:MachineryMember2021-01-012021-12-310001899830ifrs-full:LeaseholdImprovementsMember2021-01-012021-12-310001899830ifrs-full:OtherIntangibleAssetsMember2022-01-012022-12-310001899830ifrs-full:ComputerSoftwareMember2022-01-012022-12-310001899830ifrs-full:ComputerSoftwareMember2021-01-012021-12-3100018998302021-01-012021-12-3100018998302022-12-3100018998302021-12-310001899830ifrs-full:PresentValueOfDefinedBenefitObligationMemberperf:PerfectMobileCorp.TaiwanMember2022-01-012022-12-310001899830perf:PerfectMobileCorp.TaiwanMember2022-01-012022-12-310001899830ifrs-full:PresentValueOfDefinedBenefitObligationMemberperf:PerfectMobileCorp.TaiwanMember2021-01-012021-12-310001899830perf:PerfectMobileCorp.TaiwanMember2021-01-012021-12-310001899830perf:PerfectMobileCorp.TaiwanMember2022-12-310001899830perf:PerfectMobileCorp.TaiwanMember2021-12-310001899830perf:PerfectClassOrdinarySharesMember2022-01-012022-12-310001899830perf:IfrsWarrantMember2022-01-012022-12-310001899830perf:PerfectClassOrdinarySharesMember2022-12-310001899830perf:PerfectClassBOrdinarySharesMember2022-12-310001899830perf:IfrsWarrantMember2022-12-310001899830dei:BusinessContactMember2022-01-012022-12-3100018998302022-01-012022-12-31perf:Optionperf:Dperf:itemperf:advisorperf:directorperf:segmentperf:Votexbrli:sharesxbrli:pureiso4217:USDiso4217:USDxbrli:sharesperf:Yiso4217:EURiso4217:TWDiso4217:JPYiso4217:CNY

Table of Contents

UNITED STATES

SECURITIES AND EXCHANGE COMMISSION

Washington, D.C. 20549

FORM 20-F

REGISTRATION STATEMENT PURSUANT TO SECTION 12(b) OR (g) OF THE SECURITIES EXCHANGE ACT OF 1934

OR

ANNUAL REPORT PURSUANT TO SECTION 13 OR 15(d) OF THE SECURITIES EXCHANGE ACT OF 1934

For the fiscal year ended December 31, 2022

OR

TRANSITION REPORT PURSUANT TO SECTION 13 OR 15(d) OF THE SECURITIES EXCHANGE ACT OF 1934

OR

SHELL COMPANY REPORT PURSUANT TO SECTION 13 OR 15(d) OF THE SECURITIES EXCHANGE ACT OF 1934

Date of event requiring this shell company report                      

For the transition period from                       to                      

Commission file number 001-41540

Perfect Corp.

(Exact name of Registrant as specified in its charter)

N/A

(Translation of Registrant’s name into English)

Cayman Islands
(Jurisdiction of incorporation or organization)

14F, No. 98 Minquan Road Xindian District

New Taipei City 231 Taiwan

(Address of principal executive offices)

Iris Chen, Head of Finance and Accounting

Telephone: +886-2-8667-1265

Email: investor_relations@perfectcorp.com

14F, No. 98 Minquan Road Xindian District

New Taipei City 231 Taiwan

(Name, Telephone, Email and/or Facsimile number and Address of Company Contact Person)

Securities registered or to be registered pursuant to Section 12(b) of the Act.

Title of each class


Trading Symbol


Name of each exchange on which registered

Class A Ordinary Shares

PERF

New York Stock Exchange, Inc.

Warrants

PERF WS

New York Stock Exchange, Inc.

Securities registered or to be registered pursuant to Section 12(g) of the Act.

None

(Title of Class)

Securities for which there is a reporting obligation pursuant to Section 15(d) of the Act.

None

(Title of Class)

Indicate the number of outstanding shares of each of the issuer’s classes of capital or common stock as of the close of the period covered by the annual report.

As of December 31, 2022:


Class A Ordinary Shares, par value $0.10 per share

101,475,077

Class B Ordinary Shares, par value $0.10 per share

16,788,718

Warrants

20,849,975

Indicate by check mark if the registrant is a well-known seasoned issuer, as defined in Rule 405 of the Securities Act. Yes __   No 

If this report is an annual or transition report, indicate by check mark if the registrant is not required to file reports pursuant to Section 13 or 15(d) of the Securities Exchange Act of 1934. Yes __   No 

Table of Contents

Note – Checking the box above will not relieve any registrant required to file reports pursuant to Section 13 or 15(d) of the Securities Exchange Act of 1934 from their obligations under those Sections.

Indicate by check mark whether the registrant (1) has filed all reports required to be filed by Section 13 or 15(d) of the Securities Exchange Act of 1934 during the preceding 12 months (or for such shorter period that the registrant was required to file such reports), and (2) has been subject to such filing requirements for the past 90 days. Yes    No __

Indicate by check mark whether the registrant has submitted electronically every Interactive Data File required to be submitted pursuant to Rule 405 of Regulation S-T (§232.405 of this chapter) during the preceding 12 months (or for such shorter period that the registrant was required to submit such files). Yes    No _

Indicate by check mark whether the registrant is a large accelerated filer, an accelerated filer, a non-accelerated filer, or an emerging growth company. See definition of “large accelerated filer,” “accelerated filer,” and “emerging growth company” in Rule 12b-2 of the Exchange Act.

Large accelerated filer ___


Accelerated filer ___


Non-accelerated filer


Emerging growth company

If an emerging growth company that prepares its financial statements in accordance with U.S. GAAP, indicate by check mark if the registrant has elected not to use the extended transition period for complying with any new or revised financial accounting standards† provided pursuant to Section 13(a) of the Exchange Act. __

†The term “new or revised financial accounting standard” refers to any update issued by the Financial Accounting Standards Board to its Accounting Standards Codification after April 5, 2012.

Indicate by check mark whether the registrant has filed a report on and attestation to its management’s assessment of the effectiveness of its internal control over financial reporting under Section 404(b) of the Sarbanes-Oxley Act (15 U.S.C. 7262(b)) by the registered public accounting firm that prepared or issued its audit report. __

If securities are registered pursuant to Section 12(b) of the Act, indicate by check mark whether the financial statements of the registrant included in the filing reflect the correction of an error to previously issued financial statements. __

Indicate by check mark whether any of those error corrections are restatements that required a recovery analysis of incentive-based compensation received by any of the registrant’s executive officers during the relevant recovery period pursuant to §240.10D-1(b). __

Indicate by check mark which basis of accounting the registrant has used to prepare the financial statements included in this filing:

U.S. GAAP __
International Financial Reporting Standards as issued by the International Accounting Standards Board 
Other __

If “Other” has been checked in response to the previous question, indicate by check mark which financial statement item the registrant has elected to follow.

Item 17 __   Item 18 __

If this is an annual report, indicate by check mark whether the registrant is a shell company (as defined in Rule 12b-2 of the Exchange Act).

Yes __   No 

(APPLICABLE ONLY TO ISSUERS INVOLVED IN BANKRUPTCY PROCEEDINGS DURING THE PAST FIVE YEARS)

Indicate by check mark whether the registrant has filed all documents and reports required to be filed by Sections 12, 13 or 15(d) of the Securities Exchange Act of 1934 subsequent to the distribution of securities under a plan confirmed by a court.

Yes __   No __

Table of Contents

TABLE OF CONTENTS

FORWARD-LOOKING STATEMENTS

ii

CERTAIN TERMS AND CONVENTIONS

iv

PART I

1

Item 1.Identity of Directors, Senior Management and Advisors

1

Item 2.Offer Statistics and Expected Timetable

1

Item 3.Key Information

1

Item 4.Information on the Company

36

Item 4A.Unresolved Staff Comments

59

Item 5.Operating and Financial Review and Prospects

59

Item 6.Directors, Senior Management and Employees

74

Item 7.Major Shareholders and Related Party Transactions

83

Item 8.Financial Information

88

Item 9.The Offer and Listing

89

Item 10.Additional Information

89

Item 11.Quantitative and Qualitative Disclosures about Market Risk

96

Item 12.Description of Securities Other Than Equity Securities

97

PART II

97

Item 13.Defaults, Dividend Arrearages and Delinquencies

97

Item 14.Material Modifications to the Rights of Security Holders and Use of Proceeds

97

Item 15.Controls and Procedures

97

Item 16.[Reserved]

98

Item 16A.Audit Committee Financial Expert

98

Item 16B.Code of Ethics

98

Item 16C.Principal Accountant Fees and Services

99

Item 16D.Exemptions from the Listing Standards for Audit Committees

99

Item 16E.Purchase of Equity Securities by the Issuer and Affiliated Purchasers

99

Item 16F.Change in Registrant’s Certifying Accountant

99

Item 16G.Corporate Governance

99

Item 16H.Mine Safety Disclosure

100

Item 16I.Disclosure Regarding Foreign Jurisdictions that Prevent Inspections

100

PART III

100

Item 17.Financial Statements

100

Item 18.Financial Statements

100

Item 19.Exhibits

100

i

Table of Contents

Forward-Looking Statements

This annual report includes forward-looking statements regarding, among other things, our plans, strategies and prospects, both business and financial. These statements are based on the beliefs and assumptions of our management. Although we believe that our respective plans, intentions and expectations reflected in or suggested by these forward-looking statements are reasonable, we cannot assure you that we will achieve or realize these plans, intentions or expectations. Forward-looking statements are inherently subject to risks, uncertainties and assumptions. Generally, statements that are not historical facts, including statements concerning possible or assumed future actions, business strategies, events or results of operations, are forward-looking statements. These forward-looking statements are made under the “safe harbor” provisions of the U.S. Private Securities Litigation Reform Act of 1995. These statements may be preceded by, followed by or include the words “believe,” “estimate,” “expect,” “forecast,” “may,” “will,” “should,” “seek,” “plan,” “scheduled,” “anticipate” or “intend” or similar expressions. Forward-looking statements contained in this annual report include, but are not limited to, statements about:

our ability to realize the benefits expected from the Business Combination;
our ability to maintain the listing of our securities on the NYSE;
changes adversely affecting the business in which we are engaged;
management of growth;
general economic conditions;
our business strategy and plans;
the result of future financing efforts;
our future market position and growth prospects;
expected operating results, such as revenue growth, and earnings;
the effects of health epidemics, including the COVID-19 pandemic; and
the other matters described in “Item 3. Key Information — D. Risk Factors.”

Such forward-looking statements, if any, with respect to our revenues, earnings, performance, strategies, prospects and other aspects of the businesses are neither historical facts nor assurances of future performance. Instead, they are based only on our current beliefs, expectations and assumptions regarding the future of the business, future plans and strategies, anticipated events and trends, the economy and other future conditions that are subject to risks and uncertainties. These forward-looking statements are not intended to serve as, and must not be relied on as, a guarantee, an assurance, a prediction or a definitive statement of fact or probability regarding future performance, events or circumstances. Many of the factors affecting actual performance, events and circumstances are beyond our control. The risk factors and cautionary language discussed in this annual report provide examples of risks, uncertainties and events that may cause actual results to differ materially from the expectations described by us in such forward-looking statements, including among other things:

the ability to recognize the anticipated benefits of the Business Combination, which may be affected by, among other things, competition, and the ability of the combined company to grow and manage growth profitably, maintain relationships with customers and retain our management and key employees;
costs related to the Business Combination;
changes in applicable laws or regulations;

ii

Table of Contents

our estimates of expenses and profitability;
our ability to innovate, develop and provide new products and services or upgrade our existing products and services in a timely and cost-effective manner;
our ability to retain and expand sales to existing brands or attract new brands;
our ability to compete effectively or maintain market leadership in the markets in which we currently operate or expand into;
our ability to meet the challenges presented by our increasingly globalized operations;
our ability to maintain and enhance our brand awareness;
our need to retain, attract or maintain high-quality personnel;
continued and increased consumer engagement with brands in our portfolio and our mobile apps;
the impact of the ongoing COVID-19 pandemic;
changes in laws and regulations related to privacy and data protection;
our ability to enforce, protect and maintain intellectual property rights; and
the other matters described in “Item 3. Key Information — D. Risk Factors.”

Should one or more of these risks or uncertainties materialize, or should any of our assumptions prove incorrect, actual results may vary in material respects from those anticipated in these forward-looking statements. There may be additional risks currently considered to be immaterial or which are unknown. It is not possible to predict or identify all such risks.

In addition, statements that “we believe” and similar statements reflect our beliefs and opinions on the relevant subject. These statements are based upon information available to us, as of the date of this annual report, and while we believe such information forms a reasonable basis for such statements, such information may be limited or incomplete, and such statements should not be read to indicate that such party has conducted an exhaustive inquiry into, or review of, all potentially available relevant information. These statements are inherently uncertain and investors are cautioned not to unduly rely upon these statements.

You are cautioned not to place undue reliance on these forward-looking statements, which speak only as of the date of this annual report. Accordingly, forward-looking statements should not be relied upon as representing our views as of any subsequent date.

All forward-looking statements included herein are expressly qualified in their entirety by the cautionary statements contained or referred to in this section. Except to the extent required by applicable laws and regulations, we undertake no obligations to update these forward-looking statements to reflect events or circumstances after the date of this annual report or to reflect the occurrence of unanticipated events. In the event that any forward-looking statement is updated, no inference should be made that we will make additional updates with respect to that statement, related matters, or any other forward-looking statements. Any corrections or revisions and other important assumptions and factors that could cause actual results to differ materially from forward-looking statements, including discussions of additional significant risk factors, may appear in our public filings with the SEC, which are or will be (as appropriate) accessible at www.sec.gov, and which you are advised to consult. For additional information, please see “Item 10. Additional Information — H. Documents on Display.”

iii

Table of Contents

Certain Terms and Conventions

Unless otherwise indicated or the context otherwise requires, all references in this annual report to “Perfect Corp.” refer to our entity listed on the NYSE, a Cayman Islands exempted company with limited liability, and all references in this annual report to “we,” “us,” “Perfect” or the “Company” refer to Perfect Corp., together with its subsidiaries. All references in this annual report to “Provident” refer to Provident Acquisition Corp., a Cayman Islands exempted company with limited liability, which has ceased to exist on October 28, 2022. In this document:

“AI” means artificial intelligence.

“AR” means artificial reality.

“Articles” means the Sixth Amended and Restated Memorandum and Articles of Association of the Company that has been effective since October 28, 2022.

“Assignment, Assumption and Amendment Agreement” means an assignment, assumption and amendment agreement, dated as of October 28, 2022, by and among Provident, the Company and Continental Stock Transfer & Trust Company (“Continental”), pursuant to which Provident assigned to the Company all of its rights, title, interests, and liabilities and obligations in and under the Warrant Agreement, dated as of January 7, 2021, by and between Provident and Continental (the “Warrant Agreement”).

“Board” means the board of directors of the Company.

“brands” or “brand customers” mean the brand customers of the Company, including global beauty group brands, indie brands and retailers for brands, unless otherwise stated or unless the context otherwise requires.

“Business Combination” means the Mergers, and any other transactions contemplated by the Business Combination Agreement.

“Business Combination Agreement” means the Agreement and Plan of Merger, dated as of March 3, 2022, by and among Provident, the Company, Beauty Corp. and Fashion Corp., as may be amended and/or restated from time to time, including by the First Amendment to Agreement and Plan of Merger, dated as of September 16, 2022 by and among Provident, the Company, Merger Sub 1 and Merger Sub 2.

“CAGR” means compound annual growth rate.

“Churn” means a brand customer who does not have any Recurring Contract Revenue in the following year in the calculation of NDRR. Therefore, a brand customer is Churn in 2021 if the current contract period ended in 2020 and there is no new contract with such customer in 2021.

“Class A Ordinary Shares” means the Class A ordinary shares of the Company, par value $0.10 per share.

“Class B Ordinary Shares” means the Class B ordinary shares of the Company, par value $0.10 per share.

“Closing” means the consummation of the Mergers.

“Closing Date” means October 28, 2022, the date on which the Closing occurred.

“Contract Revenue” means, with respect to a brand customer that enters into a SaaS solutions subscription contract with the Company, the total dollar amount the brand customer agrees to pay for the entire contract period as consideration for certain non-recurring (i.e., one-time) services and certain recurring services (i.e., services that are ongoing during the current contract period and subject to renewal after the end of the current contract period) provided by Perfect. For the purpose of calculating the total Contract Revenue only, the total dollar amount of the SaaS solutions subscription contract is attributable only to the fiscal year during which such contract was entered into by the particular brand customer. Historically, the Contract Revenue-weighted contract period of all our brands has been approximately 13 months.

iv

Table of Contents

“COVID-19” means the novel coronavirus (SARS-CoV-2 or COVID-19), and any evolutions, mutations or variations thereof or any other related or associated public health emergency, epidemics, pandemics or disease outbreaks.

“CyberLink” means CyberLink Corp., a company incorporated in Taiwan and listed on the Taiwan Stock Exchange under the code 5203.

“CyberLink International” means CyberLink International Technology Corp., a British Virgin Islands exempted company.

“Exchange Act” means the Securities Exchange Act of 1934, as amended.

“First Merger” means the merger of Merger Sub 1 with and into Provident, with Provident surviving such merger.

“First Merger Effective Time” means the effective time of the First Merger, being 9:00 a.m. (Cayman Islands time) on October 28, 2022.

“Forward Purchase Agreements” means (i) that certain Forward Purchase Agreement, dated as of December 14, 2020, by and among Provident, Sponsor and WF Asian Reconnaissance Fund Limited, (ii) that certain Forward Purchase Agreement, dated as of December 15, 2020, between Provident and PT Nugraha Eka Kencana and (iii) that certain Forward Purchase Agreement, dated as of December 15, 2020, between Provident and Aventis Star Investments Limited.

“Forward Purchase Warrants” means the 2,750,000 warrants to purchase Provident Class A Ordinary Shares issued to the FPA Investors pursuant to the Forward Purchase Agreements.

“Founder Parties” means DVDonet.com. Inc., Golden Edge Co., Ltd., World Speed Company Limited and Alice H. Chang, a citizen of Taiwan.

“FPA Investment” means the transaction where the FPA Investors subscribed for and purchased, and Provident issued and sold to such FPA Investors, an aggregate of 5,500,000 Provident Class A Ordinary Shares and 2,750,000 Forward Purchase Warrants in consideration for an aggregate purchase price of $55.0 million, as closed on October 27, 2022.

“FPA Investors” means (i) WF Asian Reconnaissance Fund Limited (“Ward Ferry”), (ii) PT Nugraha Eka Kencana (“Saratoga”), a controlled subsidiary of PT Saratoga Investama Sedaya Tbk, an Indonesia-based investment company, and (iii) Aventis Star Investments Limited, an affiliate of Provident, and each is a party to a Forward Purchase Agreement, including their respective successors and assigns.

“IFRS” refers to International Financial Reporting Standards as issued by the International Accounting Standards Board (IASB).

“Japanese yen” and “JPY” mean the legal currency of Japan.

“JOBS Act” means the Jumpstart Our Business Startups Act.

“Key Customers” means the Company’s brand customers who contributed revenue of more than $50,000 in the trailing 12 months ended on the measurement date.

“MAU” means monthly active users, which is calculated as the number of unique user accounts, excluding spam accounts, that access an app at least once during a calendar month.

“Merger Sub 1” means Beauty Corp., a Cayman Islands exempted company with limited liability, which has ceased to exist on October 28, 2022.

“Merger Sub 2” means Fashion Corp., a Cayman Islands exempted company with limited liability, which will be deemed to be dissolved on April 13, 2023.

“Mergers” means the First Merger and the Second Merger.

v

Table of Contents

“Nasdaq” means the Nasdaq Capital Market.

“NDRR” means net dollar retention rate, which is a percentage that reflects how our annualized Recurring Contract Revenue has increased or decreased within a defined time period for a specific set of brand customers. NDRR is calculated as (i) the annualized Recurring Contract Revenue for the current fiscal year, divided by (ii) the annualized Recurring Contract Revenue in the prior fiscal year from the same set of brand customers who have subscribed to our SaaS solutions in both fiscal years. NDRR reflects existing brand customers’ renewals, expansion and contraction of subscription to our SaaS solutions, and Churn, but excludes Contract Revenue from new customers.

“New Registration Rights Agreement” means the registration rights agreement entered into by the Company, the Sponsor, and certain shareholders of the Company on the Closing Date in connection with the Business Combination.

“New Taiwan Dollar,” “NT Dollar” and “NTD” mean the legal currency of Taiwan.

“NYSE” means the New York Stock Exchange.

“Ordinary Shares” means collectively, Class A Ordinary Shares, Class B Ordinary Shares, and any other class or series of ordinary shares Perfect may issue from time to time.

“PBR” or “physically based rendering” means using realistic shading/lighting models along with measured surface values to accurately represent real-world materials.

“Perfect Forward Purchase Warrants” means Warrants issued by the Company in exchange for Forward Purchase Warrants.

“Perfect Private Placement Warrants” means Warrants issued by the Company in exchange for Private Placement Warrants.

“Perfect Public Warrants” means Warrants issued in exchange for Public Warrants.

“Perfect Shareholder Lock-Up Agreement” means the Lock-Up Agreement entered into by Provident, the Company and certain shareholders of the Company on the Closing Date.

“Perfect Shareholder Voting Agreement” means the voting agreement, dated as of March 3, 2022, entered into by the shareholders of the Company, the Company and Provident.

“PFIC” means passive foreign investment company.

“PIPE” or “PIPE Investment” means the sale of 5,000,000 Provident Class A Ordinary Shares to the PIPE Investors at a purchase price of $10.00 per Provident Class A Ordinary Share.

“PIPE Investors” means those certain investors who are party to the Subscription Agreements in connection with the PIPE Investment, including their respective successors and assigns.

“Pre-Recapitalization Shares” means prior to the Closing, (i) the common shares of the Company, par value $0.10 per share, and (ii) (a) the series A preferred shares of the Company, par value $0.10 per share, (b) the series A-1 preferred shares of the Company, par value $0.10 per share, (c) the series B preferred shares of the Company, par value $0.10 per share, (d) the series C-1 preferred shares of the Company, par value $0.10 per share, and (e) the series C-2 preferred shares of the Company, par value $0.10 per share.

“Private Placement Warrants” means the warrants sold by Provident privately to the Sponsor simultaneously with the consummation of the Provident Initial Public Offering (including the underwriters’ partial exercise of their over-allotment option).

“Provident Class A Ordinary Shares” means the Class A ordinary shares of Provident, par value $0.0001 per share.

“Provident Class B Ordinary Shares” means the Class B ordinary shares of Provident, par value $0.0001 per share.

vi

Table of Contents

“Provident Initial Public Offering” means the initial public offering of Units of Provident, consummated on January 12, 2021.

“Public Warrants” means the warrants included in the Units sold in the Provident Initial Public Offering (including the underwriters’ partial exercise of their over-allotment option), each of which is exercisable for one Provident Class A Ordinary Share, in accordance with its terms.

“Recapitalization” has the meaning given to that term in the Business Combination Agreement.

“Recurring Contract Revenue” means, with respect to a brand customer that enters into a SaaS solutions subscription contract with the Company, the portion of such brand customer’s Contract Revenue that is attributable to recurring services provided by Perfect. For the purpose of determining which fiscal year has Recurring Contract Revenue and calculating monthly Recurring Contract Revenue, the total dollar amount of Contract Revenue attributable to the recurring services is allocated on a pro rata basis to each month during the contract period. Any fiscal year that covers at least one such month is deemed to have Recurring Contract Revenue. The annualized Recurring Contract Revenue is calculated by multiplying the monthly Recurring Contract Revenue by 12.

“SaaS” means software as a service.

“SDK” means software development kit, a collection of software development tools in one installable package which can facilitate the creation of applications by having a compiler, debugger and sometimes a software framework.

“SEC” means the U.S. Securities and Exchange Commission.

“Second Merger” means the merger of Provident, being the surviving entity of the First Merger, with and into Merger Sub 2, with Merger Sub 2 surviving such as a wholly-owned subsidiary of the Company.

“Second Merger Effective Time” means the effective time of the Second Merger, being 9:05 a.m. (Cayman Islands time) on October 28, 2022.

“Securities Act” means the Securities Act of 1933, as amended.

“Shareholder Earnout Shares” means an aggregate of 10,000,000 Ordinary Shares issuable to the selected shareholders of the Company within five years of the Closing, upon the occurrence of certain milestones.

“Share Incentive Plan” means the 2021 Stock Compensation Plan adopted by the Company’s Board on December 13, 2021, as amended.

“Shares” means shares in the capital of the Company of any class including a fraction of such shares, whether the Class A Ordinary Shares or the Class B Ordinary Shares or others after the Closing and does not include Pre-Recapitalization Shares.

“SKU” means stock keeping unit, which is a scannable bar code printed on product labels.

“Sponsor” means Provident Acquisition Holdings Ltd., a Cayman Islands exempted company with limited liability.

“Sponsor Earnout Promote Shares” has the meaning given to “Earnout Promote Shares” in the Sponsor Letter Agreement.

“Sponsor Letter Agreement” means the sponsor letter agreement, dated as of March 3, 2022, entered into by the Company, Provident and Sponsor, as amended.

“Subscription Agreements” means the subscription agreements, each dated as of March 3, 2022, entered into by Provident, the Company and the PIPE Investors, pursuant to which the PIPE Investors have agreed to purchase an aggregate of 5,000,000 Provident Class A Ordinary Shares one business day before the date of the Closing at a purchase price of $10.00 per share.

“Transactions” means the transactions contemplated by the Business Combination Agreement and the other agreements, instruments and documents expressly contemplated by the Business Combination Agreement.

vii

Table of Contents

“Unit(s)” means a unit or the units issued in the Provident Initial Public Offering, each consisting of one Provident Class A Ordinary Share and one-half of one redeemable Public Warrant.

“U.S.” means the United States of America.

“U.S. dollar,” “US$,” “USD” and “$” mean the legal currency of the United States.

“U.S. GAAP” means United States generally accepted accounting principles.

“Warrants” means the warrants that entitle the holder thereof to purchase one Class A Ordinary Share pursuant to the terms of the Warrant Agreement as amended by the Assignment, Assumption and Amendment Agreement, including Perfect Public Warrants, Perfect Private Placement Warrants and Perfect Forward Purchase Warrants.

Discrepancies in any table between totals and sums of the amounts listed are due to rounding. Certain amounts and percentages have been rounded; consequently, certain figures may add up to be more or less than the total amount and certain percentages may add up to be more or less than 100% due to rounding. In particular and without limitation, amounts expressed in millions contained in this annual report have been rounded to a single decimal place for the convenience of readers. In addition, period-on-period percentage changes with respect to our IFRS measures and operating metrics have been calculated using actual figures derived from our internal accounting records and not the rounded numbers contained in this annual report, and as a result, such percentages may differ from those calculated based on the numbers contained in this annual report.

viii

Table of Contents

PART I

Item 1.Identity of Directors, Senior Management and Advisors

Not applicable.

Item 2.Offer Statistics and Expected Timetable

Not applicable.

Item 3.Key Information

A.[Reserved]
B.Capitalization and Indebtedness

Not applicable.

C.

Reasons for the Offer and Use of Proceeds

Not applicable.

D.

Risk Factors

You should carefully consider the risks described below before making an investment decision. Additional risks not presently known to us or that we currently deem immaterial may also impair our business operations. Our business, financial condition or results of operations could be materially and adversely affected by any of these risks. The trading price and value of our securities could decline due to any of these risks, and you may lose all or part of your investment. This annual report also contains forward-looking statements that involve risks and uncertainties. Our actual results could differ materially from those anticipated in these forward-looking statements as a result of certain factors, including the risks faced by us described below and elsewhere in this annual report.

Risks Related to Our Business and Industry

We operate in relatively new and rapidly evolving markets. If the development of the markets stops or slows down, our business will be materially and adversely affected.

The AR- and AI-beauty technologies and fashion tech markets are relatively new and rapidly evolving, which subjects our business to uncertainties and challenges relating to the growth and profitability of these markets as a whole. Our global addressable market is mainly driven by the growth in the beauty market and the expected marketing and AR- and AI-spending by beauty brands, which depend on a number of factors, including overall consumer awareness about beauty products and services, brands’ deployment of digital marketing to create meaningful customer interaction and engagement, brands’ investment in omni-channels to build relationships with their customers, budgetary constraints of brands, regulatory changes and changes in broader economic conditions. If beauty brands do not recognize our value proposition, a viable market may not develop further, or develop more slowly than we expect, and our business and operating results will be materially and adversely affected.

We have also benefited from the rapid growth of the demand and usage of photo-editing software among professionals as well as amateur photographers in the past few years. The popularity of photo-editing software has been fueled by the rise of the selfie culture, the popularity of social media and the increasing user adoption of smartphones and availability of high-definition cameras in smartphones.

The increased demand of photo-editing software to create the “perfect” selfies prompts the software providers to enhance their offerings by integrating advanced features such as AR effects, AI editing and layer editing. If the demand for photo-editing software slows, if we fail to accurately predict customer demand and preferences for our mobile apps, or if we fail to timely adjust to meet shifting trends in popular culture and technology, our business and operating results will be materially and adversely affected.

1

Table of Contents

We have a new business model and a short operating history in developing and rapidly evolving markets for our products and services, which makes it difficult to evaluate our future prospects.

We launched our AR Makeup solution in 2015 and have offered other solutions and products over the recent years. We are still in the process of expanding into the fashion tech market. Our limited operating history makes it difficult to effectively assess our future prospects or forecast our future results. In particular, we expect to encounter inherent risks and challenges in the developing and rapidly evolving beauty technologies and fashion tech markets, which include our ability to, among other things:

grow our brand portfolio and enhance level of consumer engagement with brands;
develop or implement additional strategic initiatives to further increase monetization of our products and services;
successfully expand our business operations and enhance the value of our brand globally;
develop and launch diversified and distinguishable products and premium features to effectively address the needs of brands;
maintain and strengthen our competitive edge on our key technologies, including our AgileFace® face-rendering technology, true-to-life AR technology, AI technology and machine-learning capabilities and big-data analytics;
maintain a reliable, secure, high-performance and scalable technology infrastructure that can efficiently handle increased usage;
develop and maintain relationships with brands, digital distribution platforms and other third parties;
successfully compete with other companies that are currently in, or may in the future enter, the markets that we operate in, or duplicate the features of our products;
maintain our innovative company culture and continue to attract, retain and motivate talented employees; and
defend ourselves against litigation, regulatory interference, claims concerning intellectual property or privacy or other aspects of our business.

Failure to adequately address any of the risks and challenges associated with these dynamic and evolving markets may adversely affect our business, financial conditions and results of operations.

If we fail to retain and expand sales to existing brands or attract new brands, or if consumers decrease their level of engagement with such brands or our mobile apps, our business and operating results may be materially and adversely affected.

Our brand portfolio and the level of consumer engagement with brands and our mobile apps are critical to our success. We had a total of approximately 509 brands in our brand portfolio as of December 31, 2022, providing services to approximately 90% of the top 20 beauty groups that have adopted AR- and AI-technologies. If the beauty technologies market matures, and product and service offerings evolve, our competitors may introduce differentiated products and services with lower cost. If our pricing is not competitive or we cannot attract new brands or maintain and expand the existing relationships with brands, our business and operating results may be harmed. Our ability to increase our revenue also depends on our ability to expand the sales of our products and services to, and renew subscriptions with, existing brands.

We expect the existing brands in our portfolio to increase their use of our products and services by purchasing new products as well as enhanced products and services and renew their subscriptions. However, we cannot guarantee that our efforts to expand sales to our existing brands in our portfolio will be successful or that such brands will renew their subscriptions with us for a similar or greater contract period or on the same or more favorable terms.

2

Table of Contents

Our business performance has been and will continue to be significantly dependent on our ability to increase the level of consumer engagement with both brands and our mobile apps. If brands and users of our mobile apps do not perceive our products and services to be useful, reliable or trustworthy, we may not be able to attract or retain consumers or otherwise maintain or increase the frequency, duration or level of their engagement. A number of factors could negatively affect the growth of brand portfolio and level of consumer engagement, including that:

we may be not be able to continue to offer products and services that meet evolving consumer preferences and demands;
our competitors may launch or develop products and services similar to ours or with better consumer experience, and consumers may increasingly engage with such competing products or services and less with our products and services;
we may not be able to timely develop and introduce new or enhanced products and services that respond to market trends or advances, or the new or enhanced products and services that we introduce may not reach wide market acceptance or popularity;
we may fail to provide adequate customer service to brands and consumers or maintain existing relationships with brands;
we may fail to address consumer concerns related to privacy and information-sharing, safety or security;
we may encounter technical or other problems that prevent us from delivering our products and services in a rapid and reliable manner or otherwise negatively affect the consumer experience; or
we may fail to maintain our brand image or our reputation may be damaged.

There is no guarantee that we will not experience decline in level of consumer engagement. A decrease in customer growth or consumer engagement may render our platform less attractive to brands and consumers, which may have a material and adverse impact on our business, financial condition, reputation and results of operations.

Our success is dependent on the continued popularity and perceived precision of our technology solutions.

Our success depends on our ability to continuously offer quality products that are attractive to brands and users of our mobile apps and our ability to effectively respond to changes in overall consumer demographics, tastes and preferences. Consumer preferences may shift over time in response to changes in demographic and social trends, technological developments, economic circumstances and the marketing efforts of our competitors. We intend to continue to implement our data and machine-learning strategy to enhance our platform and provide a wider range of products and services with higher precision and even higher true-to-life accuracy, as well as further personalization and individualized recommendations for our consumers. However, there can be no assurance that our existing products will continue to be favored by brands and users of our mobile apps or that we will be able to anticipate or respond to changes in consumer preferences, technological changes and industry trends in a timely manner.

In addition, as we expand into new countries and regions, we may not be able to launch products that appeal to local consumers due to insufficient understanding of local cultures and lifestyles. Our failure to anticipate, identify or react to these particular preferences could adversely affect our sales performance and our results of operations.

3

Table of Contents

We may not be successful if we are not able to innovate, develop and provide new products and services or upgrade our existing products and services in a timely and cost-effective manner to address rapidly evolving consumer preferences, industry trends and technological changes, and any new products and services we develop and provide may expose us to new risks and may not achieve expected returns.

We compete in markets characterized by rapidly changing products and services, evolving consumer preferences, technological advances and continual improvements in product performance characteristics and features. As a result, our success depends on our ability to anticipate and to innovate, develop and provide new products and services or upgrade our existing products and services in a timely and cost-effective manner to address evolving consumer preferences and demands, including in areas where we have little or no prior development or operating experience.

We have a team of 134 technology personnel, comprising R&D and QA staff, dedicated to the constant improvement on our platform, development of new features and creation of new apps. We provide comprehensive omni-channel solutions to brands and retailers across multiple industries, including makeup, skincare, accessories and eyewear. In 2021, we launched for brand customers live AR virtual try-ons for nails and men’s grooming products including beard dye virtual try-ons, beard-removal simulation and beard-style simulation. However, we cannot guarantee that we will succeed in developing products and services that eventually become widely accepted, or that we will be able to timely release products and services that are commercially viable. Our inability to do so would have an adverse impact on our business, financial condition and results of operations.

Our recent rapid growth may not be indicative of our future growth. Even if we continue to grow, we may not be able to successfully execute our growth strategies.

We have achieved significant scale and growth since our inception in 2015. Our total revenue grew from $29.9 million in 2020 to $47.3 million in 2022, at a CAGR of 25.8%.

The number of brands in our brand portfolio increased from 338 as of December 31, 2020 to 509 as of December 31, 2022 at a CAGR of 22.7%. We expect that our revenue growth rate will decline as our revenue increases to higher levels in the future. In particular, we believe that the growth of our revenue depends on a number of factors, in particular our ability to:

deepen our penetration into the top 20 beauty groups;
expand our reach among the indie beauty brands;
expand our product portfolio coverage to new industries, such as fashion and clothing;
enhance data and machine learning technologies to advance our platform; and
pursue strategic alliances, investments and acquisition opportunities across categories and geographies.

Given our limited operating history and the rapidly evolving nature of AR- and AI-beauty technologies and fashion tech markets, we may not be able to accomplish any of our objectives. In addition, our historical rapid growth has placed and may continue to place significant demands on our management and our operational and financial resources. Our employee headcount and the scope and complexity of our business have increased significantly, with the number of full-time employees increasing from 240 as of December 31, 2020 to 297 as of December 31, 2022. We expect headcount growth to continue for the foreseeable future. As the number of brands, users of our mobile apps and transactions and the amount of data that our infrastructure supports continue to grow, we will need to improve our operational, financial and management controls as well as our reporting systems and procedures. The growth and expansion of our business and products create significant challenges for our management and constrain operational and financial resources. We will require capital expenditures and allocation of valuable management resources to grow and change in these areas and implement more complex organizational management structures. In addition, we may also find it increasingly difficult to maintain the benefits of our corporate culture, including our ability to quickly develop and launch new and innovative products and execute our growth strategies. If we fail to adequately address any of the challenges and manage our growth effectively, our overall business performance and our business may be seriously harmed.

4

Table of Contents

Any businesses we will invest in or acquire may not perform as expected or be successfully integrated.

Although we focused on organic growth in the past, as part of our business strategy, we expect to invest in or acquire companies, form joint ventures, and acquire complementary assets or technologies. Competition within our industry for investments in and acquisitions of businesses, technologies, and assets is intense.

Even if we are able to identify a target for investment or acquisition, we may not be able to complete the transaction on commercially reasonable terms, we may not be able to receive approval under anti-monopoly and competition laws, or the target may choose to enter into a transaction with another party, which could be our competitor.

In addition, businesses we will invest in or acquire may not perform as well as we expect. Failure to manage and successfully integrate acquired businesses and technologies, including managing any privacy or data security risks associated with such acquisitions, may harm our operating results and expansion prospects. The process of integrating an acquired company, business, or technology or acquired personnel into our Company, as well as the performance of an acquired company, business, or technology or acquired personnel, are subject to various risks and challenges, including:

diverting management time and focus from operating our business;
disrupting our ongoing business operations;
customer acceptance of the acquired company’s offerings;
implementing or remediating the controls, procedures, and policies of the acquired company;
integrating the acquired business onto our systems and ensuring the acquired business meets our financial reporting requirements and timelines;
retaining and integrating acquired employees, including aligning incentives between acquired employees and existing employees, as well as managing costs associated with eliminating redundancies or transferring employees on acceptable terms with minimal business disruption;
maintaining important business relationships and contracts of the acquired business;
liability for pre-acquisition activities of the acquired company;
litigation or other claims or liabilities arising in connection with the acquired company;
impairment charges associated with goodwill, investments, and other acquired intangible assets; and
other unforeseen operating difficulties and expenditures.

We cannot predict whether any strategic investment or acquisition will be accretive to the value of our ordinary shares. It is also possible that any of our future strategic transactions could be viewed negatively by the press, investors, customers or regulators, or subject to regulatory inquiries or proceedings, which may adversely affect our reputation, business, financial condition and prospects.

5

Table of Contents

We may fail to compete effectively or maintain market leadership in the markets in which we currently operate or expand into.

The AR- and AI-beauty technologies and fashion tech markets are rapidly evolving. Our current primary competition comes from companies that offer products and services that compete with some but not all of the functionality present on our platform, and there may be an increasing number of similar solutions offered by additional competitors in the future. Our current and potential competitors may also develop and market new technologies and products that render our existing or future products less competitive, unmarketable or obsolete. For example, the mobile device manufacturers may enhance the built-in camera apps in their smartphones with AR- and AI-technologies providing similar functionality of our mobile apps, which may render our YouCam apps redundant. Similarly, brands may develop their own AR- and AI-beauty technology solutions in-house. If an increasing number of products with similar or even superior functionality to our products are introduced to the market, we may need to decrease the prices for our products and services in order to remain competitive and, as a result, our margins will be reduced and our operating results will be negatively affected. The introduction of new technologies and the influx of new entrants into the markets may intensify competition in the future, which could harm our business and our ability to increase revenues, increase or maintain brand portfolio and consumer base and maintain our prices.

Our current operations are international in scope, and we plan to further expand globally. If we fail to meet the challenges presented by our increasingly globalized operations, our business may be materially and adversely affected.

Our business operations are international in scope, with approximately 51% of our revenue coming from the United States in North America, 10% coming from Japan in Asia, and 7% coming from France in Europe in 2022. We intend to continue to expand our operations internationally, and develop strategies to address new international markets. However, global expansion has required and will continue to require considerable management attention as well as financial and other resources. We expect to face particular challenges in global expansion and operations including:

increased costs associated with developing solutions and products and providing support in different languages;
increased costs in marketing and advertising to promote our products effectively in different markets;
localizing our products, services, content and features to ensure that they are culturally attuned to the different markets;
increased competition from competitors that have strong positions in particular markets;
increased costs associated with recruiting and retaining talented and capable employees in foreign countries and maintaining our Company culture across all of our offices;
greater difficulty in receiving payments from different geographies, including difficulties associated with exchange rate fluctuations, transfer of funds, longer cycles for payment and collecting accounts receivable, especially in emerging markets;
compliance with applicable foreign laws and regulations, including laws and regulations with respect to economic sanctions and export controls, anti-corruption, anti-bribery and anti-kickback, data privacy, cybersecurity and consumer protection that may conflict with local customs and practices in some jurisdictions in which we operate, and the risk of penalties if our practices are deemed not to be in compliance;
more stringent regulations relating to privacy and data security and the unauthorized use of, or access to, commercial and personal information, particularly in Europe and other jurisdictions;
limited or insufficient intellectual property protection or difficulties enforcing our rights to intellectual property;
political, social and economic instability in some countries;
exposure to different tax jurisdictions and potential adverse tax consequences; and

6

Table of Contents

related stay-at-home, business closure, and other restrictive orders and travel restrictions associated with the COVID-19 pandemic.

If we are unable to successfully manage the complexity of our global operations and deal with the related challenges and risks, our business, financial condition and results of operations could be adversely affected.

Our sales cycle for brands and retailers can be long and unpredictable, and our sales efforts require considerable time and expenses.

Due to the length and unpredictability of the sales cycle for brands and retailers, it is difficult to predict the timing of our sales and related revenue recognition. The typical length of our sales cycle for brands and retailers, from initial evaluation to payment, is between two and eight months but can vary substantially from brand to brand. Given that these brands and retailers often view implementation of our solutions as a strategic decision and significant investment, they often require considerable time to evaluate, test and qualify our product offerings prior to entering into or expanding a subscription. During the sales cycle, we often need to spend significant time and resources to better educate and familiarize the potential brands and retailers with the value proposition of our products and services as well as on sales and marketing and contract negotiation activities. Such lengthy sales cycle for the evaluation and implementation of our solutions, in particular for highly customized applications, may cause a delay between increasing operating expenses for such sales efforts and generation of corresponding revenue upon successful sales. Additional factors that may influence the length and variability of our sales cycle to brands and retailers include:

effectiveness of our sales force, in particular new sales people as we increase the size of our sales force;
obstacles placed by their procurement process;
their integration complexity;
their familiarity with the AI and AR technologies; and
economic conditions and other factors impacting their budgets.

Given these factors, it is difficult to predict whether and when a sale will be completed, and when revenue from a sale will be recognized and reflected in our results of operations.

We make selective investments in new products and services and enhancement to our existing products and services which may not be successful and may not achieve expected returns.

Our ability to engage, retain and increase our partnerships with brands and to increase our revenue will depend heavily on our ability to continue to evolve our existing products and services to create new innovative products and services, both independently and together with third parties. We may introduce significant changes to our existing products and services or develop and introduce new and unproven products and services, including technologies with which we have little or no prior development or operating experience. For example, we are currently developing fashion technology products related to eyewear, nail design, watches, accessories and jewelry, and we also plan to further expand to areas beyond fashion, including providing solutions for dental and orthodontics services, plastic surgery and video conferencing. We do not have significant experience in these industries and areas, which may adversely affect our ability to successfully develop and market these products and technologies. We may incur substantial costs, and may not be successful in generating profits, in connection with these efforts. In addition, the introduction of new products and services, or changes to existing products and services, may result in new or enhanced governmental or regulatory scrutiny, litigation or other complications that could adversely affect our reputation, business and operating results.

7

Table of Contents

We also aim to continuously create new premium features and content, and innovate and improve on our existing products. Although we believe that these efforts are likely to benefit the aggregate consumer experience and improve our financial performance over the long term, we may experience disruptions or declines in our MAUs or user activity if new features cause technical issues that diminish the performance or attractiveness of our mobile apps. Product innovation is inherently volatile and uncertain, and if our new or enhanced products fail to engage our users, advertisers or partners, or if we fail to give our users meaningful reasons to return to our mobile apps, we may fail to attract or retain users or to generate sufficient revenue, operating margin or other value to justify our investments, any of which may seriously harm our business in the short term, long term or both.

Given that a small number of business partners contribute to a significant portion of our revenues, our business and results of operations could be materially and adversely affected if we were to lose a significant business partner or a significant portion of our business.

Currently, a limited number of business partners contribute a significant portion of our revenues. Our business partners primarily comprise top global beauty brands. In 2020, 2021 and 2022, our five largest business partners in aggregate contributed approximately 40%, 32% and 28% of our revenues, respectively. We expect that a limited number of our business partners will continue to contribute a significant portion of our revenues in the near future. If we lose any of these business partners, or if revenues generated from a significant business partner are substantially reduced due to, for example, increased competition, in-house development, a material change in the business partner’s operations, breach of contract or policy, any deterioration in our relationship with business partners, our business, financial condition and results of operations may be materially and adversely affected.

We rely primarily on certain app stores and similar digital platforms, such as the Apple App Store and Google Play, for downloads of YouCam and our other apps, as well as for payment processing, and any interruption or deterioration in our relationship with such entities may negatively impact our business.

We currently rely on third-party digital distribution platforms, primarily Apple App Store and Google Play, as the channels for downloads of our mobile apps including YouCam, as well as the processing of payments for our products and services. We expect to continue to rely on Apple App Store and Google Play for downloads of our mobile apps, as well as most of the payment processing for our products and services. Accordingly, we believe that maintaining successful partnerships with Apple and Google is critical to our success.

The operating policies of Apple or Google will affect the accessibility of our products and services. The promotion, distribution and operation of our mobile apps are subject to distribution platforms’ standard terms and policies for apps developers, which are subject to the interpretation of, and frequent changes by, these distribution platforms. If Apple App Store, Google Play or any of the major distribution platforms change their respective standard terms and conditions, application review policy or application enforcement guidelines in a manner that is detrimental to us, suspend our access to the platforms or terminate their existing relationship with us, our business, financial condition and results of operations may be materially and adversely affected. For example, Apple App Store and/or Google Play may adjust the categories of application on their distribution platforms and remove the type(s) of our mobile apps, which would significantly limit or even cut off the distribution of our mobile apps. In addition, our pricing strategy is affected by changes in the payment processing fees charged by Apple or Google. If we are unable to pass along any increases in the payment processing fees charged by Apple or Google to our users on a timely basis, or if the paying user engagement decreases due to a price increase, our net revenue or profit margin may be negatively affected. If we fail to maintain good relationships with Apple or Google, it may adversely impact our ability to continue to offer our products and services or effect payment processing, which in turn could have a material adverse impact on our business.

8

Table of Contents

We depend on the continuing efforts of our founders, senior management team and key personnel, and our business operations may be negatively affected if we lose their services.

We currently depend on the continued services and performance of our founders and other key personnel, including Alice H. Chang, our founder and CEO. Our future success will depend on the continued service of our key personnel who possess significant expertise and knowledge of our industry. In addition, many of our key technologies and products are custom-made for our business by our personnel. The loss of key personnel, including members of management, as well as key engineering, product development, marketing and sales personnel, could disrupt our operations and have an adverse effect on our reputation and business. As we grow, we cannot guarantee that we will continue to attract and retain the personnel needed to maintain our competitive position. In particular, we intend to continue to hire a significant number of technical personnel in the foreseeable future, and we expect to continue to face significant challenges in hiring such personnel. Moreover, if our reputation were to be harmed, whether as a result of media, legislative or regulatory scrutiny or otherwise, it could make it more difficult to attract and retain personnel that are critical to the success of our business.

As we continue to grow and mature our business, or if our stock price declines, the incentives to attract, retain and motivate employees provided by our equity awards or by future arrangements may not be as effective as in the past. Additionally, if we issue significant equity to attract additional employees or to retain our existing employees, we would incur substantial additional share-based compensation expense, and the ownership of our existing shareholders would be further diluted. As a result, it may be difficult for us to continue to retain and motivate certain employees, and this wealth could affect their decision about whether they continue to work for us. If we do not succeed in attracting, hiring and integrating excellent personnel, or retaining and motivating existing personnel, we may be unable to grow effectively and our reputation and business could be seriously harmed.

If we are not able to maintain and enhance our brand awareness, our business and operating results may be materially and adversely affected.

We believe that our business brands, including the brands of our mobile apps such as YouCam, have significantly contributed to the success of our business. We also believe that maintaining and enhancing our business brands is critical to expanding our base of users, advertisers and brand partners. Many of the new users of our mobile apps are referred by existing users. Maintaining and enhancing our business brands will depend largely on our ability to continue to provide useful, reliable, trustworthy and innovative products and technologies, which may not always be successful or timely. We may introduce new products or terms of service or policies that users do not like, which may negatively affect our business brands. Additionally, the actions of our developers or advertisers may affect our business brands if consumers do not have a positive experience interacting with third parties, including advertisers and platform distributors, through our products and services. We will also continue to experience media, legislative or regulatory scrutiny of our actions or decisions regarding consumer privacy, data use, encryption, content, advertising, competition, security and other issues. Our business brands may also be negatively affected by attacks from our competitors, by negative publicity about the actions of consumers that are deemed to be hostile, illegal or inappropriate to other consumers, by third-party content providers acting inappropriately, by any regulatory developments designed to address such risks, or due to legal proceedings or investigations. Maintaining and enhancing our business brands may require us to make substantial investments, which may not be successful. If we fail to successfully promote and maintain our brand awareness or if we incur excessive expenses in this effort, our business, financial condition and results of operations may be adversely affected.

User misconduct and misuse of our mobile apps or any non-compliance of third parties that we conduct business with may adversely impact our brand image and reputation, and we may be held liable for information or content displayed on, retrieved from or linked to our products and services, which may materially and adversely affect our business and operating results.

We may face claims relating to information that is published or made available on our products. Our mobile apps, in particular YouCam Makeup and YouCam Perfect, have the attributes of social media and may be misused by individuals or groups of individuals to engage in inappropriate or illegal activities. We have implemented control procedures, and have an internal team that monitors the content uploaded by users.

9

Table of Contents

While these procedures aim to detect and block illegal, fraudulent, violent, pornographic or other inappropriate content or activities conducted through the misuse of our mobile apps, particularly those that violate applicable laws and regulations, they may not be able to block all such content uploads or activities in real time due to the time lag between content upload and the inspection by our internal team. In addition, as we are developing our live streaming services on our mobile apps, it may become more difficult for our internal team to timely detect and block illegal or inappropriate content or activities in the future.

We may not be well protected from liability for third-party actions in all the jurisdictions in which we operate, as local laws vary, and some of them can be unclear or evolving. For example, in the United States, there have been various congressional and executive branch efforts to remove or restrict the scope of the protections available to online platforms under Section 230 of the Communications Decency Act, and our current protections from liability for third-party content in the United States could decrease or change. We could incur significant costs investigating and defending such claims and, if we are found liable, significant damages or license costs. We could also face fines or orders restricting or blocking our services in particular geographies as a result of content hosted on our services. For example, in June 2020, the Home Ministry in India included our mobile app, YouCam Makeup, on a list of banned applications in the country, which remains in effect, as of the date of this annual report. If any of these events occurs, we may incur significant costs or be required to make significant changes to our products, business practices or operations and our reputation, business and operating results could be seriously harmed.

Certain of our metrics and other estimates are subject to inherent uncertainties in measurement, and real or perceived inaccuracies in such metrics may harm our reputation and negatively affect our business.

We regularly review metrics, including our MAUs, to evaluate growth trends, measure our performance, and make strategic decisions. These metrics are calculated using internal company data gathered on an analytics platform that we develop and operate and have not been validated by an independent third party. While we believe these metrics are reasonable estimates of our consumer base for the applicable period of measurement, there are inherent challenges in measuring how our products are used across large populations globally. For example, there may be individuals who have multiple accounts. Our consumer metrics are also affected by technology on certain mobile devices that automatically runs in the background of our mobile apps when another phone function is used, and this activity can cause our system to miscount the consumer metrics associated with such account.

Some of our demographic data may be incomplete or inaccurate. If our consumers provide us with incorrect or incomplete information regarding their age or other attributes, then our estimates may prove inaccurate and fail to meet investor or advertiser expectations.

Errors or inaccuracies in our metrics or data could also result in incorrect business decisions and inefficiencies. For instance, if a significant understatement or overstatement of active users were to occur, we may expend resources to implement unnecessary business measures or fail to take required actions to attract a sufficient number of users to satisfy our growth strategies. We believe that we do not capture all data regarding our active users, which may result in understated metrics. This generally occurs due to technical issues. For example, our systems do not record data from a user’s application or when a user opens our mobile apps and contacts our servers but is not recorded as an active user. We continually seek to address these technical issues and improve our accuracy, but given the complexity of the systems involved and the rapidly changing nature of mobile devices and systems, we expect these issues to continue. If advertisers, partners or investors do not perceive our consumer, geographic, or other demographic metrics to be accurate representations of our consumer base or consumer engagement, or if we discover material inaccuracies in our consumer, geographic or other demographic metrics, our reputation may be seriously harmed, and our advertisers and partners may also be less willing to allocate their budgets or resources to us, which could seriously harm our business.

10

Table of Contents

We may require additional capital to support our operations and the growth of our business, and we cannot be certain that financing will be available on reasonable terms when required, or at all.

We may need additional financing from time to time to operate or grow our business. Our ability to obtain additional financing, if and when required, will depend on investor and lender demand, our operating performance, the condition of the capital markets and other factors, and we cannot assure you that additional financing will be available to us on favorable terms, or at all. For example, in connection with the Business Combination, holders of 21,651,203 Provident Class A Ordinary Shares, or 94.14% of the shares with redemption rights, exercised their right to redeem their shares for cash at a redemption price of approximately $10.01 per share, for an aggregate redemption amount of approximately $216.8 million. Given a significant number of Provident shareholders elected to redeem their shares prior to the consummation of the Business Combination, our gross proceeds from the Business Combination accordingly reduced compared to a no-redemption scenario. If we incur additional debt, including drawing on our credit facility, the debt holders would have rights senior to holders of our ordinary shares to make claims on our assets. If we raise additional funds through the issuance of equity securities, our existing shareholders will experience dilution and those new securities may have rights, preference or privileges senior to those of our ordinary shares. If adequate financing is not available on terms satisfactory to us when we require it, our ability to continue to support the operation and growth of our business could be significantly impaired and our operating results may be adversely affected.

We have limited business insurance coverage. Any interruption of our business may result in substantial costs and the diversion of our resources, and cause an adverse impact on our financial condition and results of operations.

We have obtained insurance to cover certain potential risks and liabilities, such as Error and Omission Commercial Insurance, Personal Injury Insurance, Cybersecurity Insurance and Director and Officer Insurance for certain businesses we operate. However, consistent with general industry practice, our business insurance is limited and we may not be able to acquire any insurance for all types of risks we face in our operations in all the jurisdictions where we operate. For examples, insurance companies in some of the jurisdictions where we operate offer limited cybersecurity insurance products and/or intellectual property infringement insurance products, if any. We have determined that the costs of insuring for related risks and the difficulties associated with acquiring such insurance on commercially reasonable terms make it impractical for us to have such insurance. Any uninsured damage to our systems, disruption of our business operations, litigation or natural disasters could require us to incur substantial costs and divert our resources, which could have an adverse effect on our financial condition and results of operations.

Our business depends on attracting and retaining high-quality personnel, and failure to attract or maintain such personnel could adversely affect our business.

Our future success depends on our ability to continue to attract, retain and motivate highly skilled employees, especially talent in artificial intelligence, machine learning and advanced algorithms. Competition for highly skilled personnel in our industry is intense, in particular in the fields of artificial intelligence and data science, and we expect some of our competitors or other participants in the technology industry with access to more substantial resources to pursue top talent aggressively. If we are not able to continue to attract or retain such highly skilled personnel, or maintain our existing personnel, our ability to keep pace with innovation and technological change in our industry may be hindered and our business could be seriously harmed.

Risks Related to Our Technology, Data Privacy and Intellectual Property

Security breaches, improper access to or disclosure of our data or consumer data, other hacking and phishing attacks on our systems, or other cyberattacks may cause our products and solutions to be perceived as not being secure, which could harm our reputation and adversely affect our business.

Mobile malware, viruses, hacking and phishing attacks have become more prevalent and sophisticated in our industry. If our security measures are breached, or if our products and services are subject to attacks or misuse that disrupt or deny the ability of consumers to access our products and services, our products and services may be perceived as not being secure and consumers and advertisers may curtail or stop using our products and services, which could have a material adverse effect on our reputation, business prospects and results of operations.

11

Table of Contents

Our efforts to protect the information that our consumers have shared with us could fail due to the actions of third parties, software bugs or other technical malfunctions, employee error or malfeasance, or other factors. Third parties may attempt to fraudulently induce employees or consumers to disclose information to gain access to our data or our consumers’ data. If any of these events occurs, our or our consumers’ information could be accessed or disclosed improperly. Internally, we have our privacy policy in place that governs how we may use and share the information that our consumers have provided us.

However, if third parties such as business partners and advertisers fail to implement adequate data security practices or fail to comply with our terms and policies, our consumers’ data may be improperly accessed or disclosed. Any incidents where our consumers’ information is accessed without authorization, or is improperly used, or incidents that violate our terms of service or policies, could damage our reputation and our brand image and diminish our competitive position.

We are subject to data privacy and protection laws and regulations adopted by governmental agencies.

Data privacy laws restrict our storage, use, processing, disclosure, transfer and protection of non-public personal information provided to us by our consumers. Violating existing or future regulatory orders or consent decrees could subject us to substantial monetary fines and other penalties that could seriously harm our business. While we strive to protect our consumers’ privacy and comply with all applicable data protection laws and regulations, any failure to do so may result in proceedings or actions against us by affected consumers or government authorities, which could be time-consuming and cause us to incur significant expense and liability or result in orders or consent decrees forcing us to modify our business practices.

In addition, spammers attempt to use our products to send targeted and untargeted spam messages to consumers, which may embarrass or annoy consumers and make our products less consumer-friendly. We cannot be certain that the technologies that we have developed to repel spamming attacks will be able to eliminate all spam messages from our products. Our actions to combat spam may also require diversion of significant time and focus from improving our products. As a result of spamming activities, our consumers may use our products less or stop using them altogether. Maintaining the trust of our consumers is important to sustain our growth, retention, and consumer engagement. Negative incidents or dissatisfaction in relation to our products and services regardless of all our efforts, could deter current and potential consumers from using our products and services, which could have material adverse effects on our reputation, growth and consumer engagement, and could seriously harm our operational cost structure.

Our business and operating results may be harmed by any significant service disruptions. If our products and services are subject to attacks or misuse that disrupt or deny the ability of consumers to access our products and services, and we fail to develop enhancements to resolve any defect or other problems or adapt our existing technology and infrastructure, our consumers and partners may curtail or stop using our products and services, which could significantly harm our business.

The success of our broad range of AR- and AI-powered business and consumer solutions is reliant on technology. We currently have 24 SaaS technology solutions and six mobile apps. Our ability to attract and retain consumers largely depends on our ability to maintain and scale our technical infrastructure. We expect to continue to make significant investments to maintain and improve the capacity, capability and reliability of our infrastructure. To the extent that we do not effectively address capacity constraints, upgrade our systems as needed or continually develop our technology and infrastructure to accommodate actual and anticipated changes in our consumers’ needs, our business, financial condition and results of operations may be harmed.

Our business and operating results, reputation and consumer engagement may be harmed by a disruption in our service due to failures in or changes to our systems, or by our failure to timely and effectively expand and adapt our technology and infrastructure. Our systems may not be adequately designed with the necessary reliability and redundancy to avoid performance delays or outages that could seriously harm our business. We may experience service disruptions, outages and other performance problems due to a variety of factors, including infrastructure changes, human or software errors, hardware failure, capacity constraints due to an overwhelming number of people accessing our products and services simultaneously, computer viruses, denial of service or fraud or security attacks. This would negatively impact our ability to attract consumers, platform partners and advertisers and increase consumer engagement. It is possible that we may fail to effectively scale and grow our technology infrastructure to accommodate increased demands arising from increased consumer traffic. It may also become increasingly difficult to maintain and improve the performance of our products and services, especially during peak usage times, as our products and services become more complex and our consumer traffic increases. In addition, we cannot provide assurance that we will be able to expand our data center infrastructure to meet consumers’ demand in a timely manner, or on favorable economic terms. If any system failure, interruption or downtime occurs, our business, financial condition and results of operations may be materially and adversely affected.

12

Table of Contents

In addition, a substantial portion of our network infrastructure is provided by third parties, including Amazon Web Services (“AWS”), Alibaba Cloud and Google Cloud. Any disruption or failure in the services we receive from these providers could harm our ability to handle existing or increased traffic and could significantly harm our business. Any financial or other difficulties these providers face may also adversely affect our business, and we exercise little control over these providers, which increases our vulnerability to problems with the services they provide. In the event of a significant issue with the third-party network infrastructure supporting our network traffic, some of our products and services may become inaccessible or consumers may experience difficulties accessing our products and services. Any disruption or failure in our infrastructure could hinder our ability to handle existing or increased traffic on our platform, which could significantly harm our business.

Our technical infrastructure is also vulnerable to the risk of damage from natural disasters, such as earthquakes and typhoons, as well as from acts of terrorism or other criminal acts. Our services and products also incorporate software that is highly technical and complex. Our software has contained, and may now or in the future contain, undetected errors, bugs or vulnerabilities. Some errors in our software code may only be discovered after the code has been released. In particular, the operation of some of our new businesses implicates complex technological and operational considerations, including technical or systematic issues that may arise in the ordinary course of business. In order to address such technical difficulties, we may need to make fundamental changes to the configurations or of the underlying systems we use or expend a significant amount of time and resources to obtain the technical skills or expertise needed to adequately address such issues. Any such difficulties could have a material impact on our ability to deliver the products and services we intend to offer, reduce our reliability and harm our reputation.

The successful operation of our business also depends upon the performance and reliability of the internet infrastructure in China and the safety of our network and infrastructure. If our AWS, Alibaba Cloud or Google Cloud server code comes across some serious bugs that disrupt the service, many of our online services to clients will be affected. The Service-Level Agreement we have signed with most of our clients requires 99.7% to 99.99% service availability. Failure to meet that requirement will result in penalty, i.e., extra credits or refunds, as provided by the agreements. Furthermore, even if our internet infrastructure is free of bugs, we may encounter unexpected issues solely due to administrative oversight. For example, in April 2019, merely due to our administrative error of missing the filing deadline of our server certificate, our server in China stayed non-functional for about two weeks.

We rely on AWS, Alibaba Cloud and Google Cloud for the vast majority of our computing, storage, bandwidth, and other services. Any service interruption of their operating systems, networks and hardware or other disruptions of or interference with our use of the cloud operation could impair the delivery of our platform and thus negatively affect our operations and harm our business.

Amazon, Alibaba and Google provide distributed computing infrastructure platforms for business operations, or what is commonly referred to as a “cloud” computing service. We currently run the vast majority of our computing on the three platforms, and our systems are not fully reliant on them. Historically, we have spent approximately $840,000 with AWS, $55,000 with Alibaba Cloud and $24,000 with Google Cloud annually. We have also built our software and computer systems to use computing, storage capabilities, bandwidth, and other services provided by AWS, Alibaba Cloud and Google Cloud. Any disruption of or interference with our use of AWS, Alibaba Cloud and Google Cloud would negatively affect our operations and seriously harm our business.

First of all, any transition of the cloud services currently provided by any one of AWS, Alibaba Cloud and Google Cloud to the other platform or to another cloud provider would be difficult to implement and will cause us to incur significant time and expense. The level of service provided by AWS, Alibaba Cloud and Google Cloud may also impact our users’, advertisers’, and partners’ usage of and satisfaction with products or services. If our users or partners are not able to access our mobile apps or SaaS or specific features of our products or services, or encounter difficulties in doing so, due to issues or disruptions with AWS, Alibaba Cloud or Google Cloud, or if AWS, Alibaba Cloud or Google Cloud experiences interruptions in service regularly or for a prolonged basis, or other similar issues, we may lose users, partners, or advertising revenue and our business would be seriously harmed.

13

Table of Contents

Secondly, each of Amazon, Alibaba and/or Google may take actions beyond our control that could seriously harm our business, including: (i) discontinuing or limiting our access to its cloud platform; (ii) increasing pricing terms; (iii) terminating or seeking to terminate our contractual relationship altogether; (iv) establishing more favorable relationships or pricing terms with one or more of our competitors; and (v) modifying or interpreting its terms of service or other policies in a manner that impacts our ability to run our business and operations. Amazon, Alibaba and Google each has broad discretion to change and interpret its terms of service and other policies with respect to us. If services and products provided by Amazon, Alibaba and Google are limited, restricted, curtailed or degraded in any way, or become unavailable to us or our consumers for any reason, our business may be materially and adversely affected. They may also alter how we are able to process data on their cloud platforms. If Amazon, Alibaba or Google makes changes or has interpretations that are unfavorable to us, our business could be seriously harmed. Hosting costs also have increased and will continue to increase as our consumer base and consumer engagement grows and may seriously harm our business if we are unable to grow our revenues faster than the cost of utilizing the services of AWS, Alibaba Cloud and Google Cloud.

In addition, we also currently rely on third-party mobile apps distribution channels such as iOS App Store to distribute most of our mobile apps to users. We expect a substantial number of downloads of our mobile apps will continue to be derived from these distribution channels and we expect that we will continue to rely on Apple App Store for downloads of our mobile apps. Accordingly, we believe that maintaining successful partnerships with Apple is critical to our success. If major mobile apps distribution channels change their standard terms and conditions in a manner that is detrimental to us, or terminate their existing relationship with us, our business, financial condition and results of operations may be materially and adversely affected. Moreover, the operating policies of Apple may have an impact on the accessibility of our products and services. If we fail to maintain good relationships with Apple, it may adversely impact our ability to continue to offer our products and services, which in turn could have a material adverse impact on our business.

We rely on third-party proprietary and open source software for our products and services. The inability to obtain third-party licenses for such software, obtain them on favorable terms, or adhere to the license terms or any errors or failures caused by such software could harm our business.

Some of our offerings include software or other intellectual property licensed from third parties. It may be necessary in the future to renew licenses relating to various aspects of these applications or to seek new licenses for existing or new applications. Necessary licenses may not be available on acceptable terms or under open source licenses permitting redistribution in commercial offerings, if at all. The inability to obtain certain licenses or other rights or to obtain such licenses or rights on favorable terms could result in delays in product releases until equivalent technology can be identified, licensed or developed, if at all, and integrated into our products and services, which could harm our business, results of operations and financial condition.

In addition, third parties may allege that additional licenses are required for our use of their software or intellectual property, which it may be unable to obtain on commercially reasonable terms or at all.

The inclusion in our offerings of software or other intellectual property licensed from third parties on a non-exclusive basis could limit our ability to differentiate our offerings from those of our competitors. Failure to properly adhere to the license terms for software or other intellectual property might have negative effects, such as revocation of the license grant, penalties, added license fees or other liabilities. If a distributor of open source software were to allege that we had not complied with our license, we could be required to incur significant legal expenses. Little legal precedent governs the interpretation of these licenses; therefore, the potential impact of these terms on our business is unknown and may result in unanticipated obligations regarding our technologies. To the extent that our products and services depend upon the successful operation of third-party software, any undetected errors or defects in such third-party software could also impair the functionality of our products and services, delay new feature introductions, result in a failure of products and services, and injure our reputation.

14

Table of Contents

In addition, we use open source software in our products and solutions, including various open source libraries in our product development, as well as many development tools or libraries from Apple and Google. We expect to incorporate open source software into other offerings or products in the future. Such open source software is generally licensed by its authors or other third parties under open source licenses. If we inappropriately use or incorporate open source software subject to certain types of open source licenses that challenge the proprietary nature of our software products, we may be required to re-engineer our products, discontinue the sale of our products and solutions or take other remedial actions. From time to time, there have also been claims challenging the ownership of open source software against companies that incorporate open source software into their products. As a result, we could be subject to lawsuits by parties claiming ownership of what we believe to be open source software. Litigation could be costly for us to defend, have a negative effect on our operating results and financial condition or require us to devote additional research and development resources to change our products.

Our business depends upon the interoperability of our platform across devices, operating systems, and third-party applications that we do not control.

Our success depends in part on the interoperability of our products and services with third-party operating systems, applications, data, web browsers and devices, including, but not limited to, mobile-device cameras. We may not be successful in adapting our products and services that operate effectively with these technologies, systems, networks, regulations, or standards and we may not successfully cultivate relationships with key industry participants that operate effectively with these technologies, systems, networks, regulations, or standards. We plan to continue to introduce new products regularly and have experienced that it takes time to optimize such products to function with these operating systems and hardware, impacting the popularity of such products, and we expect this trend to continue. If customers have difficulty accessing and using our products and services (including on mobile devices) or if our products and services cannot connect a broadening range of applications, data and devices, then customer growth and retention may be harmed and our business and operating results could be harmed.

In addition, the owners of those third-party operating systems, such as Google and Apple, each provides consumers with products that compete with ours. Any changes in such operating systems, applications, data, web browsers or devices that degrade the functionality of our products and services or give preferential treatment to competitive services could harm the adoption and usage of our products and services. Our competitors that control the operating systems and related hardware that our mobile apps run on could make interoperability of our products with those mobile operating systems more difficult or display their competitive offerings more prominently than ours.

Moreover, our products require high-bandwidth data capabilities. If the costs of data usage increase, our user growth, retention, and engagement may be seriously harmed. Additionally, to deliver high-quality video and other content over mobile cellular networks, our products must work well with a range of mobile technologies, systems, networks, regulations, and standards that we do not control. In particular, any future changes to the iOS or Android operating systems may impact the accessibility, speed, functionality, and other performance aspects of our products, which issues are likely to occur in the future from time to time.

Because our YouCam apps are used primarily on mobile devices, effective mobile functionality is a part of our long-term development and growth strategy. The majority of our user engagement with our mobile apps is on smartphones with Android operating systems. As a result, although our products work with iOS mobile devices, we have prioritized development of our products to operate with Android operating systems rather than smartphones with iOS operating systems. To continue growth in user engagement with our mobile apps, we will need to prioritize development of our products to operate on smartphones with iOS operating systems. Given the popularity of smartphones with iOS operating systems, if we are unable to improve operability of our products on smartphones with iOS operating systems, our business could be seriously harmed.

15

Table of Contents

We may incur substantial costs in protecting or defending our intellectual property and any failure to protect our intellectual property could impair our competitive position and the value of our brand and other intangible assets may be diminished.

Effective protection of intellectual property rights is expensive and difficult to maintain, both in terms of application and maintenance costs, as well as the costs of defending and enforcing those rights. Although we have taken measures to protect our proprietary rights, the efforts we have taken to protect our intellectual property rights may not be sufficient or effective, and our intellectual property rights will be insufficient to protect against others offering products or services that are substantially similar to ours and compete with our business. If we are unable to protect our proprietary rights or prevent unauthorized use or appropriation by third parties, the value of our brand and other intangible assets may be diminished, and competitors may be able to more effectively mimic our service and methods of operations. Any of these events could seriously harm our business.

We aim to protect our confidential proprietary information, in part, by entering into confidentiality agreements and invention assignment agreements with all our employees, consultants, advisors, and any third parties who access or contribute to our proprietary know-how, information, or technology. We also rely on trademark, copyright, patent, trade secret, and domain-name-protection laws to protect our proprietary rights. Our trade secrets, trademarks, copyrights, patents and other intellectual property rights are important assets for us. There can be no assurance that we will be able to protect against the unauthorized use of our brand, trademarks or other assets. There is also a risk that one or more of our trademarks could become generic, which could result in them being declared invalid or unenforceable. We rely on, and expect to continue to rely on, a combination of confidentiality and license agreements with our employees, consultants and third parties with whom we have relationships, as well as trademark, trade dress, domain name, copyright, trade secret and patent laws, to protect our brand and other intellectual property rights.

Significant impairments of our intellectual property rights, and limitations on our ability to assert our intellectual property rights against others, could harm our business and our ability to compete.

If we need to license or acquire new intellectual property, we may incur substantial costs and in some cases, pending trademark, copyright and patent applications may not be approved. We have filed various applications to protect aspects of our intellectual property, and we currently hold a number of issued patents, trademarks and copyrights in multiple jurisdictions. Effective protection of patents, trademarks and copyrights is expensive and difficult to maintain, both in terms of application and registration costs, as well as the costs of defending and enforcing those rights. We may be required to protect our rights in an increasing number of countries, in a process that is expensive and may not be successful, or which we may not pursue in every country in which our products and services are distributed or made available. In the future, we may acquire additional patents or patent portfolios, which could require significant cash expenditures.

Further, the laws of certain foreign countries provide different levels of protection of corporate proprietary information and assets, such as intellectual property, trade secrets, know-how, and records. We may fail to obtain effective intellectual property protection, or effective intellectual property protection may not be available in every country in which our products and services are available. As a result, we may be exposed to material risks of theft of our proprietary information and other intellectual property, including technical data, manufacturing processes, data sets, or other sensitive information, and we may also encounter significant problems in protecting and defending our intellectual property or proprietary rights abroad. In any of these cases, we may be required to expend significant time and expense to prevent infringement or to enforce our rights.

We may be subject to intellectual property infringement claims or other allegations by third parties, which may cause substantial costs and materially and adversely affect our business operations.

Companies in the mobile, camera, communication, media, internet, and other technology-related industries own large numbers of patents, copyrights, trademarks, trade secrets, and other intellectual property rights, and frequently enter into litigation based on allegations of infringement, misappropriation, or other violations of intellectual property or other rights. In addition, various “non-practicing entities” that own patents, copyrights, trademarks, trade secrets, and other intellectual property rights often attempt to aggressively assert claims in order to extract payments from technology companies. We may be subject to intellectual property infringement lawsuits that are expensive and time-consuming. If resolved adversely, these lawsuits and claims could result in our payment of substantial damages or license fees, disruption to our product and service offerings and reputational harm.

16

Table of Contents

Furthermore, from time to time we may introduce new products or make other business changes, including in areas where we currently do not compete, which could increase our exposure to patent, copyright, trademark, trade secret, and other intellectual property rights claims from competitors and non-practicing entities. Some of our agreements with advertisers, platform partners and data partners require us to indemnify them for certain intellectual property claims against them, which could require us to incur considerable costs in defending such claims, and may require us to pay significant damages in the event of an adverse ruling. Such advertisers, platform partners and data partners may also discontinue use of our products, services and technologies as a result of injunctions or otherwise, which could result in loss of revenue and adversely impact our business.

We might be subject to claims and legal proceedings from holders of patents, trademarks, copyrights, and other intellectual property rights alleging that some of our products or content infringe their rights. While we believe we have meritorious defenses to these claims, an unfavorable outcome in these lawsuits could seriously harm our business. If these or other matters continue in the future or we need to enter into licensing arrangements, which may not be available to us or on terms favorable to us, it may increase our costs and decrease the value of our products, and our business could be seriously harmed.

In addition, we may have to seek a license to continue practices found to be in violation of a third party’s rights. If we are required or choose to enter into royalty or licensing arrangements, such arrangements may not be available on reasonable terms, or at all, and may significantly increase our operating costs and expenses. As a result, we may also be required to develop or procure alternative non-infringing technology or discontinue use of the technology. The development or procurement of alternative non-infringing technology could require significant effort and expense or may not be feasible.

We may from time to time become a party to litigation, other legal or administrative disputes and proceedings that may materially and adversely affect us.

In the course of our ordinary business operations, we may become a party to litigation, legal proceedings, claims, disputes or arbitration proceedings from time to time. Were any proceedings, claims, disputes or arbitration to arise, these may distract our senior management’s attention and consume our time and other resources. In addition, even if we ultimately succeed in such proceedings, there may be negative publicity created in the course of or surrounding such proceedings, which may materially and adversely affect our reputation. In the case of an adverse verdict, we may be required to pay significant monetary damages, assume significant liabilities or suspend or terminate parts of our operations. As a result, our business, financial condition, results of operations and prospects may be materially and adversely affected.

Risks Related to Our Financial Results

We have incurred operating losses in the past, and our ability to achieve or maintain profitability in the future is uncertain.

We have incurred operating losses before and our future revenue growth and profitability depend on a variety of factors, many of which are beyond our control. Whereas, our operating expenses are expected to increase in the future as we continue to expend substantial financial resources and as a public company. In addition, we may not be able to obtain additional capital in a timely manner or on acceptable terms, or at all.

We recorded losses of $5.6 million in 2020, $156.9 million in 2021, and $161.7 million in 2022. Even though our revenues have grown over the years, from $29.9 million in 2020 to $40.8 million in 2021, and to $47.3 million in 2022, our revenue growth rate has slowed in recent years and may do so in the future due to a variety of factors. We believe that our future revenue growth will depend on, among other factors, our ability to attract new consumers while retaining current consumers, increase consumer engagement and advertisement engagement, increase our brand awareness, compete effectively, maximize our sales efforts, demonstrate a positive ROI for advertisers and successfully develop and operate new products and services. Our ability to achieve and sustain profitability is also affected by market and regulatory development related to, among others, mobile apps, online marketing and artificial intelligence. In addition, if we are unable to achieve profitability again, it may become more difficult for us to raise sufficient capital to satisfy our anticipated capital expenditures and other cash needs, in which case our business, results of operations and financial condition may be materially adversely affected. Accordingly, our ability to maintain profitability in the future is uncertain and you should not rely on the revenue growth of any prior quarterly or annual period as an indication of our future revenue growth.

17

Table of Contents

We expect our operating expenses to increase in future periods as we continue to expend substantial financial resources on: (i) marketing and sales; (ii) global expansion; (iii) our technology infrastructure; (iv) attracting and retaining talented employees; (v) strategic opportunities, including operation of newly developed or newly acquired businesses; and (vi) general administration, including personnel costs and legal and accounting expenses related to being a public company. These investments, while increasing our expenses, may not result in an increase in revenues or growth in our business. If we are unable to achieve adequate revenue growth and to manage our expenses, we may incur significant losses in the future.

In addition, we expect to increase costs as a result of being a public company, and the costs may continue to increase in the future. As a public company, we will incur significant legal, accounting and other expenses that we did not incur as a private company. The Sarbanes-Oxley Act of 2002, as well as rules subsequently implemented by the SEC and the NYSE, impose various requirements on the corporate governance practices of public companies. These rules and regulations increase our legal and financial compliance costs and some corporate activities are more time-consuming and costly. For example, in comparison with a private company, we will need an increased number of independent directors and have to adopt policies regarding internal controls and disclosure controls and procedures. In addition, we will incur additional costs associated with public company reporting requirements. We expect to incur significant expenses and devote substantial management effort toward ensuring compliance with the requirements of Section 404 of the Sarbanes-Oxley Act of 2002 (“Section 404”) and the other rules and regulations of the SEC and the NYSE.

We recognize revenue from SaaS subscriptions to our products over the terms of these subscriptions. Increases or decreases in new sales may not be immediately reflected in our results of operations and may be difficult to discern.

For the nature of our Company, we recognize revenue from SaaS subscriptions to our products ratably according to the terms of these subscriptions. Consequently, a portion of the revenue we report in each period is derived from the recognition of deferred revenue relating to SaaS subscriptions entered into during previous quarters. As a result, a decline in new or renewed SaaS subscriptions in any single reporting period may have a small impact on the revenue that we recognize for such quarter. However, such a decline will negatively affect our revenue in future quarters. As such, the effect of significant downturns in sales and potential changes in our pricing policies or rate of customer expansion or retention may not be fully reflected in our results of operations until future periods. In addition, our SaaS subscription-based revenue model also makes it difficult for us to rapidly increase our revenue through additional sales in any period, as revenue from new customers or existing customers that increase their use of our products or upgrade to higher-priced products or product tiers must be recognized over the applicable SaaS subscription term. Finally, a significant portion of our costs are expensed as incurred, while revenue is recognized over the term of the SaaS subscription. As a result, growth in the number of new customers and hosts has continued, and can continue, to result in our recognition of higher costs and lower revenue in the earlier periods of our SaaS subscriptions.

Our financial results are likely to fluctuate from period to period due to seasonality and a variety of other factors, which makes our period-to-period results volatile and difficult to predict.

Our semiannual financial results have fluctuated in the past and are likely to fluctuate in the future. As a result, you should not rely upon our past periodic financial results as indicators of future performance. You should also take into account the risks and uncertainties frequently encountered by companies in rapidly evolving markets. Our financial results in any given period can be influenced by numerous factors occurring in a particular period, many of which we are unable to predict or are outside of our control, including:

development and introduction of new products or services by us or our competitors and the market reaction to such new products or services;
our ability to renew our subscriptions with, and expand sales of our products and solutions to, our existing brand in our portfolio;
ability of our data service providers to scale effectively and timely to provide the necessary technical infrastructure to offer our services;
growth and diversification of our revenue sources;

18

Table of Contents

increases in marketing, sales and other operating expenses that we may incur to grow and expand our operations and to remain competitive;
changes in budgets of brands and retailers and in the timing of their budget cycles and purchasing decisions, including cost-cutting measures or other effects of the COVID-19 pandemic;
seasonal fluctuations in spending by brands. Historically, the fourth quarter has typically been the quarter with the largest bookings from brands and retailers, which impacts revenue, unbilled revenue, deferred revenue, accounts receivable and amortized commissions in future periods;
system failures or breaches of security or privacy of our system;
amount and timing of non-cash expenses, including stock-based compensation, goodwill impairments and other non-cash charges;
impact of new accounting pronouncements;
unforeseen contingencies, such as adverse litigation judgments, settlements or other litigation-related costs;
fluctuations in currency exchange rates and changes in the proportion of our revenue and expenses denominated in foreign currencies;
changes in laws and regulations that affect our business; and
changes in business or macroeconomic conditions, including the impact of the COVID-19 pandemic, inflationary pressures and increases in interest rates, and global conflicts, including the Russia-Ukraine war.

Changes in subjective assumptions, estimates and judgments by our management related to complex accounting matters or changes in the IFRS could significantly affect our financial condition and results of operations.

IFRS and related pronouncements, implementation guidelines, and interpretations apply to a wide range of matters that will be relevant to our business, including revenue recognition, financial instruments, stock-based compensation, deferred commissions and business combinations. These matters are complex and will involve subjective assumptions, estimates, and judgments by our management. Changes in IFRS, relevant accounting pronouncements or interpretation or changes in underlying assumptions, estimates, or judgments by our management, the International Accounting Standards Board, the SEC and others could significantly change our reported or expected financial performance, which could impact the market price of our securities.

Examinations by relevant tax authorities may result in material changes in reserves for tax positions taken in previously filed tax returns or may impact the valuation of certain deferred income tax assets.

Based on the outcome of examinations by relevant tax authorities, or as a result of the expiration of statutes of limitations for specific jurisdictions, it is possible that the reserves for tax positions taken in previously filed tax returns will materially change from those recorded in our financial statements. In addition, the outcome of examinations may impact the valuation of certain deferred income tax assets (such as net operating loss carryforward) in future periods. It is not possible to estimate the impact of such changes, if any, to the reserves for uncertain tax positions.

19

Table of Contents

Our costs are growing rapidly and may increase faster than our revenue, which could seriously harm our business or increase our losses.

As our business continues to grow, we expect our expenses to grow in the future. Historically, our costs have increased each year due to several factors, including growth of our brand portfolio and consumer base, an increase in the level of consumer engagement, development and implementation of new product features, enhancement of our technology infrastructure and hiring of additional personnel at a rapid pace to support potential future growth. We expect to continue to incur increasing costs due to these factors to expand our operation and remain competitive. In addition, we expect to continue to invest in our global infrastructure to expand our product offering to a more global consumer base, including in countries where we do not expect significant short-term monetization, if any. Our expenses may be greater than we anticipate, and our investments may outpace monetization efforts. Such increase in our costs without a corresponding growth in our revenue would increase our losses and could seriously harm our business.

Risks Related to Laws and Regulations

Our business is subject to complex and evolving domestic and international laws and regulations regarding privacy and data protection. These laws and regulations are subject to change and uncertain interpretation, which could result in claims, changes to our data and other business practices, regulatory investigations, monetary penalties, increased cost of operations, or declines in consumer growth or engagement, or otherwise harm our business.

Regulatory authorities and governments around the world have implemented and are considering further legislative and regulatory proposals regarding privacy and data protection. New laws and regulations governing new areas of data protection or imposing more stringent requirements may be introduced in various jurisdictions, including the United States, the European Union, the United Kingdom and the PRC, in which we conduct business or where we may expand. In addition, the interpretation and application of consumer and data protection laws in such jurisdictions are often uncertain, complicated and subject to change, including differentiated requirements for different groups of people or different types of data. It is possible that existing or newly introduced laws and regulations, or their interpretation, application or enforcement, could significantly affect the value of the data collected and generated by us during operation, force us to change our data and other business practices and cause us to incur significant compliance costs.

In the United States, various federal and state regulators, including governmental agencies like the Federal Trade Commission, or the FTC, have adopted, or are considering adopting, laws and regulations concerning privacy and data protection, such as the Biometric Information Privacy Act in Illinois (the “BIPA”), which has restricted the collection and use of biometric identifiers and biometric information. Certain state laws may be more stringent or broader in scope, or offer greater individual rights, with respect to personal information than federal, international or other state laws, and such laws may differ from each other, all of which may complicate compliance efforts. For instance, several class action lawsuits have been brought under BIPA, as the statute is broad and still being interpreted by the courts. Certain of our customers and we have been alleged for violating the BIPA through deploying our product and technology, including virtual try-on solutions that may be perceived as subject to these laws and regulations. These lawsuits, any future similar legal proceedings and any government enforcement actions we may become subject to under applicable privacy and data protection laws may cause us significant losses in addition to legal costs, which could adversely affect our business, results of operations and financial condition.

The GDPR, which became effective in May 2018, greatly increased the jurisdictional reach of the European Commission’s laws and adds a broad array of requirements for handling personal data (including online identifiers and location data). EU member states are tasked under the GDPR to enact, and have enacted, certain implementing legislation that adds to and/or further interprets the GDPR requirements and potentially extends our obligations and potential liability for failing to meet such obligations. The GDPR, together with national legislation, regulations and guidelines of the EU member states and the United Kingdom governing the processing of personal data, impose strict obligations and restrictions on the ability to collect, use, retain, protect, disclose, transfer and otherwise process personal data. In particular, the GDPR includes obligations and restrictions concerning the consent and rights of individuals to whom the personal data relates, the transfer of personal data out of the European Economic Area or the United Kingdom, security breach notifications and the security and confidentiality of personal data. The GDPR authorizes fines for certain violations of up to 4% of global annual revenue or €20 million, whichever is greater. In addition, some countries are considering or have passed legislation implementing data protection requirements or requiring local storage and processing of data or similar requirements that could increase the cost and complexity of delivering our services.

20

Table of Contents

The PRC regulatory and enforcement regime with regard to privacy and data security is evolving. Over the last decade, China has been putting great emphasis on cybersecurity administration, which is considered an essential part of national security. In 2016, the Cyberspace Administration of China issued the State Cyberspace Security Strategy, stressing again the importance of cybersecurity as well as national security.

The National Security Law of the People’s Republic of China has been cited as the legal accordance for certain cybersecurity and data protection regulations. In addition, the newly amended Civil Code of the People’s Republic of China, effective as of January 1, 2021, specifically set a separate chapter for privacy and personal information protection, setting the fundamental principles for personal information protection. Systematically, the Cybersecurity Law of the People’s Republic of China (the “CSL”), was enacted on June 1, 2017, and forms the backbone of cybersecurity and data privacy protection legislation in the PRC. On June 10, 2021, the Data Security Law of the People’s Republic of China (the “DSL”), was adopted at the 29th Session of the Standing Committee of the 13th National People’s Congress and became effective as of September 1, 2021. The DSL is the fundamental law in the data security area that widely covers data security mechanisms, obligations, and liabilities at both state administration and data handler levels. On August 20, 2021, the Personal Information Protection Law of the People’s Republic of China (“PIPL”), was adopted at the 30th Session of the Standing Committee of the 13th National People’s Congress and became effective as of November 1, 2021, which represents a new era of personal information protection as well as corporate compliance in the PRC. The DSL, the PIPL and the CSL constitute the three fundamental pillars of Chinese data protection legislation, and together with various systematic supplemental regulations, measures, and standards, form the cybersecurity and data protection legislative framework in China. Governmental authorities are putting great focus on data protection enforcement. Violations of data protection laws may lead to administrative penalties, including warnings, orders for rectification, suspension or termination of related businesses issued by competent authorities, revocation of business permits or licenses, or monetary fines (of up to 50 million RMB or 5% of annual turnover); civil liabilities including compensation for infringement upon legitimate rights and interests of individuals and public interests litigation by the People’s Procuratorate depending on the severity and impact of the case; and even criminal liabilities in more severe cases.

The collection, process, and use of personal data in Taiwan is primarily subject to the Personal Data Protection Act (the “PDPA”) and the Enforcement Rules as well as other applicable rulings or regulations issued by the relevant competent authorities, in particular the sectoral rules on the security maintenance plans stipulated by the regulator of different industries. The PDPA applies in principle to all of the data collection and processing activities taking place in Taiwan without regard to whether the data subjects are Taiwanese nationals or not. Pursuant to the PDPA, violating PDPA with an intent to make unlawful profit for oneself or a third party or with an intent to damage the interest of another may lead to criminal penalties. In addition, an administrative fine may be imposed for failure to comply with the requirements under the PDPA, such as the collecting or processing of personal data without a statutory ground, using personal data outside of the scope of the specified purpose under which the personal data was collected, or failure to comply with restrictions on the cross-border transfer of personal data. For any failure to comply with the notification requirements, marketing restrictions, information security requirements, or obligations to respond to data subjects’ requests, the authority may order that correction be made by a certain deadline and impose an administrative fine if correction is not made within such deadline.

As we further grow our business and expand into other markets, we will be subject to additional laws and regulations in other jurisdictions where we operate and where our brand partners and users are located.

The laws, rules and regulations of other jurisdictions may be more comprehensive, detailed and nuanced in their scope, and may impose requirements and penalties that conflict with, or are more stringent than, those we encounter in our current markets. In addition, such laws, rules and regulations may restrict the transfer of data across jurisdictions, which could impose additional and substantial operational, administrative and compliance burdens on us, and may also restrict our business activities and expansion plans, as well as impede our data-driven business strategies. Complying with laws and regulations for an increasing number of jurisdictions could require significant resources and costs, including those associated with adapting our products and solutions. Any failure, or perceived failure, by us to comply with the above and other regulatory requirements or privacy and data protection-related laws, rules and regulations could result in reputational damages or proceedings or actions against us by governmental entities, consumers or other parties. Such proceedings or actions could subject us to significant penalties and negative publicity, require us to change our data and other business practices, increase our costs and severely disrupt our business or hinder our global expansion.

21

Table of Contents

Any amendments to existing tax regulations or the implementation of any new tax laws in Taiwan, the United States or other jurisdictions in which we operate our business may have an adverse effect on our business and profitability.

While we are subject to tax laws and regulations in various jurisdictions in which we operate or conduct business, our principal operations are in Taiwan, and we are exposed primarily to taxes levied by the Taiwan government. Any unfavorable changes of tax laws and regulations in this jurisdiction could increase our effective tax rate and have an adverse effect on our operating results.

Foreign government initiatives to restrict or ban access to our products in their countries could seriously harm our business.

Foreign governments may censor or restrict access to our YouCam apps in their countries, require data localization, or impose other laws or regulations that would be difficult or even impossible for us to comply with, or would require us to rebuild our products or the infrastructure for our products. For example, our YouCam Makeup App has been banned in India since June 2020. The Indian authorities rejected our several appeals on the basis that YouCam Makeup App caused certain national security concerns under Section 69A of the Information Technology Act, 2000 of India, but they did not provide any detailed explanation for this ban or the subsequent rejections of our appeals. Any restriction on access to YouCam apps due to foreign government actions or initiatives, or any withdrawal by us from certain countries because of such actions or initiatives, would adversely affect our MAUs, including by giving our competitors an opportunity to penetrate geographic markets that we cannot access. As a result, our consumer growth, retention, and engagement may be seriously harmed, and we may not be able to maintain or grow our revenue as anticipated and our business could be seriously harmed.

Many of our customers deploy our products and solutions globally and we could be held liable in some jurisdictions in which we operate for content posted by our consumers, which could expose us to damages or other legal liability.

Our platform allows our consumers to post content globally. Although relevant laws and regulations such as Section 230 of the Communications Decency Act of the United States provide immunity, subject to certain conditions, to certain online platforms from claims related to third-party content, the law relating to the liability of online service providers for others’ activities on their services may change and our current protections from liability for third-party content in the United States could decrease or change as a result. Claims may be brought against us for defamation, negligence, breach of contract, copyright and trademark infringement, unfair competition, unlawful activity, torts, fraud, or other legal theories based on the nature and content of information available on or via our platform.

We may be subject to claims by virtue of our involvement in hosting, transmitting or providing access to content created by third parties. Defense of any such actions could be costly and involve significant time and attention of our management and other resources, may result in monetary liabilities or penalties, or may require us to change our business in an adverse manner. If the content displayed on our platform is found to be illegal under applicable local law, we may be exposed to fines, civil penalties or consent decrees for such violations of law, which could adversely affect our revenue, reputation and results of operations.

We may be subject to governmental export and import controls that could impair our ability to compete in international markets and subject us to liability if we violate the controls.

Since 2018, there have been political and trade tensions among a number of the world’s major economies. These tensions have resulted in the implementation of tariff and non-tariff trade barriers and sanctions, including the use of export control restrictions and sanctions against certain countries and individual companies. Any increase in the use of export control restrictions and sanctions to target certain countries and entities or any expansion of the extraterritorial jurisdiction of export control laws in relation to AI products could impact our ability to compete globally. In addition, measures adopted by an affected country to counteract impacts of another country’s actions or regulations could lead to significant legal liability to multinational corporations, including our own. For example, in January 2021, China adopted a blocking statute that, among other matters, entitles Chinese entities incurring damages from a multinational’s compliance with foreign laws to seek civil remedies. In February 2022, due to the military conflicts between Russia and Ukraine, several major economies, including the United States, the United Kingdom and the European Union imposed economic sanctions against Russia and certain Russian persons and entities. Our current results of operations have not been materially affected by the expanded export control regulations or the novel rules or measures adopted to counteract them. Nevertheless, depending on future developments of global trade tensions, such regulations, rules, or measures may have an adverse impact on our business and operations, and we may incur significant legal liability and financial losses as a result.

22

Table of Contents

Risks Related to Doing Business in Taiwan

Any lack of requisite approvals, licenses, permits or filings or failure to comply with any requirements of Taiwan laws, regulations and policies may materially and adversely affect our daily operations.

In accordance with the relevant Taiwan laws and regulations, our Taiwan subsidiary is required to maintain various approvals, licenses, permits and filings to operate its business. Whether such approvals, licenses, permits and filings are obtained is subject to satisfactory compliance with, among other things, the applicable laws and regulations. If our Taiwan subsidiary is unable to obtain any of such licenses and permits or extend or renew any of its current licenses or permits upon their expirations, or if it is required to incur significant additional costs to obtain or renew these licenses, permits and approvals, our daily operations could be materially and adversely affected.

Cross-Straits relationship imposes macroeconomic risks which could negatively affect our business.

We maintain our principal executive offices and a substantial amount of our assets in Taiwan, and a substantial portion of our revenues is derived from operations in Taiwan. Our business, financial condition and results of operations may be affected by potential economical and/or military issues in Taiwan.

Taiwan has a unique international political status due to historical reasons. Although significant economic and cultural relations have been established during recent years between Taiwan and the PRC, the PRC government has refused to renounce the possibility that it may at some point use force to gain control over Taiwan. For example, the PRC government adopted an anti-secession law relating to Taiwan. Sanctions against Taiwan entities or persons, and military blockage or actions from the PRC, may significantly harm Taiwan’s economy. Cross-Straits relations between Taiwan and the PRC have been strained in recent years for a variety of reasons, including tensions concerning arms sales to Taiwan by the United States government and visits to Taiwan by United States government officials. The financial markets have viewed certain past developments in relations between Taiwan and the PRC as occasions to depress general market prices of the securities of Taiwan companies. Any tension between Taiwan and the PRC, or between the United States and the PRC, could materially and adversely affect our business, financial condition and results of operations.

Our Taiwan subsidiary is subject to certain restrictions on paying dividends or making other payments to us, which may restrict our ability to satisfy the liquidity requirements.

As an exempted company with limited liability incorporated under the laws of the Cayman Islands structured as a holding company, we may need dividends and other distributions on equity from our Taiwan subsidiary to satisfy our liquidity requirements. Current Taiwan regulations permit our Taiwan subsidiary to pay dividends to its respective shareholders only out of its accumulated profits, if any, which shall first make up previous losses and set aside at least 10% of its accumulated profits each year. These reserves are not distributable as cash dividends. Furthermore, if our Taiwan subsidiary incurs debt on its own behalf in the future, the instruments governing the debt may restrict its ability to pay dividends or make other payments to us. Any limitation on the ability of our Taiwan subsidiary to distribute dividends or to make payments to us may restrict our ability to satisfy our liquidity requirements. In addition, the dividend payments by our Taiwan subsidiary to us shall be subject to a withholding tax of 21%.

Our Taiwan subsidiary is subject to foreign exchange control imposed by Taiwan authorities, which may affect paying dividends, repatriating the interest or making other payments to us.

Currently Taiwan regulates only those foreign exchange transactions that involve currency conversion from New Taiwan Dollar to foreign currency or from foreign currency to New Taiwan Dollar (collectively, “Regulated Transactions”). In general, Regulated Transactions involving NTD 500,000 or more shall be declared to the Central Bank of Taiwan. Further, for Regulated Transactions involving New Taiwan Dollar equivalent to over USD 1 million, relevant documents shall be verified by banks before such transactions can be processed. In addition, if annual accumulated settlement amount of Regulated Transactions exceeds USD 50 million, such foreign exchange settlement is subject to the approval of the Central Bank of Taiwan. The Taiwan government may impose further foreign exchange restrictions in certain emergency situations, where the Taiwan government experiences extreme difficulty in stabilizing the balance of payments or where there are substantial disturbances in the financial and capital markets in Taiwan. If the dividend payments or other payments by our Taiwan subsidiary to us involves the currency conversion from New Taiwan Dollar to United States Dollar, such conversion would be subject to the foregoing foreign exchange control. See “Item 4. Information on the Company — B. Business Overview — Regulation — Exchange Controls in Taiwan” for additional details.

23

Table of Contents

We may be required to obtain approvals from Taiwan authority for investment in our Taiwan subsidiary if the shareholding of Perfect Corp. reaches the threshold for such approval.

Under current Taiwan laws, regulations and policy, Perfect Corp., the sole shareholder of our Taiwan subsidiary, will be required to obtain an approval from the Investment Commission, Ministry of Economic Affairs of Taiwan for its investment in its Taiwanese subsidiary if more than 30% of its capital is directly or indirectly owned by, or beneficially owned by any PRC person or it is under control by any PRC person.

As of the date of this annual report, we are not aware of any PRC person who has triggered or would trigger the requirement for such approval. If such approval is needed in the future, failure to obtain it may subject us to relevant Taiwan authority’s monetary penalty of from NTD120,000 to NTD25,000,000, and we may be ordered to rectify within a specific timeline; if Perfect Corp. still fails to apply for such approval after receiving the rectification order, the Taiwan authority may order Perfect Corp. to withdraw its investment and suspend its operation in Taiwan.

Risks Related to Doing Business in the PRC

Uncertainties in the interpretation and enforcement of PRC laws and regulations could limit the legal protections available to you and us.

The PRC legal system is a civil law system based on written statutes. Unlike the common law system, prior court decisions may be cited for reference, but have limited precedential value. The uncertainty mainly lies in two prongs. On one hand, interpretation of the laws such as the PIPL can be debatable, supplemental regulations are partially lacking, and the laws are issued and amended by authorities in a relatively fast fashion. On the other hand, there exist multiple authorities governing cybersecurity and data protection law enforcement simultaneously, and their focus and frequency of enforcement activities may differ, which adds up to the uncertainty. Generally speaking, both legislation and enforcement activities fairly reflect a tightening regulatory trend.

Our mobile apps are available for downloading and use in China. Such operations are governed by PRC laws, rules and regulations. From time to time, we may have to resort to administrative and court proceedings to enforce our legal rights. The cybersecurity review may be initiated by competent authorities where risks to national security are found, such as risks of Core Data, Important Data (both of which are defined in the Cybersecurity Review measures) and the large scale of personal information being stolen, leaked, damaged, illegally utilized, transferred outside the territory of PRC. The cybersecurity review could last from thirty (30) business days to over six (6) months if such review is initiated, and if we fail the cybersecurity review, our data processing activities in China may be ordered for termination. However, since PRC administrative and court authorities have significant discretion in interpreting and implementing statutory and contractual terms, it may be more difficult to predict the outcome of administrative and court proceedings and the level of legal protection we enjoy than in more developed legal systems. Furthermore, the PRC legal system is based in part on government policies and internal rules (some of which are not published in a timely manner or at all) that may have an adverse impact on our business operations. We may not be aware of any violation of these policies and rules until after such violation has occurred, which may result in substantial costs and diversion of resources and management attention. Such unpredictability, including uncertainty as to the scope and effect of our contractual, property (including intellectual property) and procedural rights, could materially and adversely affect our business and impede our ability to continue our operations.

Changes and developments in the political and economic policies of the PRC government may materially and adversely affect our business, financial conditions and operating results.

We have operating subsidiaries located in various jurisdictions, including one operating subsidiary located in the PRC. Accordingly, our financial condition and results of operations are affected by economic, political and legal developments in the PRC.

24

Table of Contents

The PRC economy differs from the economies of most developed countries in many respects, including the level of development, growth rate, extent of government involvement, control of foreign exchange and allocation of resources. For example, the PRC government regulates industry development by imposing industrial policies. The PRC government also plays a significant role in China’s economic growth by allocating resources, controlling payment of foreign currency-denominated obligations, setting monetary policy, regulating financial services and institutions and providing preferential treatment to particular industries or companies. Our financial condition and results of operations could be materially and adversely affected by government control over foreign investments or foreign exchange that are applicable to us. In addition, the PRC government has implemented in the past certain measures, including interest rate increases, to manage the pace of economic growth and prevent the economy from overheating. Any prolonged slowdown in the Chinese economy could lead to a reduction in demand for our services and consequently have a material adverse effect on our businesses, financial condition and results of operations.

If we fail to obtain and maintain the requisite licenses and approvals required under the complex regulatory environment applicable to our businesses in the PRC, or if we are required to take actions that are time-consuming or costly, our business, financial condition and results of operations may be materially and adversely affected.

The internet industry is highly regulated in the PRC. Our business operations in the PRC are required to obtain and maintain applicable licenses and approvals from different regulatory authorities in order to provide our current services. Under the current PRC regulatory scheme, a number of regulatory agencies, including but not limited to the Ministry of Culture, which were consolidated with the National Tourism Administration and have been reformed and become the Ministry of Culture and Tourism, Ministry of Industry and Information Technology, the State Council Information Office, the Cyberspace Administration of China, the Central Cyberspace Affairs Commission, the National Development and Reform Commission, the Ministry of Public Security, the Ministry of State Security, the Ministry of Commerce, the State Administration for Market Regulation, and the National Radio and Television Administration, and local government, jointly regulate all major aspects of the internet industry and AI and AR industries. Operators must obtain various government approvals and licenses for relevant businesses.

Considerable uncertainties exist regarding the interpretation and implementation of existing and future laws and regulations governing our current business activities, including in the PRC, and new industries or businesses we may expand into. While we believe that our PRC subsidiary has obtained and maintained all applicable licenses and approvals from the applicable regulatory authorities to provide its current services, we cannot assure you that we will not be found in violation of any law and regulations currently in effect, due to the relevant authorities’ implementation or interpretation of these laws and regulations, or any future laws and regulations. If we fail to complete, obtain or maintain any of the required licenses or approvals or make the necessary filings, or otherwise fails to comply with the laws and regulations, we may be subject to various penalties, such as the imposition of fines and the discontinuation or restriction of our operations, as well as proceedings and actions. Any such penalties, proceedings or actions may disrupt our business operations and materially and adversely affect our reputation, business, financial condition and results of operations.

We have minted NFTs in the past. A particular digital asset’s status as a “security” in any relevant jurisdiction is subject to a high degree of uncertainty and if we did not or are unable to properly characterize our NFTs, we may become subject to regulatory scrutiny, investigations, fines, and other penalties, which may adversely affect our business, operating results, and financial condition.

We have minted and offered certain NFTs in the past through a third-party marketplace (OpenSea). In August 2022, we decided to suspend our NFT-related business indefinitely. See “Item 4. Information on the Company — B. Business Overview — Our Business — Product Pipeline — Non-fungible tokens (“NFTs”).” The legal test for determining whether any given digital asset is a security is a highly complex, fact-driven analysis. The SEC generally does not provide advance guidance or confirmation on the status of any particular digital asset as a security. Although the SEC’s Strategic Hub for Innovation and Financial Technology published a framework for analyzing whether any given digital asset is a security in April 2019, this framework is not a rule, regulation or statement of the SEC and is not binding on the SEC.

Foreign jurisdictions have adopted different approaches in classifying digital assets as “securities.” As a result, certain digital assets may be deemed to be a “security” under the laws of some jurisdictions but not others. Various foreign jurisdictions may, in the future, adopt additional laws, regulations, or directives that affect the characterization of digital assets as “securities.”

25

Table of Contents

The classification of a digital asset as a security under applicable law has wide-ranging implications for the regulatory obligations that flow from the offer, sale, trading, and clearing of such assets. For example, a digital asset that is a security in the United States may generally only be offered or sold in the United States pursuant to a registration statement filed with the SEC or in an offering that qualifies for an exemption from registration in accordance with Section 5 of the Securities Act. States and certain foreign jurisdictions have similar registration requirements for securities.

We have policies and procedures to analyze whether each NFT that we minted and offered in the past on OpenSea could be deemed to be a “security” under applicable laws. Our policies and procedures do not constitute a legal standard but rather represent a framework for our analysis, which permits us to make a risk-based assessment regarding the likelihood that a particular NFT could be deemed a “security” under applicable laws. We have conducted our own analysis and have concluded that our NFTs minted in the past are not a “security” under applicable laws. We only offered NFTs on OpenSea that we believed were not securities. However, there can be no assurance that we have properly characterized any given NFT as a security or non-security, or that the SEC, a state or foreign regulatory authority, or a court, if the question was presented to it, would agree with our assessment. If the SEC, a state or foreign regulatory authority, or a court were to determine that any of our NFTs minted in the past constituted a security, we could become subject to judicial, regulatory or administrative actions for failing to offer or sell the digital asset in compliance with applicable securities laws. Such actions could result in injunctions, cease and desist orders, as well as civil monetary penalties, fines, and disgorgement, criminal liability, and reputational harm, which may adversely affect our business, operating results, and financial condition. Purchasers of our NFTs minted in the past could also seek to rescind our sales transactions on the basis that our sales were conducted in violation of applicable law.

Risks Related to the Class A Ordinary Shares and Warrants

The price of Class A Ordinary Shares may be volatile, and the value of Class A Ordinary Shares may decline.

We cannot predict the prices at which Class A Ordinary Shares will trade. The price of Class A Ordinary Shares may not bear any relation to any established criteria of the value of our business and prospects. In addition, the trading price of Class A Ordinary Shares is likely to be volatile and could be subject to fluctuations in response to various factors, some of which are beyond our control. These fluctuations could cause you to lose all or part of your investment in Class A Ordinary Shares as you might be unable to sell your shares at or above the price you paid. Factors that could cause fluctuations in the trading price of Class A Ordinary Shares include the following:

actual or anticipated fluctuations in our financial condition or results of operations;
variance in our financial performance from expectations of securities analysts;
changes in the pricing of our solutions;
changes in laws or regulations applicable to our platform;
announcements by us or our competitors of significant business developments, acquisitions or new offerings;
significant data breaches, disruptions to or other incidents involving our platform;
our involvement in litigation;
conditions or developments affecting the SaaS industry;
future sales of Class A Ordinary Shares by us or our shareholders, as well as the anticipation of lock-up releases;
changes in senior management or key personnel;
the trading volume of our securities;

26

Table of Contents

changes in the anticipated future size and growth rate of our markets;
publication of research reports or news stories about us, our competitors or our industry, or positive or negative recommendations or withdrawal of research coverage by securities analysts;
general economic and market conditions; and
other events or factors, including those resulting from war, incidents of terrorism, global pandemics or responses to these events.

Broad market and industry fluctuations, as well as general economic, political, regulatory and market conditions, may also negatively impact the market price of our ordinary shares. In addition, technology stocks have historically experienced high levels of volatility. In the past, companies who have experienced volatility in the market price of their securities have been subject to securities class action litigation. We may be the target of this type of litigation in the future, which could result in substantial expenses and divert our management’s attention.

Sales of a substantial number of our securities in the public market by our existing securityholders could cause the price of our Class A Ordinary Shares and Warrants to fall.

Sales of a substantial number of Class A Ordinary Shares and/or Warrants in the public market by the existing securityholders, or the perception that those sales might occur, could depress the market price of our Class A Ordinary Shares and Warrants and could impair our ability to raise capital through the sale of additional equity securities. We are unable to predict the effect that such sales may have on the prevailing market price of our Class A Ordinary Shares and Warrants.

Class A Ordinary Shares held by certain of our shareholders are eligible for resale, subject to, in the case of certain shareholders, volume, manner of sale and other limitations under Rule 144. In addition, pursuant to the New Registration Rights Agreement, certain shareholders have the right, subject to certain conditions, to require us to register the sale of their securities under the Securities Act. By exercising their registration rights and selling a large number of our Class A Ordinary Shares, these shareholders could cause the prevailing market price of our Class A Ordinary Shares to decline. On January 17, 2023, the SEC declared effective a registration statement on Form F-1, under which the selling securityholders identified therein or their permitted transferees may offer and sell, from time to time, up to 38,850,406 Class A Ordinary Shares, 9,350,000 Warrants and 9,350,000 Class A Ordinary Shares underlying such Warrants. As restrictions on resale end and certain lock-up agreements entered into prior to the consummation of the Business Combination expire, the market price of our Class A Ordinary Shares could drop significantly if the holders of these shares sell them or are perceived by the market as intending to sell them. These factors could also make it more difficult for us to raise additional funds through future offerings of our Class A Ordinary Shares or other securities.

If we do not meet the expectations of equity research analysts, if they do not publish research or reports about our business or if they issue unfavorable commentary or downgrade Class A Ordinary Shares, the price of Class A Ordinary Shares could decline.

The trading market for Class A Ordinary Shares will rely in part on the research and reports that equity research analysts publish about us and our business. The analysts’ estimates are based upon their own opinions and are often different from our estimates or expectations. If our results of operations are below the estimates or expectations of public market analysts and investors, the price of Class A Ordinary Shares could decline. Moreover, the price of Class A Ordinary Shares could decline if one or more securities analysts downgrade Class A Ordinary Shares or if those analysts issue other unfavorable commentary or cease publishing reports about us or our business.

27

Table of Contents

Our issuance of additional share capital in connection with financings, acquisitions, investments, our equity incentive plans or otherwise will dilute all other shareholders.

We expect to issue additional share capital in the future that will result in dilution to all other shareholders. We adopted the Share Incentive Plan, which has reserved for issuance 5,311,310 Ordinary Shares, for the purpose of granting share-based compensation awards to our directors, officers, employees and advisors to incentivize their performance and align their interests with ours. A maximum of 20,849,975 Class A Ordinary Shares would be issuable upon the exercise of 20,849,975 outstanding Warrants. We have also agreed to issue a maximum of 10,000,000 Shareholder Earnout Shares and 1,175,624 Sponsor Earnout Promote Shares if relevant price targets are triggered. In addition, we may raise capital through equity financings in the future. As part of our business strategy, we may make or receive investments in companies, solutions or technologies and issue equity securities to pay for any such acquisition or investment. Any such issuances of additional share capital may cause shareholders to experience significant dilution of their ownership interests and the per share value of Class A Ordinary Shares to decline.

The dual-class structure of our Ordinary Shares has the effect of concentrating voting control with our CEO; this will limit or preclude your ability to influence corporate matters and could discourage others from pursuing change of control transactions that our shareholders may view as beneficial.

As of the date of this annual report, Alice H. Chang, our founder and CEO, is able to exercise voting rights with respect to 62.3% of the voting power of our outstanding shares through her direct and indirect holding of 16,788,718 Class B Ordinary Shares. Therefore, she is able to control the outcome of matters submitted to our shareholders for approval. Such control may be further concentrated since Alice H. Chang could be granted options under the Share Incentive Plan, and pursuant to the Share Incentive Plan, once the options granted to her are vested and exercised, Class B Ordinary Shares will be issued to her. See “Item 6. Directors, Senior Management and Employees — B. Compensation — Share Incentive Plan” for further details. This concentrated control will limit or preclude your ability to influence corporate matters for the foreseeable future and could discourage others from pursuing change of control transactions that our shareholders may view as beneficial.

Our dual-class structure may render Class A Ordinary Shares ineligible for inclusion in certain stock market indices, and thus adversely affect the trading price and liquidity of Class A Ordinary Shares.

We cannot predict whether our dual-class structure will result in a lower or more volatile market price of Class A Ordinary Shares, adverse publicity or other adverse consequences. Certain index providers have announced and implemented restrictions on including companies with multiple-class share structures in certain of their indices. For example, in July 2017, FTSE Russell announced that it would require new constituents of its indices to have greater than 5% of the company’s voting rights in the hands of public shareholders, and S&P Dow Jones announced in the same month that it would no longer admit companies with multiple-class share structures to certain of its indices. Affected indices include the Russell 2000 and the S&P 500, S&P MidCap 400 and S&P SmallCap 600, which together make up the S&P Composite 1500.

Under the announced policies, our dual-class structure might make Class A Ordinary Shares ineligible for inclusion in any of these indices, and as a result, mutual funds, exchange-traded funds and other investment vehicles that attempt to passively track these indices will not be investing in Class A Ordinary Shares. Therefore, the market price and liquidity of Class A Ordinary Shares could be materially adversely affected.

We are a “controlled company” within the meaning of the rules of the NYSE and, as a result, can rely on exemptions from certain corporate governance requirements that provide protection to shareholders of other companies.

We are a “controlled company” as defined under the rules of the NYSE since Alice H. Chang, our founder and CEO, beneficially owns more than 50% of our total voting power. For so long as we remain a controlled company under this definition, we are permitted to elect to rely, and currently we intend to rely, on certain exemptions from corporate governance rules, including the exemption from the rule that a majority of our Board must be independent directors. As a result, you will not have the same protection afforded to shareholders of companies that are subject to these corporate governance requirements.

28

Table of Contents

We do not intend to pay dividends for the foreseeable future and, as a result, your ability to achieve a return on your investment will depend on appreciation in the price of our ordinary shares.

We do not intend to pay any cash dividends in the foreseeable future, and any determination to pay dividends in the future will be at the discretion of our Board. Accordingly, you may need to rely on sales of Class A Ordinary Shares after price appreciation, which may never occur, as the only way to realize any future gains on your investment.

We are an “emerging growth company,” and we cannot be certain if the reduced reporting and disclosure requirements applicable to emerging growth companies will make Class A Ordinary Shares less attractive to investors.

We are an “emerging growth company,” as defined in the JOBS Act, and we may take advantage of certain exemptions from various reporting requirements that are applicable to other public companies that are not “emerging growth companies,” including the auditor attestation requirements of Section 404, reduced disclosure obligations regarding executive compensation in our periodic reports and proxy statements, and exemptions from the requirements of holding a nonbinding advisory vote on executive compensation and shareholder approval of any golden parachute payments not previously approved.

We will remain an emerging growth company until the earliest of: (1) the last day of the fiscal year (a) following the fifth anniversary of October 28, 2022, the date on which our Class A Ordinary Shares were offered in connection with the Transactions, (b) in which we have total annual gross revenues of at least $1.235 billion, or (c) in which we are deemed to be a “large accelerated filer” as defined in Rule 12b-2 under the Exchange Act, which would occur if the market value of our Class A Ordinary Shares that are held by non-affiliates exceeds $700 million as of the end of the prior fiscal year’s second fiscal quarter; or (2) the date on which we have issued more than $1 billion in non-convertible debt during the prior three-year period.

We cannot predict if investors will find our ordinary shares less attractive if we choose to rely on these exemptions. If some investors find our ordinary shares less attractive as a result, there may be a less active trading market for our ordinary shares, and our share price may be more volatile.

We are a foreign private issuer and, as a result, we are not subject to U.S. proxy rules and are subject to Exchange Act reporting obligations that, to some extent, are more lenient and less frequent than those of a U.S. domestic public company.

We report under the Exchange Act as a non-U.S. company with foreign private issuer status. Because we qualify as a foreign private issuer under the Exchange Act, we are exempt from certain provisions of the Exchange Act that are applicable to U.S. domestic public companies, including:

the sections of the Exchange Act regulating the solicitation of proxies, consents or authorizations in respect of a security registered under the Exchange Act;
the sections of the Exchange Act requiring insiders to file public reports of their share ownership and trading activities and liability for insiders who profit from trades made in a short period of time; and
the rules under the Exchange Act requiring the filing with the SEC of quarterly reports on Form 10-Q containing unaudited financial and other specified information, or current reports on Form 8-K upon the occurrence of specified significant event.

In addition, foreign private issuers are not required to file their annual report on Form 20-F until the end of the fourth month after the end of each fiscal year, while U.S. domestic issuers that are accelerated filers are required to file their annual report on Form 10-K within 75 days after the end of each fiscal year and U.S. domestic issuers that are large accelerated filers are required to file their annual report on Form 10-K within 60 days after the end of each fiscal year. As a result of all of the above, you may not have the same protections afforded to shareholders of a company that is not a foreign private issuer.

29

Table of Contents

We may lose our foreign private issuer status in the future, which could result in significant additional costs and expenses.

As discussed above, we are a foreign private issuer, and therefore, we are not required to comply with all of the periodic disclosure and current reporting requirements of the Exchange Act. The determination of foreign private issuer status is made annually on the last business day of an issuer’s most recently completed second fiscal quarter, and, accordingly, the next determination will be made with respect to us on June 30, 2023. In the future, we would lose our foreign private issuer status if (1) more than 50% of our outstanding voting securities are owned by U.S. residents and (2) a majority of our directors or executive officers are U.S. citizens or residents, or we fail to meet additional requirements necessary to avoid loss of foreign private issuer status. If we lose our foreign private issuer status, we will be required to file with the SEC periodic reports and registration statements on U.S. domestic issuer forms, which are more detailed and extensive than the forms available to a foreign private issuer. We will also have to mandatorily comply with U.S. federal proxy requirements, and our officers, directors and principal shareholders will become subject to the short-swing profit disclosure and recovery provisions of Section 16 of the Exchange Act. In addition, we will lose our ability to rely upon exemptions from certain corporate governance requirements under the listing rules of the NYSE. As a U.S.-listed public company that is not a foreign private issuer, we will incur significant additional legal, accounting and other expenses that we will not incur as a foreign private issuer.

As we are a “foreign private issuer” and intend to follow certain home country corporate governance practices, our shareholders may not have the same protections afforded to shareholders of companies that are subject to all NYSE corporate governance requirements.

As a foreign private issuer, we have the option to follow certain home country practices, those of the Cayman Islands, for certain governance matters which may differ significantly from corporate governance listing standards for U.S. domestic issuers. Among other things, we are not required to have: (i) a majority of the board of directors consisting of independent directors; (ii) a compensation committee; (iii) a nominating committee; or (iv) regularly scheduled executive sessions with only independent directors each year. We intend to rely on the exemptions listed above. We may in the future elect to follow home country practices with regard to other matters. As a result, you may not be provided with the benefits of certain corporate governance requirements of the NYSE applicable to U.S. domestic public companies. See “Item 6. Directors, Senior Management and Employees”.

We will incur increased costs as a result of operating as a public company, and our management will be required to devote substantial time to compliance with our public company responsibilities and corporate governance practices.

As a public company, we will incur significant legal, accounting and other expenses that we did not incur as a private company, which we expect to further increase after we are no longer an “emerging growth company”. The Sarbanes-Oxley Act, the Dodd-Frank Wall Street Reform and Consumer Protection Act, the listing requirements of the NYSE, and other applicable securities rules and regulations impose various requirements on public companies. Our management and other personnel are not experienced in managing a public company and will be required to devote a substantial amount of time to compliance with these requirements. Moreover, these rules and regulations will increase our legal and financial compliance costs and will make some activities more time-consuming and costly. We cannot predict or estimate the amount of additional costs we will incur as a public company or the specific timing of such costs.

We have identified material weaknesses in our internal control over financial reporting. If our remediation of these material weaknesses is not effective, or if we experience additional material weaknesses or otherwise fail to maintain an effective system of internal controls in the future, we may not be able to report our financial results accurately, prevent fraud or file our periodic reports as a public company in a timely manner.

Prior to our listing on the NYSE on October 31, 2022, we were a private company with limited accounting and financial reporting personnel and other supervisory resources, including a lack of an established audit committee to oversee the financial reporting process and our internal control over financial reporting.

30

Table of Contents

Our management is responsible for establishing and maintaining adequate internal control over financial reporting. Internal control over financial reporting is a process designed to provide reasonable assurance regarding the reliability of financial reporting and the preparation of financial statements in accordance with the applicable accounting standards, which for us, is IFRS. We are required, pursuant to Section 404, to furnish a report by management on, among other things, the effectiveness of our internal control over financial reporting as of the end of the fiscal year that coincides with the filing of our second annual report on Form 20-F. This assessment will need to include disclosures of any material weaknesses identified by our management in our internal control over financial reporting. The SEC defines a “material weakness” as a deficiency, or a combination of deficiencies, in internal control over financial reporting such that there is a reasonable possibility that a material misstatement of our annual or interim financial statements will not be prevented or detected on a timely basis. In addition, our independent registered public accounting firm will be required to attest to the effectiveness of our internal control over financial reporting in our first annual report required to be filed with the SEC following the date we are no longer an “emerging growth company”.

Our management has identified material weaknesses related to (1) lack of controls and documentations required under Section 404, and (2) lack of sound design and implementation controls over handling complex accounting treatments. In order to address the material weakness identified: (i) we have recruited an internal auditor with internal control experience; and (ii) we are in the process of implementing a comprehensive policy over accounting and financial reporting procedures and controls to improve the completeness and accuracy of our financial accounting, reporting and disclosures.

Management’s initial certification under Section 404 is expected to be required with our annual report on Form 20-F for the year ending December 31, 2023. In support of such certifications, we will be required to document and make significant changes and enhancements, including hiring personnel in necessary functions with relevant experience.

We cannot assure you that the measures we have taken to date, and actions we may take in the future, will be sufficient to remediate the control deficiencies that led to these material weaknesses in our internal control over financial reporting or that they will prevent or avoid potential future material weaknesses. We cannot assure you that all of our existing material weaknesses have been identified, or that we will not in the future identify additional material weaknesses. If we fail to maintain the adequacy of our internal control over financial reporting, as these standards are modified, supplemented or amended from time to time, we may not be able to conclude on an ongoing basis that we have effective internal control over financial reporting in accordance with Section 404.

Our independent registered public accounting firm will not be required to attest to the effectiveness of our internal control over financial reporting pursuant to Section 404 until the later of the year following our first annual report required to be filed with the SEC or the date we are no longer an “emerging growth company” as defined in the JOBS Act. Our remediation efforts may not enable us to avoid material weaknesses in our internal control over financial reporting in the future. In addition, as a public company, our reporting obligations may place a significant strain on our management, operational and financial resources and systems for the foreseeable future. We may be unable to timely complete our evaluation testing and any required remediation. As a result, we anticipate investing significant resources to enhance and maintain our financial controls, reporting system and procedures over the coming years.

At such time, our independent registered public accounting firm may issue a report that is adverse in the event it is not able to obtain sufficient appropriate evidence with the level at which our controls are documented, designed or operating.

31

Table of Contents

If we fail to achieve and maintain an effective internal control environment, we may not be able to prepare and disclose, in a timely manner, our financial statements and other required disclosures, or comply with existing or new reporting requirements. Any failure to report our financial results on an accurate and timely basis could result in material misstatements in our financial statements and could also impair our ability to comply with applicable financial reporting requirements and related regulatory filings on a timely basis. As a result, our businesses, financial condition, results of operations and prospects, as well as the trading price of our issued equity instruments, including our securities, may be materially and adversely affected. Additionally, ineffective internal control over financial reporting could expose us to increased risk of fraud or misuse of corporate assets and subject us to potential delisting from the stock exchange, regulatory investigations and civil or criminal sanctions. We may also be required to restate our financial statements from prior periods.

We are a holding company with no operations of our own and, as such, we depend on our subsidiaries for cash to fund our operations and expenses, including future dividend payments, if any.

As a holding company, our principal source of cash flow will be distributions or payments from our operating subsidiaries. Therefore, our ability to fund and conduct our business, service our debt and pay dividends, if any, in the future will depend on the ability of our subsidiaries to make upstream cash distributions or payments to us, which may be impacted, for example, by their ability to generate sufficient cash flow or limitations on the ability to repatriate funds whether as a result of currency liquidity restrictions, monetary or exchange controls or otherwise. Our operating subsidiaries are separate legal entities, and although they are directly or indirectly wholly owned and controlled by us, they have no obligation to make any funds available to us, whether in the form of loans, dividends or otherwise. To the extent the ability of any of our subsidiaries to distribute dividends or other payments to us is limited in any way, our ability to fund and conduct our business, service our debt and pay dividends, if any, could be harmed.

Perfect may be or become, or otherwise be treated as, a PFIC, which could result in adverse U.S. federal income tax consequences to U.S. holders of Class A Ordinary Shares or Warrants.

In general, a non-U.S. corporation is a PFIC for U.S. federal income tax purposes for any taxable year in which (i) 50% or more of the average value of its assets (generally determined on the basis of a weighted quarterly average) consists of assets that produce, or are held for the production of, passive income, or (ii) 75% or more of its gross income consists of passive income. Passive income generally includes dividends, interest, royalties, rents, investment gains, net gains from the sales of property that does not give rise to any income and net gains from the sale of commodities (subject to certain exceptions, such as an exception for certain income derived in the active conduct of a trade or business). Cash and cash equivalents are passive assets. The value of goodwill will generally be treated as an active or passive asset based on the nature of the income produced in the activity to which the goodwill is attributable. For purposes of the PFIC rules, a non-U.S. corporation that owns, directly or indirectly, at least 25% by value of the stock of another corporation is treated as if it held its proportionate share of the assets of the other corporation, and received directly its proportionate share of the income of the other corporation.

If we or any of our subsidiaries is a PFIC for any taxable year, or portion thereof, that is included in the holding period of a beneficial owner of our Class A Ordinary Shares or Warrants that is a U.S. holder (as defined below under “Item 10. Additional Information — Taxation — United States Federal Income Tax Considerations”), such U.S. holder may be subject to certain adverse U.S. federal income tax consequences and may be subject to additional reporting requirements. We do not believe we were a PFIC for U.S. federal income tax purposes for the taxable year ended December 31, 2022 and we do not presently expect to be a PFIC for the current taxable year or foreseeable future taxable years. However, this conclusion is a factual determination that must be made annually at the close of each taxable year and, thus, is subject to change. In addition, our current position that we are not a PFIC is based in part upon the value of our goodwill which is based on the expected market value for our Class A Ordinary Shares. Accordingly, there can be no assurance that we or any of our subsidiaries will not be treated as a PFIC for any taxable year. The market price of our Class A Ordinary Shares may fluctuate considerably and, consequently, we cannot assure you of our PFIC status for any taxable year. Please see “Item 10. Additional Information — E. Taxation — United States Federal Income Tax Considerations — PFIC Classification” for a more detailed discussion with respect to our PFIC status. U.S. holders are urged to consult their tax advisors regarding the possible application of the PFIC rules to holders of our Class A Ordinary Shares and Warrants.

32

Table of Contents

Our CEO has control over key decision-making as a result of her control of a majority of the voting right of our outstanding Ordinary Shares.

As of the date of this annual report, Alice H. Chang, our founder and CEO, is able to exercise voting rights with respect to 62.3% of the voting power of our outstanding shares through her direct and indirect holding of 16,788,718 Class B Ordinary Shares. Therefore, she has the ability to control the outcome of matters submitted to our shareholders for approval, including the election of directors and any merger, consolidation, or sale of all or substantially all of our assets. This concentrated control could discourage, delay or prevent a change of control, merger, consolidation, or sale of all or substantially all of our assets that our other shareholders support, or conversely this concentrated control could result in the consummation of such a transaction that our other shareholders do not support. This concentrated control could also discourage a potential investor from acquiring Class A Ordinary Shares, each of which has one vote compared to each Class B Ordinary Shares with ten votes, and might harm the trading price of Class A Ordinary Shares.

In addition, as our CEO, Ms. Chang has control over the day-to-day management and major strategic investments of our Company, subject to authorization and oversight by our Board. In the event of her death, the Ordinary Shares that Ms. Chang owns will be transferred to the persons or entities that she has designated. As a Board member and officer, Ms. Chang owes a fiduciary duty to our shareholders and must act in good faith in a manner she reasonably believes to be in the best interests of our shareholders. As a shareholder, even a controlling shareholder, Ms. Chang is entitled to vote her Ordinary Shares in her own interests, which may not always be in the interests of our shareholders generally.

We will be able to issue additional Class A Ordinary Shares upon the exercise of outstanding Warrants, which would increase the number of shares eligible for future resale in the public market and result in dilution to our shareholders.

Our Warrants are exercisable on the 30th day after the completion of the Transactions, and will expire at 5:00 p.m., New York City time, five years after the completion of the Transactions or earlier upon redemption or liquidation. To the extent the warrants are exercised, additional Class A Ordinary Shares will be issued, which will result in dilution to our shareholders and increase the number of Class A Ordinary Shares eligible for resale in the public market. Sales of substantial numbers of such shares in the public market or the fact that such warrants may be exercised could adversely affect the market price of Class A Ordinary Shares.

The Warrants may never be in the money, and may expire worthless.

The exercise price of the Warrants is $11.50 per share. The likelihood that Warrant holders will exercise the Warrants, and therefore the amount of cash proceeds that we would receive, is dependent upon the trading price of our Class A Ordinary Shares. If the trading price for our Class A Ordinary Shares is less than $11.50 per share, we believe holders of the Warrants will be unlikely to exercise their Warrants. There is no guarantee that the Warrants will be in the money prior to their expiration no later than October 28, 2027, and as such, the Warrants may expire worthless and we may receive no proceeds from the exercise of the Warrants.

We may redeem your unexpired Warrants prior to their exercise at a time that is disadvantageous to you, thereby making your warrants worthless.

Pursuant to the terms of Warrant Agreement, as amended by the Assignment, Assumption and Amendment Agreement, we will have the ability to redeem outstanding Warrants at any time after they become exercisable and prior to their expiration, at a price of $0.01 per warrant, provided that the closing price of Class A Ordinary Shares equals or exceeds $18.00 per share for any 20 trading days within a 30-trading-day period ending on the third trading day prior to the date we give notice of redemption. If and when the Warrants become redeemable by us, we may exercise the redemption right even if we are unable to register or qualify the underlying securities for sale under all applicable federal and state securities laws.

33

Table of Contents

Redemption of the outstanding Warrants could force holders to (i) exercise the Warrants and pay the exercise price therefor at a time when it may be disadvantageous to do so, (ii) sell the Warrants at the then-current market price when the holder might otherwise wish to hold onto such warrants or (iii) accept the nominal redemption price, which, at the time the outstanding Warrants are called for redemption, is likely to be substantially less than the market value of such warrants. Additionally, if a significant number of Warrant holders exercise their Warrants instead of accepting the nominal redemption price, the issuance of these shares would dilute other equity holders, which could reduce the market price of Class A Ordinary Shares. The trading price of Class A Ordinary Share may fluctuate following the consumption of the Business Combination, and can vary due to general economic conditions and forecasts, our general business condition, and the release of our financial reports.

In addition, we may redeem Warrants after they become exercisable for cash at a price of $0.10 per warrant or for a number of Class A Ordinary Shares determined based on the redemption date and the fair market value of Class A Ordinary Shares, starting at a trading price of $10.00. Since commencement of trading on October 31, 2022, the price of our Class A Ordinary Shares closed above $10.00 on certain days; however, the short track record is not indicative of any future price of our Class A Ordinary Shares.

Any such redemption may have similar consequences to a redemption described above. In addition, such redemption may occur at a time when the Warrants are “out-of-the-money,” in which case holders of Warrants would lose any potential embedded value from a subsequent increase in the value of the Class A Ordinary Shares had such holders’ Warrants remained outstanding.

The warrant agreement relating to the Warrants provided that we agreed that any action, proceeding or claim against us arising out of or relating in any way to such agreement would be brought and enforced in the courts of the State of New York or the United States District Court for the Southern District of New York, and that we irrevocably submitted to such jurisdiction, which would be the exclusive forum for any such action, proceeding or claim. This exclusive forum provision could limit the ability of holders of the Warrants to obtain what they believe to be a favorable judicial forum for disputes related to such agreement.

In connection with the Business Combination, we entered into an Assignment, Assumption and Amendment Agreement on October 28, 2022, pursuant to which Provident assigned to us all of its rights, title, interests, and liabilities and obligations in and under the Warrant Agreement, dated as of January 7, 2021, by and between Provident and Continental. The Warrant Agreement, as amended by the Assignment, Assumption and Amendment Agreement, provided that, subject to applicable law, (i) any action, proceeding or claim against us arising out of or relating in any way to the warrant agreement, including under the Securities Act, would be brought and enforced in the courts of the State of New York or the United States District Court for the Southern District of New York, and (ii) that we irrevocably submitted to such jurisdiction, which jurisdiction shall be the exclusive forum for any such action, proceeding or claim. We would waive any objection to such exclusive jurisdiction and that such courts represent an inconvenient forum. We note, however, that there is uncertainty as to whether a court would enforce this provision and that investors cannot waive compliance with the federal securities laws and the rules and regulations thereunder. Section 22 of the Securities Act creates concurrent jurisdiction for state and federal courts over all suits brought to enforce any duty or liability created by the Securities Act or the rules and regulations thereunder.

Notwithstanding the foregoing, these provisions of the Warrant Agreement, as amended by the Assignment, Assumption and Amendment Agreement, will not apply to suits brought to enforce any liability or duty created by the Exchange Act or any other claim for which the federal district courts of the United States of America are the sole and exclusive forum. Section 27 of the Exchange Act creates exclusive federal jurisdiction over all suits brought to enforce any duty or liability created by the Exchange Act or the rules and regulations thereunder. Any person or entity purchasing or otherwise acquiring any interest in any of the Warrants shall be deemed to have notice of and to have consented to the forum provisions in our Warrant Agreement. If any action, the subject matter of which is within the scope of the forum provisions of the Warrant Agreement, as amended by the Assignment, Assumption and Amendment Agreement, is filed in a court other than a court of the State of New York or the United States District Court for the Southern District of New York (a “foreign action”) in the name of any holder of the Warrants, such holder shall be deemed to have consented to: (x) the personal jurisdiction of the state and federal courts located in the State of New York in connection with any action brought in any such court to enforce the forum provisions (an “enforcement action”), and (y) having service of process made upon such warrant holder in any such enforcement action by service upon such warrant holder’s counsel in the foreign action as agent for such warrant holder.

34

Table of Contents

This choice-of-forum provision may limit a warrant holder’s ability to bring a claim in a judicial forum that it finds favorable for disputes with us, which may discourage such lawsuits. Alternatively, if a court were to find this provision of the Warrant Agreement, as amended by the Assignment, Assumption and Amendment Agreement, inapplicable or unenforceable with respect to one or more of the specified types of actions or proceedings, we may incur additional costs associated with resolving such matters in other jurisdictions, which could materially and adversely affect our business, financial condition and results of operations and result in a diversion of the time and resources of our management and Board.

Forum selection provisions in our Articles could limit the ability of holders of Class A Ordinary Shares or other securities to obtain a favorable judicial forum for disputes with us, our directors and officers and potentially others.

Our Articles provide that, unless we consent in writing to the selection of an alternative forum, the United States District Court for the Southern District of New York shall be the exclusive forum (or, if such court lacks subject matter jurisdiction over a particular dispute, the state courts in New York County, New York) for the resolution of any complaint asserting a cause of action arising out of or relating in any way to the Securities Act or the Securities Exchange Act, as amended, regardless of whether such legal suit, action, or proceeding also involves parties other than us. However, the enforceability of similar federal court choice of forum provisions has been challenged in legal proceedings in the United States, and it is possible that a court could find this type of provision to be inapplicable, unenforceable, or inconsistent with other documents that are relevant to the filing of such lawsuits. If a court were to find the federal choice of forum provision contained in our Articles to be inapplicable or unenforceable in an action, we may incur additional costs associated with resolving such action in other jurisdictions. If upheld, the forum selection clause in our Articles may limit a securityholder’s ability to bring a claim against us, our directors and officers and potentially others in his or her preferred judicial forum, and this limitation may discourage such lawsuits. In addition, the Securities Act provides that both federal and state courts have jurisdiction over suits brought to enforce any duty or liability under the Securities Act or the rules and regulations thereunder. Accepting or consent to this forum selection provision does not constitute a waiver by you of compliance with federal securities laws and the rules and regulations thereunder. You may not waive compliance with federal securities laws and the rules and regulations thereunder. The exclusive forum provision in our Articles will not operate so as to deprive the courts of the Cayman Islands from having jurisdiction over matters relating to our internal affairs.

If we do not maintain a current and effective prospectus relating to the Class A Ordinary Shares issuable upon exercise of the Perfect Public Warrants, you will only be able to exercise such Warrants on a “cashless basis”.

If we do not maintain a current and effective prospectus relating to the Class A Ordinary Shares issuable upon exercise of the Perfect Public Warrants as part of the Transactions, at the time that holders wish to exercise such Perfect Public Warrants, they will only be able to exercise them on a “cashless basis”. As a result, the number of Class A Ordinary Shares that holders will receive upon exercise of the Perfect Public Warrants will be fewer than it would have been had such holders exercised their Warrants for cash. Under the terms of the Warrant Agreement, as amended by the Assignment, Assumption and Amendment Agreement, we will agree to use our commercially reasonable efforts to maintain a current and effective prospectus relating to the Class A Ordinary Shares issuable upon exercise of the Warrants until the expiration of the Warrants. However, we cannot assure you that we will be able to do so.

General Risks

A severe or prolonged downturn of global economy or unfavorable conditions in our industry could materially and adversely affect our business and operating results.

Our international operations make us sensitive to general global economic conditions. The COVID-19 pandemic has previously adversely affected the global economy and whether this will lead to a prolonged downturn in the global economy remains unknown. In recent months, inflationary pressures, increases in interest rates and other adverse economic and market forces have contributed to volatility and uncertainty in international markets. To the extent there is a sustained general economic downturn and our software and services are perceived by our existing and potential customers to be costly or too difficult to deploy or migrate to, our revenue may be disproportionately affected by delays or reductions in general information technology spending. We cannot predict the timing, strength or duration of any economic slowdown, instability or recovery, generally, or within any particular industry. If the economic conditions of the general economy or markets in which we operate worsen from present levels, our business, results of operations and financial condition could be harmed.

35

Table of Contents

Any catastrophe, including natural catastrophes, outbreaks of health pandemics such as the COVID-19 pandemic or other extraordinary events, could disrupt our business operations and have a materially adverse impact on our business and results of operations.

Our operations rely heavily on our network infrastructure and information technology systems.

Catastrophic events such as earthquakes, fire, floods, hail, windstorms, environmental accidents, power loss, communications failures, explosions, terrorist attacks or other similar events could cause system interruptions, delays in accessing our service and loss of critical data or could prevent us from providing our products and solutions to our customers.

In addition, our business could be adversely affected by the outbreak of health pandemics, such as the ongoing COVID-19 pandemic. In response to the COVID-19 pandemic, authorities in jurisdictions where we operate, or in which our partners, customers, or others operate, have put in place quarantines, shelter-in-place orders, physical distancing requirements and similar government orders and restrictions in order to control the spread of the disease. These measures have impacted and may further impact our workforce and operations, the operations and demands of our customers, and those of our respective partners and users. The global impact of COVID-19 pandemic has and continues to evolve, and remains uncertain and subject to change. Such uncertainty from the pandemic may cause prospective or existing customers to defer investment in the areas covered by our products and services or to reduce the value or duration of contracts and may also require us to provide larger pricing discounts or extended payment terms. Since the impact of COVID-19 pandemic is ongoing and because of our subscription-based business model, the effect of the COVID-19 pandemic and the related impact on the global economy may not be fully reflected in our results of operations until future periods.

Some of our customers have experienced, and may continue to experience, financial hardships that could result in delayed or even uncollectible payments in the future. As a result, our business operations may be materially and adversely affected.

Fluctuations in exchange rates could have a material and adverse effect on our results of operations.

Our sales are substantially denominated in U.S. dollars and some of our capital expenditures are denominated in currencies other than U.S. dollars, primarily in NT dollars, Euros, RMB and Japanese yen. As a result, any significant fluctuations to our disadvantage in the exchange rate of the U.S. dollar against such currencies, in particular a continued strengthening of the U.S. dollar, would therefore reduce reported revenue and expenses from our international businesses included in our consolidated statements of operations. In addition, if the U.S. dollar appreciates significantly versus other major currencies, the demand for the products and services of our customers and for our goods and services will likely decrease, which will negatively affect our revenue.

Item 4.Information on the Company

A.

History and Development of the Company

Perfect Corp. was incorporated as a Cayman Islands exempted company on February 13, 2015, as a spin-off from CyberLink. We primarily focused on the development of makeup virtual try-on solutions. From 2015 to 2017, we refined our technology based on market feedback and expanded our development into other beauty solutions, such as nail virtual try-on and skin diagnostics on our mobile apps. Over the 2016 through 2017 period, we grew to a platform with over 300 million users of our mobile apps, which further provided feedback and guidance on consumer tastes and preferences. In 2017, we launched our SaaS business model to further monetize the technology and gain further support from large brands and retailers. With more beauty solutions such as hair color virtual try-on being developed, by the end of 2018, we were already able to provide a complete SaaS series of services. Our goal then moved to becoming a one-stop shop for AR- and AI-beauty and fashion solutions. Since early 2019, we introduced beauty tech AI and formed numerous partnerships with e-commerce and social media leaders, including Alphabet (Google and YouTube), Meta (Instagram), and Snap, as well as Asia tech platforms such as Alibaba (Taobao and Tmall). Such partnerships have been critical to our growth as an omni-channel service provider. In mid-2021, we expanded our path into the fashion tech area, which includes products such as virtual try-on for eyewear, jewelry, headwear, and watches. With innovation at the heart of our values, we seek to continue to expand our product portfolio and strengthen our leadership as provider of AR- and AI-powered solutions dedicated to the beauty and fashion industry.

On October 28, 2022, we consummated the previously announced Business Combination with Provident. On October 31, 2022, our Class A Ordinary Shares and Warrants commenced trading on the NYSE under the symbols “PERF” and “PERF WS”, respectively.

36

Table of Contents

For details of our principal capital expenditures for the previous three years ended December 31, 2022, see “Item 5. Operating and Financial Review and Prospects — B. Liquidity and Capital Resources.”

Address and Further Information

The mailing address of our principal executive office is 14F, No. 98 Minquan Road, Xindian District, New Taipei City 231, Taiwan, and our telephone number is +886-2-8667-1265. Our website address is www.perfectcorp.com. The information on our website is not a part of this annual report.

The SEC maintains a website at www.sec.gov which contains in electronic form each of the reports and other information that we have filed electronically with the SEC.

Our agent for service of process in the United States is Cogency Global Inc., 122 East 42nd Street, 18th Floor, New York, New York 10168.

B.

Business Overview

Our Mission and Vision

Our mission is to democratize the shopping experience for consumers and brands with AR, AI, and digital technologies.

Our vision is to transform the world with digital tech innovations.

We believe that our platform transforms how brands and consumers interact and creates opportunities to connect that were not possible before. With our best-in-class, hyper-realistic virtual try-on solutions, we are disrupting the traditional online and in-store shopping journey by creating instant, seamless and engaging omni-channel shopping experiences.

We believe that everyone should have access to a highly-personalized, interactive, and meaningful shopping experience. Leveraging innovative technologies, our solutions are designed to bring brands to life and allow consumers to effortlessly engage with them.

We believe there is also significant opportunity to extend our platform beyond beauty into other areas of fashion. By creating extensive try-on possibilities, anytime, anywhere, we believe that we have the potential to become a preeminent fashion tech brand.

We also strive to achieve environmental sustainability with beauty AR- and AI-technologies. As we re-imagine the way everyone tries on products, we are reducing the environmental impact of each purchase by decreasing the amount of plastic waste and reducing the carbon footprint traditionally associated with physical testers.

Our Values

Innovative — Innovation, strategic thinking and teamwork are at the heart of everything we do. We strive to be a force for good through our product development philosophy, sustainability, long-term partnerships, creative community development, and inclusive workplace.

Passionate — We pride ourselves in developing excellent SaaS products that impress and entertain, bringing consumers closer to their favorite beauty brands, even in times when online shopping is the only window of contact available. Our algorithms are developed in house by a team of passionate engineers who work with inclusivity in mind, developing technologies that can be enjoyed by everyone, regardless of gender, age, or ethnicity.

Trust-worthy — We are committed to building trust, excellence and customer satisfaction for all our partners. We seek to develop long-term business relationships that allow us to grow together through synergistic partnerships.

37

Table of Contents

Inclusivity — We have built a large inclusive online community, congregating beauty lovers from all around the world. Through our social media channels and a suite of popular YouCam mobile apps, we inspire young people to be creative, interact with art and photography, and develop appreciation for beauty, providing them with tools to express their unique personalities online.

Environmentally-Positive — Our solutions aim to make a positive impact on the planet by drastically reducing plastic waste and other related carbon footprint emissions.

Committed — We encourage our employees to be bold, dream big, and embrace change. We value diversity, integrity, and respect for others. We are an equal opportunity provider, with our team located across four continents. We actively work against gender-based pay discrimination, as well as discrimination based on race, ethnicity, nationality, economic status, marriage status, sexual orientation, age, culture, or religion.

Our Company

Founded in 2015, we are the leading SaaS technology company offering AR- and AI-powered solutions dedicated to the beauty and fashion industry. As of the date of this annual report, we cover 90% (18 out of 20) of the top 20 global beauty groups. We pride ourselves in pushing the boundaries of beauty tech innovations and delivering the most interactive and enriched beauty and fashion shopping experiences.

We offer to beauty brands and retailers subscription-based toolkits, enabling them to offer beauty product virtual try-on experiences to their consumers across multiple channels and product groups. Our current solutions include virtual try-ons for makeup, nail art, hairstyles, beard dye and styling, eyewear, jewelry, advanced skin diagnostic technology, foundation shade finder and our interactive AR makeup application tutorial platform. Brands and retailers can deploy these solutions through different channels, including mobile apps, websites, in-store kiosks, and third-party e-commerce platforms. All our solutions are paired with a powerful product recommendation engine that delivers precise and ultra-personalized options tailored to each unique consumer. As of December 31, 2022, our customer base includes over 500 brands, with over 550,000 digital SKUs for makeup, haircare, skincare, eyewear, and jewelry products, and over 10 billion virtual product try-ons annually. Within our customer base as of December 31, 2022, we had 152 Key Customers, which accounted for approximately 43.5% of our revenue in 2022. We are a trusted partner to many brands, and our solutions have proven to significantly increase Return on Investment (“ROI”) of these brands.

We also offer six mobile apps with AR- and AI-technology under the “YouCam” brand. The two flagship mobile apps, YouCam Makeup and YouCam Perfect, provide virtual try-ons and beauty camera/ portrait retouching features. Since launching, we have aggregated over one billion downloads as of December 31, 2022. For the year ended December 31, 2022, we had approximately 17.8 million average MAUs across all apps, and our two most popular apps, YouCam Makeup and YouCam Perfect, had approximately 17.3 million average MAUs. In the past, we have leveraged upon our mobile apps as a test bed for new product innovations before introducing these innovations to our beauty brand and retailers. Going forward, we intend to continue to maintain a portfolio of mobile apps for such purposes, but expect to mainly focus on the commercialization through beauty brands and retailers as our core SaaS business.

Our business operations are global, with solutions deployed by brands across 83 countries. In 2022, approximately 59%, 23% and 18% of our revenue came from American region, Asia-Pacific (APAC) region, and Europe, the Middle East and Africa (EMEA) region, respectively. We generated significant portions of revenue from certain countries. In 2022, approximately 51% of our revenue came from United States in North America, 10% came from Japan in Asia, and 7% came from France in Europe. The following table sets forth a geographic breakdown of our revenue for the periods indicated:

Year ended December 31,


2020


2021


2022

% of

% of

% of


(million)


Total


(million)


Total


(million)


Total

United States


15.0


50


20.2


50


24.3


51

Japan


3.2


11


4.5


11


4.7


10

France


3.2


11


3.2


7


3.4


7

Others


8.5


28


12.9


32


14.9


32

Total


29.9


100.0


40.8


100.0


47.3


100.0

38

Table of Contents

We have established long-term collaborative relationships with global industry leaders, such as COTY, Estée Lauder Group, Kosé and Shiseido, and our collaboration with these companies has accelerated industry-wide adoption of our solutions. We were able to benefit from their wealth of experience as global industry leaders. We also formed strategic partnerships with world-class tech giants, including Alphabet (Google and YouTube), and Snap, as well as Asia tech platforms such as Alibaba (Taobao and Tmall), providing us with a wide reach to promote our virtual try-on solutions and continuous technological advancement amongst their platforms.

We have achieved significant scale and growth since our inception in 2015. Our total revenue increased from $29.9 million in 2020 to 47.3 million in 2022, at a CAGR of 25.8%. Our momentum of acquiring new brands continues to be strong, growing from 338 brands as of December 31, 2020 to 444 and 509 as of December 31, 2021 and 2022, respectively, at a CAGR of 22.7%. The number of our Key Customers has increased from 99 in 2020 to 124 and 152 in 2021 and 2022, respectively, at a CAGR of 23.9%. As we grow and continue to expand our product offerings, we expect to significantly increase our penetration beyond beauty and into other fashion areas as well. Our net loss increased from $5.6 million in 2020 to $156.9 million in 2021, mainly due to non-cash fair value adjustment of convertible preferred shares in anticipation of the Transactions. Our net loss increased from $156.9 million in 2021 to $161.7 million in 2022, mainly due to one-off transaction cost and non-cash fair value adjustment of convertible preferred shares in the course of the Transactions. One-off transaction cost in 2022 included non-cash listing expense, which refers to the excess of the fair value of our Class A Ordinary Shares issued over the fair value of Provident’s identifiable net assets on the Closing Date, and professional services expenditures that we incurred in connection with the Transactions.

Our Strengths

We believe we have the following competitive strengths that have been instrumental to our leading position and will continue to fuel our success in the fast-growing beauty AR- and AI-market and beyond.

Beauty AR- and AI-SaaS Leadership

We are the leader in the nascent beauty AR- and AI-SaaS industry. As of the date of this annual report, we cover 90% (18 out of 20) of the top 20 beauty groups worldwide, and serve global beauty brands, including Estée Lauder, MAC and Neutrogena, covering the broad spectrum of brands and products from luxury to mass markets.

We see huge potential in not only supporting the largest players in the market, but also working with indie brands. These brands have significantly grown in popularity in recent years, primarily fueled by consumers seeking niche brands and products online.

We are a trusted partner for both global and indie brands, and our deep-rooted relationships with beauty groups consist of multi-year contracts and spread across multiple brands, channels and countries. We believe this creates substantial barriers to entry for both local and international competitors, providing us with tremendous upselling opportunity and allowing us to remain the market leader in the beauty AR- and AI-SaaS space.

Omni-Channel Presence, Scalable Platform

Our omni-channel, cross-platform coverage significantly increases the stickiness of brands’ products with consumers. We believe brands prefer a neutral platform like ours that has deployment capabilities across all sales channels and social networks, as we are able to provide brands with the peace of mind that the same set of SKUs only needs to be configured once and can then be easily and flexibly deployed in scale across sales channels for consistent consumer experience. Our fully seamless integrations across all platforms lead to a high level of consumer loyalty.

We believe we are also uniquely positioned as the only omni-channel beauty AR- and AI-solutions provider globally. Our solutions can be implemented across multiple platforms, including brand-owned channels such as brands’ official mobile apps, official websites, and in-store kiosks, as well as leading third-party platforms, including Alphabet (Google and YouTube), Snap and Alibaba (Taobao and Tmall). Through these strategic partnerships with world-class tech giants, we help brands build in beauty AR- and AI-integrations into social, search, streaming, and e-commerce platforms, allowing global coverage of brands’ end-consumers, and an integrated consumer engagement and shopping experience. As one of the few third-party service providers that are allowed to integrate their source code directly into those of the large tech platforms, we can seamlessly integrate our AI engine, enhancing the consumer experience and data communication.

39

Table of Contents

Compelling Value Proposition to Brands

We have proven to significantly deliver on brands’ ROI, both online and offline. With the true-to-life virtual try-on effects, consumers have reported spending more time on brands’ websites (over 300% for Marianna Naturals), increasing purchase conversion (over 200% for e.l.f.), and increasing online basket size (over 30% for Tarte Cosmetics). We also bring positive impact to the environment by helping brands reduce waste of beauty sampling and overconsumption. Many brands have testified the positive experiences we brought to them and have become our active endorsers.

We have a diverse customer base, with Key Customers accounting for approximately 43.5% of our 2022 revenue. Our upselling capabilities are also exceptional, with an average of 122% NDRR for the three years from 2020 to 2022, and 94% average retention rate among Key Customers for the same period.

Brands show recurring demand and strong loyalty for our platform and no intention to switch to other platforms as we provide products and services that are aligned with their value proposition.

Superior and Proven Technology and Product Capabilities

Our technological capabilities offer best-in-class accuracy, scalability and performance in our AR- and AI-powered business and consumer solutions. We have powerful AI technology that taps into deep and machine learning algorithms built on data from over 10 billion real-life try-ons every year around the world.

We are able to leverage these data to provide highly accurate and realistic AR makeover experiences, as well as personalized recommendations.

We have developed proprietary AR- and AI-technologies with over 200 points of real-time facial landmarks and over 3,900 real-time facial 3D live meshes backed by visual computing, which has enabled us to detect consumers’ facial features more accurately and offer much more true-to-life effects compared to our peers. Our technology now supports over 89,969 skin tones and 14 makeup textures, which encompass facial attributes across all ethnicities and ages, offering a fully inclusive virtual try-on experience, the most comprehensive in the industry. As of December 31, 2022, we had 25 registered patents and 24 pending patent applications in the beauty tech domain.

Data-Enabled Product Development Strategy

Based on consumers’ try-on behaviors across our multiple channels, we are able to get valuable insights into consumers’ behaviors and preferences, as well as popular trends that are developing in the industry, which in turn accelerates the product development process to create innovative products and services that cater to what the consumers want.

Big data from over 10 billion real-life try-ons globally every year and our machine learning capabilities enable us to continuously refine our platform to provide highly accurate and realistic AR makeover experiences and personalized recommendations. Our unique tech capabilities and extensive collection of training data sets help us solidify our product leadership in the beauty AR- and AI-SaaS industry.

As of December 31, 2022, our team of 134 technology staff, representing 45.1% of our employees, are dedicated to the constant improvement of our platform, development of new features, as well as creation of new apps. With the R&D center placed in Taiwan, we have a great competitive advantage thanks to the easy access to cost-effective, highly motivated, top tech talent. Our team has designed our patented and patent-pending technologies such as AgileFace® and AgileHand® AR, foundation shade matching, AI-powered wrist mapping, physically based rendering, and application of makeup effects to source images, photo albums and product promotions.

40

Table of Contents

Seasoned Management Team with Proven Track Record

We are led by a seasoned yet innovative executive team, with an average of over 20 years of experience in the technology industry. The team’s passion, dedication and entrepreneurial spirit have been critical to our successful track record. Under the leadership of our Chief Executive Officer, Alice H. Chang, our management team has been remarkably stable, with 90% of the senior management team being with us since our inception. With a balance of beauty domain experience and technology expertise, as well as innovative, entrepreneurial minds, we are able to build a digital platform that may transform the world.

Our Strategies

We believe the key strategies below will fuel our continued growth:

Deepen Penetration with Top 20 Beauty Groups

We have deep-rooted relationships with top beauty groups, and we currently cover 18 of the top 20 beauty groups. As of December 31, 2022, we cover 103 brands within the top 20 beauty groups. We currently have over 556,000 SKUs in our database, among which approximately 406,000 SKUs are for the top 20 beauty groups. We currently cover on average 6.4 countries per brand amongst the top 20 beauty groups. AR- and AI-adoption amongst beauty groups is still at an early stage, and we believe there is still significant runway for us to further expand our reach within the groups, specifically through cross-selling to sister brands within each of the beauty groups, upselling more modules and functions to brands and enabling more SKUs in all categories, and upscaling to more countries within a brand. We believe we are well positioned to capture the significant opportunities ahead to expand our reach within these beauty groups.

Expand Reach in Indie Beauty Brands

Our vision is to transform the world with digital tech innovations — through not only the beauty giants, but also indie brands. We see significant growth opportunities. Our convenient self-service platform allows for easy plug-and-play and can help smaller indie brands and beauty merchants easily personalize and customize their platforms to better serve their consumers. We offer competitive rates for our self-service platform, which we believe will encourage widespread adoption of our solutions.

We continue to improve our platform so that it can easily integrate with other systems. Currently, we leverage platforms such as Shopify and Taobao to connect smaller indie brands, offer AR- and AI-toolkits that are easy to deploy, help reduce operational costs, and significantly shorten go-to-market times. We intend to continue to explore other channels in addition to working with Shopify to offer a seamless and easy solution for indie brands to enhance their consumer experience, capturing the huge potential for growth in the beauty long-tail market.

Target New Growth Beyond Beauty

Leveraging our deep industry and technology know-how and a wide existing customer network that we have built in the beauty AR- and AI-space, our next step is to expand into synergistic categories and further expand our product portfolio.

Fashion is an area we are currently making headway in. The areas we plan to focus on in the near term include eyewear, nail design, watches, accessories, and jewelry. We have already partnered with Gucci to launch virtual try-on of eyeglasses, and expect more fashion-related products to come.
Clothing is also another category we are beginning to expand into, such as clothes, hats, scarves, and shoes. We are in discussion with different fashion retailers and aim to launch our fashion services in 2023.
Verticals beyond fashion is another area for growth. We plan to expand the use cases available on our current platform to tap diversified markets. We are currently in the process of developing and refining our solutions for hair salons, dental and orthodontics services, plastic surgery, as well as live-streaming and video conferencing.

41

Table of Contents

We intend to grow our product offerings to drive ubiquity and offer a full suite of products beyond beauty. We believe we are in a great position to drive this growth forward.

Pursue Strategic Investments, Acquisition and Partnership Opportunities

We are dedicated to evaluating and selectively pursing strategic alliances, investments and acquisition opportunities across categories and geographies. We intend to consider potential opportunities throughout the beauty and fashion value chains that will enable us to consolidate and extend market leadership, accelerate our expansion into new verticals and geographies, create synergies from our technology integration, and drive revenue growth and margin expansion.

Our Business

We are a leading player in the beauty and fashion tech revolution, providing omni-channel integrated solutions that are ultra-personalized, interactive and engaging, from online to in-store via beauty mirrors. We deliver experiences that re-imagine the way shoppers, brands, retailers, and content creators discover, try, and shop for beauty and fashion products.

We started building our AR- and AI-SaaS solutions in 2015. Our core AR- and AI-powered solutions deliver personalized beauty and fashion product recommendations. Our offering includes AR- and AI-virtual makeup try-on, foundation shade finder, AR- and AI-virtual try-on for accessories, including jewelry, headpieces, hats, and eyewear, AR- and AI-virtual try-on for hairstyles and personal diagnostic products, including skin analysis and face analyzer. We are also uniquely positioned to combine different solutions to create a comprehensive experience, dedicated to brands that sell many categories of beauty products. Our recently launched makeup tutorial tool, which enables brands’ makeup artists to create interactive and systematic AR- and AI-makeup instruction videos mapped-out on a consumer’s face, provides another innovative tool in helping brands engage with their consumers.

Our solutions are nested into a platform, which makes it easy for us to upsell and expand our offering to existing brands, providing a fast path to market. The number of brands within our coverage also increased in this period, from 338 brands as of December 31, 2020 to 444 and 509 as of December 31, 2021 and 2022, respectively, at a CAGR of 22.7%. The number of our Key Customers has increased from 99 in 2020 to 124 and 152 in 2021 and 2022, respectively, at a CAGR of 23.9%. We also have a well-diversified portfolio and are not just reliant on top 20 beauty groups. Our highly scalable business model allows for flexibility to work with both small and medium-sized brands, as well as with the industry giants.

With the broad array of SaaS solutions we offer, we are mission critical for beauty brands to achieve a successful digital transformation, as no other company in the market provides such a comprehensive catalogue of services. Our platform is very difficult for competitors to replicate and creates a high barrier to entry. As a result, we have been able to secure multi-year, multi-country contracts with top beauty giants, as well as build a highly engaged consumer base for our platform. Our business model is driven by our ability to attract new brands, retain existing brands, and upsell to both new and existing brands. We enter into agreements with beauty brands pursuant to which these brands license our solutions and make periodic payment to us, through which we generate recurring revenue. We are invested in our brands’ success, as our business grows proportionally to the volume of the digital SKUs, regional scope, and type of devices and platforms used.

Value Proposition to Brands and Consumers

As consumers’ shopping behavior and expectations change, brands need to react and deliver solutions that enhance consumers’ shopping experience and meet their new expectations. We believe our broad array of AR- and AI-beauty tech solutions is able to help beauty and fashion brands build strong brand loyalty, increase consumer satisfaction, supercharge sales, and create ultra-personalized experiences that consumers will enjoy.

Due to lack of resources, the vast majority of beauty brands do not have the capability in-house to undergo this kind of digital transformation on their own. We are able to bridge the gap between the brands and consumers, providing a wide array of omni-channel solutions that are easily implemented and are able to go to market quickly.

42

Table of Contents

We work with each brand to bring their shopping experience into the online space, deploying solutions such as virtual try-on, skin analysis, and AI face analysis, paired with ultra-personalized product recommendations. Our solutions can also be deployed in physical stores through beauty mirrors, enhancing the in-person shopping experience with the latest tech. This allows brands to create the new, seamless, and cohesive shopping experiences that modern shoppers have grown to expect. As of December 31, 2022, 100% of the top 20 beauty groups have incorporated the AR- and AI-technologies into their business model, while 18 of them are our customers.

In addition to bringing value to brands and consumers, we believe we bring positive impact to the environment by reducing waste of beauty sampling and overconsumption. Our solutions also promote brands to rethink the way they source products and design packaging, and to reduce the harmful impact on the environment. With our sustainable solutions and zero waste virtual try-on technology, we help beauty brands get closer to achieving their ESG goals, and prove to their consumers that they are worthy of such consumers’ trust. Our AR- and AI-powered virtual try-on technology was named 2021 Green Product of the Year in the BIG Awards for Business by the Business Intelligence Group.

Our Platform

We provide our solutions through our easy-to-use cloud platform — the Perfect Console. First, brands can compose virtual product SKUs directly on the Perfect Console. Second, the SKUs are then stored and can be instantly previewed. Third, brands can publish the SKUs to multiple channels and geographies, including websites, mobile apps, and in-store smart mirrors. Lastly, the Perfect Console offers in-depth product tryout insights with complete brand analysis and customer content management systems to track, analyze, and manage consumer engagement.

Our Products and Services

We provide an AR- and AI-platform that provides true-to-life virtual try-ons across multiple platforms, including brand-owned channels such as brand’s official mobile apps, official websites, and in-store kiosks, as well as leading third-party platforms such as Alphabet (Google and YouTube), Snap, Alibaba (Taobao and Tmall), WeChat, Douyin/TikTok and Shopify. Specifically, we provide the following services through (i) our cloud platform, or (ii) licensing our customers offline SDK or AR/AI offline solutions or mobile apps designed based on customers’ specifications, the revenue of which is recognized in “AR/AI cloud solutions and subscription” and “licensing” components of our revenue, respectively. See “Item 5. Operating and Financial Review and Prospects — A. Operating Results — Components of Results of Operations — Revenue.”

AR- and AI-Makeup

AR- and AI-makeup solution is our first SaaS tech solution for the beauty brands, launched in 2015. It has since then become one of the most popular solutions in our portfolio. We offer AR- and AI-makeup solutions to beauty brands around the world to help enhance consumer experience with virtual makeup try-on. Consumers can try on products in brands’ online and offline stores through our platform. Powered by our proprietary AgileFace® technology, our solution has ultra-accurate facial detection capability to conduct a full range of skin tone analysis for instant and realistic results.

Our ultra-realistic effects help color match to real products and provide true-to-life effects to match brands’ product characteristics. It provides realistic makeup textures, including metallic, pearly, shine effects, and many more. Our solution covers a wide range of virtual makeup products, including, but not limited to, foundations, lipsticks, blushes, eyeliners, mascaras, and eyeshadows. In addition, we are able to combine multiple product try-ons to create instant makeovers of a complete look, allowing consumers to see the full effects of brands’ products instantly.

One of our flagship products under AR- and AI-makeup is the AI foundation shade finder and matcher. Finding the perfect foundation shade has always been a beauty problem facing consumers and brands alike due to the complexity of identifying the accurate skin tones of individual consumers. However, with our AI foundation shade finder and matcher, consumers can find the perfect foundation shade in a matter of seconds.

43

Table of Contents

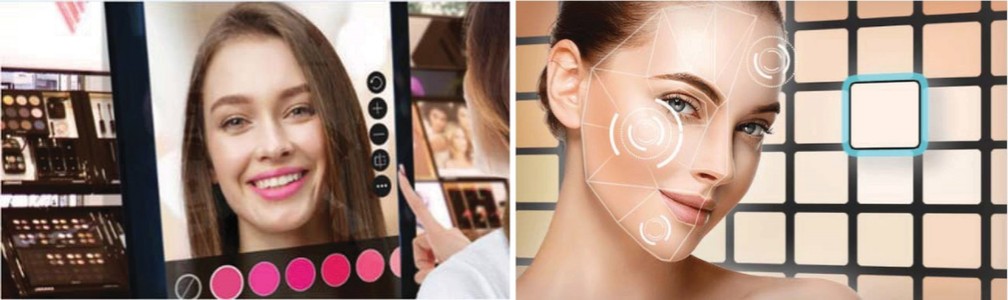
This solution was developed from a deep learning database with over 10 million sample models across all skin tone groups. The AI deep learning algorithm detects the full spectrum of skin tones based on 89,969 shades with unlimited grades from light to dark and true undertones from warm to cool, providing excellent foundation matching and product recommendation. It also supports various types of foundation textures such as matte and glow, and the intensities can also be adjusted to closely mimic the real-life coverage levels for the ultimate consumer experience.
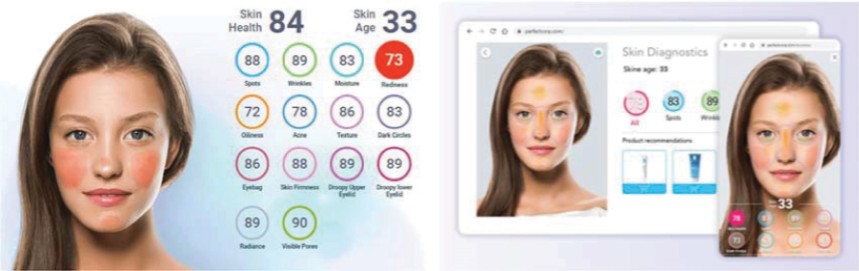
Graphic

AI Skin Analysis

Launched in 2017, our skin analysis leverages our cutting-edge technology to detect a full suite of skin concerns. We developed this skincare solution alongside dermatologists based on clinical data. It can instantaneously detect skin conditions, including moisture level, oiliness level, acne, discoloration, dark spots, dryness, uneven skin, redness, wrinkles, texture, dark circles, eye bags, etc., regardless of your skin type and ethnicity.

Our skin analysis was developed using over 70,000 medical grade images to build AI deep learning algorithms and is verified by skincare experts. It analyzes three images of a person’s face — front, left, and right profiles — which ensures full facial area coverage. In addition to detecting skin concerns, our AI engine can also generate visual simulation that tracks gradual improvements directly on a consumer’s face. It can also give recommendations to consumers that can be tailored to brands’ products and clinical tests. Our skincare solution is proven to be highly accurate against dermatological tests. It has been adopted by some of the largest global skincare brands, such as Neutrogena and Clinique.

Graphic

44

Table of Contents

AR- and AI-Hair

Our AR- and AI-Hair technology was launched in 2016, and allows consumers to try on various hair dye products in real time, giving consumers the ultimate virtual salon experience. Our solution can apply a single hair color, ombre hair color, that simulates two-color combinations, pigment hair color with holographic hair color effects, and hair highlights. The solution is currently used by major hair brands such as Aveda and Kao. Since October 2021, Kao has discontinued all in-store hair bundle color samples in Japan in favor of its hair color simulation tool, powered by our AR- and AI-Hair technology. We are also working to expand AR- and AI-Hair penetration into hair salons.

Graphic

AR- and AI-Jewelry

Our AR- and AI-Jewelry technology was introduced in December 2021 and it currently offers virtual try-on experience for earrings, necklaces, bracelets, and rings.

For earrings, our proprietary AR earring 3D model supports high-resolution textures, material reflections, and simulated motion physics with rigid body dynamics. For necklaces, our PBR technology allows our AR 3D necklaces to present product renderings with incredible accuracy. High-resolution textures and material reflections give virtual necklaces an incredibly realistic appearance, while simulated motion physics and rigid body dynamics ensure AR renders behave naturally, and follow the user as they move in real time. For bracelets and rings, our proprietary AgileHand® technology utilizes PBR 3D hand models to map a full range of gestures, providing a 3D try-on experience with high-resolution textures and reflections that deliver true-to-life virtual effects.

Graphic

45

Table of Contents

AR- and AI-Accessories, Glasses and Watches

Our AR- and AI-accessories technology provides AR effects for eyewear, headbands, hats and other accessory virtual try-ons. For eyewear, our 3D mapping technology allows brands to effortlessly create accurate virtual glasses using three still images, and using our auto pupillary distance detection, we can create very precise frame sizes for all. For AR watches, we leverage the same AgileHand® and PBR technologies to provide an ultra realistic AR try-on experience.

Graphic

AR- and AI-Nails

In 2021, we launched for our brand customers virtual try-ons for nails, a customizable solution that allows try-ons for different polish shades (single and multi-color), as well as a wide array of nail polish textures (e.g., cream, jelly, sheer, matte, etc.), through our proprietary AgileHand® technology. Nail art brands can deploy the solution both online and in-store, allowing consumers to test out latest colors and styles seamlessly, elevating the shopping experience for nail polish products.

Graphic

AR- and AI-Men’s Grooming

In 2021, we launched our first men’s grooming products, virtual try-on beard dyes and beard styles.

46

Table of Contents

Product offerings include beard dye virtual try-ons, beard removal simulation, as well as beard style simulation (e.g., trimmed beard, stubble beard, full beard, circle beard, mustache, goatee, etc.). We understand that more and more men are considering experimenting with their grooming habits. To cater to those needs, facial hair care companies are jumping on board and providing a broad array of care and styling products, including dying agents and growth serums. Our AI beard technology is dedicated to helping men virtually experience grooming products with ease and ride the wave of fashionable facial hair color, styles, and designs.

Graphic

Complementing our AR- and AI-makeup, skin analysis, hair, accessories, eyewear, nail and men’s grooming technologies, we launched various powerful features for brands to fully engage with their consumers in the past few years, including AI face analyzer and product recommendation, beauty advisor 1-on-1, live AR for corporate training, AR live casting for web and app, in-store barcode try-on, etc.

AI Product Recommendation and Face Analyzer

In 2018 and 2020, we launched our AI product recommendation and AI face analyzer tools, respectively, as we started to improve our products based on the large amount of consumer insights we gain from all the different try-ons. Our AI product recommendation provides highly accurate personalized product matching using AI-powered virtual try-on technology. The AI algorithm can use a still photo of the consumer to generate virtual makeup filters with integrated product information for consumers to try on, instantly bringing makeup looks from printed photos to life, allowing brands to create and recommend full looks to consumers.

Graphic

47

Table of Contents

Beauty Advisor 1-on-1

The beauty advisor 1-on-1 service allows online consumers to have on-demand video calls with real beauty consultants. The service provides a private interactive online environment between the consumer and the beauty consultant for a 1-on-1 virtual beauty consultation session. Consumers can get instant answers to all their beauty and makeup queries, while beauty advisors can promote brands products in real time.

Graphic

Live AR for Corporate Training

We provide the world’s only AR makeup training platform built for conducting online courses for beauty advisors. Brands such as Estée Lauder host their trainings with staff through our platform. Brand trainers can set up brands’ looks and products on the platform and virtually try on during the live training, providing an engaging and interactive live training session where students can also test out the products and looks from anywhere in the world.

Graphic

48

Table of Contents

AR Live Casting for Web and App

AR-powered beauty live casting uses virtual makeup try-ons to engage consumers in a real-time interactive experience directly on a brand’s website. Viewers can virtually try on any products mentioned, ask questions and get immediate responses and feedback on products during the livestreams. In addition, the AR service also features e-commerce capabilities, allowing viewers to instantly purchase the products featured during the broadcast. Brands can also easily integrate the interactive livestream content directly on their websites to enhance the consumer engagement and website experience.

Graphic

In-Store QRcode Try-on

With in-store QRcode try-on, consumers can scan a QRcode on selected products and directly try on the product using their phones. This tool allows brands and retailers to offer a digital way for consumers to virtually try on beauty products without using any physical samples, bringing a more economic and environmentally-friendly solution to consumers’ shoppertainment experience.

Graphic

Product Pipeline

Broadening our virtual try-on applications

In addition to the current beauty tech solutions, we are launching new virtual try-on applications for advanced lashes, teeth whitening and nail polish. We have also recently launched an advanced makeup tutorial tool, which enables brands’ makeup artists to create interactive AR makeup instruction videos mapping-out on a consumer’s face, providing brands with another innovative tool to engage with their consumers.

We are also in the process of expanding into the fashion tech area, which includes products such as virtual try-on for eyewear, jewelry, headwear, and watches.

49

Table of Contents

We are uniquely positioned to combine any of the above solutions to create a comprehensive online experience, dedicated to brands that offer many categories of beauty and fashion items. We continue to innovate and expand our product portfolio through consumer feedback and data gathered from our platform. With the rapid advancements into fashion tech, we plan to replicate our success from the beauty market and dominate the fashion vertical as well. We strive to not just be a beauty tech company, but also a fashion tech company.

Metaverse

We are also positioning ourselves to support and embrace the development of the metaverse. Our leadership in AR- and AI-technologies uniquely enables us to bridge the physical and virtual worlds through beauty and fashion. We are developing and have showcased an early version of our envisioned V-Commerce in the metaverse through a 3-D virtual booth for consumers to interact, shop and virtually try on a wide array of makeup, skincare, hair and fashion accessories.

Non-fungible tokens (“NFTs”)

Our AR- and AI-technologies can provide additional value for digital assets and related NFTs, including through virtual try-on solutions that create a new medium in which digital assets can be experienced and enjoyed.

In March 2022, we launched the first-ever virtual try-on NFTs across multiple beauty and fashion categories. Such NFTs are semi-fungible NFTs minted on the Ethereum blockchain through a third-party marketplace (OpenSea) and represent the right to “try on” digital designs, including make-up looks, watches, jewelry or glasses. Semi-fungible NFTs, known by their token standard ERC-1155 on Ethereum, are NFTs that are distinct from other NFTs, but might have a quantity greater than one. Except that the owners of our NFTs must authenticate their ownership before engaging virtual try-on, they can use these virtual try-on NFTs in the same way as consumers virtually try on make-up looks as disclosed in “—Our Products and Services — AR- and AI-Makeup.”

In August 2022, we decided to suspend our NFT-related business indefinitely because our management has determined that the benefits of developing such business, which represented an immaterial portion of our revenues, are outweighed by the potential costs in maintaining such business, including compliance costs in connection with previously contemplated offerings of virtual try-on solution technology to brand customers that mint their own NFTs. Before the suspension, we had offered eight sets of semi-fungible NFTs, each with limited quantities of 20, 50 or 100, and had revenue of approximately 0.5 Ether from sales of our NFTs on OpenSea and 0.05 Ether rewards from OpenSea for minting our NFTs. We purchased a small amount of Ether to pay the gas fees in connection with listing our NFTs on OpenSea for sale. Our Ether and NFTs are stored on the Ethereum blockchain while the private keys to these crypto assets are stored in our MetaMask digital wallet. As of the date of this annual report, we held less than one Ether and 193 NFTs. We do not own or operate any platform where users can trade, send or receive NFTs or other crypto assets.

Mobile Apps

Leveraging the same AR- and AI-technology that we offer to beauty brands, we also operate a few mobile apps under the “YouCam” brand. The two flagship mobile apps, YouCam Makeup and YouCam Perfect, offer users virtual try-on and beauty camera/portrait retouching features.

50

Table of Contents

With over one billion downloads globally as of December 31, 2022, the YouCam platform, with a suite of six freemium apps, including YouCam Makeup and YouCam Perfect, is recognized for its hyper-realistic AR- and AI-try-on experiences, dermatologist-verified skin diagnostics, and a wide range of tools for enhancing selfie pictures and videos. Our daily users are comprised of beauty lovers and photo-editing enthusiasts from all around the world.

Graphic

Our two most popular apps, YouCam Makeup and YouCam Perfect, had approximately 17.3 million average MAUs for the year ended December 31, 2022. We intend to use our portfolio of mobile apps to supplement and support the further development of our relationship with the beauty brands and retailers as a test bed for new product innovations before offering solutions to brands.

The YouCam platform is a suite of six freemium apps, including:

YouCam Makeup: an award-winning virtual beauty app that offers a full suite of virtual makeover tools, including real-time AR makeup application, selfie retouch, hair color and style retouch, skin diagnostics, and live selfie backgrounds.

YouCam Perfect: a leading photo-editing and beauty camera app. YouCam Perfect offers users a wide selection of photo-editing features, face retouch tools, filters, frames, animated effects, templates, stickers, and more. With a 4.8 rating on App Store and 4.4 rating on Google Play, YouCam Perfect is one of the most popular photo-editing apps on the market.

YouCam Video: a top-tier selfie video editor that lets users apply makeup and hair colors, retouch videos, personalize and glow up their videos with beauty filters for TikTok, YouTube, Instagram, Snapchat, Tumblr, and more in just a few taps.

YouCam Nails: a unique app that brings users one step closer to the perfect manicure. With YouCam Nails, users can create hundreds of unique designs by applying polish, drawing patterns, and adding cute nail decals.

YouCam Cut: a video editing app that allows users to be creative with their video stories. Video editing novices and aficionados alike can edit clips quickly and easily with a wide range of effects, transitions, overlays, and more. With YouCam Cut, users can adjust the mood and color of their footage with filters, as well as create slow-motion and time-lapse effects and add background music.

YouCam Fun: a fun, entertaining app that lets users snap and share live video recordings or selfies with friends instantly. Our accurate face detection technology allows users to play around with beauty filters, fun scenes, frames, animal masks, and more, in real time.

Our Partners and Customers

We serve brand owners as well as individual consumers. With over one billion downloads as of December 31, 2022 and approximately 17.8 million average MAUs of our YouCam apps globally for the year ended December 31, 2022, we have a wide consumer base. In addition, we also formed strategic partnerships with world-class tech giants, and provide solutions to multiple notable beauty or fashion accessory brand owners.

51

Table of Contents

Strategic Partnerships

We formed strategic partnerships with world-class tech giants, including Alphabet (Google and YouTube), and Snap, as well as Asia tech platforms such as Alibaba (Taobao and Tmall), to provide us with a wide reach to promote our virtual try-on solutions.

Alibaba: Since 2019, we have natively integrated our makeup AR solutions into Alibaba’s Tmall and Taobao platforms (the largest e-commerce sites in China). Brands that already use our platform are able to utilize the same set of SKUs that are already configured for other channels, and directly “switch on” a similar try-on experience in the brand’s official stores in Tmall and Taobao.

Alphabet: Similarly, our partnership with Alphabet (Google and YouTube) since 2020 allows brands to fully leverage the pre-configured SKU assortment and provide consumers with virtual try-on experience on YouTube (via brands interactive AR advertisements, under brands product videos and interactive AR advertisements) and in Google Search (when a particular brand or product is searched).

Snap: We launched the first phase of our partnership with Snap in late 2020, and plan to extend the virtual try-on functions to over 40 brands as we head into our full launch.

Meta (Instagram): Instagram partnered with us to launch the AR try-on to select merchants on Instagram in 2019 for consumers to virtually apply beauty products.

In all of these partnerships, we are one of the few third parties that are allowed to integrate their code directly into that of the large tech platforms, which makes the consumer experience via our AR- and AI-engine much more seamless. Our omni-channel, cross-platform coverage significantly increases the stickiness of its products with consumers. We believe beauty brands naturally prefer a neutral platform such as us which have deployment capabilities across all sales channels and social networks, as it provides brands with the peace of mind that the same set of SKUs only needs to be configured once and can then be flexibly deployed across sales channels for consistent consumer experience.

Graphic

52

Table of Contents

Graphic

Brand Success Stories

We have successfully helped our brand customers to achieve increased sales, increased basket size, as well as other visible improvement in terms of ROI. Set forth below is an overview of the challenges certain brands encountered and the solutions we have successfully offered.

Brand


Challenges


Solutions

Brand A

·

Provide consumers with new ways to experience products which reflect Brand A’s legacy of creating innovative, sophisticated, and high-performance beauty products

·

Lip Virtual Try-on: enabled lipstick virtual try-on

·

Real-time skin-tone detection leveraging knowledge base of 89,969 skin tones to help consumers find their preferred foundation shade

Brand B

·

Focus on inclusivity to deploy AR- and AI-technologies suitable for all skin tones and face shapes across age, ethnicity and gender

·

Enable omni-channel digital transformation by offering best-in-class virtual try-on technology to ensure precise shade accuracy and promote inclusivity

Brand C

·

Engage consumers through best-in-class AR to provide virtual try-on experiences

·

Deploy AR platform as an integral part of Brand Cs website and mobile app to enhance discovery experience for online consumers

Brand D

·

From an AR technical standpoint, brows are difficult to implement due to degree of precision required

·

Utilize our advanced facial-point detection to precisely and accurately deliver subtle complexities through brow start, arch, and tail

Brand E

·

Enable users to perform skin diagnostics, receive product recommendations and track skincare journey

·

Create bespoke skin diagnostics tool to provide users with real-time skincare analysis through utilizing AR- and AI- technologies to scan users face to provide instantaneous and detailed analysis

53

Table of Contents

We have a strong ability to deepen our existing relationships with brands. Our ability to deepen relationships with brands is a testimony to the eminence of our solutions.

Research and Development

The success of our broad range of AR- and AI-powered solutions is reliant on technology. We invested significant time, resources and expense into R&D. Innovation is part of our core values, and we are continuously pushing the frontiers of technology to develop AR- and AI-technology and provide new beauty and fashion solutions. As of December 31, 2022, we had 24 SaaS technology solutions and six mobile apps. We have 165 AR- and AI-specialists who drive the development of our technology.

Our technology highlights include:

Using 200-point real-time landmarks to map consumers’ facial features;
Generating 3,900 real-time facial 3-D live meshes backed by visual computing;
Supporting over 10 different makeup textures (e.g., matte and metallic);
Recognizing nearly 90,000 skin tones;
Employing over 10 million data sets to train AI deep-learning algorithms for the best performance across all ethnicities and skin tones; and
Protecting our intellectual property with 25 patents and 24 pending patent applications as of December 31, 2022.

Our flagship technologies are:

Our highly accurate facial AR rendering power

Our AgileFace® face technology projects 3,900 3-D mesh in real time, which allows high-performance, high-precision and high-definition facial live AR effects. We are able to perform facial makeup effects to a high level of precision, which leads to a fully inclusive virtual try-on experience, encompassing facial attributes across all ethnicities and ages. We have so far accumulated experience in simulating all makeup product categories (lip, eye, face, and hair) covering all ethnic groups.

Our true-to-life AR technology

Our patented AR technology uses 3D renderings, skin tone analysis, texture matching, and light balancing to ensure realistic makeup effects that move with the muscles of the consumer’s face regardless of the angle or expression, creating more accurate and realistic trials that match the experience of real products.

Our artificial intelligence and machine learning capabilities

We have powerful AI technology that taps into deep and machine learning algorithms built on data from over 10 billion real-life try-ons every year around the world. We are able to leverage this data to provide highly accurate and realistic AR makeover experiences, as well as personalized recommendations.

Our massive and rich database enabling development of unique business intelligence

We are able to collect data through all the different touch points of a brand, which gives us information on popular trends, a holistic view of the market, including supply and demand, as well as insight into consumers’ shopping experiences. We process 500 GB of data records per day on consumer preferences and use this data to continuously refine our technology and build out new features.

54

Table of Contents

Our precise hand tracking technology

Our AgileHand® technology employs physically based rendering method and enhanced environmental lighting to illustrate true-to-life live hand AR effects. We simulate real-life physics, including built materials, textures, micro-reflections, and light scattering, together with enhanced environmental lighting developed with proprietary visual computing algorithmic to mimic natural lighting and apply realistic effects on the virtual products. This allows us to illustrate true-to-life live virtual try-on effects for rings, bracelets, watches, nail polish, and more. AgileHand® technology is trained on real-hand models with a complete array of gestures, skin tones, textures, as well as hand and finger sizes to encompass all unique personal traits.

Intellectual Property

Intellectual property is fundamental to us. With some of the most advanced beauty tech solutions on the market, we make every effort to protect our intellectual property. We rely on a combination of patent, trademark, copyright, unfair competition, and trade secret laws, as well as confidentiality procedures and contractual restrictions to establish, maintain and protect our proprietary rights.

As of December 31, 2022, we have 25 patents registered and 24 applications pending. As a SaaS company, we license our solutions to brands and retailers without transferring any intellectual property. We intend to continue to regularly assess opportunities for seeking patent protection for our technology, which we believe provides a meaningful competitive advantage.

Regulation

Data Privacy

Privacy and data protection laws play a significant role in our business, which restrict our storage, use, processing, disclosure, transfer and protection of non-public personal information provided to us by our consumers. Laws, regulations and industry standards related to the collection of consumers’ data are constantly evolving in various jurisdictions in which we conduct business or where we may expand, including, without limitation, the following:

United States

In the United States, various federal and state regulators, including governmental agencies such as the FTC, have adopted, or are considering adopting, laws and regulations concerning privacy and data protection. Certain state laws may be more stringent or broader in scope, or offer greater individual rights, with respect to personal information than federal laws, and such laws may differ from one another. For example, the California Consumer Privacy Act of 2018, which went into effect January 1, 2020, defines “personal information” broadly enough to include online identifiers provided by individuals’ devices, and imposes more stringent obligations on companies regarding the level of information and control they provide to users about the collection and sharing of their data.

Taiwan

The collection, processing and use of personal data in Taiwan are primarily subject to the Personal Data Protection Act (the “PDPA”) and the Enforcement Rules of the Personal Data Protection Act as well as other applicable rules or regulations issued by the relevant competent authorities, in particular the sectoral rules on the security maintenance plans stipulated by the regulator of different industries. In July 2018, the National Development Council established the Personal Data Protection office in response to the implementation of the GDPR and to ensure a coherent enforcement of the PDPA. Since January 2019, the National Development Council took over the power and function of the Ministry of Justice, and has become the authority that is in charge of interpreting the PDPA and the internal coordination among different government authorities with regard to the relevant matters. The enforcement of the PDPA is administered by the central, local, municipal and county governmental authorities that regulate and supervise the business operations of non-government agencies for each industry.

55

Table of Contents

European Union and the United Kingdom

The General Data Protection Regulation (the “GDPR”), together with national legislation, regulations and guidelines, govern the processing of personal data and impose strict obligations and restrictions on the ability to collect, use, retain, protect, disclose, transfer and otherwise process personal data in the European Union and the United Kingdom. In particular, the GDPR includes obligations and restrictions concerning the consent and rights of individuals to whom the personal data relates, the transfer of personal data out of the European Economic Area or the United Kingdom, security breach notifications, and the security and confidentiality of personal data. In addition, some countries are considering or have passed legislation implementing data protection requirements or requiring local storage and processing of data or similar requirements.

China

Chinese governmental authorities, in particular the Cybersecurity Administration of China, are putting great focus on data protection enforcement. The Cybersecurity Law of the People’s Republic of China (the “CSL”) forms the backbone of cybersecurity and data privacy protection legislation in the PRC. The Data Security Law of the People’s Republic of China (the “DSL”) is the fundamental law in the data security area that widely covers data security mechanisms, obligations, and liabilities at both state administration and data handler levels. The Personal Information Protection Law of the People’s Republic of China (the “PIPL”) represents a new era of personal information protection as well as corporate compliance in the PRC. The DSL, the PIPL and the CSL constitute the three fundamental pillars of Chinese data protection legislation, and together with various systematic supplemental regulations, measures, and standards, form the cybersecurity and data protection legislative framework in China.

Our Effort of Privacy Protection

We are committed to protecting personal data. For mobile apps, we have already formulated the privacy policy for using our platform through our mobile apps. In countries where it is required by specific end-user data privacy law, we provide consumers with notice about our collection and use of data, and ask consumers for their consent to the use of data via tick-box with respect to each purpose separately. For solutions offered to beauty brands and retailers, we do not receive personal information of the end-consumers in most of the cases. Still, we cooperate with brands and retailers to comply with relevant laws and protect data privacy, including assessing the effectiveness of privacy protection of brands and retailers before entering into contracts with them, allocating the privacy protection responsibilities through contractual arrangement, and continuously improving our internal data protection mechanism. We deliver company-wide privacy training regularly, and review and adjust our privacy policies in accordance with the changes of laws and regulations.

Certification and Compliance

Adhering to the highest standards in protecting the data of both the brands that we work with and the end users of our solutions is our core commitment. We design our solutions with safety at the center stage, and take every step necessary in safeguarding sensitive data. Our dedication to this matter is reflected in the number of safety certification and compliance our solutions have received to date. All of our business practices fully comply with HIPAA, CCPA, ISO 27001, GDPR and MLPS 2.0 regulations to ensure every piece of information and data is protected with the utmost care. We strive to guarantee best practices when it comes to making sure all of our partners’ and users’ data remain secure at all times.

56

Table of Contents

Exchange Controls in Taiwan

Under applicable regulations in Taiwan, the inflow and outflow of foreign currency that do not involve the exchange of New Taiwan Dollar is free, while currency conversion between New Taiwan Dollar and foreign currency is subject to exchange transactions declarations pursuant to the Taiwan Foreign Exchange Control Act. Hence, receipts and disbursements involving the currency conversion from New Taiwan Dollar to foreign currency or from foreign currency to New Taiwan Dollar (collectively, “Regulated Transactions”) are subject to declaration obligations imposed by Taiwan authority. In general, Regulated Transactions involving NTD 500,000 or more shall be declared to the Central Bank of Taiwan. Further, for Regulated Transactions involving New Taiwan Dollar equivalent to over USD 1 million, relevant documents shall be verified by banks before such transactions can be processed. In addition, if the annual accumulated settlement amount of Regulated Transactions exceeds USD 50 million, such foreign exchange settlement is subject to the approval of the Central Bank of Taiwan. The Taiwan government may impose further foreign exchange restrictions in certain emergency situations, where the Taiwan government experiences extreme difficulty in stabilizing the balance of payments or where there are substantial disturbances in the financial and capital markets in Taiwan.

For each of the three years ended December 31, 2022, our revenue subject to foreign exchange controls in Taiwan represented less than 1.0% of our total revenue, and our revenue denominated in NTD was fully used for our Taiwan subsidiary’s operation. If our Taiwan subsidiary needs to pay Perfect Corp., for the purpose of dividend distribution or otherwise, we expect the payment to be funded by our Taiwan subsidiary’s revenue denominated in USD, which is generally not subject to foreign exchange control in Taiwan.

Sales and Marketing

Our fast-expanding team of sales representatives spans across 11 cities on four continents and has led us to closing deals with over 500 cosmetic brands as of the latest practicable date and servicing 90% of the world’s top 20 beauty groups. By employing the SaaS model, our revenue grows proportionally to the volume of the digital SKUs, regional scope, and type of devices and platforms used by our customers. We focus on cultivating synergistic, long-term relationships, helping our partners drive sales, generate engagement, and strengthen their brands.

We employ a wide range of marketing activities to engage with existing and potential business and consumer partners. These include regular press releases, social media campaigns across all major channels, including Facebook, Instagram, Twitter, YouTube, TikTok, and LinkedIn, targeted email marketing, online and offline advertising, and industry events participation.

To drive adoption of our solutions, we have developed a lead generation system for our sales team to facilitate inbound and outbound lead sources. Our inbound leads mainly consist of client referrals through positive word-of-mouth that we have built within the beauty industry. We also receive inbound leads from marketing channels such as search engine optimization and pay per click, as well as through our regular online webinars and workshops, blogs and social media posts. Our outbound leads are driven by our sales team through attending trade shows and networking events, and proactively searching out for new leads through channels such as press releases, Zoominfo and newsletters.

Once we have obtained the leads, our sales team works closely with potential clients to convert the leads into our sales pipeline. We focus on understanding the brands’ needs and recommend services that are most suitable to them. Our sales team will work step-by-step with the potential clients to understand and evaluate our services offerings, negotiate the best price, and ultimately finalize the deal.

Seasonality

We are subject to seasonal fluctuations in spending by brands. Historically, the fourth quarter has typically been the quarter with the largest bookings of our solutions from brands and retailers to coincide with the year-end holiday shopping season, which affects our business, revenue, and operating results. We expect this seasonality trend to continue.

57

Table of Contents

Competition

We have solidified our position as the world’s leading global beauty tech solutions provider, and currently we do not have significant direct competition in the SaaS solution space. We are the only AR- and AI-tech company of its kind, providing comprehensive omni-channel solutions to brands and retailers across multiple industries, including makeup, skincare, eyewear, fashion accessories, and men’s grooming. Our competitive advantage and leadership position are further supported by highly positive testimonials from brand partners, as well as a multitude of industry awards.

Modiface Inc., Revieve, Wanna, Holition, and GlamST can be considered our closest competitors, although they are limited with regards to their product offerings. We believe we compete favorably based on the following competitive factors:

Technology accuracy and platform scalability
Omni-channel presence
Product offerings
Ease of use and reliability
Research and development talent

With regards to mobile apps that we offer, we directly compete with several market players, including Lensa, Facetune2, Meitu, Picsart, Camera 360, and B612. These competing mobile apps focus on photo-editing, beautifying, and retouching features, similar to our YouCam Makeup, YouCam Perfect, and YouCam Video apps.

Employees and Human Capital

Our global team is spread across four continents. As of December 31, 2022, we have 297 employees globally, including 134 R&D staff. Our development center is located in Taiwan, which gives us easy access to a world-class, cost-effective pool of engineering talent, adding to our strong competitive advantage. None of our employees are represented by a labor union.

The following table sets forth the number of our employees categorized by function as of December 31, 2022.

Number of 


Employees


Percentage


Sales and Marketing


138


46.4

%

Research and Development


134


45.1

%

General and Administrative


25


8.5

%

Total


297


100.0

%

We have a strong depth of knowledge amongst our technology team. Our team has obtained their education at the top universities from around the world. The vast majority (90%) of our R&D team hold a master’s degree, and 3.6% hold a PhD. 40% of the team have amassed over 10 years of industry experience, with another 24% being in the business for five to ten years. We are also dedicated to nurturing young talent, with 37% of our team hired fresh out of university. These talents bring energy, excitement and out-of-the-box ideas that help us keep innovating and stay on top of industry trends.

We respect everyone equally and hire employees based on talent only. Our diverse global team is composed of talented individuals of various ethnic groups and LGBTQ+ identities, of which 53% are men and 47% are women, with 44% of our managers and executives identifying as female, including the Chief Executive Officer.

We have a dedicated, seasoned, and stable senior management team that has worked together for over a decade to grow the Company since the very early stages. Our management team is composed of top industry experts and visionaries, all with over two decades of industry experience. We are a team that is able to be extremely agile and adapt to the dynamically changing market, given our flat hierarchy structure. This also allows us to quickly make decisions, pivot if needed, and accurately execute strategies.

58

Table of Contents

Facilities

Our corporate headquarters, as well as our core R&D team, is in New Taipei City, Taiwan. We maintain offices in Taiwan, Japan, the United States and China to serve our geographically diverse customer base.

We lease all of our facilities. For additional information about the lease, see “Item 7. Major Shareholders and Related Party Transactions — B. Related Party Transactions — Related Party Transactions with CyberLink and Its Subsidiaries — Rental Agreements.” We do not own any real property. We believe our current facilities are adequate to meet our immediate needs.

Legal Proceedings

From time to time we are party to legal proceedings incidental to the conduct of our business. We are not presently party to any legal proceedings the resolution of which we believe would have a material adverse effect on our consolidated business prospects, financial condition, liquidity, results of operation, cash flows or capital levels.

C.

Organizational Structure

As of the date of this annual report, we own 100% equity interest in the following companies directly:

Perfect Corp. (Shanghai), a company incorporated in the PRC
Perfect Corp., a company incorporated in Japan
Perfect Mobile Corp., a company incorporated in Taiwan (“Perfect Mobile Taiwan”)
Perfect Mobile Corp., a company incorporated in the British Virgin Islands
Perfect Corp., a company incorporated in the State of California, the United States
Fashion Corp., a company incorporated in the Cayman Islands, which will be deemed to be dissolved on April 13, 2023

In addition, Perfect Mobile Taiwan owns 100% equity interest in Perfect Corp., a company incorporated in France.

D.

Property, Plants and Equipment

Please refer to “— B. Business Overview — Facilities” for a discussion of our property, plants and equipment.

Item 4A.Unresolved Staff Comments

None.

Item 5.Operating and Financial Review and Prospects

The following discussion and analysis provides information which our management believes is relevant to an assessment and understanding of our results of operations and financial condition. This discussion and analysis should be read together with the audited historical consolidated financial statements and related notes that are included elsewhere in this annual report. In addition to historical financial information, this discussion and analysis contains forward-looking statements based upon current expectations that involve risks, uncertainties and assumptions. For more information about forward-looking statements, see “Forward-Looking Statements”. Actual results and timing of selected events may differ materially from those anticipated in these forward-looking statements as a result of various factors, including those set forth under “Item 3. Key Information — D. Risk Factors” and elsewhere in this annual report.

59

Table of Contents

A.

Operating Results

Company Overview

Founded in 2015, we are the leading SaaS technology company offering AR- and AI-powered solutions dedicated to the beauty and fashion industry. Our platform transforms how brands and consumers interact and create opportunities to connect that were not possible before. With our cutting-edge, hyper-realistic virtual try-on solutions, we are transforming the traditional online and in-store shopping journey by creating instant, seamless and engaging omni-channel shopping experiences.

As of December 31, 2022, our total customer base includes over 500 brands, including global industry leaders such as Estée Lauder Group, LVMH, COTY and Shiseido, with over 550,000 digital SKUs for makeup, haircare, skincare, eyewear, and jewelry products, and over 10 billion virtual product try-ons annually. We have 124 Key Customers in 2021, and have further added 28 additional Key Customers for the year ended December 31, 2022. We have strong customer retention and loyalty, especially among the Key Customers, with a NDRR of 145%, 125% and 97% and a retention rate of 95%, 92% and 94% for the years ended 2020, 2021 and 2022, respectively, representing an average NDRR of 122% and an average retention rate of 94% during such period.

We also offer to consumers six mobile apps under the “YouCam” brand. These apps supplement and support innovation development of our core SaaS business.

We have achieved significant scale and growth since our inception in 2015. Our total revenue increased from $29.9 million in 2020 to $47.3 million in 2022, at a CAGR of 25.8%. Our momentum of acquiring new brands continues to be strong, growing from 338 brands as of December 31, 2020 to 444 and 509 as of December 31, 2021 and 2022, respectively, at a CAGR of 22.7%. The number of our Key Customers has increased from 99 in 2020 to 124 and 152 in 2021 and 2022, respectively, at a CAGR of 23.9%. As we grow and continue to expand our product offerings, we expect to significantly increase our penetration beyond beauty and into other fashion areas as well. Our net loss increased from $5.6 million in 2020 to $156.9 million in 2021, mainly due to non-cash fair value adjustment of convertible preferred shares in anticipation of the Transactions. Our net loss increased from $156.9 million in 2021 to $161.7 million in 2022, mainly due to one-off transaction cost and non-cash fair value adjustment of convertible preferred shares in the course of the Transactions. One-off transaction cost in 2022 included non-cash listing expense, which refers to the excess of the fair value of our Class A Ordinary Shares issued over the fair value of Provident’s identifiable net assets on the Closing Date, and professional services expenditures that we incurred in connection with the Transactions.

Completion of Business Combination

On October 28, 2022, we completed the Business Combination. On October 31, 2022, our Class A Ordinary Shares and Warrants commenced trading on the NYSE under the symbols “PERF” and “PERF WS”, respectively.

Key Factors Affecting Our Results of Operations

Our results of operations are affected by the following factors:

Overall adoption rate of AR- and AI-technology in beauty and fashion industries

Our results of operations are affected by the overall growth and adoption of AR- and AI-technology in the beauty and fashion industries, which in turn, is affected by customer demand for these technologies and the speed of digital transformation of brands. Changes in any of these general industry conditions and our ability to adapt to such changes could affect our business and results of operation.

Despite the rapid pace of digital transformation in recent years, the estimated adoption of AR- and AI-technology amongst beauty brands remains low. We see significant opportunities to continue to drive the digitization and proliferation of AR- and AI-solutions in the beauty and fashion industries. We believe that with our unique tech capabilities and extensive collection of training data sets from over 10 billion real-life yearly try-ons, we can continue to solidify our product leadership in the beauty AR- and AI-SaaS industry and drive further adoption by beauty and fashion brands.

60

Table of Contents

Our ability to monetize our services

We offer a variety of solutions, including virtual try-ons for makeup, nail art, hairstyles, beard dye and styling, eyewear, and jewelry, advanced skin diagnostic technology, foundation shade finder and our interactive platform. We also offer omni-channel, cross-platform solutions which can be implemented across multiple platforms, including brand-owned channels such as brands’ official mobile apps, official websites, in-store kiosks, as well as leading third-party platforms, including Alphabet (Google and YouTube), Meta (Instagram), Snap and Alibaba (Taobao and Tmall). We are able to provide customized solutions for each brand. For details of our products and services, see “Item 4. Information on the Company — B. Business Overview — Our Business.” For details of revenue recognition of our products and services, see “— Components of Results of Operations — Revenue” below and Note 4 “Summary of Significant Accounting Policies” to our consolidated financial statements included in this annual report. The following table sets forth a breakdown of our revenue for the years indicated based on the types of customers:

Year ended December 31,


2020


2021


2022


% of

% of

% of


total

total

total


US$’000


revenue


US$’000


revenue


US$’000


revenue


Revenue from brands


22,302


74.7

%  

26,691


65.5

%  

29,224


61.8

%

Revenue from Key Customers(1)


19,512


65.3

%  

21,666


53.2

%  

20,580


43.5

%

Revenue from non-Key Customer brands(2)


2,790


9.4

%  

5,025


12.3

%  

8,644


18.3

%

Revenue from mobile apps subscribers


5,802


19.4

%  

11,636


28.5

%  

16,230


34.3

%

Revenue from advertisement network service providers

1,742

5.8

%  

2,398

5.9

%  

1,819


3.8

%

Others


27


0.1

%  

35


0.1

%  

27


0.1

%

Total revenue


29,873


100

%  

40,760


100

%  

47,300


100

%

Notes:

(1)Represents 87.5%, 81.2% and 70.4% of our revenue from brands in 2020, 2021 and 2022, respectively.
(2)Represents 12.5%, 18.8% and 29.6% of our revenue from brands in 2020, 2021 and 2022, respectively.

Our ability to increase revenue depends in part on retaining our existing brands and expanding their use of our services. In managing our business, our management closely monitors our NDRR and retention rate of our Key Customers, which can provide reliable guidance for the growth of our business due to the following reasons: (i) revenue from Key Customers accounted for approximately 65.3%, 53.2% and 43.5% of our total revenue in 2020, 2021 and 2022, respectively, and our primary strategic focus is to allocate more resources to grow our brand customer base; (ii) revenue from all brands represented 74.7%, 65.5% and 61.8% of our total revenue in 2020, 2021 and 2022, respectively, and Key Customers constituted the core of our brand customers since revenue from Key Customers accounted for 87.5%, 81.2% and 70.4% of the revenue from all brands for the respective year; and (iii) compared to other operating metrics, NDRR and retention rate are good indicators of the sustainability of our revenue associated with services provided to our brand customers.

As we deepen long-term relationships with existing brands, we aim to increase the average recurring fees per brand through a combination of cross-selling across sister brands, geographies and verticals of beauty groups, and upselling incremental SKUs, modules and functions to beauty brands. We believe the stickiness and scalability of our platform well positions us to capture this monetization opportunity.

61

Table of Contents

In addition to the Key Customers, which are large brand customers, we also generate revenue from other customers. In 2020, 2021 and 2022, non-Key Customers contributed 34.7%, 46.8% and 56.5% of our total revenue, respectively. Such non-Key Customers primarily include non-Key Customer brands, consumers subscribing for premium value-added functions in our mobile apps and advertisement network service providers that display ads in our mobile apps. We monitor our mobile apps subscription business through MAUs and monthly active subscribers, and benchmark product ratings of, and functionalities offered by, our main mobile app competitors. We monitor our advertisement revenue via effective cost per thousand impressions. The following table sets forth our average MAUs and average monthly active subscribers of our mobile apps for the years indicated:

Year ended December 31,

(in millions)


2020


2021


2022

Average MAUs


35.4


25.1


17.8

Average monthly active subscribers(1)


0.21


0.35


0.49

Note:

(1)Monthly active subscribers refer to paying users who subscribe to our mobile apps’ premium functions and maintain an active subscription at the end of the measured month.

As our primary business strategy is to reinforce our market leadership in providing AR- and AI-SaaS solutions to brand customers, we expect to allocate fewer resources to our mobile apps subscription and advertisement services. Accordingly, our revenue from consumers and advertisement network service providers may continue to represent minority shares of our total revenue in the foreseeable future.

Our ability to expand into new verticals and grow our brand base

Our vision is to transform the world with digital tech innovations — through both global beauty groups and indie brands. We see significant growth opportunities amongst these smaller beauty brands. We intend to continue to work on providing a seamless and easy solution for these indie brands, as capturing this brand base is expected to be important to fuel the growth of our business.

Leveraging our deep industry and technology know-how and a wide existing customer network that we have built in the beauty AR- and AI-SaaS space, we also look to expand into synergistic categories and further expand our product portfolio outside of beauty to expand our brand base. We are looking to expand into fashion (in areas such as eyewear, nail design, watches, accessories, and jewelry), clothing (such as clothes, hats, scarves, and shoes), and beyond fashion (such as solutions for hair salons, dental and orthodontics services, plastic surgery, live-streaming and video conferencing). Some of these services have already been deployed, and we are in discussions with various brands in these areas as well.

We are in a unique position where our existing industry-leading solutions in facial aesthetics can be used in conjunction with these new categories. For example, with eyewear, we can provide a solution which enables consumers to try on eyewear with virtual makeup applied at the same time. This is something an eyewear AR- and AI-vendor cannot easily do given the complexity of AR- and AI-makeup. Ultimately, our goal is to grow product offerings to drive ubiquity and offer a full suite of products beyond beauty.

Our ability to manage and improve operating efficiency

Our results of operations depend on our ability to manage our costs and expenses. Going forward, our increasing scale of business and advancement in technology may lead to lower marginal operating costs and expenses. We expect our customer acquisition efforts to benefit from our strong brand recognition and word-of-mouth referrals as we expand our customer base.

Our continued investment in technology also contributes to the increase of operational efficiency, enabling the same number of employees to deliver higher productivity over time. In addition, we believe that we will continue to benefit from economies of scale as we continue to actively manage the level of our general and administrative expenses. Certain large expenses, such as the professional advisors’ fees in connection with our ongoing reporting obligations as a public company, however, will negatively affect our profitability in the next few years.

62

Table of Contents

Our people and technology

We focus on investing in our people and technology, which are crucial for us to create innovative products and services that cater to what the consumers want, and to further grow our customer base. The success of our broad range of AR- and AI-powered business and consumer solutions is reliant on technology, which offers top-notch accuracy, scalability and performance.

Impact of COVID-19 Pandemic on Our Operations and Financial Performance

The COVID-19 pandemic has adversely affected businesses around the world for the three years ended December 31, 2022, although the negative impact started to ease as countries gradually proceeded to reopening phase in 2022. In order to curb the spread of COVID-19, some countries have imposed restrictions on travel and enforced store closures, encouraging people to stay at home and avoid gathering in public places. These measures have affected our offline licensing business as shopping malls were frequently closed and demand for our offline products such as the in-store kiosks decreased significantly.

The COVID-19 pandemic has previously shifted many beauty retailers’ focus on consumer interaction from primarily offline to online, with consumers unable to interact with product or beauty consultants in the same way as in the past. We were able to capture this shift, as our customers actively expanded their online service offerings. The acceleration in digital channel adoption has led to strong growth for our online services demand and we expect this to be our main growth driver going forward.

Starting from the fourth quarter of 2021 and throughout 2022, a few new variants of COVID-19 have emerged in various countries, and differing levels of travel and gathering restrictions have been reinstated. The extent to which the COVID-19 pandemic may continue to affect our operations and financial performance will depend on future developments, which are uncertain and cannot be predicted. See “Item 3. Key Information — D. Risk Factors — General Risks — Any catastrophe, including natural catastrophes, outbreaks of health pandemics such as the COVID-19 pandemic or other extraordinary events, could disrupt our business operations and have a materially adverse impact on our business and results of operations.”

Basis of Presentation

Our consolidated financial statements have been prepared in accordance with IFRS. All intercompany accounts and transactions have been eliminated on consolidation. For the purposes of presenting consolidated financial statements, our assets and liabilities and our foreign operations (including subsidiaries in other countries that use currencies which are different from our functional currency) are translated into U.S. dollars using exchange rates prevailing at the end of each reporting period. Income and expense items are translated at the average exchange rates for the period. Exchange differences arising, if any, are recognized in other comprehensive income and accumulated in equity.

Components of Results of Operations

Revenue

Our revenue sources include four major components: AR/AI cloud solutions and subscription, licensing, advertisement and others. The first and second components constitute our core SaaS solutions.

(1)AR/AI cloud solutions and subscription

For AR/AI cloud solutions and subscription, we provide online cloud-based services to our customers, primarily including virtual try-on solutions provided to our brand customers and app premium subscription provided to individual customers.

Our typical contract terms with brand customers range from three months to multiple years, among which one-year term is the most common. Our contract terms are decided based on the following considerations: (1) functionality of the subscribed modules (e.g., makeup, skincare, hair, nail, etc.); (2) length of the service; (3) geographical coverage, such as the number of countries/regions to deploy the modules or the number of website domains to integrate our modules; (4) maximum numbers of product SKUs that a brand can utilize at the same time; and (5) additional manpower hours used for conducting the customization, if any.

63

Table of Contents

Furthermore, depending on the nature of the services provided, the charges of brand customers could be further divided to one-time fees, recurring fees, or the combination of both. One-time fees are made up of service setup fee, customization fee, and console base fee, which allows brands to create a brand console account on our platform so that they can upload and manage SKUs. Recurring fees are related to granting customers access to the modules over the contract period. These fees are recurring as the service is time-limited and scope-limited, and subject to renewal upon the expiration of the service term. For brand customers, AR/AI cloud solutions are the major revenue contributor.

In terms of the premium value-added functions in our mobile apps to which individual customers subscribe through Apple App Store and Google Play, we currently offer monthly and yearly subscription plans. The price of such premium functions service varies by country. We recognize revenue from such service based on the fulfilled contract obligation period each month.

(2)Licensing

We collect licensing fees from (1) licensing self-developed technologies, which include offline SDK and AR/AI offline solutions to brand customers and (2) licensing mobile apps designed and created based on customers’ specifications that do not require continuous support from our backend cloud computing infrastructure. For these licensing arrangements, the deliverables are handed over to customers and operated by customers on their own infrastructure without additional services from us.

Furthermore, depending on the nature of the license provided, some brand customers need to renew the licensing agreements, as the right to use our intellectual property is only granted to them for a specific period. The renewal of these licensing agreements generates recurring revenue.

(3)Advertisement

Advertisement revenue is generated from the advertisements displayed by advertisement network service providers in our apps. The consideration of such service is determined based on the frequency of click or impression of the advertisement, which should be treated as a variable consideration. The typical contract term is for one month. The numbers of advertisements are delivered and the associated fees are tracked on a daily basis, and we recognize revenue on a monthly basis based on the daily collected information.

(4)Others

Other revenue includes miscellaneous revenue streams such as hardware sales that do not fall under the aforementioned revenue types. Those revenue streams are immaterial to us.

For further details on our revenue recognition, see Note 4 “Summary of Significant Accounting Policies” to our consolidated financial statements included in this annual report.

Cost of Sales and Services

Our cost of sales and services consists primarily of kiosk hardware cost, certain R&D personnel-related expenses allocated to cost of sales and services which are directly related to revenue and services activities, warranty provision as well as third-party payment processing fees for distribution partners such as Google and Apple. We expect that our cost of sales will increase on an absolute dollar basis in tandem with the growth of our businesses for the foreseeable future as we continue to invest and broaden our offerings and scale up our operations.

Sales and Marketing Expenses

Our sales and marketing expenses consist of personnel-related expenses for salaries, employee benefits, and stock-based compensation for employees engaged in sales and marketing, advertising and promotional fees, cloud-hosting fees as well as allocated facilities and information technology costs. We plan to continue to invest in sales and marketing to grow our customer base and increase our brand awareness. As such, we expect sales and marketing expenses to increase in absolute dollars. We also expect our sales and marketing expenses as a percentage of revenue to fluctuate period-over-period in the near term as we invest to accelerate market adoption of our technologies, and to decrease over the long term as we benefit from greater scale.

64

Table of Contents

General and Administrative Expenses

Our general and administrative expenses primarily consist of personnel-related expenses for employees involved in general corporate functions, including administration, legal, human resources, accounting and finance. Personnel-related expenses primarily include salaries, benefits, and share-based compensation. In addition, general and administrative expenses also include allocated facilities costs, such as rent, depreciation expenses, professional services fees and other general corporate expenses.

Furthermore, we have incurred and expect to further incur expenses as a result of becoming a public company since October 2022, including costs for complying with the rules and regulations applicable to companies listed on a national securities exchange, costs related to compliance and reporting obligations, and increased expenses for insurance, investor relations, and professional services. We expect that our general and administrative expenses will increase in absolute dollars as we scale up our operations.

Research and Development Expenses

Our research and development expenses primarily consist of salaries and benefits, including share-based compensation, for our technology and product development personnel, and depreciation and other associated corporate costs.

We expect our research and development expenses to increase in the future as we expand our team of technology and product development professionals and continue to invest in technology infrastructure and innovative AR- and AI-solutions to enhance and broaden our product offering.

Interest Income

Our interest income primarily consists of interest earned on bank deposits and financial assets at amortized costs.

Other Income

Our other income primarily consists of subsidies from local government and VAT adjustments. We do not expect material subsidies from local government in the foreseeable future.

Other Gains and Losses

Our other gains and losses primarily consist of losses on financial liabilities at fair value through profit or loss (“FVTPL”) and foreign exchange gains and losses. The FVTPL is mainly associated with our convertible redeemable preferred shares and is a non-cash and extraordinary item that ceased to recur after our listing on the NYSE since October 31, 2022, as the convertible redeemable preferred shares issued by us have been converted into Ordinary Shares upon such listing.

Finance Costs

Our finance costs consist primarily of interest expenses on our lease liabilities.

Income Tax Expense

Our income tax expense primarily consists of current income tax expenses. As a global company, we are subject to income taxes in the jurisdictions where we do business. These foreign jurisdictions have different statutory tax rates. Accordingly, our effective tax rate will vary depending on the relative proportion of income derived in each jurisdiction, use of tax credits, changes in the valuation of our deferred tax assets and liabilities as well as changes in tax laws. Currently, the applicable tax rate in our headquarters in Taiwan is 20% while the tax rate for unappropriated earnings is 5%.

65

Table of Contents

Results of Operations

Our results of operations for the years ended December 31, 2020, 2021 and 2022 are presented below:

Year ended December 31,


2021 % 

2022 % 


($in thousands, unless otherwise stated)


2020


2021


2022


Change


Change


Revenue


29,873


40,760


47,300


36.4

%  

16.0

%

Cost of Sales and Services


(3,962)


(5,736)


(7,130)


44.8

%  

24.3

%

Gross profit


25,911


35,024


40,170


35.2

%  

14.7

%

Operating expenses:


Sales and marketing expenses


(18,107)


(25,287)


(24,544)


39.7

%  

(2.9)

%

General and administrative expenses


(3,078)


(4,936)


(76,219)


60.4

%  

1,444.1

%

Research and development expenses


(7,567)


(9,838)


(10,481)


30.0

%  

6.5

%

Total operating expenses..


(28,752)


(40,061)


(111,244)


39.3

%  

177.7

%

Operating (loss)


(2,841)


(5,037)


(71,074)


77.3

%  

1,311.0

%

Non-operating income and expenses:


Interest income.


243


131


2,029


(46.1)

%  

1,448.9

%

Other income


191


118


75


(38.2)

%  

(36.4)

%

Other gains and (losses)


(2,792)


(151,638)


(92,474)


5,331.2

%  

(39.0)

%

Finance costs


(9)


(9)


(8)


0.0

%  

(11.1)

%

Total non-operating income and expenses


(2,367)


(151,398)


(90,378)


6,296.2

%  

(40.3)

%

(Loss) income before income tax.


(5,208)


(156,435)


(161,452)


2,903.7

%  

3.2

%

Income tax expense


(385)


(417)


(292)


8.3

%  

(30.0)

%

Net (loss) income


(5,593)


(156,852)


(161,744)


2,704.4

%  

3.1

%

Comparison of Year Ended December 31, 2021 to Year Ended December 31, 2022

Revenue

Total revenue increased by $6.5 million, or 16.0%, from $40.8 million for the year ended December 31, 2021 to $47.3 million for the year ended December 31, 2022. The increase was primarily attributable to an increase by 25.3% of our revenue of AR/AI cloud solutions and subscription from $29.5 million in 2021 to $36.9 million in 2022, which was primarily driven by the continued strong demand for our online virtual product try-on solutions from brand customers as well as an increase in the consumer app monthly active subscribers, which refer to paying users who subscribe to our mobile apps’ premium functions and maintain an active subscription at the end of the measured month, partially offset by (i) a decrease by 24.1% of our advertisement revenue from $2.4 million in 2021 to $1.8 million in 2022, which was consistent with our strategy of reinforcing the market leadership in providing AR- and AI-SaaS solutions to brand customers and allocating less resources to advertisement services, and (ii) a decrease by 4.8% of licensing revenue from $8.9 million in 2021 to $8.4 million in 2022, which was due to our brand customers’ strong demand for on-line virtual product try-on instead of in-store offline solutions.

With respect to geographical contribution, revenue from the United States has increased by 20.4% from $20.2 million for the year ended December 31, 2021 to $24.3 million for the same period in 2022, revenue from Japan has increased by 4.4% from $4.5 million for the year ended December 31, 2021 to $4.7 million for the same period in 2022, and revenue from France has increased by 7.0% from $3.2 million for the year ended December 31, 2021 to $3.4 million for the same period in 2022. Revenue outside of these three major countries has grown by 15.6% from $12.9 million for the year ended December 31, 2021 to $14.9 million for the same period in 2022.

Cost of Sales and Services

Cost of sales and services increased by $1.4 million, or 24.3%, from $5.7 million for the year ended December 31, 2021 to $7.1 million for the year ended December 31, 2022. The increase was primarily due to the increase in third-party payment processing fees paid to distribution partners such as Google PlayStore and Apple AppStore in light of the increase in our mobile app subscription revenue.

66

Table of Contents

Sales and Marketing Expenses

Sales and marketing expenses decreased by $0.7 million, or 2.9%, from $25.3 million for the year ended December 31, 2021 to $24.5 million for the year ended December 31, 2022. The decrease was primarily due to a $3.9 million decrease in spending on paid advertising campaigns in connection with our mobile apps subscription, because we focused on the improvement of the organic user acquisition rate and trial-to-paid conversion rate of our mobile apps in 2022. The decrease was partially offset by an increase in sales and marketing headcount related expenses of $2.4 million.

General and Administrative Expenses

General and administrative expenses significantly increased by $71.3 million, or 1444.1%, from $4.9 million for the year ended December 31, 2021 to $76.2 million for the year ended December 31, 2022. The increase was primarily due to an increase of $71.2 million in one-off transaction cost that we incurred in connection with the Transactions. One-off transaction cost in 2022 included non-cash listing expense, which refers to the excess of the fair value of our Class A Ordinary Shares issued over the fair value of Provident’s identifiable net assets on the Closing Date, and professional services expenditures that we incurred in connection with the Transactions.

Research and Development Expenses

Research and development expenses increased by $0.6 million, or 6.5%, from $9.8 million for the year ended December 31, 2021 to $10.5 million for the year ended December 31, 2022. The increase was primarily due to an increase in R&D headcount and related personnel costs.

Interest Income

Interest income increased by $1.9 million, or 1448.9%, from $0.13 million for the year ended December 31, 2021 to $2.0 million for the year ended December 31, 2022. The significant increase was primarily due to higher interest rates of our bank deposits and cash proceeds from the Transactions.

Other Income

Other income decreased by $43,000, or 36.4%, from $118,000 for the year ended December 31, 2021 to $75,000 for the year ended December 31, 2022.

Other Gains and Losses

Other gains and losses, primarily consisting of adjustment in non-cash valuation loss on financial liabilities at fair value through profit or loss, changed favorably by $59.2 million for the year ended December 31, 2022 as compared to the year ended December 31, 2021, primarily because the incremental fair value of our convertible redeemable preferred shares in 2022 was smaller than the incremental fair value in 2021.

Finance Costs

Finance costs decreased by $1,000, or 11.1%, from $9,000 for the year ended December 31, 2021 to $8,000 for the year ended December 31, 2022.

Net Loss

As a result of the foregoing, our net loss in 2022 was $161.7 million, compared to $156.9 million in 2021.

Adjusted Net Income (Loss) (Non-IFRS)

Our adjusted net income in 2022 was $4.1 million, compared to an adjusted net loss of $1.8 million in 2021. See “— Use of Non-IFRS Financial Measures” below for more information.

67

Table of Contents

Adjusted EBITDA (Non-IFRS)

Our adjusted EBITDA improved to positive $3.1 million in 2022 from negative $0.9 million in 2021, primarily due to our strong revenue growth and efficient expense controls. See “Use of Non-IFRS Financial Measures” below for more information.

Comparison of Year Ended December 31, 2020 to Year Ended December 31, 2021

Revenue

Total revenue increased by $10.9 million, or 36.4%, in 2021, from $29.9 million for the year ended December 31, 2020 to $40.8 million for the year ended December 31, 2021. The increase was primarily attributable to (i) an increase by 69.3% of our revenue of AR/AI cloud solutions and subscription from $17.4 million in 2020 to $29.5 million in 2021, which was primarily driven by higher demand of our brand consumers for online services due to increasingly rapid lifestyle transformation towards online consumption in 2021, and (ii) an increase by 37.7% of our advertisement revenue from $1.7 million in 2020 to $2.4 million in 2021, which was driven by our expansion of the source of advertising and more frequent interstitial ads, partially offset by a decrease by 17.1% of licensing revenue from $10.7 million in 2020 to $8.9 million in 2021, which was due to lower demand for our AR/AI offline solutions resulting from extended store closure and social distancing as of result of frequent resurgence of new COVID-19 cases globally in 2021.

With respect to geographical contribution, revenue from the United States has increased by 35% from $15.0 million in 2020 to $20.2 million in 2021, revenue from Japan has increased by 41% from $3.2 million in 2020 to $4.5 million in 2021, and revenue from France has generally remained at $3.2 million in both 2020 and 2021. Revenue outside of these three major countries has grown by 52% from $8.5 million in 2020 to $12.9 million in 2021.

Cost of Sales and Services

Cost of sales and services increased by $1.7 million, or 44.8%, from $4.0 million for the year ended December 31, 2020 to $5.7 million for the year ended December 31, 2021. The increase was primarily due to an increase of $1.8 million in third-party payment processing fees paid to distribution partners such as Google and Apple.

Sales and Marketing Expenses

Sales and marketing expenses increased by $7.2 million, or 39.7%, from $18.1 million for the year ended December 31, 2020 to $25.3 million for the year ended December 31, 2021. The increase was primarily due to an increase in headcount related expenses of $2.2 million and an increased spend of $4.0 million in marketing campaigns to acquire mobile apps users.

General and Administrative Expenses

General and administrative expenses increased by $1.9 million, or 60.4%, from $3.1 million for the year ended December 31, 2020 to $4.9 million for the year ended December 31, 2021. The increase was primarily due to transaction-related fees (legal, audit, etc.) that we incurred in the course of the Transactions.

Research and Development Expenses

Research and development expenses increased by $2.2 million, or 30.0%, from $7.6 million for the year ended December 31, 2020 to $9.8 million for the year ended December 31, 2021. The increase was primarily due to an increase in R&D headcount and related personnel costs.

Interest Income

Interest income decreased by $112,000, or 46.1%, from $243,000 for the year ended December 31, 2020 to $131,000 for the year ended December 31, 2021. The decrease was primarily because the majority of our cash balance is denominated in U.S. dollars and the weighted average interest rate for our cash decreased from approximately 0.55% in 2020 to approximately 0.16% in 2021.

68

Table of Contents

Other Income

Other income decreased by $0.1 million, or 38.2%, from $0.2 million for the year ended December 31, 2020 to $0.1 million for the year ended December 31, 2021. The decrease was primarily due to the completion of a local government-sponsored project in June 2020, after which we no longer received a subsidy. We do not expect to receive any material subsidies in the foreseeable future.

Other Gains and Losses

Other gains and losses changed unfavorably by $148.8 million for the year ended December 31, 2021 as compared to the year ended December 31, 2020. The unfavorable change was primarily due to a significant increase in losses on financial liabilities at fair value through profit or loss, which reflected a much higher fair value of our convertible redeemable preferred shares in anticipation of the Transactions.

Finance Costs

For the years ended December 31, 2021 and December 31, 2020, finance costs were both about $9,000.

Net Loss

Our net loss in 2021 was $156.9 million, compared to $5.6 million in 2020, primarily due to a significant increase in losses on financial liabilities at fair value through profit or loss, which reflected a much higher fair value of our convertible redeemable preferred shares in anticipation of the Transactions.

Adjusted Net Income (Loss) (Non-IFRS)

Our adjusted net loss in 2021 was $1.8 million, compared to an adjusted net loss of $2.5 million in 2020. See “— Use of Non-IFRS Financial Measures” below for more information.

Adjusted EBITDA (Non-IFRS)

Our adjusted EBITDA in 2021 was negative $0.9 million in 2021, compared to negative $1.8 million in 2020. See “— Use of Non-IFRS Financial Measures” below for more information.

69

Table of Contents

Use of Non-IFRS Financial Measures

In addition to the measures presented in our consolidated financial statements, we use certain non-IFRS financial measures, including adjusted net income (loss) and adjusted EBITDA, to help us evaluate our business, identify trends affecting our business, formulate business plans, and make strategic decisions. We define these non-IFRS financial measures as follows:

Adjusted net income is defined as net income (loss) excluding one-off transaction costs (e.g., costs related to the Transactions), non-cash equity-based compensation, non-cash valuation (gain)/loss of preferred shares, and foreign exchange (gain)/loss. The majority of these adjustments relate to items in zero tax jurisdictions. With respect to non-zero tax jurisdictions, any related deferred tax assets do not qualify for recognition because of the cumulative losses. Hence, none of the adjusted net income in each of the three years ended December 31, 2022 was subject to income tax effects. For a reconciliation of adjusted net income (loss) to net income (loss), please see the following reconciliation table.

For the Year ended December 31,

2020


2021


2022

Items


(Expressed in thousands of United States dollars)

Net Income (Loss)


$

(5,593)


$

(156,852)


$

(161,744)

One-off Transaction Costs


1,594


71,152

Non-Cash Equity-Based Compensation


336


1,782


2,175

Non-Cash Valuation Loss of Financial Liabilities


2,022


150,745


93,777

Foreign Exchange (Gain)/Loss


770


893


(1,303)

Adjusted Net Income (Loss)

$

(2,465)

$

(1,838)

$

4,057

Adjusted EBITDA is defined as net income (loss) excluding depreciation and amortization expense, income tax expense, interest and finance costs, one-off transaction costs (e.g., costs related to the Transactions), non-cash equity-based compensation, non-cash valuation (gain)/loss of preferred shares, and foreign exchange (gain)/loss. For a reconciliation of adjusted EBITDA to net income (loss), please see the following reconciliation table.

For the Year ended December 31

2020


2021


2022

Items


(Expressed in thousands of United States dollars)

Net Income (Loss)


$

(5,593)


$

(156,852)


$

(161,744)

Depreciation and Amortization Expense


492


645


766

Income Tax Expense


385


417


292

Interest Income and Finance costs


(234)


(122)


(2,021)

One-off Transaction Costs


1,594


71,152

Non-Cash Equity-Based Compensation


336


1,782


2,175

Non-Cash Valuation Loss of Financial Liabilities


2,022


150,745


93,777

Foreign Exchange (Gain)/Loss


770


893


(1,303)

Adjusted EBITDA

$

(1,822)

$

(898)

$

3,094

Non-IFRS financial measures are not defined under IFRS and are not presented in accordance with IFRS. Non-IFRS financial measures have limitations as analytical tools, which possibly do not reflect all items of expense that affect our operations. Share-based compensation expenses have been and may continue to be incurred in our business and are not reflected in the presentation of the non-IFRS financial measures. In addition, the non-IFRS financial measures Perfect uses may differ from the non-IFRS measures used by other companies, including peer companies, and therefore their comparability may be limited. The presentation of these non-IFRS financial measures is not intended to be considered in isolation from or as a substitute for the financial information prepared and presented in accordance with IFRS. The items excluded from our adjusted net income and adjusted EBITDA are non-cash expenses or not driven by core results of operations and render comparison of IFRS financial measures with prior periods less meaningful. We believe adjusted net income (loss) and adjusted EBITDA provide useful information to investors and others in understanding and evaluating our results of operations, as well as providing a useful measure for period-to-period comparisons of our business performance. Moreover, such non-IFRS measures are used by our management internally to make operating decisions, including those related to operating expenses, evaluate performance, and perform strategic planning and annual budgeting.

70

Table of Contents

B.

Liquidity and Capital Resources

Historically, we have generated negative cash flows from operations and have financed our operations mainly through equity contributions from our shareholders and payments received from our customers. As of December 31, 2022, we had cash and cash equivalents of $162.6 million, which primarily consisted of petty cash, checking accounts, demand deposits and time deposits. Our cash and cash equivalents are primarily denominated in U.S. dollars and we do not currently enter into any hedging arrangements. In addition, we have 6-month time deposits of $30.0 million classified as current financial assets at amortized cost according to IFRS as of the same date. Our net loss increased from $5.6 million in 2020 to $156.9 million in 2021, mainly due to non-cash fair value adjustment of convertible preferred shares in anticipation of the Transactions. Our net loss increased from $156.9 million in 2021 to $161.7 million in 2022, mainly due to one-off transaction cost and non-cash fair value adjustment of convertible preferred shares in the course of the Transactions. One-off transaction cost in 2022 included non-cash listing expense, which refers to the excess of the fair value of our Class A Ordinary Shares issued over the fair value of Provident’s identifiable net assets on the Closing Date, and professional services expenditures that we incurred in connection with the Transactions.

Our cash requirements for the three years ended December 31, 2022 and any subsequent interim period primarily include our capital expenditure, lease obligations, contractual obligations and other commitments. Our capital expenditures are primarily related to purchase of certain servers in our ordinary course of business and ERP system upgrade, which has been immaterial from a dollar amount perspective. From January 1, 2020 through December 31, 2022, we incurred capital expenditure of less than $300,000 annually. Our lease obligations consist of the commitments under the rental agreements for our office premises. Our contractual obligations primarily consist of minimum commitments for marketing activities. From a dollar amount perspective, both lease obligations and contractual obligations have been immaterial. In addition, we will consume cash for additional expenses as a public company for, among other things, D&O liability insurance, director fees and additional internal and external accounting, legal and administrative resources, including increased audit and legal fees. We expect these items to be the primary part of our short-term cash requirements, and we currently do not expect any material capital expenditures in the foreseeable future. Furthermore, as part of our growth strategy, we have plans to further invest in R&D, develop new AR- and AI-solutions, broaden our customer base in the beauty industry, and expand into synergistic categories like fashion solutions. These new developments and expansions may generate long-term cash requirements. We intend to fund our future material cash requirements with net proceeds from the Transactions, equity contributions from our shareholders and payments received from our customers. We will continue to make cash commitments, including capital expenditures, to support the growth of our business.

On October 28, 2022, we completed the Business Combination. In connection with the Business Combination, holders of 21,651,203 Provident Class A Ordinary Shares, or 94.14% of the shares with redemption rights, exercised their right to redeem their shares for cash. Given a significant number of Provident shareholders elected to redeem their shares prior to the consummation of the Business Combination, our gross proceeds from the Business Combination accordingly reduced compared to a no-redemption scenario. Nevertheless, we raised $105 million from PIPE Investors and FPA Investors, which, together with the proceeds from non-redeeming Provident shareholders, amounted to $119 million in gross proceeds, and added $113 million in net proceeds to our balance sheet.

We believe that our cash and cash equivalents, including the cash we obtained from the Business Combination, and our credit facilities will be sufficient to meet our working capital and capital expenditure requirements for at least the next 12 months from the date of this annual report and sufficient to fund our operations. As of the date of this annual report, there has been no material change to our liquidity position since the closing of the Business Combination. To the extent that our current resources are insufficient to satisfy our cash requirements in the future, we may need to seek additional equity or debt financing. If the financing is not available, or if the terms of financing are less desirable than we expect, we may be forced to decrease our level of investment in product development or delay, scale back or abandon all or part of our growth strategy, which could have an adverse impact on our business and financial prospects.

We would receive the proceeds from any exercise of any outstanding Warrants that are exercised for cash pursuant to their terms. Assuming the exercise for cash of all of the 20,849,975 Warrants, consisting of 11,499,975 Perfect Public Warrants, 6,600,000 Perfect Private Placement Warrants and 2,750,000 Perfect Forward Purchase Warrants, we would receive an aggregate of approximately $239.8 million, but would not receive any proceeds from the resale of Class A Ordinary Shares issuable upon such exercise. We will have broad discretion over the use of proceeds from the exercise of these Warrants. To the extent that any of these Warrants are exercised on a “cashless basis,” the amount of cash we would receive from the exercise of these Warrants will decrease. Any proceeds from the exercise of the Warrants would increase our liquidity, but our ability to fund our operations is not dependent upon receipt of cash proceeds from the exercise of the Warrants.

71

Table of Contents

There is no assurance that our Warrants will be in the money prior to their expiration or that the holders of the Warrants will elect to exercise any or all of such Warrants. The likelihood that Warrant holders will exercise their Warrants, and therefore any cash proceeds that we may receive in relation to the exercise of the issued and outstanding Warrants, will be dependent on the trading price of our Class A Ordinary Shares. If the market price for our Class A Ordinary Shares is less than the exercise price of our Warrants, which is $11.50 per share, we believe Warrant holders will be unlikely to exercise their Warrants. As the closing price of our Class A Ordinary Shares was $6.15 as of March 28, 2023, we believe that holders of the Warrants are currently unlikely to exercise their Warrants. Accordingly, we do not expect to rely on the cash exercise of Warrants to fund our operations.

On January 17, 2023, the SEC declared effective a registration statement on Form F-1, under which the selling securityholders identified therein or their permitted transferees may offer and sell, from time to time, up to 38,850,406 Class A Ordinary Shares, 9,350,000 Warrants and 9,350,000 Class A Ordinary Shares underlying such Warrants. Given the substantial number of Class A Ordinary Shares registered for potential resale by the selling securityholders, the sale of shares by the selling securityholders, or the perception in the market that the selling securityholders of a large number of shares intend to sell their shares, could increase the volatility of the market price of our Class A Ordinary Shares or result in a significant decline in the public trading price of our Class A Ordinary Shares. These sales, or the possibility that these sales may occur, and any related volatility or decrease in market price of our Class A Ordinary Shares and Warrants, might make it more difficult for us to sell equity securities in the future at a time and at a price that we deem appropriate. See “Item 3. Key Information — D. Risk Factors — Risks Related to the Class A Ordinary Shares and Warrants — Sales of a substantial number of our securities in the public market by our existing securityholders could cause the price of our Class A Ordinary Shares and Warrants to fall.”

Cash Flows Summary

Presented below is a summary of our operating, investing, and financing cash flows:

Year ended December 31,

($ in thousands, unless otherwise stated)


2020


2021


2022

Cash flows from (used in) operating activities


$

2,193


$

1,548


$

(3,305)

Cash flows from (used in) investing activities


7,840


(213)


(30,258)

Cash flows from (used in) financing activities


39,806


(63)


118,028

Effects of exchange rates changes on cash and cash equivalents


896


163


(2,302)

Net increase (decrease) in cash and cash equivalents

$

50,735

$

1,435

$

82,163

Cash Flows Generated from (Used in) Operating Activities

Cash flows generated or used in operating activities primarily relate to the collection of accounts receivables, payment of provision and payables, net interest received and income tax paid.

Net cash used in operating activities was $3.3 million in 2022, and net cash generated from operating activities was $1.5 million in 2021 and $2.2 million in 2020, respectively. The negative operating cash flows in 2022 were mainly due to the payment of insurance premium for directors’ and officers’ insurance policy after our listing on the NYSE. The net cash generated from operating activities decreased in 2021 compared to 2020 due to the fees related to the Transactions we paid in 2021.

Cash Flows Generated from (Used in) Investing Activities

Cash used in investing activities primarily relates to acquisition of financial assets, proceeds from disposal of financial assets, acquisition of property, plant and equipment, acquisition of intangible assets, and changes in guarantee deposits paid.

Net cash used in investing activities was $30.3 million in 2022, primarily from the acquisition of financial assets. Net cash used in investing activities was $213,000 in 2021. Net cash generated from investing activities was $7.8 million in 2020, primarily from the proceeds from disposal of financial assets.

72

Table of Contents

Cash Flows Generated from (Used in) Financing Activities

Net cash from financing activities was $118.0 million in 2022, primarily consisting of gross proceeds of $112.9 million from the Transactions, and $5.6 million from the proceeds of the exercising of employee stock options, partially offset by $0.5 million in the repayment of the principal portion of lease liabilities.

Net cash used in financing activities was $63,000 in 2021, primarily consisting of $0.3 million representing the proceeds from our employees’ exercising of their stock options, offset by $0.4 million in the repayment of the principal portion of lease liabilities.

Net cash generated from financing activities was $39.8 million in 2020, primarily consisting of $50 million in proceeds from the issuance of series C convertible redeemable preference shares, and $0.1 million from the proceeds of the exercising of employee stock options, partially offset by $0.3 million in the repayment of the principal portion of lease liabilities and $10 million for the payments to acquire treasury shares.

Material Contractual Obligations and Commitments

During the periods presented, we did not have any material contractual obligations and commitments other than the convertible preferred shares that were converted into Ordinary Shares upon the Closing.

Off-Balance Sheet Arrangements

During the periods presented, we did not have any relationships with unconsolidated organizations or financial partnerships, such as structured finance or special purpose entities, which were established for the purpose of facilitating off-balance sheet arrangements.

Recent Accounting Pronouncements

For a discussion of our new or recently adopted accounting pronouncements, see Note 3 “Application of New Standards, Amendments and Interpretations” to our consolidated financial statements included in this annual report.

C.

Research and Development

See “Item 4. Information on the Company — B. Business Overview — Research and Development” and “Item 4. Information on the Company — B. Business Overview — Intellectual Property.”

D.

Trend Information

Due to the worsening macroeconomic environment, our sales cycle has been elongated in the second half of 2022. The global consumer discretionary industry and consumer spending are expected to continue to face a range of challenges during 2023, such as global high inflation, elongated sales cycles, significant fluctuations in foreign exchange rates, and geopolitical tensions and conflict. Despite these challenges, we remain confident in our long-term growth prospects and retains our commitment to iterating our products and services, further enhancing our digital solutions, expanding our customer base, diversifying our revenue streams, and further optimizing operating efficiency.

Other than as disclosed above and elsewhere in this annual report, we are not aware of any trends, uncertainties, demands, commitments or events for the period from January 1, 2022 to December 31, 2022, that are reasonably likely to have a material effect on our revenue, profitability, liquidity or capital resources, or that caused the disclosed financial information to be not necessarily indicative of future operating results or financial conditions.

73

Table of Contents

E.

Critical Accounting Estimates

Our consolidated financial statements are prepared in accordance with IFRS. The preparation of these consolidated financial statements requires us to make estimates and assumptions that affect the reported amounts of assets, liabilities, revenue, expenses and related disclosures. See Note 5 “Critical Accounting Judgements, Estimates and Key Sources of Assumption Uncertainty” to our consolidated financial statements included elsewhere in this annual report for additional information on our critical accounting estimates.

Item 6.Directors, Senior Management and Employees

A.

Directors and Senior Management

The following table sets forth certain information relating to our executive officers and directors as of the date of this annual report. Our Board is comprised of seven directors.

Name


Age


Position(s)

Alice H. Chang

61

Chief Executive Officer and Chairwoman of the Board

Michael Aw

47

Non-executive Director

Jau-Hsiung Huang

63

Non-executive Director

Jianmei Lyu

41

Non-executive Director

Meng-Shiou (Frank) Lee

61

Independent Non-executive Director

Philip Tsao

62

Independent Non-executive Director

Chung-Hui (Christine) Jih

61

Independent Non-executive Director

Pin-Jen (Louis) Chen

44

Executive Vice President and Chief Strategy Officer

Wei-Hsin Tsen (Johnny Tseng)

55

Senior Vice President and Chief Technology Officer

Weichuan (Wayne) Liu

53

Chief Growth Officer and President of Americas

Hsiao-Chuan (Iris) Chen

54

Vice President and Head of Finance and Accounting

The business address of each director and executive officer is 14F, No. 98 Minquan Road, Xindian District, New Taipei City 231, Taiwan.

Executive Officers

Alice H. Chang is our founder and has served as the CEO and Chairwoman of the Board since our inception in June 2015. Prior to founding the Company, Ms. Chang served as Chief Executive Officer of CyberLink from October 1997 to May 2015, which under her leadership became a publicly listed Taiwan-based multimedia software company with offices globally. Prior to that, Ms. Chang was the chief financial officer and executive vice president of Trend Micro Incorporated (TSE: 4704), where she led the capital markets and fund-raising activities. Prior to that, Ms. Chang held various positions in Citicorp across investment banking functions. Ms. Chang holds an MBA from the University of California, Los Angeles, and a B.Sc. from National Taiwan University.

We believe that Ms. Chang is well qualified to serve as the Chairwoman of our Board based on the unique experiences and perspectives she brings as our founder and CEO since our inception, complemented by her strong passion and extensive operational expertise across the technology and beauty industries.

Pin-Jen (Louis) Chen has served as our Executive Vice President and Chief Strategy Officer since March 2022, where he leads the Company’s corporate development, strategic partnerships and marketing efforts. Mr. Chen joined us at our inception in June 2015 as the Vice President of Business Development and Marketing. Prior to joining us, Mr. Chen spent 12 years at CyberLink, where he served as the Vice President of Business Development and Marketing, Head of Consumer Business, and as a development engineer. Mr. Chen holds an M.Sc. and a B.Sc. in computer science from National Taiwan University.

74

Table of Contents

Wei-Hsin Tsen (Johnny Tseng) has served as our Senior Vice President and Chief Technology Officer since January 2019. Dr. Tseng also served as our director from July 2018 to October 2022. Dr. Tseng joined us at our inception in June 2015 as the Senior Vice President of Research and Development, leading the Company’s engineering efforts. Prior to joining Perfect, Dr. Tseng spent 18 years at CyberLink, where he served as the Senior Vice President of its Research and Development Department, and was a director and manager of its Architecture Department. Dr. Tseng holds a Ph.D. and a B.Sc. in computer science as well as an EMBA from National Taiwan University.

Weichuan (Wayne) Liu has served as our Chief Growth Officer and President of Americas since March 2022. Mr. Liu joined us at our inception in June 2015 as the Vice President of Business Development and Marketing and the General Manager of the Company’s U.S. subsidiary. Prior to joining us, Mr. Liu served as the Associate Vice President of Business Development at CyberLink from October 2009 to May 2015. From January 2003 to September 2009, Mr. Liu worked as a senior engineering manager at NVIDIA Corporation (Nasdaq: NVDA). Mr. Liu holds an MBA from Santa Clara University, an M.Sc. from Case Western Reserve University, a B.Sc. from National Tsing Hua University, and a Ph.D. degree in electrical engineering from University of Southern California.

Hsiao-Chuan (Iris) Chen has served as our Vice President and Head of Finance and Accounting since January 2022 and oversees corporate finance and accounting activities of the Company. Prior to joining us, Ms. Chen spent 22 years at CyberLink since February 2000, with her last two roles being the Special Assistant of the Chief Executive Officer’s Office since March 2021 and the Head of Finance and Accounting since February 2000. Prior to joining CyberLink, Ms. Chen worked at Deloitte from September 1994 to August 1997. Ms. Chen holds an MBA from National Taiwan University and a B.Sc. in agricultural economics from National Chung-Hsing University.

Directors

Alice H. Chang is our CEO and Chairwoman of the Board since our inception in June 2015. For details, please see “— Executive Officers” below.

Michael Aw has served as our non-executive director since October 2022. Mr. Aw served as Provident’s Director, Chief Executive Officer and Chief Financial Officer since its inception on October 28, 2020 and is a founding partner of Provident Growth, a leading growth stage fund focused on technology investments in Southeast Asia. Mr. Aw has over 20 years of investing and investment banking experience. Mr. Aw has served on the board of directors at Pomelo Fashion Company Limited, a technology-driven modern fashion brand in Southeast Asia since October 2017 and Horangi Private Limited Company, a high-growth cybersecurity SaaS company in Southeast Asia, since January 2020. In addition, Mr. Aw has been a board observer of Traveloka Services Private Limited Company, an online travel agency with a strong presence in Southeast Asia and Australia, and an ESG board advisor of CARRO, a leading Singapore car marketplace. Prior to founding Provident Growth in January 2018, Mr. Aw was the Managing Director at Provident Capital Partners and Managing Director and Head of Technology, Media and Telecommunications, Asia, Investment Banking Division at UBS Group AG. Mr. Aw holds a B.A. in accounting and finance from the University of Manchester and a M.Phil. in management studies from the University of Cambridge. Mr. Aw was also a Cambridge Chevening Scholar.

Jau-Hsiung Huang has served as our non-executive director since July 2019. Dr. Huang founded CyberLink in February 1996 and has served as its chairman of the board of directors since January 2001 and its Chief Executive Officer since September 2015. Dr. Huang has led the product development team to deliver a full suite of software applications, including video and photo-editing, multimedia playback, file conversion as well as various mobile apps. Under his leadership, CyberLink grew from a small start-up to a publicly listed Taiwan-based multimedia software company with offices globally. From August 1988 to July 2005, Dr. Huang was a professor in the computer science department at National Taiwan University and was the co-founder of the Communications and Multimedia Lab at National Taiwan University, from which he subsequently received a series of awards, including the Distinguished Alumni Award and the Electronic Research and Service Organization (“ERSO”) Award. Dr. Huang holds a Ph.D. in computer science from the University of California, Los Angeles, and a B.Sc. in electrical engineering from National Taiwan University.

75

Table of Contents

Jianmei Lyu has served as our non-executive director since March 2022 and has over 17 years of experience in the consumer and retail industries. Ms. Lyu currently serves as the General Manager of Tmall Fast-Moving Consumer Goods Business Division at Alibaba Group Holding Limited (NYSE: BABA, SEHK: 9988, together with its subsidiaries, the “Alibaba Group”) where she is responsible for the business operations and strategic development of the division. Prior to that, Ms. Lyu served at various positions in the Alibaba Group, including as the General Manager of Tmall International Business Division from October 2021 to February 2022, General Manager of Koala International Business Division from November 2020 to October 2021, and General Manager of Taobao International Business Division from January 2019 to November 2020. Ms. Lyu first joined the Alibaba Group in August 2011 as the Vice General Manager of Tmall Apparel Business Division. Ms. Lyu holds an MBA of the joint program from Donghua University in Shanghai and Westminster College in the United States.

Meng-Shiou (Frank) Lee has served as our non-executive director since October 28, 2022 and has extensive experience in the accounting and finance industry. Mr. Lee currently serves as the Chief Executive Officer at First Elite CAPs & Co, a Taiwan-based accounting company, and is an Adjunct Lecturer at National Chung Cheng University and Director at CPA Associations R.O.C. in Taiwan. Mr. Lee has served on the board of directors at several publicly listed companies, including Mechema Chemicals International Company Limited (TWSE: 4721) since June 2017, China Electric Manufacturing Corp. (TWSE: 1611) since June 2019, and TOPCO Technologies Corp. (TWSE: 3388) since May 2020. Mr. Lee has been practicing as a Certified Public Accountant since 1988. His accounting experience includes working as a Certified Public Accountant at Deloitte Touche Tohmatsu Limited in its Taiwan office from July 1988 to July 1997 and at First Elite CAPs & Co since July 1997. Mr. Lee holds an M.A. in accounting from National Chengchi University and a B.A. in accounting from National Taiwan University.

Philip Tsao has served as our non-executive director since October 28, 2022. Mr. Tsao has served on the board of directors at several publicly listed companies, including SinoPac Financial Holdings Company Limited (TWSE: 2890) since May 2020 and China Everbright Greentech Limited (SEHK: 1257) since April 2017. He has also been a director of Bank SinoPac since May 2018 and started to serve as the Chairman of Bank SinoPac since July 2022. Mr. Tsao has held various senior positions in global and regional financial institutions, most recently as Consultant to Fubon Bank from April 2016 to March 2017, Managing Director at Barclays Capital Asia Limited from June 2011 to May 2015, Managing Director at Morgan Stanley Asia Limited, Executive Vice President at China Development Financial Holdings (TWSE: 2883), President of China Development Industrial Bank, Managing Director at UBS Asia Limited, and Executive Director at Goldman Sachs (Asia) LLC. Prior to that, Mr. Tsao also worked at Citibank for nine years across various functions. Mr. Tsao holds an MBA from National Taiwan University and a B.Sc. from Tsinghua University. He is also a Chartered Financial Analyst Charterholder.

Chung-Hui (Christine) Jih has served as our non-executive director since October 28, 2022. Ms. Jih has been serving as an independent director at CTBC Securities Company Limited, a Taiwan-based financial holding company, since May 2020. From January 2007 to August 2019, Ms. Jih was the Chairwoman and Chief Executive Officer of BNP Paribas Asset Management Taiwan Company Limited. From July 2003 to January 2007, Ms. Jih served as the General Manager of Fidelity Security Investment Trust Company (Taiwan) Limited and Spokesperson of Fidelity Securities Company (Taiwan) Limited. From September 2002 to July 2003, Ms. Jih was Chief Financial Officer of CyberLink. Prior to that, Ms. Jih also served as a financial consultant at Merrill Lynch Securities (Taiwan) Limited and Vice President and Head of Audit and Compliance at Citibank Taiwan Limited and held various roles at professional bodies, including Governor of the Board and Co-Chair of Asset Management Committee at The American Chamber of Commerce in Taiwan, and Supervisor at Securities Investment Trust & Consulting Association of Taiwan. Ms. Jih holds an MBA from Indiana University and a BBA from National Chengchi University.

Family Relationships

Jau-Hsiung Huang and Alice H. Chang are husband and wife. There are no other familial relationships among our directors and executive officers.

76

Table of Contents

B.

Compensation

For the year ended December 31, 2022, we paid an aggregate of $2.8 million in cash and benefits to our executive officers and directors, of which $0.4 million was paid in the form of stock options. For the year ended December 31, 2022, options to purchase 344,350 Class A Ordinary Shares were granted to our executive officers and directors as a group under the Share Incentive Plan at exercise prices of $3.95 per Class A Ordinary Share. None of such options have been vested and exercised as of December 31, 2022. We have not set aside or accrued any amount to provide pension, retirement or other similar benefits to our executive officers and directors.

Employment Agreements

Alice H. Chang is party to a service agreement with us dated September 26, 2019 and as amended on January 24, 2022 (the “Service Agreement”). Under the Service Agreement, Ms. Chang agreed to serve as our CEO until January 24, 2024, subject to earlier termination due to Ms. Chang’s death or disability or a termination by a unanimous decision of the Board. The Service Agreement also includes certain restrictive covenants, which include confidentiality and non-disclosure restrictions and non-competition restrictions that apply during the term and for certain periods following specified terminations of service.

Share Incentive Plan

Our Share Incentive Plan was first approved and adopted by our Board on December 13, 2021, and was amended by our Board on October 25, 2022 to make equitable adjustments to the number and class of shares to be issued thereunder for the purposes of reflecting the Recapitalization in connection with the Business Combination. The Share Incentive Plan provides for the grant of incentive stock options, within the meaning of Section 422 of the Code, to our or our affiliates’ employees, directors, agents, consultants or service providers as selected by the administrator. We have registered an aggregate of 5,311,310 Ordinary Shares available for issuance under the Share Incentive Plan in the registration statement on Form S-8 (File No. 333-268059) filed with the SEC on October 28, 2022.

For the year ended December 31, 2022, options to purchase an aggregate of 2,142,545 Class A Ordinary Shares were granted to our directors, executive officers and other grantees under the Share Incentive Plan at exercise prices of $3.95 per Class A Ordinary Share.

The following sets forth a summary of material terms of the Share Incentive Plan, which are qualified in their entirety by the Share Incentive Plan filed as Exhibits 4.14 and 4.15 to this annual report.

Authorized Shares. Subject to the adjustment provisions in the Share Incentive Plan, the maximum aggregate number of the Ordinary Shares that may be issued upon exercise of all options to be granted under the Share Incentive Plan shall be 5,311,310 Ordinary Shares; up to 5,311,310 Ordinary Shares may be issued under the Share Incentive Plan to participants who are citizens of the U.S., residents of the U.S. or are otherwise subject to the federal income tax laws of the U.S. (the “U.S. Taxpayer Participants”). Under the Share Incentive Plan to be adjusted to reflect the Recapitalization, shares to be issued upon exercise of options shall be Class B Ordinary Shares if the participant of the Share Incentive Plan is one of the Founder Parties, and shares to be issued upon exercise of options shall be Class A Ordinary Shares if the participant of the Share Incentive Plan is not one of the Founder Parties.

If an award of option should expire or become unexercisable for any reason without having been exercised in full, or if the Ordinary Shares are issued under the Share Incentive Plan and later forfeited due to the failure to vest, the unissued or forfeited Share Incentive Plan that was subject thereto shall, unless the Share Incentive Plan shall have been terminated, continue to be or again be available for issuance pursuant to future awards and grants under the Share Incentive Plan.

Plan Administration. Our Board or any senior officer(s) designated by our Board from time to time will have authority to administer the Share Incentive Plan, and their decision (save as otherwise provided herein) shall be final and binding on all parties. Our Board shall have such powers and authorizations related to the administration of the Share Incentive Plan as are consistent with our memorandum and articles of association and applicable laws. Our Board shall have the full power and authority to take all actions and to make all determinations required or provided for under the Share Incentive Plan, and to amend or terminate the Share Incentive Plan and adopt a new plan, as long as the participants’ economic interests that he or she would be otherwise entitled to are not materially adversely affected.

77

Table of Contents

If our Board proposes any amendment to the Share Incentive Plan that will have a material adverse effect on the economic interest of the participants, such amendment will take effect after the approval of the option holders representing a majority of then-granted options.

Types of Awards. The Share Incentive Plan permits the awards of options.

Eligibility. Our or our affiliates’ employees, directors, agents, consultants or service providers are eligible to participate in the Share Incentive Plan.

Grant Notices. Awards of options granted under the Share Incentive Plan are evidenced by grant notices that set forth, consistent with the Share Incentive Plan, the terms, conditions and limitations for each award.

Conditions of Awards. The administrator determines the provisions, terms and conditions of each award granted under the Share Incentive Plan, including, but not limited to, the vesting schedule, exercise price, exercise periods and any restriction or limitation regarding the awards.

Vesting Schedule. Subject to exceptions in the event of retirement, death, or permanent injury due to occupational hazards during the employment as provided in the Share Incentive Plan, no options will be vested in the first two years from the grant date; following the end of such two-year period, 50% of the options will be vested; following the end of the third anniversary of the grant date, 75% of the options cumulatively will be vested; and on the date of the fourth anniversary of the grant date, 100% of the options cumulatively will be vested.

Exercise Price. The exercise price will not be less than the par value per share. Notwithstanding the foregoing, the exercise price of options granted to U.S. Taxpayer Participants who owns shares representing more than 10% of the voting power of all classes of our shares at the time of grant, the exercise price will be no less than 110% of the fair market value as determined pursuant to the Share Incentive Plan on the date of grant; and the exercise price of options granted to any other U.S. Taxpayer Participants will be no less than 100% of such fair market value on the date of grant.

Exercise Period. The term of each option will be five years from the grant date, subject to exceptions as provided in the Share Incentive Plan. Any options not exercised during the term will be cancelled and forfeited.

Non-Transferability of Awards. Other than by will or the laws of descent and distribution, the participants may not sell, transfer, assign, pledge or otherwise dispose of any option granted under the Share Incentive Plan unless approved by the CEO or other senior officer(s) designated by the Board.

Dissolution or Liquidation. In the event of our dissolution or liquidation, each award will terminate immediately prior to the consummation of such action, unless otherwise determined by the CEO or other senior officer(s) designated by the Board.

Change in Control. In the event of a change of control as defined in the Share Incentive Plan, each outstanding award (vested or unvested) will be treated as the CEO or other senior officer(s) designated by our Board determines, which determination may be made without the consent of any participant and need not treat all outstanding awards (or portion thereof) in an identical manner. Such determination, without the consent of any participant, may provide (without limitation) for one or more of the following in the event of a change of control: (i) the termination or continuation of such outstanding awards by us (if Perfect Corp. is the surviving corporation); (ii) the assumption of such outstanding awards by the surviving corporation or its parent; or (iii) the substitution by the surviving corporation or its parent of new options or equity awards for such awards. If the award is continued, our Board, CEO or other senior officer(s) designated by our Board may make further adjustments in accordance with the adjustment provisions under the Share Incentive Plan.

Termination. The Share Incentive Plan has a term of ten years from December 13, 2021, being the date on which the Share Incentive Plan was approved and adopted by our Board, after which no further options shall be granted, but the provisions of the Share Incentive Plan shall remain in full force and effect to the extent necessary to give effect to the exercise of any options granted prior thereto or otherwise as may be required in accordance with the provisions of the Share Incentive Plan.

78

Table of Contents

Insurance and Indemnification

To the extent permitted under Cayman Islands law, we are empowered to indemnify our directors against any liability they incur by reason of their directorship. We have obtained directors’ and officers’ insurance to insure such persons against certain liabilities. Insofar as indemnification of liabilities arising under the Securities Act may be permitted to the Board, executive officers or persons controlling us pursuant to the foregoing provisions, we have been informed that, in the opinion of the SEC, such indemnification is against public policy as expressed in the Securities Act and is therefore unenforceable.

C.

Board Practices

Board of Directors

Our Board consists of seven directors as of the date of this annual report. Of these seven directors, three are independent. These three independent directors were selected and approved by our current nominating committee through a process that sought to find diversity of experience, expertise and perspectives, as well as deep understandings of different businesses, practices and markets relevant to our operations. A director may vote in respect of any contract or transaction in which he/she is interested provided that the nature of the interest of any director in any such contract or transaction is disclosed at or prior to its consideration and any vote thereon, and such director may be counted in the quorum at any meeting of directors at which any such contract or transaction is considered. A director who is interested in a contract or proposed contract with us must declare the nature of his interest at a meeting of the directors. None of our non-employee directors has a service contract with us that provides for benefits upon termination of service.

Duties of Directors

Under the laws of the Cayman Islands, our directors owe fiduciary duties to our Company, including a duty of loyalty, a duty to act honestly, and a duty to act in what they consider in good faith to be in our best interests. Our directors must also exercise their powers only for a proper purpose. Our directors also owe to our Company a duty to exercise the skill they actually possess and such care and diligence that a reasonably prudent person would exercise in comparable circumstances. It was previously considered that a director need not exhibit in the performance of his or her duties a greater degree of skill than may reasonably be expected from a person of his or her knowledge and experience. However, English and Commonwealth courts have moved towards an objective standard with regard to the required skill and care and these authorities are likely to be followed in the Cayman Islands. In fulfilling their duty of care to us, our directors must ensure compliance with our memorandum and articles of association, as amended and restated from time to time, and the class rights vested thereunder in the holders of the shares. In certain limited exceptional circumstances, a shareholder may have the right to seek damages in our name if a duty owed by our directors is breached.

Our Board has all the powers necessary for managing, and for directing and supervising, our business affairs. The functions and powers of our Board include, among others:

convening shareholders’ annual and extraordinary general meetings and reporting its work to shareholders at such meetings;
declaring dividends and distributions;
appointing officers and determining the term of office of the officers;
exercising the borrowing powers of our Company and mortgaging the property of our Company; and
approving the transfer of shares in our Company, including the registration of such shares in our register of members.

79

Table of Contents

Terms of Directors and Executive Officers

Our Board is divided into three classes: Class I, Class II and Class III. The number of directors in each class shall be as nearly equal as possible. On October 28, 2022, our Board adopted a resolution that each of Jianmei Lyu and Philip Tsao be classified as a Class I Director, each of Michael Aw and Chung-Hui (Christine) Jih be classified as a Class II Director, and each of Alice H. Chang, Jau-Hsiung Huang and Meng-Shiou (Frank) Lee be classified as a Class III Director. The Class I directors shall stand appointed for a term expiring at our first annual general meeting, the Class II directors shall stand appointed for a term expiring at our second annual general meeting, and the Class III directors shall stand appointed for a term expiring at our third annual general meeting. Commencing at our first annual general meeting, and at each annual general meeting thereafter, directors appointed to replace those directors whose terms expire shall be appointed for a term of office to expire at the third succeeding annual general meeting after their appointment. If no replacement directors are appointed, the existing directors shall be automatically re-appointed for a further term of office to expire at the third succeeding annual general meeting after their re-appointment.

Our officers are elected by and serve at the discretion of the Board. Their terms shall be decided by the Board.

Board Committees

Our Board has an audit committee. The audit committee’s members and functions are described below.

Audit Committee

The audit committee consists of three directors, Meng-Shiou (Frank) Lee, Philip Tsao and Chung-Hui (Christine) Jih. Philip Tsao is the chairperson of the audit committee. Mr. Meng-Shiou (Frank) Lee satisfies the criteria of an audit committee financial expert as set forth under the applicable rules of the SEC. Each of the audit committee members satisfies the requirements for an “independent director” within the meaning of the NYSE listing rules and the criteria for independence set forth in Rule 10A-3 of the Exchange Act.

The audit committee oversees our accounting and financial reporting processes. The audit committee is responsible for, among other things:

the quality and integrity of our financial statements,
internal control over financial reporting and disclosure controls and procedures,
our compliance with legal and regulatory requirements,
our independent registered public accounting firm’s qualifications and independence,
the performance of our internal audit function, and
the performance of our independent registered public accounting firm.

Director Nominations

Our Board will consider director candidates recommended for nomination by our shareholders during such times as they are seeking proposed nominees to stand for election at the next annual meeting of shareholders (or, if applicable, a special meeting of shareholders). Our shareholders that wish to nominate a director for election to our Board should follow the procedures set forth in our Articles.

In general, in identifying and evaluating nominees for directors, our Board considers educational background, diversity of professional experience, knowledge of our business, integrity, professional reputation, independence, character, and the ability to exercise sound judgement, and relevant skills and experience, including financial literacy, and experience in the context of the needs of our Board.

80

Table of Contents

D.

Employees

See “Item 4. Information on the Company — B. Business Overview — Employees and Human Capital.”

E.

Share Ownership

The following table sets forth information regarding the beneficial ownership of Ordinary Shares to the extent known to us as of the date of this annual report by:

each person who beneficially owns 5.0% or more of the outstanding Ordinary Shares;
each person who is our executive officer or director; and
all of our executive officers and directors as a group.

Beneficial ownership is determined in accordance with the rules of the SEC and includes voting or investment power with respect to, or the power to receive the economic benefit of ownership of, the securities. In computing the number of shares beneficially owned by a person and the percentage ownership of that person, shares that the person has the right to acquire within 60 days are included, including through the exercise of any option or other right or the conversion of any other security. However, these shares are not included in the computation of the percentage ownership of any other person. Each holder of Class A Ordinary Shares is entitled to one vote per share, and each holder of Class B Ordinary Shares is entitled to ten (10) votes per share.

The total number of Ordinary Shares outstanding as of the date of this annual report is 118,263,795 shares, consisting of 101,475,077 Class A Ordinary Shares and 16,788,718 Class B Ordinary Shares.


% of 


Class A Ordinary

% of

Class B Ordinary

% of 

voting 


Beneficial Owners


 Shares


Class†


Shares


Class†


power††


Directors and Executive Officers:


Alice H. Chang


16,788,718

(1)

100

%  

62.3

%

Wei-Hsin Tsen (Johnny Tseng)


862,769


*

%  


*

%

Weichuan (Wayne) Liu


377,103


*

%  


*

%

Pin-Jen (Louis) Chen


283,491


*

%  


*

%

Jau-Hsiung Huang


148,274


*

%  


*

%

Hsiao-Chuan (Iris) Chen


69,932


*

%  


*

%

Michael Aw


Jianmei Lyu


Meng-Shiou (Frank) Lee


Philip Tsao


5,311

(2)

*

%  


*

%

Chung-Hui (Christine) Jih


All directors and executive officers as a group


1,746,880


1.7

%  

16,788,718


100

%  

63.0

%

Five Percent or More Shareholders:


GOLDEN EDGE CO., LTD.


10,622,620

(1)

63.3

%  

39.4

%

DVDonet.com. Inc


4,669,346

(1)

27.8

%  

17.3

%

CyberLink International


36,960,961

(3)

36.4

%  


13.7

%

Taobao China Holding Limited


10,887,904

(4)

10.7

%  


4.0

%

GS Entities


8,065,686

(5)

7.9

%  


3.0

%

CCV Entities


5,725,425

(6)

5.6

%  


2.1

%

Provident Acquisition Holdings Ltd.


14,491,467

(7)

13.3

%  


5.2

%

Perfect AA Corp(8)


5,115,694


5.0

%  


1.9

%

*

Less than 1%.

81

Table of Contents

For each person or group, percentage of class is calculated by dividing the number of Class A Ordinary Shares or Class B Ordinary Shares beneficially owned by such person or group by the total Class A Ordinary Shares or Class B Ordinary Shares, respectively.

††

For each person or group, percentage of voting power is calculated by dividing the voting power beneficially owned by such person or group by the voting power of all of Class A Ordinary Shares and Class B Ordinary Shares. Each holder of Class A Ordinary Shares is entitled to one vote per share and each holder of Class B Ordinary Shares is entitled to ten votes per share on all matters submitted to them for a vote.

(1)Alice H. Chang beneficially owns (a) 10,622,620 Class B Ordinary Shares held by GOLDEN EDGE CO., LTD., a British Virgin Islands company in which Ms. Alice H. Chang has a controlling interest, (b) 4,669,346 Class B Ordinary Shares held by DVDonet.com. Inc., a British Virgin Islands company wholly owned by World Speed Company Limited, which is a British Virgin Islands company wholly owned by Ms. Alice H. Chang, (c) 523,008 Class B Ordinary Shares held by World Speed Company Limited, a British Virgin Islands company wholly owned by Ms. Alice H. Chang and (d) 973,744 Class B Ordinary Shares held by Ms. Alice H. Chang.
(2)Represents Class A Ordinary Shares indirectly held by Philip Tsao through Perfect AA Corp.
(3)Represents (a) 36,660,961 Class A Ordinary Shares issued to CyberLink International in connection with the Recapitalization before the Closing and (b) 300,000 Class A Ordinary Shares held by CyberLink International in connection with its PIPE Investment.
(4)Represents Class A Ordinary Shares directly held by Taobao China Holding Limited, a limited liability company incorporated in Hong Kong. Taobao China Holding Limited is a wholly-owned subsidiary of Taobao Holding Limited, an exempted company incorporated with limited liability incorporated in the Cayman Islands, which is a wholly-owned subsidiary of Alibaba Group Holding Limited, which is a public company listed on the New York Stock Exchange and Hong Kong Stock Exchange.
(5)Represents (a) 6,452,549 Class A Ordinary Shares held by Goldman Sachs Asia Strategic II Pte. Ltd., a private company limited by shares incorporated under the laws of Singapore (“GSAS II”), which is an indirect wholly-owned subsidiary of The Goldman Sachs Group, Inc., (b) 1,058,794 Class A Ordinary Shares held by StoneBridge 2020, L.P., a limited partnership formed and existing under the laws of the State of Delaware, United States (“StoneBridge 2020”), of which an affiliate of The Goldman Sachs Group, Inc. is the general partner, and (c) 554,343 Class A Ordinary Shares held by StoneBridge 2020 Offshore Holdings II, L.P., an exempted limited partnership registered in the Cayman Islands (“StoneBridge 2020 II”, together with GSAS II and StoneBridge 2020, the “GS Entities”), of which an affiliate of The Goldman Sachs Group, Inc. is the general partner. By virtue of the relationships among The Goldman Sachs Group, Inc. and the GS Entities, The Goldman Sachs Group, Inc. may be deemed a beneficial owner of the shares held by the GS Entities. The Goldman Sachs Group, Inc. disclaims beneficial ownership of such securities except to the extent of its pecuniary interest therein.
(6)Represents (a) 2,503,760 Class A Ordinary Shares held by Ningbo New Summit Private Equity Fund I L.P. and (b) 3,221,665 Class A Ordinary Shares held by CCV Fund I LP (together with Ningbo New Summit Private Equity Fund I L.P., the “CCV Entities”). Ningbo New Summit Private Equity Fund I L.P. is a limited partnership established under the laws of the PRC. The general partner of it is Ningbo CCV Private Equity Investment Management L.P., which is ultimately controlled by Mr. Wei Zhou. Each of Ningbo CCV Private Equity Investment Management L.P. and Mr. Zhou may be deemed to exercise voting and investment control over the shares held by Ningbo New Summit Private Equity Fund I L.P. CCV Fund I LP is a limited partnership established under law of the Cayman Islands. The general partner of it is CCV Fund I GP Limited, which is ultimately controlled by Mr. Wei Zhou. Each of CCV Fund I GP Limited and Mr. Zhou may be deemed to exercise voting and investment control over the shares held by CCV Fund I LP. Each of Mr. Zhou, Ningbo CCV Private Equity Investment Management L.P. and CCV Fund I GP Limited disclaims beneficial ownership in the securities except to the extent their pecuniary interest therein.
(7)Represents (i) 4,891,467 Class A Ordinary Shares issued as entitlement shares for the cancellation of 5,327,500 Provident Class B Ordinary Shares previously held by the Sponsor, (ii) 3,000,000 Class A Ordinary Shares consisting of (a) 2,000,000 Class A Ordinary Shares converted from 2,000,000 Provident Class A Ordinary Shares acquired by an affiliate of the Sponsor in connection with the FPA Investment and (b) 1,000,000 Class A Ordinary Shares issuable upon the exercise of 1,000,000

82

Table of Contents

Perfect Forward Purchase Warrants acquired by an affiliate of the Sponsor in connection with the FPA Investment, and (iii) 6,600,000 Class A Ordinary Shares issuable upon the exercise of 6,600,000 Warrants converted from 6,600,000 Private Placement Warrants previously held by the Sponsor. The number of Class A Ordinary Shares disclosed herein does not include 1,175,624 Sponsor Earnout Promote Shares issuable to the Sponsor upon the occurrence of certain milestones. In accordance with Rule 13d-3(d)(1)(i) under the Exchange Act, Class A Ordinary Shares not outstanding which are subject to Warrants owned by the Sponsor and its affiliate shall be deemed to be outstanding for the purpose of computing their percentage ownership of outstanding Class A Ordinary Shares but shall not be deemed to be outstanding for the purpose of computing the percentage ownership of Class A Ordinary Shares by any other person.
(8)Perfect AA Corp. is a British Virgin Islands company that holds Class A Ordinary Shares of the Company on behalf of employees who have exercised their stock options.

To our knowledge, as of March 15, 2023, 7,680,653 Class A Ordinary Shares, or 7.57% of the total outstanding Class A Ordinary Shares, were held by 12 record holders in the United States. Because a portion of these shares are held by brokers or other nominees, we cannot ascertain the exact number of Class A Ordinary Shares ultimately held by holders in the United States. As of March 15, 2023, none of our Class B Ordinary Shares was held by record holders in the United States.

We are not aware of any arrangement that may, at a subsequent date, result in a change of control of the Company.

F.

Disclosure of A Registrant’s Action to Recover Erroneously Awarded Compensation

Not Applicable.

Item 7.Major Shareholders and Related Party Transactions

A.

Major Shareholders

Please refer to “Item 6. Directors, Senior Management and Employees — E. Share Ownership.”

83

Table of Contents

B.

Related Party Transactions

Agreements Related to the Business Combination

In connection with, and pursuant to, the Business Combination Agreement, certain agreements were entered into between Perfect Corp., Provident and certain related parties following the Business Combination. These agreements include:

Sponsor Letter Agreement

Concurrently with the execution of the Business Combination Agreement on March 3, 2022, Perfect Corp., Provident and the Sponsor entered into the Sponsor Letter Agreement, pursuant to which 1,710,000 Class A Ordinary Shares held by Sponsor as of immediately after the First Merger Effective Time (the “Forfeited Shares”) were forfeited and cancelled for no consideration immediately after the Closing. Subject to the terms and conditions contemplated by the Sponsor Letter Agreement, upon the occurrence of a Sponsor Earnout Event (as defined below) during the period from and after the Closing Date until the fifth anniversary of the Closing Date (the “Earnout Period”), Perfect Corp. will issue up to 1,175,624 Class A Ordinary Shares (the “Sponsor Earnout Shares”) to Sponsor, with (i) 50% of the Sponsor Earnout Shares issuable if over any twenty (20) trading days within any 30-trading-day period during the Earnout Period the daily volume-weighted average price of the Class A Ordinary Shares is greater than or equal to $11.50, and (ii) 50% of the Sponsor Earnout Shares issuable if over any 20 trading days within any 30-trading-day period during the Earnout Period the daily volume-weighted average price of the Class A Ordinary Shares is greater than or equal to $13.00 (each, a “Sponsor Earnout Event”). In the event that, during the Earnout Period, there is a Change of Control (as defined in the Sponsor Letter Agreement) (or a definitive agreement providing for a Change of Control has been entered into prior to the expiration of the Earnout Period and such Change of Control is ultimately consummated) or any liquidation, bankruptcy or similar proceeding of Perfect Corp., then any Sponsor Earnout Shares that have not been previously issued by Perfect Corp. (whether or not previously earned) will be deemed earned and will be issued by Perfect Corp. to the Sponsor upon such event, unless in the case of a Change of Control, the value of the consideration to be received by the holders of Ordinary Shares in such transaction is less than the share price threshold applicable to the applicable Sponsor Earnout Event.

Pursuant to the Sponsor Letter Agreement, the Sponsor also agreed not to transfer, during a period of 12 months from and after October 28, 2022, any Class A Ordinary Shares and Warrants held by it immediately after the First Merger Effective Time, any Class A Ordinary Shares acquired by the Sponsor upon the exercise of such Warrants, or any Sponsor Earnout Shares issued pursuant to the Sponsor Letter Agreement subject to customary exceptions. The lock-up requirements will cease to apply after the later of (i) the date on which the daily volume-weighted average price of the Class A Ordinary Shares equals or exceeds $12.00 per share for any 20 trading days within any consecutive 30-trading-day period after October 28, 2022 and (ii) the date that is 180 days after October 28, 2022.

Perfect Shareholder Lock-Up Agreement

On October 28, 2022, Perfect Corp., Provident and certain Perfect Corp.’s shareholders (the “Perfect Lock-Up Shareholders”) entered into the Perfect Shareholder Lock-Up Agreement, pursuant to which each Perfect Lock-Up Shareholder agreed not to transfer (i) any Ordinary Shares held by such Perfect Lock-Up Shareholder immediately after the Second Merger Effective Time, (ii) any Ordinary Shares issuable upon the exercise of options or warrants to purchase Ordinary Shares held by such Perfect Lock-Up Shareholder immediately after the Second Merger Effective Time (along with such options or warrants themselves), (iii) any Ordinary Shares acquirable upon the conversion, exercise or exchange of any securities convertible into or exercisable or exchangeable for Ordinary Shares held by such Perfect Lock-Up Shareholder immediately after the Second Merger Effective Time (along with such securities themselves) and (iv) any Shareholder Earnout Shares to the extent issued pursuant to the Business Combination Agreement ((i) through (iv) collectively, the “Perfect Shareholder Locked-Up Shares”) during the applicable lock-up period, subject to customary exceptions.

For each Perfect Lock-Up Shareholder who is not CyberLink International, Founder Parties, Pin-Jen (Louis) Chen or Wei-Hsin Tsen (Johnny Tseng), the applicable lock-up period will be six months from and after October 28, 2022. For each of CyberLink International, Founder Parties, Pin-Jen (Louis) Chen and Wei-Hsin Tsen (Johnny Tseng), the applicable lock-up period will be 12 months from and after October 28, 2022.

84

Table of Contents

Perfect Shareholder Voting Agreement

Concurrently with the execution of the Business Combination Agreement on March 3, 2022, Perfect Corp., Provident and certain shareholders of Perfect Corp. (the “Perfect Voting Shareholders”) entered into the Perfect Shareholder Voting Agreement, pursuant to which each Perfect Voting Shareholder agreed to, among other things, (i) attend any shareholder meeting of Perfect Corp. to establish a quorum for the purpose of approving the Business Combination, and (ii) vote the Pre-Recapitalization Shares and any other Perfect securities acquired by such Perfect Voting Shareholder in favor of approving the transactions contemplated by the Business Combination Agreement.

New Registration Rights Agreement

On October 28, 2022, Perfect Corp., the Sponsor and certain shareholders of Perfect Corp. entered into the New Registration Rights Agreement containing customary registration rights for the Sponsor and the shareholders of Perfect Corp. who are parties thereto.

Subscription Agreements — PIPE Investment

Concurrently with the execution of the Business Combination Agreement on March 3, 2022, Provident, Perfect Corp. and the PIPE Investors entered into Subscription Agreements and certain assignment, assumption and consent agreements, pursuant to which the PIPE Investors subscribed for and purchased Provident Class A Ordinary Shares at $10.00 per share for an aggregate purchase price of $50,000,000 prior to the Closing.

At the First Merger Effective Time, each Provident Class A Ordinary Share issued in the PIPE Investment was cancelled in exchange for one Class A Ordinary Share.

Forward Purchase Agreements — FPA Investment

In connection with the Provident Initial Public Offering, Provident entered into Forward Purchase Agreements and a joinder agreement with the FPA Investors, pursuant to which the FPA Investors purchased from Provident an aggregate of 5,500,000 Provident Class A Ordinary Shares and an aggregate of 2,750,000 Forward Purchase Warrants for an aggregate purchase price of $55,000,000 prior to the Closing. At the First Merger Effective Time, each Provident Class A Ordinary Share and Forward Purchase Warrant issued in the FPA Investment was cancelled in exchange for one Class A Ordinary Share and one Warrant, respectively.

Assignment, Assumption and Amendment Agreement

On October 28, 2022, Perfect Corp., Provident, and Continental entered into the Assignment, Assumption and Amendment Agreement pursuant to which Provident assigned to Perfect Corp. all of its rights, interests, and obligations in and under the Warrant Agreement, and the terms and conditions of such Warrant Agreement were amended to reflect the assumption of the Provident Warrants by Perfect Corp.

85

Table of Contents

Related Party Transactions with CyberLink and Its Subsidiaries

Licensing Agreements

Cross License Agreement — MakeupDirector

Perfect Corp. has entered into a cross license agreement, dated as of July 1, 2016 and automatically renewed on July 1, 2019, with CyberLink (the “MakeupDirector Cross License Agreement”). Pursuant to the MakeupDirector Cross License Agreement, (i) Perfect Corp. grants to (a) CyberLink a non-exclusive and non-transferable license to use Perfect Corp.’s digital makeover technology and (b) CyberLink and CyberLink MakeupDirector users non-exclusive access to the contents and features of Beauty Circle, a beauty social platform owned by Perfect Corp.; and (ii) CyberLink grants to Perfect Corp. a non-exclusive and non-transferable worldwide license to (a) distribute CyberLink’s MakeupDirector software to users of Perfect Corp.’s mobile apps and (b) advertise for certain software applications of Perfect Corp. within certain CyberLink’s software and websites as specified under the MakeupDirector Cross License Agreement. No cash consideration is payable under the MakeupDirector Cross License Agreement. Each of Perfect Corp. and CyberLink receives its consideration for its license to the other party from the license that the other party grants to it. The term of the MakeupDirector Cross License Agreement is three (3) years starting from July 1, 2016 and shall be automatically renewed for an additional three (3) years, subject to written notice of termination by either party at least one (1) year prior to renewal of the term.

Cross License Agreement and Assignment Agreement — PerfectCam

Perfect Corp. has entered into a cross license agreement, dated as of August 8, 2017 and renewed on January 1, 2021, with CyberLink (the “PerfectCam Cross License Agreement”). Pursuant to the PerfectCam Cross License Agreement, (i) Perfect Corp. grants to CyberLink a non-exclusive and non-transferable worldwide license to use its AR technology of facial feature detection and makeup generation to be embedded into CyberLink’s PerfectCam software (“PerfectCam”), and CyberLink may sublicense its own developed SDK of PerfectCam derived from Perfect Corp.’s AR technology to its customers and other third parties; and (ii) CyberLink grants to Perfect Corp. a non-exclusive and non-transferable worldwide license to use, reproduce, distribute and sell PerfectCam and derivative work created and developed by or on behalf of CyberLink based on the AR technology provided by us under the PerfectCam Cross License Agreement. CyberLink shall share twenty-five percent (25%) of the net revenue from the sales of PerfectCam and fifty percent (50%) of the net revenue from the sublicense of the SDK of PerfectCam. The term of the PerfectCam Cross License Agreement is three (3) years starting from August 8, 2017 and shall be automatically renewed for an additional three (3) years, subject to written notice of termination by either party at least one (1) year prior to renewal of the term.

On January 1, 2018, Perfect Corp., Perfect Mobile Corporation (“Perfect Taiwan”), a wholly-owned subsidiary of Perfect Corp., and CyberLink entered into an assignment agreement, pursuant to which Perfect Corp. agreed to assign all its rights and obligations under the PerfectCam Cross License Agreement to Perfect Taiwan, and as a result, Perfect was released of any liabilities and Perfect Taiwan undertook all the rights and obligations under the PerfectCam Cross License Agreement.

License Agreement — YouCam

Perfect Taiwan has entered into a license agreement (the “YouCam License Agreement”), dated as of November 30, 2019, with CyberLink. Pursuant to the YouCam License Agreement, Perfect Taiwan grants to CyberLink a non-exclusive, non-transferable and non-sublicensable worldwide license to use its AR technology to be embedded into CyberLink’s YouCam software (“YouCam”) and the SDK of YouCam. CyberLink shall pay to Perfect Taiwan (i) a royalty calculated based on twelve percent (12%) of net revenue of sales of YouCam and (ii) a royalty fee of $1 for each copy of YouCam sold. The term of the YouCam License Agreement is three (3) years starting from November 30, 2019 and shall be automatically renewed for an additional one (1) year, subject to written notice of termination by either party at least one (1) year prior to renewal of the term.

86

Table of Contents

Services Outsourcing Agreement

Perfect Taiwan has entered into a services outsourcing agreement (the “Services Outsourcing Agreement”), dated as of January 1, 2019, with CyberLink, pursuant to which CyberLink agrees to provide support and assistance in legal services, network infrastructure and equipment maintenance services, marketing activity support and employee training programs to Perfect Taiwan for an hourly rate of NTD1,000, NTD900, NTD750, and NTD700, respectively. The term of the Services Outsourcing Agreement is one (1) year starting from January 1, 2019 and shall be automatically renewed for an additional one (1) year at each anniversary, subject to written notice of termination by either party at least 30 days prior to the expiry of the relevant term.

Rental Agreements

Perfect Taiwan entered into a property lease agreement, dated as of June 1, 2017 (the “Taiwan Property Lease Agreement”), with CyberLink for a monthly rental of NTD538,842 to lease premises for use as offices (the “Office Leases”) for two years starting from June 1, 2017. The rental was paid to CyberLink on a monthly basis. On June 1, 2019 and June 1, 2021, respectively, Perfect Taiwan renewed the Office Leases on the same terms as those of the 2017 Taiwan Property Lease Agreement.

Perfect Corp. (Japan), a wholly-owned subsidiary of Perfect Corp. organized and existing under the laws of Japan (“Perfect Japan”), has entered into an office sharing agreement (the “Japan Office Sharing Agreement”), dated as of January 1, 2020, as amended on June 1, 2021, with CyberLink Inc., a wholly-owned subsidiary of CyberLink organized and existing under the laws of Japan (“CyberLink Japan”), to share a portion of CyberLink Japan’s premises for a monthly sharing fee of JPY805,407 for one (1) year starting from January 1, 2020 and shall be automatically renewed for an additional one (1) year at each anniversary, subject to written notice of termination by either party at least 30 days prior to the expiry of the relevant term. The rent was paid to CyberLink Japan on a quarterly basis. On June 1, 2021, Perfect Japan entered into amendment to the Japan Office Sharing Agreement, pursuant to which the monthly sharing fee was changed from JPY805,407 to JPY978,128.

Other Related Party Transactions

Employment Agreements and Indemnification Agreements

See “Item 6. Directors, Senior Management and Employees — B. Compensation.”

Share Incentive Plan

See “Item 6. Directors, Senior Management and Employees — B. Compensation — Share Incentive Plan.”

Shareholders Agreement

Perfect Corp., certain of its shareholders and Alice H. Chang entered into the Second Amended and Restated Shareholders Agreement on December 18, 2020 (the “SHA”), which was further amended by Amendment No. 1 to the Second Amended and Restated Shareholders Agreement of Perfect Corp. on October 5, 2021. A copy of the SHA and its amendment is filed as Exhibits 10.2 and 10.16 of the Form F-4 filed by us on September 19, 2022, respectively. According to the SHA and its amendment, our Fourth Amended and Restated Memorandum and Articles of Association shall provide that, subject to certain requirements of shareholding percentage, each of (i) Ningbo New Summit Private Equity Fund I L.P., (ii) Taobao China Holdings Limited, (iii) CyberLink International, and (iv) Goldman Sachs (as defined in the SHA, comprising of Goldman Sachs Asia Strategic II Pte. Ltd., StoneBridge 2020, L.P. and StoneBridge 2020 Offshore Holdings II, L.P.) may appoint one (1) director. Such director appointment rights were reflected in our Fourth Amended and Restated Memorandum and Articles of Association as well as our Fifth Amended and Restated Memorandum and Articles of Association. We have adopted the Sixth Amended and Restated Memorandum and Articles of Association which no longer contains such rights.

87

Table of Contents

Director and Officer Indemnification

We have entered into indemnification agreements with our directors and executive officers. These agreements will require us to indemnify these individuals to the fullest extent permitted by Cayman Islands law against liabilities that may arise by reason of their directorship, and to advance expenses incurred as a result of any proceeding against them as to which they could be indemnified. Insofar as indemnification for liabilities arising under the Securities Act may be permitted to directors or executive officers, we have been informed that in the opinion of the SEC such indemnification is against public policy and is therefore unenforceable.

There is currently no pending material litigation or proceeding involving any of our directors, officers or employees for which indemnification is sought.

C.

Interests of Experts and Counsel

Not applicable.

Item 8.Financial Information

A.

Consolidated Statements and Other Financial Information

We have appended our consolidated financial statements filed as part of this annual report on Form 20-F.

Legal Proceedings

See “Item 4. Information on the Company — B. Business Overview — Legal Proceedings.”

Dividend Policy

We do not intend to pay any cash dividends in the foreseeable future, and any determination to pay dividends in the future will be at the discretion of our Board. The directors may from time to time declare dividends (including interim dividends) and other distributions on our shares in issue and authorize payment of the same out of our funds lawfully available therefor. In addition, our shareholders may declare dividends by ordinary resolution, but no dividend may exceed the amount recommended by the directors. Under the laws of the Cayman Islands, dividends may be paid out of either profit or share premium account; provided that in no circumstances may a dividend be paid if this would result in us being unable to pay our debts as they fall due in the ordinary course of business.

As an exempted company with limited liability incorporated under the laws of the Cayman Islands structured as a holding company, we may need dividends and other distributions on equity from our Taiwan subsidiary to satisfy our liquidity requirements. Current Taiwan regulations permit our Taiwan subsidiary to pay dividends to its respective shareholders only out of its accumulated profits, if any, which shall first make up previous losses and set aside at least 10% of its accumulated profits each year. These reserves are not distributable as cash dividends. Furthermore, if our Taiwan subsidiary incurs debt on its own behalf in the future, the instruments governing the debt may restrict its ability to pay dividends or make other payments to us. Any limitation on the ability of our Taiwan subsidiary to distribute dividends or to make payments to us may restrict our ability to satisfy our liquidity requirements. In addition, the dividend payments by our Taiwan subsidiary to us shall be subject to a withholding tax of 21%. See “Item 3. Key Information — D. Risk Factors — Risks Related to Doing Business in Taiwan — Our Taiwan subsidiary is subject to certain restrictions on paying dividends or making other payments to us, which may restrict our ability to satisfy the liquidity requirements.”

B.

Significant Changes

Except as disclosed elsewhere in this annual report, we have not experienced any significant changes since the date of our audited consolidated financial statements which is included in this annual report.

88

Table of Contents

Item 9.The Offer and Listing

A.

Offering and Listing Details

Since October 31, 2022, our Class A Ordinary Shares and Warrants have been listed on the NYSE under the symbols “PERF” and “PERF WS,” respectively.

B.

Plan of Distribution

Not applicable.

C.

Markets

Since October 31, 2022, our Class A Ordinary Shares and Warrants have been listed on the NYSE under the symbols “PERF” and “PERF WS,” respectively.

D.

Selling Shareholders

Not applicable.

E.

Dilution

Not applicable.

F.

Expenses of the Issue

Not applicable.

Item 10.Additional Information

A.

Share Capital

Not applicable.

B.

Memorandum and Articles of Association

By special resolutions passed on October 25, 2022, our shareholders adopted our Sixth Amended and Restated Memorandum and Articles of Association, effective on and from October 28, 2022. The information called for by this Item is set forth in Exhibit 2.5 to this annual report and incorporated by reference herein. With respect to the powers of our directors, please refer to “Item 6. Directors, Senior Management and Employees — C. Board Practices — Duties of Directors.”

C.

Material Contracts

For the two years immediately preceding the date of this annual report, we have not entered into any additional material contracts other than in the ordinary course of business and other than those described in “Item 4. Information on the Company,” “Item 7. Major Shareholders and Related Party Transactions — B. Related Party Transactions” or elsewhere in this annual report.

D.

Exchange Controls

See “Item 4. Information on the Company — B. Business Overview — Regulation — Exchange Controls in Taiwan.”

89

Table of Contents

E.

Taxation

United States Federal Income Tax Considerations

This section describes the material United States federal income tax consequences to a U.S. holder (as defined below) of owning our Class A Ordinary Shares and Warrants (the “Securities”). It applies to you only if you hold your Securities as capital assets for tax purposes. This discussion addresses only United States federal income taxation and does not discuss all of the tax consequences that may be relevant to you in light of your individual circumstances, including foreign, state or local tax consequences, estate and gift tax consequences, and tax consequences arising under the Medicare contribution tax on net investment income or the alternative minimum tax. This section does not apply to you if you are a member of a special class of holders subject to special rules, including:

a dealer in securities,
a trader in securities that elects to use a mark-to-market method of accounting for securities holdings,
a tax-exempt organization,
a life insurance company,
a person that actually or constructively owns 10% or more of the combined voting power of our voting stock or of the total value of our stock,
a person whose functional currency is not the U.S. dollar.

This section is based on the Internal Revenue Code of 1986, as amended, its legislative history, existing and proposed regulations, published rulings and court decisions, all as currently in effect. These authorities are subject to change, possibly on a retroactive basis. There is currently no comprehensive income tax treaty between the United States and Cayman Islands.

You are a U.S. holder if you are a beneficial owner of the Securities and, for United States federal income tax purposes, you are:

a citizen or resident of the United States,
a domestic corporation,
an estate whose income is subject to United States federal income tax regardless of its source, or
a trust if a United States court can exercise primary supervision over the trust’s administration and one or more United States persons are authorized to control all substantial decisions of the trust.

If an entity or arrangement that is treated as a partnership for United States federal income tax purposes holds the Securities, the United States federal income tax treatment of a partner will generally depend on the status of the partner and the tax treatment of the partnership. A partner in a partnership holding the Securities should consult its tax advisor with regard to the United States federal income tax treatment of an investment in the Securities.

You should consult your own tax advisor regarding the United States federal, state and local tax consequences of owning and disposing of the Securities in your particular circumstances.

The tax treatment of your Securities will depend in part on whether or not we are classified as a passive foreign investment company, or PFIC, for United States federal income tax purposes. Except as discussed below under “— PFIC Classification,” this discussion assumes that we are not classified as a PFIC for United States federal income tax purposes.

90

Table of Contents

Distributions

The gross amount of any distribution we pay out of our current or accumulated earnings and profits (as determined for United States federal income tax purposes), other than certain pro rata distributions of our shares, will be treated as a dividend that is subject to United States federal income taxation. If you are a noncorporate U.S. holder, dividends that constitute qualified dividend income will be taxable to you at the preferential rates applicable to long-term capital gains provided that you hold the Class A Ordinary Shares for more than 60 days during the 121-day period beginning 60 days before the ex-dividend date and meet other holding period requirements. Dividends we pay with respect to the Class A Ordinary Shares generally will be qualified dividend income provided that, in the year that you receive the dividend, our Class A Ordinary Shares are readily tradable on an established securities market in the United States, and we are not treated as a PFIC in the year the dividend is paid or in the preceding year and certain holding period and other requirements are met. U.S. Treasury Department guidance indicates that shares listed on the NYSE (on which our Class A Ordinary Shares are listed) will be considered readily tradable on an established securities market in the United States. Even if the Class A Ordinary Shares are listed on the NYSE, there can be no assurance that our Class A Ordinary Shares will be considered readily tradable on an established securities market in future years. U.S. holders should consult their tax advisors regarding the availability of such lower rate for any dividends paid with respect to the Class A Ordinary Shares.

Dividends will generally be income from sources outside the United States and will generally be “passive” income for purposes of computing the foreign tax credit allowable to you. However, if (a) we are 50% or more owned, by vote or value, by United States persons and (b) at least 10% of our earnings and profits are attributable to sources within the United States, then for foreign tax credit purposes, a portion of our dividends would be treated as derived from sources within the United States. With respect to any dividend paid for any taxable year, the United States source ratio of our dividends for foreign tax credit purposes would be equal to the portion of our earnings and profits from sources within the United States for such taxable year, divided by the total amount of our earnings and profits for such taxable year.

Sales or Dispositions

Except as discussed below with respect to the cashless exercise of a Warrant, if you sell or otherwise dispose of your Securities, you will recognize capital gain or loss for United States federal income tax purposes equal to the difference between the amount that you realize and your tax basis, in your Securities. Capital gain of a noncorporate U.S. holder is generally taxed at preferential rates where the property is held for more than one year. The gain or loss will generally be income or loss from sources within the United States for foreign tax credit limitation purposes.

Exercise, Lapse or Redemption of a Warrant

Except as discussed below with respect to the cashless exercise of a Warrant, a U.S. holder generally will not recognize gain or loss upon the acquisition of a Class A Ordinary Share on the exercise of a Warrant. A U.S. holder’s tax basis in a Class A Ordinary Share received upon exercise of the Warrant generally will be an amount equal to the sum of the U.S. holder’s tax basis in the Warrant exchanged therefor and the exercise price. It is unclear whether the U.S. holder’s holding period for the Class A Ordinary Share received will commence on the date of exercise of the Warrant or the day following the date of exercise of the Warrant; in either case, the holding period will not include the period during which the U.S. holder held the Warrant. If a Warrant is allowed to lapse unexercised, a U.S. holder generally will recognize a capital loss equal to such holder’s tax basis in the Warrant.

The tax consequences of a cashless exercise of a Warrant are not clear under current law. A cashless exercise may not be taxable, either because the exercise is not a realization event or because the exercise is treated as a “recapitalization” for U.S. federal income tax purposes.

In either tax-free situation, a U.S. holder’s tax basis in the Class A Ordinary Shares received generally would equal the U.S. holder’s tax basis in the Warrants. If the cashless exercise is not treated as a realization event, it is unclear whether a U.S. holder’s holding period for the Class A Ordinary Share will commence on the date of exercise of the Warrant or the day following the date of exercise of the Warrant. In either case, the holding period will not include the period during which the U.S. holder held the Warrant. If the cashless exercise is treated as a recapitalization, the holding period of the Class A Ordinary Shares would include the holding period of the Warrants.

91

Table of Contents

It is also possible that a cashless exercise may be treated in part as a taxable exchange in which gain or loss would be recognized. In such event, a portion of the Warrants to be exercised on a cashless basis could, for U.S. federal income tax purposes, be deemed to have been surrendered in consideration for the exercise price of the remaining Warrants, which would be deemed to be exercised. For this purpose, a U.S. holder may be deemed to have surrendered a number of Warrants having an aggregate value equal to the exercise price for the total number of Warrants to be deemed exercised. The U.S. holder would recognize capital gain or loss in an amount equal to the difference between the fair market value of the total number of Warrants deemed surrendered and the U.S. holder’s tax basis in such Warrants. In this case, a U.S. holder’s aggregate tax basis in Class A Ordinary Shares received would equal the sum of U.S. holder’s initial investment in the Warrants deemed exercised and the exercise price of such Warrants. It is unclear whether a U.S. holder’s holding period for the Class A Ordinary Shares would commence on the date of exercise of the Warrant or the day following the date of exercise of the Warrant.

Because of the absence of authority on the U.S. federal income tax treatment of a cashless exercise, there can be no assurance which, if any, of the alternative tax consequences and holding periods described above would be adopted by the Internal Revenue Service (“IRS”) or a court of law. Accordingly, a U.S. holder should consult its tax advisor regarding the tax consequences of a cashless exercise.

If we redeem Warrants for cash or purchase Warrants in an open market transaction, such redemption or purchase generally will be treated as a taxable disposition to the U.S. holder, taxed as described above under “— Sales or Dispositions.”

Possible Constructive Distributions

The terms of each Warrant provide for an adjustment to the number of Class A Ordinary Shares for which the Warrant may be exercised or to the exercise price of the Warrant in certain events. An adjustment which has the effect of preventing dilution generally is not taxable. The U.S. holders of the Warrants would, however, be treated as receiving a constructive distribution from us if, for example, the adjustment increases such U.S. holders’ proportionate interests in our assets or earnings and profits (e.g., through an increase in the number of Class A Ordinary Shares that would be obtained upon exercise or through a decrease to the exercise price of a Warrant) as a result of a distribution of cash or other property to the holders of Class A Ordinary Shares which is taxable to the U.S. holders of such Class A Ordinary Shares as described under “— Distributions” above. Such constructive distribution would be subject to tax as described under that section in the same manner as if the U.S. holders of the Warrants received a cash distribution from us equal to the fair market value of such increased interest, and would increase a U.S. holder’s adjusted tax basis in its Warrants to the extent that such distribution is treated as a dividend.

PFIC Classification

We believe that we should not be currently classified as a PFIC for United States federal income tax purposes and we do not expect to become a PFIC in the foreseeable future. However, this conclusion is a factual determination that is made annually and thus may be subject to change. It is therefore possible that we could become a PFIC in a future taxable year. In addition, our current position that we are not a PFIC is based in part upon the value of our goodwill (as determined for tax purposes) which is based on the market value for our shares. Accordingly, we could become a PFIC in the future if there is a substantial decline in the value of our shares.

In general, we will be a PFIC in a taxable year if:

at least 75% of our gross income for the taxable year is passive income, or
at least 50% of the value, determined on the basis of a quarterly average, of our assets in such taxable year is attributable to assets that produce or are held for the production of passive income.

“Passive income” generally includes dividends, interest, gains from the sale or exchange of investment property rents and royalties (other than certain rents and royalties derived in the active conduct of a trade or business) and certain other specified categories of income. If a foreign corporation owns at least 25% by value of the stock of another corporation, the foreign corporation is treated for purposes of the PFIC tests as owning its proportionate share of the assets of the other corporation, and as receiving directly its proportionate share of the other corporation’s income.

92

Table of Contents

If we are treated as a PFIC, and you are a U.S. holder that did not make a mark-to-market election, as described below, you will generally be subject to special rules with respect to:

any gain you realize on the sale or other disposition of your Class A Ordinary Shares, and
any excess distribution that we make to you (generally, any distributions to you during a single taxable year, other than the taxable year in which your holding period in the Class A Ordinary Shares begins, that are greater than 125% of the average annual distributions received by you in respect of the Class A Ordinary Shares during the three preceding taxable years or, if shorter, your holding period for the Class A Ordinary Shares that preceded the taxable year in which you receive the distribution).

Under these rules:

the gain or excess distribution will be allocated ratably over your holding period for the Class A Ordinary Shares,
the amount allocated to the taxable year in which you realized the gain or excess distribution or to prior years before the first year in which we were a PFIC with respect to you will be taxed as ordinary income,
the amount allocated to each other prior year will be taxed at the highest tax rate in effect for that year, and
the interest charge generally applicable to underpayments of tax will be imposed in respect of the tax attributable to each such year.

Special rules apply for calculating the amount of the foreign tax credit with respect to excess distributions by a PFIC.

If we are a PFIC in a taxable year and our Class A Ordinary Shares are treated as “marketable stock” in such year, you may make a mark-to-market election with respect to your Class A Ordinary Shares. If you make this election, you will not be subject to the PFIC rules described above. Instead, in general, you will include as ordinary income each year the excess, if any, of the fair market value of your Class A Ordinary Shares at the end of the taxable year over your adjusted basis in your Class A Ordinary Shares. You will also recognize an ordinary loss in respect of the excess, if any, of the adjusted basis of your Class A Ordinary Shares over their fair market value at the end of the taxable year (but only to the extent of the net amount of previously included income as a result of the mark-to-market election). Your basis in the Class A Ordinary Shares will be adjusted to reflect any such income or loss amounts. Any gain that you recognize on the sale or other disposition of your Class A Ordinary Shares would be ordinary income and any loss would be an ordinary loss to the extent of the net amount of previously included income as a result of the mark-to-market election and, thereafter, a capital loss.

Unless you make certain elections, your Class A Ordinary Shares will generally be treated as stock in a PFIC if we were a PFIC at any time during your holding period in your Class A Ordinary Shares, even if we are not currently a PFIC.

In addition, notwithstanding any election you make with regard to the Class A Ordinary Shares, dividends that you receive from us will not constitute qualified dividend income to you if we are a PFIC (or are treated as a PFIC with respect to you) either in the taxable year of the distribution or the preceding taxable year. Dividends that you receive that do not constitute qualified dividend income are not eligible for taxation at the preferential rates applicable to qualified dividend income. Instead, you must include the gross amount of any such dividend paid by us out of our accumulated earnings and profits (as determined for United States federal income tax purposes) in your gross income, and it will be subject to tax at rates applicable to ordinary income.

If you own Class A Ordinary Shares during any year that we are a PFIC with respect to you, you may be required to file IRS Form 8621.

93

Table of Contents

Although not entirely clear, it is likely that under current law the Warrants will not be subject to the PFIC rules even if we are classified as a PFIC. It is possible, however, that the IRS could finalize current proposed regulations with a retroactive effective date that could cause the Warrants to be subject to the PFIC rules for periods prior to the issuance of such regulations if we are classified as a PFIC. In addition, it is possible that the IRS could issue final regulations with a future effective date that could cause the Warrants to be subject to the PFIC rules if we are classified as a PFIC either in the current taxable year or a future taxable year. You should consult your tax advisors regarding the potential application of the PFIC rules to Warrants if, contrary to current expectations, we are classified as a PFIC.

Cayman Islands Tax Considerations

The following summary contains a description of certain Cayman Islands income tax consequences of the acquisition, ownership and disposition of ordinary shares, but it does not purport to be a comprehensive description of all the tax considerations that may be relevant to a decision to purchase ordinary shares. The summary is based upon the tax laws of Cayman Islands and regulations thereunder as of the date hereof, which are subject to prospective and retroactive change.

The following discussion is not intended as tax advice, does not consider any investor’s particular circumstances, and does not consider tax consequences other than those arising under Cayman Islands law. Prospective investors should consult their professional advisers on the possible tax consequences of buying, holding or selling any shares under the laws of their country of citizenship, residence or domicile.

Current Cayman Islands Laws

The Cayman Islands currently levies no taxes on individuals or corporations based upon profits, income, gains or appreciation, and there is no taxation in the nature of inheritance tax or estate duty. There are no other taxes likely to be material to us or holders of the Class A Ordinary Shares levied by the government of the Cayman Islands, except for stamp duties which may be applicable on instruments executed in, or after execution brought within the jurisdiction of the Cayman Islands. The Cayman Islands is not party to any double tax treaties that are applicable to any payments made to or by our Company. There are no exchange control regulations or currency restrictions in the Cayman Islands.

Payments of dividends and capital in respect of the Class A Ordinary Shares will not be subject to taxation in the Cayman Islands and no withholding will be required on the payment of a dividend or capital to any holder of the Class A Ordinary Shares, nor will gains derived from the disposal of the Class A Ordinary Shares be subject to Cayman Islands income or corporation tax.

94

Table of Contents

We have been incorporated under the laws of the Cayman Islands as an exempted company with limited liability and, as such, have obtained undertakings from the Governor in Cabinet of the Cayman Islands in the following form:

The Tax Concessions Law

Undertaking as to Tax Concessions

In accordance with section 6 of the Tax Concessions Act (As Revised) of the Cayman Islands, the following undertaking is hereby given to Perfect Corp.:

that no law which is thereafter enacted in the Cayman Islands imposing any tax to be levied on profits, income, gains or appreciations shall apply to Perfect Corp. or its operations; and

in addition, that no tax to be levied on profits, income, gains or appreciations or which is in the nature of estate duty or inheritance tax shall be payable:

on or in respect of the shares, debentures or other obligations of Perfect Corp.; or

by way of the withholding in whole or in part of any relevant payment as defined in the Tax Concessions Act.

The concessions apply for a period of TWENTY years from August 10, 2022.

F.

Dividends and Paying Agents

Not applicable.

G.

Statement by Experts

Not applicable.

H.

Documents on Display

We have filed this annual report, including exhibits, with the SEC. As allowed by the SEC, in Item 19 of this annual report, we incorporate by reference certain information we filed with the SEC. This means that we can disclose important information to you by referring you to another document filed separately with the SEC. The information incorporated by reference is considered to be part of this annual report.

You may read and copy this annual report, including the exhibits incorporated by reference in this annual report, at the SEC’s Public Reference Room at 100 F Street, N.E., Washington, D.C. 20549 and at the SEC’s regional offices in New York, New York, and Chicago, Illinois. You can also request copies of this annual report, including the exhibits incorporated by reference in this annual report, upon payment of a duplicating fee, by writing to the SEC’s Public Reference Room for information.

The SEC also maintains a website that contains reports, proxy statements and other information about issuers, such as us, who file electronically with the SEC. The address of that website is http://www.sec.gov. The information on that website is not a part of this annual report.

As a foreign private issuer, we are exempt under the Exchange Act from, among other things, the rules prescribing the furnishing and content of proxy statements, and our officers, directors and principal shareholders are exempt from the reporting and short-swing profit recovery provisions contained in Section 16 of the Exchange Act.

I.

Subsidiary Information

Not applicable.

95

Table of Contents

Item 11.Quantitative and Qualitative Disclosures about Market Risk

We are exposed to various risks in relation to financial instruments. The main types of risks are foreign currency risk and interest rate risk. While we may enter into hedging contracts from time to time, any change in the fair value of the contracts could be offset by changes in the underlying value of the transactions being hedged. Furthermore, we do not have foreign-exchange hedging contracts in place with respect to all currencies in which we do business.

Foreign Currency Risk

We are exposed to foreign exchange risk on transactional foreign currency risk to the extent that there is a mismatch between the currencies in which sales, purchases, receivables and borrowings that are denominated in a currency other than the respective functional currencies of our entities. Our sales are substantially denominated in U.S. dollars, but the functional currencies of our entities also include NT dollars, RMB and Japanese yen. Accordingly, changes in exchange rates are reflected in reported income and loss from our international businesses included in our consolidated statements of operations. A continued strengthening of the U.S. dollar would therefore reduce reported revenue and expenses from our international businesses included in our consolidated statements of operations.

Interest on external borrowings is denominated in the currency of the borrowing. Generally, our entities’ external borrowings are denominated in currencies that match the cash flows generated by the underlying operations, which is also the currency of the country in which the entity operates.

For the year ended December 31, 2022, we had $1.1 million of other comprehensive loss generated from the exchange differences on translation of foreign operations, whereas for the same period in 2021, we had $0.1 million of other comprehensive income generated from the same.

A hypothetical 10% change in foreign currency exchange rates on our monetary assets and liabilities would not be material to our financial condition or results of operations.

Based on the above, we believe we are not exposed to significant currency transactional foreign currency risk. While we have not engaged in the hedging of our foreign currency transactions to date and do not enter into any hedging contracts for trading or speculative purposes, we may in the future, enter into derivatives or other financial instruments in an attempt to hedge our foreign currency exchange risk. It is difficult to predict the impact hedging activities would have on our results of operations.

Interest Rates Risk

Given that we currently have no indebtedness, the risk arising from the fluctuation of interest rates should only be limited to interest income from interest-bearing assets such as cash and cash-equivalent assets that bear variable interest rates.

Credit Risk

Credit risk refers to the risk of financial loss to us arising from default by the customers or counterparties of financial instruments on the contract obligations. Our main credit risk was that counterparties could not repay in full the accounts receivable based on the agreed terms and the financial assets at amortized cost.

We actively monitor and manage our credit risk by performing credit checks and monitoring credit limits. With respect to banks and financial institutions, we only accept independently rated parties with a minimum rating of “A.” With respect to our customers, our local entities are responsible for managing and analyzing the credit risk for each of their new customers before standard payment and delivery terms and conditions are offered. Internal risk control assesses the credit quality of the customers, taking into account their financial position, past experience and other factors. Individual risk limits are set based on internal or external ratings in accordance with limits set by our Board.

96

Table of Contents

Liquidity Risk

We manage liquidity risk by monitoring and maintaining a level of cash deemed adequate to finance our operations and mitigate the effects of fluctuations in cash flows. In addition, management monitors the utilization of bank borrowings and ensures compliance with loan covenants.

Item 12.Description of Securities Other Than Equity Securities

A.

Debt Securities

Not applicable.

B.

Warrants and Rights

For a summary of the material provisions governing the Warrants, please refer to Exhibit 2.5 filed as an exhibit to this annual report.

C.

Other Securities

Not applicable.

D.

American Depositary Shares

Not applicable.

PART II

Item 13.Defaults, Dividend Arrearages and Delinquencies

None.

Item 14.Material Modifications to the Rights of Security Holders and Use of Proceeds

None.

Item 15.Controls and Procedures

As of the end of the period covered by this annual report, an evaluation has been carried out under the supervision and with the participation of our management, including our chief executive officer and our principal financial officer, of the effectiveness of the design and operation of our disclosure controls and procedures, as such term is defined under Rule 13a-15(e) promulgated under the U.S. Exchange Act. Based on that evaluation, our management has concluded that, due to the outstanding material weakness described below under “Internal Control over Financial Reporting,” as of December 31, 2022, our disclosure controls and procedures were not effective. We will undertake the remedial steps to address the material weakness in our disclosure controls and procedures as set forth below under “Internal Control over Financial Reporting.”

Management’s Annual Report on Internal Control over Financial Reporting

This annual report does not include a report of management’s assessment regarding internal control over financial reporting or an attestation report of our registered public accounting firm due to a transition period established by rules of the Securities and Exchange Commission for newly public companies.

97

Table of Contents

Internal Control over Financial Reporting

Prior to our listing on the NYSE on October 31, 2022, we were a private company with limited accounting and financial reporting personnel and other supervisory resources, including a lack of an established audit committee to oversee the financial reporting process and our internal control over financial reporting. Our management has identified material weaknesses related to (1) lack of controls and documentations required under Section 404, and (2) lack of sound design and implementation controls over handling complex accounting treatments. Neither we nor our independent registered public accounting firm undertook a comprehensive assessment of our internal control under the Sarbanes-Oxley Act for purposes of identifying and reporting any weakness in our internal control over financial reporting. We and they are required to do so only after we become a public company. Had we performed a formal assessment of our internal control over financial reporting or had our independent registered public accounting firm performed an audit of our internal control over financial reporting, additional control deficiencies may have been identified.

In order to address the material weakness identified: (i) we have recruited an internal auditor with internal control experience; and (ii) we are in the process of implementing a comprehensive policy over accounting and financial reporting procedures and controls to improve the completeness and accuracy of our financial accounting, reporting and disclosures. We cannot assure you that the measures we have taken to date, and actions we may take in the future, will be sufficient to remediate the control deficiencies that led to these material weaknesses in our internal control over financial reporting or that they will prevent or avoid potential future material weaknesses. We cannot assure you that all of our existing material weaknesses have been identified, or that we will not in the future identify additional material weaknesses. If we fail to maintain the adequacy of our internal control over financial reporting, as these standards are modified, supplemented or amended from time to time, we may not be able to conclude on an ongoing basis that we have effective internal control over financial reporting in accordance with Section 404. See “Item 3. Key Information — D. Risk Factors — Risks Related to the Class A Ordinary Shares and Warrants — We have identified material weaknesses in our internal control over financial reporting. If our remediation of these material weaknesses is not effective, or if we experience additional material weaknesses or otherwise fail to maintain an effective system of internal controls in the future, we may not be able to report our financial results accurately, prevent fraud or file our periodic reports as a public company in a timely manner.”

Attestation Report of the Registered Public Accounting Firm

This annual report does not include an attestation report of our registered public accounting firm. For as long as we are an “emerging growth company” under the JOBS Act, our independent registered public accounting firm will not be required to attest to the effectiveness of our internal controls over financial reporting pursuant to Section 404.

Changes in Internal Control over Financial Reporting

Other than as described above, there were no changes in our internal controls over financial reporting that occurred during the period covered by this annual report on Form 20-F that have materially affected, or are reasonably likely to materially affect, our internal control over financial reporting.

Item 16. [Reserved]

Item 16A. Audit Committee Financial Expert

Our Board has determined that Mr. Meng-Shiou (Frank) Lee, who is an independent non-executive director, satisfies the criteria of an audit committee financial expert as defined in Item 16A of the instruction to Form 20-F. Mr. Meng-Shiou (Frank) Lee satisfies the requirements for an “independent director” within the meaning of the NYSE listing rules and the criteria for independence set forth in Rule 10A-3 of the Exchange Act.

Item 16B. Code of Ethics

We have adopted a new code of business conduct (the “code of business conduct”) that applies to all directors, executive officers and employees which is available on our website at www.perfectcorp.com. Copies of the code of business conduct will be provided without charge upon request from us and will be posted on our website. We will make any legally required disclosures regarding amendments to, or waivers of, provisions of our code of ethics on our Internet website.

98

Table of Contents

Item 16C. Principal Accountant Fees and Services

PricewaterhouseCoopers, Taiwan served as our independent auditor for the fiscal years ended December 31, 2021 and 2022. A description of the fees billed to us by our principal accountants for professional services in each of the last two fiscal years is set forth below:

For the Year Ended December 31,


2021


2022

(In thousands of US dollars)

Audit Fees(1)


873


1,289

Audit-related Fees


Tax Fees(2)


52


183

Others


Total


925


1,472

(1)“Audit fee” represents the aggregate fees billed for each of the fiscal years listed for professional services rendered by our independent public accountant for the audit of our annual financial statements and assistance with and review of documents filed with the SEC and other statutory and regulatory filings.
(2)Tax fees include the aggregate fees billed in the fiscal period listed for professional services rendered by our principal external auditors for tax compliance, tax advice, and tax planning.

The policy of our audit committee is to pre-approve all auditing and non-audit services provided by our independent public accountant, including audit services, audit-related services, tax services and other services as described above.

Item 16D. Exemptions from the Listing Standards for Audit Committees

None.

Item 16E. Purchase of Equity Securities by the Issuer and Affiliated Purchasers

None.

Item 16F. Change in Registrant’s Certifying Accountant

Not applicable.

Item 16G. Corporate Governance

We are a “foreign private issuer” (as such term is defined in Rule 3b-4 under the Exchange Act), and are listed on the NYSE. Under Section 303A of the New York Stock Exchange Listed Company Manual, or the NYSE Manual, New York Stock Exchange listed companies that are foreign private issuers are permitted to follow home country practice in lieu of the corporate governance provisions specified by the New York Stock Exchange with limited exceptions. The following summarizes some significant ways in which our corporate governance practices differ from those followed by domestic companies under the listing standards of the New York Stock Exchange.

Under the NYSE Manual, U.S. domestic listed companies are required to have a majority of the board consisting of independent directors and have a compensation committee and a nominating/corporate governance committee, each composed entirely of independent directors, which are not required under the Companies Act (Revised) of the Cayman Islands, our home country. Currently, our board of directors is composed of seven members, only three of whom are independent directors. We do not have a compensation committee or nominating and corporate governance committee. In addition, the NYSE Manual requires shareholder approval for certain matters, such as requiring that shareholders must be given the opportunity to vote on all equity compensation plans and material revisions to those plans, which is not required under the Cayman Islands law. We intend to follow the home country practice in determining whether shareholder approval is required.

99

Table of Contents

Item 16H. Mine Safety Disclosure

Not applicable.

Item 16I. Disclosure Regarding Foreign Jurisdictions that Prevent Inspections

Not applicable.

PART III

Item 17. Financial Statements

We have elected to provide the financial statements and related information specified in Item 18 in lieu of Item 17.

Item 18. Financial Statements

The audited Consolidated Financial Statements as required under Item 18 are attached hereto starting on page F-1 of this Form 20-F.

Item 19. Exhibits

Exhibit Number


Description

1.1

Sixth Amended and Restated Memorandum and Articles of Association of Perfect Corp. (incorporated by reference to Exhibit 3.1 to the Form F-1 filed on December 12, 2022 (File no. 333-268057)).

2.1

Specimen Class A Ordinary Share Certificate of Perfect Corp. (incorporated by reference to Exhibit 4.6 to the Form F-4 filed on September 29, 2022 (File no. 333-263841)).

2.2

Specimen Warrant Certificate of Perfect Corp. (incorporated by reference to Exhibit 4.7 to the Form F-4 filed on September 29, 2022 (File no. 333-263841)).

2.3

Warrant Agreement, dated as of January 7, 2021, by and between Provident Acquisition Corp. and Continental Stock Transfer & Trust Company (incorporated by reference to Exhibit 4.4 to the Form F-4 filed on September 29, 2022 (File no. 333-263841)).

2.4

Form of Assignment, Assumption and Amendment Agreement, dated as of October 28, 2022, by and among Provident Acquisition Corp., Perfect Corp. and Continental Stock Transfer & Trust Company (incorporated by reference to Exhibit 4.5 to the Form F-4 filed on September 29, 2022 (File no. 333-263841)).

2.5*

Description of Securities Registered under Section 12 of the Securities Exchange Act of 1934.

4.1#

Agreement and Plan of Merger, dated as of March 3, 2022, by and among Provident Acquisition Corp., Perfect Corp., Beauty Corp., and Fashion Corp. (incorporated by reference to Exhibit 2.1 to the Form F-4 filed on September 29, 2022 (File no. 333-263841)).

4.2

First Amendment to Agreement and Plan of Merger, dated as of September 16, 2022, by and among Provident, Perfect, Beauty Corp., and Fashion Corp. (incorporated by reference to Exhibit 2.3 to the Form F-4 filed on September 29, 2022 (File no. 333-263841)).

4.3

Form of Subscription Agreement (incorporated by reference to Exhibit 10.1 to the Form F-4 filed on September 29, 2022 (File no. 333-263841)).

4.4#

Sponsor Letter Agreement, dated as of March 3, 2022, by and among Perfect Corp., Provident Acquisition Corp. and Provident Acquisition Holdings Ltd. (incorporated by reference to Exhibit 10.2 to the Form F-4 filed on September 29, 2022 (File no. 333-263841)).

4.5

Sponsor Warrants Purchase Agreement, dated as of January 7, 2021, between Provident Acquisition Corp. and Provident Acquisition Holdings Ltd. (incorporated by reference to Exhibit 10.4 to the Form F-4 filed on September 29, 2022 (File no. 333-263841)).

4.6

Forward Purchase Agreement, dated as of December 14, 2020, by and among Provident Acquisition Corp., Provident Acquisition Holdings Ltd. and WF Asian Reconnaissance Fund Limited (incorporated by reference to Exhibit 10.5 to the Form F-4 filed on September 29, 2022 (File no. 333-263841)).

100

Table of Contents

Exhibit Number


Description

4.7

Forward Purchase Agreement, dated as of December 15, 2020, between Provident Acquisition Corp. and PT Nugraha Eka Kencana (incorporated by reference to Exhibit 10.6 to the Form F-4 filed on September 29, 2022 (File no. 333-263841)).

4.8

Forward Purchase Agreement, dated as of December 15, 2020, between Provident Acquisition Corp. and Aventis Star Investments Limited (incorporated by reference to Exhibit 10.7 to the Form F-4 filed on September 29, 2022 (File no. 333-263841)).

4.9#

Form of Perfect Shareholder Voting Agreement (incorporated by reference to Exhibit 10.8 to the Form F-4 filed on September 29, 2022 (File no. 333-263841)).

4.10#

Form of Perfect Shareholder Lock-Up Agreement (incorporated by reference to Exhibit 10.9 to the Form F-4 filed on September 29, 2022 (File no. 333-263841)).

4.11#

Form of Registration Rights Agreement (incorporated by reference to Exhibit 10.10 to the Form F-4 filed on September 29, 2022 (File no. 333-263841)).

4.12

Director Indemnification Agreement, dated as of March 1, 2022, by and among Perfect Corp., Jianmei Lyu and Taobao China Holding Limited (incorporated by reference to Exhibit 10.11 to the Form F-4 filed on September 29, 2022 (File no. 333-263841)).

4.13

Form of Director Indemnification Agreement (incorporated by reference to Exhibit 10.12 to the Form F-4 filed on September 29, 2022 (File no. 333-263841)).

4.14

Perfect Corp. 2021 Stock Compensation Plan (incorporated by reference to Exhibit 10.13 to the Form F-4 filed on September 29, 2022 (File no. 333-263841)).

4.15

Amendment to Perfect Corp. 2021 Stock Compensation Plan (incorporated by reference to Exhibit 10.13 to the Form F-1 filed on December 12, 2022 (File no. 333-268057)).

4.16

Amendment No. 1 to Perfect Corp. Second Amended and Restated Shareholders Agreement, dated October 5, 2021, by and among Perfect Corp., common shareholders of Perfect Corp., Alice H. Chang and certain investors. (incorporated by reference to Exhibit 10.16 to the Form F-4 filed on September 29, 2022 (File no. 333-263841)).

4.17

Office Lease Agreement, dated as of March 10, 2021, between CyberLink Corp. and Perfect Corp. (English Translation) (incorporated by reference to Exhibit 10.17 to the Form F-4 filed on September 29, 2022 (File no. 333-263841)).

4.18

Promissory Note, dated June 29, 2022, issued by Provident Acquisition Corp. to Provident Acquisition Holdings Ltd. (incorporated by reference to Exhibit 10.18 to the Form F-4 filed on September 29, 2022 (File no. 333-263841)).

4.19

Assignment, Assumption and Consent Agreement, dated August 9, 2022, among the Provident, Perfect, PT Wira Laju Rejeki and Guanzhong Bamboo Capital Pte. Ltd. (incorporated by reference to Exhibit 10.19 to the Form F-4 filed on September 29, 2022 (File no. 333-263841)).

4.20

Assignment, Assumption and Consent Agreement, dated August 9, 2022, among the Provident, Perfect, PT Sensasi Istana Warna and Kofuku Ranea Capital Pte. Ltd. (incorporated by reference to Exhibit 10.20 to the Form F-4 filed on September 29, 2022 (File no. 333-263841)).

4.21

Joinder Agreement, dated August 9, 2022, between the Provident, PT Nugraha Eka Kencana and Baltimore Investments Ltd (incorporated by reference to Exhibit 10.21 to the Form F-4 filed on September 29, 2022 (File no. 333-263841)).

4.22

Consent to Joinder Agreement, dated August 9, 2022, between the Provident and Perfect (incorporated by reference to Exhibit 10.22 to the Form F-4 filed on September 29, 2022 (File no. 333-263841)).

4.23

First Amendment to Sponsor Letter Agreement, dated as of September 16, 2022 between Provident and Perfect (incorporated by reference to Exhibit 10.23 to the Form F-4 filed on September 29, 2022 (File no. 333-263841)).

8.1*

List of subsidiaries of Perfect Corp.

12.1*

Certification by the Chief Executive Officer pursuant to Section 302 of the Sarbanes-Oxley Act of 2002

12.2*

Certification by the Principal Financial Officer pursuant to Section 302 of the Sarbanes-Oxley Act of 2002

13.1**

Certification by the Chief Executive Officer pursuant to Section 906 of the Sarbanes-Oxley Act of 2002

13.2**

Certification by the Principal Financial Officer pursuant to Section 906 of the Sarbanes-Oxley Act of 2002

101

Table of Contents

Exhibit Number


Description

15.1*

Consent of PricewaterhouseCoopers, Taiwan

101.INS*

Inline XBRL Instance Document—this instance document does not appear in the Interactive Data File because its XBRL tags embedded within the Inline XBRL document

101.SCH*

Inline XBRL Taxonomy Extension Schema Document

101.CAL*

Inline XBRL Taxonomy Extension Calculation Linkbase Document

101.DEF*

Inline XBRL Taxonomy Extension Definition Linkbase Document

101.LAB*

Inline XBRL Taxonomy Extension Label Linkbase Document

101.PRE*

Inline XBRL Taxonomy Extension Presentation Linkbase Document

104*

Cover Page Interactive Data File (embedded within the Inline XBRL document)

*

Filed with this annual report on Form 20-F.

**

Furnished with this annual report on Form 20-F.

#

Portions of this exhibit have been omitted in accordance with Instruction 4 to Item 19 of Form 20-F.

102

Table of Contents

SIGNATURES

The registrant hereby certifies that it meets all of the requirements for filing on Form 20-F and that it has duly caused and authorized the undersigned to sign this annual report on its behalf.


PERFECT CORP.

By:

/s/ Alice H. Chang

Name: Alice H. Chang

Title: Chief Executive Officer

Date: March 30, 2023

Table of Contents

INDEX TO FINANCIAL STATEMENTS

Audited Consolidated Financial Statements:


Page(s)

Independent Registered Public Accounting Firm’s Report (PCAOB ID: 1345)

F-2

Consolidated Balance Sheets as of December 31, 2021 and 2022

F-3

Consolidated Statements of Comprehensive Income for the Years Ended December 31, 2020, 2021 and 2022

F-5

Consolidated Statements of Changes in Equity for the Years Ended December 31, 2020, 2021 and 2022

F-6

Consolidated Statements of Cash Flows for the Years Ended December 31, 2020, 2021 and 2022

F-7

Notes to the Consolidated Financial Statements

F-8

F-1

Table of Contents

Report of Independent Registered Public Accounting Firm

To the Shareholders and the Board of Directors of Perfect Corp.

Opinion on the Financial Statements

We have audited the accompanying consolidated balance sheets of Perfect Corp. and its subsidiaries (the “Company”) as of December 31, 2022 and 2021, and the related consolidated statements of comprehensive income, of changes in equity and of cash flows for each of the three years in the period ended December 31, 2022, including the related notes (collectively referred to as the “consolidated financial statements”). In our opinion, the consolidated financial statements present fairly, in all material respects, the financial position of the Company as of December 31, 2022 and 2021, and the results of its operations and its cash flows for each of the three years in the period ended December 31, 2022, in conformity with International Financial Reporting Standards as issued by the International Accounting Standards Board.

Basis for Opinion

These consolidated financial statements are the responsibility of the Company’s management. Our responsibility is to express an opinion on the Company’s consolidated financial statements based on our audits. We are a public accounting firm registered with the Public Company Accounting Oversight Board (United States) (PCAOB) and are required to be independent with respect to the Company in accordance with the U.S. federal securities laws and the applicable rules and regulations of the Securities and Exchange Commission and the PCAOB.

We conducted our audits of these consolidated financial statements in accordance with the standards of the PCAOB. Those standards require that we plan and perform the audit to obtain reasonable assurance about whether the consolidated financial statements are free of material misstatement, whether due to error or fraud.

Our audits included performing procedures to assess the risks of material misstatement of the consolidated financial statements, whether due to error or fraud, and performing procedures that respond to those risks. Such procedures included examining, on a test basis, evidence regarding the amounts and disclosures in the consolidated financial statements. Our audits also included evaluating the accounting principles used and significant estimates made by management, as well as evaluating the overall presentation of the consolidated financial statements. We believe that our audits provide a reasonable basis for our opinion.

/s/ PricewaterhouseCoopers, Taiwan

Taipei, Taiwan

Republic of China

March 30, 2023

We have served as the Company’s auditor since 2015.

F-2

Table of Contents

PERFECT CORP. AND SUBSIDIARIES

CONSOLIDATED BALANCE SHEETS

DECEMBER 31, 2021 AND 2022

(Expressed in thousands of United States dollars)


December 31, 2021


December 31, 2022

Assets

Notes

Amount

Amount

Current assets


Cash and cash equivalents


6(1)

$

80,453

$

162,616

Current financial assets at amortized cost

6(2)

30,000

Current contract assets

6(16)

3,660

Accounts receivables


6(3)


6,568


7,756

Other receivables


6


314

Current income tax assets


63


77

Inventories


88


45

Other current assets

6(4)


299


4,705

Total current assets


87,477


209,173

Non-current assets

Property, plant and equipment


6(5)


407


289

Right-of-use assets


6(6) and 7


620


323

Intangible assets


6(7)


100


119

Deferred income tax assets


6(23)


165


244

Guarantee deposits paid


135


125

Total non-current assets


1,427


1,100

Total assets

$

88,904

$

210,273

The accompanying notes are an integral part of these consolidated financial statements.

F-3

Table of Contents

PERFECT CORP. AND SUBSIDIARIES

CONSOLIDATED BALANCE SHEETS (continued)

DECEMBER 31, 2021 AND 2022

(Expressed in thousands of United States dollars)


December 31, 2021


December 31, 2022

Liabilities and Equity

Notes

Amount

Amount

Current liabilities

Current contract liabilities


6(16)

$

9,021

$

13,024

Other payables


6(9)

8,706

9,308

Other payables – related parties


7

73

63

Current tax liabilities

104

155

Current provisions


6(10)

1,058

1,855

Current lease liabilities


6(6) and 7

449

251

Other current liabilities

384

261

Total current liabilities

19,795

24,917

Non-current liabilities

Non-current financial liabilities at fair value through profit or loss


6(8)

259,230

3,207

Non-current lease liabilities


6(6) and 7


189


87

Net defined benefit liability, non-current


6(11)


104


73

Guarantee deposits received


28


25

Total non-current liabilities


259,551


3,392

Total liabilities


279,346


28,309

Equity

Capital stock


6(13)

Common stock


30,152


Perfect Class A Ordinary Shares, $0.1 (in dollars) par value

10,147

Perfect Class B Ordinary Shares, $0.1 (in dollars) par value

1,679

Capital surplus


6(14)

Capital surplus


2,871


556,429

Retained earnings


6(15)

Accumulated deficit


(224,097)


(385,884)

Other equity interest

Other equity interest


632


(407)

Total equity


(190,442)


181,964

Total liabilities and equity

$

88,904

$

210,273

The accompanying notes are an integral part of these consolidated financial statements.

F-4

Table of Contents

PERFECT CORP. AND SUBSIDIARIES

CONSOLIDATED STATEMENTS OF COMPREHENSIVE INCOME

YEARS ENDED DECEMBER 31, 2020, 2021 AND 2022

(Expressed in thousands of United States dollars)


Years ended December 31

2020

2021

2022

Items


Notes


Amount


Amount


Amount

Revenue


6(16) and 7

$

29,873

$

40,760

$

47,300

Cost of sales and services


6(11)(21)(22)


(3,962)


(5,736)


(7,130)

Gross profit


25,911


35,024


40,170

Operating expenses


6(6)(11)(21)(22) (26) and 7

Sales and marketing expenses


(18,107)

(25,287)

(24,544)

General and administrative expenses


(3,078)


(4,936)


(76,219)

Research and development expenses


(7,567)


(9,838)


(10,481)

Total operating expenses


(28,752)


(40,061)


(111,244)

Operating loss


(2,841)


(5,037)


(71,074)

Non-operating income and expenses


Interest income

6(17)

243


131


2,029

Other income


6(18)


191


118


75

Other gains and losses


6(8)(19)


(2,792)


(151,638)


(92,474)

Finance costs


6(6)(20) and 7


(9)


(9)


(8)

Total non-operating income and expenses


(2,367)


(151,398)


(90,378)

Loss before income tax


(5,208)


(156,435)


(161,452)

Income tax expense


6(23)


(385)


(417)

(292)

Net loss

$

(5,593)

$

(156,852)

$

(161,744)

Other comprehensive income (loss)

Components of other comprehensive income (loss) that will not be reclassified to profit or loss

Actuarial (losses) gains on defined benefit plans


6(11)

$

(36)

$

(24)

$

22

Credit risk changes in financial instrument - Preferred shares

6(8)

(58)

(7)

Total components of other comprehensive income (loss) that will not be reclassified to profit or loss

(36)

(82)

15

Components of other comprehensive income that will be reclassified to profit or loss

Exchange differences arising on translation of foreign operations


634


123


(1,097)

Other comprehensive income (loss), net

$

598

$

41

$

(1,082)

Total comprehensive loss

$

(4,995)

$

(156,811)

$

(162,826)

Net loss, attributable to:

Shareholders of the parent

$

(5,593)

$

(156,852)

$

(161,744)

Total comprehensive loss attributable to:

Shareholders of the parent

$

(4,995)

$

(156,811)

$

(162,826)

Loss per share (in dollars)

6(24)


Basic loss per share of Class A and Class B Ordinary Shares

$

(0.10)

$

(2.96)

$

(2.37)

Diluted loss per share of Class A and Class B Ordinary Shares

$

(0.10)

$

(2.96)

$

(2.37)

The accompanying notes are an integral part of these consolidated financial statements.

F-5

Table of Contents

PERFECT CORP. AND SUBSIDIARIES

CONSOLIDATED STATEMENTS OF CHANGES IN EQUITY

YEARS ENDED DECEMBER 31, 2020, 2021 AND 2022

(Expressed in thousands of United States dollars)


Equity attributable on owners of the parent

Capital surplus

Other equity interest

Credit risks

Exchange

changes in

Additional

differences arising

financial instrument-

Capital

paid-in

Accumulated

on translation of

Preference

Treasury


Notes


stock


capital


Other


deficit


foreign operations


shares


shares


Total

Year 2020

Balance at January 1, 2020

$

31,356

$

109

$

640

$

(53,233)

$

(67)

$

$

$

(21,195)

Net loss for 2020

(5,593)

(5,593)

Other comprehensive (loss) income for 2020


6(11)

(36)

634

598

Total comprehensive (loss) income

(5,629)

634

(4,995)

Share-based payment transactions


6(12)

336

336

Employee stock options exercised

6(12)(13)

111

30

(30)

111

Purchase of treasury shares

6(13)

(10,000)

(10,000)

Retirement of treasury shares


6(13)

(1,627)

(14)

(8,359)

10,000

Balance at December 31, 2020

$

29,840

$

125

$

946

$

(67,221)

$

567

$

$

$

(35,743)

Year 2021

Balance at January 1, 2021

$

29,840

$

125

$

946

$

(67,221)

$

567

$

$

$

(35,743)

Net loss for 2021

(156,852)

-

(156,852)

Other comprehensive (loss) income for 2021


6(8)(11)

(24)

123

(58)

41

Total comprehensive (loss) income

(156,876)

123

(58)

(156,811)

Share-based payment transactions


6(12)

1,782

-

1,782

Employee stock options exercised


6(12)(13)

312

183

(165)

-

330

Balance at December 31, 2021

$

30,152

$

308

$

2,563

$

(224,097)

$

690

$

(58)

$

$

(190,442)

Year 2022

Balance at January 1, 2022

$

30,152

$

308

$

2,563

$

(224,097)

$

690

$

(58)

$

$

(190,442)

Net loss for 2022


(161,744)


(161,744)

Other comprehensive (loss) income for 2022


6(8)(11)


22


(1,097)


(7)


(1,082)

Total comprehensive (loss) income


(161,722)


(1,097)


(7)


(162,826)

Share-based payment transactions


6(12)


2,175


2,175

Employee stock options exercised

6(12)(13)

2,663

5,447

(2,518)

5,592

Issuance of ordinary shares upon Recapitalization, net of issuance costs

1and 6(13)(14)

1,726

102,237

103,963

Conversion of Perfect common shares as part of the Recapitalization, including listing expense


6(13)(14)(26)


(22,715)


446,217


423,502

Reclassification adjustment- Credit risks changes in financial instrument

(65)

65

Balance at December 31, 2022

$

11,826

$

554,209

$

2,220

$

(385,884)

$

(407)

$

$

$

181,964

The accompanying notes are an integral part of these consolidated financial statements.

F-6

Table of Contents

PERFECT CORP. AND SUBSIDIARIES

CONSOLIDATED STATEMENTS OF CASH FLOWS

YEARS ENDED DECEMBER 31, 2020, 2021 AND 2022

(Expressed in thousands of United States dollars)


Years ended December 31


Notes


2020


2021


2022

CASH FLOWS FROM OPERATING ACTIVITIES


Loss before tax


$

(5,208)

$

(156,435)

$

(161,452)

Adjustments to reconcile profit (loss)


Depreciation expense


6(5)(6)(21)

456

598

703

Amortization expense


6(7)(21)

36

47

63

Interest income


6(17)

(243)

(131)

(2,029)

Interest expense


6(20)

9

9

8

Net loss on financial liabilities at fair value through profit or loss


6(8)(19)

2,022

150,745

93,777

Employees’ stock option cost


6(12)

336

1,782

2,117

Directors’ share-based compensation

6(12)

58

Recognition of listing expense

6(26)

65,264

Changes in operating assets and liabilities

Accounts receivable

861

(1,059)

(1,479)

Current contract assets

(3,701)

Other receivables

(8)

7

(3)

Other receivables – related parties

99

16

Inventories

8

43

Other current assets

113

(78)

(4,418)

Current contract liabilities

2,164

4,108

4,783

Accounts payable

(167)

Other payables

1,336

1,653

772

Other payables – related parties

(95)

(11)

(2)

Current provisions

465

586

897

Other current liabilities

35

255

(80)

Net defined benefit liability, non-current

(2)

1

Cash inflow (outflow) generated from operations

2,217

2,092

(4,678)

Interest received

257

129

1,724

Interest paid

(9)

(9)

(8)

Income tax paid

(272)

(664)

(343)

Net cash flows from (used in) operating activities

2,193

1,548

(3,305)

CASH FLOWS FROM INVESTING ACTIVITIES

Acquisition of financial assets at amortized cost

6(2)

(1,517)

(30,000)

Proceeds from disposal of financial assets at amortized cost

9,696

Acquisition of property, plant and equipment


6(5)

(215)

(154)

(165)

Acquisition of intangible assets


6(7)

(77)

(32)

(93)

Increase in guarantee deposits paid

(47)

(27)

Net cash flows from (used in) investing activities

7,840

(213)

(30,258)

CASH FLOWS FROM FINANCING ACTIVITIES

Proceeds from financial liabilities designated at fair value through profit or loss


6(8)(25)

50,000

Repayment of principal portion of lease liabilities


6(6)(25)

(305)

(393)

(457)

Employee stock options exercised

6(12)

111

330

5,592

Proceed received upon recapitalization

6(13)

112,893

Payments to acquire treasury shares

6(13)

(10,000)

Net cash flows from (used in) financing activities

39,806

(63)

118,028

Effects of exchange rates changes on cash and cash equivalents

896

163

(2,302)

Net increase in cash and cash equivalents

50,735

1,435

82,163

Cash and cash equivalents at beginning of year

28,283

79,018

80,453

Cash and cash equivalents at end of year

$

79,018

$

80,453

$

162,616

The accompanying notes are an integral part of these consolidated financial statements.

F-7

Table of Contents

PERFECT CORP. AND SUBSIDIARIES

NOTES TO THE CONSOLIDATED FINANCIAL STATEMENTS

FOR THE YEARS ENDED DECEMBER 31, 2020, 2021 AND 2022

(Expressed in thousands of United States dollars, except as otherwise indicated)

1.History and Organization

Perfect Corp. (the “Company” or “Perfect”), is a Cayman Islands exempted company with limited liability, which incorporated on February 13, 2015 with registered address PO Box 309, Ugland House, Grand Cayman, KY1-1104, Cayman Islands. The Company and its subsidiaries (collectively referred herein as the “Group”) are SaaS technology companies offering AR/AI solution dedicated to the beauty and fashion industry as well as mobile applications to consumers. The principal place of business is at 14F, No. 98 Minquan Road, Xindian District, New Taipei City 231, Taiwan.

On October 28, 2022 (the “Closing Date”), the Company consummated the previously announced merger transaction pursuant to the Business Combination Agreement dated as of March 3, 2022, by and among Perfect, Beauty Corp., a wholly-owned subsidiary of Perfect, Fashion Corp., a wholly-owned subsidiary of Perfect, and Provident Acquisition Corp. (“Provident”).

Pursuant to the Business Combination Agreement, dated as of March 3, 2022, Beauty Corp., a Cayman Islands exempted company with limited liability, merged with and into Provident (the “First Merger”), a special purpose acquisition company incorporated in the Cayman Islands and listed on the Nasdaq Stock Market (“NASDAQ”), with Provident surviving as a wholly-owned subsidiary of Perfect, and then immediately following the First Merger, Provident merged with and into Fashion Corp. (the “Second Merger”), a Cayman Islands exempted company with limited liability, with Fashion Corp. surviving as a wholly-owned subsidiary of Perfect. The consummation of the merger transactions was referred to as the “Closing”, dated as of October 28, 2022.

In connection with the merger, each Perfect original share (consisting of Perfect common share, par value $0.1 (in dollars) per share, and Perfect preferred share, par value $0.1 (in dollars) per share) converted to Perfect Class A or Perfect Class B ordinary share, par value $0.1 (in dollars) per share, based on a conversion ratio 0.17704366. Each Provident share (consisting of Provident Class A ordinary share, par value $0.0001 (in dollars) per share, and Provident Class B ordinary share, par value $0.0001 (in dollars) per share) converted to one Perfect Class A ordinary share.

Upon the consummation of the mergers and the other transactions contemplated by the Business Combination Agreement, the shareholders of Provident became shareholders of Perfect, and the Company became a publicly traded company on the New York Stock Exchange (“NYSE”) on October 31, 2022.

The merger transaction pursuant to the Business Combination Agreement is accounted for as a recapitalization. Please refer to Note 6(26) “Recapitalization”.

2.The Date of Authorization for Issuance of the Financial Statements and Procedures for Authorization

These consolidated financial statements were authorized for issuance by the Board of Directors on March 29, 2023.

F-8

Table of Contents

3.Application of New Standards, Amendments and Interpretations

3(1) New and amended standards adopted by the Group

New standards, interpretations and amendments issued by International Accounting Standards Board (the “IASB”) effective from 2022 are as follows:

New Standards, Interpretations and Amendments


Effective date by IASB

Amendments to IFRS 3, ‘Reference to the conceptual framework’

January 1, 2022

Amendments to IAS 16, ‘Property, plant and equipment: proceeds before intended use’

January 1, 2022

Amendments to IAS 37, ‘Onerous contracts—cost of fulfilling a contract’

January 1, 2022

Annual improvements to IFRS Standards 2018–2020

January 1, 2022

The above standards and interpretations have no significant impact to the Group’s financial condition and financial performance based on the Group’s assessment.

3(2) New and revised International Financial Reporting Standards not yet adopted

New and amendments to IFRSs which have been published but are not mandatory for the financial period ending December 31, 2022 are listed below:

New Standards, Interpretations and Amendments


Effective date by IASB

Amendments to IAS 1, ‘Disclosure of accounting policies’

January 1, 2023

Amendments to IAS 8, ‘Definition of accounting estimates’

January 1, 2023

Amendments to IAS 12, ‘Deferred tax related to assets and liabilities arising from a single transaction’

January 1, 2023

Amendments to IFRS 10 and IAS 28, ‘Sale or contribution of assets between an investor and its associate or joint venture’

To be determined by IASB

Amendments to IFRS 16, ‘Lease liability in a sale and leaseback’

January 1, 2024

Amendments to IAS 1, ‘Classification of liabilities as current or non-current’

January 1, 2024

Amendments to IAS 1, ‘Non-current liabilities with covenants’

January 1, 2024

The above standards and interpretations are not expected to have significant impact to the Group’s financial position and financial performance based on the Group’s assessment.

4.Summary of Significant Accounting Policies

The principal accounting policies applied in the preparation of these consolidated financial statements are set out below. These policies have been consistently applied to all the periods presented, unless otherwise stated.

4(1) Compliance statement

The consolidated financial statements of the Group have been prepared in accordance with International Financial Reporting Standards as issued by the IASB (“IFRSs”).

4(2) Basis of preparation

A.Except for the following items, the consolidated financial statements have been prepared under the historical cost convention:
(a)Financial assets and financial liabilities (including derivative instruments) at fair value through profit or loss.

F-9

Table of Contents

(b)Defined benefit liabilities recognized based on the net amount of pension fund assets less present value of defined benefit obligation.
B.The preparation of financial statements in conformity with IFRSs requires the use of certain critical accounting estimates. It also requires management to exercise its judgement in the process of applying the Group’s accounting policies. The areas involving a higher degree of judgement or complexity, or areas where assumptions and estimates are significant to the consolidated financial statements are disclosed in Note 5.

4(3) Basis of consolidation

A.Basis for preparation of consolidated financial statements:
(a)All subsidiaries are included in the Group’s consolidated financial statements. Subsidiaries are all entities (including structured entities) controlled by the Group. The Group controls an entity when the Group is exposed, or has rights, to variable returns from its involvement with the entity and has the ability to affect those returns through its power over the entity. Consolidation of subsidiaries begins from the date the Group obtains control of the subsidiaries and ceases when the Group loses control of the subsidiaries.
(b)Inter-company transactions, balances and unrealized gains or losses on transactions between companies within the Group are eliminated. Accounting policies of subsidiaries have been adjusted where necessary to ensure consistency with the policies adopted by the Group.
(c)When the Group loses control of a subsidiary, the Group remeasures any investment retained in the former subsidiary at its fair value. That fair value is regarded as the fair value on initial recognition of a financial asset or the cost on initial recognition of the associate or joint venture. Any difference between fair value and carrying amount is recognized in profit or loss. All amounts previously recognized in other comprehensive income in relation to the subsidiary are reclassified to profit or loss on the same basis as would be required if the related assets or liabilities were disposed of. That is, when the Group loses control of a subsidiary, all gains or losses previously recognized in other comprehensive income in relation to the subsidiary should be reclassified from equity to profit or loss, if such gains or losses would be reclassified to profit or loss when the related assets or liabilities are disposed of.

F-10

Table of Contents

B.Subsidiaries included in the consolidated financial statements:


Ownership (%)

Name of

Main business

December 31, 


December 31, 

Name of investor


subsidiary


Activities


2021


2022

The Company


Perfect Mobile Corp. (Taiwan)


Design, development, marketing and sales of AR/AI SaaS solution and mobile applications.


100%

100%

The Company


Perfect Corp. (USA)


Marketing and sales of AR/AI SaaS solution


100%

100%

The Company


Perfect Corp. (Japan)


Marketing and sales of AR/AI SaaS solution.


100%

100%

The Company


Perfect Corp. (Shanghai)


Marketing and sales of AR/AI SaaS solution.


100%

100%

The Company


Perfect Mobile Corp.(B.V.I.)


Investment activities


100%

100%

The Company


Beauty Corp.


For business combination purpose via SPAC transaction, please refer to Note 1 for details.


100%


—%

The Company


Fashion Corp.


For business combination purpose via SPAC transaction, please refer to Note 1 for details.


100%


100%

Perfect Mobile Corp. (Taiwan)

Perfect Corp. (France)

Marketing and Service Center for sales of AR/AI SaaS solution.

—%

100%(Note)

Perfect Mobile Corp.(B.V.I.)


Perfect Mobile Limited. (Hong Kong)


No business activity in 2019 and 2020, and deregistered on May 21, 2021


Not applicable

Not applicable

Note: Perfect Corp. (France) was established in 2022 and with no business activity during 2022.

C.Subsidiaries not included in the consolidated financial statements:

None.

D.Adjustments for subsidiaries with different balance sheet dates:

None.

E.Significant restrictions:

None.

F.Subsidiaries that have non-controlling interests that are material to the Group:

None.

F-11

Table of Contents

4(4) Foreign currency translation

Items included in the financial statements of each of the Group’s entities are measured using the currency of the primary economic environment in which the entity operates (the “functional currency”). The consolidated financial statements are presented in United States dollars, which is the Company’s functional and the Group’s presentation currency.

A.Foreign currency transactions and balances
(a)Foreign currency transactions are translated into the functional currency using the exchange rates prevailing at the dates of the transactions or valuation where items are remeasured. Foreign exchange gains and losses resulting from the settlement of such transactions are recognized in profit or loss in the period in which they arise.
(b)Monetary assets and liabilities denominated in foreign currencies at the period end are re-translated at the exchange rates prevailing at the balance sheet date. Exchange differences arising upon re-translation at the balance sheet date are recognized in profit or loss.
(c)Non-monetary assets and liabilities denominated in foreign currencies held at fair value through profit or loss are re-translated at the exchange rates prevailing at the balance sheet date; their translation differences are recognized in profit or loss. Non-monetary assets and liabilities denominated in foreign currencies held at fair value through other comprehensive income are re-translated at the exchange rates prevailing at the balance sheet date; their translation differences are recognized in other comprehensive income. However, non-monetary assets and liabilities denominated in foreign currencies that are not measured at fair value are translated using the historical exchange rates at the dates of the initial transactions.
(d)All foreign exchange gains and losses are presented in the statement of comprehensive income within ‘other gains and losses’.
B.Translation of foreign operations

The operating results and financial position of all the group entities that have a functional currency different from the presentation currency are translated into the presentation currency as follows:

(a)Assets and liabilities for each balance sheet presented are translated at the closing exchange rate at the date of that balance sheet;
(b)Income and expenses for each statement of comprehensive income are translated at average exchange rates of that period; and
(c)All resulting exchange differences are recognized in other comprehensive income.

4(5) Classification of current and non-current items

A.Assets that meet one of the following criteria are classified as current assets; otherwise they are classified as non-current assets:
(a)Assets arising from operating activities that are expected to be realized, or are intended to be sold or consumed within the normal operating cycle;
(b)Assets held mainly for trading purposes;
(c)Assets that are expected to be realized within twelve months from the balance sheet date;
(d)Cash and cash equivalents, excluding restricted cash and cash equivalents and those that are to be exchanged or used to settle liabilities more than twelve months after the balance sheet date.

F-12

Table of Contents

B.Liabilities that meet one of the following criteria are classified as current liabilities; otherwise they are classified as non-current liabilities:
(a)Liabilities that are expected to be settled within the normal operating cycle;
(b)Liabilities arising mainly from trading activities;
(c)Liabilities that are to be settled within twelve months from the balance sheet date;
(d)Liabilities for which the repayment date cannot be extended unconditionally to more than twelve months after the balance sheet date. Terms of a liability that could, at the option of the counterparty, result in its settlement by the issue of equity instruments do not affect its classification.

4(6) Cash equivalents

Cash equivalents refer to short-term, highly liquid investments that are readily convertible to known amounts of cash and which are subject to an insignificant risk of changes in value. Time deposits that meet the definition above and are held for the purpose of meeting short-term cash commitments in operations are classified as cash equivalents.

4(7) Financial assets at amortized cost

A.Financial assets at amortized cost are those that meet all of the following criteria:
(a)The objective of the Group’s business model is achieved by collecting contractual cash flows.
(b)The assets’ contractual cash flows represent solely payments of principal and interest.
B.On a regular way purchase or sale basis, financial assets at amortized cost are recognized and derecognized using trade date accounting.
C.At initial recognition, the Group measures the financial assets at fair value plus transaction costs. Interest income from these financial assets is included in finance income using the effective interest method. A gain or loss is recognized in profit or loss when the asset is derecognized or impaired.
D.The Group’s time deposits which do not fall under cash equivalents are those with a short maturity period and are measured at initial investment amount as the effect of discounting is immaterial.

4(8) Accounts receivable

A.Accounts receivable entitle the Group a legal right to receive consideration in exchange for transferred goods or rendered services.
B.The short-term accounts receivable without bearing interest are subsequently measured at initial invoice amount as the effect of discounting is immaterial.

4(9) Impairment of financial assets

For financial assets at amortized cost, at each reporting date, the Group recognizes the impairment provision for 12 months expected credit losses if there has not been a significant increase in credit risk since initial recognition or recognizes the impairment provision for the lifetime expected credit losses (ECLs) if such credit risk has increased since initial recognition after taking into consideration all reasonable and verifiable information that includes forecasts. On the other hand, for accounts receivable or contract assets that do not contain a significant financing component, the Group recognizes the impairment provision for lifetime ECLs.

F-13

Table of Contents

4(10) Derecognition of financial assets

The Group derecognizes a financial asset when the contractual rights to receive the cash flows from the financial asset expire.

4(11) Inventories

Inventories are stated at the lower of cost and net realizable value. Cost is determined using the weighted-average method. The item by item approach is used in applying the lower of cost and net realizable value. Net realizable value is the estimated selling price in the ordinary course of business, less the estimated cost of completion and applicable variable selling expenses.

4(12) Property, plant and equipment

A.Property, plant and equipment are initially recorded at cost.
B.Subsequent costs are included in the asset’s carrying amount or recognized as a separate asset, as appropriate, only when it is probable that future economic benefits associated with the item will flow to the Group and the cost of the item can be measured reliably. The carrying amount of the replaced part is derecognized. All other repairs and maintenance are charged to profit or loss during the financial period in which they are incurred.
C.Property, plant and equipment apply cost model and are depreciated using the straight-line method, except that the accelerated depreciation method is used by the US subsidiary, to allocate their cost over their estimated useful lives. Each part of an item of property, plant, and equipment with a cost that is significant in relation to the total cost of the item must be depreciated separately.
D.The assets’ residual values, useful lives and depreciation methods are reviewed, and adjusted if appropriate, at each financial year-end. If expectations for the assets’ residual values and useful lives differ from previous estimates or the patterns of consumption of the assets’ future economic benefits embodied in the assets have changed significantly, any change is accounted for as a change in estimate under IAS 8, ‘Accounting Policies, Changes in Accounting Estimates and Errors’, from the date of the change. The estimated useful lives of property, plant and equipment are as follows:

Leasehold improvements


2~3


years (or the lesser of the contract period of the lease)

Machinery

3

years

Office equipment

5

years

4(13) Leasing arrangements (lessee)  —  right-of-use assets/ lease liabilities

A.Leases are recognized as a right-of-use asset and a corresponding lease liability at the date at which the leased asset is available for use by the Group. For short-term leases or leases of low-value assets, lease payments are recognized as an expense on a straight-line basis over the lease term.
B.Lease liabilities include the net present value of the remaining lease payments at the commencement date, discounted using the incremental borrowing interest rate. Lease payments are comprised of fixed payments, less any lease incentives receivable.

The Group subsequently measures the lease liability at amortized cost using the interest method and recognizes interest expense over the lease term. The lease liability is remeasured and the amount of remeasurement is recognized as an adjustment to the right-of-use asset when there are changes in the lease term or lease payments and such changes do not arise from contract modifications.

C.At the commencement date, the right-of-use asset is stated at cost comprising the amount of the initial measurement of lease liability.

F-14

Table of Contents

The right-of-use asset is measured subsequently using the cost model and is depreciated from the commencement date to the earlier of the end of the asset’s useful life or the end of the lease term. When the lease liability is remeasured, the amount of remeasurement is recognized as an adjustment to the right-of-use asset.

4(14) Intangible assets

A.Computer software

Computer software is stated at cost and amortized on a straight-line basis over its estimated useful life of 3 years.

B.Other intangible assets, mainly composed of royalties which paid for program source code and intellectual property rights, are amortized on a straight-line basis over their estimated useful lives of 3 years.

4(15) Impairment of non-financial assets

The Group assesses at each balance sheet date the recoverable amounts of those assets where there is an indication that they are impaired. An impairment loss is recognized for the amount by which the asset’s carrying amount exceeds its recoverable amount. The recoverable amount is the higher of an asset’s fair value less costs to sell or value in use. When the circumstances or reasons for recognizing impairment loss for an asset in prior years no longer exist or diminish, the impairment loss is reversed. The increased carrying amount due to reversal should not be more than what the depreciated or amortized historical cost would have been if the impairment had not been recognized.

4(16) Accounts payable

A.Accounts payable are liabilities for purchases of goods or services.
B.The short-term accounts payable without bearing interest are subsequently measured at initial invoice amount as the effect of discounting is immaterial.

4(17) Financial liabilities at fair value through profit or loss

A.Financial liabilities are classified in this category of held for trading if acquired principally for the purpose of repurchasing in the short-term. Derivatives are also categorized as financial liabilities held for trading unless they are designated as hedges.  Financial liabilities that meet one of the following criteria are designated as financial liabilities at fair value through profit or loss on initial recognition:
(a)Hybrid (combined) contracts; or
(b)They eliminate or significantly reduce a measurement or recognition inconsistency; or
(c)They are managed and their performance is evaluated on a fair value basis, in accordance with a documented risk management policy.

As part of Business Combination, warrants sold and issued by Provident were automatically converted to Perfect Warrants. These warrants are financial liabilities measured at fair value through profit or loss. The issuances of the preferred shares with the conversion options by the Group, was recognized under ‘financial liabilities designated as at fair value through profit or loss on initial recognition’ due to their compound instrument feature.

B.At initial recognition, the Group measures the financial liabilities at fair value. All related transaction costs are recognized in profit or loss. The Group subsequently measures these financial liabilities at fair value with any gain or loss recognized in profit or loss.

F-15

Table of Contents

C.If the credit risk results in fair value changes in financial liabilities designated as at fair value through profit or loss, they are recognized in other comprehensive income in the circumstances other than avoiding accounting mismatch or recognizing in profit or loss for loan commitments or financial guarantee contracts.

4(18) Derecognition of financial liabilities

A financial liability is derecognized when the obligation specified in the contract is either discharged or cancelled or expires.

4(19) Provisions

Provisions (warranties) are recognized when the Group has a present legal or constructive obligation as a result of past events, and it is probable that an outflow of economic resources will be required to settle the obligation and the amount of the obligation can be reliably estimated. Provisions are measured at the initial estimated amount as the effect of discounting is immaterial.

4(20) Employee benefits

A.Short-term employee benefits

Short-term employee benefits are measured at the undiscounted amount of the benefits expected to be paid in respect of service rendered by employees in a period and should be recognized as expense in that period when the employees render service.

B.Pensions
(a)Defined contribution plans

For defined contribution plans, the contributions are recognized as pension expense when they are due on an accrual basis. Prepaid contributions are recognized as an asset to the extent of a cash refund or a reduction in the future payments.

(b)Defined benefit plan
i.Net obligation under a defined benefit plan is defined as the present value of an amount of pension benefits that employees will receive on retirement for their services with the Group in current period or prior periods. The liability recognized in the balance sheet in respect of defined benefit pension plans is the present value of the defined benefit obligation at the balance sheet date less the fair value of plan assets. The net defined benefit obligation is calculated annually by independent actuaries using the projected unit credit method. The rate used to discount is determined by using interest rates of high-quality corporate bonds that are denominated in the currency in which the benefits will be paid, and that have terms to maturity approximating to the terms of the related pension liability; when there is no deep market in high-quality corporate bonds, the Group uses interest rates of government bonds (at the balance sheet date) instead.
ii.Remeasurements arising on defined benefit plans are recognized in other comprehensive income in the period in which they arise and are recorded as retained earnings.

4(21) Employee share-based payment

A.For the equity-settled share-based payment arrangements, the employee services received are measured at the fair value of the equity instruments granted at the grant date, and are recognized as compensation cost over the vesting period, with a corresponding adjustment to equity. The fair value of the equity instruments granted shall reflect the impact of market vesting conditions and non-vesting conditions. Compensation cost is subject to adjustment based on the service conditions that are expected to be satisfied and the estimates of the number of equity instruments that are expected to vest under the non-market vesting conditions at each balance sheet date. Ultimately, the amount of compensation cost recognized is based on the number of equity instruments that eventually vest.

F-16

Table of Contents

B.If the modification occurs during the vesting period, the incremental fair value granted is included in the measurement of the amount recognized for services received over the period from the modification date until the date when the modified equity instruments vest, in addition to the amount based on the grant date fair value of the original equity instruments, which is recognized over the remainder of the original vesting period.

4(22) Income tax

A.The tax expense for the period comprises current and deferred tax. Tax is recognized in profit or loss, except to the extent that it relates to items recognized in other comprehensive income or items recognized directly in equity, in which cases the tax is recognized in other comprehensive income or equity.
B.The current income tax expense is calculated on the basis of the tax laws enacted or substantively enacted at the balance sheet date in the countries where the Company and its subsidiaries operate and generate taxable income. Management periodically evaluates positions taken in tax returns with respect to situations in accordance with applicable tax regulations. It establishes provisions where appropriate based on the amounts expected to be paid to the tax authorities. An additional tax is levied on the unappropriated retained earnings of the Company’s subsidiary in Taiwan and is recorded as income tax expense in the year the stockholders resolve to retain the earnings.
C.Deferred income tax is recognized, using the balance sheet liability method, on temporary differences arising between the tax bases of assets and liabilities and their carrying amounts in the consolidated balance sheet. However, the deferred income tax is not accounted for if it arises from initial recognition of goodwill or of an asset or liability in a transaction other than a business combination that at the time of the transaction affects neither accounting nor taxable profit or loss. Deferred income tax is provided on temporary differences arising on investments in subsidiaries, except where the timing of the reversal of the temporary difference is controlled by the Group and it is probable that the temporary difference will not reverse in the foreseeable future. Deferred income tax is determined using tax rates (and laws) that have been enacted or substantially enacted by the balance sheet date and are expected to apply when the related deferred income tax asset is realized or the deferred income tax liability is settled.
D.Deferred income tax assets are recognized only to the extent that it is probable that future taxable income will be available against which the temporary differences can be utilized. At each balance sheet date, unrecognized and recognized deferred income tax assets are reassessed.
E.Current income tax assets and liabilities are offset and the net amount reported in the balance sheet when there is a legally enforceable right to offset the recognized amounts and there is an intention to settle on a net basis or realize the asset and settle the liability simultaneously. Deferred income tax assets and liabilities are offset on the balance sheet when the entity has the legally enforceable right to offset current tax income assets against current income tax liabilities and they are levied by the same taxation authority on either the same entity or different entities that intend to settle on a net basis or realize the asset and settle the liability simultaneously.

4(23) Share capital

A.Ordinary shares are classified as equity. Incremental costs directly attributable to the issue of new shares or stock options are shown in equity as a deduction, net of tax, from the proceeds.
B.Where the Company repurchases the Company’s equity share capital that has been issued, the consideration paid, including any directly attributable incremental costs (net of income taxes) is deducted from equity attributable to the Company’s equity holders.

4(24) Revenue recognition

A.The Group has three major revenue streams: (1) Licensing; (2) AR/AI cloud solutions and Subscription; and (3) Advertisement. Among that (1) Licensing and (2) AR/AI cloud solutions and Subscription constitute our core SaaS solutions.

F-17

Table of Contents

B.In terms of Licensing, it could be divided into the following two categories:
(a)Designing and developing apps to brand customers

The Group delivers services based on customers’ requests. Once the customer accepts and the customized apps or licenses have been transferred, no further upgrade or revise service would be made by the Group. The customer receives and consumes the benefits provided by the Group at the point the customized apps or licenses have been transferred to them. Those services are only created for the specific customer without alternative use to the Group, and the right to payment is irrelevant to the performance obligation’s milestone. As a result, revenue is recognized at a point in time.

(b)Granting license of self-developed technologies to brand customers

The Group promises to provide a right to use the Group’s intellectual property as that intellectual property exists at the point in time at which the license is granted to the customer. The licensing includes licensing offline technology SDK (Software Development Kit) and AR/AI offline solutions. The SDK is to implement virtual try-on function to apps of brand customers which allow app users visiting. The AR/AI offline solutions is to implement virtual try-on function to applications which used in retail store. Once the function is implemented, the Group has fulfilled its performance obligation without further update. The brand customer can direct the use of, and obtain substantially all of the remaining benefits from the license at the point in time at which the license transfers.

C.In terms of AR/AI cloud solutions and Subscription, the AR/AI cloud solutions are provided to brand customers, and the Subscription is provided to individual customers. Customers simultaneously receive and consume the benefits provided by the Group’s performance.
(a)For AR/AI cloud solutions:

The AR/AI cloud solutions are to implement virtual try-on function to websites of customers which allow internet users to visit. Internet users are able to use virtual try-on such as makeup, skincare, hair, nail, etc. The AR/AI cloud solutions are consecutively provided by the Group include future updates to its customers throughout the contract period.

The typical contract terms of providing AR/AI cloud solutions to customers range from three months to multi-years, among which one year term is the most, the contract consideration was fixed and determined by the following factors: 1) functionality of the modules (eg. makeup, skincare, hair, nail, etc); 2) length of the contract period; 3) geographical coverage such as the number of countries/region to deploy the modules or the number of website domains to integrate our modules; 4) maximum numbers of product SKUs that a brand can utilize at the same time; and 5) additional manpower hours used for conducting the customization, if any.

Once the contract is agreed by customers and the Group, the performance obligations among the contract is fixed with a stand ready feature. The Group then provides services to customers based on the contract.

The Group applied output methods to recognize revenue on the straight-line basis through the contract period. Those services provided by the Group would be realized evenly during the contract period. The control of the services transfers from the Group to customers through the contract period, the performance obligation satisfied over time. As a result, revenue is recognized over time.

(b)For Subscription:

The Subscription is the Group provides premium functions in apps to customers which allow customers to subscribe through Apple App store and Google Play store. Customers who subscribe the premium functions are allowed to use the complete additional functions in the apps, remove watermarks and ad-free editing, etc. The Group currently offer monthly and yearly subscription plans (price varies by country) for such premium functions service.

F-18

Table of Contents

Apple App store and Google Play store play as platform provider for the Group to list its apps on the stores. The Group is considered as a principal on providing premium functions in apps to customers given that the Group is obliged to provide service to its customers and the Group has the right to determine the selling price of the service. Apple App store and Google Play store also claim a commission expenses from the Group based on the revenue generate from providing premium functions. The commission expenses are recognized as cost of sales and services.

The control of the services transfers from the Group to customers through the contract period, the performance obligation satisfied over time. As a result, revenue is recognized over time.

D.In terms of Advertisement, revenue is generated from the advertisements displayed by advertisement network service providers (ad networks) in the Group’s apps. The consideration of such service is determined based on the frequency of click or impression (usage-based) of the advertisement, which should be treated as a variable consideration. The typical contract term is monthly. The numbers of advertisements are delivered and the associated fees are tracked on a daily basis, and the Group recognized revenue on a monthly basis based on the daily collected information.
E.When the Group enters into contracts which contain multiple performance obligations through B to D, the Group allocates the transaction price to each performance obligation on a relative stand-alone selling price basis. The stand-alone selling price is the price at which the Group sells a good or service separately to a customer.

4(25) Cost of sales and services

Cost of sales and services primarily consists of costs related to platform commission fees paid to platform owners, payroll costs directly related to sales and services activities, accrued provision and costs of sales of products.

4(26) Government grants

Government grants are recognized at their fair value only when there is reasonable assurance that the Group will comply with any conditions attached to the grants and the grants will be received. Government grants are recognized in profit or loss on a systematic basis over the periods in which the Group recognizes expenses for the related costs for which the grants are intended to compensate.

4(27) Operating segments

Operating segments are reported in a manner consistent with the economic characteristics as well as types of products and services from which each operating segment derives its revenues, and the internal reporting provided to the chief operating decision maker. The Group’s chief operating decision maker, who is responsible for allocating resources and assessing performance of the operating segments, has been identified as the CEO (who is also the chairman of the Board of Directors) that makes strategic decisions.

Although the Group has multiple operating segments by geography, the management takes the aggregation criteria outlined in Paragraphs 11 to 14 of IFRS 8 into consideration to determine the reportable operating segments. The judgements made by management in applying the aggregation criteria are based on the similarity of economic characteristics of these operating segments  —  (a) the nature of the services: The operating segments grant license of mobile applications or platforms and provide advertising services for their customers; (b) the type or class of customer for their services: The customer types of operating segments are mainly cosmetics companies and social media companies with high similarity in industry; (c) the methods used to provide their services: The services provided are mainly customized software. Perfect Mobile Corp., the Taiwan segment, serves as the core center of research, development, and design, and then all operating segments  —  including Perfect Mobile Corp. itself  —  deliver those services to their customers. All operating segments follow the same service providing process. In light of the qualitative and quantitative criteria, the Group concluded that it has only one reportable operating segment.

F-19

Table of Contents

4(28) Recapitalization

The Recapitalization has been accounted for with Provident being identified as the “acquired” entity for financial reporting purposes. Accordingly, the Recapitalization has been accounted for as the equivalent of the Group issuing shares for the net assets of Provident, accompanied by a recapitalization with third party investors. The net assets of Provident were recognized at their net carrying amounts with no goodwill or other intangible assets.

The acquisition of the net assets of Provident on the Closing Date does not meet the definition of a business combination under IFRS 3—Business Combinations and has therefore been accounted for within the scope of IFRS 2—Share-based Payments, with the former Provident shareholders receiving Perfect Class A Ordinary Shares based on Business Combination Agreement or requested redemption. The excess of fair value of Perfect Ordinary Shares issued over the fair value of Provident’s identifiable net assets acquired represents compensation for the service of a stock exchange listing for its shares and was expensed as incurred.

5.Critical Accounting Judgements, Estimates and Key Sources of Assumption Uncertainty

The preparation of these consolidated financial statements requires management to make critical judgements in applying the Group’s accounting policies and make critical assumptions and estimates concerning future events. Assumptions and estimates may differ from the actual results and are continually evaluated and adjusted based on historical experience and other factors. Such assumptions and estimates have a significant risk of causing a material adjustment to the carrying amounts of assets and liabilities within the next financial year; and the related information is addressed below:

5(1) Critical judgements in applying the Group’s accounting policies:

A.Preferred shares

The classification of preferred shares is determined based on its nature and rights which is described in the Shareholders Agreement. Preferred shares are classified as liabilities when it is convertible to a variable number of its equity instruments or an unconditional obligation to deliver cash or another financial asset exist. Pursuant to the Shareholders Agreement, the Group has no unconditional right to avoid delivering cash to settle its contractual obligations. Also pursuant to the Shareholders Agreement, in the event of either Deemed Liquidation Event or execution of Redemption Rights is not controllable by the Group, the Group has no unconditional right to avoid delivering cash to settle its contractual obligations. Furthermore, given the conversion price might be further adjusted based on the Shareholders Agreement, the Group has, or might have, a contractual obligation to deliver a variable number of its equity instruments. As a result, the preferred shares are classified as financial liabilities.

B.Revenue recognition at a point in time or over time

The Group recognizes the revenue by determining whether the performance obligations are satisfied at a point in time or over time. In terms of Licensing, the Group recognized revenue at the point when customized apps or licenses are transferred to its customers, which customers obtain control over the customized apps or licenses simultaneously with no further maintenance or other services to be provided by the Group. In terms of AR/AI cloud solutions and Subscription, the Group delivers services to its customers and recognized revenue within the contract period on a straight-line basis. The Group grants access of its server or apps to its customers and is obliged to maintain the services operational through the contract period. The access is terminated once the contract expires and no further extension were made by both parties. After termination of the contract, the customers can no longer have access to the server or apps. In terms of Advertisement, the Group recognized revenue within the contract period on a usage basis.

As a result, based on the different feature of the services, the Group recognized revenue at a point in time or overtime, respectively.

F-20

Table of Contents

5(2) Critical accounting estimates and assumptions:

A.Fair value measurement of convertible preferred shares

The issuance of convertible preferred shares by the Group was recognized under ‘financial liabilities designated as at fair value through profit or loss on initial recognition’ due to their compound instrument feature. The fair value of convertible preferred shares is determined considering those companies’ recent funding raising activities and technical development status, fair value assessment of other companies of the same type, market conditions and other economic indicators existing on balance sheet date. Any changes in these judgements and estimates will impact the fair value measurement of these convertible preferred shares. Please refer to Note 12(3) for the financial instruments fair value information.

As of December 31, 2021 and 2022, the carrying amounts of the Group’s convertible preferred shares were $ 259,230 and $-, respectively. Please refer to Note 6(8) for the preferred shares information.

B.Fair value measurement of warrant liabilities

Public warrants, Private Placement Warrants and Forward Purchase Warrants assumed in connection with the Recapitalization were recognized under financial liabilities at fair value through profit or loss. The fair value of the warrants were measured at fair value using Monte Carlo simulation model on the Closing Date. The fair value of the Public Warrants was subsequently measured based on the listed market price. The fair value of the Private Placement Warrants and Forward Purchase Warrants were subsequently measured using a Monte Carlo simulation model each measurement date.

As of December 31, 2021 and 2022, the carrying amounts of the Group’s warrant liabilities were $- and $3,207, respectively. Please refer to Note 6(8) for the warrant liabilities information and refer to Note 12(3) for the financial instruments fair value information.

C.Fair value measurement of earnout shares

The valuation of the Group’s Sponsor Earnout Promote Shares on the Closing Date requires the use of option pricing models or other valuation techniques. The fair value is determined using a Monte Carlo simulation model for the Sponsor Earnout Promote Shares. Please refer to 6(12) for the key assumption used for estimating the fair value of the Sponsor Earnout Promote Shares.

D.Fair value measurement of Perfect Class A Ordinary Shares

For the calculation of the listing expense, the Company issued an aggregate of 6,764 thousand shares to acquire Provident’s net assets on the Closing Date, excluding the impact of PIPE and FPA investors. The fair value used to measure the Company’s Class A Ordinary Shares are the based on the opening market price of Provident of $8.35 (in dollars) per share as of October 28, 2022. Please refer to 6(26) “Recapitalization”.

6.Details of Significant Accounts

6(1) Cash and cash equivalents


December 31, 2021


December 31, 2022

Petty cash

$

1

$

1

Checking accounts


1,882


1,279

Demand deposits


38,591


11,777

Time deposits


39,800


149,300

Others


179


259

$

80,453

$

162,616

F-21

Table of Contents

The Group transacts with a variety of financial institutions all with high credit quality to disperse credit risk, so it expects that the probability of counterparty default is remote.

6(2) Current financial assets at amortized cost


December 31, 2021


December 31, 2022

Time deposits with maturities over three months

$

$

30,000

The Group has no financial assets at amortized cost pledged to others. As of December 31, 2021 and 2022, the amount of time deposits of $- and $30,000, respectively, were held at financial institutions located in Taiwan.

Information relating to credit risk of financial assets at amortized cost is provided in Note 12(3).

6(3) Accounts receivable


December 31, 2021


December 31, 2022

Accounts receivable

$

6,568

$

7,756

A.The ageing analysis of accounts receivable is as follows:


December 31, 2021


December 31, 2022

Not past due

$

5,773

$

6,062

Up to 30 days


508


851

31 to 90 days


121


327

91 to 180 days


138


417

Over 181 days


28


99

$

6,568

$

7,756

The above ageing analysis was based on days overdue.

B.As at December 31, 2021 and 2022, accounts receivable were all from contracts with customers. And as at January 1, 2021, the balance of receivables from contracts with customers amounted to $ 5,509.
C.As at December 31, 2021 and 2022, without taking into account other credit enhancements, the maximum exposure to credit risk in respect of the amount that best represents the Group’s accounts receivable was $ 6,568 and $ 7,756, respectively.
D.Information relating to credit risk of accounts receivable is provided in Note 12(3).

F-22

Table of Contents

6(4)Other current assets


December 31, 2021


December 31, 2022

Prepaid expenses

$

254

$

4,617

Others


45


88

$

299

$

4,705

6(5) Property, plant and equipment


2021

Leasehold

Office


improvements


Machinery


equipment


Total

At January 1

Cost

$

473

$

457

$

24

$

954

Accumulated depreciation


(296)


(193)


(13)


(502)

$

177

$

264

$

11

$

452

Opening net book amount

$

177

$

264

$

11

$

452

Additions


34


97


23


154

Cost of disposals


(6)


(12)


(18)

Accumulated depreciation on disposals

6

12

18

Depreciation expense


(93)


(110)


(6)


(209)

Net exchange differences


5


5


10

Closing net book amount

$

123

$

256

$

28

$

407

At December 31

Cost

$

516

$

552

$

48

$

1,116

Accumulated depreciation


(393)


(296)


(20)


(709)

$

123

$

256

$

28

$

407


2022

Leasehold

Office

improvements


Machinery


equipment


Total

At January 1

$

$

$

$

Cost

516

552

48

1,116

Accumulated depreciation


(393)


(296)


(20)


(709)

$

123

$

256

$

28

$

407

Opening net book amount

$

123

$

256

$

28

$

407

Additions


58


107


165

Cost of disposals


Accumulated depreciation on disposals


Depreciation expense


(119)


(119)


(9)


(247)

Net exchange differences


(11)


(24)


(1)


(36)

Closing net book amount

$

51

$

220

$

18

$

289

At December 31

Cost

$

521

$

602

$

46

$

1,169

Accumulated depreciation


(470)


(382)


(28)


(880)

$

51

$

220

$

18

$

289

The Group has no property, plant and equipment pledged to others.

F-23

Table of Contents

6(6) Leasing arrangements  —  lessee

A.The Group’s leases various assets including buildings and business vehicles. Rental contracts are typically made for periods of 2 to 3 years. Lease terms are negotiated on an individual basis and contain a wide range of different terms and conditions. Except that leased assets may not be used as security for borrowing purposes, leased assets may not be subleased, sold or borrowed to others or corporates in any methods.
B.Short-term leases with a lease term of 12 months or less comprise offices located in United States, Japan, China and France. On December 31, 2020, 2021 and 2022, lease commitments for short-term leases amounted to $ 95, $ 112 and $ 152, respectively.
C.The movements of right-of-use assets of the Group during the 2021 and 2022 are as follows:


2021


Buildings


Business vehicles


Total

At January 1

Cost

$

776

$

$

776

Accumulated depreciation


(457)


(457)

$

319

$

$

319

Opening net book amount

$

319

$

$

319

Additions


530


148


678

Cost of derecognition


(432)


(432)

Derecognized accumulated depreciation


432


432

Depreciation expense

(339)

(50)

(389)

Net exchange differences

11

1

12

Closing net book amount

$

521

$

99

$

620

At December 31

Cost

$

898

$

149

$

1,047

Accumulated depreciation


(377)


(50)


(427)

$

521

$

99

$

620


2022


Buildings


Business vehicles


Total

At January 1

Cost

$

898

$

149

$

1,047

Accumulated depreciation


(377)


(50)


(427)

$

521

$

99

$

620

Opening net book amount

$

521

$

99

$

620

Additions


137


76


213

Cost of derecognition


(137)


(137)

Derecognized accumulated depreciation


137


137

Depreciation expense


(361)


(95)


(456)

Net exchange differences


(45)


(9)


(54)

Closing net book amount

$

252

$

71

$

323

At December 31

Cost

$

809

$

208

$

1,017

Accumulated depreciation


(557)


(137)


(694)

$

252

$

71

$

323

F-24

Table of Contents

D.Lease liabilities relating to lease contracts:


December 31, 2021


December 31, 2022

Total lease liabilities

$

638

$

338

Less: current portion (shown as ‘current lease liabilities’)


(449)


(251)

$

189

$

87

E.The information on profit and loss accounts relating to lease contracts is as follows:


Years ended December 31,

2020

2021

2022

Items affecting profit or loss


Interest expense on lease liabilities

$

9

$

9

$

8

Expense on short-term lease contracts


292


391


383

$

301

$

400

$

391

F.For the years ended December 31, 2020, 2021 and 2022, the Group’s total cash outflow for leases were $606, $ 793 and $ 848, respectively, including the interest expense on lease liabilities amounting to $ 9, $ 9 and $ 8, expense on short-term lease contracts amounting to $ 292, $ 391 and $ 383, and repayments of principal portion of lease liabilities amounting to $ 305, $ 393 and $ 457, respectively.

6(7) Intangible assets


2021

Other


Software


 intangible assets


Total

At January 1

Cost

$

196

$

3,257

$

3,453

Accumulated amortization


(163)


(3,177)


(3,340)

$

33

$

80

$

113

Opening net book amount

$

33

$

80

$

113

Additions


32


32

Cost of disposals

(153)

(3,177)

(3,330)

Accumulated amortization on disposals

153

3,177

3,330

Amortization charge


(20)


(27)


(47)

Net exchange differences


2


2

Closing net book amount

$

45

$

55

$

100

At December 31

Cost

$

78

$

82

$

160

Accumulated amortization


(33)


(27)


(60)

$

45

$

55

$

100

F-25

Table of Contents


2022


Other


Software

intangible assets

Total

At January 1

Cost

$

78

$

82

$

160

Accumulated amortization


(33)


(27)


(60)

$

45

$

55

$

100

Opening net book amount

$

45

$

55

$

100

Additions


78


15


93

Cost of disposals


(43)


(43)

Accumulated amortization on disposals


43


43

Amortization charge


(36)


(27)


(63)

Net exchange differences


(6)


(5)


(11)

Closing net book amount

$

81

$

38

$

119

At December 31

Cost

$

104

$

89

$

193

Accumulated amortization


(23)


(51)


(74)

$

81

$

38

$

119

Details of amortization on intangible assets are as follows:


Years ended December 31,

2020

2021

2022

Research and development expenses

$

36

$

47

$

63

6(8) Financial liabilities at fair value through profit or loss


December 31, 2021


December 31, 2022

Non-current items:

Warrant liabilities

$

$

8,431

Add: Valuation adjustment

(5,224)

Financial liabilities designated as at fair value through profit or loss - Preferred share liabilities

105,469

Add: Valuation adjustment


153,761


$

259,230

$

3,207

A.

Amounts recognized in profit or loss and other comprehensive income in relation to financial liabilities at fair value through profit or loss are as follows:


Years ended December 31,

2020

2021

2022

Net losses recognized in profit or loss


Warrant liabilities


$


$


$

5,224

Financial liabilities designated as at fair value through profit or loss - Preferred share liabilities

(2,022)

(150,745)

(99,001)

$

(2,022)

$

(150,745)

$

(93,777)

Net losses recognized in other comprehensive income


Financial liabilities designated as at fair value through profit or loss - Preferred share liabilities

$

$

(58)

$

(7)

F-26

Table of Contents

B.

Warrant liabilities

(a)

As part of Business Combination, Warrants sold and issued by Provident were automatically converted to Perfect Warrants. Each warrants entitles the holder to purchase one Class A Ordinary Share at a price of $11.50 (in dollars) per share.

(b)

As of December 31, 2022 there were 20,850 thousand warrants outstanding, consisting of 11,500 thousand Public Warrants, 6,600 thousand Private Placement Warrants and 2,750 thousand Forward Purchase Warrants (as defined below). Each warrant is exercisable for one Perfect Class A Ordinary Share, in accordance with its terms.

Public Warrants

Provident sold an aggregate of 11,500 thousand Public Warrants in the Provident Initial Public Offering.

Private Placement Warrants

Provident privately issued and sold an aggregate of 6,600 thousand Private Warrants to the Sponsor simultaneously with the consummation of the Provident Initial Public Offering on January 7, 2021.

Forward Purchase Warrants

Pursuant to the Forward Purchase Agreements (FPA), Provident issued and sold to FPA Investors, an aggregate of 5,500 thousand Forward Purchase Shares and 2,750 thousand Forward Purchase Warrants in consideration for an aggregate purchase price of $55,000, as closed on October 27, 2022.

(c)Movement in all kinds of Perfect warrants (Units: thousand warrants) are as follows:


Private


Forward 

Public

Placement

Purchase 

Warrants

Warrants

Warrants

At January 1, 2022


Converted from Provident’s warrants as part of business combination


11,500


6,600


2,750

Exercised


At December 31, 2022


11,500


6,600


2,750

(d)

Redemption of Warrants when the price per Perfect Class A Ordinary Shares equal or exceed $18.00 (in dollars).

Once the Warrants become exercisable, the Company may redeem the outstanding Warrants (except as described herein with respect to Perfect Private Placement Warrants):

(i)in whole and not in part (ii) at a price of $0.01 (in dollars) per warrant (iii)upon not less than 30 days’ prior written notice of redemption to each warrant holder (the “30-day redemption period”) and (iv) if, and only if, the last reported sale price of the Perfect Class A Ordinary Shares for any 20 trading days within a 30-trading day period ending three business days before the Company sends the notice of redemption to the warrant holders (which the Company refers to as the “Reference Value”) equals or exceeds $18.00 (in dollars) per share.

(e)

Redemption of warrants when the price per Class A Ordinary Share equals or exceeds $10.00 (in dollars).

F-27

Table of Contents

Once the Warrants become exercisable, the Company may redeem the outstanding warrants:

(i) in whole and not in part (ii) at $0.10 (in dollars) per warrant upon a minimum of 30 days’ prior written notice of redemption (iii) provided that holders will be able to exercise their warrants on a cashless basis prior to redemption and receive that number of shares determined by reference to the table below, based on the redemption date and the “fair market value” of Perfect Class A Ordinary Shares (iv) if, and only if, the Reference Value equals or exceeds $10.00 (in dollars) per share and (v) if the Reference Value is less than $18.00 (in dollars) per share, Perfect Private Placement Warrants must also be concurrently called for redemption on the same terms as the outstanding Perfect Public warrants, as described above.

(f)

Private Placement Warrants

The Private Placement Warrants are identical to the Public Warrants and Forward Purchase Warrants except that Private Placement Warrants, so long as they are held by Provident Acquisition Holdings Ltd., (the “Sponsor”) or its permitted transferees, (i) will not be redeemable by the Company (ii) may not (including the Class A ordinary shares issuable upon exercise of these Private Placement Warrants), subject to certain limited exceptions, be transferred assigned or sold by the holder until 30 days after the completion of the Company’s initial Business Combination (iii) may be exercised by the holders on a cashless basis and (iv) will be entitled to certain registration rights.

If the Private Placement Warrants are held by holders other than the Sponsor or its permitted transferees, the Private Placement Warrants will be redeemable by the Company and exercisable by the holders on the same basis as Public Warrants and Forward Purchase Warrants.

C.Financial liabilities designated as at fair value through profit or loss-Preferred share liabilities

(a)The Company has issued a total of 242,331 thousand convertible preferred shares. In connection with the Recapitalization, the Company’s convertible preferred shares were canceled in exchange for 0.17704366 Perfect Class A or Class B ordinary shares on October 28, 2022. Please refer to Note 6(13) “Share capital” for information of the conversion.
(b)As of December 31, 2021, the Company has issued a total of $ 105,000 of convertible preferred shares with no maturity for five rounds in total. The details are as follows:
i.In the end of July 2017, the Company issued 31,427 thousand shares of convertible preferred shares (Series A) which was converted from convertible bonds that the Company issued on November 9, 2016. The Company issued $ 10,000 of convertible bonds with an interest rate of 0% per annum. The bonds matured 0.81 years from November 9, 2016 to August 31, 2017 and would be redeemed in cash at the face value at the maturity date. The bondholders have the right to ask for conversion of the bonds into convertible preferred shares of the Company. On July 7, 2017, the Board of Directors, during the meeting, resolved that if bondholders convert the bonds into the convertible preferred shares before the end of July 2017, all of the original bondholders would be granted a stock warrant (Series A warrant) on a pari passu basis to purchase a certain quantity of additional preferred shares at the initial conversion price, to be fully exercised prior to the end of May 2018. The Series A warrant could subscribe preferred shares (Series A) ata2 for1 basis. The convertible bonds were fully converted into convertible preferred shares (Series A) in the end of July 2017. However, the Company reissued stock warrants with same conditions to replace the initial stock warrants, which were exercisable by November 30, 2018, as resolved at the meeting of the Board of Directors on May 31, 2018.
ii.On October 17, 2017, the Company issued 47,140 thousand shares of convertible preferred shares (Series A-1) with a total issuance amount of $ 15,000.
iii.On November 19, 2018, the Company issued 15,713 thousand shares of convertible preferred shares (Series A) which were wholly-acquired by the holders of stock warrants (Series A warrant) with a total exercise price of $ 5,000. All series A warrants has been exercised.

F-28

Table of Contents

iv.On July 8, 2019, the Company issued 73,206 thousand shares of convertible preferred shares (Series B) with a total issuance amount of $ 25,000.
v.On December 11, 2020, the Company issued 74,844 thousand shares of convertible preferred shares (Series C-1 and C-2) with a total issuance amount of $ 50,000.
(c)The issuance of convertible preferred shares by the Company amounting to $ 259,230 and $ - was recognized under ‘financial liabilities designated as at fair value through profit or loss on initial recognition on December 31, 2021 and 2022, respectively, due to their compound instrument feature.
(d)When the Company issued the convertible preferred shares (Series C-1 and C-2), some of the issuance terms were amended. The initial convertible preferred shareholders (Series A, Series A-1 and Series B) can apply the issuance terms retrospectively. Please refer to the Redemption rights section below for details.
(e)The rights, preferences and privileges of the preferred shares are as follows:

Liquidation preferences

(a)In the event of any voluntary or involuntary liquidation, dissolution or winding up of the Company or any Deemed Liquidation Event, the assets of the Company or the consideration of the Deemed Liquidation Event available for distribution to its shareholders, as the case may be, shall be distributed among the shareholders.
(b)The convertible preferred shares should be repaid first at 150% of the issuing price but with the residual value as the limit. The ranking of claims are holders of convertible preferred shares (Series C), holders of convertible preferred shares (Series B) and holders of convertible preferred shares (Series A).
(c)If a merger or reorganization of the Company occurred, such events shall be deemed as Deemed Liquidation Event. The majority of convertible preferred shareholders, voting as a single class, may elect not to apply the process of liquidation in the event of a Deemed Liquidation Event. Thus, if an uncertain event occurred in the future, the Company has a contractual obligation to deliver cash to convertible preferred shareholders.

Conversion rights

(a)The conversion price of the convertible preferred shares is the initial acquisition price, and is subject to adjustments if the condition of the anti-dilution provision occurs subsequently. The conversion price will be reset based on the pricing model specified in the terms of conversion. Accordingly, the Company has a contractual obligation to deliver a variable number of its own equity instruments to convertible preferred shareholders.
(b)The convertible preferred shareholders have the right to ask for conversion of the preferred shares into common shares of the Company from the issuance date. The rights and obligations of the new shares converted from the preferred shares are the same as the issued and outstanding common shares.
(c)Without any action being required by the holder, each preferred share should automatically be converted into one common share (i) immediately upon the closing of an IPO, based on the applicable conversion price in effect at the time of the closing of such IPO; (ii) at the election of holders of a majority of the preferred shares and their conversion shares if converted, voting as a single class on an as-converted to common share but not fully-diluted basis; or (iii) if the Board of Directors duly approves in accordance with the shareholders agreement and these articles the commencement of an IPO process by the Company in Taiwan.
(d)The diluted effect of preferred shares as of December 31, 2021 and 2022 was 242,331 thousand and 0 shares, respectively.

F-29

Table of Contents

Redemption rights

(a)In the following events, the convertible preferred shareholders have the right to require the Company to redeem convertible preferred shares:
i.Before 2026 ends, if the Company does not publicly issue shares at specific price, sell at least half of the business or the first majority shareholder sells its shares, the holders of convertible preferred shares (Series C) could exercise its redeemable right;
ii.If there’s any material breach by the Company, in contravention of any applicable laws, fraud or the main holders of convertible preferred shares (Series B) exercise its redeemable rights, all the holders of convertible preferred shares could exercise the redemption right;
iii.If there’s any material breach by the Company of the Business Cooperation Agreement, then the main holders of convertible preferred shares (Series B) should be entitled to the right to exercise its redemption rights.

The principal terms of Business Cooperation Agreement are as follows:

(1)The Company’s operations in mainland China should be discussed with the holder of convertible preferred shares (Series B) before commencement, and the Company shall engage the holder of convertible preferred shares (Series B) as the priority business partner.
(2)If the following conditions are met, the holder of convertible preferred shares (Series B) shall engage the Company as the priority business partner in beauty & cosmetic augmented reality business:
(i)The Company maintains its position as leading company in the industry.
(ii)The holder of convertible preferred shares (Series B) holds the Company’s shares more than 10% of total shares.
iv.If the Company or subsidiary in Taiwan violates the PRC Investment Regulation, the main holders of the convertible preferred shares (Series C) could exercise the redemption right.
v.At any time after the occurrence of any of the abovementioned events, any Series A Holder, Series B Holder and Series C Holder may give a written notice (Redemption Notice) to the Company requesting redemption by the Company of all or part of its Equity Securities in the Company in accordance terms and conditions set forth in the Shareholders Agreement. If any Series A Holder, Series B Holder or Series C Holder exercises its right to require redemption by the Company of its Equity Securities, the Company should notify all other Series A Holders, Series B Holders and Series C Holders within ten calendar days after receipt of the Redemption Notice, and such Series A Holders, Series B Holders and Series C Holders may within ten calendar days thereafter elect to request the Company to redeem any or all of the outstanding Equity Securities of the Company held by them.
(b)The redemption price for each redemption share redeemed should be:
i.In scenario (a)i, (a)ii and (a)iv, the Company should redeem the preferred shares at the initial issuance price plus 8% compound interest and dividends declared not paid yet;
ii.In scenario (a)iii, the Company should redeem the preferred shares at the initial issuance price plus 20% interest and dividends declared not paid yet.

F-30

Table of Contents

Voting rights

(a)Each shareholder shall be entitled to cast the number of votes equal to the number of the common shares and the number of the common shares into which the preferred shares it holds are convertible as of the record date for determining the shareholders entitled to vote on such matter or, if no record date is specified, as of the date of such vote.
(b)In the event that prior to the consummation of an IPO, the holders of at least a majority of the preferred shares on an as converted to common share but not fully-diluted basis (collectively, the “Dragging Shareholders”) approve a transaction or a series of related transactions, in which a person, or a group of related persons, acquires a majority of the equity securities, assets, undertaking or voting power of the Company (either by way of transfer, acquisition, merger, consolidation, scheme of arrangement, amalgamation or otherwise) at a specific price agreed in Series C Preferred Share Subscription Agreement, then each shareholder and the Company shall sell the equity securities of the Group.

Dividends

(a)The Company should not declare, pay or set aside any dividends on shares unless preferred shares holders has received non-cumulative dividends. The ranking of claims are holders of convertible preferred shares (Series C), holders of convertible preferred shares (Series B), holders of convertible preferred shares (Series A), and the holders of common shares.
(b)The non-cumulative dividends should be declared at the simple rate of four percent (4%) or of the amount each preferred shareholder would have received had the Company distributed the dividends to all shareholders on a pro rata basis, prior and in preference to any other shareholders, whichever is higher.
(c)The dividends payable on each common share issuable upon the conversion of a preferred share, calculated on the record date for determination of holders entitled to receive such dividend.

Business Cooperation Agreement (Series B only)

The Company entered into a Business Cooperation Agreement with the main holders of convertible preferred shares (Series B) under the initial preferred share contract. In the event of any material breach of the Business Cooperation Agreement by the Group, the main holders of convertible preferred shares (Series B) have the right to require the Company to redeem convertible preferred shares at the initial issuance price plus 20% interest and dividends declared not paid yet.

6(9) Other payables


December 31, 2021


December 31, 2022

Employee bonus

$

3,766

$

4,038

Payroll


1,934


2,130

Remuneration to directors and supervisors

53

Promotional fees


851


1,039

Professional service fees


1,358


1,371

Sales VAT payables


225


175

Post and telecommunications expenses


178


173

Others

394

329

$

8,706

$

9,308

F-31

Table of Contents

6(10) Provisions


2021


2022


Warranty


Warranty

At January 1

$

480

$

1,058

Additional provisions


734


897

Used during the year


(148)


-

Net exchange differences


(8)


(100)

At December 31

$

1,058

$

1,855

Analysis of total provisions:


December 31, 2021


December 31, 2022

Current

$

1,058

$

1,855

The Group enters into the contract with customers with warranties on services provided. The warranties (loss indemnification) provide customers with assurance that the related services will function as agreed by both parties. Provision for warranty is estimated based on historical warranty data, other known events and management’s judgement. The Group recognizes such expenses within ‘Cost of sales and services’ when related services are provided. Any changes in industry circumstances might affect the provisions. Provisions shall be paid when the payment is actually claimed.

6(11) Pensions

A.Defined benefit plan
(a)The Group’s subsidiary, Perfect Mobile Corp. (Taiwan), was incorporated in Taiwan, which has a defined benefit pension plan in accordance with the Labor Standards Act, covering all regular foreign employees’ service years. Under the defined benefit pension plan, two units are accrued for each year of service for the first 15 years and one unit for each additional year thereafter, subject to a maximum of 45 units. Pension benefits are based on the number of units accrued and the average monthly salaries and wages of the last 6 months prior to retirement. Perfect Mobile Corp. (Taiwan) contributes monthly an amount equal to 2% of the employees’ monthly salaries and wages to the retirement fund deposited with Bank of Taiwan, the trustee, under the name of the independent retirement fund committee. Also, Perfect Mobile Corp. (Taiwan) would assess the balance in the aforementioned labor pension reserve account by December 31, every year. If the account balance is insufficient to pay the pension calculated by the aforementioned method, to the employees expected to qualify for retirement in the following year, Perfect Mobile Corp. (Taiwan) will make contributions for the deficit by next March.
(b)The amounts recognized in the balance sheet are as follows:


December 31, 2021


December 31, 2022

Present value of defined benefit obligations

$

(113)

$

(84)

Fair value of plan assets


9


11

Net defined benefit liability

$

(104)

$

(73)

F-32

Table of Contents

(c)Movements in net defined benefit liability are as follows:

2021

Present value

of defined benefit

Fair value of

Net defined


obligations


plan assets


benefit liability

At January 1

$

(84)

$

7

$

(77)

Current service cost


(2)


(2)


(86)


7


(79)

Remeasurements:

Change in demographic assumptions


(8)


(8)

Change in financial assumptions


16


16

Experience adjustments


(32)


(32)


(24)


(24)

Pension fund contribution


2


2

Net exchange differences


(3)


(3)

Balance at December 31

$

(113)

$

9

$

(104)

2022


Present value


of defined benefit

Fair value of

Net defined

obligations

plan assets

benefit liability

At January 1

$

(113)

$

9

$

(104)

Current service cost


(2)


(2)

Interest (expense) income


(1)


(1)

(116)

9

(107)

Remeasurements:

Return on plan assets

1

1

Change in demographic assumptions


(8)


(8)

Change in financial assumptions


10


10

Experience adjustments


19


19


21


1


22

Pension fund contribution


2


2

Net exchange differences


11


(1)


10

Balance at December 31

$

(84)

$

11

$

(73)

(d)

The Bank of Taiwan was commissioned to manage the Fund of Perfect Mobile Corp. (Taiwan)’s defined benefit pension plan in accordance with the Fund’s annual investment and utilization plan and the “Regulations for Revenues, Expenditures, Safeguard and Utilization of the Labor Retirement Fund” (Article 6: The scope of utilization for the Fund includes deposit in domestic or foreign financial institutions, investment in domestic or foreign listed, over-the-counter, or private placement equity securities, investment in domestic or foreign real estate securitization products, etc.). With regard to the utilization of the Fund, its minimum earnings in the annual distributions on the final financial statements shall be no less than the earnings attainable from the amounts accrued from two-year time deposits with the interest rates offered by local banks. If the earnings is less than aforementioned rates, government shall make payment for the deficit after being authorized by the Regulator. Perfect Mobile Corp. (Taiwan) has no right to participate in managing and operating that fund and hence Perfect Mobile Corp. (Taiwan) is unable to disclose the classification of plan assets fair value in, accordance with IAS 19 paragraph 142. The composition of fair value of plan assets as of December 31, 2021 and 2022 is given in the Annual Labor Retirement Fund Utilization Report announced by the government.

F-33

Table of Contents

(e)The principal actuarial assumptions used were as follows:

Years ended December 31,


2021


2022

Discount rate


1.00

%  

1.50

%  

Future salary increases

3.00

%  

3.00

%  

Future mortality rate was estimated based on the 5th Taiwan Standard Ordinary Experience Mortality Table.

Because the main actuarial assumption changed (mainly on discount rate and future salary increase rate), the present value of defined benefit obligation is affected. The analysis was as follows:

Discount rate

Future salary increases


Increase


Decrease


Increase


Decrease


0.25%


0.25%


0.25%


0.25%

December 31, 2021

Effect on present value of defined benefit obligation


$

(7)

$

7

$

7

$

(7)

December 31, 2022


Effect on present value of defined benefit obligation

$

(5)

$

5

$

5

$

(5)

The sensitivity analysis above is based on one assumption which changed while the other conditions remain unchanged. In practice, more than one assumption may change all at once. The method of analyzing sensitivity and the method of calculating net pension liability in the balance sheet are the same.

The methods and types of assumptions used in preparing the sensitivity analysis did not change compared to the previous period.

(f)Expected contributions to the defined benefit pension plans of Perfect Mobile Corp. (Taiwan) for the year ending December 31, 2023 amount to $5.
(g)As of December 31, 2022, the weighted average duration of the retirement plan is 24 years. The expected timing of the future pension payment was as follows:

Within 1 year


$

1-5 year(s)


Over 5 years


122

$

122

B.Defined contribution plans
(a)Perfect Mobile Corp. (Taiwan) has established a defined contribution pension plan (the “New Plan”) under the Labor Pension Act (the “Act”), covering all regular employees with R.O.C. nationality. Under the New Plan, Perfect Mobile Corp. (Taiwan) contributes monthly an amount based on 6% of the employees’ monthly salaries and wages to the employees’ individual pension accounts at the Bureau of Labor Insurance. The benefits accrued are paid monthly or in lump sum upon termination of employment.

(b)

The pension costs under defined contribution pension plan of Perfect Mobile Corp. (Taiwan) for the years ended December 31, 2020, 2021 and 2022 were $389, $468, and $ 501, respectively.

(c)The pension costs under local government law of other foreign subsidiaries for the years ended December 31, 2020, 2021 and 2022 were $90, $143, and $ 172, respectively.

F-34

Table of Contents

6(12)Share-based payment

A.Share Incentive Plan

On December 13, 2021, the Board approved and adopted the Share Incentive Plan to issue stock option of 30,000 thousand units.Prior to the recapitalization, each unit was eligible to subscribe for one Perfect Common Share.

In connection with the Recapitalization, an equitable adjustment has been made to the exercised price, number of shares and class of shares to be issued. The exercised price are changed from $0.7 (in dollars) to $3.95 (in dollars) per share. The maximum aggregate number of the Common Shares that may be issued upon exercise of all options to be granted under the Share Incentive Plan are 5,311 thousand Common Shares. After the recapitalization, 5.65 units are eligible to subscribe for one Perfect Common Share.

(a)For the year ended December 31, 2022, the Group’s Share Incentive Plan’s terms and condition were as follows:


Type of

Maximum terms of


Plan

arrangement

Settled by

option granted

Vesting conditions


Share Incentive Plan


Employee stock options


Equity


Five years


2 years’ service: exercise 50%

3 years’ service: exercise 75%

4 years’ service: exercise 100%

(b)Movements of outstanding options under Share Incentive Plan are as follows:

2022


Weighted- average

No. of options

exercise price per share 

(units in thousands)

(in dollars)

Options outstanding at January 1


$

Options granted


12,103


3.95

Options forfeited


(448)


3.95

Options exercised


Options outstanding at December 31


11,655


3.95

Options exercisable at December 31


(c)The weighted-average exercise price of stock options at exercise dates for the years ended December 31, 2022 was $3.95 (in dollars) per share.
(d)As of December 31, 2022, the exercise prices of stock options outstanding was $3.95 (in dollars) per share; the weighted-average remaining contractual period was 4.06 years.
(e)The fair value of stock options granted on grant date is measured using the Black-Scholes option-pricing model. Relevant information is as follows:


Adjusted 


Adjusted  

exercise

stock price

 price per 

Expected 

Risk-free

Fair value

Grant 

per share

share

price

Expected 

Expected 

interest 

per unit

Plan

date

(in dollars)

(in dollars)

volatility

option life

dividends

rate

(in dollars)

Share Incentive Plan

2022.1.21

$

5.39

$

3.95

53.75

%  

3.88

0.00

%  

1.46

%  

$

0.4893

Note: Expected price volatility rate was estimated by using historical volatility record of similar entities as the stock had no quoted market price.

F-35

Table of Contents

B.

Incentive Stock Option Plan

The Board of the Company has established two stock option plans, 2015 Incentive Stock Option Plan and 2018 Incentive Stock Option Plan (“Inventive Stock Option Plan”).

On November 22, 2021, the Company declared a notice pursuant to its Incentive Stock Option Plan. Based on the notice, all the unvested option shares granted by the Company to optionee becomes fully vested on November 22, 2021. The optionee may exercise the vested options within one month after November 22, 2021. Any options that are not exercised within such one month period shall be deemed cancelled and forfeited upon expiration of such period on December 22, 2021.On January 24, 2022, the Company has completed the conversion of 26,629 thousand of option shares to Perfect Common Shares and converted to Perfect Class A or Class B Ordinary Shares in connection with the Recapitalization.

(a)The following table illustrate the Group’s Incentive Stock Option plan’s original terms and condition:

Type of

Maximum terms of

Plan


Arrangement


Settled by


option granted


Vesting conditions

2015 Incentive Stock Option Plan


Employee stock options


Equity


Four years and one month


2 years’ service: exercise 50%


3 years’ service: exercise 75%


4 years’ service: exercise 100%

2018 Incentive Stock Option Plan


Employee stock options


Equity


Five years


2 years’ service: exercise 50%


3 years’ service: exercise 75%


4 years’ service: exercise 100%

(b)Movement of the Group’s Inventive Stock Option Plan prior to Recapitalization are as follows:

2020

2021

2022

Weighted-

Weighted-

Weighted-

No. of options

average exercise

No. of options

average exercise

No. of options

average exercise

(units in

price

(units in

price

(units in

price


thousands)


(in dollars)


thousands)


(in dollars)


thousands)


(in dollars)

Options outstanding at January

24,550

$

0.17

23,046

$

0.18

26,629

$

0.21

Options granted


8,388


0.27


Options forfeited


(399)


0.17


(1,681)


0.22


Options exercised

(1,105)

0.10

(3,124)

0.10

(26,629)

0.21

Options outstanding at December 31

23,046

0.18

26,629

0.21

Options exercisable at December 31


7,881


26,629


(c)The weighted-average exercise price of stock options for the years ended December 31, 2020, 2021 and 2022 were all $0.1 ~ $0.3 (in dollars).

(d)As of December 31, 2020 and 2021, the range of exercise prices of stock options outstanding were all $0.1 ~ $0.3 (in dollars); the weighted-average remaining contractual period was 1.71 ~ 3.33 years and 0 year, respectively.

F-36

Table of Contents

(e)The fair value of stock options granted on grant date is measured using the Black-Scholes option-pricing model. Relevant information is as follows:

Range of stock

Exercise

Range of

Expected

Range of risk

Range of fair

price

price

expected price

option

Expected

free interest

value per unit

Plan


(in dollars)


(in dollars)


volatility


life


dividends


rate


(in dollars)

2015 Incentive Stock Option Plan

$

0.0564~0.1777

$

0.1000

39.29%~42.25

%  

3.42

0.00

%  

0.45%~2.79

%  

$

0.0080~0.0947

2018 Incentive Stock Option Plan


0.1689~0.8931


0.3000

39.16%~53.27

%  

3.88

0.00

%  

0.58%~2.29

%  


0.0228~0.6397

Note:Expected price volatility rate was estimated by using historical volatility record of similar entities as the stock has no quoted market price.

C.Expenses incurred on share-based payment transactions are shown below:

Years ended December 31,

2020

2021

2022

Equity settled

$

336

$

1,782

$

2,175

D.The Group has service agreements with its Board of Directors to grant them awards of the Company’s Ordinary Shares at a fixed monetary value. Expense incurred for the year-ended December 31, 2022 was $58.
E.Shareholder Earnout

The Company executed additional capitalization by way of the potential issuance of Earnout Shares for Perfect shareholders. In accordance with Shareholder Earnout terms and conditions contemplated by the Business Combination Agreement, 3,000 thousand, 3,000 thousand and 4,000 thousand of the Shareholder Earnout Shares are issuable if over any 20 trading days within any 30-trading-day period during the Earnout Period when the daily volume-weighted average price of the Perfect Class A Ordinary Shares is greater than or equal to $11.50 (in dollars), $13.00 (in dollars) and $14.50 (in dollars), respectively.

Shareholder Earnout Shares are considered a potential contingent payment agreement with Shareholders, based on a market condition without link to service. Fair value of the Shareholder Earnout Shares is already reflected in Provident’s publicly quoted price that has been used to derive the estimated fair value of Perfect Ordinary Shares. It is included in the estimated fair value of the Perfect Ordinary shares as of the date of the recapitalization that was used to compute the listing charge. Accordingly, no separate adjustment to record fair value of the Shareholder Earnout is considered necessary, because the estimated fair value of such shares is already presumed to be reflected in the fair value of the Perfect shares. Please refer to Note 6(26) “Recapitalization”.

F.Sponsor Earnout

In connection with the Business Combination Agreement, the Company entered into a Sponsor Letter Agreement pursuant to which it agreed to issue Earnout shares to the Sponsors. Subject to the terms and conditions contemplated by the Sponsor Letter Agreement, upon the occurrence of specific Sponsor Earnout Event (as defined below) from October 28, 2022 to October 28, 2027 (“Earnout Period”), Perfect will issue Perfect Class A Ordinary Shares of up to 1,175,624 Class A Ordinary Shares(the “Sponsor Earnout Promote Shares”) to Sponsor, with (a) 50% of the Sponsor Earnout Promote Shares issuable if over any 20 trading days within any thirty-trading-day period during the Earnout Period the daily volume-weighted average price of the Perfect Class A Ordinary Shares is greater than or equal to $11.50 (in dollars), and (b) 50% of the Sponsor Earnout Promote Shares issuable if over any twenty (20) trading days within any thirty-trading-day period during the Earnout Period the daily volume-weighted average price of the Perfect Class A Ordinary Shares is greater than or equal to $13.00 (in dollars). None of these conditions had been met in the period up through December 31, 2022.

F-37

Table of Contents

Sponsor Earnout Promote Shares are considered a potential contingent payment agreement with Sponsor, based on a market condition without link to service. Thus, expense was recorded immediate on the grant date. Expense recorded for the year ended December 31, 2022 was $8,849. Please refer to Note 6(26) “Recapitalization”.

The expense was recognized under fair value and the Monte Carlo Simulation Model was used to estimate the fair value of Sponsor Earnout Promote Shares granted. Assumptions used in calculating the fair value are disclosed as follows:


Sponsor


Earnout


Shares


Expected dividend yield (%)


0.00

%

Expected volatility


70.00

%

Risk free interest rate


4.19

%

Expected life (years)


5

6(13) Share capital

As of December 31, 2022, the Company’s authorized capital is $82,000 consisting of 700,000 thousand shares of Class A Ordinary Shares, 90,000 thousand shares of Class B Ordinary Shares, 30,000 thousand shares of classes reserved and may determine by board of directors. The paid-in capital was $11,826, consisting of 101,475 thousand Class A Ordinary Shares and 16,789 thousand Class B Ordinary Shares with a par value of $0.1 (in dollars) per share. All proceeds from shares issued have been collected.

Perfect Class A Ordinary shares

Perfect Class A Ordinary shares have a par value of $0.1 (in dollars). Amounts received above the par value are recorded as share premium. Each holder of Perfect Class A ordinary shares will be entitled to one vote per share. Class A Ordinary Shares are listed on NYSE under the trading symbol “PERF”.

Perfect Class B Ordinary shares

Perfect Class B Ordinary shares have a par value of $0.1 (in dollars). Perfect Class B Ordinary Shares have the same rights as Perfect Class A Shares except for voting and conversion rights. Each Perfect Class B Ordinary Shares is entitled to 10 votes and is convertible into Perfect Class A Ordinary Shares at any time by the holder thereof. Each Class B Ordinary Share is convertible into one Class A Ordinary Share at any time at the option of the holder thereof. The right to convert shall be exercisable by the holder of the Class B Ordinary Share delivering a written notice to the Company that such holder elects to convert a specified number of Class B Ordinary Shares into Class A Ordinary Shares. Each Class B Ordinary Share shall, automatically and immediately, without any further action from the holder thereof, convert into one Class A Ordinary Share when it ceases being beneficially owned by any of the Principals. Class A Ordinary Shares are not convertible into Class B Ordinary Shares under any circumstances.

F-38

Table of Contents

The following table illustrates movement for the Company’s share capital:

Perfect Class A

Perfect Class B

Common Shares

Ordinary Shares

Ordinary Shares

Total

Shares

Shares

Shares

Note

(in thousand)

Amount

(in thousand)

Amount

(in thousand)

Amount

Amount

At January 1, 2020


313,562


$

31,356


$


$


$

31,356

Employee stock option exercised


1,105


111


111

Shares retired


B


(16,270)


(1,627)


(1,627)

At December 31, 2020


A


298,397


29,840


29,840

Employee stock option exercised


3,124


312


312

At December 31, 2021


A


301,521


30,152


30,152

Employee stock option exercised


26,629


2,663


2,663

Conversion as part of recapitalization


C


(328,150)


(32,815)


84,211


8,421


16,789


1,679


(22,715)

Shares Issuance to exchange Provident outstanding shares


D


17,264


1,726


1,726

At December 31, 2022


$


101,475

$

10,147


16,789

$

1,679

$

11,826

A.

The Company’s authorized capital was $82,000, consisting of 820,000 thousand shares of stock (including 45,000 thousand shares reserved for employee stock options as of December 31, 2020 and 2021.

As of December 31, 2020 and 2021, the Company’s paid-in capital was $29,840 and $30,152, consisting of 298,397 and 301,521 thousand shares of ordinary stock with a par value of $0.1 (in dollars) per share. All proceeds from shares issued have been collected.

B.

On December 11, 2020, the Board of Directors resolved to repurchase the Company’s outstanding common shares. These shares amounted to 16,270 thousand shares with a consideration in the amount of $10,000 was repurchased from the Company’s employees. The shares were retired on December 18, 2020. There were no shares repurchased by the Company in 2021.

F-39

Table of Contents

C.

Pursuant to the Business Combination Agreement, dated as of March 3, 2022, the outstanding Perfect Preferred Shares were automatically converted into Perfect Common Shares, then immediately such shares were canceled in exchange for 0.17704366 Perfect Class A and Class B ordinary shares on the Closing Date. The exchange of the Perfect Shares for the Perfect Class A and Class B ordinary shares is reflected in the table below.


Number of shares


Number of shares

Share type

(in thousand)

Share type

(in thousand)

before share

 before share

after share

 after share

combination

 combination

Conversion ratio

 conversion

 conversion

Common shares

241,650

0.17704366

Class A Ordinary Shares

42,782

Preferred share

234,003


41,429

Subtotal


475,653


84,211

Common shares


86,500


0.17704366


Class B Ordinary Shares


15,314

Preferred share


8,328


1,475

Subtotal


94,828


16,789

Total


570,481


101,000

In connection with the Recapitalization, the excess of the par value of the Perfect Common Shares and fair value of the Perfect Preferred shares on the Closing Date over the par value of the Perfect Class A and Class B Ordinary Shares were recognized as additional paid-in capital.

The following table illustrates the reconciliation of additional paid-in capital due to the conversions of the Perfect Shares and the Perfect Class A and Class B Ordinary Shares:


Additional

paid-in capital

Par value of the Perfect Common Shares

$

32,815

Fair value of the Perfect Preferred Shares on the Closing Date


358,238

Par value of the Class A and Class B Ordinary Shares


(10,100)

Subtotal


380,953

Listing expense


65,264

$

446,217

D.

In connection with the closing of the Business Combination, the Company issued (i) 17,264 thousand Perfect Class A Ordinary Share with a par value of $0.1 (in dollars) to former holders of Provident Ordinary Shares, including (a) 1,349 thousand Class A Ordinary Share to Public Shareholders who did not exercise their right to redeem any Provident Public Shares before the Closing, (b) 5,415 thousand Class A Ordinary Shares to the Sponsor and three directors and two advisors of Provident (c) 5,500 thousand Class A Ordinary Shares to FPA Investors and (d) 5,000 thousand Class A Ordinary Shares to PIPE Investors. (ii) 20,850 thousand Warrant to holders of Public Warrants, Private Placement Warrants and Forward Purchase Warrants for a total amount of $112,893.

The excess cash received over the par value of the Class A Ordinary Shares and the fair value of the warrants are accounted under the Company’s additional paid-in capital. The following table illustrates the reconciliation of the additional paid-in capital due to issuance of the Company’s Ordinary Shares.


Additional

paid-in capital

Proceed received upon recapitalization

$

112,893

Par value of the Class A Ordinary Shares


(1,726)

Fair value of the warrants at the Closing Date


(8,430)

Transactional cost  (presented as accrued expense of Provident at Closing)


(500)

$

102,237

Please refer to Note 6(26) “Recapitalization” for Private Placement Investor and Forward Purchase Agreement Investor. Please refer to Note 6(8) “Financial liability at fair value through profit or loss” for Forward Purchase Warrants.

F-40

Table of Contents

6(14) Capital surplus

Except as required by the Company’s Articles of Incorporation or Cayman’s law, capital surplus shall not be used for any other purpose but covering accumulated deficit. Capital surplus should not be used to cover accumulated deficit unless the legal reserve is insufficient.

The following tables illustrates the detail of Capital Surplus


December 31, 2021


December 31, 2022

Additional Paid-in Capital

$

308

$

554,209

Other


Employees’ stock option cost


2,563


2,162

Directors’ share-based compensation


58

Subtotal


2,563


2,220

$

2,871

$

556,429

The movement of the Additional Paid-in Capital for the year ended 2022 are as follows:


Additional

paid-in capital

At January 1, 2022

$

308

Issuance of the Perfect Class A Ordinary Shares


102,237

Conversion of Perfect common shares as part of the Recapitalization


380,953

Adjustment to the equity – listing expense


65,264

Employee stock options exercised


5,447

At December 31, 2022

$

554,209

In connection with the Recapitalization, the Company recognized additional paid-in capital of $446,217 due to conversion of Perfect Common Shares of $380,953 and the adjustment to the equity of $65,264. Please refer to Note 6(13) “Share capital” and Note 6 (26) “Recapitalization”.

6(15) Accumulated deficits

Under the Company’s Articles of Incorporation, distribution of earnings would be based on the Company’s operating and capital needs.

6(16) Revenue

Years ended December 31,

2020

2021

2022

Revenue from contracts with customers

$

29,873

$

40,760

$

47,300

F-41

Table of Contents

A.Disaggregation of revenue from contracts with customers
(a)The Group derives revenue from the transfer of goods and services over time and at a point in time in the following geographical regions:

United

2020

States

Japan

France

Others

Total

Revenue from external customer contracts

$

14,965

$

3,236

$

3,219

$

8,453

$

29,873

Timing of revenue recognition

At a point in time

$

5,711

$

961

$

1,102

$

2,955

$

10,729

Over time

9,254

2,275

2,117

5,498

19,144

$

14,965

$

3,236

$

3,219

$

8,453

$

29,873

United

2021

States

Japan

France

Others

Total

Revenue from external customer contracts

$

20,173

$

4,520

$

3,206

$

12,861

$

40,760

Timing of revenue recognition

At a point in time

$

5,114

$

676

$

771

$

2,331

$

8,892

Over time

15,059

3,844

2,435

10,530

31,868

$

20,173

$

4,520

$

3,206

$

12,861

$

40,760

United

2022

States

Japan

France

Others

Total

Revenue from external customer contracts

$

24,291

$

4,717

$

3,431

$

14,861

$

47,300

Timing of revenue recognition

At a point in time

$

5,126

$

871

$

590

$

1,979

$

8,566

Over time

19,165

3,846

2,841

12,882

38,734

$

24,291

$

4,717

$

3,431

$

14,861

$

47,300

(b)Alternatively, the disaggregation of revenue could also be distinct as follows:

Years ended December 31,

2020

2021

2022

AR/AI cloud solutions and Subscription

$

17,402

$

29,470

$

36,915

Licensing

10,679

8,857

8,432

Advertisement

1,742

2,398

1,819

Others (Note)

50

35

134

$

29,873

$

40,760

$

47,300

Note: Others are immaterial revenue streams to the Company.

(c)The revenue generated from AR/AI cloud solutions was $11,600, $17,834, and $ 20,685 for the years ended December 31, 2020, 2021 and 2022.

F-42

Table of Contents

B.Contract assets and liabilities
(a)The Group has recognized the following revenue-related contract assets mainly arose from unbilled receivables and contract liabilities mainly arose from sales contracts with receipts from customers in advance. Generally, the contract period is one year, the contract liabilities are reclassified as revenue within the following one year after the balance sheet date.


December 31, 2021


December 31, 2022

Contract assets:

Unbilled revenue

$

$

3,660

Contract liabilities:

Advance sales receipts

$

9,021

$

13,024

(b)Revenue recognized that was included in the contract liability balance at the beginning of the period


Years ended December 31,

2020

2021

2022

Revenue recognized that was included in the contract liability balance at the beginning of the period

Advance sales receipts

$

2,518

$

4,782

$

8,831

(c)Unsatisfied contracts

Aggregate amount of the transaction price allocated to contracts that are partially or fully unsatisfied as of December 31, 2021 and 2022, amounting to $ 25,825 and $ 23,653, respectively. The Group expects that 90% of the transaction price allocated to the unsatisfied contracts as of December 31, 2022, are expected to be recognized as revenue in the 2023 financial year. The remaining 10% is expected to be recognized as revenue from 2024 to 2027.

6(17) Interest income


Years ended December 31,

2020

2021

2022

Interest income from bank deposits

$

126

$

131

$

1,977

Interest income from financial assets at amortized cost


117


52

$

243

$

131

$

2,029

The nature of interest income from financial assets at amortized cost was time deposits with maturity over three months.

6(18) Other income


Years ended December 31,

2020

2021

2022

Subsidy from government

$

178

$

21

$

1

Others


13


97


74

$

191

$

118

$

75

F-43

Table of Contents

6(19) Other gains and losses


Years ended December 31,

2020

2021

2022

Foreign exchange (losses) gains

$

(770)

$

(893)

$

1,303

Losses on financial liabilities at fair value through profit or loss


(2,022)


(150,745)


(93,777)

$

(2,792)

$

(151,638)

$

(92,474)

Please refer to Note 6(8) for details of losses on financial liabilities at fair value through profit or loss.

6(20) Finance costs


Years ended December 31,

2020

2021

2022

Interest expense – lease liabilities

$

9

$

9

$

8

6(21) Costs and expenses by nature


Years ended December 31,

2020

2021

2022

Cost of goods sold

$

11

$

2

$

39

Employee benefit expenses


18,039


23,472


27,300

Promotional fees


6,511


10,841


7,517

Service providing expenses


2,548


4,286


5,518

Professional service fees


2,482


3,753


8,537

Warranty cost


780


734


897

Depreciation of right-of-use assets


306


389


456

Depreciation of property, plant and equipment


150


209


247

Insurance expenses

63

82

459

Amortization of intangible assets


36


47


63

Listing expense

65,264

Others


1,788


1,982


2,077

$

32,714

$

45,797

$

118,374

6(22) Employee benefit expenses

Years ended December 31,


2020

2021

2022

Wages and salaries

$

15,698

$

19,328

$

22,083

Remuneration to directors and supervisors

112

Employee insurance fees


1,105


1,218


1,376

Pension costs


480


613


676

Employee stock options


336


1,782


2,117

Other personnel expenses


420


531


936

$

18,039

$

23,472

$

27,300

F-44

Table of Contents

6(23) Income tax

A.Income tax expense


Years ended December 31,

2020

2021

2022

Current income tax:


Current tax expense recognized for the current period

$

371

$

300

$

390

Prior year income tax (over) under estimation


(50)


9


3

Total current tax


321


309


393

Deferred income tax:


Origination and reversal of temporary differences


(86)


(47)


(101)

Taxable losses


150


155


Total deferred income tax


64


108


(101)

Income tax expense

$

385

$

417

$

292

B.Reconciliation between income tax expense and accounting loss:


Years ended December 31,

2020

2021

2022

Tax calculated based on loss before tax and statutory tax rate (Note)

$

(418)

$

(1,132)

$

(368)

Effects from items disallowed by tax regulation


208


32


46

Effects from non-deductible offshore income tax


193


110


147

Tax exempt income by tax regulation


(14)


Temporary difference not recognized as deferred income tax assets


150


497


141

Prior year income tax (over) under estimation


(50)


9


3

Taxable loss not recognized as deferred income tax assets


173


893


638

Change in assessment of realization of deferred income tax assets


(136)


(301)

Effects from other states apart from where United States subsidiary registered


31


7


8

Effect from Japan provisional tax offsetting income tax


(5)


Others


253


1


(22)

Income tax expense

$

385

$

417

$

292

Note: The Company recognized preferred shares losses and listing expense. As a Cayman Islands corporation, the Company’s domestic statutory income tax rate is 0.0%. Hence, there was no tax impact to the Company. The difference between the Company’s domestic statutory income tax rate and its income tax expense is due to the effect of the tax rates in the other jurisdictions in which the Company operates. The basis for computing the applicable tax rate are the rates applicable in the respective countries where the Group entities operate.

The following table illustrates the statutory tax rates for significant jurisdictions that the Company operates:

Years ended December 31,


Jurisdictions

2020

2021

2022


United States (Federal/State)


21%/8.84

%  

21%/8.84

%  

21%/8.84

%  

Japan


37.47

%  

34.45

%  

35.73

%  

Taiwan


20

%  

20

%  

20

%  

F-45

Table of Contents

C.Amounts of deferred income tax assets or liabilities as a result of temporary differences and tax losses are as follows:


2021

Recognized in 

Net exchange 

January 1


profit or loss


differences


December 31

Deferred income tax assets:


 – Temporary differences:


Unrealized expenses

$

110

$

63

$

(15)

$

158

Unrealized exchange losses


14


(15)


(1)


(2)

Others


10


(1)


9

 – Taxable losses


165


(155)


(10)


$

299

$

(108)

$

(26)

$

165


2022


Recognized in


Net exchange


January 1


profit or loss


differences


 December 31

Deferred income tax assets:


 – Temporary differences:


Unrealized expenses

$

158

$

91

$

(21)

$

228

Unrealized exchange losses


(2)


2


Others


9


8


(1)


16

$

165

$

101

$

(22)

$

244

D.Expiration dates of unused taxable losses and amounts of unrecognized deferred income tax assets are as follows:


December 31, 2021


Amount filed/


Unrecognized deferred


Year incurred

assessed

Unused amount

income tax assets

Expiry year

2015

$

7,164

$

4,931

$

4,931

2025

2016

7,794

5,328

5,328

2022~2036

2017

5,572


5,522


5,522


2022~2037

2018

7,678


7,522


7,522


2027~no expiration

2019

918


918


918


2024~2029

2020

1,024


1,024


1,024


2030

2021

3,586

3,586

3,586

no expiration

$

33,736

$

28,831

$

28,831


December 31, 2022


Amount filed/


Unrecognized deferred


Year incurred


assessed


Unused amount


income tax assets


 Expiry year

2015

$

5,416

$

3,208

$

3,208

2025

2016

6,153

5,328

5,328

2026~2036

2017

5,099


5,099


5,099


2027~2037

2018

7,522


7,522


7,522


2028~no expiration

2019

918


918


918


2024~2029

2020

903


903


903


2030

2021

3,594


3,594


3,594


no expiration

2022

3,278

3,278

3,278

2027~no expiration

$

32,883

$

29,850

$

29,850

F-46

Table of Contents

E.The amounts of deductible temporary difference that are not recognized as deferred income tax assets are as follows:


December 31,


December 31,

2021

2022

Deductible temporary differences

$

2,400

$

614

6(24) Loss per share


Year ended December 31, 2020


Weighted average 


number of ordinary

Loss

 shares outstanding 

per share


Amount after tax


(share in thousands)


 (in dollars)

Basic loss per share


Loss attributable to ordinary shareholders of the parent

$

(5,593)


55,433

$

(0.10)

Dilutive loss per share


Loss attributable to ordinary shareholders of the Group plus assumed conversion of all dilutive potential ordinary shares

$

(5,593)


55,433

$

(0.10)


Year ended December 31, 2021


Weighted average 


number of ordinary 

Loss

shares outstanding

per share 

Amount after tax

 (share in thousands)

(in dollars)

Basic loss per share


Loss attributable to ordinary shareholders of the parent

$

(156,852)


52,965

$

(2.96)

Dilutive loss per share


Loss attributable to ordinary shareholders of the Group plus assumed conversion of all dilutive potential ordinary shares

$

(156,852)


52,965

$

(2.96)


Year ended December 31, 2022


Weighted average


 number of ordinary 

Loss

shares outstanding

 per share

Amount after tax


 (share in thousands)


 (in dollars)

Basic loss per share


Loss attributable to ordinary shareholders of the parent

$

(161,744)


68,337

$

(2.37)

Dilutive loss per share

Loss attributable to ordinary shareholders of the Group plus assumed conversion of all dilutive potential ordinary shares

$

(161,744)


68,337

$

(2.37)

Note: For the year ended December 31, 2022, there was 35,800 thousand potential shares outstanding to be issued, which were not included in the calculation of diluted earnings per share as their inclusion would have been anti-dilutive.

F-47

Table of Contents

6(25) Changes in liabilities from financing activities

2020

Financial liabilities

at fair value through

Lease liabilities (including

Liabilities from financing


profit or loss


current portion)


activities-gross

January 1

$

56,405

$

426

$

56,831

Changes in cash flow from financing activities


50,000


(305)


49,695

Net exchange differences


18


18

Change in fair value through profit and loss


2,022


2,022

Changes in other non-cash items – additions


201


201

December 31

$

108,427

$

340

$

108,767

2021

Financial liabilities

at fair value through

Lease liabilities (including

Liabilities from financing


profit or loss


current portion)


activities-gross

January 1


$

108,427


$

340


$

108,767

Changes in cash flow from financing activities


(393)


(393)

Net exchange differences


13


13

Change in fair value through profit and loss


150,745


150,745

Change in fair value through other comprehensive income

58

58

Changes in other non-cash items – additions


678


678

December 31


$

259,230


$

638


$

259,868


2022

Financial liabilities


at fair value through

Lease liabilities (including

Liabilities from financing

profit or loss


current portion)


activities-gross

January 1

$

259,230

$

638

$

259,868

Changes in cash flow from financing activities


(457)


(457)

Net exchange differences


(56)


(56)

Warrants assumed in connection with the Recapitalization

8,431

8,431

Exchange of preferred shares

(358,238)

(358,238)

Change in fair value through profit and loss


93,777


93,777

Change in fair value through other comprehensive income


7


7

Changes in other non-cash items – additions


213


213

December 31

$

3,207

$

338

$

3,545

6(26) Recapitalization

The Recapitalization has been accounted for with Provident being identified as the “acquired” entity for financial reporting purposes. Accordingly, the Recapitalization has been accounted for as the equivalent of Perfect issuing shares for the net assets of Provident, accompanied by a recapitalization by third party investors. The net assets of Provident were recognized at their net carrying amounts with no goodwill or other intangible assets.

F-48

Table of Contents

Perfect has been determined to be the accounting acquirer based on the evaluation of the following facts and circumstances:

the former owners of Perfect hold the largest portion of voting rights in the combined company;
Perfect has the right to appoint a majority of the directors in the combined company;
Perfect’s existing senior management team comprise a majority of management of the combined company;
the operations of Perfect represent the ongoing operations of the combined company; and
Perfect is the larger one of the combining entities based on the fair value, assets, revenues and profit/loss.

The acquisition of the net assets of Provident on the Closing Date does not meet the definition of a business combination under IFRS 3—Business Combinations and has therefore been accounted for within the scope of IFRS 2—Share-based Payments, with the former Provident shareholders receiving Perfect Class A Ordinary Shares based on Business Combination Agreement or requested redemption. The excess of fair value of Perfect Ordinary Shares issued over the fair value of Provident’s identifiable net assets acquired represents compensation for the service of a stock exchange listing for its shares and was expensed as incurred, the summary of which is as follows:

Listing expense

Net assets of Provident at Closing, excluding the impact of PIPE and FPA investors


$

63

Cash and cash equivalents

7,893


Accrued expenses

(500)

Warrant liabilities (Note i)

(7,330)

Total value of Perfect shares issued to Provident shareholders, excluding PIPE and FPA Investor (Note ii)

(56,478)

Adjustment to listing expense as result of Sponsor Earnout


(8,849)

$

(65,264)

Note i : The difference between $7,330 and the warrant liability of $8,431 in Note 6(8) is the value of the FPA warrants.

Note ii : The fair value was based on 6,764 thousand shares issued and the opening market price of Provident of $8.35 (in dollars) per share as of October 28, 2022.

The Recapitalization also involved:

Provident and certain investors (the “FPA Investors”) entered into certain FPA, pursuant to which the FPA Investors agreed to subscribe for and purchase, and Provident agreed to issue and sell to such FPA Investors, collectively, 5,500 thousand Provident Class A Ordinary Shares and 2,750 thousand warrants to purchase Provident Class A Ordinary Shares in consideration for an aggregate purchase price of $55,000 (the “FPA Investment”).
Certain investors (the “PIPE Investors”), entered into Subscription Agreements, pursuant to which, the PIPE Investors purchased, concurrently with the closing of the Transaction, in the aggregate, 5,000 thousand Provident Class A Shares for $10.00 (in dollars) per share, for an aggregate purchase price of $50,000 (the “PIPE Investment”).
Shares to be issued for Perfect shareholders pursuant to Business Combination Agreements and Shares to be issued for Provident pursuant to Sponsor Letter Agreement. Please refer to Note 6(12) Share-based payment.
Professional service expenditures of $1,594 and $5,888 incurred to facilitate listing on the NYSE for the years ended December 31, 2021 and 2022 which, in addition to the $65,264 listing expense described in the table above, has resulted in a total of $1,594 and $71,152 being recognized in profit or loss for the years ended December 31, 2021 and 2022.

F-49

Table of Contents

7.Related Party Transactions

7(1) Names of related parties and relationship

Names of related parties


Relationship with the Group


CyberLink Corp. (CyberLink)

Other related party (Significant influence (Note) over the reporting entity)

CyberLink Inc. (CyberLink-Japan)

Other related party (Subsidiary of CyberLink)

Note: CyberLink owns more than 30% of the reporting entity’s issued and outstanding ordinary shares.

7(2) Significant related party transactions

A.Revenue


Years ended December 31,

2020

2021

2022

Service revenue:


CyberLink


$

27


$

35


$

28

Sales of services are negotiated with related parties based on agreed-upon agreement and the conditions and payment terms are same as third parties.

B.Other payables

December 31, 2021

December 31, 2022

CyberLink


$

44


$

38

CyberLink-Japan


29


25


$

73


$

63

Other payables are mainly expenses from professional service, rental and payments on behalf of others.

C.Operating expenses


Years ended December 31,

Description


2020


2021


2022

CyberLink


Management service fee


$

157


$

128


$

80

CyberLink provides support and assistance in legal services, network infrastructure and equipment maintenance services, marketing activity supports and employee training programs. The service fees are calculated based on the agreed-upon hourly rate. The conditions and payment terms are same as third parties.

F-50

Table of Contents

D.Lease transactions — lessee/rent expense
(a)The Group leases offices from CyberLink and CyberLink-Japan. Rental contracts are typically made for periods of 1~2 years. The rents were paid to CyberLink and CyberLink-Japan at the beginning of next month and each quarter, respectively.
(b)Rent expense


Years ended December 31,

2020

2021

2022

CyberLink-Japan

$

91

$

99

$

90

(c)Acquisition of right-of-use assets:


Years ended December 31,

2020

2021

2022

CyberLink

$

$

530

$

(d)Lease liabilities
i.Outstanding balance:


December 31, 2021


December 31, 2022

Total lease liabilities

$

429

$

145

Less: Current portion (shown as ‘current lease liabilities’)


(268)


(145)

$

161

$

ii.Interest expense


Years ended December 31,

2020

2021

2022

CyberLink

$

4

$

4

$

5

7(3) Key management compensation

Years ended December 31,


2020

2021

2022

Salaries and other short-term employee benefits

$

1,691

$

1,711

$

2,330

Share-based payment


83


314


416

Post-employment benefits


11


12


11

$

1,785

$

2,037

$

2,757

The unpaid portion of the aforementioned information were $- and $112 for December 31, 2021 and 2022.

8.Pledged Assets

None.

9.Significant Contingent Liabilities and Unrecognized Contract Commitments

9(1) Contingencies

None.

F-51

Table of Contents

9(2) Commitments

Except for Notes 6(6), 6(8) and 7(2), there is no other significant commitments.

10.Significant Disaster Loss

None.

11.Significant Events After the Balance Sheet Date

None

12.Others

12(1) Coronavirus pandemic

Starting from January 2020, it was reported that a novel strain of coronavirus, later named COVID-19, spread worldwide. While the Group has not noted significant negative impact to the results of operations in 2020, 2021 and 2022, the extent to which COVID-19 impacts the business and financial results of the Group in the longer term will depend on future developments, which are uncertain and cannot be predicted, including new information which may emerge concerning the severity of the coronavirus and the actions to contain the coronavirus or treat its impact, among others. The Group will continue to evaluate the impact on the results of operation and financial position of the Group and react actively as the situation evolves.

12(2) Capital management

The Group’s objectives of capital management are to ensure the Group’s sustainable operation and to maintain an optimal capital structure to reduce the cost of capital and provide returns for shareholders. In order to maintain or adjust to optimal capital structure, the Group may adjust the amount of dividends paid to shareholders, return capital to shareholders, issue new shares or sell assets to reduce debt. The Group monitors capital on the basis of the gearing ratio. This ratio is calculated as total liabilities divided by total equity.

As of December 31, 2021 and 2022, the Group’s gearing ratios are as follows:


December 31, 2021


December 31, 2022

Total liabilities

$

279,346

$

28,309

Total equity

$

(190,442)

$

181,964

Gearing ratio


(1.47)


0.16

F-52

Table of Contents

12(3) Financial instruments 

A.Financial instruments by category


December 31, 2021


December 31, 2022

Financial assets


Financial assets at amortized cost


Cash and cash equivalents

$

80,453

$

162,616

Current financial assets at amortized cost

30,000

Accounts receivable


6,568


7,756

Other receivables (including related parties)


6


314

Guarantee deposits paid


135


125

$

87,162

$

200,811


December 31, 2021


December 31, 2022

Financial liabilities


Financial liabilities at fair value through profit or loss

Warrant liabilities

$

$

3,207

Financial liabilities designated as at fair value through profit or loss

259,230

$

259,230

$

3,207

Financial liabilities at amortized cost


Other payables (including related parties)

$

8,779

$

9,371

Guarantee deposits received


28


25

$

8,807

$

9,396

Lease liabilities

$

638

$

338

B.Financial risk management policies
(a)The Group’s activities expose it to a variety of financial risks: market risk (including foreign exchange risk), credit risk and liquidity risk. The Group’s overall risk management program focuses on the unpredictability of financial markets and seeks to minimize potential adverse effects on the Group’s financial position and financial performance.
(b)Risk management is carried out by a central treasury department (the Group’s finance department) under policies approved by the Board of Directors. The Group’s finance department identifies, evaluates and hedges financial risks in close co-operation with the Group’s operating units. The Board has written principles for overall risk management, as well as written policies covering specific areas and matters, such as foreign exchange risk, interest rate risk, credit risk, use of derivative and non-derivative financial instruments, and investment of excess liquidity.
C.Significant financial risks and degrees of financial risks
(a)Market risk

Foreign exchange risk

i.The Group operates internationally and is exposed to exchange rate risk arising from the transactions of the Company and its subsidiaries used in various functional currency, primarily with respect to the NTD, RMB, JPY and EUR. Exchange rate risk arises from future commercial transactions and recognized assets and liabilities.

F-53

Table of Contents

ii.The Group’s business involves some non-functional currency operations (the Company’s and certain subsidiaries’ functional currency: USD; other certain subsidiaries’ functional currency: NTD, JPY, RMB and EUR). Significant financial assets and liabilities denominated in foreign currencies are as follows:

December 31, 2021

Sensitivity analysis

Foreign


currency

Effect on

amount

Exchange

Functional

Book value

Degree of

profit or


(in thousands)


rate


currency


(USD)


variation


loss

Financial assets


Monetary items

USD:NTD

$

13,774


27.68

$

381,264

$

13,774


1

%  

$

138

EUR:NTD


1,888


31.32


59,132


2,136


1

%  


21

JPY:NTD


279,248


0.24


67,020


2,421


1

%  


24

Financial liabilities

Monetary items


USD:JPY


248


115.09


28,542


248


1

%  


2

USD:RMB


79


6.37


503


79


1

%  


1

December 31, 2022

Sensitivity analysis

Foreign

currency

Effect on

amount

Exchange

Functional

Book value

Degree of

profit or


(in thousands)

rate

currency

(USD)

variation

loss

Financial assets


Monetary items


USD:NTD

$

22,660


30.71

$

695,889

$

22,660


1

%  

$

227

EUR:NTD


833


32.72


27,256


888


1

%  


9

JPY:NTD


436,755


0.23


100,454


3,271


1

%  


33

Financial liabilities


Monetary items


USD:NTD

2,620

30.71

80,460

2,620

1

%  

26

USD:JPY


221


132.14


29,203


221


1

%  


2

USD:RMB


65


6.97


453


65


1

%  


1

iii.The total exchange (loss) gain, including realized and unrealized, arising from significant foreign exchange variation on the monetary items held by the Group for the years ended December 31, 2020, 2021 and 2022, amounted to $(770), $(893) and $1,303, respectively.
(b)Credit risk
i.Credit risk refers to the risk of financial loss to the Group arising from default by the clients or counterparties of financial instruments on the contract obligations. The main factor is that counterparties could not repay in full the accounts receivable based on the agreed terms and the financial assets at amortized cost.

F-54

Table of Contents

ii.The Group manages their credit risk taking into consideration the entire group’s concern. For banks and financial institutions, only independently rated parties with a minimum rating of ‘A’ are accepted. According to the Group’s credit policy, each local entity in the Group is responsible for managing and analyzing the credit risk for each of their new clients before standard payment and delivery terms and conditions are offered. Internal risk control assesses the credit quality of the customers, taking into account their financial position, past experience and other factors. Individual risk limits are set based on internal or external ratings in accordance with limits set by the Board of Directors. The utilization of credit limits is regularly monitored.
iii.The default occurs when the contract payments are past due over 180 days.
iv.The Group adopts following assumptions under IFRS 9 to assess whether there has been a significant increase in credit risk on that instrument since initial recognition:

If the contract payments were past due over 30 days based on the terms, there has been a significant increase in credit risk on that instrument since initial recognition.

v.The Group classifies customers’ accounts receivable in accordance with geographic area and credit rating of customer. The Group applies the modified approach to estimate expected credit loss under the provision matrix basis.
vi.The Group used the territory economic forecasts to adjust historical and timely information to assess the default possibility of accounts receivable.
vii.The loss amounts of accounts receivable allowance using simplified method were de minimis, thus, the loss was not recognized as at December 31, 2020, 2021 and 2022.
(c)Liquidity risk
i.Cash flow forecasting is performed in the operating entities of the Group and aggregated by the Group’s finance department. The Group’s finance department monitors rolling forecasts of the Group’s liquidity requirements to ensure it has sufficient cash to meet operational needs.
ii.Surplus cash held by the operating entities over and above balance required for working capital management are transferred to the Group’s finance department. The Group’s finance department invests surplus cash in interest bearing current accounts and time deposits, choosing instruments with appropriate maturities or sufficient liquidity to provide sufficient head-room as determined by the above-mentioned forecasts. As at December 31, 2021 and 2022, the Group held money market position of $ 78,391 and $191,077, respectively, which are expected to readily generate cash inflows for managing liquidity risk.
iii.The table below analyses the Group’s non-derivative financial liabilities based on the remaining period at the balance sheet date to the contractual maturity date. The amounts disclosed in the table are the contractual undiscounted cash flows.

Less than

Between 2-5

Over

Non-derivative financial liabilities: December 31, 2021

1 year

years

5 years

Financial liabilities at fair value through profit or loss

$

$

259,230

$

Other payables (including related parties)

8,779


Lease liabilities (Note)

456

190

Guarantee deposits received

28

F-55

Table of Contents

Less than

Between 2-5

Over

Non-derivative financial liabilities: December 31, 2022

1 year

years

5 years

Financial liabilities at fair value through profit or loss

$

$

3,207

$

Other payables (including related parties)

9,371

Lease liabilities (Note)

255

89

Guarantee deposits received

25

Note: The amount included the interest of estimated future payments.

12(4) Fair value information

A.The different levels that the inputs to valuation techniques are used to measure fair value of financial and non-financial instruments have been defined as follows:

Level 1: Quoted prices (unadjusted) in active markets for identical assets or liabilities that the entity can access at the measurement date. A market is regarded as active where a market in which transactions for the asset or liability take place with sufficient frequency and volume to provide pricing information on an ongoing basis.

Level 2: Inputs other than quoted prices included within Level 1 that are observable for the asset or liability, either directly or indirectly.

Level 3: Unobservable inputs for the asset or liability. The fair value of the Group’s compound instrument such as convertible preferred shares is included in Level 3.

B.The carrying amounts of the Group’s financial instruments not measured at fair value (including cash and cash equivalents, current financial assets at amortized cost, accounts receivable, other receivables (including related parties), guarantee deposits paid, accounts payable, other payables (including related parties) and guarantee deposits received) are approximate to their fair values.
C.The related information of financial instruments measured at fair value by level on the basis of the nature, characteristics and risks of the liabilities at December 31, 2021 and 2022 are as follows:
(a)The related information of natures of the liabilities is as follows:

December 31, 2021


Level 1


Level 2


Level 3


Total

Liabilities


Recurring fair value measurements


Financial liabilities at fair value through profit or loss


Compound instrument:


Convertible preferred shares

$

$

$

259,230

$

259,230

December 31, 2022


Level 1


Level 2


Level 3


Total

Liabilities


Recurring fair value measurements


Financial liabilities at fair value through profit or loss


Compound instrument:


Warrant liabilities

$

1,769

$

1,438

$

$

3,207

(b)The methods and assumptions the Group used to measure fair value are as follows:
i.Except those mentioned in point (ii) ~ (iv) below, the carrying amounts of the Group’s financial instruments not measured at fair value (including cash and cash equivalents, accounts receivable, other receivables, notes payable, accounts payable and other payables) approximate to their fair values. The fair value information of financial instruments measured at fair value is provided in Note 12(3).

F-56

Table of Contents

ii.Fair value of the Perfect Public Warrants is determined based on market quotation price.
iii.Fair value of the Perfect Private Placement Warrants and Forward Purchase Warrants are determined based on the Perfect Public Warrants with adjustments to the implied volatility.
iv.The methods and assumptions of fair value measurement are as follows:

Preferred share liabilities

The fair value measurement takes the following 2 methods into account:

(i)The recent fund raising prices as the first priority consideration if applicable.
(ii)If there are no recent fund raising prices as applicable, using market approach by considering market comparable entities and income approach to calculate total equity value first, and conduct equity value allocation via option pricing model under different scenarios (IPO and liquidation) to calculate probability weighted value of all classes of equities (including preferred shares).

In connection with the SPAC transaction closing on October 28, 2022, the fair value of preferred shares was measured based on the quoted market price which was viewed as the market participants’ expectations for the Company’s value.

D.The following chart is the movement of Level 3 for the years ended December 31, 2021 and 2022:


2021


2022

Compound

Compound

instrument:

instrument:

Convertible

Convertible

preferred shares

preferred shares

At January 1

$

108,427

$

259,230

Gains and losses recognized in profit or loss


Recorded as non-operating income and expenses


150,745


99,001

Gains and losses recognized in other comprehensive income


Recorded as credit risk changes in financial instrument through other comprehensive income


58


7

Transfers to Level 2


(358,238)

At December 31

$

259,230

$

E.Along with the insufficient observable market information became available in connection with the SPAC transaction closing on October 28, 2022, the Company transferred the fair value from Level 3 into Level 2 and preferred shares were automatically converted into Perfect Ordinary Shares immediately upon the closing.

For the year ended December 31, 2021, there was no transfer into or out from Level 3.

F-57

Table of Contents

F.The following is the qualitative information of significant unobservable inputs and sensitivity analysis of changes in significant unobservable inputs to valuation model used in Level 3 fair value measurement:


Fair value at

Valuation

unobservable

Relationship

December 31, 2021

technique

input

of inputs to fair value

Compound instrument:


Convertible preferred shares

$

259,230


Market approach


Discount for lack of marketability


The higher the discount for lack of marketability, the lower the fair value


Income approach


Weighted average cost of capital

The higher the weighted average cost of capital, the lower the fair value


Income approach


Exit multiple

The higher the exit multiple, the higher the fair value

The Company applied both market approach and income approach for valuation in 2021 due to the following facts:

(a)The Company has no recent fund raising prices as applicable in 2021.
(b)The Company has made decision and planned to become a listed company in the US capital market via merger transaction in July 2021. Hence, market approach by considering market comparable entities starts to be applicable for such circumstance. Please refer to Note 1 for the details of merger transaction.
(c)Considering the distinctness of the services and operations providing by the Company, there are seldom comparable entities provide exactly the same services and operations as the Company does. Hence, the Company took income approach into account as well.
(d)The market approach and income approach were used by giving a 50% weighting for both. The results under both approaches were immaterially deviated from each other which was below 30% difference range.
(e)The discount for lack of marketability was 10% as at December 31, 2021.
(f)The weighted average cost of capital was 13.73% as at December 31, 2021.
(g)The exit multiple was 6.93 times as at December 31, 2021.

F-58

Table of Contents

G.The Group has carefully assessed the valuation models and assumptions used to measure fair value. However, use of different valuation models or assumptions may result in different measurement. The following is the effect of profit or loss from financial liabilities categorized within Level 3 if the inputs used to valuation models have changed:

December 31, 2021

Recognized in profit or loss

Favourable 

Unfavourable 


Input


Change


change


change

Convertible preferred shares


Discount for lack of marketability


±1

%  

$

2,738


$

(2,763)

Weighted average cost of capital

±1

%  

$

4,556

$

(4,386)

Exit multiple

±1

%  

$

1,212

$

(1,212)

13.Segment Information

13(1) General information

Although the Group has multiple operating segments by geography, the management takes the aggregation criteria outlined in Paragraphs 11 to 14 of IFRS 8 into consideration to decide the reportable operating segments. In light of the qualitative and quantitative criteria, the Group concluded that it has only one reportable operating segment.

13(2) Geographical information

Geographical information for the years ended December 31, 2020, 2021 and 2022 is as follows:


Years ended December 31,

2020

2021

2022

Revenue

Revenue

Revenue

United States

$

14,965

$

20,173

$

24,291

Japan


3,236


4,520


4,717

France


3,219


3,206


3,431

Others


8,453


12,861


14,861

$

29,873

$

40,760

$

47,300

Geographical information on the revenue shows the location in which sales were generated. Non-current assets amounted to $1,127 and $731 as of December 31, 2021 and 2022, respectively.

Substantially all of the Company’s non-current assets, including property, plant and equipment, right-of-use assets and intangible assets, are located in Taiwan.

13(3) Major customer information

Major customer information of the Group (exceed 10% of revenue) for the years ended December 31, 2020, 2021 and 2022 is as follows:


Years ended December 31,

2020

2021

2022

Revenue

Revenue

Revenue

Client A

$

5,708

$

5,869

$

5,195

F-59