Table of Contents
UNITED STATES
SECURITIES AND EXCHANGE COMMISSION
Washington, D.C. 20549
SCHEDULE 14A INFORMATION
Proxy Statement Pursuant to Section 14(a) of the
Securities Exchange Act of 1934
(Amendment No. )
Filed by the Registrant ☒ Filed by a Party other than the Registrant ☐
Check the appropriate box:
| ☐ | Preliminary Proxy Statement | |||
| ☐ | Confidential, for Use of the Commission Only (as permitted by Rule 14a-6(e)(2)) | |||
| ☒ | Definitive Proxy Statement | |||
| ☐ | Definitive Additional Materials | |||
| ☐ | Soliciting Material under §240.14a-12 | |||
CENTURYLINK, INC. | ||||
| (Name of registrant as specified in its charter) | ||||
| (Name of person(s) filing proxy statement, if other than the registrant) | ||||
| Payment of Filing Fee (Check the appropriate box): | ||||
| ☒ | No fee required. | |||
| ☐ | Fee computed on table below per Exchange Act Rules 14a-6(i)(4) and 0-11. | |||
| (1) | Title of each class of securities to which transaction applies: | |||
|
| ||||
| (2) | Aggregate number of securities to which transaction applies: | |||
|
| ||||
| (3) | Per unit price or other underlying value of transaction computed pursuant to Exchange Act Rule 0-11 (set forth the amount on which the filing fee is calculated and state how it was determined): | |||
|
| ||||
| (4) | Proposed maximum aggregate value of transaction: | |||
|
| ||||
| (5) | Total fee paid: | |||
|
| ||||
| ☐ | Fee paid previously with preliminary materials. | |||
| ☐ | Check box if any part of the fee is offset as provided by Exchange Act Rule 0-11(a)(2) and identify the filing for which the offsetting fee was paid previously. Identify the previous filing by registration statement number, or the Form or Schedule and the date of its filing. | |||
| (1) | Amount Previously Paid: | |||
|
| ||||
| (2) | Form, Schedule or Registration Statement No.: | |||
|
| ||||
| (3) | Filing Party: | |||
|
| ||||
| (4) | Date Filed: | |||
|
| ||||
Table of Contents

2017 Notice of Annual Meeting
and Proxy Statement
and
Annual Financial Report
May 24, 2017
10:00 a.m. local time
100 CenturyLink Drive
Monroe, Louisiana
Table of Contents
IMPORTANT NOTICE REGARDING THE AVAILABILITY OF PROXY MATERIALS FOR THE ANNUAL MEETING OF SHAREHOLDERS TO BE HELD ON MAY 24, 2017
This proxy statement and related materials are
available at www.envisionreports.com/ctl.
All references in this proxy statement or related materials to “we,” “us,” “our,” the “Company” or “CenturyLink” refer to CenturyLink, Inc. In addition, each reference to (i) the “Board” refers to our Board of Directors, (ii) our “executives” or “executive officers” refers to our nine executive officers listed in the tables beginning on page 3 of this proxy statement, (iii) “meeting” refers to the 2017 annual meeting of our shareholders described further herein, (iv) “named executives,” “named officers,” “named executive officers” or “NEOs” refers to the five executive officers listed in the Summary Compensation Table appearing on page 52 of this proxy statement, (v) “senior officers” refers to our executive officers and a limited number of additional officers whose compensation is determined by the Human Resources and Compensation Committee of our Board, (vi) “Embarq” refers to Embarq Corporation, which we acquired on July 1, 2009, (vii) “Qwest” refers to Qwest Communications International Inc., which we acquired on April 1, 2011, (viii) “Savvis” refers to Savvis, Inc., which we acquired on July 15, 2011, (ix) “Level 3” refers to Level 3 Communications, Inc., which we expect to acquire by the end of the third quarter of 2017, and (x) the “SEC” refers to the U.S. Securities and Exchange Commission. When used herein, “consolidated free cash flow” shall have the meaning ascribed to it in our quarterly earnings releases and “consolidated operating cash flow,” “consolidated core revenue” and “absolute revenue” shall have the meanings ascribed to them herein under the heading “Compensation Discussion and Analysis.” Unless otherwise provided, all information is presented as of the date of this proxy statement.
Table of Contents
CenturyLink, Inc.
100 CenturyLink Drive
Monroe, Louisiana 71203
Notice of Annual Meeting of Shareholders
| TIME AND DATE | 10:00 a.m. local time on May 24, 2017 | |
| PLACE | Corporate Conference Room CenturyLink Headquarters 100 CenturyLink Drive Monroe, Louisiana | |
| ITEMS OF BUSINESS | (1) Elect as directors the nine nominees named in the accompanying proxy statement | |
| (2) Ratify the appointment of KPMG LLP as our independent auditor for 2017 | ||
| (3) Conduct non-binding advisory votes: | ||
| (a) to approve our executive compensation | ||
| (b) regarding the frequency of our executive compensation votes | ||
| (4) Act upon three separate shareholder proposals if properly presented at the meeting | ||
| (5) Transact such other business as may properly come before the meeting and any adjournment. | ||
| RECORD DATE | You can vote if you were a shareholder of record on April 7, 2017. | |
| PROXY VOTING | Shareholders are invited to attend the meeting in person. Even if you expect to attend, it is important that you vote by telephone or the Internet, or by completing and returning a proxy or voting instruction card. | |

Stacey W. Goff
Secretary
April 10, 2017
Table of Contents
| Page | ||||
| 1 | ||||
| 3 | ||||
| 8 | ||||
| 8 | ||||
| 10 | ||||
| 10 | ||||
| 11 | ||||
| 14 | ||||
| 14 | ||||
| 14 | ||||
| 14 | ||||
| 15 | ||||
| 16 | ||||
| 17 | ||||
| ADVISORY VOTES ON EXECUTIVE COMPENSATION AND THE FREQUENCY OF SUCH VOTES |
18 | |||
| 20 | ||||
| 27 | ||||
| 27 | ||||
| 28 | ||||
| 29 | ||||
| 29 | ||||
| Our Compensation Philosophy and Linkage to Pay for Performance |
31 | |||
| 36 | ||||
| Our Policies, Processes and Guidelines Related to Executive Compensation |
46 | |||
| 51 | ||||
| 52 | ||||
| 52 | ||||
| 53 | ||||
| 57 | ||||
| 59 | ||||
| 60 | ||||
| 64 | ||||
| 64 | ||||
| 66 | ||||
| 66 | ||||
| 67 | ||||
| 68 | ||||
| 69 | ||||
| 69 | ||||
| 69 | ||||
| 69 | ||||
| 69 | ||||
| 70 | ||||
| 70 | ||||
| 70 | ||||
| 70 | ||||
| 70 | ||||
| 70 | ||||
i
Table of Contents
| Page | ||||
| 70 | ||||
| 71 | ||||
| 71 | ||||
| 71 | ||||
| 71 | ||||
| 72 | ||||
| 72 | ||||
| Deadlines for Submitting Shareholder Nominations and Proposals for the 2018 Annual Meeting |
72 | |||
| 72 | ||||
| 73 | ||||
| A-1 | ||||
ii
Table of Contents
CenturyLink, Inc.
100 CenturyLink Drive
Monroe, Louisiana 71203
PROXY STATEMENT
April 10, 2017
GENERAL INFORMATION ABOUT THE ANNUAL MEETING
Why am I receiving these proxy materials?
Our Board of Directors is soliciting your proxy to vote at our 2017 annual meeting of shareholders because you owned shares of our stock at the close of business on April 7, 2017, the record date for the meeting, and are entitled to vote those shares at the meeting. Our proxy materials are being made available to you on the Internet beginning on or about April 13, 2017. This proxy statement summarizes information regarding matters to be considered at the meeting. For additional information on our proxy materials, see “Other Matters — Proxy Materials” appearing below.
When and where will the meeting be held?
The meeting will be held at 10:00 a.m. local time on Wednesday, May 24, 2017, in the corporate conference room at our corporate headquarters, 100 CenturyLink Drive, Monroe, Louisiana. If you would like directions to the meeting, please see our website, http://ir.centurylink.com. You do not need to attend the meeting to vote your shares.
What matters will be considered at the meeting?
Shareholders will vote on the following matters at the meeting:
| Item and Page Reference |
Board Voting Recommendation |
Vote Required for Approval | ||
| • Election of the nine director nominees named herein (Item 1, Page 3) |
For each nominee | Affirmative vote of a majority of the votes cast | ||
| • Ratification of the appointment of KPMG LLP as our independent auditor for 2017 (Item 2, Page 16) |
For | Affirmative vote of a majority of the votes cast | ||
| • Non-binding advisory vote to approve our executive compensation (Item 3(a), Page 18) |
For | Affirmative vote of a majority of the votes cast | ||
| • Non-binding advisory vote regarding the frequency of our executive compensation votes (Item 3(b), Page 19) |
One Year | Plurality of the votes cast | ||
| • A shareholder proposal regarding our equity retention policies, as further described in this proxy statement, if it is properly presented at the meeting (Item 4(a), Page 20) |
Against | Affirmative vote of a majority of the votes cast | ||
| • A shareholder proposal regarding our lobbying activities, as further described in this proxy statement, if it is properly presented at the meeting (Item 4(b), Page 22) |
Against | Affirmative vote of a majority of the votes cast | ||
| • An additional shareholder proposal regarding our lobbying activities, as further described in this proxy statement, if it is properly presented at the meeting (Item 4(c), Page 24) |
Against | Affirmative vote of a majority of the votes cast |
1
Table of Contents
How many votes may I cast?
You may cast one vote for every share of our common stock or Series L preferred stock that you owned on the record date. Our common stock and Series L preferred stock vote together as a single class on all matters. In this proxy statement, we refer to these shares as our “Common Shares” and “Preferred Shares,” respectively, and as our “Voting Shares,” collectively. As of the record date, we had 548,863,468 Common Shares and 7,018 Preferred Shares outstanding.
What is the difference between holding shares as a shareholder of record and as a beneficial owner?
If shares are registered in your name with our transfer agent, Computershare Investor Services L.L.C., you are the “shareholder of record” of those shares and you may directly vote these shares, together with any shares credited to your account if you are a participant in our automatic dividend reinvestment and stock purchase service.
If your shares are held on your behalf in a stock brokerage account or by a bank or other nominee, you are the “beneficial owner” of shares held in “street name.” We have requested that our proxy materials be made available to you by your broker, bank or nominee, who is considered the shareholder of record of those shares.
If I am a shareholder of record, how do I vote?
If you are a shareholder of record, you may vote in person at the meeting or by proxy in any of the following three ways:
| • | call 1-800-652-8683 and follow the instructions provided; |
| • | log on to the Internet at www.envisionreports.com/ctl and follow the instructions at that site; or |
| • | request a paper copy of our proxy materials and, following receipt thereof, mark, sign and date your proxy card and return it to Computershare. |
Please note that you may not vote by telephone or the Internet after 1:00 a.m. Central Time on May 24, 2017.
If I am a beneficial owner of shares held in street name, how do I vote?
As the beneficial owner, you have the right to instruct your broker, bank or nominee how to vote your shares by using any voting instruction card supplied by them or by following their instructions for voting by telephone, the Internet, or in person.
If I am a benefit plan participant, how do I vote?
Please see “Additional Information About the Meeting — Voting by Participants in Our Benefit Plans” appearing below.
Do I need identification to attend the meeting in person?
Yes. Please bring proper identification, together with the Important Notice Regarding Availability of Proxy Materials mailed to you, which will serve as your admission ticket. If your shares are held in street name, please bring acceptable proof of ownership, such as a letter from your broker or an account statement stating or showing that you beneficially owned Voting Shares on the record date.
Where can I find additional information about the conduct of the meeting, voting requirements, and other similar matters relating to the meeting?
Please see “Additional Information About the Meeting” appearing below.
2
Table of Contents
(Item 1 on Proxy or Voting Instruction Card)
The first proposal for consideration at the meeting is the election of each of the nine candidates named below as a director for a one-year term expiring at our 2018 annual meeting of shareholders, or until his or her successor is duly elected and qualified.
Acting upon the recommendation of its Nominating and Corporate Governance Committee, the Board has nominated the nine below-named directors to stand for re-election to one-year terms at the meeting. Unless authority is withheld, all votes attributable to Voting Shares represented by each duly executed and delivered proxy will be cast for the election of each of the nine below-named nominees. Under our bylaw nominating procedures, these nominees are the only individuals who may be elected at the meeting. For additional information on our nomination process, see “Corporate Governance — Director Nomination Process.” If for any reason any such nominee should decline or become unable to stand for election as a director, which we do not anticipate, the persons named as proxies may vote instead for another candidate designated by the Board, without re-soliciting proxies.
As discussed further under “Additional Information About the Meeting — Vote Required to Elect Directors,” to be elected each of the nine nominees must receive an affirmative vote of a majority of the votes cast.
Nominees For Election to the Board:
Listed below is information on each of the nine individuals nominated to stand for election to the Board.
The Board recommends that you vote “FOR” each of the following nominees:
|
|
Martha H. Bejar, age 55; a director since January 2016; co-founder and principal of Red Bison Advisory Group LLC, a telecommunications and technology advisory firm founded in early 2014; Chief Executive Officer and director of Flow Mobile, Inc., a telecommunications company offering rural broadband wireless access services, from January 2012 to December 2015; venture partner at The Prometheus Partners, a business services company, from April 2012 to May 2014; Chairperson and Chief Executive Officer of Wipro Infocrossing Inc., a U.S.-based cloud services affiliate of Wipro Limited, from January 2011 to March 2012; President of Worldwide Sales and Operations at Wipro Technologies Inc., an IT services affiliate of Wipro Limited, from June 2009 to January 2011; Corporate Vice President for the communications sector at Microsoft Corporation, from June 2007 to June 2009; held various positions at Nortel Networks Corporation, a telecommunications and data networking company, from 1997 to 2007, including Regional President and President of North America Sales, Sales Engineering and Sales Operations; currently a director of Mitel Networks Corporation; formerly a director of Polycom, Inc. within the past five years.
Key Qualifications, Experiences and Skills:
• Executive experience in communications and technology industries
• Experience as a former chief executive officer
• International business and engineering experience
• Qualifies as an “audit committee financial expert”
• Director of another publicly-held company |

3
Table of Contents
|
|
Virginia Boulet, age 63; a director since 1995; a managing director at Legacy Capital LLC, an investment banking firm based in New Orleans, Louisiana, since March 2014; Special Counsel at Adams and Reese LLP, a law firm, from 2002 to March 2014; prior to then, practiced as a corporate and securities attorney for Phelps Dunbar, L.L.P. from 1992 to 2002 and Jones Walker LLP from 1983 to 1992; an adjunct professor of securities regulation law and merger and acquisition law at Loyola University-New Orleans College of Law since 2004; currently a director of W&T Offshore, Inc.
Key Qualifications, Experiences and Skills:
• Legal experience representing telecommunications companies and regarding business combinations
• Director of another publicly-held company | |
|
|
Peter C. Brown, age 58; a director since 2009; Chairman of Grassmere Partners, LLC, a private investment firm, since July 2009; held several executive level positions, including Chairman of the Board, President and Chief Executive Officer, with AMC Entertainment Inc., a theatrical exhibition company, from 1991 to 2009; founded EPR Properties, a NYSE-listed real estate investment trust formerly known as Entertainment Properties Trust, in 1997 and served as a member of the Board of Trustees until 2003; currently a director of EPR Properties and Cinedigm Corp.; formerly a director of National CineMedia, Inc. within the past five years.
Key Qualifications, Experiences and Skills:
• Experience as a former chief executive of a publicly-held company
• Qualifies as an “audit committee financial expert”
• Director of other publicly-held companies | |
|
|
W. Bruce Hanks, age 62; a director since 1992; a consultant with Graham, Bordelon, Golson and Gilbert, Inc., an investment management and financial planning company, since 2005; Athletic Director of the University of Louisiana at Monroe from 2001 to 2004; held various executive positions at CenturyLink from 1980 through 2001, most notably Chief Operating Officer, Senior Vice President — Corporate Development and Strategy, Chief Financial Officer, and President — Telecommunications Services; worked as a certified public accountant with Peat, Marwick & Mitchell for three years prior to then; currently an advisory director of IberiaBank Corporation; also served in the past on the executive boards of several telecommunications industry associations and the boards of other publicly-held companies.
Key Qualifications, Experiences and Skills:
• Prior executive experience with, and historical knowledge of, our Company
• Former experience as a certified public accountant
• Qualifies as an “audit committee financial expert”
• Prior experience as a director of other publicly-held companies |


4
Table of Contents
|
|
Mary L. Landrieu, age 61; a director since November 2015; senior policy advisor at Van Ness Feldman, LLP, a Washington D.C.-based law firm, since May 2014; policy advisor at Walton Family Foundation, a philanthropic organization focused on improving K-12 education and supporting economic incentives for sustainable resource management, from 2014 to 2016; U.S. Senator from the State of Louisiana from 1996 to 2014, where she chaired the Senate Committee on Energy and Natural Resources, served on the Senate Committee on Appropriations, chaired the Subcommittees on Homeland Security, Financial Services and General Government, and the District of Columbia, chaired the Senate Committee on Small Business and Entrepreneurship, served on the Senate Committee on Homeland Security and chaired the Subcommittee on Disaster Recovery; Louisiana state treasurer from 1988 to 1996; Louisiana state legislative representative from 1980 to 1988; currently serves on the board of trustees or board of directors of several national organizations promoting education or children’s welfare.
Key Qualifications, Experiences and Skills:
• Governmental and government relations experience
• Public policy and governmental finance experience | |
|
|
Harvey P. Perry, age 72; a director since 1990; non-executive Vice Chairman of the Board of Directors of CenturyLink since 2004; retired from CenturyLink in 2003; joined CenturyLink in 1984, serving as Secretary and General Counsel for approximately 20 years and Executive Vice President and Chief Administrative Officer for almost five years; prior to then, worked as an attorney in private practice for 15 years.
Key Qualifications, Experiences and Skills:
• Prior executive experience with, and historical knowledge of, our Company
• Legal experience representing telecommunications companies | |
|
|
Glen F. Post, III, age 64; a director since 1985; Chief Executive Officer of CenturyLink since 1992, and President since 2009 (and from 1990 to 2002); Chairman of the Board of CenturyLink between 2002 and 2009; Vice Chairman of the Board of CenturyLink between 1993 and 2002; held various other positions at CenturyLink between 1976 and 1993, most notably Treasurer, Chief Financial Officer and Chief Operating Officer.
Key Qualifications, Experiences and Skills:
• Executive experience in the telecommunications business
• Experience as our chief executive | |
|
|
Michael J. Roberts, age 66; a director since 2011; co-founder of LYFE Kitchen, an emerging chain of lifestyle restaurants, serving as a board member since May 2014 and as Chief Executive Officer from February 2011 to May 2014; Chief Executive Officer and founder of Westside Holdings LLC, a marketing and brand development company, from 2006 to 2013; served as President and Chief Operating Officer of McDonald’s Corporation, a foodservice retailer, from 2004 to 2006; served as Chief Executive Officer of McDonald’s USA during 2004 and as President of McDonald’s USA from 2001 to 2004; currently a director of W.W. Grainger, Inc.
Key Qualifications, Experiences and Skills:
• Experience as a chief executive
• Marketing and branding expertise
• Director of another publicly-held company |


5
Table of Contents
|
|
Laurie A. Siegel, age 61; a director since 2009; a business and human resources consultant since 2012; retired in September 2012 from Tyco International Ltd., a diversified manufacturing and service company, where she served as Senior Vice President of Human Resources and Internal Communications since 2003; held various positions with Honeywell International Inc. from 1994 to 2002, including Vice President of Human Resources — Specialty Materials; prior to then, was director of global compensation at Avon Products and a principal of Strategic Compensation Associates; currently a director of FactSet Research Systems Inc. and Volt Information Sciences, Inc.
Key Qualifications, Experiences and Skills:
• Executive experience with a multi-national company
• Human resources and executive compensation expertise
• Director of other publicly-held companies |

Executive Officers Who Are Not Directors:
Listed below is information on each of our executive officers who are not directors. Unless otherwise indicated, each person has been engaged in the principal occupation shown for more than the past five years.
|
|
David D. Cole, age 59; Executive Vice President — Controller and Operations Support since May 2013; served as Senior Vice President — Controller and Operations Support from April 2011 to May 2013 and as Senior Vice President — Operations Support from 1999 to April 2011. | |
|
|
Dean J. Douglas, age 59; President — Enterprise Markets since January 2017; President — Sales and Marketing from February 2016 to January 2017; served as Chief Executive Officer at Unify GmbH & Co. KG, a provider of software-based enterprise unified communications services from January 2014 to January 2016; served in senior leadership positions at Westcon Group, Inc., a distributor of unified communications and security services, including President and Chief Executive Officer from April 2009 to January 2014 and Chief Operating Officer from June 2008 to March 2009; served as President and Chief Executive Officer at LCC International, Inc., a telecommunications services company, from October 2005 to June 2008; prior to then held leadership roles throughout his career at IBM Global Services, Motorola, Inc. and Newleaf Entertainment. | |
|
|
R. Stewart Ewing, Jr., age 65; Executive Vice President and Chief Financial Officer since 1999 and, in addition, Assistant Secretary since 2009; served as Senior Vice President and Chief Financial officer from 1989 to 1999; held various other positions at CenturyLink between 1983 and 1989, most notably Controller and Vice President of Finance. Upon completion of our pending acquisition of Level 3, Mr. Ewing plans to retire and Sunit Patel, Level 3’s Executive Vice President and Chief Financial Officer, plans to serve as our chief financial officer. |


6
Table of Contents
|
|
Stacey W. Goff, age 51; Executive Vice President, General Counsel and Secretary since 2009 and, in addition, Chief Administrative Officer since November 1, 2014; served as Senior Vice President, General Counsel and Secretary prior to 2009. | |
|
|
Aamir Hussain, age 49; Executive Vice President, Chief Technology Officer since October 2014; served as Managing Director and Chief Technology Officer for the Europe division at Liberty Global plc from February 2012 to October 2014; served as Senior Vice President and Chief Technology Officer at Covad Communications from October 2008 to February 2012; prior to then he held leadership and technology design roles throughout his career at TELUS Corporation, Qwest, BellSouth Corporation, Samsung Electronics Co. Ltd. and Motorola Solutions Inc. | |
|
|
Maxine L. Moreau, age 55; President — Consumer Markets since January 2017; Executive Vice President — Global Operations and Shared Services from November 2014 to January 2017; served as Executive Vice President — Network Services from May 2013 to October 2014; served as Senior Vice President — Network Services from May 2012 to May 2013, as Senior Vice President, Integration and Process Improvement from 2010 to May 2012, and as Senior Vice President, Centralized Operations, from 2009 to 2010. | |
|
|
Scott A. Trezise, age 48; Executive Vice President — Human Resources since August 2013; served as Senior Vice President — Human Resources for The Shaw Group, Inc. from June 2010 until its acquisition by Chicago Bridge & Iron Company N.V. in February 2013; served as Vice President of Human Resources for Honeywell International Inc. from 2005 to June 2010. | |
|
|
Girish K. Varma, age 67; President — IT and Managed Services since January 2017; President — Global Information Technology Services and New Market Development from November 2014 to January 2017; served as Executive Vice President of Information Technology from 2011 to October 2014; served as Senior Vice President and Chief Information Officer of Qwest prior to then. |


7
Table of Contents
Our Board has adopted corporate governance guidelines, which it reviews at least annually. For information on how you can obtain a complete copy of our guidelines, see “— Access to Information” below.
Among other things, our corporate governance guidelines provide as follows:
Director Qualifications
| • | The Board of Directors will have a majority of independent directors. The Nominating and Corporate Governance Committee is responsible for reviewing with the Board, on an annual basis, the requisite skills and characteristics of new Board members as well as the composition of the Board as a whole. |
| • | The Board expects directors who change the job or responsibility they held when they were elected to the Board to volunteer to resign from the Board. |
| • | On the terms and subject to the conditions specified in our bylaws, directors will be elected by a majority vote of the shareholders and any incumbent director failing to receive a majority of votes cast must promptly tender his or her resignation to the Board. |
| • | No director may serve on more than two other unaffiliated public company boards, unless this prohibition is waived by the Board. |
| • | No director may be appointed or nominated to a new term if he or she would be age 75 or older at the time of the election or appointment. |
| • | Annually, the Board will determine affirmatively which of our directors are independent for purposes of complying with our corporate governance guidelines and the listing standards of the New York Stock Exchange, or NYSE. A director will not be independent for these purposes unless the Board affirmatively determines that the director does not, either directly or indirectly through the director’s affiliates or associates, have a material commercial, banking, consulting, legal, accounting, charitable, familial or other relationship with the Company or its affiliates, other than as a director. |
Director Responsibilities
| • | The Board periodically reviews our long-term strategic plans and holds strategic planning sessions. |
| • | Directors are required to hold confidential all non-public information obtained due to their directorship position absent the express permission of the Board to disclose such information. |
| • | Unless otherwise determined by the Board, when a management director retires or ceases to be an active employee for any other reason, that director will be considered to have resigned concurrently from the Board. |
Chairman; Lead Outside Director
| • | The Board elects a Chairman from among its members. The Chairman may be a director who also has executive responsibilities, including the CEO (an executive chair), or may be one of the Company’s independent directors (a non-executive chair). The Board believes it is in the best interests of the Company for the Board to remain flexible with respect to whether to elect an executive chair or a non-executive chair so that the Board may provide for succession planning and respond effectively to changes in circumstances. |
| • | The non-management directors meet in executive session at least quarterly. The lead outside director elected by the independent directors may call additional meetings of the non-management directors at |
8
Table of Contents
| any time. At all times during which the Chairman is a non-executive chair, all of the functions and responsibilities of the lead outside director shall be performed by the non-executive chair. |
CEO Evaluation and Management Succession
| • | The Nominating and Corporate Governance Committee conducts an annual review of the CEO’s performance and provides a report of its findings to the Board. |
| • | The Nominating and Corporate Governance Committee reports periodically to the Board on succession planning. |
Recoupment of Compensation
| • | If the Board or any committee of the Board determines that any bonus, incentive payment, commission, equity award or other compensation awarded to or received by an executive officer was based on any financial or operating result that was impacted by the executive officer’s knowing or intentional fraudulent or illegal conduct, we may recover from the executive officer the compensation the Board or any committee of the Board considers appropriate under the circumstances. |
Stock Ownership Guidelines
| • | We require our executive officers to beneficially own CenturyLink stock equal in market value to specified multiples of their annual base salary. All executive officers have three years from the date they first become subject to a particular ownership level to attain that target. |
| • | We require our outside directors to beneficially own CenturyLink stock equal in market value to five times their annual cash retainer. Outside directors have five years from their election or appointment date to attain that target. |
| • | For any year during which an executive or director does not meet his or her ownership target, the executive or director is required to hold a specified percentage of the CenturyLink stock that the executive or director acquires through our equity compensation programs, excluding shares sold to pay taxes associated with the acquisition thereof. |
| • | The Human Resources and Compensation Committee administers the guidelines, and may modify their terms and grant hardship exceptions in its discretion. |
| • | See “Compensation Discussion and Analysis — Our Policies, Processes and Guidelines Related to Executive Compensation — Stock Ownership Guidelines” for information on the executive ownership multiples and the holding percentages currently in effect. |
Standards of Business Conduct and Ethics
| • | All of our directors, officers and employees are required to abide by our long-standing ethics and compliance policies and programs, which include standards of business conduct. |
| • | Any waiver of our policies, principles or guidelines relating to business conduct or ethics for executive officers or directors may be made only by the Board or one of its duly authorized committees. |
Other
| • | Directors have full access to our officers and employees. |
| • | Like most other NYSE-listed companies, (i) all of the Board’s standing committees are comprised solely of independent directors, (ii) we provide orientation for new directors, (iii) we maintain a continuing education program for our directors, and (iv) the Board and each committee conducts annual self-reviews. |
9
Table of Contents
Based on the information made available to it, the Board of Directors has affirmatively determined that each of our non-management directors qualifies as an independent director under the standards referred to above under “— Governance Guidelines.” In making these determinations, the Board, with assistance from counsel, evaluated responses to a questionnaire completed by each director regarding relationships and possible conflicts of interest. In its review of director independence, the Board considered all known commercial, banking, consulting, legal, accounting, charitable, familial or other relationships any director may have with us.
Some of our directors are employed by or affiliated with companies with which we do business in the ordinary course, either as a service provider, a customer or both. As required under the NYSE listing standards and our corporate governance guidelines, our Board examined the amounts spent by us with those companies and by those companies with us. In all cases the amounts spent under these transactions fell well below the materiality thresholds established in the NYSE listing standards and in our corporate governance guidelines. Consequently, our Board concluded that the amounts spent under these transactions did not create a material relationship with us that would interfere with the exercise of independent judgment by any of these directors.
During 2016, the Board of Directors held 14 meetings.
During 2016, the Board’s Audit Committee held eight meetings. The Audit Committee is currently composed of three independent directors, all of whom the Board has determined to be audit committee financial experts, as defined under the federal securities laws. The Audit Committee’s functions are described further below under “Audit Committee Report.”
The Board’s Human Resources and Compensation Committee (which in most instances we hereinafter refer to below as the “Compensation Committee”) met six times during 2016. The Compensation Committee is currently composed of four independent directors, all of whom qualify as “non-employee directors” under Rule 16b-3 promulgated under the Securities Exchange Act of 1934 and as “outside directors” under Section 162(m) of the Internal Revenue Code. The Compensation Committee is described further below under “Compensation Discussion and Analysis — Our Policies, Processes and Guidelines Related to Executive Compensation — Our Compensation Decision-Making Process — Role of Compensation Committee.”
The Board’s Nominating and Corporate Governance Committee (which in most instances we hereinafter refer to below as the “Nominating Committee”) is currently composed of three independent directors. It met five times during 2016. The Nominating Committee is responsible for, among other things, (i) recommending to the Board nominees to serve as directors and officers, (ii) monitoring the composition and size of the Board and its committees, (iii) periodically reassessing our corporate governance guidelines described above, (iv) leading the Board in its annual review of the Board’s performance, (v) reviewing shareholder proposals and making recommendations to the Board regarding how to respond, (vi) conducting an intensive annual review of the performance of our Chief Executive Officer, including interviewing each of our other senior officers, and (vii) reporting to the Board on succession planning for executive officers and appointing an interim CEO if the Board does not make such an appointment within 72 hours of the CEO dying or becoming disabled. For information on the director nomination process, see “— Director Nomination Process” below.
The Board also maintains a Risk Evaluation Committee, which met four times during 2016. This Committee is described further below under the heading “— Risk Oversight.”
Each of the committees listed above is composed solely of independent directors under the standards referred to above under “— Governance Guidelines.”
10
Table of Contents
The table below lists the Board’s standing committees and their membership as of the date of this proxy statement:
| Outside Director(1), (2) |
Audit |
Human Resources |
Nominating and |
Risk Evaluation | ||||
| Martha H. Bejar |
✓ | ✓ | ||||||
| Virginia Boulet |
✓ | Chair | ||||||
| Peter C. Brown |
✓ | ✓ | ||||||
| W. Bruce Hanks |
Chair | ✓ | ||||||
| Mary L. Landrieu |
✓ | |||||||
| William A. Owens |
✓ | ✓ | ||||||
| Harvey P. Perry |
✓ | |||||||
| Michael J. Roberts |
✓ | |||||||
| Laurie A. Siegel |
Chair |
| (1) | Glen F. Post, III does not serve on any board committees, other than the Special Pricing Committee described below. |
| (2) | Gregory J. McCray, who formerly chaired the Risk Evaluation Committee, resigned from the Board effective February 23, 2017, and William A. Owens will retire from the Board on May 24, 2017. As soon as practicable, the Board plans to name a new chairman of the Risk Evaluation Committee and make any other changes to the composition of the committees as it sees fit. |
If you would like additional information on the responsibilities of the committees listed above, please refer to the committees’ respective charters, which can be obtained in the manner described below under “— Access to Information.”
The Board has also established a Special Pricing Committee that has authority to approve the terms and offering prices of any CenturyLink securities sold pursuant to our outstanding shelf registration statement. This ad hoc committee is comprised of Peter C. Brown, W. Bruce Hanks and Glen F. Post, III.
During 2016, all of our directors attended at least 75% of the aggregate number of all board meetings and all meetings of board committees on which they served. In addition, each of our directors then in office attended the 2016 annual shareholders’ meeting.
General. Nominations for the election of directors at our annual shareholders’ meetings may be made by the Board (upon the receipt of recommendations of the Nominating Committee) or by any shareholder of record who complies with our bylaws, which are summarized below. For the meeting this year, the Board has nominated the nine nominees listed above under “Election of Directors” to stand for election as directors, and no shareholders submitted any nominations. For further information on procedures governing the submission of shareholder proposals, see “— Bylaw Requirements” and “Other Matters — Deadlines for Submitting Shareholder Nominations and Proposals for the 2018 Annual Meeting.”
Bylaw Requirements. If timely notice is provided, our bylaws permit shareholders to nominate a director or bring other matters before a shareholders’ meeting. The written notice required to be sent by any shareholder nominating a director must include various information, including, as to the shareholder giving the notice and the beneficial owner, if any, on whose behalf the nomination is being made, (i) the name and address of such
11
Table of Contents
shareholder, any such beneficial owner, and any other parties affiliated, associated or acting in concert therewith, (ii) their beneficial ownership interests in our Voting Shares, including disclosure of arrangements that might cause such person’s voting, investment or economic interests in our Voting Shares to differ from those of our other shareholders, (iii) certain additional information concerning such parties required under the federal proxy rules, (iv) a description of all agreements with respect to the nomination among the nominating shareholder, any beneficial owner, any person acting in concert with them, each proposed nominee and certain other persons, and (v) a representation whether any such person intends to solicit proxies or votes in support of their proposed nominees. With respect to each proposed nominee, the written notice must also, among other things, (i) set forth biographical and other data required under the federal proxy rules and a description of various compensation or other arrangements or relationships between each proposed nominee and the nominating shareholder and its affiliated parties and (ii) furnish both a completed and duly executed questionnaire and a duly executed agreement designed to disclose various aspects of the proposed nominee’s background, qualifications and certain specified arrangements with other persons, as well as to receive the proposed nominee’s commitment to abide by certain specified agreements and undertakings. We may require a proposed nominee to furnish other reasonable information or certifications. Shareholders interested in bringing before a shareholders’ meeting any matter other than a director nomination should consult our bylaws for additional procedures governing such requests. We may disregard any nomination or submission of any other matter that fails to comply with these bylaw procedures.
In addition, our bylaws provide that under certain circumstances a shareholder or group of shareholders may include director candidates that they have nominated in our annual meeting proxy materials. These proxy access provisions of our bylaws provide, among other things, that a shareholder or group of up to ten shareholders seeking to include director candidates in our annual meeting proxy materials must own 3% or more of our outstanding Common Shares continuously for at least the previous three years. The number of shareholder-nominated candidates appearing in any of our annual meeting proxy materials cannot exceed 20% of the number of directors then serving on the Board. If 20% is not a whole number, the maximum number of shareholder-nominated candidates would be the closest whole number below 20%. Based on the anticipated size of our Board in late 2017, two is the maximum number of proxy access candidates that we would be required to include in our 2018 proxy materials for the 2018 annual meeting. The nominating shareholder or group of shareholders also must deliver the information required by our bylaws, and each nominee must meet the qualifications required by our bylaws.
Shareholder requests to nominate directors or to bring any other matter before our 2018 annual shareholders’ meeting, whether or not they wish to include their candidate or proposal in our proxy materials, must be received by our Secretary by the deadlines specified in “Other Matters — Deadlines for Submitting Shareholder Nominations and Proposals for the 2018 Annual Meeting.”
The summaries above of the advance notification and proxy access provisions of our bylaws are qualified in their entirety by reference to the full text of Section 5 of Article IV of our bylaws. You may obtain a full copy of our bylaws by reviewing our reports filed with the SEC, by accessing our website at www.centurylink.com, or by contacting our Secretary in the manner specified below under “Other Matters.”
Role of Nominating Committee. The Nominating Committee will consider candidates properly and timely nominated by shareholders in accordance with our bylaws. Upon receipt of any such nominations, the Nominating Committee will review the submission for compliance with our bylaws, including determining if the proposed nominee meets the bylaw qualifications for service as a director. These provisions disqualify any person who (i) fails to respond satisfactorily to any inquiry for information to enable us to make certifications required by the Federal Communications Commission under the Anti-Drug Abuse Act of 1988, (ii) has been arrested or convicted of certain specified drug offenses or engaged in actions that could lead to such an arrest or conviction or (iii) fails to furnish any materials or agreements required to be provided by director nominees under our bylaws, or makes false statements or materially misleading statements or omissions in connection therewith.
12
Table of Contents
From time to time, we have added to our Board directors who previously served as directors of companies we acquired. For instance, in connection with acquiring Embarq in 2009 and Qwest in 2011, we added several new directors to our Board who previously served as directors of those companies, three of whom are nominees to be re-elected at the meeting. See “— Proposed Expansion of Board” for information about four additional individuals who we expect to add to the Board upon the completion of our pending acquisition of Level 3.
Under our corporate governance guidelines, the Nominating Committee assesses director candidates based on their independence, diversity, character, skills and experience in the context of the needs of the Board. Although the guidelines permit the Nominating Committee to adopt additional selection guidelines or criteria, it has chosen not to do so. Instead, the Nominating Committee annually assesses skills and characteristics then required by the Board based on its membership and needs at the time of the assessment. In evaluating the needs of the Board, the Nominating Committee considers the qualifications of incumbent directors and consults with other members of the Board and senior management. In addition, the Nominating Committee seeks candidates committed to representing the interests of all shareholders and not any particular constituency. The Nominating Committee believes this flexible approach enables it to respond to changes caused by director vacancies and industry developments.
In connection with assessing the needs of the Board, the Nominating Committee has sought individuals who possess skill and experience in a diverse range of fields. The Nominating Committee also has sought a mix of individuals from inside and outside of the communications industry. The table above listing biographical data about our directors includes a listing of the key qualifications, experiences and skills that the Nominating Committee and Board reviewed in connection with nominating or re-nominating them for service on the Board. In light of our current business and operations, we believe the following skills and experience are particularly important:
| • | senior leadership experience |
| • | industry or technical expertise |
| • | financial, accounting or capital markets expertise |
| • | public company board experience |
| • | business combination experience |
| • | brand marketing expertise |
| • | government, labor or human resources expertise |
| • | international business experience |
| • | legal expertise. |
In connection with determining the current composition of the Board, the Nominating Committee has assessed the diverse range of skills and experience of our directors outlined above, coupled with the judgment that each has exhibited and the knowledge of our operations that each has acquired in connection with their service on the Board. Although it does not have a formal diversity policy, the Nominating Committee believes that our directors possess a diverse range of backgrounds, perspectives, skills and experiences.
Although we do not have a history of receiving director nominations from shareholders, the Nominating Committee envisions that it would evaluate any such candidate on the same terms as other proposed nominees, but would place a substantial premium on retaining incumbent directors who are familiar with our management, operations, business, industry, strategies and competitive position, and who have previously demonstrated a proven ability to provide valuable contributions to the Board and CenturyLink.
13
Table of Contents
As previously disclosed, we have agreed to appoint to our Board, on or prior to the effective time of our pending acquisition of Level 3, (i) one member of Level 3’s board of directors designated by Level 3’s principal stockholder, STT Crossing Ltd. (“STT Crossing”), in accordance with the terms of our shareholder rights agreement with STT Crossing, and (ii) three members of Level 3’s board selected by us from any of Level 3’s directors who are unaffiliated with or not designated by STT Crossing. Upon completion of our pending acquisition of Level 3, we expect the following current Level 3 directors to join the Board:
| • | Jeff K. Storey, Level 3’s president and chief executive officer |
| • | T. Michael Glenn, retired executive officer of FedEx Corporation |
| • | Kevin P. Chilton, former commander of the U.S. Strategic Command |
| • | Steven T. Clontz, senior executive vice president of Singapore Technologies Telemedia Pte. Ltd. (and designee of STT Crossing). |
For additional information on our pending acquisition of Level 3 and these four designees, please see the definitive joint proxy statement/prospectus filed with the SEC on February 13, 2017, including the reports of Level 3 incorporated by reference therein.
The Compensation Committee hires consulting firms to assist it in setting executive and director compensation. In June 2015, the Committee retained Meridian Compensation Partners, LLC, following a nationwide search to replace Hay Group, which advised the Committee for the previous six years. For additional information on the processes used by the Committee to set executive compensation, see “Compensation Discussion and Analysis — Our Policies, Processes and Guidelines Related to Executive Compensation.”
Our Board oversees our Company’s risk management function, which is a coordinated effort among our business units, our senior leadership, our risk management personnel and our internal auditors. Our directors typically discharge their risk oversight responsibilities by having management provide periodic briefing and educational presentations. In some cases, including major new acquisitions, capital expenditures or strategic investments, the full Board participates in risk oversight. In most cases involving recurring systemic risk, a Board committee is primarily responsible for risk oversight. For several decades, our Board has maintained a Risk Evaluation Committee, which is responsible for assisting management to identify, monitor, and manage recurring risks to our business, properties and employees. The Risk Evaluation Committee regularly monitors our litigation, cybersecurity initiatives, enterprise risk assessments, network operations, systems integration initiatives, insurance coverages and the status of our labor relations, and is also responsible for overseeing our ethics and compliance program. The Board’s other committees are responsible for overseeing specific risks, particularly the Audit Committee with respect to financial, tax and accounting risks and the Compensation Committee with respect to compensation risks. For a discussion of the Compensation Committee’s risk analysis, see “Compensation Discussion and Analysis — Our Policies, Processes and Guidelines Related to Executive Compensation — Our Compensation Decision-Making Process — Risk Assessment.” The Board regularly receives reports from each of these committees, and periodically receives enterprise risk assessment reports from management.
Top Leadership Positions and Structure
For several years, the Board has annually elected a non-executive Chairman who also acts as our lead outside director. Admiral William A. Owens has served in these capacities since 2009, and will retain these positions through the date of the meeting, when he will retire from the Board. As soon as practicable, the Board plans to name a replacement non-executive Chairman and lead outside director.
14
Table of Contents
The Board believes that the separation of the Chairman and CEO positions has functioned effectively over the past several years. Separating these positions has allowed our CEO to have primary responsibility for the operational leadership and strategic direction of our business, while allowing our Chairman to lead the Board in its fundamental role of providing guidance to and independent oversight of management. While our bylaws and corporate governance guidelines do not require our Chairman and CEO positions to be separate, the Board believes that delegating responsibilities between our Chairman and our CEO has been the appropriate leadership structure for our Company over the past seven years, which have been marked by rapid growth in our operations and a substantial change in our product offerings. Our Board periodically reviews its leadership structure and may make such changes in the future as it deems appropriate. The Board believes that its programs for overseeing risk would be effective under a variety of top leadership structures, and, accordingly, this factor has not materially affected its current choice of leadership structure.
As explained further on our website, you may contact our Chairman by writing a letter addressed to the Chairman and Lead Outside Director, c/o Post Office Box 5061, Monroe, Louisiana 71211, or by sending an email to boardinquiries@centurylink.com.
The following documents are posted on our website at www.centurylink.com:
| • | Amended and restated articles of incorporation |
| • | Bylaws |
| • | Corporate governance guidelines |
| • | Charters of our Board committees |
| • | Corporate ethics and compliance program documents, including the CenturyLink Code of Conduct. |
15
Table of Contents
RATIFICATION OF THE SELECTION OF THE INDEPENDENT AUDITOR
(Item 2 on Proxy or Voting Instruction Card)
The Audit Committee of the Board has appointed KPMG LLP as our independent auditor for the fiscal year ending December 31, 2017, and we are submitting that appointment to our shareholders for ratification on an advisory basis at the meeting. Although shareholder ratification of KPMG’s appointment is not legally required, we are submitting this matter to the shareholders, as in the past, as a matter of good corporate practice. In determining whether to reappoint KPMG as our independent auditor, the Audit Committee considered a number of factors, including, among others, the firm’s qualifications, industry expertise, prior performance, control procedures, proposed staffing and the reasonableness of its fees on an absolute basis and as compared with fees paid by comparable companies.
If the shareholders fail to vote on an advisory basis in favor of the appointment, the Audit Committee will reconsider whether to retain KPMG, and may appoint that firm or another without re-submitting the matter to the shareholders. Even if the shareholders ratify the appointment, the Audit Committee may, in its discretion, select a different independent auditor at any time during the year if it determines that such a change would be in the Company’s best interests.
In connection with the audit of the 2017 financial statements, we entered into an engagement letter with KPMG which sets forth the terms by which KPMG will provide audit services to us. Any future disputes between KPMG and us under that letter will be subject to certain specified alternative dispute resolution procedures, none of which are intended to restrict the remedies that our shareholders might independently pursue against KPMG.
The following table lists the aggregate fees and costs billed to us by KPMG and its affiliates for the 2015 and 2016 services identified below:
| Amount Billed | ||||||||
| 2015 | 2016 | |||||||
| Audit Fees(1) |
$ | 9,146,142 | $ | 11,316,096 | ||||
| Audit-Related Fees(2) |
274,417 | 118,178 | ||||||
| Tax Fees(3) |
967,076 | 2,079,160 | ||||||
| Other |
— | — | ||||||
|
|
|
|
|
|||||
| Total Fees |
$ | 10,387,635 | $ | 13,513,434 | ||||
|
|
|
|
|
|||||
| (1) | Includes the cost of services rendered in connection with (i) auditing our annual consolidated financial statements, (ii) auditing our internal control over financial reporting in accordance with Section 404 of the Sarbanes-Oxley Act of 2002, (iii) reviewing our quarterly financial statements, (iv) auditing the financial statements of several of our subsidiaries, (v) reviewing our registration statements and issuing related comfort letters, (vi) statutory audits for certain of our foreign subsidiaries, and (vii) consultations regarding accounting standards. Additionally, the amount billed in 2016 includes $1,891,000 for services rendered in connection with auditing separate carve-out financial statements related to divestiture-related transactions. |
| (2) | Includes the cost of preparing agreed upon procedures reports and providing general accounting consulting services. |
| (3) | Includes costs associated with (i) general tax planning, consultation and compliance (which were approximately $960,000 in 2015 and $700,000 in 2016), (ii) tax planning and consultation related to transactions and divestitures (which were $0 in 2015 and $1,370,085 in 2016), and (iii) assistance in preparing income tax returns and related matters (which were approximately $7,000 in 2015 and $0 in 2016). |
16
Table of Contents
The Audit Committee maintains written procedures that require it to annually review and pre-approve the scope of all services to be performed by our independent auditor. This review includes an evaluation of whether the provision of non-audit services by our independent auditor is compatible with maintaining the auditor’s independence in providing audit and audit-related services. The Committee’s procedures prohibit the independent auditor from providing any non-audit services unless the service is permitted under applicable law and is pre-approved by the Audit Committee or its Chairman. The Chairman is authorized to pre-approve projects expected to cost no more than $100,000, provided the total cost of all projects pre-approved by the Chairman during any fiscal quarter does not exceed $150,000. The Audit Committee has pre-approved the Company’s independent auditor to provide up to $75,000 per quarter of miscellaneous permitted tax services that do not constitute discrete and separate projects. The Chairman and the Chief Financial Officer are required periodically to advise the full Committee of the scope and cost of services not pre-approved by the full Committee. Although applicable regulations waive these pre-approval requirements in certain limited circumstances, the Audit Committee did not use these waiver provisions in either 2015 or 2016.
KPMG has advised us that one or more of its partners will be present at the meeting. We understand that these representatives will be available to respond to appropriate questions and will have an opportunity to make a statement if they desire to do so.
Ratification of KPMG’s appointment as our independent auditor for 2017 will require the affirmative vote of the holders of at least a majority of the votes cast on the proposal at the meeting.
The Board unanimously recommends a vote FOR this proposal.
Management is responsible for our internal controls and financial reporting process. Our independent auditor is responsible for performing an independent audit of our consolidated financial statements and the effectiveness of our internal control over financial reporting, and to issue reports thereon. As more fully described in its charter, the Audit Committee is responsible for assisting the Board in its general oversight of these processes and for appointing and overseeing the independent auditor, including reviewing their qualifications, independence and performance.
In this context, the Committee has met and held discussions with management and our internal auditors and independent auditor for 2016, KPMG LLP. Management represented to the Committee that our consolidated financial statements were prepared in accordance with generally accepted U.S. accounting principles. The Committee has reviewed and discussed with management and KPMG the consolidated financial statements, and management’s report and KPMG’s report and attestation on internal control over financial reporting in accordance with Section 404 of the Sarbanes-Oxley Act of 2002. The Committee also discussed with KPMG matters required to be discussed by Auditing Standard No. 1301, Communications with Audit Committees.
Among other matters, over the course of the past year, the Committee also:
| • | reviewed the scope of and overall plans for the annual audit and the internal audit program, including a review of critical accounting policies, critical accounting estimates, and significant unusual transactions; |
| • | reviewed a report by the independent auditor describing the independent auditor’s internal quality control procedures; |
| • | reviewed the performance of the lead engagement partner of our independent auditor; |
| • | reviewed and discussed each quarterly and annual earnings press release before issuance; |
| • | received periodic reports from the director of internal audit, and met with other members of the internal audit staff; |
17
Table of Contents
| • | received periodic reports pursuant to our policy for the submission and confidential treatment of communications from employees and others about accounting, internal controls and auditing matters; |
| • | reviewed with management the scope and effectiveness of our disclosure controls and procedures; |
| • | met quarterly in separate executive sessions, including private sessions with the Company’s independent auditors, internal auditors and top executives; |
| • | received a report with regard to any hiring of former employees of KPMG; and |
| • | as discussed in greater detail under “Corporate Governance — Risk Oversight,” coordinated with the Risk Evaluation Committee to oversee the Company’s risk management function, especially with respect to the financial, tax and accounting risks. |
KPMG also provided to the Committee the written disclosures required by the applicable requirements of the Public Company Accounting Oversight Board regarding the independent auditor’s communications with audit committees concerning independence. The Committee discussed with KPMG that firm’s independence, and considered the effects that the provision of non-audit services may have on KPMG’s independence.
Based on and in reliance upon the reviews and discussions referred to above, and subject to the limitations on the role and responsibilities of the Committee referred to in its charter, the Committee recommended that the Board of Directors include the audited consolidated financial statements in our Annual Report on Form 10-K for the year ended December 31, 2016.
In addition to the Company’s corporate compliance program and hotline, the Audit Committee has established procedures for the receipt and evaluation, on a confidential basis, of any complaints or concerns regarding our accounting, auditing, financial reporting or related matters. To report such matters, please send written correspondence to Audit Committee Chair, c/o Post Office Box 4364, Monroe, Louisiana 71211.
If you would like additional information on the responsibilities of the Audit Committee, please refer to its charter, which you can obtain in the manner described above under “Corporate Governance — Access to Information.”
Submitted by the Audit Committee of the Board of Directors.
| W. Bruce Hanks (Chair) | Martha H. Bejar | Peter C. Brown |
ADVISORY VOTES ON EXECUTIVE COMPENSATION
AND THE FREQUENCY OF SUCH VOTES
(Items 3(a) and 3(b) on Proxy or Voting Instruction Card)
Advisory Vote to Approve Our Executive Compensation (Item 3(a))
Each year since 2011 we have provided our shareholders the opportunity to vote on a non-binding, advisory resolution to approve the compensation of our named executive officers as disclosed in our annual proxy statements pursuant to the rules of the SEC.
Under our executive compensation programs, our named executive officers are rewarded for achieving specific annual and long-term goals, as well as increased shareholder value. We believe this structure aligns executive pay with our financial performance and the creation of sustainable shareholder value. The Compensation Committee of our Board continually reviews our executive compensation programs to ensure they achieve the goals of aligning our compensation with both current market practices and your interests as shareholders. For additional information on our executive compensation, we urge you to read the “Compensation Discussion and Analysis” and “Executive Compensation” sections of this proxy statement.
18
Table of Contents
At the meeting, we will ask you to vote, in an advisory manner, to approve the overall compensation of our named executive officers, as described in this proxy statement, including the Compensation Discussion and Analysis, the Summary Compensation Table and the other related tables and disclosures. This proposal, commonly known as a “say-on-pay” proposal, gives you the opportunity to express your views. This advisory vote is not intended to address any specific element of compensation, but rather relates to the overall compensation of our named executive officers and our executive compensation policies and practices as described in this proxy statement. Accordingly, your vote will not directly affect or otherwise limit any existing compensation or award arrangement of any of our named executive officers.
While this “say-on-pay” vote is advisory and will not be binding on our Company or the Board, it will provide valuable information for future use by our Compensation Committee regarding shareholder sentiment about our executive compensation. We understand that executive compensation is an important matter for our shareholders. Accordingly, we invite shareholders who wish to communicate with our Board on executive compensation or any other matters to contact us as provided under “Corporate Governance — Top Leadership Positions and Structure.”
Approval of this proposal will require the affirmative vote of the holders of at least a majority of the votes cast on the proposal at the meeting.
The Board recommends that you vote FOR the overall compensation of our named executive officers as described in this proxy statement.
Advisory Vote Regarding the Frequency of Our Executive Compensation Votes (Item 3(b))
This year we are once again providing our shareholders with the opportunity to cast an advisory vote regarding the frequency of our advisory votes on executive compensation, commonly known as “say-on-pay” votes. Shareholders may vote on whether our say-on-pay votes should occur every one, two, or three years.
We are required to provide our shareholders with an advisory vote on the frequency of our say-on-pay votes at least every six years. In 2011, the last time we held such a vote, a majority of our shareholders voted in favor of an annual say-on-pay vote, which was the frequency recommended by the Board at that time. Following that vote, the Board adopted annual say-on-pay votes as its standard.
We believe that say-on-pay votes should be conducted annually so that you may express your views on our executive compensation programs each year. An annual advisory vote is consistent with our policy of seeking input from you on corporate governance and executive compensation matters. We understand you may have different views as to what is the best compensation approach for our executives, and we believe annual advisory votes will facilitate a continued dialogue. For additional information about our say-on-pay votes, see “— Advisory Vote to Approve Our Executive Compensation” immediately above.
The proxy card provides four choices for this frequency vote: shareholders may indicate a preference for say-on-pay votes to be held every one, two, or three years, or may abstain from voting. The frequency that receives the highest number of votes cast will be the frequency approved by our shareholders. Please be advised that this vote is advisory only, and the Board may ultimately decide that it is in the best interests of our shareholders to hold an advisory vote on executive compensation more or less frequently than the option selected by our shareholders. However, the Board intends to take into consideration the outcome of the vote when making future decisions about how frequently to schedule our say-on-pay votes.
The Board unanimously recommends that you vote to hold an advisory vote on executive compensation every YEAR.
19
Table of Contents
(Items 4(a), 4(b), and 4(c) on Proxy or Voting Instruction Card)
We periodically receive suggestions from our shareholders, some as formal shareholder proposals. We give careful consideration to all suggestions, and assess whether they promote the best long-term interests of CenturyLink and its shareholders.
We expect Items 4(a), 4(b), and 4(c) to be presented by shareholders at the meeting. Following SEC rules, we are reprinting the proposals and supporting statements as they were submitted to us, other than minor formatting changes. We take no responsibility for them. On request to the Secretary at the address listed under “Other Matters — Annual Financial Report,” we will provide information about the sponsor’s shareholdings, as well as the names, addresses, and shareholdings of any co-sponsors. Adoption of each of these three proposals requires the affirmative vote of the holders of at least a majority of the votes cast on the proposal at the meeting.
The Board recommends that you vote AGAINST Items 4(a), 4(b), and 4(c) for the reasons we give after each one below.
Equity Retention Proposal (Item 4(a))
The following proposal was submitted by the Board of Trustees of the International Brotherhood of Electrical Workers Pension Fund, located at 900 Seventh Street, NW, Washington D.C., 20001.
“RESOLVED: Shareholders of CenturyLink (the “Company”) urge the Compensation Committee of the Board of Directors (the “Committee”) to adopt a policy requiring that senior executives retain a significant percentage of shares acquired through equity compensation programs until reaching normal retirement age or terminating employment with the Company. For the purpose of this policy, normal retirement age shall be defined by the Company’s qualified retirement plan that has the largest number of plan participants. The shareholders recommend that the Committee adopt a share retention percentage requirement of at least 50 percent of net after-tax shares. The policy should prohibit hedging transactions for shares subject to this policy which are not sales but reduce the risk of loss to the executive. This policy shall supplement any other share ownership requirements that have been established for senior executives, and should be implemented so as not to violate the Company’s existing contractual obligations or the terms of any compensation or benefit plan currently in effect.
Supporting Statement: Equity-based compensation is an important component of senior executive compensation at our Company. While we encourage the use of equity-based compensation for senior executives, we are concerned that our Company’s senior executives are generally free to sell shares received from our Company’s equity compensation plans. In our opinion, the Company’s current share ownership guidelines for its senior executives do not go far enough to ensure that the Company’s equity compensation plans continue to build stock ownership by senior executives over the long-term.
For example, our Company’s share ownership guidelines require the CEO to hold an amount of shares equivalent to six times his base salary, or approximately 306,623 shares based on the current trading price. In comparison, the CEO currently owns more than 1.6 million shares. In other words, the CEO’s total shares held are more than five times greater than the share ownership requirement.
We believe that requiring senior executives to only hold shares equal to a set target loses effectiveness over time. After satisfying these target holding requirements, senior executives are free to sell all the additional shares they receive in equity compensation.
Our proposal seeks to better link executive compensation with long-term performance by requiring a meaningful share retention ratio for shares received by senior executives from the Company’s equity compensation plans. A 2009 report by the Conference Board Task Force on Executive Compensation observed that such hold-through-retirement requirements give executives ‘an ever growing incentive to
20
Table of Contents
focus on long-term stock price performance as the equity subject to the policy increases’ (available at http://www.conference-board.org/pdf_free/ExecCompensation2009.pdf).
We urge shareholders to vote FOR this proposal.”
The Board recommends that you vote AGAINST this proposal for the following reasons:
For the fifth consecutive year (and for the sixth time in seven years), you are being asked to vote on this same topic. The proponent’s proposal this year is substantially similar to its proposal in prior years. None of those proposals has ever received the support of more than 32% of the shares voted at our annual meetings. For the reasons discussed below, we continue to believe that our existing compensation policies adequately address the concerns addressed in this proposal.
The Board strongly agrees with the proponent that equity ownership by executive officers serves to align the long-term interests of our senior executives and shareholders. We believe, however, that sensible stock ownership and compensation programs should strive to balance the importance of aligning the long-term interests of executives and shareholders with the need to permit executives to prudently manage their personal financial affairs. As described further below, the Board believes that our stock ownership guidelines, in conjunction with our performance-based compensation plans and policies, successfully strike this balance effectively, making the adoption of the current proposal unnecessary. By contrast, the rigid mandate inherent in this proposal could be harmful in several respects, and could potentially put us at a competitive disadvantage for attracting and retaining executive officers.
As the proponent acknowledges, our executives are already subject to share ownership requirements. Our stock ownership guidelines (which are discussed further in “Corporate Governance — Governance Guidelines” and “Compensation Discussion and Analysis — Our Policies, Processes and Guidelines Related to Executive Compensation — Stock Ownership Guidelines”) mandate significant stock ownership for all of our executives, and require executives not in compliance with these ownership thresholds to hold specified percentages of newly-issued stock grants. Our Compensation Committee’s independent consultant advised us in 2016 that our ownership and holding requirements were more rigorous than the average ownership and holding thresholds adopted by a group of 18 surveyed peer companies. Moreover, all of our top executives own CenturyLink stock at levels well in excess of these requirements, including our CEO, who currently holds stock valued at nearly 30 times his current salary. We believe that our stock ownership guidelines accomplish the proponent’s intended purpose of aligning executive and shareholder interests through at-risk equity ownership.
Our executive compensation plans and policies are carefully designed to further align the long-term interests of our senior executives and shareholders. As discussed in greater detail elsewhere herein, a substantial majority of our annual executive compensation typically consists of awards of restricted stock, the value of which is directly tied to our long-term performance and the appreciation of our stock price over the awards’ vesting periods. In addition, we have implemented both anti-hedging and anti-pledging policies to ensure that our executives bear the full economic risk and reward of their stock ownership, and that their economic interests remain fully aligned with the economic interests of our other shareholders. We also have implemented recoupment policies designed to further assure a linkage between our executive compensation and our long-term performance.
Adoption of the proponent’s proposal could be harmful in several respects. The adoption of this policy would limit our executive officers’ abilities to engage in customary and prudent estate planning, portfolio diversification or charitable giving. Worse yet, these restrictions could create an incentive for senior executives to resign in order to realize the value of their prior service. We believe that the type of retention policy described in this proposal is, not surprisingly, uncommon among our peers and that its adoption would put us at a competitive disadvantage relative to our peers who do not have such restrictions.
21
Table of Contents
Our current guidelines, plans and policies have been developed under the guidance of our independent directors, who we believe are best suited to formulate programs that promote long-term, sustainable value creation without excessive risk-taking. We believe that our current mix of guidelines, plans and policies provide for an appropriate balance between aligning the long-term interests of our management and shareholders, while also permitting our executives to prudently manage their own affairs.
For all these reasons, our Board believes this proposal is unnecessary and undesirable, and contrary to your best interests.
Lobbying Proposal (Item (4(b))
The following proposal was submitted by the AFL-CIO Reserve Fund, located at 816 16th Street, NW, Washington D.C., 20006.
“Whereas, we believe in full disclosure of our company’s direct and indirect lobbying activities and expenditures to assess whether our company’s lobbying is consistent with CenturyLink’s expressed goals and in the best interests of shareholders.
Resolved, the shareholders of CenturyLink request the preparation of a report, updated annually, disclosing:
| 1. | Company policy and procedures governing lobbying, both direct and indirect, and grassroots lobbying communications. |
| 2. | Payments by CenturyLink used for (a) direct or indirect lobbying or (b) grassroots lobbying communications, in each case including the amount of the payment and the recipient. |
| 3. | CenturyLink’s membership in and payments to any tax-exempt organization that writes and endorses model legislation. |
| 4. | Description of management’s and the Board’s decision making process and oversight for making payments described in sections 2 and 3 above. |
For purposes of this proposal, a “grassroots lobbying communication” is a communication directed to the general public that (a) refers to specific legislation or regulation, (b) reflects a view on the legislation or regulation and (c) encourages the recipient of the communication to take action with respect to the legislation or regulation. “Indirect lobbying” is lobbying engaged in by a trade association or other organization or which CenturyLink is a member. Both “direct and indirect lobbying” and “grassroots lobbying communications” include efforts at the local, state and federal levels. The report shall be presented to the Audit Committee of the Board or other relevant oversight committees of the Board and posted on the Company’s website.
Supporting Statement
As shareholders, we encourage transparency and accountability in CenturyLink’s use of corporate funds to influence legislation and regulation. Transparent reporting of all lobbying activity will reveal whether company assets are being used for objectives contrary to CenturyLink’s long-term interests.
According to the Center for Responsive Politics, CenturyLink spent more than $4 million dollars annually on federal lobbying expenditures in 2014 and 2015 (http://www.opensecrets.org/lobby/clientsum.php?id=D000024683). These figures do not include lobbying expenditures to influence legislation in states where CenturyLink operates and disclosure requirements are uneven or absent.
For these reasons, we urge you to vote FOR this proposal.”
The Board recommends that you vote AGAINST this proposal for the following reasons:
We believe our continued success and long-term profitability are substantially dependent upon our ability to actively engage in political, legislative and regulatory processes to advocate in favor of laws and policies that are in the best interests of our company, shareholders and customers.
22
Table of Contents
For the reasons discussed further below, we believe that we currently disclose a substantial amount of information on our lobbying activities and that the preparation and publication of the report contemplated by this proposal is neither necessary nor an efficient use of our resources.
| • | Information regarding our participation in the political process is set forth in our semi-annual Political Contributions Reports (the “Semi-Annual Reports”), which are available for review on our website. Our Semi-Annual Reports outline the core principles governing our political participation. |
| • | In addition to furnishing our Semi-Annual Reports, we file substantial amounts of information about our lobbying activity under federal, state and local laws. At the federal level, we file quarterly reports under the Lobbying Disclosure Act disclosing our lobbying expenditures and detailing the entities we lobbied and the subject matter of our lobbying efforts. Any lobbying firms hired by us file similar reports, and trade associations to which we contribute are separately subject to strict public disclosure requirements regarding their lobbying activities. We and our in-house and external lobbyists also file reports disclosing political contributions and honorary payments. Furthermore, we file all lobbying reports required by state laws, which in some cases have broader disclosure requirements than federal law. Shareholders can access this information through websites maintained by the U.S. House of Representatives, the U.S. Senate, the Federal Election Commission, and various state governmental bodies. |
| • | Our policies and procedures governing lobbying and political activities are subject to rigorous internal controls designed to ensure, among other things, that our applicable disclosures are full and complete. As noted in our Semi-Annual Reports, our Senior Vice President, Public Policy and Government Relations, together with senior management, the Board, and various public policy and legal personnel, oversees and manages our corporate political activities in an effort to attain our public policy objectives and comply with all applicable laws. |
| • | We believe we significantly benefit by participating in a number of industry and trade associations, which provide us with access to valuable industry data and expertise. These groups are independent organizations that represent the diverse interests of their members. These organizations frequently make expenditures or take action contrary to our preferences, often without our knowledge. As such, our membership in these organizations should not be viewed as an endorsement of any particular organization or policy. Disclosure of the information contemplated by the proposal could be used to unfairly suggest that we support every position taken by organizations to which we contribute. For these reasons, we do not believe that additional disclosures regarding our contributions to such organizations would be helpful to shareholders. |
| • | We expend significant resources in connection with our political and lobbying activities. We believe the information that we currently furnish in our Semi-Annual Reports and file with state and federal agencies strikes an appropriate balance between transparency and avoiding excessive burden and cost. We believe that requiring us to gather and disclose additional information would result in an unproductive consumption of valuable time and corporate resources by tracking insignificant activities without materially enhancing existing disclosures. |
| • | We also oppose the proposal because many of its aspects are vague or unworkable, and may create confusion. We believe the proposal’s definition of lobbying and lobbying expenditures are ambiguous and could, depending on the jurisdiction, include items such as office rent, business travel expenses, and even employee salaries. As a result, the disclosures required by the proposal could be inconsistent and confusing, because a particular expenditure might be lobbying-related in one jurisdiction, but not in another. |
| • | The proposal seeks to impose unnecessary line-item disclosures on lobbying expenditures that are not required by law and are not standard among other companies, including our competitors. Complying with the requirements of this proposal could put us at a relative disadvantage to our competitors. Any new requirements should be addressed by lawmakers and uniformly imposed on all entities. |
23
Table of Contents
The Board is confident that the Company’s current lobbying activities are effective and fully aligned with the shareholders’ long-term interests. For the reasons set forth above, the Board believes that this proposal is overly burdensome, would result in an unproductive use of our resources, and is not in the best interests of our shareholders.
Lobbying Proposal (Item 4(c))
The following proposal was submitted by Friends Fiduciary Corporation, located at 1650 Arch Street, Suite 1904, Philadelphia, Pennsylvania, 19103.
“Whereas, we believe in full disclosure of our company’s direct and indirect lobbying activities and expenditures to assess whether our company’s lobbying is consistent with CenturyLink’s expressed goals and in the best interests of shareholders.
Resolved, the stockholders of CenturyLink request the preparation of a report, updated annually, disclosing:
| 1) | Company policy and procedures governing lobbying, both direct and indirect, and grassroots lobbying communications. |
| 2) | Payments by CenturyLink used for (a) direct or indirect lobbying or (b) grassroots lobbying communications, in each case including the amount of the payment and the recipient. |
| 3) | Description of management’s and the Board’s decision making process and oversight for making payments described in section 2 above. |
For purposes of this proposal, a “grassroots lobbying communication” is a communication directed to the general public that (a) refers to specific legislation or regulation, (b) reflects a view on the legislation or regulation and (c) encourages the recipient of the communication to take action with respect to the legislation or regulation. “Indirect lobbying” is lobbying engaged in by a trade association or other organization of which CenturyLink is a member.
Both “direct and indirect lobbying” and “grassroots lobbying communication” is a communication directed to the general public that (a) refers to specific legislation or regulation, (b) reflects a view on the legislation or regulation and (c) encourages the recipient of the communication to take action with respect to the legislation or regulation. “Indirect lobbying” is lobbying engaged in by a trade association or other organization of which CenturyLink is a member.
Both “direct and indirect lobbying” and “grassroots lobbying communications” include efforts at the local, state, and federal levels.
This report shall be presented to the Audit Committee or other relevant oversight committees and posted on CenturyLink’s website.
Supporting Statement
As shareholders, we encourage transparency and accountability in CenturyLink’s use of corporate funds to influence legislation and regulation, both directly and indirectly. According to Senate reports, CenturyLink spent more than $15,000,000 between 2012 and 2015 on federal lobbying activities (OpenSecrets.org). This figure does not include lobbying expenditures to influence legislation in 38 states where CenturyLink lobbies, for which disclosure is uneven or absent.
Absent a system of accountability, company assets could be used for objectives contrary to CenturyLink’s long-term interests, such as lobbying on issues impacting the company’s inmate calling services operations, which could expose the company to greater reputational and regulatory risk.”
The Board recommends that you vote AGAINST this proposal for the following reasons:
24
Table of Contents
This proposal is substantially identical to the proposal submitted by the AFL-CIO Reserve Fund reproduced above under the heading for Item 4(b). As we noted in response to that proposal, we believe our continued success and long-term profitability are substantially dependent upon our ability to actively engage in political, legislative and regulatory processes to advocate in favor of laws and policies that are in the best interests of our company, shareholders and customers.
For the reasons discussed further below, we believe that we currently disclose a substantial amount of information on our lobbying activities and that the preparation and publication of the report contemplated by this proposal is neither necessary nor an efficient use of our resources.
| • | Information regarding our participation in the political process is set forth in our semi-annual Political Contributions Reports (the “Semi-Annual Reports”), which are available for review on our website. Our Semi-Annual Reports outline the core principles governing our political participation. |
| • | In addition to furnishing our Semi-Annual Reports, we file substantial amounts of information about our lobbying activity under federal, state and local laws. At the federal level, we file quarterly reports under the Lobbying Disclosure Act disclosing our lobbying expenditures and detailing the entities we lobbied and the subject matter of our lobbying efforts. Any lobbying firms hired by us file similar reports, and trade associations to which we contribute are separately subject to strict public disclosure requirements regarding their lobbying activities. We and our in-house and external lobbyists also file reports disclosing political contributions and honorary payments. Furthermore, we file all lobbying reports required by state laws, which in some cases have broader disclosure requirements than federal law. Shareholders can access this information through websites maintained by the U.S. House of Representatives, the U.S. Senate, the Federal Election Commission, and various state governmental bodies. |
| • | Our policies and procedures governing lobbying and political activities are subject to rigorous internal controls designed to ensure, among other things, that our applicable disclosures are full and complete. As noted in our Semi-Annual Reports, our Senior Vice President, Public Policy and Government Relations, together with senior management, the Board, and various public policy and legal personnel, oversees and manages our corporate political activities in an effort to attain our public policy objectives and comply with all applicable laws. |
| • | We believe we significantly benefit by participating in a number of industry and trade associations, which provide us with access to valuable industry data and expertise. These groups are independent organizations that represent the diverse interests of their members. These organizations frequently make expenditures or take action contrary to our preferences, often without our knowledge. As such, our membership in these organizations should not be viewed as an endorsement of any particular organization or policy. Disclosure of the information contemplated by the proposal could be used to unfairly suggest that we support every position taken by organizations to which we contribute. For these reasons, we do not believe that additional disclosures regarding our contributions to such organizations would be helpful to shareholders. |
| • | We expend significant resources in connection with our political and lobbying activities. We believe the information that we currently furnish in our Semi-Annual Reports and file with state and federal agencies strikes an appropriate balance between transparency and avoiding excessive burden and cost. We believe that requiring us to gather and disclose additional information would result in an unproductive consumption of valuable time and corporate resources by tracking insignificant activities without materially enhancing existing disclosures. |
| • | We also oppose the proposal because many of its aspects are vague or unworkable, and may create confusion. We believe the proposal’s definition of lobbying and lobbying expenditures are ambiguous and could, depending on the jurisdiction, include items such as office rent, business travel expenses, and even employee salaries. As a result, the disclosures required by the proposal could be inconsistent and confusing, because a particular expenditure might be lobbying-related in one jurisdiction, but not in another. |
25
Table of Contents
| • | The proposal seeks to impose unnecessary line-item disclosures on lobbying expenditures that are not required by law and are not standard among other companies, including our competitors. Complying with the requirements of this proposal could put us at a relative disadvantage to our competitors. Any new requirements should be addressed by lawmakers and uniformly imposed on all entities. |
The Board is confident that the Company’s current lobbying activities are effective and fully aligned with the shareholders’ long-term interests. For the reasons set forth above, the Board believes that this proposal is overly burdensome, would result in an unproductive use of our resources, and is not in the best interests of our shareholders.
26
Table of Contents
The following table sets forth information regarding ownership of our Common Shares by the persons known to us to have beneficially owned more than 5% of the outstanding Common Shares on December 31, 2016, unless otherwise noted.
| Name and Address |
Amount and Nature of Beneficial Ownership of Common Shares(1) |
Percent of Outstanding Common Shares(1) | ||||||||
| Blackrock, Inc. 55 East 52nd Street New York, New York 10055 |
41,643,280 | (2) | 7.6 | % | ||||||
| The Vanguard Group 100 Vanguard Blvd. Malvern, Pennsylvania 19355 |
39,167,308 | (3) | 7.2 | % | ||||||
| State Street Corporation State Street Financial Center One Lincoln Street Boston, Massachusetts 02111 |
30,869,623 | (4) | 5.7 | % | ||||||
| (1) | The figures and percentages in the table above have been determined in accordance with Rule 13d-3 of the SEC based upon information furnished by investors listed, except that we have calculated the percentages in the table based on the actual number of Common Shares outstanding on December 31, 2016, as opposed to the estimated percentages set forth in the reports of the investors referred to below in notes 2 through 4. In addition to Common Shares, we have outstanding Preferred Shares that vote together with the Common Shares as a single class on all matters. One or more persons beneficially own more than 5% of the Preferred Shares; however, the percentage of total voting power held by such persons is immaterial. For additional information regarding the Preferred Shares, see “General Information About the Annual Meeting — How many votes may I cast?” |
| (2) | Based on information contained in a Schedule 13G/A Report dated as of January 19, 2017 that this investor filed with the SEC. In this report, the investor indicated that, as of December 31, 2016, it held sole voting power with respect to 36,426,600 of these shares and sole dispositive power with respect to all of the above-listed shares. |
| (3) | Based on information contained in a Schedule 13G Report dated as of February 9, 2017 that this investor filed with the SEC. In this report, the investor indicated that, as of December 31, 2016, it held sole voting power with respect to 857,601 of these shares, shared voting power with respect to 97,391 of these shares, sole dispositive power with respect to 38,215,203 of these shares and shared dispositive power with respect to 952,105 of the above-listed shares. |
| (4) | Based on information contained in a Schedule 13G Report dated as of February 6, 2017 that this investor filed with the SEC. In this report, the investor indicated that, as of December 31, 2016, (i) it shared voting power with respect to 23,733,890 shares and shared dispositive power with respect to all of the above-listed shares with various of its subsidiaries and (ii) it held 7,135,733 of these shares as investment manager for our broad-based 401(k) plans. |
27
Table of Contents
Executive Officers and Directors
The following table sets forth information, as of the record date, regarding the beneficial ownership of Common Shares by our executive officers and directors. Except as otherwise noted, all beneficially owned shares are held with sole voting and investment power and are not pledged to third parties.
| Components of Total Shares Beneficially Owned |
||||||||||||
| Name |
Unrestricted Shares Beneficially Owned(1) |
Unvested Restricted Stock(2) |
Total Shares Beneficially Owned(3), (4) |
|||||||||
| Executive Officers: |
||||||||||||
| David D. Cole |
121,501 | 104,837 | 226,338 | |||||||||
| Dean J. Douglas |
8,950 | 170,916 | 179,866 | |||||||||
| R. Stewart Ewing, Jr. |
149,881 | 143,461 | 293,342 | |||||||||
| Stacey W. Goff |
74,883 | 115,873 | 190,756 | |||||||||
| Aamir Hussain |
56,659 | 180,986 | 237,645 | |||||||||
| Maxine L. Moreau |
22,579 | 84,854 | 107,433 | |||||||||
| Glen F. Post, III |
830,507 | 781,673 | 1,612,180 | |||||||||
| Scott A. Trezise |
18,905 | 54,992 | 73,897 | |||||||||
| Girish K. Varma |
27,261 | 62,534 | 89,795 | |||||||||
| Continuing Outside Directors: |
||||||||||||
| Martha H. Bejar |
8,250 | 4,859 | 13,109 | |||||||||
| Virginia Boulet |
27,304 | 4,859 | 32,163 | |||||||||
| Peter C. Brown(5) |
19,438 | 4,859 | 24,297 | |||||||||
| W. Bruce Hanks(6) |
37,981 | 4,859 | 42,840 | |||||||||
| Mary L. Landrieu |
— | 4,859 | 4,859 | |||||||||
| Harvey P. Perry(7) |
71,168 | 4,859 | 76,027 | |||||||||
| Michael J. Roberts |
22,771 | 4,859 | 27,630 | |||||||||
| Laurie A. Siegel |
27,179 | 4,859 | 32,038 | |||||||||
| Retiring Director: |
||||||||||||
| William A. Owens(8) |
83,714 | 11,561 | 95,275 | |||||||||
| All directors and executive officers as a group (18) persons)(9) |
1,608,931 | 1,750,559 | 3,359,490 | |||||||||
| (1) | This column includes the following number of shares allocated to the individual’s account under one of our qualified 401(k) plans: 21,446 — Mr. Ewing; 6,426 — Mr. Goff; 2,405 — Ms. Moreau; and 166,681 — Mr. Post. Participants in these plans are entitled to direct the voting of their plan shares, as described in greater detail elsewhere herein. |
| (2) | Reflects (i) for all shares listed, unvested shares of restricted stock over which the person holds sole voting power but no investment power, and (ii) with respect to our performance-based restricted stock granted to our executive officers, the number of shares that will vest if we attain target levels of performance. |
| (3) | Excludes (i) shares that might be issued under restricted stock units if our performance exceeds target levels and (ii) “phantom units” held by Mr. Roberts that are payable in cash upon the termination of his service as a director, as described further under “Director Compensation — Other Benefits.” |
| (4) | None of the persons named in the table beneficially owns more than 1% of the outstanding Common Shares. The shares beneficially owned by all directors and executive officers as a group constituted 0.6% of the outstanding Common Shares as of the record date. |
| (5) | Includes 19,438 shares held by a tax-exempt charitable foundation, as to which Mr. Brown has voting and dispositive powers by virtue of his control of the foundation. |
| (6) | Includes 3,810 shares beneficially held by Mr. Hanks’ mother, as to which Mr. Hanks has voting and dispositive powers under a durable power of attorney granted to him by his mother. |
28
Table of Contents
| (7) | Includes 709 shares beneficially held by Mr. Perry’s spouse, as to which Mr. Perry disclaims beneficial ownership, and 27,959 shares held by Mr. Perry through our dividend reinvestment plan (as of the most recent date practicable). |
| (8) | Mr. Owens is scheduled to retire from the Board on May 24, 2017. |
| (9) | As described further in the notes above, includes (i) 19,438 shares held beneficially through a foundation, (ii) 3,810 shares held beneficially through a power of attorney, (iii) 709 shares held beneficially by a spouse of one of these individuals, as to which beneficial ownership is disclaimed, and (iv) 27,959 shares held through our dividend reinvestment plan (as of the most recent date practicable), excluding 2,400 shares held through such plan by two of our executive officers who no longer participate in such plan. |
COMPENSATION DISCUSSION AND ANALYSIS
Our named executive officers for 2016 were:
| Current Executives: |
||
| • Glen F. Post, III |
Chief Executive Officer and President | |
| • Dean J. Douglas |
President — Enterprise Markets | |
| • R. Stewart Ewing, Jr. |
Executive Vice President, Chief Financial Officer and Assistant Secretary | |
| • Aamir Hussain |
Executive Vice President, Chief Technology Officer | |
| • Stacey W. Goff |
Executive Vice President, Chief Administrative Officer, General Counsel and Secretary |
This Compensation Discussion and Analysis is organized into four subsections:
|
Subsection |
Page | |||||
| I. |
Executive Summary |
29 | ||||
| II. |
Our Compensation Philosophy and Linkage to Pay for Performance |
31 | ||||
| III. |
Our Compensation Program Objectives and Components of Pay |
36 | ||||
| IV. |
Our Policies, Processes and Guidelines Related to Executive Compensation |
46 | ||||
As described further below, the central goals of our executive pay programs are to incentivize our executives to attain objectives that we believe will create shareholder value, to reward performance that contributes to the execution of our business strategies, and to attract and retain the right executives for our business.
2016 Business Highlights. During 2016, we achieved several significant accomplishments, including the following:
| • | Generated solid 2016 consolidated free cash flow of $1.8 billion and paid dividends of nearly $1.2 billion to shareholders. |
| • | Invested in our network to improve transmission speed availability across our broadband service footprint, resulting in the growth of the percent of addressable units receiving service with transmission speeds of 100 megabits per second (Mbps) or higher and 1 gigabit per second (Gbps) or higher by 31% and 53%, respectively. We ended the year with 3.3 million addressable units capable of speeds of 100 Mbps or higher and approximately 1.3 million addressable units capable of 1 Gbps or higher. We also finished 2016 with 14,000 multi-tenant units in more than 600 cities enabled with fiber-ready broadband speeds up to 1 Gbps. |
| • | Announced a transformational acquisition of Level 3 which we expect to close in the third quarter of 2017. |
29
Table of Contents
| • | Launched over 60 new Business products and services – including a fully managed SD-WAN solution, Managed Security Services Suite to help organizations detect, prevent and respond to cyberattacks, and Relational DB Service on CenturyLink’s Cloud platform. |
| • | Expanded the availability of our IPTV product (Prism TV) to over 430,000 new homes in existing markets, bringing total homes enabled to over 3.6 million. We also added approximately 40,000 Prism TV customers during the year. |
| • | Reached agreements to (i) sell our data centers and colocation business and (ii) outsource our towers to Vertical Bridge under a 20-year strategic arrangement. |
2016 Executive Compensation Highlights. During 2016, the Human Resources and Compensation Committee of our Board (which we refer to from time to time as the “Committee” in this portion of the Proxy Statement) took the following steps to (i) maintain the strong linkage between executive pay and our performance and strategic goals and (ii) review and refine as necessary the compensation packages of our senior officers to ensure that they remained targeted at the 50th percentile of market compensation levels. Our recent key executive compensation decisions and highlights are summarized below.
| • | Our executive compensation program for 2016 continued to emphasize variable “at risk” compensation, with a majority of our named executive officers’ compensation delivered through a combination of short- and long-term performance-driven incentives (which, for our CEO, represented over 90% of his total target compensation). |
| • | As in prior years, the Committee set challenging performance targets under our incentive programs to ensure that payouts track corporate performance. Specifically: |
| • | Our short-term incentive bonus payouts for 2016 were 80.2% of targeted amounts for our named executive officers. |
| • | Approximately 30% of the performance-based restricted shares originally granted to our named executives in 2014 were forfeited based upon our actual performance over the three-year performance period ending December 31, 2016. |
| • | The long-term incentives granted to our named executive officers in 2016 consisted of a combination of performance-based restricted stock (60% of the target grant value) and time-based restricted stock (40% of the target grant value). |
| • | In May 2016, our shareholders cast approximately 89% of their votes in favor of our annual “say on pay” proposal. |
| • | Other than relatively modest increases to annual salaries that were necessary to address a limited number of below-market pay packages, the Committee maintained levels of target total compensation in 2016 that were substantially similar to levels awarded in prior years. |
| • | In February 2016, the Committee approved a one-time increase to the equity grant value for Mr. Hussain in order to recognize his outstanding performance. |
| • | In February 2016, Dean Douglas began his employment with CenturyLink as President, Sales and Marketing. Mr. Douglas has more than 30 years of experience in the communications, entertainment and information technology sectors, and a track record of facilitating revenue growth. His compensation is described in Subsection III below. |
For further information on our recent performance goals, see “— Short-Term Incentive Bonuses” and “— Long-Term Equity Incentive Compensation” under Subsection III below. For more information on our recent financial performance, see Appendix A to this proxy statement.
Assessment of “Say on Pay” Voting Results and Shareholder Outreach. In May 2014, 2015 and 2016, our shareholders cast approximately 93%, 95% and 89%, respectively, of their votes in favor of our “say on pay”
30
Table of Contents
proposal. The Committee takes the results of these votes into consideration when making executive compensation decisions. Although this high level of support indicates that our shareholders are generally satisfied with the scope and structure of our compensation programs, our senior management began a shareholder outreach program with our top institutional investors in 2014. Most recently, in May 2016, we contacted our top institutional investors, holding approximately 20% of our outstanding shares, and offered shareholder outreach calls. None of our top institutional investors took advantage of this offer so no calls were held. We remain committed to offering an opportunity for open dialogue with our shareholders on compensation matters and other issues relevant to our business.
II. Our Compensation Philosophy and Linkage to Pay for Performance
Our Compensation Philosophy
We compensate our senior management through a mix of programs designed to be market-competitive and fiscally responsible. More specifically, our executive compensation programs are designed to:
| • | provide an appropriate mix of fixed and variable compensation to attract, retain and motivate key executives, |
| • | ensure that a majority of our executive compensation is performance-based to support creation of long-term shareholder value, revenue growth and operational efficiency without encouraging excessive risk taking, |
| • | target compensation at the 50th percentile of market levels, when targeted levels of performance are achieved, for similarly-situated and comparably skilled executives at peer companies selected by the Committee, |
| • | recognize and reward outstanding contributions and results, both on an individual basis and a company or divisional basis, compared to peer compensation and performance benchmark levels, |
| • | promote internal equity by offering comparable pay to executives whom we expect to make roughly equivalent contributions, while differentiating executives’ compensation arrangements when appropriate, and |
| • | monitor share dilution. |
31
Table of Contents
Overview of Pay Elements and Linkage to Compensation Philosophy and Objectives
We believe the following elements of our compensation program help us to realize our compensation philosophy and objectives:
| Pay Element |
Characteristics |
Compensation Philosophy and Objectives | ||
| Salary |
Annual fixed cash compensation | Provides a competitive and stable component of income to our executives | ||
| Short-Term Incentive Bonus |
Annual variable cash compensation based on the achievement of annual performance measures. For 2016 half of these payments were based on operating cash flow and the other half on core revenue. For each executive, the Committee has an opportunity to make a positive or negative adjustment based on the executive’s performance against individual objectives | Provides competitive short-term incentive opportunities for our executives to earn annual cash bonuses based on performance objectives that, if attained, can reasonably be expected to (i) promote our business and strategic objectives and (ii) correspond to those paid to similarly-situated and comparably skilled executives at peer companies | ||
| Performance-Based Restricted Stock (60% of long-term incentive grant value) |
Annual long-term variable equity awards that cliff vest three years from the date of grant with half the number of shares based on our relative three-year total shareholder return (“TSR”) versus our custom industry peer group and the other half based on a three-year revenue target | Fosters a culture of ownership, aligns the long-term interests of our executives with our shareholders and rewards or penalizes executives based on our long-term relative TSR and absolute revenue performance | ||
| Time-Based Restricted Stock (40% of long-term incentive grant value) |
Annual long-term equity awards that vest based on years of service | Provides variable compensation that helps to retain executives and ensures our executives’ interests are aligned with those of shareholders to promote the creation of long-term value | ||
The Committee feels our incentive programs supported our strategic and cultural priorities for 2016 as described below:
| • | Our senior officers’ pay is linked to similar performance objectives for both short-term incentive compensation and performance-based restricted shares, as we feel revenue stabilization is critical and is derived by the execution of our short- and long-term strategies. |
| • | We believe our generation of core revenue is critical to our goal of stabilizing and ultimately increasing our consolidated revenues with a view to attain strategic revenue growth sufficient to offset our continuing legacy revenue losses. Core revenue is a performance measure in both our short-term incentive bonus and performance-based restricted shares, representing 28% to 31% of our executive officers’ 2016 target total compensation. |
| • | Total shareholder return relative to our peers is one of the performance measures used in our performance-based restricted shares, representing 16% to 21% of our executive officers’ 2016 target total compensation. We believe this compensation will ultimately be realized only if we successfully execute our strategic plans and perform satisfactorily in relation to our industry peers. |
| • | Operating cash flow enables us to, among other things, (i) fund strategic capital investments designed to expand our business opportunities, (ii) return cash to our shareholders through dividends or periodic |
32
Table of Contents
| share repurchases, and (iii) meet our debt and pension obligations. Operating cash flow is a performance measure in our short-term incentive bonus, representing 9% to 12% of our executive officers’ 2016 target total compensation. |
| • | The individual performance objectives provide “line of sight” to each senior officer’s performance regarding their specific areas of responsibility. In addition, we utilize this aspect of the short-term incentive plan design to reinforce leadership behaviors promoting our Unifying Principles and expectations of our broader workforce. We believe that successfully executing on clearly defined individual performance objectives will help us improve team collaboration, expand our product lines, refine our market strategies, strengthen our network, execute expansion opportunities, reduce costs and otherwise improve our operations. |
The following chart illustrates the approximate allocation of our CEO and other named executive officers (“NEOs”) total target compensation opportunity for 2016 between elements that are fixed pay and variable or performance-based pay:
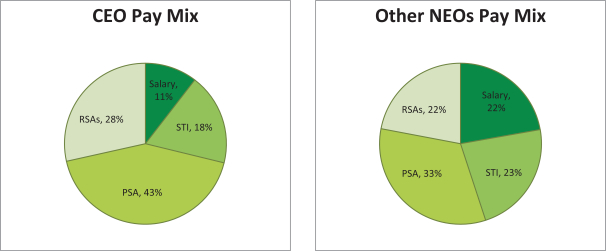
| • | A fixed annual salary represents 11% of our CEO’s total target compensation and 22% of our other NEOs’ average target total compensation. |
| • | Variable pay is comprised of a short-term incentive (“STI”) bonus, time-based restricted stock awards (“RSAs”) and performance-based restricted stock awards (“PSAs”), and represents 89% of our CEO’s total target compensation and 78% of our other NEOs’ average target total compensation. |
| • | Performance-based pay is comprised of an STI bonus and PSAs, and represents 61% of our CEO’s total target compensation and 56% of our other NEOs’ average target total compensation. |
Short-Term Incentive Performance. The Committee sets target levels of performance based on its assessment of the difficulty of achieving such levels and the potential impact of such achievement on enhancing shareholder value. The percentages in the table below represent the actual payouts to our senior officers for each of the past three years as a percentage of the target opportunity set for him by the Committee for that performance year.
| Performance Year |
Actual Payout as a % of Target Opportunity | ||||
| 2014 |
96.8 | % | |||
| 2015 |
77.6 | % | |||
| 2016 |
80.2 | % | |||
33
Table of Contents
Linkage of Long-Term Incentive Performance Objectives with our Compensation Philosophy. We believe we can increase shareholder value if we outperform our industry peers’ three-year total shareholder return and surpass the sum of our annual revenue targets over three-year performance periods. Since 2013, the Committee has granted performance-based restricted stock measuring our performance against these two objectives over a three-year performance period. In 2014, the Committee increased the percentage of the value of the executives’ long-term awards in the form of performance-based restricted stock from 50% to 60%.
The percentages in the tables below represent the percentage of the target value of the executives’ long-term awards granted in the form of performance-based restricted stock and time-vested restricted stock, including, for grant years 2013 and later, the portion based upon total shareholder return and absolute revenue performance objectives.
Grant Date Allocation of Long-Term Incentive Awards
| Grant Year |
Performance Period |
% of Total Fair Value Awarded in Time-Vested Restricted Shares |
% of Total Fair Value Awarded in TSR Performance- Based Restricted Shares(1) |
% of Total Fair Value Awarded in Absolute Revenue Performance-Based Restricted Shares |
||||||||||||
| 2010 |
2010 — 2012 | 50 | % | 50 | % | — | ||||||||||
| 2011 |
2011 — 2013 | 50 | % | 50 | % | — | ||||||||||
| 2012 |
2012 — 2014 | 50 | % | 50 | % | — | ||||||||||
| 2013 |
2013 — 2015 | 50 | % | 25 | % | 25 | % | |||||||||
| 2014 |
2014 — 2016 | 40 | % | 30 | % | 30 | % | |||||||||
| 2015 |
2015 — 2017 | 40 | % | 30 | % | 30 | % | |||||||||
| 2016 |
2016 — 2018 | 40 | % | 30 | % | 30 | % | |||||||||
| (1) | As noted in the table and commentary below, the applicable TSR peer group was the S&P 500 index prior to 2013, and a self-constructed peer group since then. |
Actual Payouts of Performance-Based Restricted Stock. The actual payouts of our previous grants of performance-based restricted stock provide further evidence of our “pay for performance” philosophy. As described in greater detail in “— Long-Term Equity Incentive Compensation” under Subsection III below, we grant amounts of our performance-based restricted stock awards based upon target performance levels, but the ultimate payout of those awards can range between 0% to 200% depending on our actual performance.
The payout percentages in the tables below represent the percentage of the target number of performance-based restricted stock granted to our senior officers that ultimately vested, with all remaining shares being forfeited. To further enhance the pay for performance linkage, any dividends granted on these shares are not paid currently, but rather accumulate during the restricted period and vest or are forfeited in tandem with the related shares.
Actual Payouts of TSR Performance-Based Restricted Stock
| Grant Year |
Performance Period |
Peer Group | CTL TSR | Percentile Rank |
Actual Payout % |
|||||||||||||||
| 2010 |
2010 — 2012 | S&P 500 | 35.29 | % | 46 | th | 92 | % | ||||||||||||
| 2011 |
2011 — 2013 | S&P 500 | -14.42 | % | 9 | th | 0 | % | ||||||||||||
| 2012 |
2012 — 2014 | S&P 500 | 33.32 | % | 19 | th | 0 | % | ||||||||||||
| 2013 |
2013 — 2015 | TSR Peer Group | -19.47 | % | 16 | th | 0 | % | ||||||||||||
| 2014 |
2014 — 2016 | TSR Peer Group | -5.34 | % | 25 | th | 50 | % | ||||||||||||
34
Table of Contents
Actual Payouts of Absolute Revenue Performance-Based Restricted Stock
| Grant Year |
Performance Period |
Performance Goal(1) | Absolute Revenue Target |
Company’s Performance |
Actual Payout % |
|||||||||||||
| 2013 |
2013 — 2015 | Sum of Core Revenue Targets over Three-Year |
$ | 49.125 million | 99.5 | % | 92.6 | % | ||||||||||
| 2014 |
2014 — 2016 | Sum of Core Revenue Targets over Three-Year Performance Period |
$ | 48.525 million | 99.2 | % | 89.1 | % | ||||||||||
| (1) | For additional information, see “— Long-Term Equity Incentive Compensation” below. |
Realizable Pay for our CEO. The chart below illustrates the realizable pay for 2014, 2015 and 2016 for our CEO, most of which was “at risk” variable compensation. We calculate realizable pay for a given year by adding together the (i) actual salary paid during the year, (ii) STI bonus that was ultimately paid out for performance during that year, (iii) the value of RSAs and PSAs that vested during the year and (iv) the RSAs and PSAs that are projected to vest based on actual performance through the end of the year, valuing the shares based on the closing price of our common stock on the last business day of the year.
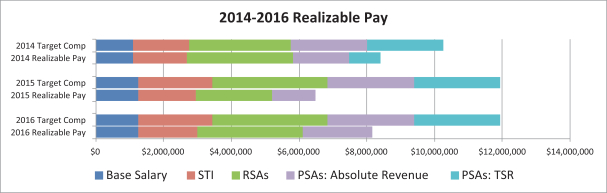
As this chart illustrates, our CEO’s realizable pay was 82%, 54% and 68% of his total target compensation for years 2014, 2015 and 2016, respectively.
Significant Stock Ownership. Stock ownership guidelines further align executives and shareholders and focus the executives on long-term success. We established our executive stock ownership guidelines after discussions with some of our shareholders. Under our stock ownership guidelines as of the record date:
| • | Mr. Post held approximately $39.5 million in stock (including restricted shares), which was approximately 31.6 times his base salary and approximately 5.3 times greater than his target ownership level of six times base salary. |
| • | Our other NEOs held an aggregate of approximately $22.1 million in stock (including restricted shares), which was, on average, over 10 times their respective base salaries and over 3.4 times greater than their respective target ownership level of three times base salary. |
35
Table of Contents
III. Our Compensation Program Objectives and Components of Pay
Our Compensation Practices
To assist us in achieving our broad compensation goals, we apply the following practices (many of which are described further elsewhere in this Compensation Discussion and Analysis):
What We Do…
| • | Focus on performance-based compensation weighted heavily towards long-term equity awards |
| • | Benchmark against 50th percentile peer compensation levels |
| • | Maintain robust stock ownership guidelines applicable to our executive officers and outside directors |
| • | Annually review our compensation programs to avoid encouraging excessively risky behavior |
| • | Conduct annual “say-on-pay” votes |
| • | Periodically seek input on our executive compensation from shareholders |
| • | Maintain a compensation “clawback” policy |
| • | Review the composition of our peer groups annually |
| • | Conduct independent and intensive performance reviews of our senior officers |
| • | Limit the maximum number of performance shares to vest if our total shareholder return is negative |
| • | Review realizable pay of our senior officers and total compensation “tally” sheets |
| • | Require shareholders to approve any future severance agreements valued at more than 2.99 times the executive’s target cash compensation |
| • | Impose compensation forfeiture covenants broader than those mandated by law |
What We Don’t Do…
| • | Enter into employment agreements with our executives |
| • | Maintain a supplemental executive retirement plan |
| • | Permit our directors or employees to hedge our stock, or our directors or senior officers to pledge our stock |
| • | Pay dividends on unvested restricted stock |
| • | Permit the Committee’s compensation consultant to provide other services to CenturyLink |
| • | Pay, provide or permit: |
| (i) | excessive perquisites, |
| (ii) | excise tax “gross-up” payments, or |
| (iii) | single-trigger change of control equity acceleration benefits. |
Summary of 2016 Compensation for our Named Executive Officers
Two of the core principles of our compensation philosophy are to offer competitive compensation to our named executive officers at the 50th percentile of market levels with an appropriate mix of fixed and variable compensation.
Our 2016 annual incentive bonus target percentages and the total fair value of our 2016 equity grants for our executive officers were based on these principles.
36
Table of Contents
Each element of our 2016 compensation is discussed further below in this Subsection under the headings “— Salary,” “— Short-Term Incentive Bonuses” and “— Long-Term Equity Incentive Compensation.” In each case, more information on how we determined specific pay levels is located in Subsection IV under the heading “— Our Compensation Decision-Making Process.”
Salary
General. Early each year, the Committee takes a number of steps in connection with setting annual salaries, including reviewing compensation tally sheets and benchmarking data, discussing with the CEO each senior officer’s pay and performance relative to other senior officers, and considering when the officer last received a pay increase. More information on how we determined specific pay levels is located under the heading “— Our Compensation Decision-Making Process” in Subsection IV below.
In September 2015, the Committee approved an annual salary of $800,010 for Mr. Douglas to be effective with the start of his employment with CenturyLink in February 2016. The salary level was based on the Committee’s review of compensation benchmarking data and was established as part of preparing a comprehensive market-competitive compensation package for Mr. Douglas. In February 2016, the Committee conducted a comprehensive benchmarking review of the compensation for all other executive officers. Based on that review, the Committee awarded a salary increase of 5.3% to Mr. Hussain in recognition of his performance demonstrated in 2015. This resulted in a salary of $500,000 for Mr. Hussain for 2016. No further salary increases were awarded at that time to the executive officers. See the additional discussion under the heading “— Use of ‘Benchmarking’ Data — Performance Benchmarking” in Subsection IV below.
Recent Actions. In February 2017, the Committee reviewed the updated compensation benchmarking data for all executive officers and awarded a salary increase of 10% for Mr. Hussain, and left unchanged the salary for our other named executive officers. See further discussion under the heading “— Use of ‘Benchmarking’ Data — Performance Benchmarking” in Subsection IV below.
Short-Term Incentive Bonuses
General. With the assistance of management and its compensation consultant, the Committee sets STI bonus targets annually. Annually in the first quarter, the Committee approves (i) the performance objectives for prospective bonuses, (ii) the “threshold,” “target” and “maximum” threshold levels of performance, (iii) the weighting of the performance objectives, (iv) the amount of bonus payable if the target level of performance is attained and (v) the finally determined amount of bonus payments attributable to performance for the prior year.
In September 2015, the Committee approved an STI bonus target of 125% for Mr. Douglas as part of his overall competitive compensation package and the Committee’s review of compensation benchmarking data. Mr. Douglas began his employment with us in February 2016, at which time he commenced accruing the right to receive a bonus for the portion of 2016 during which he provided service. In February 2016, the Committee determined that each named executive’s then-prevailing STI bonus target continued to be generally within an acceptable range of targeting an STI bonus opportunity at the 50th percentile for peers in similarly situated positions based on data compiled by its compensation consultant. Accordingly, the Committee made no changes in 2016 to our named executive officers’ prior bonus targets.
37
Table of Contents
The table below summarizes the 2016 STI bonus opportunities for our named executive officers.
| Named Officer |
2016 Salary(1) |
x | Bonus Target % |
= | Target Bonus Opportunity |
|||||||||||||||
| Glen F. Post, III |
$ | 1,250,000 | 175 | % | $ | 2,187,500 | ||||||||||||||
| Dean J. Douglas |
699,462 | 125 | % | 874,327 | ||||||||||||||||
| R. Stewart Ewing, Jr. |
666,266 | 110 | % | 732,892 | ||||||||||||||||
| Aamir Hussain |
496,049 | 100 | % | 496,049 | ||||||||||||||||
| Stacey W. Goff |
540,758 | 110 | % | 594,834 | ||||||||||||||||
| (1) | Salary reflected in this table represents earned salary during 2016 and includes a salary increase, effective on February 28, 2016, which increased the salary of Mr. Hussain from $475,000 to $500,000. Salary for Mr. Douglas represents salary earned during 2016 from his first day of work on February 16, 2016 through December 31, 2016. |
Performance Objectives and Targets. Each year, the Committee reviews in detail the relevance of our STI performance objectives for alignment with our business goals and objectives. In February 2016, the Committee reaffirmed its decision from the prior two years to offer STI bonuses for all senior officers based upon our attainment of consolidated operating cash flow and consolidated core revenue targets. See the further discussion under the heading “— Overview of Pay Elements and Linkage to Compensation Philosophy and Objectives” in Subsection II above.
In February 2016, the Committee, after discussion with our CEO, approved (i) a target level of 6% of operating cash flow return on average assets for purposes of fixing the maximum amount of potential annual bonuses for 2016 payable to our senior officers in accordance with Section 162(m) of the Internal Revenue Code, and (ii) the following threshold, target, and maximum performance levels for 2016 operating cash flow and core revenue.
| Performance Levels (in billions) | ||||||||||||||||
| Financial Performance Objectives |
Weighting | Threshold | Target(1) | Maximum | ||||||||||||
| Consolidated Operating Cash Flow(2) |
50 | % | $ | 6.365 | $ | 6.700 | $ | 7.035 | ||||||||
| Consolidated Core Revenue(3) |
50 | % | 15.319 | 15.875 | 16.431 | |||||||||||
| (1) | Based upon the same forecasts used in connection with our publicly-disclosed guidance. |
| (2) | Represents operating income plus depreciation and amortization expenses. |
| (3) | Represents the sum of strategic revenues and legacy revenues (excluding our data integration and other revenues), all as reported in our publicly-filed financial statements. |
In February 2016, the Committee, in collaboration with our CEO, also approved guidelines designed to enable the Committee, in its discretion, to increase or decrease the bonus of each senior officer by up to 10%, based on the officer’s individual performance during 2016 with respect to (i) assisting the Company to meet its expense budget, (ii) exhibiting collaboration and leadership skills, (iii) attaining three to four specific pre-selected individual performance objectives and (iv) the officer’s individual scoring under our management performance rating system.
2016 Performance Results. In February 2017, the Committee reviewed audited results of the Company’s performance as compared to the financial performance targets established for 2016. Based on the calculations described below, the Committee determined that the aggregate earned performance for these performance targets was 80.2% for our named executive officers, as described further below.
38
Table of Contents
During 2016, we achieved the financial results described below which, based on the financial objective payout scale in the table below under heading “— Calculation of Bonuses,” resulted in the following earned performance level for each financial objective:
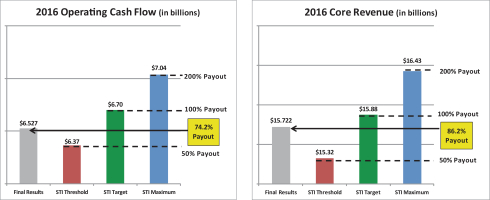
| • | 162(m) Target — Operating Cash Flow Return on Average Assets. We attained a 13.8% operating cash flow return on average assets, which exceeded the target level established by the Committee in February 2016 for purposes of fixing the maximum amount of potential annual bonuses for 2016 payable to our senior officers in accordance with Section 162(m) of the Internal Revenue Code. |
| • | Operating Cash Flow. We achieved consolidated operating cash flow results of $6.527 billion (which reflects certain adjustments for the reasons noted below), which was below our target of $6.7 billion, thereby resulting in earned performance of 74.2% of the target level. |
| • | Core Revenue. We achieved consolidated core revenue results of $15.722 billion, which was below our target of $15.875 billion, thereby resulting in earned performance of 86.2% of the target level. |
| • | Individual Performance Objectives. The Committee reviewed with management the degree to which each senior officer met certain specific individual performance objectives and benchmarks, as well as qualitative assessments of each officer’s performance. As noted below under “— Committee Discretion,” the Committee elected not to make individual performance adjustments with impact to any of our named executive officers’ 2016 bonus awards. |
We used the following scale, which was approved in 2016, to calculate bonus amounts payable with respect to company performance.
| Financial Objective Payout Scale |
||||||||||||
| Performance Level |
Consolidated Operating Cash Flow |
Consolidated Core Revenue |
Payout as % of Target Award (1) |
|||||||||
| Maximum |
³ 105.0 | % | ³ 103.5 | % | 200 | % | ||||||
| Target |
100.0 | % | 100.0 | % | 100 | % | ||||||
| Threshold |
95.0 | % | 96.5 | % | 50 | % | ||||||
| Below Threshold |
< 95.0 | % | < 96.5 | % | 0 | % | ||||||
| (1) | Linear interpolation is used when our performance is between the threshold, target and maximum amounts to determine the corresponding percentage of the target award earned. |
Upon completion of each fiscal year, if necessary, our actual operating results are adjusted up or down, as appropriate, in accordance with the Committee’s long-standing guidelines that are designed to eliminate the effects of extraordinary or non-recurring transactions that were not known, anticipated or quantifiable on the date the performance goals were established. For 2016, the Committee adjusted our operating cash flow, in accordance with such guidelines, for items which were not considered or included in the establishment of the
39
Table of Contents
original 2016 targets. These adjustments were the same adjustments publicly announced by us in connection with releasing our 2016 operating results in early 2017, including, among others, adjustments for severance costs associated with recent headcount reductions ($189 million), costs related to our pending acquisition of Level 3 ($52 million) and termination of depreciation expense related to our pending sale of the colocation business ($36 million).
Calculation of Bonuses. The STI bonus payments are calculated using the above-described financial objective payout scale and other criteria approved in the first quarter of the year by the Committee. After our internal audit personnel have reviewed these determinations and calculations, they are provided in writing to the Committee for its review and approval.
The 2016 bonuses paid to our named executives were calculated under a three-step process. In step one, the Committee determined that we had exceeded our target of operating cash flow return on average assets under 162(m) and, therefore, each of our named executives qualified for potential annual bonuses up to a fixed maximum amount defined as a percentage of the executive’s 2016 salary. In step two, the Committee calculated bonuses by measuring the company’s performance against the operating cash flow and core revenue goals described above under the heading “— 2016 Performance Results.” In step three, the Committee authorized actual bonuses for our named executives, which were substantially lower than the maximum potential bonuses calculated in step one.
The actual amounts of the named executive officers’ 2016 bonuses were calculated as follows:
| Named Officer |
Target Bonus Opportunity(1) |
x | Earned Company Performance %(2) |
+ | Discretionary Adjustment for Individual Performance(3) |
= | Bonus(4) | |||||||||||||||||||||
| Glen F. Post, III |
$ | 2,187,500 | 80.2 | % | $ | 0 | $ | 1,754,375 | ||||||||||||||||||||
| Dean J. Douglas |
874,327 | 80.2 | % | $ | 0 | 701,211 | ||||||||||||||||||||||
| R. Stewart Ewing, Jr. |
732,892 | 80.2 | % | $ | 0 | 587,780 | ||||||||||||||||||||||
| Aamir Hussain |
496,049 | 80.2 | % | $ | 0 | 397,831 | ||||||||||||||||||||||
| Stacey W. Goff |
594,834 | 80.2 | % | $ | 0 | 477,057 | ||||||||||||||||||||||
| (1) | Determined in the manner reflected in the chart above under the heading “— Short-Term Incentive Bonuses — General.” |
| (2) | Calculated or determined as discussed above under “— 2016 Performance Results.” |
| (3) | Determined based on achievement of individual performance objectives as described further above in this Subsection. |
| (4) | These bonus amounts are reflected in the Summary Compensation Table appearing below under the column “Non-Equity Incentive Plan Compensation.” |
Committee Discretion. As noted above, we exceeded our target for our 162(m) objectives which set the maximum 2016 bonuses payable to each of our senior officers. The Committee maintains the discretion, subject to certain limits, to either increase or decrease the bonus amounts determined on the basis of actual performance earned for financial and individual targets and objectives. Nonetheless, the Committee elected not to apply discretionary adjustments for the 2016 annual incentive bonus payments to any our named executive officers.
Under our annual bonus programs, the Committee may authorize the payment of annual bonuses in cash or stock. Since 2000, the Committee has paid these bonuses entirely in cash, principally to diversify our compensation mix and prevent us from over-utilizing equity grants.
Recent Actions. In connection with establishing 2017 annual incentive bonus targets, the Committee made no changes to our named executive officers’ bonus target percentages; however, the amount of Mr. Hussain’s bonus target incrementally increased in proportion with his base salary increase described above.
40
Table of Contents
Long-Term Equity Incentive Compensation
General. Our shareholder-approved long-term incentive compensation programs authorize the Committee to grant a variety of stock-based incentive awards to key personnel. We believe stock incentive awards (i) encourage key personnel to focus on sustainable long-term performance, (ii) strengthen the relationship between compensation and growth in the market price of the company’s common shares and thereby align management’s financial interests with those of the shareholders and (iii) help attract and retain talented personnel.
As it did in 2014 and 2015, the Committee in 2016 granted 60% of our senior officers’ target equity incentive compensation in the form of performance-based restricted stock, which is ultimately payable only if we attain certain specified goals. The remaining portion of our senior officers’ long-term equity incentive compensation awarded in 2014, 2015 and 2016 was granted in time-vested restricted stock, the value of which is dependent on our performance over an extended vesting period.
Performance Benchmarks. On an annual basis, the Committee reviews the relevance of our performance benchmarks for alignment with our long-term strategic plan. In 2016, we kept the same two performance benchmarks, relative TSR and absolute revenue, that we used for our 2014 and 2015 performance-based restricted shares. See further discussion under the heading “— Overview of Pay Elements and Linkage to Compensation Philosophy and Objectives” in Subsection II above.
An overview of our TSR performance-based restricted shares granted in 2016 is outlined below.
| • | Performance Benchmark: Our benchmark is our percentile rank versus the below-described 26-company TSR peer group. See further discussion under the heading “— Use of ‘Benchmarking’ Data — Performance Benchmarking” in Subsection IV below. |
| • | Performance Period: January 1, 2016 through December 31, 2018. |
| • | Performance Vesting: The ultimate number of TSR performance-based restricted shares that vest will be based on our total shareholder return during the above-described performance period relative to the total shareholder return of the TSR peer group over the same period, as illustrated in the table below. |
| Relative Total Shareholder Return |
||||||||
| Performance Level |
Company’s Percentile Rank | Payout as % of Target Award(1) |
||||||
| Maximum |
³ 75th Percentile | 200% | ||||||
| Target |
50th Percentile | 100% | ||||||
| Threshold |
25th Percentile | 50% | ||||||
| Below Threshold |
< 25th Percentile | 0% | ||||||
| (1) | Linear interpolation is used when our relative TSR performance is between the threshold, target and maximum amounts to determine the corresponding percentage of the target award earned. |
An overview of our absolute revenue performance-based restricted shares granted in 2016 is outlined below.
| • | Performance Benchmark: Our benchmark is an absolute revenue target over the below-described three-year performance period, which is equal to the sum of three annual absolute revenue targets separately established by the Committee during the first quarter of the years 2016, 2017, and 2018. “Absolute revenue” is defined as the sum of our consolidated legacy and strategic revenue, in each case defined in the same manner we report such amounts in our Annual Report on Form 10-K for the prior year. |
| • | Performance Period: January 1, 2016 through December 31, 2018. |
41
Table of Contents
| • | Performance Vesting: The ultimate number of our absolute revenue performance-based restricted shares that vest will be based on our achievement of the aggregate three-year absolute revenue target, as illustrated in the table below; provided, however, none of our absolute revenue performance-based restricted shares will vest unless we attain a 6% operating cash flow annual return on average assets during the performance period. Upon completion of each fiscal year within the three-year performance period, the Committee intends to adjust our actual operating, to the extent necessary, in accordance with the Committee’s long-standing guidelines that are designed to eliminate the effects of extraordinary or non-recurring transactions that were not known, anticipated or quantifiable on the date the performance goals were established. |
| Absolute Revenue |
||||||||
| Performance Level |
Company’s Performance(1) | Payout as % of Target Award(2) |
||||||
| Maximum |
³ 103.5% | 200% | ||||||
| Target |
100.0% | 100% | ||||||
| Threshold |
96.5% | 50% | ||||||
| Below Threshold |
< 96.5% | 0% | ||||||
| (1) | Determined by dividing (i) the sum of our absolute revenue actually attained for the years 2016, 2017 and 2018 by (ii) the sum of our absolute revenue targets separately established for each of the years 2016, 2017 and 2018. |
| (2) | Linear interpolation is used when our absolute revenue performance is between the threshold, target and maximum amounts to determine the corresponding percentage of target award earned. |
For additional information on the above-described grants, see “Executive Compensation — Incentive Compensation and Other Awards.”
2016 Executive Grants. Following its deliberations in February 2016, the Committee formally approved an increase to the targeted aggregate grant date fair value of Mr. Hussain’s equity award from $1,400,000 to $2,100,000. This increase was primarily the result of the Committee’s recognition of Mr. Hussain’s overall leadership and performance demonstrated in 2015, but also reflected the Committee’s review of compensation benchmarking. See further discussion under the heading “— Use of ‘Benchmarking’ Data — Performance Benchmarking” in Subsection IV below. During 2016, the Committee granted equity awards to our other senior officers on terms and in amounts substantially similar to the awards granted to them in 2015.
During 2016, the Committee granted our named officers the following number of (i) restricted shares that will vest over a three-year period principally in exchange for continued service (“time-based restricted shares”), (ii) performance-based restricted shares that will vest in 2019 based on our relative total shareholder return (the “TSR performance-based restricted shares”) and (iii) performance-based restricted shares that will vest in 2019
42
Table of Contents
principally based on our attainment of absolute revenue targets over the above-described three-year performance period (the “absolute revenue performance-based restricted shares”):
| Performance-Based Restricted Shares | ||||||||||||||||||||||||
| Named Officer |
Time-Based Restricted |
No. of TSR Performance- Based Restricted Shares(2) |
No. of Absolute Revenue Performance- Based Restricted Shares(2) |
Fair Value(1) |
Total Fair Value(1) |
|||||||||||||||||||
| No. of Shares |
Fair Value(1) | |||||||||||||||||||||||
| Glen F. Post, III |
130,326 | $ | 3,400,000 | 97,745 | 97,745 | $ | 5,100,000 | $ | 8,500,000 | |||||||||||||||
| Dean J. Douglas |
35,264 | 920,000 | 26,449 | 26,449 | 1,380,000 | 2,300,000 | ||||||||||||||||||
| R. Stewart Ewing, Jr. |
23,918 | 624,000 | 17,939 | 17,939 | 936,000 | 1,560,000 | ||||||||||||||||||
| Aamir Hussain |
32,198 | 840,000 | 24,149 | 24,149 | 1,260,000 | 2,100,000 | ||||||||||||||||||
| Stacey W. Goff |
19,319 | 504,000 | 14,489 | 14,489 | 756,000 | 1,260,000 | ||||||||||||||||||
| (1) | For purposes of these grants, we determined both the number of time-vested and performance-based restricted shares by dividing the total fair value granted to the executive by the volume-weighted average closing price of our Common Shares over a 15-trading day period ending five trading days prior to the grant date. In the Summary Compensation Table, however, our 2016 grants of time-vested restricted stock are valued based on the closing stock price of our Common Shares on the day of grant, and our 2016 grants of performance-based restricted shares are valued as of the grant date based on probable outcomes, in each case in accordance with mandated SEC disclosure rules. See footnote 1 to the Summary Compensation Table for more information. |
| (2) | Represents the number of restricted shares granted in 2016. As discussed further below, the actual number of shares that vest in the future may be lower or higher. |
Types of Awards. We strive to pay equity compensation in forms that create appropriate incentives to optimize performance at reasonable cost, that minimize enterprise risk, that align the interests of our officers and shareholders, that foster our long-term financial and strategic objectives and that are competitive with incentives offered by other companies. Since 2008, the Committee has elected to issue all of our long-term equity compensation grants in the form of restricted stock for a variety of reasons, including:
| • | the Committee’s recognition of the prevalent use of restricted stock by our peers, |
| • | the Committee’s desire to minimize the dilution associated with our rewards, and |
| • | the retentive value of restricted stock under varying market conditions. |
In an effort to increase the link between our performance and executive compensation, since 2010, the Committee has issued at least half of the value of our senior officers’ long-term awards in the form of performance-based restricted stock, with the rest being in the form of time-vested restricted stock.
In connection with structuring its equity grants, the Committee also reviews tax, accounting and other considerations that it deems to be relevant.
For additional information on the vesting and other terms of our equity awards (including certain voluntary limits on the number of performance-based restricted shares that vest if our total shareholder return over the performance period is negative and our intent to comply with Section 162(m) of the Internal Revenue Code) with respect to certain aspects our executive compensation, see the preceding discussion in this Compensation Discussion and Analysis and “Executive Compensation — Incentive Compensation and Other Awards.”
Recent Actions. At its February 2017 meeting, the Committee granted equity awards on terms similar to the awards granted to them in 2016. The Committee elected to grant equity awards for our named executive officers
43
Table of Contents
at substantially the same amounts granted to them in 2016, except for Mr. Hussain, whose 2017 grant date fair value was lower than his 2016 grant date fair value (a portion of which included a non-recurring grant for meritorious performance, as described further above).
Other Benefits
As a final component of executive compensation, we provide a broad array of benefits designed to be competitive, in the aggregate, with similar benefits provided by our peers. We summarize these additional benefits below.
Retirement Plans. We maintain one or more traditional qualified defined benefit retirement plans for most of our employees who meet certain eligibility requirements, plus one or more traditional qualified defined contribution 401(k) plans for a similar group of our employees. With respect to these qualified plans, we maintain nonqualified plans that permit our officers to receive or defer supplemental amounts in excess of federally-imposed caps that limit the amount of benefits highly-compensated employees are entitled to receive under qualified plans. Additional information regarding our retirement plans is provided in the tables and accompanying discussion included below under the heading “Executive Compensation.”
Change of Control Arrangements. We have agreed to provide cash and other severance benefits to each of our executive officers who is terminated under certain specified circumstances following a change of control of CenturyLink. If triggered, benefits under these change of control agreements include payment of (i) a lump sum cash severance payment equal to a multiple of the officer’s annual cash compensation, (ii) the officer’s annual bonus, based on actual performance and the portion of the year served, (iii) certain welfare benefits are continued for a limited period, and (iv) the value or benefit of any long-term equity incentive compensation, if and to the extent that the exercisability, vesting or payment thereof is accelerated or otherwise enhanced upon a change of control pursuant to the terms of any applicable long-term equity incentive compensation plan or agreement.
Under these agreements, change of control benefits are payable to our executive officers if within a certain specified period following a change in control (referred to as the “protected period”) the officer is terminated without cause or resigns with “good reason,” which is defined to include a diminution of responsibilities, an assignment of inappropriate duties, and a transfer of the officer exceeding 50 miles. We have filed with the SEC copies of our change of control agreements.
The table below shows (i) the length of the “protected period” afforded to officers following a change of control and (ii) the multiple of salary and bonus payment and years of welfare benefits to which officers will be entitled if change of control benefits become payable under our agreements and related policies:
| Protected Period |
Multiple of Annual Cash Compensation |
Years of Welfare Benefits |
||||||||||
| CEO |
2 years | 3 times | 3 years | |||||||||
| Other Executives |
1.5 years | 2 times | 2 years | |||||||||
| Other Officers |
1 year | 1 time | 1 year | |||||||||
For more information on change of control arrangements applicable to our executives, including our rationale for providing these benefits, see “Executive Compensation — Potential Termination Payments — Payments Made Upon a Change of Control.” For information on change of control severance benefits payable to our junior officers and managers, see “— Severance Benefits” in the next subsection below.
Severance Benefits. Our executive severance plan provides cash severance payments equal to two years of total targeted cash compensation (defined as salary plus the targeted amount of annual incentive bonus) for our CEO or one year of total targeted cash compensation for any other senior officer in the event that the senior officer is involuntarily terminated by us without cause in the absence of a change of control.
44
Table of Contents
Payments to senior officers terminated in connection with a change of control are separately governed by the change of control arrangements discussed immediately above under the heading “— Change of Control Arrangements.”
Under our executive severance plan, subject to certain conditions and exclusions, more junior officers or managers receive certain specified cash payments and other benefits if they are either (i) involuntarily terminated without cause in the absence of a change of control or (ii) involuntarily terminated without cause or resign with good reason in connection with a change of control. Our full-time non-union employees not covered by our executive severance plan may, subject to certain conditions, be entitled to certain specified cash severance payments in connection with certain qualifying terminations.
Under a policy that we adopted in 2012, we are required to seek shareholder approval of any future senior executive severance agreements providing for cash payments, perquisites and accelerated health or welfare benefits with a value greater than 2.99 times the sum of the executive’s base salary plus target bonus.
Life Insurance Benefits. We sponsor a long-standing supplemental life insurance plan that we closed to new participants in 2008. Under this plan, four of our senior officers hold supplemental life insurance policies for which we are obligated to pay the premiums. We have not paid any premiums to fund these benefits since 2011. Over the past several years, predecessor policies were converted to newer, lower-cost policies. Due to these conversions, we currently expect to resume paying premiums during 2017 on behalf of our four grandfathered senior executives under this plan. In consultation with the Compensation Committee, we plan to continue to evaluate other options to minimize the cost of providing these benefits to the four grandfathered plan participants.
Perquisites. Officers are entitled to be reimbursed for the cost of an annual physical examination, plus related travel expenses.
Our aircraft usage policy permits the CEO to use our aircraft for personal travel without reimbursing us, and permits each other executive officer to use our aircraft for up to $10,000 per year in personal travel without reimbursing us. In all such cases, personal travel is permitted only if aircraft is available and not needed for superseding business purposes. Periodically, the Committee receives a report on the personal use of aircraft by senior management, and determines whether or not to alter our aircraft usage policy. In connection with electing to retain this policy, the Committee has determined that the policy (i) provides valuable and cost-effective benefits to our executives residing in a small city with limited commercial airline service, (ii) enables our executives to travel in a manner that we believe is more expeditious than commercial airline service, and (iii) is being implemented responsibly by the executives.
For purposes of valuing and reporting the use of our aircraft, we determine the incremental cost of aircraft usage on an hourly basis, calculated in accordance with applicable guidelines of the SEC. The incremental cost of this usage, which may be substantially different than the cost as determined under alternative calculation methodologies, is reported in the Summary Compensation Table appearing below.
From time to time, we have scheduled one of our annual regular board meetings and related committee meetings over a multi-day period. These meetings are often held in an area where we conduct operations, and frequently include site visits that enable our directors and senior officers to meet with local personnel. The spouses of our directors and executive officers are invited to attend these retreats, and we typically schedule recreational activities for those who are able and willing to participate.
For more information on the items under this heading, see the Summary Compensation Table appearing below.
Other Employee Benefits. We maintain certain broad-based employee welfare benefit plans in which the executive officers are generally permitted to participate on terms that are either substantially similar to those
45
Table of Contents
provided to all other participants or which provide our executives with enhanced benefits upon their death or disability. We also maintain a supplemental disability plan designed to ensure disability payments to our officers in the event payments are unavailable from our disability insurer.
IV. Our Policies, Processes and Guidelines Related to Executive Compensation
Our Compensation Decision-Making Process
As described further below, the Compensation Committee of our Board establishes, evaluates and monitors our executive compensation programs, subject to the Board’s oversight. The compensation decision-making process includes input from the Committee’s compensation consultant, our CEO and management, and requires a careful balancing of a wide range of factors, which include, but are not limited to, the following:
| Compensation Decision-Making Considerations |
Input From | |||
| Structure and Elements of Pay Programs |
||||
| The competitive compensation practices of peer companies |
Consultant | |||
| Performance of our Company in relation to our peers and our internal goals |
Management | |||
| The financial impact and risk characteristics of our compensation programs |
|
Consultant and CEO |
| |
| The strategic and financial imperatives of our business |
CEO | |||
| Setting Competitive Compensation Pay Levels |
||||
| Market data regarding the officer’s base salary, short-term incentive target, long-term incentive target and total target compensation paid to comparable executives at peer companies reflected in the benchmarking data |
Consultant | |||
| The officer’s scope of responsibility, industry experience, particular set of skills, vulnerability to job solicitations from competitors and anticipated degree of difficulty of replacing the officer with someone of comparable experience and skill |
|
Consultant and CEO |
| |
| The officer’s pay and performance relative to other officers and employees |
CEO | |||
| The officer’s demonstrated leadership characteristics, ability to act as a growth agent within the company and ability to think strategically |
CEO | |||
| Internal equity issues that could impact cohesion, teamwork or the overall viability of the executive group |
CEO | |||
| The potential of these senior officers to assume different, additional or greater responsibilities in the future |
CEO | |||
| The officer’s realized and realizable compensation in recent years and, to a limited degree, his or her accumulated wealth under our programs |
|
CEO and Management |
| |
| The role these senior officers play in achieving our operational and strategic goals |
CEO | |||
| Pay for Performance |
||||
| Performance of our Company in relation to our peers and our key performance objectives (operating cash flow, core revenues and total shareholder return) |
|
Consultant, CEO and Management |
| |
| The business performance under the officer’s leadership and scope of responsibility |
CEO | |||
| The officer’s overall performance is assessed based on individual results, the role the officer plays in maintaining a cohesive management team and improving the performance of others, and the officer’s relative strengths and weaknesses compared to the other senior officers |
|
CEO and Management |
| |
| The role the officer may have played in any recent extraordinary corporate achievements |
|
CEO and Management |
| |
46
Table of Contents
For additional information on the compensation decision-making process of the Committee, see the remaining discussion in this Subsection appearing below.
Role of Human Resources and Compensation Committee. The Committee establishes, evaluates and monitors our executive compensation programs and oversees our human resources strategies, subject to the Board’s ultimate oversight. Specifically, the Committee approves:
| • | the compensation payable to each executive officer, as well as any other senior officer; |
| • | for our short-term incentive and performance-based restricted shares (i) the performance objectives, (ii) the “threshold,” “target” and “maximum” threshold levels of performance, (iii) the weighing of the performance objectives, (iv) the amount of bonus payable and shares to vest if the target level of performance is attained and (v) the finally determined amount of cash bonus payments or fully-vested shares; |
| • | the peer group for compensation benchmarking and the peer group for performance benchmarking; and |
| • | delegation of authority to the CEO for awards of equity to our non-senior officers. |
Among other things, the Committee also establishes, implements, administers and monitors our director cash and equity compensation programs. For more information, see “Director Compensation.”
Role of Compensation Consultants. The Committee engages the services of a compensation consultant to assist in the design and review of executive compensation programs, to determine whether the Committee’s philosophy and practices are reasonable and compatible with prevailing practices, and to provide guidance on specific compensation levels based on industry trends and practices.
The Committee has used Meridian Compensation Partners, LLC (“Meridian”) as its compensation consultant since June 2015. Representatives of Meridian actively participated in the design and development of our 2016 executive compensation programs and attended all of the Committee’s meetings in 2016. Meridian provides no other services to the Company, and, to our knowledge, has no prior relationship with any of our named executive officers. As required by SEC rules and New York Stock Exchange listing standards, the Committee has assessed the independence of Meridian and concluded that its work has not raised any conflicts of interest.
Role of CEO and Management. Although the Compensation Committee is responsible for all executive compensation decisions, each year it receives the CEO’s recommendations, particularly with respect to senior officers’ salaries and performance in the key areas outlined above in “ — Our Compensation Decision-Making Process.”
Senior Officers. The CEO and the executive management team, in consultation with the Committee’s compensation consultant, recommend to the Committee business goals to be used in establishing incentive compensation performance targets and awards for our senior officers. In addition, our Executive Vice President, Human Resources, works closely with the Committee and its compensation consultant to ensure that the Committee is provided with appropriate information to discharge its responsibilities.
Non-Senior Officers. The Committee oversees our processes and receives an annual report from the CEO on the compensation programs for our non-senior officers. The CEO, in consultation with the executive management team, is responsible for approval of:
| • | individual compensation levels for all of our vice presidents; |
| • | the total cash compensation paid to our non-senior officers; |
| • | all equity compensation awards to the non-senior officers, acting under authority delegated by the Committee in accordance with our shareholder approved long-term incentive plans. |
47
Table of Contents
Timing of Equity Incentive Awards. Annual grants of stock awards to executives are typically made during the first quarter after we publicly release our earnings, although the Committee may defer grants for a variety of reasons, including to request additional information or conduct further reviews of management’s performance. Grants of stock awards to newly-hired executive officers who are eligible to receive such awards are typically made at the next regularly scheduled Committee meeting following their hire date.
Tally Sheets. Each year, we compile lists of compensation data relating to each of our executives. These “tally sheets” include the executive’s salary, annual cash incentive award, equity-based compensation, and realizable pay. These tally sheets also contain performance highlights on results and behaviors for each of our executives. The Committee uses these tally sheets to (i) review the total annual compensation of the executive officers and (ii) assure that the Committee has a comprehensive understanding of all elements of our compensation programs.
Risk Assessment. As part of its duties, the Committee assesses risks arising out of our employee compensation policies and practices. Based on its most recent assessment, the Committee does not believe that the risks arising from our compensation policies and practices are reasonably likely to materially adversely affect us. In reaching this determination, we have taken into account the risk exposures of our operations and the following design elements of our compensation programs and policies:
| • | our balance of annual and long-term compensation elements at the executive and management levels, |
| • | our use of a diverse mix of performance metrics that create incentives for management to attain goals well aligned with the shareholders’ interests, |
| • | the multi-year vesting of equity awards, which promotes focus on our long-term performance and mitigates the risk of undue focus on our short-term results, |
| • | “clawback” policies and award caps that provide safeguards against inappropriate behavior, and |
| • | bonus arrangements that generally permit either the Committee (for compensation payable to senior officers) or senior management (for compensation payable to other key employees) to exercise “negative discretion” to reduce the amount of certain incentive awards. |
We believe these features, as well as the stock ownership requirements for our executive officers, result in a compensation program that aligns our executives’ interests with those of our shareholders and does not promote excessive risk-taking on the part of our executives or other employees.
Use of “Benchmarking” Data
General. With assistance from its compensation consultant, the Committee reviews each year “peer groups” of other companies comparable to CenturyLink for purposes of assessing our comparative compensation and performance. We generally endeavor to perform this analysis in the second half of each year in order to ensure they remain well-suited for its intended purposes and uses during the upcoming year.
Compensation Benchmarking. The Committee, based on input from its compensation consultant, reviewed peer group and survey data in support of pay decisions for our senior officers in 2016 in order to benchmark compensation levels for our executives against individuals who work in similarly-situated positions at companies that are comparable to ours based on revenue size, market cap, industry and business model.
48
Table of Contents
For our named executive officers, our compensation consultant utilized the compensation data publicly disclosed by companies included within the peer group below:
| Peer Group for 2016 Compensation Benchmarking | ||
| BCE Inc. |
Liberty Global plc | |
| Cablevision Systems Corporation |
Motorola Solutions, Inc. | |
| Charter Communications, Inc. |
QUALCOMM Incorporated | |
| CISCO Systems Inc. |
Sprint Corporation | |
| Comcast Corporation |
Telus Corporation | |
| Computer Sciences Corporation |
Time Warner Cable Inc. | |
| DISH Network Corporation |
T-Mobile US Inc. | |
| Frontier Communications Corp. |
Windstream Holdings, Inc. | |
| Level 3 Communications, Inc. |
Xerox Corporation | |
In selecting these 18 peer companies, the Committee focused principally on telecommunications, cable and other communications companies that are generally comparable to us in terms of size, markets and operations. Prior to the start of 2016, the Committee reviewed the prior year’s comparable peer group and elected to remove DIRECTV and to add BCE Inc., Frontier Communications Corp., Telus Corporation, T-Mobile US Inc. and Xerox Corporation.
In addition to the peer group described above, our compensation consultant utilized, to a lesser degree, survey data containing compensation information for companies in the telecommunications industry and general industry that are generally similar in size to us.
For additional information about how we set pay levels, see “— Our Compensation Decision-Making Process.”
Performance Benchmarking. With the aid of its compensation consultant, the Committee annually reviews the broad industry peer group that it introduced in 2013 for purposes of benchmarking our relative performance based upon our historical three-year total shareholder return. This peer group is focused principally on telecommunications, cable and other communications companies that are generally comparable to us in terms of size, markets and operations. Prior to adopting the peer group for use in 2016 performance benchmarking, the Committee revised it by removing Cogent Communications Holding Inc., Ciena Corporation and Finisar Corp. and adding QUALCOMM Incorporated. Thereafter, it approved the below-listed 26-company TSR Peer Group for 2016 performance benchmarking. The peer group for compensation benchmarking is somewhat constrained by the number of companies and revenue and market cap size. In contrast, the peer group for performance benchmarking is comprised of companies we believe investors are considering when they decide whether to invest in us or our industry.
| TSR Peer Group for Performance Benchmarking Relating to 2016 Awards | ||
| AT&T, Inc. |
Level 3 Communications, Inc.* | |
| Cablevision Systems Corporation* |
Liberty Global plc* | |
| Cincinnati Bell Inc. |
Motorola Solutions, Inc.* | |
| CISCO Systems Inc.* |
QUALCOMM Incorporated * | |
| Comcast Corporation* |
Rackspace Hosting, Inc. | |
| Consolidated Communications Holdings Inc. |
Sirius XM Holdings Inc. | |
| Crown Castle International Corp. |
Spok Holdings, Inc. | |
| DISH Network Corporation* |
Sprint Corporation* | |
| Equinix Inc. |
Telephone & Data Systems Inc. | |
| Frontier Communications Corp.* |
United States Cellular Corporation | |
| General Communication Inc. |
Verizon Communications Inc. | |
| IDT Corporation |
Viacom, Inc. | |
| JDS Uniphase Corporation |
Windstream Holdings, Inc.* | |
| * | Also included in the Committee’s above-listed Peer Group used for 2016 compensation benchmarking. |
49
Table of Contents
Forfeiture of Prior Compensation
For approximately 20 years, all recipients of our equity compensation grants have been required to contractually agree to forfeit certain of their awards (and to return to us any cash, securities or other assets received by them upon the sale of Common Shares they acquired through certain prior equity awards) if at any time during their employment with us or within 18 months after termination of employment they engage in activity contrary or harmful to our interests. The Committee is authorized to waive these forfeiture provisions if it determines in its sole discretion that such action is in our best interests. We have filed with the SEC copies of our form of equity incentive agreements containing these forfeiture provisions. Our 2015 Executive Officers Short-Term Incentive Plan contains substantially similar forfeiture provisions.
Our Corporate Governance Guidelines authorize the Board to recover, or “clawback,” compensation from an executive officer if the Board determines that any bonus, incentive payment, equity award or other compensation received by the executive was based on any financial or operating result that was impacted by the executive’s knowing or intentional fraudulent or illegal conduct. Certain provisions of the Sarbanes-Oxley Act of 2002 would require our CEO and CFO to reimburse us for incentive compensation paid or trading profits earned following the release of financial statements that are subsequently restated due to material noncompliance with SEC reporting requirements caused by misconduct. In addition, provisions of the Dodd-Frank Wall Street Reform and Consumer Protection Act of 2010 will, upon the completion of related rulemaking, require all of our current or former executive officers to make similar reimbursement payments in connection with certain financial statement restatements, irrespective of whether such executives were involved with the mistake that caused the restatement.
Stock Ownership Guidelines
Under our current stock ownership guidelines, our executive officers are required to beneficially own CenturyLink stock in market value equal to a multiple of their annual salary, as outlined in the table below, and each outside director must beneficially own CenturyLink stock equal in market value to five times the annual cash retainer payable to outside directors. Each executive officer and outside director has three and five years, respectively, to attain these targets.
| Executive Officer |
Stock Ownership Guidelines | Stock Ownership Guidelines | ||
| CEO |
6 times base salary | $7.5 million(1) | ||
| All Other Executive Officers |
3 times base salary | $1.6 million(2) | ||
| Outside Directors |
5 times annual cash retainer | $325,000 |
| (1) | Based on annual salary as of December 31, 2016 |
| (2) | Based on average annual salary for all other executive officers as of December 31, 2016 |
For any year during which an executive or outside director does not meet his or her ownership target, the executive or director is required to hold 65% of the CenturyLink stock that he or she acquires through our equity compensation programs, excluding shares sold to pay related taxes.
As of the record date for the meeting, all of our executive officers and all of our directors were in compliance with, and in most cases significantly exceeded, our stock ownership guidelines. For additional information on our stock ownership guidelines, see “Governance Guidelines.”
Use of Employment Agreements
We have a long-standing practice of not providing employment agreements to our officers, and none of our long-standing executives have been granted an employment agreement. In connection with our recent mergers, however, we have assumed several employment agreements formerly granted by Embarq, Qwest or Savvis to its officers, and in a couple of instances have extended or renewed these arrangements to retain officers critical to our future plans.
50
Table of Contents
Tax Gross-ups
We eliminated the use of tax “gross-up” benefits in our executives’ change of control agreements and split-dollar insurance policies in 2010, and in our outside directors’ executive physical program in early 2012. We continue to provide these tax benefits to a limited number of our officers under legacy employment agreements that are expected to lapse over the next couple of years and to all of our employees who qualify for relocation benefits under our broad-based relocation policy. Subject to these limited exceptions, we do not intend to provide tax gross-up benefits in any new compensation programs.
Anti-Hedging and Anti-Pledging Policies
Under our insider trading policy, our employees and directors may not:
| • | purchase or sell short-term options with respect to CenturyLink shares, |
| • | engage in “short sales” of CenturyLink shares, or |
| • | engage in hedging transactions involving CenturyLink shares which allow employees to fix the value of their CenturyLink shareholdings without all the risks of ownership or cause them to no longer have the same interests or objectives as our other shareholders. |
In addition, under our insider trading policy, our senior officers and directors are prohibited from holding our securities in a margin account or otherwise pledging our securities as collateral.
We believe that all of our senior officers and directors are currently in compliance with our anti-hedging and anti-pledging policies.
Deductibility of Executive Compensation
Section 162(m) of the Internal Revenue Code (the “Code”) limits the amount of compensation paid to our CEO and our other three most highly compensated executive officers, other than our CFO, that may be deducted by us for federal income tax purposes in any fiscal year to $1,000,000. “Performance-based” compensation that has been approved by our shareholders and otherwise satisfies the performance-based requirements under Section 162(m) of the Code is not subject to the Code’s $1,000,000 deduction limit. While the Committee believes that it is important for compensation paid to such covered employees to be tax deductible under the Code, the Committee also recognizes the need to retain flexibility to make compensation decisions, in the exercise of its business judgment, that may not meet the standards of Section 162(m) in order to enable us to continue to attract, retain, reward and motivate highly-qualified executives. Section 162(m) is highly technical and complex, so that even when we seek favorable tax treatment thereunder, we cannot assure you that our tax position will prevail.
The Compensation Committee has reviewed and discussed with management the report included above under the heading “Compensation Discussion and Analysis.” Based on this review and discussion, the Committee recommended to the Board that the Compensation Discussion and Analysis report be included in this proxy statement and incorporated into our Annual Report on Form 10-K for the year ended December 31, 2016.
Submitted by the Human Resources and Compensation Committee of the Board of Directors.
| Laurie A. Siegel (Chair) |
Virginia Boulet | |
| William A. Owens |
Michael J. Roberts |
51
Table of Contents
The following table sets forth certain information regarding the compensation of (i) our principal executive and financial officers and (ii) each of our three most highly compensated executive officers other than our principal executive and financial officers. Following this table is additional information regarding incentive compensation, pension benefits, deferred compensation and potential termination payments pertaining to the named officers. For additional information on the compensation summarized below and other benefits, see “Compensation Discussion and Analysis.”
Summary Compensation Table
| Name and Principal Position |
Year | Salary | Bonus | Restricted Stock Awards(1) |
Non-Equity Incentive Plan Compensation(2) |
Change in Pension Value(3) |
All Other Compensation(4) |
Total | ||||||||||||||||||||||||
| Glen F. Post, III Chief Executive Officer and President |
2016 | $ | 1,250,000 | $ | — | $ | 10,518,344 | $ | 1,754,375 | $ | 333,816 | $ | 109,679 | $ | 13,966,214 | |||||||||||||||||
| 2015 | 1,250,000 | — | 7,277,717 | 1,697,500 | 330,649 | 108,645 | 10,664,511 | |||||||||||||||||||||||||
| 2014 | 1,100,000 | — | 9,581,227 | 1,597,200 | 745,535 | 107,486 | 13,131,448 | |||||||||||||||||||||||||
| Dean J. Douglas President — Enterprise Markets |
2016 | (5) | 699,462 | 125,000 | 2,986,244 | 701,211 | — | 9,275 | 4,521,192 | |||||||||||||||||||||||
| R. Stewart Ewing, Jr. Executive Vice President, Chief Financial Officer and Assistant Secretary |
2016 | 666,266 | — | 1,930,420 | 587,780 | 186,454 | 43,456 | 3,414,376 | ||||||||||||||||||||||||
| 2015 | 663,138 | — | 1,335,661 | 566,480 | 191,830 | 47,520 | 2,804,629 | |||||||||||||||||||||||||
| |
2014 |
|
|
650,000 |
|
|
— |
|
|
1,992,894 |
|
|
692,120 |
|
|
462,796 |
|
|
44,710 |
|
|
3,842,520 |
| |||||||||
| Aamir Hussain |
2016 | 496,049 | — | 2,598,654 | 397,831 | — | 13,548 | 3,506,082 | ||||||||||||||||||||||||
| Executive Vice President, |
2015 | 475,010 | — | 1,198,665 | 368,607 | — | 9,275 | 2,051,557 | ||||||||||||||||||||||||
| Chief Technology Officer |
2014 | (6) | 85,892 | 100,000 | 2,486,653 | 83,144 | — | 344,945 | 3,100,634 | |||||||||||||||||||||||
| Stacey W. Goff Executive Vice President, Chief Administrative Officer, General Counsel and Secretary |
2016 | 540,758 | — | 1,559,195 | 477,057 | 161,857 | 36,146 | 2,775,013 | ||||||||||||||||||||||||
| 2015 | 537,728 | — | 1,078,819 | 459,417 | — | 54,279 | 2,130,243 | |||||||||||||||||||||||||
| 2014 | 520,890 | — | 1,609,657 | 611,942 | 339,053 | 45,600 | 3,127,142 | |||||||||||||||||||||||||
| (1) | The amounts shown in this column reflect the fair value of awards of restricted stock made in early 2016, 2015 and 2014 in connection with our program of making annual long-term incentive compensation grants (except, with respect to Mr. Douglas, as otherwise noted in Note 5 below). The fair value of the awards presented in the table above has been determined in accordance with FASB ASC Topic 718. For purposes of this table, in accordance with SEC disclosure rules we determined the fair value of shares of: |
| • | time-vested restricted stock using the closing trading price of our Common Shares on the day of grant; |
| • | relative performance-based restricted stock (as defined below) as of the grant date based on probable outcomes using Monte Carlo simulations; and |
| • | absolute performance-based restricted stock (as defined below) based on probable outcomes (subject to future adjustments based upon changes in the closing trading price of our Common Shares at the end of each reporting period). |
The aggregate value of the restricted stock awards granted to these named executives in 2016, based on the grant date closing trading price of our Common Shares and assuming maximum payout of his or her performance-based restricted shares, would be as follows: Mr. Post, $15,248,259, Mr. Douglas, $4,254,998, Mr. Ewing, $2,798,523, Mr. Hussain, 3,767,225, and Mr. Goff, $2,260,352. See Note 10 titled “Share-based Compensation” of the notes to our audited financial statements included in Appendix A for an explanation of material assumptions that we used to calculate the fair value of these stock awards.
52
Table of Contents
| (2) | The amounts shown in this column reflect cash payments made under our annual incentive bonus plans for actual performance in the respective years. For additional information, see “— Incentive Compensation and Other Awards — 2016 Awards.” |
| (3) | Reflects the net change during each of the years reflected in the present value of the named executives’ accumulated benefits under the defined benefit plans discussed below under the heading “— Pension Benefits.” In 2015, the present value of the accumulated benefits under those defined pension plans decreased by $123,573 for Mr. Goff (primarily due to (i) an additional year of benefit accrual, (ii) a one year decrease in the discount period and (iii) changes in both the discount rate and mortality assumption from 2014 to 2015). SEC rules dictate that the 2015 decreases be treated as a $0 Change in Pension Value for purposes of calculating total compensation. |
| (4) | The amounts shown in this column are comprised of (i) reimbursements for the cost of an annual physical examination, (ii) personal use of our aircraft, (iii) contributions or other allocations to our defined contribution plans, and (iv) reimbursements of the cost of relocating one of our named executives and his family from Europe to the site of our headquarters office in 2014, including without limitation residential closing costs, travel costs, moving expenses, loss on the sale of a vehicle and lease termination penalties (aggregating to $324,903), plus related tax-gross up payments of $20,042, in each case for and on behalf of the named executives as follows: |
| Name |
Year | Physical Exam |
Aircraft Use |
Contributions to Plans |
Relocation Costs |
Total | ||||||||||||||||||
| Mr. Post |
2016 | $ | 4,011 | $ | 2,640 | $ | 103,028 | $ | — | $ | 109,679 | |||||||||||||
| 2015 | 3,035 | 6,120 | 99,490 | — | 108,645 | |||||||||||||||||||
| 2014 | 2,831 | 7,500 | 97,155 | — | 107,486 | |||||||||||||||||||
| Mr. Douglas |
2016 | — | — | 9,275 | — | 9,275 | ||||||||||||||||||
| Mr. Ewing |
2016 | 3,753 | — | 39,703 | — | 43,456 | ||||||||||||||||||
| 2015 | 3,775 | — | 43,745 | — | 47,520 | |||||||||||||||||||
| 2014 | — | — | 44,710 | — | 44,710 | |||||||||||||||||||
| Mr. Hussain |
2016 | 4,273 | — | 9,275 | — | 13,548 | ||||||||||||||||||
| 2015 | — | — | 9,275 | — | 9,275 | |||||||||||||||||||
| 2014 | — | — | — | 344,945 | 344,945 | |||||||||||||||||||
| Mr. Goff |
2016 | — | 1,140 | 35,006 | — | 36,146 | ||||||||||||||||||
| 2015 | 7,441 | 6,600 | 40,238 | — | 54,279 | |||||||||||||||||||
| 2014 | — | 7,758 | 37,842 | — | 45,600 | |||||||||||||||||||
In accordance with applicable SEC and accounting rules, we have not reflected the accrual or payment of dividends relating to unvested restricted stock as compensation in the Summary Compensation Table. In addition, the amounts shown in the Summary Compensation Table do not reflect any benefits associated with the named officers or their family members participating in recreational activities scheduled during board retreats. For additional information, see “Compensation Discussion and Analysis — Our Compensation Program Objectives and Components of Pay — Other Benefits — Perquisites.”
| (5) | Mr. Douglas commenced employment with us on February 16, 2016. As part of his negotiated employment package, Mr. Douglas received a signing bonus valued at $250,000, 50% of which was paid in cash and 50% of which was paid in the form of shares of time-vested restricted stock granted on March 7, 2016. Mr. Douglas’ annual incentive bonus with respect to 2016 was prorated based on the number of days worked during 2016. |
| (6) | Mr. Hussain commenced employment with us on October 27, 2014. Mr. Hussain received a cash signing bonus of $100,000 as part of his negotiated employment package. Mr. Hussain’s annual incentive bonus with respect to 2014 was prorated based on the number of days worked during 2014. |
Incentive Compensation and Other Awards
2016 Awards. The table and discussion below summarize:
| • | the range of potential cash payouts under short-term incentive bonus awards that were granted to each named officer on the dates indicated below with respect to performance during 2016, and |
53
Table of Contents
| • | grants of long-term compensation awarded to each named officer on the dates indicated below, consisting of (i) the number of shares of time-vested restricted stock awarded, (ii) the range of potential share payouts under relative performance-based restricted stock awards and (iii) the range of potential share payouts under absolute performance-based restricted stock awards, which for purposes of the table below are referred to as the time-vested awards, the relative performance awards and the absolute performance awards, respectively. |
Grants of Plan-Based Awards
| Name |
Type of Award and Grant Date(1) |
Range of Payouts Under 2016 Non- Equity Incentive Plan Awards(2) |
Estimated Future Share Payouts Under Equity Incentive Plan Awards(3) |
All other Stock Awards: Unvested Shares (#)(4) |
Grant Date Fair Value of Stock Awards ($)(5) |
|||||||||||||||||||||||||||||
| Threshold ($) |
Target ($) |
Maximum ($) |
Threshold (#) |
Target (#) |
Maximum (#) |
|||||||||||||||||||||||||||||
| Glen F. Post, III |
Annual Bonus | $ | 1,093,750 | $ | 2,187,500 | $ | 4,375,000 | — | — | — | — | — | ||||||||||||||||||||||
| Time-Vested Award | — | — | — | — | — | — | 130,326 | $ | 3,812,036 | |||||||||||||||||||||||||
| Relative Performance Award | — | — | — | 48,873 | 97,745 | 195,490 | — | 4,381,908 | ||||||||||||||||||||||||||
| Absolute Performance Award | — | — | — | 48,873 | 97,746 | 195,492 | — | 2,324,400 | ||||||||||||||||||||||||||
| Dean J. Douglas |
Annual Bonus | 437,164 | 874,328 | 1,748,655 | — | — | —- | — | — | |||||||||||||||||||||||||
| Time-Vested Award | — | — | — | — | — | — | 39,674 | 1,171,578 | ||||||||||||||||||||||||||
| Relative Performance Award | — | — | — | 13,225 | 26,449 | 52,898 | — | 1,185,709 | ||||||||||||||||||||||||||
| Absolute Performance Award | — | — | — | 13,225 | 26,449 | 52,898 | — | 628,957 | ||||||||||||||||||||||||||
| R. Stewart Ewing, Jr. |
Annual Bonus | 366,446 | 732,892 | 1,465,784 | — | — | — | — | — | |||||||||||||||||||||||||
| Time-Vested Award | — | — | — | — | — | — | 23,918 | 699,602 | ||||||||||||||||||||||||||
| Relative Performance Award | — | — | — | 8,970 | 17,939 | 35,878 | — | 804,205 | ||||||||||||||||||||||||||
| Absolute Performance Award | — | — | — | 8,970 | 17,940 | 35,880 | — | 426,613 | ||||||||||||||||||||||||||
| Aamir Hussain |
Annual Bonus | 248,025 | 496,049 | 992,098 | — | — | — | — | — | |||||||||||||||||||||||||
| Time-Vested Award | — | — | — | — | — | — | 32,198 | 941,792 | ||||||||||||||||||||||||||
| Relative Performance Award | — | — | — | 12,075 | 24,149 | 48,298 | — | 1,082,600 | ||||||||||||||||||||||||||
| Absolute Performance Award | — | — | — | 12,075 | 24,149 | 48,298 | — | 574,263 | ||||||||||||||||||||||||||
| Stacey W. Goff |
Annual Bonus | 297,417 | 594,834 | 1,189,668 | — | — | — | — | — | |||||||||||||||||||||||||
| Time-Vested Award | — | — | — | — | — | — | 19,319 | 565,081 | ||||||||||||||||||||||||||
| Relative Performance Award | — | — | — | 7,245 | 14,489 | 28,978 | — | 649,542 | ||||||||||||||||||||||||||
| Absolute Performance Award | — | — | — | 7,245 | 14,490 | 28,980 | — | 344,572 | ||||||||||||||||||||||||||
| (1) | Each of these awards was granted on February 23, 2016 with respect to each named officer, except, with respect to Mr. Douglas, as otherwise noted in Note 5 to the Summary Compensation Table appearing above. |
| (2) | These columns provide information on the potential bonus payouts approved with respect to 2016 performance. For information on the actual amounts paid based on 2016 performance criteria, see the column of the Summary Compensation Table labeled “Non-Equity Incentive Plan Compensation.” As described further herein, the failure to meet the “threshold” level of performance would result in no annual bonus payment. |
| (3) | Represents the relative performance awards and absolute performance awards granted on February 23, 2016 to each named executive, as described in greater detail below. |
| (4) | Represents the time-vested awards granted in 2016 to each named executive, as described in greater detail below. |
| (5) | Calculated in accordance with FASB ASC Topic 718 in the manner described in Note 1 to the Summary Compensation Table above. |
Terms of 2016 Restricted Stock Awards. The restricted stock issued to our executive officers in 2016 consisted of awards of:
| • | time-vested restricted stock |
| • | performance-based restricted stock, the ultimate payout of which will be based on our total shareholder return relative to the peer group referred to below (“relative performance-based restricted stock”) |
54
Table of Contents
| • | performance-based restricted stock, the ultimate payout of which will be based on our attainment of the absolute financial goals described below (“absolute performance-based restricted stock” and, collectively with the relative performance-based restricted stock, the “performance-based restricted stock”). |
Vesting. For each named officer, the shares of time-vested restricted stock awarded in 2016 will vest in three equal installments on February 23, 2017, 2018 and 2019, subject to the named officer’s continued employment with us (except that a small portion of the total number of such shares awarded to Dean Douglas in 2016 will vest under a slightly different schedule). For each named officer, the shares of their 2016 performance-based restricted stock will, subject to their continued employment, vest on February 23, 2019, but only upon attaining the performance goals specified below with respect to the period between January 1, 2016 and December 31, 2018 (the “performance period”).
In addition to the vesting described above, all of the shares of the time-vested restricted stock and performance-based restricted stock awarded in 2016 also vest upon the death or disability of the named officer, and some or all of these shares may under certain circumstances vest or remain subject to future vesting upon the retirement of the named officer at his or her early or normal retirement age. In addition, upon certain terminations of employment following a change of control of the Company, the shares of the 2016 time-vested restricted stock will vest and the shares of the 2016 performance-based restricted stock will remain subject to future vesting, all as described in greater detail below under “— Potential Termination Payments.” The vesting terms for our outstanding restricted stock granted in earlier years is substantially the same as noted above.
Shares Issuable Under Performance-Based Restricted Stock. In the preceding “Grants of Plan-Based Awards” table, the number of performance-based restricted shares listed under the “target” column for each named executive officer represents the number of shares actually granted to that officer that will vest if we perform at the targeted performance level. Generally speaking, the actual number of shares of performance-based restricted stock that will vest will depend upon whether our relative and absolute performance over the performance period is less than, equal to or more than the relative and absolute targets established by the Committee in connection with granting these awards.
All shares of the relative performance-based restricted stock will vest if we perform at the “target” performance level, which is attaining total shareholder return over the three-year performance period equal to the 50th percentile of the total shareholder return of the companies in a 26-company TSR peer group for the same three-year period. Each named executive officer will receive a greater or lesser number of shares of relative performance-based restricted stock depending on our actual total shareholder return in relation to that of the 26 TSR peer companies, as discussed further under “Compensation Discussion and Analysis — Our Compensation Program Objectives and Components of Pay — Long-Term Equity Incentive Compensation.”
None of the shares of absolute performance-based restricted stock will vest unless we attain at least a 6% operating cash flow annual return on average assets during the performance period. If we do, all shares of the absolute performance-based restricted stock will vest if we attain the “target” amount of our consolidated legacy and strategic revenue (as defined in our federal securities law reports) over the three-year performance period. This target amount of such revenue over this three-year period will equal the sum of (i) the amounts of targeted legacy and strategic revenue for 2016 and 2017 as previously determined by the Committee in early 2016 and 2017, respectively, and (ii) the amount of targeted legacy and strategic revenue for 2018 to be determined by the Committee in early 2018. Each named executive officer will receive a greater or lesser number of shares of absolute performance-based restricted stock depending on our actual absolute revenues over the performance period, as discussed further under “Compensation Discussion and Analysis — Our Compensation Program Objectives and Components of Pay — Long-Term Equity Incentive Compensation.”
Any contingent right of a named executive officer to receive more than the number of shares actually granted on February 23, 2016 are treated by us as restricted stock units under the terms of the CenturyLink 2011 Equity Incentive Plan.
55
Table of Contents
Other Terms. All dividends related to shares of the above-described time-vested and performance-based restricted stock will be paid to the holder only upon the vesting of such shares. Unless and until forfeited, these shares may be voted by the named executive officers.
All of these above-described restricted shares are subject to forfeiture if the officer competes with us or engages in certain other activities harmful to us, all as specified further in the forms of incentive agreements that we have filed with the SEC. See “— Potential Termination Payments.”
For additional information about our grants of time-vested restricted stock, relative performance-based restricted stock (including the 26-company TSR peer group referred to above) and absolute performance-based restricted stock, see “Compensation Discussion and Analysis — Our Compensation Program Objectives and Components of Pay — Long-Term Equity Incentive Compensation.”
Outstanding Awards. The table below summarizes information on stock options and unvested restricted stock outstanding at December 31, 2016.
Outstanding Equity Awards at December 31, 2016(1)
| Option Awards | Stock Awards | |||||||||||||||||||||||||||||||
| Equity Incentive Plan Awards(3) | All Other Stock Awards | |||||||||||||||||||||||||||||||
| Name |
Number of Securities Underlying Unexercised Options(2) |
Option Exercise Price |
Option Expiration Date |
Grant Date |
Unvested Shares |
Market Value of Unvested Shares |
Unvested Shares(4) |
Market Value of Unvested Shares |
||||||||||||||||||||||||
| Glen F. Post, III |
200,000 | $ | 45.90 | 2/26/2017 | 2/20/2014 | 155,418 | $ | 3,695,840 | 34,537 | $ | 821,290 | |||||||||||||||||||||
| 2/23/2015 | 131,640 | 3,130,399 | 58,507 | 1,391,296 | ||||||||||||||||||||||||||||
| 2/23/2016 | 195,491 | 4,648,776 | 130,326 | 3,099,152 | ||||||||||||||||||||||||||||
| Dean J. Douglas |
— | — | — | 2/23/2016 | 52,898 | 1,257,914 | 35,264 | 838,578 | ||||||||||||||||||||||||
| 3/7/2016 | (5) | — | — | 4,410 | 104,870 | |||||||||||||||||||||||||||
| R. Stewart Ewing, Jr. |
62,500 | 45.90 | 2/26/2017 | 2/20/2014 | 32,327 | 768,736 | 7,184 | 170,836 | ||||||||||||||||||||||||
| 2/23/2015 | 24,160 | 574,525 | 10,738 | 255,350 | ||||||||||||||||||||||||||||
| 2/23/2016 | 35,879 | 853,203 | 23,918 | 568,770 | ||||||||||||||||||||||||||||
| Aamir Hussain |
— | — | — | 11/7/2014 | — | — | 21,022 | 499,903 | ||||||||||||||||||||||||
| 2/23/2015 | 21,682 | 515,598 | 9,636 | 229,144 | ||||||||||||||||||||||||||||
| 2/23/2016 | 48,298 | 1,148,526 | 32,198 | 765,668 | ||||||||||||||||||||||||||||
| Stacey W. Goff |
40,500 | 45.90 | 2/26/2017 | 2/20/2014 | 26,111 | 620,920 | 5,802 | 137,972 | ||||||||||||||||||||||||
| 2/23/2015 | 19,514 | 464,043 | 8,673 | 206,244 | ||||||||||||||||||||||||||||
| 2/23/2016 | 28,979 | 689,121 | 19,319 | 459,406 | ||||||||||||||||||||||||||||
| (1) | All information on exercisability, vesting and market value is solely as of December 31, 2016. This table does not reflect (i) lapses of options, vesting of restricted stock or other changes in the equity awards since such date or (ii) any additional equity grants since such date. |
| (2) | We have not granted options to executives since 2007. All of the options summarized under this column were exercisable as of December 31, 2016 and all of them lapsed on February 26, 2017 without being exercised. |
| (3) | Represents performance-based restricted shares granted on February 20, 2014, February 23, 2015, and February 23, 2016. The table above assumes, as of December 31, 2016, that we would perform at “target” levels such that all performance-based shares granted to each named executive would vest fully. In early 2017, we determined that (i) 50% of the TSR performance-based restricted stock granted on February 20, 2014 would vest and the remaining shares would be forfeited and (ii) 89.1% of the absolute revenue performance-based restricted stock granted on February 20, 2014 would vest and the remaining shares would be forfeited. |
56
Table of Contents
| For additional information on the vesting and other terms of our most recent grant of performance-based restricted shares, see “— 2016 Awards” and “— Terms of 2016 Restricted Stock Awards.” |
| (4) | All shares listed under this column are shares of time-vested restricted stock that generally vest at a rate of one-third per year during the first three years after that grant date. For additional information on the vesting and other terms of our most recent grant of time-vested restricted shares, see “— Terms of 2016 Restricted Stock Awards.” |
| (5) | See Note 5 to the Summary Compensation Table appearing above. |
2016 Exercises and Vesting. The following table provides information on Common Shares acquired by the named officers during 2016 in connection with the exercise of options and the vesting of restricted stock.
Option Exercises and Stock Vested During 2016
| Option Awards | Stock Awards | |||||||||||||||
| Name |
Number of Shares Acquired on Exercise |
Value Realized on Exercise |
Number of Shares Acquired on Vesting(1) |
Value Realized on Vesting(2) |
||||||||||||
| Glen F. Post, III |
— | $ | — | 133,983 | $ | 3,771,329 | ||||||||||
| Dean J. Douglas |
— | — | — | — | ||||||||||||
| R. Stewart Ewing, Jr. |
— | — | 29,143 | 817,058 | ||||||||||||
| Aamir Hussain |
— | — | 25,840 | 631,160 | ||||||||||||
| Stacey W. Goff |
— | — | 22,900 | 642,747 | ||||||||||||
| (1) | Represents the vesting of (i) time-vested restricted shares granted in 2013, 2014 and 2015, and (ii) performance-based restricted shares granted in 2013, the vesting conditions of which are described in “Compensation Discussion and Analysis — Our Compensation Philosophy and Linkage to Pay for Performance — Overview of Pay Elements and Linkage to Compensation Philosophy and Objectives —Actual Payouts of Performance-Based Restricted Stock.” |
| (2) | Based on the closing trading price of the Common Shares on the applicable vesting date. |
Amount of Benefits. The following table and discussion summarize pension benefits payable to the named officers under (i) the CenturyLink Component of the CenturyLink Combined Pension Plan, qualified under Internal Revenue Code Section 401(a), which permits eligible participants (including officers) who have completed at least five years of service to receive a pension benefit upon attaining early or normal retirement age, and (ii) our nonqualified supplemental defined benefit plan, which is designed to pay supplemental retirement benefits to certain officers in amounts equal to the benefits such officers would otherwise forego due to federal limitations on compensation and benefits under qualified plans. We refer to these particular defined benefit plans below as our “Qualified Plan” and our “Supplemental Plan,” respectively, and as our “Pension Plans,” collectively.
| Name(1) |
Plan Name |
Number of Years of Credited Service |
Present Value of Accumulated Benefit(2) |
Payments During Last Fiscal Year |
||||||||||
| Glen F. Post, III |
Qualified Plan | 18 | $ | 2,129,404 | $ | — | ||||||||
| Supplemental Plan | 18 | 2,724,257 | — | |||||||||||
| R. Stewart Ewing, Jr. |
Qualified Plan | 18 | 1,536,161 | 644,603 | (3) | |||||||||
| Supplemental Plan | 18 | 1,108,812 | 13,627 | (4) | ||||||||||
| Stacey W. Goff |
Qualified Plan | 18 | 674,394 | — | ||||||||||
| Supplemental Plan | 18 | 463,241 | — | |||||||||||
57
Table of Contents
| (1) | Neither Dean J. Douglas nor Aamir Hussain are currently eligible to participate in either of our Pension Plans. |
| (2) | These figures represent accumulated benefits as of December 31, 2016 based on several assumptions, including the assumption that the executive remains employed by us and begins receiving retirement benefits at the normal retirement age of 65, with such accumulated benefits being discounted from the normal retirement age to December 31, 2016 using discount rates ranging between 3.95% and 4.10%. No adjustments have been made to reflect reductions required under any qualified domestic relations orders. See Note 9 titled “Employee Benefits” of the notes to our audited financial statements included in Appendix A for additional information. |
| (3) | Pursuant to a qualified domestic relations order, Mr. Ewing’s former wife received a lump sum payment in the amount of $644,603 on August 1, 2015, which was not previously reported. No further benefits are owed to her under the Qualified Plan. |
| (4) | As part of the qualified domestic relations order referenced in note 3, Mr. Ewing’s former wife is receiving payments under the Supplemental Plan, which commenced on August 1, 2015, in the amount of approximately $800 per month. The amount shown in the table represents payments made to her during 2016 ($9,619) plus an additional amount ($4,008) paid to her in 2015, which was not previously reported. The present value of the annuity of Mr. Ewing’s former wife is included in the Present Value of Accumulated Benefit column. |
Pension Plans. With limited exceptions specified in the Pension Plans, we “froze” our Qualified Plan and Supplemental Plan as of December 31, 2010, which means that no additional monthly pension benefits have accrued under such plans since that date (although service after that date continues to count towards vesting and benefit eligibility and a limited transitional benefit for eligible participants continued to accrue through 2015).
Prior to this freezing of benefit accruals, the aggregate amount of these named officers’ total monthly pension benefit under the Qualified Plan and Supplemental Plan was equal to the participant’s years of service since 1999 (up to a maximum of 30 years) multiplied by the sum of (i) 0.5% of his or her final average pay plus (ii) 0.5% of his or her final average pay in excess of his or her Social Security covered compensation, where “final average pay” was defined as the participant’s average monthly compensation during the 60 consecutive month period within his or her last ten years of employment in which he or she received his or her highest compensation. Effective December 31, 2010, the Qualified Plan and Supplemental Plan were amended to cease all future benefit accruals under the above formula (except where a collective bargaining agreement provides otherwise). In lieu of additional accruals under the above-described formula, each affected participant’s accrued benefit as of December 31, 2010 increases 4% per year, compounded annually through the earlier of December 31, 2015 or the termination of the participant’s employment.
Under both Pension Plans, “average monthly compensation” is determined based on the participant’s salary plus annual cash incentive bonus. Although the retirement benefits described above are provided through separate plans, we have in the past transferred benefits from the Supplemental Plan to the Qualified Plan, and reserve the right to make further similar transfers to the extent allowed under applicable law. The value of benefits transferred to the Qualified Plan, which directly offset the value of benefits in the Supplemental Plan, will be payable to the recipients in the form of enhanced annuities or supplemental benefits and are reflected in the table above under the “Present Value of Accumulated Benefits” column.
The normal form of benefit payment under both of our Pension Plans is (i) in the case of unmarried participants, a monthly annuity payable for the life of the participant, and (ii) in the case of married participants, an actuarially equivalent monthly annuity payable for the lifetime of the participant and a survivor annuity payable for the lifetime of the spouse upon the participant’s death. Participants may elect optional forms of annuity benefits under each Pension Plan and, in the case of the Qualified Plan, an annuity that guarantees ten
58
Table of Contents
years of benefits, all of which are actuarially equivalent in value to the normal form of benefit. The enhanced annuities described in the prior paragraph may be paid in the form of a lump sum, at the participant’s election.
The normal retirement age is 65 under both of the Pension Plans. Participants may receive benefits under both of these plans upon “early retirement,” which is defined as attaining age 55 with five years of service. Under both of these plans, the benefit payable upon early termination is calculated under formulas that pay between 60% to 100% of the base plan benefit and 48% to 92% of the excess plan benefit, in each case with the lowest percentage applying to early retirement at age 55 and proportionately higher percentages applying to early retirement after age 55. For additional information on early retirement benefits, please see the applicable early retirement provisions of the Pension Plans, copies of which are filed with the SEC.
Other. R. Stewart Ewing, Jr., age 65, is currently eligible to retire under the Qualified Plan and Supplemental Plan. Mr. Ewing currently plans to retire upon completion of our pending acquisition of Level 3, which we expect to close by the end of the third quarter of 2017. The Compensation Committee has preliminarily discussed the compensation to be paid to Mr. Ewing in connection with his retirement, but has not yet approved a definitive retirement package. The Potential Termination Payments table that appears below sets forth estimates of payments and benefits that Mr. Ewing would have received if he retired as of December 31, 2016. The actual amounts to be paid to Mr. Ewing in connection with his upcoming retirement will differ from the estimated amounts shown in such table, and are expected to be higher in the aggregate.
Glen F. Post, III, age 64, is currently eligible for early retirement under the Qualified Plan and Supplemental Plan.
The following table and discussion provides information on our Supplemental Dollars & Sense Plan, which is designed to permit officers to defer a portion of their salary in excess of the amounts that may be deferred under federal law governing qualified 401(k) plans.
Non-Qualified Deferred Compensation
| Name(1) |
Aggregate Balance at December 31, 2015 |
Executive Contributions in 2016(2) |
CenturyLink Contributions in 2016(3) |
Aggregate Earnings in 2016(4) |
Aggregate Withdrawals/ Distributions |
Aggregate Balance at December 31, 2016 |
||||||||||||||||||
| Glen F. Post, III |
$ | 3,645,520 | $ | 250,519 | $ | 94,749 | $ | 323,286 | $ | — | $ | 4,314,074 | ||||||||||||
| R. Stewart Ewing, Jr. |
1,311,713 | 124,467 | 30,428 | 145,819 | — | 1,612,427 | ||||||||||||||||||
| Stacey W. Goff |
1,419,289 | 91,698 | 32,094 | 136,933 | — | 1,680,014 | ||||||||||||||||||
| (1) | Dean J. Douglas and Amir Hussain are both eligible to participate in our Supplemental Dollars & Sense Plan, but have not yet chosen to participate. |
| (2) | All of these amounts in this column reflect contributions by the officer of salary paid in 2016 and reported as 2016 salary compensation in the Summary Compensation Table. |
| (3) | This column includes our partial match of the officer’s contribution under the terms of the plan. We have reflected all of these amounts as 2016 compensation in the column of the Summary Compensation Table labeled “All Other Compensation.” |
| (4) | Aggregate earnings in 2016 include interest, dividends and distributions earned with respect to deferred compensation invested by the officers in the manner described in the text below. |
Under our Supplemental Dollars & Sense Plan, certain of our senior officers may defer up to 50% of their salary in excess of the federal limit on annual contributions to a qualified 401(k) plan. For every dollar that an eligible participant contributes to this plan up to 6% of his or her excess salary, we add an amount equal to the
59
Table of Contents
total matching percentage then in effect for matching contributions made by us under our qualified 401(k) plan (which for 2016 equaled the sum of all of the initial 1% contributed and half of the next 5% contributed). All amounts contributed under this supplemental plan by the participants or us are allocated among deemed investments which follow the performance of the same broad array of funds offered under our qualified 401(k) plan. This is reflected in the market value of each participant’s account. Participants may change their deemed investments in these funds at any time. We reserve the right to transfer benefits from the Supplemental Dollars & Sense Plan to our qualified 401(k) or retirement plans to the extent allowed under Treasury regulations and other guidance. The value of benefits transferred to our qualified plans directly offsets the value of benefits in the Supplemental Dollars & Sense Plan. Participants in the Supplemental Dollars & Sense Plan normally receive payment of their account balances in a lump sum once they cease working full-time for us, subject to any deferrals mandated by federal law.
Potential Termination Payments
The materials below discuss payments and benefits that our officers are eligible to receive if they (i) resign or retire, (ii) are terminated by us, with or without cause, (iii) die or become disabled or (iv) become entitled to termination benefits following a change of control of CenturyLink.
Notwithstanding the information appearing below, you should be aware that our officers have agreed to forfeit their equity compensation awards (and profits derived therefrom) if they compete with us or engage in other activity harmful to our interests while employed with us or within 18 months after termination. Certain other compensation might also be recoverable by us under certain circumstances after termination of employment. See “Compensation Discussion and Analysis — Our Policies, Processes and Guidelines Related to Executive Compensation — Forfeiture of Prior Compensation” for more information.
Payments Made Upon All Terminations. Regardless of the manner in which our employees’ employment terminates prior to a change of control, they are entitled to receive amounts earned during their term of employment (subject to the potential forfeitures discussed above). With respect to each such terminated employee, such amounts include his or her:
| • | salary and earned but unused vacation pay through the date of termination, payable immediately following termination in cash |
| • | annual incentive bonus, but only if such employee served for the entire bonus period or through the date such bonus is payable (unless this service requirement is waived or more favorable treatment is applicable in the case of retirement, death or disability) |
| • | restricted stock that has vested |
| • | benefits accrued and vested under our qualified and supplemental defined benefit pension plans, with payouts generally occurring at early or normal retirement age |
| • | vested account balance held in our qualified and supplemental defined contribution plans, which the employee is generally free to receive at the time of termination |
| • | rights to continued health care benefits to the extent required by law. |
Payments Made Upon Voluntary or Involuntary Terminations. In addition to benefits described under the heading immediately above, employees involuntarily terminated by us without cause prior to a change of control are also entitled, subject to certain conditions, to:
| • | exercise all vested options within 190 days of the termination date |
| • | accelerated vesting of all, or a portion of, unvested time-vested restricted stock if approved by our Compensation Committee |
| • | a cash severance payment in the amount described under “Compensation Discussion and Analysis — Our Compensation Program Objectives and Components of Pay — Other Benefits — Severance |
60
Table of Contents
| Benefits” plus the receipt of any short-term incentive bonus payable under their applicable bonus plan and outplacement assistance benefits. |
None of the benefits listed immediately above are payable if the employee resigns or is terminated for cause, except that resigning employees are entitled to exercise their vested options within 190 days and employees terminated for cause could request the Compensation Committee to accelerate their unvested time-vested restricted stock (which is unlikely to be granted).
Payments Made Upon Retirement. Employees who retire in conformity with our retirement plans and policies are entitled, subject to certain conditions, to:
| • | exercise all of their options, all of which accelerate upon retirement, within three years of their retirement date |
| • | accelerated vesting of all, or a portion of, unvested time-vested restricted stock if approved by our Compensation Committee |
| • | payment of their annual incentive bonus or a pro rata portion thereof, depending on their retirement date |
| • | post-retirement life, health and welfare benefits |
| • | all of the benefits described under the heading “— Payments Made Upon All Terminations.” |
In addition, an employee who retires from the Company will continue to vest in his or her unvested performance-based restricted stock for the remainder of the applicable performance period. If the employee takes early retirement, this continued vesting opportunity only applies to a reduced pro rata number of unvested shares, based on the number of days he or she was employed during the performance period.
Payments Made Upon Death or Disability. Upon death or disability, officers (or their estates) are generally entitled to (without duplication of benefits):
| • | payments under our disability or life insurance plans, as applicable |
| • | exercise all of their options, all of which accelerate upon death or disability, within two years |
| • | keep all of their time-vested restricted stock, whether vested or unvested |
| • | payment of their annual incentive bonus or a pro rata portion thereof, depending on their date of death or disability |
| • | continued rights to receive (i) life, health and welfare benefits at early or normal retirement age, in the event of disabilities of employees with ten years of prior service, or (ii) health and welfare benefits payable to surviving eligible dependents, in the event of death of employees meeting certain age and service requirements |
| • | all of the benefits described under the heading “— Payments Made Upon All Terminations,” except that (i) upon death benefits under our retirement plans are generally available only to surviving spouses and (ii) benefits payable to mentally disabled employees under our nonqualified defined benefit retirement plans may be paid prior to retirement age. |
Payments Made Upon a Change of Control. We have entered into agreements that entitle each of our executive officers who are terminated without cause or resign under certain specified circumstances within certain specified periods following any change in control of CenturyLink to (i) receive a lump sum cash severance payment equal to a multiple of such officer’s annual cash compensation (defined as salary plus the average annual incentive bonus over the past three years), (ii) receive such officer’s currently pending bonus or pro rata portion thereof, depending on the date of termination, and (iii) continue to receive, subject to certain
61
Table of Contents
exceptions, certain welfare benefits for certain specified periods. See “Compensation Discussion and Analysis — Our Compensation Program Objectives and Components of Pay — Other Benefits — Change of Control Arrangements” for a description of the benefits under our change of control agreements.
Under CenturyLink’s above-referenced agreements, a “change in control” of CenturyLink would be deemed to occur upon (i) any person (as defined in the Securities Exchange Act of 1934) becoming the beneficial owner of 30% or more of the outstanding Common Shares, (ii) a majority of our directors being replaced, (iii) consummation of certain mergers, substantial asset sales or similar business combinations, or (iv) approval by the shareholders of a liquidation or dissolution of CenturyLink.
The above-referenced agreements provide the benefits described above if we terminate the officer’s employment without cause or the officer resigns with “good reason,” which we describe further under the heading “Compensation Discussion and Analysis — Our Compensation Program Objectives and Components of Pay — Other Benefits — Change of Control Arrangements.” We have filed copies or forms of these agreements with the SEC.
Participants in our supplemental defined benefit plan whose service is terminated within two years of the change in control of CenturyLink will receive a cash payment equal to the present value of their plan benefits (after providing age and service credits of up to three years if the participant is terminated by us without cause or resigns with “good reason”), determined in accordance with actuarial assumptions specified in the plan. Certain account balances under our qualified retirement plans will also fully vest upon a change of control of CenturyLink.
Under the terms of our 2011 Equity Incentive Plan, incentives granted thereunder will not vest, accelerate, become exercisable or be deemed fully paid unless otherwise provided in a separate agreement, plan or instrument. None of our equity award agreements since 2011 have provided for any such accelerated recognition of benefits solely upon a change of control. Instead, our current award agreements provide that any holder of incentives who is terminated by us or our successor without cause or resigns with good reason following a change of control will be entitled to receive full vesting of his or her time-vested restricted shares and continued rights under his or her performance-based restricted shares (on the same terms as if he or she had not been terminated).
We believe the above-described change of control benefits enhance shareholder value because:
| • | prior to a takeover, these protections help us to recruit and retain talented officers and to help maintain the productivity of our workforce by alleviating concerns over economic security, and |
| • | during or after a takeover, these protections (i) help our personnel, when evaluating a possible business combination, to focus on the best interests of CenturyLink and its shareholders, and (ii) reduce the risk that personnel will accept job offers from competitors during takeover discussions. |
Estimated Potential Termination Payments. The table below provides estimates of the value of payments and benefits that would become payable if our current named executives were terminated in the manner described below, in each case based on various assumptions, the most significant of which are described in the table’s notes.
62
Table of Contents
Potential Termination Payments
| Type of Termination of Employment(1) | ||||||||||||||||||||||
| Name |
Type of Termination Payment(2) |
Involuntary Termination Without Cause(3) |
Retirement(4) | Disability | Death | Termination Upon a Change of Control(5) |
||||||||||||||||
| Glen F. Post, III |
Annual Bonus | $ | 1,754,375 | $ | 1,754,375 | $ | 1,754,375 | $ | 1,754,375 | $ | 1,754,375 | |||||||||||
| Equity Awards(6) | — | 9,038,826 | 16,786,754 | 16,786,754 | 16,786,754 | |||||||||||||||||
| Pension and Welfare(7) | 76,900 | — | — | — | 111,600 | |||||||||||||||||
| Cash Severance(8) | 6,875,000 | — | — | — | 10,312,500 | |||||||||||||||||
|
|
|
|
|
|
|
|
|
|
|
|||||||||||||
| $ | 8,706,275 | $ | 10,793,201 | $ | 18,541,129 | $ | 18,541,129 | $ | 28,965,229 | |||||||||||||
| Dean J. Douglas |
Annual Bonus | $ | 701,211 | $ | — | $ | 701,211 | $ | 701,211 | $ | 701,211 | |||||||||||
| Equity Awards(6) | — | — | 2,201,362 | 2,201,362 | 2,201,362 | |||||||||||||||||
| Pension and Welfare(7) | 17,800 | — | — | — | 28,100 | |||||||||||||||||
| Cash Severance(8) | 1,800,023 | — | — | — | 3,600,045 | |||||||||||||||||
|
|
|
|
|
|
|
|
|
|
|
|||||||||||||
| $ | 2,519,034 | $ | — | $ | 2,902,573 | $ | 2,902,573 | $ | 6,530,718 | |||||||||||||
| R. Stewart Ewing, Jr. |
Annual Bonus | $ | 587,780 | $ | 587,780 | $ | 587,780 | $ | 587,780 | $ | 587,780 | |||||||||||
| Equity Awards(6) | — | 1,769,446 | 3,191,419 | 3,191,419 | 3,191,419 | |||||||||||||||||
| Pension and Welfare(7) | 26,400 | — | — | — | 45,300 | |||||||||||||||||
| Cash Severance(8) | 1,399,141 | — | — | — | 2,798,282 | |||||||||||||||||
|
|
|
|
|
|
|
|
|
|
|
|||||||||||||
| $ | 2,013,321 | $ | 2,357,226 | $ | 3,779,199 | $ | 3,779,199 | $ | 6,622,781 | |||||||||||||
| Aamir Hussain |
Annual Bonus | $ | 397,831 | $ | — | $ | 397,831 | $ | 397,831 | $ | 397,831 | |||||||||||
| Equity Awards(6) | — | — | 3,158,840 | 3,158,840 | 3,158,840 | |||||||||||||||||
| Pension and Welfare(7) | 29,500 | — | — | — | 51,500 | |||||||||||||||||
| Cash Severance(8) | 1,000,022 | — | — | — | 2,000,044 | |||||||||||||||||
|
|
|
|
|
|
|
|
|
|
|
|||||||||||||
| $ | 1,427,353 | $ | — | $ | 3,556,671 | $ | 3,556,671 | $ | 5,608,215 | |||||||||||||
| Stacey W. Goff |
Annual Bonus | $ | 477,057 | $ | — | $ | 477,057 | $ | 477,057 | $ | 477,057 | |||||||||||
| Equity Awards(6) | — | — | 2,577,704 | 2,577,704 | 2,577,704 | |||||||||||||||||
| Pension and Welfare(7) | 31,400 | — | — | — | 55,300 | |||||||||||||||||
| Cash Severance(8) | 1,135,583 | — | — | — | 2,271,166 | |||||||||||||||||
|
|
|
|
|
|
|
|
|
|
|
|||||||||||||
| $ | 1,644,040 | $ | — | $ | 3,054,761 | $ | 3,054,761 | $ | 5,381,227 | |||||||||||||
| (1) | All data in the table reflects our estimates of the value of payments and benefits assuming the named officer was terminated on December 31, 2016. The closing price of the Common Shares on such date was $23.78. The table reflects only estimates of amounts earned or payable through or at such date based on various assumptions. Actual amounts can be determined only at the time of termination. If a named officer voluntarily resigns or is terminated with cause, he or she will not be entitled to any special or accelerated benefits, but will be entitled to receive various payments or benefits that vested before the termination date. The table reflects potential payments based upon a physical disability; additional benefits may be payable in the event of a mental disability. |
| (2) | As further described above, upon termination of employment, the named officers may become entitled to receive certain special, accelerated or enhanced benefits, including, subject to certain exceptions, the right to receive payment of their annual cash incentive bonus, an acceleration under certain circumstances of the vesting of their outstanding equity awards, current or enhanced pension and welfare benefits, or cash severance payments. The table excludes (i) payments or benefits made under broad-based plans or arrangements generally available to all salaried full-time employees and (ii) benefits, awards or amounts that the officer was entitled to receive prior to termination of employment. |
| (3) | The amounts listed in this column reflect payments to which the named officer would be entitled to under our executive severance plan if involuntarily terminated by us without cause prior to a change of control. |
63
Table of Contents
| The amounts listed in this column would not be payable if the officer voluntarily resigns or is terminated for cause. |
| (4) | Mr. Post is eligible to receive early retirement benefits, and Mr. Ewing is eligible to receive full retirement benefits, under CenturyLink’s defined benefit pension plans described above under the heading “— Pension Benefits.” The amounts reflected under the “Retirement” column do not reflect the amount of lifetime annuity payments payable upon retirement. Assuming early or full retirement as of December 31, 2016, Messrs. Post and Ewing would have been entitled to monthly annuity payments of approximately $29,965.93 and $15,759.51, respectively, over their lifetimes, some of which, in the case of Mr. Ewing, may be payable to his ex-wife under a qualified domestic relations order. For further information, see (i) the notes below and (ii) “— Pension Benefits — Other” above. |
| (5) | The information in this column assumes each named officer became entitled at December 31, 2016 to the benefits under CenturyLink’s agreements in existence on such date described above under “— Payments Made Upon a Change of Control” upon an involuntary termination without cause or resignation with good reason. All amounts are based on several assumptions. |
| (6) | The information in this row (i) reflects the benefit to the named officer arising out of the accelerated vesting of some or all of his or her restricted stock caused by the termination of employment based upon the intrinsic method of valuation, (ii) assumes that the Compensation Committee would not approve the acceleration of the named officer’s restricted stock in the event of an involuntary termination, and (iii) assumes that the Compensation Committee would approve, in the event of the early or normal retirement of Messrs. Post or Ewing, the acceleration of all of their restricted stock outstanding for at least one year. Assuming the Compensation Committee approved the acceleration of all of the named officers’ restricted stock in connection with an involuntary termination of employment at December 31, 2016, the amounts reflected in the table under the column “Involuntary Termination Without Cause” would have been higher by the following amounts: $16,786,754 for Mr. Post, $2,201,362 for Mr. Douglas, $3,191,419 for Mr. Ewing, $2,577,704 for Mr. Goff, and $3,158,840 for Mr. Hussain. |
| (7) | The information in this row reflects only the incremental benefits that accrue upon an event of termination, and excludes benefits that were vested on December 31, 2016. For information on the present value of the named officers’ accumulated benefits under our defined benefit pension plans, see “— Pension Benefits,” and for information on the aggregate balances of the named officers’ non-qualified deferred compensation, see “— Deferred Compensation.” As indicated above, the named officer would also be entitled to receive a distribution of his or her 401(k) benefits and various other broad-based benefits. |
| (8) | The information in this row excludes, in the case of disability or death, payments made by insurance companies. |
The Board believes that each director who is not employed by us (whom we refer to as outside directors or non-management directors) should be compensated through a mix of cash and equity-based compensation, which most recently has been granted in the form of restricted stock. The Compensation Committee, consisting entirely of independent directors, has primary responsibility for periodically reviewing and considering any revisions to director compensation. The Committee’s compensation consultant typically assists the Committee in connection with its review of director compensation. The Board reviews the Compensation Committee’s recommendations and determines the amount of director compensation.
64
Table of Contents
The table and the discussion below summarize how we compensated our outside directors in 2016.
2016 Compensation of Outside Directors
| Name |
Fees Earned or Paid in Cash |
Stock Awards(1),(2) |
All Other Compensation(3) |
Total | ||||||||||||
| Continuing Directors: |
||||||||||||||||
| Martha H. Bejar |
$ | 125,000 | $ | 130,804 | $ | — | $ | 255,804 | ||||||||
| Virginia Boulet |
138,000 | 130,804 | — | 268,804 | ||||||||||||
| Peter C. Brown |
125,000 | 130,804 | — | 255,804 | ||||||||||||
| W. Bruce Hanks |
152,000 | 130,804 | 5,828 | 288,632 | ||||||||||||
| Mary L. Landrieu |
105,000 | 130,804 | — | 235,804 | ||||||||||||
| Harvey P. Perry |
213,000 | 130,804 | 3,805 | 347,609 | ||||||||||||
| Michael J. Roberts |
111,000 | 130,804 | — | 241,804 | ||||||||||||
| Laurie A. Siegel |
133,750 | 130,804 | — | 264,554 | ||||||||||||
| Retiring Director:(4) |
||||||||||||||||
| William A. Owens |
123,000 | 311,222 | — | 434,222 | ||||||||||||
| Former Directors:(5) |
||||||||||||||||
| Gregory J. McCray |
129,250 | 130,804 | — | 260,054 | ||||||||||||
| C. G. Melville, Jr. |
56,750 | — | 110,000 | (6) | 166,750 | |||||||||||
| Richard A. Gephardt |
40,500 | — | — | 40,500 | ||||||||||||
| Joseph R. Zimmel |
2,000 | — | — | 2,000 | ||||||||||||
| (1) | For purposes of determining the number of restricted shares to grant to each outside director, the Compensation Committee valued each of these stock awards to equal $145,000 (or $345,000 in the case of Adm. Owens), based upon the volume-weighted average closing price of our Common Shares over a 15-day trading period ending prior to the grant date. For purposes of reporting the fair value of these awards in the table above, however, we valued each grant based upon the closing stock price of our Common Shares on the grant date in accordance with FASB ASC Topic 718. These grants vest on May 19, 2017 (subject to accelerated vesting or forfeiture in certain limited circumstances). See “— Cash and Stock Payments.” |
| (2) | As of December 31, 2016, William A. Owens held 11,561 unvested shares of restricted stock and each of our other outside directors then in office held 4,859 unvested shares of restricted stock, which constituted the only unvested equity-based awards held by our outside directors as of such date (excluding equity awards granted to Michael J. Roberts prior to his commencement of service on our board following the Qwest merger). For further information on our directors’ stock ownership, see “Ownership of Our Securities — Executive Officers and Directors,” and for information on certain deferred fee arrangements pertaining to Mr. Roberts, see “— Other Benefits.” |
| (3) | Includes (i) reimbursements for the cost of annual physical examinations and related travel of $5,828 for Mr. Hanks and $3,805 for Mr. Perry and (ii) the payments to Mr. Melville described further in Note 6 below. Except as otherwise noted in the prior sentence, the table above does not reflect (i) reimbursements for travel expenses or (ii) any benefits associated with the directors or their family members participating in recreational activities scheduled during board retreats (as described further under the heading “Compensation Discussion and Analysis — Our Compensation Program Objectives and Components of Pay — Other Benefits — Perquisites”). |
| (4) | William A. Owens will be retiring from the Board at the meeting. |
| (5) | Gregory J. McCray resigned from the Board effective February 23, 2017. C. G. Melville, Jr. and Richard A. Gephardt served as directors through May 18, 2016, when both of them retired from the Board. Joseph R. Zimmel resigned from the Board on January 19, 2016. |
| (6) | Represents payments made to Mr. Melville under the terms of our July 2016 consulting agreement with him. In May 2016, the Board, upon the recommendation of the Nominating Committee, named Mr. Melville a Founding Director in recognition of his 48 consecutive years of service as a CenturyLink director, which ended with his retirement from the Board in May 2016. In his capacity as a Founding Director, Mr. Melville |
65
Table of Contents
| attends select company training, educational and leadership events at our request in exchange for payments under the above-referenced consulting agreement. |
Each outside director is paid an annual fee of $65,000 plus $2,000 for attending each regular board meeting, special board meeting (including each day of the Board’s annual planning session), committee meeting and separate director education program.
Over the past several years, Admiral William A. Owens, in his capacity as the non-executive Chairman of the Board, received supplemental board fees at the rate of $200,000 per year payable in shares of time-vested restricted stock (valued using the 15-trading day average closing price specified in note 1 of the table appearing above under “— Overview”). The restricted stock issued to the Chairman during 2016 vests on May 19, 2017 (subject to accelerated vesting in certain limited circumstances). The Chairman’s duties are set forth in our corporate governance guidelines. See “Corporate Governance.”
Over the past several years, Harvey P. Perry, in his capacity as non-executive Vice Chairman of the Board, received supplemental board fees at the rate of $100,000 cash per year. The Vice Chairman’s current duties include, among others, (i) assisting the Chairman by facilitating communications among the directors and monitoring the activities of the Board’s committees, (ii) serving at the Chairman’s request on the board of any company in which we have an investment, (iii) monitoring our strategies and (iv) performing certain executive succession functions.
As soon as practicable, the Board intends to name a new non-executive Chairman of the Board to replace Admiral Owens, who will retire from the Board at the meeting. The Compensation Committee has not yet decided how to compensate the Chairman or any Vice Chairman for service following the date of the meeting.
We also pay annual supplemental board fees to the chairs of each of our committees as follows: (i) the chair of the Audit Committee receives $25,000, (ii) the chair of the Compensation Committee receives $18,750, (iii) the chair of the Nominating Committee receives $15,000 and (iv) the chair of the Risk Evaluation Committee receives $12,500.
During 2016, the Compensation Committee authorized each outside director to receive shares of time-vested restricted stock valued at $145,000 (valued using the 15-trading day average closing price specified in Note 1 of the table appearing above under “– Overview”) that vest on May 19, 2017 (subject to accelerated vesting in certain limited circumstances). The Compensation Committee currently expects to authorize comparable equity grants in May 2017 to each outside director serving on the day after our 2017 annual meeting.
Each outside director is entitled to be reimbursed (i) for expenses incurred in attending board and committee meetings, (ii) for expenses incurred in attending director education programs and (iii) up to $5,000 per year for the cost of an annual physical examination, plus related travel expenses.
In connection with our 2011 merger with Qwest, we assumed the Qwest Deferred Compensation Plan for Non-Employee Directors. Under this plan, Qwest outside directors could elect to defer all or a portion of their cash directors’ fees, which were then converted to a number of “phantom units” based the value of a share of Qwest stock, with credit for dividends paid to stockholders “reinvested” in additional phantom units. Certain plan balances were distributed to participants at the close of the merger, but plan balances attributable to amounts deferred on or after January 1, 2005 by Qwest directors who joined our Board following the merger were converted, based on the merger exchange ratio, to phantom units based on the value of one of our Common Shares. Other than the crediting and “reinvestment” of dividends for outstanding phantom units, CenturyLink
66
Table of Contents
does not make any contributions to, and no additional elective deferrals are permitted under, this plan. Subject to the terms of the plan, each participant’s account will be distributed as a lump sum in cash as soon as practicable following the end of his or her service as a director. As of December 31, 2016, Michael J. Roberts was the only remaining participant in this plan, with a balance of 5,566.88 phantom units with an aggregate value of $132,381 as of such date.
We supply company-owned tablets to our outside directors for use in reviewing materials posted to a dedicated portal that permits management to communicate with the Board.
Directors may use our aircraft in connection with company-related business. However, we generally do not permit either our directors or their family members to use our aircraft for personal trips (except when such use can be accommodated at no incremental cost to us or on terms generally available to all of our employees in connection with a medical emergency).
Our bylaws require us to indemnify our directors and officers so that they will be free from undue concern about personal liability in connection with their service to CenturyLink. We have signed agreements with each of those individuals contractually obligating us to provide these indemnification rights. We also provide our directors with customary directors and officers liability insurance.
Director Stock Ownership Guidelines
For information on our stock ownership guidelines for outside directors, see “Corporate Governance — Governance Guidelines — Stock Ownership Guidelines.”
67
Table of Contents
The graph below compares the cumulative total shareholder return on the Common Shares with the cumulative total return of the S&P 500 Index and the S&P 500 Integrated Telecommunication Services Index for the period from December 31, 2011 to December 31, 2016, in each case assuming (i) the investment of $100 on January 1, 2012 at closing prices on December 31, 2011, and (ii) reinvestment of dividends.
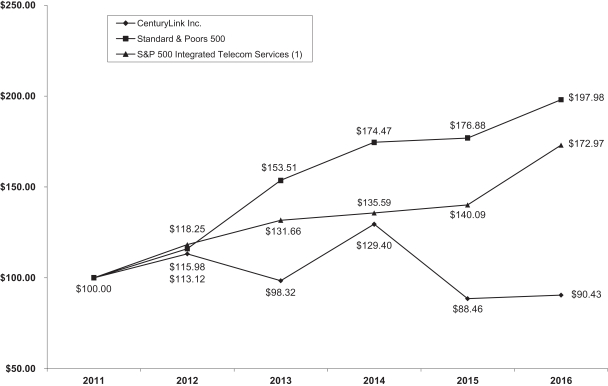
| December 31, | ||||||||||||||||||||||||
| 2011 | 2012 | 2013 | 2014 | 2015 | 2016 | |||||||||||||||||||
| CenturyLink |
$ | 100.00 | $ | 113.12 | $ | 98.32 | $ | 129.40 | $ | 88.46 | $ | 90.43 | ||||||||||||
| S&P 500 Index |
100.00 | 115.98 | 153.51 | 174.47 | 176.88 | 197.98 | ||||||||||||||||||
| S&P 500 Integrated Telecommunication Services Index(1) |
100.00 | 118.25 | 131.66 | 135.59 | 140.09 | 172.97 | ||||||||||||||||||
| (1) | As of December 31, 2016, the S&P 500 Integrated Telecommunication Services Index consisted of AT&T Inc., CenturyLink, Frontier Communications Corporation, Level 3 Communications, Inc. and Verizon Communications Inc. |
68
Table of Contents
COMPENSATION COMMITTEE INTERLOCKS AND INSIDER PARTICIPATION
During the last fiscal year, our Compensation Committee included Laurie A. Siegel, Virginia Boulet, William A. Owens, Gregory J. McCray (through February 24, 2016) and Michael J. Roberts (beginning February 24, 2016). No member of the Compensation Committee served as an officer or employee of the Company or any of our subsidiaries prior to or while serving on the Compensation Committee.
TRANSACTIONS WITH RELATED PARTIES
During 2016, we paid H. Parnell Perry, Jr., who serves as Manager — Technology Management, total gross compensation of approximately $141,841, consisting of approximately $124,133 in salary, $13,717 in annual incentive bonuses and $3,991 in matching contributions to his qualified 401(k) plan account. Mr. Perry is the son of Harvey P. Perry, one of our directors, and has been an employee of ours since 1987.
During 2016, we paid Rickey E. Lowery, who serves as Senior Lead IT Engineer, total gross compensation of approximately $133,091, consisting of approximately $117,493 in salary, $11,493 in annual incentive bonuses and $4,105 in matching contributions to his qualified 401(k) plan account. Mr. Lowery is the son-in-law of Harvey P. Perry, one of our directors, and has been an employee of ours since 1989.
During 2016, we paid Matthew J. Post, who serves as Senior Lead Architect, total gross compensation of approximately $122,968, consisting of approximately $109,275 in salary, $10,828 in annual incentive bonuses and $2,865 in matching contributions to his qualified 401(k) plan account. Mr. Post is the son of Glen Post, our Chief Executive Officer and President, and has been an employee of ours since 2014.
We are one of the largest employers in Monroe, Louisiana and in several of our other markets, and, as such, employ personnel related by birth or marriage throughout our organization. Several of our executive officers or directors have family members employed by us, although, none of them (other than H. Parnell Perry, Jr., Rickey E. Lowery and Matthew J. Post) earned 2016 compensation in excess of the $120,000 threshold that would require detailed disclosures under the federal proxy rules.
Early each year, our management distributes to the Audit Committee a written report listing our payments to vendors, including a list of transactions with our directors, officers or employees. This annual report permits the independent directors to assess and discuss our related party transactions. Although we have no formal written pre-approval procedure governing related party transactions, our CEO typically seeks approval of the Board before engaging in any new related party transaction involving significant sums or risks.
SECTION 16(A) BENEFICIAL OWNERSHIP REPORTING COMPLIANCE
The Securities Exchange Act of 1934 requires our executive officers and directors, among others, to file certain beneficial ownership reports with the SEC. To our knowledge, based solely on our review of copies of reports received by us and written representations by certain reporting persons, we believe that all such reports were timely filed during fiscal year 2016, except for one report for W. Bruce Hanks covering one transaction.
69
Table of Contents
ADDITIONAL INFORMATION ABOUT THE MEETING
Our bylaws provide that the presence at the meeting, in person or by proxy, of a majority of the outstanding Voting Shares constitutes a quorum to organize the meeting.
Vote Required to Elect Directors
Our bylaws provide that each of the nine director nominees will be elected if the number of votes cast in favor of the director exceeds the number of votes withheld with respect to the director. You may vote “for” all director nominees or withhold your vote for any one or more of the director nominees. If any of the nine directors fails to receive a majority of the votes cast at the meeting, our bylaws will require such director to tender his or her resignation to the Board for its consideration.
Vote Required to Adopt Other Proposals at the Meeting
With respect to Item 3(b), shareholders will be deemed to approve the frequency of our say-on-pay votes based upon which alternative receives the highest number of votes. With respect to all other matters to be submitted to a vote at the meeting, the matter will be approved if the votes cast in favor of such matter exceed the votes cast against such matter.
Shares as to which the proxy holders have been instructed to abstain from voting with respect to any particular matter will be treated under the Company’s bylaws as not being cast for purposes of such vote. Because all matters expected to be brought before the meeting for a vote must be approved by the holders of a majority of the votes cast, abstentions will not affect the outcome of any such vote. Shareholders abstaining from voting will be counted as present for purposes of constituting a quorum to organize the meeting.
If you properly execute and return a proxy or voting instruction card, your shares will be voted as you specify. If you are a shareholder of record and make no specifications on your validly submitted proxy card, your shares will be voted against the shareholder proposal and in favor of all other matters. If you are a beneficial owner of shares and do not give voting instructions to your broker, bank or nominee, they will be entitled to vote your shares only to the extent specified below.
Under the rules of the New York Stock Exchange, brokers who hold shares in street name for customers may vote in their discretion on matters considered to be “routine” when they have not received voting instructions from beneficial owners. Under these rules, brokers who do not receive such instructions will be entitled to vote in their discretion at the meeting with respect to the ratification of the appointment of the independent auditor, but will not be entitled to vote in their discretion with respect to any of the other matters submitted to a vote. If brokers who do not receive voting instructions do not, or cannot, exercise discretionary voting power (a “broker non-vote”) with respect to any matter to be considered at the meeting, shares that are not voted will be treated as present for purposes of constituting a quorum to organize the meeting but not cast with respect to considering such matter. Because all matters to be considered at the meeting must be approved by the holders of a majority of the votes cast, broker non-votes will not affect the outcome of any such vote.
Shareholders of record may revoke their proxy or change their votes at any time before their proxy is voted at the meeting by giving a written revocation notice to our secretary, by timely delivering a proxy bearing a later date or by voting in person at the meeting. Beneficial shareholders may revoke or change their voting instructions by contacting the broker, bank or nominee that holds their shares.
70
Table of Contents
Voting by Participants in Our Benefit Plans
If you beneficially own any of our Common Shares by virtue of participating in any retirement plan of CenturyLink, then you will receive a separate voting instruction card that will enable you to direct the voting of these shares. This voting instruction card entitles you, on a confidential basis, to instruct the trustees how to vote the shares allocated to your plan account. The plans require you to act as a “named fiduciary,” which requires you to exercise your voting rights prudently and in the interests of all plan participants. Plan participants who wish to vote should complete and return the voting instruction card in accordance with its instructions. If you elect not to vote the shares allocated to your accounts, your shares will be voted in the same proportion as voted shares regarding each of the items submitted to a vote at the meeting. Plan participants that wish to revoke their voting instructions must contact the trustee and follow its procedures.
If you beneficially own any of our Common Shares by virtue of previously participating in an employee stock purchase plan formerly maintained by us or a company that we have acquired, we have made arrangements for our proxy materials to be made available to you by the record owner of those shares. Consequently, you will be afforded the opportunity to vote those shares in the same manner as any other shares held in street name. See “General Information About the Annual Meeting.”
We will pay all expenses of soliciting proxies for the meeting. Proxies may be solicited personally, by mail, by telephone or by facsimile by our directors, officers and employees, who will not be additionally compensated therefor. We will also request persons holding Voting Shares in their names for others, such as brokers, banks and other nominees, to forward materials to their principals and request authority for the execution of proxies, and we will reimburse them for their expenses incurred in connection therewith. We have retained Innisfree M&A Incorporated, New York, New York, to assist in the solicitation of proxies, for which we will pay Innisfree fees anticipated to be $20,000 and will reimburse Innisfree for certain of its out-of-pocket expenses.
Other Matters Considered at the Meeting
Management has not timely received any notice that a shareholder desires to present any matter for action at the meeting in accordance with our bylaws (which are described below in “Other Matters — Deadlines for Submitting Shareholder Nominations and Proposals for the 2018 Annual Meeting — Other Proposals and Nominations”) other than the shareholder proposals described in this proxy statement, and is otherwise unaware of any matter to be considered by shareholders at the meeting other than those matters specified in the accompanying notice of the meeting. Our proxy and voting instruction cards, however, will confer discretionary voting authority with respect to any other matter that may properly come before the meeting. It is the intention of the persons named therein to vote in accordance with their best judgment on any such matter.
The Chairman has broad responsibility and legal authority to conduct the meeting in an orderly and timely manner. This authority includes establishing rules for shareholders who wish to address the meeting. Copies of these rules will be available at the meeting. The Chairman may also exercise broad discretion in recognizing shareholders who wish to speak and in determining the extent of discussion on each item of business. In light of the need to conduct all necessary business and to conclude the meeting within a reasonable period of time, we cannot assure that every shareholder who wishes to speak on an item of business will be able to do so.
You will not be permitted to bring audio visual equipment, ampliphones or posters into the meeting. We reserve the right, to be exercised in our sole discretion, to admit guests, such as local politicians or the press, into the meeting.
71
Table of Contents
Postponement or Adjournment of the Meeting
The Chairman may postpone or adjourn the meeting. Your proxy will still be valid and may be voted at the postponed or adjourned meeting. You will still be able to change or revoke your proxy until it is voted.
Deadlines for Submitting Shareholder Nominations and Proposals for the 2018 Annual Meeting
Proxy Statement Proposals. In order to be eligible for inclusion in our 2018 proxy materials, any shareholder proposal to elect shareholder-nominated candidates as directors or to take any other action at such meeting must be received by December 14, 2017, and must comply with applicable federal proxy rules and our bylaws. See “Corporate Governance — Director Nomination Process.” These shareholder proposals must be in writing and received by the deadline described above at our principal executive offices at 100 CenturyLink Drive, Monroe, Louisiana 71203, Attention: Stacey W. Goff, Secretary. If we do not receive a shareholder proposal by the deadline described above, we may exclude the proposal from our proxy materials for our 2018 annual meeting.
Other Proposals and Nominations. In addition, our bylaws require shareholders to furnish timely advance written notice of their intent to nominate a director or bring any other matter before a shareholders’ meeting, whether or not they wish to include their candidate or proposal in our proxy materials. In general, notice must be received in writing by our Secretary, addressed in the manner specified in the immediately-preceding paragraph, between November 24, 2017 and February 22, 2018 and must contain various information specified in our bylaws. (If the date of the 2018 annual meeting is more than 30 days before or more than 60 days after May 24, 2018, notice must be delivered not earlier than the close of business on the 180th day prior to the date of such annual meeting and not later than the close of business on the later of the 90th day prior to the date of such annual meeting or, if the first public announcement of the date of such annual meeting is less than 100 days prior to the date of such annual meeting, then 10th day following the day on which such public announcement of the date of such meeting is first made by the Company.) Notices that are not delivered in accordance with our bylaws may be disregarded by us. For additional information on these procedures, see “Corporate Governance — Director Nomination Process.”
Our above-described advance notice bylaw provisions are in addition to, and separate from, the requirements that a shareholder must meet in order to have a candidate or proposal included in our proxy materials.
Proxies granted by a shareholder will give discretionary authority to the proxy holders to vote on any matters introduced pursuant to the above-described advance notice bylaw provisions, subject to applicable rules of the SEC.
The summaries above are qualified in their entirety by reference to the full text of our bylaws. You may obtain a full copy of our bylaws by reviewing our reports filed with the SEC, by accessing our website at www.centurylink.com, or by contacting our Secretary in the manner specified below.
Most shareholders will receive only a written notice of how to access our proxy materials, and will not receive printed copies of the proxy materials unless requested. If you would like to receive a paper copy of our proxy materials, you should follow the instructions for requesting the materials in the notice.
The full set of our materials include:
| • | the notice and proxy statement for the meeting, |
| • | a proxy or voting instruction card, and |
72
Table of Contents
| • | our 2016 annual report furnished in the following two parts: (1) our 2016 Annual Financial Report, which constitutes Appendix A to this proxy statement, and (2) our 2016 review and CEO’s letter appearing at the beginning of this booklet. |
Appendix A includes our 2016 Annual Financial Report, which is excerpted from portions of our Annual Report on Form 10-K for the year ended December 31, 2016 that we filed with the SEC on February 23, 2017. In addition, we have provided you with a copy of or access to our 2016 review and CEO’s letter, which precedes this proxy statement at the beginning of this booklet. Neither of these documents is a part of our proxy soliciting materials.
You may obtain a copy of our Form 10-K report without charge by writing to Stacey W. Goff, Secretary, CenturyLink, Inc., 100 CenturyLink Drive, Monroe, Louisiana 71203, or by visiting our website at www.centurylink.com.
You may view online this proxy statement and related materials at www.envisionreports. com/ctl.
By Order of the Board of Directors
Stacey W. Goff
Secretary
Dated: April 10, 2017
73
Table of Contents
to Proxy Statement
CENTURYLINK, INC.
ANNUAL FINANCIAL REPORT
December 31, 2016
A-1
Table of Contents
INDEX TO ANNUAL FINANCIAL REPORT
December 31, 2016
The materials included in this Appendix A are excerpted from Items 5, 6, 7 and 8 of our Annual Report on Form 10-K for the year ended December 31, 2016. We filed the Form 10-K with the Securities and Exchange Commission on February 23, 2017, and have not updated any of the following excepted materials for any changes or developments since such date. Please see the Form 10-K for additional information about our business and operations.
| INFORMATION ON OUR TRADING PRICE AND DIVIDENDS |
A-3 | |||
| SELECTED FINANCIAL DATA |
A-4 | |||
| MANAGEMENT’S DISCUSSION AND ANALYSIS OF FINANCIAL CONDITION AND RESULTS OF OPERATIONS |
A-7 | |||
| CONSOLIDATED FINANCIAL STATEMENTS |
A-40 | |||
| Report Of Independent Registered Public Accounting Firm |
A-40 | |||
| Report Of Independent Registered Public Accounting Firm |
A-41 | |||
| Consolidated Statements Of Operations |
A-42 | |||
| Consolidated Statements Of Comprehensive Income (Loss) |
A-43 | |||
| Consolidated Balance Sheets |
A-44 | |||
| Consolidated Statements Of Cash Flows |
A-45 | |||
| Consolidated Statements Of Stockholders’ Equity |
A-46 | |||
| Notes To Consolidated Financial Statements* |
A-47 |
| * | All references to “Notes” in this Appendix A refer to these Notes. |
A-2
Table of Contents
INFORMATION ON OUR TRADING PRICE AND DIVIDENDS
Our common stock is listed on the New York Stock Exchange (“NYSE”) and the Berlin Stock Exchange and is traded under the symbol CTL and CYT, respectively. The following table sets forth the high and low reported sales prices on the NYSE along with the quarterly dividends, for each of the quarters indicated.
| Sales Price | Cash
Dividend per Common Share |
|||||||||||
| High | Low | |||||||||||
| 2016 |
||||||||||||
| First quarter |
$ | 32.49 | 21.94 | 0.540 | ||||||||
| Second quarter |
32.94 | 26.35 | 0.540 | |||||||||
| Third quarter |
31.56 | 26.51 | 0.540 | |||||||||
| Fourth quarter |
33.45 | 22.86 | 0.540 | |||||||||
| 2015 |
||||||||||||
| First quarter |
$ | 40.59 | 34.04 | 0.540 | ||||||||
| Second quarter |
37.00 | 29.28 | 0.540 | |||||||||
| Third quarter |
31.13 | 24.29 | 0.540 | |||||||||
| Fourth quarter |
29.37 | 24.11 | 0.540 | |||||||||
Dividends on common stock during 2016 and 2015 were paid each quarter. On February 21, 2017, our Board of Directors declared a common stock dividend of $0.54 per share.
As described in greater detail in Item 1A of our Annual Report on Form 10-K for the year ended December 31, 2016, the declaration and payment of dividends is at the discretion of our Board of Directors, and will depend upon our financial results, cash requirements, future prospects and other factors deemed relevant by our Board of Directors.
At February 16, 2017, there were approximately 122,000 stockholders of record, although there were significantly more beneficial holders of our common stock. At February 16, 2017, the closing stock price of our common stock was $24.28.
A-3
Table of Contents
SELECTED FINANCIAL DATA
The following tables of selected consolidated financial data should be read in conjunction with, and are qualified by reference to, our consolidated financial statements and notes thereto in Item 8 and “Management’s Discussion and Analysis of Financial Condition and Results of Operations” in Item 7 of our Annual Report on Form 10-K for the year ended December 31, 2016.
The tables of selected financial data shown below are derived from our audited consolidated financial statements. These historical results are not necessarily indicative of results that you can expect for any future period.
Selected financial information from our consolidated statements of operations is as follows:
| Years Ended December 31,(1) | ||||||||||||||||||||
| 2016(2)(3) | 2015(2) | 2014(4) | 2013(5) | 2012 | ||||||||||||||||
| (Dollars in millions, except per share amounts and shares in thousands) |
||||||||||||||||||||
| Operating revenues |
$ | 17,470 | 17,900 | 18,031 | 18,095 | 18,376 | ||||||||||||||
| Operating expenses |
15,139 | 15,295 | 15,621 | 16,642 | 15,663 | |||||||||||||||
|
|
|
|
|
|
|
|
|
|
|
|||||||||||
| Operating income |
$ | 2,331 | 2,605 | 2,410 | 1,453 | 2,713 | ||||||||||||||
| Income before income tax expense |
1,020 | 1,316 | 1,110 | 224 | 1,250 | |||||||||||||||
| Net income (loss) |
626 | 878 | 772 | (239 | ) | 777 | ||||||||||||||
| Basic earnings (loss) per common share |
1.16 | 1.58 | 1.36 | (0.40 | ) | 1.25 | ||||||||||||||
| Diluted earnings (loss) per common share |
1.16 | 1.58 | 1.36 | (0.40 | ) | 1.25 | ||||||||||||||
| Dividends declared per common share |
2.16 | 2.16 | 2.16 | 2.16 | 2.90 | |||||||||||||||
| Weighted average basic common shares outstanding |
539,549 | 554,278 | 568,435 | 600,892 | 620,205 | |||||||||||||||
| Weighted average diluted common shares outstanding |
540,679 | 555,093 | 569,739 | 600,892 | 622,285 | |||||||||||||||
| (1) | See “Management’s Discussion and Analysis of Financial Condition and Results of Operations—Results of Operations” in Item 7 of our Annual Report on Form 10-K for the year ended December 31, 2016 for a discussion of unusual items affecting the results for the years ended December 31, 2016, 2015 and 2014. |
| (2) | During 2016 and 2015, we recognized an incremental $201 million and $215 million, respectively, of revenue associated with the Federal Communications Commission (“FCC”) Connect America Fund Phase 2 support program as compared to the interstate USF program. For additional information, see Note 1—Basis of Presentation and Summary of Significant Accounting Policies to our consolidated financial statements in Item 8 of our Annual Report on Form 10-K for the year ended December 31, 2016. |
| (3) | During 2016, we recognized $189 million of severance expenses and other one-time termination benefits associated with our workforce reductions and $52 million of expenses related to our pending acquisition of Level 3. |
| (4) | During 2014, we recognized a $60 million tax benefit associated with a deduction for the tax basis for worthless stock in a wholly-owned foreign subsidiary and a $63 million pension settlement charge. |
| (5) | During 2013, we recorded a non-cash, non-tax-deductible goodwill impairment charge of $1.092 billion for goodwill attributed to one of our previous operating segments and a litigation settlement charge of $235 million. |
A-4
Table of Contents
Selected financial information from our consolidated balance sheets is as follows:
| As of December 31, | ||||||||||||||||||||
| 2016 | 2015 | 2014 | 2013 | 2012 | ||||||||||||||||
| (Dollars in millions) | ||||||||||||||||||||
| Net property, plant and equipment(1) |
$ | 17,039 | 18,069 | 18,433 | 18,646 | 18,909 | ||||||||||||||
| Goodwill(1)(2) |
19,650 | 20,742 | 20,755 | 20,674 | 21,627 | |||||||||||||||
| Total assets(3) |
47,017 | 47,604 | 49,103 | 50,471 | 52,901 | |||||||||||||||
| Total long-term debt(3)(4) |
19,993 | 20,225 | 20,503 | 20,809 | 20,481 | |||||||||||||||
| Total stockholders’ equity(2) |
13,399 | 14,060 | 15,023 | 17,191 | 19,289 | |||||||||||||||
| (1) | During 2016, as a result of the pending sale of our colocation business and data centers, we reclassified $1.071 billion in net property, plant and equipment and $1.141 billion of goodwill to assets held for sale which is included in other current assets on our consolidated balance sheet. See Note 3—Pending Sale of Colocation Business and Data Centers to our consolidated financial statements in Item 8 of our Annual Report on Form 10-K for the year ended December 31, 2016 for additional information. |
| (2) | During 2013, we recorded a non-cash, non-tax-deductible goodwill impairment charge of $1.092 billion for goodwill attributed to one of our previous operating segments. |
| (3) | In 2015, we adopted both ASU 2015-03 “Simplifying the Presentation of Debt Issuance Costs” and ASU 2015-17 “Balance Sheet Classification of Deferred Taxes” by retrospectively applying the requirements of the ASUs to our previously issued consolidated financial statements. The adoption of both ASU 2015-03 and ASU 2015-17 reduced total assets by $1.044 billion, $1.316 billion and $1.039 billion in each year for the three years ended December 31, 2014, respectively, and ASU 2015-03 reduced total long-term debt by $168 million, $157 million and $124 million in each year for the three years ended December 31, 2014, respectively. |
| (4) | Total long-term debt is the sum of current maturities of long-term debt, capital lease obligations of $305 million (associated with the pending sale of colocation business and data centers) included in current liabilities associated with assets held for sale and long-term debt on our consolidated balance sheets. For additional information on our total long-term debt, see Note 5—Long-Term Debt and Credit Facilities to our consolidated financial statements in Item 8 of our Annual Report on Form 10-K for the year ended December 31, 2016. For total contractual obligations, see “Management’s Discussion and Analysis of Financial Condition and Results of Operations—Future Contractual Obligations” in Item 7 of our Annual Report on Form 10-K for the year ended December 31, 2016. |
Selected financial information from our consolidated statements of cash flows is as follows:
| Years Ended December 31, | ||||||||||||||||||||
| 2016 | 2015 | 2014 | 2013 | 2012 | ||||||||||||||||
| (Dollars in millions) | ||||||||||||||||||||
| Net cash provided by operating activities |
$ | 4,608 | 5,152 | 5,188 | 5,559 | 6,065 | ||||||||||||||
| Net cash used in investing activities |
(2,994 | ) | (2,853 | ) | (3,077 | ) | (3,148 | ) | (2,690 | ) | ||||||||||
| Net cash used in financing activities |
(1,518 | ) | (2,301 | ) | (2,151 | ) | (2,454 | ) | (3,295 | ) | ||||||||||
| Payments for property, plant and equipment and capitalized software |
(2,981 | ) | (2,872 | ) | (3,047 | ) | (3,048 | ) | (2,919 | ) | ||||||||||
A-5
Table of Contents
The following table presents certain of our selected operational metrics:
| As of December 31, | ||||||||||||||||||||
| 2016 | 2015 | 2014 | 2013 | 2012 | ||||||||||||||||
| (in thousands except for data centers, which are actuals) |
||||||||||||||||||||
| Operational metrics: |
||||||||||||||||||||
| Total access lines(1) |
11,090 | 11,748 | 12,394 | 13,002 | 13,751 | |||||||||||||||
| Total broadband subscribers(1) |
5,945 | 6,048 | 6,082 | 5,991 | 5,851 | |||||||||||||||
| Prism TV subscribers |
325 | 285 | 242 | 175 | 106 | |||||||||||||||
| Total data centers(2) |
58 | 59 | 58 | 55 | 54 | |||||||||||||||
| (1) | Access lines are lines reaching from the customers’ premises to a connection with the public network and broadband subscribers are customers that purchase broadband connection service through their existing telephone lines, stand-alone telephone lines, or fiber-optic cables. Our methodology for counting our access lines and broadband subscribers includes only those lines that we use to provide services to external customers and excludes lines used solely by us and our affiliates. It also excludes unbundled loops and includes stand-alone broadband subscribers. We count lines when we install the service. |
| (2) | We define a data center as any facility where we market, sell and deliver either colocation services, multi-tenant managed services, or both. Our data centers are located in North America, Europe and Asia. |
A-6
Table of Contents
MANAGEMENT’S DISCUSSION AND ANALYSIS OF FINANCIAL
CONDITION AND RESULTS OF OPERATIONS
Certain statements in our Annual Report constitute forward-looking statements. See “Special Note Regarding Forward-Looking Statements and Related Matters” in Item 1 of our Annual Report on Form 10-K for the year ended December 31, 2016 for factors relating to these statements and “Risk Factors” in Item 1A of our Annual Report on Form 10-K for the year ended December 31, 2016 for a discussion of certain risk factors applicable to our business, financial condition, results of operations, liquidity or prospects.
OVERVIEW
We are an integrated communications company engaged primarily in providing an array of services to our residential and business customers. Our communications services include local and long-distance voice, broadband, Multi-Protocol Label Switching (“MPLS”), private line (including special access), Ethernet, colocation, hosting (including cloud hosting and managed hosting), data integration, video, network, public access, Voice over Internet Protocol (“VoIP”), information technology and other ancillary services. We strive to maintain our customer relationships by, among other things, bundling our service offerings to provide our customers with a complete offering of integrated communications services.
At December 31, 2016, we operated approximately 11.1 million access lines in 37 states and served approximately 5.9 million broadband subscribers and 325 thousand Prism TV subscribers. We also operated 58 data centers throughout North America, Europe and Asia. Our methodology for counting access lines, broadband subscribers and data centers, which is described further in the operational metrics table below under “Results of Operations”, and our methodology for counting Prism TV subscribers may not be comparable to those of other companies.
Pending Acquisition of Level 3
On October 31, 2016, we entered into a definitive merger agreement under which we propose to acquire Level 3 Communications, Inc. (“Level 3”) in a cash and stock transaction. Under the terms of the agreement, Level 3 shareholders will receive $26.50 per share in cash and 1.4286 of CenturyLink shares for each share of Level 3 common stock they own at closing. CenturyLink shareholders are expected to own approximately 51% and Level 3 shareholders are expected to own approximately 49% of the combined company at closing. On December 31, 2016, Level 3 had outstanding $10.9 billion of long-term debt.
Completion of the transaction is subject to the receipt of regulatory approvals, including the expiration or termination of the applicable waiting period under the Hart-Scott-Rodino Antitrust Improvements Act, as well as approvals from the Federal Communications Commission (the “FCC”) and certain state regulatory authorities. The transaction is also subject to the approval of CenturyLink and Level 3 shareholders at meetings scheduled to be held on March 16, 2017, as well as other customary closing conditions. Subject to these conditions, we anticipate closing this transaction by the end of the third quarter 2017. If the merger agreement is terminated under certain circumstances, we may be obligated to pay Level 3 a termination fee of $472 million, or Level 3 may be obligated to pay CenturyLink a termination fee of $738 million.
As of December 31, 2016, we had recognized $52 million of expenses associated with our activities related to the pending Level 3 acquisition. We have not recognized certain other expenses that are contingent on completion of the acquisition. These expenses include financial advisory fees and compensation expense comprised of retention bonuses, severance and stock-based compensation for stock-based awards that will vest in connection with the acquisition. Most of these contingent expenses will be recognized in our consolidated financial statements in the period in which the acquisition occurs, with the remainder recognized thereafter. The final amount of compensation expense to be recognized is partially dependent upon personnel decisions that will be made as part of integration planning. These amounts may be material.
A-7
Table of Contents
Upon completion of the acquisition, Level 3’s assets and liabilities will be revalued and recorded at fair value. The assignment of fair value will require a significant amount of judgment. The use of fair value measures will affect the comparability of our post-acquisition financial information and may make it more difficult to predict earnings in future periods. For example, Level 3 has certain deferred costs and deferred revenues on its balance sheet associated with capacity leases. Based on the accounting guidance for business combinations, these existing deferred costs and deferred revenues are expected to be assigned little or no value in the purchase price allocation process and will thus be eliminated.
For unaudited pro forma condensed combined financial information relating to the acquisition, see the definitive joint proxy statement/prospectus filed with the SEC by us on February 13, 2017. This pro forma financial information is based upon preliminary purchase price allocations and various assumptions and estimates, all of which we urge you to carefully consider in connection with your review of such information.
Pending Sale of Colocation Business and Data Centers
On November 3, 2016, we entered into a definitive stock purchase agreement to sell our data centers and colocation business to a consortium led by BC Partners, Inc. and Medina Capital (“the Purchaser”) in exchange for cash and a minority stake in the consortium’s newly-formed global secure infrastructure company. During 2016, as a result of the pending sale, the assets to be sold to the Purchaser have been reclassified as assets held for sale in other current assets on our consolidated balance sheet. Additionally, the liabilities to be assumed by the Purchaser have been reclassified and presented as current liabilities associated with assets held for sale on our consolidated balance sheet. As part of the transaction, the Purchaser will assume our capital lease obligations, which amounted to $305 million as of December 31, 2016, related to the properties that we will sell. The sale is subject to regulatory approvals, including a review by the Committee of Foreign Investments in the United States, as well as other customary closing conditions.
Upon being completed, this transaction will result in the Purchaser acquiring 57 data centers. This business generated revenues of $622 million, $626 million and $643 million (excluding revenue with affiliates) for the years ended December 31, 2016, 2015 and 2014, respectively (a small portion of which will be retained by us). Based on certain estimates and assumptions regarding the closing date and various tax matters, we currently project that the net cash proceeds from the divestiture will be approximately $1.5 billion to $1.7 billion. We plan to use a portion of these net cash proceeds to partly fund our acquisition of Level 3.
The following tables present additional metrics related to our data centers:
| As of December 31, | Increase / (Decrease) |
% Change |
||||||||||||||
| 2016 | 2015 | |||||||||||||||
| Hosting data center metrics: |
||||||||||||||||
| Number of data centers(1) |
58 | 59 | (1 | ) | (2) | % | ||||||||||
| Sellable square feet, million sq ft |
1.54 | 1.58 | (0.04 | ) | (3) | % | ||||||||||
| Billed square feet, million sq ft |
1.04 | 0.99 | 0.05 | 5 | % | |||||||||||
| Utilization |
67 | % | 63 | % | 4 | % | 6 | % | ||||||||
| As of December 31, | Increase / (Decrease) |
% Change |
||||||||||||||
| 2015 | 2014 | |||||||||||||||
| Hosting data center metrics: |
||||||||||||||||
| Number of data centers(1) |
59 | 58 | 1 | 2 | % | |||||||||||
| Sellable square feet, million sq ft |
1.58 | 1.46 | 0.12 | 8 | % | |||||||||||
| Billed square feet, million sq ft |
0.99 | 0.92 | 0.07 | 8 | % | |||||||||||
| Utilization |
63 | % | 63 | % | — | % | — | % | ||||||||
| (1) | We define a data center as any facility where we market, sell and deliver either colocation services, multi-tenant managed services, or both. Our data centers are located in North America, Europe and Asia. |
A-8
Table of Contents
See Note 3—Pending Sale of Colocation Business and Data Centers to our consolidated financial statements in Item 8 of our Annual Report on Form 10-K for the year ended December 31, 2016 for additional information on the pending sale.
We are organized into operating segments based on customer type, business and consumer. These operating segments are our two reportable segments in our consolidated financial statements:
| • | Business Segment. Consists generally of providing strategic, legacy and data integration products and services to small, medium and enterprise business, wholesale and governmental customers, including other communication providers. Our strategic products and services offered to these customers include our MPLS, Ethernet, colocation, hosting (including cloud hosting and managed hosting), broadband, VoIP, information technology and other ancillary services. Our legacy services offered to these customers primarily include local and long-distance voice, including the sale of unbundled network elements (“UNEs”), private line (including special access), switched access and other ancillary services. Our data integration offerings include the sale of telecommunications equipment located on customers’ premises and related products and professional services, all of which are described further below under the heading “Operating Revenues”; and |
| • | Consumer Segment. Consists generally of providing strategic and legacy products and services to residential customers. Our strategic products and services offered to these customers include our broadband, video (including our Prism TV services) and other ancillary services. Our legacy services offered to these customers include local and long-distance voice and other ancillary services. |
RESULTS OF OPERATIONS
The following table summarizes the results of our consolidated operations for the years ended December 31, 2016, 2015 and 2014:
| Years Ended December 31, | ||||||||||||
| 2016(1)(2) | 2015(1) | 2014(3) | ||||||||||
| (Dollars in millions except per share amounts) |
||||||||||||
| Operating revenues |
$ | 17,470 | 17,900 | 18,031 | ||||||||
| Operating expenses |
15,139 | 15,295 | 15,621 | |||||||||
|
|
|
|
|
|
|
|||||||
| Operating income |
2,331 | 2,605 | 2,410 | |||||||||
| Other expense, net |
1,311 | 1,289 | 1,300 | |||||||||
| Income tax expense |
394 | 438 | 338 | |||||||||
|
|
|
|
|
|
|
|||||||
| Net income |
$ | 626 | 878 | 772 | ||||||||
|
|
|
|
|
|
|
|||||||
| Basic earnings per common share |
$ | 1.16 | 1.58 | 1.36 | ||||||||
| Diluted earnings per common share |
$ | 1.16 | 1.58 | 1.36 | ||||||||
| (1) | During 2016 and 2015, we recognized an incremental $201 million and $215 million, respectively, of revenue associated with the FCC’s Connect America Fund Phase 2 support program as compared to the interstate USF program. For additional information, see Note 1—Basis of Presentation and Summary of Significant Accounting Policies to our consolidated financial statements in Item 8 of our Annual Report on Form 10-K for the year ended December 31, 2016. |
| (2) | During 2016, we recognized $189 million of severance expenses and other one-time termination benefits associated with our workforce reductions and $52 million of expenses related to our pending acquisition of Level 3. |
| (3) | During 2014, we recognized a $60 million tax benefit associated with a deduction for the tax basis for worthless stock in a wholly-owned foreign subsidiary and a $63 million pension settlement charge. |
A-9
Table of Contents
The following table summarizes our access lines, broadband subscribers, Prism TV subscribers, data centers and number of employees:
| As of December 31, | ||||||||||||
| 2016 | 2015 | 2014 | ||||||||||
| (in thousands except for data centers, which are actuals) |
||||||||||||
| Operational metrics: |
||||||||||||
| Total access lines(1) |
11,090 | 11,748 | 12,394 | |||||||||
| Total broadband subscribers(1) |
5,945 | 6,048 | 6,082 | |||||||||
| Total Prism TV subscribers |
325 | 285 | 242 | |||||||||
| Total data centers(2) |
58 | 59 | 58 | |||||||||
| Total employees |
40 | 43 | 45 | |||||||||
| (1) | Access lines are lines reaching from the customers’ premises to a connection with the public network and broadband subscribers are customers that purchase broadband connection service through their existing telephone lines, stand-alone telephone lines, or fiber-optic cables. Our methodology for counting our access lines and broadband subscribers includes only those lines that we use to provide services to external customers and excludes lines used solely by us and our affiliates. It also excludes unbundled loops and includes stand-alone broadband subscribers. We count lines when we install the service. |
| (2) | We define a data center as any facility where we market, sell and deliver either colocation services, multi-tenant managed services, or both. Our data centers are located in North America, Europe and Asia. |
During the last decade, we have experienced revenue declines primarily due to declines in access lines, private line customers, switched access rates and minutes of use. To mitigate these revenue declines, we remain focused on efforts to, among other things:
| • | promote long-term relationships with our customers through bundling of integrated services; |
| • | provide a wide array of diverse services, including enhanced or additional services that may become available in the future due to, among other things, advances in technology or improvements in our infrastructure; |
| • | provide our broadband and premium services to a higher percentage of our customers; |
| • | pursue acquisitions of additional assets if available at attractive prices; |
| • | increase prices on our products and services if and when practicable; |
| • | increase the capacity, speed and usage of our networks; and |
| • | market our products and services to new customers. |
Operating Revenues
From time to time, we change the categorization of our products and services, and we may make similar changes in the future. During the second quarter of 2016, we determined that because of declines due to customer migration to other strategic products and services, certain of our business low-bandwidth data services, specifically our private line (including special access) services in our business segment, are more closely aligned with our legacy services than with our strategic services. As described in greater detail in Note 14—Segment Information in our Annual Report on Form 10-K for the year ended December 31, 2016, these operating revenues are now reflected as legacy services.
We currently categorize our products, services and revenues among the following four categories:
| • | Strategic services, which include primarily broadband, MPLS, Ethernet, colocation, hosting (including cloud hosting and managed hosting), video (including our facilities-based video services, which we offer in 16 markets), VoIP, information technology and other ancillary services; |
A-10
Table of Contents
| • | Legacy services, which include primarily local and long-distance voice services, including the sale of UNEs, private line (including special access), Integrated Services Digital Network (“ISDN”) (which use regular telephone lines to support voice, video and data applications), switched access and other ancillary services; |
| • | Data integration, which includes the sale of telecommunications equipment located on customers’ premises and related products and professional services, such as network management, installation and maintenance of data equipment and the building of proprietary fiber-optic broadband networks for our governmental and business customers; and |
| • | Other operating revenues, which consists primarily of Connect America Fund (“CAF”) support payments, Universal Service Fund (“USF”) support payments and USF surcharges. We receive federal support payments from both Phase 1 and Phase 2 of the CAF program, and support payments from both federal and state USF programs. These support payments are government subsidies designed to reimburse us for various costs related to certain telecommunications services, including the costs of deploying, maintaining and operating voice and broadband infrastructure in high-cost rural areas where we are not able to fully recover our costs from our customers. We also collect USF surcharges based on specific items we list on our customers’ invoices to fund the FCC’s universal service programs. We also generate other operating revenues from the leasing and subleasing of space in our office buildings, warehouses and other properties. Because we centrally manage the activities that generate these other operating revenues, these revenues are not included in our segment revenues. |
The following tables summarize our consolidated operating revenues recorded under our four revenue categories:
| Years Ended December 31, |
Increase / (Decrease) |
% Change |
||||||||||||||
| 2016 | 2015 | |||||||||||||||
| (Dollars in millions) | ||||||||||||||||
| Strategic services |
$ | 8,050 | 7,753 | 297 | 4 % | |||||||||||
| Legacy services |
7,672 | 8,338 | (666 | ) | (8)% | |||||||||||
| Data integration |
533 | 577 | (44 | ) | (8)% | |||||||||||
| Other |
1,215 | 1,232 | (17 | ) | (1)% | |||||||||||
|
|
|
|
|
|
|
|||||||||||
| Total operating revenues |
$ | 17,470 | 17,900 | (430 | ) | (2)% | ||||||||||
|
|
|
|
|
|
|
|||||||||||
| Years Ended December 31, |
Increase / (Decrease) |
% Change |
||||||||||||||
| 2015 | 2014 | |||||||||||||||
| (Dollars in millions) | ||||||||||||||||
| Strategic services |
$ | 7,753 | 7,303 | 450 | 6 % | |||||||||||
| Legacy services |
8,338 | 9,033 | (695 | ) | (8)% | |||||||||||
| Data integration |
577 | 692 | (115 | ) | (17)% | |||||||||||
| Other |
1,232 | 1,003 | 229 | 23 % | ||||||||||||
|
|
|
|
|
|
|
|||||||||||
| Total operating revenues |
$ | 17,900 | 18,031 | (131 | ) | (1)% | ||||||||||
|
|
|
|
|
|
|
|||||||||||
Our total operating revenues decreased by $430 million, or 2%, for the year ended December 31, 2016 as compared to the year ended December 31, 2015 and decreased by $131 million, or 1%, for the year ended December 31, 2015 as compared to the year ended December 31, 2014. The decline in operating revenues for both periods was primarily due to lower legacy services revenues, which decreased by $666 million, or 8%, and $695 million, or 8%, for the respective periods.
The decline in legacy services revenues for both periods reflects the continuing loss of access lines, loss of long-distance revenues primarily due to the displacement of traditional wireline telephone services by other
A-11
Table of Contents
competitive products and services, including data and wireless communication services, and reductions in the volume of our private line (including special access) services. At December 31, 2016, we had approximately 11.1 million access lines, or approximately 5.6% less than the number of access lines we operated at December 31, 2015. At December 31, 2015, we had approximately 11.7 million access lines, or approximately 5.2% less than the number of access lines we operated at December 31, 2014. We estimate that the rate of our access lines losses will be between 4% and 6% over the full year of 2017.
For 2016, the growth in our strategic services revenues was primarily due to increased demand for our Ethernet, MPLS, facilities-based video and VoIP services and from rate increases on various services, which were partially offset by declines in our hosting services and losses of broadband customers. For 2015, the growth in our strategic services revenues was primarily due to increased demand for our Ethernet, MPLS, facilities-based video and IT Services and from rate increases on various services, which were partially offset by declines in our colocation and hosting services.
Data integration revenues, which are typically more volatile than our other sources of revenues, decreased by $44 million, or 8%, for the year ended December 31, 2016 as compared to the year ended December 31, 2015. The decline in data integration revenues was primarily due to declines in governmental and business sales and professional and maintenance services. Data integration revenues decreased by $115 million, or 17%, for the year ended December 31, 2015 as compared to the year ended December 31, 2014. The decline in data integration revenues was primarily due to declines in governmental sales and professional services, which were partially offset by an increase in maintenance services.
Other operating revenues decreased by $17 million, or 1%, for the year ended December 31, 2016 as compared to the year ended December 31, 2015. The decrease in other operating revenues was primarily due to lower high-cost support revenues. These declines were partially offset by higher USF surcharge revenues related to increased universal service fund contribution factors. Other operating revenues increased by $229 million, or 23%, for the year ended December 31, 2015 as compared to the year ended December 31, 2014. The increase in other operating revenues was primarily due to additional revenue recorded under the CAF Phase 2 support program. For additional information about the CAF Phase 2 support program, see the discussion below in “Liquidity and Capital Resources—Connect America Fund.”
We are aggressively marketing our strategic services in an effort to partially offset the continuing declines in our legacy services.
Further analysis of our segment operating revenues and trends impacting our performance are provided below in “Segment Results.”
Operating Expenses
Our current definitions of operating expenses are as follows:
| • | Cost of services and products (exclusive of depreciation and amortization) are expenses incurred in providing products and services to our customers. These expenses include: employee-related expenses directly attributable to operating and maintaining our network (such as salaries, wages, benefits and professional fees); facilities expenses (which include third-party telecommunications expenses we incur for using other carriers’ networks to provide services to our customers); rents and utilities expenses; equipment sales expenses (such as data integration and modem expenses); payments to universal service funds (which are federal and state funds that are established to promote the availability of telecommunications services to all consumers at reasonable and affordable rates, among other things, and to which we are often required to contribute); certain litigation expenses associated with our operations; and other expenses directly related to our operations; and |
| • | Selling, general and administrative expenses are corporate overhead and other operating expenses. These expenses include: employee-related expenses (such as salaries, wages, internal commissions, |
A-12
Table of Contents
| benefits and professional fees) directly attributable to selling products or services and employee-related expenses for administrative functions; marketing and advertising; property and other operating taxes and fees; external commissions; litigation expenses associated with general matters; bad debt expense; and other selling, general and administrative expenses. |
These expense classifications may not be comparable to those of other companies.
The following tables summarize our operating expenses:
| Years Ended December 31, |
Increase / (Decrease) |
% Change |
||||||||||||||
| 2016 | 2015 | |||||||||||||||
| (Dollars in millions) | ||||||||||||||||
| Cost of services and products (exclusive of depreciation and amortization) |
$ | 7,774 | 7,778 | (4 | ) | — % | ||||||||||
| Selling, general and administrative |
3,449 | 3,328 | 121 | 4 % | ||||||||||||
| Depreciation and amortization |
3,916 | 4,189 | (273 | ) | (7)% | |||||||||||
|
|
|
|
|
|
|
|||||||||||
| Total operating expenses |
$ | 15,139 | 15,295 | (156 | ) | (1)% | ||||||||||
|
|
|
|
|
|
|
|||||||||||
| Years Ended December 31, |
Increase / (Decrease) |
% Change |
||||||||||||||
| 2015 | 2014 | |||||||||||||||
| (Dollars in millions) | ||||||||||||||||
| Cost of services and products (exclusive of depreciation and amortization) |
$ | 7,778 | 7,846 | (68 | ) | (1)% | ||||||||||
| Selling, general and administrative |
3,328 | 3,347 | (19 | ) | (1)% | |||||||||||
| Depreciation and amortization |
4,189 | 4,428 | (239 | ) | (5)% | |||||||||||
|
|
|
|
|
|
|
|||||||||||
| Total operating expenses |
$ | 15,295 | 15,621 | (326 | ) | (2)% | ||||||||||
|
|
|
|
|
|
|
|||||||||||
Cost of Services and Products (exclusive of depreciation and amortization)
Cost of services and products (exclusive of depreciation and amortization) decreased by $4 million, or less than 1%, for the year ended December 31, 2016 as compared to the year ended December 31, 2015. The decrease in costs of services and products (exclusive of depreciation and amortization) was primarily due to reductions in salaries and wages from lower headcount, professional fees, payment processing fees and customer premises equipment costs, which were substantially offset by increases in content costs for Prism TV (resulting from higher content volume and rates), network expense and USF rates. Cost of services and products (exclusive of depreciation and amortization) decreased by $68 million, or 1%, for the year ended December 31, 2015 as compared to the year ended December 31, 2014. Excluding the lower customer premises equipment costs, cost of services and products increased by $56 million for the year ended December 31, 2015 as compared to the year ended December 31, 2014. The increase in costs of services and products was primarily due to increases in pension and postretirement costs, USF rate increases, higher network expenses and increases in content costs for Prism TV. These increases were partially offset by decreases in salaries and wages from lower headcount, professional fees and contract labor costs.
Selling, General and Administrative
Selling, general and administrative expenses increased by $121 million, or 4%, for the year ended December 31, 2016 as compared to the year ended December 31, 2015. The increase in selling, general and administrative expenses was primarily due to increases in severance expenses associated with our recent workforce reduction, higher payments of employee health care claims, bad debt and other expenses (including fees related to the Level 3 acquisition), which were partially offset by reductions in professional fees and
A-13
Table of Contents
property and other taxes. Selling, general and administrative expenses decreased by $19 million, or 1%, for the year ended December 31, 2015 as compared to the year ended December 31, 2014. The decrease in selling, general and administrative expenses was primarily due to lower benefit expenses, insurance costs and asset impairment charges. These decreases were partially offset by increases in bad debt expense, external commissions and regulatory fines of $15 million associated with a 911 system outage.
Pension Lump Sum Offer
Our pension plan contains provisions that allow us, from time to time, to offer lump sum payment options to certain former employees in settlement of their future retirement benefits. These lump sum payments are paid from the trust that holds the plan’s assets. Under pension settlement accounting, we record an accounting settlement charge associated with these lump sum payments only if, in the aggregate, they exceed the sum of the annual service and interest costs for the plan’s net periodic pension benefit cost. There were no pension lump sum offerings in 2016, other than those to eligible employees who terminated during 2016. For the year ended December 31, 2015, we made cash settlement payments to former employees for lump sum offers of approximately $356 million, but pension settlement accounting was not triggered in 2015. For the year ended December 31, 2014, we made cash settlement payments to former employees for lump sum offers of approximately $460 million, which triggered pension settlement accounting and resulted in us recording additional pension expense of $63 million. Pension expense is allocated to cost of services and products (exclusive of depreciation and amortization), selling, general and administrative and to capital projects. See Note 9—Employee Benefits to our consolidated financial statements in Item 8 of our Annual Report on Form 10-K for the year ended December 31, 2016 for additional information on the pension lump sum offers.
Depreciation and Amortization
The following tables provide detail of our depreciation and amortization expense:
| Years Ended December 31, |
Increase / (Decrease) |
% Change |
||||||||||||||
| 2016 | 2015 | |||||||||||||||
| (Dollars in millions) | ||||||||||||||||
| Depreciation |
$ | 2,691 | 2,836 | (145 | ) | (5)% | ||||||||||
| Amortization |
1,225 | 1,353 | (128 | ) | (9)% | |||||||||||
|
|
|
|
|
|
|
|||||||||||
| Total depreciation and amortization |
$ | 3,916 | 4,189 | (273 | ) | (7)% | ||||||||||
|
|
|
|
|
|
|
|||||||||||
| Years Ended December 31, |
Increase / (Decrease) |
% Change |
||||||||||||||
| 2015 | 2014 | |||||||||||||||
| (Dollars in millions) | ||||||||||||||||
| Depreciation |
$ | 2,836 | 2,958 | (122 | ) | (4)% | ||||||||||
| Amortization |
1,353 | 1,470 | (117 | ) | (8)% | |||||||||||
|
|
|
|
|
|
|
|||||||||||
| Total depreciation and amortization |
$ | 4,189 | 4,428 | (239 | ) | (5)% | ||||||||||
|
|
|
|
|
|
|
|||||||||||
Annual depreciation expense is impacted by several factors, including changes in our depreciable cost basis, changes in our estimates of the remaining economic life of certain network assets, the addition of new plant and our entry into an agreement to sell our data centers and colocation business. Depreciation expense decreased by $145 million, or 5%, for the year ended December 31, 2016 as compared to the year ended December 31, 2015 and decreased by $122 million, or 4%, for the year ended December 31, 2015 as compared to the year ended December 31, 2014. The depreciation expense related to our plant was lower for both periods due to full depreciation and retirement of certain plant placed in service prior to 2016 and 2015. Additionally, we ceased depreciating property, plant and equipment assets of our colocation business when we entered into the agreement to sell that business. We estimate that we would have recorded additional depreciation expense during 2016 of
A-14
Table of Contents
$30 million if we had not agreed to sell the colocation business. The decrease in both periods was partially offset by an increase in depreciation expense attributable to new plant placed in service during the respective years.
Additionally, in 2015, the lower depreciation expense was further offset by the impact of changes in the estimated lives of certain property, plant and equipment which resulted in additional depreciation. The changes in the estimated lives of certain property, plant and equipment resulted in an increase in depreciation expense of approximately $48 million for 2015, which was more than fully offset by the decrease in depreciation expense noted above. In addition, we developed a plan to migrate customers from one of our networks to another, which began in late 2014 and ended in late 2015. As a result, we implemented changes in estimates that reduced the remaining economic lives of certain network assets. The impact from the above-noted changes in estimates and network migration resulted in an increase in depreciation expense of approximately $90 million for the year ended December 31, 2014.
Amortization expense decreased by $128 million, or 9%, for the year ended December 31, 2016 as compared to the year ended December 31, 2015 and decreased by $117 million, or 8%, for the year ended December 31, 2015 as compared to the year ended December 31, 2014. The decrease in amortization expense for both periods was primarily due to the use of accelerated amortization for a portion of our customer relationship assets and our entry into an agreement to sell our data centers and colocation business. The effect of using an accelerated amortization method results in an incremental decline in expense each period as the intangible assets amortize. We ceased amortizing the intangible assets of our colocation business when we entered into the agreement to sell that business. We estimate that we would have recorded additional amortization expense during 2016 of $6 million if we had not agreed to sell the colocation business. In addition, amortization of capitalized software was lower in both periods due to software becoming fully amortized faster than new software was acquired or developed.
Other Consolidated Results
The following tables summarize our total other expense, net and income tax expense:
| Years Ended December 31, |
Increase / (Decrease) |
% Change |
||||||||||||||
| 2016 | 2015 | |||||||||||||||
| (Dollars in millions) | ||||||||||||||||
| Interest expense |
$ | (1,318 | ) | (1,312 | ) | 6 | — | % | ||||||||
| Other income, net |
7 | 23 | (16 | ) | (70 | )% | ||||||||||
|
|
|
|
|
|||||||||||||
| Total other expense, net |
$ | (1,311 | ) | (1,289 | ) | 22 | 2 | % | ||||||||
|
|
|
|
|
|||||||||||||
| Income tax expense |
$ | 394 | 438 | (44 | ) | (10 | )% | |||||||||
| Years Ended December 31, |
Increase / (Decrease) |
% Change |
||||||||||||||
| 2015 | 2014 | |||||||||||||||
| (Dollars in millions) | ||||||||||||||||
| Interest expense |
$ | (1,312 | ) | (1,311 | ) | 1 | — | % | ||||||||
| Other income, net |
23 | 11 | 12 | 109 | % | |||||||||||
|
|
|
|
|
|||||||||||||
| Total other expense, net |
$ | (1,289 | ) | (1,300 | ) | (11 | ) | (1 | )% | |||||||
|
|
|
|
|
|||||||||||||
| Income tax expense |
$ | 438 | 338 | 100 | 30 | % | ||||||||||
Interest Expense
Interest expense increased by $6 million, or less than 1%, for the year ended December 31, 2016 as compared to the year ended December 31, 2015. The increase in interest expense was substantially due to a reduction in the amount of net premium amortization recorded at acquisition due to the early retirement of
A-15
Table of Contents
several issuances of debt during the period, which has the effect of increasing interest expense and an increase in interest expense on unsecured notes related to the issuance of $1.0 billion of new debt in April, 2016 in advance of a debt maturity in June, 2016. Interest expense increased by $1 million, or less than 1%, for the year ended December 31, 2015 as compared to the year ended December 31, 2014. The increase in interest expense was primarily due to a reduction in the amortization of debt premiums, which was substantially offset by higher capitalized interest, lower bond coupon rates and lower interest under our Credit Facility. See Note 5—Long-Term Debt and Credit Facilities to our consolidated financial statements in Item 8 of our Annual Report on Form 10-K for the year ended December 31, 2016 and Liquidity and Capital Resources below for additional information about our debt.
Other Income, Net
Other income, net reflects certain items not directly related to our core operations, including our share of income from partnerships we do not control, interest income, gains and losses from non-operating asset dispositions and foreign currency gains and losses. Other income, net decreased by $16 million, or 70%, for the year ended December 31, 2016 as compared to the year ended December 31, 2015. This decrease in other income, net was primarily due to losses on early retirement of debt, which was partially offset by the impact of nonrecurring funding from a state economic development program. Other income, net increased by $12 million, or 109%, for the year ended December 31, 2015 as compared to the year ended December 31, 2014. This increase in other income, net was primarily due to the impact of a 2014 impairment charge of $14 million recorded in connection with the sale of our 700 MHz A-Block Wireless Spectrum licenses, which was partially offset by a net loss on early retirement of debt in 2015.
Income Tax Expense
Income tax expense decreased by $44 million for the year ended December 31, 2016 as compared to the year ended December 31, 2015. Our income tax expense for the year ended December 31, 2015 increased by $100 million from the amounts for the comparable prior year. For the years ended December 31, 2016, 2015 and 2014, our effective income tax rate was 38.6%, 33.3% and 30.5%, respectively. The effective tax rate for the year ended December 31, 2016 reflects a tax impact of $18 million from an intercompany dividend payment from one of our foreign subsidiaries to its domestic parent company that was made as part of our corporate restructuring in preparation for the sale of our colocation business. The effective tax rate for the year ended December 31, 2015 reflects a tax benefit of approximately $34 million related to affiliate debt rationalization, research and development tax credits of $28 million for 2011 through 2015, and a $16 million tax decrease due to changes in state taxes caused by apportionment changes, state tax rate changes and the changes in the expected utilization of net operating loss carryforwards (“NOLs”). The effective tax rate for the year ended December 31, 2014 reflects a $60 million tax benefit associated with a worthless stock deduction for the tax basis in a wholly-owned foreign subsidiary as a result of developments in bankruptcy proceedings involving its sole asset, an indirect investment in KPNQwest, N.V. The subsidiary was acquired as part of the acquisition of Qwest and we assigned it no fair value in the acquisition due to the bankruptcy proceedings, which were then ongoing. The effective tax rate for the year ended December 31, 2014 also reflects a $13 million tax decrease due to changes in state taxes caused by apportionment changes, state tax rate changes and the changes in the expected utilization of NOLs. The rate also reflects the absence of tax benefits from the impairment and disposition of our 700 MHz A-Block wireless spectrum licenses in 2014, because we are not likely to generate income of a character required to realize a tax benefit from the loss on disposition during the period permitted by law for utilization of that loss. See Note 13—Income Taxes to our consolidated financial statements in Item 8 of our Annual Report for the year ended December 31, 2016 and “Critical Accounting Policies and Estimates—Income Taxes” below for additional information.
A-16
Table of Contents
Segment Results
The results for our business and consumer segments are summarized below for the years ended December 31, 2016, 2015 and 2014:
| Years Ended December 31, | ||||||||||||
| 2016 | 2015 | 2014 | ||||||||||
| (Dollars in millions) | ||||||||||||
| Total segment revenues |
$ | 16,255 | 16,668 | 17,028 | ||||||||
| Total segment expenses |
8,492 | 8,461 | 8,502 | |||||||||
|
|
|
|
|
|
|
|||||||
| Total segment income |
$ | 7,763 | 8,207 | 8,526 | ||||||||
|
|
|
|
|
|
|
|||||||
| Total margin percentage |
48 | % | 49 | % | 50 | % | ||||||
| Business segment: |
||||||||||||
| Revenues |
$ | 10,352 | 10,646 | 11,030 | ||||||||
| Expenses |
5,930 | 5,967 | 6,019 | |||||||||
|
|
|
|
|
|
|
|||||||
| Income |
$ | 4,422 | 4,679 | 5,011 | ||||||||
|
|
|
|
|
|
|
|||||||
| Margin percentage |
43 | % | 44 | % | 45 | % | ||||||
| Consumer segment: |
||||||||||||
| Revenues |
$ | 5,903 | 6,022 | 5,998 | ||||||||
| Expenses |
2,562 | 2,494 | 2,483 | |||||||||
|
|
|
|
|
|
|
|||||||
| Income |
$ | 3,341 | 3,528 | 3,515 | ||||||||
|
|
|
|
|
|
|
|||||||
| Margin percentage |
57 | % | 59 | % | 59 | % | ||||||
The following table reconciles our total segment revenues and total segment income presented above to consolidated operating revenues and consolidated operating income reported in our consolidated statements of operations.
| Years Ended December 31, | ||||||||||||
| 2016 | 2015 | 2014 | ||||||||||
| (Dollars in millions) | ||||||||||||
| Total segment revenues |
$ | 16,255 | 16,668 | 17,028 | ||||||||
| Other operating revenues |
1,215 | 1,232 | 1,003 | |||||||||
|
|
|
|
|
|
|
|||||||
| Operating revenues reported in our consolidated statements of operations |
$ | 17,470 | 17,900 | 18,031 | ||||||||
|
|
|
|
|
|
|
|||||||
| Total segment income |
$ | 7,763 | 8,207 | 8,526 | ||||||||
| Other operating revenues |
1,215 | 1,232 | 1,003 | |||||||||
| Depreciation and amortization |
(3,916 | ) | (4,189 | ) | (4,428 | ) | ||||||
| Other unassigned operating expenses |
(2,731 | ) | (2,645 | ) | (2,691 | ) | ||||||
|
|
|
|
|
|
|
|||||||
| Operating income reported in our consolidated statements of operations |
$ | 2,331 | 2,605 | 2,410 | ||||||||
|
|
|
|
|
|
|
|||||||
Changes in Segment Reporting
During the first half of 2016, we implemented several changes with respect to the assignment of certain expenses to our reportable segments, including changes that increased our consumer segment expenses and decreased our business segment expenses in prior periods. We have recast our previously reported segment results for the years ended December 31, 2015 and 2014 to conform to the current presentation. See Note 14—Segment Information to our consolidated financial statements in Item 8 of our Annual Report on Form 10-K for the year ended December 31, 2016 for additional information on our changes in segment reporting.
A-17
Table of Contents
Allocation of Revenues and Expenses
Our segment revenues include all revenues from our strategic services, legacy services and data integration as described in more detail above. Segment revenues are based upon each customer’s classification to an individual segment. We report our segment revenues based upon all services provided to that segment’s customers. For information on how we allocate expenses to our segments, as well as other additional information about our segments, see Note 14—Segment Information our Annual Report on Form 10-K for the year ended December 31, 2016.
Business Segment
The operations of our business segment have been impacted by several significant trends, including those described below:
| • | Strategic services. Our mix of total business segment revenues continues to migrate from legacy services to strategic services as our small, medium and enterprise business, wholesale and governmental customers increasingly demand integrated data, broadband, hosting and voice services. Our Ethernet-based services in the wholesale market face competition from cable companies and competitive fiber-based telecommunications providers. We anticipate continued pricing pressure for our colocation services as vendors continue to expand their enterprise colocation operations. In recent years, our competitors, as well as several large, diversified technology companies, have made substantial investments in cloud computing. This expansion in competitive cloud computing offerings has led to increased pricing pressure, a migration towards lower-priced cloud-based services and enhanced competition for contracts, and we expect these trends to continue. Customers’ demand for new technology has also increased the number of competitors offering strategic services similar to ours. Price compression from each of these above-mentioned competitive pressures has negatively impacted the operating margins of our strategic services, and we expect this trend to continue. Operating costs also impact the operating margins of our strategic services, but to a lesser extent than price compression and customer disconnects. These operating costs include employee costs, sales commissions, software costs on selected services, installation costs and third-party facility costs. We believe increases in operating costs have generally had a greater impact on the operating margins of our strategic services as compared to our legacy services, principally because our strategic services rely more heavily upon the above-listed support functions; |
| • | Legacy services. We continue to experience customers migrating away from our higher margin legacy services into lower margin strategic services. Our legacy services revenues have been, and we expect they will continue to be, adversely affected by access line losses and price compression. In particular, our access, local services and long-distance revenues have been, and we expect will continue to be, adversely affected by customer migration to more technologically advanced services, an increase in the use of non-voice communications and a related decrease in the demand for traditional voice services, industry consolidation and price compression caused by regulation and rate reductions. For example, many of our business segment customers are substituting cable, wireless and VoIP services for traditional voice telecommunications services, resulting in continued access revenue loss. Demand for our private line services (including special access) continues to decline due to our customers’ optimization of their networks, industry consolidation and technological migration to higher-speed services. Although our legacy services generally face fewer direct competitors than certain of our strategic services, customer migration and, to a lesser degree, price compression from competitive pressures have negatively impacted our legacy revenues and the operating margins of our legacy services. We expect this trend to continue. Operating costs, such as installation costs and third-party facility costs, have also negatively impacted the operating margins of our legacy services, but to a lesser extent than customer loss, customer migration and price compression. Operating costs also tend to impact our legacy services to a lesser extent than our strategic services as noted above; |
A-18
Table of Contents
| • | Data integration. We expect both data integration revenue and the related costs will fluctuate from year to year as this offering tends to be more sensitive than others to changes in the economy and in spending trends of our federal, state and local governmental customers, many of whom have experienced substantial budget cuts over the past several years, with the possibility of additional future budget cuts. Our data integration operating margins are typically smaller than most of our other offerings; and |
| • | Operating efficiencies. We continue to evaluate our segment operating structure and focus. This involves balancing our workforce in response to our workload requirements, productivity improvements and changes in industry, competitive, technological and regulatory conditions, while achieving operational efficiencies and improving our processes through automation. However, our ongoing efforts to increase revenue will continue to require that we incur higher costs in some areas. We also expect our business segment to benefit indirectly from enhanced efficiencies in our company-wide network operations. |
The following tables summarize the results of operations from our business segment:
| Business Segment | ||||||||||||||||
| Years Ended December 31, |
Increase / (Decrease) |
% Change |
||||||||||||||
| 2016 | 2015 | |||||||||||||||
| (Dollars in millions) | ||||||||||||||||
| Segment revenues: |
||||||||||||||||
| Strategic services |
||||||||||||||||
| High-bandwidth data services(1) |
$ | 2,990 | 2,816 | 174 | 6 | % | ||||||||||
| Hosting services(2) |
1,210 | 1,281 | (71 | ) | (6) | % | ||||||||||
| Other strategic services(3) |
703 | 624 | 79 | 13 | % | |||||||||||
|
|
|
|
|
|
|
|||||||||||
| Total strategic services revenues |
4,903 | 4,721 | 182 | 4 | % | |||||||||||
|
|
|
|
|
|
|
|||||||||||
| Legacy services |
||||||||||||||||
| Voice services(4) |
2,413 | 2,588 | (175 | ) | (7) | % | ||||||||||
| Low-bandwidth data services(5) |
1,382 | 1,594 | (212 | ) | (13) | % | ||||||||||
| Other legacy services(6) |
1,123 | 1,168 | (45 | ) | (4) | % | ||||||||||
|
|
|
|
|
|
|
|||||||||||
| Total legacy services revenues |
4,918 | 5,350 | (432 | ) | (8) | % | ||||||||||
|
|
|
|
|
|
|
|||||||||||
| Data integration |
531 | 575 | (44 | ) | (8) | % | ||||||||||
|
|
|
|
|
|
|
|||||||||||
| Total revenues |
10,352 | 10,646 | (294 | ) | (3) | % | ||||||||||
|
|
|
|
|
|
|
|||||||||||
| Segment expenses: |
||||||||||||||||
| Total expenses |
5,930 | 5,967 | (37 | ) | (1) | % | ||||||||||
|
|
|
|
|
|
|
|||||||||||
| Segment income |
$ | 4,422 | 4,679 | (257 | ) | (5) | % | |||||||||
|
|
|
|
|
|
|
|||||||||||
| Segment margin percentage |
43 | % | 44 | % | ||||||||||||
| (1) | Includes MPLS and Ethernet revenue |
| (2) | Includes colocation, hosting (including cloud hosting and managed hosting) and hosting area network revenue |
| (3) | Includes primarily broadband, VoIP, video and IT services revenue |
| (4) | Includes local and long-distance voice revenue |
| (5) | Includes private line (including special access) revenue |
| (6) | Includes UNEs, public access, switched access and other ancillary revenue |
A-19
Table of Contents
| Business Segment | ||||||||||||||||
| Years Ended December 31, |
Increase / (Decrease) |
% Change |
||||||||||||||
| 2015 | 2014 | |||||||||||||||
| (Dollars in millions) | ||||||||||||||||
| Segment revenues: |
||||||||||||||||
| Strategic services |
||||||||||||||||
| High-bandwidth data services(1) |
$ | 2,816 | 2,579 | 237 | 9 | % | ||||||||||
| Hosting services(2) |
1,281 | 1,316 | (35 | ) | (3) | % | ||||||||||
| Other strategic services(3) |
624 | 558 | 66 | 12 | % | |||||||||||
|
|
|
|
|
|
|
|||||||||||
| Total strategic services revenues |
4,721 | 4,453 | 268 | 6 | % | |||||||||||
|
|
|
|
|
|
|
|||||||||||
| Legacy services |
||||||||||||||||
| Voice services(4) |
2,588 | 2,777 | (189 | ) | (7) | % | ||||||||||
| Low-bandwidth data services(5) |
1,594 | 1,893 | (299 | ) | (16) | % | ||||||||||
| Other legacy services(6) |
1,168 | 1,219 | (51 | ) | (4) | % | ||||||||||
|
|
|
|
|
|
|
|||||||||||
| Total legacy services revenues |
5,350 | 5,889 | (539 | ) | (9) | % | ||||||||||
|
|
|
|
|
|
|
|||||||||||
| Data integration |
575 | 688 | (113 | ) | (16) | % | ||||||||||
|
|
|
|
|
|
|
|||||||||||
| Total revenues |
10,646 | 11,030 | (384 | ) | (3) | % | ||||||||||
|
|
|
|
|
|
|
|||||||||||
| Segment expenses: |
||||||||||||||||
| Total expenses |
5,967 | 6,019 | (52 | ) | (1) | % | ||||||||||
|
|
|
|
|
|
|
|||||||||||
| Segment income |
$ | 4,679 | 5,011 | (332 | ) | (7) | % | |||||||||
|
|
|
|
|
|
|
|||||||||||
| Segment margin percentage |
44 | % | 45 | % | ||||||||||||
| (1) | Includes MPLS and Ethernet revenue |
| (2) | Includes colocation, hosting (including cloud hosting and managed hosting) and hosting area network revenue |
| (3) | Includes primarily broadband, VoIP, video and IT services revenue |
| (4) | Includes local and long-distance voice revenue |
| (5) | Includes private line (including special access) revenue |
| (6) | Includes UNEs, public access, switched access and other ancillary revenue |
Segment Revenues
Business segment revenues decreased by $294 million, or 3%, for the year ended December 31, 2016 as compared to the year ended December 31, 2015. The decrease in business segment revenues was primarily due to declines in our legacy services revenues. The decline in legacy services revenues was attributable to a reduction in local service access lines and lower volumes of long-distance and access services for the reasons noted above and to reductions in the volume of private line (including special access) services. The increase in our strategic services revenues was primarily due to increases in MPLS unit growth and higher Ethernet and VOIP volumes, which were partially offset by declines in our hosting services. The decrease in our data integration revenues was primarily due to lower sales of customer premises equipment to governmental and business customers and to declines in maintenance services. Business segment revenues decreased by $384 million, or 3%, for the year ended December 31, 2015 as compared to the year ended December 31, 2014. The decrease in business segment revenues was primarily due to declines in legacy services revenues and data integration revenues, which were partially offset by the growth in our strategic services revenues. The decline in legacy services revenues was attributable to a reduction in local service access lines and lower volumes of long-distance, access and traditional WAN services for the reasons noted above and a reduction in private line (including special access) volumes, as well as a pricing reduction on private line services for a large wholesale customer in exchange for a longer term commitment. The growth in our strategic services revenues was primarily due to MPLS unit growth and higher Ethernet volumes, which were partially offset by a reduction in hosting services. The decrease in data integration
A-20
Table of Contents
revenues was primarily due to lower sales of customer premises equipment to governmental and business customers during the period.
Segment Expenses
Business segment expenses decreased by $37 million, or 1%, for the year ended December 31, 2016 as compared to the year ended December 31, 2015. The decrease in our business segment expenses was primarily due to decreases in salaries and wages, professional fees and payment processing fees, which were partially offset by increases in facility costs, network expense and real estate and power costs. Business segment expenses decreased by $52 million, or 1%, for the year ended December 31, 2015 as compared to the year ended December 31, 2014. The decrease was primarily due to lower customer premises equipment costs resulting from the lower sales noted above in segment revenues. Excluding the lower customer premises equipment costs, business expenses increased by $62 million for the year ended December 31, 2015 as compared to the year ended December 31, 2014. The increase is primarily due to increases in salaries and wages, benefits expense, external commissions, network expense and facility costs, which were partially offset by decreases in professional fees, materials and supplies and fleet expenses.
Segment Income
Business segment income decreased by $257 million, or 5%, for the year ended December 31, 2016 as compared to the year ended December 31, 2015 and decreased by $332 million, or 7%, for the year ended December 31, 2015 as compared to the year ended December 31, 2014. The decrease in business segment income for both periods was due predominantly to the loss of customers and lower service volumes in our legacy services.
Consumer Segment
The operations of our consumer segment have been impacted by several significant trends, including those described below:
| • | Strategic services. In order to remain competitive and attract additional residential broadband subscribers, we believe it is important to continually increase our broadband network’s scope and connection speeds. As a result, we continue to invest in our broadband network, which allows for the delivery of higher-speed broadband services to a greater number of customers. We compete in a maturing broadband market in which most consumers already have broadband services and growth rates in new subscribers have slowed. Moreover, as described further in Item 1A of our Annual Report on Form 10-K for the year ended December 31, 2016, certain of our competitors continue to provide broadband services at higher average transmission speeds than ours or through advanced wireless data service offerings, both of which we believe have impacted the competitiveness of certain of our broadband offerings. The offering of our facilities-based video services in our markets requires us to incur substantial start-up expenses in advance of marketing and selling the service. Also, our associated content costs continue to increase and the video business has become more competitive as more options become available to customers to access video services through new technologies. The demand for new technology has increased the number of competitors offering strategic services similar to ours. Price compression and new technology from our competitors have negatively impacted the operating margins of our strategic services and we expect this trend to continue. Operating costs also impact the operating margins of our strategic services. These operating costs include employee costs, marketing and advertising expenses, sales commissions, Prism TV content costs and installation costs. We believe increases in operating costs have generally had a greater impact on our operating margins of our strategic services as compared to our legacy services, principally because our strategic services rely more heavily upon the above-listed costs; |
A-21
Table of Contents
| • | Legacy services. Our voice revenues have been, and we expect they will continue to be, adversely affected by access line losses and lower long-distance voice service volumes. Intense competition and product substitution continue to drive our access line losses. For example, many consumers are substituting cable and wireless voice services and electronic mail, texting and social networking non-voice services for traditional voice telecommunications services. We expect that these factors will continue to negatively impact our business. As a result of the expected loss of higher margin services associated with access lines, we continue to offer our customers service bundling and other product promotions to help mitigate this trend, as described below. Customer migration and price compression from competitive pressures have not only negatively impacted our legacy revenues, but they have also negatively impacted the operating margins of our legacy services and we expect this trend to continue. Operating costs, such as installation costs and facility costs, have also negatively impacted the operating margins of our legacy services, but to a lesser extent than customer migration and price compression. Operating costs also tend to impact our legacy services margins to a lesser extent than our strategic services as noted above; |
| • | Service bundling and product promotions. We offer our customers the ability to bundle multiple products and services. These customers can bundle broadband services with other services such as local voice, video, long-distance and wireless. While we believe our bundled service offerings can help retain customers, they also tend to lower our profit margins in the consumer segment due to the related discounts; and |
| • | Operating efficiencies. We continue to evaluate our segment operating structure and focus. This involves balancing our workforce in response to our workload requirements, productivity improvements and changes in industry, competitive, technological and regulatory conditions. We also expect our consumer segment to benefit indirectly from enhanced efficiencies in our company-wide network operations. |
The following tables summarize the results of operations from our consumer segment:
| Consumer Segment | ||||||||||||||||
| Years Ended December 31, |
Increase / (Decrease) |
% Change |
||||||||||||||
| 2016 | 2015 | |||||||||||||||
| (Dollars in millions) | ||||||||||||||||
| Segment revenues: |
||||||||||||||||
| Strategic services |
||||||||||||||||
| Broadband services(1) |
$ | 2,689 | 2,611 | 78 | 3 | % | ||||||||||
| Other strategic services(2) |
458 | 421 | 37 | 9 | % | |||||||||||
|
|
|
|
|
|
|
|||||||||||
| Total strategic services revenues |
3,147 | 3,032 | 115 | 4 | % | |||||||||||
|
|
|
|
|
|
|
|||||||||||
| Legacy services |
||||||||||||||||
| Voice services(3) |
2,442 | 2,676 | (234 | ) | (9) | % | ||||||||||
| Other legacy services(4) |
312 | 312 | — | — | % | |||||||||||
|
|
|
|
|
|
|
|||||||||||
| Total legacy services revenues |
2,754 | 2,988 | (234 | ) | (8) | % | ||||||||||
|
|
|
|
|
|
|
|||||||||||
| Data integration |
2 | 2 | — | — | % | |||||||||||
|
|
|
|
|
|
|
|||||||||||
| Total revenues |
5,903 | 6,022 | (119 | ) | (2) | % | ||||||||||
|
|
|
|
|
|
|
|||||||||||
| Segment expenses: |
||||||||||||||||
| Total expenses |
2,562 | 2,494 | 68 | 3 | % | |||||||||||
|
|
|
|
|
|
|
|||||||||||
| Segment income |
$ | 3,341 | 3,528 | (187 | ) | (5) | % | |||||||||
|
|
|
|
|
|
|
|||||||||||
| Segment income margin percentage |
57 | % | 59 | % | ||||||||||||
| (1) | Includes broadband and related services revenue |
A-22
Table of Contents
| (2) | Includes video and other revenue |
| (3) | Includes local and long-distance voice revenue |
| (4) | Includes other ancillary revenue |
| Consumer Segment | ||||||||||||||||
| Years Ended December 31, |
Increase / (Decrease) |
% Change |
||||||||||||||
| 2015 | 2014 | |||||||||||||||
| (Dollars in millions) | ||||||||||||||||
| Segment revenues: |
||||||||||||||||
| Strategic services |
||||||||||||||||
| Broadband services(1) |
$ | 2,611 | 2,469 | 142 | 6 | % | ||||||||||
| Other strategic services(2) |
421 | 381 | 40 | 10 | % | |||||||||||
|
|
|
|
|
|
|
|||||||||||
| Total strategic services revenues |
3,032 | 2,850 | 182 | 6 | % | |||||||||||
|
|
|
|
|
|
|
|||||||||||
| Legacy services |
||||||||||||||||
| Voice services(3) |
2,676 | 2,865 | (189 | ) | (7) | % | ||||||||||
| Other legacy services(4) |
312 | 279 | 33 | 12 | % | |||||||||||
|
|
|
|
|
|
|
|||||||||||
| Total legacy services revenues |
2,988 | 3,144 | (156 | ) | (5) | % | ||||||||||
|
|
|
|
|
|
|
|||||||||||
| Data integration |
2 | 4 | (2 | ) | (50) | % | ||||||||||
|
|
|
|
|
|
|
|||||||||||
| Total revenues |
6,022 | 5,998 | 24 | — | % | |||||||||||
|
|
|
|
|
|
|
|||||||||||
| Segment expenses: |
||||||||||||||||
| Total expenses |
2,494 | 2,483 | 11 | — | % | |||||||||||
|
|
|
|
|
|
|
|||||||||||
| Segment income |
$ | 3,528 | 3,515 | 13 | — | % | ||||||||||
|
|
|
|
|
|
|
|||||||||||
| Segment income margin percentage |
59 | % | 59 | % | ||||||||||||
| (1) | Includes broadband and related services revenue |
| (2) | Includes video and other revenue |
| (3) | Includes local and long-distance voice revenue |
| (4) | Includes other ancillary revenue |
Segment Revenues
Consumer segment revenues decreased by $119 million, or 2%, for year ended December 31, 2016 as compared to the year ended December 31, 2015. The decrease in our consumer segment revenues was primarily due to the declines in our legacy services revenues, which were partially offset by increases in our strategic revenues. The decline in our legacy services revenues for both periods was primarily due to lower local and long-distance voice service volumes associated with access line losses resulting from the competitive and technological factors noted above. The increase in our strategic services revenues was primarily due to 2016 rate increases resulting from various pricing initiatives on broadband, Prism TV and other strategic products and services, and increases in the number of our Prism TV customers, which were partially offset by a decline in broadband customers. Consumer segment revenues increased by $24 million, or less than 1%, for the year ended December 31, 2015 as compared to the year ended December 31, 2014. The increase in strategic services revenues was primarily due to increases in the number of Prism TV customers, as well as from 2015 price increases on various services. The decline in legacy services revenues was primarily due to declines in local and long-distance services volumes associated with access line losses resulting from the competitive and technological factors as further described above.
Segment Expenses
Consumer segment expenses increased by $68 million, or 3%, for the year ended December 31, 2016 as compared to the year ended December 31, 2015. The increase in our consumer segment expenses was primarily
A-23
Table of Contents
due to increases in costs related to Prism TV (resulting from higher content volume and rates), professional fees, sales commissions, bad debt expense and network costs, which were partially offset by reductions in salaries and wages from lower headcount and payment processing fees. Consumer segment expenses increased by $11 million, or less than 1%, for the year ended December 31, 2015 as compared to the year ended December 31, 2014. This increase was primarily due to increases in Prism TV content costs (resulting from higher volume and rates) and bad debt expense, which were partially offset by reductions in employee-related costs, facility costs, fleet expenses and network expenses.
Segment Income
Consumer segment income decreased by $187 million, or 5%, for the year ended December 31, 2016 as compared to the year ended December 31, 2015. This decrease was primarily due to loss of customers from legacy services and increases in the costs related to the growth in Prism TV. Consumer segment income increased by $13 million, or less than 1%, for the year ended December 31, 2015 as compared to the year ended December 31, 2014. This increase was primarily due to price increases on various services.
Critical Accounting Policies and Estimates
Our consolidated financial statements are prepared in accordance with accounting principles that are generally accepted in the United States. The preparation of these consolidated financial statements requires management to make estimates and assumptions that affect the reported amounts of our assets, liabilities, revenues and expenses. We have identified certain policies and estimates as critical to our business operations and the understanding of our past or present results of operations related to (i) goodwill, customer relationships and other intangible assets; (ii) property, plant and equipment; (iii) pension and post-retirement benefits; (iv) loss contingencies and litigation reserves; (v) Connect America Fund; and (vi) income taxes. These policies and estimates are considered critical because they had a material impact, or they have the potential to have a material impact, on our consolidated financial statements and because they require us to make significant judgments, assumptions or estimates. We believe that the estimates, judgments and assumptions made when accounting for the items described below were reasonable, based on information available at the time they were made. However, there can be no assurance that actual results will not differ from those estimates.
Goodwill, Customer Relationships and Other Intangible Assets
We amortize customer relationships primarily over an estimated life of 10 to 15 years, using either the sum-of-the-years-digits or the straight-line methods, depending on the type of customer. We amortize capitalized software using the straight-line method over estimated lives ranging up to 7 years, except for approximately $237 million of our capitalized software costs, which represents costs to develop an integrated billing and customer care system which is amortized using the straight-line method over a 20 year period. We annually review the estimated lives and methods used to amortize our other intangible assets, primarily capitalized software. The amount of future amortization expense may differ materially from current amounts, depending on the results of our annual reviews.
Our goodwill was derived from numerous acquisitions where the purchase price exceeded the fair value of the net assets acquired.
We are required to reassign goodwill to reporting units each time we reorganize our internal reporting structure which causes a change in the composition of our reporting units. We assign goodwill to the reporting units using a relative fair value approach. We utilize the trailing twelve months earnings before interest, taxes, depreciation and amortization as our allocation methodology as we believe that it represents a reasonable proxy for the fair value of the operations being reorganized. The use of other fair value assignment methods could result in materially different results. For additional information on our segments, see Note 14—Segment Information to our consolidated financial statements in Item 8 of our Annual Report on Form 10-K for the year ended December 31, 2016.
A-24
Table of Contents
We are required to assess goodwill for impairment at least annually, or more frequently, if an event occurs or circumstances change that would indicate an impairment may have occurred. We are required to write-down the value of goodwill in periods in which the recorded amount of goodwill exceeds the implied fair value of goodwill. Our reporting units are not discrete legal entities with discrete financial statements. Our assets and liabilities are employed in and relate to the operations of our reporting units. Therefore, the equity carrying value and future cash flows must be estimated each time a goodwill impairment analysis is performed on a reporting unit. As a result, our assets, liabilities and cash flows are assigned to reporting units using reasonable and consistent allocation methodologies. Certain estimates, judgments and assumptions are required to perform these assignments. We believe these estimates, judgments and assumptions to be reasonable, but changes in many of these can significantly affect each reporting unit’s equity carrying value and future cash flows utilized for our goodwill impairment test. Our annual assessment date for testing goodwill impairment is October 31.
As of October 31, 2016, we assessed goodwill for impairment for our three reporting units, which we determined to be business (excluding wholesale), consumer and wholesale and determined that the estimated fair value of our wholesale reporting unit was substantially in excess of our carrying value of equity and the estimated fair value of our business and consumer reporting units exceeded our carrying value of equity by 28% and 18%, respectively.
For additional information on our goodwill balances by segment, see Note 4—Goodwill, Customer Relationships and Other Intangible Assets in Item 8 of our Annual Report on Form 10-K for the year ended December 31, 2016.
We may be required to assess our goodwill for impairment before our next required assessment date of October 31, 2017 under certain circumstances, including any failure to meet our forecasted future operating results or any significant increases in our weighted average cost of capital. In addition, we cannot assure that adverse conditions will not trigger future goodwill impairment assessments or impairment charges. A number of factors, many of which we cannot control, could affect our financial condition, operating results and business prospects and could cause our actual results to differ from the estimates and assumptions we employed in our goodwill impairment assessment. These factors include, but are not limited to, (i) further weakening in the overall economy; (ii) a significant decline in our stock price and resulting market capitalization as a result of an adverse change to our overall business operations; (iii) changes in the discount rate we use in our testing; (iv) successful efforts by our competitors to gain market share in our markets; (v) adverse changes as a result of regulatory or legislative actions; (vi) a significant adverse change in our legal affairs or in the overall business climate; and (vii) recognition of a goodwill impairment loss in the financial statements of one or more of our subsidiaries that are a component of our segments. For additional information, see “Risk Factors” in Item 1A of our Annual Report on Form 10-K for the year ended December 31, 2016. We will continue to monitor certain events that impact our operations to determine if an interim assessment of goodwill impairment should be performed prior to the next required assessment date of October 31, 2017.
Property, Plant and Equipment
Property, plant and equipment acquired in connection with our acquisitions was recorded based on its estimated fair value as of its acquisition date, plus the estimated value of any associated legally or contractually required asset retirement obligation. Purchased and constructed property, plant and equipment is recorded at cost, plus the estimated value of any associated legally or contractually required asset retirement obligation. Renewals and betterments of plant and equipment are capitalized while repairs, as well as renewals of minor items, are charged to operating expense. Depreciation of property, plant and equipment is provided on the straight-line method using class or overall group rates. The group method provides for the recognition of the remaining net investment, less anticipated net salvage value, over the remaining useful life of the assets. This method requires the periodic revision of depreciation rates.
A-25
Table of Contents
Normal retirements of property, plant and equipment are charged against accumulated depreciation, with no gain or loss recognized. We depreciate such property on the straight-line method over estimated service lives ranging from 3 to 45 years.
We perform annual internal reviews to evaluate the reasonableness of the depreciable lives for our property, plant and equipment. Our reviews utilize models that take into account actual usage, physical wear and tear, replacement history, assumptions about technology evolution and, in certain instances, actuarially determined probabilities to estimate the remaining life of our asset base.
Due to rapid changes in technology and the competitive environment, determining the estimated economic life of telecommunications plant and equipment requires a significant amount of judgment. We regularly review data on utilization of equipment, asset retirements and salvage values to determine adjustments to our depreciation rates. The effect of a hypothetical one year increase or decrease in the estimated remaining useful lives of our property, plant and equipment would have decreased depreciation expense by approximately $390 million annually or increased depreciation expense by approximately $550 million annually, respectively.
Pension and Post-retirement Benefits
We sponsor a noncontributory qualified defined benefit pension plan (referred to as our qualified pension plan) for a substantial portion of our employees. In addition to this tax-qualified pension plan, we also maintain several non-qualified pension plans for certain eligible highly compensated employees. We also maintain post-retirement benefit plans that provide health care and life insurance benefits for certain eligible retirees.
In 2016, approximately 53% of the qualified pension plan’s January 1, 2016 net actuarial loss balance of $2.843 billion was subject to amortization as a component of net periodic expense over the average remaining service period of participating employees expected to receive benefits, which ranges from 9 to 10 years for the plan. The other 47% of the qualified pension plan’s beginning net actuarial loss balance was treated as indefinitely deferred during 2016. The entire beginning net actuarial loss of $147 million for the post-retirement benefit plans was treated as indefinitely deferred during 2016.
In 2015, approximately 45% of the qualified pension plan’s January 1, 2015 net actuarial loss balance of $2.740 billion was subject to amortization as a component of net periodic expense over the average remaining service period of participating employees expected to receive benefits, which ranges from 8 to 9 years for the plan. The other 55% of the qualified pension plan’s beginning net actuarial loss balance was treated as indefinitely deferred during 2015. The entire beginning net actuarial loss of $277 million for the post-retirement benefit plans was treated as indefinitely deferred during 2015.
In 2014, approximately 16% of the qualified pension plans’ January 1, 2014 net actuarial loss balance of $1.048 billion was subject to amortization as a component of net periodic expense over the average remaining service period of participating employees expected to receive benefits, which ranges from 8 to 9 years for the plans. The other 84% of the pension plans’ beginning net actuarial loss balance was treated as indefinitely deferred during 2014. The entire beginning net actuarial loss of $37 million for the post-retirement benefit plans was treated as indefinitely deferred during 2014.
In computing our pension and post-retirement health care and life insurance benefit obligations, our most significant assumptions are the discount rate and mortality rates. In computing our periodic pension and post-retirement benefit expense, our most significant assumptions are the discount rate and the expected rate of return on plan assets.
The discount rate for each plan is the rate at which we believe we could effectively settle the plan’s benefit obligations as of the end of the year. We selected each plan’s discount rate based on a cash flow matching analysis using hypothetical yield curves from U.S. corporate bonds rated high quality and projections of the
A-26
Table of Contents
future benefit payments that constitute the projected benefit obligation for the plans. This process establishes the uniform discount rate that produces the same present value of the estimated future benefit payments as is generated by discounting each year’s benefit payments by a spot rate applicable to that year. The spot rates used in this process are derived from a yield curve created from yields on the 60th to 90th percentile of U.S. high quality bonds.
In 2016, we changed the method we use to estimate the service and interest components of net periodic benefit expense for pension and other postretirement benefit obligations. This change resulted in a decrease in the service and interest components in 2016. Beginning in 2016, we utilized a full yield curve approach in connection with estimating these components by applying the specific spot rates along the yield curve used in the determination of the benefit obligation to the relevant projected cash flows, as opposed to the single weighted-average discount rate derived from the yield curve that we have used in the past. We believe this change more precisely measures service and interest costs by improving the correlation between projected benefit cash flows to the corresponding spot yield curve rates. This change did not affect the measurement of our total benefit obligations but lowered our annual net periodic benefit cost by approximately $149 million in 2016. This change was treated as a change in accounting estimate and, accordingly, we did not adjust the amounts recorded in 2015 or 2014.
Mortality rates help predict the expected life of plan participants and are based on historical demographic studies by the Society of Actuaries. In 2016, we adopted the revised mortality table and projection scale released by the Society of Actuaries (“SOA”), which decreased the projected benefit obligation of our benefit plans by $268 million. The 2015 revised mortality table and projection scale decreased the 2015 projected benefit obligation of our benefit plans by $379 million. In 2014, the SOA published new mortality rate tables reflecting increases in the projected life expectancies of North Americans since its publications of earlier tables. We adopted the new tables immediately. This resulted in an increase to the projected benefit obligation of approximately $1.3 billion for our pension and post-retirement benefit plans. The change in the projected benefit obligation of our benefit plans was recognized as part of the net actuarial loss and is included in accumulated other comprehensive loss, a portion of which is subject to amortization over the remaining estimated life of plan participants, which was approximately 9 to 10 years as of December 31, 2016.
The expected rate of return on plan assets is the long-term rate of return we expect to earn on the plans’ assets in the future, net of administrative expenses paid from plan assets. The rate of return is determined by the strategic allocation of plan assets and the long-term risk and return forecast for each asset class. The forecasts for each asset class are generated primarily from an analysis of the long-term expectations of various third party investment management organizations to which we then add a factor of 50 basis points to reflect the benefit we expect to result from our active management of the assets. The expected rate of return on plan assets is reviewed annually and revised, as necessary, to reflect changes in the financial markets and our investment strategy.
To compute the expected return on pension and post-retirement benefit plan assets, we apply an expected rate of return to the fair value of the pension plan assets and to the fair value of the post-retirement benefit plan assets adjusted for contribution timing and for projected benefit payments to be made from the plan assets. Annual market volatility for these assets (higher or lower than expected return) is reflected in the net actuarial losses.
Changes in any of the above factors could significantly impact operating expenses in the consolidated statements of operations and other comprehensive (loss) income in the consolidated statements of comprehensive income (loss) as well as the value of the liability and accumulated other comprehensive loss of stockholders’ equity on our consolidated balance sheets. The expected return on plan assets is reflected as a reduction to our pension and post-retirement benefit expense. If our assumed expected rates of return for 2016 were 100 basis points lower, our qualified pension and post-retirement benefit expenses for 2016 would have increased by $92 million. If our assumed discount rates for 2016 were 100 basis points lower, our qualified pension and post-retirement benefit expenses for 2016 would have increased by $46 million and our projected benefit obligation for 2016 would have increased by approximately $1.753 billion.
A-27
Table of Contents
Loss Contingencies and Litigation Reserves
We are involved in several material legal proceedings, as described in more detail in Note 16—Commitments and Contingencies to our consolidated financial statements in Item 8 of our Annual Report on Form 10-K for the year ended December 31, 2016. We assess potential losses in relation to these and other pending or threatened tax and legal matters. For matters not related to income taxes, if a loss is considered probable and the amount can be reasonably estimated, we recognize an expense for the estimated loss. To the extent these estimates are more or less than the actual liability resulting from the resolution of these matters, our earnings will be increased or decreased accordingly. If the differences are material, our consolidated financial statements could be materially impacted.
For matters related to income taxes, if we determine in our judgment that the impact of an uncertain tax position is more likely than not to be sustained upon audit by the relevant taxing authority, then we recognize in our financial statements a benefit for the largest amount that is more likely than not to be sustained. No portion of an uncertain tax position will be recognized if we determine in our judgment that the position has less than a 50% likelihood of being sustained. Though the validity of any tax position is a matter of tax law, the body of statutory, regulatory and interpretive guidance on the application of the law is complex and often ambiguous. Because of this, whether a tax position will ultimately be sustained may be uncertain.
Connect America Fund
In 2015, we accepted CAF funding from the FCC of approximately $500 million per year for six years to fund the deployment of voice and broadband capable infrastructure for approximately 1.2 million rural households and businesses (living units) in 33 states under the CAF Phase 2 high-cost support program. This program provides a monthly high-cost subsidy similar to the support provided by the FCC’s previous cost reimbursement programs. Although we believe that there is no specific authoritative U.S. GAAP guidance for the treatment of government assistance, we identified three acceptable methods to account for these funds: (1) recognize revenue when entitled to receive cash, (2) defer cash received until the living units are enabled to receive the service at the FCC specified level, or (3) record the cash received as contra capital. After assessing these alternatives, we have determined that we will recognize CAF Phase 2 funds each month as revenue when we are entitled to receive the cash less a deferred amount. The amount of revenue deferred in 2016 was approximately $12 million. We believe our recognition methodology is consistent with other companies in our industry in the United States, but may not necessarily be consistent with companies outside the United States that receive similar government funding, and we cannot provide assurances to this effect.
In computing the amount of revenue to recognize, we assume that we will not be able to economically enable 100% of the required living units in every state with voice and broadband capabilities under the CAF Phase 2 program. We defer recognition of the funds related to potential living units that we estimate we will not enable until we can with reasonable assurance determine that we can fully meet the enablement targets. As disclosed elsewhere herein, in some limited instances, a portion of the funds must be returned if enablement targets are not attained. Based on estimated enablement, the effect of a hypothetical 1% decrease in our estimate of living units we will not enable with voice and broadband capabilities under the CAF Phase 2 program would have increased our revenue by $3 million in 2016 and a 1% increase would have decreased our revenue by $9 million in 2016.
For additional information about the CAF Phase 2 support program, see the discussion below in “Liquidity and Capital Resources—Connect America Fund.”
Income Taxes
Our provision for income taxes includes amounts for tax consequences deferred to future periods. We record deferred income tax assets and liabilities reflecting future tax consequences attributable to tax credit
A-28
Table of Contents
carryforwards, differences between the financial statement carrying value of assets and liabilities and the tax bases of those assets and liabilities and tax net operating loss carryforwards, or NOLs. Deferred taxes are computed using enacted tax rates expected to apply in the year in which the differences are expected to affect taxable income. The effect on deferred income tax assets and liabilities of a change in tax rate is recognized in earnings in the period that includes the enactment date.
The measurement of deferred taxes often involves the exercise of considerable judgment related to the realization of tax basis. Our deferred tax assets and liabilities reflect our assessment that tax positions taken in filed tax returns and the resulting tax basis are more likely than not to be sustained if they are audited by taxing authorities. Assessing tax rates that we expect to apply and determining the years when the temporary differences are expected to affect taxable income requires judgment about the future apportionment of our income among the states in which we operate. Any changes in our practices or judgments involved in the measurement of deferred tax assets and liabilities could materially impact our financial condition or results of operations.
In connection with recording deferred income tax assets and liabilities, we establish valuation allowances when necessary to reduce deferred income tax assets to amounts that we believe are more likely than not to be realized. We evaluate our deferred tax assets quarterly to determine whether adjustments to our valuation allowance are appropriate in light of changes in facts or circumstances, such as changes in tax law, interactions with taxing authorities and developments in case law. In making this evaluation, we rely on our recent history of pre-tax earnings. We also rely on our forecasts of future earnings and the nature and timing of future deductions and benefits represented by the deferred tax assets, all which involve the exercise of significant judgment. At December 31, 2016, we established a valuation allowance of $375 million primarily related to state NOLs, as it is more likely than not that these NOLs will expire unused. If forecasts of future earnings and the nature and estimated timing of future deductions and benefits change in the future, we may determine that a valuation allowance for certain deferred tax assets is appropriate, which could materially impact our financial condition or results of operations. See Note 13—Income Taxes to our consolidated financial statements in Item 8 of our Annual Report on Form 10-K for the year ended December 31, 2016.
LIQUIDITY AND CAPITAL RESOURCES
Overview
At December 31, 2016, we held cash and cash equivalents of $222 million and we had $1.630 billion of borrowing capacity available under our $2 billion amended and restated revolving credit facility (referred to as our “Credit Facility”, which is described further below). At December 31, 2016, cash and cash equivalents of $44 million were held in foreign bank accounts for the purpose of funding our foreign operations. Due to various factors, our access to foreign cash is generally much more restricted than our access to domestic cash.
Our executive officers and our Board of Directors periodically review our sources and potential uses of cash in connection with our annual budgeting process. Generally speaking, our principal funding source is cash from operating activities, and our principal cash requirements include operating expenses, capital expenditures, income taxes, debt repayments, dividends, periodic stock repurchases, periodic pension contributions and other benefits payments. As discussed below, the amount we pay for income taxes is expected to increase for most of 2017, and the amount we pay for retiree healthcare benefits is expected to increase substantially in 2017. The potential impact of the pending sale of our colocation business and data centers and the potential impact of the pending acquisition of Level 3 are further described below.
Based on our current capital allocation objectives, during 2017 we anticipate expending approximately $2.6 billion of cash for capital investment in property, plant and equipment and up to $1.176 billion for dividends on our common stock, based on the current annual common stock dividend rate of $2.16 and the current number of outstanding common shares, assuming solely for these purposes no impact from the Level 3 acquisition. During
A-29
Table of Contents
2017, we have debt maturities of $1.421 billion, scheduled debt principal payments of $22 million and capital lease and other fixed payments of approximately $100 million (including $41 million of capital lease obligations related to the colocation operations), excluding liabilities that we expect to assume later in 2017 in connection with consummating the Level 3 acquisition. Each of the expenditures are described further below.
We will continue to monitor our future sources and uses of cash, and anticipate that we will make adjustments to our capital allocation strategies when, as and if determined by our Board of Directors. We typically use our revolving credit facility as a source of liquidity for operating activities and our other cash requirements.
Potential Impact of the Sale of Our Colocation Business and Data Centers
If, as anticipated, we sell our colocation business and data centers in the manner discussed in Note 3—Pending Sale of Colocation Business and Data Centers to our consolidated financial statements in Item 8 of our Annual Report on Form 10-K for the year ended December 31, 2016, we expect to receive net cash proceeds of approximately $1.5 billion to $1.7 billion from the sale, which is net of tax payments relating to the sale of approximately $100 million to $200 million, which we anticipate will be triggered by certain corporate restructuring actions we are taking in the first quarter of 2017 regarding certain subsidiaries involved in the colocation business. We also expect ongoing cash flows from operating activities will be negatively impacted by approximately $30 million to $45 million per quarter.
Potential Impact of the Pending Acquisition of Level 3
If, as anticipated, we complete the acquisition of Level 3 by the end of third quarter of 2017 in the manner discussed in Note 2—Pending Acquisition of Level 3 to our consolidated financial statements in Item 8 of our Annual Report on Form 10-K for the year ended December 31, 2016, we expect our operations, financial position and cash flows to be significantly impacted following the closing of the transaction. We expect to issue a significant amount of new debt to finance the Level 3 acquisition, and we would assume approximately $10.9 billion of Level 3’s outstanding debt upon consummating the acquisition. With this additional debt, we would expect our cash paid for interest payments to be significantly higher following the closing of the transaction. We project that our capital expenditures would increase significantly; we anticipate, based on information included in Level 3’s annual guidance regarding its estimated 2017 capital expenditures, that Level 3 will spend approximately $100 million to $125 million per month on average, in the period prior to closing, but that amount could be significantly different than amounts that we expect to spend in the months following the closing of the transaction. In connection with consummating the acquisition, we would expect to issue approximately 538 million shares of our common stock to Level 3 stockholders (including shares of CenturyLink common stock expected to be issued in exchange for outstanding Level 3 equity awards), based on the number of Level 3 shares held of record on January 27, 2017. Based on our current quarterly common stock dividend rate of $0.54 per share, this issuance of additional shares would result in an additional incremental dividend payment of approximately $290 million per quarter. Also, we expect our upcoming cash payments for transaction costs, integration costs and debt financing costs to be material primarily following the closing of the transaction. These above factors are expected to result in a net cash outflow for the period of 2017 following the closing. However, we expect we will have sufficient liquidity to more than offset the impact of the net cash outflows.
Capital Expenditures
We incur capital expenditures on an ongoing basis in order to enhance and modernize our networks, compete effectively in our markets and expand our service offerings. We evaluate capital expenditure projects based on a variety of factors, including expected strategic impacts (such as forecasted impact on revenue growth, productivity, expenses, service levels and customer retention) and our expected return on investment. The amount of capital investment is influenced by, among other things, demand for our services and products, cash flow generated by operating activities, cash required for other purposes and regulatory considerations (such as
A-30
Table of Contents
our CAF Phase 2 infrastructure buildout requirements). Based on current circumstances, we estimate that our total capital expenditures for 2017 will be approximately $2.6 billion, inclusive of CAF Phase 2 related capital expenditures, but exclusive of additional capital expenditures with respect to the Level 3 operations that we expect to acquire later this year.
Our capital expenditures continue to be focused on our strategic services. For more information on our capital spending, see “Business” and “Risk Factors” in Items 1 and 1A, respectively, of our Annual Report on Form 10-K for the year ended December 31, 2016.
Debt and Other Financing Arrangements
Subject to market conditions, we expect to continue to issue debt securities from time to time in the future to refinance a substantial portion of our maturing debt, including issuing Qwest Corporation debt securities to refinance its maturing debt to the extent feasible. The availability, interest rate and other terms of any new borrowings will depend on the ratings assigned to us and Qwest Corporation by credit rating agencies, among other factors. For further information on our debt maturities, see “Future Contractual Obligations” below.
As of the date of our Annual Report on Form 10-K for the year ended December 31, 2016, the credit ratings for the senior unsecured debt of CenturyLink, Inc. and Qwest Corporation were as follows:
| Agency |
CenturyLink, Inc. | Qwest Corporation |
||||||
| Standard & Poor’s |
BB | BBB- | ||||||
| Moody’s Investors Service, Inc.(1) |
Ba3 | Ba1 | ||||||
| Fitch Ratings |
BB+ | BBB- | ||||||
| (1) | On March 15, 2016, Moody’s Investors Service, Inc. downgraded CenturyLink, Inc.’s rating from Ba2 to Ba3 and downgraded Qwest Corporation’s rating from Baa3 to Ba1. |
Our credit ratings are reviewed and adjusted from time to time by the rating agencies, and downgrades of CenturyLink, Inc.’s senior unsecured debt ratings could, under certain circumstances, incrementally increase the cost of our borrowing under the Credit Facility. Moreover, any additional downgrades of CenturyLink, Inc.’s or Qwest Corporation’s senior unsecured debt ratings could impact our access to debt capital or further raise our borrowing costs. See “Risk Factors—Risks Affecting our Liquidity and Capital Resources” in Item 1A of our Annual Report on Form 10-K for the year ended December 31, 2016.
Following the announcement of our pending acquisition of Level 3, Standard & Poor’s indicated that CenturyLink, Inc.’s current unsecured senior debt rating of BB has been placed on watch with negative implications, Moody’s Investor Service, Inc. indicated that CenturyLink, Inc.’s current senior unsecured debt rating of Ba3 has been placed on review for downgrade and Fitch Ratings indicated that CenturyLink, Inc.’s current unsecured senior debt rating of BB+ has been placed on negative watch. Additionally, Qwest Corporation’s current unsecured senior debt rating of Ba1 has been placed on review for downgrade by Moody’s Investor Service, Inc. and its current unsecured senior debt rating of BBB- has been placed on negative watch by Fitch Ratings. It is expected that any downgrades would be made only following the completion of the Level 3 acquisition.
Net Operating Loss Carryforwards
In recent years, we have been using Net Operating Loss (“NOL”) carryforwards to offset a large portion of our federal taxable income. As of December 31, 2016, we have substantially utilized our federal NOL carryforwards. A portion of these remaining NOL carryforwards are subject to the limitations imposed by section 382 of the Internal Revenue Code (“Code”). As a result of the substantial utilization of the NOL carryforwards in prior years and the limitations imposed on portions of the remaining NOL carryforward balance, the amounts of
A-31
Table of Contents
our cash flows dedicated to or required for the payment of federal taxes has increased and is expected to continue to increase substantially during 2017 prior to our anticipated acquisition of additional NOLs later this year, as described further below. The amounts of our near-term tax payments will depend upon many factors, including our future earnings and tax circumstances. Based on current laws (including the extension of bonus depreciation) and our current estimates of 2017 earnings, we estimate our cash income tax liability related to 2017 will be between $500 million to $600 million, exclusive of (i) tax payments relating to the sale of our data centers and colocation business of approximately $100 million to $200 million, which we anticipate will be triggered by certain corporate restructuring actions we are taking in the first quarter of 2017 regarding certain subsidiaries involved in the colocation business and (ii) the impact of acquiring Level 3.
Based on information provided to us by Level 3, as of December 31, 2016, Level 3 had approximately $9.0 billion of NOL carryforwards that we expect to acquire in connection with the Level 3 transaction. We cannot assure you that we will be able to use these NOL carryforwards fully, or at all. See “Risk Factors—Risk Relating to Our Pending Acquisition of Level 3—We cannot assure you, whether, when or in what amounts we will be able to use Level 3’s net operating loss carryforwards following the Level 3 acquisition” in Item 1A of our Annual Report on Form 10-K for the year ended December 31, 2016.
Dividends
We currently expect to continue our current practice of paying quarterly cash dividends in respect of our common stock subject to our Board of Directors’ discretion to modify or terminate this practice at any time and for any reason without prior notice. Our current quarterly common stock dividend rate is $0.54 per share, as approved by our Board of Directors, which we believe is a dividend rate per share that gives us the flexibility to balance our multiple objectives of managing our business, paying our fixed commitments and returning cash to our shareholders. Assuming continued payment during 2017 at this rate of $0.54 per share, our average total dividends paid each quarter prior to the Level 3 acquisition would be approximately $294 million based on our current number of outstanding shares (which does not reflect shares that we expect to issue in connection with the Level 3 acquisition or any other shares that we might issue or repurchase in future periods). See “Risk Factors—Risks Affecting Our Business” in Item 1A of our Annual Report on Form 10-K for the year ended December 31, 2016.
Credit Facility
Our $2 billion Credit Facility matures on December 3, 2019 and has 16 lenders, each with commitments ranging from $3.5 million to $198.5 million. The Credit Facility allows us to obtain revolving loans and to issue up to $400 million of letters of credit, which upon issuance reduces the amount available for other extensions of credit. Interest is assessed on borrowings using either the LIBOR or the base rate (each as defined in the Credit Facility) plus an applicable margin between 1.00% and 2.25% per annum for LIBOR loans and 0.00% and 1.25% per annum for base rate loans depending on our then current senior unsecured long-term debt rating. Our obligations under the Credit Facility are guaranteed by nine of our subsidiaries. At December 31, 2016, we had $370 million in borrowings and no amounts of letters of credit outstanding under the Credit Facility.
Under the Credit Facility, we, and our indirect subsidiary, Qwest Corporation, must maintain a debt to EBITDA (earnings before interest, taxes, depreciation and amortization, as defined in our Credit Facility) ratio of not more than 4.0:1.0 and 2.85:1.0, respectively, as of the last day of each fiscal quarter for the four quarters then ended. The Credit Facility also contains a negative pledge covenant, which generally requires us to secure equally and ratably any advances under the Credit Facility if we pledge assets or permit liens on our property for the benefit of other debtholders. The Credit Facility also has a cross payment default provision, and the Credit Facility and certain of our debt securities also have cross acceleration provisions. When present, these provisions could have a wider impact on liquidity than might otherwise arise from a default or acceleration of a single debt instrument. Our debt to EBITDA ratios could be adversely affected by a wide variety of events, including unforeseen expenses or contingencies. This could reduce our financing flexibility due to potential restrictions on
A-32
Table of Contents
incurring additional debt under certain provisions of our debt agreements or, in certain circumstances, could result in a default under certain provisions of such agreements.
Term Loans and Revolving Letter of Credit
At December 31, 2016, CenturyLink, Inc. owed $336 million under a term loan maturing in 2019 and Qwest Corporation owed $100 million under a term loan maturing in 2025. Both of these term loans include covenants substantially similar to those set forth in the Credit Facility.
We have a $160 million uncommitted revolving letter of credit facility which enables us to provide letters of credit under terms that may be more favorable than those under the Credit Facility. At December 31, 2016, our outstanding letters of credit totaled $105 million under this facility.
For information on our outstanding debt securities, see immediately below “Future Contractual Obligations” and Note 5—Long-Term Debt and Credit Facilities to our consolidated financial statements in Item 8 of our Annual Report on Form 10-K for the year ended December 31, 2016.
Level 3 Financing Commitment Letter
In connection with entering into our merger agreement with Level 3, we obtained a debt commitment letter from a group of lenders. See Note 5—Long-Term Debt and Credit Facilities to our consolidated financial statements in Item 8 of our Annual Report on Form 10-K for the year ended December 31, 2016 for additional information on the financing commitment letter.
Future Contractual Obligations
The following table summarizes our estimated future contractual obligations as of December 31, 2016:
| 2017 | 2018 | 2019 | 2020 | 2021 | 2022 and thereafter |
Total | ||||||||||||||||||||||
| (Dollars in millions) | ||||||||||||||||||||||||||||
| Long-term debt(1)(2) |
$ | 1,544 | 280 | 1,131 | 1,032 | 2,329 | 14,003 | 20,319 | ||||||||||||||||||||
| Interest on long-term debt and capital leases(2) |
1,202 | 1,164 | 1,137 | 1,069 | 893 | 15,434 | 20,899 | |||||||||||||||||||||
| Operating leases(3) |
295 | 276 | 249 | 226 | 162 | 1,049 | 2,257 | |||||||||||||||||||||
| Purchase commitments(4) |
166 | 109 | 44 | 26 | 15 | 67 | 427 | |||||||||||||||||||||
| Post-retirement benefit obligation(5) |
97 | 94 | 90 | 87 | 83 | 775 | 1,226 | |||||||||||||||||||||
| Non-qualified pension obligations(5) |
6 | 5 | 5 | 5 | 4 | 20 | 45 | |||||||||||||||||||||
| Unrecognized tax benefits(6) |
— | — | — | — | — | 51 | 51 | |||||||||||||||||||||
| Other |
6 | 7 | 7 | 6 | 8 | 60 | 94 | |||||||||||||||||||||
|
|
|
|
|
|
|
|
|
|
|
|
|
|
|
|||||||||||||||
| Total future contractual obligations(7) |
$ | 3,316 | 1,935 | 2,663 | 2,451 | 3,494 | 31,459 | 45,318 | ||||||||||||||||||||
|
|
|
|
|
|
|
|
|
|
|
|
|
|
|
|||||||||||||||
| (1) | Includes current maturities and capital lease obligations, but excludes unamortized discounts, net and unamortized debt issuance costs. Also, includes $305 million of capital lease obligations related to our colocation operations. See Note 16—Commitments and Contingencies to our consolidated financial statements in Item 8 of our Annual Report on Form 10-K for the year ended December 31, 2016 for additional information regarding the future commitments for capital leases related to our colocation operations. |
| (2) | Actual principal and interest paid in all years may differ due to future refinancing of outstanding debt or issuance of new debt. Interest on our floating rate debt was calculated for all years using the rates effective at December 31, 2016. Also, includes interest and executory costs of $93 million associated with our capital |
A-33
Table of Contents
| lease obligations related to our colocation operations. See Note 16—Commitments and Contingencies to our consolidated financial statements in Item 8 of our Annual Report on Form 10-K for the year ended December 31, 2016 for additional information regarding the future commitments for capital leases related to our colocation operations. |
| (3) | Includes $750 million of operating lease future rental commitments related to our colocation operations. See Note 16—Commitments and Contingencies to our consolidated financial statements in Item 8 of our Annual Report on Form 10-K for the year ended December 31, 2016 for additional information regarding the future commitments for operating leases related to our colocation operations. |
| (4) | We have various long-term, non-cancelable purchase commitments for advertising and promotion services, including advertising and marketing at sports arenas and other venues and events. We also have purchase commitments with third-party vendors for operating, installation and maintenance services for facilities. In addition, we have service-related commitments with various vendors for data processing, technical and software support services. Future payments under certain service contracts will vary depending on our actual usage. In the table above, we estimated payments for these service contracts based on estimates of the level of services we expect to receive. Includes $80 million of purchase commitments related to our colocation operations. See Note 16—Commitments and Contingencies to our consolidated financial statements in Item 8 of our Annual Report on Form 10-K for the year ended December 31, 2016 for additional information regarding the purchase commitments related to our colocation operations. |
| (5) | Reflects only the portion of total obligation that is contractual in nature. See Note 7 below. |
| (6) | Represents the amount of tax and interest we would pay for our unrecognized tax benefits. The $51 million is composed of unrecognized tax benefits of $16 million and related estimated interest of $35 million, which would result in future cash payments if our tax positions were not upheld. See Note 13—Income Taxes to our consolidated financial statements in Item 8 of our Annual Report on Form 10-K for the year ended December 31, 2016 for additional information. The timing of any payments for our unrecognized tax benefits cannot be predicted with certainty; therefore, such amount is reflected in the “2022 and thereafter” column in the above table. |
| (7) | The table is limited solely to contractual payment obligations and does not include: |
| • | contingent liabilities; |
| • | our open purchase orders as of December 31, 2016. These purchase orders are generally issued at fair value, and are generally cancelable without penalty; |
| • | other long-term liabilities, such as accruals for legal matters and other taxes that are not contractual obligations by nature. We cannot determine with any degree of reliability the years in which these liabilities might ultimately settle; |
| • | cash funding requirements for qualified pension benefits payable to certain eligible current and future retirees. Benefits paid by our qualified pension plan are paid through a trust. Cash funding requirements for this trust are not included in this table as we are not able to reliably estimate required contributions to this trust. Our funding projections are discussed further below; |
| • | certain post-retirement benefits payable to certain eligible current and future retirees. Not all of our post-retirement benefit obligation amount is a contractual obligation and only the portion that we believe is a contractual obligation is reported in the table. See additional information on our benefits plans in Note 9—Employee Benefits to our consolidated financial statements in Item 8 of our Annual Report on Form 10-K for the year ended December 31, 2016; |
| • | contract termination fees. These fees are non-recurring payments, the timing and payment of which, if any, is uncertain. In the ordinary course of business and to optimize our cost structure, we enter into contracts with terms greater than one year to use the network facilities of other carriers and to purchase other goods and services. Our contracts to use other carriers’ network facilities generally have no minimum volume requirements and pricing is based upon volumes and usage. Assuming we terminate these contracts in 2017, the contract termination fees would be $359 million. Under the same assumption, we estimate that our termination fees for these contracts to purchase goods and services |
A-34
Table of Contents
| would be $165 million. In the normal course of business, we do not believe payment of these fees is likely; |
| • | service level commitments to our customers, the violation of which typically results in service credits rather than cash payments; and |
| • | potential indemnification obligations to counterparties in certain agreements entered into in the normal course of business. The nature and terms of these arrangements vary. |
For information on debt that we expect to assume or incur in connection with consummating the Level 3 acquisition, see “Risk Factors” in Item 1A of our Annual Report on Form 10-K for the year ended December 31, 2016, and Note 5—Long-Term Debt and Credit Facilities to our consolidated financial statements in Item 8 of our Annual Report on Form 10-K for the year ended December 31, 2016.
Pension and Post-retirement Benefit Obligations
We are subject to material obligations under our existing defined benefit pension plans and post-retirement benefit plans. At December 31, 2016, the accounting unfunded status of our qualified and non-qualified defined benefit pension plans and qualified post-retirement benefit plans was $2.409 billion and $3.360 billion, respectively. See Note 9—Employee Benefits to our consolidated financial statements in Item 8 of our Annual Report on Form 10-K for the year ended December 31, 2016 for additional information about our pension and post-retirement benefit arrangements.
Benefits paid by our qualified pension plan are paid through a trust that holds all of the plan’s assets. Based on current laws and circumstances, we do not expect any contributions to be required for our qualified pension plan during 2017. The amount of required contributions to our qualified pension plan in 2018 and beyond will depend on a variety of factors, most of which are beyond our control, including earnings on plan investments, prevailing interest rates, demographic experience, changes in plan benefits and changes in funding laws and regulations. We occasionally make voluntary contributions to the trust in addition to required contributions, including voluntary contributions in the amount of $100 million made in the third quarter of both 2016 and 2015. We currently expect to make a voluntary contribution of $100 million to the trust in 2017.
Substantially all of our post-retirement health care and life insurance benefits plans are unfunded. Several trusts hold assets that have been used to help cover the health care costs of certain retirees. Assets in the post-retirement trusts have been substantially depleted as of December 31, 2016; however, we will continue to pay certain benefits through the trusts. The fair value of these trust assets was approximately $53 million at December 31, 2016, with a portion comprised of investments with restricted liquidity. Benefits not paid through the trusts will be paid directly by us. As described further in Note 9—Employee Benefits to our consolidated financial statements in Item 8 of our Annual Report on Form 10-K for the year ended December 31, 2016, aggregate benefits paid by us under these plans (net of participant contributions and direct subsidy receipts) were $129 million, $116 million and $88 million for the years ended December 31, 2016, 2015 and 2014, respectively, while the amounts paid from the trust were $145 million, $163 million and $219 million, respectively. For additional information on our expected future benefits payments for our post-retirement benefit plans, please see Note 9—Employee Benefits to our consolidated financial statements in Item 8 of our Annual Report on Form 10-K for the year ended December 31, 2016.
For 2017, our estimated annual long-term rates of return are 6.5% and 5.0% for the pension plan trust assets and post-retirement plans’ trust assets, respectively, based on the assets currently held. However, actual returns could be substantially different.
Workforce Reductions
In response to the continued decline of our legacy services revenues and to better align our workforce with our workload requirements, we periodically implement workforce reduction programs. In the third quarter of 2016, we announced plans to reduce our workforce, initially through voluntary severance packages and the
A-35
Table of Contents
balance through involuntary reductions. We recognized in the fourth quarter of 2016 a charge for severance expenses and other one-time termination benefits of $164 million, $98 million of which remained to be paid as of December 31, 2016.
Connect America Fund
In 2015, we accepted CAF funding from the FCC of approximately $500 million per year for six years to fund the deployment of voice and broadband capable infrastructure for approximately 1.2 million rural households and businesses in 33 states under the CAF Phase 2 high-cost support program. The funding from the CAF Phase 2 support program has substantially replaced the funding from the interstate USF program that we previously utilized to support voice services in high-cost rural markets in these 33 states. In late 2015, we began receiving these monthly support payments from the FCC under the new CAF Phase 2 support program, which included (i) monthly support payments at a higher rate than under the interstate USF support program and (ii) a substantial one-time transitional payment, designed to align the prior USF payments with the new CAF Phase 2 payments for the full year 2015. For 2016, we continued to receive monthly support payments at the higher rate than under the interstate USF support program. We received $214 million and $209 million more cash from the CAF Phase 2 program for the years ended December 31, 2016 and 2015, respectively, than the projected amounts we would have otherwise received during the same periods under the interstate USF support program.
As a result of accepting CAF Phase 2 support payments for 33 states, we will be obligated to make substantial capital expenditures to build broadband infrastructure over the next several years. See “Capital Expenditures” above.
For additional information on the FCC’s CAF order and the USF program, see “Business—Regulation” in Item 1 our Annual Report on Form 10-K for the year ended December 31, 2016, and see “Risk Factors—Risks Affecting Our Liquidity and Capital Resources” in Item 1A of our Annual Report on Form 10-K for the year ended December 31, 2016.
In 2013, under the CAF Phase 1 Round 2 program, we received $40 million in funding for deployment of broadband services in rural areas. In compliance with program terms, during the second half of 2016 we returned $23 million for failing to meet interim buildout milestones within the FCC specified time frames. As of December 31, 2016, we have included the remaining $17 million of funding in deferred credits and other liabilities—other on our consolidated balance sheet. At the conclusion of the CAF 1 Round 2 program in the first quarter 2017, we will have an opportunity to reclaim a majority of the interim refund if we ultimately meet the CAF 1 Round 2 buildout targets.
Historical Information
The following tables summarize our consolidated cash flow activities:
| Years Ended December 31, |
Increase
/ (Decrease) |
|||||||||||
| 2016 | 2015 | |||||||||||
| (Dollars in millions) | ||||||||||||
| Net cash provided by operating activities |
$ | 4,608 | 5,152 | (544 | ) | |||||||
| Net cash used in investing activities |
(2,994 | ) | (2,853 | ) | 141 | |||||||
| Net cash used in financing activities |
(1,518 | ) | (2,301 | ) | (783 | ) | ||||||
| Years Ended December 31, |
Increase
/ (Decrease) |
|||||||||||
| 2015 | 2014 | |||||||||||
| (Dollars in millions) | ||||||||||||
| Net cash provided by operating activities |
$ | 5,152 | 5,188 | (36 | ) | |||||||
| Net cash used in investing activities |
(2,853 | ) | (3,077 | ) | (224 | ) | ||||||
| Net cash used in financing activities |
(2,301 | ) | (2,151 | ) | 150 | |||||||
A-36
Table of Contents
Operating Activities
Net cash provided by operating activities decreased by $544 million for the year ended December 31, 2016 as compared to the year ended December 31, 2015 primarily due to a significant negative variance in net income adjusted for non-cash items (attributable to higher cash taxes paid and lower profitability), which was partially offset by a positive variance in the change in accounts payable. Net cash provided by operating activities decreased by $36 million for the year ended December 31, 2015 as compared to the year ended December 31, 2014 primarily due to a slight negative variance in net income adjusted for non-cash items along with negative variances in accounts payable and other noncurrent assets and liabilities, net. The decreases were substantially offset with positive variances in accrued income and other taxes and other current assets and liabilities, net, which was primarily due to a payment of approximately $235 million in 2014 to settle certain litigation. Our net cash provided by operating activities in 2016 and 2015 were positively impacted by the cash received from the CAF Phase 2 support program, which was $214 million and $209 million greater in 2016 and 2015, respectively, than the projected amounts of cash we would have otherwise received during the same periods under the interstate USF support program. For additional information about our operating results, see “Results of Operations” above.
Investing Activities
Net cash used in investing activities increased by $141 million for the year ended December 31, 2016 as compared to the year ended December 31, 2015 substantially due to an increase in payments for property, plant and equipment. Net cash used in investing activities decreased by $224 million for the year ended December 31, 2015 as compared to the year ended December 31, 2014 primarily due to a decrease in payments of property, plant and equipment and amounts paid for acquisitions in 2015.
Financing Activities
Net cash used in financing activities decreased by $783 million for the year ended December 31, 2016 as compared to the year ended December 31, 2015 primarily due to a reduction of common stock repurchases. Net cash used in financing activities increased by $150 million for the year ended December 31, 2015 as compared to the year ended December 31, 2014 primarily due to additional common stock repurchases. Net debt repayments have been about the same for all three years.
On December 23, 2016, a subsidiary of Embarq Corporation redeemed $5 million of its 8.375% Notes due 2025, which resulted in an immaterial loss.
On September 19, 2016, a subsidiary of Embarq Corporation redeemed all of its 8.77% Notes due 2017, which was less than $4 million and resulted in an immaterial loss.
On September 15, 2016, Qwest Corporation redeemed $287 million of its 7.5% Notes due 2051, which resulted in a loss of $9 million.
On August 29, 2016, Qwest Corporation redeemed all $661 million of its 7.375% Notes due 2051, which resulted in a loss of $18 million.
On August 22, 2016, Qwest Corporation issued $978 million aggregate principal amount of 6.5% Notes due 2056, including $128 million principal amount that was sold pursuant to an over-allotment option, in exchange for net proceeds, after deducting underwriting discounts and other expenses, of $946 million.
On June 1, 2016, Embarq Corporation paid at maturity the $1.184 billion principal amount and accrued and unpaid interest due under its 7.082% Notes.
On May 2, 2016, Qwest Corporation paid at maturity the $235 million principal amount and accrued and unpaid interest due under its 8.375% Notes.
A-37
Table of Contents
On April 6, 2016, CenturyLink, Inc. issued $1 billion aggregate principal amount of 7.5% Notes due 2024, in exchange for net proceeds, after deducting underwriting discounts and other expenses, of $988 million.
On January 29, 2016, Qwest Corporation issued $235 million aggregate principal amount of 7% Notes due 2056, in exchange for net proceeds, after deducting underwriting discounts and other expenses, of $227 million.
See Note 5—Long-Term Debt and Credit Facilities to our consolidated financial statements in Item 8 of our Annual Report on Form 10-K for the year ended December 31, 2016 for additional information on our outstanding debt securities.
Other Matters
In February 2015, the FCC adopted new regulations that regulate broadband services as a public utility service under Title II of the Communications Act. In light of pending litigation and changes in the composition of the FCC, we believe it is premature for us to determine the ultimate impact of the new regulations on our operations. For additional information, see “Risk Factors—Risks Relating to Legal and Regulatory Matters” in Item 1A of our Annual Report on Form 10-K for the year ended December 31, 2016.
We have cash management arrangements with certain of our principal subsidiaries, in which substantial portions of the subsidiaries’ cash is regularly advanced to us. Although we periodically repay these advances to fund the subsidiaries’ cash requirements throughout the year, at any given point in time we may owe a substantial sum to our subsidiaries under these advances, which, in accordance with generally accepted accounting principles, are eliminated in consolidation and therefore not recognized on our consolidated balance sheets.
We also are involved in various legal proceedings that could substantially impact our financial position. See Note 16—Commitments and Contingencies to our consolidated financial statements in Item 8 of our Annual Report on Form 10-K for the year ended December 31, 2016 for the current status of such legal proceedings.
MARKET RISK
We are exposed to market risk from changes in interest rates on our variable rate long-term debt obligations and fluctuations in certain foreign currencies. We seek to maintain a favorable mix of fixed and variable rate debt in an effort to limit interest costs and cash flow volatility resulting from changes in rates.
Management periodically reviews our exposure to interest rate fluctuations and periodically implements strategies to manage the exposure. From time to time, we have used derivative instruments to (i) lock-in or swap our exposure to changing or variable interest rates for fixed interest rates or (ii) to swap obligations to pay fixed interest rates for variable interest rates. As of December 31, 2016, we had no such instruments outstanding. We have established policies and procedures for risk assessment and the approval, reporting and monitoring of derivative instrument activities. We do not hold or issue derivative financial instruments for trading or speculative purposes.
At December 31, 2016, we had approximately $19.6 billion (excluding capital lease and other obligations with a carrying amount of $440 million) of long-term debt outstanding, approximately 96% of which bears interest at fixed rates and is therefore not exposed to interest rate risk. At December 31, 2016, we had $806 million floating rate debt exposed to changes in either the London InterBank Offered Rate (LIBOR) or the Prime Rate. A hypothetical increase of 100 basis points in LIBOR relative to this debt would decrease our annual pre-tax earnings by $8 million.
By operating internationally, we are exposed to the risk of fluctuations in the foreign currencies used by our international subsidiaries, primarily the British Pound, and secondarily the Canadian Dollar, the Japanese Yen,
A-38
Table of Contents
the Hong Kong Dollar and the Singapore Dollar. Although the percentages of our consolidated revenues and costs that are denominated in these currencies are immaterial, future volatility in exchange rates and an increase in the number of transactions could adversely impact our consolidated results of operations. We use a sensitivity analysis to estimate our exposure to this foreign currency risk, measuring the change in financial position arising from a hypothetical 10% change in the exchange rates of these currencies, relative to the U.S. Dollar, with all other variables held constant. The aggregate potential change in the fair value of financial assets resulting from a hypothetical 10% change in these exchange rates was $18 million at December 31, 2016.
Certain shortcomings are inherent in the method of analysis presented in the computation of exposures to market risks. Actual values may differ materially from those disclosed by us from time to time if market conditions vary from the assumptions used in the analyses performed. These analyses only incorporate the risk exposures that existed at December 31, 2016.
OFF-BALANCE SHEET ARRANGEMENTS
We have no special purpose or limited purpose entities that provide off-balance sheet financing, liquidity, or market or credit risk support and we do not engage in leasing, hedging or other similar activities that expose us to any significant liabilities that are not (i) reflected on the face of the consolidated financial statements, (ii) disclosed in Note 16—Commitments and Contingencies to our consolidated financial statements in Item 8 of our Annual Report on Form 10-K for the year ended December 31, 2016, or in the Future Contractual Obligations table included above, or (iii) discussed under the heading “Market Risk” above.
A-39
Table of Contents
CONSOLIDATED FINANCIAL STATEMENTS AND SUPPLEMENTARY DATA
Report of Independent Registered Public Accounting Firm
The Board of Directors and Stockholders
CenturyLink, Inc.:
We have audited the accompanying consolidated balance sheets of CenturyLink, Inc. and subsidiaries (the Company) as of December 31, 2016 and 2015, and the related consolidated statements of operations, comprehensive income (loss), cash flows, and stockholders’ equity for each of the years in the three-year period ended December 31, 2016. These consolidated financial statements are the responsibility of the Company’s management. Our responsibility is to express an opinion on these consolidated financial statements based on our audits.
We conducted our audits in accordance with the standards of the Public Company Accounting Oversight Board (United States). Those standards require that we plan and perform the audit to obtain reasonable assurance about whether the financial statements are free of material misstatement. An audit includes examining, on a test basis, evidence supporting the amounts and disclosures in the financial statements. An audit also includes assessing the accounting principles used and significant estimates made by management, as well as evaluating the overall financial statement presentation. We believe that our audits provide a reasonable basis for our opinion.
In our opinion, the consolidated financial statements referred to above present fairly, in all material respects, the financial position of the Company as of December 31, 2016 and 2015, and the results of their operations and their cash flows for each of the years in the three-year period ended December 31, 2016, in conformity with U.S. generally accepted accounting principles.
We also have audited, in accordance with the standards of the Public Company Accounting Oversight Board (United States), CenturyLink, Inc.’s internal control over financial reporting as of December 31, 2016, based on criteria established in Internal Control—Integrated Framework (2013) issued by the Committee of Sponsoring Organizations of the Treadway Commission (COSO), and our report dated February 22, 2017 expressed an unqualified opinion on the effectiveness of CenturyLink, Inc.’s internal control over financial reporting.
/s/ KPMG LLP
Shreveport, Louisiana
February 22, 2017
A-40
Table of Contents
Report of Independent Registered Public Accounting Firm
The Board of Directors and Stockholders
CenturyLink, Inc.:
We have audited CenturyLink, Inc.’s (the Company) internal control over financial reporting as of December 31, 2016, based on criteria established in Internal Control—Integrated Framework (2013) issued by the Committee of Sponsoring Organizations of the Treadway Commission (COSO). The Company’s management is responsible for maintaining effective internal control over financial reporting and for its assessment of the effectiveness of internal control over financial reporting, included in the accompanying Management’s Report on Internal Control Over Financial Reporting (Item 9A). Our responsibility is to express an opinion on the Company’s internal control over financial reporting based on our audit.
We conducted our audit in accordance with the standards of the Public Company Accounting Oversight Board (United States). Those standards require that we plan and perform the audit to obtain reasonable assurance about whether effective internal control over financial reporting was maintained in all material respects. Our audit included obtaining an understanding of internal control over financial reporting, assessing the risk that a material weakness exists, and testing and evaluating the design and operating effectiveness of internal control based on the assessed risk. Our audit also included performing such other procedures as we considered necessary in the circumstances. We believe that our audit provides a reasonable basis for our opinion.
A company’s internal control over financial reporting is a process designed to provide reasonable assurance regarding the reliability of financial reporting and the preparation of financial statements for external purposes in accordance with generally accepted accounting principles. A company’s internal control over financial reporting includes those policies and procedures that (1) pertain to the maintenance of records that, in reasonable detail, accurately and fairly reflect the transactions and dispositions of the assets of the company; (2) provide reasonable assurance that transactions are recorded as necessary to permit preparation of financial statements in accordance with generally accepted accounting principles, and that receipts and expenditures of the company are being made only in accordance with authorizations of management and directors of the company; and (3) provide reasonable assurance regarding prevention or timely detection of unauthorized acquisition, use, or disposition of the company’s assets that could have a material effect on the financial statements.
Because of its inherent limitations, internal control over financial reporting may not prevent or detect misstatements. Also, projections of any evaluation of effectiveness to future periods are subject to the risk that controls may become inadequate because of changes in conditions, or that the degree of compliance with the policies or procedures may deteriorate.
In our opinion, the Company maintained, in all material respects, effective internal control over financial reporting as of December 31, 2016, based on criteria established in Internal Control—Integrated Framework (2013) issued by the Committee of Sponsoring Organizations of the Treadway Commission (COSO).
We also have audited, in accordance with the standards of the Public Company Accounting Oversight Board (United States), the consolidated balance sheets of CenturyLink, Inc. and subsidiaries as of December 31, 2016 and 2015, and the related consolidated statements of operations, comprehensive income (loss), cash flows, and stockholders’ equity for each of the years in the three-year period ended December 31, 2016, and our report dated February 22, 2017 expressed an unqualified opinion on those consolidated financial statements.
/s/ KPMG LLP
Shreveport, Louisiana
February 22, 2017
A-41
Table of Contents
CENTURYLINK, INC.
CONSOLIDATED STATEMENTS OF OPERATIONS
| Years Ended December 31, | ||||||||||||
| 2016 | 2015 | 2014 | ||||||||||
| |
(Dollars in millions, except per share amounts and shares in thousands) |
| ||||||||||
| OPERATING REVENUES |
$ | 17,470 | 17,900 | 18,031 | ||||||||
|
|
|
|
|
|
|
|||||||
| OPERATING EXPENSES |
||||||||||||
| Cost of services and products (exclusive of depreciation and amortization) |
7,774 | 7,778 | 7,846 | |||||||||
| Selling, general and administrative |
3,449 | 3,328 | 3,347 | |||||||||
| Depreciation and amortization |
3,916 | 4,189 | 4,428 | |||||||||
|
|
|
|
|
|
|
|||||||
| Total operating expenses |
15,139 | 15,295 | 15,621 | |||||||||
|
|
|
|
|
|
|
|||||||
| OPERATING INCOME |
2,331 | 2,605 | 2,410 | |||||||||
| OTHER (EXPENSE) INCOME |
||||||||||||
| Interest expense |
(1,318 | ) | (1,312 | ) | (1,311 | ) | ||||||
| Other income, net |
7 | 23 | 11 | |||||||||
|
|
|
|
|
|
|
|||||||
| Total other expense, net |
(1,311 | ) | (1,289 | ) | (1,300 | ) | ||||||
|
|
|
|
|
|
|
|||||||
| INCOME BEFORE INCOME TAX EXPENSE |
1,020 | 1,316 | 1,110 | |||||||||
| Income tax expense |
394 | 438 | 338 | |||||||||
|
|
|
|
|
|
|
|||||||
| NET INCOME |
$ | 626 | 878 | 772 | ||||||||
|
|
|
|
|
|
|
|||||||
| BASIC AND DILUTED EARNINGS PER COMMON SHARE |
||||||||||||
| BASIC |
$ | 1.16 | 1.58 | 1.36 | ||||||||
| DILUTED |
$ | 1.16 | 1.58 | 1.36 | ||||||||
| WEIGHTED AVERAGE COMMON SHARES OUTSTANDING |
||||||||||||
| BASIC |
539,549 | 554,278 | 568,435 | |||||||||
| DILUTED |
540,679 | 555,093 | 569,739 | |||||||||
See accompanying notes to consolidated financial statements.
A-42
Table of Contents
CENTURYLINK, INC.
CONSOLIDATED STATEMENTS OF COMPREHENSIVE INCOME (LOSS)
| Years Ended December 31, | ||||||||||||
| 2016 | 2015 | 2014 | ||||||||||
| (Dollars in millions) | ||||||||||||
| NET INCOME |
$ | 626 | 878 | 772 | ||||||||
|
|
|
|
|
|
|
|||||||
| OTHER COMPREHENSIVE (LOSS) INCOME: |
||||||||||||
| Items related to employee benefit plans: |
||||||||||||
| Change in net actuarial (loss) gain, net of $113, $(12) and $742 tax |
(168 | ) | 21 | (1,200 | ) | |||||||
| Change in net prior service credit (costs), net of $(4), $(47) and $1 tax |
6 | 76 | (1 | ) | ||||||||
| Foreign currency translation adjustment and other, net of $—, $— and $1 tax |
(21 | ) | (14 | ) | (14 | ) | ||||||
|
|
|
|
|
|
|
|||||||
| Other comprehensive (loss) income |
(183 | ) | 83 | (1,215 | ) | |||||||
|
|
|
|
|
|
|
|||||||
| COMPREHENSIVE INCOME (LOSS) |
$ | 443 | 961 | (443 | ) | |||||||
|
|
|
|
|
|
|
|||||||
See accompanying notes to consolidated financial statements.
A-43
Table of Contents
CENTURYLINK, INC.
CONSOLIDATED BALANCE SHEETS
| As of December 31, | ||||||||
| 2016 | 2015 | |||||||
| (Dollars in millions and shares in thousands) |
||||||||
| ASSETS |
||||||||
| CURRENT ASSETS |
||||||||
| Cash and cash equivalents |
$ | 222 | 126 | |||||
| Accounts receivable, less allowance of $178 and $152 |
2,017 | 1,943 | ||||||
| Assets held for sale |
2,376 | 8 | ||||||
| Other |
547 | 573 | ||||||
|
|
|
|
|
|||||
| Total current assets |
5,162 | 2,650 | ||||||
|
|
|
|
|
|||||
| NET PROPERTY, PLANT AND EQUIPMENT |
||||||||
| Property, plant and equipment |
39,194 | 38,785 | ||||||
| Accumulated depreciation |
(22,155 | ) | (20,716 | ) | ||||
|
|
|
|
|
|||||
| Net property, plant and equipment |
17,039 | 18,069 | ||||||
|
|
|
|
|
|||||
| GOODWILL AND OTHER ASSETS |
||||||||
| Goodwill |
19,650 | 20,742 | ||||||
| Customer relationships, net |
2,797 | 3,928 | ||||||
| Other intangible assets, net |
1,531 | 1,555 | ||||||
| Other, net |
838 | 660 | ||||||
|
|
|
|
|
|||||
| Total goodwill and other assets |
24,816 | 26,885 | ||||||
|
|
|
|
|
|||||
| TOTAL ASSETS |
$ | 47,017 | 47,604 | |||||
|
|
|
|
|
|||||
| LIABILITIES AND STOCKHOLDERS’ EQUITY |
||||||||
| CURRENT LIABILITIES |
||||||||
| Current maturities of long-term debt |
$ | 1,503 | 1,503 | |||||
| Accounts payable |
1,179 | 968 | ||||||
| Accrued expenses and other liabilities |
||||||||
| Salaries and benefits |
802 | 602 | ||||||
| Income and other taxes |
301 | 318 | ||||||
| Interest |
260 | 250 | ||||||
| Other |
213 | 220 | ||||||
| Current liabilities associated with assets held for sale |
419 | — | ||||||
| Advance billings and customer deposits |
672 | 743 | ||||||
|
|
|
|
|
|||||
| Total current liabilities |
5,349 | 4,604 | ||||||
|
|
|
|
|
|||||
| LONG-TERM DEBT |
18,185 | 18,722 | ||||||
|
|
|
|
|
|||||
| DEFERRED CREDITS AND OTHER LIABILITIES |
||||||||
| Deferred income taxes, net |
3,471 | 3,569 | ||||||
| Benefit plan obligations, net |
5,527 | 5,511 | ||||||
| Other |
1,086 | 1,138 | ||||||
|
|
|
|
|
|||||
| Total deferred credits and other liabilities |
10,084 | 10,218 | ||||||
|
|
|
|
|
|||||
| COMMITMENTS AND CONTINGENCIES (Note 16) |
||||||||
| STOCKHOLDERS’ EQUITY |
||||||||
| Preferred stock—non-redeemable, $25.00 par value, authorized 2,000 shares, issued and outstanding 7 and 7 shares |
— | — | ||||||
| Common stock, $1.00 par value, authorized 1,600,000 and 1,600,000 shares, issued and outstanding 546,545 and 543,800 shares |
547 | 544 | ||||||
| Additional paid-in capital |
14,970 | 15,178 | ||||||
| Accumulated other comprehensive loss |
(2,117 | ) | (1,934 | ) | ||||
| (Accumulated deficit) retained earnings |
(1 | ) | 272 | |||||
|
|
|
|
|
|||||
| Total stockholders’ equity |
13,399 | 14,060 | ||||||
|
|
|
|
|
|||||
| TOTAL LIABILITIES AND STOCKHOLDERS’ EQUITY |
$ | 47,017 | 47,604 | |||||
|
|
|
|
|
|||||
See accompanying notes to consolidated financial statements.
A-44
Table of Contents
CENTURYLINK, INC.
CONSOLIDATED STATEMENTS OF CASH FLOWS
| Years Ended December 31, | ||||||||||||
| 2016 | 2015 | 2014 | ||||||||||
| (Dollars in millions) | ||||||||||||
| OPERATING ACTIVITIES |
||||||||||||
| Net income |
$ | 626 | 878 | 772 | ||||||||
| Adjustments to reconcile net income to net cash provided by operating activities: |
||||||||||||
| Depreciation and amortization |
3,916 | 4,189 | 4,428 | |||||||||
| Impairment of assets |
13 | 9 | 32 | |||||||||
| Deferred income taxes |
6 | 350 | 291 | |||||||||
| Provision for uncollectible accounts |
192 | 177 | 159 | |||||||||
| Net long-term debt issuance costs and premium amortization |
2 | (3 | ) | (21 | ) | |||||||
| Net loss on early retirement of debt |
27 | — | — | |||||||||
| Share-based compensation |
80 | 73 | 79 | |||||||||
| Changes in current assets and liabilities: |
||||||||||||
| Accounts receivable |
(266 | ) | (132 | ) | (163 | ) | ||||||
| Accounts payable |
109 | (168 | ) | 70 | ||||||||
| Accrued income and other taxes |
(43 | ) | 32 | (84 | ) | |||||||
| Other current assets and liabilities, net |
92 | (53 | ) | (270 | ) | |||||||
| Retirement benefits |
(152 | ) | (141 | ) | (184 | ) | ||||||
| Changes in other noncurrent assets and liabilities, net |
(18 | ) | (78 | ) | 99 | |||||||
| Other, net |
24 | 19 | (20 | ) | ||||||||
|
|
|
|
|
|
|
|||||||
| Net cash provided by operating activities |
4,608 | 5,152 | 5,188 | |||||||||
|
|
|
|
|
|
|
|||||||
| INVESTING ACTIVITIES |
||||||||||||
| Payments for property, plant and equipment and capitalized software |
(2,981 | ) | (2,872 | ) | (3,047 | ) | ||||||
| Cash paid for acquisitions |
(39 | ) | (4 | ) | (93 | ) | ||||||
| Proceeds from sale of property and intangible assets |
30 | 31 | 63 | |||||||||
| Other, net |
(4 | ) | (8 | ) | — | |||||||
|
|
|
|
|
|
|
|||||||
| Net cash used in investing activities |
(2,994 | ) | (2,853 | ) | (3,077 | ) | ||||||
|
|
|
|
|
|
|
|||||||
| FINANCING ACTIVITIES |
||||||||||||
| Net proceeds from issuance of long-term debt |
2,161 | 989 | 483 | |||||||||
| Payments of long-term debt |
(2,462 | ) | (966 | ) | (800 | ) | ||||||
| Net payments on credit facility and revolving line of credit |
(40 | ) | (315 | ) | (4 | ) | ||||||
| Early retirement of debt costs |
— | (1 | ) | — | ||||||||
| Dividends paid |
(1,167 | ) | (1,198 | ) | (1,228 | ) | ||||||
| Proceeds from issuance of common stock |
6 | 11 | 50 | |||||||||
| Repurchase of common stock and shares withheld to satisfy tax withholdings |
(16 | ) | (819 | ) | (650 | ) | ||||||
| Other, net |
— | (2 | ) | (2 | ) | |||||||
|
|
|
|
|
|
|
|||||||
| Net cash used in financing activities |
(1,518 | ) | (2,301 | ) | (2,151 | ) | ||||||
|
|
|
|
|
|
|
|||||||
| Net increase (decrease) in cash and cash equivalents |
96 | (2 | ) | (40 | ) | |||||||
| Cash and cash equivalents at beginning of period |
126 | 128 | 168 | |||||||||
|
|
|
|
|
|
|
|||||||
| Cash and cash equivalents at end of period |
$ | 222 | 126 | 128 | ||||||||
|
|
|
|
|
|
|
|||||||
| Supplemental cash flow information: |
||||||||||||
| Income taxes paid, net |
$ | (397 | ) | (63 | ) | (27 | ) | |||||
| Interest paid (net of capitalized interest of $54, $52 and $47) |
$ | (1,301 | ) | (1,310 | ) | (1,338 | ) | |||||
See accompanying notes to consolidated financial statement
A-45
Table of Contents
CENTURYLINK, INC.
CONSOLIDATED STATEMENTS OF STOCKHOLDERS’ EQUITY
| Years Ended December 31, | ||||||||||||
| 2016 | 2015 | 2014 | ||||||||||
| (Dollars in millions) | ||||||||||||
| COMMON STOCK (represents dollars and shares) |
||||||||||||
| Balance at beginning of period |
$ | 544 | 569 | 584 | ||||||||
| Issuance of common stock through dividend reinvestment, incentive and benefit plans |
3 | 2 | 4 | |||||||||
| Repurchase of common stock |
— | (27 | ) | (19 | ) | |||||||
|
|
|
|
|
|
|
|||||||
| Balance at end of period |
547 | 544 | 569 | |||||||||
|
|
|
|
|
|
|
|||||||
| ADDITIONAL PAID-IN CAPITAL |
||||||||||||
| Balance at beginning of period |
15,178 | 16,324 | 17,343 | |||||||||
| Issuance of common stock through dividend reinvestment, incentive and benefit plans |
7 | 9 | 46 | |||||||||
| Repurchase of common stock |
— | (767 | ) | (591 | ) | |||||||
| Shares withheld to satisfy tax withholdings |
(15 | ) | (19 | ) | (16 | ) | ||||||
| Share-based compensation and other, net |
79 | 77 | 82 | |||||||||
| Dividends declared |
(279 | ) | (446 | ) | (540 | ) | ||||||
|
|
|
|
|
|
|
|||||||
| Balance at end of period |
14,970 | 15,178 | 16,324 | |||||||||
|
|
|
|
|
|
|
|||||||
| ACCUMULATED OTHER COMPREHENSIVE LOSS |
||||||||||||
| Balance at beginning of period |
(1,934 | ) | (2,017 | ) | (802 | ) | ||||||
| Other comprehensive (loss) income |
(183 | ) | 83 | (1,215 | ) | |||||||
|
|
|
|
|
|
|
|||||||
| Balance at end of period |
(2,117 | ) | (1,934 | ) | (2,017 | ) | ||||||
|
|
|
|
|
|
|
|||||||
| (ACCUMULATED DEFICIT) RETAINED EARNINGS |
||||||||||||
| Balance at beginning of period |
272 | 147 | 66 | |||||||||
| Net income |
626 | 878 | 772 | |||||||||
| Dividends declared |
(899 | ) | (753 | ) | (691 | ) | ||||||
|
|
|
|
|
|
|
|||||||
| Balance at end of period |
(1 | ) | 272 | 147 | ||||||||
|
|
|
|
|
|
|
|||||||
| TOTAL STOCKHOLDERS’ EQUITY |
$ | 13,399 | 14,060 | 15,023 | ||||||||
|
|
|
|
|
|
|
|||||||
See accompanying notes to consolidated financial statements.
A-46
Table of Contents
CENTURYLINK, INC.
NOTES TO CONSOLIDATED FINANCIAL STATEMENTS
References in the Notes to “CenturyLink,” “we,” “us” and “our” refer to CenturyLink, Inc. and its consolidated subsidiaries, unless the content otherwise requires and except in Note 5, where such references refer solely to CenturyLink, Inc.
| (1) | Background and Summary of Significant Accounting Policies |
General
We are an integrated communications company engaged primarily in providing an array of services to our residential and business customers. Our communications services include local and long-distance voice, broadband, Multi-Protocol Label Switching (“MPLS”), private line (including special access), Ethernet, colocation, hosting (including cloud hosting and managed hosting), data integration, video, network, public access, Voice over Internet Protocol (“VoIP”), information technology and other ancillary services.
On October 31, 2016, we entered into a definitive merger agreement under which we agreed to acquire Level 3 Communications, Inc. (“Level 3”) in a cash and stock transaction. See Note 2—Pending Acquisition of Level 3 for additional information. On November 3, 2016, we entered into a definitive stock purchase agreement with a consortium led by BC Partners, Inc. and Medina Capital under which we propose to sell our data centers and colocation business for a combination of cash and equity. See Note 3—Pending Sale of Colocation Business and Data Centers for additional information.
Basis of Presentation
The accompanying consolidated financial statements include our accounts and the accounts of our subsidiaries. Intercompany amounts and transactions with our consolidated subsidiaries have been eliminated.
To simplify the overall presentation of our consolidated financial statements, we report immaterial amounts attributable to noncontrolling interests in certain of our subsidiaries as follows: (i) income attributable to noncontrolling interests in other income, net, (ii) equity attributable to noncontrolling interests in additional paid-in capital and (iii) cash flows attributable to noncontrolling interests in other, net financing activities.
We reclassified certain prior period amounts to conform to the current period presentation, including the categorization of our revenues and our segment reporting. See Note 14—Segment Information for additional information. These changes had no impact on total operating revenues, total operating expenses or net income for any period presented.
Connect America Fund
In 2015, we accepted Connect America Fund (“CAF”) funding from the Federal Communications Commission (“FCC”) of approximately $500 million per year for six years to fund the deployment of voice and broadband capable infrastructure for approximately 1.2 million rural households and businesses in 33 states under the CAF Phase 2 high-cost support program. The funding from the CAF Phase 2 support program has substantially replaced the funding from the interstate Universal Service Fund (“USF”) program that we previously utilized to support voice services in high-cost rural markets in these 33 states. In late 2015, we began receiving these monthly support payments from the FCC under the new CAF Phase 2 support program, which included (i) monthly support payments at a higher rate than under the interstate USF support program and (ii) a substantial one-time transitional payment, designed to align the prior USF payments with the new CAF Phase 2 payments for the full year 2015. For 2016, we continued to receive the monthly support payments at the higher rate than under the interstate USF support program. We recorded $201 million and $215 million more revenue from the CAF Phase 2 program for the years ended December 31, 2016 and 2015, respectively, than the projected amounts we would have otherwise recorded during the same periods under the interstate USF support program.
A-47
Table of Contents
Changes in Estimates
In 2016, we changed the method we use to estimate the service and interest components of net periodic benefit expense for pension and other postretirement benefit obligations. This change resulted in a decrease in the service and interest components in 2016. Beginning in 2016, we utilized a full yield curve approach in connection with estimating these components by applying the specific spot rates along the yield curve used in the determination of the benefit obligation to the relevant projected cash flows, as opposed to the single weighted-average discount rate derived from the yield curve that we have used in the past. We believe this change more precisely measures service and interest costs by improving the correlation between projected benefit cash flows to the corresponding spot yield curve rates. This change did not affect the measurement of our total benefit obligations but lowered our annual net periodic benefit cost by approximately $149 million in 2016. This change was treated as a change in accounting estimate and accordingly, we did not adjust the amounts recorded in 2015 or 2014. The reduction in expense described above, net of tax, increased net income by $91 million, or $0.17 per basic and diluted common share, for the year ended December 31, 2016.
Summary of Significant Accounting Policies
Use of Estimates
Our consolidated financial statements are prepared in accordance with U.S. generally accepted accounting principles. These accounting principles require us to make certain estimates, judgments and assumptions. We believe that the estimates, judgments and assumptions we make when accounting for specific items and matters, including, but not limited to, investments, long-term contracts, customer retention patterns, allowance for doubtful accounts, depreciation, amortization, asset valuations, internal labor capitalization rates, recoverability of assets (including deferred tax assets), impairment assessments, pension, post-retirement and other post-employment benefits, taxes, certain liabilities and other provisions and contingencies, are reasonable, based on information available at the time they are made. These estimates, judgments and assumptions can materially affect the reported amounts of assets, liabilities and components of stockholders’ equity as of the dates of the consolidated balance sheets, as well as the reported amounts of revenues, expenses and components of cash flows during the periods presented in our other consolidated financial statements. We also make estimates in our assessments of potential losses in relation to threatened or pending tax and legal matters. See Note 13—Income Taxes and Note 16—Commitments and Contingencies for additional information.
For matters not related to income taxes, if a loss is considered probable and the amount can be reasonably estimated, we recognize an expense for the estimated loss. If we have the potential to recover a portion of the estimated loss from a third party, we make a separate assessment of recoverability and reduce the estimated loss if recovery is also deemed probable.
For matters related to income taxes, if we determine that the impact of an uncertain tax position is more likely than not to be sustained upon audit by the relevant taxing authority, then we recognize a benefit for the largest amount that is more likely than not to be sustained. No portion of an uncertain tax position will be recognized if the position has less than a 50% likelihood of being sustained. Interest is recognized on the amount of unrecognized benefit from uncertain tax positions.
For all of these and other matters, actual results could differ materially from our estimates.
Revenue Recognition
We recognize revenue for services when the related services are provided. Recognition of certain payments received in advance of services being provided is deferred until the service is provided. These advance payments include activation and installation charges, which we recognize as revenue over the expected customer relationship period, which ranges from three years to over seven years depending on the service. We also defer costs for customer activations and installations. The deferral of customer activation and installation costs is
A-48
Table of Contents
limited to the amount of revenue deferred on advance payments. Costs in excess of advance payments are recorded as expense in the period such costs are incurred. Expected customer relationship periods are estimated using historical experience. In most cases, termination fees or other fees on existing contracts that are negotiated in conjunction with new contracts are deferred and recognized over the new contract term.
We offer bundle discounts to our customers who receive certain groupings of services. These bundle discounts are recognized concurrently with the associated revenue and are allocated to the various services in the bundled offering based on the estimated selling price of services included in each bundled combination.
Customer arrangements that include both equipment and services are evaluated to determine whether the elements are separable. If the elements are deemed separable and separate earnings processes exist, the revenue associated with the customer arrangement is allocated to each element based on the relative estimated selling price of the separate elements. We have estimated the selling prices of each element by reference to vendor-specific objective evidence of selling prices when the elements are sold separately. The revenue associated with each element is then recognized as earned. For example, if we receive an advance payment when we sell equipment and continuing service together, we immediately recognize as revenue the amount allocated to the equipment as long as all the conditions for revenue recognition have been satisfied. The portion of the advance payment allocated to the service based upon its relative selling price is recognized ratably over the longer of the contractual period or the expected customer relationship period.
We periodically transfer optical capacity assets on our network to other telecommunications service carriers. These transactions are structured as indefeasible rights of use, commonly referred to as IRUs, which are the exclusive right to use a specified amount of capacity or fiber for a specified term, typically 20 years. We account for the cash consideration received on transfers of optical capacity assets and on all of the other elements deliverable under an IRU, as revenue ratably over the term of the agreement. We do not recognize revenue on any contemporaneous exchanges of our optical capacity assets for other optical capacity assets.
In connection with offering products and services provided by third-party vendors, we review the relationship between us, the vendor and the end customer to assess whether revenue should be reported on a gross or net basis. In assessing whether revenue should be reported on a gross or net basis, we consider whether we act as a principal in the transaction, take title to the products, have risk and rewards of ownership or act as an agent or broker. Based on our agreements with DIRECTV and Verizon Wireless, we offer these services through sales agency relationships which are reported on a net basis.
We have service level commitments pursuant to contracts with certain of our customers. To the extent that such service levels are not achieved or are otherwise disputed due to performance or service issues or other service interruptions or conditions, we will estimate the amount of credits to be issued and record a reduction to revenues, with a corresponding increase in the credit reserve.
USF Surcharges, Gross Receipts Taxes and Other Surcharges
In determining whether to include in our revenues and expenses the taxes and surcharges collected from customers and remitted to government authorities, including USF surcharges, sales, use, value added and some excise taxes, we assess, among other things, whether we are the primary obligor or principal taxpayer for the taxes assessed in each jurisdiction where we do business. In jurisdictions where we determine that we are the principal taxpayer, we record the surcharges on a gross basis and include them in our revenues and costs of services and products. In jurisdictions where we determine that we are merely a collection agent for the government authority, we record the taxes on a net basis and do not include them in our revenues and costs of services and products.
A-49
Table of Contents
Advertising Costs
Costs related to advertising are expensed as incurred and included in selling, general and administrative expenses in our consolidated statements of operations. Our advertising expense was $216 million, $210 million and $214 million for the years ended December 31, 2016, 2015 and 2014, respectively.
Legal Costs
In the normal course of our business, we incur costs to hire and retain external legal counsel to advise us on regulatory, litigation and other matters. We expense these costs as the related services are received.
Income Taxes
We file a consolidated federal income tax return with our eligible subsidiaries. The provision for income taxes consists of an amount for taxes currently payable, an amount for tax consequences deferred to future periods and adjustments to our liabilities for uncertain tax positions. We record deferred income tax assets and liabilities reflecting future tax consequences attributable to tax net operating loss carryforwards (“NOLs”), tax credit carryforwards and differences between the financial statement carrying value of assets and liabilities and the tax bases of those assets and liabilities. Deferred taxes are computed using enacted tax rates expected to apply in the year in which the differences are expected to affect taxable income. The effect on deferred income tax assets and liabilities of a change in tax rate is recognized in earnings in the period that includes the enactment date.
We establish valuation allowances when necessary to reduce deferred income tax assets to the amounts that we believe are more likely than not to be recovered. Each quarter we evaluate the need to retain all or a portion of the valuation allowance on our deferred tax assets. See Note 13—Income Taxes for additional information.
Cash and Cash Equivalents
Cash and cash equivalents include highly liquid investments that are readily convertible into cash and are not subject to significant risk from fluctuations in interest rates. As a result, the value at which cash and cash equivalents are reported in our consolidated financial statements approximates their fair value. In evaluating investments for classification as cash equivalents, we require that individual securities have original maturities of ninety days or less and that individual investment funds have dollar-weighted average maturities of ninety days or less. To preserve capital and maintain liquidity, we invest with financial institutions we deem to be of sound financial condition and in high quality and relatively risk-free investment products. Our cash investment policy limits the concentration of investments with specific financial institutions or among certain products and includes criteria related to credit worthiness of any particular financial institution.
Book overdrafts occur when checks have been issued but have not been presented to our controlled disbursement bank accounts for payment. Disbursement bank accounts allow us to delay funding of issued checks until the checks are presented for payment. Until the issued checks are presented for payment, the book overdrafts are included in accounts payable on our consolidated balance sheet. This activity is included in the operating activities section in our consolidated statements of cash flows.
Accounts Receivable and Allowance for Doubtful Accounts
Accounts receivable are recognized based upon the amount due from customers for the services provided or at cost for purchased and other receivables less an allowance for doubtful accounts. The allowance for doubtful accounts receivable reflects our best estimate of probable losses inherent in our receivable portfolio determined on the basis of historical experience, specific allowances for known troubled accounts and other currently available evidence. We generally consider our accounts past due if they are outstanding over 30 days. Our
A-50
Table of Contents
collection process varies by the customer segment, amount of the receivable, and our evaluation of the customer’s credit risk. Our past due accounts are written off against our allowance for doubtful accounts when collection is considered to be not probable. Any recoveries of accounts previously written off are generally recognized as a reduction in bad debt expense in the period received. The carrying value of accounts receivable net of the allowance for doubtful accounts approximates fair value.
Property, Plant and Equipment
We record property, plant and equipment acquired in connection with our acquisitions based on its estimated fair value as of its acquisition date plus the estimated value of any associated legally or contractually required retirement obligations. We record purchased and constructed property, plant and equipment at cost, plus the estimated value of any associated legally or contractually required retirement obligations. Property, plant and equipment is depreciated primarily using the straight-line group method. Under the straight-line group method, assets dedicated to providing telecommunications services (which comprise the majority of our property, plant and equipment) that have similar physical characteristics, use and expected useful lives are pooled for purposes of depreciation and tracking. The equal life group procedure is used to establish each pool’s average remaining useful life. Generally, under the straight-line group method, when an asset is sold or retired in the course of normal business activities, the cost is deducted from property, plant and equipment and charged to accumulated depreciation without recognition of a gain or loss. A gain or loss is recognized in our consolidated statements of operations only if a disposal is unusual. Leasehold improvements are amortized over the shorter of the useful lives of the assets or the expected lease term. Expenditures for maintenance and repairs are expensed as incurred. Interest is capitalized during the construction phase of network and other internal-use capital projects. Employee-related costs for construction of network and other internal use assets are also capitalized during the construction phase. Property, plant and equipment supplies used internally are carried at average cost, except for significant individual items for which cost is based on specific identification.
We perform annual internal reviews to evaluate the reasonableness of the depreciable lives for our property, plant and equipment. Our reviews utilize models that take into account actual usage, physical wear and tear, replacement history, assumptions about technology evolution and, in certain instances, actuarially determined probabilities to estimate the remaining useful life of our asset base. Our remaining useful life assessments anticipate the loss in service value of assets that may precede the physical retirement. Assets shared among many customers may lose service value as those customers leave the network. However, the asset is not retired until all customers no longer utilize the asset and we determine there is no alternative use for the asset.
We have asset retirement obligations associated with the legally or contractually required removal of a limited group of property, plant and equipment assets from leased properties and the disposal of certain hazardous materials present in our owned properties. When an asset retirement obligation is identified, usually in association with the acquisition of the asset, we record the fair value of the obligation as a liability. The fair value of the obligation is also capitalized as property, plant and equipment and then amortized over the estimated remaining useful life of the associated asset. Where the removal obligation is not legally binding, the net cost to remove assets is expensed in the period in which the costs are actually incurred.
We review long-lived tangible assets for impairment whenever facts and circumstances indicate that the carrying amounts of the assets may not be recoverable. For assessment purposes, long-lived assets are grouped with other assets and liabilities at the lowest level for which identifiable cash flows are largely independent of the cash flows of other assets and liabilities, absent a material change in operations. An impairment loss is recognized only if the carrying amount of the asset group is not recoverable and exceeds its fair value. Recoverability of the asset group to be held and used is assessed by comparing the carrying amount of the asset group to the estimated undiscounted future net cash flows expected to be generated by the asset group. If the asset group’s carrying value is not recoverable, an impairment charge is recognized for the amount by which the carrying amount of the asset group exceeds its fair value. We determine fair values by using a combination of comparable market values and discounted cash flows, as appropriate.
A-51
Table of Contents
Goodwill, Customer Relationships and Other Intangible Assets
Intangible assets arising from business combinations, such as goodwill, customer relationships, capitalized software, trademarks and trade names, are initially recorded at estimated fair value. We amortize customer relationships primarily over an estimated life of 10 to 15 years, using either the sum-of-the-years-digits or the straight-line methods, depending on the type of customer. We amortize capitalized software using the straight-line method over estimated lives ranging up to 7 years, except for approximately $237 million of our capitalized software costs, which represents costs to develop an integrated billing and customer care system which is amortized using the straight-line method over a 20 year period. We amortize our other intangible assets predominantly using the sum-of-the-years-digits method over an estimated life of 4 to 20 years. Other intangible assets not arising from business combinations are initially recorded at cost. Where there are no legal, regulatory, contractual or other factors that would reasonably limit the useful life of an intangible asset, we classify the intangible asset as indefinite-lived and such intangible assets are not amortized.
Internally used software, whether purchased or developed by us, is capitalized and amortized using the straight-line method over its estimated useful life. We have capitalized certain costs associated with software such as costs of employees devoting time to the projects and external direct costs for materials and services. Costs associated with software to be used for internal purposes are expensed until the point at which the project has reached the development stage. Subsequent additions, modifications or upgrades to internal-use software are capitalized only to the extent that they allow the software to perform a task it previously did not perform. Software maintenance, data conversion and training costs are expensed in the period in which they are incurred. We review the remaining economic lives of our capitalized software annually. Capitalized software is included in other intangible assets, net, in our consolidated balance sheets.
Our long-lived intangible assets, other than goodwill, with indefinite lives are assessed for impairment annually, or, under certain circumstances, more frequently, such as when events or changes in circumstances indicate there may be an impairment. These assets are carried at the estimated fair value at the time of acquisition and assets not acquired in acquisitions are recorded at historical cost. However, if their estimated fair value is less than the carrying amount, other indefinite-lived intangible assets are reduced to their estimated fair value through an impairment charge to our consolidated statements of operations.
We are required to assess goodwill for impairment at least annually, or more frequently, if an event occurs or circumstances change that would indicate an impairment may have occurred. We are required to write-down the value of goodwill in periods in which the recorded amount of goodwill exceeds the implied fair value of goodwill. Our reporting units are not discrete legal entities with discrete financial statements. Therefore, the equity carrying value and future cash flows must be estimated each time a goodwill impairment assessment is performed on a reporting unit. As a result, our assets, liabilities and cash flows are assigned to reporting units using reasonable and consistent allocation methodologies. Certain estimates, judgments and assumptions are required to perform these assignments. We believe these estimates, judgments and assumptions to be reasonable, but changes in many of these can significantly affect each reporting unit’s equity carrying value and future cash flows utilized for our goodwill impairment assessment.
We are required to reassign goodwill to reporting units each time we reorganize our internal reporting structure which causes a change in the composition of our reporting units. Goodwill is reassigned to the reporting units using a relative fair value approach. We utilize the earnings before interest, taxes, depreciation and amortization of each reporting unit as our allocation methodology as it represents a reasonable proxy for the fair value of the operations being reorganized.
See Note 4—Goodwill, Customer Relationships and Other Intangible Assets for additional information.
Pension and Post-Retirement Benefits
We recognize the funded status of our defined benefit and post-retirement plans as an asset or a liability on our consolidated balance sheet. Each year’s actuarial gains or losses are a component of our other comprehensive
A-52
Table of Contents
(loss) income, which is then included in our accumulated other comprehensive loss. Pension and post-retirement benefit expenses are recognized over the period in which the employee renders service and becomes eligible to receive benefits. We make significant assumptions (including the discount rate, expected rate of return on plan assets, mortality and health care trend rates) in computing the pension and post-retirement benefits expense and obligations. See Note 9—Employee Benefits for additional information.
Foreign Currency
Our results of operations include foreign subsidiaries, which are translated from the applicable functional currency to the United States Dollar using the average exchange rates during the reporting period, while assets and liabilities are translated at the reporting date. We include gains or losses from foreign currency remeasurement in other income, net in our consolidated statements of operations. Certain non-U.S. subsidiaries designate the local currency as their functional currency, and we record the translation of their assets and liabilities into U.S. Dollars at the balance sheet date as translation adjustments and include them as a component of accumulated other comprehensive loss in our consolidated balance sheets.
Common Stock
At December 31, 2016, we had 4 million unissued shares of CenturyLink, Inc. common stock reserved for acquisitions, substantially all of which are reserved for issuance in connection with our pending acquisition of Level 3. In addition, we had 21 million shares authorized for future issuance under our equity incentive plans.
Preferred stock
Holders of outstanding CenturyLink, Inc. preferred stock are entitled to receive cumulative dividends, receive preferential distributions equal to $25 per share plus unpaid dividends upon CenturyLink, Inc.’s liquidation and vote as a single class with the holders of common stock.
Dividends
We pay dividends out of retained earnings to the extent we have retained earnings on the date the dividend is declared. If the dividend is in excess of our retained earnings on the declaration date, then the excess is drawn from our additional paid-in capital.
Recent Accounting Pronouncements
Income Taxes
On October 24, 2016, the Financial Accounting Standards Board (“FASB”) issued Accounting Standards Update (“ASU”) 2016-16, “Intra-Entity Transfers of Assets Other Than Inventory” (“ASU 2016-16”). ASU 2016-16 eliminates the current prohibition on the recognition of the income tax effects on the transfer of assets among our subsidiaries. After adoption of this ASU, the income tax effects associated with these asset transfers, except for the transfer of inventory, will be recognized in the period the asset is transferred versus the current deferral and recognition upon either the sale of the asset to a third party or over the remaining useful life of the asset. We are currently reviewing the requirements of this ASU and evaluating the impact on our consolidated financial statements.
We are required to adopt the provisions of ASU 2016-16 on January 1, 2018, but have the option to early adopt as of January 1, 2017. We plan to adopt the provision of ASU 2016-16 on January 1, 2018. The impact of adopting ASU 2016-16, if any, will be recognized through a cumulative adjustment to retained earnings as of the date of adoption.
A-53
Table of Contents
Financial Instruments
On June 16, 2016, the FASB issued ASU 2016-13, “Measurement of Credit Losses on Financial Instruments” (“ASU 2016-13”). The primary impact of ASU 2016-13 for us is a change in the model for the recognition of credit losses related to our financial instruments from an incurred loss model, which recognized credit losses only if it was probable that a loss had been incurred, to an expected loss model, which requires our management team to estimate the total credit losses expected on the portfolio of financial instruments. We are currently reviewing the requirements of the standard and evaluating the impact on our consolidated financial statements.
We are required to adopt the provisions of ASU 2016-13 effective January 1, 2020, but could elect to early adopt the provisions as of January 1, 2019. We expect to recognize any impacts of adopting ASU 2016-13 through a cumulative adjustment to retained earnings as of the date of adoption. As of the date of our Annual Report on Form 10-K for the year ended December 31, 2016, we have not yet determined the date we will adopt ASU 2016-13.
Share-based Compensation
On March 30, 2016, the FASB issued ASU 2016-09, “Improvement to Employee Share-Based Payment Accounting” (“ASU 2016-09”). ASU 2016-09 modifies the accounting and associated income tax accounting for share-based compensation in order to reduce the cost and complexity associated with current generally accepted accounting principles. ASU 2016-09 became effective as of January 1, 2017. ASU 2016-09 includes different transition requirements for the different changes implemented, including some provisions which allow retrospective application. We will implement this new standard on its effective date.
The primary provisions of ASU 2016-09 that we expect will affect our financial statements are: (1) a reclassification of the tax effect associated with the difference between the expense recognized for share-based payments and the associated tax deduction from additional paid-in capital to income tax expense; (2) a reclassification of the tax effect associated with the difference between compensation expense and associated deduction from financing cash flow to operating cash flow; and (3) a change in our accounting policy to account for forfeitures of share-based payment grants as they occur as opposed to our current policy of estimating the forfeitures on the grant date. The adoption of this accounting policy change will result in an immaterial increase in our retained earnings as of January 1, 2017. Although the provisions would not have had a material impact on our previously-issued financial statements, we cannot provide any assurance regarding their future impacts. Adoption of ASU 2016-09 may increase the volatility of income tax expense and cash flow from operating activities.
Leases
On February 25, 2016, the FASB issued ASU 2016-02, “Leases” (“ASU 2016-02”). The core principle of ASU 2016-02 will require lessees to present right-of-use assets and lease liabilities on their balance sheets for operating leases, which are currently not reflected on their balance sheets.
ASU 2016-02 is effective for annual and interim periods beginning January 1, 2019. Early adoption of ASU 2016-02 is permitted. Upon adoption of ASU 2016-02, we are required to recognize and measure leases at the beginning of the earliest period presented in our consolidated financial statements using a modified retrospective approach. The modified retrospective approach includes a number of optional practical expedients that we may elect to apply. We will implement this new standard on its effective date, but we have not yet decided which practical expedient options we will elect.
We are currently evaluating our existing lease accounting systems to determine whether our current systems will support the new accounting requirements or if upgrades or new systems will be required, and we are in the
A-54
Table of Contents
process of developing an implementation plan. We are also currently evaluating and assessing the impact ASU 2016-02 will have on us and our consolidated financial statements. As of the date of our Annual Report on Form 10-K for the year ended December 31, 2016, we cannot provide any estimate of the impact of adopting ASU 2016-02.
Revenue Recognition
On May 28, 2014, the FASB issued ASU 2014-09, “Revenue from Contracts with Customers” (“ASU 2014-09”). ASU 2014-09 replaces virtually all existing generally accepted accounting principles (“GAAP”) on revenue recognition and replaces them with a principles-based approach for determining revenue recognition using a new five step model. The core principle of ASU 2014-09 is that an entity should recognize revenue to depict the transfer of promised goods or services to customers in an amount that reflects the consideration to which the entity expects to be entitled in exchange for those goods or services. ASU 2014-09 also includes new accounting principles related to the deferral and amortization of contract acquisition and fulfillment costs. We currently do not defer any contract acquisition costs, but we expect we will defer certain contract acquisition costs in the future which could have the impact of lowering our operating expenses. We currently defer contract fulfillment costs only up to the extent of any revenue deferred. Under ASU 2014-09, in certain transactions our deferred contract fulfillment costs could exceed our deferred revenues, which could result in an increase in deferred costs and could also have the impact of lowering our operating expenses.
On July 9, 2015, the FASB approved the deferral of the effective date of ASU 2014-09 by one year until January 1, 2018, which is the date we plan to adopt this standard. ASU 2014-09 may be adopted by applying the provisions of this standard on a retrospective basis to the periods included in the financial statements or on a modified retrospective basis which would result in the recognition of a cumulative effect of adopting ASU 2014-09 in the first quarter of 2018. We have completed our initial assessment of our business and systems requirements and we are currently developing and implementing a new revenue recognition system to comply with the requirements of ASU 2014-09. Based on this initial assessment, we currently plan to adopt the new revenue recognition standard under the modified retrospective transition method. Until we are further along in implementing our new revenue recognition system, we do not anticipate being able to provide reasonably accurate estimates of the impact of ASU 2014-09 on the timing of our revenue recognition.
| (2) | Pending Acquisition of Level 3 |
On October 31, 2016, we entered into a definitive merger agreement under which we propose to acquire Level 3 Communications, Inc. (“Level 3”) in a cash and stock transaction. Under the terms of the agreement, Level 3 shareholders will receive $26.50 per share in cash and 1.4286 of CenturyLink shares for each share of Level 3 common stock they own at closing. CenturyLink shareholders are expected to own approximately 51% and Level 3 shareholders are expected to own approximately 49% of the combined company at closing. On December 31, 2016, Level 3 had outstanding $10.9 billion of long-term debt.
Completion of the transaction is subject to the receipt of regulatory approvals, including the expiration or termination of the applicable waiting period under the Hart-Scott-Rodino Antitrust Improvements Act, as well as approvals from the FCC and certain state regulatory authorities. The transaction is also subject to the approval of CenturyLink and Level 3 shareholders at meetings scheduled for March 16, 2017, as well as other customary closing conditions. Subject to these conditions, we anticipate closing this transaction by the end of the third quarter 2017. If the merger is terminated under certain circumstances, we may be obligated to pay Level 3 a termination fee of $472 million, or Level 3 may be obligated to pay CenturyLink a termination fee of $738 million.
| (3) | Pending Sale of Colocation Business and Data Centers |
On November 3, 2016, we entered into a definitive stock purchase agreement to sell our data centers and colocation business to a consortium led by BC Partners, Inc. and Medina Capital in exchange for cash and a
A-55
Table of Contents
minority stake in the consortium’s newly-formed global secure infrastructure company. The sale is subject to regulatory approvals, including a review by the Committee of Foreign Investments in the United States, as well as other customary closing conditions.
Based on certain estimates and assumptions regarding the closing date and various tax matters, we currently project that the net cash proceeds from the divestiture will be approximately $1.5 billion to $1.7 billion. We plan to use a portion of these net cash proceeds to partly fund our acquisition of Level 3.
As a result of the pending sale of our colocation business and data centers, we reclassified the following assets and liabilities, which are now reflected as assets held for sale and current liabilities associated with the assets held for sale on our consolidated balance sheet, respectively, as of December 31, 2016:
| Dollars in millions | ||||
| Goodwill |
$ | 1,141 | ||
| Property, plant and equipment |
1,071 | |||
| Other intangible assets |
258 | |||
| Other assets |
45 | |||
|
|
|
|||
| Total amount reclassified to assets held for sale(1) |
$ | 2,515 | ||
|
|
|
|||
| Capital lease obligations |
305 | |||
| Other liabilities |
114 | |||
|
|
|
|||
| Total liabilities associated with assets held for sale |
$ | 419 | ||
|
|
|
|||
| (1) | A portion of the assets equivalent to our anticipated minority stake, which was based on an estimated fair value, in the consortium’s newly-formed global secure infrastructure company is reflected in non-current other assets on our consolidated balance sheet. |
The colocation business has resided in our business reporting unit. The amount of goodwill allocated to the colocation business being sold was determined using a relative-fair-value approach. The amount of goodwill included in the carrying amount of assets held for sale was based on the relative fair value of the colocation business we agreed to sell and the portion of the business reporting unit to be retained by us. We used the sale price as the fair value of the colocation business and the relative business fair value for the portion of the business reporting unit we will retain. As of November 3, 2016, we performed a quantitative assessment of the goodwill remaining in the business reporting unit after the allocation to the colocation business and concluded the remaining goodwill was not impaired as of that date.
Effective with the date we entered into the agreement to sell the colocation business we ceased recording depreciation of the property, plant and equipment to be sold and amortization of the intangible assets. We estimate that we would have recorded $36 million of depreciation and amortization expense in the two months subsequent to entering into the agreement to sell the colocation business if we had not met the held-for-sale criteria.
We have estimated that after factoring in the costs to sell the colocation business the net carrying value of the assets and liabilities being sold closely approximates the estimated value of the proceeds we will receive upon closing. We further estimate, due to corporate actions we plan to take in the first quarter of 2017 regarding certain subsidiaries involved in the colocation business, that we will trigger tax expense relating to the sale of approximately $100 million to $200 million.
For additional information on our goodwill, see Note 4—Goodwill, Customer Relationships and Other Intangible Assets.
A-56
Table of Contents
| (4) | Goodwill, Customer Relationships and Other Intangible Assets |
Goodwill, customer relationships and other intangible assets consisted of the following:
| As of December 31, | ||||||||
| 2016 | 2015 | |||||||
| (Dollars in millions) | ||||||||
| Goodwill |
$ | 19,650 | 20,742 | |||||
|
|
|
|
|
|||||
| Customer relationships, less accumulated amortization of $6,318 and $5,648 |
2,797 | 3,928 | ||||||
|
|
|
|
|
|||||
| Indefinite-life intangible assets |
269 | 269 | ||||||
| Other intangible assets subject to amortization: |
||||||||
| Capitalized software, less accumulated amortization of $2,019 and $1,778 |
1,227 | 1,248 | ||||||
| Trade names and patents, less accumulated amortization of $23 and $20 |
35 | 38 | ||||||
|
|
|
|
|
|||||
| Total other intangible assets, net |
$ | 1,531 | 1,555 | |||||
|
|
|
|
|
|||||
Total amortization expense for intangible assets for the years ended December 31, 2016, 2015 and 2014 was $1.225 billion, $1.353 billion and $1.470 billion, respectively. As of December 31, 2016, the gross carrying amount of goodwill, customer relationships, indefinite-life and other intangible assets was $32.338 billion.
We estimate that total amortization expense for intangible assets for the years ending December 31, 2017 through 2021 will be as follows:
| (Dollars in millions) | ||||
| 2017 |
$ | 1,044 | ||
| 2018 |
925 | |||
| 2019 |
808 | |||
| 2020 |
703 | |||
| 2021 |
268 | |||
Our goodwill was derived from numerous acquisitions where the purchase price exceeded the fair value of the net assets acquired.
We assess our goodwill and other indefinite-lived intangible assets for impairment annually, or, under certain circumstances, more frequently, such as when events or changes in circumstances indicate there may be impairment. We are required to write down the value of goodwill only when our assessment determines the recorded amount of goodwill exceeds the fair value. Our annual impairment assessment date for goodwill is October 31, at which date we assessed our reporting units, which are business (excluding wholesale), consumer and wholesale. Our annual impairment assessment date for indefinite-lived intangible assets other than goodwill is December 31.
Our reporting units are not discrete legal entities with discrete financial statements. Our assets and liabilities are employed in and relate to the operations of multiple reporting units. For each reporting unit, we compare its estimated fair value of equity to its carrying value of equity that we assign to the reporting unit. If the estimated fair value of the reporting unit is greater than the carrying value, we conclude that no impairment exists. If the estimated fair value of the reporting unit is less than the carrying value, a second calculation is required in which the implied fair value of goodwill is compared to the carrying value of goodwill that we assigned to the reporting unit. If the implied fair value of goodwill is less than its carrying value, goodwill must be written down to its implied fair value.
At October 31, 2016, we utilized a level 3 valuation technique to estimate the fair value of our business (excluding wholesale), consumer and wholesale reporting units by considering both a market approach and a
A-57
Table of Contents
discounted cash flow method. The market approach method includes the use of comparable multiples of publicly traded companies whose services are comparable to ours. The discounted cash flow method is based on the present value of projected cash flows and a terminal value, which represents the expected normalized cash flows of the reporting units beyond the cash flows from the discrete projection period. We discounted the estimated cash flows for our consumer and wholesale reporting units using a rate that represents their estimated weighted average cost of capital, which we determined to be approximately 6.0% as of the assessment date (which was comprised of an after-tax cost of debt of 2.8% and a cost of equity of 6.2%). We discounted the estimated cash flows of our business (excluding wholesale) reporting unit using a rate that represents its estimated weighted average cost of capital, which we determined to be approximately 7.0% as of the assessment date (which was comprised of an after-tax cost of debt of 2.8% and a cost of equity of 6.8%). We also reconciled the estimated fair values of the reporting units to our market capitalization as of October 31, 2016 and concluded that the indicated implied control premium of approximately 33.8% was reasonable based on recent transactions in the market place. As of October 31, 2016, based on our assessment performed with respect to these reporting units as described above, we concluded that our goodwill for our three reporting units was not impaired as of that date.
The following table shows the rollforward of goodwill assigned to our reportable segments from December 31, 2014 through December 31, 2016.
| Business | Consumer | Total | ||||||||||
| (Dollars in millions) | ||||||||||||
| As of December 31, 2014(1) |
$ | 10,477 | 10,278 | 20,755 | ||||||||
| Purchase accounting and other adjustments |
(13 | ) | — | (13 | ) | |||||||
|
|
|
|
|
|
|
|||||||
| As of December 31, 2015(1) |
10,464 | 10,278 | 20,742 | |||||||||
| Purchase accounting and other adjustments |
49 | — | 49 | |||||||||
| Goodwill attributable to the colocation business and data centers reclassified to assets held for sale |
(1,141 | ) | — | (1,141 | ) | |||||||
|
|
|
|
|
|
|
|||||||
| As of December 31, 2016(1) |
$ | 9,372 | $ | 10,278 | $ | 19,650 | ||||||
|
|
|
|
|
|
|
|||||||
| (1) | Goodwill is net of accumulated impairment losses of $1.1 billion that related to our former hosting segment now included in our business segment. |
During 2016, we acquired all of the outstanding stock of three companies for total consideration of $53 million, including future deferred or contingent cash payments of $14 million, of which $49 million has initially been attributed to goodwill. The valuation for these three acquisitions is preliminary and subject to change during the measurement period, which will end one year from the date of each acquisition. These acquisitions were consummated to expand the product offerings of our business segment and therefore the goodwill has been assigned to that segment. The majority of the goodwill is attributed primarily to expected future increases in business segment revenue from the sale of new products. The majority of the goodwill from these acquisitions is expected to be deductible for tax purposes.
None of the above-described acquisitions materially impacted the consolidated results of operations from the dates of the acquisitions and would not materially impact pro forma results of operations.
For additional information on our segments, see Note 14—Segment Information.
We completed our qualitative assessment of our indefinite-lived intangible assets other than goodwill as of December 31, 2016 and concluded it is more likely than not that our indefinite-lived intangible assets are not impaired; thus, no impairment charge was recorded in 2016.
As of October 31, 2015, based on our assessment performed, we concluded that our goodwill for our then three reporting units was not impaired as of that date. As of October 31, 2014, based on our assessment performed, we concluded that our goodwill for our then four reporting units was not impaired as of that date.
A-58
Table of Contents
| (5) | Long-Term Debt and Credit Facilities |
Long-term debt, including unamortized discounts and premiums and unamortized debt issuance costs, consisting of borrowings by CenturyLink, Inc. and certain of its subsidiaries, including Qwest Corporation, Qwest Capital Funding, Inc. and Embarq Corporation and its subsidiaries (“Embarq”), were as follows:
| As of December 31, | ||||||||||||
| Interest Rates | Maturities | 2016 | 2015 | |||||||||
| (Dollars in millions) | ||||||||||||
| CenturyLink, Inc. |
||||||||||||
| Senior notes |
5.150% - 7.650% | 2017 - 2042 | $ | 8,975 | 7,975 | |||||||
| Credit facility and revolving line of credit(1) |
4.500% | 2019 | 370 | 410 | ||||||||
| Term loan |
2.520% | 2019 | 336 | 358 | ||||||||
| Subsidiaries |
||||||||||||
| Qwest Corporation |
||||||||||||
| Senior notes |
6.125% - 7.750% | 2017 - 2056 | 7,259 | 7,229 | ||||||||
| Term loan |
2.520% | 2025 | 100 | 100 | ||||||||
| Qwest Capital Funding, Inc. |
||||||||||||
| Senior notes |
6.500% - 7.750% | 2018 - 2031 | 981 | 981 | ||||||||
| Embarq Corporation and subsidiaries |
||||||||||||
| Senior note |
7.995% | 2036 | 1,485 | 2,669 | ||||||||
| First mortgage bonds |
7.125% - 8.770% | 2017 - 2025 | 223 | 232 | ||||||||
| Other |
9.000% | 2019 | 150 | 150 | ||||||||
| Capital lease and other obligations |
Various | Various | 440 | 425 | ||||||||
| Unamortized discounts, net |
(133 | ) | (125 | ) | ||||||||
| Unamortized debt issuance costs |
(193 | ) | (179 | ) | ||||||||
|
|
|
|
|
|||||||||
| Total long-term debt |
19,993 | 20,225 | ||||||||||
| Less current maturities not associated with assets held for sale |
(1,503 | ) | (1,503 | ) | ||||||||
| Less capital lease obligations associated with assets held for sale(2) |
(305 | ) | — | |||||||||
|
|
|
|
|
|||||||||
| Long-term debt, excluding current maturities and capital leases obligations associated with assets held for sale |
$ | 18,185 | 18,722 | |||||||||
|
|
|
|
|
|||||||||
| (1) | The aggregate amount outstanding on our Credit Facility and revolving line of credit borrowings at December 31, 2016 and 2015 was $370 million and $410 million, respectively, with weighted-average interest rates of 4.500% and 2.756%, respectively. These amounts change on a regular basis. |
| (2) | If, as anticipated, we sell our colocation business and data centers in the manner discussed in Note 3—Pending Sale of Colocation Business and Data Centers, $305 million of the capital lease obligations as of December 31, 2016 will be assumed by the Purchaser. See Note 3—Pending Sale of Colocation Business and Data Centers for additional information. |
New Issuances
2016
On August 22, 2016, Qwest Corporation issued $978 million aggregate principal amount of 6.5% Notes due 2056, including $128 million principal amount that was sold pursuant to an over-allotment option, in exchange for net proceeds, after deducting underwriting discounts and other expenses, of $946 million. All of the 6.5% Notes are unsecured obligations and may be redeemed by Qwest Corporation, in whole or in part, on or after September 1, 2021, at a redemption price equal to 100% of the principal amount redeemed plus accrued and unpaid interest to the redemption date.
A-59
Table of Contents
On April 6, 2016, CenturyLink, Inc. issued $1 billion aggregate principal amount of 7.5% Notes due 2024, in exchange for net proceeds, after deducting underwriting discounts and other expenses, of $988 million. All of the 7.5% Notes are unsecured obligations and may be redeemed by CenturyLink, Inc., in whole or in part, on or after January 1, 2024, at a redemption price equal to 100% of the principal amount redeemed plus accrued and unpaid interest to the redemption date. At any time before January 1, 2024, the Notes are redeemable, in whole or in part, at CenturyLink, Inc.’s option, at a redemption price equal to the greater of 100% of the principal amount of the Notes to be redeemed or the sum of the present values of the remaining scheduled payments of principal and interest on the Notes to be redeemed, discounted to the redemption date in the manner described in the Notes, plus accrued and unpaid interest to the redemption date. In addition, at any time on or prior to April 1, 2019, CenturyLink, Inc. may redeem up to 35% of the aggregate principal amount of the Notes at a redemption price of 107.5% of the principal amount thereof, plus accrued and unpaid interest to the redemption date, with the net proceeds of certain equity offerings. Under certain circumstances, CenturyLink, Inc. will be required to make an offer to repurchase the Notes at a price of 101% of the aggregate principal amount plus accrued and unpaid interest to the repurchase date.
On January 29, 2016, Qwest Corporation issued $235 million aggregate principal amount of 7% Notes due 2056, in exchange for net proceeds, after deducting underwriting discounts and other expenses, of $227 million. All of the 7% Notes are unsecured obligations and may be redeemed by Qwest Corporation, in whole or in part, on or after February 1, 2021, at a redemption price equal to 100% of the principal amount redeemed plus accrued and unpaid interest to the redemption date.
2015
On September 21, 2015, Qwest Corporation issued $400 million aggregate principal amount of 6.625% Notes due 2055, in exchange for net proceeds, after deducting underwriting discounts and other expenses, of approximately $386 million. On September 30, 2015, Qwest Corporation issued an additional $10 million aggregate principal amount of the 6.625% Notes under an over-allotment option granted to the underwriter for this offering. All of the 6.625% Notes are unsecured obligations and may be redeemed by Qwest Corporation, in whole or in part, on or after September 15, 2020, at a redemption price equal to 100% of the principal amount redeemed plus accrued and unpaid interest to the redemption date.
On March 19, 2015, CenturyLink, Inc. issued in a private offering $500 million aggregate principal amount of 5.625% Notes due 2025, in exchange for net proceeds, after deducting underwriting discounts and other expenses, of approximately $494 million. The Notes are senior unsecured obligations and may be redeemed, in whole or in part, at any time before January 1, 2025 at a redemption price equal to the greater of 100% of the principal amount of the Notes or the sum of the present value of the remaining scheduled payments of principal and interest on the Notes, discounted to the redemption date in the manner described in the Notes, plus accrued and unpaid interest to the redemption date. At any time on or after January 1, 2025, CenturyLink, Inc. may redeem the Notes at par plus accrued and unpaid interest to the redemption date. In addition, at any time on or prior to April 1, 2018, CenturyLink, Inc. may redeem up to 35% of the principal amount of the Notes at a redemption price equal to 105.625% of the principal amount thereof, plus accrued and unpaid interest to the redemption date, with net cash proceeds of certain equity offerings. Under certain circumstances, CenturyLink, Inc. will be required to make an offer to repurchase the Notes at a price of 101% of the aggregate principal amount plus accrued and unpaid interest to the repurchase date. In October 2015, CenturyLink, Inc. exchanged all of the unregistered Notes issued on March 19, 2015 for fully-registered Notes.
A-60
Table of Contents
Repayments
2016
On December 23, 2016, a subsidiary of Embarq Corporation redeemed $5 million of its 8.375% Notes due 2025, which resulted in an immaterial loss.
On September 19, 2016, a subsidiary of Embarq Corporation redeemed all of its 8.77% Notes due 2017, which was less than $4 million and resulted in an immaterial loss.
On September 15, 2016, Qwest Corporation redeemed $287 million of its 7.5% Notes due 2051, which resulted in a loss of $9 million.
On August 29, 2016, Qwest Corporation redeemed all $661 million of its 7.375% Notes due 2051, which resulted in a loss of $18 million.
On June 1, 2016, Embarq Corporation paid at maturity the $1.184 billion principal amount and accrued and unpaid interest due under its 7.082% Notes.
On May 2, 2016, Qwest Corporation paid at maturity the $235 million principal amount and accrued and unpaid interest due under its 8.375% Notes.
2015
On October 13, 2015, Qwest Corporation redeemed all $250 million of its 7.2% Notes due 2026, which resulted in an immaterial gain, and redeemed $150 million of its 6.875% Notes due 2033, which resulted in an immaterial loss.
On June 15, 2015, Qwest Corporation paid at maturity the $92 million principal amount of its 7.625% Notes.
On February 17, 2015, CenturyLink, Inc. paid at maturity the $350 million principal and accrued and unpaid interest due under its Series M 5.00% Notes.
Credit Facility
Our $2 billion revolving credit facility (as amended, the “Credit Facility”) matures on December 3, 2019 and has 16 lenders, each with commitments ranging from $3.5 million to $198.5 million. The Credit Facility allows us to obtain revolving loans and to issue up to $400 million of letters of credit, which upon issuance reduce the amount available for other extensions of credit. Interest is assessed on borrowings using either the LIBOR or the base rate (each as defined in the Credit Facility) plus an applicable margin between 1.00% and 2.25% per annum for LIBOR loans and 0.00% and 1.25% per annum for base rate loans depending on our then current senior unsecured long-term debt rating. Our obligations under the Credit Facility are guaranteed by nine of our subsidiaries.
Term Loans, Revolving Line of Credit and Revolving Letter of Credit
The CenturyLink, Inc. term loan matures on April 18, 2019. In 2015, CenturyLink amended its term loan agreement to reduce the interest rate payable by it thereunder and to modify some covenants to provide additional flexibility.
In 2015, Qwest Corporation entered into a term loan in the amount of $100 million with CoBank, ACB. The outstanding unpaid principal amount of this term loan plus any accrued and unpaid interest is due on
A-61
Table of Contents
February 20, 2025. Interest is paid monthly based upon either the London Interbank Offered Rate (“LIBOR”) or the base rate (as defined in the credit agreement) plus an applicable margin between 1.50% to 2.50% per annum for LIBOR loans and 0.50% to 1.50% per annum for base rate loans depending on Qwest Corporation’s then current senior unsecured long-term debt rating. At both December 31, 2016 and 2015, the outstanding principal balance on this term loan was $100 million.
In 2016, our $85 million uncommitted revolving line of credit with one of the lenders under the Credit Facility was suspended as a result of this lender’s additional borrowing commitment towards the pending acquisition of Level 3. Interest is paid monthly based upon the LIBOR plus an applicable margin between 1.00% and 2.25% per annum. At December 31, 2016, CenturyLink, Inc. had no borrowings outstanding under this uncommitted revolving line of credit and at December 31, 2015, CenturyLink, Inc. had $80 million borrowings outstanding under this uncommitted revolving line of credit.
In April 2011, we entered into a $160 million uncommitted revolving letter of credit facility which enables us to provide letters of credit under terms that may be more favorable than those under the Credit Facility. At December 31, 2016 and 2015, our outstanding letters of credit totaled $105 million and $109 million, respectively, under this facility.
Aggregate Maturities of Long-Term Debt
Set forth below is the aggregate principal amount of our long-term debt (excluding unamortized discounts, net and unamortized debt issuance costs) maturing during the following years:
| (Dollars in millions)(1) | ||||
| 2017 |
$ | 1,544 | ||
| 2018 |
280 | |||
| 2019 |
1,131 | |||
| 2020 |
1,032 | |||
| 2021 |
2,329 | |||
| 2022 and thereafter |
14,003 | |||
|
|
|
|||
| Total long-term debt |
$ | 20,319 | ||
|
|
|
|||
| (1) | Actual principal paid in any year may differ due to the possible future refinancing of outstanding debt or the issuance of new debt. The projected amounts in the table also exclude any impacts from the sale of our colocation business or any further acquisitions. |
Interest Expense
Interest expense includes interest on total long-term debt. The following table presents the amount of gross interest expense, net of capitalized interest:
| Years Ended December 31, | ||||||||||||
| 2016 | 2015 | 2014 | ||||||||||
| (Dollars in millions) | ||||||||||||
| Interest expense: |
||||||||||||
| Gross interest expense |
$ | 1,372 | 1,364 | 1,358 | ||||||||
| Capitalized interest |
(54 | ) | (52 | ) | (47 | ) | ||||||
|
|
|
|
|
|
|
|||||||
| Total interest expense |
$ | 1,318 | 1,312 | 1,311 | ||||||||
|
|
|
|
|
|
|
|||||||
A-62
Table of Contents
Covenants
Certain of our loan agreements contain various restrictions, as described more fully below. Under current circumstances, we believe the covenants currently in effect place no significant restriction on the transfer of funds from our consolidated subsidiaries to CenturyLink.
The senior notes of CenturyLink, Inc. were issued under an indenture dated March 31, 1994. This indenture restricts our ability to (i) incur, issue or create liens upon the property of CenturyLink, Inc. and (ii) consolidate with or merge into, or transfer or lease all or substantially all of our assets to any other party. The indenture does not contain any provisions that are impacted by our credit ratings or that restrict the issuance of new securities in the event of a material adverse change to us. However, if the credit ratings relating to certain of our long-term debt securities issued under this indenture are downgraded in the manner specified thereunder in connection with a “change of control” of CenturyLink, Inc., then we will be required to offer to repurchase such debt securities.
The senior notes of Qwest Corporation were issued under indentures dated April 15, 1990 and October 15, 1999. These indentures contain restrictions on the incurrence of liens and the consummation of certain transactions substantially similar to the above-described covenants in CenturyLink, Inc.’s March 31, 1994 indenture. The senior notes of Qwest Capital Funding, Inc. were issued under an indenture dated June 29, 1998 containing terms substantially similar to those set forth in Qwest Corporation’s indentures.
Embarq’s senior note was issued pursuant to an indenture dated as of May 17, 2006. While Embarq is generally prohibited from creating liens on its property unless its senior notes are secured equally and ratably, Embarq can create liens on its property without equally and ratably securing its senior notes so long as the sum of all indebtedness so secured does not exceed 15% of Embarq’s consolidated net tangible assets. The indenture contains customary events of default, none of which are impacted by Embarq’s credit rating.
None of the above-listed indentures of CenturyLink, Inc., Qwest Corporation, Qwest Capital Funding, Inc. and Embarq contain any financial covenants or restrictions on the ability to issue new securities in accordance with the terms of the indenture.
Several of our Embarq subsidiaries have outstanding first mortgage bonds. Each issue of these first mortgage bonds is secured by substantially all of the property, plant and equipment of the issuing subsidiary. Approximately 10% of our net property, plant and equipment is pledged to secure the long-term debt of subsidiaries.
Under the Credit Facility, we, and our indirect subsidiary, Qwest Corporation, must maintain a debt to EBITDA (earnings before interest, taxes, depreciation and amortization, as defined in our Credit Facility) ratio of not more than 4.0:1.0 and 2.85:1.0, respectively, as of the last day of each fiscal quarter for the four quarters then ended. The Credit Facility also contains a negative pledge covenant, which generally requires us to secure equally and ratably any advances under the Credit Facility if we pledge assets or permit liens on our property for the benefit of other debtholders. The Credit Facility also has a cross payment default provision, and the Credit Facility and certain of our debt securities also have cross acceleration provisions. When present, these provisions could have a wider impact on liquidity than might otherwise arise from a default or acceleration of a single debt instrument. Our debt to EBITDA ratios could be adversely affected by a wide variety of events, including unforeseen expenses or contingencies. This could reduce our financing flexibility due to potential restrictions on incurring additional debt under certain provisions of our debt agreements or, in certain circumstances, could result in a default under certain provisions of such agreements.
CenturyLink, Inc. and Qwest Corporation are both indebted under term loans, each of which includes covenants substantially similar to those set forth in the Credit Facility.
At December 31, 2016, we believe we were in compliance with all of the provisions and covenants contained in our Credit Facility and other material debt agreements.
A-63
Table of Contents
Guarantees
We do not guarantee the debt of any unaffiliated parties, but certain of our subsidiaries guarantee the outstanding senior notes issued by other subsidiaries. In addition, nine of our largest wholly owned subsidiaries guarantee the obligations of CenturyLink, Inc. under the Credit Facility and its term loan.
Level 3 Financing Commitment Letter
In connection with entering into our merger agreement with Level 3 (discussed further in Note 2), on October 31, 2016, we obtained a debt commitment letter, which was amended and restated on November 13, 2016, and further amended on November 15, 2016 (the “Debt Commitment Letter”), from Bank of America, N.A., Morgan Stanley Senior Funding, Inc., The Bank of Tokyo-Mitsubishi UFJ, Ltd., Barclays Bank PLC, JPMorgan Chase Bank, N.A., Wells Fargo Bank, National Association, Royal Bank of Canada, Goldman Sachs Bank USA, SunTrust Bank, Mizuho Bank, Ltd., Regions Bank, Fifth Third Bank, Credit Suisse AG, Cayman Islands Branch, and U.S. Bank, National Association (collectively the “Commitment Parties”), pursuant to which the Commitment Parties or certain of their affiliates agreed to provide a $2.0 billion senior secured revolving credit facility, a $1.5 billion senior secured term loan “A” credit facility, a $4.5 billion senior secured term loan “B” credit facility and a $2.225 billion senior secured bridge loan facility (collectively, the “Commitment Facilities”), together with certain backstop commitments designed to provide additional acquisition-related financing in certain limited instances. The secured bridge loan facility will only be drawn to the extent we are unable to raise such amounts by issuing senior secured notes or other debt securities at or prior to the closing of the Level 3 acquisition. The senior secured revolving credit facility is designed to replace the Credit Facility. Bank of America, N.A. and Morgan Stanley Senior Funding, Inc., affiliates of BofA Merrill Lynch and Morgan Stanley, will be entitled to receive financing fees in connection with the debt commitment letter, the amount of which will vary based on, among other things, when the debt financing is incurred, whether the previously-announced divestiture of our data centers and colocation business closes prior to the Level 3 acquisition and whether the bridge loan facility is drawn. The financing fees to be payable to Bank of America, N.A. and Morgan Stanley Senior Funding, Inc. are expected to be quite substantial.
Each Commitment Party’s commitments to provide the Commitment Facilities and each Commitment Party’s agreements to perform the services described in the Commitment Letter will automatically terminate on the earliest of (i) the date of termination of our merger agreement with Level 3 in accordance with its terms, (ii) the closing of the Level 3 acquisition with or without the use of such Commitment Facilities and (iii) 11:59 p.m. on October 31, 2017 (or, if the “Termination Date” as defined in the merger agreement is extended in certain circumstances, the date to which it is extended that is not later than 11:59 p.m. on January 31, 2018).
The definitive documentation governing the Level 3 debt financing has not been finalized and, accordingly, the actual terms of the debt financing may differ from those described above. Although the debt financing described above is not subject to due diligence or a “market out,” such financing may not be considered assured. The obligation of the Commitment Parties to provide debt financing under the debt commitment letter is subject to a number of conditions, and it is anticipated that the definitive debt financing documentation will also include certain funding conditions. There is a risk that these conditions will not be satisfied and the debt financing may not be available when required. In addition, we have the right to substitute the proceeds of other debt financing, or commitments for other debt financing, for all or any portion of the Commitment Facilities. As of the date of our Annual Report on Form 10-K for the year ended December 31, 2016, no such other debt financing has been arranged.
A-64
Table of Contents
| (6) | Accounts Receivable |
The following table presents details of our accounts receivable balances:
| As of December 31, |
||||||||
| 2016 | 2015 | |||||||
| (Dollars in millions) | ||||||||
| Trade and purchased receivables |
$ | 1,882 | 1,789 | |||||
| Earned and unbilled receivables |
299 | 288 | ||||||
| Other |
14 | 18 | ||||||
|
|
|
|
|
|||||
| Total accounts receivable |
2,195 | 2,095 | ||||||
| Less: allowance for doubtful accounts |
(178 | ) | (152 | ) | ||||
|
|
|
|
|
|||||
| Accounts receivable, less allowance |
$ | 2,017 | 1,943 | |||||
|
|
|
|
|
|||||
We are exposed to concentrations of credit risk from residential and business customers within our local service area, business customers outside of our local service area and from other telecommunications service providers. We generally do not require collateral to secure our receivable balances. We have agreements with other telecommunications service providers whereby we agree to bill and collect on their behalf for services rendered by those providers to our customers within our local service area. We purchase accounts receivable from other telecommunications service providers primarily on a recourse basis and include these amounts in our accounts receivable balance. We have not experienced any significant loss associated with these purchased receivables.
The following table presents details of our allowance for doubtful accounts:
| Beginning Balance |
Additions | Deductions | Ending Balance |
|||||||||||||
| (Dollars in millions) | ||||||||||||||||
| 2016 |
$ | 152 | 192 | (166 | ) | 178 | ||||||||||
| 2015 |
$ | 162 | 177 | (187 | ) | 152 | ||||||||||
| 2014 |
$ | 155 | 159 | (152 | ) | 162 | ||||||||||
| (7) | Property, Plant and Equipment |
Net property, plant and equipment is composed of the following:
| Depreciable Lives |
As of December 31, | |||||||||
| 2016 | 2015 | |||||||||
| (Dollars in millions) | ||||||||||
| Land |
N/A | $ | 563 | 571 | ||||||
| Fiber, conduit and other outside plant(1) |
15-45 years | 16,996 | 16,166 | |||||||
| Central office and other network electronics(2) |
3-10 years | 13,768 | 14,144 | |||||||
| Support assets(3) |
3-30 years | 6,623 | 7,000 | |||||||
| Construction in progress(4) |
N/A | 1,244 | 904 | |||||||
|
|
|
|
|
|||||||
| Gross property, plant and equipment |
39,194 | 38,785 | ||||||||
| Accumulated depreciation |
(22,155 | ) | (20,716 | ) | ||||||
|
|
|
|
|
|||||||
| Net property, plant and equipment |
$ | 17,039 | 18,069 | |||||||
|
|
|
|
|
|||||||
| (1) | Fiber, conduit and other outside plant consists of fiber and metallic cable, conduit, poles and other supporting structures. |
| (2) | Central office and other network electronics consists of circuit and packet switches, routers, transmission electronics and electronics providing service to customers. |
A-65
Table of Contents
| (3) | Support assets consist of buildings, data centers, computers and other administrative and support equipment. |
| (4) | Construction in progress includes inventory held for construction and property of the aforementioned categories that has not been placed in service as it is still under construction. |
See Note 3—Pending Sale of Colocation Business and Data Centers for additional information on our colocation assets and data centers reclassified to assets held for sale.
We recorded depreciation expense of $2.691 billion, $2.836 billion and $2.958 billion for the years ended December 31, 2016, 2015 and 2014, respectively.
In 2014, we recorded an impairment charge of $17 million in connection with a sale-leaseback transaction involving an office building that we closed in the fourth quarter of 2014. This impairment charge is included in selling, general and administrative expense in our consolidated statement of operations for the year ended December 31, 2014.
Additionally, in 2014 we sold an office building for $12 million.
Asset Retirement Obligations
At December 31, 2016, our asset retirement obligations balance was primarily related to estimated future costs of removing equipment from leased properties and estimated future costs of properly disposing of asbestos and other hazardous materials upon remodeling or demolishing buildings. Asset retirement obligations are included in other long-term liabilities on our consolidated balance sheets.
The following table provides asset retirement obligation activity:
| Years Ended December 31, |
||||||||||||
| 2016 | 2015 | 2014 | ||||||||||
| (Dollars in millions) | ||||||||||||
| Balance at beginning of year |
$ | 91 | 107 | 106 | ||||||||
| Accretion expense |
6 | 7 | 7 | |||||||||
| Liabilities incurred |
— | — | 6 | |||||||||
| Liabilities settled |
(2 | ) | (2 | ) | (2 | ) | ||||||
| Change in estimate |
— | (21 | ) | (10 | ) | |||||||
|
|
|
|
|
|
|
|||||||
| Balance at end of year |
$ | 95 | 91 | 107 | ||||||||
|
|
|
|
|
|
|
|||||||
If, as anticipated, we sell our colocation business and data centers in the manner discussed in Note 3, $19 million of the asset retirement obligation as of December 31, 2016 will be assumed by the Purchaser.
Our estimates for the cost of removal of network equipment, asbestos remediation and other obligations remained unchanged for the year ended December 31, 2016. During 2015 and 2014, we revised our estimates for the cost of removal of network equipment, asbestos remediation, and other obligations by $21 million and $10 million, respectively. These revisions resulted in a reduction of the asset retirement obligation and offsetting reduction to gross property, plant and equipment, and revisions to assets specifically identified are recorded as a reduction to accretion expense.
| (8) | Severance and Leased Real Estate |
Periodically, we reduce our workforce and accrue liabilities for the related severance costs. These workforce reductions resulted primarily from the progression or completion of our post-acquisition integration plans, increased competitive pressures, cost reduction initiatives, process improvements through automation and reduced workload demands due to the loss of customers purchasing certain services.
A-66
Table of Contents
We report severance liabilities within accrued expenses and other liabilities—salaries and benefits in our consolidated balance sheets and report severance expenses in selling, general and administrative expenses in our consolidated statements of operations. As noted in Note 14—Segment Information, we do not allocate these severance expenses to our segments.
We have recognized liabilities to reflect our estimates of the fair values of the existing lease obligations for real estate which we have ceased using, net of estimated sublease rentals. Our fair value estimates were determined using discounted cash flow methods. We recognize expense to reflect accretion of the discounted liabilities and periodically we adjust the expense when our actual subleasing experience differs from our initial estimates. We report the current portion of liabilities for ceased-use real estate leases in accrued expenses and other liabilities-other and report the noncurrent portion in deferred credits and other liabilities in our consolidated balance sheets. We report the related expenses in selling, general and administrative expenses in our consolidated statements of operations. At December 31, 2016, the current and noncurrent portions of our leased real estate accrual were $8 million and $59 million, respectively. The remaining lease terms range from 1.2 years to 9.0 years, with a weighted average of 7.8 years.
Changes in our accrued liabilities for severance expenses and leased real estate were as follows:
| Severance | Real Estate |
|||||||
| (Dollars in millions) | ||||||||
| Balance at December 31, 2014 |
$ | 26 | 96 | |||||
| Accrued to expense |
96 | — | ||||||
| Payments, net |
(108 | ) | (13 | ) | ||||
| Reversals and adjustments |
— | (3 | ) | |||||
|
|
|
|
|
|||||
| Balance at December 31, 2015 |
14 | 80 | ||||||
| Accrued to expense |
173 | 4 | ||||||
| Payments, net |
(89 | ) | (20 | ) | ||||
| Reversals and adjustments |
— | 3 | ||||||
|
|
|
|
|
|||||
| Balance at December 31, 2016 |
$ | 98 | 67 | |||||
|
|
|
|
|
|||||
| (9) | Employee Benefits |
Pension, Post-Retirement and Other Post-Employment Benefits
We sponsor various defined benefit pension plans (qualified and non-qualified), which in the aggregate cover a substantial portion of our employees including legacy CenturyLink, legacy Qwest Communications International, Inc. (“Qwest”) and legacy Embarq employees. On December 31, 2014, we merged our existing qualified pension plans, which included merging the Qwest Pension Plan and Embarq Retirement Pension Plan into the CenturyLink Retirement Plan. The CenturyLink Retirement Plan was renamed the CenturyLink Combined Pension Plan (“Combined Plan”). Pension benefits for participants of the new Combined Plan who are represented by a collective bargaining agreement are based on negotiated schedules. All other participants’ pension benefits are based on each individual participant’s years of service and compensation. We also maintain non-qualified pension plans for certain current and former highly compensated employees. We maintain post-retirement benefit plans that provide health care and life insurance benefits for certain eligible retirees. We also provide other post-employment benefits for certain eligible former employees. We use a December 31 measurement date for all our plans.
Pension Benefits
Current funding laws require a company with a pension shortfall to fund the annual cost of benefits earned in addition to a seven-year amortization of the shortfall. Our funding policy for our Combined Plan is to make
A-67
Table of Contents
contributions with the objective of accumulating sufficient assets to pay all qualified pension benefits when due under the terms of the plan. The accounting unfunded status of our qualified pension plan was $2.352 billion and $2.215 billion as of December 31, 2016 and 2015, respectively.
We made a voluntary cash contribution of $100 million in both 2016 and 2015 to our qualified pension plan and paid $7 million and $6 million of benefits directly to participants of our non-qualified pension plans in 2016 and 2015, respectively. Based on current laws and circumstances, we are not required to make any contributions to our qualified pension plan in 2017, but we estimate that we will pay $6 million of benefits directly to participants of our non-qualified pension plans. We currently expect to make a voluntary contribution of $100 million to the trust for our qualified pension plan in 2017.
Our pension plans contain provisions that allow us, from time to time, to offer lump sum payment options to certain former employees in settlement of their future retirement benefits. Additionally, eligible employees who terminate employment may elect to receive a lump sum payout. We record these payments as a settlement only if, in the aggregate, they exceed the sum of the annual service and interest costs for the plan’s net periodic pension benefit costs, which represents the settlement threshold. There were no pension lump sum offerings in 2016, other than those to eligible employees who terminated during 2016. In 2015, we made cash settlement payments of $356 million through a lump sum offering to a group of former employees. The total amount of the lump sum settlement payments for the year ended December 31, 2015, which included the lump sum offer and lump sum elections from employees who terminated employment during the year, was less than the settlement threshold, therefore settlement accounting was not triggered in 2015. In 2014, lump sum pension settlement payments to terminated, but not-yet-retired legacy Qwest participants was $460 million, which exceeded the settlement threshold of $418 million. As a result, we were required to recognize a settlement charge of $63 million in 2014 to accelerate the recognition of a portion of the previously unrecognized actuarial losses in the qualified pension plan, which has been allocated and reflected in cost of services and products (exclusive of depreciation and amortization) and selling, general and administrative in our consolidated statement of operations for the year ended December 31, 2014. This charge reduced our recorded net income and retained earnings, with an offset to accumulated other comprehensive loss in shareholders’ equity. The amount of any future non-cash settlement charges will depend on the level of lump sum benefit payments made in 2017 and beyond.
Post-Retirement Benefits
Our post-retirement benefit plans provide post-retirement benefits to qualified retirees and allow (i) eligible employees retiring before certain dates to receive benefits at no or reduced cost and (ii) eligible employees retiring after certain dates to receive benefits on a shared cost basis. The post-retirement benefits not paid by the trust are funded by us and we expect to continue funding these post-retirement obligations as benefits are paid. The accounting unfunded status of our qualified post-retirement benefit plan was $3.360 billion and $3.374 billion as of December 31, 2016 and 2015, respectively.
Assets in the post-retirement trusts have been substantially depleted as of December 31, 2016; however we will continue to pay certain post-retirement benefits through the trusts. No contributions were made to the post-retirement trusts in 2016, and we do not expect to make a contribution in 2017. In 2016, we paid $129 million of post-retirement benefits, net of participant contributions and direct subsidies. In 2017, we expect to pay $275 million of post-retirement benefits, net of participant contributions and direct subsidies. The increase in anticipated post-retirement benefit payments is the result of substantially depleting the plan assets held in the trust.
We expect our health care cost trend rate to range from 5.0% to 5.5% in 2017 to 5.0% to 6.0% in 2018 and 2019 and grading to 4.50% by 2025. Our post-retirement benefit expense, for certain eligible legacy Qwest retirees and certain eligible legacy CenturyLink retirees, is capped at a set dollar amount. Therefore, those health care benefit obligations are not subject to increasing health care trends after the effective date of the caps.
A-68
Table of Contents
A change of 100 basis points in the assumed initial health care cost trend rate would have had the following effects in 2016:
| 100 Basis Points Change |
||||||||||||||||
| Increase | (Decrease) | |||||||||||||||
| (Dollars in millions) | ||||||||||||||||
| Effect on the aggregate of the service and interest cost components of net periodic post-retirement benefit expense (consolidated statement of operations) |
$ | 2 | (2 | ) | ||||||||||||
| Effect on benefit obligation (consolidated balance sheet) |
66 | (61 | ) | |||||||||||||
Expected Cash Flows
The qualified pension, non-qualified pension and post-retirement health care benefit payments and premiums and life insurance premium payments are paid by us or distributed from plan assets. The estimated benefit payments provided below are based on actuarial assumptions using the demographics of the employee and retiree populations and have been reduced by estimated participant contributions.
| Pension Plans |
Post-Retirement Benefit Plans |
Medicare Part D Subsidy Receipts |
||||||||||
| (Dollars in millions) | ||||||||||||
| Estimated future benefit payments: |
||||||||||||
| 2017 |
$ | 1,277 | 295 | (6 | ) | |||||||
| 2018 |
987 | 284 | (6 | ) | ||||||||
| 2019 |
968 | 275 | (6 | ) | ||||||||
| 2020 |
948 | 267 | (6 | ) | ||||||||
| 2021 |
928 | 259 | (6 | ) | ||||||||
| 2022—2026 |
4,280 | 1,160 | (26 | ) | ||||||||
A-69
Table of Contents
Net Periodic Benefit Expense
In 2016, we changed the method we use to estimate the service and interest components of net periodic benefit expense for pension and other postretirement benefit obligations. This change resulted in a decrease in the service and interest components in 2016. Beginning in 2016, we utilized a full yield curve approach in connection with estimating these components by applying the specific spot rates along the yield curve used in the determination of the benefit obligation to the relevant projected cash flows, as opposed to the single weighted-average discount rate derived from the yield curve that we have used in the past. We believe this change more precisely measures service and interest costs by improving the correlation between projected benefit cash flows to the corresponding spot yield curve rates. This change did not affect the measurement of our total benefit obligations but lowered our annual net periodic benefit cost by approximately $149 million in 2016. This change was treated as a change in accounting estimate and accordingly, we did not adjust the amounts recorded in 2015 or 2014.
The actuarial assumptions used to compute the net periodic benefit expense for our qualified pension, non-qualified pension and post-retirement benefit plans are based upon information available as of the beginning of the year, as presented in the following table.
| Pension Plans |
Post-Retirement Benefit Plans | |||||||||||||
| 2016 |
2015 |
2014 | 2016 |
2015 |
2014 | |||||||||
| Actuarial assumptions at beginning of year: |
||||||||||||||
| Discount rate |
3.50% - 4.50% | 3.50% - 4.10% | 4.20% - 5.10% | 4.15% | 3.80% | 4.50% | ||||||||
| Rate of compensation increase |
3.25% | 3.25% | 3.25% | N/A | N/A | N/A | ||||||||
| Expected long-term rate of return on plan assets |
7.00% | 7.50% | 7.50% | 7.00% | 7.50% | 6.00% - 7.50% | ||||||||
| Initial health care cost trend rate |
N/A | N/A | N/A | 5.00% / 5.25% | 6.00% / 6.50% | 6.00% / 6.50% | ||||||||
| Ultimate health care cost trend rate |
N/A | N/A | N/A | 4.50% | 4.50% | 4.50% | ||||||||
| Year ultimate trend rate is reached |
N/A | N/A | N/A | 2025 | 2025 | 2024 | ||||||||
N/A—Not applicable
Net periodic benefit (income) expense for our qualified and non-qualified pension plans includes the following components:
| Pension Plans Years Ended December 31, |
||||||||||||
| 2016 | 2015 | 2014 | ||||||||||
| (Dollars in millions) | ||||||||||||
| Service cost |
$ | 64 | 83 | 77 | ||||||||
| Interest cost |
427 | 568 | 602 | |||||||||
| Expected return on plan assets |
(732 | ) | (898 | ) | (891 | ) | ||||||
| Settlements |
— | — | 63 | |||||||||
| Special termination benefits charge |
13 | — | — | |||||||||
| Recognition of prior service (credit) cost |
(8 | ) | 5 | 5 | ||||||||
| Recognition of actuarial loss |
175 | 161 | 22 | |||||||||
|
|
|
|
|
|
|
|||||||
| Net periodic pension benefit income |
$ | (61 | ) | (81 | ) | (122 | ) | |||||
|
|
|
|
|
|
|
|||||||
A-70
Table of Contents
Net periodic benefit expense (income) for our post-retirement benefit plans includes the following components:
| Post-Retirement
Plans Years Ended December 31, |
||||||||||||
| 2016 | 2015 | 2014 | ||||||||||
| (Dollars in millions) | ||||||||||||
| Service cost |
$ | 19 | 24 | 22 | ||||||||
| Interest cost |
111 | 140 | 159 | |||||||||
| Expected return on plan assets |
(7 | ) | (21 | ) | (33 | ) | ||||||
| Special termination benefits charge |
3 | — | — | |||||||||
| Recognition of prior service cost |
20 | 19 | 20 | |||||||||
|
|
|
|
|
|
|
|||||||
| Net periodic post-retirement benefit expense |
$ | 146 | 162 | 168 | ||||||||
|
|
|
|
|
|
|
|||||||
We report net periodic benefit (income) expense for our qualified pension, non-qualified pension and post-retirement benefit plans in cost of services and products and selling, general and administrative expenses in our consolidated statements of operations for the years ended December 31, 2016, 2015 and 2014. In the third quarter of 2016, we announced plans to reduce our workforce, initially through voluntary severance packages and the balance through involuntary reductions. We recognized in the fourth quarter of 2016, a one-time charge of $16 million for special termination benefit enhancements paid to certain eligible employees upon voluntary retirement.
Benefit Obligations
The actuarial assumptions used to compute the funded status for the plans are based upon information available as of December 31, 2016 and 2015 and are as follows:
| Pension Plans | Post-Retirement Benefit Plans | |||||||||||
| December 31, |
December 31, | |||||||||||
| 2016 | 2015 | 2016 |
2015 | |||||||||
| Actuarial assumptions at end of year: |
||||||||||||
| Discount rate |
3.50% - 4.10% | 3.50% - 4.50% | 3.90% | 4.15% | ||||||||
| Rate of compensation increase |
3.25% | 3.25% | N/A | N/A | ||||||||
| Initial health care cost trend rate |
N/A | N/A | 5.00% / 5.50% | 5.00% / 5.25% | ||||||||
| Ultimate health care cost trend rate |
N/A | N/A | 4.50% | 4.50% | ||||||||
| Year ultimate trend rate is reached |
N/A | N/A | 2025 | 2025 | ||||||||
N/A—Not applicable
In 2016, we adopted the revised mortality table and projection scale released by the Society of Actuaries (“SOA”), which decreased the projected benefit obligation of our benefit plans by $268 million. The 2015 revised mortality table and projection scale decreased the 2015 projected benefit obligation of our benefit plans by $379 million. In 2014, to better reflect the expected lifetimes of our plan participants, we adopted a new mortality table for our defined benefit plan. The table used was based on SOA tables and increased the projected benefit obligation of our benefit plans by approximately $1.3 billion. The change in the projected benefit obligation of our benefit plans was recognized as part of the net actuarial loss and is included in accumulated other comprehensive loss, a portion of which is subject to amortization over the remaining estimated life of plan participants, which was approximately 9 to 10 years as of December 31, 2016.
A-71
Table of Contents
The following tables summarize the change in the benefit obligations for the pension and post-retirement benefit plans:
| Pension Plans Years Ended December 31, |
||||||||||||
| 2016 | 2015 | 2014 | ||||||||||
| (Dollars in millions) | ||||||||||||
| Change in benefit obligation |
||||||||||||
| Benefit obligation at beginning of year |
$ | 13,349 | 15,042 | 13,401 | ||||||||
| Service cost |
64 | 83 | 77 | |||||||||
| Interest cost |
427 | 568 | 602 | |||||||||
| Plan amendments |
2 | (100 | ) | 4 | ||||||||
| Special termination benefits charge |
13 | — | — | |||||||||
| Actuarial loss (gain) |
487 | (800 | ) | 2,269 | ||||||||
| Settlements |
— | — | (460 | ) | ||||||||
| Benefits paid by company |
(7 | ) | (6 | ) | (6 | ) | ||||||
| Benefits paid from plan assets |
(1,034 | ) | (1,438 | ) | (845 | ) | ||||||
|
|
|
|
|
|
|
|||||||
| Benefit obligation at end of year |
$ | 13,301 | 13,349 | 15,042 | ||||||||
|
|
|
|
|
|
|
|||||||
| Post-Retirement Benefit
Plans Years Ended December 31, |
||||||||||||
| 2016 | 2015 | 2014 | ||||||||||
| (Dollars in millions) | ||||||||||||
| Change in benefit obligation |
||||||||||||
| Benefit obligation at beginning of year |
$ | 3,567 | 3,830 | 3,688 | ||||||||
| Service cost |
19 | 24 | 22 | |||||||||
| Interest cost |
111 | 140 | 159 | |||||||||
| Participant contributions |
57 | 57 | 69 | |||||||||
| Plan amendments |
— | — | 23 | |||||||||
| Direct subsidy receipts |
5 | 8 | 9 | |||||||||
| Special termination benefits charge |
3 | — | — | |||||||||
| Actuarial (gain) loss |
(13 | ) | (148 | ) | 245 | |||||||
| Benefits paid by company |
(191 | ) | (181 | ) | (166 | ) | ||||||
| Benefits paid from plan assets |
(145 | ) | (163 | ) | (219 | ) | ||||||
|
|
|
|
|
|
|
|||||||
| Benefit obligation at end of year |
$ | 3,413 | 3,567 | 3,830 | ||||||||
|
|
|
|
|
|
|
|||||||
Our aggregate benefit obligation as of December 31, 2016, 2015 and 2014 was $16.714 billion, $16.916 billion and $18.872 billion, respectively.
A-72
Table of Contents
Plan Assets
We maintain plan assets for our qualified pension plan and certain post-retirement benefit plans. The qualified pension plan’s assets are used for the payment of pension benefits and certain eligible plan expenses. The post-retirement benefit plan’s assets are used to pay health care benefits and premiums on behalf of eligible retirees and to pay certain eligible plan expenses. As discussed further above, the liquid plan assets in our post-retirement trust have been substantially depleted as of December 31, 2016. The expected rate of return on plan assets is the long-term rate of return we expect to earn on the plans’ assets, net of administrative expenses paid from plan assets. The rate of return is determined by the strategic allocation of plan assets and the long-term risk and return forecast for each asset class. The forecasts for each asset class are generated primarily from an analysis of the long-term expectations of various third party investment management organizations. The expected rate of return on plan assets is reviewed annually and revised, as necessary, to reflect changes in the financial markets and our investment strategy.
The following tables summarize the change in the fair value of plan assets for the pension and post-retirement benefit plans:
| Pension Plans Years Ended December 31, |
||||||||||||
| 2016 | 2015 | 2014 | ||||||||||
| (Dollars in millions) | ||||||||||||
| Change in plan assets |
||||||||||||
| Fair value of plan assets at beginning of year |
$ | 11,072 | 12,571 | 12,346 | ||||||||
| Return on plan assets |
754 | (161 | ) | 1,373 | ||||||||
| Employer contributions |
100 | 100 | 157 | |||||||||
| Settlements |
— | — | (460 | ) | ||||||||
| Benefits paid from plan assets |
(1,034 | ) | (1,438 | ) | (845 | ) | ||||||
|
|
|
|
|
|
|
|||||||
| Fair value of plan assets at end of year |
$ | 10,892 | 11,072 | 12,571 | ||||||||
|
|
|
|
|
|
|
|||||||
| Post-Retirement Benefit
Plans Years Ended December 31, |
||||||||||||
| 2016 | 2015 | 2014 | ||||||||||
| (Dollars in millions) | ||||||||||||
| Change in plan assets |
||||||||||||
| Fair value of plan assets at beginning of year |
$ | 193 | 353 | 535 | ||||||||
| Return on plan assets |
5 | 3 | 37 | |||||||||
| Benefits paid from plan assets |
(145 | ) | (163 | ) | (219 | ) | ||||||
|
|
|
|
|
|
|
|||||||
| Fair value of plan assets at end of year |
$ | 53 | 193 | 353 | ||||||||
|
|
|
|
|
|
|
|||||||
Pension Plans: Our investment objective for the qualified pension plan assets is to achieve an attractive risk-adjusted return over time that will provide for the payment of benefits and minimize the risk of large losses. Our pension plan investment strategy is designed to meet this objective by broadly diversifying plan assets across numerous strategies with differing expected returns, volatilities and correlations. The pension plan assets have target allocations of 45% to interest rate sensitive investments and 55% to investments designed to provide higher expected returns than the interest rate sensitive investments. Interest rate sensitive investments include 30% of plan assets targeted primarily to long-duration investment grade bonds, 10% targeted to high yield and emerging market bonds and 5% targeted to diversified strategies, which primarily have exposures to global bonds, as well as some exposures to global stocks and commodities. Assets expected to provide higher returns than the interest rate sensitive assets include broadly diversified equity investments with targets of approximately 15% to U.S. equity markets and 15% to non-U.S. developed and emerging markets. Approximately 7% is targeted to broadly diversified multi-asset class strategies that have the flexibility to adjust exposures to different
A-73
Table of Contents
asset classes. Approximately 10% is allocated to private markets investments including funds primarily invested in private equity, private debt and hedge funds. Real estate investments are targeted at 8% of plan assets. At the beginning of 2017, our expected annual long-term rate of return on pension assets before consideration of administrative expenses is assumed to be 7.0%. However, projected increases in PBGC (Pension Benefit Guaranty Corporation) premium rates have now become large enough to reduce the annual long-term expected return net of administrative expenses to 6.5%.
Our non-qualified pension plans are not funded. We pay benefits directly to the participants of these plans.
Post-Retirement Benefit Plans: Our investment objective for the post-retirement benefit plans’ assets is to achieve an attractive risk-adjusted return and minimize the risk of large losses over the expected life of the assets. At the beginning of 2017, our expected annual long-term rate of return on post-retirement benefit plan assets is assumed to be 5.0%.
Permitted investments: Plan assets are managed consistent with the restrictions set forth by the Employee Retirement Income Security Act of 1974, as amended, which requires diversification of assets and also generally prohibits defined benefit and welfare plans from investing more than 10% of their assets in securities issued by the sponsor company. At December 31, 2016 and 2015, the pension and post-retirement benefit plans did not directly own any shares of our common stock and less than 1% of the assets were held in CenturyLink debt.
Derivative instruments: Derivative instruments are used to reduce risk as well as provide return. The pension and post-retirement benefit plans use exchange traded futures and swaps to gain exposure to equity and interest rate markets consistent with target asset allocations and to reduce risk relative to measurement of the benefit obligation, which is sensitive to interest rate changes. Foreign exchange forward contracts are used to manage currency exposures. Credit default swaps are used to manage credit risk exposures in a cost effective and targeted manner relative to transacting with physical corporate fixed income securities. Options are currently used to manage interest rate exposure taking into account the implied volatility and current pricing of the specific underlying market instrument. Some derivative instruments subject the plans to counterparty risk. The external investment managers, along with Plan Management, monitor counterparty exposure and mitigate this risk by diversifying the exposure among multiple high credit quality counterparties, requiring collateral and limiting exposure by periodically settling contracts.
The gross notional exposure of the derivative instruments directly held by the pension benefit plan is shown below. The notional amount of the derivatives corresponds to market exposure but does not represent an actual cash investment. Our post-retirement plans were not invested in derivative instruments for the years ended December 31, 2016 or 2015.
| Gross Notional Exposure | ||||||||
| Pension Plans | ||||||||
| Years Ended December 31, | ||||||||
| 2016 | 2015 | |||||||
| (Dollars in millions) | ||||||||
| Derivative instruments: |
||||||||
| Exchange-traded U.S. equity futures |
$ | 104 | 79 | |||||
| Exchange-traded Treasury and other interest rate futures |
1,813 | 1,767 | ||||||
| Interest rate swaps |
260 | 550 | ||||||
| Credit default swaps |
240 | 189 | ||||||
| Foreign exchange forwards |
778 | 992 | ||||||
| Options |
206 | 285 | ||||||
Fair Value Measurements: Fair value is defined as the price that would be received to sell an asset or paid to transfer a liability in an orderly transaction between independent and knowledgeable parties who are willing and
A-74
Table of Contents
able to transact for an asset or liability at the measurement date. We use valuation techniques that maximize the use of observable inputs and minimize the use of unobservable inputs when determining fair value and then we rank the estimated values based on the reliability of the inputs used following the fair value hierarchy set forth by the FASB. For additional information on the fair value hierarchy, see Note 12—Fair Value Disclosure.
At December 31, 2016, we used the following valuation techniques to measure fair value for assets. There were no changes to these methodologies during 2016:
| • | Level 1—Assets were valued using the closing price reported in the active market in which the individual security was traded. |
| • | Level 2—Assets were valued using quoted prices in markets that are not active, broker dealer quotations, net asset value of shares held by the plans and other methods by which all significant inputs were observable at the measurement date. |
| • | Level 3—Assets were valued using unobservable inputs in which little or no market data exists as reported by the respective institutions at the measurement date. |
The tables below present the fair value of plan assets by category and the input levels used to determine those fair values at December 31, 2016. It is important to note that the asset allocations do not include market exposures that are gained with derivatives. Investments include dividend and interest receivables, pending trades and accrued expenses.
| Fair Value of Pension Plan Assets at December 31, 2016 |
||||||||||||||||
| Level 1 | Level 2 | Level 3 | Total | |||||||||||||
| (Dollars in millions) | ||||||||||||||||
| Investment grade bonds(a) |
$ | 420 | 1,404 | — | $ | 1,824 | ||||||||||
| High yield bonds(b) |
7 | 597 | 11 | 615 | ||||||||||||
| Emerging market bonds(c) |
212 | 212 | — | 424 | ||||||||||||
| Convertible bonds(d) |
2 | — | — | 2 | ||||||||||||
| U.S. stocks(f) |
1,144 | 1 | — | 1,145 | ||||||||||||
| Non-U.S. stocks(g) |
721 | 1 | — | 722 | ||||||||||||
| Multi-asset strategies(m) |
389 | — | — | 389 | ||||||||||||
| Cash equivalents and short-term investments(o) |
— | 207 | — | 207 | ||||||||||||
|
|
|
|
|
|
|
|
|
|||||||||
| Total investments, excluding investments valued at NAV |
$ | 2,895 | 2,422 | 11 | 5,328 | |||||||||||
|
|
|
|
|
|
|
|||||||||||
| Investments valued at NAV |
5,564 | |||||||||||||||
|
|
|
|||||||||||||||
| Total pension plan assets |
$ | 10,892 | ||||||||||||||
|
|
|
|||||||||||||||
| Fair Value of Post-Retirement Plan Assets at December 31, 2016 |
||||||||||||||||
| Level 1 | Level 2 | Level 3 | Total | |||||||||||||
| (Dollars in millions) | ||||||||||||||||
| Investment grade bonds(a) |
$ | 1 | 2 | — | $ | 3 | ||||||||||
| High yield bonds(b) |
— | 1 | — | 1 | ||||||||||||
| U.S. stocks(f) |
2 | — | — | 2 | ||||||||||||
| Non-U.S. stocks(g) |
1 | — | — | 1 | ||||||||||||
| Cash equivalents and short-term investments(o) |
— | 5 | — | 5 | ||||||||||||
|
|
|
|
|
|
|
|
|
|||||||||
| Total investments, excluding investments valued at NAV |
$ | 4 | 8 | — | 12 | |||||||||||
|
|
|
|
|
|
|
|||||||||||
| Investments valued at NAV |
41 | |||||||||||||||
|
|
|
|||||||||||||||
| Total post-retirement plan assets |
$ | 53 | ||||||||||||||
|
|
|
|||||||||||||||
A-75
Table of Contents
The tables below present the fair value of plan assets by category and the input levels used to determine those fair values at December 31, 2015. It is important to note that the asset allocations do not include market exposures that are gained with derivatives. Investments include dividend and interest receivable, pending trades and accrued expenses.
| Fair Value of Pension Plan Assets at December 31, 2015 |
||||||||||||||||
| Level 1 | Level 2 | Level 3 | Total | |||||||||||||
| (Dollars in millions) | ||||||||||||||||
| Investment grade bonds(a) |
$ | 841 | 1,045 | — | $ | 1,886 | ||||||||||
| High yield bonds(b) |
— | 544 | 13 | 557 | ||||||||||||
| Emerging market bonds(c) |
208 | 232 | 1 | 441 | ||||||||||||
| Convertible bonds(d) |
— | 2 | — | 2 | ||||||||||||
| U.S. stocks(f) |
1,201 | — | — | 1,201 | ||||||||||||
| Non-U.S. stocks(g) |
1,127 | 1 | — | 1,128 | ||||||||||||
| Multi-asset strategies(m) |
376 | — | — | 376 | ||||||||||||
| Derivatives(n) |
2 | (6 | ) | — | (4 | ) | ||||||||||
| Cash equivalents and short-term investments(o) |
— | 192 | — | 192 | ||||||||||||
|
|
|
|
|
|
|
|
|
|||||||||
| Total investments, excluding investments valued at NAV |
$ | 3,755 | 2,010 | 14 | 5,779 | |||||||||||
|
|
|
|
|
|
|
|||||||||||
| Investments valued at NAV |
5,293 | |||||||||||||||
|
|
|
|||||||||||||||
| Total pension plan assets |
$ | 11,072 | ||||||||||||||
|
|
|
|||||||||||||||
| Fair Value of Post-Retirement Plan
Assets at December 31, 2015 |
||||||||||||||||
| Level 1 | Level 2 | Level 3 | Total | |||||||||||||
| (Dollars in millions) | ||||||||||||||||
| Investment grade bonds(a) |
$ | 2 | 1 | — | $ | 3 | ||||||||||
| High yield bonds(b) |
— | 1 | — | 1 | ||||||||||||
| U.S. stocks(f) |
16 | — | — | 16 | ||||||||||||
| Non-U.S. stocks(g) |
12 | — | — | 12 | ||||||||||||
| Emerging market stocks(h) |
4 | — | — | 4 | ||||||||||||
| Cash equivalents and short-term investments(o) |
— | 4 | — | 4 | ||||||||||||
|
|
|
|
|
|
|
|
|
|||||||||
| Total investments, excluding investments valued at NAV |
$ | 34 | 6 | — | 40 | |||||||||||
|
|
|
|
|
|
|
|||||||||||
| Investments valued at NAV |
153 | |||||||||||||||
|
|
|
|||||||||||||||
| Total post-retirement plan assets |
$ | 193 | ||||||||||||||
|
|
|
|||||||||||||||
In 2015, we adopted Accounting Standards Update 2015-07 (“ASU 2015-07”), which retrospectively changed the disclosure requirements for certain investments that are valued based upon net asset value (“NAV”) as a practical expedient. ASU 2015-07 was issued to eliminate diversity among entities on what level in the fair value hierarchy such investments were assigned. Under ASU 2015-07, investments valued using NAV as a practical expedient are no longer assigned to a level in the fair value hierarchy. The value associated with these investments is disclosed in the reconciliation of the total investments measured at fair value shown below.
A-76
Table of Contents
The table below presents the fair value of plan assets valued at NAV by category for our pension and post-retirement plans at December 31, 2016 and 2015.
| Fair Value of Plan Assets Valued at NAV | ||||||||||||||||
| Pension Plans
at December 31, |
Post-Retirement Benefit Plans
at December 31, |
|||||||||||||||
| 2016 | 2015 | 2016 | 2015 | |||||||||||||
| (Dollars in millions) | ||||||||||||||||
| Investment grade bonds(a) |
$ | 106 | 115 | — | 35 | |||||||||||
| High yield bonds(b) |
521 | 512 | 1 | 1 | ||||||||||||
| Emerging market bonds(c) |
6 | 9 | — | — | ||||||||||||
| Diversified strategies(e) |
522 | 516 | 1 | 54 | ||||||||||||
| U.S. stocks(f) |
58 | 70 | — | — | ||||||||||||
| Non-U.S. stocks(g) |
560 | 289 | 1 | — | ||||||||||||
| Emerging market stocks(h) |
76 | 64 | — | — | ||||||||||||
| Private equity(i) |
506 | 526 | 14 | 21 | ||||||||||||
| Private debt(j) |
369 | 371 | 1 | 2 | ||||||||||||
| Market neutral hedge funds(k) |
739 | 825 | 1 | 17 | ||||||||||||
| Directional hedge funds(k) |
657 | 594 | 1 | 1 | ||||||||||||
| Real estate(l) |
926 | 968 | 8 | 20 | ||||||||||||
| Multi-asset strategies(m) |
412 | 386 | — | — | ||||||||||||
| Cash equivalents and short-term investments(o) |
106 | 48 | 13 | 2 | ||||||||||||
|
|
|
|
|
|
|
|
|
|||||||||
| Total investments valued at NAV |
$ | 5,564 | 5,293 | 41 | 153 | |||||||||||
|
|
|
|
|
|
|
|
|
|||||||||
The plans’ assets are invested in various asset categories utilizing multiple strategies and investment managers. Interests in commingled funds are valued using the net asset value (“NAV”) per unit of each fund. The NAV reported by the fund manager is based on the market value of the underlying investments owned by each fund, minus its liabilities, divided by the number of shares outstanding. Commingled funds can be redeemed at NAV, generally within a year of the financial statement date. Investments in private funds, primarily limited partnerships, represent long-term commitments with a fixed maturity date and are also valued at NAV. Valuation inputs for these private fund interests are generally based on assumptions and other information not observable in the market. The assumptions and valuation methodologies of the pricing vendors, account managers, fund managers and partnerships are monitored and evaluated for reasonableness. Below is an overview of the asset categories, the underlying strategies and valuation inputs used to value the assets in the preceding tables:
(a) Investment grade bonds represent investments in fixed income securities as well as commingled bond funds comprised of U.S. Treasury securities, agencies, corporate bonds, mortgage-backed securities, asset-backed securities and commercial mortgage-backed securities. Treasury securities are valued at the bid price reported in the active market in which the security is traded and are classified as Level 1. The valuation inputs of other investment grade bonds primarily utilize observable market information and are based on a spread to U.S. Treasury securities and consider yields available on comparable securities of issuers with similar credit ratings. The primary observable inputs include references to the new issue market for similar securities, the secondary trading markets and dealer quotes. Option adjusted spread models are utilized to evaluate securities such as asset backed securities that have early redemption features. These securities are classified as Level 2. The commingled funds are valued at NAV based on the market value of the underlying fixed income securities using the same valuation inputs previously described.
(b) High yield bonds represent investments in below investment grade fixed income securities as well as commingled high yield bond funds. The valuation inputs for the securities primarily utilize observable market information and are based on a spread to U.S. Treasury securities and consider yields available on comparable securities of issuers with similar credit ratings. These securities are primarily classified as Level 2. The
A-77
Table of Contents
commingled funds are valued at NAV based on the market value of the underlying high yield instruments using the same valuation inputs previously described.
(c) Emerging market bonds represent investments in securities issued by governments and other entities located in developing countries as well as registered mutual funds and commingled emerging market bond funds. The valuation inputs for the securities utilize observable market information and are primarily based on dealer quotes or a spread relative to the local government bonds. The registered mutual fund is classified as Level 1 while individual securities are classified as Level 2. The commingled funds are valued at NAV based on the market value of the underlying emerging market bonds using the same valuation inputs previously described.
(d) Convertible bonds primarily represent investments in corporate debt securities that have features that allow the debt to be converted into equity securities under certain circumstances. The valuation inputs for the individual convertible bonds primarily utilize observable market information including a spread to U.S. Treasuries and the value and volatility of the underlying equity security. Convertible bonds are classified as Level 1.
(e) Diversified strategies represent an investment in a commingled fund that primarily has exposures to global government, corporate and inflation linked bonds, global stocks and commodities. The commingled fund is valued at NAV based on the market value of the underlying investments. The valuation inputs utilize observable market information including published prices for exchange traded securities, bid prices for government bonds, and spreads and yields available for comparable fixed income securities with similar credit ratings.
(f) U.S. stocks represent investments in stocks of U.S. based companies as well as commingled U.S. stock funds. The valuation inputs for U.S. stocks are based on the last published price reported on the major stock market on which the securities are traded and are primarily classified as Level 1. The commingled funds are valued at NAV based on the market value of the underlying investments using the same valuation inputs described above.
(g) Non-U.S. stocks represent investments in stocks of companies based in developed countries outside the U.S. as well as commingled funds. The valuation inputs for non-U.S. stocks are based on the last published price reported on the major stock market on which the securities are traded and are primarily classified as Level 1. The commingled funds are valued at NAV based on the market value of the underlying investments using the same valuation inputs described above.
(h) Emerging market stocks represent investments in an exchange traded fund and commingled funds comprised of stocks of companies located in developing markets. Exchange traded funds are based on the last published price reported on the major stock market on which the securities are traded and are classified as Level 1. The commingled funds are valued at NAV based on the market value of the underlying investments using the same valuation inputs described previously for individual stocks.
(i) Private equity represents non-public investments in domestic and foreign buy out and venture capital funds. Private equity funds are primarily structured as limited partnerships and are valued according to the valuation policy of each partnership, subject to prevailing accounting and other regulatory guidelines. The partnerships are valued at NAV using valuation methodologies that give consideration to a range of factors, including but not limited to the price at which investments were acquired, the nature of the investments, market conditions, trading values on comparable public securities, current and projected operating performance, and financing transactions subsequent to the acquisition of the investments. These valuation methodologies involve a significant degree of judgment.
(j) Private debt represents non-public investments in distressed or mezzanine debt funds. Mezzanine debt instruments are debt instruments that are subordinated to other debt issues and may include embedded
A-78
Table of Contents
equity instruments such as warrants. Private debt funds are primarily structured as limited partnerships and are valued at NAV according to the valuation policy of each partnership, subject to prevailing accounting and other regulatory guidelines. The valuation of underlying fund investments are based on factors including the issuer’s current and projected credit worthiness, the security’s terms, reference to the securities of comparable companies, and other market factors. These valuation methodologies involve a significant degree of judgment.
(k) Market neutral hedge funds hold investments in a diversified mix of instruments that are intended in combination to exhibit low correlations to market fluctuations. These investments are typically combined with futures to achieve uncorrelated excess returns over various markets. Directional hedge funds—This asset category represents investments that may exhibit somewhat higher correlations to market fluctuations than the market neutral hedge funds. Investments in hedge funds include both direct investments and investments in diversified funds of funds. Hedge funds are valued at NAV based on the market value of the underlying investments which include publicly traded equity and fixed income securities and privately negotiated debt securities. The hedge funds are valued by third party administrators using the same valuation inputs previously described.
(l) Real estate represents investments in commingled funds and limited partnerships that invest in a diversified portfolio of real estate properties. These investments are valued at NAV according to the valuation policy of each fund or partnership, subject to prevailing accounting and other regulatory guidelines. The valuation inputs of the underlying properties are generally based on third-party appraisals that use comparable sales or a projection of future cash flows to determine fair value.
(m) Multi-asset strategies represent broadly diversified strategies that have the flexibility to tactically adjust exposures to different asset classes through time. This asset category includes investments in a registered mutual fund which is classified as Level 1 and a commingled fund which is valued at NAV based on the market value of the underlying investments.
(n) Derivatives include exchange traded futures contracts which are classified as Level 1, as well as privately negotiated over-the-counter swaps and options that are valued based on the change in interest rates or a specific market index and are classified as Level 2. The market values represent gains or losses that occur due to fluctuations in interest rates, foreign currency exchange rates, security prices, or other factors.
(o) Cash equivalents and short-term investments represent investments that are used in conjunction with derivatives positions or are used to provide liquidity for the payment of benefits or other purposes. The valuation inputs of securities are based on a spread to U.S. Treasury Bills, the Federal Funds Rate, or London Interbank Offered Rate and consider yields available on comparable securities of issuers with similar credit ratings and are classified as Level 2. The commingled funds are valued at NAV based on the market value of the underlying investments using the same valuation inputs described above.
Concentrations of Risk: Investments, in general, are exposed to various risks, such as significant world events, interest rate, credit, foreign currency and overall market volatility risk. These risks are managed by broadly diversifying assets across numerous asset classes and strategies with differing expected returns, volatilities and correlations. Risk is also broadly diversified across numerous market sectors and individual companies. Financial instruments that potentially subject the plans to concentrations of counterparty risk consist principally of investment contracts with high quality financial institutions. These investment contracts are typically collateralized obligations and/or are actively managed, limiting the amount of counterparty exposure to any one financial institution. Although the investments are well diversified, the value of plan assets could change materially depending upon the overall market volatility, which could affect the funded status of the plans.
A-79
Table of Contents
The table below presents a rollforward of the pension plan assets valued using Level 3 inputs:
| Pension Plan Assets Valued Using Level 3 Inputs |
||||||||||||
| High Yield Bonds |
Emerging Market Bonds |
Total | ||||||||||
| (Dollars in millions) | ||||||||||||
| Balance at December 31, 2014 |
$ | 7 | — | 7 | ||||||||
| Net transfers |
4 | 1 | 5 | |||||||||
| Acquisitions |
4 | — | 4 | |||||||||
| Dispositions |
(2 | ) | — | (2 | ) | |||||||
|
|
|
|
|
|
|
|||||||
| Balance at December 31, 2015 |
13 | 1 | 14 | |||||||||
| Net transfers |
(2 | ) | — | (2 | ) | |||||||
| Acquisitions |
1 | — | 1 | |||||||||
| Dispositions |
(1 | ) | (1 | ) | (2 | ) | ||||||
|
|
|
|
|
|
|
|||||||
| Balance at December 31, 2016 |
$ | 11 | — | 11 | ||||||||
|
|
|
|
|
|
|
|||||||
Certain gains and losses are allocated between assets sold during the year and assets still held at year-end based on transactions and changes in valuations that occurred during the year. These allocations also impact our calculation of net acquisitions and dispositions.
For the year ended December 31, 2016, the investment program produced actual gains on qualified pension and post-retirement plan assets of $759 million as compared to expected returns of $739 million for a difference of $20 million. For the year ended December 31, 2015, the investment program produced actual losses on pension and post-retirement plan assets of $158 million as compared to the expected returns of $919 million for a difference of $1.077 billion. The short-term annual returns on plan assets will almost always be different from the expected long-term returns and the plans could experience net gains or losses, due primarily to the volatility occurring in the financial markets during any given year.
Unfunded Status
The following table presents the unfunded status of the pensions and post-retirement benefit plans:
| Pension Plans | Post-Retirement Benefit Plans |
|||||||||||||||
| Years Ended December 31, |
Years Ended December 31, |
|||||||||||||||
| 2016 | 2015 | 2016 | 2015 | |||||||||||||
| (Dollars in millions) | ||||||||||||||||
| Benefit obligation |
$ | (13,301 | ) | (13,349 | ) | (3,413 | ) | (3,567 | ) | |||||||
| Fair value of plan assets |
10,892 | 11,072 | 53 | 193 | ||||||||||||
|
|
|
|
|
|
|
|
|
|||||||||
| Unfunded status |
(2,409 | ) | (2,277 | ) | (3,360 | ) | (3,374 | ) | ||||||||
|
|
|
|
|
|
|
|
|
|||||||||
| Current portion of unfunded status |
$ | (6 | ) | (5 | ) | (236 | ) | (135 | ) | |||||||
|
|
|
|
|
|
|
|
|
|||||||||
| Non-current portion of unfunded status |
$ | (2,403 | ) | (2,272 | ) | (3,124 | ) | (3,239 | ) | |||||||
The current portion of our post-retirement benefit obligations is recorded on our consolidated balance sheets in accrued expenses and other current liabilities-salaries and benefits.
Accumulated Other Comprehensive Loss-Recognition and Deferrals
The following table presents cumulative items not recognized as a component of net periodic benefits expense as of December 31, 2015, items recognized as a component of net periodic benefits expense in 2016,
A-80
Table of Contents
additional items deferred during 2016 and cumulative items not recognized as a component of net periodic benefits expense as of December 31, 2016. The items not recognized as a component of net periodic benefits expense have been recorded on our consolidated balance sheets in accumulated other comprehensive loss:
| As of and for the Years Ended December 31, | ||||||||||||||||||||
| 2015 | Recognition of Net Periodic Benefits Expense |
Deferrals | Net Change in AOCL |
2016 | ||||||||||||||||
| (Dollars in millions) | ||||||||||||||||||||
| Accumulated other comprehensive loss: |
||||||||||||||||||||
| Pension plans: |
||||||||||||||||||||
| Net actuarial (loss) gain |
$ | (2,857 | ) | 175 | (466 | ) | (291 | ) | (3,148 | ) | ||||||||||
| Prior service benefit (cost) |
72 | (8 | ) | (2 | ) | (10 | ) | 62 | ||||||||||||
| Deferred income tax benefit (expense) |
1,070 | (67 | ) | 188 | 121 | 1,191 | ||||||||||||||
|
|
|
|
|
|
|
|
|
|
|
|||||||||||
| Total pension plans |
(1,715 | ) | 100 | (280 | ) | (180 | ) | (1,895 | ) | |||||||||||
|
|
|
|
|
|
|
|
|
|
|
|||||||||||
| Post-retirement benefit plans: |
||||||||||||||||||||
| Net actuarial (loss) gain |
(147 | ) | — | 10 | 10 | (137 | ) | |||||||||||||
| Prior service (cost) benefit |
(147 | ) | 20 | — | 20 | (127 | ) | |||||||||||||
| Deferred income tax benefit (expense) |
114 | (8 | ) | (4 | ) | (12 | ) | 102 | ||||||||||||
|
|
|
|
|
|
|
|
|
|
|
|||||||||||
| Total post-retirement benefit plans |
(180 | ) | 12 | 6 | 18 | (162 | ) | |||||||||||||
|
|
|
|
|
|
|
|
|
|
|
|||||||||||
| Total accumulated other comprehensive loss |
$ | (1,895 | ) | 112 | (274 | ) | (162 | ) | (2,057 | ) | ||||||||||
|
|
|
|
|
|
|
|
|
|
|
|||||||||||
The following table presents cumulative items not recognized as a component of net periodic benefits expense as of December 31, 2014, items recognized as a component of net periodic benefits expense in 2015, additional items deferred during 2015 and cumulative items not recognized as a component of net periodic benefits expense as of December 31, 2015. The items not recognized as a component of net periodic benefits expense have been recorded on our consolidated balance sheets in accumulated other comprehensive loss:
| As of and for the Years Ended December 31, | ||||||||||||||||||||
| 2014 | Recognition of Net Periodic Benefits Expense |
Deferrals | Net Change in AOCL |
2015 | ||||||||||||||||
| (Dollars in millions) | ||||||||||||||||||||
| Accumulated other comprehensive loss: |
||||||||||||||||||||
| Pension plans: |
||||||||||||||||||||
| Net actuarial (loss) gain |
$ | (2,760 | ) | 161 | (258 | ) | (97 | ) | (2,857 | ) | ||||||||||
| Prior service (cost) benefit |
(32 | ) | 5 | 99 | 104 | 72 | ||||||||||||||
| Deferred income tax benefit (expense) |
1,072 | (63 | ) | 61 | (2 | ) | 1,070 | |||||||||||||
|
|
|
|
|
|
|
|
|
|
|
|||||||||||
| Total pension plans |
(1,720 | ) | 103 | (98 | ) | 5 | (1,715 | ) | ||||||||||||
|
|
|
|
|
|
|
|
|
|
|
|||||||||||
| Post-retirement benefit plans: |
||||||||||||||||||||
| Net actuarial (loss) gain |
(277 | ) | — | 130 | 130 | (147 | ) | |||||||||||||
| Prior service (cost) benefit |
(166 | ) | 19 | — | 19 | (147 | ) | |||||||||||||
| Deferred income tax benefit (expense) |
171 | (7 | ) | (50 | ) | (57 | ) | 114 | ||||||||||||
|
|
|
|
|
|
|
|
|
|
|
|||||||||||
| Total post-retirement benefit plans |
(272 | ) | 12 | 80 | 92 | (180 | ) | |||||||||||||
|
|
|
|
|
|
|
|
|
|
|
|||||||||||
| Total accumulated other comprehensive loss |
$ | (1,992 | ) | 115 | (18 | ) | 97 | (1,895 | ) | |||||||||||
|
|
|
|
|
|
|
|
|
|
|
|||||||||||
A-81
Table of Contents
The following table presents estimated items to be recognized in 2017 as a component of net periodic benefit expense of the pension, non-qualified pension and post-retirement benefit plans:
| Pension Plans |
Post- Retirement Plans |
|||||||
| (Dollars in millions) | ||||||||
| Estimated recognition of net periodic (cost) benefit income in 2017: |
||||||||
| Net actuarial loss |
$ | (202 | ) | — | ||||
| Prior service income (cost) |
8 | (20 | ) | |||||
| Deferred income tax benefit |
74 | 8 | ||||||
|
|
|
|
|
|||||
| Estimated net periodic benefit expense to be recorded in 2017 as a component of other comprehensive (loss) income |
$ | (120 | ) | (12 | ) | |||
|
|
|
|
|
|||||
Medicare Prescription Drug, Improvement and Modernization Act of 2003
We sponsor post-retirement health care plans with several benefit options that provide prescription drug benefits that we deem actuarially equivalent to or exceeding Medicare Part D. We recognize the impact of the federal subsidy received under the Medicare Prescription Drug, Improvement and Modernization Act of 2003 in the calculation of our post-retirement benefit obligation and net periodic post-retirement benefit expense.
Other Benefit Plans
Health Care and Life Insurance
We provide health care and life insurance benefits to essentially all of our active employees. We are largely self-funded for the cost of the health care plan. Our health care benefit expense for current employees was $399 million, $381 million and $381 million for the years ended December 31, 2016, 2015 and 2014, respectively. Union-represented employee benefits are based on negotiated collective bargaining agreements. Employees contributed $127 million, $125 million and $136 million for the years ended December 31, 2016, 2015 and 2014, respectively. Our group basic life insurance plans are fully insured and the premiums are paid by us.
401(k) Plans
We sponsor qualified defined contribution plans covering substantially all of our employees. Under these plans, employees may contribute a percentage of their annual compensation up to certain maximums, as defined by the plans and by the Internal Revenue Service (“IRS”). Currently, we match a percentage of employee contributions in cash. At December 31, 2016 and 2015, the assets of the plans included approximately 7 million shares and 8 million shares, respectively, of our common stock all of which were the result of the combination of previous employer match and participant directed contributions. We recognized expenses related to these plans of $79 million, $83 million and $81 million and for the years ended December 31, 2016, 2015 and 2014, respectively.
Deferred Compensation Plans
We sponsored non-qualified deferred compensation plans for various groups that included certain of our current and former highly compensated employees. The value of liabilities related to these plans was not significant.
| (10) | Share-based Compensation |
We maintain equity programs that allow our Board of Directors (through its Compensation Committee or our Chief Executive Officer as its delegate) to grant incentives to certain employees and our outside directors in
A-82
Table of Contents
any one or a combination of several forms, including incentive and non-qualified stock options, stock appreciation rights, restricted stock awards, restricted stock units and market and performance shares. Stock options generally expire ten years from the date of grant. Until June 30, 2014, we offered an employee stock purchase plan, which allowed eligible employees to purchase our common stock at a 15% discount based on the lower of the beginning or ending stock price during recurring six month offering periods.
Stock Options
The following table summarizes activity involving stock option awards for the year ended December 31, 2016:
| Number of Options |
Weighted- Average Exercise Price |
|||||||
| (in thousands) | ||||||||
| Outstanding and Exercisable at December 31, 2015 |
3,525 | $ | 39.67 | |||||
| Exercised |
(31 | ) | 26.34 | |||||
| Forfeited/Expired |
(486 | ) | 37.96 | |||||
|
|
|
|||||||
| Outstanding and Exercisable at December 31, 2016 |
3,008 | 40.08 | ||||||
|
|
|
|||||||
The aggregate intrinsic value of our options outstanding and exercisable at December 31, 2016 was approximately $1 million. The weighted-average remaining contractual term for such options was 1.0 years.
During 2016, we received net cash proceeds of approximately $1 million in connection with our option exercises. The tax benefit realized from these exercises was less than $1 million. The total intrinsic value of options exercised for the years ended December 31, 2015 and 2014, was $4 million and $9 million, respectively. The total intrinsic value of options exercised for the year ended December 31, 2016 was less than $1 million.
Restricted Stock Awards
For equity based awards that contain only service conditions for vesting, we calculate the award fair value based on the closing stock price on the accounting grant date. We also grant equity based restricted stock awards which contain market conditions or performance conditions, in addition to service conditions. For equity based restricted stock awards that contain market conditions, the award fair value is calculated through Monte-Carlo simulations. These awards, with service and market or performance conditions, represent the number of target shares for the award, as each recipient has the opportunity to ultimately receive a number of shares between 0% and 200% of the target restricted stock award. For the awards with market conditions, the percentage received depends on our total shareholder return versus that of selected peer companies during the three-year term of the award and for the awards with performance conditions, the percentage received depends upon the attainment of two financial performance targets during the three-year term of the award.
During the first quarter of 2016, we granted approximately 766 thousand shares of restricted stock to certain executive level employees as part of our long-term incentive program, of which approximately 306 thousand contained only service conditions and will vest on a straight-line basis on February 23, 2017, 2018 and 2019. The remaining awards contain service conditions and either market or performance conditions and are scheduled to vest on February 23, 2019.
During the first quarter of 2016, we also granted approximately 1.9 million shares to certain key employees as part of our annual equity compensation program, of which approximately 1.7 million contained only service conditions and will vest on a straight-line basis on February 25, 2017, 2018 and 2019. The remaining awards contain service conditions and either market or performance conditions and are scheduled to vest on February 25, 2019.
A-83
Table of Contents
During the first and third quarter of 2016, we granted shares to certain key employees as part of our long-term equity retention program. These awards will vest over a three to seven year period with approximately 113 thousand, 322 thousand and 209 thousand shares vesting on August 16, 2019, 2021 and 2023, respectively, and 22 thousand shares vesting on January 13, 2021 and 22 thousand shares vesting on January 13, 2023. The remaining awards granted throughout 2016 to certain other key employees and our outside directors were made as part of our equity compensation and retention programs. These awards require only service conditions for vesting and typically vest equally over a three year period.
During the first quarter of 2015, we granted approximately 496 thousand shares of restricted stock to certain executive-level employees as part of our long-term incentive program, of which approximately 198 thousand contained only service conditions and will vest on a straight-line basis on February 23, 2016, 2017 and 2018. The remaining awards contain service conditions and market or performance conditions and are scheduled to vest on February 23, 2018.
At the end of the first quarter of 2015, we granted approximately 1.2 million shares to certain key employees as part of our annual equity compensation program. These awards contained only service conditions and will vest on a straight-line basis on March 12, 2016, 2017 and 2018. During the third quarter of 2015 we granted shares to certain key employees as part of our long-term equity retention program. These awards will vest over a three to seven year period with approximately 193 thousand, 423 thousand and 230 thousand shares vesting on August 14, 2018, 2020 and 2022, respectively, and 55 thousand shares vesting equally on August 14, 2017, 2019, and 2021. The remaining awards granted throughout 2015 to certain other key employees and our outside directors were made as part of our equity compensation and retention programs. These awards require only service conditions for vesting and typically vest equally over a three year period.
During the first quarter of 2014, we granted approximately 440 thousand shares of restricted stock to certain executive-level employees as part of our long-term incentive program, of which approximately 250 thousand contained only service conditions and will vest on a straight-line basis on February 20, 2015, 2016 and 2017. The remaining awards contain service conditions and market or performance conditions and are scheduled to vest on February 20, 2017.
During the second quarter of 2014, we granted approximately 1.5 million shares to certain key employees as part of our annual equity compensation program. These awards contained only service conditions and will vest on a straight-line basis on March 26, 2015, 2016 and 2017. During the third quarter of 2014 we granted shares to certain key employees as part of our long-term equity retention program. These awards will vest over a three to seven year period with approximately 105 thousand, 325 thousand and 220 thousand vesting on August 4, 2017, 2019 and 2021, respectively. The remaining awards granted throughout 2014 to certain other key employees and our outside directors were made as part of our equity compensation and retention programs. These awards require only service conditions for vesting and typically vest equally over a three year period.
The following table summarizes activity involving restricted stock and restricted stock unit awards for the year ended December 31, 2016:
| Number of Shares |
Weighted- Average Grant Date Fair Value |
|||||||
| (in thousands) | ||||||||
| Non-vested at December 31, 2015 |
4,902 | 33.86 | ||||||
| Granted |
3,564 | 30.83 | ||||||
| Vested |
(1,547 | ) | 34.82 | |||||
| Forfeited |
(971 | ) | 33.23 | |||||
|
|
|
|||||||
| Non-vested at December 31, 2016 |
5,948 | 31.89 | ||||||
|
|
|
|||||||
A-84
Table of Contents
During 2015, we granted 2.9 million shares of restricted stock and restricted stock unit awards at a weighted-average price of $31.83. The total fair value of restricted stock that vested during 2016, 2015 and 2014, was $47 million, $59 million and $53 million, respectively.
Compensation Expense and Tax Benefit
We recognize compensation expense related to our market and performance share-based awards with graded vesting that only have a service condition on a straight-line basis over the requisite service period for the entire award. Total compensation expense for all share-based payment arrangements for the years ended December 31, 2016, 2015 and 2014, was $80 million, $73 million and $75 million, respectively. Our tax benefit recognized in the consolidated statements of operations for our share-based payment arrangements for the years ended December 31, 2016, 2015 and 2014, was $31 million, $28 million and $29 million, respectively. At December 31, 2016, there was $137 million of total unrecognized compensation expense related to our share-based payment arrangements, which we expect to recognize over a weighted-average period of 2.6 years.
| (11) | Earnings Per Common Share |
Basic and diluted earnings per common share for the years ended December 31, 2016, 2015 and 2014 were calculated as follows:
| Years Ended December 31, | ||||||||||||
| 2016 | 2015 | 2014 | ||||||||||
| (Dollars in millions, except per share amounts, shares in thousands) |
||||||||||||
| Income (Numerator): |
||||||||||||
| Net income |
$ | 626 | 878 | 772 | ||||||||
| Earnings applicable to non-vested restricted stock |
— | — | — | |||||||||
|
|
|
|
|
|
|
|||||||
| Net income applicable to common stock for computing basic earnings per common share |
626 | 878 | 772 | |||||||||
|
|
|
|
|
|
|
|||||||
| Net income as adjusted for purposes of computing diluted earnings per common share |
$ | 626 | 878 | 772 | ||||||||
|
|
|
|
|
|
|
|||||||
| Shares (Denominator): |
||||||||||||
| Weighted average number of shares: |
||||||||||||
| Outstanding during period |
545,946 | 559,260 | 572,748 | |||||||||
| Non-vested restricted stock |
(6,397 | ) | (4,982 | ) | (4,313 | ) | ||||||
|
|
|
|
|
|
|
|||||||
| Weighted average shares outstanding for computing basic earnings per common share |
539,549 | 554,278 | 568,435 | |||||||||
| Incremental common shares attributable to dilutive securities: |
||||||||||||
| Shares issuable under convertible securities |
10 | 10 | 10 | |||||||||
| Shares issuable under incentive compensation plans |
1,120 | 805 | 1,294 | |||||||||
|
|
|
|
|
|
|
|||||||
| Number of shares as adjusted for purposes of computing diluted earnings per common share |
540,679 | 555,093 | 569,739 | |||||||||
|
|
|
|
|
|
|
|||||||
| Basic earnings per common share |
$ | 1.16 | 1.58 | 1.36 | ||||||||
|
|
|
|
|
|
|
|||||||
| Diluted earnings per common share |
$ | 1.16 | 1.58 | 1.36 | ||||||||
|
|
|
|
|
|
|
|||||||
Our calculation of diluted earnings per common share excludes shares of common stock that are issuable upon exercise of stock options when the exercise price is greater than the average market price of our common stock. We also exclude unvested restricted stock awards that are antidilutive as a result of unrecognized compensation cost. Such shares averaged 3.3 million, 3.1 million and 2.5 million for 2016, 2015 and 2014, respectively.
A-85
Table of Contents
| (12) | Fair Value Disclosure |
Our financial instruments consist of cash and cash equivalents, accounts receivable, accounts payable and long-term debt, excluding capital lease and other obligations. Due to their short-term nature, the carrying amounts of our cash and cash equivalents, accounts receivable and accounts payable approximate their fair values.
Fair value is defined as the price that would be received to sell an asset or paid to transfer a liability in an orderly transaction between independent and knowledgeable parties who are willing and able to transact for an asset or liability at the measurement date. We use valuation techniques that maximize the use of observable inputs and minimize the use of unobservable inputs when determining fair value and then we rank the estimated values based on the reliability of the inputs used following the fair value hierarchy set forth by the FASB.
We determined the fair values of our long-term debt, including the current portion, based on quoted market prices where available or, if not available, based on discounted future cash flows using current market interest rates.
The three input levels in the hierarchy of fair value measurements are defined by the FASB generally as follows:
| Input Level |
Description of Input | |
| Level 1 |
Observable inputs such as quoted market prices in active markets. | |
| Level 2 |
Inputs other than quoted prices in active markets that are either directly or indirectly observable. | |
| Level 3 |
Unobservable inputs in which little or no market data exists. |
The following table presents the carrying amounts and estimated fair values of our long-term debt, excluding capital lease and other obligations, as well as the input level used to determine the fair values indicated below:
| As of December 31, 2016 | As of December 31, 2015 | |||||||||||||||||||
| Input Level |
Carrying Amount |
Fair Value |
Carrying Amount |
Fair Value |
||||||||||||||||
| (Dollars in millions) | ||||||||||||||||||||
| Liabilities-Long-term debt, excluding capital lease and other obligations |
2 | $ | 19,553 | 19,639 | 19,800 | 19,473 | ||||||||||||||
| (13) | Income Taxes |
| Years Ended December 31, | ||||||||||||
| 2016 | 2015 | 2014 | ||||||||||
| (Dollars in millions) | ||||||||||||
| Income tax expense was as follows: |
||||||||||||
| Federal |
||||||||||||
| Current |
$ | 335 | 28 | 18 | ||||||||
| Deferred |
5 | 329 | 305 | |||||||||
|
|
|
|
|
|
|
|||||||
| State |
||||||||||||
| Current |
27 | 40 | 26 | |||||||||
| Deferred |
8 | 21 | (14 | ) | ||||||||
|
|
|
|
|
|
|
|||||||
| Foreign |
||||||||||||
| Current |
26 | 16 | 3 | |||||||||
| Deferred |
(7 | ) | 4 | — | ||||||||
|
|
|
|
|
|
|
|||||||
| Total income tax expense |
$ | 394 | 438 | 338 | ||||||||
|
|
|
|
|
|
|
|||||||
A-86
Table of Contents
| Years Ended December 31, | ||||||||||||
| 2016 | 2015 | 2014 | ||||||||||
| (Dollars in millions) | ||||||||||||
| Income tax expense was allocated as follows: |
||||||||||||
| Income tax expense in the consolidated statements of operations: |
||||||||||||
| Attributable to income |
$ | 394 | 438 | 338 | ||||||||
| Stockholders’ equity: |
||||||||||||
| Compensation expense for tax purposes in excess of amounts recognized for financial reporting purposes |
(2 | ) | (5 | ) | (5 | ) | ||||||
| Tax effect of the change in accumulated other comprehensive loss |
(109 | ) | 59 | (744 | ) | |||||||
The following is a reconciliation from the statutory federal income tax rate to our effective income tax rate:
| Years Ended December 31, | ||||||||||||
| 2016 | 2015 | 2014 | ||||||||||
| (Percentage of pre-tax income) | ||||||||||||
| Statutory federal income tax rate |
35.0 | % | 35.0 | % | 35.0 | % | ||||||
| State income taxes, net of federal income tax benefit |
2.3 | % | 2.6 | % | 2.7 | % | ||||||
| Change in liability for unrecognized tax position |
0.2 | % | 0.4 | % | 0.4 | % | ||||||
| Net foreign income taxes |
0.1 | % | 0.7 | % | 0.4 | % | ||||||
| Foreign dividend paid to a domestic parent company |
1.8 | % | — | % | — | % | ||||||
| Affiliate debt rationalization |
— | % | (2.6 | )% | — | % | ||||||
| Research and development credits |
(0.6 | )% | (2.1 | )% | — | % | ||||||
| Loss on worthless investment in foreign subsidiary |
— | % | — | % | (5.4 | )% | ||||||
| Other, net |
(0.2 | )% | (0.7 | )% | (2.6 | )% | ||||||
|
|
|
|
|
|
|
|||||||
| Effective income tax rate |
38.6 | % | 33.3 | % | 30.5 | % | ||||||
|
|
|
|
|
|
|
|||||||
The 2016 effective tax rate is 38.6% compared to 33.3% for 2015. The effective tax rate for the year ended December 31, 2016 reflects a tax impact of $18 million from an intercompany dividend payment from one of our foreign subsidiaries to its domestic parent company that was made as part of our corporate restructuring in preparation for the sale of our colocation business. The 2015 rate reflects a tax benefit of approximately $34 million related to affiliate debt rationalization, research and development tax credits of $28 million for 2011 through 2015 and a $16 million tax decrease due to changes in state taxes caused by apportionment changes, state tax rate changes and the changes in the expected utilization of net operating loss carryforwards (“NOLs”). The 2014 rate reflects a $60 million tax benefit associated with a deduction for tax basis for worthless stock in a wholly-owned foreign subsidiary as a result of developments in bankruptcy proceedings involving its sole asset and a $13 million tax decrease due to changes in the state taxes caused by apportionment changes, state tax rate changes and the changes in the expected utilization of NOLs.
A-87
Table of Contents
The tax effects of temporary differences that gave rise to significant portions of the deferred tax assets and deferred tax liabilities were as follows:
| As of December 31, | ||||||||
| 2016 | 2015 | |||||||
| (Dollars in millions) | ||||||||
| Deferred tax assets |
||||||||
| Post-retirement and pension benefit costs |
$ | 2,175 | 2,154 | |||||
| Net operating loss carryforwards |
473 | 487 | ||||||
| Other employee benefits |
125 | 182 | ||||||
| Other |
342 | 458 | ||||||
|
|
|
|
|
|||||
| Gross deferred tax assets |
3,115 | 3,281 | ||||||
| Less valuation allowance |
(375 | ) | (380 | ) | ||||
|
|
|
|
|
|||||
| Net deferred tax assets |
2,740 | 2,901 | ||||||
|
|
|
|
|
|||||
| Deferred tax liabilities |
||||||||
| Property, plant and equipment, primarily due to depreciation differences |
(3,626 | ) | (3,841 | ) | ||||
| Goodwill and other intangible assets |
(2,577 | ) | (2,588 | ) | ||||
| Other |
— | (38 | ) | |||||
|
|
|
|
|
|||||
| Gross deferred tax liabilities |
(6,203 | ) | (6,467 | ) | ||||
|
|
|
|
|
|||||
| Net deferred tax liability |
$ | (3,463 | ) | (3,566 | ) | |||
|
|
|
|
|
|||||
Of the $3.463 billion and $3.566 billion net deferred tax liability at December 31, 2016 and 2015, respectively, $3.471 billion and $3.569 billion is reflected as a long-term liability and $8 million and $3 million is reflected as a net noncurrent deferred tax asset at December 31, 2016 and 2015, respectively.
At December 31, 2016, we had federal NOLs of $61 million and state NOLs of $11.9 billion. If unused, the NOLs will expire between 2017 and 2032; however, no significant amounts expire until 2021. At December 31, 2016, we had an immaterial amount of federal tax credits. Additionally, we had $39 million ($25 million net of federal income tax) of state investment tax credit carryforwards that will expire between 2017 and 2026 if not utilized. In addition, at December 31, 2016, we have fully utilized all remaining federal alternative minimum tax, or AMT, credits. Our acquisitions of Qwest and SAVVIS, Inc. (“Savvis”) caused “ownership changes” within the meaning of Section 382 of the Internal Revenue Code (“Section 382”). As a result, our ability to use these NOLs and AMT credits are subject to annual limits imposed by Section 382. Despite this, we expect to use substantially all of these tax attributes to reduce our future federal tax liabilities, although the timing of that use will depend upon our future earnings and future tax circumstances.
We establish valuation allowances when necessary to reduce the deferred tax assets to amounts we expect to realize. As of December 31, 2016, a valuation allowance of $375 million was established as it is more likely than not that this amount of net operating loss and tax credit carryforwards will not be utilized prior to expiration. Our valuation allowance at December 31, 2016 and 2015 is primarily related to state NOL carryforwards. This valuation allowance decreased by $5 million during 2016.
A-88
Table of Contents
A reconciliation of the change in our gross unrecognized tax benefits (excluding both interest and any related federal benefit) from January 1 to December 31 for 2016 and 2015 is as follows:
| 2016 | 2015 | |||||||
| (Dollars in millions) | ||||||||
| Unrecognized tax benefits at beginning of year |
$ | 15 | 17 | |||||
| Increase in tax positions taken in the current year |
1 | 1 | ||||||
| Increase in tax positions taken in the prior year |
— | 7 | ||||||
| Decrease due to the reversal of tax positions taken in a prior year |
— | (9 | ) | |||||
| Decrease from the lapse of statute of limitations |
— | (1 | ) | |||||
|
|
|
|
|
|||||
| Unrecognized tax benefits at end of year |
$ | 16 | 15 | |||||
|
|
|
|
|
|||||
The total amount of unrecognized tax benefits that, if recognized, would impact the effective income tax rate was $34 million and $32 million at December 31, 2016 and 2015, respectively.
Our policy is to reflect interest expense associated with unrecognized tax benefits in income tax expense. We had accrued interest (presented before related tax benefits) of approximately $35 million and $33 million at December 31, 2016 and 2015, respectively.
We file income tax returns, including returns for our subsidiaries, with federal, state and local jurisdictions. Our uncertain income tax positions are related to tax years that are currently under or remain subject to examination by the relevant taxing authorities.
Beginning with the 2013 tax year, our federal consolidated returns are subject to annual examination by the IRS.
Our open income tax years by major jurisdiction are as follows at December 31, 2016:
| Jurisdiction |
Open Tax Years |
|||
| Federal |
2013—current | |||
| State |
||||
| Arizona |
2010—current | |||
| Other states |
2012—current | |||
Since the period for assessing additional liability typically begins upon the filing of a return, it is possible that certain jurisdictions could assess tax for years prior to the open tax years disclosed above. Additionally, it is possible that certain jurisdictions in which we do not believe we have an income tax filing responsibility, and accordingly did not file a return, may attempt to assess a liability, or that other jurisdictions to which we pay taxes may attempt to assert that we owe additional taxes.
Based on our current assessment of various factors, including (i) the potential outcomes of these ongoing examinations, (ii) the expiration of statute of limitations for specific jurisdictions, (iii) the negotiated settlement of certain disputed issues, and (iv) the administrative practices of applicable taxing jurisdictions, it is reasonably possible that the related unrecognized tax benefits for uncertain tax positions previously taken may decrease by up to $11 million within the next 12 months. The actual amount of such decrease, if any, will depend on several future developments and events, many of which are outside our control.
| (14) | Segment Information |
We are organized into operating segments based on customer type, business and consumer. These operating segments are our two reportable segments in our consolidated financial statements:
| • | Business Segment. Consists generally of providing strategic, legacy and data integration products and services to small, medium and enterprise business, wholesale and governmental customers, including |
A-89
Table of Contents
| other communication providers. Our strategic products and services offered to these customers include our MPLS, Ethernet, colocation, hosting (including cloud hosting and managed hosting), broadband, VoIP, information technology (“IT”) and other ancillary services. Our legacy services offered to these customers primarily include local and long-distance voice, including the sale of unbundled network elements (“UNEs”), private line (including special access), switched access and other ancillary services. Our data integration offerings include the sale of telecommunications equipment located on customers’ premises and related products and professional services, all of which are described further below under the heading “Products and Services Categories”; and |
| • | Consumer Segment. Consists generally of providing strategic and legacy products and services to residential customers. Our strategic products and services offered to these customers include our broadband, video (including our Prism TV services) and other ancillary services. Our legacy services offered to these customers include local and long-distance voice and other ancillary services. |
The following table summarizes our segment results for 2016, 2015 and 2014 based on the segment categorization we were operating under at December 31, 2016.
| Years Ended December 31, | ||||||||||||
| 2016 | 2015 | 2014 | ||||||||||
| (Dollars in millions) | ||||||||||||
| Total segment revenues |
$ | 16,255 | 16,668 | 17,028 | ||||||||
| Total segment expenses |
8,492 | 8,461 | 8,502 | |||||||||
|
|
|
|
|
|
|
|||||||
| Total segment income |
$ | 7,763 | 8,207 | 8,526 | ||||||||
|
|
|
|
|
|
|
|||||||
| Total margin percentage |
48 | % | 49 | % | 50 | % | ||||||
| Business segment: |
||||||||||||
| Revenues |
$ | 10,352 | 10,646 | 11,030 | ||||||||
| Expenses |
5,930 | 5,967 | 6,019 | |||||||||
|
|
|
|
|
|
|
|||||||
| Income |
$ | 4,422 | 4,679 | 5,011 | ||||||||
|
|
|
|
|
|
|
|||||||
| Margin percentage |
43 | % | 44 | % | 45 | % | ||||||
| Consumer segment: |
||||||||||||
| Revenues |
$ | 5,903 | 6,022 | 5,998 | ||||||||
| Expenses |
2,562 | 2,494 | 2,483 | |||||||||
|
|
|
|
|
|
|
|||||||
| Income |
$ | 3,341 | 3,528 | 3,515 | ||||||||
|
|
|
|
|
|
|
|||||||
| Margin percentage |
57 | % | 59 | % | 59 | % | ||||||
Changes in Segment Reporting
We continually review, evaluate and refine our expense allocations to better reflect how we view and manage our operations, and as a result, during the first half of 2016, we implemented several changes with respect to the assignment of certain expenses to our reportable segments. We have recast our previously-reported segment results for the years ended December 31, 2015 and 2014, to conform to the current presentation. The nature of the most significant changes to segment expenses are as follows:
| • | Certain marketing and advertising expenses were reassigned from the business segment to the consumer segment; |
| • | Certain service delivery costs were reassigned from the consumer segment to the business segment; |
| • | Centralized human resources training costs were reassigned from the business and consumer segments to corporate overhead; and |
| • | Marketing direct mail costs and certain printing expenses were reassigned from corporate overhead to the business and consumer segments. |
A-90
Table of Contents
For the year ended December 31, 2015, the segment expense recast resulted in an increase in consumer expenses of $69 million and a decrease in business expenses of $67 million. For the year ended December 31, 2014, the segment expense recast resulted in an increase in consumer expenses of $63 million and a decrease in business expenses of $70 million.
Product and Service Categories
From time to time, we change the categorization of our products and services, and we may make similar changes in the future. During the second quarter of 2016, we determined that because of declines due to customer migration to other strategic products and services, certain of our business low-bandwidth data services, specifically our private line (including special access) services in our business segment, are more closely aligned with our legacy services than with our strategic services. As a result, we reflect these operating revenues as legacy services, and we have reclassified certain prior period amounts to conform to this change. The revision resulted in a reduction of revenue from strategic services and a corresponding increase in revenue from legacy services of $1.586 billion and $1.861 billion (net of $9 million and $33 million of deferred revenue included in other business legacy services) for the years ended December 31, 2015 and 2014, respectively. In addition, our business broadband services remain a strategic service and are now included in our other business strategic services.
We categorize our products, services and revenues among the following four categories:
| • | Strategic services, which include primarily broadband, MPLS, Ethernet, colocation, hosting (including cloud hosting and managed hosting), video (including our facilities-based video services, which we offer in 16 markets), VoIP, information technology and other ancillary services; |
| • | Legacy services, which include primarily local and long-distance voice, including the sale of UNEs, private line (including special access), Integrated Services Digital Network (“ISDN”) (which use regular telephone lines to support voice, video and data applications), switched access and other ancillary services; |
| • | Data integration, which includes the sale of telecommunications equipment located on customers’ premises and related products and professional services, such as network management, installation and maintenance of data equipment and building of proprietary fiber-optic broadband networks for our governmental and business customers; and |
| • | Other operating revenues, which consist primarily of CAF support payments, USF support payments and USF surcharges. We receive federal support payments from both Phase 1 and Phase 2 of the CAF program, and support payments from both federal and state USF programs. These support payments are government subsidies designed to reimburse us for various costs related to certain telecommunications services, including the costs of deploying, maintaining and operating voice and broadband infrastructure in high-cost rural areas where we are not able to fully recover our costs from our customers. We also collect USF surcharges based on specific items we list on our customers’ invoices to fund the FCC’s universal service programs. We also generate other operating revenues from the leasing and subleasing of space in our office buildings, warehouses and other properties. Because we centrally manage the activities that generate these other operating revenues, these revenues are not included in our segment revenues. |
A-91
Table of Contents
Our operating revenues for our products and services consisted of the following categories for the years ended December 31, 2016, 2015 and 2014:
| Years Ended December 31, | ||||||||||||
| 2016 | 2015 | 2014 | ||||||||||
| (Dollars in millions) | ||||||||||||
| Strategic services |
||||||||||||
| Business high-bandwidth data services(1) |
$ | 2,990 | 2,816 | 2,579 | ||||||||
| Business hosting services(2) |
1,210 | 1,281 | 1,316 | |||||||||
| Other business strategic services(3) |
703 | 624 | 558 | |||||||||
| Consumer broadband services(4) |
2,689 | 2,611 | 2,469 | |||||||||
| Other consumer strategic services(5) |
458 | 421 | 381 | |||||||||
|
|
|
|
|
|
|
|||||||
| Total strategic services revenues |
8,050 | 7,753 | 7,303 | |||||||||
|
|
|
|
|
|
|
|||||||
| Legacy services |
||||||||||||
| Business voice services(6) |
2,413 | 2,588 | 2,777 | |||||||||
| Business low-bandwidth data services(7) |
1,382 | 1,594 | 1,893 | |||||||||
| Other business legacy services(8) |
1,123 | 1,168 | 1,219 | |||||||||
| Consumer voice services(6) |
2,442 | 2,676 | 2,865 | |||||||||
| Other consumer legacy services(9) |
312 | 312 | 279 | |||||||||
|
|
|
|
|
|
|
|||||||
| Total legacy services revenues |
7,672 | 8,338 | 9,033 | |||||||||
|
|
|
|
|
|
|
|||||||
| Data integration |
||||||||||||
| Business data integration |
531 | 575 | 688 | |||||||||
| Consumer data integration |
2 | 2 | 4 | |||||||||
|
|
|
|
|
|
|
|||||||
| Total data integration revenues |
533 | 577 | 692 | |||||||||
|
|
|
|
|
|
|
|||||||
| Other revenues |
||||||||||||
| High-cost support revenue(10) |
688 | 732 | 528 | |||||||||
| Other revenue(11) |
527 | 500 | 475 | |||||||||
|
|
|
|
|
|
|
|||||||
| Total other revenues |
1,215 | 1,232 | 1,003 | |||||||||
|
|
|
|
|
|
|
|||||||
| Total revenues |
$ | 17,470 | 17,900 | 18,031 | ||||||||
|
|
|
|
|
|
|
|||||||
| (1) | Includes MPLS and Ethernet revenue |
| (2) | Includes colocation, hosting (including cloud hosting and managed hosting) and hosting area network revenue |
| (3) | Includes primarily broadband, VoIP, video and IT services revenue |
| (4) | Includes broadband and related services revenue |
| (5) | Includes video and other revenue |
| (6) | Includes local and long-distance voice revenue |
| (7) | Includes private line (including special access) revenue |
| (8) | Includes UNEs, public access, switched access and other ancillary revenue |
| (9) | Includes other ancillary revenue |
| (10) | Includes CAF Phase 1, CAF Phase 2 and federal and state USF support revenue |
| (11) | Includes USF surcharges |
We recognize revenues in our consolidated statements of operations for certain USF surcharges and transaction taxes that we bill to our customers. Our consolidated statements of operations also reflect the offsetting expense for the amounts we remit to the government agencies. The total amount of such surcharges and transaction taxes that we included in revenues aggregated to $572 million, $544 million and $526 million for the years ended December 31, 2016, 2015 and 2014, respectively. These USF surcharges, where we record revenue, are included in “other” operating revenues and transaction taxes are included in “legacy services”
A-92
Table of Contents
revenues. We also act as a collection agent for certain other USF and transaction taxes that we are required by government agencies to bill our customers, for which we do not record any revenue or expense because we only act as a pass-through agent.
Allocations of Revenues and Expenses
Our segment revenues include all revenues from our strategic, legacy and data integration operations as described in more detail above. Segment revenues are based upon each customer’s classification as either business or consumer. We report our segment revenues based upon all services provided to that segment’s customers. Our segment expenses for our two segments include specific expenses incurred as a direct result of providing services and products to segment customers, along with selling, general and administrative expenses that are (i) directly associated with specific segment customers or activities, and (ii) allocated expenses which include network expenses, facilities expenses and other expenses such as fleet and real estate expenses. We do not assign depreciation and amortization expense or impairments to our segments, as the related assets and capital expenditures are centrally managed and are not monitored by or reported to the chief operating decision maker (“CODM”) by segment. Generally speaking, severance expenses, restructuring expenses and certain centrally managed administrative functions (such as finance, information technology, legal and human resources) are not assigned to our segments. Interest expense is also excluded from segment results because we manage our financing on a consolidated basis and have not allocated assets or debt to specific segments. Other income and expense items are not monitored as a part of our segment operations and are therefore excluded from our segment results.
The following table reconciles segment income to net income for the years ended December 31, 2016, 2015 and 2014:
| Years Ended December 31, | ||||||||||||
| 2016 | 2015 | 2014 | ||||||||||
| (Dollars in millions) | ||||||||||||
| Total segment income |
$ | 7,763 | 8,207 | 8,526 | ||||||||
| Other operating revenues |
1,215 | 1,232 | 1,003 | |||||||||
| Depreciation and amortization |
(3,916 | ) | (4,189 | ) | (4,428 | ) | ||||||
| Other unassigned operating expenses |
(2,731 | ) | (2,645 | ) | (2,691 | ) | ||||||
| Other expenses, net |
(1,311 | ) | (1,289 | ) | (1,300 | ) | ||||||
|
|
|
|
|
|
|
|||||||
| Income before income tax expense |
1,020 | 1,316 | 1,110 | |||||||||
| Income tax expense |
(394 | ) | (438 | ) | (338 | ) | ||||||
|
|
|
|
|
|
|
|||||||
| Net income |
$ | 626 | 878 | 772 | ||||||||
|
|
|
|
|
|
|
|||||||
We do not have any single customer that provides more than 10% of our total consolidated operating revenues. Substantially all of our consolidated revenues come from customers located in the United States.
A-93
Table of Contents
| (15) | Quarterly Financial Data (Unaudited) |
| First Quarter |
Second Quarter |
Third Quarter |
Fourth Quarter |
Total | ||||||||||||||||
| (Dollars in millions, except per share amounts) | ||||||||||||||||||||
| 2016 |
||||||||||||||||||||
| Operating revenues |
$ | 4,401 | 4,398 | 4,382 | 4,289 | 17,470 | ||||||||||||||
| Operating income |
694 | 650 | 595 | 392 | 2,331 | |||||||||||||||
| Net income |
236 | 196 | 152 | 42 | 626 | |||||||||||||||
| Basic earnings per common share |
0.44 | 0.36 | 0.28 | 0.08 | 1.16 | |||||||||||||||
| Diluted earnings per common share |
0.44 | 0.36 | 0.28 | 0.08 | 1.16 | |||||||||||||||
| 2015 |
||||||||||||||||||||
| Operating revenues |
$ | 4,451 | 4,419 | 4,554 | 4,476 | 17,900 | ||||||||||||||
| Operating income |
649 | 549 | 656 | 751 | 2,605 | |||||||||||||||
| Net income |
192 | 143 | 205 | 338 | 878 | |||||||||||||||
| Basic earnings per common share |
0.34 | 0.26 | 0.37 | 0.62 | 1.58 | |||||||||||||||
| Diluted earnings per common share |
0.34 | 0.26 | 0.37 | 0.62 | 1.58 | |||||||||||||||
During the fourth quarter of 2016, we recognized $164 million of severance expenses and other one-time termination benefits associated with our workforce reductions and $52 million of expenses related to our pending acquisition of Level 3.
During the third quarter of 2015, we recognized an incremental $158 million of revenue associated with the FCC’s CAF Phase 2 high-cost support program (primarily impacted by the one-time transitional payment), and an additional incremental $57 million in the fourth quarter of 2015. During the fourth quarter of 2015, we also recognized a tax benefit of approximately $34 million related to affiliate debt rationalization, research and development tax credits of $28 million for 2011 through 2015, and a $16 million tax decrease due to changes in state taxes caused by apportionment changes, state tax rate changes and the changes in the expected utilization of net operating loss carryforwards (“NOLs”).
| (16) | Commitments and Contingencies |
We are vigorously defending against all of the matters described below under the headings “Pending Matters” and “Other Proceedings and Disputes.” As a matter of course, we are prepared both to litigate these matters to judgment, as well as to evaluate and consider all reasonable settlement opportunities. In this Note, when we refer to a class action as “putative” it is because a class has been alleged, but not certified in that matter. We have established accrued liabilities for these matters described below where losses are deemed probable and reasonably estimable.
Pending Matters
CenturyLink and the members of the CenturyLink Board have been named as defendants in a putative shareholder class action lawsuit filed on January 11, 2017 in the 4th Judicial District Court of the State of Louisiana, Ouachita Parish, captioned Jeffery Tomasulo v. CenturyLink, Inc., et al., Docket No. C-20170110. The complaint asserts, among other things, that the members of CenturyLink’s Board allegedly breached their fiduciary duties to the CenturyLink shareholders in approving the Level 3 merger agreement and, more particularly, that: the consideration that CenturyLink agreed to pay to Level 3 stockholders in the transaction is allegedly unfairly high; the CenturyLink directors allegedly had conflicts of interest in negotiating and approving the transaction; and the disclosures set forth in our preliminary joint proxy statement/prospectus filed in December 2016 are insufficient in that they allegedly fail to contain material information concerning the transaction. The complaint seeks, among other things, a declaration that the members of the CenturyLink Board have breached their fiduciary duties, corrective disclosure, rescissory or other damages and equitable relief,
A-94
Table of Contents
including rescission of the transaction. On February 13, 2017, the parties entered into a memorandum of understanding providing for the settlement of the lawsuit. The proposed settlement is subject to court approval, among other conditions.
In William Douglas Fulghum, et al. v. Embarq Corporation, et al., filed on December 28, 2007 in the United States District Court for the District of Kansas, a group of retirees filed a class action lawsuit challenging the decision to make certain modifications in retiree benefits programs relating to life insurance, medical insurance and prescription drug benefits, generally effective January 1, 2006 and January 1, 2008 (which, at the time of the modifications, was expected to reduce estimated future expenses for the subject benefits by more than $300 million). Defendants include Embarq, certain of its benefit plans, its Employee Benefits Committee and the individual plan administrator of certain of its benefits plans. Additional defendants include Sprint Nextel and certain of its benefit plans. The court certified classes on the claims for vested benefits and age discrimination, but rejected class certification on the claims for breach of fiduciary duty. On October 14, 2011, the Fulghum lawyers filed a new, related lawsuit, Abbott et al. v. Sprint Nextel et al. In Abbott, approximately 1,500 plaintiffs alleged breach of fiduciary duty in connection with the changes in retiree benefits that were at issue in Fulghum. After extensive district court proceedings in Fulghum, and an interlocutory appeal to the United States Court of Appeals for the Tenth Circuit, defendants prevailed in 2015 on all age discrimination claims and on the majority of claims for vested benefits. The district court in Fulghum subsequently granted judgment in favor of defendants on all remaining vested benefits claims, and in July 2016 ordered that any affected class members could appeal this ruling. No appeal was taken, and all claims for vested benefits thus have lapsed. On August 31, 2016, the parties reached a settlement in principle on all remaining claims in Fulghum and Abbott. Assuming its terms are successfully implemented, we believe the settlement is likely to be final in mid 2017. We have accrued a liability that we believe is probable for these matters; the amount is not material to our consolidated financial statements.
Subsidiaries of CenturyLink, Inc. are among hundreds of companies in an industry-wide dispute, raised in nearly 100 federal lawsuits (filed between 2014 and 2016) that have been consolidated in the United States District Court for the District of Northern Texas for pretrial procedures. The disputes relate to switched access charges that local exchange carriers (“LECs”) collect from interexchange carriers (“IXCs”) for IXCs’ use of LEC’s access services. In the lawsuits, three IXCs, Sprint Communications Company L.P. (“Sprint”), affiliates of Verizon Communications Inc. (“Verizon”) and affiliates of Level 3 Communications LLC (“Level 3”), assert that federal and state laws bar LECs from collecting access charges when IXCs exchange certain types of calls between mobile and wireline devices that are routed through an IXC. Some of these IXCs have asserted claims seeking refunds of payments for access charges previously paid and relief from future access charges. In addition, Level 3 has ceased paying switched access charges on these calls.
In November 2015, the federal court agreed with the LECs and rejected the IXCs’ contention that federal law prohibits these particular access charges, and also allowed the IXCs to refile state-law claims. Since then, many of the LECs and IXCs have filed revised pleadings and additional motions, which remain pending. Separately, some of the defendants, including CenturyLink, Inc.’s LECs, have petitioned the FCC to address these issues on an industry-wide basis.
As both an IXC and a LEC, we both pay and assess significant amounts of the charges in question. The outcome of these disputes and lawsuits, as well as any related regulatory proceedings that could ensue, are currently not predictable. If we are required to stop assessing these charges or to pay refunds of any such charges, our financial results could be negatively affected.
CenturyLink, Inc. and several of its subsidiaries are defendants in lawsuits filed over the past few years in the Circuit Court of St. Louis County, Missouri by numerous Missouri municipalities alleging underpayment of taxes. These municipalities are seeking, among other things, (i) a declaratory judgment regarding the extent of our obligations to pay certain business license and gross receipts taxes and (ii) a monetary award of back taxes covering 2007 to the present, plus penalties and interest. In an April 2016 ruling in connection with one of these pending cases, the court made findings which, if not overturned, will result in a tax liability to us well in excess
A-95
Table of Contents
of the contingent liability we have established. Following further proceedings at the district court, we plan to file an appeal and continue to vigorously defend against these claims. For a variety of reasons, we expect the outcome of our appeal to significantly reduce our ultimate exposure, although we can provide no assurances to this effect.
Other Proceedings and Disputes
From time to time, we are involved in other proceedings incidental to our business, including patent infringement allegations, administrative hearings of state public utility commissions relating primarily to our rates or services, actions relating to employee claims, various tax issues, environmental law issues, grievance hearings before labor regulatory agencies and miscellaneous third party tort actions.
We are currently defending several patent infringement lawsuits asserted against us by non-practicing entities, many of which are seeking substantial recoveries. These cases have progressed to various stages and one or more may go to trial in the coming 24 months if they are not otherwise resolved. Where applicable, we are seeking full or partial indemnification from our vendors and suppliers. As with all litigation, we are vigorously defending these actions and, as a matter of course, are prepared to litigate these matters to judgment, as well as to evaluate and consider all reasonable settlement opportunities.
We are subject to various foreign, federal, state and local environmental protection and health and safety laws. From time to time, we are subject to judicial and administrative proceedings brought by various governmental authorities under these laws. Several such proceedings are currently pending, but none is reasonably expected to exceed $100,000 in fines and penalties.
The outcome of these other proceedings is not predictable. However, based on current circumstances, we do not believe that the ultimate resolution of these other proceedings, after considering available defenses and any insurance coverage or indemnification rights, will have a material adverse effect on our financial position, results of operations or cash flows.
Capital Leases
We lease certain facilities and equipment under various capital lease arrangements. Depreciation of assets under capital leases is included in depreciation and amortization expense in our consolidated statements of operations. Payments on capital leases are included in repayments of long-term debt, including current maturities in our consolidated statements of cash flows.
The tables below summarize our capital lease activity:
| Years Ended December 31, | ||||||||||||
| 2016 | 2015 | 2014 | ||||||||||
| (Dollars in millions) | ||||||||||||
| Assets acquired through capital leases |
45 | 17 | 37 | |||||||||
| Depreciation expense |
70 | 96 | 126 | |||||||||
| Cash payments towards capital leases |
58 | 89 | 118 | |||||||||
| As of December 31, | ||||||||
| 2016 | 2015 | |||||||
| (Dollars in millions) | ||||||||
| Assets included in property, plant and equipment |
705 | 722 | ||||||
| Accumulated depreciation |
351 | 352 | ||||||
A-96
Table of Contents
The future annual minimum payments under capital lease arrangements as of December 31, 2016 were as follows:
| Future Minimum Payments |
||||
| (Dollars in millions) |
||||
| Capital lease obligations: |
||||
| 2017 |
$ | 94 | ||
| 2018 |
91 | |||
| 2019 |
70 | |||
| 2020 |
46 | |||
| 2021 |
43 | |||
| 2022 and thereafter |
170 | |||
|
|
|
|||
| Total minimum payments |
514 | |||
| Less: amount representing interest and executory costs |
(123 | ) | ||
|
|
|
|||
| Present value of minimum payments |
391 | |||
| Less: current portion |
(69 | ) | ||
|
|
|
|||
| Long-term portion |
$ | 322 | ||
|
|
|
|||
If, as anticipated, we sell our colocation business and data centers in the manner discussed in Note 3—Pending Sale of Colocation Business and Data Centers, $305 million of the capital lease obligations as of December 31, 2016 will be assumed by the Purchaser. The future annual minimum payments under capital lease arrangements for the colocation operations as of December 31, 2016 were as follows:
| Future Minimum Payments |
||||
| (Dollars in millions) |
||||
| Capital lease obligations: |
||||
| 2017 |
$ | 60 | ||
| 2018 |
62 | |||
| 2019 |
52 | |||
| 2020 |
39 | |||
| 2021 |
40 | |||
| 2022 and thereafter |
145 | |||
|
|
|
|||
| Total minimum payments |
398 | |||
| Less: amount representing interest and executory costs |
(93 | ) | ||
|
|
|
|||
| Present value of minimum payments |
$ | 305 | ||
|
|
|
|||
The present value of the minimum payments under capital lease arrangements for the colocation operations is included in “Current liabilities associated with assets held for sale” on our consolidated balance sheets. See Note 3—Pending Sale of Colocation Business and Data Centers for additional information.
Operating Leases
CenturyLink leases various equipment, office facilities, retail outlets, switching facilities and other network sites. These leases, with few exceptions, provide for renewal options and escalations that are either fixed or based on the consumer price index. Any rent abatements, along with rent escalations, are included in the computation of rent expense calculated on a straight-line basis over the lease term. The lease term for most leases includes the
A-97
Table of Contents
initial non-cancelable term plus any term under renewal options that are reasonably assured. For the years ended December 31, 2016, 2015 and 2014, our gross rental expense was $482 million, $467 million and $446 million, respectively. We also received sublease rental income for the years ended December 31, 2016, 2015 and 2014 of $12 million, $12 million and $14 million, respectively.
At December 31, 2016, our future rental commitments for operating leases were as follows:
| Future Minimum Payments |
||||
| (Dollars in millions) |
||||
| 2017 |
$ | 295 | ||
| 2018 |
276 | |||
| 2019 |
249 | |||
| 2020 |
226 | |||
| 2021 |
162 | |||
| 2022 and thereafter |
1,049 | |||
|
|
|
|||
| Total future minimum payments(1) |
$ | 2,257 | ||
|
|
|
|||
| (1) | Minimum payments have not been reduced by minimum sublease rentals of $77 million due in the future under non-cancelable subleases. |
If, as anticipated, we sell our colocation business and data centers in the manner discussed in Note 3—Pending Sale of Colocation Business and Data Centers, $750 million of the operating leases future rental commitments as of December 31, 2016 will be assumed by the Purchaser. The future rental commitments under operating leases for the colocation operations as of December 31, 2016 were as follows:
| Future Minimum Payments |
||||
| (Dollars in millions) |
||||
| 2017 |
$ | 89 | ||
| 2018 |
84 | |||
| 2019 |
71 | |||
| 2020 |
68 | |||
| 2021 |
68 | |||
| 2022 and thereafter |
370 | |||
|
|
|
|||
| Total future minimum payments |
$ | 750 | ||
|
|
|
|||
Purchase Commitments
We have several commitments primarily for marketing activities and support services from a variety of vendors to be used in the ordinary course of business totaling $427 million at December 31, 2016. Of this amount, we expect to purchase $166 million in 2017, $153 million in 2018 through 2019, $41 million in 2020 through 2021 and $67 million in 2022 and thereafter. These amounts do not represent our entire anticipated purchases in the future, but represent only those items for which we were contractually committed as of December 31, 2016.
If, as anticipated, we sell our colocation business and data centers in the manner discussed in Note 3—Pending Sale of Colocation Business and Data Centers, $80 million of the purchase commitments as of December 31, 2016 will be assumed by the Purchaser.
A-98
Table of Contents
| (17) | Other Financial Information |
Other Current Assets
The following table presents details of other current assets in our consolidated balance sheets:
| As of December 31, | ||||||||
| 2016 | 2015 | |||||||
| (Dollars in millions) | ||||||||
| Prepaid expenses |
$ | 206 | 238 | |||||
| Materials, supplies and inventory |
134 | 144 | ||||||
| Deferred activation and installation charges |
101 | 105 | ||||||
| Other |
106 | 86 | ||||||
|
|
|
|
|
|||||
| Total other current assets |
$ | 547 | 573 | |||||
|
|
|
|
|
|||||
Selected Current Liabilities
Current liabilities reflected in our consolidated balance sheets include accounts payable and other current liabilities as follows:
| As of December 31, | ||||||||
| 2016 | 2015 | |||||||
| (Dollars in millions) | ||||||||
| Accounts payable |
$ | 1,179 | 968 | |||||
|
|
|
|
|
|||||
| Other current liabilities: |
||||||||
| Accrued rent |
$ | 31 | 32 | |||||
| Legal reserves |
30 | 20 | ||||||
| Other |
152 | 168 | ||||||
|
|
|
|
|
|||||
| Total other current liabilities |
$ | 213 | 220 | |||||
|
|
|
|
|
|||||
Included in accounts payable at December 31, 2016 and 2015, were (i) $56 million and $68 million, respectively, representing book overdrafts and (ii) $196 million and $94 million, respectively, associated with capital expenditures.
A-99
Table of Contents
| (18) | Labor Union Contracts |
Approximately 38% of our employees are members of various bargaining units represented by the Communication Workers of America and the International Brotherhood of Electrical Workers. We believe that relations with our employees continue to be generally good. Approximately 12,000, or 30%, of our employees are subject to collective bargaining agreements that are scheduled to expire in 2017, including approximately 11,000, or 28%, of our employees that are subject to collective bargaining agreements that are scheduled to expire October 7, 2017.
(19) Accumulated Other Comprehensive Loss
The table below summarizes changes in accumulated other comprehensive loss recorded on our consolidated balance sheet by component for the year ended December 31, 2016:
| Pension Plans | Post-Retirement Benefit Plans |
Foreign
Currency Translation Adjustment and Other |
Total | |||||||||||||
| (Dollars in millions) | ||||||||||||||||
| Balance at December 31, 2015 |
$ | (1,715 | ) | (180 | ) | (39 | ) | (1,934 | ) | |||||||
|
|
|
|
|
|
|
|
|
|||||||||
| Other comprehensive income (loss) before reclassifications |
(280 | ) | 6 | (22 | ) | (296 | ) | |||||||||
| Amounts reclassified from accumulated other comprehensive income |
100 | 12 | 1 | 113 | ||||||||||||
|
|
|
|
|
|
|
|
|
|||||||||
| Net current-period other comprehensive income (loss) |
(180 | ) | 18 | (21 | ) | (183 | ) | |||||||||
|
|
|
|
|
|
|
|
|
|||||||||
| Balance at December 31, 2016 |
$ | (1,895 | ) | (162 | ) | (60 | ) | (2,117 | ) | |||||||
|
|
|
|
|
|
|
|
|
|||||||||
The table below presents further information about our reclassifications out of accumulated other comprehensive loss by component for the year ended December 31, 2016:
| Year Ended December 31, 2016 |
Decrease (Increase) in Net Income |
Affected Line Item in Consolidated Statement of Operations or Footnote Where Additional Information is Presented If The Amount is not Recognized in Net Income in Total | ||||
| (Dollars in millions) | ||||||
| Amortization of pension & post-retirement plans |
||||||
| Net actuarial loss |
$ | 175 | See Note 9—Employee Benefits | |||
| Prior service cost |
12 | See Note 9—Employee Benefits | ||||
|
|
|
|||||
| Total before tax |
187 | |||||
| Income tax expense (benefit) |
(75 | ) | Income tax expense | |||
| Insignificant items |
1 | |||||
|
|
|
|||||
| Net of tax |
$ | 113 | ||||
|
|
|
|||||
A-100
Table of Contents
The table below summarizes changes in accumulated other comprehensive loss recorded on our consolidated balance sheet by component for the year ended December 31, 2015:
| Pension Plans | Post-Retirement Benefit Plans |
Foreign
Currency Translation Adjustment and Other |
Total | |||||||||||||
| (Dollars in millions) | ||||||||||||||||
| Balance at December 31, 2014 |
$ | (1,720 | ) | (272 | ) | (25 | ) | (2,017 | ) | |||||||
|
|
|
|
|
|
|
|
|
|||||||||
| Other comprehensive income (loss) before reclassifications |
(98 | ) | 80 | (14 | ) | (32 | ) | |||||||||
| Amounts reclassified from accumulated other comprehensive income |
103 | 12 | — | 115 | ||||||||||||
|
|
|
|
|
|
|
|
|
|||||||||
| Net current-period other comprehensive income (loss) |
5 | 92 | (14 | ) | 83 | |||||||||||
|
|
|
|
|
|
|
|
|
|||||||||
| Balance at December 31, 2015 |
$ | (1,715 | ) | (180 | ) | (39 | ) | (1,934 | ) | |||||||
|
|
|
|
|
|
|
|
|
|||||||||
The table below presents further information about our reclassifications out of accumulated other comprehensive loss by component for the year ended December 31, 2015:
| Year Ended December 31, 2015 |
Decrease (Increase) in Net Loss |
Affected Line Item in Consolidated Statement of Operations or Footnote Where Additional Information is Presented If The Amount is not Recognized in Net Income in Total |
||||||
| (Dollars in millions) | ||||||||
| Amortization of pension & post-retirement plans |
||||||||
| Net actuarial loss |
$ | 161 | See Note 9—Employee Benefits | |||||
| Prior service cost |
24 | See Note 9—Employee Benefits | ||||||
|
|
|
|||||||
| Total before tax |
185 | |||||||
| Income tax expense (benefit) |
(70 | ) | Income tax expense | |||||
|
|
|
|||||||
| Net of tax |
$ | 115 | ||||||
|
|
|
|||||||
| (20) | Dividends |
Our Board of Directors declared the following dividends payable in 2016 and 2015:
| Date Declared |
Record Date |
Dividend Per Share |
Total Amount | Payment Date |
||||||||||||
| (in millions) | ||||||||||||||||
| November 15, 2016 |
11/28/2016 | $ | 0.540 | $ | 294 | 12/12/2016 | ||||||||||
| August 23, 2016 |
9/2/2016 | 0.540 | 295 | 9/16/2016 | ||||||||||||
| May 18, 2016 |
5/31/2016 | 0.540 | 294 | 6/14/2016 | ||||||||||||
| February 23, 2016 |
3/4/2016 | 0.540 | 295 | 3/18/2016 | ||||||||||||
| November 10, 2015 |
11/24/2015 | 0.540 | 293 | 12/8/2015 | ||||||||||||
| August 25, 2015 |
9/8/2015 | 0.540 | 300 | 9/22/2015 | ||||||||||||
| May 20, 2015 |
6/2/2015 | 0.540 | 303 | 6/16/2015 | ||||||||||||
| February 23, 2015 |
3/6/2015 | 0.540 | 303 | 3/20/2015 | ||||||||||||
The declaration of dividends is solely at the discretion of our Board of Directors, which may change or terminate our dividend practice at any time for any reason without prior notice.
* * * * * * * * * *
A-101
Table of Contents
q IF YOU HAVE NOT VOTED VIA THE INTERNET OR TELEPHONE, FOLD ALONG THE PERFORATION, DETACH AND RETURN THE BOTTOM PORTION IN THE ENCLOSED ENVELOPE. q

Proxy — CENTURYLINK, INC.
THIS PROXY IS SOLICITED ON BEHALF OF THE BOARD OF DIRECTORS
The undersigned hereby constitutes and appoints Glen F. Post, III and Stacey W. Goff, or either of them, proxies for the undersigned, with full power of substitution, to represent the undersigned and to vote all of the shares of common stock and voting preferred stock (collectively, the “Voting Shares”) of CenturyLink, Inc. (the “Company”) that the undersigned is entitled to vote at the annual meeting of shareholders of the Company to be held on May 24, 2017, and at any and all adjournments thereof (the “Meeting”).
In addition to serving as a Proxy, this card will also serve as instructions to Computershare Trust Company, N.A. (the “Agent”) to vote in the manner designated on the reverse side hereof the shares of the Company’s common stock held as of April 7, 2017 in the name of the Agent and credited to any plan account of the undersigned in accordance with the Company’s dividend reinvestment plan. Upon the Company’s timely receipt of this Proxy, properly executed, all of your Voting Shares, including any held in the name of the Agent, will be voted as specified.
With respect to each matter listed on the reverse side, the Board of Directors recommends that you vote (i) FOR Items 1 through 3(a), (ii) for a frequency of 1 YEAR on Item 3(b), and (iii) AGAINST Items 4(a) through 4(c), each of which is described more fully in the Company’s proxy statement for the Meeting. If you properly execute and return this Proxy but fail to provide specific directions with respect to any of the matters listed on the reverse side, all of your votes will be voted in accordance with these recommendations with respect to such matters.
(Please See Reverse Side)
Table of Contents


q IF YOU HAVE NOT VOTED VIA THE INTERNET OR TELEPHONE, FOLD ALONG THE PERFORATION, DETACH AND RETURN THE BOTTOM PORTION IN THE ENCLOSED ENVELOPE. q
| A | Proposals — The Board of Directors recommends that you vote FOR Items 1 through 3(a) and in favor of 1 YEAR on Item 3(b). |
| 1. | Elect nine directors. | For | Withhold | For | Withhold | For | Withhold | For |
Withhold | + | ||||||||||||||||
|
01 - Martha H. Bejar
|
☐ | ☐ | 02 - Virginia Boulet | ☐ | ☐ | 03 - Peter C. Brown | ☐ | ☐ | 04 - W. Bruce Hanks | ☐ | ☐ | |||||||||||||||
|
05 - Mary L. Landrieu
|
☐ | ☐ | 06 - Harvey P. Perry | ☐ | ☐ | 07 - Glen F. Post, III | ☐ | ☐ | 08 - Michael J. Roberts | ☐ | ☐ | |||||||||||||||
|
09 - Laurie A. Siegel
|
☐ | ☐ |
| For | Against | Abstain | For | Against | Abstain | |||||||||||||||||
| 2. | Ratify the appointment of KPMG LLP as our independent auditor for 2017. | ☐ | ☐ | ☐ | 3(a). | Advisory vote to approve our executive compensation. | ☐ | ☐ | ☐ | |||||||||||||
| 1 Year | 2 Years | 3 Years | Abstain | |||||||||||||||||||
| 3(b). |
Advisory vote regarding the frequency of our executive compensation votes. |
☐ | ☐ | ☐ | ☐ |
| The Board of Directors recommends that you vote AGAINST Items 4(a), 4(b) and 4(c). |
| For | Against | Abstain | For | Against | Abstain | |||||||||||||||||
| 4(a). | Shareholder proposal regarding equity retention. | ☐ | ☐ | ☐ | 4(b). | Shareholder proposal regarding our lobbying activities. | ☐ | ☐ | ☐ | |||||||||||||
| 4(c). | Shareholder proposal regarding our lobbying activities. | ☐ | ☐ | ☐ | 5. |
In their discretion to vote upon such other business as may properly come before the Meeting. | ||||||||||||||||
| B | Authorized Signatures — This section must be completed for your vote to be counted. — Date and Sign Below |
| Please sign exactly as name appears on the certificate or certificates representing shares to be voted by this proxy. When signing as executor, administrator, attorney, trustee or guardian, please give full title as such. If a corporation, please sign in full corporate name by president or other authorized officer. If a partnership, please sign in partnership name by authorized persons. |
| Date (mm/dd/yyyy) — Please print date below. | Signature 1 — Please keep signature within the box. | Signature 2 — Please keep signature within the box. |
| / / |
Table of Contents
q IF YOU HAVE NOT VOTED VIA THE INTERNET OR TELEPHONE, FOLD ALONG THE PERFORATION, DETACH AND RETURN THE BOTTOM PORTION IN THE ENCLOSED ENVELOPE. q

Voting Instruction Card — CENTURYLINK, INC.
CENTURYLINK DOLLARS & SENSE 401(k) PLAN
CENTURYLINK UNION 401(k) PLAN
The undersigned, acting as a participant and a “named fiduciary” in either of the above-referenced retirement plans (collectively, the “Plans”), hereby directs The Northern Trust Company (the “Trustee”), as directed trustee of the Plans’ trust (the “Trust”), to vote at the annual meeting of shareholders of CenturyLink, Inc. (the “Company”) to be held on May 24, 2017, and any and all adjournments thereof (the “Meeting”), in the manner designated herein, the number of shares of the Company’s common stock credited to the account of the undersigned maintained under either of the Plans on the matters set forth on the reverse side hereof and more fully described in the Company’s proxy statement for the Meeting. If no instructions are furnished by the undersigned, the Trustee will vote unvoted shares and unallocated shares, if any, held in the Trust (collectively, “Undirected Shares”) in the same proportion as voted shares regarding each of the matters set forth on the reverse side hereof, except as otherwise provided in accordance with applicable law. Under the Trust, plan participants are deemed to act as “named fiduciaries” to the extent of their authority to direct the voting of shares held in their accounts and their proportionate share of Undirected Shares.
The undersigned hereby directs the Trustee to authorize the Company’s proxies to vote in their discretion upon such other business as may properly come before the Meeting.
TO BE COUNTED, THE TRUSTEE MUST RECEIVE THIS CARD, PROPERLY COMPLETED, BY 1:00 A.M. CENTRAL TIME ON MAY 22, 2017.
(Please See Reverse Side)
Table of Contents


q IF YOU HAVE NOT VOTED VIA THE INTERNET OR TELEPHONE, FOLD ALONG THE PERFORATION, DETACH AND RETURN THE BOTTOM PORTION IN THE ENCLOSED ENVELOPE. q
| A | Proposals — The Board of Directors recommends that you vote FOR Items 1 through 3(a) and in favor of 1 YEAR on Item 3(b). |
| 1. | Elect nine directors. | For | Withhold | For | Withhold | For | Withhold | For |
Withhold | + | ||||||||||||||||
|
01 - Martha H. Bejar
|
☐ | ☐ | 02 - Virginia Boulet | ☐ | ☐ | 03 - Peter C. Brown | ☐ | ☐ | 04 - W. Bruce Hanks | ☐ | ☐ | |||||||||||||||
|
05 - Mary L. Landrieu
|
☐ | ☐ | 06 - Harvey P. Perry | ☐ | ☐ | 07 - Glen F. Post, III | ☐ | ☐ | 08 - Michael J. Roberts | ☐ | ☐ | |||||||||||||||
|
09 - Laurie A. Siegel
|
☐ | ☐ |
| For | Against | Abstain | For | Against | Abstain | |||||||||||||||||
| 2. | Ratify the appointment of KPMG LLP as our independent auditor for 2017. | ☐ | ☐ | ☐ | 3(a). | Advisory vote to approve our executive compensation. | ☐ | ☐ | ☐ | |||||||||||||
| 1 Year | 2 Years | 3 Years | Abstain | |||||||||||||||||||
| 3(b). |
Advisory vote regarding the frequency of our executive compensation votes. |
☐ | ☐ | ☐ | ☐ |
| The Board of Directors recommends that you vote AGAINST Items 4(a), 4(b) and 4(c). |
| For | Against | Abstain | For | Against | Abstain | |||||||||||||||||
| 4(a). | Shareholder proposal regarding equity retention. | ☐ | ☐ | ☐ | 4(b). | Shareholder proposal regarding our lobbying activities. | ☐ | ☐ | ☐ | |||||||||||||
| 4(c). | Shareholder proposal regarding our lobbying activities. | ☐ | ☐ | ☐ | 5. |
In their discretion to vote upon such other business as may properly come before the Meeting. | ||||||||||||||||
| B | Authorized Signatures — This section must be completed for your vote to be counted. — Date and Sign Below |
| Please mark, sign, date and return these instructions promptly. When signing as executor, administrator, attorney, trustee or guardian, please give full title as such. |
| Date (mm/dd/yyyy) — Please print date below. | Signature 1 — Please keep signature within the box. | Signature 2 — Please keep signature within the box. |
| / / |