00018833132023FYfalsehttp://fasb.org/us-gaap/2023#PropertyPlantAndEquipmentAndFinanceLeaseRightOfUseAssetAfterAccumulatedDepreciationAndAmortizationhttp://fasb.org/us-gaap/2023#AccountsPayableAndAccruedLiabilitiesCurrenthttp://fasb.org/us-gaap/2023#OtherLiabilitiesNoncurrent37139840700018833132023-01-012023-12-3000018833132023-07-01iso4217:USD00018833132024-02-26xbrli:shares00018833132023-12-3000018833132022-12-31iso4217:USDxbrli:shares00018833132022-01-022022-12-3100018833132021-01-032022-01-010001883313us-gaap:CommonStockMemberus-gaap:CommonClassAMember2021-01-020001883313us-gaap:CommonClassBMemberus-gaap:CommonStockMember2021-01-020001883313us-gaap:CommonStockMember2021-01-020001883313us-gaap:AdditionalPaidInCapitalMember2021-01-020001883313us-gaap:RetainedEarningsMember2021-01-020001883313us-gaap:AccumulatedOtherComprehensiveIncomeMember2021-01-0200018833132021-01-020001883313us-gaap:CommonClassBMemberus-gaap:CommonStockMember2021-01-032022-01-010001883313us-gaap:RetainedEarningsMember2021-01-032022-01-010001883313us-gaap:AccumulatedOtherComprehensiveIncomeMember2021-01-032022-01-010001883313us-gaap:CommonStockMemberus-gaap:CommonClassAMember2022-01-010001883313us-gaap:CommonClassBMemberus-gaap:CommonStockMember2022-01-010001883313us-gaap:CommonStockMember2022-01-010001883313us-gaap:AdditionalPaidInCapitalMember2022-01-010001883313us-gaap:RetainedEarningsMember2022-01-010001883313us-gaap:AccumulatedOtherComprehensiveIncomeMember2022-01-0100018833132022-01-010001883313us-gaap:CommonStockMemberus-gaap:CommonClassAMember2022-01-022022-12-310001883313us-gaap:CommonClassBMemberus-gaap:CommonStockMember2022-01-022022-12-310001883313us-gaap:CommonStockMember2022-01-022022-12-310001883313us-gaap:AdditionalPaidInCapitalMember2022-01-022022-12-310001883313us-gaap:RetainedEarningsMember2022-01-022022-12-310001883313us-gaap:AccumulatedOtherComprehensiveIncomeMember2022-01-022022-12-310001883313us-gaap:CommonStockMemberus-gaap:CommonClassAMember2022-12-310001883313us-gaap:CommonClassBMemberus-gaap:CommonStockMember2022-12-310001883313us-gaap:CommonStockMember2022-12-310001883313us-gaap:AdditionalPaidInCapitalMember2022-12-310001883313us-gaap:RetainedEarningsMember2022-12-310001883313us-gaap:AccumulatedOtherComprehensiveIncomeMember2022-12-310001883313us-gaap:CommonStockMember2023-01-012023-12-300001883313us-gaap:AdditionalPaidInCapitalMember2023-01-012023-12-300001883313us-gaap:RetainedEarningsMember2023-01-012023-12-300001883313us-gaap:AccumulatedOtherComprehensiveIncomeMember2023-01-012023-12-300001883313us-gaap:CommonStockMemberus-gaap:CommonClassAMember2023-12-300001883313us-gaap:CommonClassBMemberus-gaap:CommonStockMember2023-12-300001883313us-gaap:CommonStockMember2023-12-300001883313us-gaap:AdditionalPaidInCapitalMember2023-12-300001883313us-gaap:RetainedEarningsMember2023-12-300001883313us-gaap:AccumulatedOtherComprehensiveIncomeMember2023-12-300001883313us-gaap:NonrelatedPartyMember2023-01-012023-12-300001883313us-gaap:NonrelatedPartyMember2022-01-022022-12-310001883313us-gaap:NonrelatedPartyMember2021-01-032022-01-010001883313us-gaap:RelatedPartyMember2023-01-012023-12-300001883313us-gaap:RelatedPartyMember2022-01-022022-12-310001883313us-gaap:RelatedPartyMember2021-01-032022-01-010001883313svv:CorporateConversionMember2022-01-0700018833132023-05-262023-05-26xbrli:pure0001883313us-gaap:IPOMember2023-07-032023-07-030001883313us-gaap:IPOMember2023-07-030001883313svv:SellingStockholdersMember2023-07-032023-07-030001883313us-gaap:OverAllotmentOptionMembersvv:SellingStockholdersMember2023-07-032023-07-0300018833132023-06-28svv:vote0001883313svv:GovernmentSubsidiesMembersvv:COVID19PandemicMember2021-01-032022-01-010001883313us-gaap:SalesChannelDirectlyToConsumerMember2023-01-012023-12-300001883313us-gaap:SalesChannelDirectlyToConsumerMember2022-01-022022-12-310001883313us-gaap:SalesChannelDirectlyToConsumerMember2021-01-032022-01-010001883313us-gaap:SalesChannelThroughIntermediaryMember2023-01-012023-12-300001883313us-gaap:SalesChannelThroughIntermediaryMember2022-01-022022-12-310001883313us-gaap:SalesChannelThroughIntermediaryMember2021-01-032022-01-01svv:financial_institution0001883313srt:MinimumMember2023-12-300001883313srt:MaximumMember2023-12-300001883313us-gaap:AccountsPayableAndAccruedLiabilitiesMember2023-12-300001883313us-gaap:AccountsPayableAndAccruedLiabilitiesMember2022-12-310001883313svv:AccruedPayrollAndRelatedTaxesMember2023-12-300001883313svv:AccruedPayrollAndRelatedTaxesMember2022-12-310001883313us-gaap:OtherLiabilitiesMember2023-12-300001883313us-gaap:OtherLiabilitiesMember2022-12-31svv:operating_segmentsvv:reportable_segment0001883313svv:A2ndAveAcquisitionMember2021-11-080001883313svv:A2ndAveAcquisitionMember2021-11-082021-11-080001883313us-gaap:LineOfCreditMembersvv:A2ndAveAcquisitionMemberus-gaap:SecuredDebtMember2021-11-082021-11-080001883313svv:A2ndAveAcquisitionMember2022-01-010001883313svv:A2ndAveAcquisitionMember2022-10-022022-12-310001883313svv:A2ndAveAcquisitionMemberus-gaap:SellingGeneralAndAdministrativeExpensesMember2022-01-010001883313svv:A2ndAveAcquisitionMember2021-01-032022-01-010001883313us-gaap:FurnitureAndFixturesMember2023-12-300001883313us-gaap:FurnitureAndFixturesMember2022-12-310001883313us-gaap:LeaseholdImprovementsMember2023-12-300001883313us-gaap:LeaseholdImprovementsMember2022-12-310001883313svv:USRetailMember2022-01-010001883313svv:CanadaRetailMember2022-01-010001883313svv:USRetailMember2022-01-022022-12-310001883313svv:CanadaRetailMember2022-01-022022-12-310001883313svv:USRetailMember2022-12-310001883313svv:CanadaRetailMember2022-12-310001883313svv:USRetailMember2023-01-012023-12-300001883313svv:CanadaRetailMember2023-01-012023-12-300001883313svv:USRetailMember2023-12-300001883313svv:CanadaRetailMember2023-12-300001883313us-gaap:TradeNamesMember2023-12-300001883313us-gaap:LicensingAgreementsMember2023-12-300001883313us-gaap:TradeNamesMember2022-12-310001883313us-gaap:LicensingAgreementsMember2022-12-310001883313us-gaap:SeniorNotesMembersvv:SeniorSecuredNotesMember2023-12-300001883313us-gaap:SeniorNotesMembersvv:SeniorSecuredNotesMember2022-12-310001883313svv:SeniorSecuredCreditFacilitiesMemberus-gaap:LineOfCreditMemberus-gaap:SecuredDebtMember2023-12-300001883313svv:SeniorSecuredCreditFacilitiesMemberus-gaap:LineOfCreditMemberus-gaap:SecuredDebtMember2022-12-310001883313svv:SeniorSecuredCreditFacilitiesMemberus-gaap:LineOfCreditMemberus-gaap:RevolvingCreditFacilityMember2023-12-300001883313svv:SeniorSecuredCreditFacilitiesMemberus-gaap:LineOfCreditMemberus-gaap:RevolvingCreditFacilityMember2022-12-310001883313us-gaap:SecuredDebtMembersvv:SeniorSecuredNotesMemberus-gaap:SecuredDebtMember2023-01-012023-12-300001883313us-gaap:SeniorNotesMembersvv:SeniorSecuredNotesMember2023-01-012023-12-300001883313svv:SeniorSecuredCreditFacilitiesMemberus-gaap:SecuredDebtMember2021-01-032022-01-010001883313us-gaap:SeniorNotesMembersvv:SeniorSecuredNotesMember2023-02-060001883313us-gaap:SeniorNotesMember2023-02-060001883313us-gaap:SeniorNotesMemberus-gaap:DebtInstrumentRedemptionPeriodOneMembersvv:SeniorSecuredNotesMember2023-02-062023-02-060001883313us-gaap:SeniorNotesMemberus-gaap:DebtInstrumentRedemptionPeriodTwoMembersvv:SeniorSecuredNotesMember2023-02-062023-02-060001883313us-gaap:DebtInstrumentRedemptionPeriodThreeMemberus-gaap:SeniorNotesMembersvv:SeniorSecuredNotesMember2023-02-062023-02-060001883313svv:February152025ThroughFebruary142026Member2023-01-012023-12-300001883313svv:February152026ThroughFebruary142027Member2023-01-012023-12-300001883313svv:OnOrAfterFebruary152027AndThereafterMember2023-01-012023-12-300001883313us-gaap:SeniorNotesMemberus-gaap:DebtInstrumentRedemptionPeriodFourMembersvv:SeniorSecuredNotesMember2023-02-062023-02-060001883313us-gaap:SeniorNotesMemberus-gaap:SubsequentEventMembersvv:SeniorSecuredNotesMember2024-03-040001883313us-gaap:SeniorNotesMemberus-gaap:SubsequentEventMembersvv:SeniorSecuredNotesMember2024-03-042024-03-040001883313svv:UncommittedIncrementalFacilityMemberus-gaap:LineOfCreditMemberus-gaap:SecuredDebtMember2023-12-300001883313svv:SeniorSecuredCreditFacilitiesMemberus-gaap:LineOfCreditMembersrt:MinimumMemberus-gaap:SecuredDebtMember2023-12-300001883313svv:SeniorSecuredCreditFacilitiesMembersrt:MaximumMemberus-gaap:LineOfCreditMemberus-gaap:SecuredDebtMember2023-12-300001883313us-gaap:SubsequentEventMembersvv:SeniorSecuredCreditFacilitiesMembersrt:MaximumMemberus-gaap:LineOfCreditMemberus-gaap:SecuredDebtMember2024-01-300001883313us-gaap:SubsequentEventMembersvv:SeniorSecuredCreditFacilitiesMemberus-gaap:LineOfCreditMembersrt:MinimumMemberus-gaap:SecuredDebtMember2024-01-300001883313us-gaap:SubsequentEventMembersvv:SeniorSecuredCreditFacilitiesMemberus-gaap:LineOfCreditMemberus-gaap:SecuredDebtMember2024-01-302024-01-300001883313us-gaap:SubsequentEventMembersvv:UncommittedIncrementalFacilityMemberus-gaap:LineOfCreditMemberus-gaap:SecuredDebtMember2024-01-300001883313us-gaap:SubsequentEventMembersvv:SeniorSecuredCreditFacilitiesMemberus-gaap:LineOfCreditMemberus-gaap:SecuredDebtMember2024-02-092024-02-090001883313svv:SeniorSecuredCreditFacilitiesMemberus-gaap:LineOfCreditMemberus-gaap:SecuredDebtMember2023-01-012023-12-300001883313us-gaap:BaseRateMembersvv:SeniorSecuredCreditFacilitiesMemberus-gaap:LineOfCreditMembersrt:MinimumMemberus-gaap:SecuredDebtMember2023-01-012023-12-300001883313us-gaap:BaseRateMembersvv:SeniorSecuredCreditFacilitiesMembersrt:MaximumMemberus-gaap:LineOfCreditMemberus-gaap:SecuredDebtMember2023-01-012023-12-300001883313svv:SecuredOvernightFinancingRateSOFRMembersvv:SeniorSecuredCreditFacilitiesMemberus-gaap:LineOfCreditMembersrt:MinimumMemberus-gaap:SecuredDebtMember2023-01-012023-12-300001883313svv:SecuredOvernightFinancingRateSOFRMembersvv:SeniorSecuredCreditFacilitiesMembersrt:MaximumMemberus-gaap:LineOfCreditMemberus-gaap:SecuredDebtMember2023-01-012023-12-300001883313us-gaap:LineOfCreditMemberus-gaap:RevolvingCreditFacilityMembersvv:TheRevolvingCreditFacilityMember2023-12-300001883313us-gaap:LetterOfCreditMemberus-gaap:LineOfCreditMembersvv:TheRevolvingCreditFacilityMember2023-12-300001883313us-gaap:RevolvingCreditFacilityMembersvv:SwinglineSublimitMembersvv:TheRevolvingCreditFacilityMember2023-12-300001883313us-gaap:BaseRateMemberus-gaap:LineOfCreditMembersrt:MinimumMemberus-gaap:RevolvingCreditFacilityMembersvv:TheRevolvingCreditFacilityMember2023-01-012023-12-300001883313us-gaap:BaseRateMembersrt:MaximumMemberus-gaap:LineOfCreditMemberus-gaap:RevolvingCreditFacilityMembersvv:TheRevolvingCreditFacilityMember2023-01-012023-12-300001883313us-gaap:LineOfCreditMemberus-gaap:RevolvingCreditFacilityMembersvv:TheRevolvingCreditFacilityMember2022-12-310001883313us-gaap:LineOfCreditMemberus-gaap:RevolvingCreditFacilityMembersvv:TheRevolvingCreditFacilityMember2022-01-022022-12-310001883313us-gaap:LineOfCreditMemberus-gaap:RevolvingCreditFacilityMembersvv:TheRevolvingCreditFacilityMember2023-01-012023-12-300001883313us-gaap:FairValueInputsLevel1Memberus-gaap:FairValueMeasurementsRecurringMemberus-gaap:MoneyMarketFundsMember2023-12-300001883313us-gaap:FairValueMeasurementsRecurringMemberus-gaap:FairValueInputsLevel2Memberus-gaap:MoneyMarketFundsMember2023-12-300001883313us-gaap:FairValueInputsLevel3Memberus-gaap:FairValueMeasurementsRecurringMemberus-gaap:MoneyMarketFundsMember2023-12-300001883313us-gaap:FairValueMeasurementsRecurringMemberus-gaap:MoneyMarketFundsMember2023-12-300001883313us-gaap:FairValueInputsLevel1Memberus-gaap:FairValueMeasurementsRecurringMemberus-gaap:InterestRateSwapMember2023-12-300001883313us-gaap:FairValueMeasurementsRecurringMemberus-gaap:FairValueInputsLevel2Memberus-gaap:InterestRateSwapMember2023-12-300001883313us-gaap:FairValueInputsLevel3Memberus-gaap:FairValueMeasurementsRecurringMemberus-gaap:InterestRateSwapMember2023-12-300001883313us-gaap:FairValueMeasurementsRecurringMemberus-gaap:InterestRateSwapMember2023-12-300001883313us-gaap:FairValueInputsLevel1Memberus-gaap:FairValueMeasurementsRecurringMemberus-gaap:CurrencySwapMember2023-12-300001883313us-gaap:FairValueMeasurementsRecurringMemberus-gaap:CurrencySwapMemberus-gaap:FairValueInputsLevel2Member2023-12-300001883313us-gaap:FairValueInputsLevel3Memberus-gaap:FairValueMeasurementsRecurringMemberus-gaap:CurrencySwapMember2023-12-300001883313us-gaap:FairValueMeasurementsRecurringMemberus-gaap:CurrencySwapMember2023-12-300001883313us-gaap:FairValueInputsLevel1Memberus-gaap:FairValueMeasurementsRecurringMember2023-12-300001883313us-gaap:FairValueMeasurementsRecurringMemberus-gaap:FairValueInputsLevel2Member2023-12-300001883313us-gaap:FairValueInputsLevel3Memberus-gaap:FairValueMeasurementsRecurringMember2023-12-300001883313us-gaap:FairValueMeasurementsRecurringMember2023-12-300001883313us-gaap:FairValueInputsLevel1Memberus-gaap:FairValueMeasurementsRecurringMemberus-gaap:ForwardContractsMember2023-12-300001883313us-gaap:FairValueMeasurementsRecurringMemberus-gaap:FairValueInputsLevel2Memberus-gaap:ForwardContractsMember2023-12-300001883313us-gaap:FairValueInputsLevel3Memberus-gaap:FairValueMeasurementsRecurringMemberus-gaap:ForwardContractsMember2023-12-300001883313us-gaap:FairValueMeasurementsRecurringMemberus-gaap:ForwardContractsMember2023-12-300001883313us-gaap:FairValueInputsLevel1Memberus-gaap:FairValueMeasurementsRecurringMemberus-gaap:InterestRateSwapMember2022-12-310001883313us-gaap:FairValueMeasurementsRecurringMemberus-gaap:FairValueInputsLevel2Memberus-gaap:InterestRateSwapMember2022-12-310001883313us-gaap:FairValueInputsLevel3Memberus-gaap:FairValueMeasurementsRecurringMemberus-gaap:InterestRateSwapMember2022-12-310001883313us-gaap:FairValueMeasurementsRecurringMemberus-gaap:InterestRateSwapMember2022-12-310001883313us-gaap:FairValueInputsLevel1Memberus-gaap:FairValueMeasurementsRecurringMemberus-gaap:CurrencySwapMember2022-12-310001883313us-gaap:FairValueMeasurementsRecurringMemberus-gaap:CurrencySwapMemberus-gaap:FairValueInputsLevel2Member2022-12-310001883313us-gaap:FairValueInputsLevel3Memberus-gaap:FairValueMeasurementsRecurringMemberus-gaap:CurrencySwapMember2022-12-310001883313us-gaap:FairValueMeasurementsRecurringMemberus-gaap:CurrencySwapMember2022-12-310001883313us-gaap:FairValueInputsLevel1Memberus-gaap:FairValueMeasurementsRecurringMemberus-gaap:ForwardContractsMember2022-12-310001883313us-gaap:FairValueMeasurementsRecurringMemberus-gaap:FairValueInputsLevel2Memberus-gaap:ForwardContractsMember2022-12-310001883313us-gaap:FairValueInputsLevel3Memberus-gaap:FairValueMeasurementsRecurringMemberus-gaap:ForwardContractsMember2022-12-310001883313us-gaap:FairValueMeasurementsRecurringMemberus-gaap:ForwardContractsMember2022-12-310001883313us-gaap:FairValueInputsLevel1Memberus-gaap:FairValueMeasurementsRecurringMember2022-12-310001883313us-gaap:FairValueMeasurementsRecurringMemberus-gaap:FairValueInputsLevel2Member2022-12-310001883313us-gaap:FairValueInputsLevel3Memberus-gaap:FairValueMeasurementsRecurringMember2022-12-310001883313us-gaap:FairValueMeasurementsRecurringMember2022-12-310001883313us-gaap:SeniorNotesMemberus-gaap:FairValueInputsLevel1Membersvv:SeniorSecuredNotesMember2023-12-300001883313us-gaap:CurrencySwapMember2023-12-300001883313us-gaap:CurrencySwapMember2022-12-310001883313us-gaap:ForeignExchangeForwardMember2023-12-300001883313us-gaap:ForeignExchangeForwardMember2022-12-310001883313us-gaap:InterestRateSwapMember2023-12-300001883313us-gaap:InterestRateSwapMember2022-12-310001883313svv:DerivativeAssetCurrentMemberus-gaap:ForeignExchangeForwardMemberus-gaap:NondesignatedMember2023-12-300001883313svv:DerivativeAssetCurrentMemberus-gaap:ForeignExchangeForwardMemberus-gaap:NondesignatedMember2022-12-310001883313svv:DerivativeAssetCurrentMemberus-gaap:CurrencySwapMemberus-gaap:NondesignatedMember2023-12-300001883313svv:DerivativeAssetCurrentMemberus-gaap:CurrencySwapMemberus-gaap:NondesignatedMember2022-12-310001883313us-gaap:CurrencySwapMemberus-gaap:NondesignatedMembersvv:DerivativeAssetNoncurrentMember2023-12-300001883313us-gaap:CurrencySwapMemberus-gaap:NondesignatedMembersvv:DerivativeAssetNoncurrentMember2022-12-310001883313us-gaap:NondesignatedMember2023-12-300001883313us-gaap:NondesignatedMember2022-12-310001883313us-gaap:AccountsPayableAndAccruedLiabilitiesMemberus-gaap:ForeignExchangeForwardMemberus-gaap:NondesignatedMember2023-12-300001883313us-gaap:AccountsPayableAndAccruedLiabilitiesMemberus-gaap:ForeignExchangeForwardMemberus-gaap:NondesignatedMember2022-12-310001883313us-gaap:CurrencySwapMemberus-gaap:AccountsPayableAndAccruedLiabilitiesMemberus-gaap:NondesignatedMember2023-12-300001883313us-gaap:CurrencySwapMemberus-gaap:AccountsPayableAndAccruedLiabilitiesMemberus-gaap:NondesignatedMember2022-12-310001883313svv:DerivativeAssetCurrentMemberus-gaap:DesignatedAsHedgingInstrumentMemberus-gaap:InterestRateSwapMember2023-12-300001883313svv:DerivativeAssetCurrentMemberus-gaap:DesignatedAsHedgingInstrumentMemberus-gaap:InterestRateSwapMember2022-12-310001883313us-gaap:DesignatedAsHedgingInstrumentMembersvv:DerivativeAssetNoncurrentMemberus-gaap:InterestRateSwapMember2023-12-300001883313us-gaap:DesignatedAsHedgingInstrumentMembersvv:DerivativeAssetNoncurrentMemberus-gaap:InterestRateSwapMember2022-12-310001883313us-gaap:DesignatedAsHedgingInstrumentMember2023-12-300001883313us-gaap:DesignatedAsHedgingInstrumentMember2022-12-310001883313us-gaap:ForeignCurrencyGainLossMemberus-gaap:ForeignExchangeForwardMember2023-01-012023-12-300001883313us-gaap:ForeignCurrencyGainLossMemberus-gaap:ForeignExchangeForwardMember2022-01-022022-12-310001883313us-gaap:ForeignCurrencyGainLossMemberus-gaap:ForeignExchangeForwardMember2021-01-032022-01-010001883313us-gaap:ForeignCurrencyGainLossMemberus-gaap:CurrencySwapMember2023-01-012023-12-300001883313us-gaap:ForeignCurrencyGainLossMemberus-gaap:CurrencySwapMember2022-01-022022-12-310001883313us-gaap:ForeignCurrencyGainLossMemberus-gaap:CurrencySwapMember2021-01-032022-01-010001883313us-gaap:InterestExpenseMemberus-gaap:InterestRateSwapMember2023-01-012023-12-300001883313us-gaap:InterestExpenseMemberus-gaap:InterestRateSwapMember2022-01-022022-12-310001883313us-gaap:InterestExpenseMemberus-gaap:InterestRateSwapMember2021-01-032022-01-010001883313us-gaap:OperatingSegmentsMembersvv:USRetailMember2023-01-012023-12-300001883313us-gaap:OperatingSegmentsMembersvv:USRetailMember2022-01-022022-12-310001883313us-gaap:OperatingSegmentsMembersvv:USRetailMember2021-01-032022-01-010001883313us-gaap:OperatingSegmentsMembersvv:CanadaRetailMember2023-01-012023-12-300001883313us-gaap:OperatingSegmentsMembersvv:CanadaRetailMember2022-01-022022-12-310001883313us-gaap:OperatingSegmentsMembersvv:CanadaRetailMember2021-01-032022-01-010001883313us-gaap:MaterialReconcilingItemsMember2023-01-012023-12-300001883313us-gaap:MaterialReconcilingItemsMember2022-01-022022-12-310001883313us-gaap:MaterialReconcilingItemsMember2021-01-032022-01-010001883313country:US2023-12-300001883313country:US2022-12-310001883313country:CA2023-12-300001883313country:CA2022-12-310001883313country:AU2023-12-300001883313country:AU2022-12-310001883313svv:A2019ManagementIncentivePlanMemberus-gaap:EmployeeStockOptionMember2019-03-282019-03-280001883313svv:A2019ManagementIncentivePlanMemberus-gaap:EmployeeStockOptionMember2023-12-300001883313svv:OmnibusIncentivePlanMember2023-01-012023-12-300001883313svv:TimeBasedOptionsMember2023-01-012023-12-300001883313svv:TimeBasedOptionsMember2022-01-022022-12-310001883313svv:TimeBasedOptionsMember2021-01-032022-01-010001883313svv:TimeBasedOptionsMember2022-12-310001883313svv:TimeBasedOptionsMember2023-12-300001883313us-gaap:PerformanceSharesMember2023-01-012023-12-300001883313us-gaap:ShareBasedCompensationAwardTrancheOneMemberus-gaap:PerformanceSharesMemberus-gaap:IPOMember2023-01-012023-12-300001883313us-gaap:ShareBasedCompensationAwardTrancheTwoMemberus-gaap:PerformanceSharesMember2023-01-012023-12-300001883313us-gaap:PerformanceSharesMember2022-10-012023-07-02svv:grantee0001883313us-gaap:PerformanceSharesMembersvv:IPOVestingMember2023-07-032023-07-030001883313svv:GradedVestingBasisMemberus-gaap:PerformanceSharesMember2023-07-032023-12-300001883313svv:BlackScholesMertonOptionPricingModelMemberus-gaap:PerformanceSharesMember2023-01-012023-12-300001883313svv:BlackScholesMertonOptionPricingModelMemberus-gaap:PerformanceSharesMember2022-01-022022-12-310001883313svv:MonteCarloSimulationMemberus-gaap:PerformanceSharesMember2023-01-012023-12-300001883313svv:MonteCarloSimulationMembersrt:MinimumMemberus-gaap:PerformanceSharesMember2023-01-012023-12-300001883313svv:MonteCarloSimulationMembersrt:MaximumMemberus-gaap:PerformanceSharesMember2023-01-012023-12-300001883313svv:MonteCarloSimulationMemberus-gaap:PerformanceSharesMember2023-07-012023-07-310001883313us-gaap:PerformanceSharesMember2022-12-310001883313us-gaap:PerformanceSharesMember2022-01-022022-12-310001883313us-gaap:PerformanceSharesMember2023-12-300001883313us-gaap:PerformanceSharesMember2021-01-032022-01-010001883313srt:MinimumMemberus-gaap:RestrictedStockUnitsRSUMember2023-01-012023-12-300001883313srt:MaximumMemberus-gaap:RestrictedStockUnitsRSUMember2023-01-012023-12-300001883313us-gaap:RestrictedStockUnitsRSUMember2022-12-310001883313us-gaap:RestrictedStockUnitsRSUMember2023-01-012023-12-300001883313us-gaap:RestrictedStockUnitsRSUMember2023-12-300001883313country:US2023-01-012023-12-300001883313country:US2022-01-022022-12-310001883313country:US2021-01-032022-01-010001883313us-gaap:NonUsMember2023-01-012023-12-300001883313us-gaap:NonUsMember2022-01-022022-12-310001883313us-gaap:NonUsMember2021-01-032022-01-010001883313us-gaap:StateAndLocalJurisdictionMember2023-12-300001883313us-gaap:StateAndLocalJurisdictionMember2022-12-310001883313us-gaap:CanadaRevenueAgencyMembersvv:A20122019Member2022-01-01iso4217:CAD0001883313us-gaap:CanadaRevenueAgencyMembersvv:A20122019Member2021-01-032022-01-010001883313us-gaap:CanadaRevenueAgencyMembersvv:A20122019Member2022-01-022022-12-3100018833132023-10-012023-12-300001883313svv:MarkWalshMember2023-01-012023-12-300001883313svv:MarkWalshMember2023-10-012023-12-300001883313svv:MarkWalshMember2023-12-300001883313svv:MindyGeisserMember2023-01-012023-12-300001883313svv:MindyGeisserMember2023-10-012023-12-300001883313svv:MindyGeisserMember2023-12-300001883313svv:RichardMedwayMember2023-01-012023-12-300001883313svv:RichardMedwayMember2023-10-012023-12-300001883313svv:RichardMedwayMember2023-12-30
UNITED STATES
SECURITIES AND EXCHANGE COMMISSION
Washington, D.C. 20549
________________________________________
FORM 10-K
________________________________________
(Mark One)
| | | | | |
| x | ANNUAL REPORT PURSUANT TO SECTION 13 OR 15(d) OF THE SECURITIES EXCHANGE ACT OF 1934 |
For the fiscal year ended December 30, 2023
OR
| | | | | |
| o | TRANSITION REPORT PURSUANT TO SECTION 13 OR 15(d) OF THE SECURITIES EXCHANGE ACT OF 1934 |
For the transition period from _________ to ________
Commission file number 001-04321
________________________________________
Savers Value Village, Inc.
________________________________________
(Exact name of registrant as specified in its charter)
| | | | | | | | |
Delaware | | 83-4165683 |
(State or other jurisdiction of incorporation or organization) | | (I.R.S. Employer Identification No.) |
| | |
11400 S.E. 6th Street Suite 125, Bellevue, WA | | 98004 |
| (Address of Principal Executive Offices) | | (Zip Code) |
425-462-1515
Registrant's telephone number, including area code
Securities registered pursuant to Section 12(b) of the Act:
| | | | | | | | |
| Title of each class | Trading Symbol(s) | Name of each exchange on which registered |
Common Stock, par value $0.000001 per share | SVV | The New York Stock Exchange |
Securities registered pursuant to section 12(g) of the Act: None.
Indicate by check mark if the registrant is a well-known seasoned issuer, as defined in Rule 405 of the Securities Act. Yes ☐ No x
Indicate by check mark if the registrant is not required to file reports pursuant to Section 13 or Section 15(d) of the Act. Yes o No x
Indicate by check mark whether the registrant: (1) has filed all reports required to be filed by Section 13 or 15(d) of the Securities Exchange Act of 1934 during the preceding 12 months (or for such shorter period that the registrant was required to file such reports); and (2) has been subject to such filing requirements for the past 90 days. Yes x No o
Indicate by check mark whether the registrant has submitted electronically every Interactive Data File required to be submitted pursuant to Rule 405 of Regulation S-T (§232.405 of this chapter) during the preceding 12 months (or for such shorter period that the registrant was required to submit such files). Yes x No ¨
Indicate by check mark whether the registrant is a large accelerated filer, an accelerated filer, a non-accelerated filer, a smaller reporting company, or an emerging growth company. See the definitions of “large accelerated filer,” “accelerated filer”, “smaller reporting company” and “emerging growth company” in Rule 12b-2 of the Exchange Act.
| | | | | | | | | | | |
| Large accelerated filer | ¨ | Accelerated filer | ¨ |
| Non-accelerated filer | x | Smaller reporting company | ¨ |
| | Emerging growth company | ¨ |
If an emerging growth company, indicate by check mark if the registrant has elected not to use the extended transition period for complying with any new or revised financial accounting standards provided pursuant to Section 13(a) of the Exchange Act. ¨
Indicate by check mark whether the registrant has filed a report on and attestation to its management's assessment of the effectiveness of its internal control over financial reporting under Section 404(b) of the Sarbanes-Oxley Act (15 U.S.C. 7262(b)) by the registered public accounting firm that prepared or issued its audit report. ¨
If securities are registered pursuant to Section 12(b) of the Act, indicate by check mark whether the financial statements of the registrant included in the filing reflect the correction of an error to previously issued financial statements. ¨
Indicate by check mark whether any of those error corrections are restatements that required a recovery analysis of incentive-based compensation received by any of the registrant’s executive officers during the relevant recovery period pursuant to §240.10D-1(b). ¨
Indicate by check mark whether the registrant is a shell company (as defined in Rule 12b-2 of the Act). Yes ¨ No x
As of July 1, 2023, the last business day of the registrant’s most recently completed second fiscal quarter, there was no established public trading market for the registrant’s equity securities. The registrant’s common stock began trading on the New York Stock Exchange on June 29, 2023 and completed its initial public offering on July 3, 2023.
The registrant had outstanding 161,363,892 shares of common stock as of February 26, 2024.
DOCUMENTS INCORPORATED BY REFERENCE
Portions of the Company’s Proxy Statement for the Annual Meeting of Shareholders to be held on June 5, 2024, are incorporated by reference into Part III of this Form 10-K.
Table of Contents
Special Note Regarding Forward-Looking Statements
This Annual Report on Form 10-K (the “Annual Report”) contains forward-looking statements within the meaning of the U.S. Private Securities Litigation Reform Act of 1995 and are made in reliance on the safe harbor protections provided thereunder. Forward looking statements can be identified by words such as “could,” “may,” “might,” “will,” “likely,” “anticipates,” “intends,” “plans,” “seeks,” “believes,” “estimates,” “expects,” “continues,” “projects” or the negative of these terms or other comparable terminology. In particular, statements about the markets in which we operate, including competition, growth and trends in our markets and industry; our strategies, outcomes and prospects; our expectations, beliefs, plans, objectives, assumptions; and future events or performance made in the sections titled “Risk Factors”, “Management’s Discussion and Analysis of Financial Condition and Results of Operations”, “Business” and “Notes to Consolidated Financial Statements” are forward-looking statements.
Forward-looking statements are based on our current expectations and assumptions. Because forward-looking statements relate to the future, by their nature, they are subject to inherent uncertainties, risks and changes in circumstances that are difficult to predict. As a result, the Company’s actual results may differ materially from those contemplated by the forward-looking statements. Some of the factors that could cause actual results to differ materially from those expressed or implied by the forward-looking statements include:
•the impact on both the supply and demand for our products caused by general economic conditions and changes in consumer confidence and spending;
•our ability to anticipate consumer demand and to source and process a sufficient quantity of quality secondhand items at attractive prices on a recurring basis;
•risks related to attracting new, and retaining existing customers, including by increasing acceptance of secondhand items among new and growing customer demographics;
•risks associated with our status as a “brick and mortar” only retailer and our lack of operations in the growing online retail marketplace;
•our failure to open new profitable stores or successfully enter new markets on a timely basis or at all;
•risks associated with doing business with international manufacturers and suppliers including, but not limited to, transportation and shipping challenges, regulatory risks in foreign jurisdictions (particularly in Canada, where we maintain extensive operations) and exchange rate risks, which we may not be able to fully hedge;
•the loss of, or disruption or interruption in the operations of, our centralized distribution centers;
•risks associated with litigation, the expense of defense, and the potential for adverse outcomes;
•our failure to properly hire and to retain key personnel and other qualified personnel;
•risks associated with the timely and effective deployment, protection, and defense of our computer networks and other electronic systems, including e-mail;
•changes in government regulations, procedures and requirements;
•our ability to maintain an effective system of internal controls and produce timely and accurate financial statements or comply with applicable regulations;
•risks associated with heightened geopolitical instability due to the conflicts in the Middle East and Eastern Europe;
•the outbreak of viruses or widespread illness, including the continued impact of COVID-19 and continuing or renewed regulatory responses thereto; and
•other factors set forth under the heading “Risk Factors” in this Annual Report.
These risks are not exhaustive. Other sections of this Annual Report include additional factors that could adversely affect our business and financial performance.
Any forward-looking statement made by us in this Annual Report speaks only as of the date on which it is made, and while we believe that information forms a reasonable basis for such statements, that information may be limited or incomplete, and our statements should not be read to indicate that we have conducted an exhaustive inquiry into, or review of, all potentially available relevant information. Moreover, factors or events that could cause our actual results to differ may emerge from time to time, and it is not possible for us to predict all of them. We are not under any obligation (and we specifically disclaim any such obligation) to update or alter these forward-looking statements, whether as a result of new information, future events or otherwise, except as required by law.
Part I
Item 1. Business
Company Overview
Our mission
To champion reuse and inspire a future where secondhand is second nature.
From the thrill of the hunt to the joy of decluttering, we help communities harness the power of pre-loved stuff to keep reusable items around for years to come.
Who we are
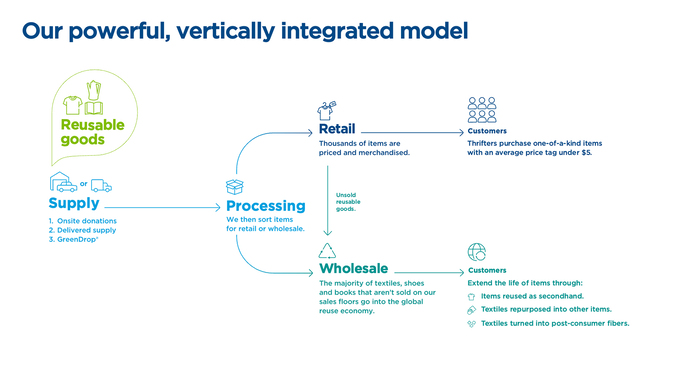
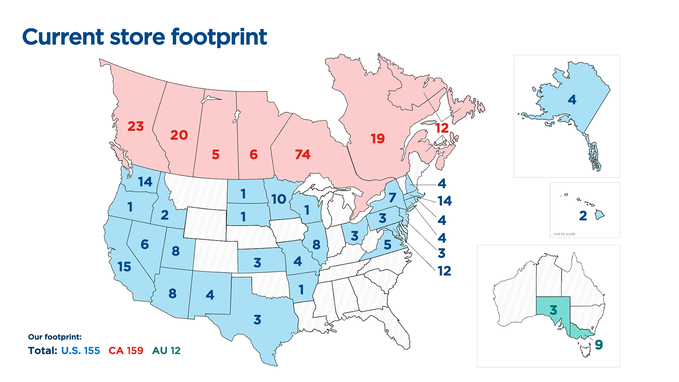
We are the largest for-profit thrift operator in the United States and Canada based on number of stores. With more than 22,000 team members, we operate a total of 326 stores under the Savers®, Value Village®, Value Village Boutique™, Village des Valeurs™, Unique® and 2nd Ave.® banners. We are committed to redefining secondhand shopping by providing one-of-a-kind, low-priced merchandise ranging from quality clothing to home goods in an exciting treasure-hunt shopping environment. We purchase secondhand textiles (e.g., clothing, bedding and bath items), shoes, accessories, housewares, books and other goods from our non-profit partners (“NPPs”), either directly from them or via on-site donations (“OSDs”) at Community Donation Centers at our stores as well as through GreenDrop locations. We then process, select, price, merchandise and sell these items in our stores. Items that are not sold to our retail customers are marketed to wholesale customers who reuse or repurpose the items they purchase from us. We believe our hyper-local and socially responsible procurement model, industry-leading and innovative operations, differentiated value proposition and deep relationships with our customers distinguish us from other secondhand and value-based retailers.
We offer a dynamic, ever-changing selection of items, with an average unit retail price (“AUR”) of approximately $5. We have a highly engaged customer base, with over 5.3 million active loyalty program members in the United States and Canada who shopped with us as of December 30, 2023, driving 70.3% of point-of-sale transaction value during fiscal year 2023. Our business model is rooted in ESG principles, with a mission to positively impact our stakeholders—thrifters, NPPs and their donors, our team members and our stockholders. As a leader and pioneer of the for-profit thrift category, we seek to positively impact the environment by reducing waste and extending the life of reusable goods. The vast majority of the clothing and textiles we source is sold to our retail or wholesale customers. During fiscal year 2023, we processed 984 million pounds of secondhand goods, compared to 985 million pounds during fiscal year 2022 and 860 million pounds during fiscal year 2021.
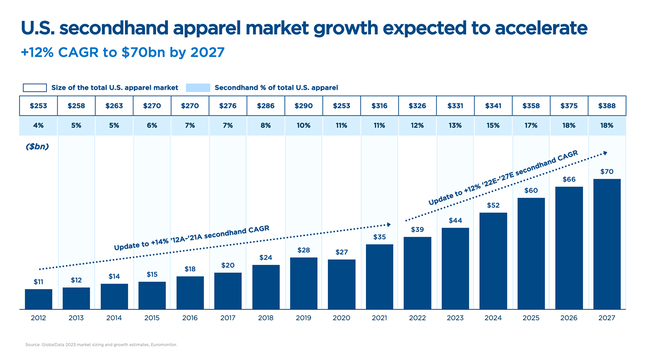
The U.S. secondhand market, which is a subset of the broader retail market, reached approximately $39 billion in 2022 and is expected to grow to more than $70 billion by 2027. Thrift accounted for approximately 56% of the total secondhand market in 2022, and we believe we benefit from the powerful secular trends driving growth in the sector. We also believe consumers are increasingly concerned about the environmental impact of the clothes they wear. There is a growing awareness that the textile and clothing industry is one of the most environmentally damaging sectors of the economy.
Meanwhile, discarded clothing remains the largest source of textile waste in the world, with the average U.S. citizen throwing away 81 pounds of clothing each year, 95% of which could have been re-worn or repurposed; yet 85% of this material ends up in landfills. To put this another way, the Ellen MacArthur Foundation reports that one garbage truck of textiles is landfilled or incinerated every second. Thrift as a business model provides one of the most effective solutions in mitigating the environmental cost of clothing and extending its life.
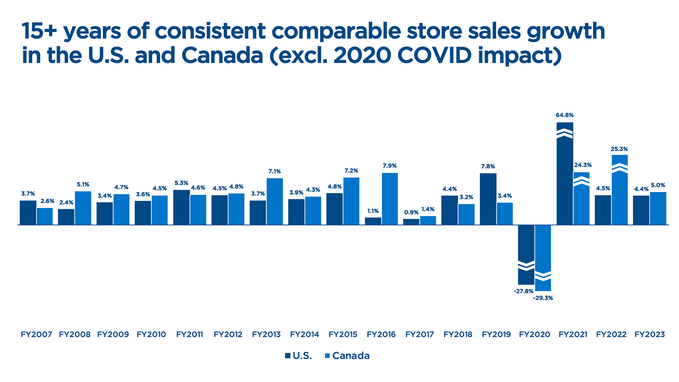
Track record of consistent growth and recent performance
We have a proven track record of consistently delivering comparable store sales growth across the United States and Canada. Prior to the start of the COVID-19 pandemic in March 2020, we achieved over ten years of positive comparable store sales growth across the United States and Canada and our business has recovered strongly from COVID-19-related disruptions.
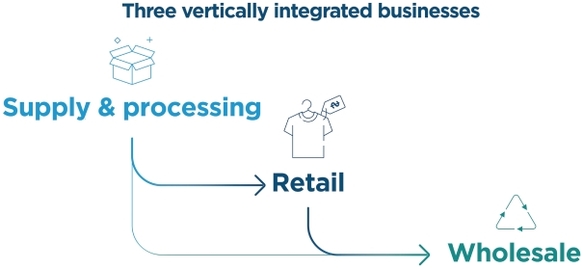
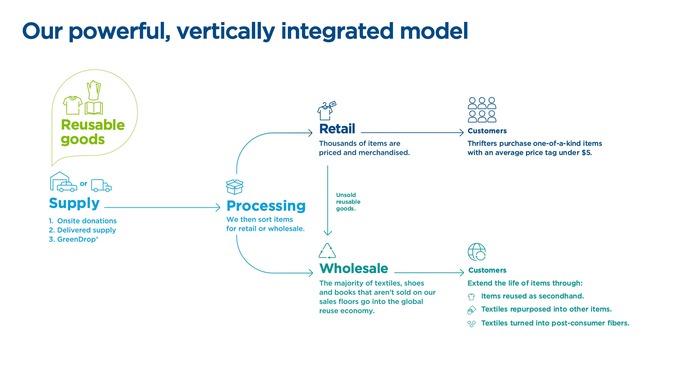
Powerful, Vertically Integrated Business Model
We have innovated and invested in the development of significant operational expertise in order to integrate the three highly-complex parts of thrift operations—supply and processing, retail, and sales to wholesale markets. Our business model enables us to provide value to our NPPs and our customers, while driving attractive profitability and cash flow.
Three vertically integrated businesses Supply & processing Retail Wholesale
Supply and processing
We source our merchandise locally by purchasing secondhand items donated to our NPPs primarily through three distinct and strategic procurement models:
•delivered supply, which includes items donated to and collected by NPPs through a variety of methods, such as neighborhood collections and donation drives, and delivered to our stores or Centralized Processing Centers, or “CPCs”;
•OSDs, which are donations of items by individuals to our NPPs made at Community Donation Centers located at our stores; and
•GreenDrop locations, which are mobile donation stations (and in some cases, brick and mortar facilities) placed in convenient, attractive and high-traffic locations that offer a fast and friendly experience to donors in the communities surrounding our stores.
Our business model is predicated on sourcing and selling quality secondhand items to our customers in local communities. We are able to meet our customer demand given our deep relationships with an extensive network of NPPs that is unmatched in the thrift industry. Our local sourcing strategy also reduces transportation costs and emissions typically associated with the production and distribution of new merchandise.
The quantity and quality of our supply of secondhand items have continued to evolve and improve, particularly as OSDs have grown as a percentage of the pounds of goods we process. While it is strategically important for us to maintain a diverse supply mix, items sourced through OSDs have a cost per pound that is on average less than one-third that of delivered supply from our NPPs. Because OSD volume is primarily driven by convenience, the more we are able to expand our footprint and geographic reach, the more we expect to attract and procure additional OSD supply, which benefits our supply cost and yields. On a comparable store basis, the average store’s OSDs have grown at a 3.5% compound annual growth rate (“CAGR”) from fiscal year 2019 through fiscal year 2023, which has expanded OSDs as a percentage of total pounds processed from 53.0% to 65.2% during the same period. Additionally, our acquisition of 2nd Ave. in November 2021 included GreenDrop, which allows donors to drop off their items at attended donation stations that are movable and can be placed in attractive locations that optimize for high-quality donations, is strengthening our supply base. During fiscal year 2023, 8.4% of total pounds processed stemmed from GreenDrop. We are currently expanding the use of GreenDrop to locations in certain other markets.
In addition, data analytics have played a critical role in elevating the quality of our delivered supply by enabling us to concentrate on supply sources with quality goods, which has been a significant driver of our gross product margin.
The vast majority of our retail stores have space dedicated to handle the processing of secondhand goods that provide the inventory to be sold on our retail sales floors. We are currently implementing our offsite processing strategy which allows us to process goods at larger-scale facilities and distribute goods to multiple stores in a local market. The processing of donations under this strategy can occur at warehouses, stores with surplus processing capacity or at CPCs. We opened our first CPC in the third quarter of fiscal year 2021, a second CPC in the second quarter of fiscal year 2022 and three additional CPCs during fiscal year 2023. The CPC system is an offsite, semi-automated processing facility that mechanizes the flow of clothing, accessories and shoes through an integrated series of conveyor belts, robotics, sensors, and other technology. We have prioritized processing capacity at CPCs toward new store growth that would not be possible without a CPC.
Retail
Our continued investment in our stores has both elevated and modernized the thrift shopping experience, transforming our stores into destinations for all generations with increasing traffic from younger generations.
Our store experience directly reflects our mission to make secondhand second nature. We deliver a well merchandised environment that maximizes customer engagement and supports a core tenet for any thrifter—the treasure hunt. Our stores offer a wide selection of quality items across clothing, home goods, books and other items at convenient locations. During fiscal year 2023, more than 35,000 items were merchandised per store every week. Our sales floor inventory is also regularly rotated and refreshed, with inventory turns of roughly 17 times a year, providing our customers with an extensive, ever-changing selection at tremendous value.
We have enhanced our visual presentation with the roll out of our updated “Thrift Proud” sign package that has a great new look, while communicating who we are and what we do. In addition, we have enhanced the customer experience by completing the roll out of self-checkout kiosks in all of our stores in the U.S. and Canada that significantly shorten and, at most times of the day, eliminate payment lines.
We have a continuous feedback loop on the customer experience. Our REactions surveys take the pulse of our customers on a weekly basis regarding the shopping experience and environment. This information is proactively shared with our leadership team and cascaded to store managers, who are measured on their ability to improve operations.
As donations continue to grow and awareness of secondhand shopping increases, we believe more consumers are likely to become thrift shoppers.
Wholesale reuse and repurpose
We display approximately 50% of all textile items we receive on our retail sales floors, approximately 50% of which are sold to thrifters. In support of our efforts to extend the life of reusable goods and recover a portion of the cost of acquiring our supply of secondhand items, we sell the majority of textile items unsold at retail to our wholesale customers, predominately comprised of textile graders and small business owners, who supply local communities across the globe with gently-used, affordable items like clothing, housewares, toys and shoes. Textiles not suitable for reuse as secondhand clothing can be repurposed into other textile items (e.g., wiping rags) and post-consumer fibers (e.g., insulation and carpet padding), further reducing waste.
ESG impact
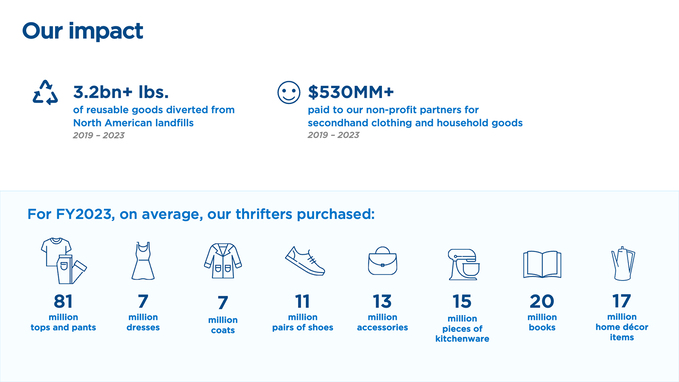
Environmental: Our business model is designed to maximize the life of reusable goods, and we found a reuse for over 3.2 billion pounds of secondhand items from 2019 to 2023. During fiscal year 2023, our thrifters purchased 274 million various items.
The environmental impacts of textile manufacturing are well documented. The textile industry largely relies on non-renewable resources such as oil for synthetic fibers, fertilizer to grow cotton, and chemicals associated with the production, dyeing, and finishing of fibers and textiles. Between 2002 and 2017, the Ellen MacArthur Foundation (“EMF”) found that clothing production approximately doubled, while utilization decreased by 36%. In addition, textile production is both energy-intensive and water-intensive. EMF estimates that the production of textiles resulted in 1.2 billion tons of carbon dioxide equivalent in 2015, which outpaced the year’s carbon dioxide emissions from all international flights and marine shipping, with additional impacts on local environments. With respect to water usage, which includes cotton farming, EMF also found that the textile industry used approximately 93 billion cubic meters of water each year, while contributing to water scarcity in many parts of the world. Since less than 1% of the material used to produce new clothing (including factory offcuts) is recycled to make new clothing, the reuse of clothing, rather than the purchase of new clothing, is key to mitigating the environmental impacts of the textile industry. In order to achieve the 2030 Paris climate objectives, 20% of garments worldwide must be traded through circular business models.
During 2021 and 2022, we purchased enough Renewable Energy Certificates to match our electricity usage with renewable energy at our two corporate offices and our largest U.S. and Canadian Wholesale Distribution and Reuse Centers through July 2023. In February 2024 we purchased sufficient Renewable Energy Certificates to cover our usage from August to December 2023 and our estimated usage for these facilities through July 2024. Over the last several years, we have completed a LED lighting retrofit for more than 90% of our U.S. and Canadian stores and warehouses.
We have engaged third-party consultants to perform assessments of the Company’s economic and environmental impacts in various communities where we have operations. For example, the Canadian accounting firm MNP studied our impact across Canada in 2022. Including direct, indirect and induced impacts, MNP concluded that our Canadian operations were estimated to generate approximately $1.2 billion of total output, $864.2 million of total GDP, $162.4 million in total revenue for all three levels of government, and 12,650 total jobs. When studying our 2022 Canadian environmental impact, MNP found that we diverted approximately 146,500 metric tonnes of material from Canada’s waste stream, with approximately half of that being clothing materials. The decrease in production of an amount of textiles equivalent to what Value Village diverted was estimated to reduce the emission of greenhouse gasses by 605,352 tonnes of carbon dioxide equivalent, comparable to the annual emissions of 131,598 passenger vehicles and reduce water used in textile production by 80.8 billion liters, comparable to the annual volume of water used by more than 1,000,000 Canadians (2.7 percent of Canada’s population).
Social: Our business model is predicated on sourcing our supply from non-profit organizations in the communities where we do business. The contracts we enter into with our NPPs are typically 1-3 years in duration. Our relationships with our top 10 NPPs average more than 27 years. Over the last five years, we have paid our NPPs more than $530 million for secondhand goods, providing them with unrestricted revenue to support their community-focused missions. From 2019 to 2023, over 90% of our supply was locally sourced, delivering a broad and diverse selection to our customers and fostering a sense of community.
Our leading “people” metric across our organization is team member engagement, which is scored across various areas, including overall job satisfaction, whether the team member would recommend us as a place to work, personal commitment, being energized at work and intent to remain employed. Our team member engagement is considered best-in-class, as measured by an external consultant, comparing our results to other companies in the retail sector. Team member engagement is crucial to customer satisfaction and the satisfaction of our NPPs and their donors.
We also invest in the training, development and advancement of our team members. During fiscal year 2023, 72% of open salaried management positions in the United States and Canada were filled by internal promotions. As of December 30, 2023, 58% of the management roles in our stores and corporate operations were held by team members identifying as female, and 57% of our U.S. workforce was represented by diverse backgrounds and ethnicities.
Governance: We are committed to ethical practices in every aspect of our business and have adopted a Savers Code of Conduct that outlines our expectations for internal interactions and helps us maintain compliance with local laws and regulations. Our five core values guide our strategic direction and how our team members interact with one another, our communities and our customers: (1) make service count; (2) celebrate uniqueness; (3) do the right thing; (4) find a better way; and (5) make an impact.
We continuously evolve our corporate governance policies, procedures and teams to ensure not only our compliance with applicable legal requirements, but that we also live up to our high ethical standards for good governance. We are proud of our highly skilled and diverse Board of Directors, which includes three key standing committees: the Audit Committee, the Compensation Committee and the Nominating, Governance, and Sustainability Committee.
Board-level oversight of ESG strategy and disclosure is a crucial component of our corporate governance. Our Company’s Nominating, Governance, and Sustainability Committee takes the lead in ESG-related matters, while our Audit Committee focuses on internal controls, cyber security and data privacy. Details of our cybersecurity risk management, strategy and governance are provided in Item 1C of this Annual Report. We also established an executive-led ESG Committee with cross-functional representation. The Committee helps to set strategic direction, plays an important role in data validation and reporting, and informs key stakeholders about new initiatives and impacts.
Giving Back to our Communities
We strive to positively impact our team members, customers and the communities in which we live and do business. We encourage team member involvement to support local causes and our stores are empowered to support local relief efforts and community nonprofits. For example, our stores have worked with local charitable organizations to provide items or discounts to individuals impacted by natural disasters such as fires and floods, teachers for their classrooms, victims of house fires, and other community requests. In partnership with Veterans Emergency Transition Service (VETS) Canada, our stores provide move-in kits to help homeless veterans settle into new homes. Kits typically include kitchenware, bed and bath accessories, and other essential items.
We have sponsored and engaged our corporate workforce in local charitable events such as nonprofit lunch and dinner galas and other community events. In 2021, we increased our commitment to corporate charitable giving by establishing a $1.5 million Donor Advised Fund in the United States and a CAD 1.5 million Donor Advised Account in Canada. Our Charitable Giving Committee establishes our corporate giving philosophy, policies, and grant making from our Donor Advised Funds. In 2023, following receipt of an award for attorneys’ fees and costs following the successful resolution of our litigation with the Washington Attorney General, we donated over $1.0 million from such award to our Donor Advised Funds.
Our Market
We operate within the large, fragmented and fast-growing secondhand market, which is a subset of the broader retail market. In addition to being recession-resilient, growth in the secondhand market is accelerating due to a number of powerful secular trends.
The emergence of conscious consumerism
Consumers are increasingly taking into consideration the ESG impacts of their shopping decisions and the brands with which they choose to interact.
Growing importance of value retail and treasure hunt experience
The relevance of value shopping and treasure hunting has grown stronger in recent years. We believe that our thrift model provides a highly compelling, differentiated customer proposition and experience that gives us a competitive advantage over traditional retail and other existing secondhand options. Today’s consumers, and thrifters specifically, are seeking experiential shopping opportunities and compelling value propositions, combined with the multifaceted possibilities of brands and styles. They are drawn to the excitement of finding great value through a treasure hunt experience. We believe that experience, combined with our low AUR, makes us more attractive to customers than traditional retail.
Furthermore, our in-store experience and broad, ever-changing inventory cannot be replicated online. The in-store thrift shopping experience is overwhelmingly preferred by consumers over online resale. We believe that we operate leading brands within the thrift industry offering consumers this unique experience.
Fast-growing secondhand market across both demand and supply
Secondhand demand-side total addressable market: The secondhand market is rapidly growing and continues to gain share in the total retail market from a wide range of traditional retailers, including department stores, fast fashion brands and off-price retailers. The secondhand market consists of both resale (e.g., consignment) and thrift goods, with thrift accounting for approximately 56% of the total market during 2022. In the United States alone, the secondhand market reached approximately $39 billion in 2022 and is expected to grow to $70 billion by 2027, representing a CAGR of 12% between 2022 to 2027.
Our total market opportunity continues to grow due to a general rise in demand for secondhand goods in part as consumers continue to expand the occasions for shopping for secondhand goods. As of the most recent date for which their Annual Reports are available, Salvation Army and Goodwill, the two leading non-profit thrift operators in the United States, operated approximately 6,900 locations and 3,300 locations, respectively, further indicating that there is a robust market for secondhand goods.
Secondhand supply-side total addressable market: There is an abundant and growing source of supply that facilitates the availability of secondhand and thrift goods. As this market continues to develop and expand with the opening of new points of collection, there is significant opportunity to unlock and drive further donations to our NPPs from OSDs and GreenDrop locations, both of which are typically driven by a combination of location, convenience, ease of drop and a fast and friendly experience, all of which will ultimately benefit our NPPs.
As donations continue to grow and awareness of secondhand shopping increases, we believe more consumers are likely to become thrift shoppers.
Competitive Strengths
We have been able to delight millions of customers each year and grow our business consistently through the following competitive strengths:
A leader in the industry with a powerful business model
We are the largest for-profit thrift operator in the United States and Canada. With 326 retail stores under the Savers, Value Village, Value Village Boutique, Village des Valeurs, Unique and 2nd Ave. banners, we are ten times larger than the next largest for-profit thrift operator. We believe our significant scale advantage allows us to deliver extreme value and a superior shopping experience to customers, while generating strong cash flow that can be reinvested in our business.
We have innovated and integrated the three highly-complex parts of thrift operations—supply and processing, retail and sales to wholesale markets—through significant operational expertise and investments. This has created a compelling business model which is differentiated against online competition and traditional retail, based on our treasure-hunt experience and low AUR. Further, our business has demonstrated resilience through economic cycles. Such advantages of our business model provide compelling value to customers, drive attractive profitability for the business, and underpin positive comparable store sales growth. Prior to the start of the COVID-19 pandemic in March 2020, we achieved over ten years of positive comparable store sales growth across the United States and Canada, and our business has recovered strongly from COVID-19-related disruptions. As interest in the secondhand market continues to grow, we will have the opportunity to elevate and define the thrift experience for decades to come.
Unmatched value proposition driving exceptional customer engagement
We offer quality items at one of the deepest values across all of our product categories and an exciting, engaging treasure hunt experience in a contemporary in-store atmosphere, which underpins strong customer loyalty. Our most engaged customers are members of our Super Savers Club® loyalty program. As of December 30, 2023, we had 5.3 million active members enrolled in our U.S. and Canadian loyalty programs who have made a purchase within the last 12 months, compared to 4.8 million active members as of December 31, 2022. Our members earn points or store credit, which further enhances the value shopping experience. Members in both the United States and Canada receive exclusive coupons and offers via email, as well as a special birthday coupon.
During fiscal year 2023, U.S. loyalty members spent approximately 29% more per shopping trip than non-members. During the same period, U.S. loyalty members shopped at our stores an average of 6.8 times annually. During fiscal year 2023, the top three loyalty segments, which represented approximately 48% of active members in the United States during that period, shopped with us more than 12 times per year. For the same period, the attrition rate was less than 5% among the top two loyalty segments. We have email addresses for 78% of our U.S. and Canadian active loyalty members as of December 30, 2023. In addition, as of December 30, 2023, 38% of our U.S. loyalty members had annual household incomes of over $75,000 and 68% identified as female.
We have a particularly active presence on social media platforms, including Facebook, Instagram and Pinterest, to connect with our customers, and we also partner with a number of social media “influencers” who generate further awareness of our brands through sponsored content. At the core of our “Thrift Proud” movement, our customers and followers on social media serve as influential peer-to-peer brand ambassadors and are tagging our brand and banners in thousands of photos and videos weekly. We enjoy highly engaged communities on social media who are inspired by thrift hauls, shopping cart photos, do-it-yourself and upcycling, and creating “new from used”. As of December 30, 2023, Savers, Value Village, Village des Valeurs and Thrift Proud branded hashtags had more than 418 million organic views on TikTok alone, 165,000 followers on Instagram and 364,000 likes on Facebook.
Supply model with proven capacity to drive growth
Quality and volume of supply play a critical role in driving traffic, customer frequency and engagement. We have developed a proven strategy to continuously improve our supply model. In order to maximize supply quality, we periodically assess sales yield, which we define as retail sales generated per pound processed on a currency neutral and comparable store basis, from each supply source to make informed decisions on supplier selection. This approach ultimately improves both our revenue and profitability. We have been strategically focused on increasing our OSDs, particularly in increasing convenience and proximity to potential donors. OSDs not only drive profitability but also enhance the consistency and reliability of supply to each of our stores. We expect our focus on increasing OSDs will contribute to further improvement and growth in our supply.
Culture of innovation and operational excellence
Our culture of innovation underpins our key decisions and the way we run our business. We continue to be an industry leader with innovation to improve the customer experience, while enhancing operational efficiency. We have continuously improved our thrift operations across sourcing, processing, and retailing. We have recently launched major initiatives that will further reinforce our competitive advantage and have a measurable impact on our financial profile:
•Self-checkout: In fiscal year 2023 we completed the roll out self-checkout kiosks in all of our stores in order to enhance the customer experience, with shorter lines and more access points.
•Automated Book Processing (ABP): The ABP system is an integrated set of technologies that efficiently identify, price, and sort books based on their critical attributes (e.g., genre, author, market price). The system design consists of high-speed conveyors, optic recognition, robot tagging and an automated book distribution system working in concert to increase throughput over traditional, manual processes.
•Centralized Processing Centers (CPCs): The CPC system is an offsite, semi-automated processing facility that mechanizes the flow of clothing, accessories, and shoes through an integrated series of conveyor belts, robotics, sensors, and other technology. CPCs play an integral role in our offsite processing strategy.
Attractive financial profile with proven track record of consistent growth
We achieved positive comparable store sales growth from 2007 through 2019, even throughout recessionary periods. We have also delivered steady and consistent gross product margin expansion over the last several years, from 46.4% for fiscal year 2015 to 58.7% for fiscal year 2023. We define gross product margin as net sales minus cost of merchandise sold, exclusive of depreciation and amortization, divided by net sales. We have utilized multiple levers that are unique to our business model to drive margin improvements, especially the growth of OSDs as part of our supply mix and sales yield improvement. As a result of our attractive financial profile, we have significant flexibility with respect to capital allocation, giving us the ability to drive long-term shareholder and stakeholder value through various operating and financial strategies.
Highly experienced and strategic leadership
Our strategic vision and culture are directed by a leadership team that combines deep industry expertise and advanced operational capabilities to continuously innovate our business. Given the unique needs of the business, our leadership team has diverse backgrounds across not only retail but also technology, manufacturing, and supply chain. We are committed to ethical practices in every aspect of our business and are guided by people who fundamentally do the right thing.
How We Plan to Grow
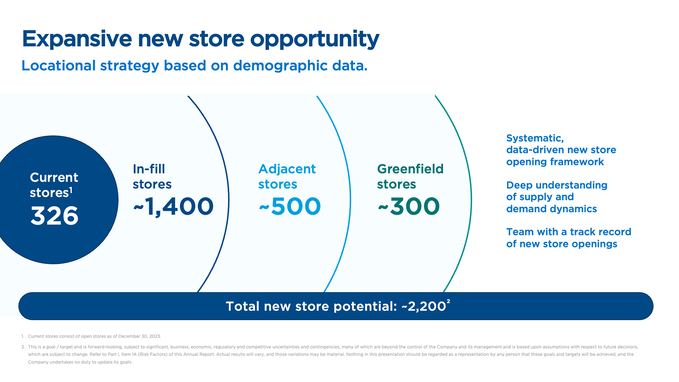
Strategically grow our store base
Our goal is to expand our position as the leading for-profit thrift operator by expanding our store footprint. We have identified approximately 2,200 potential new locations across the United States and Canada. We opened 12 new stores during fiscal year 2023, and target opening approximately 22 new stores in 2024. We target opening approximately 25 or more new stores annually from 2025 through 2027.
•In-fill opportunities: We will continue to identify attractive locations in our existing markets by leveraging our brand awareness and operational capabilities, and where we have the advantage of both attractive supply and demand. These in-fill opportunities will include both traditional and alternative format stores.
•Adjacent store opportunities: We also will pursue opportunities to expand our regional footprint in adjacent areas where we can leverage our operational capabilities and regional market knowledge.
•Greenfield store opportunities: We are currently underpenetrated in multiple important regional markets, including the South and West regions of the United States and in Central Canada.
Driven by our disciplined real estate selection approach, we expect to deliver attractive return on investment and store-level profitability. Our new stores generally take on average four years to reach mature processing efficiency, donation volume and retail demand. Our alternative store format is designed to capitalize on high real estate availability in in-fill markets through smaller formats.
Drive consistent comparable store sales growth
Our goal is to drive consistent growth in comparable store sales by maintaining a superior value proposition to our customers and continuing to offer a compelling selection of quality secondhand items. Benefiting from secular tailwinds, we expect to further drive comparable store sales growth with the following strategies:
•Quality product offerings: We will continue to procure ample supply of quality items to delight our customers. Our compelling selection of offerings enables us to drive both frequency with existing customers and the acquisition of new customers.
•Improving shopping experience: We will continue to invest in the in-store shopping experience to facilitate the treasure hunt dynamics for our customers. We have invested in renovations to modernize our stores; new technologies to optimize store operations; and alternative store formats supported by our offsite processing strategy.
•Expanding engagement with our loyalty program members: We are investing in email and text messaging as a cost-effective means of reaching our existing customers. We extended our text messaging program into Canada in August 2022 and continue to focus on collecting valid emails for our loyalty program members. Our personalized email communication and targeted offers are designed to increase engagement and drive purchase frequency of our growing loyalty program member base.
•Conducting brand marketing: We will continue to utilize our brand marketing spend to improve our brand awareness, bolstered by the broader adoption of thrift shopping overall to drive new customer acquisition.
Continue to implement strategic initiatives to drive efficiency and expand margin, and to unlock new store potential
Compared to our traditional retail competitors, we have multiple levers within our control that have been critical in driving our profitability and Free Cash Flow. For instance, our data analysis has improved our sales yield, which we define as retail sales generated per pound processed on a currency neutral and comparable store basis, which has been a primary driver of comparable store profitability. Our deliberate strategy of increasing the penetration of OSDs as a percentage of total supply has had a significant impact on the quality of our supply, further increasing sales yield and ultimately our gross product margin. In addition, the company-wide self-checkout initiative was completed in the second quarter of 2023 achieving an annual average contribution of $91,000 per store in 2023. Also, a total of eight ABP systems were deployed during 2023 bringing to eleven the total number of ABP systems in operation at December 30, 2023. Consistent with initial projections, each ABP system is projected to deliver $250,000 per year in incremental contribution.
We continue to expand offsite processing capacity and have re-allocated and prioritized CPC and warehouse processing capacity to support new store growth; the majority of new stores planned for 2024 will be serviced by an offsite processing facility and would not have been possible without offsite processing. These stores can have a more flexible layout and size; in more densely populated areas specifically, offsite processing enables in-fill opportunities in alternative store formats without the need for a full-scale processing facility in the back-of-store. Our culture of innovation and data orientation has been critical to driving operational efficiencies, and we will continue to lead in terms of innovating the thrift business model.
Selectively pursue other growth opportunities
In addition to our organic growth initiatives, we will also take an opportunistic yet disciplined approach toward potential inorganic growth opportunities. Given the fragmented nature of the thrift category, we believe there are significant opportunities for growth. This can be conducted through the acquisition of well-operated regional players where we believe we can build upon our infrastructure and scale to accelerate the growth of a potential target and generate synergies. Our acquisition criteria include a significant regional presence; access to a robust flow of quality supply; strong brand awareness; and a complementary cultural fit for our company.
For example, in November 2021, we completed the acquisition of 2nd Ave., which added 12 stores in the Northeastern and Mid-Atlantic regions of the United States, representing a complementary store footprint for our existing store network and offering new store expansion opportunities. The 2nd Ave. Acquisition also included the GreenDrop system used to provide supply to 2nd Ave. stores, which allows donors to drop off their items at attended donation stations that are movable and can be placed in attractive, high traffic areas that are convenient to donors. We are currently expanding GreenDrop to locations in certain other markets.
Supply
Supply sources overview. Our supplier base for a majority of our stores is predominantly local, with over 90% of our supply locally-sourced. As a result, each store draws its supply predominantly from local NPPs and their donors, delivering a broad and diverse selection for our customers and fostering a sense of community. Our local sourcing strategy reduces transportation costs and emissions typically associated with the production and distribution of new merchandise.
We are a for-profit company that champions reuse. While purchases made by our customers in our stores do not directly benefit any NPP, we pay our NPPs a contracted rate for all OSDs and delivered product. Our subsidiaries are registered professional fundraisers where such registration is required.
We source our merchandise primarily through three distinct and strategic methods: (i) on-site donations, (ii) delivered supply and (iii) GreenDrop locations, all of which we purchase directly from our NPPs. We pay a market-competitive contractual rate to purchase items received as OSDs or as part of delivered supply. OSDs are the largest part of our supply mix, accounting for 65.2% of our total pounds processed for fiscal year 2023.
On-Site Donations: OSDs are donations of items made by individuals to our NPPs at our stores’ Community Donation Centers. We operate as a registered professional fundraiser, where required, on behalf of NPPs in accepting donations from their respective donors. Each store is specifically designated as an OSD location for a particular NPP, such that all donations received at the Community Donation Center are credited to that NPP.
Delivered supply: Delivered supply is comprised of two types of supply: firstly, items collected by our NPPs through a variety of methods such as neighborhood collections and donation drives that they deliver to our stores and CPCs; and secondly, items we may solicit, collect and deliver to our stores and CPCs on behalf of our NPPs.
GreenDrop collections: Donations of items made by individuals to our NPPs at convenient and well-signed brick and mortar and trailer locations in neighborhoods surrounding a store location. On behalf of our NPPs, we solicit, collect, and deliver items to our stores and CPCs.
Donation drives: Donation drives operate within our FUNDrive® program and include smaller, local non-profits such as schools, sports teams, community groups and other charitable organizations. These drives are one-time and event-based, with contractual agreements based on each distinct donation drive itself.
Third-party credential: Third-party credential goods are purchased in small amounts on an as-needed basis from regional for-profit collectors, generally consisting of bin operators and other for-profit resellers.
We leverage an analytical platform to measure the sales yield and product margin of an individual stream of supply in our stores. In general, this tool is either used to periodically confirm the performance of an existing stream of supply or to evaluate the performance of a new source of supply.
Non-Profit Partners. We have deep relationships with an extensive roster of NPPs that is unmatched in the thrift industry. Our relationships with our top 10 NPPs average more than 27 years. Over the last five years we have paid our NPPs more than $530 million for goods donated to them. We support both large and small partners alike and offer a reliable, unrestricted source of revenue. Delivered product enables our NPPs to not only generate additional revenue, but also promote awareness of their missions even further throughout the community via collection truck signage, collection bin messaging and home pickup flyers.
On-Site Donations. The quantity and quality of our supply of secondhand items has continued to evolve and improve, particularly as OSDs have grown as a percentage of pounds of goods we process. While it is strategically important for us to maintain a diverse supply mix, items sourced through OSDs have a cost per pound that is on average less than one-third that of delivered supply from our NPPs. Our store footprint has played a critical role in strengthening our OSD intake by accepting OSDs on behalf of our NPPs. Additionally, because OSD volume is primarily driven by convenience, the more we are able to expand our footprint and geographic reach, the more we will be able to attract and procure additional OSD supply, which benefits our growth and margin profiles.
On a comparable store basis, the average store’s OSDs have grown at a 3.5% CAGR from fiscal year 2019 to fiscal year 2023, which has expanded OSDs as a percentage of total pounds processed from 53.0% to 65.2% during the same period. In addition, data analytics have played a critical role in elevating the quality of our delivered supply by enabling us to concentrate on supply sources with quality goods, which has been a significant driver of our gross product margin.
Processing
Overview. The vast majority of all of our retail stores have a dedicated space that handles the processing of soft and hard goods that provide the inventory to be sold on our retail sales floors. In fiscal year 2023, we processed 984 million pounds of secondhand goods. We are currently implementing our offsite processing strategy, which allows us to process goods at a larger-scale facility, such as a CPC, and distribute the goods to multiple stores in a local market. We opened our first CPC in the third quarter of fiscal year 2021, a second CPC in the second quarter of fiscal year 2022, and opened three additional CPCs during fiscal year 2023.
We display approximately 50% of all textile items we receive on our retail sales floors, approximately 50% of which are sold to thrifters. In support of our efforts to extend the life of reusable goods and recover a portion of the cost of acquiring our supply of secondhand items, we sell the majority of textile items unsold at retail to our wholesale customers, predominately comprised of textile graders and small business owners, who supply local communities across the globe with gently-used, affordable items like clothing, housewares, toys and shoes. Textiles not suitable for reuse as secondhand clothing can be repurposed into other textile items (e.g., wiping rags) and post-consumer fibers (e.g., insulation, carpet padding), further reducing waste.
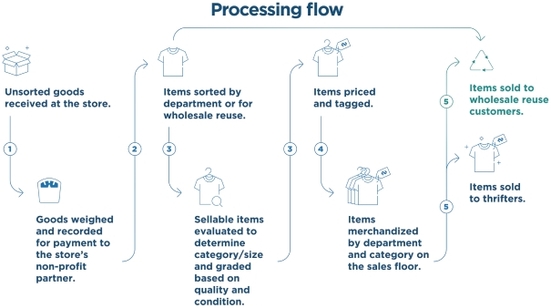
Our process has five sequential and interdependent steps: (1) Receiving; (2) Sorting; (3) Grading and Pricing; (4) Merchandising; and (5) Wholesale. Given the high volumes processed in our stores, effective process management is critical to ensuring each step is done properly and in coordination with the other steps. The typical processing room has approximately 30 team members, each of whom is trained in a specific area with many who are cross trained to support adjacent roles as needed.
Receiving
Upon receipt, most of our supply is separated into either soft goods, hard goods or books and then weighed in aggregate. The weight is then recorded into our inventory management system which initiates the payment process to our NPPs, as defined by their contracted rate. The one exception is the receipt of furniture and other large items which are received and purchased by the piece. The aggregated goods are then staged in designated areas of the processing room.
Sorting
The sorting process consists of emptying the contents of each donated bag or box, separating them by department, and then transferring them to that specific area for further inspection. Each item is inspected and determined to be either salable, unsalable or backstock storage. The salability of an item is based primarily on its quality and condition. Every effort is made by our stores to maximize the extraction of salable items, including the use of well-established analytics which are routinely used by store management. Items deemed unsalable are removed from the processing stream and incorporated into the wholesale process. Salable items that are seasonal are backstocked and stored for future sale during the appropriate season (e.g., winter coats received in the summer). On average, each of our stores evaluate approximately 15,000 items every day.
Grading and pricing
The price for a garment is determined through a grading process that ends with a centrally controlled pricing algorithm. Grading involves a team member assessing a garment for quality and condition relative to other garments within the same category. This enables a more scalable, consistent and comparative approach in determining the value of items for which there are many of the same kind. The grader enters in their assessment and the system generates a price based on an underlying pricing algorithm based on quality and condition for garments in that category. The algorithms are centrally controlled and we conduct routine analyses to monitor price and sales performance.
Merchandising
Priced goods are merchandised in our stores to maximize both customer selection and sales yield using a data-driven approach. Our stores do this by balancing and optimizing three primary levers: (i) allocation of retail floor space, (ii) processing output targets by category, and (iii) sales floor rotation. Our point-of-sale system is integrated with our grading and pricing system which provides visibility into the exact performance for over 200 categories across 10 departments. Our stores routinely modulate each of the three levers in accordance with real-time data analytics available to them.
Additionally, our stores utilize colored price tags which reflect the processing date and enable us to manage the sales floor rotation and retail lifecycle of each item. The system makes it easy for team members to determine the age of each item and distinguish between which should be removed to be sold through wholesale and which should remain on the floor.
Wholesale
The vast majority of clothing, accessories, shoes and books that either are unfit for retail sale in our stores, or, have gone unsold on our sales floor after a period of time are sold into the wholesale market. In general, clothing is baled into cubes that are required for transport to the wholesale customer. Shoes are paired and bundled in drawstring bags, and books are aggregated into cardboard gaylords. We have a variety of standards and controls across each of these product categories to ensure consistency and efficiency at our store locations.
Most stores aggregate these categories onto trailers which are then sent to one of several company-operated Wholesale Reuse and Distribution Centers. These centers perform additional sorting on certain categories, containerization, and ultimately sell to our wholesale customers.
Centralized Processing Centers and Automated Book Processing
Our first CPC and ABP systems were launched in the third quarter of 2021.
The CPC system is an offsite, semi-automated processing facility that mechanizes the flow of clothing, accessories, and shoes through an integrated series of conveyor belts, robotics, sensors, and other technology. It significantly improves upon our traditional process by (i) improving labor efficiencies, and (ii) enabling grader specialization and pricing precision.
The ABP system is an integrated set of technologies that efficiently identify, price and sort books based on their critical attributes (e.g., genre, author, market price). The system design consists of high-speed conveyors, optic recognition, robot tagging and an automated book distribution system working in concert to increase throughput eightfold over our traditional, manual process. The system also utilizes a central database of over 56.9 million ISBN records and a pricing algorithm to determine the optimal price point for each salable book.
The CPC and ABP technologies widen our competitive and operational advantage, and in the next several years we plan to expand the use of both technologies across the markets in which we operate. We have contractual arrangements with Valvan, the provider of CPC technology, and ABP technology that include exclusive rights to the use of the CPC technology and ABP technology for a period of time that may be extended as we purchase additional technology from the provider in connection with our build out of additional CPCs and ABP facilities.
Our initial contract was for a CPC system in Edmonton, Alberta, Canada. Signed in July 2020, the agreement required the design, manufacture and installation of the system over a period of eleven months, with percentage payments due at each of several milestones, with the final payment due upon acceptance of the system. The system components are designed and manufactured in Belgium, with Valvan responsible for shipping the components to the facility in Edmonton where the CPC is operating. The agreement granted an initial two-year period of exclusivity for use of the technology and design in the United States and Canada. Per the terms of that agreement and each subsequent CPC agreement with Valvan, additional purchases would extend the exclusivity period. As of December 30, 2023, purchases of seven CPCs and other combined orders have extended exclusivity for the use of the CPC technology and design in the United States and Canada through December 22, 2025. Our exclusivity in Australia lasts through October 2024.
The contract for the first ABP system was signed in September 2020 and required the design, manufacture and installation of an ABP system in Edmonton over a period of seven months. Like the CPC systems, the ABP system components are designed and manufactured in Belgium with percentage payments due at each of several milestones. The initial ABP system contract granted a one year period of exclusivity for use of the technology and design for the ABP system, extending by one year for each system purchased, up to a maximum of five years after the commissioning date of the last-commissioned system. A total of 21 ABP systems are currently under contract, extending exclusive rights in the United States, Canada and Australia until December 2029.
Our ability to extend these exclusive rights further with respect to the ABP technologies is dependent on our continuing to secure our relationship with the provider as we expand our ABP facilities. There is no guarantee that we will complete the purchases we currently plan to make, and if we do not do so, we may not extend our exclusive rights as described above.
Retail
Retail footprint and banners. As of December 30, 2023, we had 155 stores in the United States, 159 stores in Canada and 12 stores in Australia. We operate under six distinct store banners—Savers, Value Village, Value Village Boutique, Village des Valeurs, Unique and 2nd Ave.
In Canada, we operate 140 Value Village stores located in Alberta, British Columbia, Manitoba, New Brunswick, Newfoundland and Labrador, Nova Scotia, Ontario, Prince Edward Island and Saskatchewan (nine provinces). Additionally, we have 19 stores in Quebec that operate under the Village des Valeurs brand.
In the United States, Value Village is our original store brand established by our founders in 1954. We have 23 U.S. Value Village stores located in Washington, Oregon, Alaska and Maryland. However, the predominant brand in the United States is Savers and we operate 111 Savers stores across 24 states, including Arkansas, Arizona, California, Connecticut, Hawaii, Idaho, Illinois, Kansas, Massachusetts, Maryland, Minnesota, Missouri, North Dakota, New Hampshire, New Mexico, Nevada, New York, Ohio, Rhode Island, South Dakota, Texas, Utah, Virginia and Wisconsin.
In 2011 and 2013, we acquired the Unique brand name and currently operate eight stores across Minnesota, Illinois, Maryland and Virginia. We have retained the Unique store name given its strong brand equity amongst our customer base. In November 2021, in the 2nd Ave. Acquisition, we acquired an additional twelve stores operating under the 2nd Ave. banner in Virginia, Maryland, Pennsylvania and New Jersey. We then opened an additional store under the 2nd Ave. brand in 2022.
In Australia, we operate 12 stores under the Savers brand with 9 located in Victoria and 3 located in South Australia. All store banners are managed and operated centrally with a common marketing and operations strategy.
Merchandising Overview. Our merchandising strategy is focused on a broad, compelling product offering. On average, we turn our inventory approximately every three weeks to ensure we are offering a fresh assortment to new and returning customers. Items purchased from NPPs are organized within five “soft” goods and four “hard” goods departments spanning 275 distinct categories. Our product selection is consistently identified as the top driver of customer satisfaction in feedback surveys.
We monitor customer purchasing trends on a weekly and seasonal basis at each individual location to maximize sales and profitability. Space on the sales floor for each store is allocated by category, utilizing a data-driven process to predict category demand trends.
We believe that the breadth and depth of the assortment across our categories distinguishes us from our competitors.
Soft goods department and sample categories
•Women’s – e.g., long / short sleeve knits, sleeveless tops, jeans, pants, dresses, skirts
•Men’s – e.g., t-shirts, long / short sleeve shirts / knits, jeans, pants, shorts, activewear
•Kids – e.g., infants, long / short sleeve tops, dresses, shorts, skirts, activewear
•Bed & Bath – e.g., bed linens, purses, scarves, kids accessories, bags / backpacks, belts / suspenders, curtains / drapes
•Shoes – e.g., women’s shoes / active /boots / sandals; men’s active / shoes; boys active, infant / toddler
Hard goods department and sample categories
•Jewelry – e.g., costume jewelry, showcase jewelry
•Housewares – e.g., toys, home décor, toy bag, vases / floral, glassware, servicewear, plastics, office
•Furniture and Other – e.g., sporting goods, electronics, lamps, tvs / stereos / computers, tools
•Books – e.g., books, cds / cassettes / lps, dvds, video cassettes, video games / software
Shopping experience. Our store experience is a direct reflection of our mission to make secondhand second nature. We deliver a well merchandised environment that maximizes customer engagement and supports a core tenet for any thrifter—the treasure hunt. As of December 30, 2023, more than 35,000 items were merchandised per store every week. Our sales floor inventory is also regularly rotated and refreshed, with inventory turns of roughly 17 times a year, providing our customers with an extensive, ever-changing selection at tremendous value.
The average store in the United States and Canada has approximately 20,500 square feet of retail space. The retail space continues to evolve as we have executed two major initiatives to contemporize our experience. We have enhanced our visual presentation with the roll out of our updated “Thrift Proud” sign package that has a great new look, while communicating who we are and what we do. In addition, we have enhanced the customer experience with the implementation of self-checkout kiosks in all of our stores that significantly shorten and, at most times of the day, eliminate payment lines.
Lastly, we have a continuous feedback loop on the customer experience. Our REactions surveys take the pulse of our customers on a weekly basis regarding the shopping experience and environment. This information is proactively shared with our leadership team and cascaded to store managers, who are measured on their ability to improve operations.

Loyalty Program. Our most engaged customers are members of the Super Savers Club® loyalty program. As of December 30, 2023, we have 5.3 million active members enrolled in our U.S. and Canadian loyalty programs who have made a purchase within the last 12 months, compared to 4.8 million active loyalty members as of December 31, 2022. Our members earn points or store credit, which further enhances the value shopping experience. Members in both the United States and Canada receive exclusive coupons and offers via email, as well as a special birthday coupon. Beginning in the third quarter of fiscal 2023, we updated our active loyalty member statistics for both the current year and prior year to include active members in all of our stores.
The majority of our customers join our loyalty programs during the checkout process in our stores. We also offer in-store self-service sign-ups at our self-checkout kiosks, which makes the process more efficient by eliminating the need for sign-up assistance from a team member. Customers in the U.S. and Canada also have the option to sign up online or via text message. During fiscal year 2023, momentum in growing our loyalty program continued as U.S. and Canadian membership increased by more than 10% year-over-year, or by an average of 42,000 members per month.
During fiscal year 2023, U.S. loyalty members spent approximately 29% more per shopping trip than non-members. During the same period, U.S. loyalty members shopped at our stores an average of 6.8 times annually, driving 70.3% of point-of-sale transaction value. During fiscal year 2023, the top three loyalty segments, which represent approximately 48% of active members in the United States, shopped with us more than 12 times per year. The attrition rate was less than 5% among the top two loyalty segments as of December 30, 2023. In addition, as of December 30, 2023, 38% of our U.S. loyalty members had annual household incomes of over $75,000, and 68% identified as female.
We have e-mail addresses for 78% of our U.S. and Canadian active loyalty members as of December 30, 2023, which we have leveraged as a cost-effective communication channel. In August 2021, we expanded our loyalty member communications in the United States to include text messaging, and we rolled out text messaging to our loyalty members in Canada in August 2022.
Marketing and Brand Awareness. We have highly recognizable brands in Canada. In the United States, we have an opportunity to continue building brand awareness across our four brands.
We drive traffic, acquire new customers and donors to our NPPs at our Community Donation Centers and promote brand awareness through an efficient, cost-effective mix of customer engagement (word-of-mouth), paid and organic marketing. Our marketing channels and approach include social media, influencer engagement, digital media, email, text messaging, online, and in store promotional materials, which support existing and new market entries. Our website is also an extension of our brand and retail stores, and serves as a marketing and informational tool.
We believe we have an expansive opportunity to further leverage our growing social media presence to drive brand awareness and generate excitement to increase store visits. At the core of our “Thrift Proud” movement, our customers and followers on social media serve as influential peer-to-peer brand ambassadors and are tagging our brand and banners in thousands of photos and videos weekly. We enjoy highly engaged communities on social media who are inspired by thrift hauls, shopping cart photos, do-it-yourself and upcycling, creating “new from used.” As of December 30, 2023, Savers, Value Village, Village des Valeurs and Thrift Proud branded hashtags had more than 418 million organic views on TikTok alone, 165,000 followers on Instagram and 364,000 likes on Facebook.
To further strengthen brand awareness, particularly in the United States, we are partnering with authentic, relatable influencers with highly engaged audiences. Our roster of influencers has enabled us to create a steady stream of on-brand, owned content that we can use and repurpose through other marketing methods, such as paid digital amplification efforts to reach our audiences at scale. Our user and influencer-generated content strategy builds authenticity by celebrating the real, genuine shoppers who have shaped our brand image through social media, online, email, paid digital and in-store signage, among other avenues.
New Store Openings. We foresee a total addressable market potential of approximately 2,200 stores. We opened 12 new stores during fiscal year 2023 — 5 new stores in the United States and 7 new stores in Canada. We target opening approximately 22 new stores in 2024 and approximately 25 or more new stores annually from 2025 through 2027.
We use a sophisticated sales and donations projection model that incorporates key factors, including per capita income, population, internal and external competition and population psychographics to determine a market’s propensity to shop at our stores or donate to our NPPs. We also utilize store footprint analysis and market optimization tools to inform our retail site selection process.
Additionally, we employ several real estate strategies to ensure that our sites are both convenient for donors and accessible by shoppers. Through careful analysis, we have determined the optimal strategy is to lease stores within quality donation markets to secure higher donation volumes of better quality that expand gross product margins. In such cases, shoppers are willing to travel further for higher quality retail offerings and more curated assortments.
Wholesale, Reuse and Repurpose
Textiles, shoes and books that are unsold at retail stores are sold to wholesale customers, who reuse and repurpose the items we sell to them across five continents and thirteen countries. Textiles not suitable for reuse as secondhand clothing can be repurposed into other textile items (e.g., wiping rags) and post-consumer fibers (e.g., insulation, carpet padding), further reducing waste. We typically see fluctuation in the number of countries we sell into because we continually seek to maximize revenue and mitigate the inherent risks of operating in wholesale markets, including fluidity in the end-user markets and shipping challenges.
We have long-standing relationships with our wholesale customers and work directly with textile processors that have multiple reuse and repurposing streams. Other categories, such as hard goods, move directly to small businesses and shop owners in markets across the globe for resale in various retail forms.
Logistics and Distribution
The vast majority of our supply is processed as it is generated. We store very little of our collected inventory, and any excess supply that is stored is only done so for short durations on rented trailers onsite at store locations or in a variety of local trailer yards. Our supply is nearly all locally sourced and locally consumed within a few weeks after it is initially collected.
We also operate a number of warehouse locations in various markets which serve as supply and demand buffers when needed and help to modulate supply flow to the stores. Only a very small portion of supply is transferred across markets or regions.
Competition
We operate within the large, fragmented and fast-growing secondhand market, which is a subset of the broader retail market. We experience competition in these markets with respect to our retail offerings and our product supply.
Retail Competition. We compete for customer spend with value retailers, including off-price and other thrift operators. The thrift non-profit sector is largely decentralized, resulting in inconsistent shopping experiences from market to market. The thrift for-profit sector is characterized by smaller regional chains of 10-30 retail locations each. These organizations can maintain more consistent retail experiences from store to store, but typically lack the ability and capital to expand beyond their regional footprints.
Supply Competition. The thrift retail industry is made possible by the availability of quality secondhand items. As the secondhand movement continues to thrive and grow, we face increasing competition for secondhand goods from other thrift stores, consignment retailers, on-line thrift retailers and on-line marketplaces.
Trademarks and Other Intellectual Property
We believe that our brands significantly contribute to the success of our business. We own federally registered trademarks related to our brands, including SAVERS®, VALUE VILLAGE®, UNIQUE®, UNIQUE THRIFT STORE®, 2ND AVE®., 2ND AVE VALUE STORES® in the United States, VALUE VILLAGE® and VILLAGE DES VALEURSMD in Canada, and SAVERS® in Australia. In addition, we own federal trademarks for certain business programs, like FUNDRIVE® and ALTEREGO® in the United States and Canada and SUPER SAVERS CLUB® and GREENDROP® in the United States (both pending in Canada). We also pursue and maintain federal registrations for certain slogans that we use, including THRIFT PROUD® in the United States (pending in Canada) and RETHINK REUSE® and I GIVE A SH!RT® in the United States, as well as service marks such as our stylized recycling symbol comprised of folded store tags. Our trademark registrations have various expiration dates. However, assuming that the trademark registrations are properly renewed, they have a perpetual duration.
We also own several domain names, unregistered copyrights in our website content and in our Donation Manager route and schedule management software that we license for use by and on behalf of our non-profit partners.
We pursue infringement of our trademarks and copyrights when appropriate. We rely on trademark and copyright laws, trade-secret protection and confidentiality, license and other agreements with our NPPs, our vendors, employees and others to protect our intellectual property.
Exclusive rights are held for CPC technology in the United States and Canada until December 2025. Exclusive rights to the CPC technology in Australia extend to October 2024 and, under the terms of the agreement, if a purchase agreement is contracted for an Australia CPC before October 2024, will extend until at least 2027. Exclusive rights to the ABP technology in the United States, Canada and Australia currently extends to December 2029.
Government Regulation
We are subject to labor and employment laws, laws related to the collection of sales taxes and other tax matters, laws governing advertising and marketing including via text messaging and email and operation of customer loyalty programs, privacy laws, safety regulations, including consumer product safety regulations, and other laws including consumer protection regulations that regulate retailers and/or govern the promotion and sale of merchandise and the operation of stores and warehouse facilities, certain secondhand dealer ordinances, regulations related to clothing donation bins, environmental and waste regulations and laws, laws related to commercial and professional fundraiser registration and disclosure, regulations regarding telephone and mail solicitations, laws governing international trade and customs, laws governing weights and measures and laws related to transportation and trucking.
We sell certain portions of the secondhand goods that do not sell at our retail locations overseas and source a minimal amount of new goods from overseas markets. The U.S. Foreign Corrupt Practices Act (“FCPA”) and other similar anti-bribery and anti-kickback laws and regulations generally prohibit companies and their intermediaries from making improper payments to non-U.S. officials for the purpose of obtaining or retaining business. The U.S. Department of the Treasury Office of Foreign Assets Control (“OFAC”) is responsible for economic sanctions on countries, designated individuals, and entities (businesses, charities, institutions) named on its list of Specially Designated Nationals and Blocked Persons. This list includes roughly 10,000 companies, organizations, and individuals around the world with whom the vast majority of dealings with U.S. persons (including companies and companies outside the United States owned by U.S. persons) are prohibited. Our policies and our vendor compliance agreements mandate compliance with applicable laws, including these laws and regulations. For additional information on the potential effects of government regulation on our business, refer to Part I, Item 1A (Risk Factors) of this Annual Report.
Human Capital
We strive to create a culture that attracts and retains qualified talent with diverse backgrounds, experience and skills embodying our cultural values. Five core values guide our strategic direction and how our team members interact with one another, our communities and our customers: (1) make service count; (2) celebrate uniqueness; (3) do the right thing; (4) find a better way; and (5) make an impact. In recent years, we accelerated our efforts around fostering an environment in which all team members feel heard and valued.
We believe the enthusiasm of our more than 22,000 team members is one of the significant contributors to our Company’s success, as highly engaged team members will provide better service to our customers, which is critical to customer satisfaction, the satisfaction of our NPPs and their donors, and the overall profitability of our stores. Therefore, our leading “people” metric across the organization is team member engagement, which is scored across various areas including overall job satisfaction, whether the team member would recommend us as a place to work, personal commitment, being energized at work and intent to remain employed. Our team member engagement is considered best-in-class, as measured by an external consultant, comparing our results to other companies in the retail sector.
We are exceptionally proud of our culture, and continually re-invest in our team members through training, professional growth opportunities, and a quality benefits package. We are committed to an engaged workforce that sees a path to promotion and host our own in-house “university” where we offer a wide array of both mandatory and elective online technical and management training programs. During fiscal year 2023, more than 72% of open salaried management positions in the United States and Canada were filled by internal promotions.
We believe that a unique perspective is critical to solving complex problems and inspiring a new generation of consumers to think secondhand first. As of December 30, 2023, 58% of the management roles in our stores and corporate operations were held by team members identifying as female, and 57% of our U.S. workforce was represented by diverse backgrounds and ethnicities. As of December 30, 2023, approximately 28% of our workforce in the United States and Canada is aged 20 to 30, with 27% aged 51 or older. During the same period, the average tenure of our store team members was 3.7 years, and our field multi-unit leaders, directors and executive population averaged 13.4 years of tenure. Our team members are primarily full-time employees (68% of our workforce) as of December 30, 2023 and approximately 89% of our workforce is compensated on an hourly basis.
We provide a competitive total compensation package to our team members, including competitive base pay and bonus programs, healthcare (both medical and dental), flexible spending accounts, life and disability insurance, retirement savings and a 401(k) corporate match program, mental health and wellness support programs, parental leave, and vacation, sick and holiday pay.
Additional Information
Our U.S. website is www.savers.com. We make available through the “Investors” section at www.ir.savers.com, free of charge, our annual reports on Form 10-K, quarterly reports on Form 10-Q, current reports on Form 8-K, Proxy Statements and Forms 3, 4 and 5, and amendments to those reports, as soon as reasonably practicable after filing such materials with or furnishing such documents to the Securities and Exchange Commission (the “SEC”). The information found on our website is not a part of this or any other report filed with or furnished to the SEC. The SEC maintains a site that contains reports, proxy and information statements, and other information regarding issuers, such as the Company, that file electronically with the SEC at www.sec.gov.
Investors and others should note that Savers announces material financial information to its investors using its press releases, SEC filings and public conference calls and webcasts. Savers intends to also use the following channels as a means of disclosing information about Savers, its services and other matters and for complying with its disclosure obligations under Regulation FD:
Savers Investor Relations Webpage (www.ir.savers.com)
Savers X: https://twitter.com/SaversVVillage
Savers LinkedIn: https://www.linkedin.com/company/saversvaluevillage
Savers Instagram: https://www.instagram.com/savers_thrift/
Savers Meta: https://www.facebook.com/savers
The information Savers posts through these channels may be deemed material. Accordingly, investors should monitor these channels, in addition to following Savers’ press releases, SEC filings and public conference calls and webcasts. This list may be updated from time to time and reflects current updated channels as of the date of this Annual Report. The information we post through these channels is not a part of this Annual Report or any other document we file with the SEC, and the inclusion of our website addresses and X, LinkedIn, Instagram and Meta accounts are as inactive textual references only.
We have a code of ethics for senior financial officers, pursuant to Section 406 of the Sarbanes-Oxley Act. Copies of the code are available free of charge by writing to Secretary, Savers Value Village, Inc., 11400 S.E. 6th Street, Suite 125, Bellevue, WA 98004.
Item 1A. Risk Factors
Risk Factor Summary
Below is a summary of the principal factors that we believe make an investment in the Company speculative or risky. This summary does not address all of the risks that we face. Additional discussion of the risks summarized in this risk factor summary, and other risks that we face, can be found after this summary, and should be carefully considered, together with other information in this Annual Report and our other filings with the SEC, before making an investment decision.
Risks Related to Our Business and Industry
•The success of our business model depends on our ability to source quality secondhand items at attractive prices.
•The sourcing and other logistics of processing of secondhand items, especially from local communities, can be subject to fluctuating costs and can have other risks that could negatively impact our business.
•Our growth and performance depend on the efforts of our store and processing center team members and may be negatively affected by the labor market and employee relations.
•Our ability to grow may be negatively affected by perceptions of thrift, trends in consumer discretionary spending, our operational ability to manage growth and the availability of new store locations.
•Our extensive operations domestically and internationally are subject to global economic conditions, require us to manage different retail and wholesale environments and subject us to exchange rate risks.
•Highly disruptive events such as natural disasters, pandemics such as COVID-19, geo-political events or social unrest can negatively impact our logistics network and our sales.
•Our success and growth is affected by our operational efficiency, including how successfully we implement our CPC and ABP technologies, and our ability to manage acquisitions.
•Our reputation and brands may be adversely affected by actions of wholesale customers and our ability to maintain and report on our sustainability commitments.
•Competition in the secondhand market and from sellers of new items may adversely impact our revenue, profitability, market share, and partnerships.
Risks Relating to Information Technology, Intellectual Property, Data Security and Privacy
•We could be, and have in the past been, subject to cyber-attacks or data breaches, which may cause significant business disruption and require us to incur additional costs and suffer reputational harm.
•We process significant amounts of personal information and data and operate in multiple countries and jurisdictions, many of which are implementing new or updating existing privacy and information security requirements. As a result, we may experience increased compliance costs and any failure or perceived failure to comply with requirements may result in financial or reputational harm.
•We may be unable to adequately protect our intellectual property or be accused of infringing on others’ intellectual property rights and may be required to spend significant resources to defend or enforce our rights.
Risks Relating to Legal, Regulatory, Accounting and Tax Matters
•We have material weaknesses and may be unable to establish or maintain an effective system of internal control over financial reporting or maintain effective disclosure controls and procedures.
•We will incur increased expenses due to being a public company and may be exposed to a greater risk of litigation or claims, and we are obligated to indemnify our directors and officers for certain claims.
•An actual or alleged failure to comply with the laws, rules and regulations that we are subject to could negatively affect our growth or increase our costs.
•We may incur losses due to the payment methods we accept, including credit cards.
•Our financial condition and operating results may be negatively affected by inaccurate estimates or judgments, changes in tax legislation and limited ability to utilize our net operating loss carryforwards.
Risks Relating to Our Indebtedness and Liquidity
•We have a significant amount of indebtedness which requires cash to service or repay, the terms of which includes restrictions on our operations.
•Changes in interest rates or the ratings assigned to our debt could increase our debt service obligations or make it more difficult or expensive to obtain additional financing.
Risks Related to Ownership of Our Common Stock
•Our stock price may be volatile and decline due to factors outside our control, including sales by existing stockholders.
•Any additional issuances of our common stock may dilute our stockholders and affect our stock price.
•The only opportunity to achieve a return on your investment in our Company may be if our stock price appreciates and you sell your shares at a profit.
Risks Relating to Our Organizational Structure
•We rely on dividends and distributions from our operating subsidiaries to meet our obligations.
•We are a “controlled company” and majority owned and controlled by certain funds, investment vehicles and accounts managed or advised by the Private Equity Group of Ares Management Corporation (the “Ares Funds”), whose interests may conflict with ours or other stockholders.
•Provisions in our certificate of incorporation and bylaws may delay or prevent a change of control, and also contain exclusive forum provisions and renounce our interest in certain corporate opportunities.
General Risks
•We depend on our executive officers and other key employees.
•Being a public company may strain our resources, and our management has limited experience managing a public company.
A description of the risks and uncertainties associated with our business is set forth below. You should carefully consider the risks and uncertainties described below, together with all of the other information in this Annual Report on Form 10-K and our other filings with the SEC, including the section titled “Management’s Discussion and Analysis of Financial Condition and Results of Operations” and our audited consolidated financial statements and related notes, before making a decision to invest in our common stock. Our business, results of operations, financial condition, cash flows and prospects could also be harmed by risks and uncertainties not currently known to us or that we currently do not believe to be material. If any of the risks actually occur, our business, results of operations, financial condition, cash flows and prospects could be harmed, the market price of our common stock could decline, and you could lose part or all of your investment.
Risks Relating to Our Business and Industry
If we fail to obtain a sufficient quantity of new and recurring quality secondhand items at attractive prices, our business, results of operations and financial condition could be harmed.
Our business model is based on sourcing from and selling to the local community so we are dependent on our ability to obtain a sufficient quantity of quality secondhand items at attractive prices from sources in each community in which we operate. The quality and quantity of the supply of our secondhand items are critically important drivers of our sales generated per pound of goods processed, which we internally refer to as “sales yield.” If we are unable to achieve a favorable sales yield with a sufficient quantity of goods obtained at attractive prices, our profitability will suffer.
Our ability to cost-effectively obtain quality secondhand items is dependent on maintaining strong relationships with our existing NPPs, maintaining and growing OSDs and developing relationships with new NPPs and their donors. Our efforts to appeal to NPPs and their donors, including, among other things, enhancing and improving our Community Donation Centers and timely compensating our NPPs, may not result in a recurring supply of quality secondhand items and these efforts may not be cost-effective individually or in the aggregate. Numerous factors may impede these efforts, including our ability to: continue to enhance and improve our Community Donation Centers, provide timely and adequate compensation to NPPs, maintain our reputation, and face competition for secondhand items from other purchasers. We generally do not have long term supply agreements with our NPPs. Our ability to increase OSDs is dependent in large part on how convenient it is for donors to make a donation at one of our stores (which can be related to store location) and the quality of the donors’ donation experience, including the identity and their perception of the NPPs to which they are donating their items. If we are unable to meet the expectations of our NPPs and their donors and drive repeat donations, the overall supply and quality of the secondhand items we receive could be adversely affected, and we may be required to pay higher prices to our NPPs for secondhand items as a result.
Furthermore, the quality of items we receive (either directly from our NPPs or through OSDs) is critical to our sales yield and profitability, and to our customers’ experience. To the extent the items supplied to us are of low quality or poor condition, fewer of those items may be graded in our processing centers as salable at retail and a greater proportion of items may be sold at lower wholesale prices. Additionally, lower item quality may result in a lower unit retail price and may result in markdowns and other promotions. Additionally, because many of our customers desire a treasure hunt experience, a decline in the amount of desirable items displayed could have a negative effect on their shopping experience and result in a decline in store visits and purchase volumes, and could also negatively affect our ability to attract new customers.
The failure to pay attractive prices for such items could also negatively impact our sales yield, revenues and profitability and could have a material, adverse effect on our business, financial condition and results of operations. In addition, economic uncertainties, governmental orders, the recent COVID-19 pandemic and other similar events or other challenges could negatively impact the ability or desire of NPPs to continue supplying secondhand items on terms or in quantities desirable to us or their donors’ ability or willingness to make OSDs. If we are unable to obtain a sufficient volume of quality secondhand items, our sales revenue from secondhand items would be materially and adversely affected, which would have a material, adverse effect on our business, growth prospects, results of operations and financial condition.
We are subject to various risks to our physical store and processing facility locations, including with respect to the sourcing, processing, storage and other logistics of secondhand items.
The secondhand items we offer are initially sourced through our NPPs either directly or through OSDs at our stores as well as through GreenDrop locations. Beyond the price we pay for secondhand items, we may experience fluctuations in the cost of merchandise sold due to, among other things, increases in labor, transportation and storage costs, which may be driven by market forces outside of our control, such as inflation. Furthermore, our ability to generate revenue and the cost of merchandise sold in each locality may be limited or otherwise affected by each location’s processing and storage capacity. Our business, financial condition and results of operations could be negatively impacted by these cost and capacity issues.
We may also receive damaged or dangerous secondhand items, and such items can be damaged during shipping or processing, during storage or otherwise while in our stores. If we are unable to detect, quarantine and properly deal with dangerous items or contaminants at the time items are initially received, our team members could be harmed or some or all of the other secondhand items in such facilities could be contaminated. For example, we may experience contamination such as mold, bacteria, insects or other pests, or damage due to water, spills or fire. These events may also cause us to incur additional expenses and our reputation could be harmed. We are also subject to shrinkage of inventory at our stores and facilities, and if we are unable to control such shrinkage, our sales yields will be negatively affected.
Additionally, since we offer a unique selection of secondhand items in our stores, our ability to restore such selection after physical damage or a disruption of any of our transportation, storage or processing operations would take time. To the extent any such events also affect our NPPs or their donors, the supply of goods to our stores may decrease, potentially resulting in certain limitations and delays of available supply for customers, which would negatively impact our revenue, financial condition and results of operations.
While our property insurance covers certain of our inventory and losses, insurance coverage has become more expensive, which has resulted in increased premiums and deductibles. The insurance we do carry may not continue to be available on commercially reasonable terms and, in any event, may not be adequate to cover all possible losses that our business could suffer. In the event that we suffer a catastrophic loss of any or all of our facilities or the secondhand items in such facilities, our liabilities may exceed the maximum insurance coverage amount, which could adversely affect our business and results of operations.
Our business depends on our ability to attract and retain suitable workers for our stores and processing facilities and to manage labor costs, particularly given recent disruptions in the supply and cost of labor.
Our business depends on recruiting, hiring, developing, training and retaining talented key management personnel and team members in hourly full-time and part-time positions for our stores and processing facilities. Historically, our industry has been challenged by high rates of employee turnover, labor shortages and rising wage rates. In particular, retail and warehouse management positions have had historically high turnover rates which can lead to increased training and retention costs. We emphasize promotion from within and therefore must provide significant internal training and development for management personnel and must effectively manage succession planning. If we do not effectively attract or manage the promotion and retention of qualified individuals, our growth could be limited and the successful execution of our business model could be adversely affected.
Our ability to meet our labor needs while controlling labor costs is subject to many external factors, including competition for and availability of qualified personnel, rising unemployment levels, governmental regulatory bodies, wage inflation and prevailing wage rates in the jurisdictions in which we operate (including the heightened possibility of increased applicable minimum wage rules and regulations), health and other insurance costs, changes in employment and labor laws or other workplace regulations (including those relating to employee benefit programs such as health insurance and paid leave programs), our ability to maintain good relations with our team members, employee activism and our reputation and relevance within the labor market.
Recently, we have incurred higher wage rates for our employees and we expect that our labor costs, including wages and employee benefits, will continue to increase. In recent years, inflation has risen worldwide and the United States and Canada have experienced historically high levels of inflation. While we have made certain price adjustments to, among other things, address labor costs, there can be no assurance that our revenues will increase at the same rate to maintain the same level of profitability.
If we are unable to attract and retain quality employees and management personnel, or fail to comply with the regulations and laws impacting personnel, our operations, processing efficiency, customer service levels, legal and regulatory compliance and support functions could suffer, resulting in a material adverse effect on our business, financial condition and results of operations.
Our continued growth depends on attracting new, and retaining existing, customers, including by increasing the acceptance of thrift among new and growing customer demographics, and effective advertising.
Our ability to attract and retain customers also depends on our ability to offer a broad selection of desirable and quality secondhand items in our stores, our ability to consistently provide high-quality customer experiences and our ability to successfully promote and position our brands and stores. To expand our customer base, we must appeal to and attract customers who do not typically purchase secondhand items or who use other means to purchase secondhand items, such as other consignment and thrift stores or online secondary marketplaces. We reach new customers through paid search, social media, influencers, advertising, other paid marketing, press coverage, retail locations, referral programs, organic word of mouth and other methods of discovery, such as converting our NPPs’ donors to customers. We expect to continue investing in these and other marketing channels but cannot be certain that these efforts will enable us to attract and retain more customers, result in increased store visits or increased basket sizes or be cost-effective. Consequently, failure to attract new customers and to retain existing customers could harm our business, results of operations and financial condition.
However, our investments in marketing may not effectively reach potential and existing customers, which could negatively affect our results of operations. Moreover, consumer preferences may change, and customers may not purchase through our stores as frequently or spend as much with us as historically has been the case. In addition, our social media presence may expose us to reputational damage if others post negative
information concerning our business, our customers, NPPs or their donors, regardless of whether such information is accurate. Any such harm may be immediate and we may not have any opportunities for redress or correction, which could have an adverse effect on our reputation, business, results of operations, financial condition and prospects. Consequently, failure to attract new customers and to retain existing customers could harm our business, results of operations and financial condition.
Both supply of and demand for our products is influenced by general economic conditions, including trends in consumer spending.
Our business and results of operations are subject to global economic conditions, conditions in the markets in which we operate and their impact on consumer discretionary spending, particularly in the retail market. Some of the factors that may negatively influence consumer spending on retail items include high levels of unemployment, high consumer debt levels, a prolonged economic downturn or acute recession, fluctuating interest rates and credit availability, fluctuating fuel and other energy costs, fluctuating commodity prices, other inflationary pressures and general uncertainty regarding the overall future political and economic environment. For example, most Canadian mortgages require multiple term renewals until they are paid in full, and the recent inflationary pressure and interest rate increases means increased financial pressure on Canadian homeowners that may affect their spending. Additionally, economic conditions in particular regions may also be affected by natural disasters, such as earthquakes, hurricanes and wildfires; unforeseen public health crises, such as the COVID-19 pandemic; political crises, such as terrorist attacks, war, such as the ongoing Russia-Ukraine conflict and the conflict in Israel, and other incidents of political or social instability or other catastrophic events in the United States, Canada or internationally. The presence or absence of government stimulus funding programs has had and may continue to have an impact on consumer discretionary spending and, consequently, purchases at our stores.
Traditionally, consumer purchases of new retail items have declined and secondhand markets have grown during periods of economic uncertainty, when disposable income is reduced or when there is a reduction in consumer confidence. Nevertheless, we cannot guarantee that our customers will continue to visit our stores and buy our items if economic conditions worsen. On the other hand, economic upswings could increase the rate of new retail purchases in the primary market and slow the rate at which individuals choose to shop in the secondhand market, thereby decreasing our revenue.
Furthermore, fluctuations in economic and other conditions could also negatively impact the rate at which individuals choose to donate their secondhand items to our NPPs. To the extent that donors have lower actual or perceived wealth or economic security, donors may be less willing or able to donate items to our NPPs. A constriction in the supply of secondhand items could increase the price of and/or reduce the quality or quantity of items we purchase for sale in our stores, which would adversely affect our revenues, profitability and sales yields. As a result, general economic and other conditions could have a material and adverse effect on our business, results of operation and financial condition.
If we fail to manage our rapid growth effectively and execute our business plan, our business, results of operations and financial condition could be harmed.
We have experienced rapid growth in certain recent periods, and may continue to experience rapid growth in future periods, which has placed, and may continue to place, significant demands on our management and our operational and financial resources. We have also experienced significant growth in the number of customers using our stores in certain periods. Our organizational structure is becoming more complex as we scale our operational, financial and management controls as well as our reporting systems and procedures.
To manage growth in our operations and the growth in our number of customers, we will need to continue to grow and improve our operational, financial and management controls and our reporting systems and procedures. Our expansion has placed, and our expected future growth will continue to place, a significant strain on our management, people services, marketing, operations, administrative, legal, financial, customer support, information technology, investor relations and other resources. If we fail to manage our anticipated growth in a manner that preserves key aspects of our corporate culture, our employee morale, productivity and retention rates could suffer, which could negatively affect our brands and reputation and harm our ability to grow our business.
In future periods, we may not be able to sustain or increase revenue growth rates consistent with recent history, or at all. We believe our success and revenue growth depends on a number of factors, including, but not limited to, many of the risks discussed in this section.
If we are unable to execute on our strategy while effectively managing our risks, our revenue growth may be harmed. We also expect our operating expenses to increase in future periods, and if our revenue growth does not increase to offset these anticipated increases in our operating expenses, our business, results of operations and financial condition will be harmed, and we may not be able to maintain profitability.
We lease all of our locations and must identify, obtain and retain suitable locations for our stores and processing facilities to achieve our planned growth.
We lease all of our locations. Our business strategy requires us to find appropriate store sites in our targeted market areas, and we compete with other retailers and businesses for many of these locations. Furthermore, the growth of our business depends on our ability to secure additional locations for our CPCs to serve our stores. Most of our planned store locations will require processing facilities on-site, necessitating specific size, layout and other physical attributes that may not be available widely in the local area. We must also staff our CPCs with qualified workers because our CPC operations are complex and highly dependent on numerous employees and personnel working as a team. Spaces that meet our physical requirements in well-positioned geographic locations are becoming increasingly scarce, and lease terms offered by landlords are increasingly competitive, particularly in geographic locations with access to the large, qualified talent pools required for us to run our logistics infrastructure. Companies with more financial resources and negotiating leverage than us may be more attractive tenants and, as a result, we may be outbid for the facilities we seek.
Our store site selection process includes review of impactful demographic information, including regarding potential customers, donors and team members. This information can be a helpful indicator but may not accurately predict consumer preferences, buying or donation trends or workforce availability. Time frames for negotiations and store development vary from location to location and can be subject to unforeseen delays or unexpected cancellations, which could delay openings and have a negative impact on our business and operating results. Furthermore, if we are unable to locate and compete for suitable locations in the future, we may not be able to open new locations or fully realize the expected benefits of existing locations.
We are also subject to certain risks with respect to our leases. Our store leases are generally for extended terms with a typical initial term of 10 years and existing leases have an average remaining term of approximately 6.95 years as of December 30, 2023. The majority of our store leases contain provisions for base rent and a small number of our leases also contain provisions for percentage rent based on sales in excess of an agreed upon minimum annual sales level. In addition, certain of our leases may contain restrictions on our ability to terminate, assign or sublease our obligations or may contain obligations to continue operating for certain lengths of time, which could prevent us from closing or relocating certain underperforming locations. If we decide to close locations, we generally are required to continue paying rent and operating expenses for the balance of the lease term. Further, even if we are able to assign or sublease vacated locations, we may remain liable on the lease obligations for the rent differential or if the assignee or sub-lessee does not perform. Accordingly, we are subject to certain risks associated with leasing locations, which can have a material and adverse effect on us.
If we are unable to secure suitable locations in the future, we may experience difficulty in opening new locations at reasonable cost. Due to the competitive nature of the real estate market, we may be unable to renew our existing on satisfactory terms or at all. If we are unable to renew, renegotiate or replace our leases or enter into leases for new locations on favorable terms, our growth and profitability could be harmed, which could have a material and adverse effect on our business, financial condition and results of operations.
We have significant foreign operations, particularly in Canada, that subject us to additional operating risks and certain exchange rate risks, which we may not be able to fully hedge.
As of December 30, 2023, we operated 159 stores in Canada and 12 stores in Australia. Our operations in these non-U.S. jurisdictions require us to understand the retail climate and trends, customs and cultures, seasonal differences, business practices and competitive conditions in those jurisdictions. We are also required to familiarize ourselves with the laws, rules, regulations and government of each of those jurisdictions. Operations in each jurisdiction also require us to develop the appropriate in-country infrastructure, identify suitable partners for local operations and successfully integrate operations in that jurisdiction with our overall operations while effectively communicating and implementing company policies and practices. There are also financial, regulatory and other risks associated with international operations, including currency exchange fluctuations, potentially adverse tax and transfer pricing considerations, limitations on the repatriation and investment of funds outside of the country where earned, trade regulations, the risk of sudden policy or regulatory changes, the risk of political, economic and civil instability and labor unrest and uncertainties
regarding interpretation, application and enforceability of laws and agreements. Any of these risks could adversely impact our operations, profitability or liquidity.
In addition, our Canadian and Australian operations use a functional currency other than the U.S. dollar. For fiscal year 2023, 45.5% of our net sales were derived from markets outside the United States. We are exposed to currency translation risk because the results of our international businesses in some countries are generally reported in local currency, which we then translate to U.S. dollars we record for our foreign assets, liabilities, revenues and expenses, and could have a negative effect on our financial results.
Natural disasters, pandemics, geo-political events and other highly disruptive events can have an unpredictable and adverse impact on our business, results of operations and financial condition.
Our stores and processing facilities are critical to our operations. Any disruptions to those facilities or our logistics network, headquarters or any properties used by NPPs in connection with the supply of secondhand items to us could disrupt our business and overall operations. Events such as natural disasters or severe or otherwise unusual weather events (including, but not limited to, fires, hurricanes, tornadoes, tsunamis, floods, earthquakes); disease outbreaks; nuclear accidents; acts of terrorism, cyberattacks, military activities, labor strikes, social unrest, protests, riots, looting, arson; and building or construction damage or defects could cause physical damage to or destruction of one or more of our properties and/or inventory, and could further severely disrupt our operations, supply chains or utilities or data and communications systems and cause harm to our team members.
In particular, events that could limit the ability or desirability for people to shop in person, such as the COVID-19 pandemic, would also heighten certain other risks disclosed in this Annual Report. These effects have in the past and could in the future negatively impact our operations and financial performance, including our revenues and sales yield, including through impacting the amount and quality of donations to our NPPs and our customers’ willingness to shop at our stores. For example, due to the COVID-19 pandemic, our retail stores were closed for a substantial portion of 2020, which resulted in lower retail sales volume and fewer donations made to our NPPs at our CDCs. When locations were reopened, we also experienced operational challenges from personnel absences, decreased foot traffic at our stores, a decrease or volatile patterns in spending on retail in general, and continued diversion of the attention of our management team.
Further, any other events that cause closures, reductions or delays in operations can slow or temporarily halt our operations and could cause us to incur significant costs to relocate or otherwise re-establish these functions, reduce customer sales or our ability to sell items, or increase our insurance costs. These events could also cause reputational harm, decreased consumer confidence and spending and/or increased volatility in the United States, Canada and global financial markets and economies. Any of these developments could have a material and adverse effect on our business, financial condition and results of operations.
If we are unable to extend our exclusive rights with the provider of our CPC and ABP technologies, and otherwise successfully leverage technology to automate and drive efficiencies, our business, results of operations and financial condition could be harmed.
We have contractual arrangements with Valvan Baling Systems NV (“Valvan”), the provider of CPC technology, and ABP technology that include exclusive rights to the use of the CPC technology and ABP technology for a period of time that may be extended as we purchase additional technology from the provider in connection with our build out of additional CPCs and ABP facilities. The CPC and ABP technologies widen our competitive and operational advantage, and we plan to aggressively expand both across many of the markets in which we operate in the next several years. Our ability to extend these exclusive rights with respect to the CPC and ABP technologies is dependent on us continuing to secure our relationship with the provider as we continue to expand our CPCs and ABP facilities. Our failure to complete planned purchases may lead to the termination of our exclusive rights with Valvan, which could result in operational delays and weaken our competitive position, harming our business, results of operations and financial condition.
As we continue to enhance automation and add other capabilities, our operations may become increasingly complex. While we expect these technologies to improve productivity in many of our merchandising operations, any flaws, bugs or failures of such technologies could cause interruptions in and delays to our operations, which may harm our business. We are increasing our investment in technology, software and systems to support these efforts, but such investments may not increase productivity, maintain or improve the experience for customers or result in more efficient operations. While we have created our own proprietary technology to operate our business, we also rely on technology from third parties, particularly in our CPCs. If we
are no longer able to rely on such third parties, we could be required to seek other third-party licenses; redesign aspects of our operations to function without such technologies or services; or develop such technologies ourselves, any of which would result in increased costs and could result in operational delays.
Labor-related matters, including labor disputes, may adversely affect our operations.
To the extent a significant portion of our employee base would choose to unionize, or attempts to unionize, our labor and other related costs could increase. Our ability to pass along any increased labor or other related costs to our customers is constrained by our everyday low-price model, and we may not be able to adequately offset such increased costs elsewhere in our business. In September 2022, one retail store in Ontario, Canada voted to be represented by a union. We have been bargaining with the union on a proposed collective agreement since late 2022. We meet with the union periodically, and bargaining is ongoing. If our employees decide to form or affiliate with a union, we cannot predict the effects such future organizational activities will have on our business and operations. If we were to become subject to work stoppages, we could experience disruption in our operations, including increases in our labor costs, which could harm our business, results of operations and financial condition.
In addition, we have in the past and could face in the future a variety of employee claims against us, including but not limited to general discrimination, privacy, wage and hour, labor and employment, Employee Retirement Income Security Act (“ERISA”) and disability claims. Any claims could also result in litigation against us or regulatory proceedings being brought against us by various federal and state agencies that regulate our business, including the U.S. Equal Employment Opportunity Commission. Often these cases raise complex factual and legal issues and create risks and uncertainties.
Acquisitions could be difficult to identify, pose integration challenges, divert the attention of management, disrupt our business, dilute stockholder value and adversely affect our results of operations and expansion prospects.
We have in the past and may in the future consider acquisitions of other companies or technologies, but we have limited experience in such transactions. There are limited acquisition targets within our industry and even if we are able to identify a suitable target, we may not be able to complete the acquisition on commercially reasonable terms or at all. Pursuing of potential acquisitions may divert the attention of management and cause us to incur various expenses in identifying, investigating and pursuing suitable acquisitions, whether or not they are consummated.
If we do complete acquisitions, we may not be able to successfully integrate the acquired operations, systems (including financial, inventory, customer and other systems), team members and facilities into our company, or the time and resources spent on such integration could be greater than expected. In addition, we also may not accurately forecast the financial impact of an acquisition transaction, including accounting charges. Financing such acquisitions may require significant cash, debt (which indebtedness may restrict our business or require the use of available cash to make interest and principal payment) or the issuance of equity or convertible debt securities (which may result in further dilution of our existing stockholders). For example, we spent significant time and resources and incurred a significant amount of debt to finance the 2nd Ave. Acquisition and integrate its operations into our business.
As a result, our competitive position may not improve as intended, we may not realize the anticipated benefits from the acquired business or otherwise achieve our goals, and any acquisitions we complete could be viewed negatively by our investors, customers or team members. If we fail to evaluate and execute acquisitions successfully or fail to successfully address any of these risks, our results of operations and expansion prospects may be harmed.
Disruptions in the wholesale markets due to market conditions, conditions in the countries where our wholesale goods are sold or other factors may adversely affect our business.
Much of the merchandise we purchase from our NPPs is not sold in our stores, but instead is sold into the global wholesale secondhand goods market. We have in the past, and may in the future, experience fluctuations and disruptions in this market. For example, we could experience fluctuations in the demand for or the price of our secondhand goods due to an influx of competing inexpensive textiles, localized or regional events happening in the end markets for these goods, such as natural disasters, civil unrest or economic conditions; or because of changes in laws, rules and regulations in the end markets. If we are unable to sell a
sufficient amount of secondhand goods into the wholesale market, our business, our reputation and our revenues, profitability, results of operations and financial condition could be materially and adversely affected.
We may not succeed in promoting and maintaining our reputation, and our business could be negatively impacted by a failure, or perceived failure, to live up to our sustainability and corporate citizenship commitments.
We believe that our brands and reputation have significantly contributed to the success of our business, including our ability to attract and maintain relationships with our customers, NPPs and their donors, and our team members. An important goal of our brand promotion strategy is establishing trust with our customers and NPPs and their donors. For customers, maintaining our reputation requires that we foster trust through responsive and effective customer service and a broad supply of desirable brands and secondhand items. For NPPs and their donors, maintaining our brands and reputation requires that we foster convenience with service that is convenient, consistent and timely. Our payments must also be perceived by our NPPs to be adequate compensation for the items they collect. If we fail to maintain these or other elements of our reputation, our revenues and the quantity and quality of goods supplied to us could be materially and adversely affected. As a result, a failure to maintain our reputation could have a material, adverse effect on our business, growth, results of operations and financial condition.
Our business strategy is built around sustainability and the reduction of waste in our local communities and in the textile and other industries through thrift, reuse and repurposing. We also seek to maintain good corporate citizenship and continuously strive for a more inclusive and diverse workplace. Our commitment to such matters may require us to devote additional resources to operational reviews and could increase our expenses, which could reduce profitability. Further, our relationships with our customers, NPPs and their donors may be adversely affected by complaints and negative publicity about us and our merchandise, even if factually incorrect or based on isolated incidents. Negative publicity may be generated around a failure, or a perceived failure, to live up to our commitments, for the scope of our commitments and engagement, for lack of transparency or for inaccurate reporting about such matters. We also may experience damage to our brands and reputation if our wholesale customers improperly use or dispose of the items we sell to them.
These and other events or negative publicity could discourage our customers from shopping at our stores, causing our net sales to decrease, and could negatively impact our relationships with our NPPs and their donors, causing the quantity and quality of secondhand goods we receive to decrease (and thus negatively impacting our revenues and sales yields). This may also impact our ability to attract and retain talent.
The market in which we participate is competitive and rapidly changing, and if we do not compete effectively with established companies as well as new market entrants or maintain and develop strategic relationships with NPPs, our business, results of operations and financial condition could be harmed.
The markets for resale and secondhand items are highly competitive. We compete with vendors of new and secondhand items, including branded goods stores, local, national and global department stores, consignment and thrift stores (including non-profit operators), specialty retailers, direct-to-consumer, retailers, discount chains, independent retail stores, resale players focused on niche or single categories, as well as internet-based secondhand retailers and other technology-enabled marketplaces. We believe the risks described in this Annual Report, many of which are beyond our control, directly affect our ability to compete. Further, our competitive position is affected by the price at which we offer secondhand items; the speed and cost at which we can process and make available secondhand items to our customers; and the selection of items that we provide in stores.
As our market continues to evolve and we expect new market entrants and for competition to intensify. Established companies may not only develop online platforms or competing lines of business, but also acquire or establish relationships with competitors or our NPPs or their donors or provide meaningful incentives to favor their offerings over our stores. The performance of our competitors as well as changes in their pricing and promotional policies, marketing activities, new location openings, merchandising and operational strategies could negatively impact our ability to compete and to grow our revenue, and our sales and profitability may suffer.
Many of our existing competitors have, and some of our potential competitors could have, substantial competitive advantages such as greater brand name recognition and longer operating histories; larger fulfillment infrastructures; greater technical capabilities; internet-based marketplaces; broader supply; established relationships with a larger existing customer and/or NPP and donor base; better access to merchandise; superior or more desirable secondhand items for sale or resale; greater customer service resources; greater financial, marketing, institutional and other resources; greater resources to make acquisitions; lower labor and development costs; larger and more mature intellectual property portfolios; and better access to capital markets than we do. Such competitors with greater financial and operating resources may be able to respond more quickly and effectively than we can to new or changing opportunities, technologies, standards or customer requirements and derive greater revenue and profits from their existing customer bases, adopt more aggressive pricing policies to build larger customer or NPP bases or respond more quickly than we can to new or emerging technologies and changes in consumer shopping behavior.
Conditions in our market could also change rapidly and significantly as a result of technological advancements, partnering by our competitors or continuing market consolidation or strategic changes we or our competitors make in response to macro-economic or other events, and it is uncertain how our market will evolve. These competitive pressures in our market or our failure to compete effectively may result in price reductions, fewer customers and NPPs, reduced revenue, reduced profitability and loss of market share. Any failure to meet and address these factors could harm our business, results of operations and financial condition.
National retailers and brands set their own retail prices and promotional discounts on new items, which could adversely affect our value proposition to customers and harm our business, results of operations and financial condition.
National retailers and brands set pricing for their own new retail items, which can include promotional discounts. For example, there may be reductions in the price of new retail items in light of an economic downturn. Promotional pricing or other pricing strategies used by these parties may adversely affect the relative value of our offerings of secondhand items and we may need to lower our prices in order to compete. This could, as a result, adversely affect our business, revenue, growth, results of operations and financial condition.
Risks Relating to Information Technology, Intellectual Property, Data Security and Privacy
Compromises of our data security, including cyberattacks or data breaches, could cause us to incur unexpected expenses and may materially harm our reputation and results of operations.
In the ordinary course of our business, we collect, process and store certain personal information and other data, such as customer payment card data and employee information. We also maintain other confidential business information such as financial information, operating statistics and metrics, trade secrets and third-party confidential information. Like other large retailers, we rely substantially on commercially available systems, software, tools and monitoring to provide security for our processing, transmission and storage of such information. Cybercriminals may attempt to gain access to our information systems to misappropriate sensitive information or data or to deprive us from access to necessary business information and to disrupt our operations, as part of so-called “ransomware” extortion activity or otherwise. We have been in the past and could be in the future the subject of attacks. For example, in July 2020, we suffered a ransomware attack that caused the loss of some of our data and caused some temporary operational disruptions. In addition, our employees, NPPs, service providers or other third parties with whom we do business may purposefully or inadvertently release or compromise such data, including through inadequate security practices or attacks on their networks.
Despite security measures we have in place, and our efforts to prevent, monitor, and mitigate attacks and errors, our facilities, systems and confidential information may be vulnerable to attacks. The techniques used by cybercriminals change frequently, cybercriminals are increasingly sophisticated, and we continue to see advances in computer capabilities and remote access by employees. We expect to incur ongoing costs associated with the detection and prevention of security incidents and may incur additional costs in the event of a breach. Any actual or perceived compromise of our systems or data security measures or those of third parties with whom we do business, or any failure to prevent or mitigate the loss of confidential information and delays in detecting or providing notice of any such loss could disrupt our operations, damage our reputation, impact our sales and subject us to litigation, government action, increased transaction fees, regulatory fines or penalties or other additional costs and liabilities that could adversely affect our business, results of operations and financial condition.
Furthermore, our insurance coverage may not be adequate for related losses and may not continue to be available to us on economically reasonable terms, or at all. An insurer may also deny coverage as to a future claim. The successful assertion of one or more large claims against us that exceed available insurance coverage or the occurrence of changes in our insurance policies, including premium increases or the imposition of large deductible or co-insurance requirements, could harm our business, results of operations, financial condition and reputation.
Our use and other processing of personal information and other data is subject to laws and regulations. Changes in such laws or regulations or any actual or perceived compliance failures could adversely affect our business, results of operations and financial condition.
We collect, maintain and otherwise process significant amounts of personal information and other data relating to our customers, employees and other individuals. We are subject to the terms of our privacy policies and notices and may be bound by contractual requirements applicable to our collection, use, processing, security and disclosure of personal information, and may be bound by or alleged to be subject to, or voluntarily comply with, self-regulatory or other industry standards relating to these matters. Additionally, numerous state, federal and international laws and rules and regulations govern the collection, use and protection of this information. Such requirements are constantly evolving, and we expect that there will continue to be new proposed requirements relating to privacy, data protection and information security in the United States, Canada and other jurisdictions, or changes in the interpretation of existing privacy requirements. For example, the California Consumer Privacy Act (“CCPA”, effective January 1, 2020) broadly defines personal information, imposes stringent consumer data protection requirements, gives California residents expanded privacy rights, provides for civil penalties for violations and introduces a private right of action for data breaches, and the California Privacy Rights Act (“CPRA”, effective January 1, 2023) creates additional obligations relating to personal information. Other states have also proposed or enacted similar laws and regulations relating to privacy. For example, the Virginia Consumer Data Protection Act (“VCDPA”, effective on January 1, 2023); the Connecticut Data Privacy Act (“CDPA”, effective July 1, 2023), and the Utah Consumer Privacy Act (“UCPA”, effective December 31, 2023) share similarities with the CCPA, the CPRA, and legislation proposed in other states.
We have significant operations in Canada and Australia, and must also comply with data privacy laws in those jurisdictions. In Canada, our collection, use, disclosure and management of personal information must comply with both federal and provincial privacy laws. The Personal Information Protection and Electronic Documents Act (“PIPEDA”) applies in all Canadian provinces except, in certain contexts, Alberta, British Columbia and Québec, as well as to the transfer of personal information across provincial or international borders. PIPEDA imposes stringent personal information protection obligations, requires privacy breach reporting, and limits the purposes for which organizations may collect, use and disclose personal information, which includes consumer data. A bill for a replacement to PIPEDA has been tabled and is currently working its way through the Canadian federal legislative process. The provinces of Alberta, British Columbia, and Québec have enacted separate data privacy laws that are substantially similar to PIPEDA, but, among other differences, all three additionally apply to our handling of our own employees’ personal data within their respective provinces. As of September 22, 2023, Québec’s privacy act took effect, which includes transparency and data impact assessments requirements and also imposes severe financial penalties for certain offenses like unlawful use of personal information and failure to report confidentiality incidents. We may incur additional costs and expenses related to compliance with these laws. We are also subject to Canada’s anti-spam legislation (“CASL”) when sending commercial electronic messages and can be held liable for violations. In Australia, the Privacy Act 1988 and the Australian Privacy Principles (“APPs”) regulate the handling of personal information, gives the Australian Information Commissioner the power to conduct investigations, and contains civil penalties for breach. Updates to the Privacy Act in 2023 increased the civil penalties available for serious and repeated breach events. Additional changes are expected in the next year. To the extent our operations further expand internationally, we may become subject to additional laws and regulations relating to privacy and data protection.
Any failure or perceived failure by us or any third parties with which we do business to comply with these privacy requirements, with our posted privacy policies or with other similar obligations may result in investigations or governmental enforcement actions, private claims, public statements against us by consumer advocacy groups or others and fines, penalties or other liabilities. For example, California consumers whose information has been subject to a security incident may bring civil suits under the CCPA for statutory damages between $100 and $750 per consumer. In Canada, we may be subject to regulatory investigations, fines or class action suits stemming from violations of PIPEDA, provincial data privacy laws or CASL. Any such action
would be expensive to defend, likely would damage our reputation and market position, could result in substantial liability and could adversely affect our business and results of operations. Additionally, our efforts to comply with these laws may impose significant costs and challenges that are likely to increase over time, and we cannot fully predict the impact on our business or operations of certain unclear aspects of recent laws, future requirements, or changes in the interpretation of existing requirements.
We may be unable to protect our intellectual property rights, and we may be accused of infringing on the intellectual property or other proprietary rights of third parties.
We rely on a combination of intellectual property rights, contractual protections and other practices to protect our brands, proprietary information, technologies and processes. Our trademarks are valuable assets that support our brands and customers’ perception of our services and merchandise. We primarily rely on copyright and trade secret laws and exclusive licenses-in to protect our proprietary technologies and processes, including the automated operations systems and machine learning technology we use. Although we enter into confidentiality and/or invention assignment agreements with our employees, consultants and other parties with whom we have strategic relationships, no assurance can be given that these agreements will be effective. Further, these agreements do not prevent our competitors from independently developing similar technologies. To monitor and protect our intellectual property rights, we may be required to spend significant resources, and we may not be able to detect infringement by third parties. Litigation may be necessary but could be costly, time consuming and distracting to management and could result in the impairment or loss of portions of our intellectual property. Furthermore, our efforts to enforce our intellectual property rights may be met with defenses, counterclaims and countersuits attacking the validity and enforceability of our intellectual property rights. Additionally, if we are unable to protect our trademarks or domain names, our brand recognition and reputation would suffer, we would incur significant expense establishing new brands and our results of operations would be adversely impacted.
We have been in the past and may be accused in the future of infringing intellectual property or other proprietary rights of third parties, such as infringement of a state trademark or violating the right of publicity. For example, although we prohibit our employees from using the proprietary information of others, we may become subject to a claim that an employee has divulged or used the proprietary information of a former employer. In addition, our employees or third parties acting at our direction may knowingly or inadvertently make use of social media in ways that could lead to the loss or infringement of intellectual property, as well as the public disclosure of proprietary, confidential or sensitive personal information of our business, employees, customers or others. Supporting any litigation or disputes related to these claims can be expensive and distracting, and we cannot provide assurances that we will achieve a favorable outcome. If any such claim is valid, we may be compelled to cease our use of such intellectual property or other proprietary rights and pay damages, which could adversely affect our business and results of operations.
We rely on software, technology and services from other parties. Defects in or the loss of access to software or services from third parties could increase our costs and adversely affect the quality of our products.
We rely on software, technologies and services sourced or licensed from third parties to operate critical functions of our business, including payment processing services, certain aspects of CPC automation and customer relationship and management services, We also use services such as Microsoft for our business emails, file storage on internal communications. If any of the third-party software or services we utilize, or the functional equivalents thereof, were unavailable for extended periods due to outages or interruptions or because they are no longer available on commercially reasonable terms, our business would experience significant operational disruptions. In each case, we would be required to develop such software ourselves or seek similar software licenses or services from other parties and reshape our business and operations to function with such new software or services. These alternatives could require a significant capital investment, take an extended period of time to implement, and divert management’s attention from our other business concerns, which could adversely affect our business and results of operations.
Risks Relating to Legal, Regulatory, Accounting and Tax Matters
Risks arising from the material weaknesses we have identified in our internal control over financial reporting and any failure to remediate these material weaknesses.
We are required to maintain internal control over financial reporting in accordance with applicable rules and guidance and to report any material weaknesses in such internal control over financial reporting. A material weakness is a deficiency, or a combination of deficiencies, in internal control over financial reporting such that there is a reasonable possibility that a material misstatement of our financial statements will not be prevented or detected on a timely basis. In preparation for our IPO, we identified deficiencies in our internal control over financial reporting, which in the aggregate, constitute material weaknesses related to (i) the sufficiency of technical accounting and SEC reporting expertise within our accounting and financial reporting function, (ii) the establishment and documentation of clearly defined roles within our finance and accounting functions and (iii) our ability to evidence the design and implementation of effective information technology general controls (“ITGCs”) for information systems and applications that are relevant to the preparation of our financial statements.
If our steps are insufficient to successfully remediate the material weaknesses and otherwise establish and maintain an effective system of internal control over financial reporting, the reliability of our financial reporting, investor confidence in us and the value of our common stock could be materially and adversely affected. We may not be able to remediate the identified material weaknesses, and additional material weaknesses or significant deficiencies in our internal control over financial reporting may be identified in the future. Effective internal control over financial reporting is necessary for us to provide reliable and timely financial reports and, together with adequate disclosure controls and procedures, are designed to reasonably detect and prevent fraud. Our failure to implement and maintain effective internal control over financial reporting, to remedy identified material weaknesses or significant deficiencies or to implement required new or improved controls could result in errors in our financial statements that could result in a restatement of our financial statements or cause us to fail to timely meet our financial and other reporting obligations.
We may be unable to maintain an effective system of disclosure controls and procedures or internal control over financial reporting and produce timely and accurate financial statements or comply with applicable regulations.
As a public company, we are subject to the reporting requirements of the Securities Exchange Act of 1934, as amended (the “Exchange Act”) the Sarbanes-Oxley Act, and, the rules and regulations and the listing standards of the NYSE.
The Sarbanes-Oxley Act requires, among other things, that we maintain effective disclosure controls and procedures and internal control over financial reporting. We are continuing to develop and refine our disclosure controls and other procedures that are designed to ensure that information required to be disclosed by us in the reports that we will file with the SEC is recorded, processed, summarized and reported within the time periods specified in SEC rules and forms and that information required to be disclosed in reports under the Exchange Act is accumulated and communicated to our principal executive and financial officers. We are also continuing to improve our internal control over financial reporting. In order to maintain and improve the effectiveness of our disclosure controls and procedures and internal control over financial reporting, we have expended, and anticipate that we will continue to expend, significant resources, including accounting-related costs and significant management oversight.
In addition to the material weaknesses in our internal control over financial reporting that we have identified, we may discover weaknesses in our disclosure controls and procedures and internal control over financial reporting in the future. Any failure to develop or maintain effective controls or any difficulties encountered in their implementation or improvement could harm our operating results or cause us to fail to meet our reporting obligations and may result in a restatement of our financial statements for prior periods. Any failure to implement and maintain effective internal control over financial reporting also could adversely affect the results of periodic management evaluations and annual independent registered public accounting firm attestation reports regarding the effectiveness of our internal control over financial reporting that we will eventually be required to include in our Form 10-K that will be filed with the SEC. Ineffective disclosure controls and procedures and internal control over financial reporting could cause delays in our ability to comply with public company reporting requirements (including under the Exchange Act or stock exchange rules) and could also cause investors to lose confidence in our reported financial and other information, which could have a negative effect on the trading price of our common stock. In addition, if we are unable to continue to meet these
requirements, we may not be able to remain listed on the NYSE. We are not currently required to comply with the SEC rules that implement Section 404 of the Sarbanes-Oxley Act and are therefore not required to make a formal assessment of the effectiveness of our internal control over financial reporting for that purpose. As a public company, we are required to provide an annual management report on the effectiveness of our internal control over financial reporting commencing with our second annual report on Form 10-K.
Changes in Canadian, Australian or U.S. national or local regulations, including those relating to the sale of secondhand items and advertising practices, or our actual or alleged failure to comply with such regulations, may have a material adverse effect on our reputation, business, financial condition and results of operations.
Our business and financial condition could be adversely affected by unfavorable changes in or interpretations of existing laws, rules and regulations or the promulgation of new laws, rules and regulations applicable to us and our business, including those relating to consumer protection, anti-corruption, antitrust and competition, economic and trade sanctions, tax, banking, environmental protection, waste management, workplace safety, sustainability, data security, network and information systems security, and data protection and privacy. For example, we expect to be subject to newly enacted laws in the State of California that will require certain businesses operating in California to prepare climate-related financial risk report and publicly disclose Scope 1, 2 and 3 greenhouse gas emission with third-party assurance. If we were to further expand domestically or internationally, we could be subject to additional regulation.
Further, the resale of secondhand items is subject to significant regulation both domestically and internationally, including by state, provincial or other local governments and regulatory authorities, and can include jurisdiction-specific licensing requirements for secondhand dealers. For example, the resale of secondhand items is subject to regulation by the U.S. Consumer Product Safety Commission, the U.S. Federal Trade Commission (the “FTC”), the U.S. Fish and Wildlife Service, and under the Canadian Wild Animal and Plant Protection and Regulation of International and Interprovincial Trade Act, and the Convention on International Trade in Endangered Species of Wild Fauna and Flora with respect to our Australian operations. Examples of regulated items include those with certain animal product components (ivory, fur, snakeskin, etc.), jewelry, aquatic toys, children’s items. Regulation can, in some jurisdictions, also require mandatory reporting and/or carry serious penalties for non-compliance. The laws and regulations for the resale of secondhand goods are complex, vary from jurisdiction to jurisdiction and change often. We currently receive our supply of secondhand items in approximately 29 U.S. states, 10 Canadian provinces and 2 Australian states or territories. Changes in these regulations, or our growth into a new location, could require us to change the way we conduct business in the applicable jurisdictions, such as prohibiting or otherwise restricting the sale or shipment of certain items in some locations. Failure of our employees to identify prohibited items and remove them from the sale process could lead to violations of regulations, fines, penalties or other claims against us, resulting in increased expenses and costs.
Additionally, supplied secondhand items could be subject to recalls and other remedial actions and product safety, labeling and licensing concerns may cause us to voluntarily remove certain secondhand items from our stores. Such recalls or voluntary removal of items can result in, among other things, lost sales, diverted resources, potential harm to our reputation and increased customer service costs and legal expenses, which could have an adverse effect on our results of operations. Some of the secondhand items sold at our stores may expose us to product liability claims and litigation or regulatory action relating to personal injury, environmental or property damage. We cannot be certain that our insurance coverage will be adequate for liabilities actually incurred or that insurance will continue to be available to us on economically reasonable terms or at all.
If our practices were found not to comply with applicable regulatory or licensing requirements or any binding interpretation of such requirements, regulatory authorities could prevent or temporarily suspend us from conducting some or all of our activities or otherwise penalize us. Unfavorable changes or interpretations could decrease demand for our merchandise, limit marketing methods and capabilities, affect our growth, increase costs or subject us to additional liabilities.
Moreover, in connection with our marketing and advertisement practices, we have been in the past and may in the future be, the target of claims relating to false or deceptive advertising, including under the auspices of the FTC and the consumer protection statutes of some states. Additionally, the laws and regulations governing the use of social media, emails, push notifications and text messages for marketing and other business purposes continues to evolve. The failure by us, our employees or third parties acting at our direction
to comply with these laws and regulations may negatively affect our brands, reputation, adversely impact our relationships with our NPPs and subject us to penalties and fines.
Our failure to address risks associated with payment methods, credit card fraud and other consumer fraud, or our failure to control any such fraud, could damage our reputation and brands and could harm our business, results of operations and financial condition.
We have in the past incurred and may in the future incur losses from various types of fraudulent transactions, including the use of stolen credit card numbers, and claims that a customer did not authorize a purchase. In addition, as part of the payment processing process, our customers’ credit and debit card information is transmitted to our third-party payment processors, and we may in the future become subject to lawsuits or other proceedings for purportedly fraudulent transactions arising out of the actual or alleged theft of our customers’ credit or debit card information if the security of our third-party credit card payment processors are breached.
We and our third-party credit card payment processors are also subject to payment card association operating rules, certification requirements and rules governing electronic funds transfers, which could change or be reinterpreted to make it difficult or impossible for us to comply. If we or our third-party credit card payment processors fail to comply with these rules or requirements, we may be subject to fines and higher transaction fees and lose our ability to accept credit and debit card payments from our customers. Further, we could violate or be alleged to have violated applicable laws, regulations, contractual obligations or other obligations, including those regulating to privacy, data protection and data security.
Any of these could damage our reputation and market position, result in claims, litigation or regulatory investigations and proceedings or lead to expenses that could harm our business, results of operations and financial condition.
We and our directors and executive officers may be subject to litigation for a variety of claims, which could harm our reputation and adversely affect our business, results of operations and financial condition.
In the ordinary course of business, we have in the past and may in the future be involved in and subject to litigation for a variety of claims or disputes and receive regulatory inquiries. These claims, lawsuits and proceedings could include labor and employment, wage and hour, commercial, consumer protection, regulatory, antitrust, alleged securities law violations or other investor claims, intellectual property infringement and other matters. The number and significance of these potential claims and disputes may increase as our business expands. Further, our general liability insurance may not cover all potential claims made against us or be sufficient to indemnify us for all liability that may be imposed. Any claim against us, regardless of its merit, could be costly, divert management’s attention and operational resources, and harm our reputation.
Our directors and executive officers may also be subject to litigation. We indemnify our directors and officers to the fullest extent permitted by Delaware law, which may discourage derivative litigation and stockholder fiduciary duty lawsuits, even though an action, if successful, might benefit us and other stockholders. Further, a stockholder’s investment may be harmed to the extent that we pay the costs of litigation and resolution against our directors and executive officers as required by our indemnification obligations. Our insurance policies may not cover all potential claims made against our directors and executive officers, may not be available to us in the future at a reasonable rate and may not be adequate to indemnify us for all costs and liability that may be imposed. As litigation is inherently unpredictable, we cannot assure you that any potential claims or disputes will not harm our business, results of operations and financial condition.
Subjective estimates and judgments used by management in the preparation of our financial statements, including estimates and judgments that may be required by new or changed accounting standards, may impact our financial condition and results of operations.
The preparation of financial statements requires management to make estimates and judgments that affect the reported amounts of assets, liabilities, revenue and expenses. Due to the inherent uncertainty in making estimates, results reported in future periods may be affected by changes in estimates reflected in our financial statements for earlier periods. Estimates and judgments are continually evaluated and are based on historical experience and other factors, including expectations of future events that are believed to be reasonable under the circumstances. From time to time, there may be changes in the financial accounting and reporting standards that govern the preparation of our financial statements. These changes can materially
impact how we record and report our financial condition and results of operations. In some instances, we could be required to apply a new or revised standard retrospectively. If the estimates and judgments we use in preparing our financial statements are subsequently found to be incorrect or if we are required to restate prior financial statements, our financial condition or results of operations could be significantly affected.
Tax legislation could adversely affect our business, financial condition and results of operations.
The Tax Cuts and Jobs Act, (the “Tax Act”), among other things, introduced significant changes to corporate taxation, including reduction of the corporate tax rate from a top marginal rate of 35% to a flat rate of 21%, limitation of the tax deduction for interest expense to 30% of “adjusted earnings” (roughly defined as earnings before interest and taxes ), limitation of the deduction for net operating losses to 80% of current year taxable income and elimination of net operating loss carrybacks, one time taxation of offshore earnings at reduced rates regardless of whether they are repatriated, elimination of U.S. tax on foreign earnings (subject to certain important exceptions), immediate deductions for certain new investments instead of deductions for depreciation expense over time, and modifying or repealing many business deductions and credits. The most significant impacts of the Tax Act on our financial results to date have included lowering of the U.S. federal corporate income tax rate and remeasurement of our net deferred tax liabilities.
Furthermore, the Inflation Reduction Act of 2022 introduced, among other changes, a 15% corporate minimum tax on certain United States corporations and a 1% excise tax on certain stock redemptions by United States corporations. The U.S. government may enact further significant changes to the taxation of business entities, including, among other changes, an increase in the U.S. taxation of international business operations. The likelihood of these changes being enacted or implemented is unclear. We are currently unable to predict the ultimate impact of the Inflation Reduction Act or any such further changes on our business.
Our ability to utilize our net operating loss carryforwards and certain other tax attributes to offset taxable income or taxes may be limited.
As of December 30, 2023 and December 31, 2022, we did not have U.S. federal net operating loss carryforwards and had $10.0 million and $24.6 million, respectively, of U.S. state net operating loss carryforwards. These net operating loss carryforwards expire between 2024 and 2041. As of December 30, 2023, we had $0.3 million of federal foreign tax credit, no federal R&D credits and no other federal tax credits. As of December 31, 2022, we had no federal foreign tax credit, no federal R&D tax credits and $3.2 million of other federal tax credits that expire between 2039 and 2042. Portions of these net operating loss carryforwards could expire unused and be unavailable to offset future income tax liabilities. For state income tax purposes, there may be periods during which the use of net operating loss carryforwards is suspended or otherwise limited, which could accelerate or permanently increase state taxes owed.
In addition, under Sections 382 and 383 of the Internal Revenue Code of 1986, as amended, and corresponding provisions of state law, if a corporation undergoes an “ownership change,” which is generally defined as a greater than 50% change, by value, in its equity ownership over a three-year period, the corporation’s ability to use its pre-change net operating loss carryforwards and other pre-change tax attributes to offset its post-change income or taxes may be limited. We have experienced such ownership changes in the past, and may experience such ownership changes in the future as a result of subsequent shifts in our stock ownership, some of which may be outside of our control. If an ownership change occurs and our ability to use our net operating loss carryforwards is materially limited, it would harm our future results of operations by effectively increasing our future tax obligations.
We are subject to various anti-corruption and export laws and regulations, violations of which could have a material adverse effect on our business, financial condition and results of operations.
We are subject to various anti-corruption laws, including the U.S. Foreign Corrupt Practices Act that generally prohibits companies and their intermediaries from engaging in bribery or making other improper payments. Our business operations also must be conducted in compliance with applicable export control and economic sanctions laws and regulations, including rules administered by the U.S. Department of the Treasury’s Office of Foreign Assets Control, the U.S. Department of State, the U.S. Department of Commerce, the United Nations Security Council, and other relevant authorities.
Violations of anti-corruption or trade control laws and regulations, or even allegations of such violations, could result in civil or criminal penalties, as well as disrupt our business, operations, financial condition and results of operations. We cannot guarantee that we have or will continue to be in full compliance with these
rules, and our further growth or international expansion, or changes to the applicable laws and regulations, could increase our future legal exposure and compliance-related costs.
Risks Relating to Our Indebtedness and Liquidity
The amount of our indebtedness and its rating could materially adversely affect our financial condition.
We have a significant amount of indebtedness. As of December 30, 2023, our total indebtedness was $816.8 million, including $321.8 million aggregate principal amount outstanding under our Senior Secured Credit Facilities and $495.0 million aggregate principal amount of Senior Secured Notes (“Notes”) under the indenture dated as of February 6, 2023, by and among Evergreen AcqCo 1 LP, TVI, Inc., the guarantors party thereto and Wilmington Trust, National Association, as trustee (the “Indenture”). Under the Senior Secured Credit Facilities, we have the Term Loan Facility and the Revolving Credit Facility. As of December 30, 2023, we had no advances on the Revolving Credit Facility, there were $1.2 million of letters of credit outstanding and $73.8 million was available to borrow. On March 4, 2024, the Company redeemed $49.5 million aggregate principal amount of Notes. Subsequent to the redemption, the Company had total indebtedness of $767.3 million.
Our substantial indebtedness could have important consequences to the holders of our common stock, including the following:
•making it more difficult for us to satisfy our obligations with respect to our other debt;
•limiting our ability to obtain additional financing to fund future working capital, capital expenditures, acquisitions or other general corporate requirements;
•requiring us to dedicate a substantial portion of our cash flows to debt service payments instead of other purposes, thereby reducing the amount of cash flows available for working capital, capital expenditures, acquisitions and other general corporate purposes;
•increasing our vulnerability to general adverse economic and industry conditions;
•exposing us to the risk of increased interest rates as certain of our borrowings, including borrowings under the Senior Secured Credit Facilities, are at variable rates of interest;
•limiting our flexibility in planning for and reacting to changes in the industry in which we compete;
•placing us at a disadvantage compared to other, less leveraged competitors; and
•increasing our cost of borrowing.
In addition, the Senior Secured Credit Facilities and the Indenture contain restrictive covenants that limit our ability to engage in activities that may be in our long term best interest. Our failure to comply with those covenants could result in an event of default which, if not cured or waived, could result in the acceleration of all of our debt. Our debt currently has a non-investment grade rating, which could be lowered or withdrawn entirely by a rating agency. Any future lowering of our ratings likely would make it more difficult or more expensive for us to obtain additional debt financing. In the event we needed to refinance all or a portion of our indebtedness on or before the maturity thereof or acquire additional financing, we may not be able to do so on commercially reasonable terms or at all, which would have a material adverse effect on our business.
We may not be able to generate sufficient cash to service all of our indebtedness or repay such indebtedness when due and may be forced to take other actions to satisfy our obligations under our indebtedness, which may not be successful.
Our ability to make scheduled payments on or refinance our debt obligations depends on our financial condition and operating performance, which are subject to prevailing economic and competitive conditions and to financial, business, legislative, regulatory and other factors, some of which are beyond our control. We cannot be sure that our business will generate sufficient cash flows from operating activities, or that future borrowings will be available, to permit us to pay the principal, premium, if any, and interest on our indebtedness.
We may be able to incur significant additional indebtedness, or other obligations that do not constitute indebtedness, in the future. Although the Senior Secured Credit Facilities and the Indenture contain restrictions on the incurrence of additional indebtedness, these restrictions are subject to a number of significant qualifications and exceptions. The Senior Secured Credit Facilities provide for additional uncommitted incremental loans of up to the greater of $136 million and 100% of EBITDA for the most recent four fiscal
quarters, plus certain other amounts, with additional incremental loans available if certain leverage ratios are maintained. Of the incremental loans, $15.0 million was permitted to be (and was utilized as) incremental commitments under the Revolving Credit Facility. All of those borrowings would be secured by first-priority liens on our property. If our cash flows and capital resources are insufficient to fund our debt service obligations, we could face substantial liquidity problems and could be forced to reduce or delay investments and capital expenditures or to dispose of material assets or operations, seek additional debt or equity capital or restructure or refinance our indebtedness. We may not be able to implement any such alternative measures, if necessary, on commercially reasonable terms or at all and, even if successful, those alternative actions may not allow us to meet our scheduled debt service obligations. The Senior Secured Credit Facilities and the Indenture restrict our ability to dispose of assets and use the proceeds from those dispositions and may also restrict our ability to raise debt or equity capital to be used to repay other indebtedness when it becomes due. We may not be able to consummate those dispositions or to obtain proceeds in an amount sufficient to meet any debt service obligations then due. See “Management’s Discussion and Analysis of Financial Condition and Results of Operations—Liquidity and Capital Resources.”
The Term Loan Facility and the Notes will mature on April 26, 2028. The Revolving Credit Facility will mature on April 26, 2026.Our inability to generate sufficient cash flows to satisfy our debt obligations, or to refinance our indebtedness on commercially reasonable terms or at all, would have a material adverse effect on our financial condition and results of operations. If we cannot make scheduled payments and default on our debt, the lenders under the Senior Secured Credit Facilities could terminate their loan commitments , the lenders and the holders of the Notes could foreclose against the assets securing their debt, and we could be forced into bankruptcy or liquidation.In addition, we maintain domestic cash deposit balances with Federal Deposit Insurance Corporation (“FDIC”) insured banks that may exceed the FDIC insurance limits. These balances could be impacted if one or more of these banks fails or is subject to other adverse conditions in the financial or credit markets. In the event one or more of our balances are impacted, our ability to satisfy our debt
obligations may be materially adversely affected. Any of these events could result in you losing all or a portion of your investment in the common stock.
The terms of the Senior Secured Credit Facilities and the Indenture restrict our current and future operations, including our ability to respond to changes or to take certain actions.
The Senior Secured Credit Facilities and the Indenture contain a number of restrictive covenants that impose operating and financial restrictions on us. These restrictions may limit our ability to engage in acts that may be in our long-term best interest, compete effectively or take advantage of opportunities, and may affect our ability to grow in accordance with our strategy.
The restrictive covenants under the Senior Secured Credit Facilities include restrictions on our ability to:
•incur additional indebtedness and guarantee indebtedness;
•pay dividends or make other distributions or repurchase or redeem our capital stock;
•prepay, redeem or repurchase junior debt;
•issue certain preferred stock or similar equity securities;
•make loans and investments;
•sell assets or property, except in certain circumstances;
•create or incur liens;
•enter into transactions with affiliates;
•modify or waive certain material agreements in a manner that is adverse in any material respect to the lenders;
•enter into agreements restricting our subsidiaries’ ability to pay dividends; and
•make fundamental changes in our business, corporate structure or capital structure, including, among other things, entering into mergers, acquisitions, consolidations and other business combinations.
A breach of the restrictions under the Senior Secured Credit Facilities or the Indenture could result in a default or an event of default. Such a default may allow the creditors to accelerate the related debt and may result in the acceleration of any other debt to which a cross-acceleration or cross-default provision applies. In addition, an event of default under the Senior Secured Credit Facilities would permit the lenders under the
Revolving Credit Facility to terminate all commitments to extend further credit under such facility. Furthermore, if we were unable to repay the amounts due and payable under the Senior Secured Credit Facilities and the Notes, the lenders under the Senior Secured Credit Facilities and the holders of the Notes could proceed against the collateral granted to them to secure that indebtedness. In exacerbated or prolonged circumstances, one or more of these events could result in our bankruptcy or liquidation.
Recent increases in interest rates may increase our borrowing costs. We rely on available borrowings under the Revolving Credit Facility for liquidity.
Borrowings under the Senior Secured Credit Facilities are at variable rates of interest and expose us to interest rate risk. As interest rates increase, our debt service obligations on the variable rate indebtedness would increase even though the amount borrowed has remained the same, and our net income and cash flows, including cash available for servicing our indebtedness, would correspondingly decrease. Based on amounts outstanding as of on December 30, 2023, each 100 basis point change in interest rates would result in a $3.2 million change in annual interest expense on our indebtedness under the Senior Secured Credit Facilities. See “Management’s Discussion and Analysis of Financial Condition and Results of Operations—Quantitative and Qualitative Disclosures about Market Risk—Interest Rate Risk.” We enter into interest rate swaps that hedge against changes in interest rates under the Senior Secured Credit Facilities. However, we may not maintain interest rate swaps with respect to all of our variable rate indebtedness, and any swaps or other instruments we enter into may not fully mitigate our interest rate risk.
In addition to cash we generate from our business, our principal existing source of liquidity is borrowings available under the Revolving Credit Facility. As of December 30, 2023, there were no advances on the Revolving Credit facility, there were $1.2 million of letters of credit outstanding and $73.8 million was available to borrow. The inability to borrow under the Revolving Credit Facility may adversely affect our liquidity, financial position and results of operations.
Risks Relating to Ownership of Our Common Stock
The stock price of our common stock may be volatile or may decline regardless of our operating performance.
Prior to our IPO, there was no public market for shares of our common stock. The market prices of our common stock and the securities of other newly public companies have been highly volatile. The market price of our common stock may fluctuate or decline significantly in response to numerous factors, many of which are beyond our control, including:
•actual or anticipated fluctuations in our revenues or other operating results;
•variations between our actual operating results and the expectations of securities analysts, investors and the financial community;
•any forward-looking financial or operating information we may provide to the public or securities analysts, any changes in this information or our failure to meet expectations based on this information;
•actions of securities analysts who initiate or maintain coverage of us, changes in financial estimates by any securities analysts who follow us or our failure to meet these estimates or the expectations of investors;
•limited “public float” (due in part to our status as a controlled company) in the hands of a small number of persons whose sales or lack of sales could result in positive or negative pricing pressure on the market price for our common stock;
•additional shares of common stock being sold into the market by us or our existing stockholders, or the anticipation of such sales, including if existing stockholders sell shares into the market;
•announcements by us or our competitors of significant products or features, innovations, acquisitions, strategic partnerships, joint ventures, capital commitments, divestitures or other dispositions;
•loss of relationships with significant suppliers or customers;
•changes in operating performance and stock market valuations of companies in our industry, including our competitors;
•difficulties in integrating any new acquisitions we may make;
•loss of services from members of management or employees or difficulty in recruiting additional employees;
•worsening of economic conditions in the United States or Canada and reduction in demand for our products;
•price and volume fluctuations in the overall stock market, including as a result of general economic trends;
•the existence of the share repurchase program and any repurchases made or not made under such program, or the modification, suspension or termination of the program;
•lawsuits threatened or filed against us, or events that negatively impact our reputation; and
•developments in new legislation and pending lawsuits or regulatory actions, including interim or final rulings by judicial or regulatory bodies.
In addition, extreme price and volume fluctuations in the stock markets have affected and continue to affect the stock prices of many companies. Often, their stock prices have fluctuated in ways unrelated or disproportionate to their operating performance. In the past, stockholders have filed securities class action litigation against companies following periods of market volatility. Such securities litigation, if instituted against us, could subject us to substantial costs, divert resources and the attention of management from our business and seriously harm our business.
We currently do not intend to pay dividends on our common stock, our indebtedness could limit our ability to pay dividends on our common stock and we cannot guarantee that our share repurchase program will be fully consummated or that it will enhance long-term shareholder value.
We currently do not anticipate paying any cash dividends for the foreseeable future. In addition, the terms of our indebtedness limit our ability to pay dividends or make other distributions on or to repurchase or redeem, shares of our capital stock. Consequently, your only opportunity to achieve a return on your investment in our company may be if the market price of our common stock appreciates and you sell your shares at a profit. There is no guarantee that the price of our common stock will ever exceed the price that you pay.
In addition, we announced on November 9, 2023 the authorization of a share repurchase program of up to $50.0 million of the Company’s common stock. Under the program, Savers may purchase shares from time to time in compliance with applicable securities laws, that may include Securities Act Rule 10b-18. The program is currently set to expire on November 8, 2025. Although our Board of Directors has authorized the share repurchase program, we are not obligated to repurchase any specific dollar amount or to acquire any specific number of shares under the program. In addition, the share repurchase program may be suspended, modified, or terminated at any time without prior notice, which may result in a decrease in the price of our common stock. The amount, timing, and execution of our share repurchase program will be based upon a variety of factors, including the share price of our common stock, general market conditions, alternative uses for capital, our financial performance, and other considerations. Any repurchases will be funded by available cash and cash equivalents. Even if the share repurchase program is fully implemented, it may not enhance long-term stockholder value, and the program could affect the price of our common stock, increase volatility, further limit our “public float” and diminish our cash reserves.
Future issuances or sales of our common stock could cause our stock price to decline, result in significant dilution to our stockholders or dilute the voting power of our common stock.
Future issuances of our common stock could result in dilution to existing holders of our common stock. Such issuances, or the perception that such issuances may occur, could depress the market price of our common stock. We may issue additional equity securities from time to time, including equity securities that could have rights senior to those of our common stock. As a result, holders of shares of common stock bear the risk that future issuances of equity securities may reduce the value of their shares and dilute their ownership interests. Also, to the extent outstanding stock-based awards are issued or become vested, there will be further dilution to the holders of our common stock.
In addition, the Ares Funds, a term we use to describe certain funds, investment vehicles or accounts managed or advised by the Private Equity Group of Ares Management Corporation (who own a majority of our common stock), have demand and “piggy-back” registration rights with respect to our common stock, which give them the right to require us to file registration statements for public resale of their common stock or to include
such shares in registration statements that we may file for us or other stockholders. If the Ares Funds or other stockholders, including employees, who have or obtain equity, sell or indicate an intention to sell, substantial amounts of our common stock in the public market, the trading price of our common stock could decline.
Risks Relating to Our Organizational Structure
Our reliance on dividends, distributions and other payments from our subsidiaries to meet our obligations.
We are a holding company that does not conduct any business operations of our own. As a result, we are dependent upon cash distributions and other transfers from our subsidiaries to meet our obligations. Each of our subsidiaries is a distinct legal entity, and under certain circumstances legal and contractual restrictions may limit our ability to obtain cash from them. The deterioration of the earnings from, or other available assets of, our subsidiaries for any reason could impair their ability to make distributions to us.
The Ares Funds continue to control our Company, including having the right to designate nominees for election to our board of directors, and may have interests that conflict with our interests and those of other stockholders.
The Ares Funds beneficially owned 83.9% of our common stock as of December 30, 2023. Pursuant to the Stockholders Agreement between the Ares Funds and the Company, dated as of July 3, 2023 (the “Stockholders Agreement”), for so long as the Ares Funds hold 5% or more of our outstanding common stock, they have the right to designate a certain number of individuals to be included in the slate of nominees for election to our board of directors and to designate a member of each committee of the board of directors. Further, for so long as the Ares Funds own 40% or more of our outstanding common stock, the Ares Funds can designate at least a majority of our board of directors. Additionally, because our board of directors is divided into three staggered classes, the Ares Funds may be able to influence or control our affairs and policies for a period of time after such rights expire, while their nominees finish their terms as members of our board.
In addition, the Stockholders Agreement provides that, for so long as the Ares Funds own at least 30% of the outstanding shares of our common stock, certain significant corporate actions will require the prior written consent of the Ares Funds, subject to certain exceptions. These actions include, subject to certain exceptions:
•merging or consolidating with or into any other entity, or transferring all or substantially all of our assets, taken as a whole, to another entity, or undertaking any transaction that would constitute a “Change of Control” as defined in our debt agreements;
•acquiring or disposing of assets, in a single transaction or a series of related transactions, or entering into joint ventures, in each case with a value in excess of $50.0 million;
•incurring indebtedness in a single transaction or a series of related transactions in an aggregate principal amount in excess of $100.0 million;
•issuing our or our subsidiaries’ equity other than pursuant to an equity compensation plan approved by our stockholders or a majority of the directors designated by the Ares Funds;
•appointing and removing our chief executive officer;
•entering into any transactions, agreements, arrangements or payments with any other person who owns greater than or equal to 10% of our common stock then outstanding that are material or involve aggregate payments or receipts in excess of $500,000;
•amending, modifying or waiving any provision of our organizational documents in a manner that adversely affects the Ares Funds;
•commencing any liquidation, dissolution or voluntary bankruptcy, administration, recapitalization or reorganization;
•increasing or decreasing the size of our board of directors; and
•entering into of any agreement to do any of the foregoing.
The interests of the Ares Funds could conflict with or differ from our interests or the interests of our other stockholders. For example, the concentration of ownership held by the Ares Funds could delay, defer or prevent a change in control of our company or impede a merger, takeover or other business combination which may
otherwise be favorable for us. Additionally, the Ares Funds are in the business of making investments in companies and may, from time to time, acquire and hold interests in or provide advice to businesses that compete directly or indirectly with us, or are suppliers or customers of ours. Any such investment may increase the potential for the conflicts of interest discussed in this risk factor.
For so long as the Ares Funds continue to own 40% or more of our common stock, the Ares Funds will have the power to elect a majority of our directors and will have effective control over the outcome of votes on all matters requiring approval by our board of directors or our stockholders regardless of whether other stockholders believe such matter is in our best interests.Even if such amount is less than 40%, the Ares Funds will continue to be able to substantially influence or effectively control our ability to enter into corporate transactions.
Our status as a “Controlled Company” within the meaning of the NYSE rules exempts us from certain corporate governance requirements.
As a result of the Ares Funds’ control of a majority of the voting power of our outstanding voting stock, we are a controlled company within the meaning of the NYSE corporate governance standards. Under the NYSE rules, a controlled company may elect not to comply with certain corporate governance requirements, including the requirements that:
•a majority of the board of directors consist of independent directors;
•the nominating, corporate governance and sustainability committee be composed entirely of independent directors with a written charter addressing the committee’s purpose and responsibilities; and
•the compensation committee be composed entirely of independent directors with a written charter addressing the committee’s purpose and responsibilities.
We intend to utilize these exemptions as long as we remain a controlled company. As a result, we will not have a majority of independent directors; our nominating, corporate governance and sustainability committee and compensation committee will not consist entirely of independent directors or be required to ratify other independence obligations. Accordingly, you may not have the same protections afforded to stockholders of companies that are subject to all of the corporate governance requirements of the NYSE.
Certain provisions in our certificate of incorporation and our bylaws may delay or prevent a change of control.
Our certificate of incorporation and bylaws contain provisions that could depress the trading price of our common stock by acting to discourage, delay or prevent a change of control of our company or changes in our management that our stockholders may deem advantageous. In particular, our certificate of incorporation and bylaws:
•establish a classified board of directors so that not all members are elected at one time;
•permit our board of directors to establish the number of directors and fill any vacancies (including vacancies resulting from an expansion in the size of our board of directors), except in the case of the vacancy of an Ares Funds-designated director (in which case the Ares Funds will be able to fill the vacancy);
•establish limitations on the removal of directors;
•authorize the issuance of “blank check” preferred stock that our board of directors could use to implement a stockholder rights plan;
•provide that our board of directors is expressly authorized to make, alter or repeal our bylaws;
•restrict the forum for certain litigation against us to Delaware;
•provide that stockholders may not act by written consent following the time when the Ares Funds cease to beneficially own at least a majority of the shares of our outstanding common stock, which time we refer to as the Trigger Date, which would require stockholder action to be taken at an annual or special meeting of our stockholders;
•prohibit stockholders from calling special meetings following the Trigger Date, which would delay the ability of our stockholders to force consideration of a proposal or to take action, including with respect to the removal of directors; and
•establish advance notice requirements for nominations for election to our board of directors or for proposing matters that can be acted upon by stockholders at annual stockholder meetings, which may discourage or deter a potential acquirer from conducting a solicitation of proxies to elect the acquirer’s own slate of directors or otherwise attempting to obtain control of us.
Section 203 of the Delaware General Corporation Law, or the DGCL, prohibits a publicly held Delaware corporation from engaging in a business combination with an interested stockholder, generally a person, individually or together with any other interested stockholder, who owns or within the last three years has owned 15% of our voting stock, unless the business combination is approved in a prescribed manner. We have elected to opt out of Section 203 of the DGCL. While our certificate of incorporation contains a provision that is of similar effect, it exempts from its scope the Ares Funds, any of their affiliates and certain of their respective direct or indirect transferees.
Any provision of our certificate of incorporation, our bylaws or Delaware law that has the effect of delaying or deterring a change in control could limit the opportunity for our stockholders to receive a premium for their shares of common stock and could also affect the price that some investors are willing to pay for our common stock. The impact of these provisions may be intensified by other obligations, such as those found in our Stockholders Agreement, as discussed elsewhere in these risk factors.
Our certificate of incorporation provides that the Court of Chancery of the State of Delaware will be the exclusive forum for certain litigation that may be initiated by our stockholders, which could limit stockholders’ ability to obtain a favorable judicial forum for disputes with us or our directors, officers or employees.
Our certificate of incorporation provides that the Court of Chancery of the State of Delaware is the exclusive forum for the following types of actions or proceedings under Delaware statutory or common law:
•any derivative action or proceeding brought on our behalf;
•any action asserting a breach of fiduciary duty;
•any action asserting a claim against us arising under the DGCL, our certificate of incorporation or our bylaws; and
•any action asserting a claim against us that is governed by the internal-affairs doctrine.
This provision would not apply to suits brought to enforce a duty or liability created by the Exchange Act or any other claim for which the U.S. federal courts have exclusive jurisdiction. Any person or entity purchasing or otherwise acquiring any interest in shares of our capital stock will be deemed to have notice of, and consented to, the exclusive-forum provisions in our certificate of incorporation.
The exclusive-forum provisions also provides that, unless we consent in writing to the selection of an alternative forum, the federal district courts of the United States will be the exclusive forum for any complaint asserting a cause of action arising under the Securities Act. However, this provision is subject to final adjudication regarding its enforceability, the outcome of which is substantially uncertainty. For example, the Court of Chancery of the State of Delaware has determined that a provision stating that federal district courts are the exclusive forum for resolving any complaint asserting a cause of action arising under the Securities Act is not enforceable. This decision may be reviewed and ultimately overturned by the Delaware Supreme Court. If a court were to find any of the exclusive-forum provisions in our certificate of incorporation to be inapplicable or unenforceable in an action, we may incur additional costs associated with resolving the dispute in other jurisdictions, which could seriously harm our business.
These exclusive-forum provisions may limit a stockholder’s ability to bring a claim in a judicial forum that it finds favorable for disputes with us or our directors, officers or employees, which may discourage lawsuits against us and our directors, officers and employees, although our stockholders will not be deemed to have waived our compliance with federal securities laws and the rules and regulations thereunder.
Our certificate of incorporation contains a provision renouncing our interest and expectancy in certain corporate opportunities.
Under our certificate of incorporation, neither the Ares Funds nor any of their affiliates or their respective portfolio companies or affiliated funds, nor any of their respective officers, directors, employees, agents, stockholders, members or partners will have any duty to refrain from engaging, directly or indirectly, in the same business activities, similar business activities, or lines of business in which we operate. In addition, our
certificate of incorporation provides that, to the fullest extent permitted by law, no officer or director of ours who is also an officer, director, employee, agent, stockholder, member, partner or affiliate of the Ares Funds or their affiliates will be liable to us or our stockholders for breach of any fiduciary duty by reason of the fact that any such individual directs, or communicates information regarding, a corporate opportunity to the Ares Funds or their affiliates, instead of to us. For example, a director of our company who also serves as an officer, director, employee, agent, stockholder, member, partner or affiliate of the Ares Funds or their affiliates, or any of their respective portfolio companies or affiliated or managed funds, investment vehicles or accounts, may pursue the acquisition of a business that our company would also have been interested in purchasing. These potential conflicts of interest could have a material adverse effect on our business, financial condition, results of operations or prospects if attractive corporate opportunities are allocated by an Ares Fund to itself or to the Ares Funds’ affiliates or their respective portfolio companies or affiliated or managed funds, investment vehicles or accounts instead of to us.
General Risks
We depend on our executive officers and other key technical, operational and sales employees, and the loss of one or more of these employees or an inability to attract and retain other highly skilled employees could harm our business.
Our success depends largely upon the continued services of our executive officers and other key technical, operational and sales employees. From time to time, there may be changes in our executive management team resulting from the hiring or departure of executives, which could disrupt our business. Our employment agreements with our executive officers or other key personnel do not require them to continue to work for us for any specified period and, therefore, they could terminate their employment with us at any time. The loss of one or more of our executive officers, especially our Chief Executive Officer, or other executive officers or key technical, operational and sales employees could harm our business.
Volatility or lack of appreciation in the stock price of our common stock may also affect our ability to attract and retain our executive officers and key technical, operational and sales employees. Many of our senior personnel and other key technical, operational and sales employees have become, or will soon become, vested in a substantial amount of stock or stock options. Employees may be more likely to leave us if the shares they own or the shares underlying their vested options have significantly appreciated in value relative to the original purchase price of the shares or the exercise price of the options, or conversely, if the exercise price of the options that they hold are significantly above the market price of our common stock. If we do not maintain and continue to develop our corporate culture as we grow and evolve, it could harm our ability to foster the innovation, craftsmanship, teamwork, curiosity and diversity that we believe we need to support our continued growth.
Our management team has limited experience managing a public company.
Most members of our management team have limited experience managing a publicly-traded company, interacting with public company investors, securities analysts and investors and complying with the increasingly complex laws pertaining to public companies. These new obligations and constituents require significant attention from our senior management and could divert their attention away from the day-to-day management of our business, which could harm our business, results of operations and financial condition.
The requirements of being a public company may strain our resources, divert management’s attention and affect our ability to attract and retain executive management and qualified board members.
As a public company, we are subject to the reporting requirements of the Exchange Act, the listing standards of the NYSE and other applicable securities rules and regulations. We expect that the requirements of these rules and regulations will continue to increase our legal, accounting and financial compliance costs, make some activities more difficult, time-consuming and costly and place significant strain on our personnel, systems and resources. As a result of the complexity involved in complying with the rules and regulations applicable to public companies, our management’s attention may be diverted from other business concerns, which could harm our business, results of operations and financial condition. Although we have already hired additional employees to assist us in complying with these requirements, we will need to hire more employees in the future or engage outside consultants, which will increase our operating expenses.
In addition, changing laws, regulations and standards relating to corporate governance and public disclosure are creating uncertainty for public companies, increasing legal and financial compliance costs and making some activities more time-consuming. These laws, regulations and standards are subject to varying
interpretations, in many cases due to their lack of specificity, and, as a result, their application in practice may evolve over time as new guidance is provided by regulatory and governing bodies, which could result in continuing uncertainty regarding compliance matters and higher costs necessitated by ongoing revisions to disclosure and governance practices. For example, in March 2022, the SEC issued a proposed rule requiring public companies to disclose information regarding their climate-related risks in their annual filings and registration statements. On July 26, 2023, the SEC also adopted final rules requiring public companies to disclose material cybersecurity incidents on Form 8-K and to annually disclose their cybersecurity risk management, strategy, and governance. We intend to invest substantial resources to comply with evolving laws, regulations and standards, and this investment may result in increased general and administrative expenses and a diversion of management’s time and attention from business operations to compliance activities. If our efforts to comply with new laws, regulations and standards differ from the activities intended by regulatory or governing bodies due to ambiguities related to their application and practice, regulatory authorities may initiate legal proceedings against us and our business may be harmed.
New rules and regulations may make it more expensive for us to obtain director and officer liability insurance, and we may be required to accept reduced coverage or incur substantially higher costs to obtain coverage. These factors could also make it more difficult for us to attract and retain qualified members of our board of directors, particularly to serve on our audit committee and compensation committee, and qualified executive officers.
As a result of disclosure of information in filings required of a public company, our business and financial condition are more visible, which may result in an increased risk of threatened or actual litigation, including by competitors and other third parties. If such claims are successful, our business, results of operations and financial condition could be harmed, and even if the claims do not result in litigation or are resolved in our favor, these claims, and the time and resources necessary to resolve them, could divert the resources of our management and harm our business, results of operations and financial condition.
Item 1B. Unresolved Staff Comments
None.
Item 1C. Cybersecurity Risk Management, Strategy and Governance
Risk Management Strategy
Savers is committed to maintaining a cybersecurity risk management strategy that encompasses assessments, monitoring, and proactive measures to safeguard our assets and operations. Our approach involves a combination of internal and external risk assessments, monitoring, vulnerability scanning and remediation, external penetration testing and disaster recovery planning.
On an annual basis, we conduct internal and external risk assessments to identify, evaluate, and prioritize potential risks to our business operations, data, and information systems. These assessments utilize industry-standard methodologies and frameworks to evaluate emerging threats and vulnerabilities. Specifically, we align our efforts with the National Institute of Standards and Technology framework, the Center for Internet Security (CIS) Controls 8.0 version and the Payment Card Industry Data Security Standard (PCI DSS) framework. Identified risks are categorized and assessed for potential impact, allowing us to implement targeted mitigation strategies.
Continuous monitoring is a fundamental component of our risk management strategy. We employ appropriate technologies and tools to monitor our network, systems, and applications. This proactive approach supports our efforts to detect and respond to anomalies, potential threats, and emerging vulnerabilities. Our dedicated cybersecurity team conducts regular reviews of security logs and alerts, facilitating a swift and effective response to any deviations from established security baselines. We have also implemented a comprehensive third-party risk management program that includes a review of the third-party’s SOC I and II reports and their Service Level Agreements to ensure their security practices align with our standards.
We employ regular vulnerability scanning processes to identify weaknesses and potential points of exploitation within our infrastructure. Following the identification of vulnerabilities, a systematic remediation process is initiated. Our activities to mitigate vulnerabilities on an ongoing basis include the application of patches and updates, and the implementation of compensating controls to address and mitigate the identified vulnerabilities. Our goal is to maintain a proactive stance in eliminating potential entry points for cyber threats.
As part of our commitment to maintaining a robust security posture, we engage in annual external penetration testing conducted by reputable third-party security firms. These tests simulate real-world cyber-attacks to evaluate the effectiveness of our defenses and identify areas for improvement. The insights gained from penetration testing inform our ongoing security enhancements, aiding the resiliency of our systems against evolving cyber threats.
We also have deployed a Disaster Recovery as a Service solution (DRaaS) that will enhance our ability to recover and restore data in the event of a cybersecurity incident or other event, such as a natural disaster. Our systems and data are categorized into tiers, with our most critical systems covered by appropriate backup approaches and rapid recovery tools/processes matched with their criticality.
Cybersecurity Risks
In 2020, we suffered a ransomware incident associated with a well-known threat actor. While personnel time and attendance data was encrypted and unrecoverable, no evidence of unauthorized access of personal or business-related information was found, and our IT Security team immediately blocked the point of entry. Post-incident, Savers undertook a comprehensive review, identifying areas of vulnerability. Controls were systematically implemented, including appropriate backup approaches and regular testing of their effectiveness, proactive security monitoring tools and processes, and the expansion of our cybersecurity team and activities. Our continued ransomware mitigation strategies focus on resiliency, rapid recovery, and automated isolation of potentially affected assets.
Other than the 2020 incident discussed above, we have no reason to believe any risks from cybersecurity threats, including as a result of any previous cybersecurity incidents, have materially affected or are reasonably likely to materially affect us, including our business strategy, results of operations or financial condition. For additional information, see “Risks Relating to Information Technology, Intellectual Property, Data Security and Privacy,” in Item 1A, “Risk Factors” in this Annual Report.
Governance
Our Board, directly and through the Audit Committee, provides oversight of our operational risk management process and compliance with legal and regulatory requirements. As one of its responsibilities, the Audit Committee has the responsibility to review and discuss with management and the internal audit group all major financial risk exposures and management’s risk assessment and risk management policies. Further, the Audit Committee has specific oversight of risks related to data privacy and information security, including compliance with applicable laws and management’s response to material cybersecurity and privacy incidents or breaches. As part of its responsibilities, the Audit Committee periodically reviews with management the Company’s capabilities, policies, controls, methods and procedures related to (i) identifying, assessing and mitigating information and cybersecurity risks, (ii) disaster recovery and business continuity and (iii) compliance with data privacy and information security laws.
Regularly scheduled Audit Committee meetings include an information technology and cybersecurity update as a standing agenda item. These updates are typically given by our Chief Information Officer (CIO) and can include additional team members from our information technology and security team. In addition, the Audit Committee also receives periodic updates from our Enterprise Risk Committee, a management committee which provides oversight to the anticipation, identification, prioritization, and management of the Company’s material risks. The Audit Committee regularly reports to the Board on its oversight of these topics. In addition, both the Audit Committee and the Board receive special presentations about risk areas as needed.
The Company also maintains a Crisis Response Plan, which may be activated in the event of certain cybersecurity incidents. Our Crisis Response Plan includes specific procedures and considerations for cybersecurity and ransomware incidents, including involvement of our executive team and outside advisors and required reporting to the Audit Committee and Board. Typically, our Chief Compliance Officer (CCO) would lead management of a crisis incident.
Our CIO has primary responsibility for assessing and managing cybersecurity risks. The CIO reports directly to the CEO and is a member of the Enterprise Risk Committee. Our current CIO is an experienced senior technology executive with over 30 years of IT experience, including several CIO roles in leading retail and direct marketing organizations. Our CCO, who is also our General Counsel, is responsible for maintaining our Crisis Response Plan. The CCO reports directly to the CEO, is a member of the Enterprise Risk Committee and also oversees the Company’s risk department. Our CCO has navigated the Company through multiple complex situations and also led the Company’s response in its 2020 ransomware attack discussed above.
Item 2. Properties
All of our stores are occupied under operating leases. As of December 30, 2023, our total consolidated selling square feet was 6.7 million. As of December 30, 2023, we operated 326 retail stores in the United States, Canada and Australia. For more information regarding our leases, see Note 2, Summary of Significant Accounting Policies and Note 9, Leases, of the Notes to Consolidated Financial Statements included in “Part II, Item 8. Financial Statements and Supplementary Data.”
As of December 30, 2023, we had 155 U.S. retail stores located in 29 states, as set forth below:
| | | | | | | | | | | | | | | | | |
| Alaska | 4 | Maryland | 12 | Oregon | 1 |
| Arkansas | 1 | Minnesota | 10 | Pennsylvania | 3 |
| Arizona | 8 | Missouri | 4 | Rhode Island | 4 |
| California | 15 | North Dakota | 1 | South Dakota | 1 |
| Connecticut | 4 | New Hampshire | 4 | Texas | 3 |
| Hawaii | 2 | New Jersey | 3 | Utah | 8 |
| Idaho | 2 | New Mexico | 4 | Virginia | 5 |
| Illinois | 8 | Nevada | 6 | Washington | 14 |
| Kansas | 3 | New York | 7 | Wisconsin | 1 |
| Massachusetts | 14 | Ohio | 3 | | |
As of December 30, 2023, we operated 159 Canada retail stores located in 10 provinces, as set forth below:
| | | | | |
| Alberta | 20 |
| British Columbia | 23 |
| Manitoba | 6 |
| New Brunswick | 3 |
| Newfoundland | 1 |
| Nova Scotia | 7 |
| Ontario | 74 |
| Prince Edward Island | 1 |
| Quebec | 19 |
| Saskatchewan | 5 |
As of December 30, 2023, we operated 12 retail stores in Australia, with 9 located in Victoria and 3 located in South Australia.
The following table presents certain information about the properties we lease, other than our stores, as of December 30, 2023:
| | | | | | | | | | | | | | | | | | | | | | | | | | | | | | | | |
| Location | | Type of Facility | | Square
Feet | | Lease
Expiration | | Renewal
Options | | | | | | |
| Bellevue, WA | | Corporate Office | | 14,031 | | September 2028 | | One 5-Year Option | | | | | | |
| Meridian, ID | | Corporate Office | | 12,312 | | November 2025 | | One 5-Year Option | | | | | | |
| Fife, WA | | Distribution Center | | 93,146 | | April 2032 | | — | | | | | | |
| Mississauga, ON | | Distribution Center | | 21,549 | | May 2033 | | One 5-Year Option | | | | | | |
| Toronto, ON | | Distribution Center | | 94,914 | | March 2030 | | Two 5-Year Options | | | | | | |
| Edmonton, AB | | Centralized Processing Center | | 46,348 | | May 2036 | | Two 5-Year Options | | | | | | |
| Vancouver, BC | | Centralized Processing Center | | 57,843 | | July 2036 | | Two 5-Year Options | | | | | | |
| Hyattsville, MD | | Centralized Processing Center | | 56,244 | | October 2031 | | One 5-Year Option | | | | | | |
| Huntington Beach, CA | | Centralized Processing Center | | 50,897 | | November 2032 | | One 5-Year Option | | | | | | |
| Calgary, AB | | Centralized Processing Center | | 48,082 | | October 2038 | | Two 5-Year Options | | | | | | |
| Brooklyn Park, MN | | Centralized Processing Center | | 52,685 | | May 2033 | | Two 5-Year Options | | | | | | |
Item 3. Legal Proceedings
For information regarding our legal proceedings, see Note 15. Commitments and Contingencies in the accompanying consolidated financial statements.
Item 4. Mine Safety Disclosures
Not applicable.
Part II
Item 5. Market for Registrant's Common Equity, Related Stockholder Matters and Issuer Purchases of Equity Securities
On June 29, 2023, our common stock began trading on the New York Stock Exchange under the ticker symbol “SVV.” Prior to that date, there was no public trading market for our common stock. On February 26, 2024, the last reported sale price of our common stock on the NYSE was $19.55 per share. The number of holders of record of common stock on February 26, 2024 was 6.
Dividend Policy
On November 22, 2021, we paid a dividend of $75.0 million to our equityholders using cash on hand. On December 16, 2022, we paid a dividend of $69.4 million to our equityholders using borrowings from our Revolving Credit Facility and cash on hand. We subsequently repaid all amounts borrowed in connection with this dividend. On February 6, 2023, we paid a dividend of $262.2 million to our equityholders using the proceeds from the offering of the Notes. Such dividends were paid to our equityholders as a means to provide our equityholders with a return on their investment. No executive officers or directors received dividend payments. Certain of our employees and directors who held equity interests who were not eligible to receive dividend payments received bonus payments in connection with the dividend payments in December 2022 and February 2023.
We do not anticipate paying any cash dividends for the foreseeable future. Instead, we anticipate that all of our cash for the foreseeable future will be used to repay debt, for working capital, to support our operations and to finance the growth and development of our business. We may also use cash on our balance sheet, cash generated from operations or proceeds from new borrowings, or any combination of these sources of liquidity and capital, to either pay for acquisitions or to conduct repurchases of our common stock under our share repurchase program, or both. Any future determination relating to dividend policy will be made at the discretion of our board of directors and will depend on a number of factors, including restrictions in our current and future debt instruments, our future earnings, capital requirements, financial condition, prospects, and applicable Delaware law, which provides that dividends are only payable out of surplus or current net profits.
Recent Sales of Unregistered Securities; Purchases of Equity Securities by the Issuer or Affiliated Purchaser
Our stock repurchase program was approved by our Board of Directors in November 2023. Under the stock repurchase program, we are authorized, at the discretion of management and our Board of Directors, to purchase up to $50.0 million of our common stock on the open market. The program is currently set to expire on November 8, 2025. During fiscal year 2023, we did not repurchase any shares of our common stock pursuant to this stock repurchase program. As of December 30, 2023, $50.0 million remained authorized for repurchase under the program.
Stock Performance Graph
The information contained in the following chart is not considered to be “soliciting material,” or “filed,” or incorporated by reference in any past or future filing by the Company under the Securities Act or Exchange Act unless and only to the extent that, the Company specifically incorporates it by reference.
The graph below compares the cumulative total return on our common stock (SVV) with the cumulative total return on the S&P 500 Index and the S&P 500 Retail Select Industry Index, assuming an initial investment of $100 at the market close on June 29, 2023, the date our stock commenced trading on the New York Stock Exchange. Data for the S&P 500 Index and the S&P 500 Retail Select Industry Index assume reinvestment of dividends. The comparisons in the following graph are required by the SEC and are not intended to be a forecast or to be indicative of future common stock performance.
| | | | | | | | | | | | | | | | | |
| June 29, 2023 | | September 29, 2023 | | December 29, 2023 |
| Savers Value Village, Inc. | $ | 100.00 | | | $ | 81.49 | | | $ | 75.86 | |
| S&P 500 Index | $ | 100.00 | | | $ | 97.92 | | | $ | 109.36 | |
| S&P 500 Retail Select Industry Index | $ | 100.00 | | | $ | 96.21 | | | $ | 115.03 | |
Item 6. [ Reserved ]
Item 7. Management's Discussion and Analysis of Financial Condition and Results of Operations
You should read the following discussion and analysis of the financial condition and results of operations of Savers Value Village, Inc. in conjunction with our audited consolidated financial statements and related notes and other financial information included in this Annual Report. Unless the context otherwise requires, all references in this section to “Savers Value Village”, ”the Company”, “we”, “us” or “our” refer to the business of Savers Value Village, Inc. and its predecessor entities.
This discussion contains forward-looking statements that involve risks and uncertainties about our business and operations and reflect our plans, estimates and beliefs. Our actual results and the timing of selected events may differ materially from those anticipated in these forward-looking statements as a result of various factors, including those set forth under Part I, Item 1A “Risk Factors” or in other parts of this Annual Report.
Overview
We are the largest for-profit thrift operator in the United States and Canada and operate a total of 326 stores under the Savers®, Value Village®, Value Village Boutique™, Village des Valeurs™, Unique®, and 2nd Ave.® banners. We are committed to redefining secondhand shopping by providing one-of-a-kind, low-priced merchandise ranging from quality clothing to home goods in an exciting treasure-hunt shopping environment. We purchase secondhand textiles (e.g., clothing, bedding and bath items), shoes, accessories, housewares, books and other goods from our non-profit partners (“NPPs”) either directly from them or via on-site donations (“OSDs”) at Community Donation Centers (“CDCs”) at our stores as well as through GreenDrop’s mobile donation stations. We then process, select, price, merchandise and sell these items in our stores. Items that are not sold to our retail customers are marketed to wholesale customers, who reuse or repurpose the items they purchase from us. We believe our hyper-local and socially responsible procurement model, industry-leading and innovative operations, differentiated value proposition and deep relationships with our customers distinguish us from other secondhand and value-based retailers. Our business model is rooted in ESG principles, with a mission to positively impact our stakeholders: thrifters, NPPs and their donors, our team members and our stockholders. As a leader and pioneer of the for-profit thrift category, we seek to positively impact the environment by reducing waste and extending the life of reusable goods. The vast majority of the clothing and textiles we source are sold to our retail or wholesale customers.
We offer a dynamic, ever-changing selection of items, with an average unit retail (“AUR”) price of approximately $5. Our most engaged customers are members of our Super Savers Club® loyalty program. As of December 30, 2023, we had 5.3 million total active members enrolled in our U.S. and Canadian loyalty programs who have made a purchase within the last 12 months, compared to 4.8 million total active members as of December 31, 2022. Active members drove 70.3% of point-of-sale transaction value during both fiscal year 2023 and fiscal year 2022. Beginning in the third quarter of fiscal year 2023, the Company updated its active loyalty member statistics for both the current year and prior year to include active members in all stores.
We have innovated and invested in the development of significant operational expertise in order to integrate the three highly-complex parts of thrift operations—supply and processing, retail and sales to wholesale markets. Our business model enables us to provide value to our NPPs and our customers, while driving attractive profitability and cash flow.
While purchases made by our customers in our stores do not directly benefit any NPP, we pay our NPPs a contracted rate for all donations. Our subsidiaries are registered professional fundraisers where required.
We source our merchandise locally by purchasing secondhand items donated to our NPPs primarily through three distinct and strategic procurement models:
•delivered supply: items donated to and collected by our NPPs through a variety of methods, such as neighborhood collections and donation drives;
•OSDs: donations of items by individuals to our NPPs made at CDCs located at our stores; and
•GreenDrop locations: mobile donation stations placed in convenient, attractive and high-traffic locations that offer a fast and friendly experience to donors in the communities surrounding our stores.
We purchase merchandise from our NPPs which provides them with revenue to support their community-focused missions. From 2019 to 2023, over 90% of our supply was locally sourced, delivering a broad and diverse selection to our customers and fostering a sense of community. Our stores deliver a broad selection for our customers and at the same time reduce transportation costs and emissions typically associated with the production and distribution of new merchandise.
Our continued investment in our stores has both elevated and modernized the thrift shopping experience, transforming our stores into a thrift destination for all generations with increasing traffic from younger generations. To maximize traffic, we leverage data to drive our merchandising decisions. For each store, we closely track what is being sold to inform how we optimize our merchandising mix, including by leveraging data analytics. We have also implemented self-checkout kiosks in all of our stores to significantly enhance store efficiency and shorten lines, thereby further improving the shopping experience.
We display approximately 50% of all textile items we receive on our retail sales floors, approximately 50% of which are sold to thrifters. In support of our efforts to extend the life of reusable goods and recover a portion of the cost of acquiring our supply of secondhand items, we sell the majority of textiles, shoes and books unsold at retail to our wholesale customers (predominantly comprised of textile graders and small business owners) who supply local communities across the globe with gently used, affordable items like clothing, housewares, toys and shoes. Textiles not suitable for reuse as secondhand clothing can be repurposed into other textile items (e.g., wiping rags) and post-consumer fibers (e.g., insulation, carpet padding), further reducing waste.
Key Events and Recent Developments
Notes offering
On February 6, 2023, certain of our wholly-owned subsidiaries completed the issuance of $550.0 million aggregate principal amount of 9.75% Senior Secured Notes due 2028 (the “Notes”). The Notes mature on April 26, 2028, and bear interest at a fixed rate of 9.75% per year, payable semi-annually on each February 15 and August 15, commencing on August 15, 2023 through maturity. The Notes are fully and unconditionally guaranteed, jointly and severally, on a senior secured basis by S-Evergreen Holding Corp. and each of its existing and future direct and indirect wholly-owned U.S. and Canadian subsidiaries (other than the issuers of the Notes).
In connection with the Notes Offering, we repaid $233.4 million of outstanding borrowings under our Term Loan Facility and paid a $262.2 million dividend to our equityholders. We also paid a $23.6 million special one-time bonus to certain of our employees and directors participating in our management equity incentive plan, who were unable to participate in the dividend. As of December 30, 2023, $495.0 million aggregate principal amount of Notes remain outstanding.
Reverse stock split
On May 26, 2023, in anticipation of the IPO, we effectuated a reverse stock split of our then-outstanding common stock, in which each share of pre-split common stock became 0.713506461319705 of a share of post-reverse split common stock (the “Reverse Stock Split”) and corresponding adjustments were made to our outstanding equity awards. All references to units, per unit, shares and per share amounts for all periods presented have been retrospectively restated to give effect to the Reverse Stock Split.
Authorized shares
In connection with the Company’s IPO, the Company filed an amended and restated certificate of incorporation (the “A&R Charter”) on June 29, 2023. The Company also amended and restated its bylaws, effective as of June 28, 2023. The A&R Charter authorized 800.0 million shares of common stock, par value $0.000001 per share, and 100.0 million shares of preferred stock, par value $0.000001 per share.
Initial public offering
On July 3, 2023, we completed our IPO for the sale of 18.8 million shares of our common stock, $0.000001 par value per share, at a public offering price of $18.00 per share. We received net proceeds of $295.0 million after deducting discounts and commissions of $22.8 million and offering expenses of $19.7 million. We used the net proceeds from our IPO, together with cash on our balance sheet, to redeem $55.0 million aggregate principal amount of the Notes, repay $252.4 million aggregate principal amount of outstanding borrowings under the Term Loan Facility, pay accrued interest on these borrowings and pay a premium on the partial redemption of our Notes.
Stock-based compensation
Upon completion of our IPO on July 3, 2023, we commenced recognition of stock-based compensation for our performance-based options as the underlying performance-based condition was satisfied. During fiscal
year 2023, we recognized $28.0 million of expense related to performance-based options that vested upon completion of our IPO and $38.8 million of expense related to amortization of the remaining outstanding performance-based options that are recognized on a graded vesting basis over their expected vesting period.
On June 29, 2023, in connection with the IPO, we granted 0.6 million restricted stock units to certain directors and employees, including some of our named executive officers (excluding our CEO). During fiscal year 2023, we recognized $2.3 million of expense related to the amortization of these restricted stock units which vest in equal installments over a one-year or three-year period from the date of grant.
Emerging growth company status
Upon completion of our IPO on July 3, 2023, we ceased to be an emerging growth company (“EGC”) under the Jumpstart Our Business Startups (“JOBS”) Act. The previous EGC status allowed us to take advantage of certain exemptions from various reporting requirements that are applicable to other public companies that are not emerging growth companies including, but not limited to, not being required to comply with the auditor attestation requirements of Section 404 of the Sarbanes-Oxley Act of 2002 and compliance exemptions from new or revised financial accounting standards until those standards would otherwise apply to private companies.
In anticipation of losing EGC status, we have prepared for the auditor attestation requirements pursuant to Section 404 of the Sarbanes-Oxley Act and are currently in compliance with new or revised standards required for non-emerging growth companies. Accordingly, the loss of EGC status will not have a significant impact on the Company.
Share repurchase authorization
We announced on November 9, 2023 the authorization of a share repurchase program of up to $50.0 million of our common stock. Under the program, we may purchase shares from time to time in compliance with applicable securities laws, that may include Securities Act Rule 10b-18. The program is currently set to expire on November 8, 2025. The timing and amount of any shares purchased will be based upon a variety of factors, including the share price of the common stock, general market conditions, alternative uses for capital, our financial performance, and other considerations. The share repurchase program does not obligate us to purchase any minimum number of shares, and the program may be suspended, modified, or discontinued at any time without prior notice. Any repurchases will be funded by available cash and cash equivalents. As of December 30, 2023, no shares have been repurchased under this program.
Term Loan Repricing
On January 30, 2024, we entered into an amendment (the “Third Amendment”) to the Senior Secured Credit Facilities. Among other things, the Third Amendment (i) removes the SOFR adjustment margin, (ii) reduces the margin on existing borrowings under the Term Loan Facility from a range of 4.25% to 5.50% to a range of 2.75% to 4.00%, (iii) revises the leverage-based pricing grid applicable to borrowings under the Term Loan Facility such that, among other things, a lower leverage ratio than was previously required is needed to obtain a 0.25% reduction in margin, (iv) provides for a 0.25% reduction of the margin applicable to term loan borrowings if we achieve certain public corporate family ratings and (v) increases the limit on the customary incremental uncommitted revolving credit facility that does not require consent of the required lenders to the greater of (a) $102.0 million and (b) 50% of EBITDA for the prior four quarters.
Changes in the Board of Directors
On February 23, 2024, Scott Graves, a member of the Board of Directors (the “Board”) of the Company, resigned from the Board and the Compensation Committee of the Board (the “Compensation Committee”), effective immediately. Mr. Graves’ departure is not due to any disagreement with the Company or the Board on any matter relating to the operations, policies or practices of the Company.
On February 26, 2024, upon the recommendation of the Nominating, Governance and Sustainability Committee of the Board (the “NGS Committee”), the Board appointed Mr. Jordan Smith to fill the Board vacancy created by Mr. Graves’ resignation. In addition, upon the recommendation of the NGS Committee, the Board appointed Mr. Aaron Rosen, a member of the Board, as chairperson of the Board and as chairperson of the Compensation Committee. On the same date, Mr. Rosen resigned from the Audit Committee and the NGS Committee.
Partial Redemption of Senior Secured Notes
On March 4, 2024, we redeemed $49.5 million aggregate principal amount of the Notes and paid accrued interest and a premium on the partial redemption. Subsequent to the partial redemption, the Company had total borrowings of $767.3 million outstanding.
Key Performance Indicators
We use the key business metrics below to evaluate the performance of our business, identify trends, formulate financial projections and make strategic decisions. We believe that these metrics provide useful information to investors and others in understanding and evaluating our results of operations in the same manner as our management team.
The following table summarizes our key performance indicators for the periods indicated:
| | | | | | | | | | | | | | | | | |
| Fiscal Year |
| 2023 | | 2022 | | 2021 |
Comparable Store Sales Growth (1) | | | | | |
| United States | 4.4 | % | | 4.5 | % | | 64.8 | % |
| Canada | 5.0 | % | | 25.3 | % | | 24.3 | % |
Total (3) | 4.7 | % | | 13.5 | % | | 44.5 | % |
Comparable Store Daily Sales Growth (2) | | | | | |
| United States | n/m | | 4.5 | % | | 24.9 | % |
| Canada | n/m | | 4.5 | % | | 19.0 | % |
Total (3) | n/m | | 3.3 | % | | 23.7 | % |
Number of Stores | | | | | |
| United States | 155 | | 150 | | 148 |
| Canada | 159 | | 152 | | 148 |
Total (3) | 326 | | 314 | | 306 |
Other Metrics | | | | | |
Pounds Processed (Ibs mm) | 984 | | 985 | | 860 |
Sales yield (4) | $ | 1.48 | | $ | 1.39 | | $ | 1.30 |
Cost of merchandise sold per pound processed | $ | 0.63 | | $ | 0.61 | | $ | 0.55 |
| | | | | |
____________
n/m – not meaningful
(1)Comparable store sales growth is the percentage change in comparable store sales over the comparable period in the prior fiscal year. We define comparable store sales to be sales by stores that have been in operation for all or a portion of two consecutive fiscal years, or, in other words, stores that are starting their third fiscal year of operation. We consider any store temporarily closed due to the COVID-19 pandemic to be open and comparable during the period for the purposes of calculating comparable store sales growth. Comparable store sales growth excludes stores acquired in the 2nd Ave. Acquisition because those stores were not yet fully integrated during the prior year comparative period. Comparable store sales growth is measured in local currency for Canada, while total comparable store sales growth is measured on a constant currency basis.
(2)Comparable store daily sales growth represents net sales by stores in the relevant geography that were or would have been open for the entirety of both periods if not for temporary closures due to the COVID-19 pandemic, divided by the aggregate number of days those stores were open. Comparable store daily sales growth is the percentage change in comparable store daily sales over the comparable period in the prior fiscal year. Comparable store daily sales growth excludes stores acquired in the 2nd Ave. Acquisition, because those stores were not yet fully integrated during the prior year comparative period. Comparable store daily sales growth is measured in local currency for Canada, while total comparable store daily sales growth is measured on a constant currency basis.
(3)Total comparable store sales growth, total comparable store daily sales growth and total number of stores include our Australia retail locations, in addition to the United States and Canada.
(4)We define sales yield as retail sales generated per pound processed on a currency neutral and comparable store basis.
Comparable store sales growth
Comparable store sales growth provides us with visibility into top-line performance on a like-for-like basis excluding new stores opened in the current or previous reporting period and excluding all closed stores as of the end of the current reporting period. We believe investors can use this metric to assess our ability to increase comparable store sales over time.
During fiscal year 2023, our comparable store sales growth was 4.7%, primarily reflecting growth in transaction volume.
During fiscal year 2022, our comparable store sales growth was 13.5%, compared to 44.5% for fiscal year 2021. The 13.5% increase in comparable store sales growth during fiscal year 2022 primarily reflects the impact of pandemic related store closures during fiscal year 2021 which we did not experience during fiscal year 2022. The 44.5% increase in comparable store sales growth during fiscal year 2021 primarily reflects a higher percentage of open store days during 2021 resulting from reduced pandemic related restrictions.
Comparable store daily sales growth
Comparable store daily sales growth is a metric designed to adjust for temporary store closures due to COVID-19. Since there were no store closures during fiscal years 2023 and 2022 due to COVID-19, we discontinued presenting comparable store daily sales growth beginning in fiscal year 2023 since it would produce the same result as comparable store sales growth. Our percentage of open store days was 90.2% in fiscal year 2021, compared to 77.3% in fiscal year 2020.
Number of stores
Our number of stores provides us visibility into our scale of operations and is viewed as a key driver of long-term growth. We believe investors can use this metric to assess our ability to open new stores in high-growth markets while reducing the number of stores in low-growth markets.
Our number of open stores increased to 326 stores as of December 30, 2023, from 314 stores as of December 31, 2022. The increase in stores resulted from the opening of five new stores in the United States and seven new stores in Canada.
Our number of open stores increased to 314 stores as of December 31, 2022 from 306 stores as of January 1, 2022. The increase in stores resulted from the opening of eight net new stores, consisting of two in the United States, four in Canada and two in Australia.
Pounds processed
We define pounds processed as the total number of pounds of goods processed during the period, excluding furniture and other large items. We process inventory by receiving goods directly from our NPPs or through OSDs and GreenDrop, sorting them, and placing them on the sales floor. From 2019 to 2023, we have found that items sourced through OSDs have a cost per pound that is on average less than one-third that of delivered supply from our NPPs. This metric is an indicator of the amount of secondhand goods processed during the period and is typically a key driver of top-line sales growth. We believe investors can use this metric to assist in their evaluation of our sales growth and sales yield.
During fiscal years 2023, 2022 and 2021 we processed 984 million, 985 million and 860 million pounds of supply, respectively, of which 73.6%, 72.6% and 72.0% was comprised of supply from OSDs and GreenDrop, respectively.
Sales yield
We define sales yield as retail sales generated per pound processed on a currency neutral and comparable store basis. We believe investors can use this metric as an indicator of the quality of goods we source, because when the quality is high, we are able to sell more items and/or sell items at higher prices from the volume we process than we would otherwise.
On a currency neutral and comparable store basis, our sales yield for fiscal year 2023 was $1.48, compared to $1.39 for fiscal year 2022. The 6.5% improvement in sales yield primarily reflects price inflation as we have strategically increased prices to compensate for higher processing costs, and an increase in supply quality, partially driven by an increase in OSD mix as a percentage of total pounds processed, which together drove more items sold per pound processed at higher price points.
On a currency neutral and comparable store basis, our sales yield for fiscal year 2022 was $1.39, compared to $1.30 for fiscal year 2021. The 6.9% improvement in sales yield primarily reflects a shift in consumer purchasing toward items at higher price points.
Cost of merchandise sold per pound processed
We define cost of merchandise sold per pound processed as cost of merchandise sold, exclusive of depreciation and amortization, on a reported basis, divided by total pounds of goods processed. We believe investors can use this metric to determine our ability to cost-effectively purchase and process supply items, and determine the value of incremental sales.
Cost of merchandise sold per pound processed during fiscal year 2023 was $0.63, compared to $0.61 for fiscal year 2022, primarily reflecting increases in material acquisition and processing costs largely driven by higher wages, partially offset by the scaling of our business.
Cost of merchandise sold per pound processed during fiscal year 2022 was $0.61, compared to $0.55 for fiscal year 2021, primarily reflecting wage subsidies received in fiscal year 2021 that were not received in fiscal year 2022, higher wages paid to our team members in fiscal year 2022 and a decrease in the percentage of inventory received from OSDs. Excluding the receipt of wage subsidies in fiscal year 2021, our adjusted cost of merchandise sold per pound processed was $0.57 for fiscal year 2021.
Results of Operations
The following table sets forth our results of operations for each of the periods presented:
| | | | | | | | | | | | | | | | | | | | | | | | | | | | | | | | | | | |
| Fiscal Year |
| 2023 | | 2022 | | 2021 |
(in thousands) | Amount | | % of Sales | | Amount | | % of Sales | | Amount | | % of Sales |
| Net sales | $ | 1,500,249 | | 100.0% | | $ | 1,437,229 | | | 100.0% | | $ | 1,204,124 | | | 100.0% |
| Operating expenses: | | | | | | | | | | | |
| Cost of merchandise sold, exclusive of depreciation and amortization | 619,671 | | 41.3 | | 599,926 | | | 41.7 | | 474,462 | | | 39.4 |
| Salaries, wages and benefits | 366,189 | | 24.4 | | 273,587 | | | 19.0 | | 239,806 | | | 19.9 |
| Selling, general and administrative | 311,388 | | 20.8 | | 301,737 | | | 21.0 | | 260,235 | | | 21.6 |
| Depreciation and amortization | 61,144 | | 4.0 | | 55,753 | | | 3.9 | | 47,385 | | | 3.9 |
| Total operating expenses | 1,358,392 | | 90.5 | | 1,231,003 | | | 85.6 | | 1,021,888 | | | 84.8 |
| Operating income | 141,857 | | 9.5 | | 206,226 | | | 14.4 | | 182,236 | | | 15.2 |
| Other (expense) income: | | | | | | | | | | | |
| Interest expense, net | (88,500) | | (5.9) | | (64,744) | | | (4.5) | | (53,565) | | | (4.4) |
| Gain (loss) on foreign currency, net | 6,660 | | 0.4 | | (20,737) | | | (1.4) | | 1,583 | | | 0.1 |
| Other income (expense), net | 3,688 | | 0.2 | | 4,576 | | | 0.3 | | (4,848) | | | (0.5) |
| Loss on extinguishment of debt | (16,626) | | (1.1) | | (1,023) | | | (0.1) | | (47,541) | | | (3.9) |
| Other expense, net | (94,778) | | (6.4) | | (81,928) | | | (5.7) | | (104,371) | | | (8.7) |
| Income before income taxes | 47,079 | | | 3.1 | | 124,298 | | | 8.7 | | 77,865 | | | 6.5 |
| Income tax (benefit) expense | (6,036) | | | (0.4) | | 39,578 | | | 2.8 | | (5,529) | | | (0.4) |
| Net income | $ | 53,115 | | 3.5% | | $ | 84,720 | | | 5.9% | | $ | 83,394 | | | 6.9% |
Comparison of fiscal year 2023 and fiscal year 2022
Net sales
The following table presents net sales:
| | | | | | | | | | | | | | | | | | | | | | | |
| Fiscal Year | | | | |
| (in thousands) | 2023 | | 2022 | | $ Change | | % Change |
| Retail sales | $ | 1,427,024 | | | $ | 1,365,109 | | | $ | 61,915 | | | 4.5 | % |
| Wholesale sales | 73,225 | | | 72,120 | | | 1,105 | | | 1.5 | |
| Total net sales | $ | 1,500,249 | | | $ | 1,437,229 | | | $ | 63,020 | | | 4.4 | % |
Retail net sales increased by $61.9 million, or 4.5%, during fiscal year 2023 compared to fiscal year 2022. The increase in net sales resulted primarily from comparable store sales growth of 4.7% and a 3.8% increase in the number of stores year over year, partially offset by the unfavorable impact of foreign currency during fiscal year 2023.
Wholesale sales increased by $1.1 million, or 1.5%, during fiscal year 2023. The increase resulted primarily from an increase in prices charged to our wholesale customers.
Cost of merchandise sold, exclusive of depreciation and amortization
The following table presents cost of merchandise sold, exclusive of depreciation and amortization:
| | | | | | | | | | | | | | | | | | | | | | | |
| Fiscal Year | | | | |
| (in thousands) | 2023 | | 2022 | | $ Change | | % Change |
| Cost of merchandise sold, exclusive of depreciation and amortization | $ | 619,671 | | | $ | 599,926 | | | $ | 19,745 | | | 3.3 | % |
Cost of merchandise sold increased by $19.7 million, or 3.3%, during fiscal year 2023, compared to fiscal year 2022.
As a percentage of net sales, cost of merchandise sold remained consistent year over year at 41.3% during fiscal year 2023, compared to 41.7% during fiscal year 2022.
Personnel costs classified within cost of merchandise sold increased to $368.6 million during fiscal year 2023, compared to $343.4 million during fiscal year 2022. The increase in personnel costs resulted primarily from higher wages, increased labor to support transaction growth in our retail stores and an increase in the number of stores from 314 stores as of December 31, 2022 to 326 stores as of December 30, 2023.
Salaries, wages and benefits
The following table presents salaries, wages and benefits expense:
| | | | | | | | | | | | | | | | | | | | | | | |
| Fiscal Year | | | | |
| (in thousands) | 2023 | | 2022 | | $ Change | | % Change |
| Retail and wholesale | $ | 193,930 | | | $ | 195,861 | | | $ | (1,931) | | | (1.0) | % |
| Corporate | 172,259 | | | 77,726 | | | 94,533 | | | 121.6 | |
| Total salaries, wages and benefits | $ | 366,189 | | | $ | 273,587 | | | $ | 92,602 | | | 33.8 | % |
Salaries, wages and benefits expense increased by $92.6 million, or 33.8%, during fiscal year 2023, compared to fiscal year 2022.
Personnel costs for our retail and wholesale operations decreased by $1.9 million, or 1.0%, primarily from the rollout of self-checkout kiosks in our U.S. and Canada stores, partially offset by higher wage rates and 12 new stores since December 31, 2022.
Personnel costs for our corporate employees increased by $94.5 million, or 121.6%. The increase resulted primarily from the recognition of $69.1 million of stock-based compensation expense in connection with our IPO and a special one-time bonus and related taxes of $24.1 million paid to certain of our employees and directors participating in our management equity incentive plan, which we paid in connection with the offering of the Notes. The remaining increase primarily reflects increased headcount and wage rates year over year.
Upon completion of our IPO on July 3, 2023, we commenced recognition of stock-based compensation for our performance-based options as the underlying performance-based condition was satisfied. During the fiscal year 2023, we recognized $28.0 million of expense related to performance-based options that vested upon completion of our IPO and $38.8 million of expense related to amortization of the remaining outstanding performance-based options that are recognized on a graded vesting basis over their expected vesting period. Fiscal year 2023 further includes $2.3 million of expense related to the amortization of restricted stock units granted in connection with our IPO that vest in equal installments over a one-year or three-year period from the date of grant.
Selling, general and administrative
The following table presents selling, general and administrative expenses:
| | | | | | | | | | | | | | | | | | | | | | | |
| Fiscal Year | | | | |
| (in thousands) | 2023 | | 2022 | | $ Change | | % Change |
| Rent and utilities | $ | 178,503 | | | $ | 176,226 | | | $ | 2,277 | | | 1.3 | % |
| Repairs and maintenance | 34,578 | | | 33,415 | | | 1,163 | | | 3.5 | |
| Supplies | 16,440 | | | 17,534 | | | (1,094) | | | (6.2) | |
| Professional service fees | 14,249 | | | 17,289 | | | (3,040) | | | (17.6) | |
| Marketing | 9,011 | | | 11,856 | | | (2,845) | | | (24.0) | |
| Other expenses | 58,607 | | | 45,417 | | | 13,190 | | | 29.0 | |
| Total selling, general and administrative | $ | 311,388 | | | $ | 301,737 | | | $ | 9,651 | | | 3.2 | % |
SG&A increased by $9.7 million, or 3.2%, during fiscal year 2023, compared to fiscal year 2022. The increase in SG&A resulted primarily from a $13.2 million increase in other expenses which includes general corporate and store expenses such as insurance and information technology, as well as loss on disposal of property and equipment, and an increase of $2.3 million in rent and utilities primarily reflecting the addition of 12 new retail stores in fiscal year 2023. These increases were partially offset by a $3.0 million decrease in professional service fees primarily reflecting lower third-party consulting fees and a $2.8 million decrease in marketing as the Company reduced expenditure on brand awareness in Canada, where we have highly recognizable brands, and in areas where we were able to leverage marketing spend incurred on our IPO.
Depreciation and amortization
The following table presents depreciation and amortization expense:
| | | | | | | | | | | | | | | | | | | | | | | |
| Fiscal Year | | | | |
| (in thousands) | 2023 | | 2022 | | $ Change | | % Change |
| Depreciation and amortization | $ | 61,144 | | | $ | 55,753 | | | $ | 5,391 | | | 9.7 | % |
Depreciation and amortization during fiscal year 2023, increased by $5.4 million, or 9.7%, compared to fiscal year 2022. The increase in depreciation and amortization resulted primarily from investments in our store build-outs, CPCs, ABPs and store enhancement initiatives, as well as capital expenditures related to capital maintenance.
Interest expense, net
The following table presents interest expense, net:
| | | | | | | | | | | | | | | | | | | | | | | |
| Fiscal Year | | | | |
| (in thousands) | 2023 | | 2022 | | $ Change | | % Change |
| Interest expense | $ | (93,559) | | | $ | (62,908) | | | $ | (30,651) | | | 48.7 | % |
| Amortization of debt issuance costs and debt discount | (6,051) | | | (4,005) | | | (2,046) | | | 51.1 | |
| Realized and unrealized gain on interest rate swap | 11,110 | | | 2,169 | | | 8,941 | | | n/m |
| Total interest expense, net | $ | (88,500) | | | $ | (64,744) | | | $ | (23,756) | | | 36.7 | % |
____________n/m – not meaningful
Total interest expense, net increased in fiscal year 2023 by $23.8 million, or 36.7%, compared to fiscal year 2022. The increase in interest expense, net resulted primarily from higher interest rates on our variable rate borrowings and the issuance of $550.0 million of Senior Secured Notes on February 6, 2023 at a fixed interest rate of 9.75%, partially offset by principal repayments on both our Term Loan Facility ($233.4 million on February 6, 2023 and $252.4 million on July 5, 2023) and Senior Secured Notes ($55.0 million on July 3, 2023). The weighted average face value of debt in fiscal year 2023 was $944.3 million and the weighted average
interest rate paid on our debt was 10.18%, compared to $819.8 million and 7.48%, respectively, for fiscal year 2022.
Gains on our interest rate swaps increased by $8.9 million in fiscal year 2023 compared to fiscal year 2022 as short-term interest rates were higher in fiscal year 2023 than in fiscal year 2022.
Gain (loss) on foreign currency, net
The following table presents gain (loss) on foreign currency, net:
| | | | | | | | | | | | | | | | | | | | | | | |
| Fiscal Year | | | | |
| (in thousands) | 2023 | | 2022 | | $ Change | | % Change |
| Gain (loss) on foreign currency remeasurement | $ | 9,803 | | | $ | (29,955) | | | $ | 39,758 | | | (132.7) | % |
| (Loss) gain on derivative instruments | (3,143) | | | 9,218 | | | (12,361) | | | (134.1) | |
| Total gain (loss) on foreign currency, net | $ | 6,660 | | | $ | (20,737) | | | $ | 27,397 | | | (132.1) | % |
Gains and losses on foreign currency relate primarily to movements in the Canadian dollar (“CAD”) relative to the U.S. dollar (“USD”). In fiscal year 2023, the U.S. dollar weakened against the Canadian dollar resulting in remeasurement gains of $9.8 million arising primarily on USD-denominated debt held by one of our Canadian subsidiaries, which is the primary driver of foreign currency remeasurement gains and losses. We also recorded losses of $3.1 million on derivative instruments that we use to manage foreign currency exchange rate risk. The $30.0 million loss on foreign currency remeasurement in fiscal year 2022 resulted primarily from the U.S. dollar strengthening against the Canadian dollar and was partially offset by gains of $9.2 million on derivative instruments that hedge movements in the Canadian dollar.
Other income, net
The following table presents other income (expense), net:
| | | | | | | | | | | | | | | | | | | | | | | |
| Fiscal Year | | | | |
| (in thousands) | 2023 | | 2022 | | $ Change | | % Change |
| Other income, net | $ | 3,688 | | | $ | 4,576 | | | $ | (888) | | | (19.4) | % |
Other income, net is comprised primarily of miscellaneous income and expenses not directly related to our core operating activities.
Loss on extinguishment of debt
The following table presents loss on extinguishment of debt:
| | | | | | | | | | | | | | | | | | | | | | | |
| Fiscal Year | | | | |
| (in thousands) | 2023 | | 2022 | | $ Change | | % Change |
| Loss on extinguishment of debt | $ | (16,626) | | | $ | (1,023) | | | $ | (15,603) | | | n/m |
____________
n/m – not meaningful
In fiscal year 2023, the Company used net proceeds from its IPO, net proceeds from issuing $550.0 million aggregate principal amount of Senior Secured Notes and cash on hand to repay $485.8 million in outstanding borrowings on its Term Loan Facility and $55.0 million aggregate principal amount of its Senior Secured Notes (the “Notes”), and consequently recognized a loss on debt extinguishment of $16.6 million.
In fiscal year 2022, we repaid a mortgage loan with a remaining principal balance of $2.7 million, resulting in a loss on extinguishment of debt of $1.0 million.
Income tax expense
The following table presents income tax expense:
| | | | | | | | | | | | | | | | | | | | | | | |
| Fiscal Year | | | | |
| (in thousands) | 2023 | | 2022 | | $ Change | | % Change |
| Income tax (benefit) expense | $ | (6,036) | | | $ | 39,578 | | | $ | (45,614) | | | n/m |
____________
n/m – not meaningful
During fiscal year 2023, the Company recorded an income tax benefit of $6.0 million on income before income taxes of $47.1 million, resulting in an effective tax rate of (12.8)%. For fiscal year 2022, we recorded $39.6 million of income tax expense on income before income taxes of $124.3 million, resulting in an effective income tax rate of 31.8%. The decrease in our effective income tax rate resulted primarily from the reduction of the partnership basis deferred tax liability discussed in Note 14, Income Taxes, an increase to the reduction in the valuation allowances, and an increase to the Internal Revenue Code Section 162(m) limitation.
Segment results
The following table presents net sales and profit by segment for the periods presented:
| | | | | | | | | | | | | | | | | | | | | | | |
| Fiscal Year | | | | |
| (in thousands) | 2023 | | 2022 | | $ Change | | % Change |
| Net sales: | | | | | | | |
| U.S. Retail | $ | 780,126 | | | $ | 747,397 | | | $ | 32,729 | | | 4.4 | % |
| Canada Retail | 605,630 | | | 582,944 | | | 22,686 | | | 3.9 | % |
| Other | 114,493 | | | 106,888 | | | 7,605 | | | 7.1 | % |
| Total net sales | $ | 1,500,249 | | | $ | 1,437,229 | | | $ | 63,020 | | | 4.4 | % |
| Segment Profit: | | | | | | | |
| U.S. Retail | $ | 198,146 | | | $ | 181,664 | | | $ | 16,482 | | | 9.1 | % |
| Canada Retail | $ | 189,899 | | | $ | 173,917 | | | $ | 15,982 | | | 9.2 | % |
| Other | $ | 39,572 | | | $ | 33,395 | | | $ | 6,177 | | | 18.5 | % |
U.S. Retail
U.S. Retail net sales increased by $32.7 million, or 4.4%, during fiscal year 2023, compared to fiscal year 2022. The increase in net sales resulted primarily from comparable store sales growth of 4.4% and a 3.3% increase in the number of retail stores year over year. The increase in comparable store sales was primarily driven by growth in transaction volume.
U.S. Retail segment profit increased by $16.5 million, or 9.1%, during fiscal year 2023, compared to fiscal year 2022. The increase resulted primarily from higher net sales and enhanced efficiencies at our stores driven by improved leverage on retail labor and store selling, general and administrative expenses and improved OSD mix, partially offset by higher wages and increased material acquisition and logistics costs in our U.S. retail stores.
Canada Retail
Canada Retail net sales increased by $22.7 million, or 3.9%, during fiscal year 2023, compared to fiscal year 2022. The increase in net sales resulted primarily from comparable store sales growth of 5.0% and a 4.6% increase in the number of retail stores year over year, partially offset by the unfavorable impact of foreign currency. The increase in comparable store sales was primarily driven by growth in transaction volume.
Canada Retail segment profit increased by $16.0 million, or 9.2%, during fiscal year 2023, compared to fiscal year 2022. The increase in segment profit resulted primarily from higher net sales and enhanced labor efficiencies driven by the rollout of self-checkout kiosks in our Canada retail stores, partially offset by higher wages.
Other
Other net sales include our Australian retail stores and our wholesale operations. Net sales for our other businesses increased by $7.6 million, or 7.1%, during fiscal year 2023, compared to fiscal year 2022. The
increase resulted primarily from a $6.5 million increase in net sales for our Australian stores. Segment profit for our other businesses increased by $6.2 million, or 18.5%.
Comparison of fiscal year 2022 and fiscal year 2021
Net sales
The following table presents net sales:
| | | | | | | | | | | | | | | | | | | | | | | |
| Fiscal Year | | | | |
(in thousands) | 2022 | | 2021 | | $ Change | | % Change |
Retail sales | $ | 1,365,109 | | | $ | 1,154,891 | | | $ | 210,218 | | | 18.2 | % |
Wholesale sales | 72,120 | | | 49,233 | | | 22,887 | | | 46.5 | |
Total net sales | $ | 1,437,229 | | | $ | 1,204,124 | | | $ | 233,105 | | | 19.4 | % |
Our net sales increased by $233.1 million, or 19.4%, during fiscal year 2022 compared to fiscal year 2021. The increase in net sales resulted primarily from a reduction in COVID-19 related store closures in Canada, the acquisition of 2nd Ave., which occurred in November 2021, and an increase in sales yield. The increase in sales yield was most prominent in our retail business and resulted from a shift in consumer purchasing toward items at higher price points.
As public health restrictions continued to ease in fiscal year 2022, our percentage open store days increased to 100% in Canada during fiscal year 2022, compared to 81.3% during fiscal year 2021. The increase in percentage open store days contributed to a $110.7 million increase in net sales in Canada, of which $101.4 million is classified as retail sales.
New stores acquired in the 2nd Ave. Acquisition accounted for an increase of $78.4 million in retail sales during fiscal year 2022.
During fiscal year 2022, our sales yield, which we define as retail sales generated per pound processed on a currency neutral and comparable store basis, increased to $1.39 per pound processed during fiscal year 2022, compared to $1.30 during fiscal year 2021.
We supported the increase in sales volume by accepting significantly more inventory through both our OSD and delivered supply channels during fiscal year 2022. Total pounds processed increased by 14.5% to 985 million pounds during fiscal year 2022, compared to 860 million pounds during fiscal year 2021.
Wholesale sales increased by $22.9 million, or 46.5%, during fiscal year 2022. The increase in wholesale sales resulted primarily from higher price points, an increase in processing volume and the expansion of our wholesale operations resulting from the 2nd Ave. Acquisition.
Cost of merchandise sold, exclusive of depreciation and amortization
The following table presents cost of merchandise sold, exclusive of depreciation and amortization:
| | | | | | | | | | | | | | | | | | | | | | | |
| Fiscal Year | | | | |
(in thousands) | 2022 | | 2021 | | $ Change | | % Change |
Cost of merchandise sold, exclusive of depreciation and amortization | $ | 599,926 | | | $ | 474,462 | | | $ | 125,464 | | | 26.4 | % |
Cost of merchandise sold increased by $125.5 million, or 26.4%, during fiscal year 2022, compared to fiscal year 2021. As a percentage of net sales, cost of merchandise sold also increased to 41.7% during fiscal year 2022, compared to 39.4% during fiscal year 2021. Similarly, the cost of merchandise sold per pound processed increased to $0.61 per pound during fiscal year 2022 from $0.55 per pound during fiscal year 2021.
The increase in cost of merchandise sold per pound processed resulted primarily from an increase in personnel costs related to wage subsidies received in fiscal year 2021 that were not received in fiscal year 2022, higher wages paid to our team members in fiscal year 2022 and a decrease in the percentage of inventory received from OSDs.
Personnel costs classified within cost of merchandise sold increased to $343.4 million during fiscal year 2022, compared to $276.0 million during fiscal year 2021. The increase in personnel costs resulted primarily
from an increase in open store days in Canada, higher wages for store employees and a full year of operations for the 2nd Ave. stores. Furthermore, during fiscal year 2021, we received a total of $21.7 million in wage subsidies in Canada, of which $13.4 million was classified as a reduction to cost of merchandise sold. We did not receive any wage subsidies during fiscal year 2022. Excluding the receipt of wage subsidies, cost of merchandise sold per pound would have been $0.57 per pound processed during fiscal year 2021.
Our total pounds processed increased by 14.5%, reaching 985 million pounds during fiscal year 2022, compared to 860 million pounds during fiscal year 2021. While our OSDs processed increased to 619 million pounds in fiscal year 2022, compared to 605 million pounds in fiscal year 2021, the percentage of inventory received from OSDs decreased to 62.9% from 70.4%, as our percentage of delivered supply from NPPs and GreenDrop increased. We acquired GreenDrop in the 2nd Ave. Acquisition, and GreenDrop accounted for 9.9% of supply in fiscal year 2022. Delivered supply from our NPPs generally have a higher cost per pound than inventory received from OSDs.
Salaries, wages and benefits
The following table presents salaries, wages and benefits expense:
| | | | | | | | | | | | | | | | | | | | | | | |
| Fiscal Year | | | | |
(in thousands) | 2022 | | 2021 | | $ Change | | % Change |
Retail and wholesale | $ | 195,861 | | | $ | 181,191 | | | $ | 14,670 | | | 8.1 | % |
Corporate | 77,726 | | | 58,615 | | | 19,111 | | | 32.6 | |
Total salaries, wages and benefits | $ | 273,587 | | | $ | 239,806 | | | $ | 33,781 | | | 14.1 | % |
Salaries, wages and benefits expense increased by $33.8 million, or 14.1%, during fiscal year 2022, compared to fiscal year 2021.
Salaries, wages and benefits for our retail and wholesale operations increased by $14.7 million, or 8.1% during fiscal year 2022, compared to fiscal year 2021. The increase in retail and wholesale personnel costs resulted primarily from the 2nd Ave. Acquisition, which contributed to an additional $14.6 million of personnel costs. Furthermore, during fiscal year 2021, we received $8.3 million of wage subsidies for our retail and wholesale employees, which were classified as a reduction to salaries, wages and benefits. These subsidies did not reoccur during fiscal year 2022, and we do not currently expect to receive wage subsidies in future periods. These amounts were partially offset by a decrease in employee bonuses in fiscal year 2022 compared to fiscal year 2021.
Salaries, wages and benefits for our corporate employees increased by $19.1 million, or 32.6%, during fiscal year 2022, compared to fiscal year 2021. The increase in corporate personnel costs resulted from increased headcount as we onboarded personnel related to the acquisition of 2nd Ave. and expanded our finance, accounting and legal functions as we prepare to operate as a public company and scale the business to support more retail locations. Corporate personnel costs during fiscal year 2022 also includes a $6.5 million one-time bonus related to the December 2022 Dividend.
Selling, general and administrative
The following table presents selling, general and administrative expenses:
| | | | | | | | | | | | | | | | | | | | | | | |
| Fiscal Year | | $ Change | | % Change |
(in thousands) | 2022 | | 2021 | | |
Occupancy | $ | 176,226 | | | $ | 152,738 | | | $ | 23,488 | | | 15.4 | % |
Repairs and maintenance | 33,415 | | | 29,809 | | | 3,606 | | | 12.1 | |
Supplies | 17,534 | | | 12,859 | | | 4,675 | | | 36.4 | |
Professional service fees | 17,289 | | | 16,563 | | | 726 | | | 4.4 | |
Marketing | 11,856 | | | 10,706 | | | 1,150 | | | 10.7 | |
Other expenses | 45,417 | | | 37,560 | | | 7,857 | | | 20.9 | |
Total selling, general and administrative | $ | 301,737 | | | $ | 260,235 | | | $ | 41,502 | | | 15.9 | % |
Selling, general and administrative expense increased by $41.5 million, or 15.9%, during fiscal year 2022, compared to fiscal year 2021. The increase in selling, general, and administrative expenses resulted primarily from increases in occupancy, supplies, and repairs and maintenance.
Occupancy increased by $23.5 million, which resulted primarily from the reclassification of $7.7 million in right-of-use asset amortization expenses previously classified as depreciation and amortization under prior accounting guidance (which has since been superseded), $6.1 million of additional expenses related to the 2nd Ave. Acquisition and a $2.2 million increase in utility expenses. We also incurred additional occupancy expense in relation to our new retail stores and CPC facilities.
The increase and repairs and maintenance and supplies expenses of $3.6 million and $4.7 million, respectively, resulted primarily from a reduction in COVID-19 related store closures in Canada.
Other expenses increased by $7.9 million, or 20.9%, during fiscal year 2022, compared to fiscal year 2021 primarily as a result of a reduction in COVID-19 related store closures in Canada as well as an increase of $3.1 million related to disposals of property and equipment.
Depreciation and amortization
The following table presents depreciation and amortization expense:
| | | | | | | | | | | | | | | | | | | | | | | |
| Fiscal Year | | | | |
(in thousands) | 2022 | | 2021 | | $ Change | | % Change |
Depreciation and amortization | $ | 55,753 | | | $ | 47,385 | | | $ | 8,368 | | | 17.7 | % |
Depreciation and amortization during fiscal year 2022 increased by $8.4 million, or 17.7%, compared to fiscal year 2021. The increase in depreciation and amortization resulted primarily from capital expenditures related to store improvements and the opening of our CPCs in addition to the 2nd Ave. Acquisition in November 2021. These increases were partially offset by our adoption of ASC Topic 842, “Leases,” which resulted in the reclassification of amortization expense for certain acquired leases to selling, general and administrative expense.
Interest expense
The following table presents interest expense:
| | | | | | | | | | | | | | | | | | | | | | | |
| Fiscal Year | | | | |
(in thousands) | 2022 | | 2021 | | $ Change | | % Change |
Interest expense | $ | (62,908) | | | $ | (48,907) | | | $ | (14,001) | | | 28.6 | % |
Amortization of debt issuance cost and debt discount | (4,005) | | | (4,444) | | | 439 | | | (9.9) | |
Gain (loss) on interest rate swap | 2,169 | | | (214) | | | 2,383 | | | n/m |
Total interest expense | $ | (64,744) | | | $ | (53,565) | | | $ | (11,179) | | | 20.9 | % |
____________n/m – not meaningful
Total interest expense increased in 2022 by $11.2 million, or 20.9%, compared to 2021. The increase in interest expense resulted from an increase in interest rates on our variable rate debt as well as an increase in the average principal amount outstanding under the Term Loan Facility due primarily to $225.0 million of additional borrowings in November 2021 to fund the 2nd Ave. Acquisition. Our effective interest rate paid under our credit facilities was 7.48% in 2022, compared to 6.38% in 2021.
(Loss) gain on foreign currency, net
The following table presents (loss) gain on foreign currency, net:
| | | | | | | | | | | | | | | | | | | | | | | |
| Fiscal Year | | | | |
(in thousands) | 2022 | | 2021 | | $ Change | | % Change |
Loss on foreign currency remeasurement | $ | (29,955) | | | $ | (10,436) | | | $ | (19,519) | | | 187.0 | % |
Gain on derivative instruments | 9,218 | | | 12,019 | | | (2,801) | | | (23.3) | |
Total (loss) gain on foreign currency, net | $ | (20,737) | | | $ | 1,583 | | | $ | (22,320) | | | n/m |
____________n/m – not meaningful
The loss on foreign currency remeasurement in 2022 relates primarily to the U.S. dollar strengthening against the Canadian dollar. This impacted our U.S. dollar-denominated term loan held by one of our Canadian subsidiaries. The gain on derivative instruments relates primarily to our cross-currency swaps which act as an economic hedge against movements in the Canadian dollar.
Other income (expense), net
The following table presents other income (expense), net:
| | | | | | | | | | | | | | | | | | | | | | | |
| Fiscal Year | | | | |
(in thousands) | 2022 | | 2021 | | $ Change | | % Change |
Other income (expense), net | $ | 4,576 | | | $ | (4,848) | | | $ | 9,424 | | | n/m |
____________n/m – not meaningful
Other income (expense), net was comprised primarily of miscellaneous income and expenses not directly related to our core operating activities.
Loss on extinguishment of debt
The following table presents loss on extinguishment of debt:
| | | | | | | | | | | | | | | | | | | | | | | |
| Fiscal Year | | | | |
(in thousands) | 2022 | | 2021 | | $ Change | | % Change |
Loss on extinguishment of debt | $ | (1,023) | | | $ | (47,541) | | | $ | 46,518 | | | (97.8) | % |
In 2022, we repaid a mortgage loan with a remaining principal balance of $2.7 million, resulting in a loss on extinguishment of debt of $1.0 million. In 2021 we refinanced our debt and entered into the Senior Secured Credit Facilities, resulting in a loss on extinguishment of debt of $47.5 million.
Income tax expense (benefit)
The following table presents income tax expense (benefit):
| | | | | | | | | | | | | | | | | | | | | | | |
| Fiscal Year | | | | |
(in thousands) | 2022 | | 2021 | | $ Change | | % Change |
Income tax expense (benefit) | $ | 39,578 | | | $ | (5,529) | | | $ | 45,107 | | | n/m |
____________n/m – not meaningful
During fiscal year 2022, we recorded an income tax expense of $39.6 million on income before income taxes of $124.3 million, resulting in an effective income tax rate of 31.8%. During fiscal year 2021, we recorded an income tax benefit of $5.5 million on income before income taxes of $77.9 million, resulting in an effective tax rate of (7.1)%. The increase in our effective income tax rate resulted primarily from a 59.5 million release of our valuation allowance during fiscal year 2021, which was partially offset by a $24.8 million tax on distributions received from our Canadian subsidiary.
Segment results
The following table presents net sales and profit by segment for the periods presented:
| | | | | | | | | | | | | | | | | | | | | | | |
| Fiscal Year | | | | |
(in thousands) | 2022 | | 2021 | | $ Change | | % Change |
Net sales: | | | | | | | |
U.S. Retail | $ | 747,397 | | | $ | 644,182 | | | $ | 103,215 | | | 16.0 | % |
Canada Retail | 582,944 | | | 481,559 | | | 101,385 | | | 21.1 | |
Other | 106,888 | | | 78,383 | | | 28,505 | | | 36.4 | |
Total net sales | $ | 1,437,229 | | | $ | 1,204,124 | | | $ | 233,105 | | | 19.4 | % |
Segment Profit: | | | | | | | |
U.S. Retail | $ | 181,664 | | | $ | 166,988 | | | $ | 14,676 | | | 8.8 | % |
Canada Retail | $ | 173,917 | | | $ | 148,137 | | | $ | 25,780 | | | 17.4 | % |
Other | $ | 33,395 | | | $ | 16,235 | | | $ | 17,160 | | | 105.7 | % |
U.S. Retail
U.S. Retail net sales increased by $103.2 million, or 16.0%, during fiscal year 2022, compared to fiscal year 2021. The increase resulted primarily from the inclusion of the stores acquired in the 2nd Ave. Acquisition for the entirety of fiscal year 2022, as well as a 4.5% increase in comparable store sales growth and an 8.9% increase in comparable store sales yield. Stores acquired in the 2nd Ave. Acquisition added an additional $78.4 million of net sales during fiscal year 2022.
U.S. Retail segment profit increased primarily as a result of the increase in net sales.
Canada Retail
Canada Retail net sales increased by $101.4 million, or 21.1%, during fiscal year 2022, compared to fiscal year 2021. The increase resulted primarily from a reduction in COVID-19 related store closures in fiscal year 2022. Our percentage open store days was 100% during fiscal year 2022 in Canada, compared to 81.3% for fiscal year 2021.
Canada Retail segment profit increased by $25.8 million, or 17.4%, during fiscal year 2022, compared to fiscal year 2021. The increase in segment profit resulted primarily from an increase in sales volume by our Canadian stores and leveraging of our fixed costs as our operations in Canada returned to pre-pandemic levels. The increase in segment profitability was partially offset by wage subsidies received in fiscal year 2021 which did not reoccur during fiscal year 2022.
Other
Other net sales include our Australian retail stores and our wholesale operations. Net sales for our other businesses increased by $28.5 million, or 36.4%, during fiscal year 2022. The increase resulted primarily from our wholesale operations due to higher price points, an increase in processing volume and the expansion of our wholesale operations resulting from the 2nd Ave. Acquisition.
Segment profit for our other businesses increase by $17.2 million, primarily as a result of an increase in net sales.
Non-GAAP Financial Measures
The Company reports its financial results in accordance with GAAP. We also present the following non-GAAP financial measures: Adjusted net income, Adjusted net income per diluted share, Adjusted EBITDA, Adjusted EBITDA margin, Constant-currency net sales and Free cash flow. In the discussion that follows, we provide definitions and reconciliations of these non-GAAP financial measures to the most directly comparable financial measures calculated and presented in accordance with GAAP. We have provided this non-GAAP financial information, which is not calculated or presented in accordance with GAAP, as information supplemental and in addition to the financial measures presented in this Annual Report that are calculated and presented in accordance with GAAP. These non-GAAP financial measures should not be considered superior to, as a substitute for, or an alternative to, and should be considered in conjunction with, the GAAP financial
measures presented elsewhere in this Annual Report. These non-GAAP financial measures may differ from, and therefore may not be directly comparable to, similarly-titled measures used by other companies.
Adjusted net income, Adjusted net income per diluted share, Adjusted EBITDA and Adjusted EBITDA margin
Adjusted net income, Adjusted net income per diluted share, Adjusted EBITDA and Adjusted EBITDA margin are non-GAAP financial measures. We have included these non-GAAP financial measures as these are key measures used by our management and our board of directors to evaluate our operating performance and the effectiveness of our business strategies, make budgeting decisions, and evaluate compensation decisions. They also best allow comparison of the performance of one period with that of another period.
Adjusted net income is defined as net income excluding the impact of loss on extinguishment of debt, IPO-related stock-based compensation expense, COVID-19 related adjustments, transaction costs, dividend-related bonus, (gain) loss on foreign currency, net, certain other adjustments, the tax effect on the above adjustments and non-recurring tax (benefit) expense. We define Adjusted net income per diluted share as Adjusted net income divided by diluted weighted average common shares outstanding.
We define Adjusted EBITDA as net income excluding the impact of interest expense, net, income tax (benefit) expense, depreciation and amortization, loss on extinguishment of debt, stock-based compensation expense, non-cash occupancy-related costs, lease intangible asset expense, pre-opening expenses, store closing expenses, executive transition costs, COVID-19 related adjustments, transaction costs, dividend-related bonuses, (gain) loss on foreign currency, and certain other adjustments. We define Adjusted EBITDA margin as Adjusted EBITDA divided by net sales, expressed as a percentage.
A reconciliation of GAAP net income and GAAP net income per diluted share to Adjusted net income and Adjusted net income per diluted share is presented in the table below:
| | | | | | | | | | | | | | | | | |
| Fiscal Year |
| (in thousands, except per share amounts) | 2023 | | 2022 | | 2021 |
| Net income: | | | | | |
| Net income | $ | 53,115 | | $ | 84,720 | | $ | 83,394 |
Loss on extinguishment of debt(1)(2) | 16,626 | | | 1,023 | | | 47,541 | |
IPO-related stock-based compensation expense(1)(3) | 69,108 | | — | | — |
COVID-19 related adjustments(1)(4) | — | | — | | (21,367) |
Transaction costs(1)(5) | 3,103 | | 4,728 | | 12,604 |
Dividend-related bonuses(1)(6) | 24,097 | | 6,499 | | — |
(Gain) loss on foreign currency, net(1) | (6,660) | | 20,737 | | (1,583) |
Other adjustments(1)(7) | (3,260) | | 2,698 | | 3,964 |
Tax effect on adjustments(8) | (29,874) | | (11,348) | | (15,435) |
Non-recurring tax (benefit) expense(9) | (31,340) | | — | | 24,779 |
| Adjusted net income | $ | 94,915 | | $ | 109,057 | | $ | 133,897 |
| | | | | |
| Net income per share - diluted: | | | | | |
| Net income per diluted share | $ | 0.34 | | $ | 0.58 | | $ | 0.57 |
Loss on extinguishment of debt(1)(2) | 0.11 | | 0.01 | | 0.33 |
IPO related stock-based compensation expense(1)(3) | 0.44 | | — | | — |
COVID-19 related adjustments(1)(4) | — | | — | | (0.15) |
Transaction costs(1)(5) | 0.02 | | 0.03 | | 0.09 |
Dividend-related bonus(1)(6) | 0.15 | | 0.04 | | — |
(Gain) loss on foreign currency, net(1) | (0.04) | | 0.14 | | (0.01) |
Other adjustments(1)(7) | (0.02) | | 0.02 | | 0.03 |
Tax effect on adjustments(8) | (0.19) | | (0.08) | | (0.11) |
Non-recurring tax (benefit) expense(9) | (0.20) | | — | | 0.17 |
| Adjusted net income per diluted share* | $ | 0.61 | | $ | 0.75 | | $ | 0.92 |
*May not foot due to rounding(1)Presented pre-tax.
(2)Removes the effects of the loss on debt extinguishment in relation to the partial repayment of outstanding borrowings under the Term Loan Facility on February 6, 2023 and July 5, 2023, the partial redemption of our Senior Secured Notes on July 3, 2023, the repayment of a mortgage loan on January 6, 2022 and repayment of the Company’s prior term loan facility on April 26, 2021.
(3)Reflects stock-based compensation expense for performance-based options triggered by the completion of our IPO and expense related to restricted stock units issued in connection with the Company’s IPO.
(4)Represents benefits, net of costs, received in connection with the COVID-19 pandemic including wage subsidies, and severance costs.
(5)Transaction costs are comprised of non-capitalizable expenses related to offering costs and the 2nd Ave. Acquisition, such as accounting, consulting and legal fees.
(6)Represents dividend-related bonuses and related payroll taxes paid in conjunction with our February 2023 and December 2022 dividends.
(7)Other adjustments include the effect of asset disposals. Fiscal year 2023 further includes legal and insurance settlement proceeds of $4.7 million. Fiscal year 2021 includes $1.9 million of expense related to the fair value step-up of inventory pursuant to the 2nd Ave. Acquisition.
(8)Tax effect on adjustments is calculated based on the effective tax rates for the respective periods. The effective tax rate for fiscal year 2023 is adjusted to remove Section 162(m) limitations and the tax benefit of restructuring. The effective tax rate for fiscal 2021 excludes the benefit of a change in valuation allowance.
(9)Represents a one-time tax benefit of $31.3 million associated with a internal legal entity restructuring in fiscal year 2023 and a one-time tax expense of $24.8 million associated with debt restructuring in fiscal year 2021.
A reconciliation of GAAP net income to Adjusted EBITDA is presented in the table below:
| | | | | | | | | | | | | | | | | |
| Fiscal Year |
| (dollars in thousands) | 2023 | | 2022 | | 2021 |
| Net income | $ | 53,115 | | $ | 84,720 | | $ | 83,394 |
| Interest expense, net | 88,500 | | | 64,744 | | | 53,565 | |
| Income tax (benefit) expense | (6,036) | | 39,578 | | (5,529) |
| Depreciation and amortization | 61,144 | | 55,753 | | 47,385 |
Loss on extinguishment of debt(1) | 16,626 | | 1,023 | | 47,541 |
Stock-based compensation expense(2) | 72,604 | | 1,943 | | 732 |
Non-cash occupancy-related costs(3) | 5,902 | | 1,464 | | 228 |
Lease intangible asset expense(4) | 4,093 | | 7,677 | | — |
Pre-opening expenses(5) | 7,536 | | | 5,858 | | | 1,628 | |
Store closing expenses(6) | 1,613 | | 2,732 | | 397 |
Executive transition costs(7) | — | | 1,532 | | 420 |
COVID-19 related adjustments(8) | — | | — | | (21,367) |
Transaction costs(9) | 3,103 | | 4,728 | | 12,604 |
Dividend-related bonuses(10) | 24,097 | | 6,499 | | — |
| (Gain) loss on foreign currency, net | (6,660) | | 20,737 | | (1,583) |
Other adjustments(11) | (3,260) | | 2,698 | | 3,964 |
| Adjusted EBITDA | $ | 322,377 | | $ | 301,686 | | $ | 223,379 |
| Net income margin | 3.5% | | 5.9% | | 6.9% |
| Adjusted EBITDA margin | 21.5% | | 21.0% | | 18.6% |
(1)Removes the effects of the loss on debt extinguishment in relation to the partial repayment of outstanding borrowings under the Term Loan Facility on February 6, 2023 and July 5, 2023, the partial redemption of our Senior Secured Notes on July 3, 2023, the repayment of a mortgage loan on January 6, 2022 and repayment of the Company’s prior term loan facility on April 26, 2021.
(2)Represents non-cash stock-based compensation expense related to stock options and restricted stock units granted to certain of our employees and directors.
(3)Represents the difference between cash and straight-line lease expense.
(4)Represents lease expense associated with acquired lease intangibles. Prior to the adoption of Topic 842, this expense was included within depreciation and amortization.
(5)Pre-opening expenses include expenses incurred in the preparation and opening of new stores and processing locations, such as payroll, training, travel, occupancy and supplies.
(6)Costs associated with the closing of certain retail locations, including lease termination costs, amounts paid to third parties for rent reduction negotiations, and fees paid to landlords for store closings.
(7)Represents severance costs associated with executive leadership changes and the 2nd Ave. Acquisition.
(8)Represents benefits, net of costs, received in connection with the COVID-19 pandemic including wage subsidies, and severance costs.
(9)Transaction costs are comprised of non-capitalizable expenses related to offering costs and the 2nd Ave. Acquisition, such as accounting, consulting and legal fees.
(10)Represents dividend-related bonuses and related taxes paid in conjunction with our February 2023 and December 2022 dividends.
(11)Other adjustments include the effect of asset disposals. Fiscal year 2023 further includes legal and insurance settlement proceeds of $4.7 million. Fiscal year 2021 includes $1.9 million of expense related to the fair value step-up of inventory pursuant to the 2nd Ave. Acquisition.
Constant currency
The Company reports certain operating results on a constant-currency basis in order to facilitate period-to-period comparisons of its results without regard to the impact of fluctuating foreign currency exchange rates. The term foreign currency exchange rates refer to the exchange rates used to translate the Company's operating results for all countries where the functional currency is not the U.S. Dollar into U.S. Dollars. Because the Company is a global company, foreign currency exchange rates used for translation may have a significant effect on its reported results. In general, the Company's financial results are affected positively by a weaker U.S. Dollar and are affected negatively by a stronger U.S. Dollar. References to operating results on a constant-currency basis mean operating results without the impact of foreign currency exchange rate fluctuations.
The Company believes disclosure of constant-currency results is helpful to investors because it facilitates period-to-period comparisons of its results by increasing the transparency of its underlying performance by excluding the impact of fluctuating foreign currency exchange rates.
Constant currency information compares results between periods as if exchange rates had remained constant period-over-period. During fiscal year 2023, as compared to fiscal year 2022, the U.S. Dollar was stronger relative to the Canadian and Australian dollars which resulted in an unfavorable foreign currency impact on our operating results.
The Company calculates constant-currency net sales by translating current-period net sales using the average exchange rates from the comparative prior period rather than the actual average exchange rates in effect.
A reconciliation of GAAP net sales to constant-currency net sales is presented in the table below:
| | | | | | | | | | | | | | | | | | | | | | | |
| Fiscal Year | | | | |
| (dollars in thousands) | 2023 | | 2022 | | $ Change | | % Change |
| Net sales | $ | 1,500,249 | | $ | 1,437,229 | | $ | 63,020 | | 4.4 | % |
| Impact of foreign currency | 23,803 | | n/a | | 23,803 | | n/m |
| Constant-currency net sales | $ | 1,524,052 | | $ | 1,437,229 | | $ | 86,823 | | 6.0 | % |
| | |
n/a - not applicable n/m - not meaningful |
Free cash flow
We define Free Cash Flow as net cash provided by operating activities less purchases of property and equipment. Free Cash Flow is considered a non-GAAP financial measure under the SEC’s rules and regulations because it excludes purchases of property and equipment calculated in accordance with GAAP.
Management believes that Free Cash Flow, which measures the ability to generate additional cash from business operations, is an important financial measure for use in evaluating the Company’s financial performance and ability to reduce debt, fund acquisitions and fund growth initiatives.
The following table provides a reconciliation of net cash provided by operating activities, the most directly comparable GAAP financial measure, to Free Cash Flow:
| | | | | | | | | | | | | | | | | |
| Fiscal Year |
| (dollars in thousands) | 2023 | | 2022 | | 2021 |
| Net cash provided by operating activities | $ | 175,165 | | $ | 169,433 | | $ | 175,762 |
| Less: Purchases of property and equipment | (91,743) | | (110,173) | | (40,544) |
| Free cash flow | $ | 83,422 | | $ | 59,260 | | $ | 135,218 |
Liquidity and Capital Resources
Overview
We have historically financed our operations primarily with cash generated by operating activities and proceeds from debt issuances. These sources of liquidity and capital have also been the primary means by which we funded dividend payments of $262.2 million, $69.4 million and $75.0 million in fiscal years 2023, 2022 and 2021, respectively. Although we do not anticipate paying any cash dividends in the foreseeable future, any future determination relating to dividend policy will be made at the discretion of our board of directors and will depend on a number of factors, including restrictions in our current and future debt instruments, our future earnings, capital requirements, financial condition, prospects, and applicable Delaware law, which provides that dividends are only payable out of surplus or current net profits.
Our primary short-term requirements for liquidity and capital are to meet general working capital needs, fund capital expenditures and to make interest payments on our debt. Our primary long-term liquidity and capital needs relate to repaying the principal balance on our debt and making lease payments on our retail stores and processing facilities. We may also use cash on our balance sheet, cash generated from operations or proceeds from new borrowings, or any combination of these sources of liquidity and capital, to pay for acquisitions, to fund growth initiatives, to pay down debt or to conduct repurchases of our common stock under our share repurchase program, or any combination of the foregoing. Our primary sources of liquidity and capital are cash generated from operations and proceeds from borrowings, including borrowings on our Revolving Credit Facility. As of December 30, 2023, $73.8 million was available to borrow under the Revolving Credit Facility.
We believe our existing cash and cash equivalents and cash provided by our operating activities are sufficient to fund our liquidity needs for the next 12 months. We may supplement our liquidity needs with borrowings under our Revolving Credit Facility.
See Note 7 to our audited consolidated financial statements for details of our indebtedness.
Historical financing arrangements
In April 2021, the Company restructured its debt and entered into the Senior Secured Credit Facilities consisting of a $600.0 million term loan facility (the “Term Loan Facility”) and a $60.0 million revolving credit facility (the “Revolving Credit Facility”), and recognized a loss on debt extinguishment of $47.5 million. In November 2021, the Company borrowed an additional $225.0 million under the Term Loan Facility on substantially the same terms to finance the 2nd Ave. Acquisition. In November 2022, the Company increased the borrowing capacity of the Revolving Credit Facility to $75.0 million.
On February 6, 2023, the Company issued $550.0 million of Senior Secured Notes (the “Notes”) at a discount of 2.014%. In connection with the issuance of the Notes, the Company repaid $233.4 million of outstanding borrowings under the Term Loan Facility resulting in a loss on extinguishment of debt of $6.0 million. The Company did not incur a penalty on the repayment. In addition to repaying $233.4 million of outstanding borrowings with the proceeds of the Notes issuance, the Company also paid a $262.2 million dividend and a $23.6 million one-time bonus to certain of our employees and directors participating in our management equity incentive plan who were unable to participate in the dividend.
On July 3, 2023, we completed our IPO and shortly thereafter used the net proceeds raised of $305.7 million, together with cash on our balance sheet, to redeem $55.0 million aggregate principal amount of Notes,
repay $252.4 million aggregate principal amount of outstanding borrowings under the Term Loan Facility, pay accrued interest on these borrowings and pay a premium of 3%, or $1.7 million, on the partial redemption of our Notes.These transactions resulted in a loss on extinguishment of debt of $10.6 million.
On January 30, 2024, the Company entered into an amendment (the “Third Amendment”) to its Senior Secured Credit Facilities that reduced the margin on existing borrowings under the Term Loan Facility from a range of 4.25% to 5.50% to a range of 2.75% to 4.00%, and removed the SOFR adjustment margin that ranged from 0.11% to 0.43% based on the applicable interest period (one month, three months or six months). Additional details of the Third Amendment can be found in Note 7, Indebtedness.
On February 9, 2024, the Company achieved the public corporate family ratings required for a 0.25% reduction of the margin applicable to its term loan borrowings.
On March 4, 2024, the Company redeemed $49.5 million aggregate principal amount of Senior Secured Notes, equal to 10% of the outstanding balance at December 30, 2023. In addition to paying accrued interest, the Company paid a premium of 3%, or $1.5 million, on the partial redemption. This transaction resulted in a loss on extinguishment of debt of $3.4 million. Subsequent to the partial redemption, the Company had total borrowings of $767.3 million outstanding.
Share repurchase authorization
We announced on November 9, 2023 the authorization of a share repurchase program of up to $50.0 million of our common stock. Under the program, we may purchase shares from time to time in compliance with applicable securities laws, that may include Securities Act Rule 10b-18. The program is currently set to expire on November 8, 2025. Although our Board of Directors has authorized the share repurchase program, we are not obligated to repurchase any specific dollar amount or to acquire any specific number of shares under the program. In addition, the share repurchase program may be suspended, modified, or terminated at any time without prior notice. The amount, timing, and execution of our share repurchase program will be based upon a variety of factors, including the share price of our common stock, general market conditions, alternative uses for capital, our financial performance, and other considerations. Any repurchases will be funded by available cash and cash equivalents.
Cash Flows
The following table summarizes our cash flows for the periods indicated:
| | | | | | | | | | | | | | | | | |
| Fiscal Year |
| (in thousands) | 2023 | | 2022 | | 2021 |
| Net cash provided by operating activities | $ | 175,165 | | | $ | 169,433 | | | $ | 175,762 | |
| Net cash used in investing activities | (92,365) | | | (110,502) | | | (263,172) | |
| Net cash (used in) provided by financing activities | (17,044) | | | (40,218) | | | 52,999 | |
| Effect of exchange rate changes on cash and cash equivalents | 2,067 | | | (4,496) | | | (5,533) | |
| Net increase (decrease) in cash and cash equivalents | $ | 67,823 | | | $ | 14,217 | | | $ | (39,944) | |
Comparison of fiscal year 2023 and fiscal year 2022
Net cash provided by operating activities
Net cash provided by operating activities was $175.2 million for fiscal year 2023, resulting from net income of $53.1 million, non-cash charges added back of $226.0 million and a net decrease of $104.0 million in operating assets and liabilities. Net cash provided by operating activities increased by $5.7 million during fiscal year 2023.
The $5.7 million increase in net cash provided by operating activities was primarily due to net income of $53.1 million and $31.9 million of net favorable changes in our working capital, including a $9.3 million decrease in net cash outflow related to our incentive compensation plan and other movements in our working capital balances which were not individually significant. These favorable changes were offset by a $17.6 million increase in special one-time bonuses and related taxes paid in conjunction with dividends and a $17.0 million increase in interest paid on our debt as a result of a higher weighted average face value of debt and higher weighted average interest rates.
Non-cash charges primarily consisted of $119.9 million of operating lease expense, $72.6 million of stock-based compensation expense, $61.1 million of depreciation and amortization expense, $16.6 million loss on extinguishment of debt, all of which were partially offset by a net benefit of $44.3 million primarily consisting of a $35.2 million benefit in deferred income taxes, net.
Net cash used in changes in operating assets and liabilities during fiscal year 2023 consisted primarily of a $110.4 million change in operating lease liabilities and a $10.9 million change in inventory. The change in operating lease liabilities resulted from the payment towards our lease liabilities. The change in inventories is primarily due to the timing of processing and higher processing costs.
Net cash provided by operating activities was $169.4 million for fiscal year 2022, primarily resulting from net income of $84.7 million, after consideration of non-cash charges of $220.6 million and a net decrease of $135.9 million in our operating assets and liabilities.
Non-cash charges during fiscal year 2022 primarily consisted of $114.8 million of operating lease expense, $55.8 million of depreciation and amortization, and $22.8 million of other non-cash charges. Other non-cash charges included $30.6 million of foreign currency losses, partially offset by an unrealized gain of $9.5 million on our derivatives.
Net cash used in changes in operating assets and liabilities during fiscal year 2022 consisted primarily of a $104.7 million change in operating lease liabilities since the adoption of Topic 842, a $12.6 million change in accrued payroll and related taxes, a $16.9 million change in prepaid expenses and other current assets, and an $8.1 million change in trade and other receivables.
The change in operating lease liabilities during fiscal year 2022 resulted from payments toward our lease liabilities. The change in prepaid expense and other current assets primarily resulted from an increase of $6.1 million in deferred offering costs and a $9.6 million increase in general prepaid expense. The $12.6 million change in accrued payroll and related taxes resulted from the payment of incentive compensation to our employees. As of January 1, 2022, we accrued $35.3 million related to employee incentive compensation, which was subsequently paid during fiscal year 2022. As of December 31, 2022, we had accrued $25.0 million for employee incentive compensation, the majority of which we paid in the first quarter of fiscal year 2023. The change in trade and other receivables resulted primarily from higher sales volumes and price points in our wholesale operations.
Net cash used in investing activities
Net cash used in investing activities was $92.4 million for fiscal year 2023 and $110.5 million for fiscal year 2022. Expenditure in both periods consisted primarily of capital maintenance and investments in our store build-outs, CPCs, ABPs, and store enhancement initiatives, which are reported as purchases of property and equipment.
Net cash used in financing activities
Net cash used in financing activities was $17.0 million for fiscal year 2023, consisting primarily of $524.9 million of net proceeds from the issuance of our Senior Secured Notes and $305.7 million of net proceeds from our IPO, offset by $547.9 million in principal payments on our long-term debt, the payment of $262.2 million in dividends and a net repayment of $42.0 million on our Revolving Credit Facility.
Net cash used in financing activities was $40.2 million for fiscal year 2022, consisting primarily of $69.4 million in dividends and $11.0 million in principal payments on our long-term debt, partially offset by $42.0 million of net borrowings on our Revolving Credit Facility.
Comparison of fiscal year 2022 and fiscal year 2021
Net cash provided by operating activities
Net cash provided by operating activities was $169.4 million for fiscal year 2022, primarily resulting from net income of $84.7 million, after consideration of non-cash charges of $220.6 million and a change of $135.9 million in our operating assets and liabilities, as discussed in more detail below. Net cash provided by operating activities decreased by $6.3 million during fiscal year 2022 as compared to fiscal year 2021. The decrease resulted primarily from an increase in employee incentive compensation payments, which were partially offset by an increase in operating cash flows from our 2nd Ave. stores, a decrease in transaction costs associated with our IPO and an increase in net income.
Non-cash charges primarily consisted of $114.8 million of operating lease expense, $55.8 million of depreciation and amortization, and $22.8 million of other non-cash charges. Other non-cash charges included $30.6 million of foreign currency losses, partially offset by an unrealized gain of $9.5 million on our derivatives.
Net cash used in changes in operating assets and liabilities during fiscal year 2022 consisted primarily of a $104.7 million change in operating lease liabilities since the adoption of Topic 842, a $12.6 million change in accrued payroll and related taxes, a $16.9 million change in prepaid expenses and other current assets, and an $8.1 million change in trade receivables.
The change in operating lease liabilities during fiscal year 2022 resulted from payments toward our lease liabilities. The change in prepaid expense and other current assets primarily resulted from an increase of $6.1 million in deferred offering costs and a $9.6 million increase in general prepaid expense. The $12.6 million change in accrued payroll and related taxes resulted from the payment of incentive compensation to our employees. As of January 1, 2022, we accrued $35.3 million related to employee incentive compensation, which was subsequently paid during fiscal year 2022. As of December 31, 2022, we had accrued $25.0 million for employee incentive compensation, the majority of which we paid in the first quarter of fiscal year 2023. The change in trade and other receivables resulted primarily from higher sales volumes and price points in our wholesale operations.
Net cash provided by operating activities was $175.8 million for fiscal year 2021, primarily resulting from net income of $83.4 million, after consideration of non-cash charges of $83.0 million and a net change of $9.4 million in our operating assets and liabilities.
Non-cash charges during fiscal year 2021, consisted primarily of a $47.5 million loss on extinguishment of debt in relation to the refinancing of our debt in April 2021 and $47.4 million in depreciation and amortization. Net cash provided by changes in operating assets and liabilities during the fiscal year 2021 consisted primarily of an $18.0 million change in accrued payroll and related taxes and a $6.1 million change in inventory, which were partially offset by a $18.0 million change in prepaid expenses and other current assets. The change in accrued payroll and related taxes resulted from $35.3 million in unpaid bonuses in connection with our management incentive programs. We pay the majority of our management incentive bonuses in the first quarter following fiscal year-end. The change in inventory resulted from increased sales as our operations approached pre-pandemic levels. The $18.0 million change in prepaid expenses and other current assets resulted from an increase in occupancy-related prepayments as of fiscal year 2021.
Net cash used in investing activities
Net cash used in investing activities was $110.5 million for fiscal year 2022 and $263.2 million for fiscal year 2021. Net cash used in investing activities during fiscal year 2022 consisted primarily of our increased investment in our CPC, ABP and store enhancement initiatives. Net cash used in investing activities during fiscal year 2021 includes the cash payment of $220.3 million for the acquisition of 2nd Ave. in fiscal year 2021.
Net cash (used in) provided by financing activities
Net cash used in financing activities was $40.2 million for fiscal year 2022, consisting primarily of $69.4 million in dividends and $11.0 million in principal payments on our long-term debt, partially offset by $42.0 million of net borrowings on our Revolving Credit Facility.
Net cash provided by financing activities was $53.0 million for fiscal year 2021. During fiscal year 2021, we repaid $645.7 million of outstanding principal on our debt as well as paying a $22.8 million prepayment penalty related to the refinancing of our debt in April 2021. We also paid a $75.0 million dividend in November 2021. These cash payments were offset by $796.5 million of net debt proceeds received from the Term Loan Facility.
Critical Accounting Policies and Estimates
Our consolidated financial statements and the accompanying notes thereto included elsewhere in this Annual Report are prepared in accordance with GAAP. Preparation of our consolidated financial statements in conformity with GAAP requires us to make estimates and assumptions that affect the reported amounts of assets, liabilities, revenue, expenses and various other assumptions that we believe to be reasonable under the circumstances. Actual results could differ from our estimates under different assumptions or conditions. To the extent that there are differences between our estimates and actual results, our future financial statement presentation, financial condition, results of operations, and cash flows will be affected. We believe that the
assumptions and estimates associated with the impairment assessments of our goodwill and indefinite-lived intangible assets, income taxes and stock-based compensation have the greatest potential impact on our consolidated financial statements. Accordingly, these are the policies we believe are the most critical to aid in fully understanding and evaluating our Consolidated Balance Sheets, Consolidated Statements of Operations and Comprehensive Income, and Consolidated Statements of Cash Flows.
Impairment of goodwill and indefinite-lived intangible assets
We assess goodwill and our indefinite-lived intangible assets (our trademarks) for impairment annually, or more frequently if events or changes in circumstances indicate that an asset may be impaired. We assess definite-lived intangible assets and other long-lived assets (collectively, “long-lived assets”) for impairment whenever events or changes in circumstances indicate the carrying amount of an asset or asset group may not be recoverable.
We account for acquired businesses using the acquisition method of accounting which requires that the assets acquired and liabilities assumed be recorded at the date of acquisition at their respective fair values with the differences between consideration and net assets acquired being recorded as goodwill.
Goodwill is reviewed for impairment annually in our fourth quarter or whenever circumstances indicate goodwill might be impaired. We first perform a qualitative assessment, evaluating relevant events or circumstances to determine whether it is more likely than not that the fair value of a reporting unit is less than its carrying amount. If not, no further impairment testing is performed. If the assessment indicates that it is more likely than not, we compare the carrying value of the reporting unit to the estimated fair value of the reporting unit, both as of the testing date. If the carrying value of the reporting unit exceeds the estimated fair value, we will recognize an impairment charge equal to the amount by which the carrying amount exceeds the reporting unit’s fair value up to but not to exceed the total amount of goodwill allocated to the reporting unit.
In fiscal year 2023, we performed a qualitative impairment assessment (also known as the “Step 0” test). Under the Step 0 test, we assessed qualitative factors to determine whether it is more likely than not that the fair value of the U.S. and Canadian reporting units was less than their respective carrying values. Qualitative factors included, but were not limited to, economic conditions, industry and market considerations, cost factors, overall financial performance of the reporting units and other entity and reporting unit specific events. Based on the results of the qualitative impairment assessment, we determined that it was not “more likely than not” that the fair value of the U.S. and Canadian reporting units was less than their respective carrying amounts. As such, the quantitative assessment was not required or performed.
Similar to goodwill, our indefinite-lived trade names and trademarks are not amortized, but reviewed for impairment annually, or earlier whenever events or changes in business circumstances indicate that their carrying values may not be recoverable. We assessed our indefinite-lived trade names and trademarks for impairment in the fourth quarter of fiscal year 2023 by utilizing a qualitative analysis. This annual impairment test resulted in no impairment charge.
Each reporting period, we perform an evaluation of the remaining useful life of our indefinite-lived trade names and trademarks to determine whether events and circumstances continue to support an indefinite life. We consider the life of our indefinite-lived trade names and trademarks to be appropriate.
Income taxes
Management makes estimates, assumptions, and judgments to determine our provision for income taxes, deferred tax assets and liabilities, and any valuation allowance recorded against deferred tax assets. We utilize the asset and liability method of accounting for income taxes. Deferred income taxes reflect the net tax effects of temporary differences between the carrying amounts of assets and liabilities for financial reporting purposes and the amounts used for income tax purposes, as well as operating loss, capital loss, and tax credit carryforwards. Valuation allowances are established against deferred tax assets if it is more likely than not that they will not be realized. Income tax expense represents the current expense incurred for the period plus or minus the change during the period in net deferred tax assets and liabilities.
Stock-based compensation expense
We measure and recognize stock-based compensation expense based on the estimated grant date fair value of the awards. We have granted time-based options, performance-based options and RSUs. We account for forfeitures as they occur.
We estimate the fair value of time-based options using the Black-Scholes option-pricing model. We also used the Black-Scholes option-pricing model to determine the grant-date fair value of performance-based options that were tied to the Company’s IPO and a Monte Carlo simulation under the option pricing framework to determine the grant-date fair value of performance-based options subject to market-specific conditions.
We recognize expense for time-based options on a straight-line basis over the requisite service period of the awards. We recognize expense for performance-based options when it is probable that performance conditions will be achieved and recognize the expense on a straight-line basis over any remaining service period. Performance-based options are subject to continued employment through the vesting date. See Note 2, Summary of Significant Accounting Policies, and Note 13, Stock-based compensation of the notes to the consolidated financial statements in Part II Item 8 of this Annual Report for additional details on the Company’s stock-based compensation plans.
Monte Carlo simulation
One of the most judgmental assumptions in the Monte Carlo simulation is the estimated fair value of common stock underlying the award as discussed below in the section titled “Common stock valuations”. Expected volatility is based on historic share price volatilities of comparable publicly traded companies consistent with the expected term. The risk-free interest rate is based on the U.S. Treasury yield curve in effect at the time of each grant, which corresponds to the expected term of the stock options. Based upon limited exercise history, the Company has elected to use the simplified method for estimating the expected term. The expected term of options granted represents the period of time that options are expected to be outstanding.
Common stock valuations
We are required to estimate the fair value of common stock underlying our equity awards. Prior to July 3, 2023, the date we completed our IPO, the fair value of common stock underlying our equity awards was established by our Board at the date of each option grant with input from management, considering the most recently available third-party valuations of our common stock, and our Board’s assessment of additional objective and subjective factors that it believed were relevant. Prior to July 3, 2023, all options to purchase shares of our common stock were intended to be granted with an exercise price per share no less than the fair value per share of our common stock on the date of grant. Because shares of our common stock were not publicly traded prior to July 3, 2023, estimating their fair value was highly complex and subjective.
On and after July 3, 2023, the fair value of our common stock will be based on the closing quoted market price of our common stock as reported on the date of grant on The New York Stock Exchange, which is the primary stock exchange on which our common stock is traded.
Recent Accounting Pronouncements
See Note 2 to our audited consolidated financial statements for a description of recently adopted accounting pronouncements and issued accounting pronouncements not yet adopted.
Item 7A. Quantitative and Qualitative Disclosures About Market Risk
In the normal course of business, we are exposed to various market risks. Our primary market risks are interest rate risk associated with variable rate debt and foreign currency exchange risk associated with our operations in Canada and Australia. We continually monitor these risks and regularly develop appropriate strategies to manage them. Accordingly, we manage our exposure to these risks through the use of derivative financial instruments with the objective of reducing potential income statement, cash flow, and market exposures from changes in interest rates and foreign exchange rates. We use derivative financial instruments solely to mitigate market exposure and not for trading or speculative purposes. Refer to “Note 10. Derivative Financial Instruments” for additional information.
Interest rate risk
Changes in interest rates affect the amount of interest due on our variable rate debt. As of December 30, 2023, we had variable rate borrowings on the Term Loan Facility of $321.8 million, but no advances under our Revolving Credit Facility. Our variable rate debt uses Term SOFR as a reference rate and any future increases in Term SOFR will inherently result in an increase in interest expense and cash paid toward interest to the extent we are not fully hedged.
We performed a sensitivity analysis to determine the effect of interest rate fluctuations on our interest expense. A hypothetical 1.00% increase in Term SOFR would result in an increase to interest expense of $3.2 million over 12 months based on amounts outstanding and interest rates in effect as of December 30, 2023.
To reduce our exposure to fluctuations in interest rates, we have entered into interest rate swaps. These interest rate swaps reduce our exposure to interest rate movements and effectively convert a portion of our floating-rate debt to a fixed-rate basis. Based on the notional amount of interest rate swaps in effect and the amounts borrowed as of December 30, 2023, our exposure to future interest rate movements will be reduced by 85.5%. Our interest rate swaps mature on May 31, 2025.
Foreign currency exchange risk
In addition to our U.S. business, we operate in Canada and Australia. Operations conducted entirely in each jurisdiction use that jurisdiction’s currency as their functional currency and changes in foreign exchange rates affect the translation of the results of these businesses into U.S. dollars, which is the reporting currency of the Company. For the fiscal year 2023, approximately 45.5% of our net sales were denominated in a currency other than the U.S. dollar. For the fiscal year 2023, a hypothetical 10% strengthening of the U.S. dollar to the Canadian dollar would decrease our net sales by $63.9 million (and vice versa). A hypothetical 10% change in the relative fair value of the U.S. dollar to the Australian dollar would not have a material impact on our operations. We will be susceptible to fluctuations in our local currency compared to foreign currency if we do not hedge the exchange rate exposure. As such, we routinely enter into currency forwards and maintain cross currency swap contracts to reduce our exposure to fluctuations in earnings and cash flows associated with changes in foreign exchange rates. Currency forwards are maintained on a rolling 12- month basis and our cross currency swaps mature on May 31, 2025.
At December 30, 2023, the entire $321.8 million balance on our variable rate borrowings is USD-denominated and is owed by one of our Canadian subsidiaries whose functional currency is the Canadian dollar. These variable rate borrowings expose the Company to remeasurement risk. For the fiscal year 2023, a hypothetical 10% strengthening of the U.S. dollar to the Canadian dollar would decrease net income by $32.2 million (and vice versa). At December 31, 2022, the balance of variable rate borrowings that was USD-denominated and held by the same Canadian subsidiary was $592.5 million.
Item 8. Financial Statements and Supplementary Data
INDEX TO CONSOLIDATED FINANCIAL STATEMENTS
SAVERS VALUE VILLAGE, INC.
| | | | | |
| |
| Consolidated Financial Statements | |
| |
| |
| |
| |
| |
| |
KPMG LLP
Suite 600
205 North 10th Street
Boise, ID 83702-5798
Report of Independent Registered Public Accounting Firm
To the Stockholders and Board of Directors
Savers Value Village, Inc.:
Opinion on the Consolidated Financial Statements
We have audited the accompanying consolidated balance sheets of Savers Value Village, Inc. and subsidiaries (the Company) as of December 30, 2023 and December 31, 2022, the related consolidated statements of operations and comprehensive income, stockholders’ equity, and cash flows for the fiscal years ended December 30, 2023, December 31, 2022 and January 1, 2022 and the related notes (collectively, the consolidated financial statements). In our opinion, the consolidated financial statements present fairly, in all material respects, the financial position of the Company as of December 30, 2023 and December 31, 2022, and the results of its operations and its cash flows for the fiscal years ended December 30, 2023, December 31, 2022 and January 1, 2022, in conformity with U.S. generally accepted accounting principles.
Change in Accounting Principle
As discussed in Note 2 and Note 9 to the consolidated financial statements, the Company has changed its method of accounting for leases as of January 2, 2022 due to the adoption of Accounting Standards Update (“ASU”) No. 2016-02, Leases (Topic 842), including adoption of all subsequent ASUs related to Topic 842.
Basis for Opinion
These consolidated financial statements are the responsibility of the Company’s management. Our responsibility is to express an opinion on these consolidated financial statements based on our audits. We are a public accounting firm registered with the Public Company Accounting Oversight Board (United States) (PCAOB) and are required to be independent with respect to the Company in accordance with the U.S. federal securities laws and the applicable rules and regulations of the Securities and Exchange Commission and the PCAOB.
We conducted our audits in accordance with the standards of the PCAOB. Those standards require that we plan and perform the audit to obtain reasonable assurance about whether the consolidated financial statements are free of material misstatement, whether due to error or fraud. The Company is not required to have, nor were we engaged to perform, an audit of its internal control over financial reporting. As part of our audits, we are required to obtain an understanding of internal control over financial reporting but not for the purpose of expressing an opinion on the effectiveness of the Company’s internal control over financial reporting. Accordingly, we express no such opinion.
Our audits included performing procedures to assess the risks of material misstatement of the consolidated financial statements, whether due to error or fraud, and performing procedures that respond to those risks. Such procedures included examining, on a test basis, evidence regarding the amounts and disclosures in the consolidated financial statements. Our audits also included evaluating the accounting principles used and significant estimates made by management, as well as evaluating the overall presentation of the consolidated financial statements. We believe that our audits provide a reasonable basis for our opinion.
KPMG LLP, a Delaware limited liability partnership and a member firm of
the KPMG global organization of independent member firms affiliated with
KPMG International Limited, a private English company limited by guarantee.
Critical Audit Matter
The critical audit matter communicated below is a matter arising from the current period audit of the consolidated financial statements that was communicated or required to be communicated to the audit committee and that: (1) relates to accounts or disclosures that are material to the consolidated financial statements and (2) involved our especially challenging, subjective, or complex judgments. The communication of a critical audit matter does not alter in any way our opinion on the consolidated financial statements, taken as a whole, and we are not, by communicating the critical audit matter below, providing a separate opinion on the critical audit matter or on the accounts or disclosures to which it relates.
Valuation of performance-based options
As discussed in Note 13 to the consolidated financial statements, the Company modified the vesting terms of its performance-based options. The Company determined that the modified vesting terms constituted modifications and remeasured the fair value of the outstanding performance-based options as of their respective modification dates. For performance-based options subject to market-specific conditions resulting from the July 2023 modifications, the Company used a Monte-Carlo simulation under the option pricing framework to determine the grant-date fair value. For the year ended December 30, 2023, the Company reported stock-based compensation expense of $38.8 million in connection with the performance-based options subject to market-specific conditions impacted by the July 2023 modification.
We identified the assessment of fair value of performance-based options in connection with the July 2023 modifications as a critical audit matter. Specifically, subjective auditor judgment, and the need to involve valuation professionals with specialized skills and knowledge, was required because of the complexity of the Monte-Carlo simulation and the assumption of the expected price volatility of the Company’s performance-based options.
The following are the primary procedures we performed to address this critical audit matter. We involved valuation professionals with specialized skills and knowledge, who assisted in:
•developing an independent expectation using a separate Monte-Carlo simulation and comparing to the Company’s determination of fair value.
•assessing the public peer group companies used to determine the expected price volatility by reviewing the business descriptions of the public company peer group and evaluating them to determine that the companies are reasonably comparable to the Company.
We have served as the Company’s auditor since 2003.
Boise, Idaho
March 8, 2024
SAVERS VALUE VILLAGE, INC.
Consolidated Balance Sheets
(All amounts in thousands, except per share amounts)
| | | | | | | | | | | |
| December 30, 2023 | | December 31, 2022 |
| Current assets: | | | |
| Cash and cash equivalents | $ | 179,955 | | | $ | 112,132 | |
| Trade receivables, net | 11,767 | | | 14,092 | |
| Inventories | 32,820 | | | 21,822 | |
| Prepaid expenses and other current assets | 25,691 | | | 35,647 | |
| Derivative assets – current | 7,691 | | | 8,625 | |
| Total current assets | 257,924 | | | 192,318 | |
| Property and equipment, net | 229,405 | | | 190,518 | |
| Right-of-use lease assets | 499,375 | | | 437,843 | |
| Goodwill | 687,368 | | | 681,447 | |
| Intangible assets, net | 166,681 | | | 170,651 | |
| Derivative assets - non-current | 23,519 | | | 31,077 | |
| Other assets | 3,133 | | | 3,961 | |
| Total assets | $ | 1,867,405 | | | $ | 1,707,815 | |
| Current liabilities: | | | |
| Accounts payable and accrued liabilities | $ | 92,550 | | | $ | 80,748 | |
| Accrued payroll and related taxes | 65,096 | | | 62,046 | |
| Lease liabilities – current | 79,306 | | | 79,838 | |
| Current portion of long-term debt and short-term borrowings | 4,500 | | | 50,250 | |
| Total current liabilities | 241,452 | | | 272,882 | |
| Long-term debt, net | 784,593 | | | 783,347 | |
| Lease liabilities – non-current | 419,407 | | | 349,194 | |
| Deferred tax liabilities, net | 27,909 | | | 63,141 | |
| Other liabilities | 17,989 | | | 11,916 | |
| Total liabilities | 1,491,350 | | | 1,480,480 | |
| Commitments and contingencies (see Note 15) | | | |
| Stockholders’ equity: | | | |
Preferred stock, $0.000001 par value, 100,000 and zero shares authorized; zero shares issued and outstanding | — | | | — | |
Common stock, $0.000001 par value, 800,000 and 1,000,000 shares authorized; 160,453 and 141,590 shares issued and outstanding | — | | | — | |
| Additional paid-in capital | 593,109 | | | 226,327 | |
| Accumulated deficit | (247,541) | | | (38,443) | |
| Accumulated other comprehensive income | 30,487 | | | 39,451 | |
| Total stockholders’ equity | 376,055 | | | 227,335 | |
| Total liabilities and stockholders’ equity | $ | 1,867,405 | | | $ | 1,707,815 | |
The accompanying notes are an integral part of these consolidated financial statements.
SAVERS VALUE VILLAGE, INC.
Consolidated Statements of Operations and Comprehensive Income
(All amounts in thousands, except per share amounts)
| | | | | | | | | | | | | | | | | |
| Fiscal Year |
| 2023 | | 2022 | | 2021 |
| Net sales | $ | 1,500,249 | | | $ | 1,437,229 | | | $ | 1,204,124 | |
| Operating expenses: | | | | | |
| Cost of merchandise sold, exclusive of depreciation and amortization | 619,671 | | | 599,926 | | | 474,462 | |
| Salaries, wages and benefits | 366,189 | | | 273,587 | | | 239,806 | |
| Selling, general and administrative | 311,388 | | | 301,737 | | | 260,235 | |
| Depreciation and amortization | 61,144 | | | 55,753 | | | 47,385 | |
| Total operating expenses | 1,358,392 | | | 1,231,003 | | | 1,021,888 | |
| Operating income | 141,857 | | | 206,226 | | | 182,236 | |
| Other (expense) income: | | | | | |
| Interest expense, net | (88,500) | | | (64,744) | | | (53,565) | |
| Gain (loss) on foreign currency, net | 6,660 | | | (20,737) | | | 1,583 | |
| Other income (expense), net | 3,688 | | | 4,576 | | | (4,848) | |
| Loss on extinguishment of debt | (16,626) | | | (1,023) | | | (47,541) | |
| Other expense, net | (94,778) | | | (81,928) | | | (104,371) | |
| Income before income taxes | 47,079 | | | 124,298 | | | 77,865 | |
| Income tax (benefit) expense | (6,036) | | | 39,578 | | | (5,529) | |
| Net income | 53,115 | | | 84,720 | | | 83,394 | |
| Other comprehensive (loss) income, net of tax: | | | | | |
| Foreign currency translation adjustments | (995) | | | 6,514 | | | (161) | |
| Cash flow hedges | (7,969) | | | 18,473 | | | 2,542 | |
| Other comprehensive (loss) income | (8,964) | | | 24,987 | | | 2,381 | |
| Comprehensive income | $ | 44,151 | | | $ | 109,707 | | | $ | 85,775 | |
| Net income per share, basic | $ | 0.35 | | | $ | 0.60 | | | $ | 0.59 | |
| Net income per share, diluted | $ | 0.34 | | | $ | 0.58 | | | $ | 0.57 | |
| Basic weighted average shares outstanding | 151,027 | | 141,561 | | 141,545 |
| Diluted weighted average shares outstanding | 156,156 | | 146,049 | | 145,391 |
The accompanying notes are an integral part of these consolidated financial statements.
SAVERS VALUE VILLAGE, INC.
Consolidated Statements of Stockholders’ Equity
(All amounts in thousands, except per share amounts)
| | | | | | | | | | | | | | | | | | | | | | | | | | | | | | | | | | | | | | | | | | | | | | | | | | | | | | | | | | | |
| Common A units | | Common B units | | Common stock | | Additional
paid in
capital | | Accumulated
deficit | | Accumulated
other
comprehensive
income | | Total |
| Units | | Amount | | Units | | Amount | | Shares | | Amount | | | | |
| Balance at January 2, 2021 | 141,545 | | $ | 223,379 | | | — | | $ | 565 | | | — | | $ | — | | | $ | — | | | $ | (62,102) | | | $ | 12,083 | | | $ | 173,925 | |
| Stock-based compensation expense | — | | — | | | — | | 732 | | | — | | — | | | — | | | — | | | — | | | 732 | |
Dividends declared, $0.38 per share | — | | — | | | — | | — | | | — | | — | | | — | | | (75,000) | | | — | | | (75,000) | |
| Comprehensive income | — | | — | | | — | | — | | | — | | — | | | — | | | 83,394 | | | 2,381 | | | 85,775 | |
| Balance at January 1, 2022 | 141,545 | | 223,379 | | | — | | 1,297 | | | — | | — | | | — | | | (53,708) | | | 14,464 | | | 185,432 | |
| Corporate conversion of common units to common stock | (141,545) | | | (223,379) | | | — | | (1,297) | | | 141,545 | | — | | | 224,676 | | | — | | | — | | | — | |
| Stock-based compensation expense | — | | — | | | — | | — | | | — | | — | | | 1,943 | | | — | | | — | | | 1,943 | |
| Stock issued under stock incentive plan, net | — | | — | | | — | | — | | | 45 | | — | | | (292) | | | — | | | — | | | (292) | |
Dividends declared, $0.35 per share | — | | — | | | — | | — | | | — | | — | | | — | | | (69,455) | | | — | | | (69,455) | |
| Comprehensive income | — | | — | | | — | | — | | | — | | — | | | — | | | 84,720 | | | 24,987 | | | 109,707 | |
| Balance at December 31, 2022 | — | | | — | | | — | | | — | | | 141,590 | | | — | | | 226,327 | | | (38,443) | | | 39,451 | | | 227,335 | |
Proceeds from initial public offering, net of underwriting fees and offering costs of $42,473 | — | | — | | | — | | — | | | 18,750 | | — | | | 295,027 | | | — | | | — | | | 295,027 | |
| Stock-based compensation expense | — | | — | | | — | | — | | | — | | — | | | 72,604 | | | — | | | | | 72,604 | |
| Stock issued under stock incentive plans, net | — | | — | | | — | | — | | | 158 | | — | | | (150) | | | — | | | | | (150) | |
| Repurchase of common stock prior to IPO | — | | — | | | — | | | — | | | (45) | | | — | | | (699) | | | — | | | — | | | (699) | |
Dividends declared, $1.32 per share | — | | — | | | — | | — | | | — | | — | | | — | | | (262,213) | | | — | | | (262,213) | |
| Comprehensive income (loss) | — | | — | | | — | | — | | | — | | — | | | — | | | 53,115 | | | (8,964) | | | 44,151 | |
| Balance at December 30, 2023 | — | | $ | — | | | — | | $ | — | | | 160,453 | | $ | — | | | $ | 593,109 | | | $ | (247,541) | | | $ | 30,487 | | | $ | 376,055 | |
The accompanying notes are an integral part of these consolidated financial statements.
SAVERS VALUE VILLAGE, INC.
Consolidated Statements of Cash Flows
(All amounts in thousands)
| | | | | | | | | | | | | | | | | |
| Fiscal Year |
| 2023 | | 2022 | | 2021 |
| Cash flows from operating activities: | | | | | |
| Net income | $ | 53,115 | | | $ | 84,720 | | | $ | 83,394 | |
| Adjustments to reconcile net income to net cash provided by operating activities: | | | | | |
| Stock-based compensation expense | 72,604 | | | 1,943 | | | 732 | |
| Amortization of debt issuance costs and debt discount | 6,051 | | | 4,005 | | | 4,444 | |
| Depreciation and amortization | 61,144 | | | 55,753 | | | 47,385 | |
| Operating lease expense | 119,908 | | | 114,788 | | | — | |
| Deferred income taxes, net | (35,249) | | | 20,261 | | | (21,870) | |
| Loss on extinguishment of debt | 16,626 | | | 1,023 | | | 47,541 | |
| Noncash interest expense | — | | | — | | | 3,417 | |
| Other items | (15,055) | | | 22,795 | | | 1,351 | |
| Changes in operating assets and liabilities: | | | | | |
| Trade receivables | 740 | | | (8,053) | | | 3,878 | |
| Inventories | (10,926) | | | 2,246 | | | 6,091 | |
| Prepaid expenses and other current assets | 3,659 | | | (16,928) | | | (17,998) | |
| Accounts payable and accrued liabilities | 8,154 | | | 6,887 | | | 2,732 | |
| Accrued payroll and related taxes | 2,428 | | | (12,632) | | | 17,984 | |
| Operating lease liabilities | (110,438) | | | (104,685) | | | — | |
| Other liabilities | 2,404 | | | (2,690) | | | (3,319) | |
| Net cash provided by operating activities | 175,165 | | | 169,433 | | | 175,762 | |
| Cash flows from investing activities: | | | | | |
| Purchases of property and equipment | (91,743) | | | (110,173) | | | (40,544) | |
| Purchase of trade name | (650) | | | — | | | — | |
| Settlement of derivative instruments, net | 28 | | | (329) | | | (2,321) | |
| Acquisition of 2nd Ave, net of cash acquired | — | | | — | | | (220,307) | |
| Net cash used in investing activities | (92,365) | | | (110,502) | | | (263,172) | |
| Cash flows from financing activities: | | | | | |
| Proceeds from issuance of long-term debt, net | 529,247 | | | — | | | 817,149 | |
| Principal payments on long-term debt | (547,931) | | | (10,991) | | | (422,755) | |
| Principal payments on long-term debt to related parties | — | | | — | | | (222,910) | |
| Payment of debt issuance costs | (4,359) | | | (626) | | | (20,676) | |
| Prepayment premium on extinguishment of debt | (1,650) | | | (1,023) | | | (14,687) | |
| Prepayment premium on extinguishment of debt to related parties | — | | | — | | | (8,122) | |
| Advances on revolving line of credit | 42,000 | | | 102,000 | | | — | |
| Repayments of revolving line of credit | (84,000) | | | (60,000) | | | — | |
| Dividends paid | (262,235) | | | (69,433) | | | (75,000) | |
| Proceeds from initial public offering, net | 314,719 | | | — | | | — | |
| Payment of offering costs | (9,061) | | | — | | | — | |
| Repurchase of shares and shares withheld to cover taxes | (849) | | | (292) | | | — | |
| Settlement of derivative instrument, net | 8,601 | | | 147 | | | — | |
| Principal payments on finance lease liabilities | (1,526) | | | — | | | — | |
| Net cash (used in) provided by financing activities | (17,044) | | | (40,218) | | | 52,999 | |
| Effect of exchange rate changes on cash and cash equivalents | 2,067 | | | (4,496) | | | (5,533) | |
| Net change in cash and cash equivalents | 67,823 | | | 14,217 | | | (39,944) | |
| Cash and cash equivalents at beginning of period | 112,132 | | | 97,915 | | | 137,859 | |
| Cash and cash equivalents at end of period | $ | 179,955 | | | $ | 112,132 | | | $ | 97,915 | |
| Supplemental disclosures of cash flow information: | | | | | |
| Interest paid on debt | $ | 79,133 | | | $ | 62,157 | | | $ | 45,250 | |
| Income taxes paid, net | $ | 22,480 | | | $ | 31,168 | | | $ | 29,654 | |
| Supplemental disclosure of noncash investing activities: | | | | | |
| Noncash capital expenditures | $ | 5,276 | | | $ | 6,414 | | | $ | 2,891 | |
The accompanying notes are an integral part of these consolidated financial statements.
SAVERS VALUE VILLAGE, INC.
Notes to Consolidated Financial Statements
Note 1. Description of Business and Basis of Presentation
Description of business
Savers Value Village, Inc., a Washington State based company, together with its wholly owned subsidiaries (the “Company”, “we”, “us” or “our”), sells second-hand merchandise primarily in retail stores located in the United States (“U.S.”), Canada and Australia.
Basis of presentation
The accompanying consolidated financial statements include the accounts of the Company and its wholly owned subsidiaries. All intercompany accounts and transactions are eliminated in consolidation. These consolidated financial statements present the results of operations, financial position and cash flows of the Company in accordance with U.S. generally accepted accounting principles (“GAAP”).
The Company reports on a fiscal year basis, which ends on the Saturday nearest December 31. Fiscal year 2023 consisted of the 52 weeks ended December 30, 2023, fiscal year 2022 consisted of the 52 weeks ended December 31, 2022 and fiscal year 2021 consisted of the 52 weeks ended January 1, 2022. All amounts in the Notes to the Consolidated Financial Statements, with the exception of per share amounts, are rounded to the nearest thousand unless otherwise indicated.
Certain prior period information has been reclassified to conform to the current period presentation. The reclassification had no effect on the Company’s consolidated financial position or the consolidated results of operations as previously reported.
Corporate Conversion
On January 7, 2022, S-Evergreen Holding LLC converted into a Delaware corporation and the name of the Company was changed to Savers Value Village, Inc. (the “Corporate Conversion”). In the Corporate conversion, equityholders of S-Evergreen Holding LLC received one share of common stock of Savers Value Village, Inc. for each Class A Unit of S-Evergreen Holding, LLC and corresponding adjustments were made to the Company’s outstanding equity awards.
Reverse stock split
On May 26, 2023, in anticipation of the initial public offering (“IPO”), the Company effectuated a reverse stock split of its then-outstanding common stock, in which each share of pre-split common stock became 0.713506461319705 of a share of post-reverse split common stock (the “Reverse Stock Split”) and corresponding adjustments were made to the Company’s outstanding equity awards. All references to units, per unit, shares and per share amounts for all periods presented in these consolidated financial statements, including amounts in Note 12, have been retrospectively restated to give effect to the Reverse Stock Split.
Initial public offering
The registration statement related to our IPO was declared effective on June 28, 2023, and our common stock began trading on the New York Stock Exchange on June 29, 2023. On July 3, 2023, we completed our IPO for the sale of 18.8 million shares of our common stock, $0.000001 par value per share, at a public offering price of $18.00 per share. Net proceeds to the Company from the IPO were $295.0 million after deducting underwriting discounts and commissions of $22.8 million and offering expenses of $19.7 million.
In addition to the 18.8 million shares sold by the Company, certain funds, investment vehicles or accounts managed or advised by the Private Equity Group of Ares Management Corporation (the “selling stockholders”) sold 6.9 million shares, including 3.3 million shares pursuant to the exercise of the underwriters’ over-allotment option. The Company did not receive any proceeds from sales made by the selling stockholders.
Authorized shares
In connection with the Company’s IPO, the Company filed an amended and restated certificate of incorporation (the “A&R Charter”) on June 29, 2023. The Company also amended and restated its bylaws,
effective as of June 28, 2023. The A&R Charter authorized 800.0 million shares of common stock, par value $0.000001 per share, and 100.0 million shares of preferred stock, par value $0.000001 per share.
Each share of common stock entitles its holder to one vote per share on all matters to be voted on by stockholders and to receive dividends when and as declared by the board of directors from legally available sources, subject to the prior rights of the holders of our preferred stock. Common stockholders are not entitled to preemptive rights and are therefore subject to, and may be adversely affected by, the rights of the holders of shares of any series of preferred stock that the board of directors may designate and issue in the future. In the event of a liquidation, dissolution or winding-up, the assets legally available for distribution to the Company’s stockholders would be distributable ratably among the holders of common stock and any participating preferred stock outstanding at that time after payment of liquidation preferences, if any, on any outstanding shares of preferred stock and payment of claims of creditors.
Impact of the COVID-19 pandemic
In connection with the COVID-19 pandemic, the Company received wage subsidies from the Canadian and Australian governments, which were not loans to the Company. The Company did not receive any wage subsidies during fiscal years 2023 or 2022. During fiscal year 2021, we received a total of $21.7 million in wage subsidies, which are presented as reductions to cost of merchandise sold and salaries, wages and benefits in the Consolidated Statements of Operations and Comprehensive Income of $13.4 million and $8.3 million, respectively. There were no unfulfilled conditions or contingencies related to these subsidies.
Note 2. Summary of Significant Accounting Policies
Use of estimates
The preparation of these consolidated financial statements in conformity with GAAP requires management to make estimates and assumptions that affect the reported amounts of assets and liabilities and disclosure of contingent assets and liabilities at the date of the consolidated financial statements and the reported amounts of revenue and expenses during the reporting periods. These estimates are based on available information and on various other assumptions that are believed to be reasonable under the circumstances. Certain items subject to such estimates and assumptions include, but are not limited to, the valuation of insurance reserves, the valuation of intangibles, the valuation of goodwill, income taxes and stock-based compensation. Actual results could vary from those estimates under different assumptions or conditions.
Foreign currency
The functional currency of the Company’s foreign entities is the local currency of the country in which the entity operates. Assets and liabilities of foreign operations are translated into U.S. dollars, the reporting currency of Savers Value Village, Inc., using rates of exchange in effect at the end of the reporting period. The net gain or loss resulting from translation is shown as a foreign currency translation adjustment and is included in other comprehensive (loss) income in the Consolidated Statements of Operations and Comprehensive Income and in accumulated other comprehensive income on the Consolidated Balance Sheets. Income and expense accounts of the Company’s foreign entities are translated into U.S. dollars using average rates of exchange during the reporting period.
Transaction gains and losses realized upon settlement of foreign currency transactions and remeasurement gains and losses on unsettled foreign currency-denominated balances, as well as realized and unrealized gains and losses on cross currency swaps and forward contracts (see Note 10) are included in gain (loss) on foreign currency, net in the Consolidated Statements of Operations and Comprehensive Income. Aggregate transaction gains (losses) totaled $9.8 million in fiscal year 2023, $(30.0) million in fiscal year 2022 and $(10.4) million in fiscal year 2021.
From time to time, the Company has intercompany loans issued by its foreign subsidiaries. Foreign currency gains and losses related to these intercompany loans are not eliminated during consolidation and are included in gain (loss) on foreign currency, net in the Consolidated Statements of Operations and Comprehensive Income.
Revenue recognition
Retail sales. Revenue is recorded for store sales upon the purchase of merchandise by customers. Sales taxes collected from customers are not considered revenue and are included in accounts payable and accrued liabilities on the Consolidated Balance Sheets until remitted to the taxing authorities.
Revenue is recorded net of coupons, promotional discounts and sales discounts under reward programs. Revenue from gift cards is recognized upon redemption, and estimated breakage is recognized based on redemption data. The Company accounts for outstanding gift card balances as a liability, net of estimated breakage. Gift card liabilities are included in accounts payable and accrued liabilities on the Consolidated Balance Sheets. The Company does not record a sales return reserve as no right of return exists for customers.
Wholesale sales. Sales of residual products are recognized at the point of delivery with no right of return and exclude shipping and handling costs, which are paid by the customer. The Company does not have a significant financing component as customers pay within one year of title transfer.
The following table disaggregates our revenue by retail and wholesale for fiscal years 2023, 2022 and 2021:
| | | | | | | | | | | | | | | | | |
| (in thousands) | Fiscal Year |
| 2023 | | 2022 | | 2021 |
| Retail sales | $ | 1,427,024 | | | $ | 1,365,109 | | | $ | 1,154,891 | |
| Wholesale sales | 73,225 | | | 72,120 | | | 49,233 | |
| Total net sales | $ | 1,500,249 | | | $ | 1,437,229 | | | $ | 1,204,124 | |
Cash and cash equivalents
Cash and cash equivalents consist of cash, demand deposits with banks, proceeds due from credit and debit card transactions and money market funds with maturity dates of three months or less from the date of purchase. The carrying amounts reported for cash and cash equivalents are considered to approximate fair values based upon their short maturities.
The Company’s cash deposits are maintained in accounts primarily with two major financial institutions in the U.S. and Canada. Substantially all the cash on deposit exceeds the federally insured limits for such deposits.
Trade accounts receivable
Trade accounts receivable are recorded at the invoiced amount, net of any allowances. Both trade accounts receivable and the allowance for credit losses relate to wholesale sales.
Inventories
Inventories consist almost entirely of used clothing and other household goods purchased from nonprofit partners. Inventory is valued at the lower of average purchase cost or net realizable value. As of December 30, 2023 and December 31, 2022, there was no allowance for obsolete or excess inventory.
Property and equipment
Property and equipment are stated at historical cost net of accumulated depreciation. Depreciation is calculated using the straight-line method over the estimated useful lives of the assets ranging from 3 to 15 years for furniture, fixtures and equipment. Leasehold improvements are amortized using the straight-line method over the shorter of 7 years or the remaining lease term.
Intangible assets
Intangible assets represent the Company’s trade names and charity licensing agreements. The Company’s trade names, which have indefinite lives, are not amortized, but rather, reviewed for impairment at least annually in the fourth quarter and whenever circumstances indicate the trade names might be impaired. Charity licensing agreements are amortized using the straight-line method over their estimated useful life of 15 years.
For fiscal years 2023, 2022 and 2021, the Company did not identify any triggering events related to the potential impairment of its intangible assets.
Long-lived assets
The carrying value of long-lived assets, consisting of property and equipment, right-of-use lease assets and long-lived intangible assets, are reviewed for impairment when events or changes in circumstances indicate that the carrying amount may not be recoverable. When testing for impairment, we group assets and liabilities at the lowest level for which cash flows are separately identifiable. We then assess the risk of impairment by comparing an estimate of the undiscounted cash flows expected to be generated by the asset group against the carrying value of the asset group. Impairment is indicated when the carrying value of the asset group exceeds the estimated future undiscounted cash flows generated by those assets. When impairment is indicated, the Company records an impairment charge for the difference between the carrying value of the asset group and its estimated fair value. Depending on the asset, estimated fair value may be determined either by use of a discounted cash flow model or by reference to estimated selling values of assets in similar condition.
For fiscal years 2023, 2022 and 2021, the Company did not identify any triggering events related to the potential impairment of its long-lived assets.
Goodwill
Goodwill is reviewed for impairment annually in the Company’s fourth quarter and whenever circumstances indicate goodwill might be impaired. The Company first performs a qualitative assessment, evaluating relevant events and circumstances to determine whether it is more likely than not that the fair value of a reporting unit is less than its carrying amount. If not, no further impairment testing is performed. If the assessment indicates that it is more likely than not, the Company compares the carrying value of the reporting unit to the estimated fair value of the reporting unit, both as of the testing date. If the carrying value of the reporting unit exceeds the estimated fair value, the Company will recognize an impairment charge equal to the amount by which the carrying amount exceeds the reporting unit’s fair value up to but not to exceed the total amount of goodwill allocated to the reporting unit.
The Company’s reporting units are consistent with its operating segments, with goodwill balances allocated entirely to the U.S. Retail and Canada Retail reporting units. There has been no impairment identified during fiscal years 2023, 2022 and 2021.
Insurance reserves
The Company is self-insured for general liability, medical and workers’ compensation and regularly reviews the related insurance reserves and adjusts the balances as necessary. Self-insurance claims filed and claims incurred-but-not-reported are accrued based on management’s estimates of cost by considering historical claims experience, demographic factors, severity factors and other actuarial assumptions. Additionally, the Company reviews specific large insurance claims to determine whether there is a need for any additional accruals. Changes in these assumptions could materially impact the required reserve balances and it is possible that the Company’s actual loss experience could differ materially from recorded insurance reserves.
Current portions of insurance reserves of $3.2 million and $2.3 million are included in accounts payable and accrued liabilities on the Consolidated Balance Sheets and $5.7 million and $5.4 million are included in accrued payroll and related taxes on the Consolidated Balance Sheets as of December 30, 2023 and December 31, 2022, respectively. Non-current insurance reserves of $11.1 million and $8.6 million are included in other liabilities on the Consolidated Balance Sheets as of December 30, 2023 and December 31, 2022, respectively.
Advertising costs
Advertising production costs and media placement costs are expensed the first time the advertisement takes place. Total advertising costs during fiscal years 2023, 2022 and 2021 were $9.0 million, $11.9 million and $10.7 million, respectively, and are included in selling, general and administrative expense in the Consolidated Statements of Operations and Comprehensive Income.
Income taxes
The Company follows the asset and liability method of accounting for income taxes. Under this method, deferred tax assets and liabilities are recognized based on the estimated future tax consequences attributable to differences between the consolidated financial statement carrying amounts of existing assets and liabilities and their respective tax basis. Deferred tax assets and liabilities are measured using enacted tax rates in effect for the year in which those temporary differences are expected to be recovered or settled. The effect on deferred tax assets and liabilities of a change in tax rates is recognized in the period that includes the enactment date. A valuation allowance is established when necessary to reduce deferred income tax assets to the amount more likely than not expected to be realized. Income tax expense represents the current expense incurred for the period plus or minus the change during the period in net deferred tax assets and liabilities.
Section 382 of the Internal Revenue Code and similar state regulations, contain provisions that may limit the net operating loss (“NOL”) carryforwards and other tax attributes available to be used to offset income and tax liabilities in any given year upon the occurrence of certain events, including changes in ownership of more than 50%.
The Company recognizes the effect of income tax positions only if those positions are more likely than not to be sustained. Recognized income tax positions are measured at the largest amount of the benefit that is greater than 50% likelihood of being realized. Changes in recognition or measurement are reflected in the period in which the change in judgment occurs. The Company records interest related to unrecognized tax benefits in interest expense, net and penalties in income tax (benefit) expense in the Consolidated Statements of Operations and Comprehensive Income.
Stock-based compensation
The Company’s stock-based incentive plan allows for the issuance of various types of stock-based awards, including time-based options, performance-based options and restricted stock units (“RSUs”). Options are generally granted with an exercise price equal to the fair value of our common stock. Prior to July 3, 2023, the date we completed our IPO, the fair value of our common stock was established by the Board at the date of the grant. Upon completion of our IPO, the fair value of our common stock is determined based on the closing quoted market price of our common stock on the New York Stock Exchange on the date of grant.
We estimate the fair value of time-based options using the Black-Scholes option-pricing model. We also used the Black-Scholes option-pricing model to determine the grant-date fair value of performance-based options that were tied to the Company’s IPO and a Monte Carlo simulation under the option pricing framework to determine the grant-date fair value of performance-based options subject to market-specific conditions.
We recognize expense for time-based options on a straight-line basis over the requisite service period of the awards. We recognize expense for performance-based options when it is probable that performance conditions will be achieved and recognize the expense on a straight-line basis over any remaining service period.
The fair value of RSUs is estimated based on the fair value of our common stock on the date of grant which in turn is based on the New York Stock Exchange closing price on the date of grant. RSUs are recognized in compensation expense over the service period, which is generally the vesting period. For a more detailed discussion of stock-based compensation, see Note 13.
Derivative instruments
In the normal course of business, the Company uses derivative financial instruments, which may include interest rate swaps, cross currency swaps and foreign exchange forwards and swaps, to hedge against adverse fluctuations in interest rates or foreign exchange rates thereby reducing our exposure to variability in cash flows on our floating-rate debt or from foreign operations.
Derivative instruments are measured at fair value and classified as assets or liabilities, current or non-current, depending on settlement dates of the individual contracts. The accounting for changes in the fair value of a derivative depends on the intended use of the derivative and the resulting designation.
Derivative instruments that are not designated as hedges are intended to economically hedge a portion of our interest rate and foreign exchange risks. Gains and losses from changes in fair value on these derivatives are recorded immediately in other income (expense), net in the Consolidated Statements of Operations and Comprehensive Income.
For derivative instruments designated as cash flow hedges, gains and losses from changes in fair value are initially reported as a component of accumulated other comprehensive income on the Consolidated Balance Sheets and subsequently recognized in earnings. Amounts reported in accumulated other comprehensive income related to derivatives will be reclassified to interest expense, net in the Consolidated Statements of Operations and Comprehensive Income as interest payments are made on the Company’s variable-rate debt.
Realized gains and losses on interest rate swaps with an other-than-insignificant financing element at inception are reported within cash flows from financing activities on the Consolidated Statements of Cash Flows. Realized gains and losses on interest rate swaps without an other-than-insignificant financing element at inception, cross currency swaps and forward contracts are reported within cash flows from investing activities on the Consolidated Statements of Cash Flows.
The Company does not use derivative instruments for trading or speculative purposes and does not use any leveraged derivative financial instruments.
Segment reporting
Operating segments are defined as components of an entity for which discrete financial information is available and is regularly reviewed by the Chief Operating Decision Maker (“CODM”) in making decisions regarding resource allocation and performance assessment. The Company’s CODM is its Chief Executive Officer. The Company has four operating segments, of which two were determined to be reportable segments: U.S. Retail and Canada Retail.
Net income per share
Basic net income per share is computed by dividing net income by the weighted-average number of shares outstanding during the period. Diluted net income per share is computed by giving effect to all potentially dilutive common equivalent shares outstanding for the period. Prior to the Corporate Conversion, the Company computed net income per share based on the number of common units outstanding.
Leases
The Company adopted Accounting Standards Update (“ASU”) No. 2016-02, Leases (Topic 842) (“Topic 842”), as of January 2, 2022 and also adopted all subsequent ASUs related to Topic 842. The Company adopted ASU 2016-02 using the modified retrospective method and elected the transition package of practical expedients, which among other things, allowed it to carry forward the historical lease classification.
The Company leases various real estate, including retail stores, warehouses and office space as well as vehicles. The Company determines if an arrangement is a lease at inception. Operating leases are included in right-of-use (“ROU”) lease assets, lease liabilities—current and lease liabilities – non-current in our Consolidated Balance Sheets. As of December 30, 2023, finance leases of $5.3 million, $1.7 million and $3.6 million were included in property and equipment, net, accounts payable and accrued liabilities, and other liabilities, respectively, in our Consolidated Balance Sheets. Leases with an initial term of 12 months or less are not recorded on the balance sheet and expensed as paid.
Our lease assets and liabilities are recognized at the lease commencement date based on the present value of fixed lease payments over the lease term. As an implicit rate is not provided for most of our leases, we use an incremental borrowing rate which represents the rate used for a secured borrowing of a similar term as the lease. Our real estate leases typically require payment of real estate taxes, common area maintenance and insurance. These components comprise the majority of our variable lease costs and are excluded from the present value of our lease obligations.
The Company’s leases have remaining lease terms of 1 to 16 years. The lease term includes the initial contractual term as well as any options to extend the lease when it is reasonably certain that the Company will exercise that option. The option periods are generally not included in the lease term used to measure our lease liabilities and lease assets upon commencement as exercise of the options is not reasonably certain. We remeasure the lease liability and lease asset when we are reasonably certain to exercise a renewal option. The Company’s lease agreements do not contain any residual value guarantees or material restrictive covenants.
Recently adopted accounting pronouncements
In June 2016, the Financial Accounting Standards Board (“FASB”) issued Accounting Standards Update (“ASU”) 2016-13, Financial Instruments - Credit Losses (Topic 326): Measurement of Credit Losses on Financial Instruments that replaces the existing incurred loss model with an expected credit loss model and requires a financial asset measured at amortized cost to be presented at the net amount expected to be collected. The Company adopted this guidance, and subsequent amendments to this guidance, as of January 1, 2023. The change to an expected credit loss model did not have a material effect on the Company’s consolidated financial statements.
In March 2020, the FASB issued ASU 2020-04, Reference Rate Reform (Topic 848): Facilitation of the Effects of Reference Rate Reform on Financial Reporting. Topic 848 provides relief that, if elected, will ease the potential accounting burden when modifying contracts and hedging relationships that use the London Inter-Bank Offered Rate (“LIBOR”) as a reference rate. In January 2021, the FASB issued ASU 2021-01, Reference Rate Reform (Topic 848): Scope. This ASU clarifies that derivatives affected by the discounting transition are explicitly eligible for certain optional expedients and exceptions under Topic 848. In December 2022, the FASB issued ASU 2022-06, Reference Rate Reform (Topic 848): Deferral of the Sunset Date of Topic 848, which defers the sunset date of Topic 848 from December 31, 2022 to December 31, 2024, after which entities will no longer be permitted to apply the relief in Topic 848. An entity may elect to apply the amendments for contract modifications as of any date from the beginning of an interim period that includes or is subsequent to March 12, 2020, or prospectively from a date within an interim period that includes or is subsequent to March 12, 2020, up to the date that the financial statements are available to be issued. Topic 848 allows for different elections to be made at different points in time.
In accordance with the fallback provisions of our interest rate swap contracts and the discontinuation of LIBOR after June 30, 2023, the reference rate for our interest rate swaps transitioned from LIBOR to Fallback Rate (SOFR) with effect from July 1, 2023. The Company elected to apply the optional expedients under Topic 848 to this change in reference rate and therefore the modified instruments will be accounted for and presented in the same manner as the instruments existing before the modification. This change from LIBOR to Fallback Rate (SOFR) for our interest rate swaps did not have a material impact on the Company’s consolidated financial statements.
Recently issued accounting pronouncements not yet adopted
In November 2023, the FASB issued ASU 2023-07, Segment Reporting (Topic 280): Improvements to Reportable Segment Disclosures. The amendments in this Update require enhanced disclosures about significant expenses on an annual and interim basis for all public entities. The amendments in this Update are effective for fiscal years beginning after December 15, 2023, and interim periods within fiscal years beginning after December 15, 2024. Early adoption is permitted. The Company is currently in the process of evaluating the effects of this pronouncement on its related disclosures.
In December 2023, the FASB issued ASU 2023-09, Income Taxes (Topic 740): Improvements to Income Tax Disclosures. The amendments in this Update require that public business entities on an annual basis disclose specific categories in the rate reconciliation table, provide additional information for reconciling items that meet a quantitative threshold and provide additional information about income taxes paid. The amendments in this Update are effective for annual periods beginning after December 15, 2024. Early adoption is permitted for annual financial statements that have not yet been issued or made available for issuance. The Company is currently in the process of evaluating the effects of this pronouncement on its related disclosures.
Note 3. 2nd Ave. Acquisition
On November 8, 2021, the Company acquired 100% of the equity of Thrift Intermediate Holdings I, Inc. (“2nd Ave”) for cash consideration of $238.5 million (the “2nd Ave. Acquisition”). The Company financed the 2nd Ave. Acquisition with cash on hand and $225.0 million of additional borrowings under the Term Loan Facility.
The 2nd Ave. Acquisition was accounted as a business combination in accordance with Topic 805, Business Combinations, and the purchase price has been allocated to the assets acquired and the liabilities assumed based on their fair value at the acquisition date. The excess of the purchase price over the fair value of the net assets acquired was recorded as goodwill. Goodwill was allocated to the U.S. Retail operating segment and reporting unit.
The Company recognized deferred tax liabilities of $50.0 million relating to the difference between the book basis and the outside tax basis in the acquired partnerships in fiscal year 2021. During the fourth quarter of fiscal year 2022, the Company recognized a measurement period adjustment which reduced the amount of acquired deferred tax liabilities by $6.3 million. The measurement period adjustment is reflected as a reduction to goodwill during the period identified.
In fiscal year 2021, the Company recorded $1.8 million of transaction costs in selling, general and administrative expense in the Consolidated Statements of Operations and Comprehensive Income related to the 2nd Ave. Acquisition. Following the 2nd Ave. Acquisition, the Company recognized an incremental $15.5 million of net sales and $1.2 million of net income attributable to the 2nd Ave. business during fiscal year 2021.
Note 4. Property and Equipment
Property and equipment, net, consisted of the following:
| | | | | | | | | | | |
| (in thousands) | December 30, 2023 | | December 31, 2022 |
| Furniture, fixtures and equipment | $ | 293,041 | | | $ | 230,694 | |
| Leasehold improvements | 116,158 | | | 88,739 | |
| Finance leases | 5,285 | | | — | |
| Total property and equipment | 414,484 | | | 319,433 | |
| Less: accumulated depreciation | 185,079 | | | 128,915 | |
| Total property and equipment, net | $ | 229,405 | | | $ | 190,518 | |
Depreciation expense for fiscal years 2023, 2022 and 2021 was $56.0 million, $49.6 million and $38.1 million, respectively.
Note 5. Goodwill
Changes in the carrying value of goodwill by reportable segments were as follows:
| | | | | | | | | | | | | | | | | |
| (in thousands) | U.S.
Retail | | Canada
Retail | | Total |
| Balance at January 1, 2022 | $ | 421,284 | | | $ | 282,494 | | | $ | 703,778 | |
| Measurement period adjustment | (6,338) | | | — | | | (6,338) | |
| Foreign currency translation effect | — | | | (15,993) | | | (15,993) | |
| Balance at December 31, 2022 | 414,946 | | | 266,501 | | | 681,447 | |
| Foreign currency translation effect | — | | | 5,921 | | | 5,921 | |
| Balance at December 30, 2023 | $ | 414,946 | | | $ | 272,422 | | | $ | 687,368 | |
Note 6. Intangible Assets
The components of intangible assets were as follows:
| | | | | | | | | | | | | | | | | |
| (in thousands) | December 30, 2023 |
Gross carrying
amount | | Accumulated
amortization | | Net carrying
amount |
| Trade names and trademarks | $ | 118,650 | | | $ | — | | | $ | 118,650 | |
| Charity licensing agreements | 68,189 | | | (20,158) | | | 48,031 | |
| Total | $ | 186,839 | | | $ | (20,158) | | | $ | 166,681 | |
| | | | | | | | | | | | | | | | | |
| (in thousands) | December 31, 2022 |
Gross carrying
amount | | Accumulated
amortization | | Net carrying
amount |
| Trade names and trademarks | $ | 118,000 | | | $ | — | | | $ | 118,000 | |
| Charity licensing agreements | 68,309 | | | (15,658) | | | 52,651 | |
| Total | $ | 186,309 | | | $ | (15,658) | | | $ | 170,651 | |
The amortization expense associated with intangible assets was $5.2 million, $6.1 million and $9.2 million for fiscal years 2023, 2022 and 2021, respectively. The estimated aggregate amortization expense of intangible assets for each of the five years commencing after December 30, 2023 is $4.5 million.
Note 7. Indebtedness
Long-term debt consisted of the following:
| | | | | | | | | | | |
| (in thousands) | December 30, 2023 | | December 31, 2022 |
| Senior Secured Notes | $ | 495,000 | | | $ | — | |
| Term Loan Facility | 321,756 | | | 814,687 | |
| Advances on Revolving Credit Facility | — | | | 42,000 | |
| Total face value of debt | 816,756 | | | 856,687 | |
| Less: current portion of long-term debt and short-term borrowings | 4,500 | | | 50,250 | |
| Less: unamortized debt issuance costs and debt discount | 27,663 | | | 23,090 | |
| Long-term debt, net | $ | 784,593 | | | $ | 783,347 | |
In 2023, the Company used the net proceeds from its IPO, the net proceeds from issuing $550.0 million aggregate principal amount of Senior Secured Notes and cash on hand to repay $485.8 million in outstanding borrowings on its Term Loan Facility and $55.0 million aggregate principal amount of its Senior Secured Notes (the “Notes”), and consequently recognized a loss on debt extinguishment of $16.6 million. A $47.5 million loss on debt extinguishment was recorded in 2021 when the Company refinanced its debt and entered into the Senior Secured Credit Facilities consisting of a term loan facility (“Term Loan Facility”) and a revolving credit facility (“Revolving Credit Facility”).
Proceeds from the February 2023 Notes issuance were also used to pay a $262.2 million dividend and a $23.6 million one-time bonus to certain employees and directors participating in our management equity incentive plan who were unable to participate in the dividend. The bonus was recorded in salaries, wages and benefits in the Consolidated Statements of Operations and Comprehensive Income.
Senior Secured Notes
On February 6, 2023, the Company issued $550.0 million of Senior Secured Notes (the “Notes”) at a discount of 2.014%. The Notes bear interest at a fixed rate of 9.75%. Interest began accruing on the date of issuance and the first scheduled interest payment was made on August 15, 2023, with interest due every February 15 and August 15 thereafter through maturity. The Notes are due in full at maturity in April 2028, coterminous with the Term Loan Facility. The Company’s principal subsidiaries in the U.S. are issuers of the Notes. The Notes are fully and unconditionally guaranteed, jointly and severally, on a senior secured basis by most of the Company’s U.S. and Canadian subsidiaries (other than the issuers). The Notes are secured by a first priority lien on substantially all assets of the issuers and guarantors, subject to certain exceptions, on an equal and ratable basis with indebtedness under the Term Loan Facility. The Notes rank pari passu with the Term Loan Facility in right of payment and are subordinated to our existing super-priority Revolving Credit Facility in right of payment.
Prior to February 15, 2025, we may redeem the Notes at any time, in whole or in part, at a price equal to 100% of the principal amount of such Notes, plus a make-whole premium, plus accrued and unpaid interest. We may also redeem (a) up to an aggregate of 40% of the principal amount of the Notes with the proceeds of certain equity offerings at a redemption price of 109.750% of the principal amount of Notes redeemed, plus accrued and unpaid interest, and (b) up to 10% of the then outstanding aggregate principal amount of the Notes during each of the twelve-month periods ending after February 6, 2023, at a redemption price equal to 103% of the aggregate principal amount thereof, plus accrued and unpaid interest.
On or after February 15, 2025, we may redeem the Notes in whole or in part at the redemption prices set forth below, plus accrued and unpaid interest:
| | | | | | | | |
| For the period | | Redemption Price |
| February 15, 2025 through February 14, 2026 | | 104.875 | % |
| February 15, 2026 through February 14, 2027 | | 102.438 | % |
| On or after February 15, 2027 | | 100.000 | % |
If a change in control occurs, we will be required to repurchase the Notes at a purchase price equal to 101% of the principal amount of the Notes, plus accrued and unpaid interest.
The indenture, pursuant to which the Notes were issued, contains customary affirmative and negative covenants, which are similar in scope to those in the Senior Secured Credit Facilities (see below), although there are no financial maintenance covenants in the indenture governing the Notes. Certain covenants may be suspended in the event the Notes are assigned an investment grade rating from two of three rating agencies.
On March 4, 2024, the Company redeemed $49.5 million aggregate principal amount of Senior Secured Notes, equal to 10% of the outstanding balance at December 30, 2023. In addition to paying accrued interest, the Company paid a premium of 3%, or $1.5 million, on the partial redemption. This transaction resulted in a loss on extinguishment of debt of $3.4 million.
Senior Secured Credit Facilities
The Company’s principal subsidiaries in the U.S. and Canada are borrowers under the Senior Secured Credit Facilities and most of the Company’s U.S. and Canadian subsidiaries are guarantors. The Senior Secured Credit Facilities are secured by a first priority lien on substantially all assets of the borrowers and guarantors, subject to certain exceptions. The Revolving Credit Facility is senior to the Term Loan Facility in right of payment.
The Senior Secured Credit Facilities have customary affirmative and negative covenants, including restrictions on our ability to incur additional indebtedness, incur liens, make investments, make restricted payments (including restrictions on the payment of dividends), make optional prepayments on junior financings, engage in transactions with affiliates and make asset sales, in each case subject to customary exceptions and baskets.
The Senior Secured Credit Facilities also have a customary uncommitted incremental facility of (i) the greater of $136.0 million or EBITDA for the prior four fiscal quarters plus (ii) additional amounts based on the Company’s net leverage ratio or interest coverage ratio plus (iii) certain specific additional amounts.
On January 30, 2024, the Company entered into an amendment (the “Third Amendment”) to its Senior Secured Credit Facilities. Among other things, the Third Amendment (i) removes the SOFR adjustment margin, (ii) reduces the margin on existing borrowings under the Term Loan Facility from a range of 4.25% to 5.50% to a range of 2.75% to 4.00%, (iii) revises the leverage-based pricing grid applicable to borrowings under the Term Loan Facility such that, among other things, a lower leverage ratio than was previously required is needed to obtain a 0.25% reduction in margin, (iv) provides for a 0.25% reduction of the margin applicable to term loan borrowings if the Company achieves certain public corporate family ratings and (v) increases the limit on the customary incremental uncommitted revolving credit facility that does not require consent of the required lenders to the greater of (a) $102.0 million and (b) 50% of EBITDA for the prior four quarters.
On February 9, 2024, the Company achieved the public corporate family ratings required for a 0.25% reduction of the margin applicable to its term loan borrowings.
Term Loan Facility
The Term Loan Facility matures in April 2028. Total principal payments of $1.5 million are due quarterly. The Term Loan Facility bears interest at a variable rate equal to a reference rate plus a margin ranging from 4.25% to 5.50% based on loan type and our first lien net leverage ratio, plus a SOFR adjustment margin ranging from 0.11% to 0.43% based on the applicable interest period (one month, three months or six months).
Beginning in 2023, the Company is required to prepay the Term Loan Facility with a percentage of the Company’s annual excess cash flow if the first lien net leverage ratio is greater than or equal to 3.50 to 1.00. The Company is also required to prepay the Term Loan Facility with a percentage of the net cash proceeds of
certain asset sales, subject to customary reinvestment provisions, when the first lien net leverage ratio is greater than or equal to 3.50 to 1.00. The Company is able to prepay amounts outstanding under the Term Loan Facility without a prepayment premium.
Revolving Credit Facility
The Revolving Credit Facility matures in April 2026. The maximum available amount under the Revolving Credit Facility is $75.0 million, with $60.0 million available for letters of credit and a swingline sublimit of $10.0 million. As of December 30, 2023, there were no advances on the Revolving Credit Facility, there were $1.2 million of letters of credit outstanding and $73.8 million was available to borrow.
The interest rate on revolver draws is variable at a rate equal to the reference rate plus a margin of 2.00% or 3.00% based on loan type. The weighted average interest rate on borrowings outstanding under the Revolving Credit Facility at December 31, 2022 was 9.75%. A 0.5% commitment fee is payable quarterly on the unused portion of the Revolving Credit Facility.
The Revolving Credit Facility is subject to a financial maintenance covenant that requires us to maintain a maximum first lien net leverage ratio, tested quarterly. The financial maintenance covenant is only applicable if the aggregate amount of revolving loans, swingline loans and letters of credit outstanding under the Revolving Credit Facility (excluding up to $20 million of undrawn letters of credit and certain other amounts) exceeds 35% of the committed amount. The Revolving Credit Facility provides for customary equity cure rights.
Aggregate principal payments
Aggregate minimum principal payments on debt as of December 30, 2023 are as follows: | | | | | |
| (in thousands) | |
| 2024 | $ | 4,500 | |
| 2025 | 7,500 | |
| 2026 | 6,000 | |
| 2027 | 6,000 | |
| 2028 | 792,756 | |
| $ | 816,756 | |
Related party debt All related party debt was paid off in April 2021. Prior to April 2021, the company had debt arrangements with the Ares Funds, a term we use to describe certain funds, investment vehicles or accounts managed or advised by the Private Equity Group of Ares Management Corporation (who, prior to our IPO, indirectly owned substantially all of our outstanding shares of common stock). Interest expense on related party debt was $11.0 million in fiscal year 2021.
Note 8. Fair Value Measurements
The Company utilizes fair value measurements for its financial assets and financial liabilities and fair value measurements of nonfinancial items that are recognized or disclosed at fair value in the financial statements on a recurring basis. Fair value is based upon a hierarchy that prioritizes the inputs to valuation techniques used to measure fair value. The hierarchy gives the highest priority to unadjusted quoted prices in active markets for identical assets or liabilities (Level 1 measurements) and the lowest priority to measurements involving significant unobservable inputs (Level 3 measurements). The three levels of the fair value hierarchy are as follows:
•Level 1 inputs are unadjusted quoted prices in active markets for identical assets or liabilities that the Company has the ability to access at the measurement date.
•Level 2 inputs are inputs other than unadjusted quoted prices included within Level 1 that are observable for the asset or liability, either directly or indirectly.
•Level 3 inputs are unobservable inputs for the asset or liability.
The level in the fair value hierarchy within which a fair value measurement in its entirety falls is based on the lowest level input that is significant to the fair value measurement.
The following table presents financial assets and financial liabilities that are measured at fair value on a recurring basis at December 30, 2023:
| | | | | | | | | | | | | | | | | | | | | | | |
| (in thousands) | Fair Value Hierarchy | | Total |
| Level 1 | | Level 2 | | Level 3 | |
| Assets: | | | | | | | |
| Money market funds | $ | 90,000 | | | $ | — | | | $ | — | | | $ | 90,000 | |
| Interest rate swaps | — | | | 10,379 | | | — | | | 10,379 | |
| Cross currency swaps | — | | | 20,831 | | | — | | | 20,831 | |
| | | | | | | |
| Total | $ | 90,000 | | | $ | 31,210 | | | $ | — | | | $ | 121,210 | |
| Liabilities: | | | | | | | |
| Cross currency swaps | $ | — | | | $ | 466 | | | $ | — | | | $ | 466 | |
| Forward contracts | — | | | 384 | | | — | | | 384 | |
| Total | $ | — | | | $ | 850 | | | $ | — | | | $ | 850 | |
The following table presents financial assets and financial liabilities that are measured at fair value on a recurring basis at December 31, 2022:
| | | | | | | | | | | | | | | | | | | | | | | |
| (in thousands) | Fair Value Hierarchy | | Total |
| Level 1 | | Level 2 | | Level 3 | |
| Assets: | | | | | | | |
| Interest rate swaps | $ | — | | | $ | 16,472 | | | $ | — | | | $ | 16,472 | |
| Cross currency swap | — | | | 22,993 | | | — | | | 22,993 | |
| Forward contracts | — | | | 237 | | | — | | | 237 | |
| Total | $ | — | | | $ | 39,702 | | | $ | — | | | $ | 39,702 | |
| Liabilities: | | | | | | | |
| Cross currency swaps | $ | — | | | $ | 66 | | | $ | — | | | $ | 66 | |
| Forward contracts | — | | | 14 | | | — | | | 14 | |
| Total | $ | — | | | $ | 80 | | | $ | — | | | $ | 80 | |
Money market funds consist of short-term deposits with an original maturity of three months or less. Interest rate swaps, cross currency swaps and forward contracts are fair valued using independent pricing services and the Company obtains an understanding of the methods used in pricing. As such, these derivative instruments are classified within Level 2.
There were no transfers of financial assets or liabilities between Level 1, Level 2 or Level 3 for fiscal year 2023 or fiscal year 2022.
As of December 30, 2023, the fair value of the Company’s Senior Secured Notes, based on Level 1 inputs, was $525.5 million.
The fair value of borrowings under the Company’s Senior Secured Credit Facilities approximate their carrying value as the current rates approximate rates on similar debt and were based on rate notices provided by the Administrative Agent (Level 2 inputs) at December 30, 2023 and December 31, 2022 (see Note 7).
Note 9. Leases
The components of total lease costs, net, consisted of the following:
| | | | | | | | | | | |
| Fiscal Year |
| (in thousands) | 2023 | | 2022 |
| Operating lease costs | $ | 119,908 | | | $ | 114,788 | |
| Short-term and variable lease costs | 41,559 | | | 48,812 | |
| Sublease income | (2,703) | | | (2,510) | |
| Finance lease costs: | | | |
| Amortization of lease assets | 1,152 | | | — | |
| Interest on lease obligations | 247 | | | — | |
| Total lease costs, net | $ | 160,163 | | | $ | 161,090 | |
Rent expense, prior to the adoption of Topic 842, was $95.3 million for fiscal year 2021.
The maturities of our lease obligations at December 30, 2023 were as follows:
| | | | | | | | | | | | | | | | | |
| (in thousands) | Operating Leases | | Finance Leases | | Total |
| 2024 | $ | 108,706 | | $ | 1,655 | | $ | 110,361 |
| 2025 | 120,085 | | 1,304 | | 121,389 |
| 2026 | 97,402 | | 1,002 | | 98,404 |
| 2027 | 81,526 | | 837 | | 82,363 |
| 2028 | 61,908 | | 774 | | 62,682 |
| Thereafter | 208,164 | | 1,187 | | 209,351 |
| Total undiscounted payments | 677,791 | | 6,759 | | 684,550 |
| Less: Interest | 179,078 | | 1,474 | | 180,552 |
| Present value of lease obligations | $ | 498,713 | | $ | 5,285 | | $ | 503,998 |
| Weighted average remaining lease term (years) | 6.94 | | 1.50 | | |
| Weighted average discount rate | 8.53 | % | | 5.16 | % | | |
Supplemental cash flow information related to leases is as follows:
| | | | | | | | | | | |
| Fiscal Year |
| (in thousands) | 2023 | | 2022 |
| Cash paid for amounts included in the measurement of lease obligations | | | |
| Operating cash flows for operating leases | $ | 112,139 | | | $ | 105,359 | |
| Operating cash flows for finance leases | 247 | | | — | |
| Financing cash flows for finance leases | 1,526 | | | — | |
| Noncash investing activities | | | |
| Assets obtained in exchange for new operating lease obligations | $ | 145,206 | | | $ | 70,425 | |
| Assets obtained in exchange for new finance lease obligations | 3,517 | | | — | |
Note 10. Derivative Financial Instruments
As a result of its operating and financing activities, the Company is exposed to market risks from changes in interest and foreign currency exchange rates. These market risks may adversely affect the Company’s operating results, cash flows and financial position. The Company seeks to manage risk from changes in interest and foreign currency exchange rates through the use of derivative financial instruments. Derivative contracts are not collateralized and are entered into with large, reputable financial institutions that are monitored for counterparty risk. Refer to Note 8 for information on the fair value of our derivative instruments.
Foreign currency contracts
The Company operates in foreign countries, which exposes it to market risk associated with foreign currency exchange rate fluctuations. The Company uses derivative financial instruments to manage its exposure to foreign currency exchange rate risk, specifically U.S. Dollar (“USD”) – Canadian Dollar (“CAD”) cross currency swaps and forward sales of CAD. These instruments lock in the exchange rate for a portion of the estimated cash flows of the Company’s Canadian operations. As of December 30, 2023 and December 31, 2022, cross currency swaps with notional amounts of $275.0 million were outstanding. Additionally, as of December 30, 2023 and December 31, 2022, the Company’s forward contracts had USD equivalent gross notional amounts of $33.2 million and $42.1 million, respectively.
Interest rate swap contracts
The Company’s market risk is affected by changes in interest rates. The Company’s Senior Secured Credit Facilities bear interest based on market rates plus an applicable spread. Because the interest rate on the Company’s floating-rate debt is tied to market rates, the Company manages its exposure to interest rate movements by effectively converting a portion of its floating-rate debt to fixed-rate debt. Interest rate swaps involve the receipt of variable amounts from a counterparty in exchange for the Company making fixed-rate payments over the life of the agreement without exchange of the underlying notional amount.
The Company has agreements with each of its derivative counterparties that contain a provision whereby the Company could be declared in default on its derivative obligations if repayment of the underlying indebtedness is accelerated by the lender due to the Company’s default on its indebtedness.
At December 30, 2023 and December 31, 2022, interest rate swaps with notional amounts of $275.0 million were outstanding.
The fair values of cross currency swap contracts, forward contracts and interest rate swap contracts were as follows:
| | | | | | | | | | | | | | | | | | | | |
| (in thousands) | | Balance Sheet Location | | December 30, 2023 | | December 31, 2022 |
| Derivatives not designated as hedging instruments: | | | | | | |
| Forward contracts | | Derivative asset – current | | $ | — | | | $ | 237 | |
| Cross currency swaps | | Derivative asset – current | | — | | | 6 | |
| Cross currency swaps | | Derivative asset – non-current | | 20,831 | | | 22,987 | |
| Total derivatives in an asset position | | | | $ | 20,831 | | | $ | 23,230 | |
| Forward contracts | | Accounts payable and accrued liabilities | | $ | 384 | | | $ | 14 | |
| Cross currency swaps | | Accounts payable and accrued liabilities | | 466 | | | 66 | |
| Total derivatives in a liability position | | | | $ | 850 | | | $ | 80 | |
| Derivatives designated as hedging instruments: | | | | | | |
| Interest rate swaps | | Derivative asset – current | | $ | 7,691 | | | $ | 8,382 | |
| Interest rate swaps | | Derivative asset – non-current | | 2,688 | | | 8,090 | |
| Total derivatives in an asset position | | | | $ | 10,379 | | | $ | 16,472 | |
| | | | | | |
| | | | | | |
| | | | | | |
| Total deferred gain | | Accumulated other comprehensive income | | $ | 13,045 | | | $ | 21,014 | |
The impact of derivative financial instruments on the Consolidated Statements of Operations and Comprehensive Income were as follows:
| | | | | | | | | | | | | | | | | |
| (in thousands) | Fiscal Year |
| 2023 | | 2022 | | 2021 |
| (Loss) gain on forward contracts recognized in gain (loss) on foreign currency, net | $ | (373) | | | $ | 802 | | | $ | (575) | |
| (Loss) gain on cross currency swaps recognized in gain (loss) on foreign currency, net | $ | (2,770) | | | $ | 8,416 | | | $ | 12,594 | |
| Gain (loss) on interest rate swaps recognized in interest expense, net | $ | 11,110 | | | $ | 2,169 | | | $ | (214) | |
The table below presents the effect of cash flow hedge accounting on other comprehensive (loss) income, net of tax:
| | | | | | | | | | | | | | | | | |
| (in thousands) | Fiscal Year |
| 2023 | | 2022 | | 2021 |
| Amount of gain recognized in other comprehensive (loss) income | $ | 3,141 | | | $ | 20,678 | | | $ | 1,994 | |
| Amount of gain (loss) reclassified from accumulated other comprehensive income into income | $ | 11,110 | | | $ | 2,205 | | | $ | (548) | |
Amounts reclassified from accumulated other comprehensive income into income are recognized in interest expense, net in the Consolidated Statements of Operations and Comprehensive Income. Within the next 12 months, the Company estimates that an additional $10.1 million of gains recognized within accumulated other comprehensive income will be reclassified as a decrease in interest expense.
Note 11. Segment Information
The Company has two reportable segments, U.S. Retail and Canada Retail. In addition to its two reportable segments, the Company has retail stores in Australia and wholesale operations, both of which are classified within Other.
The Company evaluates the performance of its segments based on Segment Profit, which it defines as operating income, exclusive of corporate overhead and allocations, asset impairments as applicable, and certain separately disclosed unusual or infrequent items. Segment Profit, as defined herein, may not be comparable to similarly titled measures used by other entities. These measures should not be considered as alternatives to our GAAP measures of Operating income, Net income, or cash flows from operating activities as an indicator of the Company’s performance or as a measure of its liquidity.
Our segment results were as follows:
| | | | | | | | | | | | | | | | | |
| Fiscal Year |
| (in thousands) | 2023 | | 2022 | | 2021 |
| Net sales: | | | | | |
| U.S. Retail | $ | 780,126 | | | $ | 747,397 | | | $ | 644,182 | |
| Canada Retail | 605,630 | | | 582,944 | | | 481,559 | |
| Other | 114,493 | | | 106,888 | | | 78,383 | |
| Total net sales | $ | 1,500,249 | | | $ | 1,437,229 | | | $ | 1,204,124 | |
| Segment profit: | | | | | |
| U.S. Retail | $ | 198,146 | | | $ | 181,664 | | | $ | 166,988 | |
| Canada Retail | 189,899 | | | 173,917 | | | 148,137 | |
| Other | 39,572 | | | 33,395 | | | 16,235 | |
| Total segment profit | 427,617 | | | 388,976 | | | 331,360 | |
| General corporate expenses | 224,616 | | | 126,997 | | | 101,739 | |
| Depreciation and amortization | 61,144 | | | 55,753 | | | 47,385 | |
| Operating income | 141,857 | | | 206,226 | | | 182,236 | |
| Interest expense | (88,500) | | | (64,744) | | | (53,565) | |
| Gain (loss) on foreign currency, net | 6,660 | | | (20,737) | | | 1,583 | |
| Other income (expense), net | 3,688 | | | 4,576 | | | (4,848) | |
| Loss on extinguishment of debt | (16,626) | | | (1,023) | | | (47,541) | |
| Income before income taxes | 47,079 | | | 124,298 | | | 77,865 | |
| Income tax (benefit) expense | (6,036) | | | 39,578 | | | (5,529) | |
| Net income | $ | 53,115 | | | $ | 84,720 | | | $ | 83,394 | |
We do not separately present assets, depreciation expense or amortization expense for our reportable segments because the Company’s CODM does not review these amounts on a regular basis and because depreciation expense and amortization expense are excluded from segment profit. The Company’s long-lived assets are primarily located in the U.S. and Canada, with a portion located in Australia. The locations of our long-lived assets consisted of the following:
| | | | | | | | | | | |
| (in thousands) | December 30, 2023 | | December 31, 2022 |
| U.S. | $ | 453,446 | | | $ | 381,151 | |
| Canada | 302,322 | | | 275,091 | |
| Australia | 21,043 | | | 24,770 | |
| Total long-lived assets | $ | 776,811 | | | $ | 681,012 | |
Long-lived assets reflected above consist of property and equipment, net, ROU lease assets and charity licensing agreements, net.
Note 12. Net Income Per Share
Basic and diluted net income per share were as follows:
| | | | | | | | | | | | | | | | | |
| Fiscal Year |
| (in thousands, except per share data) | 2023 | | 2022 | | 2021⁽¹⁾ |
| Numerator | | | | | |
| Net income | $ | 53,115 | | | $ | 84,720 | | | $ | 83,394 | |
| Denominator | | | | | |
| Basic weighted average common shares outstanding | 151,027 | | | 141,561 | | | 141,545 | |
| Dilutive effect of employee stock options and awards | 5,129 | | | 4,488 | | | 3,846 | |
Diluted weighted average common shares outstanding (1) | 156,156 | | | 146,049 | | | 145,391 | |
| Net income per share | | | | | |
| Basic | $ | 0.35 | | | $ | 0.60 | | | $ | 0.59 | |
| Diluted | $ | 0.34 | | | $ | 0.58 | | | $ | 0.57 | |
________________________________________
(1)Prior to the Corporate Conversion in January 2022, net income per share is computed based on the number of common units outstanding.
(2)For fiscal year 2023, the calculation of diluted net income per share excludes the effect of 790 potential shares of common stock relating to awards of stock options and restricted stock units that, if exercised, would have been antidilutive. For fiscal year 2022, the calculation of diluted net income per share excludes the effect of 636 potential shares of common stock relating to awards of stock options that, if exercised, would have been antidilutive. For fiscal year 2021 there were no stock-based awards that would have had an antidilutive impact.
Note 13. Stock-based Compensation
2019 Management Incentive Plan
On March 28, 2019, the Company adopted the 2019 Management Incentive Plan (the “2019 Plan”) which allows for the issuance of stock options to directors, officers, key employees and other key individuals. Stock options awarded under the 2019 Plan contain both service and performance conditions. Awards issued under the 2019 Plan have a 10-year contractual term. In connection with the adoption of the Omnibus Incentive Compensation Plan (as defined below), the Company ceased issuing awards under the 2019 Plan. As a result, no shares remain available for issuance under the 2019 Plan; however, the 2019 Plan continues to govern awards that are outstanding under it. As of December 30, 2023, 15.5 million shares remain outstanding under the 2019 Plan.
Omnibus Incentive Plan
In connection with the IPO, the Company’s Board of Directors approved the Omnibus Incentive Compensation Plan (the “Omnibus Incentive Plan”), which became effective on June 28, 2023, the date the SEC declared our IPO registration statement on Form S-1 effective.
The Omnibus Incentive Plan allows for issuance of up to 15.0 million new shares of common stock. In addition, should any awards under the 2019 Plan expire, terminate or be canceled, the shares of common stock underlying those awards will become available for issuance under the Omnibus Incentive Plan. Awards under the Omnibus Incentive Plan may be in the form of incentive stock options, nonqualified stock options, stock appreciation rights, stock awards, stock units, other stock based awards and cash awards. Awards issued under the Omnibus Incentive Plan have a maximum contractual term of 10 years. As of December 30, 2023, there were 14.4 million shares available for future issuance under the Omnibus Incentive Plan.
Stock-based compensation
The Company classifies stock-based compensation expense in salaries, wages and benefits expense in the Consolidated Statements of Operations and Comprehensive Income. The Company recognized stock-based compensation expense of $72.6 million, $1.9 million and $0.7 million during fiscal years 2023, 2022 and
2021, respectively. The total tax benefit associated with stock-based compensation for fiscal years 2023, 2022 and 2021 was $7.2 million, $0.4 million and $0.3 million, respectively.
Time-based options
Stock option awards containing only a service condition (“time-based options”) generally vest in equal annual installments over five years from the date of grant, provided the participant continues to be employed by, or provide service to, the Company through each vesting date. Stock-based compensation cost for time-based options is measured at the grant date based on the fair value of the award using the Black-Scholes-Merton option pricing model and is recognized on a straight-line basis over the requisite service period of the award. The Company accounts for forfeitures of time-based options as they occur.
The following assumptions apply to time-based options awarded during fiscal year 2023, 2022 and 2021 under the Black-Scholes-Merton option pricing model:
| | | | | | | | | | | | | | | | | | | |
| Fiscal Year | | |
| 2023 | | 2022 | | 2021 | | |
| Expected volatility | 35.4% to 35.7% | | 32.7% to 39.8% | | 31.3% to 36.2% | | |
| Risk-free interest rate | 3.4% to 4.2% | | 1.8% to 3.6% | | 0.5% to 0.6% | | |
| Expected term (in years) | 6.5 | | 6.5 | | 6.5 | | |
The dividend yield assumption is zero. Although the Company paid a cash dividend in February 2023, December 2022 and November 2021, the Company has no history of making regular dividends, nor does it anticipate paying any cash dividends in the foreseeable future.
The weighted average grant-date fair value of time-based stock options awarded during fiscal year 2023, 2022 and 2021 was $6.01 , $5.70 and $1.22, respectively.
Expected volatility is based on historic share price volatilities of comparable publicly traded companies consistent with the expected term. The risk-free interest rate is based on the U.S. Treasury yield curve in effect at the time of each grant, which corresponds to the expected term of the stock options. Based upon limited exercise history, the Company has elected to use the simplified method for estimating the expected term.The expected term of options granted represents the period of time that options are expected to be outstanding.
The following table summarizes activity related to time-based options:
| | | | | | | | | | | | | | | | | | | | | | | |
| (in thousands, except per share amounts and remaining term) | Number of
options | | Weighted
average
exercise price
per share | | Weighted average remaining contractual term (in years) | | Aggregate
intrinsic value |
| Outstanding at December 31, 2022 | 6,976 | | $ | 4.99 | | | 7.66 | | $ | 60,229 | |
| Granted | 933 | | 13.96 | | | | | |
| Exercised | (186) | | 1.52 | | | | | |
| Forfeited or expired | (193) | | 13.00 | | | | | |
| Outstanding at December 30, 2023 | 7,530 | | 5.99 | | | 6.93 | | 85,774 | |
| Exercisable at December 30, 2023 | 4,063 | | 3.04 | | | 6.16 | | 58,280 | |
The total intrinsic value of time-based options exercised during fiscal years 2023 and 2022 was $2.6 million and $0.9 million, respectively. There were no options exercised during fiscal year 2021. As of December 30, 2023, unrecognized compensation expense related to outstanding time-based options was $11.8 million, which is expected to be recognized over a weighted average remaining vesting period of 3.64 years.
Performance-based options
Stock option awards containing a performance condition (“performance-based options”) vest in 25% increments as performance conditions are achieved through the term of the options. Twenty-five percent of outstanding performance-based options vested upon completion of the Company’s IPO, with the remainder scheduled to vest in equal increments over three years starting on June 30, 2024, provided market-specific
conditions are achieved. Performance-based options are subject to continued employment through the vesting date.
In October 2022, May 2023 and on July 2, 2023, the Company modified the vesting terms of its performance-based options to reflect the vesting terms above. The Company determined that the modified vesting terms constituted modifications under Topic 718 and thus remeasured the fair value of the outstanding performance-based options as of their respective modification dates. Forty-one grantees were affected by the modifications that occurred in October 2022, May 2023 and on July 2, 2023.
Compensation expense for performance-based options is recognized when it is probable that performance conditions will be achieved. The Company accounts for forfeitures of performance-based options as they occur. A Black-Scholes-Merton option pricing model was used to determine the grant-date fair value of the performance-based options that were tied to the Company’s IPO and a Monte Carlo simulation under the option pricing framework was used to determine the grant-date fair value of the performance-based options subject to market-specific conditions.
Upon completion of our IPO on July 3, 2023, we commenced recognition of stock-based compensation for our performance-based options as the underlying performance-based condition was satisfied. During fiscal year 2023, we recognized $28.0 million of expense related to performance-based options that vested upon completion of our IPO and $38.8 million of expense related to amortization of the remaining outstanding performance-based options that are recognized on a graded vesting basis over their expected vesting period.
Black-Scholes-Merton Option Pricing Model
The following assumptions were used to remeasure the fair value of performance-based options resulting from the October 2022 and May 2023 modifications under the Black-Scholes-Merton option pricing model:
| | | | | | | | | | | | | | |
| | Fiscal Year |
| | 2023 | | 2022 |
| Expected volatility | | 35.5% | | 35.1% |
| Risk-free interest rate | | 3.5% | | 3.8% |
| Expected term (in years) | | 6.5 | | 6.5 |
| | | | |
The dividend yield assumption is zero. Although the Company paid a cash dividend in February 2023, December 2022 and November 2021, the Company has no history of making regular dividends, nor does it anticipate paying any cash dividends in the foreseeable future.
The weighted average grant-date fair value of performance-based stock options modified during fiscal years 2023 and 2022 was $16.32 and $13.51, respectively.
Expected volatility is based on historic share price volatilities of comparable publicly traded companies consistent with the expected term. The risk-free interest rate is based on the U.S. Treasury yield curve in effect at the time of each grant, which corresponds to the expected term of the stock options. Based upon limited exercise history, the Company has elected to use the simplified method for estimating the expected term. The expected term of options granted represents the period of time that options are expected to be outstanding.
Monte Carlo Simulation
The following assumptions were used to remeasure the fair value of performance-based options resulting from the July 2023 modifications under the Monte Carlo simulation:
| | | | | | | | |
| | Fiscal Year |
| | 2023 |
| Expected volatility | | 35.0% |
| Risk-free interest rate | | 3.55% to 3.74% |
| Expected term (in years) | | 3.1 to 6.6 |
| | |
The dividend yield assumption is zero. Although the Company paid a cash dividend in February 2023, December 2022 and November 2021, the Company has no history of making regular dividends, nor does it anticipate paying any cash dividends in the foreseeable future.
The weighted average grant-date fair value of performance-based stock options modified during July 2023 was $21.18.
Expected volatility is based on historic share price volatilities of comparable publicly traded companies consistent with the expected term. The risk-free interest rate is based on the U.S. Treasury yield curve in effect at the time of each grant, which corresponds to the expected term of the stock options. Based upon limited exercise history, the Company has elected to use the simplified method for estimating the expected term. The expected term of options granted represents the period of time that options are expected to be outstanding.
The following table summarizes activity related to performance-based options:
| | | | | | | | | | | | | | | | | | | | | | | |
| (in thousands, except per share amounts and remaining term) | Number of
options | | Weighted
average
exercise price
per share | | Weighted average remaining contractual term
(in years) | | Aggregate
intrinsic value |
| Outstanding at December 31, 2022 | 7,948 | | $ | 2.05 | | | 7.02 | | $ | 90,339 | |
| | | | | | | |
| | | | | | | |
| | | | | | | |
| Outstanding at December 30, 2023 | 7,948 | | 2.05 | | | 5.78 | | 121,750 | |
| Exercisable at December 30, 2023 | 1,987 | | 2.05 | | | 5.78 | | 30,438 | |
No performance-based options were exercised during fiscal years 2023, 2022 and 2021. The Company did not award performance-based options during fiscal years 2023 and 2022. As of December 30, 2023, unrecognized compensation expense related to outstanding performance-based options was $87.5 million, which is expected to be recognized over a weighted average remaining vesting period of 2.50 years.
Restricted Stock Units
Restricted stock units (“RSUs”) containing only a service condition generally vest in equal annual installments over a one-year or three-year period from the date of grant, provided the participant continues to be employed by, or provide service to, the Company through each vesting date. The fair value of the RSUs is determined by using the closing price of the Company’s common stock on the date of the grant. All RSUs were granted after the Company’s common stock commenced trading on June 29, 2023.
The following table summarizes activity related to RSUs as of December 30, 2023:
| | | | | | | | | | | | | | |
| (in thousands, except per share amounts) | | Number of units | | Weighted average
grant-date
fair value
per share |
| Unvested at December 31, 2022 | | — | | | $ | — | |
| Granted | | 562 | | | 22.82 | |
| | | | |
| Forfeited or expired | | (15) | | | 22.91 | |
| Unvested at December 30, 2023 | | 547 | | | 22.81 | |
As of December 30, 2023, unrecognized compensation expense related to outstanding RSUs was $10.1 million, which is expected to be recognized over a weighted average remaining vesting period of 2.40 years.
Note 14. Income Taxes
Income before income taxes consisted of the following:
| | | | | | | | | | | | | | | | | |
| Fiscal Year |
| (in thousands) | 2023 | | 2022 | | 2021 |
| U.S. operations | $ | (2,940) | | | $ | 103,902 | | | $ | 86,828 | |
| Foreign operations | 50,019 | | | 20,396 | | | (8,963) | |
| Income before income taxes | $ | 47,079 | | | $ | 124,298 | | | $ | 77,865 | |
Components of income tax (benefit) expense are summarized as follows:
| | | | | | | | | | | | | | | | | |
| Fiscal Year |
| (in thousands) | 2023 | | 2022 | | 2021 |
| Current: | | | | | |
| U.S. - federal | $ | 8,280 | | | $ | 354 | | | $ | (21) | |
| U.S. - state | 6,232 | | | 3,279 | | | 4,661 | |
| Foreign | 14,838 | | | 15,401 | | | 11,701 | |
| Deferred: | | | | | |
| U.S. - federal | (19,480) | | | 16,934 | | | (7,257) | |
| U.S. - state | (13,156) | | | 4,074 | | | (7,223) | |
| Foreign | (2,750) | | | (464) | | | (7,390) | |
| Income tax (benefit) expense | $ | (6,036) | | | $ | 39,578 | | | $ | (5,529) | |
The tax effects of temporary differences that give rise to significant portions of deferred tax assets and liabilities are as follows for the consolidated taxable entities at December 30, 2023 and December 31, 2022:
| | | | | | | | | | | |
| (in thousands) | December 30, 2023 | | December 31, 2022 |
| Deferred tax assets: | | | |
| Net operating loss carryforwards | $ | 1,142 | | | $ | 2,197 | |
| | | |
| Lease liability | 129,486 | | | 106,270 | |
| | | |
| Insurance reserves | 4,935 | | | 4,235 | |
| Employment tax credits | — | | | 3,208 | |
| Deferred interest | 16,116 | | | 17,392 | |
| Deferred payroll | 13,062 | | | 6,572 | |
| Sec. 267 Deferred Basis | 8,493 | | | 8,776 | |
| Unrealized foreign exchange loss | 4,033 | | | 6,957 | |
| Other | 6,547 | | | 7,143 | |
| Deferred tax assets, exclusive of valuation allowance | 183,814 | | | 162,750 | |
| Less: valuation allowance | 5,927 | | | 8,923 | |
| Deferred tax assets, net | 177,887 | | | 153,827 | |
| Deferred tax liabilities: | | | |
| Property and equipment depreciation and amortization | 19,407 | | | 16,636 | |
| Leasehold interests | 3,856 | | | 3,930 | |
| Charity licensing agreements | 12,418 | | | 11,695 | |
| Trade names and trademarks | 28,753 | | | 23,902 | |
| Partnership tax deferral | 2,037 | | | 5,075 | |
| ROU asset | 125,937 | | | 103,297 | |
| Unrealized foreign exchange gain | 4,405 | | | 4,909 | |
| Partnership basis | — | | | 41,985 | |
| Inventory | 3,116 | | | — | |
| Other | 5,867 | | | 5,539 | |
| Deferred tax liabilities | 205,796 | | | 216,968 | |
| Deferred tax liabilities, net | $ | 27,909 | | | $ | 63,141 | |
As of December 30, 2023 and December 31, 2022, the Company did not have U.S. federal net operating loss carryforwards and had $10.0 million and $24.6 million, respectively, of U.S. state net operating loss carryforwards. These net operating loss carryforwards expire between 2024 and 2041. As of December 30, 2023, the Company had $0.3 million of federal foreign tax credit, no federal R&D credits and no other federal tax credits. As of December 31, 2022, the Company had no federal foreign tax credit, no federal R&D tax credits and $3.2 million of other federal tax credits that expire between 2039 and 2042.
Section 382 of the Internal Revenue Code and similar state regulations, contain provisions that may limit the NOL carryforwards available to be used to offset income in any given year upon the occurrence of certain events, including changes in the ownership within the meaning of Section 382. The Company reduced its tax attributes (NOLs and tax credits) and generated a limitation on utilization of such attributes resulting from the restructuring of its equity in March 2019 and the purchase by the Ares Funds of all of the Company’s outstanding equity in April 2021.
The Company maintains a valuation allowance of $2.7 million and $3.2 million related to its Canadian and Australian operations, respectively. Valuation allowances are established when necessary to reduce deferred tax assets to the amounts that are more-likely-than-not expected to be realized. Management evaluates and weighs all available positive and negative evidence such as historic results, projected future taxable income, future reversals of existing deferred tax liabilities, as well as prudent and feasible tax-planning strategies. Based upon the level of historical taxable income and projections for future taxable income over the periods in which the deferred tax assets are utilizable, we believe it is more likely than not that the Company will realize the net benefits of its deferred tax assets, other than the deferred tax assets related to the unrealized foreign exchange
loss in Canada and deferred tax assets in Australia for which a valuation allowance has been maintained due to uncertainties relating to their realization..
The differences between income taxes expected by applying the 21% U.S. federal statutory tax rate and the amount of income taxes provided for are as follows:
| | | | | | | | | | | | | | | | | |
| Fiscal Year |
| (in thousands) | 2023 | | 2022 | | 2021 |
| | | | | |
| Tax expense at statutory rate | $ | 9,887 | | | $ | 26,103 | | | $ | 16,352 | |
| Increase (decrease) in income taxes resulting from: | | | | | |
| State taxes net of federal benefit | 4,519 | | | 5,844 | | | 8,828 | |
Tax impact of restructuring(1) | (31,340) | | | — | | | 24,779 | |
| GILTI/FDII | (1,603) | | | (1,114) | | | 2,438 | |
| Foreign rate differential | 2,623 | | | — | | | — | |
| Change in valuation allowance | (2,996) | | | 4,068 | | | (59,527) | |
| Canada Revenue Agency Settlement | — | | | — | | | 973 | |
| Other | 5,386 | | | 7,248 | | | 4,868 | |
| Section 162(m) limitation | 11,229 | | | — | | | — | |
| Tax Credits | (3,741) | | | (2,571) | | | (4,240) | |
| Income tax (benefit) expense | $ | (6,036) | | | $ | 39,578 | | | $ | (5,529) | |
________________________________________(1)In October 2023 the Company underwent an internal legal entity restructuring and in April 2021 the Company restructured its debt.
The following table summarizes the activity related to the Company’s unrecognized tax benefits:
| | | | | | | | | | | | | | | | | |
| Fiscal Year |
| (in thousands) | 2023 | | 2022 | | 2021 |
| Beginning gross unrecognized tax benefits | $ | 1,912 | | | $ | 1,912 | | | $ | 1,545 | |
| Increase related to prior year tax position | — | | | — | | | 367 | |
| Ending gross unrecognized tax benefits | $ | 1,912 | | | $ | 1,912 | | | $ | 1,912 | |
In the normal course of business, the Company is subject to examination by taxing authorities in the countries in which it operates. The Company is currently under audit by several taxing jurisdictions, federal and state. Although the outcome of tax audits is always uncertain, the Company has assessed the probable outcomes and potential exposure and believes that it has provided adequate amounts of tax, interest and penalties for any adjustments that may arise from these open tax years. The Company’s continuing practice is to recognize interest and penalties related to income tax matters in income tax expense in the Consolidated Statements of Operations and Comprehensive Income.
On December 9, 2020, the Company signed a settlement agreement with Canada Revenue Agency to resolve certain income and nonresident withholding tax disputes with respect to tax years 2012–2019. Pursuant to the settlement, the Company had accrued tax and interest of CAD $28.1 million as of January 1, 2022, of which CAD $26.2 million was paid in fiscal year 2021 and CAD $1.9 million was paid in fiscal year 2022.
In October 2023, the Company went through an internal legal entity restructuring. As a result of the restructuring, the Company’s deferred tax liability on the outside basis difference in these partnerships was reduced from $42.0 million as of December 31, 2022, to zero as of December 30, 2023.
As of December 30, 2023, the Company adjusted its deferred tax assets and liabilities to account for the basis differences related to the assets it received in the distribution noted above, including Internal Revenue Code Section 732 basis adjustments to the distributed property. Deferred taxes are not recorded for the distributed non-deductible goodwill. As of December 30, 2023, the Company recognized a deferred tax benefit of $31.3 million for the reduction of the partnership outside basis difference deferred tax liability, combined with any deferred tax assets and deferred tax liabilities recognized on the distributed property.
As of December 30, 2023, the Company had not recognized a deferred tax liability on the excess of the amount for financial reporting over the tax basis in the stock of certain foreign subsidiaries that is essentially
permanent in duration. This amount becomes taxable upon a repatriation of assets from the subsidiaries or a disposal of the subsidiaries. It is not practicable to determine the amount of the related unrecognized deferred income tax liability.
Note 15. Commitments and Contingencies
Litigation and regulatory matters
The Company is involved from time to time in claims, proceedings and litigation arising in the ordinary course of business. The Company has made accruals with respect to these matters, where appropriate, which are reflected in the consolidated financial statements. For some matters, the amount of liability is not probable or the amount cannot be reasonably estimated and therefore accruals have not been made. The Company may enter into discussions regarding settlement of these matters and may enter into settlement agreements, if in the best interest of the Company. From time to time, the Company is involved in routine litigation that arises in the ordinary course of business. There are no pending significant legal proceedings to which the Company is a party for which management believes the ultimate outcome would have a material adverse effect on the Company’s financial position.
Item 9. Changes in and Disagreements With Accountants on Accounting and Financial Disclosures
None.
Item 9A. Controls and Procedures
This Annual Report does not include a report of management’s assessment regarding internal control over financial reporting or an attestation report of the Company’s registered public accountant due to a transition period established by the rules of the SEC for newly public companies.
Evaluation of Disclosure Controls and Procedures
Our management, including our Chief Executive Officer and Chief Financial Officer, evaluated the effectiveness of the design and operation of our disclosure controls and procedures (as defined in Rule 13a-15(e) of the 1934 Act) as of December 30, 2023. Based on the evaluation of the design and operation of our disclosure controls and procedures, our Chief Executive Officer and Chief Financial Officer concluded that our disclosure controls and procedures were not effective as of December 30, 2023 due to certain material weaknesses in our internal control over financial reporting as described below. In light of this fact, our management has performed additional analyses, reconciliations, and other post-closing procedures and has concluded that, notwithstanding the material weaknesses in our internal control over financial reporting, the financial statements for the periods covered by and included in this Annual Report fairly present, in all material respects, our financial position, results of operations and cash flows for the periods presented in conformity with GAAP.
Material weaknesses in internal control over financial reporting
As a public company, we are required to maintain internal control over financial reporting in accordance with applicable rules and guidance and to report any material weaknesses in such internal control over financial reporting. Prior to our IPO, we were a private company with limited accounting personnel and other resources with which to address internal control over financial reporting.
A material weakness is a deficiency, or a combination of deficiencies, in internal control over financial reporting such that there is a reasonable possibility that a material misstatement of our financial statements will not be prevented or detected on a timely basis. In connection with this Annual Report, we identified deficiencies in our internal control over financial reporting, which in the aggregate, constitute material weaknesses related to (i) the sufficiency of technical accounting and SEC reporting expertise within our accounting and financial reporting function, (ii) the establishment and documentation of clearly defined roles within our finance and accounting functions and (iii) our ability to evidence the design and implementation of effective information technology general controls (“ITGCs”) for information systems and applications that are relevant to the preparation of our financial statements.
To address these material weaknesses, we have initiated a plan to hire additional qualified personnel and establish more robust processes to support our internal control over financial reporting, including the documentation of clearly defined roles and responsibilities, and the design and implementation of effective ITGCs. To date, we have hired a director of internal audit, a manager of internal audit and a director of SEC reporting. In addition, we have engaged external advisors who are providing financial accounting assistance and are assisting in evaluating the design, implementation and operating effectiveness of our system of internal control over financial reporting.
If our steps are insufficient to successfully remediate the material weaknesses and otherwise establish and maintain an effective system of internal control over financial reporting, the reliability of our financial reporting, investor confidence in us, and the value of our common stock could be materially and adversely affected. We may not be able to remediate the identified material weaknesses, and additional material weaknesses or significant deficiencies in our internal control over financial reporting may be identified in the future. Effective internal control over financial reporting is necessary for us to provide reliable and timely financial reports and, together with adequate disclosure controls and procedures, are designed to reasonably detect and prevent fraud. Our failure to implement and maintain effective internal control over financial reporting, to remedy identified material weaknesses or significant deficiencies or to implement required new or improved controls could result in errors in our financial statements that could result in a restatement of our financial statements or cause us to fail to timely meet our financial and other reporting obligations.
Changes in Internal Control over Financial Reporting
Other than the changes intended to remediate the material weaknesses noted above, there was no change in our internal controls over financial reporting, as defined under Rule 13a-af(f) under the Exchange Act, that has materially affected, or is reasonably likely to materially affect, our internal controls over financial reporting.
Inherent Limitations Over Internal Controls
Our management, including our Chief Executive Officer and Chief Financial Officer, does not expect that our disclosure controls and procedures or our internal controls will prevent all errors and all fraud. A control system, no matter how well conceived and operated, can provide only reasonable, not absolute, assurance that the objectives of the control system are met. Our control systems are designed to provide such reasonable assurance of achieving their objectives. Further, the design of a control system must reflect the fact that there are resource constraints and the benefits of controls must be considered relative to their costs. Because of the inherent limitations in all control systems, no evaluation of controls can provide absolute assurance that all control issues and instances of fraud, if any, within our Company have been detected. These inherent limitations include, but are not limited to, the realities that judgments in decision-making can be faulty and that breakdowns can occur because of simple error or mistake. Additionally, controls can be circumvented by the individual acts of some persons, by collusion of two or more people, or by management override of the control. The design of any system of controls also is based in part upon certain assumptions about the likelihood of future events and there can be no assurance that any design will succeed in achieving its stated goals under all potential future conditions. Over time, controls may become inadequate because of changes in conditions, or the degree of compliance with policies or procedures may deteriorate. Because of the inherent limitations in a cost-effective control system, misstatements due to error or fraud may occur and not be detected.
Item 9B. Other Information
Rule 10b5-1 Plan Elections
During the fourth quarter of 2023, the adoption or termination of contracts, instructions or written plans for the purchase or sale of our securities by our executive officers and directors, each of which is intended to satisfy the affirmative defense conditions of Rule 10b5-1(c) under the Exchange Act (“Rule 10b5-1 Plan”), were as follows:
Mark Walsh, our CEO and a member of our Board of Directors, entered into a pre-arranged stock trading plan pursuant to Rule 10b5-1 on November 17, 2023. Mr. Walsh’s plan provides for the potential exercise of vested stock options and the associated sale of up to 612,000 shares of Savers common stock. The plan expires on November 22, 2024, or upon earlier completion of all authorized transactions under the plan.
Mindy Geisser, Chief People Services Officer, amended a previously adopted Rule 10b5-1 Plan on November 29, 2023. As of the date of amendment, no shares of common stock had been sold pursuant to the plan. The original plan provided for the sale of up to 104,000 shares of Savers common stock and was set to expire on December 31, 2024, or upon earlier completion of all authorized transactions under the plan. The amended plan, which will become effective only after the required cooling-off period, also provides for the sale of up to 104,000 shares of Savers common stock and has an expiration date of December 31, 2024, or upon earlier completion of all authorized transactions under the plan.
Richard Medway, General Counsel, Chief Compliance Officer and Secretary, amended a previously adopted Rule 10b5-1 Plan on November 20, 2023. As of the date of amendment, no shares of common stock had been sold pursuant to the plan. The original plan provided for the sale of up to 160,004 shares of Savers common stock and was set to expire on December 31, 2024, or upon earlier completion of all authorized transactions under the plan. The amended plan, which will become effective only after the required cooling-off period, also provides for the sale of up to 160,004 shares of Savers common stock and has an expiration date of December 31, 2024, or upon earlier completion of all authorized transactions under the plan.
Item 9C. Disclosure Regarding Foreign Jurisdiction that Prevent Inspections.
None.
Part III
Item 10. Directors, Executive Officers and Corporate Governance
The following table sets forth certain information with respect to our directors and executive officers as of the date of this Annual Report:
| | | | | | | | |
| | |
Name | Age | Position(s) |
Non-Employee Directors: | | |
Aaron Rosen | 42 | Chairman of our Board of Directors |
Robyn Collver | 59 | Director |
William T. Allen | 67 | Director |
Duane C. Woods | 72 | Director |
Aina E. Konold | 55 | Director |
Kristy Pipes | 64 | Director |
Susan O’Farrell | 60 | Director |
Jordan Smith | 36 | Director |
Executive Officers: | | |
Mark Walsh | 62 | Chief Executive Officer and Director |
Jay Stasz | 56 | Chief Financial Officer and Treasurer |
Jubran Tanious | 47 | President and Chief Operating Officer |
Richard Medway | 56 | General Counsel, Chief Compliance Officer and Secretary |
Mindy Geisser | 55 | Chief People Services Officer |
Charles Hunsinger | 56 | Chief Information Officer |
Scott Estes | 47 | Senior Vice President of Finance |
Non-employee directors
Aaron Rosen, a director since April 2019 and the Chairperson of our board of directors since February 2024, is a Partner and Co-Portfolio Manager of Special Opportunities in the Ares Private Equity Group, where he focuses on investing across various Ares fund platforms in the public and private markets. Mr. Rosen serves as a member of the Ares Private Equity Group’s Corporate Opportunities and Special Opportunities Investment Committees. Prior to joining Ares in December 2018, Mr. Rosen had been a Partner and Director of Research at Archview Investment Group, where he focused on credit and equity investments in the U.S. and internationally. Prior to Archview, Mr. Rosen was a Vice President at Citigroup, where he was a founding member of the Citibank Global Special Situations Group focused on U.S. credit and value equity investment strategies. In addition, Mr. Rosen was a member of Citigroup’s Asset-Based Finance group, where he focused on structuring senior secured debt financing for non-investment grade corporate borrowers. He also currently serves on the boards of directors of the parent entities of Virgin Voyages, Consolidated Precision Products, Hornbeck Offshore Services, TriMark USA and WHP Global. Mr. Rosen holds a B.S., summa cum laude, from New York University’s Stern School of Business in Finance and Information Systems, where he received the Valedictorian Award.
Robyn Collver, a director since May 2019, has extensive management and leadership experience. She is the Board Chair of MMBC Recycling Inc. (Recycle BC) and of Multi-Material Stewardship Western Inc., where she also sits on the Governance Committee and Transition Planning Committee. Ms. Collver served as Senior Vice President, ESG and Environmental Strategy Adviser at Canadian Tire Corporation, Limited (CTC), a family of businesses that includes a Retail segment, a Financial Services division and CT REIT until September 2022; prior thereto she was SVP, Regulatory and Chief Sustainability Officer at CTC until January 2022 and before that, SVP, Risk and Regulatory Affairs, having been appointed to that position in March 2015 after serving as Secretary and General Counsel since January 2009. She joined CTC in 2002; prior thereto she was a partner in the corporate and securities group at Cassels, Brock & Blackwell LLP, a Toronto, Canada law firm. Ms. Collver previously served on the boards of Stewardship Ontario, the Alzheimer Society of Toronto, and Automotive Materials Stewardship. Ms. Collver holds a Bachelor of Business Administration from Acadia University and a Bachelor of Laws from the University of Toronto.
William T. Allen, a director since May 2019, has an extensive 30-year background managing businesses and providing leadership to manufacturing operations requiring operational turnarounds, notably as CEO. Amongst industries Mr. Allen has worked in have included nuclear power, oil/petrochemical, automotive, industrial equipment, steel fabrication and plastic injection molding. Mr. Allen served as a director of Schultze Special Purpose Acquisition Corp. from December 2018 until its business combination with Clever Leaves Holdings Inc. in December 2020. Mr. Allen was, until December 2017, CEO of Werner Co., Inc., a leading manufacturer of industrial climbing products, from August 2007, and President and Chairman of the Board from March 2009, until its sale to Triton Funds in July 2017. Mr. Allen currently serves as a member of the board of directors of AQuity Solutions (formerly Mmodal Inc.), a leading provider of clinical documentation technology solutions to the healthcare market, and Schultze Special Purpose Acquisition Corp. II. From December 2017 until July 2018, Mr. Allen also served as a board member of Rockport, a leading provider of men’s and women’s footwear, which filed a voluntary petition for reorganization under Chapter 11 in the U.S. Bankruptcy Court for the District of Delaware and is in the process of being sold through Section 363 of the Bankruptcy Code. He has also held board positions at USI, Arclin, Inc., Constar, Ames Taping Tools, Oriental Trading Company, Hines Nurseries, Inc., Running Aces Harness Park, Wright Line LLC (former CEO), APW Company (former CEO), Chart Industries, Inc. (former CEO) and Millennium Rail, many of which were on behalf of leading alternative investment firms including Ares Management, Black Diamond Capital Management, Oaktree Capital and Crescent Capital Group. In 2012, Mr. Allen received the Pittsburgh Business Times’ Diamond Award as CEO of the Year in the ‘Large for Profit’ category.
Duane C. Woods, a director since May 2019, also served as Chief Executive Officer of us or a predecessor from 2017 to October 2019, when he led the company through a strategic business transformation and complex refinance. He previously served as Vice Chairman of the Board and CEO of Foundation Bank, a privately held state chartered bank in Bellevue, Washington, from October 2015 to September 2016. Since 2015, Mr. Woods has served as a director of RoadRunner Recycling, Inc., an innovative provider of commercial recycling and waste services, and previously served as a director of Pacific Continental Corporation, a publicly traded bank headquartered in Eugene, Oregon, from November 2016 to November 2017. Mr. Woods has more than 30 years of experience in various executive management and leadership roles and over 20 years of experience as a successful lawyer and general counsel. Mr. Woods has proven experience in leading large and small dynamic organizations to achieve consistent profitable growth, operational excellence, productivity, customer service, capital management and innovation.
Aina E. Konold, a director since June 2021, is the Chief Financial Officer of BowFlex Inc., a developer and manufacturer of fitness equipment brands including Bowflex®, Schwinn®, and JRNY®, where she leads the Finance, Strategy, Business Development, and IT functions. On March 4, 2024, BowFlex Inc. and certain of its subsidiaries filed voluntary Chapter 11 bankruptcy petitions within the U.S. Bankruptcy Court for the District of New Jersey. Ms. Konold has over 25 years of global retail, strategy, financial management, and operational experience, with a strong track record of driving growth and optimizing and scaling operating models. Prior to joining BowFlex Inc. in December 2019, Ms. Konold held several executive level positions during her 20-year career with Gap Inc., across financial planning and analysis, controllership, shared services, real estate strategy, and investor relations. From March 2011 until May 2018, she was the founding CFO for Gap Inc. in China, where she led the business through its hyper growth phase and established a scalable business model in a constantly evolving marketplace, particularly in the areas of digital and e-commerce. Ms. Konold holds a B.A. from Stanford University and began her career at PricewaterhouseCoopers.
Kristy Pipes, a director since July 2021, served until April 2019 as Managing Director and Chief Financial Officer of Deloitte Consulting, a management consultancy firm with operations in the United States, India, Germany, and Mexico, where she managed the finance function. Ms. Pipes held various leadership positions, including serving on the firm’s Management Committee and Consulting Operations Committee. Prior to joining Deloitte in 1999, Ms. Pipes was Vice President and Manager, Finance Division, at Transamerica Life Companies and Senior Vice President and Chief of Staff for the President and Chief Executive Officer (among other senior management positions) at First Interstate Bank of California. Ms. Pipes has also served as a director of AECOM since October 2022, ExlService Holdings, Inc. since January 2021, and on the board of trustees of Public Storage since October 2020.
Susan O’Farrell, a director since October 2023, has over 35 years of executive and senior leadership experience. She served as Chief Financial Officer, Principal Accounting Officer and Treasurer at BlueLinx Holdings Inc. (BXC), a wholesale distributor of building and industrial products, from 2014 to 2020. Ms. O'Farrell has been a senior financial executive holding several roles with The Home Depot, a specialty retailer, from 1999 to 2014. Ms. O'Farrell began her career with Andersen Consulting, LLP (now Accenture), leaving as an Associate Partner in 1996 for a strategic information systems role with AGL Resources (now Southern Company Gas). Ms. O'Farrell currently serves on the board of directors and as the Audit Committee Chair of Leslie's, Inc. (LESL), a specialty retailer of pool supplies, since October 2020, and on the board of directors and Audit Committee of National Vision Holdings, Inc. (EYE), an optical retailing company, since February 2024. She also serves on the board of directors of International Women's Forum - Georgia Chapter and previously served on the board of directors of American Trailer World Corp. Ms. O'Farrell is a qualified financial expert and a holder of the CERT Certificate in Cybersecurity Oversight from Carnegie Mellon. Ms. O'Farrell has a B.S. in business administration from Auburn University and completed the Emory Goizueta Executive Leadership Program.
Jordan Smith, a director since February 2024, is a Partner in the Ares Private Equity Group. Prior to joining Ares in 2011, Mr. Smith was an Analyst at Lazard, where he focused on mergers and acquisitions across various industries. Mr. Smith currently serves on the Board of Directors for the parent entities of Cooper's Hawk, LaserAway, Virgin Voyages and WHP Global. Mr. Smith previously served on the Board of Directors for the parent entities of DevaCurl, Farrow & Ball, Insight Global and Valet Living. Mr. Smith holds a B.S. with high honors from the Haas School of Business at the University of California, Berkeley.
Executive officers
Mark Walsh is currently serving as our Chief Executive Officer, a role he has held since October 2019. He also serves as a director on the board of directors, a position he has held since December 2020. After beginning his career at Deloitte Consulting and Pepsico, Mr. Walsh amassed nearly two decades of successful leadership for a wide range of top brands in apparel retailing including J. Crew, Juicy Couture, Prana, Ellen Tracy and Laundry. Prior to joining us, Mr. Walsh served as CEO of Bob’s Stores and Eastern Mountain Sports from 2008 to 2013, prior to returning to the role again from 2015 to May 2017, when the company was renamed Vestis Retail Group. During this period, Mr. Walsh optimized brand and organizational value and retained approximately 400 jobs throughout all stores, as well as managed a Section 363 sale to Versa Capital and subsequent sale to UK-based Sports Direct through a debtor in possession process. Due to these actions, both the Bob’s Stores and Eastern Mountain Sports brands are currently operating today under the Sports Direct corporate umbrella. Mr. Walsh also served as operating Chairman of Polartec from 2012 to 2014. From May 2017 to October 2019, Mr. Walsh pursued personal interests and was an independent consultant focused on special situations and interim turnaround CEO services. Mr. Walsh holds a B.A. from Brown University and an M.B.A. from The Wharton School at the University of Pennsylvania. Mr. Walsh currently serves as a director of Savers Australia Pty Ltd.
Jay Stasz is currently serving as our Chief Financial Officer and Treasurer, a role he has held since July 2022. Mr. Stasz has almost 25 years of finance leadership experience. Prior to assuming the CFO role, Mr. Stasz was Chief Financial Officer of Ollie’s Bargain Outlet (Ollie’s) since January 2018. He also served as Senior Vice President of Finance and Chief Accounting Officer at Ollie’s since November 2015. Before his role at Ollie’s, Mr. Stasz spent 17 years at Gart Sports, which merged with Sports Authority in 2003, where he held a variety of leadership positions including Senior Vice President of Finance & Accounting. He began his career as an accountant in the audit department at Deloitte. Mr. Stasz holds a Bachelor of Science in Accounting from the University of Southern California.
Jubran Tanious is currently serving as our President and Chief Operating Officer and joined us in 2011. In his role he oversees all of Store, Supply, Wholesale and Real Estate Operations. Mr. Tanious has nearly two decades of leadership and general management experience across a variety of operating companies. Prior to assuming the role of COO in November 2019, he served as our Vice President of Supply from January 2017 to October 2019 and was instrumental in transforming the Company’s supply strategy and organization. Prior to that he served as Director of Supply and Regional Director of stores. Prior to Savers, Mr. Tanious served as Director of Business Risk Management for UnitedHealth Group and as Product Marketer for the 3M Company. Early in his career he worked in an Operations Management and Engineering role for the Valspar Corporation. Mr. Tanious holds a Bachelor of Science in Chemical Engineering from the Pennsylvania State University and a Masters of Business Administration from Harvard Business School. Mr. Tanious currently serves as a director of Savers Australia Pty Ltd.
Richard Medway is currently serving as our General Counsel and Chief Compliance Officer and joined us in 2015. In November 2019, he was appointed corporate Secretary. Mr. Medway ensures our compliance with laws and regulations in each of the communities in which we operate, and assists in risk management and government relations as we grow our business and build our partnerships. Additionally, he oversees an in-house legal and risk team which oversees workplace safety, insurance and loss prevention issues. Previously, Mr. Medway served as Vice President, Deputy General Counsel for Nintendo of America and was a partner at Powell Goldstein LLP. Mr. Medway received his Bachelor of Arts from the University of Wisconsin, Madison and holds a Juris Doctor from the Catholic University of America.
Mindy Geisser has served as our Chief People Services Officer since October 2015. Ms. Geisser oversees our benefits, compensation, HR systems, recruitment, training, team member relations, and employee engagement and retention efforts. She also champions our ongoing priority around diversity and inclusion and ensuring a respectful workplace. Ms. Geisser has over three decades of HR generalist and leadership experience for companies including Colliers International, where she was the Chief Human Resources Officer, as well as Slalom Consulting, Amazon.com Inc, and Philips Medical Systems, among others. She received her Bachelor of Arts degree from the University of Wisconsin, Madison, and her Master of Arts in Industrial Relations from the University of Minnesota.
Charles Hunsinger has served as our Chief Information Officer since October 2022. Mr. Hunsinger is a senior technology executive with over 30 years of IT experience in consulting and corporate environments. He has deep industry expertise in retail, e-commerce, direct marketing/catalog, B2B, and wholesale business models. Mr. Hunsinger has held several CIO roles for leading retail and direct marketing organizations. Prior to joining Savers, he was the CIO for the previous six years for Oriental Trading Company, a company held by Berkshire Hathaway. Prior to that, he held CIO roles for Harry and David, Musicians Friend/Guitar Center, and Corporate Express/Staples, and also served as the VP of Customer Technologies for L.L.Bean. Charles started his career in the consulting industry with Accenture, one of the preeminent global business process and technology consulting firms. He holds a BS in Electrical Engineering from the University of Oklahoma.
Scott Estes has served as our Senior Vice President of Finance since July 2022 and joined us in 2015. Prior to this role, Mr. Estes served as our Chief Financial Officer and Treasurer since February 2021. Mr. Estes held the roles of Senior Vice President of Finance from October 2020 to February 2021, Vice President of Finance from November 2018 to October 2020, Director of Finance, FP&A and Treasury from July 2016 to November 2018 and Director of Finance, Australia and Canada, Retail from July 2015 to July 2016. Mr. Estes has over 20 years of finance experience, including leadership positions at Microsoft Corporation and PACCAR Inc., making him uniquely qualified to guide our day-to-day financial operations while establishing strategic long-range plans. Mr. Estes has been instrumental in managing our capital structure and developing a robust customer analytics function. Mr. Estes received his B.A. and M.B.A. from the University of Washington.
Composition and Risk Management Practices
Board Composition
The authorized number of directors comprising our board of directors may not be less than three but not more than eleven, with the actual number to be fixed from time to time by resolution of our board of directors, subject to the terms of our certificate of incorporation, bylaws and the Stockholders Agreement. Our certificate of incorporation provides for a board of directors comprised of three classes of directors, with each class serving a three-year term beginning and ending in different years than those of the other two classes. Only one class of
directors will be elected at each annual meeting of our stockholders, with the other classes continuing for the remainder of their respective three-year terms. Our board of directors is divided among the three classes as follows:
•Our class I directors are Aaron Rosen, Jordan Smith and Susan O’Farrell, and their term expires at the annual meeting of stockholders to be held in 2024.
•Our class II directors are William Allen, Robyn Collver and Mark Walsh, and their term expires at the annual meeting of stockholders to be held in 2025.
•Our class III directors are Duane Woods, Aina Konold and Kristy Pipes, and their term expires at the annual meeting of stockholders to be held in 2026.
Any additional directorships resulting from an increase in the number of directors will be distributed among the three classes so that, as nearly as possible, each class will consist of one-third of the directors. This classification of our board of directors could make it more difficult for a third party to acquire, or discourage a third party from seeking to acquire, control of us.
Pursuant to the Stockholders Agreement, the Ares Funds are entitled to designate individuals to be included in the slate of nominees for election to our board of directors as follows:
•for so long as the Ares Funds own 40% or more of the outstanding shares of our common stock, the greater of up to six directors and the number of directors comprising a majority of our board; and
• except as provided below, for so long as the Ares Funds own less than 40% of the outstanding shares of our common stock and 5% or more of the outstanding shares of our common stock, that number of directors (rounded up to the nearest whole number) that is the same percentage of the total number of directors comprising our board as the collective percentage of common stock owned by the Ares Funds.
Controlled company exemption
We are a “controlled company” under the NYSE rules, and we qualify for the “controlled company” exemption to the board of directors and committee composition requirements under the NYSE rules. Pursuant to this exception, we are exempt from the requirements that (1) our board of directors be comprised of a majority of independent directors, (2) we have a nominating, governance and sustainability committee composed entirely of independent directors and (3) our compensation committee be comprised solely of independent directors. The “controlled company” exemption does not modify the independence requirements for the audit committee, and we intend to continue to comply with the requirements of the Sarbanes-Oxley Act and the NYSE rules, which require that our audit committee be composed of at least three directors, one of whom must be independent upon the listing of our common stock on the NYSE, a majority of whom must be independent and each of whom must be independent within one year from the date of the prospectus filed in connection with our IPO. We may continue to utilize these exemptions as long as we remain a controlled company. As a result, we may not have a majority of independent directors and our nominating, governance and sustainability committee and compensation committee may not consist entirely of independent directors. Accordingly, you may not have the same protections afforded to stockholders of companies that are subject to all of the corporate governance requirements of the NYSE.
If at any time we cease to be a “controlled company” under the NYSE rules, the board of directors will take all action necessary to comply with such rules within the applicable transition periods, including appointing a majority of independent directors to the board and establishing certain committees composed entirely of independent directors.
Board leadership
Our board of directors has no policy with respect to the separation of the offices of Chief Executive Officer and Chairman of the Board. It is our board of directors’ view that rather than having a rigid policy, our board of directors should determine, as and when appropriate upon consideration of all relevant factors and circumstances, whether the two offices should be separate.
Currently, our leadership structure separates the offices of Chief Executive Officer and Chairperson of the Board, with Mr. Walsh serving as our Chief Executive Officer and Mr. Rosen serving as non-executive
Chairperson of the Board. We believe this is appropriate as it provides Mr. Walsh with the ability to focus on our day-to-day operations while Mr. Rosen focuses on the oversight of our board of directors.
Board’s role in risk management
Management is responsible for the day-to-day management of the risks facing our company, while our board of directors, as a whole and through its committees, has responsibility for the oversight of risk management. Our board of directors regularly reviews information regarding our credit, liquidity and operations, as well as the risks associated therewith. Our compensation committee is responsible for overseeing the management of risks relating to our executive compensation plans and arrangements. Our audit committee oversees management of financial and cybersecurity risks. While each committee is responsible for evaluating certain risks and overseeing the management of such risks, our full board of directors keeps itself regularly informed regarding such risks through committee reports and otherwise. We believe that the leadership structure of our board of directors provides appropriate risk oversight of our activities given the controlling interests held by the Ares Funds.
Board Committees
Our board of directors has three standing committees: an audit Committee, a compensation committee and a nominating, governance & sustainability committee, each of which has the composition and responsibilities described below. From time to time, our board of directors may establish other committees to facilitate the management of our business. Our Board has adopted a written charter for each of these committees which satisfies the applicable rules of the SEC and the listing standards of the NYSE. These charters are posted on our corporate website, ir.savers.com, in the Governance section under “Governance Documents”.
Audit Committee
The audit committee consists of three directors: Aina Konold, Robyn Collver and Susan O’Farrell, with Aina Konold serving as chairperson of the committee. Our board of directors has determined that Aina Konold, Robyn Collver and Susan O’Farrell each satisfy the independence requirements for audit committee members under the listing standards of the NYSE and Rule 10A-3 of the Exchange Act. Aina Konold and Susan O’Farrell have each been determined to be an audit committee “financial expert” as defined under SEC rules. All members of the audit committee are able to read and understand fundamental financial statements, are familiar with finance and accounting practices and principles and are financially literate.
The purpose of the audit committee is to assist our board of directors in overseeing (1) the integrity of our financial statements, (2) our compliance with legal and regulatory requirements, including global data privacy and security laws, (3) our independent auditors’ qualifications and independence, (4) the performance of the independent auditors and our internal audit function and (5) our operational and financial risk management process, including with respect to information and cybersecurity risks. The audit committee also prepares the audit committee report as required by the SEC for inclusion in our annual proxy statement.
Compensation Committee
The compensation committee consists of four directors: Aaron Rosen, William Allen, Jordan Smith and Duane C. Woods, with Aaron Rosen serving as chairperson of the committee. We may avail ourselves of the “controlled company” exemption under the NYSE rules which exempts us from the requirement that we have a compensation committee composed entirely of independent directors.
The purpose of the compensation committee is to assist our board of directors in discharging its responsibilities relating to (1) setting our compensation program and compensation of our executive officers and directors, (2) monitoring our incentive and stock-based compensation plans and (3) preparing the compensation committee report required to be included in our proxy statement under the rules and regulations of the SEC.
Nominating, Governance and Sustainability Committee
The nominating, governance and sustainability committee consists of four directors: Robyn Collver, Kristy Pipes, Duane C. Woods and Jordan Smith, with Robyn Collver serving as chairperson of the committee. We may avail ourselves of the “controlled company” exemption under the NYSE rules which exempts us from the requirement that we have a nominating, governance and sustainability committee composed entirely of independent directors.
The purpose of the nominating, governance and sustainability committee is to assist our board of directors in discharging its responsibilities relating to (1) identifying individuals qualified to serve on our Board and (2) recommending to the Board for approval director nominees, in each case consistent with criteria approved by the Board and subject to our certificate of incorporation, bylaws and the Stockholders Agreement, (3) reviewing and recommending to the Board our Corporate Governance Guidelines, (4) overseeing the evaluation of the Board and (5) overseeing our ESG strategies and initiatives.
Compensation Committee Interlocks and Insider Participation
None of our executive officers currently serves, or in the past year has served, as a member of the board of directors or compensation committee of any entity that has one or more executive officers serving on our board of directors or compensation committee. Other than Duane C. Woods, none of the members of the compensation committee is, nor has ever been, an officer or employee of our company.
Code of Ethics
We have adopted a code of business conduct and ethics that applies to all our employees, officers, and directors, including those officers responsible for financial reporting. Our code of business conduct and ethics is available on our website at www.ir.savers.com.
Item 11. Executive Compensation
Overview
On July 3, 2023, we completed our initial public offering ("IPO"). Following our IPO, our non-employee directors (excluding directors employed by Ares or its affiliates) were entitled to the following cash compensation (paid quarterly) during fiscal year 2023:
| | | | | |
| Annual cash retainer | $ | 80,000 | |
| Additional annual retainers | |
| Audit Committee Chairperson | 25,000 | |
| Compensation Committee Chairperson | 15,000 | |
| Nominating, Governance & Sustainability Committee Chairperson | 12,000 | |
Directors are reimbursed for customary expenses for attending Board and Committee meetings. Prior to our IPO, non-employee directors received annual cash retainers of $75,000, with additional retainer fees for the chair of the audit committee equal to $25,000.
Although as a private company we did not have a specific schedule for making equity grants, non-employee directors received grants of stock options from time to time.
Following the IPO, we commenced granting restricted stock units (“RSUs”), including to our non-employee directors. As a result, in connection with the IPO, each non-employee director (excluding directors employed by Ares or its affiliates) received a grant of RSUs in the amounts shown in the table and footnotes below, with vesting based on the director’s continued service until the annual meeting following the grant date of the award. Upon appointment, our new director after the IPO received a pro-rated grant of RSUs.
The following table provides compensation information for our non-employee directors for fiscal year 2023.
| | | | | | | | | | | | | | | | | |
Director Compensation for Fiscal Year 2023 |
Name(1) | Fees Earned or Paid in Cash(2) | Option Awards(3) | Stock Awards(4) | All Other Compensation(5) | Total |
| William T. Allen | $ | 76,250 | | $ | — | | $ | 165,456 | | $ | 186,000 | | $ | 427,706 | |
| Robyn Collver | 79,250 | | — | | 165,456 | | 186,000 | | 430,706 | |
| Aina E. Konold | 82,500 | | 89,183 | | 165,456 | | — | | 337,139 | |
| Susan O'Farrell | — | | — | | 91,982 | | — | | 91,982 | |
| Kristy Pipes | 95,000 | | 89,183 | | 165,456 | | — | | 349,639 | |
| Duane Woods | 76,250 | | — | | 165,456 | | 186,000 | | 427,706 | |
(1)Mr. Walsh did not receive any additional compensation for his service on the Board apart from his compensation as CEO as set forth below in the Summary Compensation Table and so is not included in this table. Our directors who are employed by Ares or its affiliates did not receive compensation from us for their service on the Board and so are not included in this table.
(2)The amounts in this column represent pro-rata pre-IPO and post-IPO annual cash retainers paid to the directors. Although Ms. Collver’s cash compensation was paid in Canadian dollars, the payment due was determined based on the amount of U.S. dollars set forth in this table, and then paid in Canadian dollars using the exchange rate in effect at the time of payment.
(3)The amounts in this column reflect the aggregate grant date fair value of stock options granted during the fiscal year, computed in accordance with FASB ASC 718. During fiscal year 2023, each of Ms. Konold and Ms. Pipes received options to purchase 15,219 shares on February 7, 2023, vesting in five equal annual installments with the first vesting date on February 7, 2024 through February 7, 2028 (with a grant date fair value of $5.86 per share), subject to continued service. For a description of the assumptions used to determine the grant date fair value of our stock options, see Note 13 to the Company’s consolidated financial statements included in the Company’s Annual Report on Form 10-K for fiscal year 2023. As of the last day of fiscal year 2023, the following directors held the following number of outstanding stock options: Ms. Collver, 100,516 options; Mr. Allen, 100,516 options; Mr. Woods, 100,516 options; Ms. Konold 64,910 options; and Ms. Pipes, 64,910 options.
(4)The amounts in this column reflect the aggregate grant date fair value of RSUs granted during the fiscal year, computed in accordance with FASB ASC 718. In connection with our IPO, each then serving non-employee director (excluding directors employed by Ares or its affiliates) received a grant of 7,222 RSUs under the Omnibus Incentive Plan. The grant date fair value for these shares (based on the closing stock price on the grant date) was $22.91 per share. On October 16, 2023, in connection with Ms. O'Farrell’s appointment to the Board of Directors, she received an award of 5,969 RSUs under the Omnibus Incentive Plan, with a grant date fair value of $15.41 per share. For a description of the assumptions used to determine the grant date fair value of our equity awards, see Note 13 to the Company’s consolidated financial statements included in the Company’s Annual Report on Form 10-K for fiscal year 2023. As of the last day of fiscal year 2023, each of: Ms. Collver, Mr. Allen, Mr. Woods, Ms. Konold; and Ms. Pipes had 7,222 RSUs outstanding; and Ms. O’Farrell had 5,969 RSUs outstanding.
(5)The amounts set forth in this column reflect special compensation paid while we were a private company in connection with the Company's issuance of $550.0 million senior secured notes on February 6, 2023.
Compensation Discussion and Analysis
Our Compensation Discussion and Analysis (“CD&A”) discusses the compensation earned by for our Named Executive Officers ("NEOs") for fiscal year 2023: Mark Walsh, Chief Executive Officer and Director; Jay Stasz, Chief Financial Officer and Treasurer; Jubran Tanious, President and Chief Operating Officer; Richard Medway, General Counsel, Chief Compliance Officer and Secretary; and Mindy Geisser, Chief People Services Officer (CPSO). In this CD&A, the “Committee” refers to our Compensation Committee.
Introduction
Each of our NEOs has extensive experience and has an in-depth understanding of our business model and growth strategy. Having a highly engaged senior leadership team with the ability to successfully execute the for-profit thrift business has been critical to our performance. As a private company for much of fiscal year 2023, we believe our executive compensation program during fiscal year 2023 supported the execution of our business model in the following ways:
•recruit and retain talented executives through a combination of fixed and variable compensation;
•reward performance against our business goals through payment of annual incentive bonuses and other periodic discretionary payments; and
•align interests of management with those of our stockholders through the grant of stock options and, following the IPO, RSUs in some cases.
Our compensation program for fiscal year 2023 was aligned with completing our IPO, along with financial performance results.
Following completion of our IPO during fiscal year 2023, we expect to continue to review and evaluate our compensation framework, which may result in future compensation programs that vary from historical practice.
The elements of our 2023 compensation program are discussed further on the following pages.
Fiscal Year 2023 Executive Compensation Program
Our fiscal year 2023 executive compensation program included base salary, annual cash incentives and long-term equity incentives, components which are expected to be part of our post-IPO program, as summarized below.
Salary: The base salary of each named executive officer is intended to align with the scope and complexity of their roles, their relative responsibilities and concerns about retention or recruitment, as applicable. As a private company through mid-2023, our board of directors periodically reviewed the base salaries of our named executive officers to ensure they were appropriate for the role. Base salaries for recently hired NEOs were based on the foregoing factors as well as considerations around the importance of the positions for a then potential IPO and the amounts needed to encourage them to join our company.
Annual Incentive Plan (AIP): For 2023, the board of directors viewed the use of annual cash bonuses as an effective means to compensate the named executive officers for achieving annual financial goals. Pursuant to our annual incentive plan for 2023, our named executive officers generally were eligible for bonus payments after year-end based on the achievement of financial performance criteria.
Equity Incentives: Equity compensation has been an important part of our executive compensation program. Although as a private company through mid-2023 we did not have a specific schedule for making annual grants, all of our NEOs received grants of stock options (in many cases, a combination of time-vesting and performance-vesting options) prior to the IPO.
As a private company through mid-2023, the amount of options granted for each NEO has been based on a combination of subjective factors considered by our board of directors, including past grants, experience and role of the recipient, potential value, dilution, and grant date value.
Grants to recently hired NEOs were determined based on a combination of subjective factors important to a private company at the time of the grant, including the amount needed to encourage executives to join our company, internal pay equity among long-term executives and newly hired executives, market review, potential value to the executives and dilution to our stockholders
Impact of IPO on our Equity Incentives Program: With respect to performance-based stock options granted to our NEOs prior to 2022, 25% of those options became vested on our initial public offering. In addition, as a public company, we may grant different types of equity awards going forward. For example, in 2023 upon completion of our IPO, we commenced granting restricted stock units (RSUs) to some of our employees, including some NEOs.
Our fiscal 2023 program also includes health and welfare, deferred compensation, and retirement benefits, as well as limited perquisites. See Other Compensation Practices and Considerations below.
CEO Compensation
On March 8, 2023, we entered into an amended and restated employment agreement with Mr. Walsh. The amended and restated employment agreement provides for an initial term through December 31, 2025, with automatic 12-month renewals thereafter, unless the term ends earlier due to termination of executive’s employment by either party at any time. Mr. Walsh’s agreement provides for an initial base salary of $964,080
(which may be increased from time to time), a target annual bonus of 100% of base salary and other benefits provided to similarly situated employees.
Our CEO’s fiscal year 2023 target compensation included base salary and cash incentive targets (100% of base salary for fiscal year 2023 annual cash incentive). No equity awards were granted to him during fiscal year 2023, although he has received stock options in prior years.
Base Salary
Base salaries provide competitive, fixed compensation to attract and retain our executives and to reflect individual responsibilities, performance, experience, and value in the marketplace. Base salaries are typically reviewed on an annual basis in connection with individual performance evaluations and may be reviewed in connection with new employment agreements, new positions, or other organizational changes. Salary reviews are based on various factors, including an assessment of individual performance and responsibilities, our prior year performance, contractual obligations, and overall competitiveness of compensation.
| | | | | |
| Base Salaries at Fiscal Year 2023 Year-End | |
| Mark Walsh | $ | 964,080 | |
| Jay Stasz | 489,600 | |
| Jubran Tanious | 519,750 | |
| Richard Medway | 516,865 | |
| Mindy Geisser | 482,040 | |
Annual Cash Incentives: Annual Incentive Plan (AIP)
The objective of annual cash incentive awards under our AIP is to motivate the performance of our NEOs and other key associates based on annual performance goals established by the Committee while also encouraging engagement and collaboration. In fiscal year 2023, our AIP program emphasis was on financial performance results.
Key Features of Fiscal Year 2023 AIP
•Emphasized execution of our business strategy, with performance results reviewed and approved by the Compensation Committee
•200% maximum payout limit applied to all awards
For 2023, the Board viewed the use of annual cash bonuses as an effective means to compensate the named executive officers for achieving annual financial goals. Pursuant to our executive bonus plan for 2023, our named executive officers generally were eligible for bonus payments after year-end based on the achievement of financial performance criteria.
| | | | | | | | |
Metric | Why It’s Include | How It’s Used |
Adjusted EBITDA* | •The adjusted EBITDA measurement removes non-recurring, irregular and one-time items that may distort EBITDA | •Sole metric in our annual cash incentive program for NEOs |
| •Represents the company’s financial health and growth, including top-line performance and effective expense management | |
| •Highly relevant to our business, well understood, and part of Savers broad-based incentive program | |
* Adjusted EBITDA is a non-GAAP metric used in our annual incentive plan. We define Adjusted EBITDA as net income excluding the impact of interest expense, net, income tax (benefit) expense, depreciation and amortization, loss on extinguishment of debt, stock-based compensation expense, non-cash occupancy-related costs, lease intangible asset expense, pre-opening expenses, store closing expenses, executive transition costs, COVID-19 related adjustments, transaction costs, dividend-related bonuses, (gain) loss on foreign currency, and certain other adjustments.
Performance Goals and Payouts for Fiscal Year 2023 AIP
For fiscal year 2023 AIP, the board of directors and Compensation Committee viewed the use of annual cash bonuses as an effective means to compensate the named executive officers for achieving annual financial goals. Pursuant to our annual incentive plan for fiscal year 2023, our named executive officers generally were eligible for bonus payments after year-end based on the achievement of financial performance criteria.
The performance metric chosen for the year was Adjusted EBITDA, which our board of directors believed was an appropriate performance measure for fiscal year 2023 to motivate our key executives, including the named executive officers, because the metric reflects our growth. Our plan provided for a threshold 10% payout if we achieved 86% of our goal; 100% payout if we achieved 100% of our goal; and a maximum 200% payout if we achieved 120% of our goal. Performance below the threshold would result in no payout.
The payout level for 2023 for each NEO was approximately 103% of target based on our achievement of approximately 101% of the goal under the AIP.
| | | | | | | | | | | | | | |
| Fiscal Year 2023 AIP Incentive Adjusted EBITDA | | | | |
| Threshold | Target | Maximum | Actual* |
| Performance goal | $ | 277,012,085 | | $ | 322,107,075 | | $ | 386,528,490 | | $ | 328,365,647 | |
| Percentage of target | 86 | % | 100 | % | 120 | % | 101 | % |
| Payout (as a % of target) | 10 | % | 100 | % | 200 | % | 103 | % |
* The Adjusted EBITDA result used for purposes of the AIP is different than as reported elsewhere in this Annual Report because we use an internal management reporting rate for constant currency purposes to account for the impact of foreign currency exchange rates in our AIP calculation.
Each NEO had a target award opportunity, expressed as a percentage of the individual’s base salary earned during the fiscal year. The Committee approved these individual award opportunities at the beginning of fiscal year 2023 based on a variety of factors, including an assessment of overall competitiveness, mix of compensation elements, individual performance and responsibilities, and contractual obligations.
| | | | | | | | |
| Fiscal Year 2023 AIP Opportunities and Payouts | | |
| Target
(as a % of Base Salary) | Actual Amount Earned |
| Mark Walsh | 100 | % | $ | 993,002 | |
| Jay Stasz | 75 | | 378,216 | |
| Jubran Tanious | 75 | | 401,507 | |
| Richard Medway | 75 | | 399,278 | |
| Mindy Geisser | 75 | | 372,376 | |
Long-Term Equity Incentives
Key Features of Fiscal Year 2023 Equity Grants
Equity compensation has been an important part of our executive compensation program. Although as a private company we did not have a specific schedule for making annual grants, all of our NEOs have received grants of stock options in the past. Generally, we have granted options that vest over time, but also, for options granted prior to 2022, a portion that vested depending on our sponsor’s return on investment. Stock options were viewed as an appropriate equity incentive for a private company to align management with our stockholders because stock options have an exercise price based on the value at the time of grant, and so the potential future value of the stock option would directly represent an increase in the value of our stock over the term of the option, benefiting our stockholders.
As a private company, the amount of options granted for each NEO were based on a combination of subjective factors considered by our board of directors, including past grants, experience and role of the recipient, potential value, dilution, and grant date value. For options granted in 2023, grants only vest based on continued service, which the board of directors determined was appropriate given our stage of development. The individual amounts for the 2023 grants were determined based on a combination of subjective factors
important to a private company at the time of the grant, including internal pay equity among long-term executives and newly hired executives, potential value to the executives and dilution to our stockholders.
With respect to performance-based stock options granted to our NEOs prior to 2022, 25% of those options became vested on our initial public offering.
As a public company, we may grant different types of equity awards going forward.
2023 Grants to Named Executive Officers
In 2023, Messrs. Stasz and Medway were the only NEOs that received long-term incentive grants.
In April 2023, Mr. Medway received a time-based stock option grant of 47,092 stock options that vest ratably over three years.
In February of 2023, Mr. Stasz received a time-based stock option grant of 111,508 stock options that vest ratably over five years.
In addition, upon completion of our IPO, we commenced granting restricted stock units (RSUs) to some of our employees, including to our CFO in the amounts set forth below in the Grants of Plan-Based Awards table. The RSU grant to the CFO was intended to further align his compensation opportunity with our public company shareholders following the IPO and recognize the fact that he was a recent executive hire with less equity ownership than other members of management.
Our Decision Making Process
The Role of the Compensation Committee
Our executive compensation programs have historically been determined by our board of directors and our Compensation Committee. In determining the overall level of executive compensation and establishing the design and mix of specific elements, the Committee may consider a number of quantitative and qualitative factors, including: | | | | | | | | |
•individual executive performance and responsibilities | •our broad-based talent and rewards practices and strategies | •stockholder feedback, including our say-on-pay vote |
•market data and peer practices | •our key business priorities and Company and divisional performance | •employment terms and contractual negotiations |
•retention, leadership stability and continuity, succession planning, and organizational changes | •our business culture and core values | •risk mitigation strategies, and the balance of risks and rewards |
The Board reviews with our executives the annual and multi-year business plans for Savers, which form the basis of the financial performance targets for our short-and long-term incentive plans. The Committee or Board may invite our executive officers to discuss business and organizational strategies and to attend portions of its meetings on various topics, which provides additional context for executive compensation decisions. For NEOs other than our CEO, the Committee or Board may consider compensation recommendations from the CEO and the results of individual performance evaluations of these other NEOs by the CEO, among other factors.
The Role of our Peer Group
The Committee uses peer group data to inform its compensation decision-making for our NEOs. Peer group data allows the Committee to evaluate the competitiveness of NEO compensation and our program design, as well as marketplace practices and the relationship of pay and performance on a relative basis.
The Committee believes that peer group data provides important context for its compensation decisions. At the same time, the Committee recognizes that our off-price retail business model, in combination with our size and global focus, is distinct from other companies, and that the retail environment in recent years has presented challenges when evaluating companies for comparability to Savers.
The Committee does not rely on strict benchmarking or target any element of NEO compensation by reference to any specified level of compensation within the peer group. The Committee monitors Savers
performance relative to the peer group, but has not adopted a formulaic approach for evaluating relative performance and determining its impact on our compensation program. The Committee may also supplement peer group data from time to time with additional case studies and market data to provide further context for its compensation decisions.
Peer Group Evaluation Criteria
The Committee expects to annually assess the composition of the peer group and may consider criteria beyond standard industry classifications in constructing and evaluating the peer group, including:
•business focus and industry similarity, targeting retail companies with comparable customer or merchandise strategies, and also considering consumer product companies that meet size and complexity criteria;
•revenues, market capitalization, and number of employees;
•business complexity, reflected by factors such as significant global operations, brand and/or product line diversity, multiple segments, and e-commerce strategy; and
•financial performance metrics, including operating and market performance.
Fiscal Year 2023 Peer Group
During fiscal year 2023, after consultation with FW Cook, the Committee determined that the following group of large, publicly traded consumer-oriented companies would be appropriate to use when considering market data for executive compensation:
| | | | | | | | |
Academy Sports & Outdoors, Inc. | Hibbett Inc. | PriceSmart, Inc. |
Boot Barn Holdings, Inc. | Leslie’s, Inc. | Shake Shack Inc. |
Five Below, Inc. | Mister Car Wash, Inc. | Shoe Carnival, Inc. |
Floor & Decor Holdings, Inc. | National Vision Holdings, Inc. | Sprouts Farmers Market, Inc. |
Grocery Outlet Holding Corp. | Ollie’s Bargain Outlet Holdings, Inc. | Texas Roadhouse, Inc. |
The Role of Compensation Consultants
The Compensation Committee engaged FW Cook to serve as the independent compensation consultant to the Committee for fiscal year 2023. FW Cook attends Committee meetings and consults with the Committee on an ongoing basis throughout the year as requested. FW Cook may provide industry, peer, and market data to the Committee.
The Committee may use information and advice from FW Cook as a reference in assessing the overall competitiveness of our NEOs’ compensation and our executive compensation program and making its compensation decisions and determinations about the design, overall level and mix of compensation, plan metrics, goals and payout formulas, and individual compensation components, including benefits and perquisites.
FW Cook did not perform any services for Savers other than work for the Compensation Committee and for the Nominating, Governance & Sustainability Committee on director compensation. FW Cook reported directly to the Compensation Committee, which determined the scope and terms of FW Cook’s engagement. During fiscal year 2023, the Committee reviewed its existing relationship with FW Cook, including potential conflicts of interest, and determined that FW Cook’s work for the Committee did not raise any conflicts of interest and that FW Cook continued to be an independent advisor to the Committee.
Health and Welfare Benefits
The named executive officers are eligible to participate in our health and welfare benefit plans, including medical benefits and life insurance.
401(k) Retirement Plan
We maintain a tax-qualified defined contribution plan, or a 401(k) plan, in which all employees may make contributions from eligible compensation, subject to Internal Revenue Code limits. We make matching
contributions, subject to Internal Revenue Code limits. The named executive officers are eligible to participate in the 401(k) plan on the same terms as other participating U.S. employees.
Deferred Compensation Plan
The named executive officers are eligible to participate in our non-qualified deferred compensation plan. Participants may elect to defer all or a portion of their eligible salary and bonus until a specified date. Executive officers who defer salary or bonus under this plan are credited with market-based returns depending upon the investment choices made by the executive. The investment options under the plan, which are similar to those provided under our qualified 401(k) plan, include a number of mutual funds with varying risk and return profiles.
Hedging and Pledging Prohibitions
Our policies prohibit our executive officers and directors from engaging in pledging or hedging transactions with respect to Savers stock.
Severance, Retirement, and Change of Control Provisions
Under our employment agreements with executive officers, we provide benefits in connection with certain terminations of employment, together with provisions in our equity plan documents described below. Each NEO has agreed to post-employment non-competition, non-solicitation, and other covenants intended to protect our business.
We believe that these benefits assist in attracting and retaining high quality executives, in our succession planning, and in keeping our executives focused on their responsibilities during any period in which a change of control may be contemplated or pending and that, more generally, it is important to define the relative obligations of the Company and our NEOs, including obtaining protection against competition and solicitation. We seek to achieve these objectives in a manner consistent with our other compensation objectives described above, taking into account contractual obligations, applicable law and current market practice, among other considerations. These provisions are described in more detail under Compensation Tables—Potential Payments upon Termination or Change of Control.
Policies on Clawback, Forfeiture, and Recovery of Compensation
Our clawback policy provides that, in the event of a material restatement of financial results, the Board or a Board Committee will recover from any current or former executive officer the portion of incentive compensation that was received by or vested in the executive officer during the three-year period prior to the determination that a restatement was required and that would not have been earned had performance been measured on the basis of the restated results.
Annual Compensation and Risk Assessment
As discussed under Compensation Program Risk Assessment above under Board Responsibilities, the Committee considers our compensation policies and practices, including our executive compensation program, as part of our annual enterprise risk assessment process. Among other things, considerations may include what risks could be created or exacerbated by our executive compensation plans and arrangements and how those potential risks are monitored, mitigated, and managed. We do not believe that our compensation policies and practices give rise to risks that are reasonably likely to have a material adverse effect on Savers.
Tax and Accounting Considerations
Deductibility of Executive Compensation. Section 162(m) of the Code denies a publicly-traded corporation a federal income tax deduction for remuneration in excess of $1 million per year per person paid to certain executive officers designated in Section 162(m) of the Code. However, we believe that maintaining the discretion to provide compensation that is non-deductible will allow us to provide appropriate executive compensation to reflect the Company’s business needs and benefit stockholders.
Accounting for Stock-Based Compensation. Generally, we are required to measure the compensation expense for all share-based awards made to employees and directors. The grant date fair value of these awards determined for financial reporting purposes may not reflect the potential value intended by the Board for the individual to receive or the actual value of the awards to the recipients, which depends on various factors, including meeting the vesting criteria and individual decisions regarding sales of shares.
Compensation Committee Report
We have reviewed and discussed the Compensation Discussion and Analysis with management. Based on these reviews and discussions, we recommended to the Board that the Compensation Discussion and Analysis be included in the Annual Report on Form 10-K for the fiscal year ended December 30, 2023.
Compensation Committee
Aaron Rosen, Chairperson
William T. Allen
Jordan Smith
Duane Woods
Summary Compensation Table
The following table provides compensation information for our principal executive officer, our principal financial officer and our three other most highly compensated executive officers for the fiscal year ended December 30, 2023, which we refer to as “fiscal year 2023”. We refer to these executive officers as the named executive officers.
| | | | | | | | | | | | | | | | | | | | | | | | | | | | | |
| Name and Principal Position | Fiscal Year | Salary($) | Bonus($)(1) | Stock Awards($)(2) | Option Awards($)(2) | Non-Equity Incentive Plan Compensation($)(3) | Nonqualified Deferred Compensation Earnings($)(4) | All other Compensation($)(5) | Total($) |
| Mark Walsh, Chief Executive Officer | 2023 | 956,949 | | 8,184,000 | | — | | — | | 993,002 | | — | | 100 | | 10,134,051 | |
| 2022 | 921,807 | | 2,170,000 | | — | | — | | 1,149,480 | | — | | 100 | | 4,241,387 | |
| 2021 | 897,403 | | — | | — | | — | | 1,800,000 | | — | | 5,223 | | 2,702,626 | |
| Jay Stasz, Chief Financial Officer | 2023 | 487,754 | | 275,000 | | 621,113 | | 653,437 | | 378,216 | | — | | 100 | | 2,415,620 | |
| 2022 | 203,077 | | — | | — | | 3,018,856 | | 204,243 | | — | | 100 | | 3,426,276 | |
| Jubran Tanious, President and Chief Operating Officer | 2023 | 517,570 | | 2,270,400 | | — | | — | | 401,507 | | — | | 13,300 | | 3,202,777 | |
| 2022 | 468,174 | | 602,000 | | — | | — | | 439,425 | | — | | 12,300 | | 1,521,899 | |
| Richard Medway, General Counsel, Chief Compliance Officer and Secretary | 2023 | 513,041 | | 1,659,100 | | — | | 307,040 | | 399,278 | | — | | 13,300 | | 2,891,759 | |
| 2022 | 493,142 | | 439,900 | | — | | — | | 462,197 | | — | | 12,300 | | 1,407,539 | |
| 2021 | 474,215 | | 10,084 | | — | | — | | 715,500 | | — | | 100 | | 1,199,899 | |
| Mindy Geisser, Chief People Services Officer | 2023 | 478,475 | | 1,362,100 | | — | | — | | 372,376 | | — | | 13,300 | | 2,226,251 | |
(1)The amounts in this column for 2023 reflect a discretionary bonus paid in connection with the February 2023 Notes Offering. For Mr. Stasz, also includes a $100,000 sign-on bonus paid in 2023.
(2)The amounts in the applicable column reflect the aggregate grant date fair value of stock options or stock awards (restricted stock units) granted during the fiscal year, computed in accordance with Accounting Standards Codification 718 issued by the Financial Accounting Standards Board, or FASB ASC 718. For a description of the assumptions used to determine the grant date fair value of our equity awards, see Note 13 to our consolidated financial statements included in our annual report on Form 10-K for the year ended December 30, 2023.
(3)The amounts in this column reflect bonus payments under our annual bonus for performance in the applicable year. Our annual bonus plan is described below.
(4)No above-market or preferential interest rate options are available under our deferred compensation plan, which is described below, and so no amounts are reported in this column.
(5)The amounts shown in this column for fiscal year 2023 include a charitable contribution benefit of $100 for each named executive officer and matching contributions to our 401(k) plan. Excludes perquisites totaling less than $10,000.
Narrative disclosure to summary compensation table
Employment arrangements. As further described under “Additional Narrative Disclosure” below, we have entered into an employment agreement with each of our named executive officers.
Cash bonus. A portion of each named executive officer’s total target compensation opportunity is in the form of an annual incentive bonus under our Store Support Center (“SSC”) Bonus Plan. Each executive has a target bonus (as a percentage of base salary at year-end) under the SSC Bonus Plan. The target amounts are 100% of base salary for Mr. Walsh and 75% of base salary for each other named executive officer with a maximum payout of 200% of target. Please see the Compensation Discussion and Analysis for further information regarding determination of payouts for fiscal year 2023.
Health and welfare benefits. The named executive officers are eligible to participate in our health and welfare benefit plans, including medical benefits and life insurance.
401(k) retirement plan. We maintain a tax-qualified defined contribution plan, or a 401(k) plan, in which all employees may make contributions from eligible compensation, subject to Internal Revenue Code limits. We make matching contributions, subject to Internal Revenue Code limits. The named executive officers are eligible to participate in the 401(k) plan on the same terms as other participating U.S. employees.
Deferred compensation plan. We provide a non-qualified deferred compensation plan to the named executive officers and other employees. Participants may elect to defer all or a portion of their eligible salary and bonus until a specified date. Executive officers who defer salary or bonus under this plan are credited with market-based returns depending upon the investment choices made by the executive. The investment options under the plan, which are similar to those provided under our qualified 401(k) plan, include a number of mutual funds with varying risk and return profiles.
Grants of Plan Based Awards in Fiscal Year 2023
The following table shows grants of awards to our NEOs during fiscal year 2023.
| | | | | | | | | | | | | | | | | | | | | | | | | | |
| | Estimated Future Payouts Under Non-Equity Incentive Plan Awards ($)(1) | | | | |
| Name and Award Type | Grant Date | Threshold | Target | Maximum | All Other Stock Award: Number of Shares of Stock or Units (#) | All Other Option Awards: Number of Securities Underlying Options (#) | Exercise or Base Price of Option Awards ($/sh) | Grant Date Fair Value of Stock and Option Awards ($)(2) |
| Mark Walsh | | | | | | | | |
| Bonus Plan | n/a | 96,408 | | 964,080 | | 1,928,160 | | | | | |
| Jay Stasz | | | | | | | | |
| Bonus Plan | n/a | 36,720 | | 367,200 | | 734,400 | | | | | |
| Stock Options | 2/7/2023 | | | | | 111,508 | | 13.57 | | 653,437 | |
| RSUs | 6/29/2023 | | | | | 27,111 | | | 621,113 | |
| Jubran Tanious | | | | | | | | |
| Bonus Plan | n/a | 38,981 | | 389,813 | | 779,625 | | | | | |
| Richard Medway | | | | | | | | |
| Bonus Plan | n/a | 38,765 | | 387,649 | | 775,298 | | | | | |
| Stock Options | 4/12/2023 | | | | | 47,092 | | 15.45 | | 307,040 | |
| Mindy Geisser | | | | | | | | |
| Bonus Plan | n/a | 36,153 | | 361,530 | | 723,060 | | | | | |
(1)Represents the threshold, target and maximum value of cash bonus awards that could have been earned by the named executive officers under our annual incentive bonus plan for performance during fiscal year 2023. The actual payments are set forth in the “Summary Compensation Table” section above.
(2)The amounts in this column reflect the aggregate grant date fair value of stock options and restricted stock units granted during the fiscal year, computed in accordance with Accounting Standards Codification 718 issued by the Financial Accounting Standards Board, or FASB ASC 718. For a description of the assumptions used to determine
the grant date fair value of our equity awards, see Note 13 to our consolidated financial statements included in this Annual Report.
Outstanding Equity Awards at Fiscal Year-End
The following table shows all outstanding equity awards held by each of the named executive officers at the end of fiscal year 2023.
| | | | | | | | | | | | | | | | | | | | | | | | | | | | | |
| | Option Awards | | Stock Awards |
| | | | Equity Incentive Plan Awards: | | | | | |
| Name | Grant Date | Number of Securities Underlying Unexercised Options (#) Exercisable | Number of Securities Underlying Unexercised Options (#) Unexercisable(1) | Number of Securities Underlying Unexercised Unearned Options (#)(2) | Option Exercise Price ($) | Option Expiration Date | | Number of Shares or Units of Stock That Have Not Vested (#)(3) | Market Value of Shares or Units of Stock That Have Not Vested ($)(4) |
| Mark Walsh | 10/7/2019 | 340,914 | | | 1,022,742 | | 1.41 | | 10/7/2029 | | | |
| 10/7/2019 | 727,284 | | 181,821 | | | 1.41 | | 10/7/2029 | | | |
| 12/9/2020 | 322,648 | | | 967,941 | | 3.16 | | 12/9/2030 | | | |
| 12/9/2020 | 516,237 | | 344,158 | | | 3.16 | | 12/9/2030 | | | |
| Jay Stasz | 8/18/2022 | 85,621 | | 342,484 | | | 14.72 | | 8/18/2032 | | | |
| 12/16/2022 | 6,115 | | 24,464 | | | 15.42 | | 12/16/2032 | | | |
| 2/7/2023 | — | | 111,508 | | | 13.57 | | 2/7/2033 | | | |
| 6/29/2023 | | | | | | | 27,111 | | 471,189 | |
| Jubran Tanious | 6/12/2019 | 145,457 | | 36,365 | | | 1.41 | | 6/12/2029 | | | |
| 6/12/2019 | 68,183 | | | 204,547 | | 1.41 | | 6/12/2029 | | | |
| 11/1/2019 | 197,027 | | 49,256 | | | 1.41 | | 11/1/2029 | | | |
| 11/1/2019 | 92,357 | | | 277,069 | | 1.41 | | 11/1/2029 | | | |
| 12/9/2020 | 37,674 | | 25,116 | | | 3.16 | | 12/9/2030 | | | |
| 12/9/2020 | 23,546 | | — | | 70,636 | | 3.16 | | 12/9/2030 | | | |
| Richard Medway | 6/12/2019 | 203,638 | | 50,910 | | | 1.41 | | 6/12/2029 | | | |
| 6/12/2019 | 95,457 | | | 286,368 | | 1.41 | | 6/12/2029 | | | |
| 12/9/2020 | 62,502 | | 41,668 | | | 3.16 | | 12/9/2030 | | | |
| 12/9/2020 | 39,066 | | | 117,195 | | 3.16 | | 12/9/2030 | | | |
| 4/12/2023 | — | | 47,092 | | | 15.45 | | 4/12/2033 | | | |
| Mindy Geisser | 6/12/2019 | 203,638 | | 50,910 | | | 1.41 | | 6/12/2029 | | | |
| 6/12/2019 | 95,457 | | | 286,368 | | 1.41 | | 6/12/2029 | | | |
| 12/9/2020 | 23,973 | | 15,982 | | | 3.16 | | 12/9/2030 | | | |
| 12/9/2020 | 14,984 | | | 44,952 | | 3.16 | | 12/9/2030 | | | |
(1)The amounts in this column represent unvested time-vesting stock options. Subject to continued employment through the applicable vesting date, these stock options vest in equal installments on each of the first, second, third, fourth and fifth anniversaries of the grant date (or, for Mr. Stasz’s August 2022 grant, anniversaries of July 19, 2022; and for the June 2019 grants, anniversaries of March 28, 2019), except for Mr. Medway's April 2023 grant, which vests in equal installments on each of the first, second and third anniversaries of the grant date.
(2)The amounts in this column represent unvested and unearned performance-vesting stock options. These stock options are eligible to become vested upon the achievement of the performance conditions described under “Additional Narrative Disclosure” below.
(3)The amounts in this column represent unvested RSUs. Subject to continued employment through the applicable vesting date, these RSUs cliff-vest on the third anniversary of the grant date.
(4)The amounts in this column represent the aggregate fair market value of RSUs as of December 29, 2023, the last trading day of fiscal year 2023. The closing price of the Company’s stock was $17.38 on that date.
Option Exercises and Stock Awards Vested During Fiscal Year 2023
There were no option exercises by any NEO, and no stock awards that vested, during the fiscal year ended December 30, 2023.
Nonqualified Deferred Compensation Plans
We provide a non-qualified deferred compensation plan to the named executive officers and other employees. The named executive officers who participate in this plan are listed in the table below. Participants may elect to defer all or a portion of their eligible salary and bonus until a specified date. Executive officers who defer salary or bonus under this plan are credited with market-based returns depending upon the investment choices made by the executive. The investment options under the plan, which are similar to those provided under our qualified 401(k) plan, include a number of mutual funds with varying risk and return profiles.
Nonqualified Deferred Compensation for Fiscal Year 2023
The following table provides information on fiscal year 2023 nonqualified deferred compensation plans for our NEOs:
| | | | | | | | | | | | | | | | | |
| Name and Plan Name | Executive Contributions in Last Fiscal Year(1) ($) | Registrant Contributions in Last Fiscal Year(1) ($) | Aggregate Earnings in Last Fiscal Year ($) | Aggregate Withdrawals/Distributions ($) | Aggregate Balance at Last Fiscal Year-End ($) |
| Richard Medway | 170,029 | | — | | 10,429 | | — | | 527,856 | |
| Mindy Geisser | 9,570 | | — | | 650 | | — | | 25,911 | |
(1)Amounts contributed by any executive would have been reported as salary or bonus amounts for the applicable year in the Summary Compensation Table, and any matching contributions would have been reported for the applicable year in the Summary Compensation Table.
Additional Narrative Disclosure
Employment Agreements
We have entered into an employment agreement with each of our named executive officers pursuant to which each executive agrees to work for us. Mr. Walsh’s amended and restated employment agreement dated March 8, 2023, which superseded his prior agreement, provides for an initial term through December 31, 2025, with automatic 12-month renewals thereafter, unless the term ends earlier due to termination of executive’s employment by either party at any time. Mr. Walsh’s agreement provides for an initial base salary of $964,080 (which may be increased from time to time), a target annual bonus of 100% of base salary and other benefits provided to similarly situated employees. Employment agreements with each of our other named executive officers provide for a term until the executive’s employment is terminated by either party at any time and for continued payments during employment of base salary, annual cash bonus eligibility (with a target bonus of 75% of salary) and other benefits provided to similarly situated employees. Mr. Stasz’s employment agreement entered into in connection with his hiring in 2022 provided for a one-time sign-on bonus on March 1, 2023 if he remained employed at such time, subject to repayment if he departs prior to March 1, 2024, other than upon involuntary termination without cause or as a result of death or disability.
Pursuant to each named executive officer’s employment agreement, upon the executive’s involuntary termination without cause or resignation for good reason (as defined below), and subject to signing a release and complying with the restrictive covenants, the executive will be entitled to receive the following:
•12 months of continued base salary (plus, for Mr. Walsh, his annual target bonus),
•a pro-rated portion of the annual bonus based on actual level of achievement,
•12 months of payment of healthcare premiums under COBRA (18 months for Mr. Walsh),
•performance-based options that were granted prior to January 1, 2022 will remain available for performance-based vesting until December 31, 2024, and
•for some NEOs, outplacement services.
In the event of death or disability, performance-based options that were granted prior to January 1, 2022 will remain available for performance-based vesting until December 31, 2024, or, for Mr. Walsh in the event of death, will be eligible for immediate vesting based on stock price calculations at the time of his death.
For purposes of each employment agreement, “good reason” generally includes one of the following occurring without the executive’s consent: (i) material diminution of authority, duties or responsibilities; (ii) a change of principal employment location by more than 50 miles (or 35 miles for Mr. Walsh); (iii) material diminution in base salary (or target bonus for Mr. Walsh); or (iv) material breach by the company of the employment agreement.
Each of the employment agreements (other than Walsh’s) provides for a Section 280G “better-of provision” such that payments or benefits that each individual receives in connection with a change in control will be reduced to the extent necessary to avoid the imposition of any excise tax under Sections 280G and 4999 of the Code if a reduction would result in greater after-tax payment amount for the individual. There are no tax gross-up provisions related to Section 280G or 4999 of the Code in the employment agreements or other agreements.
Restrictive Covenants. Each named executive officer’s employment agreement subjects the executive to a non-competition covenant for up to 18 months (or 12 months for Mr. Walsh) following termination of employment. Each named executive officer is also subject to confidentiality and proprietary information covenants, non-disparagement covenants and post-termination non-solicit covenants.
Equity Compensation
We granted equity compensation to the named executive officers prior to the initial public offering in the form of stock options under our 2019 Management Incentive Plan, as amended. In general, options granted to our named executive officers prior to fiscal year 2022 consisted of 40% time-vesting options and 60% performance-vesting options as described below. The options granted to our named executive officers during fiscal year 2022 consisted solely of time-vesting options.
•The time-vesting portion of the stock options generally vest in equal annual installments over five years, subject to continued employment through each vesting date.
•The performance-vesting portion of the stock options become vested to the extent our private equity investors receive a specified multiple of invested capital (“MOIC”) before the tenth anniversary of the option grant date, subject to the executive’s continued employment through the applicable measurement date. In addition, additional performance measures are applicable, including as a result of or following the initial public offering, as described below. Shares underlying performance-vesting options that become vested may be subject to transfer restrictions for up to one year following the initial public offering.
▪MOIC vesting. MOIC is a ratio comparing cash proceeds (including cumulative cash dividends and sale proceeds through the measurement date) to aggregate investment. Absent other events (such as the initial public offering), the percentage of the performance-vesting portion that would become vested based on MOIC is as follows: one-third if MOIC equals or exceeds a 2.00 tranche price target; an additional one-third if MOIC equals or exceeds a 3.00 tranche price target; and the final one-third if MOIC equals or exceeds a 3.75 tranche price target. The option agreements also include provisions applicable prior to the initial public offering for partial vesting upon sales by our private equity investors that exceed specified hurdles.
▪IPO vesting. 25% of the performance-vesting portion of the stock options vested upon closing of the initial public offering on July 3, 2023.
▪VWAP vesting. The performance-vesting options are eligible to vest based on our stock price performance, as measured using a 90-day volume weighted average price (or “VWAP”) on an annual basis over a three-year period ($4.91, $8.39 and $11.00, respectively).
The stock option agreements for stock options granted prior to the initial public offering provide that, if a holder’s employment is terminated without cause, then a pro-rated portion of the time-vesting stock option will become vested. In the event of a change in control, the time-vesting stock options will become fully vested, and the performance-vesting options will become vested to the extent the MOIC returns described above are met in connection with the change in control.
In connection with the IPO, we adopted our Omnibus Incentive Compensation Plan (the “Omnibus Incentive Plan”), which replaced the 2019 Management Incentive Plan. As a result, equity awards granted on and following our IPO are under the Omnibus Incentive Plan. Our named executive officers, as well as other employees, directors, officers, consultants or advisors, are eligible to receive awards under the Omnibus Incentive Plan, which has a ten-year term. The Omnibus Incentive Plan provides for “double-trigger” vesting (that is, vesting in the event of a termination without cause upon or following a change in control), unless otherwise provided in an award agreement.
The RSUs granted during 2023 to certain of our named executive officers generally cliff-vest on the third anniversary of the grant date, subject to continued employment. In addition to the above “double-trigger” vesting under the plan, the RSU agreements provide that if a holder’s employment is terminated due to death or disability, then the portion of the RSU that would vest on the next scheduled vesting date will become vested.
Potential Payments Upon Termination or Change of Control
The table below reflects estimates of the amount of compensation and benefits for each named executive officer under the employment agreements and equity award agreements and plans described under “Additional Narrative Disclosure” above in the event of a (i) termination without cause or resignation for good reason, (ii) termination without cause upon or following a change in control (if different than (i)), (iii) termination by reason of the executive’s death or disability, or (iv) upon a change in control. The amounts shown assume that the applicable triggering event occurred on December 30, 2023 and, therefore, are only estimates of the amounts that would be paid to the named executive officers upon the occurrence of the applicable triggering event under arrangements in effect on such date.
| | | | | | | | | | | |
| Cash Benefits ($) | | Accelerated Vesting of Equity Awards (1) ($) |
| Mark Walsh | | | |
Involuntary Termination Without Cause or Resignation for Good Reason (2) | 2,957,162 | | | 949,819 | |
| Death | — | | | 30,097,311 | |
| Disability | — | | | (1) |
Change in Control (3) | — | | | 56,850,535 | |
| Jay Stasz | | | |
Involuntary Termination Without Cause or Resignation for Good Reason (2) | 901,816 | | | 790,617 | |
Involuntary Termination Without Cause Upon or Following a Change in Control (3) | n/a | | 471,189 | |
| Death or Disability | — | | | 471,189 | |
Change in Control (3) | — | | | 1,623,540 | |
| Jubran Tanious | | | |
Involuntary Termination Without Cause or Resignation for Good Reason (2) | 955,257 | | | 588,441 | |
| Death or Disability | — | | | (1) |
Change in Control (3) | — | | | 16,425,562 | |
| Richard Medway | | | |
Involuntary Termination Without Cause or Resignation for Good Reason (2) | 950,143 | | | 716,342 | |
| Death or Disability | — | | | (1) |
Change in Control (3) | — | | | 11,877,126 | |
| Mindy Geisser | | | |
Involuntary Termination Without Cause or Resignation for Good Reason (2) | 888,416 | | | 630,099 | |
| Death or Disability | — | | | (1) |
Change in Control (3) | — | | | 9,845,806 | |
(1)The estimated value associated with the accelerated vesting of equity awards in this table represents, for each option or RSU that would become vested as a result of the specified event, the amount equal to $17.38 per share (which represents the closing price of our shares on December 29, 2023, the last trading day of our fiscal year) less, in the case of options, the exercise price. This amount does not attribute value to the ability to retain performance-vesting options following an involuntary termination or resignation for good reason, or following death or disability, until December 31, 2024, because they would have value only if the performance vesting conditions are met following such termination, as described above, except that Mr. Walsh’s performance-vesting options would be eligible for vesting immediately based on the volume weighted average price of the Company’s stock at the time of death and so the value of his performance-vesting options as of December 31, 2023 is reflected in this table.
(2)Reflects the severance benefits described under “Employment Agreements” above (and includes 100% of the actual bonus for 2023 representing the prorated bonus resulting from a termination on December 30, 2023) and, for involuntary termination without cause, pro-rated vesting of time-vesting stock options described under “Additional Narrative Disclosure—Equity Compensation” above.
(3)For change in control, reflects full vesting of pre-IPO stock options (assuming, for performance-vesting options, that the performance criteria are met at the maximum level at the time of the change in control), each as described under “Additional Narrative Disclosure—Equity Compensation” above. For termination without cause upon or following a change in control, reflects accelerated vesting of RSUs subject to “double-trigger” vesting under the terms of the Omnibus Incentive Plan.
Item 12. Security Ownership of Certain Beneficial Owner and Management and Related Stockholder Matters
Except as provided below, the information required by this item is included in our 2024 Annual Meeting proxy statement and is incorporated herein by reference.
Equity Compensation Plan Information
| | | | | | | | | | | | | | | | | | | | |
Plan Category | | Number of Securities to be Issued upon Exercise of Outstanding Options, Warrants and Rights (a) | | Weighted-Average Exercise Price of Outstanding Options, Warrants and Rights (b) | | Number of Securities Remaining Available for Future Issuance Under Equity Compensation Plan (Excluding Securities Reflected in Column (a)) (c) |
Equity compensation plans approved by security holders | | 16,024,740 | | $3.97 | | 14,417,767 |
Beneficial Ownership
The following table shows, as of February 15, 2024, the number of shares of our common stock beneficially owned by each of our current directors and each executive officer named in the Summary Compensation Table and all directors and executive officers as a group.
We have determined beneficial ownership in accordance with the rules of the SEC. These rules generally attribute beneficial ownership of securities to persons who possess sole or shared voting power or investment power with respect to those securities, or have the right to acquire such powers within 60 days. Under these rules, more than one person may be deemed beneficial owner of the same securities and a person may be deemed to be a beneficial owner of securities as to which such person has no economic interest. In addition, the rules include shares of common stock issuable pursuant to the exercise of stock options or warrants that are either immediately exercisable or exercisable on or before 60 days after February 15, 2024. These shares are deemed to be outstanding and beneficially owned by the person holding those options or warrants for the purpose of computing the percentage ownership of that person, but they are not treated as outstanding for the purpose of computing the percentage ownership of any other person. The information contained in the following table is not necessarily indicative of beneficial ownership for any other purpose, and the inclusion of any shares in the table does not constitute an admission of beneficial ownership of those shares. Unless otherwise indicated, the persons or entities identified in this table have sole voting and investment power with respect to all shares shown as beneficially owned by them, subject to applicable community property laws. Unless otherwise noted below, the address of each beneficial owner listed in the table is c/o Savers Value Village, Inc., 11400 S.E. 6th Street, Suite 125, Bellevue, WA 98004.
| | | | | | | | | | | | | | |
| Name | | Number of Shares(1) | | Percent of Class |
| Aaron Rosen | | — | | | * |
| Jordan Smith | | — | | | * |
| William Allen | | 19,359 | | | * |
| Robyn Collver | | 45,815 | | | * |
| Aina Konold | | 26,897 | | | * |
| Susan O'Farrell | | — | | | * |
| Kristy Pipes | | 26,897 | | | * |
| Duane Woods | | 45,815 | | | * |
| Mark Walsh | | 1,907,083 | | | 1.17 | % |
| Jay Stasz | | 114,038 | | | * |
| Jubran Tanious | | 570,609 | | | * |
| Richard Medway | | 467,271 | | | * |
| Mindy Geisser | | 388,962 | | | * |
| All Directors and Executive Officers as a Group (15 Persons) | | 4,044,891 | | | 2.44 | % |
*Represents beneficial ownership of less than 1%.
(1)Consists of shares that may be acquired within 60 days of February 15, 2024, on exercise of stock options that are or will become exercisable during such time period, except that for all directors and executive officers as a group, it also includes 8,100 shares that are held directly.
The following table shows, as of February 15, 2024, each person known by us to be the beneficial owner of more than 5% of our outstanding common stock:
| | | | | | | | | | | | | | |
| Name and Address of Beneficial Owner | | Number of Shares | | Percent of Class |
Funds, investment vehicles or accounts managed or advised by the Private Equity Group of Ares Management Corporation (2) | | 134,659,188 | | | 83.45 | % |
(2)Includes 132,148,565 shares held by Ares Corporate Opportunities Fund V, L.P. (“ACOF V”), ASSF IV AIV B Holdings III, L.P. (“ASSF IV AIV Holdings”), ASSF IV AIV B, L.P. (“ASSF IV AIV”) and ASOF Holdings I, L.P. (“ASOF Holdings I”). Ares Partners Holdco LLC (“Ares Partners”) is the sole member of each of Ares Voting LLC and Ares Management GP LLC, which are respectively the holders of the Class B and Class C common stock of Ares Management Corporation (“Ares Management”), which common stock allows them, collectively, to generally have the majority of the votes on any matter submitted to the stockholders of Ares Management if certain conditions are met. Ares Management is the sole member of Ares Holdco LLC, which is the general partner of Ares Management Holdings L.P., which is the sole member of Ares Management LLC, which is: (i) the sole member of ACOF Investment Management LLC, which is the manager of ACOF V; (ii) the general partner of ASSF Operating Manager IV, L.P., which is the manager of each of ASSF IV AIV Holdings and ASSF IV AIV; and (iii) the sole member of ASOF Investment Management LLC, which is the manager of ASOF Holdings I. We refer to all of the foregoing entities collectively as the Ares Entities. Accordingly, each of the Ares Entities may be deemed to share beneficial ownership of the securities reported herein, but each disclaims any such beneficial ownership of securities not held of record by them. Ares Partners is managed by a board of managers, which is composed of Michael J Arougheti, Ryan Berry, R. Kipp deVeer, David B. Kaplan, Antony P. Ressler and Bennett Rosenthal (collectively, the “Board Members”). Mr. Ressler generally has veto authority over Board Members’ decisions. Each of these individuals disclaims beneficial ownership of the securities that may be deemed to be beneficially owned by Ares Partners. Also includes 2,510,623 shares held by an account managed by ASSF Operating Manager IV, L.P. with respect to which the Ares Entities may be deemed to have shared voting or dispositive power with the owner of such account. The address of each Ares Entity is 2000 Avenue of the Stars, 12th Floor, Los Angeles, California 90067.
Item 13. Certain Relationships and Related Transactions, and Director Independence
Stockholders agreement
In connection with our IPO, we entered into the Stockholders Agreement with the Ares Funds, pursuant to which the Ares Funds are entitled to designate individuals to be included in the slate of nominees for election to our board of directors as follows:
•for so long as the Ares Funds own 40% or more of the outstanding shares of our common stock, the greater of up to six directors and the number of directors comprising a majority of our board; and
•except as provided below, for so long as the Ares Funds own less than 40% of the outstanding shares of our common stock and 5% or more of the outstanding shares of our common stock, that number of directors (rounded up to the nearest whole number) that is the same percentage of the total number of directors comprising our board as the collective percentage of common stock owned by the Ares Funds.
Notwithstanding the foregoing, if the Ares Funds at any time cease to own more than 5% of the outstanding shares of our common stock, the Ares Funds will not have the right to designate any directors. The Stockholders Agreement also provides for the nomination to our board of directors, subject to his or her election by our stockholders at the annual meeting, of our chief executive officer. Each of the Ares Funds has agreed, for so long as the Ares Funds hold more than 5% of the outstanding shares of our common stock, to vote all of the shares of common stock held by it in favor of the foregoing nominees.
The Stockholders Agreement also provides that, for so long as the Ares Funds own at least 30% of the outstanding shares of our common stock, the following actions require the prior written consent of the Ares Funds, subject to certain exceptions:
•merging or consolidating with or into any other entity, or transferring all or substantially all of our assets, taken as a whole, to another entity, or undertaking any transaction that would constitute a “Change of Control” as defined in our debt agreements;
•acquiring or disposing of assets, in a single transaction or a series of related transactions, or entering into joint ventures, in each case with a value in excess of $50.0 million;
•incurring indebtedness in a single transaction or a series of related transactions in an aggregate principal amount in excess of $100.0 million;
•issuing our or our subsidiaries’ equity other than pursuant to an equity compensation plan approved by our stockholders or a majority of the directors designated by the Ares Funds;
•terminating the employment of our chief executive officer or hiring or designating a new chief executive officer;
•entering into any transactions, agreements, arrangements or payments with any other person who owns greater than or equal to 10% of our common stock then outstanding that are material or involve aggregate payments or receipts in excess of $500,000;
•amending, modifying or waiving any provision of our organizational documents in a manner that adversely affects the Ares Funds;
•commencing any liquidation, dissolution or voluntary bankruptcy, administration, recapitalization or reorganization;
•increasing or decreasing the size of our board of directors; and
•entering into of any agreement to do any of the foregoing.
The Stockholders Agreement also grants the Ares Funds certain information rights.
This summary does not purport to be complete and is subject to and qualified in its entirety by the Stockholders Agreement, a copy of which is filed as Exhibit 4.1.
Registration rights agreement
In connection with our IPO, we also entered into a Registration Rights Agreement with the Ares Funds. Subject to certain conditions, the Registration Rights Agreement provides the Ares Funds with unlimited “demand” registrations and shelf registration rights, subject to certain conditions and exceptions. We are also required to cooperate in a customary manner in connection with dispositions of common stock under the registration statements filed under the Registration Rights Agreement. The Registration Rights Agreement also provides the Ares Funds with customary “piggyback” registration rights. The Registration Rights Agreement also provides that we will pay certain expenses of these holders relating to such registrations and indemnify them against certain liabilities which may arise under the Securities Act.
This summary does not purport to be complete and is subject to and qualified in its entirety by the Registration Rights Agreement, a copy of which is filed as Exhibit 4.2.
Indemnification of officers and directors
Our amended and restated certificate of incorporation and bylaws provide that we will indemnify each of our directors and officers to the fullest extent permitted by Delaware law. In addition, we have entered, or will enter, into indemnification agreements with each of our directors and executive officers.
Purchases of products in the ordinary course of business
Certain of our related persons may, either directly or through their respective affiliates, enter into commercial transactions with us from time to time in the ordinary course of business, primarily for the purchase of merchandise. We believe that none of the transactions with such persons is significant enough to be considered material to such persons or to us.
Related persons transaction policy
We have adopted formal written procedures for the review, approval or ratification of transactions with related persons, or the Related Persons Transaction Policy. The Related Persons Transaction Policy provides that the audit committee of our board of directors is charged with reviewing for approval or ratification all transactions with “related persons” (as defined in paragraph (a) of Item 404 of Regulation S-K) that are brought to the audit committee’s attention. This policy was adopted on May 30, 2023 and took effect upon the effectiveness of our amended and restated certificate of incorporation, and as a result, certain of the transactions entered into prior to that date were not reviewed under the policy.
We also maintain certain compensation agreements and other arrangements with certain of our executive officers, which are described under “Executive Compensation” in this Annual Report.
Director independence
Pursuant to the corporate governance standards of the NYSE, a director employed by us cannot be deemed an “independent director,” and each other director will qualify as “independent” only if our board of directors affirmatively determines that he or she has no material relationship with us, either directly or as a partner, stockholder or officer of an organization that has a relationship with us. The fact that a director may own our capital stock is not, by itself, considered a material relationship. Based on information provided by each director concerning his or her background, employment and affiliations, our board of directors has affirmatively determined that each of Aaron Rosen, Robyn Collver, William Allen, Duane C. Woods, Aina Konold, Kristy Pipes, Susan O’Farrell and Jordan Smith are independent in accordance with the NYSE rules.
Item 14. Principal Accounting Fees and Services
The following table sets forth the fees billed by our independent accountants, KPMG LLP (“KPMG”) for fiscal years 2023 and 2022: | | | | | | | | | | | |
| Fiscal Year |
| 2023 | | 2022 |
| Audit fees | $ | 2,776,700 | | | $ | 2,844,599 | |
| Audit-related fees | — | | | — | |
| Tax fees | 547,942 | | | 314,719 | |
| All other fees | — | | | — | |
Audit Fees
Audit fees in 2023 includes fees for our annual audit, quarterly review procedures, and other fees in connection with our IPO. Audit fees in 2022 include fees for our annual audit and other fees in connection with our IPO.
Tax Fees
Tax fees includes fees primarily for tax compliance services.
Pre-Approval Policy for Services of Independence Registered Public Accounting Firm
Consistent with SEC requirements regarding auditor independence and the Audit Committee’s charter, the Audit Committee has responsibility for engaging, setting compensation for and reviewing the performance of KPMG. In exercising this responsibility, the Audit Committee has established procedures relating to the approval of all audit and non-audit services that are to be performed by KPMG and, since our IPO, pre-approves all audit and permitted non-audit services provided by KPMG prior to each engagement.
Procedures For Audit Committee Pre-Approval of Audit and Permissible Non-Audit Services of Independent Auditor
Since our IPO, and on a going-forward basis, the audit committee has and will pre-approve all auditing services and permitted non-audit services to be performed for us by our auditors, including the fees and terms thereof (subject to the de minimis exceptions for non-audit services described in the Exchange Act which are approved by the audit committee prior to the completion of the audit).
Part IV
Item 15. Exhibits and Financial Statement Schedules
(a) Documents filed as part of this Report.
(1) The following consolidated financial statements are contained in Item 8:
| | | | | | | | |
| Consolidated Financial Statements | | Page in this Report |
Report of KPMG, independent registered public accounting firm (Public Company Accounting Oversight Board ID: 185) | | |
| Consolidated Balance Sheets | | |
| Consolidated Statements of Operations and Comprehensive Income | | |
| Consolidated Statements of Stockholders’ Equity | | |
| Consolidated Statements of Cash Flows | | |
| Notes to Consolidated Financial Statements | | |
(2) The following Financial Statement Schedules are included herein:
Schedules are not submitted because they are not applicable, not required or because the required information is included in the financial statements or the notes thereto.
(3) The following exhibits are filed as part of this report:
| | | | | | | | | | | | | | | | | | | | | | | | | | |
| | | Incorporated by Reference | | | | | | | |
Exhibit
Number | | Description of Document | Form | Exhibit | Filing Date | Filed Herewith | | | | | | |
| | | | | | | | | | | | |
| | | | | | | | | | | | |
3.1 | | | 8-K | 3.1 | 7/3/2023 | | | | | | | |
| | | | | | | | | | | | |
3.2 | | | 8-K | 3.2 | 7/3/2023 | | | | | | | |
| | | | | | | | | | | | |
4.1 | | | 10-Q | 4.1 | 8/11/2023 | | | | | | | |
| | | | | | | | | | | | |
4.2 | | | 8-K | 10.1 | 7/3/2023 | | | | | | | |
| | | | | | | | | | | | |
4.3 | | | S-1/A | 4.3 | 2/8/2023 | | | | | | | |
| | | | | | | | | | | | |
4.4 | | | | | | X | | | | | | |
| | | | | | | | | | | | |
10.1 | | | S-1/A | 10.1 | 5/11/2023 | | | | | | | |
| | | | | | | | | | | | |
| 10.2 | | Credit Agreement, dated as of April 26, 2021, by and among Evergreen Acqco 1 LP, as US Borrower, Value Village Canada Inc., as Canadian Borrower, S-Evergreen Holding Corp., as Holdings, Evergreen Acqco GP LLC, as Holdings GP, KKR Loan Administration Services LLC, as Administrative Agent and as Collateral Agent, KKR Capital Markets LLC, as Lender and as Joint Lead Arranger, Jefferies Finance LLC, as Lender and as Joint Lead Arranger, PNC Bank, National Association, as Lender and as Joint Lead Arranger, and Credit Suisse Loan Funding LLC, as Lender and as Joint Lead Arranger. | S-1/A | 10.2 | 3/30/2023 | | | | | | | |
| | | | | | | | | | | | |
| | | | | | | | | | | | | | | | | | | | | | | | | | |
| | | Incorporated by Reference | | | | | | | |
10.3 | | First Amendment to Credit Agreement, dated as of November 8, 2021, by and among Evergreen Acqco 1 LP, as US Borrower, Value Village Canada Inc., as Canadian Borrower, S-Evergreen Holding Corp., as Holdings, Evergreen Acqco GP LLC, as Holdings GP, KKR Loan Administration Services LLC, as Administrative Agent and as Collateral Agent, KKR Corporate Lending LLC, as a 2021 Incremental Term Lender, Jefferies Finance LLC, as a 2021 Incremental Term Lender and Credit Suisse AG, Cayman Islands Branch, as a 2021 Incremental Term Lender. | S-1 | 10.3 | 12/22/2021 | | | | | | | |
| | | | | | | | | | | | |
| 10.4 | | Second Amendment to Credit Agreement, dated as of November 23, 2022, among Evergreen Acqco 1 LP, as US Borrower, Value Village Canada INC., as Canadian Borrower, S-Evergreen Holding Corp., as Holdings, Evergreen Acqco GP LLC, as Holdings GP, the other Guarantors party thereto, KKR Loan Administration Services LLC, as Administrative Agent and Collateral Agent, and PNC Bank, National Association, as 2022 Incremental Revolving Lender. | S-1/A | 10.4 | 3/30/2023 | | | | | | | |
| | | | | | | | | | | | |
10.5 | | Third Amendment to Credit Agreement, dated as of January 30, 2024, by and among Evergreen Acqco 1 LP, as US Borrower, Value Village Canada Inc., as Canadian Borrower, S-Evergreen Holding Corp., as Holdings, Evergreen Acqco GP LLC, as Holdings GP, the other Guarantors party thereto and KKR Loan Administration Services LLC, as Administrative Agent and Collateral Agent. | | | | X | | | | | | |
10.6 | | | S-1 | 10.4 | 12/22/2021 | | | | | | | |
| | | | | | | | | | | | |
10.7 | | | S-1 | 10.5 | 12/22/2021 | | | | | | | |
| | | | | | | | | | | | |
10.8# | | | S-1/A | 10.7 | 5/11/2023 | | | | | | | |
| | | | | | | | | | | | |
10.9# | | | S-1/A | 10.8 | 5/11/2023 | | | | | | | |
| | | | | | | | | | | | |
10.10# | | | S-1/A | 10.9 | 5/11/2023 | | | | | | | |
| | | | | | | | | | | | |
10.11# | | | S-1/A | 10.10 | 5/11/2023 | | | | | | | |
| | | | | | | | | | | | |
10.12# | | | S-1/A | 10.11 | 5/11/2023 | | | | | | | |
| | | | | | | | | | | | |
10.13# | | | S-1/A | 10.12 | 5/11/2023 | | | | | | | |
| | | | | | | | | | | | |
10.14# | | | S-1/A | 10.13 | 5/11/2023 | | | | | | | |
| | | | | | | | | | | | |
10.15# | | | S-1/A | 10.14 | 5/11/2023 | | | | | | | |
| | | | | | | | | | | | |
10.16# | | | S-1/A | 10.15 | 5/11/2023 | | | | | | | |
| | | | | | | | | | | | |
21.1 | | | | | | X | | | | | | |
| | | | | | | | | | | | |
| 23.1 | | | | | | X | | | | | | |
| | | | | | | | | | | | |
31.1 | | | | | | X | | | | | | |
| | | | | | | | | | | | |
| | | | | | | | | | | | | | | | | | | | | | | | | | |
| | | Incorporated by Reference | | | | | | | |
31.2 | | | | | | X | | | | | | |
| | | | | | | | | | | | |
32.1 | | | | | | X | | | | | | |
| | | | | | | | | | | | |
32.2 | | | | | | X | | | | | | |
| | | | | | | | | | | | |
| 97.1 | | | | | | X | | | | | | |
| | | | | | | | | | | | |
101 | | The following financial statements from the Company’s Annual Report on Form 10-K for the Fiscal Year Ended December 30, 2023, formatted in Inline XBRL: (i) Consolidated Balance Sheets, (ii) Consolidated Statements of Operations and Comprehensive Income, (iii) Consolidated Statements of Stockholders’ Equity, (iv) Consolidated Statements of Cash Flows, and (v) Notes to Consolidated Financial Statements, tagged as blocks of text and including detailed tags. | | | | | | | | | | |
| | | | | | | | | | | | |
104 | | The cover page from the Company’s Annual Report on Form 10-K for the Fiscal Year Ended December 30, 2023, formatted in Inline XBRL (included within Exhibit 101). | | | | | | | | | | |
| | | | | | | | | | | | |
| | | | | | | | | | | | |
| | | | | | | | | | | | |
| | | | | | | | | | | | |
| | | | | | | | | | | | |
________________________________________
# Indicates management contract or compensatory plan.
Item 16. Form 10-K Summary
Not applicable.
SIGNATURES
Pursuant to the requirements of Section 13 or 15(d) of the Securities Exchange Act of 1934, the registrant has duly caused this report to be signed on its behalf by the undersigned, thereunto duly authorized.
| | | | | | | | | | | |
| | | |
| | | |
| | | |
| | | |
| Date: | March 08, 2024 | By: | /s/ Jay Stasz |
| | | Jay Stasz |
| | | Chief Financial Officer and Treasurer
(Principal Financial Officer) |
SIGNATURES
Pursuant to the requirements of the Securities Exchange Act of 1934, this report has been signed by the following persons in the capacities held on the dates indicated.
| | | | | | | | | | | | | | |
| Signature | | Title | | Date |
| | | | |
| /s/ Mark Walsh | | Chief Executive Officer (Principal Executive Officer) | | March 8, 2024 |
| Mark Walsh | | | | |
| | | | |
| /s/ Jay Stasz | | Chief Financial Officer (Principal Financial Officer and Principal Accounting Officer) | | March 8, 2024 |
| Jay Stasz | | | | |
| | | | |
/s/ Aaron Rosen | | Chairman of the Board of Directors | | March 8, 2024 |
| Aaron Rosen | | | | |
| | | | |
/s/ Jordan Smith | | Director | | March 8, 2024 |
Jordan Smith | | | | |
| | | | |
/s/ Robyn Collver | | Director | | March 8, 2024 |
| Robyn Collver | | | | |
| | | | |
/s/ William Allen | | Director | | March 8, 2024 |
| William Allen | | | | |
| | | | |
/s/ Duane Woods | | Director | | March 8, 2024 |
| Duane Woods | | | | |
| | | | |
/s/ Aina Konold | | Director | | March 8, 2024 |
| Aina Konold | | | | |
| | | | |
/s/ Kristy Pipes | | Director | | March 8, 2024 |
| Kristy Pipes | | | | |
| | | | |
/s/ Susan O’Farrell | | Director | | March 8, 2024 |
Susan O’Farrell | | | | |