00018788972022FYFALSEhttp://fasb.org/us-gaap/2022#GoodwillAndIntangibleAssetImpairment0.5P4Y00018788972022-01-012022-12-3100018788972022-06-30iso4217:USD00018788972023-03-14xbrli:shares00018788972022-12-3100018788972021-12-31iso4217:USDxbrli:shares0001878897doug:CommissionsAndOtherBrokerageIncomeMember2022-01-012022-12-310001878897doug:CommissionsAndOtherBrokerageIncomeMember2021-01-012021-12-310001878897doug:CommissionsAndOtherBrokerageIncomeMember2020-01-012020-12-310001878897doug:PropertyManagementMember2022-01-012022-12-310001878897doug:PropertyManagementMember2021-01-012021-12-310001878897doug:PropertyManagementMember2020-01-012020-12-310001878897doug:OtherAncillaryServicesMember2022-01-012022-12-310001878897doug:OtherAncillaryServicesMember2021-01-012021-12-310001878897doug:OtherAncillaryServicesMember2020-01-012020-12-3100018788972021-01-012021-12-3100018788972020-01-012020-12-310001878897doug:RealEstateAgentCommissionsMember2022-01-012022-12-310001878897doug:RealEstateAgentCommissionsMember2021-01-012021-12-310001878897doug:RealEstateAgentCommissionsMember2020-01-012020-12-310001878897doug:OperationsAndSupportMember2022-01-012022-12-310001878897doug:OperationsAndSupportMember2021-01-012021-12-310001878897doug:OperationsAndSupportMember2020-01-012020-12-310001878897doug:TechnologyMember2022-01-012022-12-310001878897doug:TechnologyMember2021-01-012021-12-310001878897doug:TechnologyMember2020-01-012020-12-310001878897us-gaap:CommonStockMember2019-12-310001878897us-gaap:AdditionalPaidInCapitalMember2019-12-310001878897us-gaap:RetainedEarningsMember2019-12-310001878897doug:FormerParentsNetInvestmentMember2019-12-310001878897us-gaap:NoncontrollingInterestMember2019-12-3100018788972019-12-310001878897doug:FormerParentsNetInvestmentMember2020-01-012020-12-310001878897us-gaap:CommonStockMember2020-12-310001878897us-gaap:AdditionalPaidInCapitalMember2020-12-310001878897us-gaap:RetainedEarningsMember2020-12-310001878897doug:FormerParentsNetInvestmentMember2020-12-310001878897us-gaap:NoncontrollingInterestMember2020-12-3100018788972020-12-310001878897us-gaap:RetainedEarningsMember2021-01-012021-12-310001878897doug:FormerParentsNetInvestmentMember2021-01-012021-12-310001878897us-gaap:NoncontrollingInterestMember2021-01-012021-12-310001878897us-gaap:AdditionalPaidInCapitalMember2021-01-012021-12-310001878897us-gaap:CommonStockMember2021-01-012021-12-310001878897us-gaap:CommonStockMember2021-12-310001878897us-gaap:AdditionalPaidInCapitalMember2021-12-310001878897us-gaap:RetainedEarningsMember2021-12-310001878897doug:FormerParentsNetInvestmentMember2021-12-310001878897us-gaap:NoncontrollingInterestMember2021-12-310001878897us-gaap:RetainedEarningsMember2022-01-012022-12-310001878897us-gaap:NoncontrollingInterestMember2022-01-012022-12-310001878897us-gaap:AdditionalPaidInCapitalMember2022-01-012022-12-310001878897us-gaap:CommonStockMember2022-01-012022-12-310001878897us-gaap:CommonStockMember2022-12-310001878897us-gaap:AdditionalPaidInCapitalMember2022-12-310001878897us-gaap:RetainedEarningsMember2022-12-310001878897doug:FormerParentsNetInvestmentMember2022-12-310001878897us-gaap:NoncontrollingInterestMember2022-12-31doug:officedoug:agent0001878897doug:DouglasEllimanTexasMemberdoug:DouglasEllimanTexasMember2021-07-31xbrli:pure0001878897doug:DouglasEllimanTexasMemberdoug:DouglasEllimanTexasMember2021-08-3100018788972018-01-012020-03-310001878897doug:CommissionsAndOtherBrokerageIncomeMember2022-12-310001878897doug:CommissionsAndOtherBrokerageIncomeMember2021-12-310001878897srt:MinimumMemberus-gaap:MachineryAndEquipmentMember2022-01-012022-12-310001878897us-gaap:MachineryAndEquipmentMembersrt:MaximumMember2022-01-012022-12-3100018788972020-01-012020-03-310001878897us-gaap:TrademarksMember2020-01-012020-03-310001878897doug:A2021ManagementIncentivePlanMemberus-gaap:RestrictedStockMember2022-01-012022-12-310001878897doug:PropertyManagementMember2022-01-012022-12-310001878897doug:PropertyManagementMember2021-01-012021-12-310001878897doug:PropertyManagementMember2020-01-012020-12-310001878897doug:PropertyManagementMemberus-gaap:EmployeeSeveranceMember2019-12-310001878897doug:PropertyManagementMemberus-gaap:OtherRestructuringMember2019-12-310001878897doug:NonCashLossonFixedAssetsMemberdoug:PropertyManagementMember2019-12-310001878897doug:PropertyManagementMember2019-12-310001878897doug:PropertyManagementMemberus-gaap:EmployeeSeveranceMember2020-01-012020-12-310001878897doug:PropertyManagementMemberus-gaap:OtherRestructuringMember2020-01-012020-12-310001878897doug:NonCashLossonFixedAssetsMemberdoug:PropertyManagementMember2020-01-012020-12-310001878897doug:PropertyManagementMemberus-gaap:EmployeeSeveranceMember2020-12-310001878897doug:PropertyManagementMemberus-gaap:OtherRestructuringMember2020-12-310001878897doug:NonCashLossonFixedAssetsMemberdoug:PropertyManagementMember2020-12-310001878897doug:PropertyManagementMember2020-12-310001878897doug:RealEstateAssociatesOfHoustonLLCMemberMemberdoug:DouglasEllimanTexasMember2021-08-060001878897doug:RealEstateAssociatesOfHoustonLLCMemberMember2021-08-062021-08-060001878897doug:RealEstateAssociatesOfHoustonLLCMemberMember2021-08-0600018788972021-08-0600018788972021-08-062021-08-060001878897doug:RealEstateAssociatesOfHoustonLLCMemberMember2021-08-0600018788972021-12-290001878897doug:CommissionAndOtherBrokerageIncomeExistingHomeSalesMember2022-01-012022-12-310001878897doug:NewYorkCityStandardMetropolitanStatisticalAreaMemberdoug:CommissionAndOtherBrokerageIncomeExistingHomeSalesMember2022-01-012022-12-310001878897doug:NortheastMemberdoug:CommissionAndOtherBrokerageIncomeExistingHomeSalesMember2022-01-012022-12-310001878897doug:SoutheastMemberdoug:CommissionAndOtherBrokerageIncomeExistingHomeSalesMember2022-01-012022-12-310001878897doug:WestMemberdoug:CommissionAndOtherBrokerageIncomeExistingHomeSalesMember2022-01-012022-12-310001878897doug:CommissionAndOtherBrokerageIncomeDevelopmentMarketingMember2022-01-012022-12-310001878897doug:CommissionAndOtherBrokerageIncomeDevelopmentMarketingMemberdoug:NewYorkCityStandardMetropolitanStatisticalAreaMember2022-01-012022-12-310001878897doug:CommissionAndOtherBrokerageIncomeDevelopmentMarketingMemberdoug:NortheastMember2022-01-012022-12-310001878897doug:SoutheastMemberdoug:CommissionAndOtherBrokerageIncomeDevelopmentMarketingMember2022-01-012022-12-310001878897doug:CommissionAndOtherBrokerageIncomeDevelopmentMarketingMemberdoug:WestMember2022-01-012022-12-310001878897doug:PropertyManagementIncomeMember2022-01-012022-12-310001878897doug:PropertyManagementIncomeMemberdoug:NewYorkCityStandardMetropolitanStatisticalAreaMember2022-01-012022-12-310001878897doug:PropertyManagementIncomeMemberdoug:NortheastMember2022-01-012022-12-310001878897doug:SoutheastMemberdoug:PropertyManagementIncomeMember2022-01-012022-12-310001878897doug:PropertyManagementIncomeMemberdoug:WestMember2022-01-012022-12-310001878897doug:EscrowAndTitleFeesMember2022-01-012022-12-310001878897doug:NewYorkCityStandardMetropolitanStatisticalAreaMemberdoug:EscrowAndTitleFeesMember2022-01-012022-12-310001878897doug:NortheastMemberdoug:EscrowAndTitleFeesMember2022-01-012022-12-310001878897doug:SoutheastMemberdoug:EscrowAndTitleFeesMember2022-01-012022-12-310001878897doug:EscrowAndTitleFeesMemberdoug:WestMember2022-01-012022-12-310001878897doug:NewYorkCityStandardMetropolitanStatisticalAreaMember2022-01-012022-12-310001878897doug:NortheastMember2022-01-012022-12-310001878897doug:SoutheastMember2022-01-012022-12-310001878897doug:WestMember2022-01-012022-12-310001878897doug:CommissionAndOtherBrokerageIncomeExistingHomeSalesMember2021-01-012021-12-310001878897doug:NewYorkCityStandardMetropolitanStatisticalAreaMemberdoug:CommissionAndOtherBrokerageIncomeExistingHomeSalesMember2021-01-012021-12-310001878897doug:NortheastMemberdoug:CommissionAndOtherBrokerageIncomeExistingHomeSalesMember2021-01-012021-12-310001878897doug:SoutheastMemberdoug:CommissionAndOtherBrokerageIncomeExistingHomeSalesMember2021-01-012021-12-310001878897doug:WestMemberdoug:CommissionAndOtherBrokerageIncomeExistingHomeSalesMember2021-01-012021-12-310001878897doug:CommissionAndOtherBrokerageIncomeDevelopmentMarketingMember2021-01-012021-12-310001878897doug:CommissionAndOtherBrokerageIncomeDevelopmentMarketingMemberdoug:NewYorkCityStandardMetropolitanStatisticalAreaMember2021-01-012021-12-310001878897doug:CommissionAndOtherBrokerageIncomeDevelopmentMarketingMemberdoug:NortheastMember2021-01-012021-12-310001878897doug:SoutheastMemberdoug:CommissionAndOtherBrokerageIncomeDevelopmentMarketingMember2021-01-012021-12-310001878897doug:CommissionAndOtherBrokerageIncomeDevelopmentMarketingMemberdoug:WestMember2021-01-012021-12-310001878897doug:PropertyManagementIncomeMember2021-01-012021-12-310001878897doug:PropertyManagementIncomeMemberdoug:NewYorkCityStandardMetropolitanStatisticalAreaMember2021-01-012021-12-310001878897doug:PropertyManagementIncomeMemberdoug:NortheastMember2021-01-012021-12-310001878897doug:SoutheastMemberdoug:PropertyManagementIncomeMember2021-01-012021-12-310001878897doug:PropertyManagementIncomeMemberdoug:WestMember2021-01-012021-12-310001878897doug:EscrowAndTitleFeesMember2021-01-012021-12-310001878897doug:NewYorkCityStandardMetropolitanStatisticalAreaMemberdoug:EscrowAndTitleFeesMember2021-01-012021-12-310001878897doug:NortheastMemberdoug:EscrowAndTitleFeesMember2021-01-012021-12-310001878897doug:SoutheastMemberdoug:EscrowAndTitleFeesMember2021-01-012021-12-310001878897doug:EscrowAndTitleFeesMemberdoug:WestMember2021-01-012021-12-310001878897doug:NewYorkCityStandardMetropolitanStatisticalAreaMember2021-01-012021-12-310001878897doug:NortheastMember2021-01-012021-12-310001878897doug:SoutheastMember2021-01-012021-12-310001878897doug:WestMember2021-01-012021-12-310001878897doug:CommissionAndOtherBrokerageIncomeExistingHomeSalesMember2020-01-012020-12-310001878897doug:NewYorkCityStandardMetropolitanStatisticalAreaMemberdoug:CommissionAndOtherBrokerageIncomeExistingHomeSalesMember2020-01-012020-12-310001878897doug:NortheastMemberdoug:CommissionAndOtherBrokerageIncomeExistingHomeSalesMember2020-01-012020-12-310001878897doug:SoutheastMemberdoug:CommissionAndOtherBrokerageIncomeExistingHomeSalesMember2020-01-012020-12-310001878897doug:WestMemberdoug:CommissionAndOtherBrokerageIncomeExistingHomeSalesMember2020-01-012020-12-310001878897doug:CommissionAndOtherBrokerageIncomeDevelopmentMarketingMember2020-01-012020-12-310001878897doug:CommissionAndOtherBrokerageIncomeDevelopmentMarketingMemberdoug:NewYorkCityStandardMetropolitanStatisticalAreaMember2020-01-012020-12-310001878897doug:CommissionAndOtherBrokerageIncomeDevelopmentMarketingMemberdoug:NortheastMember2020-01-012020-12-310001878897doug:SoutheastMemberdoug:CommissionAndOtherBrokerageIncomeDevelopmentMarketingMember2020-01-012020-12-310001878897doug:CommissionAndOtherBrokerageIncomeDevelopmentMarketingMemberdoug:WestMember2020-01-012020-12-310001878897doug:PropertyManagementIncomeMember2020-01-012020-12-310001878897doug:PropertyManagementIncomeMemberdoug:NewYorkCityStandardMetropolitanStatisticalAreaMember2020-01-012020-12-310001878897doug:PropertyManagementIncomeMemberdoug:NortheastMember2020-01-012020-12-310001878897doug:SoutheastMemberdoug:PropertyManagementIncomeMember2020-01-012020-12-310001878897doug:PropertyManagementIncomeMemberdoug:WestMember2020-01-012020-12-310001878897doug:EscrowAndTitleFeesMember2020-01-012020-12-310001878897doug:NewYorkCityStandardMetropolitanStatisticalAreaMemberdoug:EscrowAndTitleFeesMember2020-01-012020-12-310001878897doug:NortheastMemberdoug:EscrowAndTitleFeesMember2020-01-012020-12-310001878897doug:SoutheastMemberdoug:EscrowAndTitleFeesMember2020-01-012020-12-310001878897doug:EscrowAndTitleFeesMemberdoug:WestMember2020-01-012020-12-310001878897doug:NewYorkCityStandardMetropolitanStatisticalAreaMember2020-01-012020-12-310001878897doug:NortheastMember2020-01-012020-12-310001878897doug:SoutheastMember2020-01-012020-12-310001878897doug:WestMember2020-01-012020-12-310001878897us-gaap:AccountsReceivableMember2022-12-310001878897us-gaap:AccountsReceivableMember2021-12-310001878897us-gaap:OtherCurrentAssetsMember2022-12-310001878897us-gaap:OtherCurrentAssetsMember2021-12-310001878897us-gaap:OtherNoncurrentAssetsMember2022-12-310001878897us-gaap:OtherNoncurrentAssetsMember2021-12-310001878897us-gaap:OtherCurrentLiabilitiesMember2022-12-310001878897us-gaap:OtherCurrentLiabilitiesMember2021-12-310001878897doug:CurrentLiabilitiesMember2022-12-310001878897doug:CurrentLiabilitiesMember2021-12-310001878897us-gaap:OtherNoncurrentLiabilitiesMember2022-12-310001878897us-gaap:OtherNoncurrentLiabilitiesMember2021-12-310001878897doug:CommercialLeasingContractsCommissionsMember2022-01-012022-12-310001878897srt:MinimumMember2022-01-012022-12-310001878897srt:MaximumMember2022-01-012022-12-3100018788972023-01-012022-12-310001878897doug:RealEstateBrokerAgentReceivablesMember2022-12-310001878897doug:RealEstateBrokerAgentReceivablesMember2021-12-310001878897doug:RealEstateBrokerAgentReceivablesMember2022-01-012022-12-310001878897doug:RealEstateBrokerAgentReceivablesMember2020-12-310001878897doug:RealEstateBrokerAgentReceivablesMember2021-01-012021-12-310001878897doug:PropTechMembersrt:AffiliatedEntityMemberus-gaap:ConvertibleDebtSecuritiesMemberdoug:NewValleyVenturesLLCMember2022-01-012022-12-310001878897doug:PropTechMembersrt:AffiliatedEntityMemberus-gaap:ConvertibleDebtSecuritiesMemberdoug:NewValleyVenturesLLCMember2022-12-31doug:investment0001878897srt:AffiliatedEntityMemberdoug:NewValleyVenturesLLCMember2022-01-012022-12-310001878897srt:AffiliatedEntityMemberdoug:NewValleyVenturesLLCMember2022-12-310001878897doug:PropTechMembersrt:AffiliatedEntityMemberdoug:NewValleyVenturesLLCMember2022-01-012022-12-310001878897doug:PropTechMembersrt:AffiliatedEntityMemberdoug:NewValleyVenturesLLCMember2022-12-31doug:venturedoug:security0001878897us-gaap:LeaseholdImprovementsMember2022-12-310001878897us-gaap:LeaseholdImprovementsMember2021-12-310001878897us-gaap:MachineryAndEquipmentMember2022-12-310001878897us-gaap:MachineryAndEquipmentMember2021-12-310001878897doug:AncillaryServicesVenturesMember2022-12-310001878897doug:AncillaryServicesVenturesMember2021-12-310001878897srt:MinimumMemberdoug:AncillaryServicesVenturesMember2022-12-310001878897doug:AncillaryServicesVenturesMembersrt:MaximumMember2022-12-310001878897us-gaap:TrademarksMember2022-12-310001878897us-gaap:TrademarksMember2021-12-310001878897doug:DouglasEllimanTexasMemberus-gaap:TrademarksMember2021-08-060001878897us-gaap:OtherIntangibleAssetsMembersrt:MinimumMember2022-01-012022-12-310001878897us-gaap:OtherIntangibleAssetsMembersrt:MaximumMember2022-01-012022-12-310001878897us-gaap:OtherIntangibleAssetsMember2022-12-310001878897us-gaap:OtherIntangibleAssetsMember2021-12-310001878897us-gaap:SeniorNotesMember2022-12-310001878897us-gaap:SeniorNotesMember2021-12-310001878897us-gaap:NotesPayableOtherPayablesMember2022-12-310001878897us-gaap:NotesPayableOtherPayablesMember2021-12-310001878897doug:NotesPayableIssuedByNewValleyMemberus-gaap:SeniorNotesMember2018-12-310001878897doug:DouglasEllimanMember2018-12-310001878897doug:NotesPayableIssuedByNewValleyMemberus-gaap:SeniorNotesMember2022-01-012022-12-310001878897us-gaap:SeniorNotesMemberus-gaap:CarryingReportedAmountFairValueDisclosureMember2022-12-310001878897us-gaap:EstimateOfFairValueFairValueDisclosureMemberus-gaap:SeniorNotesMember2022-12-310001878897us-gaap:SeniorNotesMemberus-gaap:CarryingReportedAmountFairValueDisclosureMember2021-12-310001878897us-gaap:EstimateOfFairValueFairValueDisclosureMemberus-gaap:SeniorNotesMember2021-12-310001878897us-gaap:OtherDebtSecuritiesMemberus-gaap:CarryingReportedAmountFairValueDisclosureMember2022-12-310001878897us-gaap:OtherDebtSecuritiesMemberus-gaap:EstimateOfFairValueFairValueDisclosureMember2022-12-310001878897us-gaap:OtherDebtSecuritiesMemberus-gaap:CarryingReportedAmountFairValueDisclosureMember2021-12-310001878897us-gaap:OtherDebtSecuritiesMemberus-gaap:EstimateOfFairValueFairValueDisclosureMember2021-12-310001878897us-gaap:CarryingReportedAmountFairValueDisclosureMember2022-12-310001878897us-gaap:EstimateOfFairValueFairValueDisclosureMember2022-12-310001878897us-gaap:CarryingReportedAmountFairValueDisclosureMember2021-12-310001878897us-gaap:EstimateOfFairValueFairValueDisclosureMember2021-12-31doug:plan0001878897doug:A2021ManagementIncentivePlanMember2022-12-310001878897doug:A2021GrantsMemberus-gaap:RestrictedStockMember2021-01-012021-12-310001878897doug:A2021GrantsMemberus-gaap:RestrictedStockMember2021-12-310001878897doug:A2021GrantsMemberus-gaap:RestrictedStockMember2022-01-012022-12-310001878897doug:A2022GrantsMemberus-gaap:RestrictedStockMember2022-01-012022-12-310001878897doug:A2022GrantsMemberus-gaap:RestrictedStockMember2022-12-310001878897us-gaap:RestrictedStockMember2020-12-310001878897us-gaap:RestrictedStockMember2021-01-012021-12-310001878897us-gaap:RestrictedStockMember2021-12-310001878897us-gaap:RestrictedStockMember2022-01-012022-12-310001878897us-gaap:RestrictedStockMember2022-12-310001878897doug:VectorGroupLtdMemberdoug:TransitionServicesAgreementMember2022-01-012022-12-310001878897doug:VectorGroupLtdMemberdoug:AviationAgreementsMember2022-01-012022-12-310001878897doug:VectorGroupLtdMemberdoug:TaxIndemnificationsMember2022-01-012022-12-31doug:board_member0001878897doug:DouglasEllimanRealtyLlcMember2022-01-012022-12-310001878897doug:DouglasEllimanRealtyLlcMember2021-01-012021-12-310001878897doug:DouglasEllimanRealtyLlcMember2020-01-012020-12-310001878897doug:EntitySoldIn2019Memberdoug:EntitySoldIn2019Member2019-12-310001878897doug:EntitySoldIn2019Memberdoug:EntitySoldIn2019Membersrt:DirectorMember2019-12-310001878897doug:EntitySoldIn2019Member2022-05-012022-05-310001878897doug:EntitySoldIn2019Member2021-01-012021-12-310001878897doug:EntitySoldIn2019Member2020-01-012020-12-310001878897us-gaap:ImmediateFamilyMemberOfManagementOrPrincipalOwnerMemberdoug:DouglasEllimanRealtyLlcMemberdoug:CommissionsPaidToSonOfPresidentAndChiefExecutiveOfficerMember2022-01-012022-12-310001878897us-gaap:ImmediateFamilyMemberOfManagementOrPrincipalOwnerMemberdoug:DouglasEllimanRealtyLlcMemberdoug:CommissionsPaidToSonOfPresidentAndChiefExecutiveOfficerMember2021-01-012021-12-310001878897us-gaap:ImmediateFamilyMemberOfManagementOrPrincipalOwnerMemberdoug:DouglasEllimanRealtyLlcMemberdoug:CommissionsPaidToSonOfPresidentAndChiefExecutiveOfficerMember2020-01-012020-12-310001878897us-gaap:ImmediateFamilyMemberOfManagementOrPrincipalOwnerMemberdoug:CommissionsPaidToSpouseOfPresidentAndChiefExecutiveOfficerMemberdoug:DouglasEllimanRealtyLlcMember2022-01-012022-12-310001878897us-gaap:ImmediateFamilyMemberOfManagementOrPrincipalOwnerMemberdoug:CommissionsPaidToSpouseOfPresidentAndChiefExecutiveOfficerMemberdoug:DouglasEllimanRealtyLlcMember2021-01-012021-12-310001878897us-gaap:ImmediateFamilyMemberOfManagementOrPrincipalOwnerMemberdoug:CommissionsPaidToSpouseOfPresidentAndChiefExecutiveOfficerMemberdoug:DouglasEllimanRealtyLlcMember2020-01-012020-12-310001878897us-gaap:FairValueMeasurementsRecurringMemberus-gaap:MoneyMarketFundsMember2022-12-310001878897us-gaap:FairValueMeasurementsRecurringMemberus-gaap:FairValueInputsLevel1Memberus-gaap:MoneyMarketFundsMember2022-12-310001878897us-gaap:FairValueInputsLevel2Memberus-gaap:FairValueMeasurementsRecurringMemberus-gaap:MoneyMarketFundsMember2022-12-310001878897us-gaap:FairValueInputsLevel3Memberus-gaap:FairValueMeasurementsRecurringMemberus-gaap:MoneyMarketFundsMember2022-12-310001878897us-gaap:FairValueMeasurementsRecurringMemberus-gaap:CertificatesOfDepositMember2022-12-310001878897us-gaap:FairValueMeasurementsRecurringMemberus-gaap:CertificatesOfDepositMemberus-gaap:FairValueInputsLevel1Member2022-12-310001878897us-gaap:FairValueInputsLevel2Memberus-gaap:FairValueMeasurementsRecurringMemberus-gaap:CertificatesOfDepositMember2022-12-310001878897us-gaap:FairValueInputsLevel3Memberus-gaap:FairValueMeasurementsRecurringMemberus-gaap:CertificatesOfDepositMember2022-12-310001878897us-gaap:FairValueMeasurementsRecurringMember2022-12-310001878897us-gaap:FairValueMeasurementsRecurringMemberus-gaap:FairValueInputsLevel1Member2022-12-310001878897us-gaap:FairValueInputsLevel2Memberus-gaap:FairValueMeasurementsRecurringMember2022-12-310001878897us-gaap:FairValueInputsLevel3Memberus-gaap:FairValueMeasurementsRecurringMember2022-12-310001878897us-gaap:FairValueInputsLevel1Memberus-gaap:MoneyMarketFundsMember2022-12-310001878897us-gaap:FairValueMeasurementsRecurringMemberus-gaap:MoneyMarketFundsMember2021-12-310001878897us-gaap:FairValueMeasurementsRecurringMemberus-gaap:FairValueInputsLevel1Memberus-gaap:MoneyMarketFundsMember2021-12-310001878897us-gaap:FairValueInputsLevel2Memberus-gaap:FairValueMeasurementsRecurringMemberus-gaap:MoneyMarketFundsMember2021-12-310001878897us-gaap:FairValueInputsLevel3Memberus-gaap:FairValueMeasurementsRecurringMemberus-gaap:MoneyMarketFundsMember2021-12-310001878897us-gaap:FairValueMeasurementsRecurringMemberus-gaap:CertificatesOfDepositMember2021-12-310001878897us-gaap:FairValueMeasurementsRecurringMemberus-gaap:CertificatesOfDepositMemberus-gaap:FairValueInputsLevel1Member2021-12-310001878897us-gaap:FairValueInputsLevel2Memberus-gaap:FairValueMeasurementsRecurringMemberus-gaap:CertificatesOfDepositMember2021-12-310001878897us-gaap:FairValueInputsLevel3Memberus-gaap:FairValueMeasurementsRecurringMemberus-gaap:CertificatesOfDepositMember2021-12-310001878897us-gaap:FairValueMeasurementsRecurringMember2021-12-310001878897us-gaap:FairValueMeasurementsRecurringMemberus-gaap:FairValueInputsLevel1Member2021-12-310001878897us-gaap:FairValueInputsLevel2Memberus-gaap:FairValueMeasurementsRecurringMember2021-12-310001878897us-gaap:FairValueInputsLevel3Memberus-gaap:FairValueMeasurementsRecurringMember2021-12-310001878897us-gaap:FairValueInputsLevel1Memberus-gaap:MoneyMarketFundsMember2021-12-310001878897us-gaap:FairValueInputsLevel3Memberus-gaap:FairValueMeasurementsRecurringMemberus-gaap:ConvertibleDebtSecuritiesMember2022-12-310001878897us-gaap:FairValueMeasurementsRecurringMemberus-gaap:FairValueInputsLevel3Membersrt:MinimumMemberus-gaap:MeasurementInputInceptionDiscountRateMemberus-gaap:ValuationTechniqueDiscountedCashFlowMemberus-gaap:ConvertibleDebtSecuritiesMember2022-12-310001878897us-gaap:FairValueMeasurementsRecurringMemberus-gaap:FairValueInputsLevel3Memberus-gaap:MeasurementInputInceptionDiscountRateMemberus-gaap:ValuationTechniqueDiscountedCashFlowMemberus-gaap:ConvertibleDebtSecuritiesMembersrt:MaximumMember2022-12-310001878897us-gaap:FairValueMeasurementsRecurringMemberus-gaap:FairValueInputsLevel3Membersrt:MinimumMemberus-gaap:ValuationTechniqueDiscountedCashFlowMemberus-gaap:MeasurementInputPriceVolatilityMemberus-gaap:ConvertibleDebtSecuritiesMember2022-12-310001878897us-gaap:FairValueMeasurementsRecurringMemberus-gaap:FairValueInputsLevel3Memberus-gaap:ValuationTechniqueDiscountedCashFlowMemberus-gaap:MeasurementInputPriceVolatilityMemberus-gaap:ConvertibleDebtSecuritiesMembersrt:MaximumMember2022-12-310001878897us-gaap:MeasurementInputDiscountRateMemberus-gaap:FairValueMeasurementsRecurringMemberus-gaap:FairValueInputsLevel3Membersrt:MinimumMemberus-gaap:ValuationTechniqueDiscountedCashFlowMemberus-gaap:ConvertibleDebtSecuritiesMember2022-12-310001878897us-gaap:MeasurementInputDiscountRateMemberus-gaap:FairValueMeasurementsRecurringMemberus-gaap:FairValueInputsLevel3Memberus-gaap:ValuationTechniqueDiscountedCashFlowMemberus-gaap:ConvertibleDebtSecuritiesMembersrt:MaximumMember2022-12-310001878897us-gaap:FairValueInputsLevel3Memberus-gaap:FairValueMeasurementsRecurringMemberus-gaap:ConvertibleDebtSecuritiesMember2021-12-310001878897us-gaap:FairValueMeasurementsRecurringMemberus-gaap:FairValueInputsLevel3Memberus-gaap:MeasurementInputInceptionDiscountRateMemberus-gaap:ValuationTechniqueDiscountedCashFlowMemberus-gaap:ConvertibleDebtSecuritiesMember2021-12-310001878897us-gaap:FairValueMeasurementsRecurringMemberus-gaap:FairValueInputsLevel3Membersrt:MinimumMemberus-gaap:ValuationTechniqueDiscountedCashFlowMemberus-gaap:MeasurementInputPriceVolatilityMemberus-gaap:ConvertibleDebtSecuritiesMember2021-12-310001878897us-gaap:FairValueMeasurementsRecurringMemberus-gaap:FairValueInputsLevel3Memberus-gaap:ValuationTechniqueDiscountedCashFlowMemberus-gaap:MeasurementInputPriceVolatilityMemberus-gaap:ConvertibleDebtSecuritiesMembersrt:MaximumMember2021-12-310001878897us-gaap:MeasurementInputDiscountRateMemberus-gaap:FairValueMeasurementsRecurringMemberus-gaap:FairValueInputsLevel3Membersrt:MinimumMemberus-gaap:ValuationTechniqueDiscountedCashFlowMemberus-gaap:ConvertibleDebtSecuritiesMember2021-12-310001878897us-gaap:MeasurementInputDiscountRateMemberus-gaap:FairValueMeasurementsRecurringMemberus-gaap:FairValueInputsLevel3Memberus-gaap:ValuationTechniqueDiscountedCashFlowMemberus-gaap:ConvertibleDebtSecuritiesMembersrt:MaximumMember2021-12-310001878897doug:RealEstateBrokerageMemberus-gaap:OperatingSegmentsMember2022-01-012022-12-310001878897us-gaap:CorporateNonSegmentMember2022-01-012022-12-310001878897doug:RealEstateBrokerageMemberus-gaap:OperatingSegmentsMember2022-12-310001878897us-gaap:CorporateNonSegmentMember2022-12-310001878897doug:RealEstateBrokerageMemberus-gaap:OperatingSegmentsMember2021-01-012021-12-310001878897us-gaap:CorporateNonSegmentMember2021-01-012021-12-310001878897doug:RealEstateBrokerageMemberus-gaap:OperatingSegmentsMember2021-12-310001878897us-gaap:CorporateNonSegmentMember2021-12-310001878897doug:RealEstateBrokerageMemberus-gaap:OperatingSegmentsMember2020-01-012020-12-310001878897us-gaap:CorporateNonSegmentMember2020-01-012020-12-310001878897doug:RealEstateBrokerageMemberus-gaap:OperatingSegmentsMember2020-12-310001878897us-gaap:CorporateNonSegmentMember2020-12-310001878897us-gaap:ValuationAllowanceOfDeferredTaxAssetsMember2021-12-310001878897us-gaap:ValuationAllowanceOfDeferredTaxAssetsMember2022-01-012022-12-310001878897us-gaap:ValuationAllowanceOfDeferredTaxAssetsMember2022-12-310001878897us-gaap:ValuationAllowanceOfDeferredTaxAssetsMember2020-12-310001878897us-gaap:ValuationAllowanceOfDeferredTaxAssetsMember2021-01-012021-12-310001878897us-gaap:AllowanceForCreditLossMember2019-12-310001878897us-gaap:AllowanceForCreditLossMember2020-01-012020-12-310001878897us-gaap:AllowanceForCreditLossMember2020-12-310001878897us-gaap:ValuationAllowanceOfDeferredTaxAssetsMember2019-12-310001878897us-gaap:ValuationAllowanceOfDeferredTaxAssetsMember2020-01-012020-12-31
SECURITIES AND EXCHANGE COMMISSION
Washington, D.C. 20549
_____________________________________________
Form 10-K
_____________________________________________
☑ ANNUAL REPORT PURSUANT TO SECTION 13 OR 15(d) OF THE
SECURITIES EXCHANGE ACT OF 1934
For The Fiscal Year Ended December 31, 2022
☐ TRANSITION REPORT PURSUANT TO SECTION 13 OR 15(d) OF THE
SECURITIES EXCHANGE ACT OF 1934
_____________________________________________
DOUGLAS ELLIMAN INC.
(Exact name of registrant as specified in its charter)
_____________________________________________
| | | | | | | | | | | | | | |
| Delaware | | 1-41054 | | 87-2176850 |
(State or other jurisdiction of incorporation
incorporation or organization) | | Commission File Number | | (I.R.S. Employer Identification No.) |
4400 Biscayne Boulevard
Miami, Florida 33137
305-579-8000
(Address, including zip code and telephone number, including area code,
of the principal executive offices)
_____________________________________________
Securities registered pursuant to Section 12(b) of the Act:
| | | | | | | | |
| Title of each class: | Trading Symbol(s) | Name of each exchange on which registered: |
| Common stock, par value $0.01 per share | DOUG | New York Stock Exchange |
Securities registered pursuant to Section 12(g) of the Act: None
Indicate by check mark if the Registrant is a well-known seasoned issuer, as defined in Rule 405 of the Securities Act. o Yes þ No
Indicate by check mark if the Registrant is not required to file reports pursuant to Section 13 or Section 15(d) of the Exchange Act. o Yes þ No
Indicate by check mark whether the Registrant (1) has filed all reports required to be filed by Section 13 or 15(d) of the Securities Exchange Act of 1934, as amended (the “Exchange Act”), during the preceding 12 months (or for such shorter period that the Registrant was required to file such reports), and (2) has been subject to such filing requirements for the past 90 days. þ Yes o No
Indicate by check mark whether the Registrant has submitted electronically every Interactive Data File required to be submitted pursuant to Rule 405 of Regulation S-T (§ 232.405 of this chapter) during the preceding 12 months (or for such shorter period that the registrant was required to submit such files). þ Yes o No
Indicate by check mark whether the Registrant is a large accelerated filer, an accelerated filer, or a non-accelerated filer. See definition of “accelerated filer and large accelerated filer” in Rule 12b-2 of the Exchange Act.
| | | | | | | | | | | | | | | | | | | | | | | | | | | | | |
| ☐ | Large accelerated filer | ☑ | Accelerated filer | ☐ | Non-accelerated filer | ☐ | Smaller reporting company | ☐ | Emerging Growth Company |
Indicate by check mark whether the registrant has filed a report on and attestation to its management’s assessment of the effectiveness of its internal control over financial reporting under Section 404(b) of the Sarbanes-Oxley Act (15 U.S.C. 7262(b)) by the registered public accounting firm that prepared or issued its audit report. þ
If securities are registered pursuant to Section 12(b) of the Act, indicate by check mark whether the financial statements of the registrant included in the filing reflect the correction of an error to previously issued financial statements. ☐
Indicate by check mark whether any of those error corrections are restatements that required a recovery analysis of incentive-based compensation received by any of the registrant’s executive officers during the relevant recovery period pursuant to § 240.10D-1(b) ☐
Indicate by check mark whether the Registrant is a shell company as defined in Rule 12b-2 of the Exchange Act. ☐ Yes þ No
The aggregate market value of the common stock held by non-affiliates of Douglas Elliman Inc. as of June 30, 2022 was approximately $359.0 million.
At March 14, 2023, Douglas Elliman Inc. had 84,416,022 shares of common stock outstanding.
DOCUMENTS INCORPORATED BY REFERENCE:
Part III (Items 10, 11, 12, 13 and 14) from the definitive Proxy Statement for the 2023 Annual Meeting of Stockholders to be filed with the Securities and Exchange Commission no later than 120 days after the end of the Registrant’s fiscal year covered by this report.
Douglas Elliman Inc.
FORM 10-K
TABLE OF CONTENTS
| | | | | | | | |
| | | Page |
| | |
|
| | |
| | |
| | |
| | |
| | |
| | |
| |
|
| | |
| Reserved | |
| | |
| | |
| | |
| | |
| | |
| | |
| Disclosure Regarding Foreign Jurisdictions that Prevent Inspections | |
| |
|
| | |
| | |
| | |
| | |
| | |
| |
|
| | |
| Item 16. | Form 10-K Summary | |
| |
| | |
| EX-3.2 |
| EX-10.11 |
| EX-10.12 |
| EX-10.13 |
| EX-21.1 |
| EX-23.1 |
| EX-31.1 |
| EX-31.2 |
| EX-32.1 |
| EX-101 INSTANCE DOCUMENT - the instance document does not appear in the Interactive Data File because its XBRL tags are embedded within the Inline XBRL document. |
| EX-101 SCHEMA DOCUMENT |
| EX-101 CALCULATION LINKBASE DOCUMENT |
| EX-101 LABELS LINKBASE DOCUMENT |
| EX-101 PRESENTATION LINKBASE DOCUMENT |
| EX-101 DEFINITION LINKBASE DOCUMENT |
PART I
ITEM 1. BUSINESS
Overview
Douglas Elliman Inc. is engaged in the real estate services and property technology investment business and is seeking to acquire or invest in additional real estate services and property technology, or PropTech, companies. Douglas Elliman owns Douglas Elliman Realty, LLC, one of the largest residential brokerage companies in the New York metropolitan area, which includes New York City, Long Island, the Hamptons, Westchester, Connecticut and New Jersey, and the sixth-largest in the United States with operations in Florida, California, Texas, Colorado, Nevada, Massachusetts, Maryland, Virginia and Washington D.C. We also offer, including through our subsidiaries and ventures, ancillary services, such as property management, title and escrow services.
We are a Delaware corporation and were incorporated in 2021 in connection with the separation of Douglas Elliman from Vector Group Ltd., as an independent, publicly-traded company, listed on the New York Stock Exchange (the “Distribution”). On December 29, 2021, Vector Group completed the Distribution of the common stock of Douglas Elliman to its stockholders and we began trading on the New York Stock Exchange under the symbol “DOUG” on December 30, 2021.
Strategy
Since its inception in 1911, Douglas Elliman has challenged the status quo of the real estate industry. We were founded on Douglas L. Elliman’s vision that New Yorkers would shift their preference for traditional homes to favor luxury apartments that were both sold and managed by comprehensive real estate companies. More than a century later, the Douglas Elliman brand is still associated with service, luxury and forward thinking — our markets are primarily international finance and technology hubs that are densely populated and offer housing inventory at premium price points. The average transaction value of a home we sold in 2022 was approximately $1.62 million — significantly higher than our principal competitors.
We are building on our record of innovation. Douglas Elliman is focused on digitizing, integrating and simplifying real estate activities for agents and elevating their clients’ experiences. We are bringing innovative, technology-driven PropTech solutions to Douglas Elliman by adopting new PropTech solutions for agents and their clients and also investing in select PropTech opportunities through our subsidiary, New Valley Ventures LLC. Our model is to source and use best-of-breed products and services that we believe will increase our efficiency. In addition to entering into business relationships with PropTech companies, as described further below, we are committed to creating over time a portfolio of PropTech companies that, through our business and investment relationship, have access to our agents and their clients, as well as our knowledge and experience, to grow their own businesses, while benefiting our operations. This keeps Douglas Elliman and our agents on the cutting edge of the industry with innovative solutions and services that can be integrated into our technology, while also remaining asset-light. Furthermore, we maintain upside potential in the success of our PropTech partners in which we invest through minority stakes in their capital structures.
Douglas Elliman is well positioned to capitalize on opportunities in the U.S. residential real estate market with a leading luxury brand and a comprehensive suite of technology-enabled real estate services and investments. Despite various “agentless” models such as “iBuying,” approximately 86% of both buyers and sellers were assisted by a real estate agent or broker when purchasing or selling their home between July 2021 and June 2022, according to the National Association of Realtors (“NAR”), highlighting the central role agents continue to play in real estate transactions. Agents are able to generate significant repeat business from clients and referrals, with 63% of home sellers and 50% of home buyers between July 2021 and June 2022 choosing to work with an agent they had used in the past or from a referral, according to the NAR. Repeat business, as well the ability to provide ancillary services, allows agents to extend their client relationships and generate significant lifetime value.
After a strong 2021, when existing home sales reported by the NAR reached their highest level since 2006, the residential real estate brokerage industry encountered significant challenges in 2022. These challenges began during the second quarter of 2022 and included, among other things, a reduced inventory of homes available for sale as well as higher mortgage rates. According to the NAR, sales of existing homes declined by 34.0% in December 2022 from December 2021 and total homes sold in 2022 (5.03 million) was the lowest since 2014 (4.94 million). By comparison, our Gross Transaction Value declined only 16.2% in 2022 compared to 2021, reflecting the relative strength of the luxury markets in which we operate. In addition, our transactions of homes sold declined by 18% to 26,573 in 2022 from 32,400 in 2021. In the fourth quarter of 2022, our Gross Transaction Value and transactions of homes sold declined by approximately 40% and 43%, respectively, compared to the 2021 fourth quarter. We anticipate that the results for the first quarter of 2023 will reflect these same trends of significant year over year declines and the NAR and other real estate industry consortiums are forecasting continued challenges for the U.S. residential real estate market in 2023.
Despite these recent changes, we believe our competitive advantages in the luxury markets distinguish us from our competitors and our comprehensive suite of real estate solutions, our industry-leading brand name, and our talented team of employees and agents set us apart in the industry. As the real estate brokerage industry evolves and addresses challenges related to constrained inventory of homes as well as higher mortgage rates, we continue to pursue profitable growth opportunities through the expansion of our footprint, investments in cutting-edge PropTech companies through New Valley Ventures, continued recruitment of best-in-class talent, acquisitions (acqui-hires), and operational efficiencies. We will continue to employ a disciplined capital allocation strategy aimed at generating sustainable long-term value for our stockholders.
Real Estate Services
Large residential brokerage company with a recognized luxury brand. Douglas Elliman is one of the largest residential brokerage companies in the New York metropolitan area, which includes New York City, Long Island, the Hamptons, Westchester, Connecticut and New Jersey, and the sixth-largest in the United States. Douglas Elliman has approximately 120 offices with approximately 6,900 real estate agents in the New York metropolitan area, as well as in Florida, California, Texas, Colorado, Nevada, Massachusetts, Maryland, Virginia and Washington, D.C. The Douglas Elliman name is synonymous with luxury.
Prominent new development sales and marketing firm. Douglas Elliman’s Development Marketing division, or DEDM, distinguishes our positioning and reputation in the luxury real estate segment. DEDM is sought after by well-known real estate developers as it offers expertise in sales, leasing, and marketing for new developments throughout key markets in the United States and internationally. Drawing upon decades of experience and market-specific knowledge, DEDM offers a multidisciplinary approach that includes comprehensive in-house research, planning and design, marketing and sales. DEDM ranks among the most prominent sales and marketing firms in New York and Florida, as well as Douglas Elliman’s other luxury markets, and employs approximately 84 in-house development professionals. Through a strategic global alliance with Knight Frank Residential, the world’s largest privately-owned property consultancy, DEDM markets properties to international audiences. We employ a hybrid broker model where our traditional residential real estate agents work in tandem with our DEDM professionals and leverage their extensive industry relationships for the benefit of DEDM clients. Agents are able to market and sell high profile developments that enhance their brands and provide additional commission revenue potential. We believe this model provides a competitive advantage to our DEDM business while also increasing the attractiveness of the Douglas Elliman platform to current and prospective agents.
Premium residential property management business. Douglas Elliman is also engaged in the management of cooperative, condominium and rental apartment buildings though its subsidiary, Residential Management Group, LLC, which conducts business as Douglas Elliman Property Management. Residential Management Group provides a full range of fee-based management services for approximately 353 properties representing approximately 46,000 units in New York City, Nassau County, Long Island City and Westchester County.
Full-service title insurance business. Douglas Elliman is also engaged in the provision of title insurance services through its subsidiary DE Title Services. DE Title Services acts in the capacity of a title insurance agent and sells title insurance to property buyers and mortgage lenders. DE Title Services is licensed as a title insurance agent in New York. In addition to DE Title Services, in June 2021, we acquired a 50% interest in Partners Land Services LLC, which is engaged in the provision of title insurance services in Florida. Douglas Elliman is actively exploring similar ventures in other real estate markets.
Leading provider of escrow services. In November 2020, Douglas Elliman acquired Portfolio Escrow, an escrow company that is a leader in the California escrow market. After execution of a home purchase contract, purchase funds are deposited by the buyer into a Portfolio Escrow trust account. After all parties agree that all contingencies of the sale contract have been satisfied, Portfolio Escrow delivers all pertinent documents for recording to the appropriate county clerk’s office, then releases funds to the seller and any other agreed-upon entity. Portfolio Escrow, as an escrow holder, is paid a fee equal to a percentage of the sales price.
PropTech Solutions Supporting Real Estate Services
Our general approach to PropTech solutions is to leverage best-of-breed, proven legacy technologies while also selectively partnering with early-stage, disruptive PropTech companies to support our real estate brokerage and services operations. This strategy gives our stakeholders, including our agents, their clients and our management team, access to fast-changing and industry-leading technology. Hiring technology talent to develop new products inside of a large company such as Douglas Elliman is costly, takes longer to bring new technology to market, rarely generates the most cutting-edge solutions, and limits the value of the emerging product to our own usage. Instead, we believe technology innovation is best fostered in smaller, purpose-built PropTech companies. We operate an open architecture technology infrastructure that allows for a “plug and play” environment where new features and functionality can be quickly added for the benefit of our agents and their clients. This
ensures our technology remains state-of-the-art, vendor optionality is maintained, and our costs are minimized. Examples of our PropTech platform for Douglas Elliman’s agents and their clients are summarized below.
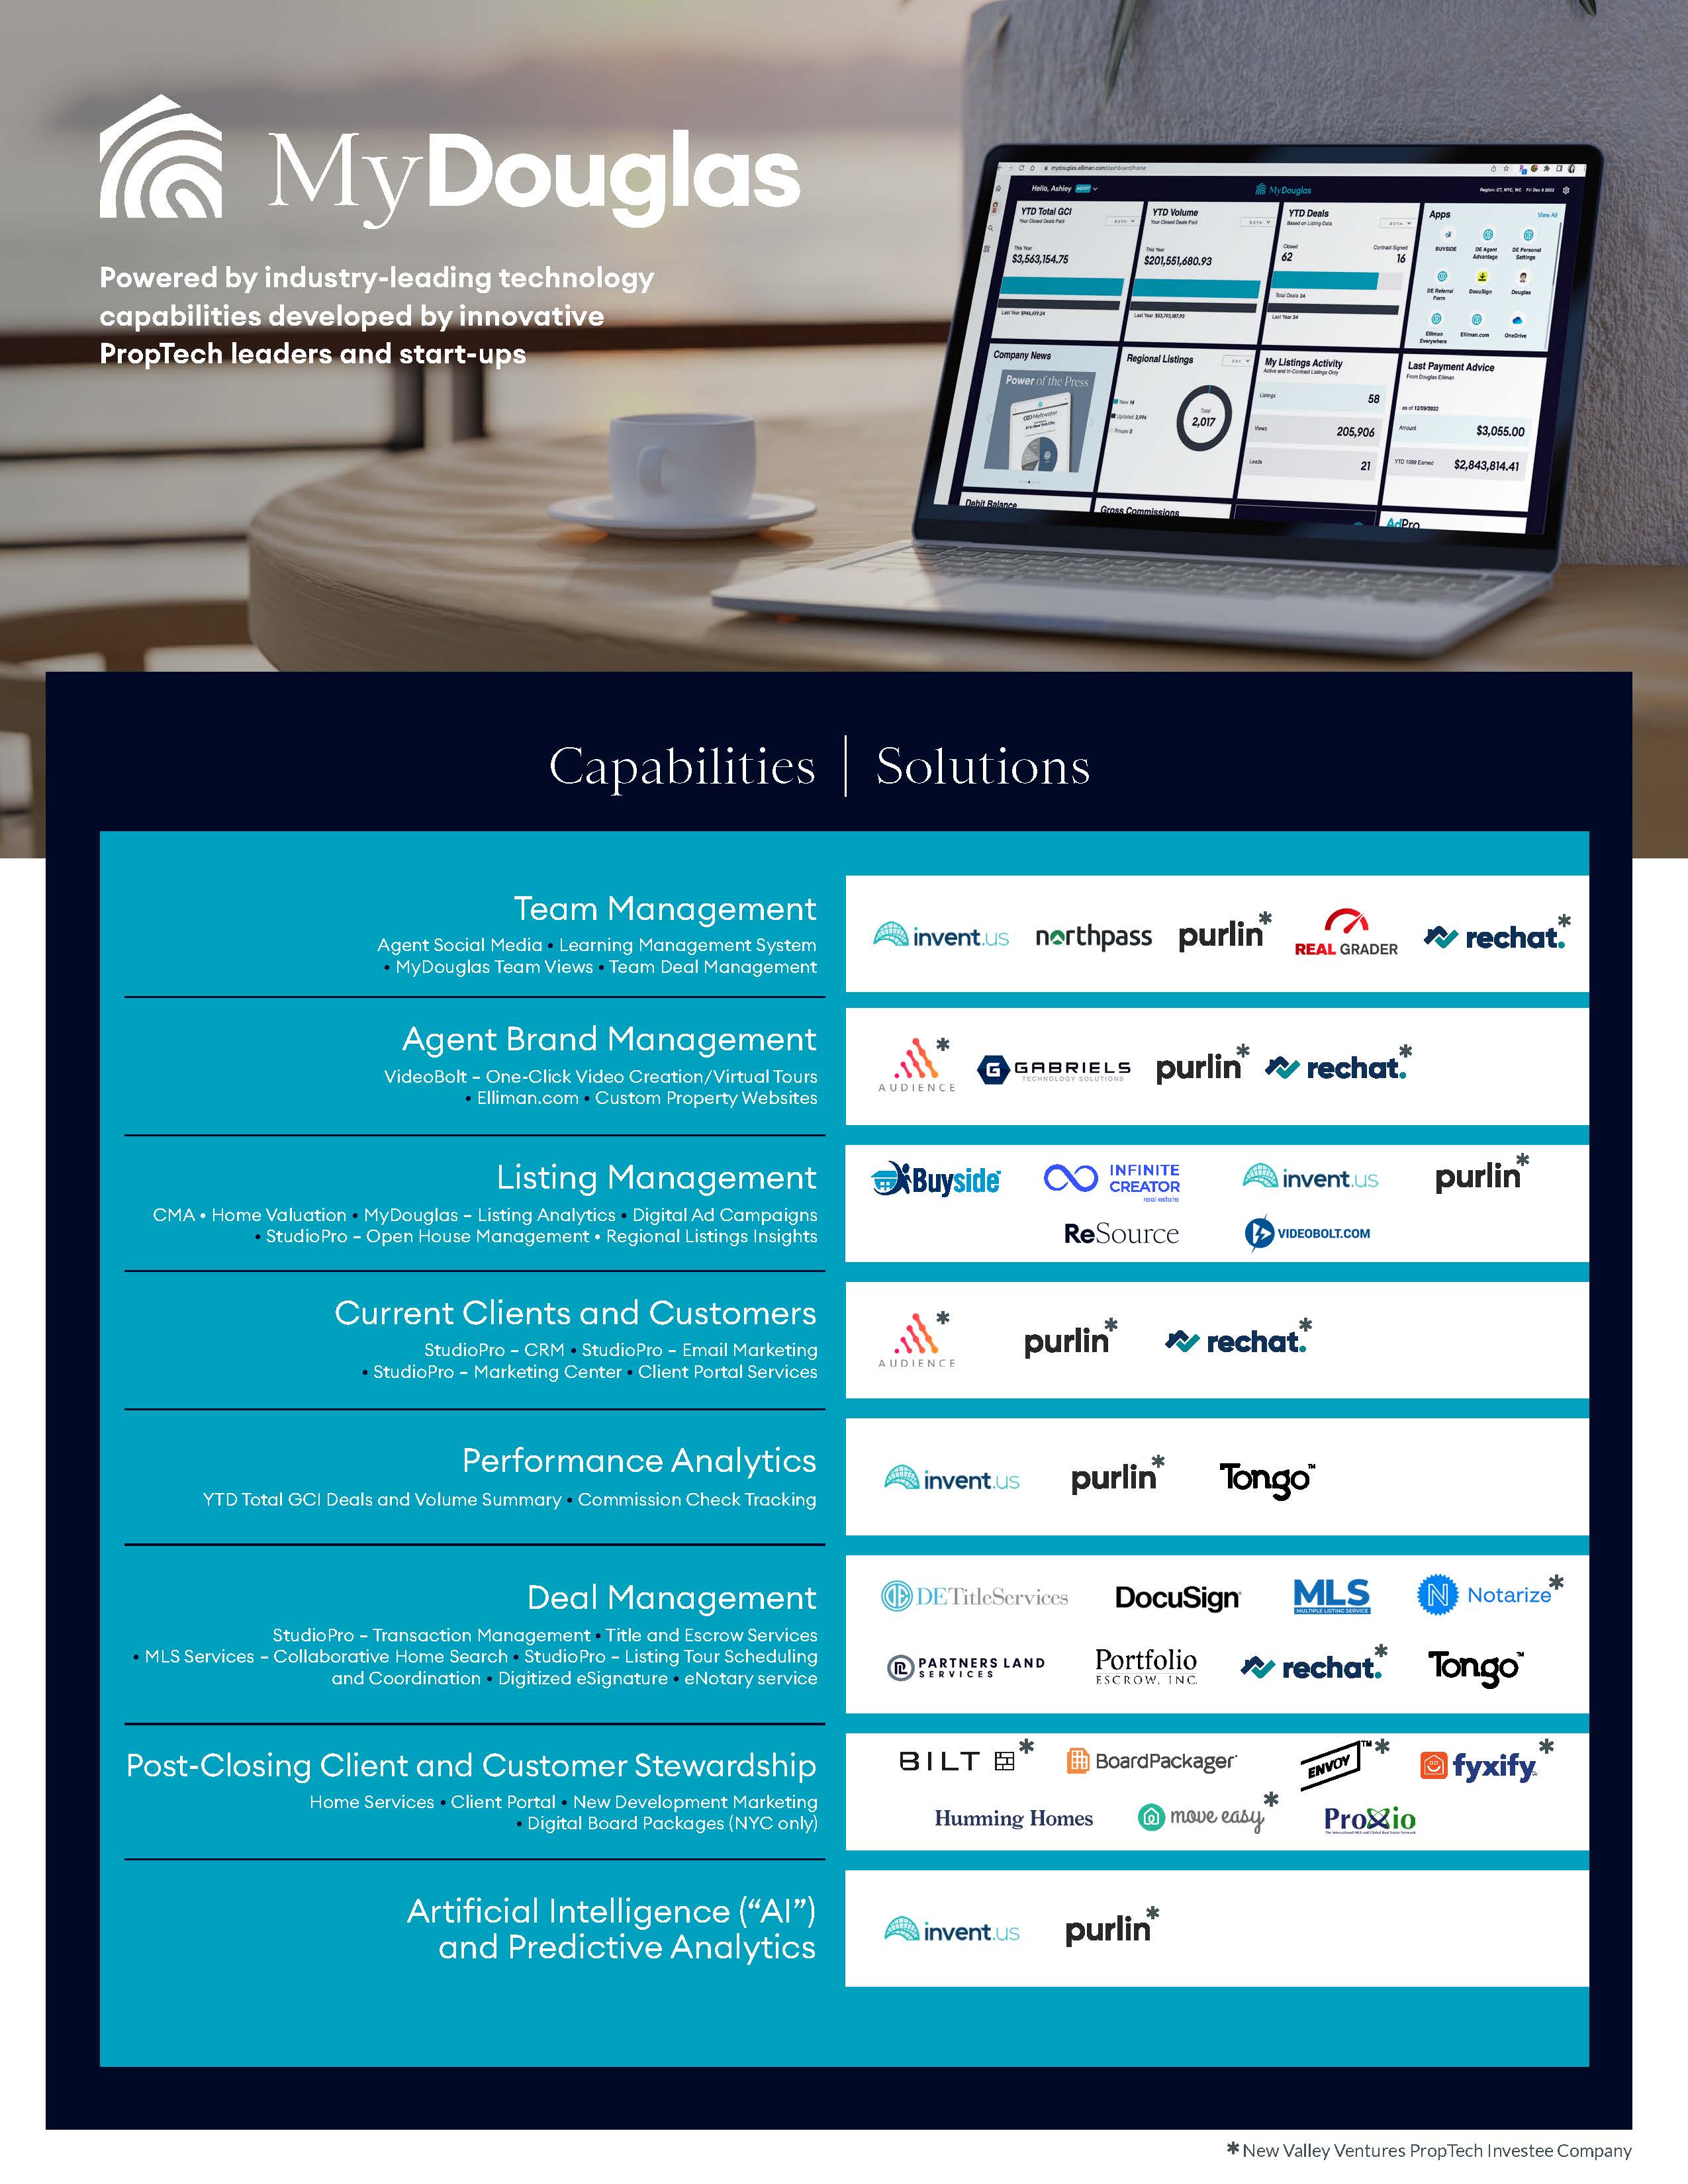
MyDouglas portal supports our agents in managing their business anytime, anywhere and on any device. Our MyDouglas agent portal is built on a native cloud SaaS technology foundation that is designed to rapidly adjust and incorporate new innovative solutions. The user-friendly portal incorporates automated and simplified workflows for agent interactions, expansive data-rich dashboards and reports backed by artificial intelligence, or AI, and integrated data assets. The technology is completely “plug and play” enabled, which supports our ability to quickly adjust our solutions in concert with the digital transformation happening in PropTech today.
Components of our MyDouglas solution include integrated customer relationship management, email marketing, marketing content creation and management, transaction management, video creation and virtual tours, comparative market analysis, home valuation tools, listing analytics, digital ad campaigns, open house management, new development sales and digital marketing, artificial intelligence, predictive analytics and more.
Elliman Everywhere offers robust virtual and mobile resources. Our Elliman Everywhere effort seeks to provide agents with the robust virtual and mobile resources they desire and will need to transact business from anywhere in the world, including markets where we do not have offices. This cloud-based agent portal includes workflow processing, a commission system, customer acquisition tools, an Innovation Lab and more, enhancing the agent experience and agents’ efficiency.
MyLearning provides our agents and employees with additional development and growth opportunities. Our MyLearning platform enables Douglas Elliman agents and employees to access and participate in live and recorded on-demand training sessions directed at various experience levels and subjects, including professional development, entrepreneurialism, business writing, public speaking and marketing.
Elliman Essentials provides agents and employees with enhanced vendor access. Elliman Essentials provides a curated list of offerings from preferred vendors that Douglas Elliman’s approximately 6,900 agents and approximately 957 employees access to source products, services and experiences in order to enhance business practices and purchase closing gifts for customers. Elliman Essentials can be accessed on our intranet portal, MyDouglas.
Launched and expanded a new client and customer lifetime concierge solution. We are offering seasoned third-party products into Elliman Showroom, a white-glove homeowners engagement solution that provides access to services such as insurance, moving, telecommunications, utilities, solar home security and home services and facilitates the moving and home management needs of our agents. This simple, “do-it-yourself,” end-to-end digital homeowner engagement platform includes more than 40 direct partnerships and integrations across multiple industries. It leverages our investee and growing PropTech startup, MoveEasy.
PropTech Investments
In addition to leveraging PropTech solutions to support our real estate brokerage and services operations, we believe that by investing in early-stage PropTech companies, Douglas Elliman can gain differentiated access to innovative PropTech services while benefiting from the expected growth and valuations of these firms without the need to build or fully acquire them. We believe investing in these PropTech companies and investment funds enables us to establish relationships with these companies (and funds’ portfolio companies) to seek preferred terms, become an early adopter of emerging technologies and achieve greater product integration with our users and IT systems. At the same time, we are actively seeking to capitalize on our unique real estate knowledge and experience by investing in PropTech companies that will both supplement and enhance the technology-based experience of Douglas Elliman’s agents and the general real estate industry as well as improve our operating efficiency. For example, the foundation for our agent communications platform and customer relationship management system was developed in consultation with one of our PropTech investee companies. We believe that these investments provide us with unique access to cutting-edge and industry-leading technology, providing us with valuable technology systems to improve the efficiency of Douglas Elliman’s businesses while also capturing some of the value created by the combination of our expertise in the real estate industry and the PropTech companies with which we partner.
As of December 31, 2022, New Valley Ventures had investments (at a carrying value) of approximately $14.8 million in PropTech companies. This amounts to approximately 3% of the value of Douglas Elliman’s total assets, which totaled approximately $550 million, as of December 31, 2022. As of December 31, 2022 our PropTech investments include:
• Rechat: a lead-to-close fully-mobile technology dashboard for real estate agents including marketing, customer relationship management and transaction-management software. Douglas Elliman has a multi-year services agreement with Rechat for its agents, who are increasingly requesting and requiring superior access to technology and back-office support services. The Rechat technology is a key element of MyDouglas, Douglas Elliman’s primary agent portal designed to be our agents’ technology front door, and StudioPro, the cloud-based agent portal and marketing tool recently launched by Douglas Elliman that helps integrate all agent resources in one user-friendly suite.
• Purlin: an automated intelligence platform to aid in home buying, an agent “paid social media” integration in MyDouglas and Portfolio Escrow client and agent portals that also integrate with MyDouglas.
• Humming Homes: a tech-enabled home management service that is creating a new category of end-to-end home management. It has built a solution that provides single-family homeowners a digital experience and offers a dedicated in-person home management team with a single point of contact and 24/7 support. The service employs data and insights to avoid reactive and expensive home maintenance issues. The investment will complement Douglas Elliman’s business in the Hamptons and align Humming Homes’ geographical growth with Douglas Elliman’s footprint in locations such as Aspen, Florida and Southern California.
• MoveEasy: a client- and customer-facing digital concierge service designed to assist clients and customers moving into and “setting up” their new homes, while offering additional services to maintain their homes. In partnership with residential real estate brokerages, MoveEasy is delivered in a white-labeled format that features the name and contact information of the selling agent.
• Fyxify: a tech-enabled platform that utilizes direct scheduling and operating technology to avoid the inefficiencies of home repairs (for example: calling around, mystery repair costs and wasting time).
• EVPassport: an entity that offers complete electronic vehicle charging solutions including hardware and software.
• Bilt: a leading loyalty program and co-branded credit card for renters to earn points on their rent payments. Douglas Elliman has joined the Bilt Rewards Alliance, a network of more than 2 million rental units across the country where renters can enroll in the loyalty program to earn points on rent paid. This platform enhances Douglas Elliman’s suite of offerings for both the renters and landlords it represents.
• Persefoni AI: a software-as-a-service (“SaaS”) platform built to enable enterprises of all sizes to measure their carbon footprint accurately, dynamically, and regularly across all operations.
• Envoy: a shared mobility company that sets up fleets of electric vehicles that can be shared by residents of a condominium development, hotel, or shared space.
• Audience: a subscription-based platform built around proprietary robotic arms that generate hand-written notes on behalf of sales-oriented professionals.
• Tongo: a financial program that gives real estate agents instant access to future commissions up to 60 days before closing.
• Guest House: a tech-enabled company focused on the home staging market.
• Alpaca: investment in Getaway House, Inc., a start-up company that provides cabin rental services in rural areas throughout the United States.
•PropTech Venture Capital Funds: investments in the following venture capital funds providing New Valley Ventures with exposure to opportunities in the emerging PropTech industry.
◦Camber Creek Venture Capital Funds: two funds that invest in a diversified pipeline of new PropTech ventures. Camber Creek’s portfolio includes Notarize, a digitized notary service, and Curbio, a renovation firm designed to increase a property’s selling price.
◦Sum Ventures: a fund that invests in growth companies in PropTech, FinTech, and CleanTech industries.
◦MetaProp Venture Capital Fund: a fund advised or managed by a New York-based venture capital firm.
◦The Lab PropTech Fund: a fund advised or managed by a Miami-based firm that aims to invest in emerging technologies with a focus on residential real estate and construction services.
Other than the five private funds listed above in which New Valley Ventures invests as a limited partner, all of these companies currently provide technology or services to Douglas Elliman. To date, we have not recognized revenue from these investments and do not anticipate recognizing revenue from these non-controlling PropTech investments. However, we target earning an attractive rate of return from the capital appreciation of our PropTech investments.
Our Competitive Strengths
Leading luxury brand with a strong presence in markets where we have brand recognition and brand equity. We have a presence in most major luxury real estate markets in the United States, including New York, Florida, California, Texas, Colorado, Nevada, Massachusetts, Maryland, Virginia and Washington D.C. and others. Further, we have established a reputation for luxury and trust, which we believe has differentiated our brand from those of our peers. To build on this established brand presence, Douglas Elliman produces owned content and generates earned media regarding a range of relevant topics — including brand initiatives, exclusive listings, new development projects and closed deals — that resonate with our clients and contribute to a strong share of voice across all major markets in which we operate, as compared to our principal real estate competitors, and enhances the professional credibility of agents and executives whose thought leadership is often sought by major global media outlets.
Experienced team of talented agents and employees. The residential real estate business is built upon personal relationships, and we have long believed Douglas Elliman’s team of approximately 957 employees and approximately 6,900 agents (including 5,407 Principal Agents) as of December 31, 2022 distinguishes us from other residential real estate brokerage firms. Forbes recognized Douglas Elliman in its 2021 list of America’s best large employers.
Leading new development marketing platform. DEDM offers leading expertise in sales, leasing, and marketing for new developments in New York City, Long Island, the Hamptons, New Jersey, South Florida, California, Massachusetts and Texas, as well as throughout the United States and internationally. We believe Douglas Elliman’s “hybrid” platform of involving both experienced new development experts and skilled brokerage professionals provides highly differentiated expertise and real-time market intelligence to its clients.
Technology that we believe is industry-leading and supports recruitment and retention of agents. We provide our agents with what we believe is the most advanced set of digital- and mobile-enabled tools and resources in the residential brokerage industry, including: cloud-based agent portal, workflow processing, commission system, customer acquisition tools, Innovation Lab, customer relationship management (“CRM”) and marketing tools. These tools are designed to support agent productivity, earnings potential and satisfaction and we believe they enhance our efforts to recruit and retain high-performing agents.
Growth Strategy
Expand our footprint into adjoining markets. We aim to build on our leadership position in the New York metropolitan area, including New York City, Long Island, Westchester and the Hamptons, while entering and expanding in adjoining markets as well as key markets in Florida, California, Texas, Colorado, Nevada, Massachusetts, Maryland, Virginia and Washington, D.C., where the Elliman brand has strong awareness and brand equity.
Continue executing the growth strategy of DEDM. Our hybrid DEDM platform matches experienced new development experts with skilled brokerage professionals to provide differentiated expertise and real time market intelligence to DEDM’s developer clients. We believe there is a clear path to growth through expansion into new markets.
Provide ancillary services to enhance the client experience and drive growth. We are seeking, through investment and acquisition, to expand and optimize our ancillary real estate services that allow our agents and our other businesses to enhance the client experience and drive growth in revenues and earnings. These services include escrow, title, mortgage finance, property management, notary, staging, renovation, security, moving, capital fundraising for developers, and more. We expect technology to be a key differentiator as we grow our ancillary services businesses, in terms of adoption by our agents, delivery to their clients and disruption of traditional business models not yet transformed by technology.
Invest in compelling PropTech opportunities that facilitate our growth and competitive differentiation. Our goal is to create over time a portfolio of PropTech companies in which we are invested and also leverage their technology for the benefit of our agents and their clients. We believe that investing strategically in disruptive, early-stage PropTech companies equips Douglas Elliman stakeholders with early and differentiated access to new technology built in entrepreneurial environments, while enabling PropTech investee companies to access our knowledge and experience through our commercial relationships in order to grow their own businesses. Concurrently, we believe investing in these PropTech companies enables us to establish relationships with these companies to seek preferred terms, become an early adopter of emerging technologies and achieve greater product integration with our users and IT systems, which enhances our competitive differentiation with agents and their clients. Furthermore, we maintain upside potential in the success of our PropTech partners in which we invest through minority stakes in their capital structures.
Continue to recruit best-in-class agents. Our recognized brand, combined with DEDM and the PropTech resources provided to our agents, support our ability to recruit experienced, high-performing agents. Leveraging regional recruiting teams, along with CRM and other necessary technology support, we seek to continue recruiting best-in-class talent at all levels.
Relentlessly pursue operational efficiencies. We have an ongoing, firm-wide focus on expense control, operational efficiency and profitability.
Human Capital
We have long believed that the diversity and talent of our people provides a competitive advantage to Douglas Elliman. As of December 31, 2022, we employed approximately 957 employees, of which 693 were employed by Douglas Elliman Realty LLC, 256 were employed at Douglas Elliman Property Management and eight were employed at Douglas Elliman’s corporate headquarters.
Real Estate Brokerage. The residential real estate business is built upon personal relationships and we have long believed Douglas Elliman’s team of approximately 693 employees and approximately 6,900 agents distinguish us from other residential real estate brokerage firms. Forbes recognized Douglas Elliman in its 2021 list of America’s best large employers and we believe this recognition is a testament to the hard work and resiliency of the Douglas Elliman family.
While most of Douglas Elliman’s employees are located in the New York and Miami metropolitan areas, our agents are located in New York, Florida, California, Texas, Colorado, Nevada, Massachusetts, Maryland, Virginia and Washington, D.C. In an effort to continue to foster relationships with our employees and agents, Douglas Elliman’s management implemented the following initiatives:
•Hosted, and continue to host, company-wide virtual town halls, podcasts and communications across all regions. These town halls are intended to promote a spirit of camaraderie and educate our employees and agents.
•In response to the COVID-19 pandemic, we converted all of its training and educational courses to its online platform in 2020.
•In 2023, we launched the inaugural “Agents of Change” initiative. “Agents of Change” is a series of conversations designed to spotlight pressing social issues and celebrate the Douglas Elliman agents who are actively working to increase diversity and spark change in the real estate industry and society at large. The initial event, held in honor of Black History Month, involved listening to five members of the Douglas Elliman community discussing their personal and professional experiences as people of color working in residential real estate and highlighted the scope of the diversity, equity and inclusion challenges facing the industry. The series will be an ongoing process designed to foster a respectful and supportive workplace that enables Douglas Elliman to attract and retain a diverse workforce that represents its customers and its communities.
•Continued to support diversity efforts, including sponsoring Aspen Gay Ski Week, matching employees’ and agents’ contributions to NAACP Legal and Education Fund, the AAPI Community Fund and various other health and social charitable organizations.
•Continued to support organizations benefiting victims of various Florida hurricanes, California wildfires, Texas and Puerto Rico flood disasters and the Ukraine Humanitarian Crisis Fund of the American Red Cross. Douglas Elliman also supports health driven organizations including God’s Love We Deliver, Project Angel Food, and the American Cancer Society.
Douglas Elliman offers comprehensive benefit programs to its employees which provide them with, among other things, medical, dental, and vision healthcare; 401(k) matching contributions; paid parental leave; and paid vacation time.
We will continue to listen, while engaging and connecting with our employees and Douglas Elliman’s agents, to further our human capital management objectives by continuing the initiatives we first began during the COVID-19 pandemic.
Available Information
Our website address is www.elliman.com. We make available free of charge on the Investor Relations section of our website (https://investors.elliman.com/overview/default.aspx) our Annual Report on Form 10-K, Quarterly Reports on Form 10-Q, Current Reports on Form 8-K and all amendments to those reports as soon as reasonably practicable after such material is electronically filed with the Securities and Exchange Commission. We also make available through our website other reports filed with the SEC under the Exchange Act, including our proxy statements and reports filed by officers and directors under Section 16(a) of that Act. Copies of these filings are also available on the SEC’s website. Copies of our Code of Business Conduct and Ethics, Corporate Governance Guidelines, Audit Committee charter, Compensation Committee charter and Corporate Responsibility and Nominating Committee charter have been posted on the Investor Relations section of our website and are also available in print to any stockholder who requests it. We do not intend for information contained in, or available through, our website to be part of this Annual Report on Form 10-K.
ITEM 1A.RISK FACTORS
Our business faces many risks. We have described below the known material risks that we and our subsidiaries face. There may be additional risks that we do not yet know of or that we do not currently perceive to be significant that may also impact our business or the business of our subsidiaries. Each of the risks and uncertainties described below could lead to events or circumstances that have a material adverse effect on the business, results of operations, cash flows, financial condition or equity of us or one or more of our subsidiaries, which in turn could negatively affect the value of our common stock. You should carefully consider and evaluate all of the information included in this report and any subsequent reports that we may file with the SEC or make available to the public before investing in our securities.
Risks Associated with Our Real Estate Business
We are subject to risks relating to the real estate industry.
The health of the U.S. real estate industry impacts our success and the industry is significantly affected by changes in economic and political conditions of the United States as well as real estate markets, which could adversely impact our real estate business, returns on our investments, trigger defaults in project financing, cause cancellations of property sales, reduce the value of our properties or investments and could affect our results of operations and liquidity. The real estate industry is cyclical and is significantly affected by changes in general and local economic conditions which are beyond our control. Because our revenue primarily consists of sales commissions and transaction fees, any industry slowdown could result in a decline in the total number of residential real estate transactions executed by our agents and could adversely affect our business, financial condition and results of operations.
These conditions include short-term and long-term interest rates, inflation, fluctuations in debt and equity capital markets, levels of unemployment, consumer confidence and the general economic condition of the United States and the global economy. The real estate market also depends upon the strength of financial institutions, which are sensitive to changes in the general macroeconomic environment. Lack of available credit or lack of confidence in the financial sector could adversely impact the real estate market.
Any of the following could be associated with cyclicality in the real estate market by halting or limiting a recovery in the residential real estate market, and have an adverse effect on our business by causing periods of lower growth or a decline in the number of home sales and/or property prices which in turn could adversely affect our revenue and profitability:
• periods of economic slowdown or recession;
• rising interest rates and inflation;
• the general availability of and cost of mortgage financing;
• a negative perception of the market for residential real estate;
• commission pressure from brokers who discount their commissions;
• an increase in the cost of homeowners’ insurance for owners of single-family homes and condominium associations;
• weak credit markets;
• a low level of consumer confidence in the economy and/or the real estate market;
• instability of financial institutions;
• legislative, tax or regulatory changes that would adversely impact the real estate market, including, but not limited to, potential reform relating to Fannie Mae, Freddie Mac and other government sponsored entities that provide liquidity to the U.S. housing and mortgage markets, and potential limits on, or elimination of, the deductibility of certain mortgage interest expense and property taxes;
•adverse changes in economic and general business conditions in the New York metropolitan area or the other markets in which we operate;
• a decline in the affordability of homes;
• declining demand for real estate;
• declining home ownership rates, declining demand for real estate and changing social attitudes toward home ownership;
• acts of God, such as hurricanes, earthquakes and other natural disasters, or acts or threats of war or terrorism; and/or
• adverse changes in global, national, regional and local economic and market conditions, particularly in the New York metropolitan area and the other markets where we operate, including those relating to pandemics and health crises, such as the COVID-19 pandemic.
We are impacted by the performance of the real estate markets in the New York metropolitan area and there may be a reduction in the attractiveness of those markets as well as the other markets in which we operate.
Our business significantly depends on sales transactions for residential property in the New York metropolitan area, and we derived approximately 55% of our revenues in 2022, 52% of our revenues in 2021 and 55% of our revenues in 2020 from the New York metropolitan area. There may be a reduction in the attractiveness of the real estate markets of the New York metropolitan area and the other markets in which we operate.
The Tax Cuts and Jobs Act of 2017 (the “Tax Act”) limited mortgage interest deductions as well as state and local income and property tax deductions. The loss of the use of these deductions has encouraged residents of states with high income and property taxes and costs of housing to migrate to states with lower tax rates and housing costs. In 2022, approximately 70.0% of our closed sales occurred in New York, California, Connecticut, New Jersey and Massachusetts, and a migration of residents from these markets or a reduction in the attractiveness of these markets as a place to live could adversely impact demand for our products and services.
We are also impacted by the attractiveness of New York City as a place to live and invest in and its status as an international center for business and commerce. If New York City’s economy stagnates or contracts or if there are significant concerns or uncertainty regarding the strength of New York City’s economy due to domestic, international or global macroeconomic trends, or other factors (including, in particular, any matters which adversely affect New York City’s status as an international center for business and commerce or the economic benefits of New York City’s financial services industry), the New York metropolitan area may become a less attractive place to live, work, study or to own residential property for investment purposes. The attractiveness of New York City may also be negatively affected by other factors, including high residential property sales prices or rents (or a risk or perceived risk of a fall in sales prices in the future), high costs of living, the impact of the Tax Act, the impact of changes in state tax law, such as the real estate transfer tax on luxury property, and negative perceptions surrounding quality of life, safety and security (including the risk or perceived risk of acts of terrorism or protests).
Any reduction in the attractiveness of New York City as a place to live or a place to invest in residential real estate and any matters which adversely affect New York City’s status as an international center for business and commerce could result in a reduction, by volume and/or by value, in residential property sales transactions in the New York metropolitan area.
There could be a lack of financing for homebuyers in the U.S. residential real estate market at favorable rates and on favorable terms.
The monetary policy of the U.S. government, and particularly the Federal Reserve Board, which regulates the supply of money and credit in the United States, significantly affects the availability of financing at favorable rates and on favorable terms, which in turn significantly affects the domestic real estate market.
We believe that low mortgage rates were a significant factor in the trend in increased homeowner equity and growth in home prices and sales in 2021, in particular. The historically low mortgage interest rates recently available to potential homebuyers have been adversely affected by the policies of the Federal Reserve Board, which began increasing its primary policy interest rate in March 2022 as well as reducing the size of its balance sheet, and such initiatives are expected to continue. Consequently, mortgage interest rates have significantly and rapidly increased, and may continue to increase. Changes in the Federal Reserve Board’s policies, the interest rate environment and mortgage market are beyond our control and difficult to predict. In 2022, the cost of financing for homebuyers increased significantly, which resulted in higher monthly payment costs that make homes less affordable to purchasers. We believe these higher interest rates also reduced home inventory because many sellers considering a move faced higher monthly payment costs as a result of moving. Consequently, both of these trends resulted in a decline of transaction volume from 2021 to 2022 and, if these trends continue, could eventually result in lower home prices.
In addition, the imposition of more stringent mortgage underwriting standards or a reduction in the availability of alternative mortgage products could also reduce homebuyers’ ability to access the credit markets on reasonable terms and adversely affect the ability and willingness of prospective buyers to finance home purchases or to sell their existing homes. This could result in a decline in the number of home sale transactions or mortgage and refinancing activity.
Declining home inventory levels have resulted in insufficient supply, which has negatively impacted home sale transactions.
The success of our business depends on the ability of our brokers and agents to sell homes. Home inventory levels have been declining in certain markets in recent years due to factors outside our control, including the pace of new housing construction, macroeconomic conditions, and, recently, the reluctance of sellers to move due to increases in mortgage costs of new homes and real estate industry businesses that purchase homes for long-term rental or corporate use. This decline has caused more homeowners to remain in their homes, reducing the volume of home sale transactions closed by our brokers and agents. The continuing decline in home inventory levels could have a material adverse effect on our business, financial condition and results of operations.
Consumers may adopt alternatives to full service agents.
A significant change in consumer sales that eliminates or minimizes the role of the agent in the real estate transaction process could have an adverse effect on our business. These options may include direct-buyer companies (also called iBuyers) that purchase directly from the seller at below-market rates in exchange for speed and convenience and then resell them shortly thereafter at market prices, and discounters who reduce the role of the agent in order to offer sellers a low commission or a flat fee while giving rebates to buyers. Consumer preferences regarding buying or selling houses and financing their home purchase will determine if these models reduce or replace the long-standing preference for full-service agents.
We depend on a strong brand, and any failure to maintain, protect and enhance the Douglas Elliman brand would have an adverse effect on our ability to grow our real estate brokerage business.
We have developed a strong brand that we believe has contributed significantly to the success of our business. Maintaining, protecting and enhancing Douglas Elliman as a premium real estate brokerage brand is critical to growing our business. If we do not successfully build and maintain a strong brand, our real estate brokerage business could be negatively impacted. Preserving and increasing the quality of the Douglas Elliman brand may require us to make substantial investments in areas such as marketing, community relations, outreach technology and employee training. Douglas Elliman actively engages in print and online advertisements, social media, targeted promotional mailings and email communications and engages on a regular basis in public relations and sponsorship activities. There is no assurance that those activities will maintain or enhance Douglas Elliman’s brand awareness.
Brand value can be severely damaged even by isolated incidents, particularly if the incidents receive considerable negative publicity or result in litigation. Some of these incidents may relate to the way we manage our relationship with our agents, our growth strategies or the ordinary course of our business or our brokerage business. Other incidents may arise from events that are or may be beyond our ability to control and may damage our brand, such as actions taken (or not taken) by one
or more agents relating to health, safety, welfare or other matters; cybersecurity incidents; litigation and claims; failure to maintain high ethical and social standards for all of our operations and activities; failure to comply with local laws and regulations; and illegal activity targeted at Douglas Elliman or others. Douglas Elliman’s brand value could diminish significantly if any such incidents or other matters erode consumer confidence in it.
The failure of third-party vendors or partners to perform as we expect or appropriately manage risks, or our failure to adequately monitor third-party performance, could result in harm to our reputation and generate revenue.
We engage with third-party vendors and partners in a variety of ways, including strategic collaborations and the development and delivery of applications, employing key internal operational processes and critical client systems. In many instances, these third parties are in direct contact with our agents and customers in order to deliver services on our behalf or to fulfill their role in the applicable collaboration. In some instances, these third parties may be in possession of personal information of our customers, agents or employees. In other instances, these third parties may play a critical role in developing products and services central to our business strategy. Our third-party partners may encounter difficulties in the provision of required deliverables or may fail to provide us with timely services, which may delay us, and also may make decisions that may harm us or that are contrary to our best interests, including by pursuing opportunities outside of the applicable Company project or program, to the detriment of such project or program.
If our third-party partners or vendors (or their respective vendors) were to fail to perform as we expect, fail to appropriately manage risks, provide diminished or delayed services to our customers or face cybersecurity breaches of their information technology systems, or if we fail to adequately monitor their performance, our operations and reputation could be materially adversely affected, in particular any such failures related to the development of key products. Depending on the function involved, vendor or third-party application failure or error may lead to increased costs, business disruption, distraction to management, processing inefficiencies, the loss of or damage to intellectual property or sensitive data through security breaches or otherwise, effects on financial reporting, loss of customers, damage to our reputation, or litigation, regulatory claims and/or remediation costs (including claims based on theories of breach of contract, vicarious liability, negligence or failure to comply with laws and regulations). Third-party vendors and partners (or their respective vendors) may also fail to maintain or keep adequate levels of insurance, which could result in a loss to us or expose us to litigation. The actions of our third party vendors and unaffiliated third-party developers are beyond our control. We face the same risks with respect to subcontractors that might be engaged by our third-party vendors and partners or their subcontractors.
The real estate brokerage business in our markets is extremely competitive.
We compete with other multi-office independent real estate organizations and with franchise real estate organizations competing in local areas. Competition is particularly intense in the densely populated metropolitan areas of New York City, South Florida and Los Angeles in which we operate. In addition, in the real estate brokerage industry, new participants face minimal barriers to entry into the market. We also compete for the services of qualified licensed agents. The ability of our brokerage offices to retain agents is generally subject to numerous factors, including the sales commissions they receive, advertising support and perception of brand value.
Our real estate brokerage business depends on the success of our agents.
Our real estate brokerage offices generate revenue in the form of commissions and service fees. Accordingly, our financial results depend upon the operational and financial success of our brokerage offices and our agents. As mentioned above, there is significant competition among brokerage firms for the services of high producing agents and we may be unable to recruit and retain agents.
Contractual obligations related to confidentiality and noncompetition may be ineffective or unenforceable against departing employees.
Our operations are dependent on the efforts, abilities and experience of our employees, and we compete for their services. We have contracts with certain employees that include provisions preventing these persons from competing with us both during and after the term of our employment contracts with them. Enforceability of the non-compete agreements that we have in place is not guaranteed, and contractual restrictions could be breached without discovery or adequate remedies.
On July 9, 2021, President Biden signed an executive order encouraging the Federal Trade Commission (“FTC”) to curtail unfair use of non-compete agreements and other agreements that may unfairly limit worker mobility. While we cannot predict how the initiatives set forth in the executive order will be implemented or, as a result, the impact that the executive order will have on our operations, there is now increased uncertainty regarding the long-term enforceability of our non-compete agreements. In January 2023, the FTC proposed a rule that, if enacted, would prohibit employers from entering into non-compete clauses with workers and require employers to rescind existing non-complete clauses.
Douglas Elliman is subject to risks and operational limitations associated with its strategic alliance with Knight Frank Residential.
Douglas Elliman has entered into a strategic alliance with Knight Frank Residential, the world’s largest privately-owned property consultancy, to market certain luxury residential properties of at least $2 million to international audiences through co-branded offices, located in the various luxury markets where Douglas Elliman operates, and select top-tier agents. The agreement provides for sharing of commissions and certain other payments in respect of jointly marketed properties. This strategic alliance subjects Douglas Elliman to a number of risks, including risks associated with the sharing of proprietary information between parties, non-performance by Douglas Elliman or Knight Frank Residential of obligations under the strategic alliance agreement, disputes over strategic or operational decisions or other matters and reputational risks, as well as litigation risks associated therewith. In particular, Douglas Elliman is subject to certain exclusivity and non-compete provisions in connection with marketing and selling properties outside the United States in various markets in which Knight Frank Residential operates, subject to certain exceptions. Although Douglas Elliman believes that the strategic alliance enhances its ability to serve its luxury customers, such restrictions could limit Douglas Elliman’s growth prospects.
Any decrease in our gross commission income or the percentage of commissions that we collect may harm our business, results of operations and financial condition. Our gross commission income or the percentage of commissions that we collect may decline.
Our business model depends upon our agents’ success in generating gross commission income, which we collect and from which we pay to them net commissions. Real estate commission rates vary somewhat by market, and although historical rates have been relatively consistent over time across markets, there can be no assurance that prevailing market practice will not change in a given market, or across the industry, in the future. Customary commission rates could change due to market forces locally or industry-wide, as well as due to regulatory or legal changes in such markets, including as a result of litigation or enforcement actions. See "Industry structure changes that disrupt the functioning of the residential real estate market could materially adversely affect our operations and financial results."
In addition, there can be no assurance that we will be able to maintain the percentage of commission income that we collect from our agents. If industry conditions change, we may be forced to reduce the percentage of commissions that we collect from our agents.
Negligence or intentional actions of real estate agents engaged by us could materially and adversely affect our reputation and subject us to liability.
Our operations rely on the performance of real estate agents. If our agents were to provide lower quality services to our customers or engage in negligent or intentional misconduct, our image and reputation could be materially adversely affected. In addition, we could also be subject to litigation and regulatory claims arising out of their performance of brokerage services, which if adversely determined, could result in substantial financial or legal penalties.
There may be adverse financial and operational consequences to us if independent real estate agents are reclassified as employees.
Although the legal relationship between residential real estate brokers and licensed real estate agents throughout most of the real estate industry historically has been that of independent contractor, newer rules and interpretations of state and federal employment laws and regulations, including those governing employee classification and wage and hour regulations in our and other industries, may impact industry practices and our company owned brokerage operations.
Significant agent reclassification determinations in the absence of available exemptions from minimum wage or overtime laws, including damages and penalties for prior periods (if assessed), could be disruptive to our business or constrain our operations in certain jurisdictions.
We may not be able to maintain or establish relationships with multiple listing services (“MLSs”) and third-party listing services, which could limit the information we are able to provide to our agents and clients.
Our ability to attract agents and to appeal to clients depends upon providing a robust number of listings. To provide these listings, we maintain relationships with multiple listing services and other third-party listing providers and aggregators, as well as our agents themselves to include listing data in our services. Certain of our agreements with real estate listing providers are short-term agreements that may be terminated with limited notice. The loss of some of our existing relationships with listing providers, whether due to termination of agreements or otherwise, changes to our rights to use listing data, or an inability to continue to add new listing providers, may cause our listing data to omit information important to our agents or clients. Any
loss or changes to our rights to use listing data or add listings, or any similar loss of rights in the markets we serve, could negatively impact agent and client confidence in the listing data we provide and reduce our ability to attract and retain agents.
Industry structure changes that disrupt the functioning of the residential real estate market could materially adversely affect our operations and financial results.
Through our brokerages, we participate in MLS and are a member of the NAR and state real estate associations and, accordingly, are subject to each group’s rules, policies, data licenses, and terms of service. The rules of each MLS to which we belong can vary widely and are complex.
From time to time, certain industry practices, including NAR and MLS rules, have come under regulatory scrutiny. There can be no assurances as to whether the Department of Justice (the “DOJ”) or FTC, their state counterparts, or other governmental body will determine that any industry practices or developments have an anti-competitive effect on the industry. Any such determination could result in industry investigations, legislative or regulatory action, private litigation or other actions, any of which could have the potential to disrupt our business.
On July 1, 2021, the DOJ announced its withdrawal from a settlement agreement reached during the prior administration with the NAR in relation to claims of anticompetitive behavior with respect to commissions received by buyers’ agents from sellers’ agents. The settlement previously required NAR to adopt certain rule changes, such as increased disclosure of commission offers from sellers’ agents to buyers’ agents. In January 2023, a federal court ruled that the DOJ must uphold the settlement agreement, although the ruling may be appealed. Although we did not experience a material erosion of our commission percentage rates from 2017 and 2021, the withdrawal of the DOJ from this settlement and the executive order signed by President Biden on July 9, 2021, which, among other things, directs the Federal Trade Commission to consider additional rule making pertaining to the real estate industry indicates increased regulatory scrutiny of the real estate industry. In addition, private litigants have filed multiple antitrust suits against NAR, some of which the DOJ has intervened in, that allege certain NAR and MLS rules are anti-competitive and result in increased costs to consumers. This litigation or subsequent regulatory action, if successful, could result in significant changes or disruptions to industry practices of the residential real estate market, including changes or disruptions to buyer's agent's commissions, and could negatively affect our financial condition and results of operations. Such increased focus may reduce the fees we receive, require additional expenditure, or distract our management’s attention from pursuing our growth strategy.
We could experience meaningful changes in industry operations or structure, as a result of governmental pressures, the result of litigation, changes to NAR or MLS rules, the actions of certain competitors or the introduction or growth of certain competitive models.
Infringement, misappropriation or dilution of the intellectual property of Douglas Elliman could harm our business.
We believe the trademark portfolio of Douglas Elliman has significant value and is an important factor in the marketing of our brand. We believe that this and other intellectual property are valuable assets that are critical to our success. We rely on a combination of protections provided by contracts, as well as copyright, trademark, and other laws, to protect our intellectual property from infringement, misappropriation or dilution. We have registered certain trademarks and service marks and have other trademark and service mark registration applications pending in the U.S. and foreign jurisdictions. Although we monitor our trademark portfolio both internally and through external search agents and impose an obligation on agents to notify us upon learning of potential infringement, there can be no assurance that we will be able to adequately maintain, enforce and protect our trademarks or other intellectual property rights.
We are not aware of any challenges to our right to use any of our brand names or trademarks. We are commonly involved in numerous proceedings, generally on a small scale, to enforce our intellectual property and protect our brand. Unauthorized uses or other infringement of our trademarks or service marks, including ones that are currently unknown to us, could diminish the value of our brand and may adversely affect our business. Failure to adequately protect our intellectual property rights could damage our brand and impair our ability to compete effectively. Even where we have effectively secured statutory protection for our trademarks and other intellectual property, our competitors may misappropriate our intellectual property. Defending or enforcing our trademark rights, branding practices and other intellectual property, and seeking an injunction and/or compensation for misappropriation of confidential information, could result in the expenditure of significant resources and divert the attention of management.
Moreover, unauthorized third parties may use Douglas Elliman’s intellectual property to trade on the goodwill of our brand, resulting in consumer confusion or dilution. Any reduction of our brand’s goodwill, consumer confusion, or dilution is likely to impact sales.
We rely on licenses to use the intellectual property rights of third parties which are incorporated into our products and services. Failure to renew or expand existing licenses may require us to modify, limit or discontinue certain offerings.
We rely on products, technologies and intellectual property that we license from third parties for use in our services. We cannot assure that these third-party licenses, or support for such licensed products and technologies, will continue to be available to us on commercially reasonable terms, if at all. In the event that we cannot renew and/or expand existing licenses, we may be required to discontinue or limit our use of the products and technologies that include or incorporate licensed intellectual property.
We cannot be certain that our licensors are not infringing the intellectual property rights of others or that our suppliers and licensors have sufficient rights to the technology in all jurisdictions in which we may operate. Some of our license agreements may be terminated by our licensors for convenience. If we are unable to obtain or maintain rights to any of this technology because of intellectual property infringement claims brought by third parties against our suppliers and licensors or against us, or if we are unable to continue to obtain the technology or enter into new agreements on commercially reasonable terms, our ability to develop our services containing that technology could be severely limited and our business could be disrupted or otherwise harmed. Additionally, if we are unable to obtain necessary technology from third parties, we may be forced to acquire or develop alternate technology, which may require significant time and effort and may be of lower quality or performance standards. This would limit and delay our ability to provide new or competitive offerings and increase our costs. If alternate technology cannot be obtained or developed, we may not be able to offer certain functionality as part of our offerings.
We rely on traffic to our websites, including our flagship website, elliman.com, directed from search engines. If these websites fail to rank prominently in unpaid search results, traffic to these websites could decline and our business would be adversely affected.
Our success depends in part on our ability to attract users through unpaid internet search results on search engines. The number of users we attract to our websites, including our flagship website elliman.com, from search engines is due in large part to how and where our websites rank in unpaid search results. These rankings can be affected by a number of factors, many of which are not under our direct control, and they may change frequently. For example, a search engine may change its ranking algorithms, methodologies or design layouts. As a result, links to our websites may not be prominent enough to drive traffic to our websites, and we may not know how or otherwise be in a position to influence the results. In some instances, search engine companies may change these rankings in order to promote their own competing services or the services of one or more of our competitors. Our websites have experienced fluctuations in search result rankings in the past, and we anticipate fluctuations in the future. Any reduction in the number of users directed to our websites could adversely affect our real estate brokerage business and results of operations. Further, a failure of our websites or website-based technology, either due to malfunction, outside intrusion through hacking or otherwise, could significantly disrupt our business and lead to reduced revenue and reputational damage as we may not be able to effectively scale and adapt our existing technology and network infrastructure to ensure our platforms are accessible.
Cybersecurity incidents could disrupt our business operations or could result in the loss of critical and confidential information, which may adversely impact our reputation and harm our business.
Global cybersecurity threats and incidents can range from uncoordinated individual attempts that gain unauthorized access to information technology systems, both internally and externally, to sophisticated and targeted measures, known as advanced persistent threats, directed at us and our affiliated agents. In the ordinary course of our business, we collect and store sensitive data, including our proprietary business information and intellectual property, and personally identifiable information of our customers. Additionally, we increasingly rely on third-party providers, including cloud storage solution providers. The secure processing, maintenance and transmission of this information are critical to our operations and with respect to information collected and stored by our third-party service providers, we are reliant upon their security procedures. Our systems and the confidential information on them may also be compromised by employee misconduct or employee error. We and our third-party service providers have experienced, and expect to continue to experience, these types of internal and external threats and incidents, which can result, and have resulted, in the misappropriation and unavailability of critical data and confidential or proprietary information (our own and that of third parties, including personally identifiable information), the disruption of business operations and the loss of funds. For example, in April 2021, we determined that an unauthorized party gained access to Douglas Elliman Property Management’s IT network, temporarily disrupted business operations and obtained certain files that contained personal information pertaining to owners and others in buildings managed by and employees of Douglas Elliman Property Management. Douglas Elliman Property Management took steps to secure its systems, contacted law enforcement, investigated and enhanced its security protocols to help prevent a similar incident from occurring in the future. Depending on their nature and scope, these incidents could potentially also result in the destruction or corruption of such data and information. Our business interruption insurance may be insufficient to compensate us for losses that may occur. The potential consequences of a material cybersecurity incident include reputational damage, litigation with third parties, diminution
in the value of the services we provide to our customers, increased cybersecurity protection and remediation costs, business disruption and the loss of funds or revenue which in turn could adversely affect our competitiveness and results of operations. Developments in the laws and regulations governing the handling and transmission of personal identifying information in the United States may require us to devote more resources to protecting such information.
Some of our products and services contain open source software, which may pose particular risks to our proprietary software, products, and services.
We use open source software in our products and services and anticipate using open source software in the future. Some open source software licenses require those who distribute open source software as part of their own software product to publicly disclose all or part of the source code to such software product or to make available any derivative works of the open source code on unfavorable terms or at no cost, and we may be subject to such terms. The terms of certain open source licenses to which our business is subject have not been interpreted by U.S. or foreign courts, and there is a risk that open source software licenses could be construed in a manner that imposes unanticipated conditions or restrictions on our ability to provide or distribute our products or services. Additionally, we could face claims from third parties alleging ownership of, or demanding release of, the open source software or derivative works that we developed using such software, which could include our proprietary source code, or otherwise seeking to enforce the terms of the applicable open source license. The use of certain open source software can lead to greater risks than use of third-party commercial software, as open source licensors generally do not provide warranties or controls on the origin of software. Any of these risks could be difficult to eliminate or manage.
We may fail to successfully complete or integrate acquisitions and joint ventures into our existing operations, or to complete or effectively manage divestitures.
We regularly review and evaluate potential acquisitions, joint ventures, divestitures, and other strategic transactions. Potential issues associated with these activities could include, among other things: our ability to complete or effectively manage such transactions on terms commercially favorable to us or at all; our ability to realize the full extent of the expected returns, benefits, cost savings or synergies as a result of a transaction, within the anticipated time frame, or at all; and diversion of management’s attention from day-to-day operations. In addition, the success of any future acquisition strategy we may pursue will depend upon our ability to fund such acquisitions given our total outstanding indebtedness, find suitable acquisition candidates on favorable terms and for target companies to find our acquisition proposals more favorable than those made by other competitors. We may not be able to complete or integrate an acquisition or joint venture into our existing operations (including our internal controls and compliance environment), or complete, manage or realize cost savings from a divestiture.
Risks Associated with our PropTech Investments
There are risks inherent in PropTech Investments.
Our PropTech investments involve a high degree of risk. In general, financial and operating risks confronting portfolio companies can be significant. While targeted returns should reflect the perceived level of risk in any investment, there can be no assurance that New Valley Ventures will be adequately compensated for risks taken, and the loss of its entire investment is possible. The investments may be difficult to value, and the timing of any profit realization is highly uncertain. Losses are likely to occur.
Early-stage and development-stage companies often experience unexpected problems in the areas of product development, manufacturing, marketing, financing and general management, which, in some cases, cannot be adequately solved. In addition, such companies may require substantial amounts of financing which may not be available through institutional private placements or the public markets. The percentage of companies that survive and prosper can be small.
Investments in more mature companies in the expansion or profitable stage also involves substantial risks. Such companies typically have obtained capital in the form of debt and/or equity to expand rapidly, reorganize operations, acquire other businesses, or develop new products and markets. These activities by definition involve a significant amount of change in a company and could give rise to significant problems in sales, manufacturing, and general management of these activities.
We may engage in business activities that could result in us holding investment interests in a number of entities which could subject us to regulation under the Investment Company Act of 1940.
Although we are subject to regulation under the Securities Act and the Exchange Act, we believe we are not subject to regulation under the Investment Company Act of 1940 (the “Investment Company Act”) insofar as we are not engaged in the business of investing or trading in securities within the definitions and parameters which would make us subject to the Investment Company Act, or holding unconsolidated minority interests in multiple companies and cash that might fall within the “holding company” definitions under the Investment Company Act. We maintain controls and procedures designed to
ensure that we will not be subject to regulation under the Investment Company Act. In the event we engage in business activities that result in us holding minority interests in a number of nonconsolidated entities with significant value, we might become subject to regulation under the Investment Company Act. In such event, we would be required to register as an investment company and incur significant registration and compliance costs. Additionally, the Investment Company Act requires that a number of structural safeguards, such as an independent board of directors and a separate investment adviser whose contract must be approved by a majority of our stockholders, be put in place within such companies. The Investment Company Act also imposes significant disclosure and reporting requirements beyond those found in the Securities Act and the Exchange Act. Likewise, the Investment Company Act contains its own anti-fraud provisions and private remedies, and it strictly limits investments made by one investment company in another to prevent pyramiding of investment companies, leading to consolidated investment companies acting in the interest of other investment companies rather than in the interest of securities holders. Regulation of Douglas Elliman as an investment company would significantly impair our business plan and operations.
Risks Relating to Our Structure and Other Business Risks
Our quarterly results and other operating metrics may fluctuate from quarter to quarter, which makes these metrics difficult to predict.
Our results of operations have fluctuated in the past and are likely to fluctuate significantly from quarter-to-quarter and year-to-year in the future for a variety of reasons, many of which are outside of our control and difficult to predict. As a result, you should not rely upon our historical results of operations as indicators of future performance. Numerous factors can influence our results of operations, including:
◦our ability to attract and retain agents;
◦our ability to develop innovative solutions and offer new services on our platform;
◦ changes in interest rates or mortgage underwriting standards;
◦ the actions of our competitors;
◦ costs and expenses related to the strategic acquisitions, investments and joint ventures;
◦increases in and timing of operating expenses that we may incur to grow and expand our operations and to remain competitive;
◦changes in the legislative or regulatory environment, including with respect to real estate commission rates and disclosures;
◦system failures or outages, or actual or perceived breaches of security or privacy, and the costs associated with preventing, responding to, or remediating any such outages or breaches;
◦adverse judgments, settlements, or other litigation-related costs and the fees associated with investigating and defending claims;
◦the overall tax rate for our business and the impact of any changes in tax laws or judicial or regulatory interpretations of tax laws, which are recorded in the period such laws are enacted or interpretations are issued and may significantly affect the effective tax rate of that period;
◦the application of new or changing financial accounting standards or practices; and
◦changes in real estate market conditions;
◦changes in regional or national business or macroeconomic conditions, including as a result of a pandemic, which may impact the other factors described above.
In addition, our results of operations are tied to certain key business metrics and non-GAAP financial measures that have fluctuated in the past and are likely to fluctuate in the future. As a result of such variability, our historical performance, including from recent quarters or years, may not be a meaningful indicator of future performance and period-to-period comparisons also may not be meaningful.
We are a holding company and depend on cash payments from our subsidiaries in order to pay dividends on our common stock.
We are a holding company and have no operations of our own. We hold our interests in our business through our wholly-owned subsidiaries. In addition to our own cash resources, our ability to pay dividends on our common stock depends on the ability of our subsidiaries to make cash available to us. Our receipt of cash payments, as dividends or otherwise, from our subsidiaries is an important source of our liquidity and capital resources. If we do not have sufficient cash resources of our own and do not receive payments from our subsidiaries in an amount sufficient to repay our debts and to pay dividends on our common stock, we must obtain additional funds from other sources. There is a risk that we will not be able to obtain additional funds at all or on terms acceptable to us. Our inability to continue to pay dividends on our common stock would significantly harm us and the value of our common stock.
Our liquidity could be adversely affected by conditions in the financial markets or the negative performance of financial institutions.
Our available cash and cash equivalents are held in accounts with or managed by financial institutions and consist of cash in our operating accounts and cash and cash equivalents invested in money market funds. The amount of cash in our operating accounts exceeds the Federal Deposit Insurance Corporation (“FDIC”) insurance limits. While we monitor our accounts regularly and adjust our balances as appropriate, the valuation of or our access to these accounts could be negatively impacted if the underlying financial institutions fail or become subject to other adverse conditions in the financial markets. The operations of U.S. and global financial services institutions are interconnected and the performance and financial strength of specific institutions are subject to rapid change, the timing and extent of which cannot be known. To date, we have experienced no material realized losses on or lack of access to our cash held in operating accounts or our invested cash or cash equivalents, however, we can provide no assurances that access to our cash held in operating accounts or our invested cash and cash equivalents will not be impacted by adverse conditions in the financial markets or the negative performance of financial institutions.
Our property management and ancillary real estate services businesses also manage assets owned by our clients in accounts with financial institutions where deposits routinely exceed the FDIC insurance limits. Should the financial institutions with which these assets are deposited experience insolvency or other financial difficulties, access to such deposits could be limited, deposit insurance may be inadequate and we could be exposed to liability from our clients and our relationships with our agents and with our clients could be negatively impacted. Any of these events would negatively impact our liquidity, results of operations and our reputation.
Goodwill and indefinite-lived intangible asset impairment charges may adversely affect our operating results and financial condition.
We have a substantial amount of goodwill and other intangible assets on our balance sheet, primarily comprised of goodwill and trademarks. Goodwill, trademarks and other identifiable intangible assets must be tested for impairment at least annually. The fair value of the goodwill assigned to a reporting unit could decline if projected revenues or cash flows were to be lower in the future due to the effects of the global economy or other causes. If the carrying value of intangible assets or of goodwill were to exceed its fair value, the asset would be written down to its fair value, with the impairment loss recognized as a non-cash charge in our combined consolidated statement of operations.
As of December 31, 2022, we had approximately $32.2 million of goodwill and $73.7 million of trademarks and other intangible assets related to Douglas Elliman. During the first quarter of 2020, we determined that a triggering event occurred related to Douglas Elliman due to a decline in sales and profitability projections for the reporting unit driven by the COVID-19 pandemic and related economic disruption. We utilized third-party valuation specialists to prepare a quantitative assessment of goodwill and trademark intangible assets related to Douglas Elliman. The quantitative assessments resulted in impairment charges to goodwill of $46.3 million and to the trademark intangible asset of $12.0 million. Changes in our future outlook of the Douglas Elliman Realty, LLC reporting unit could result in an impairment loss.
Investors’ expectations of our performance relating to environmental, social and governance factors may impose additional costs and expose us to new risks.
There is an increasing focus from certain investors, employees and other stakeholders concerning corporate responsibility, specifically related to environmental, social and governance factors. Some investors may use these factors to guide their investment strategies and, in some cases, may choose not to invest in us if they believe our policies relating to corporate responsibility are inadequate. Third-party providers of corporate responsibility ratings and reports on companies have increased to meet growing investor demand for measurement of corporate responsibility performance. The criteria by which companies’ corporate responsibility practices are assessed may change, which could result in greater expectations of us and
cause us to undertake costly initiatives to satisfy such new criteria. If we elect not to or are unable to satisfy such new criteria, investors may conclude that our policies with respect to corporate responsibility are inadequate. We may face reputational damage in the event that our corporate responsibility procedures or standards do not meet the standards set by various constituencies.
Furthermore, if our competitors’ corporate responsibility performance is perceived to be greater than ours, potential or current investors may elect to invest with our competitors instead. In addition, in the event that we communicate certain initiatives and goals regarding environmental, social and governance matters, we could fail, or be perceived to fail, in our achievement of such initiatives or goals, or we could be criticized for the scope of such initiatives or goals. We may fail to satisfy the expectations of investors, employees and other stakeholders or execute our initiatives as planned.
We are periodically subject to claims, lawsuits, government investigations and other proceedings.
We may be subject to claims, lawsuits, arbitration proceedings, government investigations and other legal and regulatory proceedings in the ordinary course of business, including those involving labor and employment, anti- discrimination, commercial disputes, competition, professional liability and consumer complaints, intellectual property disputes, compliance with regulatory requirements, antitrust and anti-competition claims (including claims related to NAR or MLS rules regarding buyer-broker commissions), securities laws and other matters, and we may become subject to additional types of claims, lawsuits, government investigations and legal or regulatory proceedings if the regulatory landscape changes or as our business grows and as we deploy new offerings, including proceedings related to our acquisitions, securities issuances or business practices.
The results of any such claims, lawsuits, arbitration proceedings, government investigations or other legal or regulatory proceedings cannot be predicted with certainty. Any claims against us or investigations involving us, whether meritorious or not, could be time-consuming, result in significant defense and compliance costs, be harmful to our reputation, require significant management attention and divert significant resources. Determining reserves for our pending litigation is a complex and fact-intensive process that requires significant subjective judgment and speculation. It is possible that a resolution of one or more such proceedings could result in substantial damages, settlement costs, fines and penalties that could adversely affect our business, financial condition and results of operations. These proceedings could also result in harm to our reputation and brand, sanctions, consent decrees, injunctions or other orders requiring a change in our business practices. Any of these consequences could adversely affect our business, financial condition and results of operations. Furthermore, under certain circumstances, we have contractual and other legal obligations to indemnify and to incur legal expenses on behalf of our business and commercial partners and current and former directors, officers and employees.
Adverse decisions in litigation or regulatory actions against companies unrelated to us could impact our business practices.
Litigation, investigations, claims and regulatory proceedings against other participants in the residential real estate or relocation industry may impact us when the rulings or settlements in those cases cover practices common to the broader industry and which may generate litigation. Examples may include claims associated with Real Estate Settlement Procedures Act (“RESPA”) compliance (including, but not limited to, those related to the broker-to-broker exception, marketing agreements or consumer rebates), broker fiduciary duties, multiple listing service practices, sales agent classification, federal and state fair housing laws, and state laws limiting or prohibiting inducements, cash rebates and gifts to consumers. Similarly, we may be impacted by litigation and other claims against companies in other industries. To the extent plaintiffs are successful in these types of litigation matters, and we cannot distinguish our or their practices (or our industry’s practices), we could face significant liability and could be required to modify certain business relationships.
Some of our potential losses may not be covered by insurance. We may not be able to obtain or maintain adequate insurance coverage.
We maintain insurance to cover costs and losses from certain risk exposures in the ordinary course of our operations, but our insurance does not cover all of the costs and losses from all events. We are responsible for certain retentions and deductibles that vary by policy, and we may suffer losses that exceed our insurance coverage limits by a material amount. We may also incur costs or suffer losses arising from events against which we have no insurance coverage. In addition, large-scale market trends or the occurrence of adverse events in our business may raise our cost of procuring insurance or limit the amount or type of insurance we are able to secure. We may not be able to maintain our current coverage, or obtain new coverage in the future, on commercially reasonable terms or at all.
Our fraud detection processes and information security systems may not successfully detect all fraudulent activity by third parties aimed at our employees or agents.
We make a large number of wire transfers in connection with loan and real estate closings and process sensitive personal data in connection with these transactions. Although we have sophisticated fraud detection processes and have taken
other measures to continuously improve controls to identify fraudulent activity, we have not been and may not be able to detect and prevent all such activity. Persistent or pervasive fraudulent activity may cause agents or clients to lose trust in us and decrease or terminate their usage of our platform.
If we are unable to satisfy the requirements of Section 404 of the Sarbanes-Oxley Act, or our internal control over financial reporting is not effective, the reliability of our financial statements may be questioned and our stock price may suffer.
Section 404 of the Sarbanes-Oxley Act requires any company subject to the reporting requirements of the U.S. securities laws to conduct a comprehensive evaluation of its and its consolidated subsidiaries’ internal control over financial reporting. To comply with this statute, we are required to document and test our internal control procedures, our management is required to assess and issue a report concerning its internal control over financial reporting, and our independent auditors are required to issue an opinion on our internal controls over financial reporting. The rules governing the standards that must be met for management to assess its internal control over financial reporting are complex and require significant documentation, testing and possible remediation to meet the detailed standards under the rules. During the course of its testing, our management may identify material weaknesses or deficiencies which may not be remedied in time to meet the deadline imposed by the Sarbanes-Oxley Act. If our management cannot favorably assess the effectiveness of our internal control over financial reporting or our auditors identify material weaknesses in our internal controls, investor confidence in our financial results may weaken, and our stock price may suffer.
Changes in accounting standards, subjective assumptions and estimates used by management related to complex accounting matters could have an adverse effect on our reported results.
Generally accepted accounting principles in the United States of America, or GAAP, and related accounting pronouncements, implementation guidance and interpretations with regard to a wide range of matters, such as revenue recognition, lease accounting, stock-based compensation, asset impairments, valuation reserves, income taxes and the fair value and associated useful lives of acquired long-lived assets, intangible assets and goodwill, are highly complex and involve many subjective assumptions, estimates and judgments made by management. Changes in these rules or their interpretations or changes in underlying assumptions, estimates or judgments made by management could significantly change our reported results.
Risks Relating to the Distribution
Following the Distribution, we are materially dependent on Vector Group’s performance under various agreements.
We entered into various agreements with Vector Group related to the Distribution, including a Distribution Agreement, a Tax Disaffiliation Agreement, a Transition Services Agreement, an Employee Matters Agreement and Aviation Agreements.
These agreements included the allocation of employee benefits, taxes and certain other liabilities and obligations attributable to periods prior to, at and after the Distribution. In connection with the Distribution, we provided Vector Group with indemnities with respect to liabilities arising out of our business, and Vector Group provided us with indemnities with respect to liabilities arising out of the business retained by Vector Group.
Vector Group provides Douglas Elliman with certain business services that were performed by Vector Group prior to the Distribution, such as information technology, accounts payable, payroll, tax, certain legal and accounting functions, human resources, insurance and risk management, government affairs, investor relations, corporate communications, benefit plan administration and reporting, and internal audit functions as well as certain marketing functions. These services include the collection and storage of certain personal information regarding employees and/or customers as well as information regarding Douglas Elliman, Vector Group and our counter-parties. We pay Vector Group $350,000 per month for these services as well as office space and secretarial and administrative services provided to members of our management team.
Douglas Elliman relies on Vector Group to perform its obligations under all of these agreements. If Vector Group were to breach or be unable to satisfy its material obligations under these agreements, including a failure to satisfy its indemnification or other financial obligations, or these agreements otherwise terminate or expire and we do not enter into replacement agreements, we could suffer operational difficulties and/or significant losses.
The Distribution could result in significant tax liability.
Vector Group obtained an opinion from Sullivan & Cromwell LLP substantially to the effect that, among other things, and subject to the assumptions and limitations described therein, the distribution by Vector Group of our common stock to the
holders of Vector Group common stock will qualify as a tax-free distribution under the Internal Revenue Code of 1986, as amended. Accordingly, for U.S. federal income tax purposes, the Distribution, excluding the distribution of our common stock with respect to Vector Group stock option awards and restricted stock awards, together with certain related transactions is not expected to result in the recognition of gain to Vector Group with respect to the distribution of our common stock to the Vector Group stockholders in respect of such Vector Group common stock and, except to the extent a stockholder received cash in lieu of fractional shares of our common stock, no income, gain or loss will be recognized by, and no amount will be included in the income of such holder upon the receipt of shares of our common stock pursuant to the Distribution. The opinion will not be binding on the Internal Revenue Service or the courts and there can be no assurance that the IRS will not challenge the validity of the Distribution and such related transactions as a reorganization for U.S. federal income tax purposes under Sections 368(a)(1)(D) and 355 of the Code eligible for tax-free treatment, or that any such challenge ultimately will not prevail. Certain transactions related to the Distribution that are not addressed by the opinion could result in the recognition of income or gain by Vector Group.
The opinion of Sullivan & Cromwell was based on, among other things, certain assumptions as well as on the continuing accuracy of certain factual representations and statements that we and Vector Group made to Sullivan & Cromwell. In rendering its opinion, Sullivan & Cromwell also relied on certain covenants that we and Vector Group entered into, including the adherence by us and by Vector Group to certain restrictions on future actions contained in the Tax Disaffiliation Agreement. If any of the representations or statements that we or Vector Group made are or become inaccurate or incomplete, or if we or Vector Group breach any of such covenants, the Distribution and such related transactions might not qualify for such tax treatment. See our Registration Statement on Form S-1, initially filed on December 7, 2021, “The Distribution — Material U.S. Federal Income Tax Consequences of the Distribution.”
The opinion and above discussed consequences do not apply to the distribution of our common stock with respect to Vector Group stock option awards and restricted stock awards.
If the Distribution does not qualify for tax-free treatment for U.S. federal income tax purposes for any reason, including as a result of a breach of a representation or covenant, then, generally, Vector Group would recognize a substantial gain for U.S. federal income tax purposes. In addition, the receipt by Vector Group stockholders of common stock of ours would be a taxable distribution, and each U.S. holder that receives our common stock in the Distribution would be treated as if the U.S. holder had received a distribution equal to the fair market value of our common stock that was distributed to it, which generally would be treated first as a taxable dividend to the extent of such holder’s pro rata share of Vector Group’s earnings and profits, then as a non-taxable return of capital to the extent of the holder’s tax basis in its Vector Group common stock, and thereafter as capital gain with respect to any remaining value. It is expected that the amount of any such taxes to Vector Group stockholders and Vector Group would be substantial. See our Registration Statement on Form S-1, initially filed on December 7, 2021, “The Distribution — Material U.S. Federal Income Tax Consequences of the Distribution.”
We may have a significant indemnity obligation to Vector Group if the Distribution is treated as a taxable transaction.
We entered into a Tax Disaffiliation Agreement with Vector Group, which sets out each party’s rights and obligations with respect to federal, state, local or foreign taxes for periods before and after the Distribution and related matters such as the filing of tax returns and the conduct of IRS and other audits. Pursuant to the Tax Disaffiliation Agreement, we are required to indemnify Vector Group for its losses and taxes resulting from the breach of certain covenants and for certain taxable gain recognized by Vector Group, including as a result of certain acquisitions of our stock or assets. If we are required to indemnify Vector Group under the circumstances set forth in the Tax Disaffiliation Agreement, we may be subject to substantial liabilities.
The tax rules applicable to the Distribution may restrict us from engaging in certain corporate transactions or from raising equity capital beyond certain thresholds for a period of time after the Distribution.
The U.S. federal income tax laws that apply to transactions like the Distribution generally create a presumption that the Distribution would be taxable to Vector Group (but not to Vector Group stockholders) if we engage in, or enter into an agreement to engage in, an acquisition of all or a significant portion of our common stock beginning two years before the Distribution date, unless it is established that the transaction is not pursuant to a plan or series or transactions related to the Distribution. U.S. Treasury regulations currently in effect generally provide that whether an acquisition transaction and a distribution are part of a plan is determined based on all of the facts and circumstances, including specific factors listed in the Treasury regulations. In addition, these Treasury regulations provide several “safe harbors” for acquisition transactions that are not considered to be part of a plan that includes a distribution.
Pursuant to the Tax Disaffiliation Agreement, we have allocated, between Vector Group and ourselves, responsibility for U.S. federal as well as state and local income and other taxes relating to taxable periods before and after the Distribution and provided for computing and apportioning tax liabilities and tax benefits between the parties. In the Tax Disaffiliation
Agreement, we agreed that, among other things, we may not take, or fail to take, any action following the Distribution if such action or failure to act would be inconsistent with or prohibit the Distribution and certain related transactions from qualifying as a tax-free reorganization under Sections 368(a)(1)(D) and 355 and related provisions of the Code to Vector Group and Vector Group stockholders (except with respect to the receipt of cash in lieu of fractional shares of Vector Group stock).
To preserve the tax-free treatment of the Distribution to Vector Group and its stockholders, under the Tax Disaffiliation Agreement with Vector Group, for the two-year period following the Distribution, we are subject to restrictions with respect to:
•entering into any transaction pursuant to which 35% or more of our shares or 50% or more of our assets would be acquired, whether by merger or otherwise, unless certain tests are met;
•issuing equity securities, if any such issuances would, in the aggregate, constitute 35% or more of the voting power or value of our capital stock;
•certain repurchases of our common shares;
•ceasing to actively conduct our business;
•selling or otherwise disposing of assets outside the ordinary course of business or materially changing the manner of operating our business;
•amendments to our organizational documents (i) affecting the relative voting rights of our stock or (ii) converting one class of our stock to another;
•liquidating or partially liquidating; and
•taking any other action that prevents the Distribution and certain related transactions from being tax-free.
These restrictions may limit our ability during such period to pursue strategic transactions of a certain magnitude that involve the issuance or acquisition of our stock or engage in new businesses or other transactions that might increase the value of our business. These restrictions may also limit our ability to raise significant amounts of cash through the issuance of stock, especially if our stock price were to suffer substantial declines, or through the sale of certain of our assets. We also agreed to indemnify Vector Group for certain tax liabilities resulting from any such transactions. Further, our stockholders may consider these covenants and indemnity obligations unfavorable as they might discourage, delay or prevent a change of control. For more information, see our Registration Statement on Form S-1 initially filed on December 7, 2021 and the sections entitled “The Distribution — Material U.S. Federal Income Tax Consequences of the Distribution” and “Certain Relationships and Related Party Transactions — Relationship Between Vector Group and Us After the Distribution — Tax Disaffiliation Agreement.”
We share certain key directors and officers with Vector Group, which means those officers do not devote their full time and attention to our affairs and the overlap may give rise to conflicts.
Following the Distribution, there is an overlap between certain key directors and officers of ours and of Vector Group. Howard M. Lorber serves as our President and Chief Executive Officer and of Vector Group. Richard J. Lampen serves as our Chief Operating Officer and of Vector Group, J. Bryant Kirkland III serves as our Chief Financial Officer and Treasurer and of Vector Group, Marc N. Bell serves as our General Counsel and Secretary and of Vector Group, and J. David Ballard serves as our Senior Vice President, Enterprise Efficiency and Chief Technology Officer and of Vector Group. As a result, not all of our executive officers devote their full time and attention to our affairs. In addition, three members of our Board, Messrs. Lorber, Lampen and White, are also directors of Vector Group. These overlap persons may have actual or apparent conflicts of interest with respect to matters involving or affecting each company. For example, there will be the potential for a conflict of interest when we on the one hand, and Vector Group and its respective subsidiaries and successors on the other hand, are party to commercial transactions concerning the same or adjacent real property investments. In addition, after the Distribution, certain of our directors and officers continue to own stock and/or stock options or other equity awards of Vector Group. These ownership interests could create actual, apparent or potential conflicts of interest when these individuals are faced with decisions that could have different implications for our Company and Vector Group. Concurrently, we depend on the efforts of these and other executive officers and other key personnel. While we believe that we could find replacements for these key personnel, the loss of their services could have a significant adverse effect on our operations.
Our overlapping directors and officers with Vector Group may result in the diversion of corporate opportunities to Vector Group, and other conflicts and provisions in our amended and restated certificate of incorporation may provide us no remedy in that circumstance.
Our amended and restated certificate of incorporation acknowledges that directors and officers of ours may also be serving as directors, officers, employees or agents of Vector Group or any subsidiary thereof, and that we may engage in material business transactions with Vector Group. We renounced our rights to certain business opportunities and our amended and restated certificate of incorporation provides that no overlap person will be liable to us or our stockholders for breach of any fiduciary duty that would otherwise occur by reason of the fact that any such individual directs a corporate opportunity (other than certain limited types of opportunities set forth in our amended and restated certificate of incorporation) to Vector Group or any subsidiary thereof instead of us, or does not refer or communicate information regarding such corporate opportunities to us. These provisions in our amended and restated certificate of incorporation also expressly validate certain contracts, agreements, arrangements and transactions (and amendments, modifications or terminations thereof) between us and Vector Group and, to the fullest extent permitted by law, provide that the actions of the overlap persons in connection therewith are not breaches of fiduciary duties owed to us, any of its subsidiaries or their respective stockholders.
ITEM 1B.UNRESOLVED STAFF COMMENTS
None.
ITEM 2.PROPERTIES
Our principal executive offices are located in Miami, Florida.
Douglas Elliman leases 128 offices and its leases expire at various times between 2023 and 2033. As of December 31, 2022, the properties leased by Douglas Elliman are as follows:
| | | | | | | | | | | | | | | | | | | | | | | | | | |
| Type | | Number of Offices | | Location | | Owned or Leased | | Approximate Total
Square Footage |
| | | | | | | | | |
| Offices | | 27 | | | New York City, NY | | Leased | | 255,000 | |
| Offices | | 38 | | | Long Island, NY | | Leased | | 123,000 | |
| Offices | | 20 | | | Florida | | Leased | | 52,000 | |
| Offices | | 4 | | | Westchester County, NY | | Leased | | 7,000 | |
| Offices | | 16 | | | California | | Leased | | 85,000 | |
| Offices | | 23 | | | Other | | Leased | | 47,500 | |
ITEM 3.LEGAL PROCEEDINGS
Reference is made to Note 14 to our combined consolidated financial statements included elsewhere in this report which is incorporated by reference and contains a general description of certain legal proceedings to which we, or our subsidiaries, are a party and certain related matters.
ITEM 4.MINE SAFETY DISCLOSURES
Not applicable.
PART II
ITEM 5.MARKET FOR REGISTRANT’S COMMON EQUITY, RELATED STOCKHOLDER MATTERS AND
ISSUER PURCHASES OF EQUITY SECURITIES
Our common stock is listed and traded on the New York Stock Exchange under the symbol “DOUG.” At February 23, 2023, there were approximately 1,172 holders of record of our common stock.
Performance Graph
The following graph compares the cumulative total annual return of our Common Stock, the S&P 500 Index, the S&P Small Cap 600 Index, and our Peer Group Index by assuming that $100 was invested in each investment as of December 30, 2021, which represents the day our common stock began trading on the NYSE, and that all cash dividends and distributions were reinvested.
We are a constituent of the S&P 600 SmallCap Index and selected it and the S&P 500 as our broad-based market indices and our Peer Group Index as a group of peer companies.
Our Peer Group Index consists of Anywhere Real Estate Inc. (HOUS), Compass, Inc. (COMP), Zillow Group, Inc. (ZG), loanDepot, Inc. (LDI), Opendoor Technologies Inc. (OPEN), Colliers International Group Inc. (CIGI), eXp World Holdings, Inc. (EXPI), Stewart Information Services Corporation (STC), Newmark Group, Inc. (NMRK), Redfin Corporation (RFIN), Offerpad Solutions Inc. (OPAD), Radian Group Inc. (RDN), Walker & Dunlop Inc. (WD), Lending Tree, Inc. (TREE), Marcus & Millichap, Inc. (MMI), Doma Holdings Inc. and RE/MAX Holdings, Inc. (RMAX). We selected our Peer Group Index based on the peer group used by our compensation and human committee, as recommended by its outside consultant, which consists of 17 publicly traded, national and regional companies conducting business in the real estate and financial services industry.
The chart does not reflect the Company’s forecast of future financial performance.
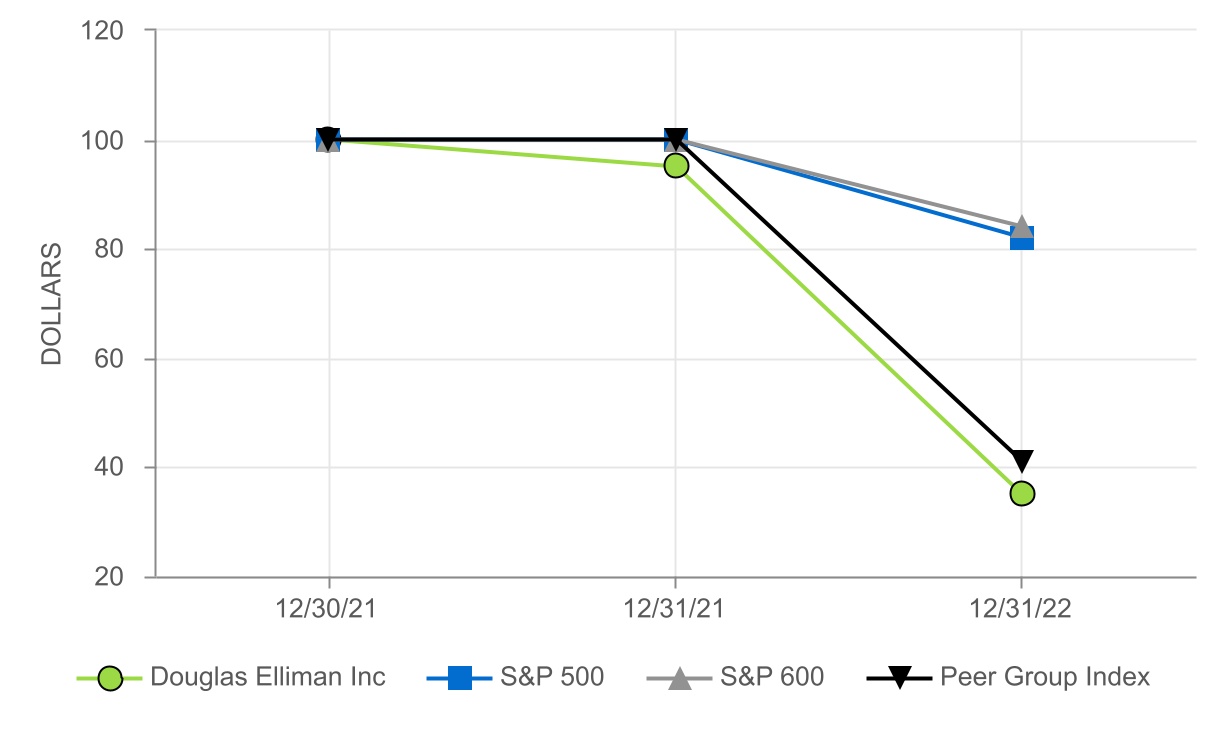
| | | | | | | | | | | |
| 12/30/21 | 12/31/21 | 12/31/22 |
| Douglas Elliman Inc. | 100 | 95 | 35 |
| S&P 500 | 100 | 100 | 82 |
| S&P 600 | 100 | 100 | 84 |
| Peer Group Index | 100 | 100 | 41 |
Unregistered Sales of Equity Securities and Use of Proceeds
No securities of ours which were not registered under the Securities Act of 1933 were issued or sold by us during the three months ended December 31, 2022.
Issuer Purchase of Equity Securities
Our purchases of our common stock during the three months ended December 31, 2022 were as follows:
| | | | | | | | | | | | | | | | | | | | | | | |
| Period | Total Number of Shares Purchased | | Average Price Paid per Share | | Total Number of Shares Purchased as Part of Publicly Announced Plans or Programs | | Maximum Number of Shares that May Yet Be Purchased Under the Plans or Programs |
| October 1 to October 31, 2022 | — | | | $ | — | | | — | | | — | |
| November 1 to November 30, 2022 | — | | | — | | | — | | | — | |
| December 1 to December 31, 2022 | 367,141 | | | 3.99 | | (1) | — | | | — | |
| Total | 367,141 | | | $ | 3.99 | | | — | | | — | |
(1) Represents withholdings of shares as payment of payroll tax liabilities incident to the vesting of an employee’s shares of restricted stock. The shares were immediately canceled.
EXECUTIVE OFFICERS OF THE REGISTRANT
The table below, together with the accompanying text, presents certain information regarding all our current executive officers as of March 16, 2023. Each of the executive officers serves until the election and qualification of such individual’s successor or until such individual’s death, resignation or removal by the Board of Directors.
| | | | | | | | | | | | | | | | | | | | |
| Name | | Age | | Position | | Year Individual
Became an
Executive Officer |
| Howard M. Lorber | | 74 | | | Chairman, President and Chief Executive Officer | | 2021 |
| Richard J. Lampen | | 69 | | | Executive Vice President and Chief Operating Officer | | 2021 |
| J. Bryant Kirkland III | | 57 | | | Senior Vice President, Chief Financial Officer and Treasurer | | 2021 |
| Marc N. Bell | | 62 | | | Senior Vice President, General Counsel and Secretary | | 2021 |
| J. David Ballard | | 55 | | | Senior Vice President, Enterprise Efficiency and Chief Technology Officer | | 2021 |
| Scott J. Durkin | | 60 | | | President and Chief Executive Officer, Douglas Elliman Realty, LLC | | 2021 |
| Stephen T. Larkin | | 53 | | | Vice President of Communications | | 2021 |
| Daniel A. Sachar | | 47 | | | Vice President Innovation and Managing Director of New Valley Ventures LLC | | 2021 |
| Lisa M. Seligman | | 46 | | | Vice President of Human Resources | | 2023 |
Howard M. Lorber is our Chairman, President and Chief Executive Officer and is Executive Chairman of Douglas Elliman Realty, LLC. He has served as President and Chief Executive Officer of Vector Group since January 2006, and, as a director of Vector Group since January 2001. From November 1994 to December 2005, Mr. Lorber served as President and Chief Operating Officer of New Valley Corporation, where he also served as a director. New Valley was merged into Vector Group in December 2005. Mr. Lorber has served as Chairman of the Board of Directors of Nathan’s Famous, Inc. (NASDAQ: NATH), a chain of fast food restaurants, since 1987 and Chief Executive Officer from November 1993 to December 2006; and a director of Clipper Realty, Inc. (NYSE: CLPR), a real estate investment trust, since July 2015. Mr. Lorber was a member of the Board of Directors of Morgans Hotel Group Co. from March 2015 until November 2016, and Chairman from May 2015 to November 2016 and was Chairman of the Board of Ladenburg Thalmann Financial Services from May 2001 to July 2006 and Vice Chairman from July 2006 to February 2020. He is also a trustee of Long Island University.
Richard J. Lampen is our Executive Vice President and Chief Operating Officer. He was appointed as a director of Vector Group as well as its Chief Operating Officer on January 14, 2021 and has served as Vector Group’s Executive Vice President since 1995. From October 1995 to December 2005, Mr. Lampen served as the Executive Vice President and General Counsel of New Valley, where he also served as a director. From September 2006 to February 2020, he served as President and Chief Executive Officer as well as a director of Ladenburg Thalmann Financial Services. Mr. Lampen also served as Chairman of Ladenburg Thalmann Financial Services from September 2018 to February 2020. From October 2008 to October 2019, Mr. Lampen served as President and Chief Executive Officer as well as a director of Castle Brands Inc.
J. Bryant Kirkland III is our Senior Vice President, Chief Financial Officer and Treasurer. He has served as Chief Financial Officer and Treasurer of Vector Group since April 2006 and as Vector Group’s Senior Vice President since May 2016. Mr. Kirkland served as a Vice President of Vector Group from January 2001 to April 2016 and served as New Valley’s Vice President and Chief Financial Officer from January 1998 to December 2005. He has served since July 1992 in various financial capacities with us, Vector Group, Liggett and New Valley. Mr. Kirkland has served as Chairman of the Board of Directors, President and Chief Executive Officer of Multi Soft II, Inc. and Multi Solutions II, Inc. since July 2012.
Marc N. Bell is our Senior Vice President, General Counsel and Secretary. He has served as Vector Group’s General Counsel and Secretary since May 1994 and Vector Group’s Senior Vice President since May 2016. Mr. Bell served as a Vice President of Vector Group from January 1998 to April 2016. From November 1994 to December 2005, Mr. Bell served as Associate General Counsel and Secretary of New Valley and from February 1998 to December 2005, as a Vice President of New Valley. Mr. Bell previously served as Liggett’s General Counsel and currently serves as an officer, director or manager for many of Vector Group’s and New Valley’s subsidiaries.
J. David Ballard is our Senior Vice President, Enterprise Efficiency and Chief Technology Officer. He has been Vector Group’s Senior Vice President, Enterprise Efficiency and Chief Technology Officer since July 2020 and, from February 2020
to July 2020, served as a consultant to Vector Group. Prior to joining Vector Group, Mr. Ballard served as Senior Vice President, Enterprise Services of Ladenburg Thalmann Financial Services Inc. from April 2019 to February 2020. Prior to joining Ladenburg, he served as President and Chief Operating Officer for Docupace Technologies, a leading digital operations technology provider in the wealth management space from March 2018 to April 2019. Mr. Ballard was Executive Vice President and Chief Operating Officer at Cetera Financial Group from April 2015 to March 2018. Prior to his role at Cetera, Mr. Ballard spent more than two decades working in executive and management positions at several firms in the independent financial advisory and asset management industries, including AIG Advisor Group, SunAmerica Mutual Funds and AIG Retirement Services.
Scott J. Durkin has served as President of Douglas Elliman since December 2017 and was named as Chief Executive Officer of Douglas Elliman Realty, LLC in August 2021, after serving as Chief Operating Officer since October 2016. His expertise in Douglas Elliman’s markets spans the past three decades. He served as Executive Vice President of Douglas Elliman from January 2016 to October 2016. Prior to 2016, Mr. Durkin enjoyed a 26-year tenure at The Corcoran Group.
Stephen T. Larkin serves as Vice President of Communications. With nearly two decades of experience in the real estate industry, Mr. Larkin is known as a trusted media source for trends in luxury living and market information and analysis. He has served as Executive Vice President and Chief Communications Officer of Douglas Elliman since September 2020, after serving as Vice President of Public Relations from December 2016 to September 2020. Prior to beginning his tenure at Douglas Elliman, Mr. Larkin served as a Director of Relevance International, an international public relations firm, from February 2015 to December 2016. Mr. Larkin previously served as a principal of Larkin Public Relations from October 2005 to February 2013 and a Vice President of The Corcoran Group from August 2003 to October 2005. Mr. Larkin graduated from Wheaton College in Massachusetts and received a Master of Science from the Columbia University Graduate School of Journalism.
Daniel A. Sachar serves as Vice President Innovation and Managing Director of New Valley Ventures. He joined Vector Group in September 2020 as Vice President Innovation after serving as Vice President of Enterprise Innovation at Ladenburg Thalmann Financial Services Inc. from January 2018 to February 2020, after serving as a full-time consultant to Ladenburg Thalmann since October 2015. Mr. Sachar led Ladenburg’s innovation platform, created a new division called the “Innovation Lab” and launched an industry-leading initiative to modernize and grow the nationwide network of independent financial advisors, until February 2020. Prior to joining Ladenburg, he spent seven years in management consulting at a New York-based firm focused on innovation and growth, helping publicly-traded companies launch new businesses. Mr. Sachar received a Bachelor of Arts degree from Swarthmore College and an MBA from Columbia Business School.
Lisa M. Seligman serves as Vice President of Human Resources. Ms. Seligman’s experience includes more than 20 years in Human Resources leadership roles at a diverse group of companies with luxury brand names, which include Dow Jones, Chanel, Shiseido and Tiffany. Most recently, she has served as Vice President and Global Head of HR at Arcade Beauty, a private equity-owned company engaged in the manufacture of sampling materials for the beauty industry.
ITEM 6.RESERVED
Reserved.
ITEM 7.MANAGEMENT’S DISCUSSION AND ANALYSIS OF FINANCIAL CONDITION AND RESULTS OF OPERATIONS
(All dollar amounts included herein are presented in thousands, except as otherwise noted)
The following discussion should be read in conjunction with the combined consolidated financial statements and corresponding notes, elsewhere in this Form 10-K. Any forward-looking statements are not historical facts, but rather are based on current expectations, estimates, assumptions and projections about our industry, business and future financial results. Any forward-looking statements are subject to a number of important factors, including those factors discussed under “Risk Factors” and “Special Note on Forward-Looking Statements,” that could cause our actual results to differ materially from those indicated in such forward-looking statements.
Overview
Douglas Elliman Inc. is a holding company and is engaged principally in two business segments:
Real Estate Brokerage: the residential real estate brokerage services through our subsidiary Douglas Elliman Realty, which operates the largest residential brokerage company in the New York metropolitan area and also conducts residential real estate brokerage operations in Florida, California, Texas, Colorado, Nevada, Massachusetts, Connecticut, Maryland, Virginia and Washington, D.C.
Corporate and other: the operations of our holding company as well as our investment business that invests in select PropTech opportunities through our New Valley Ventures subsidiary.
See Item 1. “Business” for detailed overview and description of our principal operations.
This Management’s Discussion and Analysis of Financial Condition and Results of Operations (“MD&A”) is designed to provide a reader of our financial statements with a narrative from our management’s perspective. Our MD&A is organized as follows:
Business Overview. This section provides a general description of our business, as well as other matters that we believe are important in understanding our results of operations and financial condition and in anticipating future trends.
Critical Accounting Estimates. This section includes a discussion of accounting estimates considered to be important to our financial condition and results of operations and which require significant judgment and estimates on the part of management in their application. In addition, our significant accounting estimates, including our critical accounting estimates, are discussed in the notes to our audited combined consolidated annual financial statements included elsewhere in this Form 10-K.
Results of Operations. This section provides an analysis of our results of operations for the years ended December 31, 2022 and 2021. Certain discussions of the changes in our results of operations and liquidity and capital resources from the year ended December 31, 2021 as compared to the year ended December 31, 2020 have been omitted from this Form 10-K and may be found in Item 7. “Management’s Discussion and Analysis of Financial Condition and Results of Operations” of our Form 10-K for the fiscal year ended December 31, 2021 filed with the Securities and Exchange Commission on March 31, 2022.
Liquidity and Capital Resources. This section provides a discussion of our financial condition and liquidity, an analysis of our cash flows for the years ended December 31, 2022 and 2021, as well as certain contractual obligations and off-balance sheet arrangements that existed at December 31, 2022.
Business Overview
Since its inception in 1911, Douglas Elliman has challenged the status quo of the real estate industry. We were founded on Douglas L. Elliman’s vision that New Yorkers would shift their preference for traditional homes to favor luxury apartments that were both sold and managed by comprehensive real estate companies. More than a century later, the Douglas Elliman brand is still associated with service, luxury and forward thinking — our markets are primarily international finance and technology hubs that are densely populated and offer housing inventory at premium price points. The average transaction value of a home we sold in 2022 was approximately $1.62 million — significantly higher than our principal competitors.
We are building on our record of innovation. Douglas Elliman is focused on digitizing, integrating and simplifying real estate activities for agents and elevating their clients’ experiences. We are bringing innovative, technology-driven PropTech solutions to Douglas Elliman by adopting new PropTech solutions for agents and their clients and also investing in select PropTech opportunities through our subsidiary, New Valley Ventures LLC. Our model is to source and use best-of-breed products and services that we believe will increase our efficiency. In addition to entering into business relationships with PropTech companies, as described further below, we are committed to creating over time a portfolio of PropTech companies that, through our business and investment relationship, have access to our agents and their clients, as well as our knowledge and experience, to grow their own businesses, while benefiting our operations. This keeps Douglas Elliman and our agents on the cutting edge of the industry with innovative solutions and services that can be integrated into our technology, while also remaining asset-light. Furthermore, we maintain upside potential in the success of our PropTech partners in which we invest through minority stakes in their capital structures.
Douglas Elliman is well positioned to capitalize on opportunities in the U.S. residential real estate market with a leading luxury brand and a comprehensive suite of technology-enabled real estate services and investments. Despite various “agentless” models such as “iBuying,” approximately 86% of buyers and sellers were assisted by a real estate agent or broker when purchasing or selling their home between July 2021 and June 2022, according to the National Association of Realtors (“NAR”), highlighting the central role agents continue to play in real estate transactions. Agents are able to generate significant repeat business from clients and referrals, with 63% of home sellers and 50% of home buyers between July 2021 and June 2022 choosing to work with an agent they had used in the past or through a referral, according to the NAR. Repeat business, as well the ability to provide ancillary services, allows agents to extend their client relationships and generate significant lifetime value.
Industry trends in 2022. After a strong 2021, when existing home sales reported by the NAR reached their highest level since 2006, the residential real estate brokerage industry encountered significant challenges in 2022. These challenges began during the second quarter of 2022 and included, among other things, a reduced inventory of homes available for sale as well as higher mortgage rates. According to the NAR, sales of existing homes declined by 34.0% in December 2022 from December 2021 and total homes sold in 2022 was the lowest since 2014. By comparison, our Gross Transaction Value declined by 16.2% in 2022 compared to 2021, from $51,200,000 in 2021 to $42,900,000 in 2022, reflecting the relative strength of the luxury markets in which we operate. In addition, our transactions of homes sold declined by 18% to 26,573 in 2022 from 32,400 in 2021. In the fourth quarter of 2022, our Gross Transaction Value and transactions of homes sold declined by approximately 40% and 43%, respectively, compared to the 2021 fourth quarter. We anticipate that the results for the first quarter of 2023 will reflect these same trends of significant year over year declines and the NAR and other real estate industry consortiums are forecasting continued challenges for the U.S. residential real estate market in 2023. We have maintained stable agent retention and our Principal Agents increased to 5,407 as of December 31, 2022 from 5,189 as of December 31, 2021. See Item 7, “Key Business Metrics and Non-GAAP Financial Measures.”
Despite these recent changes, we believe our competitive advantages in the luxury markets distinguish us from our competitors and our comprehensive suite of real estate solutions, our industry-leading brand name, and our talented team of employees and agents set us apart in the industry. As the real estate brokerage industry evolves and addresses challenges related to constrained inventory of homes as well as higher mortgage rates, we continue to pursue profitable growth opportunities through the expansion of our footprint, investments in cutting-edge PropTech companies through New Valley Ventures, continued recruitment of best-in-class talent, acquisitions (acqui-hires), and operational efficiencies. We will continue to employ a disciplined capital allocation strategy aimed at generating sustainable long-term value for our stockholders.
Distribution and Basis of Presentation
On December 29, 2021, Vector Group distributed all our common stock to its stockholders. Prior to the Distribution, we were a subsidiary of Vector Group and incurred indirect general and administrative costs allocated to us by Vector Group for certain functions and services including, but not limited to, executive office, finance and other administrative support. These expenses were allocated to us based on direct usage, when identifiable. After the Distribution, we are incurring expenses necessary to operate a standalone public company, including pursuant to a Transition Services Agreement entered into with Vector Group in connection with the Distribution.
Key Business Metrics and Non-GAAP Financial Measures
In addition to our financial results, we use the following business metrics to evaluate our business and identify trends affecting our business. To evaluate our operating performance, we also use Adjusted EBITDA attributed to Douglas Elliman and Adjusted EBITDA attributed to Douglas Elliman Margin and financial measures for the year ended December 31, 2022 (“Non-GAAP Financial Measures”), which are financial measures not prepared in accordance with GAAP.
| | | | | | | | | | | | | |
| Year ended December 31, |
| 2022 | | 2021 | | |
| Key Business Metrics | | | | | |
Total transactions (1) | 26,573 | | | 32,400 | | | |
Gross transaction value (in billions) (2) | $ | 42.9 | | | $ | 51.2 | | | |
Average transaction value per transaction (in thousands) (3) | $ | 1,616.3 | | | $ | 1,580.0 | | | |
Number of Principal Agents (4) | 5,407 | | | 5,189 | | | |
Annual Retention (5) | 87 | % | | 94 | % | | |
| Net (loss) income attributed to Douglas Elliman Inc. | $ | (5,622) | | | $ | 98,838 | | | |
| Net (loss) income margin | (0.49) | % | | 7.30 | % | | |
| Non-GAAP Financial Measures | | | | | |
| Adjusted EBITDA attributed to Douglas Elliman Inc. | $ | 14,951 | | | $ | 110,699 | | | |
| Adjusted EBITDA margin attributed to Douglas Elliman Inc. | 1.30 | % | | 8.18 | % | | |
_____________________________
(1)We calculate total transactions by taking the sum of all transactions closed in which our agent represented the buyer or seller in the purchase or sale of a home (excluding rental transactions). We include a single transaction twice when one or more of our agents represent both the buyer and seller in any given transaction. Total transactions by quarter for the year ended December 31, 2022 were 7,212 for the three months ended March 31, 2022, 7,789 for the three months ended June 30, 2022, 6,796 for the three months ended September 30, 2022 (previously reported 7,212) and 4,776 for the three months ended December 31, 2022.
(2)Gross transaction value is the sum of all closing sale prices for homes transacted by our agents (excluding rental transactions). We include the value of a single transaction twice when our agents serve both the home buyer and home seller in the transaction. Gross transaction value by quarter for the year ended December 31, 2022 was $11.7 billion for the three months ended March 31, 2022, $13.6 billion for the three months ended June 30, 2022, $10.2 billion for the three months ended September 30, 2022 (previously reported $11.0 billion) and $7.5 billion for the three months ended December 31, 2022.
(3)Average transaction value per transaction is the quotient of (x) gross transaction value divided by (y) total transactions.
(4)The number of Principal Agents is determined as of the last day of the specified period. We use the number of Principal Agents, in combination with our other key business metrics such as total transactions and gross transaction value, as a measure of agent productivity.
(5)Annual Retention is the quotient of (x) the prior year revenue generated by agents retained divided by (y) the prior year revenue generated by all agents. We use Annual Retention as a measure of agent stability.
Non-GAAP Financial Measures
Adjusted EBITDA attributed to Douglas Elliman is a non-GAAP financial measure that represents our net income adjusted for depreciation and amortization, investment and other income, stock-based compensation expense, benefit from income taxes, and other items. Adjusted EBITDA attributed to Douglas Elliman Margin is the quotient of (x) Adjusted EBITDA attributed to Douglas Elliman divided by (y) revenue.
We believe that Non-GAAP Financial Measures are important measures that supplement analysis of our results of operations and enhance an understanding of our operating performance. We believe Non-GAAP Financial Measures provide a useful measure of operating results unaffected by non-recurring items, differences in capital structures and ages of related assets among otherwise comparable companies. Management uses Non-GAAP Financial Measures as measures to review and assess operating performance of our business, and management and investors should review both the overall performance (GAAP net income) and the operating performance (Non-GAAP Financial Measures) of our business. While management considers Non-GAAP Financial Measures to be important, they should be considered in addition to, but not as substitutes for or superior to, other measures of financial performance prepared in accordance with GAAP, such as operating income, and net income. In addition, Non-GAAP Financial Measures are susceptible to varying calculations and our measurement of Non-GAAP Financial Measures may not be comparable to those of other companies.
Reconciliations of these non-GAAP measures have been provided in the table below.
Computation of Adjusted EBITDA attributed to Douglas Elliman
| | | | | | | | | | | | | |
| Year ended December 31, |
| 2022 | | 2021 | | |
| Net (loss) income attributed to Douglas Elliman Inc. | $ | (5,622) | | | $ | 98,838 | | | |
| Interest income, net | (1,779) | | | (83) | | | |
| Income tax expense | 6,503 | | | 2,133 | | | |
| Net loss attributed to non-controlling interest | (777) | | | (186) | | | |
| Depreciation and amortization | 8,012 | | | 8,561 | | | |
Stock-based compensation (a) | 11,138 | | | — | | | |
Equity in losses from equity method investments (b) | 563 | | | 278 | | | |
| Change in fair value of contingent liability | — | | | 1,647 | | | |
| Other, net | (3,429) | | | (529) | | | |
| Adjusted EBITDA | 14,609 | | | 110,659 | | | |
| Adjusted EBITDA attributed to non-controlling interest | 342 | | | 40 | | | |
| Adjusted EBITDA attributed to Douglas Elliman | $ | 14,951 | | | $ | 110,699 | | | |
| | | | | |
| Real estate brokerage segment | | | | | |
| Operating income | $ | 21,993 | | | $ | 102,098 | | | |
| Depreciation and amortization | 8,012 | | | 8,561 | | | |
| Stock-based compensation | 4,195 | | | — | | | |
| Adjusted EBITDA | 34,200 | | | 110,659 | | | |
| Adjusted EBITDA attributed to non-controlling interest | 342 | | | 40 | | | |
| Adjusted EBITDA attributed to Douglas Elliman | $ | 34,542 | | | $ | 110,699 | | | |
| | | | | |
| Corporate and other segment | | | | | |
| Operating loss | $ | (26,534) | | | $ | — | | | |
| Stock-based compensation | 6,943 | | | — | | | |
| Adjusted EBITDA attributed to Douglas Elliman | $ | (19,591) | | | $ | — | | | |
| | | | | |
| | | | | |
| | | | | |
| | | | | |
| Total adjusted EBITDA attributed to Douglas Elliman | $ | 14,951 | | | $ | 110,699 | | | |
_____________________________
(a)Represents amortization of stock-based compensation. $4,195 is attributable to the Real estate brokerage segment and $6,943 is attributable to the Corporate and other segment.
(b)Represents equity in losses recognized from the Company’s investment in an equity method investment that is accounted for under the equity method and is not consolidated in the Company’s financial results.
Critical Accounting Estimates
General. The preparation of financial statements in conformity with accounting principles generally accepted in the United States of America (“GAAP”) requires management to make estimates and assumptions that affect the reported amounts of assets and liabilities, disclosure of contingent assets and liabilities and the reported amounts of revenues and expenses. Significant estimates subject to material changes in the near term include revenue recognition, impairment charges, valuation of intangible assets, deferred tax liabilities, and valuation of investments, including other-than-temporary impairments to such investments. Actual results could differ from those estimates.
Revenue Recognition. Revenue is measured based on a consideration specified in a contract with a customer and excludes any sales incentives. Revenue is recognized when (a) an enforceable contract with a customer exists, that has commercial substance, and collection of substantially all consideration for services is probable; and (b) the performance obligations to the customer are satisfied either over time or at a point in time.
Real estate commissions earned by our Real Estate brokerage businesses are recognized as revenue when the real estate sale is completed or lease agreement is executed, which is the point in time that the performance obligation is satisfied. Any commission and other payments received in advance are deferred until the satisfaction of the performance obligation.
Corresponding agent commission expenses, including any advance commission or other direct expense payments, are deferred and recognized as cost of sales concurrently with related revenues.
Contracts in our development marketing business provide us with the exclusive right to sell units in a subject property for a commission fee per unit sold calculated as a percentage of the sales price of each unit. Accordingly, a performance obligation exists for each unit in the development marketing property under contract, and a portion of the total contract transaction price is allocated to and recognized at the time each unit is sold.
Under development marketing service arrangements, dedicated staff are required for a subject property and these costs are typically reimbursed from the customer through advance payments that are recoupable from future commission earnings. Advance payments received and associated direct costs paid are deferred, allocated to each unit in the subject property, and recognized at the time of the completed sale of each unit.
Development marketing service arrangements also include direct fulfillment costs incurred in advance of the satisfaction of the performance obligation. We capitalize costs incurred in fulfilling a contract with a customer if the fulfillment costs 1) relate directly to an existing contract or anticipated contract, 2) generate or enhance resources that will be used to satisfy performance obligations in the future, and 3) are expected to be recovered. These costs are amortized over the estimated customer relationship period which is the contract term. We use an amortization method that is consistent with the pattern of transfer of goods or services to its customers by allocating these costs to each unit in the subject property and expensing these costs as each unit sold is closed over the contract.
Commission revenue is recognized at the time the performance obligation is met for our Real Estate commercial leasing contracts, which is when the lease agreement is executed, as there are no further performance obligations, including any amounts of future payments under extended payment terms.
Our Real Estate property management revenue arrangements consist of providing operational and administrative services to manage a subject property. Fees for these services are typically billed and collected monthly. Property management service fees are recognized as revenue over time using the output method as the performance obligations under the customer arrangement are satisfied each month. Our Real Estate title insurance commission fee revenue is earned when the sale of the title insurance is completed, which corresponds to the point in time when the underlying real estate sale transaction closes and the payment is received.
Accounting for Leases. Under Accounting Standards Committee (“ASC”) 842, we determine if an arrangement is a lease at contract inception. At lease commencement, we record and recognize right-of-use (“ROU”) assets for the lease liability amount and initial direct costs incurred, offset by lease incentives received. We record lease liabilities for the net present value of future lease payments over the lease term. The discount rate we use is generally our estimated incremental borrowing rate unless the lessor’s implicit rate is readily determinable. We calculate discount rates periodically to estimate the rate we would pay to borrow the funds necessary to obtain an asset of similar value, over a similar term, with a similar security. The lease terms may include options to extend or terminate the lease when it is reasonably certain that we will exercise that option. We recognize operating lease expense on a straight-line basis over the lease term. Operating leases are included in operating lease ROU assets and lease liabilities on the combined consolidated balance sheets.
Stock-Based Compensation. In connection with the Distribution, we granted stock-based compensation to employees and recognized expense on such grants. Our stock-based compensation uses a fair-value-based method to recognize non-cash compensation expense for share-based transactions. Under the fair value recognition provisions, we recognize stock-based compensation net of an estimated forfeiture rate and only recognize compensation cost for those shares expected to vest on a straight-line basis over the requisite service period of the award.
Current Expected Credit Losses. We are exposed to credit losses for various amounts due from real estate agents, which are included in other current assets on the combined consolidated balance sheets, net of an allowance for credit losses. We historically estimated our allowance for credit losses on receivables from agents based on an evaluation of aging, agent sales in pipeline, any security, specific exposures, and historical experience of collections from the individual agents. Based on our historical credit losses on receivables from agents, current and expected future market trends, it was determined that the requirements of Accounting Standards Update (“ASU”) No. 2016-13 did not result in a material impact on our allowance for credit losses as of January 1, 2020 of $6,132, we estimated that the credit losses for these receivables were $10,916 and $8,607 at December 31, 2022 and 2021, respectively.
Goodwill and Indefinite Life Assets. Goodwill and intangible assets with indefinite lives are not amortized, but instead are tested for impairment on an annual basis, or whenever events or changes in business circumstances indicate the carrying value of the assets may not be recoverable. We follow ASC 350, Intangibles — Goodwill and Other, and subsequent updates including ASU 2011-08, Testing Goodwill for Impairment and ASU 2017-14, Simplifying the Test for Goodwill Impairment. The amendments permit entities to first perform a qualitative assessment to determine whether it is more likely than not that the fair value of a reporting unit is less than its carrying amount. If we conclude that it is more likely than not that a reporting unit’s
fair value is less than its carrying value or choose to bypass the optional qualitative assessment, we will then assess recoverability by comparing the fair value of the reporting unit to our carrying amount; otherwise, no further impairment test would be required. The fair value of the intangible asset associated with the Douglas Elliman trademark is determined using a “relief from royalty payments” method. This approach involves two steps: (i) estimating reasonable royalty rates for its trademark associated with the Douglas Elliman trademark and (ii) applying these royalty rates to a net sales stream and discounting the resulting cash flows to determine fair value. This fair value is then compared with the carrying value of the trademark. As discussed in Note 9 to our combined consolidated financial statements, during the first quarter of 2020, we performed quantitative assessments of our goodwill and our trademark intangible asset in conjunction with our quarterly review for indicators of impairment. The quantitative assessments resulted in impairment charges to goodwill of $46,252 and to the trademark intangible asset of $12,000. We performed a qualitative assessment for the year ended December 31, 2022, which did not result in additional impairment charges related to our goodwill or trademark.
Income Taxes. The application of income tax law is inherently complex. Laws and regulations in this area are voluminous and are often ambiguous. Therefore, we are required to make many subjective assumptions and judgments regarding our income tax exposures. Interpretations of and guidance surrounding income tax laws and regulations change over time and, as a result, changes in our subjective assumptions and judgments may materially affect amounts recognized in our combined consolidated financial statements.
Before the Distribution (and during the year ended December 31, 2021), we calculated our provision for income taxes by using a separate-return method and elected not to allocate tax expense to single-member limited liability companies or partnerships that did not incur income tax liability because they were not severally liable for the taxes of their owners. Before the Distribution, Douglas Elliman of California, Inc. and DER Holdings II LLC were the only two entities taxed as corporations for U.S. Income Tax purposes while the remaining entities were pass through entities for federal income tax purposes. Therefore, no income tax expense was allocated to entities other than DER Holdings II LLC, Douglas Elliman of California, Inc. and, for purposes of New York City Unincorporated Business Tax (“UBT”) only, Douglas Elliman Realty, LLC.
After the Distribution, we calculate our provision for income taxes based upon the taxable income attributable to our activity and the activity of our subsidiaries because after the Distribution, we are taxed as a corporation for purposes of U.S. and state and local income taxes. Therefore, after the Distribution, we have recorded an income tax provision at current income tax rates.
Results of Operations
The following discussion provides an assessment of our results of operations, capital resources and liquidity and should be read in conjunction with our combined consolidated financial statements and related notes included elsewhere in this annual report on Form 10-K.
The primary components of our operating expenses, the changes in which are described in the following discussion of our results of operations, are defined below:
•Sales and marketing. Sales and marketing expense consists primarily of marketing and advertising expenses, compensation and other personnel-related costs for employees supporting sales, marketing, expansion and related functions, occupancy-related costs and agent acquisition incentives.
•Operations and support. Operations and support expense consists primarily of compensation and other personnel-related costs for employees supporting agents, third-party consulting and professional services costs (not included in general and administrative or technology), fair value adjustments to contingent consideration for our acquisitions and other related expenses.
•General and administrative. General and administrative expense consists primarily of compensation, stock-based compensation expense and other personnel-related costs for executive management and administrative employees, including finance and accounting, legal, human resources and communications, the occupancy costs for our headquarters and other offices supporting our administrative functions and, after the Distribution (beginning in 2022), include transition services paid to our former parent, Vector Group, for the use of office space and employees, professional services fees for legal and finance, insurance expenses and talent acquisition expenses.
•Technology. Technology expense consists primarily of compensation and other personnel-related costs for employees in the product, engineering and technology functions, website hosting expenses, software licenses and equipment, third-party consulting costs, data licenses of PropTech and other related expenses associated with the implementation of our technology initiatives.
Year Ended December 31, 2022 Compared to Year Ended December 31, 2021
The following table sets forth our revenue and operating (loss) income by segment for the year ended December 31, 2022 compared to the year ended December 31, 2021:
| | | | | | | | | | | |
| Year Ended December 31, |
| 2022 | | 2021 |
| (Dollars in thousands) |
| Revenues by segment: | | | |
| Real estate brokerage segment | $ | 1,153,177 | | | $ | 1,353,138 | |
| | | |
| Operating (loss) income by segment: | | | |
| Real estate brokerage segment | $ | 21,993 | | | $ | 102,098 | |
| Corporate and other segment | (26,534) | | | — | |
| Total operating (loss) income | $ | (4,541) | | | $ | 102,098 | |
| | | |
| Real estate brokerage segment | | | |
| Operating income | $ | 21,993 | | | $ | 102,098 | |
| Depreciation and amortization | 8,012 | | | 8,561 | |
| Stock-based compensation | 4,195 | | | — | |
| Adjusted EBITDA | 34,200 | | | 110,659 | |
| Adjusted EBITDA attributed to non-controlling interest | 342 | | | 40 | |
| Adjusted EBITDA attributed to Douglas Elliman | $ | 34,542 | | | $ | 110,699 | |
| | | |
| Corporate and other segment | | | |
| Operating loss | $ | (26,534) | | | $ | — | |
| Stock-based compensation | 6,943 | | | — | |
| Adjusted EBITDA attributed to Douglas Elliman | $ | (19,591) | | | $ | — | |
| | | |
| | | |
| | | |
| | | |
| | | |
| | | |
| | | |
| | | |
| | | |
Year ended December 31, 2022 Compared to Year ended December 31, 2021
Revenues. Our revenues were $1,153,177 for the year ended December 31, 2022 compared to $1,353,138 for the year ended December 31, 2021. The $199,961 (14.8%) decline in revenues was primarily due to a $199,961 decline in the Real Estate Brokerage segment’s revenues because of lower revenues from existing home sales caused, in part, by lower listing inventory and the volatility in the financial markets as well as increases in mortgage rates. These factors were partially offset by increased revenues from the Texas market, which we began consolidating in August 2021.
Operating expenses. Our operating expenses were $1,157,718 for the year ended December 31, 2022 compared to $1,251,040 for the year ended December 31, 2021. The decline of $93,322 was due primarily to declines in real estate brokerage commissions of $148,720. This was offset by increases in expenses associated with Douglas Elliman operating as a standalone public company after the Distribution, which occurred on December 29, 2021, as well as increased expenses associated with our expansion into new markets and enhancements to our agent-facing technology platform.
Operating (loss) income. Operating loss was $4,541 for the year ended December 31, 2022 compared to operating income of $102,098 for the year ended December 31, 2021. The $106,639 decline in operating income was due to the net impact of declines in commission and other brokerage revenues, Douglas Elliman operating as a standalone public company after the Distribution, incremental expenses associated to support our business growth and agents as well as non-cash stock compensation expense.
Other income (expenses). Other income was $4,645 for the year ended December 31, 2022 compared to other expenses of $1,313 for the year ended December 31, 2021. For the year ended December 31, 2022, other income primarily consisted of investment and other income, primarily associated with our PropTech investments of $2,839, income from the indemnification by Vector Group under the Tax Disaffiliation Agreement of $589, and interest income, net of $1,779. This was offset by equity losses from equity method investments of $563.
Income before provision for income taxes. Income before income taxes was $104 and $100,785 for the years ended December 31, 2022 and 2021, respectively.
Income tax expense. Income tax expense was $6,503 and $2,133 for the years ended December 31, 2022 and 2021, respectively. The difference is primarily related to income tax expense before and after the Distribution offset by lower income before provision for income taxes for the year ended December 31, 2022. Specifically, income tax expense calculated before the Distribution when we used a separate return method for the year ended December 31, 2021 resulted in a lower income tax rate in the 2021 period and is described below.
After the Distribution, we calculate our provision for income taxes based upon the taxable income attributable to our activity and the activity of our subsidiaries.
Before the Distribution during the year ended December 31, 2021, we calculated our provision for income taxes by using a separate-return method and elected not to allocate tax expense to single-member limited liability companies or partnerships that did not incur income tax liability because they were not severally liable for the taxes of their owners. Before the Distribution, Douglas Elliman of California, Inc. and DER Holdings II LLC were the only two entities taxed as corporations for U.S. Income Tax purposes while the remaining entities were pass through entities for federal income tax purposes. Therefore, no income tax expense was allocated to entities other than DER Holdings II LLC, Douglas Elliman of California, Inc. and, for purposes of New York City UBT only, Douglas Elliman Realty, LLC.
Real Estate Brokerage.
The following table sets forth our combined consolidated statements of operations data for the Real Estate Brokerage segment for the year ended December 31, 2022 compared to the year ended December 31, 2021:
| | | | | | | | | | | | | | | | | | | | | |
| | Year Ended December 31, | | |
| | 2022 | | 2021 | | | | |
| | (Dollars in thousands) | | |
| Revenues: | | | | | | | | | |
| Commissions and other brokerage income | $ | 1,099,885 | | 95.4% | | $ | 1,292,416 | | 95.5% | | | | |
| Property management | 36,022 | | 3.1% | | 37,345 | | 2.8% | | | | |
| Other ancillary services | 17,270 | | 1.5% | | 23,377 | | 1.7% | | | | |
| Total revenues | $ | 1,153,177 | | 100% | | $ | 1,353,138 | | 100% | | | | |
| | | | | | | | | |
| Operating expenses: | | | | | | | | | |
| Real estate agent commissions | $ | 836,803 | | 72.6% | | $ | 985,523 | | 72.8% | | | | |
| Sales and marketing | 85,763 | | 7.4% | | 77,174 | | 5.7% | | | | |
| Operations and support | 72,946 | | 6.3% | | 71,641 | | 5.3% | | | | |
| General and administrative | 104,887 | | 9.1% | | 92,798 | | 6.9% | | | | |
| Technology | 22,773 | | 2.0% | | 15,343 | | 1.1% | | | | |
| Depreciation and amortization | 8,012 | | 0.7% | | 8,561 | | 0.6% | | | | |
| | | | | | | | | |
| | | | | | | | | |
| | | | | | | | | |
| Operating income | $ | 21,993 | | 1.9% | | $ | 102,098 | | 7.5% | | | | |
| | | | | | | | | |
Revenues. Our revenues were $1,153,177 for the year ended December 31, 2022 compared to $1,353,138 for the year ended December 31, 2021. The decline of $199,961 (14.8%) was primarily related to a decline of $192,531 in our commission and other brokerage income because of lower revenues from existing home sales caused, in part, by lower listing inventory and the volatility in the financial markets as well as increases in mortgage rates. These factors were partially offset by increased revenues from the Texas market, which we began consolidating in August 2021. See Item 7. “Management’s Discussion and Analysis of Financial Condition and Results of Operations Business - Overview - Industry Trends in 2022.”
Our revenues from commission and other brokerage income were $1,099,885 for the year ended December 31, 2022 compared to $1,292,416 for the year ended December 31, 2021, a decline of $192,531. In 2022, our commission and other brokerage income generated from the sales of existing homes declined by $91,738 in our Florida market, $41,263 in the Northeast region, which excludes New York City, $32,594 in New York City and $16,394 in the West region (which includes $29,499 related to our Texas market, which we began consolidating in August 2021), in each case compared to the 2021 period. In addition, our revenues from DEDM declined by $10,542 in 2022 compared to 2021.
Operating Expenses. Our operating expenses were $1,131,184 for the year ended December 31, 2022 compared to $1,251,040 for the year ended December 31, 2021, a decline of $119,856, due primarily to declines in real estate brokerage
commissions. This was offset by increases in sales and marketing, general and administrative and technology expenses. The primary components of operating expenses are described below.
Real Estate Agent Commissions. As a result of declines in commissions and other brokerage income, our real estate agent commissions expense was $836,803 for the year ended December 31, 2022 compared to $985,523 for the year ended December 31, 2021, a decline of $148,720 (15.1%). Real estate agent commissions expense, as a percentage of revenues, decreased to 72.6% for the year ended December 31, 2022 compared to 72.8% for the year ended December 31, 2021.
Sales and Marketing. Sales and marketing expenses were $85,763 for the year ended December 31, 2022 compared to $77,174 for the year ended December 31, 2021. The increase was primarily due to additional promotional sponsorships and events in the 2022 period because of the reopening of the economy.
Operations and support. Operations and support expenses were $72,946 for the year ended December 31, 2022 compared to $71,641 for the year ended December 31, 2021. The increase related increased compensation expense associated with additional personnel required to support our business growth and agents as well as wage inflation and non-cash stock compensation partially offset by lower incentive compensation expense in the 2022 period.
General and administrative. General and administrative expenses were $104,887 for the year ended December 31, 2022 compared to $92,798 for the year ended December 31, 2021. The increase in expenses was primarily because of non-cash stock compensation, the expansion into the Texas region and incremental expenses to support business growth and wage inflation.
Technology. Technology expenses were $22,773 for the year ended December 31, 2022 compared to $15,343 for the year ended December 31, 2021. The increase in the 2022 period was related to technology enhancements, incremental refinements and additional functionality of our cloud-based “MyDouglas” agent portal that included social media grading widget via Real Grader, new enhanced video capabilities from Videobolt, and newly introduced Tongo and AdPro. Tongo enables our agents to obtain instant access to future income from pending deals. AdPro is an easy-to-navigate interface to promote properties on social media platforms. There was also increased utilization of our StudioPro Customer Relationship Management marketing application as well as transaction system and the integration of our newly announced Elliman Showroom, a complimentary personal assistant platform that will guide home purchasers through a high-touch and streamlined move-in process.
Operating income. Operating income was $21,993 for the year ended December 31, 2022 compared to $102,098 for the year ended December 31, 2021. The decline in operating income is primarily associated with the decline in revenues, expenses associated with non-cash stock compensation, business growth, agent support, expansion into new markets and technology.
Corporate and Other.
Corporate and Other loss. The operating loss at the Corporate and Other segment was $26,534 for the year ended December 31, 2022 due to expenses, including non-cash stock compensation, associated with Douglas Elliman operating as a standalone publicly traded company after the Distribution.
Summary of PropTech Investments
As of December 31, 2022, New Valley Ventures had investments (at a carrying value) of approximately $14.8 million in PropTech companies. This amounts to approximately 3% of the value of Douglas Elliman’s total assets, which totaled approximately $550 million, as of December 31, 2022. As of December 31, 2022 our PropTech investments include:
■Rechat: a lead-to-close fully-mobile technology dashboard for real estate agents including marketing, customer relationship management and transaction-management software. Douglas Elliman has a multi-year services agreement with Rechat for its agents, who are increasingly requesting and requiring superior access to technology and back-office support services. The Rechat technology is a key element of MyDouglas, Douglas Elliman’s primary agent portal designed to be our agents’ technology front door, and StudioPro, the cloud-based agent portal and marketing tool recently launched by Douglas Elliman that helps integrate all agent resources in one user-friendly suite.
■Purlin: an automated intelligence platform to aid in home buying, an agent “paid social media” integration in MyDouglas and Portfolio Escrow client and agent portals that also integrate with MyDouglas.
■Humming Homes: a tech-enabled home management service that is creating a new category of end-to-end home management. It has built a solution that provides single-family homeowners with a digital experience and offers a dedicated in-person home management team with a single point of contact and 24/7 support. The service employs data and insights to avoid reactive and expensive home maintenance issues. The investment will complement Douglas Elliman’s business in the Hamptons and align Humming Homes’ geographical growth with Douglas Elliman’s footprint in locations such as Aspen, Florida and Southern California.
■MoveEasy: a client- and customer-facing digital concierge service designed to assist clients and customers moving into and “setting up” their new homes, while offering additional services to maintain their homes. In partnership with residential real estate brokerages, MoveEasy is delivered in a white-labeled format that features the name and contact information of the selling agent.
■Fyxify: a tech-enabled platform that utilizes direct scheduling and operating technology to avoid the inefficiencies of home repairs (for example: calling around, mystery repair costs and wasting time).
■EVPassport: an entity that offers complete electronic vehicle charging solutions including hardware and software.
■Bilt: a leading loyalty program and co-branded credit card for renters to earn points on their rent payments. Douglas Elliman has joined the Bilt Rewards Alliance, a network of more than 2 million rental units across the country where renters can enroll in the loyalty program to earn points on rent paid. This platform enhances Douglas Elliman’s suite of offerings for both the renters and landlords it represents.
■Persefoni AI: a software-as-a-service (“SaaS”) platform built to enable enterprises of all sizes to measure their carbon footprint accurately, dynamically, and regularly across all operations.
■Envoy: a shared mobility company that sets up fleets of electric vehicles that can be shared by residents of a condominium development, hotel, or shared space.
■Audience: a subscription-based platform built around proprietary robotic arms that generate hand-written notes on behalf of sales-oriented professionals.
■Tongo: a financial program that gives real estate agents instant access to future commissions up to 60 days before closing.
■Guest House: a tech-enabled company focused on the home staging market.
■Alpaca: investment in Getaway House, Inc., a start-up company that provides cabin rental services in rural areas throughout the United States.
■PropTech Venture Capital Funds: investments in the following venture capital funds providing New Valley Ventures exposure to opportunities in the emerging PropTech industry.
■Camber Creek Venture Capital Funds: two funds that invest in a diversified pipeline of new PropTech ventures. Camber Creek’s portfolio includes Notarize, a digitized notary service, and Curbio, a renovation firm designed to increase a property’s selling price.
■Sum Ventures: a fund that invests in growth companies in PropTech, FinTech, and CleanTech industries.
■MetaProp Venture Capital Fund: a fund advised or managed by a New York-based venture capital firm.
■The Lab PropTech Fund: a fund advised or managed by a Miami-based firm that aims to invest in emerging technologies with a focus on residential real estate and construction services.
Other than the five private funds listed above in which New Valley Ventures invests as a limited partner, all of these companies currently provide technology or services to Douglas Elliman. To date, we have not recognized revenue from these investments and do not anticipate recognizing revenue from these non-controlling PropTech investments. However, we target earning an attractive rate of return from the capital appreciation of our PropTech investments.
Liquidity and Capital Resources
Cash and cash equivalents declined by $57,484 and increased by $122,164 in 2022 and 2021, respectively. Restricted Cash, which is included in cash and cash equivalents, was $7,523 and $17,243 as of December 31, 2022 and 2021, respectively.
Cash used in operations was $14,744 in 2022 and cash provided from operations was $127,826 in 2021. The decline in the 2022 period was related to lower operating income as a result of the decline in revenues and inclusion of expenses associated with Douglas Elliman operating as a standalone public company and increased expenses in our brokerage segment. We also incurred increased income tax payments and increased discretionary compensation payments in 2022 compared to 2021. Our income tax payments increased in 2022 because we became a full taxpayer after the Distribution. Our discretionary
compensation payments increased in the 2022 period because our compensation accruals at December 31, 2021 were more than our compensation accruals at December 31, 2020 as a result of improved operating income for the year ended December 31, 2021 when compared to the year ended December 31, 2020.
Cash used in investing activities was $12,737 and $8,858 in 2022 and 2021, respectively. In 2022, cash used in investing activities was comprised of capital expenditures of $8,537, purchase of investments of $3,875 in our PropTech business, and investments of $400 in equity-method investments. This was offset by $75 of distributions from equity-method investments. In 2021, cash used in investing activities was comprised of capital expenditures of $4,106, the purchase of investments of $4,340, and $500 in connection with the acquisition of the controlling interest in Douglas Elliman Texas. This was offset by $88 of distributions from equity-method investments.
Our investment philosophy is to maximize return on investments using a reasonable expectation for return when investing in equity-method investments and PropTech investments as well as making capital expenditures.
Cash used in financing activities was $30,003 in 2022 and cash provided by financing activities was $3,196 in 2021. In 2022, cash used in financing activities was comprised of dividends and distributions on common stock of $16,250, repayment of debt of $12,528, and earn-out payments, associated with acquisitions, of $1,600. These amounts were partially offset by contributions from a non-controlling interest associated with Douglas Elliman Texas of $375. In 2021, cash provided by financing activities was comprised of net contributions from Vector Group, our former parent, of $2,062 and contributions from non-controlling interest associated with Douglas Elliman Texas of $1,625. These amounts were offset by $361 for repayment of debt and earn-out payments, associated with acquisitions, of $130.
In March 2022, we began paying a quarterly cash dividend of $0.05 per share. We contemplate continuing to pay a quarterly cash dividend of $0.05 per share, subject to approval of our Board of Directors, which would result in annual dividends of approximately $16,900. We had cash and cash equivalents of approximately $163,859 as of December 31, 2022 and, in addition to cash provided from operations, such cash is available to be used to fund such liquidity requirements as well as other anticipated liquidity needs in the normal course of business. Management currently anticipates that these amounts, as well as expected cash flows from our operations and proceeds from any financings to the extent available, should be sufficient to meet our liquidity needs over the next twelve months. We may acquire or seek to acquire additional operating businesses through merger, purchase of assets, stock acquisition or other means, or to make or seek to make other investments, which may limit our liquidity otherwise available.
Off-Balance Sheet Arrangements
We have various agreements in which we may be obligated to indemnify the other party with respect to certain matters. Generally, these indemnification clauses are included in contracts arising in the normal course of business under which we customarily agree to hold the other party harmless against losses arising from a breach of representations related to such matters as title to assets sold and licensed or certain intellectual property rights. Payment by us under such indemnification clauses is generally conditioned on the other party making a claim that is subject to challenge by us and dispute resolution procedures specified in the particular contract. Further, our obligations under these arrangements may be limited in terms of time and/or amount, and in some instances, we may have recourse against third parties for certain payments made by us. It is not possible to predict the maximum potential amount of future payments under these indemnification agreements due to the conditional nature of our obligations and the unique facts of each particular agreement. Historically, payments made by us under these agreements have not been material. As of December 31, 2022, we were not aware of any indemnification agreements that would or are reasonably expected to have a current or future material adverse impact on our financial position, results of operations or cash flows.
As of December 31, 2022, we had outstanding approximately $3,107 of letters of credit, collateralized by certificates of deposit. The letters of credit have been issued as security deposits for leases of office space, to secure the performance of our subsidiaries under various insurance programs and to provide collateral for various subsidiary borrowing and capital lease arrangements.
Market Risk
We are exposed to market risks principally from fluctuations in interest rates and could be exposed to market risks from foreign currency exchange rates and equity prices in the future. We seek to minimize these risks through our regular operating and financing activities and our long-term investment strategy. Our market risk management procedures cover material market risks for our market risk sensitive financial instruments.
New Accounting Pronouncements
Refer to Note 1, Summary of Significant Accounting Policies, to our combined consolidated financial statements for further information on New Accounting Pronouncements.
Legislation, Regulation, Taxation and Litigation
See Item 1. “Business,” Item 1A. “Risk Factors,” Item 3. “Legal Proceedings” and Note 14 to our combined consolidated financial statements, which contain a description of litigation.
SPECIAL NOTE REGARDING FORWARD-LOOKING STATEMENTS
In addition to historical information included in this annual report on Form 10-K, this report contains “forward-looking statements” within the meaning of the federal securities law. Forward-looking statements include information relating to our intent, belief or current expectations, primarily with respect to, but not limited to, economic outlook, capital expenditures, cost reduction, cash flows, operating performance, growth expectations, competition, legislation and regulations, litigation, and related industry developments (including trends affecting our business, financial condition and results of operations).
We identify forward-looking statements in this report by using words or phrases such as “anticipate,” “believe,” “continue,” “could,” “estimate,” “expect,” “intend,” “may be,” “objective,” “opportunistically,” “plan,” “potential,” “predict,” “project,” “prospects,” “seek,” and “will be” and similar words or phrases or their negatives.
Forward-looking statements involve important risks and uncertainties that could cause our actual results, performance or achievements to differ materially from our anticipated results, performance or achievements expressed or implied by the forward-looking statements. Factors that could cause actual results to differ materially from those suggested by the forward-looking statements include, without limitation, the following:
•general economic and market conditions and any changes therein, including due to macroeconomic conditions, interest rate fluctuations, inflation, acts of war and terrorism or otherwise,
•governmental regulations and policies, including with respect to regulation of the real estate market or monetary and fiscal policy and its effect on overall economic activity, in particular, mortgage interest rates,
•litigation risks,
•adverse changes in global, national, regional and local economic and market conditions, including those related to pandemics and health crises,
•our ability to effectively manage the impacts of any government-mandated or encouraged suspension of our business operations,
•the impacts of the Inflation Reduction Act of 2022 and the Tax Cuts and Jobs Act of 2017, including the continued impact on the markets of our business,
•effects of industry competition,
•severe weather events or natural or man-made disasters, including the increasing severity or frequency of such events due to climate change or otherwise, or other catastrophic events that may disrupt our business and have an unfavorable impact on home sale activity,
•the level of our expenses, including our corporate expenses as a standalone public company,
•the tax-free treatment of the Distribution,
•our lack of operating history as a public company and costs associated with being a standalone public company,
•the failure of Vector Group to satisfy its respective obligations under the Transition Services Agreement or other agreements entered into in connection with the Distribution; and
•the additional factors described under “Risk Factors” in this report.
Further information on the risks and uncertainties to our business includes the risk factors discussed above under Item 1A. “Risk Factors” and in “Management’s Discussion and Analysis of Financial Condition and Results of Operations.”
Although we believe the expectations reflected in these forward-looking statements are based on reasonable assumptions, there is a risk that these expectations will not be attained and that any deviations will be material. The forward-looking statements speak only as of the date they are made.
ITEM 7A.QUANTITATIVE AND QUALITATIVE DISCLOSURES ABOUT MARKET RISK
The information under the caption “Management’s Discussion and Analysis of Financial Condition and Results of Operations — Market Risk” is incorporated herein by reference.
ITEM 8.FINANCIAL STATEMENTS AND SUPPLEMENTARY DATA
Our combined consolidated financial statements and notes thereto, together with the report thereon of Deloitte & Touche LLP dated March 16, 2023, are set forth beginning on page F-1 of this report.
ITEM 9.CHANGES IN AND DISAGREEMENTS WITH ACCOUNTANTS ON ACCOUNTING AND FINANCIAL DISCLOSURE
None.
ITEM 9A.CONTROLS AND PROCEDURES
Evaluation of Disclosure Controls and Procedures
The Company maintains disclosure controls and procedures that are designed to ensure that information required to be disclosed, in the reports the Company files or submits under the Exchange Act, is recorded, processed, summarized and reported within the time periods specified in the SEC’s rules and forms and that such information is accumulated and communicated to the Company’s management, including its Chief Executive Officer and Chief Financial Officer, as appropriate, to allow timely decisions regarding required disclosure.
In connection with the preparation of this Form 10-K, the Company evaluated under the supervision of and with the participation of the Company’s management, including the Chief Executive Officer and Chief Financial Officer, as of December 31, 2022, of the effectiveness of the design and operation of the Company’s disclosure controls and procedures, as such term is defined in Rules 13a-15(e) and 15d-15(e) under the Exchange Act. Based upon this evaluation, the Chief Executive Officer and Chief Financial Officer concluded that as of December 31, 2022, the Company’s disclosure controls and procedures were effective as of December 31, 2022.
Management’s Annual Report on Internal Control Over Financial Reporting
Management is responsible for establishing and maintaining adequate internal control over financial reporting for the Company, as such term is defined in Rules 13a-15(f) and 15d-15(f) under the Exchange Act. Internal control over financial reporting is a process designed to provide reasonable assurance regarding the reliability of financial reporting and the preparation of financial statements for external purposes in accordance with generally accepted accounting principles and includes those policies and procedures that (i) pertain to the maintenance of records that in reasonable detail accurately and fairly reflect the transactions and dispositions of the assets of the Company, (ii) provide reasonable assurance that transactions are recorded as necessary to permit preparation of financial statements in accordance with generally accepted accounting principles, and that receipts and expenditures of the Company are being made only in accordance with authorizations of management and directors of the Company, and (iii) provide reasonable assurance regarding prevention or timely detection of unauthorized acquisition, use or disposition of the Company’s assets that could have a material effect on the financial statements.
Because of inherent limitations, internal control over financial reporting may not prevent or detect misstatements. Also, projections of any evaluation of effectiveness to future periods are subject to the risk that controls may become inadequate because of changes in conditions, or that the degree of compliance with the policies or procedures may deteriorate.
Management, including the Chief Executive Officer and Chief Financial Officer, has assessed the effectiveness of the Company’s internal control over financial reporting as of December 31, 2022, based on the criteria in Internal Control - Integrated Framework (2013) issued by the Committee of Sponsoring Organizations of the Treadway Commission (“COSO”). Based on this assessment, management concluded that the Company’s internal control over financial reporting was effective as of December 31, 2022 based on the criteria in Internal Control - Integrated Framework (2013) issued by COSO. The effectiveness of the Company’s internal control over financial reporting as of December 31, 2022 has been audited by Deloitte & Touche LLP, an independent registered public accounting firm, as stated in its report which appears herein.
Changes in Internal Control Over Financial Reporting
There were no changes in the Company’s internal control over financial reporting during the year ended December 31, 2022 that have materially affected or are reasonably likely to materially affect the Company’s internal control over financial reporting.
REPORT OF INDEPENDENT REGISTERED PUBLIC ACCOUNTING FIRM
To the Stockholders and the Board of Directors of Douglas Elliman Inc.
Opinion on Internal Control over Financial Reporting
We have audited the internal control over financial reporting of Douglas Elliman Inc. and subsidiaries (the “Company”) as of December 31, 2022, based on criteria established in Internal Control — Integrated Framework (2013) issued by the Committee of Sponsoring Organizations of the Treadway Commission (COSO). In our opinion, the Company maintained, in all material respects, effective internal control over financial reporting as of December 31, 2022, based on criteria established in Internal Control — Integrated Framework (2013) issued by COSO.
We have also audited, in accordance with the standards of the Public Company Accounting Oversight Board (United States) (PCAOB), the combined consolidated financial statements as of and for the year ended December 31, 2022, of the Company and our report dated March 16, 2023, expressed an unqualified opinion on those financial statements.
Basis for Opinion
The Company’s management is responsible for maintaining effective internal control over financial reporting and for its assessment of the effectiveness of internal control over financial reporting, included in the accompanying Management's Annual Report on Internal Control Over Financial Reporting. Our responsibility is to express an opinion on the Company’s internal control over financial reporting based on our audit. We are a public accounting firm registered with the PCAOB and are required to be independent with respect to the Company in accordance with the U.S. federal securities laws and the applicable rules and regulations of the Securities and Exchange Commission and the PCAOB.
We conducted our audit in accordance with the standards of the PCAOB. Those standards require that we plan and perform the audit to obtain reasonable assurance about whether effective internal control over financial reporting was maintained in all material respects. Our audit included obtaining an understanding of internal control over financial reporting, assessing the risk that a material weakness exists, testing and evaluating the design and operating effectiveness of internal control based on the assessed risk, and performing such other procedures as we considered necessary in the circumstances. We believe that our audit provides a reasonable basis for our opinion.
Definition and Limitations of Internal Control over Financial Reporting
A company’s internal control over financial reporting is a process designed to provide reasonable assurance regarding the reliability of financial reporting and the preparation of financial statements for external purposes in accordance with generally accepted accounting principles. A company’s internal control over financial reporting includes those policies and procedures that (1) pertain to the maintenance of records that, in reasonable detail, accurately and fairly reflect the transactions and dispositions of the assets of the company; (2) provide reasonable assurance that transactions are recorded as necessary to permit preparation of financial statements in accordance with generally accepted accounting principles, and that receipts and expenditures of the company are being made only in accordance with authorizations of management and directors of the company; and (3) provide reasonable assurance regarding prevention or timely detection of unauthorized acquisition, use, or disposition of the company’s assets that could have a material effect on the financial statements.
Because of its inherent limitations, internal control over financial reporting may not prevent or detect misstatements. Also, projections of any evaluation of effectiveness to future periods are subject to the risk that controls may become inadequate because of changes in conditions, or that the degree of compliance with the policies or procedures may deteriorate.
/s/ Deloitte & Touche LLP
Miami, Florida
March 16, 2023
ITEM 9B.OTHER INFORMATION
None.
ITEM 9C. DISCLOSURE REGARDING FOREIGN JURISDICTIONS THAT PREVENT INSPECTIONS
Not applicable.
PART III
ITEM 10.DIRECTORS, EXECUTIVE OFFICERS AND CORPORATE GOVERNANCE
The information contained under the following headings in our definitive Proxy Statement for our 2023 Annual Meeting of Stockholders (the “2023 Proxy Statement”), to be filed with the SEC not later than 120 days after the end of our fiscal year covered by this report pursuant to Regulation 14A under the Securities Exchange Act of 1934, is incorporated herein by reference: “Board Proposal 1 — Nomination and Election of Directors.” See Item 5. “Market for Registrant’s Common Equity, Related Stockholder Matters and Issuer Purchase Equity Securities. Executive Officers of the Registrant" for information regarding our executive officers. We have adopted a policy statement entitled Code of Business Conduct and Ethics that applies to all of our directors, officers and employees. In the event that an amendment to, or a waiver from, a provision of the Code of Business Conduct and Ethics is made or granted, we intend to post such information on our web site, which is investors.elliman.com.
ITEM 11.EXECUTIVE COMPENSATION
The information contained under the headings “Executive Compensation” and “Compensation Committee Interlocks and Insider Participation” in our 2023 Proxy Statement is incorporated herein by reference.
ITEM 12.SECURITY OWNERSHIP OF CERTAIN BENEFICIAL OWNERS AND MANAGEMENT AND RELATED STOCKHOLDER MATTERS
The information contained under the headings “Equity Compensation Plan Information” and “Security Ownership of Certain Beneficial Owners and Management” in our 2023 Proxy Statement is incorporated herein by reference.
ITEM 13.CERTAIN RELATIONSHIPS AND RELATED TRANSACTIONS, AND DIRECTOR INDEPENDENCE
The information contained under the headings “Certain Relationships and Related Party Transactions” and “Board of Directors and Committees” in our 2023 Proxy Statement is incorporated herein by reference.
ITEM 14.PRINCIPAL ACCOUNTANT FEES AND SERVICES
The information contained under the headings “Audit and Non-Audit Fees” and “Pre-Approval Policies and Procedures” in our 2023 Proxy Statement is incorporated herein by reference.
PART IV
ITEM 15.EXHIBITS AND FINANCIAL STATEMENT SCHEDULES
(a)(1) INDEX TO 2022 COMBINED CONSOLIDATED FINANCIAL STATEMENTS:
Our combined consolidated financial statements and the notes thereto, together with the report thereon of Deloitte & Touche LLP for the three years ended December 31, 2022, dated March 16, 2023 appear beginning on page F-1 of this report.
(a)(2) FINANCIAL STATEMENT SCHEDULES:
| | | | | |
| Schedule II — Valuation and Qualifying Accounts Page | |
(a)(3) EXHIBITS:
(a) The following is a list of exhibits filed herewith as part of this Annual Report on Form 10-K:
INDEX OF EXHIBITS
| | | | | | | | |
EXHIBIT
NO. | | DESCRIPTION |
| | |
| | Distribution Agreement, originally dated as of December 21, 2021 and amended and restated as of December 28, 2021, between Vector Group Ltd. and Douglas Elliman Inc. (incorporated by reference to Exhibit 2.1 to the Company’s Form 8-K dated December 28, 2021). |
| | |
| | Amended and Restated Certificate of Incorporation of Douglas Elliman Inc., dated December 29, 2021. (incorporated by reference to Exhibit 3.1 to the Company’s Form 8-K dated December 29, 2021). |
| | |
| | Amended and Restated Bylaws of Douglas Elliman Inc., dated November 30, 2022. |
| | |
| | Employee Matters Agreement, dated as of December 21, 2021 between Vector Group Ltd. and Douglas Elliman Inc. (incorporated by reference to Exhibit 2.2 to the Company’s Form 8-K dated December 28, 2021). |
| | |
| | Form of Restricted Stock Award Agreement under Douglas Elliman Inc. 2021 Management Incentive Plan (incorporated by reference to Exhibit 10.1 to the Company’s Form 8-K dated December 28, 2021). |
| | |
| | Transition Services Agreement, dated as of December 21, 2021 between Vector Group Ltd. and Douglas Elliman Inc. (incorporated by reference to Exhibit 10.2 to the Company’s Form 8-K dated December 28, 2021). |
| | |
| | Tax Disaffiliation Agreement, dated as of December 21, 2021 between Vector Group Ltd. and Douglas Elliman Inc. (incorporated by reference to Exhibit 10.3 to the Company’s Form 8-K dated December 28, 2021).
|
| | |
| | 2021 Management Incentive Plan (incorporated by reference to Exhibit 10.4 to the Company’s Registration Statement on Form S-1, initially filed on December 7, 2021). |
| | |
| | 2021 Employee Stock Purchase Plan (incorporated by reference to Exhibit 10.5 to the Company’s Registration Statement on Form S-1, initially filed on December 7, 2021). |
| | |
| | Employment Agreement between Douglas Elliman Inc. and Howard M. Lorber, dated January 10, 2022 (incorporated by reference to Exhibit 10.1 to the Company’s Form 8-K dated January 10, 2022).
|
| | |
| | Amendment to Employment Agreement, dated as of March 18, 2022 between Douglas Elliman Inc. and Howard M. Lorber (incorporated by reference to Exhibit 10.8 to the Company’s Form 10-K for the year ended December 31, 2021). |
| | |
| | Employment Agreement between Douglas Elliman Inc. and Richard J. Lampen, dated January 10, 2022. (incorporated by reference to Exhibit 10.2 to the Company’s Form 8-K dated January 10, 2022). |
| | |
| | Form of Indemnification Agreement between Douglas Elliman Inc. and its Directors and Officers (incorporated by reference to Exhibit 10.6 the Company’s Registration Statement on Form S-1, initially filed on December 7, 2021). |
| | | | | | | | |
EXHIBIT
NO. | | DESCRIPTION |
| | |
| | Douglas Elliman Inc. Executive Compensation Clawback Policy. |
| | |
| | Non-exclusive Aircraft Lease Agreement dated as of December 21, 2021 between VT Equipment Leasing LLC and Douglas Elliman Inc. |
| | |
| | Non-exclusive Aircraft Lease Agreement dated as of December 21, 2021 between VT Aviation Leasing LLC and Douglas Elliman Inc. |
| | |
| | Subsidiaries of Douglas Elliman Inc. |
| | | |
| | Consent of Deloitte & Touche LLP. |
| | |
| | Certification of Chief Executive Officer, Pursuant to Exchange Act Rule 13a-14(a), as Adopted Pursuant to Section 302 of the Sarbanes-Oxley Act of 2002. |
| | | |
| | Certification of Chief Financial Officer, Pursuant to Exchange Act Rule 13a-14(a), as Adopted Pursuant to Section 302 of the Sarbanes-Oxley Act of 2002. |
| | | |
| | Certification of Chief Executive Officer and Chief Financial Officer, Pursuant to 18 U.S.C. Section 1350, as Adopted Pursuant to Section 906 of the Sarbanes-Oxley Act of 2002. |
| | |
| | |
_____________________________
*Incorporated by reference
Each management contract or compensatory plan or arrangement required to be filed as an exhibit to this report pursuant to Item 15(b) is listed in exhibit numbers 10.5 through 10.11.
ITEM 16.FORM 10-K SUMMARY.
Not applicable.
SIGNATURES
Pursuant to the requirements of Section 13 or 15(d) of the Securities Exchange Act of 1934, the Registrant has duly caused this Report to be signed on its behalf by the undersigned thereunto duly authorized.
| | | | | | | | | | | |
| | Douglas Elliman Inc. |
| | (Registrant) |
| | | |
| | By: | /s/ J. Bryant Kirkland III |
| | | J. Bryant Kirkland III |
| | | Senior Vice President, Chief Financial Officer and Treasurer |
| Date: | March 16, 2023 |
POWER OF ATTORNEY
The undersigned directors and officers of Douglas Elliman Inc. hereby constitute and appoint Richard J. Lampen, J. Bryant Kirkland III and Marc N. Bell, and each of them, with full power to act without the other and with full power of substitution and resubstitutions, our true and lawful attorneys-in-fact with full power to execute in our name and behalf in the capacities indicated below, this Annual Report on Form 10-K and any and all amendments thereto and to file the same, with all exhibits thereto and other documents in connection therewith, with the Securities and Exchange Commission, and hereby ratify and confirm all that such attorneys-in-fact, or any of them, or their substitutes shall lawfully do or cause to be done by virtue hereof. Pursuant to the requirements of the Securities Exchange Act of 1934, this Report has been signed below by the following persons on behalf of the Registrant and in the capacities indicated on March 16, 2023.
| | | | | | | | |
| SIGNATURE | | TITLE |
| | | |
| /s/ Howard M. Lorber | | Chairman of the Board of Directors, President and Chief Executive Officer
(Principal Executive Officer) |
| Howard M. Lorber | |
| | | |
| /s/ J. Bryant Kirkland III | | Senior Vice President, Treasurer and Chief Financial Officer
(Principal Financial Officer and Principal Accounting Officer) |
| J. Bryant Kirkland III | |
| | | |
| /s/ Richard J. Lampen | | Director |
| Richard J. Lampen | | |
| | |
| /s/ Ronald J. Kramer | | Director |
| Ronald J. Kramer | | |
| | |
| /s/ Michael S. Liebowitz | | Director |
| Michael S. Liebowitz | | |
| | | |
| /s/ Lynn Mestel | | Director |
| Lynn Mestel | | |
| | | |
| /s/ Wilson L. White | | Director |
| Wilson L. White | | |
| | | |
| /s/ Mark D. Zeitchick | | Director |
| Mark D. Zeitchick | | |
| | |
DOUGLAS ELLIMAN INC.
FORM 10-K FOR THE YEAR ENDED DECEMBER 31, 2022
ITEMS 8, 15(a)(1) AND (2), 15(c)
INDEX TO FINANCIAL STATEMENTS
AND FINANCIAL STATEMENT SCHEDULES
Financial Statements and Schedules of the Registrant and its subsidiaries required to be included in Items 8, 15(a) (1) and (2), 15(c) are listed below:
| | | | | | |
| | Page | |
| | | |
| FINANCIAL STATEMENTS: | | |
| Douglas Elliman Inc. Combined Consolidated Financial Statements | | |
Report of Independent Registered Public Accounting Firm (PCAOB ID No. 34) | | |
| Combined Consolidated Balance Sheets as of December 31, 2022 and 2021 | | |
| Combined Consolidated Statements of Operations for the years ended December 31, 2022, 2021 and 2020 | | |
| | |
| Combined Consolidated Statements of Stockholders' Equity for the years ended December 31, 2022, 2021 and 2020 | | |
| Combined Consolidated Statements of Cash Flows for the years ended December 31, 2022, 2021 and 2020 | | |
| Notes to Combined Consolidated Financial Statements | | |
| FINANCIAL STATEMENT SCHEDULE: | | |
| Schedule II — Valuation and Qualifying Accounts | | |
Financial Statement Schedules not listed above have been omitted because they are not applicable or the required information is contained in our combined consolidated financial statements or accompanying notes.
REPORT OF INDEPENDENT REGISTERED PUBLIC ACCOUNTING FIRM
To the Stockholders and the Board of Directors of Douglas Elliman Inc.
Opinion on the Financial Statements
We have audited the accompanying combined consolidated balance sheets of Douglas Elliman Inc. and subsidiaries (the "Company") as of December 31, 2022 and 2021, the related combined consolidated statements of operations, stockholders' equity, and cash flows, for each of the three years in the period ended December 31, 2022, and the related notes and the financial statement schedule listed in the Index at Item 15 (collectively referred to as the "financial statements"). In our opinion, the financial statements present fairly, in all material respects, the financial position of the Company as of December 31, 2022 and 2021, and the results of its operations and its cash flows for each of the three years in the period ended December 31, 2022, in conformity with accounting principles generally accepted in the United States of America.
We have also audited, in accordance with the standards of the Public Company Accounting Oversight Board (United States) (PCAOB), the Company's internal control over financial reporting as of December 31, 2022, based on criteria established in Internal Control — Integrated Framework (2013) issued by the Committee of Sponsoring Organizations of the Treadway Commission and our report dated March 16, 2023, expressed an unqualified opinion on the Company's internal control over financial reporting.
Basis for Opinion
These financial statements are the responsibility of the Company's management. Our responsibility is to express an opinion on the Company's financial statements based on our audits. We are a public accounting firm registered with the PCAOB and are required to be independent with respect to the Company in accordance with the U.S. federal securities laws and the applicable rules and regulations of the Securities and Exchange Commission and the PCAOB.
We conducted our audits in accordance with the standards of the PCAOB. Those standards require that we plan and perform the audit to obtain reasonable assurance about whether the financial statements are free of material misstatement, whether due to error or fraud. Our audits included performing procedures to assess the risks of material misstatement of the financial statements, whether due to error or fraud, and performing procedures that respond to those risks. Such procedures included examining, on a test basis, evidence regarding the amounts and disclosures in the financial statements. Our audits also included evaluating the accounting principles used and significant estimates made by management, as well as evaluating the overall presentation of the financial statements. We believe that our audits provide a reasonable basis for our opinion.
Critical Audit Matter
The critical audit matter communicated below is a matter arising from the current-period audit of the financial statements that was communicated or required to be communicated to the audit committee and that (1) relates to accounts or disclosures that are material to the financial statements and (2) involved our especially challenging, subjective, or complex judgments. The communication of critical audit matters does not alter in any way our opinion on the financial statements, taken as a whole, and we are not, by communicating the critical audit matter below, providing a separate opinion on the critical audit matter or on the accounts or disclosures to which it relates.
Leases - Refer to Notes 1 and 5 to the financial statements
Critical Audit Matter Description
At December 31, 2022, the Company’s operating lease right-of-use assets and operating lease liabilities were $117.8 million and $142.8 million, respectively. Lease liabilities are recorded at commencement for the net present value of future lease payments over the lease term. The discount rate used is generally the Company’s estimated incremental borrowing rate (“IBR”) unless the lessor’s implicit rate is readily determinable. Discount rates are calculated periodically to estimate the rate the Company would pay to borrow the funds necessary to obtain an asset of similar value, over a similar term, with a similar security. Since the rate implicit to most leases is not readily determinable, the Company estimated its IBR used to calculate its right-of-use assets and lease liabilities.
We identified the IBR used to calculate the Company’s right-of-use assets and lease liabilities as a critical audit matter because of the significant assumptions management makes to reflect the rate the Company would pay to borrow the funds to obtain an asset of similar value, over a similar term, with a similar security. Changes in these significant assumptions in the IBR determination can have a significant effect on the recorded right-of-use assets and related lease liabilities. This required a high degree of auditor judgment and an increased extent of effort when performing audit procedures to evaluate the reasonableness of management’s assumptions related to estimates of the rate the Company would pay to borrow the funds necessary to obtain an asset of similar value, over a similar term, with a similar security.
How the Critical Audit Matter Was Addressed in the Audit
Our audit procedures related to the IBRs used to calculate the Company’s right-of-use assets and lease liabilities included the following, among others:
–We tested the effectiveness of controls over right-of-use assets and lease liabilities, including management’s controls over the determination of the IBR.
–We evaluated the methods and assumptions used by management to estimate the IBRs based on the definition and guidance in Financial Accounting Standards Board (FASB) Accounting Standards Codification (ASC) 842, Leases, other reference materials, and generally accepted procedures.
–We tested the inputs used by management to develop the IBRs by independently assessing the reasonableness of the inputs using third party market data and underlying lease terms as follows:
–We evaluated the reasonableness of the credit rating ascribed to the Company.
–We evaluated the reasonableness of the base rate and spreads applied in determining the IBR.
–We evaluated the accuracy of the model(s) and mathematical calculations used to estimate the IBR.
/s/ Deloitte & Touche LLP
Miami, Florida
March 16, 2023
We have served as the Company’s auditor since 2020.
DOUGLAS ELLIMAN INC. AND SUBSIDIARIES
COMBINED CONSOLIDATED BALANCE SHEETS
| | | | | | | | | | | |
| December 31,
2022 | | December 31,
2021 |
| (Dollars in thousands, except per share amounts) |
| ASSETS: | | | |
| Current assets: | | | |
| Cash and cash equivalents | $ | 163,859 | | | $ | 211,623 | |
| Receivables | 22,162 | | | 32,488 | |
| Agent receivables, net | 12,826 | | | 9,192 | |
| Income taxes receivables, net | 7,547 | | | — | |
| Restricted cash and cash equivalents | 4,985 | | | 15,336 | |
| Other current assets | 13,680 | | | 12,166 | |
| Total current assets | 225,059 | | | 280,805 | |
| Property and equipment, net | 41,717 | | | 39,381 | |
| Operating lease right-of-use assets | 117,773 | | | 123,538 | |
Long-term investments (includes $6,219 and $3,756 at fair value) | 12,932 | | | 8,094 | |
| Contract assets, net | 38,913 | | | 28,996 | |
| Goodwill | 32,230 | | | 32,571 | |
| Other intangible assets, net | 73,666 | | | 74,421 | |
| Equity-method investments | 1,629 | | | 2,521 | |
| Other assets | 6,483 | | | 4,842 | |
| Total assets | $ | 550,402 | | | $ | 595,169 | |
| LIABILITIES AND STOCKHOLDERS' EQUITY: | | | |
| Current liabilities: | | | |
| Current portion of notes payable and other obligations | $ | — | | | $ | 12,527 | |
| Current operating lease liabilities | 22,328 | | | 22,666 | |
| Income taxes payable, net | — | | | 1,240 | |
| Accounts payable | 5,456 | | | 5,874 | |
| Commissions payable | 22,117 | | | 35,766 | |
| Accrued salaries and benefits | 18,228 | | | 25,446 | |
| Contract liabilities | 8,222 | | | 6,689 | |
| Other current liabilities | 13,607 | | | 22,259 | |
| Total current liabilities | 89,958 | | | 132,467 | |
| Notes payable and other obligations less current portion | — | | | 176 | |
| Deferred income taxes, net | 14,467 | | | 11,412 | |
| Non-current operating lease liabilities | 120,508 | | | 129,496 | |
| Contract liabilities | 54,706 | | | 39,557 | |
| Other liabilities | 306 | | | 188 | |
| Total liabilities | 279,945 | | | 313,296 | |
| Commitments and contingencies (Note 14) | | | |
| Stockholders' equity: | | | |
Preferred stock, par value $0.01 per share, 10,000,000 shares authorized | — | | | — | |
Common stock, par value $0.01 per share, 250,000,000 shares authorized, 80,881,022 and 81,210,626 shares issued and outstanding | 809 | | | 812 | |
| Additional paid-in capital | 273,111 | | | 278,500 | |
| (Accumulated deficit) retained earnings | (5,000) | | | 622 | |
| | | |
| Total Douglas Elliman Inc. stockholders' equity | 268,920 | | | 279,934 | |
| Non-controlling interest | 1,537 | | | 1,939 | |
| Total stockholders' equity | 270,457 | | | 281,873 | |
| Total liabilities and stockholders' equity | $ | 550,402 | | | $ | 595,169 | |
The accompanying notes are an integral part of the combined consolidated financial statements.
DOUGLAS ELLIMAN INC. AND SUBSIDIARIES
COMBINED CONSOLIDATED STATEMENTS OF OPERATIONS
| | | | | | | | | | | | | | | | | |
| | Year Ended December 31, |
| | 2022 | | 2021 | | 2020 |
| | (Dollars in thousands, except per share amounts) |
| Revenues: | | | | | |
| Commissions and other brokerage income | $ | 1,099,885 | | | $ | 1,292,416 | | | $ | 733,751 | |
| Property management | 36,022 | | | 37,345 | | | 35,115 | |
| Other ancillary services | 17,270 | | | 23,377 | | | 5,121 | |
| Total revenues | 1,153,177 | | | 1,353,138 | | | 773,987 | |
| | | | | |
| Expenses: | | | | | |
| Real estate agent commissions | 836,803 | | | 985,523 | | | 546,948 | |
| Sales and marketing | 85,763 | | | 77,174 | | | 64,097 | |
| Operations and support | 72,946 | | | 71,641 | | | 49,895 | |
| General and administrative | 131,421 | | | 92,798 | | | 76,134 | |
| Technology | 22,773 | | | 15,343 | | | 14,858 | |
| Depreciation and amortization | 8,012 | | | 8,561 | | | 8,537 | |
| Loss on disposal of assets | — | | | — | | | 1,169 | |
| Impairments of goodwill and other intangible assets | — | | | — | | | 58,252 | |
| Restructuring | — | | | — | | | 3,382 | |
| Operating (loss) income | (4,541) | | | 102,098 | | | (49,285) | |
| | | | | |
| Other income (expenses): | | | | | |
| Interest income | 1,779 | | | 83 | | | 190 | |
| Equity in losses from equity-method investments | (563) | | | (278) | | | (225) | |
| Change in fair value of contingent liability | — | | | (1,647) | | | 2,149 | |
| Investment and other income | 3,429 | | | 529 | | | 843 | |
| | | | | |
| Income (loss) before provision for income taxes | 104 | | | 100,785 | | | (46,328) | |
| Income tax expense | 6,503 | | | 2,133 | | | 44 | |
| | | | | |
| Net (loss) income | (6,399) | | | 98,652 | | | (46,372) | |
| | | | | |
| Net loss attributed to non-controlling interest | 777 | | | 186 | | | — | |
| | | | | |
| Net (loss) income attributed to Douglas Elliman Inc. | $ | (5,622) | | | $ | 98,838 | | | $ | (46,372) | |
| | | | | |
| Per basic common share: | | | | | |
| | | | | |
| Net (loss) income applicable to common shares attributed to Douglas Elliman Inc. | $ | (0.08) | | | $ | 1.27 | | | $ | (0.60) | |
| | | | | |
| Per diluted common share: | | | | | |
| | | | | |
| Net (loss) income applicable to common shares attributed to Douglas Elliman Inc. | $ | (0.08) | | | $ | 1.27 | | | $ | (0.60) | |
The accompanying notes are an integral part of the combined consolidated financial statements.
DOUGLAS ELLIMAN INC. AND SUBSIDIARIES
COMBINED CONSOLIDATED STATEMENT OF STOCKHOLDERS’ EQUITY
| | | | | | | | | | | | | | | | | | | | | | | | | | | | | | | | | | | | | | | | | | | |
| | Common Stock | | Additional
Paid-In
Capital | | Retained Earnings (Accumulated Deficit) | | | | Former Parent’s Net Investment | | Non-controlling Interest | | |
| | Shares | | Amount | | | | | | | Total |
| | (Dollars in thousands) |
| Balance, January 1, 2020 | — | | | $ | — | | | $ | — | | | $ | — | | | | | $ | 204,283 | | | $ | — | | | $ | 204,283 | |
| Net loss | — | | | — | | | — | | | — | | | | | (46,372) | | | — | | | (46,372) | |
| Net transfers from Former Parent | — | | | — | | | — | | | — | | | | | 5,679 | | | — | | | 5,679 | |
| Balance, December 31, 2020 | — | | | — | | | — | | | — | | | | | 163,590 | | | — | | | 163,590 | |
| Net income (loss) | — | | | — | | | — | | | 622 | | | | | 98,216 | | | (186) | | | 98,652 | |
| Net transfers from Former Parent | — | | | — | | | — | | | — | | | | | 17,506 | | | — | | | 17,506 | |
| Transfer of net investment to additional paid-in capital | — | | | — | | | 279,312 | | | — | | | | | (279,312) | | | — | | | — | |
| Issuance of common stock | 77,720,626 | | | 777 | | | (777) | | | — | | | | | — | | | — | | | — | |
| Restricted stock grants | 3,490,000 | | | 35 | | | (35) | | | — | | | | | — | | | — | | | — | |
| Acquisition of subsidiary | — | | | — | | | — | | | — | | | | | — | | | 500 | | | 500 | |
| Net transfers from non-controlling interest | — | | | — | | | — | | | — | | | | | — | | | 1,625 | | | 1,625 | |
| Balance, December 31, 2021 | 81,210,626 | | | 812 | | | 278,500 | | | 622 | | | | | — | | | 1,939 | | | 281,873 | |
| Net loss | — | | | — | | | — | | | (5,622) | | | | | — | | | (777) | | | (6,399) | |
Distributions and dividends on common stock ($0.20 per share) | — | | | — | | | (16,250) | | | — | | | | | — | | | — | | | (16,250) | |
| Restricted stock grants | 65,000 | | | 1 | | | (1) | | | — | | | | | — | | | — | | | — | |
| Withholding of shares as payment of tax liabilities in connection with restricted stock vesting | (394,604) | | | (4) | | | (1,622) | | | — | | | | | — | | | — | | | (1,626) | |
| Stock-based compensation | — | | | — | | | 11,138 | | | — | | | | | — | | | — | | | 11,138 | |
| Contributions from non-controlling interest | — | | | — | | | — | | | — | | | | | — | | | 375 | | | 375 | |
| Other | — | | | — | | | 1,346 | | | — | | | | | — | | | — | | | 1,346 | |
| Balance, December 31, 2022 | 80,881,022 | | | $ | 809 | | | $ | 273,111 | | | $ | (5,000) | | | | | $ | — | | | $ | 1,537 | | | $ | 270,457 | |
The accompanying notes are an integral part of the combined consolidated financial statements.
DOUGLAS ELLIMAN INC. AND SUBSIDIARIES
COMBINED CONSOLIDATED STATEMENTS OF CASH FLOWS
| | | | | | | | | | | | | | | | | |
| | Year Ended December 31, |
| | 2022 | | 2021 | | 2020 |
| | (Dollars in thousands) |
| Cash flows from operating activities: | | | | | |
| Net (loss) income | $ | (6,399) | | | $ | 98,652 | | | $ | (46,372) | |
| Adjustments to reconcile net (loss) income to net cash (used in) provided by operating activities: | | | | | |
| Depreciation and amortization | 8,012 | | | 8,561 | | | 8,537 | |
| Non-cash stock-based compensation expense | 11,138 | | | — | | | — | |
| Impairments of goodwill and other intangible assets | — | | | — | | | 58,252 | |
| Loss on sale of assets | 11 | | | 186 | | | 1,169 | |
| Deferred income taxes | 4,193 | | | (73) | | | 78 | |
| Net gains on investment securities | (2,839) | | | (265) | | | — | |
| Equity in losses from equity-method investments | 563 | | | 278 | | | 225 | |
| Distributions from equity-method investments | 654 | | | 75 | | | 30 | |
| Non-cash lease expense | 20,621 | | | 18,667 | | | 17,326 | |
| Non-cash portion of restructuring | — | | | — | | | 1,214 | |
| Change in fair value of contingent liability | — | | | 1,647 | | | (2,149) | |
| Provision for credit losses | 4,064 | | | 3,331 | | | 1,460 | |
| Other | — | | | — | | | (1,098) | |
| Changes in assets and liabilities: | | | | | |
| Receivables | 3,377 | | | (11,705) | | | (4,816) | |
| Accounts payable and accrued liabilities | (22,734) | | | (1,127) | | | 3,529 | |
| Operating right-of-use assets and operating lease liabilities, net | (24,183) | | | (23,989) | | | (7,493) | |
| Accrued salary and benefits | (7,218) | | | 13,408 | | | (1,287) | |
| Other | (4,004) | | | 20,180 | | | 3,260 | |
| Net cash (used in) provided by operating activities | (14,744) | | | 127,826 | | | 31,865 | |
| Cash flows from investing activities: | | | | | |
| Investments in equity-method investments | (400) | | | — | | | — | |
| Distributions from equity-method investments | 75 | | | 88 | | | — | |
| Purchase of debt securities | (701) | | | — | | | — | |
| Purchase of equity securities | (2,100) | | | (3,975) | | | — | |
| Purchase of long-term investments | (1,074) | | | (365) | | | — | |
| Purchase of subsidiaries | — | | | (500) | | | (722) | |
| Cash acquired in purchase of subsidiaries | — | | | — | | | 2,760 | |
| Capital expenditures | (8,537) | | | (4,106) | | | (6,126) | |
| Net cash used in investing activities | (12,737) | | | (8,858) | | | (4,088) | |
| Cash flows from financing activities: | | | | | |
| Repayment of debt | (12,528) | | | (361) | | | (63) | |
| Contributions from Former Parent | — | | | 33,532 | | | — | |
| Distributions to Former Parent | — | | | (31,470) | | | — | |
| Dividends on common stock | (16,250) | | | — | | | — | |
| Contributions from non-controlling interest | 375 | | | 1,625 | | | — | |
| Earn out payments | (1,600) | | | (130) | | | (80) | |
| Net cash (used in) provided by financing activities | (30,003) | | | 3,196 | | | (143) | |
| Net (decrease) increase in cash, cash equivalents and restricted cash | (57,484) | | | 122,164 | | | 27,634 | |
| Cash, cash equivalents and restricted cash, beginning of year | 228,866 | | | 106,702 | | | 79,068 | |
| Cash, cash equivalents and restricted cash, end of year | $ | 171,382 | | | $ | 228,866 | | | $ | 106,702 | |
The accompanying notes are an integral part of the combined consolidated financial statements.
DOUGLAS ELLIMAN INC.
NOTES TO COMBINED CONSOLIDATED FINANCIAL STATEMENTS
(Dollars in Thousands, Except Per Share Amounts)
1. SUMMARY OF SIGNIFICANT ACCOUNTING POLICIES
(a) Basis of Presentation:
Douglas Elliman Inc. (“Douglas Elliman” or the “Company”) is engaged in the real estate services and property technology investment business and is seeking to acquire or invest in additional real estate services and property technology, or PropTech, companies. Douglas Elliman owns Douglas Elliman Realty, LLC, one of the largest residential brokerage companies in the New York metropolitan area and the sixth largest in the U.S. Douglas Elliman has approximately 120 offices with approximately 6,900 real estate agents in the New York metropolitan area as well as in Florida, California, Connecticut, Massachusetts, Colorado, New Jersey, and Texas. In August 2021, Douglas Elliman increased its ownership in Douglas Elliman Texas from 1% to 50%. Prior to December 29, 2021, the Company was wholly owned by Vector Group Ltd. (“Vector Group” and collectively, with its consolidated subsidiaries, “Former Parent”).
In December 2021, the Vector Group board of directors approved the distribution of the operations of its real estate services and property technology business through a pro rata distribution of the Company’s stock to existing Vector Group stockholders. On December 29, 2021, Vector Group stockholders received one share of Douglas Elliman common stock for every two shares of Vector Group common stock held as of the close of business on December 20, 2021 (the “Distribution”).
The accompanying combined consolidated financial statements include the accounts and transactions of Douglas Elliman, as well as the entities in which Douglas Elliman directly or indirectly has a controlling financial interest. These entities include DER Holdings LLC and New Valley Ventures LLC (“New Valley Ventures”), directly and indirectly wholly-owned subsidiaries of Vector Group. DER Holdings LLC owns Douglas Elliman Realty, LLC and Douglas Elliman of California, Inc. New Valley Ventures consists of minority investments in innovative and cutting-edge Property Technology companies (“PropTech”). The accompanying combined consolidated financial statements have been prepared in accordance with accounting principles generally accepted in the United States of America.
Douglas Elliman’s combined consolidated financial statements include certain indirect general and administrative costs allocated to it by Former Parent for certain functions and services including, but not limited to, executive office, finance and other administrative support. These expenses have been allocated to Douglas Elliman on the basis of direct usage, when identifiable, or a quarterly management fee of $500, which was charged quarterly until March 31, 2020. The management fee was suspended in connection with the impact of the COVID-19 pandemic.
Douglas Elliman’s combined consolidated results of operations, financial position and cash flows may not be indicative of its future performance and do not necessarily reflect what its combined consolidated results of operations, financial position and cash flows would have been had Douglas Elliman operated as a separate, stand- alone entity during the periods presented, including changes in its operations and capitalization as a result of the separation and distribution from Vector Group.
In presenting the combined consolidated financial statements, management makes estimates and assumptions that affect the amounts reported and related disclosures. Estimates, by their nature, are based on judgment and available information. Accordingly, actual results could differ from those estimates.
(b) Principles of Consolidation:
The combined consolidated financial statements presented herein have been prepared on a standalone basis and, prior to December 29, 2021, are derived from the combined consolidated financial statements and accounting records of Vector Group. The combined consolidated financial statements include the assets, liabilities, revenues, expenses and cash flows of DER Holdings LLC and New Valley Ventures as well as all other entities in which Douglas Elliman has a controlling financial interest. All intercompany balances and transactions have been eliminated in the combined consolidated financial statements.
When evaluating an entity for consolidation, Douglas Elliman first determines whether an entity is within the scope of the guidance for consolidation of variable interest entities (“VIE”) and if it is deemed to be a VIE. If the entity is considered to be a VIE, Douglas Elliman determines whether it would be considered the entity’s primary beneficiary. Douglas Elliman consolidates those VIEs for which it has determined that it is the primary beneficiary. If Douglas Elliman determines it does not have a controlling financial interest in an entity that is a VIE, it does not consolidate the entity. For entities where Douglas Elliman does not have a controlling financial interest, the investments in such entities are classified as available-for-sale securities or accounted for using the equity or cost method, as appropriate.
DOUGLAS ELLIMAN INC.
NOTES TO COMBINED CONSOLIDATED FINANCIAL STATEMENTS — (Continued)
(c) Former Parent’s Net Investment:
The Former Parent’s net investment in the combined consolidated statement of stockholders’ equity represents Vector Group’s historical net investment in Douglas Elliman resulting from various transactions with and allocations from the Former Parent. Balances due to and due from the Former Parent and accumulated earnings attributable to Douglas Elliman operations have been presented as components of Former Parent’s net investment.
(d) Estimates and Assumptions:
The preparation of financial statements in conformity with accounting principles generally accepted in the United States of America requires management to make estimates and assumptions that affect the reported amounts of assets and liabilities, disclosure of contingent assets and liabilities and the reported amounts of revenues and expenses. Significant estimates subject to material changes in the near term include impairment charges and valuation of intangible assets. Actual results could differ from those estimates.
(e) Cash and Cash Equivalents:
Cash includes cash on hand, cash on deposit in banks, and money market accounts. Cash equivalents include short-term investments which have an original maturity of 90 days or less. Interest on short-term investments is recognized when earned. The Company places its cash and cash equivalents with large commercial banks. The Federal Deposit Insurance Corporation and Securities Investor Protection Corporation insure these balances, up to $250 and $500, respectively. Substantially all of the Company’s cash balances at December 31, 2022 are uninsured.
(f) Reconciliation of Cash, Cash Equivalents and Restricted Cash:
Restricted cash amounts included in current assets and other assets represent cash and cash equivalents required to be deposited into escrow for amounts required for letters of credit related to office leases, and certain deposit requirements for banking arrangements. The restrictions related to the letters of credit will remain in place for the duration of the respective lease. The restrictions related to the banking arrangements will remain in place for the duration of the arrangement.
The components of “Cash, cash equivalents and restricted cash” in the combined consolidated statements of cash flows were as follows:
| | | | | | | | | | | | | | | | | |
| December 31,
2022 | | December 31,
2021 | | December 31,
2020 |
| Cash and cash equivalents | $ | 163,859 | | | $ | 211,623 | | | $ | 94,421 | |
| Restricted cash and cash equivalents included in current assets | 4,985 | | | 15,336 | | | 10,374 | |
| Restricted cash and cash equivalents included in other assets | 2,538 | | | 1,907 | | | 1,907 | |
| Total cash, cash equivalents, and restricted cash shown in the combined consolidated statements of cash flows | $ | 171,382 | | | $ | 228,866 | | | $ | 106,702 | |
(g) Investment Securities:
The Company classifies investments in debt securities as trading. Investments classified as trading are recorded at fair value, with changes in fair value recognized in net income. Gains and losses are recognized when realized in the Company’s combined consolidated statements of operations. The cost of securities sold is determined based on average cost.
(h) Significant Concentrations of Credit Risk:
Financial instruments which potentially subject the Company to concentrations of credit risk consist principally of cash and cash equivalents and trade receivables. The Company places its temporary cash in money market securities (investment grade or better) with, what management believes are, high credit quality financial institutions.
(i) Receivables:
Receivables consist of commissions earned on sales transactions which closed prior to the Company’s year-end but for which the related commissions have not yet been received. The Company provides an allowance for potential losses on uncollectible receivables based principally on the specific identification method. There are no allowances for bad debt for commission receivables as of December 31, 2022 and December 31, 2021. Uncollectible accounts are written off when the likelihood of collection is remote and when collection efforts have been abandoned.
DOUGLAS ELLIMAN INC.
NOTES TO COMBINED CONSOLIDATED FINANCIAL STATEMENTS — (Continued)
(j) Property and equipment, net:
Property and equipment, net are stated at cost and are depreciated using the straight-line method over the estimated useful lives of the respective assets, which are 3 to 10 years for furniture and equipment.
The cost and related accumulated depreciation of property and equipment, net are removed from the accounts upon retirement or other disposition and any resulting gain or loss is reflected in operations.
The cost of leasehold improvements is amortized over the lesser of the related leases or the estimated useful lives of the improvements. Costs of major additions and betterments are capitalized, while expenditures for routine maintenance and repairs are charged to expense as incurred.
(k) Investments accounted for under the equity-method of accounting:
In accounting for its equity-method investments, the Company identified its participation in Variable Interest Entities (“VIE”), which are defined as (a) entities in which the equity investment at risk is not sufficient to finance its activities without additional subordinated financial support; (b) as a group, the equity investors at risk lack 1) the power to direct the activities of a legal entity that most significantly impact the entity’s economic performance, 2) the obligation to absorb the expected losses of the entity, or 3) the right to receive the expected residual returns of the entity; or (c) as a group, the equity investors have voting rights that are not proportionate to their economic interests and the entity’s activities involve or are conducted on behalf of an investor with a disproportionately small voting interest.
The Company’s interest in VIEs is primarily in the form of equity ownership. The Company examines specific criteria and uses judgment when determining if the Company is the primary beneficiary of a VIE. Factors considered include risk and reward sharing, experience and financial condition of other partner(s), voting rights, involvement in day-to-day capital and operating decisions, representation on a VIE’s executive committee, existence of unilateral kick-out rights exclusive of protective rights or voting rights and level of economic disproportionality between the Company and its other partner(s).
Accounting guidance requires the consolidation of VIEs in which the Company is the primary beneficiary. The guidance requires consolidation of VIEs that an enterprise has a controlling financial interest. A controlling financial interest will have both of the following characteristics: (a) the power to direct the activities of a VIE that most significantly impact the VIE’s economic performance and (b) the obligation to absorb losses of the VIE that could potentially be significant to the VIE or the right to receive benefits from the VIE that could potentially be significant to the VIE.
The Company’s maximum exposure to loss in its investments in unconsolidated VIEs is limited to its investment in the VIE, any unfunded capital commitments to the VIE, and, in some cases, guarantees in connection with debt on the specific project.
On a quarterly basis, the Company evaluates its equity-method investments to determine if there are indicators of impairment. If so, the Company further investigates to determine if an impairment has occurred and whether such impairment is considered temporary or other than temporary. The Company believes that the assessment of temporary or other-than-temporary impairment is facts-and-circumstances driven.
(l) Goodwill and Other Intangible Assets:
Goodwill and intangible assets with indefinite lives are not amortized, but instead are tested for impairment on an annual basis, as of October 1, or whenever events or changes in business circumstances indicate the carrying value of the assets may not be recoverable. The Company follows ASC 350, Intangibles – Goodwill and Other, and subsequent updates including ASU 2011-08, Testing Goodwill for Impairment and ASU 2017-14, Simplifying the Test for Goodwill Impairment. The amendments permit entities to first perform a qualitative assessment to determine whether it is more likely than not that the fair value of a reporting unit is less than its carrying amount. If the Company concludes that it is more likely than not that a reporting unit’s fair value is less than its carrying value or chooses to bypass the optional qualitative assessment, the Company then assesses recoverability by comparing the fair value of the reporting unit to its carrying amount; otherwise, no further impairment test would be required. The fair value of the intangible asset associated with the Douglas Elliman trademark is determined using a “relief from royalty payments” method. This approach involves two steps: (i) estimating reasonable royalty rates for its trademark associated with the Douglas Elliman trademark and (ii) applying these royalty rates to a net sales stream and discounting the resulting cash flows to determine fair value. This fair value is then compared with the carrying value of the trademark. As discussed in Note 9 to the Company’s combined consolidated financial statements, during the first quarter of 2020, the Company performed quantitative assessments of its goodwill and its trademark intangible asset in conjunction with its quarterly review for indicators of impairment. The quantitative assessments resulted in impairment charges to goodwill of
DOUGLAS ELLIMAN INC.
NOTES TO COMBINED CONSOLIDATED FINANCIAL STATEMENTS — (Continued)
$46,252 and to the trademark intangible asset of $12,000. The Company performed a qualitative assessment for the year ended December 31, 2022, which did not result in additional impairment charges related to its goodwill or trademark.
Goodwill from acquisitions represents the excess of the purchase price over the fair value of the underlying acquired net tangible and intangible assets. Factors that contribute to the recognition of goodwill in the Company’s acquisitions include (i) expected growth rates and profitability of the acquired companies, (ii) securing buyer-specific synergies that increase revenue and profits and are not otherwise available to market participants, (iii) significant cost savings opportunities, (iv) experienced workforce and (v) the Company’s strategies for growth in sales, income and cash flows.
Intangible assets with finite lives are amortized over their respective estimated useful lives. Identifiable intangible assets that are subject to amortization are evaluated for impairment using a process similar to that used to evaluate long-lived assets described below.
(m) Impairment of Long-Lived Assets:
The Company reviews long-lived assets for impairment whenever events or changes in business circumstances indicate that the carrying amount of the assets may not be fully recoverable. The Company performs a test for recoverability, comparing projected undiscounted cash flows to the carrying value of the asset group to determine if impairment exists. If impairment is determined to exist, any related impairment loss is calculated based on fair value of the asset on the basis of discounted cash flow. Impairment losses on assets to be disposed of, if any, are based on the estimated proceeds to be received, less costs of disposal.
Additionally, the Company performs impairment reviews on its long-term investments that are classified as equity securities without readily determinable fair values that do not qualify for the net asset value (“NAV”) practical expedient. On a quarterly basis, the Company evaluates the investments to determine if there are indicators of impairment. If so, a determination is made of whether there is an impairment and if it is considered temporary or other than temporary. The assessment of temporary or other-than-temporary impairment is facts-and-circumstances driven. The impairment indicators that are taken into consideration as part of the analysis include (a) a significant deterioration in the earnings performance, credit rating, asset quality, or business prospects of the investee, (b) a significant adverse change in the regulatory, economic, or technological environment of the investee, (c) a significant adverse change in the general market condition of either the geographical area or the industry in which the investee operates, and (d) factors that raise significant concerns about the investee’s ability to continue as a going concern, such as negative cash flows from operations, working capital deficiencies, or noncompliance with statutory capital requirements or debt covenants.
(n) Leases:
The Company determines if an arrangement is a lease at inception. Operating leases are included in operating lease right-of-use (“ROU”) assets and lease liabilities on the Company’s combined consolidated balance sheets.
ROU assets represent the Company’s right to use an underlying asset for the duration of the lease term. Lease liabilities represent the Company’s obligation to make lease payments as determined by the lease agreement. Lease liabilities are recorded at commencement for the net present value of future lease payments over the lease term. The discount rate used is generally the Company’s estimated incremental borrowing rate unless the lessor’s implicit rate is readily determinable. Discount rates are calculated periodically to estimate the rate the Company would pay to borrow the funds necessary to obtain an asset of similar value, over a similar term, with a similar security. ROU assets are recorded and recognized at commencement for the lease liability amount, initial direct costs incurred and are reduced for lease incentives received. The Company’s lease terms may include options to extend or terminate the lease when it is reasonably certain that the Company will exercise that option. Operating lease expense is recognized on a straight-line basis over the lease term.
The Company has lease agreements with lease and non-lease components; the Company has elected the accounting policy to combine lease and non-lease components for all underlying asset classes.
(o) Stock Awards:
The Company accounts for employee stock compensation plans by measuring compensation cost for share-based payments at fair value at grant date. The fair value is recognized as compensation expense over the vesting period on a straight-line basis. The terms of restricted stock awarded under the 2021 Management Incentive Plan (the “2021 Plan”) provide for common stock dividend equivalents (paid in cash at the same rate as paid on the common stock) with respect to the shares underlying the unvested portion of the restricted stock award. The Company recognizes payments of the dividend equivalent rights on these restricted stock awards on the Company’s combined consolidated balance sheets as reductions in additional
DOUGLAS ELLIMAN INC.
NOTES TO COMBINED CONSOLIDATED FINANCIAL STATEMENTS — (Continued)
paid-in capital ($704 for the year ended December 31, 2022), which are included as “Distributions and dividends on common stock” in the Company’s combined consolidated statement of stockholders’ equity.
(p) Income Taxes:
The Company accounts for income taxes under the liability method and records deferred taxes for the impact of temporary differences between the amounts of assets and liabilities recognized for financial reporting purposes and the amounts recognized for tax purposes as well as tax credit carryforwards and loss carryforwards. These deferred taxes are measured by applying the enacted tax rates relative to when the deferred item is expected to reverse. A valuation allowance reduces deferred tax assets when it is deemed more likely than not that some portion or all deferred tax assets will not be realized. A current tax provision is recorded for income taxes currently payable.
In 2021, the Company calculated its provision for income taxes for the two days subsequent to the Distribution based upon the taxable income attributable to its activity and the activity of its subsidiaries during this period. The Company’s principal subsidiaries, Douglas Elliman Realty, LLC and New Valley Ventures LLC, are limited liability companies. The members of a limited liability company are taxed on their proportionate share of the Company’s taxable income. Accordingly, prior to the Distribution, no provision or liability for Federal income taxes was included in the financial statements, except for Douglas Elliman of California, Inc. which is taxed as a corporation and has net operating loss carryforwards, which have been fully reserved for with a valuation allowance. The Company is, however, subject to New York City Unincorporated Business Tax (“UBT”) and accordingly has recorded a provision for UBT in its combined consolidated financial statements.
The Company accounts for uncertainty in income taxes by recognizing tax liabilities when, despite the Company’s belief that its tax return positions are supportable, the Company believes that certain positions may not be fully sustained upon review by tax authorities. Benefits from tax positions are measured at the largest amount of benefit that is greater than 50 percent likely of being realized upon settlement. To the extent that the final tax outcome of these matters is different than the amounts recorded, such differences impact income tax expense in the period in which such determination is made. Interest and penalties, if any, related to accrued liabilities for potential tax assessments are included in income tax expense.
(q) Contingencies:
The Company and its subsidiaries record provisions in its combined consolidated financial statements for pending litigation when they determine that an unfavorable outcome is probable and the amount of loss can be reasonably estimated.
(r) Distributions and Dividends on Common Stock:
The Company records distributions on its common stock as dividends in its combined consolidated statement of stockholders’ equity to the extent of retained earnings. Any amounts exceeding retained earnings are recorded as a reduction to additional paid-in-capital to the extent paid-in-capital is available and then to retained earnings (accumulated deficit). The Company’s stock dividends are recorded as stock splits and given retroactive effect to earnings per share for all years presented.
(s) Revenue Recognition:
Commissions and other brokerage income: Real estate commissions earned by the Company’s real estate brokerage businesses are recognized as revenue when the real estate sale is completed or lease agreement is executed, which is the point in time that the performance obligation is satisfied. Any commission and other payments received in advance are deferred until the satisfaction of the performance obligation. Corresponding agent commission expenses, including any advance commission or other direct expense payments, are deferred and recognized as agent commission expenses concurrently with related revenues. The accounting for these commissions and other brokerage income under Topic 606 are largely consistent with the previous accounting for these transactions under Topic 605, except for customer arrangements in the development marketing business and extended payments terms that exist in some commercial leasing contracts.
Property management: Property management revenue arrangements consist of providing operational and administrative services to manage a subject property. Fees for these services are typically billed and collected monthly. Property management service fees are recognized as revenue over time using the output method as the performance obligations under the customer arrangement are satisfied each month.
Ancillary services: Ancillary services revenue earned by the Company related primarily to title and escrow services. These services are recognized as revenue when the real estate sale is completed, which is the point in time that the performance obligation is satisfied.
See Note 2 — Revenue Recognition for additional information.
DOUGLAS ELLIMAN INC.
NOTES TO COMBINED CONSOLIDATED FINANCIAL STATEMENTS — (Continued)
(t) Real estate agent commissions:
Real estate agent commissions consists of commissions paid to the Company’s agents, who are independent contractors, upon the closing of a real estate transaction and fees paid to external brokerages for client referrals, which are recognized and paid upon the closing of a real estate transaction.
(u) Sales and marketing expenses:
Sales and marketing expenses consists primarily of marketing and advertising expenses, compensation and other personnel-related costs for employees supporting sales, marketing, expansion and related functions, occupancy-related costs and agent acquisition incentives. Advertising expense primarily includes the cost of marketing activities such as print advertising, online advertising and promotional items, which are expensed as incurred. Compensation and other personnel-related costs include salaries, benefits, bonuses and other compensation expense.
Real estate advertising costs, which are expensed as incurred and included within sales and marketing expenses, were $29,937, $26,091 and $18,875 for the years ended December 31, 2022 and 2021 and 2020, respectively.
(v) Operations and support expenses:
Operations and support expenses consists primarily of compensation and other personnel-related costs for employees supporting agents, third-party consulting and professional services costs (not included in general and administrative or technology), fair value adjustments to contingent consideration for the Company’s acquisitions and other related expenses.
(w) General and administrative expenses:
General and administrative expenses consists primarily of compensation, stock-based compensation expense and other personnel-related costs for executive management and administrative employees, including finance and accounting, legal, human resources and communications, the occupancy costs for its headquarters and other offices supporting its administrative functions, and transition services paid to its Former Parent for the use of office space and employees, professional services fees for legal and finance, insurance expenses and talent acquisition expenses.
(x) Technology expenses:
Technology expenses consist primarily of compensation and other personnel-related costs for employees in the product, engineering and technology functions, website hosting expenses, software licenses and equipment, third-party consulting costs, data licenses of PropTech and other related expenses associated with the implementation of our technology initiatives.
(y) Restructuring:
In response to COVID-19, the Company commenced a restructuring by realigning its administrative support function and office locations as well as adjusting its business model to serve its client more efficiently. This included a reduction of staff by approximately 25% at Douglas Elliman. For the years ended December 31, 2022 and 2021, there were no restructuring charges. As of December 31, 2020, there was no accrual for restructuring charges.
The following table summarizes amounts expensed for the year ended December 31, 2020:
| | | | | | | |
| | | Year Ended December 31, 2020 |
| Cash Charges: | | | |
| Employee severance and benefits | | | $ | 1,875 | |
| | | |
| Other restructuring expenses | | | 293 | |
| | | 2,168 | |
| Non-Cash: | | | |
| Loss on fixed assets associated with consolidation of sales offices | | | 1,214 | |
| | | |
| | | |
| Total restructuring charges | | | $ | 3,382 | |
| | | |
All amounts expensed for the year ended December 31, 2020 are included as restructuring charges in the Company’s combined consolidated statements of operations.
DOUGLAS ELLIMAN INC.
NOTES TO COMBINED CONSOLIDATED FINANCIAL STATEMENTS — (Continued)
Employee severance and benefits expensed for the year ended December 31, 2020 relate entirely to the reduction in staff.
The following table presents the activity under the restructuring plan for the year ended December 31, 2020:
| | | | | | | | | | | | | | | | | | | | | | | | | | |
| | Employee Severance and Benefits | | Other | | Non-Cash Loss on Fixed Assets | | Total |
| Accrual balance as of January 1, 2020 | | $ | — | | | $ | — | | | $ | — | | | $ | — | |
| Restructuring charges | | 1,875 | | | 293 | | | 1,214 | | | 3,382 | |
| Utilized | | (1,875) | | | (293) | | | (1,214) | | | (3,382) | |
| | | | | | | | |
| Accrual balance as of December 31, 2020 | | $ | — | | | $ | — | | | $ | — | | | $ | — | |
(z) Investments and Other Income:
Investment and other income consists of the following:
| | | | | | | | | | | | | | | | | |
| Year Ended December 31, |
| 2022 | | 2021 | | 2020 |
| Net gains recognized on PropTech convertible trading debt securities. | $ | 2,184 | | | $ | 60 | | | $ | — | |
| Net gains recognized on long-term investments at fair value | 655 | | | 205 | | | — | |
| Other income | 1 | | | 264 | | | 843 | |
| Income related to Tax Disaffiliation indemnification | 589 | | | — | | | — | |
| Investment and other income | $ | 3,429 | | | $ | 529 | | | $ | 843 | |
(aa) Other Comprehensive Income:
The Company does not have any activity that results in Other Comprehensive Income.
(ab) Acquisitions:
On August 6, 2021, the Company acquired an additional 49% ownership in Douglas Elliman Texas, a licensed real estate service provider in Houston, Texas, for a purchase price of $500. The purchase price allocation for this acquisition resulted in the recognition of $6,527 of intangible assets related to a non-compete agreement, $5,047 of assets, $11,389 of liabilities and $815 of goodwill. The goodwill is not expected to be deductible for income tax purposes. The non-compete agreement is expected to be amortized over ten years. The Company controls the board of Douglas Elliman Texas and consolidates its ownership interest under the voting interest model in accordance with ASC 810, resulting in a non-controlling interest for the remaining 50% of Douglas Elliman Texas not owned by the Company on its combined consolidated financial statements.
The assets, liabilities and results of operations of Douglas Elliman Texas were not material to the Company’s combined consolidated financial position, results of operations, or cash flows and therefore pro forma financial information for the acquisition was not presented.
(ab) Subsequent Events:
The Company has evaluated subsequent events through March 16, 2023, the date the financial statements were issued.
(ac) New Accounting Pronouncements:
Accounting Standards Updates (“ASUs”) to be adopted in future periods:
In October 2021, the FASB issued ASU 2021-08, Business Combinations (Topic 805), Accounting for Contract Assets and Contract Liabilities from Contracts with Customers. The ASU requires that an acquirer recognize and measure contract assets and contract liabilities in a business combination in accordance with Topic 606. The ASU is effective for fiscal years beginning after December 15, 2022, including interim periods within those fiscal years. The Company is currently evaluating the impact of the new guidance on its consolidated financial statements.
In June 2022, the FASB issued ASU 2022-03, Fair Value Measurement (Topic 820), Fair Value Measurement of Equity Securities Subject to Contractual Sale Restrictions. The ASU clarifies the guidance in Topic 820, Fair Value Measurement,
DOUGLAS ELLIMAN INC.
NOTES TO COMBINED CONSOLIDATED FINANCIAL STATEMENTS — (Continued)
when measuring the fair value of an equity security subject to contractual restrictions that prohibit the sale of an equity security. The standard also requires certain disclosures for equity securities that are subject to contractual restrictions. The ASU is effective for fiscal years beginning after December 15, 2023, including interim periods within those fiscal years. The Company is currently evaluating the impact of the new guidance on its consolidated financial statements.
SEC Proposed Rule Changes
On March 21, 2022, the SEC proposed rule changes that would require registrants to provide certain climate-related information in their registration statements and annual reports. The proposed rules would require information about a registrant's climate-related risks that are reasonably likely to have a material impact on its business, results of operations, or financial condition. The required information about climate-related risks would also include disclosure of a registrant's greenhouse gas emissions, which have become a commonly used metric to assess a registrant's exposure to such risks. In addition, under the proposed rules, certain climate-related financial metrics would be required in a registrant's audited financial statements. The Company is currently evaluating the impact of the proposed rule changes.
2. REVENUE RECOGNITION
Revenue Recognition Policies
Revenue is measured based on a consideration specified in a contract with a customer less any sales incentives. Revenue is recognized when (a) an enforceable contract with a customer exists, that has commercial substance, and collection of substantially all consideration for services is probable; and (b) the performance obligations to the customer are satisfied either over time or at a point in time.
Real estate sales: Real estate commissions earned by the Company’s real estate brokerage businesses are recognized as revenue when the real estate sale is completed or lease agreement is executed, which is the point in time that the performance obligation is satisfied. Any commission and other payments received in advance are deferred until the satisfaction of the performance obligation. Corresponding agent commission expenses, including any advance commission or other direct expense payments, are deferred and recognized as cost of sales concurrently with related revenues.
The Company’s revenue contracts with customers do not have multiple material performance obligations to customers under Topic 606, except for contracts in the Company’s development marketing business. Contracts in the development marketing business provide the Company with the exclusive right to sell units in a subject property for a commission fee per unit sold calculated as a percentage of the sales price of each unit. Accordingly, a performance obligation exists for each unit in the development marketing property under contract, and a portion of the total contract transaction price is allocated to and recognized at the time each unit is sold. The Company applies the optional exemption in paragraph 606-10-50-14A of Topic 606 and does not disclose the amount of the transaction price allocated to the remaining performance obligations for the Real Estate development marketing business because the transaction prices in these contracts are comprised entirely of variable consideration based on the ultimate selling price of each unit in the subject property. The total contract transaction price is allocated to each unit in the subject property and recognized when the performance obligation, i.e., the sale of each unit, is satisfied. Accordingly, the transaction price allocated to the remaining performance obligations for the development marketing business represents variable consideration allocated entirely to wholly unsatisfied performance obligations.
Under development marketing service arrangements, dedicated staff are required for a subject property and these costs are typically reimbursed from the customer through advance payments that are recoupable from future commission earnings. Advance payments received and associated direct costs paid are deferred, allocated to each unit in the subject property, and recognized at the time of the completed sale of each unit.
Development marketing service arrangements also include direct fulfillment costs incurred in advance of the satisfaction of the performance obligation. The Company capitalizes costs incurred in fulfilling a contract with a customer if the fulfillment costs 1) relate directly to an existing contract or anticipated contract, 2) generate or enhance resources that will be used to satisfy performance obligations in the future, and 3) are expected to be recovered. These costs are amortized over the estimated customer relationship period which is the contract term. The Company uses an amortization method that is consistent with the pattern of transfer of goods or services to its customers by allocating these costs to each unit in the subject property and expensing these costs as each unit sold is closed over the contract.
Commission revenue is recognized at the time the performance obligation is met for commercial leasing contracts, which is when the lease agreement is executed, as there are no further performance obligations, including any amounts of future payments under extended payment terms.
DOUGLAS ELLIMAN INC.
NOTES TO COMBINED CONSOLIDATED FINANCIAL STATEMENTS — (Continued)
Property management revenue arrangements consist of providing operational and administrative services to manage a subject property. Fees for these services are typically billed and collected monthly. Property management service fees are recognized as revenue over time using the output method as the performance obligations under the customer arrangement are satisfied each month. The Company applies the optional exemption in paragraph 606-10-50-14 of Topic 606 and does not disclose the amount of the transaction price allocated to the remaining performance obligations for the Real Estate property management business because the contracts to provide property management services are typically annual contracts and provide cancellation rights to customers.
Title insurance commission fee revenue is earned when the sale of the title insurance policy is completed, which corresponds to the point in time when the underlying real estate sale is completed, which is when the performance obligation is satisfied. Escrow commission fee revenue is recorded at a point in time which occurs at the time a home sale transaction or refinancing closes.
Disaggregation of Revenue
In the following table, revenue is disaggregated by major services line and primary geographical market:
| | | | | | | | | | | | | | | | | | | | | | | | | | | | | | | |
| Year Ended December 31, 2022 |
| Total | | New York City | | Northeast | | Southeast | | West | | |
Revenues: | | | | | | | | | | | |
| Commission and other brokerage income - existing home sales | $ | 1,028,480 | | | $ | 359,417 | | | $ | 207,932 | | | $ | 263,468 | | | $ | 197,663 | | | |
| Commission and other brokerage income - development marketing | 71,405 | | | 53,773 | | | 654 | | | 13,867 | | | 3,111 | | | |
| Property management revenue | 36,022 | | | 35,421 | | | 601 | | | — | | | — | | | |
| Escrow and title fees | 17,270 | | | 3,186 | | | 1,235 | | | — | | | 12,849 | | | |
| Total revenue | $ | 1,153,177 | | | $ | 451,797 | | | $ | 210,422 | | | $ | 277,335 | | | $ | 213,623 | | | |
| | | | | | | | | | | | | | | | | | | | | | | | | | | | | | | |
| Year Ended December 31, 2021 |
| Total | | New York City | | Northeast | | Southeast | | West | | |
Revenues: | | | | | | | | | | | |
| Commission and other brokerage income - existing home sales | $ | 1,210,469 | | | $ | 392,011 | | | $ | 249,195 | | | $ | 355,206 | | | $ | 214,057 | | | |
| Commission and other brokerage income - development marketing | 81,947 | | | 48,167 | | | — | | | 32,292 | | | 1,488 | | | |
| Property management revenue | 37,345 | | | 36,756 | | | 589 | | | — | | | — | | | |
| Escrow and title fees | 23,377 | | | 5,200 | | | 1,755 | | | — | | | 16,422 | | | |
| Total revenue | $ | 1,353,138 | | | $ | 482,134 | | | $ | 251,539 | | | $ | 387,498 | | | $ | 231,967 | | | |
| | | | | | | | | | | | | | | | | | | | | | | | | | | | | | | |
| Year Ended December 31, 2020 |
| Total | | New York City | | Northeast | | Southeast | | West | | |
Revenues: | | | | | | | | | | | |
| Commission and other brokerage income - existing home sales | $ | 686,389 | | | $ | 186,229 | | | $ | 204,814 | | | $ | 160,404 | | | $ | 134,942 | | | |
| Commission and other brokerage income - development marketing | 47,362 | | | 24,590 | | | — | | | 22,081 | | | 691 | | | |
| Property management revenue | 35,115 | | | 34,209 | | | 906 | | | — | | | — | | | |
| Escrow and title fees | 5,121 | | | 2,047 | | | 1,717 | | | — | | | 1,357 | | | |
| Total revenue | $ | 773,987 | | | $ | 247,075 | | | $ | 207,437 | | | $ | 182,485 | | | $ | 136,990 | | | |
DOUGLAS ELLIMAN INC.
NOTES TO COMBINED CONSOLIDATED FINANCIAL STATEMENTS — (Continued)
Contract Balances
The following table provides information about contract assets and contract liabilities from development marketing and commercial leasing contracts with customers:
| | | | | | | | | | | |
| | | |
| December 31, 2022 | | December 31, 2021 |
| | | |
| Receivables, which are included in receivable | $ | 3,063 | | | $ | 2,749 | |
| Contract assets, net, which are included in other current assets | 4,453 | | | 2,187 | |
| Contract assets, net, which are in other assets | 38,913 | | | 28,996 | |
| Payables, which are included in other current liabilities | 2,291 | | | 2,070 | |
| Contract liabilities, which are in current liabilities | 8,222 | | | 6,689 | |
| Contract liabilities, which are in other liabilities | 54,706 | | | 39,557 | |
| | | |
Receivables and payables relate to commission receivables and commissions payable from the Real Estate commercial leasing contracts for which the performance obligation has been satisfied, have extended payment terms and are expected to be received and paid in the next twelve months. Receivables increased $314 for the year ended December 31, 2022 primarily due to revenue accrued as performance obligations are satisfied of $3,985 offset by cash collections. Correspondingly, payables increased by $221 primarily due to additional expense accruals as performance obligations are satisfied of $3,007 offset by cash payments.
Contract assets increased by $12,183 during the year ended December 31, 2022 due to $26,884 of payments made for direct fulfillment costs incurred in advance of the satisfaction of the performance obligations for Real Estate development marketing contracts, offset by costs recognized for units closed during the quarter.
Contract liabilities relate to payments received in advance of the performance obligations being satisfied under the Real Estate development marketing contracts and are recognized as revenue at the points in time when the Company performs under the contracts. Performance obligations related to the Real Estate development marketing contracts are considered satisfied when each unit is closed. Development marketing projects tend to span four to six years from the time the Company enters into the contract with the developer to the time that all of the sales of the units in a subject property are closed. The timing for sales closings is dependent upon several external factors outside the Company’s control, including, but not limited to, economic factors, seller and buyer actions, construction timing and other real estate market factors. Accordingly, all contract liabilities and contract costs associated with development marketing are considered long-term until closing dates for unit sales are scheduled. As of December 31, 2022, the Company estimates approximately $8,222 of contract liabilities will be recognized as revenue within the next twelve months.
Contract liabilities increased by $16,682 during the year ended December 31, 2022 due to $38,461 of advance payments received from customers prior to the satisfaction of performance obligations for Real Estate development marketing contracts, offset by revenue recognized for units sold during the year. The Company recognized revenue of $6,776 for the year ended December 31, 2022 that were included in the contract liabilities balances at December 31, 2021. The Company recognized revenue of $9,988 for the year ended December 31, 2021 that were included in the contract balances at December 31, 2020. The Company recognized revenue of $8,846 for the year ended December 31, 2020 that were included in the contract balances at January 1, 2020.
Topic 606 requires an entity to disclose the revenue recognized in the reporting period from performance obligations satisfied (or partially satisfied) in previous periods (for example, due to changes in transaction price). There were no revenues recognized relating to performance obligations satisfied or partially satisfied in prior periods for the years ended December 31, 2022, 2021 and 2020, respectively.
DOUGLAS ELLIMAN INC.
NOTES TO COMBINED CONSOLIDATED FINANCIAL STATEMENTS — (Continued)
3. CURRENT EXPECTED CREDIT LOSSES
Real estate broker agent receivables: Douglas Elliman Realty is exposed to credit losses for various amounts due from real estate agents, which are included in Other current assets on the combined consolidated balance sheets, net of an allowance for credit losses. The Company estimates its allowance for credit losses on receivables from agents based on an evaluation of aging, agent sales in pipeline, any security, specific exposures, historical experience of collections from the individual agents, and current and expected future market trends. The Company estimated that the credit losses for these receivables were $10,916 and $8,607 at December 31, 2022 and December 31, 2021, respectively.
The following table summarizes changes in the allowance for credit losses for the year ended December 31, 2022:
| | | | | | | | | | | | | | | | | | | | | | | | | | | | | |
| January 1,
2022 | | Current Period Provision | | Write-offs | | Recoveries | | December 31,
2022 |
| Allowance for credit losses: | | | | | | | | | |
| Real estate broker agent receivables | $ | 8,607 | | | $ | 4,064 | | (1) | $ | 1,755 | | | $ | — | | | 10,916 | |
_____________________________
(1)The current period provision for the real estate broker agent receivables is included in “General and administrative expenses” in the Company’s combined consolidated statements of operations.
The following table summarizes changes in the allowance for credit losses for the year ended December 31, 2021:
| | | | | | | | | | | | | | | | | | | | | | | | | | | | | |
| January 1,
2021 | | Current Period Provision | | Write-offs | | Recoveries | | December 31,
2021 |
| Allowance for credit losses: | | | | | | | | | |
| Real estate broker agent receivables | $ | 7,038 | | | $ | 3,331 | | (1) | $ | 1,762 | | | $ | — | | | 8,607 | |
_____________________________
(1)The current period provision for the real estate broker agent receivables is included in “General and administrative expenses” in the Company’s combined consolidated statements of operations.
4. EARNINGS (LOSS) PER SHARE
On December 29, 2021, the date of the Distribution, 77,720,626 shares of the Common Stock, par value $0.01 per share, were distributed to Vector Group stockholders of record as of December 20, 2021. This share amount is being utilized for the calculation of basic and diluted earnings per share for all periods presented prior to the Distribution as all shares were owned by Vector Group prior to the Distribution. For the 2020 calculation, these shares are treated as issued and outstanding at January 1, 2020 for purposes of calculating historical basic and diluted earnings per share.
The Company has restricted stock awards which will provide cash dividends at the same rate as paid on the common stock with respect to the shares underlying the restricted stock awards. These outstanding restricted stock awards would represent participating securities under authoritative guidance. The Company would recognize payments of the cash dividends on these awards as reductions in additional paid-in-capital on the Company’s combined consolidated balance sheets. The Company did not pay any dividends for the years ended December 31, 2021 and 2020, respectively.
As a result, in its calculation of basic and dilutive EPS for the years ended December 31, 2022, 2021 and 2020, respectively, the Company did not adjust its net (loss) income for the effect of these participating securities because the adjustment was negligible.
| | | | | | | | | | | | | | | | | |
| For the year ended December 31, |
| 2022 | | 2021 | | 2020 |
| Net (loss) income attributed to Douglas Elliman Inc. | $ | (5,622) | | | $ | 98,838 | | | $ | (46,372) | |
| Income attributable to participating securities | (704) | | | (12) | | | — | |
| Net (loss) income available to common stockholders attributed to Douglas Elliman Inc. | $ | (6,326) | | | $ | 98,826 | | | $ | (46,372) | |
Basic EPS is computed by dividing net (loss) income available to common stockholders attributed to Douglas Elliman Inc. by the weighted-average number of shares outstanding, which will include vested restricted stock.
DOUGLAS ELLIMAN INC.
NOTES TO COMBINED CONSOLIDATED FINANCIAL STATEMENTS — (Continued)
Basic and diluted EPS were calculated using the following common shares for the years ended December 31, 2022, 2021 and 2020:
| | | | | | | | | | | | | | | | | |
| For the year ended December 31, |
| 2022 | | 2021 | | 2020 |
| | | | | |
| | | | | |
| | | | | |
| Weighted-average shares for basic and diluted EPS | 77,728,081 | | | 77,720,626 | | | 77,720,626 | |
There were 26,984 non-vested restricted shares that were outstanding during the year ended December 31, 2022, but were not included in the computation of diluted EPS because the impact of the shares was anti-dilutive to EPS.
5. LEASES
The Company has operating leases for corporate and sales offices and equipment. The leases have remaining lease terms of less than one year to eleven years, some of which include options to extend for up to five years, and some of which include options to terminate the leases within one year. However, the Company in general is not reasonably certain to exercise options to renew or terminate, and therefore renewal and termination options are not considered in the lease term or the ROU asset and lease liability balances. The Company’s lease population includes purchase options on equipment leases that are included in the lease payments when reasonably certain to be exercised. The Company’s lease population does not include any residual value guarantees. The Company’s lease population does not contain any material restrictive covenants.
The Company has leases with variable payments, most commonly in the form of Common Area Maintenance (“CAM”) and tax charges which are based on actual costs incurred. These variable payments were excluded from the ROU asset and lease liability balances since they are not fixed or in-substance fixed payments. Variable payments are expensed as incurred.
The components of lease expense were as follows:
| | | | | | | | | | | | | | | | | | | | | |
| | | Year Ended December 31, |
| | | 2022 | | 2021 | | 2020 |
| Operating lease cost | | | $ | 33,248 | | | $ | 32,694 | | | $ | 32,926 | |
| Short-term lease cost | | | 1,064 | | | 794 | | | 912 | |
| Variable lease cost | | | 4,144 | | | 3,623 | | | 3,552 | |
| Less: Sublease income | | | (579) | | | (458) | | | (325) | |
| Total lease cost | | | $ | 37,877 | | | $ | 36,653 | | | $ | 37,065 | |
| | | | | | | |
Supplemental cash flow information related to leases was as follows:
| | | | | | | | | | | | | | | | | |
| Year Ended December 31, |
| 2022 | | 2021 | | 2020 |
| Cash paid for amounts included in measurement of lease liabilities: | | | | | |
| Operating cash flows from operating leases | $ | 36,956 | | | $ | 38,416 | | | $ | 22,201 | |
| | | | | |
| ROU assets obtained in exchange for lease obligations: | | | | | |
| Operating leases | 14,856 | | | 9,102 | | | 12,977 | |
| | | | | |
| | | | | |
Supplemental balance sheet information related to leases was as follows:
| | | | | | | | | | | | | | |
| | | | |
| | December 31, | | December 31, |
| | 2022 | | 2021 |
| | | | |
| Weighted average remaining lease term in years: | | | | |
| Operating leases | | 7.03 | | 7.65 |
| | | | |
| Weighted average discount rate: | | | | |
| Operating leases | | 8.73 | % | | 9.12 | % |
| | | | |
| | | | |
DOUGLAS ELLIMAN INC.
NOTES TO COMBINED CONSOLIDATED FINANCIAL STATEMENTS — (Continued)
As of December 31, 2022, maturities of lease liabilities were as follows:
| | | | | | |
| Operating Leases | |
| Year Ending December 31: | | |
| 2023 | $ | 34,607 | | |
| 2024 | 29,657 | | |
| 2025 | 24,936 | | |
| 2026 | 22,617 | | |
| 2027 | 19,792 | | |
| Thereafter | 64,121 | | |
| | |
| Total lease payments | 195,730 | | |
| Less imputed interest | (52,894) | | |
| Total | $ | 142,836 | | |
As of December 31, 2022, the Company had $217 undiscounted lease payments relating to leases that have not yet commenced.
The Company’s rental expense for the years ended December 31, 2022, 2021 and 2020 was $33,248, $32,692 and $32,937, respectively. Rent expense for the year ended December 31, 2022 consisted of $20,621 of amortization and $12,627 of lease expense for interest accretion on operating lease liabilities. Rent expense for the year ended December 31, 2021 consisted of $18,667 of amortization and $14,025 of lease expense for interest accretion on operating lease liabilities. Rent expense for the year ended December 31, 2020 consisted of $17,326 of amortization and impairment of ROU assets and $15,611 of lease expense for interest accretion on operating lease liabilities.
6. LONG-TERM INVESTMENTS
Long-term investments consisted of the following:
| | | | | | | | | | | |
| December 31, 2022 | | December 31, 2021 |
| PropTech convertible trading debt securities | $ | 2,957 | | | $ | 2,222 | |
Long-term investment securities at fair value (1) | 3,262 | | | 1,534 | |
| PropTech investments at cost | 8,588 | | | 4,338 | |
| Total investments | 14,807 | | | 8,094 | |
PropTech current convertible trading debt securities (2) | 1,875 | | | — | |
| Total long-term investments | $ | 12,932 | | | $ | 8,094 | |
_____________________________
(1) These assets are measured at net asset value (“NAV”) as a practical expedient under ASC 820.
(2) These amounts are included in “Other current assets” on the combined consolidated balance sheets.
Net gains recognized on long-term investment securities were as follows:
| | | | | | | | | | | | | | | | | |
| Year Ended December 31, |
| 2022 | | 2021 | | 2020 |
| Net gains recognized on PropTech convertible trading debt securities | $ | 2,184 | | | $ | 60 | | | $ | — | |
| Net gains recognized on long-term investment securities at fair value | 655 | | | 205 | | | — | |
| Net gains recognized on long-term investment securities | $ | 2,839 | | | $ | 265 | | | $ | — | |
(a) PropTech Convertible Trading Debt Securities:
During the year ended December 31, 2022, New Valley Ventures invested $701 into convertible notes of two PropTech ventures. The securities are classified as trading debt securities and are accounted for at fair value. The maturities of all convertible notes range from March 2023 to February 2025.
DOUGLAS ELLIMAN INC.
NOTES TO COMBINED CONSOLIDATED FINANCIAL STATEMENTS — (Continued)
(b) Long-Term Investment Securities at Fair Value:
The following is a summary of unrealized and realized net gains recognized in net income on long-term investment securities at fair value during the years ended December 31, 2022, 2021 and 2020, respectively:
| | | | | | | | | | | | | | | | | |
| Year Ended December 31, |
| 2022 | | 2021 | | 2020 |
| Net gains recognized on long-term investment securities | $ | 655 | | | $ | 205 | | | $ | — | |
| Less: Net gains recognized on long-term investment securities sold | — | | | — | | | — | |
| Net unrealized gains recognized on long-term investment securities still held at the reporting date | $ | 655 | | | $ | 205 | | | $ | — | |
| | | | | |
The Company has unfunded commitments of $1,085 related to long-term investment securities at fair value as of December 31, 2022. During the year ended December 31, 2022, New Valley Ventures invested $500 into one additional investment that is classified as a long-term investment security at fair value.
(c) Equity Securities Without Readily Determinable Fair Values That Do Not Qualify for the NAV Practical Expedient
During the year ended December 31, 2022, New Valley Ventures invested $1,500 into four additional PropTech ventures, which do not qualify for the NAV practical expedient. During the year ended December 31, 2022, one of the convertible trading debt securities was converted and it was classified as an equity security without a readily determinable fair value. The total carrying value of these investments was $8,588 and $4,338 as of December 31, 2022 and 2021, respectively. No impairment or other adjustments related to observable price changes in orderly transactions for identical or similar investments were identified for the year ended December 31, 2022.
7. PROPERTY AND EQUIPMENT, NET
Property and equipment, net consisted of the following:
| | | | | | | | | | | |
| December 31,
2022 | | December 31,
2021 |
| Leasehold improvements | $ | 52,986 | | | $ | 51,571 | |
| Furniture and equipment | 40,531 | | | 32,985 | |
| | 93,517 | | | 84,556 | |
| Less accumulated depreciation and amortization | (51,800) | | | (45,175) | |
| | $ | 41,717 | | | $ | 39,381 | |
Depreciation and amortization expense related to property and equipment, net for the years ended December 31, 2022, 2021 and 2020 was $7,257, $8,144 and $8,373, respectively.
8. EQUITY METHOD INVESTMENTS
Equity-method investments consisted of the following:
| | | | | | | | | | | |
| December 31, 2022 | | December 31, 2021 |
| Ancillary services ventures | $ | 1,629 | | | $ | 2,521 | |
At December 31, 2022, the Company’s ownership percentages in these investments ranged from 17.0% to 50.0%; therefore, the Company accounts for these investments under the equity method of accounting.
VIE Consideration:
The Company has determined that the Company is not the primary beneficiary of any of its equity method investments because it does not control the activities that most significantly impact the economic performance of each investment. The Company determined that the entities were VIEs but the Company was not the primary beneficiary. Therefore, the Company’s equity method investments have been accounted for under the equity method of accounting.
DOUGLAS ELLIMAN INC.
NOTES TO COMBINED CONSOLIDATED FINANCIAL STATEMENTS — (Continued)
Maximum Exposure to Loss:
The Company’s maximum exposure to loss from its equity method investments consists of the net carrying value of the investments adjusted for any future capital commitments and/or guarantee arrangements and was $1,629 as of December 31, 2022.
9. GOODWILL AND OTHER INTANGIBLE ASSETS
The components of Goodwill and other intangible assets were as follows:
| | | | | | | | | | | | | | |
| | December 31,
2022 | | December 31,
2021 |
| Goodwill | | $ | 32,230 | | | $ | 32,571 | |
| | | | |
| Indefinite-life intangibles: | | | | |
| Trademark - Douglas Elliman | | $ | 68,000 | | | $ | 68,000 | |
| Intangibles with a finite life, net | | 5,666 | | | 6,421 | |
| Total other intangible assets, net | | $ | 73,666 | | | $ | 74,421 | |
The carrying amounts of goodwill and intangibles with a finite life, net related to acquisitions made in 2022 were as follows:
| | | | | | | | | | | | | | |
| | Goodwill | | Intangibles with a finite life, net |
| Balance as of January 1, 2022 | | $ | 32,571 | | | $ | 6,421 | |
Purchase price adjustment (1) | | (341) | | | — | |
| Amortization | | — | | | (755) | |
| Balance as of December 31, 2022 | | $ | 32,230 | | | $ | 5,666 | |
_____________________________
(1) Purchase price adjustment related to the Douglas Elliman Texas acquisition. Refer to Note 1, Summary of Significant Accounting Policies, for further information.
The carrying amounts of goodwill and intangibles with a finite life, net related to the August 6, 2021 acquisition of an additional 49% ownership in Douglas Elliman Texas were as follows:
| | | | | | | | | | | | | | |
| | Goodwill | | Intangibles with a finite life, net |
| Balance as of January 1, 2021 | | $ | 31,756 | | | $ | 310 | |
Acquisitions (1) | | 815 | | | 6,527 | |
| Amortization | | — | | | (416) | |
| Balance as of December 31, 2021 | | $ | 32,571 | | | $ | 6,421 | |
_____________________________
(1) Refer to Note 1, Summary of Significant Accounting Policies, for further information.
Goodwill is evaluated for impairment annually or whenever the Company identifies certain triggering events or circumstances that would more likely than not reduce the fair value of the Company below its carrying amount. Events or circumstances that might indicate an interim evaluation is warranted include, among other things, unexpected adverse business conditions, macro and reporting unit specific economic factors (for example, interest rate and foreign exchange rate fluctuations, and loss of key personnel), supply costs, unanticipated competitive activities, and acts by governments and courts.
During the first quarter of 2020, the Company determined that a triggering event occurred due to a decline in sales and profitability projections for the Company driven by the COVID-19 pandemic and related economic disruption. The Company utilized third-party valuation specialists to prepare a quantitative assessment of goodwill and trademark intangible asset related to Douglas Elliman.
For the goodwill testing, the Company utilized an income approach (a discounted cash flows method) to estimate the fair value of the Douglas Elliman business. The estimated fair value of the trademark indefinite-life intangible asset related to the
DOUGLAS ELLIMAN INC.
NOTES TO COMBINED CONSOLIDATED FINANCIAL STATEMENTS — (Continued)
Douglas Elliman brand name was determined using an approach that values the Company’s cash savings from having a royalty-free license compared to the market rate it would pay for access to use the trade name.
The third-party quantitative assessments of the goodwill and trademark intangible asset reflected management’s assumptions regarding revenue growth rates, economic and market trends including current expectations of deterioration resulting from the COVID-19 pandemic, changes to cost structures and other expectations about the anticipated short-term and long-term operating results of the Company. The quantitative assessments resulted in impairment charges to goodwill of $46,252 and to the trademark intangible asset of $12,000.
The Company determined that there have not been any triggering events since the first quarter of 2020. If the Company fails to achieve the financial projections used in the quantitative assessments of fair value, additional impairment charges could result in future periods, and such impairment charges could be material.
Other intangible assets and contract liabilities assumed were as follows:
| | | | | | | | | | | | | | | | | |
| Useful Lives in Years | | December 31,
2022 | | December 31,
2021 |
| Trademark - Douglas Elliman | Indefinite | | $ | 68,000 | | | $ | 68,000 | |
| | | | | |
| | | | | |
| Other intangibles | 1 - 10 | | 11,216 | | | 11,216 | |
| | | | 11,216 | | | 11,216 | |
| Less: Accumulated amortization on amortizable intangibles | | | (5,550) | | | (4,795) | |
| Other intangibles, net | | | $ | 5,666 | | | $ | 6,421 | |
| | | | | |
| | | | | |
| | | | | |
| | | | | |
| | | | | |
| | | | | |
| | | | | |
The trademark intangible has been attributed to the acquisition of the Douglas Elliman brand name which the Company plans to continue using. The fair value of the intangible asset associated with the Douglas Elliman trademark is determined using a “relief from royalty payments” method. This approach involves two steps: (i) estimating reasonable royalty rates for its Douglas Elliman trademark and (ii) applying these royalty rates to a net sales stream and discounting the resulting cash flows to determine fair value. This fair value is then compared with the carrying value of the trademark. The Company performed its impairment test for the year ended December 31, 2022, which did not result in additional impairment charges related to the Company’s trademark. If the Company fails to achieve the financial projections used in the quantitative assessments of fair value, additional impairment charges could result in future periods, and such impairment charges could be material.
As of December 31, 2022, other intangibles with finite lives included non-compete agreements recognized business combinations. Other intangibles in prior periods included backlog and listing inventory for Development sales.
For the years ended December 31, 2022, 2021, and 2020, respectively, amortization of other intangibles was $755, $416 and $164.
10. NOTES PAYABLE AND OTHER OBLIGATIONS
Notes payable and other obligations consisted of the following:
| | | | | | | | | | | |
| December 31, 2022 | | December 31, 2021 |
| Notes payable | $ | — | | | $ | 12,500 | |
| Other | — | | | 203 | |
| Total notes payable and other obligations | — | | | 12,703 | |
| Less: | | | |
| Current maturities | — | | | (12,527) | |
| Amount due after one year | $ | — | | | $ | 176 | |
Notes Payable:
The notes payable in the amount of $30,000 were issued by DER Holdings LLC on December 31, 2018, in connection with the acquisition of the 29.41% interest in Douglas Elliman. The remaining $12,500 of notes were repaid in full during 2022.
DOUGLAS ELLIMAN INC.
NOTES TO COMBINED CONSOLIDATED FINANCIAL STATEMENTS — (Continued)
Fair Value of Notes Payable and Other Obligations:
The estimated fair value of the Company’s notes payable and long-term debt was as follows:
| | | | | | | | | | | | | | | | | | | | | | | |
| | December 31, 2022 | | December 31, 2021 |
| Carrying
Value | | Fair
Value | | Carrying
Value | | Fair
Value |
| Notes payable | $ | — | | | $ | — | | | $ | 12,500 | | | $ | 12,500 | |
| Other | — | | | — | | | 203 | | | 203 | |
| Notes payable and other obligations | $ | — | | | $ | — | | | $ | 12,703 | | | $ | 12,703 | |
Notes payable and other obligations are recorded at amortized cost. The fair value determinations disclosed above would be classified as Level 2 under the fair value hierarchy disclosed in Note 17 if such liabilities were recorded on the combined consolidated balance sheets at fair value.
Considerable judgment is required to develop the estimates of fair value and, accordingly, the estimate presented herein is not necessarily indicative of the amount that could be realized in a current market exchange.
11. EMPLOYEE BENEFIT PLANS
Profit Sharing and 401(k) Plans:
The Company maintains two 401(k) plans for substantially all of its U.S. employees which allow eligible employees to invest a percentage of their pre-tax compensation. The Company contributed to the 401(k) plans and expensed $689, $598 and $370 for the years ended December 31, 2022, 2021 and 2020, respectively.
DOUGLAS ELLIMAN INC.
NOTES TO COMBINED CONSOLIDATED FINANCIAL STATEMENTS — (Continued)
12. INCOME TAXES
The financial statements of Douglas Elliman Inc. include the tax accounts of the following entities: (i) DER Holdings LLC, the parent of Douglas Elliman Realty LLC, is a single-member limited liability company that is a disregarded entity for U.S. income tax purposes, (ii) Douglas Elliman Realty LLC is a limited liability company that files as a partnership for U.S. income tax purposes, (iii) Douglas Elliman of California, Inc. is a corporation that reported on a separate company basis until February 28, 2019, then elected to become a consolidated subsidiary included in Vector Group’s consolidated U.S. income tax return until the Distribution, and thereafter is a consolidated subsidiary of Douglas Elliman Inc., (iv) DER Holdings II LLC, a subsidiary of DER Holdings LLC, which has elected to be taxed as corporation for U.S. income tax purposes, and (v) certain single member limited liability companies that are treated as disregarded entities for U.S. income tax purposes. Upon completion of the Distribution, Douglas Elliman Inc. and its subsidiaries detailed above became a separate taxable entity for federal and state income tax purposes.
After the Distribution, the Company calculates its provision for income taxes based upon the taxable income attributable to its activity and the activity of its subsidiaries. The net deferred tax liabilities attributable to the Company and its subsidiaries were transferred from Vector Group to the Company in connection with the tax-free Distribution.
For the periods presented prior to the Distribution, the Company calculated its provision for income taxes by using a separate-return method and elected not to allocate tax expense to single-member limited liability companies or partnerships that did not incur income tax liability because they were not severally liable for the taxes of their owners. Prior to the Distribution, Douglas Elliman of California, Inc. and DER Holdings II LLC were the only two entities taxed as a corporation for U.S. Income Tax purposes while the remaining entities were pass through entities for federal income tax purposes. Therefore, no income tax expense was allocated to entities other than DER Holdings LLC, Douglas Elliman of California, Inc. and, for purposes of New York City UBT only, Douglas Elliman Realty, LLC.
The amounts provided for income taxes were as follows:
| | | | | | | | | | | | | | | | | |
| | Year Ended December 31, |
| | 2022 | | 2021 | | 2020 |
| Current: | | | | | |
| U.S. Federal | $ | 1,039 | | | $ | (64) | | | $ | (20) | |
| State and local | 1,271 | | | 2,270 | | | (14) | |
| | 2,310 | | | 2,206 | | | (34) | |
| Deferred: | | | | | |
| U.S. Federal | 1,421 | | | (48) | | | 56 | |
| State and local | 2,772 | | | (25) | | | 22 | |
| | 4,193 | | | (73) | | | 78 | |
| Total | $ | 6,503 | | | $ | 2,133 | | | $ | 44 | |
DOUGLAS ELLIMAN INC.
NOTES TO COMBINED CONSOLIDATED FINANCIAL STATEMENTS — (Continued)
The tax effect of temporary differences which give rise to a significant portion of deferred tax assets and liabilities is as follows:
| | | | | | | | | | | |
| | December 31, 2022 | | December 31, 2021 |
| Deferred tax assets: | | | |
| | | |
| Allowance for doubtful accounts | $ | 212 | | | $ | 200 | |
| Basis differences on fixed and intangible assets | 391 | | | 265 | |
| Various U.S. federal and state tax loss carryforwards | 6,417 | | | 5,196 | |
| Operating lease liabilities | 5,901 | | | 5,538 | |
| | | |
| Other | — | | | 77 | |
| 12,921 | | | 11,276 | |
| Less: Valuation allowance | (6,417) | | | (5,196) | |
| Net deferred tax assets | $ | 6,504 | | | $ | 6,080 | |
| | | |
| Deferred tax liabilities: | | | |
| | | |
| | | |
| | | |
| Basis differences on prepaid assets | $ | (204) | | | $ | (197) | |
| Revenue recognition | (40) | | | (167) | |
| Basis differences on long-term investments | (954) | | | — | |
| Basis differences on acquisition | (14,340) | | | (12,151) | |
| Operating lease right-of-use assets | (5,320) | | | (4,977) | |
| Other | (113) | | | — | |
| $ | (20,971) | | | $ | (17,492) | |
| | | |
| Net deferred tax liabilities | $ | (14,467) | | | $ | (11,412) | |
The Company’s subsidiary, Douglas Elliman of California, Inc., files a consolidated U.S. income tax return that includes its wholly-owned U.S. subsidiaries. Standalone subsidiaries had tax-effected federal and state net operating loss (“NOL”) carryforwards of $6,417 and $5,196 at December 31, 2022 and 2021, respectively, with $4,388 expiring through tax year 2040 and the remaining carried forward indefinitely. The Company records a valuation allowance against deferred tax assets if, based on the weight of available evidence, it is more likely than not that some or all of the deferred tax assets will not be realized. The Company had valuation allowances of $6,417 and $5,196 at December 31, 2022 and 2021, respectively. The valuation allowances at December 31, 2022 and 2021 related to federal and state net operating loss carryforwards and the deferred tax assets of Douglas Elliman of California, Inc. prior to March 1, 2019, which are limited for use in the future to the extent of the taxable income of Douglas Elliman of California, Inc. under the “Separate Return Limitation Year” rules of Internal Revenue Code Section 381.
The combined consolidated balance sheets of the Company include deferred income tax assets and liabilities, which represent temporary differences in the application of accounting rules established by GAAP and income tax laws.
DOUGLAS ELLIMAN INC.
NOTES TO COMBINED CONSOLIDATED FINANCIAL STATEMENTS — (Continued)
Differences between the amounts provided for income taxes and amounts computed at the federal statutory tax rate are summarized as follows:
| | | | | | | | | | | | | | | | | |
| | Year Ended December 31, |
| | 2022 | | 2021 | | 2020 |
| Income (loss) before provision for income taxes | $ | 104 | | | $ | 100,785 | | | $ | (46,328) | |
| Federal income tax expense (benefit) at statutory rate | 22 | | | 21,165 | | | (9,729) | |
| Less Federal income tax (expense) benefit attributable to pass through entities | — | | | (20,278) | | | 7,915 | |
| | | | | |
| State and local income taxes, net of federal income tax benefits | 2,213 | | | 1,769 | | | (418) | |
| Impact of non-controlling interest | 163 | | | — | | | — | |
| Non-deductible expenses | 1,715 | | | 361 | | | 568 | |
| | | | | |
| | | | | |
| Excess tax benefits on stock-based compensation | 812 | | | — | | | — | |
| Loss carryforwards from tax consolidation of subsidiary | (331) | | | 1,145 | | | — | |
| | | | | |
| Changes in valuation allowance, net of equity and tax audit adjustments | 1,221 | | | (2,035) | | | 1,708 | |
| | | | | |
| | | | | |
| Other | 688 | | | 6 | | | — | |
| Income tax expense | $ | 6,503 | | | $ | 2,133 | | | $ | 44 | |
The Company’s income tax expense is principally attributable to the Company’s federal, state and local income taxes based on the Company’s earnings.
The Company files U.S. and state and local income tax returns in jurisdictions with varying statutes of limitations. Liabilities for uncertain tax positions reflected as of December 31, 2022 and 2021 were not significant and it is not anticipated that they will materially change in the next 12 months. Douglas Elliman Realty, LLC is under an IRS audit for its 2018 tax return. Although the outcome of tax audits is always uncertain, Douglas Elliman Realty, LLC believes that its tax positions will generally be sustained under audit.
13. STOCK COMPENSATION
On December 31, 2021, the Company granted equity compensation under its 2021 Plan. The 2021 Plan was adopted on December 22, 2021 and approved by the Company’s stockholder on December 24, 2021. The 2021 Plan provides for the Company to grant nonqualified stock options, incentive stock options, stock appreciation rights, restricted shares, restricted stock units, performance share awards, other stock-based awards and cash-based awards. Shares available for issuance under the 2021 Plan are 6,839,604 shares as of December 31, 2022. The Company may satisfy its obligations under any award granted under the 2021 Plan by issuing new shares.
On December 31, 2021, the Company granted 3,490,000 restricted shares of the Company’s common stock (“the 2021 grants”) pursuant to the 2021 Plan to its executive officers, directors and certain employees. The shares vest over a period of four years and the Company will recognize $40,135 of expense over the vesting period of the 2021 grants. The Company recognized expense of $11,042 for the year ended December 31, 2022.
In 2022, the Company granted 65,000 restricted shares, net of forfeitures, of the Company’s common stock (“the 2022 grants”) pursuant to the 2021 Plan. The shares vest over a period of four years and the Company will recognize $487 of expense over the vesting period. The Company recognized expense of $96 for the year ended December 31, 2022.
DOUGLAS ELLIMAN INC.
NOTES TO COMBINED CONSOLIDATED FINANCIAL STATEMENTS — (Continued)
A summary of employee restricted stock award transactions is presented below:
| | | | | | | | | | | |
| Shares | | Weighted Average Grant Date Fair Value |
| Nonvested at January 1, 2021 | — | | | $ | — | |
| Granted | 3,490,000 | | | $ | 11.50 | |
| | | |
| | | |
| Nonvested at December 31, 2021 | 3,490,000 | | | $ | 11.50 | |
| Granted | 90,000 | | | $ | 8.25 | |
| Vested | (953,750) | | | $ | 11.49 | |
| Forfeited | (25,000) | | | $ | 10.21 | |
| Nonvested at December 31, 2022 | 2,601,250 | | | $ | 11.40 | |
As of December 31, 2022, there was $29,484 of total unrecognized compensation costs related to nonvested restricted stock awards. The cost is expected to be recognized over a weighted-average period of approximately 1.93 years.
14. CONTINGENCIES
The Company is involved in litigation through the normal course of business. The majority of claims are covered by the Company’s insurance policies in excess of any applicable retention. Some claims may not be covered by the Company’s insurance policies. The Company believes that the resolution of these matters will not have a material adverse effect on the financial position, results of operations or cash flows of the Company.
15. SUPPLEMENTAL CASH FLOW INFORMATION
| | | | | | | | | | | | | | | | | |
| | Year Ended December 31, |
| | 2022 | | 2021 | | 2020 |
| Cash paid during the period for: | | | | | |
| Interest | $ | 177 | | | $ | 24 | | | $ | 1 | |
| Income taxes, net | 11,083 | | | 681 | | | — | |
| Non-cash investing and financing activities: | | | | | |
| Capital expenditures incurred but not paid | 1,070 | | | 2 | | | 243 | |
| Transfers from Former Parent, net | — | | | 15,444 | | | 5,679 | |
DOUGLAS ELLIMAN INC.
NOTES TO CONSOLIDATED FINANCIAL STATEMENTS — (Continued)
16. RELATED PARTY TRANSACTIONS
On December 29, 2021, Vector Group completed the Distribution and the Company and Vector Group entered into a distribution agreement (the “Distribution Agreement”) and several ancillary agreements for the purpose of accomplishing the Distribution. The Distribution Agreement includes an agreement that the Company and Vector Group will provide each other with appropriate indemnities with respect to liabilities arising out of the business retained by Vector Group and the business transferred to Douglas Elliman by Vector Group. These agreements also govern the Company’s relationship with Vector Group subsequent to the Distribution and provide for the allocation of employee benefit, tax and some other liabilities and obligations attributable to periods prior to, at and after the Distribution. These agreements also include arrangements with respect to transition services (the “Transition Services Agreement”). The Company and Vector Group entered into a Transition Services Agreement with respect to transition services and a number of ongoing commercial relationships. Under the agreement, the Company paid Vector Group $4,200 in 2022. The Company and Vector Group also entered into Aircraft Lease Agreements for the right to lease on a flight-by-flight basis certain aircraft owned by Vector. Under the agreements, the Company paid Vector Group $2,418 in 2022. Vector Group has agreed to indemnify the Company for certain tax matters under the Tax Disaffiliation Agreement. The Company received $589 and recorded the amount in Investment and other income in its combined consolidated statements of operations for the year ended December 31, 2022 related to the tax indemnifications.
Following the Distribution, there is an overlap between certain officers of the Company and Vector Group. The President and Chief Executive Officer, the Chief Operating Officer, the Chief Financial Officer and Treasurer, and the General Counsel and Secretary of Douglas Elliman serve in the same role at Vector Group. Furthermore, three of the members of Douglas Elliman’s Board of Directors also serve as directors of Vector Group.
The Company has been engaged by certain developers as the sole broker or the co-broker for several of the real estate development projects that New Valley owns an interest in through its real estate venture investments. The Company had gross commissions of approximately $1,709, $8,956 and $10,783 from these projects for the years ended December 31, 2022, 2021 and 2020, respectively.
The Company and a director each owned a 50% interest in an entity the assets and business of which were sold in 2019. The Company received $654 in May 2022 as a final distribution of an earn-out payment based on the performance of the entity in 2020 and 2021. The Company recorded equity in earnings from this equity-method investment of $654, $75 and $30 for the years ended December 31, 2022, 2021 and 2020, respectively.
A son of the Company’s President and Chief Executive Officer is an associate broker with the Company and he received commissions and other payments of $1,490, $925 and $870, respectively, in accordance with brokerage activities in 2022, 2021 and 2020, respectively.
The spouse of the President and Chief Executive Officer of Douglas Elliman Realty, LLC is a real estate agent whose license is held at a subsidiary of the Company, and who received commissions and other payments of $230, $420 and $40 in accordance with brokerage activities in 2022, 2021 and 2020, respectively.
DOUGLAS ELLIMAN INC.
NOTES TO CONSOLIDATED FINANCIAL STATEMENTS — (Continued)
17. INVESTMENTS AND FAIR VALUE MEASUREMENTS
The Company’s financial assets and liabilities subject to fair value measurements were as follows:
| | | | | | | | | | | | | | | | | | | | | | | | | | | | |
| | Fair Value Measurements as of December 31, 2022 | | |
| Description | | Total | | Quoted Prices in Active Markets for Identical Assets
(Level 1) | |
Significant Other Observable Inputs
(Level 2) | |
Significant Unobservable Inputs
(Level 3) | | |
| Assets: | | | | | | | | | | |
Money market funds (1) | | $ | 153,941 | | | $ | 153,941 | | | $ | — | | | $ | — | | | |
Certificates of deposit (2) | | 569 | | | — | | | 569 | | | — | | | |
| PropTech convertible trading debt securities | | 1,875 | | | — | | | — | | | 1,875 | | | |
| Long-term investments | | | | | | | | | | |
| PropTech convertible trading debt securities | | 1,082 | | | — | | | — | | | 1,082 | | | |
Long-term investment securities at fair value (3) | | 3,262 | | | — | | | — | | | — | | | |
| | | | | | | | | | |
| Total long-term investments | | 4,344 | | | — | | | — | | | 1,082 | | | |
| Total assets | | $ | 160,729 | | | $ | 153,941 | | | $ | 569 | | | $ | 2,957 | | | |
| | | | | | | | | | |
| | | | | | | | | | |
| | | | | | | | | | |
| | | | | | | | | | |
| | | | | | | | | | |
| | | | | | | | | | |
| | | | | | | | | | |
| | | | | | | | | | |
| | | | | | | | | | |
| | | | | | | | | | |
| | | | | | | | | | |
| | | | | | | | | | |
_____________________________
(1)Amounts included in Cash and cash equivalents on the combined consolidated balance sheets, except for $4,985 that is included in current restricted cash and cash equivalents and $2,538 that is included in non-current restricted assets.
(2)Amounts included in current restricted assets and non-current restricted assets on the combined consolidated balance sheets.
(3)In accordance with Subtopic 820-10, investments that are measured at fair value using the NAV practical expedient are not classified in the fair value hierarchy.
| | | | | | | | | | | | | | | | | | | | | | | | | | | | |
| | Fair Value Measurements as of December 31, 2021 | | |
| Description | | Total | | Quoted Prices in Active Markets for Identical Assets
(Level 1) | |
Significant Other Observable Inputs
(Level 2) | |
Significant Unobservable Inputs
(Level 3) | | |
| Assets: | | | | | | | | | | |
Money market funds (1) | | $ | 51,492 | | | $ | 51,492 | | | $ | — | | | $ | — | | | |
Certificates of deposit (2) | | 569 | | | — | | | 569 | | | — | | | |
| Long-term investments | | | | | | | | | | |
| PropTech convertible trading debt securities | | 2,222 | | | — | | | — | | | 2,222 | | | |
Long-term investment securities at fair value (3) | | 1,534 | | | — | | | — | | | — | | | |
| Total long-term investments | | 3,756 | | | — | | | — | | | 2,222 | | | |
| Total assets | | $ | 55,817 | | | $ | 51,492 | | | $ | 569 | | | $ | 2,222 | | | |
| | | | | | | | | | |
| | | | | | | | | | |
| | | | | | | | | | |
| | | | | | | | | | |
| | | | | | | | | | |
| | | | | | | | | | |
_____________________________
(1)Amounts included in Cash and cash equivalents on the combined consolidated balance sheets, except for $15,336 that is included in current restricted assets and $1,907 that is included in non-current restricted assets.
(2)Amounts included in current restricted assets and non-current restricted assets on the combined consolidated balance sheets.
(3)In accordance with Subtopic 820-10, investments that are measured at fair value using the NAV practical expedient are not classified in the fair value hierarchy.
The fair value of the Level 2 certificates of deposit is based on the discounted value of contractual cash flows. The discount rate is the rate offered by the financial institution. The fair value of investment securities at fair value included in Level 1 is based on quoted market prices from various stock exchanges. The Level 2 investment securities at fair value are based on quoted market prices of securities that are thinly traded, quoted prices for identical or similar assets in markets that are not active or inputs other than quoted prices such as interest rates and yield curves.
DOUGLAS ELLIMAN INC.
NOTES TO CONSOLIDATED FINANCIAL STATEMENTS — (Continued)
The fair values of the Level 3 PropTech convertible trading debt securities were derived using a discounted cash flow model utilizing a probability-weighted expected return method based on the probabilities of different potential outcomes for the convertible trading debt securities.
The long-term investments are based on NAV per share provided by the partnerships based on the indicated market value of the underlying assets or investment portfolio. In accordance with Subtopic 820-10, these investments are not classified under the fair value hierarchy disclosed above because they are measured at fair value using the NAV practical expedient.
The unobservable inputs related to the valuations of the Level 3 assets and liabilities were as follows at December 31, 2022:
| | | | | | | | | | | | | | | | | | | | | | | | | | |
| | Quantitative Information about Level 3 Fair Value Measurements |
| | Fair Value at | | | | | | |
| | December 31,
2022 | | Valuation Technique | | Unobservable Input | | Range (Actual) |
| | | | | | | | |
| | | | | | | | |
| | | | | | | | |
| | | | | | | | |
| | | | | | | | |
| | | | | | | | |
| | | | | | | | |
| | | | | | | | |
| PropTech convertible trading debt securities | | $ | 2,957 | | | Discounted cash flow | | Interest rate | | 4% - 8% |
| | | | | | Maturity | | Mar 2023 - Feb 2025 |
| | | | | | Volatility | | 60.7% - 103.3% |
| | | | | | Discount rate | | 29.39% - 186.15% |
| | | | | | | | |
| | | | | | | | |
| | | | | | | | |
| | | | | | | | |
The unobservable inputs related to the valuations of the Level 3 assets and liabilities were as follows at December 31, 2021:
| | | | | | | | | | | | | | | | | | | | | | | | | | |
| | Quantitative Information about Level 3 Fair Value Measurements |
| | Fair Value at | | | | | | |
| | December 31,
2021 | | Valuation Technique | | Unobservable Input | | Range (Actual) |
| | | | | | | | |
| | | | | | | | |
| | | | | | | | |
| | | | | | | | |
| | | | | | | | |
| | | | | | | | |
| | | | | | | | |
| | | | | | | | |
| PropTech convertible trading debt securities | | $ | 2,222 | | | Discounted cash flow | | Interest rate | | 5% |
| | | | | | Maturity | | Feb 2023 - Mar 2023 |
| | | | | | Volatility | | 37.7% - 86.8% |
| | | | | | Discount rate | | 27.25% - 46.83% |
In addition to assets and liabilities that are recorded at fair value on a recurring basis, the Company is required to record assets and liabilities at fair value on a nonrecurring basis. Generally, assets and liabilities are recorded at fair value on a nonrecurring basis as a result of impairment charges. The Company had no nonrecurring nonfinancial assets subject to fair value measurements as of December 31, 2022 and 2021, respectively.
DOUGLAS ELLIMAN INC.
NOTES TO CONSOLIDATED FINANCIAL STATEMENTS — (Continued)
18. SEGMENT INFORMATION
The Company’s business segments were Real Estate Brokerage and Corporate and Other. The accounting policies of the segments are the same as those described in the summary of significant accounting policies.
Financial information for the Company’s operations before taxes and non-controlling interests for the years ended December 31, 2022, 2021, and 2020 was as follows:
| | | | | | | | | | | | | | | | | |
| Real Estate Brokerage | | Corporate
and Other | | Total |
| 2022 | | | | | |
| Revenues | $ | 1,153,177 | | | $ | — | | | $ | 1,153,177 | |
| Operating income (loss) | 21,993 | | | (26,534) | | | (4,541) | |
| | | | | |
| Identifiable assets | 512,524 | | | 37,878 | | | 550,402 | |
| Depreciation and amortization | 8,012 | | | — | | | 8,012 | |
| Capital expenditures | 8,537 | | | — | | | 8,537 | |
| | | | | |
| 2021 | | | | | |
| Revenues | $ | 1,353,138 | | | $ | — | | | $ | 1,353,138 | |
| Operating income | 102,098 | | | — | | | 102,098 | |
| | | | | |
| Identifiable assets | 548,217 | | | 46,952 | | | 595,169 | |
| Depreciation and amortization | 8,561 | | | — | | | 8,561 | |
| Capital expenditures | 4,106 | | | — | | | 4,106 | |
| | | | | |
| 2020 | | | | | |
| Revenues | $ | 773,987 | | | $ | — | | | $ | 773,987 | |
Operating loss (1) | (49,285) | | | — | | | (49,285) | |
| | | | | |
| Identifiable assets | 453,745 | | | 237 | | | 453,982 | |
| Depreciation and amortization | 8,537 | | | — | | | 8,537 | |
| Capital expenditures | 6,126 | | | — | | | 6,126 | |
_____________________________
(1)Operating loss includes $58,252 of charges related to impairments of goodwill and intangible assets, $3,382 of restructuring charges and $1,169 of loss on sale of assets.
DOUGLAS ELLIMAN INC.
SCHEDULE II — VALUATION AND QUALIFYING ACCOUNTS
(Dollars in Thousands)
| | | | | | | | | | | | | | | | | | | | | | | | | | |
| Description | | Balance at
Beginning
of Period | | Additions
Charged to
Costs and
Expenses | | Deductions | | Balance
at End
of Period |
| Year Ended December 31, 2022 | | | | | | | | |
| Allowances for: | | | | | | | | |
| | | | | | | | |
| Deferred tax valuation allowance | | $ | 5,196 | | | $ | 1,221 | | | $ | — | | | $ | 6,417 | |
| Total | | $ | 5,196 | | | $ | 1,221 | | | $ | — | | | $ | 6,417 | |
| Year Ended December 31, 2021 | | | | | | | | |
| Allowances for: | | | | | | | | |
| | | | | | | | |
| Deferred tax valuation allowance | | $ | 7,231 | | | $ | — | | | $ | 2,035 | | | $ | 5,196 | |
| Total | | $ | 7,231 | | | $ | — | | | $ | 2,035 | | | $ | 5,196 | |
| Year Ended December 31, 2020 | | | | | | | | |
| Allowances for: | | | | | | | | |
| Doubtful accounts | | $ | 245 | | | $ | — | | | $ | 245 | | | $ | — | |
| Deferred tax valuation allowance | | 5,590 | | | 1,641 | | | — | | | 7,231 | |
| Total | | $ | 5,835 | | | $ | 1,641 | | | $ | 245 | | | $ | 7,231 | |