
United States Securities and Exchange Commission Washington, D.C. 20549 FORM 6-K REPORT OF FOREIGN PRIVATE ISSUER PURSUANT TO RULE 13a-16 OR 15d-16 UNDER THE SECURITIES EXCHANGE ACT OF 1934 For the month of August 2024 Commission File Number 132-02847 INTER & Co, INC. (Exact name of registrant as specified in its charter) N/A (Translation of Registrant’s executive offices) Av Barbacena, 1.219, 22nd Floor Belo Horizonte, Brazil, ZIP Code 30 190-131 Telephone: +55 (31) 2138-7978 (Address of principal executive office) Indicate by check mark whether the registrant files or will file annual reports under cover of Form 20-F or Form 40-F. Form 20-F ☒ Form 40-F ☐ Indicate by check mark if the registrant is submitting the Form 6-K in paper as permitted by Regulation S-T Rule 101(b)(1): Yes ☐ No ☒ Indicate by check mark if the registrant is submitting the Form 6-K in paper as permitted by Regulation S-T Rule 101(b)(7): Yes ☐ No ☒

E A R N I N G S P R E S E N T A T I O N | 2 Q 2 4 2Q24 Earnings Presentation August 2024
E A R N I N G S P R E S E N T A T I O N | 2 Q 2 4 Disclaimer This report may contain forward-looking statements regarding Inter, anticipated synergies, growth plans, projected results and future strategies. While these forward-looking statements reflect our Management’s good faith beliefs, they involve known and unknown risks and uncertainties that could cause the company’s results or accrued results to differ materially from those anticipated and discussed herein. These statements are not guarantees of future performance. These risks and uncertainties include, but are not limited to, our ability to realize the amount of projected synergies and the projected schedule, in addition to economic, competitive, governmental and technological factors affecting Inter, the markets, products and prices and other factors. In addition, this presentation contains managerial numbers that may differ from those presented in our financial statements. The calculation methodology for these managerial numbers is presented in Inter’s quarterly earnings release. Statements contained in this report that are not facts or historical information may be forward-looking statements under the terms of the Private Securities Litigation Reform Act of 1995. These forward-looking statements may, among other things, beliefs related to the creation of value and any other statements regarding Inter. In some cases, terms such as “estimate”, “project”, “predict”, “plan”, “believe”, “can”, “expectation”, “anticipate”, “intend”, “aimed”, “potential”, “may”, “will/shall” and similar terms, or the negative of these expressions, may identify forward looking statements. These forward-looking statements are based on Inter's expectations and beliefs about future events and involve risks and uncertainties that could cause actual results to differ materially from current ones. Any forward-looking statement made by us in this document is based only on information currently available to us and speaks only as of the date on which it is made. We undertake no obligation to publicly update any forward-looking statement, whether written or oral, that may be made from time to time, whether as a result of new information, future developments or otherwise. For additional information that about factors that may lead to results that are different from our estimates, please refer to sections “Cautionary Statement Concerning Forward-Looking Statements” and “Risk Factors” of Inter&Co Annual Report on Form 20-F. The numbers for our key metrics (Unit Economics), which include active users, as average revenue per active client (ARPAC), cost to serve (CTS), are calculated using Inter’s internal data. Although we believe these metrics are based on reasonable estimates, but there are challenges inherent in measuring the use of our business. In addition, we continually seek to improve our estimates, which may change due to improvements or changes in methodology, in processes for calculating these metrics and, from time to time, we may discover inaccuracies and make adjustments to improve accuracy, including adjustments that may result in recalculating our historical metrics. About Non-IFRS Financial Measures To supplement the financial measures presented in this press release and related conference call, presentation, or webcast in accordance with IFRS, Inter&Co also presents non-IFRS measures of financial performance, as highlighted throughout the documents. The non-IFRS Financial Measures include, among others: Adjusted Net Income, Cost to Serve, Cost of Funding, Efficiency Ratio, Underwriting, NPL > 90 days, NPL 15 to 90 days, NPL and Stage 3 Formation, Cost of Risk, Coverage Ratio, Funding, All-in Cost of Funding, Gross Merchandise Volume (GMV), Premiuns, Net Inflows, Global Services Deposits and Investments, Fee Income Ratio, Client Acquisition Cost, Cards+PIX TPV, Gross ARPAC, Net ARPAC, Marginal NIM 1.0, Marginal NIM 2.0, Net Interest Margin IEP + Non-int. CC Receivables (1.0), Net Interest Margin IEP (2.0), Cost-to-Serve, Risk-Adjusted Net Interest Margin IEP + Non-int. CC Receivables (1.0), Risk Adjusted Net Interest Margin IEP (2.0), Risk Adjusted Efficiency Ratio. A “non-IFRS financial measure” refers to a numerical measure of Inter&Co’s historical or financial position that either excludes or includes amounts that are not normally excluded or included in the most directly comparable measure calculated and presented in accordance with IFRS in Inter&Co’s financial statements. Inter&Co provides certain non-IFRS measures as additional information relating to its operating results as a complement to results provided in accordance with IFRS. The non-IFRS financial information presented herein should be considered together with, and not as a substitute for or superior to, the financial information presented in accordance with IFRS. There are significant limitations associated with the use of non-IFRS financial measures. Further, these measures may differ from the non-IFRS information, even where similarly titled, used by other companies and therefore should not be used to compare Inter&Co’s performance to that of other companies. 2
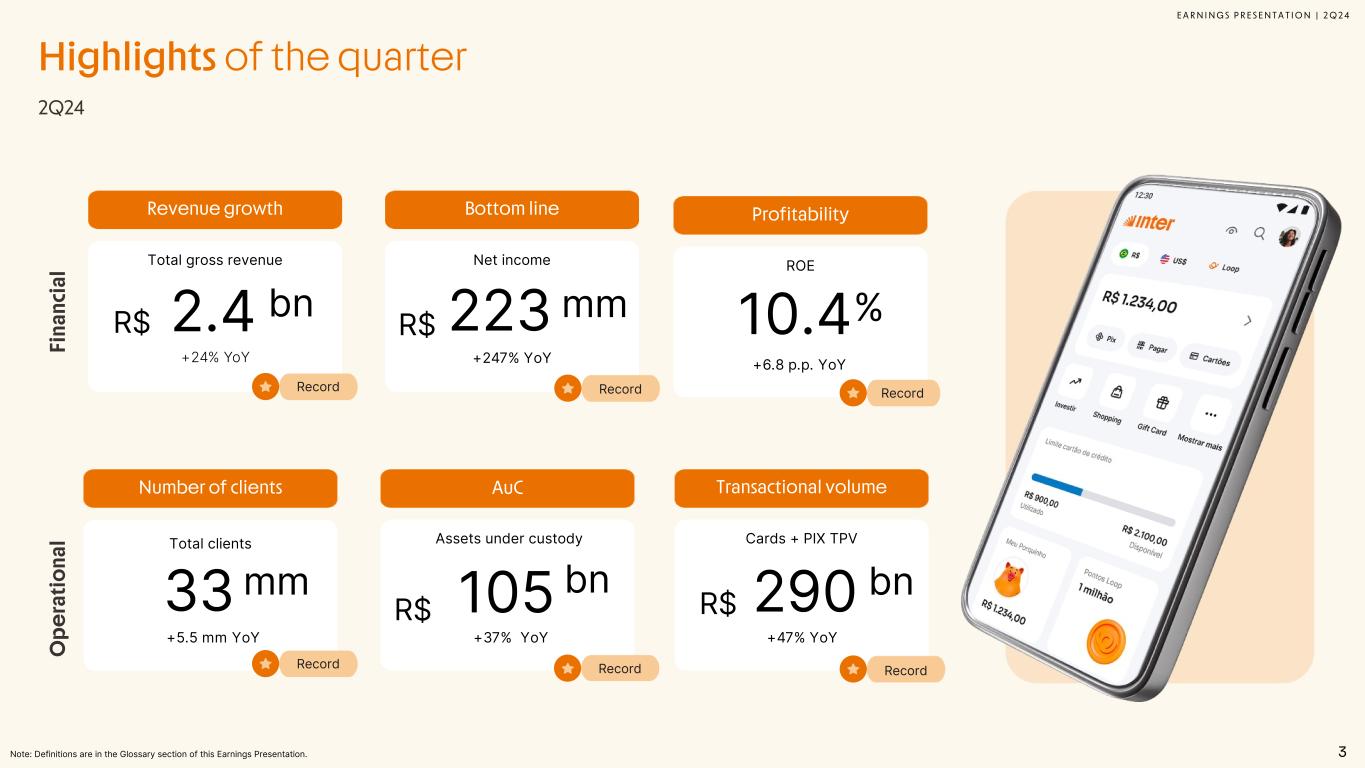
E A R N I N G S P R E S E N T A T I O N | 2 Q 2 4 2Q24 Fi na nc ia l O pe ra tio na l Note: Definitions are in the Glossary section of this Earnings Presentation. 3 Highlights of the quarter Revenue growth Total gross revenue bnR$ Record 2.4 +24% YoY Number of clients Total clients mm Record 33 AuC Assets under custody Record 105 Profitability ROE % Record 10.4 +6.8 p.p. YoY Bottom line Net income R$ Record 223mm +247% YoY +5.5 mm YoY +37% YoY Transactional volume Cards + PIX TPV bnR$ Record 290 +47% YoY bn R$

E A R N I N G S P R E S E N T A T I O N | 2 Q 2 4 Agenda 1.CEO Overview 2.Business Update 3.Financial Performance
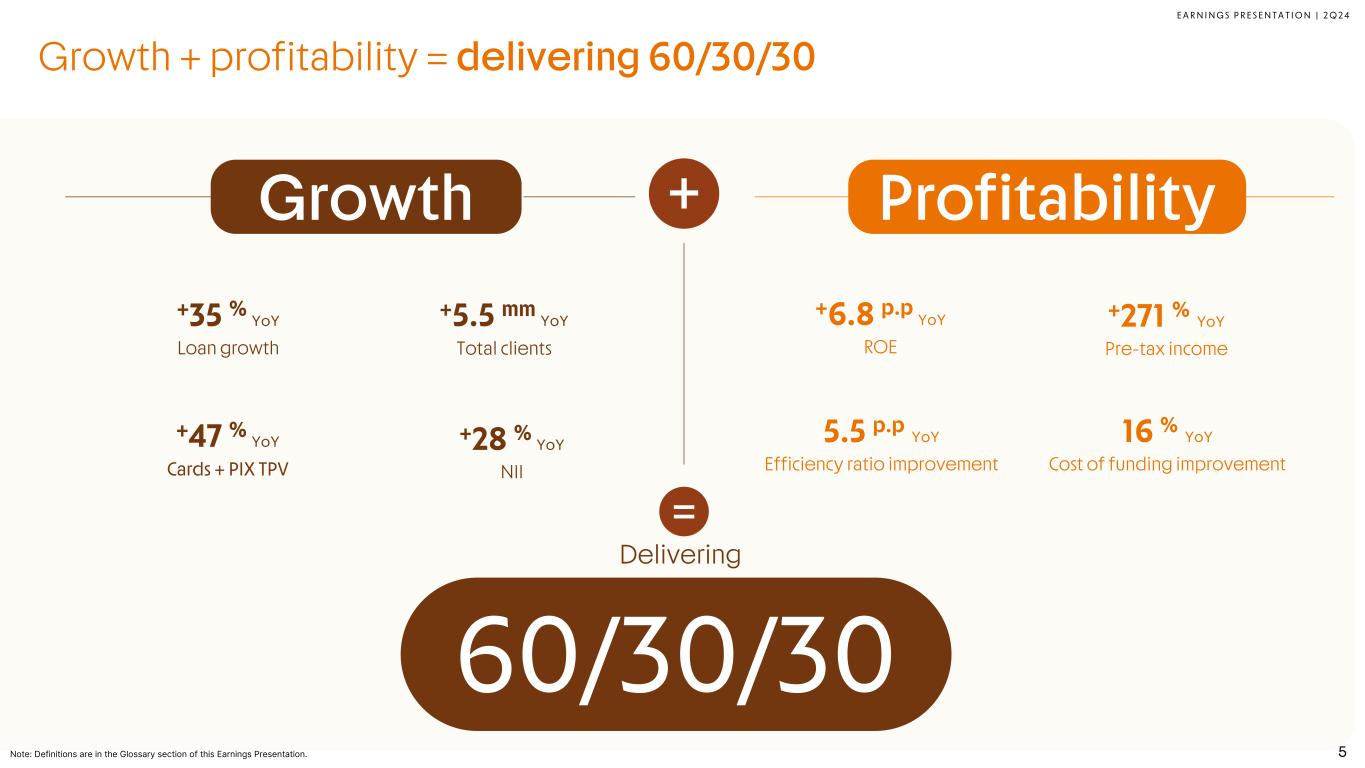
E A R N I N G S P R E S E N T A T I O N | 2 Q 2 4 5 Growth + profitability = delivering 60/30/30 +35 % YoY Loan growth +5.5 mm YoY Total clients +47 % YoY Cards + PIX TPV 5.5 p.p YoY Efficiency ratio improvement +271 % YoY Pre-tax income +6.8 p.p YoY ROE +28 % YoY NII 16 % YoY Cost of funding improvement Growth 60/30/30 Delivering = Profitability+ Note: Definitions are in the Glossary section of this Earnings Presentation.

E A R N I N G S P R E S E N T A T I O N | 2 Q 2 4 YoY Growth In % 6 A platform that generates alpha Individuals Banking Accounts Inter2 Market1 Business Banking Accounts Inter4 Market3 Cards TPV Inter8 Market7 FGTS Loans Inter6 Market5 Home Equity PF Inter10 Market9 Excess Growth +3% +6% +11% +23% +17% +23% +23% +24% +93% +36% +8x +4x +2x +4x +2x Note: Notes are in the Appendix section of this Earnings Presentation.
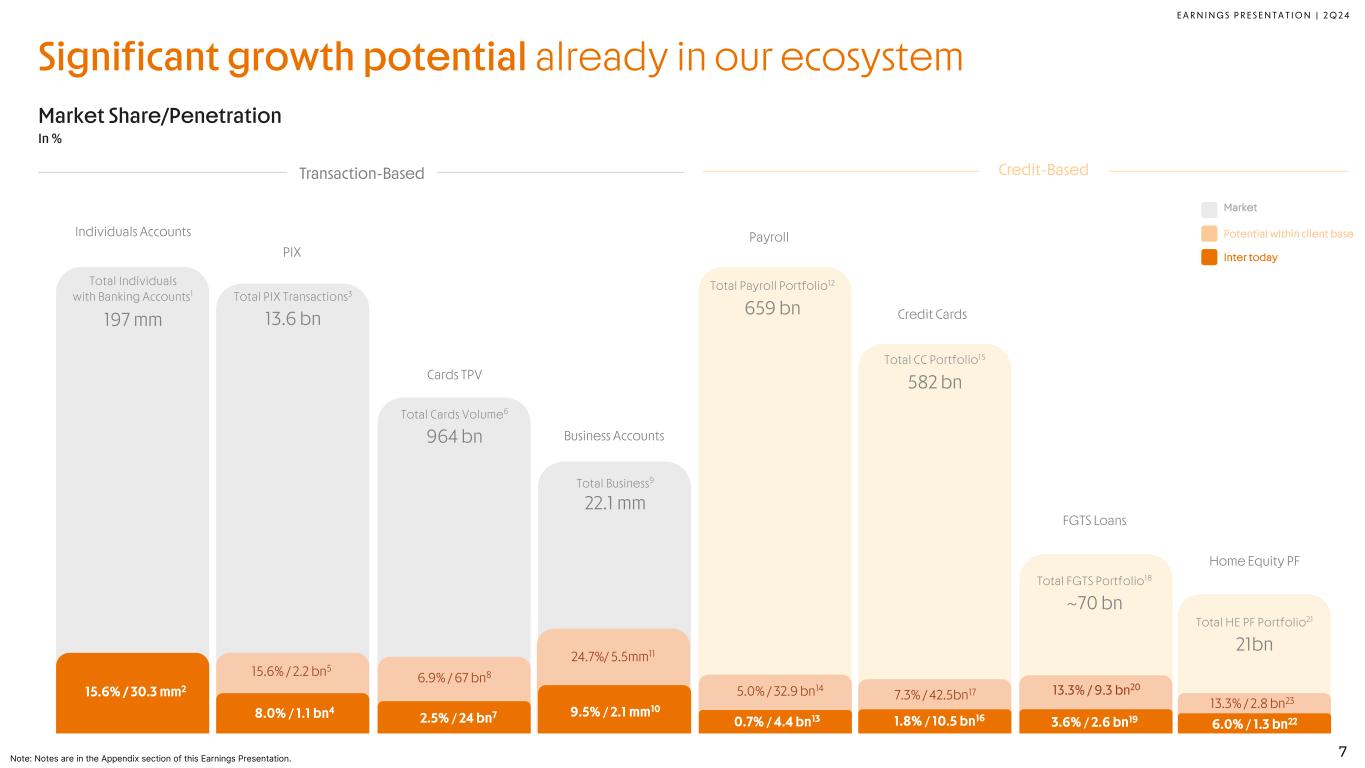
E A R N I N G S P R E S E N T A T I O N | 2 Q 2 4 Total Individuals with Banking Accounts1 197 mm Total PIX Transactions3 13.6 bn Total Cards Volume6 964 bn Total Business9 22.1 mm Total Payroll Portfolio12 659 bn Total CC Portfolio15 582 bn Total FGTS Portfolio18 ~70 bn Total HE PF Portfolio21 21bn Significant growth potential already in our ecosystem Market Share/Penetration In % Transaction-Based Individuals Accounts Business Accounts PIX Cards TPV Payroll Credit Cards FGTS Loans Home Equity PF Credit-Based Potential within client base Inter today Market 24.7%/ 5.5mm11 15.6% / 2.2 bn5 6.9% / 67 bn8 5.0% / 32.9 bn14 7.3% / 42.5bn17 13.3% / 9.3 bn20 13.3% / 2.8 bn23 15.6% / 30.3 mm2 8.0% / 1.1 bn4 2.5% / 24 bn7 9.5% / 2.1 mm10 0.7% / 4.4 bn13 1.8% / 10.5 bn16 3.6% / 2.6 bn19 6.0% / 1.3 bn22 7Note: Notes are in the Appendix section of this Earnings Presentation.
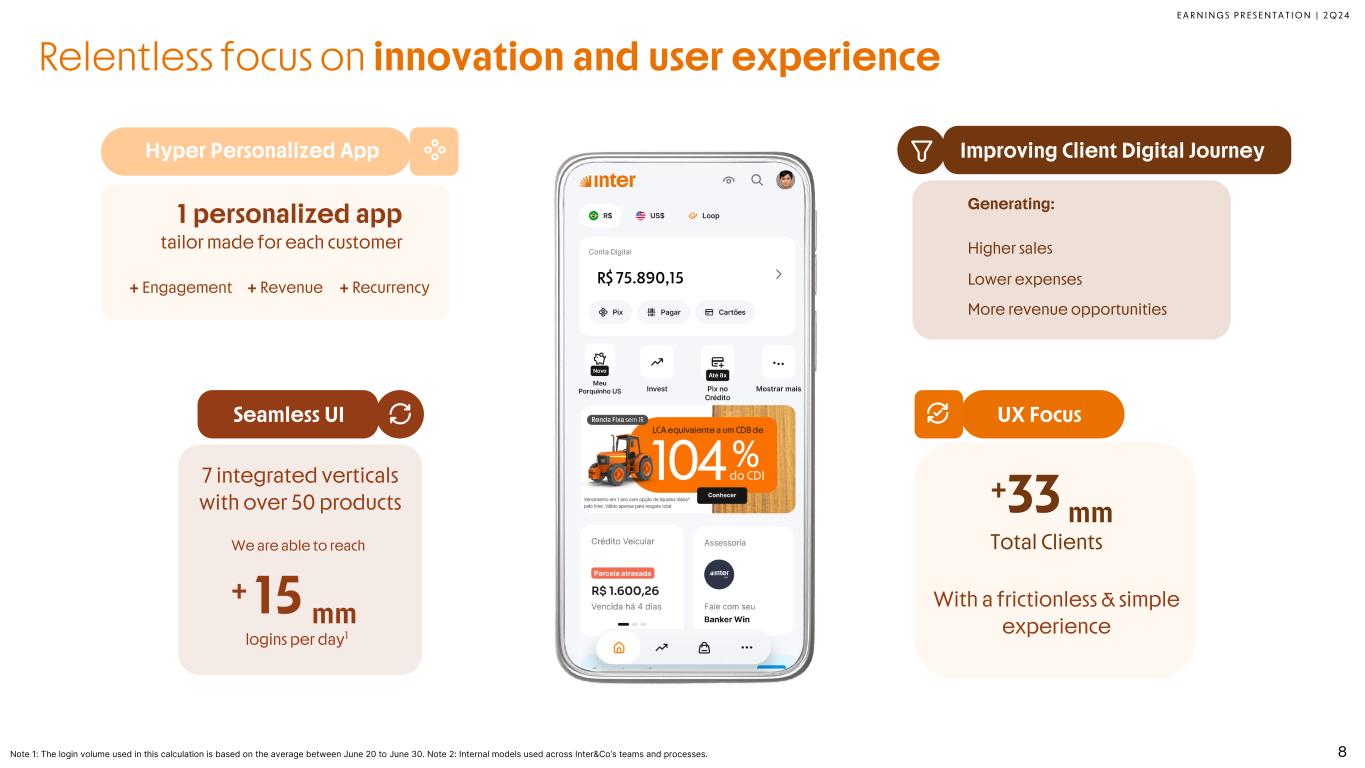
E A R N I N G S P R E S E N T A T I O N | 2 Q 2 4 R$ 75.890,15 Relentless focus on innovation and user experience Note 1: The login volume used in this calculation is based on the average between June 20 to June 30. Note 2: Internal models used across Inter&Co’s teams and processes. 8 Seamless UI 7 integrated verticals with over 50 products + 15 mm logins per day1 We are able to reach + Engagement + Revenue + Recurrency Hyper Personalized App 1 personalized app tailor made for each customer Improving Client Digital Journey Generating: Higher sales Lower expenses More revenue opportunities UX Focus +33mm Total Clients With a frictionless & simple experience
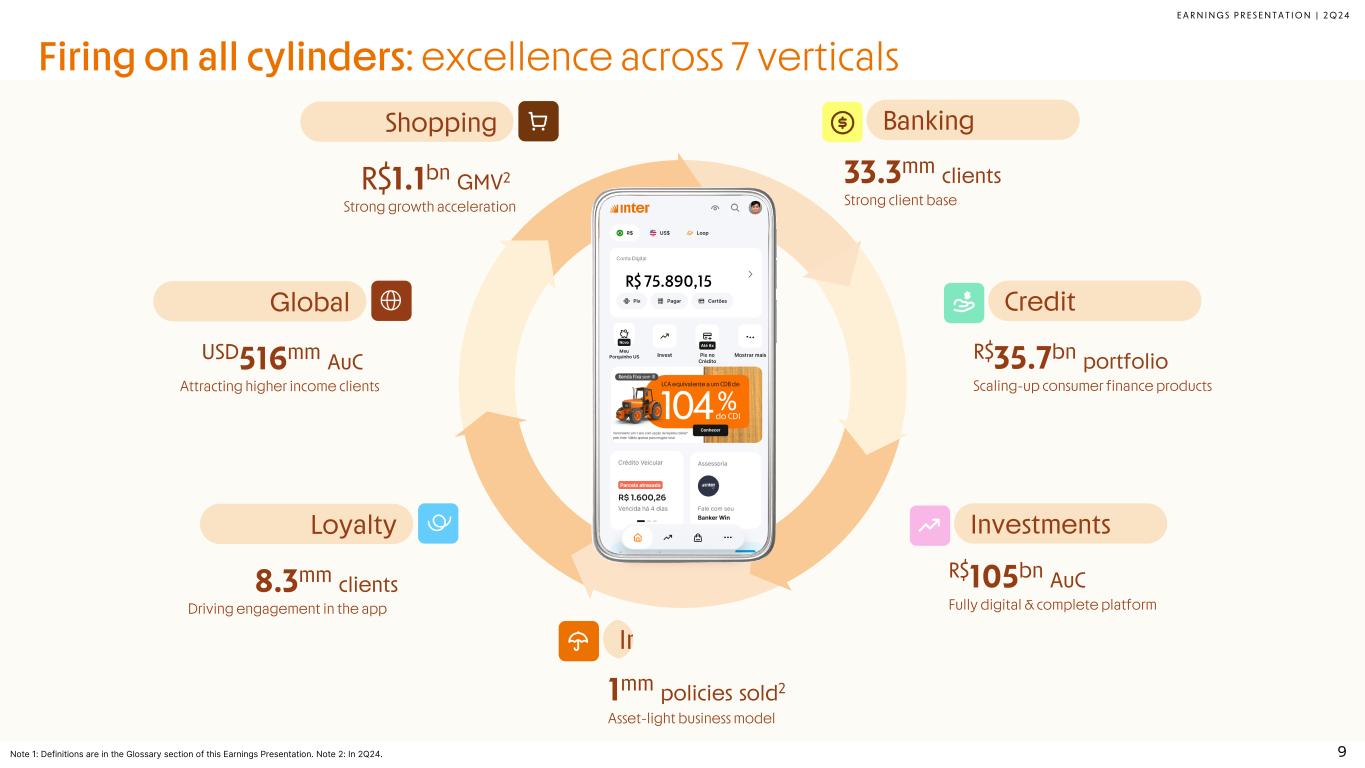
E A R N I N G S P R E S E N T A T I O N | 2 Q 2 4 Firing on all cylinders: excellence across 7 verticals 9 Banking 33.3mm clients Strong client base Credit R$35.7bn portfolio Scaling-up consumer finance products Insurance 1mm policies sold2 Asset-light business model Shopping R$1.1bn GMV2 Strong growth acceleration Global USD516mm AuC Attracting higher income clients Loyalty 8.3mm clients Driving engagement in the app Note 1: Definitions are in the Glossary section of this Earnings Presentation. Note 2: In 2Q24. Investments R$105bn AuC Fully digital & complete platform R$ 75.890,15

E A R N I N G S P R E S E N T A T I O N | 2 Q 2 4 Agenda 1.CEO Overview 2.Business Update 3.Financial Performance
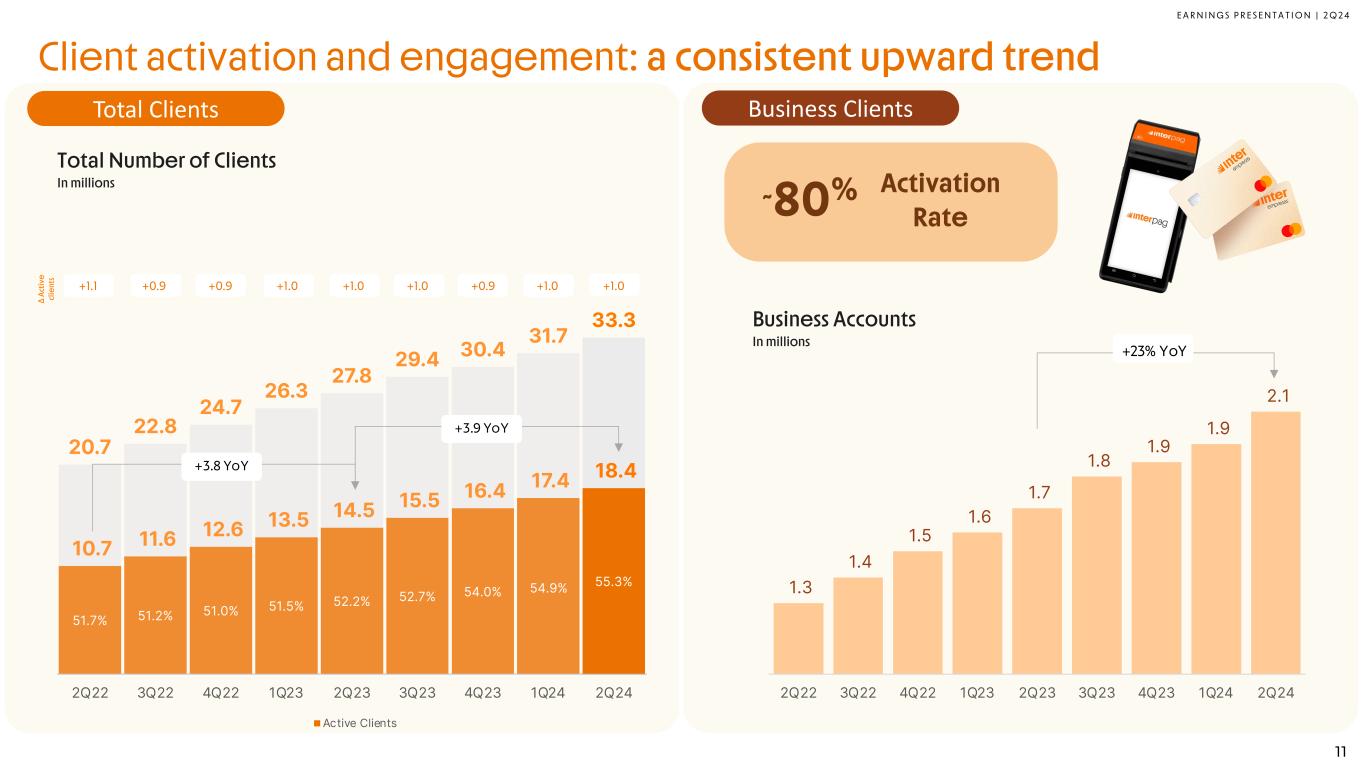
E A R N I N G S P R E S E N T A T I O N | 2 Q 2 4 Client activation and engagement: a consistent upward trend 51.7% 51.2% 51.0% 51.5% 52.2% 52.7% 54.0% 54.9% 55.3% 10.7 11.6 12.6 13.5 14.5 15.5 16.4 17.4 18.4 20.7 22.8 24.7 26.3 27.8 29.4 30.4 31.7 33.3 - 5 .0 1 0. 1 5.0 2 0. 2 5.0 3 0. 3 5.0 2Q22 3Q22 4Q22 1Q23 2Q23 3Q23 4Q23 1Q24 2Q24 Active Clients Total Number of Clients In millions Δ Ac tiv e cl ie nt s 11 +1.1 +0.9 +0.9 +1.0 +1.0 +1.0 +0.9 +1.0 +1.0 1.3 1.4 1.5 1.6 1.7 1.8 1.9 1.9 2.1 1 .0 1 .2 1 .4 1 .6 1 .8 2 .0 2 .2 2Q22 3Q22 4Q22 1Q23 2Q23 3Q23 4Q23 1Q24 2Q24 Business Accounts In millions +23% YoY Business ClientsTotal Clients ˜80% Activation Rate +3.9 YoY +3.8 YoY
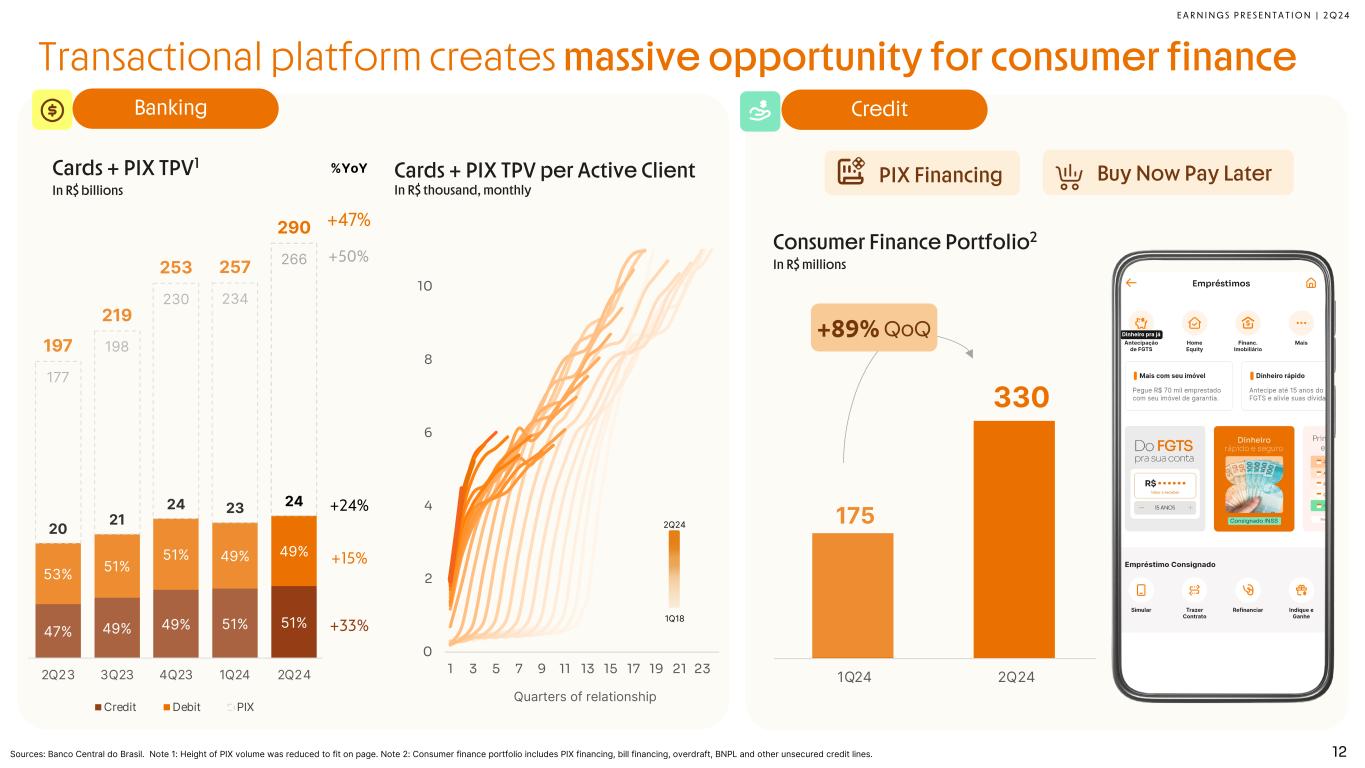
E A R N I N G S P R E S E N T A T I O N | 2 Q 2 4 Quarters of relationship Cards + PIX TPV per Active Client In R$ thousand, monthly Cards + PIX TPV1 In R$ billions Transactional platform creates massive opportunity for consumer finance Sources: Banco Central do Brasil. Note 1: Height of PIX volume was reduced to fit on page. Note 2: Consumer finance portfolio includes PIX financing, bill financing, overdraft, BNPL and other unsecured credit lines. 2Q24 1Q18 12 Banking 47% 49% 49% 51% 51% 53% 51% 51% 49% 49% 20 21 24 23 24 177 198 230 234 266 197 219 253 257 290 0. 0 10. 0 20 .0 30 .0 40 .0 50 .0 60 .0 70 .0 80 .0 2Q23 3Q23 4Q23 1Q24 2Q24 Credit Debit PIX %YoY +47% +50% +24% +15% +33% Credit 175 330 1Q24 2Q24 Consumer Finance Portfolio2 In R$ millions QoQ+89% PIX Financing Buy Now Pay Later 0 2 4 6 8 10 1 3 5 7 9 11 13 15 17 19 21 23
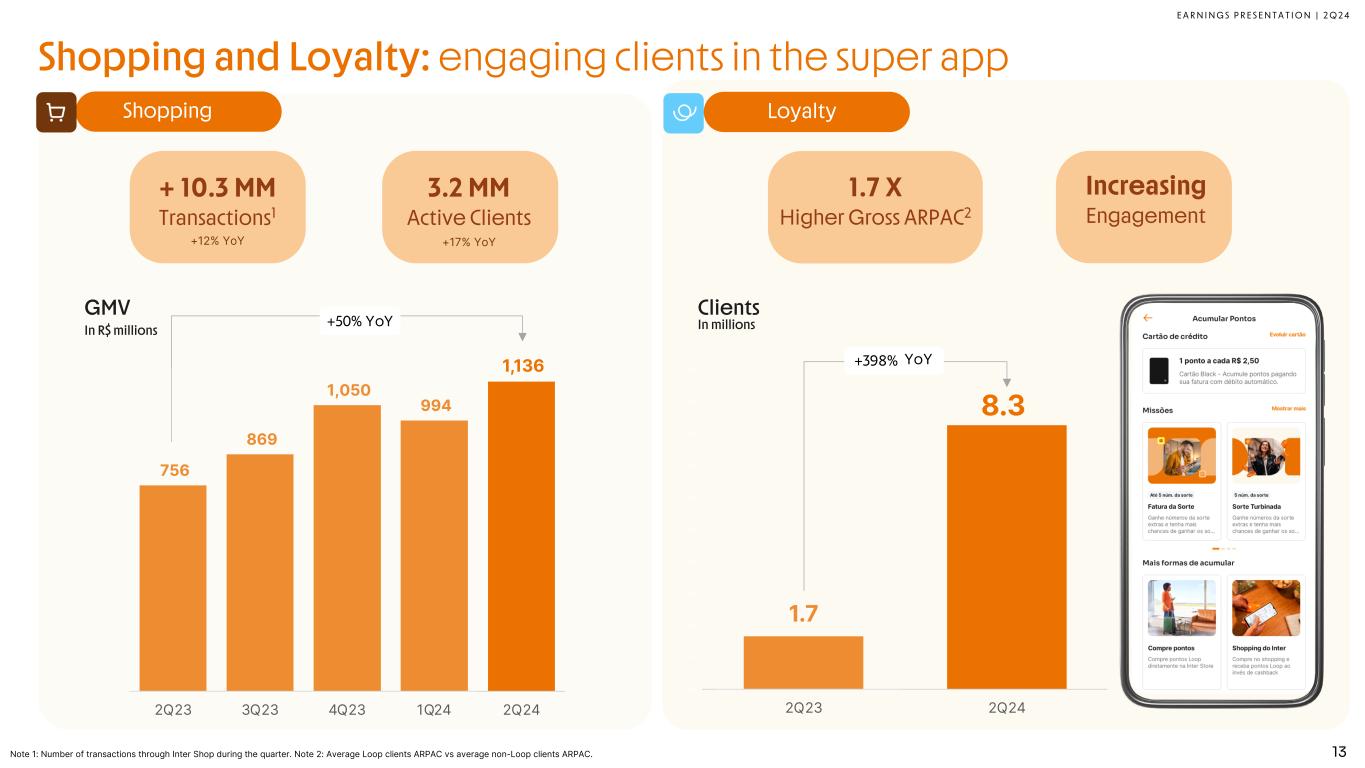
E A R N I N G S P R E S E N T A T I O N | 2 Q 2 4 GMV In R$ millions 756 869 1,050 994 1,136 2Q23 3Q23 4Q23 1Q24 2Q24 13 Shopping and Loyalty: engaging clients in the super app +50% YoY Shopping Loyalty 1.7 8.3 0.0 1.0 2. 0 3. 0 4.0 5. 0 6.0 7.0 8.0 9.0 10.0 2Q23 2Q24 Clients In millions +398% YoY 1.7 X Higher Gross ARPAC2 Increasing Engagement + 10.3 MM Transactions1 +12% YoY 3.2 MM Active Clients +17% YoY Note 1: Number of transactions through Inter Shop during the quarter. Note 2: Average Loop clients ARPAC vs average non-Loop clients ARPAC.
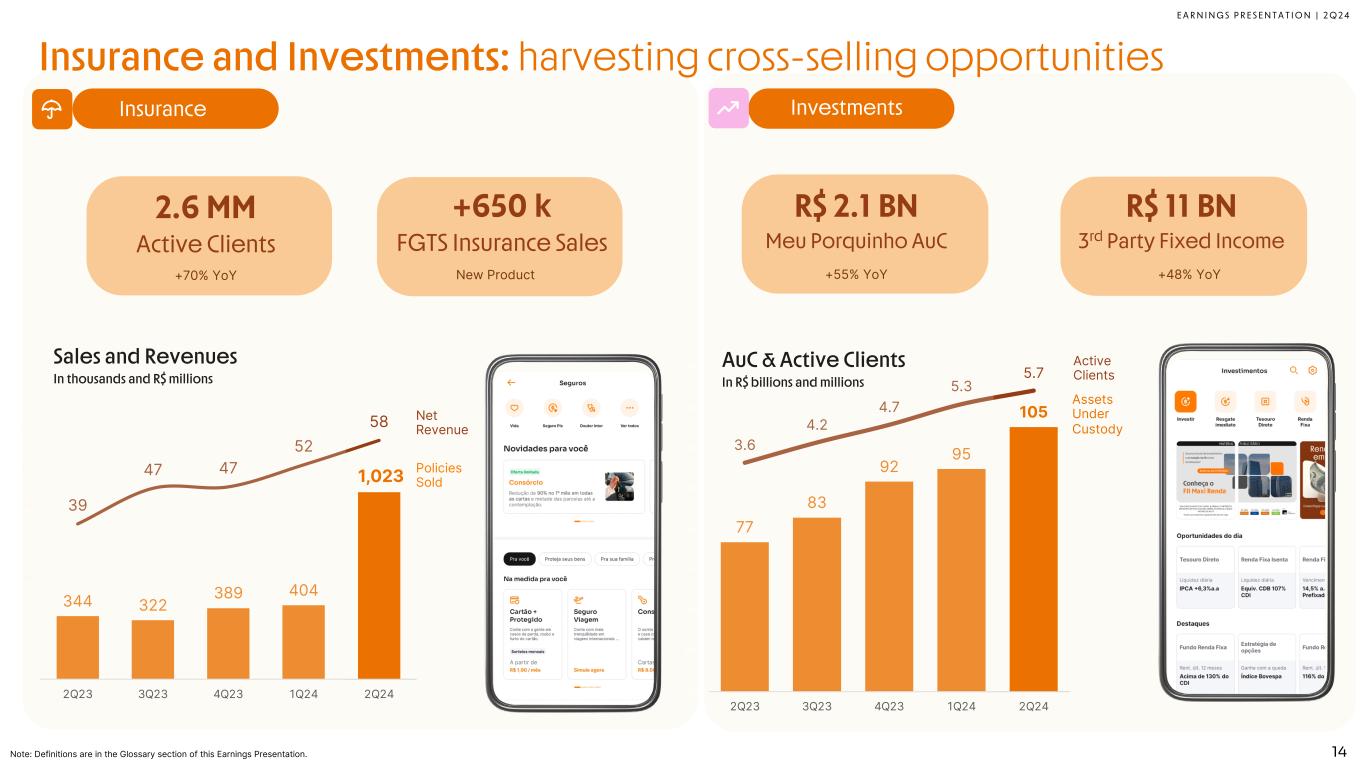
E A R N I N G S P R E S E N T A T I O N | 2 Q 2 4 14 Insurance 344 322 389 404 1,023 39 47 47 52 58 0 10 2 0 3 0 4 0 5 0 6 0 -5 0 150 35 0 55 0 75 0 950 115 0 135 0 2Q23 3Q23 4Q23 1Q24 2Q24 +650 k FGTS Insurance Sales New Product Policies Sold Investments 77 83 92 95 105 3.6 4.2 4.7 5.3 5.7 -3. 0 -2. 0 -1.0 0. 0 1.0 2. 0 3. 0 4. 0 5. 0 6. 0 7. 0 40.0 50.0 60.0 70.0 80.0 90.0 100.0 110.0 120.0 2Q23 3Q23 4Q23 1Q24 2Q24 R$ 2.1 BN Meu Porquinho AuC +55% YoY R$ 11 BN 3rd Party Fixed Income +48% YoY 2.6 MM Active Clients +70% YoY Sales and Revenues In thousands and R$ millions Net Revenue AuC & Active Clients In R$ billions and millions Assets Under Custody Active Clients Note: Definitions are in the Glossary section of this Earnings Presentation. Insurance and Investments: harvesting cross-selling opportunities
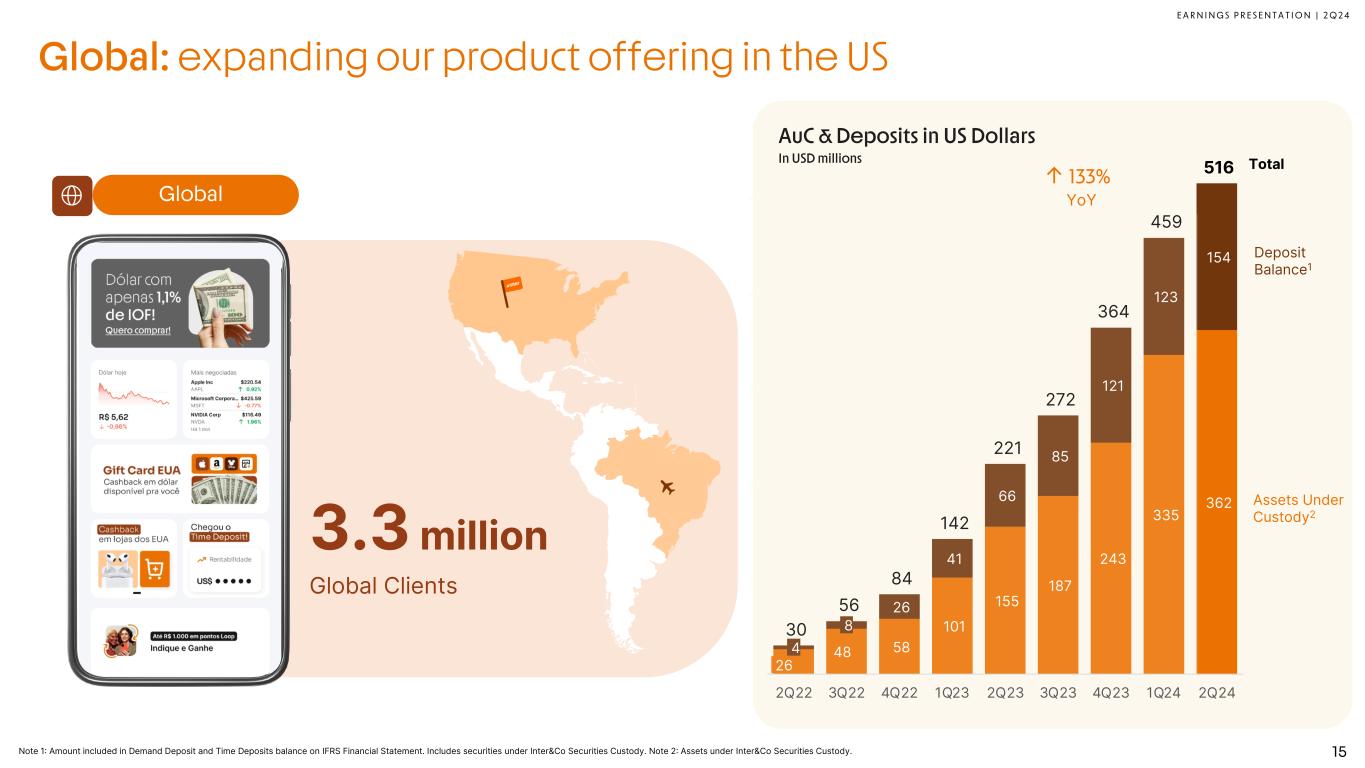
E A R N I N G S P R E S E N T A T I O N | 2 Q 2 4 26 48 58 101 155 187 243 335 362 4 8 26 41 66 85 121 123 154 30 56 84 142 221 272 364 459 516 - 100 200 300 400 500 2Q22 3Q22 4Q22 1Q23 2Q23 3Q23 4Q23 1Q24 2Q24 AuC & Deposits in US Dollars In USD millions Assets Under Custody2 Deposit Balance1 Total Note 1: Amount included in Demand Deposit and Time Deposits balance on IFRS Financial Statement. Includes securities under Inter&Co Securities Custody. Note 2: Assets under Inter&Co Securities Custody. Global: expanding our product offering in the US 3.3million Global Clients ↑ YoY 15 133% Global

E A R N I N G S P R E S E N T A T I O N | 2 Q 2 4 Agenda 1.CEO Overview 2.Business Update 3.Financial Performance
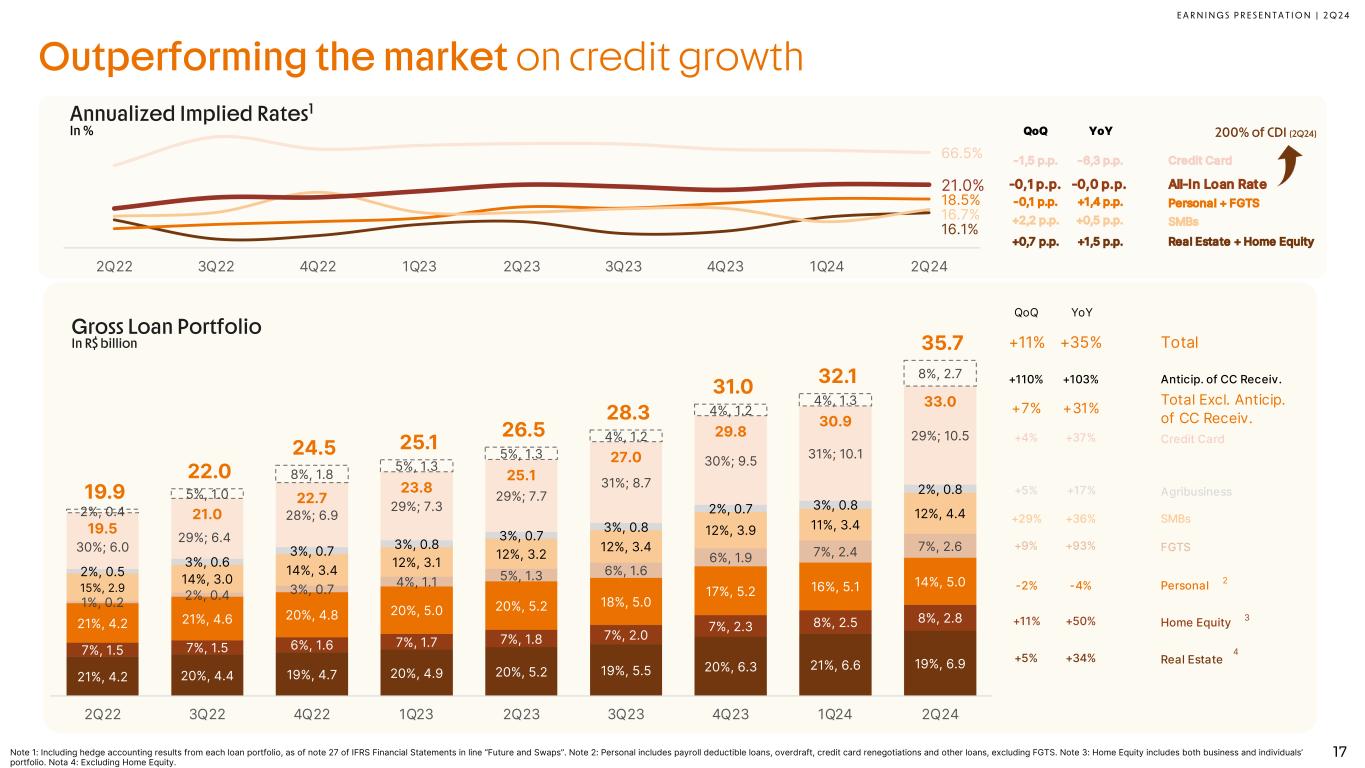
E A R N I N G S P R E S E N T A T I O N | 2 Q 2 4 Outperforming the market on credit growth Annualized Implied Rates1 In % 21%, 4.2 20%, 4.4 19%, 4.7 20%, 4.9 20%, 5.2 19%, 5.5 20%, 6.3 21%, 6.6 19%, 6.9 7%, 1.5 7%, 1.5 6%, 1.6 7%, 1.7 7%, 1.8 7%, 2.0 7%, 2.3 8%, 2.5 8%, 2.821%, 4.2 21%, 4.6 20%, 4.8 20%, 5.0 20%, 5.2 18%, 5.0 17%, 5.2 16%, 5.1 14%, 5.0 1%, 0.2 2%, 0.4 3%, 0.7 4%, 1.1 5%, 1.3 6%, 1.6 6%, 1.9 7%, 2.4 7%, 2.6 15%, 2.9 14%, 3.0 14%, 3.4 12%, 3.1 12%, 3.2 12%, 3.4 12%, 3.9 11%, 3.4 12%, 4.4 2%, 0.5 3%, 0.6 3%, 0.7 3%, 0.8 3%, 0.7 3%, 0.8 2%, 0.7 3%, 0.8 2%, 0.8 30%; 6.0 29%; 6.4 28%; 6.9 29%; 7.3 29%; 7.7 31%; 8.7 30%; 9.5 31%; 10.1 29%; 10.5 19.5 21.0 22.7 23.8 25.1 27.0 29.8 30.9 33.0 2%, 0.4 5%, 1.0 8%, 1.8 5%, 1.3 5%, 1.3 4%, 1.2 4%, 1.2 4%, 1.3 8%, 2.7 19.9 22.0 24.5 25.1 26.5 28.3 31.0 32.1 35.7 0 .0 5 .0 10 .0 15 .0 2 0. 0 2 5. 0 3 0. 0 3 5. 0 4 0. 0 2Q22 3Q22 4Q22 1Q23 2Q23 3Q23 4Q23 1Q24 2Q24 Gross Loan Portfolio In R$ billion 16.1% 18.5% 16.7% 21.0% 66.5% 0 .0 % 10 .0 % 2 0. 0% 3 0. 0% 4 0. 0% 5 0. 0% 6 0. 0% 7 0. 0% 8 0. 0% 2Q22 3Q22 4Q22 1Q23 2Q23 3Q23 4Q23 1Q24 2Q24 17 QoQ YoY +11% +35% Total +110% +103% Anticip. of CC Receiv. +7% +31% Total Excl. Anticip. of CC Receiv. +4% +37% Credit Card +5% +17% Agribusiness +29% +36% SMBs +9% +93% FGTS -2% -4% Personal +11% +50% Home Equity +5% +34% Real Estate QoQ YoY -1,5 p.p. -6,3 p.p. Credit Card -0,1 p.p. -0,0 p.p. All-In Loan Rate -0,1 p.p. +1,4 p.p. Personal + FGTS +2,2 p.p. +0,5 p.p. SMBs +0,7 p.p. +1,5 p.p. Real Estate + Home Equity 200% of CDI (2Q24) Note 1: Including hedge accounting results from each loan portfolio, as of note 27 of IFRS Financial Statements in line “Future and Swaps”. Note 2: Personal includes payroll deductible loans, overdraft, credit card renegotiations and other loans, excluding FGTS. Note 3: Home Equity includes both business and individuals’ portfolio. Nota 4: Excluding Home Equity. 2 3 4
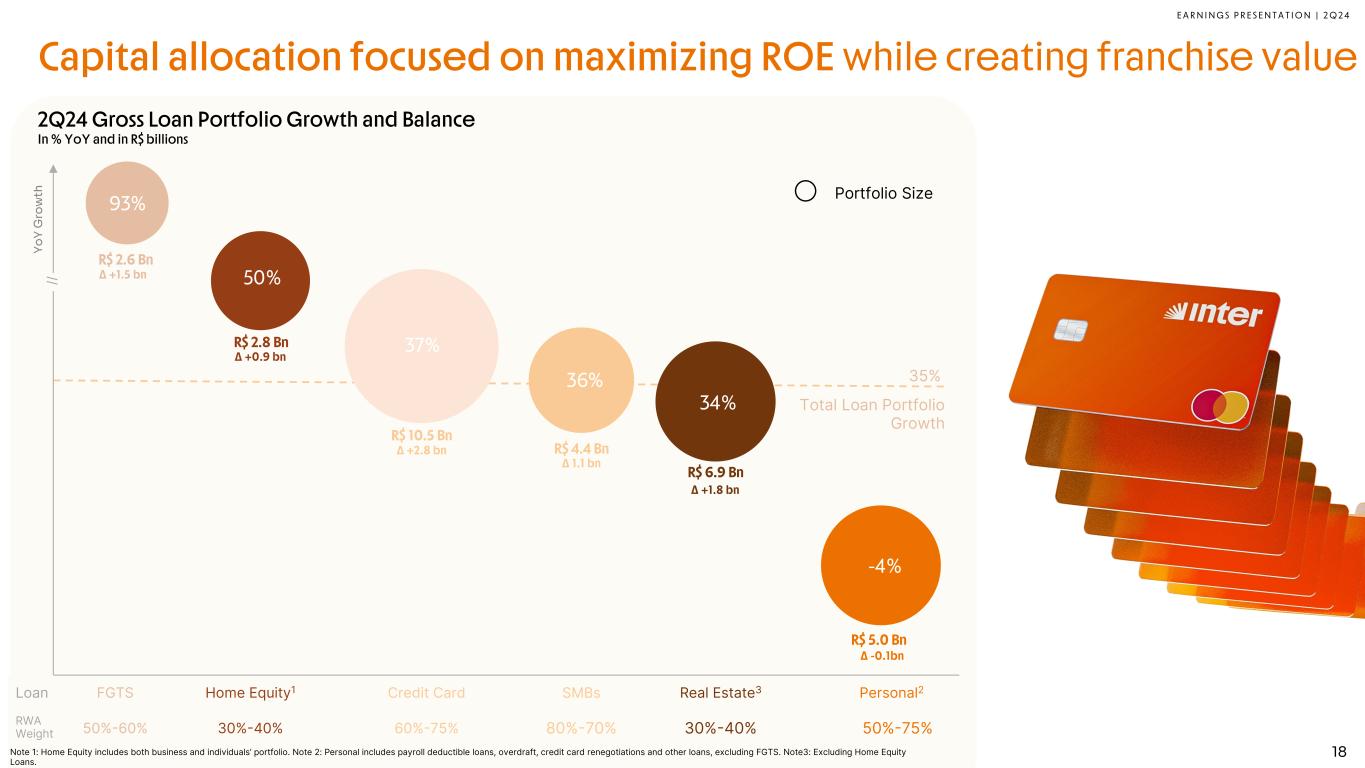
E A R N I N G S P R E S E N T A T I O N | 2 Q 2 4 2Q24 Gross Loan Portfolio Growth and Balance In % YoY and in R$ billions Total Loan Portfolio Growth 35% Yo Y G ro w th Portfolio Size // Capital allocation focused on maximizing ROE while creating franchise value 18 R$ 2.6 Bn Δ +1.5 bn 93% R$ 2.8 Bn Δ +0.9 bn 50% R$ 10.5 Bn Δ +2.8 bn 37% R$ 4.4 Bn Δ 1.1 bn 36% R$ 6.9 Bn Δ +1.8 bn 34% R$ 5.0 Bn Δ -0.1bn -4% Personal2 50%-75% Credit Card 60%-75% FGTS 50%-60% Home Equity1 30%-40%RWA Weight Loan Real Estate3 30%-40% SMBs 80%-70% Note 1: Home Equity includes both business and individuals’ portfolio. Note 2: Personal includes payroll deductible loans, overdraft, credit card renegotiations and other loans, excluding FGTS. Note3: Excluding Home Equity Loans.
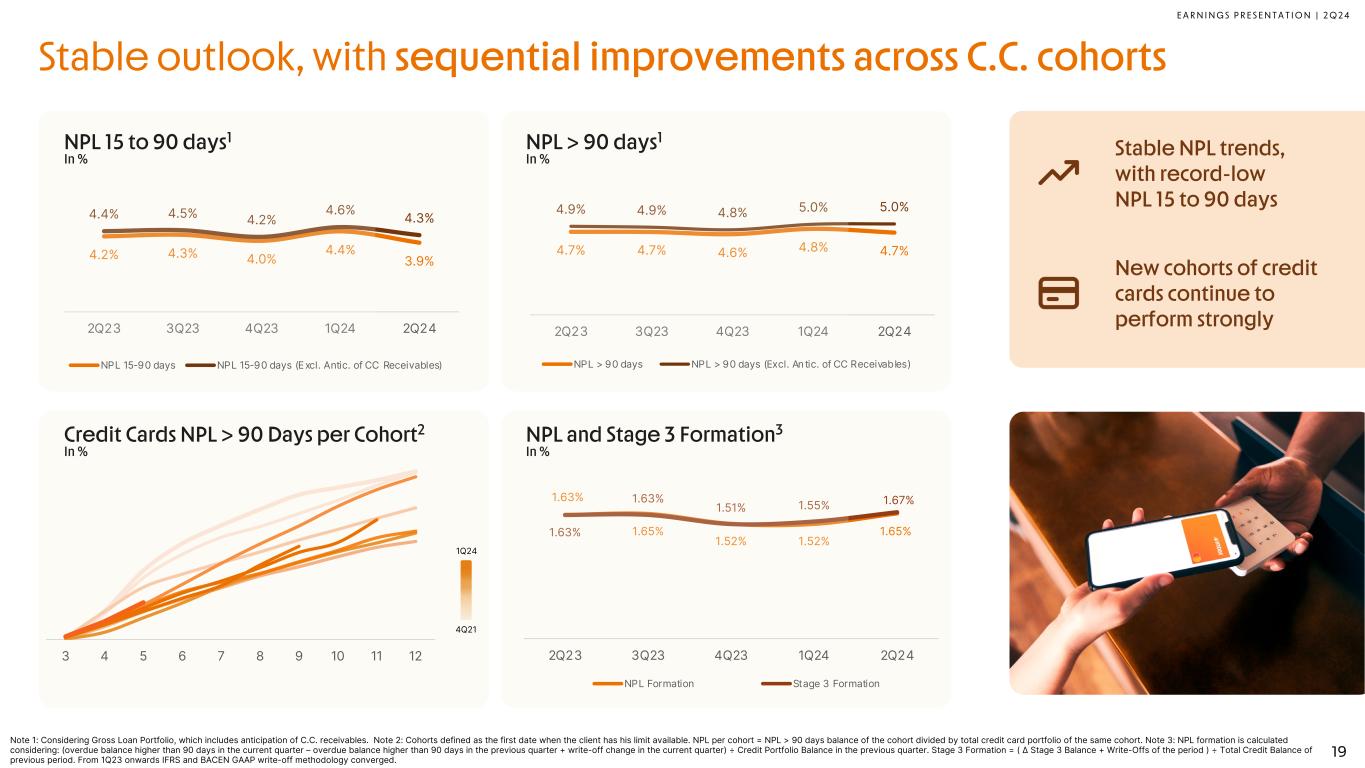
E A R N I N G S P R E S E N T A T I O N | 2 Q 2 4 Stable outlook, with sequential improvements across C.C. cohorts Stable NPL trends, with record-low NPL 15 to 90 days New cohorts of credit cards continue to perform strongly 3 4 5 6 7 8 9 10 11 12 4.7% 4.7% 4.6% 4.8% 4.7% 4.9% 4.9% 4.8% 5.0% 5.0% 1.0% 2.0% 3.0% 4.0% 5.0% 6.0% 7.0% 8.0% 2Q23 3Q23 4Q23 1Q24 2Q24 NPL > 90 days NPL > 90 days (Excl. Antic. of CC Receivables) 4.2% 4.3% 4.0% 4.4% 3.9% 4.4% 4.5% 4.2% 4.6% 4.3% 1.0% 2.0% 3.0% 4.0% 5.0% 6.0% 7.0% 8.0% 2Q23 3Q23 4Q23 1Q24 2Q24 NPL 15-90 days NPL 15-90 days (Excl. Antic. of CC Receivables) 1.63% 1.65% 1.52% 1.52% 1.65%1.63% 1.63% 1.51% 1.55% 1.67% 0 .0 % 0 .5 % 1. 0% 1. 5% 2 .0 % 2Q23 3Q23 4Q23 1Q24 2Q24 NPL Formation Stage 3 Formation NPL > 90 days1 In % Credit Cards NPL > 90 Days per Cohort2 In % NPL 15 to 90 days1 In % NPL and Stage 3 Formation3 In % Note 1: Considering Gross Loan Portfolio, which includes anticipation of C.C. receivables. Note 2: Cohorts defined as the first date when the client has his limit available. NPL per cohort = NPL > 90 days balance of the cohort divided by total credit card portfolio of the same cohort. Note 3: NPL formation is calculated considering: (overdue balance higher than 90 days in the current quarter – overdue balance higher than 90 days in the previous quarter + write-off change in the current quarter) ÷ Credit Portfolio Balance in the previous quarter. Stage 3 Formation = ( Δ Stage 3 Balance + Write-Offs of the period ) ÷ Total Credit Balance of previous period. From 1Q23 onwards IFRS and BACEN GAAP write-off methodology converged. 1Q24 4Q21 19
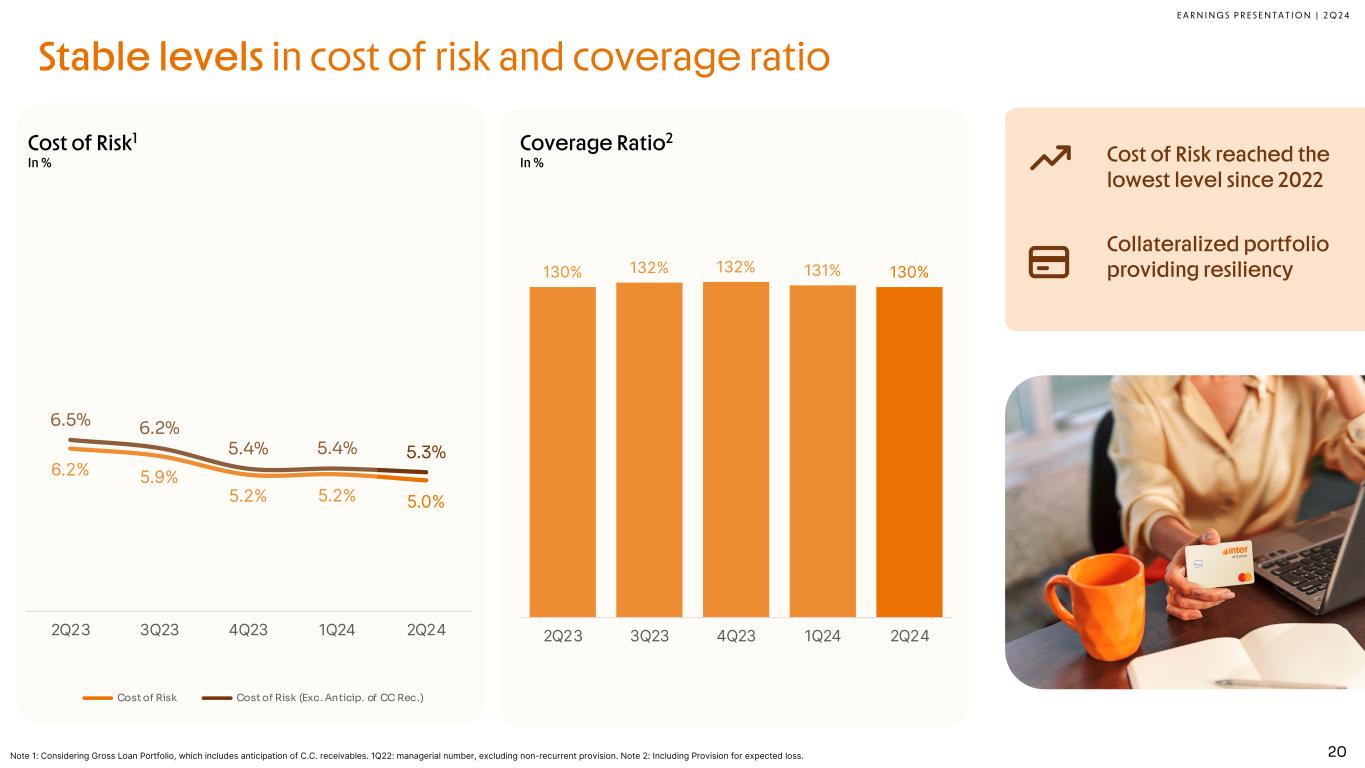
E A R N I N G S P R E S E N T A T I O N | 2 Q 2 4 Coverage Ratio2 In % 6.2% 5.9% 5.2% 5.2% 5.0% 6.5% 6.2% 5.4% 5.4% 5.3% 2Q23 3Q23 4Q23 1Q24 2Q24 Cost of Risk Cost of Risk (Exc. Anticip. of CC Rec.) 130% 132% 132% 131% 130% 2Q23 3Q23 4Q23 1Q24 2Q24 Cost of Risk1 In % Stable levels in cost of risk and coverage ratio Note 1: Considering Gross Loan Portfolio, which includes anticipation of C.C. receivables. 1Q22: managerial number, excluding non-recurrent provision. Note 2: Including Provision for expected loss. 20 Cost of Risk reached the lowest level since 2022 Collateralized portfolio providing resiliency
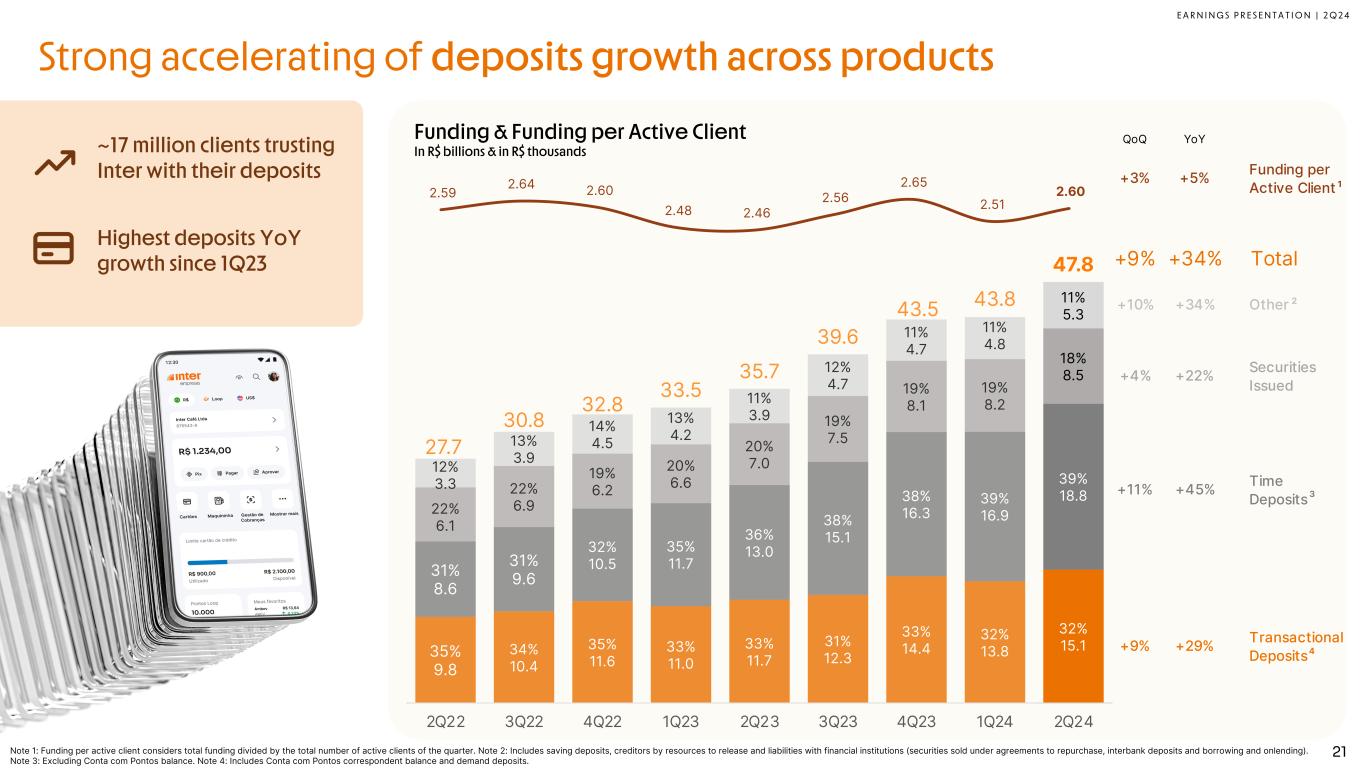
E A R N I N G S P R E S E N T A T I O N | 2 Q 2 4 35% 9.8 34% 10.4 35% 11.6 33% 11.0 33% 11.7 31% 12.3 33% 14.4 32% 13.8 32% 15.1 31% 8.6 31% 9.6 32% 10.5 35% 11.7 36% 13.0 38% 15.1 38% 16.3 39% 16.9 39% 18.8 22% 6.1 22% 6.9 19% 6.2 20% 6.6 20% 7.0 19% 7.5 19% 8.1 19% 8.2 18% 8.5 12% 3.3 13% 3.9 14% 4.5 13% 4.2 11% 3.9 12% 4.7 11% 4.7 11% 4.8 11% 5.3 27.7 30.8 32.8 33.5 35.7 39.6 43.5 43.8 47.8 2Q22 3Q22 4Q22 1Q23 2Q23 3Q23 4Q23 1Q24 2Q24 Strong accelerating of deposits growth across products Funding & Funding per Active Client In R$ billions & in R$ thousands Note 1: Funding per active client considers total funding divided by the total number of active clients of the quarter. Note 2: Includes saving deposits, creditors by resources to release and liabilities with financial institutions (securities sold under agreements to repurchase, interbank deposits and borrowing and onlending). Note 3: Excluding Conta com Pontos balance. Note 4: Includes Conta com Pontos correspondent balance and demand deposits. ~17 million clients trusting Inter with their deposits Highest deposits YoY growth since 1Q23 21 QoQ YoY +3% +5% Funding per Active Client +9% +34% Total +10% +34% Other +4% +22% Securities Issued +11% +45% Time Deposits +9% +29% Transactional Deposits 2.59 2.64 2.60 2.48 2.46 2.56 2.65 2.51 2.60 1 2 3 4
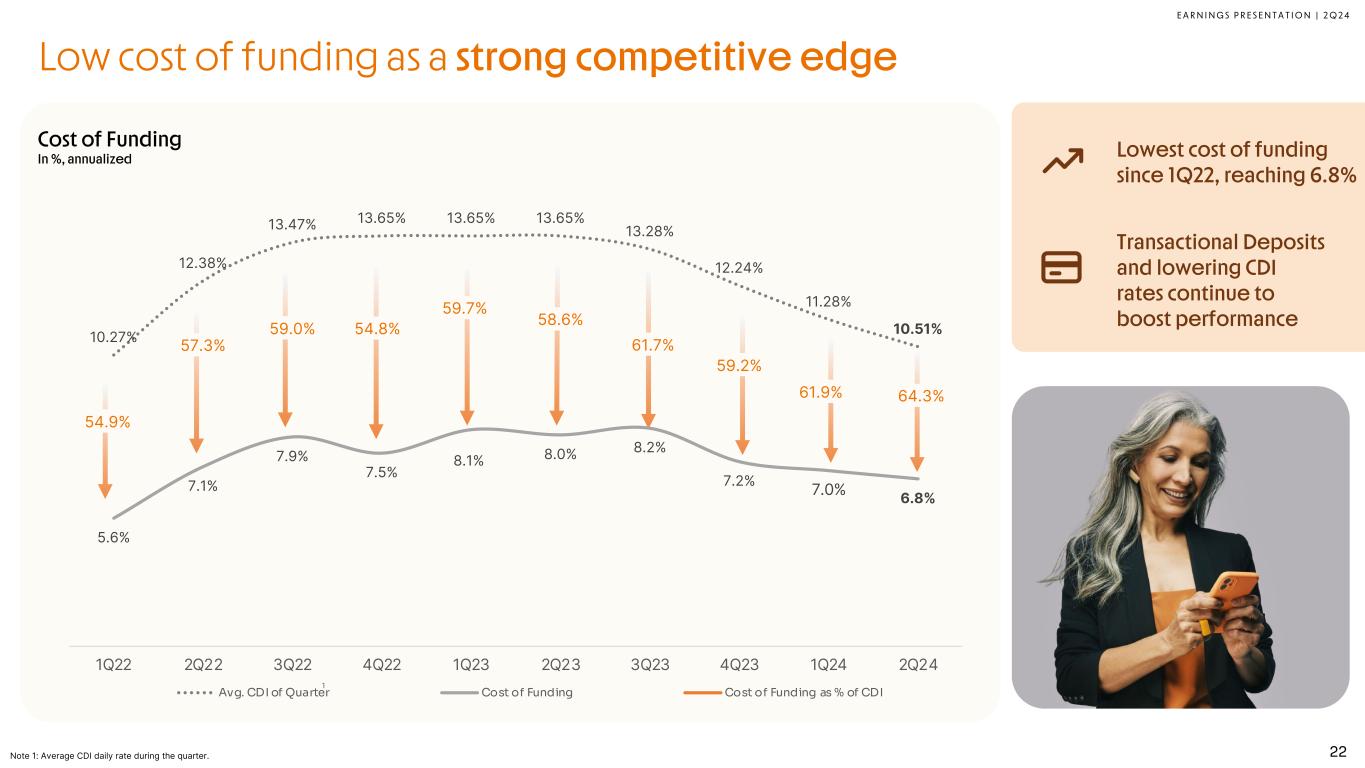
E A R N I N G S P R E S E N T A T I O N | 2 Q 2 4 Avg. CDI of Quarter Cost of Funding Cost of Funding as % of CDI Cost of Funding In %, annualized Low cost of funding as a strong competitive edge Note 1: Average CDI daily rate during the quarter. 1 10.27% 12.38% 13.47% 13.65% 13.65% 13.65% 13.28% 12.24% 11.28% 10.51% 5.6% 7.1% 7.9% 7.5% 8.1% 8.0% 8.2% 7.2% 7.0% 6.8% 54.9% 57.3% 59.0% 54.8% 59.7% 58.6% 61.7% 59.2% 61.9% 64.3% 2.0% 4.0 % 6.0 % 8.0% 10.0% 12.0% 14.0% 1Q22 2Q22 3Q22 4Q22 1Q23 2Q23 3Q23 4Q23 1Q24 2Q24 22 Lowest cost of funding since 1Q22, reaching 6.8% Transactional Deposits and lowering CDI rates continue to boost performance
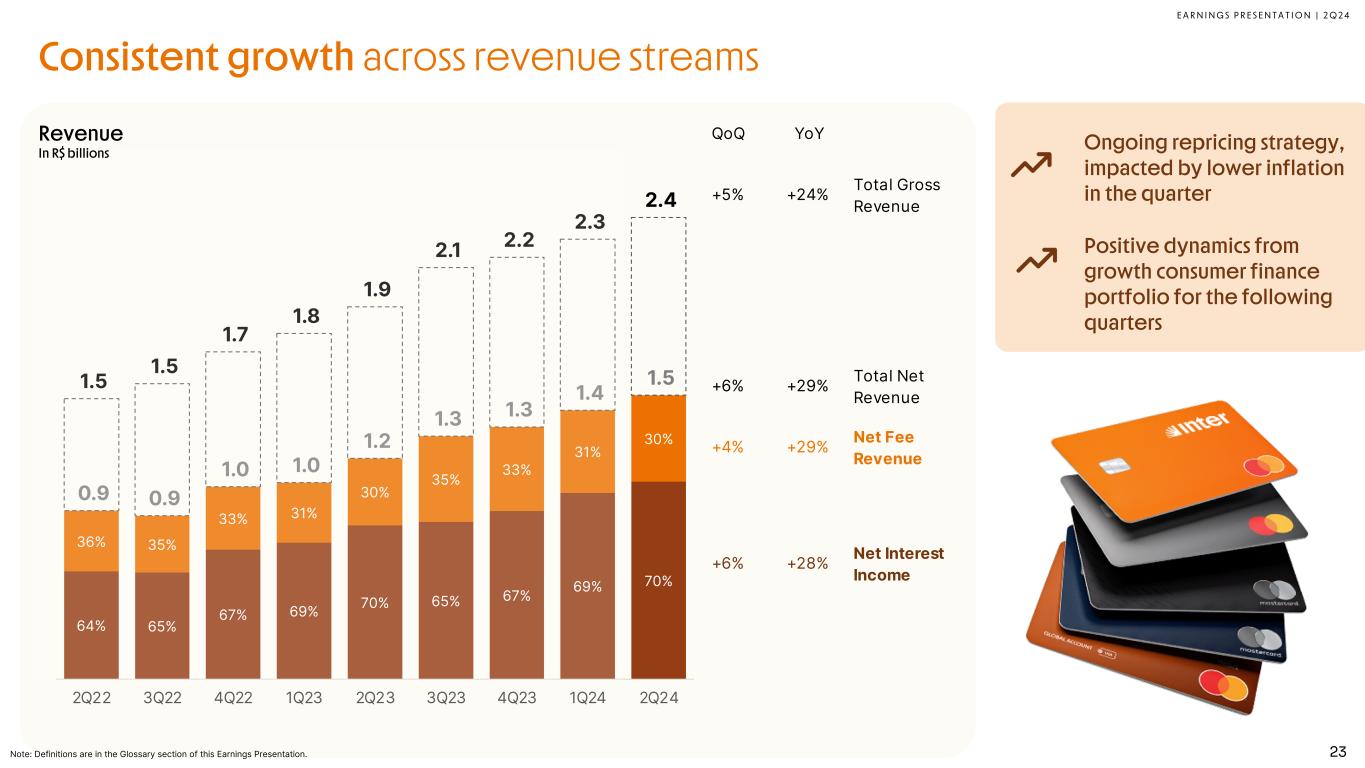
E A R N I N G S P R E S E N T A T I O N | 2 Q 2 4 64% 65% 67% 69% 70% 65% 67% 69% 70% 36% 35% 33% 31% 30% 35% 33% 31% 30% 0.9 0.9 1.0 1.0 1.2 1.3 1.3 1.4 1.5 1.5 1.5 1.7 1.8 1.9 2.1 2.2 2.3 2.4 - 0 .5 1 .0 1 .5 2 .0 2 .5 3 .0 2Q22 3Q22 4Q22 1Q23 2Q23 3Q23 4Q23 1Q24 2Q24 Revenue In R$ billions Consistent growth across revenue streams 23 QoQ YoY +5% +24% Total Gross Revenue +6% +29% Total Net Revenue +4% +29% Net Fee Revenue +6% +28% Net Interest Income Ongoing repricing strategy, impacted by lower inflation in the quarter Positive dynamics from growth consumer finance portfolio for the following quarters Note: Definitions are in the Glossary section of this Earnings Presentation.
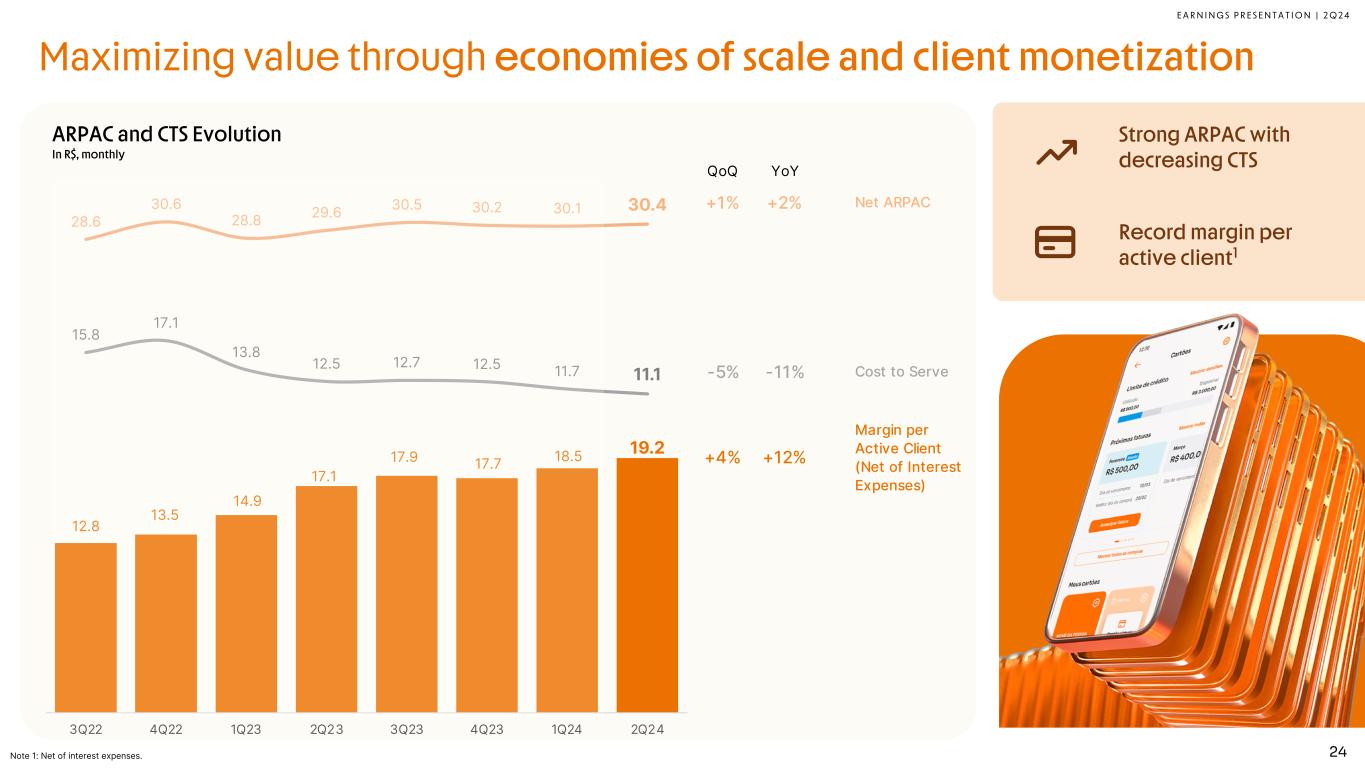
E A R N I N G S P R E S E N T A T I O N | 2 Q 2 4 ARPAC and CTS Evolution In R$, monthly 12.8 13.5 14.9 17.1 17.9 17.7 18.5 19.2 28.6 30.6 28.8 29.6 30.5 30.2 30.1 30.4 15.8 17.1 13.8 12.5 12.7 12.5 11.7 11.1 3Q22 4Q22 1Q23 2Q23 3Q23 4Q23 1Q24 2Q24 Maximizing value through economies of scale and client monetization Note 1: Net of interest expenses. 24 QoQ YoY +1% +2% Net ARPAC -5% -11% Cost to Serve +4% +12% Margin per Active Client (Net of Interest Expenses) Strong ARPAC with decreasing CTS Record margin per active client1
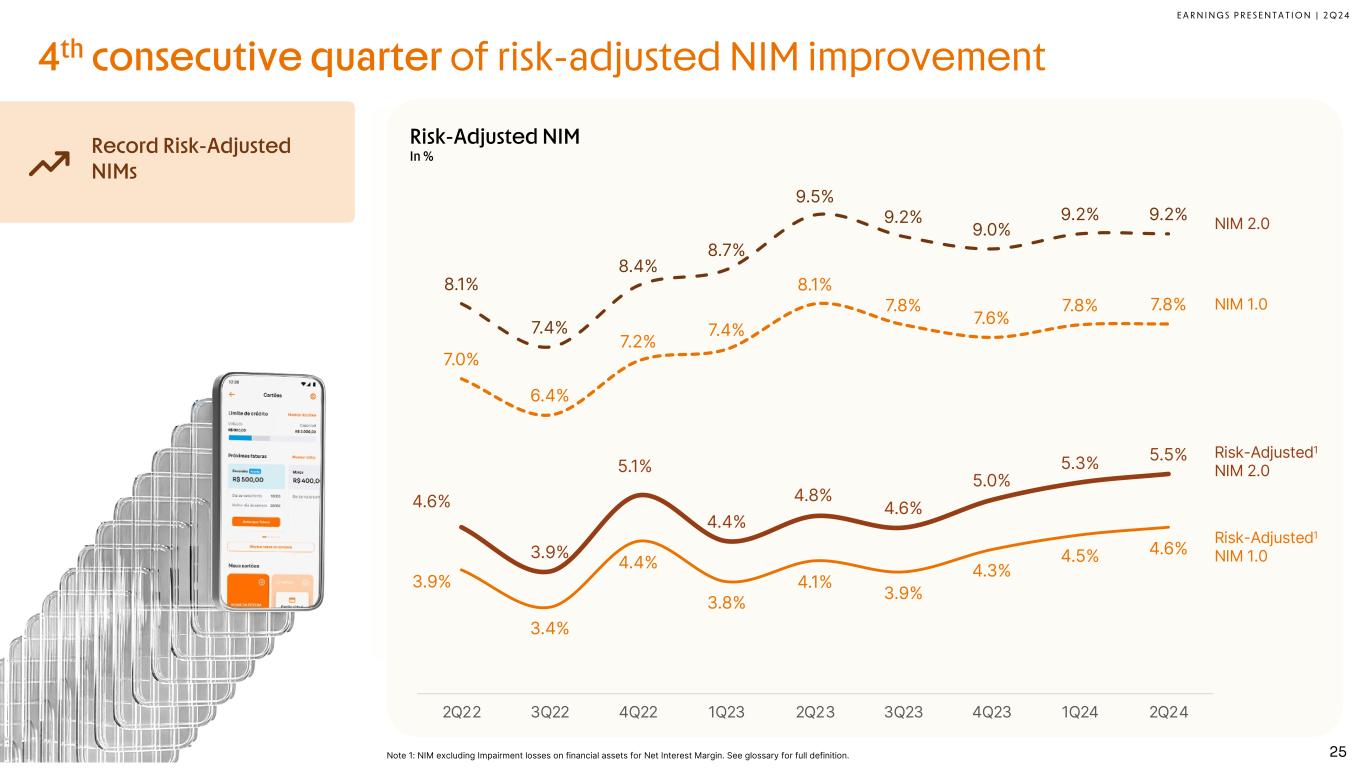
E A R N I N G S P R E S E N T A T I O N | 2 Q 2 4 Risk-Adjusted1 NIM 2.0 Risk-Adjusted1 NIM 1.0 4th consecutive quarter of risk-adjusted NIM improvement NIM 2.0 NIM 1.0 Risk-Adjusted NIM In % 25 3.9% 3.4% 4.4% 3.8% 4.1% 3.9% 4.3% 4.5% 4.6% 4.6% 3.9% 5.1% 4.4% 4.8% 4.6% 5.0% 5.3% 5.5% 7.0% 6.4% 7.2% 7.4% 8.1% 7.8% 7.6% 7.8% 7.8% 8.1% 7.4% 8.4% 8.7% 9.5% 9.2% 9.0% 9.2% 9.2% 2. 0% 3. 0% 4. 0% 5. 0% 6. 0% 7. 0% 8. 0% 9. 0% 10. 0% 2Q22 3Q22 4Q22 1Q23 2Q23 3Q23 4Q23 1Q24 2Q24 Record Risk-Adjusted NIMs Note 1: NIM excluding Impairment losses on financial assets for Net Interest Margin. See glossary for full definition.
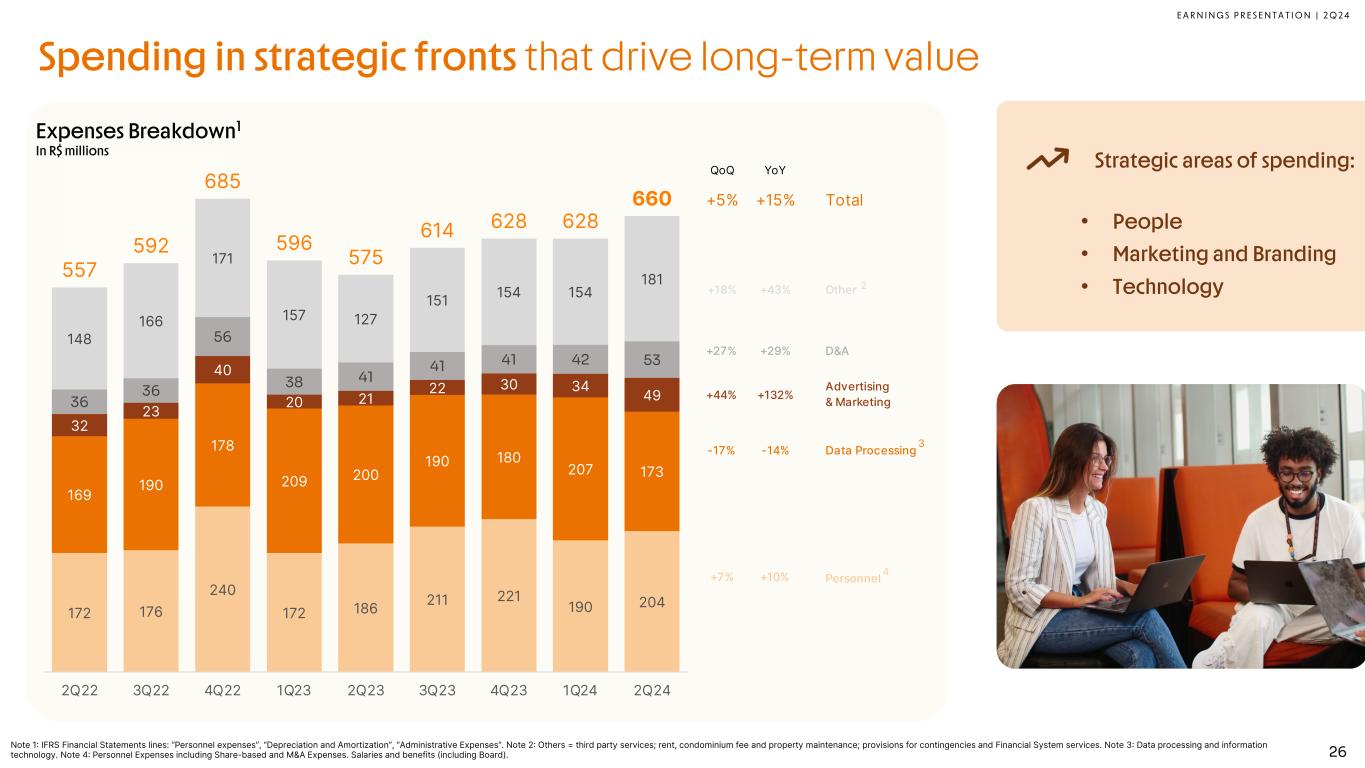
E A R N I N G S P R E S E N T A T I O N | 2 Q 2 4 Note 1: IFRS Financial Statements lines: “Personnel expenses”, “Depreciation and Amortization”, “Administrative Expenses”. Note 2: Others = third party services; rent, condominium fee and property maintenance; provisions for contingencies and Financial System services. Note 3: Data processing and information technology. Note 4: Personnel Expenses including Share-based and M&A Expenses. Salaries and benefits (including Board). 172 176 240 172 186 211 221 190 204 169 190 178 209 200 190 180 207 173 32 23 40 20 21 22 30 34 4936 36 56 38 41 41 41 42 53 148 166 171 157 127 151 154 154 181557 592 685 596 575 614 628 628 660 - 50 5 0 15 0 2 50 3 50 4 50 5 50 6 50 7 50 2Q22 3Q22 4Q22 1Q23 2Q23 3Q23 4Q23 1Q24 2Q24 Expenses Breakdown1 In R$ millions 26 Spending in strategic fronts that drive long-term value QoQ YoY +5% +15% Total +18% +43% Other +27% +29% D&A +44% +132% Advertising & Marketing -17% -14% Data Processing +7% +10% Personnel 2 4 3 Strategic areas of spending: • People • Marketing and Branding • Technology
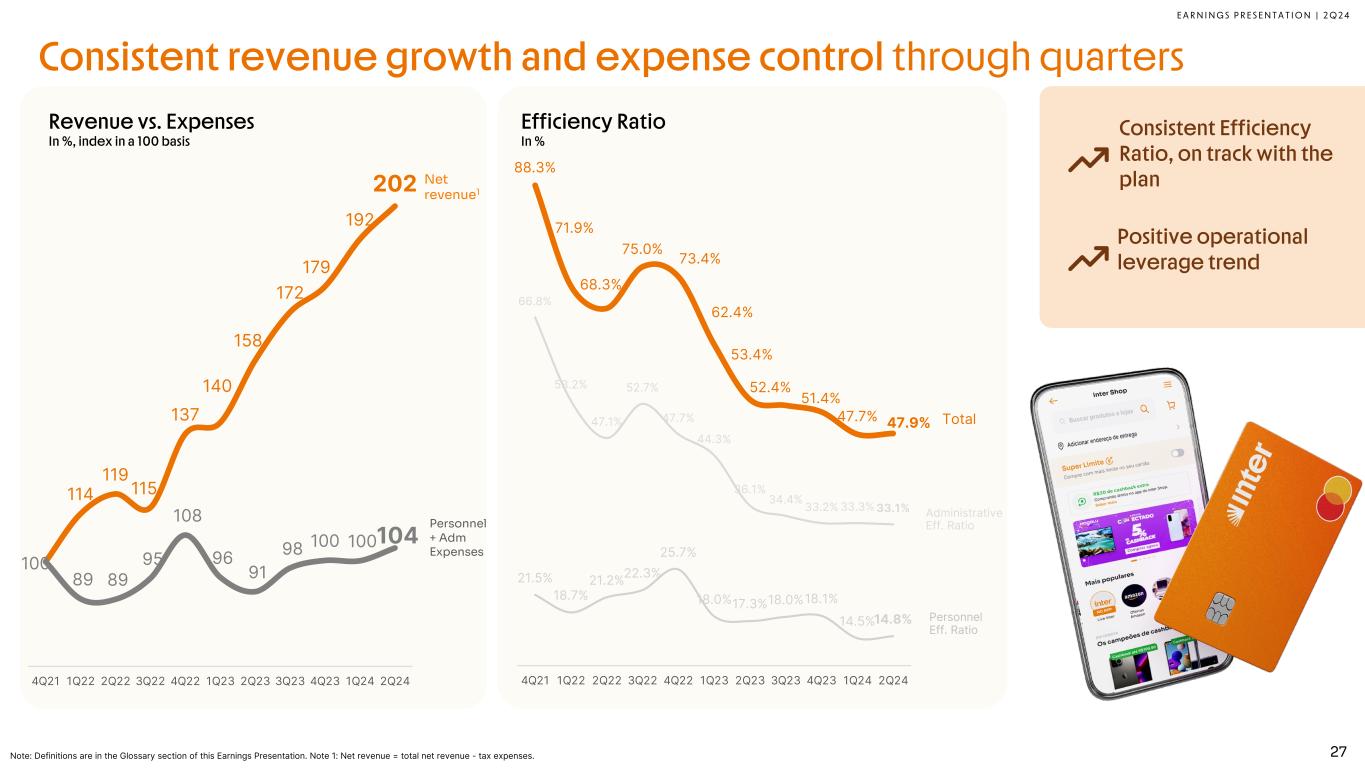
E A R N I N G S P R E S E N T A T I O N | 2 Q 2 4 114 119 115 137 140 158 172 179 192 202 100 89 89 95 108 96 91 98 100 100 104 7 0 10 0 13 0 16 0 19 0 2 20 4Q21 1Q22 2Q22 3Q22 4Q22 1Q23 2Q23 3Q23 4Q23 1Q24 2Q24 88.3% 71.9% 68.3% 75.0% 73.4% 62.4% 53.4% 52.4% 51.4% 47.7% 47.9% 21.5% 18.7% 21.2%22.3% 25.7% 18.0%17.3%18.0%18.1% 14.5%14.8% 66.8% 53.2% 47.1% 52.7% 47.7% 44.3% 36.1% 34.4% 33.2% 33.3%33.1% 10 % 2 0% 3 0% 4 0% 5 0% 6 0% 7 0% 8 0% 9 0% 4Q21 1Q22 2Q22 3Q22 4Q22 1Q23 2Q23 3Q23 4Q23 1Q24 2Q24 Personnel + Adm Expenses Total Administrative Eff. Ratio Personnel Eff. Ratio Consistent revenue growth and expense control through quarters Note: Definitions are in the Glossary section of this Earnings Presentation. Note 1: Net revenue = total net revenue - tax expenses. Revenue vs. Expenses In %, index in a 100 basis Efficiency Ratio In % Net revenue1 27 Consistent Efficiency Ratio, on track with the plan Positive operational leverage trend
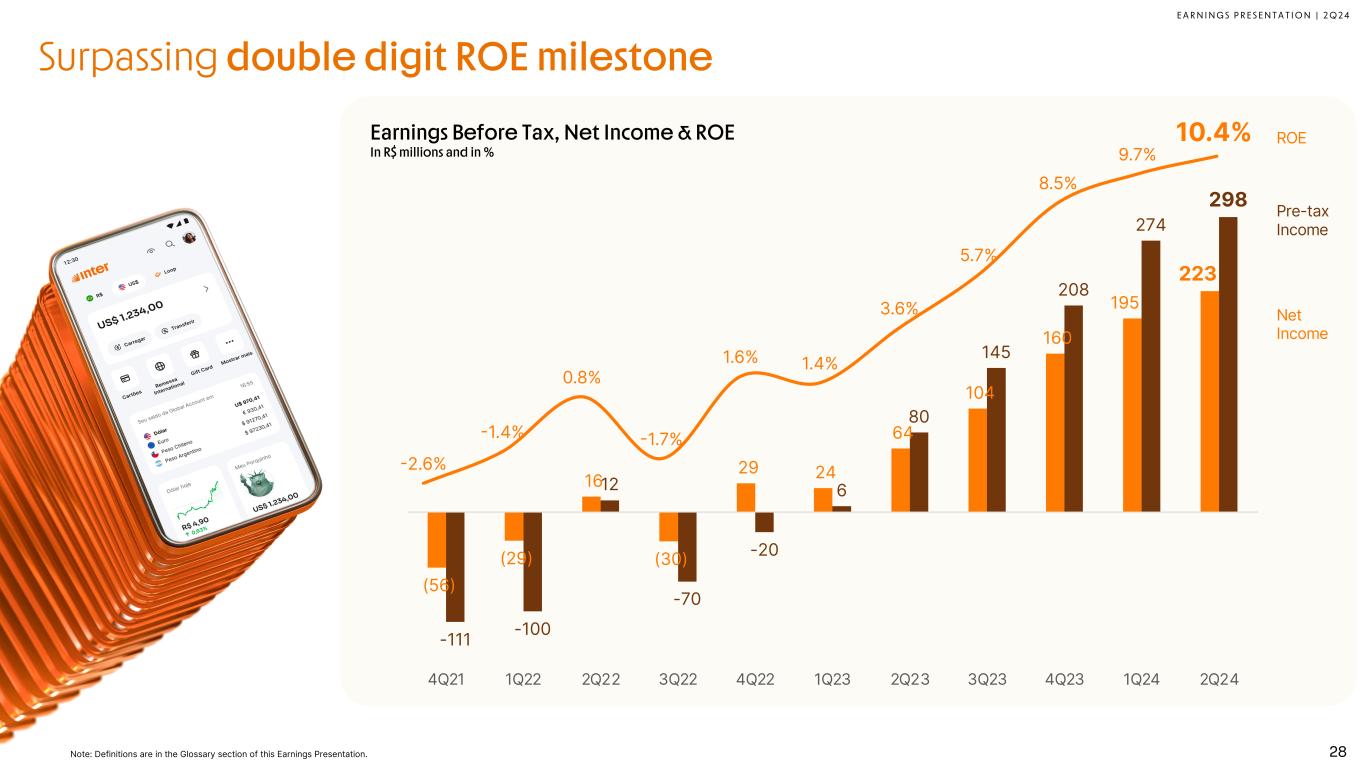
E A R N I N G S P R E S E N T A T I O N | 2 Q 2 4 -2.6% -1.4% 0.8% -1.7% 1.6% 1.4% 3.6% 5.7% 8.5% 9.7% 10.4%Earnings Before Tax, Net Income & ROE In R$ millions and in % Pre-tax Income Net Income ROE Surpassing double digit ROE milestone (56) (29) 16 (30) 29 24 64 104 160 195 223 -111 -100 12 -70 -20 6 80 145 208 274 298 -150 -100 -50 0 50 100 150 200 250 300 350 4Q21 1Q22 2Q22 3Q22 4Q22 1Q23 2Q23 3Q23 4Q23 1Q24 2Q24 28Note: Definitions are in the Glossary section of this Earnings Presentation.

E A R N I N G S P R E S E N T A T I O N | 2 Q 2 4 Closing Remarks
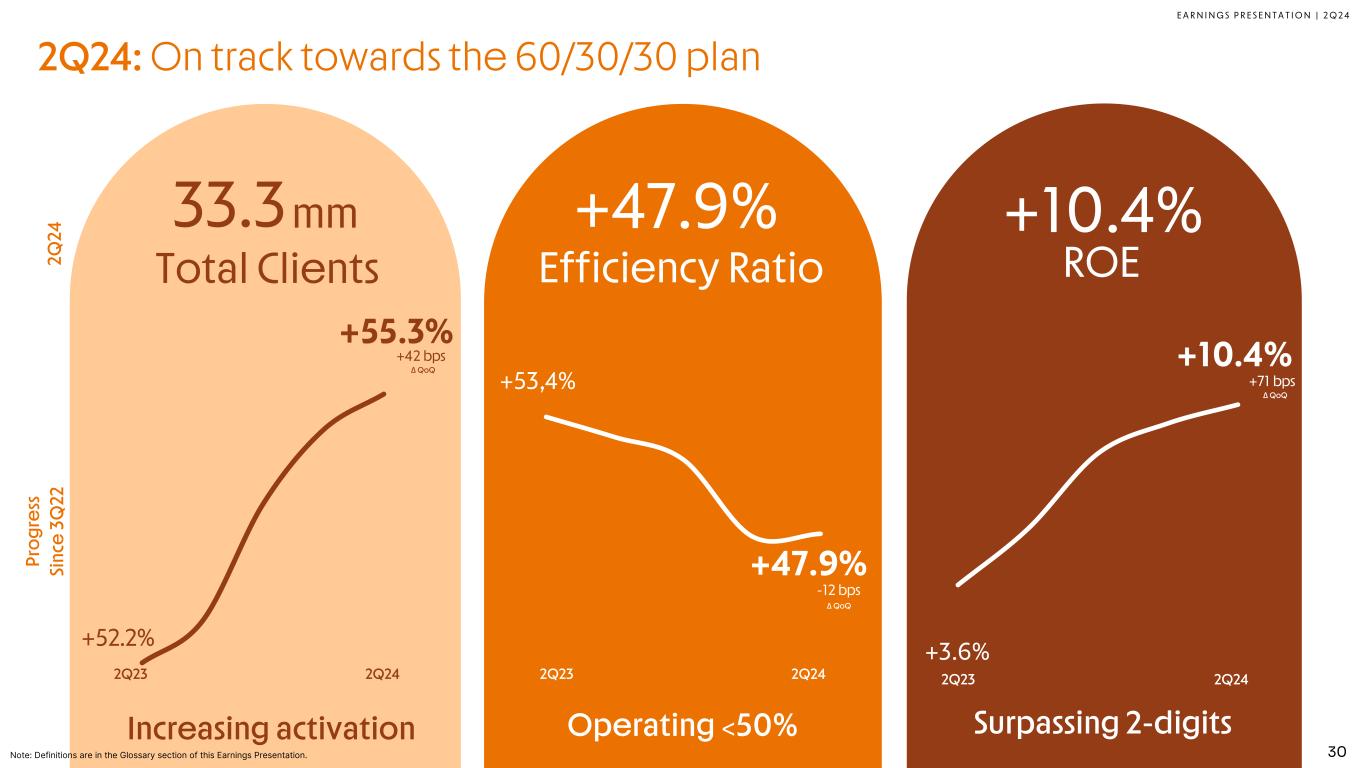
E A R N I N G S P R E S E N T A T I O N | 2 Q 2 4 2Q 24 Pr og re ss Si nc e 3Q 22 2Q24: On track towards the 60/30/30 plan mm 2Q23 2Q24 Δ QoQ +42 bps +52.2% +55.3% 33.3 Total Clients Increasing activation 30 -12 bps +71 bps Note: Definitions are in the Glossary section of this Earnings Presentation. 2Q23 2Q24 Δ QoQ +47.9% +53,4% +47.9% Efficiency Ratio Operating <50% -12 s 2Q23 2Q24 Δ QoQ +10.4% +3.6% +10.4% ROE Surpassing 2-digits +71 bps
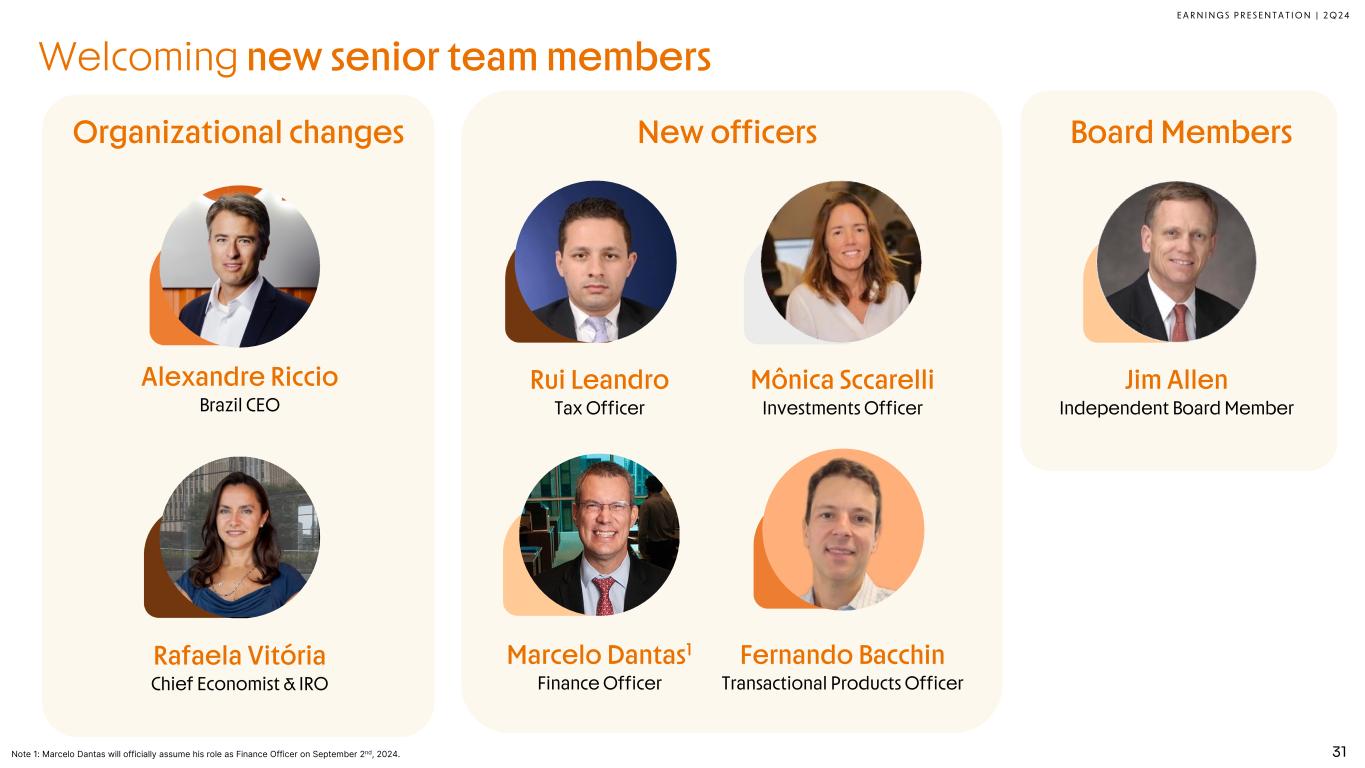
E A R N I N G S P R E S E N T A T I O N | 2 Q 2 4 Rafaela Vitória Chief Economist & IRO Jim Allen Independent Board Member Mônica Sccarelli Investments Officer Alexandre Riccio Brazil CEO Welcoming new senior team members Rui Leandro Tax Officer Fernando Bacchin Transactional Products Officer Marcelo Dantas1 Finance Officer Organizational changes New officers Board Members 31Note 1: Marcelo Dantas will officially assume his role as Finance Officer on September 2nd, 2024.

E A R N I N G S P R E S E N T A T I O N | 2 Q 2 4 Appendix
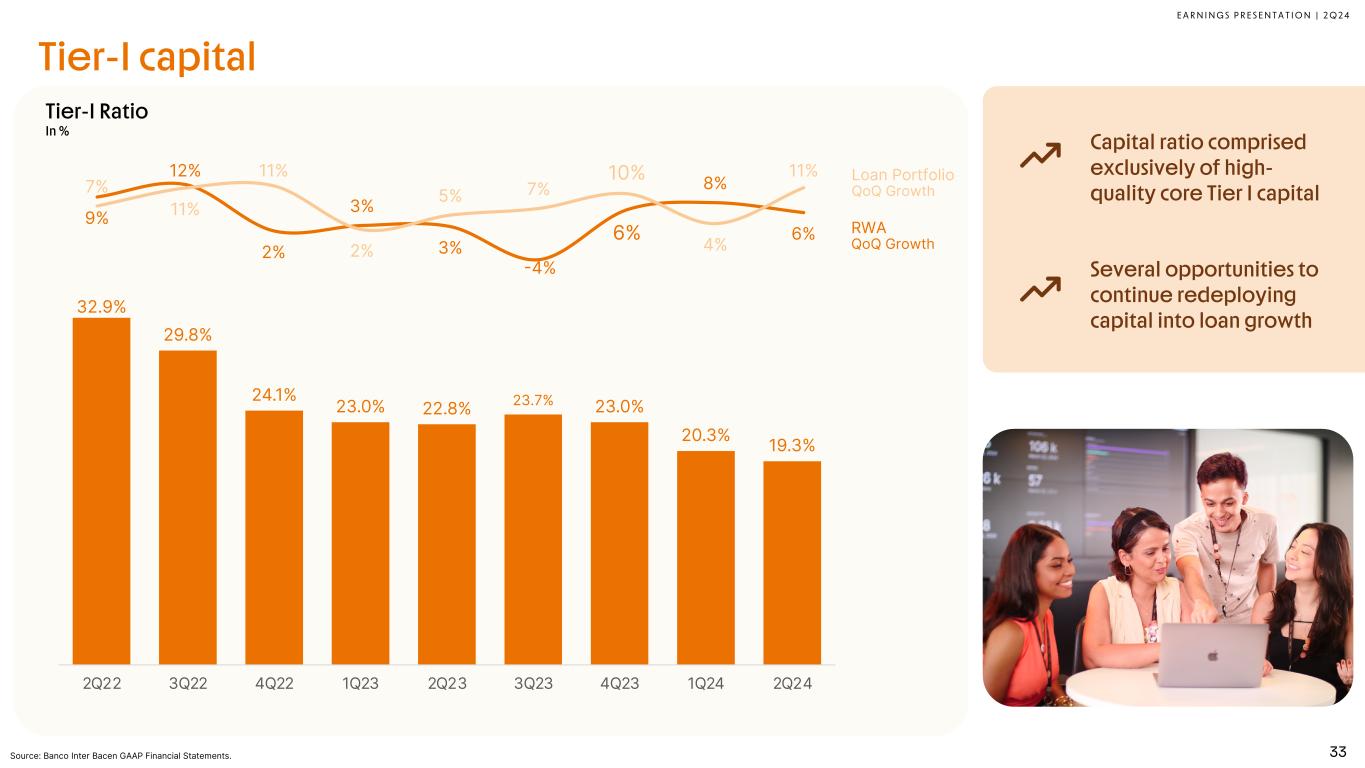
E A R N I N G S P R E S E N T A T I O N | 2 Q 2 4 33 Loan Portfolio QoQ Growth RWA QoQ Growth Tier-I Ratio In % Capital ratio comprised exclusively of high- quality core Tier I capital Several opportunities to continue redeploying capital into loan growth Tier-I capital Source: Banco Inter Bacen GAAP Financial Statements. 32.9% 29.8% 24.1% 23.0% 22.8% 23.7% 23.0% 20.3% 19.3% 2Q22 3Q22 4Q22 1Q23 2Q23 3Q23 4Q23 1Q24 2Q24 9% 12% 2% 3% 3% -4% 6% 8% 6% 7% 11% 11% 2% 5% 7% 10% 4% 11% -6 % -4 % -2 % 0 % 2 % 4 % 6 % 8 % 1 0% 1 2% 1 4%
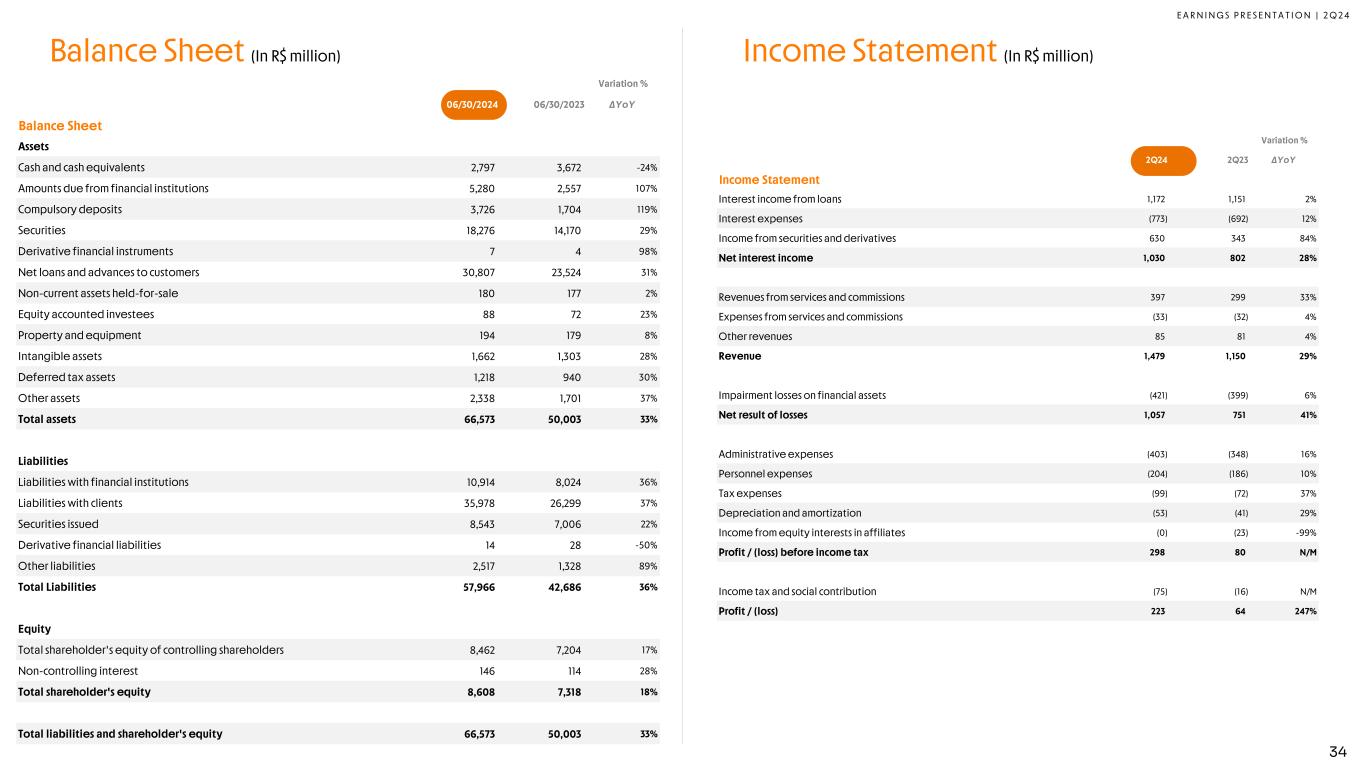
E A R N I N G S P R E S E N T A T I O N | 2 Q 2 4 Balance Sheet (In R$ million) Income Statement (In R$ million) 34 2Q24 2Q23 Variation % 06/30/2024 06/30/2023 ∆YoY Balance Sheet Assets Cash and cash equivalents 2,797 3,672 -24% Amounts due from financial institutions 5,280 2,557 107% Compulsory deposits 3,726 1,704 119% Securities 18,276 14,170 29% Derivative financial instruments 7 4 98% Net loans and advances to customers 30,807 23,524 31% Non-current assets held-for-sale 180 177 2% Equity accounted investees 88 72 23% Property and equipment 194 179 8% Intangible assets 1,662 1,303 28% Deferred tax assets 1,218 940 30% Other assets 2,338 1,701 37% Total assets 66,573 50,003 33% Liabilities Liabilities with financial institutions 10,914 8,024 36% Liabilities with clients 35,978 26,299 37% Securities issued 8,543 7,006 22% Derivative financial liabilities 14 28 -50% Other liabilities 2,517 1,328 89% Total Liabilities 57,966 42,686 36% Equity Total shareholder's equity of controlling shareholders 8,462 7,204 17% Non-controlling interest 146 114 28% Total shareholder's equity 8,608 7,318 18% Total liabilities and shareholder's equity 66,573 50,003 33% Variation % 2Q24 2Q23 ∆YoY Income Statement Interest income from loans 1,172 1,151 2% Interest expenses (773) (692) 12% Income from securities and derivatives 630 343 84% Net interest income 1,030 802 28% Revenues from services and commissions 397 299 33% Expenses from services and commissions (33) (32) 4% Other revenues 85 81 4% Revenue 1,479 1,150 29% Impairment losses on financial assets (421) (399) 6% Net result of losses 1,057 751 41% Administrative expenses (403) (348) 16% Personnel expenses (204) (186) 10% Tax expenses (99) (72) 37% Depreciation and amortization (53) (41) 29% Income from equity interests in affiliates (0) (23) -99% Profit / (loss) before income tax 298 80 N/M Income tax and social contribution (75) (16) N/M Profit / (loss) 223 64 247%
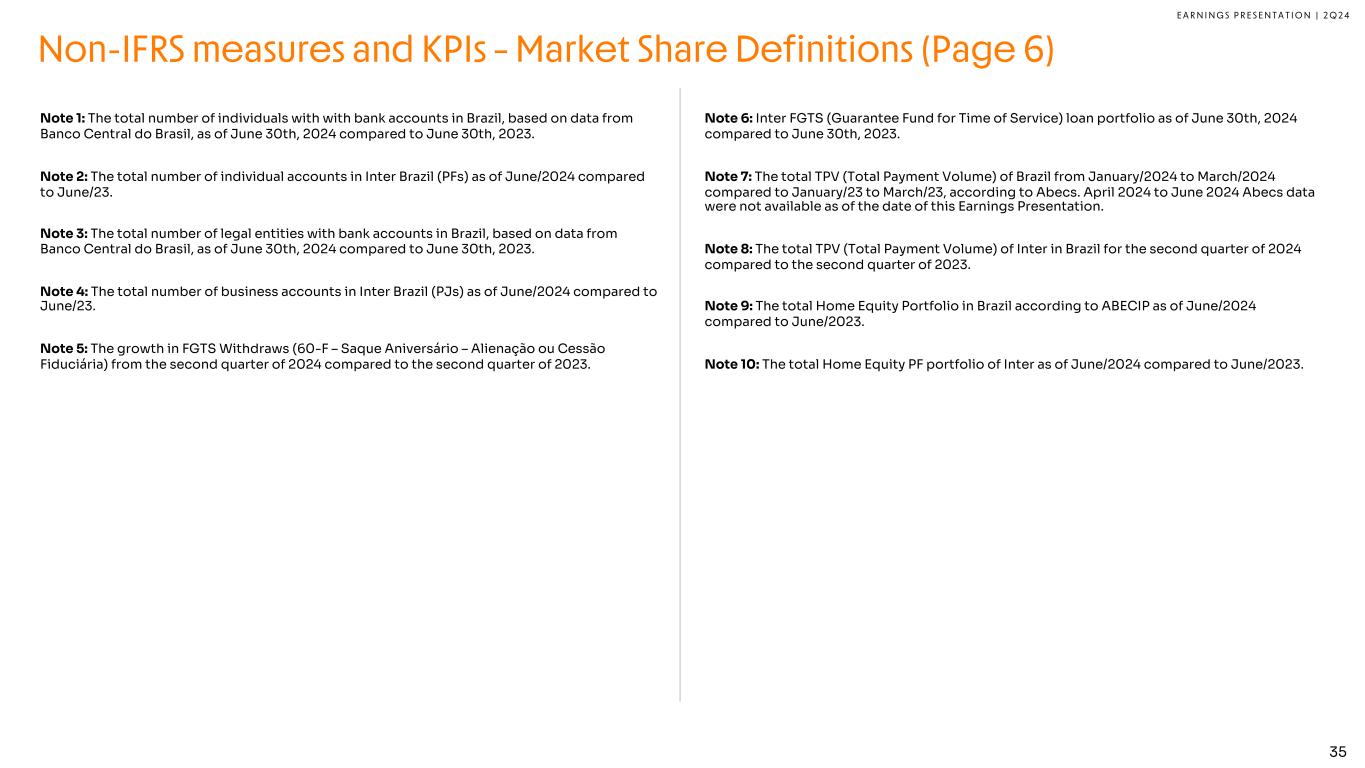
E A R N I N G S P R E S E N T A T I O N | 2 Q 2 4 Non-IFRS measures and KPIs – Market Share Definitions (Page 6) Note 1: The total number of individuals with with bank accounts in Brazil, based on data from Banco Central do Brasil, as of June 30th, 2024 compared to June 30th, 2023. Note 2: The total number of individual accounts in Inter Brazil (PFs) as of June/2024 compared to June/23. Note 3: The total number of legal entities with bank accounts in Brazil, based on data from Banco Central do Brasil, as of June 30th, 2024 compared to June 30th, 2023. Note 4: The total number of business accounts in Inter Brazil (PJs) as of June/2024 compared to June/23. Note 5: The growth in FGTS Withdraws (60-F – Saque Aniversário – Alienação ou Cessão Fiduciária) from the second quarter of 2024 compared to the second quarter of 2023. Note 6: Inter FGTS (Guarantee Fund for Time of Service) loan portfolio as of June 30th, 2024 compared to June 30th, 2023. Note 7: The total TPV (Total Payment Volume) of Brazil from January/2024 to March/2024 compared to January/23 to March/23, according to Abecs. April 2024 to June 2024 Abecs data were not available as of the date of this Earnings Presentation. Note 8: The total TPV (Total Payment Volume) of Inter in Brazil for the second quarter of 2024 compared to the second quarter of 2023. Note 9: The total Home Equity Portfolio in Brazil according to ABECIP as of June/2024 compared to June/2023. Note 10: The total Home Equity PF portfolio of Inter as of June/2024 compared to June/2023. 35
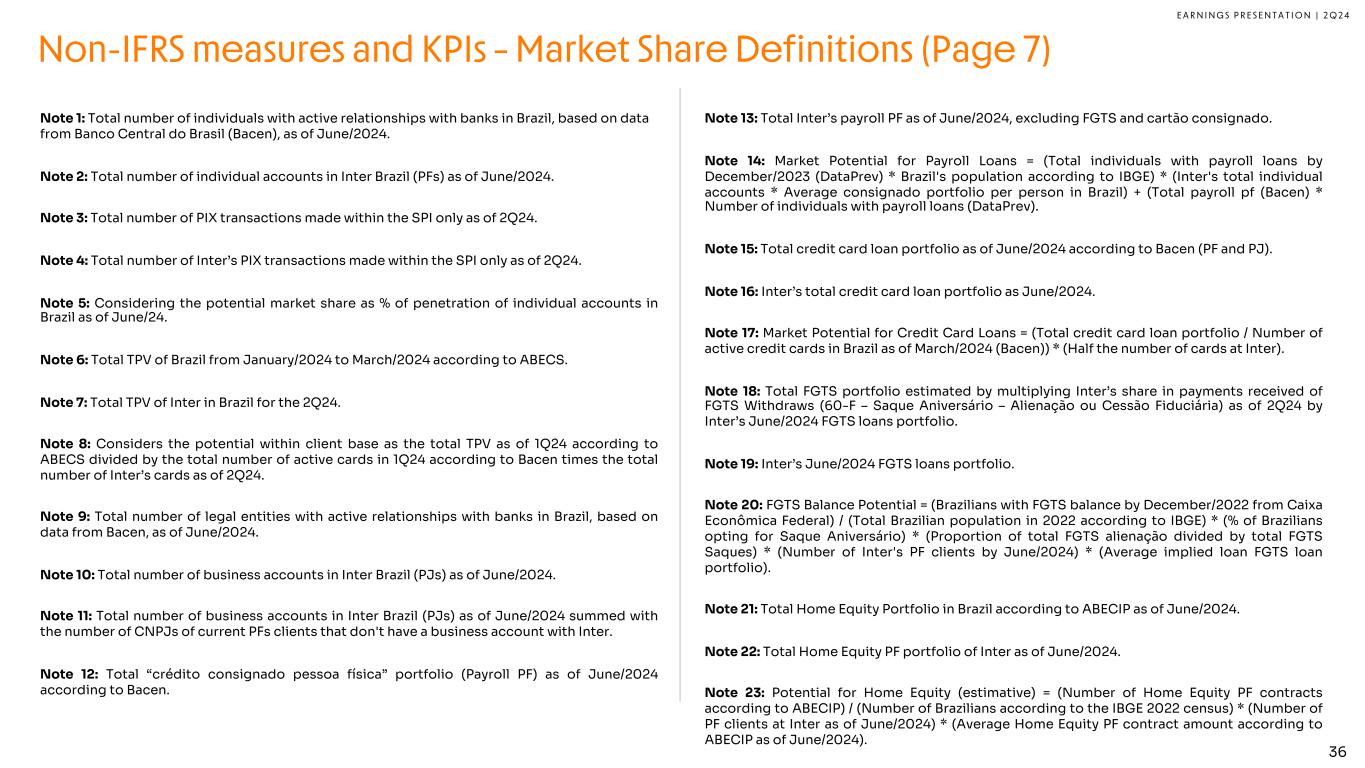
E A R N I N G S P R E S E N T A T I O N | 2 Q 2 4 Non-IFRS measures and KPIs – Market Share Definitions (Page 7) Note 1: Total number of individuals with active relationships with banks in Brazil, based on data from Banco Central do Brasil (Bacen), as of June/2024. Note 2: Total number of individual accounts in Inter Brazil (PFs) as of June/2024. Note 3: Total number of PIX transactions made within the SPI only as of 2Q24. Note 4: Total number of Inter’s PIX transactions made within the SPI only as of 2Q24. Note 5: Considering the potential market share as % of penetration of individual accounts in Brazil as of June/24. Note 6: Total TPV of Brazil from January/2024 to March/2024 according to ABECS. Note 7: Total TPV of Inter in Brazil for the 2Q24. Note 8: Considers the potential within client base as the total TPV as of 1Q24 according to ABECS divided by the total number of active cards in 1Q24 according to Bacen times the total number of Inter’s cards as of 2Q24. Note 9: Total number of legal entities with active relationships with banks in Brazil, based on data from Bacen, as of June/2024. Note 10: Total number of business accounts in Inter Brazil (PJs) as of June/2024. Note 11: Total number of business accounts in Inter Brazil (PJs) as of June/2024 summed with the number of CNPJs of current PFs clients that don't have a business account with Inter. Note 12: Total “crédito consignado pessoa física” portfolio (Payroll PF) as of June/2024 according to Bacen. Note 13: Total Inter’s payroll PF as of June/2024, excluding FGTS and cartão consignado. Note 14: Market Potential for Payroll Loans = (Total individuals with payroll loans by December/2023 (DataPrev) * Brazil's population according to IBGE) * (Inter's total individual accounts * Average consignado portfolio per person in Brazil) + (Total payroll pf (Bacen) * Number of individuals with payroll loans (DataPrev). Note 15: Total credit card loan portfolio as of June/2024 according to Bacen (PF and PJ). Note 16: Inter’s total credit card loan portfolio as June/2024. Note 17: Market Potential for Credit Card Loans = (Total credit card loan portfolio / Number of active credit cards in Brazil as of March/2024 (Bacen)) * (Half the number of cards at Inter). Note 18: Total FGTS portfolio estimated by multiplying Inter’s share in payments received of FGTS Withdraws (60-F – Saque Aniversário – Alienação ou Cessão Fiduciária) as of 2Q24 by Inter’s June/2024 FGTS loans portfolio. Note 19: Inter’s June/2024 FGTS loans portfolio. Note 20: FGTS Balance Potential = (Brazilians with FGTS balance by December/2022 from Caixa Econômica Federal) / (Total Brazilian population in 2022 according to IBGE) * (% of Brazilians opting for Saque Aniversário) * (Proportion of total FGTS alienação divided by total FGTS Saques) * (Number of Inter's PF clients by June/2024) * (Average implied loan FGTS loan portfolio). Note 21: Total Home Equity Portfolio in Brazil according to ABECIP as of June/2024. Note 22: Total Home Equity PF portfolio of Inter as of June/2024. Note 23: Potential for Home Equity (estimative) = (Number of Home Equity PF contracts according to ABECIP) / (Number of Brazilians according to the IBGE 2022 census) * (Number of PF clients at Inter as of June/2024) * (Average Home Equity PF contract amount according to ABECIP as of June/2024). 36
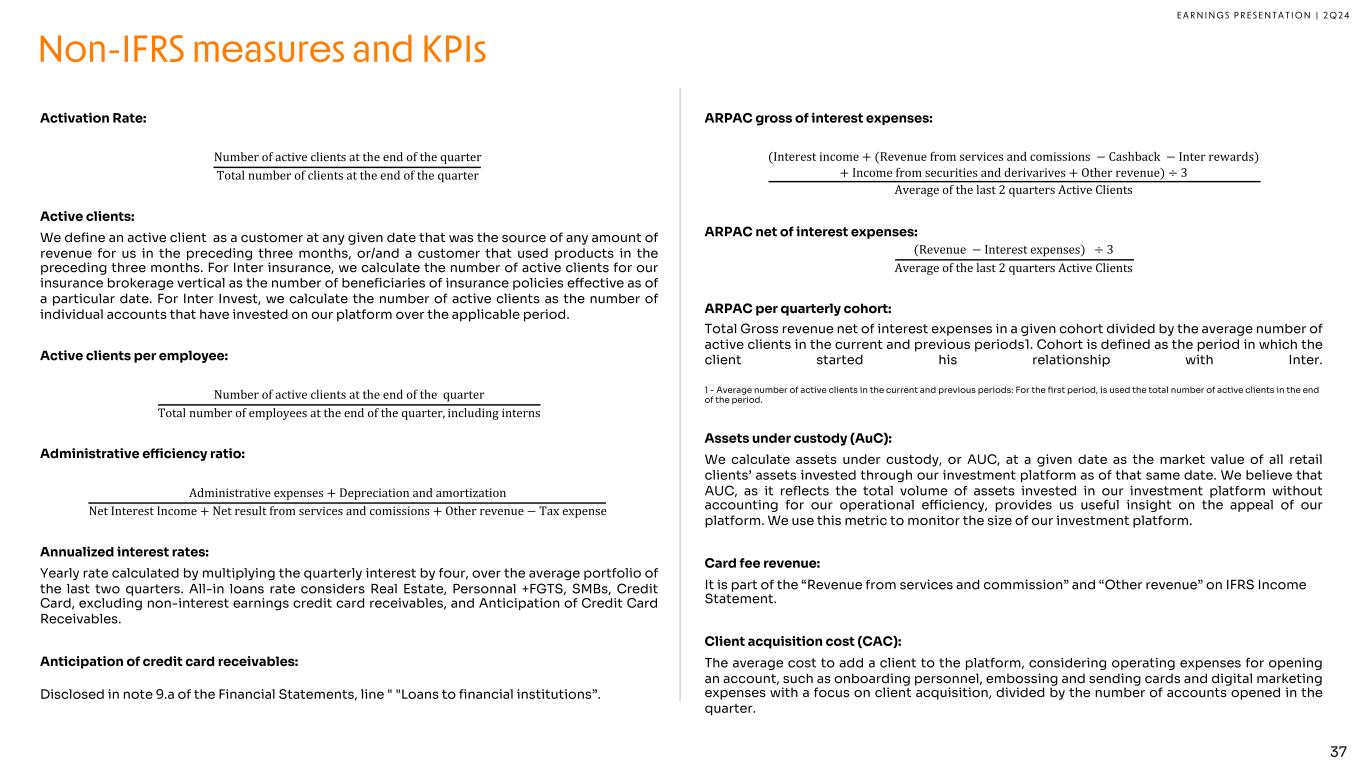
E A R N I N G S P R E S E N T A T I O N | 2 Q 2 4 Non-IFRS measures and KPIs Activation Rate: Number of active clients at the end of the quarter Total number of clients at the end of the quarter Active clients: We define an active client as a customer at any given date that was the source of any amount of revenue for us in the preceding three months, or/and a customer that used products in the preceding three months. For Inter insurance, we calculate the number of active clients for our insurance brokerage vertical as the number of beneficiaries of insurance policies e!ective as of a particular date. For Inter Invest, we calculate the number of active clients as the number of individual accounts that have invested on our platform over the applicable period. Active clients per employee: Number of active clients at the end of the quarter Total number of employees at the end of the quarter, including interns Administrative e!ciency ratio: Administrative expenses + Depreciation and amortization Net Interest Income + Net result from services and comissions + Other revenue − Tax expense Annualized interest rates: Yearly rate calculated by multiplying the quarterly interest by four, over the average portfolio of the last two quarters. All-in loans rate considers Real Estate, Personnal +FGTS, SMBs, Credit Card, excluding non-interest earnings credit card receivables, and Anticipation of Credit Card Receivables. Anticipation of credit card receivables: Disclosed in note 9.a of the Financial Statements, line " "Loans to financial institutions”. ARPAC gross of interest expenses: (Interest income + (Revenue from services and comissions − Cashback − Inter rewards) + Income from securities and derivarives + Other revenue) ÷ 3 Average of the last 2 quarters Active Clients ARPAC net of interest expenses: (Revenue − Interest expenses) ÷ 3 Average of the last 2 quarters Active Clients ARPAC per quarterly cohort: Total Gross revenue net of interest expenses in a given cohort divided by the average number of active clients in the current and previous periods1. Cohort is defined as the period in which the client started his relationship with Inter. 1 - Average number of active clients in the current and previous periods: For the first period, is used the total number of active clients in the end of the period. Assets under custody (AuC): We calculate assets under custody, or AUC, at a given date as the market value of all retail clients’ assets invested through our investment platform as of that same date. We believe that AUC, as it reflects the total volume of assets invested in our investment platform without accounting for our operational e"ciency, provides us useful insight on the appeal of our platform. We use this metric to monitor the size of our investment platform. Card fee revenue: It is part of the “Revenue from services and commission” and “Other revenue” on IFRS Income Statement. Client acquisition cost (CAC): The average cost to add a client to the platform, considering operating expenses for opening an account, such as onboarding personnel, embossing and sending cards and digital marketing expenses with a focus on client acquisition, divided by the number of accounts opened in the quarter. 37
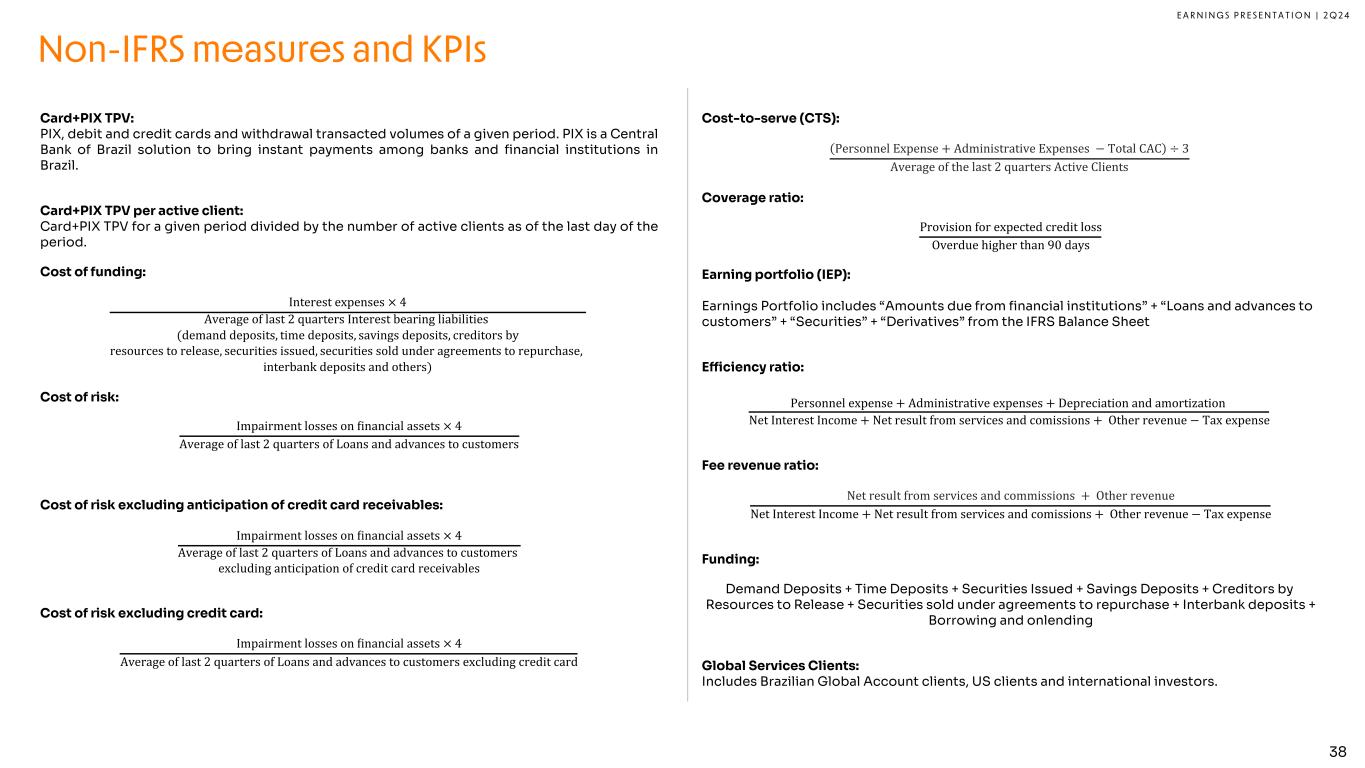
E A R N I N G S P R E S E N T A T I O N | 2 Q 2 4 Card+PIX TPV: PIX, debit and credit cards and withdrawal transacted volumes of a given period. PIX is a Central Bank of Brazil solution to bring instant payments among banks and financial institutions in Brazil. Card+PIX TPV per active client: Card+PIX TPV for a given period divided by the number of active clients as of the last day of the period. Cost of funding: Interest expenses × 4 Average of last 2 quarters Interest bearing liabilities (demand deposits, time deposits, savings deposits, creditors by resources to release, securities issued, securities sold under agreements to repurchase, interbank deposits and others) Cost of risk: Impairment losses on Minancial assets × 4 Average of last 2 quarters of Loans and advances to customers Cost of risk excluding anticipation of credit card receivables: Impairment losses on Minancial assets × 4 Average of last 2 quarters of Loans and advances to customers excluding anticipation of credit card receivables Cost of risk excluding credit card: Impairment losses on Minancial assets × 4 Average of last 2 quarters of Loans and advances to customers excluding credit card Cost-to-serve (CTS): Personnel Expense + Administrative Expenses − Total CAC ÷ 3 Average of the last 2 quarters Active Clients Coverage ratio: Provision for expected credit loss Overdue higher than 90 days Earning portfolio (IEP): Earnings Portfolio includes “Amounts due from financial institutions” + “Loans and advances to customers” + “Securities” + “Derivatives” from the IFRS Balance Sheet E!ciency ratio: Personnel expense + Administrative expenses + Depreciation and amortization Net Interest Income + Net result from services and comissions + Other revenue − Tax expense Fee revenue ratio: Net result from services and commissions + Other revenue Net Interest Income + Net result from services and comissions + Other revenue − Tax expense Funding: Demand Deposits + Time Deposits + Securities Issued + Savings Deposits + Creditors by Resources to Release + Securities sold under agreements to repurchase + Interbank deposits + Borrowing and onlending Global Services Clients: Includes Brazilian Global Account clients, US clients and international investors. Non-IFRS measures and KPIs 38
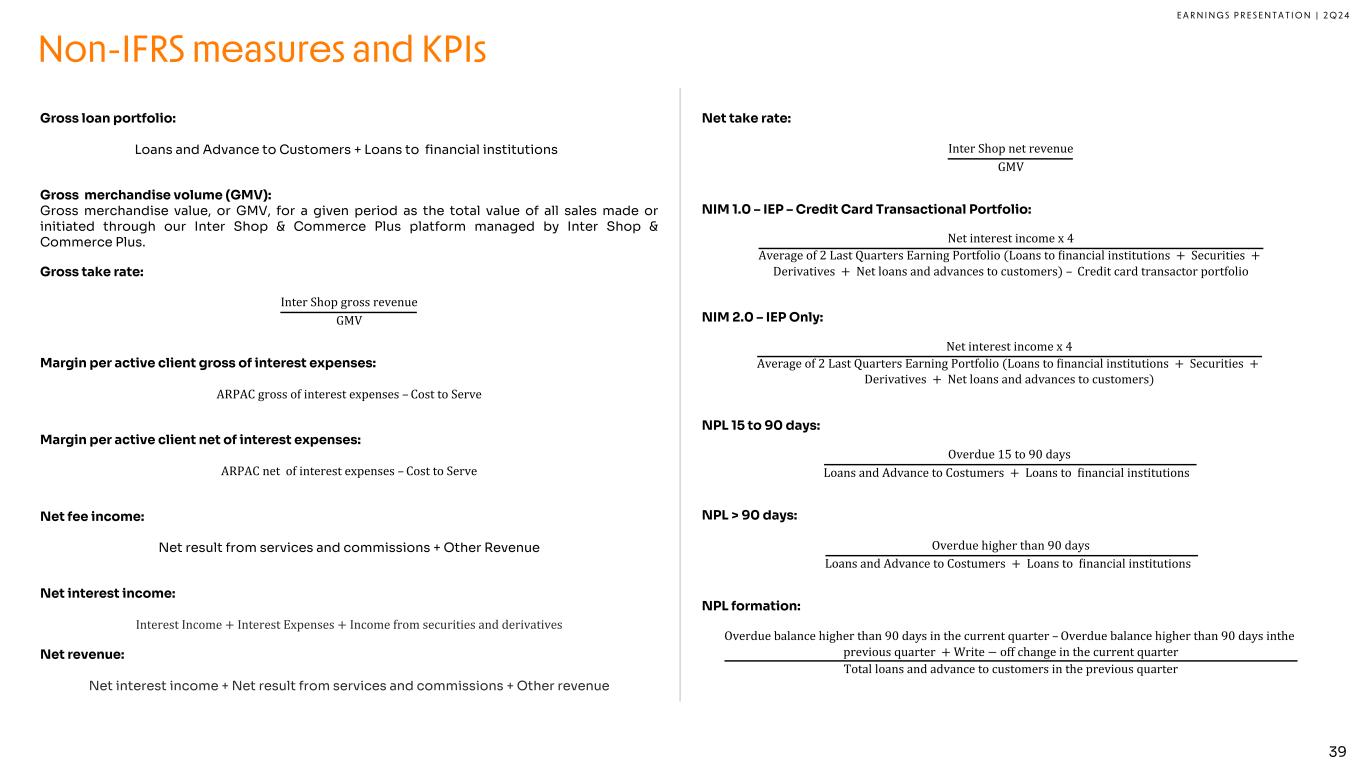
E A R N I N G S P R E S E N T A T I O N | 2 Q 2 4 Gross loan portfolio: Loans and Advance to Customers + Loans to financial institutions Gross merchandise volume (GMV): Gross merchandise value, or GMV, for a given period as the total value of all sales made or initiated through our Inter Shop & Commerce Plus platform managed by Inter Shop & Commerce Plus. Gross take rate: Inter Shop gross revenue GMV Margin per active client gross of interest expenses: ARPAC gross of interest expenses – Cost to Serve Margin per active client net of interest expenses: ARPAC net of interest expenses – Cost to Serve Net fee income: Net result from services and commissions + Other Revenue Net interest income: Interest Income + Interest Expenses + Income from securities and derivatives Net revenue: Net interest income + Net result from services and commissions + Other revenue Net take rate: Inter Shop net revenue GMV NIM 1.0 – IEP – Credit Card Transactional Portfolio: Net interest income x 4 Average of 2 Last Quarters Earning Portfolio (Loans to Minancial institutions + Securities + Derivatives + Net loans and advances to customers) – Credit card transactor portfolio NIM 2.0 – IEP Only: Net interest income x 4 Average of 2 Last Quarters Earning Portfolio (Loans to Minancial institutions + Securities + Derivatives + Net loans and advances to customers) NPL 15 to 90 days: Overdue 15 to 90 days Loans and Advance to Costumers + Loans to Minancial institutions NPL > 90 days: Overdue higher than 90 days Loans and Advance to Costumers + Loans to Minancial institutions NPL formation: Overdue balance higher than 90 days in the current quarter –Overdue balance higher than 90 days inthe previous quarter +Write − off change in the current quarter Total loans and advance to customers in the previous quarter Non-IFRS measures and KPIs 39
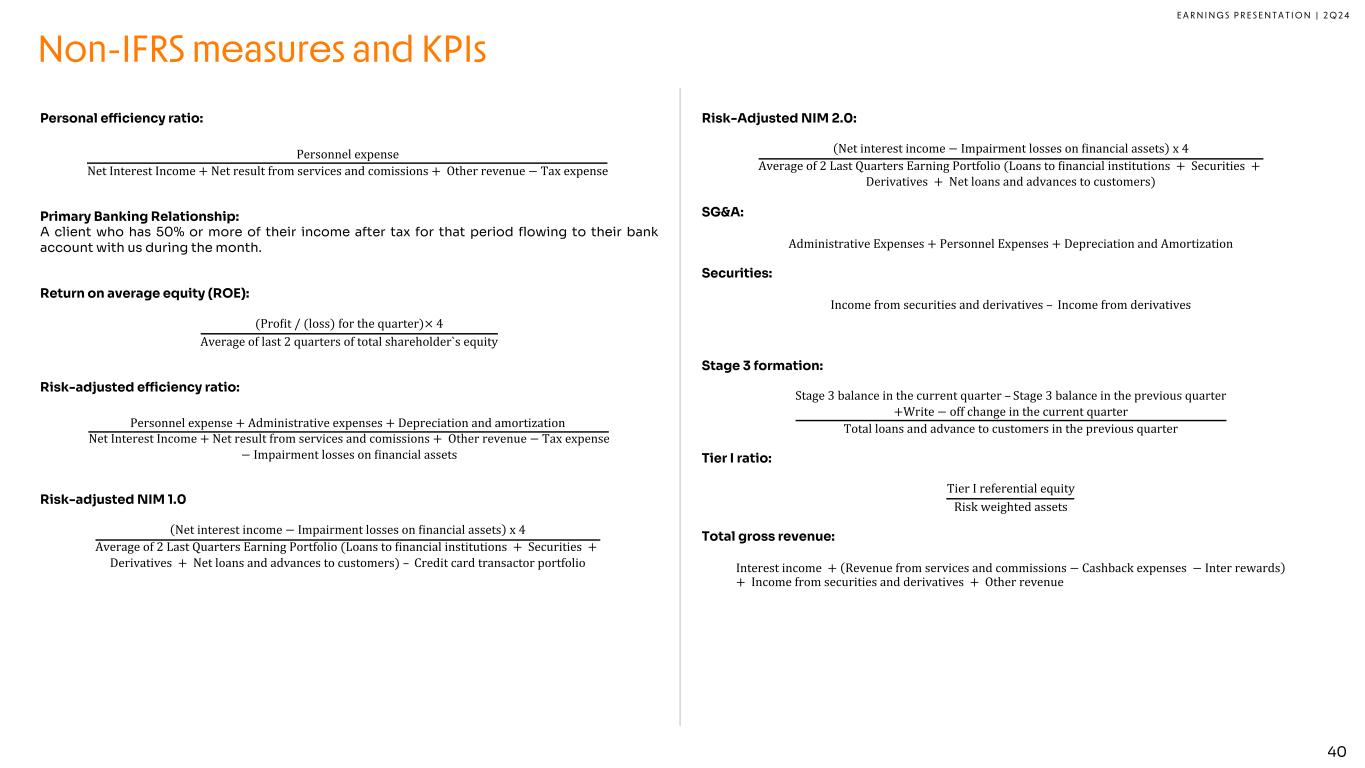
E A R N I N G S P R E S E N T A T I O N | 2 Q 2 4 Risk-Adjusted NIM 2.0: Net interest income − Impairment losses on Minancial assets x 4 Average of 2 Last Quarters Earning Portfolio (Loans to Minancial institutions + Securities + Derivatives + Net loans and advances to customers) SG&A: Administrative Expenses + Personnel Expenses + Depreciation and Amortization Securities: Income from securities and derivatives – Income from derivatives Stage 3 formation: Stage 3 balance in the current quarter – Stage 3 balance in the previous quarter +Write − off change in the current quarter Total loans and advance to customers in the previous quarter Tier I ratio: Tier I referential equity Risk weighted assets Total gross revenue: Interest income + Revenue from services and commissions − Cashback expenses − Inter rewards + Income from securities and derivatives + Other revenue Non-IFRS measures and KPIs Personal e!ciency ratio: Personnel expense Net Interest Income + Net result from services and comissions + Other revenue − Tax expense Primary Banking Relationship: A client who has 50% or more of their income after tax for that period flowing to their bank account with us during the month. Return on average equity (ROE): (ProMit / (loss) for the quarter)× 4 Average of last 2 quarters of total shareholder`s equity Risk-adjusted e!ciency ratio: Personnel expense + Administrative expenses + Depreciation and amortization Net Interest Income + Net result from services and comissions + Other revenue − Tax expense − Impairment losses on Minancial assets Risk-adjusted NIM 1.0 Net interest income − Impairment losses on Minancial assets x 4 Average of 2 Last Quarters Earning Portfolio (Loans to Minancial institutions + Securities + Derivatives + Net loans and advances to customers) – Credit card transactor portfolio 40


SIGNATURE Pursuant to the requirements of the Securities Exchange Act of 1934, the registrant has duly caused this report to be signed on its behalf by the undersigned, thereunto duly authorized. INTER & Co, INC. By: /s/ Rafaela de Oliveira Vitoria Name: Rafaela de Oliveira Vitoria Title: Investor Relations Officer Date: August 7, 2024