0001856525falseDEF 14Aiso4217:USD00018565252023-01-302024-01-2800018565252022-01-312023-01-2900018565252021-02-012022-01-300001856525ecd:PeoMembercnm:ValueOfStockOptionsAndRSUsMember2023-01-302024-01-280001856525cnm:ValueOfStockOptionsAndRSUsMemberecd:NonPeoNeoMember2023-01-302024-01-280001856525ecd:PeoMembercnm:ValueOfStockOptionsAndRSUsMember2022-01-312023-01-290001856525cnm:ValueOfStockOptionsAndRSUsMemberecd:NonPeoNeoMember2022-01-312023-01-290001856525ecd:PeoMembercnm:ValueOfStockOptionsAndRSUsMember2021-02-012022-01-300001856525cnm:ValueOfStockOptionsAndRSUsMemberecd:NonPeoNeoMember2021-02-012022-01-300001856525cnm:YearEndFairValueOfUnvestedStockOptionsAndRSUsGrantedMemberecd:PeoMember2023-01-302024-01-280001856525cnm:YearEndFairValueOfUnvestedStockOptionsAndRSUsGrantedMemberecd:NonPeoNeoMember2023-01-302024-01-280001856525cnm:YearEndFairValueOfUnvestedStockOptionsAndRSUsGrantedMemberecd:PeoMember2022-01-312023-01-290001856525cnm:YearEndFairValueOfUnvestedStockOptionsAndRSUsGrantedMemberecd:NonPeoNeoMember2022-01-312023-01-290001856525cnm:YearEndFairValueOfUnvestedStockOptionsAndRSUsGrantedMemberecd:PeoMember2021-02-012022-01-300001856525cnm:YearEndFairValueOfUnvestedStockOptionsAndRSUsGrantedMemberecd:NonPeoNeoMember2021-02-012022-01-300001856525ecd:PeoMembercnm:YearOverYearDifferenceOfYearEndFairValuesForUnvestedAwardsGrantedInPriorYearsMember2023-01-302024-01-280001856525cnm:YearOverYearDifferenceOfYearEndFairValuesForUnvestedAwardsGrantedInPriorYearsMemberecd:NonPeoNeoMember2023-01-302024-01-280001856525ecd:PeoMembercnm:YearOverYearDifferenceOfYearEndFairValuesForUnvestedAwardsGrantedInPriorYearsMember2022-01-312023-01-290001856525cnm:YearOverYearDifferenceOfYearEndFairValuesForUnvestedAwardsGrantedInPriorYearsMemberecd:NonPeoNeoMember2022-01-312023-01-290001856525ecd:PeoMembercnm:YearOverYearDifferenceOfYearEndFairValuesForUnvestedAwardsGrantedInPriorYearsMember2021-02-012022-01-300001856525cnm:YearOverYearDifferenceOfYearEndFairValuesForUnvestedAwardsGrantedInPriorYearsMemberecd:NonPeoNeoMember2021-02-012022-01-300001856525ecd:PeoMembercnm:DifferenceInFairValuesBetweenPriorYearEndFairValuesAndVestingDateFairValuesForAwardsGrantedInPriorYearsMember2023-01-302024-01-280001856525cnm:DifferenceInFairValuesBetweenPriorYearEndFairValuesAndVestingDateFairValuesForAwardsGrantedInPriorYearsMemberecd:NonPeoNeoMember2023-01-302024-01-280001856525ecd:PeoMembercnm:DifferenceInFairValuesBetweenPriorYearEndFairValuesAndVestingDateFairValuesForAwardsGrantedInPriorYearsMember2022-01-312023-01-290001856525cnm:DifferenceInFairValuesBetweenPriorYearEndFairValuesAndVestingDateFairValuesForAwardsGrantedInPriorYearsMemberecd:NonPeoNeoMember2022-01-312023-01-290001856525ecd:PeoMembercnm:DifferenceInFairValuesBetweenPriorYearEndFairValuesAndVestingDateFairValuesForAwardsGrantedInPriorYearsMember2021-02-012022-01-300001856525cnm:DifferenceInFairValuesBetweenPriorYearEndFairValuesAndVestingDateFairValuesForAwardsGrantedInPriorYearsMemberecd:NonPeoNeoMember2021-02-012022-01-300001856525ecd:PeoMembercnm:TotalAdjustmentsMember2023-01-302024-01-280001856525cnm:TotalAdjustmentsMemberecd:NonPeoNeoMember2023-01-302024-01-280001856525ecd:PeoMembercnm:TotalAdjustmentsMember2022-01-312023-01-290001856525cnm:TotalAdjustmentsMemberecd:NonPeoNeoMember2022-01-312023-01-290001856525ecd:PeoMembercnm:TotalAdjustmentsMember2021-02-012022-01-300001856525cnm:TotalAdjustmentsMemberecd:NonPeoNeoMember2021-02-012022-01-30000185652542023-01-302024-01-28000185652512023-01-302024-01-28000185652522023-01-302024-01-28000185652532023-01-302024-01-28
UNITED STATES
SECURITIES AND EXCHANGE COMMISSION
WASHINGTON, D.C. 20549
___________________________________
SCHEDULE 14A
Proxy Statement Pursuant to Section 14(a) of
the Securities Exchange Act of 1934
___________________________________
Filed by the Registrant ☒
Filed by a Party other than the Registrant ☐
Check the appropriate box:
| | | | | |
| ☐ | Preliminary Proxy Statement |
| | |
| ☐ | Confidential, for Use of the Commission Only (as permitted by Rule 14a-6(e)(2)) |
| | |
| ☒ | Definitive Proxy Statement |
| | |
| ☐ | Definitive Additional Materials |
| | |
| ☐ | Soliciting Material Pursuant to §240.14a-12 |
Core & Main, Inc.
_________________________________________________________________________________________________
(Name of Registrant as Specified In Its Charter)
_________________________________________________________________________________________________
(Name of Person(s) Filing Proxy Statement, if other than the Registrant)
Payment of Filing Fee (Check the appropriate box):
| | | | | | | | | | | | | | |
| ☒ | | No fee required. |
| ☐ | | Fee paid previously with preliminary materials. |
| ☐ | | Fee computed on table in exhibit required by Item 25(b) per Exchange Act Rules 14a-6(i)(1) and 0-11 |
TABLE OF CONTENTS
| | | | | |
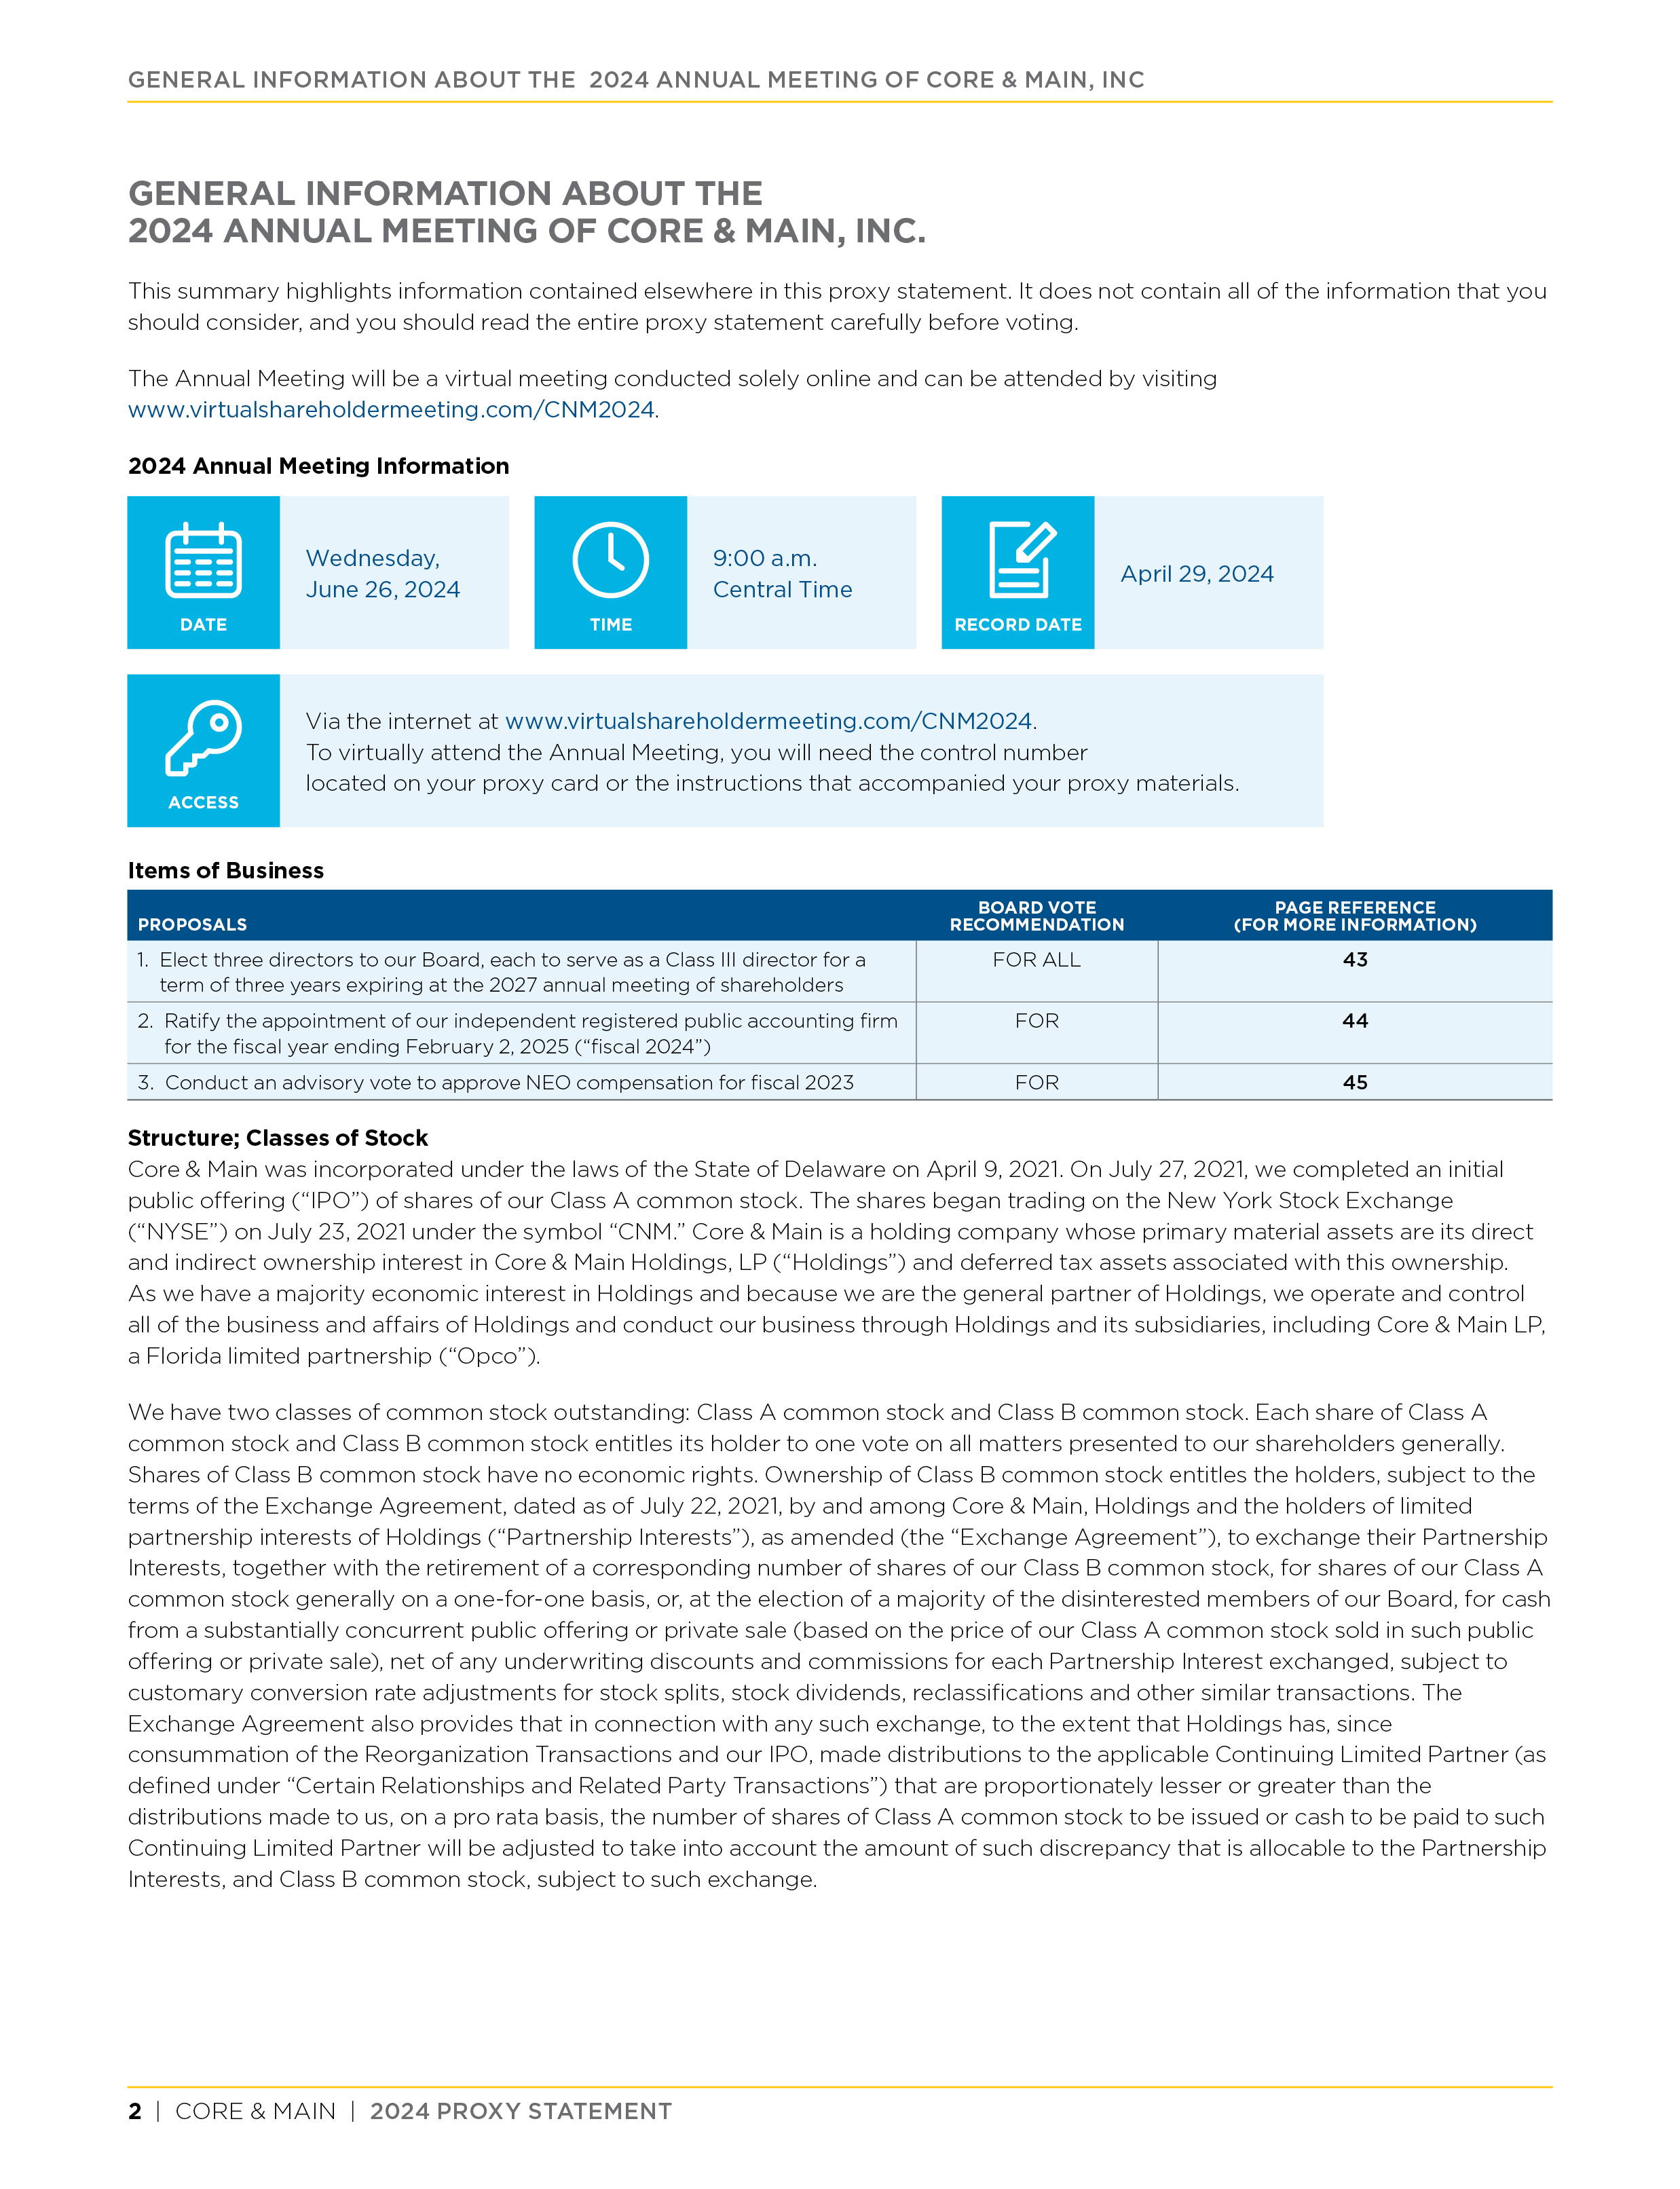
General Information About the 2024 Annual Meeting of Core & Main, Inc. | |
| Proposals | |
| Questions and Answers | |
| Directors, Executive Officers and Corporate Governance | |
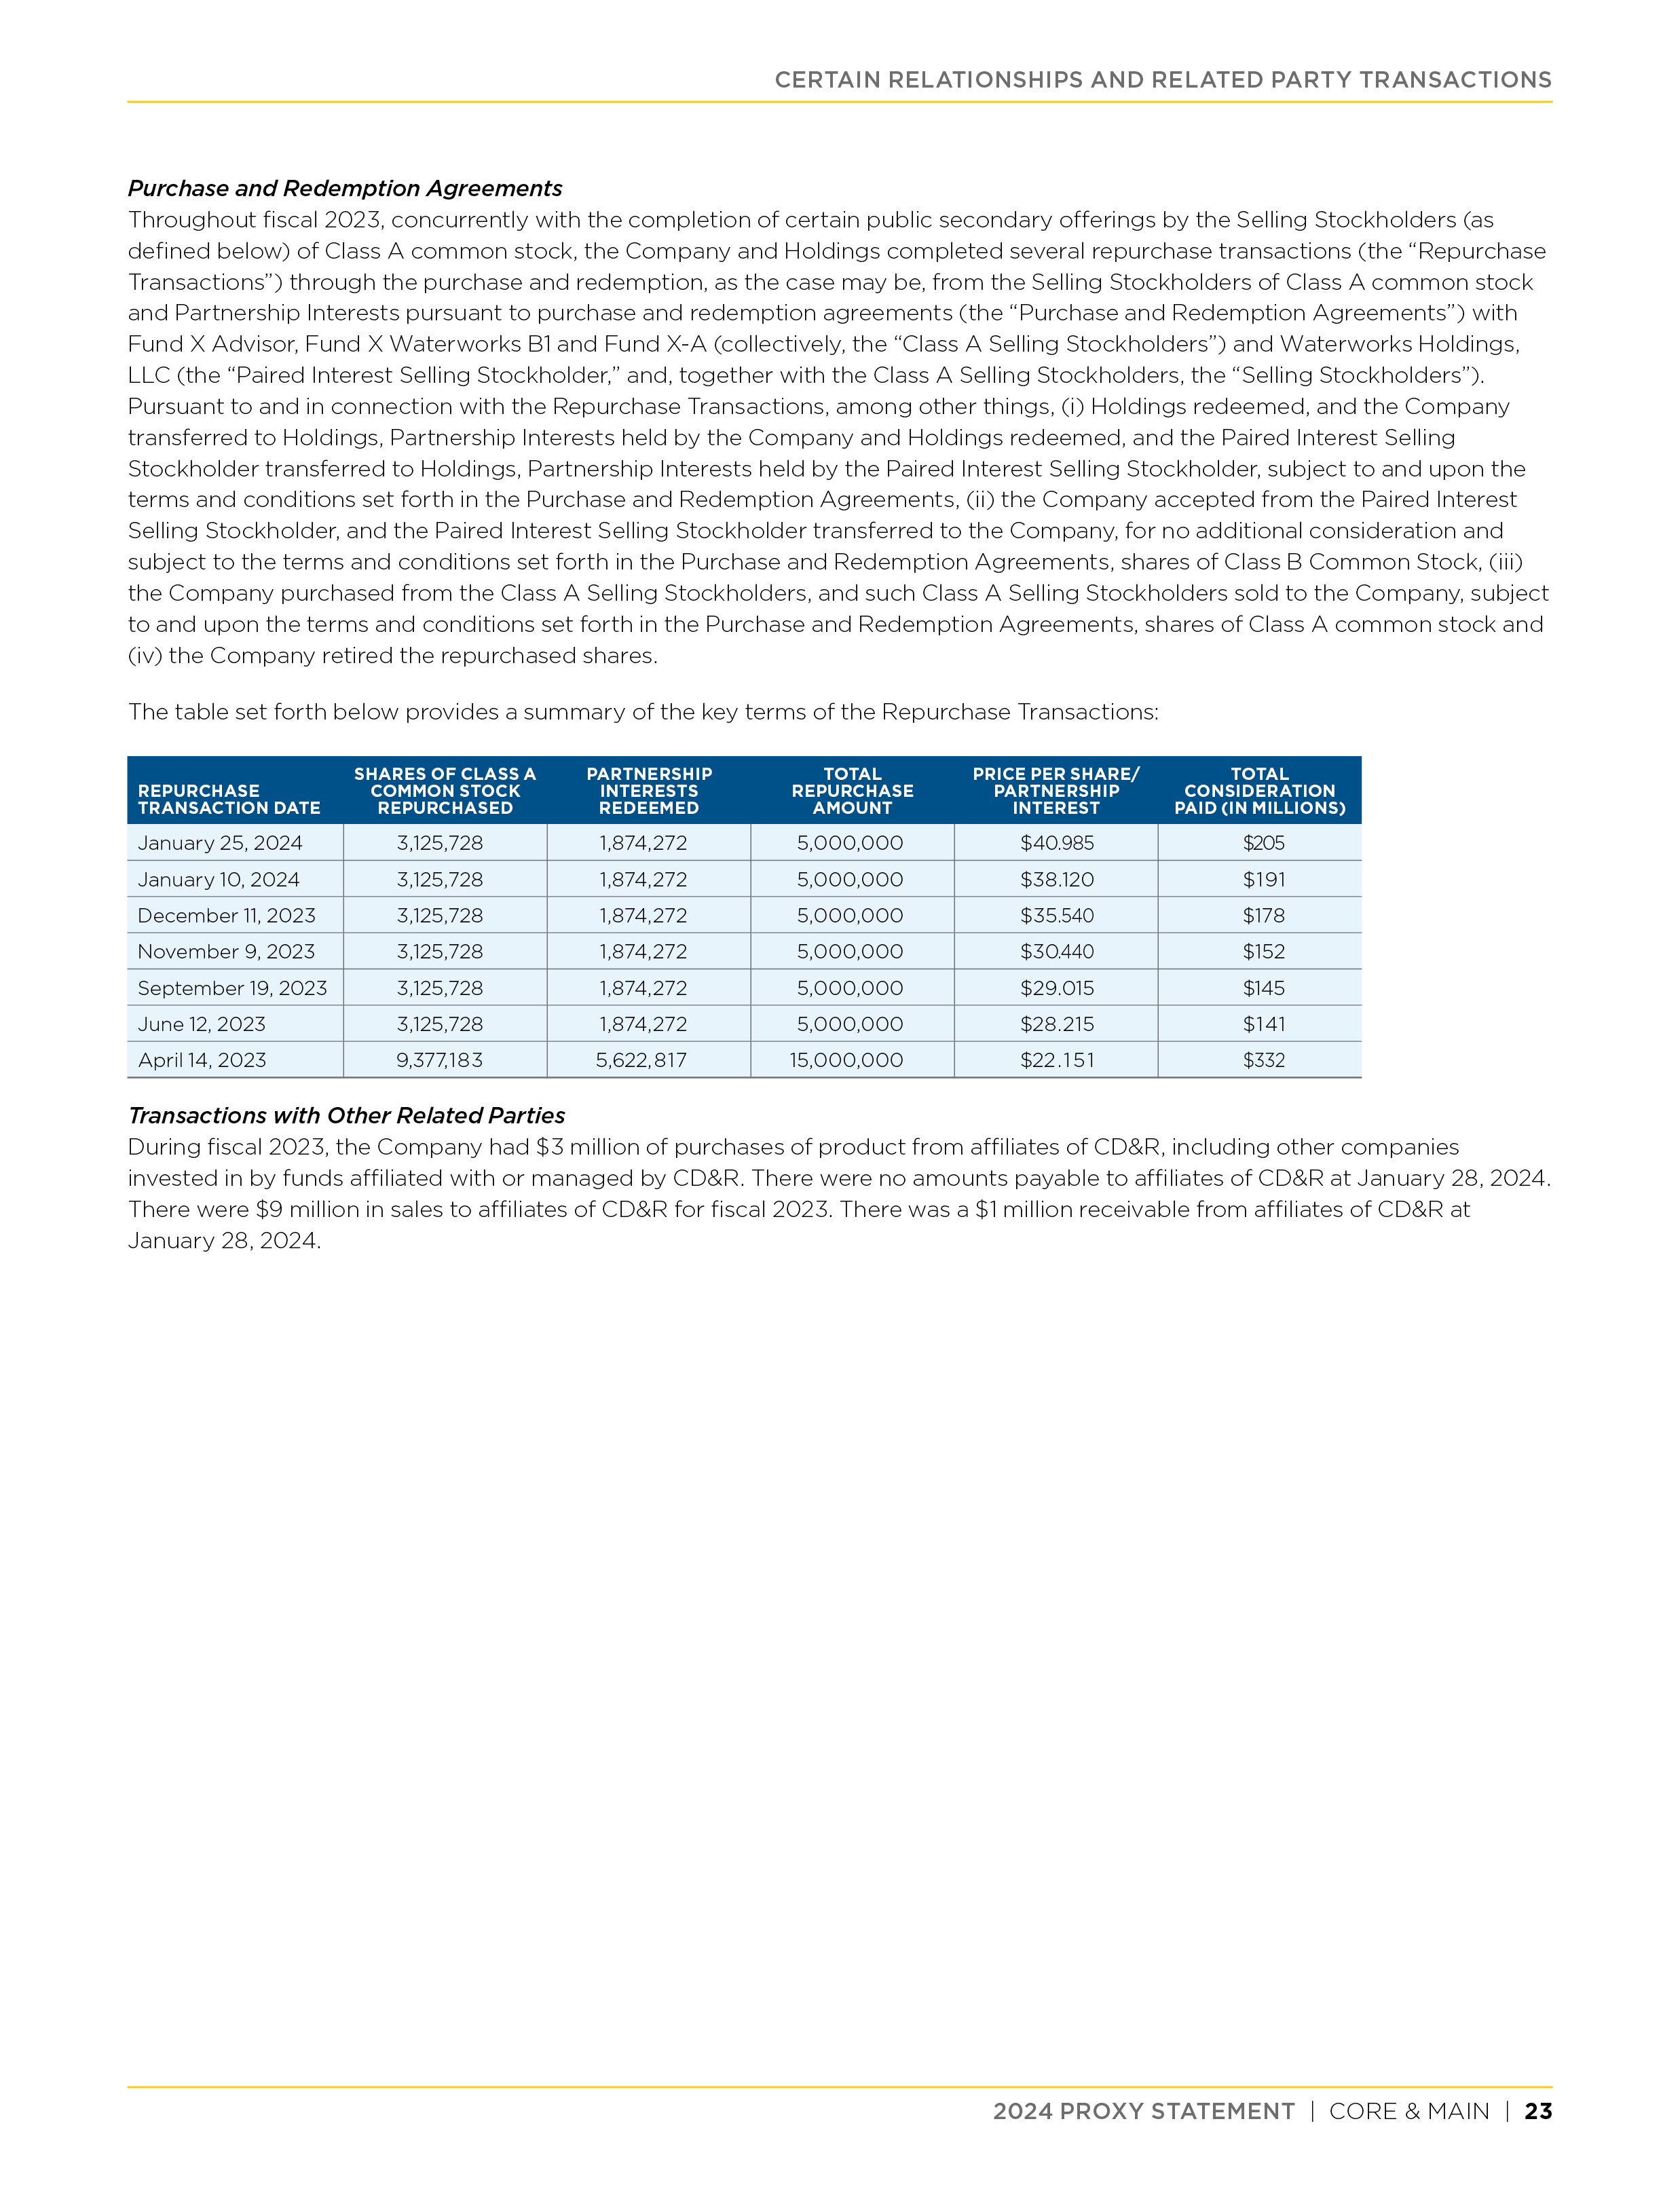
| Certain Relationships and Related Party Transactions | |
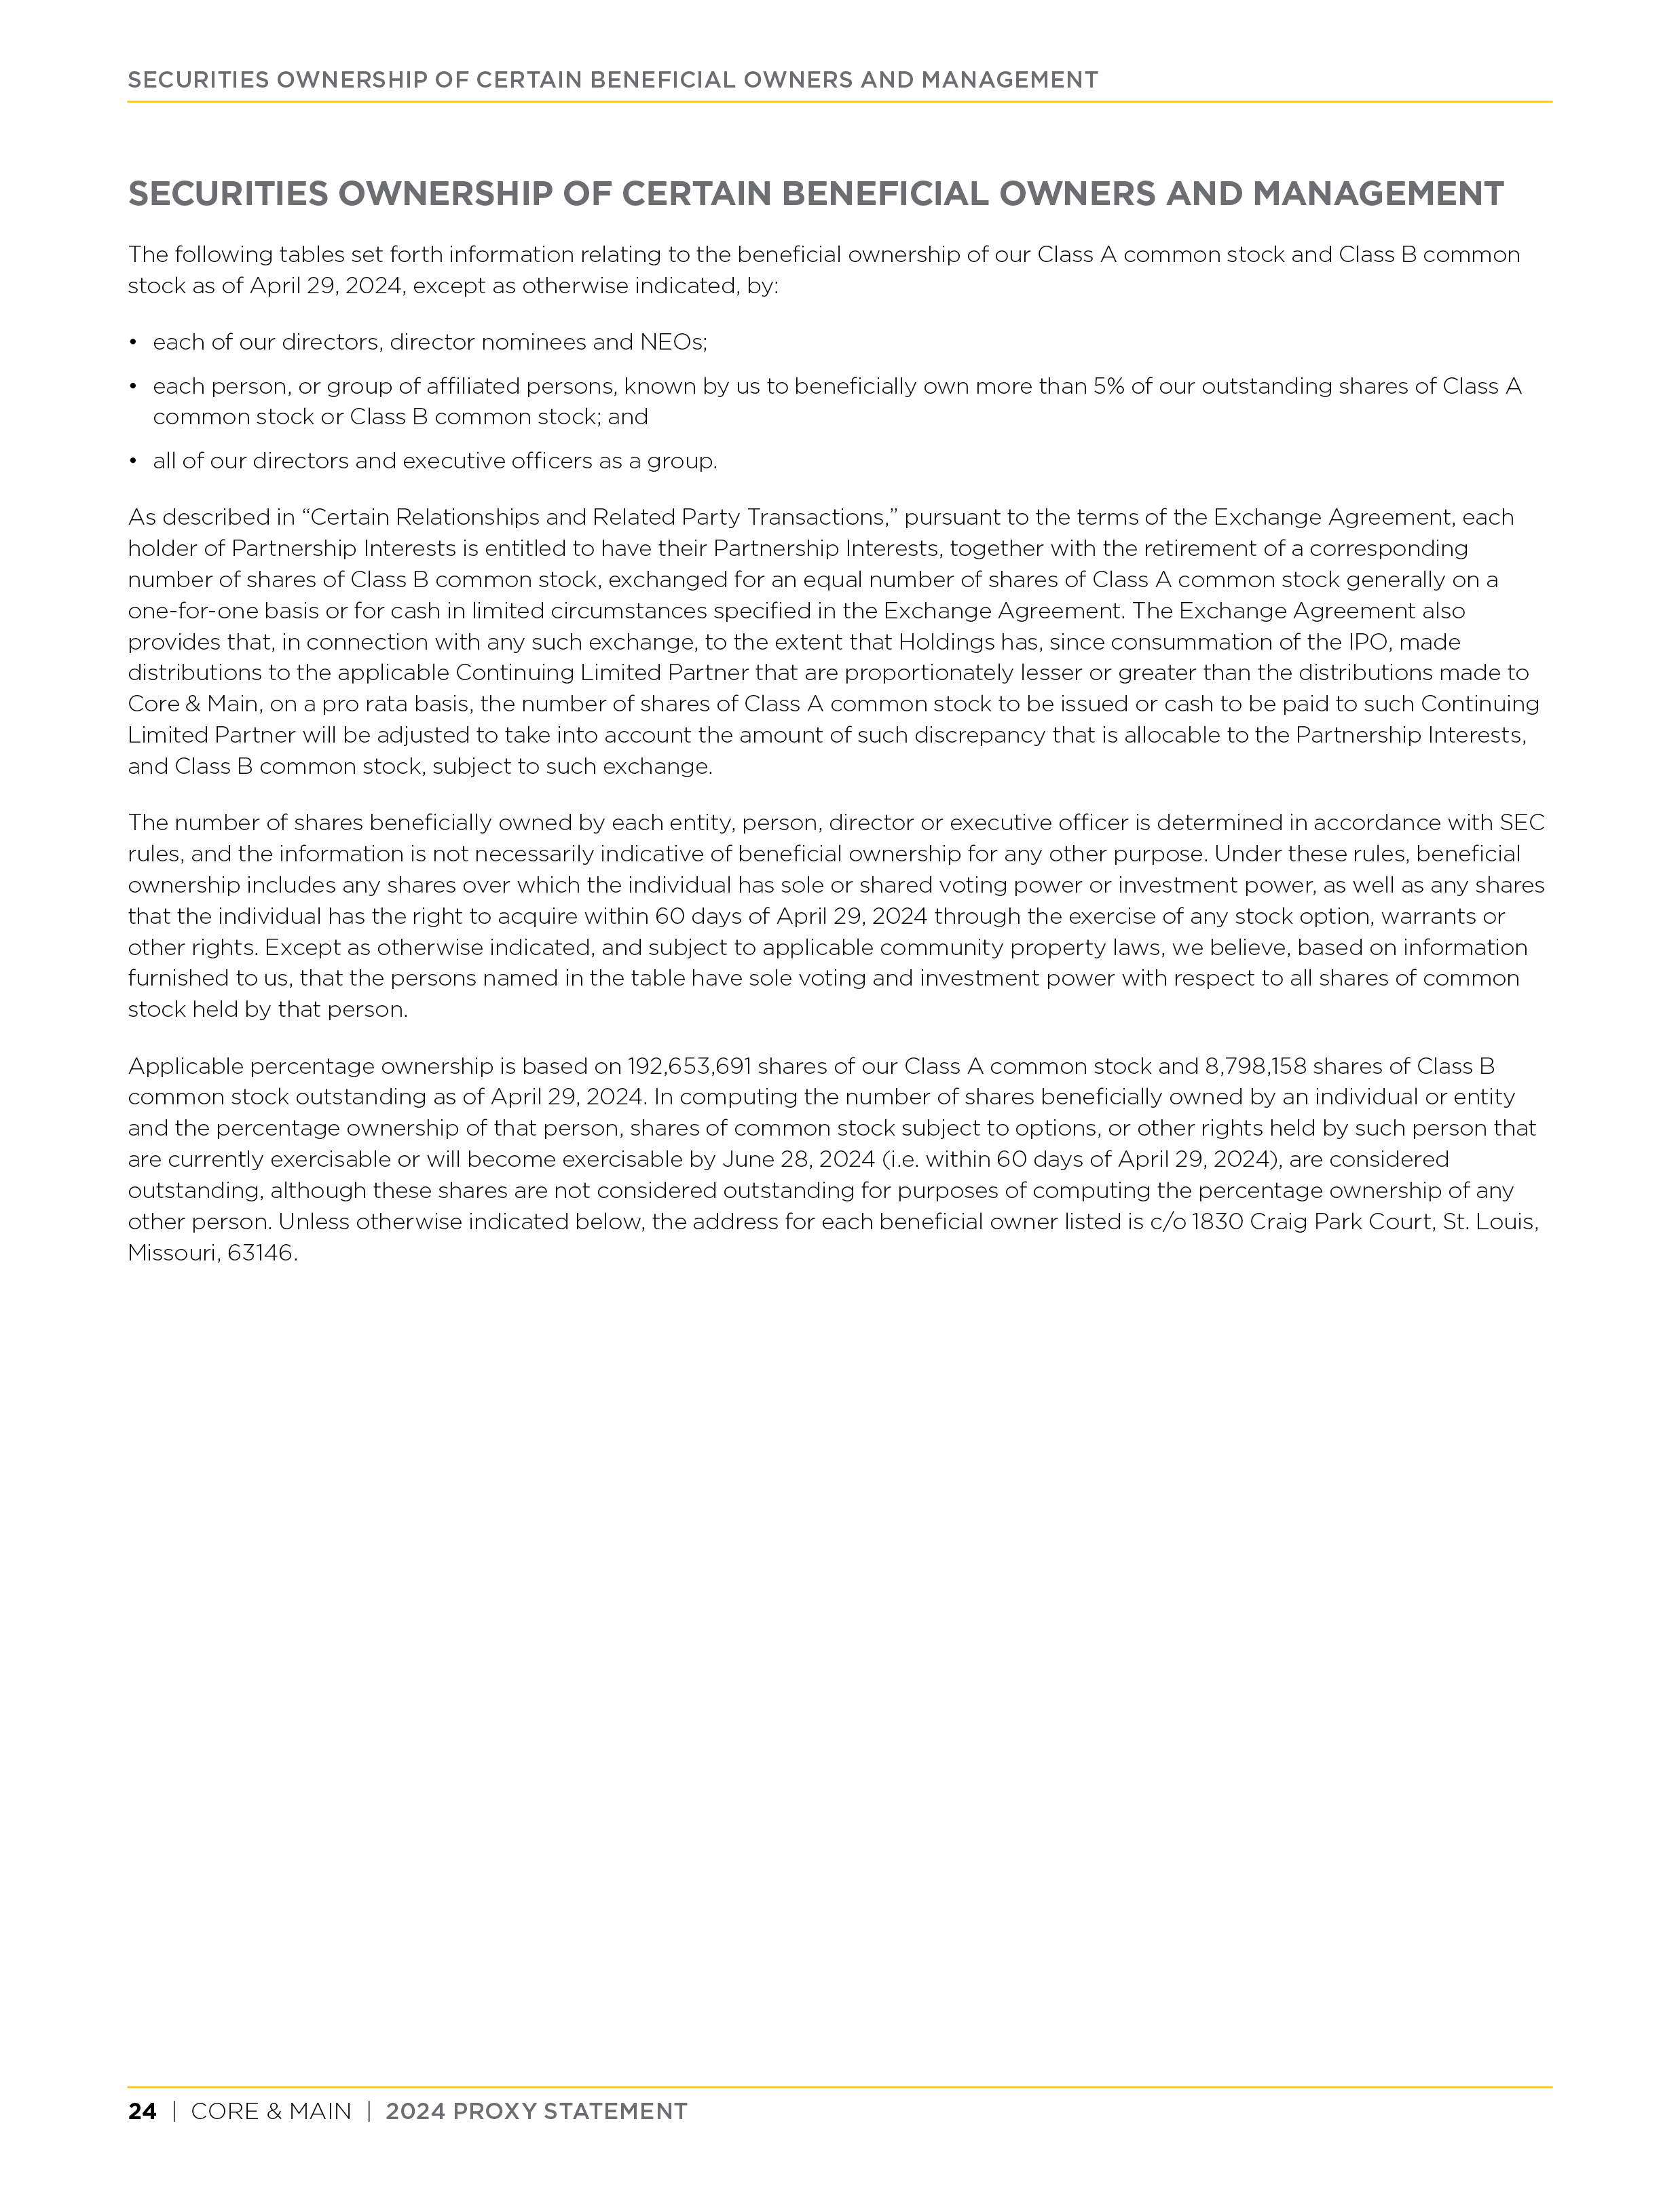
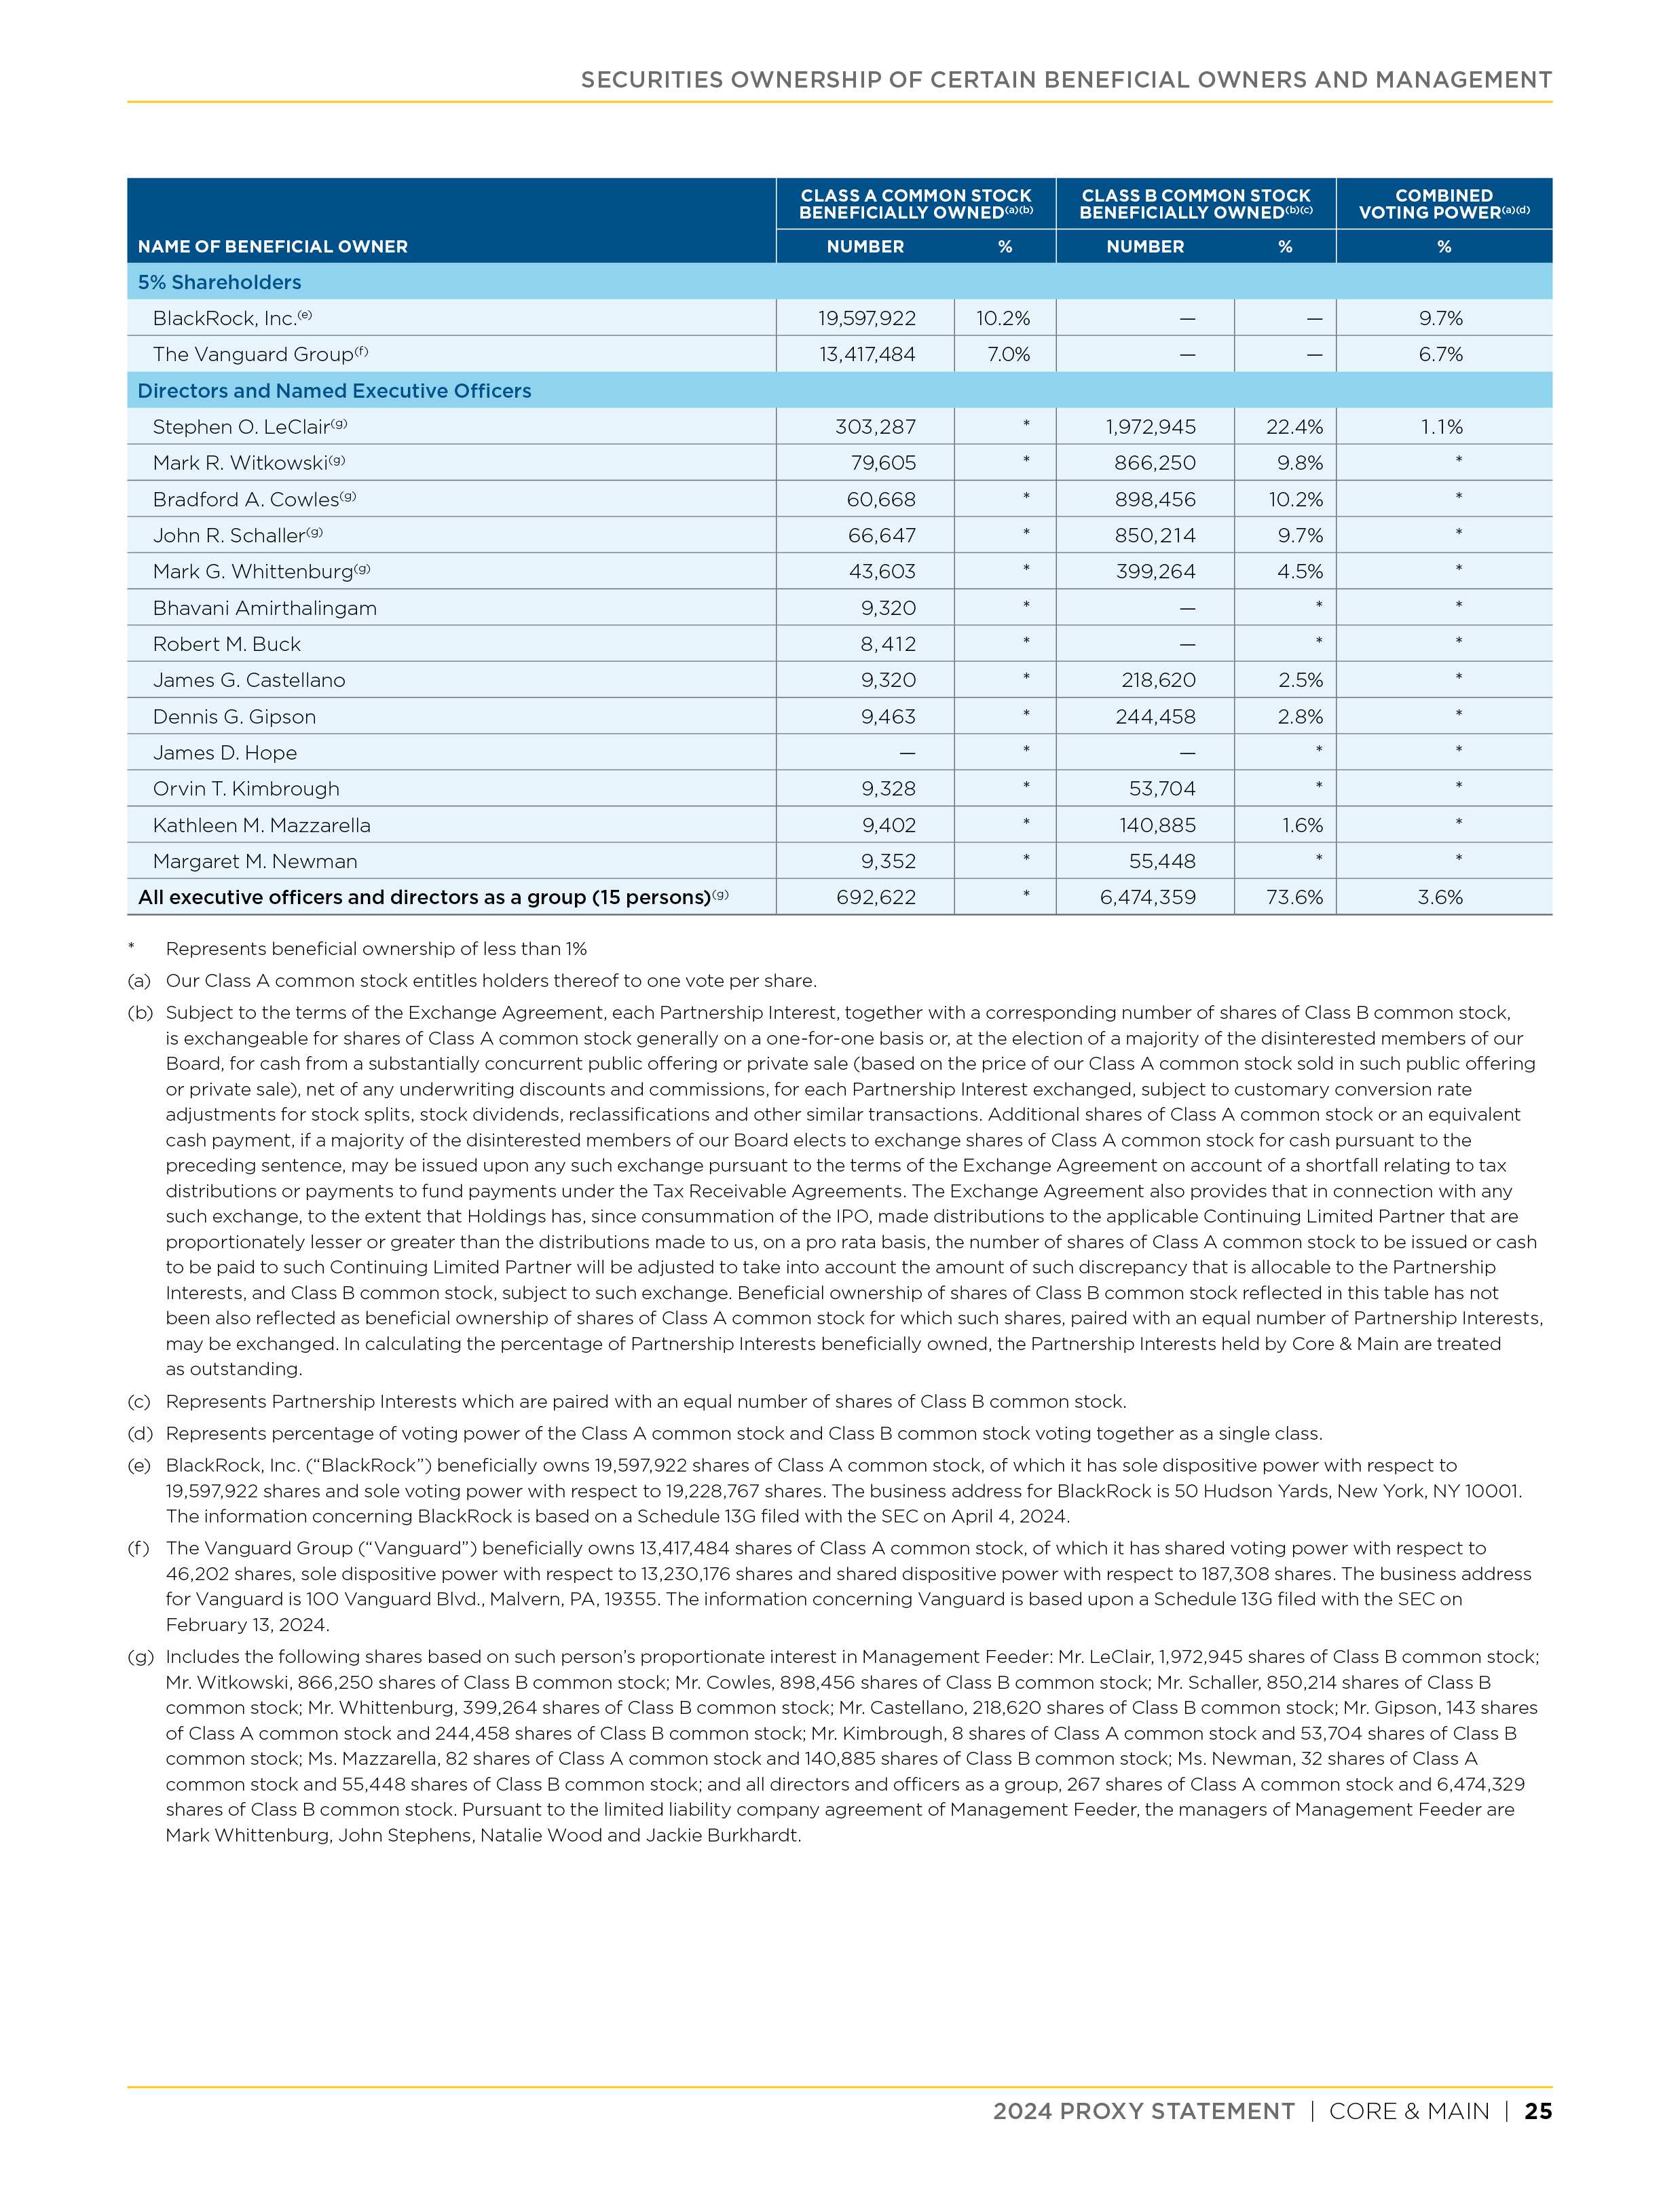
| Securities Ownership of Certain Beneficial Owners and Management | |
| Director and Executive Compensation | |
| Talent and Compensation Committee Report | |
| Pay Versus Performance | |
| CEO Pay Ratio | |
| Audit Matters | |
| Proposal 1 - Election of Directors | |
Proposal 2 - Ratification of the Appointment of
Independent Registered Public Accounting Firm | |
| Proposal 3 - Advisory Vote to Approve Named Executive Officer Compensation | |
| Other Information for Shareholders | |
| | | | | | | | | | | |
| | | |
| 2024 PROXY STATEMENT | CORE & MAIN | 1 |
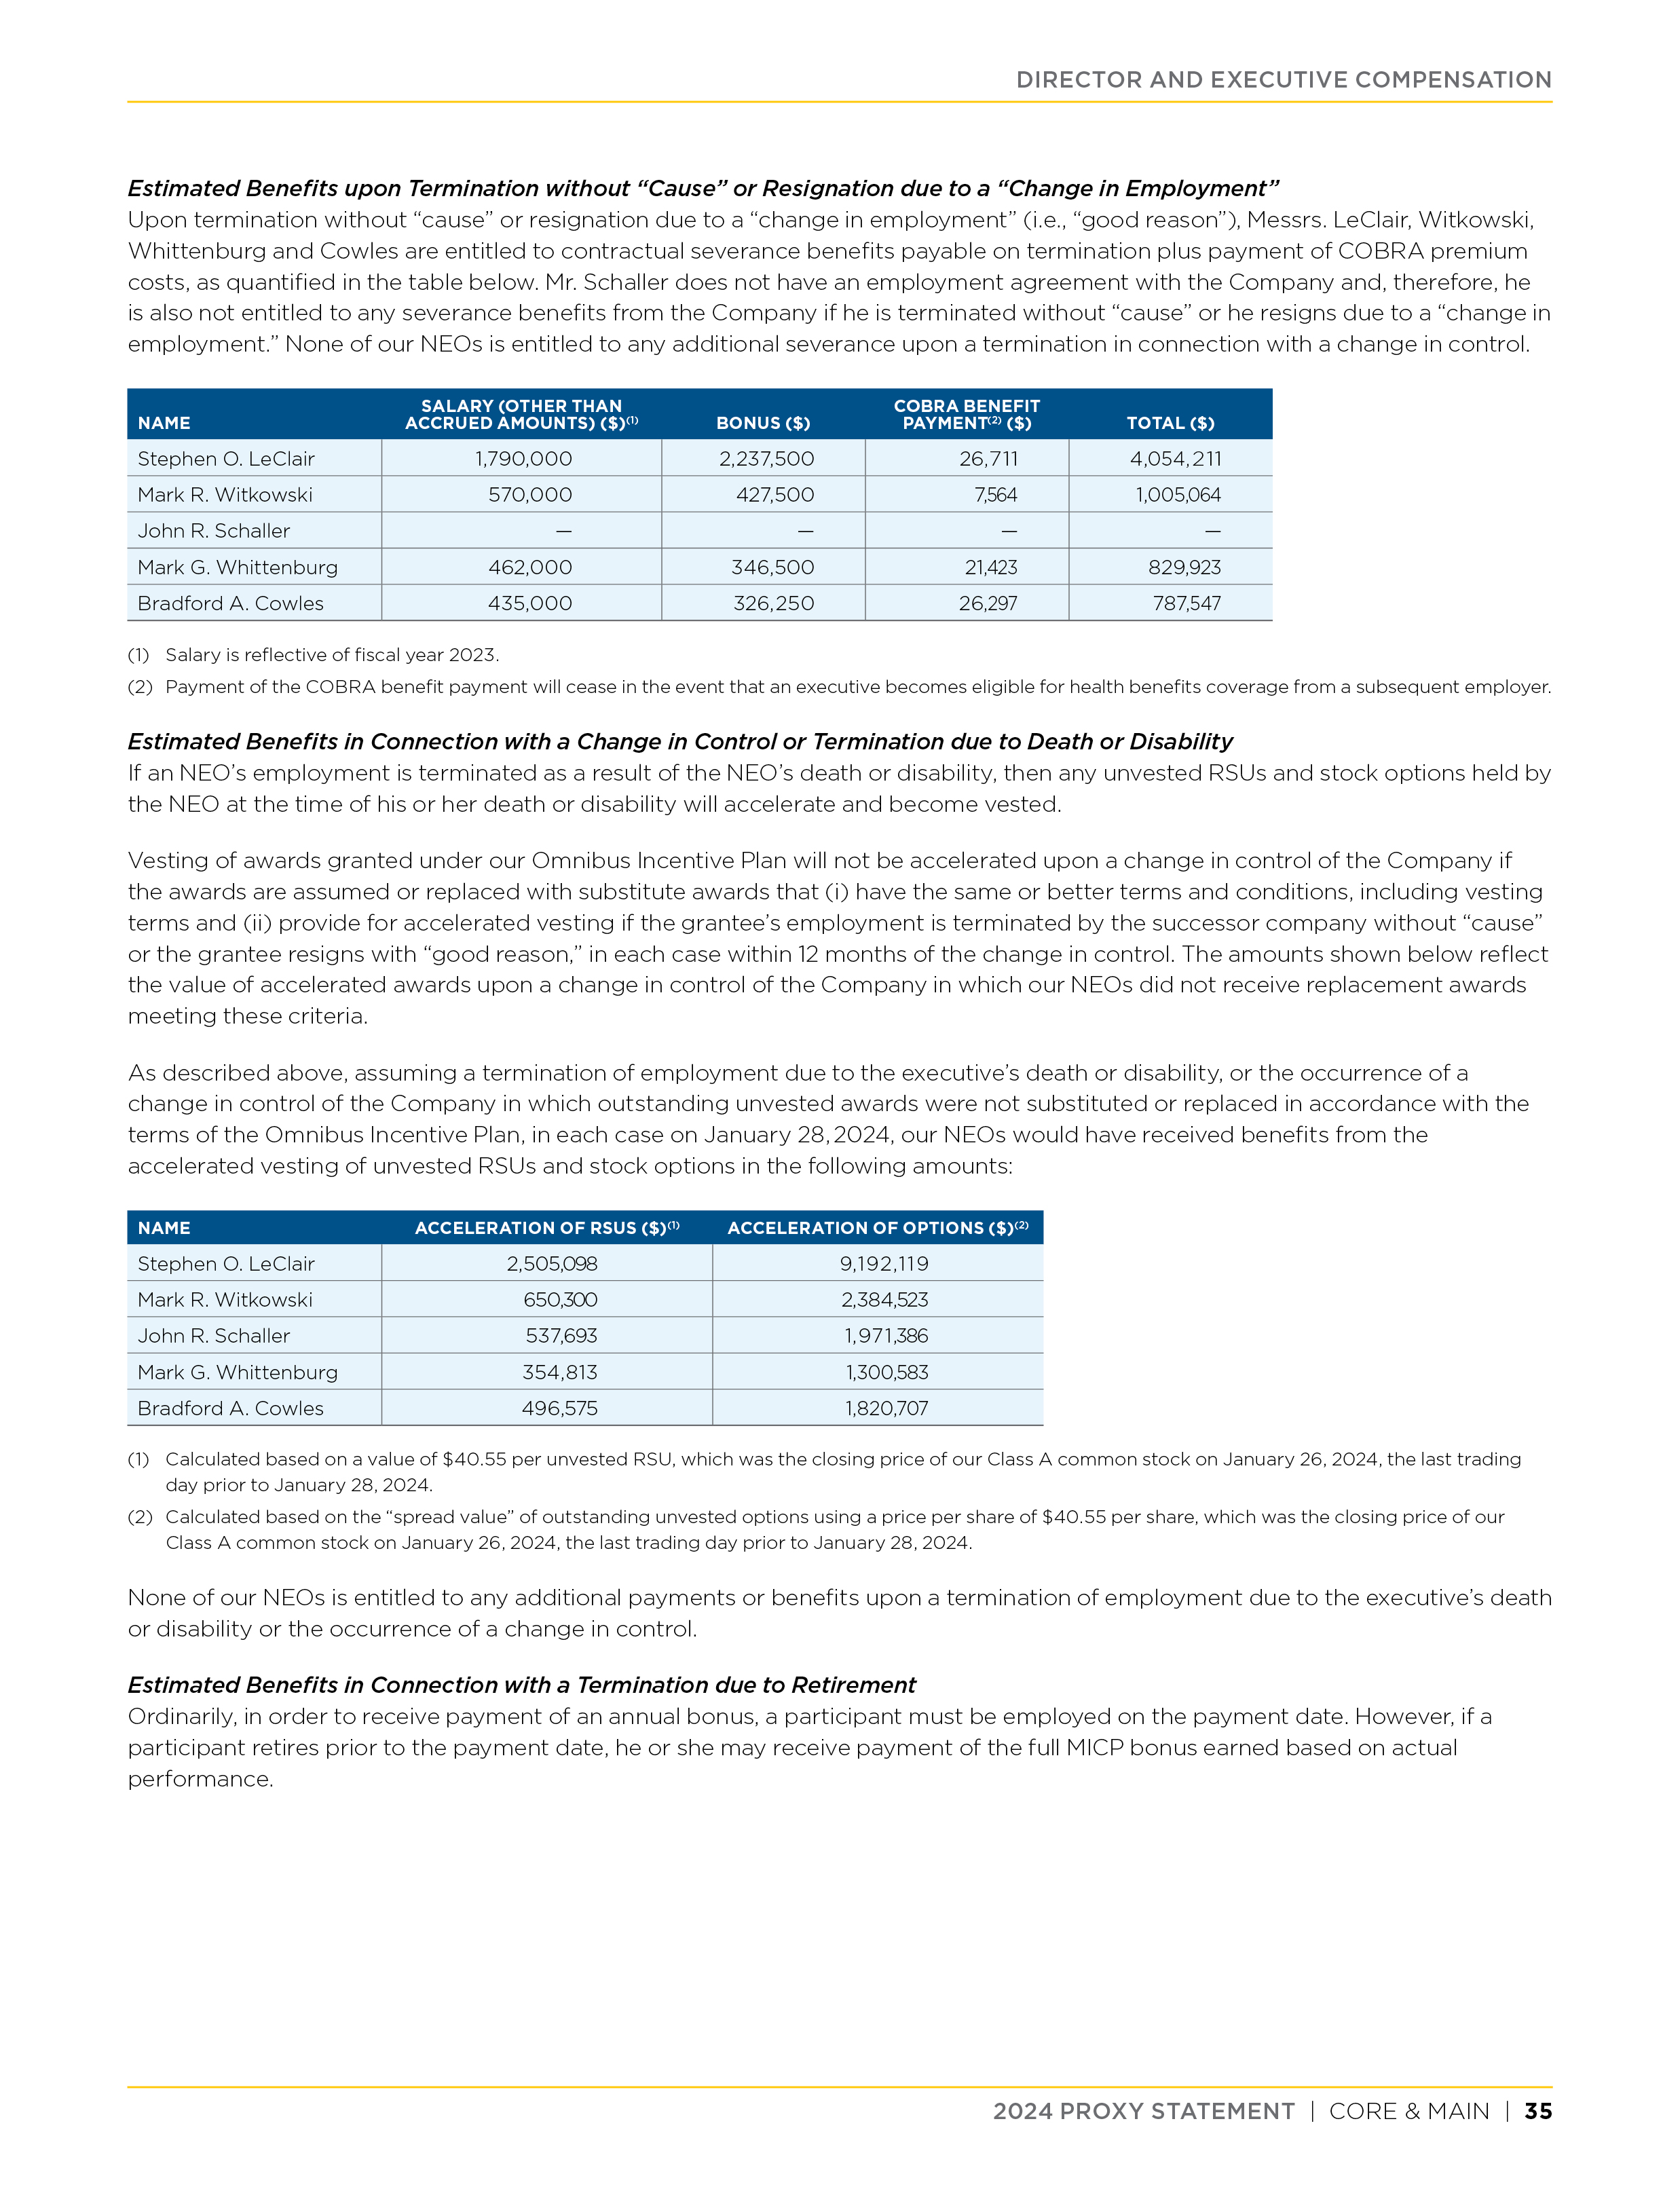
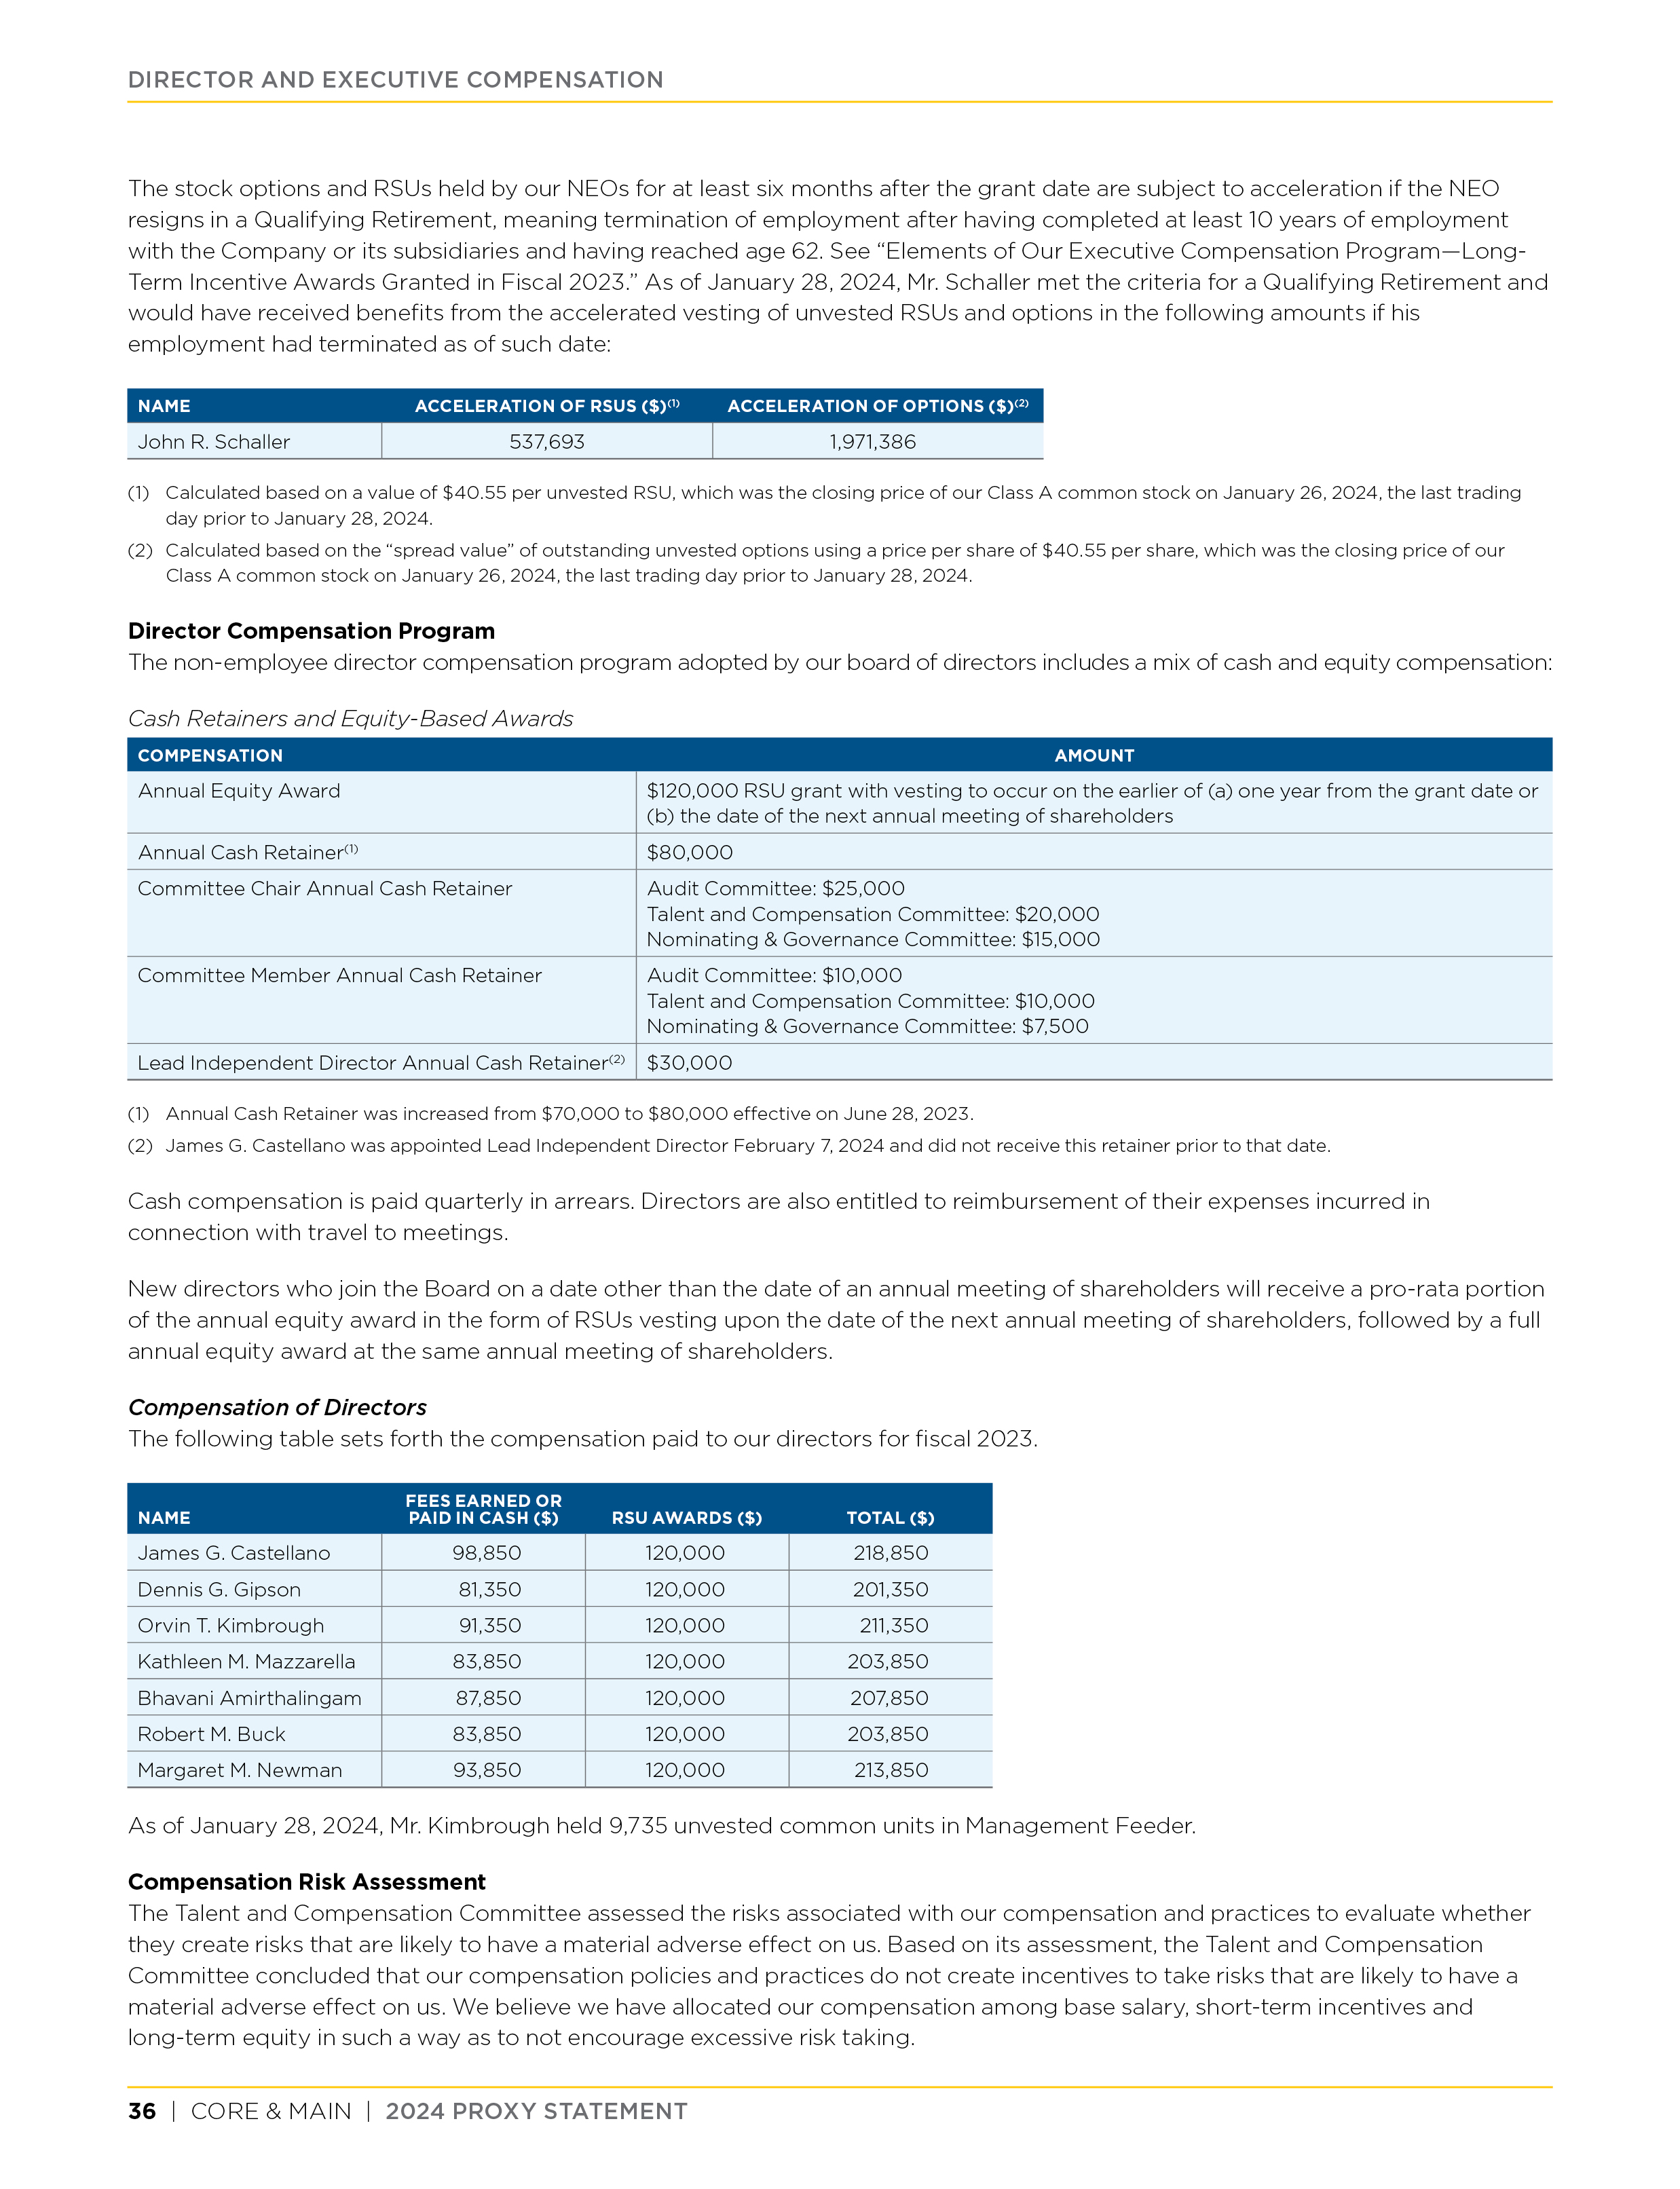
PAY VERSUS PERFORMANCE
In accordance with SEC rules, this section presents information about the relationship between compensation paid to our executives and certain Company financial performance metrics. For information about the Company’s compensation philosophy and objectives, please refer to the compensation discussion and analysis above, under the heading “Director and Executive Compensation.”
| | | | | | | | | | | | | | | | | | | | | | | | | | |
| YEAR | SUMMARY COMPENSATION TABLE TOTAL FOR PEO (1) | COMPENSATION ACTUALLY PAID TO PEO (3) | AVERAGE SUMMARY COMPENSATION TABLE TOTAL FOR NON-PEO NAMED EXECUTIVE OFFICERS (2) | AVERAGE COMPENSATION ACTUALLY PAID TO NON-PEO NAMED EXECUTIVE OFFICERS (3) | VALUE OF INITIAL FIXED $100 INVESTMENT BASED ON (7): | NET INCOME (MILLIONS) (5) | MICP ADJUSTED EBITDA (MILLIONS) (6) |
CORE & MAIN
TOTAL
SHAREHOLDER
RETURN | PEER GROUP TOTAL SHAREHOLDER RETURN(4) |
| 2023 | $5,546,122 | $13,225,593 | $1,609,568 | $3,166,945 | $171.10 | $121.62 | $531 | $888 |
| 2022 | 5,564,480 | 6,240,946 | 1,710,361 | 1,896,515 | 91.43 | 103.74 | 581 | 924 |
| 2021 | 2,292,431 | 3,348,965 | 979,397 | 1,381,409 | 98.95 | 97.17 | 225 | 604 |
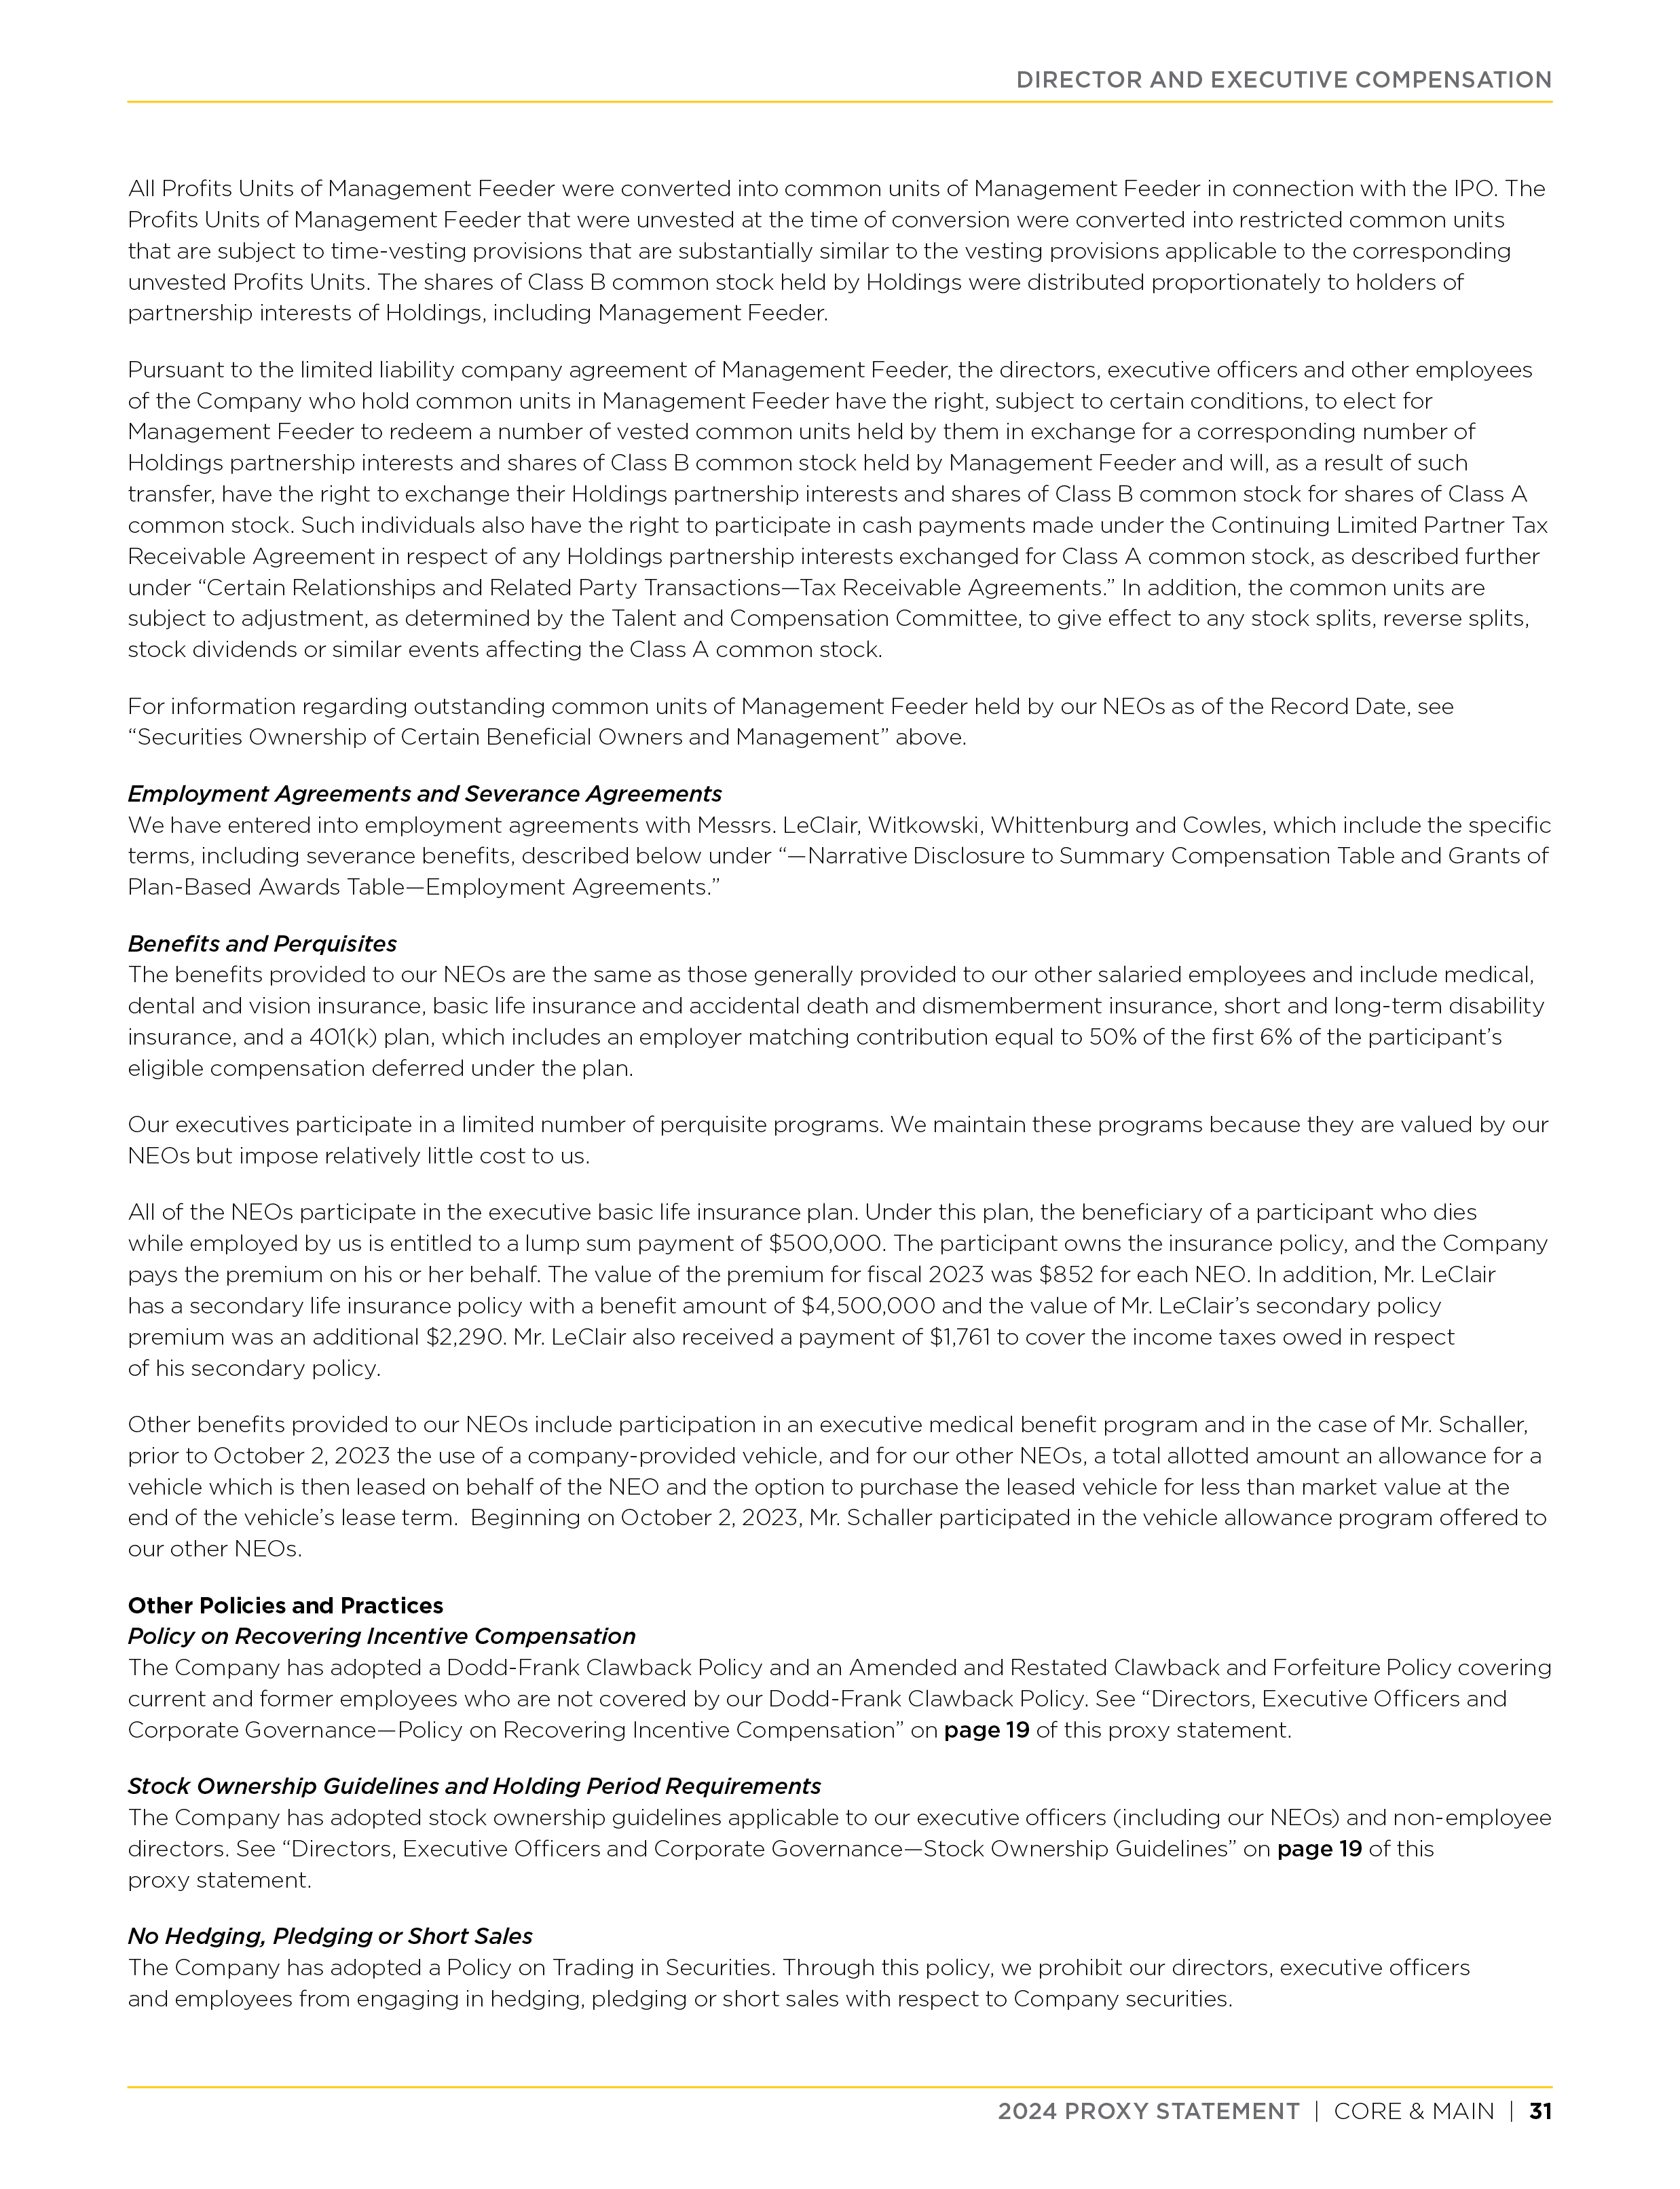
(1)Reflects the amount of total compensation reported in the Summary Compensation Table (“SCT”) for Stephen LeClair, our Principal Executive Officer (“PEO”) for the applicable year. See “Director and Executive Compensation—Summary Compensation Table.”
(2)Reflects the average of the total compensation reported in the SCT for the Company’s NEOs as a group (excluding Mr. LeClair) for the applicable year. The NEOs included in this calculation for each of 2023, 2022 and 2021 are Mark Witkowski, John Schaller, Mark Whittenburg, and Bradford Cowles. See “Director and Executive Compensation—Summary Compensation Table.”
(3)Amounts reported in this column represent the amount of compensation actually paid (“CAP”) to Mr. LeClair or the non-PEO NEOs, as applicable, computed in accordance with Item 402(v) of Regulation S-K. The dollar amounts do not reflect the actual amount of compensation earned by or paid during the applicable year, primarily due to unrealized gains in unvested equity awards. In accordance with the requirements of Item 402(v) of Regulation S-K, the CAP reported for Mr. LeClair and the non-PEO NEOs reflects the following adjustments to the total compensation reported in the SCT to determine the applicable CAP:
| | | | | | | | | | | | | | | | | | | | |
| 2023 | 2022 | 2021 |
| SCT TO CAP RECONCILIATION | PEO | Average NON-PEO NEOs | PEO | Average NON-PEO NEOs | PEO | Average NON-PEO NEOs |
| Reported SCT Total Compensation | $ | 5,546,122 | | $ | 1,609,568 | | $ | 5,564,480 | | $ | 1,710,361 | | $ | 2,292,431 | | $ | 979,397 | |
| Value of stock options and RSUs reported in SCT | (3,356,279) | | (668,682) | | (2,975,049) | | (625,652) | | — | | — | |
| Year-end fair value of unvested stock options and RSUs granted in the current fiscal year | 8,559,699 | | 1,705,345 | | 3,393,622 | | 713,678 | | — | | — | |
| Year-over-year difference of year-end fair values for unvested awards granted in prior years | 2,624,073 | | 551,843 | | — | | — | | (103,989) | | (39,568) | |
| Difference in fair values between prior year-end fair values and vesting date fair values for awards granted in prior years | (148,022) | | (31,129) | | 257,893 | | 98,128 | | 1,160,523 | | 441,580 | |
| Total Adjustments | 7,679,471 | | 1,557,377 | | 676,466 | | 186,154 | | 1,056,534 | | 402,012 | |
| CAP: | $13,225,593 | $3,166,945 | $6,240,946 | $1,896,515 | $3,348,965 | $1,381,409 |
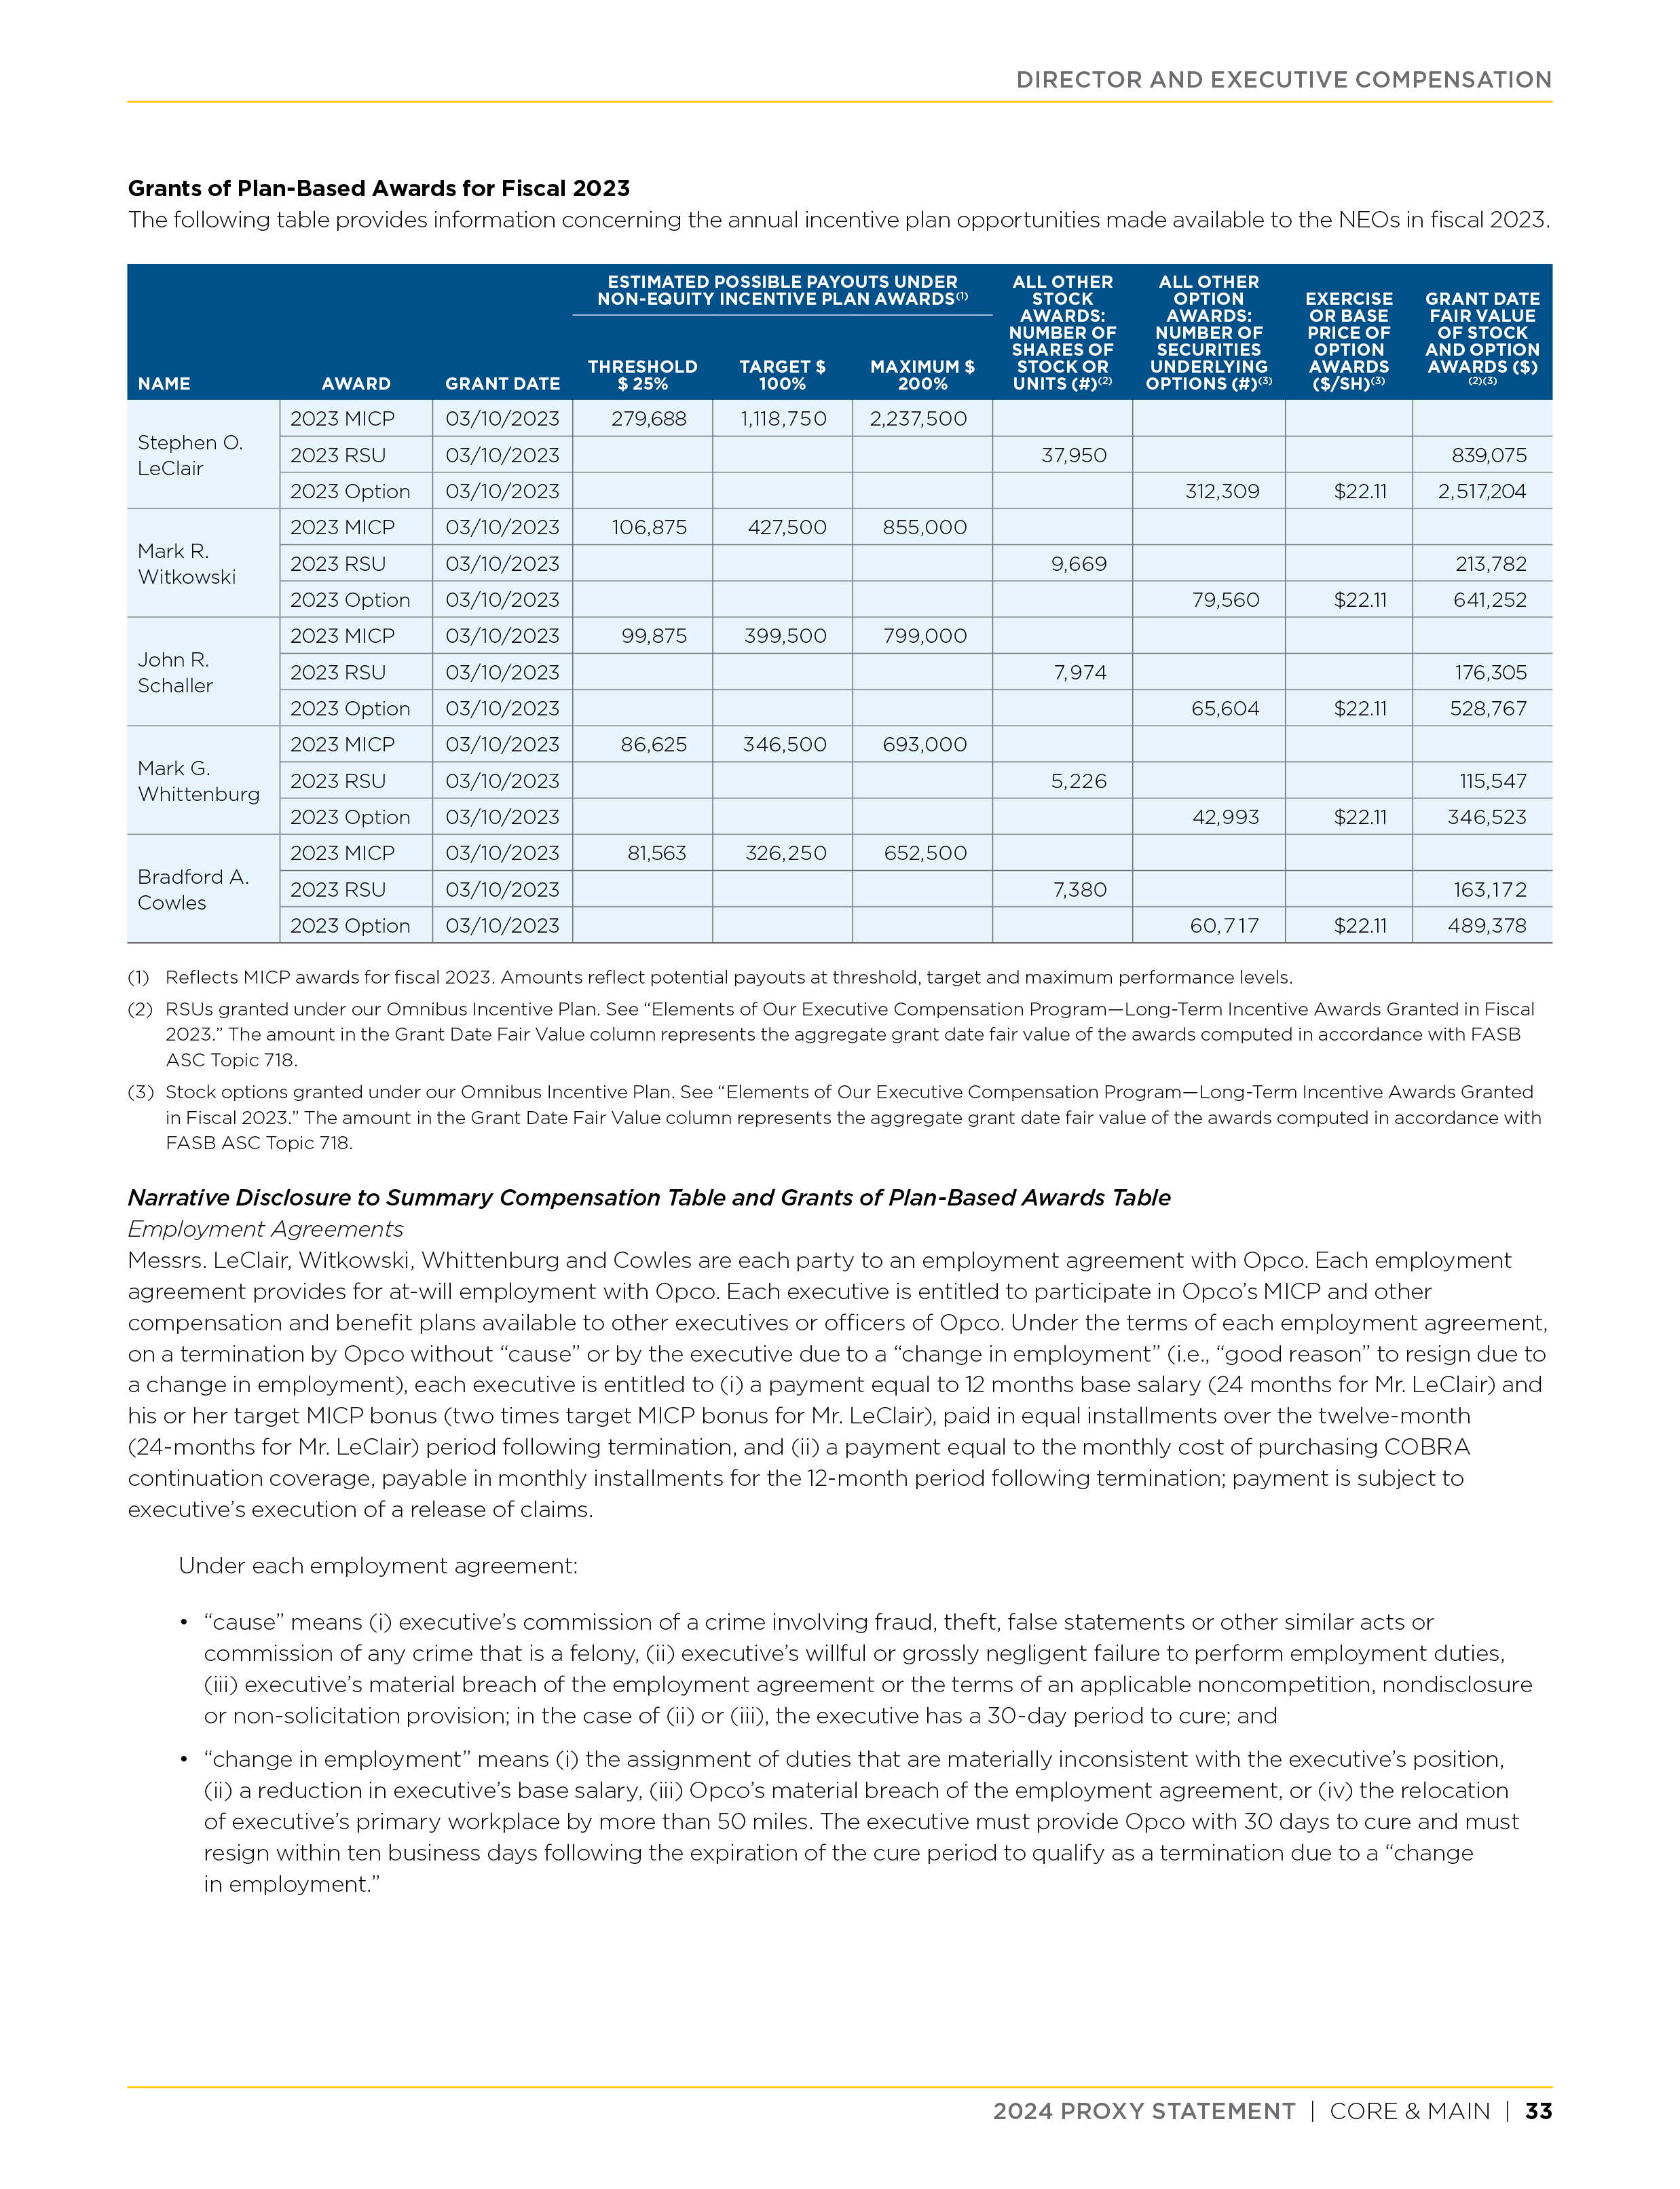
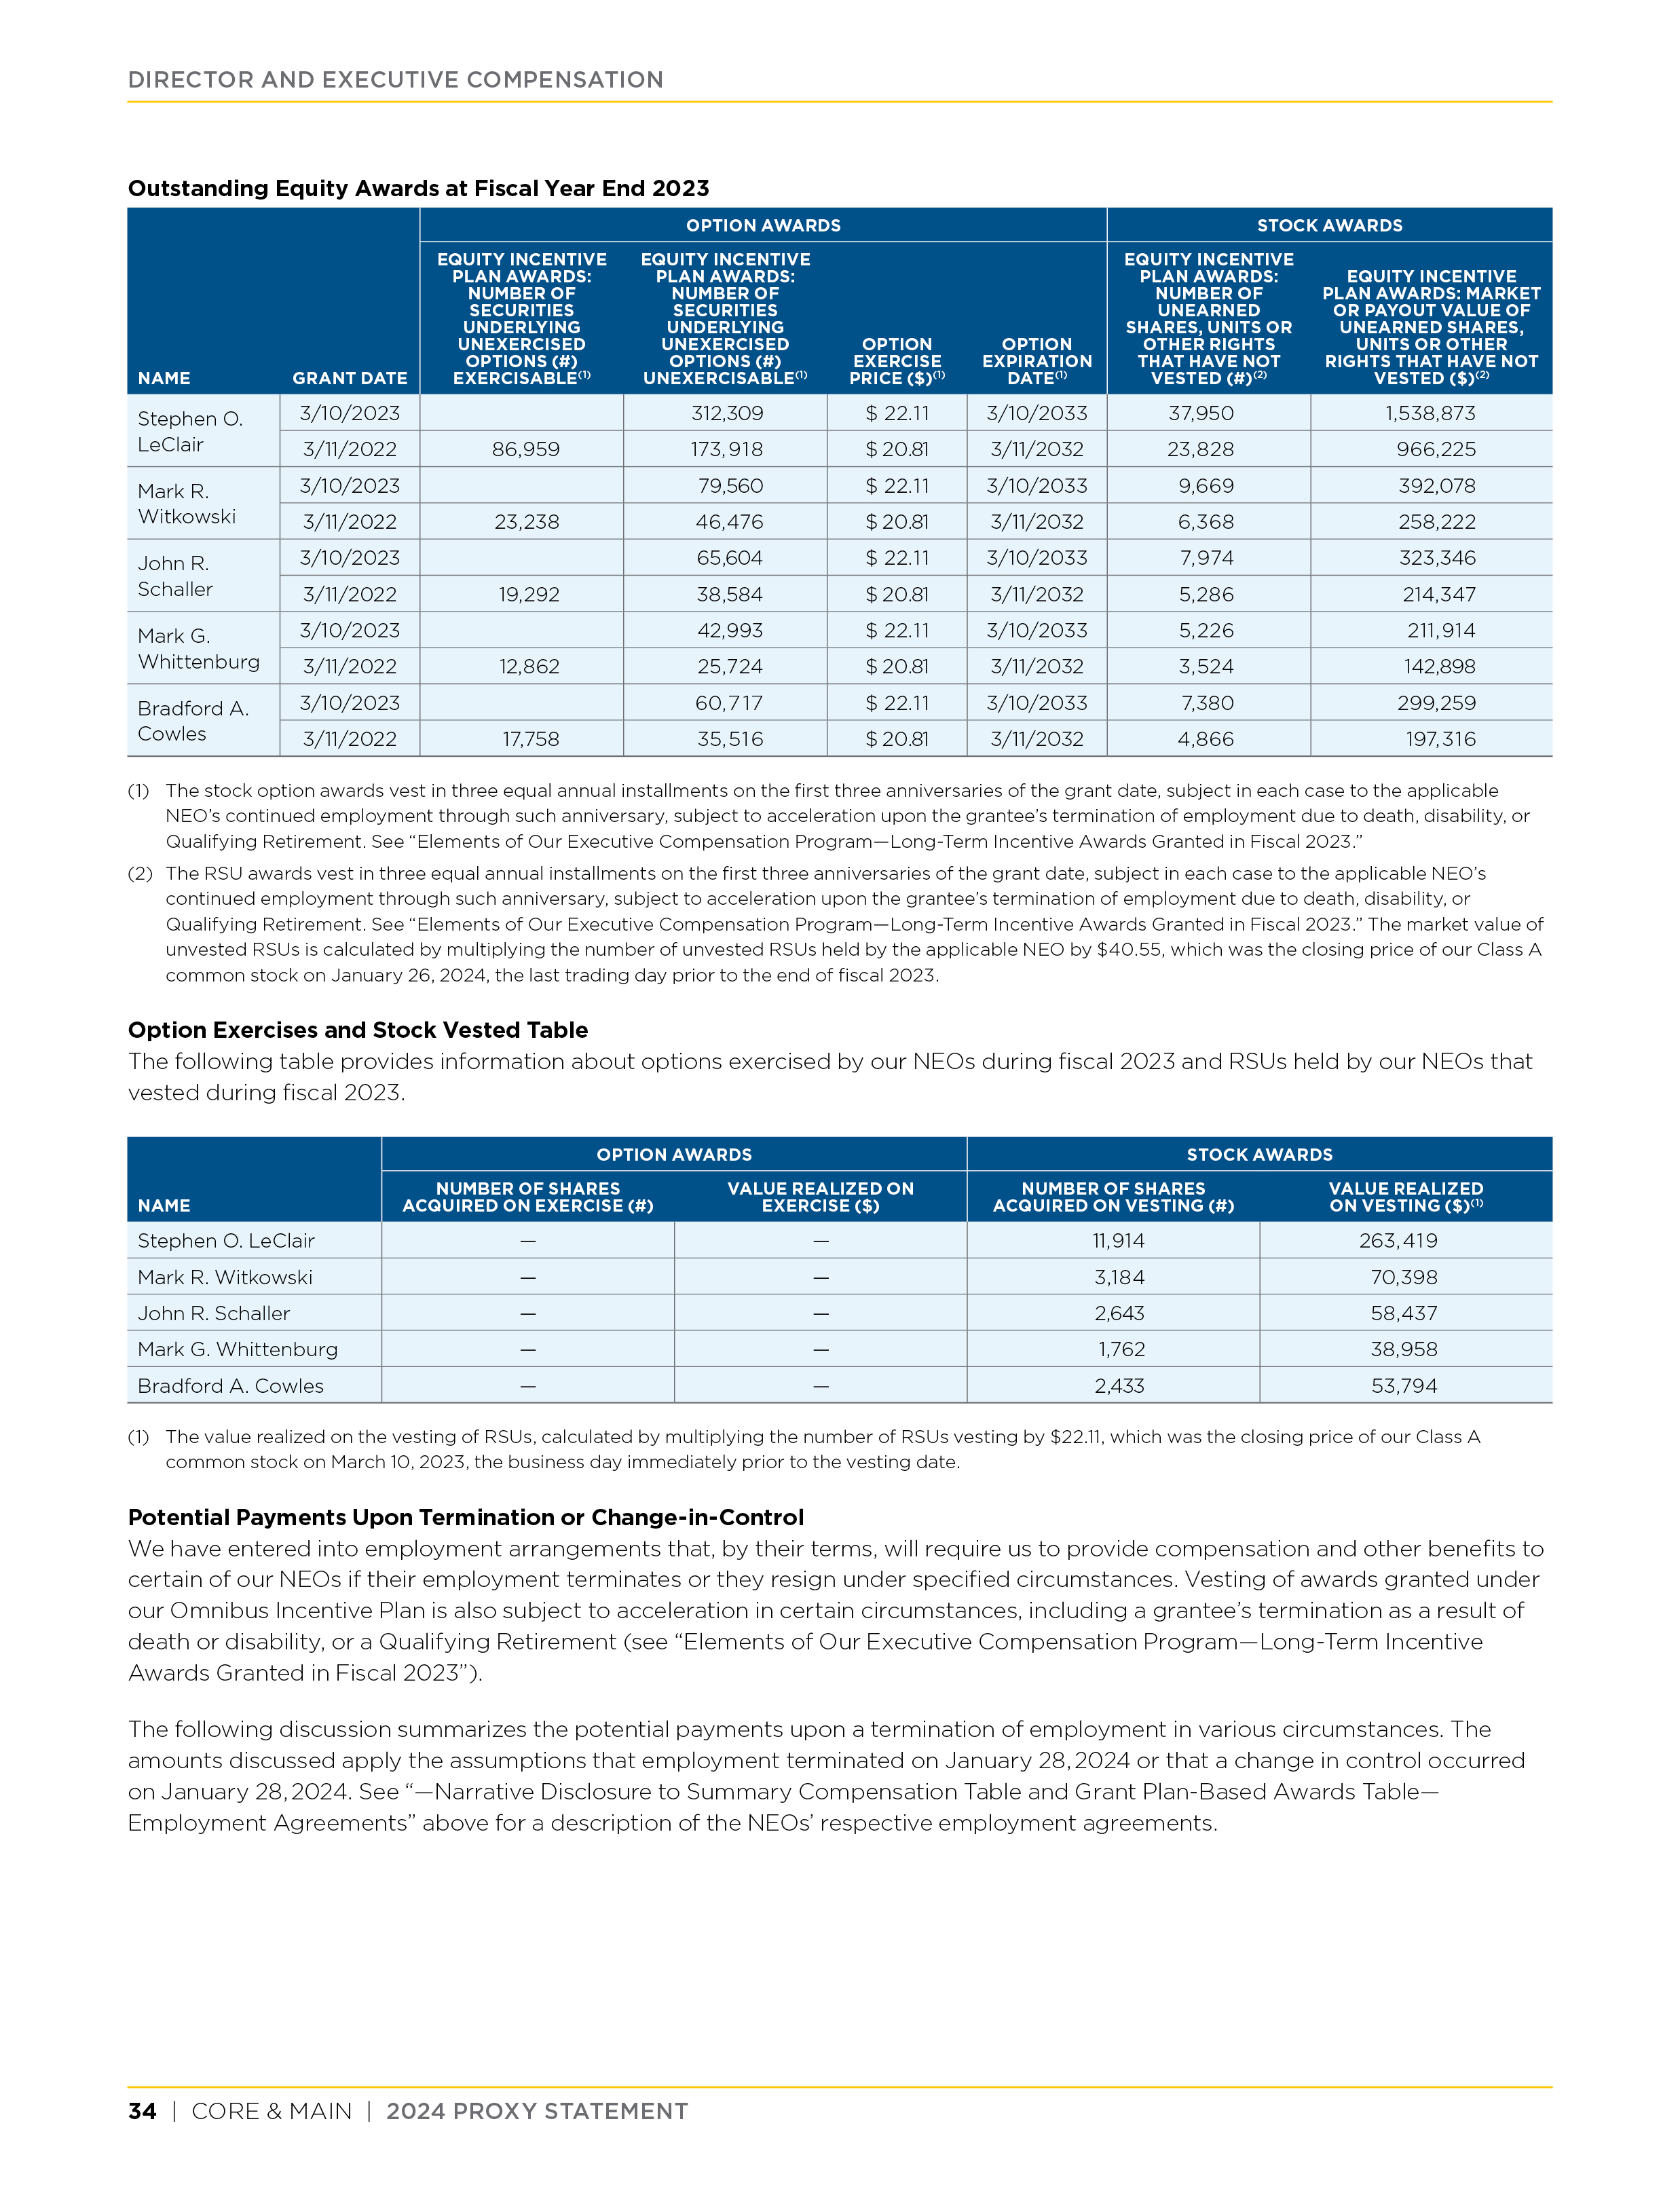
The fair value of stock options reported in this table were determined using the Black-Scholes option pricing model. The assumptions used for purposes of calculating fair values of stock options as of the vesting date or fiscal year-end date, as applicable, are (i) the expected life of each stock option is based on the “simplified method” using an average of the remaining vesting period and remaining term as of the applicable vesting date or fiscal year end date; (ii) the exercise price is based on each grant date closing price and asset price is based on the applicable vesting date or fiscal year end closing price; (iii) the risk free interest rate is based on the Treasury Constant Maturity rate closest to the remaining expected life as of the applicable vesting date or fiscal year end date; and (iv) historical volatility is based on daily price history for the expected life of the stock option prior to the applicable vesting date or fiscal year end date. The portion of CAP that is based on fiscal year-end share price reflects the share prices of $40.55, $21.67 and $23.45 for fiscal year 2023, 2022 and 2021, respectively.
(4)Represents the weighted peer group total shareholder return (“TSR”), weighted according to the respective companies’ stock market capitalization at the beginning of each period for which a return is indicated. The peer group used for this purpose is the S&P 400 Industrials Index, a published industry index.
(5)Reflects “Net Income” in the Company’s Consolidated Financial Statements included in the 2023 Form 10-K for the applicable fiscal year.
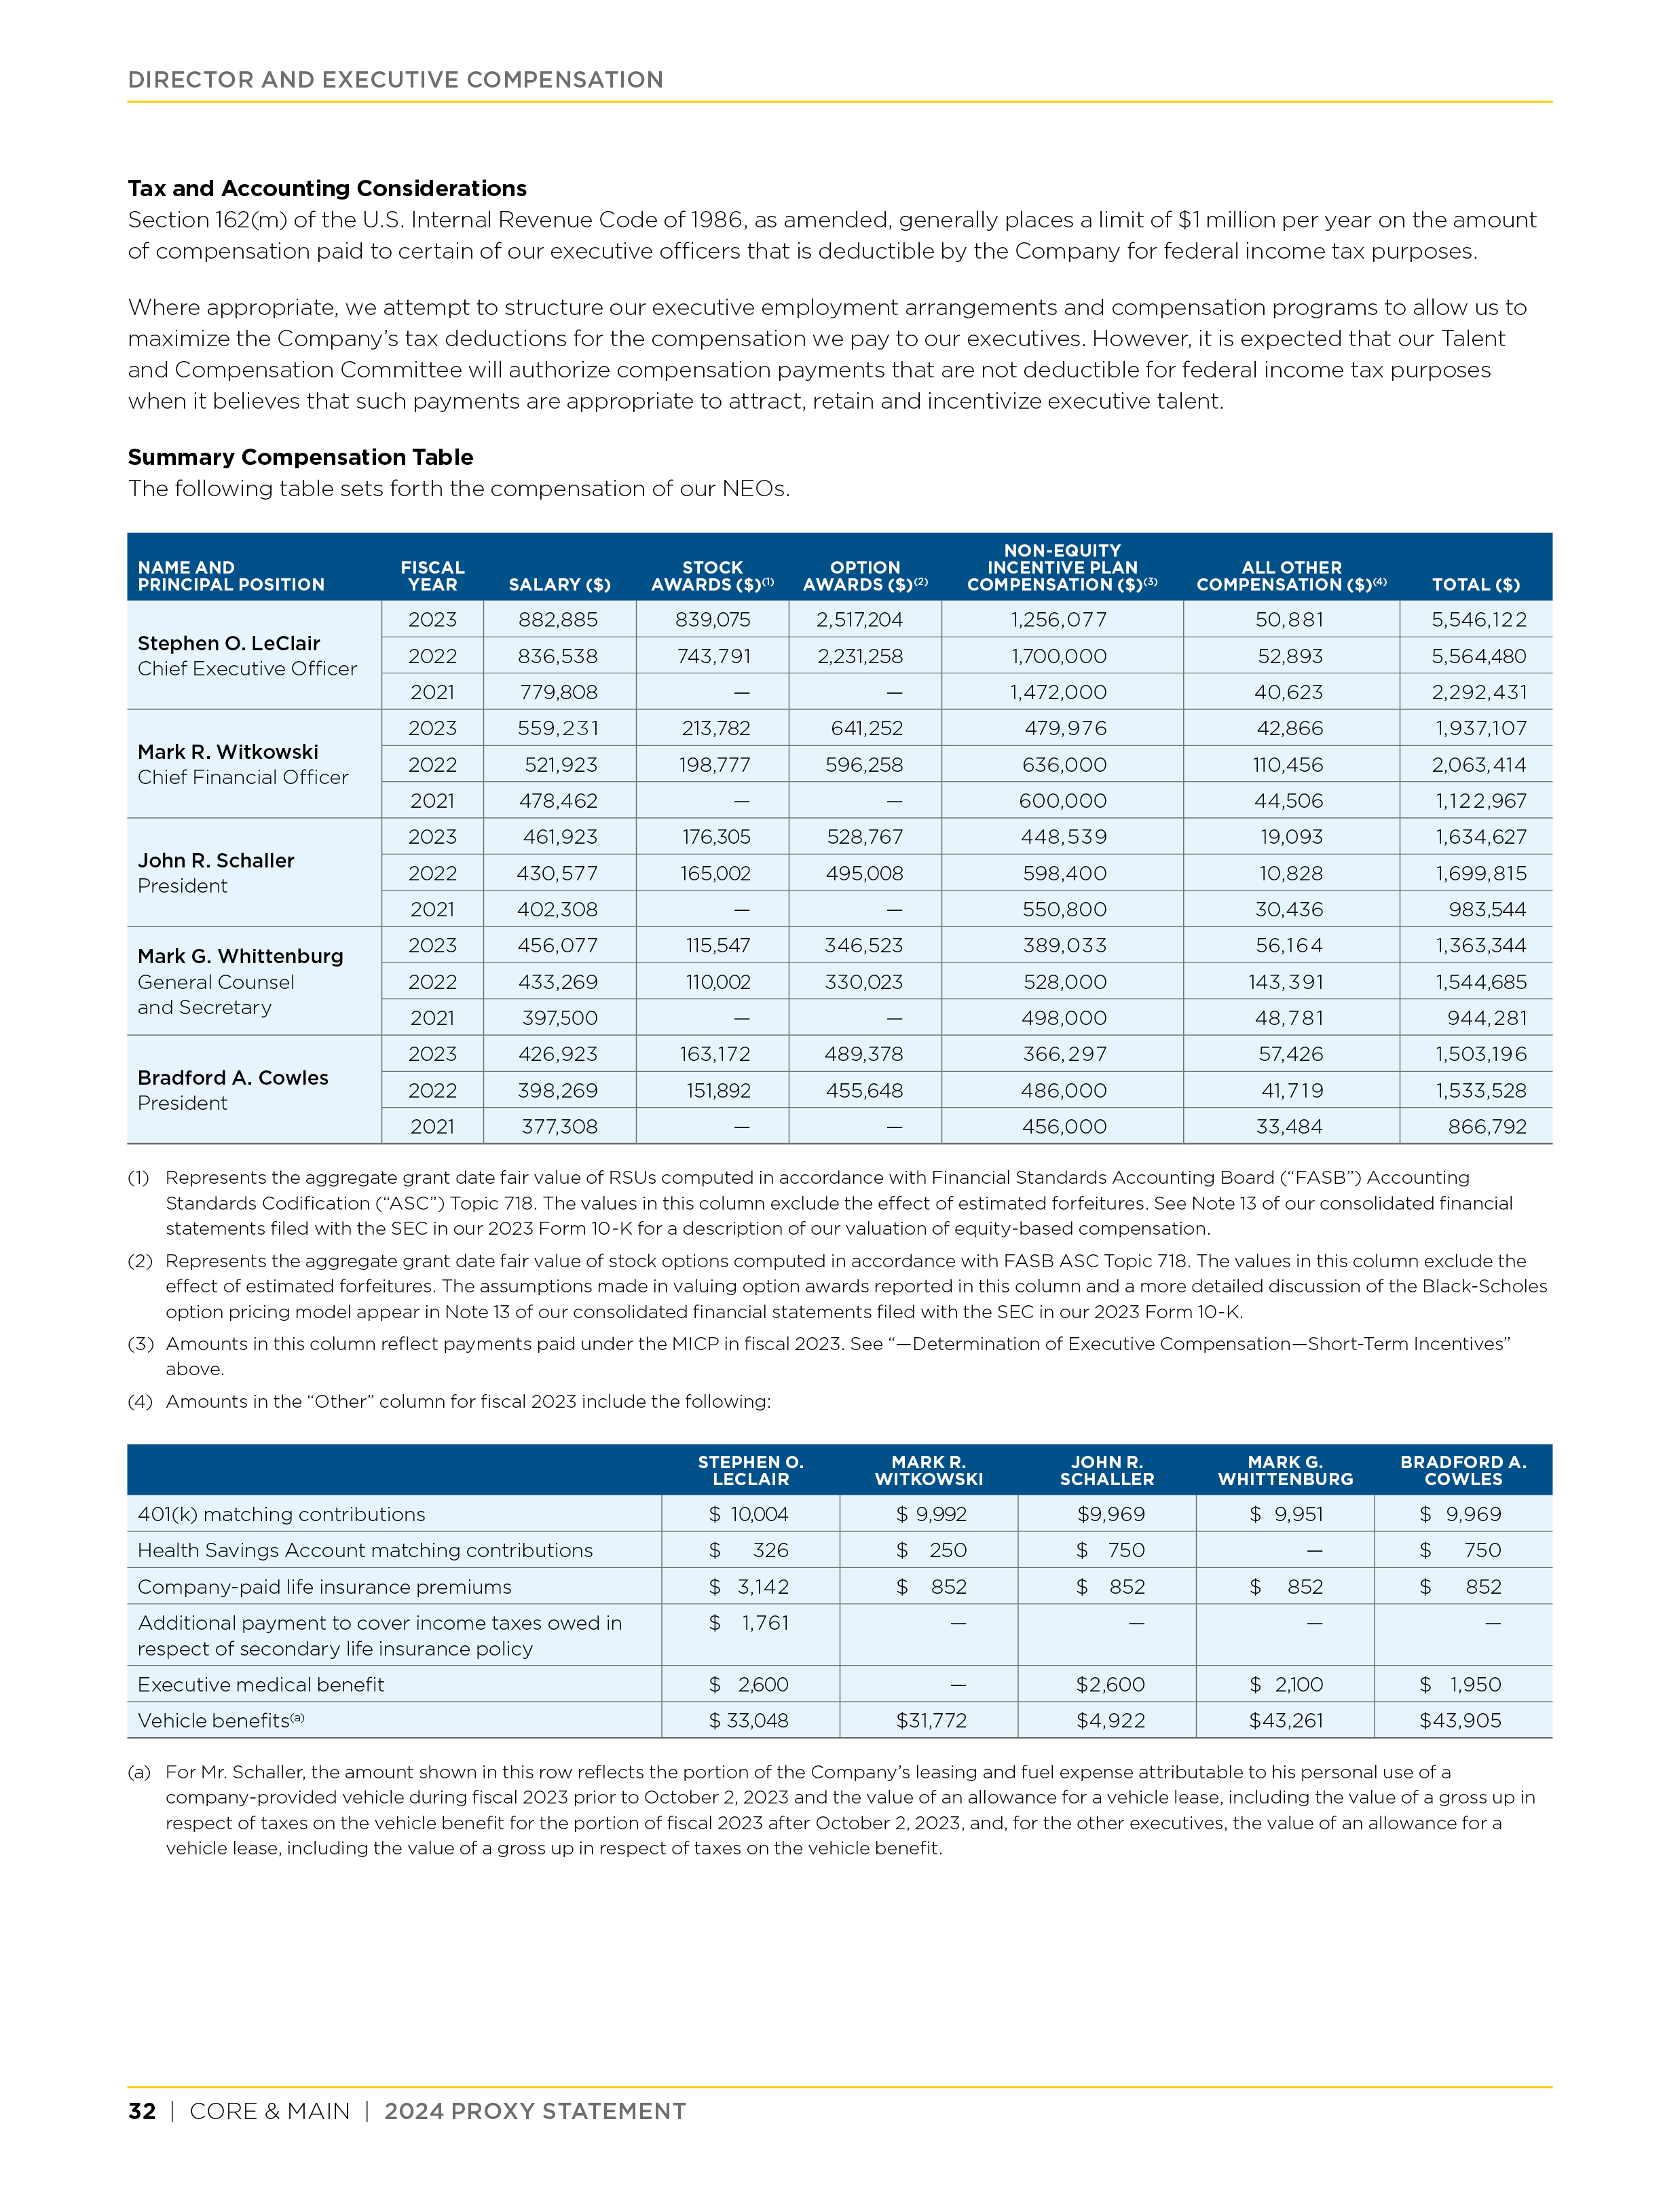
(6)MICP Adjusted EBITDA is calculated as Adjusted EBITDA (calculated as described in our 2023 Form 10-K) less the estimated Adjusted EBITDA of acquisitions completed subsequent to the establishment of the MICP Adjusted EBITDA target. See “Director and Executive Compensation – Elements of Our Executive Compensation Program – Short-Term Incentives”. The Company has determined that MICP Adjusted EBITDA is the most important performance measure used by the Company to link compensation actually paid to the Company’s NEOs to Company performance
(7)These columns represent the value at the end of the respective fiscal year of a $100 initial investment on July 23, 2021, the date of our IPO, for our Class A common stock and the S&P 400 Industrials Index. We measure the total shareholder return in a fiscal year as the change from the cumulative investment value from the prior fiscal year-end value divided by the cumulative investment value as of the prior fiscal year-end.
| | | | | | | | | | | |
| | | |
| 38 | CORE & MAIN | 2024 PROXY STATEMENT | |
Performance Measures
The performance measures listed below represent, in the Company’s assessment, the most important performance measures that link compensation actually paid to our NEOs for fiscal 2023 to Company performance. The Company uses MICP Adjusted EBITDA and MICP Working Capital Percentage in its annual cash incentive program, and share price is a key determinant of the value of long-term incentive awards held by our NEOs in the form of stock options and RSUs.
| | |
Most Important Measures for 2023 |
| MICP Adjusted EBITDA |
MICP Working Capital Percentage (1) |
| Share price |
(1)Calculated as year-end accounts receivable plus inventory less accounts payable, as a percentage of fiscal 2023 net sales. The MICP Working Capital Percentage is also adjusted to exclude the same acquisitions as were excluded for the MICP Adjusted EBITDA calculation (see “Director and Executive Compensation – Elements of Our Executive Compensation Program – Short-Term Incentives”).
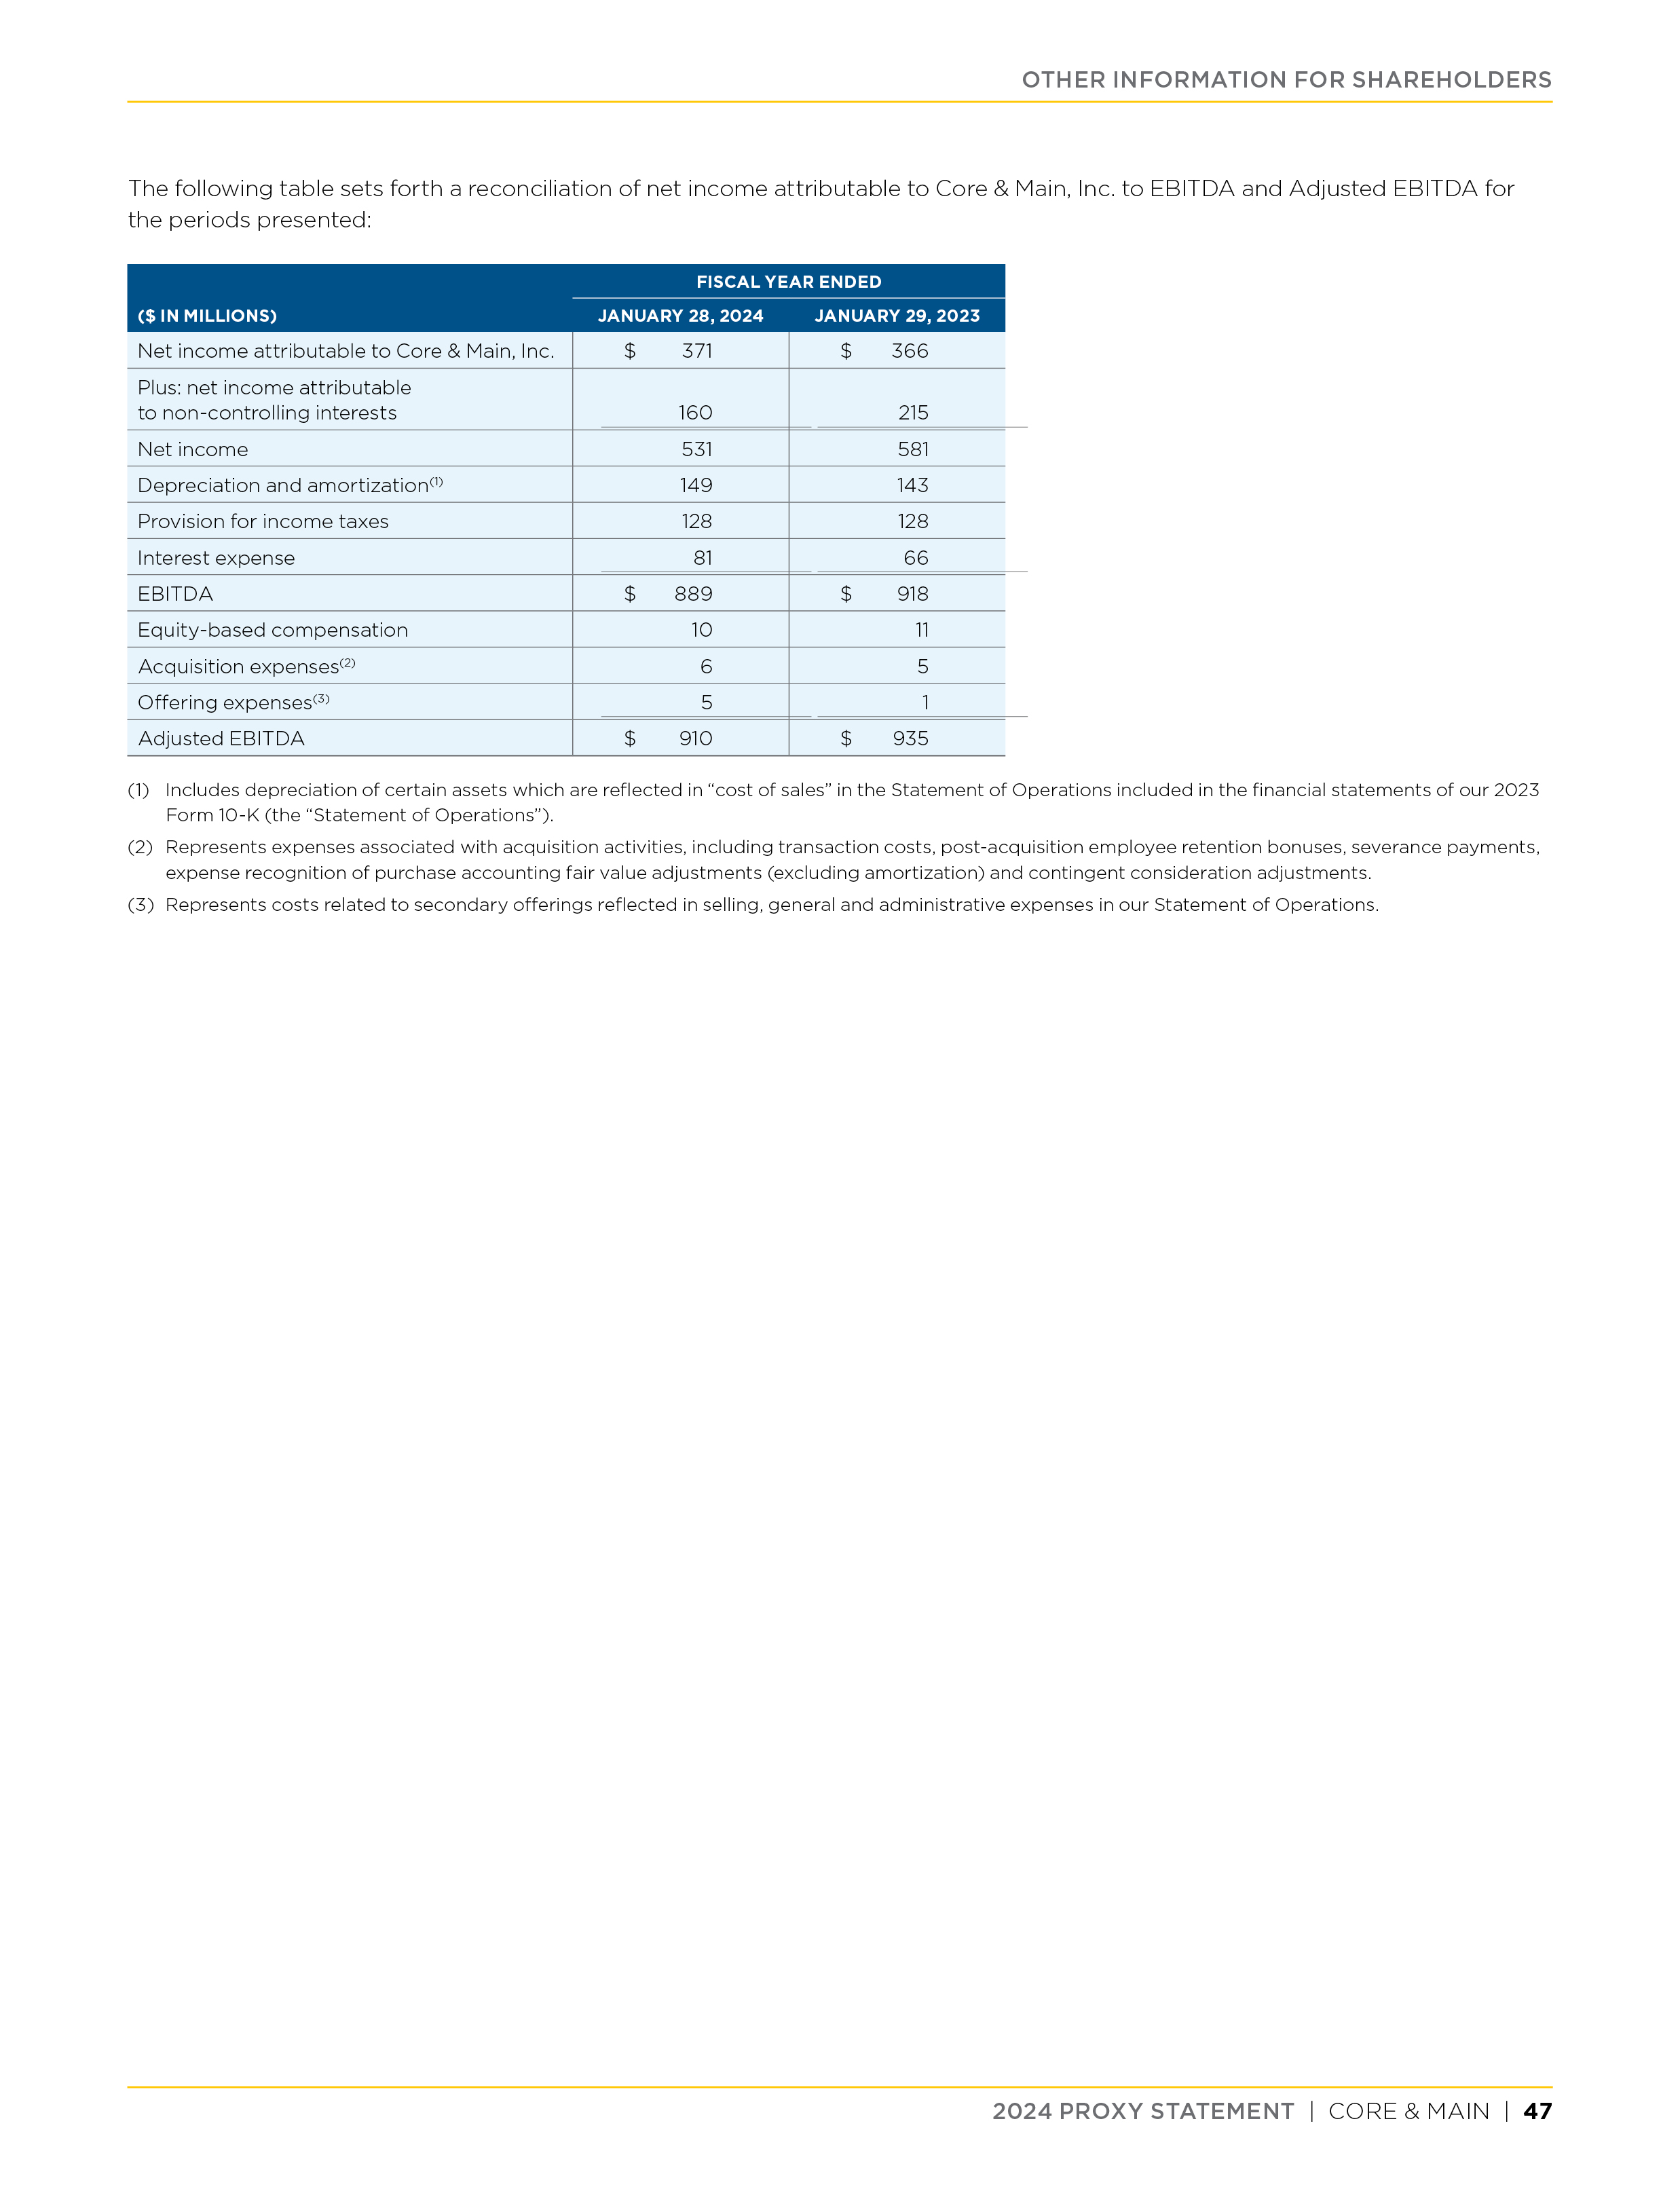
Additional information regarding these measures, including a reconciliation to the most comparable GAAP measure, is included under the heading “Non-GAAP Reconciliation” beginning on page 46 of this proxy statement and under the heading “Management’s Discussion and Analysis of Financial Condition and Results of Operations—Non-GAAP Financial Measures” in our 2023 Form 10-K.
CAP compared to TSR, Net Income and MICP Adjusted EBITDA; Company TSR Compared to S&P 400 Industrial Index
From fiscal 2022 to fiscal 2023, PEO CAP increased by $6,984,647 or 112%, and the average CAP for the non-PEO NEOs increased by $1,270,430 or 67%. For the same period, net income decreased by $50 million or 9%, and MICP Adjusted EBITDA decreased by $36 million or 4%. Also during this period, cumulative Core & Main TSR was 87%, and TSR for the S&P 400 Industrial Index was 17%. The increase in PEO CAP, non-PEO NEOs and TSR were primarily driven by the increase in CNM share price from $21.67 at the end of fiscal 2022 to $40.55 at the end of fiscal 2023.
As discussed in greater detail under the heading “Director and Executive Compensation,” the Talent and Compensation Committee considers many factors when making decisions concerning the compensation of our executive officers. TSR, net income and MICP Adjusted EBITDA are examples of indicators of the Company’s overall financial performance, which may directly or indirectly impact the Company’s compensation decisions as well as CAP. However, as calculated under SEC rules, CAP reflects adjusted values to unvested and vested equity awards, GAAP valuation assumptions, and projected performance modifiers but does not reflect actual amounts realized by our executives for those awards.
| | | | | | | | | | | |
| | | |
| 2024 PROXY STATEMENT | CORE & MAIN | 39 |
