Cayman Islands |
7372 |
Not Applicable | ||
(State or Other Jurisdiction of Incorporation or Organization) |
(Primary Standard Industrial Classification Code Number) |
(I.R.S. Employer Identification Number) |
ii | ||||
iii | ||||
iii | ||||
iv | ||||
1 | ||||
7 | ||||
8 | ||||
56 | ||||
57 | ||||
60 | ||||
61 | ||||
62 | ||||
90 | ||||
120 | ||||
150 | ||||
160 | ||||
162 | ||||
175 | ||||
180 | ||||
187 | ||||
189 | ||||
195 | ||||
199 | ||||
200 | ||||
201 | ||||
202 | ||||
203 | ||||
F-1 |
• | Developments related to the COVID-19 pandemic, including, among others, with respect to stay-at-home orders, social distancing measures, the success of vaccine rollouts, numbers of COVID-19 cases and the occurrence of new COVID-19 strains; |
• | The regulatory environment and changes in laws, regulations or policies in the jurisdictions in which we operate; |
• | Our ability to successfully compete in highly competitive industries and markets; |
• | Our ability to reduce incentives paid to driver-partners, merchant-partners and consumers; |
• | Our ability to continue to adjust our offerings to meet market demand, attract users to our platform and grow our ecosystem; |
• | Political instability in the jurisdictions in which we operate; |
• | Breaches of laws or regulations in the operation and management of our current and future businesses and assets; |
• | The overall economic environment and general market and economic conditions in the jurisdictions in which we operate; |
• | Our ability to execute our strategies, manage growth and maintain our corporate culture as we grow; |
• | Our anticipated investments in new products and offerings, and the effect of these investments on our results of operations; |
• | Changes in the need for capital and the availability of financing and capital to fund these needs; |
• | Anticipated technology trends and developments and our ability to address those trends and developments with our products and offerings; |
• | The safety, affordability, convenience and breadth of our platform and offerings; |
• | Man-made or natural disasters, including war, acts of international or domestic terrorism, civil disturbances, occurrences of catastrophic events and acts of God such as floods, earthquakes, wildfires, typhoons and other adverse weather and natural conditions that may directly or indirectly affect our business or assets; |
• | The loss of key personnel and the inability to replace such personnel on a timely basis or on acceptable terms; |
• | Exchange rate fluctuations; |
• | Changes in interest rates or rates of inflation; |
• | Legal, regulatory and other proceedings; |
• | Changes in applicable laws or regulations, or the application thereof on us; |
• | Our ability to maintain the listing of our securities on NASDAQ; and |
• | The results of any future financing efforts. |
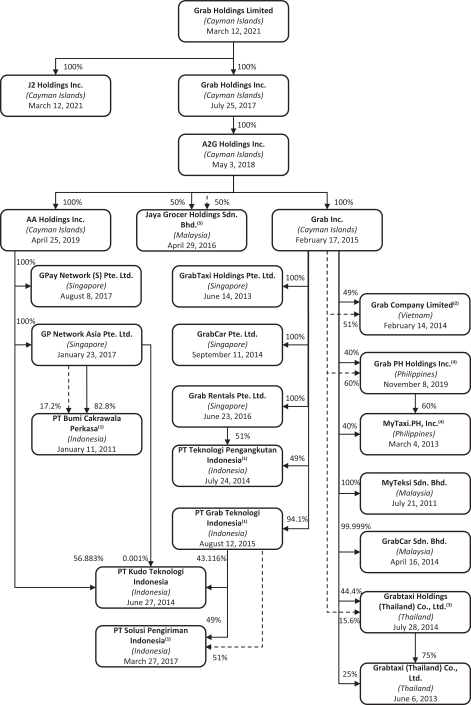
Our equity ownership. |
… | Our direct and/or indirect contractual rights. See footnotes below for information on our contractual rights. |
(1) | Indonesia: |
(2) | Vietnam: |
(3) | Thailand: |
(4) | Philippines: |
(5) | Malaysia |
• | Our business is still in a relatively early stage of growth, and if our business or superapp platform do not continue to grow, grow more slowly than we expect, fail to grow as large as we expect or fail to achieve profitability, our business, financial condition, results of operations and prospects could be materially and adversely affected. |
• | We face intense competition across the segments and markets we serve. |
• | We have incurred net losses in each year since inception and may not be able to continue to raise sufficient capital or achieve or sustain profitability. |
• | Our ability to decrease net losses and achieve profitability is dependent on our ability to reduce the amount of partner and consumer incentives we pay relative to the commissions and fees we receive for our services. |
• | Our business is subject to numerous legal and regulatory risks that could have an adverse impact on our business and prospects. |
• | Our brand and reputation are among our most important assets and are critical to the success of our business. |
• | The COVID-19 pandemic has materially impacted our business, is still ongoing, and it or other pandemics or public health threats could adversely affect our business, financial condition, results of operations and prospects. |
• | If we fail to manage our growth effectively, our business, financial condition, results of operations and prospects could be materially and adversely affected. |
• | We are subject to various laws with regard to anti-corruption, anti-bribery, anti-money laundering and countering the financing of terrorism and have operations in certain countries known to experience high levels of corruption. Our audit and risk committee led an investigation into potential violations of certain anti-corruption laws related to our operations in one of the countries in which we operate and have voluntarily self-reported the potential violations to the U.S. Department of Justice. There can be no assurance that failure to comply with any such laws would not have a material adverse effect on us. |
• | If we are required to reclassify drivers as employees or otherwise, or if driver-partners and/or employees unionize, there may be adverse business, financial, tax, legal and other consequences. |
• | If we are unable to continue to grow our base of platform users, including driver- or merchant-partners and consumers accessing our offerings, our value proposition for each such constituent group could diminish, impacting our results of operations and prospects. |
• | In certain jurisdictions, we are subject to restrictions on foreign ownership. |
• | We are subject to risks associated with operating in the rapidly evolving Southeast Asia, and we are therefore exposed to various risks inherent in operating and investing in the region. |
• | Our revenue and net income may be materially and adversely affected by any economic slowdown or developments in the social, political, regulatory and economic environments in any regions of Southeast Asia as well as globally. |
• | Uncertainties with respect to the legal system in certain markets in Southeast Asia could adversely affect us. |
• | We could face uncertain tax liabilities in various jurisdictions where we operate, and suffer adverse financial consequences as a result. |
• | The prices of our Class A Ordinary Shares and Warrants may be volatile. |
• | Sales of a substantial number of our securities in the public market by our existing securityholders could cause the price of our Class A Ordinary Shares and Warrants to fall. |
• | Unanticipated losses, write-downs or write-offs, restructuring and impairment or other charges, taxes (direct or indirect), levies or other liabilities may be incurred or required subsequent to, or in connection with, the Business Combination consummated in December 2021, which could have a significant negative effect on our financial condition and results of operations and the price of Class A Ordinary Shares and Warrants, which in turn could cause you to lose some or all of your investment. |
• | Becoming a public company through a merger rather than an underwritten offering presents risks to unaffiliated investors. We may be required to subsequently take write-downs or write-offs, restructuring and impairment or other charges that could have a significant negative effect on our financial condition, results of operations and the price of our Securities, which could cause our shareholders to lose some or all of their investment. |
• | We may issue additional securities without shareholder approval in certain circumstances, which would dilute existing ownership interests and may depress the market price of our shares. |
Securities being registered for resale by the Selling Securityholders named in the prospectus |
(i) 2,347,361,422 Class A Ordinary Shares; (ii) 15,500,000 Class A Ordinary Shares issuable upon the exercise of the Warrants; and (iii) 15,500,000 Warrants. |
Terms of Warrants |
Each Warrant entitles the holder to purchase one Class A Ordinary Share at a price of $11.50 per share. Our Warrants expire on December 1, 2026 at 5:00 p.m., New York City time. |
Offering prices |
The securities offered by this prospectus may be offered and sold at prevailing market prices, privately negotiated prices or such other prices as the Selling Securityholders may determine. See “Plan of Distribution.” |
Ordinary shares issued and outstanding prior to any exercise of Warrants |
3,721,578,210 Class A Ordinary Shares and 129,749,667 Class B Shares as of June 30, 2022. |
Warrants issued and outstanding |
25,999,981 Warrants as of June 30, 2022. |
Use of proceeds |
All of the securities offered by the Selling Securityholders pursuant to this prospectus will be sold by the Selling Securityholders for their respective accounts. We will not receive any of the proceeds from such sales, except with respect to amounts received by the Company upon exercise of the Warrants to the extent such Warrants are exercised for cash. |
Dividend Policy |
We have never declared or paid any cash dividend on our Class A Ordinary Shares. We currently intend to retain any future earnings and do not expect to pay any dividends in the foreseeable future. Any further determination to pay dividends on our ordinary shares would be at the discretion of our board of directors, subject to applicable laws, and would depend on our financial condition, results of operations, capital requirements, general business conditions, and other factors that our board of directors may deem relevant. |
Market for our Class A Ordinary Shares and Warrants |
Our Class A Ordinary Shares and Warrants are listed on NASDAQ under the trading symbols “GRAB” and “GRABW,” respectively. |
Risk factors |
Prospective investors should carefully consider the “Risk Factors” for a discussion of certain factors that should be considered before buying the securities offered hereby. |
• | expand and diversify our deliveries, mobility, financial services and other offerings, which include innovating in new areas such as financial services and often requires us to make long-term investments and absorb losses while we build scale; |
• | maintain and/or increase the scale of the driver- and merchant-partner base and increase consumer usage of our platform and the synergies within our ecosystem; |
• | optimize our cost efficiency; |
• | reduce incentives paid to driver-partners, merchant-partners and consumers; |
• | enhance and develop our superapp, the tools we provide the driver- and merchant-partners and payments network along with our other technology and infrastructure; |
• | recruit and retain high quality industry talent; |
• | expand our business in the countries in which we operate, which requires managing varying infrastructure, regulations, systems and user expectations and implementing our hyperlocal approach to operations; |
• | navigate any downward trends and volatility in macroeconomic conditions and any resulting negative impact on and fluctuations in our business; |
• | expand into business activities where we have limited experience, such as offline businesses, or no experience at all; |
• | manage price sensitivity and driver- and merchant-partner and consumer preferences by segment and geographic location, particularly as we aim to increase market penetration within our markets; |
• | maintain and enhance our reputation and brand; |
• | ensure adequate safety and hygiene standards are established and maintained across our offerings; |
• | continue to form strategic partnerships, including with leading multinationals and global brands; |
• | manage our relationships with stakeholders and regulators in each of our markets, as well as the impact of existing and evolving regulations; |
• | obtain and maintain licenses and regulatory approvals that may be required for our financial services or other offerings; |
• | compete effectively with our competitors; and |
• | manage the challenges associated with the COVID-19 pandemic. |
• | complaints or negative publicity, including those related to personal injury or sexual assault cases involving consumers using our mobility offerings or other third parties; |
• | issues with the choices and quality of our products and offerings or trust in our offerings; |
• | illegal or inappropriate behavior by employees, consumers or driver-partners or merchant-partners or other third parties we work with, including relating to the safety of consumers and driver- and merchant-partners; |
• | improper, unauthorized, or illegal actions by third parties who conduct fraudulent or other activities, such as phishing-attacks; |
• | the convenience and reliability of our superapp and technology platform, as well as any cybersecurity incidents affecting, disruptions to the availability of or defects in our platform or superapp; |
• | issues with the pricing of our offerings or the terms on which we do business with platform users including consumers and driver- and merchant-partners; |
• | service delays or failures, such as missing, incorrect or canceled fulfillment of orders or rides, or issues with cleanliness, food tampering or inappropriate or unsanitary food preparation, handling or delivery; |
• | lack of community support, interest or involvement, including protests or other negative publicity that may stem from a variety of factors beyond our control, such as the general political environment or a rise in nationalism in any of the markets where we operate; |
• | failing to meet public or market expectations and act responsibly or in compliance with regulatory requirements, some of which may be evolving or ambiguous, in areas including labor, anti-corruption, anti-money laundering, safety and security, data security, privacy, provision of information about consumers and activities on our platform, or environmental requirements in areas including emissions, sustainability, human rights, diversity, non-discrimination and support for employees, driver- and merchant-partners and local communities; and |
• | media or legislative scrutiny or litigation or investigations by regulators or other third parties. |
• | Deliveries |
• | Mobility |
• | Financial Services |
• | the occurrence of new COVID-19 strains and other new developments that may emerge concerning the severity of the disease; |
• | the efficacy of current and future vaccines and treatments and the speed of vaccine or treatment roll-outs; |
• | the implementation, duration, and nature of stay-at-home orders, social distancing measures, business closures or capacity limits, travel restrictions, and other measures implemented to combat the spread of the disease, which can negatively impact demand for our offerings and also supply of driver-partners; |
• | the economic impact of the pandemic in the markets in which we operate, which could impact demand for offerings or opportunities on our platform by consumers and driver- and merchant-partners; |
• | the continued provision of support and relief to small businesses, residents and economic activity by governments in the countries in which we operate, such as in Singapore and Malaysia where the government has implemented substantial and comprehensive support measures that have benefited the population, including consumers and driver- and merchant-partners; |
• | government measures, intervention or subsidies, or increased government scrutiny with respect to our business or industry, which could impact, among other things, the competitive landscape in our markets and cause us to incur unforeseen expenses; |
• | other business disruptions that affect our workforce; |
• | the impact on capital and financial markets; |
• | impairment charges associated with goodwill, long-lived assets, investments and other acquired intangible assets; and |
• | other unforeseen operating difficulties and expenditures. |
• | If consumers are not attracted to our platform or choose deliveries, mobility or financial services providers outside of our platform, we may be unable to attract driver- and merchant-partners to our platform, which in turn means consumers using our platform may have fewer choices and may not be able to obtain better value options thereby making our platform less attractive to consumers. Consumers choose our platform based on many factors, including the convenience of our superapp, trust in the services offered through our platform as well as our technology platform and the choices and quality of our products and offerings. A deterioration in any of these factors could result in a decline in the number of consumers using the offerings on our platform, or the frequency with which they use such offerings. |
• | If driver-partners are not attracted to our platform or choose not to offer their services through our platform, or elect to offer them through a competitor’s platform, we may lack a sufficient supply of driver-partners to attract and retain consumers and merchant-partners to our platform. Driver-partners choose us based on many factors, including the opportunity to earn money, the flexibility and autonomy to choose where, when and how often to work, the tools and opportunities we provide to seek to maximize productivity and other benefits that we provide to them. Lockdowns relating to COVID-19 have also negatively impacted driver-partner supply in certain jurisdictions. It is also important that we maintain a balance between demand and supply for mobility services in any given area at any given time. We have experienced and expect to continue to experience driver-partner supply constraints or oversupply from time to time in certain areas (including certain areas or locations within cities). To the extent that we experience driver-partner supply constraints in a given market, we may need to increase, or may not be able to reduce, the driver-partner incentives that we offer. |
• | If merchant-partners, such as restaurants, convenience and grocery stores, multinational franchises and lifestyle service providers, are not attracted to our platform or choose to partner with our competitors, we may lack a sufficient variety and supply of options, or lack access to the most popular merchant-partners, such that the offerings on our platform will become less appealing to consumers and the driver-partners will have fewer opportunities to provide services. The merchant-partners choose us based on many factors, including access to the consumer base and delivery and payment network available through our platform, the tools and opportunities we provide to enhance their profitability and the opportunity to leverage our data insights. We seek to leverage off the strong consumer base using our platform in our deliveries and mobility segments to grow our financial services and other businesses. |
• | intense competition for suitable targets and partners, which could increase prices and adversely affect our ability to consummate deals on favorable or acceptable terms; |
• | complex technologies, terms and arrangements, which may be difficult to implement and manage; |
• | failures or delays in closing transactions; |
• | difficulties integrating brand identity, technologies, operations, existing contracts, and personnel; |
• | failure to realize the anticipated return on investment, benefits or synergies; |
• | exclusivity provisions which prevent us from providing a particular service outside of the strategic alliance or partnership in a particular jurisdiction which could serve to limit access to business opportunities; |
• | failure to identify the problems, liabilities, or other shortcomings or challenges of an acquired company, partner or technology, including but not limited to issues related to intellectual property, cybersecurity risks, regulatory compliance practices, litigation, security interests over assets, contractual issues, revenue recognition or other accounting practices, or employee or user issues; |
• | expanding into business activities where we have limited experience, such as offline businesses, or no experience at all; |
• | failure to retain key employees, to ensure that we can preserve value in the existing platform and avoid loss of institutional knowledge; |
• | risks that regulatory bodies do not approve our acquisitions or business combinations or delay such approvals or other adverse reactions from regulators; |
• | regulatory changes that require adjustments to our business or shareholding or rights in relation to subsidiaries or joint ventures; and |
• | adverse reactions to acquisitions by investors and other stakeholders. Each acquisition will require management bandwidth to integrate, commensurate to the size and scale of the acquisition, which may distract our management from executing our existing roadmap. If we fail to address the risks or other problems encountered in connection with past or future transactions such as the foregoing, or if we fail to successfully integrate or manage such transactions, our business, financial condition, results of operations and prospects could be materially and adversely affected. |
• | staying true to our values and withstanding competitive pressures to move in a direction that may divert us from doing so; |
• | maintaining appropriate alignment between our values and the fiduciary duties that our directors have under Cayman Islands law to act in the best interests of the company; |
• | failure to identify, attract, reward, and retain people in leadership positions in our organization who share our values; |
• | negative perception of our treatment of employees, consumers or driver- and merchant-partners; and |
• | maintaining our culture while integrating new personnel and businesses as we grow. |
• | inconsistent and evolving regulations, licensing and legal requirements may increase our operational risks and cost of operations among the countries in Southeast Asia in which we operate; |
• | currencies may be devalued or may depreciate or currency restrictions or other restraints on transfer of funds may be imposed; |
• | the effects of inflation within Southeast Asia generally and/or within any specific country in which we operate may increase our cost of operations; |
• | governments or regulators may impose new or more burdensome regulations, taxes or tariffs; |
• | political changes may lead to changes in the business, legal and regulatory environments in which we operate; |
• | economic downturns, political instability, civil disturbances, war, military conflict, religious or ethnic strife, terrorism and general security concerns may negatively affect our operations; |
• | enactment or any increase in the enforcement of laws, rules and regulations, including, but not limited to, those related to personal data protection and localization and cybersecurity, may incur compliance costs, in particular where there is uncertainty around the interpretation, implementation, or applicability of such laws, rules and regulations; |
• | health epidemics, pandemics or disease outbreaks (including the COVID-19 outbreak) may affect our operations and demand for our offerings; and |
• | natural disasters like volcanic eruptions, floods, typhoons and earthquakes may impact our operations severely. |
• | changes in the industries and countries in which we operate; |
• | developments involving our competitors; |
• | changes in laws and regulations affecting our businesses; |
• | variations in our operating performance and the performance of our competitors in general; |
• | actual or anticipated fluctuations in our quarterly or annual operating results; |
• | publication of research reports by securities analysts about us or our competitors or our industry; |
• | the public’s reaction to our press releases, our other public announcements and our filings with the SEC; |
• | actions by shareholders, including the sale by the PIPE Investors of any of their Class A Ordinary Shares; |
• | short seller reports that make allegations against us or our affiliates, even if unfounded; |
• | departures of key personnel; |
• | commencement of, or involvement in, litigation; |
• | changes in our capital structure, such as future issuances of securities or the incurrence of additional debt; |
• | the volume of our Class A Ordinary Shares available for public sale; and |
• | general economic and political conditions, such as the effects of the COVID-19 pandemic, recessions, interest rates, local and national elections, fuel prices, international currency fluctuations, corruption, political instability and acts of war or terrorism. |
• | On May 30, 2022, which was 180 days after the consummation of the Business Combination, up to 2,598,192,720 Class A Ordinary Shares held by certain of our shareholders became eligible for resale, but pursuant to a new lock-up agreement dated March 14, 2022, lock-up restriction on certain of such Class A Ordinary Shares that are held by our key executives, namely, Anthony Tan, Hooi Ling Tan, Ming Maa, Peter Oey, Chin Yin Ong and Alex Hungate, has been extended to May 30, 2023; |
• | One year after the consummation of the Business Combination, up to 2,867,235 Class A Ordinary Shares received by certain of our executives upon settlement of certain RSU awards granted with respect to the Business Combination; |
• | Three years after the consummation of the Business Combination, up to 32,451,891 Ordinary Shares received by the Key Executives upon settlement of certain restricted stock awards granted with respect to the Business Combination; and |
• | Three years after the consummation of the Business Combination, up to 12,275,000 Class A Ordinary Shares, or other securities convertible into or exercisable or exchangeable for Class A Ordinary Shares, held by Sponsor. |
As of June 30, 2022 |
||||
($ in millions) |
||||
Cash and cash equivalents |
2,793 | |||
|
|
|||
Total equity |
7,166 | |||
Debt: |
||||
Bank loans and term loans (non-current) |
1,863 | |||
Bank loans and term loans (current) |
123 | |||
|
|
|||
Total indebtedness |
1,986 | |||
|
|
|||
Total capitalization |
9,152 | |||
|
|
($ in millions, except share and per share amounts) | Six Months Ended June 30, |
Year Ended December 31, |
||||||||||||||||||
2022 |
2021 |
2021 |
2020 |
2019 |
||||||||||||||||
(unaudited) |
||||||||||||||||||||
Revenue |
549 |
396 |
675 |
469 |
(845 |
) | ||||||||||||||
Cost of revenue |
(647 | ) | (507 | ) | (1,070 | ) | (963 | ) | (1,320 | ) | ||||||||||
Other income |
6 | 16 | 12 | 33 | 14 | |||||||||||||||
Sales and marketing expenses |
(142 | ) | (105 | ) | (241 | ) | (151 | ) | (238 | ) | ||||||||||
General and administrative expense |
(331 | ) | (243 | ) | (545 | ) | (326 | ) | (304 | ) | ||||||||||
Research and development expenses |
(240 | ) | (167 | ) | (356 | ) | (257 | ) | (231 | ) | ||||||||||
Net impairment loss on financial assets |
(22 | ) | (10 | ) | (19 | ) | (63 | ) | (56 | ) | ||||||||||
Other expenses |
(1 | ) | * | (11 | ) | (40 | ) | (30 | ) | |||||||||||
|
|
|
|
|
|
|
|
|
|
|||||||||||
Operating loss |
(828 |
) |
(620 |
) |
(1,555 |
) |
(1,298 |
) |
(3,010 |
) | ||||||||||
Net finance costs |
(173 | ) | (840 | ) | (1,989 | ) | (1,437 | ) | (971 | ) | ||||||||||
Share of loss of equity-accounted investees (net of tax) |
(3 | ) | (4 | ) | (8 | ) | (8 | ) | * | |||||||||||
|
|
|
|
|
|
|
|
|
|
|||||||||||
Loss before income tax |
(1,004 |
) |
(1,464 |
) |
(3,552 |
) |
(2,743 |
) |
(3,981 |
) | ||||||||||
Income tax expense |
(3 | ) | (3 | ) | (3 | ) | (2 | ) | (7 | ) | ||||||||||
|
|
|
|
|
|
|
|
|
|
|||||||||||
Loss for the period |
(1,007 |
) |
(1,467 |
) |
(3,555 |
) |
(2,745 |
) |
(3,988 |
) | ||||||||||
Loss Attributable to: |
||||||||||||||||||||
Owners of the Company |
(970 | ) | (1,425 | ) | (3,449 | ) | (2,608 | ) | (3,747 | ) | ||||||||||
Non-controlling interests |
(37 | ) | (42 | ) | (106 | ) | (137 | ) | (241 | ) | ||||||||||
Basic weighted-average ordinary shares outstanding |
3,793,892 | 236,264 | 539,947 | 181,190 | 154,126 | |||||||||||||||
Basic loss per share attributable to ordinary shareholders |
(0.26 | ) | (6.03 | ) | (6.39 | ) | (14.39 | ) | (24.31 | ) |
* | Amounts less than $1 million |
($ in millions, unless otherwise stated) | As of June 30, |
As of December 31, |
||||||||||
2022 |
2021 |
2020 |
||||||||||
(unaudited) |
||||||||||||
Assets |
||||||||||||
Non-current assets |
2,904 | 2,503 | 1,687 | |||||||||
Current assets |
7,450 | 8,675 | 3,755 | |||||||||
Total assets |
10,354 | 11,178 | 5,442 | |||||||||
Equity |
||||||||||||
Equity/(deficit) attributable to owners of the Company |
7,151 | 7,733 | (6,399 | ) | ||||||||
Non-controlling interests |
15 | 286 | 105 | |||||||||
Total equity/(deficit) |
7,166 | 8,019 | (6,294 | ) | ||||||||
Liabilities |
||||||||||||
Non-current liabilities |
2,183 | 2,133 | 10,900 | |||||||||
Current liabilities |
1,005 | 1,026 | 836 | |||||||||
Total liabilities |
3,188 | 3,159 | 11,736 | |||||||||
Total equity and liabilities |
10,354 | 11,178 | 5,442 |
($ in millions, unless otherwise stated) |
Six Months Ended June 30, |
1H2021-1H2022 % Change |
Year Ended December 31, |
2020-2021 % Change |
2019-2020 % Change |
|||||||||||||||||||||||||||
2022 |
2021 |
2021 |
2020 |
2019 |
||||||||||||||||||||||||||||
Financial Measures: |
||||||||||||||||||||||||||||||||
Revenue |
549 | 396 | 39 | % | 675 | 469 | (845 | ) | 44 | % | NM | |||||||||||||||||||||
Loss for the period |
(1,007 | ) | (1,467 | ) | 31 | % | (3,555 | ) | (2,745 | ) | (3,988 | ) | (30 | )% | 31 | % | ||||||||||||||||
Total Segment Adjusted EBITDA (Non-IFRS) (1) |
(94 | ) | 21 | NM | (125 | ) | (226 | ) | (1,554 | ) | 45 | % | 85 | % | ||||||||||||||||||
Adjusted EBITDA (Non-IFRS) (1) |
(520 | ) | (325 | ) | (60 | )% | (842 | ) | (780 | ) | (2,237 | ) | (8 | )% | 65 | % | ||||||||||||||||
Operating Metrics: |
||||||||||||||||||||||||||||||||
GMV (2) |
9,860 | 7,522 | 31 | % | 16,061 | 12,492 | 12,251 | 29 | % | 2 | % | |||||||||||||||||||||
MTU (3) (millions of users) |
31.8 | 28.6 | 11 | % | 24.1 | 24.5 | 29.2 | (2 | )% | (16 | )% | |||||||||||||||||||||
GMV per MTU ($) |
310 | 263 | 18 | % | 666 | 509 | 419 | 31 | % | 21 | % | |||||||||||||||||||||
Partner incentives (4) |
428 | 311 | 38 | % | 717 | 621 | 1,234 | 15 | % | (50 | )% | |||||||||||||||||||||
Consumer incentives (5) |
655 | 429 | 53 | % | 1,065 | 616 | 1,117 | 73 | % | (45 | )% | |||||||||||||||||||||
Partner and consumer incentives |
1,083 | 740 | 46 | % | 1,782 | 1,237 | 2,351 | 44 | % | (47 | )% |
(1) | For a reconciliation to the most directly comparable IFRS measure see the section titled “—Reconciliation of Non-IFRS Financial Measures.” |
(2) | GMV means gross merchandise value, an operating metric representing the sum of the total dollar value of transactions from our services, including any applicable taxes, tips, tolls and fees, over the period of measurement. |
(3) | MTUs means monthly transacting users, which is defined as the monthly number of unique consumers who have successfully paid for an offering on our platform within a given month, across any of our segments. MTUs over a quarterly or annual period are calculated based on the average of the MTUs for each month in the relevant period. MTUs for the six months ended June 30, 2022 and 2021 are inclusive of OVO MTUs. Excluding OVO MTUs, our MTUs for the six months ended June 30, 2022 and 2021 would be 28.7 million and 24.3 million, respectively, and GMV per MTU would be $344 and $310, respectively. |
(4) | Partner incentives represent the dollar value of incentives granted to driver- and merchant-partners, the effect of which is to reduce revenue. The incentives granted to driver- and merchant-partners include base incentives and excess incentives, with base incentives being the amount of incentives paid to driver- and merchant-partners up to the amount of commissions and fees earned by us from those driver- and merchant-partners, and excess incentives being the amount of payments made to driver- and merchant-partners that exceed the amount of commissions and fees earned by us from those driver- and merchant-partners. Base incentives amounted to $92 million and $78 million for the six months ended June 30, 2022 and 2021, respectively, and $155 million, $178 million and $519 million for the year ended December 31, 2021, 2020 and 2019, respectively. |
(5) | Consumer incentives represent the dollar value of discounts and promotions offered to consumers, the effect of which is to reduce revenue. |
• | Rapid urbanization driven by macroeconomic and demographic growth. |
• | Mobile-first population with increasing digital engagement. |
• | Increasing digitalization of services and consumption. |
• | Regulatory landscape supportive of technology and digital advancement. |
• | Large unbanked and underserved population. |
• | GrabFood |
• | GrabKitchen |
• | GrabMart |
• | GrabExpress |
• | GrabExpress web booking portal |
• | Grab for Business platform |
• | In Indonesia, our GrabKios |
• | GrabCar |
• | GrabTaxi |
• | JustGrab |
• | JustGrab Green |
• | GrabBike |
• | Three-wheel vehicles |
• | Our shared mobility |
• | Similar to our enterprise deliveries offerings, through the Grab for Business platform |
• | Specific to our driver-partners, we offer GrabRentals |
• | GrabPay |
• | In 2019, we launched the GrabPay card |
• | GrabPay is the first non-bank e-wallet to be accepted as a payment option across all McDonald’s stores in Singapore. |
• | GrabRewards |
• | GrabFinance |
• | PayLater |
• | GrabInsure |
• | GrabInvest |
• | GrabLink |
• | The Digital Banking JV has been granted a digital full bank license in Singapore, and in May 2022, the Digital Banking JV received approval from the MAS to commence restricted business activities, but has yet to receive approval to commence full business activities (including the provision of a wide range of financial services, such as lending services and taking deposits from retail consumers and businesses). |
• | On April 29, 2022, the Digital Banking JV and a consortium of partners were selected to receive a full digital banking license in Malaysia, subject to meeting all of Bank Negara Malaysia’s regulatory conditions. |
• | GrabAds |
• | GrabMaps |
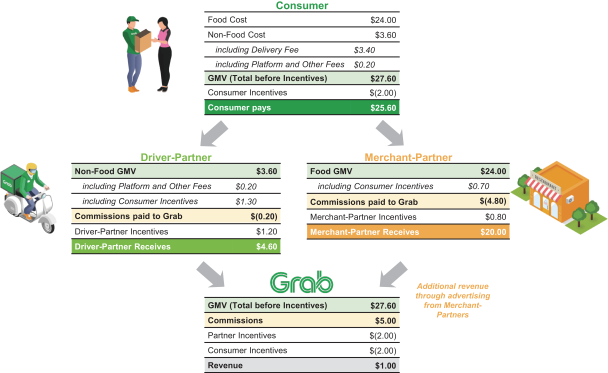
• | The dollar value of goods ordered: $24.00; |
• | Delivery fee: $3.40; and |
• | Platform and other fees: $0.20. |
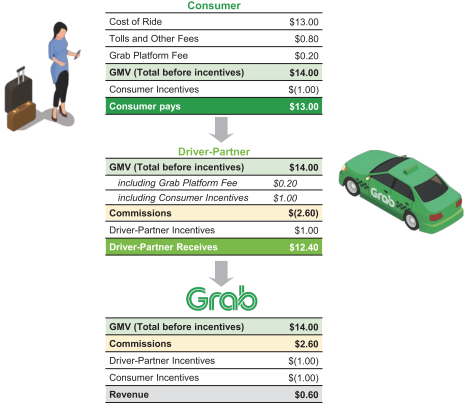
• | The dollar value of the ride: $13.00; |
• | Tolls and other fees: $0.80; and |
• | Platform fee: $0.20. |
Euromonitor estimated 2021 regional category share |
||||||||
Grab |
Next closest competitor |
|||||||
Segment |
||||||||
Online food delivery |
51 | % | 2.1x | |||||
Ride-hailing |
71 | % | 3.9x | |||||
E-wallet |
21 | % | 1.3x |
(1) | Includes only mobility and deliveries (excluding non-consumer services such as GrabRentals and GrabKios) |
(1) | Figures may not add up to 100% due to rounding. |
• | Reliability and resilience |
• | Security |
• | Trust & safety |
• | Marketplace optimization |
• | Artificial intelligence |
• | Our platform has served over eight billion driver-partner trips and aggregated over 49 billion kilometers of GPS trace data. More importantly, many streets in the cities we operate in are actually alleys or shortcuts that are not mapped by mapping service providers. However, our two-wheel driver-partners are able to utilize these alleys and shortcuts in many situations. We integrate data from trips through these alleys and shortcuts into our maps, using the real-time mapping data we collect from our driver-partners. With our data and the investments we have made into AI and other technologies, we have developed proprietary mapping, routing, journey time prediction and point of interest (“POI”) capabilities. This has not only helped reduce our reliance on external mapping service providers, but has also enabled us to improve user experience with more accurate travel time prediction and better routing. |
• | We have developed a proprietary technology stack to power GrabAds, our in-house advertising platform. This stack includes advertisement serving, personalization and reporting capabilities that leverage Grab’s unique assets, such as geo-location, loyalty rewards and GrabPay. The combination of these tools is aimed at enabling us to deliver a competitive return on advertising spend for our advertising clients and merchant-partners while ensuring we continue to provide relevant, engaging content for consumers using our superapp. |
• | GrabLink, our in-house PCI-compliant secure payment gateway, provides the ability for us to process card payments without third-party payment service providers. Today, GrabLink is directly connected to seven acquirers in five countries and processes more than a million payment transactions daily, saving us millions of dollars in payment processing costs every year. |
• | Consumers |
• | Driver-Partners |
• | Merchant-Partners |
• | Refine our on-demand delivery algorithm and mapping capabilities to further optimize routing and reduce delivery times. |
• | Focus investment on AI to better predict our users’ needs so as to enable more relevant, personalized and engaging experiences. |
• | Leverage automation to increase the efficiency of operational processes such as the processing of support enquiries. |
• | Increase engagement as well as addressable advertising opportunities by increasing the breadth and deepening the personalization of our diversified offerings. |
• | Optimize our driver-partner network and maximize efficiencies as we enable more driver-partners to service multiple verticals to satisfy demand. |
• | Offer more tools to assist our merchant-partners to innovate and increase their revenue and productivity. |
• | Cross-sell financial services such as loan and insurance products to our driver- and merchant-partners. |
• | Package and groceries delivery |
• | Financial services |
• | Enterprise services |
• | Heart |
• | Hunger |
• | Honor |
• | Humility |
Function |
Number of Employees |
|||
General and administrative |
1,117 | |||
Sales and marketing |
839 | |||
Operations and support |
4,372 | |||
Research and development |
3,165 | |||
Total |
9,493 |
• | On December 4, 2020, the Malaysian Association of Taxi, Rental Car, Limousine and Airport Taxi, or GTSM, filed a claim against Grabcar Sdn. Bhd. in the Kuala Lumpur High Court claiming that Grabcar Sdn. Bhd. illegally provided online transportation services prior to obtaining the relevant government approval, thereby creating unfair competition and denying its 10,000 members from their livelihood. The claim amount is approximately $24 million. Grabcar Sdn. Bhd. filed an application to strike out the action that was heard in the High Court on June 3, 2021 and was decided in favor of Grabcar Sdn. Bhd. on July 14, 2021. On August 11, 2021, GTSM filed a notice of appeal against the decision of the High Court. The hearing of the appeal is fixed for October 7, 2022. |
• | In October 2018, a Thai taxi driver filed a claim against a Thai regulator alleging that the Thai regulator omitted and neglected to perform its duties by allowing Grabtaxi (Thailand) Co., Ltd. (“Grabtaxi Thailand”) to operate GrabCar (i.e. allowing Grabtaxi Thailand to assist its driver-partners to use private cars to provide public transport service). Grabtaxi Thailand is a co-defendant in this case. The case is still pending. We believe the potential impact in the case of any adverse outcome from this case should be limited to a fine that may be imposed by the regulator. |
• | In December 2018, Grab was assessed approximately PHP1.4 billion (approximately $25 million) in the Philippines for an alleged deficiency in local business taxes. We are contesting this assessment and the case remains under review by the regional trial court. |
• | On September 21, 2021, Grab Greco LLP was served with a claim in the Bangalore City Civil Court in India by a former employee and a company from which Grab Greco LLP had acquired intellectual property assets in 2018. The plaintiffs allege that Grab’s wallet platform breaches the plaintiffs’ intellectual property rights. The relief sought from the Bangalore City Civil Court includes an injunction to restrain Grab from using the claimants’ purported copyright and patents and an account of profits. Grab believes the case has no merit and is contesting it on the basis that, among other things, Grab completed the purchase of the relevant intellectual property in 2018. The case is still pending. |
• | Beginning in March 2022, various putative shareholder class action lawsuits were filed against our Company and certain of its officers in the U.S. District Court for the Southern District of New York. On June 7, 2022, the Court appointed Lead Plaintiffs and consolidated all actions under the caption In re Grab Holdings Limited Securities Litigation |
• | Commenced operations in Singapore, the Philippines, Thailand, Indonesia, Vietnam, Cambodia and Myanmar |
• | Completed the acquisition of Uber’s business in Southeast Asia through an all-share deal following which Uber became a major strategic shareholder in Grab |
• | Launched GrabForGood, Grab’s social impact program |
• | Announced GrabForGood Fund |
• | Completed the Business Combination |
• | Listed on NASDAQ |
• | Completed acquisition of the majority economic interest in Jaya Grocer |
• | Launched GrabTaxi (previously called MyTeksi), a taxi booking and dispatch service |
• | Launched GrabCar, expanding from taxi to economy and premium ride-hailing booking services |
• | Launched GrabBike |
• | Launched GrabHitch |
• | Launched GrabShare, a commercial carpooling booking service |
• | Launched GrabExpress |
• | Acquired Kudo, an Indonesian agent network company, later rebranded to GrabKios |
• | Launched GrabFood |
• | Launched GrabKitchen |
• | Launched GrabMart |
• | Launched GrabMerchant |
• | Acquired a majority equity interest in Jaya Grocer, a supermarket chain in Malaysia |
• | Launched GrabPay |
• | Launched GrabRewards |
• | Invested in OVO, a digital payments platform in Indonesia |
• | Launched GrabFinance, lending and receivables factoring for driver- and merchant-partners, MSMEs and consumers |
• | Launched GrabInsure, a joint venture with a subsidiary of ZhongAn Online P&C Insurance Co., Ltd. for sales, marketing and distribution of insurance for consumers and driver-partners, including health, ride and delivery and travel insurance |
• | GrabPay Malaysia entered into a joint venture with Maybank, pursuant to which Maybank acquired a 30% interest in GPay Network (M) Sdn Bhd |
• | Entered into strategic alliance with MUFG to create affordable financial services |
• | Acquired Bento Invest Holding Company Pte. Ltd., now known as GrabInvest (S) Pte. Ltd., a robo-advisory start-up offering retail wealth management solutions |
• | Launched AutoInvest, a micro-investment solution |
• | Launched PayLater on selected e-commerce sites |
• | Launched payment processing and merchant acquiring services |
• | Digital Banking JV selected for a digital full bank license in Singapore by the MAS |
• | Raised Series A financing for GFG |
• | Signed the joint venture agreement for Digital Banking JV with Singtel |
• | Digital Banking JV granted in-principle approval by the MAS for a digital full bank license |
• | Increased equity interest in OVO |
• | Acquired a minority equity interest in Bank Fama International |
• | Digital Banking JV received approval from the MAS to commence restricted business activities |
• | Digital Banking JV and a consortium of partners were selected to receive a full digital banking license in Malaysia, subject to meeting all of Bank Negara Malaysia’s regulatory conditions |
• | Launched GrabAds, our advertising business |
• | Launched GrabDefence, a fraud detection and prevention solution |
• | Launched GrabHealth—powered by Good Doctor Technology (GDT), a telemedicine offering in partnership with Ping An Good Doctor |
• | Launched GrabMaps, a mapping and location-based service |
• | In Thailand, we exercise control over relevant Thai operating entities as a result of a dual-class share and two-tiered corporate structure. We own ordinary shares in the top level holding company, Thai Holding Entity 2, that gives us control of Thai Holding Entity 2 based on shareholder meeting quorum and voting requirements. Our Thai local partner, Mr. Vee Charununsiri (“Thai local partner”), holds preference shares in Thai Holding Entity 2 that have limited rights to liquidation proceeds upon liquidation of the company. Such arrangements are reflected in the Articles of Association of Thai Holding Entity 2. In addition to the Articles of Association, which provide us with our control over Thai Holding Entity 2, pursuant to a Call Option Agreement between us and our Thai local partner, we also have the right to acquire the Thai local partner’s shares in Thai Holding Entity 2 upon the occurrence of certain events. |
• | In Indonesia, powers of attorney granted by PT Ekanusa Yadhikarya Indah and PT Ekanusa Yudhakarya Indah (both of which are controlled by our Indonesian local partner, Mr. Leo Mamahit) with respect to PT Solusi Pengiriman Indonesia provide us control over those two Indonesian operating entities. PT Ekanusa Yadhikarya Indah and PT Ekanusa Yudhakarya Indah agree thereunder to hold their shares in trust for our benefit and to exercise their voting rights as instructed by us. With respect to BCP, pursuant to a shareholders agreement entered into with PT Cakra Finansindo Investama (which is controlled by our Indonesian local partner, Mr. Arsjad Rasjid) and PT Abhimata Anugrah Abadi (which is controlled by our local partner, Mr. Alvin Sariaatmadja), we have certain contractual rights, which include rights to (a) control the appointment of the Chief Executive Officer and the Chief Financial Officer (including the right to nominate any such officers as directors or as president director), (b) approve the budget and business plan of BCP and its subsidiaries; and (c) approve future funding of BCP and its subsidiaries, whether through debt, equity or otherwise. In each case, in addition to the aforementioned contractual rights, we also have a call option that provides us the right to require the aforementioned local partners to transfer their shares in the aforementioned entities to another party and the local partners’ shares in such entities are also pledged, which means the local partners can transfer their shares only upon receiving our consent. |
• | In Vietnam, we exercise control over relevant Vietnam operating entities based on voting thresholds set forth in Grab Company Limited, the Vietnam holding company’s charter, pursuant to which resolutions are passed by way of written resolutions agreed by members holding at least 75% of the company’s share capital or votes at a physical meeting where members holding at least 75% of the company’s share capital vote in favor of the resolution. Since we hold 49% of the share capital of the Vietnam holding company, our affirmative vote is required for passage of any resolution of the Vietnam holding company. In addition, pursuant to a Members’ Agreement entered into by us with our Vietnamese local partner, Ms. Ly Thuy Bich Huyen (“Vietnamese local partner”), to the extent permitted by local law, certain reserved matters, including important matters that relate to businesses and operations of Grab Vietnam are subject to our consent. In addition to the aforementioned charter and Members’ Agreement which provide us with control over our Vietnam operating entities, we also have a call option that provides us with the right to acquire the Vietnamese local partner’s shares in the Vietnam holding company, and this right is secured by a security arrangement over the Vietnamese local partner’s shares. The Vietnamese local partner’s shares in the Vietnam holding company are also pledged, which prevents the Vietnamese local partner from disposing of its shares without our consent. |
• | In the Philippines, we exercise control over relevant Philippine operating entities pursuant to an Investment Agreement between us and our Philippine local partner, Mr. Jesse Stefan H. Maxwell, relating to Grab PH Holdings Inc. that gives us (A) the right to (i) appoint directors in proportion to our shareholding interest, (ii) exercise veto rights with respect to certain reserved matters that fundamentally affect the business of the company and (iii) receive the economic benefits and absorb losses of the Philippine entities in proportion to the amount and value of our investment, and (B) an exclusive call option to purchase all or part of the equity interests in certain circumstances. In addition, the above-mentioned control-related rights under the Investment Agreement have been included in the Amended Articles of Incorporation and By-Laws of Grab PH Holdings Inc., which was approved by the Philippines Securities and Exchange Commission on July 12, 2022. Thus, the relevant terms of the Investment Agreement has been memorialized in the Amended Articles of Incorporation and By-Laws and become public records that are binding not only on Grab PH Holdings Inc. and the shareholders but also on third-parties in relation to the matters covered thereby. A breach of the Investment Agreement (including in respect of the above-mentioned control rights) would give rise to the right to bring a claim for breach of contract thereunder. Additionally, any action that contravenes the Amended Articles of Incorporation and By-Laws would be invalid and unenforceable and thereby be incrementally beneficial to the party seeking to enforce its terms. Nevertheless, the Investment Agreement provides sufficient control rights to us, and the Investment Agreement also provides that in the event of a conflict between the organizational documents of Grab PH Holdings Inc. (such as the Amended Articles of Incorporation and By-Laws) and the Investment Agreement, the Investment Agreement will prevail and the shareholders of Grab PH Holdings Inc. agree to do all such acts and things and sign and execute all such documents and instruments as may be necessary, desirable or expedient to make the necessary changes in the organizational documents of Grab PH Holdings Inc. (such as the Amended Articles of Incorporation and By-Laws) to remove such inconsistency or otherwise give effect to the Investment Agreement. |
• | In Malaysia, we own 50% of the voting shares in Jaya Grocer outright. The balance of the voting shares are owned by our Malaysian local partner, Green Aurora Sdn Bhd (“Malaysian local partner”), an entity owned by our co-founder, Hooi Ling Tan. Pursuant to a management agreement entered into by us through our wholly owned subsidiary, Jaya Grocer and the Malaysian local partner, to the extent permitted by local law, we generally have the right to decide, among others, on business and financial strategies, including funding, and other strategy matters in relation to the business of Jaya Grocer, in the best interest of Jaya Grocer and in consultation with the Malaysian local partner. We also have a call option that provides us with the right, to the extent permitted by local law, to acquire the Jaya Grocer shares held by the Malaysian local partner and also a power of attorney that provides us with the right to direct the transfer of the shares of the Malaysian local partner (and therefore, indirectly, its shares in Jaya Grocer), to the extent permitted by local law, in the event of a default under the subscription agreement with respect to the preference shares with the Malaysian local partner. |
Our direct and/or indirect equity ownership. |
… | Our contractual rights. See footnotes below for information on our contractual rights. |
(1) | Indonesia |
(2) | Vietnam |
(3) | Thailand: |
(4) | Philippines: |
(5) | Malaysia |
Region |
Minimum Tariff |
Maximum Tariff |
||||||
Sumatra, Java, Bali |
IDR3,500/km | IDR6,000/km | ||||||
Kalimantan, Nusa Tenggara, Sulawesi, Maluku, Papua |
IDR3,700/km | IDR6,500/km |
Type of Liabilities |
Description | |
Civil Liability (section 77-78) |
Actual Damage and Punitive Damage | |
Criminal Liability (section 79-81) |
The criminal penalties for non-compliance with PDPA by unauthorized processing or disclosure of sensitive personal data (i.e., processing or disclosing personal data without legal basis or consent when required by law) or transfer such data to a foreign country that do not have an adequate data protection standard without other legal exceptions in a manner that is likely to cause the data subject or any other person to suffer any damage, impair the person’s reputation, or expose the person to be scorned, hated, or humiliated, the punishment shall be imprisonment not exceeding six months, or a fine not exceeding 500,000 Baht, or both. In the case where such offense is conducted with the intention of receiving unlawful benefits (or to secure benefits for others), the punishment shall be imprisonment not exceeding one year, or a fine not exceeding 1,000,000 Baht, or both. | |
Where the offender who commits the offense under the PDPA is a juristic person and the offense is conducted as a result of the instructions given by or the act of any director, manager or person, who is be responsible for such act of the juristic person, or in the case where such person has a duty to instruct or perform any act, but omits to instruct or perform such act until the juristic person commits such offense, such person shall also be punished with the punishment as prescribed for such offense. | ||
Administrative Liability (section 82-90) |
Maximum penalties for non-compliance under the PDPA is an administrative fine not exceeding THB 5,000,000 Examples of non-compliance under the PDPA are set both below: | |
• Collect, use, or disclose sensitive personal data without legal basis or consent (section 26) | ||
• Collect, use or disclose personal data without legal basis or consent (section 27) | ||
• Fail to inform the purposes of data processing and/or use or process personal data for any other new purposes (section 27) | ||
• Transfer personal data to other countries without legal basis or consent, and/or without sufficient security safeguard (section 28) |
Personal Data Protection Act 2010 | ||||
S.6 | General Principle | A data user who breaches these Principles commits an offense and shall, on conviction, be liable to a fine not exceeding MYR300,000 or to imprisonment for a term not exceeding two (2) years or to both. | ||
S.7 | Notice and Choice Principle | |||
S.8 | Disclosure Principle | |||
S.9 | Security Principle | |||
S.10 | Retention Principle | |||
S.11 | Data Integrity Principle | |||
S.12 | Access Principle | |||
S.16 | Failure to obtain Certificate of Registration | A person who belongs to the class of data users as specified in the order made under subsection 14(1) and who processes personal data without a certificate of registration issued in pursuance of paragraph 16(1)(a) commits an offense and shall, on conviction, be liable to a fine not exceeding MYR500,000 or to imprisonment for a term not exceeding three (3) years or to both. | ||
S.18 | Processing of Personal Data after revocation of registration | A data user whose registration has been revoked under this section and who continues to process personal data thereafter commits an offense and shall, on conviction, be liable to a fine not exceeding MYR500,000 or to imprisonment for a term not exceeding three (3) years or to both. | ||
S.19 | Where the certificate of registration is revoked and certification is not surrendered to the Commission | A person who fails to surrender the revoked certification commits an offense and shall, on conviction, be liable to a fine not exceeding MYR200,000 or to imprisonment for a term not exceeding two (2) years or to both. | ||
S.29 | Non-compliance with code of practice | A data user who fails to comply with any provision of the code of practice that is applicable to the data user commits an offense and shall, on conviction, be liable to a fine not exceeding MYR100,000 or to imprisonment for a term not exceeding one (1) year or to both | ||
S.37 | Notification of refusal to comply with data correction request | A data user who contravenes subsection (2) commits an offense and shall, on conviction, be liable to a fine not exceeding MYR100,000 or to imprisonment for a term not exceeding one (1) year or to both | ||
(1) Where a data user who pursuant to section 36 refuses to comply with a data correction request under section 34, the data user shall, not later than 21 days from the date of receipt of the data correction request, by notice in writing, inform the requestor— (a) of the refusal and the reasons for the refusal; and |
||||
(b) where paragraph 36(1)(e) is applicable, of the name and address of the other data user concerned. | ||||
(2) Without prejudice to the generality of subsection (1), where personal data to which the data correction request relates is an expression of opinion and the data user is not satisfied that the expression of opinion is inaccurate, incomplete, misleading or not up-to-date, the data user shall— |
(a) make a note, whether annexed to the personal data or elsewhere— |
||||
(i) of the matters in respect of which the expression of opinion is considered by the requestor to be inaccurate, incomplete, misleading or not up-to-date; and | ||||
(ii) in such a way that the personal data cannot be used by any person without the note being drawn to the attention of and being available for inspection by that person; and | ||||
(b) attach a copy of the note to the notice referred to in subsection (1) which relates to the data correction request. | ||||
(3) In this section, “expression of opinion” includes an assertion of fact which is unverifiable or in all circumstances of the case is not practicable to verify | ||||
S.38 | Withdrawal of consent to process personal data (1) A data subject may by notice in writing withdraw his consent to the processing of personal data in respect of which he is the data subject. |
A data user who contravenes subsection (2) commits an offense and shall, on conviction, be liable to a fine not exceeding MYR100,000 or to imprisonment for a term not exceeding one (1) year or to both. | ||
(2) The data user shall, upon receiving the notice under subsection (1), cease the processing of the personal data. | ||||
S.40 | Processing of sensitive personal data not in accordance with the Personal Data Protection Act 2010 | A person who contravenes subsection (1) commits an offense and shall, on conviction, be liable to a fine not exceeding MYR200,000 or to imprisonment for a term not exceeding two (2) years or to both. | ||
S.42 | Failure to comply with Commissioner’s direction to comply with data subject notice to prevent processing likely to cause damage or distress | A person who contravenes the relevant subsection commits an offense and shall, on conviction, be liable to a fine not exceeding MYR 200,000 or to imprisonment for a term not exceeding two (2) years or to both | ||
S.108 | Failure to comply with an enforcement notice by the Commissioner | A person who fails to comply with an enforcement notice commits an offense and shall, on conviction, be liable to a fine not exceeding MYR200,000 or to imprisonment for a term not exceeding two (2) years or to both. | ||
S.113 | Search and seizure with warrant | A person who, without lawful authority, breaks, tampers with or damages the seal or removes any computer, book, account, computerized data or other document, signboard, card, letter, pamphlet, leaflet, notice, equipment, instrument or article under seal or attempts to do so commits an offense and shall, on conviction, be liable to a fine not exceeding MYR50,000 or to imprisonment for a term not exceeding six (6) months or to both., | ||
S.120 | Obstruction to search | Any person who— (a) refuses any authorized officer access to any premise which the authorized officer is entitled to have under this Act or in the execution of any duty imposed or power conferred by this Act; |
(b) assaults, obstructs, hinders or delays any authorized officer in effecting any entry which the authorized officer is entitled to effect under this Act, or in the execution of any duty imposed or power conferred by this Act; or | ||||
(c) refuses any authorized officer any information relating to an offense or suspected offense under this Act or any other information which may reasonably be required of him and which he has in his knowledge or power to give, commits an offense and shall, on conviction, be liable to imprisonment for a term not exceeding two (2) years or to a fine not exceeding MYR10,000 or to both | ||||
S.129 | Transfer of personal data to places outside Malaysia in contravention of the Personal Data Protection Act | A data user who contravenes this subsection commits an offense and shall, on conviction, be liable to a fine not exceeding MYR300,000 or to imprisonment for a term not exceeding two (2) years or to both. | ||
S.130 | Unlawful collecting, etc., of personal data | A person who commits an offense under this section shall, upon conviction, be liable to a fine not exceeding MYR500,000 or to imprisonment for a term not exceeding three (3) years or to both. | ||
S.141 | Obligation of secrecy Except for any of the purposes of this Act or for the purposes of any civil or criminal proceedings under any written law or where otherwise authorized by the Minister— |
A person who contravenes this subsection commits an offense and shall, on conviction, be liable to a fine not exceeding MYR100,000 or to imprisonment for a term not exceeding one (1) year or to both. | ||
(a) the Commissioner, Deputy Commissioner, Assistant Commissioner, any officer or servant of the | ||||
Commissioner, any member of the Advisory Committee, any member, officer or servant of the Appeal Tribunal, any authorized officer or any person attending any meeting or deliberation of the Advisory Committee, whether during or after his tenure of office or employment, shall not disclose any information obtained by him in the course of his duties; and (b) no other person who has by any means access to any information or documents relating to the affairs of the Commissioner shall disclose such information or document. |
||||
PERSONAL DATA PROTECTION REGULATIONS 2013 | ||||
S.3(1) | Consent of data subject to be obtained in any form that such consent can be recorded and maintained properly by the data user. | Any data user who contravenes sub-regulation 3(1), regulations 6, 7 and 8 commits an offense and shall, on conviction, be liable to a fine not exceeding MYR250,000 or imprisonment for a term not exceeding two (2) years or to both. | ||
S.6 | Security policy | |||
S.7 | Retention standard | |||
S.8 | Data Integrity Standard |
1. | A nominal interest rate ceiling equivalent to 6 percent per month (~0.2 percent per day). |
2. | An effective interest rate ceiling equivalent to 15 percent per month (~0.5 percent per day), which shall include the nominal interest rate along with all other applicable fees and charges (i.e., processing fees, service fees, notarial fees, handling fees and verification fees, among others) but excluding fees and penalties for late payment or nonpayment. |
3. | A cap on penalties for late payment or non-payment at 5 percent per month on outstanding scheduled amount due. |
4. | A total cost cap of 100 percent of total amount borrowed (applying to all interest, other fees and charges, and penalties) regardless of time the loan has been outstanding. |
($ in millions, unless otherwise stated) |
Six Months Ended June 30, |
1H2021-1H2022 % Change |
Year Ended December 31, |
2020-2021 % Change |
2019-2020 % Change |
|||||||||||||||||||||||||||
2022 |
2021 |
2021 |
2020 |
2019 |
||||||||||||||||||||||||||||
Financial Measures: |
||||||||||||||||||||||||||||||||
Revenue |
549 | 396 | 39 | % | 675 | 469 | (845 | ) | 44 | % | NM | |||||||||||||||||||||
Loss for the period |
(1,007 | ) | (1,467 | ) | 31 | % | (3,555 | ) | (2,745 | ) | (3,988 | ) | (30 | )% | 31 | % | ||||||||||||||||
Total Segment Adjusted EBITDA (Non-IFRS) (1) |
(94 | ) | 21 | NM | (125 | ) | (226 | ) | (1,554 | ) | 45 | % | 85 | % | ||||||||||||||||||
Adjusted EBITDA (Non-IFRS) (1) |
(520 | ) | (325 | ) | (60 | )% | (842 | ) | (780 | ) | (2,237 | ) | (8 | )% | 65 | % | ||||||||||||||||
Operating Metrics: |
||||||||||||||||||||||||||||||||
GMV (2) |
9,860 | 7,522 | 31 | % | 16,061 | 12,492 | 12,251 | 29 | % | 2 | % | |||||||||||||||||||||
MTUs (3) (millions of users) |
31.8 | 28.6 | 11 | % | 24.1 | 24.5 | 29.2 | (2 | )% | (16 | )% | |||||||||||||||||||||
GMV per MTU ($) |
310 | 263 | 18 | % | 666 | 509 | 419 | 31 | % | 21 | % | |||||||||||||||||||||
Partner incentives (4) |
428 | 311 | 38 | % | 717 | 621 | 1,234 | 15 | % | (50 | )% | |||||||||||||||||||||
Consumer incentives (5) |
655 | 429 | 53 | % | 1,065 | 616 | 1,117 | 73 | % | (45 | )% | |||||||||||||||||||||
Partner and consumer incentives |
1,083 | 740 | 46 | % | 1,782 | 1,237 | 2,351 | 44 | % | (47 | )% |
(1) | For a reconciliation to the most directly comparable IFRS measure see the section titled “—Reconciliation of Non-IFRS Financial Measures.” |
(2) | GMV means gross merchandise value, an operating metric representing the sum of the total dollar value of transactions from our services, including any applicable taxes, tips, tolls and fees, over the period of measurement. |
(3) | MTUs means monthly transacting users, which is defined as the monthly number of unique consumers who have successfully paid for an offering on our platform within a given month, across any of our segments. MTUs over a quarterly or annual period are calculated based on the average of the MTUs for each month in the relevant period. MTUs for the six months ended June 30, 2022 and 2021 are inclusive of OVO MTUs. Excluding OVO MTUs, our MTUs for the six months ended June 30, 2022 and 2021 would be 28.7 million and 24.3 million, respectively, and GMV per MTU would be $344 and $310, respectively. |
(4) | Partner incentives represent the dollar value of incentives granted to driver- and merchant-partners, the effect of which is to reduce revenue. The incentives granted to driver- and merchant-partners include base incentives and excess incentives, with base incentives being the amount of incentives paid to driver- and merchant-partners up to the amount of commissions and fees earned by us from those driver- and merchant-partners, and excess incentives being the amount of payments made to driver- and merchant-partners that exceed the amount of commissions and fees earned by us from those driver- and merchant-partners. Base incentives amounted to $92 million and $78 million for the six months ended June 30, 2022 and 2021, respectively, and $155 million, $178 million and $519 million for the year ended December 31, 2021, 2020 and 2019, respectively. |
(5) | Consumer incentives represent the dollar value of discounts and promotions offered to consumers, the effect of which is to reduce revenue. |
• | Deliveries |
• | Mobility |
• | Financial Services |
• | Enterprise and New Initiatives |
($ in millions, unless otherwise stated) | Six Months Ended June 30, |
Year Ended December 31, |
||||||||||||||||||
2022 |
2021 |
2021 |
2020 |
2019 |
||||||||||||||||
Revenue |
549 |
396 |
675 |
469 |
(845 |
) | ||||||||||||||
Cost of revenue |
(647 | ) | (507 | ) | (1,070 | ) | (963 | ) | (1,320 | ) | ||||||||||
Other income |
6 | 16 | 12 | 33 | 14 | |||||||||||||||
Sales and marketing expenses |
(142 | ) | (105 | ) | (241 | ) | (151 | ) | (238 | ) | ||||||||||
General and administrative expense |
(331 | ) | (243 | ) | (545 | ) | (326 | ) | (304 | ) | ||||||||||
Research and development expenses |
(240 | ) | (167 | ) | (356 | ) | (257 | ) | (231 | ) | ||||||||||
Net impairment loss on financial assets |
(22 | ) | (10 | ) | (19 | ) | (63 | ) | (56 | ) | ||||||||||
Other expenses |
(1 | ) | * | (11 | ) | (40 | ) | (30 | ) | |||||||||||
|
|
|
|
|
|
|
|
|
|
|||||||||||
Operating loss |
(828 |
) |
(620 |
) |
(1,555 |
) |
(1,298 |
) |
(3,010 |
) | ||||||||||
Net finance costs |
(173 | ) | (840 | ) | (1,989 | ) | (1,437 | ) | (971 | ) | ||||||||||
Share of loss of equity-accounted investees (net of tax) |
(3 | ) | (4 | ) | (8 | ) | (8 | ) | * | |||||||||||
|
|
|
|
|
|
|
|
|
|
|||||||||||
Loss before income tax |
(1,004 |
) |
(1,464 |
) |
(3,552 |
) |
(2,743 |
) |
(3,981 |
) | ||||||||||
Income tax expense |
(3 | ) | (3 | ) | (3 | ) | (2 | ) | (7 | ) | ||||||||||
|
|
|
|
|
|
|
|
|
|
|||||||||||
Loss for the period |
(1,007 |
) |
(1,467 |
) |
(3,555 |
) |
(2,745 |
) |
(3,988 |
) |
* | Amounts less than $1 million |
($ in millions, unless otherwise stated) | Six Months Ended June 30, |
|||||||
2022 |
2021 |
|||||||
Revenue |
549 |
396 |
||||||
Deliveries |
224 | 98 | ||||||
Mobility |
273 | 263 | ||||||
Financial Services |
24 | 14 | ||||||
Enterprise and New Initiatives |
28 | 21 |
($ in millions, unless otherwise stated) | Six Months Ended June 30, |
1H2021-1H2022 |
||||||||||
2022 |
2021 |
% Change |
||||||||||
Cost of revenue |
647 | 507 | 28 | % |
($ in millions, unless otherwise stated) | Six Months Ended June 30, |
1H2021-1H2022 |
||||||||||
2022 |
2021 |
% Change |
||||||||||
Other income |
6 | 16 | (64 | )% |
($ in millions, unless otherwise stated) | Six Months Ended June 30, |
1H2021-1H2022 |
||||||||||
2022 |
2021 |
% Change |
||||||||||
Sales and marketing expenses |
142 | 105 | 35 | % |
($ in millions, unless otherwise stated) | Six Months Ended June 30, |
1H2021-1H2022 |
||||||||||
2022 |
2021 |
% Change |
||||||||||
General and administrative expenses |
331 | 243 | 36 | % |
($ in millions, unless otherwise stated) | Six Months Ended June 30, |
1H2021-1H2022 |
||||||||||
2022 |
2021 |
% Change |
||||||||||
Research and development expenses |
240 | 167 | 44 | % |
($ in millions, unless otherwise stated) | Six Months Ended June 30, |
1H2021-1H2022 |
||||||||||
2022 |
2021 |
% Change |
||||||||||
Net impairment loss on financial assets |
22 | 10 | 120 | % |
($ in millions, unless otherwise stated) | Six Months Ended June 30, |
1H2021-1H2022 |
||||||||||
2022 |
2021 |
% Change |
||||||||||
Other expenses |
1 | * | NM |
* | Amounts less than $1 million |
($ in millions, unless otherwise stated) | Six Months Ended June 30, |
1H2021-1H2022 |
||||||||||
2022 |
2021 |
% Change |
||||||||||
Net finance costs |
173 | 840 | (79 | )% |
($ in millions, unless otherwise stated) | Year Ended December 31, |
|||||||
2021 |
2020 |
|||||||
Revenue |
675 |
469 |
||||||
Deliveries |
148 | 5 | ||||||
Mobility |
456 | 438 | ||||||
Financial Services |
27 | (10 | ) | |||||
Enterprise and New Initiatives |
44 | 36 |
($ in millions, unless otherwise stated) | Year Ended December 31, |
|||||||
2021 |
2020 |
|||||||
Revenue |
675 |
469 |
||||||
Singapore |
283 | 246 | ||||||
Malaysia |
108 | 91 | ||||||
Philippines |
81 | 51 | ||||||
Thailand |
76 | 57 | ||||||
Rest of Southeast Asia |
127 | 24 |
($ in millions, unless otherwise stated) | Year Ended December 31, |
2020-2021 % Change |
||||||||||
2021 |
2020 |
|||||||||||
Cost of revenue |
1,070 | 963 | 11 | % |
($ in millions, unless otherwise stated) | Year Ended December 31, |
2020-2021 % Change |
||||||||||
2021 |
2020 |
|||||||||||
Other income |
12 | 33 | (64 | )% |
($ in millions, unless otherwise stated) | Year Ended December 31, |
2020-2021 % Change |
||||||||||
2021 |
2020 |
|||||||||||
Sales and marketing expenses |
241 | 151 | 59 | % |
($ in millions, unless otherwise stated) | Year Ended December 31, |
2020-2021 % Change |
||||||||||
2021 |
2020 |
|||||||||||
General and administrative expenses |
545 | 326 | 67 | % |
($ in millions, unless otherwise stated) | Year Ended December 31, |
2020-2021 % Change |
||||||||||
2021 |
2020 |
|||||||||||
Research and development expenses |
356 | 257 | 39 | % |
($ in millions, unless otherwise stated) | Year Ended December 31, |
2020-2021 % Change |
||||||||||
2021 |
2020 |
|||||||||||
Net impairment loss on financial assets |
19 | 63 | (71 | )% |
($ in millions, unless otherwise stated) | Year Ended December 31, |
2020-2021 % Change |
||||||||||
2021 |
2020 |
|||||||||||
Other expenses |
11 | 40 | (73 | )% |
($ in millions, unless otherwise stated) | Year Ended December 31, |
2020-2021 % Change |
||||||||||
2021 |
2020 |
|||||||||||
Net finance costs |
1,989 | 1,437 | 38 | % |
($ in millions, unless otherwise stated) | Year Ended December 31, |
|||||||
2020 |
2019 |
|||||||
Revenue |
469 |
(845 |
) | |||||
Deliveries |
5 | (638 | ) | |||||
Mobility |
438 | 9 | ||||||
Financial Services |
(10 | ) | (229 | ) | ||||
Enterprise and New Initiatives |
36 | 13 |
($ in millions, unless otherwise stated) | Year Ended December 31, |
|||||||
2020 |
2019 |
|||||||
Revenue |
469 |
(845 |
) | |||||
Singapore |
246 | (30 | ) | |||||
Malaysia |
91 | 92 | ||||||
Philippines |
51 | 39 | ||||||
Thailand |
57 | (19 | ) | |||||
Rest of Southeast Asia |
24 | (927 | ) |
($ in millions, unless otherwise stated) | Year Ended December 31, |
2019-2020 |
||||||||||
2020 |
2019 |
% Change |
||||||||||
Cost of revenue |
963 | 1,320 | (27 | )% |
($ in millions, unless otherwise stated) | Year Ended December 31, |
2019-2020 |
||||||||||
2020 |
2019 |
% Change |
||||||||||
Other income |
33 | 14 | 136 | % |
($ in millions, unless otherwise stated) | Year Ended December 31, |
2019-2020 |
||||||||||
2020 |
2019 |
% Change |
||||||||||
Sales and marketing expenses |
151 | 238 | (37 | )% |
($ in millions, unless otherwise stated) | Year Ended December 31, |
2019-2020 |
||||||||||
2020 |
2019 |
% Change |
||||||||||
General and administrative expenses |
326 | 304 | 7 | % |
($ in millions, unless otherwise stated) | Year Ended December 31, |
2019-2020 |
||||||||||
2020 |
2019 |
% Change |
||||||||||
Research and development expenses |
257 | 231 | 11 | % |
($ in millions, unless otherwise stated) | Year Ended December 31, |
2019-2020 |
||||||||||
2020 |
2019 |
% Change |
||||||||||
Net impairment loss on financial assets |
63 | 56 | 13 | % |
($ in millions, unless otherwise stated) | Year Ended December 31, |
2019-2020 % Change |
||||||||||
2020 |
2019 |
|||||||||||
Other expenses |
40 | 30 | 33 | % |
($ in millions, unless otherwise stated) | Year Ended December 31, |
2019-2020 % Change |
||||||||||
2020 |
2019 |
|||||||||||
Net finance costs |
1,437 | 971 | 48 | % |
($ in millions, unless otherwise stated) | Six Months Ended June 30, |
1H2021- 1H2022 % Change |
Year Ended December 31, |
2020-2021 % Change |
2019-2020 % Change |
|||||||||||||||||||||||||||
2022 |
2021 |
2021 |
2020 |
2019 |
||||||||||||||||||||||||||||
Overall Total Segment Adjusted EBITDA |
(94 |
) |
21 |
NM |
(125 |
) |
(226 |
) |
(1,554 |
) |
45 |
% |
85 |
% | ||||||||||||||||||
Deliveries |
(90 | ) | (24 | ) | (283 | )% | (130 | ) | (211 | ) | (809 | ) | 38 | % | 74 | % | ||||||||||||||||
Mobility |
207 | 205 | 1 | % | 345 | 307 | (194 | ) | 13 | % | NM | |||||||||||||||||||||
Financial Services |
(217 | ) | (163 | ) | (34 | )% | (349 | ) | (331 | ) | (548 | ) | (5 | )% | 40 | % | ||||||||||||||||
Enterprise & New Initiatives |
6 | 3 | 83 | % | 9 | 9 | (3 | ) | NM | NM |
($ in millions, unless otherwise stated) | Six Months Ended June 30, |
Year Ended December 31, | ||||||||||||||||||
2022 |
2021 |
2021 |
2020 |
2019 |
||||||||||||||||
Loss for the period |
(1,007 |
) |
(1,467 |
) |
(3,555 |
) |
(2,745 |
) |
(3,988 |
) | ||||||||||
Net interest expenses |
45 | 864 | 1,675 | 1,391 | 977 | |||||||||||||||
Other income |
(3 | ) | (11 | ) | (12 | ) | (10 | ) | (13 | ) | ||||||||||
Income tax expenses |
3 | 3 | 3 | 2 | 7 | |||||||||||||||
Depreciation and amortization |
72 | 170 | 345 | 387 | 647 | |||||||||||||||
Share-based compensation expenses |
231 | 140 | 357 | 54 | 34 | |||||||||||||||
Unrealized foreign exchange (gain) loss |
(4 | ) | (4 | ) | 1 | * | 4 | |||||||||||||
Impairment loss on goodwill and non-financial assets |
3 | 2 | 15 | 43 | 60 | |||||||||||||||
Fair value changes on investments |
133 | (47 | ) | (37 | ) | 57 | 3 | |||||||||||||
Restructuring costs |
1 | * | 1 | 2 | 1 | |||||||||||||||
Legal, tax and regulatory settlement provisions |
6 | 25 | 12 | 39 | 31 | |||||||||||||||
Share listing and associated expenses |
— | — | 353 | — | — | |||||||||||||||
|
|
|
|
|
|
|
|
|
|
|||||||||||
Adjusted EBITDA |
(520 |
) |
(325 |
) |
(842 |
) |
(780 |
) |
(2,237 |
) | ||||||||||
Regional corporate costs |
426 | 346 | 717 | 554 | 683 | |||||||||||||||
|
|
|
|
|
|
|
|
|
|
|||||||||||
Total Segment Adjusted EBITDA |
(94 |
) |
21 |
(125 |
) |
(226 |
) |
(1,554 |
) | |||||||||||
|
|
|
|
|
|
|
|
|
|
|||||||||||
Segment Adjusted EBITDA |
||||||||||||||||||||
Deliveries |
(90 | ) | (24 | ) | (130 | ) | (211 | ) | (809 | ) | ||||||||||
Mobility |
207 | 205 | 345 | 307 | (194 | ) | ||||||||||||||
Financial Services |
(217 | ) | (163 | ) | (349 | ) | (331 | ) | (548 | ) | ||||||||||
Enterprise and New Initiatives |
6 | 3 | 9 | 9 | (3 | ) | ||||||||||||||
|
|
|
|
|
|
|
|
|
|
|||||||||||
Total Segment Adjusted EBITDA |
(94 |
) |
21 |
(125 |
) |
(226 |
) |
(1,554 |
) | |||||||||||
|
|
|
|
|
|
|
|
|
|
* | Amount less than $1 million |
($ in millions, unless otherwise stated) | Six Months Ended June 30, |
1H2021-1H2022 % Change |
Year Ended December 31, |
2020-2021 % Change |
2019-2020 % Change |
|||||||||||||||||||||||||||
2022 |
2021 |
2021 |
2020 |
2019 |
||||||||||||||||||||||||||||
Revenue |
224 | 98 | 129 | % | 148 | 5 | (638 | ) | NM | NM | ||||||||||||||||||||||
Segment Adjusted EBITDA (1) |
(90 | ) | (24 | ) | (283 | )% | (130 | ) | (211 | ) | (809 | ) | 38 | % | 74 | % | ||||||||||||||||
% of GMV |
(2 | )% | (1 | )% | (2 | )% | (4 | )% | (27 | )% |
(1) | Segment Adjusted EBITDA is a non-IFRS financial measure, representing the Adjusted EBITDA of each of our four business segments, excluding, in each case, regional corporate costs. |
($ in millions, unless otherwise stated) | Six Months Ended June 30, |
1H2021-1H2022 % Change |
Year Ended December 31, |
2020-2021 % Change |
2019-2020 % Change |
|||||||||||||||||||||||||||
2022 |
2021 |
2021 |
2020 |
2019 |
||||||||||||||||||||||||||||
Revenue |
273 | 263 | 4 | % | 456 | 438 | 9 | 4 | % | NM | ||||||||||||||||||||||
Segment Adjusted EBITDA (1) |
207 | 205 | 1 | % | 345 | 307 | (194 | ) | 13 | % | NM | |||||||||||||||||||||
% of GMV |
11 | % | 14 | % | 12 | % | 9 | % | (3 | )% |
(1) | Segment Adjusted EBITDA is a non-IFRS financial measure, representing the Adjusted EBITDA of each of our four business segments, excluding, in each case, regional corporate costs. |
($ in millions) | Six Months Ended June 30, |
1H2021-1H2022 % Change |
Year Ended December 31, |
2020-2021 % Change |
2019-2020 % Change |
|||||||||||||||||||||||||||
2022 |
2021 |
2021 |
2020 |
2019 |
||||||||||||||||||||||||||||
Revenue |
24 | 14 | 71 | % | 27 | (10 | ) | (229 | ) | NM | 95 | % | ||||||||||||||||||||
Segment Adjusted EBITDA (1) |
(217 | ) | (163 | ) | (34 | )% | (349 | ) | (331 | ) | (548 | ) | (5 | )% | 40 | % |
(1) | Segment Adjusted EBITDA is a non-IFRS financial measure, representing the Adjusted EBITDA of each of our four business segments, excluding, in each case, regional corporate costs. |
($ in millions, unless otherwise stated) | Six Months Ended June 30, |
1H2021- 1H2022 % Change |
Year Ended December 31, |
2020-2021 % Change |
2019-2020 % Change |
|||||||||||||||||||||||||||
2022 |
2021 |
2021 |
2020 |
2019 |
||||||||||||||||||||||||||||
Revenue |
28 | 21 | 32 | % | 44 | 36 | 13 | 22 | % | 178 | % | |||||||||||||||||||||
Segment Adjusted EBITDA (1) |
6 | 3 | 83 | % | 9 | 9 | (3 | ) | NM | NM | ||||||||||||||||||||||
% of GMV |
6 | % | 5 | % | 6 | % | 21 | % | (34 | )% |
(1) | Segment Adjusted EBITDA is a non-IFRS financial measure, representing the Adjusted EBITDA of each of our four business segments, excluding, in each case, regional corporate costs. |
($ in millions, unless otherwise stated) | Six Months Ended June 30, |
1H2021- 1H2022 % Change |
Year Ended December 31, |
2020-2021 % Change |
2019-2020 % Change |
|||||||||||||||||||||||||||
2022 |
2021 |
2021 |
2020 |
2019 |
||||||||||||||||||||||||||||
GMV (1) |
9,860 | 7,522 | 31 | % | 16,061 | 12,492 | 12,251 | 29 | % | 2 | % | |||||||||||||||||||||
MTUs (2) (millions in users) |
31.8 | 28.6 | 11 | % | 24.1 | 24.5 | 29.2 | (2 | )% | (16 | )% | |||||||||||||||||||||
Partner incentives (3) |
428 | 311 | 38 | % | 717 | 621 | 1,234 | 15 | % | (50 | )% | |||||||||||||||||||||
Consumer incentives (4) |
655 | 429 | 53 | % | 1,065 | 616 | 1,117 | 73 | % | (45 | )% | |||||||||||||||||||||
Partner and consumer incentives |
1,083 | 740 | 46 | % | 1,782 | 1,237 | 2,351 | 44 | % | (47 | )% |
(1) | GMV means gross merchandise value, an operating metric representing the sum of the total dollar value of transactions from our services, including any applicable taxes, tips, tolls and fees, over the period of measurement. |
(2) | MTUs means monthly transacting users, which is defined as the monthly number of unique consumers who have successfully paid for an offering on our platform within a given month, across any of our segments. MTUs over a quarterly or annual period are calculated based on the average of the MTUs for each month in the relevant period. MTUs for the six months ended June 30, 2022 and 2021 are inclusive of OVO MTUs. Excluding OVO MTUs, our MTUs for the six months ended June 30, 2022 and 2021 would be 28.7 million and 24.3 million, respectively. |
(3) | Partner incentives represent the dollar value of incentives granted to driver- and merchant-partners, the effect of which is to reduce revenue. The incentives granted to driver- and merchant-partners include base incentives and excess incentives, with base incentives being the amount of incentives paid to driver- and merchant-partners up to the amount of commissions and fees earned by us from those driver- and merchant-partners, and excess incentives being the amount of payments made to driver- and merchant-partners that exceed the amount of commissions and fees earned by us from those driver- and merchant-partners. Base incentives amounted to $92 million and $78 million for the six months ended June 30, 2022 and June 30, 2021, respectively, and $155 million, $178 million and $519 million for the year ended December 31, 2021, 2020 and 2019, respectively. |
(4) | Consumer incentives represent the dollar value of discounts and promotions offered to consumers, the effect of which is to reduce revenue. |
($ in millions, unless otherwise stated) | Six Months Ended June 30, |
1H2021- 1H2022 % Change |
Year Ended December 31, |
2020-2021 % Change |
2019-2020 % Change |
|||||||||||||||||||||||||||
2022 |
2021 |
2021 |
2020 |
2019 |
||||||||||||||||||||||||||||
Overall GMV |
9,860 | 7,522 | 31 | % | 16,061 | 12,492 | 12,251 | 29 | % | 2 | % | |||||||||||||||||||||
Deliveries GMV |
5,037 | 3,775 | 33 | % | 8,530 | 5,468 | 2,947 | 56 | % | 86 | % | |||||||||||||||||||||
Mobility GMV |
1,869 | 1,493 | 25 | % | 2,787 | 3,232 | 5,715 | (14 | )% | (43 | )% | |||||||||||||||||||||
Financial Services GMV |
2,850 | 2,193 | 30 | % | 4,591 | 3,748 | 3,579 | 22 | % | 5 | % | |||||||||||||||||||||
Enterprise & New Initiatives GMV |
104 | 61 | 72 | % | 153 | 44 | 9 | 248 | % | 416 | % |
(monthly average in millions, unless otherwise stated) |
Six Months Ended June 30, |
1H2021- 1H2022 % Change |
Year Ended December 31, |
2020-2021 % Change |
2019-2020 % Change |
|||||||||||||||||||||||||||
2022 |
2021 |
2021 |
2020 |
2019 |
||||||||||||||||||||||||||||
Overall MTUs |
31.8 | 28.6 | 11 | % | 24.1 | 24.5 | 29.2 | (2 | )% | (16 | )% | |||||||||||||||||||||
Deliveries MTUs |
19.5 | 16.4 | 19 | % | 17.3 | 14.8 | 10.7 | 17 | % | 38 | % | |||||||||||||||||||||
Mobility MTUs |
15.2 | 12.5 | 22 | % | 11.4 | 14.6 | 24.7 | (22 | )% | (41 | )% | |||||||||||||||||||||
Financial Services MTUs |
20.4 | 16.9 | 21 | % | 12.7 | 10.4 | 10.3 | 22 | % | 1 | % |
($ in millions, unless otherwise stated) | Six Months Ended June 30, |
1H2021- 1H2022 % Change |
Year Ended December 31, |
2020-2021 % Change |
2019-2020 % Change |
|||||||||||||||||||||||||||
2022 |
2021 |
2021 |
2020 |
2019 |
||||||||||||||||||||||||||||
Overall GMV per MTU |
310 | 263 | 18 | % | 666 | 509 | 419 | 31 | % | 21 | % |
($ in millions, unless otherwise stated) | Six Months Ended June 30, |
1H2021- 1H2022 % Change |
Year Ended December 31, |
2020-2021 % Change |
2019-2020 % Change |
|||||||||||||||||||||||||||
2022 |
2021 |
2021 |
2020 |
2019 |
||||||||||||||||||||||||||||
Overall partner incentives |
428 | 311 | 38 | % | 717 | 621 | 1,234 | 15 | % | (50 | )% | |||||||||||||||||||||
% of GMV |
4 | % | 4 | % | 4 | % | 5 | % | 10 | % | ||||||||||||||||||||||
Deliveries |
328 | 262 | 25 | % | 602 | 466 | 477 | 29 | % | (2 | )% | |||||||||||||||||||||
Mobility |
99 | 48 | 106 | % | 114 | 151 | 743 | 25 | % | (80 | )% | |||||||||||||||||||||
Financial Services |
* | * | NM | * | 3 | 13 | NM | (80 | )% | |||||||||||||||||||||||
Enterprise & New Initiatives |
* | * | NM | * | 2 | 1 | NM | 139 | % |
* | Amounts less than $1 million |
($ in millions, unless otherwise stated) | Six Months Ended June 30, |
1H2021- 1H2022 % Change |
Year Ended December 31, |
2020-2021 % Change |
2019-2020 % Change |
|||||||||||||||||||||||||||
2022 |
2021 |
2021 |
2020 |
2019 |
||||||||||||||||||||||||||||
Overall consumer incentives |
655 | 429 | 53 | % | 1,065 | 616 | 1,117 | 73 | % | (45 | )% | |||||||||||||||||||||
% of GMV |
7 | % | 6 | % | 7 | % | 5 | % | 9 | % | ||||||||||||||||||||||
Deliveries |
471 | 323 | 46 | % | 800 | 437 | 483 | 83 | % | (10 | )% | |||||||||||||||||||||
Mobility |
62 | 34 | 81 | % | 82 | 100 | 394 | (17 | )% | (75 | )% | |||||||||||||||||||||
Financial Services |
51 | 34 | 47 | % | 80 | 80 | 244 | NM | (67 | )% | ||||||||||||||||||||||
Enterprise & New Initiatives |
71 | 37 | 93 | % | 103 | * | (5 | ) | NM | NM |
* | Amounts less than $1 million |
($ in millions, unless otherwise stated) | Six Months Ended June 30, |
1H2021- 1H2022 % Change |
Year Ended December 31, |
2020-2021 % Change |
2019-2020 % Change |
|||||||||||||||||||||||||||
2022 |
2021 |
2021 |
2020 |
2019 |
||||||||||||||||||||||||||||
Overall partner and consumer incentives |
1,083 | 740 | 46 | % | 1,782 | 1,237 | 2,351 | 44 | % | (47 | )% | |||||||||||||||||||||
% of GMV |
11 | % | 10 | % | 11 | % | 10 | % | 19 | % | ||||||||||||||||||||||
Deliveries |
799 | 586 | 37 | % | 1,402 | 903 | 960 | 55 | % | (6 | )% | |||||||||||||||||||||
Mobility |
162 | 82 | 96 | % | 196 | 251 | 1,137 | (22 | )% | (78 | )% | |||||||||||||||||||||
Financial Services |
51 | 35 | 47 | % | 80 | 82 | 258 | (2 | )% | (68 | )% | |||||||||||||||||||||
Enterprise & New Initiatives |
71 | 37 | 93 | % | 103 | 2 | (4 | ) | NM | NM |
($ in millions, unless otherwise stated) | Six Months Ended June 30, |
1H2021- 1H2022 % Change |
Year Ended December 31, |
2020-2021 % Change |
2019-2020 % Change |
|||||||||||||||||||||||||||
2022 |
2021 |
2021 |
2020 |
2019 |
||||||||||||||||||||||||||||
Revenue |
224 | 98 | 129 | % | 148 | 5 | (638 | ) | NM | NM | ||||||||||||||||||||||
Segment Adjusted EBITDA (1) |
(90 | ) | (24 | ) | 283 | % | (130 | ) | (211 | ) | (809 | ) | 38 | % | 74 | % | ||||||||||||||||
GMV (2) |
5,037 | 3,775 | 33 | % | 8,530 | 5,468 | 2,947 | 56 | % | 86 | % | |||||||||||||||||||||
MTUs (3) |
19.5 | 16.4 | 19 | % | 17.3 | 14.8 | 10.7 | 17 | % | 38 | % | |||||||||||||||||||||
Commission rate (4) |
20 | % | 18 | % | 18 | % | 17 | % | 11 | % | ||||||||||||||||||||||
Partner incentives (5) |
(328 | ) | (262 | ) | 25 | % | (602 | ) | (466 | ) | (477 | ) | 29 | % | (2 | )% | ||||||||||||||||
Consumer incentives (6) |
(471 | ) | (323 | ) | 46 | % | (800 | ) | (437 | ) | (483 | ) | 83 | % | (10 | )% |
(1) | Segment Adjusted EBITDA is a non-IFRS financial measure, representing the Adjusted EBITDA of each of our four business segments, excluding, in each case, regional corporate costs. |
(2) | GMV means gross merchandise value, an operating metric representing the sum of the total dollar value of transactions from our services, including any applicable taxes, tips, tolls and fees, over the period of measurement. |
(3) | MTUs means monthly transacting users, which is an operating metric defined as the monthly number of unique users who transact via our products, where transact means to have successfully paid for any of our products. MTUs over a quarterly or annual period are calculated based on the average of the MTUs for each month in the relevant period. |
(4) | Commission rate is an operating metric, representing the total dollar value paid to us in the form of commissions and fees from each transaction, without any adjustments for incentives paid to driver- and merchant-partners or promotions to end-users, as a percentage of GMV, over the period of measurement. |
(5) | Partner incentives represent the dollar value of incentives granted to driver- and merchant-partners, the effect of which is to reduce revenue. The incentives granted to driver- and merchant-partners include base incentives and excess incentives, with base incentives being the amount of incentives paid to driver- and merchant-partners up to the amount of commissions and fees earned by us from those driver- and merchant-partners, and excess incentives being the amount of payments made to driver- and merchant-partners that exceed the amount of commissions and fees earned by us from those driver- and merchant-partners. Base incentives amounted to $30 million and $46 million for the six months ended June 30, 2022 and 2021, respectively, and $89 million, $64 million and $53 million for the years ended December 31, 2021, 2020 and 2019, respectively. |
(6) | Consumer incentives represent the dollar value of discounts and promotions offered to consumers, the effect of which is to reduce revenue. |
($ in millions, unless otherwise stated) | Six Months Ended June 30, |
1H2021- 1H2022 % Change |
Year Ended December 31, |
2020-2021 % Change |
2019-2020 % Change |
|||||||||||||||||||||||||||
2022 |
2021 |
2021 |
2020 |
2019 |
||||||||||||||||||||||||||||
Revenue |
273 | 263 | 4 | % | 456 | 438 | 9 | 4 | % | NM | ||||||||||||||||||||||
Segment Adjusted EBITDA (1) |
207 | 205 | 1 | % | 345 | 307 | (194 | ) | 13 | % | NM | |||||||||||||||||||||
GMV (2) |
1,869 | 1,493 | 25 | % | 2,787 | 3,232 | 5,715 | (14 | )% | (43 | )% | |||||||||||||||||||||
MTUs (3) |
15.2 | 12.5 | 22 | % | 11.4 | 14.6 | 24.7 | (22 | )% | (41 | )% | |||||||||||||||||||||
Commission rate (4) |
23 | % | 23 | % | 23 | % | 21 | % | 20 | % | ||||||||||||||||||||||
Partner incentives (5) |
(99 | ) | (48 | ) | 106 | % | (114 | ) | (151 | ) | (743 | ) | (25 | )% | (80 | )% | ||||||||||||||||
Consumer incentives (6) |
(62 | ) | (34 | ) | 81 | % | (82 | ) | (100 | ) | (394 | ) | (17 | )% | (75 | )% |
(1) | Segment Adjusted EBITDA is a non-IFRS financial measure, representing the Adjusted EBITDA of each of our four business segments, excluding, in each case, regional corporate costs. |
(2) | GMV means gross merchandise value, an operating metric representing the sum of the total dollar value of transactions from our services, including any applicable taxes, tips, tolls and fees, over the period of measurement. |
(3) | MTUs means monthly transacting users, which is an operating metric defined as the monthly number of unique users who transact via our products, where transact means to have successfully paid for any of our products. MTUs over a quarterly or annual period are calculated based on the average of the MTUs for each month in the relevant period. |
(4) | Commission rate is an operating metric, representing the total dollar value paid to us in the form of commissions and fees from each transaction, without any adjustments for incentives paid to driver- and merchant-partners or promotions to end-users, as a percentage of GMV, over the period of measurement. |
(5) | Partner incentives represent the dollar value of incentives granted to driver- and merchant-partners, the effect of which is to reduce revenue. The incentives granted to driver- and merchant-partners include base incentives and excess incentives, with base incentives being the amount of incentives paid to driver- and merchant-partners up to the amount of commissions and fees earned by us from those driver- and merchant-partners, and excess incentives being the amount of payments made to driver- and merchant-partners that exceed the amount of commissions and fees earned by us from those driver- and merchant-partners. Base incentives amounted to $62 million and $32 million for the six months ended June 30, 2022 and 2021, respectively, and $66 million, $114 million and $464 million for the years ended December 31, 2021, 2020 and 2019, respectively. |
(6) | Consumer incentives represent the dollar value of discounts and promotions offered to consumers, the effect of which is to reduce revenue. |
($ in millions, unless otherwise stated) | Six Months Ended June 30, |
1H2021- 1H2022 % Change |
Year Ended December 31, |
2020-2021 % Change |
2019-2020 % Change |
|||||||||||||||||||||||||||
2022 |
2021 |
2021 |
2020 |
2019 |
||||||||||||||||||||||||||||
Revenue |
24 | 14 | 71 | % | 27 | (10 | ) | (229 | ) | NM | 95 | % | ||||||||||||||||||||
Segment Adjusted EBITDA (1) |
(217 | ) | (163 | ) | (34 | )% | (349 | ) | (331 | ) | (548 | ) | (5 | )% | 40 | % | ||||||||||||||||
Pre-InterCo TPV (2) |
7,378 | 5,614 | 31 | % | 12,149 | 8,856 | 7,773 | 37 | % | 14 | % | |||||||||||||||||||||
GMV (3) |
2,850 | 2,193 | 30 | % | 4,591 | 3,748 | 3,579 | 22 | % | 5 | % | |||||||||||||||||||||
MTUs (4) |
20.4 | 16.9 | 21 | % | 12.7 | 10.4 | 10.3 | 22 | % | 1 | % | |||||||||||||||||||||
Commission rate (5) |
3 | % | 2 | % | 2 | % | 2 | % | 1 | % | ||||||||||||||||||||||
Partner incentives (6) |
( | *) | ( | *) | NM | ( | *) | (3 | ) | (13 | ) | NM | (80 | )% | ||||||||||||||||||
Consumer incentives (7) |
(51 | ) | (34 | ) | 47 | % | (80 | ) | (80 | ) | (224 | ) | NM | (67 | )% |
* | Amount less than $1 million. |
(1) | Segment Adjusted EBITDA is a non-IFRS financial measure, representing the Adjusted EBITDA of each of our four business segments, excluding, in each case, regional corporate costs. |
(2) | Pre-InterCo TPV for the financial services segment is equivalent to the total payments volume, or TPV, processed through our platform for the financial services segment. TPV is the value of payments received from consumers, net of payment reversals, successfully completed through our platform. |
(3) | GMV for the financial services segment is equivalent to the total payments volume, or TPV, processed through our platform for the financial services segment, excluding amounts from transactions between entities within the Grab group that are eliminated upon consolidation. |
(4) | MTUs means monthly transacting users, which is an operating metric defined as the monthly number of unique users who transact via our products, where transact means to have successfully paid for any of our products. MTUs over a quarterly or annual period are calculated based on the average of the MTUs for each month in the relevant period. MTUs for the six months ended June 30, 2022 and 2021 are inclusive of OVO MTUs. Excluding OVO MTUs, our MTUs for the six months ended June 30, 2022 and 2021 would be 17.1 million and 12.3 million, respectively. |
(5) | Commission rate is an operating metric, representing the total dollar value paid to us in the form of commissions and fees from each transaction, without any adjustments for incentives paid to driver- and merchant-partners or promotions to end-users, as a percentage of GMV, over the period of measurement. |
(6) | Partner incentives represent the dollar value of incentives granted to driver- and merchant-partners, the effect of which is to reduce revenue. The incentives granted to driver- and merchant-partners include base incentives and excess incentives, with base incentives being the amount of incentives paid to driver- and merchant-partners up to the amount of commissions and fees earned by us from those driver- and merchant-partners, and excess incentives being the amount of payments made to driver- and merchant-partners that exceed the amount of commissions and fees earned by us from those driver- and merchant-partners. Base incentives were less than $1 million for the six months ended June 30, 2022 and 2021, and less than $1 million, less than $1 million and $2 million for the years ended December 31, 2021, 2020 and 2019, respectively. |
(7) | Consumer incentives represent the dollar value of discounts and promotions offered to consumers, the effect of which is to reduce revenue. |
($ in millions, unless otherwise stated) | Six Months Ended June 30, |
1H2021- 1H2022 % Change |
Year Ended December 31, |
2020-2021 % Change |
2019-2020 % Change |
|||||||||||||||||||||||||||
2022 |
2021 |
2021 |
2020 |
2019 |
||||||||||||||||||||||||||||
Revenue |
28 | 21 | 32 | % | 44 | 36 | 13 | 22 | % | 178 | % | |||||||||||||||||||||
Segment Adjusted EBITDA (1) |
6 | 3 | 83 | % | 9 | 9 | (3 | ) | NM | NM | ||||||||||||||||||||||
GMV (2) |
104 | 61 | 72 | % | 153 | 44 | 9 | 248 | % | 416 | % | |||||||||||||||||||||
Partner incentives (3) |
(*) | ( | *) | NM | ( | *) | (2 | ) | ( | *) | NM | NM | ||||||||||||||||||||
Consumer incentives (4) |
(71) | (37) | 93 | % | (103 | ) | ( | *) | 5 | NM | NM |
* | Amount less than $1 million |
(1) | Segment Adjusted EBITDA is a non-IFRS financial measure, representing the Adjusted EBITDA of each of our four business segments, excluding, in each case, regional corporate costs. |
(2) | GMV means gross merchandise value, an operating metric representing the sum of the total dollar value of transactions from our services, including any applicable taxes, tips, tolls and fees, over the period of measurement. |
(3) | Partner incentives represent the dollar value of incentives granted to driver- and merchant-partners, the effect of which is to reduce revenue. The incentives granted to driver- and merchant-partners include base incentives and excess incentives, with base incentives being the amount of incentives paid to driver- and merchant-partners up to the amount of commissions and fees earned by us from those driver- and merchant-partners, and excess incentives being the amount of payments made to driver- and merchant-partners that exceed the amount of commissions and fees earned by us from those driver- and merchant-partners. Base incentives were less than $1 million for the six months ended June 30, 2022 and 2021 and for the years ended December 31, 2021, 2020 and 2019. |
(4) | Consumer incentives represent the dollar value of discounts and promotions offered to consumers, the effect of which is to reduce revenue. |
($ in millions, unless otherwise stated) | Six Months Ended June 30, |
Year Ended December 31, |
||||||||||||||||||
2022 |
2021 |
2021 |
2020 |
2019 |
||||||||||||||||
Net cash flow |
(2,161 |
) |
1,323 |
2,871 |
617 |
232 |
||||||||||||||
Net cash used in operating activities |
(717 | ) | (303 | ) | (938 | ) | (643 | ) | (2,112 | ) | ||||||||||
Net cash used in investing activities |
(1,241 | ) | (700 | ) | (2,757 | ) | (318 | ) | 393 | |||||||||||
Net cash (used in)/provided by financing activities |
(203 | ) | 2,326 | 6,566 | 1,578 | 1,951 |
($ in millions, unless otherwise stated) | As of June 30, |
As of December 31, |
||||||||||
2022 |
2021 |
2020 |
||||||||||
Current maturities of long-term liabilities |
||||||||||||
Bank loans and term loans |
153 | 122 | 121 | |||||||||
Long-term liabilities—net of current maturities |
||||||||||||
Bank loans and term loans |
2,015 | 1,930 | 91 | |||||||||
|
|
|
|
|
|
|||||||
Total |
2,168 |
2,052 |
212 |
|||||||||
|
|
|
|
|
|
($ in millions, unless otherwise stated) | Payments Due by Period |
|||||||||||||||
Total |
Less than 1 year |
1-5 years |
More than 5 years |
|||||||||||||
Bank loans and term loans (1) |
2,441 | 220 | 2,221 | — | ||||||||||||
Lease liabilities commitments |
233 | 35 | 84 | 114 | ||||||||||||
Non-cancelable purchase obligations (2) |
681 | 483 | 198 | — | ||||||||||||
|
|
|
|
|
|
|
|
|||||||||
Total contractual obligations |
3,355 | 738 | 2,503 | 114 | ||||||||||||
|
|
|
|
|
|
|
|
(1) | Each item includes expected interest payments. |
(2) | Non-cancelable purchase obligations primarily pertain to the purchase of onboarding, data processing and technology platform infrastructure services. |
Name |
Age |
Position/Title | ||
Anthony Tan Ping Yeow | 40 | Founder, Chairman and Chief Executive Officer | ||
Tan Hooi Ling | 38 | Founder and Director | ||
Maa Ming-Hokng | 45 | President | ||
Alex Hungate | 56 | Chief Operating Officer | ||
Peter Oey | 51 | Chief Financial Officer | ||
Ong Chin Yin | 48 | Chief People Officer | ||
Suthen Thomas Paradatheth (1) |
40 | Group Chief Technology Officer | ||
John Rogers | 54 | Independent Director | ||
Dara Khosrowshahi | 53 | Independent Director | ||
Ng Shin Ein | 48 | Independent Director | ||
Oliver Jay | 38 | Independent Director |
(1) | with effect from October 1, 2022 |
Board Diversity Matrix (as of September 22, 2022) |
||||||||||||||||
Country of Principal Executive Offices: |
Singapore | |||||||||||||||
Foreign Private Issuer |
Yes | |||||||||||||||
Disclosure Prohibited under Home Country Law |
No | |||||||||||||||
Total Number of Directors |
6 | |||||||||||||||
Female |
Male |
Non- Binary |
Did Not Disclose Gender |
|||||||||||||
Part I: Gender Identity |
||||||||||||||||
Directors |
2 | 4 | 0 | 0 | ||||||||||||
Part II: Demographic Background |
||||||||||||||||
Underrepresented Individual in Home Country Jurisdiction |
0 | |||||||||||||||
LGBTQ+ |
0 | |||||||||||||||
Did Not Disclose Demographic Background |
1 |
• | overseeing the relationship with our independent auditors, including: |
• | appointing, retaining and determining the compensation of our independent auditors; |
• | approving auditing and pre-approving non-auditing services permitted to be performed by the independent auditors; |
• | discussing with the independent auditors the overall scope and plans for their audits and other financial reviews; |
• | reviewing at least annually the qualifications, performance and independence of the independent auditors; |
• | reviewing reports from the independent auditors regarding all critical accounting policies and practices to be used by us and all other material written communications between the independent auditors and management; and |
• | reviewing and resolving any disagreements between management and the independent auditors regarding financial controls or financial reporting; |
• | overseeing the internal audit function, including conducting an annual appraisal of the internal audit function, reviewing and discussing with management the appointment of the head of internal audit, at least quarterly meetings between the chairperson of the audit committee and the head of internal audit, reviewing any significant issues raised in reports to management by internal audit and ensuring that there are no unjustified restrictions or limitations on the internal audit function and that it has sufficient resources; |
• | reviewing and recommending all related party transactions to our board of directors for approval, and reviewing and approving all changes to our related party transactions policy; |
• | reviewing and discussing with management the annual audited financial statements and the design, implementation, adequacy and effectiveness of our internal controls; |
• | overseeing risks and exposure associated with financial matters; and |
• | establishing and overseeing procedures for the receipt, retention and treatment of complaints received from our employees regarding accounting, internal accounting controls or audit matters and the confidential, anonymous submission by our employees of concerns regarding questionable accounting, auditing and internal control matters. |
• | reviewing at least annually the goals and objectives of our executive compensation plans, and amending, or recommending that our board of directors amend, these goals and objectives if the committee deems it appropriate; |
• | reviewing at least annually our executive compensation plans in light of our goals and objectives with respect to such plans, and, if the committee deems it appropriate, adopting, or recommending to our board of directors the adoption of, new, or the amendment of existing, executive compensation plans; |
• | evaluating at least annually the performance of our executive officers in light of the goals and objectives of our compensation plans, and determining and approving the compensation of such executive officers, provided that Mr. Tan shall not participate in such determination and approval relating to him personally; |
• | evaluating annually the appropriate level of compensation for our board of directors and committee service by non-employee directors; |
• | reviewing and approving any severance or termination arrangements to be made with any executive officer, provided that Mr. Tan shall not participate in such determination and approval relating to him personally; |
• | reviewing perquisites or other personal benefits to executive officers and directors and recommend any changes to our board of directors; and |
• | administering our equity plans. |
• | reviewing annually with the board of directors the characteristics such as knowledge, skills, qualifications, experience and diversity of directors other than the Class B Directors; |
• | overseeing director training and development programs; and |
• | advising the board of directors periodically with regards to significant developments in the law and practice of corporate governance as well as compliance with applicable laws and regulations, and making recommendations to the board of directors on all matters of corporate governance and on any remedial action to be taken. |
• | the rules under the Exchange Act requiring the filing of quarterly reports on Form 10-Q or current reports on Form 8-K with the SEC; |
• | the sections of the Exchange Act regulating the solicitation of proxies, consents, or authorizations in respect of a security registered under the Exchange Act; |
• | the sections of the Exchange Act requiring insiders to file public reports of their share ownership and trading activities and liability for insiders who profit from trades made in a short period of time; and |
• | the selective disclosure rules by issuers of material nonpublic information under Regulation Fair Disclosure, or Regulation FD, which regulates selective disclosure of material non-public information by issuers. |
• | a majority independent board of directors; |
• | a compensation committee consisting of independent directors; |
• | a nominating committee consisting of independent directors; or |
• | regularly scheduled executive sessions with only independent directors each year. |
• | Anthony Tan Ping Yeow had (x) outstanding options to purchase a total of 12,130,207 Class B Ordinary Shares, with per-share exercise price of $1.90, grant date of December 31, 2019, and expiration date of December 31, 2029, (y) outstanding restricted shares with respect to a total of 11,295,170 of Class B Ordinary Shares with a grant date of April 11, 2021 and (z) outstanding RSUs with respect to a total of 6,621,176 of Class B Ordinary Shares with a grant date of March 15, 2022; |
• | Tan Hooi Ling who owned less than 1% of the outstanding Ordinary Shares on an as converted basis, had (x) outstanding options to purchase Class B Ordinary Shares, with a per-share exercise price of $1.90, grant dates that range from December 24, 2019 to December 31, 2019, and expiration dates that range from December 24, 2029 to December 31, 2029, (y) outstanding restricted shares with respect to Class B Ordinary Shares with a grant date of April 11, 2021 and (z) outstanding RSUs with respect to Class B Ordinary Shares with a grant date of March 15, 2022; |
• | Maa Ming-Hokng, who owned less than 1% of the outstanding Ordinary Shares on an as converted basis, had (x) outstanding options to purchase Class B Ordinary Shares, with per-share exercise prices that range from $0.67 to $4.03, grant dates that range from November 24, 2017 to December 28, 2020, and expiration dates that range from November 23, 2027 to December 28, 2030, (y) outstanding RSUs with respect to Class B Ordinary Shares with grant dates that range from April 30, 2018 to March 15, 2022, and (z) outstanding restricted shares with respect to Class B Ordinary Shares with a grant date of April 11, 2021; |
• | Peter Oey, who owned less than 1% of the outstanding Ordinary Shares on an as converted basis, had outstanding RSUs with respect to Class A Ordinary Shares with grant dates that range from April 30, 2020 to March 15, 2022; |
• | Ong Chin Yin, who owned less than 1% of the outstanding Ordinary Shares on an as converted basis, had (x) outstanding options to purchase Class A Ordinary Shares, with per-share exercise prices that range from $0.48 to $2.32, grant dates that range from August 26, 2016 to September 19, 2020, and expiration dates that range from August 25, 2026 to December 13, 2029, and (y) outstanding RSUs with respect to Class A Ordinary Shares with grant dates that range from October 23, 2018 to March 15, 2022; |
• | Alex Hungate, who owned less than 1% of the outstanding Ordinary Shares on an as converted basis, had outstanding RSUs with respect to Class A Ordinary Shares with a grant date of February 15, 2022; |
• | Suthen Thomas Paradatheth, who owned less than 1% of the outstanding Ordinary Shares on an as converted basis, had (x) outstanding options to purchase Class A Ordinary Shares, with per-share exercise prices that range from $0.67 to $2.32, grant dates that range from November 24, 2017 to September 22, 2020, and expiration dates that range from November 23, 2027 to September 22, 2030, and (y) outstanding RSUs with respect to Class A Ordinary Shares with grant dates that range from October 23, 2018 to March 15, 2022; |
• | John Rogers had outstanding RSUs with respect to Class A Ordinary Shares with a grant date of March 15, 2022; |
• | Dara Khosrowshahi did not have any outstanding options, RSUs or restricted shares in respect of Ordinary Shares; |
• | Ng Shin Ein, who owned less than 1% of the outstanding Ordinary Shares on an as converted basis, had outstanding RSUs with respect to Class A Ordinary Shares with grant dates that range from January 28, 2021 to March 15, 2022; and |
• | Oliver Jay, who owned less than 1% of the outstanding Ordinary Shares on an as converted basis, had outstanding RSUs with respect to Class A Ordinary Shares with grant dates that range from March 10, 2021 to March 15, 2022. |
• | each person known by us to be the beneficial owner of more than 5% of Ordinary Shares; |
• | each of our directors and executive officers; and |
• | all our directors and executive officers as a group. |
Class A Ordinary Shares |
Class B Ordinary Shares |
% of Total Ordinary Shares |
% of Voting Power (2) |
|||||||||||||
Directors and Executive Officers (1) |
||||||||||||||||
Anthony Tan Ping Yeow |
— | 136,175,320 | (3) |
3.5 | % (3) |
62.2 | % (3) | |||||||||
Tan Hooi Ling |
* | 28,281,841 | (4) |
* | (4) |
* | (4) | |||||||||
Ming-Hokng Maa |
— | 16,981,930 | (5) |
— | (5) |
— | (5) | |||||||||
Alex Hungate |
— | — | — | — | ||||||||||||
Peter Oey |
* | — | * | * | ||||||||||||
Ong Chin Yin |
* | — | * | * | ||||||||||||
Suthen Thomas Paradatheth (6) |
* | — | * | * | ||||||||||||
John Rogers |
— | — | — | — | ||||||||||||
Dara Khosrowshahi |
— | — | — | — | ||||||||||||
Ng Shin Ein |
* | — | * | * | ||||||||||||
Oliver Jay |
* | — | * | * | ||||||||||||
All executive officers and directors as a group |
* | 136,175,320 | 3.6 | % | 62.3 | % | ||||||||||
Principal Shareholders |
||||||||||||||||
SVF Investments (UK) Limited (7) |
699,175,218 | — | 18.2 | % | 7.3 | % | ||||||||||
Uber Technologies, Inc. |
535,902,982 | — | 13.9 | % | 5.6 | % | ||||||||||
Didi Chuxing (8) |
280,175,307 | — | 7.3 | % | 2.9 | % | ||||||||||
Toyota Motor Corp |
222,906,079 | — | 5.8 | % | 2.3 | % |
* | Less than 1% of the total number of outstanding Ordinary Shares |
(1) | The business address for the directors and executive officers of the Company is 3 Media Close, #01-03/06, Singapore 138498. |
(2) | For each person and group included in this column, the percentage of voting power is calculated by dividing the voting power beneficially owned by such person or group by the voting power of all of Ordinary Shares as a single class. In respect of matters requiring a shareholder vote, each Class A Ordinary Share will be entitled to one vote and each Class B Ordinary Share will be entitled to 45 votes. Each Class B Ordinary Share will be convertible into one Class A Ordinary Share at any time by the holder thereof. Class A Ordinary Shares will not be convertible into Class B Ordinary Shares under any circumstances. |
(3) | Consists of (i) 71,419,219 Class B Ordinary Shares held by Mr. Tan; (ii) 19,492,330 Class B Ordinary Shares held by Hibiscus Worldwide Ltd., a Cayman limited company (“Hibiscus”), and deemed beneficially owned by Mr. Tan pursuant to the shareholders’ deed dated April 12, 2021 (the “Shareholders’ Deed”), by and among GHL, Altimeter Growth Holdings, Grab Holdings Inc., the Key Executives and certain entities related to Mr. Tan; (iii) options exercisable within 60 days held by Ms. Tan to acquire 3,326,734 Class B Ordinary Shares and 24,955,107 Class B Ordinary Shares held by Ms. Tan, both deemed beneficially owned by Mr. Tan pursuant to the Shareholders’ Deed; and (iv) 13,883,011 Class B Ordinary Shares held by Mr. Maa and the trusts created by Mr. Maa for which he is the trustee (the “Maa Trusts”), and options exercisable within 60 days held by Mr. Maa to acquire 3,098,919 Class B Ordinary Shares, both deemed beneficially owned by Mr. Tan pursuant to the Shareholders’ Deed. Also pursuant to the Shareholders’ Deed, Ms. Tan, Mr. Maa and any trusts created by Ms. Tan or Mr. Maa irrevocably appoints Mr. Tan as attorney-in-fact and proxy to vote all of their Class B Ordinary Shares. |
(4) | Pursuant to the Shareholders’ Deed, these shares will be voted solely, and deemed beneficially owned, by Mr. Tan. |
(5) | Pursuant to the Shareholders’ Deed, these shares will be voted solely, and deemed beneficially owned, by Mr. Tan. |
(6) | Appointed as Group Chief Technology Officer effective October 1, 2022. |
(7) | SB Investment Advisers (UK) Limited has been appointed as the alternative investment fund manager of SVF Investments (UK) Limited. Investment and divestment decisions for securities held by SVF Investments (UK) Limited are made by the investment committee of SB Investment Advisers (UK) Limited which, as the Company has been informed by SVF Investments (UK) Limited, has three voting members, comprised of Masayoshi Son, Rajeev Misra and Saleh Romeih. |
(8) | Represents shares held through Didi Global Inc., formerly known as Xiaoju Kuaizhi Inc., and Marvelous Yarra Limited. |
Securities beneficially owned prior to this offering |
Securities to be sold in this offering |
Securities beneficially owned after this offering |
||||||||||||||||||||||||||||||
Name of Selling Securityholder |
Class A Ordinary Shares |
Warrants |
Class A Ordinary Shares |
Warrants |
Class A Ordinary Shares (1)(2) |
% (1)(2) |
Warrants (1)(2) |
% (1)(2) |
||||||||||||||||||||||||
Altimeter Growth Holdings (3) |
12,275,000 | 12,000,000 | 12,275,000 | 12,000,000 | — | — | — | — | ||||||||||||||||||||||||
Richard N Barton (4) |
625,000 | — | 625,000 | — | — | — | — | — | ||||||||||||||||||||||||
Aishetu Fatima Dozie (5) |
75,000 | — | 75,000 | — | — | — | — | — | ||||||||||||||||||||||||
Dev Ittycheria (6) |
75,000 | — | 75,000 | — | — | — | — | — | ||||||||||||||||||||||||
Altimeter Partners Fund, L.P. (7) |
49,214,995 | 3,502,000 | 49,214,995 | 3,500,000 | — | — | 2,000 | * | ||||||||||||||||||||||||
Kinsted Global Equity Pool (8) |
229,164 | — | 46,890 | — | 182,274 | * | — | — | ||||||||||||||||||||||||
Morgan Stanley Investment Funds, Counterpoint Global Fund (9) |
23,159 | — | 4,630 | — | 18,529 | * | — | — | ||||||||||||||||||||||||
Morgan Stanley Institutional Fund Inc, Counterpoint Global Portfolio (10) |
46,102 | — | 10,646 | — | 35,456 | * | — | — | ||||||||||||||||||||||||
Morgan Stanley Institutional Fund Inc, International Advantage Portfolio (11) |
18,186,141 | — | 4,009,631 | — | 14,176,510 | * | — | — | ||||||||||||||||||||||||
Valic Co I International Growth Fund (12) |
1,659,464 | — | 478,823 | — | 1,180,641 | * | — | — | ||||||||||||||||||||||||
Canadian Pooled Funds, International Opportunity Fund I (13) |
602,223 | — | 123,275 | — | 478,948 | * | — | — |
Securities beneficially owned prior to this offering |
Securities to be sold in this offering |
Securities beneficially owned after this offering |
||||||||||||||||||||||||||||||
Name of Selling Securityholder |
Class A Ordinary Shares |
Warrants |
Class A Ordinary Shares |
Warrants |
Class A Ordinary Shares (1)(2) |
% (1)(2) |
Warrants (1)(2) |
% (1)(2) |
||||||||||||||||||||||||
Morgan Stanley Institutional Fund Inc., International Opportunity Portfolio (14) |
14,969,988 | — | 3,818,981 | — | 11,151,007 | * | — | — | ||||||||||||||||||||||||
Morgan Stanley Institutional Fund Inc., Asia Opportunity Portfolio (15) |
2,547,834 | — | 573,253 | — | 1,974,581 | * | — | — | ||||||||||||||||||||||||
Morgan Stanley Investment Funds, Asia Opportunity Fund (16) |
42,067,677 | — | 7,245,742 | — | 34,821,935 | * | — | — | ||||||||||||||||||||||||
Morgan Stanley Investment Funds, Developing Opportunity Fund (17) |
1,121,258 | — | 285,658 | — | 835,600 | * | — | — | ||||||||||||||||||||||||
Morgan Stanley Institutional Fund Inc., Developing Opportunity Portfolio (18) |
951,517 | — | 260,149 | — | 691,368 | * | — | — | ||||||||||||||||||||||||
Morgan Stanley Funds (UK), Developing Opportunity Fund (19) |
161,547 | — | 26,794 | — | 134,753 | * | — | — | ||||||||||||||||||||||||
Morgan Stanley Institutional Fund Inc., Global Insight Portfolio (20) |
1,747,077 | — | 358,845 | — | 1,388,232 | * | — | — | ||||||||||||||||||||||||
Morgan Stanley Investment Funds, Global Advantage Fund (21) |
7,816,733 | — | 977,038 | — | 6,839,695 | * | — | — | ||||||||||||||||||||||||
Morgan Stanley Insight Fund (22) |
11,490,095 | — | 6,182,808 | — | 5,307,287 | * | — | — | ||||||||||||||||||||||||
Johnson & Johnson Pension And Savings Plans Master Trust (JJ9L) (23) |
168,402 | — | 55,516 | — | 112,886 | * | — | — | ||||||||||||||||||||||||
Johnson & Johnson Pension And Savings Plans Master Trust (JJ9LDB) (24) |
1,662,335 | — | 492,958 | — | 1,169,377 | * | — | — | ||||||||||||||||||||||||
Morgan Stanley Investment Funds, US Insight Fund (25) |
370,853 | — | 150,801 | — | 220,052 | * | — | — | ||||||||||||||||||||||||
Canadian Pooled Funds, Global Opportunity Fund I (26) |
1,004,841 | — | 275,955 | — | 728,886 | * | — | — | ||||||||||||||||||||||||
Nissan North America, Inc., Employee Retirement Plan Master Trust (27) |
251,043 | — | 82,266 | — | 168,777 | * | — | — | ||||||||||||||||||||||||
The Municipal Employees’ Pension Fund (28) |
514,227 | — | 128,275 | — | 385,952 | * | — | — | ||||||||||||||||||||||||
Morgan Stanley Investment Funds—Global Opportunity Fund (29) |
52,980,335 | — | 16,982,775 | — | 35,997,560 | * | — | — | ||||||||||||||||||||||||
Ngs Super (30) |
1,574,740 | — | 389,251 | — | 1,185,489 | * | — | — | ||||||||||||||||||||||||
New York City Board Of Education Retirement System (31) |
298,967 | — | 73,401 | — | 225,566 | * | — | — | ||||||||||||||||||||||||
New York City Fire Department Pension Fund (32) |
597,765 | — | 146,757 | — | 451,008 | * | — | — | ||||||||||||||||||||||||
Pensiondanmark Pensionsforsikringsaktieselskab (33) |
949,203 | — | 298,626 | — | 650,577 | * | — | — | ||||||||||||||||||||||||
Public Employees Pension Board (34) |
2,079,284 | — | 411,391 | — | 1,667,893 | * | — | — | ||||||||||||||||||||||||
Russell Investment Company V Plc, Russell Investments Global Ethical Equity Fund (35) |
229,102 | — | 79,736 | — | 149,366 | * | — | — | ||||||||||||||||||||||||
Morgan Stanley Institutional Fund, Inc., Global Opportunity Portfolio (36) |
19,290,581 | — | 6,029,129 | — | 13,261,452 | * | — | — | ||||||||||||||||||||||||
EuroPacific Growth Fund (37) |
27,853,323 | — | 26,602,915 | — | 1,250,408 | * | — | — | ||||||||||||||||||||||||
Capital Group EuroPacific Growth Trust (US) (38) |
369,204 | — | 281,300 | — | 87,904 | * | — | — |
Securities beneficially owned prior to this offering |
Securities to be sold in this offering |
Securities beneficially owned after this offering |
||||||||||||||||||||||||||||||
Name of Selling Securityholder |
Class A Ordinary Shares |
Warrants |
Class A Ordinary Shares |
Warrants |
Class A Ordinary Shares (1)(2) |
% (1)(2) |
Warrants (1)(2) |
% (1)(2) |
||||||||||||||||||||||||
Emerging Markets Growth Fund, Inc. (39) |
1,249,028 | — | 1,249,028 | — | — | — | — | — | ||||||||||||||||||||||||
Emerging Markets Equity Fund (40) |
1,045,484 | — | 1,045,484 | — | — | — | — | — | ||||||||||||||||||||||||
Capital Group, Emerging Markets Growth Fund (LUX) (41) |
193,262 | — | 193,262 | — | — | — | — | — | ||||||||||||||||||||||||
Capital Group, Emerging Markets Restricted Equity Common Trust (US) (42) |
312,588 | — | 312,588 | — | — | — | — | — | ||||||||||||||||||||||||
Capital Group Asian Horizon Fund (LUX) (43) |
7,126 | — | 7,126 | — | — | — | — | — | ||||||||||||||||||||||||
Capital Group New World Fund (LUX) (44) |
78,730 | — | 78,730 | — | — | — | — | — | ||||||||||||||||||||||||
New World Fund, Inc. (45) |
11,425,948 | — | 11,425,948 | — | — | — | — | — | ||||||||||||||||||||||||
American Funds Insurance Series International Fund (46) |
4,196,198 | — | 2,632,544 | — | 1,563,654 | * | — | — | ||||||||||||||||||||||||
American Funds Insurance Series New World Fund (47) |
853,798 | — | 853,798 | — | — | — | — | — | ||||||||||||||||||||||||
AmanahRaya Trustees Berhad (Registration No.200701008892 (766894-T)) in its capacity as trustee for Amanah Saham (48) |
14,625,202 | — | 14,625,202 | — | — | — | — | — | ||||||||||||||||||||||||
AmanahRaya Trustees Berhad (Registration No.200701008892 (766894-T)) in its capacity as trustee for Amanah Saham Bumiputera 2 (49) |
1,086,877 | — | 1,086,877 | — | — | — | — | — | ||||||||||||||||||||||||
AmanahRaya Trustees Berhad (Registration No.200701008892 (766894-T)) in its capacity as trustee for Amanah Saham Bumiputera 3 (50) |
652,126 | — | 652,126 | — | — | — | — | — | ||||||||||||||||||||||||
AmanahRaya Trustees Berhad (Registration No.200701008892 (766894-T)) in its capacity as trustee for Amanah Saham Malaysia (51) |
1,930,321 | — | 1,930,321 | — | — | — | — | — | ||||||||||||||||||||||||
AmanahRaya Trustees Berhad (Registration No.200701008892 (766894-T)) in its capacity as trustee for Amanah Saham Malaysia 2—Wawasan (52) |
2,050,610 | — | 2,050,610 | — | — | — | — | — | ||||||||||||||||||||||||
AmanahRaya Trustees Berhad (Registration No.200701008892 (766894-T)) in its capacity as trustee for Amanah Saham Malaysia 3—Didik (53) |
1,315,675 | — | 1,315,675 | — | — | — | — | — | ||||||||||||||||||||||||
AmanahRaya Trustees Berhad (Registration No.200701008892 (766894-T)) in its capacity as trustee for Amanah Saham Nasional (54) |
282,576 | — | 282,576 | — | — | — | — | — | ||||||||||||||||||||||||
AmanahRaya Trustees Berhad (Registration No.200701008892 (766894-T)) in its capacity as trustee for ASN Equity 2 (55) |
217,376 | — | 217,376 | — | — | — | — | — | ||||||||||||||||||||||||
AmanahRaya Trustees Berhad (Registration No.200701008892 (766894-T)) in its capacity as trustee for ASN Equity 3 (56) |
509,053 | — | 509,053 | — | — | — | — | — |
Securities beneficially owned prior to this offering |
Securities to be sold in this offering |
Securities beneficially owned after this offering |
||||||||||||||||||||||||||||||
Name of Selling Securityholder |
Class A Ordinary Shares |
Warrants |
Class A Ordinary Shares |
Warrants |
Class A Ordinary Shares (1)(2) |
% (1)(2) |
Warrants (1)(2) |
% (1)(2) |
||||||||||||||||||||||||
AmanahRaya Trustees Berhad (Registration No.200701008892 (766894-T)) in its capacity as trustee for ASN Equity 5 (57) |
104,285 | — | 104,285 | — | — | — | — | — | ||||||||||||||||||||||||
AmanahRaya Trustees Berhad (Registration No.200701008892 (766894-T)) in its capacity as trustee for ASN Imbang (Mixed Asset Balanced) 1 (58) |
311,647 | — | 311,647 | — | — | — | — | — | ||||||||||||||||||||||||
AmanahRaya Trustees Berhad (Registration No.200701008892 (766894-T)) in its capacity as trustee for ASN Imbang (Mixed Asset Balanced) 2 (59) |
444,864 | — | 444,864 | — | — | — | — | — | ||||||||||||||||||||||||
AmanahRaya Trustees Berhad (Registration No.200701008892 (766894-T)) in its capacity as trustee for ASN Imbang (Mixed Asset Balanced) 3 Global (60) |
554,860 | — | 554,860 | — | — | — | — | — | ||||||||||||||||||||||||
AmanahRaya Trustees Berhad (Registration No.200701008892 (766894-T)) in its capacity as trustee for ASN Sara (Mixed Asset Conservative) 1 (61) |
681,097 | — | 681,097 | — | — | — | — | — | ||||||||||||||||||||||||
AmanahRaya Trustees Berhad (Registration No.200701008892 (766894-T)) in its capacity as trustee for ASN Sara (Mixed Asset Conservative) 2 (62) |
450,396 | — | 450,396 | — | — | — | — | — | ||||||||||||||||||||||||
Permodalan Nasional Berhad IFM (63) |
2,246,806 | — | 2,246,806 | — | — | — | — | — | ||||||||||||||||||||||||
Permodalan Nasional Berhad, IFMMMF (64) |
36,229 | — | 36,229 | — | — | — | — | — | ||||||||||||||||||||||||
College Retirement Equities Fund on behalf of CREF Stock Account (65) |
4,397,338 | — | 4,397,338 | — | — | — | — | — | ||||||||||||||||||||||||
College Retirement Equities Fund on behalf of CREF Growth Account (66) |
8,050,962 | — | 8,050,962 | — | — | — | — | — | ||||||||||||||||||||||||
College Retirement Equities Fund on behalf of CREF Global Equities Account (67) |
784,010 | — | 784,010 | — | — | — | — | — | ||||||||||||||||||||||||
TIAA-CREF Funds on behalf of TIAA-CREF Emerging Markets Equity Fund (68) |
722,668 | — | 722,668 | — | — | — | — | — | ||||||||||||||||||||||||
TIAA-CREF Funds on behalf of TIAA-CREF Large-Cap Growth Fund (69) |
3,133,698 | — | 3,133,698 | — | — | — | — | — | ||||||||||||||||||||||||
TIAA-CREF Funds on behalf of TIAA-CREF Mid-Cap Growth Fund (70) |
814,235 | — | 814,235 | — | — | — | — | — | ||||||||||||||||||||||||
TIAA-CREF Funds on behalf of TIAA-CREF Growth & Income Fund (71) |
1,001,000 | — | 1,001,000 | — | — | — | — | — | ||||||||||||||||||||||||
TIAA-CREF Funds on behalf of TIAA-CREF International Opportunities Fund (72) |
980,069 | — | 980,069 | — | — | — | — | — | ||||||||||||||||||||||||
TIAA-CREF Life Funds on behalf of TIAA-CREF Life Growth & Income Fund (73) |
31,200 | — | 31,200 | — | — | — | — | — | ||||||||||||||||||||||||
TIAA-CREF Life Funds on behalf of TIAA-CREF Life Growth Equity Fund (74) |
77,546 | — | 77,546 | — | — | — | — | — |
Securities beneficially owned prior to this offering |
Securities to be sold in this offering |
Securities beneficially owned after this offering |
||||||||||||||||||||||||||||||
Name of Selling Securityholder |
Class A Ordinary Shares |
Warrants |
Class A Ordinary Shares |
Warrants |
Class A Ordinary Shares (1)(2) |
% (1)(2) |
Warrants (1)(2) |
% (1)(2) |
||||||||||||||||||||||||
T. Rowe Price Associates, Inc, T. Rowe Price Global Equity Fund (75) |
2,789,319 | — | 2,789,319 | — | — | — | — | — | ||||||||||||||||||||||||
T. Rowe Price Associates, Inc, T. Rowe Price Global Growth Stock Fund (76) |
1,067,832 | — | 1,067,832 | — | — | — | — | — | ||||||||||||||||||||||||
T. Rowe Price Associates, Inc, Equipsuper Pty Ltd as Trustee for Equipsuper Superannuation Fund (77) |
569,617 | — | 569,617 | — | — | — | — | — | ||||||||||||||||||||||||
T. Rowe Price Associates, Inc, Campbell Pension Plans, Master Retirement Trust (78) |
40,005 | — | 40,005 | — | — | — | — | — | ||||||||||||||||||||||||
T. Rowe Price Associates, Inc, T. Rowe Price Global Growth Equity Pool (79) |
575,697 | — | 575,697 | — | — | — | — | — | ||||||||||||||||||||||||
T. Rowe Price Associates, Inc, Public Service Pension Plan Fund (80) |
212,261 | — | 212,261 | — | — | — | — | — | ||||||||||||||||||||||||
T. Rowe Price Associates, Inc, Teachers’ Pension Plan Fund (81) |
217,888 | — | 217,888 | — | — | — | — | — | ||||||||||||||||||||||||
T. Rowe Price Associates, Inc, T. Rowe Price Global Growth Equity Trust (82) |
527,377 | — | 527,377 | — | — | — | — | — | ||||||||||||||||||||||||
T. Rowe Price Associates, Inc, Canada Life Global Growth Equity Fund (T. Rowe Price) (83) |
22,281 | — | 22,281 | — | — | — | — | — | ||||||||||||||||||||||||
T. Rowe Price Associates, Inc, Delaware Public Employees’ Retirement System (84) |
767,095 | — | 767,095 | — | — | — | — | — | ||||||||||||||||||||||||
T. Rowe Price Associates, Inc, Arlington County Employees’ Retirement System (85) |
140,572 | — | 140,572 | — | — | — | — | — | ||||||||||||||||||||||||
Janus Henderson Global Technology and Innovation Portfolio (86) |
1,113,261 | 43,562 | 421,689 | — | 691,572 | * | 43,562 | * | ||||||||||||||||||||||||
Janus Henderson Global Technology and Innovation Fund (86) |
8,441,264 | 333,275 | 3,269,751 | — | 5,171,513 | * | 333,275 | * | ||||||||||||||||||||||||
Janus Henderson Capital Funds plc, Janus Henderson Global Technology and Innovation Fund (86) |
636,812 | 25,783 | 243,320 | — | 393,492 | * | 25,783 | * | ||||||||||||||||||||||||
Brown Brothers Harriman & Co. FBO Fidelity Funds on behalf of Fidelity Funds, Asian Special Situations (87) |
2,974,159 | — | 2,974,159 | — | — | — | — | — | ||||||||||||||||||||||||
Brown Brothers Harriman & Co. FBO Fidelity Funds on behalf of Fidelity Funds (88) |
2,739,344 | — | 2,739,344 | — | — | — | — | — | ||||||||||||||||||||||||
Evans Investments Pte Ltd (89) |
10,000,000 | — | 10,000,000 | — | — | — | — | — | ||||||||||||||||||||||||
MIC Capital Partners (Public) Parallel Cayman, LP (90) |
5,000,000 | — | 5,000,000 | — | — | — | — | — | ||||||||||||||||||||||||
Massachusetts Institute of Technology (91) |
3,200,000 | — | 3,200,000 | — | — | — | — | — | ||||||||||||||||||||||||
238 Plan Associates LLC (92) |
800,000 | — | 800,000 | — | — | — | — | — | ||||||||||||||||||||||||
Clearlake Flagship Plus Partners, Master Fund, L.P. (93) |
8,500,000 | 500,000 | 3,000,000 | — | 5,500,000 | * | 500,000 | * | ||||||||||||||||||||||||
Select International Equity Managed Fund (94) |
45,192 | — | 45,192 | — | — | — | — | — | ||||||||||||||||||||||||
Emerging Markets Equity Corporate Class (95) |
252,995 | — | 252,995 | — | — | — | — | — | ||||||||||||||||||||||||
CI Global Alpha Innovators Corporate Class (96) |
1,692,407 | — | 1,692,407 | — | — | — | — | — |
Securities beneficially owned prior to this offering |
Securities to be sold in this offering |
Securities beneficially owned after this offering |
||||||||||||||||||||||||||||||
Name of Selling Securityholder |
Class A Ordinary Shares |
Warrants |
Class A Ordinary Shares |
Warrants |
Class A Ordinary Shares (1)(2) |
% (1)(2) |
Warrants (1)(2) |
% (1)(2) |
||||||||||||||||||||||||
Select International Equity Managed Corporate Class (97) |
8,551 | — | 8,551 | — | — | — | — | — | ||||||||||||||||||||||||
CI Emerging Markets Corporate Class (98) |
449,908 | — | 449,908 | — | — | — | — | — | ||||||||||||||||||||||||
CI Asian Opportunities Fund (99) |
24,635 | — | 24,635 | — | — | — | — | — | ||||||||||||||||||||||||
CI Asian Opportunities Corporate Class (100) |
5,715 | — | 5,715 | — | — | — | — | — | ||||||||||||||||||||||||
CI Emerging Markets Fund (101) |
134,102 | — | 134,102 | — | — | — | — | — | ||||||||||||||||||||||||
Emerging Markets Equity Pool (102) |
386,495 | — | 386,495 | — | — | — | — | — | ||||||||||||||||||||||||
Barings International Umbrella Fund, Barings ASEAN Frontiers Fund (103) |
1,518,000 | — | 1,518,000 | — | — | — | — | — | ||||||||||||||||||||||||
Barings International Umbrella Fund, Barings Asia Growth Fund (104) |
861,000 | — | 861,000 | — | — | — | — | — | ||||||||||||||||||||||||
Barings Eastern Trust (105) |
821,000 | — | 821,000 | — | — | — | — | — | ||||||||||||||||||||||||
Entities affiliated with The Baupost Group, L.L.C. (106) |
6,105,101 | — | 2,431,550 | — | 3,673,551 | * | — | — | ||||||||||||||||||||||||
President & Fellows of Harvard College (107) |
9,301,490 | — | 2,000,000 | — | 7,301,490 | * | — | — | ||||||||||||||||||||||||
Highline Investments LLC (108) |
1,500,000 | — | 1,500,000 | — | — | — | — | — | ||||||||||||||||||||||||
Kwidnet Holdings LLC (109) |
500,000 | — | 500,000 | — | — | — | — | — | ||||||||||||||||||||||||
Topia Ventures, LLC (110) |
1,500,000 | — | 1,500,000 | — | — | — | — | — | ||||||||||||||||||||||||
Arena Capital Advisors, LLC Arena Capital Fund, LP—Series 3 (111) |
200,000 | — | 200,000 | — | — | — | — | — | ||||||||||||||||||||||||
Arena Capital Advisors, LLC Arena Capital Fund, LP—Series 5 (112) |
200,000 | — | 200,000 | — | — | — | — | — | ||||||||||||||||||||||||
Arena Capital Advisors, LLC Arena Capital Fund, LP—Series 6 (113) |
400,000 | — | 400,000 | — | — | — | — | — | ||||||||||||||||||||||||
GPI Capital Guardian Holdco LP (114) |
1,500,000 | — | 1,500,000 | — | — | — | — | — | ||||||||||||||||||||||||
Chescaplq LLC (115) |
1,425,138 | 100,000 | 573,965 | — | 851,173 | * | 100,000 | * | ||||||||||||||||||||||||
Janchor Partners Pan-Asian Master Fund (116) |
1,000,000 | — | 1,000,000 | — | — | — | — | — | ||||||||||||||||||||||||
Gobi Master Fund Ltd. (117) |
500,000 | — | 500,000 | — | — | — | — | — | ||||||||||||||||||||||||
Octahedron Master Fund, L.P. (118) |
100,000 | — | 100,000 | — | — | — | — | — | ||||||||||||||||||||||||
White Willow Limited (119) |
2,000,000 | — | 2,000,000 | — | — | — | — | — | ||||||||||||||||||||||||
Two Trees Family Holdings Pte. Ltd. (120) |
2,000,000 | — | 2,000,000 | — | — | — | — | — | ||||||||||||||||||||||||
Isla Asia Limited (121) |
3,000,000 | — | 3,000,000 | — | — | — | — | — | ||||||||||||||||||||||||
Davinia Investment Ltd (122) |
3,000,000 | — | 3,000,000 | — | — | — | — | — | ||||||||||||||||||||||||
JS Oasis Limited (123) |
1,000,000 | — | 1,000,000 | — | — | — | — | — | ||||||||||||||||||||||||
Sarath Ratanavadi (124) |
1,800,000 | — | 1,800,000 | — | — | — | — | — | ||||||||||||||||||||||||
Phileo Capital Limited (125) |
500,000 | — | 500,000 | — | — | — | — | — | ||||||||||||||||||||||||
Trinidas Limited (126) |
350,000 | — | 350,000 | — | — | — | — | — | ||||||||||||||||||||||||
Kuang Ming Investments Pte Limited (127) |
2,000,000 | — | 2,000,000 | — | — | — | — | — | ||||||||||||||||||||||||
K3 Auklet Capital II Limited (128) |
1,000,000 | — | 1,000,000 | — | — | — | — | — | ||||||||||||||||||||||||
Soo Hoo Khoon Peng (129) |
150,000 | — | 150,000 | — | — | — | — | — | ||||||||||||||||||||||||
Catcha Investments Ltd (130) |
100,000 | — | 100,000 | — | — | — | — | — | ||||||||||||||||||||||||
LightVC, Ltd. (131) |
1,250,000 | — | 1,250,000 | — | — | — | — | — | ||||||||||||||||||||||||
Alvin Sariaatmadja (132) |
2,500,000 | — | 2,500,000 | — | — | — | — | — | ||||||||||||||||||||||||
Sing Lun Industrial Pte Ltd (133) |
100,000 | — | 100,000 | — | — | — | — | — |
Securities beneficially owned prior to this offering |
Securities to be sold in this offering |
Securities beneficially owned after this offering |
||||||||||||||||||||||||||||||
Name of Selling Securityholder |
Class A Ordinary Shares |
Warrants |
Class A Ordinary Shares |
Warrants |
Class A Ordinary Shares (1)(2) |
% (1)(2) |
Warrants (1)(2) |
% (1)(2) |
||||||||||||||||||||||||
The 2018 Yuan and Zhang Revocable Trust (134) |
300,000 | — | 300,000 | — | — | — | — | — | ||||||||||||||||||||||||
Antelle Holding Limited (135) |
100,000 | — | 100,000 | — | — | — | — | — | ||||||||||||||||||||||||
Leland A. Philip and Co. Limited (136) |
200,000 | — | 200,000 | — | — | — | — | — | ||||||||||||||||||||||||
Krian Upatkoon (137) |
200,000 | — | 200,000 | — | — | — | — | — | ||||||||||||||||||||||||
Chen Jianwen (138) |
200,000 | — | 200,000 | — | — | — | — | — | ||||||||||||||||||||||||
Martua Sitorus (139) |
500,000 | — | 500,000 | — | — | — | — | — | ||||||||||||||||||||||||
Wee Wei Chi (140) |
50,000 | — | 50,000 | — | — | — | — | — | ||||||||||||||||||||||||
Supreme Island Corporation (141) |
1,750,000 | — | 1,750,000 | — | — | — | — | — | ||||||||||||||||||||||||
Wee Ee Cheong (142) |
100,000 | — | 100,000 | — | — | — | — | — | ||||||||||||||||||||||||
Wee Ee Lim (143) |
100,000 | — | 100,000 | — | — | — | — | — | ||||||||||||||||||||||||
Chubb Tempest Reinsurance Ltd. (144) |
2,500,000 | — | 2,500,000 | — | — | — | — | — | ||||||||||||||||||||||||
Pelago Holdings (145) |
400,000 | — | 400,000 | — | — | — | — | — | ||||||||||||||||||||||||
Poonen Capital LLC (146) |
50,000 | — | 50,000 | — | — | — | — | — | ||||||||||||||||||||||||
Takao Yasuda (147) |
1,000,000 | — | 1,000,000 | — | — | — | — | — | ||||||||||||||||||||||||
RHB Trustees Berhad (as trustee for Areca Focus UniGrowth Fund) (148) |
2,000,000 | — | 2,000,000 | — | — | — | — | — | ||||||||||||||||||||||||
TXX Family Trust (149) |
200,000 | — | 200,000 | — | — | — | — | — | ||||||||||||||||||||||||
ACP Global Fund SPC Value Segregated Portfolio (150) |
934,000 | — | 934,000 | — | — | — | — | — | ||||||||||||||||||||||||
Lim Hock Chee (151) |
400,000 | — | 400,000 | — | — | — | — | — | ||||||||||||||||||||||||
SVF Investments (UK) Limited (152) |
699,175,218 | — | 699,175,218 | — | — | — | — | — | ||||||||||||||||||||||||
Marvelous Yarra Limited (153) |
271,180,007 | — | 271,180,007 | — | — | — | — | — | ||||||||||||||||||||||||
Didi Global Inc. (154) |
8,995,300 | — | 8,995,300 | — | — | — | — | — | ||||||||||||||||||||||||
Uber Technologies, Inc. (155) |
535,902,982 | — | 535,902,982 | — | — | — | — | — | ||||||||||||||||||||||||
Toyota Motor Corporation (156) |
222,906,079 | — | 222,906,079 | — | — | — | — | — | ||||||||||||||||||||||||
MUFG Bank, Limited (157) |
142,913,428 | — | 142,913,428 | — | — | — | — | — | ||||||||||||||||||||||||
MUFG Innovation Partners No.1 Investment Partnership (158) |
2,114,733 | — | 2,114,733 | — | — | — | — | — | ||||||||||||||||||||||||
Krungsri Finnovate Company Limited (159) |
4,229,465 | — | 4,229,465 | — | — | — | — | — | ||||||||||||||||||||||||
Anthony Tan Ping Yeow (160) |
90,170,602 | — | 83,549,426 | — | 6,621,176 | * | — | — | ||||||||||||||||||||||||
Hibiscus Worldwide Ltd. (161) |
19,492,330 | — | 19,492,330 | — | — | — | — | — | ||||||||||||||||||||||||
Ming-Hokng Maa (162) |
* | — | 11,830,161 | — | * | * | — | — | ||||||||||||||||||||||||
Ming-Hokng Maa, in his capacity as trustee of The Ming-Hokng Maa 2021 (163) |
1,065,451 | — | 1,065,451 | — | — | — | — | — | ||||||||||||||||||||||||
Ming-Hokng Maa, in his capacity as trustee of The Maa-Liao Revocable Trust (164) |
12,666,654 | — | 12,666,654 | — | — | — | — | — | ||||||||||||||||||||||||
Tan Hooi Ling (165) |
* | — | 32,418,408 | — | * | * | — | — | ||||||||||||||||||||||||
Oey Peter Henry (166) |
* | — | 2,280,755 | — | * | * | — | — | ||||||||||||||||||||||||
Ong Chin Yin (167) |
* | — | 2,447,508 | — | * | * | — | — | ||||||||||||||||||||||||
Ng Shin Ein (168) |
* | — | 186,633 | — | * | * | — | — | ||||||||||||||||||||||||
Jay Oliver (169) |
* | — | 432,692 | — | * | * | — | — | ||||||||||||||||||||||||
Andrew Geoffrey Mills (170) |
* | — | 216,026 | — | * | * | — | — |
* | Represents beneficial ownership of less than 1% of our company’s total outstanding Ordinary Shares. |
(1) | The percentage of Ordinary Shares and Warrants beneficially owned is computed on the basis of 3,709,406,012 Ordinary Shares and 25,999,981 Warrants outstanding, respectively, on March 31, 2022. |
(2) | Assumes the sale of all securities offered in this prospectus. |
(3) | The business address of Altimeter Growth Holdings is 2550 Sand Hill Road STE 150, Menlo Park, CA 94025. |
(4) | Consists of (i) 75,000 Class A Ordinary Shares held directly by Richard N. Barton and (ii) 550,000 Class A Ordinary Shares held by Barton Ventures II, LLC. Richard N. Barton serves as the sole manager and exercises voting and dispositive power over the Class A Ordinary Shares held by Barton Ventures II, LLC. The business address of Richard N. Barton is 1301 Second Avenue, Floor 31, Seattle, WA 98101. |
(5) | The business address of Aishetu Fatima Dozie is c/o Altimeter Growth Corp., 2550 Sand Hill Road STE 150, Menlo Park, CA 94025. |
(6) | The business address of Dev Ittycheria is c/o Altimeter Growth Corp., 2550 Sand Hill Road STE 150, Menlo Park, CA 94025. |
(7) | The business address of Altimeter Partners Fund, L.P. is c/o Altimeter Capital Management, LP, Attn: John Kiernan, One International Place, Suite 4610, Boston, MA 02110. |
(8) | The business address of Kinsted Global Equity Pool is Morgan Stanley Investment Management, Inc. as Investment Manager, 522 Fifth Avenue, New York, NY 10036. |
(9) | The business address of Morgan Stanley Investment Funds – Counterpoint Global Fund is Morgan Stanley Investment Management, Inc. as Investment Manager, 522 Fifth Avenue, New York, NY 10036. |
(10) | The business address of Morgan Stanley Institutional Fund Inc – Counterpoint Global Portfolio is Morgan Stanley Investment Management, Inc. as Investment Manager, 522 Fifth Avenue, New York, NY 10036. |
(11) | The business address of Morgan Stanley Institutional Fund Inc – International Advantage Portfolio is Morgan Stanley Investment Management, Inc. as Investment Manager, 522 Fifth Avenue, New York, NY 10036. |
(12) | The business address of Valic Co I – International Growth Fund is Morgan Stanley Investment Management, Inc. as Investment Manager, 522 Fifth Avenue, New York, NY 10036. |
(13) | The business address of Canadian Pooled Funds—International Opportunity Fund I is Morgan Stanley Investment Management, Inc. as Investment Manager, 522 Fifth Avenue, New York, NY 10036. |
(14) | The business address of Morgan Stanley Institutional Fund Inc—International Opportunity Portfolio is Morgan Stanley Investment Management, Inc. as Investment Manager, 522 Fifth Avenue, New York, NY 10036. |
(15) | The business address of Morgan Stanley Institutional Fund Inc—Asia Opportunity Portfolio is Morgan Stanley Investment Management, Inc. as Investment Manager, 522 Fifth Avenue, New York, NY 10036. |
(16) | The business address of Morgan Stanley Investment Funds—Asia Opportunity Fund is Morgan Stanley Investment Management, Inc. as Investment Manager, 522 Fifth Avenue, New York, NY 10036. |
(17) | The business address of Morgan Stanley Investment Funds—Developing Opportunity Fund is Morgan Stanley Investment Management, Inc. as Investment Manager, 522 Fifth Avenue, New York, NY 10036. |
(18) | The business address of Morgan Stanley Institutional Fund Inc—Developing Opportunity Portfolio is Morgan Stanley Investment Management, Inc. as Investment Manager, 522 Fifth Avenue, New York, NY 10036. |
(19) | The business address of Morgan Stanley Funds (UK)—Developing Opportunity Fund is Morgan Stanley Investment Management, Inc. as Investment Manager, 522 Fifth Avenue, New York, NY 10036. |
(20) | The business address of Morgan Stanley Institutional Fund Inc—Global Insight Portfolio is Morgan Stanley Investment Management, Inc. as Investment Manager, 522 Fifth Avenue, New York, NY 10036. |
(21) | The business address of Morgan Stanley Investment Funds—Global Advantage Fund is Morgan Stanley Investment Management, Inc. as Investment Manager, 522 Fifth Avenue, New York, NY 10036. |
(22) | The business address of Morgan Stanley Insight Fund is Morgan Stanley Investment Management, Inc. as Investment Manager, 522 Fifth Avenue, New York, NY 10036. |
(23) | The business address of Johnson & Johnson Pension And Savings Plans Master Trust is Morgan Stanley Investment Management, Inc. as Investment Manager, 522 Fifth Avenue, New York, NY 10036. |
(24) | The business address of Johnson & Johnson Pension And Savings Plans Master Trust is Morgan Stanley Investment Management, Inc. as Investment Manager, 522 Fifth Avenue, New York, NY 10036. |
(25) | The business address of Morgan Stanley Investment Funds—Us Insight Fund is Morgan Stanley Investment Management, Inc. as Investment Manager, 522 Fifth Avenue, New York, NY 10036. |
(26) | The business address of Canadian Pooled Funds—Global Opportunity Fund I is Morgan Stanley Investment Management, Inc. as Investment Manager, 522 Fifth Avenue, New York, NY 10036. |
(27) | The business address of Nissan North America, Inc. Employee Retirement Plan Master Trust is Morgan Stanley Investment Management, Inc. as Investment Manager, 522 Fifth Avenue, New York, NY 10036. |
(28) | The business address of The Municipal Employees’ Pension Fund is Morgan Stanley Investment Management, Inc. as Investment Manager, 522 Fifth Avenue, New York, NY 10036. |
(29) | The business address of Morgan Stanley Investment Funds—Global Opportunity Fund is Morgan Stanley Investment Management, Inc. as Investment Manager, 522 Fifth Avenue, New York, NY 10036. |
(30) | The business address of Ngs Super is Morgan Stanley Investment Management, Inc. as Investment Manager, 522 Fifth Avenue, New York, NY 10036. |
(31) | The business address of New York City Board Of Education Retirement System is Morgan Stanley Investment Management, Inc. as Investment Manager, 522 Fifth Avenue, New York, NY 10036. |
(32) | The business address of New York City Fire Department Pension Fund is Morgan Stanley Investment Management, Inc. as Investment Manager, 522 Fifth Avenue, New York, NY 10036. |
(33) | The business address of Pensiondanmark Pensionsforsikringsaktieselskab is Morgan Stanley Investment Management, Inc. as Investment Manager, 522 Fifth Avenue, New York, NY 10036. |
(34) | The business address of Public Employees Pension Board is Morgan Stanley Investment Management, Inc. as Investment Manager, 522 Fifth Avenue, New York, NY 10036. |
(35) | The business address of Russell Investment Company V Plc—Russell Investments Global Ethical Equity Fund is Morgan Stanley Investment Management, Inc. as Investment Manager, 522 Fifth Avenue, New York, NY 10036. |
(36) | The business address of Morgan Stanley Institutional Fund, Inc.—Global Opportunity Portfolio is Morgan Stanley Investment Management, Inc. as Investment Manager, 522 Fifth Avenue, New York, NY 10036. |
(37) | The business address for EuroPacific Growth Fund is c/o Capital Research and Management Company, 333 South Hope Street, 55th Floor, Los Angeles, CA 90071. |
(38) | The business address for Capital Group EuroPacific Growth Trust (US) is c/o Capital Research and Management Company, 333 South Hope Street, 55th Floor, Los Angelesd, CA 90071. |
(39) | The business address for Emerging Markets Growth Fund, Inc. is c/o Capital Research and Management Company, 333 South Hope Street, 55th Floor, Los Angeles, CA 90071. |
(40) | The business address for Emerging Markets Equity Fund is c/o Capital Research and Management Company, 333 South Hope Street, 55th Floor, Los Angeles, CA 90071. |
(41) | The business address for Capital Group Emerging Markets Growth Fund (LUX) is c/o Capital Research and Management Company, 333 South Hope Street, 55th Floor, Los Angeles, CA 90071. |
(42) | The business address for Capital Group, Emerging Markets Restricted Equity Common Trust (US) is c/o Capital Research and Management Company, 333 South Hope Street, 55th Floor, Los Angeles, CA 90071. |
(43) | The business address for Capital Group Asian Horizon Fund (LUX) is c/o Capital Research and Management Company, 333 South Hope Street, 55th Floor, Los Angeles, CA 90071. |
(44) | The business address for Capital Group New World Fund (LUX) is c/o Capital Research and Management Company, 333 South Hope Street, 55th Floor, Los Angeles, CA 90071. |
(45) | The business address for New World Fund, Inc. is c/o Capital Research and Management Company, 333 South Hope Street, 55th Floor, Los Angeles, CA 90071. |
(46) | The business address for American Funds Insurance Series—International Fund is c/o Capital Research and Management Company, 333 South Hope Street, 55th Floor, Los Angeles, CA 90071. |
(47) | The business address for American Funds Insurance Series—New World Fund is c/o Capital Research and Management Company, 333 South Hope Street, 55th Floor, Los Angeles, CA 90071. |
(48) | The business address of AmanahRaya Trustees Berhad-Amanah Saham Bumiputera is Level 14, Wisma AmanahRaya, No 2, Jalan Ampang, 50508 Kuala Lumpur, Malaysia. |
(49) | The business address of AmanahRaya Trustees Berhad-Amanah Saham Bumiputera 2 is Level 14, Wisma AmanahRaya, No 2, Jalan Ampang, 50508 Kuala Lumpur, Malaysia. |
(50) | The business address of AmanahRaya Trustees Berhad-Amanah Saham Bumiputera 3—Didik is Level 14, Wisma AmanahRaya, No 2, Jalan Ampang, 50508 Kuala Lumpur, Malaysia. |
(51) | The business address of AmanahRaya Trustees Berhad-Amanah Saham Malaysia is Level 14, Wisma AmanahRaya, No 2, Jalan Ampang, 50508 Kuala Lumpur, Malaysia. |
(52) | The business address of AmanahRaya Trustees Berhad-Amanah Saham Malaysia 2—Wawasan is Level 14, Wisma AmanahRaya, No 2, Jalan Ampang, 50508 Kuala Lumpur, Malaysia. |
(53) | The business address of AmanahRaya Trustees Berhad-Amanah Saham Malaysia 3 is Level 14, Wisma AmanahRaya, No 2, Jalan Ampang, 50508 Kuala Lumpur, Malaysia. |
(54) | The business address of AmanahRaya Trustees Berhad-Amanah Saham Nasional is Level 14, Wisma AmanahRaya, No 2, Jalan Ampang, 50508 Kuala Lumpur, Malaysia. |
(55) | The business address of AmanahRaya Trustees Berhad-ASN Equity 2 is Level 14, Wisma AmanahRaya, No 2, Jalan Ampang, 50508 Kuala Lumpur, Malaysia. |
(56) | The business address of AmanahRaya Trustees Berhad-ASN Equity 3 is Level 14, Wisma AmanahRaya, No 2, Jalan Ampang, 50508 Kuala Lumpur, Malaysia. |
(57) | The business address of AmanahRaya Trustees Berhad-ASN Equity 5 is Level 14, Wisma AmanahRaya, No 2, Jalan Ampang, 50508 Kuala Lumpur, Malaysia. |
(58) | The business address of AmanahRaya Trustees Berhad-ASN Imbang (Mixed Asset Balanced) 1 is Level 14, Wisma AmanahRaya, No 2, Jalan Ampang, 50508 Kuala Lumpur, Malaysia. |
(59) | The business address of AmanahRaya Trustees Berhad-ASN Imbang (Mixed Asset Balanced) 2 is Level 14, Wisma AmanahRaya, No 2, Jalan Ampang, 50508 Kuala Lumpur, Malaysia. |
(60) | The business address of AmanahRaya Trustees Berhad-ASN Imbang (Mixed Asset Balanced) 3 Global is Level 14, Wisma AmanahRaya, No 2, Jalan Ampang, 50508 Kuala Lumpur, Malaysia. |
(61) | The business address of AmanahRaya Trustees Berhad-ASN Sara (Mixed Asset Conservative) 1 is Level 14, Wisma AmanahRaya, No 2, Jalan Ampang, 50508 Kuala Lumpur, Malaysia. |
(62) | The business address of AmanahRaya Trustees Berhad-ASN Sara (Mixed Asset Conservative) 2 is Level 14, Wisma AmanahRaya, No 2, Jalan Ampang, 50508 Kuala Lumpur, Malaysia. |
(63) | The business address of Permodalan Nasional Berhad—IFM is Level 4, Balai PNB, 201-A Jalan Tun Razak, 50400 Kuala Lumpur, Malaysia. |
(64) | The business address of Permodalan Nasional Berhad—IFMMMF is Level 4, Balai PNB, 201-A Jalan Tun Razak, 50400 Kuala Lumpur, Malaysia. |
(65) | The business address for College Retirement Equities Fund on behalf of CREF Stock Account is 730 Third Avenue New York, NY 10017. |
(66) | The business address for College Retirement Equities Fund on behalf of CREF Growth Account is 730 Third Avenue New York, NY 10017. |
(67) | The business address for College Retirement Equities Fund on behalf of CREF Global Equities Account is 730 Third Avenue New York, NY 10017. |
(68) | The business address for TIAA-CREF Funds on behalf of TIAA-CREF Emerging Markets Equity Fund is 730 Third Avenue New York, NY 10017. |
(69) | The business address for TIAA-CREF Funds on behalf of TIAA-CREF Large-Cap Growth Fund is 730 Third Avenue New York, NY 10017. |
(70) | The business address for TIAA-CREF Funds on behalf of TIAA-CREF Mid-Cap Growth Fund is 730 Third Avenue New York, NY 10017. |
(71) | The business address for TIAA-CREF Funds on behalf of TIAA-CREF Growth & Income Fund is 730 Third Avenue New York, NY 10017. |
(72) | The business address for TIAA-CREF Funds on behalf of TIAA-CREF International Opportunities Fund is 730 Third Avenue New York, NY 10017. |
(73) | The business address for TIAA-CREF Life Funds on behalf of TIAA-CREF Life Growth & Income Fund is 730 Third Avenue New York, NY 10017. |
(74) | The business address for TIAA-CREF Life Funds on behalf of TIAA-CREF Life Growth Equity Fund is 730 Third Avenue New York, NY 10017. |
(75) | The business address for T. Rowe Price Global Equity Fund is Attn: Bonnie L. Maher, BA-0828, 100 East Pratt Street, Baltimore, MD 21202. |
(76) | The business address for T. Rowe Price Global Growth Stock Fund is Attn: Bonnie L. Maher, BA-0828, 100 East Pratt Street, Baltimore, MD 21202. |
(77) | The business address for Equipsuper Pty Ltd as Trustee for Equipsuper Superannuation Fund is Attn: Bonnie L. Maher, BA-0828, 100 East Pratt Street, Baltimore, MD 21202. |
(78) | The business address for Campbell Pension Plans Master Retirement Trust is Attn: Bonnie L. Maher, BA-0828, 100 East Pratt Street, Baltimore, MD 21202. |
(79) | The business address for T. Rowe Price Global Growth Equity Pool is Attn: Bonnie L. Maher, BA-0828, 100 East Pratt Street, Baltimore, MD 21202. |
(80) | The business address for Public Service Pension Plan Fund is Attn: Bonnie L. Maher, BA-0828, 100 East Pratt Street, Baltimore, MD 21202. |
(81) | The business address for Teachers’ Pension Plan Fund is Attn: Bonnie L. Maher, BA-0828, 100 East Pratt Street, Baltimore, MD 21202. |
(82) | The business address for T. Rowe Price Global Growth Equity Trust is Attn: Bonnie L. Maher, BA-0828, 100 East Pratt Street, Baltimore, MD 21202. |
(83) | The business address for Canada Life Global Growth Equity Fund (T. Rowe Price) is Attn: Bonnie L. Maher, BA-0828, 100 East Pratt Street, Baltimore, MD 21202. |
(84) | The business address for Delaware Public Employees’ Retirement System is Attn: Bonnie L. Maher, BA-0828, 100 East Pratt Street, Baltimore, MD 21202. |
(85) | The business address for Arlington County Employees’ Retirement System is Attn: Bonnie L. Maher, BA-0828, 100 East Pratt Street, Baltimore, MD 21202. |
(86) | Such securities owned by the Funds may be deemed to be beneficially owned by, Janus Henderson Investors US LLC (“Janus”), an investment adviser registered under the Investment Advisers Act of 1940, who acts as investment adviser for the Funds set forth above and has the ability to make decisions with respect to the voting and disposition of the securities subject to the oversight of the board of trustees (or similar entity) of each Fund. Under the terms of its management contract with each Fund, Janus has overall responsibility for directing the investments of the Fund in accordance with the Fund’s investment objective, policies and limitations. Each Fund has one or more portfolio managers appointed by and serving at the pleasure of Janus who makes decisions with respect to the disposition of the securities. The address for Janus is 151 Detroit Street, Denver, CO 80206. The portfolio managers for the funds are Denny Fish, Jonathan Cofsky and Nick. Schommer. |
(87) | The business address for Fidelity Funds—Asian Special Situations Fund is 2a, rue Albert Borschette, B.P. 2174, L-1021 Luxembourg, Grand Duchy of Luxembourg. |
(88) | The business address for Fidelity Funds—Pacific Fund is 2a, rue Albert Borschette, B.P. 2174, L-1021 Luxembourg, Grand Duchy of Luxembourg. |
(89) | The business address for Evans Investments Pte Ltd is 60B Orchard Road, #06-18, The Atrium @ Orchard, 238891, Singapore. |
(90) | The business address of MIC Capital Partners (Public) Parallel Cayman, LP is 190 Elgin Avenue, George Town, Grand Cayman KY1-9008, Cayman Islands. |
(91) | The business address of Massachusetts Institute of Technology is One Broadway, 9th Flr, Suite 200, Attn: MITIMCo Operations, Cambridge, MA 02142. |
(92) | The business address of 238 Plan Associates LLC is One Broadway, 9th Flr, Suite 200, Attn: MITIMCo Operations, Cambridge, MA 02142. |
(93) | The business address of Clearlake Flagship Plus Partners Master Fund, L.P. is 233 Wilshire Blvd, Suite 800, Santa Monica, CA 90401. |
(94) | The business address of Select International Equity Managed Fund is 15 York Street, Toronto, ON M5J 0A3. |
(95) | The business address of Emerging Markets Equity Corporate Class is 15 York Street, Toronto, ON M5J 0A3. |
(96) | The business address of CI Global Alpha Innovators Corporate Class is 15 York Street, Toronto, ON M5J 0A3. |
(97) | The business address of Select International Equity Managed Corporate Class is 15 York Street, Toronto, ON M5J 0A3. |
(98) | The business address of CI Emerging Markets Corporate Class is 15 York Street, Toronto, ON M5J 0A3. |
(99) | The business address of CI Asian Opportunities Fund is 15 York Street, Toronto, ON M5J 0A3. |
(100) | The business address of CI Asian Opportunities Corporate Class is 15 York Street, Toronto, ON M5J 0A3. |
(101) | The business address of CI Emerging Markets Fund is 15 York Street, Toronto, ON M5J 0A3. |
(102) | The business address of Emerging Markets Equity Pool is 15 York Street, Toronto, ON M5J 0A3. |
(103) | The business address of Barings International Umbrella Fund—Barings ASEAN Frontiers Fund is 35/F, Gloucester Tower, 15 Queen’s Road, Central Hong Kong. |
(104) | The business address of Barings International Umbrella Fund—Barings Asia Growth Fund is 35/F, Gloucester Tower, 15 Queen’s Road, Central Hong Kong. |
(105) | The business address of Barings Eastern Trust is 35/F, Gloucester Tower, 15 Queen’s Road, Central Hong Kong. |
(106) | The Baupost Group, L.L.C. (“Baupost”) is a registered investment adviser and acts as the investment adviser and general partner to certain private investment limited partnerships on whose behalf these shares were indirectly purchased. Baupost Group GP, L.L.C. (“Baupost GP”), as the manager of Baupost, and Seth A. Klarman (“Mr. Klarman”), as the sole managing member of Baupost GP and a controlling person of Baupost, may be deemed to have beneficial ownership of the shares beneficially owned by Baupost. Baupost GP and Mr. Klarman disclaim beneficial ownership of the shares except to the extent of their pecuniary interest therein, if any. The business address of Baupost, Baupost GP and Mr. Klarman is 10 St. James Ave., Suite 1700, Boston, Massachusetts, 02116. |
(107) | The business address of President & Fellows of Harvard College is 600 Atlantic Ave, Boston, MA 02210. |
(108) | The business address of Highline Investments LLC is 200 Clarendon Street, 59th Floor, Boston, MA 02116. |
(109) | The business address of Kwidnet Holdings LLC is 200 Clarendon Street, 59th Floor, Boston, MA 02116. |
(110) | The business address of Topia Ventures, LLC is c/o Topia Ventures Management, LLC, 104 W. 40th Street, 19th Floor, New York, NY 10018. |
(111) | The business address of Arena Capital Fund, LP—Series 3 is 12121 Wilshire Blvd, Suite 1010 Los Angeles, CA 90025. |
(112) | The business address of Arena Capital Fund, LP—Series 5 is 12121 Wilshire Blvd, Suite 1010 Los Angeles, CA 90025. |
(113) | The business address of Arena Capital Fund, LP—Series 6 is 12121 Wilshire Blvd, Suite 1010 Los Angeles, CA 90025. |
(114) | The business address for GPI Capital Guardian Holdco LP is 1345 Avenue of the Americas, 32nd Floor, New York, NY 10105. |
(115) | The business address of Chescaplq LLC is 2800 Quarry Lake Drive, Suite 300, Baltimore, MD 21209. |
(116) | The business address of Janchor Partners Pan-Asian Master Fund is One Nexus Way, Camana Bay, Grand Cayman, KY1-9005, Cayman Islands. |
(117) | The business address of Gobi Master Fund Ltd. is 909 Montgomery Street, Suite 400, San Francisco, CA 94133. |
(118) | The business address of Octahedron Master Fund, L.P. is 4126 17th Street #2, San Francisco, California 94114. |
(119) | The business address of White Willow Limited is c/o Genting Berhad, 24th Floor, Wisma Genting, No. 28, Jalan Sultan Ismail, 50250, Kuala Lumpur, W.P., Malaysia. |
(120) | The business address of Two Trees Family Holdings Pte. Ltd. is 320 Serangoon Road, #15-08 Centrium Square, Singapore 218108. |
(121) | The business address of Isla Asia Limited is Commence Chambers, Road Town, P.O. Box 2208, Tortola, British Virgin Islands. |
(122) | The business address of Davinia Investment Ltd is Level 1, Palm Grove House, Wickham’s Cay 1 Road Town, Tortola, British Virgin Islands. |
(123) | The business address of JS Oasis Limited is Woodbourne Hall, Road Town, P.O. Box 916, Tortola, British Virgin Islands. |
(124) | The business address of Sarath Ratanavadi is 87 Wireless Road, 11th Floor, M Thai Tower, All Seasons Place, Lumpini, Pathuwan, Bangkok 10330 Thailand. |
(125) | The business address of Phileo Capital Limited is 380 Jalan Besar #16-01 Singapore 209000. Mr. Kooi Ong Tong is the ultimate beneficial owner of Phileo Capital Limited. |
(126) | The business address of Trinidas Limited is Grand Cayman, P.O. Box 448, KY1—1106, George Town, Cayman Islands. |
(127) | The business address of Kuang Ming Investments Pte Limited is 14 Scotts Road, #06-01 Far East Plaza, Singapore 228213. |
(128) | The business address of K3 Auklet Capital II Limited is Vistra Corporate Services Centre, Wickhams Cay II, Road Town, Tortola, VG1110, British Virgin Islands. |
(129) | The business address of Khoon Peng Soo Soo is 6 Stevens Drive 04-05 Singapore 257902. |
(130) | The business address of Catcha Investments Ltd is 45-7 The Boulevard Mid Valley City, 59200 Kuala Lumpur, Malaysia. |
(131) | The business address of LightVC, Ltd. is c/o Lathan & Watkins LLP, 9 Raffles Place, #42-02 Republic Plaza, Singapore 048690. |
(132) | The business address of Alvin Sariaatmadja is JL. Lumajang 1, Jakarta, Indonesia. |
(133) | The business address of Sing Lun Industrial Pte Ltd is 50B Circular Road, Singapore 049405. |
(134) | The business address of The 2018 Yuan and Zhang Revocable Trust is 55 Almaden Boulevard, 6th Floor, San Jose, CA 95113-1608. |
(135) | The business address of Antelle Holding Limited is Floor 3A, No. 47 Jalan Kuchai Maju, Kuchai Entrepreneurs’ Park, 58200 Kuala Lumpur, Malaysia. |
(136) | The business address of Leland A. Philip and Co. Limited is P.O. Box 146, Road Town, Tortola, British Virgin Islands. |
(137) | The business address of Krian Upatkoon is Unit 1 Seventy Damansara, Kuala Lumpur, Malaysia 50480. |
(138) | The business address of Chen Jianwen is 29 Oei Tiong Ham Park #03-01, Singapore. |
(139) | The business address of Martua Sitorus is 11 Ford Ave, Singapore. |
(140) | The business address of Wee Wei Chi is 7 Camden Park, Singapore 299797. |
(141) | The business address of Supreme Island Corporation is 8 Anthony Road #01-02, Singapore 229957. |
(142) | The business address of Wee Ee Cheong is 5 Camden Park, Singapore 299797. |
(143) | The business address of Wee Ee Lim is 6 Camden Park, Singapore 299797. |
(144) | The business address of Chubb Tempest Reinsurance Ltd. is Chubb Building, 17 Woodbourne Ave, Hamilton, Bermuda HM-08. |
(145) | The business address of Pelago Holdings is 182 Cecil Street, Frasers Tower #17-28, Singapore 069547. |
(146) | The business address of Poonen Capital LLC is 1512 Country Club Dr, Los Altos, CA 94024. |
(147) | The business address of Takao Yasuda is 50 Lakeshore View, Singapore 098525. |
(148) | The business address of Areca Focus UniGrowth Fund is Level 11, Tower Three, RHB Centre, Jalan Tun Razak, 50400 Kuala Lumpur, Malaysia. |
(149) | The business address of TXX Family Trust is c/o of Dentons US LLP, 1221 Avenue of the Americas, New York, New York 10020. |
(150) | The business address of ACP Global Fund SPC—Value Segregated Portfolio is Cricket Square, Hutchins Drive, PO Box 2681, Grand Cayman, KY1-1111, Cayman Islands. |
(151) | The business address of Lim Hock Chee is 33 Olive Rd, Singapore 298270. |
(152) | The business address of SVF Investments (UK) Limited is 69 Grosvenor Street, London, United Kingdom, W1K 3JP. |
(153) | The business address of Didi Global Inc., formerly named as Xiaoju Kuaizhi Inc., is No. 1 Block B, Shangdong Digital Valley, No. 8 Dongbeiwang West Road, Haidian District, Beijing, P.R.C. |
(154) | The business address of Marvelous Yarra Limited is No. 1 Block B, Shangdong Digital Valley, No. 8 Dongbeiwang West Road, Haidian District, Beijing, P.R.C. |
(155) | The business address of Uber Technologies, Inc. is 1515 3rd Street, San Francisco, CA 94158. |
(156) | The business address of Toyota Motor Corporation is 4-7-1,Meieki, Nakamura-ku,450-8711, Japan. |
(157) | The business address of MUFG Bank, Limited is 11th Floor, 5-1-1, Kojimachi, Chiyoda-ku, Tokyo 102-0083, Japan. |
(158) | The business address of MUFG Innovation Partners No. 1 Investment Partnership is 1-1-1 Otemachi, Chiyoda-ku, Tokyo, Japan. |
(159) | The business address of Krugsri Finnovate Company Limited is 1222 21Fl. Rama III Road, Bang Phongphang, Yan Nawa, Bangkok, 10120, Thailand. |
(160) | The securities to be offered by Mr. Tan in this offering consist of (i) 71,419,219 Class B Ordinary Shares and (ii) 12,130,207 Class B Ordinary Shares issuable upon exercise of options. The securities owned by Mr. Tan prior to this offering consist of (i) 71,419,219 Class B Ordinary Shares, (ii) 12,130,207 Class B Ordinary Shares issuable upon exercise of options and (iii) 6,621,176 Class B Ordinary Shares underlying RSUs. Mr. Tan is our Chief Executive Officer and Chairman of our board of directors. Mr. Tan’s business address is 3 Media Close, #01-03/06, Singapore 138492. |
(161) | Anthony Tan is a director of Hibiscus Worldwide Ltd. (“Hibiscus”). Hibiscus’ business address is 3 Media Close, #01-03/06, Singapore 138492. |
(162) | The securities to be offered by Mr. Maa in this offering consist of (i) 11,665,629 Class B Ordinary Shares issuable upon exercise of options and (ii) 164,532 Class B Ordinary Shares underlying RSUs. Mr. Maa is our President. Mr. Maa’s business address is 3 Media Close, #01-03/06, Singapore 138492. |
(163) | The trustee’s business address is 3 Media Close, #01-03/06, Singapore 138492. |
(164) | The trustee’s business address is 3 Media Close, #01-03/06, Singapore 138492. |
(165) | The securities to be offered by Ms. Tan in this offering consist of (i) 24,955,107 Class B Ordinary Shares, (ii) 220,000 Class A Ordinary Shares, and (iii) 7,243,301 Class B Ordinary Shares issuable upon exercise of options. Ms. Tan is a director of the Company. Ms. Tan’s business address is 3 Media Close, #01-03/06, Singapore 138492. |
(166) | Consists of Class A Ordinary Shares and Class A Ordinary Shares underlying RSUs. Mr. Oey is our Chief Financial Officer. Mr. Oey’s business address is 3 Media Close, #01-03/06, Singapore 138492. |
(167) | Consists of Class A Ordinary Shares, Class A Ordinary Shares issuable upon exercise of options, and Class A Ordinary Shares underlying RSUs. Ms. Ong is our Chief People Officer. Ms. Ong’s business address is 3 Media Close, #01-03/06, Singapore 138492. |
(168) | Consists of Class A Ordinary Shares and Class A Ordinary Shares underlying RSUs. Ms. Ng is a director of the Company. Ms. Ng’s business address is 3 Media Close, #01-03/06, Singapore 138492. |
(169) | Consists of Class A Ordinary Shares and Class A Ordinary Shares underlying RSUs. Mr. Jay is a director of the Company. Mr. Jay’s business address is 3 Media Close, #01-03/06, Singapore 138492. |
(170) | Consists of (i) 16,944 Class A Ordinary Shares and (ii) 229,379 Class A Ordinary Shares issuable upon exercise of options. Mr. Mills was a director of GHI prior to the Closing Date. Mr. Mills’ business address is c/o The Grace & Mercy Foundation, 22nd Floor, 888 7th Avenue, New York, NY 10106. |
• | each AGC Unit issued and outstanding immediately prior to the Initial Merger Effective Time was automatically separated and the holder thereof was deemed to hold one AGC Class A Ordinary Share and one-fifth of an AGC Warrant; |
• | immediately following the separation of each AGC Unit, each (a) AGC Class A Ordinary Share issued and outstanding immediately prior to the Initial Merger Effective Time was canceled in exchange for the right to receive one Class A Ordinary Share, and (b) AGC Class B Ordinary Share issued and outstanding immediately prior to the Initial Merger Effective Time was canceled in exchange for the right to receive one Class A Ordinary Share; |
• | each AGC Warrant outstanding immediately prior to the Initial Merger Effective Time ceased to be a warrant with respect to AGC Shares and was assumed by the Company and converted into a warrant to purchase one Class A Ordinary Share, subject to substantially the same terms and conditions prior to the Initial Merger Effective Time in accordance with the provisions of the Assignment, Assumption and Amendment Agreement; and |
• | the single Ordinary Share outstanding immediately prior to the Initial Merger Effective Time was canceled for no consideration. |
• | each GHI Ordinary Share and GHI Preferred Share (other than GHI Key Executive Shares, GHI Restricted Stock, GHI Key Executive Restricted Stock, GHI Dissenting Shares and GHI treasury shares) issued and outstanding immediately prior to the Acquisition Effective Time was canceled in exchange for the right to receive such fraction of a newly issued Class A Ordinary Share that is equal to the Exchange Ratio, without interest, subject to rounding up to the nearest whole Class A Ordinary Share; |
• | each GHI Key Executive Share (other than GHI Key Executive Restricted Stock and GHI Dissenting Shares) issued and outstanding immediately prior to the Acquisition Effective Time was canceled in exchange for the right to receive such fraction of a newly issued Class B Ordinary Share that is equal to the Exchange Ratio, without interest, subject to rounding up to the nearest whole Class A Ordinary Share; |
• | each GHI Option outstanding immediately prior to the Acquisition Effective Time, whether vested or unvested, was automatically assumed by GHL and converted into an option to purchase the number of Class A Ordinary Shares equal to (i) the number of GHI Ordinary Shares subject to such GHI Option immediately prior to the Acquisition Effective Time multiplied by (ii) the Exchange Ratio (such product rounded down to the nearest whole number), and otherwise, became subject to substantially the same terms and conditions as were applicable to such GHI Option immediately prior to the Acquisition Effective Time; |
• | each GHI Key Executive Option outstanding immediately prior to the Acquisition Effective Time, whether vested or unvested, was automatically assumed by GHL and converted into an option to purchase the number of Class B Ordinary Shares equal to (i) the number of GHI Ordinary Shares subject to such GHI Key Executive Option immediately prior to the Acquisition Effective Time multiplied by (ii) the Exchange Ratio (such product rounded down to the nearest whole number), and otherwise, became subject to substantially the same terms and conditions as were applicable to such GHI Key Executive Option immediately prior to the Acquisition Effective Time; |
• | each award of GHI Restricted Stock outstanding immediately prior to the Acquisition Effective Time was automatically converted into an award of restricted Class A Ordinary Shares equal to (i) the number of GHI Shares subject to the GHI Restricted Stock award immediately before the Acquisition Effective Time multiplied by (ii) the Exchange Ratio (such product rounded down to the nearest whole number), and otherwise, became subject to substantially the same terms and conditions as were applicable to such award of GHI Restricted Stock immediately prior to the Acquisition Effective Time; |
• | each award of GHI Key Executive Restricted Stock outstanding immediately prior to the Acquisition Effective Time was automatically converted into an award of restricted Class B Ordinary Shares equal to (i) the number of GHI Shares subject to the GHI Key Executive Restricted Stock award immediately before the Acquisition Effective Time multiplied by (ii) the Exchange Ratio (such product rounded down to the nearest whole number), and otherwise, became subject to substantially the same terms and conditions as were applicable to such award of GHI Key Executive Restricted Stock immediately prior to the Acquisition Effective Time; |
• | each GHI RSU outstanding immediately prior to the Acquisition Effective Time, whether vested or unvested, was automatically assumed by GHL and converted into an award of restricted share units representing the right to receive the number of Class A Ordinary Shares equal to (i) the number of GHI Ordinary Shares subject to such GHI RSU immediately prior to the Acquisition Effective Time multiplied by (ii) the Exchange Ratio (such product rounded down to the nearest whole number), and otherwise, became subject to substantially the same terms and conditions as were applicable to such GHI RSU immediately prior to the Acquisition Effective Time; and |
• | each GHI Key Executive RSU outstanding immediately prior to the Acquisition Effective Time, whether vested or unvested, was automatically assumed by GHL and converted into an award of restricted share units representing the right to receive the number of Class B Ordinary Shares equal to (i) the number of GHI Ordinary Shares subject to such GHI Key Executive RSU immediately prior to the Acquisition Effective Time multiplied by (ii) the Exchange Ratio (such product rounded down to the nearest whole number), and otherwise, became subject to substantially the same terms and conditions as were applicable to such GHI Key Executive RSU immediately prior to the Acquisition Effective Time. |
• | increase the number of authorized Class B Ordinary Shares; |
• | issue any Class B Ordinary Shares or securities convertible into or exchangeable for Class B Ordinary Shares, other than to Key Executives or their affiliates, including Permitted Entities; |
• | create, authorize, issue, or reclassify into, any preference shares in our capital or any shares in our capital that carry more than one vote per share; |
• | reclassify any Class B Ordinary Shares into any other class of shares or consolidate or combine any Class B Ordinary Shares without proportionately increasing the number of votes per Class B Ordinary Share; |
• | amend, restate, waive, adopt any provision inconsistent with or otherwise alter any provision of the Amended Articles relating to the voting, conversion or other rights, powers, preferences, privileges or restrictions of the Class B Ordinary Shares; or |
• | nominate, appoint or remove a majority of our board of directors or the “Class B Directors.” |
• | on the first anniversary of Mr. Tan’s death or incapacity; |
• | on a date determined by our board of directors during the period commencing 90 days after, and ending 180 days after, the date on which Mr. Tan is terminated for cause (and in the event of a dispute regarding whether there was cause, cause will be deemed not to exist unless and until an affirmative ruling regarding such cause has been made by a court or arbitral panel of competent jurisdiction, and such ruling has become final and non-appealable); or |
• | on a date determined by our board of directors during the period commencing 90 days and ending 180 days after the date that Mr. Tan and his affiliates and Permitted Entities together own less than 33% of the number of Class B Ordinary Shares that he and his affiliates and Permitted Entities owned immediately following the consummation of the Business Combination. |
• | the instrument of transfer is lodged with us, or the designated transfer agent or share registrar, accompanied by the certificate for the shares to which it relates (if any) and such other evidence as our board of directors may reasonably require to show the right of the transferor to make the transfer; |
• | the instrument of transfer is in respect of only one class of shares; |
• | the instrument of transfer is properly stamped, if required; |
• | the transferred shares are fully paid up and free of any lien in favor of us (it being understood and agreed that all other liens, e.g. pursuant to a bona fide loan or indebtedness transaction, shall be permitted); or |
• | a fee of such maximum sum as NASDAQ may determine to be payable, or such lesser sum as our board of directors may from time to time require, is paid to us in respect thereof. |
• | increase the share capital by such sum, to be divided into shares of such classes and amount, as the resolution will prescribe; |
• | consolidate and divide all or any share capital into shares of a larger amount than existing shares; |
• | sub-divide its existing shares or any of them into shares of a smaller amount; provided that in the subdivision the proportion between the amount paid and the amount, if any, unpaid on each reduced share will be the same as it was in case of the share from which the reduced share is derived; or |
• | cancel any shares that at the date of the passing of the resolution have not been taken or agreed to be taken by any person and diminish the amount of its share capital by the amount of the shares so canceled. |
• | “Forward Purchase Warrants” refer to the warrants purchased by (i) Altimeter Partners Fund, L.P. (the “Sponsor Affiliate”) pursuant to the Forward Purchase Agreement between AGC and the Sponsor Affiliate, as amended and restated as of April 12, 2021, and (ii) JS Capital LLC (“JS Securities”) pursuant to the Forward Purchase Agreement between AGC and JS Securities, as amended and restated as of April 12, 2021; |
• | “Private Placement Warrants” refer to warrants issued to the Sponsor pursuant to the certain Private Placement Warrants Purchase Agreement between AGC and the Sponsor, and assumed by Grab pursuant to the Warrant Agreement; and |
• | “Public Warrants” refer to the warrants issued to public investors in AGC’s initial public offering and assumed by Grab pursuant to the Warrant Agreement. |
• | an exempted company does not have to file an annual return of its shareholders with the Registrar of Companies of the Cayman Islands; |
• | an exempted company’s register of members is not open to inspection; |
• | an exempted company does not have to hold an annual general meeting; |
• | an exempted company may issue no par value shares; |
• | an exempted company may obtain an undertaking against the imposition of any future taxation (such undertakings are usually given for 20 years in the first instance); |
• | an exempted company may register by way of continuation in another jurisdiction and be deregistered in the Cayman Islands; |
• | an exempted company may register as a limited duration company; and |
• | an exempted company may register as a segregated portfolio company. |
• | On May 30, 2022, which was 180 days after the consummation of the Business Combination, up to 2,598,192,720 Class A Ordinary Shares held by certain of our shareholders became eligible for resale, but pursuant to a new lock-up agreement dated March 14, 2022, lock-up restriction on certain of such Class A Ordinary Shares that are held by our key executives, namely, Anthony Tan, Hooi Ling Tan, Ming Maa, Peter Oey, Chin Yin Ong and Alex Hungate, has been extended to May 30, 2023; |
• | One year after the consummation of the Business Combination, up to 2,867,235 Class A Ordinary Shares received by Mr. Oey and Ms. Ong upon settlement of certain RSUs granted with respect to the Business Combination; |
• | Three years after the consummation of the Business Combination, up to 32,451,891 Ordinary Shares received by the Key Executives upon settlement of certain restricted stock awards granted with respect to the Business Combination; and |
• | Three years after the consummation of the Business Combination, up to 12,275,000 Class A Ordinary Shares, or other securities convertible into or exercisable or exchangeable for Class A Ordinary Shares, held by Sponsor. |
• | one percent (1%) of the total number of Ordinary Shares then issued and outstanding; or |
• | the average weekly reported trading volume of the Class A Ordinary Shares during the four calendar weeks preceding the filing of a notice on Form 144 with respect to the sale. |
• | the issuer of the securities that was formerly a shell company has ceased to be a shell company; |
• | the issuer of the securities is subject to the reporting requirements of Section 13 or 15(d) of the Exchange Act; |
• | the issuer of the securities has filed all Exchange Act reports and material required to be filed, as applicable, during the preceding 12 months (or such shorter period that the issuer was required to file such reports and materials); and |
• | at least one year has elapsed from the time that the issuer filed Form 20-F type information with the SEC, which is expected to be filed promptly after consummation of the Business Combination, reflecting its status as an entity that is not a shell company. |
• | our officers or directors; |
• | banks, financial institutions or financial services entities; |
• | broker-dealers; |
• | taxpayers that are subject to the mark-to-market accounting rules; |
• | tax-exempt entities; |
• | S-corporations; |
• | governments or agencies or instrumentalities thereof; |
• | insurance companies; |
• | regulated investment companies; |
• | real estate investment trusts; |
• | expatriates or former long-term residents of the United States; |
• | persons that actually or constructively own five percent or more of our shares by vote or value; |
• | persons that acquired the Securities pursuant to an exercise of employee share options, in connection with employee share incentive plans or otherwise as compensation or in connection with services; |
• | persons that hold the Securities as part of a straddle, constructive sale, hedging, conversion or other integrated or similar transaction; or |
• | U.S. Holders (as defined below) whose functional currency is not the U.S. dollar. |
• | an individual citizen or resident of the United States; |
• | a corporation (or other entity treated as a corporation for U.S. federal income tax purposes) that is created or organized (or treated as created or organized) in or under the laws of the United States, any state thereof or the District of Columbia; |
• | an estate the income of which is subject to U.S. federal income taxation regardless of its source; or |
• | a trust if (A) a court within the United States is able to exercise primary supervision over the administration of the trust and one or more U.S. persons have the authority to control all substantial decisions of the trust, or (B) it has in effect under applicable U.S. Treasury regulations a valid election to be treated as a U.S. person. |
• | the U.S. Holder’s gain or excess distribution will be allocated ratably over the U.S. Holder’s holding period for the Class A Ordinary Shares or Warrants; |
• | the amount allocated to the U.S. Holder’s taxable year in which the U.S. Holder recognized the gain or received the excess distribution, or to the period in the U.S. Holder’s holding period before the first day of our first taxable year in which we were a PFIC, will be taxed as ordinary income; |
• | the amount allocated to other taxable years (or portions thereof) of the U.S. Holder and included in its holding period will be taxed at the highest tax rate in effect for that year and applicable to the U.S. Holder; and |
• | an additional tax equal to the interest charge generally applicable to underpayments of tax will be imposed on the U.S. Holder with respect to the tax attributable to each such other taxable year of the U.S. Holder. |
(a) | no law which is thereafter enacted in the Cayman Islands imposing any tax to be levied on profits, income, gains or appreciations shall apply to GHL or its operations; and |
(b) | in addition, that no tax to be levied on profits, income, gains or appreciations or which is in the nature of estate duty or inheritance tax shall be payable: |
(i) | on or in respect of the shares, debentures or other obligations of GHL; or |
(ii) | by way of the withholding in whole or in part of any relevant payment as defined in the Tax Concessions Act. |
• | purchases by a broker-dealer as principal and resale by such broker-dealer for its own account pursuant to this prospectus; |
• | ordinary brokerage transactions and transactions in which the broker solicits purchasers; |
• | block trades in which the broker-dealer so engaged will attempt to sell the securities as agent but may position and resell a portion of the block as principal to facilitate the transaction; |
• | an over-the-counter distribution in accordance with the rules of NASDAQ; |
• | through trading plans entered into by a Selling Securityholder pursuant to Rule 10b5-1 under the Exchange Act that are in place at the time of an offering pursuant to this prospectus and any applicable prospectus supplement hereto that provide for periodic sales of their securities on the basis of parameters described in such trading plans; |
• | through one or more underwritten offerings on a firm commitment or best efforts basis; |
• | settlement of short sales entered into after the date of this prospectus; |
• | agreements with broker-dealers to sell a specified number of the securities at a stipulated price per share or warrant; |
• | distribution to employees, members, limited partners or stockholders of the Selling Securityholder or its affiliates by pledge to secure debts and other obligations; |
• | delayed delivery arrangements; |
• | in “at the market” offerings, as defined in Rule 415 under the Securities Act, at negotiated prices, at prices prevailing at the time of sale or at prices related to such prevailing market prices, including sales made directly on a national securities exchange or sales made through a market maker other than on an exchange or other similar offerings through sales agents; |
• | directly to purchasers, including through a specific bidding, auction or other process or in privately negotiated transactions; |
• | through the writing or settlement of options or other hedging transactions, whether through an options exchange or otherwise; |
• | through a combination of any of the above methods of sale; or |
• | any other method permitted pursuant to applicable law. |
• | the specific securities to be offered and sold; |
• | the names of the Selling Securityholders; |
• | the respective purchase prices and public offering prices, the proceeds to be received from the sale, if any, and other material terms of the offering; |
• | settlement of short sales entered into after the date of this prospectus; |
• | the names of any participating agents, broker-dealers or underwriters; and |
• | any applicable commissions, discounts, concessions and other items constituting compensation from the Selling Securityholders. |
SEC registration fee |
$ | 1,698,695.97 | ||
FINRA filing fee |
* | |||
Legal fees and expenses |
* | |||
Accountants’ fees and expenses |
* | |||
Printing expenses |
* | |||
Transfer agent fees and expenses |
* | |||
Miscellaneous costs |
* | |||
|
|
|||
Total |
$ |
1,698,695.97 |
||
|
|
* | These fees are calculated based on the securities offered and the number of issuances and accordingly cannot be defined at this time. |
Unaudited Condensed Consolidated Financial Statements of Grab Holdings Limited and its subsidiaries |
Page |
|||
F-2 | ||||
F-3 |
||||
F-5 |
||||
F-7 |
||||
F-9 |
||||
Audited Consolidated Financial Statements of Grab Holdings Limited and its subsidiaries |
Page |
|||
F-19 | ||||
F-20 | ||||
F-21 | ||||
F-22 | ||||
F-25 | ||||
F-27 |
Note |
June 30, 2022 |
December 31, 2021 |
||||||||||
$ |
$ |
|||||||||||
Non-current assets |
||||||||||||
Property, plant and equipment |
4 | |||||||||||
Intangible assets and goodwill |
5 | |||||||||||
Associates and joint venture |
||||||||||||
Deferred tax assets |
||||||||||||
Other investments |
6(i) | |||||||||||
Prepayments and other assets |
||||||||||||
Current assets |
||||||||||||
Inventories |
15(iii) | |||||||||||
Trade and other receivables |
||||||||||||
Prepayments and other assets |
||||||||||||
Other investments |
6(i) | |||||||||||
Cash and cash equivalents |
6 | |||||||||||
|
|
|
|
|||||||||
Total assets |
||||||||||||
|
|
|
|
|
|
|
|
|
|
|
|
|
Equity |
||||||||||||
Share capital and share premium |
7 | |||||||||||
Reserves |
7 | |||||||||||
Accumulated losses |
( |
) | ( |
) | ||||||||
Equity attributable to owners of the Company |
||||||||||||
Non-controlling interests |
||||||||||||
|
|
|
|
|||||||||
Total equity |
||||||||||||
|
|
|
|
|||||||||
Non-current liabilities |
|
|
|
|
|
|
|
|
|
|
|
|
Warrant liabilities |
||||||||||||
Loans and borrowings |
8 | |||||||||||
Provisions |
||||||||||||
Other liabilities |
15(iii) | |||||||||||
Deferred tax liabilities |
||||||||||||
Current liabilities |
||||||||||||
Loans and borrowings |
8 | |||||||||||
Provisions |
||||||||||||
Trade payables and other liabilities |
||||||||||||
Current tax liabilities |
||||||||||||
|
|
|
|
|||||||||
Total liabilities |
||||||||||||
|
|
|
|
|||||||||
Total equity and liabilities |
Note |
2022 |
2021 |
||||||||||
$ |
$ |
|||||||||||
Revenue |
10 | |||||||||||
Cost of revenue |
( |
) | ( |
) | ||||||||
Other income |
||||||||||||
Sales and marketing expenses |
( |
) | ( |
) | ||||||||
General and administrative expenses |
( |
) | ( |
) | ||||||||
Research and development expenses |
( |
) | ( |
) | ||||||||
Net impairment loss on financial assets |
( |
) | ( |
) | ||||||||
Other expenses |
( |
) | * | |||||||||
Operating loss |
( |
) |
( |
) | ||||||||
Finance income |
||||||||||||
Finance costs |
( |
) | ( |
) | ||||||||
Net finance costs |
( |
) |
( |
) | ||||||||
Share of loss of equity-accounted investees (net of tax) |
( |
) | ( |
) | ||||||||
Loss before income tax |
( |
) |
( |
) | ||||||||
Income tax expense |
( |
) | ( |
) | ||||||||
Loss for the period |
( |
) |
( |
) | ||||||||
Items that will not be reclassified to profit or loss: |
||||||||||||
Defined benefit plan remeasurements |
* | |||||||||||
Items that are or may be reclassified subsequently to profit or loss: |
||||||||||||
Foreign currency translation differences – foreign operations |
( |
) | ( |
) | ||||||||
Other comprehensive loss for the period , net of tax |
( |
) |
( |
) | ||||||||
|
|
|
|
|||||||||
Total comprehensive loss for the period |
( |
) |
( |
) |
* |
Amount less than $1 million |
Note |
2022 |
2021 |
||||||||||
$ |
$ |
|||||||||||
Loss attributable to: |
||||||||||||
Owners of the Company |
( |
) |
( |
) | ||||||||
Non-controlling interests |
( |
) |
( |
) | ||||||||
Loss for the period |
( |
) |
( |
) | ||||||||
Total comprehensive loss attributable to: |
||||||||||||
Owners of the Company |
( |
) |
( |
) | ||||||||
Non-controlling interests |
( |
) |
( |
) | ||||||||
|
|
|
|
|||||||||
Total comprehensive loss for the period |
( |
) |
( |
) | ||||||||
|
|
|
|
|
|
|
|
|
|
|
|
|
Loss per share |
||||||||||||
Basic loss per share |
11 |
( |
) |
( |
) | |||||||
Diluted loss per share |
11 |
( |
) |
( |
) |
Note |
Share capital |
Share premium |
Accumulated losses |
Other reserve |
Share option reserve |
Foreign currency translation reserve |
Equity (deficit) attributable to owners of the Company |
Non-controlling interests |
Total equity (deficit) |
|||||||||||||||||||||||||||||||
$ |
$ |
$ |
$ |
$ |
$ |
$ |
$ |
$ |
||||||||||||||||||||||||||||||||
At December 31, 2021 |
* | ( |
) | ( |
) | |||||||||||||||||||||||||||||||||||
Total comprehensive loss for the period |
||||||||||||||||||||||||||||||||||||||||
Loss for the period |
( |
) | ( |
) | ( |
) | ( |
) | ||||||||||||||||||||||||||||||||
Other comprehensive income |
||||||||||||||||||||||||||||||||||||||||
Exchange differences on translation of foreign operations |
( |
) | ( |
) | ( |
) | ||||||||||||||||||||||||||||||||||
|
|
|
|
|
|
|
|
|
|
|
|
|
|
|
|
|
|
|||||||||||||||||||||||
Total other comprehensive loss |
( |
) | ( |
) | ( |
) | ||||||||||||||||||||||||||||||||||
|
|
|
|
|
|
|
|
|
|
|
|
|
|
|
|
|
|
|||||||||||||||||||||||
Total comprehensive loss for the period |
( |
) | ( |
) | ( |
) | ( |
) | ( |
) | ||||||||||||||||||||||||||||||
Transactions with owners, recorded directly in equity |
||||||||||||||||||||||||||||||||||||||||
Contributions by owners |
||||||||||||||||||||||||||||||||||||||||
Business combination |
15 | * | ( |
) | ( |
) | ( |
) | ||||||||||||||||||||||||||||||||
Share options exercised/restricted stock units vested |
* | ( |
) | |||||||||||||||||||||||||||||||||||||
Share-based payment |
9 | |||||||||||||||||||||||||||||||||||||||
|
|
|
|
|
|
|
|
|
|
|
|
|
|
|
|
|
|
|||||||||||||||||||||||
Total contributions by owners |
* | ( |
) | ( |
) | |||||||||||||||||||||||||||||||||||
Changes in ownership interests in subsidiaries |
||||||||||||||||||||||||||||||||||||||||
Changes in non-controlling interests without a loss of control |
7 | ( |
) | ( |
) | * | ||||||||||||||||||||||||||||||||||
|
|
|
|
|
|
|
|
|
|
|
|
|
|
|
|
|
|
|||||||||||||||||||||||
Total changes in ownership interests in subsidiaries |
( |
) | ( |
) | * |
|||||||||||||||||||||||||||||||||||
|
|
|
|
|
|
|
|
|
|
|
|
|
|
|
|
|
|
|||||||||||||||||||||||
Total transactions with owners |
* | ( |
) | ( |
) | ( |
) | ( |
) | |||||||||||||||||||||||||||||||
|
|
|
|
|
|
|
|
|
|
|
|
|
|
|
|
|
|
|||||||||||||||||||||||
At June 30, 2022 |
* | ( |
) | ( |
) | |||||||||||||||||||||||||||||||||||
|
|
|
|
|
|
|
|
|
|
|
|
|
|
|
|
|
|
* |
Amount less than $1 million |
Unaudited condensed consolidated statement of changes in equity For the six months ended June 30, 2021 (in $ millions) |
Note |
Share capital |
Share premium |
Accumulated losses |
Other reserve |
CRPS reserve |
Share option reserve |
Foreign currency translation reserve |
Equity (deficit) attributable to owners of the Company |
Non-controlling interests |
Total equity (deficit) |
||||||||||||||||||||||||||||||||||
$ |
$ |
$ |
$ |
$ |
$ |
$ |
$ |
$ |
||||||||||||||||||||||||||||||||||||
At December 31, 2020 |
* | ( |
) | ( |
) | ( |
) | |||||||||||||||||||||||||||||||||||||
Total comprehensive loss for the period |
||||||||||||||||||||||||||||||||||||||||||||
Loss for the period |
( |
) | ( |
) | ( |
) | ( |
) | ||||||||||||||||||||||||||||||||||||
Other comprehensive income |
||||||||||||||||||||||||||||||||||||||||||||
Exchange differences on translation of f oreign operations |
( |
) | ( |
) | ( |
) | ( |
) | ||||||||||||||||||||||||||||||||||||
Total other comprehensive loss |
( |
) | ( |
) | ( |
) | ( |
) | ||||||||||||||||||||||||||||||||||||
|
|
|
|
|
|
|
|
|
|
|
|
|
|
|
|
|
|
|
|
|||||||||||||||||||||||||
Total comprehensive loss for the period |
( |
) | ( |
) | ( |
) | ( |
) | ( |
) | ||||||||||||||||||||||||||||||||||
|
|
|
|
|
|
|
|
|
|
|
|
|
|
|
|
|
|
|
|
|||||||||||||||||||||||||
Transactions with owners, recorded directly in equity |
||||||||||||||||||||||||||||||||||||||||||||
Contributions by owners |
||||||||||||||||||||||||||||||||||||||||||||
Share options exercised/restricted stock units vested |
* | ( |
) | |||||||||||||||||||||||||||||||||||||||||
Share-based payment |
||||||||||||||||||||||||||||||||||||||||||||
Equity component of convertible redeemable preference shares |
||||||||||||||||||||||||||||||||||||||||||||
|
|
|
|
|
|
|
|
|
|
|
|
|
|
|
|
|
|
|
|
|||||||||||||||||||||||||
Total contributions by owners |
* | |||||||||||||||||||||||||||||||||||||||||||
|
|
|
|
|
|
|
|
|
|
|
|
|
|
|
|
|
|
|
|
|||||||||||||||||||||||||
Changes in ownership interests in subsidiaries |
||||||||||||||||||||||||||||||||||||||||||||
Changes in non-controlling interests without a loss of control |
||||||||||||||||||||||||||||||||||||||||||||
Advance contribution by non-controlling interests |
||||||||||||||||||||||||||||||||||||||||||||
|
|
|
|
|
|
|
|
|
|
|
|
|
|
|
|
|
|
|
|
|||||||||||||||||||||||||
Total changes in ownership interests in subsidiaries |
||||||||||||||||||||||||||||||||||||||||||||
|
|
|
|
|
|
|
|
|
|
|
|
|
|
|
|
|
|
|
|
|||||||||||||||||||||||||
Total transactions with owners |
||||||||||||||||||||||||||||||||||||||||||||
|
|
|
|
|
|
|
|
|
|
|
|
|
|
|
|
|
|
|
|
|||||||||||||||||||||||||
At June 30, 2021 |
* |
( |
) |
( |
) |
( |
) | |||||||||||||||||||||||||||||||||||||
|
|
|
|
|
|
|
|
|
|
|
|
|
|
|
|
|
|
|
|
* |
Amount less than $1 million |
Unaudited condensed consolidated statement of cash flows For the six months ended June 30 (in $ millions) |
Note |
2022 |
2021 |
||||||||||
$ |
$ |
|||||||||||
Cash flows from operating activities |
||||||||||||
Loss before income tax |
( |
) | ( |
) | ||||||||
Adjustments for: |
||||||||||||
Amortization of intangible assets |
||||||||||||
Depreciation of property, plant and equipment |
||||||||||||
Impairment of property, plant and equipment |
||||||||||||
Equity-settled share-based payment |
9 | |||||||||||
Finance costs |
||||||||||||
Net impairment loss on financial assets |
||||||||||||
Finance income |
( |
) | ( |
) | ||||||||
Loss on disposal of property, plant and equipment |
||||||||||||
Gain on disposal of associate |
( |
) | ||||||||||
Share of loss of equity-accounted investees (net of tax) |
||||||||||||
Change in provisions |
( |
) | ||||||||||
( |
) | ( |
) | |||||||||
Changes in: |
||||||||||||
- Inventories |
( |
) | ||||||||||
- Deposits pledged |
( |
) | ||||||||||
- Trade and other receivables |
( |
) | ( |
) | ||||||||
- Trade and other payables |
( |
) | ||||||||||
Cash used in operations |
( |
) | ( |
) | ||||||||
Income tax paid |
( |
) | ( |
) | ||||||||
|
|
|
|
|||||||||
Net cash used in operating activities |
( |
) | ( |
) | ||||||||
Cash flows from investing activities |
|
|
|
|
|
|
|
|
|
|
|
|
Acquisition of property, plant and equipment |
4 | ( |
) |
( |
) | |||||||
Purchase of intangible assets |
( |
) | ( |
) | ||||||||
Proceeds from disposal of property, plant and equipment |
||||||||||||
Acquisition of subsidiaries with non-controlling interests, net of cash acquired |
( |
) | ||||||||||
Acquisition of additional interests in associate |
( |
) | ( |
) | ||||||||
Proceeds from disposal of associate |
||||||||||||
Net acquisitions of other investments |
( |
) | ( |
) | ||||||||
Restricted cash |
( |
) | ||||||||||
Interest received |
||||||||||||
|
|
|
|
|||||||||
Net cash used in investing activities |
( |
) | ( |
) |
* | Amount less than $1 million |
Note |
2022 |
2021 |
||||||||||
$ |
$ |
|||||||||||
Cash flows from financing activities |
||||||||||||
Proceeds from exercise of share options |
||||||||||||
Payment of share listing and associated expenses |
( |
) | ||||||||||
Proceeds from bank loans |
||||||||||||
Repayment of bank loans |
( |
) | ( |
) | ||||||||
Payment of lease liabilities |
( |
) | ( |
) | ||||||||
Proceeds from issuance of convertible redeemable preference shares |
||||||||||||
Proceeds from subscription of shares in subsidiaries by non-controlling interests |
||||||||||||
Deposits pledged |
||||||||||||
Interest paid |
( |
) | ( |
) | ||||||||
|
|
|
|
|||||||||
Net cash (used in)/ from financing activities |
( |
) | ||||||||||
Net (decrease)/ increase in cash and cash equivalents |
( |
) | ||||||||||
Cash and cash equivalents at January 1 |
6 | |||||||||||
Effect of exchange rate fluctuations on cash held |
( |
) | ( |
) | ||||||||
Cash and cash equivalents at June 30 |
6 |
* |
Amount less than $1 million |
1 |
Domicile and activities |
2 |
Going concern |
3 |
Basis of preparation |
3.1 |
Statement of compliance |
3.2 |
Functional and presentation currency |
3.3 |
Use of estimates and judgments |
• | Level 1: quoted prices (unadjusted) in active markets for identical assets or liabilities. |
• | Level 2: inputs other than quoted prices included in Level 1 that are observable for the asset or liability, either directly (i.e. as prices) or indirectly (i.e. derived from prices). |
• | Level 3: inputs for the asset or liability that are not based on observable market data (unobservable inputs). |
• |
Note 5 – Intangible assets and goodwill, |
• |
Note 13 – Financial instruments, and |
• |
Note 15 – Business combinations |
3.4 |
Change in accounting policies |
4 |
Property, plant and equipment |
• | motor vehicles held for leasing of $ |
• | right-of-use |
5 |
Intangible assets and goodwill |
6 |
Cash and cash equivalents |
June 30, 2022 |
December 31, 2021 |
|||||||
(in $ millions) |
$ |
$ |
||||||
Short-term deposits |
||||||||
Cash at banks and on hand |
||||||||
Cash and cash equivalents in the statement of financial position |
||||||||
Restricted cash |
( |
) | ( |
) | ||||
Cash and cash equivalents in the statement of cash flows |
i) |
Term deposits classification as cash equivalents or other investments |
ii) |
Restricted cash |
7 |
Capital and reserves |
(in thousands of shares) |
Class A ordinary shares |
Class B ordinary shares |
||||||
In issue at December 31, 2021 |
||||||||
Restricted ordinary shares issued but not paid |
( |
) | ||||||
In issue at December 31 – fully paid |
||||||||
Issued for acquisition of non-controlling interests (described below) |
||||||||
Issued in relation to business combination |
||||||||
Restricted share units vested |
||||||||
Exercise of share options |
||||||||
Restricted ordinary shares vested |
||||||||
Conversion of Class B ordinary shares to Class A ordinary shares |
( |
) | ||||||
In issue at June 30 – fully paid |
$ million |
||||
Carrying amount of non-controlling interests acquired |
||||
GHL Class A ordinary shares issued as consideration for acquisition of non-controlling interests |
( |
) | ||
Decrease in equity attributable to owners of the Company recognised in accumulated losses |
( |
) |
8 |
Loans and borrowings |
June 30, 2022 |
December 31, 2021 |
|||||||
(in $ millions) |
$ |
$ |
||||||
Non-current |
||||||||
Bank loans |
||||||||
Term loan |
||||||||
Lease liabilities |
||||||||
Current |
||||||||
Bank loans |
||||||||
Term loan |
||||||||
Lease liabilities |
||||||||
Currency |
Nominal interest rate |
Year of maturity |
Carrying amount |
|||||||||||||
% |
$ |
|||||||||||||||
Bank loans |
||||||||||||||||
Bank loans |
||||||||||||||||
Bank loans |
||||||||||||||||
Bank loans |
||||||||||||||||
Bank loans |
||||||||||||||||
Bank loans |
||||||||||||||||
Term loan |
||||||||||||||||
Lease liabilities |
||||||||||||||||
* |
cost of funds |
9 |
Share-based payment arrangements |
i) |
Description of the share-based payment arrangements |
1. | issue restricted share units/awards (‘RSUs’); or |
2. | grant options to purchase its ordinary shares (‘Share Options’); or |
3. | issued restricted ordinary shares to selected employees, officers, directors and consultants of the Group and non-employee directors of the Company. |
a) |
Outstanding RSUs |
Number of unvested restricted share units ‘000 |
||||
As of January 1, 2022 |
||||
Granted |
||||
Vested |
( |
) | ||
Canceled and forfeited |
( |
) | ||
As of June 30, 2022 |
||||
b) |
Outstanding Share Options |
Number of Share Options ’000 |
Weighted average exercise price per share $ |
Weighted-average remaining contractual life (in years) |
||||||||||
As of January 1, 2022 |
||||||||||||
Granted and assumed |
||||||||||||
Exercised |
( |
) | ||||||||||
Canceled and forfeited |
( |
) | ||||||||||
As of June 30, 2022 |
||||||||||||
Exercisable |
||||||||||||
As of January 1, 2022 |
||||||||||||
As of June 30, 2022 |
||||||||||||
10 |
Revenue |
i) |
Revenue streams |
For six months ended June 30 |
||||||||
2022 |
2021 |
|||||||
(in $ millions) |
$ |
$ |
||||||
|
|
|
|
|||||
Deliveries |
||||||||
Mobility |
||||||||
Financial services |
||||||||
Enterprise and new initiatives |
||||||||
|
|
|
|
|||||
|
|
|
|
11 |
Loss per share |
For six months ended June 30 |
||||||||
2022 |
2021 |
|||||||
$ |
$ |
|||||||
Loss for the year |
( |
) | ( |
) | ||||
Add: Loss attributable to non-controlling interests |
||||||||
Loss for the year attributable to ordinary shareholders |
( |
) |
( |
) | ||||
Basic and diluted weighted-average ordinary shares outstanding |
||||||||
Basic loss per share attributable to ordinary shareholders |
( |
) | ( |
) | ||||
Diluted loss per share attributable to ordinary shareholders |
( |
) | ( |
) |
For six months ended June 30 |
||||||||
2022 |
2021 |
|||||||
Convertible redeemable preference shares |
||||||||
Warrants |
||||||||
Restricted ordinary shares (Note 7) |
||||||||
Share options (Note 9) |
||||||||
RSUs (Note 9) |
||||||||
Options to swap the shares in GHL subsidiaries for GHL Class A Ordinary Shares |
||||||||
|
|
|
|
|||||
Total |
||||||||
|
|
|
|
|
|
|
|
|
12 |
Related parties |
i) |
Compensation of Key Management Personnel (“KMP”) |
ii) |
Other related party transactions |
13 |
Financial instruments |
Carrying amount |
Fair value |
|||||||||||||||||||||||||||||||
Note |
Fair value |
Amortized cost |
Total |
Level 1 |
Level 2 |
Level 3 |
Total |
|||||||||||||||||||||||||
$ |
$ |
$ |
$ |
$ |
$ |
$ |
||||||||||||||||||||||||||
(in $ millions) |
||||||||||||||||||||||||||||||||
June 30, 2022 |
||||||||||||||||||||||||||||||||
Financial assets |
||||||||||||||||||||||||||||||||
Debt investments |
||||||||||||||||||||||||||||||||
Equity investments |
||||||||||||||||||||||||||||||||
Time deposits |
||||||||||||||||||||||||||||||||
Trade and other receivables |
||||||||||||||||||||||||||||||||
Other assets |
||||||||||||||||||||||||||||||||
Cash and cash equivalents |
6 | |||||||||||||||||||||||||||||||
|
|
|
|
|
|
|
|
|
|
|
|
|
|
|||||||||||||||||||
Total |
||||||||||||||||||||||||||||||||
|
|
|
|
|
|
|
|
|
|
|
|
|
|
|||||||||||||||||||
Financial liabilities |
||||||||||||||||||||||||||||||||
Term loan |
( |
) | ( |
) | ||||||||||||||||||||||||||||
Warrant liabilities |
( |
) | ( |
) | ( |
) | ( |
) | ||||||||||||||||||||||||
Bank loans |
( |
) | ( |
) | ||||||||||||||||||||||||||||
Trade payables and other liabilities |
( |
) | ( |
) | ( |
) | ( |
) | ( |
) | ||||||||||||||||||||||
|
|
|
|
|
|
|
|
|
|
|
|
|
|
|||||||||||||||||||
Total |
( |
) |
( |
) |
( |
) |
( |
) |
( |
) |
( |
) | ||||||||||||||||||||
|
|
|
|
|
|
|
|
|
|
|
|
|
|
Carrying amount |
Fair value |
|||||||||||||||||||||||||||||||
Note |
Fair value |
Amortized cost |
Total |
Level 1 |
Level 2 |
Level 3 |
Total |
|||||||||||||||||||||||||
$ |
$ |
$ |
$ |
$ |
$ |
$ |
||||||||||||||||||||||||||
(in $ millions) |
||||||||||||||||||||||||||||||||
December 31, 2021 |
||||||||||||||||||||||||||||||||
Financial assets |
||||||||||||||||||||||||||||||||
Debt investments |
||||||||||||||||||||||||||||||||
Equity investments |
||||||||||||||||||||||||||||||||
Time deposits |
||||||||||||||||||||||||||||||||
Trade and other receivables |
||||||||||||||||||||||||||||||||
Other assets |
||||||||||||||||||||||||||||||||
Cash and cash equivalents |
6 | |||||||||||||||||||||||||||||||
Total |
||||||||||||||||||||||||||||||||
Financial liabilities |
||||||||||||||||||||||||||||||||
Term loans |
( |
) | ( |
) | ||||||||||||||||||||||||||||
Warrant liabilities |
( |
) | ( |
) | ( |
) | ( |
) | ( |
) | ||||||||||||||||||||||
Bank loans |
( |
) | ( |
) | ||||||||||||||||||||||||||||
Trade payables and other liabilities |
( |
) | ( |
) | ( |
) | ( |
) | ( |
) | ||||||||||||||||||||||
Total |
( |
) |
( |
) |
( |
) |
( |
) |
( |
) |
( |
) | ||||||||||||||||||||
ii) |
Measurement of fair values |
Valuation technique |
Significant unobservable inputs |
Inter-relationship between significant unobservable inputs and fair value measurement | ||||
Assets |
||||||
Debt investments |
Quoted broker prices | Not applicable | Not applicable | |||
Equity investment |
Market comparison technique | Adjusted market multiple | The estimated fair value would increase (decrease) if the adjusted market multiple were higher (lower). | |||
Liabilities |
||||||
Put liability (see Note 15) |
Income approach | Probability attributed to achieving certain milestones | The estimated fair value of the put liability would increase (decrease) if the probability attributed to achieving certain milestones were higher (lower). |
Equity investments |
Other liabilities |
Total |
||||||||||
$ |
$ |
$ |
||||||||||
(in $ millions) |
||||||||||||
At January 1, 2021 |
||||||||||||
Net change in fair value (unrealized) |
||||||||||||
At June 30, 2021 |
||||||||||||
At January 1, 2022 |
( |
) |
||||||||||
Put liability arising from business combination |
— | ( |
) |
( |
) | |||||||
Net change in fair value (unrealized) |
( |
) | — |
( |
) | |||||||
Net purchases/ (issuances) |
— |
|||||||||||
Transfer between Level 3 and Level 1 |
— | |||||||||||
At June 30, 2022 |
( |
) |
||||||||||
14 |
Operating segments |
i) |
Basis for segmentation |
Reportable segments |
Operations | |
Deliveries |
Connecting driver-partner and merchant-partner with consumers to create a localized logistics platform, facilitating and performing on-demand and scheduled delivery of a wide variety of daily necessities, including ready-to-eat point-to-point | |
Mobility |
Connecting consumers with rides provided by driver-partners across a wide variety of multi-modal mobility options including private cars, taxis, motorcycles (in certain countries), and shared mobility options, such as carpooling. It also includes vehicle rental to enable driver-partners to be able to offer services through the platform. | |
Financial services |
Digital solutions offered by and with business partners to address the financial needs of driver and merchant partners and consumers, including digital payments, lending, receivables factoring, insurance distribution and wealth management in selected markets. | |
Enterprise and new initiatives |
Enterprise offerings including advertising and marketing offerings, and anti-fraud offerings. It also includes other lifestyle services offered by our business partners to consumers including domestic and home services, flights, hotel bookings and subscriptions in certain markets. |
ii) |
Information about reportable segments |
For six months ended June 30 |
||||||||
2022 |
2021 |
|||||||
(in $ millions) |
$ |
$ |
||||||
Segment Adjusted EBITDA |
||||||||
Deliveries |
( |
) | ( |
) | ||||
Mobility |
||||||||
Financial services |
( |
) | ( |
) | ||||
Enterprise and new initiatives |
||||||||
Total reportable Segment Adjusted EBITDA |
( |
) |
||||||
Regional corporate costs |
( |
) | ( |
) | ||||
Net interest expenses |
( |
) | ( |
) | ||||
Other income |
||||||||
Income tax expenses |
( |
) | ( |
) | ||||
Depreciation and amortization |
( |
) | ( |
) | ||||
Stock-based compensation expenses |
( |
) | ( |
) | ||||
Unrealized foreign exchange gain |
||||||||
Impairment loss on goodwill and non-financial assets |
( |
) | ( |
) | ||||
Fair value changes on investments |
( |
) | ||||||
Restructuring costs |
( |
) | * |
|||||
Legal, tax and regulatory settlement provisions |
( |
) | ( |
) | ||||
Consolidated profit or loss after tax |
( |
) | ( |
) |
15 |
Business combinations |
i) |
Purchase consideration |
(in $ millions) |
$ | |||
Cash |
||||
Equity instruments ( |
||||
ii) |
Acquisition related costs |
iii) |
Identifiable assets acquired and liabilities assumed |
(in $ millions) |
$ | |||
Property, plant and equipment |
||||
Right-of-use |
||||
Intangible assets |
||||
Merchandise inventories |
||||
Trade and other receivables |
||||
Cash and cash equivalents |
||||
Loans and borrowings |
( |
) | ||
Lease liabilities |
( |
) | ||
Deferred tax liabilities |
( |
) | ||
Trade payables and other liabilities |
( |
) | ||
Identifiable net assets acquired |
||||
Less: Non-controlling interest proportionate share of identifiable net assets |
( |
) | ||
Goodwill on acquisition (described below) |
||||
Purchase consideration |
Assets acquired |
Valuation technique | |
Property, plant and equipment |
||
Intangible assets (Trademark) |
||
Inventories |
16 |
Subsequent events |
Note |
2021 |
2020 |
||||||||||
$ |
$ |
|||||||||||
Non-current assets |
||||||||||||
Property, plant and equipment |
5 | 441 | 384 | |||||||||
Intangible assets and goodwill |
6 | 675 | 913 | |||||||||
Associates and joint venture |
14 | 9 | ||||||||||
Deferred tax assets |
17 | (iii) | 5 | — | ||||||||
Other investments |
7 | 1,241 | 377 | |||||||||
Prepayments and other assets |
9 | 127 | 4 | |||||||||
|
|
|
|
|||||||||
2,503 | 1,687 | |||||||||||
|
|
|
|
|||||||||
Current assets |
||||||||||||
Inventories |
4 | 3 | ||||||||||
Trade and other receivables |
8 | 255 | 172 | |||||||||
Prepayments and other assets |
9 | 185 | 109 | |||||||||
Other investments |
7 | 3,240 | 1,298 | |||||||||
Cash and cash equivalents |
10 | 4,991 | 2,173 | |||||||||
|
|
|
|
|||||||||
8,675 | 3,755 | |||||||||||
|
|
|
|
|||||||||
Total assets |
11,178 |
5,442 |
||||||||||
|
|
|
|
|||||||||
Equity |
||||||||||||
Share capital and share premium |
11 | 21,529 | 140 | |||||||||
Reserves |
11 | (ii) | 606 | 3,951 | ||||||||
Accumulated losses |
(14,402 | ) | (10,490 | ) | ||||||||
Equity/(deficit) attributable to owners of the Company |
7,733 | (6,399 | ) | |||||||||
Non-controlling interests |
12 | 286 | 105 | |||||||||
|
|
|
|
|||||||||
Total equity/(deficit) |
8,019 |
(6,294 |
) | |||||||||
|
|
|
|
|||||||||
Non-current liabilities |
||||||||||||
Convertible redeemable preference shares |
11 | (ii) | — | 10,767 | ||||||||
Warrant liabilities |
13 | 54 | — | |||||||||
Loans and borrowings |
14 | 2,031 | 111 | |||||||||
Provisions |
15 | 18 | 3 | |||||||||
Trade and other payables |
16 | 27 | 18 | |||||||||
Deferred tax liabilities |
17 | (iii) | 3 | 1 | ||||||||
|
|
|
|
|||||||||
2,133 | 10,900 | |||||||||||
|
|
|
|
|||||||||
Current liabilities |
||||||||||||
Loans and borrowings |
14 | 144 | 140 | |||||||||
Provisions |
15 | 35 | 35 | |||||||||
Trade and other payables |
16 | 844 | 661 | |||||||||
Current tax liabilities |
3 | * | ||||||||||
|
|
|
|
|||||||||
1,026 | 836 | |||||||||||
|
|
|
|
|||||||||
Total liabilities |
3,159 |
11,736 |
||||||||||
|
|
|
|
|||||||||
Total equity/(deficit) and liabilities |
11,178 |
5,442 |
||||||||||
|
|
|
|
* | Amount less than $1 million |
Note |
2021 |
2020 |
2019 |
|||||||||||||
$ |
$ |
$ |
||||||||||||||
Revenue |
19 | 675 | 469 | (845 | ) | |||||||||||
Cost of revenue |
20 | (iii) | (1,070 | ) | (963 | ) | (1,320 | ) | ||||||||
Other income |
20 | (i) | 12 | 33 | 14 | |||||||||||
Sales and marketing expenses |
20 | (iii) | (241 | ) | (151 | ) | (238 | ) | ||||||||
General and administrative expenses |
20 | (iii) | (545 | ) | (326 | ) | (304 | ) | ||||||||
Research and development expenses |
20 | (iii) | (356 | ) | (257 | ) | (231 | ) | ||||||||
Net impairment losses on financial assets |
25 | (b) | (19 | ) | (63 | ) | (56 | ) | ||||||||
Other expenses |
20 | (ii) | (11 | ) | (40 | ) | (30 | ) | ||||||||
|
|
|
|
|
|
|||||||||||
Operating loss |
(1,555 | ) | (1,298 | ) | (3,010 | ) | ||||||||||
Finance income |
21 | 65 | 53 | 85 | ||||||||||||
Finance costs |
21 | (1,701 | ) | (1,490 | ) | (1,056 | ) | |||||||||
Share listing and associated expenses |
28 | (353 | ) | — | — | |||||||||||
|
|
|
|
|
|
|||||||||||
Net finance costs |
21 | (1,989 | ) | (1,437 | ) | (971 | ) | |||||||||
Share of loss of equity-accounted investees (net of tax) |
(8 | ) | (8 | ) | * | |||||||||||
|
|
|
|
|
|
|||||||||||
Loss before income tax |
(3,552 | ) | (2,743 | ) | (3,981 | ) | ||||||||||
Income tax expense |
17 | (3 | ) | (2 | ) | (7 | ) | |||||||||
|
|
|
|
|
|
|||||||||||
Loss for the year |
(3,555 | ) | (2,745 | ) | (3,988 | ) | ||||||||||
Items that will not be reclassified to profit or loss: |
||||||||||||||||
Defined benefit plan remeasurements |
1 | (2 | ) | (2 | ) | |||||||||||
Items that are or may be reclassified subsequently to profit or loss: |
||||||||||||||||
Foreign currency translation differences – foreign operations |
(42 | ) | 5 | 6 | ||||||||||||
Other comprehensive (loss)/ income for the year, net of tax |
(41 | ) | 3 | 4 | ||||||||||||
|
|
|
|
|
|
|||||||||||
Total comprehensive loss for the year |
(3,596 | ) | (2,742 | ) | (3,984 | ) | ||||||||||
|
|
|
|
|
|
|||||||||||
Loss attributable to: |
||||||||||||||||
Owners of the Company |
(3,449 | ) | (2,608 | ) | (3,747 | ) | ||||||||||
Non-controlling interests |
(106 | ) | (137 | ) | (241 | ) | ||||||||||
|
|
|
|
|
|
|||||||||||
Loss for the year |
(3,555 | ) | (2,745 | ) | (3,988 | ) | ||||||||||
|
|
|
|
|
|
|||||||||||
Total comprehensive loss attributable to: |
||||||||||||||||
Owners of the Company |
(3,489 | ) | (2,599 | ) | (3,751 | ) | ||||||||||
Non-controlling interests |
(107 | ) | (143 | ) | (233 | ) | ||||||||||
|
|
|
|
|
|
|||||||||||
Total comprehensive loss for the year |
(3,596 | ) | (2,742 | ) | (3,984 | ) | ||||||||||
|
|
|
|
|
|
|||||||||||
Loss per share (restated # ) |
||||||||||||||||
Basic loss per share |
22 | (6.39 | ) | (14.39 | ) # |
(24.31 | ) # | |||||||||
Diluted loss per share |
22 | (6.39 | ) | (14.39 | ) # |
(24.31 | ) # |
* | Amount less than $1 million |
# |
See Note 22 for details regarding the retrospective restatement of ‘Loss per share’ for years ended December 31, 2020 and 2019 as a result of the Reverse Recapitalization. |
Note |
Share capital |
Share premium |
Accumulated losses |
CRPS reserve |
Other reserve (Note 7) |
Share option reserve |
Foreign currency translation reserve |
Equity (deficit) attributable to owners of the Company |
Non- controlling interests |
Total equity (deficit) |
||||||||||||||||||||||||||||||||||
$ |
$ |
$ |
$ |
$ |
$ |
$ |
$ |
$ |
$ |
|||||||||||||||||||||||||||||||||||
At January 1, 2021 |
* | 140 | (10,490 | ) | 3,850 | — | 79 | 22 | (6,399 | ) | 105 | (6,294 | ) | |||||||||||||||||||||||||||||||
Total comprehensive loss for the period |
||||||||||||||||||||||||||||||||||||||||||||
Loss for the period |
— | — | (3,449 | ) | — | — | — | — | (3,449 | ) | (106 | ) | (3,555 | ) | ||||||||||||||||||||||||||||||
Other comprehensive income |
||||||||||||||||||||||||||||||||||||||||||||
Exchange differences on translation of foreign operations |
— | — | — | — | — | — | (41 | ) | (41 | ) | (1 | ) | (42 | ) | ||||||||||||||||||||||||||||||
Defined benefit plan remeasurement |
— | — | 1 | — | — | — | — | 1 | — | 1 | ||||||||||||||||||||||||||||||||||
Total other comprehensive loss |
— | — | 1 | — | — | — | (41 | ) | (40 | ) | (1 | ) | (41 | ) | ||||||||||||||||||||||||||||||
|
|
|
|
|
|
|
|
|
|
|
|
|
|
|
|
|
|
|
|
|||||||||||||||||||||||||
Total comprehensive loss for the period |
— | — | (3,448 | ) | — | — | — | (41 | ) | (3,489 | ) | (107 | ) | (3,596 | ) | |||||||||||||||||||||||||||||
|
|
|
|
|
|
|
|
|
|
|
|
|
|
|
|
|
|
|
|
|||||||||||||||||||||||||
Transactions with owners, recorded directly in equity |
||||||||||||||||||||||||||||||||||||||||||||
Contributions by owners |
||||||||||||||||||||||||||||||||||||||||||||
Equity component of convertible redeemable preference shares (“CRPS”) |
11 | — | — | — | 27 | — | — | — | 27 | — | 27 | |||||||||||||||||||||||||||||||||
Share options exercised/restricted stock units vested |
11 | * | 97 | — | — | — | (51 | ) | — | 46 | — | 46 | ||||||||||||||||||||||||||||||||
Share-based payment |
18 | — | — | — | — | — | 357 | — | 357 | — | 357 | |||||||||||||||||||||||||||||||||
Issuance of ordinary shares upon Reverse Recapitalization (refer to Note 1 for definition), net of issuance costs |
* | 4,642 | — | — | — | — | — | 4,642 | — | 4,642 | ||||||||||||||||||||||||||||||||||
Conversion of CPRS into GHL ordinary shares as part of the Reverse Recapitalization |
11 | * | 16,650 | — | (3,877 | ) | — | — | — | 12,773 | — | 12,773 | ||||||||||||||||||||||||||||||||
|
|
|
|
|
|
|
|
|
|
|
|
|
|
|
|
|
|
|
|
|||||||||||||||||||||||||
Total contributions by owners |
* | 21,389 | — | (3,850 | ) | — | 306 | — | 17,845 | — | 17,845 | |||||||||||||||||||||||||||||||||
|
|
|
|
|
|
|
|
|
|
|
|
|
|
|
|
|
|
|
|
|||||||||||||||||||||||||
Changes in ownership interests in subsidiaries |
||||||||||||||||||||||||||||||||||||||||||||
Changes in non-controlling interests without a loss of control |
— | — | (464 | ) | — | 243 | (3 | ) | — | (224 | ) | 288 | 64 | |||||||||||||||||||||||||||||||
|
|
|
|
|
|
|
|
|
|
|
|
|
|
|
|
|
|
|
|
|||||||||||||||||||||||||
Total changes in ownership interests in subsidiaries |
* | — | (464 | ) | — | 243 | (3 | ) | — | (224 | ) | 288 | 64 | |||||||||||||||||||||||||||||||
|
|
|
|
|
|
|
|
|
|
|
|
|
|
|
|
|
|
|
|
|||||||||||||||||||||||||
Total transactions with owners |
* | 21,389 | (464 | ) | (3,850 | ) | 243 | 303 | — | 17,621 | 288 | 17,909 | ||||||||||||||||||||||||||||||||
|
|
|
|
|
|
|
|
|
|
|
|
|
|
|
|
|
|
|
|
|||||||||||||||||||||||||
At December 31, 2021 |
* | 21,529 | (14,402 | ) | — | 243 | 382 | (19 | ) | 7,733 | 286 | 8,019 | ||||||||||||||||||||||||||||||||
|
|
|
|
|
|
|
|
|
|
|
|
|
|
|
|
|
|
|
|
* | Amount less than $1 million |
Note |
Share capital |
Share premium |
Accumulated losses |
CRPS reserve |
Share option reserve |
Foreign currency translation reserve |
Equity (deficit) attributable to owners of the Company |
Non- controlling interests |
Total equity (deficit) |
|||||||||||||||||||||||||||||||
$ |
$ |
$ |
$ |
$ |
$ |
$ |
$ |
$ |
||||||||||||||||||||||||||||||||
At January 1, 2020 |
* | 79 | (7,982 | ) | 3,552 | 49 | 11 | (4,291 | ) | 67 | (4,224 | ) | ||||||||||||||||||||||||||||
Total comprehensive loss for the period |
||||||||||||||||||||||||||||||||||||||||
Loss for the period |
— | — | (2,608 | ) | — | — | — | (2,608 | ) | (137 | ) | (2,745 | ) | |||||||||||||||||||||||||||
Other comprehensive income |
||||||||||||||||||||||||||||||||||||||||
Exchange differences on translation of foreign operations |
— | — | — | — | — | 11 | 11 | (6 | ) | 5 | ||||||||||||||||||||||||||||||
Defined benefit plan remeasurement |
— | — | (2 | ) | — | — | — | (2 | ) | — | (2 | ) | ||||||||||||||||||||||||||||
|
|
|
|
|
|
|
|
|
|
|
|
|
|
|
|
|
|
|||||||||||||||||||||||
Total other comprehensive loss |
— | — | (2 | ) | — | — | 11 | 9 | (6 | ) | 3 | |||||||||||||||||||||||||||||
|
|
|
|
|
|
|
|
|
|
|
|
|
|
|
|
|
|
|||||||||||||||||||||||
Total comprehensive loss for the period |
— | — | (2,610 | ) | — | — | 11 | (2,599 | ) | (143 | ) | (2,742 | ) | |||||||||||||||||||||||||||
|
|
|
|
|
|
|
|
|
|
|
|
|
|
|
|
|
|
|||||||||||||||||||||||
Transactions with owners, recorded directly in equity |
||||||||||||||||||||||||||||||||||||||||
Contributions by owners |
||||||||||||||||||||||||||||||||||||||||
Shares issued for acquisition of a subsidiary |
* | 1 | — | — | — | — | 1 | — | 1 | |||||||||||||||||||||||||||||||
Share options exercised/restricted stock units vested |
* | 27 | — | — | (24 | ) | — | 3 | — | 3 | ||||||||||||||||||||||||||||||
Share-based payment |
18 | — | — | — | — | 54 | — | 54 | — | 54 | ||||||||||||||||||||||||||||||
Equity component of convertible redeemable preference shares |
— | — | — | 298 | — | — | 298 | — | 298 | |||||||||||||||||||||||||||||||
|
|
|
|
|
|
|
|
|
|
|
|
|
|
|
|
|
|
|||||||||||||||||||||||
Total contributions by owners |
* | 28 | — | 298 | 30 | — | 356 | — | 356 | |||||||||||||||||||||||||||||||
|
|
|
|
|
|
|
|
|
|
|
|
|
|
|
|
|
|
|||||||||||||||||||||||
Changes in ownership interests in subsidiaries |
||||||||||||||||||||||||||||||||||||||||
Changes in non-controlling interests without a loss of control |
— | 33 | 102 | — | — | — | 135 | 181 | 316 | |||||||||||||||||||||||||||||||
|
|
|
|
|
|
|
|
|
|
|
|
|
|
|
|
|
|
|||||||||||||||||||||||
Total changes in ownership interests in subsidiaries |
— | 33 | 102 | — | — | — | 135 | 181 | 316 | |||||||||||||||||||||||||||||||
|
|
|
|
|
|
|
|
|
|
|
|
|
|
|
|
|
|
|||||||||||||||||||||||
Total transactions with owners |
* | 61 | 102 | 298 | 30 | — | 491 | 181 | 672 | |||||||||||||||||||||||||||||||
|
|
|
|
|
|
|
|
|
|
|
|
|
|
|
|
|
|
|||||||||||||||||||||||
At December 31, 2020 |
* | 140 | (10,490 | ) | 3,850 | 79 | 22 | (6,399 | ) | 105 | (6,294 | ) | ||||||||||||||||||||||||||||
|
|
|
|
|
|
|
|
|
|
|
|
|
|
|
|
|
|
* | Amount less than $1 million |
Note |
Share capital |
Share premium |
Accumulated losses |
CRPS reserve |
Share option reserve |
Foreign currency translation reserve |
Equity (deficit) attributable to owners of the Company |
Non- controlling interests |
Total equity (deficit) |
|||||||||||||||||||||||||||||||
$ |
$ |
$ |
$ |
$ |
$ |
$ |
$ |
$ |
||||||||||||||||||||||||||||||||
At January 1, 2019 |
* | 53 | (4,281 | ) | 2,987 | 31 | 13 | (1,197 | ) | 132 | (1,065 | ) | ||||||||||||||||||||||||||||
Total comprehensive loss for the period |
||||||||||||||||||||||||||||||||||||||||
Loss for the period |
— | — | (3,747 | ) | — | — | — | (3,747 | ) | (241 | ) | (3,988 | ) | |||||||||||||||||||||||||||
Other comprehensive income |
||||||||||||||||||||||||||||||||||||||||
Exchange differences on translation of foreign operations |
— | — | — | — | — | (2 | ) | (2 | ) | 8 | 6 | |||||||||||||||||||||||||||||
Defined benefit plan remeasurement |
— | — | (2 | ) | — | — | — | (2 | ) | — | (2 | ) | ||||||||||||||||||||||||||||
|
|
|
|
|
|
|
|
|
|
|
|
|
|
|
|
|
|
|||||||||||||||||||||||
Total other comprehensive loss |
— | — | (2 | ) | — | — | (2 | ) | (4 | ) | 8 | 4 | ||||||||||||||||||||||||||||
|
|
|
|
|
|
|
|
|
|
|
|
|
|
|
|
|
|
|||||||||||||||||||||||
Total comprehensive loss for the period |
— | — | (3,749 | ) | — | — | (2 | ) | (3,751 | ) | (233 | ) | (3,984 | ) | ||||||||||||||||||||||||||
|
|
|
|
|
|
|
|
|
|
|
|
|
|
|
|
|
|
|||||||||||||||||||||||
Transactions with owners, recorded directly in equity |
||||||||||||||||||||||||||||||||||||||||
Contributions by owners |
||||||||||||||||||||||||||||||||||||||||
Issue of ordinary shares |
* | 2 | — | — | — | — | 2 | — | 2 | |||||||||||||||||||||||||||||||
Issue of ordinary shares related to business combination |
* | 5 | — | — | — | — | 5 | — | 5 | |||||||||||||||||||||||||||||||
Share options exercised/restricted stock units vested |
* | 19 | — | — | (16 | ) | — | 3 | — | 3 | ||||||||||||||||||||||||||||||
Share-based payment |
18 | — | — | — | — | 34 | — | 34 | — | 34 | ||||||||||||||||||||||||||||||
Equity component of convertible redeemable preference shares |
— | — | — | 565 | — | — | 565 | — | 565 | |||||||||||||||||||||||||||||||
|
|
|
|
|
|
|
|
|
|
|
|
|
|
|
|
|
|
|||||||||||||||||||||||
Total contributions by owners |
* | 26 | — | 565 | 18 | — | 609 | — | 609 | |||||||||||||||||||||||||||||||
|
|
|
|
|
|
|
|
|
|
|
|
|
|
|
|
|
|
|||||||||||||||||||||||
Changes in ownership interests in subsidiaries |
||||||||||||||||||||||||||||||||||||||||
Changes in non-controlling interests without a loss of control |
— | — | 48 | — | — | — | 48 | 168 | 216 | |||||||||||||||||||||||||||||||
|
|
|
|
|
|
|
|
|
|
|
|
|
|
|
|
|
|
|||||||||||||||||||||||
Total changes in ownership interests in subsidiaries |
— | — | 48 | — | — | — | 48 | 168 | 216 | |||||||||||||||||||||||||||||||
|
|
|
|
|
|
|
|
|
|
|
|
|
|
|
|
|
|
|||||||||||||||||||||||
Total transactions with owners |
* | 26 | 48 | 565 | 18 | — | 657 | 168 | 825 | |||||||||||||||||||||||||||||||
|
|
|
|
|
|
|
|
|
|
|
|
|
|
|
|
|
|
|||||||||||||||||||||||
At December 31, 2019 |
* | 79 | (7,982 | ) | 3,552 | 49 | 11 | (4,291 | ) | 67 | (4,224 | ) | ||||||||||||||||||||||||||||
|
|
|
|
|
|
|
|
|
|
|
|
|
|
|
|
|
|
* | Amount less than $1 million |
Note |
2021 |
2020 |
2019 |
|||||||||||||
$ |
$ |
$ |
||||||||||||||
Cash flows from operating activities |
||||||||||||||||
Loss before income tax |
(3,552 | ) | (2,743 | ) | (3,981 | ) | ||||||||||
Adjustments for: |
||||||||||||||||
Amortization of intangible assets |
6 | 236 | 261 | 538 | ||||||||||||
Depreciation of property, plant and equipment |
5 | 109 | 126 | 109 | ||||||||||||
Impairment of intangible assets and goodwill |
6 | 8 | 28 | 28 | ||||||||||||
Impairment of property, plant and equipment |
5 | 7 | 15 | 32 | ||||||||||||
Equity-settled share-based payment |
18 | 357 | 54 | 34 | ||||||||||||
Finance costs |
21 | 1,701 | 1,490 | 1,056 | ||||||||||||
Net impairment loss on financial assets |
25 | 19 | 63 | 56 | ||||||||||||
Finance income |
21 | (65 | ) | (53 | ) | (85 | ) | |||||||||
(Gain)/Loss on disposal of property, plant and equipment |
(1 | ) | 9 | 1 | ||||||||||||
Loss on disposal of intangible assets |
— | * | 1 | |||||||||||||
Gain on disposal of associate |
(2 | ) | — | — | ||||||||||||
Share listing and associated expenses |
28 | 353 | — | — | ||||||||||||
Share of loss of equity-accounted investees (net of tax) |
8 | 8 | * | |||||||||||||
Change in provisions |
15 | 15 | 31 | (1 | ) | |||||||||||
|
|
|
|
|
|
|||||||||||
(807 | ) | (711 | ) | (2,212 | ) | |||||||||||
Changes in: |
||||||||||||||||
- Inventories |
(1 | ) | 2 | 2 | ||||||||||||
- Deposits pledged |
(83 | ) | — | — | ||||||||||||
- Trade and other receivables |
(181 | ) | 31 | (75 | ) | |||||||||||
- Trade and other payables |
137 | 42 | 181 | |||||||||||||
|
|
|
|
|
|
|||||||||||
Cash used in operations |
(935 | ) | (636 | ) | (2,104 | ) | ||||||||||
Income tax paid |
(3 | ) | (7 | ) | (8 | ) | ||||||||||
|
|
|
|
|
|
|||||||||||
Net cash used in operating activities |
(938 | ) | (643 | ) | (2,112 | ) | ||||||||||
|
|
|
|
|
|
|||||||||||
Cash flows from investing activities |
||||||||||||||||
Acquisition of property, plant and equipment |
(73 | ) | (22 | ) | (98 | ) | ||||||||||
Purchase of intangible assets |
(12 | ) | (18 | ) | (42 | ) | ||||||||||
Proceeds from disposal of property, plant and equipment |
25 | 63 | 6 | |||||||||||||
Acquisition of businesses, net of cash acquired |
— | (3 | ) | (22 | ) | |||||||||||
Acquisition of additional interests in associate |
(16 | ) | — | (10 | ) | |||||||||||
Proceeds from disposal of associate |
8 | — | — | |||||||||||||
Net (acquisitions of)/proceeds from other investments |
(2,717 | ) | (359 | ) | 579 | |||||||||||
Restricted cash |
10 | — | (30 | ) | (99 | ) | ||||||||||
Interest received |
28 | 51 | 79 | |||||||||||||
|
|
|
|
|
|
|||||||||||
Net cash (used in)/from investing activities |
(2,757 | ) | (318 | ) | 393 | |||||||||||
|
|
|
|
|
|
* | Amount less than $1 million |
Note |
2021 |
2020 |
2019 |
|||||||||||||
$ |
$ |
$ |
||||||||||||||
Cash flows from financing activities |
||||||||||||||||
Proceeds from exercise of share options |
46 | 5 | 6 | |||||||||||||
Proceeds from the reverse recapitalization |
4,425 | — | — | |||||||||||||
Proceeds from bank loans |
1,980 | 8 | — | |||||||||||||
Repayment of bank loans |
(176 | ) | (106 | ) | (69 | ) | ||||||||||
Payment of lease liabilities |
(24 | ) | (30 | ) | (28 | ) | ||||||||||
Proceeds from issuance of convertible redeemable preference shares |
463 | 1,389 | 1,938 | |||||||||||||
Acquisition of non-controlling interests without change in control |
(460 | ) | * | (203 | ) | |||||||||||
Proceeds from subscription of shares in subsidiaries by non-controlling interests without change in control |
443 | 329 | 327 | |||||||||||||
Deposits pledged |
(23 | ) | — | — | ||||||||||||
Interest paid |
(108 | ) | (17 | ) | (20 | ) | ||||||||||
|
|
|
|
|
|
|||||||||||
Net cash from financing activities |
6,566 | 1,578 | 1,951 | |||||||||||||
|
|
|
|
|
|
|||||||||||
Net increase in cash and cash equivalents |
2,871 | 617 | 232 | |||||||||||||
Cash and cash equivalents at January 1 |
2,004 | 1,372 | 1,128 | |||||||||||||
Effect of exchange rate fluctuations on cash held |
(37 | ) | 15 | 12 | ||||||||||||
|
|
|
|
|
|
|||||||||||
Cash and cash equivalents at December 31 |
10 | 4,838 | 2,004 | 1,372 | ||||||||||||
|
|
|
|
|
|
* | Amount less than $1 million |
1 |
Domicile and activities |
• | a special purpose acquisition company (“SPAC”) Altimeter Growth Corp (“AGC”), incorporated in the Cayman Islands and listed on the Nasdaq Stock Market (“NASDAQ”); and merging on December 1, 2021 with J2 Holdings Inc., incorporated in the Cayman Islands and a direct wholly owned subsidiary of GHL; with J2 Holdings Inc. surviving and remaining as a wholly owned subsidiary of GHL; |
• | GHI merging on December 1, 2021 with J3 Holdings Inc., incorporated in the Cayman Islands and a direct wholly owned subsidiary of GHL; with GHI surviving and becoming a wholly owned subsidiary of GHL; |
• | additional capitalisation by way of the issuance of GHL shares and warrants to third party investors on December 1, 2021 pursuant to investment commitments in previously agreed subscription agreements; and |
• | the Company becoming a publicly traded company on NASDAQ on December 2, 2021. |
2 |
Going concern |
3 |
Basis of preparation |
3.1 |
Statement of compliance |
3.2 |
Basis of measurement |
3.3 |
Functional and presentation currency |
3.4 |
Use of estimates and judgments |
• | Notes 4.11 and 19 – Revenue recognition: principal vs. agent considerations and customer identification; and |
• | Notes 4.3 (vii) and 11 – Debt and equity classification of compound financial instruments. |
• | Note 5 – Impairment test of property, plant and equipment: key assumptions underlying recoverable amounts. |
• | Note 6 – Impairment test of intangible assets and goodwill: key assumptions underlying recoverable amounts. |
• | Notes 4.4 (i) and 25 – Measurement of expected credit losses (“ECL”) for financial assets. |
• | Notes 15 and 29 – Recognition and measurement of provisions and contingencies: key assumptions about the likelihood and magnitude of an outflow of resources. |
• | Level 1: quoted prices (unadjusted) in active markets for identical assets or liabilities. |
• | Level 2: inputs other than quoted prices included in Level 1 that are observable for the asset or liability, either directly (i.e. as prices) or indirectly (i.e. derived from prices). |
• | Level 3: inputs for the asset or liability that are not based on observable market data (unobservable inputs). |
• | Note 6 – Intangible assets and goodwill, |
• | Note 18 – Share-based payment arrangements, |
• | Note 25 – Financial instruments, and |
• | Note 28 – Reverse Recapitalization |
3.5 |
Change in accounting policies and comparative information |
i) |
Change in accounting policies |
ii) |
Change in comparative information |
4 |
Significant accounting policies |
4.1 |
Basis of consolidation |
i) |
Business combinations |
• | the fair value of the consideration transferred; plus |
• | the recognized amount of any non-controlling interests (“NCI”) in the acquiree; plus |
• | if the business combination is achieved in stages, the fair value of the pre-existing equity interest in the acquiree, over the net recognized amount (generally fair value) of the identifiable assets acquired and liabilities assumed. Any goodwill that arises is tested annually for impairment. |
ii) |
Reverse acquisitions |
iii) |
Subsidiaries |
iv) |
Acquisitions from entities under common control |
v) |
Loss of control |
vi) |
Investments in associates and joint ventures (equity-accounted investees) |
vii) |
Investments in associates (measured at fair value through profit or loss) |
viii) |
Transactions eliminated on consolidation |
4.2 |
Foreign currency |
i) |
Foreign currency transactions |
ii) |
Foreign operations |
4.3 |
Financial instruments |
i) |
Recognition and initial measurement |
ii) |
Classification and subsequent measurement |
a) |
Financial assets |
• | it is held within a business model whose objective is to hold assets to collect contractual cash flows; and |
• | its contractual terms give rise on specified dates to cash flows that are solely payments of principal and interest on the principal amount outstanding. |
• | it is held within a business model whose objective is achieved by both collecting contractual cash flows and selling financial assets; and |
• | its contractual terms give rise on specified dates to cash flows that are solely payments of principal and interest on the principal amount outstanding. |
• | the stated policies and objectives for the portfolio and the operation of those policies in practice. These include whether management’s strategy focuses on earning contractual interest income, maintaining a particular interest rate profile, matching the duration of the financial assets to the duration of any related liabilities or expected cash outflows or realizing cash flows through the sale of the assets; |
• | how the performance of the portfolio is evaluated and reported to the Group’s management; |
• | the risks that affect the performance of the business model (and the financial assets held within that business model) and how those risks are managed; |
• | how managers of the business are compensated – e.g. whether compensation is based on the fair value of the assets managed or the contractual cash flows collected; and |
• | the frequency, volume and timing of sales of financial assets in prior years, the reasons for such sales and expectations about future sales activity. |
• | contingent events that would change the amount or timing of cash flows; |
• | terms that may adjust the contractual coupon rate, including variable-rate features; |
• | prepayment and extension features; and |
• | terms that limit the Group’s claim to cash flows from specified assets (e.g. non-recourse features). |
b) |
Financial liabilities – Classification, subsequent measurement and gains and losses |
iii) |
Derecognition |
a) |
Financial assets |
b) |
Financial liabilities |
iv) |
Offsetting |
v) |
Cash and cash equivalents |
vi) |
Share capital |
vii) |
Warrants |
viii) |
Compound financial instruments |
4.4 |
Impairment |
i) |
Non-derivative financial assets |
• | 12-month ECLs: these are ECLs that result from default events that are possible within the 12 months after the reporting date (or for a shorter period if the expected life of the instrument is less than 12 months); or |
• | Lifetime ECLs: these are ECLs that result from all possible default events over the expected life of a financial instrument or contract asset. |
• | the borrower is unlikely to pay its credit obligations to the Group in full, without recourse by the Group to actions such as realizing security (if any is held); or |
• | the financial asset is more than 90 days past due (more than 120 days past due for trade receivables). |
• | significant financial difficulty of the borrower or issuer; |
• | a breach of contract such as a default or being more than 90 days past due (more than 120 days past due for trade receivables); |
• | the restructuring of a loan or advance by the Group on terms that the Group would not consider otherwise; |
• | it is probable that the borrower will enter bankruptcy or another financial reorganization; or |
• | the disappearance of an active market for a security because of financial difficulties. |
ii) |
Non-financial assets |
4.5 |
Property, plant and equipment |
i) |
Recognition and measurement |
• | any other costs directly attributable to bringing the assets to a working condition for their intended use; and |
• | when the Group has an obligation to remove the asset or restore the site, an estimate of the costs of dismantling and removing the items and restoring the site on which they are located. |
ii) |
Subsequent costs |
iii) |
Depreciation |
• | Computers | 2 - 3 years | ||
• | Building and renovation | 3 - 4 years | ||
• | Motor vehicles | 5 - 7 years | ||
• | Office and other equipment | 4 - 5 years |
4.6 |
Intangible assets and goodwill |
i) |
Recognition and measurement |
a) |
Goodwill |
b) |
Research and development |
c) |
Other intangible assets |
ii) |
Subsequent expenditure |
iii) |
Amortization |
• | Software | 3 years | ||
• | Non-compete agreement |
4 years | ||
• | Other intangible assets | 3 years |
4.7 |
Leases |
i) |
As a lessee |
• | fixed payments, including in-substance fixed payments; |
• | variable lease payments that depend on an index or a rate, initially measured using the index or rate as at the commencement date; |
• | amounts expected to be payable under a residual value guarantee; and |
• | the exercise price under a purchase option that the Group is reasonably certain to exercise, lease payments in an optional renewal period if the Group is reasonably certain to exercise an extension option, and penalties for early termination of a lease unless the Group is reasonably certain not to terminate early. |
ii) |
As a lessor |
4.8 |
Inventories |
4.9 |
Employee benefits |
i) |
Defined contribution plans |
ii) |
Defined benefits plans |
iii) |
Short-term employee benefits |
iv) |
Employee leave entitlement |
v) |
Share-based payment transactions |
4.10 |
Provisions |
4.11 |
Revenue |
i) |
Revenue by segment |
a) |
Deliveries |
b) |
Mobility |
• | the driver-partners (to connect the drive-partners with consumers to facilitate and successfully complete transportation and delivery services), |
• | the merchant-partners (to connect the merchant-partners with consumers to facilitate and successfully complete ordering services); and |
• | the consumer (to connect the consumer with driver-partners and merchant-partners). |
c) |
Financial services |
d) |
Enterprise and new initiatives |
ii) |
Incentives to customers |
4.12 |
Expenses |
i) | Cost of revenue comprises expenses directly or indirectly attributable to the Group’s Deliveries, Mobility, Financial Services and Enterprise offerings (see Note 4.11) and primarily consists of data management and platform related technology costs including amortization of technology and market activity related intangible assets, compensation costs (including share-based compensation) for operations and support personnel, payment processing fees, costs incurred in relation to its motor vehicle fleet used for rental services including depreciation and impairment; and an allocation of associated corporate costs such as depreciation of right-of-use |
ii) | Sales and marketing primarily consist of advertising costs, compensation costs (including share-based compensation) to sales and marketing employees and an allocation of associated corporate costs such as depreciation of right-of-use assets. |
iii) | Research and development expenses primarily consist of compensation cost (including share-based compensation) to engineering, design and product development employees, and allocation of associated corporate costs such as depreciation of right-of-use assets. |
iv) | General and administrative expenses primarily consist of compensation costs (including share-based compensation) for executive management and administrative personnel (including finance and accounting, human resources, policy and communications, legal, facility and general administration employees), occupancy and facility costs, administrative fees, professional service fees, depreciation on certain administration assets, legal settlement accrual and allocation of associated corporate costs such as depreciation of right-of-use assets. |
4.13 |
Finance income and finance costs |
• | interest income; |
• | interest expense; |
• | the net gain or loss on financial assets at FVTPL; |
• | the foreign currency gain or loss on financial assets and financial liabilities; |
• | the gain or loss on modification of financial liabilities; and |
• | the unwinding of the discount on provisions. |
• | the gross carrying amount of the financial asset; or |
• | the amortized cost of the financial liability. |
4.14 |
Related parties |
4.15 |
Income tax |
• | temporary differences on the initial recognition of assets or liabilities in a transaction that is not a business combination and that affects neither accounting nor taxable profit or loss; |
• | temporary differences related to investments in subsidiaries to the extent that the Group is able to control the timing of the reversal of the temporary difference and it is probable that they will not reverse in the foreseeable future; and |
• | taxable temporary differences arising on the initial recognition of goodwill. |
4.16 |
Loss per share |
4.17 |
Segment reporting |
4.18 |
Government grants |
4.19 |
Standards issued but not yet effective |
• | Onerous contracts – Cost of Fulfilling a Contract (Amendments to IAS 37) |
• | Deferred Tax related to Assets and Liabilities arising from a Single Transaction (Amendments to IAS 12) |
• | COVID-19-Related June 2021 (Amendment to IFRS 16) |
• | Annual Improvements to IFRS Standards 2018–2020 |
• | Property, Plant and Equipment: Proceeds before Intended Use (Amendments to IAS 16) |
• | Reference to Conceptual Framework (Amendments to IFRS 3) |
• | Classification of Liabilities as Current or Non-current (Amendments to IAS 1) |
• | IFRS 17 Insurance Contracts and amendments to IFRS 17 Insurance Contracts |
• | Disclosure of Accounting Policies (Amendments to IAS 1 and IFRS Practice Statement 2) |
• | Definition of Accounting Estimates (Amendments to IAS 8) |
5 |
Property, plant and equipment |
i) |
Reconciliation of carrying amount |
Computers |
Buildings and renovation |
Motor vehicles held for leasing |
Office and other equipment |
Total |
||||||||||||||||
(in $ millions) |
$ |
$ |
$ |
$ |
$ |
|||||||||||||||
Cost |
||||||||||||||||||||
At January 1, 2020 |
45 | 117 | 564 | 33 | 759 | |||||||||||||||
Additions |
6 | 30 | 23 | 4 | 63 | |||||||||||||||
Write-offs/disposal |
(2 | ) | (20 | ) | (104 | ) | (1 | ) | (127 | ) | ||||||||||
Effects of movements in exchange rates |
1 | 2 | 3 | * | 6 | |||||||||||||||
|
|
|
|
|
|
|
|
|
|
|||||||||||
At December 31, 2020 |
50 | 129 | 486 | 36 | 701 | |||||||||||||||
Additions |
16 | 136 | 41 | 6 | 199 | |||||||||||||||
Write-offs/disposal |
(3 | ) | (39 | ) | (48 | ) | (2 | ) | (92 | ) | ||||||||||
Effects of movements in exchange rates |
(1 | ) | 2 | (9 | ) | (1 | ) | (9 | ) | |||||||||||
|
|
|
|
|
|
|
|
|
|
|||||||||||
At December 31, 2021 |
62 | 228 | 470 | 39 | 799 | |||||||||||||||
|
|
|
|
|
|
|
|
|
|
Computers |
Buildings and renovation |
Motor vehicles held for leasing |
Office and other equipment |
Total |
||||||||||||||||
(in $ millions) |
$ |
$ |
$ |
$ |
$ |
|||||||||||||||
Accumulated depreciation and impairment losses |
||||||||||||||||||||
At January 1, 2020 |
20 | 46 | 148 | 11 | 225 | |||||||||||||||
Depreciation for the year |
15 | 39 | 65 | 7 | 126 | |||||||||||||||
Write-offs/disposal |
(1 | ) | (15 | ) | (39 | ) | * | (55 | ) | |||||||||||
Impairment loss |
— | * | 15 | — | 15 | |||||||||||||||
Effects of movements in exchange rates |
1 | 2 | 3 | * | 6 | |||||||||||||||
|
|
|
|
|
|
|
|
|
|
|||||||||||
At December 31, 2020 |
35 | 72 | 192 | 18 | 317 | |||||||||||||||
Depreciation for the year |
16 | 34 | 53 | 6 | 109 | |||||||||||||||
Write-offs/disposal |
(3 | ) | (39 | ) | (24 | ) | (2 | ) | (68 | ) | ||||||||||
Impairment loss |
— | 1 | 6 | — | 7 | |||||||||||||||
Effects of movements in exchange rates |
(1 | ) | (1 | ) | (4 | ) | (1 | ) | (7 | ) | ||||||||||
|
|
|
|
|
|
|
|
|
|
|||||||||||
At December 31, 2021 |
47 | 67 | 223 | 21 | 358 | |||||||||||||||
|
|
|
|
|
|
|
|
|
|
|||||||||||
Carrying amounts |
||||||||||||||||||||
At January 1, 2020 |
25 | 71 | 416 | 22 | 534 | |||||||||||||||
At December 31, 2020 |
15 | 57 | 294 | 18 | 384 | |||||||||||||||
At December 31, 2021 |
15 | 161 | 247 | 18 | 441 |
* | Amount less than $1 million |
ii) |
Depreciation of property, plant and equipment |
iii) |
Impairment of motor vehicles held for leasing |
2021 |
2020 |
2019 |
||||||||||
% |
% |
% |
||||||||||
Discount rate |
6.6 to 12 | 6.9 to 12 | 6.7 to 12 | |||||||||
Budgeted rental rate growth/(decline) |
0 to 1.8 | 0 to 4 | (1) to 0 | |||||||||
Utilization rates |
46 to 94 | 45 to 95 | 93 to 97 |
6 |
Intangible assets and goodwill |
i) |
Reconciliation of carrying amount |
Software |
Goodwill |
Non-compete agreement |
Other intangible assets |
Total |
||||||||||||||||
(in $ millions) |
$ |
$ |
$ |
$ |
$ |
|||||||||||||||
Cost |
||||||||||||||||||||
At January 1, 2020 |
66 | 709 | 1,644 | 17 | 2,436 | |||||||||||||||
Additions |
6 | — | — | * | 6 | |||||||||||||||
Acquisitions – internally developed |
12 | — | — | — | 12 | |||||||||||||||
Acquisition through business combination |
2 | 3 | — | — | 5 | |||||||||||||||
Disposals/Write-off |
(2 | ) | — | — | — | (2 | ) | |||||||||||||
Effects of movements in exchange rates |
* | — | — | * | * | |||||||||||||||
|
|
|
|
|
|
|
|
|
|
|||||||||||
At December 31, 2020 |
84 | 712 | 1,644 | 17 | 2,457 | |||||||||||||||
Additions |
2 | — | — | 1 | 3 | |||||||||||||||
Acquisitions – internally developed |
9 | — | — | — | 9 | |||||||||||||||
Disposals/Write-off/Derecognition |
(1 | ) | — | — | — | (1 | ) | |||||||||||||
Effects of movements in exchange rates |
(5 | ) | — | — | * | (5 | ) | |||||||||||||
|
|
|
|
|
|
|
|
|
|
|||||||||||
At December 31, 2021 |
89 | 712 | 1,644 | 18 | 2,463 | |||||||||||||||
|
|
|
|
|
|
|
|
|
|
* | Amount less than $1 million |
Software |
Goodwill |
Non-compete agreement |
Other intangible assets |
Total |
||||||||||||||||
(in $ millions) |
$ |
$ |
$ |
$ |
$ |
|||||||||||||||
Accumulated amortization and impairment losses |
| |||||||||||||||||||
At January 1, 2020 |
27 | 28 | 1,188 | 13 | 1,256 | |||||||||||||||
Amortization for the year |
18 | — | 242 | 1 | 261 | |||||||||||||||
Disposal |
(2 | ) | — | — | — | (2 | ) | |||||||||||||
Impairment loss |
— | 28 | — | — | 28 | |||||||||||||||
Effects of movements in exchange rates |
* | — | — | 1 | 1 | |||||||||||||||
|
|
|
|
|
|
|
|
|
|
|||||||||||
At December 31, 2020 |
43 | 56 | 1,430 | 15 | 1,544 | |||||||||||||||
Amortization for the year |
21 | — | 214 | 1 | 236 | |||||||||||||||
Disposal/Derecognition |
(1 | ) | — | — | — | (1 | ) | |||||||||||||
Impairment loss |
— | 8 | — | — | 8 | |||||||||||||||
Effects of movements in exchange rates |
* | 1 | — | * | 1 | |||||||||||||||
|
|
|
|
|
|
|
|
|
|
|||||||||||
At December 31, 2021 |
63 | 65 | 1,644 | 16 | 1,788 | |||||||||||||||
|
|
|
|
|
|
|
|
|
|
|||||||||||
Carrying amounts |
||||||||||||||||||||
At January 1, 2020 |
39 | 681 | 456 | 4 | 1,180 | |||||||||||||||
At December 31, 2020 |
41 | 656 | 214 | 2 | 913 | |||||||||||||||
At December 31, 2021 |
26 | 647 | — | 2 | 675 |
* | Amount less than $1 million |
ii) |
Development costs |
iii) |
Amortization |
2021 |
2020 |
2019 |
||||||||||
(in $ millions) |
$ |
$ |
$ |
|||||||||
Amortization of intangible assets |
236 | 261 | 538 |
iv) |
Impairment testing for CGUs containing goodwill |
Note |
2021 |
2020 |
||||||||||
(in $ millions) |
reference |
$ |
$ |
|||||||||
Goodwill allocated |
||||||||||||
Southeast Asia Ride Hailing CGUs |
6(iv)(a) | 606 | 606 | |||||||||
Indonesia Payment CGU |
6(iv)(b) | 34 | 34 | |||||||||
Multiple units without significant goodwill |
7 | 16 |
Impairment losses on goodwill are included in ‘Other expenses’ (see Note 20(ii)). |
2021 |
2020 |
2019 |
||||||||||
(in $ millions) |
$ |
$ |
$ |
|||||||||
Impairment loss on goodwill |
8 | 28 | 28 |
a) |
Southeast Asia ride hailing cash generating units (“Ride Hailing CGUs”) |
b) |
Indonesian mobile payments and rewards cash generating unit (“Indonesia Payment CGU”) |
7 |
Other investments |
2021 |
2020 |
|||||||
(in $ millions) |
$ |
$ |
||||||
Non-current investments |
||||||||
Time deposits |
2 | * | ||||||
Debt investments – at FVTPL |
621 | 234 | ||||||
Equity investments – at FVTPL |
618 | 143 | ||||||
|
|
|
|
|||||
1,241 | 377 | |||||||
|
|
|
|
|||||
Current investments |
||||||||
Time deposits |
3,176 | 1,282 | ||||||
Debt investments – at FVTPL |
64 | 16 | ||||||
|
|
|
|
|||||
3,240 | 1,298 | |||||||
|
|
|
|
|||||
4,481 | 1,675 | |||||||
|
|
|
|
* | Amount less than $1 million |
i) |
Equity investments |
ii) |
Time deposits |
iii) |
Financial risk management |
8 |
Trade and other receivables |
2021 |
2020 |
|||||||
(in $ millions) |
$ |
$ |
||||||
Current |
||||||||
Trade receivables |
117 | 124 | ||||||
Less: Loss allowance (see Note 25) |
(22 | ) | (40 | ) | ||||
|
|
|
|
|||||
95 | 84 | |||||||
|
|
|
|
|||||
Loans and advances |
118 | 40 | ||||||
Less: Loss allowance (see Note 25) |
(11 | ) | (9 | ) | ||||
|
|
|
|
|||||
107 | 31 | |||||||
|
|
|
|
|||||
Payment cycle receivables |
71 | 69 | ||||||
Less: Loss allowance |
(18 | ) | (12 | ) | ||||
|
|
|
|
|||||
53 | 57 | |||||||
|
|
|
|
|||||
255 | 172 | |||||||
|
|
|
|
i) |
Trade receivables |
ii) |
Loans and advances |
iii) |
Payment cycle receivables |
iv) |
Financial risk management |
9 |
Prepayments and other assets |
2021 |
2020 |
|||||||
(in $ millions) |
$ |
$ |
||||||
Non-current |
||||||||
Deposits |
127 | 4 | ||||||
Current |
||||||||
Prepayments |
81 | 34 | ||||||
Tax recoverable |
48 | 25 | ||||||
Deposits |
48 | 35 | ||||||
Others |
23 | 28 | ||||||
Less: Loss allowance |
(15 | ) | (13 | ) | ||||
|
|
|
|
|||||
185 | 109 | |||||||
|
|
|
|
Tax recoverable |
10 |
Cash and cash equivalents |
2021 |
2020 |
|||||||
(in $ millions) |
$ |
$ |
||||||
Short-term deposits |
594 | 287 | ||||||
Cash at banks and on hand |
4,397 | 1,886 | ||||||
|
|
|
|
|||||
Cash and cash equivalents in the statement of financial position |
4,991 | 2,173 | ||||||
Restricted cash |
(153 | ) | (169 | ) | ||||
|
|
|
|
|||||
Cash and cash equivalents in the statement of cash flows |
4,838 | 2,004 | ||||||
|
|
|
|
i) |
Classification as cash equivalents |
ii) |
Restricted cash |
11 |
Capital and reserves |
i) |
Share capital and share premium |
(a) |
Movements in GHI ordinary shares and GHI convertible redeemable preference shares (collectively “GHI Shares”) |
(in thousands of shares) Grab Holdings Inc. |
Note |
Ordinary shares # |
CRPS # |
|||||||||||||||||||||||||
2021 |
2020 |
2019 |
2021 |
2020 |
2019 |
|||||||||||||||||||||||
In issue on January 1 |
198,538 | 161,371 | 140,786 | 2,871,351 | 2,576,688 | 2,166,043 | ||||||||||||||||||||||
Issued for acquisition of NCI/ in business combination |
964 | 19,332 | 1,134 | — | 652 | 869 | ||||||||||||||||||||||
Issued for cash |
— | — | — | 98,065 | 294,011 | 409,776 | ||||||||||||||||||||||
Restricted share units vested |
18 | 11,810 | 10,166 | 10,253 | — | — | — | |||||||||||||||||||||
Exercise of share options |
18 | 61,845 | 7,669 | 9,198 | — | — | — | |||||||||||||||||||||
Restricted ordinary shares |
18 | 32,452 | — | — | — | — | — | |||||||||||||||||||||
Exchange for GHL Class A and Class B ordinary shares as part of Reverse Recapitalization |
11(i)(b), 28 | (305,609 | ) | — | — | (2,969,416 | ) | — | — | |||||||||||||||||||
|
|
|
|
|
|
|
|
|
|
|
|
|||||||||||||||||
In issue at December 31 – fully paid |
— | 198,538 | 161,371 | — | 2,871,351 | 2,576,688 | ||||||||||||||||||||||
|
|
|
|
|
|
|
|
|
|
|
|
# |
the number of shares have been retrospectively restated to reflect the exchange ratio to receive 1.3032888 GHL Ordinary Shares for each GHI Share |
(b) |
Movements in GHL Class A ordinary shares and Class B ordinary shares (collectively “GHL Ordinary Shares”): |
(in thousands of shares) Grab Holdings Limited |
Note |
Class A ordinary shares |
Class B ordinary shares |
|||||||
Issuance of GHL shares as part of Reverse Recapitalization |
||||||||||
Exchange of GHI ordinary shares and CRPS |
11(i)(a) |
3,152,143 | 122,882 | |||||||
Merger with AGC |
28 |
62,491 | — | |||||||
Issued for cash to external investors |
28 |
404,009 | — | |||||||
Restricted share units vested |
276 | — | ||||||||
Exercise of share options |
179 | — | ||||||||
|
|
|
|
|||||||
In issue at December 31 |
3,619,098 | 122,882 | ||||||||
Restricted ordinary shares issued but not paid |
— | (32,452) | ||||||||
|
|
|
|
|||||||
In issue at December 31 – fully paid |
3,619,098 | 90,430 | ||||||||
|
|
|
|
ii) |
Nature and purpose of reserves |
2021 |
2020 |
|||||||
(in $ millions) |
$ |
$ |
||||||
CRPS reserve |
— | 3,850 | ||||||
Share option reserve |
382 | 79 | ||||||
Foreign currency translation reserve |
(19 | ) | 22 | |||||
Other reserve |
243 | — | ||||||
|
|
|
|
|||||
606 | 3,951 | |||||||
|
|
|
|
a) |
CRPS reserve and liability component |
2021 |
2020 |
|||||||
(in $ millions) |
$ |
$ |
||||||
Balance at January 1 |
10,767 | 8,256 | ||||||
Issuance of CRPS |
436 | 1,095 | ||||||
Interest expense |
1,570 | 1,416 | ||||||
Preference shares converted to GHL Ordinary Shares |
(12,773 | ) | — | |||||
|
|
|
|
|||||
Balance at December 31 |
— | 10,767 | ||||||
|
|
|
|
b) |
Share option reserve |
c) |
Foreign currency translation reserve |
d) |
Other reserve |
iii) |
Dividends |
12 |
Subsidiaries and non-controlling interests |
Name of subsidiaries |
Country of incorporation/ operation |
Ownership interests held by the Group |
||||||||
2021 |
2020 |
|||||||||
% |
% |
|||||||||
Grab Holdings Inc. |
Cayman | 100 | * | |||||||
Grab Inc. |
Cayman | 100 | 100 | |||||||
A2G Holdings Inc. |
Cayman | 100 | 100 |
* | Refer to Note 1 for details. |
(in $ millions) |
$ |
|||
Carrying amount of BCP NCI acquired |
(130 | ) | ||
Consideration paid/payable to BCP NCI |
460 | |||
Decrease in equity attributable to owners of the Company |
(590 | ) |
13 |
Warrant liabilities |
2021 |
||||||||||||
Registered for resale |
In process of registration for resale |
Total |
||||||||||
(in $ millions) |
$ |
$ |
$ |
|||||||||
Initial recognition |
36 | 55 | 91 | |||||||||
Change in fair value |
(15 | ) | (22 | ) | (37 | ) | ||||||
|
|
|
|
|
|
|||||||
As at 31 December 2021 |
21 | 33 | 54 | |||||||||
|
|
|
|
|
|
14 |
Loans and borrowings |
2021 |
2020 |
|||||||
(in $ millions) |
$ |
$ |
||||||
Non-current |
||||||||
Bank loans |
55 | 91 | ||||||
Term loan |
1,875 | — | ||||||
Lease liabilities |
101 | 20 | ||||||
|
|
|
|
|||||
2,031 | 111 | |||||||
|
|
|
|
|||||
Current |
||||||||
Bank loans |
83 | 121 | ||||||
Term loan |
39 | — | ||||||
Lease liabilities |
22 | 19 | ||||||
|
|
|
|
|||||
144 | 140 | |||||||
|
|
|
|
i) |
Terms and debt repayment schedule |
Currency |
Nominal interest rate |
Year of maturity |
Carrying amount |
|||||||||||||
% |
$ |
|||||||||||||||
2021 |
||||||||||||||||
Bank loans |
SGD | 1.5% to 2.16% | 2022-2026 |
77 | ||||||||||||
Bank loans |
SGD | COF* + 1% to 1.1% | 2022-2024 | 11 | ||||||||||||
Bank loans |
MYR | 3.09% | 2022-2024 | 8 | ||||||||||||
Bank loans |
IDR | 2.48% to 11.5% | 2022-2025 | 15 | ||||||||||||
Bank loans |
IDR | COF* + 1.75% to 2.00% | 2022-2025 | 12 | ||||||||||||
Bank loans |
THB | COF* + 7.0% | 2022 | 15 | ||||||||||||
Term loan |
USD | |
5.5% (based on contractual terms) |
|
2026 | 1,914 | ||||||||||
Lease liabilities |
Multiple | 1.85% to 11% | 2022-2037 | 123 | ||||||||||||
|
|
|||||||||||||||
2,175 | ||||||||||||||||
|
|
|||||||||||||||
2020 |
||||||||||||||||
Bank loans |
SGD | 1.82% to 2.16% | 2021-2026 |
110 | ||||||||||||
Bank loans |
SGD | COF* + 0.85% to 1.1% | 2021-2025 | 29 | ||||||||||||
Bank loans |
MYR | 3.09% | 2021-2024 | 12 | ||||||||||||
Bank loans |
IDR | 2.48% to 11.5% | 2021-2025 | 36 | ||||||||||||
Bank loans |
IDR | COF* + 1.75% to 2.00% | 2021-2025 | 21 | ||||||||||||
Bank loans |
THB | COF* + 7.0% | 2021 | 4 | ||||||||||||
Lease liabilities |
Multiple | 1.85% to 11% | 2021-2030 | 39 | ||||||||||||
|
|
|||||||||||||||
251 | ||||||||||||||||
|
|
* |
cost of funds |
ii) |
Breach of loan covenant |
iii) |
Financial risk management |
iv) |
Reconciliation of movements of liabilities to cash flows arising from financing activities |
Liabilities |
||||||||||||||||||||||||
Convertible redeemable preference shares (Note 11) |
Bank loans |
Term loan |
Lease liabilities |
Equity component of convertible redeemable preference shares |
Total |
|||||||||||||||||||
(in $ millions) |
$ |
$ |
$ |
$ |
$ |
$ |
||||||||||||||||||
Balance at January 1, 2021 |
10,767 | 212 | — | 39 | 3,850 | 14,868 | ||||||||||||||||||
Changes from financing cash flows |
||||||||||||||||||||||||
Proceeds from issuance of CRPS |
436 | — | — | — | 27 | 463 | ||||||||||||||||||
Proceeds from bank loans |
— | 60 | 1,920 | — | — | 1,980 | ||||||||||||||||||
Payment of bank loans |
— | (151 | ) | (25 | ) | — | — | (176 | ) | |||||||||||||||
Payment of lease liabilities |
— | — | — | (24 | ) | — | (24 | ) | ||||||||||||||||
Interest paid |
— | (23 | ) | (83 | ) | (2 | ) | — | (108 | ) | ||||||||||||||
|
|
|
|
|
|
|
|
|
|
|
|
|||||||||||||
Total changes from financing cash flows |
436 | (114 | ) | 1,812 | (26 | ) | 27 | 2,135 | ||||||||||||||||
|
|
|
|
|
|
|
|
|
|
|
|
|||||||||||||
Effect of changes in foreign exchange rates |
— | (3 | ) | (1 | ) | (1 | ) | — | (5 | ) | ||||||||||||||
|
|
|
|
|
|
|
|
|
|
|
|
|||||||||||||
Other changes |
||||||||||||||||||||||||
Liability-related |
||||||||||||||||||||||||
Recognition of lease liabilities |
— | — | — | 106 | — | 106 | ||||||||||||||||||
Derecognition of lease liabilities |
— | — | — | * | — | * | ||||||||||||||||||
Secured bank loans for asset acquisition |
— | 20 | — | — | — | 20 | ||||||||||||||||||
Interest expense |
1,570 | 23 | 103 | 5 | — | 1,701 | ||||||||||||||||||
CRPS converted to GHL ordinary shares |
(12,773 | ) | — | — | — | (3,877 | ) | (16,650 | ) | |||||||||||||||
|
|
|
|
|
|
|
|
|
|
|
|
|||||||||||||
Total liability-related other changes |
(11,203 | ) | 43 | 103 | 111 | (3,877 | ) | (14,823 | ) | |||||||||||||||
|
|
|
|
|
|
|
|
|
|
|
|
|||||||||||||
Balance at December 31, 2021 |
— | 138 | 1,914 | 123 | — | 2,175 | ||||||||||||||||||
|
|
|
|
|
|
|
|
|
|
|
|
Liabilities |
||||||||||||||||||||||||
Convertible redeemable preference shares (Note 11) |
Bank loans |
Term loan |
Lease liabilities |
Equity component of convertible redeemable preference shares |
Total |
|||||||||||||||||||
(in $ millions) |
$ |
$ |
$ |
$ |
$ |
$ |
||||||||||||||||||
Balance at January 1, 2020 |
8,256 | 296 | — | 49 | 3,552 | 12,153 | ||||||||||||||||||
Changes from financing cash flows |
||||||||||||||||||||||||
Proceeds from issuance of CRPS |
1,091 | — | — | — | 298 | 1,389 | ||||||||||||||||||
Proceeds from bank loans |
— | 8 | — | — | — | 8 | ||||||||||||||||||
Payment of bank loans |
— | (106 | ) | — | — | — | (106 | ) | ||||||||||||||||
Payment of lease liabilities |
— | — | — | (30 | ) | — | (30 | ) | ||||||||||||||||
Interest paid |
— | (14 | ) | — | (3 | ) | — | (17 | ) | |||||||||||||||
|
|
|
|
|
|
|
|
|
|
|
|
|||||||||||||
Total changes from financing cash flows |
1,091 | (112 | ) | — | (33 | ) | 298 | 1,244 | ||||||||||||||||
|
|
|
|
|
|
|
|
|
|
|
|
|||||||||||||
The effect of changes in foreign exchange rates |
— | (3 | ) | — | 1 | — | (2 | ) | ||||||||||||||||
|
|
|
|
|
|
|
|
|
|
|
|
|||||||||||||
Other changes |
||||||||||||||||||||||||
Liability-related |
||||||||||||||||||||||||
Issuance of CRPS |
4 | — | — | — | — | 4 | ||||||||||||||||||
Recognition of lease liabilities |
— | — | — | 24 | — | 24 | ||||||||||||||||||
Derecognition of lease liabilities |
— | — | — | (5 | ) | — | (5 | ) | ||||||||||||||||
Secured bank loans for asset acquisition |
— | 17 | — | — | — | 17 | ||||||||||||||||||
Interest expense |
1,416 | 14 | — | 3 | — | 1,433 | ||||||||||||||||||
|
|
|
|
|
|
|
|
|
|
|
|
|||||||||||||
Total liability-related other changes |
1,420 | 31 | — | 22 | — | 1,473 | ||||||||||||||||||
|
|
|
|
|
|
|
|
|
|
|
|
|||||||||||||
Balance at December 31, 2020 |
10,767 | 212 | — | 39 | 3,850 | 14,868 | ||||||||||||||||||
|
|
|
|
|
|
|
|
|
|
|
|
15 |
Provisions |
2021 |
2020 |
|||||||
(in $ millions) |
$ |
$ |
||||||
Site restoration |
21 | 6 | ||||||
Legal |
32 | 32 | ||||||
|
|
|
|
|||||
53 | 38 | |||||||
|
|
|
|
2021 |
2020 |
|||||||
(in $ millions) |
$ |
$ |
||||||
Non-current |
18 | 3 | ||||||
Current |
35 | 35 | ||||||
|
|
|
|
|||||
53 | 38 | |||||||
|
|
|
|
i) |
Site restoration |
2021 |
2020 |
|||||||
(in $ millions) |
$ |
$ |
||||||
Balance at January 1 |
6 | 6 | ||||||
Provisions made during the year |
18 | 1 | ||||||
Provisions reversed during the year |
(3 | ) | (1 | ) | ||||
|
|
|
|
|||||
Balance at December 31 |
21 | 6 | ||||||
|
|
|
|
ii) |
Legal |
2021 |
2020 |
|||||||
(in $ millions) |
$ |
$ |
||||||
Balance at January 1 |
32 | * | ||||||
Provisions made during the year |
1 | 31 | ||||||
Effect of movements in exchange rates |
(1 | ) | 1 | |||||
|
|
|
|
|||||
Balance at December 31 |
32 | 32 | ||||||
|
|
|
|
* | Amounts less than $1 million |
16 |
Trade and other payables |
2021 |
2020 |
|||||||
(in $ millions) |
$ |
$ |
||||||
Non-current liabilities |
||||||||
Other payables |
12 | 3 | ||||||
Employee defined benefit |
15 | 15 | ||||||
|
|
|
|
|||||
27 | 18 | |||||||
|
|
|
|
|||||
Current liabilities |
||||||||
Trade payables |
167 | 109 | ||||||
Accrued operating expenses |
345 | 278 | ||||||
Electronic wallets |
242 | 204 | ||||||
Tax payables |
29 | 20 | ||||||
Deposits |
20 | 17 | ||||||
Contract liabilities |
9 | 13 | ||||||
Others |
32 | 20 | ||||||
|
|
|
|
|||||
844 | 661 | |||||||
|
|
|
|
i) |
Employee defined benefit |
ii) |
Tax payables |
iii) |
Financial risk management |
17 |
Income taxes |
i) |
Amounts recognized in profit or loss |
2021 |
2020 |
2019 |
||||||||||
(in $ millions) |
$ |
$ |
$ |
|||||||||
Current tax expense |
||||||||||||
Current year |
6 | 7 | 6 | |||||||||
Changes in estimates related to prior years |
* | * | 2 | |||||||||
|
|
|
|
|
|
|||||||
6 | 7 | 8 | ||||||||||
|
|
|
|
|
|
|||||||
Deferred tax (credit)/expense |
||||||||||||
Origination and reversal of temporary difference |
(3 | ) | (5 | ) | (1 | ) | ||||||
|
|
|
|
|
|
|||||||
Income tax expense |
3 | 2 | 7 | |||||||||
|
|
|
|
|
|
* | Amount less than $1 million |
ii) |
Reconciliation of effective tax rate |
2021 |
2020 |
2019 |
||||||||||
(in $ millions) |
$ |
$ |
$ |
|||||||||
Loss before tax |
(3,552 | ) | (2,743 | ) | (3,981 | ) | ||||||
Tax at the domestic rates applicable to profits in the countries where the Group operates |
(238 | ) | (241 | ) | (606 | ) | ||||||
Non-deductible expenses |
46 | 66 | 108 | |||||||||
Current year losses for which no deferred tax asset is recognized |
211 | 196 | 513 | |||||||||
Benefits from previously unrecognized tax losses |
(16 | ) | (19 | ) | (10 | ) | ||||||
Changes in estimates related to prior years |
* | * | 2 | |||||||||
|
|
|
|
|
|
|||||||
Income tax expense |
3 | 2 | 7 | |||||||||
|
|
|
|
|
|
* | Amount less than $1 million |
iii) |
Movement in deferred tax balances |
2021 |
2020 |
|||||||
(in $ millions) |
$ |
$ |
||||||
Deferred tax assets |
||||||||
Deferred revenue and others |
5 | — | ||||||
Deferred tax liabilities |
||||||||
Property, plant and equipment and others |
3 | 1 |
Deferred tax liability arising from Property, plant and equipment and others |
Deferred tax asset arising from Deferred revenue and others |
|||||||
(in $ millions) |
$ |
$ |
||||||
Balance at January 1, 2020 |
6 | — | ||||||
Recognized in profit or loss |
(5 | ) | — | |||||
|
|
|
|
|||||
Balance at December 31, 2020 |
1 | — | ||||||
|
|
|
|
|||||
Balance at January 1, 2021 |
1 | — | ||||||
Recognized in profit or loss |
2 | 5 | ||||||
|
|
|
|
|||||
Balance at December 31, 2021 |
3 | 5 | ||||||
|
|
|
|
iv) |
Unrecognized deferred tax assets |
2021 |
2020 |
|||||||
(in $ millions) |
$ |
$ |
||||||
Unutilized tax losses |
6,324 | 4,933 |
v) |
Tax losses carried forward |
Expire by |
$ |
|||
(in $ millions) |
||||
2022 |
407 | |||
2023 |
922 | |||
2024 |
1,614 | |||
2025 |
600 | |||
2026 |
496 | |||
2027 |
— | |||
2028 |
72 | |||
2029 |
27 | |||
2030 |
7 |
18 |
Share-based payment arrangements |
i) |
Description of the share-based payment arrangements |
1. | grant options to purchase its ordinary shares (‘Share Options’); or |
2. | issue restricted share units/awards (‘RSUs’); or |
3. | issued restricted ordinary shares |
a) |
Reconciliation of outstanding Share Options |
Weighted average |
Weighted-average |
|||||||||||
Number of Share |
exercise price per |
remaining contractual |
||||||||||
Options # |
GHI share # |
life |
||||||||||
GHI 2018 Plan and GHI 2015 Plan |
’000 |
$ |
(in years) |
|||||||||
As of January 1, 2019 |
89,944 | 0.61 | 8.23 | |||||||||
Granted |
41,220 | 1.87 | ||||||||||
Exercised |
(8,612 | ) | 0.55 | |||||||||
Canceled and forfeited |
(7,340 | ) | 0.68 | |||||||||
|
|
|
|
|||||||||
As of December 31, 2019 |
115,212 | 1.06 | 8.21 | |||||||||
Granted |
11,736 | 1.85 | ||||||||||
Exercised |
(7,308 | ) | 0.59 | |||||||||
Canceled and forfeited |
(5,397 | ) | 0.99 | |||||||||
|
|
|
|
|||||||||
As of December 31, 2020 |
114,243 | 1.17 | 7.54 | |||||||||
Granted |
2,848 | 1.29 |
Weighted average |
Weighted-average |
|||||||||||
Number of Share |
exercise price per |
remaining contractual |
||||||||||
Options # |
GHI share # |
life |
||||||||||
GHI 2018 Plan and GHI 2015 Plan |
’000 |
$ |
(in years) |
|||||||||
Exercised |
(62,220 | ) | 0.81 | |||||||||
Canceled and forfeited |
(1,564 | ) | 1.04 | |||||||||
Effect of replacement of GHI 2018 Plan and GHI 2015 Plan with 2021 GHL Plan as a part of Reverse Recapitalization | (53,307 | ) | 1.97 | |||||||||
|
|
|
|
|||||||||
As of December 31, 2021 |
— | — | — | |||||||||
|
|
|
|
|||||||||
Exercisable |
||||||||||||
As of December 31, 2019 |
38,507 | 0.53 | ||||||||||
|
|
|
|
|||||||||
As of December 31, 2020 |
57,634 | 0.80 | ||||||||||
|
|
|
|
# |
The number and exercise price of share options have been retrospectively restated to reflect the exchange ratio to receive 1.3032888 GHL Ordinary Shares for each GHI Share. |
Weighted average |
Weighted-average |
|||||||||||
Number of Share |
exercise price per |
remaining contractual |
||||||||||
Options |
GHI share |
life |
||||||||||
2021 GHL Plan |
’000 |
$ |
(in years) |
|||||||||
Reverse Recapitalization replacement issuance |
53,307 | 1.97 | 7.41 | |||||||||
Exercised |
(188 | ) | 0.81 | |||||||||
Canceled and forfeited |
(23 | ) | 1.73 | |||||||||
|
|
|
|
|||||||||
As of December 31, 2021 |
53,096 | 1.98 | 7.81 | |||||||||
|
|
|
|
|||||||||
Exercisable |
||||||||||||
As of December 31, 2021 |
18,010 | 1.76 | ||||||||||
|
|
|
|
b) |
Reconciliation of outstanding RSUs |
Number of unvested restricted share units # |
||||
GHI 2018 Plan and GHI 2015 Plan |
’000 |
|||
As of January 1, 2019 |
25,804 | |||
Granted |
30,285 | |||
Vested |
(10,293 | ) | ||
Canceled and forfeited |
(9,494 | ) | ||
|
|
|||
As of December 31, 2019 |
36,302 | |||
Granted |
19,850 | |||
Vested |
(10,114 | ) | ||
Canceled and forfeited |
(9,492 | ) | ||
|
|
|||
As of December 31, 2020 |
36,546 | |||
Granted |
47,895 | |||
Vested |
(11,783 | ) | ||
Canceled and forfeited |
(6,201 | ) | ||
Effect of replacement of GHI 2018 Plan and GHI 2015 Plan with 2021 GHL Plan as a part of Reverse Recapitalization | (66,457 | ) | ||
|
|
|||
As of December 31, 2021 |
— | |||
|
|
# |
The number of RSUs have been retrospectively restated to reflect the exchange ratio to receive 1.3032888 GHL Ordinary Shares for each GHI Share. |
Number of unvested restricted share units |
||||
2021 GHL Plan |
’000 |
|||
Reverse Recapitalization replacement issuance |
66,457 | |||
Vested |
(330 | ) | ||
Canceled and forfeited |
(1,481 | ) | ||
|
|
|||
As of December 31, 2021 |
64,646 | |||
|
|
c) |
Restricted ordinary shares |
ii) |
Share-based payment expenses |
2021 |
2020 |
2019 |
||||||||||
(in $ millions) |
$ |
$ |
$ |
|||||||||
Cost of revenue |
42 | 10 | 4 | |||||||||
Sales and marketing |
11 | 2 | 1 | |||||||||
Research and development |
89 | 14 | 12 | |||||||||
General and administrative |
215 | 28 | 17 | |||||||||
|
|
|
|
|
|
|||||||
Total |
357 | 54 | 34 | |||||||||
|
|
|
|
|
|
iii) |
Measurement of fair values |
a) |
Share Options |
2021 |
2020 |
2019 |
||||||||||
Fair value at grant date (weighted average) # |
$ | 8.95 | $ | 2.46 | $ | 1.13 | ||||||
Share price at grant date (weighted average) # |
$ | 9.97 | $ | 3.59 | $ | 2.08 | ||||||
Exercise price at grant date (weighted average) # |
$ | 1.29 | $ | 1.85 | $ | 1.87 | ||||||
Expected volatility (weighted average) |
61.57 | % | 56.46 | % | 52.70 | % | ||||||
Expected terms (years) (weighted average) |
6.2 | 6.0 | 6.2 | |||||||||
Expected dividend (weighted average) |
0 | % | 0 | % | 0 | % | ||||||
Risk-free interest rate (weighted average) |
1.24 | % | 0.40 | % | 1.80 | % |
# |
The fair value and exercise price of share options and the fair value of the share price at grant date have been retrospectively restated to reflect the exchange ratio to receive 1.3032888 GHL Ordinary Shares for each GHI Share. |
b) |
RSUs |
2020 |
2019 |
|||||||
Fair value at grant date (weighted average) # |
$ | 1.96 | $ | 2.04 | ||||
Expected volatility |
49.6% to 66.3 | % | 46.6% to 49.6 | % | ||||
Risk-free interest rate |
0.13% to 1.6 | % | 1.6% to 2.49 | % | ||||
Expected dividend (weighted average) |
0 | % | 0 | % | ||||
Discount for lack of marketability |
20 | % | 20% to 27.5 | % |
# |
The fair value at grant date has been retrospectively restated to reflect the exchange ratio to receive 1.3032888 GHL Ordinary Shares for each GHI Share. |
19 |
Revenue |
i) |
Revenue streams |
2021 |
2020 |
2019 |
||||||||||
(in $ millions) |
$ |
$ |
$ |
|||||||||
Deliveries |
148 | 5 | (638 | ) | ||||||||
Mobility |
456 | 438 | 9 | |||||||||
Financial services |
27 | (10 | ) | (229 | ) | |||||||
Enterprise and new initiatives |
44 | 36 | 13 | |||||||||
|
|
|
|
|
|
|||||||
675 | 469 | (845 | ) | |||||||||
|
|
|
|
|
|
ii) |
Geographic information |
2021 |
2020 |
2019 |
||||||||||
(in $ millions) |
$ |
$ |
$ |
|||||||||
Singapore |
283 | 246 | (30 | ) | ||||||||
Malaysia |
108 | 91 | 92 | |||||||||
Philippines |
81 | 51 | 39 | |||||||||
Thailand |
76 | 57 | (19 | ) | ||||||||
Rest of Southeast Asia |
127 | 24 | (927 | ) | ||||||||
|
|
|
|
|
|
|||||||
675 | 469 | (845 | ) | |||||||||
|
|
|
|
|
|
iii) |
Major customers |
20 |
Income and expenses |
i) |
Other income |
2021 |
2020 |
2019 |
||||||||||
(in $ millions) |
$ |
$ |
$ |
|||||||||
Government grant income |
8 | 18 | — | |||||||||
Others |
4 | 15 | 14 | |||||||||
|
|
|
|
|
|
|||||||
12 | 33 | 14 | ||||||||||
|
|
|
|
|
|
ii) |
Other expenses |
2021 |
2020 |
2019 |
||||||||||
(in $ millions) |
$ |
$ |
$ |
|||||||||
Impairment of goodwill (Note 6) |
8 | 28 | 28 | |||||||||
Others |
3 | 12 | 2 | |||||||||
|
|
|
|
|
|
|||||||
11 | 40 | 30 | ||||||||||
|
|
|
|
|
|
iii) |
Expenses by nature |
2021 |
2020 |
2019 |
||||||||||
(in $ millions) |
$ |
$ |
$ |
|||||||||
Staff costs |
1,019 | 639 | 600 | |||||||||
Operation costs |
462 | 425 | 545 | |||||||||
Depreciation and amortization |
345 | 387 | 647 | |||||||||
Marketing expenses |
177 | 65 | 111 | |||||||||
Professional fees |
82 | 56 | 60 |
21 |
Net finance costs |
2021 |
2020 |
2019 |
||||||||||
(in $ millions) |
$ |
$ |
$ |
|||||||||
Interest income under the effective interest method on: |
||||||||||||
- Time deposits |
11 | 28 | 43 | |||||||||
- Cash and cash equivalents |
15 | 14 | 33 | |||||||||
Net change in fair value of financial assets and liabilities |
37 | — | — | |||||||||
Net foreign exchange gain |
2 | 11 | 9 | |||||||||
|
|
|
|
|
|
|||||||
Finance income |
65 |
53 |
85 |
|||||||||
Financial liabilities measured at amortized cost – interest expense |
(1,701 | ) | (1,433 | ) | (1,053 | ) | ||||||
Impairment loss and change in fair value on investment in associates |
— | (15 | ) | — | ||||||||
Net change in fair value of financial assets and liabilities |
— | (42 | ) | (3 | ) | |||||||
|
|
|
|
|
|
|||||||
Finance costs |
(1,701 |
) |
(1,490 |
) |
(1,056 |
) | ||||||
Share listing and associated expenses (Note 28) |
(353 | ) | — | — | ||||||||
|
|
|
|
|
|
|||||||
Net finance costs recognized in profit or loss |
(1,989 |
) |
(1,437 |
) |
(971 |
) | ||||||
|
|
|
|
|
|
22 |
Loss per share |
2021 |
2020 (Restated) |
2019 (Restated) |
||||||||||
$ |
$ |
$ |
||||||||||
Loss for the year |
(3,555 | ) | (2,745 | ) | (3,988 | ) | ||||||
Add: Loss attributable to non-controlling interests |
(106 | ) | (137 | ) | (241 | ) | ||||||
|
|
|
|
|
|
|||||||
Loss for the year attributable to ordinary shareholders |
(3,449 | ) | (2,608 | ) | (3,747 | ) | ||||||
|
|
|
|
|
|
|||||||
Basic weighted-average ordinary shares outstanding |
539,947 | 181,190 | 154,126 | |||||||||
Basic loss per share attributable to ordinary shareholders |
(6.39 | ) | (14.39 | ) | (24.31 | ) | ||||||
Diluted loss per share attributable to ordinary shareholders |
(6.39 | ) | (14.39 | ) | (24.31 | ) |
2021 |
2020 (Restated) |
2019 (Restated) |
||||||||||
Convertible redeemable preference shares |
— | 2,871,351 | 2,576,688 | |||||||||
Warrants (Note 13) |
26,000 | — | — | |||||||||
Restricted ordinary shares (Note 18) |
32,452 | — | — | |||||||||
Share options (Note 18) |
53,096 | 114,244 | 115,212 | |||||||||
RSUs (Note 18) |
64,752 | 36,546 | 36,301 | |||||||||
Options to swap the shares in GHL subsidiaries for GHL Class A Ordinary Shares |
47,755 | — | — | |||||||||
|
|
|
|
|
|
|||||||
Total |
224,055 | 3,022,141 | 2,728,201 | |||||||||
|
|
|
|
|
|
23 |
Related parties |
i) |
Transactions with key management personnel compensation |
2021 |
2020 |
2019 |
||||||||||
(in $ millions) |
$ |
$ |
$ |
|||||||||
Short-term employee benefits |
4 | 2 | 2 | |||||||||
Post-employment benefits |
* | * | * | |||||||||
Share-based payment |
172 | 24 | 6 |
* | Amount less than $1 million |
ii) |
Other related party transactions |
24 |
Leases |
i) |
As a lessee |
a) |
Right-of-use |
Property |
Motor vehicles |
Total |
||||||||||
(in $ millions) |
$ |
$ |
$ |
|||||||||
Balance at January 1, 2020 |
48 |
1 |
49 |
|||||||||
Depreciation |
(29 |
) |
(1 |
) |
(30 |
) | ||||||
Additions |
24 |
* |
24 |
|||||||||
Derecognition |
(5 |
) |
* |
(5 |
) | |||||||
Effects of movement in exchange rates |
1 |
* |
1 |
|||||||||
|
|
|
|
|
|
|||||||
Balance at December 31, 2020 |
39 |
* |
39 |
|||||||||
|
|
|
|
|
|
* | Amounts less than $1 million |
Property |
Motor vehicles |
Total |
||||||||||
(in $ millions) |
$ |
$ |
$ |
|||||||||
Balance at January 1, 2021 |
39 |
* |
39 |
|||||||||
Depreciation |
(27 |
) |
* |
(27 |
) | |||||||
Additions |
100 |
6 |
106 |
|||||||||
Derecognition |
* |
* |
* |
|||||||||
Effects of movement in exchange rates |
* |
* |
* |
|||||||||
|
|
|
|
|
|
|||||||
Balance at December 31, 2021 |
112 |
6 |
118 |
|||||||||
|
|
|
|
|
|
* | Amounts less than $1 million |
b) |
Amounts recognized in profit or loss |
2021 |
2020 |
|||||||
(in $ millions) |
$ |
$ |
||||||
Interest on lease liabilities |
5 | 3 | ||||||
Income from sub-leasing right-of-use |
(1 | ) | (2 | ) | ||||
Expenses relating to short-term leases |
1 | 1 | ||||||
Expenses relating to leases of low-value assets, excluding short-term leases of low-value assets |
* | * | ||||||
Expenses relating to variable lease payments not included in the measurement of lease liabilities |
1 | 1 |
* | Amount less than $1 million |
c) |
Amounts recognized in statement of cash flows |
2021 |
2020 |
|||||||
(in $ millions) |
$ |
$ |
||||||
Total cash outflow for leases |
24 | 30 |
ii) |
As a lessor |
2021 |
2020 |
|||||||
(in $ millions) |
$ |
$ |
||||||
Not later than one year |
42 | 52 | ||||||
Later than one year and not later than five years |
3 | 33 |
25 |
Financial instruments |
i) |
Financial risk management |
• | credit risk; |
• | liquidity risk; and |
• | market risk |
a) |
Risk management framework |
b) |
Credit risk |
2021 |
2020 |
2019 |
||||||||||
(in $ millions) |
$ |
$ |
$ |
|||||||||
Trade receivables |
8 |
33 |
35 |
|||||||||
Loans and advances at amortized cost |
11 |
10 |
15 |
|||||||||
Payment cycle receivables |
5 |
3 |
12 |
|||||||||
Other receivables |
3 |
11 |
(5 |
) | ||||||||
Time deposits |
(8 |
) |
8 |
* |
||||||||
Cash and cash equivalents |
— |
(2 |
) |
(1 |
) | |||||||
|
|
|
|
|
|
|||||||
19 |
63 |
56 |
||||||||||
|
|
|
|
|
|
* | Amount less than $1 million |
Net carrying amount |
||||||||
2021 |
2020 |
|||||||
(in $ millions) |
$ |
$ |
||||||
Indonesia |
36 | 39 | ||||||
Singapore |
25 | 20 | ||||||
Philippines |
5 | 7 | ||||||
Malaysia |
13 | 6 | ||||||
Vietnam |
7 | 7 | ||||||
Other countries |
9 | 5 | ||||||
|
|
|
|
|||||
95 | 84 | |||||||
|
|
|
|
Weighted average loss rate |
Gross carrying amount |
Loss allowance |
Credit impaired |
|||||||||||||
(in $ millions) |
% |
$ |
$ |
|||||||||||||
2021 |
||||||||||||||||
Current (not past due) |
2.94 | 70 | (2 | ) | No | |||||||||||
1 – 30 days past due |
10.08 | 17 | (2 | ) | No | |||||||||||
31 – 60 days past due |
20.46 | 10 | (2 | ) | No | |||||||||||
61 – 90 days past due |
50.14 | 5 | (2 | ) | No | |||||||||||
91 – 120 days past due |
55.76 | 4 | (3 | ) | No | |||||||||||
More than 121 days |
98.54 | 11 | (11 | ) | Yes | |||||||||||
|
|
|
|
|||||||||||||
117 | (22 | ) | ||||||||||||||
|
|
|
|
Weighted average loss rate |
Gross carrying amount |
Loss allowance |
Credit impaired |
|||||||||||||
(in $ millions) |
% |
$ |
$ |
|||||||||||||
2020 |
||||||||||||||||
Current (not past due) |
7.48 | 68 | (5 | ) | No | |||||||||||
1 – 30 days past due |
16.65 | 17 | (3 | ) | No | |||||||||||
31 – 60 days past due |
45.85 | 4 | (2 | ) | No | |||||||||||
61 – 90 days past due |
49.32 | 4 | (2 | ) | No | |||||||||||
91 – 120 days past due |
76.74 | 3 | (2 | ) | No | |||||||||||
More than 121 days |
94.57 | 28 | (26 | ) | Yes | |||||||||||
|
|
|
|
|||||||||||||
124 | (40 | ) | ||||||||||||||
|
|
|
|
2021 |
2020 |
|||||||
(in $ millions) |
$ |
$ |
||||||
At January 1 |
40 | 26 | ||||||
Impairment loss recognized |
8 | 33 | ||||||
Amounts written off |
(24 | ) | (20 | ) | ||||
Exchange translation differences |
(2 | ) | 1 | |||||
|
|
|
|
|||||
At December 31 |
22 | 40 | ||||||
|
|
|
|
Carrying amount |
||||||||
2021 |
2020 |
|||||||
(in $ millions) |
$ |
$ |
||||||
Malaysia |
14 | 2 | ||||||
Singapore |
40 | 9 | ||||||
Thailand |
33 | 11 | ||||||
Philippines |
13 | 7 | ||||||
Indonesia |
2 | * | ||||||
Vietnam |
5 | 2 | ||||||
|
|
|
|
|||||
107 | 31 | |||||||
|
|
|
|
* | Amount less than $1 million |
Weighted average loss rate |
Gross carrying amount |
Loss allowance |
Credit- impaired |
|||||||||||||
(in $ millions) |
% | $ |
$ |
|||||||||||||
2021 |
||||||||||||||||
Current (not past due) |
5.37 | 97 | (5 | ) | No | |||||||||||
1 – 30 days past due |
12.84 | 16 | (2 | ) | No | |||||||||||
31 – 60 days past due |
46.53 | 2 | (1 | ) | No | |||||||||||
61 – 90 days past due |
56.23 | 1 | (1 | ) | No | |||||||||||
91 – 120 days past due |
87.43 | 1 | (1 | ) | Yes | |||||||||||
More than 121 days |
91.12 | 1 | (1 | ) | Yes | |||||||||||
|
|
|
|
|||||||||||||
118 | (11 | ) | ||||||||||||||
|
|
|
|
Weighted average loss rate |
Gross carrying amount |
Loss allowance |
Credit- impaired |
|||||||||||||
(in $ millions) |
% | $ |
$ |
|||||||||||||
2020 |
||||||||||||||||
Current (not past due) |
7.19 | 29 | (2 | ) | No | |||||||||||
1 – 30 days past due |
42.85 | 5 | (2 | ) | No | |||||||||||
31 – 60 days past due |
79.55 | 3 | (2 | ) | No | |||||||||||
61 – 90 days past due |
80.80 | 1 | (1 | ) | No | |||||||||||
91 – 120 days past due |
100.00 | 1 | (1 | ) | Yes | |||||||||||
More than 121 days |
100.00 | 1 | (1 | ) | Yes | |||||||||||
|
|
|
|
|||||||||||||
40 | (9 | ) | ||||||||||||||
|
|
|
|
2021 |
2020 |
|||||||
(in $ millions) |
$ |
$ |
||||||
At January 1 |
9 | 13 | ||||||
Impairment loss recognized |
11 | 10 | ||||||
Amounts written off |
(9 | ) | (14 | ) | ||||
Exchange translation differences |
* | * | ||||||
|
|
|
|
|||||
At December 31 |
11 | 9 | ||||||
|
|
|
|
* | Amount less than $1 million |
c) |
Liquidity risks |
Contractual cash flows |
||||||||||||||||||||
Carrying amount |
Total |
Less than 1 year |
1 to 5 years |
More than 5 years |
||||||||||||||||
(in $ millions) |
$ |
$ |
$ |
$ |
$ |
|||||||||||||||
2021 |
||||||||||||||||||||
Financial liabilities |
||||||||||||||||||||
Bank loans |
138 | (150 | ) | (74 | ) | (76 | ) | — | ||||||||||||
Term loan |
1,914 | (2,422 | ) | (131 | ) | (2,291 | ) | — | ||||||||||||
Trade and other payables |
780 | (780 | ) | (770 | ) | (10 | ) | — | ||||||||||||
Lease liabilities |
123 | (197 | ) | (23 | ) | (58 | ) | (116 | ) | |||||||||||
|
|
|
|
|
|
|
|
|
|
|||||||||||
2,955 | (3,549 | ) | (998 | ) | (2,435 | ) | (116 | ) | ||||||||||||
|
|
|
|
|
|
|
|
|
|
|||||||||||
2020 |
||||||||||||||||||||
Financial liabilities |
||||||||||||||||||||
Bank loans |
212 | (233 | ) | (136 | ) | (97 | ) | — | ||||||||||||
Trade and other payables |
586 | (586 | ) | (585 | ) | (1 | ) | — | ||||||||||||
Lease liabilities |
39 | (40 | ) | (19 | ) | (21 | ) | * | ||||||||||||
Convertible redeemable preference shares |
10,767 | (15,535 | ) | — | (15,535 | ) | — | |||||||||||||
|
|
|
|
|
|
|
|
|
|
|||||||||||
11,604 | (16,394 | ) | (740 | ) | (15,654 | ) | * | |||||||||||||
|
|
|
|
|
|
|
|
|
|
* | Amount less than $1 million |
d) |
Market risks |
Carrying amount |
||||||||
2021 |
2020 |
|||||||
(in $ millions) |
$ |
$ |
||||||
Fixed-rate instruments |
||||||||
Other investments |
3,178 | 1,282 | ||||||
Cash and cash equivalents |
4,991 | 2,173 | ||||||
CRPS (liability component) |
— | (10,767 | ) | |||||
Bank loans |
(100 | ) | (162 | ) | ||||
Variable-rate instruments |
||||||||
Bank loans |
(38 | ) | (50 | ) | ||||
Term loan |
(1,914 | ) | — |
ii) |
Capital management |
iii) |
Accounting classification and fair values |
Carrying amount |
Fair value |
|||||||||||||||||||||||||||||||
Note |
Fair value |
Amortized cost |
Total |
Level 1 |
Level 2 |
Level 3 |
Total |
|||||||||||||||||||||||||
$ |
$ |
$ |
$ |
$ |
$ |
$ |
||||||||||||||||||||||||||
(in $ millions) |
||||||||||||||||||||||||||||||||
December 31, 2021 |
||||||||||||||||||||||||||||||||
Financial assets |
||||||||||||||||||||||||||||||||
Debt investments |
685 | — | 685 | 594 | 91 | — | 685 |
|||||||||||||||||||||||||
Equity investments |
7 | 618 | — | 618 | 457 | — | 161 | 618 |
||||||||||||||||||||||||
Time deposits |
7 | — | 3,178 | 3,178 | — | — | — | — | ||||||||||||||||||||||||
Trade and other receivables |
8 | — | 255 | 255 | — | — | — | — | ||||||||||||||||||||||||
Other assets |
9 | — | 172 | 172 | — | — | — | — | ||||||||||||||||||||||||
Cash and cash equivalents |
10 | — | 4,991 | 4,991 | — | — | — | — | ||||||||||||||||||||||||
|
|
|
|
|
|
|
|
|
|
|
|
|
|
|||||||||||||||||||
Total |
1,303 |
8,596 |
9,899 |
1,051 |
91 |
161 |
1,303 |
|||||||||||||||||||||||||
|
|
|
|
|
|
|
|
|
|
|
|
|
|
|||||||||||||||||||
Financial liabilities |
||||||||||||||||||||||||||||||||
Term loan |
— | (1,914 | ) | (1,914 | ) | — | — | — | — |
|||||||||||||||||||||||
Warrant liabilities |
13 | (54 | ) | — | (54 | ) | (21 | ) | — | (33 | ) | (54 |
) | |||||||||||||||||||
Bank loans |
14 | — | (138 | ) | (138 | ) | — | — | — | — |
||||||||||||||||||||||
Trade and other payables |
16 | (9 | ) | (771 | ) | (780 | ) | — | — | (9 | ) | (9 |
) | |||||||||||||||||||
|
|
|
|
|
|
|
|
|
|
|
|
|
|
|||||||||||||||||||
Total |
(63 |
) |
(2,823 |
) |
(2,886 |
) |
(21 |
) |
— | (42 |
) |
(63 |
) | |||||||||||||||||||
|
|
|
|
|
|
|
|
|
|
|
|
|
|
|||||||||||||||||||
Carrying amount |
Fair value |
|||||||||||||||||||||||||||||||
Note |
Fair value |
Amortized cost |
Total |
Level 1 |
Level 2 |
Level 3 |
Total |
|||||||||||||||||||||||||
$ |
$ |
$ |
$ |
$ |
$ |
$ |
||||||||||||||||||||||||||
(in $ millions) |
||||||||||||||||||||||||||||||||
December 31, 2020 |
||||||||||||||||||||||||||||||||
Financial assets |
||||||||||||||||||||||||||||||||
Debt investments |
250 | — | 250 | 228 | 22 | — | 250 |
|||||||||||||||||||||||||
Equity investments |
7 | 143 | — | 143 | — | — | 143 | 143 |
||||||||||||||||||||||||
Time deposits |
7 | — | 1,282 | 1,282 | — | — | — | — | ||||||||||||||||||||||||
Trade and other receivables |
8 | — | 172 | 172 | — | — | — | — | ||||||||||||||||||||||||
Other assets |
9 | — | 42 | 42 | — | — | — | — | ||||||||||||||||||||||||
Cash and cash equivalents |
10 | — | 2,173 | 2,173 | — | — | — | — | ||||||||||||||||||||||||
|
|
|
|
|
|
|
|
|
|
|
|
|
|
|||||||||||||||||||
Total |
393 |
3,669 |
4,062 |
228 |
22 |
143 |
393 |
|||||||||||||||||||||||||
|
|
|
|
|
|
|
|
|
|
|
|
|
|
|||||||||||||||||||
Financial liabilities |
||||||||||||||||||||||||||||||||
Convertible redeemable preference shares – liability component |
— | (10,767 | ) | (10,767 | ) | — | — | — | — | |||||||||||||||||||||||
Bank loans |
14 | — | (212 | ) | (212 | ) | — | — | — | — | ||||||||||||||||||||||
Trade and other payables |
16 | — | (586 | ) | (586 | ) | — | — | — | — | ||||||||||||||||||||||
|
|
|
|
|
|
|
|
|
|
|
|
|
|
|||||||||||||||||||
Total |
— | (11,565 |
) |
(11,565 |
) |
— | — | — | — | |||||||||||||||||||||||
|
|
|
|
|
|
|
|
|
|
|
|
|
|
iv) |
Measurement of fair values |
a) |
Valuation techniques and significant unobservable inputs |
Valuation technique |
Significant unobservable inputs |
Inter-relationship between significant unobservable inputs | ||||
Assets |
||||||
Debt investments | Quoted broker prices | Not applicable | Not applicable | |||
Equity investment | Market comparison technique | Adjusted market multiple | The estimated fair value would increase (decrease) if the adjusted market multiple were higher (lower). | |||
Warrants | Quoted market prices | Discount for lack of marketability | The estimated fair value would decrease (increase) if the discount for a lack of marketability were higher (lower). |
b) |
Level 3 fair values |
$ |
||||
(in $ millions) |
||||
At January 1, 2020 |
132 | |||
Net change in fair value (unrealized) |
(42 | ) | ||
Net purchases/ (issuances) |
53 | |||
|
|
|||
At December 31, 2020 |
143 | |||
|
|
|||
At January 1, 2021 |
143 | |||
Net change in fair value (unrealized) |
35 | |||
Net purchases/ (issuances) |
(59 | ) | ||
|
|
|||
At December 31, 2021 |
119 | |||
|
|
26 |
Operating segments |
i) |
Basis for segmentation |
Reportable segments |
Operations | |
Deliveries | Connecting driver-partner and merchant-partner with consumers to create a localized logistics platform, facilitating and performing on-demand and scheduled delivery of a wide variety of daily necessities, including ready-to-eat point-to-point | |
Mobility | Connecting consumers with rides provided by driver-partners across a wide variety of multi-modal mobility options including private cars, taxis, motorcycles (in certain countries), and shared mobility options, such as carpooling. It also includes vehicle rental to enable driver-partners to be able to offer services through the platform. | |
Financial services | Digital solutions offered by and with business partners to address the financial needs of driver and merchant partners and consumers, including digital payments, lending, receivables factoring, insurance distribution and wealth management in selected markets. | |
Enterprise and new initiatives | A growing suite of enterprise offerings including advertising and marketing offerings, and anti-fraud offerings. It also includes other lifestyle services offered by our business partners to consumers including domestic and home services, flights, hotel bookings and subscriptions in certain markets. |
ii) |
Information about reportable segments |
2021 |
2020 |
2019 |
||||||||||
(in $ millions) |
$ |
$ |
$ |
|||||||||
Segment Adjusted EBITDA |
||||||||||||
Deliveries |
(130 | ) | (211 | ) | (809 | ) | ||||||
Mobility |
345 | 307 | (194 | ) | ||||||||
Financial services |
(349 | ) | (331 | ) | (548 | ) | ||||||
Enterprise and new initiatives |
9 | 9 | (3 | ) | ||||||||
|
|
|
|
|
|
|||||||
Total reportable Segment Adjusted EBITDA |
(125 | ) | (226 | ) | (1,554 | ) | ||||||
Regional corporate costs |
(717 | ) | (554 | ) | (683 | ) | ||||||
Net interest income (expenses) |
(1,675 | ) | (1,391 | ) | (977 | ) | ||||||
Other income (expenses) |
12 | 10 | 13 | |||||||||
Income tax expenses |
(3 | ) | (2 | ) | (7 | ) | ||||||
Depreciation and amortization |
(345 | ) | (387 | ) | (647 | ) | ||||||
Stock-based compensation expenses |
(357 | ) | (54 | ) | (34 | ) | ||||||
Unrealized foreign exchange loss |
(1 | ) | * | (4 | ) | |||||||
Impairment losses on goodwill and non-financial assets |
(15 | ) | (43 | ) | (60 | ) | ||||||
Fair value changes on investments |
37 | (57 | ) | (3 | ) | |||||||
Restructuring costs |
(1 | ) | (2 | ) | (1 | ) | ||||||
Legal, tax and regulatory settlement provisions |
(12 | ) | (39 | ) | (31 | ) | ||||||
Share listing and associated expenses |
(353 | ) | — | — | ||||||||
|
|
|
|
|
|
|||||||
Consolidated profit or loss after tax |
(3,555 | ) | (2,745 | ) | (3,988 | ) | ||||||
|
|
|
|
|
|
* | Amount less than $1 million |
27 |
Business combinations |
28 |
Reverse Recapitalization |
• | the assets and liabilities of GHI recognized and measured in the GHL consolidated financial statements at their carrying amounts immediately prior to the Reverse Recapitalization; |
• | the retained earnings and other equity balances of GHI recognised in the GHL consolidated financial statements at amounts immediately prior to the Reverse Recapitalization; |
• | the comparative information presented in the GHL consolidated financial statements are that of GHI Group. |
• | GHI’s previous shareholders have the largest voting interest in GHL with approximately 90% of the voting interest (refer to Note 11 for a description of the terms of exchange of the GHI shares for GHL shares); |
• | GHI’s previous shareholders have the right to nominate, appoint and remove the majority of the members on the GHL board of directors; |
• | GHI’s previous key management personnel are the current key management personnel of GHL; |
• | The business of GHL is a continuation of the ongoing operations of GHI; and |
• | GHI is the larger entity, in terms of substantive operations and employee base. |
(in $ millions) |
$ |
|||||||
Fair value of net assets of AGC comprising |
398 | |||||||
Cash and cash equivalents |
482 | |||||||
Payables |
(7 | ) | ||||||
Warrant liabilities |
(77 | ) | ||||||
Less: Fair value of consideration comprising: |
||||||||
62.5 million GHL Class A ordinary shares (see Note 11) |
(688 | ) | ||||||
|
|
|||||||
Share listing expenses recognised in profit or loss |
(290 | ) | ||||||
|
|
• | the former AGC warrant holders receiving one warrant to purchase a Class A ordinary share in GHL, for each issued and outstanding warrant to acquire ordinary shares in AGC, which has resulted in the issuance of 22 million warrants (see Note 13); |
• | additional capitalization by way of the issuance of GHL shares and warrants to third party investors on December 1, 2021, pursuant to investment commitments in previously agreed subscription agreements in which the investors committed to subscribe for and purchase 404 million GHL Class A Ordinary Shares (see Note 11) and 4 million GHL warrants (see Note 13) for an aggregate purchase price of $4,040 million; and |
• | professional services expenditure of $63 million incurred to facilitate listing on NASDAQ which, in addition to the $290 million described in the table above, has resulted in a total of $353 million share listing and associated expenses being recognised in the profit or loss. |
29 |
Contingencies and commitments |
i) |
Contingencies |
a) | an internal investigation into potential violations of certain anti-corruption laws relating to the Group’s operations in one of the countries in which it operates. The Group has voluntarily self-reported the potential violations to the U.S. Department of Justice. As at December 31, 2021, in view of the uncertainty of the outcome of this matter, the Group does not consider it to result in a present obligation that will give rise to probable outflow of resources that can be reliably estimated; and |
b) | a tax audit on matters of withholding tax by the local tax office in one of the countries in which the Group operates. As at December 31, 2021, in view of the uncertainty of the outcome of this matter, the Group does not consider it to result in a present obligation that will give rise to probable outflow of resources that can be reliably estimated. |
ii) |
Commitments |
Payments due by period |
||||||||||||
Total |
Less than 1 year |
1 to 5 years |
||||||||||
(in $ millions) |
$ |
$ |
$ |
|||||||||
Non-cancellable purchase obligations |
544 | 299 | 245 |
30 |
Subsequent events |
i) | In January 2022, the Group acquired a 75% ownership interest in Jaya Grocer Holdings Sdn. Bhd. (“Jaya Grocer”), an operator in the premium grocery segment in Malaysia predominantly in the Klang Valley near Kuala Lumpur. Subject to certain terms, the Group will have the option to buy, and the current shareholders will have the option to sell to the Group, the remaining 25% of the ownership interest of Jaya Grocer after the closing of the transaction. The consideration for the acquisition of 75% ownership interest includes $191 million in cash and 8.2 million shares of GHL common stock. The determination of consideration is subject to finalization, as is the resultant accounting. |
ii) | In February 2022, the entire NCI in AA Holdings Inc. (“AAHI Inc.”), the investment holding company of the subsidiaries offering financial services, was acquired by the Company by way of an exchange of shares through the issuance of GHL Class A ordinary shares. |
Item 6. |
Indemnification of Directors and Officers |
Item 7. |
Recent Sales of Unregistered Securities. |
• | On December 1, 2021, in connection with the Business Combination and the related transactions described in this registration statement, we issued 404,008,565 Class A Ordinary Shares to PIPE Investors, JS Securities and Sponsor Affiliate in reliance on the exemption from registration under Section 4(a)(2) of the Securities Act and/or Regulation D or Regulation S promulgated thereunder. Such Class A Ordinary Shares are being registered pursuant to this registration statement. |
• | On December 1, 2021, in connection with the Business Combination and the related transactions described in this registration statement, we issued 16,000,000 Warrants to Sponsor, Sponsor Affiliate and JS Securities in reliance on the exemption from registration under Section 4(a)(2) of the Securities Act and/or Regulation D or Regulation S promulgated thereunder. Such Warrants are being registered pursuant to this registration statement. |
• | On January 31, 2022, in connection with our acquisition of a majority economic interest in Jaya Grocer, we issued an aggregate of 8,173,375 Class A Ordinary Shares to the vendors in that transaction in reliance on the exemption from registration under Section 4(a)(2) of the Securities Act and/or Regulation D or Regulation S promulgated thereunder. |
• | On December 8, 2021, GHL entered into an Agreement and Plan of Merger (the “GFG Swap-Up Agreement”) with, among others, GFG and each of the holders of Series A preference shares of GFG (the “Electing GFG Shareholders”), pursuant to which the Electing GFG Shareholders agreed, upon closing, to exchange their GFG Series A preference shares in exchange for Class A Ordinary Shares (the “GFG Swap-Up”). Pursuant to the GFG Swap-Up Agreement, GHL also agreed to issue to the other GFG shareholders (other than the GHL holding vehicle through which GHL indirectly held its interest in GFG), Class A Ordinary Shares in exchange for their shares of GFG. The closing of the GFG Swap-Up was subject to certain customary closing conditions, including receipt of regulatory approval from the MAS. The GFG Swap-Up Agreement also granted certain customary registration rights to the Electing GFG Shareholders, in connection with which GHL was obligated to register their Class A Ordinary Shares received in connection with the GFG Swap-Up. Following satisfaction of all closing conditions, the GFG Swap-Up was consummated on February 9, 2022, pursuant to which all of the GFG shares held by persons other than the GHL holding vehicle were canceled in exchange for the issuance of an aggregate of 62,963,425 Class A Ordinary Shares in reliance on the exemption from registration under Section 4(a)(2) of the Securities Act and/or Regulation D or Regulation S promulgated thereunder. |
• | On January 28, 2022, GHL entered into a Swap-Up Agreement (the “Zhong An Swap-Up Agreement) with, among others, A3 Holdings Inc. (“GrabInsure”) and ZA Tech Global (Cayman) Limited (“Zhong An”), pursuant to which Zhong An agreed to exchange its ordinary shares of GrabInsure to GHL in exchange for Class A Ordinary Shares (the “Zhong An Swap-Up”). The Zhong An Swap-Up Agreement also granted certain customary registration rights to Zhong An, in connection with which GHL was obligated to register Zhong An’s Class A Ordinary Shares received in connection with the Zhong An Swap-Up. The Zhong An Swap-Up closed concurrently with execution of the Zhong An Swap-Up Agreement, upon which Zhong An contributed all of its GrabInsure ordinary shares to GHL in exchange for the issuance of an aggregate of 8,800,000 Class A Ordinary Shares in reliance on the exemption from registration under Section 4(a)(2) of the Securities Act and/or Regulation D or Regulation S promulgated thereunder. |
• | On March 3, 2022, in connection with our acquisition of Bento Invest Holding Company Pte. Ltd., GHL issued an aggregate of 20,753 Class A Ordinary Shares to the vendors in that transaction in reliance on the exemption from registration under Section 4(a)(2) of the Securities Act and/or Regulation D or Regulation S promulgated thereunder. |
• | On April 11, 2022, GHL entered into a Swap-Up Agreement (the “CIL Swap-Up Agreement) with, among others, GrabLink Pte. Ltd. (“GrabLink”) and CT Link Corporation Limited (“CIL” or “CardInfoLink”), pursuant to which CIL agreed to exchange its ordinary shares of GrabLink to GHL in exchange for Class A Ordinary Shares (the “CIL Swap-Up”). The CIL Swap-Up Agreement also granted certain customary registration rights to CIL, in connection with which GHL was obligated to register CIL’s Class A Ordinary Shares received in connection with the CIL Swap-Up. The CIL Swap-Up closed concurrently with execution of the CIL Swap-Up Agreement, upon which CIL contributed all of its GrabLink ordinary shares to GHL in exchange for the issuance of an aggregate of 4,117,000 Class A Ordinary Shares in reliance on the exemption from registration under Section 4(a)(2) of the Securities Act and/or Regulation D or Regulation S promulgated thereunder. |
• | On May 9, 2022, GHL entered into a Swap-Up Agreement (the “Zhong An Tech Swap-Up Agreement) with ZA Tech Global Limited (“Zhong An Tech”), pursuant to which Zhong An Tech agreed to exchange its ordinary shares of PT Visionet Internasional Proteksi (“OVOInsure”) to GP Network Asia Pte. Ltd. in exchange for the issuance of Class A Ordinary Shares to Zhong An (the “Zhong An Tech Swap-Up”). The Zhong An Tech Swap-Up Agreement also granted certain customary registration rights to Zhong An, in connection with which GHL was obligated to register Zhong An’s Class A Ordinary Shares received in connection with the Zhong An Tech Swap-Up. The Zhong An Tech Swap-Up closed concurrently with execution of the Zhong An Tech Swap-Up Agreement, upon which Zhong An Tech contributed all of its OVOInsure ordinary shares to GHL in exchange for the issuance of an aggregate of 1,290,032 Class A Ordinary Shares to Zhong An in reliance on the exemption from registration under Section 4(a)(2) of the Securities Act and/or Regulation D or Regulation S promulgated thereunder. |
Item 8. |
Exhibits |
Incorporation by Reference |
||||||||||||||||||
Exhibit No. |
Description |
Form |
File No. |
Exhibit No. |
Filing Date |
|||||||||||||
23.8 |
Consent of Soewito Suhardiman Eddymurthy Kardono (included in Exhibit 99.4 to this Registration Statement). | F-1 | 333-261949 | 23.10 | December 30, 2021 | |||||||||||||
23.9 |
Consent of Rahmat Lim & Partners (included in Exhibit 99.5 to this Registration Statement). | F-1 | 333-261949 | 23.9 | May 10, 2022 | |||||||||||||
24.1 |
Power of Attorney. | F-1 | 333-261949 | 24.1 | December 30, 2021 | |||||||||||||
99.1 |
Opinion of Baker & McKenzie Ltd. regarding certain Thai law matters. | F-1 | 333-261949 | 99.1 | December 30, 2021 | |||||||||||||
99.2 |
Opinion of SyCip Salazar Hernandez & Gatmaitan regarding certain Philippine law matters. | F-1 | 333-261949 | 99.2 | December 30, 2021 | |||||||||||||
99.3 |
Opinion of YKVN LLC regarding certain Vietnamese law matters. | F-1 | 333-261949 | 99.3 | December 30, 2021 | |||||||||||||
99.4 |
Opinion of Soewito Suhardiman Eddymurthy Kardono regarding certain Indonesian law matters. | F-1 | 333-261949 | 99.4 | December 30, 2021 | |||||||||||||
99.5 |
Opinion of Rahmat Lim & Partners regarding certain Malaysian law matters. | F-1 | 333-261949 | 99.5 | May 10, 2022 | |||||||||||||
101.INS* |
Inline XBRL Instance Document—this instance document does not appear in the Interactive Data File because its XBRL tags embedded within the Inline XBRL document | |||||||||||||||||
101.SCH* |
Inline XBRL Taxonomy Extension Schema Document | |||||||||||||||||
101.CAL* |
Inline XBRL Taxonomy Extension Calculation Linkbase Document | |||||||||||||||||
101.DEF* |
Inline XBRL Taxonomy Extension Definition Linkbase Document | |||||||||||||||||
101.LAB* |
Inline XBRL Taxonomy Extension Label Linkbase Document | |||||||||||||||||
101.PRE* |
Inline XBRL Taxonomy Extension Presentation Linkbase Document | |||||||||||||||||
104 |
Cover Page Interactive Data File (embedded within the Inline XBRL document) |
* | Filed herewith |
# | Portions of this exhibit have been omitted pursuant to Item 601(b)(10)(iv) of Regulation S-K on the basis that the Company customarily and actually treats that information as private or confidential and the omitted information is not material. |
Item 9. |
Undertakings |
GRAB HOLDINGS LIMITED | ||
By: | /s/ Anthony Tan | |
Name: Anthony Tan | ||
Title: Chief Executive Officer |
NAME |
POSITION |
DATE | ||
/s/ Anthony Tan Anthony Tan |
Chief Executive Officer and Chairman of the Board of Directors ( Principal Executive Officer |
September 22, 2022 | ||
/s/ Peter Oey Peter Oey |
Chief Financial Officer ( Principal Financial and Accounting Officer |
September 22, 2022 | ||
* Tan Hooi Ling |
Director | September 22, 2022 | ||
* John Rogers |
Director | September 22, 2022 | ||
* Dara Khosrowshahi |
Director | September 22, 2022 | ||
* Ng Shin Ein |
Director | September 22, 2022 | ||
* Oliver Jay |
Director | September 22, 2022 |
* By: | /s/ Peter Oey | |
Peter Oey Attorney-in-fact |
By: |
/s/ Donald J. Puglisi | |
Name: Donald J. Puglisi | ||
Title: Authorized Representative |