UNITED STATES
SECURITIES AND EXCHANGE COMMISSION
WASHINGTON, D.C. 20549
FORM
(Mark One)
| QUARTERLY REPORT PURSUANT TO SECTION 13 OR 15(d) OF THE SECURITIES EXCHANGE ACT OF 1934 |
For
the quarterly period ended
OR
| TRANSITION REPORT PURSUANT TO SECTION 13 OR 15(d) OF THE SECURITIES EXCHANGE ACT OF 1934 |
For the transition period from to
Commission
File Number:
(Exact name of registrant as specified in its charter)
(State or other jurisdiction of incorporation or organization) |
(I.R.S. Employer Identification Number) |
| (Address of principal executive offices) | (Zip Code) |
Registrant’s
telephone number, including area code:
Securities registered pursuant to Section 12(b) of the Act:
| Title of each class | Trading Symbol | Name of each exchange on which registered | ||
| The |
Indicate
by check mark whether the registrant: (1) has filed all reports required to be filed by Section 13 or 15(d) of the Securities Exchange
Act of 1934 during the preceding 12 months (or for such shorter period that the registrant was required to file such reports), and (2)
has been subject to such filing requirements for the past 90 days. ☒
Indicate
by check mark whether the registrant has submitted electronically every Interactive Data File required to be submitted pursuant to Rule
405 of Regulation S-T (§ 232.405 of this chapter) during the preceding 12 months (or for such shorter period that the registrant
was required to submit such files). ☒
Indicate by check mark whether the registrant is a large accelerated filer, an accelerated filer, a non-accelerated filer, smaller reporting company, or an emerging growth company. See the definitions of “large accelerated filer,” “accelerated filer,” “smaller reporting company,” and ‘‘emerging growth company’’ in Rule 12b-2 of the Exchange Act.
| Large accelerated filer | ☐ | Accelerated filer | ☐ |
| ☒ | Smaller reporting company filer | ||
| Emerging growth company |
If
an emerging growth company, indicate by check mark if the registrant has elected not to use the extended transition period for complying
with any new or revised financial accounting standards provided pursuant to Section 13(a) of the Exchange Act.
Indicate
by check mark whether the registrant is a shell company (as defined in Rule 12b-2 of the Exchange Act). Yes ☐
As of May 10, 2023, the registrant had shares of common stock, par value $0.001 per share, outstanding.
THE GLIMPSE GROUP, INC.
TABLE OF CONTENTS
Page No. | ||
| PART I | FINANCIAL INFORMATION | 3 |
| ITEM 1. | FINANCIAL STATEMENTS (Unaudited) | 3 |
| Consolidated Balance Sheets | 5 | |
| Consolidated Statements of Operations | 6 | |
| Consolidated Statements of Stockholders’ Equity (Deficit) | 7 | |
| Consolidated Statements of Cash Flows | 9 | |
| Notes to Consolidated Financial Statements | 10 | |
| ITEM 2. | MANAGEMENT’S DISCUSSION AND ANALYSIS OF FINANCIAL CONDITION AND RESULTS OF OPERATIONS | 31 |
| ITEM 3. | QUANTITATIVE AND QUALITATIVE DISCLOSURES ABOUT MARKET RISK | 39 |
| ITEM 4. | CONTROLS AND PROCEDURES | 39 |
| PART II | OTHER INFORMATION | 40 |
| ITEM 1. | LEGAL PROCEEDINGS | 40 |
| ITEM 1A. | RISK FACTORS | 40 |
| ITEM 2. | UNREGISTERED SALES OF EQUITY SECURITIES AND USE OF PROCEEDS | 40 |
| ITEM 6. | EXHIBITS | 41 |
| SIGNATURES | 42 | |
| 2 |
THE GLIMPSE GROUP, INC.
CONSOLIDATED FINANCIAL STATEMENTS
(UNAUDITED)
FOR THE THREE AND NINE MONTHS ENDED MARCH 31, 2023 and 2022
| 3 |
THE GLIMPSE GROUP, INC.
INDEX TO CONSOLIDATED FINANCIAL STATEMENTS
(UNAUDITED)
| 4 |
THE GLIMPSE GROUP, INC.
CONSOLIDATED BALANCE SHEETS
As of March 31, 2023 (Unaudited) | As of June 30, 2022 (Audited) | |||||||
| ASSETS | ||||||||
| Cash and cash equivalents | $ | $ | ||||||
| Investments | ||||||||
| Accounts receivable | ||||||||
| Deferred costs/contract assets | ||||||||
| Prepaid expenses and other current assets | ||||||||
| Total current assets | ||||||||
| Equipment, net | ||||||||
| Note receivable | ||||||||
| Right-of-use assets | ||||||||
| Intangible assets, net | ||||||||
| Goodwill | ||||||||
| Other assets | ||||||||
| Restricted cash | ||||||||
| Total assets | $ | $ | ||||||
| LIABILITIES AND STOCKHOLDERS’ EQUITY | ||||||||
| Accounts payable | $ | $ | ||||||
| Accrued liabilities | ||||||||
| Accrued bonuses | ||||||||
| Deferred revenue/contract liabilities | ||||||||
| Asset purchase payable | ||||||||
| Lease liabilities, current portion | ||||||||
| Contingent consideration for acquisitions, current portion | ||||||||
| Total current liabilities | ||||||||
| Long term liabilities | ||||||||
| Contingent consideration for acquisitions, net of current portion | ||||||||
| Lease liabilities, net of current portion | ||||||||
| Total liabilities | ||||||||
| Commitments and contingencies | ||||||||
| Stockholders’ Equity | ||||||||
| Preferred Stock, par value $ per share, million shares authorized; shares issued and outstanding | ||||||||
| Common Stock, par value $ per share, million shares authorized; and issued and outstanding | ||||||||
| Additional paid-in capital | ||||||||
| Accumulated deficit | ( | ) | ( | ) | ||||
| Total stockholders’ equity | ||||||||
| Total liabilities and stockholders’ equity | $ | $ | ||||||
The accompanying notes are an integral part of these consolidated financial statements.
| 5 |
THE GLIMPSE GROUP, INC.
CONSOLIDATED STATEMENTS OF OPERATIONS
(Unaudited)
| For the Three Months Ended | For the Nine Months Ended | |||||||||||||||
| March 31, | March 31, | |||||||||||||||
| 2023 | 2022 | 2023 | 2022 | |||||||||||||
| Revenue | ||||||||||||||||
| Software services | $ | $ | $ | $ | ||||||||||||
| Software license/software as a service | ||||||||||||||||
| Total Revenue | ||||||||||||||||
| Cost of goods sold | ||||||||||||||||
| Gross Profit | ||||||||||||||||
| Operating expenses: | ||||||||||||||||
| Research and development expenses | ||||||||||||||||
| General and administrative expenses | ||||||||||||||||
| Sales and marketing expenses | ||||||||||||||||
| Amortization of acquisition intangible assets | ||||||||||||||||
| Intangible asset impairment | ||||||||||||||||
| Change in fair value of acquisition contingent consideration | ( | ) | ||||||||||||||
| Total operating expenses | ||||||||||||||||
| Loss from operations before other income (expense) | ( | ) | ( | ) | ( | ) | ( | ) | ||||||||
| Other income (expense) | ||||||||||||||||
| Forgiveness of Paycheck Protection Program loan | ||||||||||||||||
| Interest income | ||||||||||||||||
| Loss on conversion of convertible notes | ( | ) | ||||||||||||||
| Total other income (expense), net | ||||||||||||||||
| Net Loss | $ | ( | ) | $ | ( | ) | $ | ( | ) | $ | ( | ) | ||||
| Basic and diluted net loss per share | $ | ( | ) | $ | ( | ) | $ | ( | ) | $ | ( | ) | ||||
| Weighted-average shares used to compute basic and diluted net loss per share | ||||||||||||||||
The accompanying notes are an integral part of these consolidated financial statements.
| 6 |
THE GLIMPSE GROUP, INC.
CONSOLIDATED STATEMENT OF STOCKHOLDERS’ EQUITY
FOR THE THREE MONTHS ENDED MARCH 31, 2023
(Unaudited)
| Common Stock | Additional Paid-In | Accumulated | ||||||||||||||||||
| Shares | Amount | Capital | Deficit | Total | ||||||||||||||||
| Balance as of January 1, 2023 | $ | $ | $ | ( | ) | $ | ||||||||||||||
| Common stock issued to vendors for compensation | ||||||||||||||||||||
| Common stock issued for exercise of options | ||||||||||||||||||||
| Common stock issued to satisfy contingent acquisition obligations | ||||||||||||||||||||
| Common stock and stock option based compensation expense | ||||||||||||||||||||
| Stock option-based board of directors expense | - | |||||||||||||||||||
| Net loss | - | ( | ) | ( | ) | |||||||||||||||
| Balance as of March 31, 2023 | $ | $ | $ | ( | ) | $ | ||||||||||||||
THE GLIMPSE GROUP, INC.
CONSOLIDATED STATEMENT OF STOCKHOLDERS’ EQUITY
FOR THE NINE MONTHS ENDED MARCH 31, 2023
(Unaudited)
| Common Stock | Additional Paid-In | Accumulated | ||||||||||||||||||
| Shares | Amount | Capital | Deficit | Total | ||||||||||||||||
| Balance as of July 1, 2022 | $ | $ | $ | ( | ) | $ | ||||||||||||||
| Common stock issued for acquisition | ||||||||||||||||||||
| Common stock issued for satisfaction of prior year acquisition liability | ||||||||||||||||||||
| Common stock issued for purchase of intangible asset - technology | ||||||||||||||||||||
| Common stock issued to vendors for compensation | ||||||||||||||||||||
| Common stock issued for exercise of options | ||||||||||||||||||||
| Common stock issued to satisfy contingent acquisition obligations | ||||||||||||||||||||
| Common stock and stock option based compensation expense | ||||||||||||||||||||
| Stock option-based board of directors expense | - | |||||||||||||||||||
| Net loss | - | ( | ) | ( | ) | |||||||||||||||
| Balance as of March 31, 2023 | $ | $ | $ | ( | ) | $ | ||||||||||||||
The accompanying notes are an integral part of these consolidated financial statements.
| 7 |
THE GLIMPSE GROUP, INC.
CONSOLIDATED STATEMENT OF STOCKHOLDERS’ EQUITY
FOR THE THREE MONTHS ENDED MARCH 31, 2022
(Unaudited)
| Common Stock | Additional Paid-In | Accumulated | ||||||||||||||||||
| Shares | Amount | Capital | Deficit | Total | ||||||||||||||||
| Balance as of January 1, 2022 | $ | $ | $ | ( | ) | $ | ||||||||||||||
| Common stock issued for acquisition - fair value adjustment at close | - | ( | ) | ( | ) | |||||||||||||||
| Common stock issued for legacy acquisition obligation | ||||||||||||||||||||
| Common stock issued to vendors for compensation | ||||||||||||||||||||
| Common stock issued for exercise of options | ||||||||||||||||||||
| Common stock and stock option based compensation expense | - | |||||||||||||||||||
| Stock option-based board of directors expense | - | |||||||||||||||||||
| Net loss | - | ( | ) | ( | ) | |||||||||||||||
| Balance as of March 31, 2022 | $ | $ | $ | ( | ) | $ | ||||||||||||||
THE GLIMPSE GROUP, INC.
CONSOLIDATED STATEMENT OF STOCKHOLDERS’ EQUITY (DEFICIT)
FOR THE NINE MONTHS ENDED MARCH 31, 2022
(Unaudited)
| Common Stock | Additional Paid-In | Accumulated | ||||||||||||||||||
| Shares | Amount | Capital | Deficit | Total | ||||||||||||||||
| Balance as of July 1, 2021 | $ | $ | $ | ( | ) | $ | ( | ) | ||||||||||||
| Common stock issued in Initial Public Offering, net | ||||||||||||||||||||
| Common stock issued in Securities Purchase Agreement, net | ||||||||||||||||||||
| Common stock issued for convertible note conversion | ||||||||||||||||||||
| Common stock issued for acquisition | ||||||||||||||||||||
| Common stock issued to satisfy legacy acquisition obligation | ||||||||||||||||||||
| Common stock issued to vendors for compensation | ||||||||||||||||||||
| Common stock issued for exercise of options | ||||||||||||||||||||
| Common stock and stock option based compensation expense | ||||||||||||||||||||
| Stock option-based board of directors expense | - | |||||||||||||||||||
| Net loss | - | ( | ) | ( | ) | |||||||||||||||
| Balance as of March 31, 2022 | $ | $ | $ | ( | ) | $ | ||||||||||||||
The accompanying notes are an integral part of these consolidated financial statements.
| 8 |
THE GLIMPSE GROUP, INC.
CONSOLIDATED STATEMENTS OF CASH FLOWS
(Unaudited)
| For the Nine Months Ended March 31, | ||||||||
| 2023 | 2022 | |||||||
| Cash flows from operating activities: | ||||||||
| Net loss | $ | ( | ) | $ | ( | ) | ||
| Adjustments to reconcile net loss to net cash used in operating activities: | ||||||||
| Amortization and depreciation | ||||||||
| Common stock and stock option based compensation for employees and board of directors | ||||||||
| Acquisition contingent consideration fair value adjustment | ( | ) | ||||||
| Impairment of intangible assets | ||||||||
| Issuance of common stock to vendors as compensation | ||||||||
| Amortization of right-to-use-assets | ||||||||
| Loss on conversion of convertible notes | ||||||||
| Forgiveness of Paycheck Protection Program loan | ( | ) | ||||||
| Changes in operating assets and liabilities: | ||||||||
| Accounts receivable | ( | ) | ( | ) | ||||
| Pre-offering costs | ||||||||
| Deferred costs/contract assets | ( | ) | ||||||
| Prepaid expenses and other current assets | ( | ) | ( | ) | ||||
| Other assets | ( | ) | ||||||
| Accounts payable | ( | ) | ( | ) | ||||
| Accrued liabilities | ( | ) | ||||||
| Accrued bonuses | ( | ) | ( | ) | ||||
| Deferred revenue/contract liabilities | ( | ) | ||||||
| Lease liabilities | ( | ) | ||||||
| Net cash used in operating activities | ( | ) | ( | ) | ||||
| Cash flow from investing activities: | ||||||||
| Purchases of equipment | ( | ) | ( | ) | ||||
| Acquisitions, net of cash acquired | ( | ) | ( | ) | ||||
| Asset acquisition | ( | ) | ||||||
| Purchase of investments | ( | ) | ( | ) | ||||
| Net cash used in investing activities | ( | ) | ( | ) | ||||
| Cash flows from financing activities: | ||||||||
| Proceeds from initial public offering, net | ||||||||
| Proceeds from securities purchase agreement, net | ||||||||
| Proceeds from exercise of stock options | ||||||||
| Issuance of note receivable | ( | ) | ||||||
| Net cash provided by financing activities | ||||||||
| Net change in cash, cash equivalents and restricted cash | ( | ) | ||||||
| Cash, cash equivalents and restricted cash, beginning of period | ||||||||
| Cash, cash equivalents and restricted cash, end of period | $ | $ | ||||||
| Non-cash Investing and Financing activities: | ||||||||
| Common stock issued for acquisitions | $ | $ | ||||||
| Common stock issued for satisfaction of prior year acquisition lability | $ | $ | ||||||
| Common stock issued for purchase of intangible asset - technology | $ | $ | ||||||
| Issuance of common stock for satisfaction of contingent liability, net of note extinguishment | $ | $ | ||||||
| Extinguishment of note receivable for satisfaction of contingent liability | $ | $ | ||||||
| Contingent acquisition consideration liability recorded at closing | $ | $ | ||||||
| Issuance of common stock for satisfaction of contingent liability | $ | $ | ||||||
| Lease liabilities arising from right-of-use assets | $ | $ | ||||||
| Issuance of common stock for satisfaction of legacy acquisition liability | $ | $ | ||||||
| Conversion of convertible promissory notes into common stock | $ | $ | ||||||
| Issuance of warrants in connection with initial public offering | $ | $ | ||||||
| Issuance of warrants in connection with securities purchase agreement | $ | $ | ||||||
The accompanying notes are an integral part of these consolidated financial statements.
| 9 |
THE GLIMPSE GROUP, INC.
NOTES TO CONSOLIDATED FINANCIAL STATEMENTS
(UNAUDITED)
MARCH 31, 2023 AND 2022
NOTE 1. DESCRIPTION OF BUSINESS
The Glimpse Group, Inc. (“Glimpse” and together with its wholly owned subsidiaries, collectively, the “Company”) is a Virtual (VR) and Augmented (AR) Reality company, comprised of a diversified portfolio of wholly owned VR and AR software and services companies. Glimpse’s subsidiary companies are located in the United States, Turkey, Israel and Australia. The Company was incorporated in the State of Nevada in June 2016.
Glimpse’s robust VR/AR ecosystem, collaborative environment and business model strive to simplify the many challenges faced by companies in an emerging industry. Glimpse cultivates, optimizes and manages business operations while providing a strong network of professional relationships, thereby allowing the subsidiary company to maximize their time and resources in pursuit of mission-critical endeavors, reducing time to market, optimizing costs, improving product quality and leveraging joint go-to-market strategies, while simultaneously providing investors an opportunity to invest directly into the VR/AR industry via a diversified platform.
The Company completed an initial public offering (“IPO”) of its common stock on the Nasdaq Capital Market Exchange (“Nasdaq”) on July 1, 2021, under the ticker VRAR. In addition, pursuant to a Securities Purchase Agreement (“SPA”) the Company sold additional common stock to certain institutional investors in November 2021. See Note 8.
NOTE 2. LIQUIDITY AND CAPITAL RESOURCES
The
Company incurred losses of approximately $
The
Company is striving to reach cash flow neutrality from operations in calendar year 2023. The following steps have been taken since the
end of calendar year 2022 in order to achieve this objective: workforce reduction of approximately
| 10 |
THE GLIMPSE GROUP, INC.
NOTES TO CONSOLIDATED FINANCIAL STATEMENTS
(UNAUDITED)
MARCH 31, 2023 AND 2022
NOTE 3. SUMMARY OF SIGNIFICANT ACCOUNTING POLICIES
Basis of presentation
The unaudited consolidated financial statements have been prepared in accordance with accounting principles generally accepted in the United States for interim financial information and the rules and regulations of the SEC. In the opinion of management, the unaudited consolidated financial statements have been prepared on the same basis as the annual consolidated financial statements and reflect all adjustments, which include only normal recurring adjustments, necessary to present fairly the financial position as of March 31, 2023, the results of operations for the three and nine months ended March 31, 2023 and 2022, and cash flows for the nine months ended March 31, 2023 and 2022. The financial data and other information disclosed in these notes to the interim financial statements related to these periods are unaudited. The results for the three and nine months ended March 31, 2023 are not necessarily indicative of the results to be expected for the entire year ending June 30, 2023 or for any subsequent periods. The consolidated balance sheet at June 30, 2022 has been derived from the audited consolidated financial statements at that date.
Certain information and footnote disclosures normally included in financial statements prepared in accordance with accounting principles generally accepted in the United States (“GAAP”) have been condensed or omitted pursuant to the Securities and Exchange Commission’s rules and regulations.
These unaudited consolidated financial statements should be read in conjunction with our audited consolidated financial statements and notes thereto for the year ended June 30, 2022.
Principles of Consolidation
The accompanying consolidated financial statements include the balances of Glimpse and its wholly owned subsidiaries. All significant intercompany accounts and transactions have been eliminated in consolidation.
Use of Accounting Estimates
The preparation of the accompanying consolidated financial statements in conformity with GAAP requires management to make estimates and assumptions that affect the reported amounts of assets and liabilities and disclosure of contingent assets and liabilities as of the date of the accompanying consolidated financial statements and the reported amounts of revenue and expenses during the reporting period. Actual results could differ from those estimates.
The principal estimates relate to the valuation of allowance for doubtful accounts, stock options, warrants, revenue recognition, cost of goods sold, allocation of the purchase price of assets relating to business combinations and calculation of contingent consideration for acquisitions.
Cash and Cash Equivalents, Restricted Cash
Cash and cash equivalents consist of cash and deposits in bank checking accounts with immediate access and cash equivalents that represent highly liquid investments.
Restricted cash represents escrowed cash related to the Sector 5 Digital, LLC (“S5D”) acquisition.
The components of cash, cash equivalents and restricted cash on the consolidated statements of cash flows as of March 31, 2023 and 2022 are as follows:
| As of March 31, | As of March 31, | |||||||
| 2023 | 2022 | |||||||
| Cash and cash equivalents | $ | $ | ||||||
| Restricted cash | ||||||||
| Total | $ | $ | ||||||
| 11 |
THE GLIMPSE GROUP, INC.
NOTES TO CONSOLIDATED FINANCIAL STATEMENTS
(UNAUDITED)
MARCH 31, 2023 AND 2022
Accounts Receivable
Accounts receivable consists primarily of amounts due from customers under normal trade terms. Allowances for uncollectible accounts are provided for based upon a variety of factors, including historical amounts written-off, an evaluation of current economic conditions, and assessment of customer collectability. As of March 31, 2023 and June 30, 2022 no allowance for doubtful accounts was recorded as all amounts were considered collectible.
Customer Concentration and Credit Risk
Two
customers accounted for approximately
Two
customers accounted for approximately
The Company maintains cash in accounts that, at times, may be in excess of the Federal Deposit Insurance Corporation limit. The Company has not experienced any losses on such accounts.
Business Combinations
The results of a business acquired in a business combination are included in the Company’s consolidated financial statements from the date of the acquisition. Purchase accounting results in assets and liabilities of an acquired business generally being recorded at their estimated fair values as of the acquisition date. Any excess consideration over the fair value of assets acquired and liabilities assumed is recognized as goodwill. Acquisition-related expenses are recognized separately from the business combination and are expensed as incurred.
The Company performs valuations of assets acquired and liabilities assumed and allocates the purchase price to its respective assets and liabilities. Determining the fair value of assets acquired and liabilities assumed may require management to use significant judgment and estimates, including the selection of valuation methodologies, estimates of future revenues, costs and cash flows. Estimates of fair value are based upon assumptions believed to be reasonable, but which are inherently uncertain and unpredictable and, as a result, actual results may differ from estimates. During the measurement period, which is typically one year from the acquisition date, if new information is obtained about facts and circumstances that existed as of the acquisition date, changes in the estimated values of the net assets recorded may change the amount of the purchase price allocated to goodwill. Upon the conclusion of the measurement period, any subsequent adjustments are recorded in the consolidated statement of operations. At times, the Company engages the assistance of valuation specialists in concluding on fair value measurements in connection with determining fair values of assets acquired and liabilities assumed in a business combination.
Further, during the year ended June 30, 2022, the Company early adopted ASU No. 2021-08, Business Combinations (Topic 805): Accounting for Contract Assets and Contract Liabilities from Contracts with Customers, which requires an acquirer to account for the related revenue contracts, acquired in the business acquisition, in accordance with ASC Topic 606 Revenue from Contracts with a Customer as if the Company had originated the contracts.
| 12 |
THE GLIMPSE GROUP, INC.
NOTES TO CONSOLIDATED FINANCIAL STATEMENTS
(UNAUDITED)
MARCH 31, 2023 AND 2022
Intangible assets (other than Goodwill)
Intangibles represent the allocation of a portion of the acquisition’s purchase price (see Note 5). Intangibles are stated at allocated cost less accumulated amortization. Amortization is computed using the straight-line method over the estimated useful lives of the related assets. The Company reviews intangibles, being amortized, for impairment when current events indicate that the fair value may be less than the carrying value.
Goodwill
Goodwill represents the excess of the purchase price over the fair value of identifiable net assets acquired in business combinations accounted for under the acquisition method. Goodwill is not amortized but instead is tested at least annually for impairment, or more frequently when events or changes in circumstances indicate that goodwill might be impaired.
Fair Value of Financial Instruments
Fair value is defined as the exchange price that would be received for an asset or paid to transfer a liability (an exit price) in the principal or most advantageous market for the asset or liability in an orderly transaction between market participants on the measurement date. Valuation techniques used to measure fair value must maximize the use of observable inputs and minimize the use of unobservable inputs. The fair value hierarchy, which is based on three levels of inputs, the first two of which are considered observable and the last unobservable, that may be used to measure fair value, is as follows:
● Level 1 — quoted prices (unadjusted) in active markets for identical assets or liabilities;
● Level 2 — inputs other than Level 1 that are observable, either directly or indirectly, such as quoted prices for similar assets or liabilities; quoted prices in markets that are not active; or other inputs that are observable or can be corroborated by observable market data for substantially the full term of the assets or liabilities; or
● Level 3 — unobservable inputs that are supported by little or no market activity and that are significant to the fair value of the assets or liabilities.
The Company classifies its cash equivalents and investments within Level 1 of the fair value hierarchy on the basis of valuations based on quoted prices for the specific securities in an active market.
The Company’s contingent consideration is categorized as Level 3 within the fair value hierarchy. Contingent consideration is recorded within contingent consideration, current, and contingent consideration, non-current, in the Company’s consolidated balance sheets as of March 31, 2023 and June 30, 2022. Contingent consideration has been recorded at its fair values using unobservable inputs and have included using the Monte Carlo simulation option pricing framework, incorporating contractual terms and assumptions regarding financial forecasts, discount rates, and volatility of forecasted revenue. The development and determination of the unobservable inputs for Level 3 fair value measurements and fair value calculations are the responsibility of the Company’s management, with the assistance of a third-party valuation specialist.
The Company’s other financial instruments consist primarily of accounts receivable, accounts payable, accrued liabilities and other liabilities, and approximate fair value due to the short-term nature of these instruments.
| 13 |
THE GLIMPSE GROUP, INC.
NOTES TO CONSOLIDATED FINANCIAL STATEMENTS
(UNAUDITED)
MARCH 31, 2023 AND 2022
Revenue Recognition
Nature of Revenues
The Company reports its revenues in two categories:
| ● | Software Services: Virtual and Augmented Reality projects, solutions and consulting services. | |
| ● | Software License and Software-as-a-Service (“SaaS”): Virtual and Augmented Reality software that is sold either as a license or as a SaaS subscription. |
The Company applies the following steps in order to determine the appropriate amount of revenue to be recognized as it fulfills its obligations under each of its agreements:
| ● | identify the contract with a customer; | |
| ● | identify the performance obligations in the contract; | |
| ● | determine the transaction price; | |
| ● | allocate the transaction price to performance obligations in the contract; | |
| ● | recognize revenue as the performance obligation is satisfied; | |
| ● | determine that collection is reasonably assured. |
Revenue is recognized when the Company satisfies its performance obligation under the contract by transferring the promised product to its customer or service is performed and collection is reasonably assured. A performance obligation is a promise in a contract to transfer a distinct product or service to a customer. A portion of the Company’s contracts have a single performance obligation, as the promise to transfer products or services is not separately identifiable from other promises in the contract and, therefore, not distinct. Other contracts can include various services and products which are at times capable of being distinct, and therefore may be accounted for as separate performance obligations.
Revenue is measured as the amount of consideration the Company expects to receive in exchange for transferring products or providing services. As such, revenue is recorded net of returns, allowances, customer discounts, and incentives. Sales taxes and other taxes are excluded from revenues.
For distinct performance obligations recognized at a point in time, any unrecognized portion of revenue and any corresponding unrecognized expenses are presented as deferred revenue/contract liability and deferred costs/contract asset, respectively, in the accompanying consolidated balance sheets. Deferred costs/contract assets include cash and equity based payroll costs, and may include payments to consultants and vendors.
For distinct performance obligations recognized over time, the Company records a contract asset (costs in excess of billings) when revenue is recognized prior to invoicing, or a contract liability (billings in excess of costs) when revenue is recognized subsequent to invoicing.
Significant Judgments
The Company’s contracts with customers may include promises to transfer multiple products/services. Determining whether products/services are considered distinct performance obligations that should be accounted for separately versus together may require significant judgment. Further, judgment may be required to determine the standalone selling price for each distinct performance obligation.
| 14 |
THE GLIMPSE GROUP, INC.
NOTES TO CONSOLIDATED FINANCIAL STATEMENTS
(UNAUDITED)
MARCH 31, 2023 AND 2022
Disaggregation of Revenue
The Company generated revenue for the nine months ended March 31, 2023 and 2022 by delivering: (i) Software Services, consisting primarily of VR/AR software projects, solutions and consulting services, and (ii) Software Licenses & SaaS, consisting primarily of VR and AR software licenses or SaaS. The Company currently generates its revenues primarily from customers in the United States.
Revenue for a significant portion of Software Services projects and solutions (projects whereby, the development of the project leads to an identifiable asset with an alternative use to the Company) is recognized at the point of time in which the customer obtains control of the project, customer accepts delivery and confirms completion of the project. Certain other Software Services revenues are custom project solutions (projects whereby, the development of the custom project leads to an identifiable asset with no alternative use to the Company, and, in which, the Company also has an enforceable right to payment under the contract) and are therefore recognized based on the percentage of completion using an input model with a master budget. The budget is reviewed periodically and percentage of completion adjusted accordingly.
Revenue for Software Services consulting services and website maintenance is recognized when the Company performs the services, typically on a monthly retainer basis.
Revenue for Software License is recognized at the point of time in which the Company delivers the software and customer accepts delivery. If there are significant contractually stated ongoing service obligations to be performed during the term of the Software License or SaaS contract, then revenues are recognized ratably over the term of the contract.
Timing of Revenue
The timing of revenue recognition for the three and nine months ended March 31, 2023 and 2022 was as follows:
| For the Three Months Ended | For the Nine Months Ended | |||||||||||||||
| March 31, | March 31, | |||||||||||||||
| 2023 | 2022 | 2023 | 2022 | |||||||||||||
| Products and services transferred at a point in time | $ | $ | $ | $ | ||||||||||||
| Products and services transferred/recognized over time | ||||||||||||||||
| Total Revenue | $ | $ | $ | $ | ||||||||||||
Remaining Performance Obligations
Timing of revenue recognition may differ from the timing of invoicing to customers. The Company generally records a receivable/contract asset when revenue is recognized prior to invoicing, or deferred revenue/contract liability when revenue is recognized subsequent to invoicing.
For certain Software Services project contracts the Company invoices customers after the project has been delivered and accepted by the customer. Software Service project contracts typically consist of designing and programming software for the customer. In most cases, there is only one distinct performance obligation, and revenue is recognized upon completion, delivery and customer acceptance. Contracts may include multiple distinct projects that can each be implemented and operated independently of subsequent projects in the contract. In such cases, the Company accounts for these projects as separate distinct performance obligations and recognizes revenue upon the completion of each project or obligation, its delivery and customer acceptance.
For contracts recognized over time, contract liabilities include billings invoiced for software projects for which the contract’s performance obligations are not complete.
| 15 |
THE GLIMPSE GROUP, INC.
NOTES TO CONSOLIDATED FINANCIAL STATEMENTS
(UNAUDITED)
MARCH 31, 2023 AND 2022
For certain other Software Services project contracts, the Company invoices customers for a substantial portion of the project upon entering into the contract due to their custom nature and revenue is recognized based upon percentage of completion. Revenue recognized subsequent to invoicing is recorded as a deferred revenue/contract liability (billings in excess of cost) and revenue recognized prior to invoicing is recorded as a deferred cost/contract asset (cost in excess of billings).
For Software Services consulting or retainer contracts, the Company generally invoices customers monthly at the beginning of each month in advance for services to be performed in the following month. The sole performance obligation is satisfied when the services are performed. Software Services consulting or retainer contracts typically consist of ongoing support for a customer’s software or specified business practices.
For Software License contracts, the Company generally invoices customers when the software has been delivered to and accepted by the customer, which is also when the performance obligation is satisfied. For SaaS contracts, the Company generally invoices customers in advance at the beginning of the service term.
For multi-period Software License contracts, the Company generally invoices customers annually at the beginning of each annual coverage period. Software License contracts consist of providing clients with software designed by the Company. For Software License contracts, there are generally no ongoing support obligations unless specified in the contract (becoming a Software Service).
Unfulfilled
performance obligations represent amounts expected to be earned by the Company on executed contracts. As of March 31, 2023, the Company
had approximately $
The Company recognizes stock-based compensation expense related to grants to employees or service providers based on grant date fair values of common stock or the stock options, which are amortized over the requisite period, as well as forfeitures as they occur.
The Company values the options using the Black-Scholes Merton (“Black Scholes”) method utilizing various inputs such as expected term, expected volatility and the risk-free rate. The expected term reflects the application of the simplified method, which is the weighted average of the contractual term of the grant and the vesting period for each tranche. Expected volatility is derived from a weighted average of volatility inputs for the Company. The risk-free rate is based on the implied yield of U.S. Treasury notes as of the grant date with a remaining term approximately equal to the expected life of the award.
Research and Development Costs
Research and development expenses are expensed as incurred, and include payroll, employee benefits and stock-based compensation expense. Research and development expenses also include third-party development and programming costs. Given the emerging industry and uncertain market environment the Company operates in, research and development costs are not capitalized.
Basic earnings per share (“EPS”) is computed based on the weighted average number of shares of common stock outstanding during the period. Diluted EPS is computed based on the weighted average number of shares of common stock plus the effect of dilutive potential shares of common stock outstanding during the period using the treasury stock method. Dilutive potential common shares include the issuance of potential shares of common stock for outstanding stock options and warrants.
| 16 |
THE GLIMPSE GROUP, INC.
NOTES TO CONSOLIDATED FINANCIAL STATEMENTS
(UNAUDITED)
MARCH 31, 2023 AND 2022
Reclassifications
Certain accounts in the prior period financial statements have been reclassified for comparative purposes to conform with the presentation in the current period financial statements.
Recently Adopted Accounting Pronouncements
Leases
Adoption of the New Lease Accounting Standard
On July 1, 2022, the Company adopted ASU No. 2016-02, Leases (Topic 842), using the modified retrospective transition method applied at the adoption date of the standard. Results for reporting periods beginning after July 1, 2022 are presented under the new leasing standard, while prior period amounts are not adjusted and continue to be reported in accordance with the Company’s historic accounting. The Company has elected to utilize the package of practical expedients at the time of adoption, which allows the Company to (1) not reassess whether any expired or existing contracts are or contain leases, (2) not reassess the lease classification of any expired or existing leases, and (3) not reassess initial direct costs for any existing leases. The Company also has elected to utilize the short-term lease recognition exemption and, for those leases that qualified, the Company did not recognize right-of-use (“ROU”) assets or lease liabilities. As a result of adoption, the Company recorded ROU assets related to office facility leases which are recognized on the consolidated balance sheet and the associated lease liabilities are recognized on the consolidated balance sheet. The present value of the Company’s remaining lease payments, which comprise the lease liabilities, was estimated using an estimated incremental borrowing rate as of the adoption date.
The adoption resulted in no adjustment to July 1, 2022 accumulated deficit on the consolidated balance sheet.
As
of July 1, 2022, the Company recorded right-of-use assets of $
New Lease Accounting Policies
The Company determines if an arrangement is a lease at inception and determines the classification of the lease, as either operating or finance, at commencement.
| 17 |
THE GLIMPSE GROUP, INC.
NOTES TO CONSOLIDATED FINANCIAL STATEMENTS
(UNAUDITED)
MARCH 31, 2023 AND 2022
Recent Accounting Pronouncements
Management does not believe that any recently issued, but not yet effective, accounting standards if currently adopted would have a material effect on the Company’s financial statements.
NOTE 4. BUSINESS ACQUISITION AND ASSET ACQUISTION - TECHNOLGY
Acquisition (“BLI”)
On May 25, 2022, Glimpse entered into an Agreement and Plan of Merger (the “Merger Agreement”), with BLI and each of the equity holders of BLI named therein (collectively, the “Members”). BLI is an immersive technology company that provides VR and AR based training scenarios and simulations for commercial and government customers. The acquisition significantly expands the Company’s operating and financial scale, introduces new tier 1 customers specifically in the communication, entertainment and government segments, and bolsters the executive management team.
In August 2022, BLI became a wholly-owned subsidiary of Glimpse.
The
aggregate consideration to the Members per the Agreement consisted of: (a) $
The fair value allocation for the purchase price consideration paid at Closing (including subsequent post-closing adjustments) was recorded as follows:
| Purchase price consideration: | ||||
| Cash paid to members at Closing | $ | |||
| Post-closing working capital adjustments | ( | ) | ||
| Company common stock fair value at Closing | ||||
| Fair value of contingent consideration to be achieved | ||||
| Total purchase price | $ | |||
| Fair value allocation of purchase price: | ||||
| Cash and cash equivalents | $ | |||
| Accounts receivable | ||||
| Deferred costs/contract assets | ||||
| Other assets | ||||
| Equipment, net | ||||
| Accounts payable and accrued expenses | ( | ) | ||
| Deferred revenue/contract liabilities | ( | ) | ||
| Intangible assets - customer relationships | ||||
| Intangible assets - technology | ||||
| Goodwill | ||||
| Total fair value allocation of purchase price | $ | |||
| 18 |
THE GLIMPSE GROUP, INC.
NOTES TO CONSOLIDATED FINANCIAL STATEMENTS
(UNAUDITED)
MARCH 31, 2023 AND 2022
The Company’s fair value estimate of the contingent consideration for the BLI acquisition was determined using a Monte Carlo simulation and other methods which account for the probabilities of various outcomes. The Company’s fair value estimate related to the identified intangible asset of customer relationships was determined using the Multi-Period Excess Earnings Method. This valuation method requires management to project revenues, customer attrition and cash flows for the reporting unit over a multiyear period, as well as determine the weighted average cost of capital to be used as a discount rate. The Company’s fair value estimate related to the identified intangible asset of technology was determined using the Relief from Royalty Method. This valuation method requires management to estimate the royalty rate based on market data for royalty arrangements involving similar technology, the obsolesce rate, and the weighted average cost of capital to be used as a discount rate.
The goodwill recognized in connection with the acquisition is primarily attributable to new markets access and will be deductible for tax purposes.
In
accordance with GAAP, the fair value of the contingent consideration was remeasured at March 31, 2023, based on market conditions as
of that date. The remeasurement resulted in a fair value amount at March 31, 2023 of $
Unaudited Pro Forma Results
The unaudited pro forma financial information in the table below summarizes the combined results of operations for the Company and BLI, as if the companies were combined for the nine months ended March 31, 2023. The unaudited pro forma financial information includes the business combination accounting effects resulting from this acquisition, including adjustments to reflect recognition of intangible asset amortization. The unaudited pro forma financial information as presented below is for informational purposes only and is not necessarily indicative of the results of operations that would have been achieved if the acquisitions had taken place at July 1, 2022.
The approximate unaudited pro forma financial information if BLI was included since July 1, 2022 would be:
| For the Nine Months Ended | ||||
| March 31, 2023 | ||||
| Revenue | $ | |||
| Net Loss | $ | ( | ) | |
The
pro forma net loss was adjusted to exclude approximately $
Costs
related to the acquisition, which include legal, accounting and valuation fees, in the amount of approximately $
The
Company recognized approximately $
The BLI acquisition above was considered a business combination in accordance with GAAP.
Asset Acquisition - Technology
In November 2022, the Company entered into an assignment agreement with inciteVR (“IVR”), whereby the Company purchased the entire right, title and interest to certain VR/AR technology, as defined, to expand product offerings.
The
Company issued shares of the Company’s common stock, with a fair value of approximately $
Certain IVR owners became employees of Glimpse after the assignment.
| 19 |
THE GLIMPSE GROUP, INC.
NOTES TO CONSOLIDATED FINANCIAL STATEMENTS
(UNAUDITED)
MARCH 31, 2023 AND 2022
NOTE 5. INTANGIBLE ASSETS
Intangible assets, their respective amortization period, and accumulated amortization at March 31, 2023 are as follows:
| As of March 31, 2023 | ||||||||||||||||||||||||||
| Value ($) | Amortization Period (Years) | |||||||||||||||||||||||||
| XR Terra | S5D | PulpoAR | BLI | inciteVR | Total | |||||||||||||||||||||
| Intangible Assets | ||||||||||||||||||||||||||
| Customer Relationships | $ | $ | $ | $ | $ | $ | ||||||||||||||||||||
| Technology | ||||||||||||||||||||||||||
| Less: Accumulated Amortization | ( | ) | ( | ) | ( | ) | ( | ) | ( | ) | ( | ) | ||||||||||||||
| Intangible Assets, net | $ | $ | | $ | | $ | | $ | | $ | | |||||||||||||||
Intangible
asset amortization expense for the three and nine months ended March 31, 2023 was approximately $
Intangible
asset amortization expense for the three and nine months ended March 31, 2022 was approximately $
Estimated intangible asset amortization expense for the remaining lives are as follows:
| Remaining Fiscal Year Ended June 30, 2023 | $ | |||
| Fiscal Year Ended June 30, 2024 | $ | |||
| Fiscal Year Ended June 30, 2025 | $ | |||
| Fiscal Year Ended June 30, 2026 | $ | |||
| Fiscal Year Ended June 30, 2027 | $ | |||
| Fiscal Year Ended June 30, 2028 | $ |
AUGGD
During
the three months ended March 31, 2023, primarily due to a lack of market traction, a decision was made by the Company to cease the operations
of its wholly owned subsidiary MotionZone, LLC (dba “AUGGD”) and divest any related assets and potential liabilities. The
assets of AUGGD were originally acquired by the Company in August 2021. The assets of AUGGD were deemed worthless with no future benefit
at March 31, 2023. The assets were transferred to a new independent entity, majority owned by the original sellers of AUGGD, in return
for a
Accordingly,
the net book value of intangible assets, including goodwill, originally recorded at the time of purchase of AUGGD, were written off as
of March 31, 2023. The $
For
the three and nine months ended March 31, 2023, AUGGD had less than $
| 20 |
THE GLIMPSE GROUP, INC.
NOTES TO CONSOLIDATED FINANCIAL STATEMENTS
(UNAUDITED)
MARCH 31, 2023 AND 2022
NOTE 6. FINANCIAL INSTRUMENTS
Cash and Cash Equivalents and Investments
The Company’s money market funds and investments (short term, investment grade corporate bonds) are categorized as Level 1 within the fair value hierarchy. As of March 31, 2023 and June 30, 2022, the Company’s cash and cash equivalents and investments were as follows:
| As of March 31, 2023 | ||||||||||||||||||||
| Cost | Unrealized Gain (Loss) | Fair Value | Cash and Cash Equivalents | Investments | ||||||||||||||||
| Cash | $ | $ | - | $ | ||||||||||||||||
| Level 1: | ||||||||||||||||||||
| Money market funds | - | $ | ||||||||||||||||||
| Total cash and cash equivalents | $ | $ | - | $ | $ | |||||||||||||||
| Level 1: | ||||||||||||||||||||
| Investments | $ | $ | ( | ) | $ | $ | ||||||||||||||
| As of June 30, 2022 | ||||||||||||||||||||
| Cost | Unrealized Gain (Loss) | Fair Value | Cash and Cash Equivalents | Investments | ||||||||||||||||
| Cash | $ | $ | - | $ | ||||||||||||||||
| Level 1: | ||||||||||||||||||||
| Money market funds | - | $ | ||||||||||||||||||
| Total cash and cash equivalents | $ | $ | - | $ | $ | |||||||||||||||
| Level 1: | ||||||||||||||||||||
| Investments | $ | $ | ( | ) | $ | $ | ||||||||||||||
Contingent Consideration
As of March 31, 2023 and June 30, 2022, the Company’s contingent consideration liabilities related to acquisitions are categorized as Level 3 within the fair value hierarchy. Contingent consideration was valued at the time of acquisitions and at March 31, 2023 and June 30, 2022, using unobservable inputs and have included using the Monte Carlo simulation model. This model incorporates revenue volatility, internal rate of return, and risk-free rate. The development and determination of the unobservable inputs for Level 3 fair value measurements and fair value calculations are the responsibility of the Company’s management, with the assistance of a third-party valuation specialist.
| 21 |
THE GLIMPSE GROUP, INC.
NOTES TO CONSOLIDATED FINANCIAL STATEMENTS
(UNAUDITED)
MARCH 31, 2023 AND 2022
As of March 31, 2023, the Company’s contingent consideration liabilities current and non-current balances were as follows:
| As of March 31, 2023 | ||||||||||||||||||||
| Contingent Consideration at Purchase Date | Consideration Paid | Changes in Fair Value | Fair Value | Contingent Consideration | ||||||||||||||||
| Level 3: | ||||||||||||||||||||
| Contingent consideration, current - S5D | $ | $ | ( | ) | $ | $ | $ | |||||||||||||
| Contingent consideration, current - BLI | ( | ) | ||||||||||||||||||
| Contingent consideration, current - XRT | ( | ) | ||||||||||||||||||
| Total contingent consideration, current portion | $ | $ | ( | ) | $ | $ | $ | |||||||||||||
| Level 3: | ||||||||||||||||||||
| Contingent consideration, non-current - S5D | $ | $ | ( | ) | $ | ( | ) | $ | $ | |||||||||||
| Contingent consideration, non-current - BLI | ( | ) | ||||||||||||||||||
| Total contingent consideration, net of current portion | $ | $ | ( | ) | $ | ( | ) | $ | $ | |||||||||||
A
summary of the quantitative significant inputs used to value S5D’s contingent consideration as of March 31, 2023 was: $
A
summary of the quantitative significant inputs used to value BLI’s contingent consideration as of March 31, 2023 was: $
The
change in fair value of contingent consideration for S5D and BLI for the three and nine months ended March 31, 2023 was a non-cash expense
of approximately $
As
of March 31, 2023, the Company’s contingent consideration liability related to XR Terra, LLC (“XRT”) is categorized
as Level 3 within the fair value hierarchy as it is based on contractual amounts pursuant to the acquisition agreement, of which certain
inputs are unobservable. The change in fair value of contingent consideration for XRT for the three and nine months ended March 31, 2023
was an expense of approximately $
| 22 |
THE GLIMPSE GROUP, INC.
NOTES TO CONSOLIDATED FINANCIAL STATEMENTS
(UNAUDITED)
MARCH 31, 2023 AND 2022
Goodwill
of AUGGD, totaling $
| As of June 30, 2022 | ||||||||||||||||
| Contingent Consideration at Purchase Date | Changes in Fair Value | Fair Value | Contingent Consideration | |||||||||||||
| Level 3: | ||||||||||||||||
| Contingent consideration, current - S5D | $ | $ | ( | ) | $ | $ | ||||||||||
| Contingent consideration, current - AUGGD | ||||||||||||||||
| Total contingent consideration, current | $ | $ | ( | ) | $ | $ | ||||||||||
| Level 3: | ||||||||||||||||
| Contingent consideration, non-current - S5D | $ | $ | ( | ) | $ | $ | ||||||||||
A
summary of the quantitative significant inputs used to value S5D’s contingent consideration as of June 30, 2022 was: $
As of June 30, 2022, the Company’s contingent consideration liability related to MotionZone, LLC (“AUGGD”) is categorized as Level 3 within the fair value hierarchy as it is based on contractual amounts pursuant to the acquisition agreement, of which certain inputs are unobservable.
The
was
NOTE 7. DEFERRED COSTS/CONTRACT ASSETS and DEFERRED REVENUE/CONTRACT LIABILITIES
At
March 31, 2023 and June 30, 2022, deferred costs/contract assets totaling $
| 23 |
THE GLIMPSE GROUP, INC.
NOTES TO CONSOLIDATED FINANCIAL STATEMENTS
(UNAUDITED)
MARCH 31, 2023 AND 2022
The following table shows the reconciliation of the costs in excess of billings and billings in excess of costs for contracts recognized over time:
| As of Mar 31, 2023 | ||||
| Cost incurred on uncompleted contracts | $ | |||
| Estimated earnings | ||||
| Earned revenue | ||||
| Less: billings to date | ||||
| Billings in excess of costs, net | $ | ( | ) | |
| Balance Sheet Classification | ||||
| Contract assets includes, costs and estimated earnings in excess of billings on uncompleted contracts | $ | |||
| Contract liabilities includes, billings in excess of costs and estimated earnings on uncompleted contracts | ( | ) | ||
| Billings in excess of costs, net | $ | ( | ) | |
NOTE 8. EQUITY
Initial Public Offering (“IPO”)
On July 1, 2021, the Company completed an IPO of common stock on the Nasdaq under the symbol “VRAR”, at a price of $ per share.
The
Company sold approximately million shares of common stock and realized net proceeds (after underwriting, professional fees and listing
expenses) of $
In
connection with the IPO, and for services rendered, the underwriter was issued a warrant to purchase shares of common stock at
$ per share. The warrant could not be exercised prior to December 30, 2021 and expires in June 2026. The warrant was valued at approximately
$
In
conjunction with the IPO, outstanding convertible promissory notes totaling approximately $
Securities Purchase Agreement (“SPA”)
In
November 2021, the Company sold $
Under
the terms of the SPA, the Company sold million shares of its common stock and warrants to purchase
| 24 |
THE GLIMPSE GROUP, INC.
NOTES TO CONSOLIDATED FINANCIAL STATEMENTS
(UNAUDITED)
MARCH 31, 2023 AND 2022
Common Stock Issued
Common stock issued for Business Acquisitions and Asset Acquisition - Technology
During
the nine months ended March 31, 2023, the Company issued approximately: shares of common stock, valued at $
During
the nine months ended March 31, 2022 the Company issued approximately shares of common stock, valued at $
Common stock issued to satisfy contingent acquisition obligations
During
the nine months ended March 31, 2023 the Company issued approximately shares of common stock, with a fair value of approximately
$
During
the nine months ended March 31, 2022 the Company issued shares of common stock to satisfy pre-IPO legacy acquisition obligations
of $
Common stock issued for Exercise of Stock Options
During
the nine months ended March 31, 2023 and 2022, the Company issued approximately and shares of common stock in cash and
cashless transactions, respectively, upon exercise of the respective option grants and realized cash proceeds of approximately $
Common stock issued to Vendors
During
the nine months ended March 31, 2023 and 2022, the Company issued approximately and shares of common stock, to various vendors
for services performed and recorded share-based compensation of approximately $
Common stock issued to Employees as Compensation
During
the nine months ended March 31, 2023 and 2022, the Company issued approximately and shares of common stock, to various
employees as compensation and recorded share-based compensation of approximately $
| 25 |
THE GLIMPSE GROUP, INC.
NOTES TO CONSOLIDATED FINANCIAL STATEMENTS
(UNAUDITED)
MARCH 31, 2023 AND 2022
Employee Stock-Based Compensation
Stock Option issuance to Executives
In February 2023, pursuant to the Equity Incentive Plan, the Company granted certain executive officers million stock options as a long-term incentive. The options have an exercise price of $ per share. Approximately million of these options vest ratably over (“Initial Options”). The remainder (“Target Options”) vest in fixed amounts based on achieving various revenue or common stock prices within seven years of grant date.
Equity Incentive Plan
The Company’s 2016 Equity Incentive Plan (the “Plan”), as amended, has approximately million common shares reserved for issuance. As of March 31, 2023, there were approximately million shares available for issuance under the Plan.
The Company recognizes compensation expense relating to awards ratably over the requisite period, which is generally the vesting period.
For the Three Months Ended March 31, | For the Nine Months Ended March 31, | |||||||||||||||
| 2023 | 2022 | 2023 | 2023 | |||||||||||||
| Weighted average expected terms (in years) | ||||||||||||||||
| Weighted average expected volatility | % | % | % | % | ||||||||||||
| Weighted average risk-free interest rate | % | % | % | % | ||||||||||||
| Expected dividend yield | % | % | % | % | ||||||||||||
The weighted average expected term (in years) excludes the executive Target Options.
The grant date fair value, for options granted during the nine months ended March 31, 2023 and 2022 was approximately $ million (including executive officers’ Initial Options of $ million and Target Options of $ million) and $ million, respectively.
| 26 |
THE GLIMPSE GROUP, INC.
NOTES TO CONSOLIDATED FINANCIAL STATEMENTS
(UNAUDITED)
MARCH 31, 2023 AND 2022
| Weighted Average | ||||||||||||||||
| Remaining | ||||||||||||||||
| Exercise | Contractual | Intrinsic | ||||||||||||||
| Options | Price | Term (Yrs) | Value | |||||||||||||
| Outstanding at July 1, 2022 | $ | $ | ||||||||||||||
| Options Granted | ||||||||||||||||
| Options Exercised | ( | ) | ||||||||||||||
| Options Forfeited / Cancelled | ( | ) | ||||||||||||||
| Outstanding at March 31, 2023 | $ | $ | ||||||||||||||
| Exercisable at March 31, 2023 | $ | $ | ||||||||||||||
| Weighted Average | ||||||||||||||||
| Remaining | ||||||||||||||||
| Exercise | Contractual | Intrinsic | ||||||||||||||
| Options | Price | Term (Yrs) | Value | |||||||||||||
| Outstanding at July 1, 2021 | $ | $ | ||||||||||||||
| Options Granted | ||||||||||||||||
| Options Exercised | ( | ) | ( | ) | ||||||||||||
| Options Forfeited / Cancelled | ( | ) | ( | ) | ||||||||||||
| Outstanding at March 31, 2022 | $ | $ | ||||||||||||||
| Exercisable at March 31, 2022 | $ | $ | ||||||||||||||
The intrinsic value of stock options at March 31, 2023 and 2022 was computed using a fair market value of the common stock of $/share and $/share, respectively.
| For the Three Months Ended | For the Nine Months Ended | |||||||||||||||
| March 31, | March 31, | |||||||||||||||
| 2023 | 2022 | 2023 | 2022 | |||||||||||||
| Stock option-based expense : | ||||||||||||||||
| Research and development expenses | $ | $ | $ | $ | ||||||||||||
| General and administrative expenses | ||||||||||||||||
| Sales and marketing expenses | ||||||||||||||||
| Cost of goods sold | ||||||||||||||||
| Board option expense | ||||||||||||||||
| Total | $ | $ | $ | $ | ||||||||||||
Stock option-based expense attributable to the executive officers’ Initial Options for the three and nine months ended March 31, 2023 was approximately $ million, and included in the table above. There is no expense included for the executive officers’ Target Options.
| 27 |
THE GLIMPSE GROUP, INC.
NOTES TO CONSOLIDATED FINANCIAL STATEMENTS
(UNAUDITED)
MARCH 31, 2023 AND 2022
At March 31, 2023 total unrecognized compensation expense to employees, board members and vendors related to stock options was approximately $ million (including executive officers’ Initial and Target Options of $ million and $ million, respectively), and is expected to be recognized over a weighted average period of years (which excludes the executive Target Options).
| For the Three Months Ended | For the Nine Months Ended | |||||||||||||||
| March 31, | March 31, | |||||||||||||||
| Numerator: | 2023 | 2022 | 2023 | 2022 | ||||||||||||
| Net loss | $ | ( | ) | $ | ( | ) | $ | ( | ) | $ | ( | ) | ||||
| Denominator: | ||||||||||||||||
| Weighted-average common shares outstanding for basic and diluted net loss per share | ||||||||||||||||
| Basic and diluted net loss per share | $ | ( | ) | $ | ( | ) | $ | ( | ) | $ | ( | ) | ||||
| At March 31, 2023 | At March 31, 2022 | |||||||
| Stock Options | ||||||||
| Warrants | ||||||||
| Total | ||||||||
NOTE 10. RELATED PARTY TRANSACTIONS
Augmented Reality Investments Pty Ltd (“ARI”)
In March 2022, the Company lent to ARI, the entity from which the assets of AUGGD (see Notes 5 and 12) were bought, $ million pursuant to a secured promissory note due March 31, 2024. The two owners of ARI are a current employee and a ex-non-employee advisor to the Company.
The
note bore interest at the rate of
The note and any accrued interest were extinguished in July 2022. See Note 11.
NOTE 11. COMMITMENTS AND CONTINGENCIES
Lease Costs
The
Company made cash payments for all operating leases for the nine months ended March 31, 2023, of approximately $
| 28 |
THE GLIMPSE GROUP, INC.
NOTES TO CONSOLIDATED FINANCIAL STATEMENTS
(UNAUDITED)
MARCH 31, 2023 AND 2022
The
Company made cash payments for all operating leases for the nine months ended March 31, 2022, of approximately $
The
total rent expense for all operating leases for the three and nine months ended March 31, 2023, was approximately $
The
total rent expense for all operating leases for the three and nine months ended March 31, 2022, was approximately $
Lease Commitments
The
Company has various operating leases for its offices.
Future approximate undiscounted lease payments for the Company’s operating lease liabilities and a reconciliation of these payments to its operating lease liabilities at March 31, 2023 are as follows:
| Years Ended June 30, | ||||
| 2023 (three months) | $ | |||
| 2024 | ||||
| 2025 | ||||
| 2026 | ||||
| Total future minimum lease commitments, including short-term leases | ||||
| Less: future minimum lease payments of short -term leases | ( | ) | ||
| Less: imputed interest | ( | ) | ||
| Present value of future minimum lease payments, excluding short term leases | $ | |||
| Current portion of operating lease liabilities | $ | |||
| Non-current portion of operating lease liabilities | ||||
| Total operating lease liability | $ | |||
| 29 |
THE GLIMPSE GROUP, INC.
NOTES TO CONSOLIDATED FINANCIAL STATEMENTS
(UNAUDITED)
MARCH 31, 2023 AND 2022
Contingent Consideration for Acquisitions
Contingent consideration for acquisitions, consists of the following as of March 31, 2023 and June 30, 2022 respectively:
| As of March 31, | As of June 30, | |||||||
| 2023 | 2022 | |||||||
| S5D, current portion | $ | $ | ||||||
| BLI, current portion (see Note 4) | ||||||||
| AUGGD | ||||||||
| XRT | ||||||||
| Subtotal current portion | ||||||||
| S5D, net of current portion | ||||||||
| BLI, net of current portion (see Note 4) | ||||||||
| Total contingent consideration for acquisitions | $ | $ | ||||||
AUGGD
In
June 2022, AUGGD achieved its initial revenue threshold as defined in the asset acquisition agreement, and was issued shares of Company
stock in July 2022 reflecting the payment of additional asset acquisition consideration. The share issuance was done inclusive of netting
the outstanding balance of a $ million note receivable due the Company by ARI (see Note 10). This additional consideration of approximately
$
Potential Future Distributions Upon Divestiture or Sale
Upon
a divestiture or sale of certain subsidiary companies, the Company is contractually obligated to distribute up to
COVID-19
The COVID-19 pandemic caused significant business and financial markets disruption worldwide and there was significant uncertainty around the duration of this disruption. We continue to monitor the situation and the effects on our business and operations. While some level of potential uncertainty remains, given the current state of the pandemic, we do not expect the impact of COVID-19 to be material to our business and operations.
NOTE 12. SUBSEQUENT EVENTS
AUGGD
As
more fully described in Note 5, on April 1, 2023 the Company executed the amendment to the asset purchase agreement for the purchase
of AUGGD whereby the Company divested the assets of AUGGD and assigned those assets to a new entity, of which the Company has a
| 30 |
Item 2. Management’s Discussion and Analysis of Financial Condition and Results of Operations
The following discussion and analysis summarizes the significant factors affecting the consolidated operating results, financial condition, liquidity and cash flows of our Company as of and for the periods presented below. The following discussion and analysis of our financial condition and results of operations should be read in conjunction with our unaudited condensed consolidated financial statements and related notes included in this Quarterly Report on Form 10-Q and the audited financial statements and notes thereto, and related disclosures, as of and for the year ended June 30, 2022, which are included in the Form 10-K filed with the Securities and Exchange Commission (the “SEC”) on September 28, 2022. Unless the context requires otherwise, references in this Quarterly Report on Form 10-Q to “we,” “us,” “our” or “the Company,” refer to The Glimpse Group, Inc., a Nevada corporation and its subsidiaries.
Forward-Looking Statements
The information in this discussion contains forward-looking statements and information within the meaning of Section 27A of the Securities Act of 1933, as amended, or the Securities Act, and Section 21E of the Securities Exchange Act of 1934, as amended, (the “Exchange Act”), which are subject to the “safe harbor” created by those sections. These forward-looking statements include, but are not limited to, statements concerning our strategy, future operations, future financial position, future revenues, projected costs, prospects and plans and objectives of management. The words “anticipates,” “believes,” “estimates,” “expects,” “intends,” “may,” “plans,” “projects,” “will,” “would” and similar expressions are intended to identify forward-looking statements, although not all forward-looking statements contain these identifying words. We may not actually achieve the plans, intentions, or expectations disclosed in our forward-looking statements and you should not place undue reliance on our forward-looking statements. Actual results or events could differ materially from the plans, intentions and expectations disclosed in the forward-looking statements that we make. These forward-looking statements involve risks and uncertainties that could cause our actual results to differ materially from those in the forward-looking statements, including, without limitation, the risks set forth in Part II, Item 1A, “Risk Factors” in this Quarterly Report on Form 10-Q and in our other filings with the SEC. The forward-looking statements are applicable only as of the date on which they are made, and we do not assume any obligation to update any forward-looking statements.
Overview
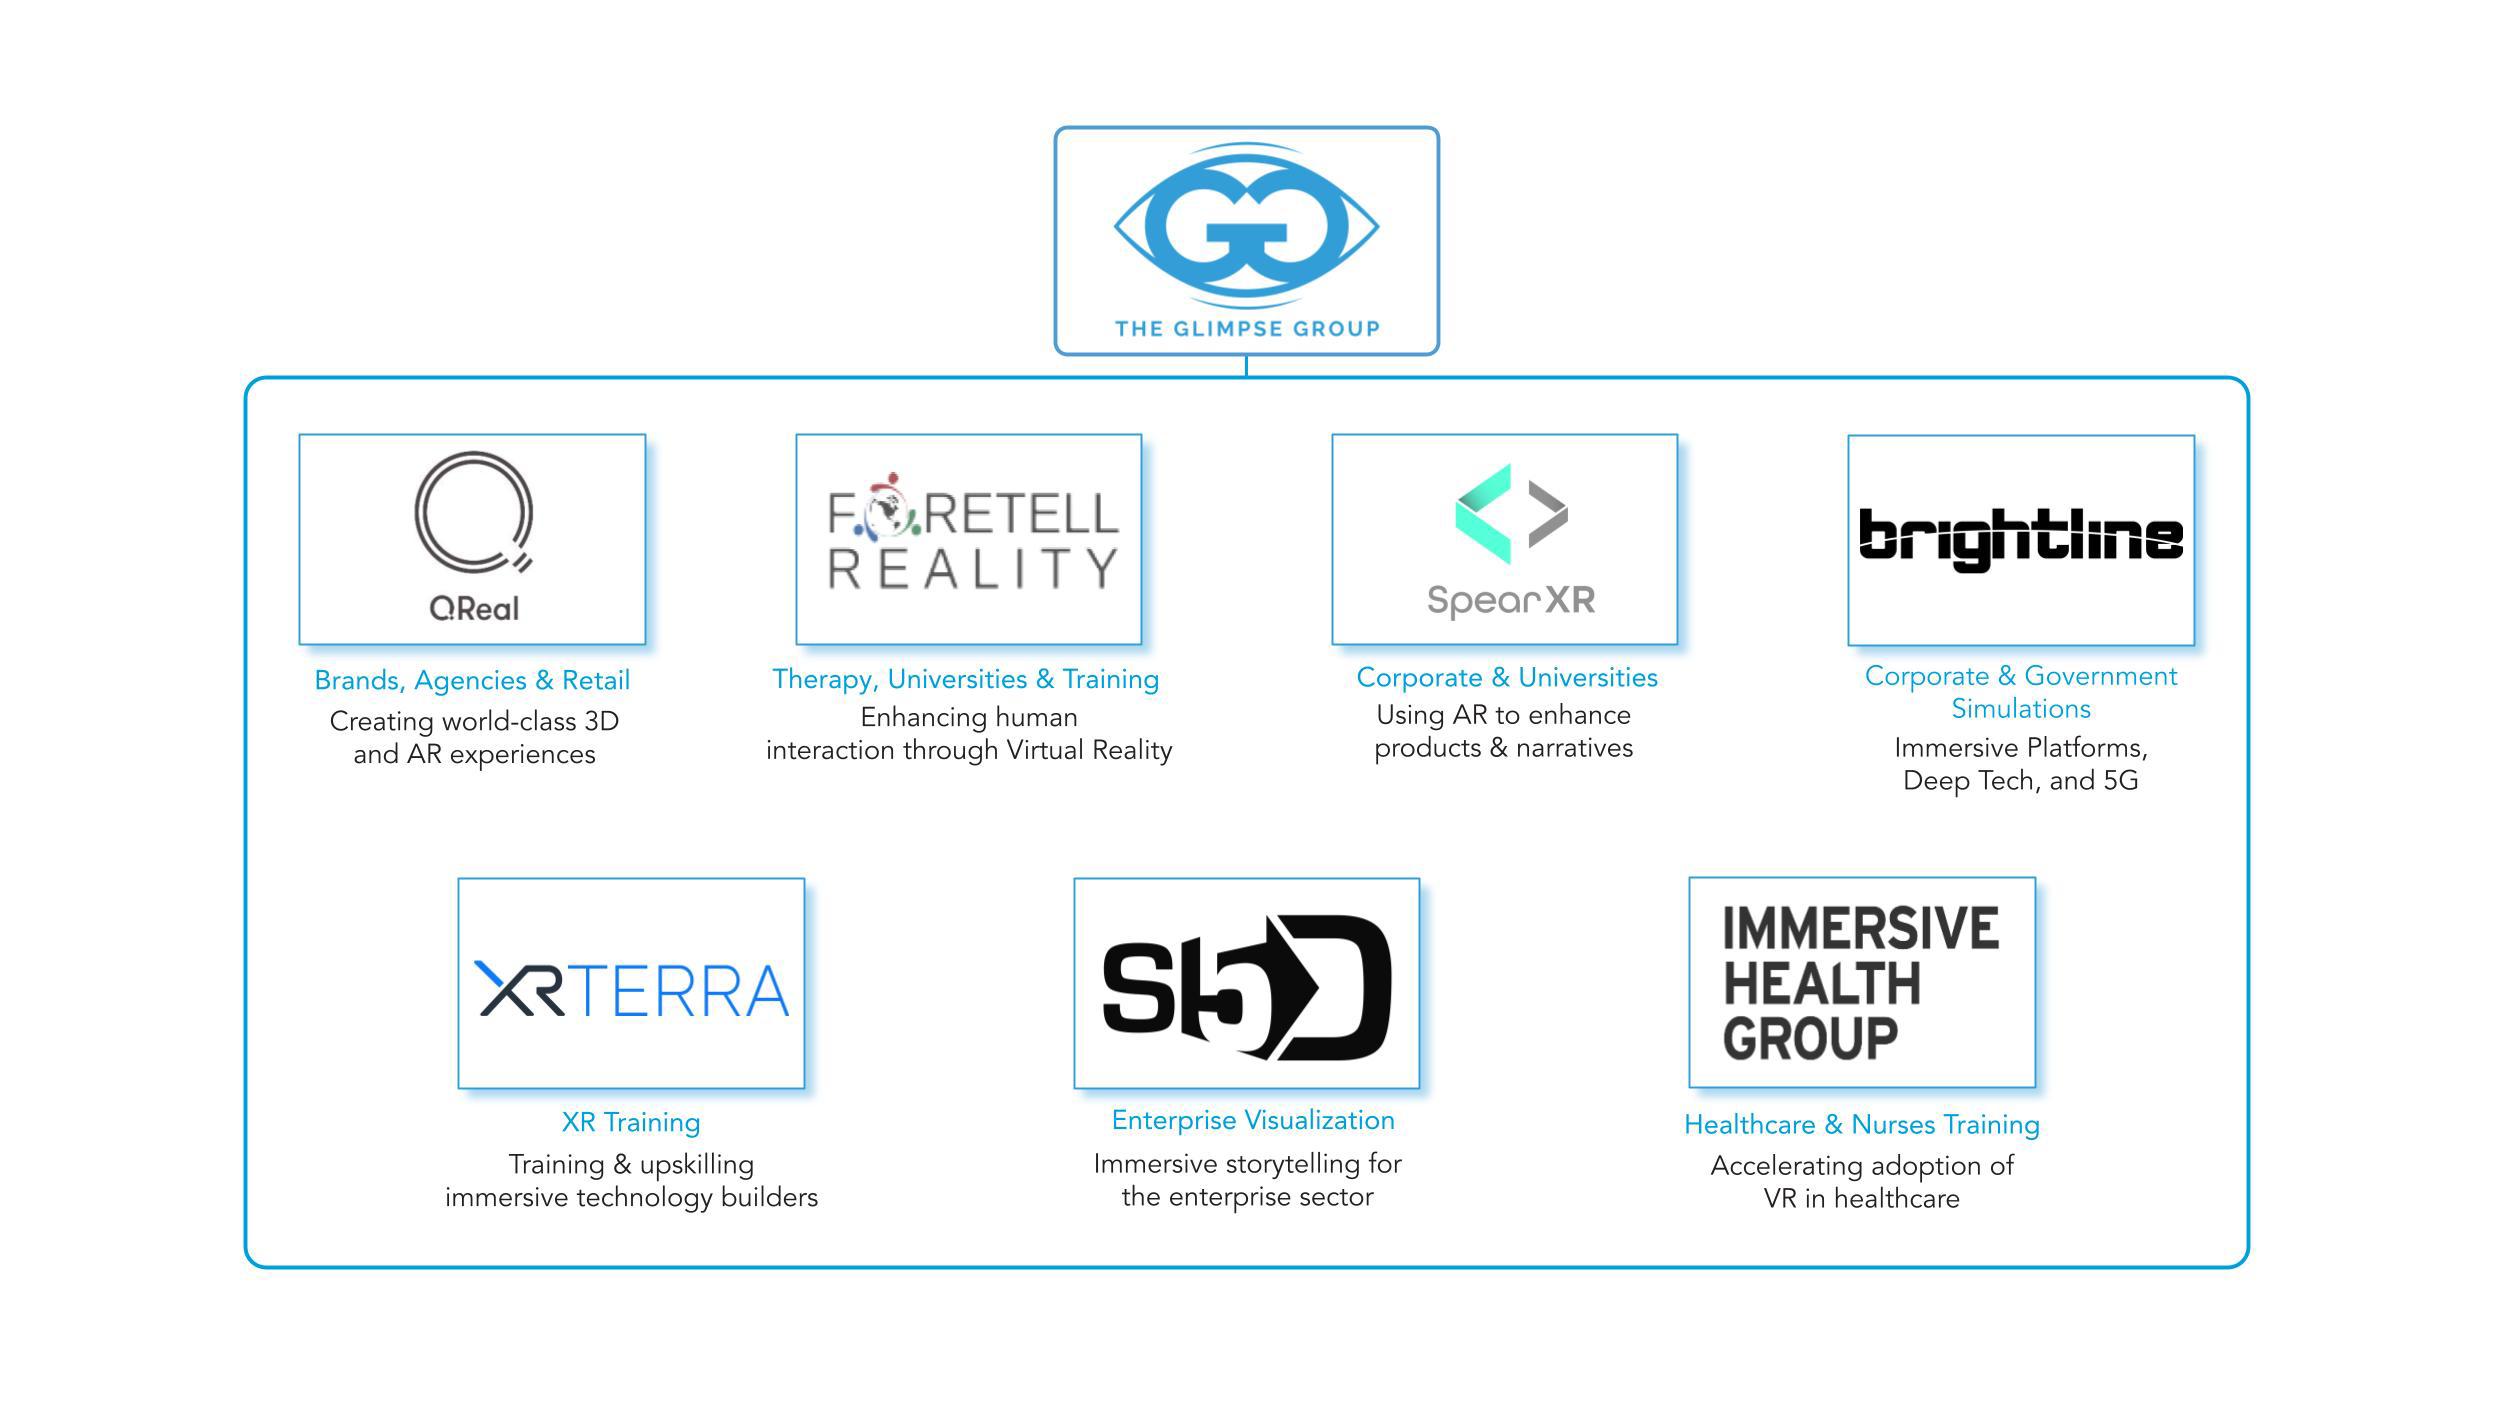
We are a Virtual (“VR”) and Augmented (“AR”) Reality platform company, comprised of a diversified group of wholly-owned and operated VR and AR companies, providing enterprise-focused software, services and solutions. We believe that we offer significant exposure to the rapidly growing and potentially transformative VR and AR markets, while mitigating downside risk via our diversified model and ecosystem.
We were incorporated as The Glimpse Group, Inc. in the State of Nevada, on June 15, 2016 and are headquartered in New York, New York. We currently own and operate numerous subsidiary companies (“Subsidiary Companies”, “Subsidiaries”) operating under the following business names as represented in the organizational chart below:
| 31 |
Significant Transactions
As further detailed in the Form 8-K filed on February 15, 2023, on that same date the Company granted as an incentive to certain executives 2.2 million stock options with a $7.00 exercise price. 10% of the options vest ratably over four years in annual tranches, with the initial vesting event on February 15, 2024. The remaining stock options vest in fixed amounts solely based on achieving, within seven years of grant, revenue targets of $30, $50, $75 and $100 million over consecutive four quarter periods in the aggregate or on achieving fifteen consecutive closing trading prices equal to or above $20, $30, $45 and $60 per share.
Financial Highlights for the three and nine months ended March 31, 2023 compared to the three and nine months ended March 31, 2022
Results of Operations
The following table sets forth our results of operations for the three and nine months ended March 31, 2023 and 2022:
Summary P&L
| For the Three Months Ended | For the Nine Months Ended | |||||||||||||||||||||||||||||||
| March 31, | Change | March 31, | Change | |||||||||||||||||||||||||||||
| 2023 | 2022 | $ | % | 2023 | 2022 | $ | % | |||||||||||||||||||||||||
| (in millions) | (in millions) | |||||||||||||||||||||||||||||||
| Revenue | $ | 3.67 | $ | 2.05 | $ | 1.62 | 79 | % | $ | 10.57 | $ | 4.77 | $ | 5.80 | 122 | % | ||||||||||||||||
| Cost of Goods Sold | 1.22 | 0.37 | 0.85 | 230 | % | 3.31 | 0.73 | 2.58 | 353 | % | ||||||||||||||||||||||
| Gross Profit | 2.45 | 1.68 | 0.77 | 46 | % | 7.26 | 4.04 | 3.22 | 80 | % | ||||||||||||||||||||||
| Total Operating Expenses | 7.73 | 4.06 | 3.67 | 90 | % | 16.74 | 9.39 | 7.35 | 78 | % | ||||||||||||||||||||||
| Loss from Operations before Other Income (Expense) | (5.28 | ) | (2.38 | ) | (2.90 | ) | -122 | % | (9.48 | ) | (5.35 | ) | (4.13 | ) | 77 | % | ||||||||||||||||
| Other Income (Expense), net | 0.06 | 0.63 | (0.57 | ) | 90 | % | 0.18 | 0.37 | (0.19 | ) | 51 | % | ||||||||||||||||||||
| Net Loss | $ | (5.22 | ) | $ | (1.75 | ) | $ | (3.47 | ) | -198 | % | $ | (9.30 | ) | $ | (4.98 | ) | $ | (4.32 | ) | 87 | % | ||||||||||
| 32 |
Revenue
| For the Three Months Ended | For the Nine Months Ended | |||||||||||||||||||||||||||||||
| March 31, | Change | March 31, | Change | |||||||||||||||||||||||||||||
| 2023 | 2022 | $ | % | 2023 | 2022 | $ | % | |||||||||||||||||||||||||
| (in millions) | (in millions) | |||||||||||||||||||||||||||||||
| Software Services | $ | 3.12 | $ | 1.92 | $ | 1.20 | 63 | % | $ | 9.87 | $ | 4.34 | $ | 5.53 | 127 | % | ||||||||||||||||
| Software License/Software as a Service | 0.55 | 0.13 | 0.42 | 323 | % | 0.70 | 0.43 | 0.27 | 63 | % | ||||||||||||||||||||||
| Total Revenue | $ | 3.67 | $ | 2.05 | $ | 1.62 | 79 | % | $ | 10.57 | $ | 4.77 | $ | 5.80 | 122 | % | ||||||||||||||||
Total revenue for the three months ended March 31, 2023 was approximately $3.67 million compared to approximately $2.05 million for the three months ended March 31, 2022, an increase of 79%. Total revenue for the nine months ended March 31, 2023 was approximately $10.57 million compared to approximately $4.77 million for the nine months ended March 31, 2022, an increase of 122%. The increase for both periods reflect the addition of several subsidiary companies through acquisitions and new customers.
We break out our revenues into two main categories – Software Services and Software License.
| ● | Software Services revenues are primarily comprised of VR/AR projects, services related to our software licenses and consulting retainers. |
| ● | Software License revenues are comprised of the sale of our internally developed VR/AR software as licenses or as software-as-a-service (“SaaS”). |
For the three months ended March 31, 2023, Software Services revenue was approximately $3.12 million compared to approximately $1.92 million for the three months ended March 31, 2022, an increase of approximately 63%. For the nine months ended March 31, 2023, Software Services revenue was approximately $9.87 million compared to approximately $4.34 million for the nine months ended March 31, 2022, an increase of approximately 127%. The increase for both periods reflect the addition of several subsidiary companies through acquisitions and new customers.
For the three months ended March 31, 2023, Software License revenue was approximately $0.55 million compared to approximately $0.13 million for the three months ended March 31, 2022, an approximate threefold increase. For the nine months ended March 31, 2023, Software License revenue was approximately $0.70 million compared to approximately $0.43 million for the nine months ended March 31, 2022, an increase of approximately 63%. The increase for both periods reflect the addition of several subsidiary companies through acquisitions and new customers. As the VR and AR industries continue to mature, we expect our Software License revenue to continue to grow on an absolute basis and as an overall percentage of total revenue.
For the three months ended March 31, 2023, non-project revenue (i.e., VR/AR Software and Services revenue only), was approximately $1.04 million compared to approximately $1.19 million for the three months ended March 31, 2022, a decrease of approximately 13%, primarily reflecting a non-returning customer in 2023. For the three months ended March 31, 2023, non-project revenue accounted for approximately 28% of total revenues compared to approximately 58% for the three months ended March 31, 2022. For the nine months ended March 31, 2023, non-project revenue (i.e., VR/AR Software and Services revenue only), was approximately $3.25 million compared to approximately $2.89 million for the nine months ended March 31, 2022, an increase of approximately 13%, reflecting organic growth and the addition of new customers. For the nine months ended March 31, 2023, non-project revenue accounted for approximately 31% of total revenues compared to approximately 61% for the nine months ended March 31, 2022. The decrease in both periods reflects the additions of Brightline Interactive (“BLI”) and Sector 5 Digital (“S5D”), which primarily generate project revenue, representing an increased portion of total revenue.
Customer Concentration
Two customers accounted for approximately 32% (21% and 11%, respectively) of the Company’s total gross revenues during the three months ended March 31, 2023. One of the same customers and two different customers accounted for approximately 61% (32%, 16% and 13%, respectively) of the Company’s total gross revenues during the three months ended March 31, 2022. Two customers accounted for approximately 49% (28% and 21%, respectively) of the Company’s total gross revenues during the nine months ended March 31, 2023. One of the same customers and a different customer accounted for approximately 59% (42% and 17%, respectively) of the Company’s total gross revenues during the nine months ended March 31, 2022.
| 33 |
We operate in an early-stage industry, and customers are exploring various options for AR and VR solutions and acting as early adopters. As such, there can be a high degree of variance in our source of revenues while customers are on-boarded and our software products and solutions are integrated, measured and digested. A customer that may account for a higher percentage of revenue in one period may not account for any revenue in subsequent periods. In some cases, those customers could re-engage after they have evaluated our solutions and may or may not be a source of future revenue. Recently, a significant percentage of our revenues have come from two strategic customers. A reduction of revenue from these strategic customers – which we do not currently anticipate – would have a detrimental impact on the Company’s revenues. The addition of BLI and S5D has reduced the reliance on a single customer. In general, a customer that makes up a significant portion of revenues in one period, often does not make up a significant portion in other periods. Given this dynamic we expect this variability in Customer Concentration to continue until such point in time when our revenue has reached larger scale, and with a larger portion of our revenues coming from Software Licenses/SaaS.
Gross Profit
| For the Three Months Ended | For the Nine Months Ended | |||||||||||||||||||||||||||||||
| March 31, | Change | March 31, | Change | |||||||||||||||||||||||||||||
| 2023 | 2022 | $ | % | 2023 | 2022 | $ | % | |||||||||||||||||||||||||
| (in millions) | (in millions) | |||||||||||||||||||||||||||||||
| Revenue | $ | 3.67 | $ | 2.05 | $ | 1.62 | 79 | % | $ | 10.57 | $ | 4.77 | $ | 5.80 | 122 | % | ||||||||||||||||
| Cost of Goods Sold | 1.22 | 0.37 | 0.85 | 230 | % | $ | 3.31 | 0.73 | 2.58 | 353 | % | |||||||||||||||||||||
| Gross Profit | 2.45 | 1.68 | 0.77 | 46 | % | 7.26 | 4.04 | 3.22 | 80 | % | ||||||||||||||||||||||
| Gross Profit Margin | 67 | % | 82 | % | 69 | % | 85 | % | ||||||||||||||||||||||||
Gross profit was approximately 67% for the three months ended March 31, 2023 compared to approximately 82% for the three months ended March 31, 2022. Gross profit was approximately 69% for the nine months ended March 31, 2023 compared to approximately 85% for the nine months ended March 31, 2022. The decrease for both periods was driven by the addition of BLI and S5D lower margin project revenue.
For the three months ended March 31, 2023 and 2022, internal staffing was approximately $0.73 million (60% of total cost of goods sold) and approximately $0.29 million (78% of total cost of goods sold), respectively. For the nine months ended March 31, 2023 and 2022, internal staffing was approximately $1.99 million (60% of total cost of goods sold) and approximately $0.61 million (84% of total cost of goods sold), respectively. The decrease for both periods in internal staffing as a percentage of total cost of goods sold was due to the addition of BLI and S5D, which have a higher utilization of external production sources.
Operating Expenses
| For the Three Months Ended | For the Nine Months Ended | |||||||||||||||||||||||||||||||
| March 31, | Change | March 31, | Change | |||||||||||||||||||||||||||||
| 2023 | 2022 | $ | % | 2023 | 2022 | $ | % | |||||||||||||||||||||||||
| (in millions) | (in millions) | |||||||||||||||||||||||||||||||
| Research and development expenses | $ | 2.16 | $ | 1.91 | $ | 0.25 | 13 | % | $ | 6.69 | $ | 4.09 | $ | 2.60 | 64 | % | ||||||||||||||||
| General and administrative expenses | 1.14 | 1.13 | 0.01 | 1 | % | 3.77 | 3.02 | 0.75 | 25 | % | ||||||||||||||||||||||
| Sales and marketing expenses | 1.45 | 0.86 | 0.59 | 69 | % | 4.94 | 2.03 | 2.91 | 143 | % | ||||||||||||||||||||||
| Amortization of acquisition intangible assets | 0.55 | 0.16 | 0.39 | 244 | % | 1.54 | 0.25 | 1.29 | 516 | % | ||||||||||||||||||||||
| Intangible asset impairment | 0.48 | - | 0.48 | N/A | 0.48 | - | 0.48 | N/A | ||||||||||||||||||||||||
| Change in fair value of acquisition contingent consideration | 1.95 | - | 1.95 | N/A | (0.68 | ) | - | (0.68 | ) | N/A | ||||||||||||||||||||||
| Total Operating Expenses | $ | 7.73 | $ | 4.06 | $ | 3.67 | 90 | % | $ | 16.74 | $ | 9.39 | $ | 7.35 | 78 | % | ||||||||||||||||
Operating expenses for the three months ended March 31, 2023 were approximately $7.73 million compared to $4.06 million for the three months ended March 31, 2022, an increase of approximately 90%. The increase is driven by the addition of several new subsidiaries through acquisitions and headcount additions to support growth.
| 34 |
Operating expenses for the nine months ended March 31, 2023 were approximately $16.74 million compared to $9.39 million for the nine months ended March 31, 2022, an increase of approximately 78%. The increase is driven by the addition of several new subsidiaries through acquisitions and headcount additions to support growth.
Research and Development
Research and development expenses for the three months ended March 31, 2023 were approximately $2.16 million compared to $1.91 million for the three months ended March 31, 2022, an increase of approximately 13%. Research and development expenses for the nine months ended March 31, 2023 were approximately $6.69 million compared to $4.09 million for the nine months ended March 31, 2022, an increase of approximately 64%. For both periods, this reflects the addition of several new subsidiaries through acquisitions (primarily headcount and software expenses) and base headcount additions to support growth. The year over year expense percentage increase for the three months ended March 31 compared to the previous year is notably less than the year over year increase for the nine-month period. This represents a greater portion of research and development headcount being recorded as cost of goods sold reflecting a more efficient utilization of employees.
For the three months ended March 31, 2023, non-cash stock option and common stock expenses relating to research and development included approximately $0.47 million of employee compensation expenses, comprising approximately 22% of total research and development expenses. For the three months ended March 31, 2022, non-cash stock option expenses relating to research and development included approximately $0.45 million of employee compensation expenses, comprising approximately 24% of total research and development expenses. For the nine months ended March 31, 2023, non-cash stock option and common stock expenses relating to research and development included approximately $1.24 million of employee compensation expenses, comprising approximately 19% of total research and development expenses. For the nine months ended March 31, 2022, non-cash stock option expenses relating to research and development included approximately $1.05 million of employee compensation expenses, comprising approximately 26% of total research and development expenses. Over time, we expect non-cash stock options and common stock research and development expenses, as a percentage of the total related expenses, to continue to decrease as we utilize a larger portion of cash for compensation thereby minimizing dilution.
General and Administrative
General and administrative expenses for the three months ended March 31, 2023 were approximately $1.14 million compared to $1.13 million for the three months ended March 31, 2022, consistent year over year. This reflects the addition of several new subsidiaries through acquisitions offset by the absence of merger and acquisition professional fees in 2023. General and administrative expenses for the nine months ended March 31, 2023 were approximately $3.77 million compared to $3.02 million for the nine months ended March 31, 2022, an increase of approximately 25%. This reflects the addition of several new subsidiaries through acquisitions, primarily headcount and infrastructure expenses.
For the three months ended March 31, 2023, non-cash stock option and common stock expenses relating to general and administrative expenses included approximately $0.22 million of employee and board of directors expenses, comprising approximately 19% of total general and administrative expenses. For the three months ended March 31, 2022, non-cash stock option and common stock expenses relating to general and administrative expenses included approximately $0.32 million of employee, board of directors and vendor expenses, comprising approximately 28% of total general and administrative expenses. For the nine months ended March 31, 2023, non-cash stock option and common stock expenses relating to general and administrative expenses included approximately $0.62 million of employee and board of directors expenses, comprising approximately 16% of total general and administrative expenses. For the nine months ended March 31, 2022, non-cash stock option and common stock expenses relating to general and administrative expenses included approximately $0.67 million of employee, board of directors and vendor expenses, comprising approximately 22% of total general and administrative expenses. Over time, we expect non-cash stock options and common stock general and administrative expenses, as a percentage of the total related expenses, to continue to decrease as we utilize a larger portion of cash for compensation thereby minimizing dilution.
| 35 |
Sales and Marketing
Sales and marketing expenses for the three months ended March 31, 2023 were approximately $1.45 million compared to $0.86 million for the three months ended March 31, 2022, an increase of approximately 69%. This reflects the addition of several new subsidiaries through acquisitions (primarily headcount related) and employee incentives based on achievement of certain revenue targets. Sales and marketing expenses for the nine months ended March 31, 2023 were approximately $4.94 million compared to $2.03 million for the nine months ended March 31, 2022, an increase of approximately 143%. This reflects the addition of several new subsidiaries through acquisitions, including both headcount and increased use of outside marketing events / firms to drive revenue growth, and employee incentives based on achievement of certain revenue targets.
For the three months ended March 31, 2023, non-cash stock option and common stock expenses relating to sales and marketing expenses included approximately $0.40 million of employee compensation expenses, comprising approximately 28% of total sales and marketing expenses (this period reflects certain employee incentive expense for achievement of revenue targets paid in common stock). For the three months ended March 31, 2022, non-cash stock option and common stock expenses relating to sales and marketing expenses included approximately $0.17 million of employee, vendor and fee compensation expenses, comprising approximately 20% of total sales and marketing expenses. For the nine months ended March 31, 2023, non-cash stock option and common stock expenses relating to sales and marketing expenses included approximately $0.93 million of employee compensation expenses, comprising approximately 19% of total sales and marketing expenses. For the nine months ended March 31, 2022, non-cash stock option and common stock expenses relating to sales and marketing expenses included approximately $0.49 million of employee, vendor and fee compensation expenses, comprising approximately 24% of total sales and marketing expenses. Over time, we expect non-cash stock options and common stock sales and marketing expenses, as a percentage of the total related expenses, to continue to decrease as we utilize a larger portion of cash for compensation thereby minimizing dilution.
Amortization of Acquisition Intangible Assets
Amortization of acquisition intangible assets expense for the three months ended March 31, 2023 was approximately $0.55 million compared to $0.16 million for the three months ended March 31, 2022. Amortization of acquisition intangible assets expense for the nine months ended March 31, 2023 were approximately $1.54 million compared to $0.25 million for the nine months ended March 31, 2022. For both periods, this primarily reflects the addition of several new subsidiaries through acquisitions.
Change in Fair Value of Acquisition Contingent Consideration
Change in fair value of acquisition contingent consideration for the three and nine months ended March 31, 2023 was an expense of approximately $1.95 million and a gain of approximately $0.68 million, respectively. For both periods, this represents a change in the fair value of the contingent consideration liability related to the S5D and BLI acquisitions. The change in both periods is driven primarily by changes in the common stock price of Glimpse between measurement dates and revisions to revenue projections.
Intangible Asset Impairment
Intangible asset impairment for the three and nine months ended March 31, 2023 was approximately $0.48 million. Primarily due to a lack of market traction, a decision was made by the Company to cease operations of its wholly owned subsidiary MotionZone, LLC (dba “AUGGD”). The Company transferred all assets to a new independent entity, majority owned by the original sellers of AUGGD, in return for a 19.99% interest in said new entity. The Company considers the assets transferred and the Company’s interest in the new entity to have no value at March 31, 2023. The expense represents the write-off of the net book value of intangible assets, including goodwill, related to the August 2021 asset acquisition of AUGGD.
| 36 |
Other Income (Expense), net
| For the Three Months Ended | For the Nine Months Ended | |||||||||||||||||||||||||||||||
| March 31, | Change | March 31, | Change | |||||||||||||||||||||||||||||
| 2023 | 2022 | $ | % | 2023 | 2022 | $ | % | |||||||||||||||||||||||||
| (in millions) | (in millions) | |||||||||||||||||||||||||||||||
| Forgiveness of PPP loan | $ | - | $ | 0.63 | $ | (0.63 | ) | N/A | $ | - | $ | 0.63 | $ | (0.63 | ) | N/A | ||||||||||||||||
| Interest income | 0.06 | - | 0.06 | N/A | 0.18 | 0.02 | 0.16 | 800 | % | |||||||||||||||||||||||
| Loss on conversion of convertible notes | - | - | - | N/A | - | (0.28 | ) | 0.28 | N/A | |||||||||||||||||||||||
| Other Income (Expense), net | $ | 0.06 | $ | 0.63 | $ | (0.57 | ) | 100 | % | $ | 0.18 | $ | 0.37 | $ | (0.19 | ) | -51 | % | ||||||||||||||
Other income (expense), net for the three months ended March 31, 2023 was income of $0.06 million compared to $0.63 million for the three months ended March 31, 2022. The decrease reflects the 2022 income from forgiveness of a Paycheck Protection Plan loan. Other income (expense), net for the nine months ended March 31, 2023 was income of $0.18 million compared to $0.37 million for the nine months ended March 31, 2022. The change is driven by the 2022 income from forgiveness of a Paycheck Protection Plan loan offset by a loss incurred on conversion of convertible debt to common stock that occurred at the IPO in the 2022 period. Interest income for all periods reflects interest income on cash and cash equivalent balances.
Net Loss
Net loss for the three months ended March 31, 2023 was $5.22 million, as compared to a net loss of $1.75 million for the comparable 2022 period, a $3.47 million increase. The increase is primarily driven by the combined $2.82 million non-cash increase in intangible acquisition asset amortization, impairment of intangible assets and change in the fair value of acquisition contingent consideration. The remaining increase primarily represents an increase in sales and marketing expenses. Net loss for the nine months ended March 31, 2023 was $9.30 million, as compared to a net loss of $4.98 million for the comparable 2022 period, a $4.32 million increase This change is primarily driven by the increase in operating expenses from the acquisition of several subsidiaries (inclusive of significant non-cash charges for stock compensation expense and intangible acquisition asset amortization) outpacing the increase in gross profit.
Non-GAAP Financial Measures
The following discussion and analysis includes both financial measures in accordance with Generally Accepted Accounting Principles, or GAAP, as well as non-GAAP financial measures. Generally, a non-GAAP financial measure is a numerical measure of a company’s performance, financial position or cash flows that either excludes or includes amounts that are not normally included or excluded in the most directly comparable measure calculated and presented in accordance with GAAP. Non-GAAP financial measures should be viewed as supplemental to, and should not be considered as alternatives to, net income (loss), operating income (loss), and cash flow from operating activities, liquidity or any other financial measures. They may not be indicative of the historical operating results of the Company nor are they intended to be predictive of potential future results. Investors should not consider non-GAAP financial measures in isolation or as substitutes for performance measures calculated in accordance with GAAP. Our management uses and relies on EBITDA and Adjusted EBITDA, which are non-GAAP financial measures. We believe that both management and shareholders benefit from referring to the following non-GAAP financial measures in planning, forecasting and analyzing future periods.
Our management uses these non-GAAP financial measures in evaluating its financial and operational decision making and as a means to evaluate period-to-period comparisons. Our management recognizes that the non-GAAP financial measures have inherent limitations because of the described excluded items.
The Company defines Adjusted EBITDA as earnings (or loss) from continuing operations before the items in the table below. Adjusted EBITDA is an important measure of our operating performance because it allows management, investors and analysts to evaluate and assess our core operating results from period-to-period after removing the impact of items of a non-operational nature that affect comparability.
We have included a reconciliation of our financial measures calculated in accordance with GAAP to the most comparable non-GAAP financial measures. We believe that providing the non-GAAP financial measures, together with the reconciliation to GAAP, helps investors make comparisons between the Company and other companies. In making any comparisons to other companies, investors need to be aware that companies use different non-GAAP measures to evaluate their financial performance. Investors should pay close attention to the specific definition being used and to the reconciliation between such measures and the corresponding GAAP measures provided by each company under applicable SEC rules.
| 37 |
The following table presents a reconciliation of net loss to Adjusted EBITDA for the three and nine months ended March 31, 2023 and 2022:
| For the Three Months Ended | For the Nine Months Ended | |||||||||||||||
| March 31, | March 31, | |||||||||||||||
| 2023 | 2022 | 2023 | 2022 | |||||||||||||
| (in millions) | (in millions) | |||||||||||||||
| Net loss | $ | (5.22 | ) | $ | (1.75 | ) | $ | (9.30 | ) | $ | (4.98 | ) | ||||
| Depreciation and amortization | 0.59 | 0.18 | 1.65 | 0.28 | ||||||||||||
| EBITDA loss | (4.63 | ) | (1.57 | ) | (7.65 | ) | (4.70 | ) | ||||||||
| Stock based compensation expenses | 1.07 | 0.96 | 2.79 | 2.27 | ||||||||||||
| Stock based financing related expenses | - | - | - | 0.28 | ||||||||||||
| Forgiveness of PPP loan | - | (0.63 | ) | - | (0.63 | ) | ||||||||||
| Acquisition related expenses | - | 0.12 | 0.28 | 0.23 | ||||||||||||
| Change in fair value of acquisition contingent consideration | 1.95 | - | (0.68 | ) | - | |||||||||||
| Intangible asset impairment | 0.48 | - | 0.48 | - | ||||||||||||
| Adjusted EBITDA loss | $ | (1.13 | ) | $ | (1.12 | ) | $ | (4.78 | ) | $ | (2.55 | ) | ||||
Adjusted EBITDA loss for the three months ended March 31, 2023 was $1.13 million compared to $1.12 million for the comparable 2022 period. This adjusted EBITDA result occurred notwithstanding the onboarding of several large new subsidiary acquisitions and reflects the more efficient utilization of headcount (see Operating Expense – Research and Development discussion). Adjusted EBITDA loss for the nine months ended March 31, 2023 was of $4.78 million compared to $2.55 million for the comparable 2022 period. The increase in EBITDA loss was driven by an increase in operating expense outlays in all areas of the Company to propel future growth, including the acquisition of several new subsidiaries. This increase in operating expense outlays was partially offset by non-cash expenses.
Liquidity and Capital Resources
| For the Nine Months Ended | ||||||||||||||||
| March 31, | Change | |||||||||||||||
| 2023 | 2022 | $ | % | |||||||||||||
| (in millions) | ||||||||||||||||
| Net cash used in operating activities | $ | (7.60 | ) | $ | (3.68 | ) | $ | (3.92 | ) | -107 | % | |||||
| Net cash used in investing activities | (2.67 | ) | (4.53 | ) | 1.86 | 41 | % | |||||||||
| Net cash provided by financing activities | 0.07 | 26.48 | (26.41 | ) | -100 | % | ||||||||||
| Net increase (decrease) in cash, cash equivalents and restricted cash | (10.20 | ) | 18.27 | (28.47 | ) | -156 | % | |||||||||
| Cash, cash equivalents and restricted cash, beginning of period | 18.25 | 1.77 | 16.48 | 931 | % | |||||||||||
| Cash, cash equivalents and restricted cash, end of period | $ | 8.05 | $ | 20.04 | $ | (11.99 | ) | -60 | % | |||||||
Operating Activities
Net cash used in operating activities was $7.60 million for the nine months ended March 31, 2023, compared to $3.68 million during the prior period, an increase of approximately $3.92 million. This is primarily driven by an increase in net loss and a decrease in accounts payable and deferred revenue primarily related to the BLI acquisition.
Investing Activities
Net cash used in investing activities for the nine months ended March 31, 2023 was approximately $2.67 million compared to $4.53 million during the prior period, a decrease of approximately $1.86 million. This reflects the difference in the cash component of the BLI 2023 acquisition compared to the S5D and XR Terra 2022 acquisitions, along with 2022 initial purchase of short-term corporate bond investments.
| 38 |
Financing Activities
Cash flow provided from financing activities during the nine months ended March 31, 2023 was negligible, compared to $26.48 million for the prior 2022 period. Cash flow for the 2022 period primarily reflects the net proceeds from our IPO and Securities Purchase Agreement.
Capital Resources
As of March 31, 2023, the Company had cash, cash equivalents and restricted cash balances of $8.05 million, plus $0.25 million of liquid corporate bond investments and $1.55 million of accounts receivable. The March 31, 2023 cash, cash equivalents and restricted cash balances include $2.0 million cash escrow for potential future contingent consideration of the S5D acquisition, payable upon achievement of S5D and the Company’s performance targets (refundable to Glimpse if targets not achieved).
As of March 31, 2023, the Company had no outstanding debt obligations.
As of March 31, 2023, the Company had no issued and outstanding preferred stock.
The Company has taken expense reduction steps since the end of calendar year 2022, and may continue to do as needed, with the objective of reaching cash flow neutrality from operations in calendar year 2023. The Company believes that it is sufficiently funded to meet its operational plan and future obligations beyond the 12-month period from the date of this filing.
Recently Adopted Accounting Pronouncements
Please see Note 11 of the attached March 31, 2023 consolidated financial statements that describe the impact, if any, from the adoption of Recent Accounting Pronouncements.
Item 3. Quantitative and Qualitative Disclosures about Market Risk
Not required for smaller reporting companies.
Item 4. Controls and Procedures
Evaluation of Disclosure Controls and Procedures
We maintain “disclosure controls and procedures,” as such term is defined in Rule 13a-15(e) under the Securities Exchange Act of 1934 (the “Exchange Act”), that are designed to provide reasonable assurance that information required to be disclosed by us in reports that we file or submit under the Exchange Act is recorded, processed, summarized and reported within the time periods specified in Securities and Exchange Commission rules and forms, and that such information is accumulated and communicated to our management, including our Chief Executive Officer and Chief Financial Officer, as appropriate, to allow timely decisions regarding required disclosure.
Our management, with the participation of the Chief Executive Officer and the Chief Financial Officer, has evaluated the effectiveness of our disclosure controls and procedures as of the end of the period covered by this Quarterly Report on Form 10-Q. Based on that evaluation, our Chief Executive Officer and Chief Financial Officer have concluded that our disclosure controls and procedures were effective as of the end of such period.
In designing and evaluating our disclosure controls and procedures, management recognized that disclosure controls and procedures, no matter how well conceived and operated, can provide only reasonable, not absolute, assurance that the objectives of the disclosure controls and procedures are met. Additionally, in designing disclosure controls and procedures, we are required to apply judgment in evaluating the cost-benefit relationship of possible disclosure controls and procedures. The design of any disclosure controls and procedures also is based in part upon certain assumptions about the likelihood of future events, and there can be no assurance that any design will succeed in achieving its stated goals under all potential future conditions.
| 39 |
Our management is responsible for establishing and maintaining adequate internal control over financial reporting, as such term is defined in Exchange Act Rule 13a-15(f). All internal control systems, no matter how well designed, have inherent limitations. Therefore, even those systems determined to be effective can provide only reasonable assurance with respect to financial statement preparation and presentation. Under the supervision and with the participation of our management, including our Chief Executive Officer and Chief Financial Officer, we conducted an evaluation of the effectiveness of our internal control over financial reporting based on the 2013 framework set forth in the report entitled Internal Control — Integrated Framework issued by the Committee of Sponsoring Organizations of the Treadway Commission (“COSO”). The COSO framework summarizes each of the components of a company’s internal control system, including (i) the control environment, (ii) risk assessment, (iii) control activities, (iv) information and communication, and (v) monitoring.
Based on our evaluation, our management concluded that our internal control over financial reporting was effective as of March 31, 2023.
During the period ended March 31, 2023, there was no change in our internal control over financial reporting or in other factors that have materially affected, or are reasonably likely to materially affect, our internal control over financial reporting.
PART II - OTHER INFORMATION
Item 1. Legal Proceedings
None.
Item 1A. Risk Factors
Our Annual Report on Form 10-K for the year ended June 30, 2022 contains a discussion of the material risks associated with our business. There have been no material changes to the risks described in such Annual Report on Form 10-K.
Item 2. Unregistered Sales of Equity Securities and Use of Proceeds.
Recent Sale of Unregistered Equity Securities
During the three months ended March 31, 2023, the Company issued 374,125 shares of Common Stock for:
| Number of Shares | Cash Proceeds | Value of Shares | ||||||||||
| Exercise of options | 15,315 | $ | 21,195 | $ | 21,195 | |||||||
| Contingent acquisition obligation | 326,684 | - | 1,359,004 | |||||||||
| Compensation and vendor expense | 32,126 | - | 93,853 | |||||||||
| Total | 374,125 | $ | 21,195 | $ | 1,474,052 | |||||||
The foregoing transactions were exempt from the registration requirements of the Securities Act of 1933, as amended, pursuant to Section 4(a)(2) thereof.
Item 3. Defaults Upon Senior Securities.
None.
Item 4. Mine Safety Disclosures
Not Applicable.
Item 5. Other Information.
None.
| 40 |
Item 6. Exhibits
The following exhibits are filed as part of this Quarterly Report on Form 10-Q.
* Filed herewith.
** Furnished herewith.
| 41 |
SIGNATURES
Pursuant to the requirements of the Securities Exchange Act of 1934, as amended, the Registrant has duly caused this report to be signed on its behalf by the undersigned thereunto duly authorized, on this 15th day of May, 2023.
| THE GLIMPSE GROUP, INC. | |
| /s/ Lyron Bentovim | |
| Lyron Bentovim | |
| Chief Executive Officer, President | |
| (Principal Executive Officer) | |
| /s/ Maydan Rothblum | |
| Maydan Rothblum | |
| Chief Financial Officer & Chief Operating Officer | |
| (Principal Financial Officer) |
| 42 |