0001840776FALSEFY202312/31P3YP1YP1YP3Yhttp://fasb.org/us-gaap/2023#LiabilitiesCurrenthttp://fasb.org/us-gaap/2023#LiabilitiesCurrentP2Y00018407762023-01-012023-12-310001840776us-gaap:CommonClassAMember2023-01-012023-12-310001840776us-gaap:WarrantMember2023-01-012023-12-3100018407762023-06-30iso4217:USD0001840776us-gaap:CommonClassAMember2024-03-01xbrli:shares0001840776hgty:CommonClassVMember2024-03-010001840776hgty:ReinsuranceAgreementMembersrt:AffiliatedEntityMember2023-01-012023-12-31xbrli:pure0001840776hgty:ReinsuranceAgreementMembersrt:AffiliatedEntityMember2022-01-012022-12-310001840776hgty:ReinsuranceAgreementMembersrt:AffiliatedEntityMember2021-01-012021-12-3100018407762021-12-020001840776us-gaap:SubsequentEventMemberhgty:ConsolidatedNationalInsuranceCompanyCNICMember2024-01-122024-01-1200018407762022-01-012022-12-3100018407762023-12-310001840776hgty:SpeedDigitalAndBroadArrowMember2023-12-310001840776hgty:PrivatePlacementWarrantsMemberus-gaap:MeasurementInputExercisePriceMember2023-12-31iso4217:USDxbrli:shares0001840776hgty:UnderwriterWarrantsMemberus-gaap:MeasurementInputExercisePriceMember2023-12-310001840776hgty:OTMWarrantsMemberus-gaap:MeasurementInputExercisePriceMember2023-12-310001840776hgty:PIPEWarrantsMemberus-gaap:MeasurementInputExercisePriceMember2023-12-310001840776us-gaap:MeasurementInputSharePriceMemberhgty:PrivatePlacementWarrantsMember2023-12-310001840776hgty:UnderwriterWarrantsMemberus-gaap:MeasurementInputSharePriceMember2023-12-310001840776hgty:OTMWarrantsMemberus-gaap:MeasurementInputSharePriceMember2023-12-310001840776us-gaap:MeasurementInputSharePriceMemberhgty:PIPEWarrantsMember2023-12-310001840776us-gaap:MeasurementInputPriceVolatilityMemberhgty:PrivatePlacementWarrantsMember2023-12-310001840776hgty:UnderwriterWarrantsMemberus-gaap:MeasurementInputPriceVolatilityMember2023-12-310001840776hgty:OTMWarrantsMemberus-gaap:MeasurementInputPriceVolatilityMember2023-12-310001840776us-gaap:MeasurementInputPriceVolatilityMemberhgty:PIPEWarrantsMember2023-12-310001840776hgty:PrivatePlacementWarrantsMemberus-gaap:MeasurementInputExpectedTermMember2023-12-31hgty:year0001840776hgty:UnderwriterWarrantsMemberus-gaap:MeasurementInputExpectedTermMember2023-12-310001840776hgty:OTMWarrantsMemberus-gaap:MeasurementInputExpectedTermMember2023-12-310001840776hgty:PIPEWarrantsMemberus-gaap:MeasurementInputExpectedTermMember2023-12-310001840776hgty:PrivatePlacementWarrantsMemberus-gaap:MeasurementInputRiskFreeInterestRateMember2023-12-310001840776hgty:UnderwriterWarrantsMemberus-gaap:MeasurementInputRiskFreeInterestRateMember2023-12-310001840776hgty:OTMWarrantsMemberus-gaap:MeasurementInputRiskFreeInterestRateMember2023-12-310001840776hgty:PIPEWarrantsMemberus-gaap:MeasurementInputRiskFreeInterestRateMember2023-12-310001840776us-gaap:MeasurementInputExpectedDividendRateMemberhgty:PrivatePlacementWarrantsMember2023-12-310001840776hgty:UnderwriterWarrantsMemberus-gaap:MeasurementInputExpectedDividendRateMember2023-12-310001840776hgty:OTMWarrantsMemberus-gaap:MeasurementInputExpectedDividendRateMember2023-12-310001840776us-gaap:MeasurementInputExpectedDividendRateMemberhgty:PIPEWarrantsMember2023-12-310001840776hgty:CommissionRevenueAndFeeRevenueMember2023-01-012023-12-310001840776hgty:CommissionRevenueAndFeeRevenueMember2022-01-012022-12-310001840776hgty:CommissionRevenueAndFeeRevenueMember2021-01-012021-12-3100018407762021-01-012021-12-310001840776hgty:MembershipAndOtherRevenueMember2023-01-012023-12-310001840776hgty:MembershipAndOtherRevenueMember2022-01-012022-12-310001840776hgty:MembershipAndOtherRevenueMember2021-01-012021-12-310001840776us-gaap:CommonClassAMember2022-01-012022-12-310001840776us-gaap:CommonClassAMember2021-01-012021-12-3100018407762022-12-310001840776us-gaap:CommonClassAMember2022-12-310001840776us-gaap:CommonClassAMember2023-12-310001840776hgty:CommonClassVMember2022-12-310001840776hgty:CommonClassVMember2023-12-310001840776us-gaap:SeriesAPreferredStockMemberus-gaap:PreferredStockMember2022-12-310001840776us-gaap:CommonStockMemberus-gaap:CommonClassAMember2022-12-310001840776hgty:CommonClassVMemberus-gaap:CommonStockMember2022-12-310001840776us-gaap:AdditionalPaidInCapitalMember2022-12-310001840776us-gaap:RetainedEarningsMember2022-12-310001840776us-gaap:AccumulatedOtherComprehensiveIncomeMember2022-12-310001840776us-gaap:ParentMember2022-12-310001840776us-gaap:NoncontrollingInterestMember2022-12-310001840776us-gaap:RetainedEarningsMember2023-01-012023-12-310001840776us-gaap:ParentMember2023-01-012023-12-310001840776us-gaap:NoncontrollingInterestMember2023-01-012023-12-310001840776us-gaap:SeriesAPreferredStockMemberus-gaap:PreferredStockMember2023-01-012023-12-310001840776us-gaap:AdditionalPaidInCapitalMember2023-01-012023-12-310001840776us-gaap:AccumulatedOtherComprehensiveIncomeMember2023-01-012023-12-310001840776us-gaap:CommonStockMemberus-gaap:CommonClassAMember2023-01-012023-12-310001840776us-gaap:SeriesAPreferredStockMemberus-gaap:PreferredStockMember2023-12-310001840776us-gaap:CommonStockMemberus-gaap:CommonClassAMember2023-12-310001840776hgty:CommonClassVMemberus-gaap:CommonStockMember2023-12-310001840776us-gaap:AdditionalPaidInCapitalMember2023-12-310001840776us-gaap:RetainedEarningsMember2023-12-310001840776us-gaap:AccumulatedOtherComprehensiveIncomeMember2023-12-310001840776us-gaap:ParentMember2023-12-310001840776us-gaap:NoncontrollingInterestMember2023-12-3100018407762020-12-310001840776us-gaap:MemberUnitsMember2020-12-310001840776us-gaap:CommonStockMemberus-gaap:CommonClassAMember2020-12-310001840776hgty:CommonClassVMemberus-gaap:CommonStockMember2020-12-310001840776us-gaap:AdditionalPaidInCapitalMember2020-12-310001840776us-gaap:RetainedEarningsMember2020-12-310001840776us-gaap:AccumulatedOtherComprehensiveIncomeMember2020-12-310001840776us-gaap:ParentMember2020-12-310001840776us-gaap:NoncontrollingInterestMember2020-12-310001840776us-gaap:RetainedEarningsMember2021-01-012021-12-310001840776us-gaap:ParentMember2021-01-012021-12-310001840776us-gaap:NoncontrollingInterestMember2021-01-012021-12-310001840776us-gaap:AccumulatedOtherComprehensiveIncomeMember2021-01-012021-12-310001840776us-gaap:MemberUnitsMember2021-01-012021-12-310001840776us-gaap:CommonStockMemberus-gaap:CommonClassAMember2021-01-012021-12-310001840776hgty:CommonClassVMemberus-gaap:CommonStockMember2021-01-012021-12-310001840776us-gaap:AdditionalPaidInCapitalMember2021-01-012021-12-3100018407762021-12-310001840776us-gaap:MemberUnitsMember2021-12-310001840776us-gaap:CommonStockMemberus-gaap:CommonClassAMember2021-12-310001840776hgty:CommonClassVMemberus-gaap:CommonStockMember2021-12-310001840776us-gaap:AdditionalPaidInCapitalMember2021-12-310001840776us-gaap:RetainedEarningsMember2021-12-310001840776us-gaap:AccumulatedOtherComprehensiveIncomeMember2021-12-310001840776us-gaap:ParentMember2021-12-310001840776us-gaap:NoncontrollingInterestMember2021-12-310001840776us-gaap:RetainedEarningsMember2022-01-012022-12-310001840776us-gaap:ParentMember2022-01-012022-12-310001840776us-gaap:NoncontrollingInterestMember2022-01-012022-12-310001840776us-gaap:AccumulatedOtherComprehensiveIncomeMember2022-01-012022-12-310001840776us-gaap:AdditionalPaidInCapitalMember2022-01-012022-12-310001840776us-gaap:CommonStockMemberus-gaap:CommonClassAMember2022-01-012022-12-310001840776srt:CumulativeEffectPeriodOfAdoptionAdjustmentMemberus-gaap:RetainedEarningsMember2021-12-310001840776us-gaap:ParentMembersrt:CumulativeEffectPeriodOfAdoptionAdjustmentMember2021-12-310001840776srt:CumulativeEffectPeriodOfAdoptionAdjustmentMemberus-gaap:NoncontrollingInterestMember2021-12-310001840776srt:CumulativeEffectPeriodOfAdoptionAdjustmentMember2021-12-310001840776us-gaap:MemberUnitsMember2022-12-310001840776srt:ParentCompanyMember2023-01-012023-12-310001840776srt:ParentCompanyMember2022-01-012022-12-310001840776srt:ParentCompanyMember2021-01-012021-12-310001840776hgty:TheHagertyGroupLLCMember2023-01-012023-12-310001840776hgty:TheHagertyGroupLLCMember2022-01-012022-12-310001840776hgty:MemberHubsHoldingLLCMemberhgty:TheHagertyGroupLLCMember2023-01-012023-12-310001840776hgty:MemberHubsHoldingLLCMemberhgty:TheHagertyGroupLLCMember2022-01-012022-12-310001840776us-gaap:VariableInterestEntityPrimaryBeneficiaryMember2023-12-310001840776us-gaap:VariableInterestEntityPrimaryBeneficiaryMember2022-12-31hgty:segment0001840776hgty:BroadArrowGroupIncMember2023-01-012023-12-310001840776srt:MinimumMemberus-gaap:ComputerEquipmentMember2023-12-310001840776us-gaap:AutomobilesMembersrt:MaximumMember2023-12-310001840776us-gaap:BuildingAndBuildingImprovementsMember2023-12-310001840776srt:MinimumMember2023-12-310001840776srt:MaximumMember2023-12-310001840776us-gaap:CustomerRelationshipsMembersrt:MinimumMember2023-12-310001840776us-gaap:CustomerRelationshipsMembersrt:MaximumMember2023-12-310001840776us-gaap:SalesRevenueNetMemberhgty:TheHagertyGroupLLCMemberus-gaap:CustomerConcentrationRiskMember2023-01-012023-12-310001840776hgty:LaborAndRelatedExpenseMemberMember2023-01-012023-12-310001840776hgty:LaborAndRelatedExpenseMemberMember2022-01-012022-12-310001840776hgty:LaborAndRelatedExpenseMemberMember2021-01-012021-12-310001840776us-gaap:SalesChannelThroughIntermediaryMemberhgty:CommissionAndFeeRevenueMember2023-01-012023-12-310001840776us-gaap:SalesChannelDirectlyToConsumerMemberhgty:CommissionAndFeeRevenueMember2023-01-012023-12-310001840776hgty:CommissionAndFeeRevenueMember2023-01-012023-12-310001840776hgty:ContingentCommissionMemberus-gaap:SalesChannelThroughIntermediaryMember2023-01-012023-12-310001840776hgty:ContingentCommissionMemberus-gaap:SalesChannelDirectlyToConsumerMember2023-01-012023-12-310001840776hgty:ContingentCommissionMember2023-01-012023-12-310001840776us-gaap:SalesChannelThroughIntermediaryMemberus-gaap:MembershipMember2023-01-012023-12-310001840776us-gaap:SalesChannelDirectlyToConsumerMemberus-gaap:MembershipMember2023-01-012023-12-310001840776us-gaap:MembershipMember2023-01-012023-12-310001840776us-gaap:ProductAndServiceOtherMemberus-gaap:SalesChannelThroughIntermediaryMember2023-01-012023-12-310001840776us-gaap:ProductAndServiceOtherMemberus-gaap:SalesChannelDirectlyToConsumerMember2023-01-012023-12-310001840776us-gaap:ProductAndServiceOtherMember2023-01-012023-12-310001840776us-gaap:SalesChannelThroughIntermediaryMember2023-01-012023-12-310001840776us-gaap:SalesChannelDirectlyToConsumerMember2023-01-012023-12-310001840776us-gaap:SalesChannelThroughIntermediaryMemberhgty:CommissionAndFeeRevenueMember2022-01-012022-12-310001840776us-gaap:SalesChannelDirectlyToConsumerMemberhgty:CommissionAndFeeRevenueMember2022-01-012022-12-310001840776hgty:CommissionAndFeeRevenueMember2022-01-012022-12-310001840776hgty:ContingentCommissionMemberus-gaap:SalesChannelThroughIntermediaryMember2022-01-012022-12-310001840776hgty:ContingentCommissionMemberus-gaap:SalesChannelDirectlyToConsumerMember2022-01-012022-12-310001840776hgty:ContingentCommissionMember2022-01-012022-12-310001840776us-gaap:SalesChannelThroughIntermediaryMemberus-gaap:MembershipMember2022-01-012022-12-310001840776us-gaap:SalesChannelDirectlyToConsumerMemberus-gaap:MembershipMember2022-01-012022-12-310001840776us-gaap:MembershipMember2022-01-012022-12-310001840776us-gaap:ProductAndServiceOtherMemberus-gaap:SalesChannelThroughIntermediaryMember2022-01-012022-12-310001840776us-gaap:ProductAndServiceOtherMemberus-gaap:SalesChannelDirectlyToConsumerMember2022-01-012022-12-310001840776us-gaap:ProductAndServiceOtherMember2022-01-012022-12-310001840776us-gaap:SalesChannelThroughIntermediaryMember2022-01-012022-12-310001840776us-gaap:SalesChannelDirectlyToConsumerMember2022-01-012022-12-310001840776us-gaap:SalesChannelThroughIntermediaryMemberhgty:CommissionAndFeeRevenueMember2021-01-012021-12-310001840776us-gaap:SalesChannelDirectlyToConsumerMemberhgty:CommissionAndFeeRevenueMember2021-01-012021-12-310001840776hgty:CommissionAndFeeRevenueMember2021-01-012021-12-310001840776hgty:ContingentCommissionMemberus-gaap:SalesChannelThroughIntermediaryMember2021-01-012021-12-310001840776hgty:ContingentCommissionMemberus-gaap:SalesChannelDirectlyToConsumerMember2021-01-012021-12-310001840776hgty:ContingentCommissionMember2021-01-012021-12-310001840776us-gaap:SalesChannelThroughIntermediaryMemberus-gaap:MembershipMember2021-01-012021-12-310001840776us-gaap:SalesChannelDirectlyToConsumerMemberus-gaap:MembershipMember2021-01-012021-12-310001840776us-gaap:MembershipMember2021-01-012021-12-310001840776us-gaap:ProductAndServiceOtherMemberus-gaap:SalesChannelThroughIntermediaryMember2021-01-012021-12-310001840776us-gaap:ProductAndServiceOtherMemberus-gaap:SalesChannelDirectlyToConsumerMember2021-01-012021-12-310001840776us-gaap:ProductAndServiceOtherMember2021-01-012021-12-310001840776us-gaap:SalesChannelThroughIntermediaryMember2021-01-012021-12-310001840776us-gaap:SalesChannelDirectlyToConsumerMember2021-01-012021-12-310001840776country:UShgty:CommissionAndFeeRevenueMember2023-01-012023-12-310001840776country:CAhgty:CommissionAndFeeRevenueMember2023-01-012023-12-310001840776hgty:CommissionAndFeeRevenueMembersrt:EuropeMember2023-01-012023-12-310001840776country:UShgty:ContingentCommissionMember2023-01-012023-12-310001840776country:CAhgty:ContingentCommissionMember2023-01-012023-12-310001840776hgty:ContingentCommissionMembersrt:EuropeMember2023-01-012023-12-310001840776country:USus-gaap:MembershipMember2023-01-012023-12-310001840776country:CAus-gaap:MembershipMember2023-01-012023-12-310001840776us-gaap:MembershipMembersrt:EuropeMember2023-01-012023-12-310001840776country:USus-gaap:ProductAndServiceOtherMember2023-01-012023-12-310001840776us-gaap:ProductAndServiceOtherMembercountry:CA2023-01-012023-12-310001840776us-gaap:ProductAndServiceOtherMembersrt:EuropeMember2023-01-012023-12-310001840776country:US2023-01-012023-12-310001840776country:CA2023-01-012023-12-310001840776srt:EuropeMember2023-01-012023-12-310001840776country:UShgty:CommissionAndFeeRevenueMember2022-01-012022-12-310001840776country:CAhgty:CommissionAndFeeRevenueMember2022-01-012022-12-310001840776hgty:CommissionAndFeeRevenueMembersrt:EuropeMember2022-01-012022-12-310001840776country:UShgty:ContingentCommissionMember2022-01-012022-12-310001840776country:CAhgty:ContingentCommissionMember2022-01-012022-12-310001840776hgty:ContingentCommissionMembersrt:EuropeMember2022-01-012022-12-310001840776country:USus-gaap:MembershipMember2022-01-012022-12-310001840776country:CAus-gaap:MembershipMember2022-01-012022-12-310001840776us-gaap:MembershipMembersrt:EuropeMember2022-01-012022-12-310001840776country:USus-gaap:ProductAndServiceOtherMember2022-01-012022-12-310001840776us-gaap:ProductAndServiceOtherMembercountry:CA2022-01-012022-12-310001840776us-gaap:ProductAndServiceOtherMembersrt:EuropeMember2022-01-012022-12-310001840776country:US2022-01-012022-12-310001840776country:CA2022-01-012022-12-310001840776srt:EuropeMember2022-01-012022-12-310001840776country:UShgty:CommissionAndFeeRevenueMember2021-01-012021-12-310001840776country:CAhgty:CommissionAndFeeRevenueMember2021-01-012021-12-310001840776hgty:CommissionAndFeeRevenueMembersrt:EuropeMember2021-01-012021-12-310001840776country:UShgty:ContingentCommissionMember2021-01-012021-12-310001840776country:CAhgty:ContingentCommissionMember2021-01-012021-12-310001840776hgty:ContingentCommissionMembersrt:EuropeMember2021-01-012021-12-310001840776country:USus-gaap:MembershipMember2021-01-012021-12-310001840776country:CAus-gaap:MembershipMember2021-01-012021-12-310001840776us-gaap:MembershipMembersrt:EuropeMember2021-01-012021-12-310001840776country:USus-gaap:ProductAndServiceOtherMember2021-01-012021-12-310001840776us-gaap:ProductAndServiceOtherMembercountry:CA2021-01-012021-12-310001840776us-gaap:ProductAndServiceOtherMembersrt:EuropeMember2021-01-012021-12-310001840776country:US2021-01-012021-12-310001840776country:CA2021-01-012021-12-310001840776srt:EuropeMember2021-01-012021-12-310001840776hgty:MarkelMembersrt:AffiliatedEntityMemberhgty:AllianceAgreementMember2023-12-180001840776us-gaap:ShortTermContractWithCustomerMember2023-01-012023-12-310001840776us-gaap:FinanceReceivablesMemberus-gaap:CustomerConcentrationRiskMember2023-12-310001840776us-gaap:FinanceReceivablesMemberus-gaap:CustomerConcentrationRiskMemberhgty:Borrower1Member2023-01-012023-12-310001840776us-gaap:FinanceReceivablesMemberus-gaap:CustomerConcentrationRiskMember2023-01-012023-12-310001840776us-gaap:LandAndLandImprovementsMember2023-12-310001840776us-gaap:LandAndLandImprovementsMember2022-12-310001840776us-gaap:BuildingMember2023-12-310001840776us-gaap:BuildingMember2022-12-310001840776us-gaap:LeaseholdImprovementsMember2023-12-310001840776us-gaap:LeaseholdImprovementsMember2022-12-310001840776us-gaap:FurnitureAndFixturesMember2023-12-310001840776us-gaap:FurnitureAndFixturesMember2022-12-310001840776hgty:ComputerEquipmentAndSoftwareMember2023-12-310001840776hgty:ComputerEquipmentAndSoftwareMember2022-12-310001840776us-gaap:AutomobilesMember2023-12-310001840776us-gaap:AutomobilesMember2022-12-3100018407762022-01-012022-01-010001840776hgty:MemberHubsHoldingLLCMember2023-07-012023-09-300001840776hgty:HagertyDriveShareLLCMember2023-07-012023-09-3000018407762021-12-022021-12-020001840776hgty:PIPEWarrantsMember2021-12-020001840776hgty:HagertyHoldingCorpMember2021-12-022021-12-020001840776us-gaap:MemberUnitsMemberhgty:HagertyHoldingCorpMember2021-12-022021-12-020001840776hgty:CommonClassVMemberhgty:HagertyHoldingCorpMember2021-12-022021-12-020001840776hgty:MarkelMemberus-gaap:MemberUnitsMember2021-12-022021-12-020001840776hgty:MarkelMemberhgty:CommonClassVMember2021-12-022021-12-020001840776hgty:AldelMemberus-gaap:CommonClassAMember2021-12-022021-12-310001840776hgty:AldelMemberus-gaap:CommonClassAMember2021-12-010001840776hgty:AldelMemberus-gaap:CommonClassAMember2021-12-020001840776hgty:AldelMemberus-gaap:CommonClassAMember2021-12-022021-12-020001840776us-gaap:CommonClassAMember2021-12-020001840776hgty:CommonClassVMember2021-12-020001840776us-gaap:AdditionalPaidInCapitalMember2021-12-020001840776hgty:BroadArrowGroupIncMember2022-01-012022-01-310001840776hgty:BroadArrowGroupIncMember2022-01-310001840776hgty:BroadArrowGroupIncMember2022-08-310001840776hgty:BroadArrowGroupIncMember2022-08-162022-08-160001840776hgty:BroadArrowGroupIncMember2022-08-160001840776hgty:BroadArrowGroupIncMember2022-08-012022-08-310001840776hgty:BroadArrowGroupIncMember2022-07-012022-09-300001840776us-gaap:TradeNamesMemberhgty:BroadArrowGroupIncMember2022-08-310001840776us-gaap:TradeNamesMemberhgty:BroadArrowGroupIncMember2022-08-012022-08-310001840776hgty:SpeedDigitalLLCMember2022-04-012022-04-300001840776hgty:SpeedDigitalLLCMember2022-04-300001840776hgty:SpeedDigitalLLCMembersrt:DirectorMember2022-04-012022-04-300001840776hgty:MemberHubsHoldingLLCMember2023-09-290001840776hgty:MemberHubsHoldingLLCMemberhgty:HagertyVenturesLLCMember2023-09-292023-09-290001840776hgty:MemberHubsHoldingLLCMember2023-07-012023-09-300001840776hgty:HagertyDriveShareLLCMember2023-10-092023-10-090001840776hgty:HagertyDriveShareLLCMember2023-07-012023-09-300001840776srt:WeightedAverageMemberus-gaap:CustomerContractsMember2023-12-310001840776us-gaap:CustomerContractsMember2023-12-310001840776us-gaap:CustomerContractsMember2022-12-310001840776us-gaap:ComputerSoftwareIntangibleAssetMembersrt:WeightedAverageMember2023-12-310001840776us-gaap:ComputerSoftwareIntangibleAssetMember2023-12-310001840776us-gaap:ComputerSoftwareIntangibleAssetMember2022-12-310001840776srt:WeightedAverageMemberus-gaap:TrademarksAndTradeNamesMember2023-12-310001840776us-gaap:TrademarksAndTradeNamesMember2023-12-310001840776us-gaap:TrademarksAndTradeNamesMember2022-12-310001840776us-gaap:CustomerRelatedIntangibleAssetsMembersrt:WeightedAverageMember2023-12-310001840776us-gaap:CustomerRelatedIntangibleAssetsMember2023-12-310001840776us-gaap:CustomerRelatedIntangibleAssetsMember2022-12-310001840776srt:WeightedAverageMemberus-gaap:OtherIntangibleAssetsMember2023-12-310001840776us-gaap:OtherIntangibleAssetsMember2023-12-310001840776us-gaap:OtherIntangibleAssetsMember2022-12-310001840776hgty:MemberHubsHoldingLLCMemberus-gaap:CustomerRelatedIntangibleAssetsMember2023-07-012023-09-300001840776hgty:AutoInsurancePolicyMember2023-12-310001840776hgty:AutoInsurancePolicyMember2022-12-310001840776hgty:MarineInsurancePolicyMember2023-12-310001840776hgty:MarineInsurancePolicyMember2022-12-310001840776hgty:AutoInsurancePolicyMemberus-gaap:ShortDurationInsuranceContractAccidentYear2019Member2019-12-310001840776hgty:AutoInsurancePolicyMemberus-gaap:ShortDurationInsuranceContractAccidentYear2019Member2020-12-310001840776hgty:AutoInsurancePolicyMemberus-gaap:ShortDurationInsuranceContractAccidentYear2019Member2021-12-310001840776hgty:AutoInsurancePolicyMemberus-gaap:ShortDurationInsuranceContractAccidentYear2019Member2022-12-310001840776hgty:AutoInsurancePolicyMemberus-gaap:ShortDurationInsuranceContractAccidentYear2019Member2023-12-31hgty:claim0001840776us-gaap:ShortDurationInsuranceContractAccidentYear2020Memberhgty:AutoInsurancePolicyMember2020-12-310001840776us-gaap:ShortDurationInsuranceContractAccidentYear2020Memberhgty:AutoInsurancePolicyMember2021-12-310001840776us-gaap:ShortDurationInsuranceContractAccidentYear2020Memberhgty:AutoInsurancePolicyMember2022-12-310001840776us-gaap:ShortDurationInsuranceContractAccidentYear2020Memberhgty:AutoInsurancePolicyMember2023-12-310001840776hgty:AutoInsurancePolicyMemberus-gaap:ShortDurationInsuranceContractAccidentYear2021Member2021-12-310001840776hgty:AutoInsurancePolicyMemberus-gaap:ShortDurationInsuranceContractAccidentYear2021Member2022-12-310001840776hgty:AutoInsurancePolicyMemberus-gaap:ShortDurationInsuranceContractAccidentYear2021Member2023-12-310001840776us-gaap:ShortDurationInsuranceContractAccidentYear2022Memberhgty:AutoInsurancePolicyMember2022-12-310001840776us-gaap:ShortDurationInsuranceContractAccidentYear2022Memberhgty:AutoInsurancePolicyMember2023-12-310001840776hgty:AutoInsurancePolicyMemberus-gaap:ShortDurationInsuranceContractAccidentYear2023Member2022-12-310001840776hgty:AutoInsurancePolicyMemberus-gaap:ShortDurationInsuranceContractAccidentYear2023Member2023-12-310001840776hgty:VariousReinsurersMember2023-01-012023-12-31hgty:letter_of_credit0001840776Catastrophe Reinsurance Layer One2023-01-012023-12-310001840776Catastrophe Reinsurance Layer Two2023-01-012023-12-310001840776hgty:VariousReinsurersMemberCatastrophe Program - High Net Worth2023-01-012023-01-010001840776hgty:EvanstonInsuranceCompanyMemberus-gaap:SubsequentEventMemberCatastrophe Program - High Net Worth2024-01-012024-01-010001840776us-gaap:SubsequentEventMemberhgty:VariousReinsurersMemberCatastrophe Program - High Net Worth2024-01-012024-01-010001840776us-gaap:LineOfCreditMemberhgty:StateFarmTermLoanFacilityMember2023-09-190001840776hgty:ReductionInForceMember2022-01-012022-12-310001840776hgty:VoluntaryRetirementProgramMember2022-01-012022-12-310001840776hgty:ReductionInForceMember2023-01-012023-12-310001840776us-gaap:InterestRateSwapMember2023-12-31hgty:swap0001840776us-gaap:InterestRateSwapMember2022-12-310001840776hgty:PublicWarrantsMember2023-12-310001840776hgty:PublicWarrantsMember2022-12-310001840776hgty:PrivatePlacementWarrantsMember2023-12-310001840776hgty:PrivatePlacementWarrantsMember2022-12-310001840776hgty:UnderwriterWarrantsMember2023-12-310001840776hgty:UnderwriterWarrantsMember2022-12-310001840776hgty:OTMWarrantsMember2023-12-310001840776hgty:OTMWarrantsMember2022-12-310001840776hgty:PIPEWarrantsMember2023-12-310001840776hgty:PIPEWarrantsMember2022-12-310001840776us-gaap:MeasurementInputExpectedDividendRateMember2023-12-310001840776us-gaap:InterestRateSwapMemberus-gaap:FairValueMeasurementsRecurringMember2023-12-310001840776us-gaap:InterestRateSwapMemberus-gaap:FairValueMeasurementsRecurringMemberus-gaap:FairValueInputsLevel1Member2023-12-310001840776us-gaap:InterestRateSwapMemberus-gaap:FairValueMeasurementsRecurringMemberus-gaap:FairValueInputsLevel2Member2023-12-310001840776us-gaap:FairValueInputsLevel3Memberus-gaap:InterestRateSwapMemberus-gaap:FairValueMeasurementsRecurringMember2023-12-310001840776us-gaap:FairValueMeasurementsRecurringMember2023-12-310001840776us-gaap:FairValueMeasurementsRecurringMemberus-gaap:FairValueInputsLevel1Member2023-12-310001840776us-gaap:FairValueMeasurementsRecurringMemberus-gaap:FairValueInputsLevel2Member2023-12-310001840776us-gaap:FairValueInputsLevel3Memberus-gaap:FairValueMeasurementsRecurringMember2023-12-310001840776hgty:PublicWarrantsMemberus-gaap:FairValueMeasurementsRecurringMember2023-12-310001840776hgty:PublicWarrantsMemberus-gaap:FairValueMeasurementsRecurringMemberus-gaap:FairValueInputsLevel1Member2023-12-310001840776hgty:PublicWarrantsMemberus-gaap:FairValueMeasurementsRecurringMemberus-gaap:FairValueInputsLevel2Member2023-12-310001840776us-gaap:FairValueInputsLevel3Memberhgty:PublicWarrantsMemberus-gaap:FairValueMeasurementsRecurringMember2023-12-310001840776us-gaap:FairValueMeasurementsRecurringMemberhgty:PrivatePlacementWarrantsMember2023-12-310001840776us-gaap:FairValueMeasurementsRecurringMemberus-gaap:FairValueInputsLevel1Memberhgty:PrivatePlacementWarrantsMember2023-12-310001840776us-gaap:FairValueMeasurementsRecurringMemberus-gaap:FairValueInputsLevel2Memberhgty:PrivatePlacementWarrantsMember2023-12-310001840776us-gaap:FairValueInputsLevel3Memberus-gaap:FairValueMeasurementsRecurringMemberhgty:PrivatePlacementWarrantsMember2023-12-310001840776hgty:UnderwriterWarrantsMemberus-gaap:FairValueMeasurementsRecurringMember2023-12-310001840776hgty:UnderwriterWarrantsMemberus-gaap:FairValueMeasurementsRecurringMemberus-gaap:FairValueInputsLevel1Member2023-12-310001840776hgty:UnderwriterWarrantsMemberus-gaap:FairValueMeasurementsRecurringMemberus-gaap:FairValueInputsLevel2Member2023-12-310001840776us-gaap:FairValueInputsLevel3Memberhgty:UnderwriterWarrantsMemberus-gaap:FairValueMeasurementsRecurringMember2023-12-310001840776hgty:OTMWarrantsMemberus-gaap:FairValueMeasurementsRecurringMember2023-12-310001840776hgty:OTMWarrantsMemberus-gaap:FairValueMeasurementsRecurringMemberus-gaap:FairValueInputsLevel1Member2023-12-310001840776hgty:OTMWarrantsMemberus-gaap:FairValueMeasurementsRecurringMemberus-gaap:FairValueInputsLevel2Member2023-12-310001840776us-gaap:FairValueInputsLevel3Memberhgty:OTMWarrantsMemberus-gaap:FairValueMeasurementsRecurringMember2023-12-310001840776us-gaap:FairValueMeasurementsRecurringMemberhgty:PIPEWarrantsMember2023-12-310001840776us-gaap:FairValueMeasurementsRecurringMemberus-gaap:FairValueInputsLevel1Memberhgty:PIPEWarrantsMember2023-12-310001840776us-gaap:FairValueMeasurementsRecurringMemberus-gaap:FairValueInputsLevel2Memberhgty:PIPEWarrantsMember2023-12-310001840776us-gaap:FairValueInputsLevel3Memberus-gaap:FairValueMeasurementsRecurringMemberhgty:PIPEWarrantsMember2023-12-310001840776us-gaap:InterestRateSwapMemberus-gaap:FairValueMeasurementsRecurringMember2022-12-310001840776us-gaap:InterestRateSwapMemberus-gaap:FairValueMeasurementsRecurringMemberus-gaap:FairValueInputsLevel1Member2022-12-310001840776us-gaap:InterestRateSwapMemberus-gaap:FairValueMeasurementsRecurringMemberus-gaap:FairValueInputsLevel2Member2022-12-310001840776us-gaap:FairValueInputsLevel3Memberus-gaap:InterestRateSwapMemberus-gaap:FairValueMeasurementsRecurringMember2022-12-310001840776us-gaap:FairValueMeasurementsRecurringMember2022-12-310001840776us-gaap:FairValueMeasurementsRecurringMemberus-gaap:FairValueInputsLevel1Member2022-12-310001840776us-gaap:FairValueMeasurementsRecurringMemberus-gaap:FairValueInputsLevel2Member2022-12-310001840776us-gaap:FairValueInputsLevel3Memberus-gaap:FairValueMeasurementsRecurringMember2022-12-310001840776hgty:PublicWarrantsMemberus-gaap:FairValueMeasurementsRecurringMember2022-12-310001840776hgty:PublicWarrantsMemberus-gaap:FairValueMeasurementsRecurringMemberus-gaap:FairValueInputsLevel1Member2022-12-310001840776hgty:PublicWarrantsMemberus-gaap:FairValueMeasurementsRecurringMemberus-gaap:FairValueInputsLevel2Member2022-12-310001840776us-gaap:FairValueInputsLevel3Memberhgty:PublicWarrantsMemberus-gaap:FairValueMeasurementsRecurringMember2022-12-310001840776us-gaap:FairValueMeasurementsRecurringMemberhgty:PrivatePlacementWarrantsMember2022-12-310001840776us-gaap:FairValueMeasurementsRecurringMemberus-gaap:FairValueInputsLevel1Memberhgty:PrivatePlacementWarrantsMember2022-12-310001840776us-gaap:FairValueMeasurementsRecurringMemberus-gaap:FairValueInputsLevel2Memberhgty:PrivatePlacementWarrantsMember2022-12-310001840776us-gaap:FairValueInputsLevel3Memberus-gaap:FairValueMeasurementsRecurringMemberhgty:PrivatePlacementWarrantsMember2022-12-310001840776hgty:UnderwriterWarrantsMemberus-gaap:FairValueMeasurementsRecurringMember2022-12-310001840776hgty:UnderwriterWarrantsMemberus-gaap:FairValueMeasurementsRecurringMemberus-gaap:FairValueInputsLevel1Member2022-12-310001840776hgty:UnderwriterWarrantsMemberus-gaap:FairValueMeasurementsRecurringMemberus-gaap:FairValueInputsLevel2Member2022-12-310001840776us-gaap:FairValueInputsLevel3Memberhgty:UnderwriterWarrantsMemberus-gaap:FairValueMeasurementsRecurringMember2022-12-310001840776hgty:OTMWarrantsMemberus-gaap:FairValueMeasurementsRecurringMember2022-12-310001840776hgty:OTMWarrantsMemberus-gaap:FairValueMeasurementsRecurringMemberus-gaap:FairValueInputsLevel1Member2022-12-310001840776hgty:OTMWarrantsMemberus-gaap:FairValueMeasurementsRecurringMemberus-gaap:FairValueInputsLevel2Member2022-12-310001840776us-gaap:FairValueInputsLevel3Memberhgty:OTMWarrantsMemberus-gaap:FairValueMeasurementsRecurringMember2022-12-310001840776us-gaap:FairValueMeasurementsRecurringMemberhgty:PIPEWarrantsMember2022-12-310001840776us-gaap:FairValueMeasurementsRecurringMemberus-gaap:FairValueInputsLevel1Memberhgty:PIPEWarrantsMember2022-12-310001840776us-gaap:FairValueMeasurementsRecurringMemberus-gaap:FairValueInputsLevel2Memberhgty:PIPEWarrantsMember2022-12-310001840776us-gaap:FairValueInputsLevel3Memberus-gaap:FairValueMeasurementsRecurringMemberhgty:PIPEWarrantsMember2022-12-310001840776hgty:PrivatePlacementWarrantsMemberhgty:WarrantLiabilitiesMember2021-12-310001840776hgty:UnderwriterWarrantsMemberhgty:WarrantLiabilitiesMember2021-12-310001840776hgty:OTMWarrantsMemberhgty:WarrantLiabilitiesMember2021-12-310001840776hgty:WarrantLiabilitiesMemberhgty:PIPEWarrantsMember2021-12-310001840776hgty:WarrantLiabilitiesMember2021-12-310001840776hgty:PrivatePlacementWarrantsMemberhgty:WarrantLiabilitiesMember2022-01-012022-12-310001840776hgty:UnderwriterWarrantsMemberhgty:WarrantLiabilitiesMember2022-01-012022-12-310001840776hgty:OTMWarrantsMemberhgty:WarrantLiabilitiesMember2022-01-012022-12-310001840776hgty:WarrantLiabilitiesMemberhgty:PIPEWarrantsMember2022-01-012022-12-310001840776hgty:WarrantLiabilitiesMember2022-01-012022-12-310001840776hgty:PrivatePlacementWarrantsMemberhgty:WarrantLiabilitiesMember2022-12-310001840776hgty:UnderwriterWarrantsMemberhgty:WarrantLiabilitiesMember2022-12-310001840776hgty:OTMWarrantsMemberhgty:WarrantLiabilitiesMember2022-12-310001840776hgty:WarrantLiabilitiesMemberhgty:PIPEWarrantsMember2022-12-310001840776hgty:WarrantLiabilitiesMember2022-12-310001840776hgty:PrivatePlacementWarrantsMemberhgty:WarrantLiabilitiesMember2023-01-012023-12-310001840776hgty:UnderwriterWarrantsMemberhgty:WarrantLiabilitiesMember2023-01-012023-12-310001840776hgty:OTMWarrantsMemberhgty:WarrantLiabilitiesMember2023-01-012023-12-310001840776hgty:WarrantLiabilitiesMemberhgty:PIPEWarrantsMember2023-01-012023-12-310001840776hgty:WarrantLiabilitiesMember2023-01-012023-12-310001840776hgty:PrivatePlacementWarrantsMemberhgty:WarrantLiabilitiesMember2023-12-310001840776hgty:UnderwriterWarrantsMemberhgty:WarrantLiabilitiesMember2023-12-310001840776hgty:OTMWarrantsMemberhgty:WarrantLiabilitiesMember2023-12-310001840776hgty:WarrantLiabilitiesMemberhgty:PIPEWarrantsMember2023-12-310001840776hgty:WarrantLiabilitiesMember2023-12-310001840776hgty:PIPEWarrantsMember2022-01-012022-12-310001840776hgty:PIPEWarrantsMember2023-01-012023-12-310001840776us-gaap:FixedIncomeSecuritiesMemberus-gaap:CarryingReportedAmountFairValueDisclosureMember2023-12-310001840776us-gaap:EstimateOfFairValueFairValueDisclosureMemberus-gaap:FairValueInputsLevel2Memberus-gaap:FixedIncomeSecuritiesMember2023-12-310001840776us-gaap:FixedIncomeSecuritiesMemberus-gaap:CarryingReportedAmountFairValueDisclosureMember2022-12-310001840776us-gaap:EstimateOfFairValueFairValueDisclosureMemberus-gaap:FairValueInputsLevel2Memberus-gaap:FixedIncomeSecuritiesMember2022-12-310001840776us-gaap:RevolvingCreditFacilityMemberhgty:JPMCreditFacilityMemberus-gaap:LineOfCreditMember2023-12-310001840776us-gaap:RevolvingCreditFacilityMemberhgty:JPMCreditFacilityMemberus-gaap:LineOfCreditMember2022-12-310001840776hgty:BACCreditFacilityMemberus-gaap:RevolvingCreditFacilityMemberus-gaap:LineOfCreditMember2023-12-310001840776hgty:BACCreditFacilityMemberus-gaap:RevolvingCreditFacilityMemberus-gaap:LineOfCreditMember2022-12-310001840776us-gaap:LineOfCreditMemberhgty:StateFarmTermLoanFacilityMember2023-12-310001840776us-gaap:LineOfCreditMemberhgty:StateFarmTermLoanFacilityMember2022-12-310001840776us-gaap:NotesPayableOtherPayablesMember2023-12-310001840776us-gaap:NotesPayableOtherPayablesMember2022-12-310001840776us-gaap:LetterOfCreditMemberhgty:JPMCreditFacilityMemberus-gaap:LineOfCreditMember2023-12-310001840776us-gaap:RevolvingCreditFacilityMemberhgty:JPMCreditFacilityMemberus-gaap:ForeignLineOfCreditMember2023-12-310001840776hgty:BACCreditFacilityMemberus-gaap:RevolvingCreditFacilityMemberus-gaap:LineOfCreditMember2023-12-210001840776hgty:BACCreditFacilityMemberus-gaap:RevolvingCreditFacilityMemberus-gaap:LineOfCreditMember2023-01-012023-12-310001840776country:GBus-gaap:NotesPayableOtherPayablesMember2023-12-310001840776country:GBus-gaap:NotesPayableOtherPayablesMember2022-12-310001840776srt:MinimumMembercountry:GBus-gaap:NotesPayableOtherPayablesMember2023-12-310001840776country:GBsrt:MaximumMemberus-gaap:NotesPayableOtherPayablesMember2023-12-310001840776us-gaap:SeriesAPreferredStockMember2023-06-232023-06-230001840776us-gaap:SeriesAPreferredStockMember2023-06-230001840776us-gaap:SeriesAPreferredStockMember2023-12-310001840776us-gaap:SeriesAPreferredStockMember2023-01-012023-12-31hgty:consecutiveTradingDay0001840776us-gaap:DebtInstrumentRedemptionPeriodOneMemberus-gaap:CommonClassAMember2023-01-012023-12-310001840776us-gaap:DebtInstrumentRedemptionPeriodTwoMemberus-gaap:CommonClassAMember2023-01-012023-12-310001840776us-gaap:DebtInstrumentRedemptionPeriodOneMemberus-gaap:SeriesAPreferredStockMemberhgty:ChangeOfControlMember2023-01-012023-12-310001840776us-gaap:DebtInstrumentRedemptionPeriodTwoMemberus-gaap:SeriesAPreferredStockMemberhgty:ChangeOfControlMember2023-01-012023-12-310001840776us-gaap:DebtInstrumentRedemptionPeriodThreeMemberus-gaap:SeriesAPreferredStockMemberhgty:ChangeOfControlMember2023-01-012023-12-310001840776hgty:FundamentalTransactionMemberus-gaap:SeriesAPreferredStockMember2023-12-310001840776hgty:FundamentalTransactionMemberus-gaap:DebtInstrumentRedemptionPeriodOneMemberus-gaap:SeriesAPreferredStockMember2023-01-012023-12-310001840776hgty:FundamentalTransactionMemberus-gaap:DebtInstrumentRedemptionPeriodTwoMemberus-gaap:SeriesAPreferredStockMember2023-01-012023-12-310001840776hgty:FundamentalTransactionMemberus-gaap:DebtInstrumentRedemptionPeriodFourMemberus-gaap:SeriesAPreferredStockMember2023-01-012023-12-310001840776hgty:FundamentalTransactionMemberus-gaap:SeriesAPreferredStockMemberus-gaap:DebtInstrumentRedemptionPeriodFiveMember2023-01-012023-12-310001840776hgty:FundamentalTransactionMemberhgty:DebtInstrumentRedemptionPeriodSixMemberus-gaap:SeriesAPreferredStockMember2023-01-012023-12-310001840776hgty:FundamentalTransactionMemberus-gaap:SeriesAPreferredStockMemberhgty:DebtInstrumentRedemptionPeriodSevenMember2023-01-012023-12-310001840776hgty:FundamentalTransactionMemberhgty:DebtInstrumentRedemptionPeriodEightMemberus-gaap:SeriesAPreferredStockMember2023-01-012023-12-310001840776us-gaap:DebtInstrumentRedemptionPeriodFourMemberhgty:OptionalTermRedemptionMemberus-gaap:SeriesAPreferredStockMember2023-01-012023-12-310001840776hgty:OptionalTermRedemptionMemberus-gaap:SeriesAPreferredStockMemberus-gaap:DebtInstrumentRedemptionPeriodFiveMember2023-01-012023-12-310001840776hgty:DebtInstrumentRedemptionPeriodSixMemberhgty:OptionalTermRedemptionMemberus-gaap:SeriesAPreferredStockMember2023-01-012023-12-310001840776hgty:OptionalTermRedemptionMemberus-gaap:SeriesAPreferredStockMemberhgty:DebtInstrumentRedemptionPeriodSevenMember2023-01-012023-12-310001840776hgty:OptionalTermRedemptionMemberus-gaap:SeriesAPreferredStockMemberhgty:DebtInstrumentRedemptionPeriodThirteenMember2023-01-012023-12-310001840776hgty:OptionalTermRedemptionMemberus-gaap:SeriesAPreferredStockMemberhgty:DebtInstrumentRedemptionPeriodFourteenMember2023-01-012023-12-31hgty:vote0001840776hgty:CommonClassVMember2023-01-012023-12-310001840776us-gaap:ConvertiblePreferredStockMember2023-12-310001840776hgty:TheHagertyGroupLLCMember2023-12-310001840776hgty:TheHagertyGroupLLCMember2022-12-3100018407762022-01-012022-03-230001840776us-gaap:AdditionalPaidInCapitalMember2022-01-012022-03-230001840776us-gaap:RetainedEarningsMember2022-01-012022-03-2300018407762022-03-230001840776us-gaap:RetainedEarningsMember2022-03-232022-03-230001840776us-gaap:AdditionalPaidInCapitalMember2022-03-232022-03-230001840776us-gaap:NoncontrollingInterestMember2022-03-232022-03-230001840776hgty:HagertyGroupUnitsMember2023-01-012023-12-310001840776hgty:HagertyGroupUnitsMember2022-01-012022-12-310001840776hgty:HagertyGroupUnitsMember2021-01-012021-12-310001840776us-gaap:SeriesAPreferredStockMember2023-01-012023-12-310001840776us-gaap:SeriesAPreferredStockMember2022-01-012022-12-310001840776us-gaap:SeriesAPreferredStockMember2021-01-012021-12-310001840776us-gaap:StockCompensationPlanMember2023-01-012023-12-310001840776us-gaap:StockCompensationPlanMember2022-01-012022-12-310001840776us-gaap:StockCompensationPlanMember2021-01-012021-12-310001840776us-gaap:WarrantMember2023-01-012023-12-310001840776us-gaap:WarrantMember2022-01-012022-12-310001840776us-gaap:WarrantMember2021-01-012021-12-310001840776hgty:A2021StockIncentivePlanMemberus-gaap:CommonClassAMember2021-12-310001840776hgty:A2021StockIncentivePlanMember2023-12-310001840776us-gaap:RestrictedStockUnitsRSUMember2023-01-012023-12-310001840776us-gaap:RestrictedStockUnitsRSUMember2022-01-012022-12-310001840776us-gaap:PerformanceSharesMember2023-01-012023-12-310001840776us-gaap:PerformanceSharesMember2022-01-012022-12-310001840776hgty:EmployeeStockPurchasePlanMember2023-01-012023-12-310001840776hgty:EmployeeStockPurchasePlanMember2022-01-012022-12-310001840776us-gaap:EmployeeStockOptionMembersrt:MinimumMember2023-01-012023-12-310001840776us-gaap:EmployeeStockOptionMembersrt:MaximumMember2023-01-012023-12-310001840776us-gaap:RestrictedStockUnitsRSUMember2023-12-310001840776us-gaap:RestrictedStockUnitsRSUMember2022-12-310001840776us-gaap:PerformanceSharesMember2022-04-012022-04-300001840776us-gaap:ShareBasedCompensationAwardTrancheOneMemberus-gaap:PerformanceSharesMember2022-04-012022-04-300001840776us-gaap:ShareBasedCompensationAwardTrancheOneMemberus-gaap:PerformanceSharesMember2022-04-30utr:D0001840776us-gaap:ShareBasedCompensationAwardTrancheTwoMemberus-gaap:PerformanceSharesMember2022-04-012022-04-300001840776us-gaap:ShareBasedCompensationAwardTrancheTwoMemberus-gaap:PerformanceSharesMember2022-04-300001840776us-gaap:ShareBasedCompensationAwardTrancheThreeMemberus-gaap:PerformanceSharesMember2022-04-012022-04-300001840776us-gaap:ShareBasedCompensationAwardTrancheThreeMemberus-gaap:PerformanceSharesMember2022-04-300001840776srt:MinimumMemberus-gaap:PerformanceSharesMember2022-04-012022-04-300001840776srt:MaximumMemberus-gaap:PerformanceSharesMember2022-04-012022-04-300001840776us-gaap:PerformanceSharesMember2023-12-310001840776us-gaap:PerformanceSharesMember2022-12-310001840776hgty:EmployeeStockPurchasePlanMemberus-gaap:CommonClassAMember2021-01-012021-03-310001840776hgty:EmployeeStockPurchasePlanOneMemberus-gaap:CommonClassAMember2021-01-012021-03-310001840776hgty:EmployeeStockPurchasePlanTwoMemberus-gaap:CommonClassAMember2021-01-012021-03-310001840776hgty:EmployeeStockPurchasePlanMemberus-gaap:CommonClassAMember2023-01-012023-12-310001840776hgty:EmployeeStockPurchasePlanMemberus-gaap:CommonClassAMember2023-12-310001840776us-gaap:ForeignCountryMember2023-12-310001840776us-gaap:ForeignCountryMember2022-12-310001840776hgty:Expiring2036Member2023-12-310001840776hgty:Expiring2037Member2023-12-310001840776hgty:Expiring2038Member2023-12-310001840776hgty:Expiring2039Member2023-12-310001840776hgty:Expiring2040Member2023-12-310001840776hgty:Expiring2041Member2023-12-310001840776hgty:Expiring2042Member2023-12-310001840776hgty:Expiring2043Member2023-12-310001840776hgty:MarkelMembersrt:AffiliatedEntityMemberhgty:HagertyIncMemberus-gaap:CommonClassAMember2023-12-310001840776srt:AffiliatedEntityMemberhgty:HagertyIncMemberhgty:StateFarmMemberus-gaap:CommonClassAMember2023-12-310001840776hgty:MarkelMemberhgty:CommonClassVMembersrt:AffiliatedEntityMemberhgty:HagertyIncMember2023-12-310001840776hgty:CommonClassVMembersrt:AffiliatedEntityMemberhgty:HagertyIncMemberhgty:StateFarmMember2023-12-310001840776hgty:MarkelMembersrt:AffiliatedEntityMemberhgty:HagertyIncMemberus-gaap:SeriesAPreferredStockMember2023-12-310001840776srt:AffiliatedEntityMemberhgty:HagertyIncMemberus-gaap:SeriesAPreferredStockMemberhgty:StateFarmMember2023-12-310001840776hgty:MarkelMembersrt:AffiliatedEntityMemberhgty:HagertyIncMemberhgty:HagertyGroupUnitsMember2023-12-310001840776srt:AffiliatedEntityMemberhgty:HagertyIncMemberhgty:HagertyGroupUnitsMemberhgty:StateFarmMember2023-12-310001840776us-gaap:ParentMemberhgty:MarkelMembersrt:AffiliatedEntityMemberhgty:HagertyIncMember2023-12-310001840776us-gaap:ParentMembersrt:AffiliatedEntityMemberhgty:HagertyIncMemberhgty:StateFarmMember2023-12-310001840776hgty:MarkelMembersrt:AffiliatedEntityMemberus-gaap:NoncontrollingInterestMemberhgty:HagertyIncMember2023-12-310001840776srt:AffiliatedEntityMemberus-gaap:NoncontrollingInterestMemberhgty:HagertyIncMemberhgty:StateFarmMember2023-12-310001840776srt:AffiliatedEntityMemberhgty:AllianceAgreementMemberhgty:StateFarmMember2020-01-012020-12-310001840776srt:AffiliatedEntityMemberhgty:AllianceAgreementMemberhgty:StateFarmMember2023-09-30hgty:state0001840776srt:AffiliatedEntityMemberhgty:AllianceAgreementMemberhgty:StateFarmMember2020-12-310001840776hgty:ReinsuranceAgreementMembersrt:AffiliatedEntityMember2023-03-012023-03-010001840776srt:AffiliatedEntityMemberhgty:ReinsuranceAgreementMemberhgty:StateFarmMember2023-12-310001840776srt:AffiliatedEntityMemberhgty:ReinsuranceAgreementMemberhgty:StateFarmMember2023-01-012023-12-310001840776hgty:MarkelMembersrt:AffiliatedEntityMemberhgty:AllianceAgreementMember2023-12-182023-12-180001840776hgty:MarkelMembersrt:AffiliatedEntityMemberhgty:AllianceAgreementMembersrt:MinimumMember2023-12-180001840776hgty:MarkelMembersrt:AffiliatedEntityMemberhgty:AllianceAgreementMembersrt:MaximumMember2023-12-180001840776hgty:MarkelMembersrt:AffiliatedEntityMemberhgty:AllianceAgreementMember2023-12-310001840776hgty:MarkelMembersrt:AffiliatedEntityMemberhgty:AllianceAgreementMember2022-12-310001840776hgty:DueToRelatedPartiesMemberhgty:MarkelMembersrt:AffiliatedEntityMemberhgty:AllianceAgreementMemberhgty:RelatedPartyConcentrationRiskMember2023-01-012023-12-310001840776hgty:DueToRelatedPartiesMemberhgty:MarkelMembersrt:AffiliatedEntityMemberhgty:AllianceAgreementMemberhgty:RelatedPartyConcentrationRiskMember2022-01-012022-12-310001840776hgty:MarkelMembersrt:AffiliatedEntityMemberhgty:AllianceAgreementMember2023-01-012023-12-310001840776hgty:MarkelMembersrt:AffiliatedEntityMemberhgty:AllianceAgreementMember2022-01-012022-12-310001840776hgty:MarkelMembersrt:AffiliatedEntityMemberhgty:AllianceAgreementMember2021-01-012021-12-310001840776hgty:MarkelMembersrt:AffiliatedEntityMemberhgty:AllianceAgreementMemberhgty:RelatedPartyConcentrationRiskMemberus-gaap:RevenueFromContractWithCustomerMember2023-01-012023-12-310001840776hgty:MarkelMembersrt:AffiliatedEntityMemberhgty:AllianceAgreementMemberhgty:RelatedPartyConcentrationRiskMemberus-gaap:RevenueFromContractWithCustomerMember2022-01-012022-12-310001840776hgty:MarkelMembersrt:AffiliatedEntityMemberhgty:AllianceAgreementMemberhgty:RelatedPartyConcentrationRiskMemberus-gaap:RevenueFromContractWithCustomerMember2021-01-012021-12-310001840776srt:AffiliatedEntityMemberhgty:ReinsuranceAgreementMembercountry:GB2023-01-012023-12-310001840776srt:AffiliatedEntityMemberhgty:ReinsuranceAgreementMembercountry:GB2022-01-012022-12-310001840776hgty:ReinsuranceAgreementMembersrt:AffiliatedEntityMember2022-12-312022-12-310001840776hgty:ReinsuranceAgreementMembersrt:AffiliatedEntityMember2023-01-012023-01-010001840776hgty:MarkelMembersrt:AffiliatedEntityMemberhgty:ReinsuranceAgreementMember2023-12-310001840776hgty:MarkelMembersrt:AffiliatedEntityMemberhgty:ReinsuranceAgreementMember2022-12-310001840776hgty:MarkelMembersrt:AffiliatedEntityMemberhgty:ReinsuranceAgreementMember2023-01-012023-12-310001840776hgty:MarkelMembersrt:AffiliatedEntityMemberhgty:ReinsuranceAgreementMember2022-01-012022-12-310001840776hgty:MarkelMembersrt:AffiliatedEntityMemberhgty:ReinsuranceAgreementMember2021-01-012021-12-310001840776srt:AffiliatedEntityMemberhgty:ReinsuranceAgreementMemberhgty:EvanstonMember2023-12-310001840776srt:AffiliatedEntityMemberhgty:ReinsuranceAgreementMemberhgty:EvanstonMember2022-12-310001840776srt:ParentCompanyMember2023-12-310001840776srt:ParentCompanyMember2022-12-310001840776srt:ParentCompanyMemberus-gaap:CommonClassAMember2022-12-310001840776srt:ParentCompanyMemberus-gaap:CommonClassAMember2023-12-310001840776hgty:CommonClassVMembersrt:ParentCompanyMember2022-12-310001840776hgty:CommonClassVMembersrt:ParentCompanyMember2023-12-310001840776srt:ParentCompanyMember2021-12-310001840776srt:ParentCompanyMember2020-12-310001840776us-gaap:ValuationAllowanceOfDeferredTaxAssetsMember2022-12-310001840776us-gaap:ValuationAllowanceOfDeferredTaxAssetsMember2023-01-012023-12-310001840776us-gaap:ValuationAllowanceOfDeferredTaxAssetsMember2023-12-310001840776us-gaap:ValuationAllowanceOfDeferredTaxAssetsMember2021-12-310001840776us-gaap:ValuationAllowanceOfDeferredTaxAssetsMember2022-01-012022-12-310001840776us-gaap:ValuationAllowanceOfDeferredTaxAssetsMember2020-12-310001840776us-gaap:ValuationAllowanceOfDeferredTaxAssetsMember2021-01-012021-12-3100018407762023-10-012023-12-31
UNITED STATES
SECURITIES AND EXCHANGE COMMISSION
Washington, D.C. 20549
FORM 10-K
(Mark One)
| | | | | |
☒ | ANNUAL REPORT PURSUANT TO SECTION 13 OR 15(d) OF THE SECURITIES EXCHANGE ACT OF 1934 |
For the fiscal year ended December 31, 2023
OR
| | | | | |
☐ | TRANSITION REPORT PURSUANT TO SECTION 13 OR 15(d) OF THE SECURITIES EXCHANGE ACT OF 1934 |
For the transition period from ________ to _______
Commission file number: 001-40244
HAGERTY, INC.
(Exact name of registrant as specified in its charter)
| | | | | | | | |
Delaware | | 86-1213144 |
(State of incorporation) | | (I.R.S. Employer Identification No.) |
| | |
121 Drivers Edge, Traverse City, Michigan | | 49684 |
| (Address of principal executive offices) | | (Zip code) |
| | |
| (800) 922-4050 | |
| Registrant's telephone number, including area code | |
Securities registered pursuant to Section 12(b) of the Act:
| | | | | | | | | | | | | | |
| Title of each class | | Trading Symbols | | Name of each exchange on which registered |
| Class A common stock, par value $0.0001 per share | | HGTY | | The New York Stock Exchange |
Warrants, each whole warrant exercisable for one share
of Class A common stock, each at an exercise price of
$11.50 per share | | HGTY.WS | | The New York Stock Exchange |
| | | | |
Securities registered pursuant to section 12(g) of the Act: None
Indicate by check mark if the registrant is a well-known seasoned issuer, as defined in Rule 405 of the Securities Act. Yes ☐ No ☒
Indicate by check mark if the registrant is not required to file reports pursuant to Section 13 or Section 15(d) of the Act. Yes ☐ No ☒
Indicate by check mark whether the registrant: (1) has filed all reports required to be filed by Section 13 or 15(d) of the Securities Exchange Act of 1934 during the preceding 12 months (or for such shorter period that the registrant was required to file such reports); and (2) has been subject to such filing requirements for the past 90 days. Yes ☒ No ☐
Indicate by check mark whether the registrant has submitted electronically and posted on its corporate web site, if any, every Interactive Data File required to be submitted and posted pursuant to Rule 405 of Regulation S-T (§232.405 of this chapter) during the preceding 12 months (or for such shorter period that the registrant was required to submit and post such files). Yes ☒ No ☐
Indicate by check mark whether the registrant is a large accelerated filer, an accelerated filer, a non-accelerated filer, smaller reporting company, or an emerging growth company. See the definitions of "large accelerated filer," "accelerated filer," "smaller reporting company," and "emerging growth company" in Rule 12b-2 of the Exchange Act.
| | | | | | | | | | | |
| Large accelerated filer | ☐ | Accelerated filer | ☒ |
Non-accelerated filer | ☐ | Smaller reporting company | ☐ |
| | Emerging growth company | ☒ |
If an emerging growth company, indicate by check mark if the registrant has elected not to use the extended transition period for complying with any new or revised financial accounting standards provided pursuant to Section 13(a) of the Exchange Act.☐
Indicate by check mark whether the registrant has filed a report on and attestation to its management's assessment of the effectiveness of its internal control over financial reporting under Section 404(b) of the Sarbanes-Oxley Act (15 U.S.C. 7262(b)) by the registered public accounting firm that prepared or issued its audit report. ☐
If securities are registered pursuant to Section 12(b) of the Act, indicate by check mark whether the financial statements of the registrant included in the filing reflect the correction of an error to previously issued financial statements. ☐
Indicate by check mark whether any of those error corrections are restatements that required a recovery analysis of incentive-based compensation received by any of the registrant's executive officers during the relevant recovery period pursuant to §240.10D-1(b) ☐
Indicate by check mark whether the registrant is a shell company (as defined in Rule 12b-2 of the Act). Yes ☐ No ☒
The aggregate market value of voting stock held by non-affiliates of the Registrant on June 30, 2023, based on the closing price of $9.36 for shares of the Registrant’s Class A Common Stock as reported by the New York Stock Exchange, was approximately $231.8 million. Shares of common stock beneficially owned by each executive officer, director, and holders of more than 10% of our common stock have been excluded in that such persons may be deemed to be affiliates. This determination of affiliate status is not necessarily a conclusive determination for other purposes.
The registrant had 84,655,539 shares of Class A Common Stock outstanding and 251,033,906 shares of Class V Common Stock outstanding as of March 1, 2024.
Documents incorporated by reference:
Portions of the registrant's definitive Proxy Statement for its 2024 Annual Meeting of Stockholders, which will be filed with the Securities and Exchange Commission within 120 days of December 31, 2023, are incorporated by reference into Part III, Items 10-14 of this Annual Report on Form 10-K.
Table of Contents
Where You Can Find More Information
In this Annual Report on Form 10-K (this "Annual Report"), "we," "our," "us," "Hagerty," "HGTY," and the "Company" refer to Hagerty, Inc., formerly known as Aldel Financial Inc. ("Aldel"), and its consolidated subsidiaries including The Hagerty Group, LLC ("The Hagerty Group"), unless the context requires otherwise. We file annual, quarterly, and current reports, proxy statements and other information with the United States Securities and Exchange Commission (the "SEC"). General information about us can be found at investor.hagerty.com. Our Annual Report, Quarterly Reports on Form 10-Q and Current Reports on Form 8-K, as well as any amendments to those reports, are available free of charge through our website at investor.hagerty.com as soon as reasonably practicable after we file them with, or furnish them to, the SEC. The SEC also maintains a website at www.sec.gov that contains reports, proxy statements, and other information regarding SEC registrants, including Hagerty, Inc.
We use our investor relations website, investor.hagerty.com, as a means of disclosing information which may be of interest or material to our investors and for complying with disclosure obligations under Regulation FD. Accordingly, investors should monitor our investor relations website, in addition to following our press releases, SEC filings, public conference calls, webcasts, and social media channels. Information contained on or accessible through, including any reports available on, our website or social media channels is not a part of, and is not incorporated by reference into, this Annual Report or any other report or document we file with the SEC. Any reference to our website in this Form 10-K is intended to be an inactive textual reference only.
Cautionary Statement Regarding Forward-Looking Statements
This Annual Report, as well as information included in oral statements or other written statements made by us, contain statements that constitute "forward-looking statements" within the meaning of the Private Securities Litigation Reform Act of 1995. All statements contained in this Annual Report other than statements of historical fact, are forward-looking statements, including statements regarding our future operating results and financial position, our business strategy and plans, products, services, and technology offerings, market conditions, growth and trends, expansion plans and opportunities, and our objectives for future operations. Forward-looking statements can be identified by words such as "anticipate," "believe," "envision," "estimate," "expect," "intend," "may," "plan," "predict," "project," "target," "potential," "will," "would," "could," "should," "continue," "ongoing," "contemplate," and other similar expressions, although not all forward-looking statements contain these identifying words.
We have based these forward-looking statements largely on our current expectations and projections about future events and trends that we believe may affect our financial condition, results of operations, business strategy, short-term and long-term business operations and objectives, and financial needs. These forward-looking statements are subject to a number of risks, uncertainties, and assumptions, including those described in Part I, Item 1A. "Risk Factors" in this Annual Report. In light of these risks, uncertainties, and assumptions, the future events and trends discussed in this Annual Report may not occur and actual results could differ materially and adversely from those anticipated or implied in the forward-looking statements.
Factors that could cause actual results to differ materially from those expressed or implied in forward-looking statements include, among other things, our ability to:
•compete effectively within our industry and attract and retain our insurance policyholders and paid HDC subscribers (collectively, "Members");
•maintain key strategic relationships with our insurance distribution and underwriting carrier partners;
•prevent, monitor, and detect fraudulent activity;
•manage risks associated with disruptions, interruptions, outages or other issues with our technology platforms or our use of third-party services;
•accelerate the adoption of our membership products as well as any new insurance programs and products we offer;
•manage the cyclical nature of the insurance business, including through any periods of recession, economic downturn or inflation;
•address unexpected increases in the frequency or severity of claims;
•comply with the numerous laws and regulations applicable to our business, including state, federal and foreign laws relating to insurance and rate increases, privacy, the internet, and accounting matters;
•manage risks associated with being a controlled company; and
•successfully defend any litigation, government inquiries, and investigations.
You should not rely on forward-looking statements as predictions of future events. Although we believe that the expectations reflected in the forward-looking statements are reasonable, we cannot guarantee that the future results, performance, or events and circumstances reflected in the forward-looking statements will occur. Moreover, we operate in a very competitive and rapidly changing environment. New risks emerge from time to time. It is not possible for our management to predict all risks, nor can we assess the effect of all factors on our business or the extent to which any factor, or combination of factors, may cause actual results to differ materially from those contained in any forward-looking statements we may make. The forward-looking statements in this Annual Report represent our views as of the date of this Annual Report. We undertake no obligation to update any of these forward-looking statements for any reason after the date of this Annual Report or to conform these statements to actual results or revised expectations.
PART I
ITEM 1: BUSINESS
Company Overview
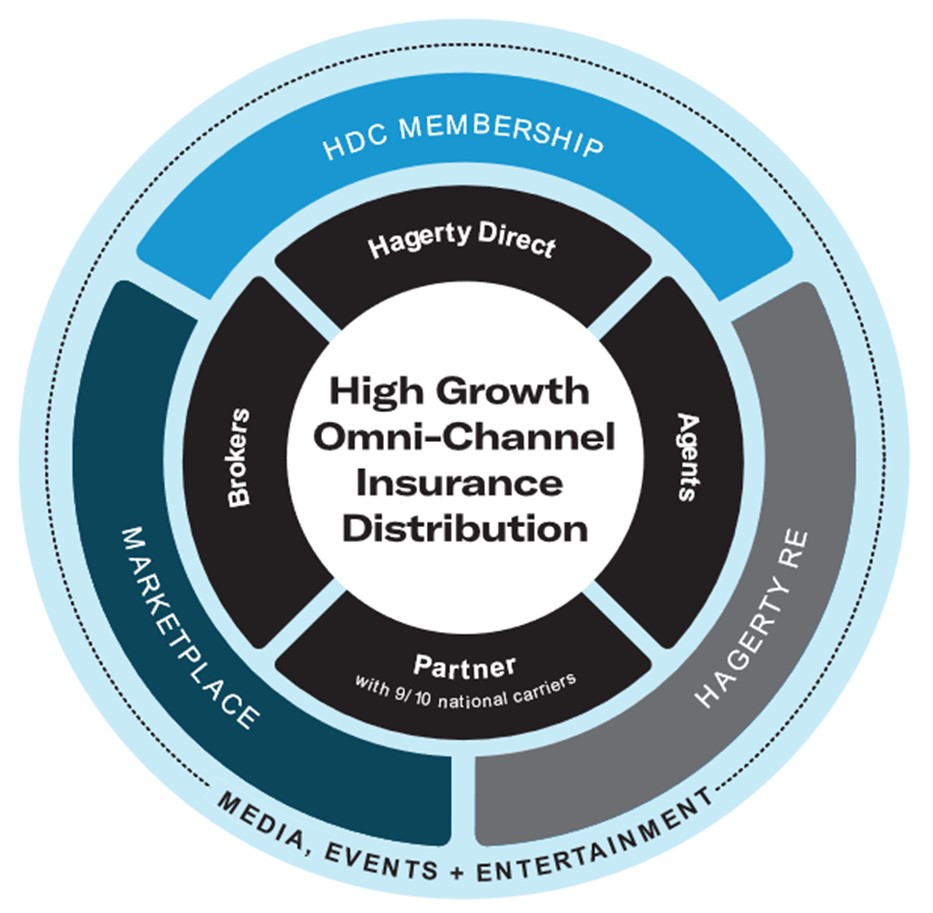
We are a market leader in providing insurance for classic cars and enthusiast vehicles. Through our insurance model, we act as a Managing General Agent ("MGA") by underwriting, selling and servicing classic car and enthusiast vehicle insurance policies. Then, due to our consistent track record of delivering strong underwriting results, we reinsure a large portion of the risks written by our MGA subsidiaries through our wholly owned subsidiary, Hagerty Reinsurance Limited ("Hagerty Re"). In addition, we offer Hagerty Drivers Club ("HDC") memberships, which can be bundled with our insurance policies and give subscribers access to an array of products and services, including Hagerty Drivers Club Magazine, automotive enthusiast events, our proprietary vehicle valuation tool, emergency roadside assistance, and special vehicle-related discounts. Lastly, to complement our insurance and membership offerings, we also offer Hagerty Marketplace ("Marketplace"), where car enthusiasts can buy, sell, and finance collector cars. Through these offerings, our goal is to be the world's most trusted and preferred brand for enthusiasts to protect, buy and sell, and enjoy the special cars that are their passion.
The backbone of our ecosystem is our fast-growing insurance business. People take excellent care of the things they love, and we take great pride in protecting and preserving their treasured vehicles. For almost 40 years, we have consistently grown our insurance business and currently insure approximately 2.4 million classic cars and enthusiast vehicles. We have built a strong reputation for providing excellent customer service through our passionate member service center, resulting in a Net Promoter Score ("NPS") of at least 82 in recent years, an insurance policy retention rate close to 90%, and a typical policy life of approximately nine years.
HDC and Marketplace, as well as our media and entertainment platforms, work synergistically with our insurance business to drive retention and loyalty and enable auto enthusiasts to protect, buy and sell, and enjoy their special cars, whether it be on the road, on the track, in the garage, at an event, or through our media content. We believe the combination of these complementary offerings creates an enthusiast-centered ecosystem of products and services, generating multiple points of monetization, resulting in an attractive recurring revenue business model with relatively low customer acquisition costs that benefit from increasing scale.
With a rich heritage spanning over 40 years, the first Hagerty company was founded in 1984. Hagerty, Inc., a Delaware corporation, was formed in 2020 and became a public company traded on the New York Stock Exchange ("NYSE") in 2021.
Industry and Market Opportunity
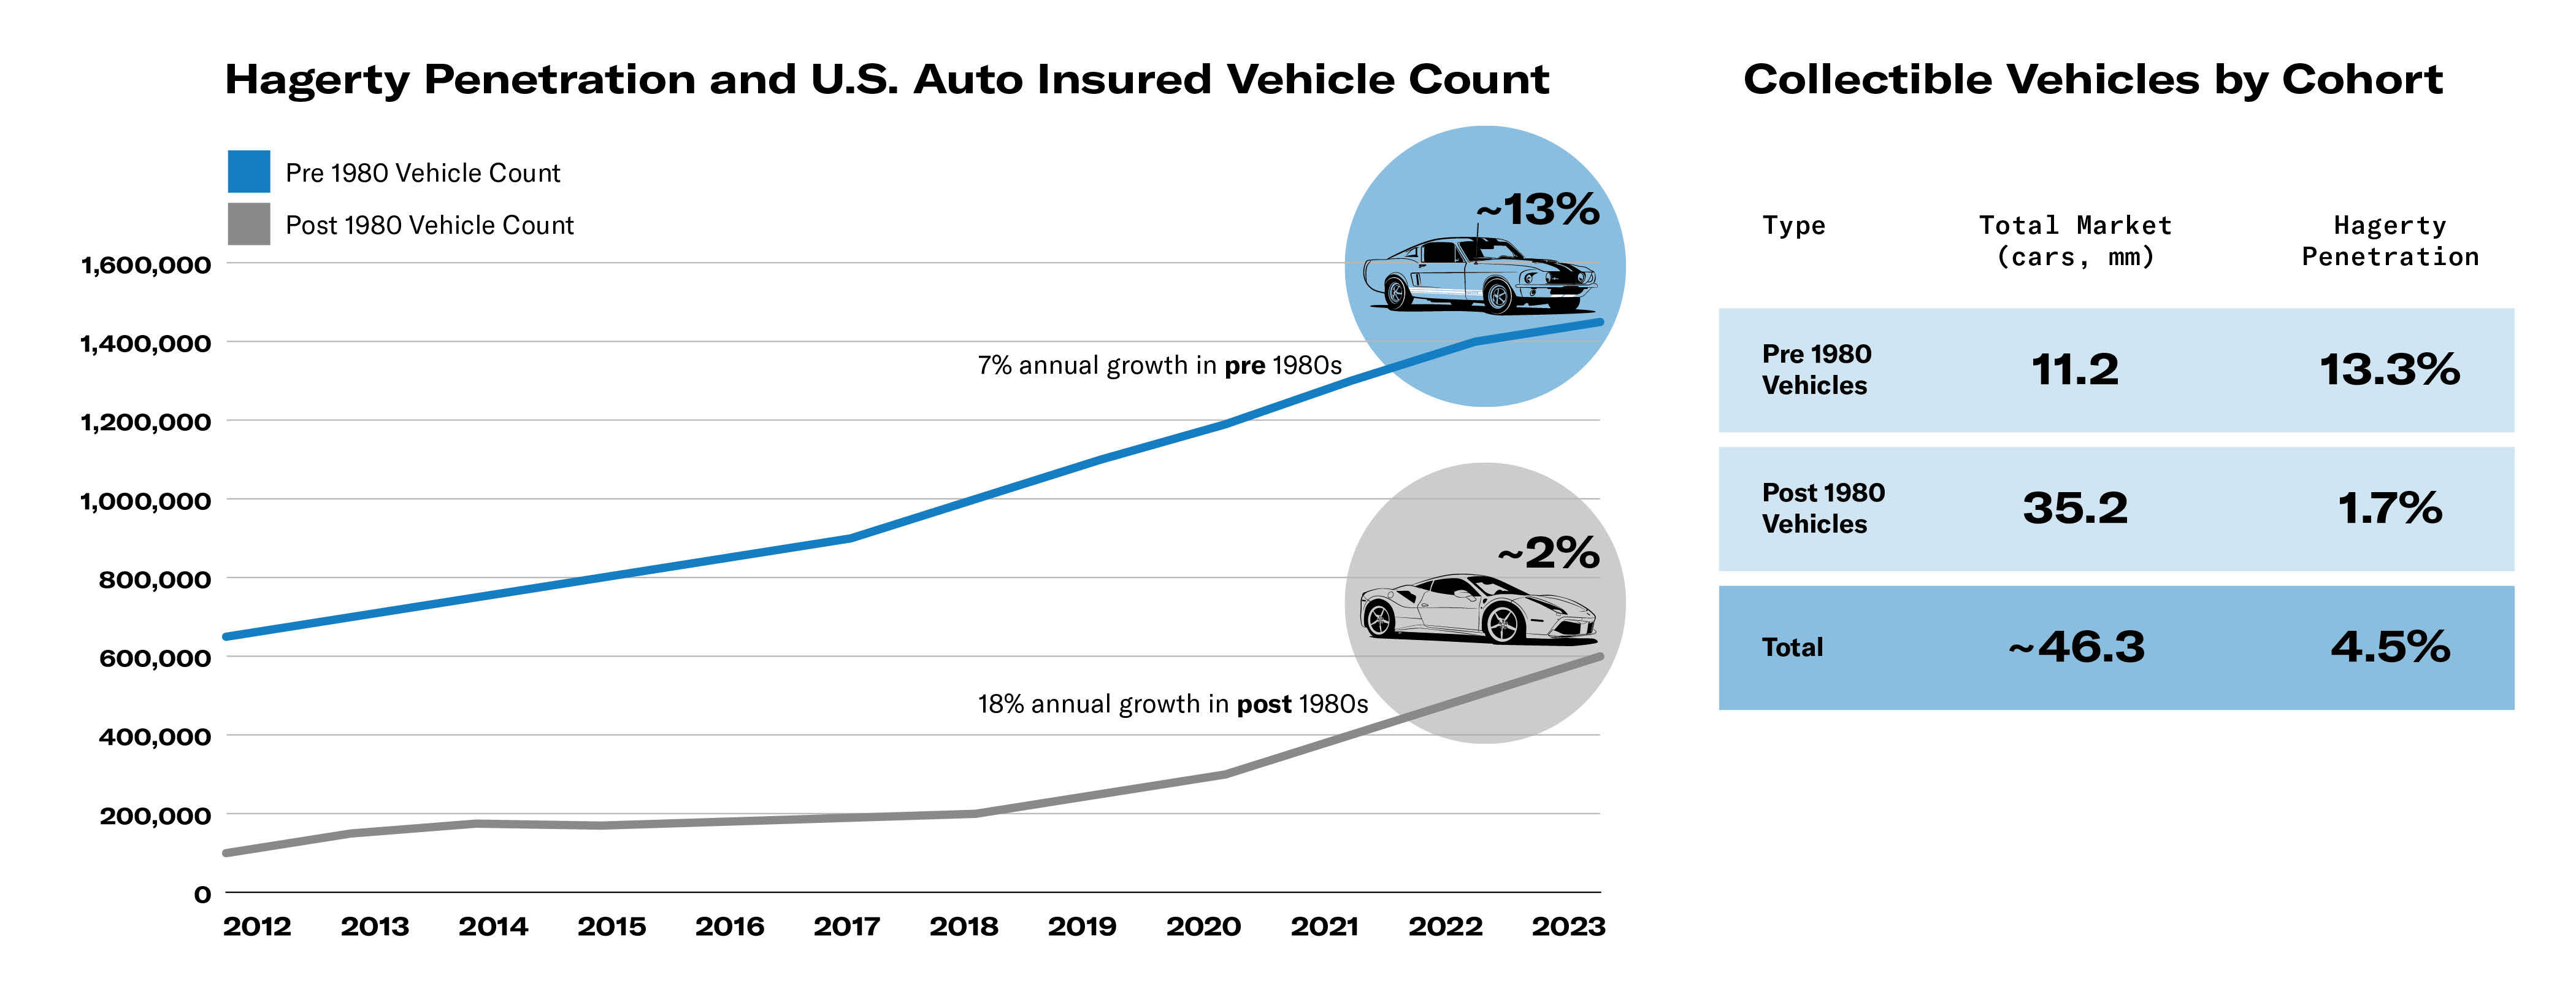
We love cars and we are not alone, as evidenced by the large and growing collector car market. We estimate that there are approximately 46 million insurable collector cars in the United States ("U.S."), of which approximately 11 million are pre-1981 and 35 million are post-1980 collectibles. On this basis, we estimate that the U.S. market translates into $18 billion of annual premium for insurable collector cars based on our average vehicle premium of approximately $381 per year. Over the last decade, we have increased our written premium by a compound annual growth rate ("CAGR") of 13%, powered primarily by strong growth in the number of our insurance policies in force. While we have become one of the leading providers of insurance for pre-1981 classics, with an estimated market share of 13.3% in that cohort, we estimate our market share for post-1980 collectibles is only 1.7%, resulting in an overall collector car market share of under 5%. We believe that our strong brand and value proposition focused on our "Guaranteed Value" insurance policies position us well to capture a larger share of this growing market over the coming decade.
In order to fully capitalize on this opportunity, we perform a data-driven Member and vehicle analysis to understand vehicle ownership data, demographic data, vehicle usage, and values. Based upon this analysis, we are able to identify key vehicle markets, explore additional opportunities within these markets, overlay demographic and usage data to enrich our approach and leverage the information to better serve the auto enthusiast community.
Business Model and Competitive Strengths
The Hagerty brand has been carefully curated over the last four decades by providing Members with excellent customer service through our passionate team of automotive experts. We have become known as an auto enthusiast brand for car people, by car people. We believe that consumers who feel a part of an enthusiast community or club are more engaged and have higher renewal rates than those who simply purchase a good or service. With an insurance policy retention rate of nearly 90% and an average policy life of nine years, we have demonstrated a strong recurring revenue model that benefits from a combination of high insurance policy retention, new Member growth, and increases in premium rates driven, in part, by increasing valuation.
The enthusiast community created by our insurance, membership and Marketplace offerings is enhanced by our media and entertainment platforms, as well as our renowned car events, which generate positive ongoing engagement with current Members, as well as interest from prospective members, in our brand, products and services. Our media content features the work of talented automotive content creators, journalists, and storytellers who bring the automotive world to life in exciting and unexpected ways across a variety of digital, print, and video media formats. Our media team covers entertainment, news, market information, and vehicle valuation trends, all of which helps generate an engaged audience that drives retention and brings new Members into our ecosystem.
Our enthusiast-centered ecosystem is built for car lovers, enabling them to protect, buy and sell, and enjoy the special cars that are their passion, thereby increasing our share of their discretionary spending. We believe that this enthusiast-centered business model, with a focus on community and engagement, is a significant advantage over competitors who, without strong affinity or engagement, are left to compete mainly on price.
Insurance
We provide insurance for approximately 2.4 million classic cars and enthusiast vehicles. Our insurance business model positions us to control the pricing and underwriting of the insurance policies, benefit from steady commission income and engage directly with consumers. We operate an omnichannel distribution model, including our direct sales channel serviced by our employee agents, our vast network of independent agents and brokers, and our insurance distribution partners. We believe this system of cooperation and partnership creates a win-win situation that allows us to capture more of the collector car and enthusiast vehicle insurance market.
Our insurance business generates two types of revenue: (1) commissions and fees earned by our MGA subsidiaries from the underwriting, sale and servicing of classic car and enthusiast vehicle insurance policies, and (2) insurance premiums earned for the risk assumed by Hagerty Re.
We utilize our data science capabilities to benefit both our MGA activities, as well as our risk-taking activities through Hagerty Re. Some examples of how we utilize data science include:
•Underwriting and Risk Assessment: Decades of data allow us to accurately assess the risk associated with insuring collector cars through actuarial analysis, which leads to more efficient underwriting and appropriate pricing.
•Market Analysis: Machine learning algorithms are designed to analyze data on collector car sales and values to identify trends and initiate automated marketing, sales and servicing workflows.
•Customer Service: AI-powered tools provide instant and accurate responses to Member inquiries, freeing up our member service agents to handle more complex issues and improve the Member experience.
•Claims Processing: Streamlining the claims process by automating routine tasks and flagging potential fraud.
We are investing substantial resources in research and development to enhance our platform, develop new products and features, and improve the speed, scalability, and security of our platform infrastructure. Our research and development organization consists of world-class engineering, product, data, and design teams. These teams work collaboratively to bring our products to life, from conception and validation to implementation.
Managing General Agent
We earn commission revenue from the underwriting, sale, and servicing of classic car and enthusiast vehicle insurance policies on behalf of our insurance carrier partners. Our insurance products are unique due to our omnichannel distribution approach, meaning we sell our insurance wherever our policyholders need us. This omnichannel approach allows us to offer our insurance products across three channels: (1) directly to consumers; (2) through independent agents and brokers; and (3) through strategic distribution partnerships with large traditional auto insurers. Historically, our MGA subsidiaries have earned a base commission of approximately 32% of written premium, as well as an additional contingent
underwriting commission ("CUC") of up to 10%. In December 2023, our alliance agreement and associated agency agreement with Markel Group, Inc. ("Markel"), which generated approximately 95% of our total commission revenue in 2023, was amended to increase the base commission rate on our personal lines U.S. auto business to 37% and to adjust the profit share commission factors to scale annually from -5% to a maximum of +5% of written premium, with 80% of the expected CUC being paid monthly, beginning in 2024. Refer to the section titled "Markel Alliance" below. Markel is a related party to the Company. Refer to Note 23 — Related-Party Transactions in Item 8 of Part II of this Annual Report for additional information.
Our insurance offerings are centered around our "Guaranteed Value" insurance policy which differentiates our coverage from the standard auto insurance market by insuring covered vehicles at their agreed upon value, rather than the depreciated value typically provided by standard auto coverage. We work closely with our Members to determine the right amount of coverage for their vehicle, utilizing Hagerty Valuation Tools ("HVT"), which has been built over decades of collecting vehicle sales information. If a vehicle experiences a covered total loss, we pay the full amount of the vehicle's insured value without any depreciation.
In addition, our MGA subsidiaries also handle the claims for our insurance products to ensure our Members receive a high level of service focused on the unique requirements of repairing vintage and rare vehicles.
For the years ended December 31, 2023, 2022, and 2021, MGA commission and fee revenue represented 37%, 39%, and 44%, respectively, of our total revenue.
Direct Sales Channel
Our direct sales channel is serviced by our employee agents working across all 50 states and three countries to drive new business flow. Approximately 45% of our total U.S. auto written premium is generated through direct sales. As discussed above under "Business Model and Competitive Strengths", we have created an auto enthusiast ecosystem that connects with Members across multiple points of engagement whereas typical insurance companies engage with their customers only at the point of purchase and upon renewal.
Independent Agent and Broker Channel
Approximately 33% of our total U.S. auto written premium is generated by our relationships with over 49,000 independent agents and brokers, including the independent agents in our partnership channel, as discussed below. These independent agents and brokers represent all top 10 brokers in the U.S. by revenue. We are often told by agents and brokers that partnering with us brings value and joy to their enthusiast clients that is unmatched in the industry. Our high-engagement and experiential approach to the market is often co-branded by independent agents and brokers to deliver auto enthusiasts an experience the agent or broker could not deliver themselves. As a result, both brands benefit symbiotically through longer-lasting and more intimate customer relationships.
Partnership Channel
We also market our insurance products through our insurance distribution partners, who account for approximately 22% of our U.S. auto total written premium. This channel consists of partnerships with 9 of the top 10 largest auto insurers, as ranked by the National Association of Insurance Commissioners based upon 2022 direct premiums written, including State Farm Mutual Automobile Insurance Company ("State Farm"). Under these arrangements, we generally make our specialty insurance products and related services available to the carrier's agents, who then refer or present Hagerty to their customers. Our track record of expertise and growth creates opportunities for cultivating strong, mutually beneficial partnerships that allow us to continue to meaningfully grow our share of the collector car market in the U.S.
Most insurance companies offer and compete for multi-line insurance: auto, homeowners, umbrella, watercraft, aircraft, and other exclusive collectibles. Our focus on collector car products and services reduces competitive threats for partners and raises their confidence in transacting with us. Furthermore, we focus our investments on developing capabilities that serve the interests of the car enthusiast market. This depth and discipline of focus has enabled us to maintain a "neutral" and non-threatening partner of choice position with the highest quality automobile insurance companies in the market as we help them reduce the risk of losing a customer and the total value of the bundled insurance and membership offerings.
Our approach to partnerships enables complementary growth. Our business model is attractive to our partners because we offer a full-service solution for their customers and their special cars. We handle product development and pricing, sales and service, underwriting, and claims services on behalf of our carrier partners, and we offer Member benefits tailored to the enthusiast all through our proprietary technology and by our sales and service teams. For partners, our focus on the collector car space allows them to focus on other parts of their business portfolios. We then align financial interests so both parties benefit from the relationship, which creates strong and more durable institutional bonds. When our partners win and grow, we do as well. We take great care to build partnerships with companies who share our intense focus on customer service.
Strategic Agreements
State Farm Alliance
Hagerty has a 10-year master alliance agreement with State Farm under which State Farm's customers, through State Farm agents, are able to access Hagerty's features and services. This program began issuing policies in four initial states in September 2023. Under this agreement, State Farm paid Hagerty an advanced commission of $20.0 million in 2020, which is being recognized as "Commission and fee revenue" over the remaining life of the arrangement.
In conjunction with the master alliance agreement, the Company also entered into a managing general underwriter agreement whereby the State Farm Classic+ policy is offered through State Farm Classic Insurance Company, a wholly owned subsidiary of State Farm. The State Farm Classic+ policy is available to new and existing State Farm customers through their agents on a state-by-state basis. Hagerty is paid a commission under the managing general underwriter agreement and ancillary agreements for servicing the State Farm Classic+ policies. Additionally, we have the opportunity to offer HDC membership to State Farm Classic+ customers which provides Hagerty an additional revenue opportunity.
State Farm is a related party to the Company. Refer to Note 23 — Related-Party Transactions in Item 8 of Part II of this Annual Report for additional information.
Markel Alliance
Markel is the ultimate parent company of Essentia Insurance Company ("Essentia"), which serves as the dedicated carrier for the specialty classic and collector vehicle insurance policies sold by our U.S. MGA subsidiaries. Essentia is exclusive to our U.S. MGA subsidiaries and only writes insurance policies we produce. Under this arrangement, we are licensed and appointed as Essentia’s MGA and are authorized to develop insurance products, underwrite, bill, and perform claims services for policies written through Essentia. State laws govern many of the activities under this relationship and our MGA subsidiaries must maintain the appropriate licensing as a producer and, where required, as an MGA, plus additional requirements in some states for claims adjusting.
Essentia cedes premiums and risk through quota share reinsurance agreements to three of our key insurance distribution partners with the remaining retained premium being ceded to its affiliate, Evanston Insurance Company ("Evanston"). Evanston, in turn, cedes a portion of the business it reinsures from Essentia to Hagerty Re. For Evanston to take credit for reinsurance under applicable state law, Hagerty Re maintains funds in trust for the benefit of Evanston.
On December 18, 2023, the Markel Alliance Agreement was amended to, among other things, (i) include a new definition of "Enthusiast Business", and remove Enthusiast Business from both definitions of "Restricted Business" and "Alliance Business"; (ii) delay the Company's acquisition rights to Essentia until 2026 at the earliest and 2030 at the latest and; (iii) grant the Company a new waiver to pursue a strategic opportunity with a third party insurance company. In connection with the amendments to the Markel Alliance Agreement, the Company and Markel also amended the agency agreement referenced in the Markel Alliance Agreement to increase the base commission rate on our personal lines U.S. auto business to 37% and to adjust the profit share commission factors to scale annually from -5% to a maximum of +5% of written premium, with 80% of the expected CUC being paid monthly, beginning in 2024. The Markel and Hagerty agreements governing the relationship expire at the end of 2030 and include extension periods.
Markel is a related party to the Company. Refer to Note 23 — Related-Party Transactions in Item 8 of Part II of this Annual Report for additional information.
Aviva Canada Alliance
Aviva Canada Inc. ("Aviva") is the parent company of Elite Insurance Company which serves as the carrier for our Canadian MGA subsidiary ("Hagerty Canada") collector vehicle insurance program. The relationship with Aviva in Canada is exclusive with respect to specialty, enthusiast, classic, and collector vehicle insurance, with the exception of the Quebec province, where a third-party insurance agency carries the appropriate licenses and authority to submit business to Elite Insurance Company. Elite Insurance Company and Hagerty Re have a reinsurance quota share agreement. The terms of the Aviva agreements expire in 2030 and include a 5-year extension. Canadian provincial laws govern many of the activities under this relationship and, in addition to appropriate carrier licensing requirements, Hagerty Canada must maintain the appropriate licensing.
Hagerty Re
Because we have confidence in the risks underwritten by our MGA subsidiaries, we reinsure a large portion of that risk and share in the underwriting profit through Hagerty Re, which is registered as a Class 3A reinsurer under the Bermuda Insurance Act of 1978. For the years ended December 31, 2023, 2022, and 2021, Hagerty Re's U.S. quota share, or assumed risk, was approximately 80%, 70%, and 60%, respectively. We anticipate that Hagerty Re's U.S. quota share will remain at 80% going forward.
Hagerty Re allows us to efficiently deploy capital and create steady, consistent underwriting results due to our deliberate approach to managing risk and employing actuarial discipline to the underwriting process, which has resulted in an attractive average loss ratio of 43% over the last three years. This compares favorably to the overall auto insurance industry average of approximately 69%, excluding loss adjustment expenses.
For the years ended December 31, 2023, 2022, and 2021, Hagerty Re earned premium represented 53%, 51%, and 48%, respectively, of our total revenue.
Membership
We offer HDC memberships to our insurance policyholders as a way to strengthen the bonds of those relationships. As of December 31, 2023, approximately three-quarters of new insurance policyholders also purchase a subscription to HDC. In addition, we offer HDC memberships as a stand-alone product to continue to build the broader enthusiast community. Our focus on HDC membership offerings is intended to build a community of car lovers that are loyal to the Hagerty brand due to the multiple valuable points of engagement we provide.
Typical insurance businesses engage with their customers only a few times a year. Through our diverse Membership offerings, we deploy an ecosystem of engagement, including both physical (through events and social functions) and digital platforms (through media content, social media engagement, market news and valuation data) that can result in numerous touchpoints with Members each year. We believe our leading NPS and strong retention rates reflect the effectiveness of our enthusiast ecosystem.
Marketplace
The market for buying and selling collector cars is substantial, encompassing live and time-based online auctions, as well as private sales. We estimate that there are approximately 46 million insurable collector cars in the U.S., valued at approximately $1.0 trillion. In 2023, we observed approximately 300,000 buy/sell collector car transactions representing approximately $14.2 billion in total value trading hands in our U.S. insurance book, or approximately 1.4% of the estimated U.S. market value. We believe we can differentiate ourselves from other platforms and services by injecting a higher level of trust into this marketplace by using our existing size, scale, improved processes, and trusted brand status.
Marketplace leverages the power of our ecosystem by providing a platform where enthusiasts can buy, sell, and finance collector cars. At the high-end of the collector car market, where values typically exceed $100,000, our wholly owned subsidiary, Broad Arrow Group, Inc. ("Broad Arrow"), helps collectors and enthusiasts buy and sell at live auctions and also facilitates private sales. At lower price points, typically below $100,000, Hagerty Marketplace offers time-based online auctions, as well as classified listings through Hagerty Classifieds, which enables collectors and enthusiasts to buy and sell collector cars through our digital platform. Lastly, through Broad Arrow Capital LLC ("BAC"), we provide financing solutions to qualified collectors and businesses in the U.S., Canada, the U.K., and certain European countries by structuring loans secured by their collector cars. Loans underwritten by BAC are typically $250,000 or higher, with a focus on classic and collector cars that are typically not financed by traditional banks and lenders.
Marketplace utilizes HVT, our valuation tool used by over three million people each year to access current and historic pricing data on more than 48,000 collector vehicle models based on our robust proprietary database.
Business Attributes
Intellectual Property
We believe our intellectual property rights are valuable and important to our business. We rely on trademarks, patents, copyrights, trade secrets, license agreements, intellectual property assignment agreements, confidentiality procedures, non-disclosure agreements, and electronic and physical security measures to establish and protect our proprietary rights. Though we rely in part upon these legal, contractual, and other protections, we believe that factors such as the skill and ingenuity of our employees and the functionality and frequent enhancements to our platform are large contributors to our success. We intend to pursue additional intellectual property protection on such enhancements to the extent we believe it would be beneficial and cost-effective.
As of December 31, 2023, we have two issued patents in the U.S. and one in Canada. The issued patents generally relate to (i) our vehicle information number decoder, which allows us to determine vehicle configuration details and associated vehicle values and (ii) our method and system for storage and selective sharing of vehicle data. The issued patents are expected to expire in August 2030, May 2031, and May 2033, respectively. We continually review our development efforts to assess the existence and the ability to protect new intellectual property.
We have trademark rights in our name, our logo, and other brand indicia, and have trademark registrations for select markets in the U.S., Canada, U.K., European Union ("E.U."), and Australia. We have copyrights for our media and entertainment content and registered copyrights for our vehicle information tools in the U.S. We also have registered various domain names related to our brand for websites that we use in our business, including Hagerty.com.
Although we believe our intellectual property rights are valuable and strong, intellectual property rights are sometimes subject to invalidation or circumvention. Refer to the section titled "Risk Factors — Risks Related to Our Business — Our intellectual property rights are extremely valuable and if they are not properly protected, our products, services, and brand could be adversely impacted." within Part I, Item IA — Risk Factors, in this Annual Report for additional information.
Seasonality
Due to our significant North American footprint, our revenue streams, and in particular, commission and fee revenue, exhibit seasonality, with a larger percentage of revenue derived in the second and third quarters, while the first and fourth quarters generate lower revenue and profitability. This seasonality is due to the fact that more vehicles are driven and purchased during the second and third quarters, and our twelve-month insurance policies renew during those same quarters. We expect to experience seasonal fluctuations in our quarterly operating results, which may not fully reflect the underlying performance of our business.
Competition
We believe that our business model of integrated products and services is unique. While there are a number of other specialty insurance companies that offer collector car insurance, we believe our enthusiast-centered ecosystem, with a focus on community and engagement, is a significant competitive advantage over competitors who, without strong affinity or engagement, are left to compete primarily based on price. We experience some competition in the larger standard auto insurance market as the majority of collectible vehicles are currently insured through national carriers. However, in lieu of competing directly with standard auto insurance carriers, we have formed relationships with many of them to offer their customers our membership subscription model coupled with our specialty insurance products. These relationships with the largest auto insurance carriers allows us to provide a high-touchpoint experience resulting in more appropriate levels of cost coverage and higher overall service satisfaction of Members.
Government Regulation
We operate across jurisdictions in North America and Europe and our businesses (in particular, insurance) are subject to comprehensive and detailed regulation and supervision. Each jurisdiction in which we operate has established supervisory agencies with broad administrative powers for various business practices (for example, financial services consumer protection and data protection). While we are not aware of any proposed or recently enacted domestic or international regulation that would have a material impact on our operations, earnings, or competitive position, we cannot predict the effect that future regulatory changes might have on us.
Investments
As of December 31, 2023, the substantial majority of our portfolio of investable assets was held by Hagerty Re, which holds only cash and cash equivalents and Canadian Sovereign and Provincial fixed income securities. As we continue to grow and strengthen our track record, Hagerty Re intends to prudently diversify its portfolio, while maintaining a low tolerance for risk. Hagerty Re manages its investment portfolio in accordance with an investment policy approved by its Board of Directors, which seeks to generate an attractive total return on an after-tax basis on its investment assets, over the long-term, subject to compliance with all of the following constraints and objectives: (i) comply with certain portfolio-level and asset-level class constraints; (ii) preserve capital by assuming only a modest amount of risk of principal loss; (iii) ensure sufficient liquidity to meet obligations; (iv) comply with all legal, regulatory, and contractual requirements; and (v) employ an efficient portfolio in terms of assumed risk and relative to expected return.
Human Capital
Our performance-based culture is shaped by our people, and their engagement, accountability and alignment with our key objectives as an organization. Our strategy involves hiring great people, providing challenging and meaningful work, and investing in their professional and personal development, and we believe this creates a strategic advantage for us. In 2022, we transitioned to a "remote-first" work model, which we believe enables us to attract top talent and provide employees the flexibility they increasingly seek. Our objectives include effectively identifying, recruiting, retaining, incentivizing, and integrating our existing and additional employees. As of December 31, 2023, we had 1,732 total employees, 1,726 of which were full-time employees. None of our employees are represented by a labor union or covered by collective bargaining agreements.
Compensation
Our compensation programs are designed to attract, retain and motivate talented, deeply qualified and committed individuals who believe in our mission, while rewarding employees for long-term value creation. We have a pay-for-performance culture in which employee compensation is aligned to company performance, as well as individual contributions and impacts. The potential for stock-based compensation awards through our equity incentive plan, as well as the opportunity to participate in the Employee Stock Purchase Plan are designed to align employee compensation to the long-term interests of our stockholders, while encouraging them to think and act like owners. We strive for a fair, competitive, transparent and equitable approach in recognizing and rewarding our employees.
Health and Wellness
The health and wellness of our employees and their families is integral to our success. We have a comprehensive benefits program to support the physical, mental and financial well-being of our employees. We have a self-insured medical plan in which our employees pay up to 29% of the monthly estimated premiums. In addition to core medical benefits, we offer maternity and paternity benefits, as well as employee assistance programs to support the mental health of our employees. Additionally, aside from our competitive paid time off program, we offer caregiver time off, which provides employees 40 hours each year of paid time off for caregiver responsibilities.
Diversity, Equity, and Inclusion
Our diversity, equity, and inclusion objective is to be a company where each employee genuinely belongs, is respected and valued, and can do their best work. We take this to heart not just within our Company, but also within the broader automotive enthusiast community.
To help achieve our goals, we ensure fair and transparent processes in talent assessment and hiring, performance management and career progression and retention. We are creating a stronger sense of inclusion and belonging for our employees in general with a lens on representation. Engagement and belonging are fueled by having a meaningful connection to others and opportunities to grow and develop careers. Across these dimensions, we are building programs, systems and tools that foster greater belonging.
We intend to continue to invest and further develop our leadership training and support to ensure that all leaders — those promoted, developing or hired — understand how to lead, keeping our diversity and inclusion principles top of mind in every aspect of their role.
Business Combination
On December 2, 2021, The Hagerty Group, LLC completed a business combination with Aldel Financial Inc. ("Aldel"), and Aldel Merger Sub LLC ("Merger Sub"), a Delaware limited liability company and wholly owned subsidiary of Aldel (the "Business Combination"). In connection with the closing, (i) Aldel changed its name from Aldel Financial Inc. to Hagerty, Inc., and (ii) we were organized in what is commonly known as an "Up-C" structure in which substantially all of the assets and liabilities of Hagerty, Inc. are held by The Hagerty Group.
Refer to Note 8 — Business Combination in Item 8 of Part II of this Annual Report for additional information on the Business Combination.
ITEM 1A. RISK FACTORS
Described below are certain risks and uncertainties that we believe are applicable to our business and the industry in which we operate, and some of which are beyond our control. The following factors are not the only risks and uncertainties we face. Additional risks and uncertainties that we are unaware of, or that we currently believe are not material, may also become important factors that affect us. You should carefully read the following risks as well as the cautionary statements referred to in "Cautionary Statement Regarding Forward-Looking Statements" herein. If any of the risks and uncertainties described below or elsewhere in this Annual Report actually occur, our business, financial condition or results of operations could be materially adversely affected, the trading price of our securities could decline, and you might lose all or part of your investment.
Risk Factors Summary
Our business is subject to numerous risks and uncertainties of which you should be aware. Among others, these risks relate to:
•our ability to attract and retain Members and compete effectively within our industry;
•our dependence on a limited number of insurance distribution and underwriting carrier partners;
•our ability to prevent, monitor and detect fraudulent activity;
•our reliance on a limited number of payment processing services;
•our reliance on a highly skilled and diverse management team and workforce and a unique culture;
•our ability to successfully execute and integrate future acquisitions, partnerships and investments;
•issues with our technology platforms and our ability to anticipate or prevent cyberattacks;
•the limited operating history of some or our membership products and the success of any new insurance programs and products we offer;
•our susceptibility to inflation, interest rate, and foreign currency exchange rate fluctuations;
•our ability to continue to develop, implement, and maintain the confidentiality of our proprietary technology and prevent the misappropriation of our data;
•the cyclical nature of the insurance business and our dependence on our ability to collect vehicle usage and driving data;
•compliance with the numerous laws and regulations applicable to our business, including state, federal and foreign laws relating to insurance and rate increases, privacy, the internet, accounting matters, tax, and economic sanctions;
•unexpected increases in the frequency or severity of claims, including increases caused by catastrophic events;
•our reinsurers may not pay claims on a timely basis, or at all, which may materially adversely affect our business, financial condition, and results of operations;
•unexpected changes in the interpretation of our coverage or provisions, including loss limitations and exclusions;
•significant fluctuations in the collector car market and asset values may materially impact our ability to obtain and sell consigned property within our Marketplace business;
•our only material asset is our interest in The Hagerty Group, and, accordingly, we will depend on distributions from The Hagerty Group to pay our taxes, including payments under the Tax Receivable Agreement ("TRA");
•whether investors or securities analysts view our stock structure unfavorably, particularly our dual-class structure;
•Hagerty Holding Corp. ("HHC") controls us, and its interests may conflict with ours or yours in the future;
•we are a "controlled company" within the meaning of the NYSE listing requirements, as a result, we will qualify for, and intend to rely on, exemptions from certain corporate governance requirements; and
•our common stock, including trading price declines from missed earnings guidance, trading volatility, lack of dividends, and anti-takeover provisions in our governing documents.
Risks Related to Our Business
We have experienced significant Member growth over the past several years, and our continued business and revenue growth are dependent on our ability to continuously attract and retain Members and we cannot be sure we will be successful in these efforts, or that Member retention levels will not materially decline.
If consumers do not perceive our service offerings to be of value, including if we introduce new or adjust existing features, adjust pricing, coverage or service offerings, or change the mix of offerings in a manner that is not favorably received by consumers, we may not be able to attract and retain Members. We may, from time to time, adjust the pricing or the pricing model itself, which may not be well received by consumers, and which may result in existing Members canceling their membership or obtaining services from a competitor and may result in fewer new Members joining our programs. In addition, many of our Members are referred to us through word-of-mouth from existing Members. If our efforts to satisfy our existing Members are not successful, we may not be able to attract new Members, and as a result, our ability to maintain and/or grow our business will be adversely affected.
A large percentage of our revenues are derived from sales through direct-to-consumer sales, including through digital channels. If we fail to meet consumer expectations for the Member experience through digital or other sales channels, our growth may be impacted through the loss of existing Members or inability to attract new Members.
A large percentage of our products and services are distributed through a few relationships and the loss of business provided by any one of them could have an adverse effect on us.
In addition to our direct sales efforts and independent channels, we market our insurance products through several insurance distribution partners. For the year ended December 31, 2023, approximately 16% of our commission revenues were attributable to four distribution partner marketing relationships. For two of these distribution partners, we have long-term arrangements, one of which has an expiration date in 2029 and the other in 2030. The other relationships have shorter durations. Upon expiration or termination of these agreements, these partners may decide not to continue to distribute our products and services or may be unwilling to do so on terms acceptable to us. If we are not successful in maintaining existing relationships and in continuing to expand our distribution relationships, or if we encounter regulatory, technological, or other impediments to delivering our services to Members through these relationships, our ability to retain Members and grow our business could be adversely impacted. In addition, the broker/agent relationships with many of the partners we work with may change and their own internal strategy about how products are marketed may change, and, where we do not have exclusivity, we face competition by providers who seek to build or strengthen the relationships without distribution partners, which could cause a loss of focus on or exposure to our products and services, adversely impacting new sales.
We may not be able to prevent, monitor, or detect fraudulent activity, including transactions with insurance policies or payments of claims as well as transactions through our Marketplace business.
If we fail to maintain adequate systems and processes to prevent, monitor, and detect fraud, including employee fraud, agent fraud, fraudulent policy acquisitions, vendor fraud, buyer or seller marketplace sales fraud, fraudulent claims activity, or if an inadvertent error occurs because of human or system error, our business could be materially adversely impacted. Fraud schemes have become increasingly more sophisticated and are ever evolving into different avenues of fraudulent activity. While we believe that any past incidents of fraudulent activity have been relatively isolated, we cannot be certain that our systems and processes will always be adequate as fraudulent activity and schemes continue to evolve. Our employees are required to take anti-fraud training, and we use a variety of tools to protect against fraud, but the trainings and these tools may not always be successful at preventing fraud.
Instances of fraud may result in increased costs, including possible settlement and litigation expenses, and could have a material adverse effect on our business and reputation. In addition, failure to monitor and detect fraud and otherwise comply with state Special Investigation Unit requirements can result in regulatory fines or penalties.
We rely on the expertise of our Chief Executive Officer, senior management team, and other key employees. If we are unable to attract, retain, or motivate key personnel, our business may be severely impacted.
Our success depends on the ability to attract, retain, and motivate a highly skilled and diverse management team and workforce. Our Chief Executive Officer is well known and respected in our industry. He is an integral part of our brand and his departure would likely create difficulty with respect to both the perception and execution of our business. Additionally, the loss of a member of our senior management team, specialized insurance experts or key personnel might significantly delay or prevent the achievement of our strategic business objectives and could harm our business. We rely on a small number of highly specialized insurance experts, the loss of any one of whom could have a disproportionate impact on our business. Our compensation arrangements, such as our equity award programs, may not always be successful in attracting new employees and retaining and motivating our existing employees. Moreover, if and when our equity awards are substantially vested, employees under such equity arrangements may be more likely to leave, particularly if the underlying shares have seen a significant appreciation in value.
Our inability to ensure that we have the depth and breadth of management and personnel with the necessary skills and experience could impede our ability to deliver growth objectives and execute our operational strategy. As we continue to expand and grow, we will need to promote or hire additional staff, and it may be difficult to attract or retain such individuals in a timely manner and without incurring significant additional costs. If we are not able to integrate new team members or if they do not perform adequately, our business may be harmed.
Our unique culture has contributed to our success, and if we are not able to maintain this culture in the future, our business could be harmed.
Our culture supports a high level of employee engagement, which translates into a service model that produces a high level of Member satisfaction and retention. We face a number of challenges that may affect our ability to sustain our culture, including:
•failure to identify, attract, reward, and retain people in leadership positions in our organization who share and further our culture, values, and mission;
•the size and geographic diversity of our workforce and our ability to promote a uniform and consistent culture across all our offices and employees working remotely;
•competitive pressures to move in directions that may divert us from our mission, vision, and values;
•the continued challenges of a rapidly evolving industry; and
•the increasing need to develop expertise in new areas of business needed to execute our growth plans and strategy.
If we are not successful in instilling our culture in new employees, or maintaining our culture as we grow, our operations may be disrupted, and our financial performance may suffer.
Our future growth and profitability may be affected by new entrants into the market or current competitors developing preferred offerings.
Our business is rapidly growing and evolving, and we have many competitors across our different offerings. The markets in which we operate are highly competitive and we may not continue to compete effectively within our industry. We face competition from large, well-capitalized national and international companies, including other insurance providers, technology companies, automotive media companies, automotive auction and marketplace providers, other well-financed companies seeking new opportunities, or new competitors with technological or other innovations. Many of our competitors have substantial resources, experienced management, strong marketing, underwriting, and pricing capabilities. Because collector auto insurance constitutes a significant portion of our overall business, we may be more sensitive than other providers of insurance to, and more adversely affected by, trends that could decrease auto insurance rates or reduce demand for auto insurance over time, such as industry advances in mileage-based or usage-based insurance offerings, changes in vehicle technology, autonomous or semi-autonomous vehicles, or vehicle sharing arrangements. In addition, there are limited barriers to entry in the automotive lifestyle business. Accordingly, more established brands with significantly more resources may compete against us in the automotive lifestyle business in the future. If we are unable to compete effectively, we may not be able to grow our business and our financial condition and results of operations may be adversely affected.
As a result of a number of factors, including increasing competition, negative brand or reputational impact, changes in geographic mix or product mix, and the continued expansion of our business into a variety of new areas, we may not be able to continue to grow our revenues at a high rate or at all. We may also experience a decline in our revenue growth rate as our revenues increase to higher levels. Our revenue growth may be impacted if there is a deceleration or decline in demand for our products and services due to changing market dynamics or demographic shifts.
Future acquisitions or investments contain inherent strategic, execution, and compliance risks that could disrupt our business and harm our financial condition.
We may pursue acquisitions or investments to grow our business in line with our strategic objectives. Any acquisition or investment (whether for service offerings, technology, or product offerings, or for other external uses) may not achieve the desired return sought. These acquisitions or investments may also result in unforeseen liabilities or expenses, such as higher than expected costs due to market competition, regulatory approval requirements, delays in implementation, lost opportunities that could have been pursued with cash being used, litigation or regulatory enforcement post-acquisition or investment, contingent liabilities, implementation cost, misalignment of culture, loss of technology through theft or trade secrets exchanged, loss of key partners/vendors, currency exchange rate for foreign investment, timing within overall economic environment, carrying costs, and tax liabilities. Additionally, the risks from future acquisitions or investments could result in impairment charges against goodwill and intangible assets or increases in the liabilities on our Consolidated Balance Sheets, as well as missed earnings results.
We may be subject to cyberattacks, and our reliance on third party providers for technology and service mean our operations could be disrupted due to the lack of resiliency in the operations of other companies, or a breach in their obligations to us, and could impair the operability of our website and other technology-based operations.
Cyberattacks, denial-of-service attacks, ransomware attacks, business email compromises, computer malware, viruses, social engineering (including phishing) and other malicious internet-based activity are prevalent in our industry and such attacks continue to increase. We also utilize third-party providers to host, transmit, or otherwise process electronic data in connection with our business activities. We or our vendors and business partners may experience attacks, unavailable systems, unauthorized access, or disclosure due to employee or other theft or misuse, denial-of-service attacks, sophisticated attacks by nation-state and nation-state supported actors, and advanced persistent threat intrusions. Despite our efforts to ensure the security, privacy, integrity, confidentiality, availability, and authenticity of information technology networks and systems, processing and information, we may not be able to anticipate, or to implement, preventive and remedial measures effective against all data security and privacy threats. The recovery systems, security protocols, network protection mechanisms, and other security measures that we have integrated into our systems, networks, and physical facilities, may not be adequate to prevent or detect service interruption, system failure, data loss or theft, or other material adverse consequences. No security solution, strategy, or measures can address all possible security threats or block all methods of penetrating a network or otherwise perpetrating a security incident. The risk of unauthorized circumvention of our security measures, or those of our third-party providers, clients, and partners has been heightened by advances in computer and software capabilities and the increasing sophistication of hackers who employ complex techniques, including without limitation, the theft or misuse of personal and financial information, counterfeiting, "phishing" or social engineering incidents, ransomware, extortion, publicly announcing security breaches, account takeover attacks, denial or degradation of service attacks, malware, fraudulent payment, and identity theft.
In 2021, we experienced an unauthorized access into our online insurance quote feature whereby attackers used personal information already in their possession to obtain additional consumer data, including driver’s license numbers. While none of our systems or databases were compromised or significantly disrupted as part of this incident and the costs associated with the incident and our remediation efforts were not material, we could be subject to litigation or regulatory enforcement actions. In 2023, the Company accrued an estimated liability related to this incident based on the facts known by management and developed through its assessment of the current status of ongoing dialog with the regulatory investigators. The amount of the estimated liability is not material to our Consolidated Financial Statements, though any actual fines, penalties, or settlements may differ from our estimates and the amounts accrued.
Any regulatory enforcement actions, or future cyberattacks on our systems, could cause irreparable harm to our reputation and lead our current and prospective Members away from using our services. Further, we may be required to expend significant financial and operational resources in response to a security breach, including repairing system damage, increasing security protection costs by deploying additional personnel and protection technologies, and defending against and resolving legal and regulatory claims, all of which could be costly and divert resources and the attention of our management and key personnel away from our business operations.
Some of our membership products are newer and have limited operating history, which makes it difficult to forecast operating results. We may not show profitability from these newer products as quickly as we anticipate or at all.
The success of new product and service introductions depends on a number of factors, including timely and successful development, market acceptance, our ability to manage the risks associated with new product production ramp-up issues, the availability of application software for new products, the effective management of purchase commitments and vendor relationships in line with anticipated product demand, the availability of products in appropriate quantities and at expected costs to meet anticipated demand, and the risk that new products and services may have quality or other defects or deficiencies. Accordingly, we cannot determine in advance the ultimate effect of new product and service introductions and transitions. If our new products or services are not well received, or if we are unable to introduce them in a cost-effective manner, we may not be able to realize a profit on those products and services and may, in fact, recognize losses for some time. This could have an adverse effect on our financial condition and results of operations.
We are subject to payment processing risks which could adversely affect our results of operations.
We currently rely on a limited number of payment processing services, including the processing of payments from credit cards and debit cards, and our business would be disrupted if any of the vendors become unwilling or unable to provide these services to us, and we are unable to find a suitable replacement on a timely basis. If we or our processing vendors fail to maintain adequate systems for the authorization and processing of credit card transactions, it could cause one or more of the major credit card companies to disallow our continued use of their payment products. In addition, if these systems fail to work properly and, as a result, we do not charge our customers’ credit cards on a timely basis, or at all, our business, financial condition and results of operations could be harmed.
The payment methods that we offer also subject us to potential fraud and theft by criminals, who are becoming increasingly more sophisticated, seeking to obtain unauthorized access to, or exploit weaknesses that may exist in the payment systems. There are potential legal, contractual, and regulatory risks if we are not able to properly process payments. If we are unable to comply with applicable rules or requirements for the payment methods that we accept, or if payment-related data is compromised due to an incident or a breach, we may be liable for significant costs incurred by payment card issuing banks and other third parties, subject to fines and higher transaction fees, subject to potential litigation or enforcement action, or our ability to accept or facilitate certain types of payments may be impaired.
In addition, our customers could lose confidence in certain payment types, which may result in a shift to other payment types or potential changes to our payment systems that may result in higher costs. If we fail to adequately control fraudulent credit card transactions, we could face civil liability, diminished public perception of our security measures, and significantly higher credit card-related costs, each of which could harm our business, financial condition and results of operations.
Rising inflation and interest rates may affect demand for our products and services.
Global economic conditions, including increases in inflation and interest rates, have resulted in uncertainty in consumer discretionary spending, employment rate fluctuations and overall volatility in the financial markets. These unfavorable economic conditions have led, and in the future may lead, consumers to reduce their spending on collectible cars and related services, which in turn could lead to a decrease in the demand for our products and services. Our sensitivity to economic cycles and any related fluctuation in consumer demand may have a material adverse effect on our business, results of operations, and financial condition.
Rising interest rates increase our cost of borrowing and could adversely affect our results of operations.
The Federal Reserve Board significantly increased the federal funds rate in 2023 and while it has indicated that rates are expected to decrease in 2024, there is no certainty how significant, if any, such rate cuts will be. A sustained elevated interest rate environment will have a corresponding impact to our costs of borrowing and may have an adverse impact on our ability to raise funds through the offering of our securities or through the issuance of debt due to higher debt capital costs, diminished credit availability, and less favorable equity markets. Any significant additional federal fund rate increases may have a material adverse effect on our business, financial condition, and results of operations.
As we continue to grow operations in different geographic locations, additional risk related to foreign currencies may have an impact on revenue and our results of operations.
We have foreign operations, and in some instances, collect from customers in foreign currencies. The exchange rates we use to consolidate our foreign entities may be less favorable to us than the actual exchange rates used to convert the funds into U.S. dollars. These foreign exchange risks could have a material negative impact on our financial condition and results of operations.
Our technology platforms may not function properly, which might subject us to loss of business and revenue, breach of contractual obligations, and place us out of compliance with state and federal rules and regulations.
We utilize numerous technology platforms throughout our business for various functions, including to gather Member data in order to determine whether or not to write and how to price our insurance products, to process many of our claims, to issue and service our membership products, and to provide valuation services. We use proprietary artificial intelligence algorithms in certain circumstances within our underwriting processes for efficiency. Our technology platforms are expensive and complex. The continuous development, maintenance, and operation of our technology platforms may entail unforeseen difficulties, including material performance problems or undetected defects or errors. We may encounter technical obstacles, and it is possible that we may discover additional problems that prevent our technology from operating properly. If our platforms do not function reliably, we may incorrectly select our Members, bill our Members, price insurance products, or incorrectly pay or deny insurance claims made by our Members. These errors could result in inadequate insurance premiums paid relative to claims made, resulting in increased financial losses. These errors could also cause Member dissatisfaction with us, which could cause Members to cancel or fail to renew their insurance policies with us or make it less likely that prospective Members obtain new insurance policies from us. Additionally, technology platform errors may lead to unintentional bias and discrimination in the underwriting process, which could subject us to legal or regulatory liability and harm our brand and reputation. Any of these eventualities could result in a material adverse effect on our business, financial condition and results of operations.
Our future success depends on the ability to continue to develop and implement technology to transform or replace legacy technology, and to maintain the security and confidentiality of this technology in compliance with evolving privacy laws.
Our future success depends on our ability to continue to develop, implement, and maintain the security and confidentiality of our proprietary technology in compliance with evolving privacy laws. Changes to existing laws, their interpretation or implementation, or the introduction of new laws could impede our use of this technology or require that we disclose our proprietary technology to our competitors, which could negatively impact our competitive position and result in a material adverse effect on our business, financial condition and results of operations.
We rely on internet and mobile technologies and applications to market our products and services. Any future legal or regulatory requirements impacting these applications or that restricts our ability to collect or use personal data may impact how we interact with our Members and prospective Members, and could potentially have an adverse effect on our business, financial condition and operations.
We rely in part on internet and mobile applications to execute our business strategy. We are subject to domestic and international laws and regulations governing our activity and transactions both offline and online through the internet and mobile applications, including (i) how personal data can be collected, used, shared, transferred, stored, or otherwise processed ("Privacy Laws"), (ii) cybersecurity and data security obligations, and (iii) protections relating to our marketing and advertising activities (together with Privacy Laws, "Internet Laws"). Existing and future Internet Laws may impede our use of the internet to interact with current and future Members and to effectively market our products and services. In particular, an increasing number of Privacy Laws regulate our ability to use personal data for targeted or cross-context behavioral advertising, as well as give individuals the ability to opt out of such advertising.
It is possible that (i) the Internet Laws or general business laws and regulations may be interpreted and applied in a manner that is inconsistent from one jurisdiction to another and may conflict with other rules or our practices; (ii) as new Internet Laws and consumer expectations are adopted, our compliance obligations may increase; (iii) government regulatory authorities may interpret and amend their Internet Laws and may require us to incur substantial costs to comply, and we may be penalized or precluded from carrying on our current activities; (iv) we may be subject to individual or class action claims by plaintiffs using both new and pre-existing Internet Laws based on new technologies, some of which are part of our marketing efforts, and; (v) our practices have not historically complied, do not currently comply, or will not fully comply in the future with all Internet Laws.
Any failure, or perceived failure, by us to comply with any Internet Laws could result in: (i) damage to our reputation, including consumer trust, (ii) a loss in business potentially leading to lower revenue and Member growth; (iii) proceedings or actions against us by governmental entities or private litigants including, for example, the Data Security Incident referenced in Note 24 — Commitments and Contingencies in Item 8 of Part II of this Annual Report; (iv) significant additional expense and time in defending regulatory proceedings or legal actions; (v) imposition of monetary liability; (vi) disgorgement of personal data and any algorithms trained on, or products or services derived from, such personal data; (vii) regulatory proceedings or legal actions distracting management; (viii) increased cost of doing business; (ix) decreased use of our mobile applications or websites by current and future Members; (x) contractual liability to indemnify and hold harmless third parties from the costs or consequences of non-compliance with the Internet Laws. In addition, our insurance coverage relating to any damages or expenses may not be sufficient to compensate for the liabilities we may incur. Any legal or regulatory requirements that restrict how we interact with our Members and future Members, or our actual or perceived failure to comply with Internet Laws, could have a material adverse effect on our business, financial condition and results of operations.
We may not be able to prevent or address the misappropriation of Hagerty-owned data.
From time to time, third parties may misappropriate our data through website scraping, bots, or other means and aggregate this data on their websites with data from other companies. In addition, copycat websites or mobile apps may misappropriate data and attempt to imitate our brand or the functionality of our website or our mobile app. If we become aware of such websites or mobile apps, we intend to employ technological or legal measures in an attempt to halt their operations. However, we may be unable to detect all such websites or mobile apps in a timely manner and, even if we could, technological and legal measures may be insufficient to halt their operations.
In some cases, particularly in the case of websites operating outside of the U.S., our available remedies may not be adequate to protect us against the effect of the operation of such websites or mobile apps. Regardless of whether we can successfully enforce our rights against the operators of these websites or mobile apps, any measures that we may take could require us to expend significant financial or other resources, which could harm our business, financial condition or results of operations. In addition, to the extent that such activity creates confusion among consumers or advertisers, our brand and business could be harmed.
Changes in social attitudes may make ownership of collector vehicles less desirable, leading to a decline in demand for our products and services.
Changing consumer preferences and social attitude toward options such as electric vehicles and/or autonomous driving could have a material impact on our business. The traditional business model of car sales is starting to be complemented by a range of diverse, on-demand mobility solutions, especially in dense urban environments that proactively discourage private-car use. This shift, along with a significant rise in the annual growth of car sharing members and autonomous and electric vehicles in the markets we currently conduct business, could have a trickle-down effect to the collector car space and create a drop in demand for our products and services, which could have a material adverse effect on our business, financial condition and results of operations.
An inadequate strategy to address and respond to issues of diversity, equity, and inclusion could leave us insufficiently prepared for significant cultural shifts affecting our marketplace and may create a negative brand image, leading to the alienation of our employees and clients.
Companies must achieve diversity if they want to acquire and retain talent, build employee engagement, and improve business performance. Diversity, equity, and inclusion have been shown to drive higher innovation, enhanced job performance, less employee turnover, and greater profits. If there is not a focus on developing a cohesive strategy to create a sense of belonging with clear and impactful diversity, equity, and inclusion initiatives, we could potentially put ourselves in a position where our brand and/or sales are impacted as a result of a failure to create a successful strategy.
Performance of our investment portfolio is subject to a variety of investments risks that may adversely affect our financial results.
Our results of operations depend, in part, on the performance of our investment portfolio. We seek to hold a portfolio of investments in accordance with our investment policy and routinely reviewed by our Investment Committee.
The significant majority of our investment portfolio is invested in cash and cash equivalents and fixed maturity securities. This portfolio mix may change over time if we elect to diversify our holdings into other asset classes. In recent years, interest rates have been at or near historic lows, however, throughout 2023, interest rates have steadily risen. Should the recent rate increases cease or decline, including as a result of steps taken by the federal government to slow inflation, such as the passage of the Inflation Reduction Act of 2022, a low interest rate environment would continue to place pressure on our net investment income, particularly as it relates to these securities and short-term investments, which, in turn, may adversely affect our operating results. Recent and future increases in interest rates could cause the values of our fixed income securities portfolios to decline, with the magnitude of the decline depending on the duration of securities included in our portfolio and the amount by which interest rates increase.
Risks for all types of securities are managed through the application of our investment policy, which establishes investment parameters that include, but are not limited to, maximum percentages of investment in certain types of securities and minimum levels of credit quality. We cannot be certain that our investment objectives will be achieved, and results may vary substantially over time. In addition, although we seek to employ investment strategies that are not correlated with our insurance and reinsurance exposures, losses in our investment portfolio may occur at the same time as underwriting losses and, therefore, exacerbate the adverse effect of the losses on us.
We may require additional capital in the future, which may not be available or may only be available on unfavorable terms. We may also encounter difficulty in obtaining funds to meet our commitments.
We are exposed to credit risk, or liquidity risk, through our banking partners. If we were to experience operating losses and are not able to generate additional liquidity through a capital raise or other cash infusion, we may need to secure additional sources of funds, which may or may not be available. Additionally, a failure to generate additional liquidity could negatively impact our ability to operate our business.
To the extent that cash flows generated by our operations are insufficient to fund future operating requirements, or that our capital position is adversely impacted by a decline in the fair value of our investment portfolio, losses from catastrophic events or otherwise, we may need to raise additional funds. We also may be required to liquidate fixed maturity securities, which may result in realized investment losses. Any further sources of capital, including capacity needed for letters of credit, if available at all, may be on terms that are unfavorable to us. Our access to additional sources of capital will depend on a variety of factors, such as market conditions, the general availability of credit, the availability of credit to the industries in which we operate, our financial condition, results of operations, credit ratings and credit capacity, as well as pending litigation or regulatory investigations. Our ability to borrow under our revolving credit facilities and letter of credit facilities is contingent on our compliance with the covenants and other requirements under those facilities. Similarly, our access to capital may be impaired if regulatory authorities or rating agencies take negative actions against us. Additionally, to reduce the risk of a bank failure, we engage only with high-quality counterparties with high credit ratings. Our inability to obtain adequate capital when needed could have a negative impact on our ability to invest in, or take advantage of opportunities to expand our businesses, such as possible acquisitions or the creation of new ventures, and inhibit our ability to refinance our existing indebtedness on terms acceptable to us. Any of these effects could have a material adverse effect on our financial condition and results of operations.
Our day-to-day operations create transactions, events, and conditions that may give rise to the need for accounting estimates to be recognized or disclosed in the financial statements. There is a risk that these estimates are incorrect, which could have a material adverse effect on our results of operations and/or financial condition for accounting purposes.
The preparation of our financial statements requires us to make estimates and assumptions affecting the reported amounts of our assets, liabilities, revenues and expenses. If these estimates or assumptions are incorrect, it could have a material adverse effect on our results of operations and/or financial condition. We have identified several accounting estimates as being "critical" to the fair presentation of our financial condition and results of operations because they involve major aspects of our business and require us to make judgments about matters that are inherently uncertain. Refer to "Critical Accounting Estimates" within Item 7 of Part II of this Annual Report for additional information.
Risks Related to Our Insurance Products and Services
The insurance products that we develop and sell for our underwriting carriers are subject to regulatory approval, and we may incur significant expenses in connection with the development and filing of new products before revenue is generated from new products.
The insurance products that we develop and sell require regulatory approvals in each respective jurisdiction. This product development and filing cycle can take time. The product development and filing process can be challenging and expensive. The process can also be delayed, given the unknown timelines in which insurance departments might take to review and approve filings. Questions and objections from insurance departments can also delay the product launch date. Moreover, there could be an inability to obtain regulatory approval on a product filing.
The nature of the product development and filing cycles may cause us to experience delays between the time we incur expenses associated with research and development and the time we generate revenues, if any, from the new products. If we spend a significant amount of resources on research and development, and our efforts do not lead to the successful introduction or improvement of products that are competitive in the marketplace, this could materially and adversely affect our business and results of operations.
Additionally, there could be a change in the anticipated Member demand for a product we are developing before the product is released. Member demand could decrease after the development cycle has begun. A decrease in Member demand for a new or improved product could cause us to fall short of our sales targets, and we might not be able to avoid the substantial costs associated with the product’s development or improvement. If we are unable to complete product development and filing cycles successfully, in a timely manner, that meets Member demand for new or improved products, and generate revenues from these future products, the growth of our business could be harmed.
As an MGA, we operate in a highly regulated environment for our insurance product distribution and face risks associated with compliance requirements, some of which cause us to make judgment calls that could have an adverse effect on us.
The insurance industry in which we operate is subject to extensive regulation. We are subject to regulation and supervision both federally and in each applicable local state or provincial jurisdiction. In general, these regulations are designed to protect Members, policyholders, and insureds and to protect the integrity of the financial markets, rather than to protect stockholders or creditors. Our ability to conduct business in these jurisdictions depends on our compliance with the rules and regulations promulgated by federal and state or provincial regulatory bodies and other regulatory authorities. Maintaining compliance with rules and regulations is often complex and challenging, and it sometimes requires us to make determinations that require judgments regarding uncertain issues that ultimately may be resolved differently than we have determined, which could have an adverse effect on us.
We may not be able to adapt effectively and timely to any changes in law.
A failure to comply with regulatory requirements, or changes in regulatory requirements or interpretations, can result in actions by regulators, potentially leading to penalties and enforcement actions, and in extreme cases, revocation of an authority to do business in one or more jurisdictions. This could result in adverse publicity and potential damage to our brand and reputation in the marketplace. In addition, we could face lawsuits by Members and other parties for alleged violations of these laws and regulations.
State insurance laws grant supervisory agencies, including state insurance departments, broad administrative authority. Canadian, Bermuda, and U.K. insurance regulators and, in the U.S., state insurance regulators and the National Association of Insurance Commissioners continually review existing laws and regulations, some of which affect our business. These supervisory agencies regulate many aspects of the insurance business, including the licensing of insurance brokers and agents and other insurance intermediaries; the handling of third-party funds held in a fiduciary capacity; and trade practices, such as marketing, advertising, and compensation arrangements entered into by insurance brokers and agents. Individuals who engage in the solicitation, negotiation, or sale of insurance, or provide certain other insurance services, generally are required to be licensed individually. Insurance laws and regulations govern whether licensees may share commissions with unlicensed entities and individuals. We believe that generally any payments we make to third parties are in compliance with applicable laws. However, should any regulatory agency take a contrary position and prevail, we will be required to change the manner in which we pay fees to individuals and entities for placing insurance policies through us.
Regulatory review or the issuance of interpretations of existing laws and regulations may result in the enactment of new laws and regulations that could adversely affect our operations or our ability to conduct business profitably. It is difficult to predict whether, and to what degree, changes resulting from new laws and regulations will affect the industry or our business.
We do business with a limited number of key underwriting carrier partners in our insurance markets, and we may not be able to find suitable replacements for our existing carriers.
We work with a limited number of carriers in the U.S., Canada, and the U.K. for our personal lines insurance products, and there is a risk that if one or more of the carriers becomes impaired or terminates its relationship with us that our profitability may be adversely affected. If a carrier partner relationship terminates or there is loss of strategic support or alignment, we may be unable to transition to a new relationship without disruption, increased cost, lost profits, or lost market share, or a combination of the foregoing.
We derive a large portion of our revenue from commissions and quota share reinsurance on the sale of personal lines insurance products in the U.S. primarily through our exclusive relationship with Essentia, in Canada through our exclusive relationship with Aviva's Canadian subsidiary, Elite Insurance Company, and in the U.K., through our relationship with Aviva. If these carriers were to experience liquidity problems or other financial (such as rating agency downgrades) or operational difficulties, we could encounter business disruptions as a result, and our results of operations may suffer.
Our contracts with each of Markel and State Farm, regarding the State Farm Classic+ program, contain provisions that allow those partners to terminate our agreements with them at any time upon the occurrence of a change of control. One of the events triggering a change of control would occur if the Hagerty family ceases to own shares representing a majority of our voting power. Accordingly, if we experience a change of control, including as a result of the Hagerty family's sale of a sufficient number of shares to result in their controlling less than a majority of their voting power, we could lose our agreements with one or both of these partners, which could have a material adverse effect on our business, operations and financial results.
A regulatory environment that requires rate increases to be approved and that can dictate underwriting and pricing and mandate participation in loss sharing arrangements may adversely affect our financial condition and results of operations.
Political events and positions can affect the insurance market on occasion, including efforts to reduce rates to a level that may prevent us from being profitable or may not allow us to reach our goals. If the loss ratio for the insurance programs that we administer is favorable to that of the industry, regulatory authorities could impose rate restrictions, require payment of premium refunds to policyholders, or could challenge or delay efforts to raise rates. Rate changes may be required for us to achieve our goals related to profitability and return on equity. If we were to experience challenges in obtaining approvals for rate changes, that could limit us in reaching our targeted goals and profitability. For example, certain states have enacted laws that require an insurer conducting business in that state to participate in assigned risk plans, reinsurance facilities, and joint underwriting associations. Certain states also require insurers to offer coverage to all consumers, often restricting an insurer’s ability to charge the price it might otherwise charge. Laws and regulations of many states also limit an insurer’s ability to withdraw from one or more lines of insurance there, except pursuant to a plan that is approved by the state insurance department. This limitation can prolong and provide additional challenges for strategic business plans related to conversions, transfers, and book rolls. Although we are not an insurer, our business, financial condition or results of operations could be adversely affected by any of these factors, as they are applicable to the insurance programs we administer.
The underwriting companies that we work with, and our insurance agencies, are periodically subject to examinations and audits by insurance regulators, which could result in adverse findings, enforcement actions, require payments of fines or penalties, and necessitate remedial actions.
In the U.S., our insurance agencies operate as an MGA for Essentia and also operate in this capacity for State Farm Classic Insurance Company in order to service the State Farm Classic+ program. Essentia is currently domiciled in Missouri and has a classic auto insurance program in all 50 United States, plus the District of Columbia. We operate as the MGA for the Essentia program in all 51 jurisdictions. We also operate a similar auto insurance program in Canada (underwritten by Elite Insurance Company) and in the U.K. (underwritten by Aviva).
Additionally, under its license as a Class 3A insurer, Hagerty Re must meet and maintain the relevant solvency margin, and liquidity and other ratios applicable under Bermuda law. Hagerty Re's license limits it to accepting only business produced through our MGA that is underwritten by carriers rated A- or better by A.M. Best or similar rating agency.
Insurance regulators periodically subject the underwriting companies that we work with to conduct audits and examinations to assess compliance with applicable laws and regulations, financial condition, and the conduct of regulated activities. These examinations and audits may be conducted during a jurisdiction’s normal review cycle, or because of a targeted investigation. Our insurance agencies can also be subject to regulatory audits and exams. A formal examination or audit provides insurance regulators with a significant opportunity to review and scrutinize the underwriting companies we work with, the insurance programs we administer, and our operations.
As a result of an examination or an audit, an insurance regulator could determine that an underwriting company’s financial condition or capital resources are less than satisfactory. An insurance regulator could also determine that there are other aspects of either the underwriting company or our operations that are less than satisfactory, or that either us or the underwriting company that we work with are in violation of applicable laws or regulations. These types of examination or audit findings could lead an insurance regulator to require either us or the underwriting company that we work with to take one or more remedial actions or otherwise subject us to regulatory scrutiny, impose fines and penalties, or take further actions.
We cannot predict with precision the likelihood, nature, or extent, including the associated costs, of any necessary remedial actions, or any financial impact that could result from an examination or audit. Any regulatory or enforcement action or any regulatory order imposing remedial, injunctive, or other corrective action against us or any of the underwriting companies we work with resulting from these examinations or audits could have a material adverse effect on our business, reputation, financial condition and results of operations.
We rely on external data and our digital platform to collect and evaluate information that we utilize in producing, pricing, and underwriting insurance policies (in accordance with the rates, rules, and forms filed with regulators, where required), managing claims and customer support, and improving business processes. Any future legal or regulatory requirements that might restrict our ability to collect or utilize this data could potentially have an adverse effect on our business, financial condition, and prospects.
We use our digital platform to collect data points that we evaluate in pricing and underwriting insurance policies, managing claims and customer support, and improving business processes. Our business model is dependent on our ability to collect vehicle and personal data. If federal, state, or international regulators were to determine that the type of data we collect, the process we use for collecting this data, or how we use it, unfairly discriminates against a protected class of people or otherwise violates applicable data Privacy Laws and regulations, regulators could prohibit or restrict our collection or use of this data. In addition, if legislation were to restrict our ability to collect personal data, it could impair our capacity to underwrite insurance cost effectively, negatively impacting our revenue and earnings.
The insurance business, including the market for property and casualty insurance, is historically cyclical in nature, and there may be periods with excess underwriting capacity and unfavorable premium rates, which could adversely affect our business.
We operate primarily in North America and the seasonality of driving in that region has caused a large portion of our revenue to be generated in the spring and summer months of each year. This in turn impacts operational cash flows and could produce volatility in our earnings. Fluctuations in our operating results could be due to a number of other factors, many of which may be outside of our control, including competition, frequency and severity of catastrophic events, levels of capacity, adverse litigation trends, regulatory constraints, general economic conditions, and agreement on underwriting appetite with our carrier partners, and other factors. The supply of insurance is related to prevailing prices, the level of insured losses, and the level of capital available to the industry that, in turn, may fluctuate in response to changes in rates of return on investments being earned in the insurance industry. As a result, the auto insurance business historically has been a cyclical industry characterized by periods of intense price competition due to excessive underwriting capacity, as well as periods when shortages of capacity increased premium levels. We operate in a specialty sector of the auto insurance market and need to be mindful of these and other factors which could impact our operations. Demand for insurance depends on numerous factors, including the frequency and severity of catastrophic events, levels of capacity, the introduction of new capital providers, and general economic conditions. All of these factors fluctuate and may contribute to price declines generally in the insurance industry. We cannot predict with certainty whether market conditions affecting the auto insurance market and the insurance market in general will improve, remain constant, or deteriorate. Negative market conditions may impair our ability to underwrite insurance at rates we consider appropriate and commensurate relative to the risk assumed. Additionally, negative market conditions could result in a decline in policies sold, an increase in the frequency or severity of claims and premium defaults, and an uptick in the frequency of fraud, including the falsification of claims. If we cannot underwrite insurance at appropriate rates, our ability to transact business will be materially and adversely affected. Any of these factors could lead to an adverse effect on our business, financial condition and results of operations.
The reinsurance that Hagerty Re purchases to protect against catastrophic and large losses may be unavailable at current coverage terms, limits, or pricing.
The business that Hagerty Re reinsures is exposed to catastrophic events that are inherently unpredictable and may cause capacity in the reinsurance market to become scarcer leading to rate increases or changes in coverage terms, or a combination of both. This in turn may cause Hagerty Re to retain more risk, be unable to accept risk and grow, or require greater capital investment that may not be available, in each case resulting in lower profits, as well as a material effect on our financial condition and results of operations.
Unexpected increases in the frequency or severity of claims may adversely affect our operations and financial condition.
We may experience increases in claim frequency on occasion. Short-term trends with an increase in claim frequency may not continue over the longer term. Any changes in claim frequency might be derived from changes in miles driven, driving behaviors, macroeconomics, weather-related events, or other factors. A significant increase in claim frequency could have an adverse effect on our financial condition and results of operations.
We could also experience increases in the severity of claims. Changes in bodily injury claim severity can be impacted by inflation in medical costs, litigation trends and precedents, regulation, and the overall safety of automobile travel. Changes in auto property damage claim severity can be driven by inflation in the cost to repair vehicles, including parts and labor rates, the mix of vehicles that are declared total losses, the availability of parts to repair vehicles, and an increase in value for collector vehicles. Unanticipated increases in claim severity can arise from events that are inherently difficult to predict. Although we pursue various loss management initiatives to mitigate future increases in claim severity, these initiatives may not successfully identify or reduce the effect of future increases in claim severity. A significant increase in claim severity could have an adverse effect on our financial condition and results of operations.
Severe weather events, catastrophes, and unnatural events are unpredictable, and we may experience losses or disruptions from these events.
Our business may be exposed to catastrophic events such as tornadoes, tsunamis, tropical storms (including hurricanes), earthquakes, windstorms, hailstorms, severe thunderstorms, wildfires and other fires, as well as non-natural events such as explosions, riots, pandemics, terrorism, or war, which could cause operating results to vary significantly from one period to the next. We may incur catastrophe losses in our business in excess of: (i) those experienced in prior years, (ii) the average expected level used in pricing, (iii) current reinsurance coverage limits, or (iv) loss estimates from external tornado, hail, hurricane, and earthquake models at various levels of probability. In addition, we are subject to Member insurance claims arising from weather events such as winter storms, rain, hail, and high winds.
There is generally an increase in the frequency and severity of Member insurance claims when severe weather conditions occur. The incidence and severity of severe weather conditions and catastrophes are inherently unpredictable and the occurrence of one catastrophe does not render the possibility of another catastrophe greater or lower. The extent of losses from a catastrophe is a function of both the total amount of insured exposure in the area affected by the event and the severity of the event. In particular, severe weather and other catastrophes could significantly increase our costs due to a surge in claims following such events and/or legal and regulatory changes in response to catastrophes that may impair our ability to limit our liability under our policies. Severe weather conditions and catastrophes can cause greater losses, which can cause our liquidity and financial condition to deteriorate.
Climate change may affect the occurrence of certain natural events, such as an increase in the frequency or severity of wind and thunderstorm events, eruptions of volcanoes, and tornado or hailstorm events due to increased convection in the atmosphere; more frequent wildfires and subsequent landslides in certain geographies; higher incidence of deluge flooding and the potential for an increase in severity of the hurricane events due to higher sea surface temperatures. Additionally, climate change may cause an impact on the demand, price and availability of insurance, as well as the value of our investment portfolio. Due to significant variability associated with future changing climate conditions, we are unable to predict the impact climate change will have on our business.
If the risks within the insurance programs that we offer on behalf of our underwriting carriers are not priced and underwritten accurately with competitive, yet profitable, rates, our business and financial condition could be adversely affected.
As an MGA, we operate under delegated underwriting authority in the U.S. In general, the premiums for the insurance policies in our program are established at the time a policy is issued and, therefore, before all of the underlying costs are known. The accuracy of the pricing is subject to our ability to adequately assess risks, estimate losses, and comply with insurance laws and regulations. Like others in the industry, we rely on estimates and assumptions in setting the premium rates. We also utilize the data that we gather through our interactions with Members.
Establishing adequate premium rates is necessary, together with investment income, if any, to generate sufficient revenue to offset losses, loss adjustment expenses, and other costs. If we do not accurately assess the risks that are underwritten, adequate premiums may not be charged to cover losses and expenses, which would adversely affect our results of operations and our profitability. Moreover, if we determine that the prices are too low, insurance regulations may prevent non-renewing insurance contracts, non-renewing Members, or raising prices. Alternatively, we could set the premiums too high, which could reduce our competitiveness and lead to lower revenues, which could have a material adverse effect on our business, financial condition and results of operations.
Pricing involves the acquisition and analysis of historical loss data and the projection of future trends, loss costs, expenses, and inflation trends, among other factors, for each of the products in multiple risk levels and many different markets. In order to accurately price the policies, we must, among other factors:
•collect and properly and accurately analyze a substantial volume of data from our Members;
•develop, test, and apply appropriate actuarial projections and rating formulas;
•review and evaluate competitive product offerings and pricing dynamics;
•closely monitor and timely recognize changes in trends;
•project both frequency and severity of our Members’ losses with reasonable accuracy; and
•in many jurisdictions, obtain regulatory approval for the resulting rates.
We may not have success in implementing a pricing methodology accurately in accordance with our assumptions. Our ability to accurately price policies is subject to a number of risks and uncertainties, including, but not limited to:
•insufficient, inaccurate, or unreliable data;
•incorrect or incomplete analysis of available data;
•uncertainties generally inherent in estimates and assumptions;
•our inability to implement appropriate actuarial projections and rating formulas or other pricing methodologies;
•incorrect or incomplete analysis of the competitive environment;
•regulatory constraints on rate increases or coverage limitations;
•our inability to accurately estimate investment yields and the duration of our liability for loss and loss adjustment expenses; and
•unanticipated litigation, court decisions, and legislative or regulatory actions or changes to the existing regulatory landscape.
To address the potential errors or desired or required changes in our current business model, we may be compelled to increase the amount allocated to cover policy claims, or to address other economic factors resulting in an increase in future premium rates, or to additionally or alternatively adopt different underwriting standards. Any of these changes may result in a decline in new business and renewals and, as a result, have a material adverse effect on our business, financial condition, and results of operations.
Reinsurance subjects Hagerty Re to counterparty risk where reinsurers fail to pay or timely pay claims due to insolvency or otherwise fail to honor their obligations.
Hagerty Re is legally obligated to pay claims under the reinsurance agreements where Hagerty Re has assumed risk, regardless of whether Hagerty Re is able to secure its own reinsurance for ceded reinsurance coverages. If one or more of Hagerty Re's reinsurance providers become insolvent or default in payment when reimbursement is sought by Hagerty Re, this may have a material effect on Hagerty Re's financial condition and results of operations as well as its ability to accept risk. Such an event may cause Hagerty Re to require capital investments that may not be available.
Unexpected changes in the interpretation of coverage or provisions, including loss limitations and exclusions, in the insurance policies we sell and service could have a material adverse effect on our financial condition and operations.
We have specifically negotiated loss limitations and exclusions in the policies we sell and service, and these limitations and exclusions may not be enforceable in the manner we intend. As industry practices and legal, judicial, social, and other conditions change, unexpected and unintended issues related to claims and coverage may emerge. While these limitations and exclusions help us assess and mitigate our loss exposure, it is possible that a court or regulatory authority could nullify or void a limitation or exclusion, or legislation could be enacted modifying or barring the use of such limitations or exclusions. These types of governmental actions could result in higher than anticipated losses and loss adjustment expenses, which could have a material adverse effect on our financial condition or results of operations. In addition, court decisions have eliminated long standing coverage limitations by a narrow reading of policy exclusions. Under the insurance laws, the insurer typically has the burden of proving an exclusion applies and any ambiguities in the terms of a loss limitation or exclusion provision are typically construed against the insurer. These types of cases and the issues they raise may adversely affect our business by either broadening coverage beyond our underwriting intent or by increasing the frequency or severity of claims. In some instances, these changes may not become apparent until sometime after we have issued insurance contracts that are affected by the changes. As a result, the full extent of liability under the insurance contract may not be known for many years after a contract is issued. There could also be additional exposure with claims for other household vehicles that are not covered under an insurance policy issued by us, such as for someone’s regular use vehicle. It is possible that our underwriting companies that we write business through may share in liability with these types of claims in certain instances.
Hagerty Re's actual ultimate loss liability could potentially be greater than our loss and loss adjustment expense reserves, which could have a material adverse effect on our financial condition and results of operations.
Significant periods of time often elapse between the occurrence of an insured or reinsured loss, the reporting of the loss to us, and our payment of that loss. To recognize liabilities for unpaid losses, we establish reserves as balance sheet liabilities representing estimates of amounts needed to pay reported and unreported losses and the related loss adjustment expenses. The process of estimating loss reserves is a difficult and complex exercise involving many variables and subjective judgments. As part of the reserving process, we review historical data and consider the impact of such factors as:
•trends in claim frequency and severity;
•changes in operations;
•emerging economic and social trends;
•trends in insurance rates;
•changing mix of insured risks;
•inflation or deflation; and
•changes in the regulatory and litigation environments.
This process assumes that past experience, adjusted for the effects of current developments and anticipated trends, is an appropriate basis for predicting future events. There is no precise method, however, for evaluating the impact of any specific factor on the adequacy of reserves, and actual results will differ from original estimates. As part of the reserving process, we regularly review our loss reserves and make adjustments as necessary. Future increases in loss reserves for our underwriting operations will, and for our program’s services operations may, result in additional charges to earnings, which may be material. Our estimates could prove to be inadequate, and this underestimation could have a material adverse effect on our financial condition.
Hagerty Re is required to maintain its reserves and financial condition in accordance with Bermuda law and the Bermuda Solvency Capital Requirement ("BSCR") administered by the Bermuda Monetary Authority ("BMA"). Inadequate current reserves may adversely affect earnings in future periods, as well as the ability to continue to accept risk, and Hagerty Re's ability to maintain its financial condition and meet solvency requirements necessary to maintain its license in Bermuda. Under Bermuda law, Hagerty Re is prohibited from declaring or making payment of a dividend if it fails to meet its minimum solvency margin or minimum liquidity ratio. Prior approval from the BMA is also required if Hagerty Re's proposed dividend payments would exceed 25% of its prior year-end total statutory capital and surplus.
Our expansion into different insurance products and jurisdictions may subject us to additional costs and expenses, and our plans might not be as profitable as projected.
We believe that the growth of our business and revenue depends in part upon our ability to: (i) retain our existing Members and add new Members in our current, as well as new, geographic markets; (ii) add new insurance programs and products; and (iii) add to and continue to grow our offering of non-insurance automotive enthusiast-related products.
Expanding into new geographic markets and introducing new products takes time, requires us to navigate and comply with extensive regulations, and may happen more slowly than we expect or than it has occurred in the past. If we were to lose Members, our value might diminish. A future loss of Members could lead to higher loss ratios, loss ratios that cease to decline, or declining revenue — any of which would adversely impact our profitability. If we are unable to remain competitive on Member experience, pricing, or insurance coverage options, our ability to grow and retain our business may also be adversely affected. In addition, we might not be able to accurately predict risk segmentation of new and renewal Members or potential Members, which could also reduce our profitability.
While a key part of our business strategy is to retain and add Members in our existing markets, we may also seek to expand our operations into new markets and new products. In doing so, we may incur losses or otherwise not be successful in entering new markets or introducing new products. Our expansion into new markets and new products may place us in unfamiliar competitive environments and involve various risks, including competition, government regulation, the need to invest significant resources, and the possibility that returns on such investments might not be achieved for several years, or at all.
We may not be successful in these efforts, and even if we are successful, these efforts may increase or create the following risks, among others:
•we might not be able to effectively use search engines, social media platforms, content-based online advertising, and other online sources for generating traffic to our website;
•potential Members in a particular marketplace could generally not meet the underwriting guidelines;
•demand for new products or expansion into new markets may not meet our expectations;
•new products and expansion into new markets may increase or change our risk exposures, and the data and models we use to manage those exposures may not be as effective as those we use in existing markets or with existing products;
•models underlying automated underwriting and pricing decisions may not be effective;
•efforts to develop new products or expand into new markets or to change commission terms may create or increase distribution channel conflicts;
•in connection with the conversion of existing policyholders to a new product, some policyholders’ pricing may increase while the pricing for other policyholders may decrease, the net impact of which could negatively impact retention and profit margins;
•changes to our business processes or workflow, including the use of new technologies, may give rise to execution risk;
•our products might not be competitive in terms of Member experience, pricing, or insurance coverage options;
•there could be barriers in obtaining the governmental and regulatory approvals, licenses, or other authorizations necessary for expansion into new markets or in relation to our products (such as line, form, underwriting, and rating approvals), or such approvals could contain conditions that impose restrictions on our operations (such as limitations on growth);
•our digital platform might experience disruptions;
•we could suffer reputational harm to our brand resulting from negative publicity, whether accurate or inaccurate;
•we may not be able to offer new and competitive products, to provide effective updates to our existing products, or to keep pace with technological improvements in our industry;
•we might not be able to maintain traditional retail agent relationships;
•Members may have difficulty installing, updating, or otherwise accessing our website on mobile devices or web browsers as a result of actions by us or third parties;
•Members may be unable or unwilling to adopt or embrace new technology;
•technical or other problems may frustrate the Member experience, particularly if those problems prevent us from generating quotes or paying claims in a fast and reliable manner;
•we might not be able to address Member concerns regarding the content, data privacy, and security generally or for our digital platform specifically;
•we may not identify or enter joint ventures with strategic partners or we may enter into joint ventures that do not produce the desired results; or
•there may be challenges in, and with the cost of, complying with various laws and regulatory standards, including with respect to the insurance business and insurance distribution, capital and outsourcing requirements, data privacy, tax, and regulatory restrictions.
These efforts may require additional investments by us, some of which could be significant. These costs may also include hiring additional personnel, as well as engaging third-party service providers, and other research and development costs. If we grow our geographic footprint or product offering at a slower rate than expected, or if we are unable to overcome the challenges listed above, our business, financial condition and results of operations could be materially and adversely affected.
Our reliance on technology and intellectual property from third parties for pricing and underwriting insurance policies, handling claims, and maximizing automation, could cause an adverse impact on our business and operations if these third parties become unavailable or provide us with inaccurate information.
We use data, technology, and intellectual property licensed from unaffiliated third parties in certain components of our products, including insurance industry proprietary information that we license, and we may license additional third-party technology and intellectual property in the future. Any errors or defects in this third-party technology and intellectual property could result in errors that could harm our brand and business. In addition, licensed technology and intellectual property may not continue to be available on commercially reasonable terms, or at all. Also, should a company refuse to license its proprietary information to us on the same terms that it offers to our competitors, we could be placed at a significant competitive disadvantage. If any technology and intellectual property we license from others becomes unavailable, we may not be able to find replacement technologies at a reasonable cost or at all, which could materially harm our business and results of operations.
Denial of claims or the failure to accurately and timely pay claims on behalf of our underwriting carriers could have an adverse impact on our own business, financial condition and prospects.
We must accurately and timely evaluate and pay claims that are made under the insurance policies in our program. There are many factors that could affect our ability to pay claims accurately and timely, including the efficiency of our claims processing, the training and experience of our claim’s adjusters, and our ability to develop or select and implement appropriate procedures and systems to support our claims functions.
The risks included in our insurance programs are typically those of an antique, classic, or collectible vehicle nature. Adjusting claims on these types of risks often requires specialized knowledge of collector vehicles, so our claims staff is trained to have collectible vehicle expertise to provide an efficient, yet comprehensive, claims experience. The manner in how we handle claims is a differentiating factor for our business, and an inability to be able to continue to offer a timely and comprehensive claims experience could undermine our brand and position in the insurance marketplace. Additionally, any failure to pay claims accurately or timely could also lead to regulatory and administrative actions or material litigation, loss or reduction in reinsurance recoverable, or result in damage to our reputation, any one of which could materially and adversely affect our business, financial condition, results of operations and prospects.
If our claims adjusters are unable to effectively process our volume of claims in the manner that our Members expect, our ability to grow our business while maintaining high levels of Member satisfaction could be compromised, which in turn, could adversely affect our reputation, financial condition and results of operations.
A downward change in Essentia’s financial strength rating may adversely affect our ability to conduct business as currently conducted.
Essentia’s ability to underwrite business is dependent upon its financial strength rating as evaluated by independent rating agencies. In the event that Essentia is downgraded (or if Evanston is downgraded), we believe our ability to write business through Essentia would be adversely affected. In the normal course of business, we evaluate Essentia’s capital needs to support the amount of business it writes in order to maintain its financial strength ratings.
Hagerty Re is subject to regulatory requirements to maintain its license in Bermuda as a Class 3A insurer.
Hagerty Re is registered as a Class 3A insurer under the Bermuda Insurance Act. The BMA issues regulations and other guidance prescribing requirements that Bermuda-licensed insurance companies, like Hagerty Re, are required to comply with. For example, the BMA requires Bermuda-licensed insurers to maintain a minimum level of capital and surplus, comply with restrictions on dividends, make financial statement filings, prepare a financial condition report, maintain a head office in Bermuda from which insurance business is directed and managed and allow for the performance of certain periodic examinations of financial condition. These statutes and regulations may restrict Hagerty Re's ability to write reinsurance contracts, distribute funds and pursue its investment strategy.
Under its license as a Class 3A insurer, Hagerty Re must meet and maintain the relevant solvency margin, and liquidity and other ratios applicable under Bermuda law. For example, Hagerty Re's license limits it to reinsuring business that is underwritten by carriers rated A- or better by A.M. Best or similar rating agencies. Additional operational requirements for Hagerty Re in Bermuda include:
•maintaining a principal office in Bermuda and having a certain number of Bermuda-domiciled managers involved in overseeing operations;
•obtaining prior approval for changes in ownership/transfers of shares;
•having restrictions on dividends;
•complying with Bermuda know-your-customer and anti-bribery type laws;
•having audited financial statements and being subject to BMA examination; and
•carrying out operations in accordance with its filed and approved business plan.
Failure to operate properly in accordance with Bermuda law could cause Hagerty Re's license to be restricted or revoked, result in possible supervisory control of Hagerty Re and its assets and termination of reinsurance agreements with its ceding insurers. Additionally, Bermuda insurance statutes, regulations and the policies of the BMA are less restrictive than U.S. insurance statutes and regulations. Insurance supervisors in the U.S. may review Hagerty Re's activities and determine that Hagerty Re is subject to a U.S. jurisdiction’s licensing requirements or determine that our U.S.-domiciled underwriting partners cannot transact business with us. Any such determination would have an adverse impact on Hagerty Re's operations and financial condition.
Risks Related to Hagerty Marketplace
If we are unable to realize the anticipated synergies and cost savings from the Broad Arrow acquisition and integration, or if we are unable to retain the key employees, the business, financial condition and results of operations of our Marketplace business could be materially and adversely affected.
In 2022, Hagerty purchased Broad Arrow and its consolidated subsidiaries in an all-stock transaction. Broad Arrow offers services for buying, selling and financing collector cars, primarily through auctions and facilitating private sales, and enables the Company to further leverage respective product offerings under Marketplace.
It is possible that the synergies and cost savings anticipated by the acquisition and integration of Broad Arrow into Hagerty could take longer than anticipated and could result in the loss of valuable employees, Member and supplier relationships, the disruption of each party’s ongoing businesses, processes, and systems, or inconsistencies in standards, controls, procedures, practices, policies, and compensation arrangements, any of which could adversely affect our ability to achieve the anticipated benefits of the Broad Arrow acquisition.
Broad Arrow is largely a service business in which the ability of its employees to develop and maintain relationships with potential sellers and buyers of collector cars is essential to its success. Broad Arrow's business, financial condition, and results of operations are highly dependent on a small number of team members who generate substantially all of Broad Arrow's revenues. Therefore, our ability to attract, motivate, and/or retain those key employees is critical, and the loss of any key revenue generator could have a disproportionate impact on our Marketplace business. Our compensation arrangements, such as our sales incentive plan and equity award programs, may not always be successful in attracting new employees and motivating and retaining key employees.
Competition in the global collector car sales market and the variability of the value, demand and availability of quality collector cars for sale may adversely impact the business, results of operations, and financial condition of our Marketplace business.
We compete with other collector car auction houses, dealers, brokers and classifieds platforms to obtain valuable consignments to offer for sale either at auction or through private sale. The level of competition is intense and can adversely impact our ability to obtain valuable consignments for sale, as well as the commission margins achieved on such consignments.
The values and availability of quality collector cars for sale is influenced by a number of factors not within our control. The supply and demand for collector cars, and therefore the values of collector cars, are influenced not only by overall economic conditions, but also by changing trends in the collector car market as to which vehicles and provenance are most sought after and by the collecting preferences of individual collectors. Marketplace businesses generate revenues through fees and commissions generally based on a percentage of the final sale price, which can fluctuate based on the market dynamics. Further, the fees and commissions we charge may be lowered based on both the level of compensation and the market dynamics between supply and demand for collector cars. These conditions and trends are difficult to predict and may adversely impact our ability to obtain and sell consigned property and our ability to maintain our fee structure, which may cause significant variability in our results of operations from period to period.
Many major consignments, and specifically large single-owner collection sale consignments, are often driven by personal circumstances of the owner, including but not limited to death, divorce, and/or other financial circumstances, all of which are unpredictable and may cause significant variability in our results of operations from period to period.
We could be exposed to losses in the event of title, authenticity or other claims related to damage or theft.
The assessment of collector cars offered for auction or private sale can involve potential claims regarding title, authenticity of chassis and vehicle identification numbers, provenance, and condition. The vehicles we sell may be subject to statutory warranties as to title or other limited warranties that cannot be disclaimed under our General Conditions of Sale that are published online or in our auction sale catalogs and the terms stated in, and the laws applicable to, agreements governing private sale transactions. Our assessment of the vehicles we offer is based on scholarship and research, but necessarily requires a degree of judgment from our car specialists and researchers. In the event of a title, authenticity or other claim against us, we may have recourse against the consignor or seller of the property and may have the benefit of insurance, but a claim could nevertheless expose us to losses and to reputational risk.
Valuable collector cars are exhibited and stored at events and facilities around the world. Although we maintain security measures at our premises and insurance, valuable property may be subject to damage or theft. The damage or theft of valuable property despite these security measures and insurance could have a material adverse impact on our business and reputation.
If we are unable to maintain or obtain our dealer licenses, auctioneer licenses, and/or other applicable permits and licenses as required in certain jurisdictions in which we operate, or plan to operate, such licensing issues may adversely impact the business results of operation, and financial condition of our Marketplace business.
Several businesses underneath our Marketplace business operate under a dealer license, auctioneer license, and/or other permits and licenses in certain jurisdictions in which we operate as a dealer, auction house, lender, or intermediary to facilitate the auction, sale, purchase, or financing of collector cars. Our inability to maintain the necessary licenses or permits as required in those jurisdictions may adversely impact the business, results of operations, and financial condition of our Marketplace business. Also, our inability to obtain the necessary licenses or permits as required in new jurisdictions in which we plan to operate may adversely impact the growth of the business, results of operations, and financial condition.
The limited operating history of BAC may not represent BAC’s future operating results, as minimal loan losses on the BAC loan portfolio to date may not be indicative of future loan loss experience and our ability to realize proceeds from the sale of collateral for BAC loans may be delayed or limited.
BAC, our wholly owned collector car financing business, has a limited operating history and has incurred minimal losses on its loan portfolio. Accordingly, despite our conservative loan underwriting standards, our current loan loss experience may not be indicative of the future performance of the loan portfolio. In situations when there are competing claims on the collateral or mispricing of the collateral value for BAC loans and/or when a borrower and/or the collateral becomes subject to a dispute, including but not limited to bankruptcy, litigation or insolvency laws, our ability to realize proceeds from the sale of collateral may be limited and/or delayed.
Changes to tax laws may affect the volume of collector vehicle inventory available for our Marketplace business, and increase our compliance risks.
Our collectors reside in various tax jurisdictions. Changes to tax laws or tax reporting obligations in any of these jurisdictions could adversely impact the ability and/or willingness of our collectors to sell or purchase collector cars. Additionally, we are subject to laws and regulations involving sales, use, and other indirect taxes which are assessed by various governmental authorities and imposed on certain transactions between us and our collectors. Changes to the laws and regulations involving such sales, use, and other indirect taxes could increase the complexity of our compliance obligations. Generally, we are not responsible for these indirect tax liabilities unless we fail to collect the appropriate amount of sales, use, or other indirect taxes or applicable tax exemption documentation. Failure to collect the correct amount of indirect tax or applicable tax exemption documentation on a transaction may expose us to claims from tax authorities.
Legal, Regulatory and Political Risks
The legal and regulatory requirements applicable to our business are extensive. If we are not able to comply, it could have an adverse effect on us. Extensive regulation and potential further restrictive regulation could increase our operating costs and limit our growth.
We are subject to extensive laws, regulations, and supervision in the jurisdictions in which we transact business. These laws are complex and subject to change. Changes can sometimes lead to additional expenses, increased legal exposure, increased required capital and surplus, delays in implementing desired rate increases or business operations, and additional limits on our ability to grow or achieve targeted goals and profitability. Our business is highly dependent on the ability to engage on a daily basis in financial and operational activities, many of which are highly complex, including, but not limited to, insurance underwriting, claim processing, and providing products and services to businesses and consumers in a hospitable and efficient manner. These activities are subject to internal guidelines and policies, as well as legal and regulatory requirements, including, but not limited to, those related to:
•data privacy and security;
•anti-corruption and anti-bribery;
•domestic and international economic sanctions;
•restrictions on advertising and marketing;
•restrictions on rebating and inducements related to insurance transactions;
•restrictions on sharing insurance commissions and payments of referral fees;
•restrictions related to underwriting and pricing of insurance;
•approval of policy forms and premiums;
•restrictions on the adjustment and settlement of insurance claims;
•restrictions on the sale, solicitation, and negotiation of insurance;
•rules regarding licensing, affiliations, and appointments;
•state-mandated premium rebates, refunds, or reductions as a result of potentially lower risk exposure due to emergency orders;
•regulation of registered securities, corporate governance and risk management; and
•periodic examinations of operations, finances, market conduct and claims practices.
While we believe that we have adopted adequate and effective risk management and compliance programs, compliance risks remain, especially as we become subject to additional rules and regulations. The requirement to oversee and monitor the increasing speed and volume of regulatory changes could hinder our ability to appropriately review, analyze, and implement processes to ensure compliance in a timely manner. Failure to comply with, or to obtain, appropriate authorizations or exemptions under any applicable laws and regulations could result in restrictions on our ability to do business or undertake activities that are regulated in one or more of the jurisdictions in which we conduct business. Any such failure could also subject us to fines, penalties, equitable relief, and changes to our business practices.
Future regulatory changes could limit or impact our business model.
Compliance with applicable laws and regulations is time consuming and personnel- and systems-intensive. The current political environment, and the current high level of government intervention and regulatory reform may lead to substantial new regulations and compliance obligations. Any changes in, or the enactment of new, applicable laws and regulations may increase the complexity of the regulatory environment in which we operate, which could materially increase our direct and indirect compliance costs and other expenses of doing business and have a material adverse effect on financial condition and results of operations. Although state insurance regulators have primary responsibility for administering and enforcing insurance regulations in the U.S., such laws and regulations are further administered and enforced by a number of additional governmental authorities, each of which exercises a degree of interpretive latitude, including state securities administrators; state attorneys general, as well as federal agencies including the SEC, the Financial Industry Regulatory Authority, the Federal Reserve Board, the Federal Insurance Office, the U.S. Department of Labor, the U.S. Department of Justice, and the National Labor Relations Board. Similarly, there are governmental authorities in U.K., such as the Financial Conduct Authority; the BMA in Bermuda; and numerous federal and provincial governmental and oversight organizations in Canada. Consequently, compliance with any particular regulator’s or enforcement authority’s interpretation of a legal issue may not result in compliance with another’s interpretation of the same issue, particularly when compliance is judged in hindsight. Such regulations or enforcement actions are often responsive to current consumer and political sensitivities, which may arise after a major event. Such rules and regulations may result in rate suppression, limit our ability to manage our exposure to unprofitable or volatile risks, or lead to fines, premium refunds, or other adverse consequences.
The federal government may also regulate aspects of our business, such as the protection of consumer confidential information or the use of consumer insurance (credit) scores to underwrite and assess the risk of customers under the Fair Credit Reporting Act ("FCRA") in the U.S. Among other things, for insurance purposes, the FCRA requires that (i) there is a permissible purpose before obtaining and using a consumer report for underwriting purposes, and (ii) there is compliance with related notice and recordkeeping requirements. Failure to comply with federal requirements under the FCRA or any other applicable federal laws could subject us to regulatory fines and other sanctions. In addition, there is risk that a particular regulator’s or enforcement authority’s interpretation of a legal issue or the scope of a regulator’s authority may change over time to our detriment. There is also a risk that changes in the overall legal environment may cause us to change our views regarding the actions we need to take from a legal risk management perspective. This would necessitate changes to our practices that may adversely impact our business.
Legal or regulatory requirements impacting the use of personal data may impact how we interact with our insurance customers and how we market to future Members, and could have an adverse effect on our business, financial condition and operations.
We are subject to insurance regulatory requirements in the handling of personal data of our insurance customers and applicants in the jurisdictions in which we operate. Existing and future Privacy Laws applicable to our regulated insurance activities may impact our ability to: (i) interact with existing insureds; (ii) effectively market to future insurance customers; and, (iii) cross-sell additional products and services.
Laws and regulations govern how insurance related personal data can be collected, used, shared, transferred, and stored. As new Privacy Laws, regulations and expectations are adopted, our compliance obligations may increase, and our ability to market to and reach Members may be impacted, potentially leading to lower revenue and Member growth. We are subject to government regulatory authorities’ power to impose fines and penalties in their interpretation and enforcement of insurance regulations regarding our processing and use of personal data. Such authorities may require us to incur substantial costs in order to comply with such laws and regulations. Laws and regulations are broad in scope and subject to differing interpretations. In some areas of our business, we act on the basis of our own or the industry’s interpretations of applicable laws or regulations, which may conflict from jurisdiction to jurisdiction. In the event those interpretations prove different from the interpretations of regulatory authorities, we may be penalized or precluded from carrying on our previous activities. Additionally, we may be exposed to plaintiffs bringing class action claims. We cannot be sure that our practices have complied, currently comply, or will comply fully with all such laws and regulations. Any failure, or perceived failure, by us to comply with any of these laws or regulations could result in damage to our reputation, a loss in business, and proceedings or actions against us by governmental entities or private litigants. Any such proceedings or actions require us to spend significant amounts in defense of these proceedings or actions, distract our management, increase our costs of doing business, decrease the use of our mobile application or website by consumers and suppliers, and may result in the imposition of monetary liability. We may also be contractually liable to indemnify and hold harmless third parties from the costs or consequences of non-compliance with any such laws or regulations. Our insurance coverage relating to any data security and privacy damages and claim expenses may not be sufficient to compensate for all liabilities we may incur.
Our intellectual property rights are extremely valuable and if they are not properly protected, our products, services, and brand could be adversely impacted.
As we continue expanding our development of intellectual property across all channels, we may be unable to adequately protect and/or obtain appropriate rights, leading to increased risk. Competitors may target certain products or services and seek to assert competing rights. If appropriate contractual measures are not maintained, employees, contractors, and vendors may divulge trade secrets or claim ownership over our intellectual property.
New legislation or legal requirements impacting the use of petroleum-based vehicles and/or supporting autonomous vehicles could significantly challenge and impact our core insurance model and company purpose.
A significant majority of our Members currently drive gas-powered vehicles and engage in automotive enthusiast activities where they are able to drive and enjoy their vehicles. Changes in the law that create higher barriers to the use and enjoyment of their vehicles may in turn reduce the need or desire for many of our products and services, leading to lost revenue and lower profits and the inability to deliver on our purpose in an impactful manner.
Risks Related to Ownership of Our Securities
Our stock may be diluted by future issuances of additional Class A Common Stock in connection with our incentive plans, acquisitions or otherwise; future sales of such shares in the public market or the expectations that such sales may occur could lower our stock price.
We may issue additional shares of Class A Common Stock in several ways:
By the Board of Directors (the "Board"). Our Amended and Restated Charter authorizes us to issue shares of our Class A Common Stock and options, rights, warrants and appreciation rights relating to our Class A Common Stock and on the terms and conditions established by our Board in its sole discretion, whether in connection with acquisitions or otherwise.
Under the 2021 Equity Incentive Plan. We have reserved 38,317,399 shares of Class A Common Stock for issuance under our 2021 Equity Incentive Plan (as defined in Note 21 — Share-Based Compensation in Item 8 of Part II of this Annual Report). As of December 31, 2023, we have issued 965,517 shares under this Plan.
Under the 2021 Employee Stock Purchase Plan. We have reserved 11,495,220 shares of Class A Common Stock for issuance under our 2021 Employee Stock Purchase Plan (as defined in Note 21 — Share-Based Compensation in Item 8 of Part II of this Annual Report). As of December 31, 2023, we have issued 197,819 shares under this Plan.
Under the Contribution and Exchange Agreement. We reserved 4,724,560 shares of Class A Common Stock for exchange under our Contribution and Exchange Agreement (as defined within the Sixth Amended and Restated Limited Liability Company Agreement of The Hagerty Group, incorporated by reference within Item 6. Exhibits, in this Annual Report). As of December 31, 2023, we have exchanged 259,302 shares under the Contribution and Exchange Agreement.
The compensation committee of our Board may determine the exact number of shares to be reserved for future issuance under its equity incentive plans at its discretion. We will file one or more registration statements on Form S-8 under the Securities Act to register shares of Common Stock or securities convertible into or exchangeable for shares of Common Stock issued pursuant to our equity incentive plans. Any such Form S-8 registration statements will automatically become effective upon filing. Accordingly, shares registered under such registration statements will be available for sale in the open market.
Any stock that we issue or exchange would dilute the percentage ownership held by the investors who purchase Class A Common Stock. The market price of shares of our Class A Common Stock could decline as a result of newly issued or exchanged stock, or the perception that we might issue or exchange stock. A decline in the price of our Class A Common Stock might impede our ability to raise capital through the issuance of additional shares of Class A Common Stock or other equity securities.
Substantial blocks of our total outstanding shares may be sold into the market. If there are substantial sales of shares of our Class A Common Stock, the price of our Class A Common Stock could decline.
The price of our Class A Common Stock could decline if there are substantial sales of our Class A Common Stock, particularly sales by our directors, executive officers, and significant stockholders, or if there is a large number of shares of our Class A Common Stock available for sale. As of March 1, 2024, we have 84,655,539 shares of our Class A Common Stock outstanding. All of the shares of Class A Common Stock sold at the completion of our Business Combination are available for sale in the public market. Shares held by directors, executive officers and other affiliates are subject to volume limitations under Rule 144 under the Securities Act of 1933, as amended, or the Securities Act, and various vesting agreements.
The market price of the shares of our Class A Common Stock could decline as a result of the sale of a substantial number of our shares of Class A Common Stock in the public market or the perception in the market that the holders of a large number of such shares intend to sell their shares.
Certain warrants to purchase our Class A Common Stock are now exercisable and could become exercisable in 2024, which could increase the number of shares eligible for future resale in the public market and result in dilution to our stockholders.
PIPE Warrants to purchase an aggregate of 12,147,300 shares of Class A Common Stock became exercisable on the 30th day following the closing of the Business Combination in accordance with the terms of the warrant agreement governing those securities. In addition, Public Warrants to purchase an aggregate of 5,750,000 shares of Class A Common Stock and Underwriter Warrants to purchase an aggregate of 28,750 shares of Class A Common Stock became exercisable on April 12, 2022 in accordance with the warrant agreement covering those securities. Each such PIPE Warrant, Underwriter Warrant and Public Warrant entitles its holder to purchase one share of Class A Common Stock at an exercise price of $11.50 per share and will expire at 5:00 p.m., New York time, five years after the closing of the Business Combination or earlier upon redemption or our liquidation. In addition, the Private Placement Warrants and OTM Warrants became exercisable on December 2, 2022, subject to the achievement of certain trading thresholds pursuant to the terms of the Sponsor Warrant Lock-up Agreement. To the extent warrants are exercised, additional shares of Class A Common Stock will be issued, which will result in dilution to our then existing stockholders and increase the number of shares eligible for resale in the public market. Sales of substantial numbers of such shares in the public market could depress the market price of our common stock.
We qualify as an "emerging growth company" within the meaning of the Securities Act, and if we take advantage of certain exemptions from disclosure requirements available to emerging growth companies, it could make our securities less attractive to investors and may make it more difficult to compare our performance to the performance of other public companies.
We qualify as an "emerging growth company" as defined in Section 2(a)(19) of the Securities Act, as modified by the JOBS Act. As such, we are eligible for and intend to take advantage of certain exemptions from various reporting requirements applicable to other public companies that are not emerging growth companies for as long as we continue to be an emerging growth company, including (i) the exemption from the auditor attestation requirements with respect to internal control over financial reporting under Section 404(b) of the Sarbanes-Oxley Act of 2002, as amended ("Sarbanes-Oxley") and (ii) the exemptions from say-on-pay, say-on-frequency and say-on-golden parachute voting requirements and (iii) reduced disclosure obligations regarding executive compensation in its periodic reports and proxy statements. We will remain an emerging growth company until the earliest of (i) the last day of the fiscal year in which the market value of Class A Common Stock that is held by non-affiliates exceeds $700 million as of June 30 of that fiscal year, (ii) the last day of the fiscal year in which we have total annual gross revenue of $1.235 billion or more during such fiscal year (as indexed for inflation), (iii) the date on which we have issued more than $1 billion in non-convertible debt in the prior three-year period or (iv) December 31, 2026. In addition, Section 107 of the JOBS Act also provides that an emerging growth company can take advantage of the exemption from complying with new or revised accounting standards provided in Section 7(a)(2)(B) of the Securities Act as long as we are an emerging growth company. An emerging growth company can therefore delay the adoption of certain accounting standards until those standards would otherwise apply to private companies. We intend to avail ourselves of such extended transition period and, therefore, we may not be subject to the same new or revised accounting standards as other public companies that are not emerging growth companies or that have opted out of using such extended transition period. Investors may find the Class A Common Stock less attractive because we will rely on these exemptions, which may result in a less active trading market for the Class A Common Stock and its price may be more volatile.
We qualify as, and have elected to be treated as, a "controlled company" within the meaning of the NYSE listing standards and, as a result, our stockholders may not have certain corporate governance protections that are available to stockholders of companies that are not controlled companies.
So long as more than 50% of the voting power for the election of directors is held by an individual, a group, or another company, we will qualify as a "controlled company" under the NYSE listing requirements. As of December 31, 2023, HHC controls approximately 67.7% of the voting power of our outstanding capital stock. As a result, we qualify as, and elect to be treated as, a "controlled company" under the NYSE listing standards and will not be subject to the requirements that would otherwise require us to have: (i) a majority of "independent directors," as defined under the listing standards of the NYSE; (ii) a nominating committee comprised solely of independent directors; (iii) compensation of our executive officers determined by a majority of the independent directors or a compensation committee comprised solely of independent directors; and (iv) director nominees selected, or recommended for the board of directors’ selection, either by a majority of the independent directors or a nominating committee comprised solely of independent directors.
HHC may have its interest diluted due to future equity issuances or its own actions in selling shares of common stock, in each case, which could result in a loss of the "controlled company" exemption under the NYSE listing rules. We would then be required to comply with those provisions of the NYSE listing requirements.
The dual class structure of our common stock may adversely affect the trading market for our Class A Common Stock.
S&P Dow Jones and FTSE Russell limit their eligibility criteria for inclusion of shares of public companies on certain indices, including the S&P 500, namely, to exclude companies with multiple classes of shares of common stock from being added to such indices. In addition, several stockholder advisory firms have announced their opposition to the use of multiple class structures. As a result, the dual class structure of our common stock may prevent the inclusion of our Class A Common Stock in such indices and may cause stockholder advisory firms to publish negative commentary about our corporate governance practices or otherwise seek to cause us to change our capital structure. Any such exclusion from indices could result in a less active trading market for our Class A Common Stock. Any actions or publications by stockholder advisory firms critical of our corporate governance practices or capital structure could also adversely affect the value of our Class A Common Stock.
The dual class structure of our common stock will have the effect of concentrating voting power with two stockholders, which will limit your ability to influence the outcome of important transactions, including a change in control.
Our Class V Common Stock has 10 votes per share and our Class A Common Stock has one vote per share. Markel and HHC, who currently hold all of the Class V Common Stock, together will hold a substantial majority of the voting power of our outstanding capital stock. Because of the 10-to-1 voting ratio between our Class V and Class A Common Stock, the holders of our Class V Common Stock will collectively control a majority of the combined voting power of common stock and, therefore, will be able to control all matters submitted to our stockholders until the earlier of (i) 15 years from the date of the consummation of the Business Combination and (ii) the date on which such share of Class V Common Stock is transferred other than pursuant to a Qualified Transfer (as defined in our Amended and Restated Charter). This concentrated control will limit or preclude your ability to influence the outcome of important corporate matters, including a change in control, for the foreseeable future.
Transfers by holders of Class V Common Stock will generally result in those shares losing their super voting rights, subject to limited exceptions, such as certain transfers effected for estate planning or charitable purposes.
Our three largest stockholders hold significant voting power, have the right to designate directors to our Board and are entitled to preemptive rights with respect to the issuance of new Class A Common Stock, which provides these stockholders with significant power to influence our business and affairs.
Our three largest stockholders are HHC, Markel and State Farm. HHC controls approximately 67.7% of the voting power, Markel controls approximately 29.0% of the voting power, and State Farm controls approximately 2.1% of the voting power. Pursuant to the terms of the Investor Rights Agreement among HHC, Markel and State Farm, HHC has the right to designate two directors to our Board, and Markel and State Farm have each designated one director to our Board. Pursuant to the Investor Rights Agreement, each of HHC, Markel and State Farm has agreed to vote for the election of any director nominated by HHC, Markel and State Farm in furtherance of the director designation rights described above. As a consequence, at present, the re-election in 2024 of the directors designated by HHC, Markel and State Farm is assured.
Moreover, under the terms of the Investor Rights Agreement, each of HHC, Markel and State Farm has a contractual preemptive right. Specifically, under the terms of the Investor Rights Agreement, for so long as HHC, Markel and State Farm, as applicable, are entitled to nominate a director, each of HHC, Markel and State Farm, as applicable, subject to certain conditions, has a preemptive right to purchase up to the amount of any new securities we propose to issue or sell as is necessary to maintain the relative pro rata ownership position (determined on a fully diluted basis at the time of determination) of HHC, Markel and State Farm, as applicable. Therefore, while other holders of our stock would risk suffering a reduction in percentage ownership in connection with a new issuance of securities by us, HHC, Markel and State Farm would, through this preemptive right, have the opportunity to avoid a reduction in percentage ownership. As long as HHC, Markel and State Farm continue to hold a significant portion of our outstanding common stock, each will have the ability to influence the vote in any election of directors and over decisions that require stockholder approval.
By virtue of their voting power and Board designation rights, preemptive right to purchase additional equity securities in future stock offerings and approval rights, HHC, Markel and State Farm, collectively and separately, have the power to significantly influence our business and affairs and the outcome of matters required to be submitted to stockholders for approval, including the election of our directors, amendments to our charter, mergers, or sales of assets. Their influence over our business and affairs may not be consistent with the interests of some or all of our other stockholders and might negatively affect the market price of our common stock.
We may redeem unexpired warrants prior to their exercise at a time that is disadvantageous to the holders of such warrants, thereby making such warrants worthless.
We have the ability to redeem outstanding warrants at any time after they become exercisable and prior to their expiration, at a price of $0.01 per warrant, provided that the last reported sales price of Class A Common Stock equals or exceeds $18.00 per share (as adjusted for stock splits, stock dividends, reorganizations, recapitalizations and the like) for any 20 trading days within a 30 trading-day period commencing once the warrants become exercisable and ending on the third trading day prior to the date on which we give proper notice of such redemption and provided certain other conditions are met. If and when the warrants become redeemable by us, we may not exercise our redemption right if the issuance of shares of Class A Common Stock upon exercise of the warrants is not exempt from registration or qualification under applicable state blue sky laws or we are unable to effect such registration or qualification. We will use our best efforts to register or qualify such shares of Class A Common Stock under the blue sky laws of the state of residence in those states in which the warrants were offered. Redemption of the outstanding warrants could force you (i) to exercise your Public Warrants and pay the exercise price therefor at a time when it may be disadvantageous for you to do so, (ii) to sell your warrants at the then-current market price when you might otherwise wish to hold your warrants or (iii) to accept the nominal redemption price which, at the time the outstanding warrants are called for redemption, is likely to be substantially less than the market value of your warrants. None of the Private Placement Warrants or Underwriter Warrants are redeemable by us so long as they are held by the Sponsor, FG SPAC Partners LP, the underwriter in Aldel's initial public offering, or their permitted transferees.
Because we have no current plans to pay cash dividends on our Class A Common Stock for the foreseeable future, you may not receive any return on investment unless you sell your Class A Common Stock for a price greater than that which you paid for it.
We intend to retain future earnings, if any, for future operations, expansion and debt repayment and there are no current plans to pay any cash dividends on our Class A Common Stock for the foreseeable future. The declaration, amount and payment of any future dividends on shares of our Class A Common Stock will be at the sole discretion of our Board. Our Board may take into account general and economic conditions, our financial condition and results of operations, our available cash and current and anticipated cash needs, capital requirements, contractual, legal, tax, and regulatory restrictions, implications on the payment of dividends by us to our stockholders or by our subsidiaries to us and such other factors as our Board may deem relevant. In addition, our ability to pay dividends is limited by covenants of our existing and outstanding indebtedness and may be limited by covenants of any future indebtedness we incur. As a result, you may not receive any return on an investment in our Class A Common Stock unless you sell our Class A Common Stock for a price greater than that which you paid for it.
Anti-takeover provisions in our organizational documents and applicable insurance laws could delay or prevent a change of control.
Certain provisions of our Amended and Restated Charter and Amended and Restated Bylaws may have an anti-takeover effect and may delay, defer or prevent a merger, acquisition, tender offer, takeover attempt or other change of control transaction that a stockholder might consider in its best interest, including those attempts that might result in a premium over the market price for the shares held by our stockholders.
These provisions provide for, among other things:
•the ability of our Board to issue one or more series of preferred stock;
•advance notice for nominations of directors by stockholders and for stockholders to include matters to be considered at our annual meetings;
•certain limitations on convening special stockholder meetings; and
•limiting the ability of stockholders to act by written consent;
These anti-takeover provisions could make it more difficult for a third party to acquire us, even if the third party’s offer may be considered beneficial by many of our stockholders. As a result, our stockholders may be limited in their ability to obtain a premium for their shares. These provisions could also discourage proxy contests and make it more difficult for you and other stockholders to elect directors of your choosing and to cause us to take other corporate actions you desire.
Further, the insurance laws applicable to our regulated insurance subsidiaries prohibit any person from acquiring direct or indirect control of us or our regulated insurance subsidiaries, generally defined as owning or having the power to vote 10% or more of our outstanding voting stock, without the prior written approval of state regulators.
Our Amended and Restated Charter designates the Court of Chancery of the State of Delaware as the sole and exclusive forum for certain types of actions and proceedings that may be initiated by our stockholders, which could limit our stockholders’ ability to obtain a favorable judicial forum for disputes with us or our directors, officers, employees or stockholders.
Our Amended and Restated Charter provides that, subject to limited exceptions, any (1) derivative action or proceeding brought on behalf of us under Delaware law, (2) action asserting a claim of breach of a fiduciary duty owed by any current or former director, officer, or other employee to us or our stockholders, (3) action asserting a claim against us, our directors, officers or other employees arising under the Delaware General Corporation Law ("DGCL"), our Amended and Restated Charter or our Amended and Restated Bylaws (in each case, as may be amended from time to time), (4) action asserting a claim against us or any of our directors, officers or other employees governed by the internal affairs doctrine of the State of Delaware or (5) other action asserting an "internal corporate claim," as defined in Section 115 of the DGCL, in all cases subject to the court having personal jurisdiction over all indispensable parties named as defendants shall, to the fullest extent permitted by law, be exclusively brought in the Court of Chancery of the State of Delaware or, if such court does not have subject matter jurisdiction thereof, another state or federal court located within the State of Delaware. Any person or entity purchasing or otherwise acquiring any interest in shares of our capital stock shall be deemed to have notice of and to have consented to the provisions of our Amended and Restated Charter described above. This choice of forum provision may limit a stockholder’s ability to bring a claim in a judicial forum that it finds favorable for disputes with us or our directors, officers or other employees, which may discourage such lawsuits against us and our directors, officers and employees. Alternatively, if a court were to find these provisions of our Amended and Restated Charter inapplicable to, or unenforceable in respect of, one or more of the specified types of actions or proceedings, we may incur additional costs associated with resolving such matters in other jurisdictions, which could adversely affect our business and financial condition.
There is no public market for the Series A Convertible Preferred Stock.
There is no established public trading market for the Series A Convertible Preferred Stock, and we do not expect a market to develop. The Series A Convertible Preferred Stock is not currently listed on any securities exchange or nationally recognized trading system, including the New York Stock Exchange, and we may choose not to apply to list it in the future. Without an active market, the liquidity of the Series A Convertible Preferred Stock will be limited.
Risks Related to Tax
We are a holding company, and our only material asset is our interest in The Hagerty Group, and we will therefore be dependent upon distributions made by The Hagerty Group to pay taxes, make payments under the TRA and pay other expenses.
We are a holding company with no material assets other than our ownership of The Hagerty Group units and our managing member interest in The Hagerty Group. As a result, we will have no independent means of generating revenue or cash flow. Our ability to pay taxes, make payments under the TRA and pay dividends (in the event that any dividends are declared) and other expenses will depend on the financial results and cash flows of The Hagerty Group and the distributions we receive from The Hagerty Group. Deterioration in the financial condition, earnings or cash flow of The Hagerty Group for any reason could limit or impair The Hagerty Group’s ability to pay such distributions. Additionally, to the extent that we need funds and The Hagerty Group is restricted from making such distributions under applicable law or regulation or under the terms of any financing arrangements, or The Hagerty Group is otherwise unable to provide such funds, it could materially adversely affect our liquidity and financial condition.
The Hagerty Group will be treated as a partnership for U.S. federal income tax purposes and, as such, generally will not be subject to any entity-level U.S. federal or state income tax. Instead, the taxable income of The Hagerty Group will be allocated to the members of The Hagerty Group, including us. Accordingly, we will be required to pay income taxes on our allocable share of any net taxable income of The Hagerty Group. Under the terms of The Hagerty Group, LLC Agreement, The Hagerty Group is obligated to make tax distributions to the members of The Hagerty Group (including us) calculated at certain assumed tax rates. In addition to tax expenses, we will also incur expenses related to our operations, including payment obligations under the TRA (and the cost of administering such payment obligations), which could be significant. We intend to cause The Hagerty Group to make distributions to the members of The Hagerty Group in amounts sufficient to cover all applicable taxes (calculated at assumed tax rates) and payments under the TRA. However, The Hagerty Group’s ability to make such distributions may be subject to various limitations and restrictions including, but not limited to, restrictions on distributions that would either violate any contract or agreement to which The Hagerty Group is then a party, including debt agreements, or any applicable law, or that would have the effect of rendering The Hagerty Group insolvent. If our cash resources are insufficient to meet our obligations under the TRA and to fund our obligations, we may be required to incur additional indebtedness to provide the liquidity needed to make such payments, which could materially adversely affect our liquidity and financial condition and subject us to various restrictions imposed by any such lenders. To the extent that we are unable to make payments under the TRA for any reason, such payments will be deferred and will accrue interest until paid; provided, however, that nonpayment for a specified period may constitute a breach of a material obligation under the TRA and therefore accelerate payments due under the TRA.
Hagerty, Inc. is required to pay Legacy Unit Holders and any other persons that become parties to the TRA for certain tax benefits we may receive and the amounts payable may be substantial.
In connection with the consummation of the Business Combination, Hagerty, Inc. entered into a TRA with HHC and Markel ("Legacy Unit Holders"). The Hagerty Group intends to have in effect an election under Section 754 of the Internal Revenue Code ("IRC") for each taxable year in which TRA exchanges occur, which is expected to result in adjustments to the tax basis of the assets of The Hagerty Group as a result of such TRA exchanges. The TRA generally provides for the payment by Hagerty, Inc. to Legacy Unit Holders of 85% of the cash tax benefits, if any, realized as a result of (i) tax basis adjustments resulting from TRA exchanges in connection with or following the Business Combination, (ii) certain other tax benefits related to entering into the TRA, including tax benefits attributable to making payments under the TRA. We expect that the payments required under the TRA could be substantial. Estimating the amount and timing of realization of tax benefits subject to the TRA is by its nature imprecise.
Payments under the TRA will be based on the tax reporting positions determined, and the Internal Revenue Service ("IRS") or another tax authority may challenge all or a part of the existing tax basis, tax basis increases, or other tax attributes subject to the TRA, and a court could sustain such challenge. The parties to the TRA will not reimburse Hagerty, Inc. for any payments previously made if such tax basis or other tax benefits are subsequently disallowed, except that any excess payments made to a party under the TRA will be netted against future payments otherwise to be made under the TRA, if any, after the determination of such excess. In addition, the TRA provides that if (1) Hagerty, Inc. breaches any material obligations under the TRA (including in the event payments are more than three months late under the TRA, subject to certain exceptions), (2) Hagerty, Inc. is subject to certain bankruptcy, insolvency or similar proceedings, or (3) at any time, Hagerty, Inc. may elect an early termination of the TRA, the obligations under the TRA (with respect to all The Hagerty Group units, whether or not such units have been exchanged or redeemed before or after such transaction) would accelerate and become payable in a lump sum amount equal to the present value of the anticipated future tax benefits calculated based on certain assumptions, including that Hagerty, Inc. would have sufficient taxable income to fully utilize the deductions arising from the tax deductions, tax basis and other tax attributes subject to the TRA.
The TRA also provides that, upon certain changes of control or other significant transactions, in the discretion of HHC and Markel, obligations under the TRA may be accelerated and become payable in a lump sum as described above. Such acceleration would be based on certain assumptions, including that Hagerty, Inc. would have sufficient taxable income to fully utilize the increased tax deductions and tax basis and other benefits covered by the TRA. As a result, upon any acceleration of the obligations under the TRA (including a change of control), Hagerty, Inc. could be required to make payments under the TRA that are greater than 85% of actual cash tax savings, which could negatively impact liquidity. The change of control provisions in the TRA may also result in situations where HHC and Markel have interests that differ from or are in addition to those of our Class A stockholders.
To the extent we receive tax distributions in excess of our actual tax liabilities and retain such excess cash, HHC and Markel may benefit from such accumulated cash balances if they exercise their exchange rights.
Under the terms of The Hagerty Group LLC Agreement, The Hagerty Group is obligated to make tax distributions to the members of The Hagerty Group calculated at certain assumed tax rates. Because tax distributions will be made pro rata based on ownership and due to, among other items, differences between the tax rates applicable to us and the assumed individual income tax rate used in the calculation and requirements under the applicable tax rules that The Hagerty Group’s net taxable income be allocated disproportionately to its unit holders in certain circumstances, tax distributions may significantly exceed the actual tax liability for certain The Hagerty Group unit holders. If Hagerty, Inc. retains the excess cash we receive, Markel and HHC could benefit from any value attributable to such accumulated cash balances as a result of their rights under the Exchange Agreement with the Legacy Unit Holders.
If The Hagerty Group were to become a publicly traded partnership taxable as a corporation for U.S. federal income tax purposes, we and The Hagerty Group might be subject to potentially significant tax inefficiencies, and we would not be able to recover payments previously made by us under the TRA even if the corresponding tax benefits were subsequently determined to have been unavailable due to such status.
The Hagerty Group intends to operate such that it does not become a publicly traded partnership taxable as a corporation for U.S. federal income tax purposes. A "publicly traded partnership" is a partnership the interests of which are listed for trading on an established securities market or are readily tradable on a secondary market or the substantial equivalent thereof. Applicable U.S. Treasury regulations provide for certain safe harbors from treatment as a publicly traded partnership, and The Hagerty Group intends to operate such that it will qualify for one or more of such safe harbors, although it may be unable to do so.
If The Hagerty Group were to become a publicly traded partnership taxable as a corporation for U.S. federal income tax purposes, significant tax inefficiencies might result for Hagerty, Inc. and for The Hagerty Group, for example, if Hagerty, Inc. is not able to file a consolidated U.S. federal income tax return with The Hagerty Group. In addition, Hagerty, Inc. may not be able to realize tax benefits covered under the TRA, and Hagerty, Inc. would not be able to recover any payments previously made under the TRA, even if the corresponding tax benefits (including any claimed increase in the tax basis of The Hagerty Group’s assets) were subsequently determined to have been unavailable.
Increases in applicable tax rates, changes in applicable tax laws or disagreements with tax authorities can adversely affect our business, financial condition and results of operations.
Hagerty, Inc. will have no material assets other than the interest in The Hagerty Group, which holds, directly or indirectly, all of the operating assets of The Hagerty Group’s business. The Hagerty Group, with the exception of certain corporate subsidiaries, will not be subject to U.S. federal or state income tax. Hagerty, Inc. is a U.S. corporation that will be subject to U.S. corporate income tax on our worldwide operations, including our allocable share of any net taxable income of The Hagerty Group. We will be subject to various U.S. federal, state and local taxes, in addition to taxes in other countries.
New U.S. laws and policy relating to income and non-income-based taxes may have an adverse effect on our business and future profitability. Further, existing U.S. tax laws, statutes, rules, regulations or ordinances could be interpreted, changed, modified or applied adversely to us. Increases in income tax rates or other changes in income tax laws in any particular jurisdiction in which we operate or are otherwise subject to tax can reduce our after-tax income from such jurisdiction and adversely affect our business, financial condition or results of operations. Existing tax laws have been and could in the future be subject to significant change.
We will be subject to reviews, examinations and audits by the IRS and other taxing authorities with respect to income and non-income-based taxes. Economic and political pressures to increase tax revenues in jurisdictions in which we operate, or the adoption of new or reformed tax legislation or regulation, may make resolving tax disputes more difficult and the final resolution of tax audits and any related litigation can differ from The Hagerty Group’s historical provisions and accruals, resulting in an adverse impact on our business, financial condition or results of operations.
Additionally, the provision for income taxes involves a significant amount of judgement regarding the interpretation of relevant facts and laws in the jurisdictions in which we operate. Our income tax expense and recorded tax balances can change significantly between periods due to a number of complex factors including but not limited to, changes in the valuation of our deferred tax assets and liabilities as well as increases or decreases to valuation allowances recorded against our deferred tax assets.
General Risk Factors
The price of our securities may be volatile or may decline regardless of our operating performance and you could lose all or part of your investment as a result.
The trading price of our common stock and warrants is likely to be volatile. The stock market recently has experienced extreme volatility. This volatility often has been unrelated or disproportionate to the operating performance of particular companies. You may not be able to resell your shares or warrants at an attractive price due to a number of factors such as those listed elsewhere in this "Risk Factors" section and this Annual Report, as well as the following:
•results of operations that vary from the expectations of securities analysts and investors;
•results of operations that vary from those of our competitors;
•public float and trading volume of our securities is low;
•changes in expectations as to our future financial performance, including financial estimates and investment recommendations by securities analysts and investors;
•declines in the market prices of stocks generally;
•strategic actions by us or our competitors;
•announcements by us or our competitors of significant contracts, acquisitions, joint ventures, other strategic relationships or capital commitments;
•any significant change in our management;
•changes in general economic or market conditions or trends in our industry or markets;
•changes in business or regulatory conditions, including new laws or regulations or new interpretations of existing laws or regulations applicable to our business;
•future sales of our Common Stock or other securities;
•investor perceptions or the investment opportunity associated with our Common Stock relative to other investment alternatives;
•the public’s response to press releases or other public announcements by us or third parties, including our filings with the SEC;
•litigation involving us, our industry, or both, or investigations by regulators into our operations or those of our competitors;
•guidance, if any, that we provide to the public, any changes in this guidance or our failure to meet this guidance;
•the development and sustainability of an active trading market for our Common Stock;
•actions by institutional or activist stockholders;
•changes in accounting standards, policies, guidelines, interpretations or principles; and
•other events or factors, including those resulting from pandemics or epidemics, natural disasters, war, acts of terrorism or responses to these events.
These broad market and industry fluctuations may adversely affect the market price of our Class A Common Stock and Public Warrants, regardless of our actual operating performance.
In the past, following periods of market volatility, stockholders have instituted securities class action litigation. If we were involved in securities litigation, it could have a substantial cost and divert resources and the attention of executive management from our business regardless of the outcome of such litigation.
If securities or industry analysts do not publish research or publish inaccurate or unfavorable research reports about our business, or if they downgrade our stock or our sector, our stock price and trading volume could decline.
The trading market for our Class A Common Stock will rely in part on the research and reports that industry or financial analysts publish about us or our business. We will not control these analysts. In addition, some financial analysts may have limited expertise with our business model and operations. Furthermore, if one or more of the analysts who do cover us downgrade our stock or industry, or the stock of any of our competitors, or publish inaccurate or unfavorable research about our business, the price of our stock could decline. If one or more of these analysts ceases coverage of us or fails to publish reports on it regularly, we could lose visibility in the market, which in turn could cause our stock price or trading volume to decline.
ITEM 1B. UNRESOLVED STAFF COMMENTS
None.
ITEM 1C. CYBERSECURITY
Risk Management and Strategy
Our cybersecurity strategy is predicated on a risk-based approach, which is continuously informed by the standards provided by organizations such as the American Institute of Certified Public Accountants, the National Institute of Standards and Technology ("NIST"), the International Organization for Standardization, the Payment Card Industry, and others. Cybersecurity represents an important input to our overall approach to enterprise risk management ("ERM").
Our cybersecurity program is based on a framework designed to safeguard the confidentiality, integrity, and availability of our information assets. This program encompasses enterprise security policies, procedures, and technical measures to manage risks, protect sensitive data, and ensure compliance with relevant regulations. Our information security program utilizes a layered defense approach where components such as risk assessments, access controls, network security, encryption, employee training, and continuous monitoring and response processes provide layers of protection for our systems and assets.
As part of our cybersecurity program, our information security team identifies and assesses material risks based on the NIST risk assessment model and then collaborates with internal business and technical partners to proactively create internal risk treatment plans that address identified risk exposures. In addition, we assess and manage cybersecurity risks through an incident security program which consolidates input from three primary departments, including our ERM department, which operates out of the Office of the Chief Financial Officer, our Privacy department which operates out of the Office of the Chief Legal Officer, and the Information Security department which operates out of the Office of the Chief Information Officer ("CIO"). Together, these departments provide subject matter expertise and specialized resources to deliver concentric layers of risk management and defense against both internal and external threats.
In addition, our cybersecurity program includes third-party cyber risk assessments which evaluate the security posture of our vendors and partners to mitigate potential vulnerabilities introduced through external connections. Data loss prevention controls are systematically implemented to prevent unauthorized data exfiltration and to protect sensitive information from compromise.
Our information security program undergoes assessments conducted by both internal and external experts. The outcomes of these evaluations are communicated to senior management and the Board for review.
Governance
The Board, through the Audit Committee, oversees our risk assessment and risk management activities, including our cybersecurity program. The Audit Committee receives periodic reports from our CIO and is notified any time our incident security program has determined that a cybersecurity incident is material or requires reporting to a regulatory body. Further, the Chair of the Audit Committee is regularly informed of both material and non-material cybersecurity risks and incidents.
Our cybersecurity program is led by an experienced CIO and an experienced Chief Information Security Officer ("CISO"). Our CIO has extensive experience in our industry with over 30 years of information technology experience, including extensive experience leading large global teams at several companies in his tenure. Our CISO has over 35 years of information technology experience, including 24 years of experience as a CISO leading large cybersecurity teams at four different insurance companies. Our CISO also has several industry recognized designations.
As part of our cybersecurity risk management program, our information security department identifies, assesses, and manages cybersecurity risks, whether material or non-material. Through our Information Security department, the CIO
and CISO work to ensure that key stakeholders are informed about the prevention, detection, mitigation, and remediation of cybersecurity risks and incidents.
We have established and maintain incident response and recovery plans that address the detection, reporting, analysis, response, recovery, communication, documentation, and post-incident review of cybersecurity incidents. We periodically test and evaluate such plans on a routine basis.
As of the date of this Annual Report, we do not believe that any risks from cybersecurity threats, including as a result of previous cybersecurity incidents, are reasonably likely to have a material adverse effect on us, our business strategy, results of operations, or financial condition.
ITEM 2. PROPERTIES
Our corporate headquarters are located in Traverse City, Michigan, and consist of approximately 109,500 square feet of office space at the main campus location under a lease agreement that expires in March 2036. In the U.S., we lease additional office space in Ohio, Colorado, Connecticut, and Michigan. Internationally, we lease offices in Canada, the U.K. and Germany. We believe our facilities are adequate and suitable for our current needs and that, should it be needed, suitable additional or alternative space will be available to accommodate our operations.
In 2022, Hagerty approved an initiative to increase operational efficiencies and flexibility by transitioning to a "remote first" work model for employees. As a result, we have subleased a portion of our office space in Ohio and Canada and intend to sublease portions of our office space in Colorado, Connecticut, and Michigan.
In addition, we have three Hagerty Garage + Social locations in the U.S., which includes one location in California, and two locations in Florida. In Canada, we have one location in Ontario.
ITEM 3. LEGAL PROCEEDINGS
From time to time, we are involved in various claims and legal actions that arise in the ordinary course of business. Although the results of litigation and claims cannot be predicted with certainty, we do not believe that the ultimate resolution of these actions will have a material adverse effect on our financial position, results of operations, liquidity or capital resources.
Future litigation may be necessary to defend ourselves and our partners by determining the scope, enforceability and validity of third party proprietary rights or to establish our proprietary rights. The results of any current or future litigation cannot be predicted with certainty, and regardless of the outcome, litigation can have an adverse impact on us because of defense and settlement costs, diversion of management resources and other factors.
Refer to Note 24 — Commitments and Contingencies in Item 8 of Part II of this Annual Report for additional information related to legal proceedings.
ITEM 4. MINE SAFETY DISCLOSURES
Not applicable.
PART II
ITEM 5. MARKET FOR REGISTRANT'S COMMON EQUITY, RELATED STOCKHOLDER MATTERS AND ISSUER PURCHASES OF EQUITY SECURITIES
Market Information
Our Class A Common Stock and Public Warrants are traded on the NYSE under the symbols "HGTY" and "HGTY.WS", respectively.
Stockholders of Record
As of March 1, 2024, there were 12 record holders of our Class A Common Stock and two record holders of our Class V Common Stock. Additionally, there were 15 record holders of our PIPE Warrants, two record holders of our OTM Warrants and nine record holders of our Public Warrants, Private Placement Warrants and Underwriter Warrants, in the aggregate, as of March 1, 2024. The number of record holders does not include persons who held shares of our common stock or warrants in nominee or "street name" accounts through brokers.
Dividend Policy
We do not currently intend to pay cash dividends on our Class A Common Stock. Any declaration and payment of dividends will be at the sole discretion of our Board, which may change our dividend policy at any time. Our Board will take into account:
•general economic and business conditions;
•our results of operations and financial condition;
•our available cash and current and anticipated cash needs;
•our capital requirements;
•contractual, legal, tax and regulatory restrictions and implications on the payment of dividends by us to our stockholders or by our subsidiaries (including The Hagerty Group) to us; and
•such other factors as our Board may deem relevant.
Subject to funds being legally available, we intend to cause The Hagerty Group to make pro rata distributions to the other unit holders and us in an amount at least sufficient to allow us and the other unit holders to pay all applicable taxes, to make payments under the TRA we entered into with The Hagerty Group unit holders and to pay our corporate and other overhead expenses.
Hagerty, Inc. is a holding company and does not have material assets other than its ownership of units of The Hagerty Group, and as a consequence, our ability to declare and pay dividends to the holders of our Class A Common Stock is subject to the ability of The Hagerty Group to provide distributions to us. If The Hagerty Group makes such distributions, The Hagerty Group unit holders will be entitled to receive pro-rata distributions from The Hagerty Group. However, because we must pay taxes, make payments under the TRA, and pay our expenses, amounts ultimately distributed as dividends to holders of our Class A Common Stock are expected to be less than the amounts distributed by The Hagerty Group to its unit holders on a per share basis.
Assuming The Hagerty Group makes distributions to its members in any given year, the determination to pay dividends, if any, to holders of our Class A Common Stock out of the portion, if any, of such distributions remaining after our payment of taxes, TRA payments and expenses (any such portion, an "excess distribution") will be made by our Board. Because our Board may determine to pay or not pay dividends to holders of our Class A Common Stock, holders of our Class A Common Stock may not necessarily receive dividend distributions relating to excess distributions, even if The Hagerty Group makes such distributions to us.
Stock Performance Graph
The following shall not be deemed to be "soliciting material" or to be "filed" with the SEC for purposes of Section 18 of the Exchange Act, or otherwise subject to the liabilities under that Section, and shall not be deemed to be incorporated by reference into any of our other filings under the Securities Act or the Exchange Act.
The performance presentation shown below is being furnished as required by applicable rules of the SEC and was prepared using the following assumptions:
•A $100 investment was made in our Class A Common Stock, the Russell 2000 and our peer group as of December 3, 2021, which is the date our Class A Common Stock began trading on the NYSE;
•Investment in our peer group was weighted based on the stock market capitalization of each individual company within the peer group at the beginning of each period for which a return is indicated; and
•Dividends were reinvested on the relevant payment dates.
Our customized peer group consists of the companies listed below.
| | | | | | | | | | | | | | |
| Safety Insurance Group, Inc. | | Universal Insurance Holdings, Inc. | | Heritage Insurance Holdings, Inc. |
| Erie Indemnity Company | | BRP Group, Inc. | | Palomar Holdings, Inc. |
| Ryan Specialty Holdings, Inc. | | Kinsale Capital Group, Inc. | | Goosehead Insurance, Inc. |
| Tiptree Inc. | | United Fire Group, Inc. | | American Coastal Insurance Corporation |
| RLI Corp. | | Donegal Group Inc. | |
| Horace Mann Educators Corporation | | | | |
| | | | | | | | | | | | | | | | | | | | | | | | | | |
| | December 3, 2021 | | December 31, |
| | | 2021 | | 2022 | | 2023 |
| Hagerty, Inc. | | $ | 100.00 | | | $ | 133.02 | | | $ | 78.89 | | | $ | 73.17 | |
| Russell 2000 | | $ | 100.00 | | | $ | 101.88 | | | $ | 81.06 | | | $ | 94.78 | |
| Customized Peer Group | | $ | 100.00 | | | $ | 103.47 | | | $ | 107.57 | | | $ | 131.15 | |
ITEM 6. [ Reserved ]
Not applicable.
ITEM 7. MANAGEMENT’S DISCUSSION AND ANALYSIS OF FINANCIAL CONDITION AND RESULTS OF OPERATIONS
Management's Discussion and Analysis of Financial Condition and Results of Operations is intended to provide the reader of the financial statements with a narrative from the perspective of management on the financial condition, results of operations, liquidity and certain other factors that may affect our operating results. The following discussion and analysis of our financial condition and results of operations should be read in conjunction with the Consolidated Financial Statements and related Notes included in Item 8 of Part II of this Annual Report. In addition to historical financial information, the following discussion and analysis contains forward-looking statements that involve risks, uncertainties, and assumptions. Our actual results and timing of selected events may differ materially from those anticipated in these forward-looking statements as a result of many factors, including those discussed within "Risk Factors" in Item 1A of this report.
The following discussion contains references to the years ended December 31, 2023 and 2022. A discussion of the Company’s results of operations comparing results for the years ended December 31, 2022 and 2021 is included under the section entitled “Results of Operations” in Item 7 of Part II of the Annual Report on Form 10-K for the year ended December 31, 2022, and is incorporated by reference into this Annual Report for the year ended December 31, 2023.
Overview
We are a market leader in providing insurance for classic cars and enthusiast vehicles. Through our insurance model, we act as an MGA by underwriting, selling and servicing classic car and enthusiast vehicle insurance policies. Then, due to our consistent track record of delivering strong underwriting results, we reinsure a large portion of the risks written by our MGA subsidiaries through our wholly owned subsidiary, Hagerty Re. In addition, we offer HDC memberships, which can be bundled with our insurance policies and give subscribers access to an array of products and services, including Hagerty Drivers Club Magazine, automotive enthusiast events, our proprietary vehicle valuation tool, emergency roadside assistance, and special vehicle-related discounts. Lastly, to complement our insurance and membership offerings, we also offer Marketplace, where car enthusiasts can buy, sell, and finance collector cars. Through these offerings, our goal is to be the world's most trusted and preferred brand for enthusiasts to protect, buy and sell, and enjoy the special cars that are their passion.
Business Review
In 2023, we conducted a review of certain components of our operations which resulted in the sale or reorganization of certain businesses, including Hagerty Garage + Social and DriveShare, as discussed below. This initiative supported our strategy to prioritize investments and resources in the areas of our business that offer the strongest growth and profit potential. As a result of this review, we recognized approximately $4.0 million of losses and impairments in the third quarter of 2023 related to actions taken with respect to Hagerty Garage + Social and DriveShare. We may incur additional losses and/or impairment charges in future periods as a result of actions which we may take related to this review.
Hagerty Garage + Social
On September 29, 2023, Hagerty Ventures LLC ("HV"), a wholly owned subsidiary of The Hagerty Group, entered into an agreement with HGS Hub Holdings LLC ("H3") to terminate the joint venture agreement governing Member Hubs Holding, LLC ("MHH"), which operates as Hagerty Garage + Social. In connection with this agreement, H3's 20% equity interest in MHH was redeemed and MHH's equity interests in the Palm Beach, Florida and Redmond, Washington locations of Hagerty Garage + Social were distributed to H3. Following the termination of the joint venture agreement, HV now owns 100% of MHH and its remaining Hagerty Garage + Social locations in Delray Beach, Florida; Miami, Florida; Van Nuys, California; and Burlington, Ontario.
As a result of the joint venture termination, we recognized a loss of $2.9 million in the third quarter of 2023, as well as a $0.6 million loss related to the termination of the real estate lease held by the Culver City, California location of Hagerty Garage + Social. Following this lease termination, MHH no longer operates a Hagerty Garage + Social location in Culver City, California. Refer to Note 10 — Losses and Impairments Related to Divestitures in Item 8 of Part II of this Annual Report for additional information.
Hagerty DriveShare
In the third quarter of 2023, The Hagerty Group entered into an agreement to sell Hagerty DriveShare, LLC ("DriveShare"), a peer-to-peer rental platform for collector vehicles, to a third party. The sale was completed on October 9, 2023. As a result of the sale, the Company recognized a $0.4 million loss in the third quarter of 2023. Refer to Note 10 — Losses and Impairments Related to Divestitures in Item 8 of Part II of this Annual Report for additional information.
Recent Developments
On January 12, 2024, our subsidiary, Hagerty Insurance Holdings, Inc., agreed to acquire all of the issued and outstanding capital stock of Consolidated National Insurance Company ("CNIC") for approximately $18.4 million, subject to upward or downward adjustment in accordance with the terms of the agreement. The closing price will be comprised of approximately $10 million for CNIC's approved state licenses and $8 million for the expected capital and surplus. We believe that the CNIC acquisition will allow us to continue driving high rates of written premium growth, better control our underwriting profits, and offer new products and coverages to fill an underserved segment of the enthusiast vehicle market. Subject to the satisfactory completion of various closing conditions, we expect to complete the CNIC acquisition during the second quarter of 2024.
Key Performance Indicators
The tables below present a summary of our Key Performance Indicators, which include important operational metrics, as well as certain GAAP and non-GAAP financial measures as of and for the periods presented. We use these Key Performance Indicators to evaluate our business, measure our performance, identify trends against planned initiatives, prepare financial projections, and make strategic decisions. We believe these Key Performance Indicators are useful in evaluating our performance when read together with our Consolidated Financial Statements prepared in accordance with GAAP.
| | | | | | | | | | | | | | | | | | |
| | | | Year Ended December 31, |
| | | | | | 2023 | | 2022 |
| Operational Metrics | | | | | | | | |
Total Written Premium (in thousands) (1) | | | | | | $ | 907,175 | | | $ | 776,664 | |
Loss Ratio (2) | | | | | | 41.5 | % | | 45.3 | % |
New Business Count — Insurance (3) | | | | | | 254,386 | | | 234,520 | |
| | | | | | | | |
| | | | | | | | |
| | | | | | | | |
| | | | | | | | |
| | | | | | | | |
| | | | | | | | |
| | | | | | | | |
| | | | | | | | |
| GAAP Measures | | | | | | | | |
Total Revenue (in thousands) | | | | | | $ | 1,000,213 | | | $ | 787,588 | |
Operating Income (Loss) (in thousands) | | | | | | $ | 10,408 | | | $ | (67,566) | |
Net Income (in thousands) | | | | | | $ | 28,179 | | | $ | 2,403 | |
| Basic Earnings Per Share | | | | | | $ | 0.19 | | | $ | 0.39 | |
| Diluted Earnings (Loss) Per Share | | | | | | $ | 0.09 | | | $ | (0.07) | |
| | | | | | | | |
| Non-GAAP Financial Measures | | | | | | | | |
Adjusted EBITDA (in thousands) (4) | | | | | | $ | 88,162 | | | $ | (1,940) | |
Adjusted Earnings (Loss) Per Share (4) | | | | | | $ | 0.04 | | | $ | (0.20) | |
| | | | | | | | | | | | | | |
| | December 31, |
| | 2023 | | 2022 |
| Operational Metrics | | | | |
Policies in Force (5) | | 1,401,037 | | | 1,315,977 | |
Policies in Force Retention (6) | | 88.7 | % | | 88.0 | % |
Vehicles in Force (7) | | 2,378,883 | | | 2,234,461 | |
HDC Paid Member Count (8) | | 815,007 | | | 752,754 | |
Net Promoter Score (9) | | 82 | | | 83 | |
| | | | |
(1) Total Written Premium is the total amount of insurance premium written by our MGA subsidiaries on policies that were bound by our insurance carrier partners during the period. We view Total Written Premium as an important metric as it most closely correlates with our growth in insurance commission revenue and Hagerty Re earned premium. Total Written Premium reflects the actual business volume and direct economic benefit generated from our policy acquisition efforts.
(2) Loss Ratio, expressed as a percentage, is the ratio of (i) losses and loss adjustment expenses incurred to (ii) earned premium in Hagerty Re. We view Loss Ratio as an important metric because it is a powerful benchmark for profitability. This benchmark allows us to evaluate our historical loss patterns including incurred losses and make necessary and appropriate adjustments. In 2023, our Loss Ratio improved to 41.5% from 45.3% in the prior year due, in part, to better underwriting results. The comparison to the prior year is also favorably impacted by $10.0 million of catastrophe losses related to Hurricane Ian incurred in 2022 that were not repeated in the current year.
(3) New Business Count represents the number of new insurance policies issued by our MGA subsidiaries during the applicable period. We view New Business Count as an important metric to assess our financial performance because it is critical to achieving our growth objectives. While Hagerty benefits from strong renewal retention, new business policies more than offset those cancelled or non-renewed at expiration. Often new policies mean new relationships and an opportunity to sell additional products and services.
(4) Refer to "Non-GAAP Financial Measures" below for a description of this non-GAAP financial measure and a reconciliation to the most comparable GAAP amount.
(5) Policies in Force ("PIF") represents the number of current and active insurance policies as of the applicable period end date. We view PIF as an important metric to assess our financial performance because policy growth drives our revenue growth, increases brand awareness and market penetration, generates additional insight to improve the performance of our platform, and provides key data to assist us in strategic decision making.
(6) PIF Retention represents the percentage of expiring insurance policies that are renewed on the renewal effective date, calculated on a rolling twelve months basis. We view PIF Retention as an important measurement of the number of policies retained each year, which contributes to recurring revenue streams from MGA commissions, membership fees, and earned premiums. It also contributes to maintaining our NPS, as discussed below.
(7) Vehicles in Force represents the number of current insured vehicles as of the applicable period end date. We view Vehicles in Force as an important metric to assess our financial performance because insured vehicle growth drives our revenue growth and increases market penetration.
(8) HDC Paid Member Count represents the number of current Members who pay an annual membership subscription as of the applicable period end date. We believe that HDC Paid Member Count is important because it helps us measure membership revenue growth and provides an opportunity to customize our value proposition and benefits to specific types of enthusiasts, both by demographic and vehicle interest.
(9) Hagerty uses Net Promoter Score ("NPS") as an important measure of the overall strength of our relationship with insurance policyholders and paid HDC subscribers (who are collectively referred to herein as Members). NPS is measured twice annually through a web-based survey sent by email invitation to a random sample of existing Members, which currently excludes customers in our new Marketplace business, and is reported annually using an average of the two surveys. Often referred to as a barometer of brand loyalty and engagement, NPS is well-known in our industry as a strong indicator of growth and retention.
Components of Our Results of Operations
Revenue
Commission and fee revenue
We generate commission and fee revenue through our MGA subsidiaries primarily from the underwriting, sale, and servicing of classic car and enthusiast vehicle insurance policies on behalf of our insurance carrier partners. Commissions are earned for both new and renewed policies. In addition, under the terms of certain of our contracts with insurance carriers, we have the opportunity to earn a CUC based on written or earned premium and the loss ratio results of the insurance book of business.
Historically, our MGA subsidiaries have earned, on average, a base commission of approximately 32% of written premium, as well as a CUC of up to 10%. In December 2023, our alliance agreement and associated agency agreement with Markel, which generated approximately 95% of our total commission revenue in 2023, was amended to increase the base commission rate to 37% and to adjust the profit share commission factors to scale from -5% to a maximum of +5% of written premium, with 80% of the expected CUC being paid monthly, beginning in 2024.
Commission and fee revenue is earned when the policy becomes effective, net of allowances for policy changes and cancellations, as our performance obligation is substantially complete when the policy is issued.
Earned premium
We earn reinsurance premium revenue for the risks assumed by Hagerty Re from the classic car and enthusiast vehicle insurance policies underwritten by our MGA subsidiaries. Hagerty Re is registered as a Class 3A reinsurer under the Bermuda Insurance Act of 1978.
Earned premium represents the earned portion of written premiums that Hagerty Re has assumed under quota share reinsurance agreements with our insurance carrier partners, net of premiums ceded to various reinsurers and the cost of catastrophe reinsurance coverage. Premiums assumed and ceded are recognized on a pro-rata basis over the term of the related reinsured policies, which is generally 12 months. The cost of catastrophe reinsurance coverage is recognized over the contract period in proportion to the related earned premium.
Membership, marketplace and other revenue
We earn subscription revenue through HDC memberships, which can be bundled with our insurance policies and give subscribers access to an array of products and services, including Hagerty Drivers Club Magazine, automotive enthusiast events, our proprietary vehicle valuation tool, emergency roadside assistance, and special vehicle-related discounts. We also earn fee-based revenue from Hagerty Garage + Social memberships, which include storage services in addition to the HDC Member benefits. Revenue from the sale of HDC and storage memberships is recognized ratably over the period of the membership. The membership is treated as a single performance obligation to provide access to stated member benefits over the life of the membership, which is currently one year.
Marketplace earns fee-based revenue primarily from the sale of collector cars through live auctions, time-based online auctions, and brokered private sales. In addition, Marketplace earns revenue from financing provided to qualified collectors and businesses secured by their collector cars. Fee-based revenue earned by Marketplace is recognized when the underlying sale is completed. Finance revenue is recognized when earned based on the amount of the outstanding loan, the applicable interest rate on the loan, and the length of time the loan was outstanding during the period.
Lastly, other revenue includes sponsorship, admission, advertising, valuation and registration income. Other revenue is recognized when the performance obligation for the related product or service is satisfied.
Operating Expenses
Salaries and benefits
Salaries and benefits consist primarily of costs related to employee compensation, payroll taxes, employee benefits, and employee development costs. Employee compensation includes wages paid to employees, as well as various incentive compensation plans. Employee benefits include the costs of various employee benefit plans, including retirement, medical, dental, and wellness plans. Costs related to employee education, training, and recruiting are included in employee development costs. Salaries and benefits are expensed as incurred except for those costs which are required to be capitalized, which are then amortized over the useful life of the asset created, primarily software. Salaries and benefits are expected to increase over time as the business continues to grow but will likely decrease as a percent of revenue.
Ceding commission, net
Ceding commission, net represents the commissions paid by Hagerty Re to insurance carrier partners for the risk assumed under the quota share agreements with those carriers. These commissions represent Hagerty Re's pro-rata share of the carrier's costs including (i) policy acquisition costs, which primarily consists of the commissions earned by our MGA subsidiaries, (ii) general and administrative costs, and (iii) other costs. Ceding commissions paid is recorded net of commissions received by Hagerty Re related to ceded reinsurance premiums. Ceding commission, net is recognized ratably over the term of the related reinsured policies, which is generally 12 months.
Losses and loss adjustment expenses
Losses and loss adjustment expenses represents our best estimate of the losses related to the risk assumed by Hagerty Re. Losses consist of claims paid, case reserves, and incurred but not reported ("IBNR") costs, which are recorded net of estimated recoveries from reinsurance, salvage and subrogation. Loss adjustment expenses consist of the cost associated with the investigation and settlement of claims. The estimates utilized in determining the amount of losses and loss adjustment expenses recorded in a period are based on statistical analysis performed by our internal and external actuarial team. Reserves are reviewed regularly and adjusted, as necessary, to reflect our estimate of the ultimate cost of settlement. (Refer to "Critical Accounting Estimates" below.)
Sales expense
Sales expense includes costs related to the sale and servicing of insurance policies, as well as costs related to our Membership and Marketplace offerings, such as broker expense, cost of sales, promotion expense, and travel and entertainment expenses. Broker expense is the compensation paid to our agent partners and national broker partners when an insurance policy is written through a broker relationship. Broker expense generally tracks with written premium growth. Cost of sales includes payment processing fees, emergency roadside service costs, postage and other variable costs associated with the sale and servicing of a policy. Cost of sales also includes costs associated with vehicles held in our inventory and sold through Marketplace. Promotion expense includes various costs related to branding, events, advertising, marketing, and customer acquisition. Sales expenses, in general, are expensed as incurred and will trend with revenue growth.
General and administrative services
General and administrative services primarily consist of expenses related to professional services, occupancy costs, and non-capitalized hardware and software. These costs are expensed as incurred. We expect this expense category to increase in dollar amount over time but will likely decrease as a percentage of revenue over the next few years after we reach scale to handle incoming business from new partnerships.
Depreciation and amortization
Depreciation and amortization reflects the recognition of the cost of our investments in various assets over their useful lives. Depreciation expense relates to leasehold improvements, furniture and equipment, vehicles, hardware, and purchased software. Amortization relates to investments associated with acquisitions, SaaS implementation, and internal software development, as well as investments made in and impairments of digital media content assets. Depreciation and amortization are expected to increase in dollar amount over time but will likely decrease as a percent of revenue as investments in platform technology reach scale.
Other Items
Change in fair value of warrant liabilities
Our warrants are accounted for as liabilities and measured at fair value each reporting period, with changes in fair value recognized as non-operating income (expense) in our Consolidated Statements of Operations. In general, under the fair value accounting model, in periods when our stock price increases, the warrant liability increases, and we recognize additional expense. In periods when our stock price decreases, the warrant liability decreases, and we recognize additional income. (Refer to "Critical Accounting Estimates" below.)
Interest and other income (expense)
Interest and other income (expense) primarily includes interest income related to our cash balances and interest expense related to outstanding borrowings, as well as changes in the value of the liability related to our TRA with Hagerty Holding Corp. ("HHC") and Markel. Refer to "Critical Accounting Estimates" and Note 22 — Taxation in Item 8 of Part II of this Annual Report for additional information related to the TRA.
Income tax expense
The Hagerty Group is taxed as a pass-through ownership structure under provisions of the IRC and a similar section of state income tax law, except certain U.S. corporate subsidiaries and foreign subsidiaries. Any taxable income or loss generated by The Hagerty Group is passed through to and included in the taxable income or loss of all holders of The Hagerty Group units, including Hagerty, Inc. Hagerty, Inc. is taxed as a corporation and pays corporate federal, state, and local taxes with respect to income allocated from The Hagerty Group.
Results of Operations for the Years Ended December 31, 2023 and 2022
The following table summarizes our results of operations for the years ended December 31, 2023 and 2022, and the dollar and percentage change between the two periods:
| | | | | | | | | | | | | | | | | | | | | | | | | | |
| | Year Ended December 31, |
| | 2023 | | 2022 | | $ Change | | % Change |
| | | | | | | | |
| REVENUE: | | in thousands (except percentages) |
| Commission and fee revenue | $ | 365,512 | | | $ | 307,238 | | | $ | 58,274 | | | 19.0 | % |
| Earned premium | 531,866 | | | 403,061 | | | 128,805 | | | 32.0 | % |
| Membership, marketplace and other revenue | 102,835 | | | 77,289 | | | 25,546 | | | 33.1 | % |
| Total revenue | 1,000,213 | | | 787,588 | | | 212,625 | | | 27.0 | % |
| OPERATING EXPENSES: | | | | | | | |
| Salaries and benefits | 216,896 | | | 199,542 | | | 17,354 | | | 8.7 | % |
| Ceding commission, net | 251,805 | | | 191,150 | | | 60,655 | | | 31.7 | % |
| Losses and loss adjustment expenses | 220,658 | | | 182,402 | | | 38,256 | | | 21.0 | % |
| Sales expense | 156,378 | | | 140,781 | | | 15,597 | | | 11.1 | % |
| General and administrative services | 85,434 | | | 89,068 | | | (3,634) | | | (4.1) | % |
| Depreciation and amortization | 45,809 | | | 33,887 | | | 11,922 | | | 35.2 | % |
| Restructuring, impairment and related charges, net | 8,812 | | | 18,324 | | | (9,512) | | | (51.9) | % |
| Losses and impairments related to divestitures | 4,013 | | | — | | | 4,013 | | | 100.0 | % |
| Total operating expenses | 989,805 | | | 855,154 | | | 134,651 | | | 15.7 | % |
| OPERATING INCOME (LOSS) | 10,408 | | | (67,566) | | | 77,974 | | | 115.4 | % |
| Change in fair value of warrant liabilities | 11,543 | | | 41,899 | | | (30,356) | | | (72.5) | % |
| Revaluation gain on previously held equity method investment | — | | | 34,735 | | | (34,735) | | | (100.0) | % |
| Interest and other income | 22,821 | | | 2,028 | | | 20,793 | | | N/M |
| INCOME BEFORE INCOME TAX EXPENSE | 44,772 | | | 11,096 | | | 33,676 | | | N/M |
| Income tax expense | (16,593) | | | (7,017) | | | (9,576) | | | (136.5) | % |
| Loss from equity method investment, net of tax | — | | | (1,676) | | | 1,676 | | | 100.0 | % |
| NET INCOME | | $ | 28,179 | | | $ | 2,403 | | | $ | 25,776 | | | N/M |
| | | | | | | | |
N/M = Not meaningful
Revenue
Commission and fee revenue
Commission and fee revenue was $365.5 million for the year ended December 31, 2023, an increase of $58.3 million, or 19.0%, compared to 2022, consisting of increases of $47.7 million related to renewal policies and $10.6 million related to new policies.
The increase in revenue from renewal policies was primarily related to an increase of 17.0% in the underlying policy premiums, as well as continued strong policy retention. The increase in renewal policy premiums reflects sustained year-over-year growth in PIF, as well as rate increases in several states due to inflation and higher vehicle repair costs, both of which contribute to higher premiums and, in turn, higher commission revenue.
The increase in revenue from new policies was driven by sustained year-over-year growth in New Business Count, as well as rate increases in several states. The average premium on a newly issued policy increased 7.0% when compared to the prior year period as a result of writing policies with higher insured values at higher premium rates. Accordingly, premiums from new policies increased $23.7 million, or 16.1%, during the year ended December 31, 2023. In turn, base commission revenue from newly issued policies grew by $7.6 million, or 16.5%, over the same period.
Commission and fee revenue from agent sources increased $34.3 million, or 20.6%, and Commission and fee revenue from direct sources increased $24.0 million, or 17.0%, during the year ended December 31, 2023. Commission rates vary based on geography, but do not differ by distribution channel (i.e., whether they are direct-sourced or agent-sourced).
Earned premium
Earned premium at Hagerty Re was $531.9 million for the year ended December 31, 2023, an increase of $128.8 million, or 32.0%, compared to 2022. This increase correlates with the $162.1 million, or 34.2%, increase in assumed premium resulting from an increase in Hagerty Re's U.S. quota share from 70% in 2022 to approximately 80% in 2023.
Also contributing to the increase in Hagerty Re earned premium is the consistent growth in the volume of subject premiums written through our MGA subsidiaries in the U.S.
The following table presents premiums assumed by Hagerty Re and the related quota share percentages for the years ended December 31, 2023 and 2022:
| | | | | | | | | | | | | | | | | | | | | | | |
| Year Ended December 31, 2023 |
| U.S. | | Canada | | U.K. | | Total |
| | | | | | | |
| in thousands (except percentages) |
| Subject premium | $ | 754,746 | | | $ | 54,536 | | | $ | 9,129 | | | $ | 818,411 | |
| Quota share percentage | 81.0 | % | | 35.0 | % | | 80.0 | % | | 77.8 | % |
| Assumed premium in Hagerty Re | 609,975 | | | 19,088 | | | 7,303 | | | 636,366 | |
| Reinsurance premiums ceded | | | | | | | (33,070) | |
| Net assumed premium | | | | | | | 603,296 | |
| Change in unearned premiums | | | | | | | (81,813) | |
| Change in deferred reinsurance premiums | | | | | | | 10,383 | |
| Earned premium | | | | | | | $ | 531,866 | |
| | | | | | | |
| Year Ended December 31, 2022 |
| U.S. | | Canada | | U.K. | | Total |
| | | | | | | |
| in thousands (except percentages) |
| Subject premium | $ | 643,777 | | | $ | 50,434 | | | $ | 8,569 | | | $ | 702,780 | |
| Quota share percentage | 70.0 | % | | 35.0 | % | | 70.0 | % | | 67.5 | % |
| Assumed premium in Hagerty Re | 450,644 | | | 17,652 | | | 5,998 | | | 474,294 | |
| Reinsurance premiums ceded | | | | | | | (10,749) | |
| Net assumed premium | | | | | | | 463,545 | |
| Change in unearned premiums | | | | | | | (60,264) | |
| Change in deferred reinsurance premiums | | | | | | | (220) | |
| Earned premium | | | | | | | $ | 403,061 | |
Membership, marketplace and other revenue
Membership, marketplace and other revenue was $102.8 million for the year ended December 31, 2023, an increase of $25.5 million, or 33.1%, compared to 2022.
Membership fee revenue was $52.5 million for the year ended December 31, 2023, an increase of $7.2 million, or 16.0%, compared to 2022, which was primarily attributable to an increase in new policies issued with a bundled HDC membership, as well as an increase in storage revenue attributable to more Hagerty Garage + Social locations being in operation for most of the current year. For the years ended December 31, 2023 and December 31, 2022, membership fees were 51.0% and 58.5%, respectively, of total Membership, marketplace and other revenue. Refer to Note 10 — Losses and Impairments Related to Divestitures in Item 8 of Part II of this Annual Report for additional information related to Hagerty Garage + Social.
Marketplace revenue was $28.6 million for the year ended December 31, 2023, an increase of $14.9 million, or 109.1%, compared to 2022, which was primarily attributable to the auction, private sale, and lending activities of Broad Arrow, which was acquired and consolidated into our results beginning in August 2022. For the years ended December 31, 2023 and 2022, Marketplace revenue was 27.8% and 17.7%, respectively, of total Membership, marketplace and other revenue.
Other revenue, which primarily includes sponsorship, admission, advertising, valuation and registration income, was $21.8 million for the year ended December 31, 2023, an increase of $3.4 million, or 18.6%, compared to 2022, primarily due to increased event sponsorship and admission revenue. For the years ended December 31, 2023 and December 31, 2022, other revenue was 21.2% and 23.8%, respectively, of total Membership, marketplace and other revenue.
Costs and Expenses
Salaries and benefits
Salaries and benefits were $216.9 million for the year ended December 31, 2023, an increase of $17.4 million, or 8.7%, compared to 2022. This increase was principally due to an increase in incentive compensation consistent with our improved year-over-year results, as well as an increase in stock-based compensation expense. The overall increase in Salaries and benefits was partially offset by headcount reductions associated with the voluntary retirement program (the "VRP") and reductions in force implemented in the fourth quarter of 2022 and first quarter of 2023. Refer to Note 15 — Restructuring, Impairment and Related Charges in Item 8 of Part II of this Annual Report for information related to our restructuring plans.
Ceding commission, net
Ceding commission, net at Hagerty Re was $251.8 million for the year ended December 31, 2023, an increase of $60.7 million, or 31.7%, compared to 2022. This increase is consistent with the 32.0% increase in Hagerty Re Earned premium, as discussed above.
The following table summarizes the components of Ceding commission, net for the years ended December 31, 2023 and 2022:
| | | | | | | | | | | | | | | |
| | Year Ended December 31, | |
| | 2023 | | 2022 | |
| | | | | |
| | in thousands (except percentages) |
| Ceding commission: | | | | | |
| Ceding commission – reinsurance assumed | | $ | 256,000 | | | $ | 191,150 | | |
| Ceding commission – reinsurance ceded | | (4,195) | | | — | | |
Ceding commission, net | | $ | 251,805 | | | $ | 191,150 | | |
| Percentage of earned premium | | 47.3 | % | | 47.4 | % | |
Losses and loss adjustment expenses
Losses and loss adjustment expenses at Hagerty Re were $220.7 million for the year ended December 31, 2023, an increase of $38.3 million, or 21.0%, compared to 2022. This increase reflects higher 2023 incurred losses related to the increase in Hagerty Re's U.S. quota share during the period from 70% in 2022 to approximately 80% in 2023, as well as underlying growth in our business. While incurred losses increased, Hagerty Re's loss ratio improved to 41.5% for the year ended December 31, 2023. This improvement was due, in part, to better underwriting results in the current year. In addition, prior year results include $10.0 million of catastrophe losses related to Hurricane Ian. For the year ended December 31, 2022, Hagerty Re's loss ratio was 45.3%, including the impact of Hurricane Ian, and 42.8%, excluding the impact of Hurricane Ian.
Sales expense
Sales expense was $156.4 million for the year ended December 31, 2023, an increase of $15.6 million, or 11.1%, compared to 2022, which was primarily attributable to an increase in broker expense of $9.4 million, consistent with written premium growth at our MGA subsidiaries across the agent distribution channel. In addition, cost of sales increased $7.2 million, primarily driven by Broad Arrow vehicles sales and related commissions. Lastly, credit card processing fees increased $2.1 million, primarily due to a shift in consumer preference towards credit cards as a payment method within our MGA subsidiaries. The overall increase in Sales expense was partially offset by reductions in promotion and travel and entertainment costs of $2.2 million and $1.3 million, respectively.
General and administrative services
General and administrative services expense was $85.4 million for the year ended December 31, 2023, a decrease of $3.6 million, or 4.1%, compared to 2022. This decrease was driven by a reduction in professional services of $7.0 million, primarily in digital technology consulting, as well as a continued focus by management on expense management. The overall decrease in General and administrative services expense was partially offset by a $4.8 million increase in software subscription licenses.
Depreciation and amortization
Depreciation and amortization expense was $45.8 million for the year ended December 31, 2023, an increase of $11.9 million, or 35.2%, compared to 2022. This increase was due, in part, to a higher base of capital assets in 2023 as a result of digital platform investments made in recent years, which resulted in an increase in Depreciation and amortization of approximately $5.8 million. Additionally, we incurred a $4.3 million loss related to digital media content asset impairments in 2023 due to lower than anticipated advertising and sponsorship revenue associated with these assets.
Restructuring, impairment and related charges, net
During the year ended December 31, 2022, management approved an initiative to increase operational efficiencies and flexibility by transitioning to a "remote-first" work model for employees. In addition, in the fourth quarter of 2022, the Board approved the VRP, as well as a reduction in force (the "2022 RIF"). As a result, in 2022, we recognized restructuring, impairment and related charges of $18.3 million, which primarily consisted of $12.2 million in employee severance-related expenses related to the VRP and 2022 RIF and $6.2 million related to operating lease ROU asset impairments and related leasehold disposals.
During the year ended December 31, 2023, the Board approved an additional reduction in force (the "2023 RIF") in the first quarter of 2023 and as a result, recognized $5.4 million in employee severance-related expenses and a $0.4 million impairment charge to write-down the value of certain digital media content assets. Additionally, in 2023, we recognized $3.1 million of charges associated with operating lease ROU asset impairments and related leasehold disposals in connection with the Company's ongoing transition to a "remote-first" work model.
Refer to Note 15 — Restructuring, Impairment and Related Charges in Item 8 of Part II of this Annual Report for additional information with respect to our restructuring initiatives.
Losses and impairments related to divestitures
During the year ended December 31, 2023, the Company recognized $4.0 million of losses and impairments related to Hagerty Garage + Social and DriveShare, as discussed above under "Business Review". Refer to Note 10 — Losses and Impairments Related to Divestitures in Item 8 of Part II of this Annual Report for additional information.
Change in fair value of warrant liabilities
During the years ended December 31, 2023 and 2022, the change in the fair value of our warrant liabilities resulted in a gain of $11.5 million and $41.9 million, respectively. Refer to Note 16 — Fair Value Measurements in Item 8 of Part II of this Annual Report for additional information with respect to our warrants.
Revaluation gain on previously held equity method investment
During the year ended December 31, 2022, the Company recognized a revaluation gain on a previously held equity method investment of $34.7 million, which represents the remeasurement of our 40% equity interest in Broad Arrow immediately prior to the Broad Arrow Acquisition in August 2022. Refer to Note 9 — Acquisitions and Investments in Item 8 of Part II of this Annual Report for additional information with respect to our acquisition of Broad Arrow.
Interest and other income (expense)
Interest and other income (expense) was $22.8 million of income for the year ended December 31, 2023, compared to $2.0 million of income for the year ended December 31, 2022. This increase was primarily due to a $19.5 million increase in interest income on cash balances, resulting from higher variable interest rates and increased cash balances. In addition, the value of the TRA liability decreased by $2.6 million. These factors were partially offset by an increase in interest expense of $0.5 million related to outstanding JPM Credit Facility borrowings due to higher variable interest rates.
Income tax expense
Income tax expense was $16.6 million for the year ended December 31, 2023, an increase of $9.6 million compared to 2022. The increase in income tax expense for the year ended December 31, 2023 compared to 2022 was primarily due to an increase in income before income tax expense of $46.0 million within Hagerty Re, which is taxed as a corporation in the U.S. Refer to Note 22 — Taxation in Item 8 of Part II of this Annual Report for additional information with respect to items affecting our effective tax rate.
Liquidity and Capital Resources
Maintaining a strong balance sheet and capital position is a top priority for us. We manage liquidity globally and across all operating subsidiaries.
Key Developments — Financing Activities
In 2023, we took a number of actions to enhance our capital structure, strengthen our liquidity position, and provide additional financial flexibility including the following:
•On June 23, 2023, Hagerty, Inc. issued 8,483,561 shares of our newly-designated Series A Convertible Preferred Stock for an aggregate purchase price of $80.0 million. This capital raise bolsters our cash balances and liquidity and provides working capital to drive profitable growth. Refer to Note 18 — Convertible Preferred Stock in Item 8 of Part II of this Annual Report for additional information related to the Series A Convertible Preferred Stock.
•On September 19, 2023, Hagerty Re entered into an unsecured term loan credit facility with State Farm Mutual Automobile Insurance Company ("State Farm") in the aggregate principal amount of $25.0 million (the "State Farm Term Loan"). As of December 31, 2023, Hagerty Re's statutory capital and surplus included $25.0 million related to the State Farm Term Loan, which is recorded for statutory purposes as "Other Fixed Capital" and is also eligible as "Tier 2 Ancillary Capital". This capital raise supports Hagerty Re's growth and we believe raising this additional capital was a positive factor that helped Hagerty Re be assigned a financial strength rating of A- (Excellent) from AM Best. Refer to Note 17 — Long-Term Debt in Item 8 of Part II of this Annual Report for additional information related to the State Farm Term Loan.
•On November 28, 2023, The Hagerty Group entered into a Tenth Amendment to the JPM Credit Agreement (as defined below), which provides additional operational flexibility to The Hagerty Group and its subsidiaries, and includes, among other things (i) additional baskets for investments, incurrence of indebtedness and liens; (ii) changes to financial covenants; and (iii) the ability to issue additional indebtedness in the form of either incremental debt on a pari-passu basis or on an asset-backed securitization basis. Refer to Note 17 — Long-Term Debt in Item 8 of Part II of this Annual Report for additional information related to the JPM Credit Agreement.
•On December 21, 2023, Broad Arrow Capital LLC, as initial servicer, and its wholly owned subsidiary BAC Funding 2023-1, LLC, as borrower, entered into a revolving credit agreement with a certain lender (the "BAC Credit Agreement"). The BAC Credit Agreement provides for a revolving credit facility (the "BAC Credit Facility") with an aggregate borrowing capacity of $75.0 million which will be used to fund the growth of BAC's asset-based lending activities. Refer to Note 17 — Long-Term Debt in Item 8 of Part II of this Annual Report for additional information related to the BAC Credit Facility.
Sources and Uses of Liquidity
Our sources of liquidity include our: (i) balances of cash and cash equivalents; (ii) net working capital; (iii) cash flows from operations; (iv) borrowings from the JPM Credit Facility (as defined below) to fund the general corporate needs of The Hagerty Group and its subsidiaries; and (v) borrowings from the BAC Credit Facility to fund a substantial portion of the lending activities of BAC.
Our primary liquidity needs and capital requirements include cash required for: (i) the funding of business operations, including strategic investments; (ii) the servicing and repayment of borrowings under the JPM Credit Facility, the BAC Credit Facility, and the State Farm Term Loan; (iii) the payment of income taxes; and (iv) the funding of potential payments under the TRA.
Based on our current expectations, we believe that these sources of liquidity will be sufficient to provide an adequate level of capital to support our anticipated short and long-term commitments, operating needs, and capital requirements.
Financing Arrangements
JPM Credit Facility
The Hagerty Group has a credit agreement with JPMorgan Chase Bank, N.A., as administrative agent, and the other financial institutions party thereto from time to time as lenders, as amended (the "JPM Credit Agreement"). The JPM Credit Agreement provides for a revolving credit facility (the "JPM Credit Facility") with an aggregate borrowing capacity of $230.0 million. The JPM Credit Agreement matures in October 2026, but may be extended if agreed to by us and the lenders party thereto. As of December 31, 2023, total outstanding borrowings under the JPM Credit Facility were $77.3 million. JPM Credit Facility borrowings are collateralized by the assets of and equity interests in The Hagerty Group and its consolidated subsidiaries, except for (a) the assets held by the special purpose entities related to the BAC Credit Facility and (b) all or a portion of certain foreign and certain excluded or immaterial subsidiaries. Under the JPM Credit Agreement, we are required, among other things, to meet certain financial covenants, including a fixed charge coverage ratio and a leverage ratio. We were in compliance with these financial covenants as of December 31, 2023.
Refer to Note 17 — Long-Term Debt in Item 8 of Part II of this Annual Report for additional information on the JPM Credit Facility.
BAC Credit Facility
On December 21, 2023, Broad Arrow Capital LLC and its wholly owned subsidiary BAC Funding 2023-1, LLC, as borrower, entered into the BAC Credit Agreement. The BAC Credit Agreement provides for the BAC Credit Facility, which has an aggregate borrowing capacity of $75.0 million and is subject to a borrowing base that is determined by a calculation that is primarily based upon a percentage of the carrying value of certain BAC notes receivable. As of December 31, 2023, the borrowing base for the BAC Credit Agreement was $25.8 million.
The revolving borrowing period provided by the BAC Credit Agreement expires on December 21, 2025 and the BAC Credit Agreement matures on December 21, 2026. The revolving borrowing period and the maturity date of the BAC Credit Agreement may be extended by one year if requested by Broad Arrow Capital LLC and agreed to by the administrative agent. Broad Arrow Capital LLC is not a borrower or guarantor of the BAC Credit Facility.
In conjunction with the BAC Credit Agreement, Broad Arrow Capital LLC and certain of its subsidiaries transfer certain notes receivable originated by Broad Arrow Capital LLC and certain of its subsidiaries to wholly owned, bankruptcy remote special purpose entities (each, an "SPE") to secure the borrowings under the BAC Credit Agreement. These SPEs have the limited purpose of acquiring notes receivable or a certificate representing beneficial ownership interest therein from Broad Arrow Capital LLC and certain of its subsidiaries, with BAC Funding 2023-1, LLC also being the borrower under the BAC Credit Agreement. Assets transferred to each SPE are legally isolated from the Company and its subsidiaries. Further, the assets of each SPE are owned by such SPE and are not available to satisfy the debts or other obligations of the Company or any of its other subsidiaries. Broad Arrow Capital LLC continues to service the notes receivable transferred to the SPEs.
Recourse to the Company and its subsidiaries that originated and transferred notes receivable that represent collateral under the BAC Credit Facility is limited to (i) an obligation of the applicable seller to repurchase a note receivable if it is determined that there was a breach of any representation or warranty relating to such note receivable as of the relevant date specified in the related transfer agreement and (ii) a limited guarantee covering certain liabilities that may result under certain foreign exchange hedging activity of one of the SPEs.
Under the BAC Credit Agreement, Broad Arrow Capital LLC and BAC Funding 2023-1, LLC are required, among other things, to meet certain financial covenants, including the requirement of Broad Arrow Capital LLC, as the servicer, to maintain a minimum tangible net worth, minimum liquidity balances, and an indebtedness to tangible net worth ratio. As of December 31, 2023, the Company was in compliance with the financial covenants under the BAC Credit Agreement.
Refer to Note 17 — Long-Term Debt in Item 8 of Part II of this Annual Report for additional information related to the BAC Credit Agreement.
Capital and Dividend Restrictions
Through our reinsurance subsidiary, Hagerty Re, we reinsure the same personal lines risks that are underwritten by our MGA subsidiaries on behalf of our insurance carrier partners. Hagerty Re's reinsurance operations are funded primarily through existing capital and net cash flows from operations. In addition, as discussed above under "Key Developments — Financing Activities," on September 19, 2023, Hagerty Re bolstered its balance of cash and cash equivalents with the $25.0 million in gross proceeds from the State Farm Term Loan. As of December 31, 2023, Hagerty Re had approximately $558.2 million in "Cash and cash equivalents" and "Restricted cash and cash equivalents".
We, and particularly Hagerty Re, pay close attention to the underlying underwriting and reserving risks by monitoring the pricing and loss development of the underlying business written through our MGA subsidiaries. Additionally, Hagerty Re manages its investment portfolio in accordance with an investment policy approved by its Board of Directors that seeks to generate an attractive total return on an after-tax basis on its investment assets, over the long-term, subject to compliance with several constraints and objectives including a requirement to assume only a modest amount of risk of principal loss.
Capital Restrictions
In Bermuda, Hagerty Re is subject to the Bermuda Solvency Capital Requirement ("BSCR") administered by the BMA. No regulatory action is taken by the BMA if an insurer’s capital and surplus is equal to or in excess of their enhanced capital requirement, as determined by the BSCR model. In addition, the BMA has established a target capital level for each insurer which is 120% of the enhanced capital requirement. Hagerty Re maintained sufficient statutory capital and surplus to comply with regulatory requirements as of December 31, 2023.
Dividend Restrictions
Under Bermuda law, Hagerty Re is prohibited from declaring or issuing a dividend if it fails to meet its minimum solvency margin or minimum liquidity ratio. Prior approval from the BMA is also required if Hagerty Re's proposed dividend payments would exceed 25% of its prior year-end total statutory capital and surplus. The amount of dividends which could be paid by Hagerty Re in 2024 without prior approval is $54.7 million.
We believe that Hagerty Re's existing cash and cash equivalents, municipal securities, and cash flow from operations will be sufficient to support its working capital and capital expenditure requirements for at least the next 12 months. Hagerty Re's future capital requirements will depend on many factors, including its reinsurance premium growth rate, renewal rates, underwriting results, successful entry in new geographic markets, and the continuing market adoption of its product offerings.
Comparative Cash Flows
The following table summarizes our cash flow data for the years ended December 31, 2023 and 2022:
| | | | | | | | | | | | | | | | | | | | | | | | | | |
| | Year Ended December 31, |
| | 2023 | | 2022 | | $ Change | | % Change |
| | | | | | | | |
| | in thousands (except percentages) |
| Net Cash Provided by Operating Activities | | $ | 133,706 | | | $ | 55,328 | | | $ | 78,378 | | | 141.7 | % |
| Net Cash Used in Investing Activities | | $ | (52,647) | | | $ | (91,521) | | | $ | 38,874 | | | 42.5 | % |
| Net Cash Provided by (Used in) Financing Activities | $ | 103,161 | | | $ | (28,084) | | | $ | 131,245 | | | N/M |
| | | | | | | | |
N/M = Not meaningful
Operating Activities
Cash provided by operating activities primarily consists of net income, adjusted for non-cash items, and changes in working capital balances. Net cash provided by operating activities for the years ended December 31, 2023 and 2022 is presented below:
| | | | | | | | | | | | | | | | | | | | | | | | | | |
| | Year Ended December 31, |
| | 2023 | | 2022 | | $ Change | | % Change |
| | | | | | | | |
| | in thousands (except percentages) |
| Net income | | $ | 28,179 | | | $ | 2,403 | | | $ | 25,776 | | | N/M |
| Non-cash adjustments to net income | | 71,294 | | | (5,547) | | | 76,841 | | | N/M |
| Changes in operating assets and liabilities | | 34,233 | | | 58,472 | | | (24,239) | | | (41.5) | % |
| Net Cash Provided by Operating Activities | | $ | 133,706 | | | $ | 55,328 | | | $ | 78,378 | | | 141.7 | % |
| | | | | | | | |
N/M = Not meaningful
Net cash provided by operating activities for the year ended December 31, 2023 was $133.7 million, an increase of $78.4 million, or 141.7%, compared to 2022. This increase was due to a $102.6 million increase in Net income, after excluding non-cash adjustments, partially offset by a $24.2 million decrease in cash from operating assets and liabilities.
The increase in Net income, after excluding non-cash adjustments, was primarily driven by organic growth across all areas of our business, as well as management's cost containment measures. Also contributing to the favorable comparison to the prior year is an increase in interest income due to higher variable interest rates earned on cash balances.
The decrease in cash from operating assets and liabilities was primarily due to a decrease in Losses payable as a result of the settlement of claims, including those related to Hurricane Ian. Also contributing to the change in operating assets and liabilities was the increase in Hagerty Re's U.S. quota share percentage and organic revenue growth across our business.
Investing Activities
Cash used in investing activities for the year ended December 31, 2023 decreased $38.9 million when compared to 2022. The lower level of cash used in investing activities was primarily due to a decrease in spending on internally developed software, as well as a lower level of acquisitions. Also contributing to the year-over-year decrease is the $15.3 million Broad Arrow equity method investment made in January 2022 for which there was no comparable investment made in the current year. The overall decrease in cash used in investing activities was partially offset by net cash outflows associated with the lending activities of Broad Arrow, which increased $8.8 million compared to 2022. Refer to Note 4 — Notes Receivable and Note 9 — Acquisitions and Investments in Item 8 of Part II of this Annual Report for additional information related to the acquisition of Broad Arrow and its lending activities.
Financing Activities
Cash provided by financing activities for the year ended December 31, 2023 increased $131.2 million when compared to 2022, primarily due to the issuance of the Series A Convertible Preferred Stock, which resulted in net cash proceeds of $79.2 million, after deducting issuance costs. In addition, Hagerty Re entered into the State Farm Term Loan resulting in net cash inflows of $24.4 million, after deducting issuance costs, and Broad Arrow Capital LLC, as initial servicer, and its wholly owned subsidiary BAC Funding 2023-1, LLC, as borrower, entered into the BAC Credit Agreement, resulting in net cash inflows of $22.9 million, after deducting issuance costs.
Tax Receivable Agreement
Hagerty, Inc. expects to have adequate capital resources to meet the requirements and obligations under the TRA entered into with the Legacy Unit Holders on December 2, 2021. The TRA provides for the payment by Hagerty, Inc. to the Legacy Unit Holders of 85% of the amount of cash savings, if any, under U.S. federal, state and local income tax or franchise tax realized as a result of (i) any increase in tax basis of Hagerty, Inc.'s assets resulting from (a) the purchase of The Hagerty Group units from any of the Legacy Unit Holders using the net proceeds from any future offering, (b) redemptions or exchanges by the Legacy Unit Holders of Class V Common Stock and The Hagerty Group units for shares of Class A Common Stock or (c) payments under the TRA and (ii) tax benefits related to imputed interest deemed arising as a result of payments made under the TRA.
Legacy Unit Holders may, subject to certain conditions and transfer restrictions as described in the Legacy Unit Holders Exchange Agreement executed in connection with the Business Combination, redeem or exchange their Class V Common Stock and The Hagerty Group units for shares of Class A Common Stock of Hagerty, Inc. on a one-for-one basis. The Hagerty Group made an election under Section 754 of the IRC with the filing of its 2019 income tax return, which cannot be revoked without the permission of the IRS Commissioner and will be in place for any future exchange of The Hagerty Group units. The redemptions and exchanges are expected to result in increases in the tax basis of the tangible and intangible assets of The Hagerty Group. These increases in tax basis may reduce the amount of tax that Hagerty, Inc. would otherwise be required to pay in the future. This payment obligation as a part of the TRA is an obligation of Hagerty, Inc. and not of The Hagerty Group. For purposes of the TRA, the cash tax savings in income tax will be computed by comparing the actual income tax liability of Hagerty, Inc. (calculated with certain assumptions) to the amount of such taxes that Hagerty, Inc. would have been required to pay had there been no increase to the tax basis of the assets of The Hagerty Group as a result of the redemptions or exchanges and had Hagerty, Inc. not entered into the TRA. Estimating the amount of payments that may be made under the TRA is by nature imprecise, insofar as the calculation of amounts payable depends on a variety of factors.
Contractual Obligations
The following table summarizes our significant contractual obligations and other commitments as of December 31, 2023:
| | | | | | | | | | | | | | | | | | | | | | | | | | | | | | | | |
| | Payments Due by Period |
| | Total | | Less than 1 year | | 1-3 years | | 3-5 years | | More than 5 years |
| | | | | | | | | | |
| | in thousands |
Debt (1) | | $ | 134,915 | | | $ | 3,654 | | | $ | 3,221 | | | $ | 103,040 | | | $ | 25,000 | |
Interest payments (2) | | 20,710 | | | 2,814 | | | 4,396 | | | 4,000 | | | 9,500 | |
| Operating leases | | 71,113 | | | 9,067 | | | 16,893 | | | 15,867 | | | 29,286 | |
| Purchase commitments | | 8,618 | | | 8,350 | | | 268 | | | — | | | — | |
| Total | | $ | 235,356 | | | $ | 23,885 | | | $ | 24,778 | | | $ | 122,907 | | | $ | 63,786 | |
| | | | | | | | | | |
(1) Refer to Note 17 — Long-Term Debt within Item 8 of Part II of this Annual Report for additional information regarding outstanding debt balances.
(2) Excludes variable rate debt interest payments and commitment fees related to borrowings under our JPM Credit Facility and BAC Credit Facility.
On June 23, 2023, we issued 8,483,561 shares of Series A Convertible Preferred Stock for an aggregate purchase price of $80.0 million. Dividends on the Series A Convertible Preferred Stock are cumulative and accrue from the date of issuance at the rate per annum of 7% of the Series A Purchase Price of each share, plus the amount of previously accrued dividends, compounded annually (the "Accruing Dividends"). The Company may elect to pay the Accruing Dividends either in cash or in additional shares of Series A Convertible Preferred Stock. In addition, shares of the Series A Convertible Preferred Stock are contingently redeemable for cash under certain circumstances. The table of contractual obligations above excludes any potential cash payments related to the Series A Convertible Preferred Stock. Refer to Note 18 — Convertible Preferred Stock in Item 8 of Part II of this Annual Report for additional information on the Series A Convertible Preferred Stock.
Off-Balance Sheet Arrangements
We do not have any material off-balance sheet arrangements as of December 31, 2023.
Critical Accounting Estimates
The preparation of financial statements in accordance with GAAP requires management to make significant judgments, assumptions, and estimates that materially affect the amounts reported in the Company's Consolidated Financial Statements. Management's judgments, assumptions, and estimates are based on historical experience, future expectations, and other factors that are believed to be reasonable as of the date of the Consolidated Financial Statements. Actual results may ultimately differ from management's original estimates, as future events and circumstances sometimes do not develop as expected. The following is a discussion of the critical accounting estimates that may have a material impact on our Consolidated Financial Statements.
Provision for Unpaid Losses and Loss Adjustment Expenses
Description
The provision for unpaid losses and loss adjustment expenses is the difference between management's estimate of the ultimate cost of losses incurred by Hagerty Re and the amount of paid losses as of the reporting date. These reserves reflect management's best estimate of unpaid losses related to both reported claims and IBNR claims. These reserves also include management's best estimate of all expenses associated with processing and settling reported and unreported claims. Management regularly reviews its reserve estimates and updates those estimates as new information becomes available or as events emerge that may affect the resolution of unsettled claims. Updates made to reserve estimates based on new information may cause changes in prior reserve estimates. These changes are recorded within losses and loss adjustment expenses in the period such changes are determined.
The following table presents Hagerty Re's provision for losses and loss adjustment expenses, both gross and net of reinsurance recoverables, as of December 31, 2023 and 2022:
| | | | | | | | | | | | | | | | | | | | | | | |
| December 31, 2023 |
| Gross | | % of Total | | Net | | % of Total |
| | | | | | | |
| in thousands (except percentages) |
| Outstanding losses reported | $ | 86,420 | | | 63.3 | % | | $ | 84,651 | | | 63.0 | % |
| IBNR | 50,087 | | | 36.7 | % | | 49,621 | | | 37.0 | % |
| Total provision for unpaid losses and loss adjustment expenses | $ | 136,507 | | | 100.0 | % | | $ | 134,272 | | | 100.0 | % |
| | | | | | | |
| December 31, 2022 |
| Gross | | % of Total | | Net | | % of Total |
| | | | | | | |
| in thousands (except percentages) |
| Outstanding losses reported | $ | 66,824 | | | 59.8 | % | | $ | 65,981 | | | 59.5 | % |
| IBNR | 44,917 | | | 40.2 | % | | 44,917 | | | 40.5 | % |
| Total provision for unpaid losses and loss adjustment expenses | $ | 111,741 | | | 100.0 | % | | $ | 110,898 | | | 100.0 | % |
The following table summarizes the development of management's estimate of gross and net ultimate losses and loss adjustment expenses for the 2019 to 2022 accident years:
| | | | | | | | | | | | | | | | | | | | | | | | | | | | | | | | | | | | | | |
| | Gross Ultimate Loss & Loss Adjustment Expenses | | Net Ultimate Loss & Loss Adjustment Expenses |
| Accident Year | | 2023 | | 2022 | | Change | | 2023 | | 2022 | | Change |
| | | | | | | | | | | | |
| | in thousands |
| 2019 | | $ | 60,495 | | | $ | 60,495 | | | $ | — | | | $ | 60,495 | | | $ | 60,495 | | | $ | — | |
| 2020 | | $ | 85,313 | | | $ | 86,113 | | | $ | (800) | | | $ | 85,313 | | | $ | 86,113 | | | $ | (800) | |
| 2021 | | $ | 126,391 | | | $ | 130,016 | | | $ | (3,625) | | | $ | 126,391 | | | $ | 130,016 | | | $ | (3,625) | |
| 2022 | | $ | 188,012 | | | $ | 191,815 | | | $ | (3,803) | | | $ | 183,188 | | | $ | 186,463 | | | $ | (3,275) | |
| 2023 | | $ | 231,231 | | | N/A | | N/A | | $ | 228,465 | | | N/A | | N/A |
Judgments and Uncertainties
Estimating the ultimate cost of claims and claims expenses is an inherently complex and subjective process that involves a high degree of judgment. The factors considered by management in estimating the provision for unpaid losses and loss adjustment expenses include the following:
•historical trends in claim frequency and severity;
•the changing mix of business due to the large growth in modern collectible cars which carry a different risk profile than the risks associated with classic cars;
•emerging economic and social trends;
•inflation, both economic and social;
•retention limits under current catastrophe and treaty reinsurance programs;
•legislative and judicial changes in the jurisdictions in which we write insurance; and
•management's assessment of broader industry experience and trends.
Claims are analyzed and reported based on the year in which the loss occurred - i.e., on an accident year basis. Accident year data is classified and utilized within actuarial models to prepare estimates of required reserves for payments to be made in the future. The timing of claim settlement varies and depends on the type of claim being reported. Claims involving property damage are generally settled faster than bodily injury claims. Historical loss patterns are then applied to actual paid losses and reported losses by accident year to develop expectations of future claim payments. Implicit within the actuarial models are estimates of the impacts of inflation, especially for claims with longer expected cycle times. Refer to Note 12 — Provision for Unpaid Losses and Loss Adjustment Expenses in Item 8 of Part II of this Annual Report for additional information regarding the methodologies used to estimate loss and loss adjustment expense reserves.
Reserves are reviewed quarterly and periodically throughout the year by combining historical results and current actual results to calculate new development factors. When estimating loss and loss adjustment expense reserves, our actuarial reserving group considers claim cycle time, claims settlement practices, adequacy of case reserves over time, the seasonality of our business, and current economic conditions.
Effect if Actual Results Differ From Estimates and Assumptions
Because actual experience can differ from key assumptions used in estimating reserves, there may be significant variation in the development of reserves and the amount of actual losses and loss adjustment expenses ultimately paid in the future. Any adjustments to the provision for losses and loss adjustment expenses are recognized in our Consolidated Statements of Operations in the period in which management determines that an adjustment is required.
If the actual level of loss frequency and/or severity is higher or lower than our expectations, the ultimate cost of claims paid will differ from management's estimates. An illustration of the potential effect of higher or lower levels of loss frequency and severity on our ultimate cost of claims for the 2023 accident year is provided in the following table:
| | | | | | | | | | | | | | |
| Change in both loss frequency and severity | | Ultimate Cost of Claims Occurring in 2023 | | Change |
| | in thousands |
| 3% Higher | | $ | 242,379 | | | $ | 13,914 | |
| 2% Higher | | $ | 237,695 | | | $ | 9,230 | |
| 1% Higher | | $ | 233,057 | | | $ | 4,592 | |
| Base Scenario | | $ | 228,465 | | | $ | — | |
| 1% Lower | | $ | 223,919 | | | $ | (4,546) | |
| 2% Lower | | $ | 219,418 | | | $ | (9,047) | |
| 3% Lower | | $ | 214,963 | | | $ | (13,502) | |
| | | | |
| | | | |
Deferred Income Taxes
Description
Where applicable, income taxes are accounted for under the asset and liability method. Deferred tax assets and liabilities are recognized for the future tax consequences attributable to differences between the financial statement carrying values of existing assets and liabilities and their respective tax basis and operating loss and tax-credit carryforwards. Deferred tax assets and liabilities are measured using enacted tax rates expected to apply to taxable income in the years in which those temporary differences are expected to be recovered or settled. In determining the provision for income taxes for financial statement purposes, we make estimates and judgments which affect our evaluation of the carrying value of our deferred tax assets, as well as our calculation of certain tax liabilities.
Judgments and Uncertainties
We evaluate the carrying value of our deferred tax assets on a quarterly basis. In completing this evaluation, we consider all available positive and negative evidence. Such evidence includes historical operating results, the existence of cumulative earnings and losses in the most recent fiscal years, taxable income in prior carryback year(s) if permitted under the tax law, expectations for future taxable income, the time period over which our temporary differences will reverse, and the implementation of feasible and prudent tax planning strategies. Estimating future taxable income is inherently uncertain and requires judgment. Deferred tax assets are reduced by a valuation allowance if, based on the weight of this evidence, it is more likely than not that all or a portion of the recorded deferred tax assets will not be realized in future periods.
As of December 31, 2023, the Company has recorded deferred tax assets of $184.2 million, of which $146.0 million relates to the difference between the outside tax basis and book basis of its investment in the assets of The Hagerty Group. As of December 31, 2023, based on an assessment of all available positive and negative evidence, management believes it is more likely than not that certain deferred tax assets, including the deferred tax asset for the investment in the assets of The Hagerty Group, will not be realized. As a result, the Company has recorded a valuation allowance of $169.6 million against its deferred tax assets as of December 31, 2023.
Effect if Actual Results Differ From Estimates and Assumptions
If management's projections of future taxable income and other positive evidence considered in evaluating the need for the valuation allowance prove, with the benefit of hindsight, to be inaccurate, it could prove more difficult to support the realization of the net deferred tax asset. As a result, an additional valuation allowance could be required, which would have an adverse impact on the Company’s effective income tax rate and results. Conversely, if management determines that sufficient positive evidence exists in the jurisdiction in which a valuation allowance is recorded, the Company may reverse all or a portion of the valuation allowance in that jurisdiction. In such situations, the adjustment made to the deferred tax asset would have a favorable impact on the Company’s effective income tax rate and results in the period such determination was made.
Liabilities under Tax Receivable Agreement
Description
In connection with the Business Combination, Hagerty, Inc. entered into a TRA with the Legacy Unit Holders. The TRA provides for payment to the Legacy Unit Holders of 85% of the U.S. federal, state and local income tax savings realized by Hagerty, Inc. as a result of the increases in tax basis and certain other tax benefits as outlined in the Business Combination Agreement (provided as Exhibit 2.1, incorporated by reference within Item 6. Exhibits, in this Annual Report) upon the exchange of The Hagerty Group units and Hagerty, Inc. Class V Common Stock for Hagerty, Inc. Class A Common Stock or cash. The Hagerty Group made an election under Section 754 of the IRC with the filing of its 2019 income tax return, which cannot be revoked without the permission of the IRS Commissioner and will be in place for any future exchange of The Hagerty Group units. The remaining 15% cash tax savings resulting from the basis adjustments will be retained by Hagerty, Inc.
Judgments and Uncertainties
The amount and timing of any payments under the TRA will vary depending on a number of factors, including, but not limited to, the increase in tax basis of The Hagerty Group's assets, the timing of any future redemptions, exchanges or purchases of The Hagerty Group units held by Legacy Unit Holders, the price of Hagerty, Inc. Class A Common Stock at the time of the purchase, redemption or exchange, the extent to which redemptions or exchanges are taxable, the amount and timing of the taxable income that Hagerty, Inc. generates in the future, the tax rates then applicable and the portion of the payments under the TRA constituting imputed interest.
If we do not generate sufficient taxable income in the aggregate over the term of the TRA to utilize the tax benefits, then we would not be required to make the related payment under the TRA. Therefore, we only recognize a liability for the TRA if we determine it is probable that we will generate sufficient future taxable income over the term of the TRA to utilize the related tax benefits. Estimating future taxable income is inherently uncertain and requires significant management judgment.
As of December 31, 2023, the Company has recognized a liability of $0.6 million relating to its obligations under the TRA, which is limited by its ability to currently utilize the related tax benefits.
Effect if Actual Results Differ From Estimates and Assumptions
Changes in the liability resulting from historical exchanges under the TRA may occur based on changes in anticipated future taxable income, changes in applicable tax rates, or other changes in tax attributes that may occur and impact the expected future tax benefits to be received by the Company. Changes in the projected liability under the TRA are and will be recorded as a component of "Interest and other income (expense)" each period. Actual taxable income may differ from estimates, which could significantly impact the liability under the TRA and the Company's Consolidated Statements of Operations.
Goodwill and Intangible Assets
Description
Goodwill represents the excess of the purchase price paid over the fair value of net assets acquired in a business combination. Goodwill is not amortized, but is tested annually for impairment at the reporting unit level as of October 1 and between annual tests if indicators of potential impairment exist. These indicators could include a decline in the Company’s stock price and market capitalization, a significant change in the outlook for the reporting unit's business, lower than expected operating results, increased competition, legal factors, or the sale or disposition of a significant portion of a reporting unit. For reporting units with goodwill, an impairment loss is recognized for the amount by which the reporting unit's carrying value, including goodwill, exceeds its fair value.
Our intangible assets are evaluated for impairment only when there is evidence that events or changes in circumstances indicate that the carrying amount of these assets may not be recoverable.
Judgments and Uncertainties
Application of the goodwill impairment test requires judgment, including the identification of reporting units and the determination of the estimated fair value of reporting units. For reporting units with goodwill, we perform a qualitative analysis to determine whether it is more likely than not the fair value of the reporting unit is less than its carrying amount. When assessing goodwill for impairment, our decision to perform a qualitative assessment for an individual reporting unit is based on a number of factors, including the carrying value of the reporting unit's goodwill, the amount of time in between quantitative fair value assessments, macro-economic conditions, industry and market conditions and the operating performance of the reporting unit. If it is determined, based on qualitative factors, that it is more likely than not that the fair value of the reporting unit is less than its carrying amount, a quantitative impairment test is performed, in which we determine the estimated fair value of the reporting unit using a discounted cash flow analysis. This analysis requires significant judgment, including the estimation of future cash flows, which is dependent on internal forecasts, available industry/market data, the estimation of the long-term rate of growth for the reporting unit including expectations and assumptions regarding the impact of general economic conditions on the reporting unit, the estimation of the useful life over which cash flows will occur (including terminal multiples), the determination of the respective weighted average cost of capital and market participant assumptions. Changes in these estimates and assumptions could materially affect the determination of estimated fair value and potential impairment for each reporting unit.
As of December 31, 2023, the Company has recorded goodwill of $114.2 million, including $103.6 million attributable to the Marketplace reporting unit, and intangible assets of $91.9 million, consisting principally of internally developed software, renewal rights, and trade names and trademarks.
Effect if Actual Results Differ from Estimates and Assumptions
Fair value determinations require considerable judgment and are sensitive to changes in underlying assumptions and factors. As a result, there can be no assurance that the estimates and assumptions made for purposes of the annual goodwill impairment test will prove to be an accurate prediction of the future. Examples of events or circumstances that could reasonably be expected to negatively affect the underlying key assumptions and ultimately impact the estimated fair value of our reporting units may include such items as: (i) failure to meet business plans; (ii) deterioration of the U.S. economy; (iii) an increase in interest rates; or (iv) other unanticipated events and circumstances that may decrease the projected cash flows or increase the discount rates and could potentially result in an impairment charge.
While historical performance and current expectations have generally resulted in the conclusion that our goodwill is not impaired, if our assumptions are not realized, it is possible that an impairment charge may need to be recorded in the future. There can be no assurance that the estimates and assumptions made for purposes of the annual goodwill impairment tests will prove to be an accurate prediction of the future.
Warrant Liabilities
Description
As of December 31, 2023, the Company had 5,750,000 Public Warrants outstanding, 257,500 Private Placement Warrants outstanding, 28,750 Underwriter Warrants, 1,300,000 OTM Warrants outstanding, and 12,147,300 PIPE Warrants outstanding.
The Company accounts for these warrants as liabilities as they do not meet the criteria for equity treatment. Accordingly, the warrants are measured at fair value each reporting period with the change in fair value between reporting periods recorded within "Change in fair value of warrant liabilities" in the Consolidated Statements of Operations.
Judgments and Uncertainties
The Company's Private Placement Warrants, Underwriter Warrants, OTM Warrants, and PIPE Warrants are Level 3 within the fair value hierarchy. The Company utilizes a Monte Carlo simulation model to measure the fair value of these warrants. The Company’s Monte Carlo simulation model includes assumptions related to the expected stock price volatility, expected term, dividend yield, and risk-free interest rate.
The following table summarizes the significant inputs used in the valuation model for the private warrants as of December 31, 2023:
| | | | | | | | | | | | | | | | | | | | | | | | | | |
| Inputs | | Private Placement Warrants | | Underwriter Warrants | | OTM Warrants | | PIPE Warrants |
| Exercise price | | $11.50 | | $11.50 | | $15.00 | | $11.50 |
| Common stock price | | $7.80 | | $7.80 | | $7.80 | | $7.80 |
| Volatility | | 48.6% | | 48.6% | | 46.0% | | 48.6% |
| Expected term of the warrants | | 2.92 | | 2.92 | | 7.93 | | 2.92 |
| Risk-free rate | | 4.00% | | 4.00% | | 3.90% | | 4.00% |
| Dividend yield | | —% | | —% | | —% | | —% |
Effect if Actual Results Differ from Estimates and Assumptions
We believe that the significant inputs and assumptions used in the Monte Carlo simulation model are reasonable and appropriately value our Level 3 warrants. However, to the extent that the significant inputs and assumptions used in the valuation model change between reporting periods, the recorded amount of our warrant liabilities would be impacted, resulting in an increase or decrease to the liability and our earnings.
Refer to Note 16 — Fair Value Measurements, in Item 8 of Part II of this Annual Report, for additional information related to the significant inputs to the Monte Carlo simulation model.
New Accounting Standards
New accounting standards are described in Note 1 — Summary of Significant Accounting Policies and New Accounting Standards, in Item 8 of Part II of this Annual Report, which are incorporated herein by reference.
Non-GAAP Financial Measures
Adjusted EBITDA
We define Adjusted EBITDA as consolidated Net income excluding interest and other income (expense), income tax expense, and depreciation and amortization, adjusted to exclude (i) changes in the fair value of our warrant liabilities; (ii) share-based compensation expense; and when applicable, (iii) restructuring, impairment and related charges, net; (iv) the net gain or loss from asset disposals; (v) losses and impairments related to divestitures; (vi) the revaluation gain on a previously held equity method investment; and (vii) certain other unusual items.
We present Adjusted EBITDA because we consider it to be an important supplemental measure of the Company's performance and believe it is frequently used by securities analysts, investors, and other interested parties in the evaluation of companies in our industry. Management uses Adjusted EBITDA as a measure of the operating performance of our business on a consistent basis, as it removes the impact of items not directly resulting from our core operations.
By providing this non-GAAP financial measure, together with a reconciliation to net income (loss), which is the most comparable GAAP measure, we believe we are enhancing investors’ understanding of our business and our results of operations, as well as assisting investors in evaluating how well we are executing our strategic initiatives. However, Adjusted EBITDA has limitations as an analytical tool, and should not be considered in isolation, or as an alternative to, or a substitute for net income (loss) or other financial statement data presented in our Consolidated Financial Statements as indicators of financial performance. Hagerty's definition of Adjusted EBITDA may be different than similarly titled measures used by other companies in our industry, which could reduce the usefulness of this non-GAAP financial measure when comparing our performance to that of other companies.
The following table reconciles Adjusted EBITDA to the most directly comparable GAAP measure, which is Net income:
| | | | | | | | | | | | | | | | | | | | |
| | | | Year Ended December 31, |
| | | | | | 2023 | | 2022 | | |
| | | | | | | | | | |
| | | | | | in thousands |
| Net income | | | | | $ | 28,179 | | | $ | 2,403 | | | |
| Interest and other income | | | | | (22,821) | | | (2,028) | | | |
| Income tax expense | | | | | 16,593 | | | 7,017 | | | |
| Depreciation and amortization | | | | | 45,809 | | | 33,887 | | | |
| EBITDA | | | | | 67,760 | | | 41,279 | | | |
| Restructuring, impairment and related charges, net | | | | | 8,812 | | | 18,324 | | | |
| Change in fair value of warrant liabilities | | | | | (11,543) | | | (41,899) | | | |
| Share-based compensation expense | | | | | 17,729 | | | 12,129 | | | |
| Losses and impairments related to divestitures | | | | | 4,013 | | | — | | | |
| Revaluation gain previously held equity method investment | | | | | — | | | (34,735) | | | |
| Net loss from asset disposals | | | | | | — | | | 1,970 | | | |
Other unusual items (1) | | | | | 1,391 | | | 992 | | | |
| Adjusted EBITDA | | | | | $ | 88,162 | | | $ | (1,940) | | | |
| | | | | | | | | | |
(1) Other unusual items primarily includes certain legal settlement expenses (net) recognized in the years ended December 31, 2023 and 2022, and certain non-restructuring severance expenses recognized in the year ended December 31, 2022.
Adjusted EPS
We define Adjusted Earnings (Loss) Per Share ("Adjusted EPS") as consolidated Net income (loss), less changes in the fair value of our warrant liabilities and, when applicable, the revaluation gain on a previously held equity method investment, divided by our outstanding and total potentially dilutive securities, which includes (i) the weighted-average issued and outstanding shares of Class A Common Stock; (ii) all issued and outstanding non-controlling interest units of The Hagerty Group; (iii) all unexercised warrants; (iv) all unissued share-based compensation awards; and (v) all issued and outstanding shares of our Series A Convertible Preferred Stock on an as-converted basis.
The most directly comparable GAAP measure to Adjusted EPS is basic earnings per share ("Basic EPS"), which is calculated as Net income (loss) available to Class A Common Stockholders divided by the weighted average number of Class A Common Stock shares outstanding during the period.
We present Adjusted EPS because we consider it to be an important supplemental measure of our operating performance and believe it is used by securities analysts, investors and other interested parties in evaluating the consolidated performance of other companies in our industry. We also believe that Adjusted EPS, which compares our consolidated Net income (loss) with our outstanding and potentially dilutive shares, provides useful information to investors regarding our performance on a fully consolidated basis.
Management uses Adjusted EPS:
•as a measurement of operating performance of our business on a fully consolidated basis;
•to evaluate the performance and effectiveness of our operational strategies; and
•as a preferred predictor of core operating performance, comparisons to prior periods and competitive positioning.
We caution investors that Adjusted EPS is not a recognized measure under GAAP and should not be considered in isolation or as a substitute for, or superior to, the financial information prepared and presented in accordance with GAAP, including Basic EPS, and that Adjusted EPS, as we define it, may be defined or calculated differently by other companies. In addition, Adjusted EPS has limitations as an analytical tool and should not be considered as a measure of profit or loss per share.
The following table reconciles Adjusted EPS to the most directly comparable GAAP measure, which is Basic EPS:
| | | | | | | | | | | | | | | | | | | | |
| | | | Year Ended December 31, |
| | | | | | 2023 | | 2022 | | |
| | | | | | | | | | |
| | | | | | in thousands (except per share amounts) |
| Numerator: | | | | | | | | | |
Net income available to Class A Common Stockholders (1) | | | | | $ | 15,881 | | | $ | 32,078 | | | |
| Undistributed earnings allocated to Series A Convertible Preferred Stock | | | | | 673 | | | — | | | |
| Accretion of Series A Convertible Preferred Stock | | | | | 3,677 | | | — | | | |
| Net income (loss) attributable to non-controlling interest | | | | | 7,948 | | | (29,675) | | | |
| Consolidated net income | | | | | 28,179 | | | 2,403 | | | |
| Change in fair value of warrant liabilities | | | | | (11,543) | | | (41,899) | | | |
| Revaluation gain on previously held equity method investment | | | | | — | | | (34,735) | | | |
Adjusted consolidated net income (loss) (2) | | | | | $ | 16,636 | | | $ | (74,231) | | | |
| | | | | | | | | |
| Denominator: | | | | | | | | | |
Weighted average shares of Class A Common Stock outstanding — basic (1) | | | | | 84,180 | | 82,728 | | |
| Total potentially dilutive securities outstanding: | | | | | | | | | |
Conversion of non-controlling interest units of The Hagerty Group to Class A Common Stock | | | | | 255,499 | | | 255,758 | | | |
Conversion of Series A Convertible Preferred Stock to Class A Common Stock | | | | | 6,785 | | | — | | | |
| Total unissued share-based compensation awards | | | | | 8,385 | | | 6,902 | | | |
| Total warrants outstanding | | | | | 19,484 | | | 19,484 | | | |
| Potentially dilutive shares outstanding | | | | | 290,153 | | | 282,144 | | | |
Fully dilutive shares outstanding (2) | | | | | 374,333 | | | 364,872 | | | |
| | | | | | | | | | |
Basic EPS (1) | | | | | $ | 0.19 | | | $ | 0.39 | | | |
| | | | | | | | | | |
Adjusted EPS (2) | | | | | $ | 0.04 | | | $ | (0.20) | | | |
| | | | | | | | | | |
(1) Numerator and Denominator, respectively, of the GAAP measure Basic EPS
(2) Numerator and Denominator, respectively, of the non-GAAP measure Adjusted EPS
ITEM 7A. QUANTITATIVE AND QUALITATIVE DISCLOSURES ABOUT MARKET RISK
We are exposed to interest rate risk as part of our ongoing business operations. Interest rate risk is the risk that the fair value of future cash flows of a financial instrument will fluctuate due to changes in prevailing market interest rates.
As of December 31, 2023, we had approximately $68.0 million of variable rate indebtedness (after taking into consideration $35.0 million in interest rate swaps which effectively convert variable-rate debt to fixed-rate debt), representing approximately 50% of our total debt outstanding, at an average interest rate during the year ended December 31, 2023 of approximately 7.30%. Based on variable-rate borrowings outstanding as of December 31, 2023, a 100-basis point (or 1.0%) change in our borrowing rates would result in our annual interest payments changing by approximately $0.7 million.
We also have a portfolio of loans secured by collector cars of approximately $52.9 million as of December 31, 2023, upon which interest is earned predominately at variable rates including Prime Rate and Term Secured Overnight Financing Rate ("SOFR").
ITEM 8. FINANCIAL STATEMENTS AND SUPPLEMENTARY DATA
| | | | | | | | |
| Financial Statements | | Page No. |
| | |
| | |
| | |
| | |
| | |
| | |
| | |
| | |
| Financial Statement Schedule: | | |
| | |
| | |
All other schedules are omitted because they are not applicable or the required information is shown in the Consolidated Financial Statements or Notes thereto.
REPORT OF INDEPENDENT REGISTERED PUBLIC ACCOUNTING FIRM
To the stockholders and the Board of Directors of Hagerty, Inc.
Opinion on the Financial Statements
We have audited the accompanying consolidated balance sheets of Hagerty, Inc. and subsidiaries (the "Company") as of December 31, 2023 and 2022, the related consolidated statements of operations, comprehensive income (loss), changes in temporary and stockholders' equity, and cash flows, for each of the three years in the period ended December 31, 2023, and the related notes and the schedules listed in the index at Item 8 (collectively referred to as the "financial statements"). In our opinion, the financial statements present fairly, in all material respects, the financial position of the Company as of December 31, 2023, and 2022, and the results of its operations and its cash flows for each of the three years in the period ended December 31, 2023, in conformity with accounting principles generally accepted in the United States of America.
Basis for Opinion
These financial statements are the responsibility of the Company's management. Our responsibility is to express an opinion on the Company's financial statements based on our audits. We are a public accounting firm registered with the Public Company Accounting Oversight Board (United States) (PCAOB) and are required to be independent with respect to the Company in accordance with the U.S. federal securities laws and the applicable rules and regulations of the Securities and Exchange Commission and the PCAOB.
We conducted our audits in accordance with the standards of the PCAOB. Those standards require that we plan and perform the audit to obtain reasonable assurance about whether the financial statements are free of material misstatement, whether due to error or fraud. The Company is not required to have, nor were we engaged to perform, an audit of its internal control over financial reporting. As part of our audits, we are required to obtain an understanding of internal control over financial reporting but not for the purpose of expressing an opinion on the effectiveness of the Company's internal control over financial reporting. Accordingly, we express no such opinion.
Our audits included performing procedures to assess the risks of material misstatement of the financial statements, whether due to error or fraud, and performing procedures that respond to those risks. Such procedures included examining, on a test basis, evidence regarding the amounts and disclosures in the financial statements. Our audits also included evaluating the accounting principles used and significant estimates made by management, as well as evaluating the overall presentation of the financial statements. We believe that our audits provide a reasonable basis for our opinion.
/s/ DELOITTE & TOUCHE LLP
Detroit, Michigan
March 12, 2024
We have served as the Company’s auditor since 2019.
Hagerty, Inc.
Consolidated Statements of Operations
| | | | | | | | | | | | | | | | | | | | | |
| | | Year Ended December 31, |
| | | | | 2023 | | 2022 | | 2021 |
| | | | | | | | | |
| REVENUE: | | | | | in thousands (except per share amounts) |
| Commission and fee revenue | | | | | $ | 365,512 | | | $ | 307,238 | | | $ | 271,571 | |
| Earned premium | | | | | 531,866 | | | 403,061 | | | 295,824 | |
| Membership, marketplace and other revenue | | | | | 102,835 | | | 77,289 | | | 51,684 | |
| Total revenue | | | | | 1,000,213 | | | 787,588 | | | 619,079 | |
| OPERATING EXPENSES: | | | | | | | | | |
| Salaries and benefits | | | | | 216,896 | | | 199,542 | | | 171,901 | |
| Ceding commission, net | | | | | 251,805 | | | 191,150 | | | 140,983 | |
| Losses and loss adjustment expenses | | | | | 220,658 | | | 182,402 | | | 122,080 | |
| Sales expense | | | | | 156,378 | | | 140,781 | | | 107,483 | |
| General and administrative services | | | | | 85,434 | | | 89,068 | | | 64,558 | |
| Depreciation and amortization | | | | | 45,809 | | | 33,887 | | | 22,144 | |
| Restructuring, impairment and related charges, net | | | | | 8,812 | | | 18,324 | | | — | |
| Losses and impairments related to divestitures | | | | | 4,013 | | | — | | | — | |
| Total operating expenses | | | | | 989,805 | | | 855,154 | | | 629,149 | |
| OPERATING INCOME (LOSS) | | | | | 10,408 | | | (67,566) | | | (10,070) | |
| Change in fair value of warrant liabilities | | | | | 11,543 | | | 41,899 | | | (42,540) | |
| Revaluation gain on previously held equity method investment | | | | | — | | | 34,735 | | | — | |
| Interest and other income (expense) | | | | | 22,821 | | | 2,028 | | | (1,993) | |
| INCOME (LOSS) BEFORE INCOME TAX EXPENSE | | | | | 44,772 | | | 11,096 | | | (54,603) | |
| Income tax expense | | | | | (16,593) | | | (7,017) | | | (6,751) | |
| Loss from equity method investment, net of tax | | | | | — | | | (1,676) | | | — | |
| NET INCOME (LOSS) | | | | | 28,179 | | | 2,403 | | | (61,354) | |
| Net (income) loss attributable to non-controlling interest | | | | | (7,948) | | | 29,675 | | | 398 | |
| Net loss attributable to redeemable non-controlling interest | | | | | — | | | — | | | 14,598 | |
| Accretion of Series A Convertible Preferred Stock | | | | | (3,677) | | | — | | | — | |
| NET INCOME (LOSS) ATTRIBUTABLE TO CLASS A COMMON STOCKHOLDERS | | | | | $ | 16,554 | | | $ | 32,078 | | | $ | (46,358) | |
| | | | | | | | | |
Earnings (loss) per share of Class A Common Stock: | | | | | | | | | |
| Basic | | | | | $ | 0.19 | | | $ | 0.39 | | | $ | (0.56) | |
| Diluted | | | | | $ | 0.09 | | | $ | (0.07) | | | $ | (0.56) | |
| | | | | | | | | |
Weighted-average shares of Class A Common Stock outstanding: | | | | | | | | | |
| Basic | | | | | 84,180 | | | 82,728 | | | 82,327 | |
| Diluted | | | | | 340,323 | | | 336,147 | | | 82,327 | |
The accompanying Notes are an integral part of these Consolidated Financial Statements.
See Note 23 for information regarding Related-Party Transactions.
Hagerty, Inc.
Consolidated Statements of Comprehensive Income (Loss)
| | | | | | | | | | | | | | | | | | | | | |
| | | Year Ended December 31, |
| | | | | 2023 | | 2022 | | 2021 |
| | | | | | | | | |
| | | | | in thousands |
| Net income (loss) | | | | | $ | 28,179 | | | $ | 2,403 | | | (61,354) | |
| Other comprehensive income, net of tax: | | | | | | | | | |
| Foreign currency translation adjustments | | | | | 1,564 | | | (1,834) | | | (792) | |
| Derivative instruments | | | | | (1,060) | | | 2,699 | | | 1,019 | |
| Other comprehensive income | | | | | 504 | | | 865 | | | 227 | |
| Comprehensive income (loss) | | | | | 28,683 | | | 3,268 | | | (61,127) | |
| Comprehensive (income) loss attributable to non-controlling interest | | | | | (8,327) | | | 29,675 | | | 398 | |
| Comprehensive loss attributable to redeemable non-controlling interest | | | | | — | | | — | | | 14,598 | |
| Accretion of Series A Convertible Preferred Stock | | | | | (3,677) | | | — | | | — | |
| Comprehensive income (loss) attributable to Class A Common Stockholders | | | | | $ | 16,679 | | | $ | 32,943 | | | $ | (46,131) | |
The accompanying Notes are an integral part of these Consolidated Financial Statements.
See Note 23 for information regarding Related-Party Transactions.
Hagerty, Inc.
Consolidated Balance Sheets
| | | | | | | | | | | | | |
| December 31, | | |
| 2023 | | 2022 | | |
| | | | | |
| ASSETS | in thousands (except share amounts) |
| Current Assets: | | | | | |
| Cash and cash equivalents | $ | 108,326 | | | $ | 95,172 | | | |
| Restricted cash and cash equivalents | 615,950 | | | 444,019 | | | |
| Accounts receivable | 71,530 | | | 58,255 | | | |
| Premiums receivable | 137,525 | | | 100,700 | | | |
| Commissions receivable | 79,115 | | | 60,151 | | | |
| Notes receivable | 35,896 | | | 25,493 | | | |
| Deferred acquisition costs, net | 141,637 | | | 107,342 | | | |
| Other current assets | 60,239 | | | 45,651 | | | |
| Total current assets | 1,250,218 | | | 936,783 | | | |
| Notes receivable | 17,018 | | | 11,934 | | | |
| Property and equipment, net | 20,764 | | | 25,256 | | | |
| Lease right-of-use assets | 50,515 | | | 82,398 | | | |
| Intangible assets, net | 91,924 | | | 104,024 | | | |
| Goodwill | 114,214 | | | 115,041 | | | |
| Other long-term assets | 43,559 | | | 37,082 | | | |
| TOTAL ASSETS | $ | 1,588,212 | | | $ | 1,312,518 | | | |
| LIABILITIES, TEMPORARY EQUITY AND STOCKHOLDERS' EQUITY | | | | | |
| Current Liabilities: | | | | | |
| Accounts payable, accrued expenses and other current liabilities | $ | 87,175 | | | $ | 77,049 | | | |
| Losses payable | 62,001 | | | 55,516 | | | |
| Provision for unpaid losses and loss adjustment expenses | 136,507 | | | 111,741 | | | |
| Commissions payable | 108,739 | | | 77,075 | | | |
| Due to insurers | 79,815 | | | 68,171 | | | |
| Advanced premiums | 20,471 | | | 17,084 | | | |
| Unearned premiums | 317,275 | | | 235,462 | | | |
| Contract liabilities | 30,316 | | | 25,257 | | | |
| Total current liabilities | 842,299 | | | 667,355 | | | |
| Long-term lease liabilities | 50,459 | | | 80,772 | | | |
| Long-term debt, net | 130,680 | | | 108,280 | | | |
| Warrant liabilities | 34,018 | | | 45,561 | | | |
| Deferred tax liability | 15,937 | | | 12,850 | | | |
| Contract liabilities | 17,335 | | | 19,169 | | | |
| Other long-term liabilities | 4,139 | | | 11,162 | | | |
| TOTAL LIABILITIES | 1,094,867 | | | 945,149 | | | |
Commitments and Contingencies (Note 24) | — | | | — | | | |
| TEMPORARY EQUITY | | | | | |
Preferred stock, $0.0001 par value (20,000,000 shares authorized, 8,483,561 Series A Convertible Preferred Stock issued and outstanding as of December 31, 2023 and no shares issued and outstanding as of December 31, 2022) | 82,836 | | | — | | | |
| STOCKHOLDERS' EQUITY | | | | | |
Class A Common Stock, $0.0001 par value (500,000,000 shares authorized, 84,588,536 and 83,202,969 issued and outstanding as of December 31, 2023 and December 31, 2022, respectively) | 8 | | | 8 | | | |
Class V Common Stock, $0.0001 par value (300,000,000 authorized, 251,033,906 shares issued and outstanding as of December 31, 2023 and December 31, 2022) | 25 | | | 25 | | | |
| Additional paid-in capital | 561,754 | | | 549,034 | | | |
| Accumulated earnings (deficit) | (468,995) | | | (489,602) | | | |
| Accumulated other comprehensive income (loss) | (88) | | | (213) | | | |
| Total stockholders' equity | 92,704 | | | 59,252 | | | |
| Non-controlling interest | 317,805 | | | 308,117 | | | |
Total equity (Note 19) | 410,509 | | | 367,369 | | | |
| TOTAL LIABILITIES, TEMPORARY EQUITY AND STOCKHOLDERS' EQUITY | $ | 1,588,212 | | | $ | 1,312,518 | | | |
The accompanying Notes are an integral part of these Consolidated Financial Statements.
See Note 23 for information regarding Related-Party Transactions.
Hagerty, Inc.
Consolidated Statements of Changes in Temporary Equity and Stockholders' Equity
| | | | | | | | | | | | | | | | | | | | | | | | | | | | | | | | | | | | | | | | | | | | | | | | | | | | | | | | | | | | | | | | | | | | | | | | | |
| Temporary Equity | | | | Stockholders' Equity |
| Series A Convertible Preferred Stock | | | | Class A Common Stock | | Class V Common Stock | | Additional Paid in Capital | | Accumulated Earnings (Deficit) | | Accumulated Other Comprehensive Income (Loss) | | Total Stockholders' Equity | | Non-controlling Interest | | Total Equity |
| in thousands | Shares | | Amount | | | Shares | | Amount | | Shares | | Amount | | | | | | |
| | | | | | | | | | | | | | | | | | | | | | | | | |
| | | | | | | | | | | | | | | | | | | | | | | | | |
| | | | | | | | | | | | | | | | | | | | | | | | | |
| | | | | | | | | | | | | | | | | | | | | | | | | |
| | | | | | | | | | | | | | | | | | | | | | | | | |
| | | | | | | | | | | | | | | | | | | | | | | | | |
| | | | | | | | | | | | | | | | | | | | | | | | | |
| | | | | | | | | | | | | | | | | | | | | | | | | |
| | | | | | | | | | | | | | | | | | | | | | | | | |
| | | | | | | | | | | | | | | | | | | | | | | | | |
| | | | | | | | | | | | | | | | | | | | | | | | | |
| | | | | | | | | | | | | | | | | | | | | | | | | |
| | | | | | | | | | | | | | | | | | | | | | | | | |
| | | | | | | | | | | | | | | | | | | | | | | | | |
Balance at December 31, 2022 | — | | | $ | — | | | | | 83,203 | | | $ | 8 | | | 251,034 | | | $ | 25 | | | $ | 549,034 | | | $ | (489,602) | | | $ | (213) | | | $ | 59,252 | | | $ | 308,117 | | | $ | 367,369 | |
| Net income | — | | | — | | | | | — | | | — | | | — | | | — | | | — | | | 20,231 | | | — | | | 20,231 | | | 7,948 | | | 28,179 | |
| Accretion of Series A Convertible Preferred Stock | — | | | 3,677 | | | | | — | | | — | | | — | | | — | | | (3,677) | | | — | | | — | | | (3,677) | | | — | | | (3,677) | |
| Other comprehensive income | — | | | — | | | | | — | | | — | | | — | | | — | | | — | | | — | | | 125 | | | 125 | | | 379 | | | 504 | |
| Issuance of shares under employee plans | — | | | — | | | | | 1,126 | | | — | | | — | | | — | | | 1,526 | | | — | | | — | | | 1,526 | | | — | | | 1,526 | |
| Stock-based compensation | — | | | — | | | | | — | | | — | | | — | | | — | | | 18,017 | | | — | | | — | | | 18,017 | | | — | | | 18,017 | |
| Conversion of The Hagerty Group units to Class A Common Stock | — | | | — | | | | | 260 | | | — | | | — | | | — | | | 2,311 | | | — | | | — | | | 2,311 | | | (2,311) | | | — | |
| Issuance of Series A Convertible Preferred Stock, net of issuance costs | 8,484 | | | 79,159 | | | | | — | | | — | | | — | | | — | | | — | | | — | | | — | | | — | | | — | | | — | |
| Non-controlling interest issued capital | — | | | — | | | | | — | | | — | | | — | | | — | | | — | | | — | | | — | | | — | | | 779 | | | 779 | |
Termination of MHH Joint Venture (see Note 10) | — | | | — | | | | | — | | | — | | | — | | | — | | | (1,038) | | | 376 | | | — | | | (662) | | | (1,526) | | | (2,188) | |
| Reallocation between controlling and non-controlling interest | — | | | — | | | | | — | | | — | | | — | | | — | | | (4,419) | | | — | | | — | | | (4,419) | | | 4,419 | | | — | |
Balance at December 31, 2023 | 8,484 | | | $ | 82,836 | | | | | 84,589 | | | $ | 8 | | | 251,034 | | | $ | 25 | | | $ | 561,754 | | | $ | (468,995) | | | $ | (88) | | | $ | 92,704 | | | $ | 317,805 | | | $ | 410,509 | |
The accompanying Notes are an integral part of these Consolidated Financial Statements.
See Note 23 for information regarding Related-Party Transactions.
Hagerty, Inc.
Consolidated Statements of Changes in Temporary Equity and Stockholders' Equity
| | | | | | | | | | | | | | | | | | | | | | | | | | | | | | | | | | | | | | | | | | | | | | | | | | | | | | | | | | | | | | | | | | | | | | | |
| Temporary Equity | | Stockholders' Equity |
| Redeemable Non-controlling Interest | | Members' Equity | | Class A Common Stock | | Class V Common Stock | | Additional Paid in Capital | | Accumulated Earnings (Deficit) | | Accumulated Other Comprehensive Income/(Loss) | | Total Stockholders' / Members' Equity | | Non-controlling Interest | | Total Equity |
| in thousands | | | Shares | | Amount | | Shares | | Amount | | | | | | |
Balance at December 31, 2020 | $ | — | | | $ | 62,320 | | | — | | | $ | — | | | — | | | $ | — | | | $ | — | | | $ | 56,832 | | | $ | (1,954) | | | $ | 117,198 | | | $ | 123 | | | $ | 117,321 | |
| Net income (loss) before Business Combination | — | | | — | | | — | | | — | | | — | | | — | | | — | | | (3,089) | | | — | | | (3,089) | | | (312) | | | (3,401) | |
| Other comprehensive income before Business Combination | — | | | — | | | — | | | — | | | — | | | — | | | — | | | — | | | 248 | | | 248 | | | — | | | 248 | |
| Distributions before Business Combination | — | | | (4,056) | | | — | | | — | | | — | | | — | | | — | | | — | | | — | | | (4,056) | | | — | | | (4,056) | |
| Non-controlling interest issued capital before Business Combination | — | | | — | | | — | | | — | | | — | | | — | | | — | | | — | | | — | | | — | | | 1,580 | | | 1,580 | |
| Business Combination | 238,265 | | | (58,264) | | | 82,327 | | | 8 | | | 251,034 | | | 25 | | | 526,711 | | | (489,661) | | | — | | | (21,181) | | | — | | | (21,181) | |
| Net income (loss) after Business Combination | (11,510) | | | — | | | — | | | — | | | — | | | — | | | — | | | (46,358) | | | | | (46,358) | | | (86) | | | (46,444) | |
| Other comprehensive income (loss) after Business Combination | — | | | — | | | — | | | — | | | — | | | — | | | — | | | — | | | (21) | | | (21) | | | — | | | (21) | |
| Fair value adjustment for redeemable non-controlling interest | 366,522 | | | — | | | — | | | — | | | — | | | — | | | (366,522) | | | — | | | — | | | (366,522) | | | — | | | (366,522) | |
Balance at December 31, 2021 | $ | 593,277 | | | $ | — | | | 82,327 | | | $ | 8 | | | 251,034 | | | $ | 25 | | | $ | 160,189 | | | $ | (482,276) | | | $ | (1,727) | | | $ | (323,781) | | | $ | 1,305 | | | $ | (322,476) | |
| Net income (loss) before exchange agreement amendment | (11,205) | | | — | | | — | | | — | | | — | | | — | | | — | | | (3,679) | | | — | | | (3,679) | | | (172) | | | (3,851) | |
| Other comprehensive income before exchange agreement amendment | — | | | — | | | — | | | — | | | — | | | — | | | — | | | — | | | 1,657 | | | 1,657 | | | — | | | 1,657 | |
| Redemption value adjustment for redeemable non-controlling interest | 1,560,418 | | | — | | | — | | | — | | | — | | | — | | | (162,095) | | | (1,398,325) | | | — | | | (1,560,420) | | | — | | | (1,560,420) | |
| Removal of the redeemable feature of the non-controlling interest | (2,142,490) | | | — | | | — | | | — | | | — | | | — | | | 528,615 | | | 1,398,325 | | | — | | | 1,926,940 | | | 215,550 | | | 2,142,490 | |
| Net income (loss) after exchange agreement amendment | — | | | — | | | — | | | — | | | — | | | — | | | — | | | 35,757 | | | — | | | 35,757 | | | (18,298) | | | 17,459 | |
| Other comprehensive income (loss) after exchange agreement amendment | — | | | — | | | — | | | — | | | — | | | — | | | — | | | — | | | (792) | | | (792) | | | — | | | (792) | |
| Exercise of warrants | — | | | — | | | 125 | | | — | | | — | | | — | | | 1,906 | | | — | | | — | | | 1,906 | | | — | | | 1,906 | |
| Issuance of shares under employee plans | — | | | — | | | 37 | | | — | | | — | | | — | | | — | | | — | | | — | | | — | | | — | | | — | |
| Stock-based compensation | — | | | — | | | — | | | — | | | — | | | — | | | 12,129 | | | — | | | — | | | 12,129 | | | — | | | 12,129 | |
| Non-controlling interest issued capital | — | | | — | | | — | | | — | | | — | | | — | | | — | | | — | | | — | | | — | | | 1,700 | | | 1,700 | |
| Broad Arrow acquisition | — | | | — | | | 714 | | | — | | | — | | | — | | | 9,613 | | | — | | | — | | | 9,613 | | | 63,640 | | | 73,253 | |
| Cumulative effect of adoption of ASC 842 | — | | | — | | | — | | | — | | | — | | | — | | | — | | | 1,066 | | | — | | | 1,066 | | | 3,248 | | | 4,314 | |
| Reallocation between controlling and non-controlling interest | — | | | — | | | — | | | — | | | — | | | — | | | (1,323) | | | (40,470) | | | 649 | | | (41,144) | | | 41,144 | | | — | |
Balance at December 31, 2022 | $ | — | | | $ | — | | | 83,203 | | | $ | 8 | | | 251,034 | | | $ | 25 | | | $ | 549,034 | | | $ | (489,602) | | | $ | (213) | | | $ | 59,252 | | | $ | 308,117 | | | $ | 367,369 | |
The accompanying Notes are an integral part of these Consolidated Financial Statements.
See Note 23 for information regarding Related-Party Transactions.
Hagerty, Inc.
Consolidated Statements of Cash Flows
| | | | | | | | | | | | | | | | | |
| Year Ended December 31, |
| 2023 | | 2022 | | 2021 |
| | | | | |
| OPERATING ACTIVITIES: | in thousands |
| Net income (loss) | $ | 28,179 | | | $ | 2,403 | | | $ | (61,354) | |
Adjustments to reconcile net income (loss) to net cash from operating activities: | | | | | |
| Change in fair value of warrant liabilities | (11,543) | | | (41,899) | | | 42,540 | |
| Loss on equity method investment | — | | | 1,676 | | | — | |
| Revaluation gain on previously held equity method investment | — | | | (34,735) | | | — | |
| Depreciation and amortization | 45,809 | | | 33,887 | | | 22,144 | |
| Provision for deferred taxes | 2,921 | | | 2,973 | | | 3,038 | |
| Impairment of operating lease right-of-use assets | 1,147 | | | 4,698 | | | — | |
Loss on disposals of equipment, software and other assets | 1,894 | | | 4,316 | | | 2,425 | |
| Losses and impairments related to divestitures | 2,827 | | | — | | | — | |
| Share-based compensation expense | 18,017 | | | 12,129 | | | — | |
| Non-cash lease expense | 11,681 | | | 10,875 | | | — | |
| Other | (1,459) | | | 533 | | | 155 | |
| Changes in operating assets and liabilities: | | | | | |
| Accounts, premiums and commission receivable | (69,879) | | | (52,036) | | | (39,123) | |
| Deferred acquisition costs | (34,295) | | | (25,807) | | | (22,963) | |
| Losses payable | 6,485 | | | 21,034 | | | 12,502 | |
| Provision for unpaid losses and loss adjustment expenses | 24,766 | | | 36,872 | | | 19,882 | |
| Commissions payable | 31,664 | | | 16,472 | | | 16,805 | |
| Due to insurers | 11,510 | | | 10,427 | | | 8,883 | |
| Advanced premiums | 3,370 | | | 3,259 | | | 124 | |
| Unearned premiums | 81,813 | | | 60,263 | | | 50,491 | |
| Operating lease liabilities | (11,243) | | | (9,779) | | | — | |
| Other assets and liabilities, net | (9,958) | | | (2,233) | | | (13,268) | |
| Net Cash Provided by Operating Activities | 133,706 | | | 55,328 | | | 42,281 | |
| INVESTING ACTIVITIES: | | | | | |
| Capital expenditures | (26,403) | | | (44,375) | | | (43,370) | |
Acquisitions, net of cash acquired | (8,683) | | | (15,404) | | | (14,609) | |
| Purchase of previously held equity method investment | — | | | (15,250) | | | — | |
| Issuance of note receivable to previously held equity method investment | — | | | (7,000) | | | — | |
| Issuance of notes receivable | (24,939) | | | (6,123) | | | — | |
| Collection of notes receivable | 10,357 | | | 370 | | | — | |
| Purchase of fixed income securities | (10,568) | | | (4,234) | | | (12,246) | |
| Maturities of fixed income securities | 7,468 | | | 1,216 | | | 1,183 | |
| Other investing activities | 121 | | | (721) | | | 48 | |
| Net Cash Used in Investing Activities | (52,647) | | | (91,521) | | | (68,994) | |
| FINANCING ACTIVITIES: | | | | | |
| Payments on long-term debt | (139,850) | | | (122,500) | | | (42,500) | |
| Proceeds from long-term debt, net of issuance costs | 161,547 | | | 94,367 | | | 108,038 | |
| Proceeds from issuance of preferred stock, net of issuance costs | 79,159 | | | — | | | — | |
| Contribution from non-controlling interest | 779 | | | 1,700 | | | 1,580 | |
| Distributions | — | | | — | | | (4,056) | |
| Cash received in Business Combination | — | | | — | | | 789,661 | |
| Cash consideration to HHC at closing of Business Combination | — | | | — | | | (489,661) | |
| Payment of capitalized transaction costs | — | | | (1,651) | | | (30,991) | |
| Proceeds from issuance of common stock under employee stock purchase plan | 1,526 | | | — | | | — | |
| Net Cash Provided by (Used in) Financing Activities | 103,161 | | | (28,084) | | | 332,071 | |
Effect of exchange rate changes on cash and cash equivalents and restricted cash and cash equivalents | 865 | | | (504) | | | (464) | |
| | | | | |
Change in cash and cash equivalents and restricted cash and cash equivalents | 185,085 | | | (64,781) | | | 304,894 | |
Beginning cash and cash equivalents and restricted cash and cash equivalents | 539,191 | | | 603,972 | | | 299,078 | |
Ending cash and cash equivalents and restricted cash and cash equivalents | $ | 724,276 | | | $ | 539,191 | | | $ | 603,972 | |
The accompanying Notes are an integral part of these Consolidated Financial Statements.
See Note 23 for information regarding Related-Party Transactions.
Hagerty, Inc.
Notes To Consolidated Financial Statements
1 — Summary of Significant Accounting Policies and New Accounting Standards
In these Notes to the Consolidated Financial Statements, the terms "Hagerty," and "the Company" refer to Hagerty, Inc. and its consolidated subsidiaries, including The Hagerty Group, LLC ("The Hagerty Group"), unless the context requires otherwise. In addition, the Company's insurance policyholders and paid Hagerty Drivers Club ("HDC") subscribers are collectively referred to herein as "Members".
Description of Business — Hagerty is a market leader in providing insurance for classic cars and enthusiast vehicles. Through Hagerty's insurance model, the Company acts as a Managing General Agent ("MGA") by underwriting, selling and servicing classic car and enthusiast vehicle insurance policies. The Company then reinsures a large portion of the risks written by its MGA subsidiaries through its wholly owned subsidiary, Hagerty Reinsurance Limited ("Hagerty Re"). In addition, Hagerty offers HDC memberships, which can be bundled with its insurance policies and give subscribers access to an array of products and services, including Hagerty Drivers Club Magazine, automotive enthusiast events, Hagerty's proprietary vehicle valuation tool, emergency roadside assistance, and special vehicle-related discounts. Lastly, to complement its insurance membership offerings, the Company offers Hagerty Marketplace ("Marketplace"), where car enthusiasts can buy, sell, and finance collector cars.
Basis of Presentation — The Consolidated Financial Statements are prepared in accordance with accounting principles generally accepted in the United States of America ("GAAP") and pursuant to the regulations of the Securities and Exchange Commission and include the accounts of Hagerty, Inc., which is comprised of The Hagerty Group and its consolidated subsidiaries.
The Consolidated Financial Statements reflect all normal recurring adjustments and accruals that are, in the opinion of management, necessary for a fair statement of the Company's financial position and results of operations for periods presented.
Principles of Consolidation — The Consolidated Financial Statements contain the accounts of Hagerty, Inc. and its majority-owned or controlled subsidiaries.
As of December 31, 2023 and 2022, Hagerty, Inc. had economic ownership of 24.9% and 24.5%, respectively, of The Hagerty Group and is its sole managing member. Hagerty, Inc. reports a non-controlling interest representing the economic interest in The Hagerty Group held by other parties.
As of December 31, 2023 and 2022, The Hagerty Group owned 100% and approximately 80%, respectively, of Member Hubs Holding, LLC ("MHH"), which operates as Hagerty Garage + Social. Refer to Note 10 — Losses and Impairments Related to Divestitures for additional information related to MHH and Hagerty Garage + Social.
The financial statements of The Hagerty Group and MHH are consolidated by the Company under the voting interest method guidance in accordance with Accounting Standards Codification ("ASC") Topic 810, Consolidations ("ASC 810"). The non-controlling interests related to The Hagerty Group and MHH are presented separately on the Consolidated Statements of Operations, Consolidated Statements of Comprehensive Income (Loss), Consolidated Balance Sheets, and Consolidated Statements of Changes in Temporary Equity and Stockholders' Equity.
All intercompany accounts and transactions have been eliminated in consolidation.
Variable Interest Entities — Broad Arrow Capital LLC ("BAC") and certain of its subsidiaries transfer notes receivable to wholly owned, bankruptcy-remote, special purpose entities (each, an "SPE") to secure borrowings under the BAC Credit Agreement (as defined in Note 17 — Long-Term Debt).
These SPEs are considered to be variable interest entities (each, a "VIE") under GAAP and their financial statements are consolidated by BAC, which is the primary beneficiary of the SPEs and a consolidated subsidiary of the Company. BAC is considered to be the primary beneficiary of the SPEs because it has (i) power over the significant activities of the SPEs through its role as servicer of the notes receivable used to secure borrowings under the BAC Credit Agreement and (ii) the obligation to absorb losses or the right to receive returns that could be significant through its interest in the residual cash flows of the SPEs.
Refer to 4 — Notes Receivable and Note 17 — Long-Term Debt for additional information.
The following table presents the assets and liabilities of the Company's consolidated variable interest entities:
| | | | | | | | | | | |
| December 31, |
| 2023 | | 2022 |
| | | |
| ASSETS | in thousands |
| Cash and cash equivalents | $ | 83 | | | $ | — | |
| Restricted cash and cash equivalents | 961 | | | — | |
| Accounts receivable | 190 | | | — | |
| Notes receivable | 30,125 | | | — | |
| Other assets | 2,900 | | | — | |
| TOTAL ASSETS | $ | 34,259 | | | $ | — | |
| LIABILITIES | | | |
| Accounts payable, accrued expenses and other current liabilities | $ | 1,881 | | | $ | — | |
| Long-term debt, net | 25,782 | | | — | |
| TOTAL LIABILITIES | $ | 27,663 | | | $ | — | |
Emerging Growth Company — The Company currently qualifies as an "emerging growth company" under the Jumpstart Our Business Startups Act of 2012 and can delay the adoption of new or revised accounting standards until those standards would apply to private companies.
The Company intends to avail itself of this extended transition period and, therefore, the Company may not be subject to the same new or revised accounting standards as other public companies that are not emerging growth companies or have opted out of using such extended transition period. As of December 31, 2023, the Company has not delayed the adoption of any new or revised accounting standards despite qualifying as an emerging growth company.
Use of Estimates — The preparation of the Consolidated Financial Statements in conformity with GAAP requires management to make estimates and assumptions that affect the reported amounts of assets and liabilities, and the disclosure of contingent assets and liabilities as of the date of the Consolidated Financial Statements, as well as the reported amounts of revenue and expenses during the reporting period. Although the estimates are considered reasonable, actual results could materially differ from those estimates.
Significant estimates made by management include, but are not limited to: (i) the provision for unpaid losses and loss adjustment expenses, including incurred but not reported ("IBNR") claims (see Note 12); (ii) the valuation of the Company's deferred income tax assets (see Note 22); (iii) the amount of the liability associated with the Tax Receivable Agreement ("TRA") (see Note 22); (iv) the fair values of the reporting units used in assessing the recoverability of goodwill (see Note 11); (v) the valuation and useful lives of intangible assets (see Note 11); and (vi) the fair value of the Company's warrant liabilities (see Note 16). Although some variability is inherent in these estimates, management believes that the current estimates are reasonable in all material respects. These estimates are reviewed regularly and adjusted as necessary. Adjustments related to changes in estimates are reflected in the Company’s results of operations in the period during which those estimates changed.
Segment Information — The Company has one operating segment and one reportable segment. The Company’s Chief Operating Decision Maker ("CODM") is the Chief Executive Officer ("CEO"), who makes resource allocation decisions and assesses performance based on consolidated financial information. The Company’s segment presentation reflects a management approach that utilizes a decision making framework with its Members and customers at the center of all decisions, which requires the CODM to have a consolidated view of the Company's results.
Foreign Currency Translation — The Company translates its foreign currency denominated assets and liabilities into United States ("U.S.") dollars at current rates of exchange as of the balance sheet date, and foreign currency denominated income and expense items at the average exchange rate for the reporting period. Translation adjustments resulting from exchange rate fluctuations are recorded in "Foreign currency translation adjustments", a component of Accumulated other comprehensive income (loss). Foreign currency transaction gains and losses are recognized within "Interest and other income (expense)" in the Consolidated Statements of Operations.
Cash and Cash Equivalents and Restricted Cash and Cash Equivalents — Cash and cash equivalents includes amounts held in banks in operating accounts and money market funds. The Company considers money market funds with maturities within 90 days of the purchase date to be equivalent to cash. At December 31, 2023 and 2022, the Company’s cash accounts exceeded federally insured limits.
The Company's MGA subsidiaries collect premiums from insureds on behalf of insurance carriers. Prior to remittance to the insurance carrier, these funds are required to be held in trust and segregated from the Company's operating cash. These funds are recorded within "Restricted cash and cash equivalents" with a corresponding liability recorded within "Due to insurers" on the Consolidated Balance Sheets.
Hagerty Re maintains a trust account for the benefit of the ceding insurer as security for their obligations for losses, loss expenses, unearned premium and profit-sharing commissions. The use of the funds in this trust account is restricted to the payment of these amounts and is reported within "Restricted cash and cash equivalents" on the Consolidated Balance Sheets.
Broad Arrow Capital LLC and its consolidated subsidiaries maintain bank accounts that are required for the operation of the BAC Credit Facility (as defined in Note 17 — Long-Term Debt). The funds in these bank accounts represent security under the BAC Credit Facility and their use is restricted to the servicing of the debt outstanding under that facility. The funds held in these bank accounts are reported within "Restricted cash and cash equivalents" on the Consolidated Balance Sheets.
The following table provides a reconciliation of cash and cash equivalents and restricted cash and cash equivalents as of December 31, 2023 and 2022:
| | | | | | | | | | | | | |
| December 31, | | |
| 2023 | | 2022 | | |
| | | | | |
| in thousands |
| Cash and cash equivalents | $ | 108,326 | | | $ | 95,172 | | | |
| Restricted cash and cash equivalents | 615,950 | | | 444,019 | | | |
Total cash and cash equivalents and restricted cash and cash equivalents | $ | 724,276 | | | $ | 539,191 | | | |
The table below presents information regarding the Company's non-cash investing and financing activities, as well as the cash paid for interest and taxes for the years ended December 31, 2023, 2022, and 2021:
| | | | | | | | | | | | | | | | | |
| Year Ended December 31, |
| 2023 | | 2022 | | 2021 |
| | | | | |
| NON-CASH INVESTING AND FINANCING ACTIVITIES: | in thousands |
| Capital expenditures | $ | 282 | | | $ | 1,592 | | | $ | 4,668 | |
| Broad Arrow acquisition | $ | — | | | $ | 73,253 | | | $ | — | |
| Other acquisitions and investments | $ | 2,142 | | | $ | 8,273 | | | $ | 3,774 | |
| Warrant liabilities recognized in Business Combination | $ | — | | | $ | — | | | $ | 46,826 | |
| Termination of MHH Joint Venture (Refer to Note 10) | $ | 2,929 | | | $ | — | | | $ | — | |
| | | | | |
| CASH PAID FOR: | | | | | |
| Interest | $ | 6,126 | | | $ | 4,868 | | | $ | 2,502 | |
| Income taxes | $ | 10,500 | | | $ | 5,253 | | | $ | 2,160 | |
Deferred Acquisition Costs, net — Deferred acquisition costs are the ceding commissions paid by Hagerty Re to insurance carriers for the risk assumed under the quota share agreements with those carriers. Deferred acquisition costs are recorded net of commissions received by Hagerty Re for the risk ceded to various reinsurers. Net acquisition costs are deferred and recognized ratably over the term of the related policies, which is generally 12 months.
Deferred acquisition costs are considered to be recoverable if the sum of expected future earned premiums exceeds expected future claims and expenses. Anticipated investment income is also a factor in the recoverability analysis. If, as a result of the recoverability analysis, a loss is determined to be probable, a premium deficiency reserve is recognized in the period in which such determination is made. At December 31, 2023 and 2022, deferred acquisition costs were considered fully recoverable and no premium deficiency reserve was recorded.
Other Assets — Other assets, current and long-term, primarily consists of prepaid sales, general and administrative expenses, prepaid software-as-a-service ("SaaS") implementation costs, fixed income investments, and deferred reinsurance premiums ceded.
•Prepaid expenses are recorded at cost and amortized over the applicable service term.
•The Company expenses SaaS implementation costs incurred during the preliminary project stage and, upon management approval, capitalizes direct implementation costs once the development phase begins. Capitalized SaaS implementation costs are recorded within prepaid expenses and are amortized over the term of the underlying service agreement. The Company monitors SaaS implementation projects on an ongoing basis and capitalizes the costs of any major improvements or new functionality. Once the software is fully implemented, ongoing maintenance costs are expensed as incurred.
•Fixed income investments consist of Canadian provincial and municipal bonds which qualify as debt securities under ASC Topic 320, Investments – Debt Securities. Fixed income investments are classified as held-to-maturity because the Company has the intent and ability to hold these investments to maturity. As a result, fixed income investments are carried at amortized cost on the Consolidated Balance Sheets. Amortized cost is the amount at which an investment is acquired, adjusted for applicable accrued interest and accretion of discount or amortization of premium. Premium or discount is amortized on a straight-line basis to maturity. Refer to Note 16 — Fair Value Measurements for additional information.
•Deferred reinsurance premiums ceded consists of the unearned portion of premiums ceded by Hagerty Re to various reinsurers. Deferred reinsurance premiums are recognized on a pro-rata basis over the term of the related reinsured policies as a reduction to "Earned premium" in the Consolidated Statements of Operations.
Notes Receivable — Notes receivable includes loans underwritten by BAC secured by collector cars. Notes receivable are recorded on the date the loan is funded based on the amount stipulated in the underlying agreement. Loans made by BAC carry either a fixed or variable rate of interest and typically have an initial maturity of up to two years, often with an option for the borrower to renew for one year increments, provided the borrower remains in good standing. Finance revenue on the loans is recognized when earned based on the amount of the outstanding loan, the applicable interest rate on the loan, and the length of time the loan was outstanding during the period.
Notes receivable are recorded net of an allowance for expected credit losses, which is based on management's quarterly risk assessment and takes into consideration a number of factors including the level of historical losses for similar loans, the quality of collateral, the low loan-to-value ratio of the loans, management's overall assessment of the current circumstances and risks related to each loan, and, to a lesser extent, the circumstances related to each borrower. The valuation of collector cars is inherently subjective, and the realizable value of collector cars often fluctuates over time. Refer to Note 4 — Notes Receivable for additional information.
Property and Equipment — Property and equipment are recorded at cost and depreciated over the estimated useful life of each asset. Leasehold improvements are amortized over the shorter of either the lease term or the estimated useful lives of the improvements. Estimated useful lives range from three to seven years for computers, automobiles and office furniture. Building and building improvements have estimated useful lives of 39 years. Upon sale or retirement, the cost and related accumulated depreciation of the assets disposed are derecognized, and any resulting gain or loss is reflected in the Consolidated Statements of Operations. Annual depreciation is calculated based on the straight-line method. Maintenance, repair costs and minor renovations are expensed as incurred, while expenditures that increase the asset's estimated useful life are capitalized.
Leases — At inception, contracts are evaluated to determine whether they are or contain a lease. A contract is or contains a lease if it conveys the right to control the use of identified property, plant or equipment for a period of time in exchange for consideration. At commencement, leases are evaluated for classification as an operating lease or finance lease. Operating lease right-of-use ("ROU") assets and liabilities are recognized at the commencement date of the lease based on the present value of lease payments over the lease term, discounted using the Company's incremental borrowing rate. The Company estimates the incremental borrowing rate based on qualitative factors including company specific credit rating, lease term, impact of collateral, general economics and the interest rate environment. Operating lease liabilities represent the present value of lease payments not yet paid. Operating lease ROU assets are recorded based upon the operating lease liabilities adjusted for prepayments or accrued lease payments, initial direct costs, lease incentives, and previously recognized impairments. The Company does not recognize ROU assets and lease liabilities for short-term leases. The Company has real estate lease agreements that contain lease and non-lease components, which are accounted for as a single lease component.
The Company’s leases often contain fixed rent escalations over the lease term. The Company recognizes expense for these leases on a straight-line basis over the lease term. The Company also has lease agreements that are subject to annual changes in the Consumer Price Index ("CPI"). While lease liabilities are not remeasured as a result of changes to the CPI, changes to the CPI are treated as variable lease payments and recognized in the period in which the obligation for those payments has incurred.
The Company’s lease agreements may contain variable costs such as common area maintenance, operating expenses, real estate taxes or other costs. Variable lease costs are expensed as incurred within "General and administrative services" in the Consolidated Statements of Operations. The Company’s lease agreements generally do not contain any residual value guarantees or restrictive covenants.
The Company has the option to extend most of its lease agreements, with renewals ranging from one to 20 years. The Company includes renewal options in lease terms that are deemed reasonably certain of being exercised in the lease term. As it is not reasonably certain that the Company will exercise these renewal options, they are not included in the lease terms for purposes of calculating the Company's lease liability. The Company adopted ASC Topic 842, Leases ("ASC 842") effective January 1, 2022 under the modified retrospective approach.
The Company’s primary operating leases consist of office space. The Company’s leases have remaining terms of one to 13 years. As of December 31, 2023 and 2022, the Company had not entered into any finance leases. Refer to Note 7 — Leases for additional information.
Intangible Assets — Intangible assets are recorded at cost and amortized over the estimated life of each intangible asset. Acquired intangible assets are initially recorded at fair value using generally accepted valuation methods appropriate for the type of intangible assets. Intangible assets primarily consist of insurance policy renewal rights, internally developed software, trade names, non-compete agreements and customer relationships. Amortization is recorded using the straight-line method over their estimated lives as it approximates the pattern over which economic benefits are realized. Insurance policy renewal rights, internally developed software, trade names, non-complete agreements and customer relationships are amortized over three to 25 years. The Company expenses internally developed software costs incurred during the preliminary project stage and, upon management approval, capitalizes direct development costs including the associated payroll and related costs for employees working on development and outside contractor costs.
Impairment of Long-Lived Assets — The Company reviews all long-lived assets that have finite lives for impairment whenever events or changes in circumstances indicate that the carrying amount may not be recoverable in accordance with ASC Topic 360, Impairment and Disposal of Long-Lived Assets ("ASC 360"). If it is determined the carrying amount of the asset (or asset group) is not recoverable, the Company recognizes an impairment loss as an operating expense in the current period in the Consolidated Statements of Operations.
The determination of the recoverability of a long-lived asset (or asset group) is based on an estimate of the undiscounted cash flows resulting from the use of the asset (or asset group) and its eventual disposition. If the carrying value of the long-lived asset (or asset group) is not recoverable on an undiscounted cash flow basis, an impairment is recognized to the extent that the carrying value exceeds its fair value. Fair value is determined through various valuation techniques including discounted cash flow models, quoted market values and third-party independent appraisals, as necessary.
Goodwill — Goodwill represents the excess of the cost of a business combination, as defined in ASC Topic 805, Business Combinations ("ASC 805"), over the fair value of net assets acquired, including identifiable intangible assets. Goodwill is not amortized, but is tested annually for impairment at the reporting unit level as of October 1 and between annual tests if indicators of potential impairment exist.
For reporting units with goodwill, the Company performs a qualitative analysis to determine whether it is more likely than not the fair value of the reporting unit is less than its carrying amount. When assessing goodwill for impairment, the Company's decision to perform a qualitative assessment for an individual reporting unit is based on a number of factors, including the carrying value of the reporting unit's goodwill, the amount of time in between quantitative fair value assessments, macro-economic conditions, industry and market conditions and the operating performance of the reporting unit. If it is determined, based on qualitative factors, that it is more likely than not that the fair value of the reporting unit is less than its carrying amount, a quantitative impairment test is performed, in which the Company determines the estimated fair value of the reporting unit using a discounted cash flow analysis. This analysis requires significant judgment, including the estimation of future cash flows, which is dependent on internal forecasts, available industry/market data, the estimation of the long-term rate of growth for the reporting unit including expectations and assumptions regarding the impact of general economic conditions on the reporting unit, the estimation of the useful life over which cash flows will occur (including terminal multiples), the determination of the respective weighted average cost of capital and market participant assumptions.
As of December 31, 2023, the Company has recorded goodwill of $114.2 million, including $103.6 million attributable to
the Marketplace reporting unit. The Company did not recognize any goodwill impairments during the years ended December 31, 2023, 2022, and 2021.
Losses Payable — Losses payable represents the amount due to insurance carriers by Hagerty Re for paid and billed losses as of the balance sheet date.
Provision for Unpaid Losses and Loss Adjustment Expenses — The provision for unpaid losses and loss adjustment expenses is the difference between management's estimate of the ultimate cost of losses and loss adjustment expenses incurred by Hagerty Re and the amount of paid losses as of the reporting date. These reserves reflects management’s best estimate of unpaid losses related to both reported claims and IBNR claims.
Estimating the ultimate cost of claims and claims expenses is an inherently complex and subjective process that involves a high degree of judgment. Reserves are reviewed by management quarterly and periodically throughout the year by combining historical results and current actual results to calculate new development factors. When estimating loss and loss adjustment expense reserves, the Company's actuarial reserving group considers claim cycle time, claims settlement practices, adequacy of case reserves over time, seasonality, and current economic conditions. Because actual experience can differ from key assumptions used in estimating reserves, there may be significant variation in the development of reserves and the amount of actual losses and loss adjustment expenses ultimately paid in the future. Any adjustments to the provision for losses and loss adjustment expenses, and any related reinsurance recoverables, are recognized in the Consolidated Statements of Operations in the period in which management makes the determination that an adjustment is required.
The amount of any reinsurance recoverable is determined by applying the contract terms specific to Hagerty Re's various reinsurance treaties to incurred losses arising from a qualifying event. Reinsurance recoverables are recorded within "Other current assets" on the Consolidated Balance Sheets.
Refer to Note 12 — Provision for Unpaid Losses and Loss Adjustment Expenses for additional information regarding the methodologies used to estimate loss and loss adjustment expense reserves.
Due to Insurers — Due to insurers represents the net amount of premium owed to insurance carriers by the Company's MGA subsidiaries based on the respective contract with each carrier. The net amount due is equal to the gross written premium less the Company’s commission for policies that have reached their effective date.
Advanced Premiums — Advanced premiums represent the gross written premium received by the Company's MGA subsidiaries from insurance Members prior to the effective date of the policy. At the effective date of the policy, "Advanced premiums" are reclassified to "Due to insurers" in the Consolidated Balance Sheets and commission revenue is recognized in the Consolidated Statements of Operations.
Warrant Liabilities — The Company accounts for its outstanding warrants in accordance with ASC Topic 815, Derivatives and Hedging ("ASC 815"). The warrants do not meet the criteria for equity treatment and as such, are recorded at fair value as a non-cash liability. The warrant liability is subject to remeasurement each reporting period with the change in fair value between reporting periods recorded within "Change in fair value of warrant liabilities" in the Consolidated Statements of Operations. Refer to Note 16 — Fair Value Measurements for additional information.
Derivative Instruments — The Company enters into certain derivative financial instruments, when available on a cost-effective basis, to mitigate its risk associated with changes in interest rates and foreign currency exchange rates. The Company accounts for derivatives in accordance with ASC 815, which establishes accounting and reporting standards requiring that all derivative instruments (including certain derivative instruments embedded in other contracts), whether designated as hedging relationships or not, be recorded on the Consolidated Balance Sheets as either an asset or liability measured at fair value. If a derivative is designated as a cash flow hedge for accounting purposes, the effective portion of the change in the fair value of the derivative is recorded in "Other comprehensive income". If a derivative is not designated as a hedge for accounting purposes, the change in fair value is recognized within "Interest and other income (expense)" in the Consolidated Statements of Operations each reporting period. All derivative instruments are managed on a consolidated basis to efficiently minimize exposures.
Gains and losses related to the derivative instruments are expected to be largely offset by gains and losses on the underlying asset or liability. The Company does not use derivative financial instruments for speculative purposes.
The Company is exposed to credit loss in the event of nonperformance by the counterparties on derivative contracts. It is the Company’s policy to manage its credit risk on these transactions by dealing only with financial institutions having a long-term credit rating of "A" or better.
Business Combinations — The Company accounts for acquisitions of entities or asset groups that qualify as a business
using the acquisition method in accordance with ASC 805. Purchase consideration is allocated to the tangible and intangible assets acquired and liabilities assumed based on the estimated fair values as of the acquisition date, which are measured in accordance with the principles outlined in ASC Topic 820, Fair Value Measurement ("ASC 820"). The determination of fair value requires management to make estimates about discount rates, future expected cash flows, market conditions and other future events that are highly subjective in nature. The excess of the total purchase consideration over the fair value of the identified net assets acquired is recognized as goodwill. The results of the acquired businesses are included in the results of operations beginning from the date of acquisition. Acquisition-related costs are expensed as incurred.
During the measurement period, which may be up to one year from the acquisition date, the Company may record adjustments to the allocation of purchase consideration and to the fair values of assets acquired and liabilities assumed to the extent that additional information becomes available. After this period, any subsequent adjustments are recorded in the Consolidated Statements of Operations.
Revenue Recognition — The Company recognizes revenue under both ASC Topic 606, Revenue from Contracts with Customers ("ASC 606") and ASC Topic 944, Financial Services — Insurance ("ASC 944").
Commission and fee revenue
The Company's MGA subsidiaries earn commission and fee revenue primarily from the underwriting, sale, and servicing of classic car and enthusiast vehicle insurance policies written on behalf of the Company's insurance carrier partners. Approximately 93% of commission and fee revenue is earned through the policies sold by Hagerty's U.S. MGAs. These policies are underwritten by a subsidiary of Markel Group, Inc. ("Markel"), which is a related party. Refer to Note 23 — Related-Party Transactions for additional information.
The Company has identified the insurance carrier as its customer and determined that the transaction price is the estimated commissions to be received over the term of the policy. The transaction price is determined based on an estimate of premiums placed, net of a constraint for policy changes and cancellations. These commissions and fees, including those paid via installment plan, are earned when the policy becomes effective, as our performance obligation is substantially complete when the policy is issued, all rights are passed to the insured, and the obligation to pay a claim resides with the carrier.
Under the terms of certain of its contracts with insurance carriers, the Company has the opportunity to earn a contingent underwriting commission ("CUC"), or profit share, based on written or earned premium and the loss ratio results of the insurance book of business. Each insurance carrier partner contract and related CUC is calculated independently. The CUCs represent a form of variable consideration associated with the placement of insurance coverage. Under ASC 606, the Company must estimate the amount of consideration that it will become entitled to receive during the calendar year such that a significant reversal of revenue is not probable. As such, CUCs are recognized as a contract asset within "Commissions receivable" on the Consolidated Balance Sheets in the period that the policy is issued using the applicable premium and payout factors based on the estimated loss ratio from the contract.
Earned premium
Hagerty Re, which is registered as a Class 3A reinsurer under the Bermuda Insurance Act of 1978, earns reinsurance premium revenue for risks assumed primarily from the classic car and enthusiast vehicle insurance policies underwritten by the Company's MGA subsidiaries. In the third quarter of 2023, AM Best assigned a financial strength rating of A- (Excellent) to Hagerty Re.
Earned premium represents the earned portion of written premiums that Hagerty Re has assumed under quota share reinsurance agreements with the Company's insurance carrier partners, net of premiums ceded to various reinsurers and the cost of catastrophe reinsurance coverage. Premiums assumed and ceded are earned on a pro-rata basis over the term of the related insurance policies, which is generally 12 months, with the unearned portion recorded as "Unearned premiums" on the Consolidated Balance Sheets. The cost of catastrophe reinsurance coverage is recognized over the contract period in proportion to the related earned premium.
Membership, marketplace and other revenue
Subscription revenue is earned through HDC memberships, which can be bundled with the Company's insurance policies and give subscribers access to an array of products and services, including Hagerty Drivers Club Magazine, automotive enthusiast events, the Company's proprietary vehicle valuation tool, emergency roadside assistance, and special vehicle-related discounts. The Company also earns fee-based revenue from Hagerty Garage + Social memberships, which include storage services in addition to the HDC Member benefits. Revenue from the sale of HDC and storage memberships is recognized ratably over the period of the membership. The membership is treated as a single performance obligation to provide access to stated member benefits over the life of the membership, which is currently one year.
Marketplace earns fee-based revenue from the sale of collector cars through live auctions, time-based online auctions, and brokered private sales. In addition, Marketplace earns revenue from financing provided to qualified collectors and businesses secured by their collector cars. Fee-based revenue earned by Marketplace is recognized when the underlying sale is completed. Finance revenue is recognized when earned based on the amount of the outstanding loan, the applicable interest rate on the loan and the length of time the loan was outstanding during the period.
Lastly, other revenue includes sponsorship, admission, advertising, valuation and registration income. Other revenue is recognized when the performance obligation for the related product or service is satisfied.
Contract Assets and Liabilities — The Company recognizes contract assets for amounts due to the Company's MGA subsidiaries for CUCs earned but not yet billed under terms of the contract. Contract assets are recorded within "Commissions receivable" on the Consolidated Balance Sheets.
Contract liabilities are recorded primarily as deferred revenue when payments are received in advance of performance under a contract before the transfer of goods or services to a customer or fulfillment of the contract obligations. Contract liabilities consist primarily of an advanced commission payment, along with the obligation to fulfill HDC membership benefits over the one-year life of a membership.
Contract Costs — The Company accounts for contract costs under ASC Topic 340, Other Assets and Deferred Costs, ("ASC 340"), which requires companies to defer certain incremental costs to obtain customer contracts and certain costs to fulfill customer contracts.
The Company capitalizes the incremental costs to obtain contracts, which are primarily related to commission payments on new policy sales. These deferred costs are amortized within "Sales expense" in the Consolidated Statements of Operations based on the average expected life of the insurance policy and are included within "Other current assets" on the Company’s Consolidated Balance Sheets as of December 31, 2023 and 2022.
Advertising — Advertising and sales promotion costs are expensed the first time the advertising or sales promotion takes place. Advertising costs were $25.5 million, $27.8 million, and $24.1 million for the years ended December 31, 2023, 2022, and 2021, respectively, and are reflected as a component of "Sales expense" in the Consolidated Statements of Operations.
Income Taxes — The Hagerty Group is taxed as a pass-through ownership structure under the Internal Revenue Code ("IRC") and a similar section of state income tax law, except for certain U.S. corporate subsidiaries and foreign subsidiaries. Any taxable income or loss generated by The Hagerty Group is passed through to and included in the taxable income or loss of all of The Hagerty Group unit holders, which includes Hagerty, Inc. Hagerty, Inc. is taxed as a corporation and pays corporate federal, state and local taxes with respect to income allocated from The Hagerty Group. Hagerty, Inc., Hagerty Re, Broad Arrow Group, Inc. ("Broad Arrow"), Hagerty Radwood, Inc., and various foreign subsidiaries are treated as taxable entities and income taxes are provided where applicable. Refer to Note 22 — Taxation for additional information.
Where applicable, income taxes are accounted for under the asset and liability method. Deferred tax assets and liabilities are recognized for the future tax consequences attributable to differences between the financial statement carrying values of existing assets and liabilities and their respective tax basis and operating loss and tax-credit carryforwards. Deferred tax assets and liabilities are measured using enacted tax rates expected to apply to taxable income in the years in which those temporary differences are expected to be recovered or settled. The effect on deferred tax assets and liabilities of a change in tax rates is recognized in the Consolidated Statements of Operations in the period of the enactment date.
The Company evaluates the carrying value of its deferred tax assets on a quarterly basis. In completing this evaluation, management considers all available positive and negative evidence. Such evidence includes historical operating results, the existence of cumulative earnings and losses in the most recent fiscal years, taxable income in prior carryback year(s) if permitted under the tax law, expectations for future pre-tax operating income, the time period over which temporary differences will reverse, and the implementation of feasible and prudent tax planning strategies. Estimating future taxable income is inherently uncertain and requires judgment. Deferred tax assets are reduced by a valuation allowance if, based on the weight of this evidence, it is more likely than not that all or a portion of the recorded deferred tax assets will not be realized in future periods.
Tax Receivable Agreement Liability — In connection with the Business Combination, Hagerty, Inc. entered into a TRA with Hagerty Holding Corp. ("HHC") and Markel (together the "Legacy Unit Holders"). The TRA provides for payment to the Legacy Unit Holders of 85% of the U.S. federal, state and local income tax savings realized by Hagerty, Inc. as a result of the increases in tax basis and certain other tax benefits as outlined in the Business Combination Agreement (provided as Exhibit 2.1, incorporated by reference within Item 6. Exhibits, in this Annual Report) upon the exchange of The Hagerty Group units and Class V Common Stock of the Company for Class A Common Stock of the Company or cash. The Hagerty Group made an election under Section 754 of the IRC with the filing of the 2019 income tax return, which cannot be revoked without the permission of the Internal Revenue Service ("IRS") commissioner and will be in place for any future exchange of The Hagerty Group units. The remaining 15% cash tax savings resulting from the basis adjustments will be retained by Hagerty, Inc. Refer to Note 8 — Business Combination for additional information regarding the Business Combination.
In general, cash tax savings result in a year when the tax liability of Hagerty, Inc. for the year, computed without regard to the deductions attributable to the amortization of the basis increase and other deductions that arise in connection with the payment of the cash consideration under the TRA or the exchange of The Hagerty Group units and Class V Common Stock for Class A Common Stock, would be more than the tax liability for the year taking into account such deductions. Payments under the TRA will not be due until the Company produces taxable income and the resulting cash tax liability is reduced by deducting the amortization of the basis increase on a filed tax return. The payments under the TRA are expected to be substantial. The estimated value of the TRA is recorded in "Other long-term liabilities" on the Consolidated Balance Sheets.
Hagerty, Inc. accounted for the effects of the basis increases as follows:
•Hagerty, Inc. recorded an increase in deferred tax assets for the income tax effects of the increases in tax basis based on enacted federal and state income tax rates at the date of the exchange.
•Hagerty, Inc. evaluated the ability to realize the full benefit represented by the deferred tax asset based on an analysis that considered expectations of future earnings, among other things. If Hagerty, Inc. determined that the full benefit is not likely to be realized, a valuation allowance was established to reduce the amount of the deferred tax assets to an amount that is more likely than not to be realized.
•Hagerty, Inc. recorded 85% of the estimated realizable tax benefit as an increase to the liability due under the TRA, which is recorded within "Other long-term liabilities", with a decrease to "Additional paid-in capital" on the Consolidated Balance Sheets. The remaining 15% of the estimated realizable tax benefit will be retained by Hagerty, Inc.
All of the effects of changes in any of the estimates after the date of the redemption or exchange are recorded within "Interest and other income (expense)" in the Consolidated Statements of Operations.
Earnings Per Share — The Company calculates basic and diluted earnings (loss) per share ("EPS") in accordance with ASC Topic 260, Earnings Per Share ("ASC 260").
Basic EPS is computed under the Two-Class Method by using Net income (loss) available to Class A Common Stockholders divided by the weighted-average number of shares of Class A Common Stock outstanding during the period.
Diluted earnings (loss) per share is calculated using diluted Net income (loss) available to Class A Common Stockholders divided by the weighted average number of shares of Class A Common Stock outstanding during the period, adjusted to give effect to potentially dilutive securities. The Company's potentially dilutive securities consist of (i) unexercised warrants, unvested share-based compensation awards, and shares issuable under the employee stock purchase plan, with the dilutive effect calculated using the Treasury Stock Method, and (ii) non-controlling interest units of The Hagerty Group and the Series A Convertible Preferred Stock, with the dilutive effect calculated using the more dilutive of the If-Converted Method and the Two-Class Method.
In periods in which the Company reports a net loss attributable to Class A Common Stockholders, diluted net loss per share attributable to Class A Common Stockholders would be equal to basic net loss per share since potentially dilutive Class A Common Stock is not assumed to be issued if their effect is anti-dilutive.
Share-Based Compensation — The Company issues restricted stock units and performance restricted stock units under the 2021 Equity Incentive Plan. The grant date fair value for restricted stock units is determined based on the closing price of the Company's Class A Common Stock on the business day prior to grant. The Company uses a Monte Carlo simulation model to estimate the fair value of performance restricted stock units when the terms of the grant are based on the Company's stock price. Share-based compensation expense is recognized over the applicable requisite service period of the award, generally using the straight-line method. Forfeitures are recorded in the period in which they occur. Refer to Note 21 — Share-Based Compensation for additional information.
Self-Insurance — The Company has elected to self-insure certain costs related to U.S. employee health benefit and short-term disability programs. Costs resulting from self-insured losses are charged to expense when incurred. The Company has purchased insurance that limits its aggregate annual exposure for healthcare costs to approximately $16.3 million, $11.4 million, and $10.8 million for the years ended December 31, 2023, 2022, and 2021, respectively. Total expenses for healthcare claims incurred for the years ended December 31, 2023, 2022, and 2021 were approximately $14.2 million, $13.2 million, and $10.9 million, respectively. Healthcare claims are recorded within "Salaries and benefits" on the Consolidated Statements of Operations. As of December 31, 2023 and 2022, the Company has recorded approximately $1.4 million and $1.2 million as an estimate of IBNR claims, respectively. The amount of actual losses incurred could differ materially from the estimate reflected in these financial statements.
Postretirement Benefits — The Company offers postretirement benefits. In the U.S., the Company offers a 401(k) plan covering substantially all U.S. employees. The plan provides for 4.0% matching contributions. Contributions to the plan were $6.0 million, $6.2 million, and $4.9 million for the years ended December 31, 2023, 2022 and 2021, respectively.
Recently Adopted Accounting Standards
Credit Losses — In June 2016, the Financial Accounting Standards Board ("FASB") issued Accounting Standards Update ("ASU") No. 2016-13, Financial Instruments - Credit Losses (ASC 326): Measurement of Credit Losses on Financial Instruments, which amends previously issued guidance regarding the impairment of financial instruments by creating an impairment model that is based on expected losses rather than incurred losses. This standard requires financial assets measured on the amortized cost basis to be presented at the net amount expected to be collected. The following financial assets held by the Company are within the scope of ASU No. 2016-13: (i) Accounts receivable, (ii) Premiums receivable, (iii) Commissions receivable, (iv) Notes receivable, (v) consignor advances, and (vi) certain fixed income securities. The amount of any required allowance for expected credit losses is determined utilizing historical loss rates, which are then adjusted, if necessary, for specific financial assets that are judged to have a higher-than-normal risk profile. Additional credit loss allowances may also be recorded after taking into account macro-economic and industry risk factors. For Notes receivable and consignor advances, to the extent necessary, the amount of any required allowance for credit losses takes into account the estimated realizable value of the collateral securing the loan or advance. The Company adopted ASU No. 2016-13 on January 1, 2023 without a material effect on the Company's Consolidated Financial Statements and with no required cumulative-effect adjustment to "Accumulated earnings (deficit)" within the Consolidated Statements of Changes in Temporary Equity and Stockholders' Equity.
Accounting Standards Not Yet Adopted
Income Taxes — In December 2023, the FASB issued ASU No. 2023-09 - Income Taxes (ASC 740), Improvements to Income Tax Disclosures, which enhances the transparency and decision usefulness of income tax disclosures through changes to the rate reconciliation and income taxes paid information. ASU No. 2023-09 modifies the rules on income tax disclosures to require entities to disclose (i) specific categories in the rate reconciliation, (ii) the income or loss from continuing operations before income tax expense or benefit (separated between domestic and foreign), and (iii) income tax expense or benefit from continuing operations (separated by federal, state and foreign). ASU No. 2023-09 also requires entities to disclose their income tax payments to international, federal, state and local jurisdictions, among other changes. The effective date of ASU No. 2023-09 is for annual periods beginning after December 15, 2024. The Company is still assessing the impact of ASU No. 2023-09 and upon adoption may be required to include certain additional disclosure in the footnotes to the Consolidated Financial Statements.
Segment Reporting — In November 2023, the FASB issued ASU No. 2023-07 - Segment Reporting (ASC 280): Improvements to Reportable Segment Disclosures, which enables investors to better understand an entity's overall performance and assess potential future cash flows through improved reportable segment disclosure requirements. The amendments enhance disclosures about significant segment expenses, clarify circumstances in which an entity can disclose multiple segment measures of profit or loss, provide new segment disclosure requirements for entities with a single reportable segment, and contain other disclosure requirements. The effective date of ASU 2023-07 is for annual periods beginning after December 15, 2023. The Company does not expect this standard to have a material impact on the Consolidated Financial Statements and related disclosures.
2 — Revenue
Disaggregation of Revenue — The following tables present Hagerty's revenue by distribution channel, as well as a reconciliation to total revenue for the years ended December 31, 2023, 2022, and 2021. Commission and fee revenue and contingent commission revenue earned from the agent distribution channel includes revenue generated through Hagerty's relationships with independent agents and brokers. Commission and fee revenue and contingent commission revenue earned from the direct distribution channel includes revenue generated by Hagerty's employee agents.
| | | | | | | | | | | | | | | | | |
| Year Ended December 31, 2023 |
| Agent | | Direct | | Total |
| | | | |
| in thousands |
| Commission and fee revenue | $ | 158,354 | | | $ | 131,178 | | | $ | 289,532 | |
| Contingent commission revenue | 42,408 | | | 33,572 | | | 75,980 | |
| Membership revenue | — | | | 52,460 | | | 52,460 | |
| Marketplace and other revenue | — | | | 50,375 | | | 50,375 | |
| Total revenue from customer contracts | 200,762 | | | 267,585 | | | 468,347 | |
| Earned premium | | | | | 531,866 | |
| Total revenue | | | | | $ | 1,000,213 | |
| | | | | |
| | | | | | | | | | | | | | | | | |
| Year Ended December 31, 2022 |
| Agent | | Direct | | Total |
| | | | | |
| in thousands |
| Commission and fee revenue | $ | 133,584 | | | $ | 113,864 | | | $ | 247,448 | |
| Contingent commission revenue | 32,899 | | | 26,891 | | | 59,790 | |
| Membership revenue | — | | | 45,234 | | | 45,234 | |
| Marketplace and other revenue | — | | | 32,055 | | | 32,055 | |
| Total revenue from customer contracts | 166,483 | | | 218,044 | | | 384,527 | |
| Earned premium | | | | | 403,061 | |
| Total revenue | | | | | $ | 787,588 | |
| | | | | | | | | | | | | | | | | |
| Year Ended December 31, 2021 |
| Agent | | Direct | | Total |
| | | | | |
| in thousands |
| Commission and fee revenue | $ | 115,310 | | | $ | 98,926 | | | $ | 214,236 | |
| Contingent commission revenue | 29,552 | | | 27,783 | | | 57,335 | |
| Membership revenue | — | | | 40,605 | | | 40,605 | |
| Marketplace and other revenue | — | | | 11,079 | | | 11,079 | |
| Total revenue from customer contracts | 144,862 | | | 178,393 | | | 323,255 | |
| Earned premium | | | | | 295,824 | |
| Total revenue | | | | | $ | 619,079 | |
The following tables present Hagerty's revenue disaggregated by geographic area, as well as a reconciliation to total revenue for the years ended December 31, 2023, 2022, and 2021:
| | | | | | | | | | | | | | | | | | | | | | | |
| Year Ended December 31, 2023 |
| U.S. | | Canada | | Europe | | Total |
| | | | | | |
| in thousands |
| Commission and fee revenue | $ | 264,137 | | | $ | 20,597 | | | $ | 4,798 | | | $ | 289,532 | |
| Contingent commission revenue | 75,810 | | | — | | | 170 | | | 75,980 | |
| Membership revenue | 48,902 | | | 3,558 | | | — | | | 52,460 | |
| Marketplace and other revenue | 45,769 | | | 1,594 | | | 3,012 | | | 50,375 | |
| Total revenue from customer contracts | 434,618 | | | 25,749 | | | 7,980 | | | 468,347 | |
| Earned premium | | | | | | | 531,866 | |
| Total revenue | | | | | | | $ | 1,000,213 | |
| | | | | | | |
| |
| | | | | | | |
| | | | | | | |
| | | | | | | |
| | | | | | | |
| | | | | | | |
| | | | | | | |
| | | | | | | |
| | | | | | | | | | | | | | | | | | | | | | | |
| Year Ended December 31, 2022 |
| U.S. | | Canada | | Europe | | Total |
| | | | | | | |
| in thousands |
| Commission and fee revenue | $ | 224,255 | | | $ | 19,142 | | | $ | 4,051 | | | $ | 247,448 | |
| Contingent commission revenue | 59,664 | | | — | | | 126 | | | 59,790 | |
| Membership revenue | 41,893 | | | 3,341 | | | — | | | 45,234 | |
| Marketplace and other revenue | 29,920 | | | 767 | | | 1,368 | | | 32,055 | |
| Total revenue from customer contracts | 355,732 | | | 23,250 | | | 5,545 | | | 384,527 | |
| Earned premium | | | | | | | 403,061 | |
| Total revenue | | | | | | | $ | 787,588 | |
| | | | | | | | | | | | | | | | | | | | | | | |
| Year Ended December 31, 2021 |
| U.S. | | Canada | | Europe | | Total |
| | | | | | | |
| in thousands |
| Commission and fee revenue | $ | 193,520 | | | $ | 16,782 | | | $ | 3,934 | | | $ | 214,236 | |
| Contingent commission revenue | 57,424 | | | (383) | | | 294 | | | 57,335 | |
| Membership revenue | 37,688 | | | 2,917 | | | — | | | 40,605 | |
| Marketplace and other revenue | 9,448 | | | 301 | | | 1,330 | | | 11,079 | |
| Total revenue from customer contracts | 298,080 | | | 19,617 | | | 5,558 | | | 323,255 | |
| Earned premium | | | | | | | 295,824 | |
| Total revenue | | | | | | | $ | 619,079 | |
Refer to Note 13 — Reinsurance for information regarding "Earned premium" recognized under ASC 944.
Contract Assets and Liabilities — The following table is a summary of the Company's contract assets and liabilities as of December 31, 2023 and 2022.
| | | | | | | | | | | |
| December 31, |
| 2023 | | 2022 |
| | | |
| in thousands |
| Contract assets | $ | 75,891 | | | $ | 60,151 | |
| Contract liabilities | $ | 47,651 | | | $ | 44,426 | |
Contract assets, which are reported within "Commissions receivable" on the Consolidated Balance Sheets, consist of CUC receivables, which are earned throughout the year and have historically been settled by a cash payment from the insurance carrier in the first quarter of the following year. In December 2023, the Company amended its alliance agreement and associated agency agreement with Markel and, as a result, beginning in 2024, 80% of the CUC receivables from Markel will be settled monthly rather than on an annual basis. For the year ended December 31, 2023, the increase in contract assets was primarily due to $74.9 million of CUC revenue that was recognized but not received, partially offset by $59.2 million of CUC payments collected in the current year.
Contract liabilities consist of cash collected in advance of revenue recognition and primarily includes the unrecognized portion of HDC membership fees, as well as the unrecognized portion of the advanced commission payment received from State Farm Mutual Automobile Insurance Company ("State Farm") in 2020 (refer to Note 23 — Related-Party Transactions for additional information). For the year ended December 31, 2023, the Company recognized approximately $56.5 million of net revenue that was in recorded in the contract liabilities balance as of December 31, 2022.
3 — Deferred Acquisition Costs
The following table presents a reconciliation of the changes in deferred acquisition costs for the years ended December 31, 2023 and 2022:
| | | | | | | | | | | |
| 2023 | | 2022 |
| | | |
| in thousands |
| Deferred acquisition costs as of January 1, | $ | 107,342 | | | $ | 81,535 | |
| Acquisition costs deferred, net | 286,100 | | | 216,957 | |
| Amortization of acquisition costs, net | (251,805) | | | (191,150) | |
Deferred acquisition costs as of December 31, | $ | 141,637 | | | $ | 107,342 | |
4 — Notes Receivable
BAC provides financing solutions to qualified collectors and businesses by structuring loans secured by their collector cars. The loans underwritten by BAC include term loans and short-term bridge financings. BAC also provides advances to consignors who agree to sell their cars via auction or private sale through Broad Arrow subsidiaries. The loans underwritten by BAC are recorded on the Consolidated Balance Sheets within "Notes receivable" while consignor advances are recorded within "Other current assets".
Loans carry either a fixed or variable rate of interest and typically have an initial maturity of up to two years, often with an option for the borrower to renew for one year increments, provided the borrower remains in good standing. The carrying value of the BAC loan portfolio approximates its fair value due to the relatively short-term maturities and the market rates of interest associated with most loans.
In certain situations, BAC makes loans to refinance accounts receivable balances generated by Broad Arrow auction or private sale purchases. These loans are accounted for on the Consolidated Balance Sheets as non-cash reclassifications between "Accounts receivable" and "Notes receivable" and are, therefore, not presented within Investing Activities in the Company's Consolidated Statements of Cash Flows. Upon repayment, the cash received in settlement of such loans is classified within Operating Activities in the Company's Consolidated Statements of Cash Flows.
Beginning in December 2023, a substantial portion of the lending activities of BAC are funded with borrowings drawn from the BAC Credit Facility, with the remainder funded by the Company's available liquidity. Prior to December 2023, the lending activities of BAC were funded primarily by the Company's available liquidity. Refer to Note 17 — Long-Term Debt for additional information regarding the BAC Credit Facility.
BAC aims to mitigate the risk associated with a potential devaluation in collateral by targeting a maximum loan-to-value ("LTV") ratio of 65% (i.e., the principal loan amount divided by the estimated value of the collateral at the time of underwriting). The LTV ratio is reassessed on a quarterly basis or if the loan is renewed, and more frequently if there is a material change in the circumstances related to the loan, including the value of the collateral, the borrower's disposal plans for the collateral, or if an event of default occurs. If, as a result of this reassessment, the LTV ratio increases above the target level, the borrower may be asked to make principal payments and/or post sufficient additional collateral to reduce the LTV ratio as a condition of future financing, renewal, or to avoid a default. In the event of a default by a borrower, BAC is entitled to sell the collateral to recover the outstanding principal, accrued interest balance, and any expenses incurred with respect to the recovery process.
Management considers the valuation of the underlying collateral and the LTV ratio as the two most critical credit quality indicators for the loans made by BAC. In estimating the value of the underlying collateral for BAC's loans, management utilizes its expertise in the collector car market and considers an array of factors impacting the current and expected sale value of each car including the year, make, model, mileage, history, and in the case of classic cars, the provenance, quality of restoration (if applicable), the originality of the body, chassis, and mechanical components, and comparable market transaction values.
The repayment of BAC's loans can be adversely impacted by a decline in the collector car market in general or in the value of the collateral, which may be concentrated within certain marques, vintages, or types of cars. In addition, in situations when BAC’s claim on the collateral is subject to a legal process, the ability to realize proceeds from the collateral may be limited or delayed.
As of December 31, 2023, BAC's net notes receivable balance was $52.9 million, of which $35.9 million was classified within current assets and $17.0 million was classified within long-term assets on the Consolidated Balance Sheets. As of December 31, 2022, BAC's net notes receivable balance was $37.4 million, of which $25.5 million was classified within current assets and $11.9 million was classified within long-term assets on the Consolidated Balance Sheets. The
classification of a loan as current or long-term takes into account the contractual maturity date of the loan, as well as known renewals after the balance sheet date.
The table below provides the aggregate LTV ratio for BAC's loan portfolio as of December 31, 2023 and December 31, 2022:
| | | | | | | | | | | |
| December 31, |
| 2023 | | 2022 |
| | | |
| in thousands |
| Secured loans | $ | 52,914 | | | $ | 37,427 | |
| Estimate of collateral value | $ | 108,496 | | | $ | 75,802 | |
| Aggregate LTV ratio | 48.8 | % | | 49.4 | % |
As of December 31, 2023, two borrowers had loan balances that exceeded 10% of the total loan portfolio. These loans total $21.6 million, representing 41% of the total loan portfolio. The collateral related to these loans was $50.7 million, resulting in an aggregate LTV ratio of 43%.
Management considers a loan to be past due when an interest payment is not paid within 10 business days of the monthly due date, or if the principal amount is not repaid by the contractual maturity date. Typically, a loan becomes past due only for a short period of time during which the loan is renewed or collateral is sold to satisfy the borrower's obligations. As of December 31, 2023 and 2022, the amount of past due interest payments was immaterial and there were no past due principal payments.
A non-accrual loan is a loan for which future interest income is not recorded due to management’s determination that it is probable that future interest on the loan will not be collectible. BAC did not have any non-accrual loans as of December 31, 2023 or 2022.
As of December 31, 2023 and 2022, the allowance for expected credit losses related to the BAC loan portfolio was not material based on management’s quarterly risk assessment, which takes into consideration a number of factors including the level of historical losses for similar loans, the quality of the collateral, the low LTV ratio of the loans, management's overall assessment of the current circumstances and risks related to each loan, and, to a lesser extent, the circumstances related to each borrower.
As of December 31, 2023 and 2022, management performed an analysis on the loan portfolio for indicators of impairment and determined that there were no impaired loans outstanding.
5 — Other Assets
As of December 31, 2023 and 2022, other assets, current and long-term, consisted of:
| | | | | | | | | | | | | | |
| | |
| | | | |
| | December 31, |
| | 2023 | | 2022 |
| | | | |
| | in thousands |
| Prepaid sales, general and administrative expenses | $ | 21,300 | | | $ | 24,234 | |
| Prepaid SaaS implementation costs | 21,941 | | | 18,501 | |
| Fixed income investments | 16,472 | | | 12,986 | |
Deferred reinsurance premiums ceded (1) | 10,474 | | | 91 | |
| Contract costs | 8,851 | | | 6,576 | |
Inventory (2) | 5,038 | | | 2,074 | |
| Digital media content | 2,151 | | | 5,580 | |
| Deferred financing costs | | 5,053 | | | 1,387 | |
| Other | 12,518 | | | 11,304 | |
| Other assets | $ | 103,798 | | | $ | 82,733 | |
| | | | |
(1) Deferred reinsurance premiums ceded consists of the unearned portion of premiums ceded by Hagerty Re to various reinsurers. Refer to Note 13 — Reinsurance for additional information on the Company’s reinsurance programs.
(2) Inventory primarily includes vehicles owned by Broad Arrow that have been purchased for resale purposes.
The reduction in digital media content when compared to December 31, 2022 is primarily attributable to $4.3 million of impairments recorded during 2023 as a result of lower than anticipated advertising and sponsorship revenue associated with these assets.
As of December 31, 2023, other primarily included $4.4 million of other investments, $2.8 million related to an outstanding reinsurance recoverable, $2.7 million of collector vehicle investments, and the $2.2 million fair value of an interest rate swap. As of December 31, 2022, other primarily included $4.0 million of other investments, the $3.3 million fair value of an interest rate swap, $2.5 million of collector vehicle investments, and $1.4 million related to an outstanding reinsurance recoverable.
6 — Property and Equipment
As of December 31, 2023 and 2022, property and equipment consisted of:
| | | | | | | | | | | |
| December 31, |
| 2023 | | 2022 |
| | | |
| in thousands |
| Land and land improvements | $ | 930 | | | $ | 930 | |
| Buildings | 1,200 | | | 1,200 | |
| Leasehold improvements | 9,005 | | | 9,299 | |
| Furniture and equipment | 12,212 | | | 13,194 | |
| Computer equipment and software | 20,922 | | | 21,698 | |
| Automobiles | 697 | | | 791 | |
| Total property and equipment | 44,966 | | | 47,112 | |
| Less: accumulated depreciation | (24,202) | | | (21,856) | |
| Property and equipment, net | $ | 20,764 | | | $ | 25,256 | |
Property and equipment depreciation expense was $6.2 million, $6.6 million, and $6.4 million for the years ended December 31, 2023, 2022, and 2021, respectively.
7 — Leases
The following table summarizes the components of the Company's operating lease expense for the years ended December 31, 2023 and 2022:
| | | | | | | | | | | | | | | | | | | | |
| | | | Year Ended December 31, |
| | | | | | 2023 | | 2022 | | |
| | | | | | | | | | |
| | | | | | in thousands |
Operating lease expense (1) | | | | | | $ | 11,681 | | | $ | 10,737 | | | |
Short-term lease expense (1) | | | | | | 378 | | | 187 | | | |
Variable lease expense (1) (2) | | | | | | 4,307 | | | 3,943 | | | |
Sublease revenue (3) | | | | | | (704) | | | (156) | | | |
| Lease cost, net | | | | | | $ | 15,662 | | | $ | 14,711 | | | |
| | | | | | | | | | |
(1) Classified within "General and administrative services" on the Consolidated Statements of Operations.
(2) Amounts include payments for maintenance, taxes, insurance, and payments affected by the Consumer Price Index.
(3) Classified within "Membership, marketplace and other revenue" on the Consolidated Statements of Operations.
The following tables summarize supplemental balance sheet information related to operating leases as of December 31, 2023 and 2022:
| | | | | | | | | | | | | | |
| | December 31, |
| | 2023 | | 2022 |
| | | | |
| | in thousands |
| Operating lease ROU assets | $ | 50,515 | | | $ | 82,398 | |
| | | | |
Current lease liabilities (1) | 6,500 | | | 7,556 | |
| Long-term lease liabilities | 50,459 | | | 80,772 | |
| Total operating lease liabilities | $ | 56,959 | | | $ | 88,328 | |
| | | | |
| | | | |
| | December 31, |
| | 2023 | | 2022 |
| | | | |
| in thousands |
ROU assets obtained in exchange for new operating lease liabilities (2) | $ | 632 | | | $ | 82,398 | |
| Gains on sales and leaseback transactions, net | $ | — | | | $ | 4,314 | |
| Weighted-average lease term | 9.01 | | 10.23 |
| Weighted-average discount rate | 4.8 | % | | 5.5 | % |
| | | | |
(1) Current lease liabilities are recorded within "Accounts payable, accrued expenses and other current liabilities" on the Consolidated Balance Sheets.
(2) Represents the amount of ROU assets obtained during the years ended December 31, 2023 and 2022, which includes the transition adjustment of $72.8 million for operating lease ROU assets recorded as of January 1, 2022, upon the adoption of ASC 842.
The total decrease in operating lease ROU assets and liabilities when compared to December 31, 2022 was primarily attributable to the termination of the joint venture agreement governing MHH, which resulted in the divestiture of certain Hagerty Garage + Social locations and the termination of the lease for the Hagerty Garage + Social location in Culver City, California. The termination of the joint venture agreement governing MHH resulted in decreases of $14.8 million in operating lease ROU assets and $15.2 million in operating lease liabilities in the third quarter of 2023. The termination of the Culver City, California lease resulted in decreases of $9.3 million in operating lease ROU assets and $10.1 million in operating lease liabilities in the third quarter of 2023. Refer to Note 10 — Losses and Impairments Related to Divestitures for additional information regarding the Company's termination of the joint venture agreement governing MHH.
The following table summarizes information about the amount and timing of the Company's future operating lease commitments as of December 31, 2023:
| | | | | |
| in thousands |
| 2024 | $ | 9,067 | |
| 2025 | 8,737 | |
| 2026 | 8,156 | |
| 2027 | 7,921 | |
| 2028 | 7,946 | |
| Thereafter | 29,286 | |
| Total lease payments | 71,113 | |
| Less: imputed interest | (14,154) | |
| Total lease liabilities | $ | 56,959 | |
8 — Business Combination
On December 2, 2021, through The Hagerty Group, the Company completed a business combination pursuant to the Business Combination Agreement, with Aldel Financial Inc. ("Aldel") and Aldel Merger Sub LLC ("Merger Sub"), a Delaware limited liability company and wholly owned subsidiary of Aldel (the "Business Combination"), with The Hagerty Group surviving as a subsidiary of the Company immediately following the Business Combination. In connection with the closing, (i) Aldel changed its name from Aldel Financial Inc. to Hagerty, Inc., and (ii) the Company reorganized into what is commonly known as an "Up-C" structure in which substantially all of the assets and liabilities of Hagerty, Inc. are held by The Hagerty Group.
Pursuant to the terms of the Business Combination Agreement: (1) Merger Sub was merged with and into The Hagerty Group, whereupon the separate limited liability company existence of Merger Sub ceased to exist and The Hagerty Group became the surviving company and continues to exist under the Delaware Limited Liability Company Act and (2) the existing limited liability company agreement of The Hagerty Group was amended and restated to, among other things, make Aldel a member of The Hagerty Group.
As outlined within the Business Combination Agreement, certain accredited investors or qualified institutional buyers (the "PIPE Investors") entered into the Subscription Agreement, pursuant to which the PIPE Investors agreed to purchase 70,385,000 shares (the "PIPE Shares") of Class A Common Stock and 12,669,300 warrants to purchase shares of Class A Common Stock (the "PIPE Warrants" and, together with the PIPE Shares, the "PIPE Securities") for an aggregate purchase price of $703.9 million. The sale of the PIPE Securities was consummated concurrently with the closing of the Business Combination.
In connection with the consummation of the Business Combination:
•all of the existing limited liability company interests of The Hagerty Group held by HHC were converted into (1) $489.7 million in cash, (2) 176,033,906 units of The Hagerty Group, and (3) 176,033,906 shares of Class V Common Stock;
•all of the existing limited liability company interests of The Hagerty Group held by Markel were converted into (1) 75,000,000 units of The Hagerty Group, and (2) 75,000,000 shares of Class V Common Stock;
•3,005,034 shares of Aldel's 11,500,000 shares of Class A Common Stock subject to redemption were redeemed, resulting in 8,494,966 shares of Class A Common Stock remaining outstanding;
•all of the 2,875,000 outstanding shares of Aldel's Class B Common Stock were converted into shares of Class A Common Stock on a one-for-one basis; and
•572,500 outstanding shares of Aldel Class A Common Stock became Hagerty Class A Common Stock.
Immediately after giving effect to the Business Combination, there were 82,327,466 shares of Hagerty Class A Common Stock outstanding, 251,033,906 shares of Hagerty Class V Common Stock outstanding and 20,005,550 warrants outstanding which can be converted on a one-for-one basis to Class A Common Stock. Refer to Note 16 — Fair Value Measurements for additional information on the Company's warrants.
In connection with the Business Combination, the Company incurred direct and incremental costs of approximately $41.9 million, consisting of primarily investment banking, insurance, and professional fees, of which $32.6 million were recorded as a reduction of "Additional-paid-in-capital" within the Consolidated Balance Sheets.
In connection with the Business Combination, Hagerty, Inc. entered into the TRA with the Legacy Unit Holders. The TRA provides for payment to the Legacy Unit Holders of 85% of the U.S. federal, state and local income tax savings realized by Hagerty, Inc. as a result of the increases in tax basis and certain other tax benefits related to the transactions contemplated under the Business Combination Agreement upon the exchange of The Hagerty Group units and Class V Common Stock for Class A Common Stock and The Hagerty Group units or cash. Refer to Note 22 — Taxation for additional information related to the TRA.
The following table is a summary of the cash inflows and outflows related to the Business Combination:
| | | | | |
| Business Combination |
| in thousands |
| Cash in trust, net of redemptions | $ | 85,811 | |
| Cash, PIPE | 703,850 | |
| Less: transaction costs and advisory fees | (41,859) | |
Less: cash consideration to HHC at Closing | (489,661) | |
| Net cash received from Business Combination | $ | 258,141 | |
9 — Acquisitions and Investments
Broad Arrow Acquisition
In January 2022, the Company entered into a joint venture with Broad Arrow, pursuant to which it invested $15.3 million in cash in exchange for equity ownership of approximately 40% of Broad Arrow. Following its entry into the joint venture, the Company used the equity method of accounting for its investment in Broad Arrow with its share of income (loss) recorded within "Loss from equity method investment, net of tax" on the Consolidated Statements of Operations.
In August 2022, the Company acquired the remaining 60% of Broad Arrow from the former Broad Arrow shareholders in exchange for equity consideration consisting of shares of the Company's Class A Common Stock and The Hagerty Group units. The number of Class A Common Stock shares and The Hagerty Group units issued was calculated using a 20-day volume weighted average stock price of the Class A Common Stock prior to the closing date on August 16, 2022. The fair value of the purchase consideration of $73.3 million was calculated based on the Class A Common Stock price of $13.47 as of the closing date. As a result of the Broad Arrow Acquisition, the Company and Broad Arrow are further leveraging their respective product offerings and continue to build Marketplace.
Fair Value of Consideration Transferred
The following table summarizes the fair value of Broad Arrow as of the date of the acquisition:
| | | | | | | | |
| in thousands |
| Total equity consideration | $ | 73,253 | |
Fair value of previously held equity interest in Broad Arrow (1) | 48,309 | |
| Total consideration and value to be allocated to net assets | $ | 121,562 | |
| | |
(1) The Broad Arrow Acquisition was accounted for as a step acquisition. Accordingly, the Company remeasured its existing 40% equity interest in Broad Arrow immediately prior to the completion of the acquisition to its estimated fair value of $48.3 million. This fair value was derived from the Hagerty, Inc. stock price of $13.47 as of the closing date and thus represents a Level 1 fair value measurement. As a result of the remeasurement, the Company recorded a net gain of $34.7 million in the third quarter of 2022, representing the excess of the $48.3 million estimated fair value of its existing 40% equity interest over its closing date carrying value of $13.6 million.
Allocation of Consideration Transferred
The following table summarizes the allocation of the purchase consideration to the fair values of the identifiable assets acquired and liabilities assumed as of the date of the Broad Arrow Acquisition:
| | | | | | | | |
| in thousands |
Notes receivable (1) | $ | 21,594 | |
Intangible assets, net (2) | 3,100 | |
Other assets (3) | 11,756 | |
Other liabilities (4) | (13,449) | |
| Total identifiable net assets acquired | 23,001 | |
| Goodwill | 98,561 | |
| Total purchase consideration allocated to net assets acquired | $ | 121,562 | |
| | |
(1) Broad Arrow makes loans secured by collector cars. The fair value of the acquired loans approximated their carrying value due to the relatively short-term maturities and market rates of interest associated with most of the loans. Refer to Note 4 — Notes Receivable for additional information.
(2) The fair value of the identifiable intangible assets acquired is a Level 3 fair value measurement, estimated using significant assumptions that are not observable in the market through the use of a discounted cash flow model. Inputs utilized in this model include the discount rate and terminal growth rate, as well as the return on assets. Identifiable intangible assets acquired consisted of trade names of $3.1 million with a 5-year estimated useful life.
(3) Other assets includes $2.8 million of cash acquired, $2.6 million of Accounts receivable and $6.2 million of Other current assets.
(4) Other liabilities includes a $7.0 million Note payable, $5.3 million of Contract liabilities and $0.7 million of Accounts payable.
The excess of the purchase consideration over the aggregate estimated fair values of identifiable assets acquired, net of liabilities assumed, was recorded as goodwill. The goodwill recognized is primarily a result of the expected enhancement of Marketplace through Broad Arrow's various service offerings, including the buying, selling and financing of collector cars through live auctions and facilitating private sales, as well as the assembled workforce and various other factors.
The acquisition of Broad Arrow was not material to the Company's Consolidated Statements of Operations. Therefore, pro forma results of operations related to this acquisition have not been presented. Following the Broad Arrow Acquisition, the financial statements of Broad Arrow are consolidated into the Company's Consolidated Financial Statements.
Speed Digital Acquisition
In April 2022, Hagerty acquired Speed Digital LLC ("Speed Digital") for a purchase price of $15.0 million. The Company paid $7.5 million at closing with an additional two annual installments of $3.75 million to be paid in 2023 and 2024. The first annual installment was paid during the year ended December 31, 2023 and the second annual installment will be paid in the first quarter of 2024. Speed Digital was previously wholly owned indirectly by Robert Kauffman, a member of the Company's Board of Directors (the "Board"), who will receive 100% of the proceeds of the purchase price. Speed Digital operates a SaaS business primarily serving collector car dealers and auction houses, and an advertising and content syndication platform, which includes Motorious.com. The Company acquired Speed Digital to enhance the Marketplace business to establish relationships with their dealer partners and facilitate growth in Marketplace products; augment the Company's automotive intelligence data; and allow Motorious.com to drive audience engagement, content distribution, and advertising revenue.
10 — Losses and Impairments Related to Divestitures
In 2023, management conducted a review of certain components of the Company's operations which resulted in the sale or reorganization of certain businesses, including Hagerty Garage + Social and DriveShare, as discussed below. This initiative supported the Company's strategy to prioritize investments and resources in the areas of its business that offer the strongest growth and profit potential.
Hagerty Garage + Social
On September 29, 2023, Hagerty Ventures LLC ("HV"), a wholly owned subsidiary of The Hagerty Group, entered into an agreement with HGS Hub Holdings LLC ("H3") to terminate the joint venture agreement governing MHH, which operates as Hagerty Garage + Social. In connection with this agreement, H3's approximately 20% equity interest in MHH was redeemed and MHH's equity interests in the Palm Beach, Florida and Redmond, Washington locations of Hagerty Garage + Social were distributed to H3. Following the termination of the joint venture agreement, HV now owns 100% of MHH and its remaining Hagerty Garage + Social locations in Delray Beach, Florida; Miami, Florida; Van Nuys, California; and Burlington, Ontario.
As a result of the joint venture termination, the Company recognized a loss of $2.9 million in the third quarter of 2023, representing the difference between the fair value of the approximately 20% equity interest in MHH received by HV and the carrying value of the equity interests distributed to H3. The fair value of the approximately 20% equity interest received by MHH is a Level 3 fair value measurement and was determined using a combination of the discounted cash flow model and the adjusted book value method. This loss is recorded within "Losses and impairments related to divestitures" on the Company's Consolidated Statements of Operations.
Immediately prior to the joint venture termination, MHH entered into an agreement to terminate the real estate lease held by the Culver City, California location of Hagerty Garage + Social. In connection with this lease termination agreement, MHH paid a termination fee funded by the Company and H3 in exchange for the extinguishment of its remaining obligations under the lease. As a result of this lease termination, the Company recognized a loss of $0.6 million in the third quarter of 2023, consisting of the lease termination fee paid to the landlord, partially offset by the net effect of the derecognition of the assets and liabilities related to the lease. This loss is reported within "Losses and impairments related to divestitures" on the Company's Consolidated Statements of Operations. Following this lease termination, MHH no longer operates a Hagerty Garage + Social location in Culver City, California.
Hagerty DriveShare
In the third quarter of 2023, The Hagerty Group entered into an agreement to sell Hagerty DriveShare, LLC ("DriveShare"), a peer-to-peer rental platform for collector vehicles, to a third party. The sale was completed on October 9, 2023 and the Company recognized a $0.4 million loss related to this sale. This loss is recorded within "Losses and impairments related to divestitures" on the Company's Consolidated Statements of Operations.
11 — Goodwill and Intangible Assets
Goodwill
The following is a reconciliation of the changes in the Company's goodwill for the years ended December 31, 2023 and 2022:
| | | | | | | | | | | | | | |
| | 2023 | | 2022 |
| | | | |
| | in thousands |
| Goodwill as of January 1, | $ | 115,041 | | | $ | 11,488 | |
| Acquisitions | — | | | 103,605 | |
| Divestitures | (846) | | | — | |
| Effect of foreign currency translation | 19 | | | (52) | |
Goodwill as of December 31, | | $ | 114,214 | | | $ | 115,041 | |
| | | | |
The acquisition of Speed Digital in April 2022 and Broad Arrow in August 2022 together resulted in the recognition of $103.6 million of goodwill in the Marketplace reporting unit during the year ended December 31, 2022. Refer to Note 9 — Acquisitions and Investments for additional information.
The termination of the joint venture agreement governing MHH and the divestiture of DriveShare together resulted in the derecognition of $0.8 million of goodwill in the third quarter of 2023. Refer to Note 10 — Losses and Impairments Related to Divestitures for additional information.
Intangible Assets
The cost and accumulated amortization of intangible assets as of December 31, 2023 and 2022 are as follows:
| | | | | | | | | | | | | | | | | | | | |
| | Weighted Average Useful Life | | December 31, |
| | | 2023 | | 2022 |
| | | | | | |
| | | | in thousands |
| Renewal rights | | 10.0 | | $ | 20,226 | | | $ | 17,282 | |
| Internally developed software | | 3.4 | | 126,972 | | | 109,764 | |
| Trade names and trademarks | | 14.0 | | 12,541 | | | 12,541 | |
| Relationships and customer lists | | 15.7 | | 8,876 | | | 13,890 | |
| Other | | 4.4 | | 1,445 | | | 1,434 | |
| Intangible assets | | | | 170,060 | | | 154,911 | |
| Less: accumulated amortization | | | | (78,136) | | | (50,887) | |
| Intangible assets, net | | | | $ | 91,924 | | | $ | 104,024 | |
| | | | | | |
The termination of the joint venture agreement governing MHH resulted in the derecognition of $5.0 million of relationships and customer lists in the third quarter of 2023. Refer to Note 10 — Losses and Impairments Related to Divestitures for information related to the termination of the joint venture agreement governing MHH, which resulted in the divestiture of certain Hagerty Garage + Social locations.
Intangible asset amortization expense was $28.6 million, $21.8 million, and $12.8 million for the years ended December 31, 2023, 2022, and 2021, respectively.
Estimated future aggregate amortization expense related to intangible assets as of December 31, 2023 is as follows:
| | | | | |
| in thousands |
| 2024 | $ | 27,879 | |
| 2025 | 20,544 | |
| 2026 | 13,341 | |
| 2027 | 9,314 | |
| 2028 | 7,499 | |
| Thereafter | 13,347 | |
| Total | $ | 91,924 | |
12 — Provision for Unpaid Losses and Loss Adjustment Expenses
The following table presents Hagerty Re's provision for unpaid losses and loss adjustment expenses as of December 31, 2023 and December 31, 2022:
| | | | | | | | | | | |
| December 31, |
| 2023 | | 2022 |
| | | |
| in thousands |
| Outstanding losses reported | $ | 84,651 | | | $ | 65,981 | |
| IBNR | 49,621 | | | 44,917 | |
| Net reserves for unpaid losses and loss adjustment expenses | 134,272 | | | 110,898 | |
| Reinsurance recoverable on unpaid losses and loss adjustment expenses | 2,235 | | | 843 | |
| Gross reserves for unpaid losses and loss adjustment expenses | $ | 136,507 | | | $ | 111,741 | |
The following table presents a reconciliation of the beginning and ending provision for unpaid losses and loss adjustment expenses related to Hagerty Re, net of amounts recoverable from various reinsurers:
| | | | | | | | | | | | | | | | | | | | | | | | |
| | | | Year Ended December 31, |
| | | | | | 2023 | | 2022 | | 2021 |
| | | | | | | | | | |
| | | | | | in thousands |
| Gross reserves for unpaid losses and loss adjustment expenses, beginning of year | | | | | $ | 111,741 | | | $ | 74,869 | | | $ | 54,988 | |
| Less: Reinsurance recoverable on unpaid losses and loss adjustment expenses | | | | | 843 | | | — | | | — | |
Net reserves for unpaid losses and loss adjustment expenses, beginning of year | | | | | 110,898 | | | 74,869 | | | 54,988 | |
| Incurred losses and loss adjustment expenses: | | | | | | | | | |
| Current accident year | | | | | 228,358 | | | 186,478 | | | 132,481 | |
Prior accident year (1) | | | | | (7,700) | | | (4,076) | | | (10,401) | |
| Total incurred losses and loss adjustment expenses | | | | | 220,658 | | | 182,402 | | | 122,080 | |
| Payments: | | | | | | | | | |
| Current accident year | | | | | 138,263 | | | 109,555 | | | 76,559 | |
| Prior accident year | | | | | 59,128 | | | 36,803 | | | 25,656 | |
| Total payments | | | | | 197,391 | | | 146,358 | | | 102,215 | |
| Effect of foreign currency rate changes | | | | | 107 | | | (15) | | | 16 | |
Net reserves for unpaid losses and loss adjustment expenses, end of period | | | | | 134,272 | | | 110,898 | | | 74,869 | |
| Reinsurance recoverable on unpaid losses and loss adjustment expenses | | | | | 2,235 | | | 843 | | | — | |
Gross reserves for unpaid losses and loss adjustment expenses, end of period | | | | | $ | 136,507 | | | $ | 111,741 | | | $ | 74,869 | |
| | | | | | | | | | |
(1) Prior accident year development reflects a lower frequency and severity of claims than originally estimated for accident years 2017 to 2022.
Hagerty Re's loss reserve estimates are updated based on an evaluation of inputs from many sources, including actual claims data, the performance of prior reserve estimates, observed industry trends, and internal review processes, including the views of the Company’s actuary. These inputs are used to improve evaluation techniques and to analyze and assess the change in estimated ultimate losses for each accident year by line of business. These analyses produce a range of indications from various methods, from which an actuarial point estimate is recorded.
The factors considered by management in estimating the provision for unpaid losses and loss adjustment expenses as of December 31, 2023 and 2022, include the following:
•historical trends in claim frequency and severity;
•the changing mix of business due to the large growth in modern collectible cars which carry a different risk profile than the risks associated with classic cars;
•emerging economic and social trends;
•inflation, both economic and social;
•retention limits under current catastrophe and treaty reinsurance programs;
•legislative and judicial changes in the jurisdictions in which the Company writes insurance; and
•management's assessment of broader industry experience and trends.
The following factors are relevant to the additional information included in the tables below:
•Table organization: The tables are organized by accident year and include policies written on an occurrence basis.
•Groupings: Reserves for losses and loss adjustment expenses are grouped by line of business. The Company believes that losses included in each line of business have homogenous risk characteristics with similar development patterns and would generally be subject to similar trends.
•Claim counts: The Company considers a reported claim to be one claim for each claimant for each loss occurrence.
•Limitations: There are limitations that should be considered on the reported claim count data in the tables below, including that claim counts are presented only on a reported (not an ultimate) basis.
The following table presents a summary of total reserves for losses and loss adjustment expenses by line of business for the periods specified below:
| | | | | | | | | | | |
| December 31, |
| 2023 | | 2022 |
| | | |
| in thousands |
| Gross reserves for unpaid losses and loss adjustment expenses | | | |
| Auto | $ | 136,294 | | | $ | 111,575 | |
| Marine | 213 | | | 166 | |
Total gross reserves for unpaid losses and loss adjustment expenses | $ | 136,507 | | | $ | 111,741 | |
| | | |
| Reinsurance recoverable on unpaid losses and loss adjustment expenses | | | |
| Auto | $ | 2,235 | | | $ | 843 | |
| Marine | — | | | — | |
| Total reinsurance recoverable on unpaid losses and loss adjustment expenses | $ | 2,235 | | | $ | 843 | |
| | | |
| Net reserves for unpaid losses and loss adjustment expenses | | | |
| Auto | $ | 134,059 | | | $ | 110,732 | |
| Marine | 213 | | | 166 | |
| Total net reserves for unpaid losses and loss adjustment expenses | $ | 134,272 | | | $ | 110,898 | |
The following table presents incurred losses and loss adjustment expenses, by accident year, undiscounted and net of reinsurance recoveries:
| | | | | | | | | | | | | | | | | | | | | | | | | | | | | | | | | | | | | | | | | | | | |
| Auto Insurance | | | | | | | | | | | | | | |
| (dollars in thousands) | | | | | | | | | | Reserves for Losses and Loss Adjustment Expenses Incurred But Not Reported | | Cumulative Number of Reported Claims |
| | Reporting Years Ended December 31, | | |
| Accident Year | | 2019* | | 2020* | | 2021* | | 2022* | | 2023 | | As of December 31, 2023 |
| 2019 | | $ | 63,642 | | | $ | 63,642 | | | $ | 59,660 | | | $ | 59,660 | | | $ | 59,660 | | | $ | 445 | | | 23,800 | |
| 2020 | | | | 90,110 | | | 86,608 | | | 85,111 | | | 84,311 | | | 1,600 | | | 27,204 | |
| 2021 | | | | | | 131,643 | | | 129,259 | | | 125,634 | | | 1,851 | | | 35,430 | |
| 2022 | | | | | | | | 186,073 | | | 182,783 | | | 10,032 | | | 39,199 | |
| 2023 | | | | | | | | | | 228,071 | | | 35,318 | | | 39,738 | |
| Total | | | | | | | | | | 680,459 | | | 49,246 | | | 165,371 | |
Cumulative paid losses and loss adjustment expenses from the table below | | (547,214) | | | — | | | |
Reserves for losses and loss adjustment expenses before 2019, net of reinsurance | | 707 | | | 303 | | | |
| Effect of foreign currency rate changes | | 107 | | | — | | | |
Reserves for losses and loss adjustment expenses, undiscounted and net of reinsurance | | $ | 134,059 | | | $ | 49,549 | | | |
The following table presents cumulative paid losses and loss adjustment expenses by accident year:
| | | | | | | | | | | | | | | | | | | | | | | | | | | | | | | | | | | |
| | | | | | | | | | | |
| Auto Insurance | | | | | | | | | | | |
| (in thousands) | | | As of December 31, |
| Accident Year | | | 2019* | | 2020* | | 2021* | | 2022* | | 2023 |
| 2019 | | | $ | 37,910 | | | $ | 51,491 | | | $ | 55,617 | | | $ | 57,393 | | | $ | 58,415 | |
| 2020 | | | | | 53,167 | | | 73,402 | | | 78,079 | | | 80,656 | |
| 2021 | | | | | | | 75,933 | | | 105,475 | | | 114,884 | |
| 2022 | | | | | | | | | 109,255 | | | 155,157 | |
| 2023 | | | | | | | | | | | 138,102 | |
| Total | | | | | | | | | | | $ | 547,214 | |
| | | | | | | | | | | |
* Unaudited required supplemental information.
The following table presents supplementary information about average historical claims duration as of December 31, 2023 based on the cumulative incurred and paid losses and allocated loss adjustment expenses presented above.
| | | | | | | | | | | | | | | | | | | | | | | | | | | | | |
| Average Annual Percentage of Payout of Incurred Claims by Age (in Years), Net of Reinsurance (Unaudited) |
| Years | Year 1 | | Year 2 | | Year 3 | | Year 4 | | Year 5 |
| Auto Insurance | 61.1 | % | | 24.4 | % | | 5.8 | % | | 3.9 | % | | 2.5 | % |
13 — Reinsurance
The following table presents Hagerty Re's total premiums assumed and ceded on a written and earned basis for the years ended December 31, 2023, 2022, and 2021:
| | | | | | | | | | | | | | | | | | | | | |
| | | Year Ended December 31, |
| | | | | 2023 | | 2022 | | 2021 |
| | | | | in thousands |
| Premiums: | | | | | | | | | |
| Assumed | | | | | $ | 636,366 | | | $ | 474,294 | | | $ | 353,925 | |
| Ceded | | | | | (33,070) | | | (10,749) | | | (7,920) | |
| Net | | | | | $ | 603,296 | | | $ | 463,545 | | | $ | 346,005 | |
| | | | | | | | | |
| Premiums earned: | | | | | | | | | |
| Assumed | | | | | $ | 554,553 | | | $ | 414,030 | | | $ | 303,434 | |
| Ceded | | | | | (22,687) | | | (10,969) | | | (7,610) | |
| Net | | | | | $ | 531,866 | | | $ | 403,061 | | | $ | 295,824 | |
The following table presents gross, ceded, and net losses and loss adjustment expenses incurred for the years ended December 31, 2023, 2022, and 2021:
| | | | | | | | | | | | | | | | | |
| Year Ended December 31, |
| 2023 | | 2022 | | 2021 |
| in thousands |
| Gross losses and loss adjustment expenses | $ | 222,895 | | | $ | 187,754 | | | $ | 122,080 | |
| Ceded losses and loss adjustment expenses | (2,237) | | | (5,352) | | | — | |
| Net losses and loss adjustment expenses | $ | 220,658 | | | $ | 182,402 | | | $ | 122,080 | |
Ceded Reinsurance
Hagerty Re purchases catastrophe reinsurance to protect its capital from large catastrophic events and to provide earnings protection and stability. Hagerty Re renegotiated its catastrophe reinsurance coverage effective January 1, 2024, with terms and limits similar to 2023. The 2024 catastrophe reinsurance program for accounts with total insured values ("TIV") of up to $5.0 million affords coverage in excess of a per event retention of $28.0 million in two layers; $22.0 million excess of $28.0 million, and $55.0 million excess of $50.0 million for a total of $105.0 million.
Beginning in 2023, Hagerty Re entered into quota share agreements with various reinsurers to cede 70% of its physical damage exposure on U.S. accounts written or renewed with TIV equal to or greater than $5.0 million ("High-Net-Worth Accounts"). These High-Net-Worth Accounts are assumed 100% from Evanston Insurance Company ("Evanston"). Commencing January 1, 2024, Hagerty Re will cede to various reinsurers 100% of its High-Net-Worth Accounts physical damage exposure. Some of the reinsurers involved in this quota share are related parties. Refer to Note 23 — Related-Party Transactions for additional information.
Hagerty Re receives ceding commissions related to premiums ceded under reinsurance contracts related to High-Net-Worth Accounts. Ceding commissions are recognized ratably over the terms of the related policies, which are generally 12 months, and are recorded within "Ceding commission, net" in the Company's Consolidated Statements of Operations. Deferred portions of ceding commissions received are included in "Deferred acquisition costs, net" on the Company's Consolidated Balance Sheets.
The following table presents the reinsurance recoverable on paid and unpaid losses and loss adjustment expenses as of December 31, 2023 and December 31, 2022:
| | | | | | | | | | | |
| December 31, |
| 2023 | | 2022 |
| | | |
| in thousands |
| Reinsurance recoverable on paid losses and loss adjustment expenses | $ | 548 | | | $ | 605 | |
| Reinsurance recoverable on unpaid losses and loss adjustment expenses | 2,235 | | | 843 | |
| Total reinsurance recoverable | $ | 2,783 | | | $ | 1,448 | |
Reinsurance contracts do not relieve Hagerty Re from its primary liability to the ceding carriers according to the terms of its reinsurance treaties. Failure of reinsurers to honor their obligations could result in additional losses to Hagerty Re. Hagerty Re evaluates the financial condition of its reinsurers and monitors concentration of credit risk arising from its exposure to individual reinsurers. All of Hagerty Re's reinsurers have an A.M. Best rating of A- (Excellent) or better, or fully collateralize their maximum obligation under the treaty.
14 — Statutory Capital and Surplus
Dividend Restrictions — Under Bermuda law, Hagerty Re is prohibited from declaring or issuing a dividend if it fails to meet its minimum solvency margin or minimum liquidity ratio. Prior approval from the Bermuda Monetary Authority ("BMA") is also required if Hagerty Re's proposed dividend payments would exceed 25% of its prior year-end total statutory capital and surplus. The amount of dividends which could be paid in 2024 without prior approval is $54.7 million.
Capital Restrictions — In Bermuda, Hagerty Re is subject to the Bermuda Solvency Capital Requirement ("BSCR") administered by the BMA. No regulatory action is taken by the BMA if an insurer’s capital and surplus is equal to or in excess of its enhanced capital requirement, as determined by the BSCR model. In addition, the BMA has established a target capital level for each insurer, which is 120% of the enhanced capital requirement. Hagerty Re maintained sufficient statutory capital and surplus to comply with regulatory requirements as of December 31, 2023.
Statutory Financial Information — Hagerty Re prepares its statutory financial statements in conformity with the accounting principles set forth in the Bermuda Insurance Act 1978, amendments thereto and related regulations. As of December 31, 2023 and 2022, the general business statutory capital and surplus of Hagerty Re was $218.9 million and $131.7 million, respectively. Statutory capital and surplus as of December 31, 2023 included $25.0 million of "Other Fixed Capital" represented by the State Farm Term Loan to Hagerty Re. The general business statutory net income of Hagerty Re was $62.3 million, $24.4 million, and $25.2 million for the years ended December 31, 2023, 2022, and 2021 respectively.
15 — Restructuring, Impairment and Related Charges
In 2022, management approved an initiative to increase operational efficiencies and flexibility by transitioning to a "remote first" work model for employees. This initiative primarily included the rationalization of the Company's office space throughout the U.S., Canada, and the United Kingdom ("U.K.") Additionally, in the fourth quarter of 2022, the Board approved a voluntary retirement program ("VRP") and a reduction in force (the "2022 RIF"). As a result of these actions (collectively, the "2022 Restructuring Actions"), the Company recognized $18.3 million within "Restructuring, impairment and related charges, net" in the Consolidated Statements of Operations for the year ended December 31, 2022. These charges consisted of $8.0 million of severance-related costs associated with the 2022 RIF and $4.2 million of severance-related costs associated with the VRP, as well as an impairment charge of $4.7 million related to operating lease ROU assets and a $1.5 million loss on the disposal of leasehold improvements associated with the impaired leases.
In 2023, the Board approved a further reduction in force (the "2023 RIF") following a strategic review of business processes as the Company focuses on driving efficiencies in order to achieve growth and profitability goals. As a result of these actions (collectively, the "2023 Restructuring Actions"), the Company recognized $8.8 million within "Restructuring, impairment and related charges, net" in the Consolidated Statements of Operations. These charges consisted of $5.4 million of severance-related costs associated with the 2023 RIF and a $0.4 million impairment charge to write-down the value of certain digital media content assets. In addition, the Company recognized $3.1 million of charges associated with operating lease ROU assets and leasehold improvements for office space that was vacated and listed for sublease in the period as a result of the Company's continuing transition to a "remote first" work model.
The following is a reconciliation of the liability related to the 2022 Restructuring Actions and the 2023 Restructuring Actions, which is recorded within "Accounts payable, accrued expenses and other current liabilities" on the Consolidated Balance Sheets.
| | | | | | | | |
| | in thousands |
Balance at December 31, 2022 | | $ | 9,470 | |
| Costs incurred and charged to expense | | 8,812 | |
Costs paid or otherwise settled (1) | | (18,282) | |
Balance at December 31, 2023 | | $ | — | |
| | |
(1) Includes cash payments made for severance, as well as $3.1 million of impairment and related charges associated with operating lease ROU assets and associated leasehold improvements, a $0.4 million non-cash impairment related to certain digital media content assets and the non-cash share-based compensation effects related to the 2023 RIF.
16 — Fair Value Measurements
The Company's recurring significant fair value measurements primarily relate to interest rate swaps, warrant liabilities, and fixed income investments. The Company uses valuation techniques based on inputs such as observable data, independent market data, and/or unobservable data. Additionally, the Company makes assumptions in valuing its assets and liabilities, including assumptions about risk and the risks inherent in the inputs to the valuation techniques.
The Company classifies fair value measurements within one of three levels in the fair value hierarchy. The level assigned to a fair value measurement is based on the lowest level input that is significant to the fair value measurement in its entirety. Assessing the significance of a particular input requires judgment. The three levels of the fair value hierarchy are as follows:
•Level 1 — Quoted prices (unadjusted) in active markets for identical assets or liabilities that are accessible at the measurement date. Active markets are those in which transactions for the asset or liability occur with sufficient frequency and volume to provide pricing information on an ongoing basis.
•Level 2 — Inputs other than quoted prices included within Level 1 that are either directly or indirectly observable for substantially the full term of the asset or liability.
•Level 3 — Unobservable inputs that management believes are predicated on the assumptions market participants would use to measure the asset or liability at fair value.
The Company's policy is to recognize significant transfers between levels, if any, at the end of the reporting period.
Recurring fair value measurements
Interest rate swaps
Interest rate swap agreements are used to fix the interest rate on a portion of the Company's existing variable rate debt to reduce the exposure to interest rate fluctuations. The notional amounts of the interest rate swap agreements are used to measure interest to be paid or received and do not represent the amount of exposure to credit loss. The differential paid or received on the interest rate swap agreements is recognized as an adjustment to interest expense within "Interest and other income (expense)" in the Consolidated Statements of Operations.
As of December 31, 2023, the Company had one outstanding interest rate swap, which was entered into in December 2020, with an original notional amount of $35.0 million and maturity in December 2025. In September 2022, the interest rate swap was amended to replace LIBOR with Term Secured Overnight Financing Rate ("SOFR") and, as a result, the fixed swap rate is now 0.81%. The estimated fair value of the interest rate swap is included within either "Other long-term assets" or "Other long-term liabilities" on the Consolidated Balance Sheets.
The Company designated its outstanding interest rate swap as a cash flow hedge and formally documented the relationship between the interest rate swap and the variable rate borrowings, as well as its risk management objective and strategy for undertaking the hedge transaction. The Company also assessed, at the hedge's inception and will continue to assess on an ongoing basis, whether the interest rate swap was highly effective in offsetting variability in the cash flows of the variable rate borrowings. The hedge is deemed effective, and therefore, the change in fair value is recorded within "Derivative instruments" in the Consolidated Statements of Comprehensive Income (Loss). In the event the cash flow hedge is no longer deemed effective, such amounts would be reclassified into interest expense, net from "Other comprehensive income". There were no such reclassifications during the years ended December 31, 2023, 2022, and 2021. The Company does not expect to have a reclassification into earnings within the next 12 months.
As of December 31, 2023 and 2022, the interest swap was in an asset position and had a fair value of $2.2 million and $3.3 million, respectively.
Interest rate swaps are determined to be Level 2 within the fair value hierarchy. The significant inputs used to determine the fair value of interest rate swaps, such as the SOFR forward curve, are considered observable market inputs. The Company monitors the credit and nonperformance risk associated with its counterparty and believes them to be insignificant.
Warrant liabilities
The following table summarizes the Company's outstanding warrants as of December 31, 2023 and 2022:
| | | | | | | | | | | | | | |
| | December 31, |
| | 2023 | | 2022 |
| | | | |
| | | | |
| | in thousands |
Public warrants (1) | | 5,750 | | | 5,750 | |
Private placement warrants (2) | | 258 | | | 258 | |
Underwriter warrants (2) | | 29 | | | 29 | |
OTM warrants (3) | | 1,300 | | | 1,300 | |
PIPE warrants (2) | | 12,147 | | | 12,147 | |
| Total | | 19,484 | | | 19,484 | |
| | | | |
(1) The Public warrants may be exercised on a cash basis only and expire in December 2026.
(2) The Private Placement, Underwriter and PIPE warrants may be exercised on a cashless basis and expire in December 2026.
(3) The OTM warrants may be exercised on a cashless basis and expire in December 2031.
The Company's Public Warrants are Level 1 within the fair value hierarchy as they are measured utilizing quoted market prices. The Company's Private Placement Warrants, Underwriter Warrants, OTM Warrants, and PIPE Warrants are Level 3 within the fair value hierarchy. The Company utilizes a Monte Carlo simulation model to measure the fair value of these warrants. The Company’s Monte Carlo simulation model includes assumptions related to the expected stock price volatility, expected term, dividend yield, and risk-free interest rate.
The following table summarizes the significant inputs used in the valuation model for the private warrants as of December 31, 2023:
| | | | | | | | | | | | | | | | | | | | | | | | | | |
| Inputs | | Private Placement Warrants | | Underwriter Warrants | | OTM Warrants | | PIPE Warrants |
| Exercise price | | $11.50 | | $11.50 | | $15.00 | | $11.50 |
| Common stock price | | $7.80 | | $7.80 | | $7.80 | | $7.80 |
| Volatility | | 48.6% | | 48.6% | | 46.0% | | 48.6% |
| Expected term of the warrants | | 2.92 | | 2.92 | | 7.93 | | 2.92 |
| Risk-free rate | | 4.00% | | 4.00% | | 3.90% | | 4.00% |
| Dividend yield | | —% | | —% | | —% | | —% |
The Company estimates the volatility of its common stock based on factors including, but not limited to, implied volatility of the Public Warrants, the historical performance of comparable companies, and management's understanding of the volatility associated with similar instruments of other entities.
The risk-free rate is based on the yield of the U.S. Treasury Constant Maturity for a term that approximates the expected remaining life of the warrants, which is assumed to be the remaining contractual term.
The dividend rate is based on the Company’s historical rate, which is expected to remain at zero.
The fair value of the Company's financial assets and liabilities measured at fair value as of December 31, 2023 and 2022, are shown in the tables below:
| | | | | | | | | | | | | | | | | | | | | | | |
| Estimated Fair Value as of December 31, 2023 |
| Total | | Level 1 | | Level 2 | | Level 3 |
| | | | | | | |
| in thousands |
| Financial Assets | | | | | | | |
| Interest rate swaps | $ | 2,234 | | | $ | — | | | $ | 2,234 | | | $ | — | |
| Total | $ | 2,234 | | | $ | — | | | $ | 2,234 | | | $ | — | |
| | | | | | | |
| Financial Liabilities | | | | | | | |
| Public warrants | $ | 9,488 | | | $ | 9,488 | | | $ | — | | | $ | — | |
| Private placement warrants | 476 | | | — | | | — | | | 476 | |
| Underwriter warrants | 53 | | | — | | | — | | | 53 | |
| OTM warrants | 3,981 | | | — | | | — | | | 3,981 | |
| PIPE warrants | 20,020 | | | — | | | — | | | 20,020 | |
| Total | $ | 34,018 | | | $ | 9,488 | | | $ | — | | | $ | 24,530 | |
| | | | | | | |
| Estimated Fair Value as of December 31, 2022 |
| Total | | Level 1 | | Level 2 | | Level 3 |
| | | | | | | |
| in thousands |
| Financial Assets | | | | | | | |
| Interest rate swaps | $ | 3,294 | | | $ | — | | | $ | 3,294 | | | $ | — | |
| Total | $ | 3,294 | | | $ | — | | | $ | 3,294 | | | $ | — | |
| | | | | | | |
| Financial Liabilities | | | | | | | |
| Public warrants | $ | 12,880 | | | $ | 12,880 | | | $ | — | | | $ | — | |
| Private placement warrants | 673 | | | — | | | — | | | 673 | |
| Underwriter warrants | 75 | | | — | | | — | | | 75 | |
| OTM warrants | 4,706 | | | — | | | — | | | 4,706 | |
| PIPE warrants | 27,227 | | | — | | | — | | | 27,227 | |
| Total | $ | 45,561 | | | $ | 12,880 | | | $ | — | | | $ | 32,681 | |
The following table presents a reconciliation of the Company's warrant liabilities that are classified as Level 3 within the fair value hierarchy for the years ended December 31, 2023 and 2022:
| | | | | | | | | | | | | | | | | | | | | | | | | | | | | |
| Private Placement Warrants | | Underwriter Warrants | | OTM Warrants | | PIPE Warrants | | Total |
| | | | | | | | | |
| in thousands |
Balance at December 31, 2021 | $ | 1,248 | | | $ | 139 | | | $ | 6,849 | | | $ | 55,887 | | | $ | 64,123 | |
| Change in fair value of warrant liabilities | (575) | | | (64) | | | (2,143) | | | (26,754) | | | (29,536) | |
| Exercise of warrants | — | | | — | | | — | | | (1,906) | | | (1,906) | |
| | | | | | | | | |
Balance at December 31, 2022 | $ | 673 | | | $ | 75 | | | $ | 4,706 | | | $ | 27,227 | | | $ | 32,681 | |
| | | | | | | | | |
| | | | | | | | | |
| Change in fair value of warrant liabilities | (197) | | | (22) | | | (725) | | | (7,207) | | | (8,151) | |
| | | | | | | | | |
| | | | | | | | | |
Balance at December 31, 2023 | $ | 476 | | | $ | 53 | | | $ | 3,981 | | | $ | 20,020 | | | $ | 24,530 | |
During the year ended December 31, 2022, 522,000 PIPE warrants were exercised, on a cashless basis, for an equivalent of 124,748 shares of Class A Common Stock. The cashless exercise resulted in a decrease in "Warrant liabilities" and an increase in "Class A Common Stock" and "Additional paid-in capital" of $1.9 million on the Consolidated Balance Sheets. No warrants were exercised during the year ended December 31, 2023.
Fixed Income Investments
The Company has fixed income investments that consist of Canadian Sovereign, Provincial and Municipal fixed income securities held in a trust account to meet the requirements of a third-party insurer in connection with Hagerty Re's reinsurance agreement. These fixed income investments are classified as held-to-maturity because the Company has the intent and ability to hold these investments to maturity. The Company has determined that its fixed income investments are Level 2 within the fair value hierarchy, as these investments are valued using observable inputs such as quoted prices for similar assets at the measurement date. The critical credit quality indicator for the fixed income investments is the credit ratings of the issuer. Management considers all of the fixed income investments currently held by Hagerty Re to be investment grade.
The following table discloses the fair value and related carrying amount of fixed income investments held within Hagerty Re as of December 31, 2023 and December 31, 2022:
| | | | | | | | | | | | | | | | | | | | | | | |
| December 31, 2023 | | December 31, 2022 |
| Carrying Amount | | Estimated Fair Value | | Carrying Amount | | Estimated Fair Value |
| | | | | | | |
| in thousands |
| Short-term | $ | 10,946 | | | $ | 10,864 | | | $ | 6,296 | | | $ | 6,205 | |
| Long-term | 5,526 | | | 5,398 | | | 6,690 | | | 6,316 | |
| Total | $ | 16,472 | | | $ | 16,262 | | | $ | 12,986 | | | $ | 12,521 | |
Each reporting period management reviews the credit rating of each security to ensure it is considered investment grade. Based on the factors outlined above, as of December 31, 2023, the Company does not expect any credit losses related to the fixed income investments and therefore there is no allowance for credit losses recorded. The Company did not record any gains or losses on these securities during the years ended December 31, 2023 or 2022.
17 — Long-Term Debt
As of December 31, 2023 and December 31, 2022, "Long-term debt, net" consisted of the following:
| | | | | | | | | | | | | | | | | |
| | | December 31, |
| Maturity | | 2023 | | 2022 |
| | | | | |
| | | in thousands |
| JPM Credit Facility | October 2026 | | $ | 77,258 | | | $ | 105,000 | |
| BAC Credit Facility | December 2026 | | 25,782 | | | — | |
| State Farm Term Loan | September 2033 | | 25,000 | | | — | |
| Notes payable | 2024-2025 | | 6,875 | | | 3,280 | |
| Total debt | | | 134,915 | | | 108,280 | |
| Less: Notes payable, current portion | | | (3,654) | | | — | |
| Less: Unamortized debt issuance costs | | | (581) | | | — | |
| Total long-term debt, net | | | $ | 130,680 | | | $ | 108,280 | |
JPM Credit Facility
The Hagerty Group has a credit agreement with JPMorgan Chase Bank, N.A. ("JPM"), as administrative agent, and the other financial institutions party thereto from time to time as lenders, as amended (the "JPM Credit Agreement"). The JPM Credit Agreement provides for a revolving credit facility (the "JPM Credit Facility") with an aggregate borrowing capacity of $230.0 million. The JPM Credit Agreement also provides for an uncommitted incremental facility under which the Company may request one or more increases in the amount of the commitments available under the JPM Credit Facility in an aggregate amount not to exceed $50.0 million. Additionally, the JPM Credit Agreement provides for the issuance of letters of credit of up to $25.0 million and borrowings in the British Pound and Euro of up to $25.0 million in the aggregate. The JPM Credit Agreement matures in October 2026, but may be extended if agreed to by the Company and the lenders party thereto. Any unpaid balance on the JPM Credit Facility is due at maturity.
In the fourth quarter of 2023, The Hagerty Group entered into a Tenth Amendment to the JPM Credit Agreement, which provides additional operational flexibility to The Hagerty Group and its subsidiaries, and includes, among other things, (i) additional baskets for investments, incurrence of indebtedness and liens; (ii) changes to financial covenants; and (iii) the ability to raise additional indebtedness in the form of either incremental debt on a pari-passu basis or on an asset-backed securitization basis.
The JPM Credit Facility accrues interest at the applicable reference rate (primarily SOFR) depending on the currency of the borrowing plus an applicable margin determined by the Company's net leverage ratio for the preceding period (as defined in the Credit Agreement). The effective interest rate related to the JPM Credit Facility was 7.28% and 6.57% for the years ended December 31, 2023 and 2022, respectively.
JPM Credit Facility borrowings are collateralized by assets and equity interests in The Hagerty Group and its consolidated subsidiaries, except for (a) the assets held by the special purpose entities related to the BAC Credit Facility and (b) all or a portion of foreign and certain excluded or immaterial subsidiaries.
Under the JPM Credit Agreement, The Hagerty Group is required, among other things, to meet certain financial covenants (as defined in the JPM Credit Agreement), including a fixed charge coverage ratio and a leverage ratio. As of December 31, 2023 and December 31, 2022, the Company was in compliance with the financial covenants under the JPM Credit Agreement.
BAC Credit Facility
On December 21, 2023, Broad Arrow Capital LLC and its wholly owned subsidiary BAC Funding 2023-1, LLC, as borrower, entered into the BAC Credit Agreement. The BAC Credit Agreement provides for the BAC Credit Facility, which has an aggregate borrowing capacity of $75.0 million and is subject to a borrowing base that is determined by a calculation that is primarily based upon a percentage of the carrying value of certain BAC notes receivable. As of December 31, 2023, the borrowing base for the BAC Credit Agreement was $25.8 million.
The revolving borrowing period provided by the BAC Credit Agreement expires on December 21, 2025 and the BAC Credit Agreement matures on December 21, 2026. The revolving borrowing period and the maturity date of the BAC Credit Agreement may be extended by one year if requested by Broad Arrow Capital LLC and agreed to by the administrative agent. Broad Arrow Capital LLC is not a borrower or guarantor of the BAC Credit Facility.
In conjunction with the BAC Credit Agreement, Broad Arrow Capital LLC and certain of its subsidiaries transfer certain notes receivable originated by Broad Arrow Capital LLC and certain of its subsidiaries to wholly owned, bankruptcy remote special purpose entities (each, an "SPE") to secure the borrowings under the BAC Credit Agreement. These SPEs have the limited purpose of acquiring notes receivable or a certificate representing beneficial ownership interest therein from Broad Arrow Capital LLC and certain of its subsidiaries. Assets transferred to each SPE are legally isolated from the Company and its subsidiaries. Further, the assets of each SPE are owned by such SPE and are not available to satisfy the debts or other obligations of the Company or any of its other subsidiaries. Broad Arrow Capital LLC continues to service the notes receivable transferred to the SPEs.
Recourse to the Company and its subsidiaries that originated and transferred notes receivable that represent collateral under the BAC Credit Facility is limited to (i) an obligation of the applicable seller to repurchase a note receivable if it is determined that there was a breach of any representation or warranty relating to such note receivable as of the relevant date specified in the related transfer agreement and (ii) a limited guarantee covering certain liabilities that may result under certain foreign exchange hedging activity of one of the SPEs.
Under the BAC Credit Agreement, Broad Arrow Capital LLC and BAC Funding 2023-1, LLC are required, among other things, to meet certain financial covenants, including the requirement of Broad Arrow Capital LLC, as the servicer, to maintain a minimum tangible net worth, minimum liquidity balances, and an indebtedness to tangible net worth ratio. As of December 31, 2023, the Company was in compliance with the financial covenants under the BAC Credit Agreement.
State Farm Term Loan
On September 19, 2023, Hagerty Re entered into an unsecured term loan credit facility with State Farm in the aggregate principal amount of $25.0 million (the "State Farm Term Loan"). The State Farm Term Loan bears interest at a rate of 8.0% per annum and will mature on September 19, 2033. State Farm is a related party to the Company. Refer to Note 23 — Related-Party Transactions for additional information.
Notes Payable
As of December 31, 2023 and December 31, 2022, the Company had outstanding notes payable, which are used to fund certain loans made by BAC in the U.K., totaling $6.9 million and $3.3 million, respectively. The effective interest rates for these notes payable range from 7.0% to 9.8% with repayment due between October 2024 and August 2025. Refer to Note 4 — Notes Receivable for additional information on the lending activities of BAC.
Letters of Credit
The Company authorized three letters of credit for a total of $11.1 million for operational purposes related to Section 953(d) tax structuring election and lease down payment support.
18 — Convertible Preferred Stock
On June 23, 2023, the Company entered into a Securities Purchase Agreement (the "Purchase Agreement") with certain accredited investors (the "Investors"), pursuant to which it closed, issued and sold (the "Closing") to the Investors an aggregate of 8,483,561 shares of the Company’s newly-designated Series A Convertible Preferred Stock, par value $0.0001 per share, for an aggregate purchase price of $80.0 million, at a per-share purchase price of $9.43 (the "Series A Purchase Price" and the transaction, the "Private Placement").
The Investors include State Farm, Markel, and persons related to HHC. State Farm and Markel are both significant stockholders of the Company, each holding in excess of 5% of the outstanding common stock. McKeel Hagerty is the Company’s CEO and a member of the Company’s Board. Mr. Hagerty and Tammy Hagerty may be deemed to control HHC, which is the controlling stockholder of the Company. Prior to and continuing after the Private Placement, each of State Farm and Markel have the right to nominate one director to the Company’s Board and HHC has the right to nominate two directors to the Company’s Board. Refer to Note 19 — Stockholders' Equity and Note 23 — Related-Party Transactions for additional information.
The net proceeds from the Private Placement, after deducting issuance costs of approximately $0.8 million, were $79.2 million, which was recorded within Temporary Equity on the Company's Consolidated Balance Sheets. The Company is using the net proceeds from the Private Placement for general corporate purposes.
As of December 31, 2023, the estimated redemption value of the Series A Convertible Preferred Stock was $123.4 million, which represents the maximum cash payment, including cumulative dividends, that would be required to be paid if the Optional Term Redemption provision in the Certificate of Designations, as summarized below, is exercised as of the earliest possible redemption date of June 23, 2028. The decision to redeem the Series A Convertible Preferred Stock for cash is made at the discretion of the Company; however, the Company is controlled by HHC through its voting control of the Company. Accordingly, the redemption of the Series A Convertible Preferred Stock is considered outside the control of the Company and, as a result, the Series A Convertible Preferred Stock is recorded within Temporary Equity on the Company's Consolidated Balance Sheets.
The Company has elected to apply the accretion method to adjust the carrying value of the Series A Convertible Preferred Stock to its estimated redemption value. Amounts recognized to accrete the Series A Convertible Preferred Stock to its estimated redemption value are treated as a deemed dividend and are recorded as a reduction to "Additional paid-in capital". The estimated redemption value may vary in subsequent periods and the Company has elected to recognize such changes prospectively.
The captioned sections below provide a summary of the material terms of the Series A Convertible Preferred Stock, as set forth in the Certificate of Designations, Preferences and Rights of the Series A Convertible Preferred Stock (the "Certificate of Designations").
Ranking — The Series A Convertible Preferred Stock ranks senior to the Class A Common Stock, the Class V Common Stock and each other class or series of shares of the Company that the Company may issue in the future the terms of which do not expressly provide that such class or series ranks equally with, or senior to, the Series A Convertible Preferred Stock, with respect to dividend rights and/or rights upon liquidation, winding up or dissolution.
Dividends — Dividends on the Series A Convertible Preferred Stock are cumulative and accrue from the date of issuance at the rate per annum of 7% of the Series A Purchase Price of each share, plus the amount of previously accrued dividends, compounded annually (the "Accruing Dividends"). The Company may elect to pay the Accruing Dividends either in cash or in additional shares of Series A Convertible Preferred Stock. Prior to the third anniversary of the Closing, the Series A Convertible Preferred Stock will participate on an as-converted basis in dividends declared and paid on the Class A Common Stock.
Conversion — Any shares of Series A Convertible Preferred Stock may, at the option of the holder, be converted at any time into shares of Class A Common Stock. The conversion price for the Series A Convertible Preferred Stock is initially $11.79 and is subject to adjustment upon certain events, including a stock split, a reverse stock split, or a dividend of the Class A Common Stock or Class V Common Stock to the Company’s common stockholders (as adjusted, the "Conversion Price"). The Company may require such conversion (i) if the closing price per share of Class A Common Stock, for at least twenty (20) of any thirty (30) consecutive trading days, exceeds: (a) on or after the third and prior to the seventh anniversary of the Closing, 150% of the Conversion Price; or (b) on or after the seventh and prior to the tenth anniversary of the Closing, 100% of the Conversion Price; and (ii) on or after the tenth anniversary of the Closing. The conversion rate in effect at any applicable time (the "Conversion Rate") is the quotient obtained by dividing the Series A Purchase Price by the Conversion Price.
As of December 31, 2023, no shares of Series A Convertible Preferred Stock have been converted and the outstanding Series A Convertible Preferred Stock was convertible into 6,785,410 shares of Class A Common Stock.
Voting — The Series A Convertible Preferred Stock votes together with the Class A Common Stock on an as-converted basis, and not as a separate class. The Investors have veto rights over (i) changes to the terms of the Certificate of Designations or the Company's certificate of incorporation or bylaws that adversely impact the Series A Convertible Preferred Stock and (ii) the issuance of equity securities senior to the Series A Convertible Preferred Stock or other securities convertible thereto.
Liquidation Preference — In the event of any liquidation, dissolution or winding up of the Company, each share of Series A Convertible Preferred Stock will be paid the greater of (i) the Series A Purchase Price plus any Accruing Dividends accrued but unpaid thereon, and (ii) the amount that such share of Series A Convertible Preferred Stock would have received had it converted into the Class A Common Stock immediately prior to such liquidation, dissolution or winding up of the Company (the "Liquidation Preference"). After payment of the Liquidation Preference, the Series A Convertible Preferred Stock will no longer be convertible and will not participate in any distribution made to the holders of the Class A Common Stock or Class V Common Stock.
Change of Control — Upon a merger, consolidation, sale or other change of control transaction as described in the Certificate of Designations (a "Change of Control"), either (i) the Company may elect to redeem the Series A Convertible Preferred Stock or (ii) each holder of Series A Convertible Preferred Stock, individually, may require the Company to redeem all or any portion of the Series A Convertible Preferred Stock. The redemption price per share to be paid by the Company would be the greater of: (a) the Series A Purchase Price plus any accrued but unpaid Accruing Dividends multiplied by (i) if prior to or on the third anniversary of the Closing, 120%; (ii) if after the third but prior to or on the fifth anniversary of the Closing, 110%; (iii) if after the fifth anniversary of the Closing, 100%; and (b) the amount such share of Series A Convertible Preferred Stock would have received had it converted into the Class A Common Stock prior to the Change of Control. Any shares of Series A Convertible Preferred Stock that are not so redeemed will automatically convert into shares of Class A Common Stock and be paid in connection with the Change of Control.
Fundamental Transaction — In the event of any acquisition by the Company with a transaction value of at least $500.0 million or any equity or debt financing by the Company that raises at least $500.0 million, either (i) the Company may elect to redeem the Series A Convertible Preferred Stock, or (ii) each holder of Series A Convertible Preferred Stock, individually, may require the Company to redeem all or any portion of its Series A Convertible Preferred Stock. The redemption price per share to be paid by the Company would be the Series A Convertible Preferred Stock plus any accrued but unpaid Accruing Dividends multiplied by: (a) if prior to or on the third anniversary of the Closing, 120%; (b) if after the third but prior to or on the fifth anniversary of the Closing, 110%; (c) if after the fifth but prior to or on the sixth anniversary of the Closing, 108%; (d) if after the sixth but prior to or on the seventh anniversary of the Closing, 106%; (e) if after the seventh but prior to or on the eighth anniversary of the Closing, 104%; (f) if after the eighth but prior to or on the ninth anniversary of the Closing, 102%; or (g) if after the ninth anniversary of the Closing, 100%.
Optional Term Redemption — Any time after the fifth anniversary of the Closing, the Company may redeem all or any portion of the then-outstanding shares of the Series A Convertible Preferred Stock for cash (a "Term Redemption"). The redemption price per share to be paid by the Company would be equal to the greater of: (i) the Series A Purchase Price plus any accrued but unpaid Accruing Dividends multiplied by: (a) if after the fifth but prior to the sixth anniversary of the Closing, 110%; (b) if on or after the sixth but prior to the seventh anniversary of the Closing, 108%; (c) if on or after the seventh but prior to the eighth anniversary of the Closing, 106%; (d) if on or after the eighth but prior to the ninth anniversary of the Closing, 104%; (e) if on or after the ninth but prior to tenth anniversary of the Closing, 102%; or (f) if on or after the tenth anniversary of the Closing, 100%; and (ii) the amount such share of Series A Convertible Preferred Stock would have received had it converted into Class A Common Stock prior to the Term Redemption.
Registration Rights Agreement — In connection with the Private Placement, the Company entered into a registration rights agreement with the Investors (the "Registration Rights Agreement") pursuant to which, the Investors will be entitled to certain demand, shelf and piggyback registration rights with respect to the Series A Convertible Preferred Stock and shares of the Class A Common Stock issuable upon conversion thereof.
19 — Stockholders' Equity
Class A Common Stock — Hagerty is authorized to issue 500,000,000 shares of Class A Common Stock with a par value of $0.0001 per share. Holders of Class A Common Stock are entitled to one vote for each share. As of December 31, 2023 and December 31, 2022, there were 84,588,536 and 83,202,969 shares of Class A Common Stock issued and outstanding, respectively.
Class V Common Stock — Hagerty is authorized to issue 300,000,000 shares of Class V Common Stock with a par value of $0.0001 per share. Class V Common Stock represents voting, non-economic interests in Hagerty. Holders of Class V Common Stock are entitled to 10 votes for each share. In connection with the Business Combination, Hagerty issued shares of Class V Common Stock to the Legacy Unit Holders along with an equivalent number of The Hagerty Group units, as discussed below. Each share of Class V Common Stock, together with the corresponding unit of The Hagerty Group, is exchangeable for one share of Class A Common Stock. As of December 31, 2023 and December 31, 2022, there were 251,033,906 shares of Class V Common Stock issued and outstanding.
Preferred Stock — Hagerty is authorized to issue 20,000,000 shares of Preferred Stock with a par value of $0.0001 per share. Hagerty's Board has the authority to issue shares of Preferred Stock with such designations, voting and other rights and preferences as may be determined from time to time.
On June 23, 2023, the Company issued 8,483,561 shares of the Company’s newly-designated Series A Convertible Preferred Stock, par value $0.0001 per share, for an aggregate purchase price of $80.0 million, at a per-share purchase price of $9.43. As of December 31, 2023, there were 8,483,561 shares of Preferred Stock issued and outstanding. Refer to Note 18 — Convertible Preferred Stock for additional information.
As of December 31, 2022, there were no shares of Preferred Stock issued and outstanding.
Non-controlling Interests — Hagerty, Inc. is the sole managing member of The Hagerty Group and, as a result,
consolidates the financial statements of The Hagerty Group into its Consolidated Financial Statements. Hagerty, Inc. reports a non-controlling interest representing the economic interest in The Hagerty Group held by other unit holders of The Hagerty Group. Each Hagerty Group Unit and, if applicable, the associated share of Class V Common Stock, is exchangeable for one share of Class A Common Stock.
The following table summarizes the ownership of The Hagerty Group units as of December 31, 2023 and December 31, 2022:
| | | | | | | | | | | | | | | | | | | | | | | |
| December 31, 2023 | | December 31, 2022 |
| Units Owned | | Ownership Percentage | | Units Owned | | Ownership Percentage |
The Hagerty Group units held by Hagerty, Inc. | 84,588,536 | | | 24.9 | % | | 83,202,969 | | 24.5 | % |
The Hagerty Group units held by other unit holders | 255,499,164 | | | 75.1 | % | | 255,758,466 | | | 75.5 | % |
| Total | 340,087,700 | | | 100.0 | % | | 338,961,435 | | | 100.0 | % |
In connection with the Private Placement, the Fourth Amended and Restated Limited Liability Company Agreement of The Hagerty Group was amended and restated in the form of a Fifth Amended and Restated Limited Liability Company Agreement, to, among other things, create a new series of preferred units within The Hagerty Group ("The Hagerty Group Preferred Units"), which are all held by Hagerty, Inc., to parallel the Series A Convertible Preferred Stock. The Hagerty Group Preferred Units are recorded on the standalone unconsolidated financial statements of The Hagerty Group at their estimated redemption value, which represents the maximum cash payment, including cumulative dividends, that would be required to be paid to Hagerty, Inc. upon a Term Redemption of the Series A Convertible Preferred Stock. Amounts recognized to accrete The Hagerty Group Preferred Units to their estimated redemption value are treated as a deemed dividend due to Hagerty, Inc. The amount of this deemed dividend is attributed entirely to Hagerty, Inc. prior to allocating the remainder of The Hagerty Group's net income between controlling and non-controlling interests. Refer to Note 18 — Convertible Preferred Stock for additional information on the Private Placement and the Series A Convertible Preferred Stock.
At the end of each reporting period, The Hagerty Group equity attributable to Hagerty, Inc. and the non-controlling unit holders, respectively, is reallocated to reflect their current ownership in The Hagerty Group.
Redeemable Non-controlling Interest — In connection with the Business Combination, Hagerty, Inc. entered into the Legacy Unit Holders Exchange Agreement. The Legacy Unit Holders Exchange Agreement permitted the Legacy Unit Holders to exchange shares of Class V Common Stock and the associated units of The Hagerty Group for an equivalent amount of shares of Class A Common Stock or, at the option of the Company, for cash. Because the Company had the option to redeem the non-controlling interest for cash and the Company is controlled by the Legacy Unit Holders through their voting control, the non-controlling interest was considered redeemable as the redemption was considered outside the Company's control. This redeemable non-controlling interest represented the economic interests of the Legacy Unit Holders. Income or loss was attributed to the redeemable non-controlling interest based on the weighted average ownership of The Hagerty Group units outstanding during the period held by the Legacy Unit Holders.
The redeemable non-controlling interest was measured at the greater of the initial fair value or the redemption value and was required to be presented as Temporary Equity on the Consolidated Balance Sheets, with a corresponding adjustment to "Additional paid-in capital" and "Accumulated earnings (deficit)". The total redeemable non-controlling interest as of December 31, 2021 was $593.3 million. For the period from January 1, 2022 to March 23, 2022, additional accretion of $1.6 billion was recognized, with a corresponding adjustment of $162.1 million and $1.4 billion to "Additional paid-in capital" and "Accumulated earnings (deficit)", respectively.
On March 23, 2022, the Legacy Unit Holders Exchange Agreement was amended to revise the option for the Company to settle the exchange of Class V Common Stock and associated The Hagerty Group units in cash. Under the terms of the amendment, a cash exchange is only allowable in the event that net cash proceeds are received from a new permanent equity offering. The redeemable non-controlling interest balance of $2.1 billion as of March 23, 2022 was recorded in equity as non-controlling interest with corresponding adjustments of $1.4 billion, $528.6 million, and $215.6 million to "Accumulated earnings (deficit)", "Additional paid-in capital" and "Non-controlling interest", respectively.
20 — Earnings (Loss) Per Share
Basic earnings (loss) per share is calculated under the Two-Class Method using Net income (loss) available to Class A Common Stockholders, divided by the weighted average number of shares of Class A Common Stock outstanding during the period.
Diluted earnings (loss) per share is calculated using diluted Net income (loss) available to Class A Common Stockholders divided by the weighted average number of shares of Class A Common Stock outstanding during the period, adjusted to give effect to potentially dilutive securities.
The Company's potentially dilutive securities consist of (i) unexercised warrants, unvested share-based compensation awards, and shares issuable under the employee stock purchase plan, with the dilutive effect calculated using the Treasury Stock Method, and (ii) non-controlling interest units of The Hagerty Group and Series A Convertible Preferred Stock, with the dilutive effect calculated using the more dilutive of the If-Converted Method and the Two-Class Method.
The following table summarizes the basic and diluted earnings per share calculations for the years ended December 31, 2023, 2022, and 2021:
| | | | | | | | | | | | | | | | | | | | | |
| | | Year Ended December 31, |
| | | | | 2023 | | 2022 | | 2021 |
| | | | | | | | | |
| | | | | in thousands (except per share amounts) |
| Earnings (Loss) Per Share of Class A Common Stock, Basic | | | | | | | | | |
| Net income (loss) available to Class A Common Stockholders | | | | | $ | 15,881 | | | $ | 32,078 | | | $ | (46,358) | |
| Weighted-average shares of Class A Common Stock outstanding | | | | | 84,180 | | | 82,728 | | | 82,327 | |
| Net income (loss) per share of Class A Common Stock, basic | | | | | $ | 0.19 | | | $ | 0.39 | | | $ | (0.56) | |
| | | | | | | | | |
| Earnings (Loss) Per Share of Class A Common Stock, Diluted | | | | | | | | | |
| Net income (loss) available to Class A Common Stockholders | | | | | $ | 31,769 | | | $ | (23,956) | | | $ | (46,358) | |
| Weighted-average shares of Class A Common Stock outstanding | | | | | 340,323 | | | 336,147 | | | 82,327 | |
| Net income (loss) per share of Class A Common Stock, Diluted | | | | | $ | 0.09 | | | $ | (0.07) | | | $ | (0.56) | |
| | | | | | | | | |
| Net Income (Loss) Available to Class A Common Stockholders | | | | | | | | | |
| Net income (loss) | | | | | $ | 28,179 | | | $ | 2,403 | | | $ | (61,354) | |
| Net (income) loss attributable to non-controlling interest | | | | | (7,948) | | | 29,675 | | | 398 | |
| Net loss attributable to redeemable non-controlling interest | | | | | — | | | — | | | 14,598 | |
| Accretion of Series A Convertible Preferred Stock | | | | | (3,677) | | | — | | | — | |
| Undistributed earnings allocated to Series A Convertible Preferred Stock | | | | | (673) | | | — | | | — | |
| Net income (loss) available to Class A Common Stockholders, Basic | | | | | 15,881 | | | 32,078 | | | (46,358) | |
| Undistributed earnings allocated to Series A Convertible Preferred Stock | | | | | 347 | | | — | | | — | |
| Adjustment for potentially dilutive units of The Hagerty Group | | | | | 15,526 | | | (28,642) | | | — | |
| Adjustment for potentially dilutive Series A Convertible Preferred Stock | | | | | — | | | — | | | — | |
| Adjustment for potentially dilutive share-based compensation awards | | | | | 15 | | | — | | | — | |
| Adjustment for potentially dilutive warrant liabilities | | | | | — | | | (27,392) | | | — | |
| Net income (loss) available to Class A Common Stockholders, Diluted | | | | | $ | 31,769 | | | $ | (23,956) | | | $ | (46,358) | |
| | | | | | | | | |
| Weighted-Average Shares of Class A Common Stock Outstanding | | | | | | | | | |
| Weighted-average shares of Class A Common Stock outstanding, Basic | | | | | 84,180 | | | 82,728 | | | 82,327 | |
| Adjustment for potentially dilutive units of The Hagerty Group | | | | | 255,559 | | | 252,806 | | | — | |
| Adjustment for potentially dilutive Series A Convertible Preferred Stock | | | | | — | | | — | | | — | |
| Adjustment for potentially dilutive share-based compensation awards | | | | | 584 | | | — | | | — | |
| Adjustment for potentially dilutive warrants | | | | | — | | | 613 | | | — | |
| Weighted-average shares of Class A Common Stock outstanding, Diluted | | | | | 340,323 | | | 336,147 | | | 82,327 | |
| | | | | | | | | |
The following table summarizes the weighted-average potential shares of Class A Common Stock excluded from diluted earnings (loss) per share of Class A Common Stock as their effect would be anti-dilutive:
| | | | | | | | | | | | | | | | | | | | | | | | |
| | | | Year Ended December 31, |
| | | | | | 2023 | | 2022 | | 2021 |
| | | | | | | | | | |
| | | | | | in thousands |
The Hagerty Group units | | | | | | — | | | — | | | 251,034 | |
| Series A Convertible Preferred Stock | | | | | | 3,569 | | | — | | | — | |
| Unvested shares associated with share-based compensation awards | | | | | | 3,767 | | | 7,048 | | | — | |
| Warrants | | | | | | 19,484 | | | 7,050 | | | 20,006 | |
| Total | | | | | | 26,820 | | | 14,098 | | | 271,040 | |
21 — Share-Based Compensation
The Company's 2021 Equity Incentive Plan provides for the issuance of up to approximately 38.3 million shares of Class A Common Stock to employees and non-employee directors. The 2021 Equity Incentive Plan allows for the issuance of incentive stock options, non-qualified stock options, restricted stock awards, stock appreciation rights, restricted stock units and performance restricted stock units. As of December 31, 2023, there were approximately 29.0 million shares available for future grants under the 2021 Equity Incentive Plan.
Share-based compensation expense related to employees is recognized in the Consolidated Statements of Operations within "Salaries and benefits" and, to a much lesser extent, when applicable, "Restructuring, impairment and related charges, net." Share-based compensation expense related to non-employee directors is recognized within "General and administrative services." The Company recognizes forfeitures of share-based compensation awards in the period in which they occur.
The following table summarizes share-based compensation expense recognized during the years ended December 31, 2023 and 2022. As the first share-based compensation grant occurred in the second quarter of 2022, there was no share-based compensation expense during the year ended December 31, 2021:
| | | | | | | | | | | | | | | | | |
| | | Year Ended December 31, |
| | | | | 2023 | | 2022 | | |
| | | | | | | | | |
| | | | | in thousands |
| Restricted stock units | | | | | $ | 14,991 | | | $ | 9,814 | | | |
| Performance restricted stock units | | | | | 2,861 | | | 2,146 | | | |
| Employee stock purchase plan | | | | | 165 | | | 169 | | | |
| Total share-based compensation expense | | | | | $ | 18,017 | | | $ | 12,129 | | | |
Restricted Stock Units
RSU grants typically vest over a two to five-year period. The grant date fair value is determined based on the closing market price of the Class A Common Stock on the business day prior to the grant date. The total fair value of RSUs that vested during the years ended December 31, 2023 and 2022 was $10.0 million and $0.4 million, respectively. The weighted average grant date fair value of RSUs granted during the years ended December 31, 2023 and 2022 was $9.12 and $10.76, respectively. There was no share-based compensation activity during the year ended December 31, 2021.
The tax impact related to vested shares for the years ended December 31, 2023 and 2022 was not material to the Company's Consolidated Financial Statements due to the full valuation allowance on the deferred tax asset for the investment in the assets of The Hagerty Group.
Unrecognized compensation expense related to RSUs as of December 31, 2023 was $31.6 million, which the Company expects to recognize over a weighted average period of 3.35 years.
The following table provides a summary of the RSU activity during the year ended December 31, 2023:
| | | | | | | | | | | |
| Restricted Stock Units | | Weighted Average Grant Date Fair Value |
Unvested balance as of December 31, 2022 | 3,195,038 | | $ | 10.76 | |
| Granted | 2,628,874 | | 9.12 | |
| Vested | (927,891) | | 10.75 | |
| Forfeited | (217,989) | | 9.85 | |
Unvested balance as of December 31, 2023 | 4,678,032 | | $ | 9.88 | |
Performance Restricted Stock Units
In April 2022, the CEO was granted performance-based RSUs, which provide him the opportunity to receive up to 3,707,136 shares of Class A Common Stock. The award had a grant date fair value of approximately $19.2 million, which was estimated using a Monte Carlo simulation model. The performance-based RSUs have both market-based and service-based vesting conditions. Shares of Class A Common Stock issuable under this award will be earned based on the achievement of the following stock price targets: (i) 25% of the shares can be earned when the stock price of the Class A Common Stock exceeds $20.00 per share for 60 consecutive days, (ii) 25% of the shares can be earned when the stock price of the Class A Common Stock exceeds $25.00 per share for 60 consecutive days, and (iii) 50% of the shares can be earned when the stock price of the Class A Common Stock exceeds $30.00 per share for 60 consecutive days. These market-based conditions must be met in order for these performance-based RSUs to vest, and it is therefore possible that no shares will ultimately vest. If the market-based conditions are met, shares of Class A Common Stock earned will vest over the earlier of three years after achievement of the stock price target or the end of the seven-year performance period. The Company will recognize the entire $19.2 million of compensation expense for this award, regardless of whether such market-based conditions are met, over the requisite service period.
The following table summarizes the assumptions and related information used to determine the grant-date fair value of performance-based RSUs awarded in April 2022:
| | | | | | | | |
| Inputs | | Performance Restricted Stock Units |
| Weighted average grant-date fair value per share | | $5.19 |
| Expected stock volatility | | 35% |
| Expected term (in years) | | 7.0 |
| Risk-free interest rate | | 2.5% |
| Dividend yield | | —% |
The following table provides a summary of performance-based RSU activity during the year ended December 31, 2023:
| | | | | | | | | | | |
| Performance Restricted Stock Units | | Weighted Average Fair Value |
Outstanding as of December 31, 2022 | 3,707,136 | | | $ | 5.19 | |
| Granted | — | | — |
Outstanding as of December 31, 2023 | 3,707,136 | | $ | 5.19 | |
Employee Stock Purchase Plan
The 2021 Employee Stock Purchase Plan (the "ESPP") allows substantially all of the Company's employees to purchase shares of the Class A Common Stock. The ESPP allows purchases of Class A Common Stock to be made at a discount of up to 15% and for the purchase price to occur at the lesser of the fair market value of the Class A Common Stock on (i) the offering date and (ii) the applicable purchase date. The Company's two previous offering periods offered discounts of 10% and 5%. Employees are allowed to terminate their participation in the ESPP at any time during the purchase period prior to the purchase of shares. As of December 31, 2023, 197,819 shares had been purchased under the ESPP and there were approximately 11.3 million shares available for future purchases.
22 — Taxation
United States — The Hagerty Group is taxed as a pass-through ownership structure under provisions of the IRC and a similar section of state income tax law except for certain U.S. corporate subsidiaries and foreign subsidiaries. Any taxable income or loss generated by The Hagerty Group is passed through to and included in the taxable income or loss of The Hagerty Group unit holders, including Hagerty, Inc. Hagerty, Inc. is taxed as a corporation under the IRC and pays corporate, federal, state, and local taxes with respect to income allocated from The Hagerty Group. Hagerty, Inc., Hagerty Re, Broad Arrow, Hagerty Radwood, Inc., and various foreign subsidiaries are treated as taxable entities and income taxes are provided where applicable.
The Company has a TRA with the Legacy Unit Holders that requires the Company to pay 85% of the tax savings that are realized as a result of increases in the tax basis in The Hagerty Group's assets as a result of an exchange of The Hagerty Group units and Class V Common Stock for Class A Common Stock or cash. See "Tax Receivable Agreement Liability" below for additional information.
Canada — Canadian entities are taxed as non-resident corporations and subject to income tax in Canada under provisions of the Canadian Revenue Agency.
United Kingdom — U.K. entities are taxed as corporations and subject to income tax in the U.K. under provisions of HM Revenue & Customs.
Bermuda — Hagerty Re made an irrevocable election under Section 953(d) of the U.S. IRC, as amended, to be taxed as a U.S. domestic corporation. As a result of this "domestic election", Hagerty Re is subject to U.S. taxation on its world-wide income as if it were a U.S. corporation. In accordance with an agreement between Hagerty Re and the IRS, Hagerty Re established an irrevocable letter of credit with the IRS in 2021.
Tax Legislation — In August 2022, the Inflation Reduction Act ("IRA") was enacted into law. Among the provisions in the IRA was a 15% corporate minimum tax effective for years beginning after December 31, 2022, and a 1% tax on share repurchases after December 31, 2022. The Company does not expect the tax provisions of the IRA to have a material impact on its effective tax rate or its Consolidated Financial Statements.
On December 27, 2023, Bermuda enacted legislation implementing a corporate income tax, effective for fiscal years beginning on or after January 1, 2025. Without making an election, Hagerty Re would not be considered a Bermuda Constituent Entity since Hagerty, Inc. owns less than 80% of the economic value of Hagerty Re. Hagerty Re has not made and does not intend to make an election to be a Bermuda Constituent Entity and therefore is not subject to the corporate income tax regime in Bermuda.
The Organisation for Economic Co-operation and Development ("OECD") has a framework to implement a global minimum corporate tax of 15% for companies with global revenues and profits above certain thresholds (referred to as "Pillar 2"), with certain aspects of Pillar 2 effective January 1, 2024 and other aspects effective January 1, 2025. While its uncertain whether the U.S. will enact legislation to adopt Pillar 2, certain countries in which the Company operates have adopted legislation, and other countries are in the process of introducing legislation to implement Pillar 2. The Company is still assessing the impact of Pillar 2.
Income Tax Expense — Income (loss) before income tax expense includes the following components:
| | | | | | | | | | | | | | | | | |
| Year Ended December 31, |
| 2023 | | 2022 | | 2021 |
| | | | | |
| in thousands |
| United States | $ | 62,030 | | | $ | 24,778 | | | $ | (44,434) | |
| Foreign | (17,258) | | | (13,682) | | | (10,169) | |
| Total | $ | 44,772 | | | $ | 11,096 | | | $ | (54,603) | |
Total income tax expense (benefit) attributable to income (loss) for the years ended December 31, 2023, 2022 and 2021 consists of the following components:
| | | | | | | | | | | | | | | | | |
| Year Ended December 31, |
| 2023 | | 2022 | | 2021 |
| | | | | |
| in thousands |
| Current: | | | | | |
| Federal | $ | 13,664 | | | $ | 4,041 | | | $ | 3,753 | |
| State | 8 | | | 3 | | | — | |
| Foreign | — | | | — | | | (40) | |
| $ | 13,672 | | | $ | 4,044 | | | $ | 3,713 | |
| Deferred: | | | | | |
| Federal | $ | 2,899 | | | $ | 2,999 | | | $ | 3,038 | |
| State | 22 | | | (26) | | | — | |
| Foreign | — | | | — | | | — | |
| 2,921 | | | 2,973 | | | 3,038 | |
| Total | $ | 16,593 | | | $ | 7,017 | | | $ | 6,751 | |
Income tax expense (benefit) reflected in the Consolidated Financial Statements differs from the tax computed by applying the statutory U.S. federal rate of 21% to "Income (loss) before income tax expense" as follows:
| | | | | | | | | | | | | | | | | | | | | | | | | | | | | | | | | | | |
| Year Ended December 31, |
| 2023 | | 2022 | | 2021 |
| | | | | | | | | | | |
| in thousands (except percentages) |
| Income tax (benefit) expense at statutory rate | $ | 9,402 | | | 21 | % | | $ | 2,330 | | | 21 | % | | $ | (11,467) | | | 21 | % |
| State taxes | (232) | | | (1) | % | | (479) | | | (4) | % | | (163) | | | — | % |
| Loss not subject to entity-level taxes | 5,000 | | | 11 | % | | 8,727 | | | 79 | % | | 6,485 | | | (12) | % |
| Foreign rate differential | (529) | | | (1) | % | | (375) | | | (3) | % | | (276) | | | 1 | % |
| Change in valuation allowance | 393 | | | 1 | % | | 5,647 | | | 51 | % | | 2,759 | | | (5) | % |
| Change in fair value of warrant liability | (2,424) | | | (5) | % | | (8,799) | | | (79) | % | | 8,933 | | | (16) | % |
| Permanent items | 914 | | | 2 | % | | 852 | | | 8 | % | | 477 | | | (1) | % |
| Effect of changes in tax rates | 4,018 | | | 9 | % | | (851) | | | (8) | % | | — | | | — | % |
| Other, net | 51 | | | — | % | | (35) | | | — | % | | 3 | | | — | % |
| Income tax expense | $ | 16,593 | | | 37 | % | | $ | 7,017 | | | 65 | % | | $ | 6,751 | | | (12) | % |
Deferred Tax Assets and Liabilities — Deferred tax assets and liabilities reflect temporary differences between the carrying amounts of assets and liabilities for financial reporting purposes and the amount recognized for tax purposes, as adjusted for foreign currency translation. At December 31, 2023 and 2022, the tax effects of temporary differences that give rise to significant portions of the deferred tax provision are as follows:
| | | | | | | | | | | |
| December 31, |
| 2023 | | 2022 |
| | | |
| in thousands |
| Deferred tax assets: | | | |
| Discount on provision for losses and loss adjustment expenses | $ | 1,019 | | | $ | 802 | |
| Unearned premiums | 12,886 | | | 9,886 | |
| Unrealized foreign currency gain | 110 | | | 229 | |
| Excess tax basis | 145,970 | | | 159,337 | |
| Net operating loss ("NOL") and other carryforwards | 23,768 | | | 17,197 | |
| Other | 419 | | | 457 | |
| Gross deferred tax assets | 184,172 | | | 187,908 | |
| Less: valuation allowance | (169,632) | | | (176,116) | |
| Total net deferred tax assets | $ | 14,540 | | | $ | 11,792 | |
| | | |
| Deferred tax liabilities: | | | |
| Deferred acquisition costs | $ | (29,744) | | | $ | (22,542) | |
| Excise tax accrual | — | | | (1,068) | |
| Unrealized foreign currency gain | (110) | | | (229) | |
| Unrealized investment gain | (46) | | | (37) | |
| Intangible assets | (555) | | | (759) | |
| Other | (22) | | | (7) | |
| Total deferred tax liabilities | $ | (30,477) | | | $ | (24,642) | |
| Net deferred tax liability | $ | (15,937) | | | $ | (12,850) | |
As of December 31, 2023 and 2022, the Company has recorded deferred tax assets of $184.2 million and $187.9 million, respectively, of which $146.0 million and $159.3 million, respectively, relates to the difference between the outside tax basis and book basis of its investment in the assets of The Hagerty Group. The Company's deferred tax assets are reduced by a valuation allowance when management believes it is more likely than not that some, or all, of the deferred tax assets will not be realized. After considering all positive and negative evidence of taxable income in the carryback and carryforward periods, as permitted by law, the Company believes it is more likely than not that certain deferred tax assets, including the deferred tax asset for the investment in the assets of The Hagerty Group, will not be realized. As a result, the Company has recorded a valuation allowance of $169.6 million and $176.1 million against its deferred tax assets as of December 31, 2023 and 2022, respectively. In the event that management subsequently determines that it is more likely than not that the Company will realize its deferred tax assets in the future over the recorded amount, a decrease to the valuation allowance will be made, which will reduce the provision for income taxes.
The Company has income tax NOL carryforwards related to U.S. and foreign operations of approximately $129.1 million and $93.5 million as of December 31, 2023 and 2022, respectively. The Company has recorded a deferred tax asset of $23.3 million reflecting the benefit of these loss carryforwards as of December 31, 2023. Of these deferred tax assets, $13.6 million does not expire, and the remaining $9.6 million expires as follows:
| | | | | |
| in thousands |
| 2036 | $ | 404 | |
| 2037 | $ | 725 | |
| 2038 | $ | 867 | |
| 2039 | $ | — | |
| 2040 | $ | 1,179 | |
| 2041 | $ | 1,459 | |
| 2042 | $ | 1,998 | |
| 2043 | $ | 3,018 | |
Tax Examinations — The Company is subject to taxation and files income tax returns in the U.S. federal jurisdiction, as well as many state and foreign jurisdictions. As of December 31, 2023, tax years 2020 to 2022 are subject to examination by various tax authorities. With few exceptions, as of December 31, 2023, the Company is no longer subject to U.S. federal, state, local or foreign examinations for years before 2020. The Hagerty Group is currently under audit by the IRS for the 2021 tax year.
The Canadian statute of limitation for tax year 2018 was open as of December 31, 2023 and remains open because the Company is currently under examination by the Canadian Revenue Agency for that year.
Uncertain Tax Positions — The calculation of the Company's tax liabilities involves uncertainties in the application of complex tax laws and regulations in a multitude of jurisdictions across its global operations. ASC 740 states that a tax benefit from an uncertain tax position may be recognized when it is more likely than not that the position will be sustained upon examination, including resolutions of any related appeals or litigation processes, on the basis of the technical merits.
The Company records uncertain tax benefits ("UTB") as liabilities in accordance with ASC 740 and adjusts these liabilities when management's conclusion changes as a result of the evaluation of new information not previously available. Because of the complexity of some of these uncertainties, the ultimate resolution may result in a payment that is materially different from the current estimate of the UTB liabilities. These differences will be reflected as increases or decreases to income tax expense in the period in which new information is available.
As of December 31, 2023 and 2022, the Company did not have any unrecognized tax benefits and had no material accrued interest or penalties related to uncertain tax positions. If recorded, interest and penalties would be recorded within "Income tax expense" in the Consolidated Statements of Operations.
Tax Receivable Agreement Liability — The TRA provides for payment to the Legacy Unit Holders of 85% of the U.S. federal, state and local income tax savings realized by Hagerty, Inc. as a result of the increases in tax basis and certain other tax benefits as outlined in the Business Combination Agreement (provided as Exhibit 2.1, incorporated by reference within Item 6. Exhibits, in this Annual Report) upon the exchange of The Hagerty Group units and Hagerty, Inc. Class V Common Stock for Hagerty, Inc. Class A Common Stock or cash. The Hagerty Group made an election under Section 754 of the IRC with the filing of its 2019 income tax return, which cannot be revoked without the permission of the IRS Commissioner and will be in place for any future exchange of The Hagerty Group units. The remaining 15% cash tax savings resulting from the basis adjustments will be retained by Hagerty, Inc.
The amount and timing of any payments under the TRA will vary depending on a number of factors, including, but not limited to, the increase in tax basis of The Hagerty Group's assets, the timing of any future redemptions, exchanges or purchases of The Hagerty Group units held by Legacy Unit Holders, the price of Hagerty, Inc. Class A Common Stock at the time of the purchase, redemption, or exchange, the extent to which redemptions or exchanges are taxable, the amount and timing of the taxable income that Hagerty, Inc. generates in the future, the tax rates then applicable and the portion of the payments under the TRA constituting imputed interest. The estimated value of the TRA recorded by the Company within "Other long-term liabilities" on the Consolidated Balance Sheets was $0.6 million and $3.2 million as of December 31, 2023 and 2022, respectively, which was limited by the ability to currently utilize tax benefits. The decrease in value of $2.7 million was recorded in "Interest and other income (expense)" within the Consolidated Statements of Operations.
In general, cash tax savings result in a year when the tax liability of Hagerty, Inc. for the year, computed without regard to the deductions attributable to the amortization of the basis increase and other deductions that arise in connection with the payment of the cash consideration under the TRA or the exchange of The Hagerty Group units and Hagerty, Inc. Class V Common Stock for Hagerty, Inc. Class A Common Stock, would be more than the tax liability for the year taking into account such deductions. Payments under the TRA will not be due until the Company produces taxable income and the resulting cash tax liability is reduced by deducting the amortization of the basis increase on a filed tax return. The payments under the TRA are expected to be substantial.
23 — Related-Party Transactions
As of December 31, 2023, Markel and State Farm had the following equity interests in Hagerty and as a result, are considered related parties:
| | | | | | | | | | | | | | | | | | | | | | | | | | |
| | Markel | | State Farm |
| Equity Interest | | Shares/Units | | Percentage of total outstanding (1) | | Shares/Units | | Percentage of total outstanding (1) |
| Hagerty, Inc. Class A Common Stock | | 3,000,000 | | | 3.5 | % | | 50,000,000 | | | 59.1 | % |
| Hagerty, Inc. Class V Common Stock | | 75,000,000 | | | 29.9 | % | | — | | | — | % |
| Hagerty, Inc. Series A Convertible Preferred Stock | | 1,590,668 | | | 18.8 | % | | 5,302,226 | | | 62.5 | % |
The Hagerty Group units | | 75,000,000 | | | 22.1 | % | | — | | | — | % |
| | | | | | | | |
| Controlling Interest | | 3,000,000 | | | 3.5 | % | | 50,000,000 | | | 59.1 | % |
| Non-controlling Interest | | 75,000,000 | | | 29.4 | % | | — | | | — | |
| | | | | | | | |
(1) The percentages reflected represent only the ownership of the specific security identified in each row, and are not reflective of the total economic ownership in Hagerty. Further, these percentages do not reflect any ownership of warrants.
Refer to Note 19 — Stockholders' Equity for a description of each equity interest in the table above.
State Farm
Alliance Agreement
Hagerty has a 10-year master alliance agreement with State Farm under which State Farm’s customers, through State Farm agents, are able to access Hagerty's features and services. This program began issuing policies in four initial states in September 2023. Under this agreement, State Farm paid Hagerty an advanced commission of $20.0 million in 2020, which is being recognized as "Commission and fee revenue" over the remaining life of the arrangement.
In conjunction with the master alliance agreement, the Company also entered into a managing general underwriter agreement whereby the State Farm Classic+ policy is offered through State Farm Classic Insurance Company, a wholly owned subsidiary of State Farm. The State Farm Classic+ policy is available to new and existing State Farm customers through their agents on a state-by-state basis. Hagerty is paid a commission under the managing general underwriter agreement and ancillary agreements for servicing the State Farm Classic+ policies. Additionally, the Company has the opportunity to offer HDC membership to State Farm Classic+ customers which provides Hagerty an additional revenue opportunity. Commission revenue associated with the State Farm Classic+ policies issued were not material for the year ended December 31, 2023.
Reinsurance Agreement
Effective March 1, 2023, Hagerty Re entered into a quota share reinsurance agreement to cede 50% of the risk assumed from Evanston in relation to High-Net-Worth Accounts to Oglesby Reinsurance Company, a subsidiary of State Farm. Refer to Note 13 — Reinsurance for additional information on the Company's reinsurance programs.
The following tables summarize all balances related to the risk ceded by Hagerty Re to State Farm subsidiaries:
| | | | | | | | |
| | December 31, 2023 |
| | |
| Assets: | | in thousands |
| Commissions receivable | | $ | 1,963 | |
Deferred acquisition costs, net (1) | | (3,898) | |
| Other current assets | | 9,268 | |
| Total assets | | $ | 7,333 | |
| Liabilities: | | |
| Accounts payable, accrued expenses and other current liabilities | | $ | 3,775 | |
| Total liabilities | | $ | 3,775 | |
| | |
(1) Represents unearned ceding commission received from State Farm subsidiaries.
| | | | | | | | | | | | |
| | | | | | Year Ended December 31, 2023 |
| | | | |
| | | | | | |
| | | | | | |
| Revenue: | | | | | | in thousands |
Earned premium (1) | | | | | | $ | (5,883) | |
| Expenses: | | | | | | |
Ceding commission, net (2) | | | | | | $ | (3,059) | |
Losses and loss adjustment expenses (3) | | | | | | (1,877) | |
| Total expenses | | | | | | $ | (4,936) | |
| | | | | | |
(1) Represents premiums ceded to State Farm subsidiaries, which are accounted for as a reduction to Earned premium.
(2) Represents commissions from State Farm subsidiaries related to ceded reinsurance, which are accounted for as a reduction to Ceding commission, net.
(3) Represents loss recoveries associated with reinsurance ceded to State Farm subsidiaries, which are accounted for as a reduction to Losses and loss adjustment expenses.
State Farm Term Loan
On September 19, 2023, Hagerty Re entered into an unsecured term loan facility with State Farm in an aggregate principal amount of $25.0 million and an interest rate of 8.0% per annum. The State Farm Term Loan will mature on September 19, 2033. Refer to Note 17 — Long-Term Debt for additional information.
Markel
Alliance Agreement
The Company and Markel have an alliance agreement (the "Markel Alliance Agreement") and associated agency agreement pursuant to which policies sold by Hagerty's U.S. MGAs are underwritten by Essentia Insurance Company ("Essentia") and reinsured with Essentia's affiliate, Evanston, which is a wholly owned subsidiary of Markel.
On December 18, 2023, the Markel Alliance Agreement was amended to, among other things, (i) include a new definition of "Enthusiast Business" and remove Enthusiast Business from both definitions of "Restricted Business" and "Alliance Business"; (ii) delay the Company's acquisition rights to Essentia until 2026 at the earliest and 2030 at the latest and; (iii) grant the Company a new waiver to pursue a strategic opportunity with a third party insurance company. In connection with the amendments to the Markel Alliance Agreement, the Company and Markel also amended the agency agreement referenced in the Markel Alliance Agreement to increase the base commission rate earned on personal lines U.S. auto coverage to 37% and to adjust the profit share commission factors to scale from -5% to a maximum +5% of written premium, with 80% of the expected CUC being paid monthly, beginning in 2024.
The following tables provide information related to Markel-affiliated Due to insurer liabilities and Commission revenue associated with the Markel Alliance Agreement:
| | | | | | | | | | | |
| December 31, |
| 2023 | | 2022 |
| | | |
| in thousands (except percentages) |
| Due to insurer | $ | 75,922 | | | $ | 64,873 | |
| Percent of total | 95 | % | | 95 | % |
| | | | | | | | | | | | | | | | | | | | | |
| | | Year Ended December 31, |
| | | | | 2023 | | 2022 | | 2021 |
| | | | | | | | | |
| | | | | in thousands (except percentages) |
| Commission revenue | | | | | $ | 340,534 | | | $ | 285,254 | | | $ | 239,432 | |
| Percent of total | | | | | 95 | % | | 95 | % | | 90 | % |
Reinsurance Agreement
For the years ended December 31, 2023 and 2022, under a quota share agreement with Evanston, a wholly owned subsidiary of Markel, Hagerty Re assumed approximately 80% and 70%, respectively, of the risks written through the Company’s U.S. MGAs. Additionally, under a quota share agreement with Markel International Insurance Company Limited, Hagerty Re reinsured approximately 80% and 70% of the risks for the years ended December 31, 2023 and 2022, respectively, written through the Company’s U.K. MGA.
Effective January 1, 2023, the quota share agreement with Evanston was amended to increase Hagerty Re's participation on High-Net-Worth Accounts from 80% to 100%. At the same time, Hagerty Re entered into a reinsurance agreement to cede 10% of the High-Net-Worth Accounts physical damage risks assumed from Evanston to Markel International, a subsidiary of Markel.
The following tables summarize all balances related to the Company's reinsurance business with Markel affiliates:
| | | | | | | | | | | |
| December 31, |
| 2023 | | 2022 |
| | | |
| Assets: | in thousands |
| Premiums receivable | $ | 134,376 | | | $ | 97,897 | |
| Commissions receivable | 630 | | | — | |
| Deferred acquisition costs, net | 141,880 | | | 103,869 | |
| Other current assets | 1,915 | | | — | |
| Total assets | $ | 278,801 | | | $ | 201,766 | |
| Liabilities: | | | |
| Accounts payable, accrued expenses and other current liabilities | $ | 1,553 | | | $ | — | |
| Losses payable | 60,253 | | | 53,800 | |
| Provision for unpaid losses and loss adjustment expenses | 129,267 | | | 106,436 | |
| Commissions payable | 107,286 | | | 75,898 | |
| Unearned premiums | 307,504 | | | 227,192 | |
| Total liabilities | $ | 605,863 | | | $ | 463,326 | |
| | | | | | | | | | | | | | | | | | | | | |
| | | Year Ended December 31, |
| | | | | 2023 | | 2022 | | 2021 |
| | | | | | | | | |
| Revenue: | | | | | in thousands |
| Earned premium | | | | | $ | 535,352 | | | $ | 386,696 | | | $ | 281,794 | |
| Expenses: | | | | | | | | | |
| Ceding commission, net | | | | | $ | 247,918 | | | $ | 184,124 | | | $ | 134,946 | |
| Losses and loss adjustment expenses | | | | | 214,401 | | | 182,340 | | | 116,396 | |
| Total expenses | | | | | $ | 462,319 | | | $ | 366,464 | | | $ | 251,342 | |
Pursuant to the terms of the quota share agreement with Evanston, Hagerty Re maintains funds in trust for the benefit of Evanston. These funds are included within "Restricted cash and cash equivalents" in the Company's Consolidated Balance Sheets. The balance held in trust for the benefit of Evanston was $517.2 million and $360.2 million as of December 31, 2023 and December 31, 2022, respectively.
Broad Arrow
In January 2022, the Company entered into a joint venture with Broad Arrow and acquired approximately 40% equity ownership interest in Broad Arrow. In August 2022, the Company acquired the remaining 60% of Broad Arrow in exchange for $73.3 million of Class A Common Stock and The Hagerty Group units exchangeable for Class A Common Stock. Prior to the Company's joint venture with Broad Arrow in January 2022, Broad Arrow was majority owned by Kenneth Ahn, the President of Marketplace, who received The Hagerty Group units as a part of this transaction. Refer to Note 9 — Acquisitions and Investments for additional information.
Speed Digital
In April 2022, Hagerty acquired Speed Digital for a purchase price of $15.0 million. Speed Digital was previously wholly owned indirectly by Robert Kauffman, a director on Hagerty's Board, who will receive 100% of the proceeds of the purchase price. Refer to Note 9 — Acquisitions and Investments for additional information.
Other Related Party Transactions
From time-to-time, in the ordinary course of business, related parties, such as members of the Board and management, buy and sell collector cars through Marketplace auctions or private sales.
24 — Commitments and Contingencies
Employee Compensation Agreements — In the ordinary course of conducting its business, the Company enters into certain employee compensation agreements from time to time which commit the Company to severance obligations in the event an employee terminates employment with the Company. If applicable, these obligations are included in the accrued expenses lines of the Consolidated Balance Sheets.
Litigation — From time to time, the Company is involved in various claims and legal actions that arise in the ordinary course of business. Management is required to assess the likelihood of any adverse judgments or outcomes related to these legal contingencies, as well as potential ranges of probable or reasonably possible losses. The determination of the amount of any losses to be recorded or disclosed as a result of these contingencies is based on a careful analysis of each individual exposure with, in some cases, the assistance of outside legal counsel. The amount of losses recorded or disclosed for such contingencies may change in the future due to new developments in each matter or a change in legal or settlement strategy. While the impact of any one or more legal claims or proceedings could be material to the Company's operating results in any period, management does not believe that the outcome of any of these pending claims or proceedings (including the Data Security Incident discussed below), individually or in the aggregate, will have a material adverse effect on the Company's consolidated financial condition.
Data Security Incident — In 2021, the Company experienced an unauthorized access into its online insurance quote feature whereby attackers used personal information already in their possession to obtain additional consumer data, including driver’s license numbers. The unauthorized access issue has been remediated. This incident is the subject of coordinated industry-wide regulatory investigations in New York state. The Company could be subject to litigation, fines and/or penalties related to this incident. In 2023, the Company accrued an estimated liability related to this incident based on the facts known by management and developed through its assessment of the current status of ongoing dialog with the regulatory investigators. The amount of the estimated liability is not material to the Company's Consolidated Financial Statements. The amount of any fines, penalties, and/or settlements related to this incident could differ from the amount currently accrued and such difference is not currently estimable.
25 — Subsequent Events
On January 12, 2024, the Company's subsidiary, Hagerty Insurance Holdings, Inc., agreed to acquire all of the issued and outstanding capital stock of Consolidated National Insurance Company ("CNIC") for approximately $18.4 million, subject to upward or downward adjustment in accordance with the terms of the agreement. The closing price will be comprised of approximately $10 million for CNIC's approved state licenses and $8 million for the expected capital and surplus. Subject to the satisfactory completion of various closing conditions, the Company expects to complete the CNIC acquisition during the second quarter of 2024.
Schedule I - Condensed Financial Information of Registrant Parent Company
Hagerty, Inc.
Condensed Statement of Operations (Parent Company Only)
| | | | | | | | | | | | | | | | | | | | | | | | |
| | | | Year Ended December 31, |
| | | | | | 2023 | | 2022 | | 2021 |
| | | | | | | | | | |
| OPERATING EXPENSES: | | | | | | (in thousands) |
| Sales expense | | | | | | $ | 7 | | | $ | 14 | | | $ | — | |
| General and administrative services | | | | | | 791 | | | 1,018 | | | 43 | |
| Total operating expenses | | | | | | 798 | | | 1,032 | | | 43 | |
| OPERATING LOSS | | | | | | (798) | | | (1,032) | | | (43) | |
| Change in fair value of warrant liabilities | | | | | | 11,543 | | | 41,899 | | | (42,540) | |
| Interest and other income (expense) | | | | | | 2,788 | | | 529 | | | — | |
Intercompany dividend income (1) | | | | | | 3,677 | | | — | | | — | |
| INCOME (LOSS) BEFORE INCOME TAX EXPENSE | | | | | | 17,210 | | | 41,396 | | | (42,583) | |
| Income tax expense | | | | | | — | | | (3) | | | — | |
| Equity earnings (loss) in subsidiaries, net of tax | | | | | | 10,969 | | | (38,990) | | | (18,771) | |
| NET INCOME (LOSS) | | | | | | 28,179 | | | 2,403 | | | (61,354) | |
| Net (income) loss attributable to non-controlling interest | | | | | | (7,948) | | | 29,675 | | | 398 | |
| Net loss attributable to redeemable non-controlling interest | | | | | | — | | | — | | | 14,598 | |
| Accretion of Series A Convertible Preferred Stock | | | | | | (3,677) | | | — | | | — | |
| NET INCOME (LOSS) ATTRIBUTABLE TO CLASS A COMMON STOCKHOLDERS | $ | 16,554 | | | $ | 32,078 | | | $ | (46,358) | |
| | | | | | | | | | |
(1) Eliminated in consolidation.
Hagerty, Inc.
Condensed Balance Sheets (Parent Company Only)
| | | | | | | | | | | | | | |
| | December 31, |
| | 2023 | | 2022 |
| | | | |
| ASSETS | | in thousands (except share amounts) |
| Current Assets: | | | | |
| Cash and cash equivalents | | $ | 604 | | | $ | 24,177 | |
| Other current assets | | 549 | | | 514 | |
| Total current assets | | 1,153 | | | 24,691 | |
| Other long-term assets | | 1,498 | | | 2,011 | |
Investment in subsidiaries (1) | | 526,130 | | | 395,580 | |
| TOTAL ASSETS | | $ | 528,781 | | | $ | 422,282 | |
| LIABILITIES, TEMPORARY EQUITY AND STOCKHOLDERS' EQUITY | | | |
| Current Liabilities: | | | | |
| Accounts payable, accrued expenses and other current liabilities | $ | — | | | $ | 30 | |
Intercompany payable (1) | | 846 | | | 6,114 | |
| Total current liabilities | | 846 | | | 6,144 | |
| Warrant liabilities | | 34,018 | | | 45,561 | |
| Other long-term liabilities | | 572 | | | 3,208 | |
| TOTAL LIABILITIES | | 35,436 | | | 54,913 | |
| TEMPORARY EQUITY | | | | |
Preferred Stock, $0.0001 par value (20,000,000 shares authorized, 8,483,561 Series A Convertible Preferred Stock issued and outstanding as of December 31, 2023 and no shares issued and outstanding as of December 31, 2022) | 82,836 | | | — | |
| STOCKHOLDERS' EQUITY | | | | |
Class A Common Stock, $0.0001 par value (500,000,000 shares authorized, 84,588,536 and 83,202,969 issued and outstanding as of December 31, 2023 and December 31, 2022, respectively) | 8 | | | 8 | |
Class V Common Stock, $0.0001 par value (300,000,000 authorized, 251,033,906 shares issued and outstanding as of December 31, 2023 and December 31, 2022) | 25 | | | 25 | |
| Additional paid-in capital | | 561,754 | | | 549,034 | |
| Accumulated deficit | | (468,995) | | | (489,602) | |
| Accumulated other comprehensive income (loss) | | (88) | | | (213) | |
| Total stockholders' equity | | 92,704 | | | 59,252 | |
| Non-controlling interest | | 317,805 | | | 308,117 | |
| Total equity | | 410,509 | | | 367,369 | |
| TOTAL LIABILITIES, TEMPORARY EQUITY AND STOCKHOLDERS' EQUITY | $ | 528,781 | | | $ | 422,282 | |
| | | | |
(1) Eliminated in consolidation.
Hagerty, Inc.
Condensed Statements of Cash Flows (Parent Company Only)
| | | | | | | | | | | | | | | | | | | | |
| | Year Ended December 31, |
| | 2023 | | 2022 | | 2021 |
| OPERATING ACTIVITIES: | | | | | | |
| Net income (loss) | | $ | 28,179 | | | $ | 2,403 | | | $ | (61,354) | |
| Adjustments to reconcile net income (loss) to net cash from operating activities: | | | | | |
| Equity in undistributed income (loss) of subsidiaries | | (14,646) | | | 38,990 | | | 18,771 | |
| Change in fair value of warrant liabilities | | (11,543) | | | (41,899) | | | 42,540 | |
| Other | | (2,636) | | | (300) | | | — | |
| Changes in operating assets and liabilities: | | | | | | |
| Prepaid expenses and other assets | | 478 | | | 513 | | | (3,038) | |
Intercompany payable (1) | | — | | | 1,616 | | | (1,334) | |
| Accounts payable and accrued expenses | | (32) | | | (50) | | | 140 | |
| Net Cash Used in Operating Activities | | (200) | | | 1,273 | | | (4,275) | |
| INVESTING ACTIVITIES: | | | | | | |
Investment in subsidiaries (1) | | (102,635) | | | (30,000) | | | (210,179) | |
| Net Cash Used in Investing Activities | | (102,635) | | | (30,000) | | | (210,179) | |
| FINANCING ACTIVITIES: | | | | | | |
| Proceeds from issuance of preferred stock, net of issuance costs | 79,262 | | | — | | | — | |
| Cash received in Business Combination | | — | | | — | | | 789,661 | |
| Cash consideration to HHC at closing of Business Combination | — | | | — | | | (489,661) | |
| Payment of capitalized transaction costs | | — | | | (1,651) | | | (30,991) | |
| Proceeds from issuance of common stock under employee stock purchase plan | — | | | — | | | — | |
| Net Cash Provided by Financing Activities | | 79,262 | | | (1,651) | | | 269,009 | |
| Change in cash and cash equivalents and restricted cash and cash equivalents | (23,573) | | | (30,378) | | | 54,555 | |
| Beginning cash and cash equivalents and restricted cash and cash equivalents | 24,177 | | | 54,555 | | | — | |
| Ending cash and cash equivalents and restricted cash and cash equivalents | $ | 604 | | | $ | 24,177 | | | $ | 54,555 | |
| | | | | | |
| | | | | | |
| CASH PAID FOR: | | | | | | |
| Taxes | | $ | — | | | $ | 3 | | | $ | — | |
| | | | | | |
(1) Eliminated in consolidation.
Hagerty, Inc.
Notes to Condensed Financial Statements (Parent Company Only)
1 — Summary of Significant Accounting Policies
Nature of Operations — Hagerty, Inc. (the "Parent Company") was formed in 2020 as a Delaware corporation and is a holding company with no direct operations. The Parent Company's assets and liabilities primarily consist of its equity interest in The Hagerty Group and its consolidated subsidiaries, as well as its warrant liabilities.
Basis of Presentation — The Parent Company's Condensed Financial Statements have been prepared using the equity method, whereby the investment in consolidated subsidiaries is stated at cost plus equity in undistributed earnings of consolidated subsidiaries since the date of acquisition. These Condensed Financial Statements should be read in conjunction with the Company's Consolidated Financial Statements and related notes thereto.
Use of Estimates — The preparation of the Parent Company's Condensed Financial Statements in conformity with GAAP requires management to make estimates and assumptions that affect the reported amounts of assets and liabilities, and the disclosure of contingent assets and liabilities as of the date of the Consolidated Financial Statements, as well as the reported amounts of revenue and expenses during the reporting period. Although the estimates are considered reasonable, actual results could materially differ from those estimates.
Schedule II - Valuation and Qualifying Accounts
| | | | | | | | | | | | | | | | | | | | | | | | | | | | | | | | |
| | | | Additions | | | | |
| in thousands | | Balance at beginning of period | | Charged to costs and expenses | | Charge to other accounts | | (Deductions) | | Balance at end of period |
| Year Ended December 31, 2023 | | | | | | | | | | |
| Valuation allowance for deferred tax assets | | $ | 176,116 | | | $ | 393 | | | $ | (6,877) | | | $ | — | | | $ | 169,632 | |
| | | | | | | | | | |
| Year Ended December 31, 2022 | | | | | | | | | | |
| Valuation allowance for deferred tax assets | | $ | 174,821 | | | $ | 5,647 | | | $ | (4,352) | | | $ | — | | | $ | 176,116 | |
| | | | | | | | | | |
| Year Ended December 31, 2021 | | | | | | | | | | |
| Valuation allowance for deferred tax assets | | $ | 4,771 | | | $ | 2,759 | | | $ | 167,291 | | | $ | — | | | $ | 174,821 | |
ITEM 9. CHANGES IN AND DISAGREEMENTS WITH ACCOUNTANTS ON ACCOUNTING AND FINANCIAL DISCLOSURES
None.
ITEM 9A. CONTROLS AND PROCEDURES
Disclosure Controls and Procedures
Our management, including the Chief Executive Officer and Chief Financial Officer, evaluated the effectiveness of our disclosure controls and procedures (as such term is defined in Rules 13a-15(e) and 15d-15(e) under the Exchange Act) as of the end of the period covered by this Annual Report.
Based on this evaluation, our Chief Executive Officer and Chief Financial Officer concluded that our disclosure controls and procedures were effective as of December 31, 2023 to provide reasonable assurance that information required to be disclosed by us in reports that we file or submit under the Exchange Act is (i) recorded, processed, summarized and reported within the time periods specified in the rules and forms specified by the SEC and (ii) accumulated and communicated to our management, including our Chief Executive Officer and Chief Financial Officer, as appropriate to allow timely decisions regarding required disclosure.
Changes in Internal Controls Over Financial Reporting
There were no changes to our internal control over financial reporting that occurred during the three months ended December 31, 2023, which were identified in connection with management's evaluation required by paragraph (d) of Rules 13a-15 and 15d-15 under the Exchange act, that have materially affected, or are reasonably likely to materially affect, our internal control over financial reporting.
Management's Report on Internal Controls over Financial Reporting
Our management is responsible for establishing and maintaining adequate internal control over financial reporting as such term is defined in Exchange Act Rule 13a-15(f). Our Chief Executive Officer and our Chief Financial Officer, with assistance from other members of management, assessed the effectiveness of our internal control over financial reporting as of December 31, 2023, based on the framework and criteria established in Internal Control—Integrated Framework (2013 Framework), issued by the Committee of Sponsoring Organizations of the Treadway Commission. Based on its evaluation, management has concluded that our internal control over financial reporting was effective as of December 31, 2023.
Inherent Limitations over Internal Controls
Our internal control over financial reporting is a process designed to provide reasonable assurance regarding the reliability of financial reporting and the preparation of financial statements for external purposes in accordance with U.S. GAAP. Our internal control over financial reporting includes those policies and procedures that (i) pertain to the maintenance of records that, in reasonable detail, accurately and fairly reflect the transactions and dispositions of the assets of the
Company; (ii) provide reasonable assurance that transactions are recorded as necessary to permit preparation of financial statements in accordance with U.S. GAAP, and that receipts and expenditures of the Company are being made only in accordance with authorizations of management and directors of the Company; and (iii) provide reasonable assurance regarding prevention or timely detection of unauthorized acquisition, use, or disposition of the Company's assets that could have a material effect on the financial statements.
Management, including our Chief Executive Officer and Chief Financial Officer, does not expect that the Company's internal controls will prevent or detect all errors and all fraud. A control system, no matter how well designed and operated, can provide only reasonable, not absolute, assurance that the objectives of the control system are met. Further, the design of a control system must reflect the fact that there are resource constraints, and the benefits of controls must be considered relative to their costs. Because of its inherent limitations, internal control over financial reporting may not prevent or detect misstatements. Also, projections of any evaluation of effectiveness to future periods are subject to the risk that controls may become inadequate because of changes in conditions, or that the degree of compliance with the policies or procedures may deteriorate.
As we are an "emerging growth company" under the JOBS Act of 2012, the Company's independent registered public accounting firm, Deloitte & Touche LLP, is not required to attest to the effectiveness of our internal control over financial reporting and no attestation report has been included in this Annual Report.
ITEM 9B. OTHER INFORMATION
Rule 10b5-1 Trading Plans
A portion of the compensation of our executive officers is delivered in the form of deferred equity awards, including time and performance-based restricted stock unit awards. This compensation design is intended to align our executive compensation with the interests of our stockholders. Following the delivery of shares of our Class A Common Stock under those equity awards, once any applicable service time vesting standards have been satisfied, our executive officers from time to time may engage in the open-market sale of some of those shares. Our executive officers may also engage from time to time in other transactions involving our securities.
Transactions in our securities by our executive officers are required to be made in accordance with our Insider Trading Policy, which, among other things, requires that the transactions be in accordance with applicable U.S. federal securities laws that prohibit trading while in possession of material nonpublic information. Rule 10b5-1 under the Exchange Act provides an affirmative defense that enables prearranged transactions in securities in a manner that avoids concerns about initiating transactions at a future date while possibly in possession of material nonpublic information. Our Insider Trading Policy permits our executive officers to enter into trading plans designed to comply with Rule 10b5-1. Accordingly, sales under these plans may occur at any time, including possibly before, simultaneously with, or immediately after significant events involving our company.
During the three months ended December 31, 2023, no director or officer of the Company has adopted or terminated a "Rule 10b5-1 trading arrangement" or “non-Rule 10b5-1 trading arrangement,” as each term is defined in Item 408(a) of Regulation S-K.
ITEM 9C. DISCLOSURE REGARDING FOREIGN JURISDICTION THAT PREVENT INSPECTIONS
None.
PART III
ITEM 10. DIRECTORS, EXECUTIVE OFFICERS AND CORPORATE GOVERNANCE
The information required by this Item 10 is incorporated by reference to our Proxy Statement to be filed with the SEC in connection with the solicitation of proxies for our 2024 Annual Meeting of Stockholders to be filed with the SEC within 120 days after the end of the fiscal year ended December 31, 2023 ("2024 Proxy Statement").
ITEM 11. EXECUTIVE COMPENSATION
The information required by this Item 11 will be included in our 2024 Proxy Statement and is incorporated herein by reference.
ITEM 12. SECURITY OWNERSHIP OF CERTAIN BENEFICIAL OWNER AND MANAGEMENT AND RELATED STOCKHOLDER MATTERS
The information required by this Item 12 will be included in our 2024 Proxy Statement and is incorporated herein by reference.
ITEM 13. CERTAIN RELATIONSHIPS AND RELATED TRANSACTIONS, AND DIRECTOR INDEPENDENCE
The information required by this Item 13 will be included in our 2024 Proxy Statement and is incorporated herein by reference.
ITEM 14. PRINCIPAL ACCOUNTING FEES AND SERVICES
The information required by this Item 14 will be included in our 2024 Proxy Statement and is incorporated herein by reference.
PART IV
ITEM 15. EXHIBITS, FINANCIAL STATEMENT SCHEDULES
(a) Financial statements and financial statement schedules filed as part of this report are listed in the index included in Item 8 of Part II Financial Statements and Supplementary Data of this report.
(b) Exhibits. The following exhibits, as required by Item 601 of Regulation S-K, are filed with or incorporated by reference in this report as stated below.
| | | | | | | | |
| Exhibit No. | | Description |
| 2.1* | | |
| 3.1 | | |
| 3.2 | | |
| 3.3 | | |
| 4.1 | | |
| 4.2 | | |
| 4.3 | | |
| 4.4 | | |
| 4.5 | | |
| 4.6 | | |
| 10.1 | | |
| 10.2 | | Amended and Restated Registration Rights Agreement, dated as of August 17, 2021, among the Company, Aldel Investors LLC, FG SPAC Partners LP, ThinkEquity, a division of Fordham Financial Management, Inc., HHC, State Farm Mutual Automobile Insurance Company, Markel Corporation, and certain other parties (incorporated by reference to Exhibit 10.3 of the Company’s Form 8-K (File No. 001-40244), filed with the SEC on August 18, 2021). |
| 10.3 | | |
| 10.4 | | |
| 10.5 | | |
| 10.6 | | |
| 10.7 | | |
| | | | | | | | |
| 10.8 | | |
| 10.9† | | |
| 10.10† | | |
| 10.11† | | |
| 10.12* | | Securities Purchase Agreement, dated as of June 23, 2023, by and among the Company, State Farm Mutual Automobile Insurance Company, Markel Group Inc., McKeel O Hagerty Revocable Trust dated September 18, 2003, and First Restated Tammy J. Hagerty Revocable Trust dated September 2, 2004 (incorporated by reference to Exhibit 10.1 of the Company’s Form 8-K (File No. 001-40244), filed with the SEC on June 23, 2023). |
| 10.13 | | Registration Rights Agreement, dated as of June 23, 2023, by and among the Company, State Farm Mutual Automobile Insurance Company, Markel Group Inc., McKeel O Hagerty Revocable Trust dated September 18, 2003, and First Restated Tammy J. Hagerty Revocable Trust dated September 2, 2004 (incorporated by reference to Exhibit 10.2 of the Company’s Form 8-K (File No. 001-40244), filed with the SEC on June 23, 2023). |
| 10.14† | | |
| 10.15† | | |
| 10.16† | | |
| 10.17† | | |
| 10.18† | | |
| 10.19† | | |
| 10.20† | | |
| 10.21† | | |
| 10.22† | | |
| 10.23† | | |
| 10.24 | | |
| 10.25 | | |
| | | | | | | | |
| 10.26* | | Eighth Amendment to Amended and Restated Credit Agreement, dated as of June 15, 2023, among The Hagerty Group LLC, Broad Arrow Capital Europe Limited, Broad Arrow Capital UK Limited, the Lenders party hereto, and JPMorgan Chase Bank, N.A., as Administrative Agent, (incorporated by reference to Exhibit 10.1 of the Company’s Form 10-Q (File No. 001-40244), filed with the SEC on August 8, 2023). |
| 10.27 | | Ninth Amendment to Amended and Restated Credit Agreement, dated as of September 19, 2023, among The Hagerty Group LLC, Broad Arrow Capital Europe Limited, Broad Arrow Capital UK Limited, the Lenders party hereto, and JPMorgan Chase Bank, N.A., as Administrative Agent (incorporated by reference to Exhibit 10.3 of the Company’s Form 10-Q (File No. 001-40244), filed with the SEC on November 8, 2023). |
| 10.28* | | Tenth Amendment to Amended and Restated Credit Agreement, dated as of November 28, 2023, among The Hagerty Group, LLC, the Foreign Subsidiary Borrowers party hereto, the Lenders party hereto, and JPMorgan Chase Bank, N.A., as Administrative Agent (incorporated by reference to Exhibit 10.1 of the Company’s Form 8-K (File No. 001-40244), filed with the SEC on December 1, 2023). |
| 10.29* | | |
| | |
| | |
| | |
| 10.30† | | |
| 10.31† | | |
| 10.32† | | |
| 10.33† | | |
| 10.34† | | |
| 19.1 | | |
| 21.1 | | |
| 23.1 | | |
| 24.1 | | |
| 31.1 | | |
| 31.2 | | |
| 32.1# | | |
| 32.2# | | |
| 97.1 | | |
| 101.INS | | XBRL Instance Document. |
| 101.SCH | | XBRL Taxonomy Extension Schema Document. |
| 101.CAL | | XBRL Taxonomy Extension Calculation Linkbase Document. |
| 101.LAB | | XBRL Taxonomy Extension Label Linkbase Document. |
| 101.PRE | | XBRL Taxonomy Extension Presentation Linkbase Document |
| 101.DEF | | XBRL Taxonomy Extension Definition Linkbase Document. |
| 104 | | Cover Page Interactive Data File (formatted as Inline XBRL). |
| | | | | | | | |
| * | | The schedules and exhibits to this agreement have been omitted pursuant to Item 601(a)(5) of Regulation S-K. A copy of any omitted schedule and/or exhibit will be furnished to the SEC upon request. |
| † | | Indicates management contract or compensatory plan or arrangement. |
| # | | This certification is deemed not filed for purpose of Section 18 of the Exchange Act or otherwise subject to the liability of that section, nor shall it be deemed incorporated by reference into any filing under the Securities Act or the Exchange Act. |
ITEM 16. FORM 10-K SUMMARY
None.
Signatures
Pursuant to the requirements of the Securities Exchange Act of 1934, the registrant has duly caused this report to be signed on its behalf by the undersigned, thereunto duly authorized, on March 12, 2024.
| | | | | | | | | | | | | | |
| | HAGERTY, INC. | |
| | | | |
| | By: | /s/ McKeel O Hagerty | |
| | | McKeel O Hagerty | |
| | | Chief Executive Officer | |
Power Of Attorney
KNOW ALL PERSONS BY THESE PRESENTS, that each person whose signature appears below constitutes and appoints McKeel O Hagerty and Diana M. Chafey, jointly and severally, his or her attorneys-in-fact, each with the power of substitution, for him or her in any and all capacities, to sign any amendments to this Annual Report on Form 10-K, and to file the same with exhibits thereto and other documents in connection therewith, with the Securities and Exchange Commission, hereby ratifying and confirming all that each of said attorneys-in-fact, or his or her substitute or substitutes, may do or cause to be done by virtue hereof.
Pursuant to the requirements of the Securities Exchange Act of 1934, this report has been signed below by the following persons on behalf of the registrant and in the capacities indicated on March 12, 2024.
| | | | | | | | | | | | | | |
| Name | | Title | | Date |
| | | | |
/s/ McKeel O Hagerty | | | | |
| McKeel O Hagerty | | Chief Executive Officer (Principal Executive Officer) and Director | | March 12, 2024 |
| | | | |
| /s/ Patrick McClymont | | | | |
| Patrick McClymont | | Chief Financial Officer (Principal Financial Officer) | | March 12, 2024 |
| | | | |
| /s/ Kevin M. Delaney | | | | |
| Kevin M. Delaney | | Chief Accounting Officer and Controller (Principal Accounting Officer) | | March 12, 2024 |
| | | | |
| /s/ Michael E. Angelina | | | | |
| Michael E. Angelina | | Chairman of the Board | | March 12, 2024 |
| | | | |
| /s/ F. Michael Crowley | | | | |
| F. Michael Crowley | | Director | | March 12, 2024 |
| | | | |
| /s/ Laurie L. Harris | | | | |
| Laurie L. Harris | | Director | | March 12, 2024 |
| | | | |
| /s/ Robert I. Kauffman | | | | |
| Robert I. Kauffman | | Director | | March 12, 2024 |
| | | | |
| /s/ Sabrina Kay | | | | |
| Sabrina Kay | | Director | | March 12, 2024 |
| | | | |
| /s/ Mika Salmi | | | | |
| Mika Salmi | | Director | | March 12, 2024 |
| | | | |
| /s/ William H. Swanson | | | | |
| William H. Swanson | | Director | | March 12, 2024 |
| | | | |
| /s/ Randall Harbert | | | | |
| Randall Harbert | | Director | | March 12, 2024 |