Delaware |
7373 |
85-4218526 | ||
(State or other jurisdiction of incorporation or organization) |
(Primary Standard Industrial Classification Code Number) |
(I.R.S. Employer Identification No.) |
Large accelerated filer | ☐ |
Accelerated filer | ☐ |
|||||||
Non-accelerated filer |
☒ |
Smaller reporting company | ||||||||
Emerging growth company |
Title of Securities to be Registered (1) |
Amount to be Registered (1)(2) |
Proposed Maximum Offering Price per Share (3) |
Proposed Maximum Aggregate Offering Price |
Amount of Registration Fee | ||||
Common stock, par value $0.0001 per share |
132,632,441 |
$13.16 |
$1,745,442,923.56 |
$190,427.82 |
(1) |
Pursuant to Rule 416 under the Securities Act of 1933, as amended (the “Securities Act”), the securities being registered hereunder include such indeterminate number of additional securities as may be issuable to prevent dilution resulting of any stock dividend, stock split, recapitalization or other similar transaction. |
(2) |
Consists of 132,632,441 shares of common stock registered for sale by the selling stockholders named in this registration statement. |
(3) |
Estimated solely for the purpose of calculating the registration fee in accordance with Rule 457(c) under the Securities Act, based on the average of the high and low prices of the registrant’s Class A Common Stock of the New York Stock Exchange on September 20, 2021, which was $13.16 per share. |
ii | ||||
iii | ||||
iv | ||||
1 | ||||
5 | ||||
6 |
37 | ||||
38 | ||||
39 | ||||
45 | ||||
49 | ||||
76 | ||||
88 | ||||
97 | ||||
106 | ||||
112 | ||||
115 | ||||
121 | ||||
127 |
132 | ||||
134 | ||||
134 | ||||
134 | ||||
F-1 |
• | “Board” means the board of directors of the Company. |
• | “Class A Common Stock” means the shares of the FWAA’s Class A Common Stock, par value $0.0001 per share, prior to the Business Combination, and to shares of our Class A Common Stock, par value $0.0001 per share, after the Business Combination; |
• | “Code” means the Internal Revenue Code of 1986, as amended. |
• | “DGCL” means the General Corporation Law of the State of Delaware. |
• | “Exchange Act” means the Securities Exchange Act of 1934, as amended. |
• | “Fifth Wall” means, collectively, Fifth Wall Asset Management, LLC, Fifth Wall Ventures Management, LLC and their affiliates and any investment funds, investment vehicles or accounts managed or advised by any of the foregoing. FWAA is sponsored by Sponsor, which is an affiliate of Fifth Wall. However, FWAA is an independent publicly traded company, and not a member of Fifth Wall or the Fifth Wall Group. Fifth Wall has not and is not providing investment advice to any person in connection with the matters contemplated herein, including us, FWAA or Sponsor. |
• | “GAAP” means U.S. generally accepted accounting principles. |
• | “Investment Company Act” means the Investment Company Act of 1940, as amended. |
• | “SEC” means the U.S. Securities and Exchange Commission. |
• | “Selling Stockholders” means the persons listed in the table in the section entitled “ Selling Stockholders |
• | execute our business strategy, including expansions in existing and into new lines of business; |
• | anticipate the uncertainties inherent in the development of new business lines and business strategies; |
• | realize the benefits expected from the Business Combination; |
• | continue to develop new products and innovations to meet constantly evolving customer demands; |
• | accelerate adoption of our products and services; |
• | acquire or make investments in other businesses, patents, technologies, products or services to grow the business; |
• | develop, design, and sell services that are differentiated from those of competitors; |
• | anticipate the impact of the coronavirus (“COVID-19”) pandemic and its effect on our business and financial condition; |
• | manage risks associated with operational changes in response to the COVID-19 pandemic; |
• | attract, train, and retain effective officers, key employees or directors; |
• | enhance future operating and financial results; |
• | comply with laws and regulations applicable to our business; |
• | stay abreast of modified or new laws and regulations applicable to our business, including copyright and privacy regulation; |
• | anticipate the significance and timing of contractual obligations; |
• | maintain key strategic relationships with partners and distributors; |
• | respond to uncertainties associated with product and service development and market acceptance; |
• | successfully defend litigation; |
• | upgrade and maintain information technology systems; |
• | acquire and protect intellectual property; |
• | anticipate rapid technological changes; |
• | meet future liquidity requirements and comply with restrictive covenants related to long-term indebtedness; |
• | maintain the listing of our securities from, the NYSE; |
• | obtain additional capital, including use of the debt market; and |
• | successfully deploy the proceeds from the Business Combination. |
• | We are an early-stage company with a history of losses, including net losses of $37.1 million and $30.3 million for the years ended December 31, 2020 and 2019, respectively. We have not been profitable historically and may not achieve or maintain profitability in the future. |
• | If the smart home technology industry does not grow as we expect, or if we cannot expand our products and solutions to meet the demands of this market, our revenue may decline, fail to grow or fail to grow at an accelerated rate, and we may incur operating losses. |
• | Our limited operating history, recent growth and the quickly changing markets in which we operate make evaluating our current business and future prospects difficult, which may increase the risk of investing in our Class A Common Stock. |
• | We collect, store, process and use personal information of our customers and their residents, which subjects us to legal obligations and laws and regulations related to security and privacy, and any actual or perceived failure to meet those obligations could harm our business. |
• | If our security controls are breached, or if unauthorized or inadvertent access to customer or residential information or other data or to control or view systems is otherwise obtained, our products and solutions may be perceived as insecure, our business may be harmed, and we may incur significant liabilities. |
• | The markets in which we participate could become more competitive as many companies, including large technology companies and managed service providers, may target the markets in which we do business. If we are unable to compete effectively with these potential competitors and sustain pricing levels for our products and solutions, our sales and profitability could be adversely affected. |
• | The loss of one or more key members of our management team or personnel, or our failure to attract, integrate and retain additional personnel in the future, could harm our business and negatively affect our ability to successfully grow our business. |
• | We have limited control over our suppliers, manufacturers and partners, which may subject us to significant risks, including the potential inability to produce or obtain quality products and services on a timely basis or in sufficient quantity. If these third-party suppliers, manufacturers and partners experience any delay, disruption or quality control problems in their operations, including due to the COVID-19 pandemic, we could lose market share and our results of operations may suffer. |
• | Interruptions to, or other problems with, our website and interactive user interface, information technology systems, manufacturing processes or other operations could damage our reputation and brand and substantially harm our business and results of operations. |
• | We may expand through acquisitions of, or investments in, other companies, each of which may divert management’s attention, result in additional dilution to our stockholders, increase expenses, disrupt our operations and harm our results of operations. |
• | Product liability, warranty, personal injury, property damage and recall claims may materially affect our financial condition and damage our reputation. |
• | Some of our products and solutions contain open source software, which may pose particular risks to our proprietary software, technologies, products and solutions in a manner that could harm our business. |
• | Our smart home technology is subject to varying state and local regulations, which may be updated from time to time. |
• | From time to time, we may be subject to legal proceedings, regulatory disputes and governmental inquiries that could cause us to incur significant expenses, divert management’s attention and materially harm our business, financial condition and operating results. |
• | The issuance of additional shares of our Class A Common Stock or convertible securities could make it difficult for another company to acquire us, may dilute your ownership of us and could adversely affect our stock price. |
• | Future sales, or the perception of future sales, of shares of our Class A Common Stock by us or our existing stockholders in the public market could adversely affect our stock price. |
• | Our management has limited experience in operating a public company. |
• | the option to present only two years of audited financial statements and only two years of related “Management’s Discussion and Analysis of Financial Condition and Results of Operations” in this prospectus; |
• | not being required to comply with the auditor attestation requirements of Section 404 of the Sarbanes-Oxley Act of 2002, as amended (the “Sarbanes-Oxley Act”); |
• | not being required to comply with any requirement that may be adopted by the Public Company Accounting Oversight Board regarding mandatory audit firm rotation or a supplement to the auditor’s report providing additional information about the audit and the financial statements (i.e., an auditor discussion and analysis); |
• | reduced disclosure obligations regarding executive compensation in our periodic reports, proxy statements and registration statements; and |
• | exemptions from the requirements of holding a nonbinding advisory vote of stockholders on executive compensation, stockholder approval of any golden parachute payments not previously approved and having to disclose the ratio of the compensation of our chief executive officer to the median compensation of our employees. |
Issuer |
SmartRent, Inc. |
Shares of Class A Common |
132,632,441 shares. See “ Selling Stockholders |
Class A Common Stock Outstanding |
193,864,107 shares as of September 20, 2021, including 132,632,441 shares being offered by the Selling Stockholders. |
Use of Proceeds |
We will not receive any proceeds from the sale of shares of our Class A Common Stock by the Selling Stockholders. The Selling Stockholders will receive the net proceeds from the sale of shares of our Class A Common Stock covered by this prospectus, but we will pay certain expenses of this offering. See “ Use of Proceeds |
Risk Factors |
Investing in our securities involves a high degree of risk. See “ Risk Factors |
Market for Our Class A Common Stock |
Shares of our Class A Common Stock are listed on the NYSE under the symbol “SMRT.” |
• | the proportion of our revenue attributable to software-as-a-service |
• | fluctuations in demand for our platform and solutions; |
• | changes in pricing by us in response to competitive pricing actions; |
• | the ability of our hardware vendors to continue to manufacture high-quality products and to supply sufficient products to meet our demands; |
• | the timing and success of introductions of new solutions, products or upgrades by us or our competitors; |
• | changes in our business and pricing policies or those of our competitors; |
• | the ability to accurately forecast revenue; |
• | our ability to control costs, including our operating expenses and the costs of the hardware we purchase; |
• | competition, including entry into the industry by new competitors and new offerings by existing competitors; |
• | our ability to successfully manage any future acquisitions and integrations of businesses; |
• | issues related to introductions of new or improved products, such as shortages of prior generation products or short-term decreased demand for next generation products; |
• | the amount and timing of expenditures, including those related to expanding our operations, increasing research and development, introducing new solutions or paying litigation expenses; |
• | the ability to effectively manage growth within existing and new markets domestically and internationally; |
• | changes in the payment terms for our platform and solutions; |
• | the strength of regional, national and global economies; and |
• | the impact of other events or factors, including those resulting from natural disasters, pandemics, war, acts of terrorism or responses to these events. |
• | our failure to introduce new features, software, products, or solutions that customers find engaging or our introduction of new products or solutions, or changes to existing products and solutions that are not favorably received; |
• | harm to our brand and reputation; |
• | pricing and perceived value of our offerings; |
• | our inability to deliver quality products and solutions in a timely manner; |
• | our customers engaging with competitive software, services, products, and solutions; |
• | technical or other problems preventing customers or their residents from using our products and solutions in a rapid and reliable manner or otherwise affecting the customer experience; |
• | deterioration of the apartment or real estate industry, including declining levels of multifamily and single-family rental buildings and reduced spending in the apartment industry; |
• | unsatisfactory experiences with the delivery, installation, or products or solutions; and |
• | deteriorating general economic conditions or a change in consumer spending preferences or buying trends. |
• | our product and solution functionality, performance, ease of use, reliability, availability, and cost effectiveness relative to that of our competitors’ products and solutions; |
• | our success in utilizing new and proprietary technologies to offer solutions and features previously not available in the marketplace; |
• | our success in identifying new markets, applications and technologies; |
• | our ability to attract and retain partners; |
• | our name recognition and reputation; |
• | our ability to recruit software engineers and sales and marketing personnel; and |
• | our ability to protect our intellectual property. |
• | inability to satisfy demand for our products; |
• | reduced control over delivery timing and product reliability; |
• | reduced ability to monitor the manufacturing process and components used in our products; |
• | limited ability to develop comprehensive manufacturing specifications that take into account any materials shortages or substitutions; |
• | variance in the manufacturing capability of our third-party manufacturers; |
• | price increases; |
• | failure of a significant supplier, manufacturer, or partner to perform its obligations to us for technical, market, or other reasons; |
• | insolvency, bankruptcy or liquidation of a significant supplier, manufacturer, or partner; |
• | difficulties in establishing additional supplier, manufacturer, or partner relationships if we experience difficulties with our existing suppliers, manufacturers, or partners; |
• | shortages of materials or components; |
• | disagreements with suppliers, manufacturers, or logistics partners as to quality control, leading to a surplus of ineffective products; |
• | misappropriation of our intellectual property; |
• | exposure to natural catastrophes, political unrest, terrorism, labor disputes, and economic instability resulting in the disruption of trade from foreign countries in which our products are manufactured or the components thereof are sourced; |
• | changes in local economic conditions in the jurisdictions where our suppliers, manufacturers, and partners are located; |
• | the imposition of new laws and regulations, including those relating to labor conditions, quality and safety standards, imports, duties, tariffs, taxes, and other charges on imports, as well as trade restrictions and restrictions on currency exchange or the transfer of funds; and |
• | insufficient warranties and indemnities on components supplied to our manufacturers or performance by our partners. |
• | the potential failure to achieve the expected benefits of the combination or acquisition; |
• | unanticipated costs and liabilities; |
• | difficulties in integrating new products, solutions, software, features, services, businesses, operations and technology infrastructure in an efficient and effective manner; |
• | difficulties in maintaining customer relations; |
• | the potential loss of key employees of the acquired businesses; |
• | the diversion of the attention of our senior management from the operation of our daily business; |
• | the potential adverse effect on our cash position to the extent that we use cash for the purchase price; |
• | the potential significant increase of our interest expense, leverage, and debt service requirements if we incur additional debt to pay for an acquisition; |
• | the potential issuance of securities that would dilute our stockholders’ percentage ownership; |
• | the potential to incur large and immediate write-offs and restructuring and other related expenses; and |
• | the inability to maintain uniform standards, controls, policies and procedures. |
• | result in the loss of a substantial number of existing customers or prohibit the acquisition of new customers; |
• | cause us to pay license fees for intellectual property we are deemed to have infringed; |
• | cause us to incur costs and devote valuable technical resources to redesigning our products or solutions; |
• | cause our cost of revenues to increase; |
• | cause us to accelerate expenditures to preserve existing revenues; |
• | materially and adversely affect our brand in the marketplace and cause a substantial loss of goodwill; |
• | cause us to change our business methods; and |
• | require us to cease certain business operations or offering certain products or features. |
• | restricted access to customers’ properties and communities, leading to suspensions and interruptions in product installation; |
• | our inability to manage our business effectively due to key employees becoming ill, working from home inefficiently, and being unable to travel to our facilities; |
• | our and our customers’, third-party suppliers’ and other business partners’ inability to operate worksites, including construction sites, manufacturing facilities and shipping and fulfillment centers, due to employee illness or reluctance to appear at work, or “stay-at-home” |
• | interruptions in manufacturing (including the sourcing of key components) and shipment of our products; |
• | disruptions of the operations of our third-party suppliers, which could impact our ability to purchase components at efficient prices and in sufficient amounts; |
• | reduced demand for our products and services, including due to any prolonged economic downturn that may occur; |
• | our inability to raise additional capital or the dilution of our common stock if we raise capital by issuing equity securities; and |
• | volatility in the market price of our Class A Common Stock. |
• | changes in the valuation of our deferred tax assets and liabilities; |
• | expiration of, or lapses in, the research and development tax credit laws; |
• | expiration or non-utilization of net operating loss carryforwards; |
• | tax effects of share-based compensation; |
• | expansion into new jurisdictions; |
• | potential challenges to and costs related to implementation and ongoing operation of our intercompany arrangements; |
• | increases in state or federal statutory tax rates on corporate income; |
• | changes in tax laws and regulations and accounting principles, or interpretations or applications thereof; and |
• | certain non-deductible expenses as a result of acquisitions. |
• | our ability to comply with differing and evolving technical and environmental standards, telecommunications regulations, building and fire codes, and certification requirements outside the United States; |
• | difficulties and costs associated with staffing and managing foreign operations; |
• | our ability to effectively price our products and solutions in competitive international markets; |
• | potentially greater difficulty collecting accounts receivable and longer payment cycles; |
• | the need to adapt and localize our products and subscriptions for specific countries; |
• | the need to offer customer care in various native languages; |
• | reliance on third parties over which we have limited control; |
• | availability of reliable network connectivity in targeted areas for expansion; |
• | difficulties in understanding and complying with local laws, regulations, and customs in foreign jurisdictions; |
• | restrictions on travel to or from countries in which we operate or inability to access certain areas; |
• | changes in diplomatic and trade relationships, including tariffs and other non-tariff barriers, such as quotas and local content rules; |
• | U.S. government trade restrictions, including those which may impose restrictions such as prohibitions, on the exportation, re-exportation, sale, shipment or other transfer of programming, technology, components, and/or services to foreign persons; |
• | our ability to comply with different and evolving laws, rules, and regulations, including the European Union General Data Protection Regulation and other data privacy and data protection laws, rules and regulations; |
• | compliance with various anti-bribery and anti-corruption laws such as the Foreign Corrupt Practices Act and U.K. Bribery Act of 2010; |
• | more limited protection for intellectual property rights in some countries; |
• | adverse tax consequences; |
• | fluctuations in currency exchange rates; |
• | exchange control regulations, which might restrict or prohibit our conversion of other currencies into U.S. Dollars; |
• | new and different sources of competition; |
• | political and economic instability created by the United Kingdom’s departure from the European Union; |
• | deterioration of political relations between the United States and other countries in which we may operate; or |
• | political or social unrest, economic instability, conflict or war in such countries, or sanctions implemented by the United States against countries in which we operate, all of which could have a material adverse effect on our operations. |
• | the impact of the COVID-19 pandemic on our financial condition and the results of operations; |
• | our operating and financial performance and prospects; |
• | our quarterly or annual earnings or those of other companies in our industry compared to market expectations; |
• | conditions that impact demand for our products and/or services; |
• | future announcements concerning our business, our clients’ businesses or our competitors’ businesses; |
• | the public’s reaction to our press releases, other public announcements and filings with the SEC; |
• | the market’s reaction to our reduced disclosure and other requirements as a result of being an “emerging growth company” under the JOBS Act; |
• | the size of our public float; |
• | coverage by or changes in financial estimates by securities analysts or failure to meet their expectations; |
• | market and industry perception of our success, or lack thereof, in pursuing our growth strategy; |
• | strategic actions by us or our competitors, such as acquisitions or restructurings; |
• | changes in laws or regulations which adversely affect our industry or us; |
• | privacy and data protection laws, privacy or data breaches, or the loss of data; |
• | changes in accounting standards, policies, guidance, interpretations or principles; |
• | changes in senior management or key personnel; |
• | issuances, exchanges or sales, or expected issuances, exchanges or sales of our capital stock; |
• | changes in our dividend policy; |
• | adverse resolution of new or pending litigation against us; and |
• | changes in general market, economic and political conditions in the United States and global economies or financial markets, including those resulting from natural disasters, terrorist attacks, acts of war and responses to such events. |
• | a staggered board, which means that the Board is classified into three classes of directors, with staggered three-year terms and directors are only able to be removed from office for cause; |
• | limitations on convening special stockholder meetings, which could make it difficult for our stockholders to adopt desired governance changes; |
• | a prohibition on stockholder action by written consent, which means that our stockholders are only able to take action at a meeting of stockholders and are not be able to take action by written consent for any matter; |
• | a forum selection clause, which means certain litigation against us can only be brought in Delaware; |
• | the authorization of undesignated preferred stock, the terms of which may be established and shares of which may be issued without further action by our stockholders; and |
• | advance notice procedures, which apply for stockholders to nominate candidates for election as directors or to bring matters before an annual meeting of stockholders. |
• | the merger of Merger Sub, the wholly owned subsidiary of FWAA, with and into SmartRent, with SmartRent as the surviving company; |
• | the conversion of all outstanding shares of Legacy SmartRent preferred stock into Legacy SmartRent common stock that rolled over into our common stock; |
• | the conversion of all outstanding FWAA shares into FWAA common stock that will roll over into our common stock; |
• | the rollover of Legacy SmartRent’s options, warrants, and restricted stock units into options, warrants and restricted stock units in SmartRent; and |
• | the issuance of shares of our Class A Common Stock valued at $10.00 per share as follows: 157,678,300 shares to Legacy SmartRent, 34,499,754 shares to FWAA, 15,500,000 shares to the PIPE Investors, and 9,672,500 shares to Sponsor. |
• | the historical unaudited financial statements of FWAA as of and for the six months ended June 30, 2021 included in FWAA’s Quarterly Report filed on the Form 10-Q filed with the SEC on August 13, 2021, and the historical audited financial statements of FWAA as of December 31, 2020; |
• | the historical unaudited condensed consolidated financial statements of Legacy SmartRent as of and for the six months ended June 30, 2021 and the historical audited consolidated financial statements of SmartRent as of and for the year ended December 31, 2020; and |
• | other information relating to the Merger Agreement between FWAA and Legacy SmartRent and the description of certain terms thereof included in this prospectus. |
• | Legacy SmartRent’s stockholders have more than 70% of the voting interest of the Company; |
• | Legacy SmartRent’s senior management comprise the senior management of the Company; |
• | the directors nominated by Legacy SmartRent represent the majority of the Board; |
• | Legacy SmartRent is the larger entity based on historical revenues and business operations; |
• | Legacy SmartRent’s operations comprise the ongoing operations of the Company; and |
• | the Company assumed Legacy SmartRent’s name. |
(in millions) |
||||
Share issuance to FWAA stockholders |
$345.0 | |||
Share issuance to Sponsor |
96.7 | |||
Share issuance to Legacy SmartRent stockholders |
1,576.8 | |||
Share issuance to Subscribers |
155.0 | |||
|
|
|||
Stock Consideration at Closing |
$ |
2,173.5 |
||
|
|
Shares |
% Owned |
|||||||
Company shares issued to FWAA public stockholders |
34,499,754 | 16% | ||||||
Company shares issued to Sponsor and certain FWAA’s directors |
9,672,500 | 4% | ||||||
Company shares issued in the Business Combination |
157,678,300 | 73% | ||||||
Company shares issued to PIPE Investors |
15,500,000 | 7% | ||||||
|
|
|
|
|||||
Pro Forma Common Stock at June 30, 2021 |
217,350,554 |
100% |
||||||
|
|
|
|
|
SmartRent (Historical) |
FWAA (Historical) |
Transaction Accounting Adjustments |
Pro Forma Combined |
||||||||||||
Assets |
||||||||||||||||
Current assets: |
||||||||||||||||
Cash and cash equivalents |
$53,534 | $655 | $345,017 (1) |
$503,704 | ||||||||||||
(12,075) (2) |
||||||||||||||||
(27,100) (3) |
||||||||||||||||
155,000 (4) |
||||||||||||||||
(11,325) (4) |
||||||||||||||||
(2) (5) |
||||||||||||||||
Accounts receivable, net |
27,028 | — | 27,028 | |||||||||||||
Inventory |
21,701 | — | 21,701 | |||||||||||||
Deferred cost of revenues, current portion |
7,645 | — | 7,645 | |||||||||||||
Prepaid expenses and other current assets |
11,220 | 1,353 | (2,783) (3) |
9,790 | ||||||||||||
|
|
|
|
|
|
|
|
|||||||||
Total current assets |
121,128 |
2,008 |
446,732 |
569,868 |
||||||||||||
|
|
|
|
|
|
|
|
|||||||||
Cash held in trust account |
— | 345,017 | (345,017) (1) |
— | ||||||||||||
Property and equipment, net |
1,292 | — | 1,292 | |||||||||||||
Deferred cost of revenues |
13,394 | — | 13,394 | |||||||||||||
Goodwill |
4,162 | — | 4,162 | |||||||||||||
Other long-term assets |
1,281 | — | 1,281 | |||||||||||||
|
|
|
|
|
|
|
|
|||||||||
Total assets |
$141,257 |
$347,025 |
$101,715 |
$589,997 |
||||||||||||
|
|
|
|
|
|
|
|
|||||||||
Current liabilities |
||||||||||||||||
Accounts payable |
4,864 | 337 | (1,085) (3) |
4,116 | ||||||||||||
Accrued expenses and other current liabilities |
7,769 | 2,119 | (2,954) (3) |
6,934 | ||||||||||||
Due to related party |
— | 15 | 15 | |||||||||||||
Franchise tax payable |
— | 98 | 98 | |||||||||||||
Deferred revenues, current portion |
35,066 | — | 35,066 | |||||||||||||
Current portion of long-term debt |
1,652 | — | 1,652 | |||||||||||||
|
|
|
|
|
|
|
|
|||||||||
Total current liabilities |
49,351 |
2,569 |
(4,039) |
47,881 |
||||||||||||
|
|
|
|
|
|
|
|
|||||||||
Long-term debt, net |
2,343 | — | 2,343 | |||||||||||||
Deferred revenues |
39,439 | — | 39,439 | |||||||||||||
Other long-term liabilities |
273 | — | 273 | |||||||||||||
Deferred underwriting commissions in connection with the initial public offering |
— | 12,075 | (12,075) (2) |
— | ||||||||||||
|
|
|
|
|
|
|
|
|||||||||
Total liabilities |
91,406 |
14,644 |
(16,114) |
89,936 |
||||||||||||
|
|
|
|
|
|
|
|
|||||||||
Convertible preferred stock |
146,225 | — | (146,225) (9) |
— | ||||||||||||
Common stock subject to redemption |
— | 327,380 | (327,380) (10) |
— | ||||||||||||
Common stock |
— | — | — | |||||||||||||
Class A Common Stock |
— | — | 2 (4) |
20 | ||||||||||||
— (5) |
||||||||||||||||
15 (6) |
||||||||||||||||
2 (9) |
||||||||||||||||
1 (7) |
||||||||||||||||
Class B common stock |
— | 1 | (1) (7) |
— | ||||||||||||
Additional paid-in capital |
5,416 | 8,272 | 154,998 (4) |
607,865 | ||||||||||||
(11,325) (4) |
||||||||||||||||
(19,809) (3) |
||||||||||||||||
(2) (5) |
||||||||||||||||
(15) (6) |
||||||||||||||||
(3,273) (8) |
||||||||||||||||
146,223 (9) |
||||||||||||||||
327,380 (10) |
||||||||||||||||
Accumulated other comprehensive income (loss) |
170 | — | 170 | |||||||||||||
Accumulated deficit |
(101,960) | (3,273) | 3,273 (8) |
(107,995) | ||||||||||||
(6,035) (3) |
||||||||||||||||
|
|
|
|
|
|
|
|
|||||||||
Total stockholders’ (deficit) equity |
(96,374) |
5,000 |
591,434 |
500,061 |
||||||||||||
|
|
|
|
|
|
|
|
|||||||||
Total liabilities, convertible preferred stock, and stockholders’ (deficit) equity |
$141,257 |
$347,025 |
$101,715 |
$589,997 |
||||||||||||
|
|
|
|
|
|
|
|
SmartRent (Historical) |
FWAA (Historical) |
Transaction Accounting Adjustments |
Pro Forma Combined |
|||||||||||||
Revenue |
||||||||||||||||
Hardware | $26,427 | $— | $— | $26,427 | ||||||||||||
Professional services | 7,165 | — | — | 7,165 | ||||||||||||
Hosted services | 7,245 | — | — | 7,245 | ||||||||||||
|
|
|
|
|
|
|
|
|||||||||
Total revenue | 40,837 | — | — | 40,837 | ||||||||||||
Cost of Revenue |
||||||||||||||||
Hardware | 24,657 | — | — | 24,657 | ||||||||||||
Professional services | 11,734 | — | — | 11,734 | ||||||||||||
Hosted services | 4,577 | — | — | 4,577 | ||||||||||||
|
|
|
|
|
|
|
|
|||||||||
Total cost of revenue | 40,968 | — | — | 40,968 | ||||||||||||
Operating expenses |
||||||||||||||||
Research and development | 7,176 | — | — | 7,176 | ||||||||||||
Sales and marketing | 4,146 | — | — | 4,146 | ||||||||||||
General and administrative | 7,763 | 3,186 | (2,970) (A) |
7,979 | ||||||||||||
Franchise tax expense | — | 98 | — | 98 | ||||||||||||
|
|
|
|
|
|
|
|
|||||||||
Total operating expenses | 19,085 | 3,284 | (2,970) | 19,399 | ||||||||||||
|
|
|
|
|
|
|
|
|||||||||
Loss from operations |
(19,216) | (3,284) | 2,970 | (19,530) | ||||||||||||
Income from investments held in Trust Account | 17 | (17) (B) |
— | |||||||||||||
Other expense: |
||||||||||||||||
Interest expense | (142) | — | — | (142) | ||||||||||||
Other income (expense), net | 127 | — | — | 127 | ||||||||||||
|
|
|
|
|
|
|
|
|||||||||
Loss before income taxes |
(19,231) |
(3,267) |
2,953 |
(19,545) |
||||||||||||
|
|
|
|
|
|
|
|
|||||||||
Provision for income taxes | 87 | — | — | 87 | ||||||||||||
|
|
|
|
|
|
|
|
|||||||||
Net (loss) income |
(19,318) |
$(3,267) |
$2,953 |
$(19,632) |
||||||||||||
|
|
|
|
|
|
|
|
|||||||||
Foreign currency translation adjustment | (65) | — | — | (65) | ||||||||||||
Comprehensive loss |
$(19,383) |
$(3,267) |
$2,953 |
$(19,697) |
||||||||||||
|
|
|
|
|
|
|
|
|||||||||
Net loss attributable to common stockholders | $(19,318) | $(19,632) | ||||||||||||||
|
|
|
|
|||||||||||||
Weighted average redeemable common shares outstanding, basic and diluted | 32,738,037 | 193,716,196 | ||||||||||||||
|
|
|
|
|||||||||||||
Basic and diluted net income (loss) per share | $(0.10) | $(0.10) | ||||||||||||||
|
|
|
|
|||||||||||||
Weighted average non-redeemable common shares outstanding, basic and diluted |
1,990,000 | 11,434,463 | ||||||||||||||
|
|
|
|
|||||||||||||
Basic and diluted net income (loss) per share | $(9.71) | $(0.29) | ||||||||||||||
|
|
|
|
(A) | Reflects the reversal of transaction costs incurred by FWAA during the six months ends June 30, 2021 that were reflected in the unaudited pro forma condensed combined statement of operations for the year ended December 31, 2020, including, but not limited to, advisory fees, legal fees, and registration fees. This is a non-recurring item. |
(B) | Reflects the elimination of investment income from the Trust Account. |
SmartRent (Historical) |
FWAA (Historical) |
Transaction Accounting Adjustments |
Pro Forma Combined |
|||||||||||||
Revenue |
||||||||||||||||
Hardware | $31,978 | $— | $— | $31,978 | ||||||||||||
Professional services | 12,304 | — | — | 12,304 | ||||||||||||
Hosted services | 8,252 | — | — | 8,252 | ||||||||||||
|
|
|
|
|
|
|
|
|||||||||
Total revenue | 52,534 | — | — | 52,534 | ||||||||||||
Cost of Revenue |
||||||||||||||||
Hardware | $35,225 | $— | $— | $35,225 | ||||||||||||
Professional services | 16,176 | — | — | 16,176 | ||||||||||||
Hosted services | 5,430 | — | — | 5,430 | ||||||||||||
|
|
|
|
|
|
|
|
|||||||||
Total cost of revenue | 56,831 | — | — | 56,831 | ||||||||||||
Operating expenses |
||||||||||||||||
Research and development | 9,406 | — | — | 9,406 | ||||||||||||
Sales and marketing | 5,429 | — | — | 5,429 | ||||||||||||
General and administrative | 16,584 | 6 | 9,004 | 25,594 | ||||||||||||
Franchise tax expense | — | 1 | — | 1 | ||||||||||||
|
|
|
|
|
|
|
|
|||||||||
Total operating expenses | 31,419 | 7 | 9,004 | 40,430 | ||||||||||||
|
|
|
|
|
|
|
|
|||||||||
Loss from operations |
(35,716) | (7) | (9,004) | (44,727) | ||||||||||||
Other expense: |
||||||||||||||||
Interest expense | 559 | — | — | 559 | ||||||||||||
Other expense, net | 685 | — | — | 685 | ||||||||||||
|
|
|
|
|
|
|
|
|||||||||
Loss before income taxes |
(36,960) |
(7) |
(9,004) |
(45,971) |
||||||||||||
|
|
|
|
|
|
|
|
|||||||||
Provision for income taxes | 149 | — | — | 149 | ||||||||||||
|
|
|
|
|
|
|
|
|||||||||
Net (loss) income |
$(37,109) |
$(7) |
$(9,004) |
$(46,120) |
||||||||||||
|
|
|
|
|
|
|
|
|||||||||
Foreign currency translation adjustment | 235 | — | — | 235 | ||||||||||||
Comprehensive loss |
$(36,874) |
$(7) |
$(9,004) |
$(45,885) |
||||||||||||
|
|
|
|
|
|
|
|
|||||||||
Net loss attributable to common stockholders | $(37,109) | $(46,120) | ||||||||||||||
|
|
|
|
|||||||||||||
Weighted average redeemable common shares outstanding, basic and diluted | 33,066,841 | 193,716,196 | ||||||||||||||
|
|
|
|
|||||||||||||
Basic and diluted net income loss) per share | $0.00 | $(0.24) | ||||||||||||||
|
|
|
|
|||||||||||||
Weighted average non-redeemable common shares outstanding, basic and diluted |
1,550,000 | 11,105,659 | ||||||||||||||
|
|
|
|
|||||||||||||
Basic and diluted net income (loss) per share | $(23.94) | $0.00 | ||||||||||||||
|
|
|
|
(A) | Reflects the transaction costs incurred by FWAA in 2021 including, but not limited to, advisory fees, legal fees, and registration fees. This is a non-recurring item. |
1. |
Basis of Presentation |
• | the historical unaudited financial statements of FWAA as of and for the six months ended June 30, 2021 included in FWAA’s Quarterly Report filed on the Form 10-Q filed with the SEC on August 13, 2021, and the historical audited financial statements of FWAA as of December 31, 2020; |
• | the historical unaudited condensed consolidated financial statements of Legacy SmartRent as of and for the six months ended June 30, 2021 and the historical audited consolidated financial statements of SmartRent as of and for the year ended December 31, 2020; and |
• | other information relating to the Merger Agreement between FWAA and Legacy SmartRent and the description of certain terms thereof included in this prospectus. |
2. |
Accounting Policies |
3. |
Adjustments to Unaudited Pro Forma Condensed Combined Financial Information |
(1) | Reflects the reclassification of cash and cash equivalents held in the Trust Account that became available in connection with the Business Combination. |
(2) | Reflects the settlement of deferred underwriters’ fees incurred during the FWAA IPO that were due upon completion of the Business Combination. |
(3) | Reflects the transaction costs incurred by SmartRent and FWAA subsequent to June 30, 2021 including, but not limited to, advisory fees, legal fees, and registration |
fees that were paid in connection with the consummation of the Business Combination. This adjustment includes the reclassification of $2.8 million of deferred transaction costs incurred by SmartRent for accounting, legal, and advisory fees that are included in the $19.8 million reduction of additional paid-in capital since they are direct and incremental costs associated with the Business Combination. These amounts are excluded from cash as the costs were previously reflected in the historical cash balance of SmartRent. This adjustment also includes the write-off of $4.0 million of accounts payable and accrued expenses recognized by FWAA and SmartRent for accounting, legal, and advisory fees. Approximately $1.1 million of the amount is included in the $19.8 million reduction of additional paid-in capital since the amounts are direct and incremental costs associated with the Business Combination. The remaining $2.9 million is included in accumulated deficit as the costs are not direct and incremental to the Business Combination. The total increase to accumulated deficit of $6.0 million is related to the transaction costs incurred by FWAA in 2021 including, but not limited to, advisory fees, legal fees and registration fees. These transaction costs are also reflected in the unaudited pro forma condensed combined statement of operations for the year ended December 31, 2020 as an adjustment to general and administrative expense. |
(4) | Represents the proceeds from the issuance of 15,500,000 shares of the Company at $10.00 per share to the PIPE Investors, offset by the PIPE Transaction placement fees of $11.3 million. The costs related to the issuance of the shares in the PIPE Transaction are adjusted against additional paid-in capital. |
(5) | Reflects the actual redemptions of 246 public shares for aggregate redemption payments of $2,460 allocated to Class A Common Stock and additional paid-in capital using par value $0.0001 per share and at a redemption price of $10.00 per share. |
(6) | Reflects the recapitalization of SmartRent through (a) the contribution of all the share capital in SmartRent to FWAA in the amount of $5.4 million and (b) the issuance of 157,678,300 shares of FWAA Class A Common Stock at par value of $0.0001. |
(7) | Reflects the conversion of FWAA Class B common stock held by the initial stockholders to shares of FWAA Class A Common Stock. |
(8) | Reflects the elimination of the historical accumulated deficit of FWAA, the legal acquirer, in the amount of $3.3 million. |
(9) | Represents the conversion of Legacy SmartRent’s convertible preferred stock immediately prior to the consummation of the Business Combination into Legacy SmartRent common stock. |
(10) | Represents the reclassification of historical FWAA’s Class A Common Stock previously subject to possible redemption from temporary equity into permanent equity immediately prior to the consummation of the Business Combination. |
4. |
Net loss per Share |
(Net loss presented in thousands of dollars) |
||||||||
Six Months Ended June 30, 2021 |
Twelve Months Ended December 31, 2020 |
|||||||
Pro forma net loss |
$(19,632) | $(46,120) | ||||||
Weighted average shares outstanding, basic and diluted |
193,716,196 | 193,716,196 | ||||||
Net loss per share - Basic and Diluted |
$(0.10) | $(0.24) | ||||||
Basic weighted average shares outstanding |
||||||||
Company shares issued to Legacy SmartRent |
134,043,942 | 134,043,942 | ||||||
Company shares issued to FWAA public shareholders |
34,499,754 | 34,499,754 | ||||||
Company shares issued to PIPE Investors |
15,500,000 | 15,500,000 | ||||||
Company shares issued to Sponsor and certain FWAA directors |
9,672,500 | 9,672,500 | ||||||
|
|
|
|
|||||
193,716,196 | 193,716,196 | |||||||
|
|
|
|
• | The 10,457,305 rollover options outstanding, of which 7,089,184 are vested and 3,368,121 are unvested. |
• | The 5,689,731 rollover warrants outstanding, of which 153,027 are vested and 5,536,704 are unvested. |
• | Our workforce. COVID-19 pandemic, we established new protocols to protect the health and safety of our workforce, |
including restricting employee travel, recommending that all non-essential personnel work from home and cancelled or reduced physical participation in sales activities, meetings, events and conferences and implemented additional safety protocols for essential workers. |
• | Operations and supply chain. COVID-19 pandemic on our sourcing, manufacturing, and logistics channels. For example, as described below, we have experienced SmartHub production delays as a result of a global shortage of Z-wave chips, which facilitate the communication protocol used for communication between our SmartHub and all other smart devices. |
• | Demand for our products. COVID-19 pandemic and customers’ delayed purchasing decisions. While we continue to engage with existing and potential customers, we believe some customers may continue to delay purchases from us because their development programs may also be delayed as a result of the COVID-19 pandemic. We believe that demand for our products remains strong, but due to the COVID-19 pandemic, a portion of the transactions expected to be completed in 2020 were delayed until early 2021 and, similarly, that transactions expected to be completed in early 2021 may be delayed until later in the year. In connection with the preparation of the unaudited projected financial information included in this prospectus in the section entitled “The Business Combination — Unaudited Prospective Financial Information of SmartRent |
Three Months Ended June 30, |
Change $ |
Change % |
Six Months Ended June 30, |
Change $ |
Change % |
|||||||||||||||||||||||||||
2021 |
2020 |
|
|
2021 |
2020 |
|
|
|||||||||||||||||||||||||
(dollars in thousands) |
|||||||||||||||||||||||||||||||
Revenue |
||||||||||||||||||||||||||||||||
Hardware |
$14,029 | $2,881 | $11,148 | 387 | % | $26,427 | $14,174 | $12,253 | 86 | % | ||||||||||||||||||||||
Professional services |
3,564 | 1,210 | 2,354 | 195 | % | 7,165 | 4,841 | 2,324 | 48 | % | ||||||||||||||||||||||
Hosted services |
4,084 | 1,700 | 2,384 | 140 | % | 7,245 | 3,330 | 3,915 | 118 | % | ||||||||||||||||||||||
|
|
|
|
|
|
|
|
|
|
|
|
|||||||||||||||||||||
Total revenue |
$21,677 | $5,791 | $15,886 | 274 | % | $40,837 | $22,345 | $18,492 | 83 | % | ||||||||||||||||||||||
|
|
|
|
|
|
|
|
|
|
|
|
|||||||||||||||||||||
Cost of Revenue |
||||||||||||||||||||||||||||||||
Hardware |
12,514 | 4,410 | 8,104 | 184 | % | 24,657 | 14,563 | 10,094 | 69 | % | ||||||||||||||||||||||
Professional services |
6,274 | 2,218 | 4,056 | 183 | % | 11,734 | 6,749 | 4,985 | 74 | % | ||||||||||||||||||||||
Hosted services |
2,606 | 1,226 | 1,380 | 113 | % | 4,577 | 2,384 | 2,193 | 92 | % | ||||||||||||||||||||||
|
|
|
|
|
|
|
|
|
|
|
|
|||||||||||||||||||||
Total cost of revenue |
21,394 | 7,854 | 13,540 | 172 | % | 40,968 | 23,696 | 17,272 | 73 | % | ||||||||||||||||||||||
|
|
|
|
|
|
|
|
|
|
|
|
|||||||||||||||||||||
Operating expense |
||||||||||||||||||||||||||||||||
Research and development |
4,083 | 2,134 | 1,949 | 91 | % | 7,176 | 4,004 | 3,172 | 79 | % | ||||||||||||||||||||||
Sales and marketing |
2,392 | 1,183 | 1,209 | 102 | % | 4,146 | 2,720 | 1,426 | 52 | % | ||||||||||||||||||||||
General and administrative |
3,806 | 4,642 | (836) | (18) | % | 7,763 | 8,655 | (892) | (10) | % | ||||||||||||||||||||||
|
|
|
|
|
|
|
|
|
|
|
|
|||||||||||||||||||||
Total operating expenses |
10,281 | 7,959 | 2,322 | 29 | % | 19,085 | 15,379 | 3,706 | 24 | % | ||||||||||||||||||||||
|
|
|
|
|
|
|
|
|
|
|
|
|||||||||||||||||||||
Loss from operations |
(9,998) | (10,022) | 24 | — | % | (19,216) | (16,730) | (2,486) | 15 | % | ||||||||||||||||||||||
Other expense |
||||||||||||||||||||||||||||||||
Interest expense |
(64) | (170) | 106 | (62 | %) | (142) | (380) | 238 | (63) | % | ||||||||||||||||||||||
Other income (expense), net |
52 | (212) | 264 | (125) | % | 127 | (492) | 619 | (126) | % | ||||||||||||||||||||||
|
|
|
|
|
|
|
|
|
|
|
|
|||||||||||||||||||||
Loss before income taxes |
(10,010) | (10,404) | 394 | (4) | % | (19,231) | (17,602) | (1,629) | 9 | % | ||||||||||||||||||||||
Provision for income taxes |
41 | 44 | (3) | (7) | % | 87 | 122 | (35) | (29) | % | ||||||||||||||||||||||
|
|
|
|
|
|
|
|
|
|
|
|
|||||||||||||||||||||
Net Loss |
$(10,051) | $(10,448) | $397 | (4) | % | $(19,318) | $(17,724) | $(1,594) | 9 | % | ||||||||||||||||||||||
|
|
|
|
|
|
|
|
|
|
|
|
Three Months Ended June 30, |
Change $ |
Change % |
Six Months Ended June 30, |
Change $ |
Change % |
|||||||||||||||||||||||||||
2021 |
2020 |
|
|
2021 |
2020 |
|
|
|||||||||||||||||||||||||
(dollars in thousands) |
|||||||||||||||||||||||||||||||
Revenue |
||||||||||||||||||||||||||||||||
Hardware |
$14,029 | $2,881 | $11,148 | 387 | % | $26,427 | $14,174 | $12,253 | 86 | % | ||||||||||||||||||||||
Professional services |
3,564 | 1,210 | 2,354 | 195 | % | 7,165 | 4,841 | 2,324 | 48 | % | ||||||||||||||||||||||
Hosted services |
4,084 | 1,700 | 2,384 | 140 | % | 7,245 | 3,330 | 3,915 | 118 | % | ||||||||||||||||||||||
|
|
|
|
|
|
|
|
|
|
|
|
|||||||||||||||||||||
Total |
$21,677 | $5,791 | $15,886 | 274 | % | $40,837 | $22,345 | $18,492 | 83 | % | ||||||||||||||||||||||
|
|
|
|
|
|
|
|
|
|
|
|
Three Months Ended June 30, |
Change $ |
Change % |
Six Months Ended June 30, |
Change $ |
Change % |
|||||||||||||||||||||||||||
2021 |
2020 |
|
|
2021 |
2020 |
|
|
|||||||||||||||||||||||||
(dollars in thousands) |
|||||||||||||||||||||||||||||||
Cost of revenue |
||||||||||||||||||||||||||||||||
Hardware |
$12,514 | $4,410 | $8,104 | 184 | % | $24,657 | $14,563 | $10,094 | 69 | % | ||||||||||||||||||||||
Professional services |
6,274 | 2,218 | 4,056 | 183 | % | 11,734 | 6,749 | 4,985 | 74 | % | ||||||||||||||||||||||
Hosted services |
2,606 | 1,226 | 1,380 | 113 | % | 4,577 | 2,384 | 2,193 | 92 | % | ||||||||||||||||||||||
|
|
|
|
|
|
|
|
|
|
|
|
|||||||||||||||||||||
Total |
$21,394 | $7,854 | 13,540 | 172 | % | $40,968 | $23,696 | $17,272 | 73 | % | ||||||||||||||||||||||
|
|
|
|
|
|
|
|
|
|
|
|
Three Months Ended June 30, |
Change $ |
Change % |
Six Months Ended June 30, |
Change $ |
Change % |
|||||||||||||||||||||||||||
2021 |
2020 |
|
|
2021 |
2020 |
|
|
|||||||||||||||||||||||||
(dollars in thousands) |
|||||||||||||||||||||||||||||||
Research and development |
$4,083 | $2,134 | $1,949 | 91 | % | $7,176 | $4,004 | $3,172 | 79 | % | ||||||||||||||||||||||
Sales and marketing |
2,392 | 1,183 | 1,209 | 102 | % | 4,146 | 2,720 | 1,426 | 52 | % | ||||||||||||||||||||||
General and administrative |
3,806 | 4,642 | (836) | (18) | % | 7,763 | 8,655 | (892) | (10) | % |
Three Months Ended June 30, |
Change $ |
Change % |
Six Months Ended June 30, |
Change $ |
Change % |
|||||||||||||||||||||||||||
2021 |
2020 |
|
|
2021 |
2020 |
|
|
|||||||||||||||||||||||||
(dollars in thousands) |
|||||||||||||||||||||||||||||||
Interest expense, net |
$ | (64 | ) | $ | (170 | ) | $ | 106 | (62 | )% | $ | (142 | ) | $ | (380 | ) | $ | 238 | (63 | )% | ||||||||||||
Other income (expense), net |
52 | (212 | ) | 264 | (125 | )% | 127 | (492 | ) | 619 | (126 | )% |
Three Months Ended June 30, |
Change $ |
Change % |
Six Months Ended June 30, |
Change $ |
Change % |
|||||||||||||||||||||||||||
2021 |
2020 |
|
|
2021 |
2020 |
|
|
|||||||||||||||||||||||||
(dollars in thousands) |
|||||||||||||||||||||||||||||||
Loss before income taxes |
$ | (10,010) | $ | (10,404) | $ | 394 | (4) | % | $ | (19,231) | $ | (17,602) | $ | (1,629) | 9 | % | ||||||||||||||||
Provision for income taxes |
41 | 44 | (3) | (7) | % | 87 | 122 | (35) | (29) | % |
Years Ended December 31, |
Change $ |
Change % |
||||||||||||||
2020 |
2019 |
|||||||||||||||
(dollars in thousands) |
||||||||||||||||
Revenue |
||||||||||||||||
Hardware |
$31,978 | $24,017 | $7,961 | 33% | ||||||||||||
Professional services |
12,304 | 9,095 | 3,209 | 35% | ||||||||||||
Hosted services |
8,252 | 3,120 | 5,132 | 164% | ||||||||||||
|
|
|
|
|
|
|
|
|||||||||
Total revenue |
52,534 | 36,232 | 16,302 | 45% | ||||||||||||
|
|
|
|
|
|
|
|
|||||||||
Cost of revenue |
||||||||||||||||
Hardware |
35,225 | 20,462 | 14,763 | 72% | ||||||||||||
Professional services |
16,176 | 14,438 | 1,738 | 12% | ||||||||||||
Hosted services |
5,430 | 2,380 | 3,050 | 128% | ||||||||||||
|
|
|
|
|
|
|
|
|||||||||
Total cost of revenue |
56,831 | 37,280 | 19,551 | 52% | ||||||||||||
|
|
|
|
|
|
|
|
|||||||||
Operating expense |
||||||||||||||||
Research and development |
9,406 | 7,731 | 1,675 | 22% | ||||||||||||
Sales and marketing |
5,429 | 3,261 | 2,168 | 66% | ||||||||||||
General and administrative |
16,584 | 17,794 | (1,210) | (7)% | ||||||||||||
|
|
|
|
|
|
|
|
|||||||||
Total operating expenses |
31,419 | 28,786 | 2,633 | 9% | ||||||||||||
|
|
|
|
|
|
|
|
|||||||||
Loss from operations |
(35,716) | (29,834) | (5,882) | 20% | ||||||||||||
Other expense |
||||||||||||||||
Interest expense |
559 | 158 | 401 | 254% | ||||||||||||
Other expense, net |
685 | 269 | 416 | 155% | ||||||||||||
|
|
|
|
|
|
|
|
|||||||||
Loss before income taxes |
(36,960) | (30,261) | (6,699) | 22% | ||||||||||||
Provision for (benefit from) income taxes |
149 | — | 149 | 100% | ||||||||||||
|
|
|
|
|
|
|
|
|||||||||
Net loss |
$(37,109) | $(30,261) | $(6,848) | 23% | ||||||||||||
|
|
|
|
|
|
|
|
Years Ended December 31, |
Change $ |
Change % |
||||||||||||||
2020 |
2019 |
|||||||||||||||
(dollars in thousands) |
||||||||||||||||
Revenue |
||||||||||||||||
Hardware |
$31,978 | $24,017 | $7,961 | 33% | ||||||||||||
Professional services |
12,304 | 9,095 | 3,209 | 35% | ||||||||||||
Hosted services |
8,252 | 3,120 | 5,132 | 164% | ||||||||||||
|
|
|
|
|
|
|||||||||||
Total |
$52,534 | $36,232 | $16,302 | 45% | ||||||||||||
|
|
|
|
|
|
Years Ended December 31, |
Change $ |
Change % |
||||||||||||||
2020 |
2019 |
|||||||||||||||
(dollars in thousands) |
||||||||||||||||
Research and development |
9,406 | 7,731 | 1,675 | 22 | % | |||||||||||
Sales and marketing |
5,429 | 3,261 | 2,168 | 66 | % | |||||||||||
General and administrative |
16,584 | 17,794 | (1,210) | (7) | % |
Years Ended December 31, |
Change $ |
Change % |
||||||||||||||
2020 |
2019 |
|||||||||||||||
(dollars in thousands) |
||||||||||||||||
Interest expense |
$ | 559 | $ | 158 | $ | 401 | 254 | % | ||||||||
Other expense, net |
685 | 269 | 416 | 155 | % |
Years Ended December 31, |
Change $ |
Change % |
||||||||||||||
2020 |
2019 |
|||||||||||||||
(dollars in thousands) |
||||||||||||||||
Loss before income taxes |
$ | (36,960) | $ | (30,261) | $ | (6,699) | 22 | % | ||||||||
Provision for (benefit from) income taxes |
149 | — | 149 | 100 | % |
Three months ended June 30, |
Six months ended June 30, |
|||||||||||||||
(amounts in thousands) |
2021 |
2020 |
2021 |
2020 |
||||||||||||
Net loss |
$(10,051) | $(10,448) | $(19,318) | $(17,724) | ||||||||||||
Interest expense, net |
64 | 170 | 142 | 380 | ||||||||||||
Provision for income taxes |
41 | 44 | 87 | 122 | ||||||||||||
Depreciation and amortization |
93 | 95 | 173 | 121 | ||||||||||||
|
|
|
|
|
|
|
|
|||||||||
EBITDA |
(9,853) | (10,139) | (18,916) | (17,101) | ||||||||||||
Stock-based compensation |
428 | 641 | 855 | 902 | ||||||||||||
Non-cash warrant expense |
167 | 36 | 399 | 182 | ||||||||||||
Loss on extinguishment of debt |
- | - | - | 164 | ||||||||||||
Loss on change in exchange rates |
- | 79 | - | 165 | ||||||||||||
Compensation expense in connection with Zipato acquisition | - | 1,745 | - | 2,593 | ||||||||||||
Other non-operating expense, net |
4 | 31 | 4 | 14 | ||||||||||||
|
|
|
|
|
|
|
|
|||||||||
Adjusted EBITDA |
$(9,254) | $(7,607) | $(17,658) | $(13,081) | ||||||||||||
|
|
|
|
|
|
|
|
Years Ended December 31, |
||||||||
(amounts in thousands) |
2020 |
2019 |
||||||
Net loss |
$ | (37,109) | $ | (30,261) | ||||
Interest expense, net |
559 | 158 | ||||||
Provision for income taxes |
149 | — | ||||||
Depreciation and amortization |
295 | 59 | ||||||
|
|
|
|
|||||
EBITDA |
(36,106) | (30,044) | ||||||
Stock-based compensation |
1,759 | 7,012 | ||||||
Non-employee warrant expense |
481 | 648 | ||||||
Loss on extinguishment of debt |
164 | 303 | ||||||
Loss on change in exchange rates |
470 | — | ||||||
Compensation expense in connection with Zipato acquisition |
3,353 | — | ||||||
Other non-operating expense, net |
(15) | 4 | ||||||
|
|
|
|
|||||
Adjusted EBITDA |
$ | (29,894) | $ | (22,077) | ||||
|
|
|
|
Six Months Ended June 30, |
||||||||
2021 |
2020 |
|||||||
(dollars in thousands) |
||||||||
Net cash provided by (used in): |
||||||||
Operating activities |
$ | (18,684) | $ | (25,765) | ||||
Investing activities |
(340) | (2,540) | ||||||
Financing activities |
33,964 | 52,687 |
Years Ended December 31, |
||||||||
2020 |
2019 |
|||||||
(dollars in thousands) |
||||||||
Net cash provided by (used in): |
||||||||
Operating activities |
$ | (28,490) | $ | (21,863) | ||||
Investing activities |
(2,680) | (821) | ||||||
Financing activities |
48,221 | 40,978 |
Payment Due by Period |
||||||||||||||||||||
Less than 1 Year |
1 to 3 Years |
3 to 5 Years |
More than 5 Years |
Total |
||||||||||||||||
(in thousands) |
||||||||||||||||||||
Operating leases (1) |
$482 | $577 | $— | $— | $1,059 | |||||||||||||||
Term Loan Facility (2) |
$1,907 | $3,373 | $— | $— | $5,280 | |||||||||||||||
Purchase obligation (3) |
$12,611 | $— | $— | $— | $12,611 |
(1) | Consists of future non-cancelable minimum rental payments under operating leases for our offices and manufacturing facilities. |
(2) | Payments due include amounts related to principal and the associated interest. |
(3) | As of December 31, 2020, we had a commitment with a supplier to place firm product orders periodically based on agreed-upon minimum volumes. |
• | relevant precedent transactions involving our capital stock; |
• | the liquidation preferences, rights, preferences, and privileges of our redeemable convertible preferred stock relative to the common stock; |
• | our actual operating and financial performance; |
• | current business conditions and projections; |
• | our stage of development; |
• | the likelihood and timing of achieving a liquidity event for the shares of common stock underlying the stock options, such as an initial public offering, given prevailing market conditions; |
• | any adjustment necessary to recognize a lack of marketability of the common stock underlying the granted options; |
• | recent secondary stock sales and tender offers; |
• | the market performance of comparable publicly-traded companies; and |
• | the U.S. and global capital market conditions. |
• | the option to present only two years of audited financial statements and only two years of related “Management’s Discussion and Analysis of Financial Condition and Results of Operations” in this prospectus; |
• | not being required to comply with the auditor attestation requirements of Section 404 of the Sarbanes-Oxley Act of 2002, as amended (the “Sarbanes-Oxley Act”); |
• | not being required to comply with any requirement that may be adopted by the Public Company Accounting Oversight Board regarding mandatory audit firm rotation or a supplement to the auditor’s report providing additional information about the audit and the financial statements (i.e., an auditor discussion and analysis); |
• | reduced disclosure obligations regarding executive compensation in our periodic reports, proxy statements and registration statements; and |
• | exemptions from the requirements of holding a nonbinding advisory vote of stockholders on executive compensation, stockholder approval of any golden parachute payments not previously approved and having to disclose the ratio of the compensation of our chief executive officer to the median compensation of our employees. |
• | Operating Efficiency de-carbonization goals, with an estimated potential savings of more than 326,000 MW of electricity annually compared to a traditional system if all units opted into an energy savings program. |
• | Incremental Revenue Generation re-leasing activities, and provide ancillary monetization opportunities. |
• | Cost Reduction re-leasing costs by approximately 20% to 50% by streamlining the processes associated with touring, resident onboarding and offboarding, and customer servicing. For example, our self-guided-tour solution allows prospective residents to tour a property 24 hours a day, seven days a week, without assistance from property management staff. In addition, we expect our solutions will help to eliminate or reduce rekeying and lockout expenses and other property management redundancies. |
• | Asset Protection |
• | We offer a holistic integrated solution that includes enterprise software, hardware, and resident applications. |
• | We are hardware agnostic and our solutions are compatible with most other smart devices including, among others, Google Home, Amazon Alexa, Google Assistant, Honeywell thermostats, and Yale smart locks. |
• | We have an open architecture that can integrate with most property management systems, including, among others, Yardi, Entrata, Realpage, and Engrain. |
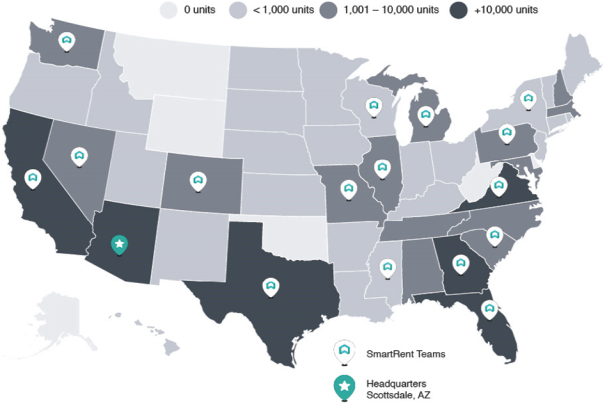
• | We provide in-house installation services with approximately 200 employees in our implementation, installation, support, and warehouse departments in 31 states across the United States, which allows us to maintain consistent quality and service across markets. |
• | Multifamily Residential Properties. |
• | Single-Family Rental Homes. |
• | Homebuilders and iBuyers. ® and the U.S. Census Bureau, there were approximately 6.0 million newly constructed and existing homes that were sold in the United States in 2019. We believe homebuilders can easily incorporate our solutions as part of their newly constructed homes, while iBuyers serve as an additional channel through which our solutions can be offered. |
• | Other Products and Asset Classes built-in thermostat and a touch screen. In addition, we believe there are many adjacent commercial real estate asset classes where our solutions can easily be applied, including, among others, the senior housing, student housing, and lodging and hospitality sectors. In particular, we believe the senior housing and student housing sectors have many similarities with our core addressable residential real estate markets. |
• | Expansion in International Markets. |
• | Generate Additional Revenue from Existing Customers. up-selling different products. Assuming full deployment across the approximately 3.5 million rental units owned by existing customers and based on the number of our existing and committed hubs as of June 30, 2021, we believe we have an opportunity to generate up to $1.8 billion in annual revenue without adding a single new customer or product. As of June 30, 2021, we had approximately 606,000 Committed Units. |
• | Pursue New Customers and Markets. co-living. |
• | Execute on Compelling Acquisition Pipeline. |
• | Continue Investments in Technology for Market Leadership. |
• | Pursue Integrations and Partnerships. |
• | Utilize Strategic Investor Relationships |
• | Video Doorbells. |
• | Indoor and Outdoor Cameras. plug-in options available, customers have flexibility to select the cameras that are appropriate for each property. |
• | Smart Locks and Lock Boxes. Z-Wave or Bluetooth-enabled smart locks and lock boxes offer customers options for keyless entry and simplified guest access. With various keyless entry options, including deadbolts, interconnected locks, lever locks, and patio locks, these products can be customized to meet each property’s needs. |
• | Smart Thermostats, Sensors, Plugs, Switches, Dimmers, and Readers |
Name |
Age |
Position | ||
Directors |
||||
Lucas Haldeman |
44 | Director and Chairman of the Board | ||
Alana Beard |
39 | Director | ||
Robert Best |
74 | Director | ||
John Dorman |
71 | Director | ||
Ann Sperling |
66 | Director | ||
Bruce Strohm |
66 | Director | ||
Frederick Tuomi |
66 | Director | ||
Executive Officers |
||||
Lucas Haldeman |
44 | Chief Executive Officer | ||
Demetrios Barnes |
34 | Chief Operating Officer | ||
Isaiah DeRose-Wilson |
37 | Chief Technology Officer | ||
CJ Edmonds |
53 | Chief Revenue Officer | ||
Mitch Karren |
36 | Chief Product Officer | ||
Jonathan Wolter |
71 | Chief Financial Officer |
• | appointing a registered public accounting firm for the purpose of preparing an audit report or performing other audit, review or attest services for us; |
• | evaluating the independence and performance of the registered public accounting firm; |
• | reviewing and discussing with the independent auditors their annual audit plan, including the timing and scope of audit activities; |
• | pre-approving audit and permissible non-audit services; |
• | overseeing the financial reporting process and discussing with management and our independent registered public accounting firm the quarterly and annual financial statements that we file with the SEC; |
• | reviewing the adequacy and effectiveness of our accounting and internal control policies and procedures on a regular basis; |
• | discussing guidelines and policies governing the process by which our senior management assesses and manages our exposure to risk; |
• | establishing and implementing policies relating to related party transactions; |
• | establishing procedures for the receipt, retention and treatment of complaints received by us and the confidential, anonymous submission by our employees of concerns regarding questionable accounting or auditing matters; |
• | reviewing our program to monitor compliance with our code of ethics; and |
• | reviewing significant deficiencies and material weaknesses in the design or operation of internal control over financial reporting which are reasonably likely to adversely affect our ability to record, process, summarize and report financial information. |
• | evaluating and determining the compensation of our executive officers; |
• | reviewing and recommending to the Board the compensation of our directors; |
• | reviewing our executive compensation plan and recommending that the Board amend these plans if deemed appropriate; |
• | reviewing our general compensation plan and other employee benefit plans, including incentive compensation and equity-based plans and recommending that the Board amend these plans if deemed appropriate; |
• | reviewing and approving any severance or termination arrangements to be made with any of our executive officers; and |
• | reviewing the goals and objectives of our general compensation plans and other employee benefit plans. |
• | establishing criteria for the selection of new directors to serve on the Board; |
• | identifying and evaluating candidates for nomination to the Board; |
• | recommending the membership composition of the committees of the Board; |
• | recommending changes regarding corporate governance matters including changes to our charter and bylaws; |
• | reviewing compliance with NYSE’s corporate governance listing requirements; |
• | reviewing and reassessing the adequacy of our code of ethics; |
• | developing and recommending to the Board a set of corporate governance guidelines; and |
• | overseeing annual evaluations of the Board and the committees thereof. |
• | executive compensation will be competitive with our peers in order to attract and retain highly qualified executive officers; |
• | the largest portion of executive compensation is intended to be provided in the form of long-term equity awards, to both encourage retention and align the executive officers’ incentives with our long-term success and value creation and the interests of our stockholders; and |
• | a substantial portion of executive compensation will be “at risk” and tied to specific performance objectives that support our business plan. |
Name and principal position |
Year |
Salary ($) |
Bonus ($) (1) |
Option awards ($) (2) |
Non-equity incentive plan compensation ($) |
All other compensation ($) (3) |
Total ($) |
|||||||||||||||||||||
Lucas Haldeman, Chief Executive Officer and Chairman of the Board |
2020 | 325,000 | 162,500 | 1,362,683 | - | 13,000 | 1,863,183 | |||||||||||||||||||||
Demetrios Barnes, Chief Operating Officer |
2020 | 231,750 | 46,350 | - | - | 9,670 | 287,770 | |||||||||||||||||||||
Isaiah DeRose-Wilson, Chief Technology Officer |
2020 | 231,750 | 46,350 | - | - | 9,656 | 287,756 |
(1) | Represents a discretionary performance bonus awarded to our named executive officers for the year ended December 31, 2020. |
(2) | Represents the grant date fair value of equity awards granted in 2020, in accordance with ASC 718. For information regarding assumptions underlying the value of equity awards, see Note 8 to our financial statements included elsewhere in this prospectus. |
(3) | Represents the matching of contributions under our 401(k) savings plan, which we provide to all eligible employees. |
Option award |
||||||||||||||||||||||||
Grant Date |
Initial Vesting Date |
Number of shares of SmartRent common stock underlying unexercised options (#) exercisable |
Number of shares of SmartRent common stock underlying unexercised options (#) unexercisable |
Option exercise price ($) |
Option expiration date |
|||||||||||||||||||
Lucas Haldeman |
11/18/2020 | 11/18/2020 | (1) |
— | 485,652 | 3.16 | 11/18/2030 | |||||||||||||||||
8/17/2019 | 10/21/2017 | (2) |
362,690 | 95,446 | 2.30 | 8/16/2029 | ||||||||||||||||||
Demetrios Barnes |
8/17/2019 | 10/23/2017 | (2) |
241,794 | 63,630 | 2.30 | 8/16/2029 | |||||||||||||||||
Isaiah DeRose-Wilson |
8/17/2019 | 10/23/2017 | (2) |
241,794 | 63,630 | 2.30 | 8/16/2029 |
(1) | 25% of the shares underlying this option award vest on the one-year anniversary of the initial vesting date, and the remainder vest in 36 equal monthly installments, one on each monthly anniversary thereafter, until vested in full, subject to the awardee’s continuous service to SmartRent. |
(2) | The shares underlying this option award vest in 48 equal monthly installments, one on each monthly anniversary thereafter, until vested in full, subject to the awardee’s continuous service to SmartRent. |
• | 2,000,000 shares; |
• | 1.0% of the outstanding shares of our common stock on the immediately preceding December 31; or |
• | such other amount as may be determined by the administrator. |
• | immediately after the grant would own stock or options to purchase stock possessing 5.0% or more of the total combined voting power or value of all classes of our capital stock; or |
• | holds rights to purchase stock under all of our employee stock purchase plans that would accrue at a rate that exceeds $25,000 worth of our stock for each calendar year in which the right to be granted would be outstanding at any time. |
• | the issuer of the securities that was formerly a shell company has ceased to be a shell company; |
• | the issuer of the securities is subject to the reporting requirements of Section 13 or 15(d) of the Exchange Act; |
• | the issuer of the securities has filed all Exchange Act reports and material required to be filed, as applicable, during the preceding 12 months (or such shorter period that the issuer was required to file such reports and materials), other than Form 8-K reports; and |
• | at least one year has elapsed from the time that the issuer filed current Form 10 type information with the SEC reflecting its status as an entity that is not a shell company. |
• | 1% of the total number of shares of Class A Common Stock or warrants, as applicable, then outstanding; or |
• | the average weekly reported trading volume of our Class A Common Stock or warrants, as applicable, during the four calendar weeks preceding the filing of a notice on Form 144 with respect to the sale. |
• | each person known by us to be the beneficial owner of more than 5% of the outstanding shares of our Class A Common Stock; |
• | each of our named executive officers and directors; and |
• | all of our executive officers and directors as a group. |
Name of Beneficial Owner |
Number of Shares |
Percent Owned |
||||||
5% Holders |
||||||||
Entities Affiliated with RET Ventures (1) |
43,673,430 | 22.5% | ||||||
Entities affiliated with Bain Capital Venture Investors, LLC (2) |
21,972,649 | 11.3% | ||||||
Lucas Haldeman (3) |
13,541,131 | 6.9% | ||||||
Entities affiliated with Spark Capital Partners, LLC (4) |
11,715,137 | 6.0% | ||||||
LEN FW Investor, LLC (5) |
10,872,108 | 5.6% | ||||||
Fifth Wall Acquisition Sponsor, LLC (6) |
9,528,500 | 4.9% | ||||||
Fifth Wall Ventures II, L.P. (6) |
4,686,054 | 2.4% | ||||||
Directors and Named Executive Officers |
||||||||
Lucas Haldeman (3) |
13,541,131 | 6.9% | ||||||
Robert Best (7) |
4,596,222 | 2.4% | ||||||
Frederick Tuomi (8) |
543,276 | * | ||||||
Alana Beard |
36,000 | * | ||||||
Bruce Strohm |
10,000 | * | ||||||
John Dorman |
— | — | ||||||
Ann Sperling |
— | — | ||||||
Demetrios Barnes (9) |
1,421,613 | * | ||||||
Isaiah DeRose-Wilson (10) |
1,421,613 | * | ||||||
All directors and executive officers as a group (12 individuals) (11) |
23,179,278 | 11.5% |
* | Less than one percent. |
(1) | Entities affiliated with RET Ventures (“RET”) beneficially own 43,673,430 shares of our Class A Common Stock which includes: (i) 526,135 shares owned by Real Estate Technology Ventures Associates, L.P. (“RET Associates”); (ii) 30,129,921 shares owned by Real Estate Technology Ventures, L.P. (“RET Fund I”); (iii) 468,604 shares owned by Real Estate Technology Ventures II, L.P. (“RET Fund II”); (iv) 6,925,506 shares owned by Real Estate Technology Ventures-A, L.P. (“RET Fund I-A”); and (v) 5,623,264 shares owned by RET Ventures SPV I, L.P. (“RET SPV I”). RETV GP, LLC (“RET GP I”) is the general partner of each of RET Associates, RET Fund I, RET Fund I-A (collectively, “RETV I”) and RET SPV I and may be deemed to have sole |
investment and voting power over the shares held by each of RETV I and RET SPV I. John Helm is the sole Managing Director of RET GP I and may be deemed to have voting and dispositive power over the shares held by each of RETV I and RET SPV I. RETV GP II, LLC (“RET GP II”) is the general partner of RET Fund II and may be deemed to have sole investment and voting power over the shares held by RET Fund II. John Helm and Christopher Yip are the Managing Directors of RET GP II and may be deemed to have shared voting and dispositive power over the shares held by RET Fund II. The address for these entities is c/o RET Ventures, 136 Heber Ave, Suite 304, Park City, UT 84060. |
(2) | Entities affiliated with Bain Capital Venture Investors, LLC (“BCVI”) beneficially own 21,972,649 shares of our Class A Common Stock, which includes: (i) 19,132,251 shares owned by Bain Capital Venture Fund 2019, L.P. (“BCV Fund 2019”); (ii) 1,946,413 shares owned by BCIP Venture Associates II, L.P.(“BCIP Venture II”); (iii) 158,127 shares owned by BCIP Venture Associates II-B, L.P. (BCIP Venture II-B”); and (iv) 735,858 shares owned by BCV 2019-MD Primary, L.P. (“BCV MD Primary,” and together with BCV Fund 2019, BCIP Venture II, and BCIP Venture II-B, the “Bain Capital Venture Entities”). BCVI, the Executive Committee of which consists of Enrique Salem and Ajay Agarwal, is the ultimate general partner of each of BCV Fund 2019 and BCV MD Primary and governs the investment strategy and decision-making process with respect to investments held by BCIP Venture II and BCIP Venture II-B. As a result, each of BCVI and Messrs. Salem and Agarwal may be deemed to share voting and dispositive power with respect to the securities held by the Bain Capital Venture Entities. The address for the Bain Capital Venture Entities is c/o Bain Capital Venture Investors, LLC, 200 Clarendon Street, Boston, MA 02116. |
(3) | Lucas Haldeman, the Chief Executive Officer of the Company and Chairman of the Board beneficially owns 10,854,029 shares of our Class A Common Stock and 2,132,420 shares of our Class A Common Stock subject to stock options with an exercise price of $0.47 per share and 554,682 shares of our Class A Common Stock subject to stock options with an exercise price of $0.65 per share that he has the right to acquire within 60 days of September 20, 2021. |
(4) | Entities affiliated with Spark Capital Partners, LLC beneficially own 11,715,137 shares of our Class A Common Stock, which includes: (i) 130,036 shares owned by Spark Capital Growth Founders’ Fund II, L.P. (“SCGFF II”); and (ii) 11,585,101 shares owned by Spark Capital Growth Fund II, L.P. (“SCGF II” and together with SCGFF II, the “Spark Growth II Funds”). Spark Growth Management Partners II, LLC (“Spark Growth II GP”) is the sole general partner of each of the Spark Growth II Funds and may be deemed to have sole voting and dispositive power over the shares held by each of the Spark Growth II Funds. Any action by the Spark Growth II Funds with respect to shares of our Class A Common Stock, including voting and dispositive decisions, requires at least a majority vote of the managing members of Spark Growth II GP, who are Jeremy Philips, Santo Politi, Bijan Sabet and Paul Conway. Under the so-called “rule of three,” because voting and dispositive decisions are made by a majority of the managing members, no individual managing member of Spark Growth II GP has voting or dispositive power over such shares and no individual managing member is deemed to be a beneficial owner of the Spark Growth II Funds’ shares of our Class A Common Stock. The address for each of the Spark Growth II Funds and Spark Growth II GP is c/o Spark Capital Partners, LLC, 137 Newbury Street, 8th Floor, Boston, MA 02116. |
(5) | Each of LEN X, LLC and Lennar Corporation have shared voting and dispositive power over the shares held by LEN FW Investor, LLC. The address for LEN FW Investor, LLC is 700 Northwest 107th Avenue, Miami, Florida 33172. |
(6) | Sponsor holds 9,528,500 shares of our Class A Common Stock (the “Sponsor Shares”). The managers of Sponsor are Brendan Wallace and Andriy Mykhaylovskyy. Fifth Wall Ventures II, L.P. (“Fifth Wall Fund II”) holds 4,686,054 shares of our Class A Common Stock (the “Fifth Wall Fund II Shares”). The general partner of Fifth Wall Fund II is Fifth Wall Ventures GP II, L.P. (“Fifth Wall Fund II GP”). The general partner of Fifth Wall Fund II GP is Fifth Wall Ventures UGP II, LLC (“Fifth Wall Fund II UGP”). The sole manager of Fifth Wall Fund II UGP |
is Fifth Wall Ventures Management, L.P. (“Fifth Wall Management”). The general partner of Fifth Wall Management is Fifth Wall Ventures Management GP, LLC. (“Fifth Wall Management GP” and, together with Fifth Wall Fund II, Fifth Wall Fund II GP, Fifth Wall Fund II UGP and Fifth Wall Management, the “Fifth Wall Fund II Entities”). Investment and voting decisions with respect to interests held by Fifth Wall Management GP are made by its members, Brendan Wallace, Andriy Mykhaylovskyy and Brad Greiwe (the “Fifth Wall Members”). Accordingly, (i) each of the Fifth Wall Fund II Entities may be deemed to share beneficial ownership of the Fifth Wall Fund II Shares held directly by Fifth Wall Fund II and (ii) Sponsor, Mr. Wallace and Mr. Mykhaylovskyy may be deemed to share beneficial ownership of the Sponsor Shares held directly by Sponsor. Each of the Fifth Wall Fund II Entities, Sponsor and the Fifth Wall Members expressly disclaims beneficial ownership of any such securities except to the extent of their pecuniary interest therein. Without limiting the foregoing, (i) Fifth Wall Fund II expressly disclaims beneficial ownership of any of the Sponsor Shares held by Sponsor, (ii) Sponsor expressly disclaims beneficial ownership of any Fifth Wall Fund II Shares held by Fifth Wall Fund II and (iii) each of the Fifth Wall Members expressly disclaims beneficial ownership of the Fifth Wall Fund II Shares held by the Fifth Wall Fund II. Sponsor, Mr. Wallace, Mr. Mykhaylovskyy and the Fifth Wall Fund II Entities may be deemed to constitute a group within the meaning of Section 13(d)(3) of the Exchange Act, provided that each of them expressly disclaims membership in a group. The address of Sponsor, Mr. Wallace, Mr. Mykhaylovskyy and the Fifth Wall Fund II Entities is 6060 Center Drive, 10th Floor, Los Angeles, California 90045. |
(7) | Beneficial ownership consists of 4,596,222 shares of our Class A Common Stock held by the Best Family Trust, established October 2, 2001 for the benefit of Robert Best and of which Robert Best is a trustee. |
(8) | Beneficial ownership consists of (i) 150,685 shares of our Class A Common Stock subject to stock options with an exercise price of $0.47 that Frederick Tuomi has the right to acquire within 60 days of September 20, 2021 and (ii) 392,591 shares of our Class A Common Stock to be owned by Mr. Tuomi through FCT Fund, LTD. |
(9) | Beneficial ownership consists of 1,421,613 shares our Class A Common Stock subject to stock options with an exercise price of $0.47 per share that Demetrios Barnes has the right to acquire within 60 days of September 20, 2021. |
(10) | Beneficial ownership consists of 1,421,613 shares of our Class A Common Stock subject to stock options with an exercise price of $0.47 per share that Isaiah DeRose-Wilson has the right to acquire within 60 days of September 20, 2021. |
(11) | Beneficial ownership consists of 6,832,181 shares of our Class A Common Stock subject to stock options that the directors and executive officers have the right to acquire in the aggregate within 60 days of September 20, 2021. |
Number of Shares Beneficially Owned Before Resale of Shares Offered Hereby |
Maximum Number of Shares Offered for Resale |
Number of Shares Beneficially Owned After Resale of Shares Offered Hereby | ||||||||||||||||
Name and Address of Beneficial Owner |
Number |
% |
Number |
Number |
% | |||||||||||||
Real Estate Technology Ventures, L.P. (1) |
30,129,921 | 15.6 | 30,129,921 | — | * | |||||||||||||
Bain Capital Venture Fund 2019, L.P. (2) |
19,132,251 | 9.9 | 19,132,251 | — | * | |||||||||||||
Lucas Haldeman (3) |
13,541,131 | 7.0 | 10,854,029 | 2,687,102 | 1.4 | |||||||||||||
LEN FW Investor, LLC (4) |
10,872,108 | 5.6 | 10,872,108 | — | * | |||||||||||||
Fifth Wall Acquisition Sponsor, LLC (5) |
9,528,500 | 4.9 | 9,528,500 | — | * | |||||||||||||
Real Estate Technology Ventures-A, L.P.(1) |
6,925,506 | 3.6 | 6,925,506 | — | * | |||||||||||||
RET VENTURES SPV I, L.P. (1) |
5,623,264 | 2.9 | 5,623,264 | — | * | |||||||||||||
Fifth Wall Ventures II, L.P. (5) |
4,686,054 | 2.4 | 4,686,054 | — | * | |||||||||||||
Opendoor Labs Inc. (6) |
4,686,054 | 2.4 | 4,686,054 | — | * |
Number of Shares Beneficially Owned Before Resale of Shares Offered Hereby |
Maximum Number of Shares Offered for Resale |
Number of Shares Beneficially Owned After Resale of Shares Offered Hereby | ||||||||||||||||
Name and Address of Beneficial Owner |
Number |
% |
Number |
Number |
% | |||||||||||||
American Bankers Insurance Group, Inc. (7) |
3,691,319 | 1.9 | 3,691,319 | — | * | |||||||||||||
SOF-XII SR Holdings, L.P.(8) |
3,000,000 | 1.5 | 3,000,000 | — | * | |||||||||||||
Energy Impact Fund II LP (9) |
2,343,024 | 1.2 | 2,343,024 | — | * | |||||||||||||
BCIP Venture Associates II, L.P. (2) |
1,946,413 | * | 1,946,413 | — | * | |||||||||||||
D1 Capital Partners Master LP (10) |
1,500,000 | * | 1,500,000 | — | * | |||||||||||||
Spring Creek Capital, LLC (11) |
1,500,000 | * | 1,500,000 | — | * | |||||||||||||
Nine Four Ventures, LP (12) |
1,370,939 | * | 1,370,939 | — | * | |||||||||||||
Long Pond US Master, LP (13) |
1,160,600 | * | 1,160,600 | — | * | |||||||||||||
Ryan C. Best (14) |
1,149,058 | * | 1,149,058 | — | * | |||||||||||||
Connor N. Best (15) |
1,149,053 | * | 1,149,053 | — | * | |||||||||||||
Baron Small Cap Fund (16) |
1,111,111 | * | 1,111,111 | — | * | |||||||||||||
Long Pond Offshore Master, LP (17) |
839,400 | * | 839,400 | — | * | |||||||||||||
Baron Growth Fund (16) |
740,741 | * | 740,741 | — | * | |||||||||||||
BCV 2019-MD Primary, L.P.(2) |
735,858 | * | 735,858 | — | * | |||||||||||||
Castle Hook Master Fund Ltd. (17) |
700,000 | * | 700,000 | — | * | |||||||||||||
Conversant Opportunity Master Fund LP (18) |
628,875 | * | 500,000 | 128,875 | * | |||||||||||||
David Zelman (19) |
586,699 | * | 392,591 | 194,108 | * | |||||||||||||
Invitation Homes Operating Partnership LP (20) |
539,527 | * | 539,527 | — | * | |||||||||||||
Real Estate Technology Ventures Associates, L.P. (1) |
526,135 | * | 526,135 | — | * | |||||||||||||
Real Estate Technology Ventures II, L.P. (1) |
468,604 | * | 468,604 | — | * | |||||||||||||
Ghisallo Master Fund LP (21) |
450,000 | * | 450,000 | — | * | |||||||||||||
Blackstone Alternative Investment Funds (22) |
400,000 | * | 400,000 | — | * | |||||||||||||
RETV Grand Avenue Partners, LLC (23) |
392,591 | * | 392,591 | — | * | |||||||||||||
UDR, Inc. (24) |
392,591 | * | 392,591 | — | * | |||||||||||||
Essex Portfolio, L.P. (25) |
392,591 | * | 392,591 | — | * | |||||||||||||
FCT Fund LTD (26) |
392,591 | * | 392,591 | — | * | |||||||||||||
JAWS Equity Owner 117, LLC (27) |
392,591 | * | 392,591 | — | * | |||||||||||||
Integrated Core Strategies (US) LLC (28) |
307,878 | * | 200,000 | 107,878 | * | |||||||||||||
RWSC Ventures, GP (29) |
300,000 | * | 300,000 | — | * | |||||||||||||
Alyeska Master Fund, L.P. (30) |
250,000 | * | 250,000 | — | * | |||||||||||||
Luxor Capital Partners, LP (31) |
207,880 | * | 207,880 | — | * | |||||||||||||
BCIP Venture Associates II-B, L.P.(2) |
158,127 | * | 158,127 | — | * | |||||||||||||
Chesapeake Insurance Company (32) |
150,000 | * | 150,000 | — | * | |||||||||||||
Luxor Capital Partners Offshore Master Fund, LP (31) |
125,534 | * | 125,534 | — | * | |||||||||||||
Valley National Bancorp (33) |
117,151 | * | 117,151 | — | * | |||||||||||||
Blackstone Alternative Investment Funds PLC (34) |
100,000 | * | 100,000 | — | * | |||||||||||||
Luxor Wavefront, LP (31) |
92,555 | * | 92,555 | — | * | |||||||||||||
LVIP Baron Growth Opportunities Fund (16) |
91,481 | * | 91,481 | — | * | |||||||||||||
VY Baron Growth Portfolio (16) |
56,667 | * | 56,667 | — | * | |||||||||||||
Victor Coleman (35) |
36,000 | * | 36,000 | — | * | |||||||||||||
Alana Beard (36) |
36,000 | * | 36,000 | — | * | |||||||||||||
Wisdom Lu (37) |
36,000 | * | 36,000 | — | * | |||||||||||||
Angela Huang (38) |
36,000 | * | 36,000 | — | * |
Number of Shares Beneficially Owned Before Resale of Shares Offered Hereby |
Maximum Number of Shares Offered for Resale |
Number of Shares Beneficially Owned After Resale of Shares Offered Hereby | ||||||||||||||||
Name and Address of Beneficial Owner |
Number |
% |
Number |
Number |
% | |||||||||||||
Luxor Gibraltar, LP (31) |
14,532 | * | 14,532 | — | * | |||||||||||||
Luxor Capital Partners Long, LP (31) |
7,128 | * | 7,128 | — | * | |||||||||||||
Luxor Capital Partners Long Offshore Master Fund, LP (31) |
2,371 | * | 2,371 | — | * |
* | indicates less than 1% |
(1) | RET GP I is the general partner of RETV I and RET SPV I and may be deemed to have sole investment and voting power over the shares held by each of RETV I and RET SPV I. John Helm is the sole Managing Director of RET GP I and may be deemed to have voting and dispositive power over the shares held by each of RET Associates, RET Fund I, RET Fund I-A and RET SPV I. The address for these entities is c/o RET Ventures, 136 Heber Ave, Suite 304, Park City, UT 84060. |
(2) | BCVI, the Executive Committee of which consists of Enrique Salem and Ajay Agarwal, is the ultimate general partner of each of BCV Fund 2019 and BCV MD Primary and governs the investment strategy and decision-making process with respect to investments held by BCIP Venture II and BCIP Venture II-B. As a result, each of BCVI and Messrs. Salem and Agarwal may be deemed to share voting and dispositive power with respect to the securities held by the Bain Capital Venture Entities. The address for the Bain Capital Venture Entities is c/o Bain Capital Venture Investors, LLC, 200 Clarendon Street, Boston, MA 02116. |
(3) | Lucas Haldeman, our Chief Executive Officer and Chairman of the Board, beneficially owns 10,854,029 shares of our Class A Common Stock and 2,132,420 shares of our Class A Common Stock subject to stock options with an exercise price of $0.47 per share and 554,682 shares of our Class A Common Stock subject to stock options with an exercise price of $0.65 per share that he has the right to acquire within 60 days of September 20, 2021. The address of Lucas Haldeman is c/o SmartRent, Inc., 18835 N Thompson Peak Parkway, Suite 300, Scottsdale, AZ 85255. |
(4) | Each of LEN X, LLC and Lennar Corporation have shared voting and dispositive power over the shares held by LEN FW Investor, LLC. The address for LEN FW Investor, LLC is 700 Northwest 107th Avenue, Miami, FL 33172. |
(5) | (i) Each of the Fifth Wall Fund II Entities may be deemed to share beneficial ownership of the Fifth Wall Fund II Shares held directly by Fifth Wall Fund II and (ii) Sponsor, Mr. Wallace and Mr. Mykhaylovskyy may be deemed to share beneficial ownership of the Sponsor Shares held directly by Sponsor. Each of the Fifth Wall Fund II Entities, Sponsor and the Fifth Wall Members expressly disclaims beneficial ownership of any such securities except to the extent of their pecuniary interest therein. Without limiting the foregoing, (i) Fifth Wall Fund II expressly disclaims beneficial ownership of the Sponsor Shares held by Sponsor, (ii) Sponsor expressly disclaims beneficial ownership of any Fifth Wall Fund II Shares held by Fifth Wall Fund II and (iii) each of the Fifth Wall Members expressly disclaims beneficial ownership of the Fifth Wall Fund II Shares held by the Fifth Wall Fund II. Sponsor, Mr. Wallace, Mr. Mykhaylovskyy and the Fifth Wall Fund II Entities may be deemed to constitute a group within the meaning of Section 13(d)(3) of the Exchange Act, provided that each of them expressly disclaims membership in a group. The address of Sponsor, Mr. Wallace, Mr. Mykhaylovskyy and the Fifth Wall Fund II Entities is 6060 Center Drive, 10th Floor, Los Angeles, CA 90045. |
(6) | Opendoor Technologies Inc. has voting and dispositive power over the shares held by Opendoor Labs Inc. The address for both entities is 410 N. Scottsdale Road, Suite 1600, Tempe, AZ 85281. |
(7) | Assurant, Inc. has voting and dispositive power over the shares held by American Bankers Insurance Group, Inc. The address of American Bankers Insurance Group, Inc. is c/o Assurant, Inc., Corporate Secretary’s Office, 11222 Quail Roost Drive, Miami, FL 33157. |
(8) | Berry Sternlicht has voting and dispositive power over the shares held by SOF-XII SR Holdings, L.P, as the chairman and chief financial officer of its general partner, SOF-XII SR Holdings GP, L.L.C. The address of SOF-XII SR Holdings, L.P. is 591 West Putman Avenue, Greenwich, CT 06830. |
(9) | The address of Energy Impact Fund II LP is 600 Third Avenue, 38th Floor, New York, NY 10016. |
(10) | D1 Capital Partners L.P. is a registered investment adviser and serves as the manager of private investment vehicles and accounts, including D1 Capital Partners Master LP, and may be deemed to beneficially own the securities held by D1 Capital Partners Master LP. Daniel Sundheim indirectly controls D1 Capital Partners L.P. and may be deemed to beneficially own the securities held by D1 Capital Partners Master LP. The address of D1 Capital Partners Master LP is c/o D1 Capital Partners L.P., 9 West 57th Street, 36th Floor, New York, NY 10019. |
(11) | Eric Butcher has voting and dispositive power over the shares held by Spring Creek Capital, LLC. The address of Spring Creek Capital, LLC is 4111 E. 37th Street N., Wichita, KS 67220. |
(12) | Jeffrey S. Elowe has voting and dispositive power over the shares held by Nine Four Ventures, LP. The address of Nine Four Ventures, LP is 30 S. Wacker, Suite 2750, Chicago, IL 60606. |
(13) | John Khoury, as the principal of Long Pond Capital, LP, which serves as the investment manager to Long Pond Offshore Master, LP and Long Pond US Master, LP, may direct the vote and disposition of the shares held by Long Pond Offshore Master, LP and Long Pond US Master, LP. The address of each such entity is 527 Madison Avenue, 15th Floor, New York, NY 10022. |
(14) | The address for Ryan C. Best is 320 Flower Street, Costa Mesa, CA 92627. |
(15) | The address for Connor N. Best is 5829 E Arcadia Lane, Phoenix, Arizona, 85018. |
(16) | Mr. Ronald Baron has voting and investment control over the shares held by Baron Growth Fund and Baron Small Cap Fund. BAMCO, Inc., as the sub-advisor to each of LVIP Baron Growth Opportunities Fund and VY Baron Growth Portfolio, has voting and investment control over the shares held by LVIP Baron Growth Opportunities Fund and VY Baron Growth Portfolio. As the principal of BAMCO, Inc., Mr. Baron may additionally be deemed to have beneficial ownership of the shares held by LVIP Baron Growth Opportunities Fund and VY Baron Growth Portfolio. Mr. Baron disclaims beneficial ownership of all such shares. The address for Baron Growth Fund, Baron Small Cap Fund and BAMCO, Inc. is 767 Fifth Avenue, 49th Fl, New York, NY 10153. |
(17) | Castle Hook Partners LP, the investment manager of Castle Hook Master Fund Ltd., has voting and investment power over the shares held by Castle Hook Master Fund Ltd. David Rogers is the Chief Investment Officer, Founding Partner and Managing Member of Castle Hook Partners LP. Castle Hook Master Fund Ltd. and David Rogers each disclaims beneficial ownership of these securities. The address for Castle Hook Master Fund Ltd. is c/o Castle Hook Partners LP 250 West 55th Street, 32nd Floor New York, NY 10019. |
(18) | Michael Simanovsky, as managing member of each of Conversant GP Holdings LLC, the general partner of Conversant Opportunity Master Fund LP, and Conversant Capital LLC, the investment manager to Conversant Opportunity Master Fund LP, has voting and investment power over the shares held by Conversant Opportunity Master Fund LP. The address for Conversant Opportunity Master Fund LP is 25 Deforest Ave, 3rd Floor, Summit, NJ 07901. |
(19) | The address for David Zelman is 35850 South Woodland Rd., Moreland Hills, Ohio 44022. |
(20) | Invitation Homes Inc. has shared voting and dispositive power over the shares held by Invitation Homes Operating Partnership LP. The address for Invitation Homes Operating Partnership LP is 1717 Main Street, Suite 2000, Dallas, TX 75201. |
(21) | Michael Germino has voting and investment control over the shares held by Ghisallo Master Fund LP. The address for Ghisallo Master Fund LP is c/o Walkers, 190 Elgin Avenue, George Town, Grand Cayman, Cayman Islands KY 1-9008. |
(22) | Reflects securities held directly by Blackstone Alternative Multi-Strategy Fund, a series of Blackstone Alternative Investment Funds (“BAMSF”). Blackstone Alternative Investment Advisors LLC (“BAIA”) is the investment manager of BAMSF. Blackstone Holdings I L.P. is the sole member of BAIA. Blackstone Holdings I/II GP L.L.C. is the general partner of Blackstone Holdings I L.P. Blackstone Inc. is the sole member of Blackstone Holdings I/II GP L.L.C. Blackstone Group Management L.L.C. is the sole holder of the Series II preferred stock of Blackstone Inc. Blackstone Group Management L.L.C. is wholly owned by its senior managing directors and controlled by its founder, Stephen A. Schwarzman. Each of such Blackstone entities and Mr. Schwarzman may be deemed to beneficially own the securities beneficially owned by BAMSF directly or indirectly controlled by it or him, but each (other than BAMSF to the extent of its direct holdings) disclaims beneficial ownership of such securities. The address of each of such entity is c/o Blackstone Inc., 345 Park Avenue, New York, NY 10154. |
(23) | Taejo Kim and Cary Kleinman, have shared voting and investment control over the shares held by RETV Grand Avenue Partners, LLC. The address of RETV Grand Avenue Partners, LLC is 333 S. Grand Avenue, 28th Floor, Los Angeles, CA, 90071. |
(24) | The address of UDR, Inc. is 1745 Shea Center Drive, Suite 200, Highlands Ranch, CO 80129. |
(25) | Essex Property Trust, Inc. has voting and investment control over the shares held by Essex Portfolio, L.P. The address of Essex Portfolio, L.P. is 1100 Park Place, Suite 200, San Mateo, CA 94403. |
(26) | Frederick Tuomi, a director of the Company, has voting and dispositive power over the shares held by FCT Fund, LTD as the president of FCT Management, LLC, the General Partner of the FCT Fund. The address of FCT Fund, LTD is c/o SmartRent, Inc., 18835 N Thompson Peak Parkway, Suite 300, Scottsdale, AZ 85255. |
(27) | Barry S. Sternlicht has voting and dispositive power over the shares held by JAWS Equity Owner 117, LLC. The address of JAWS Equity Owner 117, LLC is 1601 Washington Avenue, Miami Beach, FL 33140. |
(28) | Millennium Management LLC is the general partner of the managing member of Integrated Core Strategies (US) LLC and may be deemed to have shared voting control and investment discretion over the shares owned by Integrated Core Strategies (US) LLC. Millennium Group Management LLC is the managing member of Millennium Management LLC and may also be deemed to have shared voting control and investment discretion over the shares owned by Integrated Core Strategies (US) LLC. The managing member of Millennium Group Management LLC is a trust of which Israel A. Englander currently serves as the sole voting trustee. Therefore, Mr. Englander may also be deemed to have shared voting control and investment discretion over the shares owned by Integrated Core Strategies (US) LLC. The foregoing should not be construed in and of itself as an admission by Millennium Management LLC, Millennium Group Management LLC or Mr. Englander as to beneficial ownership of the shares owned by Integrated Core Strategies (US) LLC. The address of each such entity and Mr. Englander is c/o Millennium Management LLC, 399 Park Avenue, New York, NY 10022. |
(29) | Richard W. Selby, Steven K Fowlkes, and Jefferey P. Mazzarella have shared voting and dispositive power over the shares held by RWSC Ventures, GP. The address for RWSC Ventures, GP is 11661 San Vicente Blvd. #510, Los Angeles, CA 90049. |
(30) | Alyeska Investment Group, L.P., the investment manager of Alyeska Master Fund, L.P., has voting and investment control of the shares held by Alyeska Master Fund, L.P. Anand Parekh is the Chief Executive Officer of Alyeska Investment Group, L.P. and may be deemed to be the beneficial owner of such shares. Mr. Parekh disclaims any beneficial ownership of the |
shares held by Alyeska Master Fund, L.P. The registered address of Alyeska Master Fund, L.P. is at c/o Maples Corporate Services Limited, P.O. Box 309, Ugland House, South Church Street George Town, Grand Cayman, KY1-1104, Cayman Islands. Alyeska Investment Group, L.P. is located at 77 W. Wacker, Suite 700, Chicago, IL 60601. |
(31) | Christian Leone has voting and dispositive power over shares owned by each of Luxor Capital Partners, LP, Luxor Capital Partners Long, LP, Luxor Capital Partners Offshore Master Fund, LP, Luxor Capital Partners Long Offshore Master Fund, LP, Luxor Gibraltar, LP, and Luxor Wavefront, LP as the Portfolio manager of Luxor Capital Group, LP, the Investment Manager of each such entity. The address for such entities is 1114 Avenue of the Americas, 28th Fl, New York, NY 10036. |
(32) | Thomas S. Buzzuto, Thomas S. Buzzuto, Jr, and Richard L. Mostyn have shared voting and dispositive power over shares owned by the Chesapeake Insurance Company. The address of the Chesapeake Insurance Company is 701 East Bay Street, Suite 514, Charleston, SC 29403. |
(33) | The address for Valley National Bancorp is One Penn Plaza, New York, NY 10119. |
(34) | Reflects securities held directly by Blackstone Diversified Multi-Strategy Fund, a sub-fund of Blackstone Alternative Investment Funds PLC (an umbrella fund with segregated liability between sub-funds) (“BXDMS”). BAIA is the investment manager of BXDMS. Blackstone Holdings I L.P. is the sole member of BAIA. Blackstone Holdings I/II GP L.L.C. is the general partner of Blackstone Holdings I L.P. Blackstone Inc. is the sole member of Blackstone Holdings I/II GP L.L.C. Blackstone Group Management L.L.C. is the sole holder of the Series II preferred stock of Blackstone Inc. Blackstone Group Management L.L.C. is wholly owned by its senior managing directors and controlled by its founder, Stephen A. Schwarzman. Each of such Blackstone entities and Mr. Schwarzman may be deemed to beneficially own the securities beneficially owned by BXDMS directly or indirectly controlled by it or him, but each (other than BXDMS to the extent of its direct holdings) disclaims beneficial ownership of such securities. The address of each such entity is c/o Blackstone Inc., 345 Park Avenue, New York, NY 10154. |
(35) | The address for Victor Coleman is 11601 Wilshire Blvd #900, Los Angeles, CA 90025. |
(36) | The address for Alana Beard is c/o SmartRent, Inc., 18835 N Thompson Peak Parkway, Suite 300, Scottsdale, AZ 85255. |
(37) | The address for Wisdom Lu is 605 S Hudson Ave., Los Angeles, CA 90005. |
(38) | The Address for Angela Huang is Nathan Road #12-04 Singapore 248730. |
• | Sarah Roudybush, the spouse of Lucas Haldeman, is employed by us as a Co-Founder and earned $0, $38,636 and $111,852 in compensation in 2018, 2019 and 2020, respectively. |
• | Samantha Barnes, the spouse of Demetrios Barnes, provides services to us as an independent contractor through Fenix Group Consulting, pursuant to an Independent Contractor Agreement, including services related to the implementation of Netsuite and Salesforce. Mr. Barnes serves as the President and Ms. Barnes serves as the Chief Executive Officer of Fenix. |
Name |
Shares of Series A Preferred Stock |
Total Purchase Price |
||||||
Real Estate Technology Ventures Associates, L.P. (1) |
63,573 | $70,000.23 | ||||||
Real Estate Technology Ventures, L.P. (1) |
3,641,812 | $4,009,999.19 | ||||||
Real Estate Technology Ventures-A, L.P.(1) |
835,528 | $919,999.88 |
(1) | John Helm was a member of the Legacy SmartRent board of directors at the time of the Business Combination and is affiliated with RET. As of September 20, 2021, entities affiliated with RET (including RET Associates, RET Fund I, and RET Fund II) held more than 5% of the outstanding shares of our Class A Common Stock. |
Name |
Shares of Series B Preferred Stock |
Total Purchase Price |
||||||
Bain Capital Venture Fund 2019, L.P. (1) |
3,499,213 | $21,768,254.15 | ||||||
BCIP Venture Associates II, L.P. (1) |
355,991 | $2,214,584.41 | ||||||
BCIP Venture Associates II-B, L.P. (1) |
28,921 | $179,914.65 | ||||||
BCV 2019-MD Primary, L.P. (1) |
134,586 | $837,246.05 | ||||||
Real Estate Technology Ventures Associates, L.P. (2) |
9,001 | $55,994.32 | ||||||
Real Estate Technology Ventures, L.P. (2) |
514,845 | $3,202,799.26 | ||||||
Real Estate Technology Ventures-A, L.P.(2) |
119,146 | $741,195.35 |
(1) | Merritt Hummer was a member of the Legacy SmartRent board of directors at the time of the Business Combination and is affiliated with BCVI. As of September 20, 2021, entities affiliated |
with BCVI (including BCV Fund 2019, BCIP Venture II, BCIP Venture II-B, and BCV MD Primary) held more than 5% of the outstanding shares of Class A Common Stock. |
(2) | John Helm was a member of the Legacy SmartRent board of directors at the time of the Business Combination and is affiliated with RET. As of September 20, 2021, entities affiliated with RET (including RET Associates, RET Fund I, and RET Fund II) held more than 5% of the outstanding shares of our Class A Common Stock. |
Name |
Shares of Series B-1 Preferred Stock |
Total Purchase Price |
||||||
Real Estate Technology Ventures Associates, L.P. (1) |
7,107 | $35,369.41 | ||||||
Real Estate Technology Ventures, L.P. (1) |
406,522 | $2,023,138.04 | ||||||
Real Estate Technology Ventures-A, L.P.(1) |
94,079 | $468,202.96 |
(1) | John Helm was a member of the Legacy SmartRent board of directors at the time of the Business Combination and is affiliated with RET. As of September 20, 2021, entities affiliated with RET (including RET Associates, RET Fund I, and RET Fund II) held more than 5% of the outstanding shares of our Class A Common Stock. |
Name |
Shares of Series B Preferred Stock |
Total Purchase Price |
||||||
Bain Capital Venture Fund 2019, L.P. (1) |
417,672 | $4,353,645.86 | ||||||
BCIP Venture Associates II, L.P. (1) |
42,492 | $442,919.62 | ||||||
BCIP Venture Associates II-B, L.P.(1) |
3,452 | $35,982.27 | ||||||
BCV 2019-MD Primary, L.P.(1) |
16,064 | $167,444.72 | ||||||
LEN FW Investor, LLC (2) |
1,918,722 | $19,999,990.64 | ||||||
Real Estate Technology Ventures II, L.P. (3) |
95,936 | $999,998.49 | ||||||
RET Ventures SPV I, L.P. (3) |
1,151,233 | $11,999,992.31 | ||||||
Spark Capital Growth Founders’ Fund II, L.P. (4) |
26,622 | $277,497.08 | ||||||
Spark Capital Growth Fund II, L.P. (4) |
2,371,781 | $24,722,496.44 |
(1) | Merritt Hummer was a member of the Legacy SmartRent board of directors at the time of the Business Combination and is affiliated with BCVI. As of September 20, 2021, entities affiliated with BCVI (including BCV Fund 2019, BCIP Venture II, BCIP Venture II-B, and BCV MD Primary) held more than 5% of the outstanding shares of Class A Common Stock. |
(2) | Eric Feder was a member of the Legacy SmartRent board of directors at the time of the Business Combination and is affiliated with LEN FW Investor, LLC. As of September 20, 2021, LEN FW Investor, LLC held more than 5% of the outstanding shares of Class A Common Stock. |
(3) | John Helm was a member of the Legacy SmartRent board of directors at the time of the Business Combination and is affiliated with RET. As of September 20, 2021, entities affiliated with RET (including RET Associates, RET Fund I, and RET Fund II) held more than 5% of the outstanding shares of our Class A Common Stock. |
(4) | Will Reed was a member of the Legacy SmartRent board of directors at the time of the Business Combination and is affiliated with Spark Capital Partners, LLC. As of September 20, 2021, entities affiliated with Spark Capital Partners, LLC (including Spark Capital Growth Founders’ Fund II, L.P. and Spark Capital Growth Fund II, L.P.) held more than 5% of the outstanding shares of Class A Common Stock. |
• | financial institutions or financial services entities; |
• | broker-dealers; |
• | governments or agencies or instrumentalities thereof; |
• | regulated investment companies; |
• | real estate investment trusts; |
• | expatriates or former long-term residents of the United States; |
• | persons that actually or constructively own five percent or more (by vote or value) of our shares; |
• | persons that acquired our common stock pursuant to an exercise of employee share options, in connection with employee share incentive plans or otherwise as compensation; |
• | insurance companies; |
• | dealers or traders subject to a mark-to-market |
• | persons holding our common stock as part of a “straddle,” constructive sale, hedge, conversion or other integrated or similar transaction; |
• | U.S. holders (as defined below) whose functional currency is not the U.S. dollar; |
• | partnerships (or entities or arrangements classified as partnerships or other pass-through entities for U.S. federal income tax purposes) and any beneficial owners of such partnerships; |
• | tax-exempt entities; |
• | controlled foreign corporations; and |
• | passive foreign investment companies. |
• | an individual who is a citizen or resident of the United States; |
• | a corporation (or other entity taxable as a corporation) organized in or under the laws of the United States, any state thereof or the District of Columbia; |
• | an estate the income of which is includible in gross income for U.S. federal income tax purposes regardless of its source; or |
• | a trust, if (i) a court within the United States is able to exercise primary supervision over the administration of the trust and one or more United States persons (as defined in the Code) have authority to control all substantial decisions of the trust or (ii) it has a valid election in effect under Treasury Regulations to be treated as a United States person. |
• | a non-resident alien individual (other than certain former citizens and residents of the United States subject to U.S. tax as expatriates); |
• | a foreign corporation; or |
• | an estate or trust that is not a U.S. holder; |
• | the gain is effectively connected with the conduct by the Non-U.S. holder of a trade or business within the United States (and, under certain income tax treaties, is attributable to a United States permanent establishment or fixed base maintained by the Non-U.S. holder); or |
• | we are or have been a “United States real property holding corporation” for U.S. federal income tax purposes at any time during the shorter of the five-year period ending on the date of disposition or the period that the Non-U.S. holder held our common stock, and, in the case where shares of our common stock are regularly traded on an established securities market, the Non-U.S. holder has owned, directly or constructively, more than 5% of our common stock at any time within the shorter of the five-year period preceding the disposition or such Non-U.S. holder’s holding period for the shares of our common stock. There can be no assurance that our common stock will be treated as regularly traded on an established securities market for this purpose. |
• | purchases by a broker-dealer as principal and resale by such broker-dealer for its own account pursuant to this prospectus; |
• | ordinary brokerage transactions and transactions in which the broker solicits purchasers; |
• | block trades in which the broker-dealer so engaged will attempt to sell the securities as agent but may position and resell a portion of the block as principal to facilitate the transaction; |
• | an over-the-counter |
• | settlement of short sales entered into after the date of this prospectus; |
• | agreements with broker-dealers to sell a specified number of the securities at a stipulated price per share; |
• | in “at the market” offerings, as defined in Rule 415 under the Securities Act, at negotiated prices, at prices prevailing at the time of sale or at prices related to such prevailing market prices, including sales made directly on a national securities exchange or sales made through a market maker other than on an exchange or other similar offerings through sales agents; |
• | directly to purchasers, including through a specific bidding, auction or other process or in privately negotiated transactions; |
• | through the writing or settlement of options or other hedging transactions, whether through an options exchange or otherwise; |
• | through a combination of any of the above methods of sale; or |
• | any other method permitted pursuant to applicable law. |
Page |
||||
Audited Financial Statements of Fifth Wall Acquisition Corp. I |
||||
F-2 |
||||
F-3 |
||||
F-4 |
||||
F-5 |
||||
F-6 |
||||
F-7 |
||||
Unaudited Financial Statements of Fifth Wall Acquisition Corp. I |
||||
F-16 |
||||
F-17 |
||||
F-18 |
||||
F-19 |
||||
F-20 |
||||
Audited Consolidated Financial Statements SmartRent.com, Inc. and Subsidiaries: |
||||
F-34 |
||||
F-35 |
||||
F-36 |
||||
F-37 |
||||
F-38 |
||||
F-40 |
||||
Unaudited Consolidated Financial Statements SmartRent.com, Inc. and Subsidiaries: |
||||
F-73 |
||||
F-74 |
||||
F-75 |
||||
F-77 |
||||
F-79 |
Assets: |
||||
Deferred offering costs associated with proposed public offering |
$ | |||
Total assets |
$ |
|||
Liabilities and Stockholder’s Equity: |
||||
Current liabilities: |
||||
Accounts payable |
$ | |||
Accrued expenses |
||||
Franchise tax payable |
||||
Total current liabilities |
||||
Commitments and Contingencies |
||||
Stockholder’s Equity: |
||||
Preferred stock, $ |
— | |||
Class A common stock, $ |
— | |||
Class B common stock, $ (1)(2) |
||||
Additional paid-in capital |
||||
Accumulated deficit |
( |
|||
Total stockholder’s equity |
||||
Total Liabilities and Stockholder’s Equity |
$ |
|||
(1) | This number includes up to |
(2) | On February 4, 2021, the Company effected a 1:1.2 stock split for Class B common stock, resulting in an aggregate of 8,625,000 Class B common stock outstanding. All shares and associated amounts have been retroactively restated to reflect the stock split (see Note 4). |
General and administrative expenses |
$ | |||
Franchise tax expenses |
||||
Net loss |
$ | ( |
||
Weighted average shares outstanding of Class B common stock, basic and diluted(1)(2) |
||||
Basic and diluted net loss per share, Class B |
$ | ( |
||
(1) | This number excludes an aggregate of up to |
(2) | On February 4, 2021, the Company effected a 1:1.2 stock split for Class B common stock, resulting in an aggregate of |
Common Stock |
Additional Paid-In Capital |
Accumulated Deficit |
Total Stockholder’s Equity |
|||||||||||||||||||||||||
Class A |
Class B |
|||||||||||||||||||||||||||
Shares |
Amount |
Shares |
Amount |
|||||||||||||||||||||||||
Balance – November 23, 2020 (inception) |
$ |
$ |
$ |
$ |
$ |
|||||||||||||||||||||||
Issuance of Class B common stock to Sponsor(1)(2) | ||||||||||||||||||||||||||||
Net loss |
— | — | ( |
( |
||||||||||||||||||||||||
Balance – December 31, 2020 |
$ |
$ |
$ |
$ |
( |
$ |
||||||||||||||||||||||
(1) | This number includes up to |
(2) | On February 4, 2021, the Company effected a |
Cash Flows from Operating Activities: |
||||
Net loss |
$ | ( |
||
Adjustments to reconcile net loss to net cash used in operating activities: |
||||
General and administrative expenses paid by Sponsor in exchange for issuance of Class B common stock | ||||
Changes in operating assets and liabilities: |
||||
Accrued expenses |
||||
Franchise tax payable |
||||
Net cash used in operating activities |
||||
Net change in cash |
||||
Cash – beginning of the period |
||||
Cash – end of the period |
$ |
|||
Supplemental disclosure of noncash financing activities: |
||||
Deferred offering costs paid in exchange for issuance of Class B common stock to Sponsor | $ | |||
Deferred offering costs included in accounts payable |
$ | |||
Deferred offering costs included in accrued expenses |
$ |
June 30, 2021 |
December 31, 2020 |
|||||||
Assets: |
(Unaudited) |
|||||||
Current assets: |
||||||||
Cash |
$ | $ | — | |||||
Prepaid expenses |
— | |||||||
Total current assets |
— | |||||||
Investments held in Trust Account |
— | |||||||
Deferred offering costs |
— | |||||||
Total Assets |
$ |
$ |
||||||
Liabilities and Stockholders’ Equity: |
||||||||
Current liabilities: |
||||||||
Accounts payable |
$ | $ | ||||||
Accrued expenses |
||||||||
Due to related party |
— | |||||||
Franchise tax payable |
||||||||
Total current liabilities |
||||||||
Deferred underwriting commissions |
— | |||||||
Total liabilities |
||||||||
Commitments and Contingencies |
||||||||
Class A common stock, $ |
— | |||||||
Stockholders’ Equity: |
||||||||
Preferred stock, $ |
— | — | ||||||
Class A common stock, $ - - |
— | |||||||
Class B common stock, $ |
||||||||
Additional paid-in capital |
||||||||
Accumulated deficit |
( |
) | ( |
) | ||||
Total stockholders’ equity |
||||||||
Total Liabilities and Stockholders’ Equity |
$ |
$ |
||||||
For the Three Months Ended June 30, 2021 |
For the Six Months Ended June 30, 2021 |
|||||||
General and administrative expenses |
$ | $ | ||||||
Franchise tax expenses |
||||||||
Loss from operations |
( |
) | ( |
) | ||||
Income from investments held in Trust Account |
||||||||
Net loss |
$ | ( |
) | $ | ( |
) | ||
Weighted average shares outstanding of redeemable Class A common stock |
|
|
||||||
Basic and diluted net income per share, redeemable Class A common stock |
$ | $ | ||||||
Weighted average shares outstanding of non-redeemable Class A and Class B common stock |
||||||||
Basic and diluted net income per share, non-redeemable Class A and Class B common stock |
$ | ( |
) | $ | ( |
) | ||
Common Stock |
Additional Paid-In Capital |
Accumulated Deficit |
Total Stockholders’ Equity |
|||||||||||||||||||||||||
Class A |
Class B |
|||||||||||||||||||||||||||
Shares |
Amount |
Shares |
Amount |
|||||||||||||||||||||||||
Balance — December 31, 2020 |
— |
$ |
— |
$ |
$ |
$ |
( |
) |
$ |
|||||||||||||||||||
Sale of shares in initial public offering, gross | — | — | — | |||||||||||||||||||||||||
Offering costs | — | — | — | — | ( |
) | — | ( |
) | |||||||||||||||||||
Sale of private placement shares to Sponsor in private placement | — | — | — | |||||||||||||||||||||||||
Class A Common stock subject to possible redemption | ( |
) | ( |
) | — | — | ( |
) | — | ( |
) | |||||||||||||||||
Net loss | — | — | — | — | — | ( |
) | ( |
) | |||||||||||||||||||
Balance — March 31, 2021 (unaudited) |
( |
) | ||||||||||||||||||||||||||
Class A Common stock subject to possible redemption | — | — | — | |||||||||||||||||||||||||
Net loss | — | — | — | — | — | ( |
) | ( |
) | |||||||||||||||||||
Balance — June 30, 2021 (unaudited) |
$ |
$ |
$ |
$ |
$ |
( |
) |
$ |
||||||||||||||||||||
Cash Flows from Operating Activities: |
||||
Net loss |
$ | ( |
||
Adjustments to reconcile net loss to net cash used in operating activities: |
||||
Income from investments held in Trust Account |
( |
|||
Changes in operating assets and liabilities: |
||||
Prepaid expenses |
( |
|||
Accounts payable |
||||
Due to related party |
||||
Accrued expenses |
||||
Franchise tax payable |
||||
Net cash used in operating activities |
( |
|||
Cash Flows from Investing Activities |
||||
Cash deposited in Trust Account |
( |
|||
Net cash used in investing activities |
( |
|||
Cash Flows from Financing Activities: |
||||
Repayment of note payable to related party |
||||
Proceeds from note payable to related parties |
( |
|||
Proceeds received from initial public offering, gross |
||||
Proceeds received from private placement |
||||
Offering costs paid |
( |
|||
Net cash provided by financing activities |
|
|||
Net change in cash |
||||
Cash - beginning of the period |
||||
Cash - end of the period |
$ |
|||
Supplemental disclosure of noncash financing activities: |
||||
Offering costs included in accrued expenses |
$ | |||
Deferred underwriting commissions in connection with the initial public offering |
$ | |||
Initial value of Class A common stock subject to possible redemption |
$ | |||
Change in initial value of Class A common stock subject to possible redemption |
$ | ( |
• | Level 1, defined as observable inputs such as quoted prices (unadjusted) for identical instruments in active markets; |
• | Level 2, defined as inputs other than quoted prices in active markets that are either directly or indirectly observable such as quoted prices for similar instruments in active markets or quoted prices for identical or similar instruments in markets that are not active; and |
• | Level 3, defined as unobservable inputs in which little or no market data exists, therefore requiring an entity to develop its own assumptions, such as valuations derived from valuation techniques in which one or more significant inputs or significant value drivers are unobservable. |
For the Three Months Ended June 30, 2021 |
For the Six Months Ended June 30, 2021 |
|||||||
Redeemable Class A common stock |
||||||||
Numerator: Income allocable to redeemable Class A common stock | ||||||||
Income from investments held in Trust Account |
$ | $ | ||||||
Less: Company’s portion available to be withdrawn to pay taxes |
( |
( |
||||||
Net income attributable |
$ |
— |
$ |
— |
||||
Denominator: Weighted average redeemable Class A common stock | ||||||||
Basic and diluted weighted average shares outstanding of redeemable Class A common stock | ||||||||
Basic and diluted net income per ordinary share, redeemable Class A common stock | $ |
$ |
||||||
For the Three Months Ended June 30, 2021 |
For the Six Months Ended June 30, 2021 |
|||||||
Non-redeemable Class A and Class B common stock |
||||||||
Numerator: Net loss minus net income allocable to redeemable Class A common stock | ||||||||
Net (loss) income |
$ |
( |
$ |
( |
||||
Net income allocable to redeemable Class A common stock |
— | — | ||||||
Net (loss) income attributable to non-redeemable Class A and Class B common stock |
$ |
( |
$ |
( |
||||
Denominator: weighted average of non-redeemable Class A and Class B common stock |
||||||||
Basic and diluted weighted average shares outstanding of non-redeemable Class A and Class B common stock |
||||||||
Basic and diluted net (loss) income per ordinary share, non-redeemable Class A and Class B common stock |
$ |
( |
$ |
( |
||||
Description |
Quoted Prices in Active Markets (Level 1) |
Significant Other Observable Inputs (Level 2) |
Significant Other Unobservable Inputs (Level 3) |
|||||||||
Assets: |
||||||||||||
Investments held in Trust Account - money market funds | $ | |
— | — |
December 31, 2020 |
December 31, 2019 |
|||||||
ASSETS |
||||||||
Current assets |
||||||||
Cash and cash equivalents |
$ | $ | ||||||
Accounts receivable, net |
||||||||
Inventory |
||||||||
Deferred cost of revenue, current portion |
||||||||
Prepaid expenses and other current assets |
||||||||
Total current assets |
||||||||
Property and equipment, net |
||||||||
Deferred cost of revenue |
||||||||
Goodwill |
||||||||
Other long-term assets |
||||||||
Total assets |
$ | $ | ||||||
LIABILITIES, CONVERTIBLE PREFERRED STOCK AND STOCKHOLDERS’ DEFICIT |
||||||||
Current liabilities |
||||||||
Accounts payable |
$ | $ | ||||||
Accrued expenses and other current liabilities |
||||||||
Deferred revenue, current portion |
||||||||
Current portion of long-term debt |
||||||||
Total current liabilities |
||||||||
Revolving line of credit |
||||||||
Long-term debt, net |
||||||||
Deferred revenue |
||||||||
Other long-term liabilities |
||||||||
Total liabilities |
||||||||
Commitments and contingencies (Note 12) |
||||||||
Convertible preferred stock, $ |
||||||||
Stockholders’ deficit |
||||||||
Common stock, $ |
||||||||
Additional paid-in capital |
||||||||
Accumulated deficit |
( |
( |
||||||
Accumulated other comprehensive income (loss) |
||||||||
Total stockholders’ deficit |
( |
( |
||||||
Total liabilities, convertible preferred stock and stockholders’ deficit |
$ | $ | ||||||
For the years ended December 31, |
||||||||
2020 |
2019 |
|||||||
Revenue |
||||||||
Hardware |
$ | $ | ||||||
Professional services |
||||||||
Hosted services |
||||||||
Total revenue |
||||||||
Cost of revenue |
||||||||
Hardware |
||||||||
Professional services |
||||||||
Hosted services |
||||||||
Total cost of revenue |
||||||||
Operating expense |
||||||||
Research and development |
||||||||
Sales and marketing |
||||||||
General and administrative |
||||||||
Total operating expense |
||||||||
Loss from operations |
( |
( |
||||||
Interest expense |
||||||||
Other expense, net |
||||||||
Loss before income taxes |
( |
( |
||||||
Provision for income taxes |
— | |||||||
Net loss |
( |
( |
||||||
Less: Deemed dividend to preferred stockholder on exchange for common shares |
( |
|||||||
Net Loss attributable to SmartRent.com common stockholders, basic and diluted |
$ | ( |
$ | ( |
||||
Net loss per common share |
||||||||
Basic and diluted |
$ | ( |
$ | ( |
||||
Weighted-average number of shares used in computing net loss per share |
||||||||
Basic and diluted |
||||||||
Other comprehensive income |
||||||||
Foreign currency translation adjustment |
— | |||||||
Comprehensive loss |
$ | ( |
$ | ( |
||||
Convertible Preferred Stock |
Common Stock |
|||||||||||||||||||||||||||||||
Shares |
Amount (Par Value $0.00001) |
Shares |
Amount (Par Value $0.00001) |
Additional Paid In Capital |
Accumulated Deficit |
Accumulated other comprehensive income |
Total Stockholder’s Equity (Deficit) |
|||||||||||||||||||||||||
Balance, January 1, 2019 as previously reported |
$ |
$ |
— |
$ |
$ |
( |
$ |
— |
$ |
( |
||||||||||||||||||||||
Restatement adjustment (see Note 1) | ( |
( |
||||||||||||||||||||||||||||||
Balance, January 1, 2019 as restated (see Note 1) | $ | $ | — | $ | $ | ( |
$ | — | $ | ( |
||||||||||||||||||||||
Stock-based compensation | — | — | — | — | — | — | ||||||||||||||||||||||||||
Conversion of Convertible Note to Series B-1 Preferred Stock |
— | — | — | — | — | |||||||||||||||||||||||||||
Issuance of Series B Preferred Stock for cash, net of offering costs | — | — | — | — | — | |||||||||||||||||||||||||||
Issuance of Warrants in connection with Credit Facility | — | — | — | — | — | — | ||||||||||||||||||||||||||
Issuance of Series B Preferred Stock in exchange for Common Stock and Series Seed Preferred Stock | ( |
— | ( |
( |
— | ( |
||||||||||||||||||||||||||
Common stock warrant related to marketing expense | ||||||||||||||||||||||||||||||||
Net loss | — | — | — | — | — | ( |
— | ( |
||||||||||||||||||||||||
Balance, December 31, 2019 |
— |
( |
— |
( |
||||||||||||||||||||||||||||
Stock-based compensation | — | — | — | — | — | — | ||||||||||||||||||||||||||
Stock-based compensation related to acquisition | — | — | — | — | — | |||||||||||||||||||||||||||
Issuance of Series C Preferred Stock for cash, net of offering costs | — | — | — | — | — | |||||||||||||||||||||||||||
Conversion of Convertible Note to Series C-1 Preferred Stock |
— | — | — | — | — | |||||||||||||||||||||||||||
Common stock warrants related to marketing expense | ||||||||||||||||||||||||||||||||
Issuance of common stock in connection with acquisition | — | — | — | — | — | |||||||||||||||||||||||||||
Exercise of warrants | — | — | — | — | — | — | — | |||||||||||||||||||||||||
Net loss | — | — | — | — | — | ( |
— | ( |
||||||||||||||||||||||||
Other comprehensive income | — | — | — | — | — | — | ||||||||||||||||||||||||||
Balance, December 31, 2020 |
$ |
$ |
— |
$ |
$ |
( |
$ |
$ |
( |
|||||||||||||||||||||||
For the years ended December 31, |
||||||||
2020 |
2019 |
|||||||
CASH FLOWS FROM OPERATING ACTIVITIES |
||||||||
Net loss |
$ | ( |
$ | ( |
||||
Adjustments to reconcile net loss to net cash used by operating activities |
||||||||
Depreciation and amortization |
||||||||
Amortization of debt discount |
||||||||
Non-employee warrant expense |
||||||||
Provision for warranty expense |
||||||||
Loss on extinguishment of debt |
||||||||
Non-cash lease expense |
||||||||
Stock-based compensation related to acquisition |
||||||||
Non-cash compensation expense related to acquisition |
||||||||
Stock-based compensation |
||||||||
Non-cash interest expense |
||||||||
Provision for excess and obsolete inventory |
||||||||
Provision for doubtful accounts |
||||||||
Change in operating assets and liabilities |
||||||||
Accounts receivable |
( |
( |
||||||
Inventory |
( |
( |
||||||
Deferred cost of revenue |
( |
( |
||||||
Prepaid expenses and other assets |
( |
|||||||
Accounts payable |
( |
|||||||
Accrued expenses and other liabilities |
( |
|||||||
Deferred revenue |
||||||||
Lease liabilities |
( |
( |
||||||
Net cash used in operating activities |
( |
( |
||||||
CASH FLOWS FROM INVESTING ACTIVITIES |
||||||||
Zenith acquisition, net of cash acquired |
( |
|||||||
Purchase of property and equipment |
( |
( |
||||||
Cost method investment |
( |
|||||||
Net cash used in investing activities |
( |
( |
||||||
CASH FLOWS FROM FINANCING ACTIVITIES |
||||||||
Proceeds from revolving line of credit |
||||||||
Payments on revolving line of credit |
( |
( |
||||||
Proceeds from term loan |
||||||||
Payments on term loan |
( |
|||||||
Payments on note payable related to acquisition |
( |
|||||||
Proceeds from warrant exercises |
||||||||
Proceeds from convertible notes |
For the years ended December 31, |
||||||||
2020 |
2019 |
|||||||
Convertible preferred stock issued, net of expenses |
||||||||
Net cash provided by financing activities |
||||||||
Effect of exchange rate changes on cash and cash equivalents |
||||||||
Net increase in cash and cash equivalents |
||||||||
Cash and cash equivalents – beginning of period |
||||||||
Cash and cash equivalents – end of period |
$ | $ | ||||||
Supplemental disclosure of cash flow information |
||||||||
Interest paid |
$ | $ | ||||||
Cash paid for taxes |
$ | $ | ||||||
Schedule of non-cash investing and financing activities |
||||||||
Accrued property and equipment at period end |
$ | $ | ||||||
Conversion of convertible debt to preferred stock |
$ | $ | ||||||
Common stock issued as consideration for acquisition |
$ | $ | ||||||
Recognition of ROU asset and lease liability |
$ | $ |
(i) | (i) Weighted-average shares used in computing net loss per share deep-in-the-money Correction of amounts included in additional paid in capital |
net decrease in the Company’s weighted-average shares outstanding by |
(ii) | (ii) Correction of amounts included in additional paid in capital |
(iii) | Correction of purchase accounting adjustments |
(iv) Consolidated Statement of Operations for the year ended December 31, 2019 |
2019 (As previously reported) |
(i) Weighted- average shares outstanding correction |
(ii) Equity correction |
2019 (As restated) | ||||||||||||
Net loss attributable to common stockholders | ( |
— | ( |
( |
||||||||||||
Net loss per common share, basic and diluted | ( |
— | ( |
|||||||||||||
Weighted-average number of shares used in computing net loss per share, basic and diluted | — |
Consolidated Statement of Operations for the year ended December 31, 2020 |
2020 (As previously reported) |
(i) Weighted- average shares outstanding correction |
2020 (As restated) | |||||||||
Net loss per common share, basic and diluted | $ | ( |
$ | ( |
$ | ( |
||||||
Weighted-average number of shares used in computing net loss per share, basic and diluted | ( |
Consolidated Balance Sheet at December 31, 2019 |
2019 (As previously reported) |
(ii) Equity correction |
2019 (As restated) | |||||||||
Convertible preferred stock |
||||||||||||
Additional paid-in capital |
( |
|||||||||||
Accumulated deficit |
( |
( |
( |
|||||||||
Total stockholders’ deficit |
( |
( |
( |
Consolidated Balance Sheet at December 31, 2020 |
2020 (As previously reported) |
(ii) Equity correction |
2020 (As restated) | |||||||||
Convertible preferred stock |
||||||||||||
Additional paid-in capital |
( |
|||||||||||
Accumulated deficit |
( |
( |
( |
|||||||||
Total stockholders’ deficit |
( |
( |
( |
Statement of Cash Flow for the year ended December 31, 2020 |
2020 (As previously reported) |
(iii) Purchase accounting correction |
2020 (As restated) | |||||||||
Change in operating assets: |
||||||||||||
Accounts receivable |
( |
( |
||||||||||
Prepaid expenses and other |
( |
|||||||||||
Accounts payable |
( |
( |
||||||||||
Accrued expenses and other liabilities |
( |
( |
( |
Accounts Receivable |
Revenue |
|||||||||||||||
December 31, |
Year ended December 31, |
|||||||||||||||
2020 |
2019 |
2020 |
2019 |
|||||||||||||
Customer A |
* | |||||||||||||||
Customer B |
* | * | * | |||||||||||||
Customer C |
* | * | ||||||||||||||
Customer D |
* | * | * | |||||||||||||
Customer E |
* | * | * |
Computer hardware and software |
||
Furniture and fixtures |
||
Warehouse equipment |
||
Leasehold Improvements |
Year ended December 31, |
||||||||
2020 |
2019 |
|||||||
Balance as of January 1 |
$ | $ | ||||||
Additions to deferred contract costs |
||||||||
Amortization of deferred contract costs |
( |
) | ||||||
Balance as of December 31 |
$ | |
$ | |
||||
Assets on the Consolidated Balance Sheets |
As of December 31, 2020 |
As of December 31, 2019 |
||||||||||||||||||||||||||
Carrying Value |
Unrealized Losses |
Fair Value |
Carrying Value |
Unrealized Losses |
Fair Value |
|||||||||||||||||||||||
Cash |
Level 1 | $ | $ | — | $ | $ | — | $ | ||||||||||||||||||||
Money market funds |
Level 1 | — | — | |||||||||||||||||||||||||
Total |
$ | |
$ | — | $ | |
$ | |
$ | — | $ | |
||||||||||||||||
Liabilities on the Consolidated Balance Sheets |
As of December 31, 2020 |
As of December 31, 2019 |
||||||||||||||||||
Carrying Value(1) |
Fair Value |
Carrying Value(1) |
Fair Value |
|||||||||||||||||
Revolving line of credit |
Level 2 | $ | — | $ | — | $ | $ | |||||||||||||
Term loan |
Level 2 | |||||||||||||||||||
Convertible note |
Level 2 | — | — | |||||||||||||||||
Total liabilities |
$ | |
$ | |
$ | |
$ | |
||||||||||||
(1) | The carrying values are shown exclusive of discounts and other offsets. |
Year ended December 31, |
||||||||
2020 |
2019 |
|||||||
Revenue by geography |
||||||||
United States |
$ | $ | ||||||
International |
||||||||
Total Revenue |
$ | |
$ | |
||||
Year ended December 31, |
||||||||
2020 |
2019 |
|||||||
Revenue by type |
||||||||
Hardware |
||||||||
Professional services |
||||||||
Hosted Services |
||||||||
Total Revenue |
$ | |
$ | |
||||
Year ended December 31, |
||||||||
2020 |
2019 |
|||||||
Deferred revenue balance as of January 1 |
$ | $ | ||||||
Revenue recognized from balance of deferred revenue at the beginning of the year |
( |
) | ( |
) | ||||
Revenue deferred during the year |
||||||||
Revenue recognized from revenue originated and deferred during the year |
( |
) | ( |
) | ||||
Deferred revenue balance as of December 31 |
$ | |
$ | |
||||
As of December 31, |
||||||||
2020 |
2019 |
|||||||
Prepaid expenses |
$ | $ | ||||||
Other current assets |
||||||||
Total prepaid expenses and other current assets |
$ | |
$ | |
||||
As of December 31, |
||||||||
2020 |
2019 |
|||||||
Computer hardware and software |
$ | $ | ||||||
Furniture and fixtures |
||||||||
Leasehold improvements |
||||||||
Warehouse equipment |
||||||||
Property and equipment, gross |
|
|
||||||
Less: Accumulated depreciation and amortization |
( |
) | ( |
) | ||||
Total property and equipment, net |
$ | $ | ||||||
As of December 31, |
||||||||
2020 |
2019 |
|||||||
Warranty allowance |
$ | $ | ||||||
Accrued compensation costs |
||||||||
Sales tax payable |
||||||||
Accrued expenses |
||||||||
Lease liabilities, current |
||||||||
Other |
||||||||
Total accrued expenses and other current liabilities |
$ | |
$ | |
||||
Maturity Date |
Interest Rate (1) |
December 31, 2020 |
December 31, 2019 |
|||||||||||||
Term loan facility |
% | $ | $ | |||||||||||||
Debt discount, net |
( |
( |
||||||||||||||
Term loan facility – carrying value |
$ | |
$ | |
||||||||||||
Revolving facility |
% | $ | $ | |||||||||||||
(1) | Interest rates for the Term Loan Facility and the Revolving Facility are based upon the prime rate as published by the Wall Street Journal (Prime Rate) plus an applicable margin, subject to floors as described below. As of December 31, 2020 and 2019, the applicable margins for the Revolving Facility and Term Loan Facility were |
Coupon Rate |
Conversion Rate |
Maturity Date |
December 31, 2019 |
|||||||||||||
Convertible Note |
% | $ |
Year |
Term Loan Facility |
|||
2021 |
$ | |||
2022 |
||||
2023 |
||||
2024 and thereafter |
||||
Total |
||||
Less: unamortized debt discount |
( |
) | ||
Total carrying value |
$ | |||
Issue Date |
Series |
Shares Authorized |
Shares Issued and Outstanding |
Original Issue Price per Share |
Liquidation Preference |
|||||||||||||||
March 2018 |
Seed | $ | $ | |||||||||||||||||
September 2018 |
A | $ | $ | |||||||||||||||||
May 2019 |
B-1 |
$ | $ | |||||||||||||||||
May 2019 |
B | $ | $ | |||||||||||||||||
March 2020 |
C-1 |
$ | $ | |||||||||||||||||
March – May 2020 |
C | $ | |
$ | ||||||||||||||||
$ | |
|||||||||||||||||||
Issue Date |
Series |
Shares Authorized |
Shares Issued and Outstanding |
Original Issue Price per Share |
Liquidation Preference |
|||||||||||||||
March 2018 |
Seed | $ | |
$ | ||||||||||||||||
September 2018 |
A | $ | $ | |||||||||||||||||
May 2019 |
B-1 |
$ | $ | |||||||||||||||||
May 2019 |
B | $ | $ | |||||||||||||||||
|
|
$ | |
|||||||||||||||||
Options Outstanding |
||||||||||||||||
Number of Options |
Weighted- Average Exercise Price ($ per share) |
Weighted Average Remaining Contractual Life (years) |
Aggregate Intrinsic Value |
|||||||||||||
January 1, 2019 |
$ | |
$ | — | $ | — | ||||||||||
Granted |
$ | |||||||||||||||
December 31, 2019 |
$ | |
— | |||||||||||||
Granted |
$ | |||||||||||||||
Cancelled |
( |
) | $ | |||||||||||||
December 31, 2020 |
|
$ | — | |||||||||||||
December 31, 2020 |
December 31, 2019 |
|||||||
Risk free interest |
||||||||
Dividend yield |
||||||||
Expected volatility |
||||||||
Expected life (years) |
Year Ended December 31, |
||||||||
Income Tax Provision |
2020 |
2019 |
||||||
Federal |
$ | $ | ||||||
Foreign |
||||||||
State and local |
||||||||
Current expense |
$ | $ | ||||||
Federal |
||||||||
Foreign |
||||||||
State and local |
||||||||
Deferred (benefit) |
$ | $ | ||||||
Income tax expense |
$ | $ | ||||||
Year Ended December 31, |
||||||||
Rate Reconciliation |
2020 |
2019 |
||||||
U.S. statutory rate |
||||||||
State rate net of fed benefit |
||||||||
Change in valuation allowance |
( |
( |
||||||
Other |
||||||||
Permanent adjustments |
( |
|||||||
Effective Tax Rate |
|
|
||||||
As of December 31, |
||||||||
Tax Effects of Temporary Differences |
2020 |
2019 |
||||||
Attributes |
||||||||
Deferred tax asset |
||||||||
Federal NOLs |
$ | $ | |
|||||
State NOLs |
||||||||
Deferred revenue |
||||||||
Other deferred tax assets |
||||||||
Total deferred tax assets |
||||||||
Less: Valuation allowance |
( |
) | ( |
) | ||||
Total net deferred tax asset |
$ | |
$ | |||||
IRC 481(a) adjustment |
$ | ( |
) | $ | ||||
Deferred costs of revenue |
( |
) | ( |
) | ||||
Other deferred tax liabilities |
( |
) | ||||||
Total deferred tax liabilities |
( |
) | ( |
) | ||||
Net deferred tax liability |
$ | ( |
) | $ | ||||
December 31, 2020 |
December 31, 2019 |
|||||||
Convertible preferred stock |
||||||||
Common stock options |
||||||||
Common stock warrants |
||||||||
Shares subject to repurchase |
||||||||
Total |
|
|
||||||
Operating Leases |
||||
2021 |
$ | |||
2022 |
||||
2023 |
||||
2024 and thereafter |
||||
Total lease payments |
||||
Less: imputed interest |
( |
) | ||
Total lease liability |
||||
Less: Lease liability, current portion |
( |
) | ||
Lease liability, noncurrent |
$ | |
||
Consideration |
||||
Cash consideration |
$ | |||
Promissory note consideration |
||||
Stock consideration |
||||
Settlement of preexisting relationships |
||||
Fair Value of Total Consideration Transferred |
||||
Recognized amounts of identifiable assets acquired and liabilities assumed |
||||
Cash |
$ | |||
Accounts receivable |
||||
Inventory |
||||
Prepaid expenses and other current assets |
||||
Property and equipment, net |
||||
Total identifiable assets acquired |
||||
Accounts payable |
||||
Accrued expenses and other current liabilities |
||||
Total liabilities assumed |
||||
Total identifiable net assets |
||||
Goodwill |
$ |
June 30, 2021 |
December 31, 2020 |
|||||||
ASSETS |
||||||||
Current assets |
||||||||
Cash and cash equivalents |
$ | $ | ||||||
Accounts receivable, net |
||||||||
Inventory |
||||||||
Deferred cost of revenue, current portion |
||||||||
Prepaid expenses and other current assets |
||||||||
Total current assets |
||||||||
Property and equipment, net |
||||||||
Deferred cost of revenue |
||||||||
Goodwill |
||||||||
Other long-term assets |
||||||||
Total assets |
$ | $ | ||||||
LIABILITIES, CONVERTIBLE PREFERRED STOCK AND STOCKHOLDERS’ DEFICIT |
||||||||
Current liabilities |
||||||||
Accounts payable |
$ | $ | ||||||
Accrued expenses and other current liabilities |
||||||||
Deferred revenue, current portion |
||||||||
Current portion of long-term debt |
||||||||
Total current liabilities |
||||||||
Long-term debt, net |
||||||||
Deferred revenue |
||||||||
Other long-term liabilities |
||||||||
Total liabilities |
||||||||
Commitments and contingencies (Note 12) |
||||||||
Convertible preferred stock, $ |
||||||||
Stockholders’ deficit |
||||||||
Common stock, $ |
||||||||
Additional paid-in capital |
||||||||
Accumulated deficit |
( |
) | ( |
) | ||||
Accumulated other comprehensive income |
||||||||
Total stockholders’ deficit |
( |
) | ( |
) | ||||
Total liabilities, convertible preferred stock and stockholders’ deficit |
$ | $ | ||||||
For the three months ended June 30, |
For the six months ended June 30, |
|||||||||||||||
2021 |
2020 |
2021 |
2020 |
|||||||||||||
Revenue |
||||||||||||||||
Hardware |
$ | $ | $ | $ | ||||||||||||
Professional services |
||||||||||||||||
Hosted services |
||||||||||||||||
Total revenue |
||||||||||||||||
Cost of revenue |
||||||||||||||||
Hardware |
||||||||||||||||
Professional services |
||||||||||||||||
Hosted services |
||||||||||||||||
Total cost of revenue |
||||||||||||||||
Operating expense |
||||||||||||||||
Research and development |
||||||||||||||||
Sales and marketing |
||||||||||||||||
General and administrative |
||||||||||||||||
Total operating expense |
||||||||||||||||
Loss from operations |
( |
) | ( |
) | ( |
) | ( |
) | ||||||||
Interest expense, net |
( |
) | ( |
) | ( |
) | ( |
) | ||||||||
Other income (expense), net |
( |
) | ( |
) | ||||||||||||
Loss before income taxes |
( |
) | ( |
) | ( |
) | ( |
) | ||||||||
Provision for income taxes |
||||||||||||||||
Net loss |
( |
) | ( |
) | ( |
) | ( |
) | ||||||||
Other comprehensive loss |
||||||||||||||||
Foreign currency translation adjustment |
( |
) | ||||||||||||||
Comprehensive loss |
$ | ( |
) | $ | ( |
) | $ | ( |
) | $ | ( |
) | ||||
Net loss per common share |
||||||||||||||||
Basic and diluted |
$ | ( |
) | $ | ( |
) | $ | ( |
) | $ | ( |
) | ||||
Weighted-average number of shares used in computing net loss per share |
||||||||||||||||
Basic and diluted |
||||||||||||||||
For the six months ended June 30, 2021 |
||||||||||||||||||||||||||||||||
Convertible Preferred Stock |
Common Stock |
|||||||||||||||||||||||||||||||
Shares |
Amount (Par Value $0.00001) |
Shares |
Amount (Par Value $0.00001) |
Additional Paid In Capital |
Accumulated Deficit |
Accumulated other comprehensive income |
Total Stockholder’s Deficit |
|||||||||||||||||||||||||
Balance, December 31, 2020 |
$ |
$ |
— |
$ |
$ |
( |
) |
$ |
$ |
( |
) | |||||||||||||||||||||
Stock-based compensation |
||||||||||||||||||||||||||||||||
Stock-based compensation related to acquisition |
||||||||||||||||||||||||||||||||
Issuance of Series C Convertible Preferred Stock |
||||||||||||||||||||||||||||||||
Common stock warrants issued to customers as consideration |
||||||||||||||||||||||||||||||||
Common stock warrants related to marketing expense |
||||||||||||||||||||||||||||||||
Exercise of warrants |
||||||||||||||||||||||||||||||||
Net loss |
( |
) | ( |
) | ||||||||||||||||||||||||||||
Other comprehensive loss |
( |
) | ( |
) | ||||||||||||||||||||||||||||
Balance, March 31, 2021 |
$ |
$ |
— |
$ |
$ |
( |
) |
$ |
$ |
( |
) | |||||||||||||||||||||
Stock-based compensation |
||||||||||||||||||||||||||||||||
Stock-based compensation related to acquisition |
||||||||||||||||||||||||||||||||
Common stock warrants issued to customers as consideration |
||||||||||||||||||||||||||||||||
Common stock warrants related to marketing expense |
||||||||||||||||||||||||||||||||
Net loss |
( |
) | ( |
) | ||||||||||||||||||||||||||||
Other comprehensive income |
||||||||||||||||||||||||||||||||
Balance, June 30, 2021 |
$ |
$ |
— |
$ |
$ |
( |
) |
$ |
$ |
( |
) | |||||||||||||||||||||
For the six months ended June 30, 2020 |
||||||||||||||||||||||||||||||||
Convertible Preferred Stock |
Common Stock |
|||||||||||||||||||||||||||||||
Shares |
Amount (Par Value $0.00001) |
Shares |
Amount (Par Value $0.00001) |
Additional Paid In Capital |
Accumulated Deficit |
Accumulated other comprehensive income |
Total Stockholder’s Deficit |
|||||||||||||||||||||||||
Balance, December 31, 2019 |
$ |
$ |
— |
$ |
$ |
( |
) |
$ |
— |
$ |
( |
) | ||||||||||||||||||||
Stock-based compensation |
||||||||||||||||||||||||||||||||
Stock-based compensation related to acquisition |
||||||||||||||||||||||||||||||||
Issuance of Series C Preferred Stock for cash, net of offering costs |
||||||||||||||||||||||||||||||||
Conversion of Convertible Note to Series C-1 Preferred Stock |
||||||||||||||||||||||||||||||||
Issuance of common stock in connection with acquisition |
||||||||||||||||||||||||||||||||
Common stock warrants related to marketing expense |
||||||||||||||||||||||||||||||||
Net loss |
( |
) | ( |
) | ||||||||||||||||||||||||||||
Other comprehensive loss |
( |
) | ( |
) | ||||||||||||||||||||||||||||
Balance, March 31, 2020 |
$ |
$ |
— |
$ |
$ |
( |
) |
$ |
( |
) |
$ |
( |
) | |||||||||||||||||||
Stock-based compensation |
||||||||||||||||||||||||||||||||
Stock-based compensation related to acquisition |
||||||||||||||||||||||||||||||||
Issuance of Series C Preferred Stock for cash, net of offering costs |
— | |||||||||||||||||||||||||||||||
Common stock warrants related to marketing expense |
||||||||||||||||||||||||||||||||
Exercise of warrants |
— | |||||||||||||||||||||||||||||||
Net loss |
( |
) | ( |
) | ||||||||||||||||||||||||||||
Other comprehensive income |
||||||||||||||||||||||||||||||||
Balance, June 30, 2020 |
$ |
$ |
— |
$ |
$ |
( |
) |
$ |
$ |
( |
) | |||||||||||||||||||||
For the six months ended June 30, |
||||||||
2021 |
2020 |
|||||||
CASH FLOWS FROM OPERATING ACTIVITIES |
||||||||
Net loss |
$ | ( |
) | $ | ( |
) | ||
Adjustments to reconcile net loss to net cash used by operating activities |
||||||||
Depreciation and amortization |
||||||||
Amortization of debt discount |
||||||||
Non-employee warrant expense |
||||||||
Provision for warranty expense |
— | |||||||
Loss on extinguishment of debt |
— | |||||||
Non-cash lease expense |
||||||||
Stock-based compensation related to acquisition |
||||||||
Non-cash compensation expense related to acquisition |
— | |||||||
Stock-based compensation |
||||||||
Non-cash interest expense |
— | |||||||
Provision for excess and obsolete inventory |
— | |||||||
Provision for doubtful accounts |
( |
) | — | |||||
Change in operating assets and liabilities |
||||||||
Accounts receivable |
( |
) | ( |
) | ||||
Inventory |
( |
) | ( |
) | ||||
Deferred cost of revenue |
( |
) | ( |
) | ||||
Prepaid expenses and other assets |
( |
) | ( |
) | ||||
Accounts payable |
( |
) | ||||||
Accrued expenses and other liabilities |
( |
) | ||||||
Deferred revenue |
||||||||
Lease liabilities |
( |
) | ( |
) | ||||
Net cash used in operating activities |
( |
) | ( |
) | ||||
CASH FLOWS FROM INVESTING ACTIVITIES |
||||||||
Zenith acquisition, net of cash acquired |
— | ( |
) | |||||
Purchase of property and equipment |
( |
) | ( |
) | ||||
Net cash used in investing activities |
( |
) | ( |
) | ||||
CASH FLOWS FROM FINANCING ACTIVITIES |
||||||||
Proceeds from revolving line of credit |
— | |||||||
Payments on revolving line of credit |
— | ( |
) | |||||
Payments on term loan |
( |
) | — | |||||
Proceeds from warrant exercise |
— | |||||||
Proceeds from convertible notes |
— | |||||||
Convertible preferred stock issued, net of expenses |
||||||||
Net cash provided by financing activities |
||||||||
Effect of exchange rate changes on cash and cash equivalents |
( |
) | ||||||
Net increase in cash and cash equivalents |
||||||||
Cash and cash equivalents- beginning of period |
||||||||
Cash and cash equivalents—end of period |
$ | $ | ||||||
For the six months ended June 30, |
||||||||
2021 |
2020 |
|||||||
Supplemental disclosure of cash flow information |
||||||||
Interest paid |
$ | $ | ||||||
Cash paid for income taxes |
$ | $ | ||||||
Schedule of non-cash investing and financing activities |
||||||||
Accrued property and equipment at period end |
$ | $ | ||||||
Conversion of convertible debt to preferred stock |
$ | — | $ | |||||
Common stock issued as consideration for acquisition |
$ | — | $ |
• | Our workforce |
• | Operations and supply chain |
• | Demand for our products |
Accounts Receivable |
Revenue |
|||||||||||||||||||||||
As of |
For the three months ended June 30, |
For the six months ended June 30, |
||||||||||||||||||||||
June 30, 2021 |
December 31, 2020 |
2021 |
2020 |
2021 |
2020 |
|||||||||||||||||||
Customer A |
% | % | % | * | % | % | ||||||||||||||||||
Customer B |
% | % | * | * | * | * | ||||||||||||||||||
Customer C |
* | * | * | % | * | % | ||||||||||||||||||
Customer D |
* | * | * | % | * | * | ||||||||||||||||||
Customer E |
* | * | * | % | * | * | ||||||||||||||||||
Customer F |
* | * | * | % | * | * |
* | Total less than 10% for the respective period |
• | Hardware Revenue |
• | Professional Services Revenue |
• | Hosted Services Revenue |
• | Hardware |
• | Professional Services |
• | Hosted Services |
As of June 30, 2021 |
As of December 31, 2020 |
|||||||||||||||||||||||||||
Assets on the Consolidated Balance Sheets |
Carrying Value |
Unrealized Losses |
Fair Value |
Carrying Value |
Unrealized Losses |
Fair Value |
||||||||||||||||||||||
Cash |
Level 1 | $ | $ | — | $ | $ | — | $ | ||||||||||||||||||||
Money market funds |
Level 1 | — | — | |||||||||||||||||||||||||
Total |
$ | $ | — | $ | $ | $ | — | $ | ||||||||||||||||||||
As of June 30, 2021 |
As of December 31, 2020 |
|||||||||||||||||||
Liabilities on the Consolidated Balance Sheets |
Carrying Value(1) |
Fair Value |
Carrying Value(1) |
Fair Value |
||||||||||||||||
Term loan |
Level 2 | $ | $ | $ | $ | |||||||||||||||
Total liabilities |
$ | $ | $ | $ | ||||||||||||||||
(1) | The carrying values are shown exclusive of discounts and other offsets. |
For the three months ended June 30, |
For the six months ended June 30, |
|||||||||||||||
2021 |
2020 |
2021 |
2020 |
|||||||||||||
Revenue by geography |
||||||||||||||||
United States |
$ | $ | $ | $ | ||||||||||||
International |
||||||||||||||||
Total revenue |
$ | $ | $ | $ | ||||||||||||
For the three months ended June 30, |
For the six months ended June 30, |
|||||||||||||||
2021 |
2020 |
2021 |
2020 |
|||||||||||||
Revenue by type |
||||||||||||||||
Hardware |
$ | $ | $ | $ | ||||||||||||
Professional services |
||||||||||||||||
Hosted services |
||||||||||||||||
Total revenue |
$ | $ | $ | $ | ||||||||||||
For the six months ended June 30, |
||||||||
2021 |
2020 |
|||||||
Deferred revenue balance as of January 1 |
$ | $ | ||||||
Revenue recognized from balance of deferred revenue at the beginning of the period |
( |
) | ( |
) | ||||
Revenue deferred during the period |
||||||||
Revenue recognized from revenue originated and deferred during the period |
( |
) | ( |
) | ||||
Deferred revenue balance as of March 31 |
||||||||
Revenue recognized from balance of deferred revenue at the beginning of the period |
( |
) | ( |
) | ||||
Revenue deferred during the period |
||||||||
Revenue recognized from revenue originated and deferred during the period |
( |
) | ( |
) | ||||
Deferred revenue balance as of June 30 |
$ | $ | ||||||
June 30, 2021 |
December 31, 2020 |
|||||||
Prepaid expenses |
$ | $ | ||||||
Other current assets |
||||||||
Total prepaid expenses and other current assets |
$ | $ | ||||||
June 30, 2021 |
December 31, 2020 |
|||||||
Computer hardware and software |
$ | $ | ||||||
Furniture and fixtures |
||||||||
Leasehold improvements |
||||||||
Warehouse and other equipment |
||||||||
Property and equipment, gross |
||||||||
Less: Accumulated depreciation and amortization |
( |
) | ( |
) | ||||
Total property and equipment, net |
$ | $ | ||||||
June 30, 2021 |
December 31, 2020 |
|||||||
Accrued compensation costs |
$ | $ | ||||||
Sales tax payable |
||||||||
Warranty allowance |
||||||||
Lease liabilities, current |
||||||||
Accrued expenses |
||||||||
Other |
||||||||
Total accrued expenses and other current liabilities |
$ | $ | ||||||
Maturity Date |
Interest Rate(1) |
June 30, 2021 |
December 31, 2020 |
|||||||||||||
Term loan facility |
% | $ | $ | |||||||||||||
Debt discount, net |
( |
) | ( |
) | ||||||||||||
Term loan facility - carrying value |
$ | $ | ||||||||||||||
(1) | Interest rates for the Term Loan Facility and the Revolving Facility are based upon the prime rate as published by the Wall Street Journal (Prime Rate) plus an applicable margin, subject to floors as described below. As of June 30, 2021 and December 31, 2020, the applicable margins for the Revolving Facility and Term Loan Facility was |
Year |
Term Loan Facility |
|||
Remainder of 2021 |
$ | |||
2022 |
||||
2023 |
||||
2024 and thereafter |
||||
Total |
||||
Less: unamortized debt discount |
( |
) | ||
Total carrying value |
$ | |||
Issue Date |
Series |
Shares Authorized |
Shares Issued and Outstanding |
Original Issue Price per Share |
Liquidation Preference |
|||||||||||||
March 2018 |
Seed | $ | $ | |||||||||||||||
September 2018 |
A | $ | $ | |||||||||||||||
May 2019 |
B-1 |
$ | $ | |||||||||||||||
May 2019 |
B | $ | $ | |||||||||||||||
March 2020 |
C-1 |
$ | $ | |||||||||||||||
March - May 2020; March 2021 |
C | $ | $ | |||||||||||||||
$ | ||||||||||||||||||
Issue Date |
Series |
Shares Authorized |
Shares Issued and Outstanding |
Original Issue Price per Share |
Liquidation Preference |
|||||||||||||||
March 2018 |
Seed | $ | $ | |||||||||||||||||
September 2018 |
A | $ | $ | |||||||||||||||||
May 2019 |
B-1 |
$ | $ | |||||||||||||||||
May 2019 |
B | $ | $ | |||||||||||||||||
March 2020 |
C-1 |
$ | $ | |||||||||||||||||
March - May 2020 |
C | $ | $ | |||||||||||||||||
$ | ||||||||||||||||||||
Options Outstanding |
||||||||||||||||
Number of Options |
Weighted- Average Exercise Price ($ per share) |
Weighted Average Remaining Contractual Life (years) |
Aggregate Intrinsic Value |
|||||||||||||
December 31, 2020 |
$ | $ | — | |||||||||||||
Granted |
||||||||||||||||
Cancelled |
||||||||||||||||
June 30, 2021 |
$ | $ | — | |||||||||||||
For the three months ended June 30, |
For the six months ended June 30, |
|||||||||||||||
2021 |
2020 |
2021 |
2020 |
|||||||||||||
Research and development |
$ | $ | $ | $ | ||||||||||||
Sales and marketing |
||||||||||||||||
General and administrative |
||||||||||||||||
Total |
$ | $ | $ | $ | ||||||||||||
For the three months ended June 30, |
For the six months ended June 30, |
|||||||||||||||
2021 |
2020 |
2021 |
2020 |
|||||||||||||
Convertible preferred stock |
||||||||||||||||
Common stock options |
||||||||||||||||
Common stock warrants |
||||||||||||||||
Shares subject to repurchase |
||||||||||||||||
Total |
||||||||||||||||
Consideration |
||||||||
Cash Consideration |
$ | |||||||
Promissory Note Consideration |
||||||||
Stock Consideration |
||||||||
Settlement of Preexisting Relationships |
||||||||
Fair Value of Total Consideration Transferred |
||||||||
Recognized amounts of identifiable assets acquired and liabilities assumed |
||||||||
Cash |
$ | |||||||
Accounts receivable |
||||||||
Inventory |
||||||||
Prepaid expenses and other current assets |
||||||||
Property and equipment, net |
||||||||
Total identifiable assets acquired |
||||||||
Accounts payable |
||||||||
Accrued expenses and other current liabilities |
||||||||
Total liabilities assumed |
||||||||
Total identifiable net assets |
||||||||
Goodwill |
$ | |||||||
Item 13. |
Other Expenses of Issuance and Distribution. |
Expense |
Estimated Amount |
|||
Securities and Exchange Commission registration fee |
$ | 192,037 | ||
Accounting fees and expenses |
25,000 | |||
Legal fees and expenses |
150,000 | |||
Financial printing and miscellaneous expenses |
132,963 | |||
|
|
|||
Total |
$ | 500,000 | ||
|
|
|||
Each of the amounts set forth above, other than the registration fee, is an estimate. |
|
Item 14. |
Indemnification of Directors and Officers. |
Item 15. |
Recent Sales of Unregistered Securities. |
Item 16. |
Exhibits and Financial Statements. |
Exhibits . |
Incorporated by Reference | ||||||||||
Exhibit Herewith |
Description |
Form |
Exhibit |
Filing Date |
Filed Herewith | |||||
10.11 | Stock Option Agreement under the SmartRent, Inc. 2021 Equity Incentive Plan. | 8-K |
10.12 | Aug 30, 2021 | ||||||
10.12 | Stock Option Agreement under the SmartRent.com, Inc. Amended and Restated 2018 Stock Plan. | 8-K |
10.13 | Aug 30, 2021 | ||||||
10.13 | Restricted Stock Units Award Agreement under the SmartRent.com, Inc. Amended and Restated 2018 Stock Plan. | 8-K |
10.14 | Aug 30, 2021 | ||||||
10.14 | Employment Agreement, dated as of March 16, 2021, by and between Legacy SmartRent and Lucas Haldeman. | S-4/A |
10.15 | July 26, 2021 | ||||||
10.15 | Employment Agreement, dated as of March 16, 2021, by and between Legacy SmartRent and Demetrios Barnes. | S-4/A |
10.18 | July 26, 2021 | ||||||
10.16 | Employment Agreement, dated as of March 16, 2021, by and between Legacy SmartRent and Isaiah DeRose-Wilson. | S-4/A |
10.21 | July 26, 2021 | ||||||
21.1 | Subsidiaries of the Company. | 8-K |
21.1 | Aug 30, 2021 | ||||||
23.1 | Consent of WithumSmith+Brown, PC. | X | ||||||||
23.2 | Consent of Deloitte & Touche LLP. | X | ||||||||
24.1 | Power of Attorney (included on signature page of this Registration Statement) | X | ||||||||
101.INS | Inline XBRL Instance Document. | X | ||||||||
101.PRE | Inline XBRL Taxonomy Extension Presentation Linkbase | |||||||||
101.SCH | Inline XBRL Taxonomy Extension Schema Document. | X | ||||||||
101.CAL | Inline XBRL Taxonomy Extension Calculation Linkbase Document. | X | ||||||||
101.DEF | Inline XBRL Taxonomy Extension Definition Linkbase Document. | X | ||||||||
101.LAB | Inline XBRL Taxonomy Extension Label Linkbase Document. | X | ||||||||
* Certain of the exhibits and schedules to this Exhibit have been omitted in accordance with Regulation S-K Item 601(a)(5). The Company agrees to furnish a copy of all omitted exhibits andschedules to the SEC upon its request. |
Item 17. |
Undertakings. |
(1) | To file, during any period in which offers or sales are being made, a post-effective amendment to this registration statement: |
i. | To include any prospectus required by Section 10(a)(3) of the Securities Act of 1933, as amended; |
ii. | To reflect in the prospectus any facts or events arising after the effective date of the registration statement (or the most recent post-effective amendment thereof) which, individually or in the aggregate, represent a fundamental change in the information set forth in the registration statement. Notwithstanding the foregoing, any increase or decrease in volume of securities offered (if the total dollar value of securities offered would not exceed that which was registered) and any deviation from the low or high end of the estimated maximum offering range may be reflected in the form of prospectus filed with the SEC pursuant to Rule 424(b) if, in the aggregate, the changes in volume and price represent no more than a 20% change in the maximum aggregate offering price set forth in the “Calculation of Registration Fee” table in the effective registration statement; and |
iii. | To include any material information with respect to the plan of distribution not previously disclosed in the registration statement or any material change to such information in the registration statement. |
(2) | That, for the purpose of determining any liability under the Securities Act, each such post-effective amendment shall be deemed to be a new registration statement relating to the securities offered therein, and the offering of such securities at that time shall be deemed to be the initial bona fide |
(3) | To remove from registration by means of a post-effective amendment any of the securities being registered which remain unsold at the termination of the offering. |
(4) | That, for the purpose of determining liability under the Securities Act to any purchaser, each prospectus filed pursuant to Rule 424(b) as part of a registration statement relating to an offering, other than registration statements relying on Rule 430B or other than prospectuses filed in reliance on Rule 430A, shall be deemed to be part of and included in the registration statement as of the date it is first used after effectiveness. Provided, however, that no statement made in a registration statement or prospectus that is part of the registration statement or made in a document incorporated or deemed incorporated by reference into the registration statement or prospectus that is part of the registration statement will, as to a purchaser with a time of contract of sale prior to such first use, supersede or modify any statement that was made in the registration statement or prospectus that was part of the registration statement or made in any such document immediately prior to such date of first use. |
(5) | That, for the purpose of determining liability of the registrant under the Securities Act to any purchaser in the initial distribution of the securities, the undersigned registrant undertakes that in a primary offering of securities of the undersigned registrant pursuant to this registration statement, regardless of the underwriting method used to sell the securities to the purchaser, if the securities are offered or sold to such |
purchaser by means of any of the following communications, the undersigned registrant will be a seller to the purchaser and will be considered to offer or sell such securities to such purchaser: |
i. | Any preliminary prospectus or prospectus of the undersigned registrant relating to the offering required to be filed pursuant to Rule 424; |
ii. | Any free writing prospectus relating to the offering prepared by or on behalf of the undersigned registrant or used or referred to by the undersigned registrant; |
iii. | The portion of any other free writing prospectus relating to the offering containing material information about the undersigned registrant or its securities provided by or on behalf of the undersigned registrant; and |
iv. | Any other communication that is an offer in the offering made by the undersigned registrant to the purchaser. |
SMARTRENT, INC. | ||
By: | /s/ Lucas Haldeman | |
Name: Lucas Haldeman | ||
Title: Chief Executive Officer and Director |
Name |
Title |
Date | ||
/s/ Lucas Haldeman |
Chief Executive Officer and Director (Principal Executive Officer) |
September 23, 2021 | ||
Lucas Haldeman | ||||
/s/ Jonathan Wolter |
Chief Financial Officer (Principal Financial and Accounting Officer) |
September 23, 2021 | ||
Jonathan Wolter | ||||
/s/ Alana Beard |
Director |
September 23, 2021 | ||
Alana Beard | ||||
/s/ Robert Best |
Director |
September 23, 2021 | ||
Robert Best | ||||
/s/ John Dorman |
Director |
September 23, 2021 | ||
John Dorman | ||||
/s/ Ann Sperling |
Director |
September 23, 2021 | ||
Ann Sperling | ||||
/s/ Bruce Strohm |
Director |
September 23, 2021 | ||
Bruce Strohm | ||||
/s/ Frederick Tuomi |
Director |
September 23, 2021 | ||
Frederick Tuomi |