INVESTOR DAY November 2023
DISCLAIMERS Forward-Looking Statements This presentation includes “forward-looking statements” within the meaning of the “safe harbor” provisions of the Private Securities Litigation Reform Act of 1996. The Company's actual results may differ from its expectations, estimates and projections and consequently, you should not rely on these forward-looking statements as predictions of future events. Words such as "expect," "estimate," "project," "budget," "forecast," "anticipate," "intend," "plan," "may," "will," "could," "should," "believes," "predicts," "potential," "continue," "aim," and similar expressions are intended to identify such forward-looking statements. These forward-looking statements include, without limitation, the Company's expectations regarding its future financial results and expected growth. These forward-looking statements involve significant risks and uncertainties that could cause the actual results to differ materially from the expected results, including Innovid's ability to achieve and, if achieved, maintain profitability, decrease and/or changes in CTV audience viewership behavior, Innovid's failure to make the right investment decisions or to innovate and develop new solutions, inaccurate estimates or projections of future financial performance, Innovid's failure to manage growth effectively, the dependence of Innovid's revenues and business on the overall demand for advertising and a limited number of advertising agencies and advertisers, the actual or potential impacts of international conflicts and humanitarian crises on global markets, the rejection of digital advertising by consumers, future restrictions on Innovid's ability to collect, use and disclose data, market pressure resulting in a reduction of Innovid's revenues per impression, Innovid's failure to adequately scale its platform infrastructure, exposure to fines and liability if advertisers, publishers and data providers do not obtain necessary and requisite consents from consumers for Innovid to process their personal data, competition for employee talent, seasonal fluctuations in advertising activity, payment-related risks, interruptions or delays in services from third parties, errors, defects, or unintended performance problems in Innovid's platform, intense market competition, failure to comply with the terms of third-party open source components, changes in tax laws or tax rulings, failure to maintain an effective system of internal controls over financial reporting, failure to comply with data privacy and data protection laws, infringement of third-party intellectual property rights, difficulty in enforcing Innovid's own intellectual property rights, system failures, security breaches or cyberattacks, additional financing if required may not be available, the volatility of the price of Innovid's common stock and warrants, and other important factors discussed under the caption "Risk Factors" in Innovid's Annual Report on Form 10-K filed with the SEC on March 3, 2023, as such factors may be updated from time to time in its other filings with the SEC, accessible on the SEC's website at www.sec.gov and the Investors Relations section of Innovid's website at investors.innovid.com. You should carefully consider the risks and uncertainties described in the documents filed by the Company from time to time with the U.S. Securities and Exchange Commission. These filings identify and address other important risks and uncertainties that could cause actual events and results to differ materially from those contained in the forward-looking statements. Most of these factors are outside the Company's control and are difficult to predict. The Company cautions not to place undue reliance upon any forward-looking statements, including projections, which speak only as of the date made. The Company does not undertake or accept any obligation to release publicly any updates or revisions to any forward-looking statements to reflect any change in its expectations or any change in events, conditions or circumstances on which any such statement is based. General Disclaimer This presentation contains summary information about Innovid and its activities as at the date of this presentation. It should be read in conjunction with Innovid's periodic disclosure announcements filed with the NYSE, available at investors.innovid.com. This presentation is for information purposes only and is not a prospectus or a product disclosure statement, financial product or investment advice or a recommendation to acquire Innovid shares or other securities. It has been prepared without taking into account the objectives, financial situation or needs of individuals. Before making an investment decision, prospective investors should consider the appropriateness of the information having regard to their own objectives, financial situation and needs and seek legal, financial and taxation advice appropriate to their jurisdiction. Past performance is no guarantee or future performance. No representation or warranty, expressed or implied, is made to the fairness, accuracy, completeness or correctness of the information, opinions and conclusions contained in this presentation. To the maximum extent permitted by law, none of Innovid and its related bodies corporate, or their respective directors, employees or agents, nor any other person accepts liability for any loss arising from the use of this presentation or its contents or otherwise arising in connection with it, including, without limitation, any liability from fault or negligence. External Data Sources In addition, this presentation contains industry and market data and forecasts that are based on our analysis of multiple sources, including publicly available information, industry publications and surveys, reports from government agencies, reports by market research firms and consultants and our own estimates based on internal company data and management’s knowledge of and experience in the market sectors in which the Company competes. While management believes such information and data are reliable, we have not independently verified the accuracy or completeness of the data contained in these sources and other publicly available information. Accordingly, we make no representations as to the accuracy or completeness of that data nor do we undertake to update such data after the date of this presentation. Non-GAAP Measures and Certain Operational Metrics Innovid prepares unaudited interim condensed consolidated financial statements in accordance with U.S. generally accepted accounting principles ("GAAP"). Innovid also discloses and discusses non-GAAP financial measures such as Adjusted EBITDA and Adjusted EBITDA margin and Free Cash Flow. We use Adjusted EBITDA, Adjusted EBITDA margin and Free Cash Flow as measures of operational efficiency to understand and evaluate our core business operations. We believe that these non-GAAP financial measures are also useful to investors for period-to-period comparisons of our core business. Additionally, these figures provide an understanding and evaluation of our trends when comparing our operating results, on a consistent basis, by excluding items that we do not believe are indicative of our core operating performance. 2 |
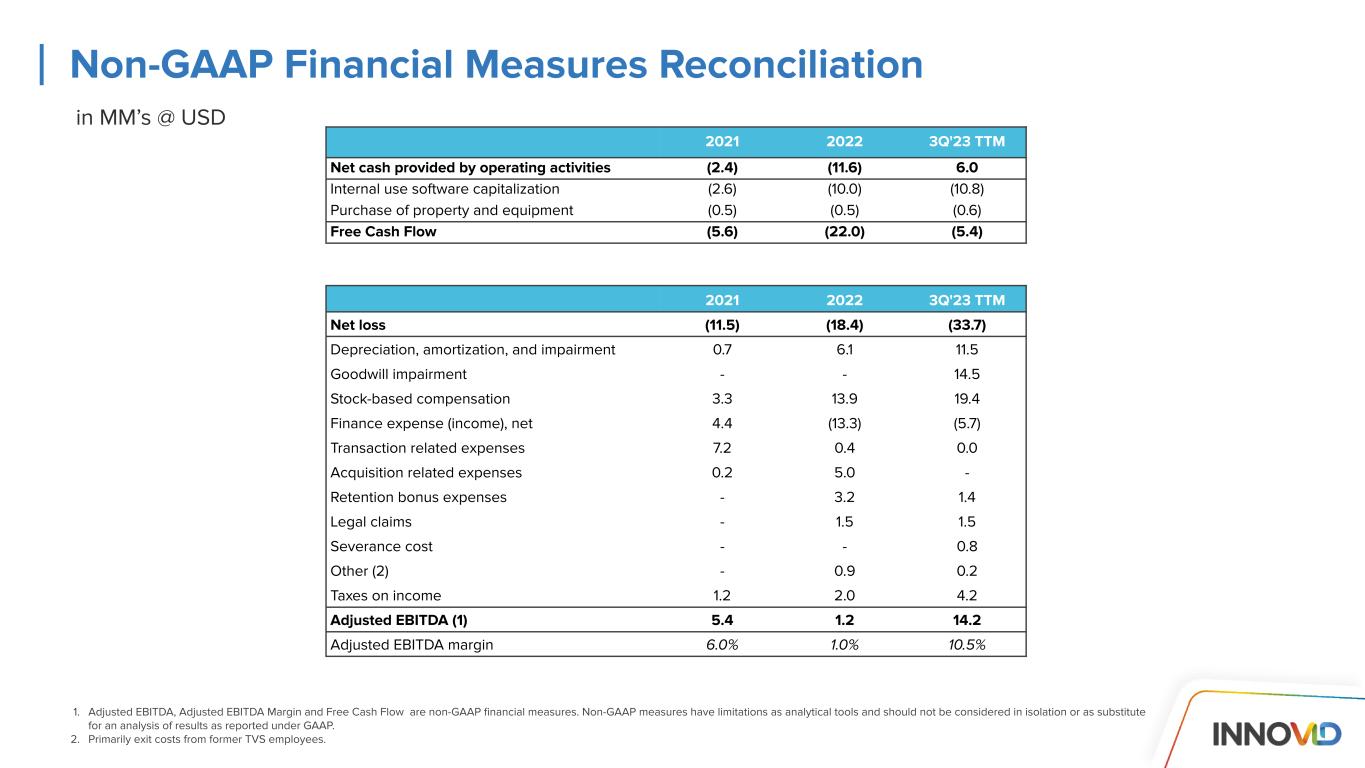
DISCLAIMERS (Cont’d) These non-GAAP financial measures have limitations as analytical tools and should not be considered in isolation or as substitutes for an analysis of our results as reported under GAAP. Some of the limitations of these measures are: ● they do not reflect changes in, or cash requirements for, our working capital needs; ● Adjusted EBITDA does not reflect our capital expenditures or future requirements for capital expenditures or contractual commitments; ● they do not reflect costs of acquiring and integrating businesses, which will continue to be a part of our growth strategy; ● they do not reflect one-time, non-recurring, bonus costs and third-party costs associated with the SPAC merger transaction and regulatory filings; ● they do not reflect goodwill impairment; ● they do not reflect severance costs; ● they do not reflect income tax expense or the cash requirements to pay income taxes; ● they do not reflect our interest expense or the cash requirements necessary to service interest or principal payments on our debt; and ● although depreciation and amortization are non-cash charges related mainly to intangible assets and amortization of software development costs, certain assets being depreciated and amortized will have to be replaced in the future, and Adjusted EBITDA does not reflect any cash requirements for such replacements. Adjusted EBITDA is defined as net loss attributable to Innovid, excluding (1) depreciation, amortization and long-lived assets impairment, (2) goodwill impairment, (3) stock-based compensation, (4) finance (income) expenses, net, (5) transaction-related expenses, (6) acquisition related expenses, (7) retention bonus expenses, (8) legal claims, (9) severance cost, (9) other, and (10) taxes on income. We calculate Adjusted EBITDA margin as Adjusted EBITDA divided by total revenue. We define Free Cash Flow as net cash provided by operating activities less capital expenditures. Other companies in our industry may calculate the above described non-GAAP financial measures differently than we do, limiting their usefulness as a comparative measure. You should compensate for these limitations by relying primarily on our US GAAP results and using the non-GAAP financial measures only supplementally. Innovid has provided a reconciliation of Adjusted EBITDA and Adjusted EBITDA margin to net (loss) income, the most directly comparable GAAP measure, for historical periods in the appendix hereto. We also have provided reconciliation of Free Cash Flow to net cash provided by operating activities. We are not able to provide a reconciliation of the projected Adjusted EBITDA or Adjusted EBITDA margin to expected net (loss) income attributable to Innovid for the fourth quarter of 2023 or the full-year 2023, without unreasonable effort. This is due to the unknown effect, timing, and potential significance of the effects of taxes on income in multiple jurisdictions, finance (income)/expenses including valuations, among others. These items have in the past, and may in the future, significantly affect GAAP results in a particular period. Trademarks The companies depicted in the photographs herein, or any third-party trademarks, including names, logos and brands, referenced by the Company in this presentation, are the property of their respective owners. All references to third-party trademarks are for identification purposes only and shall be considered nominative fair use under trademark law. Further, none of these companies are affiliated with the Company in any manner. 3 |

Agenda Delivering on Our Vision Powering the Future of TV Advertising Capturing the Market Momentum Growth and Profitability Closing 1 2 3 4 6 7 Customer Panel: Disney, Publicis, Verizon Innovation Ahead5
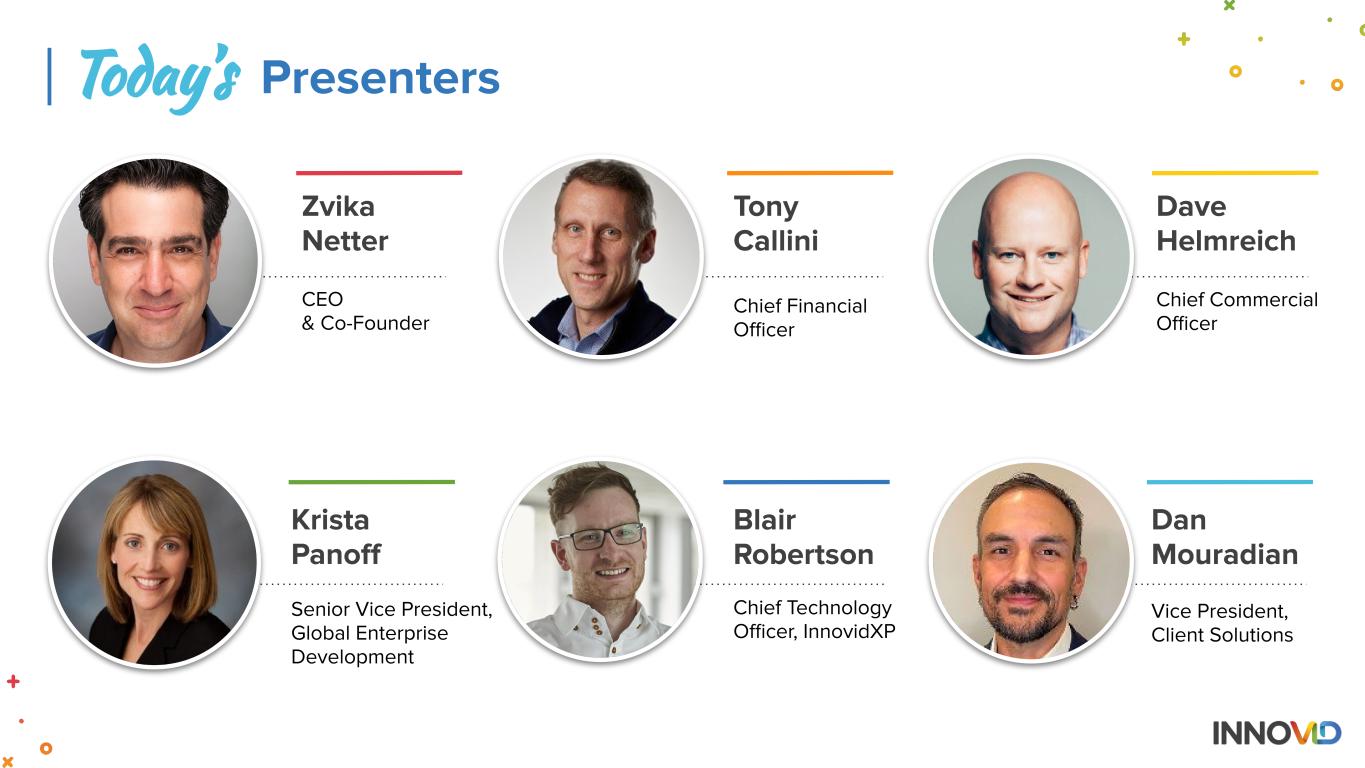
5 | Dave Helmreich Tony Callini Chief Financial Officer Chief Commercial Officer Zvika Netter CEO & Co-Founder Today’s Presenters Krista Panoff Dan Mouradian Vice President, Client Solutions Senior Vice President, Global Enterprise Development Blair Robertson Chief Technology Officer, InnovidXP
Delivering on Our Vision Zvika Netter CEO & Co-Founder
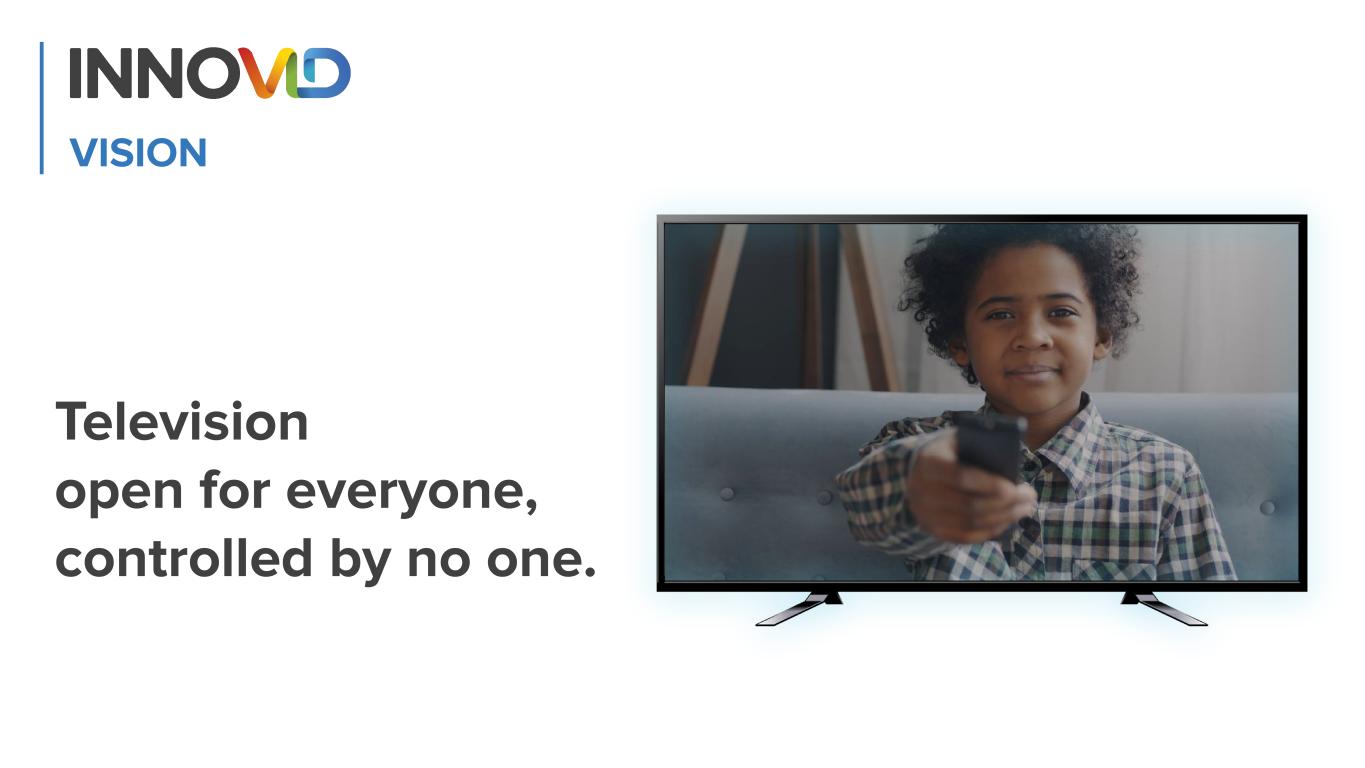
Television open for everyone, controlled by no one. VISION
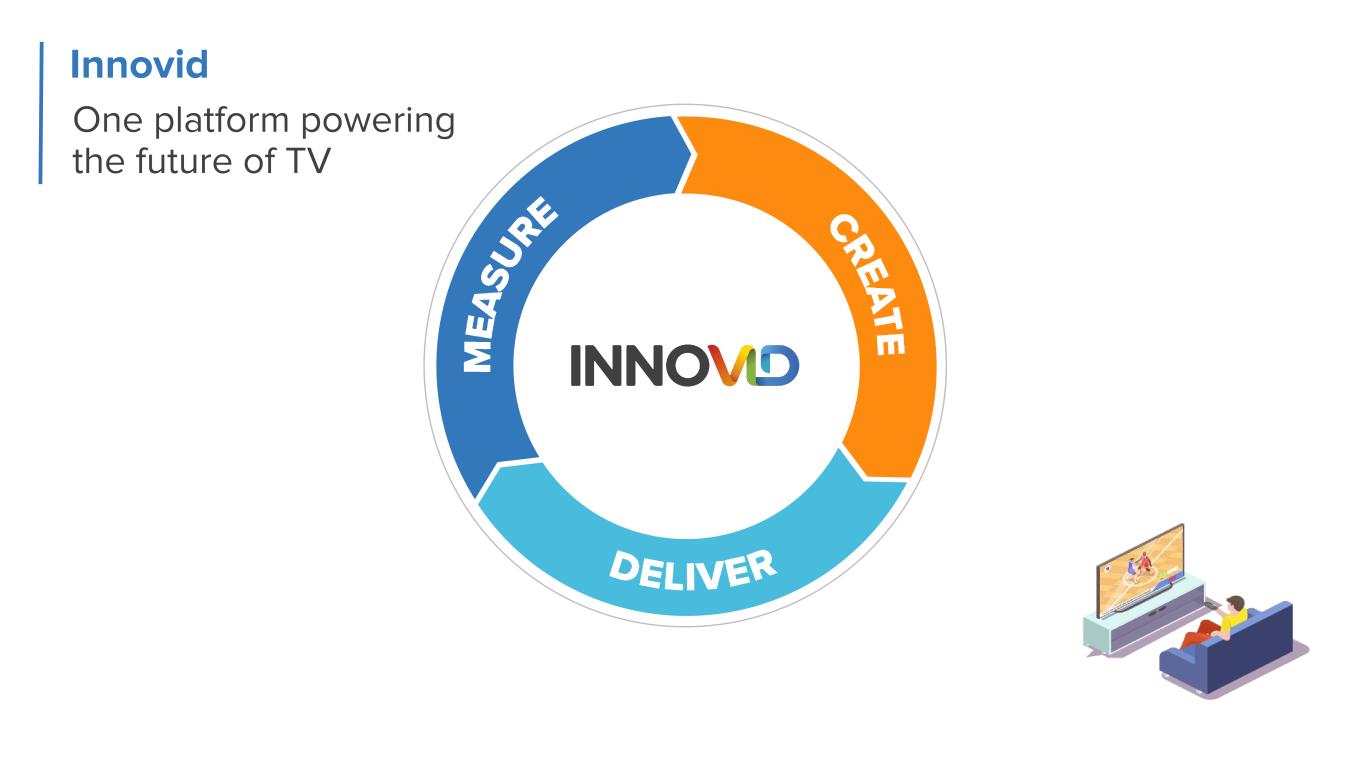
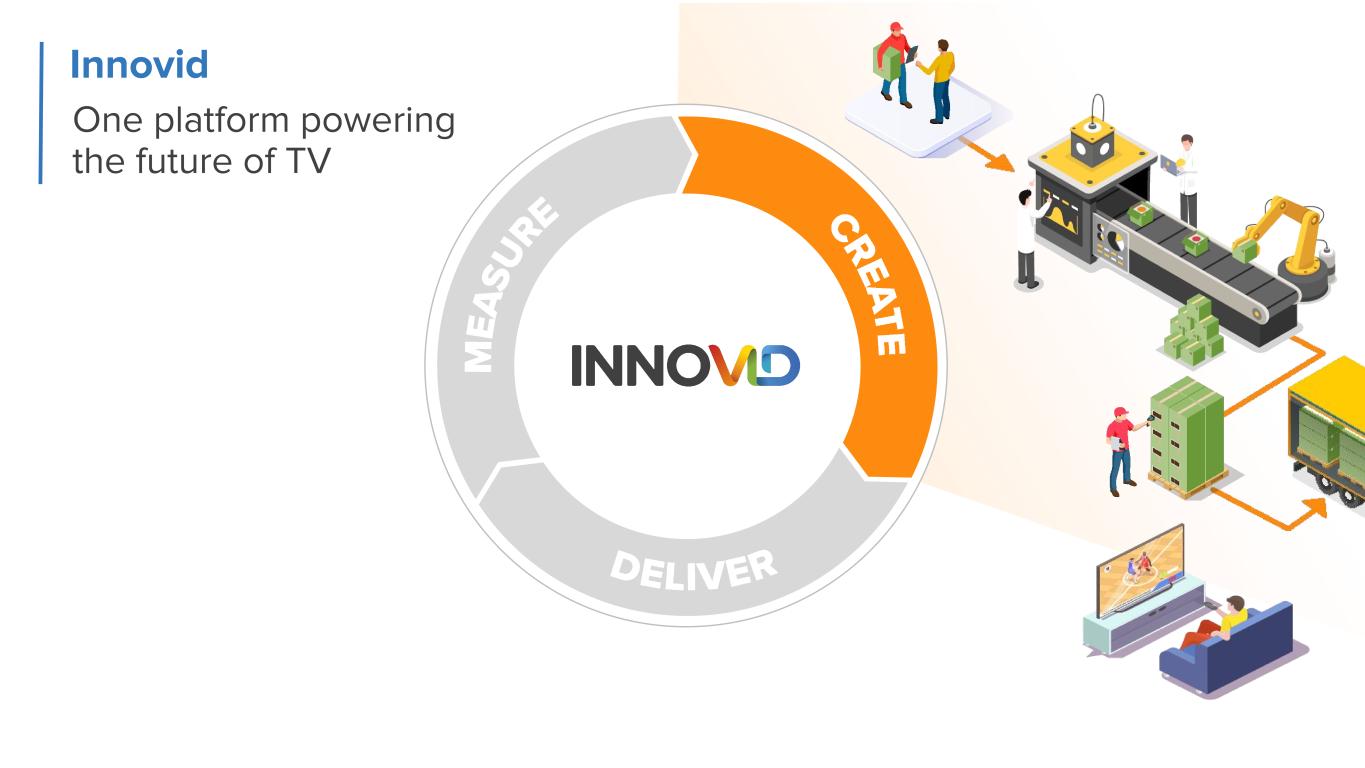
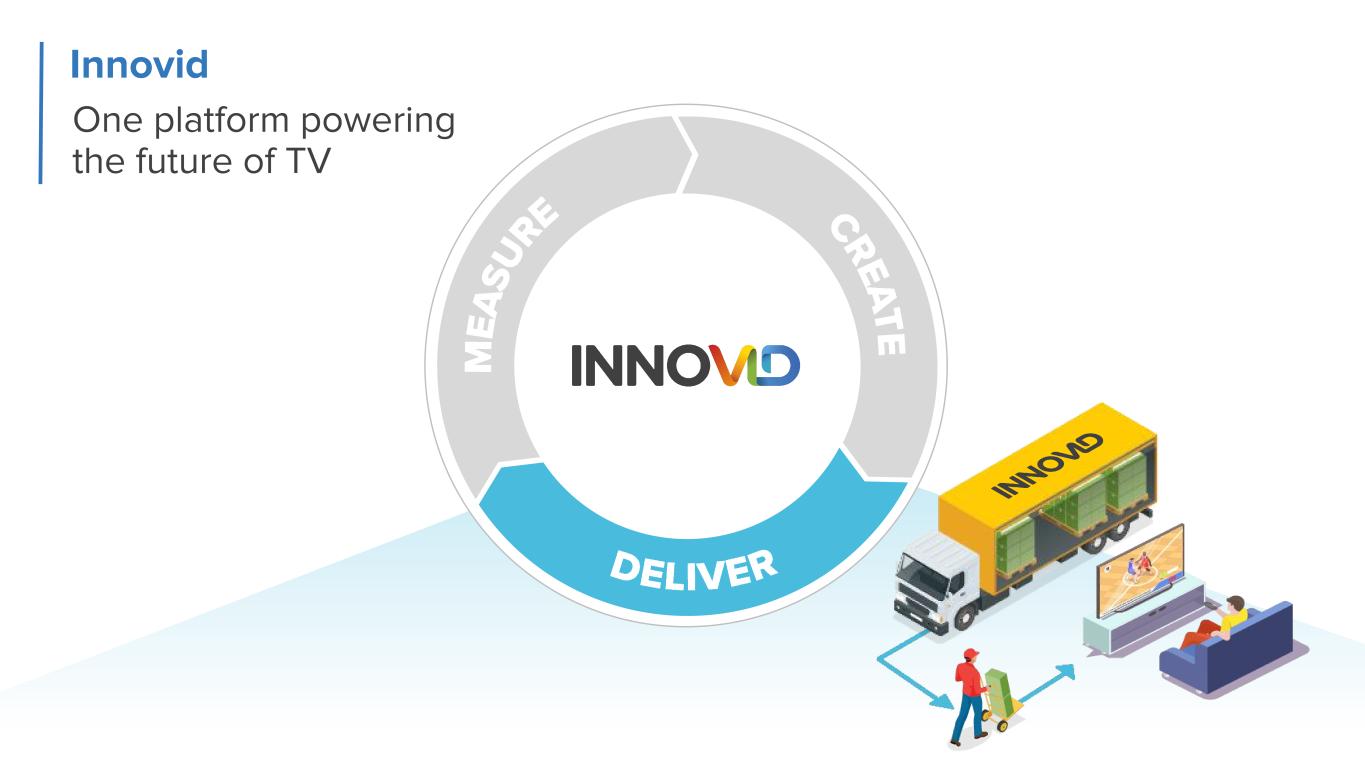
To empower the creation, delivery, measurement, and optimization of ad-supported TV experiences that people love. MISSION
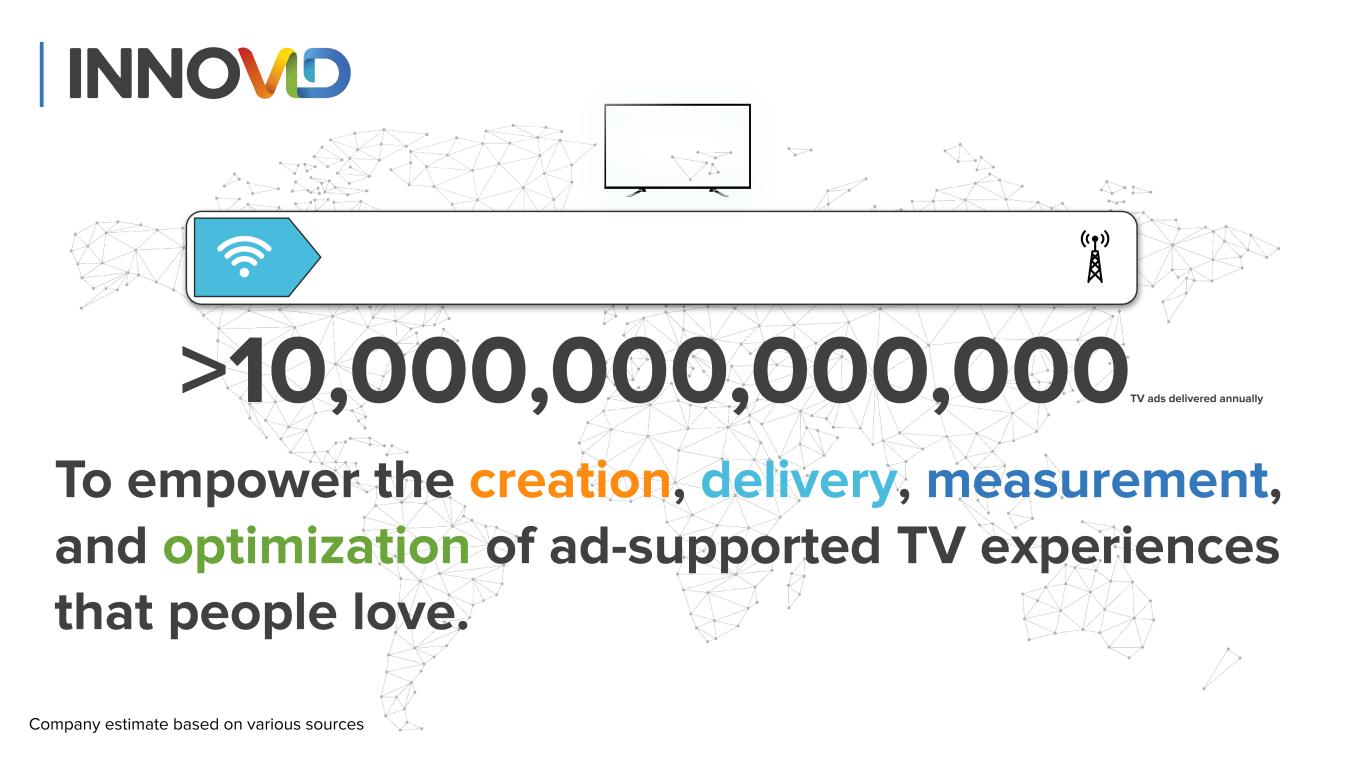
To empower the creation, delivery, measurement, and optimization of ad-supported TV experiences that people love. >10,000,000,000,000TV ads delivered annually Company estimate based on various sources
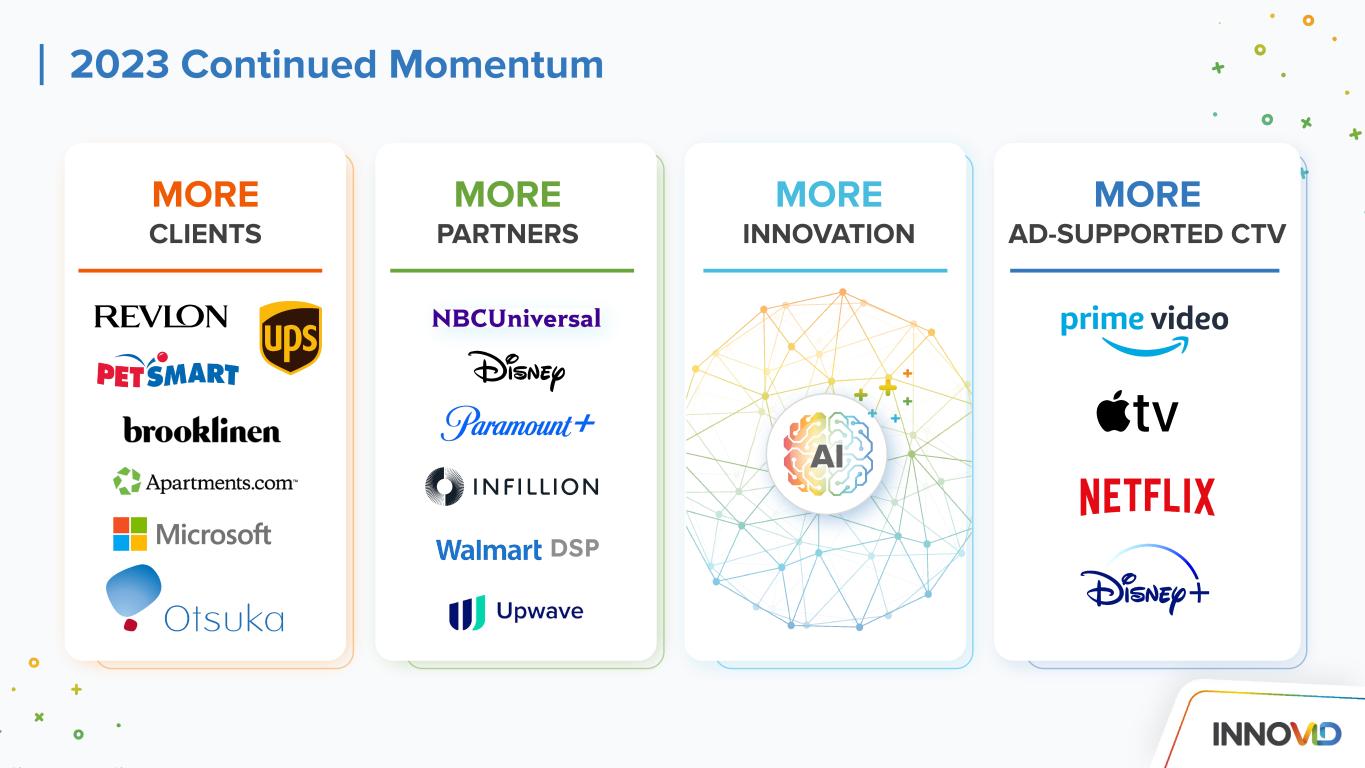
MORE CLIENTS MORE PARTNERS 2023 Continued Momentum DSP MORE INNOVATION MORE AD-SUPPORTED CTV AI
On Top of Our Existing Best-in-Class Client Base
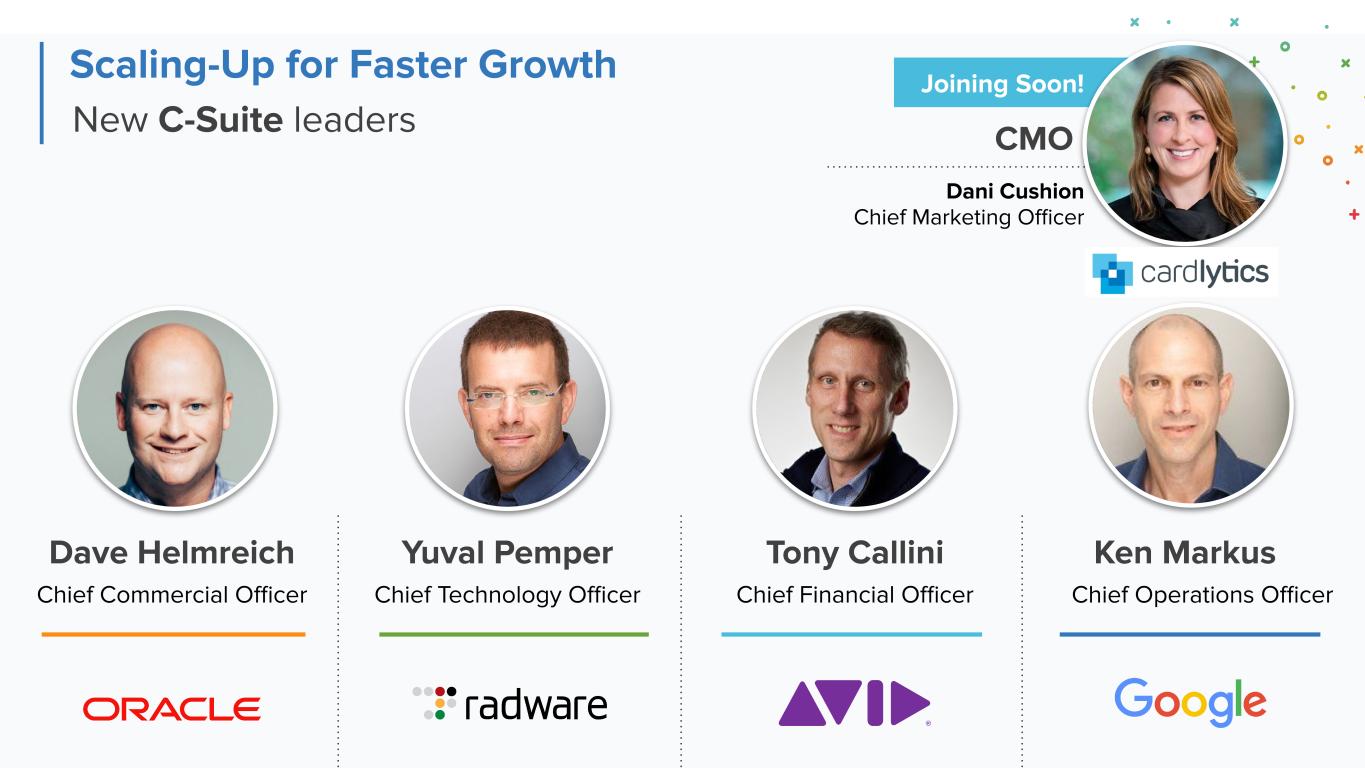
Dave Helmreich Yuval Pemper Tony Callini Ken Markus Chief Technology Officer Chief Financial Officer Chief Operations Officer New C-Suite leaders Scaling-Up for Faster Growth Chief Commercial Officer CMO Dani Cushion Chief Marketing Officer Joining Soon!
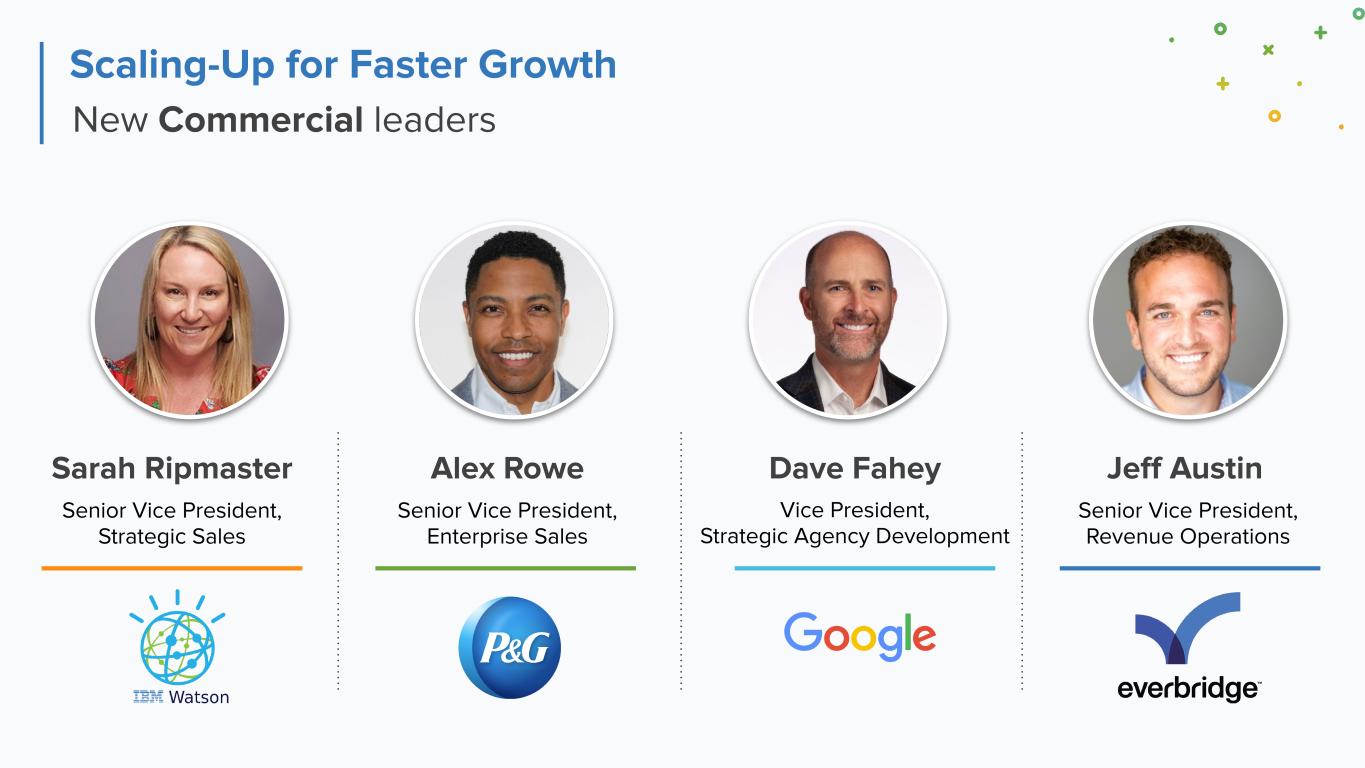
New Commercial leaders Scaling-Up for Faster Growth Sarah Ripmaster Alex Rowe Dave Fahey Jeff Austin Senior Vice President, Enterprise Sales Vice President, Strategic Agency Development Senior Vice President, Revenue Operations Senior Vice President, Strategic Sales

13% 18% 2023 Focusing on Profitable Growth 10% 15% 20% 5% 8% 2022 2023 Adjusted EBITDA Margins (5%) -5% -10% (12%) Q1 2022 2023 2022 2023 2022 2023 Q2 Q3 0.50%

Adjusted EBITDA MARGIN TARGET OF 30% On Our Path to “Rule of 40” Reacceleration to DOUBLE-DIGIT REVENUE GROWTH Investment in CTV INNOVATION
One platform powering the future of TV
Innovid One platform powering the future of TV
Innovid One platform powering the future of TV
One platform powering the future of TV Innovid
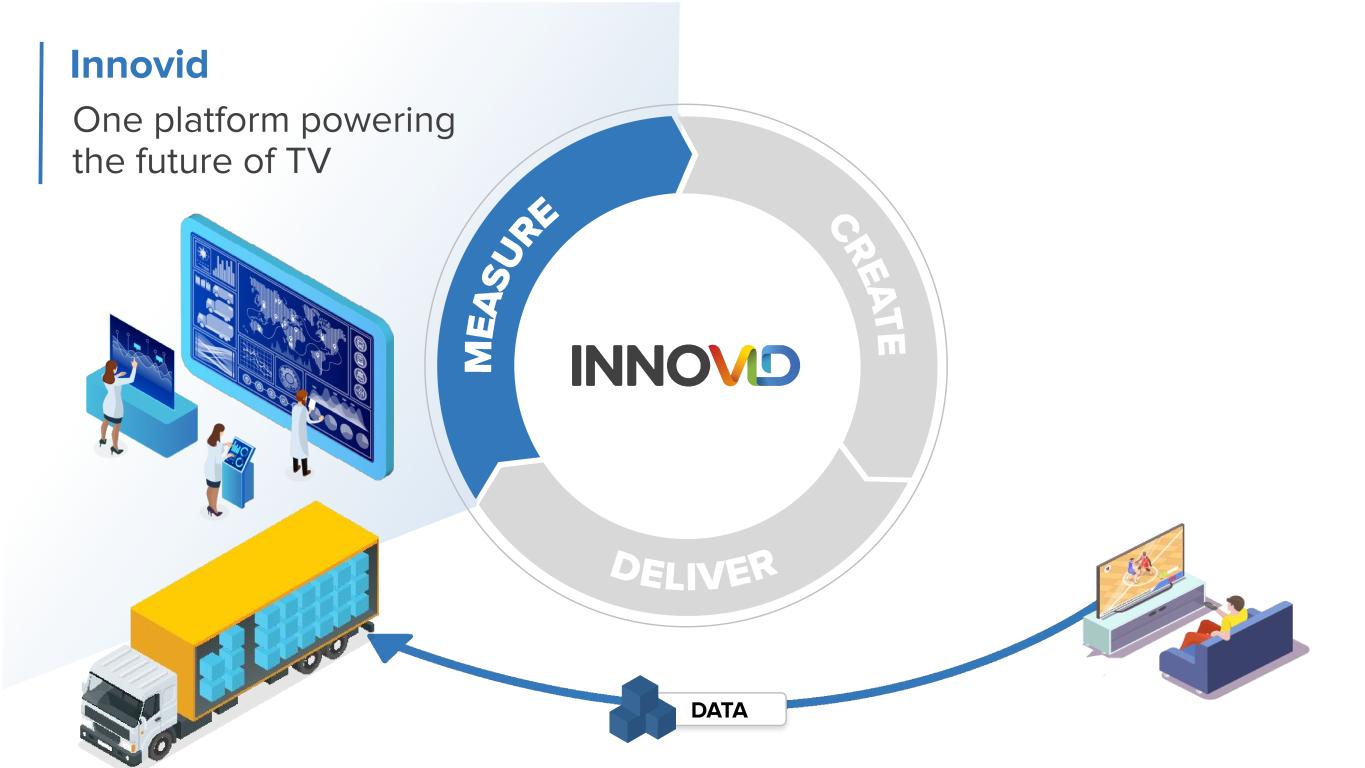
One platform powering the future of TV Innovid DATA
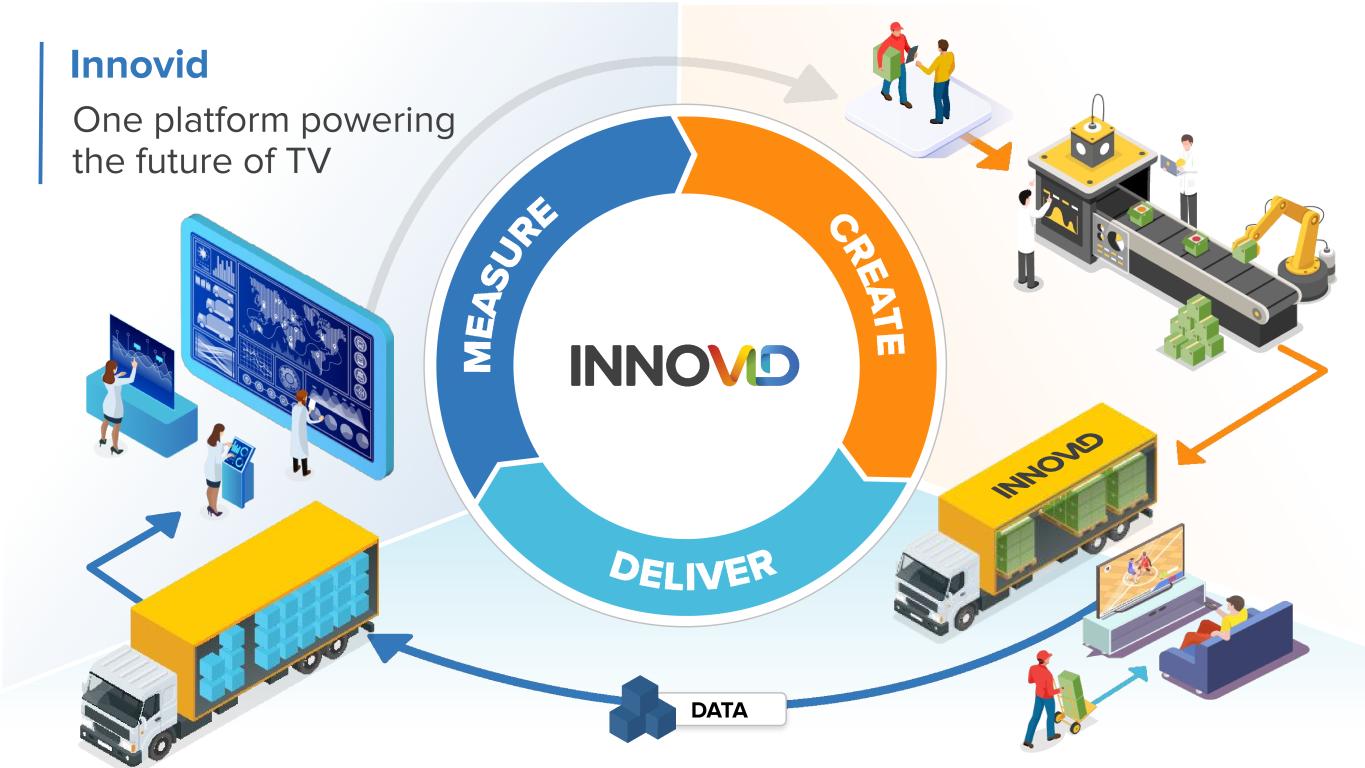
Innovid One platform powering the future of TV DATA
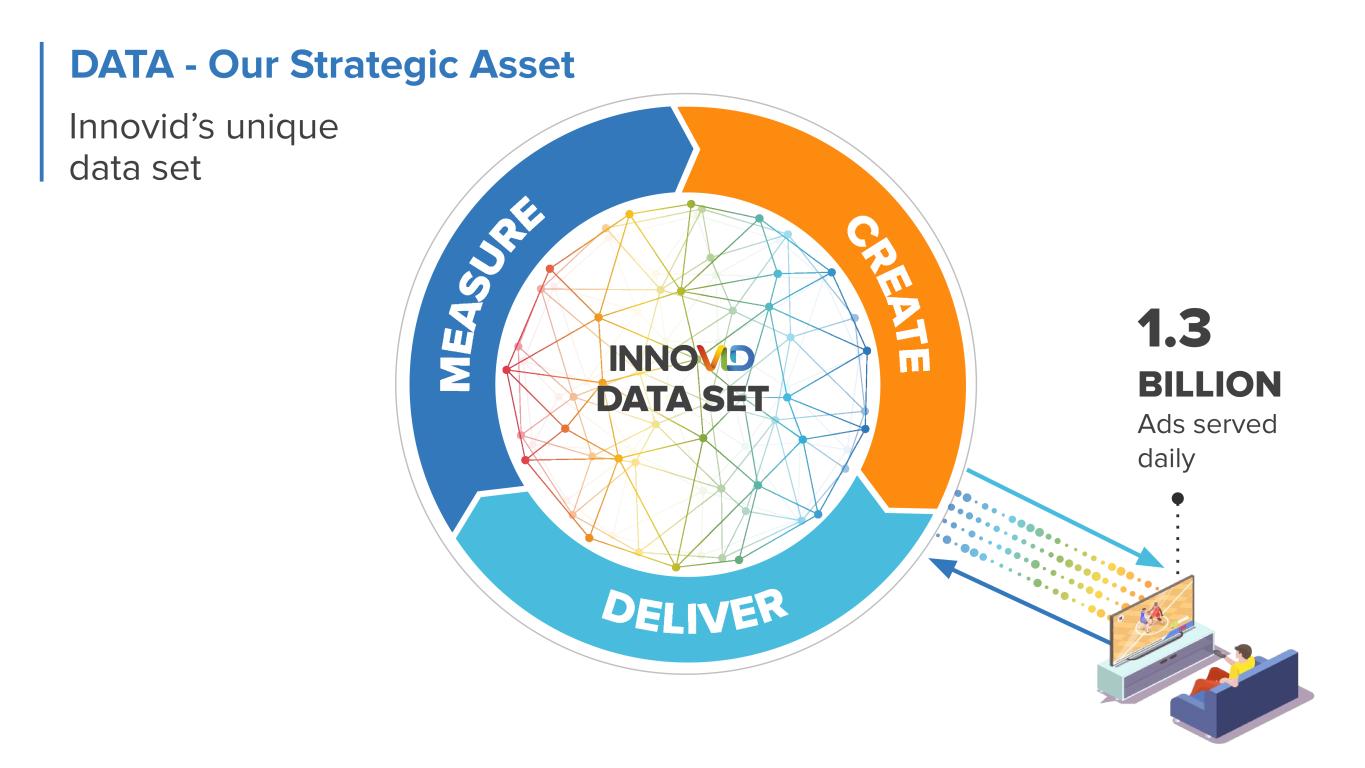
1.3 BILLION Ads served daily DATA SET DATA - Our Strategic Asset Innovid’s unique data set

DATA SET TRILLIONS of observations 1.3 BILLION Ads served daily DATA TYPES Publishers Devices Households Creative Reach Frequency Outcome & more Innovid’s unique data set DATA - Our Strategic Asset
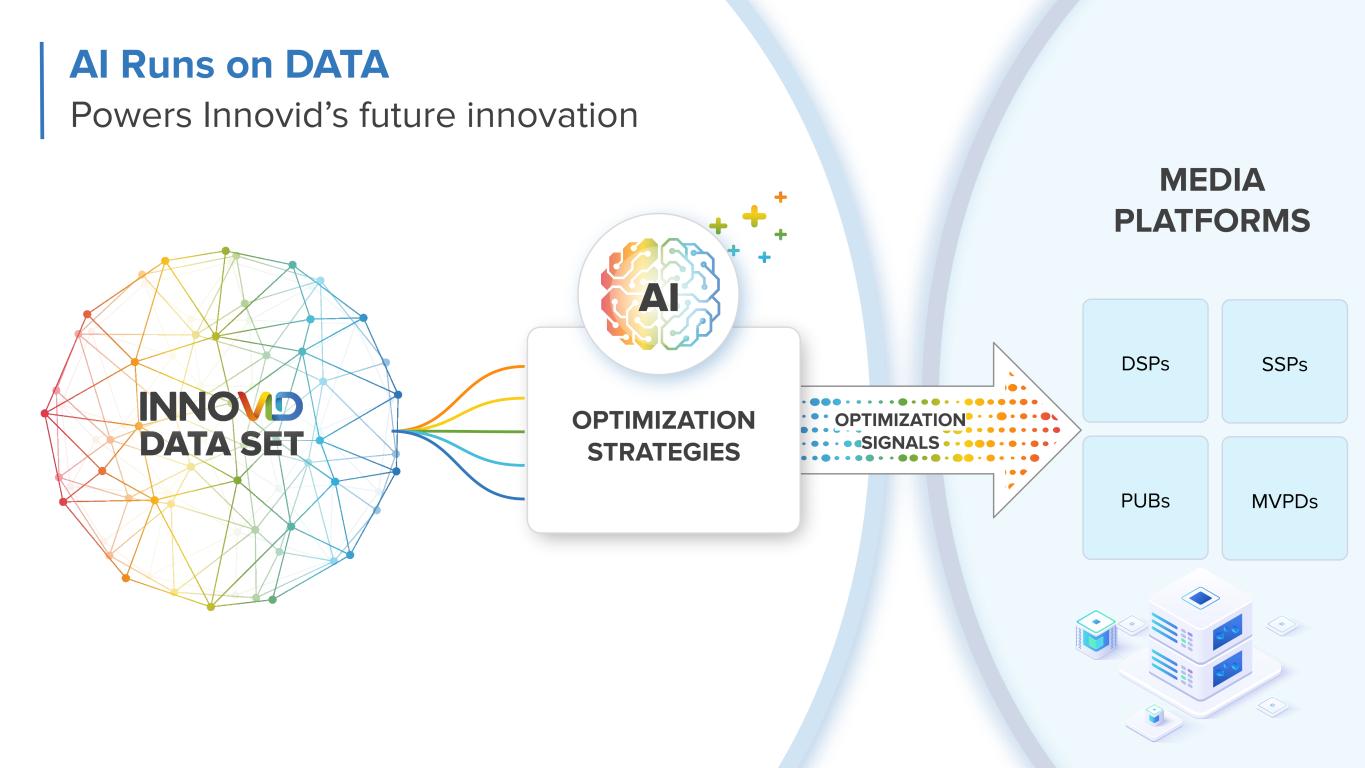
OPTIMIZATION STRATEGIES AI OPTIMIZATION SIGNALSDATA SET AI Runs on DATA Powers Innovid’s future innovation SSPs MVPDs DSPs PUBs MEDIA PLATFORMS
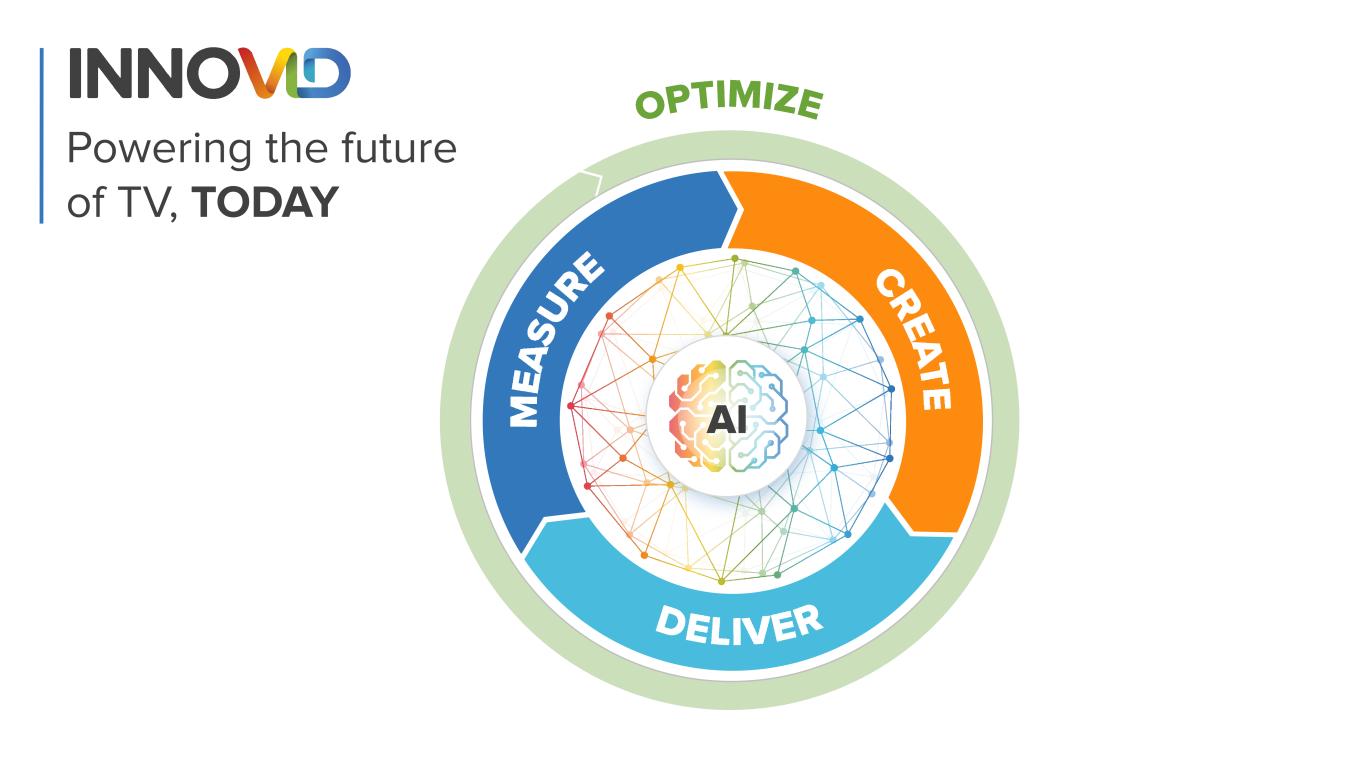
Powering the future of TV, TODAY AI

Powering the Future of TV Advertising VP, Client Solutions Blair Robertson Chief Technology Officer, InnovidXP Dan Mouradian
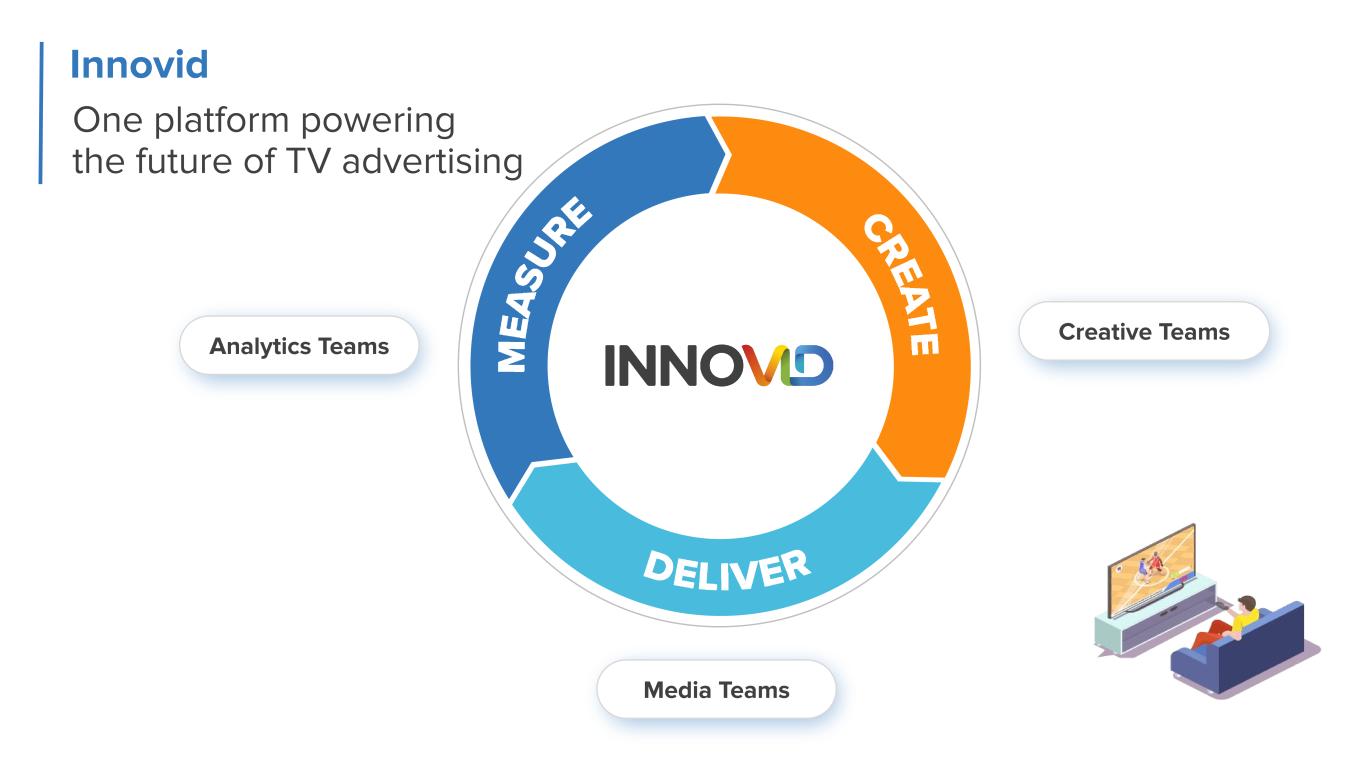
Innovid One platform powering the future of TV advertising Analytics Teams Media Teams Creative Teams

Innovid Enabling creative storytelling The evolution of TV creative Single TV Spot Personalized Multi-version Interactive Shoppable Creative Teams

Innovid Enabling creative storytelling The evolution of TV creative Single TV Spot Personalized Multi-version Interactive Shoppable Creative Teams
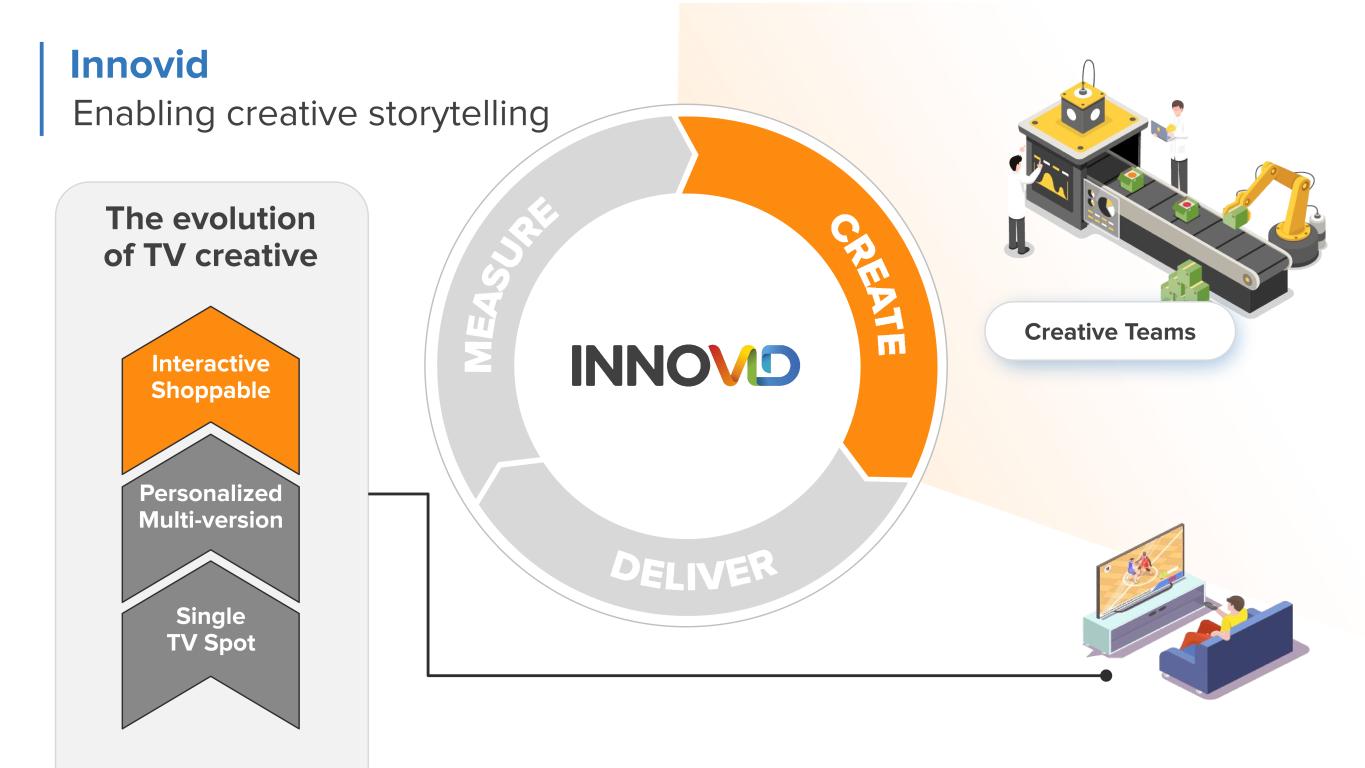
Innovid Enabling creative storytelling The evolution of TV creative Single TV Spot Personalized Multi-version Interactive Shoppable Creative Teams

One platform powering the future of TV advertising Innovid Media Teams CTV Campaign Management Challenges Different OS/Specs Rejected videos Asset management Complex data management

One platform powering the future of TV advertising Innovid DATA Media Analysts Analysts prove & improve Unique reach Frequency Media selection Creative Cost
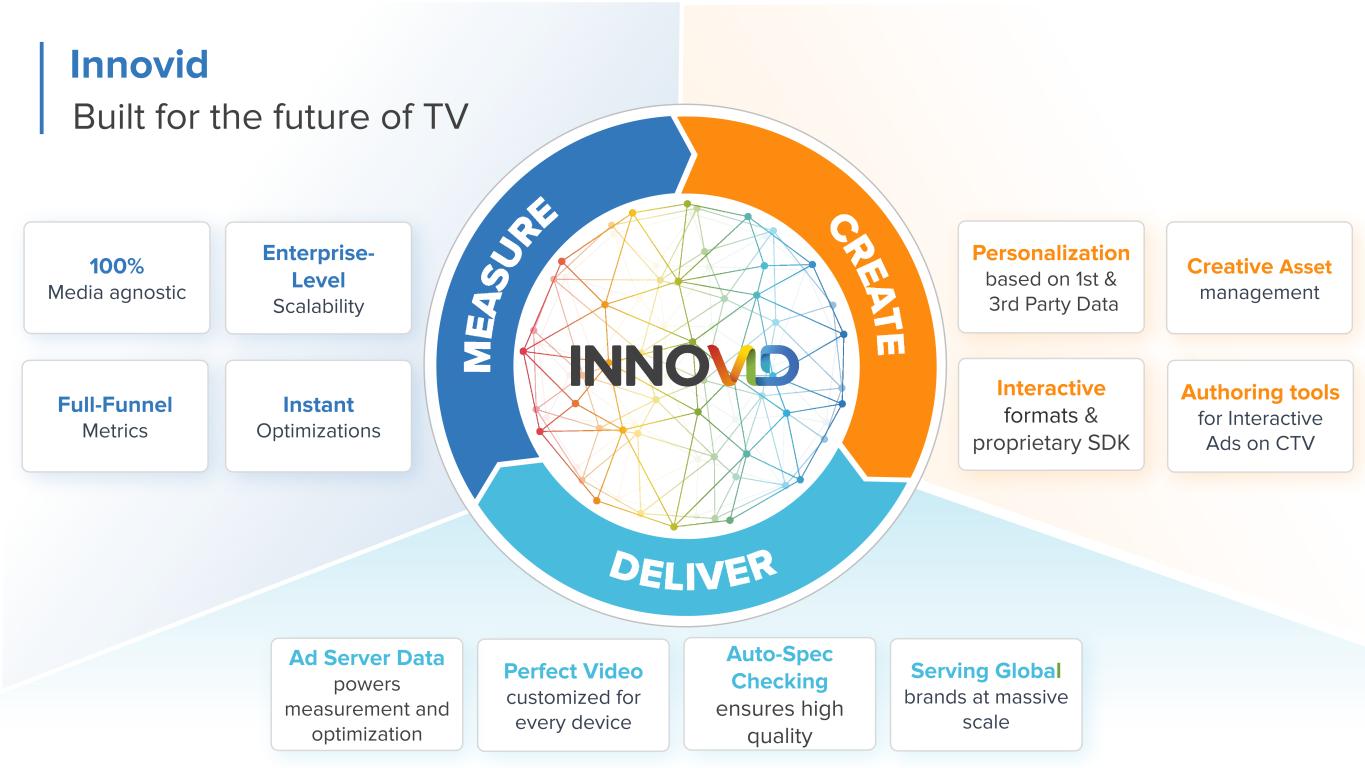
Innovid Built for the future of TV Creative Asset management Personalization based on 1st & 3rd Party Data Authoring tools for Interactive Ads on CTV Interactive formats & proprietary SDK 100% Media agnostic Full-Funnel Metrics Instant Optimizations Enterprise- Level Scalability Perfect Video customized for every device Ad Server Data powers measurement and optimization Auto-Spec Checking ensures high quality Serving Global brands at massive scale
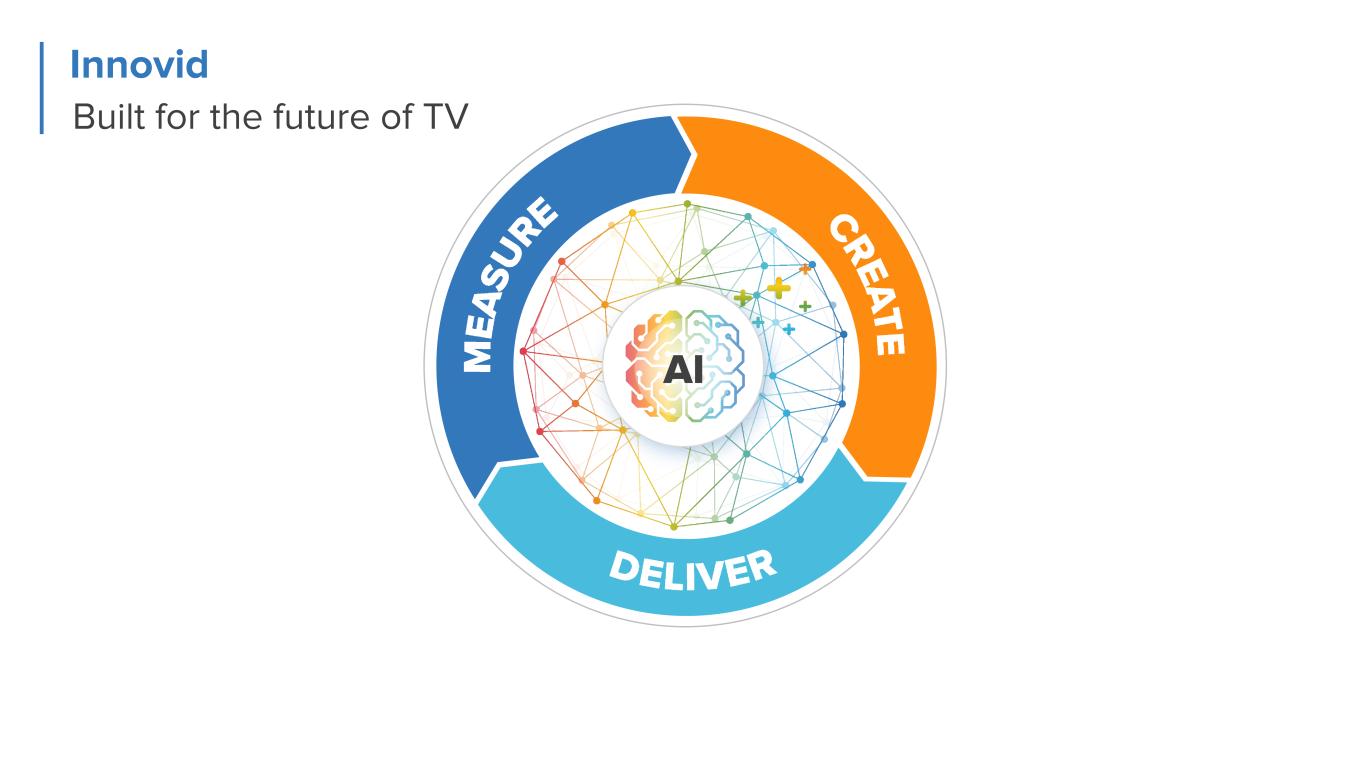
Innovid Built for the future of TV AI
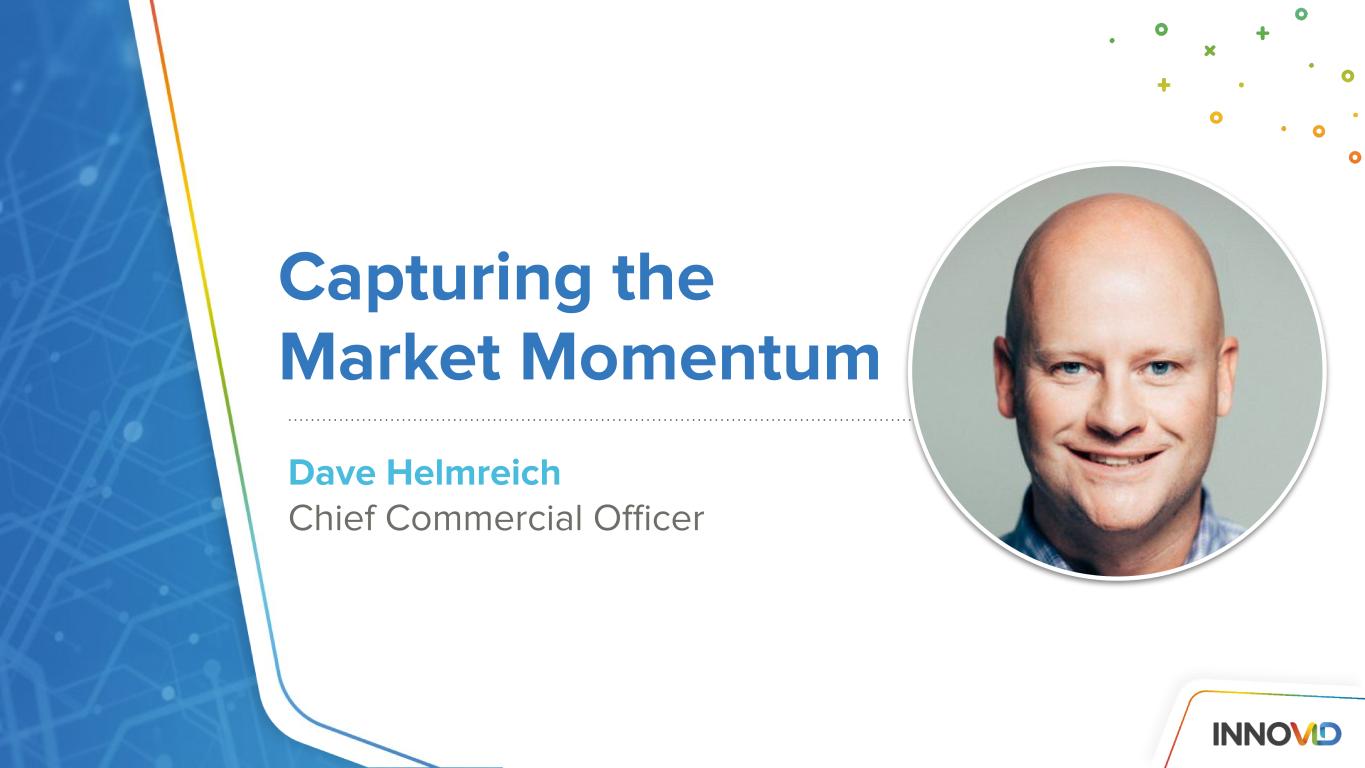
Capturing the Market Momentum Dave Helmreich Chief Commercial Officer
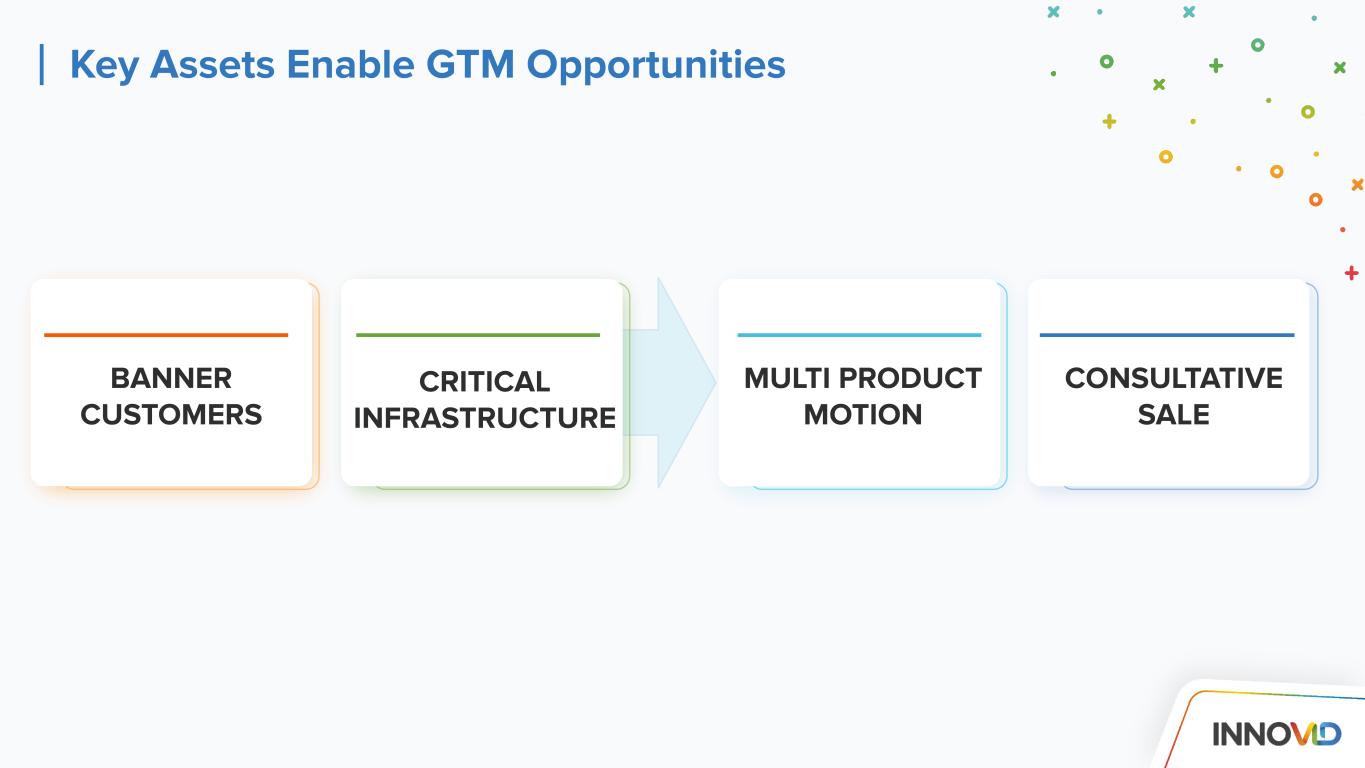
Key Assets Enable GTM Opportunities MULTI PRODUCT MOTION CONSULTATIVE SALE BANNER CUSTOMERS CRITICAL INFRASTRUCTURE
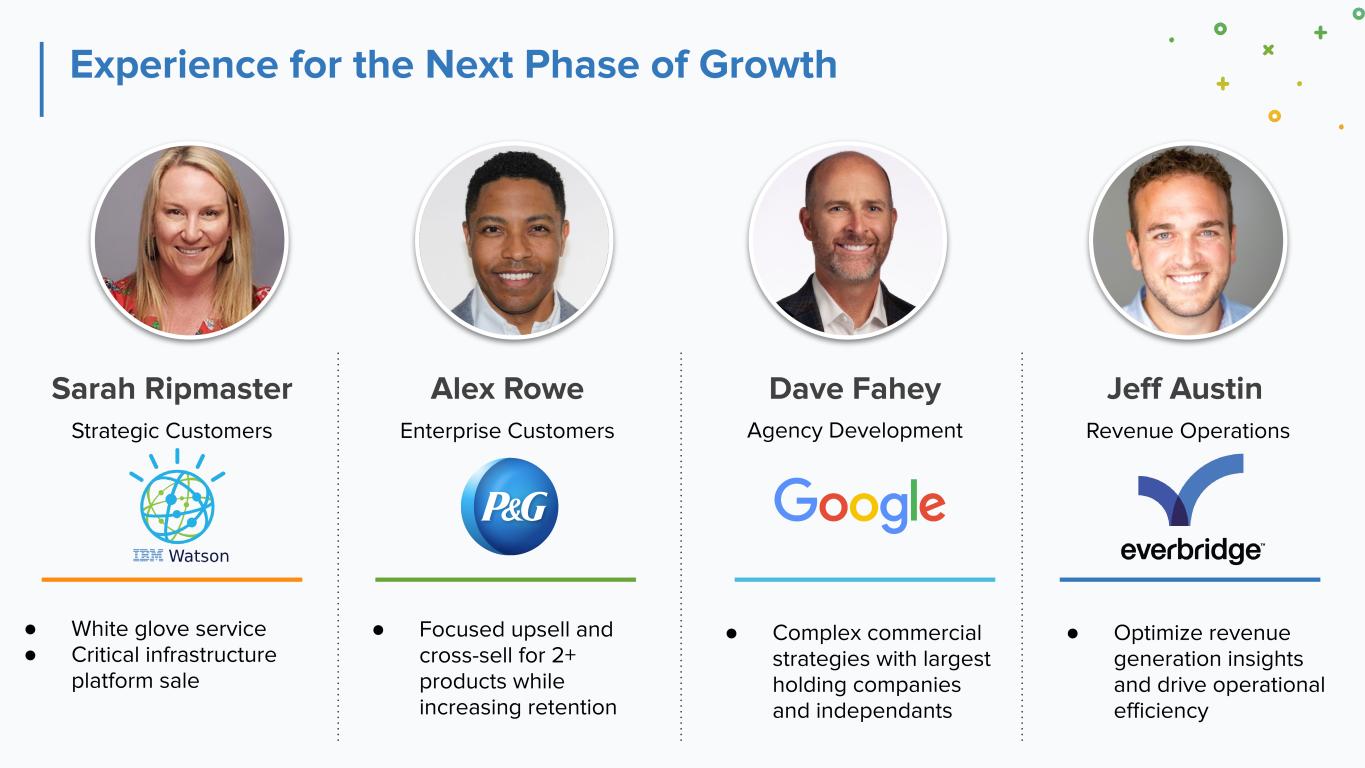
Experience for the Next Phase of Growth Sarah Ripmaster Alex Rowe Dave Fahey Jeff Austin Enterprise Customers Agency Development Revenue OperationsStrategic Customers ● White glove service ● Critical infrastructure platform sale ● Complex commercial strategies with largest holding companies and independants ● Focused upsell and cross-sell for 2+ products while increasing retention ● Optimize revenue generation insights and drive operational efficiency

Four Primary Growth Drivers CTV VOLUME GROWTH CROSS-SELLUPSELL NEW LOGO 1 32 4
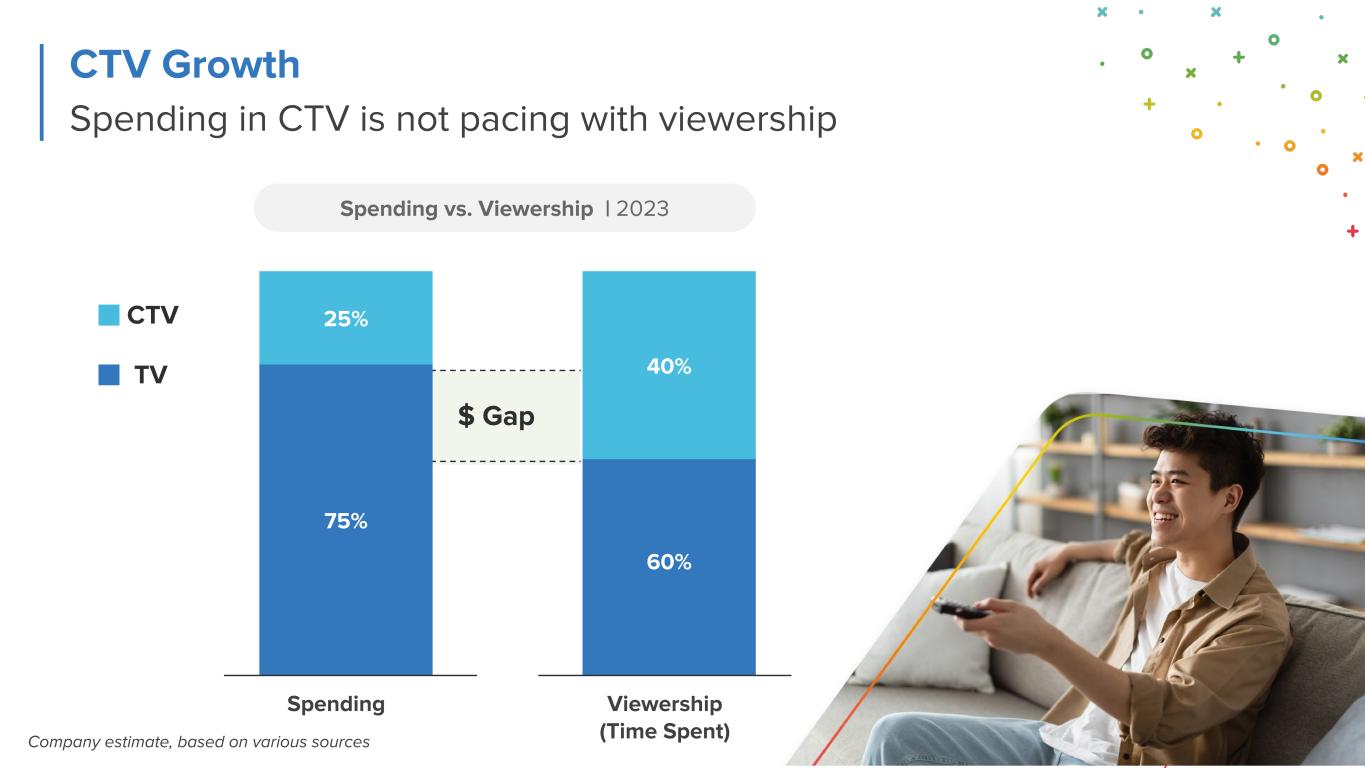
Company estimate, based on various sources Spending vs. Viewership | 2023 60% 40% Viewership (Time Spent) Spending Spending in CTV is not pacing with viewership CTV Growth TV CTV 25% 75% $ Gap
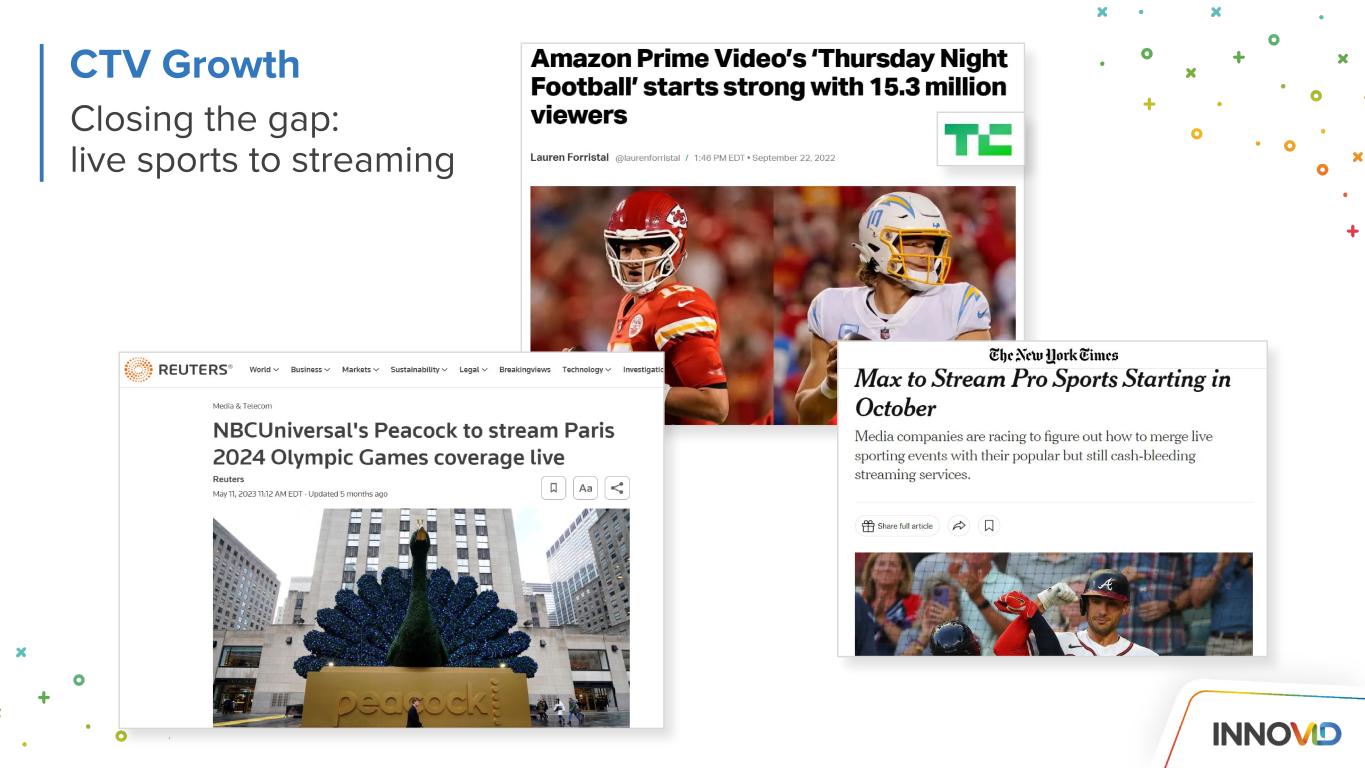
Closing the gap: live sports to streaming CTV Growth
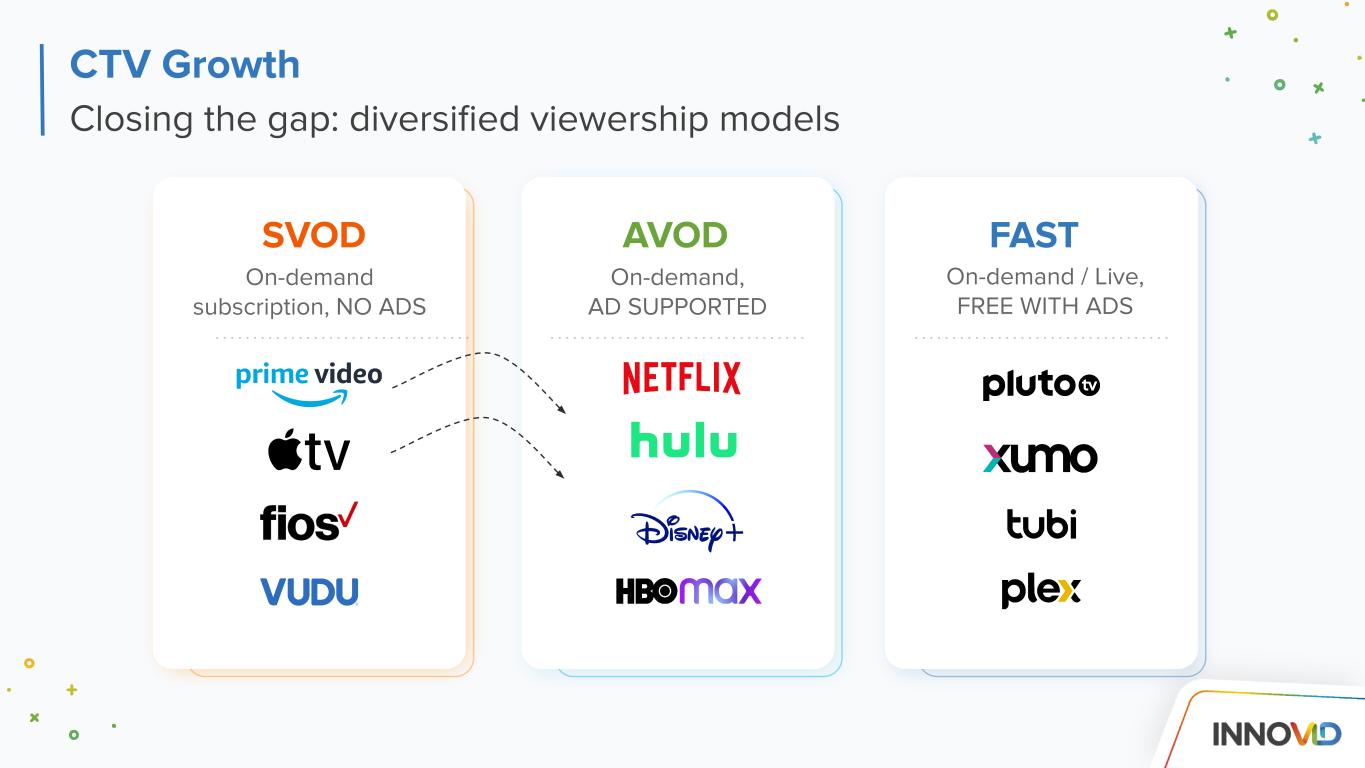
Closing the gap: diversified viewership models CTV Growth SVOD AVOD FAST On-demand subscription, NO ADS On-demand, AD SUPPORTED On-demand / Live, FREE WITH ADS
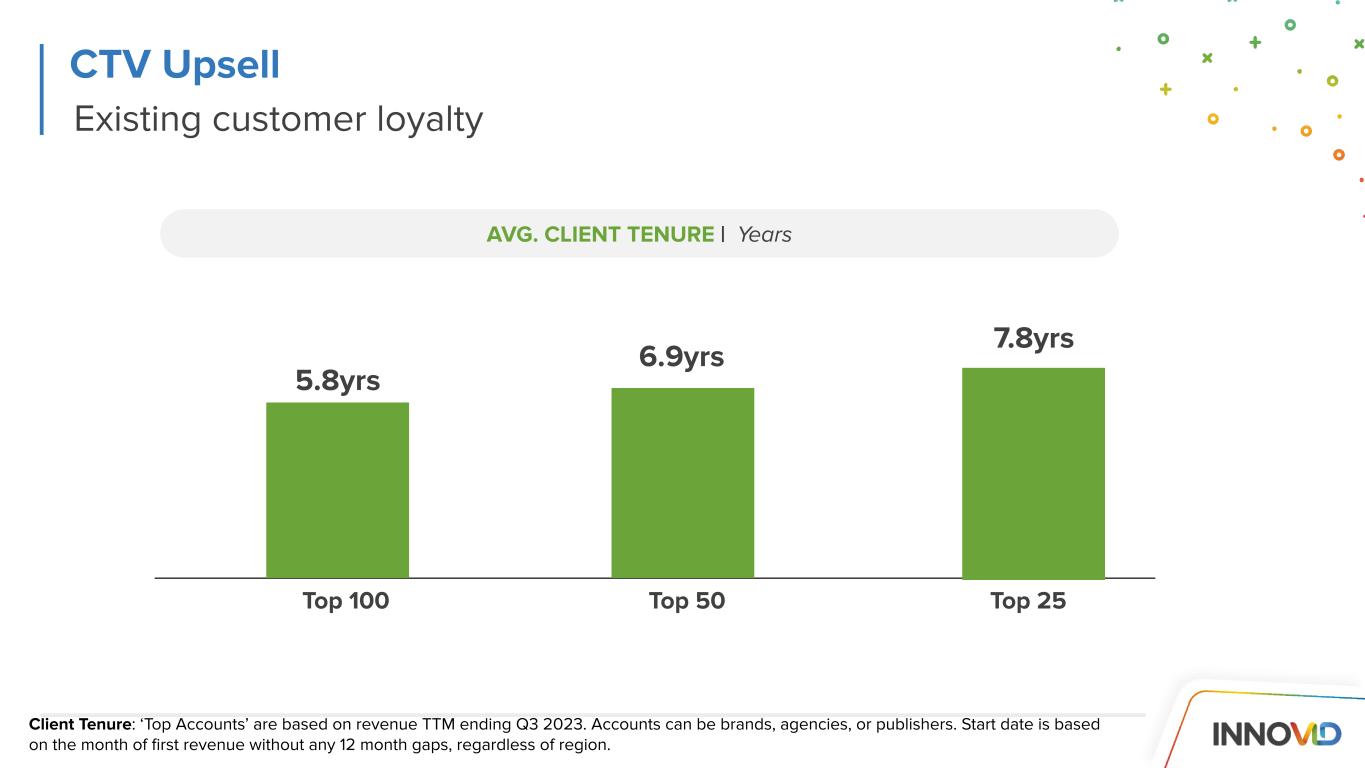
Existing customer loyalty CTV Upsell 6.9yrs AVG. CLIENT TENURE | Years Top 50 Client Tenure: ‘Top Accounts’ are based on revenue TTM ending Q3 2023. Accounts can be brands, agencies, or publishers. Start date is based on the month of first revenue without any 12 month gaps, regardless of region. Top 100 5.8yrs 7.8yrs Top 25
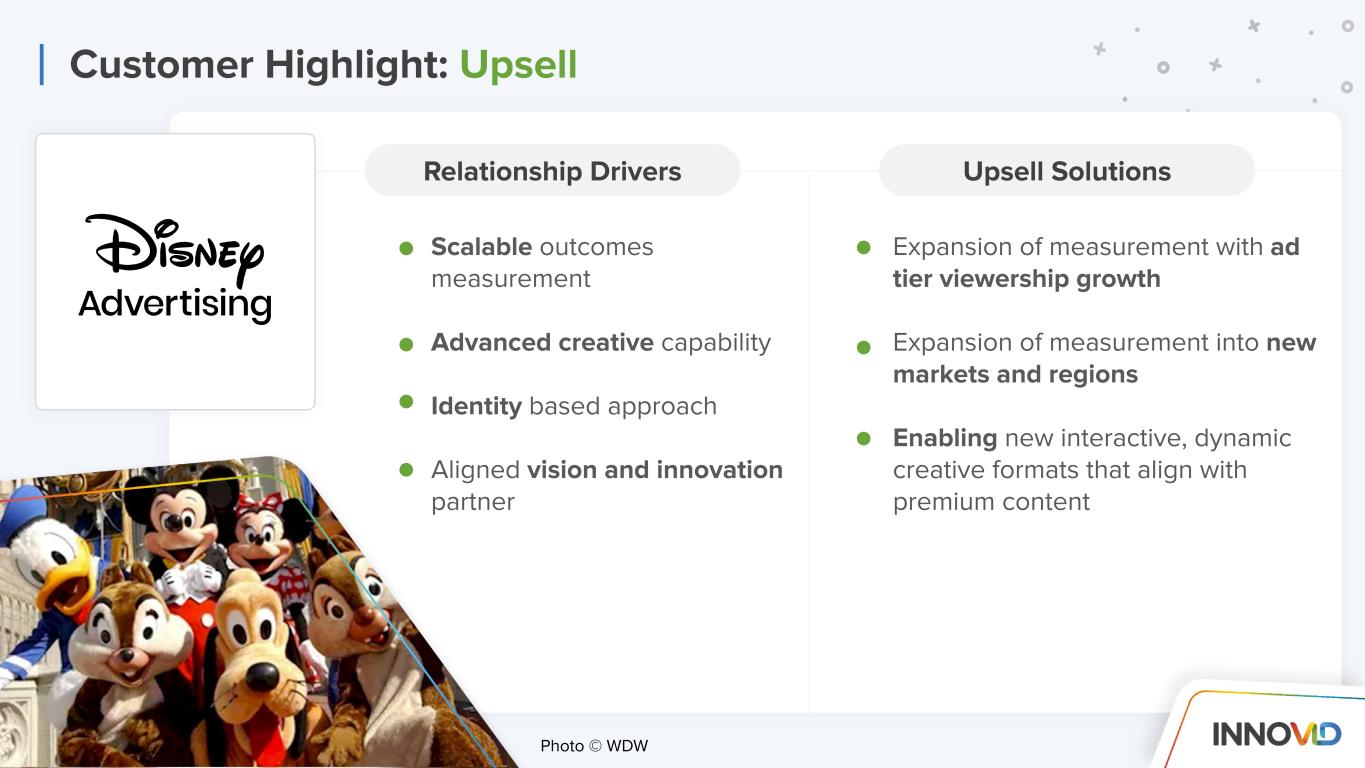
Scalable outcomes measurement Advanced creative capability Identity based approach Aligned vision and innovation partner Expansion of measurement with ad tier viewership growth Expansion of measurement into new markets and regions Enabling new interactive, dynamic creative formats that align with premium content Customer Highlight: Upsell Relationship Drivers Upsell Solutions Photo © WDW
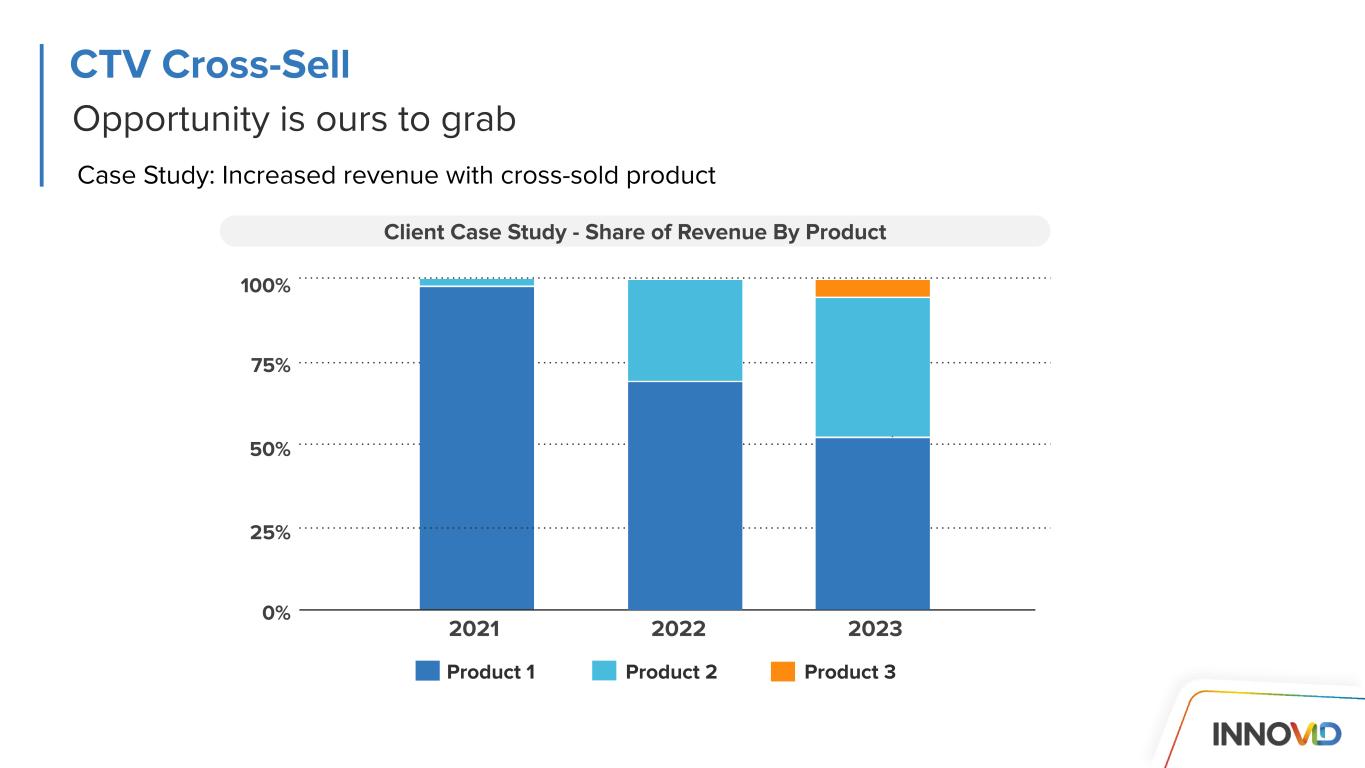
Opportunity is ours to grab CTV Cross-Sell Case Study: Increased revenue with cross-sold product 18% 8% 2022 2023 Q3 50% 75% 100% 25% 0% 2021 2022 2023 Client Case Study - Share of Revenue By Product Product 1 Product 2 Product 3

Agency > Brand Direct Dynamic personalization + ad serving excellence Active innovation partner Consultative and flexible services InnovidXP measurement to prove the value of increasing CTV/video investment Measurement innovation and strategic POVs Customer Highlight: Cross-Sell Relationship Drivers Cross-Sell Solutions Photo © Verizon
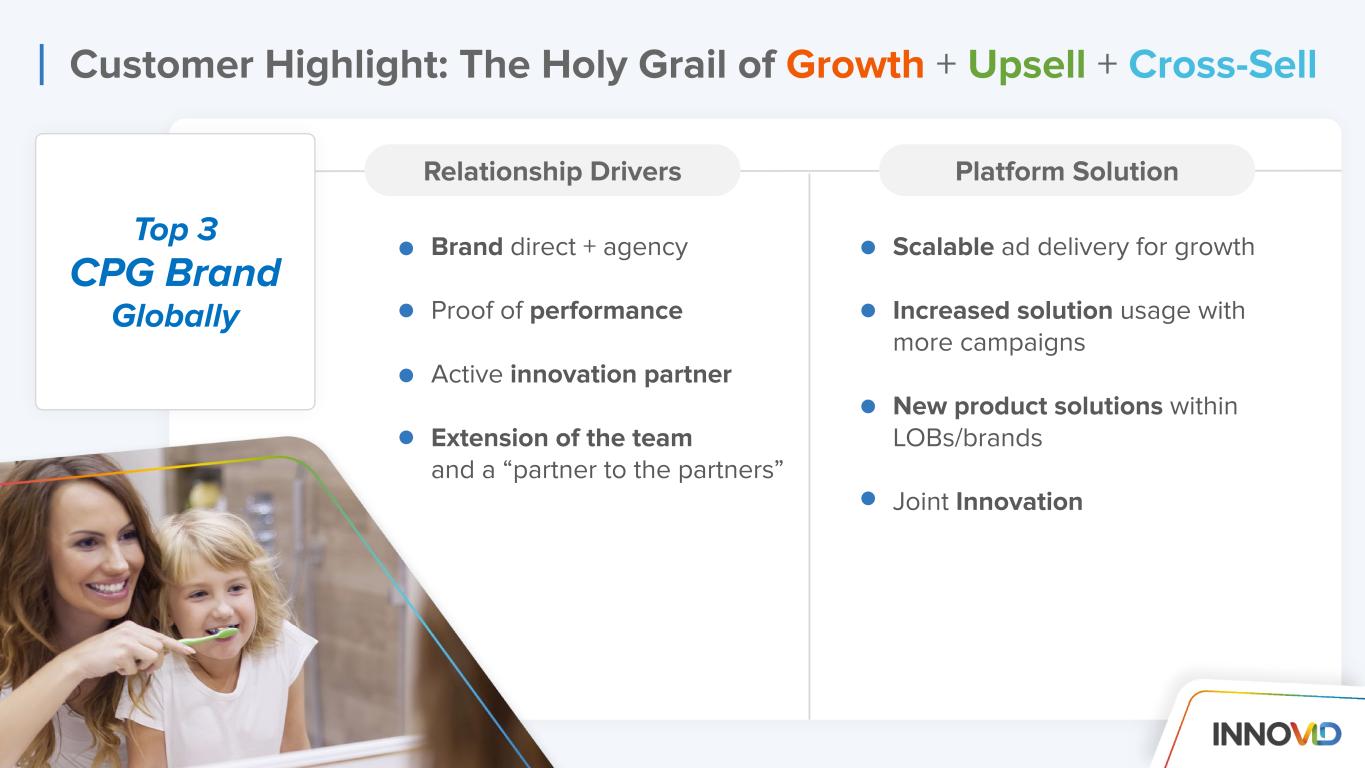
Brand direct + agency Proof of performance Active innovation partner Extension of the team and a “partner to the partners” Scalable ad delivery for growth Increased solution usage with more campaigns New product solutions within LOBs/brands Joint Innovation Customer Highlight: The Holy Grail of Growth + Upsell + Cross-Sell Top 3 CPG Brand Globally Relationship Drivers Platform Solution
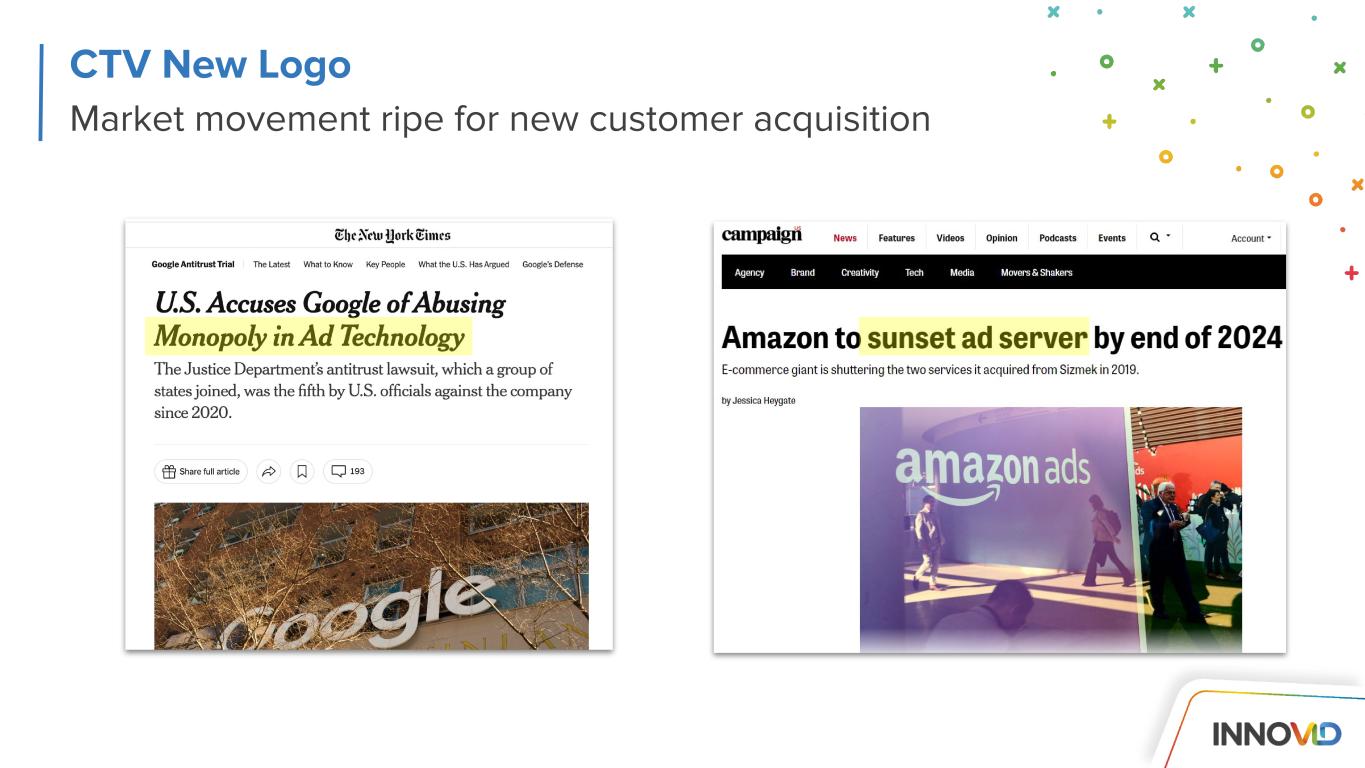
Market movement ripe for new customer acquisition CTV New Logo
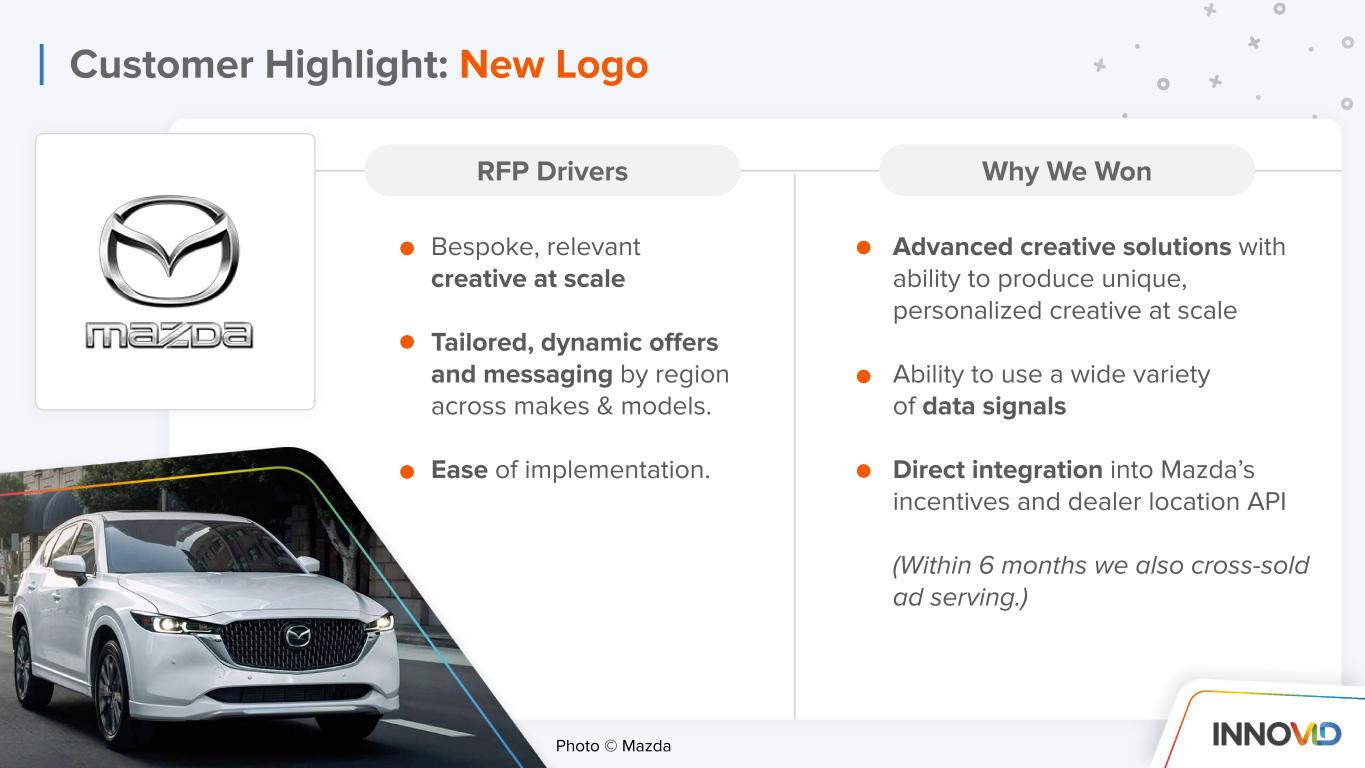
RFP Drivers Why We Won Bespoke, relevant creative at scale Tailored, dynamic offers and messaging by region across makes & models. Ease of implementation. Advanced creative solutions with ability to produce unique, personalized creative at scale Ability to use a wide variety of data signals Direct integration into Mazda’s incentives and dealer location API (Within 6 months we also cross-sold ad serving.) Customer Highlight: New Logo Photo © Mazda

Innovation Ahead VP, Client Solutions Blair Robertson Chief Technology Officer, InnovidXP Dan Mouradian AI
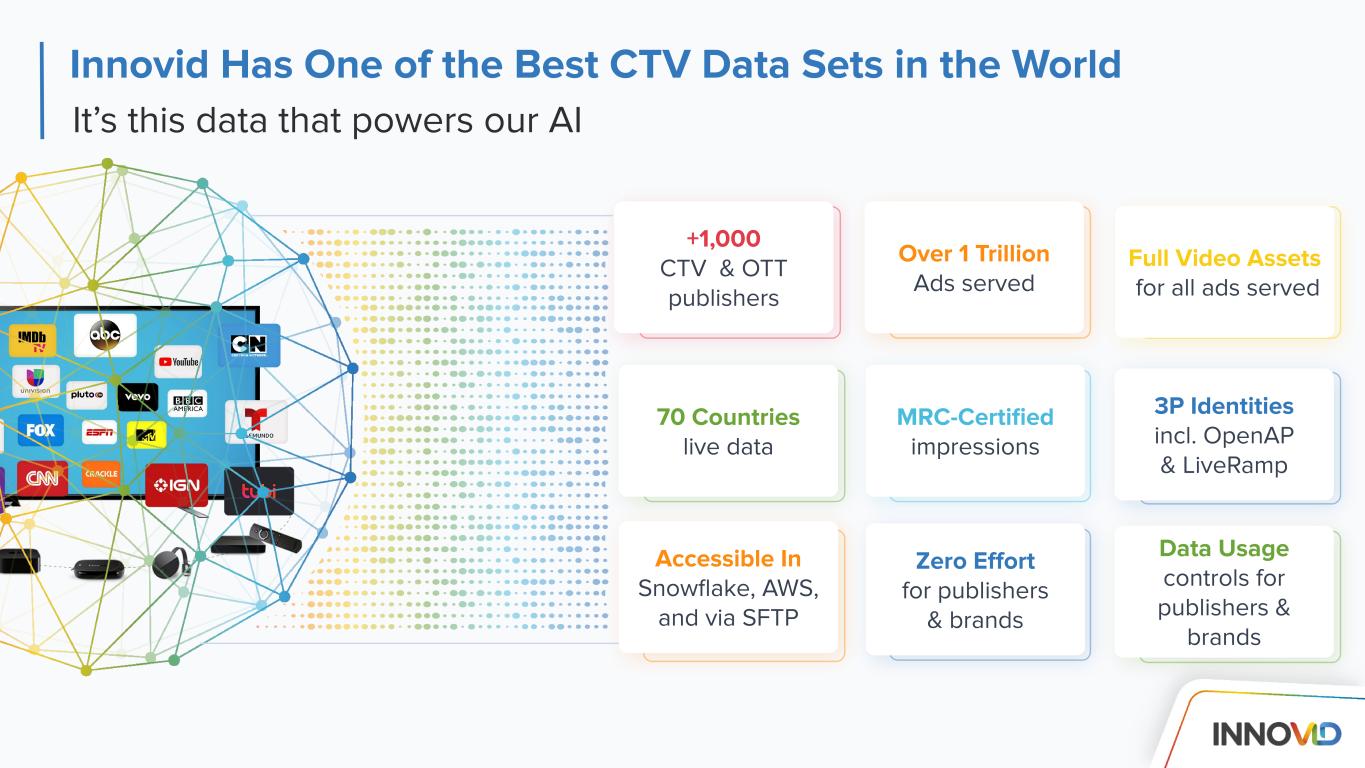
ה Innovid Has One of the Best CTV Data Sets in the World It’s this data that powers our AI +1,000 CTV & OTT publishers Over 1 Trillion Ads served 70 Countries live data MRC-Certified impressions Accessible In Snowflake, AWS, and via SFTP Zero Effort for publishers & brands Full Video Assets for all ads served 3P Identities incl. OpenAP & LiveRamp Data Usage controls for publishers & brands

Data + AI + Serving Powers Innovid’s future innovation OPTIMIZATION STRATEGIES AI DATA SET
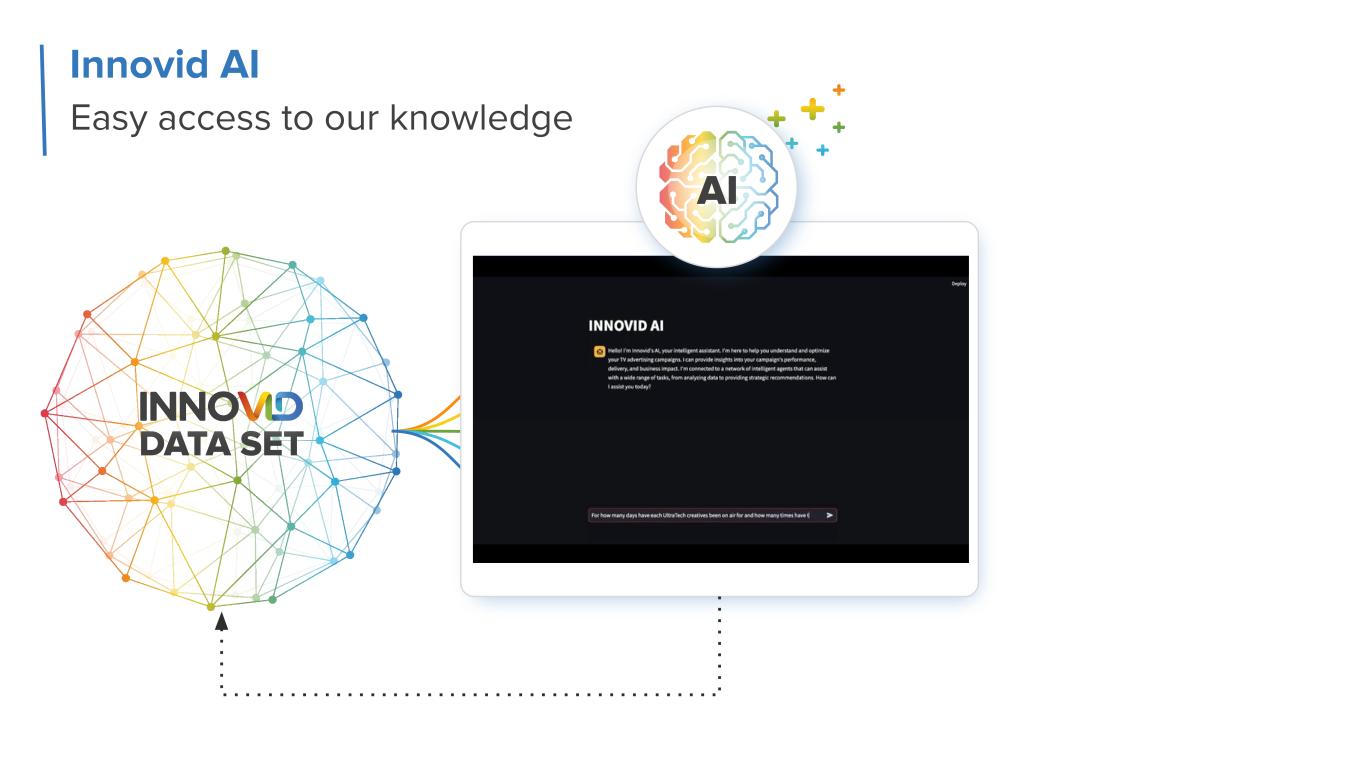
Innovid AI Easy access to our knowledge DATA SET AI
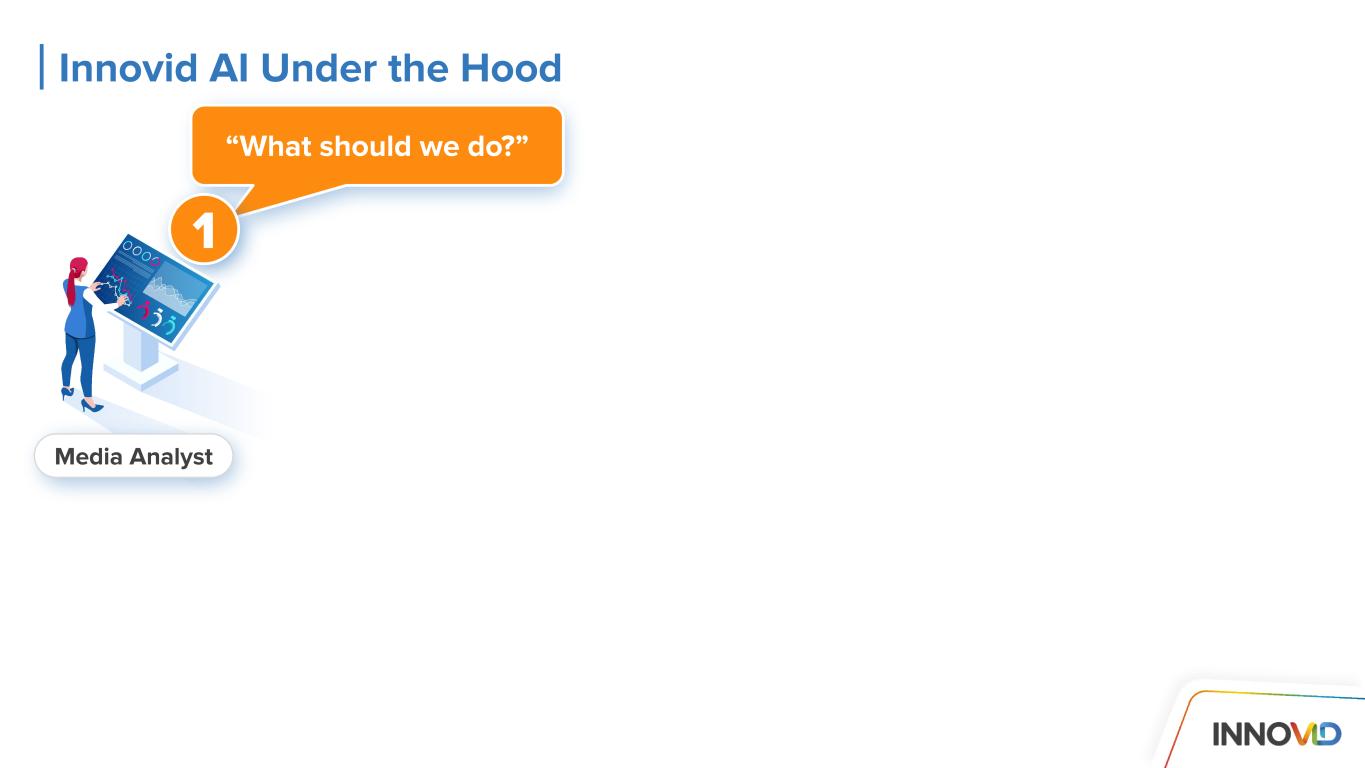
“What should we do?” 11 Media Analyst Innovid AI Under the Hood

Innovid AI Under the Hood Media Analyst Language AI “Please turn this question into code.” 2 “What should we do?” 1

Language AI “Please turn this question into code.” “Please review this code.” Tester AI Dev AI 33 Media Analyst 2 “What should we do?” 1 Innovid AI Under the Hood
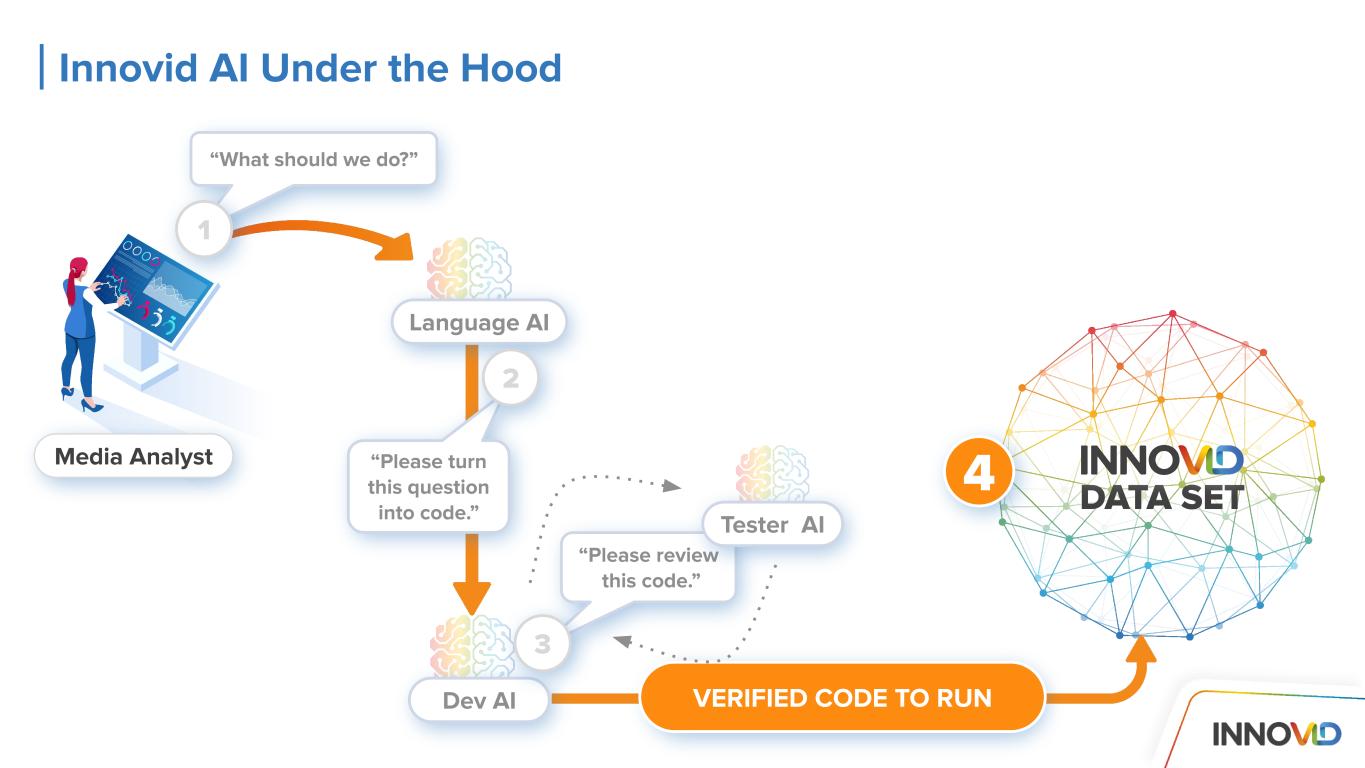
“Please turn this question into code.” “Please review this code.” Language AI Tester AI Dev AI VERIFIED CODE TO RUN Media Analyst “What should we do?” 2 3 1 4 Innovid AI Under the Hood DATA SET
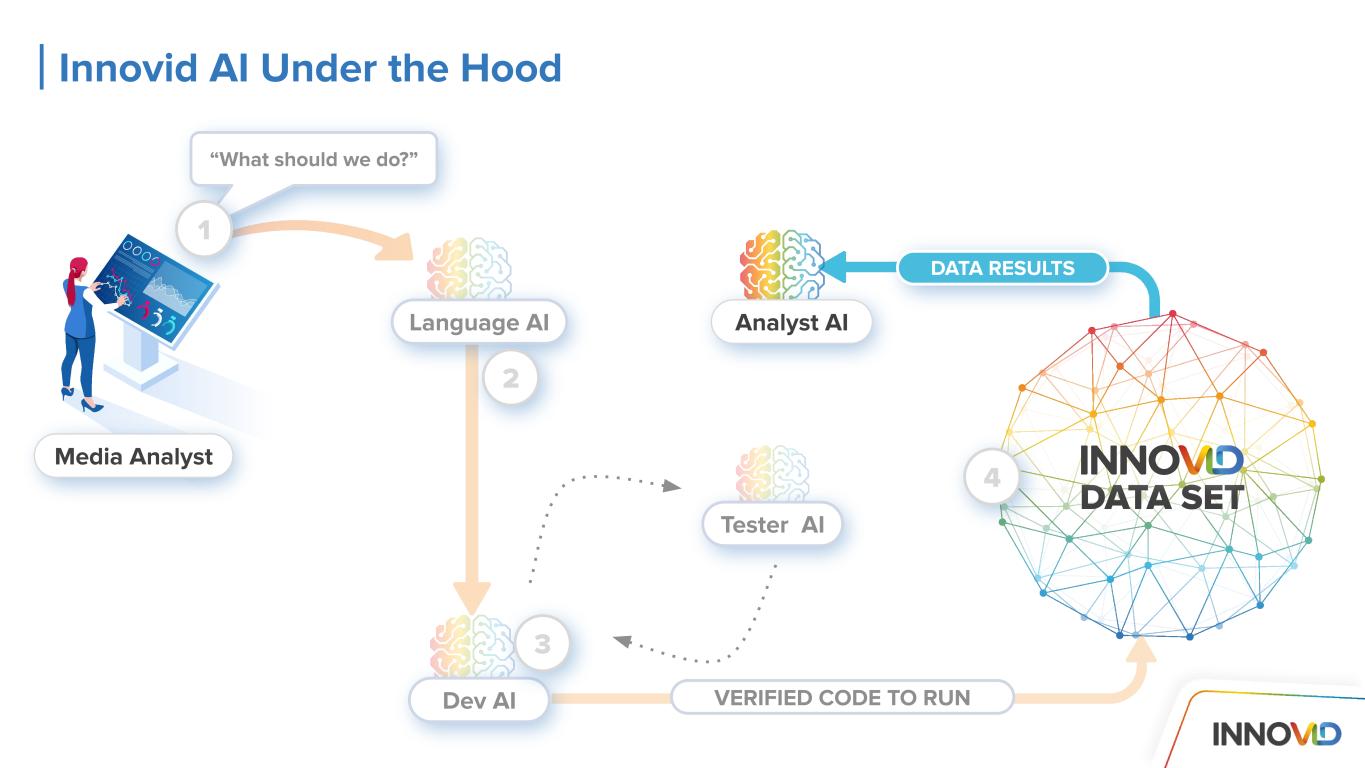
Language AI Analyst AI Dev AI DATA RESULTS Media Analyst Tester AI “What should we do?” 2 OPTIMIZED CODE TO RUN 3 4 1 VERIFIED CODE TO RUN Innovid AI Under the Hood DATA SET
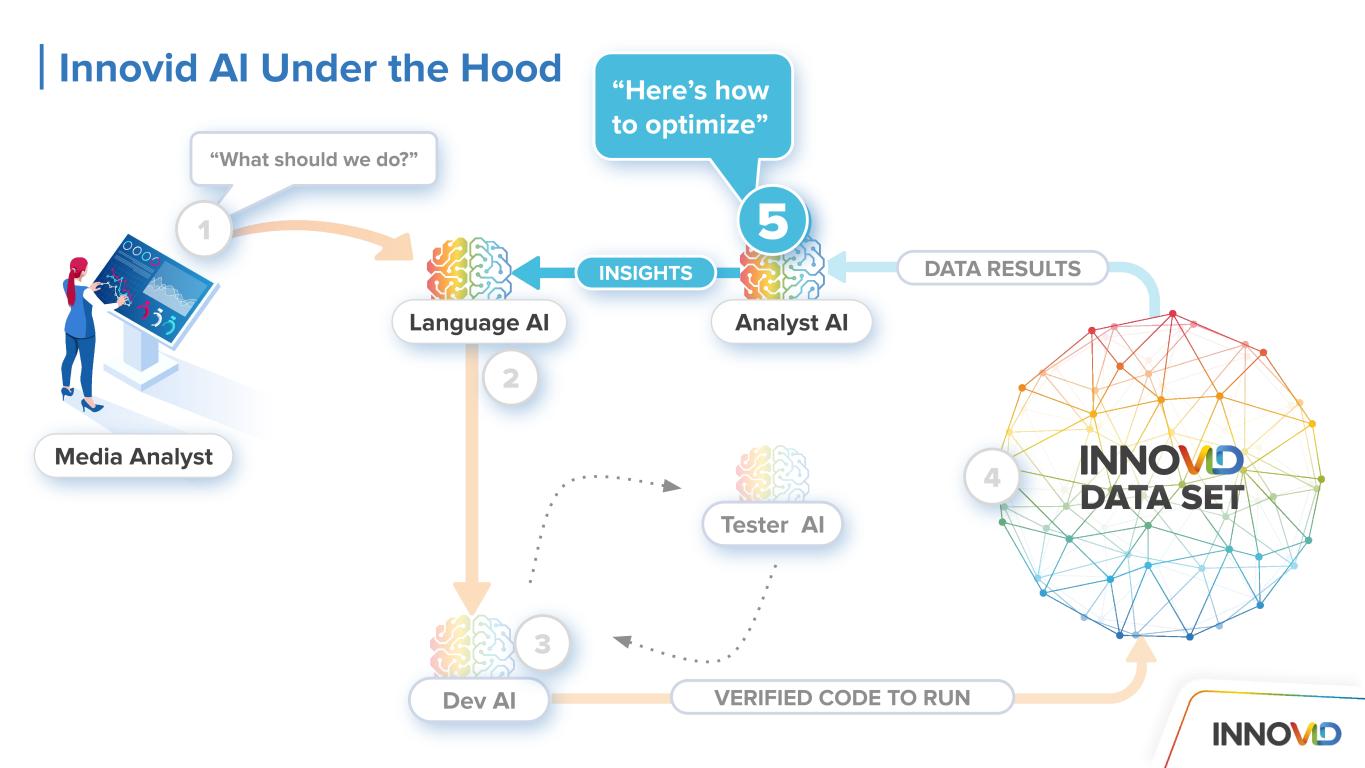
DATA RESULTS “Here’s how to optimize” Analyst AI 5 INSIGHTS 5 Language AI Dev AI Media Analyst Tester AI “What should we do?” 2 OPTIMIZED CODE TO RUN 3 4 1 VERIFIED CODE TO RUN Innovid AI Under the Hood DATA SET
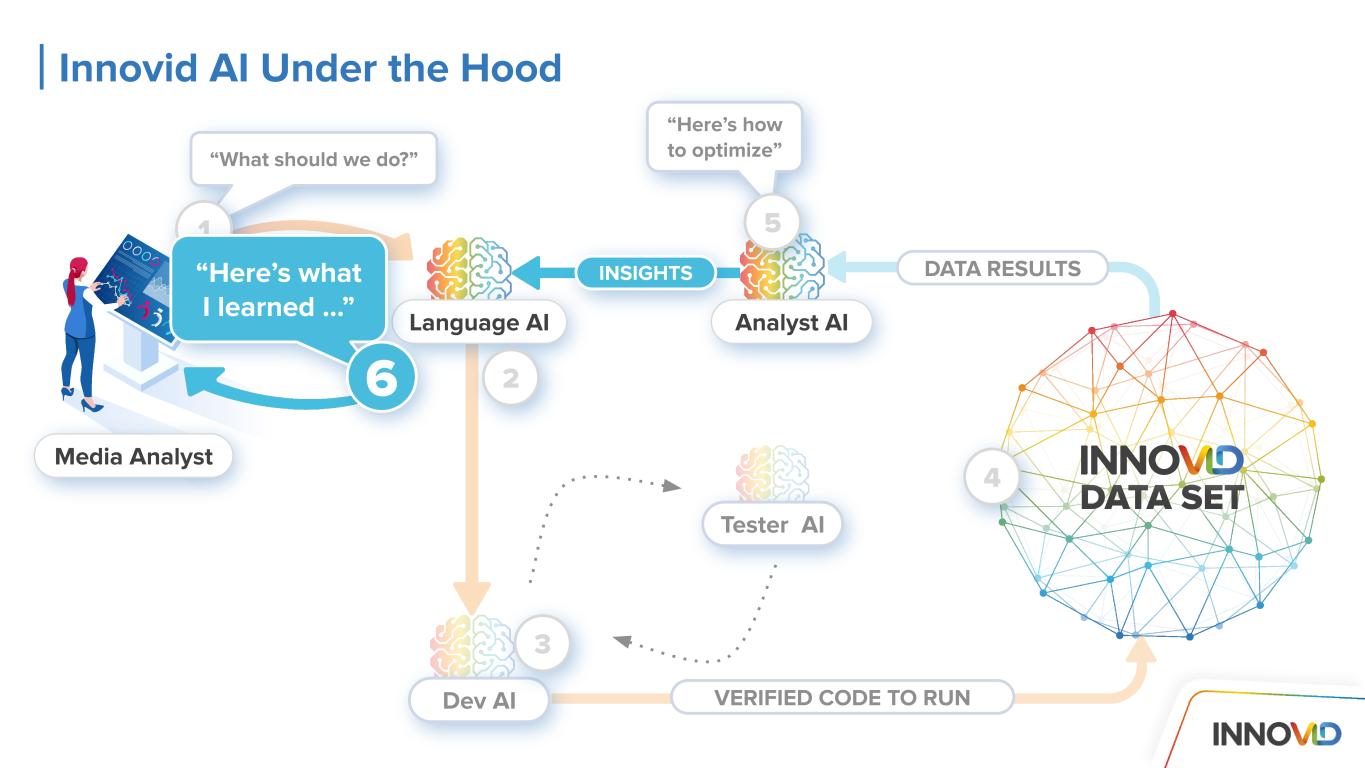
DATA RESULTS Analyst AILanguage AI Dev AI Media Analyst Tester AI “What should we do?” 2 OPTIMIZED CODE TO RUN 3 4 1 VERIFIED CODE TO RUN “Here’s what I learned …” 6 Innovid AI Under the Hood INSIGHTS DATA SET “Here’s how to optimize” 5

DATA RESULTS “Here’s how to optimize” Analyst AILanguage AI Dev AI MEDIA PLATFORMS Tester AI 2 OPTIMIZED CODE TO RUN 3 4 1 VERIFIED CODE TO RUN 6 Innovid AI Under the Hood INSIGHTS 5 DATA SET
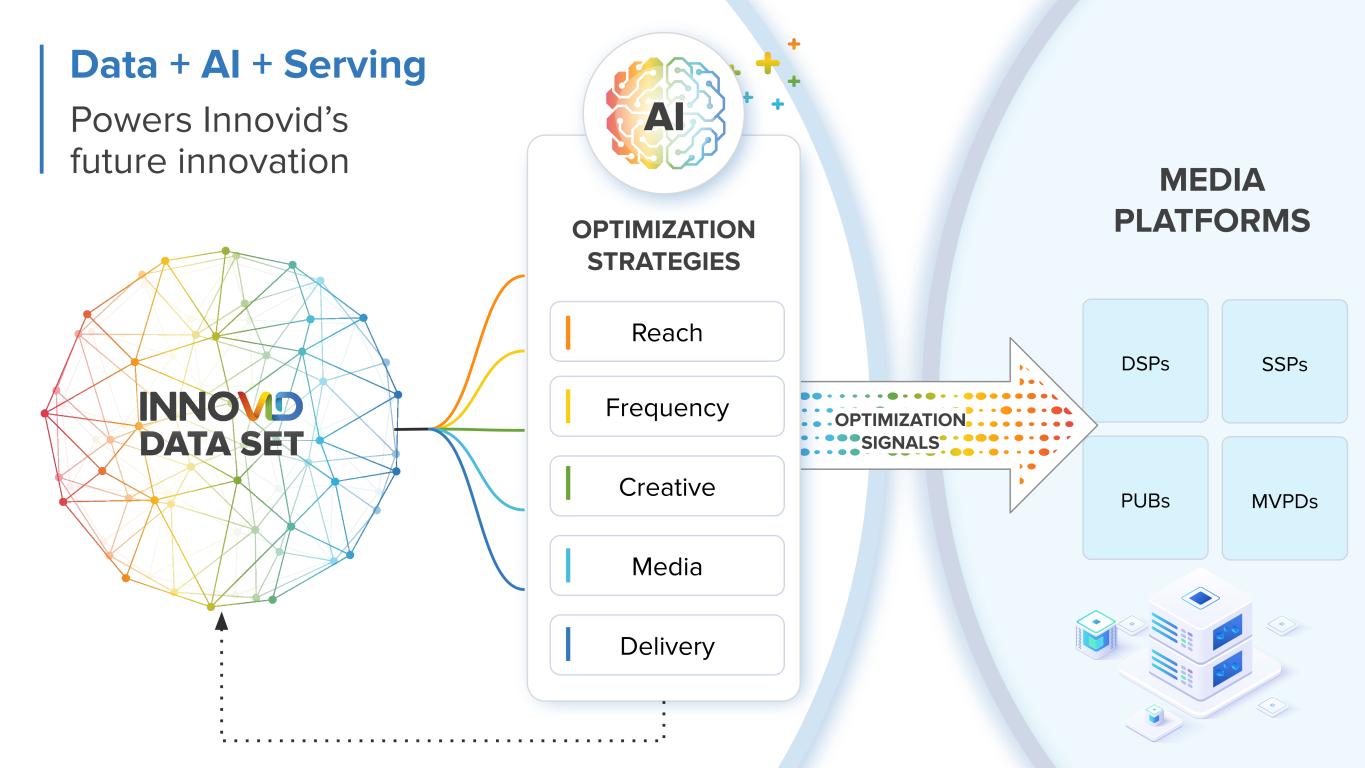
SSPs MVPDs DSPs PUBs MEDIA PLATFORMS Data + AI + Serving Powers Innovid’s future innovation OPTIMIZATION STRATEGIES Frequency Creative Media Delivery Reach AI DATA SET OPTIMIZATION SIGNALS
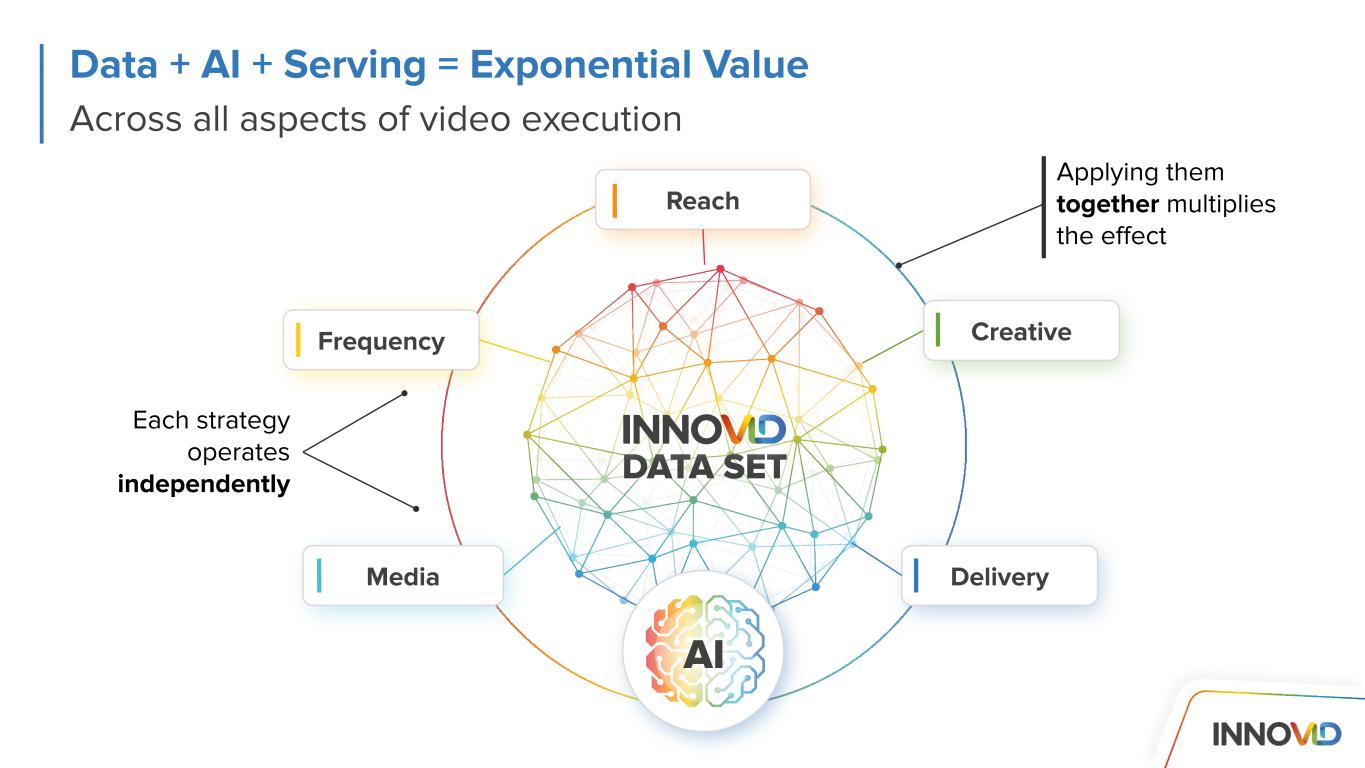
Across all aspects of video execution Reach Each strategy operates independently Applying them together multiplies the effect Delivery Data + AI + Serving = Exponential Value CreativeFrequency Media AI DATA SET

Growth & Profitability Tony Callini Chief Financial Officer
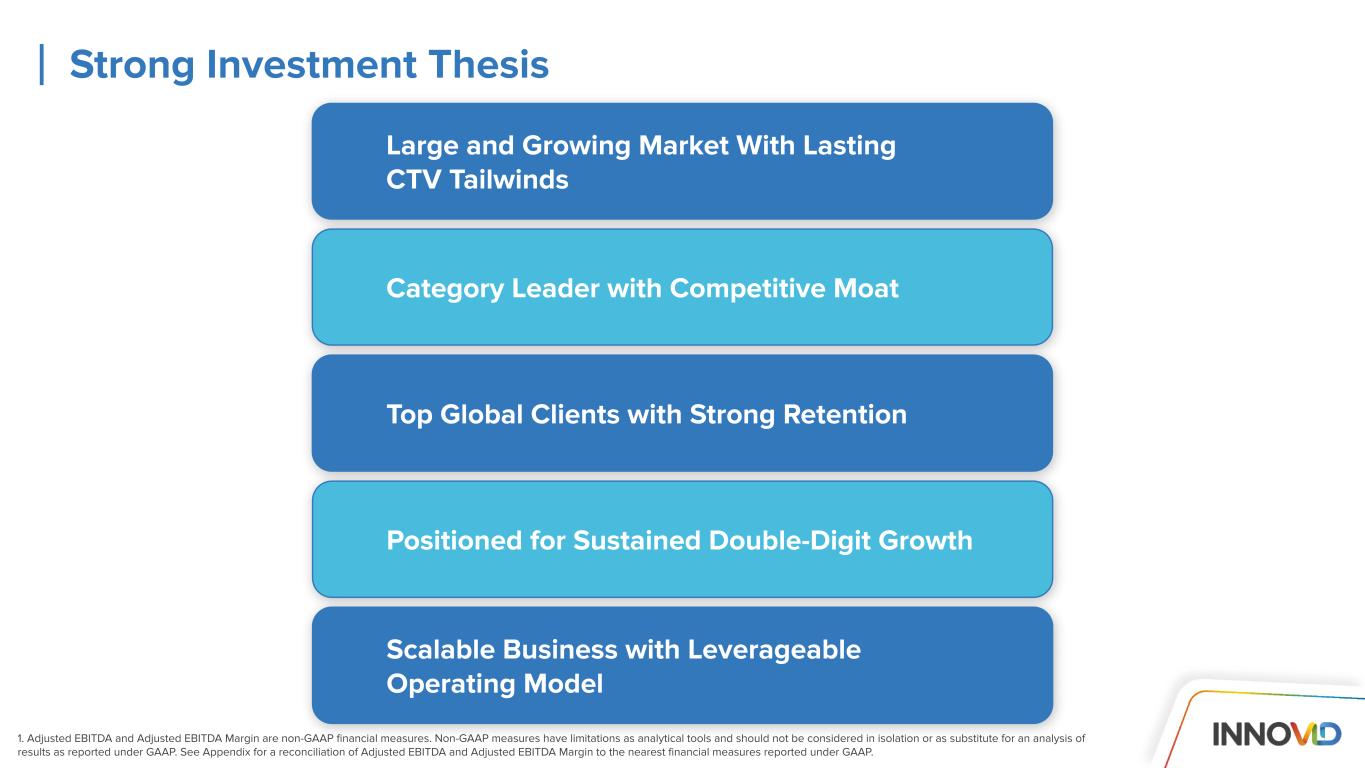
1. Adjusted EBITDA and Adjusted EBITDA Margin are non-GAAP financial measures. Non-GAAP measures have limitations as analytical tools and should not be considered in isolation or as substitute for an analysis of results as reported under GAAP. See Appendix for a reconciliation of Adjusted EBITDA and Adjusted EBITDA Margin to the nearest financial measures reported under GAAP. Strong Investment Thesis Large and Growing Market With Lasting CTV Tailwinds Category Leader with Competitive Moat Top Global Clients with Strong Retention Positioned for Sustained Double-Digit Growth Scalable Business with Leverageable Operating Model

● Approx. $200B TV ad market ● Continued shift from linear to CTV ● Live sports can accelerate transition ● Growth in ad-supported models ● Independent platform built purposely for CTV ● Accredited, award-winning technology ● Invaluable data set of trillions CTV data observations ● Disney, GM, Verizon, Mazda, Revlon, etc. ● Top 25 clients average 7 years of tenure ● Revenue base shifting to recurring model ● Compounding Growth Vectors ● Longer-term target or 20%+ annual growth ● Q323 Adjusted EBITDA Margin of 18% ● Longer-term target of 30%+ Large and Growing Market With Lasting CTV Tailwinds 1. Adjusted EBITDA and Adjusted EBITDA Margin are non-GAAP financial measures. Non-GAAP measures have limitations as analytical tools and should not be considered in isolation or as substitute for an analysis of results as reported under GAAP. See Appendix for a reconciliation of Adjusted EBITDA and Adjusted EBITDA Margin to the nearest financial measures reported under GAAP. Strong Investment Thesis Category Leader with Competitive Moat Top Global Clients with Strong Retention Positioned for Sustained Double-Digit Growth Scalable Business with Leverageable Operating Model
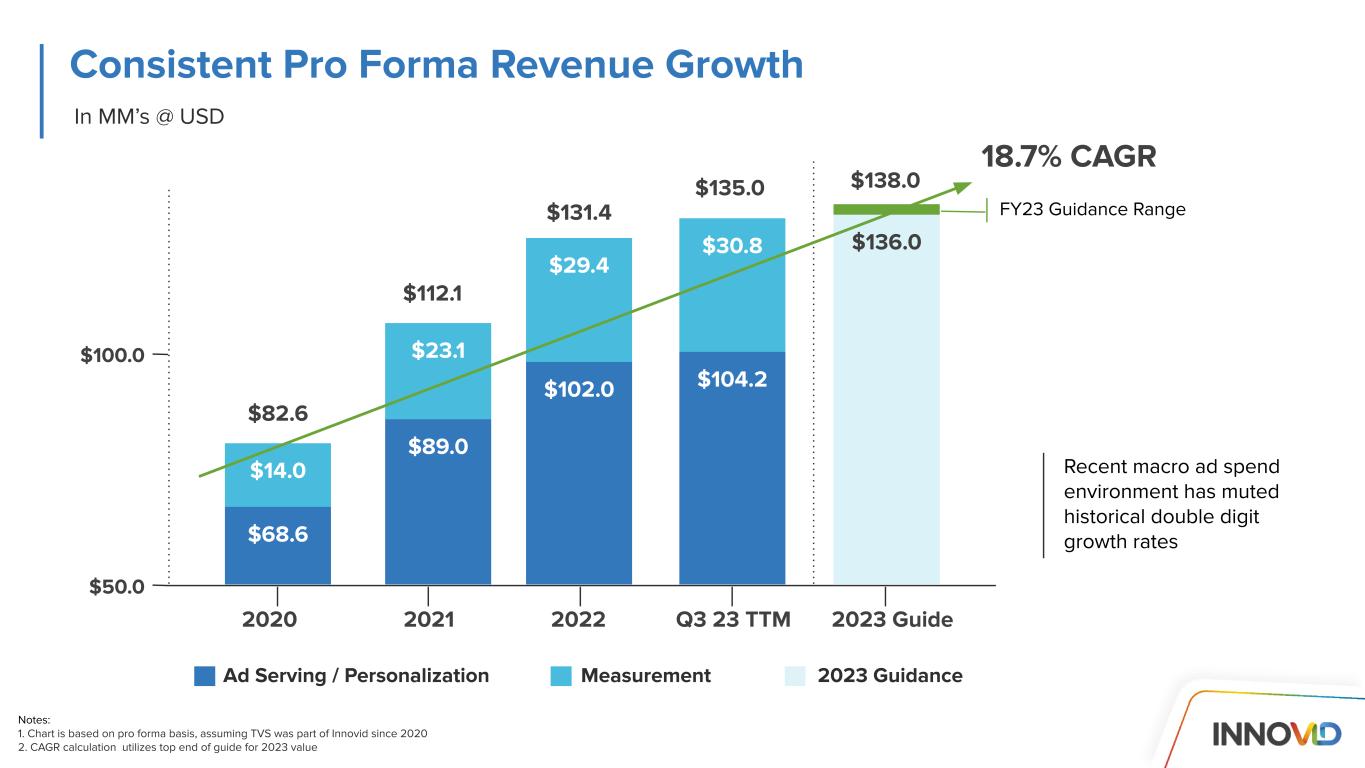
In MM’s @ USD Notes: 1. Chart is based on pro forma basis, assuming TVS was part of Innovid since 2020 2. CAGR calculation utilizes top end of guide for 2023 value Recent macro ad spend environment has muted historical double digit growth rates Consistent Pro Forma Revenue Growth $68.6 2021 $14.0 $82.6 Ad Serving / Personalization Measurement $89.0 $23.1 $102.0 $29.4 $104.2 $30.8 $136.0 Q3 23 TTM 2023 Guide $112.1 $131.4 $135.0 $138.0 18.7% CAGR 2020 2022 FY23 Guidance Range 2023 Guidance $50.0 $100.0
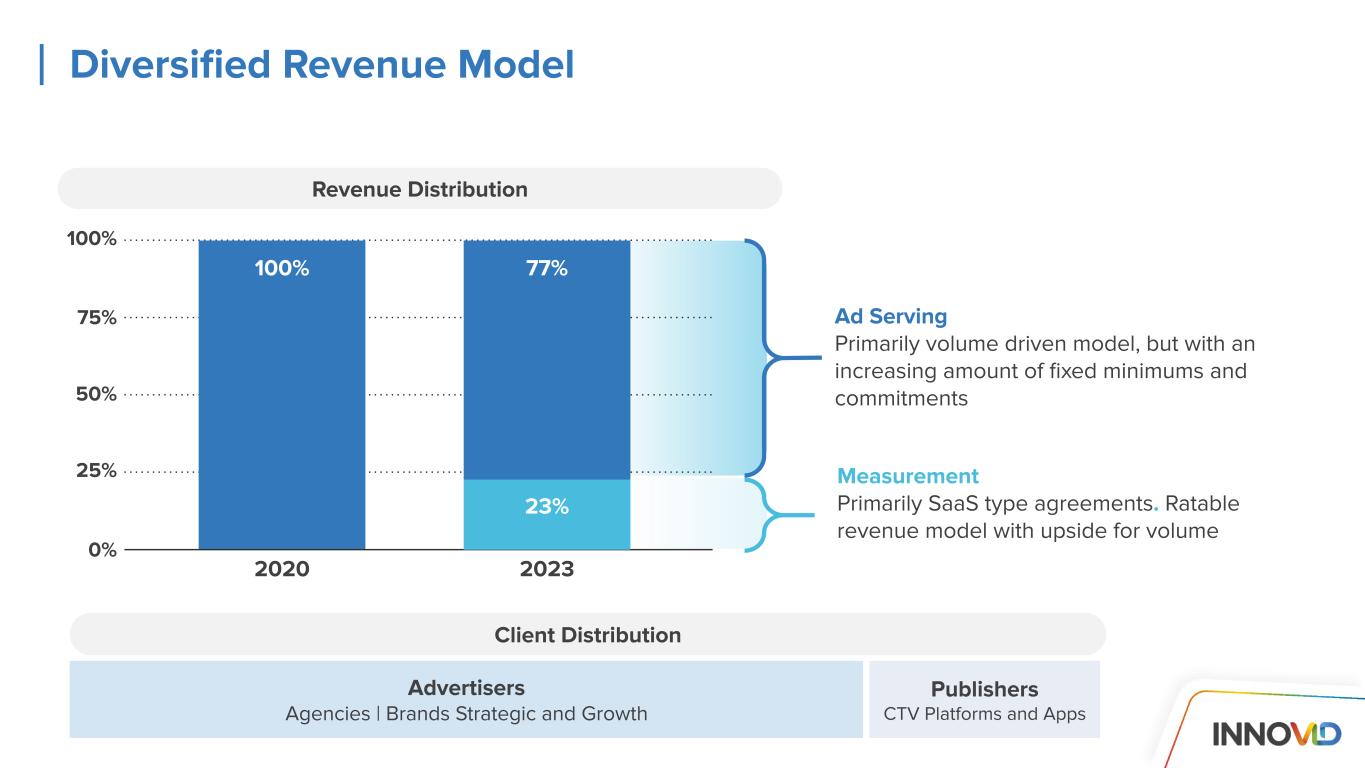
Advertisers Agencies | Brands Strategic and Growth Diversified Revenue Model 100% 23% 2023 77% 2020 75% 100% 25% 0% 50% Revenue Distribution Ad Serving Primarily volume driven model, but with an increasing amount of fixed minimums and commitments Measurement Primarily SaaS type agreements. Ratable revenue model with upside for volume Client Distribution Publishers CTV Platforms and Apps
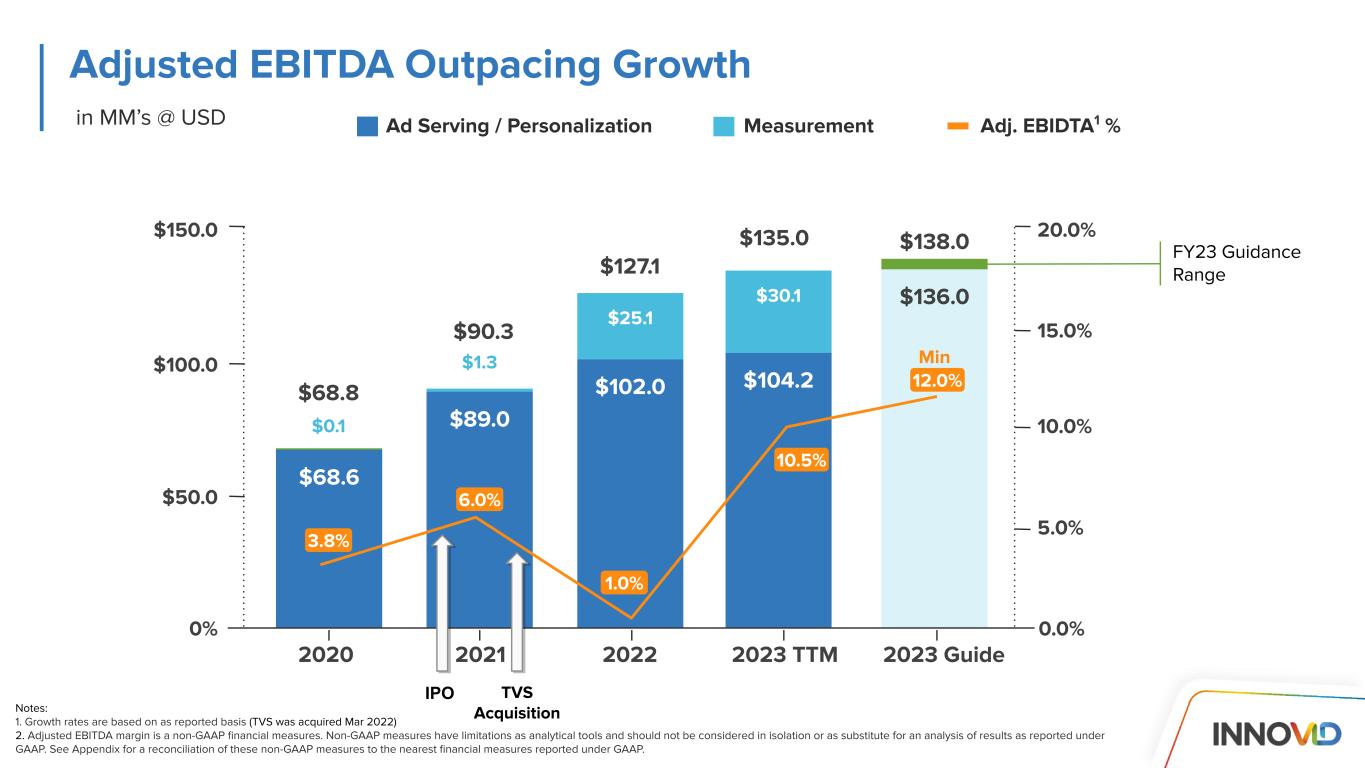
$25.1 $30.1 Notes: 1. Growth rates are based on as reported basis (TVS was acquired Mar 2022) 2. Adjusted EBITDA margin is a non-GAAP financial measures. Non-GAAP measures have limitations as analytical tools and should not be considered in isolation or as substitute for an analysis of results as reported under GAAP. See Appendix for a reconciliation of these non-GAAP measures to the nearest financial measures reported under GAAP. Adjusted EBITDA Outpacing Growth in MM’s @ USD $68.6 2021 $89.0 $102.0 $104.2 $136.0 2023 TTM 2023 Guide2020 2022 $68.8 $90.3 $127.1 $135.0 $138.0$150.0 $50.0 0% $100.0 $0.1 $1.3 20.0% 5.0% 0.0% 10.0% 15.0% FY23 Guidance Range 3.8% 6.0% 1.0% 10.5% 12.0% Min Ad Serving / Personalization Measurement Adj. EBIDTA1 % TVS Acquisition IPO
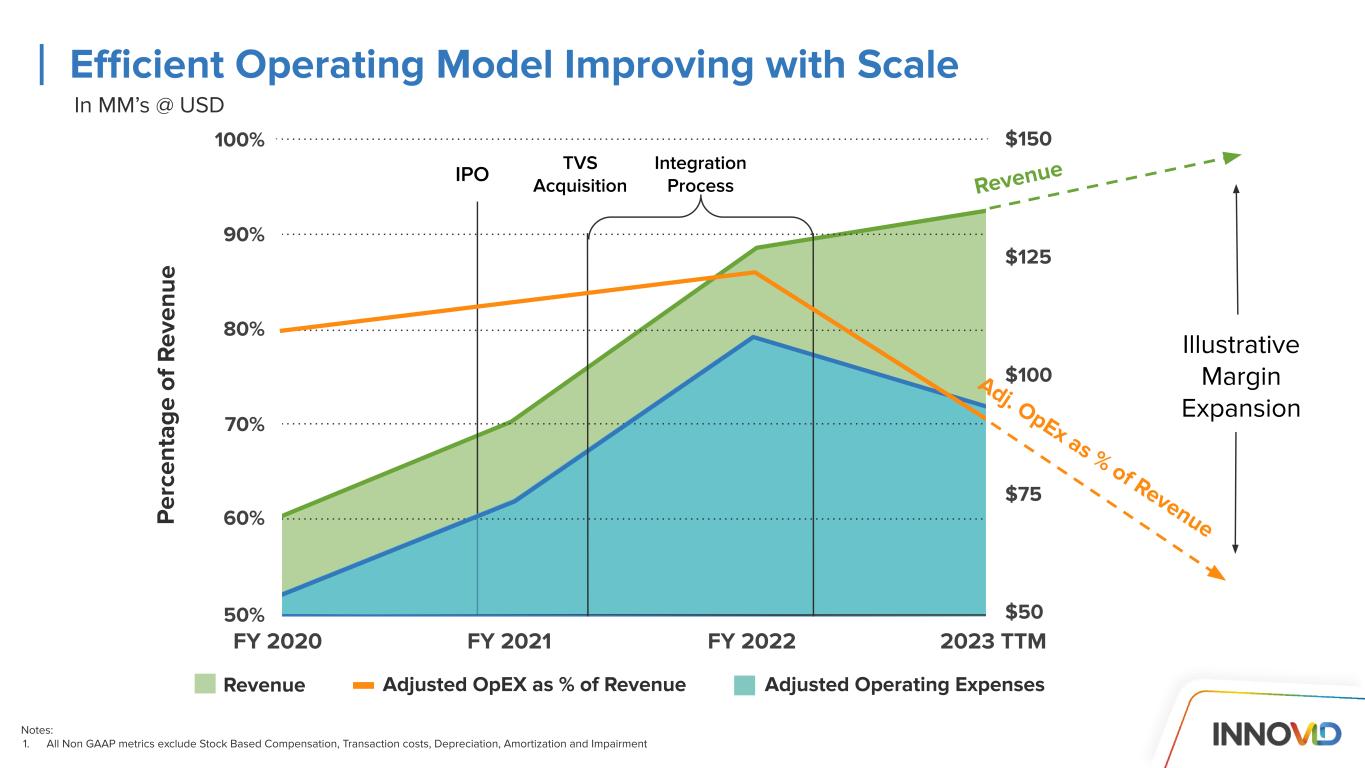
Notes: 1. All Non GAAP metrics exclude Stock Based Compensation, Transaction costs, Depreciation, Amortization and Impairment IPO TVS Acquisition Integration Process Efficient Operating Model Improving with Scale 90% 100% 70% 60% Revenue Adjusted Operating ExpensesAdjusted OpEX as % of Revenue FY 2021 FY 2022 2023 TTMFY 2020 P er ce nt ag e of R ev en ue 50% 80% $125 $150 $75 $50 $100 Revenue Adj. OpEx as % of Revenue Illustrative Margin Expansion In MM’s @ USD

hdd FY 2023 GuidanceQ4 2023 Guidance $35M $37M Revenue + 4-10% year-over-year as-reported growth $5.5M $7.5M Adjusted EBITDA1 $136M $138M Revenue 12% or greater Adjusted EBITDA1 1. Adjusted EBITDA and Adjusted EBITDA Margin are non-GAAP financial measures. Non-GAAP measures have limitations as analytical tools and should not be considered in isolation or as substitute for an analysis of results as reported under GAAP. See Appendix for a reconciliation of Adjusted EBITDA and Adjusted EBITDA Margin to the nearest financial measures reported under GAAP. 2. Including growth when accounting for TVS revenue effective the acquisition date 12x better than 2022 on as-reported basis + 84-148% year-over-year as-reported growth + 7-9% year-over-year as-reported growth Q4 and FY 2023 Guidance - in MM’s @ USD - -

Multiple growth vectors supports sustained double digit growth Efficient operating model converts more revenue to profit at scale No significant incremental capital requirements drives healthy Free Cash Flow1 realization Well Positioned for Margin Expansion on Growth Innovid Long-Term Model Revenue Revenue less Cost of Revenue Adj. EBITDA Margin1 Free Cash Flow1 Realization 20% + Approx 80% of Revenue 30% + > 60% of Adj. EBITDA 1. Adjusted EBITDA Margin and Free Cash Flow are non-GAAP financial measures. Non-GAAP measures have limitations as analytical tools and should not be considered in isolation or as substitute for an analysis of results as reported under GAAP. See Appendix for a reconciliation of Adjusted EBITDA Margin and Free Cash Flow to the nearest financial measures reported under GAAP.
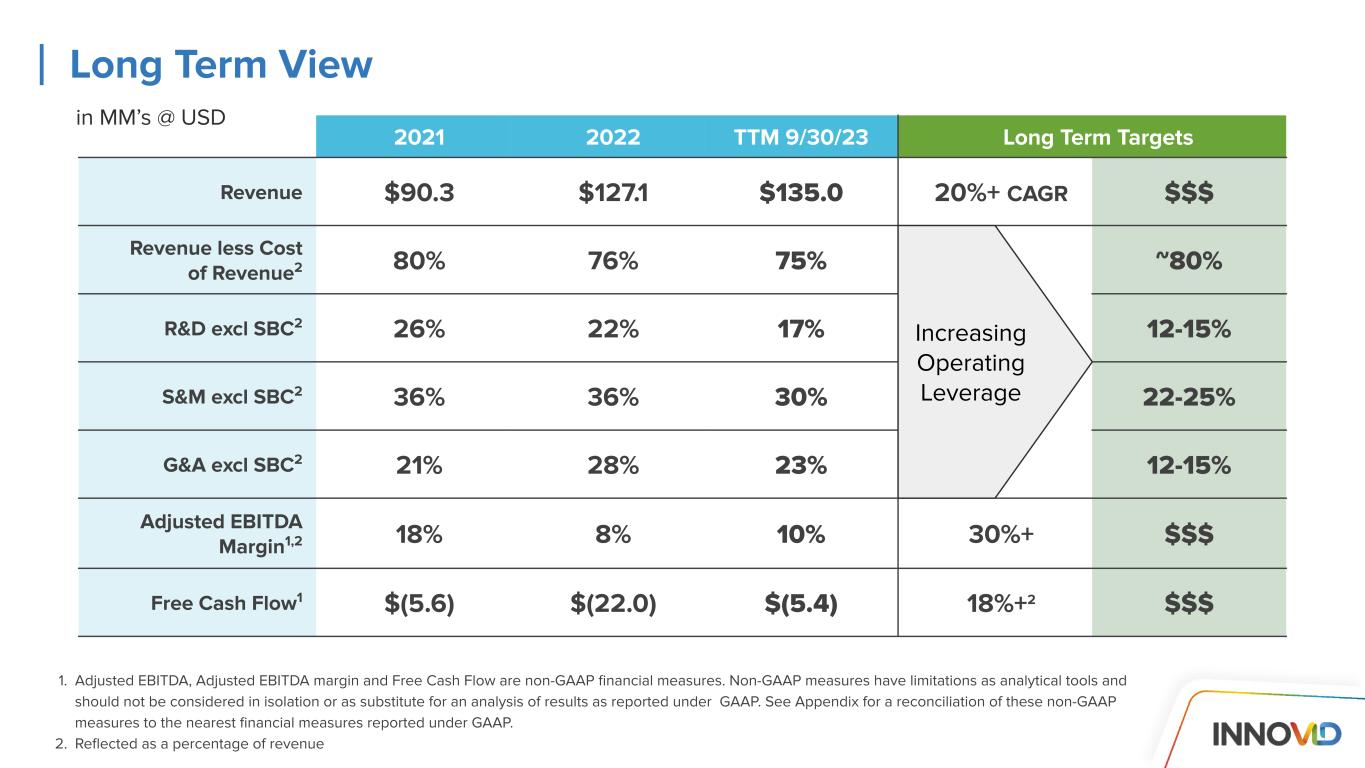
1. Adjusted EBITDA, Adjusted EBITDA margin and Free Cash Flow are non-GAAP financial measures. Non-GAAP measures have limitations as analytical tools and should not be considered in isolation or as substitute for an analysis of results as reported under GAAP. See Appendix for a reconciliation of these non-GAAP measures to the nearest financial measures reported under GAAP. 2. Reflected as a percentage of revenue 2021 2022 TTM 9/30/23 Long Term Targets Revenue $90.3 $127.1 $135.0 20%+ CAGR $$$ Revenue less Cost of Revenue2 80% 76% 75% ~80% R&D excl SBC2 26% 22% 17% 12-15% S&M excl SBC2 36% 36% 30% 22-25% G&A excl SBC2 21% 28% 23% 12-15% Adjusted EBITDA Margin1,2 18% 8% 10% 30%+ $$$ Free Cash Flow1 $(5.6) $(22.0) $(5.4) 18%+2 $$$ Long Term View Increasing Operating Leverage in MM’s @ USD
Thank You.
1. Adjusted EBITDA, Adjusted EBITDA Margin and Free Cash Flow are non-GAAP financial measures. Non-GAAP measures have limitations as analytical tools and should not be considered in isolation or as substitute for an analysis of results as reported under GAAP. 2. Primarily exit costs from former TVS employees. Non-GAAP Financial Measures Reconciliation 2021 2022 3Q'23 TTM Net cash provided by operating activities (2.4) (11.6) 6.0 Internal use software capitalization (2.6) (10.0) (10.8) Purchase of property and equipment (0.5) (0.5) (0.6) Free Cash Flow (5.6) (22.0) (5.4) 2021 2022 3Q'23 TTM Net loss (11.5) (18.4) (33.7) Depreciation, amortization, and impairment 0.7 6.1 11.5 Goodwill impairment - - 14.5 Stock-based compensation 3.3 13.9 19.4 Finance expense (income), net 4.4 (13.3) (5.7) Transaction related expenses 7.2 0.4 0.0 Acquisition related expenses 0.2 5.0 - Retention bonus expenses - 3.2 1.4 Legal claims - 1.5 1.5 Severance cost - - 0.8 Other (2) - 0.9 0.2 Taxes on income 1.2 2.0 4.2 Adjusted EBITDA (1) 5.4 1.2 14.2 Adjusted EBITDA margin 6.0% 1.0% 10.5% in MM’s @ USD