Exhibit 99.1

| Media Contact | Investor Contact | |
| Lee Underwood Media Relations (706) 644-0528 |
Steve Adams Investor Relations (706) 641-6462 |
Synovus Announces Earnings for the Second Quarter 2018
Diluted Earnings per Share of $0.91, up 52.7% vs. $0.60 in 2Q17
COLUMBUS, Ga., July 24, 2018 – Synovus Financial Corp. (NYSE: SNV) today reported financial results for the quarter ended June 30, 2018.
Second Quarter Highlights
| • | Net income available to common shareholders was $108.6 million or $0.91 per diluted share as compared to $100.6 million or $0.84 per diluted share for the first quarter 2018 and $73.4 million or $0.60 per diluted share for the second quarter 2017. |
| ○ | Adjusted earnings per diluted share for the second quarter 2018 were $0.92, up 7.8% from the first quarter 2018 and a 52.6% increase from the second quarter 2017. |
| • | Return on average assets was 1.42%, up 8 basis points from the previous quarter and up 42 basis points from the second quarter 2017. |
| • | Return on average common equity was 15.39%, up 77 basis points from the previous quarter and up 505 basis points from the second quarter 2017. |
| ○ | Adjusted return on average common equity was 15.59%, an improvement of 510 basis points from the second quarter 2017. |
| ○ | Adjusted return on average tangible common equity was 15.97%, an increase of 522 basis points from the second quarter 2017. |
| • | Total loans ended the quarter at $25.13 billion, up $251.0 million or 4.0% annualized from the previous quarter and up $703.5 million or 2.9% as compared to the second quarter 2017. |
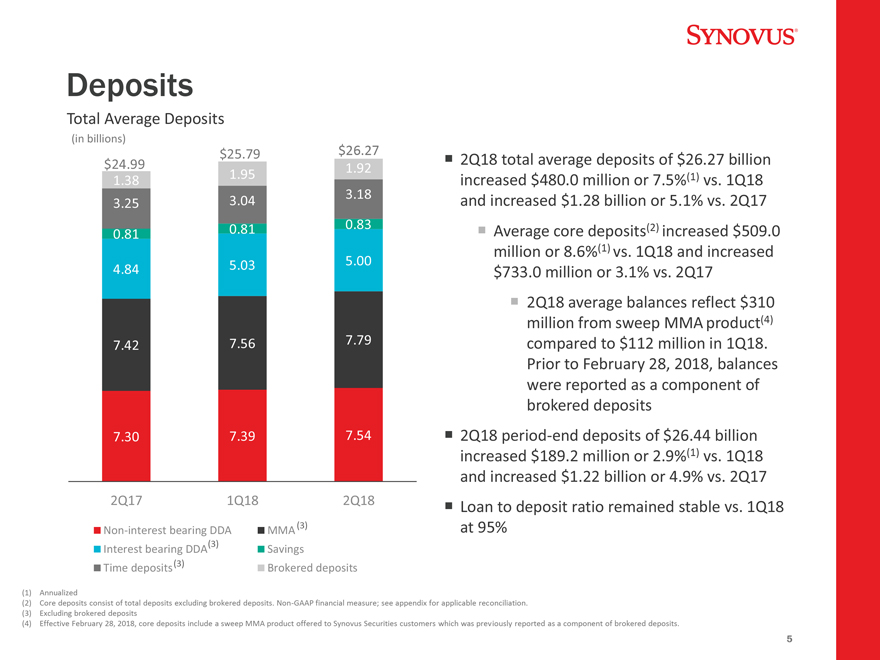
| • | Total average deposits grew $480.0 million or 7.5% annualized from the previous quarter and $1.28 billion or 5.1% versus the second quarter 2017. |
| • | Total ending deposits increased $189.2 million or 2.9% from the previous quarter and increased $1.22 billion or 4.9% from the second quarter 2017. |
| • | Total revenues1 were $359.3 million, an increase of 12.3% from the prior-year quarter. |
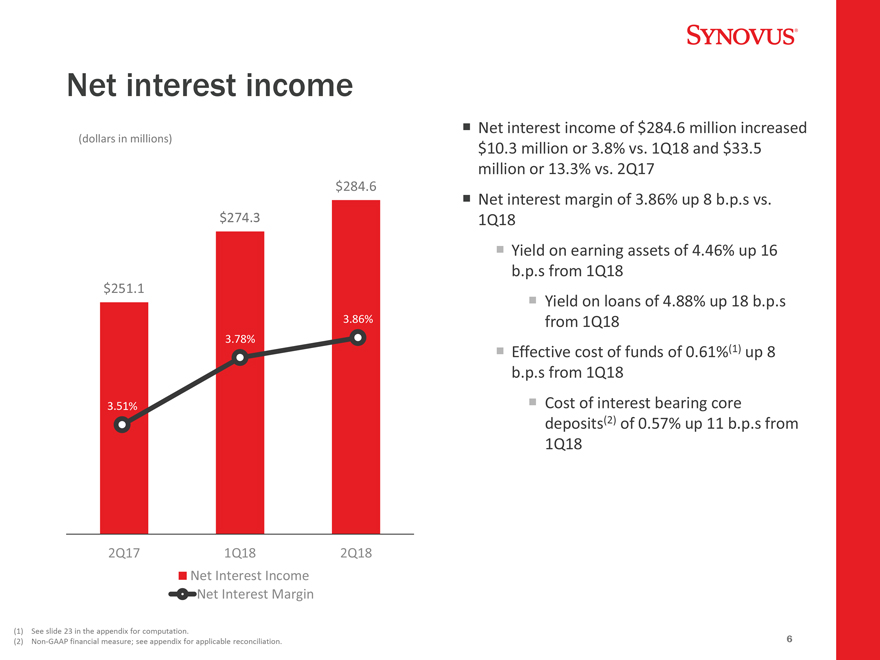
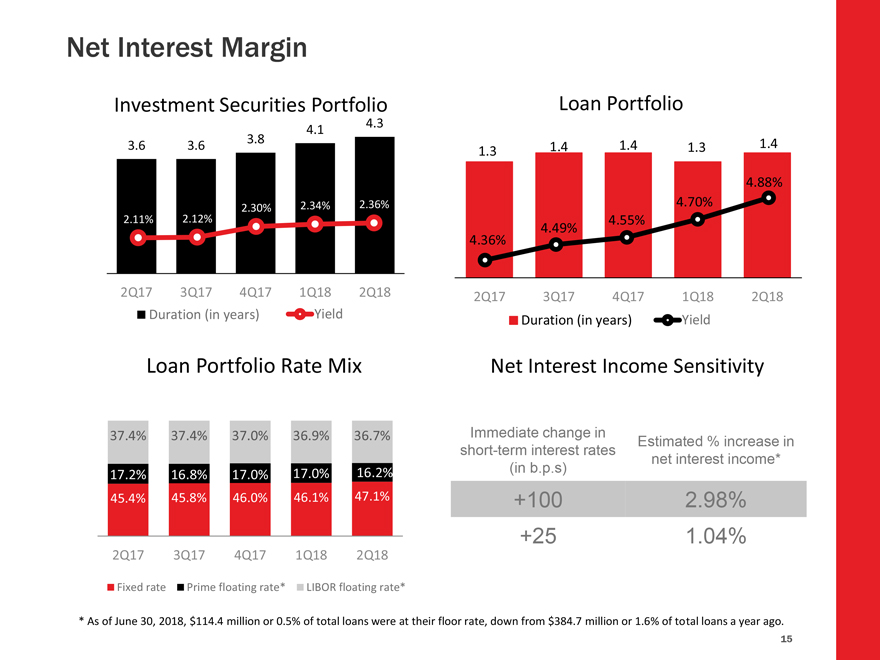
| • | Net interest margin was 3.86%, up 8 basis points from the previous quarter and up 35 basis points from the second quarter 2017. |
| • | Efficiency ratio was 56.78%, down 38 basis points from the previous quarter and down 312 basis points from the prior-year quarter. |
| • | Credit quality metrics remained favorable, with a non-performing asset ratio of 50 basis points, down 3 basis points from the previous quarter and down 23 basis points from the second quarter 2017. |
| • | The effective tax rate in the second quarter of 2018 was 21.8% compared to 35.5% in the prior-year quarter. |
| 1 | Total revenues consist of net interest income and non-interest income excluding investment securities gains/(losses). |
| • | On June 21, Synovus completed a public offering of $200 million of Fixed-to-Floating Rate Non-Cumulative Perpetual Preferred Stock, Series D. |
“This was another solid quarter of performance for Synovus, with strong earnings and revenue growth,” said Kessel Stelling, Synovus chairman and CEO. “During the first half of the year, we successfully completed our transition to a unified brand, completed a public offering of $200 million of Series D Preferred Stock, and were ranked among American Banker’s most reputable banks for the fourth consecutive year. We are energized about the strong momentum going into the second half of the year as we focus on growing relationships and strengthening our communities.”
Balance Sheet
| • | Total average loans were $24.95 billion, up $93.9 million or 1.5% annualized from the previous quarter and $596.3 million or 2.4% as compared to the second quarter 2017. |
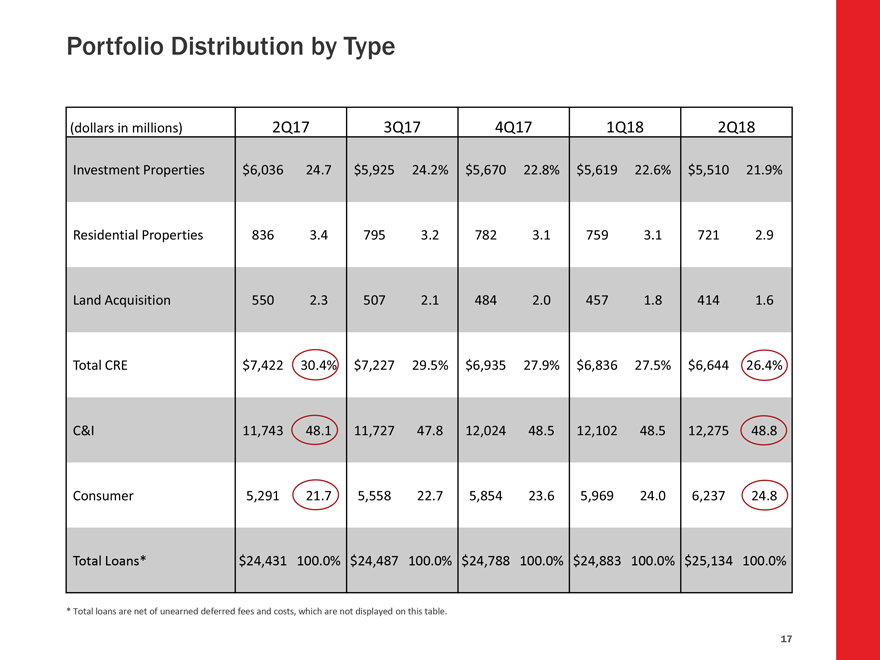
| • | Total loans ended the quarter at $25.13 billion, up $251.0 million or 4.0% annualized from the previous quarter and up $703.5 million or 2.9% as compared to the second quarter 2017. |
| ○ | Commercial and industrial loans grew by $173.6 million or 5.8% annualized from the previous quarter and $532.5 million or 4.5% as compared to the second quarter 2017. |
| ○ | Consumer loans grew by $267.8 million or 18.0% annualized from the previous quarter and $945.8 million or 17.9% as compared to the second quarter 2017. |
| ○ | Commercial real estate loans declined by $191.6 million or 11.2% annualized from the previous quarter and declined $778.1 million or 10.5% as compared to the second quarter 2017. |
| • | Total average deposits were $26.27 billion, up $480.0 million or 7.5% annualized from the previous quarter and $1.28 billion or 5.1% as compared to the second quarter 2017. |
Core Performance
| • | Total revenues1 were $359.3 million, up $17.9 million or 5.3% from the previous quarter and $39.5 million or 12.3% from the second quarter 2017. |
| • | Net interest income was $284.6 million, up $10.3 million or 3.8% from the previous quarter and up 13.3% from the second quarter 2017. |
| • | Net interest margin was 3.86%, up 8 basis points from the previous quarter. Yield on earning assets was 4.46%, up 16 basis points from the previous quarter, and the effective cost of funds was 0.61%, up 8 basis points from the previous quarter. |
| • | Total non-interest income was $73.4 million, up $6.3 million or 9.5% compared to the previous quarter and up $4.7 million or 6.8% from second quarter 2017. |
| ○ | Adjusted non-interest income was $74.7 million, up $4.6 million or 6.6% from the previous quarter and up $4.7 million or 6.7% as compared to the second quarter 2017. |
| • | Core banking fees2 were $37.4 million, up $1.6 million or 4.4% from the previous quarter and $757 thousand or 2.1% year-over-year. |
| • | Fiduciary and asset management fees, brokerage revenue, and insurance revenues were $24.8 million, up $1.5 million or 6.1% from the previous quarter and 19.1% from the prior-year quarter. |
| 1 | Total revenues consist of net interest income and non-interest income excluding investment securities gains/(losses). |
| 2 | Core banking fees include service charges on deposit accounts, card fees, letter of credit fees, ATM fee income, line of credit non-usage fees, gains from sales of government guaranteed loans, and miscellaneous other service charges. |
| • | Mortgage banking income was $4.8 million, down 4.1% from the previous quarter and down 16.3% from the second quarter 2017. |
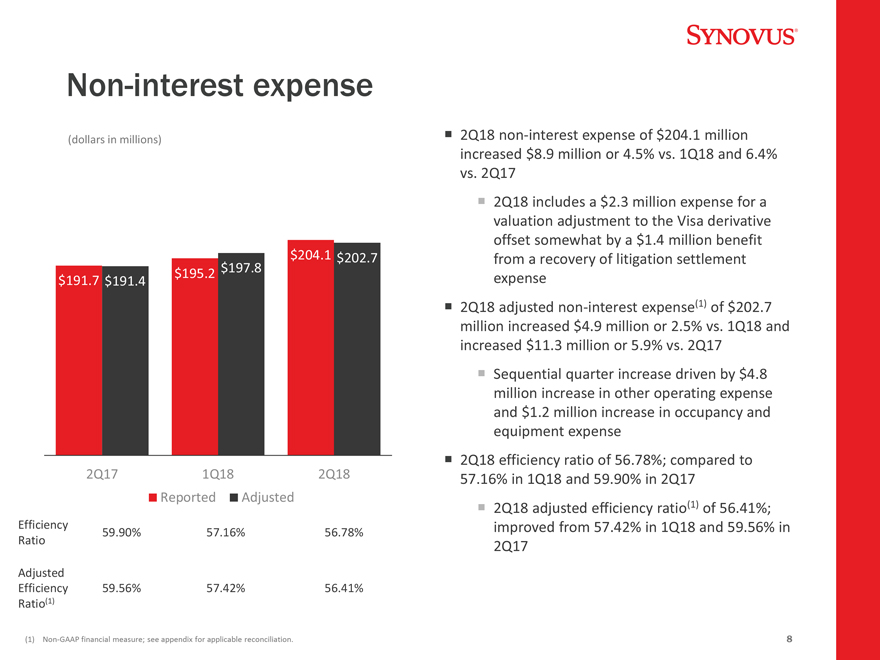
| • | Total non-interest expense was $204.1 million, up $8.9 million or 4.5% from the previous quarter and up 6.4% from the second quarter 2017. |
| ○ | Second quarter 2018 includes a $2.3 million expense for a valuation adjustment to the Visa derivative, partially offset by a $1.4 million benefit from recovery of litigation settlement expenses. |
| • | Adjusted non-interest expense was $202.7 million, up $4.9 million or 2.5% from the previous quarter and $11.3 million or 5.9% from the second quarter 2017. |
| ○ | Employment expense of $111.9 million declined 1.6% from the previous quarter and increased 6.3% from the second quarter 2017. |
| ○ | Occupancy and equipment expense of $32.7 million increased 3.7% from the previous quarter and increased 9.1% from the prior-year quarter. |
| ○ | Other expenses of $25.2 million increased $4.8 million or 23.3% from the previous quarter and increased 27.7% from the second quarter 2017. |
| ○ | Efficiency ratio was 56.78%, compared to 57.16% the previous quarter and 59.90% in the second quarter 2017. |
| ◾ | Adjusted efficiency ratio was 56.41%, an improvement of 101 basis points from the first quarter 2018 and 315 basis points from the second quarter 2017. |
Credit Quality
| • | Non-performing loans were $117.3 million at June 30, 2018, down $2.8 million from March 31, 2018, and down $42.0 million or 26.4% from June 30, 2017. The non-performing loan ratio was 0.47% at June 30, 2018, compared to 0.48% at March 31, 2018, and 0.65% at June 30, 2017. |
| • | Total non-performing assets were $126.3 million at June 30, 2018, down $4.8 million from March 31, 2018 and down $52.6 million or 29.4% from June 30, 2017. The non-performing asset ratio was 0.50% at June 30, 2018, as compared to 0.53% at March 31, 2018, and 0.73% at June 30, 2017. |
| • | Net charge-offs were $17.8 million in the second quarter 2018, up $13.6 million from $4.3 million in the previous quarter and up $2.2 million from $15.7 million in the second quarter 2017. The annualized net charge-off ratio was 0.29% in the second quarter as compared to 0.07% in the previous quarter and 0.26% in the second quarter 2017. |
| • | Total delinquencies (consisting of loans 30 or more days past due and still accruing) remained low at 0.22% of total loans at June 30, 2018, unchanged from the previous quarter and down 5 basis points from June 30, 2017. |
Capital
| • | During the second quarter 2018, Synovus repurchased $50.0 million in common stock, as part of the previously announced share repurchase program of up to $150 million. |
| • | On June 21, Synovus completed a public offering of $200 million of Fixed-to-Floating Rate Non-Cumulative Perpetual Preferred Stock, Series D. |
| • | Common Equity Tier 1 ratio was 10.11% at June 30, 2018, compared to 10.09% at March 31, 2018. |
| • | Tier 1 Capital ratio was 11.25% at June 30, 2018, compared to 10.53% at March 31, 2018. |
| • | Total Risk Based Capital ratio was 13.07% at June 30, 2018, compared to 12.40% at March 31, 2018. |
| • | Tier 1 Leverage ratio was 10.03% at June 30, 2018, compared to 9.37% at March 31, 2018. |
| • | Tangible Common Equity ratio was 8.77% at June 30, 2018, compared to 8.79% at March 31, 2018. |
Second Quarter Earnings Conference Call
Synovus will host an earnings highlights conference call at 8:30 a.m. EDT on July 24, 2018. The earnings call will be accompanied by a slide presentation. Shareholders and other interested parties may listen to this conference call via simultaneous Internet broadcast. For a link to the webcast, go to investor.synovus.com/event. The replay will be archived for 12 months and will be available 30-45 minutes after the call.
Synovus Financial Corp. is a financial services company based in Columbus, Georgia, with approximately $32 billion in assets. Synovus provides commercial and retail banking, investment, and mortgage services through 250 branches in Georgia, Alabama, South Carolina, Florida, and Tennessee. Synovus Bank, a wholly owned subsidiary of Synovus, has been recognized as one the country’s 10 “Most Reputable Banks” by American Banker and the Reputation Institute for four consecutive years. Synovus is on the web at synovus.com, and on Twitter, Facebook, LinkedIn, and Instagram.
Forward-Looking Statements
This press release and certain of our other filings with the Securities and Exchange Commission contain statements that constitute “forward-looking statements” within the meaning of, and subject to the protections of, Section 27A of the Securities Act of 1933, as amended, and Section 21E of the Securities Exchange Act of 1934, as amended. All statements other than statements of historical fact are forward-looking statements. You can identify these forward-looking statements through Synovus’ use of words such as “believes,” “anticipates,” “expects,” “may,” “will,” “assumes,” “should,” “predicts,” “could,” “would,” “intends,” “targets,” “estimates,” “projects,” “plans,” “potential” and other similar words and expressions of the future or otherwise regarding the outlook for Synovus’ future business and financial performance and/or the performance of the banking industry and economy in general. These forward-looking statements include, among others, our expectations regarding deposits, loan growth and the net interest margin; expectations on our growth strategy, expense initiatives, capital management and future profitability; expectations on credit trends and key credit metrics; and the assumptions underlying our expectations. Prospective investors are cautioned that any such forward-looking statements are not guarantees of future performance and involve known and unknown risks and uncertainties which may cause the actual results, performance or achievements of Synovus to be materially different from the future results, performance or achievements expressed or implied by such forward-looking statements. Forward-looking statements are based on the information known to, and current beliefs and expectations of, Synovus’ management and are subject to significant risks and uncertainties. Actual results may differ materially from those contemplated by such forward-looking statements. A number of factors could cause actual results to differ materially from those contemplated by the forward-looking statements in this press release. Many of these factors are beyond Synovus’ ability to control or predict.
These forward-looking statements are based upon information presently known to Synovus’ management and are inherently subjective, uncertain and subject to change due to any number of risks and uncertainties, including, without limitation, the risks and other factors set forth in Synovus’ filings
with the Securities and Exchange Commission, including its Annual Report on Form 10-K for the year ended December 31, 2017, under the captions “Cautionary Notice Regarding Forward-Looking Statements” and “Risk Factors” and in Synovus’ quarterly reports on Form 10-Q and current reports on Form 8-K. We believe these forward-looking statements are reasonable; however, undue reliance should not be placed on any forward-looking statements, which are based on current expectations and speak only as of the date that they are made. We do not assume any obligation to update any forward-looking statements as a result of new information, future developments or otherwise, except as otherwise may be required by law.
Non-GAAP Financial Measures
The measures entitled adjusted non-interest income; adjusted non-interest expense; adjusted efficiency ratio; adjusted earnings per diluted share; adjusted return on average common equity; adjusted return on average tangible common equity; tangible common equity ratio; and common equity Tier 1 (CET1) ratio (fully phased-in) are not measures recognized under GAAP and therefore are considered non-GAAP financial measures. The most comparable GAAP measures to these measures are total non-interest income; total non-interest expense; efficiency ratio; earnings per diluted common share; return on average common equity; the ratio of total shareholders’ equity to total assets; and the CET1 ratio, respectively.
Management believes that these non-GAAP financial measures provide meaningful additional information about Synovus to assist management and investors in evaluating Synovus’ operating results, financial strength, the performance of its business, and the strength of its capital position. However, these non-GAAP financial measures have inherent limitations as analytical tools and should not be considered in isolation or as a substitute for analyses of operating results or capital position as reported under GAAP. The non-GAAP financial measures should be considered as additional views of the way our financial measures are affected by significant items and other factors, and since they are not required to be uniformly applied, they may not be comparable to other similarly titled measures at other companies. Adjusted non-interest income is a measure used by management to evaluate total revenue and non-interest income exclusive of net investment securities gains/losses and changes in fair value of private equity investments, net. Adjusted non-interest expense and the adjusted efficiency ratio are measures utilized by management to measure the success of expense management initiatives focused on reducing recurring controllable operating costs. Adjusted earnings per diluted share and adjusted return on average common equity are measures used by management to evaluate operating results exclusive of items that are not indicative of ongoing operations and impact period-to-period comparisons. The adjusted return on average tangible common equity is a measure used by management to compare Synovus’ performance with other financial institutions because it calculates the return available to common shareholders without the impact of intangible assets and their related amortization, thereby allowing management to evaluate the performance of the business consistently. The tangible common equity ratio and common equity Tier 1 (CET1) ratio (fully phased-in) are used by management and bank regulators to assess the strength of our capital position. The computations of these measures are set forth in the tables below.
Reconciliation of Non-GAAP Financial Measures
| (dollars in thousands) | 2Q18 |
1Q18 |
2Q17 |
|||||||||
| Adjusted non-interest income |
||||||||||||
| Total non-interest income |
$73,387 | $67,046 | $68,701 | |||||||||
| Add: Investment securities losses, net |
1,296 | - | 1 | |||||||||
| Add: Decrease in fair value of private equity investments, net |
37 | 3,056 | 1,352 | |||||||||
| Adjusted non-interest income |
$74,720 | $70,102 | $70,054 | |||||||||
| Adjusted non-interest expense |
||||||||||||
| Total non-interest expense |
$ 204,057 | $ 195,179 | $191,747 | |||||||||
| Add: Litigation settlement/contingency expense |
1,400 | 2,626 | - | |||||||||
| Subtract/add: Restructuring charges, net |
(103) | 315 | (13) | |||||||||
| Subtract: Amortization of intangibles |
(292) | (292) | (292) | |||||||||
| Subtract: Valuation adjustment to Visa derivative |
(2,328) | - | - | |||||||||
| Adjusted non-interest expense |
$ 202,734 | $ 197,828 | $191,442 | |||||||||
| Adjusted efficiency ratio |
||||||||||||
| Adjusted non-interest expense |
$ 202,734 | $ 197,828 | $191,442 | |||||||||
| Net interest income |
284,577 | 274,284 | 251,097 | |||||||||
| Add: Tax equivalent adjustment |
120 | 116 | 298 | |||||||||
| Add: Total non-interest income |
73,387 | 67,046 | 68,701 | |||||||||
| Add: Investment securities losses, net |
1,296 | - | 1 | |||||||||
| Total FTE revenues |
359,380 | 341,446 | 320,097 | |||||||||
| Add: Decrease in fair value of private equity investments, net |
37 | 3,056 | 1,352 | |||||||||
| Adjusted total revenues |
$ 359,417 | $ 344,502 | $321,449 | |||||||||
| Efficiency ratio |
56.78% | 57.16% | 59.90% | |||||||||
| Adjusted efficiency ratio |
56.41% | 57.42% | 59.56% | |||||||||
Reconciliation of Non-GAAP Financial Measures, continued
| (in thousands, except per share data) | 2Q18 |
1Q18 |
2Q17 |
|||||||||
| Adjusted earnings per diluted share |
||||||||||||
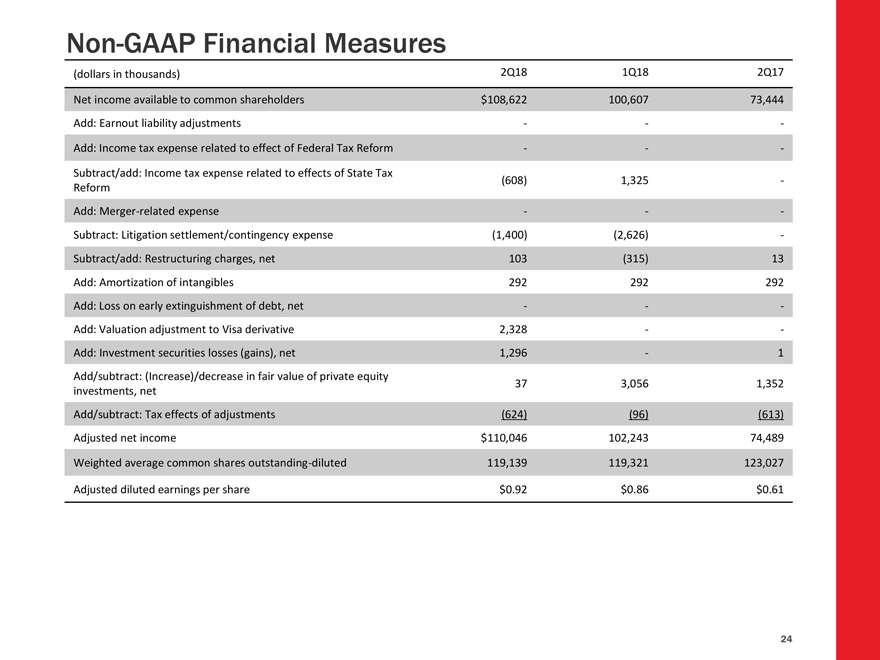
| Net income available to common shareholders |
$ 108,622 | $ 100,607 | $73,444 | |||||||||
| Subtract/add: Income tax expense related to effects of State Tax Reform |
(608) | 1,325 | - | |||||||||
| Subtract: Litigation settlement/contingency expense |
(1,400) | (2,626) | - | |||||||||
| Add/subtract: Restructuring charges, net |
103 | (315) | 13 | |||||||||
| Add: Amortization of intangibles |
292 | 292 | 292 | |||||||||
| Add: Valuation adjustment to Visa derivative |
2,328 | - | - | |||||||||
| Add: Investment securities losses, net |
1,296 | - | 1 | |||||||||
| Add: Decrease in fair value of private equity investments, net |
37 | 3,056 | 1,352 | |||||||||
| Subtract: Tax effect of adjustments |
(624) | (96) | (613) | |||||||||
| Adjusted net income available to common shareholders |
$ 110,046 | $ 102,243 | $74,489 | |||||||||
| Weighted average common shares outstanding, diluted |
119,139 | 119,321 | 123,027 | |||||||||
| Adjusted earnings per diluted share |
$0.92 | $0.86 | $0.61 | |||||||||
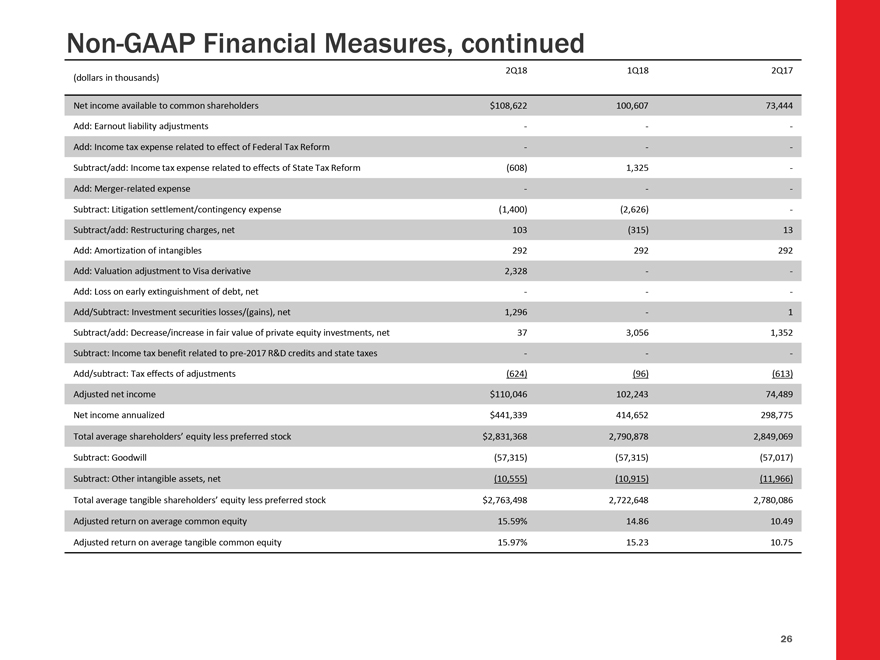
Reconciliation of Non-GAAP Financial Measures, continued
| (dollars in thousands) | 2Q18 |
1Q18 |
2Q17 |
|||||||||
| Adjusted return on average common equity and adjusted return on average tangible common equity | ||||||||||||
| Net income available to common shareholders |
$108,622 | $100,607 | $73,444 | |||||||||
| Subtract/add: Income tax expense related to effects of State Tax Reform | (608) | 1,325 | - | |||||||||
| Subtract: Litigation settlement/contingency expense |
(1,400) | (2,626) | - | |||||||||
| Add/subtract: Restructuring charges, net |
103 | (315) | 13 | |||||||||
| Add: Amortization of intangibles |
292 | 292 | 292 | |||||||||
| Add: Valuation adjustment to Visa derivative |
2,328 | - | - | |||||||||
| Add: Investment securities losses, net |
1,296 | - | 1 | |||||||||
| Add: Decrease in fair value of private equity investments, net |
37 | 3,056 | 1,352 | |||||||||
| Subtract: Tax effect of adjustments |
(624) | (96) | (613) | |||||||||
| Adjusted net income available to common shareholders |
$110,046 | $102,243 | $74,489 | |||||||||
| Net income annualized |
$441,339 | $414,652 | $298,775 | |||||||||
| Total average shareholders’ equity less preferred stock |
$2,831,368 | $2,790,878 | $2,849,069 | |||||||||
| Subtract: Goodwill |
(57,315) | (57,315) | (57,018) | |||||||||
| Subtract: Other intangibles assets, net |
(10,555) | (10,915) | (11,966) | |||||||||
| Total average tangible shareholders’ equity less preferred stock |
$2,763,498 | $2,722,648 | $2,780,085 | |||||||||
| Adjusted return on average common equity |
15.59% | 14.86% | 10.49% | |||||||||
| Adjusted return on average tangible common equity |
15.97% | 15.23% | 10.75% | |||||||||
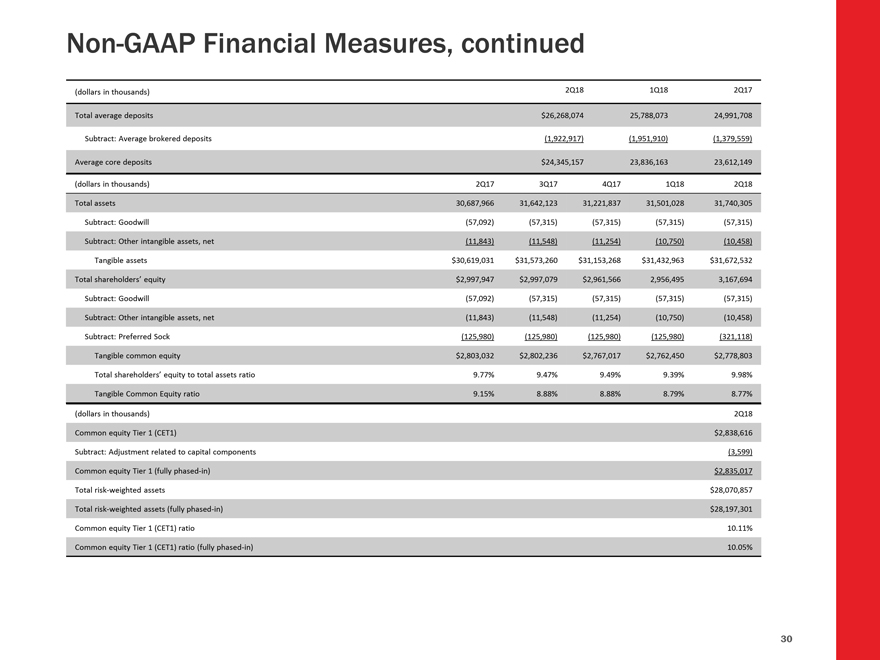
Reconciliation of Non-GAAP Financial Measures,
continued
| (dollars in thousands) | 2Q18 |
1Q18 |
2Q17 |
|||||||||
| Tangible common equity ratio |
||||||||||||
| Total assets |
$31,740,305 | $31,501,028 | $30,687,966 | |||||||||
| Subtract: Goodwill |
(57,315) | (57,315) | (57,092) | |||||||||
| Subtract: Other intangible assets, net |
(10,458) | (10,750) | (11,843) | |||||||||
| Tangible assets |
$ 31,672,532 | $ 31,432,963 | $ 30,619,031 | |||||||||
| Total shareholders’ equity |
$3,167,694 | $2,956,495 | $2,997,947 | |||||||||
| Subtract: Goodwill |
(57,315) | (57,315) | (57,092) | |||||||||
| Subtract: Other intangible assets, net |
(10,458) | (10,750) | (11,843) | |||||||||
| Subtract: Preferred Stock |
(321,118) | (125,980) | (125,980) | |||||||||
| Tangible common equity |
$ 2,778,803 | $ 2,762,450 | $ 2,803,032 | |||||||||
| Total shareholders’ equity to total assets ratio |
9.98% | 9.39% | 9.77% | |||||||||
| Tangible common equity ratio |
8.77% | 8.79% | 9.15% | |||||||||
| Common equity Tier 1 (CET1) ratio (fully phased-in) |
||||||||||||
| Common Equity Tier 1 (CET1) |
$2,838,616 | |||||||||||
| Subtract: Adjustment related to capital components |
(3,599) | |||||||||||
| CET1 (fully phased-in) |
$ 2,835,017 | |||||||||||
| Total risk-weighted assets |
$28,070,857 | |||||||||||
| Total risk-weighted assets (fully phased-in) |
$28,197,301 | |||||||||||
| Common equity Tier 1 (CET 1) ratio |
10.11% | |||||||||||
| Common Equity Tier 1 (CET1) ratio (fully phased-in) |
10.05% | |||||||||||