Exhibit 99.1

For Immediate Release
| Contact: | Patrick A. Reynolds | |
| Director of Investor Relations | ||
| (706) 649-4973 |
Synovus Reports Earnings for Fourth Quarter of 2013
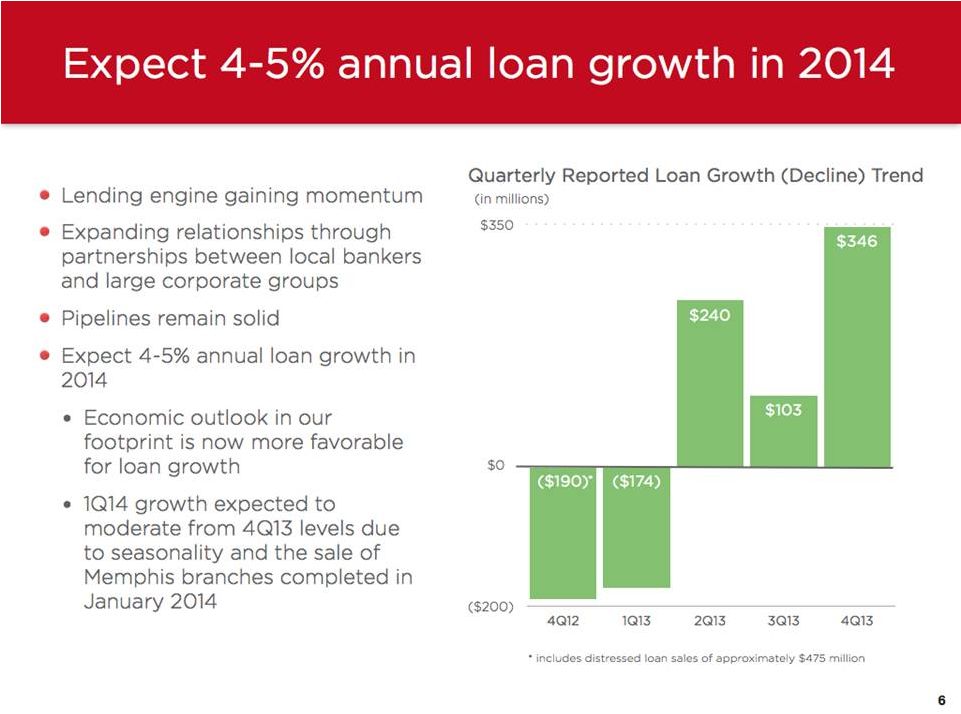
Total Loans Grow $346 Million or 7.0% Annualized
Columbus, Ga., January 21, 2014 – Synovus Financial Corp. (NYSE: SNV) today reported financial results for the quarter ended December 31, 2013.
Fourth Quarter Results
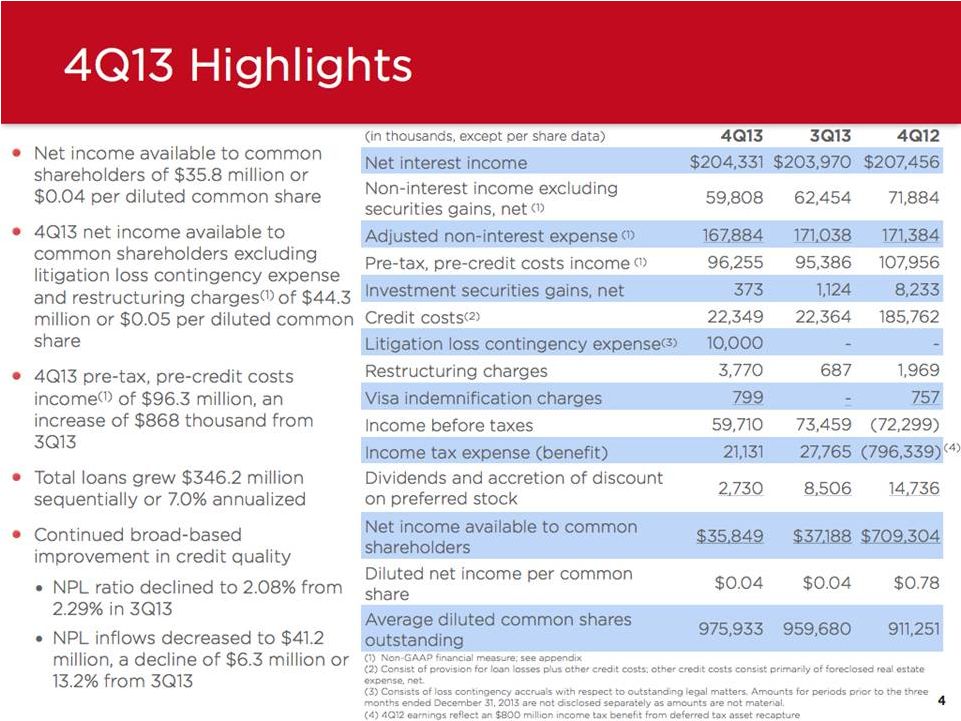
| — | Net income available to common shareholders was $35.8 million for the fourth quarter of 2013, compared to $37.2 million for the third quarter of 2013, and $709.3 million for the fourth quarter of 2012. Diluted net income per common share for the fourth quarter of 2013 was $0.04 compared to $0.04 for the third quarter of 2013 and $0.78 for the fourth quarter of 2012. Excluding litigation loss contingency expense and restructuring charges (net of tax), the fourth quarter of 2013 net income available to common shareholders was $44.3 million or $0.05 per diluted common share. |
| ¡ | The fourth quarter of 2013 results included litigation loss contingency expense of $10 million or $0.01 per share. |
| ¡ | The fourth quarter of 2012 results included an $800 million tax benefit related to the deferred tax asset recapture. |
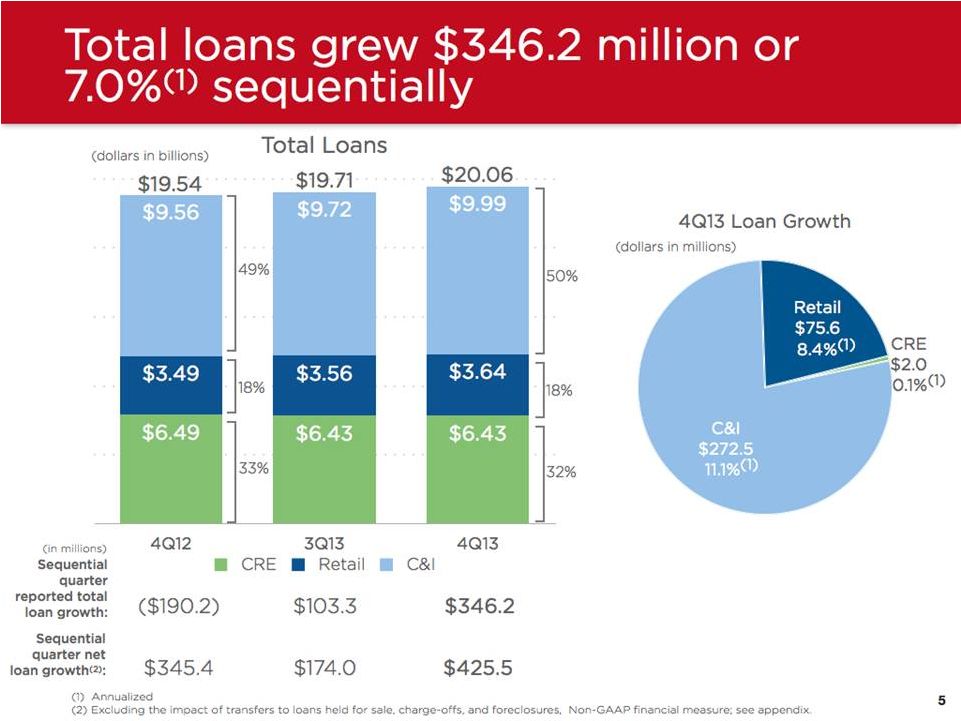
| — | Total loans grew $346.2 million sequentially or 7.0% annualized. |
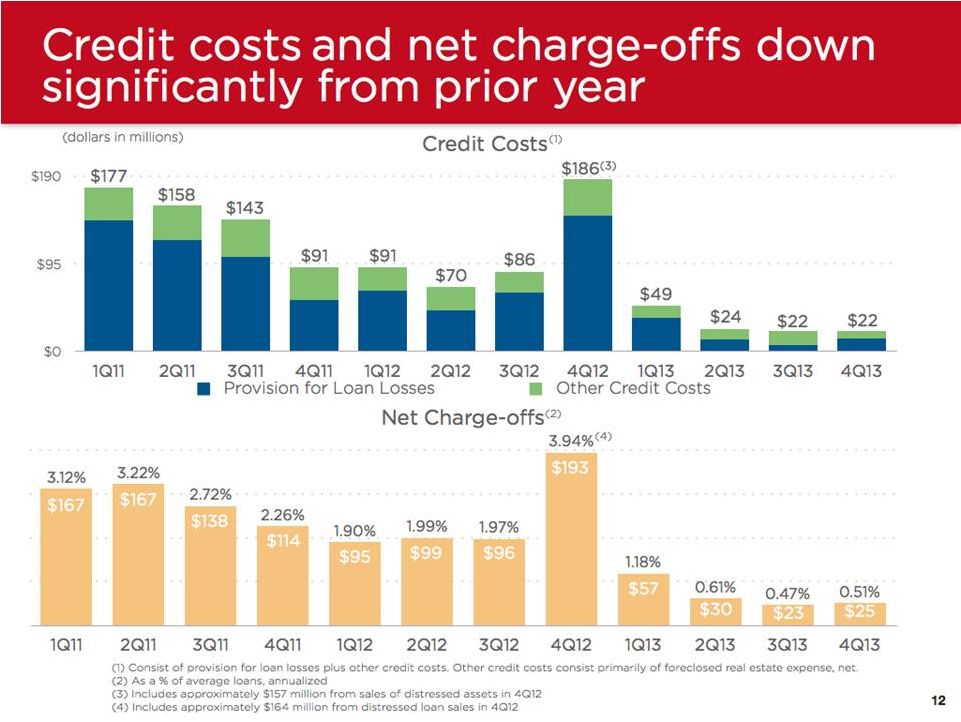
| — | Credit costs totaled $22.3 million for the fourth quarter of 2013, compared to $22.4 million for the third quarter of 2013 and $185.8 million for the fourth quarter of 2012. |
“We were pleased to report 7% annualized sequential quarter loan growth, driven primarily by C&I and retail lending,” said Kessel D. Stelling, Chairman and CEO of Synovus. “Partnerships between our local bank divisions and large corporate banking teams across our five-state footprint produced meaningful results, and we saw growth in key markets such as Atlanta, Tampa, Charleston, Nashville, Savannah, and Columbus. HELOC and private client mortgages drove the growth in retail loans during the quarter. Credit quality continued to improve, and our net interest margin remained stable. Additionally, our focus on cost savings continued as we completed implementation of initiatives necessary to achieve the $30 million in expense reductions announced at the beginning of the year.”
Core Performance
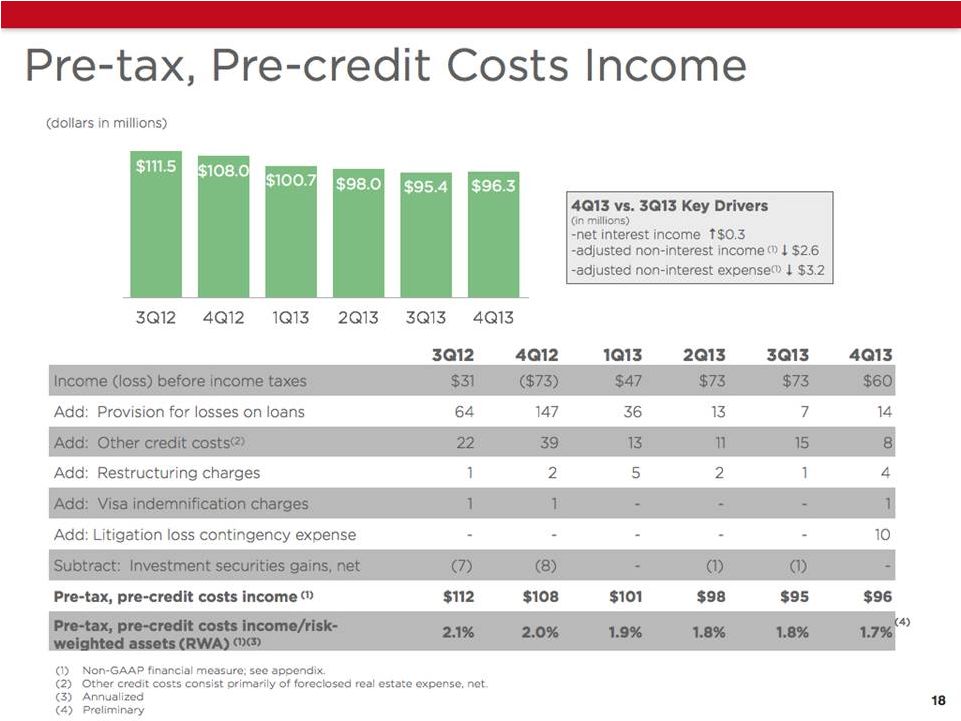
Pre-tax, pre-credit costs income was $96.3 million for the fourth quarter of 2013, an increase of $868 thousand from $95.4 million for the third quarter of 2013.
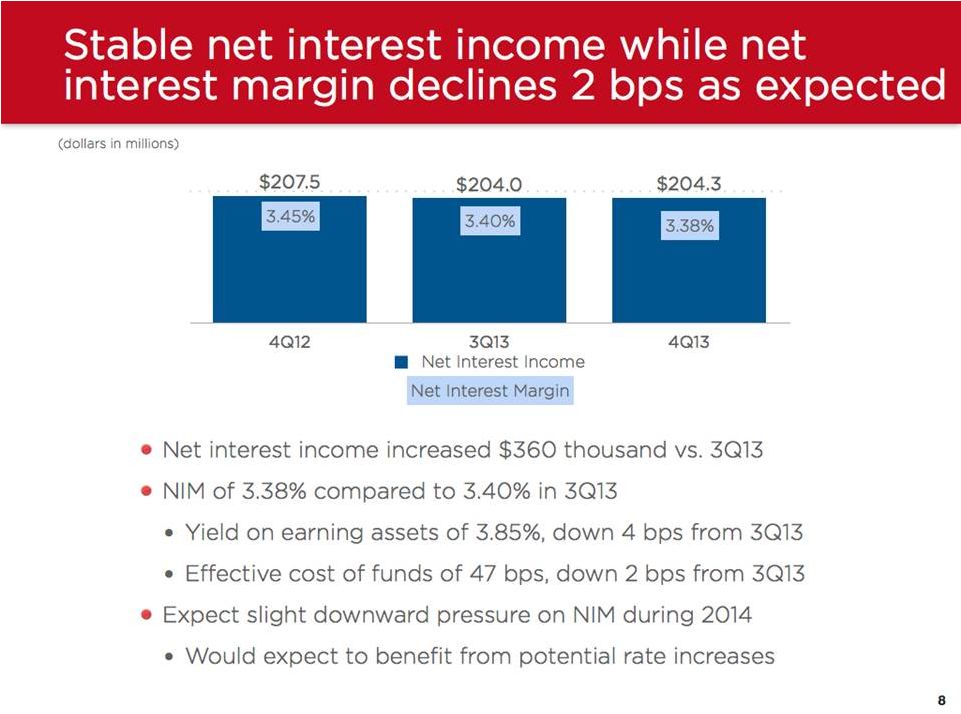
| — | Net interest income was $204.3 million for the fourth quarter of 2013, up $360 thousand from $204.0 million in the previous quarter. |
| — | The net interest margin was 3.38%, compared to 3.40% in the third quarter of 2013, with the yield on earning assets down four basis points and the effective cost of funds down two basis points. |
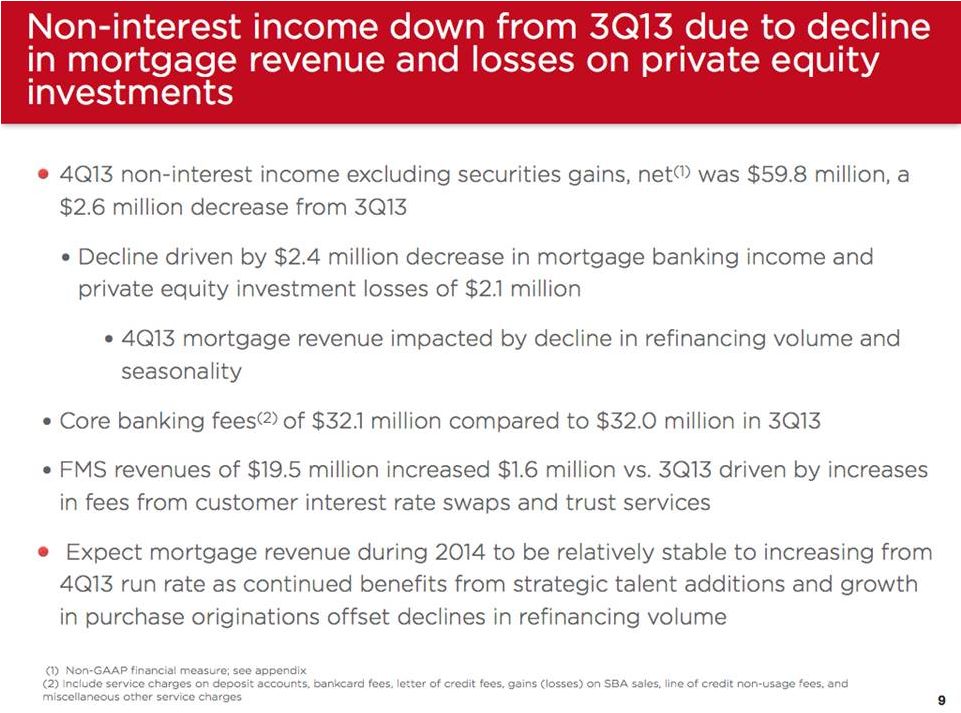
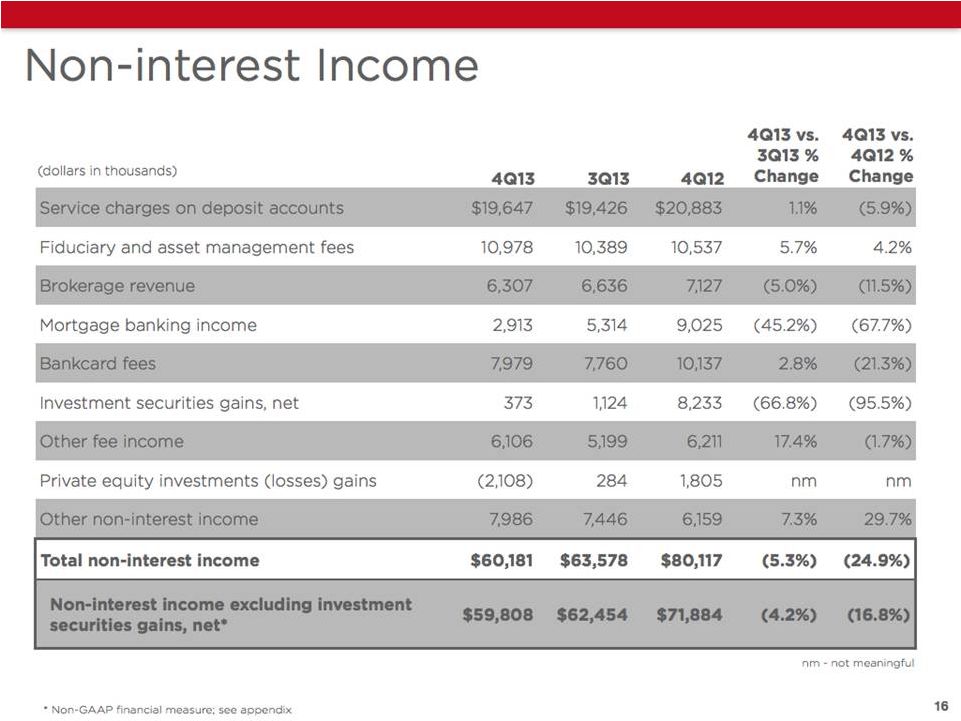
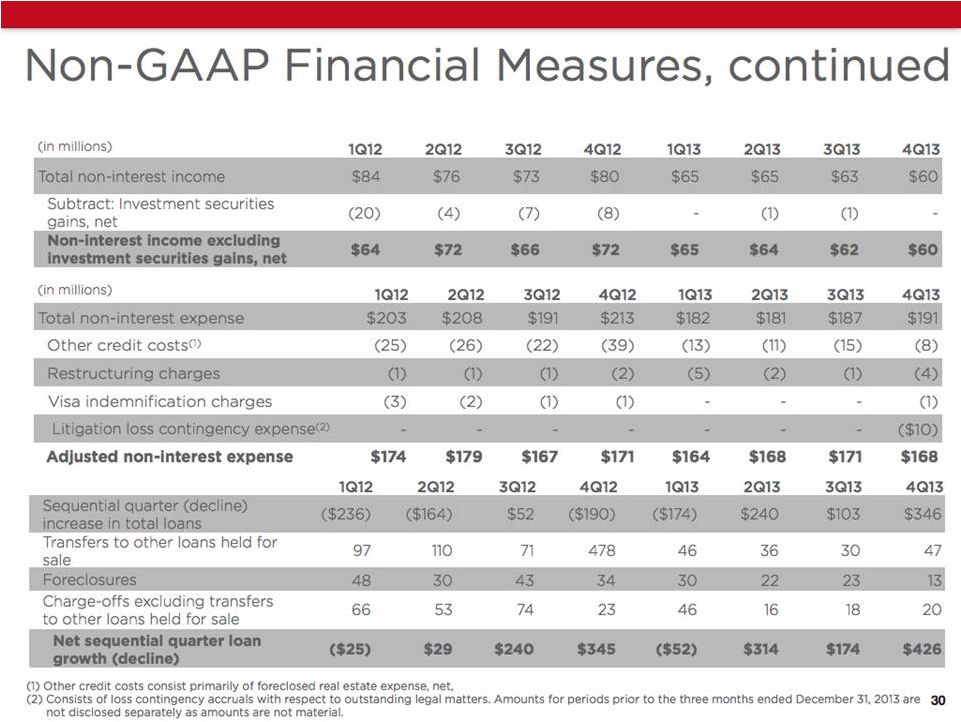
| — | Total non-interest income was $60.2 million for the fourth quarter of 2013, down $3.4 million, compared to $63.6 million for the third quarter of 2013, due primarily to a decline in mortgage banking income of $2.4 million and private equity investment losses of $2.1 million. |
| ¡ | Financial Management Services revenues were $19.5 million, up $1.6 million compared to the third quarter, dTARriven by increases in fees from customer interest rate swaps and trust services. |
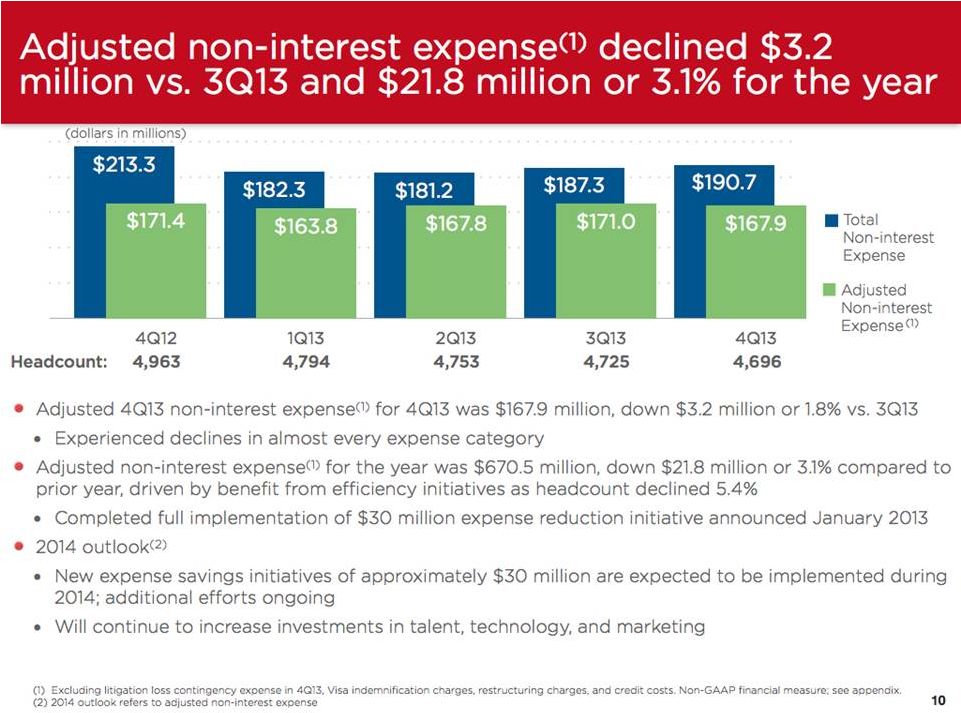
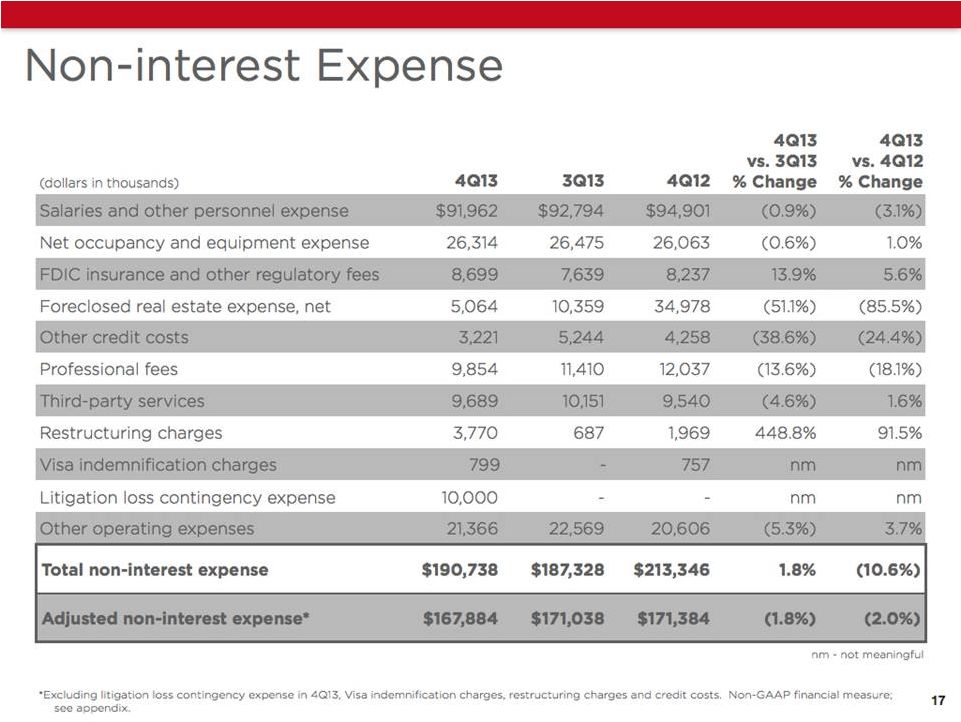
| — | Non-interest expense for the fourth quarter of 2013 was $190.7 million, up $3.4 million from the third quarter of 2013. |
| ¡ | The fourth quarter of 2013 non-interest expense includes $10.0 million in litigation loss contingency expense and $3.8 million in restructuring charges. |
| ¡ | Adjusted non-interest expense (excludes Visa indemnification charges, restructuring charges, litigation loss contingency expense and other credit costs) was $167.9 million, down $3.2 million from $171.0 million for the third quarter of 2013, driven by declines in almost every category. |
| ¡ | The $30 million expense reduction initiative announced in January 2013 was fully implemented during the year. |
Balance Sheet Fundamentals
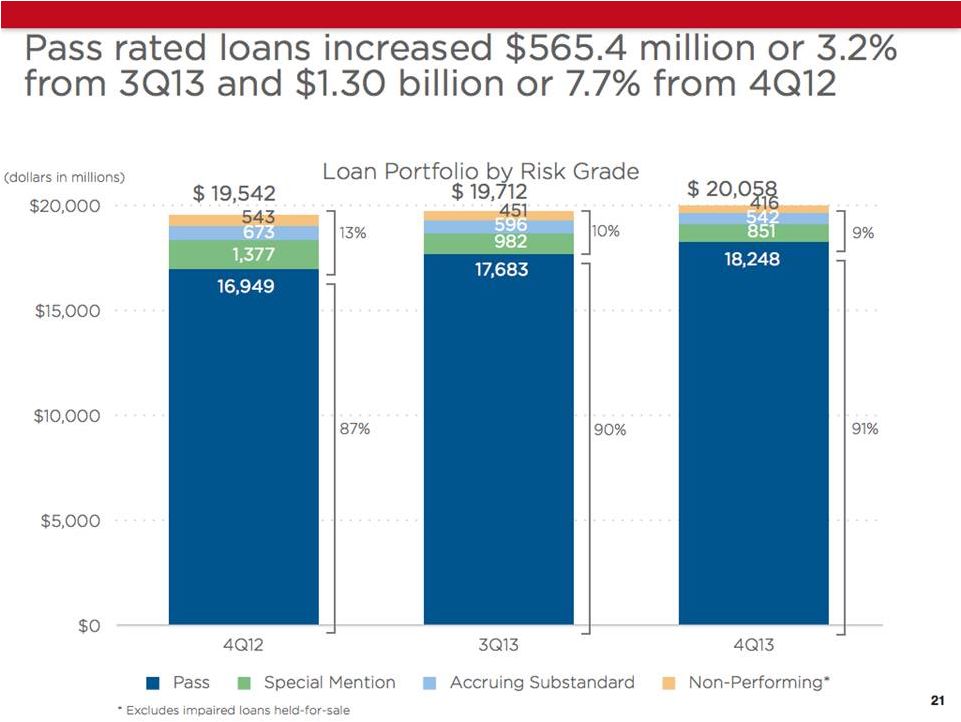
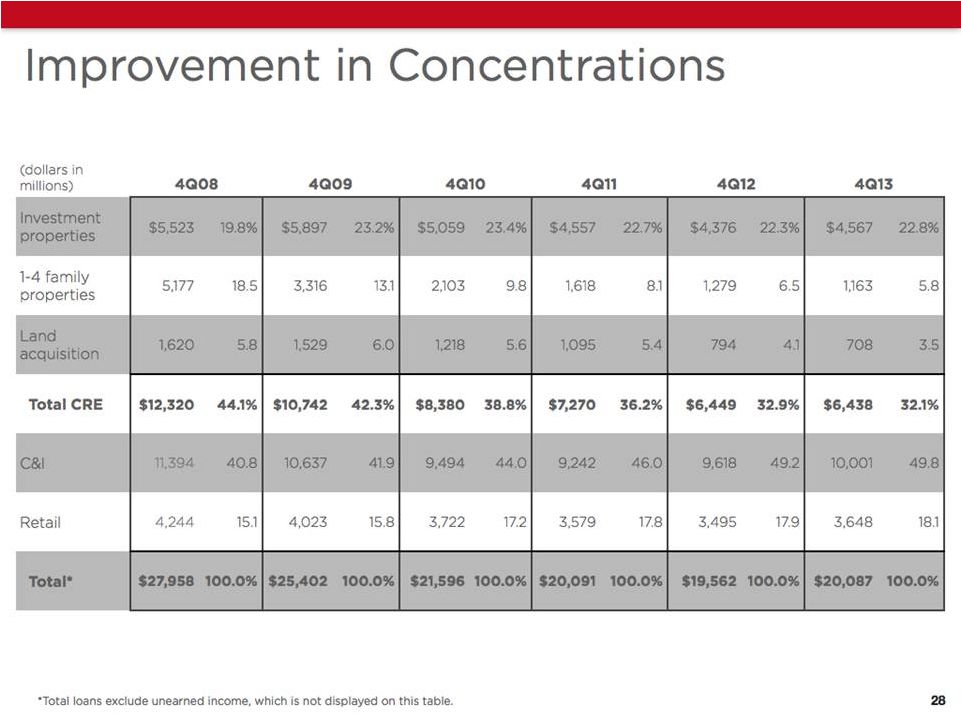
| — | Total reported loans ended the quarter at $20.06 billion, a $346.2 million increase from the third quarter of 2013. |
| ¡ | Commercial and industrial loans grew by $272.5 million from the third quarter of 2013, or 11.1% annualized. |
| ¡ | Retail loans grew by $75.6 million from the third quarter of 2013, or 8.4% annualized. |
| ¡ | Commercial real estate loans grew by $2.0 million from the third quarter of 2013. |
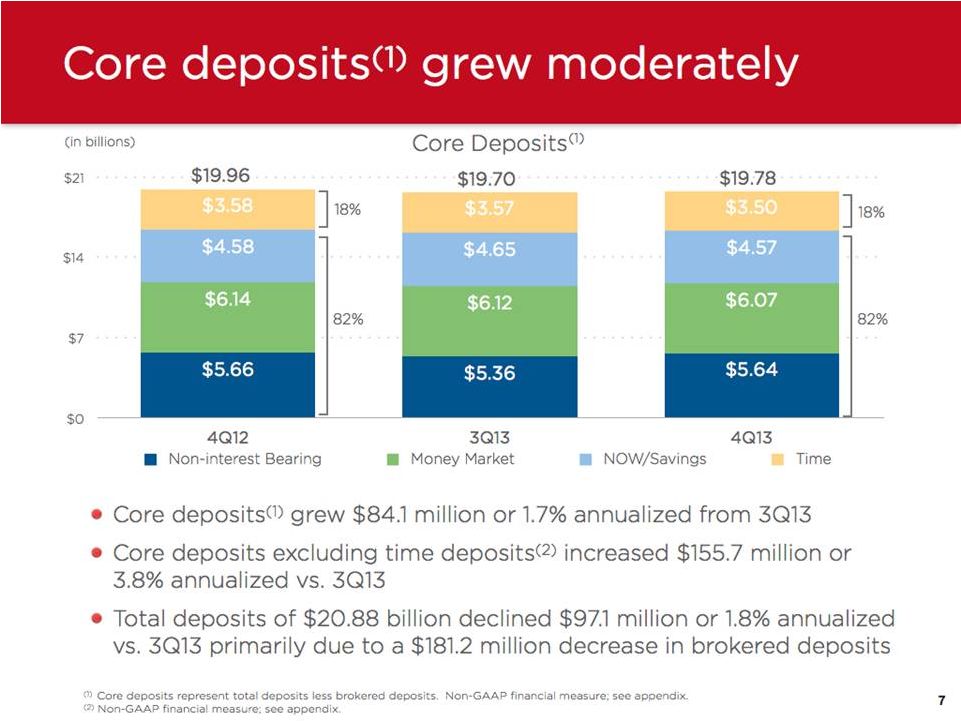
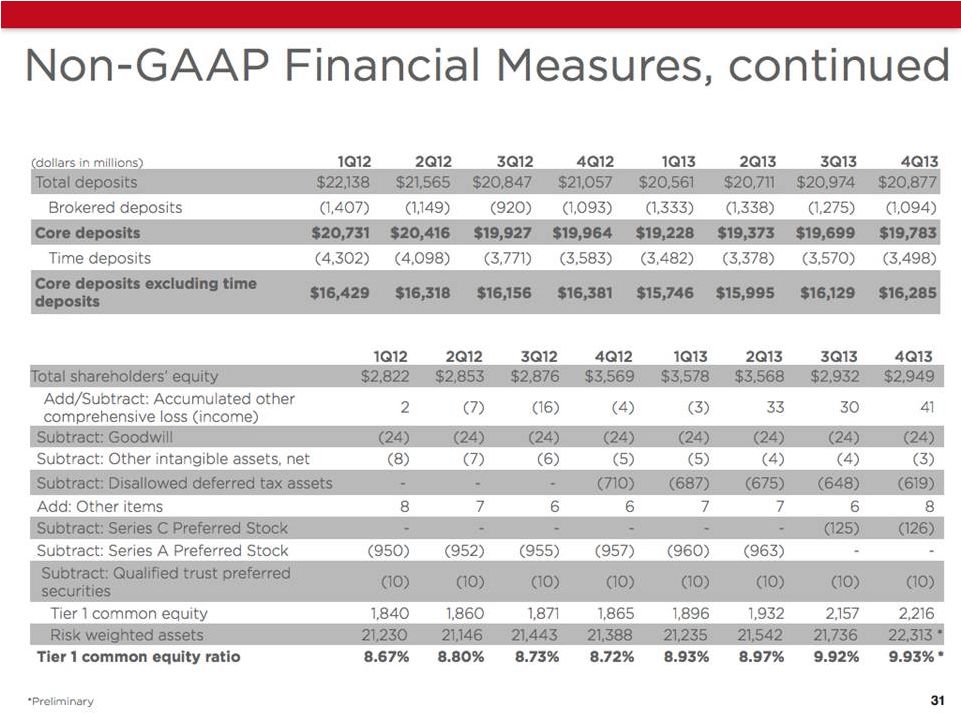
| — | Total deposits ended the quarter at $20.88 billion, down $97.1 million from the previous quarter due primarily to a decline in brokered time deposits. |
| — | Core deposits ended the quarter at $19.78 billion, up $84.1 million compared to the third quarter of 2013. Core deposits, excluding time deposits, increased $155.7 million compared to the previous quarter. |
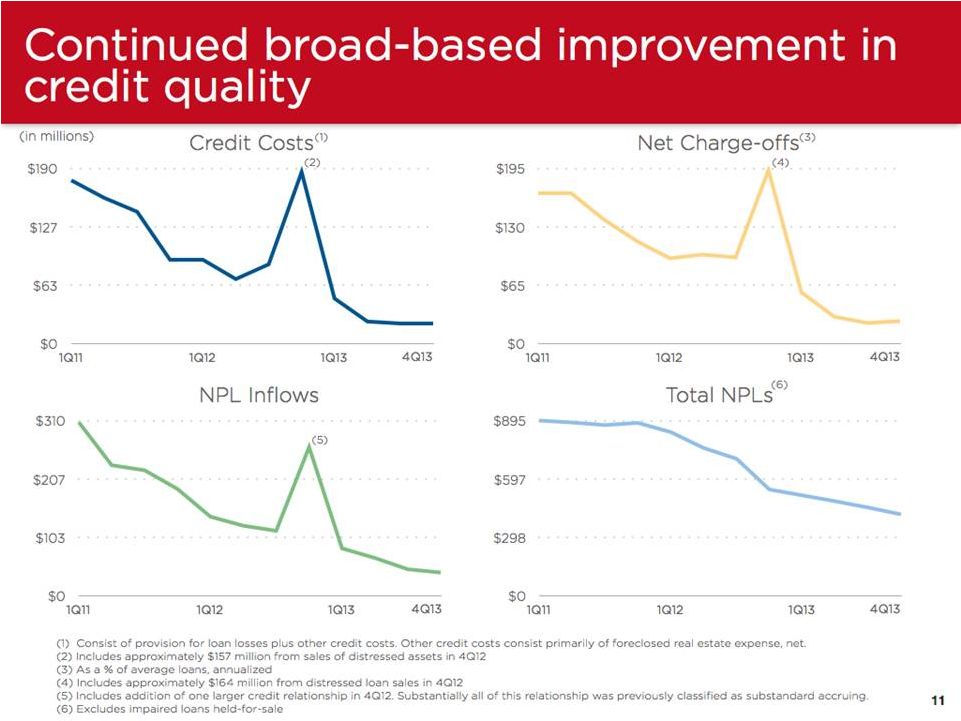
Credit Quality
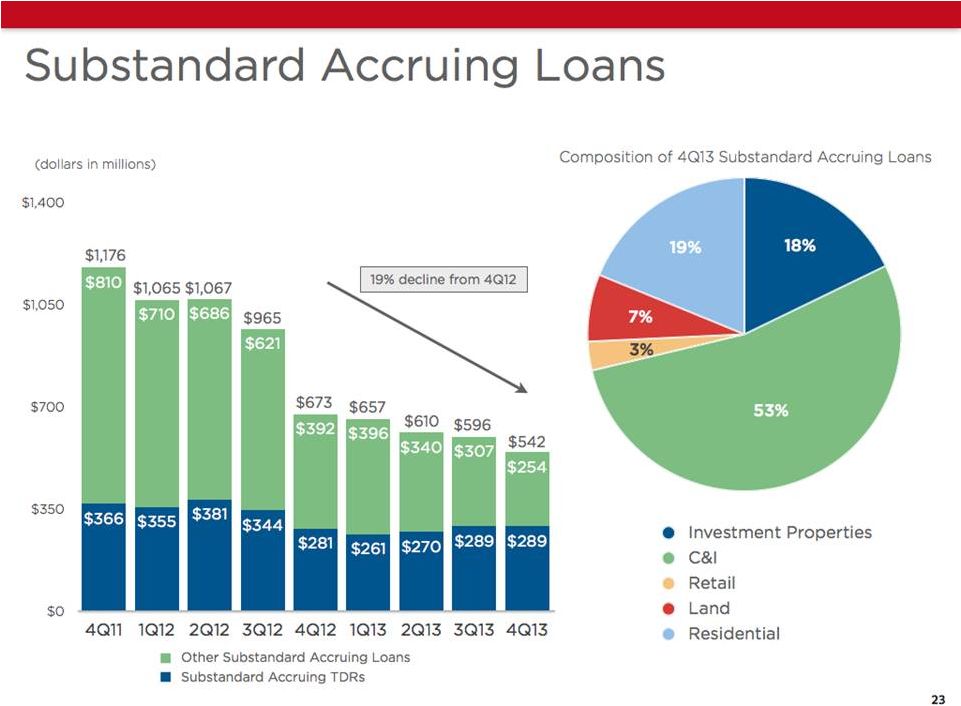
Broad based improvement in credit quality continued.
| — | Total credit costs were $22.3 million in the fourth quarter of 2013, down from $22.4 million in the third quarter of 2013 and $185.8 million in the fourth quarter of 2012. |
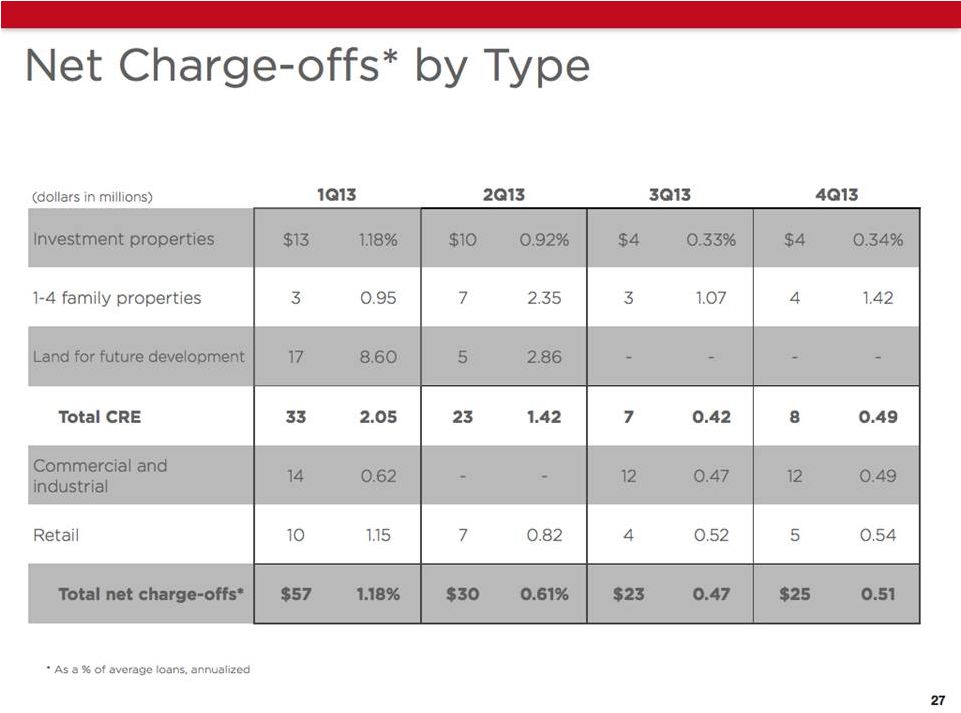
| — | Net charge-offs were $25.1 million in the fourth quarter of 2013, up from $23.0 million in the third quarter of 2013 and down from $193.5 million in the fourth quarter of 2012. The annualized net charge-off ratio was 0.51% in the fourth quarter, up from 0.47% in the previous quarter and down from 3.94% in the fourth quarter of 2012. |
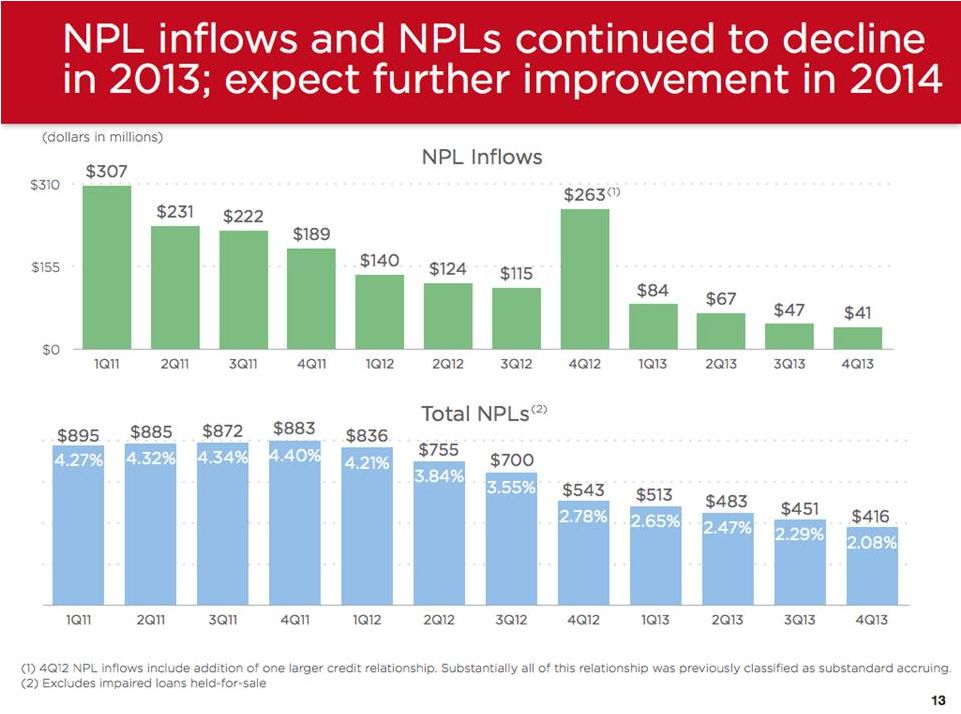
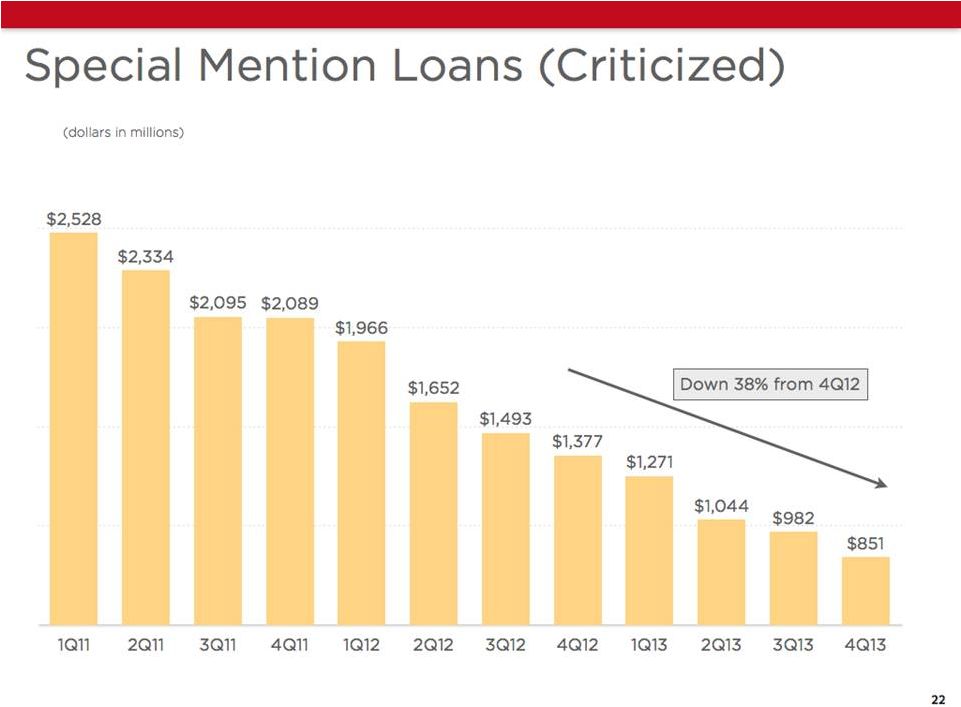
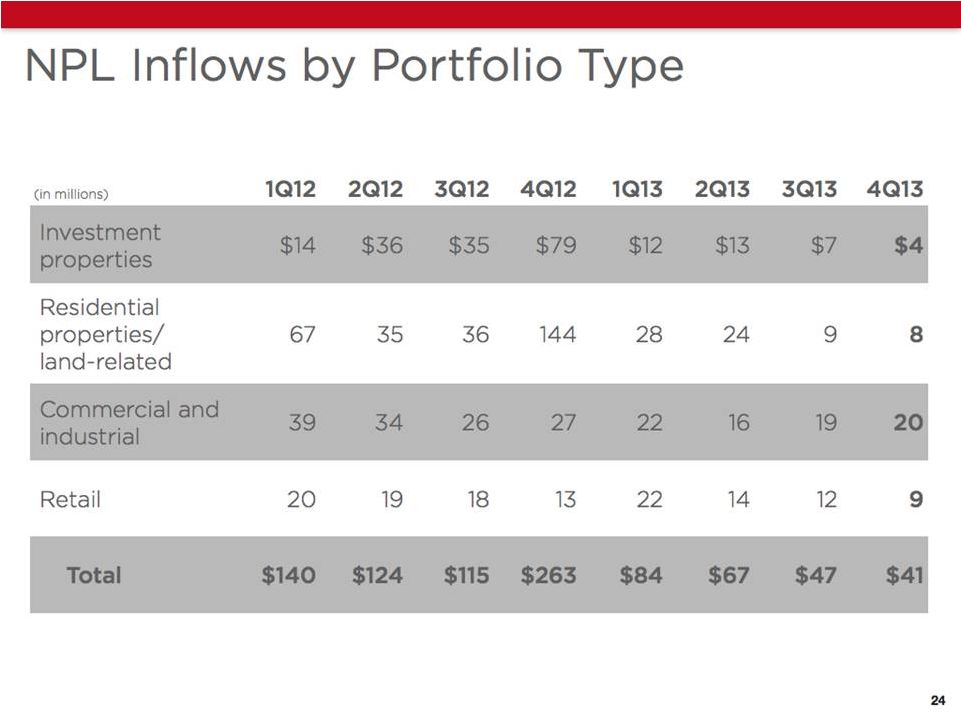
| — | Non-performing loan inflows were $41.2 million in the fourth quarter of 2013, down from $47.4 million in the third quarter of 2013 and $262.7 million in the fourth quarter of 2012. |
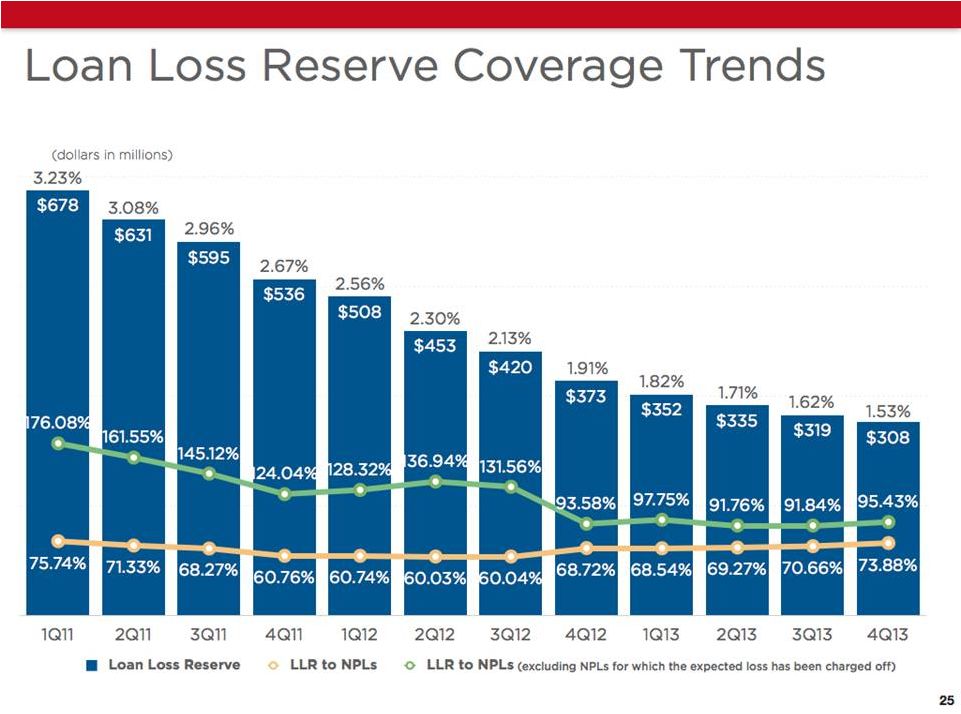
| — | Non-performing loans, excluding loans held for sale, were $416.3 million at December 31, 2013, down $34.6 million from the previous quarter, and down $127.0 million or 23.4% from the fourth quarter of 2012. The non-performing loan ratio was 2.08% at December 31, 2013, down from 2.29% at the end of the previous quarter and 2.78% at December 31, 2012. |
| — | Total non-performing assets were $539.6 million at December 31, 2013, down $47.3 million from the previous quarter, and down $163.4 million or 23.2% from the fourth quarter of 2012. The non-performing asset ratio was 2.67% at December 31, 2013, compared to 2.96% at the end of the previous quarter and 3.57% at December 31, 2012. |
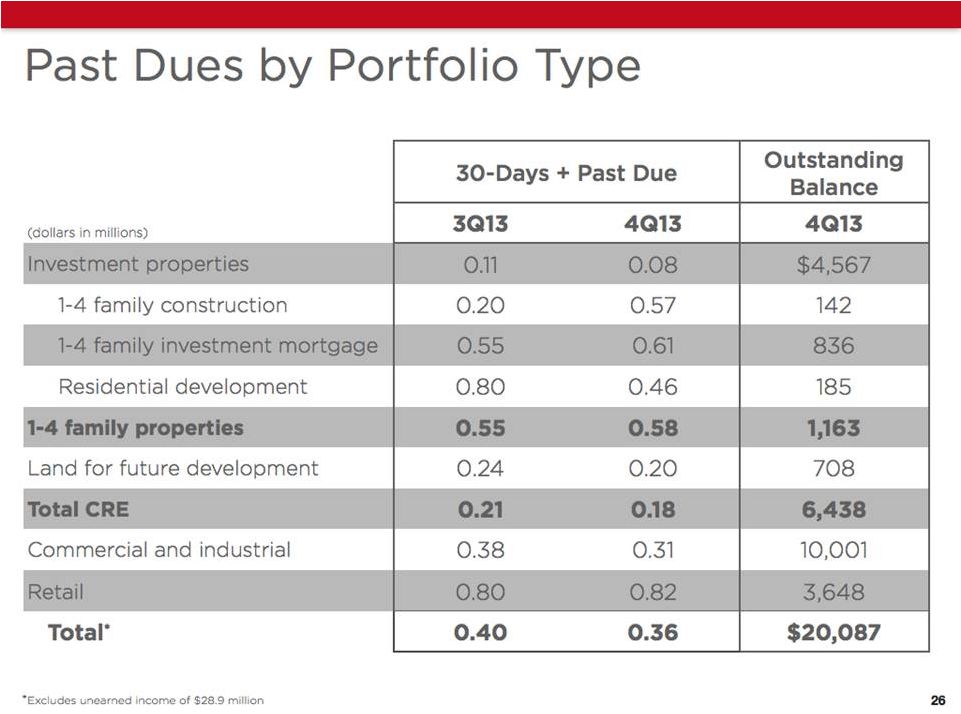
| — | Total delinquencies (consisting of loans 30 or more days past due and still accruing) declined to 0.36% of total loans at December 31, 2013, compared to 0.40% at September 30, 2013, and 0.54% at December 31, 2012. Total loans past due 90 days or more and still accruing remained low at 0.02% at December 31, 2013, compared to 0.02% at September 30, 2013, and 0.03% at December 31, 2012. |
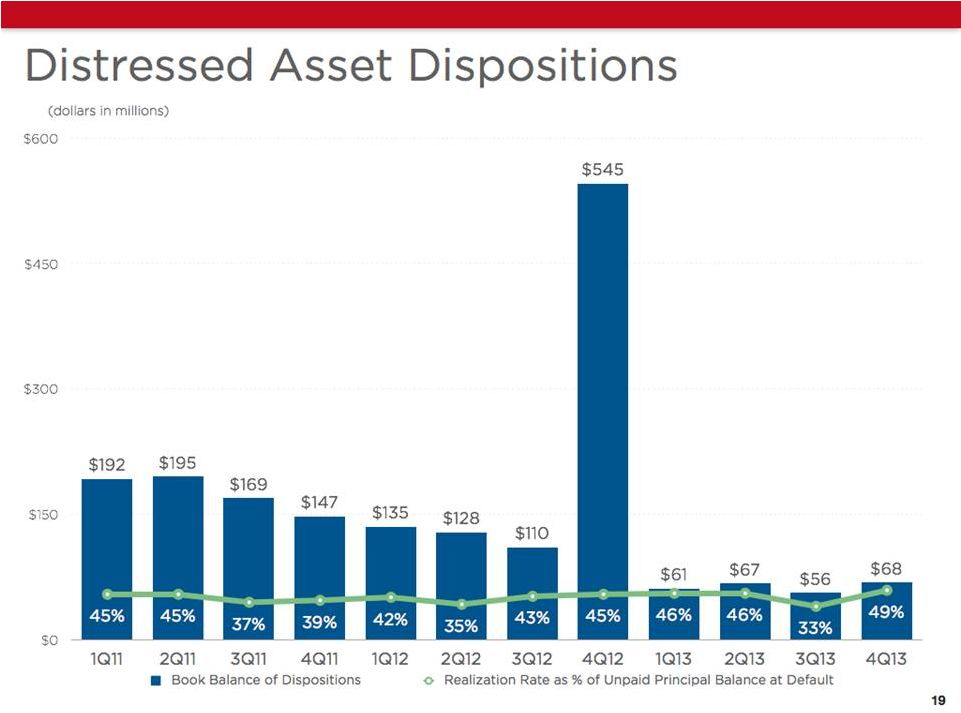
| — | Distressed asset sales were approximately $68 million during the fourth quarter, compared to approximately $56 million in the third quarter of 2013, and approximately $545 million in the fourth quarter of 2012, which included the completion of a bulk asset sale in December of 2012. |
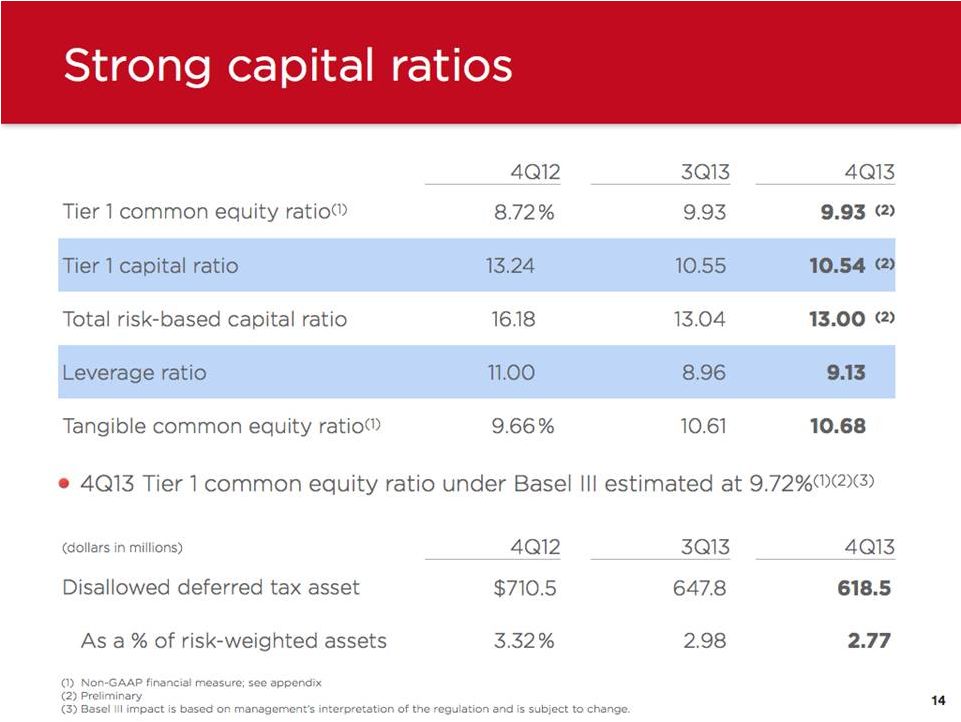
Capital Ratios
| — | Tier 1 Common Equity ratio was 9.93% at December 31, 2013, unchanged from September 30, 2013. |
| — | Tier 1 Capital ratio was 10.54% at December 31, 2013, compared to 10.55% at September 30, 2013. |
| — | Total Risk Based Capital ratio was 13.00% at December 31, 2013, compared to 13.04% at September 30, 2013. |
| — | Tier 1 Leverage ratio was 9.13% at December 31, 2013, compared to 8.96% at September 30, 2013. |
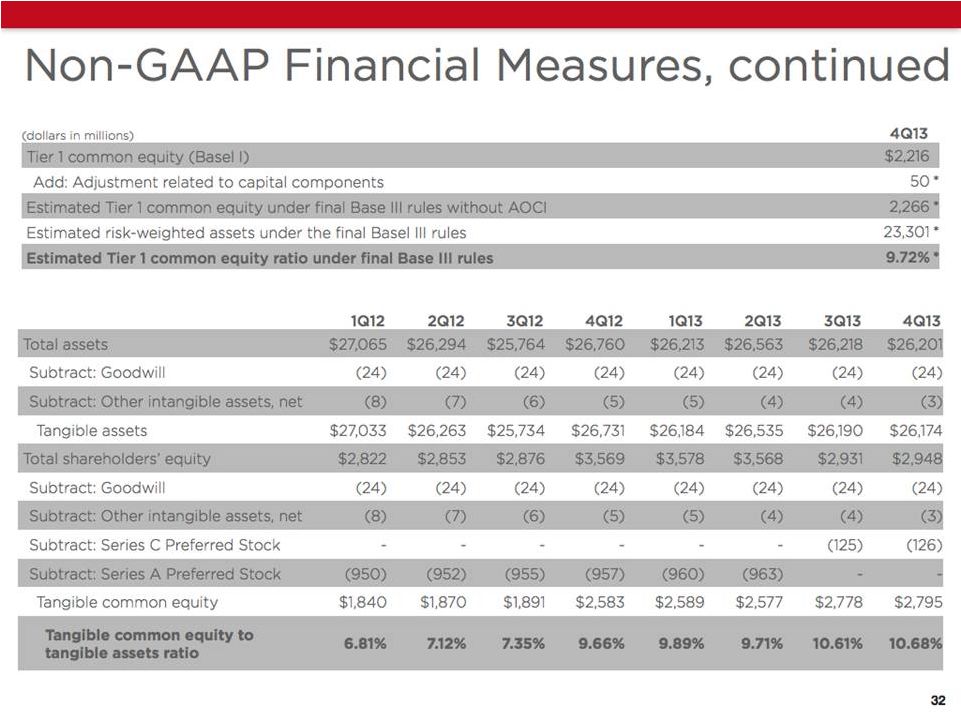
| — | Tangible Common Equity ratio was 10.68% at December 31, 2013, compared to 10.61% at September 30, 2013. |
Stelling concluded, “Our team’s 125th anniversary celebration during the fourth quarter was an appropriate way to close out a successful year defined by several important achievements, including upgrades from three rating agencies, two successful capital raises, and the redemption of our TARP obligation. Entering 2014, our capital position is strong, our customers remain our central focus, and our lending engine is gaining good traction. While expense management continues to be a major focus for our company, with additional reductions of approximately $30 million planned for 2014, we are also making strategic investments in talent, technology, and marketing that will improve our customers’ experience and support future growth.”
Synovus will host an earnings highlights conference call at 8:30 a.m. EDT on January 21, 2014. The earnings call will be accompanied by a slide presentation. Shareholders and other interested parties can access the slide presentation and listen to the conference call via simultaneous Internet broadcast at www.synovus.com by clicking on the “Live Webcast” icon. RealPlayer or Windows Media Player can be downloaded prior to accessing the actual call or the replay. The replay will be archived for 12 months and will be available 30-45 minutes after the call.
About Synovus
Synovus Financial Corp. is a financial services company based in Columbus, Georgia, with approximately $26 billion in assets. Synovus Financial Corp. provides commercial and retail banking, investment and mortgage services to customers in Georgia, Alabama, South Carolina, Florida and Tennessee. See Synovus Financial Corp. on the web at www.synovus.com.
Forward-Looking Statements
This press release and certain of our other filings with the Securities and Exchange Commission contain statements that constitute “forward-looking statements” within the meaning of, and subject to the protections of, Section 27A of the Securities Act of 1933, as amended, and Section 21E of the Securities Exchange Act of 1934, as amended. All statements other than statements of historical fact are forward-looking statements. You can identify these forward-looking statements through Synovus’ use of words such as “believes,” “anticipates,” “expects,” “may,” “will,” “assumes,” “should,” “predicts,” “could,” “would,” “intends,” “targets,” “estimates,” “projects,” “plans,” “potential” and other similar words and expressions of the future or otherwise regarding the outlook for Synovus’ future business and financial performance and/or the performance of the commercial banking industry and economy in general. These forward-looking statements include, among others, our expectations on credit trends and key credit metrics; expectations regarding deposits, loan growth and the net interest margin; expectations on our growth strategy, strategic investments, expense initiatives, and future profitability; and the assumptions underlying our expectations. Prospective investors are cautioned that any such forward-looking statements are not guarantees of future performance and involve known and unknown risks and uncertainties which may cause the actual results, performance or achievements of Synovus to be materially different from the future results, performance or achievements expressed or implied by such forward-looking statements. Forward-looking statements are based on the information known to, and current beliefs and expectations of, Synovus’ management and are subject to significant risks and uncertainties. Actual results may differ materially from those contemplated by such forward-looking statements. A number of factors could cause actual results to differ materially from those contemplated by the forward-looking statements in this report. Many of these factors are beyond Synovus’ ability to control or predict.
These forward-looking statements are based upon information presently known to Synovus’ management and are inherently subjective, uncertain and subject to change due to any number of risks and uncertainties, including, without limitation, the risks and other factors set forth in Synovus’ filings with the Securities and Exchange Commission, including its Annual Report on Form 10-K for the year ended December 31, 2012 under the captions “Cautionary Notice Regarding Forward-Looking Statements” and “Risk Factors” and in Synovus’ quarterly reports on Form 10-Q and current reports on Form 8-K. We believe these forward-looking statements are reasonable; however, undue reliance should not be placed on any forward-looking statements, which are based on current expectations and speak only as of the date that they are made. We do not assume any obligation to update any forward-looking statements as a result of new information, future developments or otherwise, except as otherwise may be required by law.
Use of Non-GAAP Financial Measures
The measures entitled core deposits, core deposits excluding time deposits, tangible common equity to tangible assets ratio, Tier 1 common equity ratio, net income available to common shareholders excluding litigation loss contingency expense and restructuring charges, pre-tax, pre-credit costs income, and adjusted non-interest expense are not measures recognized under U.S. generally accepted accounting principles (GAAP) and therefore are considered non-GAAP financial measures. The most comparable GAAP measures are total deposits, total shareholders’ equity to total assets ratio, Tier 1 capital to risk-weighted assets ratio, net income available to common shareholders, income (loss) before income taxes, and total non-interest expense, respectively.
Synovus believes that these non-GAAP financial measures provide meaningful additional information about Synovus to assist management and investors in evaluating Synovus’ capital strength and the performance of its core business. These non-GAAP financial measures should not be considered as substitutes for total deposits, total shareholders’ equity to total assets ratio, Tier 1 capital to risk-weighted assets ratio, net income available to common shareholders, income (loss) before income taxes, or total non-interest expense determined in accordance with GAAP and may not be comparable to other similarly titled measures at other companies.
The computations of core deposits, core deposits excluding time deposits, tangible common equity to tangible assets ratio, Tier 1 common equity ratio, net income available to common shareholders excluding litigation loss contingency expense and restructuring charges, pre-tax, pre-credit costs income, and adjusted non-interest expense, and the reconciliation of these measures to total deposits, total shareholders’ equity to total assets ratio, Tier 1 capital to risk-weighted assets ratio, income (loss) before income taxes, and total non-interest expense are set forth in the tables below.
|
Reconciliation of Non-GAAP Financial Measures |
||||||||||||||||||||
| (dollars in thousands) |
4Q13 | 3Q13 | 2Q13 | 1Q13 | 4Q12 | |||||||||||||||
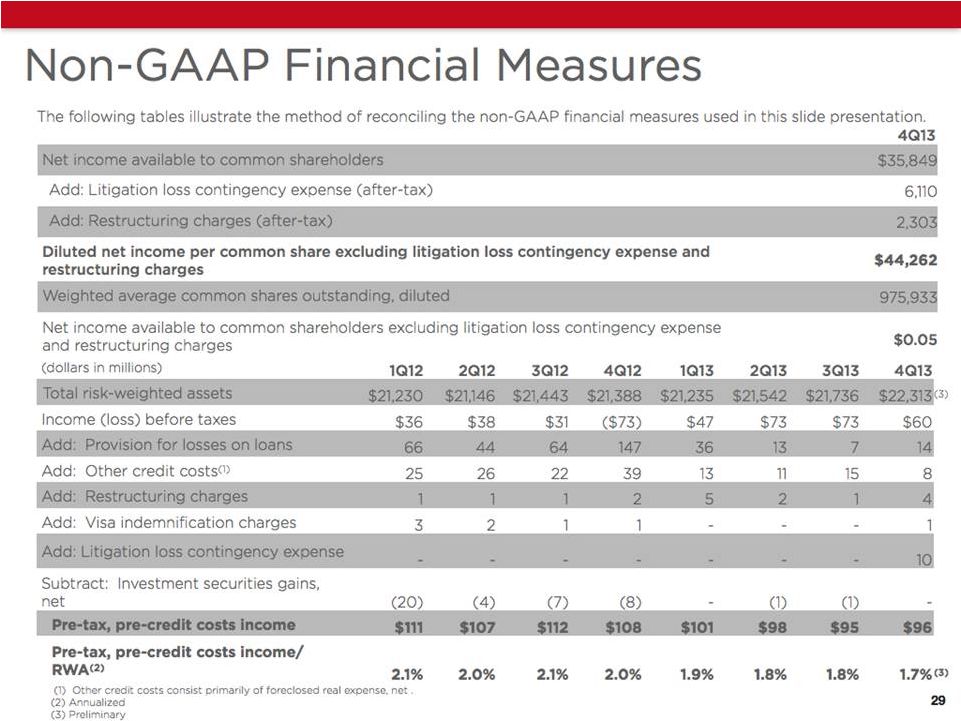
| Net income available to common shareholders excluding litigation loss contingency expense and restructuring charges |
||||||||||||||||||||
| Net income available to common shareholders |
$ 35,849 | |||||||||||||||||||
| Add: Litigation loss contingency expense (after-tax) |
6,110 | |||||||||||||||||||
| Add: Restructuring charges (after-tax) |
2,303 | |||||||||||||||||||
| Net income available to common shareholders excluding litigation loss contingency expense and restructuring charges |
$ 44,262 | |||||||||||||||||||
| Weighted average common shares outstanding - diluted |
975,933 | |||||||||||||||||||
| Net income per common share, diluted, excluding litigation loss contingency expense and restructuring charges |
$ 0.05 | |||||||||||||||||||
| Pre-tax, Pre-credit Costs Income |
||||||||||||||||||||
| Income (loss) before income taxes |
$ 59,709 | 73,459 | 72,906 | 46,553 | (72,299) | |||||||||||||||
| Add: Provision for losses on loans |
14,064 | 6,761 | 13,077 | 35,696 | 146,526 | |||||||||||||||
| Add: Other credit costs(1) |
8,285 | 15,603 | 10,887 | 13,595 | 39,236 | |||||||||||||||
| Add: Restructuring charges |
3,770 | 687 | 1,758 | 4,850 | 1,969 | |||||||||||||||
| Add: Litigation loss contingency expense(2) |
10,000 | - | - | - | - | |||||||||||||||
| Subtract: Investment securities gains, net |
(373) | (1,124) | (1,403) | (45) | (8,233) | |||||||||||||||
| Add: Visa indemnification charges |
799 | - | 764 | 37 | 757 | |||||||||||||||
| Pre-tax, pre-credit costs income |
$ 96,254 | 95,386 | 97,989 | 100,686 | 107,956 | |||||||||||||||
| Adjusted Non-interest Expense |
||||||||||||||||||||
| Total non-interest expense |
$ 190,738 | 187,328 | 181,186 | 182,286 | 213,346 | |||||||||||||||
| Subtract: Other credit costs(1) |
(8,285) | (15,603) | (10,887) | (13,595) | (39,236) | |||||||||||||||
| Subtract: Restructuring charges |
(3,770) | (687) | (1,758) | (4,850) | (1,969) | |||||||||||||||
| Subtract: Visa indemnification charges |
(799) | - | (764) | (37) | (757) | |||||||||||||||
| Subtract: Litigation loss contingency expense(2) |
(10,000) | - | - | - | - | |||||||||||||||
| Adjusted non-interest expense |
$ 167,884 | 171,038 | 167,777 | 163,804 | 171,384 | |||||||||||||||
| Core deposits |
||||||||||||||||||||
| Core deposits excluding time deposits |
||||||||||||||||||||
| Total deposits |
$ 20,876,790 | 20,973,856 | 20,710,703 | 20,561,193 | 21,057,044 | |||||||||||||||
| Subtract: Brokered deposits |
(1,094,002) | (1,275,200) | (1,338,064) | (1,332,632) | (1,092,749) | |||||||||||||||
| Core deposits |
19,782,788 | 19,698,656 | 19,372,639 | 19,228,561 | 19,964,295 | |||||||||||||||
| Subtract: Time deposits |
(3,498,200) | (3,569,752) | (3,377,215) | (3,482,196) | (3,583,304) | |||||||||||||||
| Core deposits excluding time deposits |
$ 16,284,588 | 16,128,904 | 15,995,424 | 15,746,365 | 16,380,991 | |||||||||||||||
| Tier 1 Common Equity Ratio |
||||||||||||||||||||
| Total shareholders’ equity |
$ 2,948,985 | 2,931,860 | 3,568,204 | 3,578,106 | 3,569,431 | |||||||||||||||
| Add/subtract: Accumulated other comprehensive loss (income) |
41,258 | 29,514 | 33,060 | (2,787) | (4,101) | |||||||||||||||
| Subtract: Goodwill |
(24,431) | (24,431) | (24,431) | (24,431) | (24,431) | |||||||||||||||
| Subtract: Other intangible assets, net |
(3,415) | (3,783) | (4,156) | (4,583) | (5,149) | |||||||||||||||
| Subtract: Disallowed deferred tax asset |
(618,516) | (647,828) | (674,996) | (687,007) | (710,488) | |||||||||||||||
| Other items |
7,612 | 7,426 | 7,304 | 7,191 | 6,982 | |||||||||||||||
| Tier 1 capital |
2,351,493 | 2,292,758 | 2,904,985 | 2,866,489 | 2,832,244 | |||||||||||||||
| Subtract: Qualifying trust preferred securities |
(10,000) | (10,000) | (10,000) | (10,000) | (10,000) | |||||||||||||||
| Subtract: Series C Preferred Stock, no par value |
(125,862) | (125,400) | - | - | - | |||||||||||||||
| Subtract: Series A Preferred Stock, no par value |
- | - | (962,725) | (960,005) | (957,327) | |||||||||||||||
| Tier 1 common equity |
2,215,631 | 2,157,358 | 1,932,260 | 1,896,484 | 1,864,917 | |||||||||||||||
| Risk-weighted assets |
22,312,655(3) | 21,735,363 | 21,542,287 | 21,235,129 | 21,387,935 | |||||||||||||||
| Tier 1 common equity ratio |
9.93%(3) | 9.93 | 8.97 | 8.93 | 8.72 | |||||||||||||||
| Tangible common equity to tangible assets ratio |
||||||||||||||||||||
| Total assets |
$ 26,201,604 | 26,218,360 | 26,563,174 | 26,212,879 | 26,760,012 | |||||||||||||||
| Subtract: Goodwill |
(24,431) | (24,431) | (24,431) | (24,431) | (24,431) | |||||||||||||||
| Subtract: Other intangible assets, net |
(3,415) | (3,783) | (4,156) | (4,583) | (5,149) | |||||||||||||||
| Tangible assets |
$ 26,173,758 | 26,190,146 | 26,534,587 | 26,183,865 | 26,730,432 | |||||||||||||||
| Total shareholders’ equity |
$ 2,948,985 | 2,931,860 | 3,568,204 | 3,578,106 | 3,569,431 | |||||||||||||||
| Subtract: Goodwill |
(24,431) | (24,431) | (24,431) | (24,431) | (24,431) | |||||||||||||||
| Subtract: Other intangible assets, net |
(3,415) | (3,783) | (4,156) | (4,583) | (5,149) | |||||||||||||||
| Subtract: Series C Preferred Stock, no par value |
(125,862) | (125,400) | - | - | - | |||||||||||||||
| Subtract: Series A Preferred Stock, no par value |
- | - | (962,725) | (960,005) | (957,327) | |||||||||||||||
| Tangible common equity |
$ 2,795,277 | 2,778,246 | 2,576,892 | 2,589,087 | 2,582,524 | |||||||||||||||
| Total shareholders’ equity to total assets ratio |
11.25% | 11.18 | 13.43 | 13.65 | 13.34 | |||||||||||||||
| Tangible common equity to tangible assets ratio |
10.68% | 10.61 | 9.71 | 9.89 | 9.66 | |||||||||||||||
| (1) Other credit costs consist primarily of foreclosed real estate expense, net (2) Consists of loss contingency accruals with respect to outstanding legal matters. Amounts for periods prior to the three months ended December 31, 2013 are not disclosed separately as amounts are not material. (3) Preliminary |
| |||||||||||||||||||
###