SECURITIES AND EXCHANGE COMMISSION
Washington, D.C. 20549
Form 8-K
CURRENT REPORT
Pursuant to Section 13 or 15(d) of
the Securities Exchange Act of 1934
October 22, 2013
Date of Report
(Date of Earliest Event Reported)
Synovus Financial Corp.
(Exact Name of Registrant as Specified in its Charter)
Georgia (State of Incorporation) |
1-10312 (Commission File Number) |
58-1134883 (IRS Employer Identification No.) |
1111 Bay Avenue, Suite 500, Columbus, Georgia 31901
(Address of principal executive offices) (Zip Code)
(706) 649-2311
(Registrants telephone number, including area code)
(Former name or former address, if changed since last report)
Check the appropriate box below if the Form 8-K filing is intended to simultaneously satisfy the filing obligation of the registrant under any of the following provisions:
¨ | Written communications pursuant to Rule 425 under the Securities Act (17 CFR 230.425) |
¨ | Soliciting material pursuant to Rule 14a-12 under the Exchange Act (17 CFR 240.14a-12) |
¨ | Pre-commencement communications pursuant to Rule 14d-2(b) under the Exchange Act (17 CFR 240.14d-2(b)) |
¨ | Pre-commencement communications pursuant to Rule 13e-4(c) under the Exchange Act (17 CFR 240.13e-4(c)) |
Item 2.02 | Results of Operations and Financial Condition |
On October 22, 2013, Synovus Financial Corp. (the Company) issued a press release announcing the Companys financial results for the three and nine month periods ended September 30, 2013.
Pursuant to General Instruction F to Current Report on Form 8-K, the press release is attached to this Current Report as Exhibit 99.1 and only those portions of the press release related to the historical results of operations of the Company for the three and nine months ended September 30, 2013 are incorporated into this Item 2.02 by reference. The information contained in this Item 2.02, including the information set forth in the press release filed as Exhibit 99.1 to, and incorporated in, this Current Report is being furnished and shall not be deemed filed for the purposes of Section 18 of the Securities Exchange Act of 1934, as amended (the Exchange Act), or otherwise subject to the liabilities of that Section. The information in Exhibit 99.1 furnished pursuant to this Item 2.02 shall not be incorporated by reference into any registration statement or other documents pursuant to the Securities Act of 1933, as amended (the Securities Act), or into any filing or other document pursuant to the Exchange Act except as otherwise expressly stated in any such filing.
Item 7.01 | Regulation FD Disclosure |
On October 22, 2013, the Company made available the supplemental information (the Supplemental Information) and slide presentation (Slide Presentation) prepared for use with the press release. The investor call and webcast will be held at 8:30 a.m., ET, on October 22, 2013.
Pursuant to General Instruction F to Current Report on Form 8-K, the Supplemental Information and the Slide Presentation are attached to this Current Report as Exhibits 99.2 and Exhibit 99.3, respectively, and incorporated into this Item 7.01 by reference. The information contained in this Item 7.01, including the information set forth in the Supplemental Information and Slide Presentation filed as Exhibit 99.2 and Exhibit 99.3 to, and incorporated in, this Current Report, is being furnished and shall not be deemed filed for the purposes of Section 18 of the Exchange Act or otherwise subject to the liabilities of that Section. The information in Exhibit 99.2 and Exhibit 99.3 furnished pursuant to this Item 7.01 shall not be incorporated by reference into any registration statement or other documents pursuant to the Securities Act or into any filing or other document pursuant to the Exchange Act except as otherwise expressly stated in any such filing.
2
Item 9.01 | Financial Statements and Exhibits |
(d) | Exhibits |
Exhibit No. | Description |
99.1 | Synovus press release dated October 22, 2013 |
99.2 | Supplemental Information prepared for use with the press release |
99.3 | Slide presentation prepared for use with the press release |
3
Signature
Pursuant to the requirements of the Securities Exchange Act of 1934, as amended, Synovus has caused this report to be signed on its behalf by the undersigned hereunto duly authorized.
SYNOVUS FINANCIAL CORP. | ||||
(Synovus)
| ||||
Dated: October 22, 2013 | By: | /s/Samuel F. Hatcher | ||
Samuel F. Hatcher | ||||
Executive Vice President, General Counsel and Secretary |
4
Exhibit 99.1
For Immediate Release
Contact: | Patrick A. Reynolds | |
Director of Investor Relations | ||
(706) 649-4973 |
Synovus Reports Earnings for Third Quarter of 2013
Net Income Available to Common Shareholders Increases by 21%
Columbus, Ga., October 22, 2013 Synovus Financial Corp. (NYSE: SNV) today reported financial results for the quarter ended September 30, 2013.
Third Quarter Results
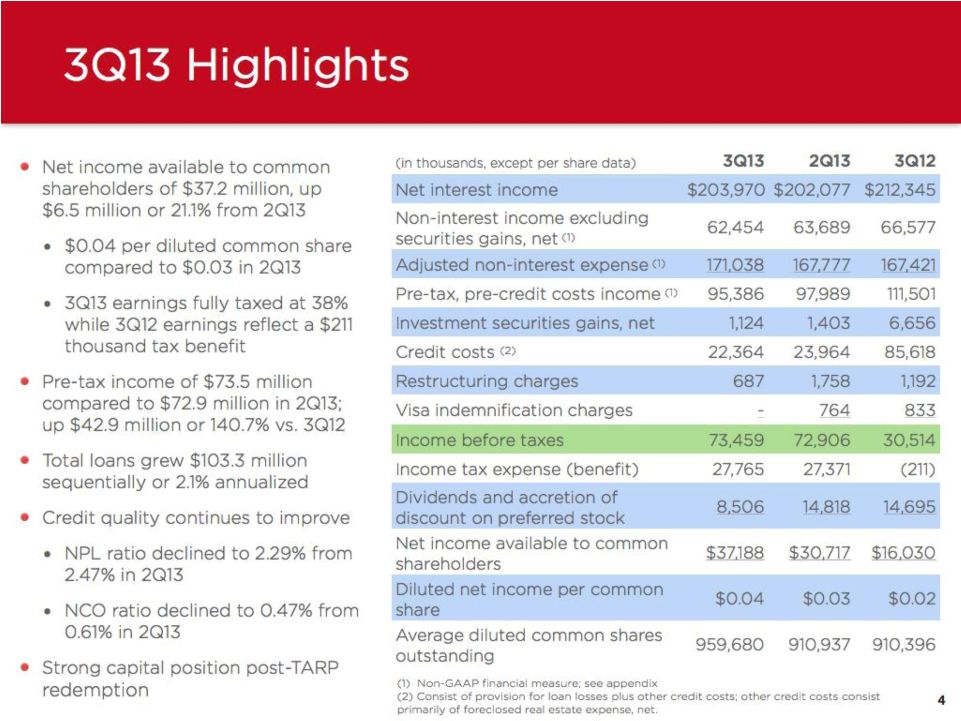
| Net income available to common shareholders increased to $37.2 million for the third quarter of 2013, a 21% increase compared to $30.7 million for the second quarter of 2013, and $16.0 million for the third quarter of 2012. Diluted net income per common share for the third quarter of 2013 was $0.04 compared to $0.03 for the second quarter of 2013 and $0.02 for the third quarter of 2012. |
¡ | The third quarter of 2013 results included income tax expense of $27.8 million compared to $27.4 million in the second quarter of 2013 and a tax benefit of $211 thousand in the third quarter of 2012. |
| Credit costs declined to $22.4 million for the third quarter of 2013, compared to $24.0 million for the second quarter of 2013 and $85.6 million for the third quarter of 2012. |
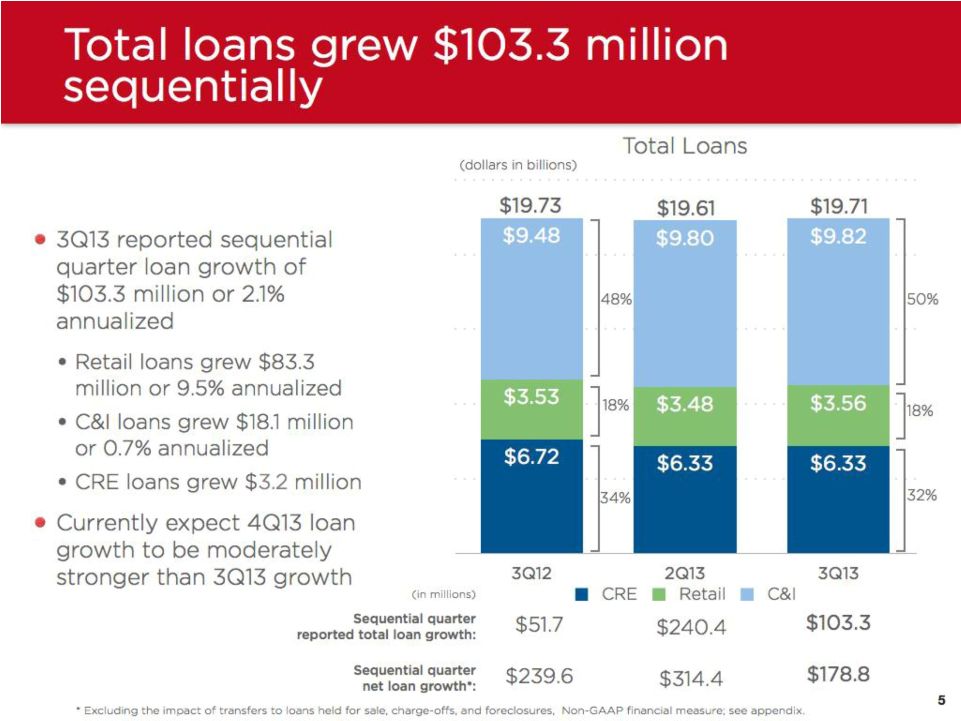
| Total loans grew $103.3 million sequentially or 2.1% annualized. |
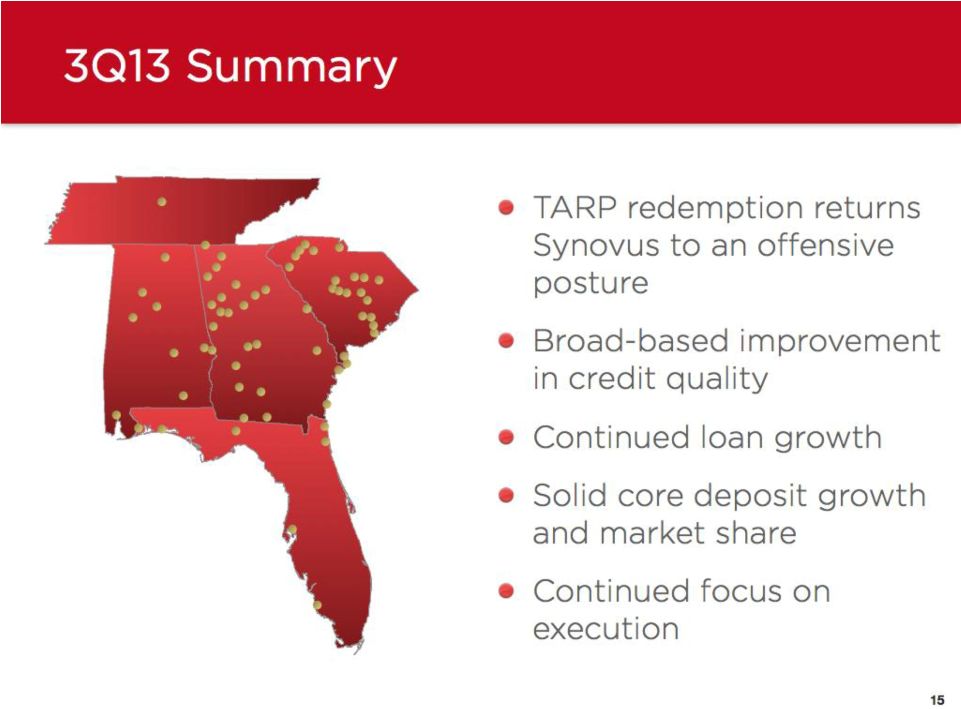
We were pleased with the continued growth in profitability during the third quarter, with a 21% increase in net income available to common shareholders compared to last quarter. This upward trend signals one of the many and immediate benefits of our companys July 26th exit from the Troubled Asset Relief Program (TARP), said Kessel D. Stelling, Chairman and CEO of Synovus. Third quarter results also included other encouraging signs, including growth in loans and deposits, stability in the net interest margin, and continued positive credit trends.
Core Performance
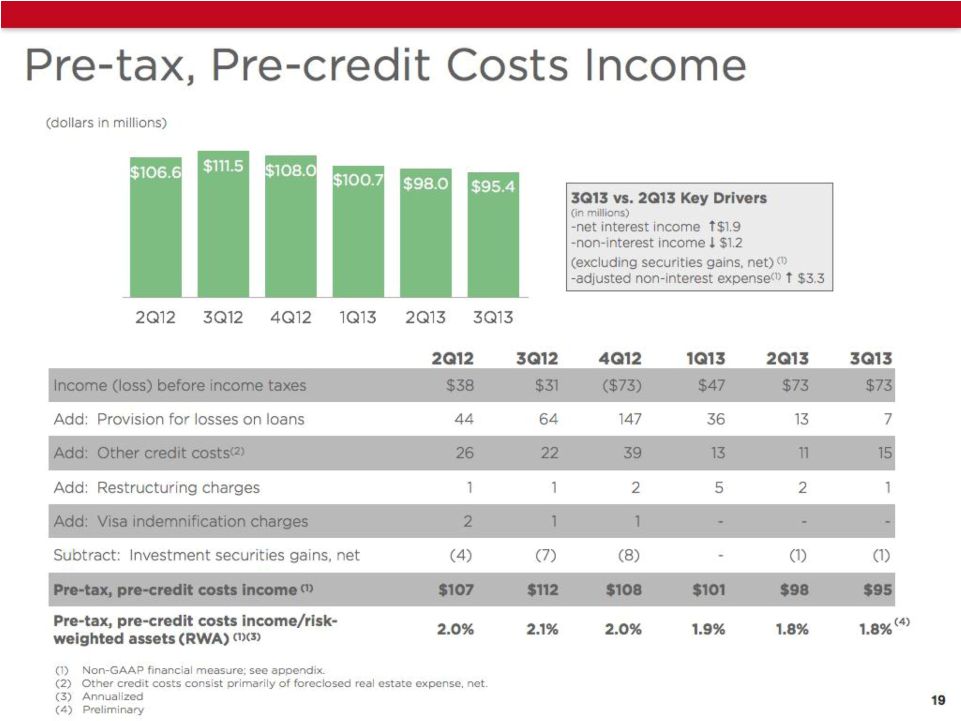
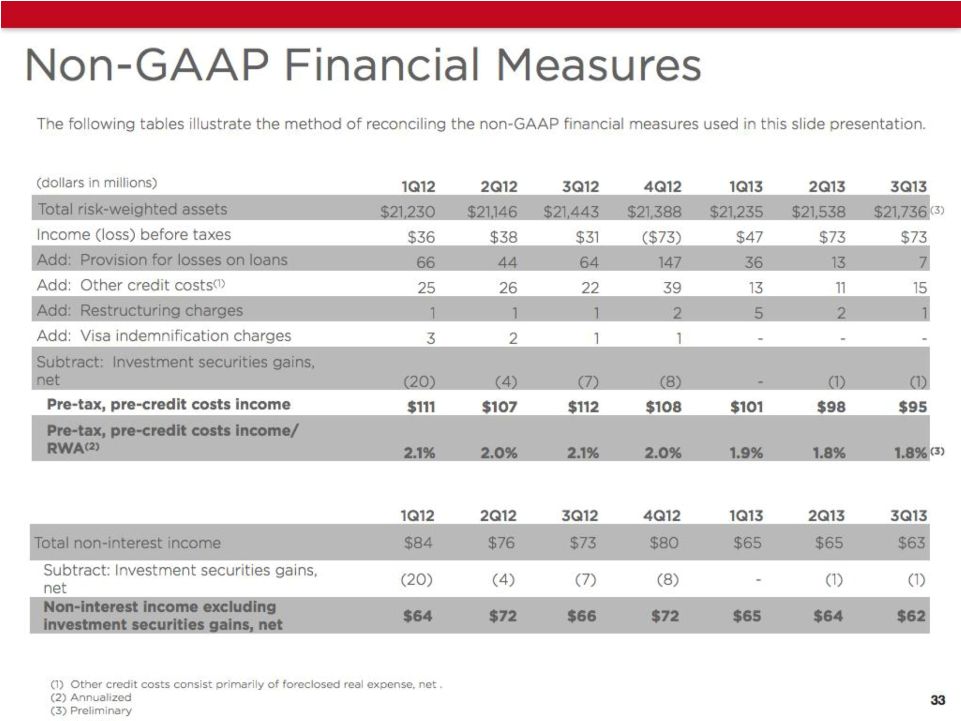
Pre-tax, pre-credit costs income was $95.4 million for the third quarter of 2013, down $2.6 million from $98.0 million for the second quarter of 2013.
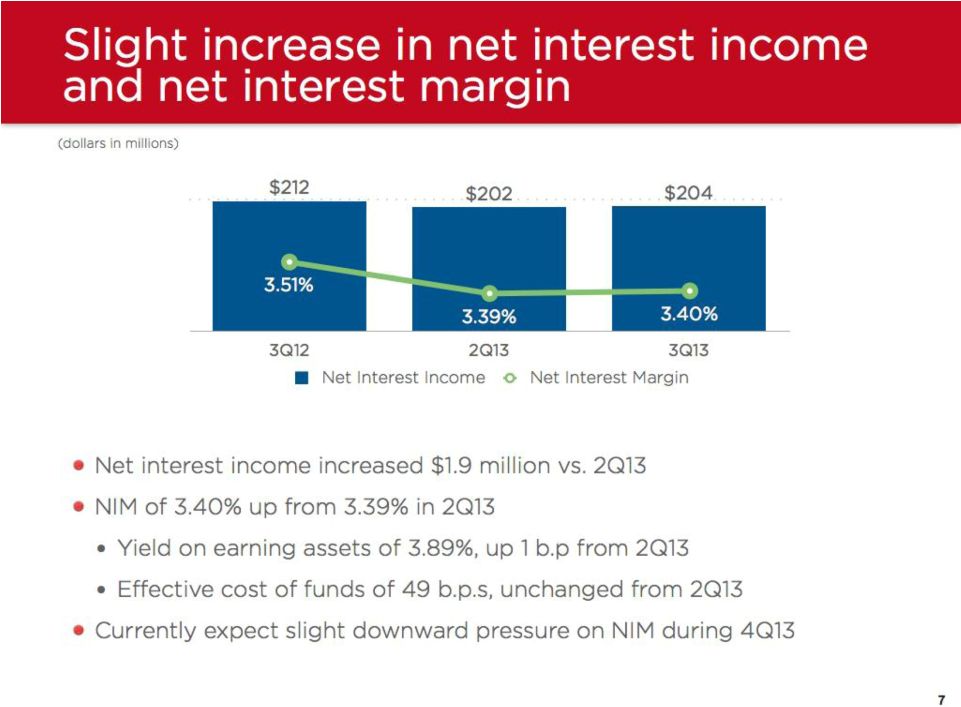
| Net interest income was $204.0 million for the third quarter of 2013, up $1.9 million from $202.1 million in the previous quarter. |
| The net interest margin increased to 3.40%, up one basis point from the second quarter of 2013, with the yield on earning assets up one basis point and the effective cost of funds unchanged. |
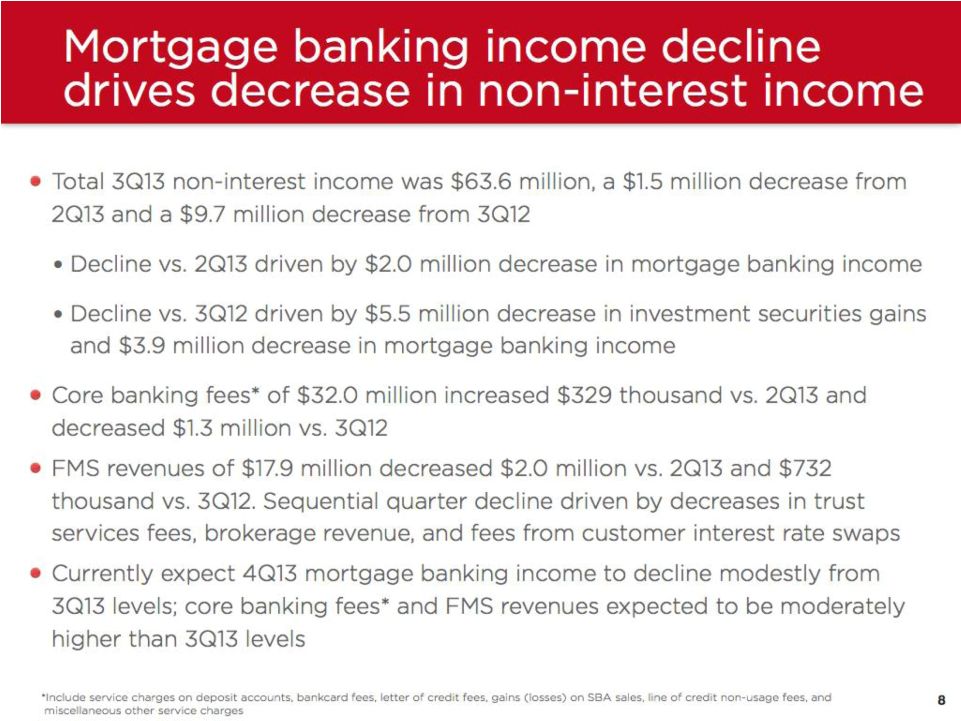
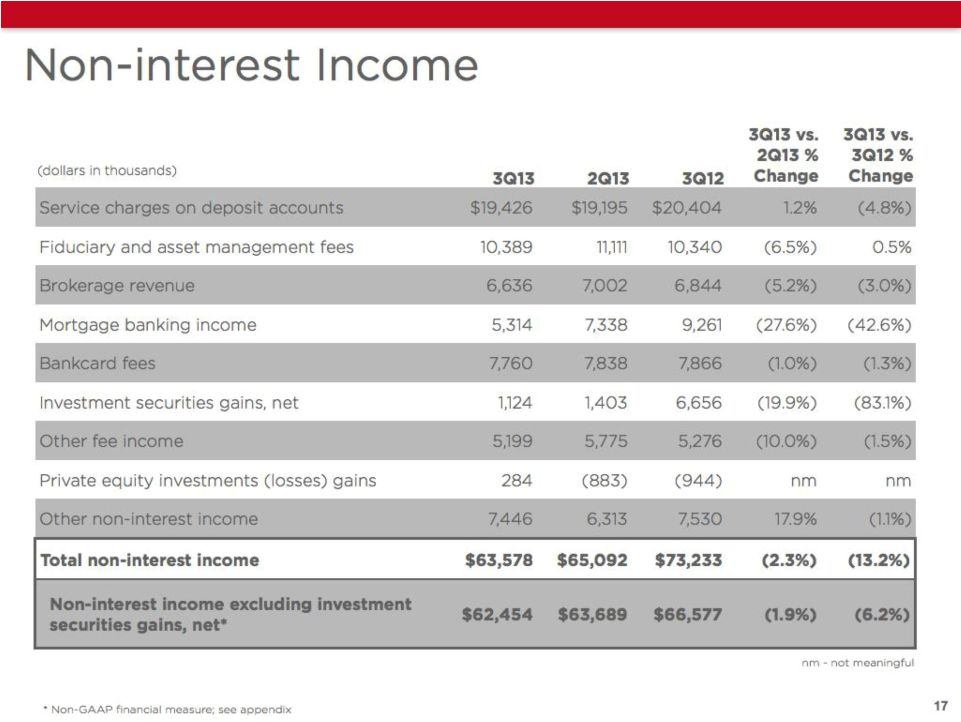
| Total non-interest income was $63.6 million for the third quarter of 2013, down $1.5 million, compared to $65.1 million for the second quarter of 2013, due primarily to a decline in mortgage banking income of $2.0 million. |
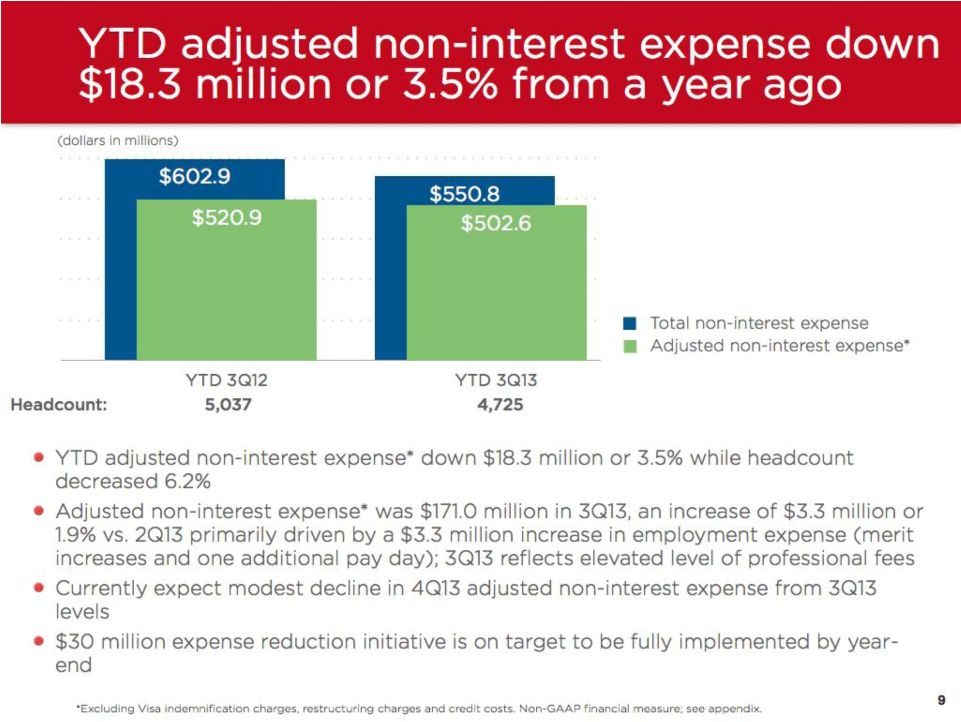
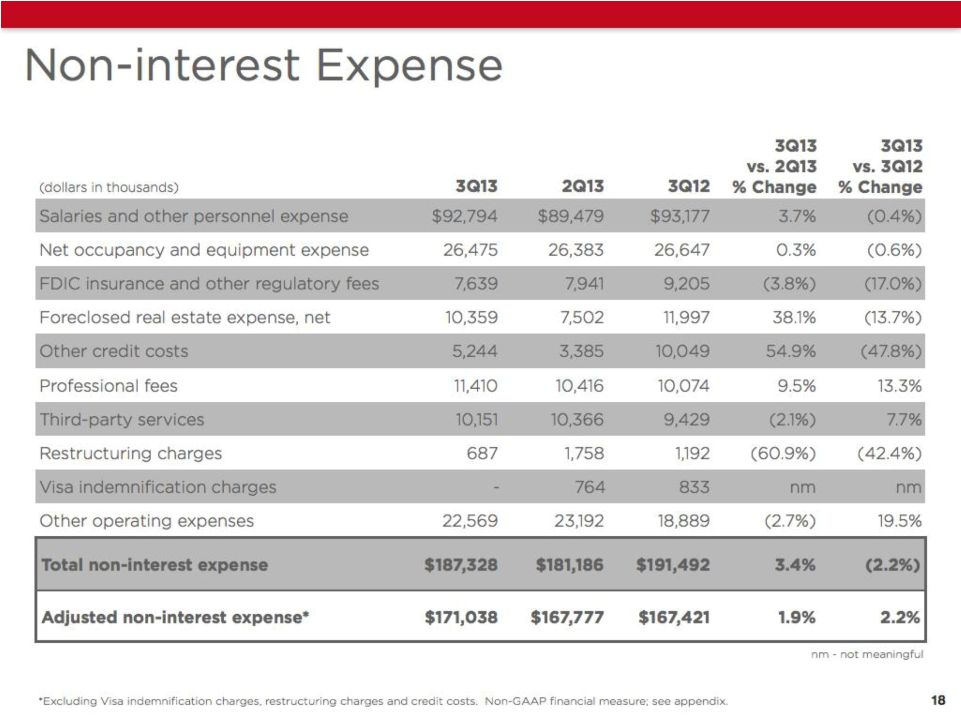
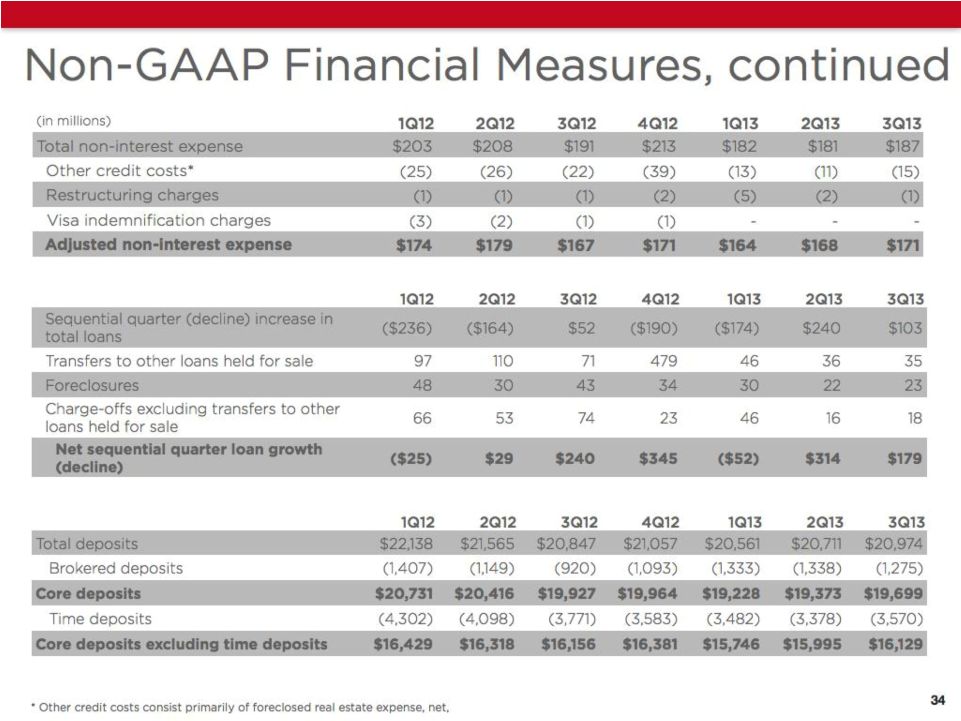
| Adjusted non-interest expense (excludes Visa indemnification charges, restructuring charges and other credit costs) was $171.0 million, up $3.3 million from $167.8 million for the second quarter of 2013, due primarily to a $3.3 million increase in employment expenses (merit increases and one additional pay day) and elevated professional fees. |
Balance Sheet Fundamentals
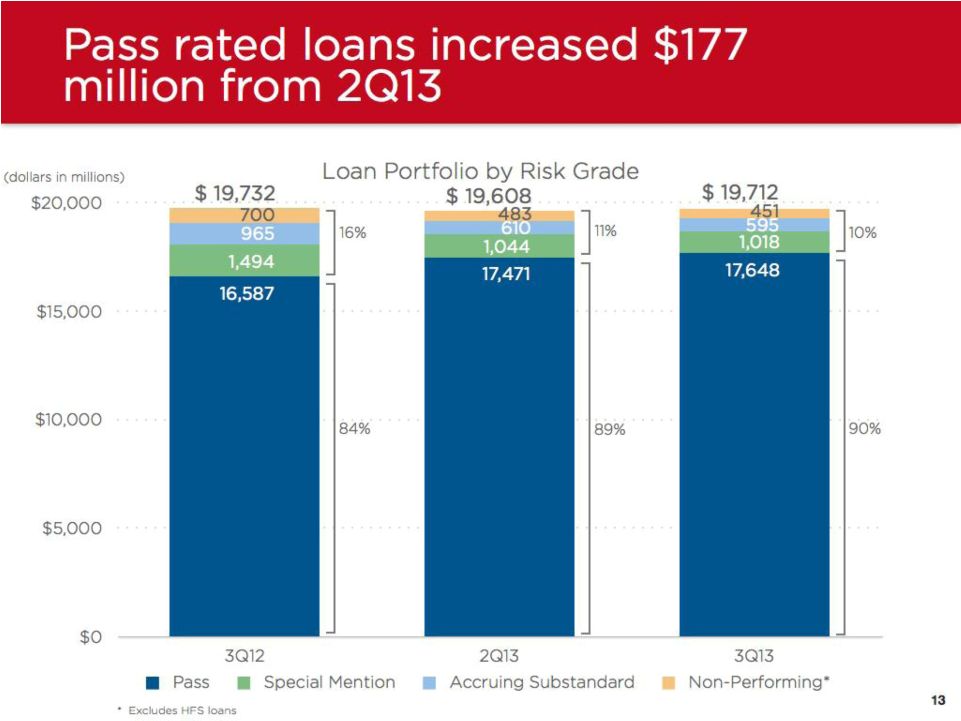
| Total reported loans ended the quarter at $19.71 billion, a $103.3 million increase from the second quarter of 2013. |
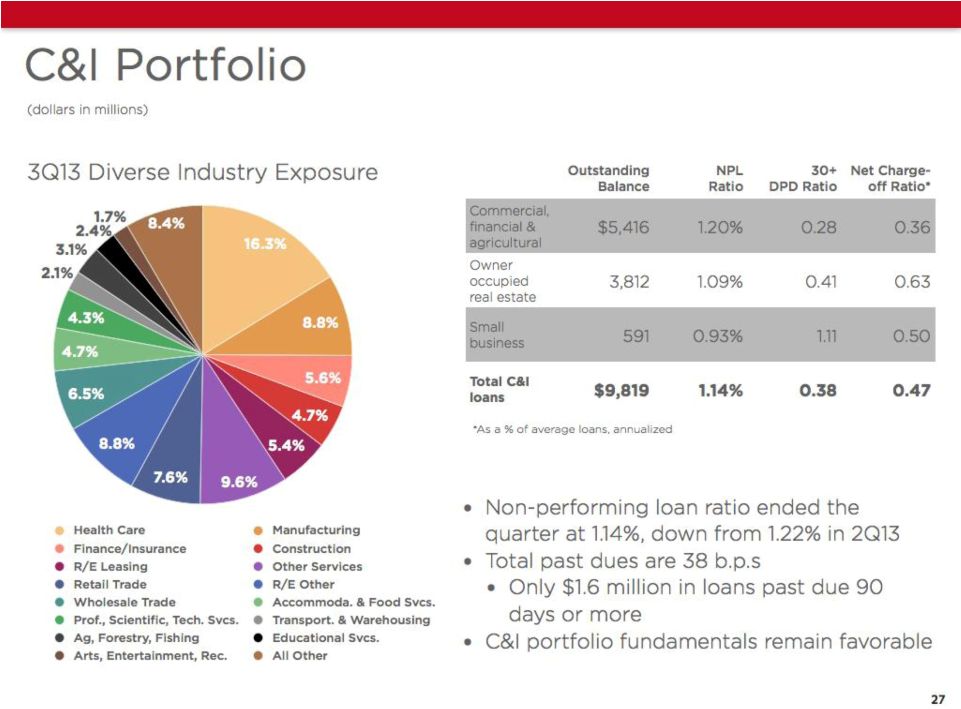
¡ | Commercial and industrial loans grew by $18.1 million from the second quarter of 2013, or 0.7% annualized. |
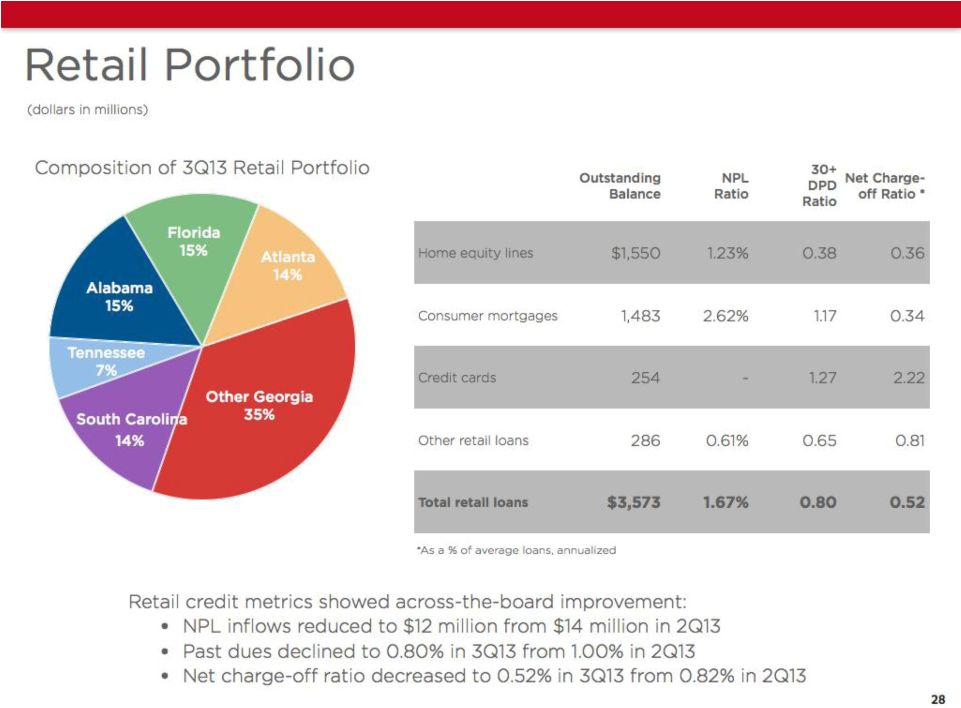
¡ | Retail loans grew by $83.3 million from the second quarter of 2013, or 9.5% annualized. |
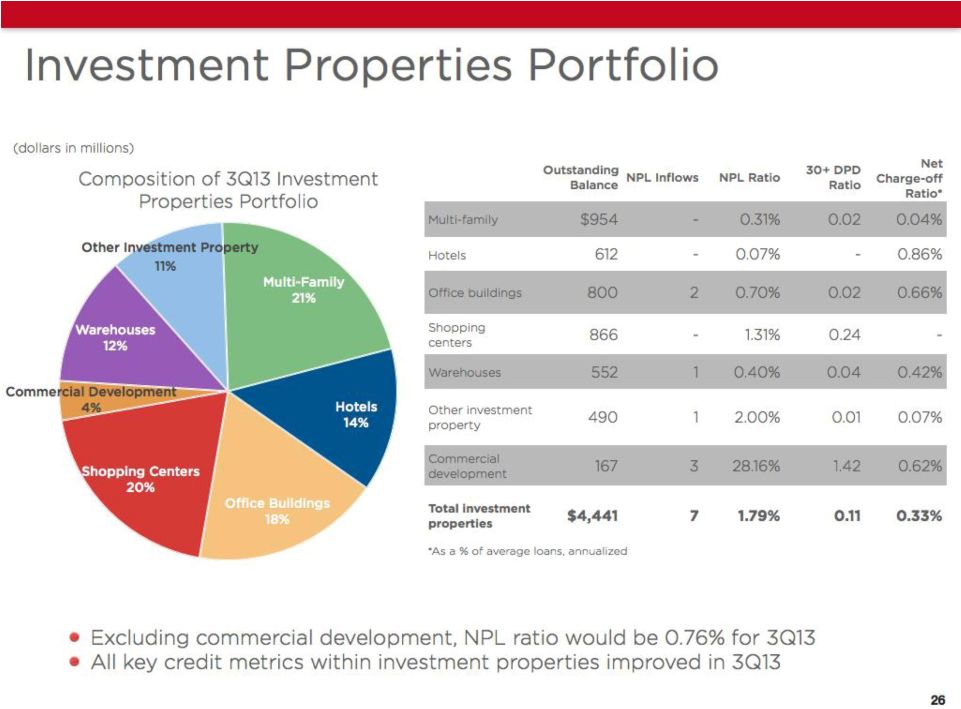
¡ | Commercial real estate loans grew by $3.2 million from the second quarter of 2013. |
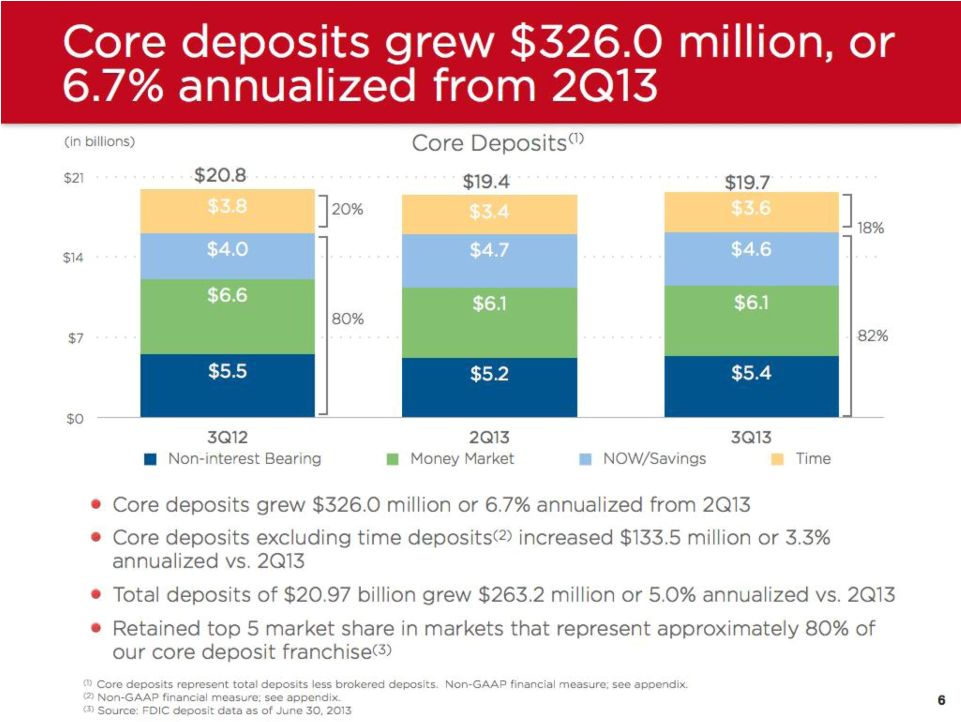
| Total deposits ended the quarter at $20.97 billion, up $263.2 million from the previous quarter due primarily to increases in non-interest bearing demand deposits and time deposits. |
| Core deposits ended the quarter at $19.70 billion, up $326.0 million compared to the second quarter of 2013. Core deposits, excluding time deposits, increased $133.5 million compared to the previous quarter. |
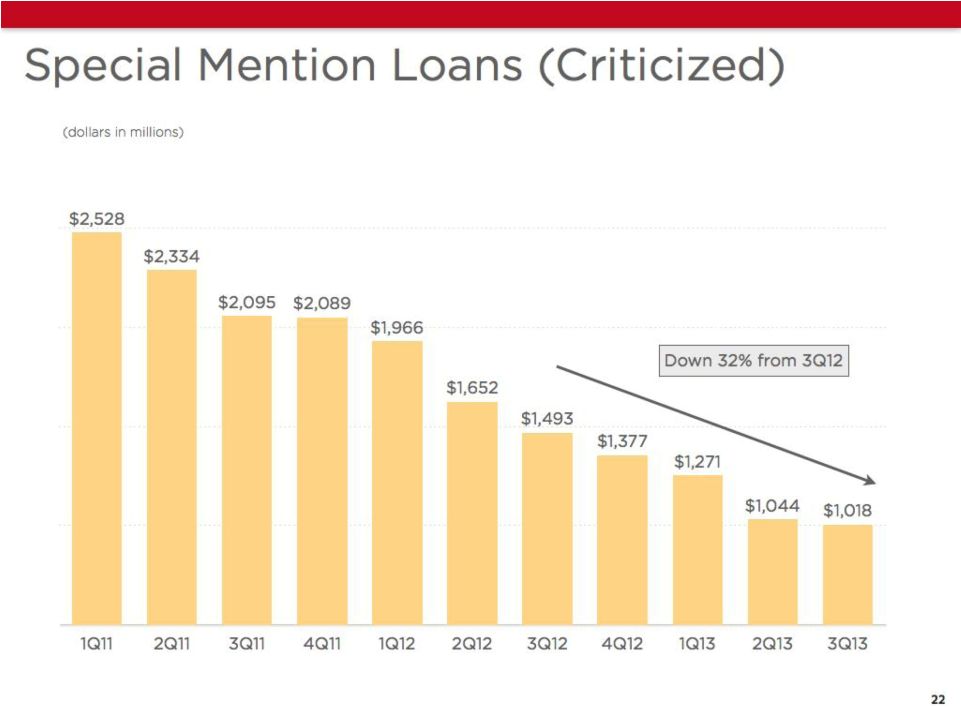
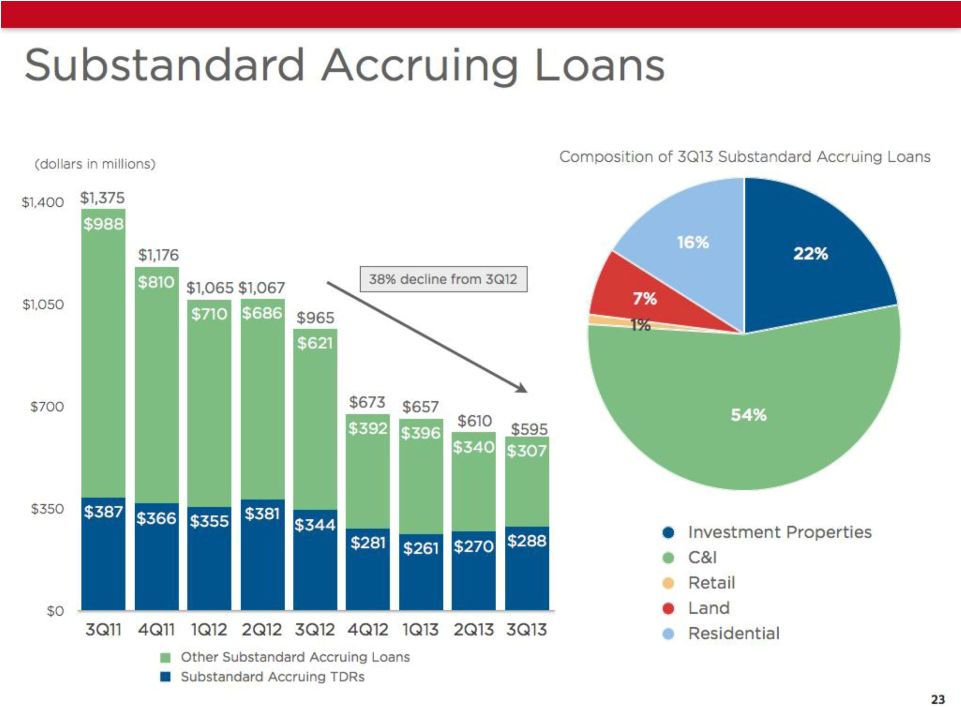
Credit Quality
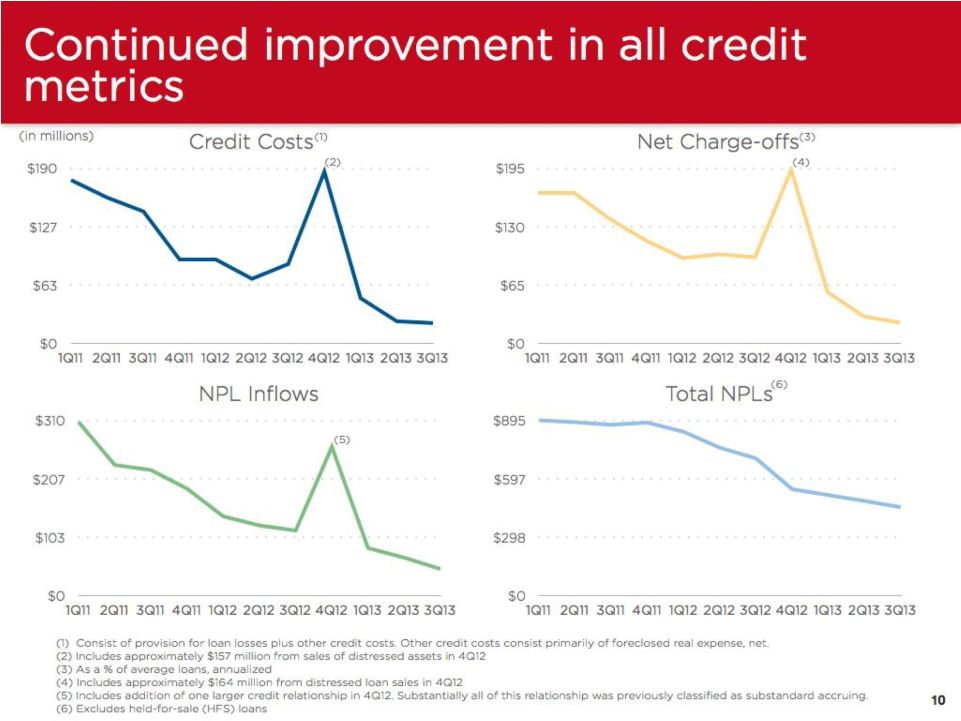
All key credit quality metrics continued to improve.
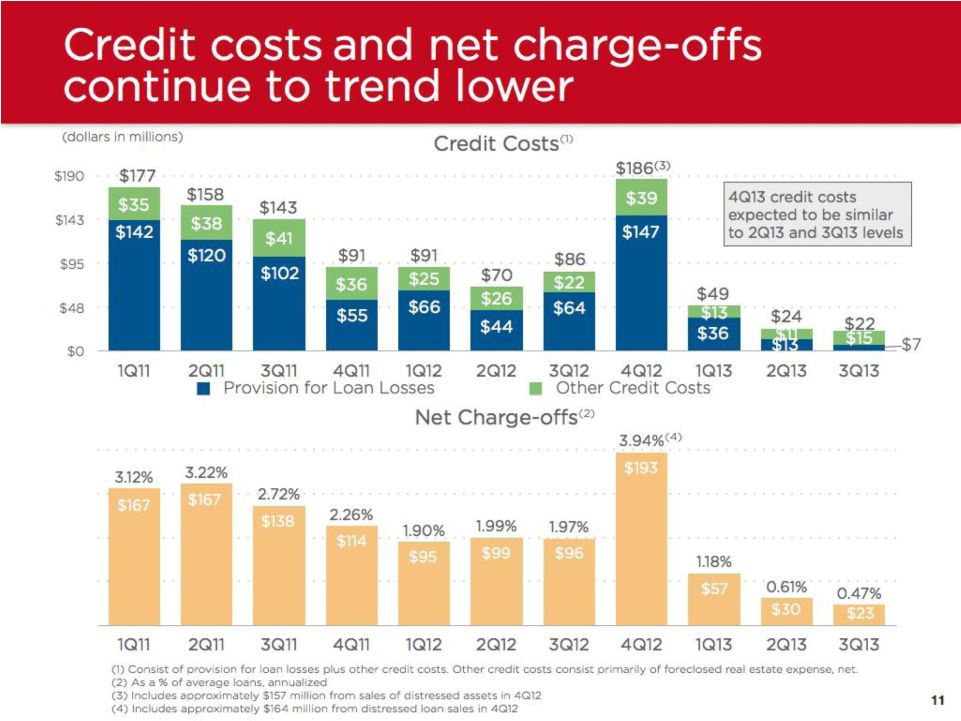
| Total credit costs were $22.4 million in the third quarter of 2013, down from $24.0 million in the second quarter of 2013 and $85.6 million in the third quarter of 2012. |
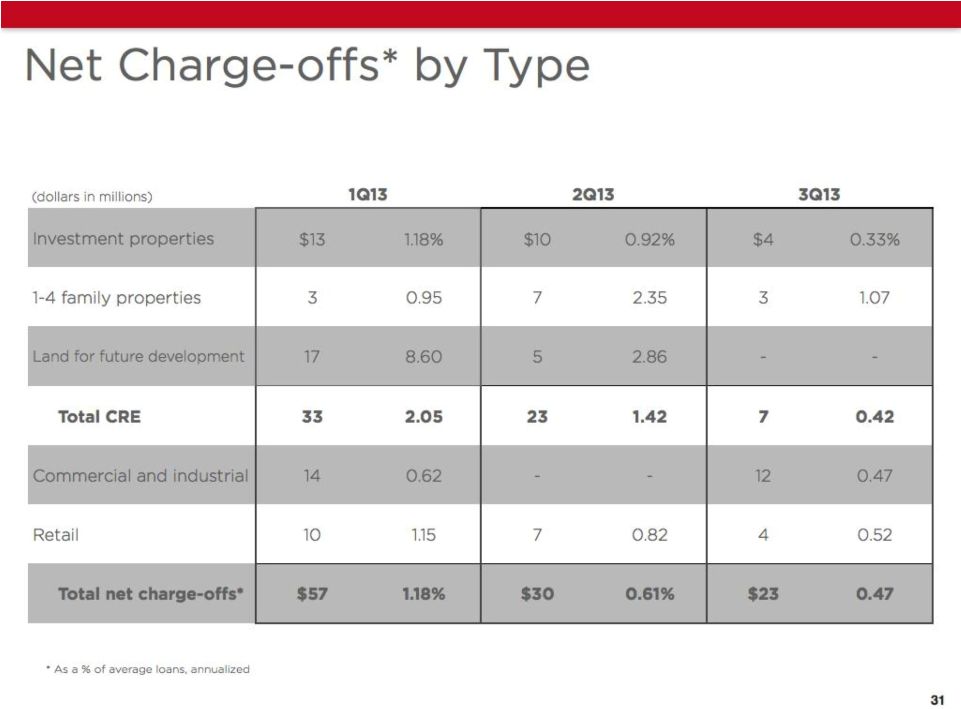
| Net charge-offs were $23.0 million in the third quarter of 2013, down from $30.0 million in the second quarter of 2013 and $96.5 million in the third quarter of 2012. The annualized net charge-off ratio was 0.47% in the third quarter, down from 0.61% in the previous quarter and 1.97% in the third quarter of 2012. |
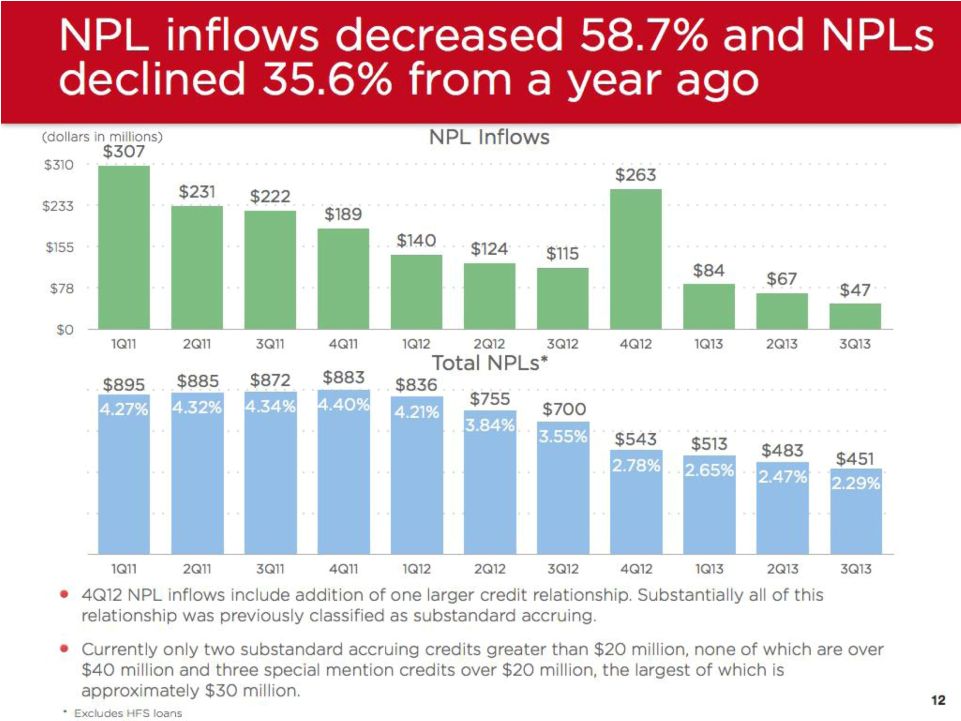
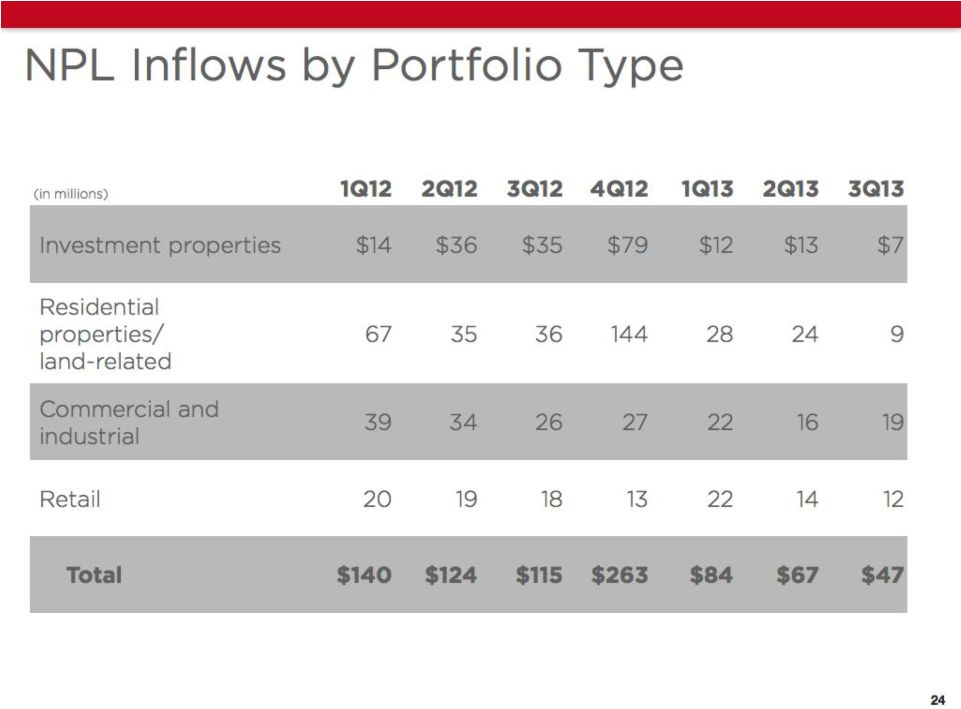
| Non-performing loan inflows were $47.4 million in the third quarter of 2013, down from $66.9 million in the second quarter of 2013 and $114.8 million in the third quarter of 2012. |
| Non-performing loans, excluding loans held for sale, were $450.9 million at September 30, 2013, down $32.6 million from the previous quarter, and down $249.3 million or 35.6% from the third quarter of 2012. The non-performing loan ratio was 2.29% at September 30, 2013, down from 2.47% at the end of the previous quarter and 3.55% at September 30, 2012. |
| Total non-performing assets were $586.9 million at September 30, 2013, down $48.3 million from the previous quarter, and down $312.5 million or 34.7% from the third quarter of 2012. The non-performing asset ratio was 2.96% at September 30, 2013, compared to 3.21% at the end of the previous quarter and 4.51% at September 30, 2012. |
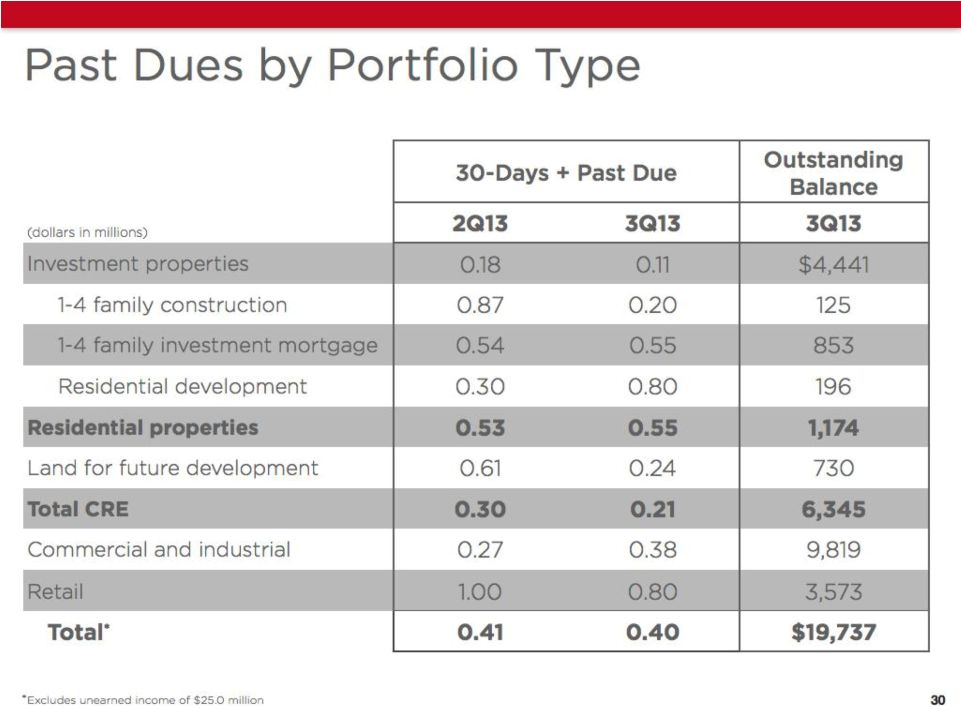
| Total delinquencies (consisting of loans 30 or more days past due and still accruing) declined to 0.40% of total loans at September 30, 2013, compared to 0.41% at June 30, 2013, and 0.55% at September 30, 2012. Total loans past due 90 days or more and still accruing remained low at 0.02% at September 30, 2013, compared to 0.02% at June 30, 2013, and 0.05% at September 30, 2012. |
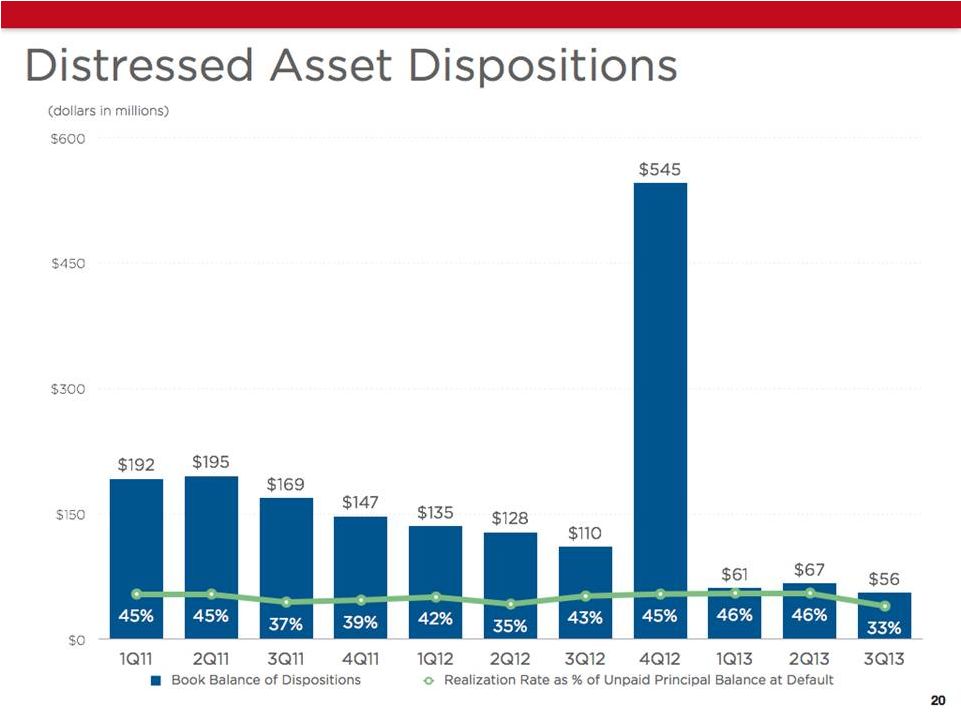
| Distressed asset sales were approximately $56 million during the third quarter, compared to approximately $67 million in the second quarter of 2013, and approximately $110 million in the third quarter of 2012. |
Capital Ratios
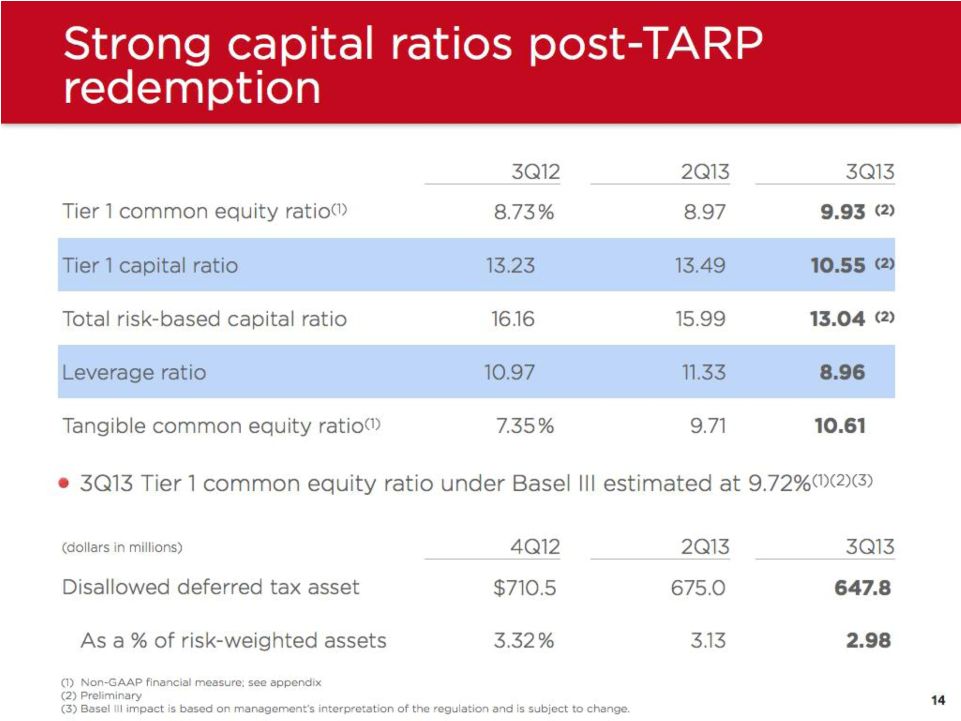
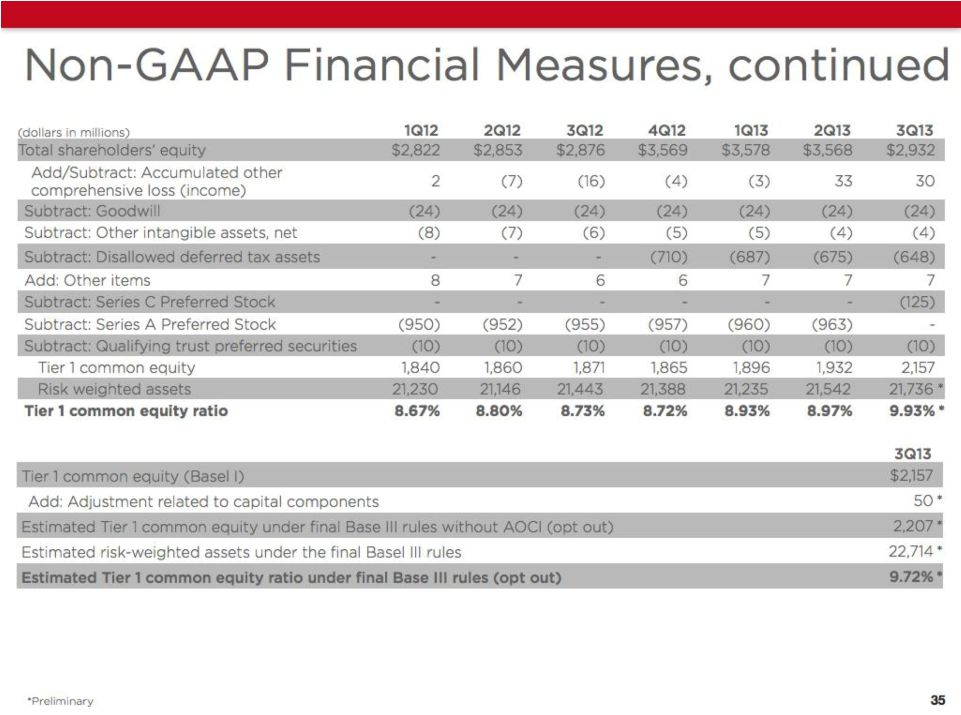
The September 30, 2013 capital ratios reflect the common and preferred stock offerings ($300 million in net proceeds) completed during the third quarter in connection with the July 2013 $968 million TARP redemption.
| Tier 1 Common Equity ratio was 9.93% at September 30, 2013, compared to 8.97% at June 30, 2013. |
| Tier 1 Capital ratio was 10.55% at September 30, 2013, compared to 13.49% at June 30, 2013. |
| Total Risk Based Capital ratio was 13.04% at September 30, 2013, compared to 15.99% at June 30, 2013. |
| Tier 1 Leverage ratio was 8.96% at September 30, 2013, compared to 11.33% at June 30, 2013. |
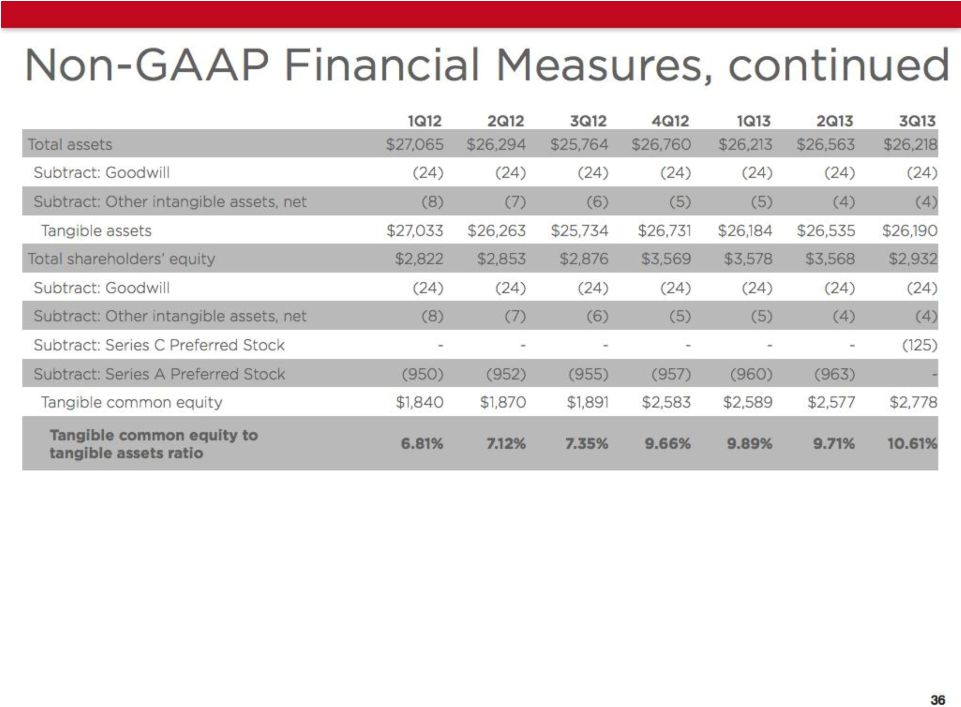
| Tangible Common Equity ratio was 10.61% at September 30, 2013, compared to 9.71% at June 30, 2013. |
We will recognize later this month our 125th anniversary as a banking organization, and I want to thank our team members and our customers for their dedication and loyalty to our company. While we celebrate our rich past, we are also looking ahead to a bright future.
Our post-TARP redemption capital position is strong, and our company is well-positioned in growing markets throughout the southeast. According to recently released FDIC data, we again retained top five market share in markets that represent approximately 80% of our core deposit franchise. We continue to invest in high-opportunity markets and business lines where we can leverage our proven, relationship-based delivery model to build long-term customer relationships, Stelling concluded.
Synovus will host an earnings highlights conference call at 8:30 a.m. EDT on October 22, 2013. The earnings call will be accompanied by a slide presentation. Shareholders and other interested parties can access the slide presentation and listen to the conference call via simultaneous Internet broadcast at www.synovus.com by clicking on the Live Webcast icon. RealPlayer or Windows Media Player can be downloaded prior to accessing the actual call or the replay. The replay will be archived for 12 months and will be available 30-45 minutes after the call.
About Synovus
Synovus Financial Corp. is a financial services company with approximately $26 billion in assets based in Columbus, Georgia. Synovus Financial Corp. provides commercial and retail banking, investment and mortgage services to customers in Georgia, Alabama, South Carolina, Florida and Tennessee. See Synovus Financial Corp. on the web at www.synovus.com.
Forward-Looking Statements
This press release and certain of our other filings with the Securities and Exchange Commission contain statements that constitute forward-looking statements within the meaning of, and subject to the protections of, Section 27A of the Securities Act of 1933, as amended, and Section 21E of the Securities Exchange Act of 1934, as amended. All statements other than statements of historical fact are forward-looking statements. You can identify these forward-looking statements through Synovus use of words such as believes, anticipates, expects, may, will, assumes, should, predicts, could, would, intends, targets, estimates, projects, plans, potential and other similar words and expressions of the future or otherwise regarding the outlook for Synovus future business and financial performance and/or the performance of the commercial banking industry and economy in general. These forward-looking statements include, among others, our expectations on credit trends and key credit metrics; expectations regarding deposits, loan growth and the net interest margin; expectations on our growth strategy and future profitability; and the assumptions underlying our expectations. Prospective investors are cautioned that any such forward-looking statements are not guarantees of future performance and involve known and unknown risks and uncertainties which may cause the actual results, performance or achievements of Synovus to be materially different from the future results, performance or achievements expressed or implied by such forward-looking statements. Forward-looking statements are based on the information known to, and current beliefs and expectations of, Synovus management and are subject to significant risks and uncertainties. Actual results may differ materially from those contemplated by such forward-looking statements. A number of factors could cause actual results to differ materially from those contemplated by the forward-looking statements in this report. Many of these factors are beyond Synovus ability to control or predict.
These forward-looking statements are based upon information presently known to Synovus management and are inherently subjective, uncertain and subject to change due to any number of risks and uncertainties, including, without limitation, the risks and other factors set forth in Synovus filings with the Securities and Exchange Commission, including its Annual Report on Form 10-K for the year ended December 31, 2012 under the captions Cautionary Notice Regarding Forward-Looking Statements and Risk Factors and in Synovus quarterly reports on Form 10-Q and current reports on Form 8-K. We believe these forward-looking statements are reasonable; however, undue reliance should not be placed on any forward-looking statements, which are based on current expectations and speak only as of the date that they are made. We do not assume any obligation to update any forward-looking statements as a result of new information, future developments or otherwise, except as otherwise may be required by law.
Use of Non-GAAP Financial Measures
The measures entitled pre-tax, pre-credit costs income, adjusted non-interest expense, core deposits, core deposits excluding time deposits, Tier 1 common equity ratio, and tangible common equity to tangible assets ratio are not measures recognized under U.S. generally accepted accounting principles (GAAP) and therefore are considered non-GAAP financial measures. The most comparable GAAP measures are income (loss) before income taxes, total non-interest expense, total deposits, Tier 1 capital to risk-weighted assets ratio, and total shareholders equity to total assets ratio, respectively.
Synovus believes that these non-GAAP financial measures provide meaningful additional information about Synovus to assist management and investors in evaluating Synovus capital strength and the performance of its core business. These non-GAAP financial measures should not be considered as substitutes for income (loss) before income taxes, or total non-interest expense, total deposits, Tier 1 capital to risk-weighted assets ratio, and total shareholders equity to total assets ratio determined in accordance with GAAP and may not be comparable to other similarly titled measures at other companies.
The computations of pre-tax, pre-credit costs income, adjusted non-interest expense, core deposits, core deposits excluding time deposits, Tier 1 common equity ratio, and tangible common equity to tangible assets ratio, the reconciliation of these measures to income (loss) before income taxes, total non-interest expense, total deposits, Tier 1 capital to risk-weighted assets ratio, and total shareholders equity to total assets ratio are set forth in the tables below.
Reconciliation of Non-GAAP Financial Measures |
||||||||||||||||||||
(dollars in thousands) |
3Q13 | 2Q13 | 1Q13 | 4Q12 | 3Q12 | |||||||||||||||
Pre-tax, Pre-credit Costs Income |
||||||||||||||||||||
Income (loss) before income taxes |
$ 73,459 | 72,906 | 46,553 | (72,299) | 30,514 | |||||||||||||||
Add: Provision for losses on loans |
6,761 | 13,077 | 35,696 | 146,526 | 63,572 | |||||||||||||||
Add: Other credit costs(1) |
15,603 | 10,887 | 13,595 | 39,236 | 22,046 | |||||||||||||||
Add: Restructuring charges |
687 | 1,758 | 4,850 | 1,969 | 1,192 | |||||||||||||||
Subtract: Investment securities gains, net. |
(1,124) | (1,403) | (45) | (8,233) | (6,656) | |||||||||||||||
Add: Visa indemnification charges |
- | 764 | 37 | 757 | 833 | |||||||||||||||
Pre-tax, pre-credit costs income |
$ 95,386 | 97,989 | 100,686 | 107,956 | 111,501 | |||||||||||||||
Adjusted Non-interest Expense |
||||||||||||||||||||
Total non-interest expense |
$ 187,328 | 181,186 | 182,286 | 213,346 | 191,492 | |||||||||||||||
Subtract: Other credit costs(1) |
(15,603) | (10,887) | (13,595) | (39,236) | (22,046) | |||||||||||||||
Subtract: Restructuring charges |
(687) | (1,758) | (4,850) | (1,969) | (1,192) | |||||||||||||||
Subtract: Visa indemnification charges |
- | (764) | (37) | (757) | (833) | |||||||||||||||
Adjusted non-interest expense |
$ 171,038 | 167,777 | 163,804 | 171,384 | 167,421 | |||||||||||||||
Core deposits |
||||||||||||||||||||
Core deposits excluding time deposits |
||||||||||||||||||||
Total deposits |
$ 20,973,856 | 20,710,703 | 20,561,193 | 21,057,044 | 20,846,830 | |||||||||||||||
Subtract: Brokered deposits |
(1,275,200) | (1,338,064) | (1,332,632) | (1,092,749) | (919,959) | |||||||||||||||
Core deposits |
19,698,656 | 19,372,639 | 19,228,561 | 19,964,295 | 19,926,871 | |||||||||||||||
Subtract: Time deposits |
(3,569,752) | (3,377,215) | (3,482,196) | (3,583,304) | (3,771,117) | |||||||||||||||
Core deposits excluding time deposits |
$ 16,128,904 | 15,995,424 | 15,746,365 | 16,380,991 | 16,155,754 | |||||||||||||||
Tier 1 Common Equity Ratio |
||||||||||||||||||||
Total shareholders equity |
$ 2,931,860 | 3,568,204 | 3,578,106 | 3,569,431 | 2,875,700 | |||||||||||||||
Add/subtract: Accumulated other comprehensive loss (income) |
29,514 | 33,060 | (2,787) | (4,101) | (16,156) | |||||||||||||||
Subtract: Goodwill |
(24,431) | (24,431) | (24,431) | (24,431) | (24,431) | |||||||||||||||
Subtract: Other intangible assets, net |
(3,783) | (4,156) | (4,583) | (5,149) | (5,895) | |||||||||||||||
Subtract: Disallowed deferred tax asset |
(647,828) | (674,996) | (687,007) | (710,488) | - | |||||||||||||||
Other items |
7,425 | 7,304 | 7,191 | 6,982 | 6,732 | |||||||||||||||
Tier 1 capital |
2,292,757 | 2,904,985 | 2,866,489 | 2,832,244 | 2,835,950 | |||||||||||||||
Subtract: Qualifying trust preferred securities |
(10,000) | (10,000) | (10,000) | (10,000) | (10,000) | |||||||||||||||
Subtract: Series C Preferred Stock, no par value |
(125,400) | - | - | - | - | |||||||||||||||
Subtract: Series A Preferred Stock, no par value |
- | (962,725) | (960,005) | (957,327) | (954,690) | |||||||||||||||
Tier 1 common equity |
2,157,357 | 1,932,260 | 1,896,484 | 1,864,917 | 1,871,260 | |||||||||||||||
Risk-weighted assets |
21,736,116(2) | 21,542,287 | 21,235,129 | 21,387,935 | 21,443,178 | |||||||||||||||
Tier 1 common equity ratio |
9.93%(2) | 8.97 | 8.93 | 8.72 | 8.73 | |||||||||||||||
Tangible common equity to tangible assets ratio |
||||||||||||||||||||
Total assets |
$ 26,218,360 | 26,563,174 | 26,212,879 | 26,760,012 | 25,764,644 | |||||||||||||||
Subtract: Goodwill |
(24,431) | (24,431) | (24,431) | (24,431) | (24,431) | |||||||||||||||
Subtract: Other intangible assets, net |
(3,783) | (4,156) | (4,583) | (5,149) | (5,895) | |||||||||||||||
Tangible assets |
$ 26,190,146 | 26,534,587 | 26,183,865 | 26,730,432 | 25,734,318 | |||||||||||||||
Total shareholders equity |
$ 2,931,860 | 3,568,204 | 3,578,106 | 3,569,431 | 2,875,700 | |||||||||||||||
Subtract: Goodwill |
(24,431) | (24,431) | (24,431) | (24,431) | (24,431) | |||||||||||||||
Subtract: Other intangible assets, net |
(3,783) | (4,156) | (4,583) | (5,149) | (5,895) | |||||||||||||||
Subtract: Series C Preferred Stock, no par value |
(125,400) | - | - | - | - |
Subtract: Series A Preferred Stock, no par value |
- | (962,725) | (960,005) | (957,327) | (954,690) | |||||||||||||||
Tangible common equity |
$ 2,778,246 | 2,576,892 | 2,589,087 | 2,582,524 | 1,890,684 | |||||||||||||||
Total shareholders equity to total assets ratio |
11.18% | 13.43 | 13.65 | 13.34 | 11.16 | |||||||||||||||
Tangible common equity to tangible assets ratio |
10.61% | 9.71 | 9.89 | 9.66 | 7.35 | |||||||||||||||
(1) Other credit costs consist primarily of foreclosed real estate expense, net (2) Preliminary |
|
###
Exhibit 99.2
Synovus
INCOME STATEMENT DATA | Nine Months Ended | |||||||||||||||||||
(Unaudited) | ||||||||||||||||||||
(Dollars in thousands, except per share data)
|
September 30,
| |||||||||||||||||||
|
| |||||||||||||||||||
2013
|
2012
|
Change
|
||||||||||||||||||
|
| |||||||||||||||||||
Interest income |
$ |
|
695,755 |
|
764,140 | (8.9) | % | |||||||||||||
Interest expense
|
|
89,894
|
|
|
117,479
|
|
|
(23.5)
|
|
|||||||||||
|
|
|
|
|
|
|||||||||||||||
Net interest income |
|
605,861 |
|
|
646,661 |
|
|
(6.3) |
|
|||||||||||
Provision for loan losses
|
|
55,534
|
|
|
173,843
|
|
|
(68.1)
|
|
|||||||||||
|
|
|
|
|
|
|||||||||||||||
Net interest income after provision for loan losses
|
|
550,327
|
|
|
472,818
|
|
|
16.4
|
|
|||||||||||
|
|
|
|
|
|
|||||||||||||||
Non-interest income: |
||||||||||||||||||||
Service charges on deposit accounts |
58,142 | 57,319 | 1.4 | |||||||||||||||||
Fiduciary and asset management fees |
32,471 | 31,966 | 1.6 | |||||||||||||||||
Brokerage revenue |
21,231 | 19,786 | 7.3 | |||||||||||||||||
Mortgage banking income |
19,569 | 23,247 | (15.8) | |||||||||||||||||
Bankcard fees |
22,662 | 23,938 | (5.3) | |||||||||||||||||
Investment securities gains, net |
2,571 | 30,909 | (91.7) | |||||||||||||||||
Other fee income |
16,461 | 14,927 | 10.3 | |||||||||||||||||
(Decrease) increase in fair value of private equity investments, net |
(856) | 6,428 | nm | |||||||||||||||||
Other non-interest income |
|
21,139
|
|
|
25,329
|
|
|
(16.5)
|
|
|||||||||||
|
|
|
|
|
|
|||||||||||||||
Total non-interest income |
|
193,390
|
|
|
233,849
|
|
|
(17.3)
|
|
|||||||||||
|
|
|
|
|
|
|||||||||||||||
Non-interest expense: |
||||||||||||||||||||
Salaries and other personnel expense |
276,190 | 280,972 | (1.7) | |||||||||||||||||
Net occupancy and equipment expense |
77,025 | 79,512 | (3.1) | |||||||||||||||||
FDIC insurance and other regulatory fees |
24,059 | 37,171 | (35.3) | |||||||||||||||||
Foreclosed real estate expense, net |
28,800 | 55,677 | (48.3) | |||||||||||||||||
Losses on other loans held for sale, net |
487 | 4,005 | (87.8) | |||||||||||||||||
Professional fees |
28,922 | 29,270 | (1.2) | |||||||||||||||||
Third-party services |
30,446 | 28,466 | 7.0 | |||||||||||||||||
Visa indemnification charges |
801 | 5,546 | (85.6) | |||||||||||||||||
Restructuring charges |
7,295 | 3,444 | 111.8 | |||||||||||||||||
Other operating expenses |
|
76,774
|
|
|
78,827
|
|
|
(2.6)
|
|
|||||||||||
|
|
|
|
|
|
|||||||||||||||
Total non-interest expense
|
|
550,799
|
|
|
602,890
|
|
|
(8.6)
|
|
|||||||||||
|
|
|
|
|
|
|||||||||||||||
Income before income taxes |
192,918 | 103,777 | 85.9 | |||||||||||||||||
Income tax expense (benefit)
|
|
72,114
|
|
|
(2,393)
|
|
|
nm
|
|
|||||||||||
|
|
|
|
|
|
|||||||||||||||
Net income |
120,804 | 106,170 | 13.8 | |||||||||||||||||
Dividends and accretion of discount on Series A Preferred Stock
|
|
38,100
|
|
|
43,968
|
|
|
(13.3)
|
|
|||||||||||
|
|
|
|
|
|
|||||||||||||||
Net income available to common shareholders
|
$
|
|
82,704
|
|
|
62,202
|
|
|
33.0
|
|
||||||||||
|
|
|
|
|
|
|||||||||||||||
Net income per common share, basic |
0.10 | 0.08 | 20.8 | |||||||||||||||||
Net income per common share, diluted |
0.09 | 0.07 | 30.4 | |||||||||||||||||
Cash dividends declared per common share |
0.03 | 0.03 | - | |||||||||||||||||
Return on average assets |
0.61 | % | 0.53 | 15.1 | ||||||||||||||||
Return on average common equity |
4.16 | 4.33 | (3.9) | |||||||||||||||||
Weighted average common shares outstanding, basic |
865,565 | 786,429 | 10.1 | % | ||||||||||||||||
Weighted average common shares outstanding, diluted |
927,329 | 909,717 | 1.9 |
nm - not meaningful
Synovus
INCOME STATEMENT DATA | ||||||||||||||||||||||||||||||||||||
(Unaudited) | ||||||||||||||||||||||||||||||||||||
(Dollars in thousands, except per share data) | 2013 |
2012 |
3rd Quarter |
|||||||||||||||||||||||||||||||||
|
|
|||||||||||||||||||||||||||||||||||
Third Quarter |
Second Quarter |
First Quarter |
Fourth Quarter |
Third Quarter |
13 vs. 12 Change |
|||||||||||||||||||||||||||||||
|
|
|||||||||||||||||||||||||||||||||||
Interest income |
$ | 233,852 | 231,513 | 230,391 | 240,000 | 247,676 | (5.6) | % | ||||||||||||||||||||||||||||
Interest expense |
29,882 | 29,436 | 30,577 | 32,544 | 35,331 | (15.4) | ||||||||||||||||||||||||||||||
|
|
|
|
|
|
|
|
|
|
|
|
|||||||||||||||||||||||||
Net interest income |
203,970 | 202,077 | 199,814 | 207,456 | 212,345 | (3.9) | ||||||||||||||||||||||||||||||
Provision for loan losses |
6,761 | 13,077 | 35,696 | 146,526 | 63,572 | (89.4) | ||||||||||||||||||||||||||||||
|
|
|
|
|
|
|
|
|
|
|
|
|||||||||||||||||||||||||
Net interest income after provision for loan losses |
197,209 | 189,000 | 164,118 | 60,930 | 148,773 | 32.6 | ||||||||||||||||||||||||||||||
|
|
|
|
|
|
|
|
|
|
|
|
|||||||||||||||||||||||||
Non-interest income: |
||||||||||||||||||||||||||||||||||||
Service charges on deposit accounts |
19,426 | 19,195 | 19,521 | 20,883 | 20,404 | (4.8) | ||||||||||||||||||||||||||||||
Fiduciary and asset management fees |
10,389 | 11,111 | 10,971 | 10,537 | 10,340 | 0.5 | ||||||||||||||||||||||||||||||
Brokerage revenue |
6,636 | 7,002 | 7,594 | 7,127 | 6,844 | (3.0) | ||||||||||||||||||||||||||||||
Mortgage banking income |
5,314 | 7,338 | 6,917 | 9,025 | 9,261 | (42.6) | ||||||||||||||||||||||||||||||
Bankcard fees |
7,760 | 7,838 | 7,064 | 10,137 | 7,866 | (1.3) | ||||||||||||||||||||||||||||||
Investment securities gains, net |
1,124 | 1,403 | 45 | 8,233 | 6,656 | (83.1) | ||||||||||||||||||||||||||||||
Other fee income |
5,199 | 5,775 | 5,487 | 6,211 | 5,276 | (1.5) | ||||||||||||||||||||||||||||||
Increase (decrease) in fair value of private equity investments, net |
284 | (883) | (257) | 1,805 | (944) | nm | ||||||||||||||||||||||||||||||
Other non-interest income |
7,446 | 6,313 | 7,379 | 6,159 | 7,530 | (1.1) | ||||||||||||||||||||||||||||||
|
|
|
|
|
|
|
|
|
|
|
|
|||||||||||||||||||||||||
Total non-interest income |
63,578 | 65,092 | 64,721 | 80,117 | 73,233 | (13.2) | ||||||||||||||||||||||||||||||
|
|
|
|
|
|
|
|
|
|
|
|
|||||||||||||||||||||||||
Non-interest expense: |
||||||||||||||||||||||||||||||||||||
Salaries and other personnel expense |
92,794 | 89,479 | 93,917 | 94,901 | 93,177 | (0.4) | ||||||||||||||||||||||||||||||
Net occupancy and equipment expense |
26,475 | 26,383 | 24,167 | 26,063 | 26,647 | (0.6) | ||||||||||||||||||||||||||||||
FDIC insurance and other regulatory fees |
7,639 | 7,941 | 8,480 | 8,237 | 9,205 | (17.0) | ||||||||||||||||||||||||||||||
Foreclosed real estate expense, net |
10,359 | 7,502 | 10,940 | 34,978 | 11,997 | (13.7) | ||||||||||||||||||||||||||||||
Losses (gains) on other loans held for sale, net |
408 | (86) | 165 | 675 | 4,104 | (90.1) | ||||||||||||||||||||||||||||||
Professional fees |
11,410 | 10,416 | 7,095 | 12,037 | 10,074 | 13.3 | ||||||||||||||||||||||||||||||
Third-party services |
10,151 | 10,366 | 9,929 | 9,540 | 9,429 | 7.7 | ||||||||||||||||||||||||||||||
Visa indemnification charges |
- | 764 | 37 | 757 | 833 | (100.0) | ||||||||||||||||||||||||||||||
Restructuring charges |
687 | 1,758 | 4,850 | 1,969 | 1,192 | (42.4) | ||||||||||||||||||||||||||||||
Other operating expenses |
27,405 | 26,663 | 22,706 | 24,189 | 24,834 | 10.4 | ||||||||||||||||||||||||||||||
|
|
|
|
|
|
|
|
|
|
|
|
|||||||||||||||||||||||||
Total non-interest expense |
187,328 | 181,186 | 182,286 | 213,346 | 191,492 | (2.2) | ||||||||||||||||||||||||||||||
|
|
|
|
|
|
|
|
|
|
|
|
|||||||||||||||||||||||||
Income before income taxes |
73,459 | 72,906 | 46,553 | (72,299) | 30,514 | 140.7 | ||||||||||||||||||||||||||||||
Income tax expense (benefit) |
27,765 | 27,371 | 16,979 | (796,339) | (211) | nm | ||||||||||||||||||||||||||||||
|
|
|
|
|
|
|
|
|
|
|
|
|||||||||||||||||||||||||
Net income |
45,694 | 45,535 | 29,574 | 724,040 | 30,725 | 48.7 | ||||||||||||||||||||||||||||||
Dividends and accretion of discount on Series A Preferred Stock |
8,506 | 14,818 | 14,776 | 14,736 | 14,695 | (42.1) | ||||||||||||||||||||||||||||||
|
|
|
|
|
|
|
|
|
|
|
|
|||||||||||||||||||||||||
Net income available to common shareholders |
$ | 37,188 | 30,717 | 14,798 | 709,304 | 16,030 | 132.0 | |||||||||||||||||||||||||||||
|
|
|
|
|
|
|
|
|
|
|
|
|||||||||||||||||||||||||
Net income per common share, basic |
0.04 | 0.04 | 0.02 | 0.90 | 0.02 | 90.7 | ||||||||||||||||||||||||||||||
Net income per common share, diluted |
0.04 | 0.03 | 0.02 | 0.78 | 0.02 | 120.1 | ||||||||||||||||||||||||||||||
Cash dividends declared per common share |
0.01 | 0.01 | 0.01 | 0.01 | 0.01 | - | ||||||||||||||||||||||||||||||
Return on average assets * |
0.69 | % | 0.69 | % | 0.46 | % | 11.13 | % | 0.47 | 46.8 | ||||||||||||||||||||||||||
Return on average common equity * |
5.40 | 4.70 | 2.30 | 149.46 | 3.30 | 63.6 | ||||||||||||||||||||||||||||||
Weighted average common shares outstanding, basic |
956,694 | 851,093 | 787,043 | 786,576 | 786,576 | 21.6 | % | |||||||||||||||||||||||||||||
Weighted average common shares outstanding, diluted |
959,680 | 910,937 | 910,835 | 911,251 | 910,396 | 5.4 |
nm - not meaningful
* - ratios are annualized
Synovus
|
|
|
|
|
|
|||||||||
BALANCE SHEET DATA | September 30, 2013 | December 31, 2012 | September 30, 2012 | |||||||||||
(Unaudited) | ||||||||||||||
(In thousands, except share data) | ||||||||||||||
ASSETS |
||||||||||||||
Cash and cash equivalents |
$ |
514,694 | 614,630 | 454,028 | ||||||||||
Interest bearing funds with Federal Reserve Bank |
966,435 | 1,498,390 | 815,156 | |||||||||||
Interest earning deposits with banks |
14,060 | 23,442 | 27,215 | |||||||||||
Federal funds sold and securities purchased under resale agreements |
80,177 | 113,517 | 116,318 | |||||||||||
Trading account assets, at fair value |
17,363 | 11,102 | 5,953 | |||||||||||
Mortgage loans held for sale, at fair value |
61,232 | 212,663 | 246,224 | |||||||||||
Other loans held for sale |
9,351 | 10,690 | 11,254 | |||||||||||
Investment securities available for sale, at fair value |
3,151,344 | 2,981,112 | 3,229,440 | |||||||||||
Loans, net of deferred fees and costs |
19,711,610 | 19,541,690 | 19,731,865 | |||||||||||
Allowance for loan losses |
(318,612) | (373,405) | (420,404) | |||||||||||
|
|
|
|
|
|
|||||||||
Loans, net |
19,392,998 | 19,168,285 | 19,311,461 | |||||||||||
|
|
|
|
|
|
|||||||||
Premises and equipment, net |
476,088 | 479,546 | 475,222 | |||||||||||
Goodwill |
24,431 | 24,431 | 24,431 | |||||||||||
Other intangible assets, net |
3,783 | 5,149 | 5,895 | |||||||||||
Other real estate |
126,640 | 150,271 | 189,182 | |||||||||||
Deferred tax asset, net |
763,050 | 806,406 | 1,985 | |||||||||||
Other assets |
616,714 | 660,378 | 850,880 | |||||||||||
|
|
|
|
|
|
|||||||||
Total assets |
$ | 26,218,360 | 26,760,012 | 25,764,644 | ||||||||||
|
|
|
|
|
|
|||||||||
LIABILITIES AND SHAREHOLDERS EQUITY |
||||||||||||||
Liabilities: |
||||||||||||||
Deposits: |
||||||||||||||
Non-interest bearing deposits |
$ | 5,358,659 | 5,665,527 | 5,503,288 | ||||||||||
Interest bearing deposits, excluding brokered deposits |
14,339,997 | 14,298,768 | 14,423,583 | |||||||||||
Brokered deposits |
1,275,200 | 1,092,749 | 919,959 | |||||||||||
|
|
|
|
|
|
|||||||||
Total deposits |
20,973,856 | 21,057,044 | 20,846,830 | |||||||||||
Federal funds purchased, securities sold under repurchase agreements, and other short-term liabilities |
194,613 | 201,243 | 165,865 | |||||||||||
Long-term debt |
1,885,057 | 1,726,455 | 1,654,183 | |||||||||||
Other liabilities |
232,974 | 205,839 | 222,066 | |||||||||||
|
|
|
|
|
|
|||||||||
Total liabilities |
23,286,500 | 23,190,581 | 22,888,944 | |||||||||||
|
|
|
|
|
|
|||||||||
Shareholders equity: |
||||||||||||||
Series A Preferred Stock - no par value, 967,870 outstanding at December 31, 2012 and September 30, 2012 |
- | 957,327 | 954,690 | |||||||||||
Series C Preferred Stock - no par value, 5,200,000 outstanding at September 30, 2013 |
125,400 | - | - | |||||||||||
Common stock - $1.00 par value. 972,230,238 outstanding at September 30, 2013, 786,579,240 outstanding at December 31, 2012, and 786,575,516 outstanding at September 30, 2012 |
977,924 | 792,273 | 792,269 | |||||||||||
Additional paid-in capital |
2,138,593 | 2,189,874 | 2,202,903 | |||||||||||
Treasury stock, at cost - 5,693,452 shares |
(114,176) | (114,176) | (114,176) | |||||||||||
Accumulated other comprehensive (loss) income |
(29,514) | 4,101 | 16,156 | |||||||||||
Accumulated deficit |
(166,367) | (259,968) | (976,142) | |||||||||||
|
|
|
|
|
|
|||||||||
Total shareholders equity |
2,931,860 | 3,569,431 | 2,875,700 | |||||||||||
Total liabilities and shareholders equity |
$ | 26,218,360 | 26,760,012 | 25,764,644 | ||||||||||
|
|
|
|
|
|
Synovus
AVERAGE BALANCES AND YIELDS/RATES (1) | ||||||||||||||||||||||
(Unaudited) | ||||||||||||||||||||||
(Dollars in thousands) | ||||||||||||||||||||||
2013
|
2012 | |||||||||||||||||||||
Third Quarter
|
Second Quarter |
First Quarter |
Fourth Quarter |
Third Quarter |
||||||||||||||||||
Interest Earning Assets |
||||||||||||||||||||||
Taxable investment securities (2) |
$ | 3,062,976 | 3,034,152 | 2,984,129 | 3,069,000 | 3,495,838 | ||||||||||||||||
Yield
|
1.79 | % | 1.70 | 1.42 | 1.62 | 1.67 | ||||||||||||||||
Tax-exempt investment securities (2) (4) |
$ | 9,835 | 11,435 | 14,362 | 17,377 | 19,503 | ||||||||||||||||
Yield (taxable equivalent)
|
6.26 | % | 6.47 | 6.34 | 6.59 | 6.47 | ||||||||||||||||
Trading account assets |
$ | 13,806 | 7,847 | 8,629 | 9,600 | 12,343 | ||||||||||||||||
Yield
|
4.50 | % | 6.34 | 7.12 | 8.04 | 8.27 | ||||||||||||||||
Commercial loans (3) (4) |
$ | 16,067,424 | 16,075,832 | 16,000,000 | 16,171,318 | 16,102,353 | ||||||||||||||||
Yield
|
4.37 | % | 4.39 | 4.48 | 4.50 | 4.65 | ||||||||||||||||
Consumer loans (3) |
$ | 3,528,057 | 3,454,874 | 3,461,622 | 3,514,256 | 3,529,528 | ||||||||||||||||
Yield
|
4.61 | % | 4.62 | 4.68 | 4.70 | 4.72 | ||||||||||||||||
Allowance for loan losses
|
$ | (328,084) | (351,075) | (372,239) | (405,237) | (446,495) | ||||||||||||||||
|
|
|||||||||||||||||||||
Loans, net (3) |
$ | 19,267,397 | 19,179,631 | 19,089,383 | 19,280,337 | 19,185,386 | ||||||||||||||||
Yield
|
4.50 | % | 4.52 | 4.54 | 4.65 | 4.79 | ||||||||||||||||
Mortgage loans held for sale |
$ | 85,493 | 129,742 | 179,507 | 208,839 | 175,199 | ||||||||||||||||
Yield
|
4.07 | % | 4.35 | 3.80 | 3.72 | 4.03 | ||||||||||||||||
Federal funds sold, due from Federal Reserve Bank, and other short-term investments |
$ | 1,375,921 | 1,550,113 | 1,343,652 | 1,366,422 | 1,215,743 | ||||||||||||||||
Yield
|
0.24 | % | 0.24 | 0.24 | 0.24 | 0.24 | ||||||||||||||||
Federal Home Loan Bank and Federal Reserve Bank stock (5) |
$ | 70,741 | 65,014 | 65,330 | 66,630 | 53,239 | ||||||||||||||||
Yield
|
2.30 | % | 2.35 | 2.36 | 2.03 | 1.87 | ||||||||||||||||
Total interest earning assets |
$ | 23,886,169 | 23,977,934 | 23,684,992 | 24,018,205 | 24,157,251 | ||||||||||||||||
Yield
|
3.89 | % | 3.88 | 3.95 | 3.99 | 4.09 | ||||||||||||||||
Interest Bearing Liabilities |
||||||||||||||||||||||
Interest bearing demand deposits |
$ | 3,933,902 | 3,895,675 | 3,839,707 | 3,872,025 | 3,344,561 | ||||||||||||||||
Rate
|
0.23 | % | 0.18 | 0.18 | 0.18 | 0.19 | ||||||||||||||||
Money market accounts |
$ | 6,148,289 | 6,072,155 | 6,135,649 | 6,251,374 | 6,751,607 | ||||||||||||||||
Rate
|
0.33 | % | 0.33 | 0.33 | 0.33 | 0.33 | ||||||||||||||||
Savings deposits |
$ | 607,144 | 609,832 | 581,792 | 558,726 | 557,086 | ||||||||||||||||
Rate
|
0.11 | % | 0.11 | 0.11 | 0.10 | 0.10 | ||||||||||||||||
Time deposits under $100,000 |
$ | 1,526,974 | 1,537,639 | 1,581,092 | 1,648,554 | 1,763,864 | ||||||||||||||||
Rate
|
0.62 | % | 0.64 | 0.69 | 0.74 | 0.85 | ||||||||||||||||
Time deposits over $100,000 |
$ | 2,022,719 | 1,891,624 | 1,958,870 | 2,015,582 | 2,176,488 | ||||||||||||||||
Rate
|
0.84 | % | 0.88 | 0.93 | 0.99 | 1.11 | ||||||||||||||||
Brokered money market accounts |
$ | 202,802 | 202,532 | 202,734 | 180,216 | 186,336 | ||||||||||||||||
Rate
|
0.27 | % | 0.31 | 0.32 | 0.34 | 0.33 | ||||||||||||||||
Brokered time deposits |
$ | 1,130,491 | 1,131,444 | 1,013,461 | 800,434 | 820,908 | ||||||||||||||||
Rate
|
0.70 | % | 0.77 | 0.99 | 1.42 | 1.83 | ||||||||||||||||
|
|
|||||||||||||||||||||
Total interest bearing deposits |
$ | 15,572,321 | 15,340,901 | 15,313,305 | 15,326,911 | 15,600,850 | ||||||||||||||||
Rate
|
0.42 | % | 0.42 | 0.44 | 0.47 | 0.54 | ||||||||||||||||
Federal funds purchased and other short-term liabilities |
$ | 195,717 | 206,046 | 214,661 | 266,431 | 350,183 | ||||||||||||||||
Rate
|
0.14 | % | 0.15 | 0.17 | 0.17 | 0.17 | ||||||||||||||||
Long-term debt |
$ | 1,885,385 | 1,762,173 | 1,688,580 | 1,740,588 | 1,372,741 | ||||||||||||||||
Rate
|
2.85 | % | 3.06 | 3.26 | 3.31 | 4.09 | ||||||||||||||||
Total interest bearing liabilities |
$ | 17,653,423 | 17,309,120 | 17,216,546 | 17,333,930 | 17,323,774 | ||||||||||||||||
Rate
|
0.67 | % | 0.68 | 0.72 | 0.75 | 0.81 | ||||||||||||||||
Non-interest bearing demand deposits
|
$ | 5,306,447 | 5,327,795 | 5,232,587 | 5,466,312 | 5,560,827 | ||||||||||||||||
Effective cost of funds
|
0.49 | % | 0.49 | 0.52 | 0.54 | 0.58 | ||||||||||||||||
Net interest margin |
3.40 | % | 3.39 | 3.43 | 3.45 | 3.51 | ||||||||||||||||
Taxable equivalent adjustment |
$ | 529 | 557 | 618 | 766 | 761 |
(1) | Yields and rates are annualized. | |
(2) | Excludes net unrealized gains and (losses). | |
(3) | Average loans are shown net of unearned income. Non-performing loans are included. | |
(4) | Reflects taxable-equivalent adjustments, using the statutory federal income tax rate of 35%, in adjusting interest on tax-exempt loans and investment securities to a taxable-equivalent basis. | |
(5) | Included as a component of Other Assets on the balance sheet |
Synovus
LOANS OUTSTANDING AND NON-PERFORMING LOANS COMPOSITION | ||||||||||||||||||||||||||||
(Unaudited) | ||||||||||||||||||||||||||||
(Dollars in thousands) | ||||||||||||||||||||||||||||
September 30, 2013 | ||||||||||||||||||||||||||||
Loan Type |
Total Loans | Loans as a % of Total Loans Outstanding |
Total Non-performing Loans |
Non-performing Loans as a % of Total Nonperforming Loans |
||||||||||||||||||||||||
Multi-Family |
$ | 953,632 | 4.8 | % | $ | 2,991 | 0.7 | % | ||||||||||||||||||||
Hotels |
611,756 | 3.1 | 452 | 0.1 | ||||||||||||||||||||||||
Office Buildings |
799,613 | 4.1 | 5,623 | 1.2 | ||||||||||||||||||||||||
Shopping Centers |
866,460 | 4.4 | 11,389 | 2.5 | ||||||||||||||||||||||||
Commercial Development |
167,435 | 0.8 | 47,150 | 10.5 | ||||||||||||||||||||||||
Warehouses |
552,378 | 2.8 | 2,184 | 0.5 | ||||||||||||||||||||||||
Other Investment Property |
489,839 | 2.5 | 9,795 | 2.2 | ||||||||||||||||||||||||
|
|
|
|
|
|
|
|
|||||||||||||||||||||
Total Investment Properties
|
4,441,113 | 22.5 | 79,584 | 17.8 | ||||||||||||||||||||||||
|
|
|
|
|
|
|
|
|||||||||||||||||||||
1-4 Family Construction |
125,134 | 0.6 | 3,199 | 0.7 | ||||||||||||||||||||||||
1-4 Family Investment Mortgage |
853,060 | 4.3 | 25,820 | 5.7 | ||||||||||||||||||||||||
Residential Development |
196,051 | 1.0 | 17,781 | 3.9 | ||||||||||||||||||||||||
|
|
|
|
|
|
|
|
|||||||||||||||||||||
Total 1-4 Family Properties
|
1,174,245 | 6.0 | 46,800 | 10.4 | ||||||||||||||||||||||||
|
|
|
|
|
|
|
|
|||||||||||||||||||||
Land Acquisition
|
730,135 | 3.7 | 152,911 | 33.9 | ||||||||||||||||||||||||
|
|
|
|
|
|
|
|
|||||||||||||||||||||
Total Commercial Real Estate
|
6,345,493 | 32.2 | 279,295 | 61.9 | ||||||||||||||||||||||||
|
|
|
|
|
|
|
|
|||||||||||||||||||||
Commercial, Financial, and Agricultural |
5,415,424 | 27.5 | 64,907 | 14.4 | ||||||||||||||||||||||||
Owner-Occupied Real Estate |
3,811,649 | 19.3 | 41,559 | 9.2 | ||||||||||||||||||||||||
Small Business
|
|
591,377
|
|
|
2.9
|
|
|
5,475
|
|
|
1.2
|
|
||||||||||||||||
|
|
|
|
|
|
|
|
|||||||||||||||||||||
Total Commercial & Industrial
|
9,818,450 | 49.8 | 111,941 | 24.8 | ||||||||||||||||||||||||
Home Equity Lines |
1,549,582 | 7.9 | 18,996 | 4.2 | ||||||||||||||||||||||||
Consumer Mortgages |
1,482,861 | 7.5 | 38,902 | 8.6 | ||||||||||||||||||||||||
Credit Cards |
253,805 | 1.3 | - | - | ||||||||||||||||||||||||
Other Retail Loans
|
|
286,421
|
|
|
1.5
|
|
|
1,745
|
|
|
0.4
|
|
||||||||||||||||
|
|
|
|
|
|
|
|
|||||||||||||||||||||
Total Retail
|
3,572,669 | 18.0 | 59,643 | 13.2 | ||||||||||||||||||||||||
Unearned Income
|
(25,002) | nm | - | nm | ||||||||||||||||||||||||
|
|
|
|
|
|
|
|
|||||||||||||||||||||
Total |
$ | 19,711,610 | 100.0 | % | $ | 450,879 | 100.0 | % | ||||||||||||||||||||
|
|
|
|
|
|
|
|
|||||||||||||||||||||
LOANS OUTSTANDING BY TYPE COMPARISON |
||||||||||||||||||||||||||||
(Unaudited) | ||||||||||||||||||||||||||||
(Dollars in thousands) |
|
|
|
|
|
|||||||||||||||||||||||
Loan Type |
Total Loans September 30, 2013 |
June 30, 2013 | 3Q13 vs. 2Q13 % change (1) |
September 30, 2012 | 3Q13 vs. 3Q12 % change |
|||||||||||||||||||||||
Multi-Family |
$ | 953,632 | 898,472 | 24.4 | 759,500 | 25.6 | % | |||||||||||||||||||||
Hotels |
611,756 | 656,471 | (27.0) | 689,196 | (11.2) | |||||||||||||||||||||||
Office Buildings |
799,613 | 782,196 | 8.8 | 772,961 | 3.4 | |||||||||||||||||||||||
Shopping Centers |
866,460 | 844,309 | 10.4 | 918,224 | (5.6) | |||||||||||||||||||||||
Commercial Development |
167,435 | 177,511 | (22.5) | 279,585 | (40.1) | |||||||||||||||||||||||
Warehouses |
552,378 | 538,274 | 10.4 | 508,770 | 8.6 | |||||||||||||||||||||||
Other Investment Property
|
|
489,839
|
|
|
495,290
|
|
|
(4.4)
|
|
|
474,228
|
|
|
3.3
|
|
|||||||||||||
|
|
|
|
|
|
|
|
|
|
|||||||||||||||||||
Total Investment Properties
|
4,441,113 | 4,392,523 | 4.4 | 4,402,464 | 0.9 | |||||||||||||||||||||||
|
|
|
|
|
|
|
|
|
|
|||||||||||||||||||
1-4 Family Construction |
125,134 | 120,417 | 15.5 | 152,598 | (18.0) | |||||||||||||||||||||||
1-4 Family Investment Mortgage |
853,060 | 857,063 | (1.9) | 906,744 | (5.9) | |||||||||||||||||||||||
Residential Development |
196,051 | 220,007 | (43.2) | 367,908 | (46.7) | |||||||||||||||||||||||
|
|
|
|
|
|
|
|
|
|
|||||||||||||||||||
Total 1-4 Family Properties
|
1,174,245 | 1,197,487 | (7.7) | 1,427,250 | (17.7) | |||||||||||||||||||||||
|
|
|
|
|
|
|
|
|
|
|||||||||||||||||||
Land Acquisition
|
730,135 | 752,319 | (11.7) | 909,420 | (19.7) | |||||||||||||||||||||||
|
|
|
|
|
|
|
|
|
|
|||||||||||||||||||
Total Commercial Real Estate
|
6,345,493 | 6,342,329 | 0.2 | 6,739,134 | (5.8) | |||||||||||||||||||||||
|
|
|
|
|
|
|
|
|
|
|||||||||||||||||||
Commercial, Financial, and Agricultural |
5,415,424 | 5,397,786 | 1.3 | 5,163,546 | 4.9 | |||||||||||||||||||||||
Owner-Occupied Real Estate |
3,811,649 | 3,833,713 | (2.3) | 3,877,578 | (1.7) | |||||||||||||||||||||||
Small Business
|
|
591,377
|
|
|
568,881
|
|
|
15.7
|
|
|
444,784
|
|
|
33.0
|
|
|||||||||||||
|
|
|
|
|
|
|
|
|
|
|||||||||||||||||||
Total Commercial & Industrial
|
9,818,450 | 9,800,380 | 0.7 | 9,485,908 | 3.5 | |||||||||||||||||||||||
Home Equity Lines |
1,549,582 | 1,507,738 | 11.0 | 1,572,986 | (1.5) | |||||||||||||||||||||||
Consumer Mortgages |
1,482,861 | 1,451,212 | 8.7 | 1,416,820 | 4.7 | |||||||||||||||||||||||
Credit Cards |
253,805 | 251,788 | 3.2 | 257,922 | (1.6) | |||||||||||||||||||||||
Other Retail Loans
|
|
286,421
|
|
|
278,603
|
|
|
11.1
|
|
|
276,148
|
|
|
3.7
|
|
|||||||||||||
|
|
|
|
|
|
|
|
|
|
|||||||||||||||||||
Total Retail
|
3,572,669 | 3,489,341 | 9.5 | 3,523,876 | 1.4 | |||||||||||||||||||||||
Unearned Income
|
(25,002) | (23,767) | nm | (17,053) | nm | |||||||||||||||||||||||
|
|
|
|
|
|
|
|
|
|
|||||||||||||||||||
Total |
$ | 19,711,610 | 19,608,283 | 2.1 | % | 19,731,865 | (0.1) | % | ||||||||||||||||||||
|
|
|
|
|
|
|
|
|
|
(1) Percentage change is annualized.
Synovus
CREDIT QUALITY DATA | ||||||||||||||||||||||||||||||||
(Unaudited) | ||||||||||||||||||||||||||||||||
(Dollars in thousands) | 2013 | 2012 | 3rd Quarter | |||||||||||||||||||||||||||||
Third Quarter |
Second Quarter |
First Quarter |
Fourth Quarter |
Third Quarter |
13 vs. 12 Change |
|||||||||||||||||||||||||||
Non-performing Loans |
$ | 450,879 | 483,464 | 513,227 | 543,333 | 700,204 | (35.6) % | |||||||||||||||||||||||||
Other Loans Held for Sale (1) |
9,351 | 12,083 | 9,129 | 9,455 | 10,019 | (6.7) | ||||||||||||||||||||||||||
Other Real Estate |
126,640 | 139,653 | 155,237 | 150,271 | 189,182 | (33.1) | ||||||||||||||||||||||||||
|
|
|
|
|
|
|
|
|
|
|
|
|||||||||||||||||||||
Non-performing Assets |
586,870 | 635,200 | 677,592 | 703,059 | 899,405 | (34.7) | ||||||||||||||||||||||||||
Allowance for Loan Losses |
318,612 | 334,880 | 351,772 | 373,405 | 420,404 | (24.2) | ||||||||||||||||||||||||||
Net Charge-Offs - Quarter |
23,030 | 29,969 | 57,328 | 193,525 | 96,493 | (76.1) | ||||||||||||||||||||||||||
Net Charge-Offs / Average Loans - Quarter (2) |
0.47 | % | 0.61 | 1.18 | 3.94 | 1.97 | ||||||||||||||||||||||||||
Non-performing Loans / Loans |
2.29 | 2.47 | 2.65 | 2.78 | 3.55 | |||||||||||||||||||||||||||
Non-performing Assets / Loans, Other Loans Held for Sale & ORE |
2.96 | 3.21 | 3.47 | 3.57 | 4.51 | |||||||||||||||||||||||||||
Allowance / Loans |
1.62 | 1.71 | 1.82 | 1.91 | 2.13 | |||||||||||||||||||||||||||
Allowance / Non-performing Loans |
70.66 | 69.27 | 68.54 | 68.72 | 60.04 | |||||||||||||||||||||||||||
Allowance / Non-performing Loans (3) |
91.84 | 91.76 | 97.75 | 93.49 | 131.56 | |||||||||||||||||||||||||||
Past Due Loans over 90 days and Still Accruing |
$ | 4,738 | 4,596 | 5,799 | 6,811 | 8,972 | (47.2) % | |||||||||||||||||||||||||
As a Percentage of Loans Outstanding |
0.02 | % | 0.02 | 0.03 | 0.03 | 0.05 | ||||||||||||||||||||||||||
Total Past Dues Loans and Still Accruing |
$ | 78,906 | 80,678 | 88,330 | 104,825 | 108,633 | (27.4) | |||||||||||||||||||||||||
As a Percentage of Loans Outstanding |
0.40 | % | 0.41 | 0.46 | 0.54 | 0.55 | ||||||||||||||||||||||||||
Accruing troubled debt restructurings (TDRs) |
$ | 574,236 | 635,125 | 623,900 | 673,383 | 698,847 | (17.8) | |||||||||||||||||||||||||
(1) Represent impaired loans that are intended to be sold. Held for sale loans are carried at the lower of cost or fair value, less costs to sell. |
| |||||||||||||||||||||||||||||||
(2) Ratio is annualized. |
| |||||||||||||||||||||||||||||||
(3) Excludes non-performing loans for which the expected loss has been charged off.
|
| |||||||||||||||||||||||||||||||
|
||||||||||||||||||||||||||||||||
SELECTED CAPITAL INFORMATION (1) |
||||||||||||||||||||||||||||||||
(Unaudited) | ||||||||||||||||||||||||||||||||
(Dollars in thousands) |
|
|
|
|||||||||||||||||||||||||||||
September 30, 2013 | December 31, 2012 | September 30, 2012 | ||||||||||||||||||||||||||||||
Tier 1 Capital |
$ | 2,292,757 | 2,832,244 | 2,835,950 | ||||||||||||||||||||||||||||
Total Risk-Based Capital |
2,835,116 | 3,460,998 | 3,465,950 | |||||||||||||||||||||||||||||
Tier 1 Capital Ratio |
10.55 | % | 13.24 | 13.23 | ||||||||||||||||||||||||||||
Tier 1 Common Equity Ratio |
9.93 | 8.72 | 8.73 | |||||||||||||||||||||||||||||
Total Risk-Based Capital Ratio |
13.04 | 16.18 | 16.16 | |||||||||||||||||||||||||||||
Tier 1 Leverage Ratio |
8.96 | 11.00 | 10.97 | |||||||||||||||||||||||||||||
Common Equity as a Percentage of Total Assets (2) |
10.70 | 9.76 | 7.46 | |||||||||||||||||||||||||||||
Tangible Common Equity as a Percentage of Tangible Assets (3) |
10.61 | 9.66 | 7.35 | |||||||||||||||||||||||||||||
Tangible Common Equity as a Percentage of Risk Weighted Assets (3) |
12.78 | 12.07 | 8.82 | |||||||||||||||||||||||||||||
Book Value Per Common Share (4) (5) |
2.89 | 2.99 | 2.11 | |||||||||||||||||||||||||||||
Tangible Book Value Per Common Share (3) (5) |
2.86 | 2.95 | 2.07 | |||||||||||||||||||||||||||||
(1) Current quarter regulatory capital information is preliminary. |
| |||||||||||||||||||||||||||||||
(2) Common equity consists of Total Shareholders Equity less Preferred Stock. |
| |||||||||||||||||||||||||||||||
(3) Excludes the carrying value of goodwill and other intangible assets from common equity and total assets. |
| |||||||||||||||||||||||||||||||
(4) Book Value Per Common Share consists of Total Shareholders Equity less Preferred Stock divided by total common shares outstanding. |
| |||||||||||||||||||||||||||||||
(5) September 30, 2013 includes addition to common shares from the final settlement of tangible equity units (tMEDS) of 122.8 million shares. Equity and common shares for prior periods exclude impact of unexercised tangible equity units (tMEDs). |
|
![]() Exhibit 99.3 |
![]() |
![]() |
![]() |
![]() |
![]() |
![]() |
![]() |
![]() |
![]() |
![]() |
![]() |
![]() |
![]() |
![]() |
![]() |
![]() |
![]() |
![]() |
![]() |
![]() |
![]() |
![]() |
![]() |
![]() |
![]() |
![]() |
![]() |
![]() |
![]() |
![]() |
![]() |
![]() |
![]() |
![]() |
![]() |
PX75+(F#9/DU2ZRPC\JXD%"2M IAC,]+IZ
MY=2UOAU1UY"9@Y?PV\!Y2%?[2[9UVKMM+'=C$1=>8TX_N;HCBYUC.ZK74\D,
MU23V, I2%=O%:B;'&.4C%,`H231-P*1^@1`JS=0QDSE])3E
M$!UL)Q>1MLOCH,G9NZK6>)KVGS.%5^5'6>E,OH75F1T=GHS%F,;>2V\K3V/B
M<6G\!I4'M!"[!U]Z\RJUO?GRTZN$W@#B#3&[>4M=LLK*WR:"*:;A^@LX=!"U
M:/3$"'6;'>/5S*F`NPG3`-]PU'#?C*NO)<=H^R`?>S2B1PI5PJ>B,#R5)K[@
M6W'V9.B8ZSQ
MBP%CG$->C6+1>O5]B>S/6J")%9NWO4$W-DEW;@A`4=JN)-0Y4SJ"8Q4")DWV
M*`:S;I73UKIC!6^'MFM!BC'60/A2'B]Q/;5U:$]E!V+7'O5NGFMX]R\MK[,2
MRN%[=/,$;G$B&V:>FWA:TDA@9$&]0;0%Y<[FXJF?W5V;1CS\Y`$9MD6I'$E"
M/5RH$*F59XYB4S.'*@%``,LL8-S&](CJ'.[+&,W"R`8``7,/#REO$^Z5^@/P
M,W$]SX5-*.N'ND /HU)[36XVD]4AK+"Y:R]/\S+1DE?(`>#OX! *P^-GC/(DPRR'I/F>`6N\SBJSN=<*7GC1F&
MY8:NS5Q%V:A31B1KT2G(G+P97!EJU9HM8>GUAD_9D((*$'8JI3%\!#49L[A+
M_3.8FPU\"RZMW^B?RFUJR1I[01V^4%;C-M-QM,[QZ`Q^X.G7LGPN4M_XV/@3
M%-TTN;:5O'I>QQ<"T\V%IY%7>>W1RPA.6W&BF7`)%NK?ZLP94_*,1YI!?1UM
MB&B2"SY=N`%.1G8$4P>-S]/08B@E`=R&`)L[=ZLAU=IJ&]ZA]81`1SM[6R-%
M":>1_P`)I[0?,5^ 6;A\S;Y.:>VEG:[YN^*;I
M/3WHJ&/$G4>EW,&JQPXL]PKG]PP@F.,,H\> /!`5-CE/5
MWJ^/PNZPD=T#+:>!\]]%[ZVGVA6,?T<9M_5S,?Q>K/OFP/T'*^K/7-^RMK+[
M6TYZ_%[Z?:%8Q_1QFW]7,Q_%Z??-@?H.5]6>G[*VLOM;3GK\7OI]H5C']'&;
M?UH^
M9H`'N*JWWR.(*&*
18P[8"(N3+,P43Z^C<
MQM\M:ET7)G+H7%O<=VSJZRQP)#9:!HFC+2"UX#1P-6U%:<2H*;1^(6#;G#.Q
M60Q@N9Q'W/?1.8U\]F7R2NL+ILK)&/MW22/)
D5B%,,+;8T0D*U+I&
M$IC)"TE4$P4,7X0H'4+Z#"&NIU;IZ#5&GKG"ST!EC]`GXLC>+'?@`>&.[`J`R"]\P-E9!
MR`/:UDO#-](L)/PC9Y&V6HR@@JF/B10H+B@8NX?&(?PU`4&_P>4#O2BR5G/[
MA:^-W_P7ZAI8M,[F:)=#_%WFD-08L@'@YDEO=1\#VCA4'S$*\3/\]\>0/`YG
MS2 /=%S3R
MSL;520Q[AV57-3?6P,JS+(-#J0]&:-S"04Q6C620O=O0`[#N.^HR:&A.O=T+
M[6%P"9.I$#Q%1Z,0'9P:.KW5N0\2E]%X8_!=IK87%N#-5ZBAZKTM`#NAU)
MKQS@"#220B$5KPYU5I'4G5IK5$GNP_V_L]?]9KW^B$]0:W;_`.H60]V/_57Z
M4O`G_P!J>E?WMS_;%64^RG_8%QW_`$GOG]9'FI&[*_\`(5O_`%TO^N5J-]H?
M_P!T&6_P5C_NS%+'K+"@^FB*LEWWTE%\\<-$42"HJL]DTDDR[=1U%)R.*0A=
M]@W,8=1OWP!.HL`!S[T_VC%MS]F\X-VFW1QS`(W$>1X/:IO-9K6NQ-$58CN(S37DYW4>+
M''RFB-E#&3^%^FK9D
*-5W+$\O&1[!,7AD%#)^>H)`'<@Z(IR-$31%
M6"]KIAIJ=[0TNQ@8>7FWH
V
M9VX)'BP6PYPSM-)7GD]DDKE6P2PNSRK:GL)-4'3^)92:QCFDYF07'=\^#P.`
M>6G^#WW]EMGMS)I829O.O$^I[FI>ZO4(P34M#CSKNUVB"KEOL(B'DKJ)F52V$
MP_%$/3HBWVB+8JQD:N[1D%H]BL_;@`-WJK1!1V@`=6P(N3IBLD`=8_%,'I'W
M]$6^T1<=(0\1+$*25BXZ3(7XI)!BV>D+OXCTET1;O1%Q;R$A9!4%W\1%OEP*!`6>1[1RJ!"[B
M!`462.?I`1\`WVT1;7Z*UC\7('^9X_\`R?1%RGJ#'U3YO]3:>H>7Y/J7JZ/J
MGE?XKU;H\GR_^+T[:(MUHB:(FB)HB:(FB)HB:(FB)HB:(FB)HB:(O!1,BI#I
M*D(HFH4Q%$U"@
OQ>^O`_<-Q@F43#C?-P@4!$>G'$R(^'
MO!T>G5#O/@0*FQROJSU*?^AEUO\`\#Y?_BJ/^$T\4_\`0RZW_P"!\O\`\56!11S/
MN'U:C_(ON1O_`/":>*?^AEUO_P`#Y?\`XJC_`(33Q3_T,NM_^!\O_P`56!11
MS/N+ZM1_D7W(W_\`A-/%/_0RZW_X'R__`!5'_":>*?\`H9=;_P#`^7_XJL"B
MCF?*?\`H9=;_P#`^7_XJC_A-/%/_0RZW_X'R_\`Q58%
M%',^XOJU'^1?*?^AEUO\`\#Y?_BJ/^$T\
M4_\`0RZW_P"!\O\`\56!11S/N'U:C_(ON1O_`/":>*?^AEUO_P`#Y?\`XJC_
M`(33Q3_T,NM_^!\O_P`56!11S/N'U:C_`"+[D;__``FGBG_H9=;_`/`^7_XJ
MC_A-/%/_`$,NM_\`@?+_`/%5@44*?^AE
MUO\`\#Y?_BJ/^$T\4_\`0RZW_P"!\O\`\56!11S/N'U:C_(ON1O_`/":>*?^
MAEUO_P`#Y?\`XJC_`(33Q3_T,NM_^!\O_P`56!11S/N'U:C_`"+[D;__``FG
MBG_H9=;_`/`^7_XJC_A-/%/_`$,NM_\`@?+_`/%5@44*?^AEUO\`\#Y?_BJ/^$T\4_\`0RZW_P"!\O\`\56!11S/N'U:
MC_(ON1O_`/":>*?^AEUO_P`#Y?\`XJC_`(33Q3_T,NM_^!\O_P`56!11S/N'
MU:C_`"+[D;__``FGBG_H9=;_`/`^7_XJC_A-/%/_`$,NM_\`@?+_`/%5@44<
MS[A]6H_R+[D;_P#PFGBG_H9=;_\``^7_`.*H_P"$T\4_]#+K?_@?+_\`%5@4
M4N9]P^K4?Y%]R-__`(33Q3_T,NM_^!\O_P`51_PFGBG_`*&76_\`P/E_^*K`
MHI\S[A]6H_R+[D;_`/PFGBG_`*&76_\`P/E_^*H_X33Q3_T,NM_^!\O_`,56
M!11S/N'U:C_(ON1O_P#":>*?^AEUO_P/E_\`BJ/^$T\4_P#0RZW_`.!\O_Q5
M8%%',^X?5J/\B^Y&_P#\)IXI_P"AEUO_`,#Y?_BJ/^$T\4_]#+K?_@?+_P#%
M5@44*?\`H9=;_P#`^7_XJC_A-/%/_0RZW_X'R_\`
MQ58%%',^X?5J/\B^Y&__`,)IXI_Z&76__`^7_P"*H_X33Q3_`-#+K?\`X'R_
M_%5@44*?^AEUO_P/E_\`BJ/^$T\4_P#0RZW_
M`.!\O_Q58%%',^X?5J/\B^Y&_P#\)IXI_P"AEUO_`,#Y?_BJ/^$T\4_]#+K?
M_@?+_P#%5@44*?\`H9=;_P#`^7_XJC_A-/%/_0RZ
MW_X'R_\`Q58%%',^X?5J/\B^Y&__`,)IXI_Z&76__`^7_P"*H_X33Q3_`-#+
MK?\`X'R__%5@44*?^AEUO_P/E_\`BJ/^$T\4_P#0
MRZW_`.!\O_Q58%%',^X?5J/\B^Y&_P#\)IXI_P"AEUO_`,#Y?_BJ/^$T\4_]
M#+K?_@?+_P#%5@44618XT9W8[551DDU.^B-FU%78RBO6O#7P2U?4+87.LWD.E1$9V
MLF]_Q&0!^=;3?`FWN(S_`&?XF@EE`^Z8003^#<5K["=KV/(J9]@83Y7/[EH>
M%TM=1XT\#:UX1N`-3M]T#'"7$>2C?CVKEZR::=F>E1KTZ\%4INZ"BBDH-A:*
M**`\@HHI*`6H45TNA>#-6UK0;W6+)(S9VFX2%GP,I5*TJ,7K&U_F5Z*0\&EJ;G4%%)FEH"X444E`"T4447"
MP4444`%%%%`"4M>F/X"TT?"1/%`FN3?$9V;AY?WMO3&>GO7F?3BB47%V9RX;
M%4\3S.G]EV^84E+7I?@7X=6GB/P?=ZS/J3VTL+.JQA00VU01UJH0<]$/%8JG
MA8<]7:]CS.EH]ORI.]1