Exhibit 99.1

For Immediate Release
| Contact: | Patrick A. Reynolds | |
| Director of Investor Relations | ||
| (706) 649-4973 |
Synovus Reports Earnings for Second Quarter of 2013
Strong Improvement in Credit Quality Drives Performance;
Loans Grow $240 Million, or 5% Annualized, Over Previous Quarter
Columbus, Ga., July 18, 2013 – Synovus Financial Corp. (NYSE: SNV) today reported financial results for the quarter ended June 30, 2013.
Second Quarter Results
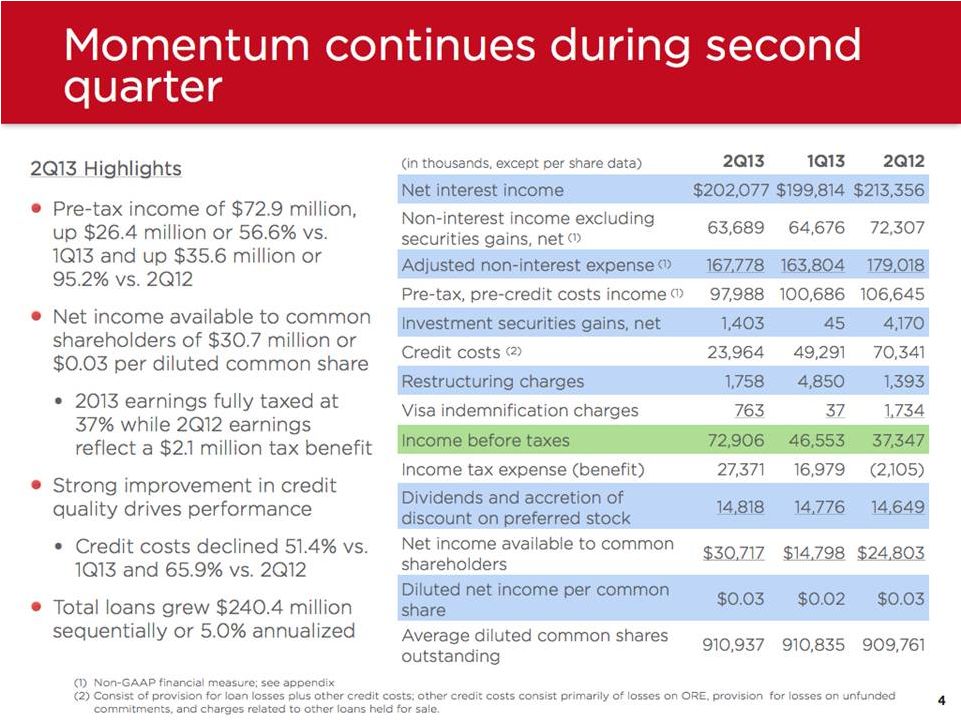
| — | Pre-tax income increased to $72.9 million for the second quarter of 2013, up 56.6% from $46.6 million in the first quarter of 2013, and up 95.2% from $37.3 million in the second quarter of 2012. |
| — | Net income available to common shareholders increased to $30.7 million for the second quarter of 2013, compared to $14.8 million for the first quarter of 2013 and $24.8 million for the second quarter of 2012. Diluted net income per common share for the second quarter of 2013 was $0.03 compared to $0.02 for the first quarter of 2013 and $0.03 for the second quarter of 2012. |
| ¡ | The second quarter of 2013 results included income tax expense of $27.4 million compared to $17.0 million in the first quarter of 2013 and a tax benefit of $2.1 million in the second quarter of 2012. |
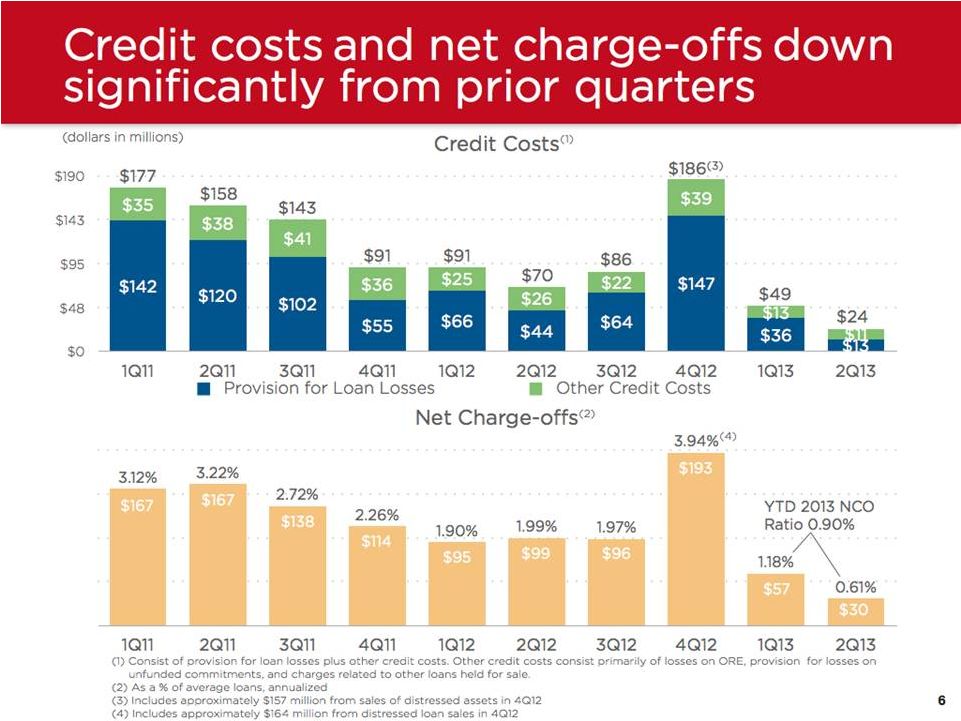
| — | Credit costs declined substantially to $24.0 million for the second quarter of 2013, compared to $49.3 million for the first quarter of 2013 and $70.3 million for the second quarter of 2012. |
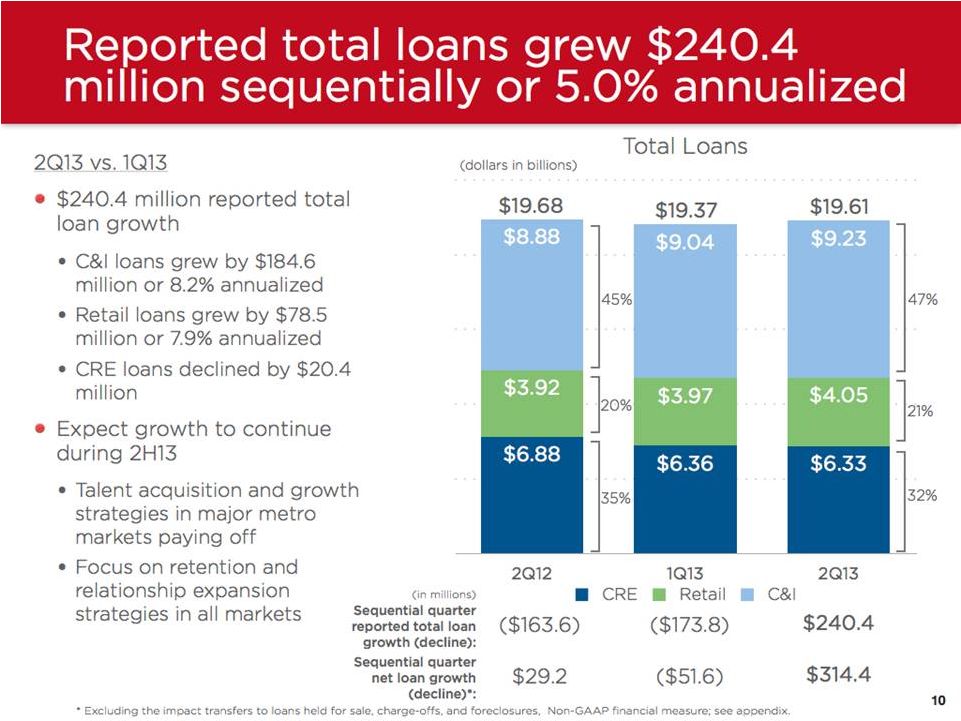
| — | Total loans grew $240.4 million sequentially or 5.0% annualized. |
“Our second quarter results reflect continued, steady progress,” said Kessel D. Stelling, Chairman and CEO of Synovus. “During the quarter, net income available to common shareholders increased to $31 million, credit costs again declined significantly to $24 million – down 51% from the previous quarter – and net charge-offs declined by 48% compared to last quarter. While continuing to operate in a challenging environment, we grew loans $240 million sequentially, or 5% annualized.”
Core Performance
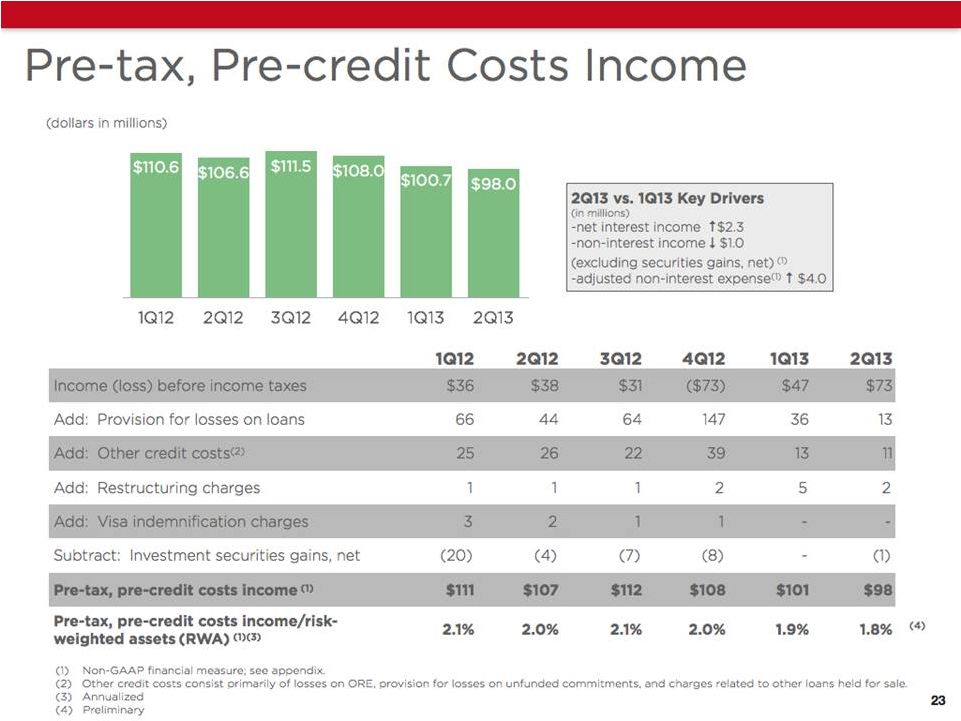
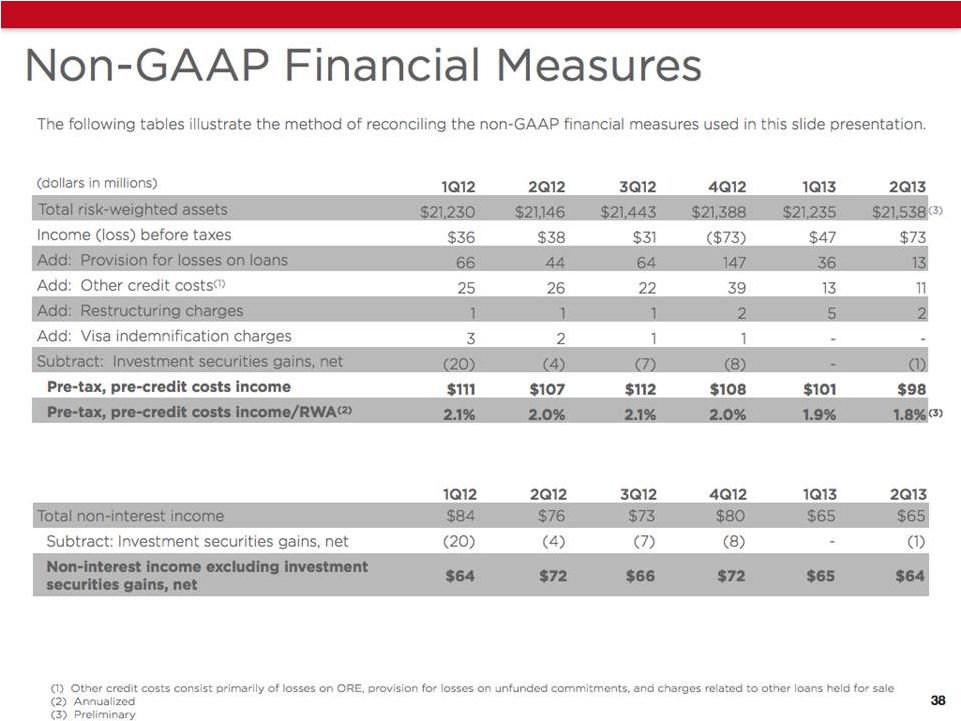
Pre-tax, pre-credit costs income was $98.0 million for the second quarter of 2013, down $2.7 million from $100.7 million for the first quarter of 2013.
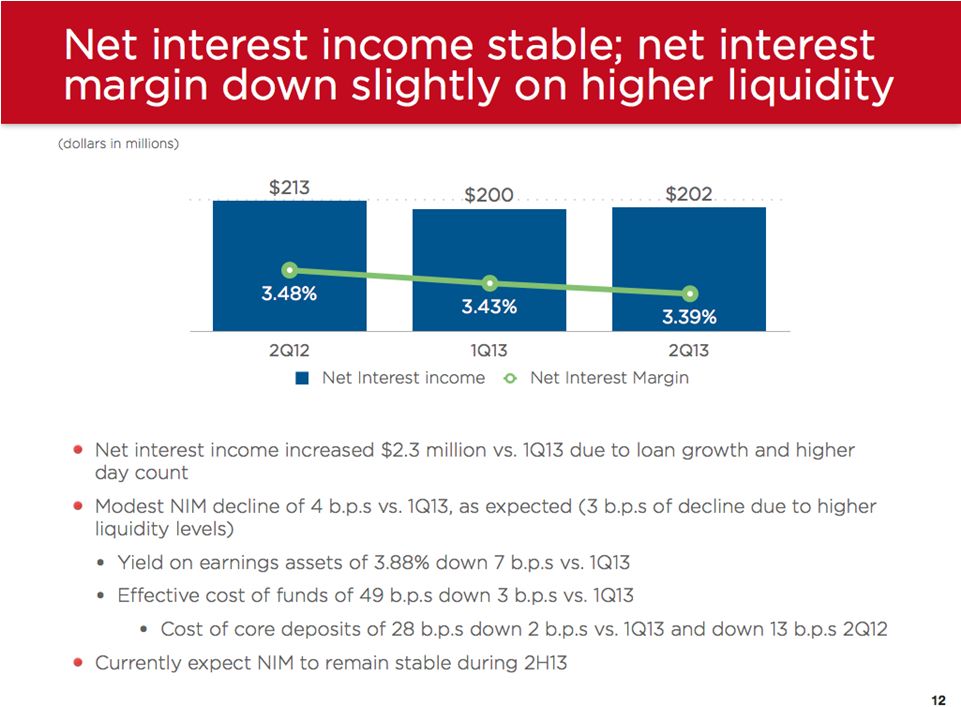
| — | Net interest income was $202.1 million for the second quarter of 2013, up $2.3 million from $199.8 million in the previous quarter. |
| — | The net interest margin was 3.39%, down four basis points from the first quarter of 2013, due to a decline in the yield on earning assets of seven basis points which was partially offset by a decline in the effective cost of funds of three basis points. |
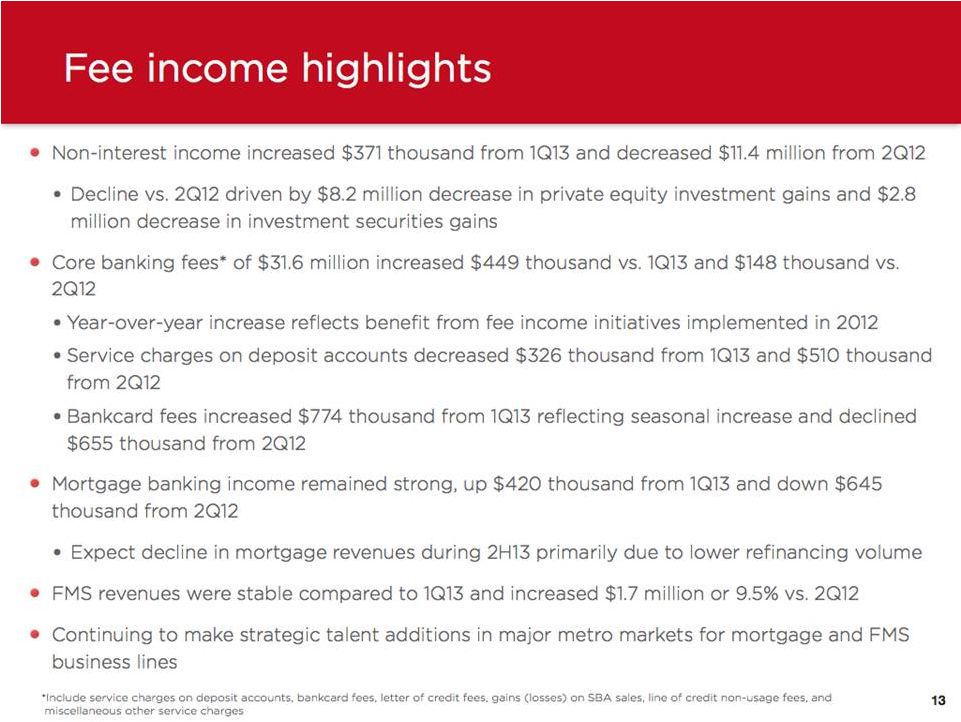
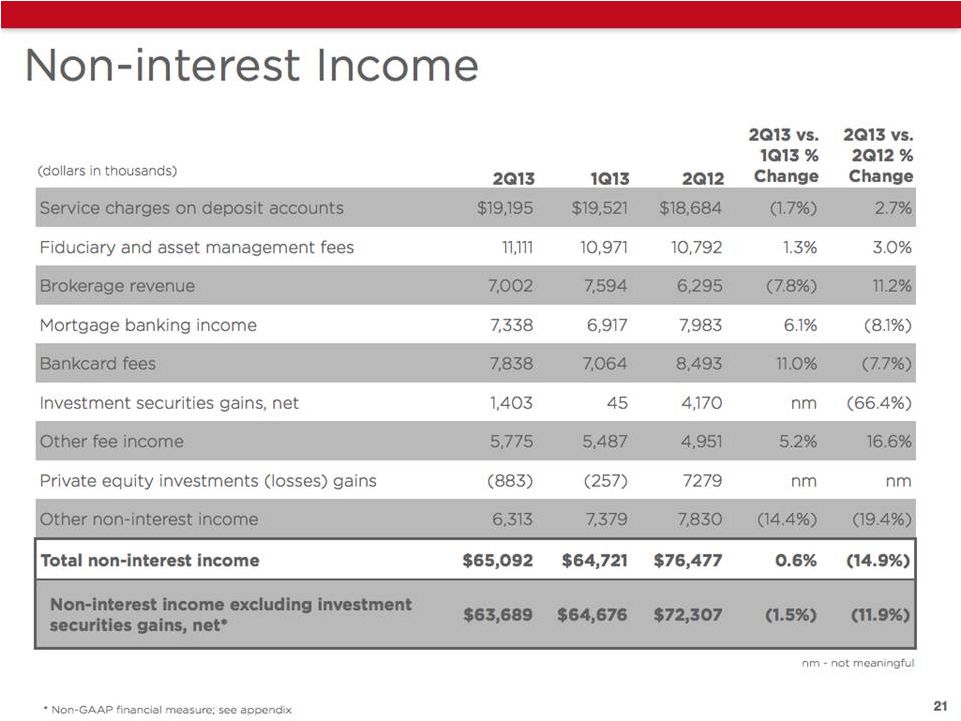
| — | Total non-interest income was $65.1 million for the second quarter of 2013, up $0.4 million, compared to $64.7 million for the first quarter of 2013. |
| ¡ | Bankcard fees increased $0.8 million. |
| ¡ | Mortgage banking income increased $0.4 million. |
| ¡ | Fiduciary and asset management fees increased $0.1 million. |
| ¡ | Service charges on deposit accounts declined $0.3 million. |
| ¡ | Brokerage revenue declined $0.6 million. |
| ¡ | Securities gains were $1.4 million in the quarter. |
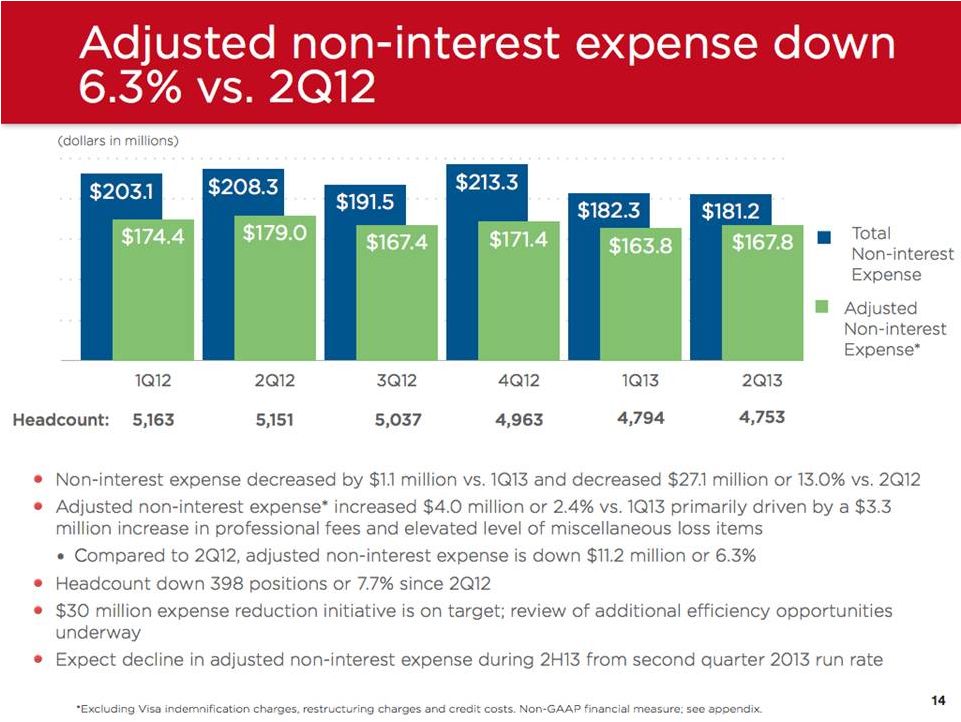
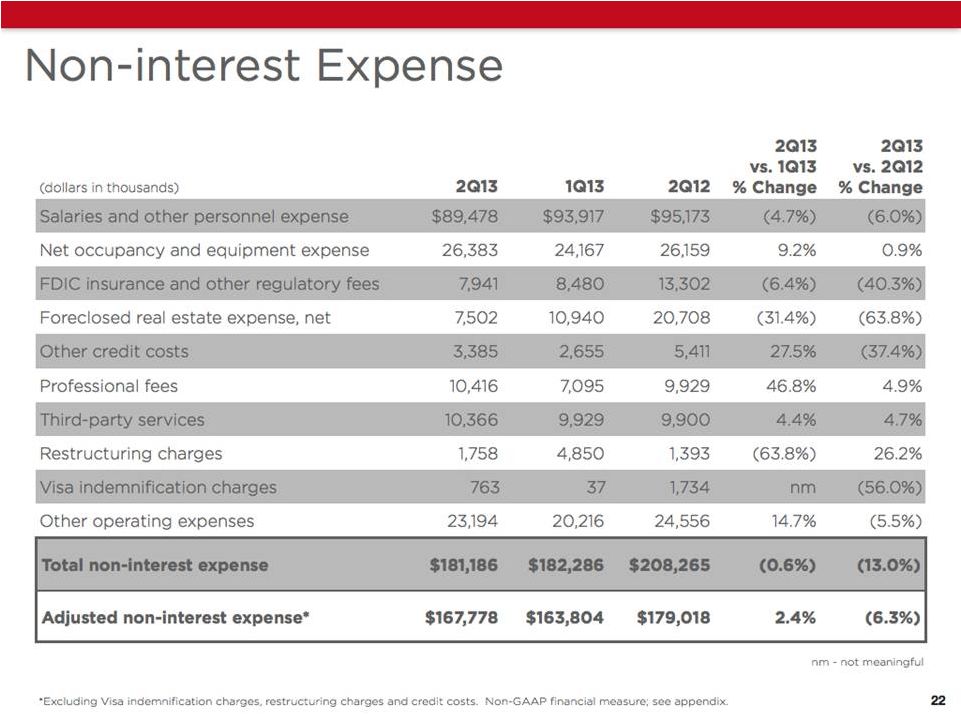
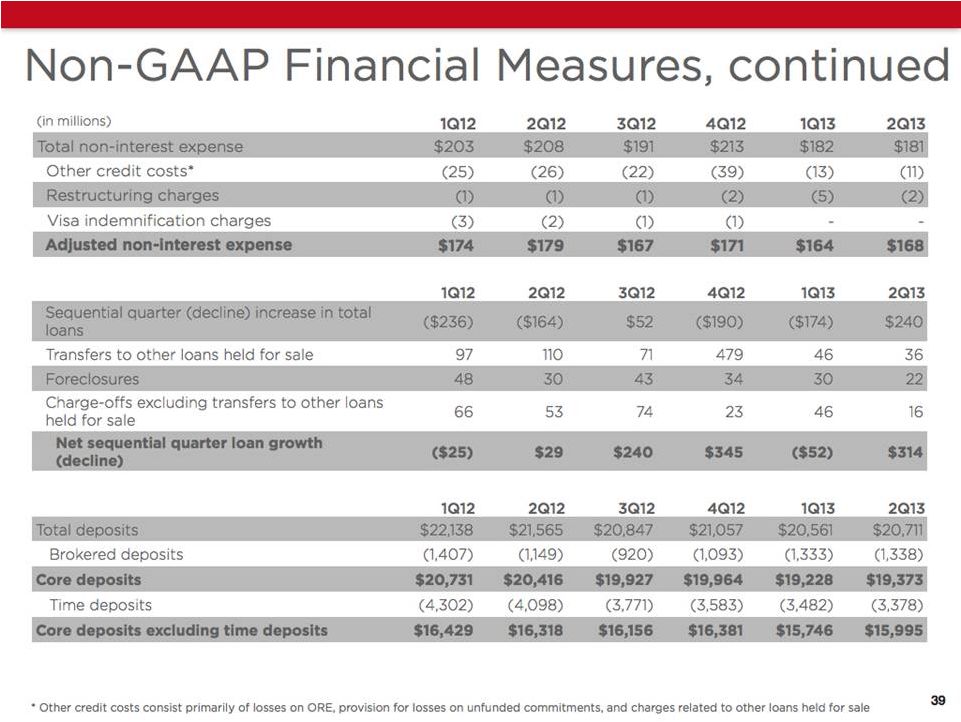
| — | Adjusted non-interest expense (excludes Visa indemnification charges, restructuring charges and other credit costs) was $167.8 million, up $4.0 million from $163.8 million for the first quarter of 2013, due primarily to higher professional fees. |
Balance Sheet Fundamentals
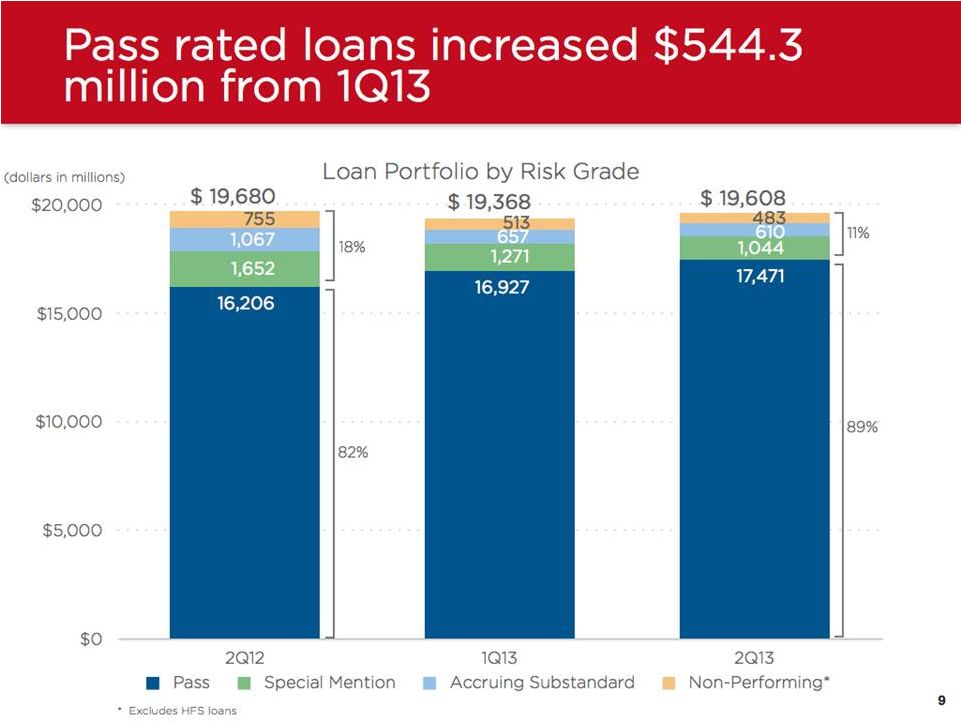
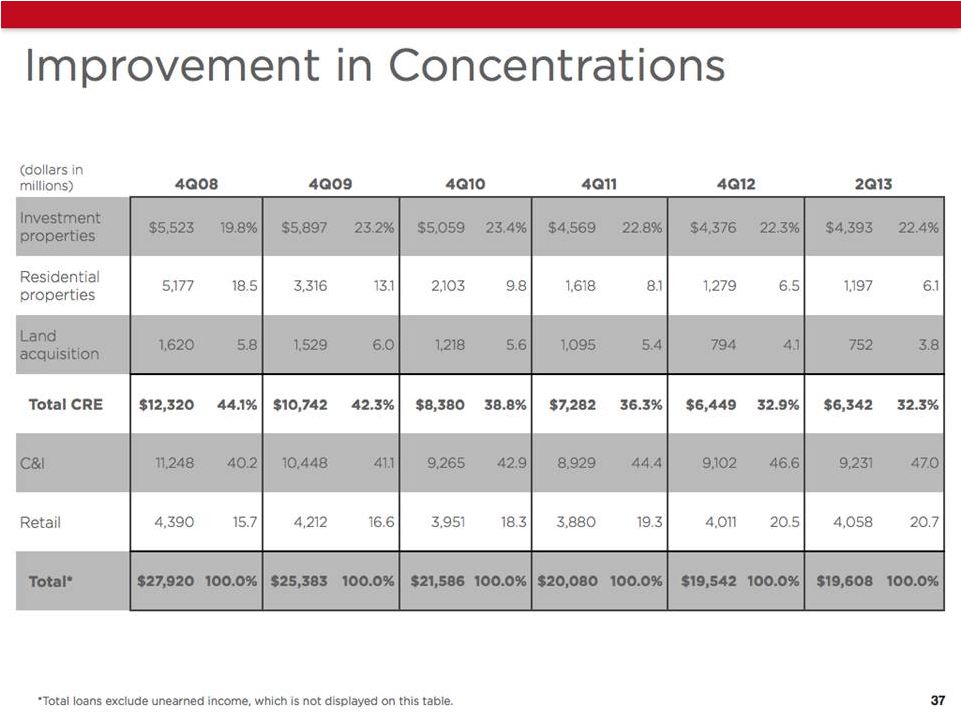
| — | Total reported loans ended the quarter at $19.61 billion, a $240.4 million increase from the first quarter of 2013. |
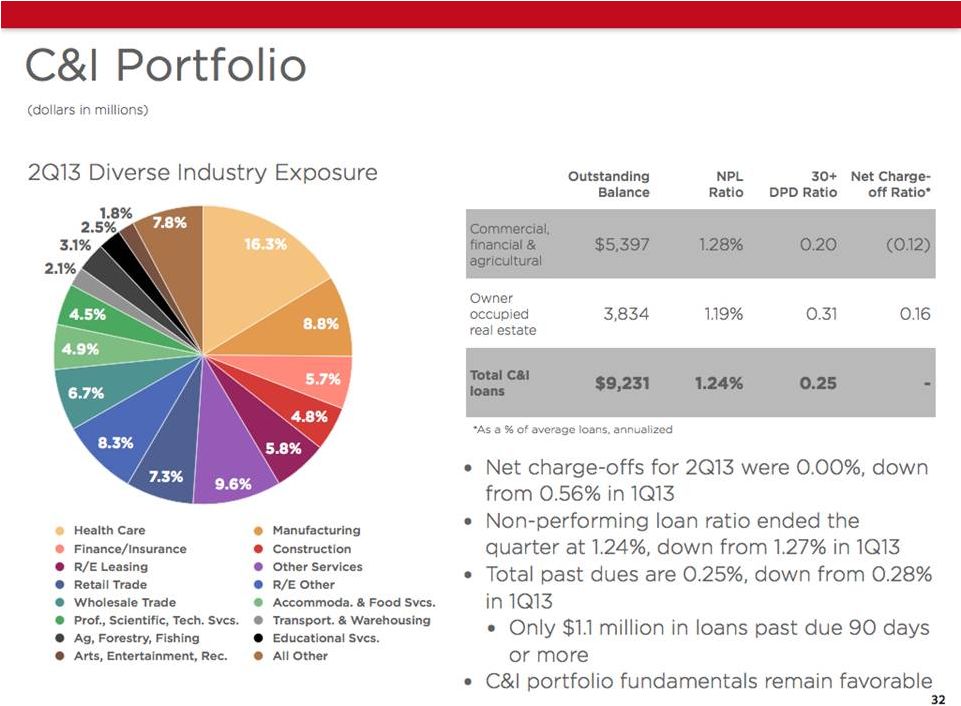
| ¡ | Commercial and industrial loans grew by $184.6 million from the first quarter of 2013, or 8.2% annualized. |
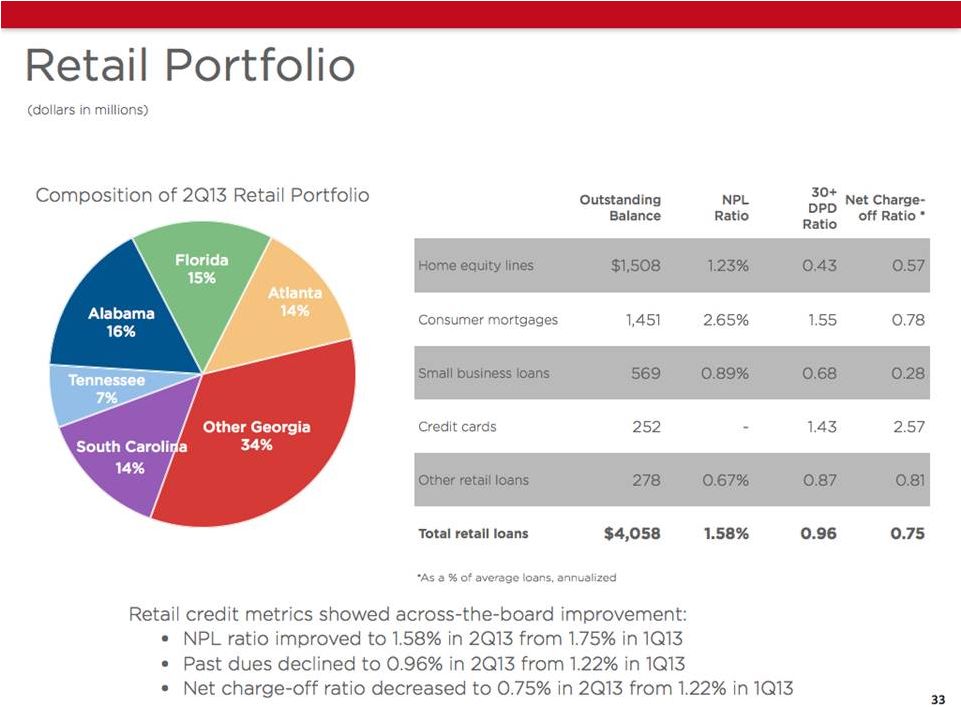
| ¡ | Retail loans grew by $78.5 million from the first quarter of 2013, or 7.9% annualized. |
| ¡ | Commercial real estate loans declined by $20.4 million from the first quarter of 2013. |
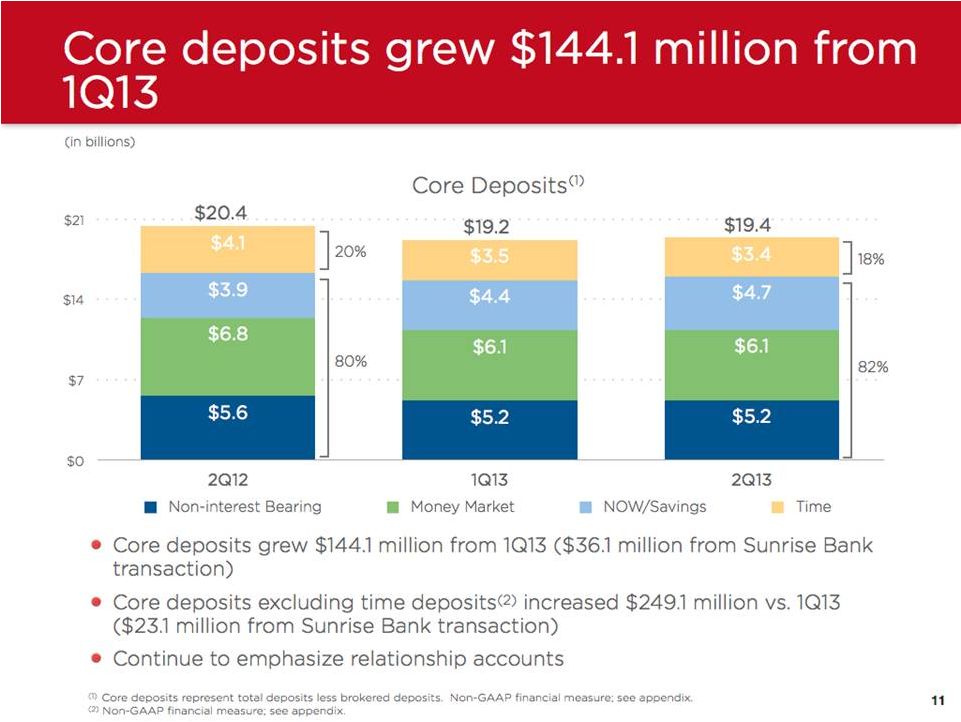
| — | Total deposits ended the quarter at $20.71 billion, up $149.5 million from the previous quarter due primarily to increases in non-interest bearing demand deposits and NOW account balances. |
| — | Core deposits ended the quarter at $19.37 billion, up $144.1 million compared to the first quarter of 2013. Core deposits, excluding time deposits, increased $249.1 million compared to the previous quarter. |
Credit Trends
| — | Total credit costs were $24.0 million in the second quarter of 2013, down from $49.3 million in the first quarter of 2013 and $70.3 million in the second quarter of 2012. |
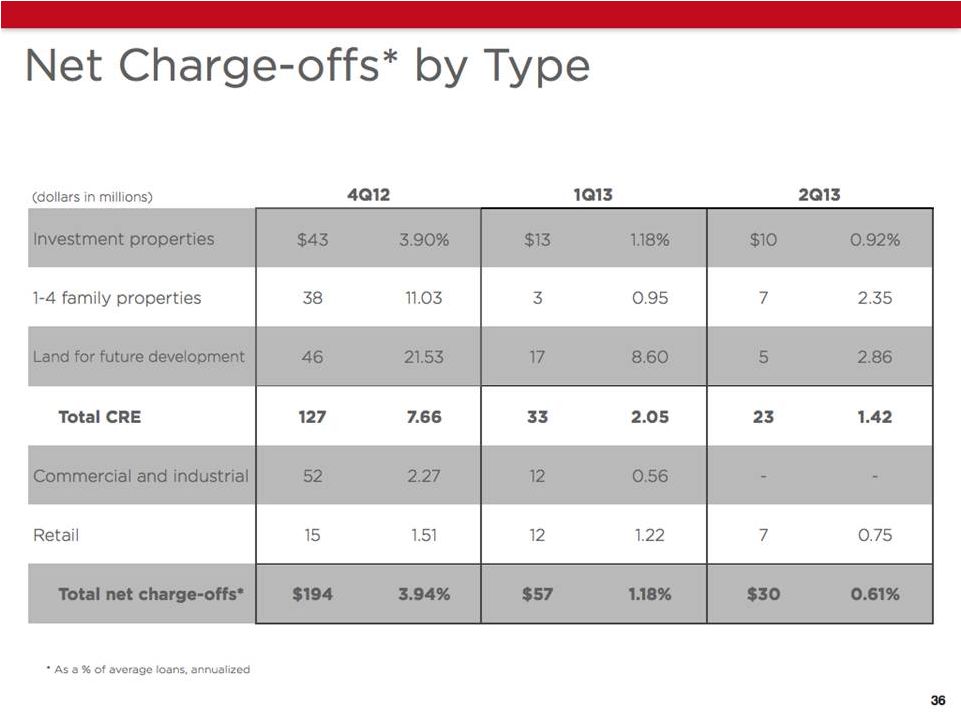
| — | Net charge-offs were $30.0 million in the second quarter of 2013, down from $57.3 million in the first quarter of 2013 and $98.7 million in the second quarter of 2012. The annualized net charge-off ratio was 0.61% in the second quarter, down from 1.18% in the previous quarter and 1.99% in the second quarter of 2012. |
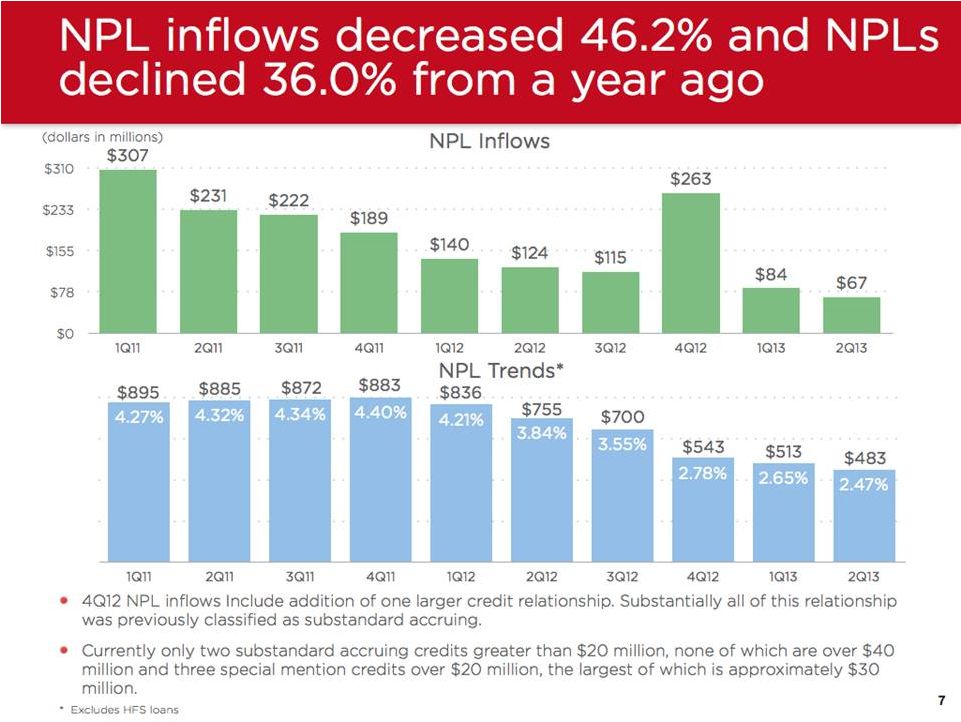
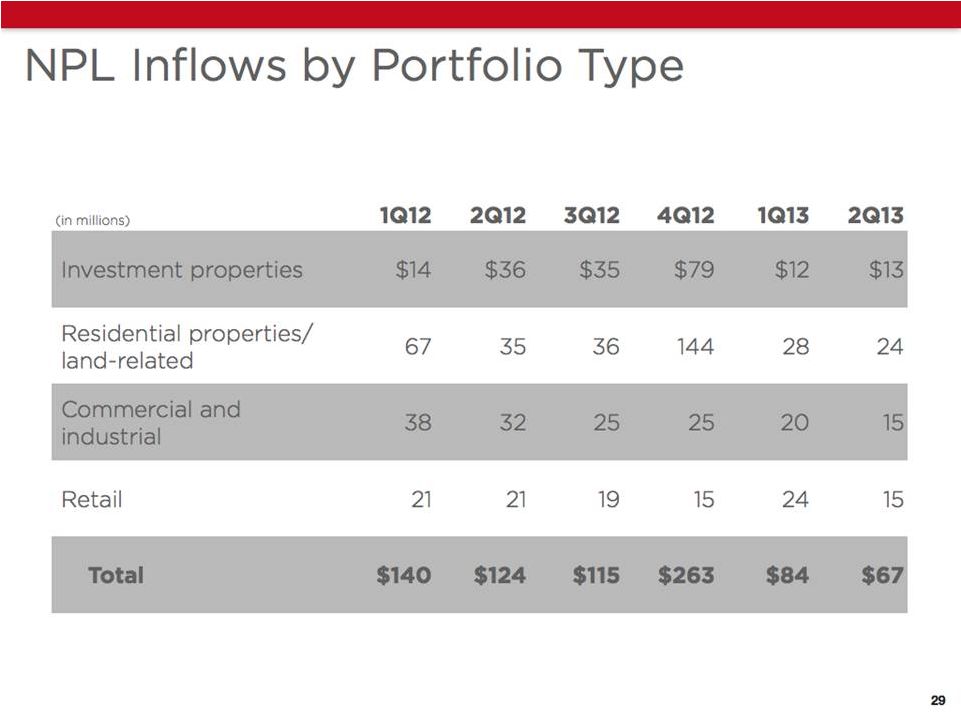
| — | Non-performing loan inflows were $66.9 million in the second quarter of 2013, down from $83.9 million in the first quarter of 2013 and $124.3 million in the second quarter of 2012. |
| — | Non-performing loans, excluding loans held for sale, were $483.5 million at June 30, 2013, down $29.8 million from the previous quarter, and down $271.7 million or 36.0% from the second quarter of 2012. The non-performing loan ratio was 2.47% at June 30, 2013, down from 2.65% at the end of the previous quarter and 3.84% at June 30, 2012. |
| — | Total non-performing assets were $635.2 million at June 30, 2013, down $42.4 million from the previous quarter, and down $326.2 million or 33.9% from the second quarter of 2012. The non-performing asset ratio was 3.21% at June 30, 2013, compared to 3.47% at the end of the previous quarter and 4.83% at June 30, 2012. |
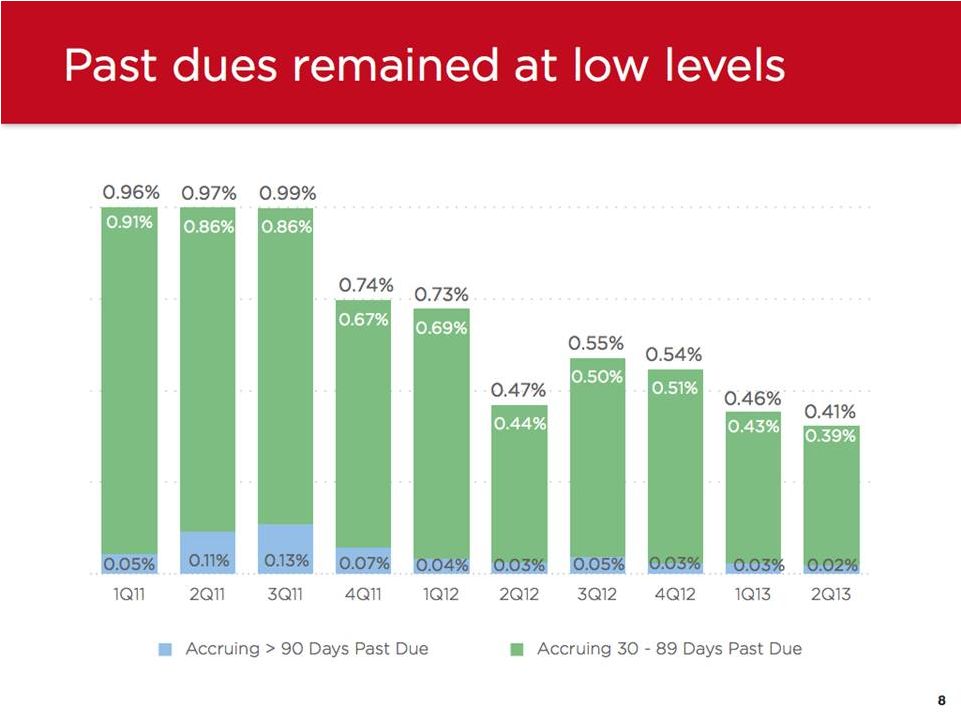
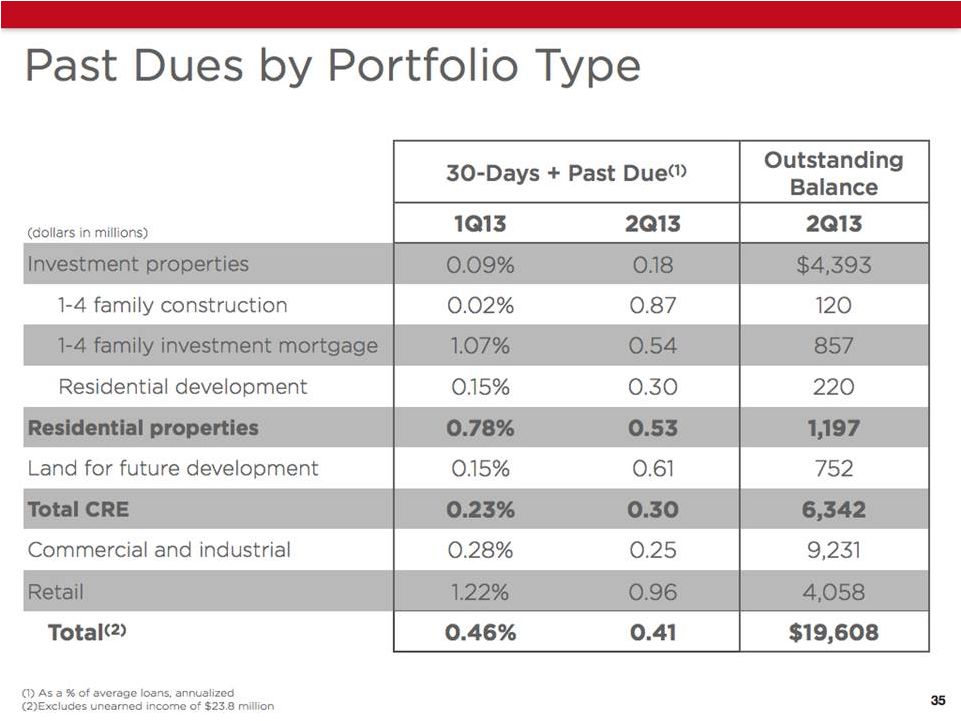
| — | Total delinquencies (consisting of loans 30 or more days past due and still accruing) declined to 0.41% of total loans at June 30, 2013, compared to 0.46% at March 31, 2013, and 0.47% at June 30, 2012. Total loans past due 90 days or more and still accruing declined to 0.02% at June 30, 2013, compared to 0.03% at March 31, 2013, and 0.03% at June 30, 2012. |
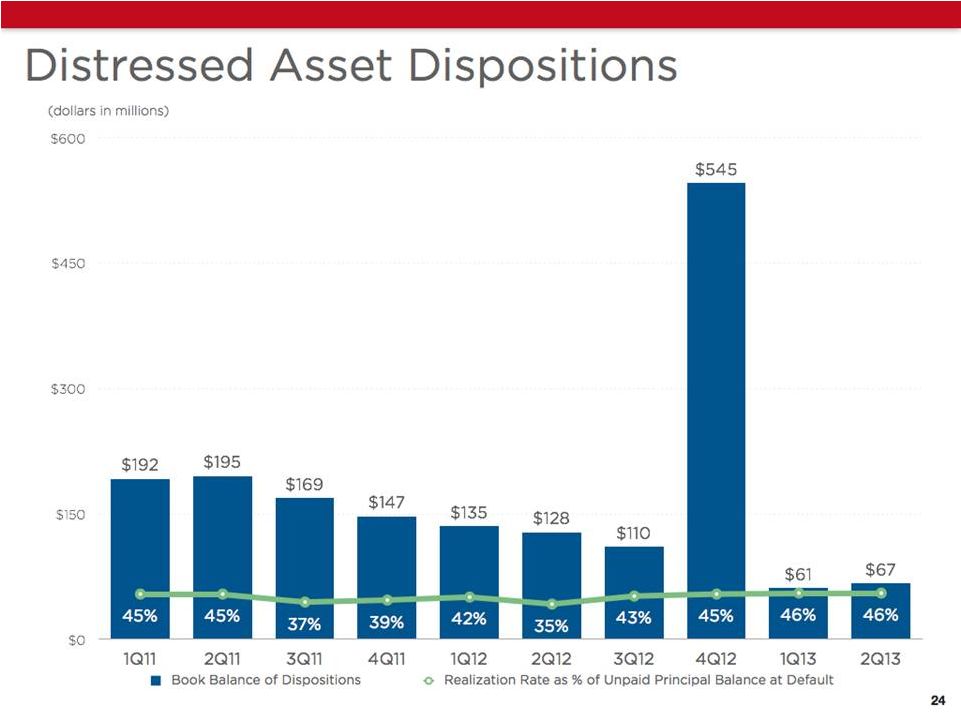
| — | Distressed asset sales were approximately $67 million during the second quarter, compared to approximately $61 million in the first quarter of 2013, and approximately $128 million in the second quarter of 2012. |
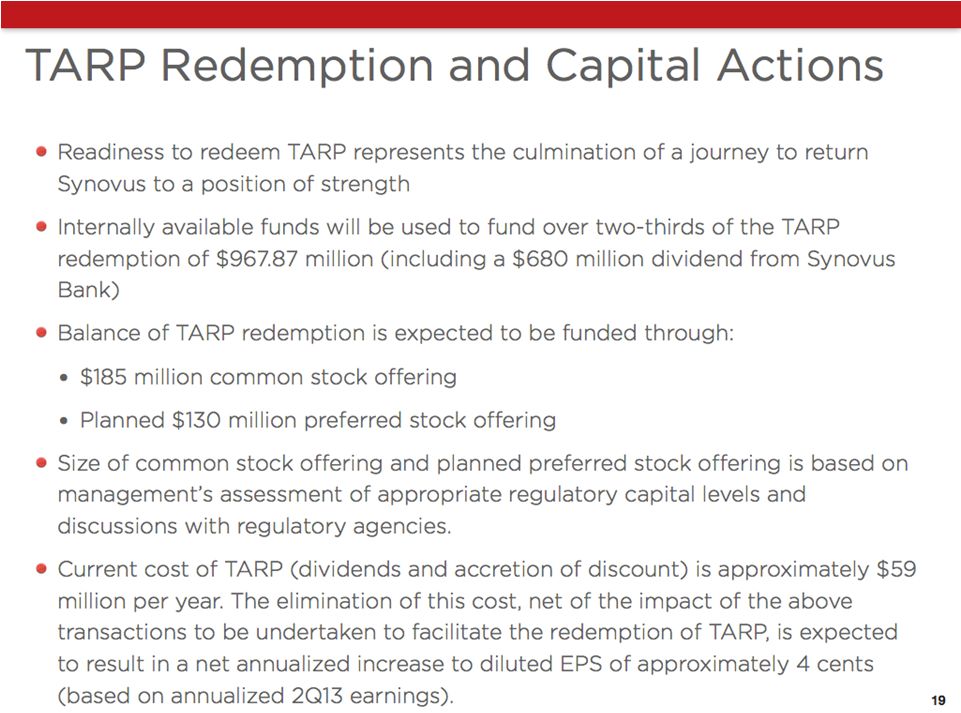
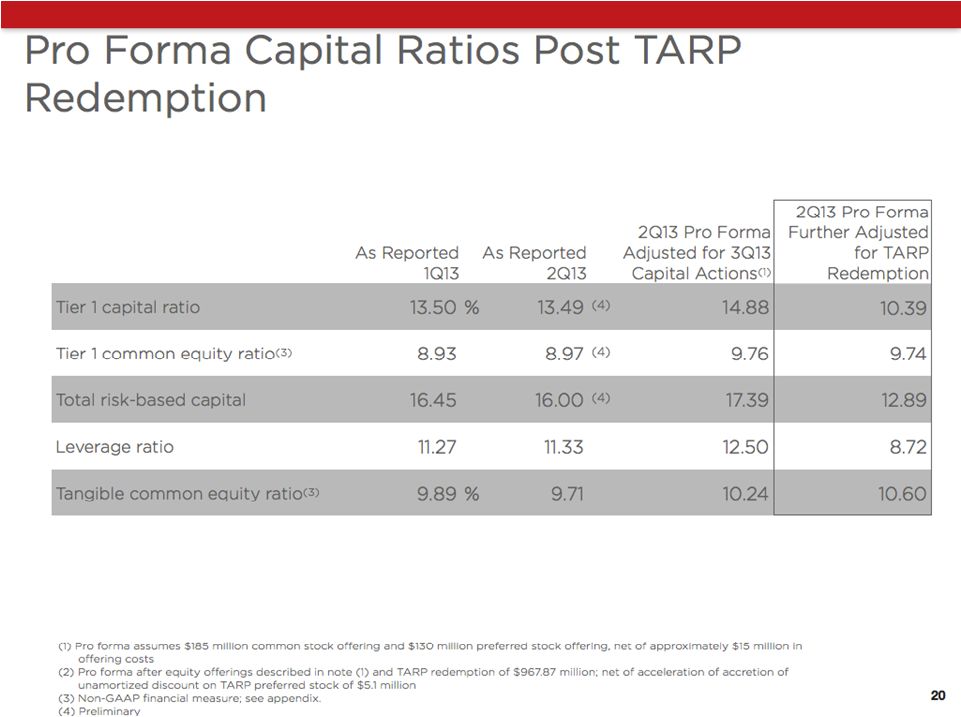
Capital Ratios
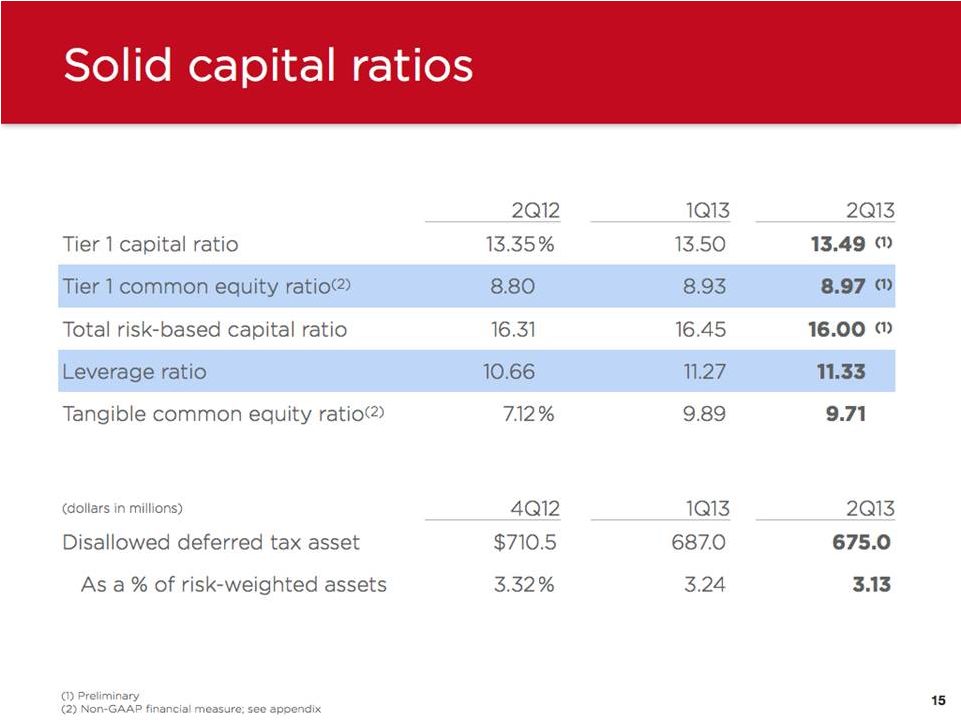
| — | Tier 1 Capital ratio was 13.49% at June 30, 2013, compared to 13.50% at March 31, 2013. |
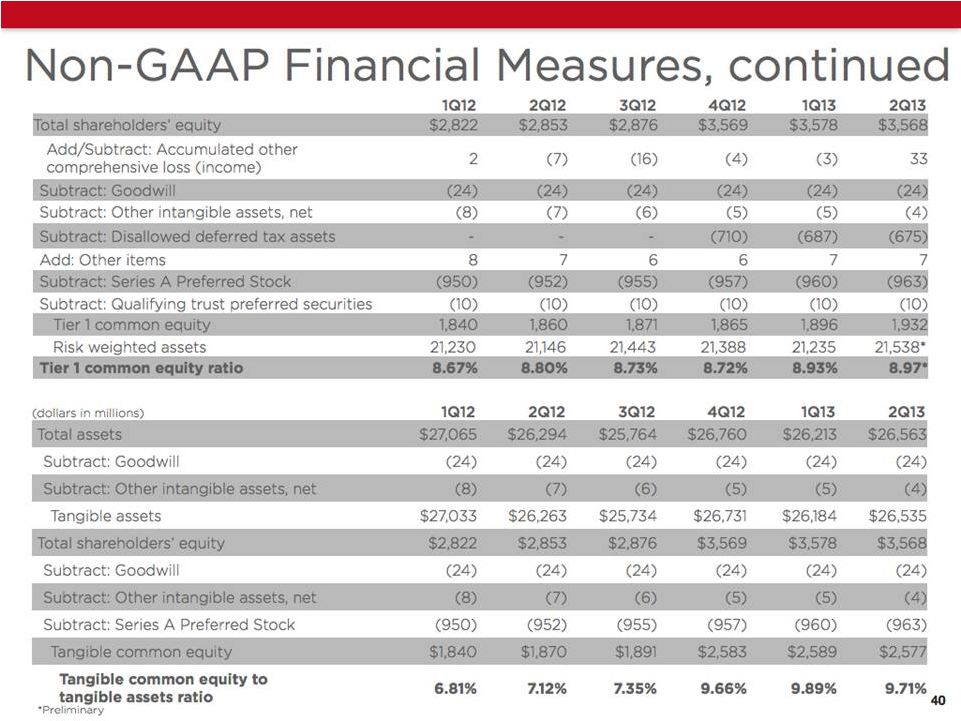
| — | Tier 1 Common Equity ratio was 8.97% at June 30, 2013, compared to 8.93% at March 31, 2013. |
| — | Total Risk Based Capital ratio was 16.00% at June 30, 2013, compared to 16.45% at March 31, 2013. |
| — | Tier 1 Leverage ratio was 11.33% at June 30, 2013, compared to 11.27% at March 31, 2013. |
| — | Tangible Common Equity ratio was 9.71% at June 30, 2013, compared to 9.89% at March 31, 2013. |
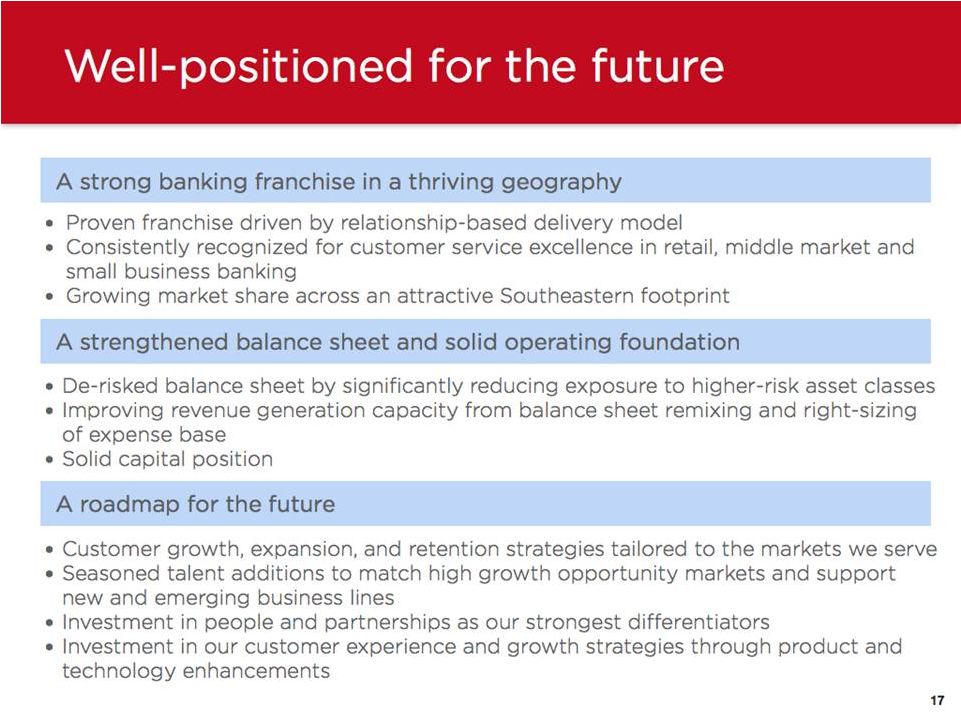
Stelling concluded, “We are pleased with the growth in loans and deposits, the strong improvement in credit trends, and the growth in profitability – all accomplishments that continue to signal our increasing strength. We have entered the second half of 2013 with even greater confidence in our company’s future. Our enhanced financial performance, attractive Southeastern footprint, and passion for service to customers and communities provide the right formula for long-term success in this competitive banking environment.”
Synovus will host an earnings highlights conference call at 5:00 p.m. EDT on July 18, 2013. The earnings call will be accompanied by a slide presentation. Shareholders and other interested parties can access the slide presentation and listen to the conference call via simultaneous Internet broadcast at www.synovus.com by clicking on the “Live Webcast” icon. RealPlayer or Windows Media Player can be downloaded prior to accessing the actual call or the replay. The replay will be archived for 12 months and will be available 30-45 minutes after the call.
About Synovus
Synovus Financial Corp. is a financial services company with approximately $27 billion in assets based in Columbus, Georgia. Synovus Financial Corp. provides commercial and retail banking, investment and mortgage services to customers in Georgia, Alabama, South Carolina, Florida and Tennessee. See Synovus Financial Corp. on the web at www.synovus.com.
Forward-Looking Statements
This press release and certain of our other filings with the Securities and Exchange Commission contain statements that constitute “forward-looking statements” within the meaning of, and subject to the protections of, Section 27A of the Securities Act of 1933, as amended, and Section 21E of the Securities Exchange Act of 1934, as amended. All statements other than statements of historical fact are forward-looking statements. You can identify these forward-looking statements through Synovus’ use of words such as “believes,” “anticipates,” “expects,” “may,” “will,” “assumes,” “should,” “predicts,” “could,” “would,” “intends,” “targets,” “estimates,” “projects,” “plans,” “potential” and other similar words and expressions of the future or otherwise regarding the outlook for Synovus’ future business and financial performance and/or the performance of the commercial banking industry and economy in general. These forward-looking statements include, among others, our expectations on credit trends and key credit metrics; expectations regarding deposits, loan growth and our loan portfolio; expectations on growth, and future profitability; expectations regarding the impact of our ongoing efficiency initiatives and future cost savings; and the assumptions underlying our expectations. Prospective investors are cautioned that any such forward-looking statements are not guarantees of future performance and involve known and unknown risks and uncertainties which may cause the actual results, performance or achievements of Synovus to be materially different from the future results, performance or achievements expressed or implied by such forward-looking statements. Forward-looking statements are based on the information known to, and current beliefs and expectations of, Synovus’ management and are subject to significant risks and uncertainties. Actual results may differ materially from those contemplated by such forward-looking statements. A number of factors could cause actual results to differ materially from those contemplated by the forward-looking statements in this report. Many of these factors are beyond Synovus’ ability to control or predict.
These forward-looking statements are based upon information presently known to Synovus’ management and are inherently subjective, uncertain and subject to change due to any number of risks and uncertainties, including, without limitation, the risks and other factors set forth in Synovus’ filings with the Securities and Exchange Commission, including its Annual Report on Form 10-K for the year ended December 31, 2012 under the captions “Cautionary Notice Regarding Forward-Looking Statements” and “Risk Factors” and in Synovus’ quarterly reports on Form 10-Q and current reports on Form 8-K. We believe these forward-looking statements are reasonable; however, undue reliance should not be placed on any forward-looking statements, which are based on current expectations and speak only as of the date that they are made. We do not assume any obligation to update any forward-looking statements as a result of new information, future developments or otherwise, except as otherwise may be required by law.
Use of Non-GAAP Financial Measures
The measures entitled core deposits, core deposits excluding time deposits, tangible common equity to tangible assets ratio, Tier 1 common equity ratio, pre-tax, pre-credit costs income, and adjusted non-interest expense are not measures recognized under U.S. generally accepted accounting principles (GAAP) and therefore are considered non-GAAP financial measures. The most comparable GAAP measures are total deposits, total shareholders’ equity to total assets ratio, Tier 1 capital to risk-weighted assets ratio, income (loss) before income taxes, and total non-interest expense, respectively.
Synovus believes that these non-GAAP financial measures provide meaningful additional information about Synovus to assist management and investors in evaluating Synovus’ capital strength and the performance of its core business. These non-GAAP financial measures should not be considered as substitutes for total deposits, total shareholders’ equity to total assets ratio, Tier 1 capital to risk-weighted assets ratio, income (loss) before income taxes, or total non-interest expense determined in accordance with GAAP and may not be comparable to other similarly titled measures at other companies.
The computations of core deposits, core deposits excluding time deposits, tangible common equity to tangible assets ratio, Tier 1 common equity ratio, pre-tax, pre-credit costs income, and adjusted non-interest expense, and the reconciliation of these measures to total deposits, total shareholders’ equity to total assets ratio, Tier 1 capital to risk-weighted assets ratio, income (loss) before income taxes, and total non-interest expense are set forth in the tables below.
| Reconciliation of Non-GAAP Financial Measures | ||||||||||||||||||||
| (dollars in thousands) | 2Q13 | 1Q13 | 4Q12 | 3Q12 | 2Q12 | |||||||||||||||
| Core deposits Core deposits excluding time deposits |
||||||||||||||||||||
| Total deposits |
$ | 20,710,703 | 20,561,193 | 21,057,044 | 20,846,830 | 21,565,065 | ||||||||||||||
| Subtract: Brokered deposits |
(1,338,064) | (1,332,632) | (1,092,749) | (919,959) | (1,148,892) | |||||||||||||||
|
|
|
|
|
|
|
|
|
|
|
|||||||||||
| Core deposits |
19,372,639 | 19,228,561 | 19,964,295 | 19,926,871 | 20,416,173 | |||||||||||||||
| Subtract: Time deposits |
(3,377,215) | (3,482,196) | (3,583,304) | (3,771,117) | (4,097,834) | |||||||||||||||
|
|
|
|
|
|
|
|
|
|
|
|||||||||||
| Core deposits excluding time deposits |
$ | 15,995,424 | 15,746,365 | 16,380,991 | 16,155,754 | 16,318,339 | ||||||||||||||
|
|
|
|
|
|
|
|
|
|
|
|||||||||||
| Tangible common equity to tangible assets ratio |
||||||||||||||||||||
| Total assets |
$ | 26,563,174 | 26,212,879 | 26,760,012 | 25,764,644 | 26,294,110 | ||||||||||||||
| Subtract: Goodwill |
(24,431) | (24,431) | (24,431) | (24,431) | (24,431) | |||||||||||||||
| Subtract: Other intangible assets, net |
(4,156) | (4,583) | (5,149) | (5,895) | (6,693) | |||||||||||||||
|
|
|
|
|
|
|
|
|
|
|
|||||||||||
| Tangible assets |
$ | 26,534,587 | 26,183,865 | 26,730,432 | 25,734,318 | 26,262,986 | ||||||||||||||
|
|
|
|
|
|
|
|
|
|
|
|||||||||||
| Total shareholders’ equity |
$ | 3,568,203 | 3,578,106 | 3,569,431 | 2,875,700 | 2,853,389 | ||||||||||||||
| Subtract: Goodwill |
(24,431) | (24,431) | (24,431) | (24,431) | (24,431) | |||||||||||||||
| Subtract: Other intangible assets, net |
(4,156) | (4,583) | (5,149) | (5,895) | (6,693) | |||||||||||||||
| Subtract: Series A Preferred Stock, no par value |
(962,725) | (960,005) | (957,327) | (954,690) | (952,093) | |||||||||||||||
|
|
|
|
|
|
|
|
|
|
|
|||||||||||
| Tangible common equity |
$ | 2,576,891 | 2,589,087 | 2,582,524 | 1,890,684 | 1,870,172 | ||||||||||||||
|
|
|
|
|
|
|
|
|
|
|
|||||||||||
| Total shareholders’ equity to total assets ratio |
13.43% | 13.65 | 13.34 | 11.16 | 10.85 | |||||||||||||||
| Tangible common equity to tangible assets ratio |
9.71% | 9.89 | 9.66 | 7.35 | 7.12 | |||||||||||||||
| Tier 1 Common Equity Ratio |
||||||||||||||||||||
| Total shareholders’ equity |
$ | 3,568,203 | 3,578,106 | 3,569,431 | 2,875,700 | 2,853,389 | ||||||||||||||
| Add/Subtract: Accumulated other comprehensive loss (income) |
33,060 | (2,787) | (4,101) | (16,156) | (7,003) | |||||||||||||||
| Subtract: Goodwill |
(24,431) | (24,431) | (24,431) | (24,431) | (24,431) | |||||||||||||||
| Subtract: Other intangible assets, net |
(4,156) | (4,583) | (5,149) | (5,895) | (6,693) | |||||||||||||||
| Subtract: Disallowed deferred tax asset |
(674,996) | (687,007) | (710,488) | - | - | |||||||||||||||
| Other items |
7,305 | 7,191 | 6,982 | 6,732 | 7,225 | |||||||||||||||
|
|
|
|
|
|
|
|
|
|
|
|||||||||||
| Tier 1 capital |
$ | 2,904,985 | 2,866,489 | 2,832,244 | 2,835,950 | 2,822,487 | ||||||||||||||
|
|
|
|
|
|
|
|
|
|
|
|||||||||||
| Subtract: Qualifying trust preferred securities |
(10,000) | (10,000) | (10,000) | (10,000) | (10,000) | |||||||||||||||
| Subtract: Series A Preferred Stock |
(962,725) | (960,005) | (957,327) | (954,690) | (952,093) | |||||||||||||||
|
|
|
|
|
|
|
|
|
|
|
|||||||||||
| Tier 1 common equity |
$ | 1,932,260 | 1,896,484 | 1,864,917 | 1,871,260 | 1,860,394 | ||||||||||||||
|
|
|
|
|
|
|
|
|
|
|
|||||||||||
| Risk-weighted assets |
21,538,426 | (1) | 21,235,129 | 21,387,935 | 21,443,178 | 21,146,174 | ||||||||||||||
| Tier 1 common equity ratio |
8.97% | (1) | 8.93 | 8.72 | 8.73 | 8.80 | ||||||||||||||
|
|
|
|
|
|
|
|
|
|
|
|||||||||||
| Pre-tax, Pre-credit Costs Income |
||||||||||||||||||||
| Income (loss) before income taxes |
$ | 72,906 | 46,553 | (72,299) | 30,514 | 37,347 | ||||||||||||||
| Add: Provision for losses on loans |
13,077 | 35,696 | 146,526 | 63,572 | 44,222 | |||||||||||||||
| Add: Other credit costs(2) |
10,887 | 13,595 | 39,236 | 22,046 | 26,119 | |||||||||||||||
| Add: Restructuring charges |
1,758 | 4,850 | 1,969 | 1,192 | 1,393 | |||||||||||||||
| Subtract: Investment securities gains, net |
(1,403) | (45) | (8,233) | (6,656) | (4,170) | |||||||||||||||
| Add: Visa indemnification charges |
763 | 37 | 757 | 833 | 1,734 | |||||||||||||||
|
|
|
|
|
|
|
|
|
|
|
|||||||||||
| Pre-tax, pre-credit costs income |
$ | 97,988 | 100,686 | 107,956 | 111,501 | 106,645 | ||||||||||||||
|
|
|
|
|
|
|
|
|
|
|
|||||||||||
| Adjusted Non-interest Expense |
||||||||||||||||||||
| Total non-interest expense |
$ | 181,186 | 182,286 | 213,346 | 191,492 | 208,264 | ||||||||||||||
| Subtract: Other credit costs(2) |
(10,887) | (13,595) | (39,236) | (22,046) | (26,119) | |||||||||||||||
| Subtract: Restructuring charges |
(1,758) | (4,850) | (1,969) | (1,192) | (1,393) | |||||||||||||||
| Subtract: Visa indemnification charges |
(763) | (37) | (757) | (833) | (1,734) | |||||||||||||||
|
|
|
|
|
|
|
|
|
|
|
|||||||||||
| Adjusted non-interest expense |
$ | 167,778 | 163,804 | 171,384 | 167,421 | 179,018 | ||||||||||||||
|
|
|
|
|
|
|
|
|
|
|
|||||||||||
| (1) | Preliminary |
| (2) | Other credit costs consist primarily of losses on ORE, provision for losses on unfunded commitments, and charges related to other loans held for sale |
###