Delaware |
3559 |
85-3692788 | ||
(State or other jurisdiction of incorporation or organization) |
(Primary Standard Industrial Classification Code Number) |
(I.R.S. Employer Identification No.) |
Large accelerated filer |
☐ |
Accelerated filer |
☐ | |||
Non-accelerated filer |
☒ |
Smaller reporting company |
||||
Emerging growth company |
• |
up to 8,625,000 shares of Common Stock issued to the Sponsor and GSAM prior to the ENNV IPO (the “ Founder Shares |
• |
up to 6,266,667 shares of Common Stock that are issuable by us upon exercise of the Private Placement Warrants (the “ Private Warrant Shares |
• |
up to 625,000 shares of Common Stock that are issuable by us upon exercise of the Forward Purchase Warrants (the “ Forward Purchase Warrant Shares |
• |
up to 8,625,000 shares (the “ Public Warrant Shares Warrant Shares Public Warrants |
• |
up to 125,000 shares (the “ Forward Purchase Shares |
• |
up to 755,461 shares (the “ ECP Notes Shares |
• |
up to 7,500,000 shares of Common Stock (the “ PIPE Shares PIPE Investors |
• |
up to 39,286,460 shares of outstanding Common Stock held by certain of our directors, officers and affiliates (collectively, the “ Insider Shares |
• |
up to 7,196,224 shares of Common Stock (the “ Control Earnout Shares |
• |
up to 2,661,465 shares of Common Stock issuable upon exercise of outstanding options (the “ Options Option Shares |
• |
up to 970,952 shares of Common Stock underlying nonvested RSUs (the “ Executive RSUs RSU Shares |
• |
up to 568,092 shares of Common Stock underlying outstanding restricted stock awards (the “ Executive RSAs RSA Shares |
ii | ||||
iv | ||||
1 | ||||
7 | ||||
8 | ||||
54 | ||||
55 | ||||
56 | ||||
68 | ||||
84 | ||||
101 | ||||
108 | ||||
120 | ||||
128 | ||||
130 | ||||
136 | ||||
154 | ||||
148 | ||||
157 | ||||
158 | ||||
160 | ||||
F-1 |
• | the Company’s ability to execute its business strategy, including monetization of solutions and services provided; |
• | the Company’s ability to scale and adapt existing technology, processes, and infrastructure to meet the needs of its business; |
• | the Company’s ability to realize the benefits expected from the Business Combination; |
• | the Company’s ability to continue to develop new solutions and innovations to meet constantly evolving customer demands; |
• | the Company’s ability to acquire or make investments in other businesses, patents, technologies, solutions, or services to grow the business; |
• | the Company’s ability to compete in the markets it serves; |
• | the Company’s ability to increase brand awareness; |
• | the Company’s ability to develop, design, and sell solutions that are differentiated from those of competitors; |
• | the Company’s ability to anticipate the impact of the COVID-19 pandemic and its effect on business and financial conditions; |
• | the Company’s ability to manage risks associated with operational changes in response to the COVID-19 pandemic; |
• | the Company’s ability to retain and hire necessary employees; |
• | the Company’s ability to attract, train, and retain effective officers, key employees or directors; |
• | the Company’s ability to enhance future operating and financial results; |
• | the Company’s ability to comply with laws and regulations applicable to its business; |
• | the Company’s ability to stay abreast of modified or new laws and regulations applying to its business, including trade export and privacy regulations; |
• | the Company’s ability to anticipate the impact of, and response to, new accounting standards; |
• | the Company’s ability to respond to fluctuations in foreign currency exchange rates and political unrest and regulatory changes in international markets from various events; |
• | the Company’s ability to anticipate the significance and timing of contractual obligations; |
• | the Company’s ability to maintain key strategic relationships with customers and suppliers; |
• | the Company’s ability to respond to uncertainties associated with solution development and market acceptance; |
• | the Company’s ability to successfully defend litigation; |
• | the Company’s ability to upgrade and maintain information technology systems; |
• | the Company’s ability to acquire and protect intellectual property; |
• | the Company’s ability to anticipate rapid technological changes; |
• | the Company’s ability to meet future liquidity requirements and comply with restrictive covenants related to long-term indebtedness; |
• | the Company’s ability to maintain the listing of its securities on NASDAQ or another national securities exchange; |
• | the Company’s ability to effectively respond to general economic and business conditions; |
• | the Company’s ability to implement and maintain effective internal controls over financial reporting; |
• | the Company’s ability to obtain additional capital, including through the use of the debt markets; |
• | the Company’s ability to successfully deploy the proceeds from the Business Combination and the PIPE Investment (as defined below); |
• | the Company’s ability to continue as a going concern; |
• | the fluctuation of operating results from period to period due to a number of factors, including the pace of customer adoption of our solutions; |
• | increasing competition in the advanced manufacturing industry; |
• | the impact of changes in consumer spending patterns, consumer preferences, local, regional and national economic conditions, crime, weather, and demographic trends; and |
• | any defects in new solutions or enhancements to existing solutions. |
• | Design |
• | Make front-end user experience to facilitate the ordering and procurement process for industrial-grade parts. Users also have access to a set of features that shows exactly where their part is in the production process, enhancing visibility into production and order status. |
• | Move |
• | Merger Sub merged with and into Legacy Fast Radius, with Legacy Fast Radius surviving as a wholly-owned subsidiary of the Company; |
• | each share of Legacy Fast Radius capital stock that was issued and outstanding was cancelled and converted into the right to receive (i) approximately 2.1 shares of Common Stock and (ii) approximately 0.3 Merger Earnout Shares; |
• | each outstanding and unexercised option to purchase Legacy Fast Radius common stock was assumed by the Company and converted into an option (each such option, an “ Exchanged Option |
1 |
Our Net Promoter Score is a three-month rolling average of our NPS score derived through regular online surveys we send to customers after parts have been shipped to and/or received by the customer. |
2 |
NPS is a score that measures the likelihood of users to recommend a company’s products or services to others, and ranges from a low of negative 100 to high of positive 100, and benchmark scores can vary significantly by industry. A score greater than zero represents a company having more promoters than detractors. Industry average NPS is based on survey data from Clearly Rated: https://www.clearlyrated.com/solutions/2021-nps-benchmarks-for-b2b-service-industries/. |
• | each outstanding restricted stock award relating to shares of Legacy Fast Radius common stock converted into restricted stock awards (each such restricted stock award, an “ Exchanged Restricted Stock Award |
• | each restricted stock unit relating to Legacy Fast Radius common stock (each, a “ Legacy Fast Radius RSU Vested RSU |
• | each outstanding Legacy Fast Radius RSU (other than Vested RSUs) converted into an award of restricted stock units (each such restricted stock unit, an “ Exchanged RSU |
• | each share of common stock, par value $0.001 per share, of Merger Sub issued and outstanding immediately prior to the Effective Time was cancelled and automatically converted into one validly issued, fully paid and nonassessable share of Legacy Fast Radius common stock held by the Company; |
• | all of the outstanding 8,625,000 shares of the Company’s Class B common stock, par value of $0.0001 per share (the “ Class B Common Stock Sponsor GSAM |
• | all of the ENNV units were separated into one share of Common Stock and one-quarter (1/4) of one Warrant to purchase one share of Common Stock at an exercise price of $11.50 per share; and |
• | the Company issued an aggregate of 125,000 shares of Common Stock to GSAM pursuant to the Forward Purchase Agreement. |
• | We are an early-stage company with a history of losses. We have not been profitable historically and may not achieve or maintain profitability for any period in the future or sustain cash flow from operating activities. |
• | We have a relatively limited operating history and have experienced rapid growth, which makes evaluating our current business and future prospects difficult and may increase the risk of your investment. |
• | We may not timely and effectively scale and adapt our existing technology, processes, and infrastructure to meet the needs of our business. |
• | Our operating results may fluctuate significantly from period-to-period |
• | The global COVID-19 pandemic has significantly affected our business and operations. |
• | We face intense and growing competition in the advanced manufacturing industry. Our inability to compete effectively with competitors could affect our ability to achieve our anticipated market penetration and achieve or sustain profitability. |
• | The advanced manufacturing industry in which we operate is characterized by rapid technological change, requiring continual innovation and development of new solutions and innovations to meet constantly evolving customer demands. |
• | Forecasts of our market and market growth may prove to be inaccurate, and even if the markets in which we compete achieve the forecasted growth, there can be no assurance that our business will serve a significant portion of the market or grow at similar rates, or at all. |
• | We may experience significant delays in the design, production and launch of our advanced manufacturing solutions and enhancements to existing solutions, and we may be unable to successfully commercialize solutions on our planned timelines. |
• | We may require additional capital to support business growth, and this capital might not be available on acceptable terms, if at all. If we fail to obtain additional capital on terms that are acceptable, we may not be able to implement such plans for business growth fully, if at all. |
• | Without obtaining adequate capital funding or improving our financial performance, we may not be able to continue as a going concern. |
• | If demand for our solutions does not grow as expected, or if market adoption of advanced manufacturing and our Cloud Manufacturing Platform does not continue to develop, or develops more slowly than expected, our revenues may stagnate or decline, and our business may be adversely affected. |
• | We rely on a limited number of third-party logistics providers for distribution of our products, and their failure to distribute products effectively would adversely affect our sales. |
• | Our bookings might not accurately predict our future revenue, and we might not realize all or any part of the anticipated revenues reflected in bookings. |
• | A real or perceived defect, security vulnerability, error or performance failure in our software or technical problems or disruptions caused by our third-party service providers could cause us to lose revenue, damage our reputation and expose us to liability. |
• | We may not be able to adequately protect our proprietary and intellectual property rights in our data or technology. |
• | If third parties claim that we infringe upon or otherwise violate their intellectual property rights, our business could be adversely affected. |
• | Our internal controls over financial reporting currently do not meet all of the standards contemplated by Section 404 of the Sarbanes Oxley Act, and failure to achieve and maintain effective internal controls over financial reporting in accordance with Section 404 of the Sarbanes Oxley Act could impair our ability to produce timely and accurate financial statements or comply with applicable regulations and have a material adverse effect on our business. |
• | We have identified material weaknesses in our internal control over financial reporting and may identify additional material weaknesses in the future or fail to maintain effective internal control over financial reporting, which may result in material misstatements of our consolidated financial statements or cause us to fail to meet our periodic reporting obligations. |
Securities offered by the selling securityholders |
We are registering the resale by the selling securityholders named in this prospectus, or their permitted transferees, of up to (i) 6,891,667 |
Warrants consisting of (A) up to 6,266,667 Private Placement Warrants and (B) up to 625,000 Forward Purchase Warrants and (ii) up to an aggregate of 83,205,321 shares of Common Stock consisting of: |
• | up to 8,625,000 Founder Shares (as defined below); |
• | up to 15,516,667 Warrant Shares; |
• | up to 755,461 ECP Notes Shares; |
• | up to 125,000 Forward Purchase Shares; |
• | up to 7,500,000 PIPE Shares; and |
• | up to 50,683,193 Control Shares. |
Terms of the offering |
The selling securityholders will determine if, when and how they will dispose of the securities registered pursuant to the registration statement of which this prospectus forms a part. |
Shares of Common Stock outstanding prior to the offering |
As of March 31, 2022, 73,041,156 shares of our Common Stock were issued and outstanding. |
Shares of Common Stock outstanding after the offering |
99,386,464 shares of Common Stock (assuming the exercise for cash of warrants to purchase 15,516,667 shares of our Common Stock, the purchase for cash of the 2,661,465 Option Shares, the full vesting of the 970,952 RSU Shares, and the issuance of 7,196,224 Control Earnout Shares to the selling securityholders) |
Use of proceeds |
We will not receive any proceeds from the sale of shares of Common Stock or Warrants by the selling securityholders. We will receive the proceeds from any exercise for cash of any warrants and the Options, which we intend to use for general corporate and working capital purposes. See “ Use of Proceeds |
Risk factors |
See “ Risk Factors |
NASDAQ symbol for our Common Stock |
“FSRD” |
NASDAQ symbol for our Public Warrants |
“FSRDW” |
• | the degree of market acceptance of our Cloud Manufacturing Platform and related solutions; |
• | our ability to compete with competitors and new entrants into our markets; |
• | changes in our pricing policies or those of our competitors, including our response to price competition; |
• | the effectiveness of our securing new orders and fulfilling existing orders; |
• | the adoption and capital expenditure cycles of our customers’ sales cycle, and seasonality among our customers; |
• | the impact of the COVID-19 pandemic on our customers, suppliers, manufacturers, and operations; |
• | the mix of products that we sell and the cost of manufacturing during any period; |
• | the cost to acquire new customers through our various customer acquisition channels, including digital marketing, inside sales, and business development; |
• | The financial position of our customers; |
• | the retention rates and average revenue and gross margins of existing and new customers; |
• | the timing of our sales and deliveries of products to customers; |
• | changes in the amount that we spend to develop and manufacture new solutions or technologies; |
• | timing of expenditures to develop and bring to market new or enhanced solutions and the generation of revenue from those solutions; |
• | changes in the cost of satisfying our warranty obligations and servicing products; |
• | litigation-related expenses and/or liabilities; |
• | the effectiveness of our internal controls and ability to remediate the material weaknesses in our internal control over financial reporting; |
• | unforeseen liabilities or difficulties in integrating our acquisitions or newly acquired businesses; |
• | our ability to collect against our accounts receivables balances from our customers in a timely manner, or at all; |
• | disruptions to our internal and third-party supplier facilities and processes; |
• | disruptions to our information technology systems or our third-party suppliers; |
• | disruptions to our global supply chain, including raw materials availability; |
• | the geographic distribution of our sales; |
• | general economic and industry conditions that affect customer demand; and |
• | changes in accounting rules and tax laws. |
• | predict future customer demand; |
• | develop cost effective new solutions and technologies that address the increasingly complex needs of prospective customers; |
• | enhance our existing solutions and technologies; |
• | respond to technological advances and emerging industry standards and certifications on a cost-effective and timely basis; |
• | adequately protect our intellectual property as we develop new solutions and technologies; |
• | identify the appropriate technology or solutions to which to devote our resources; or |
• | ensure the availability of cash resources to fund research and development. |
• | misalignment between the solutions and customer needs; |
• | length of sales cycles; |
• | insufficient solution innovation; |
• | solution quality and performance issues; |
• | insufficient resources or qualified personnel to develop the solution; |
• | failure of the solution to perform in accordance with the customer’s expectations and industry standards; |
• | inability to procure parts of adequate quality needed to build a product on commercially acceptable terms, or at all; |
• | insufficient labor or process stability to build the product to required specifications; |
• | ineffective distribution, sales, and marketing; |
• | delay in obtaining any required regulatory approvals; |
• | the impact of the COVID-19 pandemic on production and demand for our solutions; |
• | unexpected production costs and delays; or |
• | release of competitive solutions. |
• | If we fail to supply products in accordance with contractual terms, including terms related to time of delivery and performance specifications, we may be required to repair or replace defective products and may become liable for direct, special, consequential and other damages, even if manufacturing or delivery was outsourced; |
• | Raw materials used in the manufacturing process, labor and other key inputs may become scarce, obsolete, and expensive, causing our costs to exceed cost projections and associated revenues; |
• | Manufacturing processes typically involve large machinery, fuels, and chemicals, any or all of which may lead to accidents involving bodily harm, destruction of facilities and environmental contamination and associated liabilities; |
• | As our manufacturing operations expand, we expect that a portion of our manufacturing will be done in regions outside the United States, either by third-party contractors or in a factory owned by us. Any manufacturing done in such locations presents risks associated with quality control, currency exchange rates, foreign laws and customs, timing and loss risks associated with international transportation and potential adverse changes in the political, legal, and social environment in the host county; |
• | We have made, and may be required to make, representations as to our right to supply and/or license intellectual property and to our compliance with laws. Such representations are usually supported by indemnification provisions requiring us to defend our customers and otherwise make them whole if we license or supply products that infringe on third-party technologies or violate government regulations; |
• | As our manufacturing operations scale, so will our dependence on skilled labor at both in-house and third-party manufacturing facilities. If we are unable to obtain and maintain skilled labor resources, we may unable to meet customer production demands; and |
• | With scaling production volume, demand for our products may make up a significant percentage of global volume in select categories or commodities. Such commodities could be subject to large pricing swings due to the global political, legal, and social environment and could cause our costs to exceed production and associated revenues. |
• | diversion of management’s attention from existing operations; |
• | unanticipated costs or liabilities associated with the acquisition, including risks associated with acquired intellectual property and/or technologies; |
• | difficulties in, and the cost of, integrating personnel and cultures, operations, technologies, solutions, and services which may lead to failure to achieve the expected benefits on a timely basis or at all; |
• | challenges in achieving strategic objectives, cost savings and other anticipated benefits; |
• | inability to maintain relationships with key customers, suppliers, vendors and other third parties on which the purchased business relies; |
• | the difficulty of incorporating acquired technology and rights into our solutions and solution portfolio and of maintaining quality and security standards consistent with our brand; |
• | ineffective controls, procedures and policies inherited from the acquired company or during the transition and integration; |
• | inability to generate sufficient revenue to offset acquisition and/or investment costs; |
• | negative impact to our results of operations because of the amortization and depreciation of amounts related to acquired intangible assets and fixed assets; |
• | requirements to record certain acquisition-related costs and other items as current period expenses, which would have the effect of reducing our reported earnings in the period in which an acquisition is consummated; |
• | the loss of acquired unearned revenue and unbilled unearned revenue; |
• | recording goodwill or other long-lived asset impairment charges (if any) in the periods in which they occur, which could result in a significant charge to our earnings in any such period; |
• | use of substantial portions of our available cash, issuance of dilutive equity or the incurrence of debt to consummate the acquisition; |
• | potential write-offs of acquired assets or investments, and potential financial and credit risks associated with acquired customers; |
• | tax effects and costs of any such acquisitions, including the related integration into our tax structure and assessment of the impact on the realizability of our future tax assets or liabilities; |
• | the potential entry into new markets in which we have little or no experience or where competitors may have stronger market positions; and |
• | currency and regulatory risks associated with conducting operations in foreign countries. |
• | the size, complexity and duration of the products being manufactured; |
• | changes in delivery schedules; and |
• | the cancellation or delay of a contract or purchase order. |
• | our operations are disrupted or shut down; |
• | our confidential, proprietary information is stolen or disclosed; |
• | we incur costs or are required to pay fines in connection with stolen customer, employee, or other confidential information; or |
• | we must dedicate significant resources to system repairs or increase cyber security protection. |
• | unexpected increases in manufacturing and repair costs; |
• | inability to control the quality and reliability of products or materials; |
• | inability to control delivery schedules; |
• | potential liability for expenses incurred by third-party suppliers in reliance on our forecasts that later prove to be inaccurate; |
• | potential lack of adequate capacity to manufacture all or a part of the products we require; |
• | potential labor unrest affecting the ability of the third-party suppliers to produce our products; and |
• | unexpected component or process obsolescence making key components unavailable. |
• | potential shortages of some key components; |
• | product performance shortfalls, if traceable to particular product components, since the supplier of the faulty component cannot readily be replaced; |
• | discontinuation of a product or certain materials on which we rely; |
• | potential insolvency of these vendors; and |
• | reduced control over delivery schedules, manufacturing capabilities, quality, and costs. |
• | difficulties in staffing and managing foreign operations; |
• | limited protection for the enforcement of contract and intellectual property rights in certain countries where we may sell our products or work with suppliers or other third parties; |
• | potentially longer sales and payment cycles and potentially greater difficulties in collecting accounts receivable; |
• | costs and difficulties of customizing products for foreign countries; |
• | challenges in providing solutions across a significant distance, in different languages and among different cultures; |
• | laws and business practices favoring local competition; |
• | being subject to a wide variety of complex foreign laws, treaties and regulations and adjusting to any unexpected changes in such laws, treaties, and regulations, including local labor laws; |
• | strict laws and regulations governing privacy and data security, including the European Union’s General Data Protection Regulation; |
• | uncertainty and resultant political, financial and market instability arising from the United Kingdom’s exit from the European Union; |
• | compliance with U.S. laws affecting activities of U.S. companies abroad, including the U.S. Foreign Corrupt Practices Act; |
• | tariffs, trade barriers and other regulatory or contractual limitations on our ability to sell or develop our products in certain foreign markets; |
• | operating in countries with a higher incidence of corruption and fraudulent business practices; |
• | changes in regulatory requirements, including export controls, tariffs and embargoes, other trade restrictions, competition, corporate practices, and data privacy concerns; |
• | failure by our distribution partners to comply with local laws or regulations, export controls, tariffs and embargoes or other trade restrictions; |
• | potential adverse tax consequences arising from global operations; |
• | seasonal reductions in business activity in certain parts of the world, particularly during the summer months in Europe and at year end globally; |
• | rapid changes in government, economic and political policies, and conditions; and |
• | political or civil unrest or instability, terrorism, war or epidemics and other similar outbreaks or events. |
• | require that we obtain and maintain material governmental authorizations and approvals to conduct our business as it is currently conducted; |
• | require certification and disclosure of cost and pricing data in connection with certain contract negotiations; |
• | impose rules that define allowable and unallowable costs and otherwise govern our right to reimbursement under certain cost-based U.S. government contracts; |
• | may require certain products that the U.S. government purchases to be manufactured in the U.S. and other relatively high-cost manufacturing locations under Buy American Act or other regulations, and we may not manufacture all products in locations that meet these requirements, which may preclude our ability to sell some solutions or services; |
• | restrict the use and dissemination of information classified for national security purposes and the export of certain products and technical data; and |
• | impose requirements relating to ethics and business practices, which carry penalties for noncompliance ranging from monetary fines and damages to loss of the ability to do business with the U.S. government as a prime contractor or subcontractor. |
• | be expensive and time consuming to defend; |
• | cause us to cease making, licensing, or using our Cloud Manufacturing Platform or solutions that incorporate the challenged intellectual property; |
• | require us to modify, redesign, reengineer or rebrand our Cloud Manufacturing Platform or solutions, if feasible; |
• | divert management’s attention and resources; or |
• | require us to enter into royalty or licensing agreements to obtain the right to use a third-party’s intellectual property. |
• | We did not design and maintain formal accounting policies, procedures, and controls to achieve complete, accurate and timely financial accounting, reporting and disclosures, including controls over the preparation and review of account reconciliations, journal entries, and complex transactions; and |
• | We did not design and maintain effective controls over segregation of duties for key financial processes and access within IT systems, which includes certain personnel having the ability to both prepare and post manual journal entries without an independent review by someone without the ability to prepare and post manual journal entries. |
• | Revenue was recorded incorrectly for transactions which we could not assert that collection from the customer was probable under the requirements of Accounting Standard Codification (“ASC”) 606. |
• | Software capitalization costs and the associated amortization were incorrectly calculated and recorded due to errors in tracking the time period when the design, development and testing of the software occurs and is therefore capitalizable under ASC 350-40. |
• | We incorrectly accrued certain transaction costs twice. |
• | Certain transaction-related fees that were paid were incorrectly classified as operating cash flows on the condensed consolidated statement of cash flows |
• | engaging a third party to assist with the development of a Sarbanes-Oxley program; |
• | hiring additional competent and qualified accounting and reporting personnel with appropriate knowledge and experience of GAAP and SEC financial reporting requirements; |
• | establishing and designing internal financial reporting structures and authorizing certain departments or capable and responsible persons to be in charge of the overall financial management and financial objectives of the Company; |
• | establishing an ongoing program to provide sufficient additional training to our accounting staff, especially training related to GAAP and SEC financial reporting requirements; |
• | designing and preparing accounting policies in accordance with relevant rules, especially in relation to complex and major transactions; and |
• | updating our policies and procedures to address segregation of duties for key financial processes. |
• | not being required to comply with the auditor attestation requirements of Section 404 of the Sarbanes- Oxley Act; |
• | not being required to comply with any requirement that may be adopted by the Public Company Accounting Oversight Board regarding mandatory audit firm rotation or a supplement to the auditor’s report providing additional information about the audit and the consolidated financial statements (i.e., an auditor discussion and analysis); |
• | reduced disclosure obligations regarding executive compensation in our periodic reports, proxy statements, and registration statements; and |
• | exemptions from the requirements of holding a nonbinding advisory vote of stockholders on executive compensation, stockholder approval of any golden parachute payments not previously approved, and having to disclose the ratio of the compensation of our chief executive officer to the median compensation of our employees. |
• | the impact of the COVID-19 pandemic on our financial condition and the results of operations; |
• | our operating and financial performance and prospects; |
• | our quarterly or annual earnings or those of other companies in our industry compared to market expectations; |
• | conditions that impact demand for our products and/or services; |
• | future announcements concerning our business, our clients’ businesses or our competitors’ businesses; |
• | the public’s reaction to our press releases, other public announcements and filings with the SEC; |
• | the market’s reaction to our reduced disclosure and other requirements as a result of being an “emerging growth company” under the Jumpstart Our Business Startups Act (the “ JOBS Act |
• | the size of our public float; |
• | coverage by or changes in financial estimates by securities analysts or failure to meet their expectations; |
• | market and industry perception of our success, or lack thereof, in pursuing our growth strategy; |
• | strategic actions by us or our competitors, such as acquisitions or restructurings; |
• | changes in laws or regulations which adversely affect our industry or us; |
• | privacy and data protection laws, privacy or data breaches, or the loss of data; |
• | changes in accounting standards, policies, guidance, interpretations or principles; |
• | changes in senior management or key personnel; |
• | the restatement of our financial statements; |
• | issuances, exchanges or sales, or expected issuances, exchanges or sales of our capital stock; |
• | changes in our dividend policy; |
• | adverse resolution of new or pending litigation against us; and |
• | changes in general market, economic and political conditions in the United States and global economies or financial markets, including those resulting from natural disasters, terrorist attacks, acts of war and responses to such events. |
• | a limited availability of market quotations for our securities; |
• | a determination that the Common Stock is a “penny stock” which will require brokers trading in its common stock to adhere to more stringent rules, possibly resulting in a reduced level of trading activity in the secondary trading market for the common stock; |
• | a limited amount of analyst coverage; and |
• | a decreased ability to issue additional securities or obtain additional financing in the future. |
• | a staggered board, which means that our board of directors is classified into three classes of directors with staggered three-year terms and directors will only be able to be removed from office for cause; |
• | limitations on convening special stockholder meetings, which could make it difficult for our stockholders to adopt desired governance changes; |
• | a prohibition on stockholder action by written consent, which means that our stockholders will only be able to take action at a meeting of stockholders and will not be able to take action by written consent for any matter; |
• | a forum selection clause, which means certain litigation against us can only be brought in Delaware; |
• | the authorization of undesignated preferred stock, the terms of which may be established and shares of which may be issued without further action by our stockholders; and |
• | advance notice procedures, which apply for stockholders to nominate candidates for election as directors or to bring matters before an annual meeting of stockholders. |
Legacy Fast Radius (Historical) |
ENNV (Historical) |
Pro Forma Adjustments |
Pro Forma Combined |
|||||||||||||||||
ASSETS |
||||||||||||||||||||
Current Assets: |
||||||||||||||||||||
Cash and cash equivalents |
$ | 8,702 | $ | 82 | $ | 1,250 | A | $ | 103,791 | |||||||||||
345,034 | F | |||||||||||||||||||
75,000 | G | |||||||||||||||||||
(8,336 | ) | H | ||||||||||||||||||
(2,000 | ) | M | ||||||||||||||||||
(500 | ) | O | ||||||||||||||||||
(315,441 | ) | P | ||||||||||||||||||
Accounts receivable, net of allowances for doubtful accounts of $930 |
7,015 | — | — | 7,015 | ||||||||||||||||
Inventories |
449 | — | — | 449 | ||||||||||||||||
Prepaid production costs |
987 | — | — | 987 | ||||||||||||||||
Prepaid expenses and other current assets |
4,422 | 728 | (3,605 | ) | H | 1,545 | ||||||||||||||
Income taxes receivable |
— | — | — | — | ||||||||||||||||
|
|
|
|
|
|
|
|
|||||||||||||
Total current assets |
21,575 | 810 | 91,402 | 113,787 | ||||||||||||||||
|
|
|
|
|
|
|
|
|||||||||||||
Non-current assets: |
||||||||||||||||||||
Marketable securities held in Trust Account |
— | 345,034 | (345,034 | ) | F | — | ||||||||||||||
Property and equipment, net |
9,528 | — | — | 9,528 | ||||||||||||||||
Other non-current assets |
535 | 77 | — | 612 | ||||||||||||||||
|
|
|
|
|
|
|
|
|||||||||||||
Total non-current assets |
10,063 | 345,111 | (345,034 | ) | 10,140 | |||||||||||||||
|
|
|
|
|
|
|
|
|||||||||||||
TOTAL ASSETS |
$ | 31,638 | $ | 345,921 | $ | (253,632 | ) | $ | 123,927 | |||||||||||
|
|
|
|
|
|
|
|
|||||||||||||
LIABILITIES, TEMPORARY EQUITY, AND STOCKHOLDERS’ EQUITY (DEFICIT) |
||||||||||||||||||||
Accounts payable |
3,987 | 81 | 8,051 | H | 12,119 | |||||||||||||||
Accrued compensation |
3,097 | — | 3,550 | E | 6,647 | |||||||||||||||
Accrued and other liabilities |
11,610 | 3,409 | (9,314 | ) | H | 5,417 | ||||||||||||||
(467 | ) | N | ||||||||||||||||||
179 | Q | |||||||||||||||||||
Franchise tax payable |
— | 179 | (179 | ) | Q | — | ||||||||||||||
Advances to customers |
258 | — | — | 258 | ||||||||||||||||
Payables to related party |
2,513 | 500 | (500 | ) | O | 2,513 | ||||||||||||||
Warrant liability |
2,968 | — | (2,968 | ) | B | — | ||||||||||||||
Current portion of term loan |
13,266 | — | (2,000 | ) | M | 11,266 | ||||||||||||||
|
|
|
|
|
|
|
|
|||||||||||||
Total current liabilities |
37,699 | 4,169 | (3,648 | ) | 38,220 | |||||||||||||||
|
|
|
|
|
|
|
|
|||||||||||||
Non-current liabilities: |
||||||||||||||||||||
Warrant liability |
— | 10,498 | 444 | A | 10,942 | |||||||||||||||
Forward purchase agreement |
— | 175 | (175 | ) | A | — | ||||||||||||||
Term loans – net of current portion and debt issuance costs |
16,776 | — | — | 16,776 | ||||||||||||||||
Related party convertible notes and derivative liabilities |
16,857 | — | (16,857 | ) | N | — | ||||||||||||||
Deferred underwriting fee payable |
— | 12,075 | (7,046 | ) | R | 5,029 | ||||||||||||||
Other long-term liabilities |
396 | — | — | 396 | ||||||||||||||||
|
|
|
|
|
|
|
|
|||||||||||||
Total non-current liabilities |
34,029 | 22,748 | (23,634 | ) | 33,143 | |||||||||||||||
|
|
|
|
|
|
|
|
|||||||||||||
TOTAL LIABILITIES |
71,728 | 26,917 | (27,282 | ) | 71,363 | |||||||||||||||
|
|
|
|
|
|
|
|
Legacy Fast Radius (Historical) |
ENNV (Historical) |
Pro Forma Adjustments |
Pro Forma Combined |
|||||||||||||||||
COMMITMENTS AND CONTINGENCIES |
||||||||||||||||||||
Temporary equity: |
||||||||||||||||||||
Class A common stock, $0.0001 par value, subject to possible redemption; 34,500,000 shares at redemption value |
— | 345,000 | (345,000 | ) | I | — | ||||||||||||||
Series Seed Preferred stock |
1,893 | — | (1,893 | ) | J | — | ||||||||||||||
Series Seed - 1 Preferred stock |
2,892 | — | (2,892 | ) | J | — | ||||||||||||||
Series A - 1 Preferred stock |
5,714 | — | (5,714 | ) | J | — | ||||||||||||||
Series A - 2 Preferred stock |
2,779 | — | (2,779 | ) | J | — | ||||||||||||||
Series A - 3 Preferred stock |
4,286 | — | (4,286 | ) | J | — | ||||||||||||||
Series B Preferred stock |
56,726 | — | (56,726 | ) | J | — | ||||||||||||||
|
|
|
|
|
|
|
|
|||||||||||||
Total Temporary equity |
74,290 | 345,000 | (419,290 | ) | — | |||||||||||||||
Stockholders’ equity (deficit): |
||||||||||||||||||||
Preferred stock |
— | — | — | — | ||||||||||||||||
Class A common stock |
— | — | — | A | 2 | |||||||||||||||
— | B | |||||||||||||||||||
1 | C | |||||||||||||||||||
— | D | |||||||||||||||||||
1 | G | |||||||||||||||||||
1 | J | |||||||||||||||||||
1 | L | |||||||||||||||||||
1 | N | |||||||||||||||||||
(3 | ) | P | ||||||||||||||||||
Class B common stock |
— | 1 | (1 | ) | L | — | ||||||||||||||
Treasury Stock |
(221 | ) | — | — | (221 | ) | ||||||||||||||
Additional paid-in capital |
9,113 | — | 1,250 | A | 201,145 | |||||||||||||||
6,151 | C | |||||||||||||||||||
2,968 | B | |||||||||||||||||||
13,282 | D | |||||||||||||||||||
74,999 | G | |||||||||||||||||||
(8,841 | ) | H | ||||||||||||||||||
345,000 | I | |||||||||||||||||||
74,289 | J | |||||||||||||||||||
(25,997 | ) | K | ||||||||||||||||||
17,323 | N | |||||||||||||||||||
(315,438 | ) | P | ||||||||||||||||||
7,046 | R | |||||||||||||||||||
Retained earnings (deficit) |
(123,272 | ) | (25,997 | ) | (6,152 | ) | C | (148,362 | ) | |||||||||||
(13,282 | ) | D | ||||||||||||||||||
(269 | ) | A | ||||||||||||||||||
(3,550 | ) | E | ||||||||||||||||||
(1,837 | ) | H | ||||||||||||||||||
25,997 | K | |||||||||||||||||||
|
|
|
|
|
|
|
|
|||||||||||||
Total stockholders’ equity (deficit) |
(114,380 | ) | (25,996 | ) | 192,940 | 52,564 | ||||||||||||||
|
|
|
|
|
|
|
|
|||||||||||||
TOTAL LIABILITIES, TEMPORARY EQUITY AND STOCKHOLDERS’ EQUITY (DEFICIT) |
$ | 31,638 | $ | 345,921 | $ | (253,632 | ) | $ | 123,927 | |||||||||||
|
|
|
|
|
|
|
|
Legacy Fast Radius (Historical) |
ENNV (Historical) |
Pro Forma Adjustments |
Pro Forma Combined |
|||||||||||||||||
Revenue |
$ | 20,012 | $ | — | $ | — | $ | 20,012 | ||||||||||||
Cost of Revenues |
20,300 | — | 26 | U | 20,326 | |||||||||||||||
|
|
|
|
|
|
|
|
|||||||||||||
Gross profit |
(288 | ) | — | (26 | ) | (314 | ) | |||||||||||||
|
|
|
|
|
|
|
|
|||||||||||||
Operating expenses: |
||||||||||||||||||||
Sales and marketing |
22,721 | — | — | 22,721 | ||||||||||||||||
General and administrative |
32,974 | 4,976 | 1,837 | S | 68,251 | |||||||||||||||
3,550 | T | |||||||||||||||||||
18,104 | U | |||||||||||||||||||
5,933 | V | |||||||||||||||||||
698 | W | |||||||||||||||||||
179 | AA | |||||||||||||||||||
Research and development |
5,036 | — | 52 | U | 5,088 | |||||||||||||||
Franchise tax expense |
— | 179 | (179 | ) | AA | — | ||||||||||||||
|
|
|
|
|
|
|
|
|||||||||||||
Total operating expenses |
60,731 | 5,155 | 30,174 | 96,060 | ||||||||||||||||
|
|
|
|
|
|
|
|
|||||||||||||
Loss from operations |
(61,019 | ) | (5,155 | ) | (30,200 | ) | (96,374 | ) | ||||||||||||
|
|
|
|
|
|
|
|
|||||||||||||
Other income (expenses): |
||||||||||||||||||||
Change in fair value of warrants |
(1,781 | ) | 11,741 | 1,781 | X | 11,741 | ||||||||||||||
Change in fair value of derivative liability |
(208 | ) | — | 208 | X | — | ||||||||||||||
Change in fair value of forward purchase agreement |
— | 1,333 | (1,333 | ) | Z | — | ||||||||||||||
Interest income and other income |
1 | — | 1 | |||||||||||||||||
Interest expense, including amortization of debt issuance costs |
(4,877 | ) | — | 1,750 | X | (3,127 | ) | |||||||||||||
Offering costs on Founder Shares issued to related party |
— | (1,250 | ) | — | (1,250 | ) | ||||||||||||||
Offering costs allocated to derivative warrant liabilities |
— | (751 | ) | — | (751 | ) | ||||||||||||||
Interest and dividends earned on marketable securities held in Trust Account |
— | 34 | (34 | ) | Y | — | ||||||||||||||
|
|
|
|
|
|
|
|
|||||||||||||
Total other income (expenses) |
(6,865 | ) | 11,107 | 2,372 | 6,614 | |||||||||||||||
|
|
|
|
|
|
|
|
|||||||||||||
Net income (loss) loss before income taxes |
(67,884 | ) | 5,952 | (27,828 | ) | (89,760 | ) | |||||||||||||
Provision for income taxes |
— | — | — | — | ||||||||||||||||
|
|
|
|
|
|
|
|
|||||||||||||
Net income (loss) |
$ | (67,884 | ) | $ | 5,952 | $ | (27,828 | ) | $ | (89,760 | ) | |||||||||
|
|
|
|
|
|
|
|
|||||||||||||
Fast Radius, Inc. (Historical) |
ENNV (Historical) |
Pro Forma Combined |
||||||||||||||||||
Weighted Common shares outstanding – Basic and Diluted |
4,139 | — | 73,843 | |||||||||||||||||
Net loss per share - Basic and Diluted |
$ | (16.40 | ) | — | $ | (1.22 | ) | |||||||||||||
Weighted shares outstanding of Class A redeemable common stock - Basic and Diluted |
— | 30,625 | — | |||||||||||||||||
Net income per share - Basic and Diluted, Class A |
$ | — | $ | 0.15 | $ | — | ||||||||||||||
Weighted shares outstanding of Class B non-redeemable common stock - Basic and Diluted |
— | 8,499 | — | |||||||||||||||||
Net income per share - Basic and Diluted, Class B |
$ | — | $ | 0.15 | $ | — |
(shares in thousands) |
Post Redemptions (Shares) |
% |
||||||
Fast Radius Shareholders (1) |
65,000 | 77.2 | % | |||||
|
|
|||||||
Total Fast Radius Merger Shares |
65,000 | 77.2 | % | |||||
|
|
|||||||
ENNV Public Shares (2) |
2,987 | 3.5 | % | |||||
ENNV Founder Shares (3)(4) |
8,280 | 9.8 | % | |||||
|
|
|||||||
Total ENNV Shares |
11,267 | 13.3 | % | |||||
|
|
|||||||
PIPE Investors and GSAM (5) |
7,970 | 9.5 | % | |||||
|
|
|||||||
Pro Forma Shares of Common Stock |
84,237 | 100 | % | |||||
|
|
(1) | Excludes the Merger Earn Out Shares and includes 9,580,413 shares reserved for issuance in respect of or otherwise relating to Exchanged Options, Exchanged Restricted Stock Awards and Exchanged RSUs. The Merger Earn Out Shares are equity-classified and will be issued upon the satisfaction of certain price targets set forth in the Merger Agreement during the Earn Out Period. See “The Merger Agreement—Merger Consideration.” |
(2) | Includes the 2,375,000 shares purchased by GSAM pursuant to the forward purchase agreement side letter. |
(3) | Includes the Sponsor Earn Out Shares. The Sponsor Earn Out Shares are equity-classified and will be treated as an adjustment to additional paid-in-capital See “The Merger Agreement—Merger Consideration.” |
(4) | Includes 140,000 shares of Common Stock held by former ENNV directors and officers. |
(5) | Includes (a) 1,000,000 shares of Common Stock acquired by the Sponsor, in its capacity as a PIPE Investor, upon consummation of the PIPE Investment, (b) 6,500,000 shares of Common Stock acquired by the other PIPE Investors, upon consummation of the PIPE Investment, (c) 125,000 shares of Common Stock acquired by GSAM pursuant to the Forward Purchase Agreement and (d) 345,000 shares of Common Stock acquired by GSAM upon conversion of Founder Shares received in connection with GSAM’s entry into the Forward Purchase Agreement in connection with ENNV’s initial public offering. |
• | the (i) historical audited financial statements of Legacy Fast Radius as of and for the year ended December 31, 2021, and (ii) historical audited financial statements of ENNV as of and for the year ended December 31, 2021, and the related notes, in each case, included elsewhere in this prospectus; and |
• | the disclosures and discussion in “ Item 7. Management’s Discussion and Analysis of Financial Condition and Results of Operations Fast Radius’ Management’s Discussion and Analysis of Financial Condition and Results of Operations |
(A) | Represents ENNV’s issuance of $1.3 million in Forward Purchase Units. $0.2 million represents the reduction of the Forward Purchase liability, and $0.4 million represents the issuance of GSAM warrants. |
(B) | Represents the exercise of Legacy Fast Radius warrants concurrent with the Closing Date. |
(C) | Represents the distribution of Common Stock to Legacy Fast Radius equity holders related to the equity-classified Merger Earn Out Shares. Because the Business Combination is accounted for as a reverse recapitalization, the issuance of the Merger Earn Out Shares has been treated as a deemed dividend and recorded as a reclassification within equity between additional paid-in capital and accumulated deficit. |
(D) | Represents additional compensation expense related to vesting of the RSUs and accelerated vesting of Options at Close. |
(E) | Represents the accrual of transaction bonuses to certain founders and employees of Legacy Fast Radius upon consummation of the Business Combination. |
(F) | Reflects the reclassification of $345.0 million of marketable securities held in the Trust Account at the balance sheet date that became available to fund the operations of the Company, prior to the cash paid for final redemptions. |
(G) | Represents the net proceeds from the private placement of 7,500,000 shares of Common Stock at $10.00 per share, or an aggregate of approximately $75.0 million, pursuant to the PIPE Investment. |
(H) | Represents additional transaction costs of $1.8 million that were incurred subsequent to December 31, 2021 and equity issuance costs of $8.8 million that were treated as a reduction to additional paid-in capital. Certain of the transaction and equity issuance costs were incurred prior to December 31, 2021 and were recognized within prepaid expenses and other current assets and accrued and other liabilities in the Legacy Fast Radius or ENNV historical balance sheets as of December 31, 2021 and have been derecognized in the unaudited pro forma condensed combined balance sheet as of December 31, 2021. Additionally, certain transaction and equity issuance costs were not paid in cash at the Closing of the Business Combination and have been recognized as accounts payable in the unaudited pro forma condensed combined balance sheet as of December 31, 2021. Those transaction and equity issuance |
costs exclude $21.0 million in other cash payments that were disbursed at the Closing of the Business Combination and are not reflected in the unaudited condensed combined financial information as they were not directly related to the Business Combination. Those cash disbursements included $8.2 million in D&O insurance premiums and $12.8 million related to IT and other costs. |
(I) | Represents ENNV’s reclassification of shares of ENNV Class A Common Stock converted to permanent equity in conjunction with the Business Combination. |
(J) | Represents the recapitalization of Legacy Fast Radius’ equity and issuance of shares of the Company’s common stock to Legacy Fast Radius equity holders as consideration for the reverse recapitalization. |
(K) | Reflects the reclassification of ENNV’s historical accumulated deficit to additional paid-in-capital |
(L) | Represents ENNV’s reclassification of shares of ENNV Class B common stock converted to permanent equity in conjunction with the Business Combination |
(M) | Represents the amendment to the 2021 SVB Loan on February 4, 2022 which extended the maturity date from February 4, 2022 to April 3, 2023 and required payment of $2.0 million of the $20.0 million outstanding principal balance in conjunction with the Closing. |
(N) | Represents the conversion of outstanding Legacy Fast Radius convertible notes into 989,539 shares of Legacy Fast Radius common stock (2,034,513 shares in the Company) at Close. The Legacy Fast Radius convertible notes contained a mandatory conversion feature that caused conversion of the outstanding principal and interest amounts of the Legacy Fast Radius convertible notes at a price of 90% (for the convertible notes issued to ECP and Drive Capital) or 80% (for the convertible notes issued to Energize Ventures) of the lowest price of a qualified equity financing. |
(O) | Represents the repayment of the ECP working capital loan at Close. |
(P) | Reflects the redemption of 31,512,573 shares for aggregate redemption payments of $315.4 million allocated to ENNV Class A common stock and additional paid-in capital using par value of $0.0001 per share and at a redemption price of $10.01 per share. |
(Q) | Reflects the reclassification of ENNV’s historical franchise tax payable balance to accrued and other liabilities to conform with the presentation that will be used following the Business Combination. |
(R) | Represents a $7.0 million reduction in ENNV deferred underwriting fees and other accrued offering costs upon negotiations after December 31, 2021. |
(S) | Reflects actual transaction costs not yet incurred as of December 31, 2021 but were incurred prior to Closing. |
(T) | Reflects expenses for the bonuses to the founders and other key employees of Legacy Fast Radius that were contingent upon Closing. |
(U) | Reflects the adjustment to stock-based compensation expense for 1,121,637 outstanding employee RSUs (2,623,797 shares in the Company) and 25,306 options (59,196 shares in the Company) granted to consultants at Closing. Of the RSUs that vested, 597,430 (1,397,542 shares in the Company) vested at Close, while the remaining 524,207 RSUs (1,226,255 shares in the Company) are standard employee RSUs which vest over four years that already met a time vesting condition in addition to the Business Combination performance condition now being satisfied at Close. The consultant options immediately vested at Close. The expense was based on the fair value of the RSUs and options at the date of grant. |
(V) | Reflects the adjustment to stock-based compensation expense for the Closing RSU Award granted at Close. This adjustment reflects the vesting of 1,130,414 shares in the Company during the period. Refer to Note 6 - Closing RSU Award for further information. |
(W) | Reflects the acceleration of unrecognized ENNV director compensation associated with the Founder Shares transferred. |
(X) | Reflects the reversal of the change in fair value of Fast Radius’ derivative liability and interest expense and warrant expense, which relate to the convertible notes and warrants that were converted into shares of Fast Radius common stock concurrent with the Closing. |
(Y) | Reflects the elimination of ENNV’s historical interest and dividend income earned on ENNV’s Trust Account. |
(Z) | Reflects the settlement of ENNV’s forward purchase agreement. |
(AA) | Reflects the reclassification of ENNV’s historical franchise tax expense to general and administrative expense to conform with the presentation that will be used following the Business Combination. |
(in thousands, except per share amounts) |
For the Year ended December 31, 2021 |
|||
Pro forma net loss |
$ | (89,760 | ) | |
Weighted average shares outstanding of common stock |
73,843 | |||
Net loss per share (Basic and Diluted) attributable to common stockholders |
$ | (1.22 | ) |
Closing RSU Award |
||||
Expected stock price |
$ | 7.63 | ||
Expected volatility |
67.2 | % | ||
Expected term (in years) |
10.0 | |||
Risk-free rate |
1.92 | % | ||
Discount for lack of marketability (“DLOM”) |
14.8 | % |
For the Year Ended December 31, |
||||||||||||||||
(Dollars in thousands) |
2021 |
2020 |
Change ($) |
Change (%) |
||||||||||||
Revenues |
20,012 | 13,966 | 6,046 | 43 | % | |||||||||||
Cost of revenues (1) |
20,300 | 12,039 | 8,261 | 69 | % | |||||||||||
|
|
|
|
|
|
|
|
|||||||||
Gross Profit |
(288 |
) |
1,927 |
(2,215 |
) |
-115 |
% | |||||||||
Operating expenses |
||||||||||||||||
Sales and marketing (1) |
22,721 | 8,328 | 14,393 | 173 | % | |||||||||||
General and administrative (1) |
32,974 | 12,044 | 20,930 | 174 | % | |||||||||||
Research and development (1) |
5,036 | 2,959 | 2,077 | 70 | % | |||||||||||
|
|
|
|
|
|
|
|
|||||||||
Total operating expenses |
60,731 |
23,331 |
37,400 |
160 |
% | |||||||||||
Loss from Operations |
(61,019 |
) |
(21,404 |
) |
(39,615 |
) |
-185 |
% | ||||||||
Change in fair value of warrants |
(1,781 | ) | (80 | ) | (1,701 | ) | N.M. | |||||||||
Change in fair value of derivatives |
(208 | ) | — | (208 | ) | N.M. | ||||||||||
Interest income and other income |
1 | 121 | (120 | ) | N.M. | |||||||||||
Interest expense, including amortization of debt issuance costs |
(4,877 | ) | (308 | ) | (4,569 | ) | 1,483 | % | ||||||||
|
|
|
|
|
|
|
|
|||||||||
Loss before income taxes |
(67,884 |
) |
(21,671 |
) |
(46,213 |
) |
213 |
% | ||||||||
Provision for income taxes |
— | — | — | N.M. | ||||||||||||
|
|
|
|
|
|
|
|
|||||||||
Net Loss |
(67,884 |
) |
(21,671 |
) |
(46,213 |
) |
213 |
% |
(1) | Includes stock-based compensation, as follows: |
Cost of Revenues |
$ | 13 | $ | 14 | (1 | ) | -7 | % | ||||||||
General and Administrative |
680 | 826 | (146 | ) | -18 | % | ||||||||||
Selling and Marketing |
80 | 105 | (25 | ) | -24 | % | ||||||||||
Research & Development |
82 | 47 | 35 | 74 | % | |||||||||||
|
|
|
|
|
|
|
|
|||||||||
Total |
855 |
992 |
(137 |
) |
-14 |
% | ||||||||||
|
|
|
|
|
|
|
|
• | although depreciation and amortization are non-cash charges, the assets being depreciated and amortized may have to be replaced in the future, and Adjusted EBITDA does not reflect cash used for capital expenditures for such replacements or for new capital expenditures; |
• | Adjusted EBITDA does not include the dilution that results from stock-based compensation or any cash outflows included in stock-based compensation, including from our purchases of shares of outstanding common stock; |
• | Adjusted EBITDA does not reflect tax payments that may represent a reduction in cash available to us; and other companies may calculate Adjusted EBITDA differently, which reduces its usefulness as a comparative measure. |
For the Year Ended, December 31 |
||||||||
(Dollars in thousands) |
2021 |
2020 |
||||||
Net loss |
$ | (67,884 | ) | $ | (21,671 | ) | ||
Interest expense |
4,877 | 308 | ||||||
Income tax expense (benefit), net |
— | — | ||||||
Depreciation and amortization |
1,653 | 842 | ||||||
|
|
|
|
|||||
EBITDA |
(61,354 |
) |
(20,521 |
) | ||||
Stock compensation expense |
855 | 992 | ||||||
Change in fair value of warrant liability |
1,781 | 80 | ||||||
Change in fair value of derivative liabilities |
208 | — | ||||||
Transaction and related costs |
5,194 | — | ||||||
|
|
|
|
|||||
Adjusted EBITDA |
(53,316 |
) |
(19,449 |
) | ||||
|
|
|
|
For the Year Ended, December 31 |
||||||||
(Dollars in thousands) |
2021 |
2020 |
||||||
Net cash used in operating activities |
$ |
(48,771 |
) |
$ |
(20,904 |
) | ||
Net cash used in investing activities |
(8,622 |
) |
(712 |
) | ||||
Net cash provided by financing activities |
47,601 |
5,294 |
||||||
|
|
|
|
|||||
Net decrease in cash |
$ |
(9,792 |
) |
$ |
(16,322 |
) | ||
|
|
|
|
• |
Material changes in milestones established by the entity |
• |
Material changes in management’s forecast |
• |
Material changes in strategic relationships with major suppliers or customers |
• |
Material changes in enterprise cost structure and financial condition |
• |
Material change in the state of the industry and economy |
• |
Material changes in competence of management team |
• |
Material changes in workforce and workforce skills |
• |
Material changes in existing proprietary technology, products, or services |
• |
Material third-party arm’s-length transactions in the entity’s equity |
• |
Material changes in valuation assumptions used in the last valuation |
Valuation Date |
Common Stock Per Share Value |
Valuation Model |
Enterprise Value of Company (Private) |
Enterprise Value of Company (SPAC) |
SPAC Likelihood |
Enterprise Value of Company (Weighted Average) |
||||||||||||||||||
March 31, 2019 |
$ | 1.77 | OPM | — | — | — | $ | 105,227,000 | ||||||||||||||||
March 31, 2020 |
$ | 1.97 | OPM | — | — | — | $ | 123,389,000 | ||||||||||||||||
December 31, 2020 |
$ | 4.11 | PWERM | $ | 128,300,000 | $ | 809,322,034 | 10 | % | $ | 196,402,203 | |||||||||||||
February 14, 2021 |
$ | 16.53 | PWERM | $ | 405,100,000 | $ | 1,000,390,383 | 40 | % | $ | 643,216,153 | |||||||||||||
May 17, 2021 |
$ | 21.21 | PWERM | $ | 498,000,000 | $ | 951,000,000 | 65 | % | $ | 792,450,000 | |||||||||||||
September 7, 2021 |
$ | 25.77 | PWERM | $ | 578,000,000 | $ | 973,000,000 | 85 | % | $ | 913,750,000 | |||||||||||||
December 31, 2021 |
$ | 28.05 | PWERM | $ | 586,000,000 | $ | 970,000,000 | 95 | % | $ | 950,800,000 |
• | Design: |
• | Make: front-end user experience to facilitate the ordering and procurement process for industrial-grade parts. Users also have access to a set of features that shows exactly where their part is in the production process, enhancing visibility into production and order status. |
• | Move: |
1 |
Our Net Promoter Score is a three-month rolling average of our NPS score derived through regular online surveys we send to customers after parts have been shipped to and/or received by the customer. |
2 |
NPS is a score that measures the likelihood of users to recommend a company’s products or services to others, and ranges from a low of negative 100 to high of positive 100, and benchmark scores can vary significantly by industry. A score greater than zero represents a company having more promoters than detractors. Industry average NPS is based on survey data from Clearly Rated: https://www.clearlyrated.com/solutions/2021-nps-benchmarks-for-b2b-service-industries/. |
• | Expertise gap in Industry 4.0: |
• | Consumerization of B2B: On-demand fulfillment is now expected by customers and new, digital-driven ways of working have been accelerated by the COVID-19 pandemic. |
• | More agile and sustainable supply chains: |
• | Instead of centralized mega-factories, Fast Radius will be building localized microfactories, enabling a more distributed manufacturing footprint which allows for products be produced closer to the point of consumption. |
• | Instead of slow-moving, carbon intensive supply chains, Fast Radius will allow customers to move parts “at the speed of light” by shipping digital part files across the internet and producing them in a local micro-factory. |
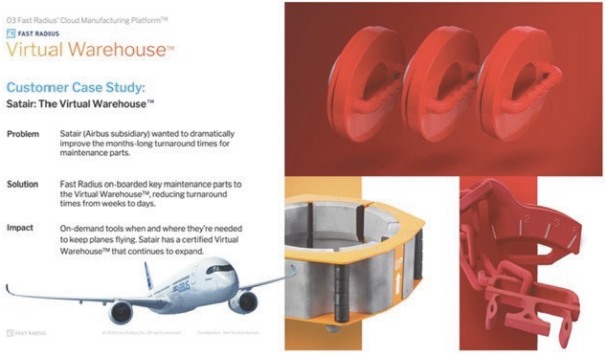
• | Instead of physical inventory, the Fast Radius Virtual Warehouse enables a new paradigm of digital inventory where part designs and manufacturing instructions are stored in the Virtual Warehouse and will be produced on-demand when and where they are needed. |
• | Instead of sub-scale operators struggling to embrace Industry 4.0 innovations, the Fast Radius Cloud Manufacturing Platform embraces the new tools of Industry 4.0 to enable a modern, software-driven end-to-end |
3 |
Census Bureau, 2017 Statistics of U.S. Businesses Annual Data Tables by Establishment Industry: https://www.census.gov/data/tables/2017/econ/susb/2017-susb-annual.html; U.S. Census Bureau, 2017 County Business Patterns and Economic Census: https://www2.census.gov/programs-surveys/susb/tables/2017/us_state_naics_detailedsizes_2017.xlsx. |
• | Infrastructure: |
• | Digital Thread and Learning Engine: |
• | Operating System: end-to-end |
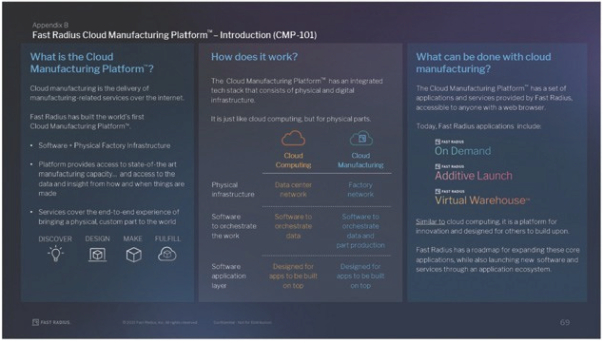
• | Applications & Services: On-Demand, (2) Fast Radius Additive Launch, and (3) Fast Radius Virtual Warehouse. |
• | Fast Radius On-Demand: on-demand parts. The On-Demand application is built for production, not just prototyping, allowing customers to scale to high-volume production on the platform. |
• | Fast Radius Additive Launch: |
• | Fast Radius Virtual Warehouse: |
• | Existing customer expansion |
• | New customer acquisition |
• | Manufacturing capability expansion |
• | Geographic expansion |
• | Continued development of our apps and services ecosystem |
• | Opportunistic acquisitions to accelerate capability and geographic expansion |
• | Digital Marketing. on-board them to our Cloud Manufacturing Platform. |
• | Inside Sales. |
• | Business Development. |
• | Access. |
• | Speed. |
• | Elasticity. scale-up with their demand. The platform can produce a few parts or a few thousand parts, with carbon-friendly digital warehouses, rather than wasteful physical storage, and on-demand human expertise when customers need it, rather than constant hiring. |
• | Knowledge. |
• | Global Reach. |
• | Cost Advantage. |
• | Reduced Transportation Emissions. on-demand microfactory model enables on-shore production, cutting off significant amounts of transportation emissions. |
• | Reduced Energy Consumption. on-demand part production enables reduction in inventory and cuts the emissions generated by the warehousing. |
• | Reduced Material Waste. |
• | Proprietary technology. |
• | Operations advantage. end-to-end |
• | Systems integration and scale advantage. |
• | Network effects. |
• | High switching costs. |
• | Software applications that provide our customers with a modern software experience and the ability to access our cloud manufacturing infrastructure; |
• | Data science and engineering that gathers data across our operations and connects our factories and supply chain in order to drive highly informed data driven decisions and operations; |
• | Data analysis and machine learning technologies that analyze manufacturing data and information to optimize our factory operations and provide customers with insights and expertise; |
• | Factory technologies including factory software and automation, metrology and quality systems, and computer vision; |
• | Digital design, including software tools that streamline and optimize design of mechanical components; and |
• | Integration with other third-party software and computing infrastructure which can further expand the capabilities of the cloud platform (for example, connectivity with data science and engineering software tools). |
• | Competitive Pay and Benefits |
• | Health and Safety COVID-19 pandemic and related mitigation measures, we implemented changes in our business in 2020 in an effort to better protect our employees and customers, and to support appropriate health and safety protocols. For example, we implemented extensive cleaning and sanitation processes for both production and office administration spaces and implemented broad work-from-home initiatives for employees in our administrative functions. While our essential workers (manufacturing employees) have continued to work at our facilities and provide services to our customers, most employees in our administrative functions have effectively worked remotely since March 2020. We continually evaluate our COVID-19 safety protocols and will adjust our remote work and other policies over time. |
• | Recruitment, Training and Development instructor-led and on-the-job |
Location | ~Size (sq. ft.) |
Lease Expiration |
Purpose | |||
Chicago, IL (Main) | 17,500 | Month-to-Month | Headquarters, Innovation Center, and Microfactories | |||
Chicago, IL | 50,000 | February 2026 | Microfactories | |||
Chicago, IL | 30,000 | August 2023 | Sales & Operations | |||
Louisville, KY | 3,000 | December 2022 | Microfactory located on UPS’s Worldport facility | |||
Atlanta, GA | 2,000 | February 2023 | Sales & Operations | |||
Singapore | 500 | May 2022 | Operations |
• | Our platform was designed from the beginning to support production at scale up to 100,000 units. We also serve companies in the prototyping and end-of-life |
• | Our Cloud Manufacturing Platform is designed for applications and services to be built on top of it. Some competitors offer on-demand manufacturing, but our platform offers a growing suite of applications, including Fast Radius On-Demand, Fast Radius Additive Launch, and Fast Radius Virtual Warehouse. We and third-party developers plan to continue expanding this library of software applications and manufacturing services, creating a unique ecosystem built on a foundation of proprietary data. |
• | Our Cloud Manufacturing Platform includes applications that leverage data collected from our factories. These applications provide users with feedback and information about how to design their parts and configure their orders for best results and lowest cost. We believe most competitors cannot capture the same level of data fidelity since they do not manufacture the parts themselves (e.g., digital brokerages) or they do not have the Industry 4.0 factory infrastructure (e.g. sub-scale, fragmented machine shops). |
• | Our Cloud Manufacturing Platform provides an end-to-end |
• | The Fast Radius platform covers the entire product lifecycle, allowing users to monitor where these parts are during production and fulfillment. |
• | We operate our factories using our own manufacturing execution software, which allows us to monitor and control factory operations in real time. |
• | We have a quality system for internal production that is very capable and that can satisfy customer requirements across multiple industries. The quality system for our suppliers is rigorous and scalable. |
Name |
Age* |
Position | ||||
Executive Officers |
||||||
Lou Rassey |
48 | Chief Executive Officer, Chairperson & Director | ||||
Prithvi Gandhi |
52 | Chief Financial Officer | ||||
Pat McCusker |
44 | Chief Operating Officer | ||||
Non-Employee Directors |
||||||
Matthew Flanigan (1)(3) |
60 | Director | ||||
Steven Koch (1) |
66 | Director | ||||
Matthew Maloney (2)(3) |
46 | Director | ||||
Tyler Reeder |
48 | Director | ||||
Nick Solaro (2) |
40 | Director | ||||
Betsy Ziegler (1)(2)(3) |
50 | Director |
* | As of March 31, 2022. |
(1) | Member of the Audit Committee |
(2) | Member of the Compensation Committee |
(3) | Member of the Nominating and Corporate Governance Committee |
• | Class I directors are Tyler Reeder and Nick Solaro, whose terms of office will expire at our annual meeting of stockholders to be held in 2023; |
• | Class II directors are Matthew Maloney and Betsy Ziegler, whose terms of office will expire at our annual meeting of stockholders to be held in 2024; and |
• | Class III directors are Lou Rassey, Matthew Flanigan and Steven Koch, whose terms of office will expire at our annual meeting of stockholders to be held in 2025. |
• | appointing, compensating, retaining, evaluating, terminating and overseeing the Company’s independent registered public accounting firm; |
• | discussing with the independent registered public accounting firm of the Company its independence from management; |
• | reviewing, with the independent registered public accounting firm of the Company the scope and results of their audit; |
• | approving all audit and permissible non-audit services to be performed by the independent registered public accounting firm of the Company; |
• | overseeing the financial reporting process and discussing with management and the independent registered public accounting firm of the Company the quarterly and annual financial statements that the Company files with the SEC; |
• | overseeing the Company’s financial and accounting controls and compliance with legal and regulatory requirements; |
• | reviewing the Company’s policies on risk assessment and risk management; |
• | reviewing related person transactions; and |
• | establishing procedures for the confidential anonymous submission of concerns regarding questionable accounting, internal controls or auditing matters. |
• | reviewing and approving the corporate goals and objectives, evaluating the performance of and reviewing and approving (either alone or, if directed by our board of directors, in conjunction with a majority of the independent members of our board of directors), the compensation of the Chief Executive Officer of the Company; |
• | overseeing an evaluation of the performance of and reviewing and setting or making recommendations to our board of directors regarding the compensation of the other executive officers of our board of directors; |
• | reviewing and approving or making recommendations to our board of directors regarding the incentive compensation and equity-based plans, policies and programs of our board of directors; |
• | reviewing and approving all employment agreement and severance arrangements for the executive officers of the Company; |
• | making recommendations to our board of directors regarding the compensation of the members of our board of directors; and |
• | retaining and overseeing. |
• | identifying individuals qualified to become members of the Company’s board of directors, consistent with criteria approved by the Company’s board of directors; |
• | overseeing succession planning for the Chief Executive Officer and other executive officers of the Company; |
• | periodically reviewing the Company board of directors’ leadership structure and recommending any proposed changes to the Company’s board of directors; |
• | overseeing an annual evaluation of the effectiveness of the Company’s board of directors and its committees; and |
• | developing and recommending to the Company’s board of directors a set of corporate governance guidelines. |
• | Lou Rassey, Chief Executive Officer |
• | Patrick McCusker, Chief Operating Officer |
• | John Nanry, Chief Manufacturing Officer |
Name and principal position |
Year |
Salary ($) |
Non-Equity Incentive Compensation ($) (2) |
Equity Awards ($) (3) |
All other compensation ($) (4) |
Total ($) |
||||||||||||||||||
Lou Rassey |
2021 | $ | 441,800 | $ | 192,500 | $ | 9,875,006 | $ | 16,800 | $ | 10,526,106 | |||||||||||||
Chief Executive Officer |
||||||||||||||||||||||||
Patrick McCusker |
2021 | $ | 391,800 | $ | 192,500 | $ | 2,993,775 | $ | 16,800 | $ | 3,594,875 | |||||||||||||
Chief Operating Officer |
||||||||||||||||||||||||
John Nanry |
2021 | $ | 254,266 | $ | 105,000 | $ | 1,959,910 | $ | 12,600 | $ | 2,331,776 | |||||||||||||
Chief Manufacturing Officer |
(1) | Compensation amounts shown in the Summary Compensation Table for 2021 above reflect amounts paid to our named executive officers for 2021 and do not necessarily reflect amounts that are expected to be paid in 2022 and beyond. |
(2) | Bonus amounts payable to the named executive officers for fiscal year 2021 were earned at 70% of the 2021 target bonus amounts for the Company’s named executive officers (“Target Bonuses”), with 40% of the Target Bonuses being awarded in a cash payment and 30% of the Target Bonuses being awarded in the form of fully-vested restricted stock units which were automatically granted to the named executive officers on the date that the Company’s initial Registration Statement on Form S-8 was filed with the SEC on April 15, 2022. |
(3) | Represents the grant date fair value under FASB ASC Topic 718 of equity awards granted during 2021. |
(4) | Represents a subsidy for the employee portion of insurance premiums for health and welfare benefits. Our named executive officers also receive the $600 monthly subsidy received by all employees. |
Tranche |
# of RSUs Eligible to Vest |
Mult. of Offering Price |
Price Hurdle |
|||||||||
Baseline |
$ | 10.00 | ||||||||||
|
|
|||||||||||
1 |
10 | % | 1.5x | $ | 15.00 | |||||||
2 |
10 | % | 2.0x | $ | 20.00 | |||||||
3 |
10 | % | 2.5x | $ | 25.00 | |||||||
4 |
10 | % | 3.0x | $ | 30.00 | |||||||
5 |
10 | % | 3.5x | $ | 35.00 | |||||||
6 |
10 | % | 4.0x | $ | 40.00 | |||||||
7 |
10 | % | 5.0x | $ | 50.00 | |||||||
8 |
10 | % | 6.0x | $ | 60.00 | |||||||
9 |
10 | % | 7.0x | $ | 70.00 | |||||||
10 |
10 | % | 8.0x | $ | 80.00 |
• | The maximum potential purchase price per share payable for the Common Stock in the Change of Control (including any contingent consideration) which we refer to as the Change in Control Price will be used to determine whether any previously unmet Price Hurdle goal shall be deemed to have been fully or partially attained upon such Change in Control such that any additional portion of the Closing RSU Award will be eligible to vest upon such full or partial attainment of such Price Hurdle in connection with the Change in Control. |
• | If the Change in Control Price is not greater than all previously attained Price Hurdles, no additional portion of the Closing RSU Award will be eligible to vest in connection with the Change in Control and the then remaining unvested portion of the Closing RSU Award shall be cancelled and terminated upon the closing of such Change in Control and shall not thereafter be eligible to vest. |
• | If the Change in Control Price is greater than all previously attained Price Hurdles, a portion of the Closing RSU Award will be eligible vest contingent and upon closing of such Change of Control and the continued employment of Mr. Rassey through such Change of Control. Such additional portion of the Closing RSU Award eligible to vest in the Change in Control will be determined by reference to the Change in Control Price as compared to any previously unmet Price Hurdles. Partial attainment of a previously unmet Price Hurdle in connection with a Change in Control (as determined by reference to the Change in Control Price) will result in pro-rata partial vesting with respect to such 10% vesting installment using linear interpolation between the applicable Price Hurdle goals. Any portion of the Closing RSU Award which does not vest based on the level of attainment of the Price Hurdles as determined by reference to the Change in Control Price shall be cancelled and terminated at the closing of the Change of Control and shall not thereafter be eligible to vest. |
Option Awards |
Stock Awards |
|||||||||||||||||||||||||||||||
Name |
Grant Date |
Vesting Commencement Date |
Number of Securities Underlying Unexercised Options (#) Exercisable |
Number of Securities Underlying Unexercised Options (#) Unexercisable |
Option Exercise Price ($) |
Option Expiration Date |
Equity incentive plan awards: number of unearned shares, units or other rights that have not vested (#) |
Equity incentive plan awards: market or payout value of unearned shares, units or other rights that have not vested ($) (7) |
||||||||||||||||||||||||
Lou Rassey |
6/8/2018 | (1) |
6/11/2018 | — | — | — | — | 145,943 | $ | 0.21 | ||||||||||||||||||||||
5/20/2019 | (2) |
2/3/2020 | 30,272 | 83,247 | $ | 1.63 | 5/20/2029 | — | — | |||||||||||||||||||||||
5/20/2019 | (3) |
3/21/2019 | 343,395 | 310,691 | $ | 1.63 | 5/20/2029 | — | — | |||||||||||||||||||||||
5/16/2020 | (4) |
5/16/2020 | — | — | — | — | 10,418 | $ | 1.97 | |||||||||||||||||||||||
2/14/2021 | (5) |
2/1/2021 | — | — | — | — | 362,079 | $ | 16.53 | |||||||||||||||||||||||
2/14/2021 | (6) |
2/1/2021 | — | — | — | — | 235,351 | $ | 16.53 | |||||||||||||||||||||||
Patrick McCusker |
6/8/2018 | (1) |
6/11/2018 | — | — | — | — | 78,699 | $ | 0.21 | ||||||||||||||||||||||
5/20/2019 | (2) |
2/3/2020 | 9,255 | 25,451 | $ | 1.63 | 5/20/2029 | — | — | |||||||||||||||||||||||
5/20/2019 | (3) |
3/21/2019 | 104,986 | 94,987 | $ | 1.63 | 5/20/2029 | — | — | |||||||||||||||||||||||
5/16/2020 | (4) |
5/16/2020 | — | — | — | — | 9,192 | $ | 1.97 | |||||||||||||||||||||||
2/14/2021 | (5) |
2/1/2021 | — | — | — | — | 109,771 | $ | 16.53 | |||||||||||||||||||||||
2/14/2021 | (6) |
2/1/2021 | — | — | — | — | 71,350 | $ | 16.53 | |||||||||||||||||||||||
John Nanry |
6/8/2018 | (1) |
6/11/2018 | — | — | — | — | 17,263 | $ | 0.21 | ||||||||||||||||||||||
5/20/2019 | (2) |
2/3/2020 | 2,567 | 7,060 | $ | 1.63 | 5/20/2029 | — | — | |||||||||||||||||||||||
5/20/2019 | (3) |
3/21/2019 | 29,123 | 26,349 | $ | 1.63 | 5/20/2029 | — | — | |||||||||||||||||||||||
5/16/2020 | (4) |
5/16/2020 | — | — | — | — | 4,902 | $ | 1.97 | |||||||||||||||||||||||
2/14/2021 | (5) |
2/1/2021 | — | — | — | — | 71,863 | $ | 16.53 | |||||||||||||||||||||||
2/14/2021 | (6) |
2/1/2021 | — | — | — | — | 46,710 | $ | 16.53 |
(1) | Such shares were acquired through the early exercise of options which were granted on June 8, 2018 and are subject to repurchase at cost if the executive terminates employment before vesting. Such shares vest on a monthly basis until (a) 50% are fully vested in June 2023 and (b) 50% are fully vested in March 2024. |
(2) | Such option vested 10% on February 4, 2021, then 1/60th vests on a monthly basis thereafter through February 4, 2022, then 1/40th vests on a monthly basis thereafter through February 4, 2023, then 1/30th vests on a monthly basis thereafter until fully vested in February 2024. |
(3) | Such option vested 10% on March 21, 2020, then 1/60th vests on a monthly basis thereafter through March 21, 2021, then 1/40th vests on a monthly basis thereafter through March 21, 2022, then 1/30th vests on a monthly basis thereafter until fully vested in March 2023. |
(4) | Represents a grant of restricted shares of common stock that vested 25% on the first anniversary of the date of grant, then 1/48th vests on a monthly basis thereafter for three years. |
(5) | Represents a grant of restricted stock units which will vest upon the first to occur of (i) the consummation of an initial public offering and (ii) the consummation of a transaction with a special purpose acquisition company. |
(6) | Represents a grant of restricted stock units which will vest upon the first day following the lapse of the “ Lock-up PeriodLock-up Period means the first 180 days after the consummation of an initial public offering or transaction with a special purpose acquisition company. |
(7) | Represents the grant date fair value under FASB ASC Topic 718 of equity awards granted. |
• | we have been or are to be a participant; |
• | the amount involved exceeds or will exceed $120,000; and |
• | any of our directors, executive officers or beneficial holders of more than 5% of our capital stock, or any immediate family member of, or person sharing the household with, any of these individuals (other than tenants or employees), had or will have a direct or indirect material interest. |
Name |
Shares of Series B Preferred Stock |
Total Purchase Price |
||||||
United Parcel Service General Services Co. (1) |
2,609,438 | $ | 35,201,331.86 | |||||
Drive Capital Fund II, L.P. (2) |
391,538 | $ | 5,281,854.17 | |||||
Drive Capital Fund II (TE), L.P. (2) |
337,654 | $ | 4,554,955.51 | |||||
Drive Capital Ignition Fund II (2) |
12,097 | $ | 163,178.93 | |||||
JCDP-4 LLC(3) |
111,193 | $ | 1,499,993.57 | |||||
Skydeck Holdings II LLC (4) |
111,193 | $ | 1,499,993.57 | |||||
Energize Ventures Fund LP (5) |
444,773 | $ | 5,999,987.77 | |||||
|
|
|
|
|||||
Total |
4,017,886 |
$ |
54,201,295.38 |
|||||
|
|
|
|
(1) | Michael Culloty was a member of the Legacy Fast Radius board of directors and is affiliated with United Parcel Service General Services Co. (“ UPS |
(2) | Nick Solaro was a member of the Legacy Fast Radius board of directors and is affiliated with Drive Capital Fund II, L.P., Drive Capital Fund II (TE), L.P. and Drive Capital Ignition Fund II (collectively, “ Drive Capital |
(3) | On December 31, 2021, JCDP-4 LLC held more than 5% of Legacy Fast Radius’s outstanding capital stock. |
(4) | Michael Polsky was a member of the Legacy Fast Radius board of directors and is affiliated with Skydeck Holdings II LLC (“ Skydeck Energize |
(5) | On December 31, 2021, entities affiliated with Energize held more than 5% of Legacy Fast Radius’s outstanding capital stock. |
Name |
Aggregate Principal Amount |
|||
Energize Ventures Fund LP (1) |
$ | 1,000,000 | ||
Energize Growth Fund I LP (1) |
4,750,000 | |||
EV FR SPV LLC (1) |
1,750,000 | |||
|
|
|||
Total |
$ |
7,500,000 |
||
|
|
(1) | On December 31, 2021, entities affiliated with Energize held more than 5% of Legacy Fast Radius’s outstanding capital stock. |
Name |
Aggregate Principal Amount |
|||
Drive Capital Fund II, L.P. (1) |
$ | 1,584,570 | ||
Drive Capital Fund II (TE), L.P. (1) |
1,366,500 | |||
Drive Capital Ignition Fund II, L.P (1) |
48,930 | |||
Total |
$ |
3,000,000 |
||
|
|
(1) | On December 31, 2021, entities affiliated with Drive Capital held more than 5% of Fast Radius’s outstanding capital stock. |
• | In 2016, Legacy Fast Radius entered into a commercial agreement with UPS (as amended, the “ UPS Agreement on-demand manufacturing partner. In exchange for the services, Legacy Fast Radius agreed to compensate UPS in the form of equity royalties or a quarterly cash payment equal to six percent (6%) of Legacy Fast Radius’ gross revenues up to an aggregate cumulative maximum of approximately $7.6 million. Under the UPS Agreement, Legacy Fast Radius may not enter into any commercial agreement with certain competitors of UPS to the extent UPS offers similar competitive services of such competitors in a given country. |
• | Legacy Fast Radius entered into a warehouse rental agreement with UPS in January 2015. Fast Radius leases space in a warehouse in Louisville, Kentucky that is used for printing equipment, supplies, packages, and shipping space. Legacy Fast Radius paid approximately $66,700 and $65,700 in lease payments to UPS for the years ended December 31, 2021 and 2020, respectively. |
• | Legacy Fast Radius entered into a sub-lease agreement with UPS in August 2018. Legacy Fast Radius sub-leases office space from UPS in Singapore. Legacy Fast Radius paid approximately $7,300 and $6,700 in lease payments to UPS for the years ended December 31, 2021 and 2020, respectively. |
• | Legacy Fast Radius entered into a shipping service agreement with UPS in 2016. Legacy Fast Radius receives pickup and delivery services in this arrangement. Legacy Fast Radius paid approximately $1,148,236 and $449,876 in fees to UPS for shipping services for the years ended December 31, 2021 and 2020, respectively. |
• | each person known by the Company to be the beneficial owner of more than five percent (5%) of the outstanding shares of the Company’s Common Stock; |
• | each current executive officer and director of the Company; and |
• | all current executive officers and directors of the Company, as a group. |
Name and Address of Beneficial Owner (1) |
Number of Shares |
Percentage of Common Stock Outstanding |
||||||
5% or Greater Stockholders: |
||||||||
Entities affiliated with Drive (2) |
13,836,851 | 18.94 | % | |||||
ECP ControlCo, LLC and its affiliates (3) |
9,895,461 | 13.55 | % | |||||
Entities affiliated with Energize Ventures (4) |
4,961,315 | 6.79 | % | |||||
United Parcel Service General Services Co. (5) |
13,897,447 | 19.03 | % | |||||
Executive Officers and Directors: |
||||||||
Lou Rassey (6) |
9,896,157 | 13.21 | % | |||||
Prithvi Gandhi |
— | — | ||||||
Pat McCusker (7) |
2,122,207 | 2.88 | % | |||||
John Nanry (8) |
1,693,296 | 2.31 | % | |||||
Matthew Flanigan |
— | — | ||||||
Steven Koch (9) |
136,151 | 0.19 | % | |||||
Matthew Maloney |
— | — | ||||||
Tyler Reeder |
— | — | ||||||
Nick Solaro |
— | — | ||||||
Betsy Ziegler |
— | — | ||||||
|
|
|
|
|||||
All current directors and executive officers as a group (10 persons) |
13,847,811 | 18.59 | % | |||||
|
|
|
|
* | Less than one percent. |
(1) | Unless otherwise indicated, the business address of each of the directors and executive officers of the Company is c/o Fast Radius, Inc., 113 N. May St., Chicago, IL 60607. |
(2) | Consists of (a) 7,308,432 shares of Common Stock held by Drive Capital Fund II, L.P. (“ DC Fund II DC Fund II (TE) Fund II GP II LLC |
the voting of the shares held by Fund II. Nick Solaro, who is a member of the board of directors of Fast Radius, Inc., is a member of GP II LLC, but does not exercise voting or dispositive power over, and disclaims beneficial ownership of, the shares held by Fund II. The business address of Fund II is c/o Drive Capital, 629 N. High St., Columbus, OH 43215. |
(3) | Consists of (a) 8,140,000 shares of Common Stock held by the Sponsor resulting out of the conversion of Founder Shares at the Closing of the Business Combination, (b) 200,000 PIPE Shares held by the Sponsor, (c) 731,340 PIPE Shares held by ECP Energy Transition Opportunities Fund A, LP, an affiliate of ECP ControlCo, LLC (“ECP ControlCo”), (d) 68,660 PIPE Shares held by ECP Energy Transition Opportunities Fund B, LP, an affiliate of ECP ControlCo, and (e) 755,461 shares of Common Stock held by Energy Capital Partners Holdings, LP, an affiliate of ECP ControlCo, resulting out of the conversion of the ECP Notes at the Closing of the Business Combination. ENNV GP, LLC is the managing member of the Sponsor. ECP Energy Transition Opportunities GP, LP is the general partner of each of ECP Energy Transition Opportunities Fund A, LP and ECP Energy Transition Opportunities Fund B, LP. ECP Energy Transition Opportunities, LLC is the general partner of ECP Energy Transition Opportunities GP, LP. ECP ControlCo is the managing member of each of ENNV GP, LLC and ECP Energy Transition Opportunities, LLC, as well as the general partner of Energy Capital Partners Holdings, LP. Douglas Kimmelman, Andrew Singer, Peter Labbat, Tyler Reeder and Rahman D’Argenio are the managing members of ECP ControlCo and share the power to vote and dispose of the securities beneficially owned by ECP ControlCo. As such, Messrs. Kimmelman, Singer, Labbat, Reeder and D’Argenio disclaim any beneficial ownership of the shares beneficially owned by ECP ControlCo except to the extent of their indirect pecuniary interest in such shares. |
(4) | Consists of (a) 777,205 shares of Common Stock held by Energize Growth Fund I LP (“ EGF EVF FR SPV Energize Funds Growth GP Ventures GP |
(5) | Consists of (a) 1,000,000 PIPE Shares and (b) 12,897,447 shares of Common Stock. This entity is ultimately controlled by United Parcel Service, Inc., a public company incorporated in Delaware. The business address of this entity is c/o United Parcel Service, 55 Glenlake Parkway NE, Atlanta, GA 30328. |
(6) | Consists of (a) 6,895,883 shares of Common Stock held directly by Mr. Rassey, (b) 213,253 shares of Common Stock held by Two Roads Group, LLC, which Mr. Rassey controls, (c) 904,652 shares of Common Stock held by family trusts, which are controlled by Mr. Rassey’s brother, Robert Rassey, as the sole trustee, consisting of (i) 226,163 shares of Common Stock held by TRF I Trust, (ii) 226,163 shares of Common Stock held by TRF II Trust, (iii) 226,163 shares of Common Stock held by TRF III Trust, and (iv) 226,163 shares of Common Stock held by TRF IV Trust, (d) 1,767,069 shares of Common Stock subject to vested options and restricted stock units and (e) 115,300 shares of Common Stock subject to options exercisable within 60 days of March 31, 2022. Mr. Rassey may be deemed to beneficially own the reported securities held by Two Roads Group, LLC, TRF I Trust, TRF II Trust, TRF III Trust and TRF IV Trust and disclaims beneficial ownership of such reported securities except to the extent of his pecuniary interest therein. |
(7) | Consists of (a) 1,538,223 shares of Common Stock held directly by Mr. McCusker, (b) 548,733 shares of Common Stock subject to vested options and restricted stock units and (c) 35,251 shares of Common Stock subject to options and restricted stock units that are exercisable or vest within 60 days of March 31, 2022. |
(8) | Consists of (a) 1,442,071 shares of Common Stock held directly by Mr. Nanry, (b) 241,446 shares of Common Stock subject to vested options and restricted stock units and (c) 9,779 shares of Common Stock subject to options and restricted stock units that are exercisable or vest within 60 days of March 31, 2022. |
(9) | Consists of 136,151 shares of Common Stock subject to options exercisable within 60 days of March 31, 2022, which are held by Mohawk Consultants, LLC, which Mr. Koch controls. |
Names and Addresses |
Securities Beneficially Owned prior to this Offering (1)(2) |
Securities to be Sold in this Offering |
Securities Beneficially Owned after this Offering (2) |
|||||||||||||||||||||||||||||
Shares of Common Stock |
Warrants |
Shares of Common Stock |
Warrants |
Shares of Common Stock |
Percentage |
Warrants |
Percentage |
|||||||||||||||||||||||||
Bill King (3) |
1,510,391 | 1,510,391 | — | — | — | — | ||||||||||||||||||||||||||
Corebetti Capital Equity Inc. (4) |
250,000 | 250,000 | — | — | — | — | ||||||||||||||||||||||||||
David Lockwood (5) |
35,000 | 35,000 | ||||||||||||||||||||||||||||||
Entities affiliated with Drive (6) |
16,359,455 | 16,359,455 | — | — | — | — | ||||||||||||||||||||||||||
ECP ControlCo, LLC and its affiliates (7) |
14,042,667 | 5,702,667 | 14,042,667 | 5,702,667 | — | — | — | |||||||||||||||||||||||||
Energy Capital Partners Holdings, LP (8) |
755,461 | 755,461 | — | — | — | — | ||||||||||||||||||||||||||
ECP Energy Transition Opportunities Fund A, LP (9) |
731,340 | 731,340 | — | — | — | — | ||||||||||||||||||||||||||
ECP Energy Transition Opportunities Fund B, LP (10) |
68,660 | 68,660 | — | — | — | — | ||||||||||||||||||||||||||
Entities affiliated with Goldman Sachs .(11) |
1,659,000 | 1,189,000 | 1,659,000 | 1,189,000 | — | — | — | — | ||||||||||||||||||||||||
JCDP-4 LLC(12) |
2,892,319 | 1,400,000 | — | |||||||||||||||||||||||||||||
John Nanry (13) |
1,558,530 | 1,558,530 | — | — | — | — | ||||||||||||||||||||||||||
Kathryn E. Coffey (14) |
35,000 | 35,000 | ||||||||||||||||||||||||||||||
Lou Rassey (15) |
8,234,259 | 8,234,259 | — | — | — | — | ||||||||||||||||||||||||||
Macro Continental, Inc. (16) |
250,000 | 250,000 | — | — | — | — | ||||||||||||||||||||||||||
Palantir Technologies Inc. (17) |
2,000,000 | 2,000,000 | — | — | — | |||||||||||||||||||||||||||
Pat McCusker (18) |
1,601,683 | 1,601,683 | — | — | — | — | ||||||||||||||||||||||||||
Richard Burke (19) |
35,000 | 35,000 | ||||||||||||||||||||||||||||||
Seven Grand Partners LLC (20) |
40,000 | 40,000 | — | — | — | — | ||||||||||||||||||||||||||
Skydeck Holdings II LLC (21) |
3,196,973 | 400,000 | — | — | — | |||||||||||||||||||||||||||
Steven Koch (22) |
136,152 | 136,152 | — | — | — | — | ||||||||||||||||||||||||||
Tracy McKibben (23) |
35,000 | 35,000 | ||||||||||||||||||||||||||||||
United Parcel Service General Services Co. (24) |
16,359,455 | 16,359,455 | — | — | — | — | ||||||||||||||||||||||||||
Walleye Opportunities Master Fund, Ltd. (25) |
162,700 | 110,531 | 160,000 | — | — | — | — | |||||||||||||||||||||||||
ZP Master Utility Fund, Ltd. (26) |
1,000,000 | 1,000,000 | — | — | — | — |
* | Less than 1%. |
(1) | Includes Founder Shares, ECP Notes Shares, Forward Purchase Shares, PIPE Shares, Control Shares, Private Placement Warrants, Forward Purchase Warrants and shares of Common Stock issuable upon exercise of the Private Placement Warrants and the Forward Purchase Warrants. |
(2) | The securities registered for sale include the Founder Shares, ECP Notes Shares, PIPE Shares, Forward Purchase Shares, Control Shares, Private Placement Warrants, Forward Purchase Warrants and shares of |
Common Stock issuable upon exercise of the Private Placement Warrants, the Forward Purchase Warrants and the Public Warrants (together, the “ Resale Securities |
(3) | Consists of (a) 1,068,350 shares of Common Stock held directly by Bill King, (b) 206,070 Control Earnout Shares, (c) 116,704 shares of Common Stock subject to vested restricted stock units as of Closing, and (d) 119,267 shares of Common Stock subject to options and restricted stock units that are exercisable or vest within 60 days of Closing. Dr. King has served as Chief Scientist of the Company since the Closing on February 4, 2022. These securities are subject to a contractual lock-up for 180 days following the Closing Date, subject to limited exceptions, and are being registered in accordance with the terms of an Amended and Restated Registration Rights Agreement, dated as of July 18, 2021, by and between the Company, the selling securityholder and the other parties thereto, as described under “Certain Relationships and Related Party Transactions—Registration Rights Agreement.” |
(4) | These shares are being registered in accordance with the terms of a Subscription Agreement, dated as of July 18, 2021, by and between the Company and the selling securityholder. The shares were issued to the selling securityholder on February 4, 2022 in connection with the Closing. The registered address of Corebetti Capital Equity Inc. is OMC Chambers, Wickhams Cay 1, Road Town, Tortola, British Virgin Islands. |
(5) | The shares reported above are held of record in the name of Spyder Retirement Trust. David Lockwood is the sole trustee of Spyder Retirement Trust and has sole power to vote and dispose of such securities. David Lockwood served as a member of the board of directors of ENNV prior to the Closing on February 4, 2022. These securities are subject to a contractual lock-up for 180 days following the Closing Date, subject to limited exceptions, and are being registered in accordance with the terms of an Amended and Restated Registration Rights Agreement, dated as of July 18, 2021, by and between the Company, David Lockwood and the other parties thereto, as described under “Certain Relationships and Related Party Transactions—Registration Rights Agreement.” |
(6) | Consists of (i) 7,308,432 shares of Common Stock held by DC Fund II, (ii) 1,332,404 Control Earnout Shares held by DC Fund II (iii) 6,302,629 shares of Common Stock held by DC Fund II (TE), (iv) 1,149,036 Control Earnout Shares held by DC Fund II (TE), (v) 225,790 shares of Common Stock held by Drive Capital Ignition Fund II (“DC Ignition Fund”) and (vi) 41,164 Control Earnout Shares held by DC Ignition Fund. GP II LLC serves as the general partner of Fund II. As the sole member of the investment committee of GP II LLC, Christopher Olsen controls decisions regarding the disposition of the shares held by Fund II. As the sole managing member of Drive Capital, LLC, which serves as the manager of GP II LLC, Christopher Olsen controls decisions regarding the voting of the shares held by Fund II. Nick Solaro, who is a member of the board of directors of Fast Radius, Inc., is a member of GP II LLC, but does not exercise voting or dispositive power over, and disclaims beneficial ownership of, the shares held by Fund II. The business address of Fund II is c/o Drive Capital, 629 N. High St., Columbus, OH 43215. |
(7) | Consists of (i) 5,702,667 Common Stock underlying Private Placement Warrants and 5,702,667 Private Placement Warrants held by ENNV Holdings, LLC (ii) 8,140,000 Founder Shares and (iii) 200,000 PIPE Shares. The shares reported above are held in the name of the Sponsor. ENNV GP, LLC is the managing member of the Sponsor. ECP ControlCo is the managing member of ENNV GP, LLC. Douglas Kimmelman, Andrew Singer, Peter Labbat, Tyler Reeder and Rahman D’Argenio are the managing members of ECP ControlCo and share the power to vote and dispose of the securities beneficially owned by ECP ControlCo. As such, Messrs. Kimmelman, Singer, Labbat, Reeder and D’Argenio disclaim any beneficial ownership of the shares beneficially owned by ECP ControlCo except to the extent of their indirect pecuniary interest in such shares. |
(8) | Consists of 755,461 ECP Notes Shares held by Energy Capital Partners Holdings, LP, an affiliate of ECP ControlCo. ECP ControlCo is the general partner of Energy Capital Partners Holdings, LP. Douglas Kimmelman, Andrew Singer, Peter Labbat, Tyler Reeder and Rahman D’Argenio are the managing members of ECP ControlCo and share the power to vote and dispose of the securities beneficially owned by ECP ControlCo. As such, Messrs. Kimmelman, Singer, Labbat, Reeder and D’Argenio disclaim any beneficial ownership of the shares beneficially owned by ECP ControlCo except to the extent of their indirect pecuniary interest in such shares. |
(9) | Consists of 731,340 PIPE Shares held by ECP Energy Transition Opportunities Fund A, LP. ECP ControlCo is the managing member of ECP Energy Transition Opportunities, LLC, which is the general partner of ECP Energy Transition Opportunities GP, LP, which is the general partner of ECP Energy Transition Opportunities Fund A, LP. Douglas Kimmelman, Andrew Singer, Peter Labbat, Tyler Reeder and Rahman D’Argenio are the managing members of ECP ControlCo and share the power to vote and dispose of the securities beneficially owned by ECP ControlCo. As such, Messrs. Kimmelman, Singer, Labbat, Reeder and D’Argenio disclaim any beneficial ownership of the shares beneficially owned by ECP ControlCo except to the extent of their indirect pecuniary interest in such shares. |
(10) | Consists of 68,660 PIPE Shares held by ECP Energy Transition Opportunities Fund B, LP. ECP ControlCo is the managing member of ECP Energy Transition Opportunities, LLC, which is the general partner of ECP Energy Transition Opportunities GP, LP, which is the general partner of ECP Energy Transition Opportunities Fund B, LP. Douglas Kimmelman, Andrew Singer, Peter Labbat, Tyler Reeder and Rahman D’Argenio are the managing members of ECP ControlCo and share the power to vote and dispose of the securities beneficially owned by ECP ControlCo. As such, Messrs. Kimmelman, Singer, Labbat, Reeder and D’Argenio disclaim any beneficial ownership of the shares beneficially owned by ECP ControlCo except to the extent of their indirect pecuniary interest in such shares. |
(11) | Consists of (i) 203,881 Founder Shares, 69,602 Forward Purchase Shares, 348,008 shares of Common Stock underlying Forward Purchase Warrants, 348,008 Forward Purchase Warrants, 333,300 shares of Common Stock underlying Private Placement Warrants and 333,300 Private Placement Warrants held by Goldman Sachs MLP Energy Infrastructure Fund, (ii) 34,371 Founder Shares, 13,407 Forward Purchase Shares, 67,035 shares of Common Stock underlying Forward Purchase Warrants, 67,035 Forward Purchase Warrants, 56,189 shares of Common Stock underlying Private Placement Warrants and 56,189 Private Placement Warrants held by Goldman Sachs MLP and Energy Renaissance Fund, (iii) 49,248 Founder Shares, 17,562 Forward Purchase Shares, 87,810 shares of Common Stock underlying Forward Purchase Warrants, 87,810 Forward Purchase Warrants, 80,510 shares of Common Stock underlying Private Placement Warrants and 80,510 Private Placement Warrants held by Goldman Sachs Energy Infrastructure Fund, and (iv) 57,500 Founder Shares, 24,429 Forward Purchase Shares, 122,147 shares of Common Stock underlying Forward Purchase Warrants, 122,147 Forward Purchase Warrants, 94,001 shares of Common Stock underlying Private Placement Warrants and 94,001 Private Placement Warrants held by Goldman Sachs Clean Energy Income Fund. The business address of GSAM, Goldman Sachs MLP Energy Infrastructure Fund, Goldman Sachs MLP and Energy Renaissance Fund, Goldman Sachs Energy Infrastructure Fund and Goldman Sachs Clean Energy Income Fund is 200 West Street 3 rd Floor, New York, NY 10282. |
(12) | Consists of 2,892,319 shares of Common Stock, including 1,400,000 PIPE Shares. These shares are being registered in accordance with the terms of a Subscription Agreement, dated as of July 18, 2021, by and between the Company and the selling securityholder. The shares were issued to the selling securityholder on February 4, 2022 in connection with the Closing. The business address of JCDP-4 LLC is 600 W. Chicago Ave., Suite 625, Chicago, IL 60654. |
(13) | Consists of (a) 1,442,071 shares of Common Stock held directly by John Nanry, (b) 284,136 Control Earnout Shares, (c) 155,047 shares of Common Stock subject to vested restricted stock units as of Closing, and (d) 272,231 shares of Common Stock subject to options and restricted stock units that are exercisable or vest within 60 days of Closing. Mr. Nanry has served as Chief Manufacturing Officer of the Company since the Closing on February 4, 2022. These securities are subject to a contractual lock-up for 180 days following the Closing Date, subject to limited exceptions, and are being registered in accordance with the terms of an Amended and Restated Registration Rights Agreement, dated as of July 18, 2021, by and between the Company, the selling securityholder and the other parties thereto, as described under “Certain Relationships and Related Party Transactions—Registration Rights Agreement.” |
(14) | Kathryn E. Coffey served as a member of the board of directors of ENNV prior to the Closing on February 4, 2022. These securities are subject to a contractual lock-up for 180 days following the Closing Date, subject to limited exceptions, and are being registered in accordance with the terms of an Amended and Restated Registration Rights Agreement, dated as of July 18, 2021, by and between the Company, the selling securityholder and the other parties thereto, as described under “Certain Relationships and Related Party Transactions—Registration Rights Agreement.” |
(15) | Consists of (a) 7,800,535 shares of Common Stock including (i) 6,895,883 shares of Common Stock held directly by Mr. Rassey, (ii) 213,253 shares of Common Stock held by Two Roads Group, LLC, which Mr. Rassey controls, (iii) 904,652 shares of Common Stock held by family trusts, which are controlled by Mr. Rassey’s brother, Robert Rassey, as the sole trustee, consisting of (w) 226,163 shares of Common Stock held by TRF I Trust, (x) 226,163 shares of Common Stock held by TRF II Trust, (y) 226,163 shares of Common Stock held by TRF III Trust, and (z) 226,163 shares of Common Stock held by TRF IV Trust, (b) 1,540,070 Control Earnout Shares, (c) 759,949 shares of Common Stock subject to vested restricted stock units as of Closing, and (d) 2,368,865 shares of Common Stock subject to options and restricted stock units that are exercisable or vest within 60 days of Closing. Mr. Rassey has served as Chief Executive Officer of the Company since the Closing on February 4, 2022. These securities are subject to a contractual lock-up for 180 days following the Closing Date, subject to limited exceptions, and are being registered in accordance with the terms of an Amended and Restated Registration Rights Agreement, dated as of July 18, 2021, by and between the Company, the selling securityholder and the other parties thereto, as described under “Certain Relationships and Related Party Transactions—Registration Rights Agreement.” Mr. Rassey may be deemed to beneficially own the reported securities held by Two Roads Group, LLC, TRF I Trust, TRF II Trust, TRF III Trust and TRF IV Trust and disclaims beneficial ownership of such reported securities except to the extent of his pecuniary interest therein. |
(16) | Consists of 250,000 PIPE Shares. These shares are being registered in accordance with the terms of a Subscription Agreement, dated as of July 18, 2021, by and between the Company and the selling securityholder. The shares were issued to the selling securityholder on February 4, 2022 in connection with the Closing. The business address of Macro Continental Inc. is Shirley Street & Victoria Avenue, Nassau Bahamas. |
(17) | Consists of 2,000,000 PIPE Shares. These shares are being registered in accordance with the terms of a Subscription Agreement, dated as of July 18, 2021, by and between the Company and the selling securityholder. The shares were issued to the selling securityholder on February 4, 2022 in connection with the Closing. The business address of Palantir Technologies is 1555 Blake Street, Suite 250, Denver, CO 80202. |
(18) | Consists of (a) 1,538,223 shares of Common Stock held directly by Pat McCusker, (b) 292,004 Control Earnout Shares, (c) 239,375 shares of Common Stock subject to vested restricted stock units as of Closing, and (d) 735,902 shares of Common Stock subject to options and restricted stock units that are exercisable or vest within 60 days of Closing. Mr. McCusker has served as Chief Operating Officer of the Company since the Closing on February 4, 2022. These securities are subject to a contractual lock-up for 180 days following the Closing Date, subject to limited exceptions, and are being registered in accordance with the terms of an Amended and Restated Registration Rights Agreement, dated as of July 18, 2021, by and between the Company, the selling securityholder and the other parties thereto, as described under “Certain Relationships and Related Party Transactions—Registration Rights Agreement.” |
(19) | Richard Burke served as a member of the board of directors of ENNV prior to the Closing on February 4, 2022. These securities are subject to a contractual lock-up for 180 days following the Closing Date, subject to limited exceptions, and are being registered in accordance with the terms of an Amended and Restated Registration Rights Agreement, dated as of July 18, 2021, by and between the Company, the selling securityholder and the other parties thereto, as described under “Certain Relationships and Related Party Transactions—Registration Rights Agreement.” |
(20) | Consists of 40,000 PIPE Shares. These shares are being registered in accordance with the terms of a Subscription Agreement, dated as of July 18, 2021, by and between the Company and the selling securityholder. The shares were issued to the selling securityholder on February 4, 2022 in connection with the Closing. The business address of Seven Grand Partners LLC is 81 Pondfield Road, Suite C302, Bronxville, NY 10708. |
(21) | Consists of 400,000 PIPE Shares. These shares are being registered in accordance with the terms of a Subscription Agreement, dated as of July 18, 2021, by and between the Company and the selling securityholder. The shares were issued to the selling securityholder on February 4, 2022 in connection with the Closing. The business address Skydeck Holdings II LLC is 1 S Wacker, Suite 1800, Chicago, IL 60606. |
(22) | Steven Koch has served as a member of the board of directors of the Company since the Closing on February 4, 2022. Consists of 136,151 shares of Common Stock subject to options exercisable within 60 days of the Closing, which are held by Mohawk Consultants, LLC, which Mr. Koch controls. |
(23) | Tracy McKibben served as a member of the board of directors of ENNV prior to the Closing on February 4, 2022. These securities are subject to a contractual lock-up for 180 days following the Closing Date, subject to limited exceptions, and are being registered in accordance with the terms of an Amended and Restated Registration Rights Agreement, dated as of July 18, 2021, by and between the Company, the selling securityholder and the other parties thereto, as described under “Certain Relationships and Related Party Transactions—Registration Rights Agreement.” The business address of Skydeck Holdings II LLC is 1 S Wacker Drive Suite 1810, Chicago IL 60606. |
(24) | Consists of (i) 1,000,000 PIPE Shares, (ii) 12,897,447 Insider Shares, and (iii) 2,351,340 Control Earnout Shares. This entity is ultimately controlled by United Parcel Service, Inc., a public company incorporated in Delaware. The business address of this entity is c/o United Parcel Service, 55 Glenlake Parkway NE, Atlanta, GA 30328. |
(25) | Consists of 162,700 shares of Common Stock, including 160,000 PIPE Shares, and 110,531 Public Warrants. These shares are being registered in accordance with the terms of a Subscription Agreement, dated as of July 18, 2021, by and between the Company and the selling securityholder. The shares were issued to the selling securityholder on February 4, 2022 in connection with the Closing. The business address of Walleye Opportunities Master Fund, Ltd. is 2800 Niagara Lane North Plymouth, MN 55447 |
(26) | Consists of 1,000,000 PIPE Shares. These shares are being registered in accordance with the terms of a Subscription Agreement, dated as of July 18, 2021, by and between the Company and the selling securityholder. The shares were issued to the selling securityholder on February 4, 2022 in connection with the Closing. ZP Master Utility Fund, Ltd. (the “Fund”) has delegated to Zimmer Partners, LP, as investment manager (the “Investment Manager”), sole voting and investment power over the Resale Securities held by the Fund pursuant to its investment management agreement with Zimmer Partners, LP. As a result, each of the Investment Manager, Zimmer Partners GP, LLC, as the general partner of the Investment Manager, Zimmer Financial Services Group LLC (fka Sequentis Financial LLC), as the sole member of Zimmer Partners GP, LLC, and Stuart J. Zimmer, as the managing member of Zimmer Financial Services Group LLC, may be deemed to exercise voting and investment power over the Resale Securities held by the Fund and thus may be deemed to beneficially own such Resale Securities. The business address of the foregoing entities is c/o Zimmer Partners, 9 West 57th St., 33 Floor, New York, NY 10019. |
• | in whole and not in part; |
• | at a price of $0.01 per Public Warrants; |
• | upon not less than 30 days’ prior written notice of redemption (the “30-day redemption period”) to each warrant holder; and |
• | if, and only if, the last reported sale price of the Common Stock equals or exceeds $18.00 per share (as adjusted for stock splits, stock dividends, reorganizations, recapitalizations and the like and for certain issuances of Common Stock and equity-linked securities as described below) for any 20 trading days within a 30-trading day period ending on the third trading day prior to the date we send the notice of redemption to the warrant holders. |
• | in whole and not in part; |
• | at $0.10 per Public Warrant upon a minimum of 30 days’ prior written notice of redemption provided that holders will be able to exercise their Public Warrant on a cashless basis prior to redemption and receive that number of shares determined by reference to the table below, based on the redemption date and the “fair market value” of our Common Stock (as defined below) except as otherwise described below; and |
• | if, and only if, the last reported sale price of our Common Stock equals or exceeds $10.00 per share (as adjusted per stock splits, stock dividends, reorganizations, reclassifications, recapitalizations and the like and for certain issuances of Common Stock and equity-linked securities as described above) on the trading day prior to the date on which we send the notice of redemption to the warrant holders. |
Fair market value of Common Stock | ||||||||||||||||||||||||||||||||||||
Redemption date (period to expiration of warrants) |
≤10.00 | 11.00 | 12.00 | 13.00 | 14.00 | 15.00 | 16.00 | 17.00 | ≥18.00 | |||||||||||||||||||||||||||
57 months |
0.257 | 0.277 | 0.294 | 0.310 | 0.324 | 0.337 | 0.348 | 0.358 | 0.361 | |||||||||||||||||||||||||||
54 months |
0.252 | 0.272 | 0.291 | 0.307 | 0.322 | 0.335 | 0.347 | 0.357 | 0.361 | |||||||||||||||||||||||||||
51 months |
0.246 | 0.268 | 0.287 | 0.304 | 0.320 | 0.333 | 0.346 | 0.357 | 0.361 | |||||||||||||||||||||||||||
48 months |
0.241 | 0.263 | 0.283 | 0.301 | 0.317 | 0.332 | 0.344 | 0.356 | 0.361 | |||||||||||||||||||||||||||
45 months |
0.235 | 0.258 | 0.279 | 0.298 | 0.315 | 0.330 | 0.343 | 0.356 | 0.361 | |||||||||||||||||||||||||||
42 months |
0.228 | 0.252 | 0.274 | 0.294 | 0.312 | 0.328 | 0.342 | 0.355 | 0.361 | |||||||||||||||||||||||||||
39 months |
0.221 | 0.246 | 0.269 | 0.290 | 0.309 | 0.325 | 0.340 | 0.354 | 0.361 | |||||||||||||||||||||||||||
36 months |
0.213 | 0.239 | 0.263 | 0.285 | 0.305 | 0.323 | 0.339 | 0.353 | 0.361 | |||||||||||||||||||||||||||
33 months |
0.205 | 0.232 | 0.257 | 0.280 | 0.301 | 0.320 | 0.337 | 0.352 | 0.361 | |||||||||||||||||||||||||||
30 months |
0.196 | 0.224 | 0.250 | 0.274 | 0.297 | 0.316 | 0.335 | 0.351 | 0.361 | |||||||||||||||||||||||||||
27 months |
0.185 | 0.214 | 0.242 | 0.268 | 0.291 | 0.313 | 0.332 | 0.350 | 0.361 | |||||||||||||||||||||||||||
24 months |
0.173 | 0.204 | 0.233 | 0.260 | 0.285 | 0.308 | 0.329 | 0.348 | 0.361 | |||||||||||||||||||||||||||
21 months |
0.161 | 0.193 | 0.223 | 0.252 | 0.279 | 0.304 | 0.326 | 0.347 | 0.361 | |||||||||||||||||||||||||||
18 months |
0.146 | 0.179 | 0.211 | 0.242 | 0.271 | 0.298 | 0.322 | 0.345 | 0.361 | |||||||||||||||||||||||||||
15 months |
0.130 | 0.164 | 0.197 | 0.230 | 0.262 | 0.291 | 0.317 | 0.342 | 0.361 | |||||||||||||||||||||||||||
12 months |
0.111 | 0.146 | 0.181 | 0.216 | 0.250 | 0.282 | 0.312 | 0.339 | 0.361 | |||||||||||||||||||||||||||
9 months |
0.090 | 0.125 | 0.162 | 0.199 | 0.237 | 0.272 | 0.305 | 0.336 | 0.361 | |||||||||||||||||||||||||||
6 months |
0.065 | 0.099 | 0.137 | 0.178 | 0.219 | 0.259 | 0.296 | 0.331 | 0.361 | |||||||||||||||||||||||||||
3 months |
0.034 | 0.065 | 0.104 | 0.150 | 0.197 | 0.243 | 0.286 | 0.326 | 0.361 | |||||||||||||||||||||||||||
0 months |
— | — | 0.042 | 0.115 | 0.179 | 0.233 | 0.281 | 0.323 | 0.361 |
• | an individual who is a U.S. citizen or resident of the United States, as determined for U.S. federal income tax purposes; |
• | a corporation or other entity treated as a corporation for United States federal income tax purposes created in, or organized under the law of, the United States or any state or political subdivision thereof; |
• | an estate the income of which is includible in gross income for U.S. federal income tax purposes regardless of its source; or |
• | a trust (A) the administration of which is subject to the primary supervision of a United States court and which has one or more United States persons (within the meaning of Section 7701(a)(30) of the Code) who have the authority to control all substantial decisions of the trust or (B) that has in effect a valid election under applicable Treasury Regulations to be treated as a United States person for U.S. federal income tax purposes. |
• | the gain is effectively connected with the conduct of a trade or business by the non-U.S. Holder within the United States (and, if an applicable tax treaty so requires, is attributable to a U.S. permanent establishment or fixed base maintained by the non-U.S. Holder); |
• | the non-U.S. Holder is an individual who is present in the United States for 183 days or more in the taxable year of disposition and certain other conditions are met; or |
• | we are or have been a “United States real property holding corporation” for U.S. federal income tax purposes at any time during the shorter of the five-year period ending on the date of disposition or the period that the non-U.S. Holder held our Common Stock or Warrants and, in the case where shares of our Common Stock are regularly traded on an established securities market, the non-U.S. Holder has owned, directly or constructively, more than 5% of our Common Stock at any time within the shorter of the five-year period preceding the disposition or such Non-U.S. holder’s holding period for the shares of our Common Stock. There can be no assurance that our Common Stock will be treated as regularly traded on an established securities market for this purpose. |
• | ordinary brokerage transactions and transactions in which the broker-dealer solicits purchasers; |
• | block trades in which the broker-dealer will attempt to sell the shares as agent, but may position and resell a portion of the block as principal to facilitate the transaction; |
• | purchases by a broker-dealer as principal and resale by the broker-dealer for their account; |
• | an exchange distribution in accordance with the rules of the applicable exchange; |
• | privately negotiated transactions; |
• | to or through underwriters; |
• | in “at the market” offerings, as defined in Rule 415 under the Securities Act, at negotiated prices, at prices prevailing at the time of sale or at prices related to such prevailing market prices, including sales made directly on a national securities exchange or sales made through a market maker other than on an exchange or other similar offerings through sales agents; |
• | short sales effected after the date the registration statement of which this prospectus is a part is declared effective by the SEC; |
• | through the writing or settlement of options or other hedging transactions, whether through an options exchange or otherwise; |
• | broker-dealers may agree with the selling securityholders to sell a specified number of such shares at a stipulated price per share; |
• | distribution to members, limited partners or stockholders of selling security holders; |
• | a combination of any such methods of sale; and |
• | any other method permitted by applicable law. |
Page |
||||
F-2 | ||||
F-3 | ||||
F-4 | ||||
F-5 | ||||
F-7 | ||||
F-8 |
Page |
||||
F-30 | ||||
F-31 | ||||
F-32 | ||||
F-33 | ||||
F-34 | ||||
F-35 |
December 31, 2021 |
December 31, 2020 |
|||||||
ASSETS |
||||||||
Cash |
$ | $ | ||||||
Prepaid expenses |
— | |||||||
Total current assets |
||||||||
Deferred offering costs associated with the initial public offering |
— | |||||||
Marketable securities held in Trust Account |
— | |||||||
Prepaid expenses – non-current |
— | |||||||
Total assets |
$ | $ | ||||||
LIABILITIES AND STOCKHOLDERS’ (DEFICIT) EQUITY |
||||||||
Current liabilities: |
||||||||
Accounts payable |
$ | $ | ||||||
Working capital loans |
— | |||||||
Franchise tax payable |
— | |||||||
Accrued expenses |
||||||||
Total current liabilities |
||||||||
Derivative warrant liabilities |
— | |||||||
Forward purchase agreement |
— | |||||||
Deferred underwriting commission |
— | |||||||
Total liabilities |
||||||||
Commitments and Contingencies (Note 5) |
||||||||
Class A common stock, $ |
— |
|||||||
Stockholders’ (Deficit) Equity: |
||||||||
Preferred stock, $ |
||||||||
Class A common stock, $ - |
— | |||||||
Class B common stock, $ |
||||||||
Additional paid-in capital |
||||||||
Accumulated deficit |
( |
) | ( |
) | ||||
Total stockholders’ (deficit) equity |
( |
) | ||||||
Total liabilities and stockholders’ (deficit) equity |
$ | $ | ||||||
For The Year Ended December 31, 2021 |
For The Period From October 29, 2020 (Inception) Through December 31, 2020 |
|||||||
General and administrative |
$ | $ | ||||||
Franchise tax expense |
||||||||
|
|
|
|
|
|
|
|
|
Loss from operations |
( |
) | ( |
) | ||||
Other Income (Expense) |
||||||||
Offering costs allocated to derivative warrant liabilities |
( |
) | ||||||
Offering costs on Founder Shares issued to related party |
( |
) | ||||||
Interest and dividends earned on marketable securities held in Trust Account |
||||||||
Change in fair value of derivative warrant liabilities |
||||||||
Change in fair value of forward purchase agreement |
||||||||
|
|
|
|
|||||
Net income (loss) |
$ | $ | ( |
) | ||||
|
|
|
|
|||||
Weighted average shares outstanding of Class A redeemable common stock, basic and diluted |
||||||||
|
|
|
|
|||||
Basic and diluted net earnings per share of redeemable common stock, Class A |
$ |
$ |
||||||
|
|
|
|
|||||
Weighted average shares outstanding of Class B non-redeemable common stock, basic and diluted |
||||||||
|
|
|
|
|||||
Basic and diluted net earnings per share of non-redeemable common stock, Class B |
$ |
$ |
||||||
|
|
|
|
Common Stock |
Additional Paid-In Capital |
Accumulated Deficit |
Total Stockholders’ (Deficit) Equity |
|||||||||||||||||
Class B |
||||||||||||||||||||
Shares |
Amount |
|||||||||||||||||||
Balance as of January 1, 2021 |
$ |
$ |
$ ( |
) |
$ |
|||||||||||||||
Excess cash received over fair value of Private Placement Warrants |
— | — | — | |||||||||||||||||
Remeasurement of Class A Common Stock to redemption value |
— | — | ( |
) | ( |
) | ( |
) | ||||||||||||
Net incom e |
— | — | — | |||||||||||||||||
|
|
|
|
|
|
|
|
|
|
|||||||||||
Balance as of December 31, 2021 |
$ |
$ |
$ |
( |
$ |
( |
||||||||||||||
|
|
|
|
|
|
|
|
|
|
Common Stock |
Additional Paid-In Capital |
Accumulated Deficit |
Total Stockholders’ Equity |
|||||||||||||||||
Class B |
||||||||||||||||||||
Shares |
Amount |
|||||||||||||||||||
Balance as of October 29, 2020 (Inception) |
$ |
$ |
$ |
$ |
||||||||||||||||
Issuance of common stock to Sponsor |
||||||||||||||||||||
Net loss |
— | — | — | ( |
) | ( |
) | |||||||||||||
|
|
|
|
|
|
|
|
|
|
|||||||||||
Balance as of December 31, 2020 |
$ |
$ |
$ ( |
$ |
||||||||||||||||
|
|
|
|
|
|
|
|
|
|
For The Year Ended December 31, 2021 |
For The Period From October 29, 2020 (Inception) Through December 31, 2020 |
|||||||
Cash Flows from Operating Activities: |
||||||||
Net Income (Loss) |
$ | $ | ( |
) | ||||
Adjustments to reconcile net income to net cash used in operating activities: |
||||||||
Change in fair value of derivative warrant liabilities and forward purchase agreement |
( |
) | — | |||||
Interest and dividends earned on marketable securities held in Trust Account |
( |
) | — | |||||
Offering costs allocated to derivative warrant liabilities |
— | |||||||
Offering costs on Founder Shares issued to related party |
— | |||||||
General and administrative expenses paid by related party |
— | |||||||
Amortization of prepaid expenses |
— |
|||||||
Changes in operating assets and liabilities |
||||||||
Prepaid expenses |
( |
) | — | |||||
Other assets |
( |
) | — | |||||
Accounts payable |
— | |||||||
Franchise tax payable |
— | |||||||
Accrued expenses |
— | |||||||
Net cash used in operating activities |
( |
) | ( |
) | ||||
Cash Flows from Investing Activities: |
||||||||
Investment of cash into Trust Account |
( |
) | — | |||||
Net cash used in investing activities |
( |
) | — | |||||
Cash Flows from Financing Activities: |
||||||||
Proceeds from issuance of Class B common stock to Sponsor |
— | |||||||
Repayment of Sponsor loan |
( |
) | — | |||||
Working capital loan from related party |
— | |||||||
Proceeds from Initial Public Offering, net of underwriters’ fees |
— | |||||||
Proceeds from Private Placement Warrants |
— | |||||||
Payment of other offering costs |
( |
) | — | |||||
Net cash provided by financing activities |
||||||||
Net increase in cash |
||||||||
Cash—beginning of period |
— | |||||||
Cash—end of period |
$ | $ | ||||||
Supplemental disclosure of noncash financing activities: |
||||||||
Deferred underwriting fees payable |
$ | $ | — | |||||
Offering costs included in accounts payable |
$ | — | $ | |||||
Offering costs included in accrued expenses |
$ | $ | ||||||
Offering costs paid through promissory note—related party |
$ | $ | — | |||||
Deferred offering costs in accrued offering costs and accounts payable at December 31, 2020 |
$ | $ | — | |||||
Gross proceeds |
$ | |
||
Less: |
||||
Proceeds allocated to public warrants |
( |
) | ||
Deferred underwriting fees |
( |
) | ||
Other offering costs |
( |
) | ||
Plus: |
||||
Total remeasurement of carrying value to redemption value |
||||
Class A common stock subject to possible redemption |
$ |
|||
• |
Level 1, defined as observable inputs such as quoted prices for identical instruments in active markets; |
• |
Level 2, defined as inputs other than quoted prices in active markets that are either directly or indirectly observable such as quoted prices for similar instruments in active markets or quoted prices for identical or similar instruments in markets that are not active; and |
• |
Level 3, defined as unobservable inputs in which little or no market data exists, therefore requiring an entity to develop its own assumptions, such as valuations derived from valuation techniques in which one or more significant inputs or significant value drivers are unobservable. |
For the Year Ended December 31, 2021 |
For The Period From October 29, 2020 (Inception) Through December 31, 2020 |
|||||||
Numerator: Earnings allocable to Redeemable Class A Common Stock |
||||||||
Net Earnings allocable to Redeemable Class A Common Stock |
$ | $ | ||||||
Denominator: Weighted Average Share Outstanding, Redeemable Class A Common Stock |
||||||||
Basic and diluted weighted average shares outstanding, Redeemable Class A |
||||||||
|
|
|
|
|||||
Basic and diluted net earnings per share, Redeemable Class A |
$ | $ | ||||||
|
|
|
|
For the Year Ended December 31, 2021 |
For The Period From October 29, 2020 (Inception) Through December 31, 2020 |
|||||||
Non-Redeemable Class B Common Stock |
||||||||
Numerator: Net Income allocable to Non-Redeemable Net Earnings |
||||||||
Net Income allocable to Non-Redeemable Class B Common Stock |
$ | $ | ( |
) | ||||
Denominator: Weighted Average Non-Redeemable Class B Common Stock |
||||||||
Basic and diluted weighted average shares outstanding, Non-Redeemable Class B |
||||||||
|
|
|
|
|||||
Basic and diluted net earnings per share, Non-Redeemable Class B |
$ | $ | ||||||
|
|
|
|
• | in whole and not in part; |
• | at a price of $ |
• | upon a minimum of |
• | if, and only if, the last reported sale price (the “closing price”) of shares of Class A common stock equals or exceeds $ |
• |
in whole and not in part; |
• | upon a minimum of |
• | if, and only if, the last reported sale price of Class A common stock equals or exceeds $ |
• | if, and only if, the Private Placement Warrants are also concurrently called for redemption on the same terms as the outstanding Public Warrants, as described above. |
Description |
Level |
Fair Value |
||||||||||
December 31, 2021 |
Marketable securities | 1 | $ | |
||||||||
|
|
|
|
Level 1 |
Level 2 |
Level 3 |
Total |
|||||||||||||
Derivative liabilities: |
||||||||||||||||
Public Warrants |
$ | $ | — | $ | — | $ | ||||||||||
Private Placement Warrants |
— | — | ||||||||||||||
Forward Purchase Agreement |
— | |||||||||||||||
|
|
|
|
|
|
|
|
|||||||||
Total liabilities |
$ | $ | $ | $ | ||||||||||||
|
|
|
|
|
|
|
|
Public Warrant Liability |
Private Warrant Liability |
Forward purchase Agreement |
Total |
|||||||||||||
Fair value, February 11, 2021 |
$ | $ | $ | $ | ||||||||||||
|
|
|
|
|
|
|
|
|||||||||
Recognized gain on change in fair value |
||||||||||||||||
|
|
|
|
|
|
|
|
|||||||||
Fair value, December 31, 2021 |
$ | $ | $ | $ | ||||||||||||
|
|
|
|
|
|
|
|
At issuance |
As of December 31, 2021 |
|||||||
Exercise Price |
$ |
$ |
||||||
Probability of merger closing |
% |
% | ||||||
Valuation date price |
$ |
$ |
||||||
Volatility |
% |
% | ||||||
Expected time until merger (years) |
||||||||
Effective expected warrant term (years) |
||||||||
Risk-free rate |
% |
% |
Deferred tax assets |
||||
Organization costs |
$ |
|||
Net Operating Loss Carryforward |
||||
|
|
|||
Total deferred tax asset . . . . . . . . . . . . . . . . . . . . . . . . . .. |
||||
Valuation allowance . . . . . . . . . . . . . . . . . . . . . . . . . . . . . |
( |
) | ||
|
|
|||
Deferred tax asset, net of allowance |
$ |
|||
|
|
Deferred expense (benefit) |
||||
Federal . . . . . . . . . . . . . . . . . . . . . . . . . . . . . . . . . . . . . . . |
$ |
( |
) | |
Valuation allowance . . . . . . . . . . . . . . . . . . . . . . . . . . . . . |
$ |
|||
|
|
|||
Total income expense (benefit) |
||||
|
|
Effective Tax Rate Reconciliation |
Rate |
|||
Pre-Tax Book Income |
% | |||
Permanent Items |
||||
Change in FMV of warrant liabilities |
( |
)% | ||
Non-deductible transaction costs |
% | |||
Post-LOI merger costs |
% | |||
Offering costs allocated to derivative liabilities |
% |
Effective Tax Rate Reconciliation |
Rate |
|||
Change in fair value of forward purchasing agreement |
( |
)% | ||
Change in Valuation Allowance . . . . . . . . . . . |
% | |||
|
|
|||
Income Tax Expense / (Benefit) . . . . . . . . . . . |
% | |||
|
|
Consolidated Financial Statements |
||||
F-31 |
||||
F-32 |
||||
F-33 |
||||
F-34 |
||||
F-35 |
December 31, 2021 |
December 31, 2020 |
|||||||
Assets |
||||||||
Current assets |
||||||||
Cash and cash equivalents |
$ | $ | ||||||
Accounts receivable, net of allowances for doubtful accounts of $ |
||||||||
Inventories |
||||||||
Prepaid production costs |
||||||||
Prepaid expenses and other current assets |
||||||||
|
|
|
|
|||||
Total current assets |
$ |
$ |
||||||
Non-current assets |
||||||||
Property and equipment, net |
||||||||
Other non-current assets |
||||||||
|
|
|
|
|||||
Total assets |
$ |
$ |
||||||
|
|
|
|
|||||
Liabilities, temporary equity and stockholders’ deficit |
||||||||
Current liabilities |
||||||||
Accounts payable |
$ | $ | ||||||
Accrued compensation |
||||||||
Accrued and other liabilities |
||||||||
Advances from customers |
||||||||
Accrued liabilities – |
||||||||
Deferred revenue |
||||||||
Warrant liability |
||||||||
Current portion of long-term debt |
||||||||
|
|
|
|
|||||
Total current liabilities |
$ |
$ |
||||||
|
|
|
|
|||||
Other long-term liabilities |
||||||||
Term loans - net of current portion and debt issuance costs |
||||||||
Related party convertible notes and derivative liabilities |
||||||||
|
|
|
|
|||||
Total liabilities |
$ |
$ |
||||||
|
|
|
|
|||||
Commitments and contingencies (Note 11) |
||||||||
Temporary equity |
||||||||
Series Seed Preferred stock; par value $ |
$ | $ | ||||||
Series Seed - 1 Preferred stock; par value $ |
||||||||
Series A - 1 Preferred stock; par value $ |
||||||||
Series A - 2 Preferred stock; par value $ |
||||||||
Series A - 3 Preferred stock; par value $ |
||||||||
Series B Preferred stock; par value $ |
||||||||
|
|
|
|
|||||
Total temporary equity |
$ |
$ |
||||||
Stockholders’ deficit |
||||||||
Common Stock, $ |
||||||||
Treasury Stock, held at cost; |
( |
) | ( |
) | ||||
Additional paid-in capital |
||||||||
Accumulated deficit |
( |
) | ( |
) | ||||
Total stockholders’ deficit |
( |
) |
( |
) | ||||
|
|
|
|
|||||
|
|
|
|
|||||
Total liabilities, temporary equity and stockholders’ deficit |
$ |
$ |
||||||
|
|
|
|
For the years ended |
December 31, 2021 |
December 31, 2020 |
||||||
Revenues |
$ | $ | ||||||
Cost of revenues |
||||||||
|
|
|
|
|||||
Gross profit |
( |
) | ||||||
Operating expenses |
||||||||
Sales and marketing |
||||||||
General and administrative |
||||||||
Research and development |
||||||||
|
|
|
|
|||||
Total operating expenses |
||||||||
Loss from operations |
( |
) |
( |
) | ||||
Change in fair value of warrants |
( |
) | ( |
) | ||||
Change in fair value of derivative liability |
( |
) | — | |||||
Interest income and other income |
||||||||
Interest expense, including amortization of debt issuance costs |
( |
) | ( |
) | ||||
|
|
|
|
|||||
Loss before income taxes |
( |
) |
( |
) | ||||
Income tax expense (benefit) |
||||||||
|
|
|
|
|||||
Net loss and comprehensive loss |
$ |
( |
) |
$ |
( |
) | ||
|
|
|
|
|||||
Net loss per share |
||||||||
Basic and diluted |
$ | ( |
) | $ | ( |
) | ||
Weighted average shares outstanding: |
||||||||
Basic and diluted |
Convertible Preferred Stock 1 |
Common Stock |
Treasury Stock |
Additional paid- in capital |
Accumulated Deficit |
Total |
|||||||||||||||||||||||||||||||
Shares |
Amount |
Shares |
Amount |
Shares |
Amount |
Amount |
Amount |
Amount |
||||||||||||||||||||||||||||
Balance at January 1, 2020 |
$ |
$ |
( |
) |
$ |
( |
) |
$ |
$ |
( |
) |
$ |
( |
) | ||||||||||||||||||||||
Net loss |
( |
) | ( |
) | ||||||||||||||||||||||||||||||||
Issuance of equity warrant s |
||||||||||||||||||||||||||||||||||||
Issuance preferred stock (Series B) |
||||||||||||||||||||||||||||||||||||
Exercise of stock options and release of notes’ recourse provision |
||||||||||||||||||||||||||||||||||||
Stock-based compensation |
||||||||||||||||||||||||||||||||||||
|
|
|
|
|
|
|
|
|
|
|
|
|
|
|
|
|
|
|||||||||||||||||||
Balance at December 31, 2020 |
$ |
$ |
( |
) |
$ |
( |
) |
$ |
$ |
( |
) |
$ |
( |
) | ||||||||||||||||||||||
|
|
|
|
|
|
|
|
|
|
|
|
|
|
|
|
|
|
|||||||||||||||||||
Balance at January 1, 2021 |
$ |
$ |
( |
) |
$ |
( |
) |
$ |
$ |
( |
) |
$ |
( |
) | ||||||||||||||||||||||
Net loss |
( |
) | ( |
) | ||||||||||||||||||||||||||||||||
Issuance of equity warrants to related party |
||||||||||||||||||||||||||||||||||||
Issuance of equity warrants |
||||||||||||||||||||||||||||||||||||
Exercise of stock options and release of notes’ recourse provision |
||||||||||||||||||||||||||||||||||||
Stock-based compensation |
||||||||||||||||||||||||||||||||||||
|
|
|
|
|
|
|
|
|
|
|
|
|
|
|
|
|
|
|||||||||||||||||||
Balance at December 31, 2021 |
( |
) |
( |
) |
( |
) |
( |
) | ||||||||||||||||||||||||||||
|
|
|
|
|
|
|
|
|
|
|
|
|
|
|
|
|
|
1 |
Refer to Note 7 |
For the years ended |
December 31, 2021 |
December 31, 2020 |
||||||
Cash flows from operating activities |
||||||||
Net loss |
$ | ( |
) | $ | ( |
) | ||
Adjustments to reconcile net loss to net cash used in operating activities |
||||||||
Depreciation and amortization |
||||||||
Amortization of deferred financing fees and convertible debt discount |
||||||||
Stock-based compensation |
||||||||
Compensation expense related to equity classified warrants |
||||||||
Change in fair value of warrants |
||||||||
Change in fair value of derivative liability |
||||||||
Provision for doubtful accounts |
||||||||
Loss on disposal of assets |
||||||||
Changes in operating assets and liabilities |
||||||||
Accounts receivable |
( |
) | ( |
) | ||||
Inventories |
( |
) | ( |
) | ||||
Prepaid production costs |
( |
) | ||||||
Prepaid expenses and other current assets |
( |
) | ( |
) | ||||
Accounts payable |
( |
) | ||||||
Accrued compensation and other liabilities |
||||||||
Advances from customers |
( |
) | ||||||
Deferred revenue |
( |
) | ( |
) | ||||
Other |
( |
) | ( |
) | ||||
|
|
|
|
|||||
Cash used in operating activities |
$ |
( |
) |
$ |
( |
) | ||
|
|
|
|
|||||
Cash flows from investing activities |
||||||||
Additions to property, plant and equipment |
( |
) | ( |
) | ||||
|
|
|
|
|||||
Cash used in investing activities |
$ |
( |
) |
$ |
( |
) | ||
|
|
|
|
|||||
Cash flows from financing activities |
||||||||
Proceeds from term loans |
$ | |||||||
Repayment of term loans |
( |
) | ( |
) | ||||
Proceeds from convertible notes and warrants with related parties |
||||||||
Proceeds from temporary equity contributions |
||||||||
Convertible notes issuance costs |
( |
) | ||||||
Proceeds from exercise of stock options |
||||||||
Payment of deferred financing costs |
( |
) | ||||||
|
|
|
|
|||||
Cash provided by financing activities |
$ |
$ | ||||||
|
|
|
|
|||||
Change in cash and cash equivalents |
( |
) |
( |
|||||
Cash and cash equivalents, beginning of period |
||||||||
|
|
|
|
|||||
Cash and cash equivalents, end of period |
$ |
$ |
||||||
|
|
|
|
|||||
Supplemental disclosure of cash flow information |
||||||||
Issuance of liability classified warrants in connection with debt |
$ | $ | ||||||
Issuance of equity classified warrants in connection with debt |
$ | $ | ||||||
Capital expenditures not yet paid |
$ | $ | ||||||
Interest paid |
$ | $ |
December 31, 2021 |
December 31, 2020 |
|||||||
Trade receivables |
$ | $ | ||||||
Allowance for doubtful accounts |
( |
) | ( |
) | ||||
|
|
|
|
|||||
Total accounts receivable |
$ |
$ |
December 31, 2021 |
December 31, 2020 |
|||||||
Balance at beginning of period |
$ | ( |
) | $ | ( |
) | ||
Provision for uncollectible accounts |
( |
) | ( |
) | ||||
Uncollectible accounts written off |
||||||||
|
|
|
|
|||||
Balance at end of period |
$ |
( |
) |
$ |
( |
) |
December 31, 2021 |
December 31, 2020 |
|||||||
Revenue for the years ended |
||||||||
Customer A |
< |
% |
% |
December 31, 2021 |
December 31, 2020 |
|||||||
Accounts receivable |
||||||||
Customer A |
< 0 |
% |
% | |||||
Customer B |
< |
% |
% |
December 31, 2021 |
December 31, 2020 |
|||||||
Raw materials |
$ | $ | ||||||
Work-in-process |
||||||||
Finished goods |
||||||||
|
|
|
|
|||||
Total Inventories |
$ |
$ |
Advanced Manufacturing Machinery & Quality Equipment |
||||
Computer & Office Hardware |
||||
Furniture & Fixtures |
||||
Internally Developed Software |
||||
Leasehold Improvements |
|
or estimated useful life |
|
• |
Identification of the contract, or contracts, with a customer; |
• |
Identification of the performance obligations in the contract; |
• |
Determination of the transaction price; |
• |
Allocation of the transaction price to the performance obligations in the contracts; and |
• |
Recognition of revenue when, or as, the Company satisfies a performance obligation |
Years Ended December 31, |
||||||||
2021 |
2020 |
|||||||
Revenues |
||||||||
Americas |
$ | $ | ||||||
Europe |
||||||||
Asia Pacific |
||||||||
|
|
|
|
|||||
Total |
$ |
$ |
December 31, 2021 |
December 31, 2020 |
|||||||
Advanced manufacturing machinery & quality equipment |
$ | $ | ||||||
Software |
||||||||
Computer & office hardware |
||||||||
Furniture and fixtures |
||||||||
Leasehold improvements |
||||||||
|
|
|
|
|||||
Total property and equipment |
$ |
$ |
||||||
Less: accumulated depreciation and amortization |
( |
) | ( |
) | ||||
|
|
|
|
|||||
Property and equipment (Net) |
$ |
$ |
||||||
|
|
|
|
December 31, 2021 |
December 31, 2020 |
|||||||
2018 ATEL Loan |
$ | $ | ||||||
2020 MFS Loan |
||||||||
Manufacturers Capital Promissory Notes |
||||||||
Related Party - Energize Convertible Debt |
||||||||
2020 SVB Loan |
||||||||
2021 SVB Loan |
||||||||
Related Party - Drive Capital Convertible Debt |
||||||||
Related Party - ECP Holdings Convertible Debt |
||||||||
|
|
|
|
|||||
Total Outstanding Principal |
$ |
$ |
||||||
Less: Discounts |
( |
) | ||||||
Less: Deferred financing fees |
( |
) | ( |
) | ||||
|
|
|
|
|||||
Total Outstanding debt |
$ |
$ |
||||||
Fair value of derivatives |
||||||||
|
|
|
|
|||||
Total Debt and derivative liabilities |
$ |
$ |
||||||
|
|
|
|
Amounts |
||||
2022 |
$ | |||
2023 |
||||
2024 |
||||
2025 |
||||
|
|
|||
Total |
$ |
|||
|
|
Year ended December 31, |
||||
(in thousands) | 2021 |
|||
Contractual interest expense |
$ | |||
Amortization of deferred financing costs and convertible debt discount |
||||
|
|
|||
Total Interest Expense |
$ |
|||
Effective interest rate |
% |
As of |
||||
(in thousands) | December 31, 2021 |
|||
Unamortized deferred issuance costs, derivative, and warrants |
$ | |||
Net carrying amount of convertible note |
||||
|
|
|||
Principal value of convertible note |
$ |
|||
Fair value of convertible note and derivative liability |
||||
Fair value of convertible note excluding the derivative liability |
$ | |||
Fair value level |
Level 3 |
Year ended December 31, |
||||
(in thousands) | 2021 |
|||
Contractual interest expense |
$ | |||
Amortization of deferred financing costs and convertible debt discount |
||||
|
|
|||
Total Interest Expense |
$ |
|||
Effective interest rate |
% |
As of |
||||
(in thousands) | December 31, |
|||
Unamortized deferred issuance costs, derivative, and warrants |
$ | |||
Net carrying amount of convertible note |
||||
|
|
|||
Principal value of convertible note |
$ |
|||
Fair value of convertible note and derivative liability |
||||
Fair value of convertible note excluding the derivative liability |
$ | |||
Fair value level |
Level 3 |
Year ended December 31, |
||||
(in thousands) | 2021 |
|||
Contractual interest expense |
$ | |||
Amortization of deferred financing costs and convertible debt discount |
||||
|
|
|||
Total Interest Expense |
$ |
|||
Effective interest rate |
% |
(in thousands) | As of December 31, 2021 |
|||
Unamortized deferred issuance costs, derivative, and warrants |
$ | |||
Net carrying amount of convertible note |
||||
|
|
|||
Principal value of convertible note |
$ |
|||
Fair value of convertible note and derivative liability |
||||
Fair value of convertible note excluding the derivative liability |
$ | |||
Fair value level |
Level 3 |
Years Ended December 31, |
||||||||
2021 |
2020 |
|||||||
United States |
$ | ( |
) | $ | ( |
) | ||
Foreign |
||||||||
|
|
|
|
|||||
Total |
$ |
( |
) |
$ |
( |
) | ||
|
|
|
|
Years Ended December 31, |
||||||||
2021 |
2020 |
|||||||
Federal statutory income tax rate |
% | % | ||||||
Federal income tax at statutory rates |
$ | ( |
) | $ | ( |
) | ||
Valuation Allowance |
||||||||
Other, permanent difference |
||||||||
|
|
|
|
|||||
Total income tax provision |
$ |
$ |
||||||
|
|
|
|
|||||
Effective income tax rate |
% |
% |
Years Ended December 31, |
||||||||
2021 |
2020 |
|||||||
Deferred Tax Assets: |
||||||||
Allowance for doubtful accounts |
$ | $ | ||||||
Accruals and reserves |
||||||||
Disallowed interest carryforwards |
||||||||
Net operating loss and other carryforwards |
||||||||
Stock based compensation |
||||||||
Other, net |
||||||||
Deferred tax assets before valuation allowance |
$ | $ | ||||||
Valuation Allowance |
( |
) | ( |
) | ||||
Total Deferred Tax Assets, net of valuation allowance |
||||||||
Deferred Tax Liabilities: |
||||||||
Depreciation |
||||||||
Total Deferred Tax Liabilities |
$ |
|||||||
Net Deferred Tax Assets (Liabilities) |
$ |
$ |
Valuation allowance as of January 1, 2020 |
$ | |||
Adjustments to the valuation allowance |
||||
Valuation allowances as of December 31, 2020 |
||||
Adjustments to the valuation allowance |
||||
Valuation allowance as of December 31, 2021 |
$ |
Number of warrants |
Weighted average exercise price |
Weighted average grant date fair value |
Weighted average remaining contractual term (years) |
|||||||||||||
Outstanding at January 1, 2020 |
$ | |
$ | |||||||||||||
Granted |
||||||||||||||||
Exercised |
||||||||||||||||
|
|
|
|
|
|
|
|
|||||||||
Outstanding at December 31, 2020 |
$ | $ | ||||||||||||||
|
|
|
|
|
|
|
|
|||||||||
Exercisable |
||||||||||||||||
|
|
|||||||||||||||
Number of warrants |
Weighted average exercise price |
Weighted average grant date fair value |
Weighted average remaining contractual term (years) |
|||||||||||||
Outstanding at January 1, 2021 |
$ | $ | ||||||||||||||
Granted |
||||||||||||||||
Exercised |
||||||||||||||||
|
|
|
|
|
|
|
|
|||||||||
Outstanding at December 31, 2021 |
$ | $ | ||||||||||||||
|
|
|
|
|
|
|
|
|||||||||
Exercisable |
||||||||||||||||
|
|
December 31, 2021 |
December 31, 2020 |
|||||||
Cost of Revenues |
$ | $ | ||||||
General and Administrative |
$ | $ | ||||||
Selling and Marketing |
$ | $ | ||||||
Research & Development |
$ | $ |
Number of Shares/Units |
Weighted Average Exercise Price |
Weighted Average Grant Date Fair Value |
Weighted Average Remaining Contractual Life |
Aggregate Intrinsic Value |
||||||||||||||||
(years) | ||||||||||||||||||||
Balance at January 1, 2021 |
$ |
$ |
$ |
|||||||||||||||||
Granted |
||||||||||||||||||||
Exercised |
||||||||||||||||||||
Forfeited |
||||||||||||||||||||
Expired |
||||||||||||||||||||
|
|
|
|
|
|
|
|
|
|
|||||||||||
Balance at December 31, 2021 |
$ |
$ |
$ |
|||||||||||||||||
Exercisable at December 31, 2021 |
||||||||||||||||||||
Expected to vest at December 31, 2021 |
2020 |
||||
Expected annual dividend yield |
% | |||
Expected volatility |
% | |||
Risk-free rate of return |
% | |||
Expected option term (years) |
Number of units |
Weighted average grant date fair value |
|||||||
Non-vested at January 1, 2021 |
$ | |||||||
Granted |
||||||||
Vested |
||||||||
Forfeited |
( |
) | ||||||
Non-vested at December 31, 2021 |
$ |
Level 1 - | Inputs used to measure fair value are unadjusted quoted prices that are available in active markets for the identical assets or liabilities as of the reporting date. Therefore, determining fair value for Level 1 investments generally does not require significant judgment, and the estimation is not difficult. |
Level 2 - | Pricing is provided by third-party sources of market information obtained through investment advisors. The Company does not adjust for or apply any additional assumptions or estimates to the pricing information received from its advisors. |
Level 3 - | Inputs used to measure fair value are unobservable inputs that are supported by little or no market activity and reflect the use of significant management judgment. These values are generally determined using pricing models for which the assumptions utilize management’s estimates of market participant assumptions. The determination of fair value for Level 3 instruments involves the most management judgment and subjectivity. |
December 31, 2021 |
||||||||||||
Quoted prices in active markets |
Significant other observable inputs |
Significant unobservable inputs |
||||||||||
(Level 1) | (Level 2) | (Level 3) | ||||||||||
Cash sweep and money mar accountsket |
$ | $ | $ | |||||||||
Related party derivative liabilities |
$ | — | $ | — | $ | |||||||
Warrant liability |
$ | — | $ | — | $ |
December 31, 2020 |
||||||||||||
Quoted prices in active markets |
Significant other observable inputs |
Significant unobservable inputs |
||||||||||
(Level 1) |
(Level 2) |
(Level 3) |
||||||||||
Cash sweep and money market accounts |
$ | $ | — | $ | — | |||||||
Warrant liability |
$ | — | $ | — | $ |
December 31, 2021 |
December 31, 2020 |
|||||||
Beginning balance |
$ | $ | ||||||
Additions |
||||||||
Change in fair value recorded in earnings |
||||||||
|
|
|
|
|||||
Ending balance |
$ | $ | ||||||
|
|
|
|
December 31, 2021 |
December 31, 2020 |
|||||||
Stock Price |
$ | $ | ||||||
Term (Years) |
||||||||
Volatility |
% | % | ||||||
Risk-free rate of return |
% | % | ||||||
Dividend Yield |
% | % |
December 31, 2021 |
December 31, 2020 |
|||||||
Beginning balance |
$ | $ | ||||||
Additions |
— |
— |
||||||
Change in fair value recorded in earnings |
||||||||
|
|
|
|
|||||
Ending balance |
$ | $ | ||||||
|
|
|
|
December 31, 2021 |
December 31, 2020 |
|||||||
Stock/ Price |
$ | $ | ||||||
Term (Years) |
||||||||
Volatility |
% | % | ||||||
Risk-free rate of return |
% | % | ||||||
Dividend Yield |
% | % |
December 31, 2021 |
||||
Beginning balance |
$ | |||
Additions |
||||
Change in fair value recorded in earnings |
||||
|
|
|||
Ending balance |
$ | |||
|
|
Energize Ventures |
December 31, 2021 |
April 13, 2021 (Inception) |
||||||
Cost of debt |
% | % | ||||||
Term (Years) |
||||||||
Present value factor |
||||||||
Drive Capital |
December 31, 2021 |
August 24, 2021 (Inception) |
||||||
Cost of debt |
% | % | ||||||
Term (Years) |
||||||||
Present value factor |
||||||||
ECP Holdings |
December 31, 2021 |
October 26, 2021 (Inception) |
||||||
Cost of debt |
% | % | ||||||
Term (Years) |
||||||||
Present value factor |
Amounts |
||||
2022 |
||||
2023 |
||||
2024 |
||||
2025 |
||||
2026 |
||||
|
|
|||
Total |
$ |
|||
|
|
December 31, 2021 |
December 31, 2020 |
|||||||
Income (loss) available to Common Stockholders per share: |
||||||||
Net loss |
$ | ( |
) | $ | ( |
) | ||
Weighted average common shares outstanding: |
||||||||
Basic and Diluted |
||||||||
Net loss per share – Basic and Diluted |
$ | ( |
) | $ | ( |
) | ||
|
|
|
|
• | Each issued and outstanding share of Fast Radius capital stock was converted into and exchanged for |
• | Outstanding p rincipal on the mandatorily redeemable Fast Radius convertible notes were converted into |
• | |
• | |
• | $ |
• |
The Company identified that it recorded revenue in the third quarter of 2021 prior to the criteria for revenue recognition under U.S. generally accepted accounting principles being satisfied. Specifically, certain transactions were recorded as revenue for which the Company could not assert that collection from the customer was probable under the requirements of Accounting Standard Codification (“ASC”) 606. Accordingly, for the subject revenue transactions, revenue and accounts receivable balances were reduced by $ |
• |
The Company identified that it had capitalized certain costs related to the development of internal-use software that were not eligible for capitalization during the nine-month period ended September 30, 2021. Accordingly, property and equipment, net has been reduced by $ |
• |
The Company identified that it over accrued certain expenses related to the Business Combination as of September 30, 2021. Accordingly, accrued and other liabilities was reduced by $ |
• |
The Company identified that it classified certain cash payments related to direct and incremental equity issuance-related transaction costs within operating cash flows rather than financing cash flows on the condensed consolidated statement of cash flows for the nine months ended September 30, 2021. Accordingly, operating cash flows increased and financing cash flows decreased by $ |
As of September 30, 2021 |
As previously reported |
Restatement impact |
As Restated |
|||||||||
Assets |
||||||||||||
Current assets |
||||||||||||
Cash and cash equivalents |
$ |
$ |
$ |
|||||||||
Accounts receivable, net of allowances for doubtful accounts of $ |
( |
) |
||||||||||
Inventories |
||||||||||||
Prepaid production costs |
||||||||||||
Prepaid expenses and other current assets |
||||||||||||
|
|
|
|
|
|
|||||||
Total current assets |
$ |
$ |
( |
) |
$ |
|||||||
Non-current assets |
||||||||||||
Property and equipment, net |
( |
) |
||||||||||
Other non-current assets |
||||||||||||
|
|
|
|
|
|
|||||||
Total assets |
$ |
$ |
( |
) |
$ |
|||||||
|
|
|
|
|
|
|||||||
Liabilities, temporary equity and stockholders’ deficit |
||||||||||||
Current liabilities |
||||||||||||
Accounts payable |
$ |
$ |
$ |
|||||||||
Accrued compensation |
||||||||||||
Accrued and other liabilities |
( |
) |
||||||||||
Advances from customers |
||||||||||||
Accrued liabilities – related parties |
||||||||||||
Warrant liability |
||||||||||||
Current portion of long-term debt |
||||||||||||
|
|
|
|
|
|
|||||||
Total current liabilities |
$ |
$ |
( |
) |
$ |
|||||||
|
|
|
|
|
|
|||||||
Other long-term liabilities |
||||||||||||
Term loans - net of current portion and debt issuance costs |
||||||||||||
Related party convertible notes and derivative liabilities |
||||||||||||
|
|
|
|
|
|
|||||||
Total liabilities |
$ |
$ |
( |
) |
$ |
|||||||
|
|
|
|
|
|
|||||||
Commitments and contingencies (Note 11) |
||||||||||||
Temporary equity |
||||||||||||
Series Seed Preferred stock; par value $ |
$ |
$ |
||||||||||
Series Seed - 1 Preferred stock; par value $ |
||||||||||||
Series A - 1 Preferred stock; par value $ |
||||||||||||
Series A - 2 Preferred stock; par value $ |
||||||||||||
Series A - 3 Preferred stock; par value $ |
||||||||||||
Series B Preferred stock; par value $ |
||||||||||||
|
|
|
|
|
|
|||||||
Total temporary equity |
$ |
$ |
$ |
|||||||||
Stockholders’ deficit |
||||||||||||
Common Stock, $ |
||||||||||||
Treasury Stock, held at cost; |
( |
) |
( |
) | ||||||||
Additional paid-in capital |
||||||||||||
Accumulated deficit |
( |
) |
( |
) |
( |
) | ||||||
|
|
|
|
|
|
|||||||
Total stockholders’ deficit |
( |
) |
( |
) |
( |
) | ||||||
|
|
|
|
|
|
|||||||
Total liabilities, temporary equity and stockholders’ deficit |
$ |
$( |
$ |
|||||||||
|
|
|
|
|
|
For the nine months ended September 30, 2021 |
As previously reported |
Restatement impact |
As Restated |
|||||||||
Revenues |
$ |
$ |
( |
) |
$ |
|||||||
Cost of revenues |
( |
) |
||||||||||
|
|
|
|
|
|
|||||||
Gross profit |
( |
) |
( |
) | ||||||||
Operating expenses |
||||||||||||
Sales and marketing |
( |
) |
||||||||||
General and administrative |
( |
) |
||||||||||
Research and development |
||||||||||||
|
|
|
|
|
|
|||||||
Total operating expenses |
||||||||||||
Loss from operations |
( |
) |
( |
) |
( |
) | ||||||
Change in fair value of warrants |
( |
) |
— |
( |
) | |||||||
Change in fair value of derivative liability |
( |
) |
— |
( |
) | |||||||
Interest income and other income |
— |
|||||||||||
Interest expense, including amortization of debt issuance costs |
( |
) |
— |
( |
) | |||||||
|
|
|
|
|
|
|||||||
Loss before income taxes |
( |
) |
( |
) |
( |
) | ||||||
Income tax expense (benefit) |
||||||||||||
|
|
|
|
|
|
|||||||
Net loss and comprehensive loss |
$ |
( |
) |
$ |
( |
) |
$ |
( |
) | |||
|
|
|
|
|
|
|||||||
Net loss per share |
||||||||||||
Basic and diluted |
$ |
( |
) |
( |
) |
$ |
( |
) | ||||
Weighted average shares outstanding: |
||||||||||||
Basic and diluted |
Convertible Preferred Stock 1 |
Common Stock |
Treasury Stock |
Additional paid- in capital |
Accumulated Deficit |
Total |
|||||||||||||||||||||||||||||||
As previously reported |
Shares |
Amount |
Shares |
Amount |
Shares |
Amount |
Amount |
Amount |
Amount |
|||||||||||||||||||||||||||
Balance at January 1, 2021 |
$ |
$ |
( |
) |
$ |
( |
) |
$ |
$ |
( |
) |
$ |
( |
) | ||||||||||||||||||||||
Net loss |
( |
) |
( |
) | ||||||||||||||||||||||||||||||||
Issuance of equity warrants to related party |
||||||||||||||||||||||||||||||||||||
Issuance of equity warrants |
||||||||||||||||||||||||||||||||||||
Exercise of stock options and release of notes’ recourse provision |
||||||||||||||||||||||||||||||||||||
Stock-based compensation |
||||||||||||||||||||||||||||||||||||
|
|
|
|
|
|
|
|
|
|
|
|
|
|
|
|
|
|
|||||||||||||||||||
Balance at September 30, 2020 |
$ |
$ |
( |
) |
$ |
( |
) |
$ |
$ |
( |
) |
$ |
( |
) | ||||||||||||||||||||||
|
|
|
|
|
|
|
|
|
|
|
|
|
|
|
|
|
|
|||||||||||||||||||
Restatement impact |
||||||||||||||||||||||||||||||||||||
Net income |
$ |
$ |
$ |
$ |
$ |
( |
) |
$ |
( |
) | ||||||||||||||||||||||||||
As Restated |
||||||||||||||||||||||||||||||||||||
Balance at January 1, 2021 |
$ |
$ |
( |
) |
$ |
( |
) |
$ |
$ |
( |
) |
$ |
( |
) | ||||||||||||||||||||||
Net loss |
( |
) |
( |
) | ||||||||||||||||||||||||||||||||
Issuance of equity warrants to related party |
||||||||||||||||||||||||||||||||||||
Issuance of equity warrants |
||||||||||||||||||||||||||||||||||||
Exercise of stock options and release of notes’ recourse provision |
||||||||||||||||||||||||||||||||||||
Stock-based compensation |
||||||||||||||||||||||||||||||||||||
|
|
|
|
|
|
|
|
|
|
|
|
|
|
|
|
|
|
|||||||||||||||||||
Balance at September 30, 2021 |
$ |
$ |
( |
) |
$ |
( |
) |
$ |
$ |
( |
) |
$ |
( |
) | ||||||||||||||||||||||
|
|
|
|
|
|
|
|
|
|
|
|
|
|
|
|
|
|
For the nine months ended September 30, 2021 |
As previously reported |
Restatement impact |
As Restated |
|||||||||
Cash flows from operating activities |
||||||||||||
Net loss |
$ |
( |
) |
$ |
( |
) |
$ |
( |
) | |||
Adjustments to reconcile net loss to net cash used in operating activities |
||||||||||||
Depreciation and amortization |
( |
) |
||||||||||
Amortization of deferred financing fees and convertible debt discount |
||||||||||||
Stock-based compensation |
||||||||||||
Loss on disposal of assets |
||||||||||||
Change in fair value of warrants |
||||||||||||
Change in fair value of derivative liability |
||||||||||||
Provision for doubtful accounts |
||||||||||||
Other |
( |
) |
( |
) | ||||||||
Changes in operating assets and liabilities |
||||||||||||
Accounts receivable |
( |
) |
( |
) | ||||||||
Inventories |
( |
) |
( |
) | ||||||||
Prepaid production costs |
( |
) |
( |
) | ||||||||
Prepaid expenses and other current assets |
( |
) |
( |
) | ||||||||
Accounts payable |
||||||||||||
Accrued compensation and other liabilities |
( |
) |
||||||||||
Advances from customers |
||||||||||||
Deferred revenue |
( |
) |
( |
) | ||||||||
|
|
|
|
|
|
|||||||
Cash used in operating activities |
$ |
( |
) |
$ |
( |
) |
$ |
( |
) | |||
|
|
|
|
|
|
|||||||
Cash flows from investing activities |
||||||||||||
Additions to property, plant and equipment |
( |
) |
( |
) | ||||||||
|
|
|
|
|
|
|||||||
Cash used in investing activities |
$ |
( |
) |
$ |
$ |
( |
) | |||||
|
|
|
|
|
|
|||||||
Cash flows from financing activities |
||||||||||||
Proceeds from term loans |
$ |
|||||||||||
Repayment of term loans |
( |
) |
( |
) | ||||||||
Proceeds from convertible notes and warrants with related parties |
||||||||||||
Convertible notes issuance costs |
( |
) |
( |
) | ||||||||
Deferred financing fees |
— |
( |
) |
( |
) | |||||||
Proceeds from exercise of stock options |
||||||||||||
|
|
|
|
|
|
|||||||
Cash provided by financing activities |
$ |
$ |
( |
) |
$ |
|||||||
|
|
|
|
|
|
|||||||
Change in cash and cash equivalents |
( |
) |
( |
) | ||||||||
Cash and cash equivalents, beginning of period |
||||||||||||
|
|
|
|
|
|
|||||||
Cash and cash equivalents, end of period |
$ |
$ |
$ |
|||||||||
|
|
|
|
|
|
Amount |
||||
Securities and Exchange Commission registration fee |
$ | 15,128.56 |
||
Accounting fees and expenses |
* | |||
Legal fees and expenses |
* | |||
Transfer agent and registrar fees and expenses |
* | |||
Financial printing and miscellaneous expenses |
* | |||
|
|
|||
Total expenses |
$ | * |
* | These fees are calculated based on the securities offered and the number of issuances and accordingly cannot be defined at this time. |
Item 16. |
Exhibits and Financial Statement Schedules. |
(a) | Exhibits. |
Incorporated by Reference |
||||||||||||||||||
Exhibit Number |
Description |
Schedule/ Form |
File No. |
Exhibit |
Filing Date |
|||||||||||||
23.2* | Consent of Deloitte & Touche LLP (with respect to Legacy Fast Radius’s consolidated financial statements) | |||||||||||||||||
23.3* | Consent of DLA Piper LLP (US) (included in Exhibit 5.1) | |||||||||||||||||
24.1* | Power of Attorney (included on signature page) | |||||||||||||||||
101.INS* | Inline XBRL Instance Document (the instance document does not appear in the Interactive Data File because iXBRL tags are embedded within the Inline XBRL document) | |||||||||||||||||
101.SCH* | Inline XBRL Taxonomy Extension Schema Document | |||||||||||||||||
101.CAL* | Inline XBRL Taxonomy Calculation Linkbase Document | |||||||||||||||||
101.DEF* | Inline XBRL Taxonomy Definition Linkbase Document | |||||||||||||||||
101.LAB* | Inline XBRL Taxonomy Extension Label Linkbase Document | |||||||||||||||||
101.PRE* | Inline XBRL Taxonomy Extension Presentation Linkbase Document | |||||||||||||||||
104* | Cover Page Interactive Data File, formatted in Inline XBRL (included within the Exhibit 101 attachments) | |||||||||||||||||
107* | Filing Fee Table |
* | Filed herewith. |
† | Certain of the exhibits and schedules to this Exhibit have been omitted in accordance with Regulation S-K Item 601. The Company agrees to furnish a copy of all omitted exhibits and schedules to the SEC upon its request. |
# | Indicates a management contract or compensatory plan, contract or arrangement. |
+ | Certain portions of this exhibit have been omitted pursuant to Regulation S-K, Item (601)(b)(10). |
Item 17. |
Undertakings. |
Fast Radius, Inc. | ||
By: | /s/ Lou Rassey | |
Name: Lou Rassey | ||
Title: Chief Executive Officer |
Signature |
Title |
Date | ||
/s/ Lou Rassey Lou Rassey |
Chief Executive Officer, Chairperson and Director ( Principal Executive Officer |
April 21, 2022 | ||
/s/ Prithvi Gandhi Prithvi Gandhi |
Chief Financial Officer ( Principal Financial and Accounting Officer |
April 21, 2022 | ||
/s/Matthew Flanigan Matthew Flanigan |
Director | April 21, 2022 | ||
/s/ Steven Koch Steven Koch |
Director | April 21, 2022 | ||
/s/ Matthew Maloney Matthew Maloney |
Director | April 21, 2022 | ||
/s/ Tyler Reeder Tyler Reeder |
Director | April 21, 2022 | ||
/s/ Nick Solaro Nick Solaro |
Lead Independent Director | April 21, 2022 | ||
/s/ Elizabeth Ziegler Elizabeth Ziegler |
Director | April 21, 2022 |