As filed with the Securities and Exchange Commission on January 8, 2021
Registration No. 333-
Delaware | | | 6162 | | | 47-1776572 |
(State or other jurisdiction of incorporation or organization) | | | (Primary Standard Industrial Classification Code Number) | | | (I.R.S. Employer Identification Number) |
Joseph H. Kaufman, Esq. Simpson Thacher & Bartlett LLP 425 Lexington Avenue New York, NY 10017 (212) 455-2000 | | | Michael Kaplan, Esq. Shane Tintle, Esq. Davis Polk & Wardwell LLP 450 Lexington Avenue New York, NY 10017 (212) 450-4000 |
Large accelerated filer | | | ☐ | | | Accelerated filer | | | ☐ |
Non-accelerated filer | | | ☒ | | | Smaller reporting company | | | ☐ |
| | | | | Emerging growth company | | | ☒ |
Title of Each Class of Securities to be Registered | | | Proposed Maximum Aggregate Offering Price(1)(2) | | | Amount of Registration Fee |
Common stock, par value $0.01 per share | | | $100,000,000 | | | $10,910 |
(1) | Includes additional shares of common stock that the underwriters have the option to purchase. See “Underwriting (Conflicts of Interest).” |
(2) | Estimated solely for the purpose of calculating the registration fee in accordance with Rule 457(o) of the Securities Act of 1933, as amended. |
| | | Per Share | | | Total | |
Price to the public | | | $ | | | $ |
Underwriting discounts and commissions(1) | | | $ | | | $ |
Proceeds to us (before expenses) | | | $ | | | $ |
Proceeds to the selling stockholders (before expenses) | | | $ | | | $ |
(1) | See “Underwriting (Conflicts of Interest)” for additional information regarding underwriter compensation. |
Goldman Sachs & Co. LLC | | | Wells Fargo Securities | | | Morgan Stanley | | | UBS Investment Bank |
Credit Suisse | | | J.P. Morgan | | | BofA Securities |
JMP Securities | | | Piper Sandler | | | R. Seelaus & Co., LLC | | | SPC Capital Markets LLC |
Wedbush Securities | | | Zelman Partners LLC |
| | | Page | |
| | | ||
| | | ||
| | | ||
| | | ||
| | | ||
| | | ||
| | | ||
| | | ||
| | | ||
| | | ||
| | | ||
| | | ||
| | | ||
| | | ||
| | | ||
| | | ||
| | | ||
| | | ||
| | | ||
| | | ||
| | | ||
| | | ||
| | | ||
| | | ||
| | | ||
| | | ||
| | |
• | “An Agency” or “Agencies” refers to Ginnie Mae, the FHA, the VA, the USDA and/or GSEs. |
• | “CFPB” refers to the Consumer Financial Protection Bureau. |
• | “Fannie Mae” refers to the Federal National Mortgage Association. |
• | “FHA” refers to the Federal Housing Administration. |
• | “Freddie Mac” refers to the Federal Home Loan Mortgage Corporation. |
• | “Ginnie Mae” refers to the Government National Mortgage Association. |
• | “GSE” refers to Government-Sponsored Enterprises, such as Fannie Mae and Freddie Mac. |
• | “Holdings” refers to Home Point Capital LP, a Delaware limited partnership, the direct parent of Home Point Capital Inc. |
• | “HUD” refers to the U.S. Department of Housing and Urban Development. |
• | “MBS” refers to mortgage-backed securities—a type of asset-backed security that is secured by a group of mortgage loans. |
• | “MSRs” refers to mortgage servicing rights—the right and obligation to service a loan or pool of loans and to receive a servicing fee as well as certain ancillary income. MSRs may be bought and sold, resulting in the transfer of loan servicing obligations. MSRs are designated as such when the benefits of servicing the loans are expected to adequately compensate the servicer for performing the servicing. |
• | “Sponsor” or “Stone Point Capital” refers to Stone Point Capital LLC. |
• | “Trident Stockholders” refers, collectively, to one or more investment entities directly or indirectly managed by Stone Point Capital, including Trident VI, L.P., Trident VI Parallel Fund, L.P., Trident VI DE Parallel Fund, L.P. and Trident VI Professionals Fund, L.P. |
• | “USDA” means the U.S. Department of Agriculture. |
• | “VA” means the U.S. Department of Veterans Affairs. |

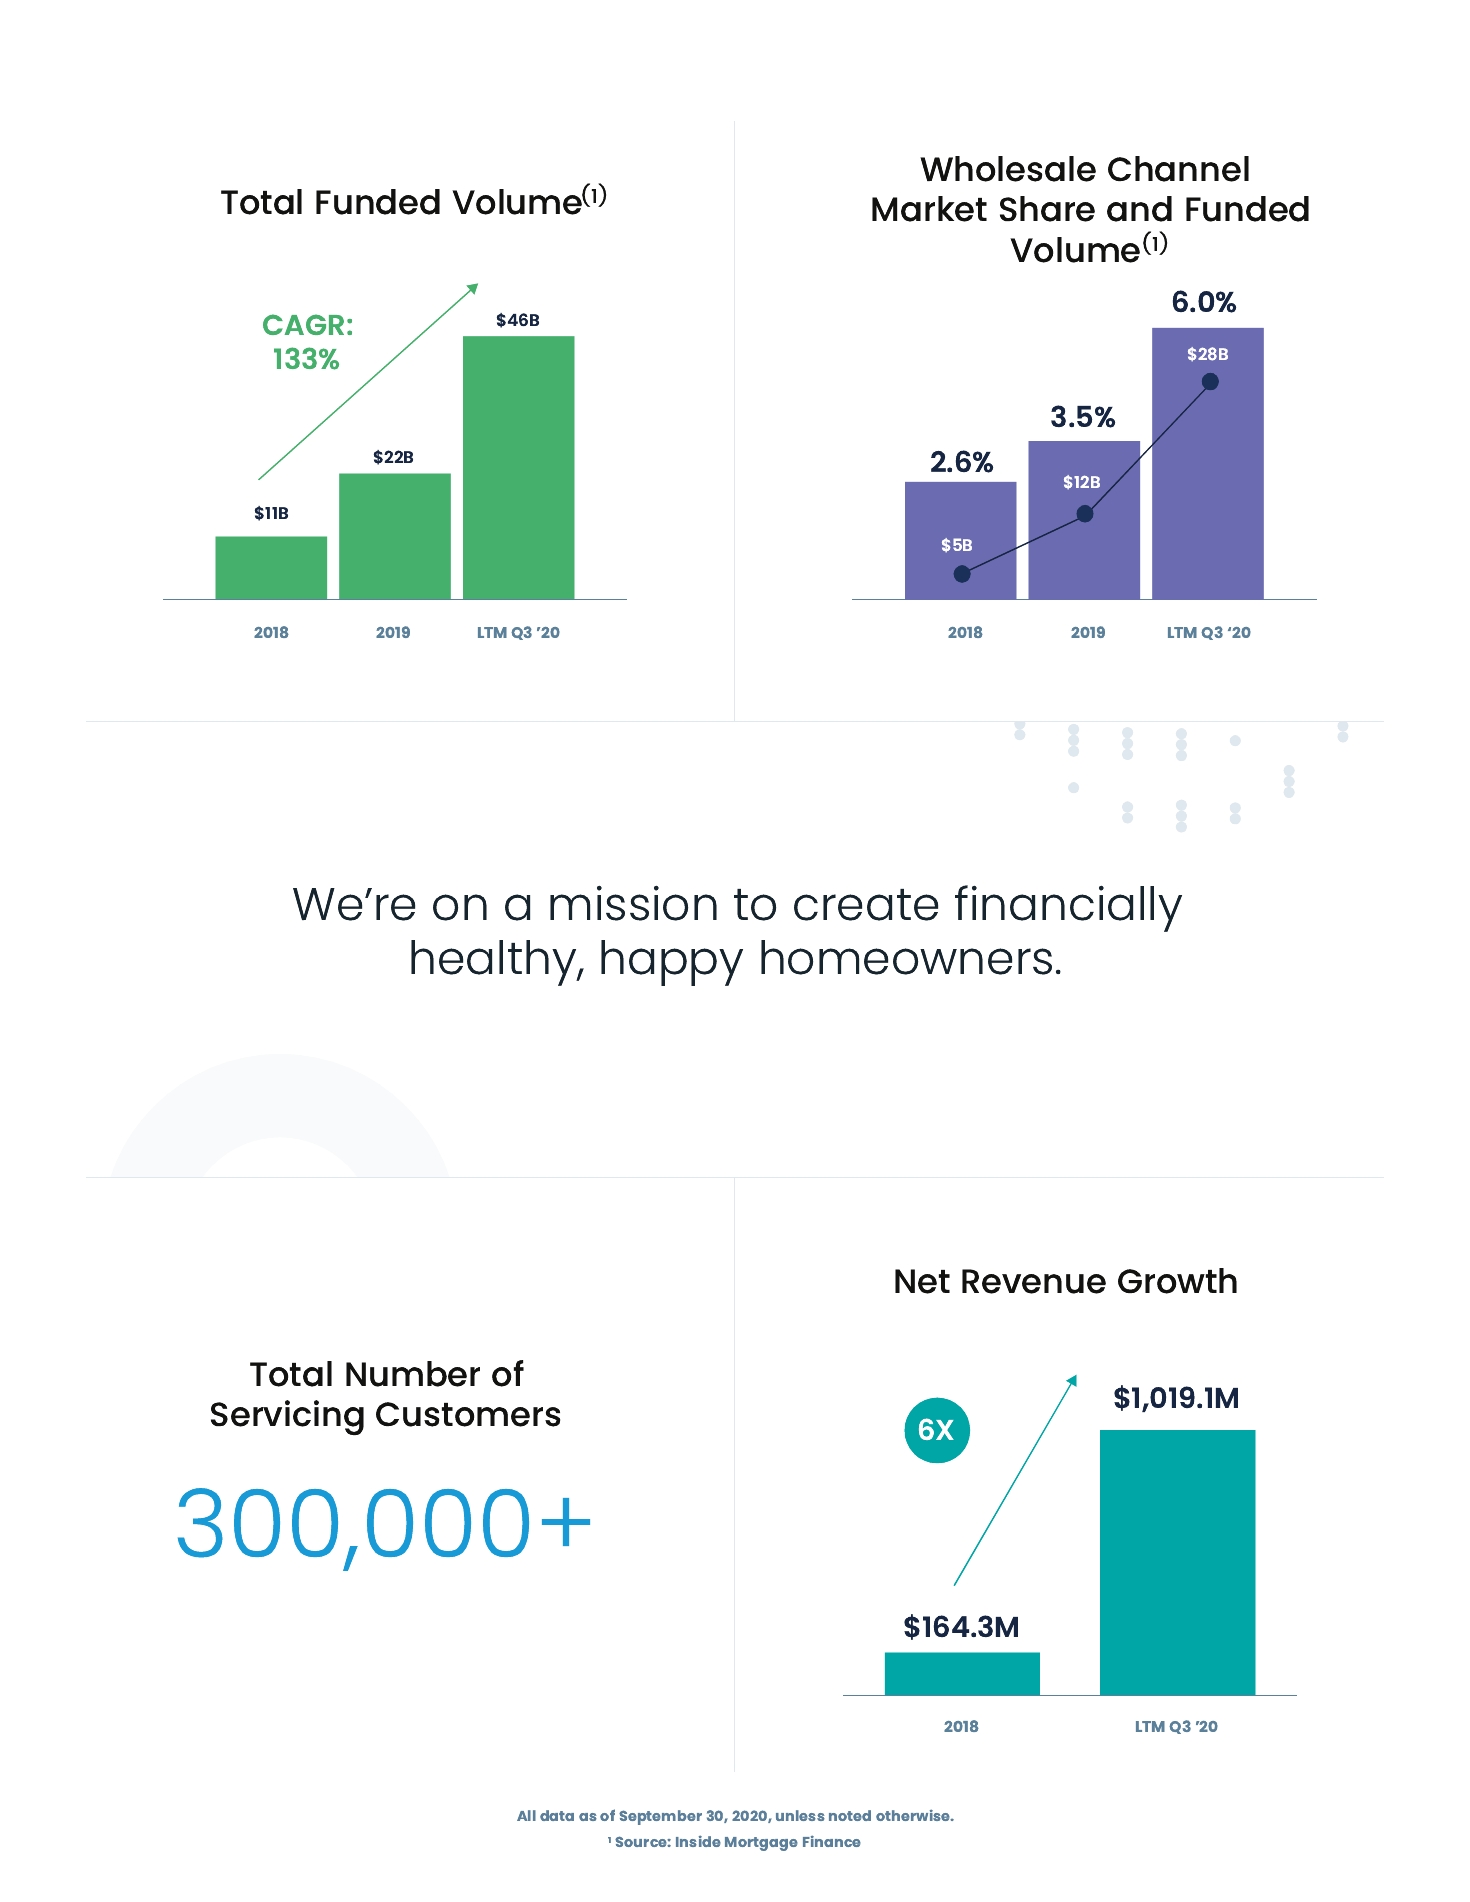
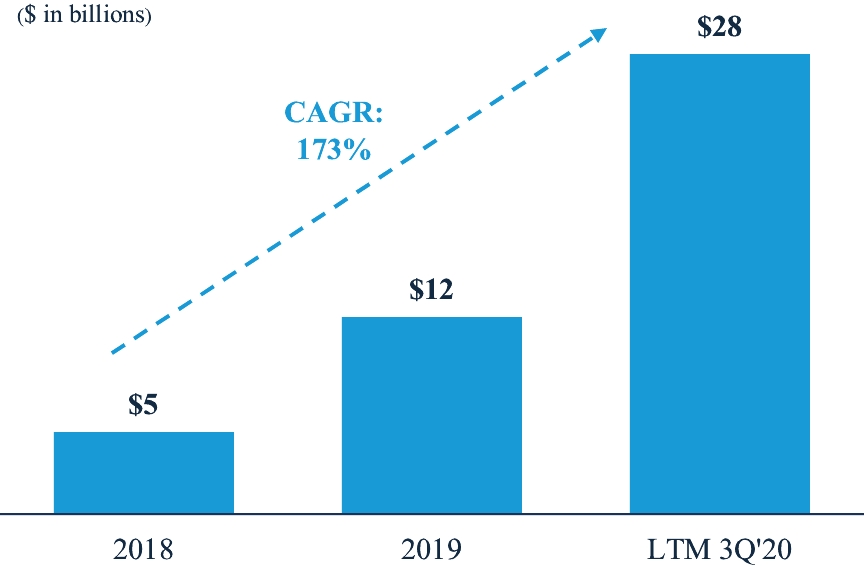
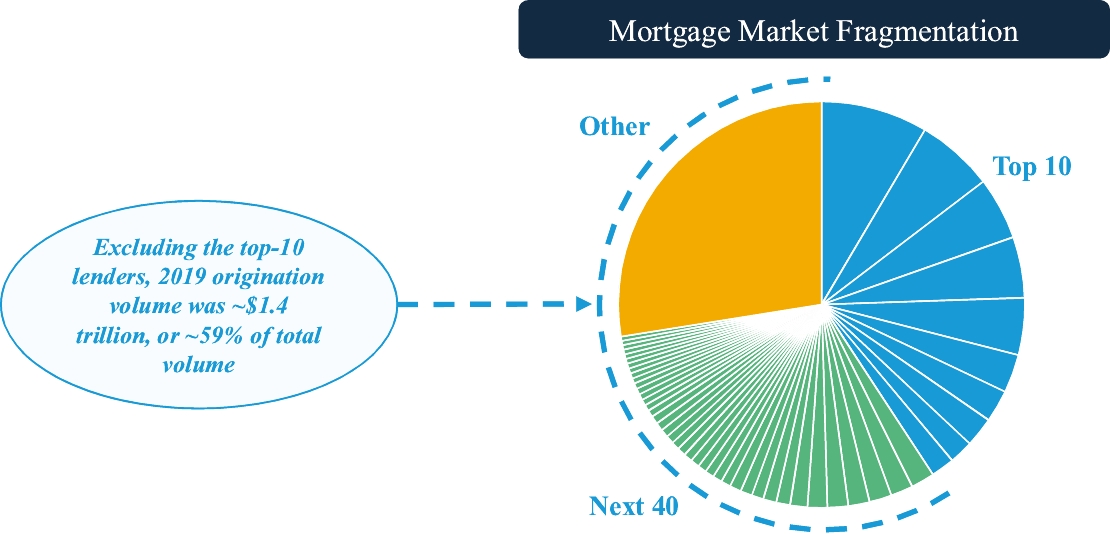
(1) | Total origination volume excludes origination volume from the Distributed Retail channel, which was included in discontinued operations in our results of operations for the year ended December 31, 2018. |
(2) | Origination volume figures used to calculate market share include $1.0 billion of Distributed Retail originations in our results of operations for the year ended December 31, 2018. |
* | LTM 3Q’20 represents the twelve months ended September 30, 2020. |

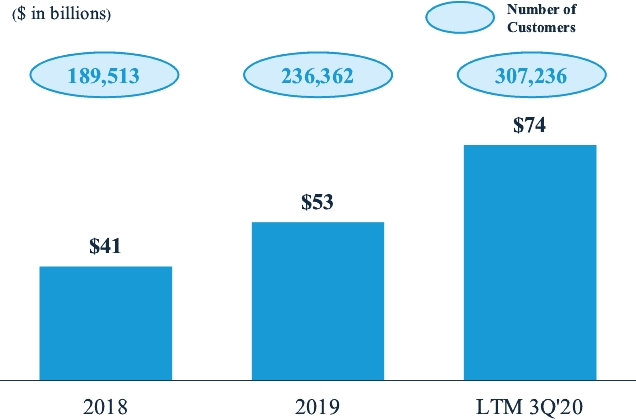
* | LTM 3Q’20 represents the twelve months ended September 30, 2020. |

* | LTM 3Q’20 represents the twelve months ended September 30, 2020. |
• | provide us efficient access to both purchase and refinance transactions throughout market cycles; |
• | benefit from the premise that in-market advisors will continue to be a cornerstone of the mortgage origination process; |
• | are highly scalable and flexible; and |
• | provide an optimized experience for our customers. |
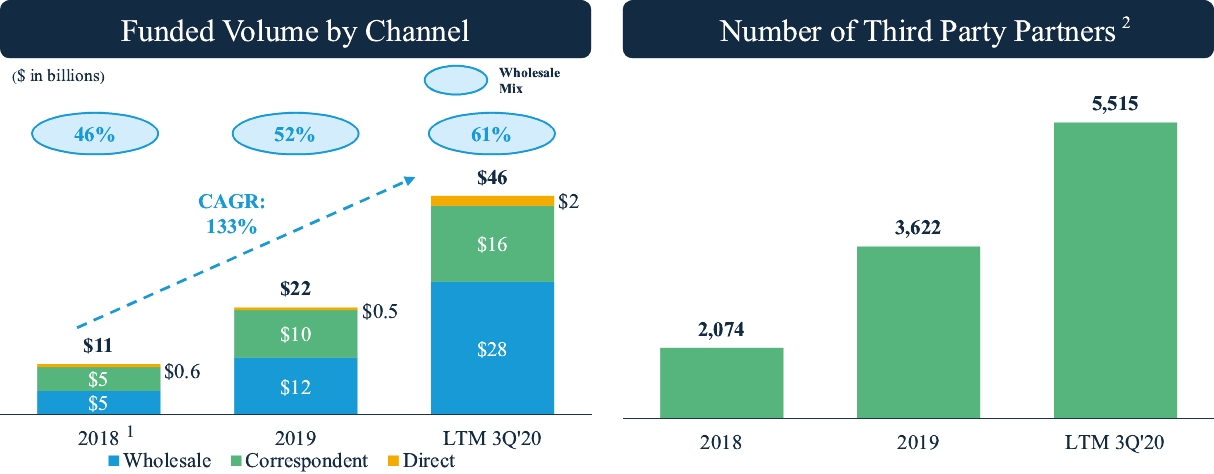
(1) | Total origination volume excludes origination volume from the Distributed Retail channel, which was included in discontinued operations in our results of operations for the year ended December 31, 2018. |
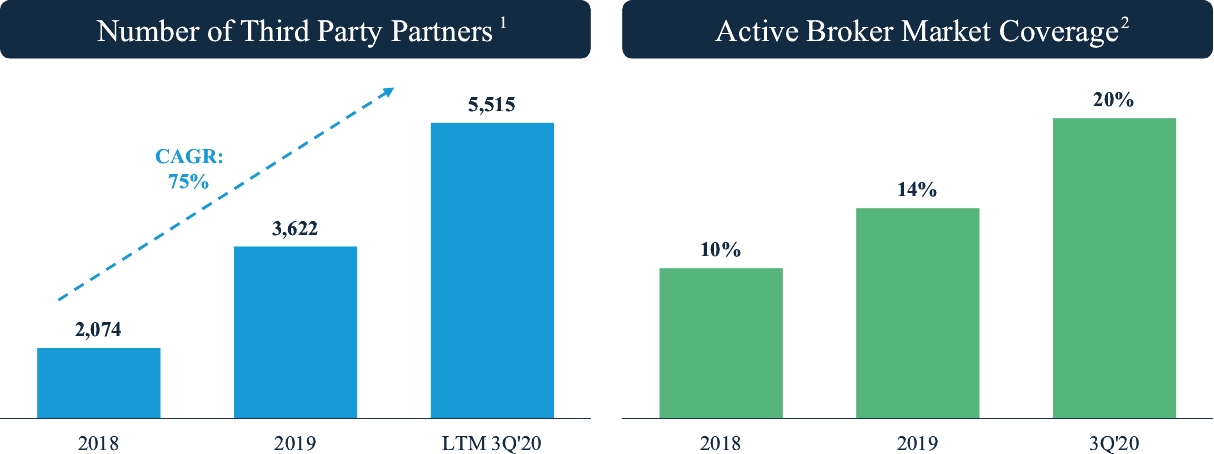
(2) | Third Party Partners includes both Broker Partners and Correspondent Partners. |
* | LTM 3Q’20 represents the twelve months ended September 30, 2020. |
* | LTM 3Q’20 represents the twelve months ended September 30, 2020. |
Activation Rate by Broker Partner Cohort | | | Wallet Share Growth by Broker Partner Cohort Following Initial Onboarding |


* | LTM 3Q’20 represents the twelve months ended September 30, 2020. |
(1) | Third Party Partners includes both Broker Partners and Correspondent Partners. |
(2) | Active broker market coverage is calculated as the total number of active brokers at Home Point divided by the total number of brokers in the market. |
* | LTM 3Q’20 represents the twelve months ended September 30, 2020. |

* | LTM 3Q’20 represents the twelve months ended September 30, 2020. |

* | LTM 3Q’20 represents the twelve months ended September 30, 2020. |


* | LTM 3Q’20 represents the twelve months ended September 30, 2020. |
* | LTM 3Q’20 represents the twelve months ended September 30, 2020. |


• | economies of scale: allows brokers to benefit from the scale of a larger organization while being able to run their business at a size that can be most responsive to their customers; |
• | optimal choice: rather than needing to work with one originator, brokers have the ability to partner with multiple lenders to determine the best financing alternative for their customers; and |
• | scalability of cost structure: reduce cost per loan and limited overhead. |


• | the spread of the COVID-19 (as defined below) outbreak and severe disruptions in the U.S. and global economy and financial markets it has caused; |
• | our reliance on our financing arrangements to fund mortgage loans and otherwise operate our business; |
• | the dependence of our loan origination and servicing revenues on macroeconomic and U.S. residential real estate market conditions; |
• | the requirement to repurchase mortgage loans or indemnify investors if we breach representations and warranties; |
• | counterparty risk; |
• | the requirement to make servicing advances that can be subject to delays in recovery or may not be recoverable in certain circumstances; |
• | competition for mortgage assets that may limit the availability of desirable originations, acquisitions and result in reduced risk-adjusted returns; |
• | our ability to continue to grow our loan origination business or effectively manage significant increases in our loan production volume; |
• | competition in the industry in which we operate; |
• | our ability to acquire loans and sell the resulting MBS in the secondary markets on favorable terms in our production activities; |
• | our being a “controlled company” within the meaning of rules and, as a result, qualifying for exemptions from certain corporate governance requirements; and |
• | our Sponsor controlling us and its interests conflicting with ours or yours in the future. |
• | the last day of the year following the fifth anniversary of this offering; |
• | the last day of the first year in which our annual gross revenues exceed an amount specified by regulation (currently $1.07 billion); |
• | the day we are deemed to be a “large accelerated filer” as defined in Rule 12b-2 under the Securities Exchange Act of 1934, as amended, or the Exchange Act, which would occur if the market value of our common stock held by non-affiliates exceeded $700.0 million as of the last business day of the second quarter of such year; and |
• | the date on which we have issued more than $1.0 billion in non-convertible debt securities during the preceding three-year period. |
• | no exercise of the underwriters’ option to purchase additional shares of our common stock; |
• | an initial public offering price of $ per share of common stock, which is the midpoint of the estimated price range set forth on the cover page of this prospectus; |
• | the filing and effectiveness of our amended and restated certificate of incorporation and the adoption of our amended and restated bylaws immediately prior to the consummation of this offering; |
• | the -for-one stock split of our common stock, which we intend to effectuate prior to the effectiveness of the registration statement of which this prospectus forms a part; and |
• | the merger of Holdings with and into the Company concurrent with the consummation of this offering, with the Company as the surviving entity. |
• | shares of common stock issuable upon exercise of outstanding options, (i) of which are vested, with a weighted-average exercise price of $ per share, and (ii) of which are not vested, with a weighted-average exercise price of $ per share, in each case, issued under our 2015 Option Plan. See “Executive Compensation—Narrative Disclosure to Summary Compensation Table—Equity Awards”; and |
• | shares of common stock reserved for future issuance under the 2021 Incentive Plan and shares of common stock reserved for future issuance under the 2021 Employee Stock Purchase Plan, each of which we intend to adopt in connection with this offering. See “Executive Compensation—Actions in Connection with this Offering.” |
| | | Nine months ended September 30, | | | Year ended December 31, | |||||||
(In thousands, except shares and per share amounts) | | | 2020 | | | 2019 | | | 2019 | | | 2018 |
| | | (unaudited) | | | (audited) | |||||||
Statement of Operations Data | | | | | | | | | ||||
Gain on loans, net | | | $962,778 | | | $135,495 | | | $199,501 | | | $84,068 |
Loan fee income | | | 60,630 | | | 19,829 | | | 32,112 | | | 19,603 |
Interest income | | | 42,370 | | | 35,101 | | | 51,801 | | | 35,179 |
Interest expense | | | (47,845) | | | (41,933) | | | (57,942) | | | (47,486) |
Interest loss, net | | | (5,475) | | | (6,832) | | | (6,141) | | | (12,307) |
Loan servicing fees | | | 133,904 | | | 104,089 | | | 144,228 | | | 119,049 |
Change in fair value of mortgage servicing rights | | | (230,524) | | | (151,168) | | | (173,134) | | | (47,312) |
Other income | | | 1,022 | | | 1,591 | | | 3,159 | | | 1,156 |
Total net revenue | | | 922,335 | | | 103,004 | | | 199,725 | | | 164,257 |
| | | | | | | | | |||||
Compensation and benefits | | | 251,462 | | | 104,571 | | | 156,197 | | | 109,577 |
Loan expense | | | 28,581 | | | 10,182 | | | 15,626 | | | 16,882 |
Loan servicing expense | | | 22,742 | | | 15,781 | | | 20,924 | | | 18,488 |
Occupancy and equipment | | | 17,006 | | | 12,567 | | | 16,768 | | | 20,521 |
General and administrative | | | 28,373 | | | 14,687 | | | 21,407 | | | 29,165 |
Depreciation and amortization | | | 4,222 | | | 4,394 | | | 5,918 | | | 7,612 |
Other expenses | | | 12,087 | | | 2,770 | | | 4,296 | | | 4,060 |
Total expenses | | | 364,473 | | | 164,952 | | | 241,136 | | | 206,305 |
| | | | | | | | | |||||
Income (loss) from continuing operations before income tax | | | 557,862 | | | (61,948) | | | (41,411) | | | (42,048) |
Income tax expense (benefit) from continuing operations | | | 149,306 | | | (14,080) | | | (9,500) | | | (10,485) |
Income from equity method investment | | | 14,050 | | | 2,591 | | | 2,701 | | | 209 |
Net income (loss) from continuing operations | | | 422,606 | | | (45,277) | | | (29,210) | | | (31,354) |
Net income from discontinued operations before tax | | | — | | | — | | | — | | | 9,707 |
Income tax provision | | | — | | | — | | | — | | | 2,550 |
Income from discontinued operations, net of tax | | | — | | | — | | | — | | | 7,157 |
Total net income (loss) | | | $422,606 | | | $(45,277) | | | $(29,210) | | | $(24,197) |
| | | Nine months ended September 30, | | | Year ended December 31, | |||||||
(In thousands, except shares and per share amounts) | | | 2020 | | | 2019 | | | 2019 | | | 2018 |
| | | (unaudited) | | | (audited) | |||||||
Basic and diluted earnings per share | | | | | | | | | ||||
Basic and diluted income (loss) per share from continuing operations | | | $4,226 | | | $(453) | | | $(292) | | | $(314) |
Basic and diluted earnings per share from discontinued operations | | | — | | | — | | | — | | | 72 |
Basic and diluted total net income (loss) per share | | | $4,226 | | | $(453) | | | $(292) | | | $(242) |
Weighted average shares of common stock outstanding | | | | | | | | | ||||
Basic and diluted | | | 100 | | | 100 | | | 100 | | | 100 |
| | | September 30, | | | December 31, | ||||
(In thousands, except shares and per share amounts) | | | 2020 | | | 2019 | | | 2018 |
| | | (unaudited) | | | (audited) | ||||
Balance Sheet Data: | | | | | | | |||
Assets: | | | | | | | |||
Cash and cash equivalents | | | $271,483 | | | $30,630 | | | $44,010 |
Restricted cash | | | 41,907 | | | 51,101 | | | 38,234 |
Cash and cash equivalents and restricted cash | | | 313,390 | | | 81,731 | | | 82,244 |
Mortgage loans held for sale (at fair value) | | | 2,281,835 | | | 1,554,230 | | | 421,754 |
Mortgage servicing rights (at fair value) | | | 583,263 | | | 575,035 | | | 532,526 |
Property and equipment, net | | | 18,595 | | | 12,051 | | | 10,075 |
Accounts receivable, net | | | 79,320 | | | 57,872 | | | 44,422 |
Derivative assets | | | 314,794 | | | 40,544 | | | 18,990 |
Goodwill and intangibles | | | 11,083 | | | 11,935 | | | 10,957 |
GNMA loans eligible for repurchase | | | 2,919,881 | | | 499,207 | | | 451,209 |
Other assets | | | 65,745 | | | 76,162 | | | 64,214 |
Total assets | | | $6,587,906 | | | $2,908,767 | | | $1,636,391 |
| | | | | | | ||||
Liabilities and Shareholder’s equity: | | | | | | | |||
Liabilities: | | | | | | | |||
Warehouse lines of credit | | | $2,092,477 | | | $1,478,183 | | | $404,237 |
Term debt and other borrowings, net | | | 374,090 | | | 424,958 | | | 276,277 |
Accounts payable and accrued expenses | | | 269,016 | | | 39,739 | | | 21,243 |
GNMA loans eligible for repurchase | | | 2,919,881 | | | 499,207 | | | 451,209 |
Other liabilities | | | 189,700 | | | 56,368 | | | 44,654 |
Total liabilities | | | $5,845,164 | | | 2,498,455 | | | 1,197,620 |
| | | | | | | ||||
Shareholder’s equity: | | | | | | | |||
Common stock (100 shares issued and outstanding, par value $0.01 per share) | | | — | | | — | | | — |
Additional paid-in-capital | | | 519,177 | | | 454,861 | | | 454,110 |
Accumulated deficit | | | 223,565 | | | (44,549) | | | (15,339) |
Total shareholder’s equity | | | 742,742 | | | 410,312 | | | 438,771 |
Total liabilities and shareholder’s equity | | | $6,587,906 | | | $2,908,767 | | | $1,636,391 |
| | | Nine months ended September 30, | | | Year ended December 31, | |||||||
| | | 2020 | | | 2019 | | | 2019 | | | 2018 | |
Other financial data | | | | | | | | | ||||
Adjusted revenue(1) | | | $1,034,687 | | | $190,522 | | | $276,907 | | | $154,118 |
Adjusted net income (loss)(1) | | | 494,598 | | | 20,347 | | | 28,185 | | | (32,006) |
Adjusted EBITDA(1) | | | 688,847 | | | 52,288 | | | 69,410 | | | (19,613) |
| | | Nine Months Ended September 30, | | | Year Ended December 31, | |||||||
($ in thousands) | | | 2020 | | | 2019 | | | 2019 | | | 2018(2) |
Origination Segment KPIs | | | | | | | | | ||||
| | | | | | | | | |||||
Origination Volume by Channel | | | | | | | | | ||||
Wholesale(3) | | | $23,772,112 | | | $7,023,411 | | | $11,564,971 | | | $4,889,220 |
Correspondent(3) | | | 12,696,815 | | | 6,676,458 | | | 10,215,300 | | | 5,081,719 |
Direct(3) | | | 1,576,959 | | | 291,302 | | | 487,322 | | | 608,148 |
Origination volume(3) | | | $38,045,886 | | | $13,991,171 | | | $22,267,593 | | | $10,579,087 |
| | | | | | | | | |||||
Gain on sale margin | | | | | | | | | ||||
Gain on sale margin (bps)(4) | | | 253.1 | | | 96.8 | | | 89.6 | | | 79.5 |
| | | | | | | | | |||||
Market Share | | | | | | | | | ||||
Overall share of origination market(5) | | | 1.4% | | | 0.9% | | | 1.0% | | | 0.7% |
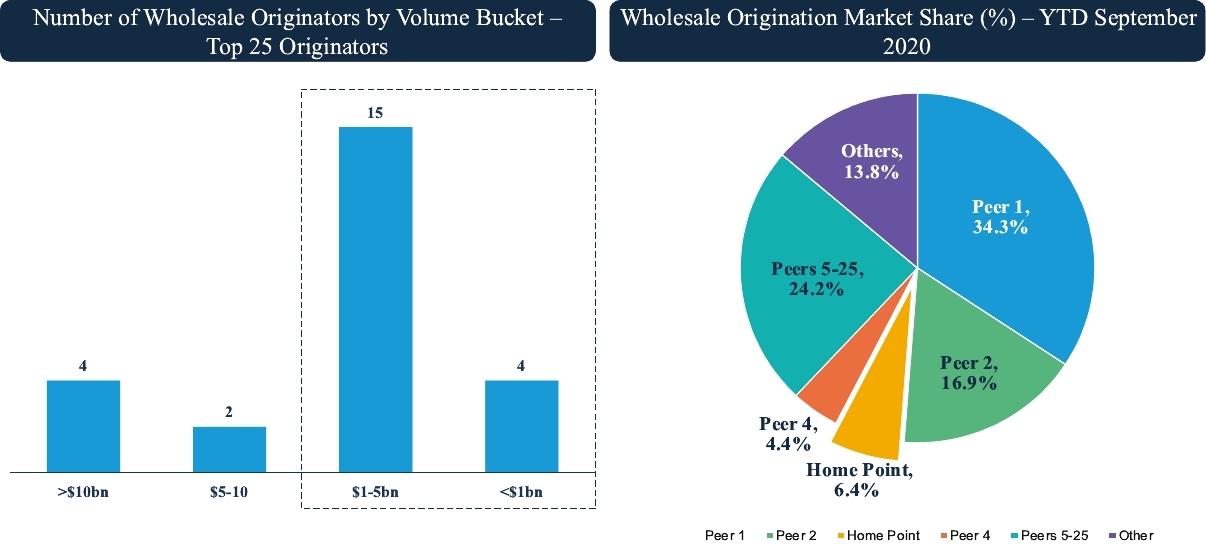
Share of wholesale channel(6) | | | 6.4% | | | 3.0% | | | 3.5% | | | 2.6% |
| | | | | | | | | |||||
Origination Volume by Purpose(7) | | | | | | | | | ||||
Purchase | | | 31.7% | | | 54.4% | | | 50.6% | | | 66.5% |
Refinance | | | 68.3% | | | 45.6% | | | 49.4% | | | 33.5% |
| | | | | | | | | |||||
Third Party Partners | | | | | | | | | ||||
Number of Broker Partners(8) | | | 4,921 | | | 2,684 | | | 3,085 | | | 1,623 |
Number of Correspondent Partners(9) | | | 594 | | | 516 | | | 537 | | | 451 |
| | | Nine Months Ended September 30, | | | Year Ended December 31, | |||||||
($ in thousands) | | | 2020 | | | 2019 | | | 2019 | | | 2018(2) |
Servicing Segment KPIs | | | | | | | | | ||||
| | | | | | | | | |||||
Mortgage Servicing | | | | | | | | | ||||
MSR servicing portfolio - UPB(10) | | | $73,951,042 | | | $47,887,643 | | | $52,600,546 | | | $41,423,825 |
Servicing portfolio - Units(11) | | | 307,236 | | | 217,558 | | | 236,362 | | | 189,513 |
| | | | | | | | | |||||
60 days or more delinquent(12) | | | 6.6% | | | 2.0% | | | 1.7% | | | 2.3% |
| | | | | | | | | |||||
MSR Portfolio | | | | | | | | | ||||
MSR multiple(13) | | | 2.6x | | | 3.2x | | | 3.4x | | | 4.3x |
(1) | We define Adjusted revenue as Total net revenue exclusive of the impact of the change in fair value of MSRs related to changes in valuation inputs and assumptions, net of MSRs hedge and adjusted for Income from equity method investment. |
| | | Nine Months Ended September 30, | | | Year Ended December 31, | |||||||
($ in thousands) | | | 2020 | | | 2019 | | | 2019 | | | 2018 |
Total net revenue | | | $922,335 | | | $103,004 | | | $199,725 | | | $164,257 |
Income from equity method investment | | | 14,050 | | | 2,591 | | | 2,701 | | | 209 |
Change in fair value of MSR (due to inputs and assumptions), net of hedge | | | 98,302 | | | 84,927 | | | 74,481 | | | (10,348) |
Adjusted revenue | | | $1,034,687 | | | $190,522 | | | $276,907 | | | $154,118 |
| | | Nine Months Ended September 30, | | | Year Ended December 31, | |||||||
($ in thousands) | | | 2020 | | | 2019 | | | 2019 | | | 2018 |
Total net income (loss) | | | $422,606 | | | $(45,277) | | | $(29,210) | | | $(24,197) |
Change in fair value of MSR (due to inputs and assumptions), net of hedge | | | 98,302 | | | 84,927 | | | 74,481 | | | (10,348) |
Income tax effect of change in fair value of MSR (due to inputs and assumptions), net of hedge | | | (26,310) | | | (19,303) | | | (17,086) | | | 2,539 |
Adjusted net income (loss) | | | $494,598 | | | $20,347 | | | $28,185 | | | $(32,006) |
| | | Nine Months Ended September 30, | | | Year Ended December 31, | |||||||
($ in thousands) | | | 2020 | | | 2019 | | | 2019 | | | 2018 |
Total net income (loss) | | | $422,606 | | | $(45,277) | | | $(29,210) | | | $(24,197) |
Income from discontinued operations, net of tax | | | — | | | — | | | — | | | (7,157) |
Interest expense on corporate debt | | | 14,411 | | | 22,324 | | | 27,721 | | | 24,962 |
Income tax expense (benefit) from continuing operations | | | 149,306 | | | (14,080) | | | (9,500) | | | (10,485) |
Depreciation and amortization | | | 4,222 | | | 4,394 | | | 5,918 | | | 7,612 |
Change in fair value of MSR (due to inputs and assumptions), net of hedge | | | 98,302 | | | 84,927 | | | 74,481 | | | (10,348) |
Adjusted EBITDA | | | $688,847 | | | $52,288 | | | $69,410 | | | $(19,613) |
(2) | Unless otherwise indicated, our Distributed Retail channel was included in discontinued operations in our results of operations for the year ended December 31, 2018 and as such it has been excluded from our key performance indicators for the year ended December 31, 2018. |
(3) | Origination dollar value of new loans funded by channel. Origination volume excludes Origination volume from the Distributed Retail channel, which was included in discontinued operations in our results of operations for the year ended December 31, 2018. |
(4) | Calculated as Gain on sale, net divided by Origination volume. |
(5) | Calculated as the Company’s originations dollar value for the year divided by the total residential originations in the United States of America per Inside Mortgage Finance, a third party provider of residential mortgage industry news and statistics each year. Origination volume figures used to calculate market share include $1 billion of Distributed Retail originations in our results of operations for the year ended December 31, 2018. |
(6) | Calculated as the Company’s originations dollar value for the year divided by the total wholesale originations in the United States of America per Inside Mortgage Finance, each year. |
(7) | Origination volume excludes Origination volume from the Distributed Retail channel, which was included in discontinued operations in our results of operations for the year ended December 31, 2018. |
(8) | Number of Broker Partners with whom the Company sources loans from. |
(9) | Number of Correspondent Partners from whom the Company purchases loans from. |
(10) | The unpaid principal balance of loans we service on behalf of Ginnie Mae, Fannie Mae, Freddie Mae and others, at period end. |
(11) | Number of loans in our serving portfolio at period end. |
(12) | Total balances of outstanding loan principals for which installment payments are at least 60 days past due as a percentage of the outstanding loan principal as of a specified date. |
(13) | Calculated as the MSR fair market value as of a specified date divided by the related UPB divided by the weighted average service fee. |
• | a general decline in business activity; |
• | negatively impacting demand for our mortgage loan products, as well as borrowers’ ability to fulfill their loan obligations leading to an increase in delinquency rates, which could have a significant impact on the value of our mortgage assets; |
• | the requirement for us to advance material amounts of cash for delinquent principal, interest, taxes and insurance typically paid by borrowers, which may not be reimbursed for an extended period of time; |
• | the costs of preserving and liquidating defaulted properties, as a result of increased serious delinquencies and defaults; |
• | the destabilization of the real estate and mortgage markets, which could negatively impact fair value of our assets, reduce our loan production volume, reduce the profitability of servicing mortgages or adversely affect our ability to sell mortgage loans; |
• | difficulty accessing the capital markets on attractive terms, or at all, and a severe disruption and instability in the global financial markets, including the MBS market, or deteriorations in credit and financing conditions which could affect our access to capital necessary to fund business operations or address maturing liabilities on a timely basis; |
• | the inability to promptly foreclose on defaulted mortgage loans and liquidate the underlying real property due to the rapidly changing regulatory and administrative climate, including the suspension of foreclosures and evictions as mandated by governmental bodies; |
• | the potential negative impact on the health of our highly qualified personnel, in particular skilled managers, loan servicers, debt default specialists and underwriters, especially if a significant number of them are impacted; and |
• | a deterioration in our ability to ensure business continuity during a disruption. |
• | restrictive covenants and borrowing conditions in our existing or future financing arrangements that may limit our ability to raise additional debt; |
• | a decline in the liquidity in the credit markets; |
• | prevailing interest rates; |
• | the financial strength of our lenders; |
• | the decisions of lenders from whom we borrow to reduce their exposure to mortgage loans; and |
• | accounting changes that impact the calculations of covenants in our debt agreements. |
• | an increase in the number of similar loans available for sale; |
• | conditions in the loan securitization market or in the secondary market for loans in general or for our loans in particular, which could make our loans less desirable to potential investors; |
• | defaults under loans in general; |
• | loan-level pricing adjustments imposed by Fannie Mae and Freddie Mac, including the recently imposed adjustments for the purchase of loans in forbearance and, although deferred for later implementation, refinancing loans; |
• | the types and volume of loans being originated or sold by us; |
• | the level and volatility of interest rates; and |
• | the quality of loans previously sold by us. |
• | loss of our licenses and approvals to engage in our servicing and lending/loan purchasing businesses; |
• | damage to our reputation in the industry; |
• | governmental investigations and enforcement actions; |
• | administrative fines and penalties and litigation; |
• | civil and criminal liability, including class action lawsuits; |
• | diminished ability to sell loans that we originate or purchase, requirements to sell such loans at a discount compared to other loans or repurchase or address indemnification claims from purchasers of such loans, including the GSEs; |
• | inability to raise capital; and |
• | inability to execute on our business strategy, including our growth plans. |
• | underwriting standards and credit standards for mortgage loans; |
• | our staffing levels and other servicing practices; |
• | the servicing and ancillary fees that we may charge; |
• | our modification standards and procedures; |
• | the amount of reimbursable and non-reimbursable advances that we may make; and |
• | the types of loan products that are eligible for sale or securitization. |
• | a majority of our board of directors consist of “independent directors” as defined under the rules of NASDAQ; |
• | our director nominees be selected, or recommended for our board of directors’ selection by a nominating/governance committee comprised solely of independent directors; and |
• | the compensation of our executive officers be determined, or recommended to our board of directors for determination, by a compensation committee comprised solely of independent directors. |
• | we will not be required to comply with the auditor attestation requirements of Section 404(b) of the Sarbanes-Oxley Act, |
• | we will be subject to reduced disclosure obligations regarding executive compensation in our periodic reports and proxy statements, and |
• | we will not be required to hold nonbinding advisory votes on executive compensation or stockholder approval of any golden parachute payments not previously approved. |
• | results of operations that vary from the expectations of securities analysts and investors; |
• | results of operations that vary from those of our competitors; |
• | changes in expectations as to our future financial performance, including financial estimates and investment recommendations by securities analysts and investors; |
• | changes in economic conditions for companies in our industry; |
• | changes in market valuations of, or earnings and other announcements by, companies in our industry; |
• | declines in the market prices of stocks generally, particularly those of companies in our industry; |
• | additions or departures of key management personnel; |
• | strategic actions by us or our competitors; |
• | announcements by us, our competitors, our suppliers of significant contracts, price reductions, new products or technologies, acquisitions, dispositions, joint marketing relationships, joint ventures, other strategic relationships or capital commitments; |
• | changes in preference of our customers and our market share; |
• | changes in general economic or market conditions or trends in our industry or the economy as a whole; |
• | changes in business or regulatory conditions; |
• | future sales of our common stock or other securities; |
• | investor perceptions of or the investment opportunity associated with our common stock relative to other investment alternatives; |
• | changes in the way we are perceived in the marketplace, including due to negative publicity or campaigns on social media to boycott certain of our products, our business or our industry; |
• | the public’s response to press releases or other public announcements by us or third parties, including our filings with the SEC; |
• | changes or proposed changes in laws or regulations or differing interpretations or enforcement thereof affecting our business; |
• | announcements relating to litigation or governmental investigations; |
• | guidance, if any, that we provide to the public, any changes in this guidance or our failure to meet this guidance; |
• | the development and sustainability of an active trading market for our common stock; |
• | exchange rate fluctuations; |
• | tax developments; |
• | changes in accounting principles; and |
• | other events or factors, including those resulting from informational technology system failures and disruptions, epidemics, pandemics, natural disasters, war, acts of terrorism, civil unrest or responses to these events. |
• | a classified board of directors, as a result of which our board of directors will be divided into three classes, with each class serving for staggered three-year terms; |
• | the ability of our board of directors to issue one or more series of preferred stock; |
• | advance notice requirements for nominations of directors by stockholders and for stockholders to include matters to be considered at our annual meetings; |
• | certain limitations on convening special stockholder meetings; |
• | the removal of directors only for cause and only upon the affirmative vote of the holders of at least 66 2/3% of the shares of common stock entitled to vote generally in the election of directors if our Sponsor and its affiliates cease to beneficially own at least 40% of shares of common stock entitled to vote generally in the election of directors; and |
• | that certain provisions may be amended only by the affirmative vote of at least 66 2/3% of shares of common stock entitled to vote generally in the election of directors if our Sponsor and its affiliates cease to beneficially own at least 40% of shares of common stock entitled to vote generally in the election of directors. |
• | the spread of the COVID-19 outbreak and severe disruptions in the U.S. and global economy and financial markets it has caused; |
• | our reliance on our financing arrangements to fund mortgage loans and otherwise operate our business; |
• | the dependence of our loan origination and servicing revenues on macroeconomic and U.S. residential real estate market conditions; |
• | the requirement to repurchase mortgage loans or indemnify investors if we breach representations and warranties; |
• | counterparty risk; |
• | the requirement to make servicing advances that can be subject to delays in recovery or may not be recoverable in certain circumstances; |
• | competition for mortgage assets that may limit the availability of desirable originations, acquisitions and result in reduced risk-adjusted returns; |
• | our ability to continue to grow our loan origination business or effectively manage significant increases in our loan production volume; |
• | competition in the industry in which we operate; |
• | our success and growth of our production and servicing activities and the dependence upon our ability to adapt to and implement technological changes; |
• | the effectiveness of our risk management efforts; |
• | our ability to detect misconduct and fraud; |
• | any failure to attract and retain a highly skilled workforce, including our senior executives; |
• | our ability to obtain, maintain, protect and enforce our intellectual property; |
• | any cybersecurity risks, cyber incidents and technology failures; |
• | material changes to the laws, regulations or practices applicable to reverse mortgage programs operated by FHA and HUD; |
• | our vendor relationships; |
• | our failure to deal appropriately with various issues that may give rise to reputational risk, including legal and regulatory requirements; |
• | any employment litigation and related unfavorable publicity; |
• | exposure to new risks and increased costs as a result of initiating new business activities or strategies or significantly expanding existing business activities or strategies; |
• | any failure to comply with the significant amount of regulation applicable to our new investment management subsidiary; |
• | the impact of changes in political or economic stability or by government policies on our material vendors with operations in India; |
• | our ability to fully utilize our NOL and other tax carryforwards; |
• | any challenge by the IRS of the amount, timing and/or use of our NOL carryforwards; |
• | possible changes in legislation and the effect on our ability to use the tax benefits associated with our NOL carryforwards; |
• | the impact of other changes in tax laws; |
• | the impact of interest rate fluctuations; |
• | risks associated with hedging against interest rate exposure; |
• | the impact of any prolonged economic slowdown, recession or declining real estate values; |
• | risks associated with financing our assets with borrowings; |
• | risks associated with a decrease in value of our collateral; |
• | the dependence of our operations on access to our financing arrangements, which are mostly uncommitted; |
• | risks associated with the financial and restrictive covenants included in our financing agreements; |
• | our exposure to volatility in the London Inter-Bank Offered Rate; |
• | our ability to raise the debt or equity capital required to finance our assets and grow our business; |
• | risks associated with higher risk loans that we service; |
• | risks associated with derivative financial instruments; |
• | our ability to foreclose on our mortgage assets in a timely manner or at all; |
• | our ability to obtain and/or maintain licenses and other approvals in those jurisdictions where required to conduct our business; |
• | the impact of revised rules and regulations and enforcement of existing rules and regulations by the CFPB; |
• | legislative and regulatory changes that impact the mortgage loan industry or housing market; |
• | changes in regulations or the occurrence of other events that impact the business, operations or prospects of government agencies such as Ginnie Mae, the FHA or the VA, the USDA, or GSEs such as Fannie Mae or Freddie Mac, or such changes that increase the cost of doing business with such entities; |
• | the Dodd-Frank Act and its implementing regulations and regulatory agencies, and any other legislative and regulatory changes that impact the business, operations or governance of mortgage lenders; |
• | the CFPB, and its issued and future rules and the enforcement thereof; |
• | changes in government support of homeownership; |
• | changes in government or government sponsored home affordability programs; |
• | changes in governmental regulations, accounting treatment, tax rates and similar matters; |
• | risks associated with our acquisition of MSRs; |
• | the impact of our counterparties terminating our servicing rights under which we conduct servicing activities; and |
• | our failure to deal appropriately with issues that may give rise to reputational risk. |
• | on an actual basis; |
• | on a pro forma basis, giving effect to the Debt Transaction; and |
• | on a pro forma as adjusted basis, giving effect to the Debt Transaction, as well as (i) the stock split and the merger of Holdings into the Company described elsewhere in this prospectus and (ii) this offering and the use of proceeds received by us therefrom, assuming an initial public offering price of $ per share of common stock, which is the mid-point of the estimated offering price range set forth on the cover page of this prospectus, and after deducting the underwriting discounts and commissions and estimated offering expenses. |
| | | September 30, 2020 | |||||||
(Unaudited) (In thousands, except shares and per share data) | | | Actual | | | Pro Forma for Debt Transaction | | | Pro Forma As Adjusted for the Debt Transaction and this Offering |
Cash and cash equivalents(1) | | | $271,483 | | | $ (3) | | | $ |
| | | | | | | ||||
Debt | | | | | | | |||
Warehouse lines of credit | | | $2,092,477 | | | $ | | | $ |
Operating line of credit | | | 1,000 | | | | | ||
Advance facilities | | | 18,250 | | | | | ||
Term debt, net(2) | | | 354,840 | | | | | ||
Senior Unsecured Notes | | | — | | | | | ||
Total debt | | | $2,466,567 | | | $ | | | |
| | | | | | | ||||
Stockholder’s equity | | | | | | | |||
Common stock, par value $0.01 per share (100 shares authorized, issued and outstanding, actual and pro forma; and shares authorized, shares issued and outstanding, pro forma as adjusted) | | | $— | | | $ | | | $ |
Additional paid in capital | | | 519,177 | | | | | ||
Retained earnings | | | 223,565 | | | | | ||
Total stockholder’s equity | | | 742,742 | | | $ | | | $ |
| | | | | | | ||||
Total capitalization | | | $3,209,309 | | | $ | | | $ |
(1) | Does not include Restricted cash. Also excludes the impact of the cash dividend declared by our board of directors on September 30, 2020 in the amount of $154.5 million, which was paid to Holdings, the sole stockholder, on October 5, 2020. See “Prospectus Summary—Recent Developments—Payment of Cash Dividend.” |
(2) | Net of issuance costs. |
(3) | A $1.00 increase (decrease) in the assumed initial public offering price of $ per share would increase (decrease) the amount of net proceeds to us from this offering by $ , assuming the number of shares of common stock offered by us, as set forth on the cover page of this prospectus, remains the same, and after deducting the estimated underwriting discounts and commissions and estimated offering expenses payable by us. |
Assumed initial public offering price per share of common stock | | | $ |
Pro forma net tangible book value (deficit) per share of common stock as of September 30, 2020 before this offering | | | |
Increase in pro forma net tangible book value per share of common stock attributable to investors in this offering | | | |
Pro forma net tangible book value (deficit) per share of common stock after this offering | | | |
Dilution per share of common stock to investors in this offering | | | $ |
| | | Shares Purchased | | | Total Consideration | | | Average Price Per Share | |||||||
Name of Beneficial Owners | | | Number | | | Percent | | | Amount | | | Percent | | ||
Existing owners | | | | | | | | | | | |||||
New investors in this offering | | | | | | | | | | | |||||
Total | | | | | | | | | | | |||||
• | the issuance in January 2021 of $ aggregate principal amount of Senior Unsecured Notes; |
• | the use of approximately $ of the net proceeds from the issuance of the Senior Unsecured Notes to repay outstanding amounts under our MSR Facility; |
• | the use of approximately $ of the net proceeds from the issuance of the Senior Unsecured Notes to fund a distribution to our existing shareholders; and |
• | this offering and the application of the estimated net proceeds from this offering received by us as described under “Use of Proceeds”. |
| | | As Reported | | | Pro Forma Adjustments Related to Debt Transaction | | | Footnotes | | | Pro Forma for Debt Transaction | | | Pro Forma Adjustments Related to This Offering | | | Footnotes | | | Pro Forma As Adjusted | |
Assets: | | | | | | | | | | | | | | | |||||||
Cash and cash equivalents | | | $271,483 | | | | | (A) | | | | | | | (F) | | | ||||
Restricted cash | | | 41,907 | | | | | | | | | | | | | ||||||
Cash and cash equivalents and restricted cash | | | 313,390 | | | | | | | | | | | | | ||||||
Mortgage loans held for sale (at fair value) | | | 2,281,835 | | | | | | | | | | | | | ||||||
Mortgage servicing rights (at fair value) | | | 583,263 | | | | | | | | | | | | | ||||||
Property and equipment, net | | | 18,595 | | | | | | | | | | | | | ||||||
Accounts receivable, net | | | 79,320 | | | | | | | | | | | | | ||||||
Derivative assets | | | 314,794 | | | | | | | | | | | | | ||||||
Goodwill and intangibles | | | 11,083 | | | | | | | | | | | | | ||||||
GNMA loans eligible for repurchase | | | 2,919,881 | | | | | | | | | | | | | ||||||
Other assets | | | 65,745 | | | | | | | | | | | (G) | | | |||||
Total assets | | | $6,587,906 | | | | | | | | | | | | | ||||||
| | | | | | | | | | | | | | | ||||||||
Liabilities and Shareholders’ Equity: | | | | | | | | | | | | | | | |||||||
Liabilities: | | | | | | | | | | | | | | | |||||||
Warehouse lines of credit | | | $2,092,477 | | | | | | | | | | | | | ||||||
Term debt and other borrowings, net | | | 374,090 | | | | | (C) | | | | | | | | | |||||
Accounts payable and accrued expenses | | | 269,017 | | | | | (B) | | | | | | | (H) | | | ||||
GNMA loans eligible for repurchase | | | 2,919,881 | | | | | | | | | | | | | ||||||
Other liabilities | | | 189,700 | | | | | | | | | | | | | ||||||
Total liabilities | | | $5,845,165 | | | | | | | | | | | | | ||||||
| | | | | | | | | | | | | | | ||||||||
Shareholders’ Equity: | | | | | | | | | | | | | | | |||||||
Common stock (100 shares issued and outstanding, par value $0.01 per share) | | | — | | | | | | | | | | | (F) | | | |||||
Additional paid-in capital | | | 519,177 | | | | | (E) | | | | | | | (I) | | | ||||
Retained earnings (accumulated deficit) | | | 223,565 | | | | | (D) | | | | | | | (H) | | | ||||
Total shareholders' equity | | | 742,742 | | | | | | | | | | | | | ||||||
Total liabilities and shareholders' equity | | | $6,587,906 | | | | | | | | | | | | |
| | | As Reported | | | Pro Forma Adjustments Related to Debt Transaction | | | Footnotes | | | Pro Forma for Debt Transaction | | | Pro Forma Adjustments Related to This Offering | | | Footnotes | | | Pro Forma As Adjusted | |
Revenue: | | | | | | | | | | | | | | | |||||||
Gain on loans, net | | | $962,778 | | | | | | | | | | | | | ||||||
Loan fee income | | | 60,630 | | | | | | | | | | | | | ||||||
Interest income | | | 42,370 | | | | | | | | | | | | | ||||||
Interest expense | | | (47,845) | | | | | (A) | | | | | | | | | |||||
Interest loss, net | | | (5,476) | | | | | | | | | | | | | ||||||
Loan servicing fees | | | 133,904 | | | | | | | | | | | | | ||||||
Change in fair value of mortgage servicing rights | | | (230,524) | | | | | | | | | | | | | ||||||
Other income | | | 1,022 | | | | | | | | | | | | | ||||||
Total net revenue | | | 922,335 | | | | | | | | | | | | | ||||||
| | | | | | | | | | | | | | | ||||||||
Expenses: | | | | | | | | | | | | | | | |||||||
Compensation and benefits | | | 251,462 | | | | | | | | | | | | | ||||||
Loan expense | | | 28,581 | | | | | | | | | | | | | ||||||
Loan servicing expense | | | 22,742 | | | | | | | | | | | | | ||||||
Occupancy and equipment | | | 17,006 | | | | | | | | | | | | | ||||||
General and administrative | | | 28,373 | | | | | | | | | | | | | ||||||
Depreciation and amortization | | | 4,222 | | | | | | | | | | | | | ||||||
Other expenses | | | 12,087 | | | | | | | | | | | | | ||||||
Total expenses | | | 364,473 | | | | | | | | | | | | | ||||||
| | | | | | | | | | | | | | | ||||||||
Income (loss) before income tax | | | 557,862 | | | | | | | | | | | | | ||||||
Income tax expense (benefit) | | | 149,306 | | | | | (B) | | | | | | | | | |||||
Income from equity method investment | | | 14,050 | | | | | | | | | | | | | ||||||
| | | | | | | | | | | | | | | ||||||||
Total net income (loss) | | | $422,606 | | | | | | | | | | | | | ||||||
| | | | | | | | | | | | | | | ||||||||
Earnings Per Share: | | | | | | | | | | | | | | | |||||||
Basic and diluted earnings per share | | | | | | | | | | | | | (C) | | | — |
| | | As Reported | | | Pro Forma Adjustments Related to Debt Transaction | | | Footnotes | | | Pro Forma for Debt Transaction | | | Pro Forma Adjustments Related to This Offering | | | Footnotes | | | Pro Forma As Adjusted | |
Revenue: | | | | | | | | | | | | | | | |||||||
Gain on loans, net | | | $199,501 | | | | | | | | | | | | | ||||||
Loan fee income | | | 32,112 | | | | | | | | | | | | | ||||||
Interest income | | | 51,801 | | | | | | | | | | | | | ||||||
Interest expense | | | (57,942) | | | | | (A) | | | | | | | | | |||||
Interest loss, net | | | (6,141) | | | | | | | | | | | | | ||||||
Loan servicing fees | | | 144,228 | | | | | | | | | | | | | ||||||
Change in fair value of mortgage servicing rights | | | (173,134) | | | | | | | | | | | | | ||||||
Other income | | | 3,159 | | | | | | | | | | | | | ||||||
Total net revenue | | | 199,725 | | | | | | | | | | | | | ||||||
| | | | | | | | | | | | | | | ||||||||
Expenses: | | | | | | | | | | | | | | | |||||||
Compensation and benefits | | | 156,197 | | | | | | | | | | | | | ||||||
Loan expense | | | 15,626 | | | | | | | | | | | | | ||||||
Loan servicing expense | | | 20,924 | | | | | | | | | | | | | ||||||
Occupancy and equipment | | | 16,768 | | | | | | | | | | | | | ||||||
General and administrative | | | 21,407 | | | | | | | | | | | | | ||||||
Depreciation and amortization | | | 5,918 | | | | | | | | | | | | | ||||||
Other expenses | | | 4,296 | | | | | | | | | | | | | ||||||
Total expenses | | | 241,136 | | | | | | | | | | | | | ||||||
| | | | | | | | | | | | | | | ||||||||
Income (loss) before income tax | | | (41,411) | | | | | | | | | | | | | ||||||
Income tax expense (benefit) | | | (9,500) | | | | | (B) | | | | | | | | | |||||
Income from equity method investment | | | 2,701 | | | | | | | | | | | | | ||||||
| | | | | | | | | | | | | | | ||||||||
Total net income (loss) | | | $(29,210) | | | | | | | | | | | | | ||||||
| | | | | | | | | | | | | | | ||||||||
Earnings Per Share: | | | | | | | | | | | | | | | |||||||
Basic and diluted earnings per share | | | | | | | | | | | | | (C) | | | — |
(A) | Represents the net adjustment to Cash and cash equivalents to reflect (i) the net cash proceeds of $ million received from the issuance of the Senior Unsecured Notes and the payment of $ million to repay a portion of the MSR Facility as discussed in note (C), (ii) $ million distributed to our existing shareholder, (iii) $ million used to pay debt issuance costs related to the issuance of the Senior Unsecured Notes; and (iv) $ million used to pay accrued interest related to the MSR Facility as discussed in note (B). |
(B) | Represents the adjustment to Accounts payable and accrued expenses to reflect the payment of $ million of accrued interest associated with the repayment of a portion of the MSR Facility. |
(C) | Represents the issuance of $ million aggregate principal amount of Senior Unsecured Notes, a portion of the net proceeds of which was used to pay down $ million of the MSR Facility. As a result, Term debt and other borrowings, net decreased by $ million. |
Issuance of the Senior Unsecured Notes | | | $ |
Debt issuance costs of Senior Unsecured Notes | | | |
Repayment of portion of the MSR Facility | | | |
Net adjustment to Term debt and other borrowings, net | | | $ |
(D) | Represents the adjustment to reduce retained earnings to zero to reflect the $ million of the total $ million distribution paid to our existing shareholder from the net proceeds of the Senior Unsecured Notes. The remainder of the distribution, $ million, has been reflected as a decrease to Additional paid-in capital as discussed in note (E). |
(E) | Represents the adjustment to reduce Additional paid-in capital in excess of Retained earnings balance by $ million as a result of the distribution paid to our existing shareholder from the net proceeds of the Senior Unsecured Notes. |
(F) | Represents the estimated net proceeds received by us in the offering, approximately $ million based on an assumed initial public offering price of $ per share, which is the midpoint of the estimated offering price range set forth on the cover page of this prospectus, after deducting $ of assumed underwriting discounts and commissions. We intend to use the net proceeds received by us from this offering for general corporate purposes. We will not receive any proceeds from the sale of shares by the selling stockholders. Of the total proceeds received by us of $ million, $ million will be reflected as an increase to our Common stock with the remaining $ increasing Additional paid-in capital. See “Use of Proceeds” for further information. |
Gross proceeds from the offering | | | $ | | | |
Underwriting discounts and commissions | | | | | ||
Change in pro forma cash from the offering | | | $ | | |
(G) | Represents an adjustment in Other assets to reflect certain deferred costs related to the offering which are primarily related to legal, accounting and other direct costs. Upon completion of this offering, these deferred costs will be charged against the proceeds from this offering with a corresponding reduction to Additional paid-in capital as discussed in note (I). As of September 30, 2020, on an actual basis, $ million of deferred offering costs were recorded in Other assets. |
(H) | Subsequent to September 30, 2020, an additional $ million of capitalizable costs were incurred which were recorded in Accounts payable and accrued expenses with a corresponding reduction to Additional paid-in capital as discussed in note (I). After September 30, 2020, the Company incurred an additional $ million of costs associated with this offering that were not eligible for capitalization. These costs were expensed as incurred and were recorded to Accounts payable and accrued expenses and Retained earnings. |
(I) | The following table is a reconciliation of the adjustments impacting Additional paid-in-capital after giving effect to the Pro Forma Transactions (in thousands): |
Net proceeds from offering of common stock | | | $ | | | (F) |
Reclassification of deferred costs incurred in this offering to Additional paid-in capital | | | | | (G), (H) | |
Net Additional paid-in capital pro forma adjustment | | | $ | | |
(A) | Represents the net adjustment to Interest expense associated with the payment of a portion of the MSR Facility and the issuance of the Senior Unsecured Notes (in thousands): |
| | | Nine months ended September 30, 2020 | | | Year ended December 31, 2019 | |
Interest expense — Senior Unsecured Notes | | | | | ||
Interest expense — MSR Facility | | | | | ||
Net adjustments to Interest expense | | | | |
(B) | Represents a reduction of $ million and $ million in Income tax expense for the nine months ended September 30, 2020 and for the year ended December 31, 2019, respectively. The adjustment was based on the statutory tax rate of %. The adjustment is the result of the net increase in pro forma Interest expense arising from the issuance of the Senior Unsecured Notes partially offset by the repayment of a portion of the MSR Facility. |
(C) | Pro forma Basic and diluted earnings per share has been calculated based on the number of shares assumed to be outstanding, assuming such shares were outstanding for the full periods presented and reflects shares of common stock outstanding. The following table sets forth the computation of unaudited pro forma Basic and diluted earnings per share (in thousands, except for share and per share data): |
| | | Nine months ended September 30, 2020 | | | Year ended December 31, 2019 | |
Numerator | | | | | ||
Pro forma net income (basic and diluted) | | | | | ||
Denominator | | | | | ||
Weighted average of common stock outstanding | | | | | ||
Assumed shares sold in this offering sufficient to pay dividends in excess of current year earnings | | | | | ||
Assumed shares sold in this offering sufficient to partially repay debt | | | | | ||
Weighted average shares of common stock outstanding (basic and dilutive) | | | | | ||
Pro forma net income per share (basic and dilutive) | | | | |
| | | Nine Months Ended September 30, | | | Year Ended December 31, | |||||||
(In thousands, except shares and per share amounts) | | | 2020 | | | 2019 | | | 2019 | | | 2018 |
| | | (unaudited) | | | (audited) | |||||||
Statement of Operations Data | | | | | | | | | ||||
Gain on loans, net | | | $962,778 | | | $135,495 | | | $199,501 | | | $84,068 |
Loan fee income | | | 60,630 | | | 19,829 | | | 32,112 | | | 19,603 |
Interest income | | | 42,370 | | | 35,101 | | | 51,801 | | | 35,179 |
Interest expense | | | (47,845) | | | (41,933) | | | (57,942) | | | (47,486) |
Interest loss, net | | | (5,475) | | | (6,832) | | | (6,141) | | | (12,307) |
Loan servicing fees | | | 133,904 | | | 104,089 | | | 144,228 | | | 119,049 |
Change in fair value of mortgage servicing rights | | | (230,524) | | | (151,168) | | | (173,134) | | | (47,312) |
Other income | | | 1,022 | | | 1,591 | | | 3,159 | | | 1,156 |
Total net revenue | | | 922,335 | | | 103,004 | | | 199,725 | | | 164,257 |
| | | | | | | | | |||||
Compensation and benefits | | | 251,462 | | | 104,571 | | | 156,197 | | | 109,577 |
Loan expense | | | 28,581 | | | 10,182 | | | 15,626 | | | 16,882 |
Loan servicing expense | | | 22,742 | | | 15,781 | | | 20,924 | | | 18,488 |
Occupancy and equipment | | | 17,006 | | | 12,567 | | | 16,768 | | | 20,521 |
General and administrative | | | 28,373 | | | 14,687 | | | 21,407 | | | 29,165 |
Depreciation and amortization | | | 4,222 | | | 4,394 | | | 5,918 | | | 7,612 |
Other expenses | | | 12,087 | | | 2,770 | | | 4,296 | | | 4,060 |
Total expenses | | | 364,473 | | | 164,952 | | | 241,136 | | | 206,305 |
| | | | | | | | | |||||
Income (loss) from continuing operations before income tax | | | 557,862 | | | (61,948) | | | (41,411) | | | (42,048) |
Income tax expense (benefit) from continuing operations | | | 149,306 | | | (14,080) | | | (9,500) | | | (10,485) |
Net income (loss) from continuing operations | | | 408,556 | | | (47,868) | | | (31,911) | | | (31,563) |
Net income from discontinued operations before tax | | | — | | | — | | | — | | | 9,707 |
Income tax provision | | | — | | | — | | | — | | | 2,550 |
Income from discontinued operations, net of tax | | | — | | | — | | | — | | | 7,157 |
Income from equity method investment | | | 14,050 | | | 2,591 | | | 2,701 | | | 209 |
Total net income (loss) | | | $422,606 | | | $(45,277) | | | $(29,210) | | | $(24,197) |
| | | Nine Months Ended September 30, | | | Year Ended December 31, | |||||||
(In thousands, except shares and per share amounts) | | | 2020 | | | 2019 | | | 2019 | | | 2018 |
| | | (unaudited) | | | (audited) | |||||||
Basic and diluted loss earnings per share: | | | | | | | | | ||||
Basic and diluted income (loss) per share from continuing operations | | | $4,226 | | | $(453) | | | $(319) | | | $(316) |
Basic and diluted earnings per share from discontinued operations | | | — | | | — | | | — | | | 72 |
Basic and diluted total net income (loss) per share | | | $4,226 | | | $(453) | | | $(292) | | | $(242) |
Weighted average shares of common stock outstanding | | | | | | | | | ||||
Basic and diluted | | | 100 | | | 100 | | | 100 | | | 100 |
| | | September 30, | | | December 31, | ||||
(In thousands, except shares and per share amounts) | | | 2020 | | | 2019 | | | 2018 |
| | | (unaudited) | | | (audited) | ||||
Balance Sheet Data | | | | | | | |||
Assets: | | | | | | | |||
Cash and cash equivalents | | | $271,483 | | | $30,630 | | | $44,010 |
Restricted cash | | | 41,907 | | | 51,101 | | | 38,234 |
Cash and cash equivalents and restricted cash | | | 313,390 | | | 81,731 | | | 82,244 |
Mortgage loans held for sale (at fair value) | | | 2,281,835 | | | 1,554,230 | | | 421,754 |
Mortgage servicing rights (at fair value) | | | 583,263 | | | 575,035 | | | 532,526 |
Property and equipment, net | | | 18,595 | | | 12,051 | | | 10,075 |
Accounts receivable, net | | | 79,320 | | | 57,872 | | | 44,422 |
Derivative assets | | | 314,794 | | | 40,544 | | | 18,990 |
Goodwill and intangibles | | | 11,083 | | | 11,935 | | | 10,957 |
GNMA loans eligible for repurchase | | | 2,919,881 | | | 499,207 | | | 451,209 |
Other assets | | | 65,745 | | | 76,162 | | | 64,214 |
Total assets | | | $6,587,906 | | | $2,908,767 | | | $1,636,391 |
| | | | | | | ||||
Liabilities and Shareholder’s equity: | | | | | | | |||
Liabilities: | | | | | | | |||
Warehouse lines of credit | | | $2,092,477 | | | $1,478,183 | | | $404,237 |
Term debt and other borrowings, net | | | 374,090 | | | 424,958 | | | 276,277 |
Accounts payable and accrued expenses | | | 269,016 | | | 39,739 | | | 21,243 |
GNMA loans eligible for repurchase | | | 2,919,881 | | | 499,207 | | | 451,209 |
Other liabilities | | | 189,700 | | | 56,368 | | | 44,654 |
Total liabilities | | | $5,845,164 | | | 2,498,455 | | | 1,197,620 |
| | | | | | | ||||
Shareholder’s equity: | | | | | | | |||
Common stock (100 shares issued and outstanding, par value $0.01 per share) | | | — | | | — | | | — |
Additional paid-in-capital | | | 519,177 | | | 454,861 | | | 454,110 |
Accumulated deficit | | | 223,565 | | | (44,549) | | | (15,339) |
Total shareholder’s equity | | | 742,742 | | | 410,312 | | | 438,771 |
Total liabilities and shareholder’s equity | | | $6,587,906 | | | $2,908,767 | | | $1,636,391 |
| | | Nine Months Ended September 30, | | | Year Ended December 31 | |||||||
($ in thousands) | | | 2020 | | | 2019 | | | 2019 | | | 2018(a) |
Origination Volume by Channel | | | | | | | | | ||||
Wholesale(b) | | | $23,772,112 | | | $7,023,411 | | | $11,564,971 | | | $4,889,220 |
Correspondent(b) | | | 12,696,815 | | | 6,676,458 | | | 10,215,300 | | | 5,081,719 |
Direct(b) | | | 1,576,959 | | | 291,302 | | | 487,322 | | | 608,148 |
Origination volume(b) | | | $38,045,886 | | | $13,991,171 | | | $22,267,593 | | | $10,579,087 |
| | | | | | | | | |||||
Gain on sale margin | | | | | | | | | ||||
Gain on sale margin (bps)(c) | | | 253.1 | | | 96.8 | | | 89.6 | | | 79.5 |
| | | | | | | | | |||||
Market Share | | | | | | | | | ||||
Overall share of origination market(d) | | | 1.4% | | | 0.9% | | | 1.0% | | | 0.7% |
Share of wholesale channel(e) | | | 6.4% | | | 3.0% | | | 3.5% | | | 2.6% |
| | | | | | | | | |||||
Origination Volume by Purpose(f) | | | | | | | | | ||||
Purchase | | | 31.7% | | | 54.4% | | | 50.6% | | | 66.5% |
Refinance | | | 68.3% | | | 45.6% | | | 49.4% | | | 33.5% |
| | | | | | | | | |||||
| | | Nine Months Ended September 30, | | | Year Ended December 31 | |||||||
($ in thousands) | | | 2020 | | | 2019 | | | 2019 | | | 2018(a) |
Third Party Partners | | | | | | | | | ||||
Number of Broker Partners(g) | | | 4,921 | | | 2,684 | | | 3,085 | | | 1,623 |
Number of Correspondent Partners(h) | | | 594 | | | 516 | | | 537 | | | 451 |
| | | Nine Months Ended September 30, | | | Year Ended December 31 | |||||||
($ in thousands) | | | 2020 | | | 2019(a) | | | 2019 | | | 2018(a) |
Mortgage Servicing | | | | | | | | | ||||
MSR Servicing Portfolio - UPB(i) | | | $73,951,042 | | | $47,887,643 | | | $52,600,546 | | | $41,423,825 |
MSR Servicing Portfolio - Units(j) | | | 307,236 | | | 217,558 | | | 236,362 | | | 189,513 |
| | | | | | | | | |||||
60 days or more delinquent(k) | | | 6.6% | | | 2.0% | | | 1.7% | | | 2.3% |
| | | | | | | | | |||||
MSR Portfolio | | | | | | | | | ||||
MSR multiple(l) | | | 2.6x | | | 3.2x | | | 3.4x | | | 4.3x |
(a) | Unless otherwise indicated, our Distributed Retail channel was included in discontinued operations in our results of operations for the year ended December 31, 2018 and as such it has been excluded from our key performance indicators for the year ended December 31, 2018. |
(b) | Origination dollar value of new loans funded by channel. Origination volume excludes Origination volume from the Distributed Retail channel, which was included in discontinued operations in our results of operations for the year ended December 31, 2018. |
(c) | Calculated as Gain on sale, net divided by Origination volume. |
(d) | Calculated as the Company’s originations dollar value for the year divided by the total residential originations in the United States of America per Inside Mortgage Finance, a third party provider of residential mortgage industry news and statistics each year. Origination volume figures used to calculate market share include $1 billion of Distributed Retail originations in our results of operations for the year ended December 31, 2018. |
(e) | Calculated as the Company’s originations dollar value for the year divided by the total wholesale originations in the United States of America per Inside Mortgage Finance, each year. |
(f) | Origination volume excludes Origination volume from the Distributed Retail channel, which was included in discontinued operations in our results of operations for the year ended December 31, 2018. |
(g) | Number of Broker Partners with whom the Company sources loans from. |
(h) | Number of Correspondent Partners from whom the Company purchases loans. |
(i) | The unpaid principal balance of loans we service on behalf of Ginnie Mae, Fannie Mae, Freddie Mae and others, at period end. |
(j) | Number of loans in our serving portfolio at period end. |
(k) | Total balances of outstanding loan principals for which installment payments are at least 60 days past due as a percentage of the outstanding loan principal as of a specified date. |
(l) | Calculated as the MSR fair market value as of a specified date divided by the related UPB divided by the weighted average service fee. |
| | | Nine Months Ended September 30, | | | Year Ended December 31, | |||||||
($ in thousands) | | | 2020 | | | 2019 | | | 2019 | | | 2018 |
Total net revenue | | | $922,335 | | | $103,004 | | | $199,725 | | | $164,257 |
Income from equity method investment | | | 14,050 | | | 2,591 | | | 2,701 | | | 209 |
Change in fair value of MSR (due to inputs and assumptions), net of hedge(a) | | | 98,302 | | | 84,927 | | | 74,481 | | | (10,348) |
Adjusted revenue | | | $1,034,687 | | | $190,522 | | | $276,907 | | | $154,118 |
| | | Nine Months Ended September 30, | | | Year Ended December 31, | |||||||
($ in thousands) | | | 2020 | | | 2019 | | | 2019 | | | 2018 |
Total net income (loss) | | | $422,606 | | | $(45,277) | | | $(29,210) | | | $(24,197) |
Change in fair value of MSR (due to inputs and assumptions), net of hedge(a) | | | 98,302 | | | 84,927 | | | 74,481 | | | (10,348) |
Income tax effect of change in fair value of MSR (due to inputs and assumptions), net of hedge(b) | | | (26,310) | | | (19,303) | | | (17,086) | | | 2,539 |
Adjusted net income (loss) | | | $494,598 | | | $20,347 | | | $28,185 | | | $(32,006) |
| | | Nine Months Ended September 30, | | | Year Ended December 31, | |||||||
($ in thousands) | | | 2020 | | | 2019 | | | 2019 | | | 2018 |
Total net income (loss) | | | $422,606 | | | $(45,277) | | | $(29,210) | | | $(24,197) |
Income from discontinued operations, net of tax | | | — | | | — | | | — | | | (7,157) |
Interest expense on corporate debt | | | 14,411 | | | 22,324 | | | 27,721 | | | 24,962 |
Income tax expense (benefit) from continuing operations | | | 149,306 | | | (14,080) | | | (9,500) | | | (10,485) |
Depreciation and amortization | | | 4,222 | | | 4,394 | | | 5,918 | | | 7,612 |
Change in fair value of MSR (due to inputs and assumptions), net of hedge(a) | | | 98,302 | | | 84,927 | | | 74,481 | | | (10,348) |
Adjusted EBITDA | | | $688,847 | | | $52,288 | | | $69,410 | | | $(19,613) |
(a) | MSR fair value changes due to valuation inputs and assumptions are measured using a stochastic discounted cash flow model that includes assumptions such as prepayment speeds, delinquencies, discount rates, and effects of changes in market interest rates. Refer to “Note 2, Basis of Presentation and Significant Accounting Policies” and “Note 5, Mortgage Servicing Rights” to our unaudited condensed consolidated financial statements included elsewhere in this prospectus and to “Note 2, Basis of Presentation and Significant Accounting Policies” and “Note 7, Mortgage Servicing Rights” to our audited consolidated financial statements included elsewhere in this prospectus. The change in the value of the MSR hedge is measured based on third party market values and cash settlement. Refer to “Note 14, Fair Value Measurements”, to our unaudited condensed consolidated financial statements included elsewhere in this prospectus and “Note 18, Fair Value Measurements” to our audited consolidated financial statements included elsewhere in this prospectus. We exclude changes in fair value of MSRs, net of hedge from Adjusted revenue as they add volatility and we believe that they are not indicative of the Company’s operating performance or results of operations. This adjustment does not include changes in fair value of MSRs due to realization of cash flows, which remain in Adjusted EBITDA. Realization of cash flows occurs when cash is collected as customers make scheduled payments, partial prepayments of principal, or pay their mortgage in full. |
(b) | The income tax effect of change in fair value of MSR (due to inputs and assumptions), net of hedge is calculated as the MSR valuation change, net of hedge multiplied by the quotient of Income tax expense (benefit) divided by Income (loss) before income tax. |
| | | Nine Months Ended September 30, | | | | | ||||||
($ in thousands) | | | 2020 | | | 2019 | | | $ Change | | | % Change |
Gain on loans, net | | | 962,778 | | | 135,495 | | | 827,283 | | | 610.6% |
Loan fee income | | | 60,630 | | | 19,829 | | | 40,801 | | | 205.8% |
Interest income | | | 42,370 | | | 35,101 | | | 7,269 | | | 20.7% |
Interest expense | | | (47,845) | | | (41,933) | | | (5,912) | | | 14.1% |
Interest loss, net | | | (5,475) | | | (6,832) | | | 1,357 | | | 19.9% |
Loan servicing fees | | | 133,904 | | | 104,089 | | | 29,815 | | | 28.6% |
Change in fair value of mortgage servicing rights | | | (230,524) | | | (151,168) | | | (79,356) | | | 52.5% |
Other income | | | 1,022 | | | 1,591 | | | (569) | | | (35.8)% |
Total net revenue | | | 922,335 | | | 103,004 | | | 819,331 | | | 795.4% |
| | | | | | | | | |||||
Compensation and benefits | | | 251,462 | | | 104,571 | | | 146,891 | | | 140.5% |
Loan expense | | | 28,581 | | | 10,182 | | | 18,399 | | | 180.7% |
Loan servicing expense | | | 22,742 | | | 15,781 | | | 6,961 | | | 44.1% |
Occupancy and equipment | | | 17,006 | | | 12,567 | | | 4,439 | | | 35.3% |
General and administrative | | | 28,373 | | | 14,687 | | | 13,686 | | | 93.2% |
Depreciation and amortization | | | 4,222 | | | 4,394 | | | (172) | | | (3.9)% |
Other expenses | | | 12,087 | | | 2,770 | | | 9,317 | | | 336.4% |
Total expenses | | | 364,473 | | | 164,952 | | | 199,521 | | | 121.0% |
| | | | | | | | | |||||
Income (loss) before income tax | | | 557,862 | | | (61,948) | | | 619,810 | | | 1,000.5% |
Income tax expense (benefit) | | | 149,306 | | | (14,080) | | | 163,386 | | | 1,160.4% |
Income from equity method investment | | | 14,050 | | | 2,591 | | | 11,459 | | | 442.3% |
Total net income (loss) | | | 422,606 | | | (45,277) | | | 467,883 | | | 1,033.4% |
| | | Nine Months Ended September 30, | ||||
($ in thousands) | | | 2020 | | | 2019 |
Gain on sales, net(a) | | | $657,355 | | | $(37,127) |
Origination of mortgage service rights | | | 352,118 | | | 175,756 |
Change in fair value of loans held for sale, IRLCs, and related hedges | | | 301,173 | | | 55,599 |
Realized and unrealized gain (loss) from derivative financial instruments | | | (330,851) | | | (56,569) |
Provision for losses relating to representations and warranties | | | (17,017) | | | (2,164) |
Gain on loans, net | | | $962,778 | | | $135,495 |
(a) | The Gain on sales, net includes income related to originations of mortgage servicing rights. |
Nine Months Ended September 30, | | |||||
(in thousands) | | | 2020 | | | 2019 |
Origination volume | | | 38,045,886 | | | 13,991,171 |
Originated MSR - UPB | | | 37,066,235 | | | 12,678,916 |
Gain on sale margin(a) | | | 253.1 | | | 96.8 |
Retained servicing (UPB)(b) | | | 99.2% | | | 96.2 % |
(a) | Gain on sale margin represents the margin on loans sold, including the realized and unrealized gains and losses on sales of mortgage loans, as well as the changes in fair value of all loan-related derivatives, including interest rate lock commitments, freestanding loan-related derivatives, and representation and warranty reserve, and is calculated as the ratio of Gain on loans, net to the Sales volume UPB. |
(b) | Represents the percentage of our loan sales UPBs for which we retained the underlying servicing UPB during the period. |
| | | Nine Months Ended September 30, | ||||
($ in thousands) | | | 2020 | | | 2019 |
Retained servicing fees, net of guarantees | | | $135,813 | | | $101,138 |
Late fees and other | | | (1,909) | | | 2,951 |
Loan servicing fees | | | $133,904 | | | $104,089 |
| | | Nine Months Ended September 30, | ||||
($ in thousands) | | | 2020 | | | 2019 |
MSR Servicing Portfolio - UPB | | | $73,951,042 | | | $47,887,643 |
Average MSR Servicing Portfolio - UPB | | | $63,275,795 | | | $44,655,734 |
MSR Servicing Portfolio – units | | | 307,236 | | | 217,558 |
MSRs Fair Value Multiple (x) | | | 2.57x | | | 3.15x |
Delinquency Rates (%) | | | 12.6% | | | 2.2% |
Weighted average credit score | | | 734 | | | 721 |
Weighted average servicing fee, net (bps) | | | 0.3 | | | 0.3 |
| | | Nine Months Ended September 30, | ||||
($ in thousands) | | | 2020 | | | 2019 |
Realization of cash flows | | | $(132,222) | | | $(66,241) |
Valuation inputs and assumptions | | | (211,667) | | | (163,025) |
Hedge | | | 113,365 | | | 78,098 |
Change in fair value of MSRs | | | (230,524) | | | (151,168) |
| | | Nine Months Ended September 30, | ||||
($ in thousands) | | | 2020 | | | 2019 |
Interest income | | | 42,370 | | | 35,101 |
Interest expense | | | (47,845) | | | (41,933) |
Interest loss, net | | | (5,475) | | | (6,832) |
• | Our Origination segment consists of a combination of retail and third-party loan production operations. The increase in revenues for the Origination segment was primarily driven by an increase in loan Origination volume. |
• | Our Servicing segment consists of servicing loans the Company had initially originated and subsequently sold, for which the Company retained servicing rights as well as MSRs the Company occasionally purchases from others. The decrease in revenues for the Servicing segment was primarily driven by a decrease in interest rates. |
| | | Nine Months Ended September 30, | ||||
($ in thousands) | | | 2020 | | | 2019 |
Gain on loans, net | | | 962,778 | | | 135,853 |
Loan fee income | | | 60,630 | | | 19,788 |
Loan servings fees | | | (1,982) | | | (459) |
Interest income | | | 1,804 | | | 2,237 |
Change in FV of MSRs | | | — | | | — |
Other income | | | — | | | — |
Total Origination segment revenue | | | 1,023,230 | | | 157,419 |
Directly attributable expense | | | 231,315 | | | 97,041 |
Contribution margin | | | 791,915 | | | 60,378 |
| | | Nine Months Ended September 30, | ||||
($ in thousands) | | | 2020 | | | 2019 |
Gain on loans, net | | | $— | | | $(358) |
Loan servicing fees | | | 135,886 | | | 104,548 |
Change in fair value of mortgage servicing rights | | | (230,524) | | | (151,168) |
Interest income | | | 7,130 | | | 13,255 |
Other income | | | 205 | | | 4 |
Total Servicing segment revenue | | | (87,303) | | | (33,719) |
Change in mortgage servicing rights due to valuation, net of hedge | | | (98,302) | | | (84,927) |
Directly attributable expense | | | 42,664 | | | 29,754 |
Contribution margin | | | $(31,665) | | | $21,454 |
| | | Year Ended December 31, | | | | | ||||||
($ in thousands) | | | 2019 | | | 2018 | | | $ Change | | | % Change |
Gain on loans, net | | | $199,501 | | | $84,068 | | | $115,433 | | | 137.3% |
Loan fee income | | | 32,112 | | | 19,603 | | | 12,509 | | | 64.0% |
Interest income | | | 51,801 | | | 35,179 | | | 16,622 | | | 47.2% |
Interest expense | | | (57,942) | | | (47,486) | | | (10,456) | | | 22.0% |
Interest loss, net | | | (6,141) | | | (12,307) | | | 6,166 | | | -50.1% |
Loan servicing fees | | | 144,228 | | | 119,049 | | | 25,179 | | | 21.2% |
Change in fair value of mortgage servicing rights | | | (173,134) | | | (47,312) | | | (125,822) | | | 265.9% |
Other income | | | 3,159 | | | 1,156 | | | 2,003 | | | 173.3% |
Total net revenue | | | 199,725 | | | 164,257 | | | 35,468 | | | 21.6% |
| | | | | | | | | |||||
Compensation and benefits | | | 156,197 | | | 109,577 | | | 46,620 | | | 42.5% |
Loan expense | | | 15,626 | | | 16,882 | | | (1,256) | | | -7.4% |
Loan servicing expense | | | 20,924 | | | 18,488 | | | 2,436 | | | 13.2% |
Occupancy and equipment | | | 16,768 | | | 20,521 | | | (3,753) | | | -18.3% |
General and administrative | | | 21,407 | | | 29,165 | | | (7,758) | | | -26.6% |
Depreciation and amortization | | | 5,918 | | | 7,612 | | | (1,694) | | | -22.3% |
Other expenses | | | 4,296 | | | 4,060 | | | 236 | | | 5.8% |
Total expenses | | | 241,136 | | | 206,305 | | | 34,833 | | | 16.9% |
| | | | | | | | | |||||
Loss from continuing operations before income tax | | | (41,411) | | | (42,048) | | | 637 | | | -1.5% |
Income tax benefit from continuing operations | | | (9,500) | | | (10,485) | | | 985 | | | -9.4% |
Income from equity method investments | | | 2,701 | | | 209 | | | 2,492 | | | 1,192.3% |
Net loss from continuing operations | | | (29,210) | | | (31,354) | | | 2,144 | | | -6.8% |
Net income from discontinued operations before tax | | | — | | | 9,707 | | | (9,707) | | | N/M |
Income tax provision from discontinued operations | | | — | | | 2,550 | | | (2,550) | | | N/M |
Income from discontinued operations, net of tax | | | — | | | 7,157 | | | (7,157) | | | N/M |
Total net loss | | | $(29,210) | | | $(24,197) | | | $(5,013) | | | 20.7% |
| | | Year Ended December 31, | ||||
($ in thousands) | | | 2019 | | | 2018 |
Gain on sales, net(a) | | | $209,261 | | | $80,536 |
Change in fair value of loans held for sale, IRLCs, and related hedges | | | 54,723 | | | (17,818) |
Realized and unrealized gain (loss) from derivative financial instruments | | | (60,290) | | | 22,717 |
Provision for losses relating to representations and warranties | | | (4,193) | | | (1,367) |
Gain on loans, net | | | $199,501 | | | $84,068 |
(a) | The Gain on sales, net includes income related to originations of mortgage servicing rights. |
| | | Year Ended December 31, | ||||
(in thousands) | | | 2019 | | | 2018 |
Origination volume(a) | | | 22,267,593 | | | 10,579,087 |
Originated MSR UPB | | | 20,484,918 | | | 11,690,884 |
Gain on sale margin(a)(b) | | | 89.6 | | | 79.5 |
Retained servicing (UPB)(c) | | | 96.8% | | | 97.4% |
(a) | Origination volume excludes Origination volume from the Distributed Retail channel, which was included in discontinued operations in our results of operations for the year ended December 31, 2018. |
(b) | Gain on sale margin represents the margin on loans sold, including the realized and unrealized gains and losses on sales of mortgage loans, as well as the changes in fair value of all loan-related derivatives, including interest rate lock commitments, freestanding loan-related derivatives, and representation and warranty reserve, and is calculated as the ratio of Gain on loans, net to the Sales volume UPB |
(c) | Represents the percentage of our loan sales UPBs for which we retained the underlying servicing UPB during the period |
| | | Year Ended December 31, | ||||
($ in thousands) | | | 2019 | | | 2018 |
Retained servicing fees, net of guarantees | | | $141,195 | | | $118,096 |
Late fees and other | | | 3,033 | | | 953 |
Loan servicing fees | | | $144,228 | | | $119,049 |
| | | Year Ended December 31, | ||||
($ in thousands) | | | 2019 | | | 2018 |
MSR Servicing Portfolio (UPB) | | | $52,600,546 | | | $41,423,825 |
Average MSR Servicing Portfolio (UPB) | | | $47,012,186 | | | $37,037,889 |
MSR Servicing Portfolio (Loan Count) | | | 236,362 | | | 189,513 |
MSRs Fair Value Multiple (x) | | | 3.4x | | | 4.3x |
Delinquency Rates (%) | | | 3.5 | | | 3.8 |
Weighted average credit score | | | 722 | | | 721 |
Weighted average servicing fee, net (bps) | | | 0.3 | | | 0.3 |
| | | Year Ended December 31, | ||||
($ in thousands) | | | 2019 | | | 2018 |
Realization of cash flows | | | $(98,650) | | | (57,659) |
Valuation inputs and assumptions | | | (133,997) | | | (9,903) |
Hedge | | | 59,513 | | | 20,250 |
Change in fair value of MSRs | | | (173,134) | | | (47,312) |
| | | Year Ended December 31, | ||||
($ in thousands) | | | 2019 | | | 2018 |
Interest income | | | 51,801 | | | 35,179 |
Interest expense | | | (57,942) | | | (47,486) |
Interest (loss), net | | | (6,141) | | | (12,307) |
• | Our Origination segment consists of a combination of retail and third-party loan production operations. The increase in revenues for the Origination segment was primarily driven by an increase in loan Origination volume. |
• | Our Servicing segment consists of servicing loans the Company had initially originated and subsequently sold, for which the Company retained servicing rights as well as MSRs the Company occasionally purchases from others. The decrease in revenues for the Servicing segment was primarily driven by a decrease in interest rates. |
| | | Year Ended December 31, | ||||
($ in thousands) | | | 2019 | | | 2018 |
Gain on loans, net | | | $200,646 | | | $84,127 |
Loan fee income | | | 32,072 | | | 18,462 |
Loan servings fees | | | (846) | | | — |
Interest income | | | 2,697 | | | 6,028 |
Other income | | | — | | | 44 |
Total Origination segment revenue | | | 234,569 | | | 108,661 |
Directly attributable expense | | | 145,113 | | | 108,410 |
Contribution margin | | | $89,456 | | | $251 |
| | | Year Ended December 31, | ||||
($ in thousands) | | | 2019 | | | 2018 |
Gain on loans, net(a) | | | $(1,145) | | | $(59) |
Loan servicing fees | | | 145,074 | | | 119,049 |
Change in fair value of mortgage servicing rights | | | (173,134) | | | (47,312) |
Interest income | | | 18,883 | | | 2,228 |
Other income | | | 13 | | | (98) |
Total Servicing segment revenue | | | (10,309) | | | 73,808 |
Change in mortgage servicing rights due to valuation, net of hedge | | | (74,481) | | | 10,348 |
Directly attributable expense | | | 39,579 | | | 37,280 |
Contribution margin | | | $24,593 | | | $26,180 |
(a) | Gain on loans, net includes a loss on a prior sale of servicing that we reserved for the year ended December 31, 2019. For the year ended December 31, 2018, the loss is from a loss on GNMA note modifications completed by Servicing. |
• | Borrowings, including under our warehouse funding facilities and other secured and unsecured financing facilities |
• | Cash flow from our operations, including: |
• | Sale of mortgage loans held for sale |
• | Loan origination fees |
• | Servicing fee income |
• | Interest income on loans held for sale, and |
• | Cash and marketable securities on hand |
• | Origination of loans |
• | Payment of interest expense |
• | Repayment of debt |
• | Payment of operating expenses, and |
• | Changes in margin requirements for derivative contracts |
| | | Nine Months Ended September 30, | | | Year Ended December 31, | |||||||
($ in thousands) | | | 2020 | | | 2019 | | | 2019 | | | 2018 |
Net cash (used in) provided by operating activities | | | $(385,095) | | | $(975,613) | | | $(1,206,693) | | | $262,832 |
Net cash (used in) provided by investing activities | | | (9,914) | | | (5,401) | | | (10,608) | | | 149,281 |
Net cash provided by (used in) financing activities | | | 626,668 | | | 986,606 | | | 1,216,788 | | | (412,457) |
Net increase (decrease) in Cash and cash equivalents and restricted cash | | | 231,659 | | | 5,592 | | | (513) | | | (344) |
Cash and cash equivalents and restricted cash at end of period | | | $313,390 | | | $87,836 | | | 81,731 | | | 82,244 |
($ in thousands) | | | Nine Months Ended September 30, | | | Year Ended December 31, | ||||||
Cash flows from: | | | 2020 | | | 2019 | | | 2019 | | | 2018 |
Mortgage loans held for sale (at fair value) | | | $51,131 | | | $(904,170) | | | $(1,113,232) | | | $380,500 |
Other operating sources | | | (436,226) | | | (71,443) | | | (93,461) | | | (117,668) |
Net cash (used in) provided by operating activities | | | (385,095) | | | (975,613) | | | (1,206,693) | | | 262,832 |
($ in thousands) | | | Nine Months Ended September 30, | | | Year Ended December 31, | ||||||
Cash flows from: | | | 2020 | | | 2019 | | | 2019 | | | 2018 |
Warehouse borrowings | | | $614,294 | | | $931,498 | | | 1,073,946 | | | (521,784) |
Other financing sources | | | 12,374 | | | 55,108 | | | 142,842 | | | 109,327 |
Net cash provided by (used in) financing activities | | | 626,668 | | | 986,606 | | | 1,216,788 | | | (412,457) |
($ in thousands) | | | Total | | | Less than 1 year | | | 1-3 years | | | 3-5 years | | | More than 5 years |
Term debt(a) | | | 366,708 | | | — | | | 366,708 | | | — | | | — |
Interest on long term debt | | | 52,673 | | | 20,348 | | | 32,325 | | | — | | | — |
Advance facilities(b) | | | 48,250 | | | 48,250 | | | — | | | — | | | — |
Warehouse facilities(b) | | | 1,478,183 | | | 1,478,183 | | | — | | | — | | | — |
Operating line of credit(b) | | | 10,000 | | | 10,000 | | | — | | | — | | | — |
Mortgage-backed securities forward trades | | | 3,350,161 | | | 3,350,161 | | | | | | | |||
Interest rate lock commitments | | | 3,171,868 | | | 3,171,868 | | | | | | | |||
Operating Leases(c) | | | 23,320 | | | 7,512 | | | 13,320 | | | 2,488 | | | — |
Total | | | 8,501,163 | | | 8,086,322 | | | 412,353 | | | 2,488 | | | — |
(a) | The rate used to estimate interest was the rate as of December 31, 2019. The rate is based on the LIBOR rate and there has been a significant decline in the rate in 2020 which is not reflected above. Term debt is net of debt issuance costs. |
(b) | Interest expense on advance, warehouse facilities and operating lines of credit is not presented in this table due to the short-term nature of these facilities. |
(c) | Payments due for our leases of office space and equipment expiring at various dates through 2025. The payments represent future minimum rental payments under the leases having an initial or remaining non-cancelable term in excess of one year. |
(1) | Total origination volume excludes origination volume from the Distributed Retail channel, which was included in discontinued operations in our results of operations for the year ended December 31, 2018. |
(2) | Origination volume figures used to calculate market share include $1.0 billion of Distributed Retail originations in our results of operations for the year ended December 31, 2018. |
* | LTM 3Q’20 represents the twelve months ended September 30, 2020. |
* | LTM 3Q’20 represents the twelve months ended September 30, 2020. |
* | LTM 3Q’20 represents the twelve months ended September 30, 2020. |
• | provide us efficient access to both purchase and refinance transactions throughout market cycles; |
• | benefit from the premise that in-market advisors will continue to be a cornerstone of the mortgage origination process; |
• | are highly scalable and flexible; and |
• | provide an optimized experience for our customers. |
(1) | Total origination volume excludes origination volume from the Distributed Retail channel, which was included in discontinued operations in our results of operations for the year ended December 31, 2018. |
(2) | Third Party Partners includes both Broker Partners and Correspondent Partners. |
* | LTM 3Q’20 represents the twelve months ended September 30, 2020. |

* | LTM 3Q’20 represents the twelve months ended September 30, 2020. |
Activation Rate by Broker Partner Cohort | | | Wallet Share Growth by Broker Partner Cohort Following Initial Onboarding |

* | LTM 3Q’20 represents the twelve months ended September 30, 2020. |
(1) | Third Party Partners includes both Broker Partners and Correspondent Partners. |
(2) | Active broker market coverage is calculated as the total number of active brokers at Home Point divided by the total number of brokers in the market. |
* | LTM 3Q’20 represents the twelve months ended September 30, 2020. |

* | LTM 3Q’20 represents the twelve months ended September 30, 2020. |

* | LTM 3Q’20 represents the twelve months ended September 30, 2020. |
* | LTM 3Q’20 represents the twelve months ended September 30, 2020. |
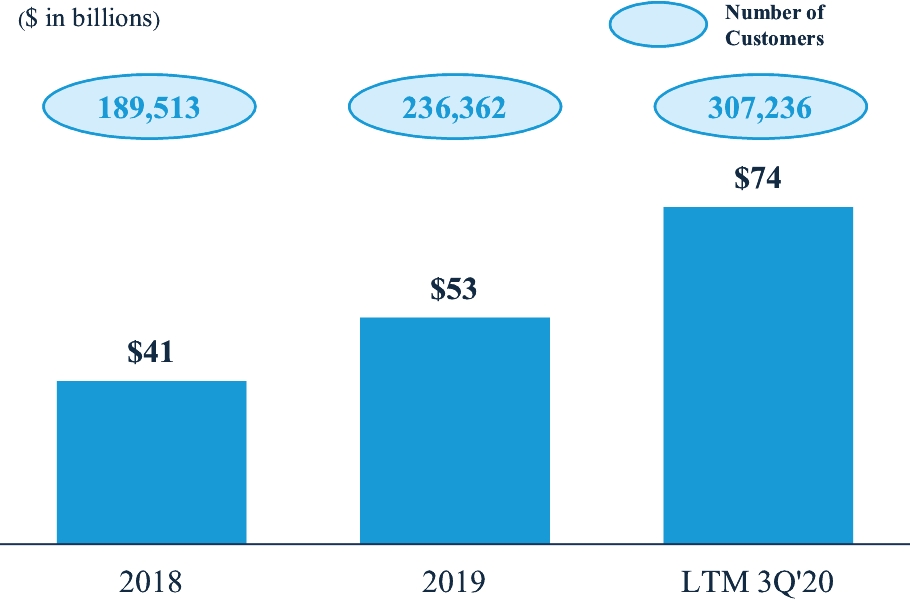
* | LTM 3Q’20 represents the twelve months ended September 30, 2020. |
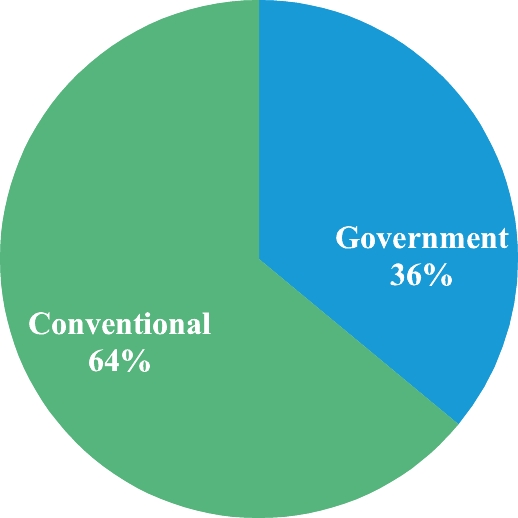

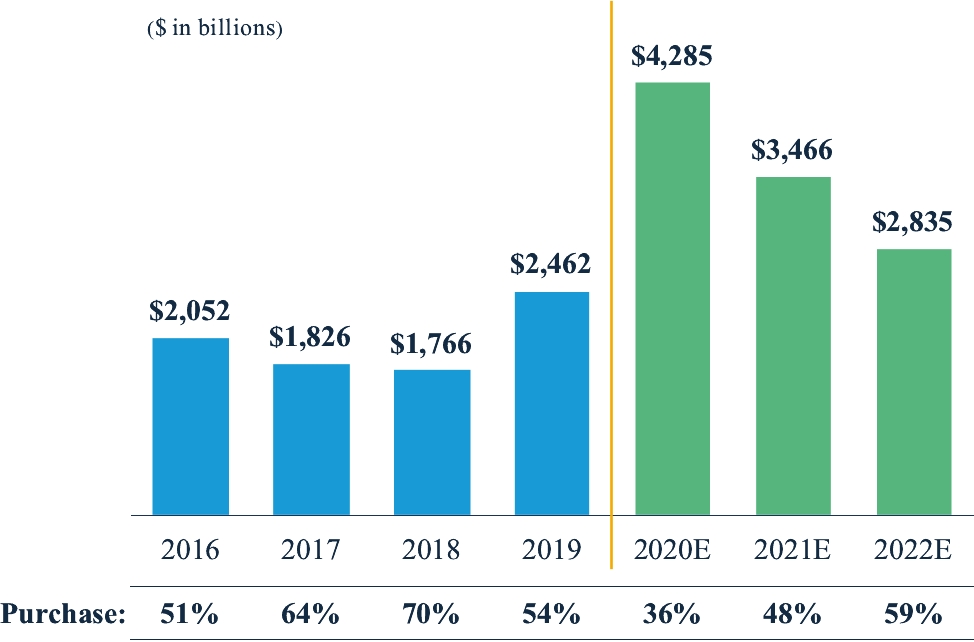

(1) | Freddie Mac Primary Mortgage Market Survey, August 1, 2020. 50bps buffer represents an assumption on the cost of refinancing. |

• | economies of scale: allows brokers to benefit from the scale of a larger organization while being able to run their business at a size that can be most responsive to their customers; |
• | optimal choice: rather than needing to work with one originator, brokers have the ability to partner with multiple lenders to determine the best financing alternative for their customers; and |
• | scalability of cost structure: reduce cost per loan and limited overhead. |
• | the Real Estate Settlement Procedures Act and Regulation X, which (1) require certain disclosures to be made to the borrower at application, as to the lender’s good faith estimate of loan origination costs, and at closing with respect to the real estate settlement statement, (2) apply to certain loan servicing practices including escrow accounts, customer complaints, servicing transfers, lender-placed insurance, error resolution and loss mitigation, and (3) prohibit giving or accepting any fee, kickback or a thing of a thing of value for the referral of real estate settlement services; |
• | The Truth In Lending Act, or TILA, Home Ownership and Equity Protection Act of 1994, and Regulation Z, which regulate mortgage loan origination activities, require certain disclosures be made to borrowers throughout the loan process regarding terms of mortgage financing, provide for a three-day right to rescind some transactions, regulate certain higher-priced and high-cost mortgages, require lenders to make a reasonable and good faith determination that consumers have the ability to repay the loan, mandate home ownership counseling for mortgage applicants, impose restrictions on loan originator compensation, and apply to certain loan servicing practices; |
• | Regulation N, which prohibits certain unfair and deceptive acts and practices related to mortgage advertising; |
• | certain provisions of the Dodd-Frank Act, including the Consumer Financial Protection Act, which, among other things, prohibit unfair, deceptive or abusive acts or practices; |
• | the Fair Credit Reporting Act, as amended by the Fair and Accurate Credit Transactions Act, and Regulation V, which regulate the use and reporting of information related to the credit history of consumers, require disclosures to consumers regarding the use of credit report information in certain credit decisions and require lenders to undertake remedial actions if there is a breach in the lender’s data security; |
• | the Equal Credit Opportunity Act and Regulation B, which prohibit discrimination on the basis of age, race and certain other characteristics in the extension of credit and require certain disclosures to applicants for credit; |
• | the Homeowners Protection Act, which requires certain disclosures and the cancellation or termination of mortgage insurance once certain equity levels are reached; |
• | the Home Mortgage Disclosure Act and Regulation C, which require reporting of loan origination data, including the number of loan applications taken, approved, denied and withdrawn; |
• | the Fair Housing Act, which prohibits discrimination in housing on the basis of race, sex, national origin, and certain other characteristics; |
• | the Fair Debt Collection Practices Act, which regulates the timing and content of third-party debt collection communications; |
• | the Gramm-Leach-Bliley Act, which requires initial and periodic communication with consumers on privacy matters and the maintenance of privacy regarding certain consumer data in our possession; |
• | the Bank Secrecy Act and related regulations from the Office of Foreign Assets Control, and the Uniting and Strengthening America by Providing Appropriate Tools Required to Intercept and Obstruct Terrorism Act, or the USA PATRIOT Act, which impose certain due diligence and recordkeeping requirements on lenders to detect and block money laundering that could support terrorist or other illegal activities; |
• | the Secure and Fair Enforcement for Mortgage Licensing Act, or the SAFE Act, which imposes state licensing requirements on mortgage loan originators; |
• | the Military Lending Act, or MLA, which restricts, among other things, the interest rate and other terms that can be offered to active military personnel and their dependents on most types of consumer credit, requires certain disclosures and prohibits certain terms, such as mandatory arbitration if a dispute arises concerning the consumer credit product; |
• | the Servicemembers Civil Relief Act, which provides financial protections for eligible service members; |
• | the Federal Trade Commission Act, the FTC Credit Practices Rules and the FTC Telemarketing Sales Rule, which prohibit unfair or deceptive acts or practices and certain related practices; |
• | the Telephone Consumer Protection Act, which restricts telephone and text solicitations and communications and the use of automatic telephone equipment; |
• | the Electronic Signatures in Global and National Commerce Act, or ESIGN, and similar state laws, particularly the Uniform Electronic Transactions Act, or UETA, which require businesses that use electronic records or signatures in consumer transactions and provide required disclosures to consumers electronically, to obtain the consumer’s consent to receive information electronically; |
• | the Electronic Fund Transfer Act of 1978, or EFTA, and Regulation E, which protect consumers engaging in electronic fund transfers; |
• | the Controlling the Assault of Non-Solicited Pornography and Marketing Act of 2003 and the FTC’s rules promulgated pursuant to such Act, or the CAN-SPAM Act, which establish requirements for certain “commercial messages” and “transactional or relationship messages” transmitted via email; and |
• | the Bankruptcy Code and bankruptcy injunctions and stays, which can restrict collection of debts. |
• | loss of our licenses and approvals to engage in our servicing and lending businesses; |
• | governmental investigations and enforcement actions; |
• | administrative fines and penalties and litigation; |
• | civil and criminal liability, including class action lawsuits and actions to recover incentive and other payments made by governmental entities; |
• | breaches of covenants and representations resulting in defaults and cross-defaults under our servicing and trade agreements and financing arrangements; |
• | damage to our reputation; |
• | inability to obtain new financing and maintain existing financing; |
• | inability to raise capital; or |
• | inability to execute on our business strategy. |
Name | | | Age | | | Position |
William A. Newman | | | 56 | | | Director, President and Chief Executive Officer |
Mark E. Elbaum | | | 58 | | | Chief Financial Officer |
Maria N. Fregosi | | | 55 | | | Chief Investment Officer |
Phillip R. Shoemaker Jr. | | | 41 | | | President of Originations |
Phillip M. Miller | | | 51 | | | Chief Operating Officer |
Brian R. Ludtke | | | 53 | | | Chief Administrative Officer and Corporate Secretary |
Perry Hilzendeger | | | 53 | | | President of Servicing |
Laurie S. Goodman | | | 65 | | | Director Nominee* |
Agha S. Khan | | | 41 | | | Director |
Stephen A. Levey | | | 46 | | | Director |
Timothy R. Morse | | | 51 | | | Director Nominee* |
Eric L. Rosenzweig | | | 38 | | | Director |
* | To be elected to the board upon or before the consummation of this offering. |
• | any breach of the director’s duty of loyalty to us or our stockholders; |
• | any act or omission not in good faith or that involves intentional misconduct or a knowing violation of law; |
• | unlawful payments of dividends or unlawful stock repurchases or redemptions as provided in Section 174 of the DGCL; or |
• | any transaction from which the director derived an improper personal benefit. |
• | selecting, evaluating, compensating and overseeing the independent registered public accounting firm; |
• | overseeing our financial reporting activities and the accounting standards and principles followed; |
• | reviewing and discussing with management and the independent auditor, as appropriate, the effectiveness of our internal control over financial reporting; |
• | as required by the listing standards of NASDAQ, reviewing our major financial risk exposures (and the steps management has taken to monitor and control these risks) and our risk assessment and risk management practices and the guidelines, policies and processes for risk assessment and risk management; |
• | approving audit and non-audit services provided by the independent registered public accounting firm; |
• | reviewing and, if appropriate, approving or ratifying transactions with related persons required to be disclosed under SEC rules; |
• | meeting with management and the independent registered public accounting firm to review and discuss our financial statements and other matters; |
• | overseeing our internal audit function, including reviewing its organization, performance and audit findings, and reviewing our internal controls; |
• | monitoring the integrity of our financial statements and our compliance with legal and regulatory requirements as they relate to our financial statements and accounting matters; |
• | establishing procedures for the receipt, retention and treatment of complaints received by us regarding accounting, internal controls, auditing or compliance matters; |
• | reviewing proposed waivers of the code of conduct for directors and executive officers; and |
• | reviewing the audit committee charter and the committee’s performance at least annually. |
• | will serve as the chairperson of the audit committee. We believe that will qualify as independent directors according to the rules and regulations of the SEC and the listing rules of NASDAQ with respect to audit committee membership. Not later than the first anniversary of the effectiveness of the registration statement, all members of the audit committee will be independent. |
• | select, or recommend that our board of directors select, the director nominees to stand for election at each annual general meeting of our stockholders or to fill vacancies on our board of directors; |
• | develop and recommend to our board of directors a set of corporate governance guidelines applicable to us and monitor compliance with such guidelines; and |
• | oversee the annual performance evaluation of our board of directors (and any committees thereof) and management. |
• | review and approve, or recommend to the full board of directors, the goals and objectives relating to the compensation of our executive officers, including any long-term incentive components of our compensation programs; |
• | evaluate the performance of our executive officers in light of the goals and objectives of our compensation programs and approve, or recommend to the full board of directors, each executive officer’s compensation based on such evaluation; |
• | oversee the evaluation of each of our executive officers’ performance; |
• | review and approve, or recommend to the full board of directors, subject, if applicable, to stockholder approval, our compensation programs; |
• | review the operation and efficacy of our executive compensation programs in light of their goals and objectives; |
• | review and assess risks arising from our compensation programs; |
• | periodically review that our executive compensation programs comport with the compensation committee’s stated compensation philosophy; |
• | review our management succession planning; |
• | review and recommend to the board of directors the appropriate structure and amount of compensation for our directors; |
• | establish and periodically review policies for the administration of our equity compensation plans; and |
• | review the adequacy of the compensation committee and its charter and recommend any proposed changes to the board of directors not less than annually. |
Name and Principal Position | | | Year | | | Salary ($)(1) | | | Bonus ($)(2) | | | Option Awards ($)(3) | | | Non-Equity Incentive Plan Compensation ($) | | | All Other Compensation ($) | | | Total ($) |
William Newman President and Chief Executive Officer | | | 2020 | | | 400,000 | | | 1,125,000 | | | — | | | — | | | — | | | 1,525,000 |
Maria Fregosi Chief Investment Officer(4) | | | 2020 | | | 350,000 | | | 223,500 | | | — | | | — | | | — | | | 573,500 |
Phil Shoemaker President of Originations | | | 2020 | | | 375,000 | | | 120,000 | | | — | | | — | | | — | | | 495,000 |
(1) | The amounts reported represent the named executive officer’s base salary earned during the fiscal year covered. |
(2) | The amounts reported represent the 2020 Special Bonuses in an amount equal to: $1,125,000 for Mr. Newman, $223,500 for Ms. Fregosi and $125,000 for Mr. Shoemaker. See “—Special Bonus Agreement” below. The named executive officers are also eligible to receive a discretionary bonus based on fiscal 2020 performance. We expect that such bonuses will be determined and paid in March 2021. |
(3) | The amounts reported represent the aggregate grant-date fair value of performance-vesting options awarded to the named executive officer in 2020, calculated in accordance with FASB ASC Topic 718 (“Topic 718”), utilizing the assumptions discussed in Note 20 – Stock Options, to our consolidated financial statements included elsewhere in this prospectus. The performance-vesting options are subject to market conditions and an implied performance condition as defined under applicable accounting standards. The grant date fair value of the performance-vesting options was computed based upon the probable outcome of the performance conditions as of the grant date in accordance with Topic 718. Achievement of the performance conditions for the performance-vesting options was not deemed probable on the grant date and, accordingly, no value is included in the table for these awards pursuant to the SEC’s disclosure rules. Assuming achievement of the performance conditions, the aggregate grant date fair values of the performance-vesting options granted in fiscal 2020 to each of our named executive officers would have been: Mr. Newman ($342,322); Ms. Fregosi ($224,757); and Mr. Shoemaker ($273,857). |
(4) | Until December 2020, Ms. Fregosi served as our Chief Financial Officer. |
• | A portion of the special incentive bonus was paid to each of the named executive officers on October 9, 2020 (the “2020 Special Bonus”). |
• | A portion of the special incentive bonus will be paid to Ms. Fregosi and Mr. Shoemaker in equal installments on the first payroll date after the end of each fiscal quarter of the Company beginning on December 31, 2020 and continuing until December 31, 2023 (the “Time-Vesting Bonus”). |
• | A portion of the special incentive bonus will be paid to each of the named executive officers upon the consummation of a “sponsor exit transaction” or a “public offering” (each as defined in the 2015 Option Plan), subject to the satisfaction of specified transfer and financial targets in connection with the sponsor exit transaction or public offering (the “Performance-Vesting Bonus”). |
Executive | | | 2020 Special Bonus ($) | | | Time- Vesting Bonus ($) | | | Performance- Vesting Bonus ($) | | | Total Special Incentive Bonus ($) |
William Newman | | | 1,125,000 | | | — | | | 1,875,000 | | | 3,000,000 |
Maria Fregosi | | | 223,500 | | | 76,500 | | | 600,000 | | | 900,000 |
Phil Shoemaker | | | 120,000 | | | 480,000 | | | 1,200,000 | | | 1,800,000 |
| | | Number of Substitute Options (#) | | | Exercise Price ($) | |
William Newman | | | | | ||
Maria Fregosi | | | | | ||
Phil Shoemaker | | | | |
• | 50% of the common units granted pursuant to each option are “time-vesting options,” which generally vest in annual installments over the first five years of the grant date, except that all unvested time-vesting options vest on a “sponsor exit transaction” (as defined in the 2015 Option Plan); and |
• | 50% of the common units granted pursuant to the options are “performance-vesting options” that vest only upon the consummation of a “sponsor exit transaction” (as defined in the 2015 Option Plan) or certain initial public offerings of equity securities of Holdings or any of its subsidiaries pursuant to an effective registration statement under the Securities Act (a “public offering”) and only if specified transfer and financial targets are satisfied. For substitute options, sales of our common stock by the Sponsor Partners (as defined in the 2015 Option Plan) after this offering will also be included in determining whether a sponsor exit transaction has occurred, and the financial targets will be tested once the Sponsor Partners have sold at least 50% of their common units of Holdings (or shares of our common stock into which such common units have been converted in connection with the merger and this offering) and at each subsequent sale by the Sponsor Partners. |
| | | Option Awards | ||||||||||||||||
Name | | | Date of Grant | | | Number of Securities Underlying Unexercised Options (#) Exercisable(1) | | | Number of Securities Underlying Unexercised Options (#) Unexercisable(2) | | | Equity Incentive Plan Awards: Number of Securities Underlying Unexercised Unearned Options (#)(3) | | | Option Exercise Price ($) | | | Option Expiration Date |
| | | | | | | | | | | | | |||||||
William Newman | | | 4/1/15 | | | 375,000 | | | — | | | 375,000 | | | 10.00 | | | 4/1/25 |
| | 2/28/20 | | | — | | | — | | | 250,000 | | | 10.50 | | | 2/28/30 | ||
Maria Fregosi | | | 4/1/15 | | | 62,500 | | | — | | | 62,500 | | | 10.00 | | | 4/1/25 |
| | 2/16/16 | | | 5,000 | | | — | | | 5,000 | | | 10.00 | | | 2/16/26 | ||
| | 4/16/18 | | | 3,000 | | | 4,500 | | | 7,500 | | | 10.46 | | | 4/16/28 | ||
| | 12/5/18 | | | 10,000 | | | 15,000 | | | 25,000 | | | 10.25 | | | 12/5/28 | ||
| | 2/28/20 | | | — | | | — | | | 50,000 | | | 10.50 | | | 2/28/30 | ||
| | 6/15/20 | | | — | | | — | | | 50,000 | | | 10.50 | | | 6/15/30 | ||
Phil Shoemaker | | | 12/5/18 | | | 80,000 | | | 120,000 | | | 200,000 | | | 10.25 | | | 12/5/28 |
| | 2/28/20 | | | — | | | — | | | 200,000 | | | 10.50 | | | 2/28/30 | ||
(1) | The numbers in this column represent vested and exercisable time-vesting options. |
(2) | The numbers in this column represent unvested outstanding time-vesting options. |
(3) | The numbers in this column represent unvested outstanding performance-vesting options. The vesting terms of these options are described above under “Narrative Disclosure to Summary Compensation Table.” |
| | | Shares of common stock beneficially owned prior to this offering | | | | | Shares of common stock beneficially owned after this offering assuming no exercise of underwriters’ option | | | Shares of common stock beneficially owned after this offering assuming full exercise of underwriters’ option | |||||||||||
Name of Beneficial Owners(1) | | | Shares of common stock | | | Percentage of Total Outstanding Common Stock (%) | | | Number of Shares Being Sold in this Offering | | | Shares of common stock | | | Percentage of Total Outstanding Common Stock (%) | | | Shares of common stock | | | Percentage of Total Outstanding Common Stock (%) |
Greater than 5% Stockholders | | | | | | | | | | | | | | | |||||||
Trident Stockholders(2) | | | | | % | | | | | | | % | | | | | % | ||||
| | | | | | | | | | | | | | | ||||||||
Named Executive Officers | | ||||||||||||||||||||
William A. Newman | | | | | % | | | | | | | % | | | | | % | ||||
Maria N. Fregosi | | | | | % | | | | | | | % | | | | | % | ||||
Phillip R. Shoemaker Jr. | | | | | % | | | | | | | % | | | | | % | ||||
| | | | | | | | | | | | | | | ||||||||
Directors and Director Nominees | | | | | | | | | | | | | | | |||||||
Laurie S. Goodman(3) | | | | | % | | | | | | | % | | | | | % | ||||
Agha S. Khan | | | | | % | | | | | | | % | | | | | % | ||||
Stephen A. Levey | | | | | % | | | | | | | % | | | | | % | ||||
Timothy R. Morse(3) | | | | | % | | | | | | | % | | | | | % | ||||
Eric L. Rosenzweig | | | | | % | | | | | | | % | | | | | % | ||||
| | | | | | | | | | | | | | | ||||||||
Directors, Director Nominees and Executive Officers as a group ( persons) | | | | | % | | | | | | | % | | | | | % | ||||
* | Less than 1% of common stock outstanding. |
(1) | Unless otherwise indicated below, the address of each of the individuals named above is: c/o Home Point Capital Inc., 2211 Old Earhart Road, Suite 250, Ann Arbor, Michigan 48105. |
(2) | Following the consummation of this offering, Trident VI, L.P. (“Trident VI”), Trident VI Parallel Fund, L.P. (“Trident VI Parallel”), Trident VI DE Parallel Fund, L.P. (“Trident VI DE”) and Trident VI Professionals Fund, L.P. (“Trident VI Professionals”) will hold shares of our common stock. Each of Trident VI, Trident VI Parallel, Trident VI DE and Trident VI Professionals and each of their respective general partners, as well as Stone Point Capital, the manager of Trident VI, Trident VI Parallel, Trident VI DE and Trident VI Professionals, also may be deemed to be the beneficial owners having shared voting power and shared investment power over the securities described in this footnote. Agha S. Khan, Stephen A. Levey and Eric L. Rosenzweig, each of whom is a member of our Board, are employees of Stone Point Capital. The principal business address of each of the entities identified in this footnote is c/o Stone Point Capital LLC, 20 Horseneck Lane, Greenwich, CT 06830. |
(3) | To be elected to the board upon or before the consummation of this offering. |
• | the designation of the series; |
• | the number of shares of the series, which our board of directors may, except where otherwise provided in the preferred stock designation, increase (but not above the total number of authorized shares of the class) or decrease (but not below the number of shares then outstanding); |
• | whether dividends, if any, will be cumulative or non-cumulative and the dividend rate of the series; |
• | the dates at which dividends, if any, will be payable; |
• | the redemption rights and price or prices, if any, for shares of the series; |
• | the terms and amounts of any sinking fund provided for the purchase or redemption of shares of the series; |
• | the amounts payable on shares of the series in the event of any voluntary or involuntary liquidation, dissolution or winding-up of the affairs of the Company; |
• | whether the shares of the series will be convertible into shares of any other class or series, or any other security, of the Company or any other corporation and, if so, the specification of the other class or series or other security, the conversion price or prices or rate or rates, any rate adjustments, the date or dates as of which the shares will be convertible and all other terms and conditions upon which the conversion may be made; |
• | restrictions on the issuance of shares of the same series or of any other class or series; and |
• | the voting rights, if any, of the holders of the series. |
• | prior to such time, our board of directors approved either the business combination or the transaction which resulted in the stockholder becoming an interested stockholder; |
• | upon consummation of the transaction that resulted in the stockholder becoming an interested stockholder, the interested stockholder owned at least % of our voting stock outstanding at the time the transaction commenced, excluding certain shares; or |
• | at or subsequent to that time, the business combination is approved by our board of directors and by the affirmative vote of holders of at least 66 2⁄3% of the outstanding voting stock that is not owned by the interested stockholder. |
• | the provision requiring a 66 2/3% supermajority vote for stockholders to amend our amended and restated bylaws; |
• | the provisions providing for a classified board of directors (the election and term of our directors); |
• | the provisions regarding resignation and removal of directors; |
• | the provisions regarding competition and corporate opportunities; |
• | the provisions regarding entering into business combinations with interested stockholders; |
• | the provisions regarding stockholder action by written consent; |
• | the provisions regarding calling special meetings of stockholders; |
• | the provisions regarding filling vacancies on our board of directors and newly created directorships; |
• | the provisions eliminating monetary damages for breaches of fiduciary duty by a director; and |
• | the amendment provision requiring that the above provisions be amended only with a 66 2/3% supermajority vote. |
• | 1% of the number of shares of our common stock then outstanding, which will equal approximately shares immediately after this offering; or |
• | the average reported weekly trading volume of our common stock on NASDAQ during the four calendar weeks preceding the filing of a notice on Form 144 with respect to such sale. |
• | an individual citizen or resident of the United States; |
• | a corporation (or any other entity treated as a corporation for U.S. federal income tax purposes) created or organized in or under the laws of the United States, any state thereof or the District of Columbia; |
• | an estate the income of which is subject to U.S. federal income taxation regardless of its source; or |
• | a trust if it (1) is subject to the primary supervision of a court within the United States and one or more United States persons as defined under the Code, have the authority to control all substantial decisions of the trust or (2) has a valid election in effect under applicable U.S. Treasury regulations to be treated as a United States person. |
• | the gain is effectively connected with a trade or business of the non-U.S. holder in the United States (and, if required by an applicable income tax treaty, is attributable to a U.S. permanent establishment of the non-U.S. holder); |
• | the non-U.S. holder is an individual who is present in the United States for 183 days or more in the taxable year of that disposition, and certain other conditions are met; or |
• | we are or have been a “United States real property holding corporation” for U.S. federal income tax purposes, at any time within the five-year period preceding the disposition or the non-U.S. holder’s holding period, which period is shorter and certain other conditions are met. |
Underwriter | | | Number of Shares |
Goldman Sachs & Co. LLC | | | |
Wells Fargo Securities, LLC | | | |
Morgan Stanley & Co. LLC | | | |
UBS Securities LLC | | | |
Credit Suisse Securities (USA) LLC | | | |
J.P. Morgan Securities LLC | | | |
BofA Securities, Inc. | | | |
JMP Securities LLC | | | |
Piper Sandler & Co. | | | |
R. Seelaus & Co., LLC | | | |
SPC Capital Markets LLC | | | |
Wedbush Securities Inc. | | | |
Zelman Partners LLC | | | |
Total | | |
| | | No Exercise | | | Full Exercise | |
Per Share | | | $ | | | $ |
Total | | | $ | | | $ |
| | | No Exercise | | | Full Exercise | |
Per Share | | | $ | | | $ |
Total | | | $ | | | $ |
(a) | to any legal entity which is a qualified investor as defined under the Prospectus Regulation; |
(b) | to fewer than 150 natural or legal persons (other than qualified investors as defined under the Prospectus Regulation); or |
(c) | in any other circumstances falling within Article 1(4) of the Prospectus Regulation, |
(a) | to any legal entity which is a qualified investor as defined in Article 2 of the UK Prospectus Regulation; |
(b) | to fewer than 150 natural or legal persons (other than qualified investors as defined in Article 2 of the UK Prospectus Regulation); or |
(c) | in any other circumstances falling within section 86 of the Financial Services and Markets Act 2000 (“FSMA”), |
• | does not constitute a disclosure document or a prospectus under Chapter 6D.2 of the Corporations Act 2001 (Cth) (the “Corporations Act”); |
• | has not been, and will not be, lodged with the Australian Securities and Investments Commission (“ASIC”), as a disclosure document for the purposes of the Corporations Act and does not purport to include the information required of a disclosure document for the purposes of the Corporations Act; and |
• | may only be provided in Australia to select investors who are able to demonstrate that they fall within one or more of the categories of investors, available under section 708 of the Corporations Act (“Exempt Investors”). |
UNAUDITED CONSOLIDATED FINANCIAL STATEMENTS | | | |
| | | ||
| | | ||
| | | ||
| | | ||
| | | ||
| | | ||
| | | ||
| | | ||
AUDITED CONSOLIDATED FINANCIAL STATEMENTS | | | |
| | | ||
| | | ||
| | | ||
| | | ||
| | | ||
| | | ||
| | |
| | | September 30, 2020 (unaudited) | | | Pro forma September 30, 2020 (unaudited) | | | December 31, 2019 | |
Assets: | | | | | | | |||
Cash and cash equivalents | | | $271,483 | | | | | $30,630 | |
Restricted cash | | | 41,907 | | | | | 51,101 | |
Cash and cash equivalents and Restricted cash | | | 313,390 | | | | | 81,731 | |
Mortgage loans held for sale (at fair value) | | | 2,281,835 | | | | | 1,554,230 | |
Mortgage servicing rights (at fair value) | | | 583,263 | | | | | 575,035 | |
Property and equipment, net | | | 18,595 | | | | | 12,051 | |
Accounts receivable, net | | | 79,320 | | | | | 57,872 | |
Derivative assets | | | 314,794 | | | | | 40,544 | |
Goodwill and intangibles | | | 11,083 | | | | | 11,935 | |
GNMA loans eligible for repurchase | | | 2,919,881 | | | | | 499,207 | |
Other assets | | | 65,745 | | | | | 76,162 | |
Total assets | | | $6,587,906 | | | | | $2,908,767 | |
Liabilities and Shareholders’ Equity: | | | | | | | |||
Liabilities: | | | | | | | |||
Warehouse lines of credit | | | $2,092,477 | | | | | $1,478,183 | |
Term debt and other borrowings, net | | | 374,090 | | | | | 424,958 | |
Accounts payable and accrued expenses | | | 269,016 | | | | | 39,739 | |
GNMA loans eligible for repurchase | | | 2,919,881 | | | | | 499,207 | |
Other liabilities | | | 189,700 | | | | | 56,368 | |
Total liabilities | | | $5,845,164 | | | | | $2,498,455 | |
Commitments and Contingencies (Note 11) | | | | | | | |||
| | | | | | | ||||
Shareholders’ Equity: | | | | | | | |||
Common stock (100 shares issued and outstanding, par value $0.01 per share) | | | — | | | | | — | |
Additional paid-in capital | | | 519,177 | | | | | 454,861 | |
Retained earnings (accumulated deficit) | | | 223,565 | | | | | (44,549) | |
Total shareholders' equity | | | 742,742 | | | | | 410,312 | |
Total liabilities and shareholders' equity | | | $6,587,906 | | | | | $2,908,767 |
| | | Nine months Ended September 30, | ||||
| | | 2020 | | | 2019 | |
Revenue: | | | | | ||
Gain on loans, net | | | $962,778 | | | $135,495 |
Loan fee income | | | 60,630 | | | 19,829 |
Interest income | | | 42,370 | | | 35,101 |
Interest expense | | | (47,845) | | | (41,933) |
Interest loss, net | | | (5,475) | | | (6,832) |
Loan servicing fees | | | 133,904 | | | 104,089 |
Change in fair value of mortgage servicing rights | | | (230,524) | | | (151,168) |
Other income | | | 1,022 | | | 1,591 |
Total net revenue | | | $922,335 | | | $103,004 |
Expenses: | | | | | ||
Compensation and benefits | | | 251,462 | | | 104,571 |
Loan expense | | | 28,581 | | | 10,182 |
Loan servicing expense | | | 22,742 | | | 15,781 |
Occupancy and equipment | | | 17,006 | | | 12,567 |
General and administrative | | | 28,373 | | | 14,687 |
Depreciation and amortization | | | 4,222 | | | 4,394 |
Other expenses | | | 12,087 | | | 2,770 |
Total expenses | | | $364,473 | | | $164,952 |
Income (loss) before income tax | | | 557,862 | | | (61,948) |
Income tax expense (benefit) | | | 149,306 | | | (14,080) |
Income from equity method investment | | | 14,050 | | | 2,591 |
Total net income (loss) | | | $422,606 | | | $(45,277) |
| | | | | |||
Basic and diluted loss earnings per share: | | | | | ||
Basic and diluted total net income (loss) per share | | | $4,226 | | | $(453) |
| | | Common Stock | | | Additional Paid in Capital | | | Retained Earnings (Accumulated Deficit) | | | Total Shareholders’ Equity | ||||
| | | Shares | | | Amount | | |||||||||
Ending balance, December 31, 2018 | | | 100 | | | — | | | $454,110 | | | $(15,339) | | | $438,771 |
Stock based compensation | | | — | | | — | | | 534 | | | — | | | 534 |
Net loss | | | — | | | — | | | — | | | (45,277) | | | (45,277) |
Ending balance, September 30, 2019 | | | 100 | | | — | | | $454,644 | | | $(60,616) | | | $394,028 |
Ending balance, December 31, 2019 | | | 100 | | | — | | | $454,861 | | | $(44,549) | | | $410,312 |
Capital contributions from parent | | | — | | | — | | | 63,774 | | | — | | | 63,774 |
Cash dividends declared | | | — | | | — | | | — | | | (154,492) | | | (154,492) |
Stock based compensation | | | — | | | — | | | 542 | | | — | | | 542 |
Net income | | | — | | | — | | | — | | | 422,606 | | | 422,606 |
Ending balance, September 30, 2020 | | | 100 | | | — | | | $519,177 | | | $223,565 | | | $742,742 |
| | | Nine months Ended September 30, | ||||
| | | 2020 | | | 2019 | |
Operating activities: | | | | | ||
Net income (loss) | | | $422,606 | | | $(45,277) |
Adjustments to reconcile net income (loss) to cash used in operating activities: | | | | | ||
Depreciation | | | 3,370 | | | 2,779 |
Amortization of intangible assets | | | 852 | | | 1,615 |
Amortization of debt issuance costs | | | 531 | | | 5,669 |
Gain on loans, net | | | (962,778) | | | (135,495) |
Provision for representation and warranty reserve | | | 10,025 | | | 900 |
Stock based compensation expense | | | 542 | | | 534 |
Deferred income tax | | | 133,645 | | | (15,046) |
Gain on equity investment | | | (14,050) | | | (2,591) |
Origination of mortgage loans held for sale | | | (38,534,747) | | | (14,735,416) |
Proceeds on sale and payments from mortgage loans held for sale | | | 38,585,878 | | | 13,831,246 |
Change in fair value of mortgage servicing rights | | | 230,524 | | | 151,168 |
Change in fair value of mortgage loans held for sale | | | (54,709) | | | (31,013) |
Change in fair value of derivative assets | | | (274,250) | | | (31,340) |
Changes in operating assets and liabilities: | | | | | ||
Increase in accounts receivable, net | | | (21,448) | | | (2,518) |
Decrease in other assets | | | 3,798 | | | 705 |
Increase in accounts payable and accrued expenses | | | 74,787 | | | 11,081 |
Increase in other liabilities | | | 10,329 | | | 17,386 |
Net cash used in operating activities | | | $(385,095) | | | $(975,613) |
| | | | | |||
Investing activities: | | | | | ||
Purchases of property and equipment, net of disposals | | | (9,914) | | | (3,633) |
Equity method investment | | | | | 5 | |
Business acquisitions, net of cash acquired | | | | | (1,773) | |
Net cash used in investing activities | | | $(9,914) | | | $(5,401) |
| | | | | |||
Financing activities: | | | | | ||
Proceeds from warehouse borrowings | | | 38,381,219 | | | 14,697,210 |
Payments on warehouse borrowings | | | (37,766,925) | | | (13,765,712) |
Proceeds from term debt borrowings | | | 47,600 | | | 309,000 |
Payments on term debt borrowings | | | (60,000) | | | (245,156) |
Proceeds from other borrowings | | | 64,500 | | | 159,600 |
Payments on other borrowings | | | (103,500) | | | (166,000) |
Payments of debt issuance costs | | | | | (2,336) | |
Capital contributions from parent | | | 63,774 | | | — |
Net cash provided by financing activities | | | 626,668 | | | 986,606 |
Net increase in cash, cash equivalents and restricted cash | | | $231,659 | | | $5,592 |
Cash, cash equivalents and restricted cash at beginning of period | | | 81,731 | | | 82,244 |
Cash, cash equivalents and restricted cash at end of period | | | $313,390 | | | $87,836 |
Supplemental disclosure: | | | | | ||
Cash paid for interest | | | 46,715 | | | 35,054 |
Cash paid for taxes | | | 22,034 | | | 966 |
1. | All of Platinum Mortgage, Inc.’s rights and ownership in certain tangible and intangible property, including but not limited to information, books, and records of the Platinum Mortgage, Inc. such as filers, invoices, credit and sales records, personnel records, and all agreements to which Platinum Mortgage, Inc. is a party and identified as material contracts; |
2. | Employees, including underwriters, closers, account managers, administrative staff; |
3. | Building lease and all related facilities contracts; |
4. | Retained assets, including office furniture and computer equipment. |
Fair value of assets acquired: | | | |
Fixed assets | | | $93 |
Consideration transferred: | | | |
Cash | | | 124 |
Earnout | | | 1,648 |
| | | $1,772 | |
Goodwill | | | $1,679 |
Fair value of assets acquired: | | | |
Cash | | | $2 |
Mortgage loans held for sale | | | 214 |
Mortgage servicing rights | | | 1,528 |
Servicing advances | | | 181 |
Accounts receivable | | | 31 |
Foreclosure assets | | | 334 |
Real estate owned | | | 247 |
Prepaid expenses and other assets | | | 20 |
GNMA loans eligible for repurchase | | | 1,580 |
Total assets | | | $4,137 |
| | | ||
Representation and warranty reserve | | | 85 |
Accrued expenses | | | 424 |
Deferred tax liability, net | | | 304 |
GNMA loans eligible for repurchase | | | 1,580 |
Total liabilities | | | $2,393 |
Net assets | | | $1,744 |
| | | ||
Consideration transferred: | | | |
Cash | | | 2,152 |
Holdback | | | 1,000 |
Goodwill | | | $1,408 |
| | | September 30, 2020 | |||||||
| | | Unpaid Principal | | | Fair Value Adjustment | | | Total Fair Value | |
Conventional(1) | | | $1,479,984 | | | $66,285 | | | $1,546,269 |
Government(2) | | | 699,775 | | | 35,599 | | | 735,374 |
Reverse(3) | | | 275 | | | (83) | | | 192 |
Total | | | $2,180,034 | | | $101,801 | | | $2,281,835 |
(1) | Conventional includes FNMA and FHLMC mortgage loans. |
(2) | Government includes GNMA mortgage loans (including Federal Housing Administration, Department of Veterans Affairs, and United States Department of Agriculture). |
(3) | Reverse loan presented in Mortgage loans held for sale on the condensed consolidated balance sheets as a result of a repurchase |
| | | December 31, 2019 | |||||||
| | | Unpaid Principal | | | Fair Value Adjustment | | | Total Fair Value | |
Conventional(1) | | | $454,225 | | | $8,787 | | | $463,012 |
Government(2) | | | 1,052,638 | | | 38,388 | | | 1,091,026 |
Reverse(3) | | | 275 | | | (83) | | | 192 |
Total | | | $1,507,138 | | | $47,092 | | | $1,554,230 |
(1) | Conventional includes FNMA and FHLMC mortgage loans. |
(2) | Government includes GNMA mortgage loans (including Federal Housing Administration, Department of Veterans Affairs and United States Department of Agriculture). |
(3) | Reverse loan presented in Mortgage loans held for sale on the condensed consolidated balance sheets as a result of a repurchase |
| | | Nine Months Ended September 30, | ||||
| | | 2020 | | | 2019 | |
Fair value at beginning of period | | | $1,554,230 | | | $421,754 |
Mortgage loans originated and purchased(1) | | | 38,534,747 | | | 14,735,416 |
Proceeds on sales and payments received(1) | | | (38,585,878) | | | (13,831,246) |
Change in fair value | | | 54,709 | | | 31,013 |
Gain on loans(2) | | | 724,027 | | | 37,837 |
Fair value at end of period | | | $2,281,835 | | | $1,394,774 |
(1) | This line as presented on the condensed consolidated statements of cash flows for the nine months ended September 30, 2019, excludes the portion related to HPMAC, which is included in Business acquisitions within Investing activities. The portion related to HPMAC is recorded on Business acquisitions, net of cash acquired line. This schedule contains HPMAC. |
(2) | This line as presented on the condensed consolidated statements of cash flows excludes OMSR and MSR hedging. |
| | | Nine Months Ended September 30, | ||||
| | | 2020 | | | 2019 | |
Balance at beginning of period | | | $575,035 | | | $532,526 |
MSRs originated | | | 352,118 | | | 175,756 |
Changes in valuation model inputs | | | (211,668) | | | (163,026) |
Change in cash payoffs and principal amortization | | | (132,222) | | | (66,240) |
Balance at end of period | | | $583,263 | | | $479,016 |
| | | | | |||
| | | September 30, 2020 | | | December 31, 2019 | |
Ginnie Mae | | | $26,319,278 | | | $24,611,487 |
Fannie Mae | | | 29,140,239 | | | 14,895,853 |
Freddie Mac | | | 18,432,195 | | | 13,021,778 |
Other | | | 59,330 | | | 71,428 |
Total mortgage servicing portfolio | | | $73,951,042 | | | $52,600,546 |
MSR balance | | | $583,263 | | | $575,035 |
MSR balance as % of unpaid mortgage principal balance | | | 0.79% | | | 1.09% |
| | | Discount Rate | | | Prepayment Speeds | |||||||
| | | 100 BPS Adverse Change | | | 200 BPS Adverse Change | | | 10% Adverse Change | | | 20% Adverse Change | |
September 30, 2020 | | | | | | | | | ||||
HPF Portfolio | | | $(19,124) | | | $(36,901) | | | $(37,208) | | | $(70,451) |
HPMAC Portfolio | | | (27) | | | (51) | | | (59) | | | (112) |
December 31, 2019 | | | | | | | | | ||||
HPF Portfolio | | | $(20,938) | | | $(40,288) | | | $(29,530) | | | $(56,176) |
HPMAC Portfolio | | | (52) | | | (100) | | | (81) | | | (154) |
| | | September 30, 2020 | | | December 31, 2019 | |
Total unpaid principal balance | | | $75,248,444 | | | $54,329,300 |
Loans 30-89 days delinquent | | | 1,509,076 | | | 1,308,095 |
Loans delinquent 90 or more days or in foreclosure(1) | | | 4,335,046 | | | 735,282 |
(1) | Of the $4.3 billion of loans delinquent 90 days or more, approximately $3.8 billion are in forbearance primarily related to COVID-19 forbearance provided under the CARES Act. |
| | | Nine Months Ended September 30, | ||||
| | | 2020 | | | 2019 | |
Contractual servicing fees | | | $135,813 | | | $101,138 |
Late fees | | | 4,564 | | | 4,437 |
Other | | | (6,473) | | | (1,486) |
Loan servicing fees | | | $133,904 | | | $104,089 |
| | | Nine Months Ended September 30, 2020 | ||||||||||
| | | Notional Value | | | Derivative Asset | | | Derivative Liability | | | Recorded Gain/(Loss) | |
Mortgage-backed securities forward trades | | | 9,848,702 | | | $2,793 | | | 23,586 | | | $(16,565) |
Interest rate lock commitments | | | 15,103,027 | | | 272,837 | | | — | | | 252,274 |
Hedging Mortgage Servicing Rights | | | 4,306,000 | | | 8,730 | | | — | | | 73,489 |
Margin | | | | | 30,434 | | | | | |||
Total | | | | | 314,794 | | | 23,586 | | | ||
Cash placed with counterparties, net | | | | | 30,435 | | | | | |||
| | | Nine Months Ended September 30, 2019 | ||||||||||
| | | Notional Value | | | Derivative Asset | | | Derivative Liability | | | Recorded Gain | |
Mortgage-backed securities forward trades | | | 3,182,711 | | | $4,580 | | | $6,941 | | | $4,786 |
Interest rate lock commitments | | | 3,690,218 | | | 31,626 | | | — | | | 23,636 |
Hedging Mortgage Servicing Rights | | | 1,355,000 | | | 14,124 | | | — | | | 57,811 |
Margin | | | | | | | 4,330 | | | |||
Total | | | | | 50,330 | | | 11,271 | | | ||
Cash held from counterparties, net | | | | | | | 4,330 | | | |||
| | | September 30, 2020 | |||||||
| | | Gross Amount of Recognized Assets (liabilities) | | | Gross Offset | | | Net Assets (Liabilities) | |
Balance at September 30, 2020 | | | | | | | |||
Derivatives subject to master netting agreements: | | | | | | | |||
Assets: | | | | | | | |||
Mortgage-backed securities forward trades | | | $2,793 | | | $(17,749) | | | $(14,956) |
Hedging mortgage servicing rights | | | 1,893 | | | (40) | | | 1,853 |
Margin (cash placed with counterparties) | | | 30,434 | | | (1,926) | | | 28,508 |
Liabilities: | | | | | | | |||
Mortgage-backed securities forward trades | | | (23,546) | | | 17,749 | | | (5,797) |
Hedging mortgage servicing rights | | | (40) | | | 40 | | | — |
Margin (cash placed with counterparties) | | | — | | | 1,926 | | | 1,926 |
| | | | | | | ||||
Derivatives not subject to master netting agreements: | | | | | | | |||
Assets: | | | | | | | |||
Interest rate lock commitments | | | 272,837 | | | — | | | 272,837 |
Hedging Mortgage Servicing Rights | | | 6,837 | | | — | | | 6,837 |
Total derivatives | | | | | | | |||
Assets | | | 314,794 | | | (19,715) | | | 295,079 |
Liabilities | | | (23,586) | | | 19,715 | | | (3,871) |
| | | December 31, 2019 | |||||||
| | | Gross Amount of Recognized Assets (liabilities) | | | Gross Offset | | | Net Assets (Liabilities) | |
Balance at December 31, 2019 | | | | | | | |||
Derivatives subject to master netting agreements: | | | | | | | |||
Assets: | | | | | | | |||
Mortgage-backed securities forward trades | | | $1,443 | | | $(1,061) | | | $382 |
Hedging mortgage servicing rights | | | 1,005 | | | (2) | | | 1,003 |
Margin (cash placed with counterparties) | | | — | | | 706 | | | 706 |
Liabilities: | | | | | | | |||
Mortgage-backed securities forward trades | | | (5,632) | | | 1,061 | | | (4,571) |
Hedging mortgage servicing rights | | | (2) | | | 2 | | | — |
Margin (cash placed with counterparties) | | | 3,372 | | | (706) | | | 2,666 |
| | | | | | | ||||
Derivatives not subject to master netting agreements: | | | | | | | |||
Assets: | | | | | | | |||
Interest rate lock commitments | | | 25,618 | | | | | 25,618 | |
Hedging Mortgage Servicing Rights | | | 12,478 | | | | | 12,478 | |
Total derivatives | | | | | | | |||
Assets | | | $40,544 | | | $(357) | | | $40,187 |
Liabilities | | | $(2,262) | | | $357 | | | $(1,905) |
| | | As of September 30, 2020 | | | As of December 31, 2019 | |
Prepaid and other | | | $20,298 | | | $24,098 |
Equity method investments | | | 45,447 | | | 31,397 |
Deferred tax asset, net | | | — | | | 20,667 |
Total | | | $65,745 | | | $76,162 |
| | | As of September 30, 2020 | | | As of December 31, 2019 | |
Servicing advance receivable | | | $69,427 | | | $53,531 |
Servicing advance reserves | | | (7,263) | | | (4,308) |
Servicing receivable-general | | | 922 | | | 3,523 |
Income tax receivable | | | 13,900 | | | 1,031 |
Interest on servicing deposits | | | 86 | | | 1,105 |
Other | | | 2,248 | | | 2,990 |
Accounts receivable, net | | | 79,320 | | | $57,872 |
| | | Maturity Date | | | Balance at September 30, 2020 | |
$300M Warehouse Facility | | | August 2021 | | | $262.9 million |
$500M Warehouse Facility | | | September 2021 | | | $353.4 million |
$300M Warehouse Facility | | | Evergreen | | | $213.7 million |
$800M Warehouse Facility | | | May 2021 | | | $485.9 million |
$500M Warehouse Facility | | | September 2021 | | | $318.3 million |
$300M Warehouse Facility | | | June 2021 | | | $201.7 million |
$400M Warehouse Facility | | | August 2021 | | | $256.6 million |
Total warehouse lines of credit | | | | | $2,092.5 million |
| | | Maturity Date | | | Balance at December 31, 2019 | |
$300M Warehouse Facility(1) | | | July 2020 | | | $299.3 million |
$300M Warehouse Facility(2) | | | September 2020 | | | $292.5 million |
$200M Warehouse Facility(3) | | | Evergreen | | | $143.0 million |
$600M Warehouse Facility(4) | | | May 2020 | | | $501.8 million |
$250M Warehouse Facility(5) | | | May 2020 | | | $238.9 million |
$0.8M Warehouse Facility(6) | | | Feb 2020 | | | $0.8 million |
$50M Warehouse Facility(7) | | | Evergreen | | | $1.9 million |
Total warehouse lines of credit | | | | | $1,478.2 million |
(1) | Subsequent to December 31, 2019, this facility was amended with a maturity date of August 2021. |
(2) | Subsequent to December 31, 2019, this facility was amended with a maturity date of September 2021 and an increased capacity up to $500 million. |
(3) | Subsequent to December 31, 2019, this facility was amended with an increased capacity up to $300 million. |
(4) | Subsequent to December 31, 2019, this facility was amended with a maturity date of May 2021 and an increased capacity up to $800 million. |
(5) | Subsequent to December 31, 2019, this facility was amended with a maturity date of September 2021 and an increased capacity up to $500 million. |
(6) | Subsequent to December 31, 2019, this facility was not renewed upon maturity. |
(7) | Subsequent to December 31, 2019, this facility was closed in May 2020. |
| | | Maturity Date | | | Collateral | | | Balance at September 30, 2020 | | | Balance at December 31, 2019 | |
$500M MSR Line of Credit | | | January 2023 | | | Mortgage Servicing Rights | | | $356.6 million | | | $369.0 million |
$85M Servicing Advance Facility | | | May 2021 | | | Servicing Advances | | | $18.3 million | | | $48.2 million |
$10M Operating Line of Credit | | | May 2021 | | | Mortgage loans | | | $1.0 million | | | $10.0 million |
Total | | | | | | | $375.9 million | | | $427.2 million | ||
Debt issuance costs | | | | | | | $(1.8) million | | | $(2.3) million | ||
Term debt and other borrowings, net | | | | | | | $374.1 million | | | $424.9 million |
• | Base of $2,500 plus 25 basis points of outstanding UPB for total loans serviced. |
• | Adjusted/Tangible Net Worth comprises of total equity less goodwill, intangible assets, affiliate receivables, deferred tax assets and certain pledged assets. |
• | Base of $2,500 plus 35 basis points of the issuer’s total single-family effective outstanding obligations. |
• | Adjusted/Tangible Net Worth comprises of total equity less goodwill, intangible assets, affiliate receivables, deferred tax assets and certain pledged assets. |
• | 3.5 basis points of total Agency servicing. |
• | Incremental 200 basis points of total nonperforming Agency, measured as 90 plus day delinquencies, servicing in excess of 6% of the total Agency servicing UPB. |
• | Allowable assets for liquidity may include: cash and cash equivalents (unrestricted); available for sale or held for trading investment grade securities (e.g., Agency MBS, Obligations of Government Sponsored Entities (“GSE”), US Treasury Obligations); and unused/available portion of committed servicing advance lines. |
• | Maintain liquid assets equal to the greater of $1,000 or 10 basis points of our outstanding single-family MBS. |
| | | Nine Months Ended September 30, | ||||
| | | 2020 | | | 2019 | |
Repurchase reserve, at beginning of period | | | $3,964 | | | $3,429 |
Additions | | | 17,017 | | | 2,165 |
Charge-offs | | | (6,992) | | | (1,265) |
Repurchase reserves, at end of period | | | $13,989 | | | $4,329 |
Level Input: | | | Input Definition: |
| | | ||
Level 1 | | | Unadjusted, quoted prices in active markets for identical assets or liabilities. |
| | | ||
Level 2 | | | Prices determined using other significant observable inputs. Observable inputs are inputs that other market participants would use in pricing an asset or liability and are developed based on market data obtained from sources independent of the Company. These may include quoted prices for similar assets and liabilities, interest rates, prepayment speeds, credit risk and others. |
| | | ||
Level 3 | | | Prices determined using significant unobservable inputs. In situations where quoted prices or observable inputs are unavailable (for example, when there is little or no market activity), unobservable inputs may be used. Unobservable inputs reflect the Company's own assumptions about the factors that market participants would use in pricing the asset or liability and are based on the best information available in the circumstances. |
| | | September 30, 2020 | ||||||||||
| | | Level 1 | | | Level 2 | | | Level 3 | | | Total | |
Assets: | | | | | | | | | ||||
Mortgage loans held for sale | | | $— | | | $2,281,835 | | | $— | | | $2,281,835 |
Derivative assets (IRLCs) | | | — | | | — | | | 272,837 | | | 272,837 |
Derivative assets (MBS forward trades) | | | — | | | 3,625 | | | — | | | 3,625 |
Derivative assets (MSRs) | | | — | | | 7,897 | | | — | | | 7,897 |
Mortgage servicing rights | | | — | | | — | | | 583,263 | | | 583,263 |
Total assets | | | $— | | | $2,293,357 | | | $856,100 | | | $3,149,457 |
| | | September 30, 2020 | ||||||||||
| | | Level 1 | | | Level 2 | | | Level 3 | | | Total | |
Liabilities: | | | | | | | | | ||||
Derivative liabilities (MBS forward trades) | | | $— | | | $23,586 | | | $— | | | $23,586 |
Total liabilities | | | $— | | | $23,586 | | | $— | | | $23,586 |
| | | December 31, 2019 | ||||||||||
| | | Level 1 | | | Level 2 | | | Level 3 | | | Total | |
Assets: | | | | | | | | | ||||
Mortgage loans held for sale | | | $— | | | $1,551,136 | | | $— | | | $1,551,136 |
Mortgage loans held for sale – EBO | | | — | | | — | | | 3,094 | | | 3,094 |
Derivative assets (IRLCs) | | | — | | | — | | | 25,618 | | | 25,618 |
Derivative assets (MBS forward trades) | | | — | | | 1,750 | | | — | | | 1,750 |
Derivative assets (MSRs) | | | — | | | 13,176 | | | — | | | 13,176 |
Mortgage servicing rights | | | — | | | — | | | 575,035 | | | 575,035 |
Total assets | | | $— | | | $1,566,062 | | | $603,747 | | | $2,169,809 |
Liabilities: | | | | | | | | | ||||
Derivative liabilities (MBS forward trades) | | | $— | | | $5,634 | | | $— | | | $5,634 |
Total liabilities | | | $— | | | $5,634 | | | $— | | | $5,634 |
| | | Nine Months Ended September 30, 2020 | |||||||
| | | MSRs | | | IRLC | | | EBO | |
Balance at beginning of period | | | $575,035 | | | $25,618 | | | $3,094 |
Purchases, sales, issuances, contributions and settlements | | | 352,118 | | | — | | | (2,171) |
Change in fair value | | | (343,890) | | | 247,219 | | | — |
Transfers in/out(1) | | | — | | | — | | | (923) |
Balance at end of period | | | $583,263 | | | $272,837 | | | $— |
| | | Nine Months Ended September 30, 2019 | |||||||
| | | MSRs | | | IRLC | | | EBO | |
Balance at beginning of period | | | $532,526 | | | $7,517 | | | $5,232 |
Purchases, Sales, Issuances, Contributions and Settlements | | | 175,756 | | | — | | | (481) |
Change in fair value | | | (229,266) | | | 24,109 | | | (21) |
Transfers in/out(1) | | | — | | | — | | | (727) |
Balance at end of period | | | $479,016 | | | $31,626 | | | $4,003 |
(1) | Transfers in/out represents acquired assets and assets transferred out due to reclassification as real estate owned, foreclosure or claims. |
| | | Fair Value | | | Principal Amount Due Upon Maturity | | | Difference(1) | |
Balance at September 30, 2020 | | | $2,281,835 | | | $2,180,034 | | | $101,801 |
Balance at December 31, 2019 | | | $1,551,136 | | | $1,507,139 | | | $43,997 |
(1) | Represents the amount of gains related to changes in fair value of items accounted for using the fair value option included in Gain on loans, net within the condensed consolidated statements of operations. |
| | | | | September 30, 2020 | |||||
Asset | | | Key Input | | | Range | | | Weighted Average |
Mortgage servicing rights | | | Discount rate | | | 9.0% - 12.2% | | | 9.6% |
| | | Prepayment speeds | | | 15.5% - 18.3% | | | 16.1% | |
Interest rate lock commitments | | | Pull-through rate | | | 17% - 100% | | | 72% |
| | | | | December 31, 2019 | |||||
Asset | | | Key Input | | | Range | | | Weighted Average |
Mortgage servicing rights | | | Discount rate | | | 9.0% - 12.2% | | | 9.8% |
| | | Prepayment speeds | | | 11.1% - 13.3% | | | 12.5% | |
Interest rate lock commitments | | | Pull-through rate | | | 19% - 100% | | | 82% |
| | | Number of Shares | | | Weighted Average Exercise Price | | | Weighted Average Contractual Life (Years) | | | Weighted Average Grant Date Fair Value | |
Outstanding at December 31, 2019 | | | 3,291,875 | | | $10.12 | | | 7.15 | | | $2.41 |
Granted | | | 1,606,500 | | | $11.26 | | | 9.56 | | | $2.10 |
Exercised | | | — | | | — | | | — | | | — |
Forfeited | | | (276,500) | | | $10.27 | | | 6.85 | | | $2.02 |
Outstanding at September 30, 2020 | | | 4,621,875 | | | $10.50 | | | 7.36 | | | $2.33 |
| | | Number of Shares | | | Weighted Average Grant Date Fair Value | |
Non-vested at December 31, 2019 | | | 2,555,487 | | | $2.46 |
Granted | | | 1,606,500 | | | $2.10 |
Vested | | | (203,187) | | | $2.24 |
Exercised | | | — | | | — |
Forfeited | | | (276,500) | | | $2.02 |
Non-vested at September 30, 2020 | | | 3,682,300 | | | $2.35 |
| | | Nine Months Ended September 30 | ||||
| | | 2020 | | | 2019 | |
Income (loss) before income taxes | | | $557,862 | | | $(61,948) |
Total provision/(benefit) from income taxes | | | 149,306 | | | (14,080) |
Effective tax provision rate | | | 26.8% | | | 22.7% |
| | | Nine Month Ended September 30, 2020 | |||||||||||||||||||
| | | Origination | | | Servicing | | | Segments Total | | | All Other | | | Total | | | Reconciliation Item(1) | | | Total Consolidated | |
Revenue | | | | | | | | | | | | | | | |||||||
Gain on loans, net | | | $962,778 | | | $— | | | $962,778 | | | | | $962,778 | | | | | $962,778 | ||
Loan fee income | | | 60,630 | | | — | | | 60,630 | | | | | 60,630 | | | | | 60,630 | ||
Loan servicing fees | | | (1,982) | | | 135,886 | | | 133,904 | | | | | 133,904 | | | | | 133,904 | ||
Change in FV of MSRs | | | — | | | (230,524) | | | (230,524) | | | | | (230,524) | | | | | (230,524) | ||
Interest income (loss), net | | | 1,804 | | | 7,130 | | | 8,934 | | | (14,409) | | | (5,475) | | | | | (5,475) | |
Other income | | | — | | | 205 | | | 205 | | | 14,867 | | | 15,072 | | | (14,050) | | | 1,022 |
Total U.S. GAAP Revenue | | | 1,023,230 | | | (87,303) | | | 935,927 | | | 458 | | | 936,385 | | | (14,050) | | | 922,335 |
Contribution margin | | | $791,915 | | | $(31,665) | | | $760,250 | | | $(90,036) | | | $670,214 | | | | | — | |
(1) | The Company includes the income from its equity method investments in the All Other category. In order to reconcile to Total net revenue on the condensed consolidated statements of operations, it must be removed as is presented above. |
| | | Nine Months Ended September 30, 2019 | |||||||||||||||||||
| | | Origination | | | Servicing | | | Segments Total | | | All Other | | | Total | | | Reconciliation Item(1) | | | Total Consolidated | |
Revenue | | | | | | | | | | | | | | | |||||||
Gain on loans, net | | | $135,853 | | | $(358) | | | $135,495 | | | $— | | | $135,495 | | | | | $135,495 | |
Loan fee income | | | 19,788 | | | — | | | 19,788 | | | 41 | | | 19,829 | | | | | 19,829 | |
Loan servicing fees | | | (459) | | | 104,548 | | | 104,089 | | | — | | | 104,089 | | | | | 104,089 | |
Change in FV of MSRs | | | — | | | (151,168) | | | (151,168) | | | — | | | (151,168) | | | | | (151,168) | |
Interest income (loss), net | | | 2,237 | | | 13,255 | | | 15,492 | | | (22,324) | | | (6,832) | | | | | (6,832) | |
Other income | | | — | | | 4 | | | 4 | | | 4,178 | | | 4,182 | | | (2,591) | | | 1,591 |
Total U.S. GAAP Revenue | | | 157,419 | | | (33,719) | | | 123,700 | | | (18,105) | | | 105,595 | | | (2,591) | | | 103,004 |
Contribution margin | | | $60,378 | | | $21,454 | | | $81,832 | | | $(56,262) | | | $25,570 | | | | | — | |
(1) | The Company includes the income from its equity method investments in the All Other segment. In order to reconcile to Total net revenue on the condensed consolidated statements of operations, it must be removed as is presented above. |
| | | Nine Months Ended September 30, | ||||
| | | 2020 | | | 2019 | |
Income (loss) before income tax | | | $557,862 | | | $(61,948) |
Decrease (increase) in MSRs due to valuation assumptions | | | 98,302 | | | 84,927 |
Income from equity method investment | | | 14,050 | | | 2,591 |
Contribution margin, excluding change in MSRs due to valuation assumption | | | $670,214 | | | $25,570 |
| | | September 30, 2020 (unaudited) | | | December 31, 2019 | |
Cash and cash equivalents | | | $41 | | | $202 |
Investment in subsidiary | | | 703,516 | | | 380,961 |
Equity method investment | | | 45,447 | | | 31,283 |
Other assets | | | 4,280 | | | 486 |
Total assets | | | $753,284 | | | $412,932 |
Accounts payable | | | $2,362 | | | $2,137 |
Deferred tax liabilities | | | 8,180 | | | 483 |
Total liabilities | | | 10,542 | | | 2,620 |
| | | | | |||
Equity: | | | | | ||
Common stock (100 shares issued and outstanding, par value $.01 per share) | | | — | | | — |
Additional paid in capital | | | 519,177 | | | 454,861 |
Accumulated deficit | | | 223,565 | | | (44,549) |
Total liabilities and equity | | | $753,284 | | | $412,932 |
| | | Nine Months Ended September 30, | ||||
| | | 2020 | | | 2019 | |
Interest income | | | $2 | | | $2 |
Other income | | | 5 | | | — |
Net gain (loss) of subsidiaries | | | 412,673 | | | (46,987) |
Total gain (loss) | | | 412,680 | | | (46,985) |
Total expenses | | | 655 | | | 241 |
Income (loss) before tax | | | 412,025 | | | (47,226) |
Income tax provision | | | 3,469 | | | 642 |
Income from equity method investments | | | 14,050 | | | 2,591 |
Total net income (loss) | | | $422,606 | | | $(45,277) |
| | | Nine Months Ended September 30, | ||||
| | | 2020 | | | 2019 | |
Operating activities: | | | | | ||
Net income (loss) | | | $422,606 | | | $(45,277) |
Adjustments to reconcile net income (loss) to net cash provided by operating activities: | | | | | ||
Net income (loss) of subsidiaries | | | (412,673) | | | 46,987 |
(Gain) on equity investment | | | (14,050) | | | (2,591) |
Decrease in deferred taxes | | | 7,696 | | | 589 |
(Increase) decrease in prepaid expenses and other assets | | | (3,794) | | | 353 |
Decrease in accounts payable and other assets | | | 224 | | | 1,546 |
Net cash provided by operating cash flows activities | | | 9 | | | 1,607 |
| | | | | |||
Investing activities: | | | | | ||
Investment in subsidiaries | | | (63,945) | | | (1,840) |
Net cash used in investing cash flows activities | | | (63,945) | | | (1,840) |
| | | | | |||
Financing activities: | | | | | ||
Capital contributions from parent | | | 63,774 | | | — |
Net cash provided by financing activities | | | 63,774 | | | — |
| | | | | |||
Net increase in cash, cash equivalents and restricted cash | | | (162) | | | (233) |
Cash, cash equivalents and restricted cash at beginning of period | | | 203 | | | 460 |
Cash, cash equivalents and restricted cash at end of period | | | 41 | | | 227 |
| | | | | |||
Cash paid for interest | | | — | | | — |
Cash paid for income taxes | | | — | | | 54 |
| | | December 31, | ||||
| | | 2019 | | | 2018 | |
Assets: | | | | | ||
Cash and cash equivalents | | | $30,630 | | | $44,010 |
Restricted cash | | | 51,101 | | | 38,234 |
Cash and cash equivalents and Restricted cash | | | 81,731 | | | 82,244 |
Mortgage loans held for sale (at fair value) | | | 1,554,230 | | | 421,754 |
Mortgage servicing rights (at fair value) | | | 575,035 | | | 532,526 |
Property and equipment, net | | | 12,051 | | | 10,075 |
Accounts receivable, net | | | 57,872 | | | 44,422 |
Derivative assets | | | 40,544 | | | 18,990 |
Goodwill and intangibles | | | 11,935 | | | 10,957 |
GNMA loans eligible for repurchase | | | 499,207 | | | 451,209 |
Other assets | | | 76,162 | | | 64,214 |
Total assets | | | $2,908,767 | | | $1,636,391 |
Liabilities and Shareholders’ Equity: | | | | | ||
Liabilities: | | | | | ||
Warehouse lines of credit | | | $1,478,183 | | | $404,237 |
Term debt and other borrowings, net | | | 424,958 | | | 276,277 |
Accounts payable and accrued expenses | | | 39,739 | | | 21,243 |
GNMA loans eligible for repurchase | | | 499,207 | | | 451,209 |
Other liabilities | | | 56,368 | | | 44,654 |
Total liabilities | | | 2,498,455 | | | 1,197,620 |
Commitments and Contingencies (Note 15) | | | | | ||
| | | | | |||
Shareholders’ Equity: | | | | | ||
Common stock (100 shares issued and outstanding, par value $0.01 per share) | | | — | | | — |
Additional paid-in capital | | | 454,861 | | | 454,110 |
Accumulated deficit | | | (44,549) | | | (15,339) |
Total shareholders' equity | | | 410,312 | | | 438,771 |
Total liabilities and shareholders' equity | | | $2,908,767 | | | $1,636,391 |
| | | Years Ended December 31, | ||||
| | | 2019 | | | 2018 | |
Revenue: | | | | | ||
Gain on loans, net | | | $199,501 | | | $84,068 |
Loan fee income | | | 32,112 | | | 19,603 |
Interest income | | | 51,801 | | | 35,179 |
Interest expense | | | (57,942) | | | (47,486) |
Interest loss, net | | | (6,141) | | | (12,307) |
Loan servicing fees | | | 144,228 | | | 119,049 |
Change in fair value of mortgage servicing rights | | | (173,134) | | | (47,312) |
Other income | | | 3,159 | | | 1,156 |
Total net revenue | | | 199,725 | | | 164,257 |
Expenses: | | | | | ||
Compensation and benefits | | | 156,197 | | | 109,577 |
Loan expense | | | 15,626 | | | 16,882 |
Loan servicing expense | | | 20,924 | | | 18,488 |
Occupancy and equipment | | | 16,768 | | | 20,521 |
General and administrative | | | 21,407 | | | 29,165 |
Depreciation and amortization | | | 5,918 | | | 7,612 |
Other expenses | | | 4,296 | | | 4,060 |
Total expenses | | | 241,136 | | | 206,305 |
Loss from continuing operations before income tax | | | (41,411) | | | (42,048) |
Income tax benefit from continuing operations | | | (9,500) | | | (10,485) |
Income from equity method investments | | | 2,701 | | | 209 |
Net loss from continuing operations | | | (29,210) | | | (31,354) |
Net income from discontinued operations before tax | | | — | | | 9,707 |
Income tax provision | | | — | | | 2,550 |
Income from discontinued operations, net of tax | | | — | | | 7,157 |
Total net loss | | | $(29,210) | | | $(24,197) |
| | | | | |||
Basic and diluted loss earnings per share: | | | | | ||
Basic and diluted loss per share from continuing operations | | | $(292) | | | $(314) |
Basic and diluted earnings per share from discontinued operations | | | — | | | 72 |
Basic and diluted total net loss per share | | | $(292) | | | $(242) |
| | | Common Stock | | | Additional Paid in Capital | | | Retained Earnings (Accumulated Deficit) | | | Total Shareholders’ Equity | ||||
| | | Shares | | | Amount | | |||||||||
Balance January 1, 2018 | | | 100 | | | — | | | $410,758 | | | $8,858 | | | $419,616 |
Contributed capital | | | — | | | — | | | 42,970 | | | — | | | 42,970 |
Stock based compensation | | | — | | | — | | | 382 | | | — | | | 382 |
Net loss | | | — | | | — | | | — | | | (24,197) | | | (24,197) |
Ending balance, December 31, 2018 | | | 100 | | | — | | | 454,110 | | | (15,339) | | | 438,771 |
| | | | | | | | | | | ||||||
Contributed capital | | | — | | | — | | | — | | | — | | | — |
Stock based compensation | | | — | | | — | | | 751 | | | — | | | 751 |
Net loss | | | — | | | — | | | — | | | (29,210) | | | (29,210) |
Ending balance, December 31, 2019 | | | 100 | | | — | | | $454,861 | | | $(44,549) | | | $410,312 |
| | | Years Ended December 31, | ||||
| | | 2019 | | | 2018 | |
Operating activities: | | | | | ||
Net loss | | | $(29,210) | | | $(24,197) |
Adjustments to reconcile net loss to cash (used in) provided by operating activities: | | | | | ||
Depreciation | | | 3,807 | | | 4,110 |
Amortization of intangible assets | | | 2,111 | | | 3,564 |
Amortization of debt issuance costs | | | 5,839 | | | 1,386 |
Gain on loans, net | | | (199,501) | | | (116,228) |
Gain on sale of Natty Mac | | | — | | | (909) |
Provision for representation and warranty reserve | | | 451 | | | (770) |
Stock based compensation expense | | | 751 | | | 382 |
Deferred income tax | | | (9,144) | | | (7,047) |
Gain on equity investment | | | (2,701) | | | (209) |
Origination of mortgage loans held for sale | | | (23,116,236) | | | (12,067,560) |
Proceeds on sale and payments from mortgage loans held for sale | | | 22,003,004 | | | 12,448,060 |
Change in fair value of mortgage servicing rights | | | 173,134 | | | 47,312 |
Change in fair value of mortgage loans held for sale | | | (33,643) | | | 11,429 |
Change in fair value of derivative assets | | | (21,554) | | | (6,815) |
Changes in operating assets and liabilities: | | | | |||
Increase in accounts receivable, net | | | (13,238) | | | (11,670) |
Increase (decrease) in other assets | | | 188 | | | (10,740) |
Increase in accounts payable and accrued expenses | | | 18,071 | | | (16,255) |
Decrease in assets and liabilities – discontinued operations | | | — | | | 396 |
Increase in other liabilities – discontinued operations | | | — | | | (262) |
Increase in other liabilities | | | 11,178 | | | 8,855 |
Net cash (used in) provided by operating activities | | | (1,206,693) | | | 262,832 |
| | | Years Ended December 31, | ||||
| | | 2019 | | | 2018 | |
Investing activities: | | | | | ||
Purchases of property and equipment, net of disposals | | | (5,690) | | | (3,499) |
Purchases of property and equipment, net of disposals- discontinued operations | | | — | | | 751 |
Proceeds from sale of mortgage servicing rights | | | — | | | 40,939 |
Business acquisitions, net of cash acquired | | | (4,923) | | | — |
Disposition of intangible assets | | | — | | | 191 |
Proceeds from sale of Natty Mac | | | — | | | 2,500 |
Purchases of mortgage servicing rights | | | — | | | (7,044) |
Equity method investment | | | 5 | | | (2,500) |
Decrease in warehouse lending receivables | | | — | | | 117,943 |
Net cash (used in) provided by investing activities | | | (10,608) | | | 149,281 |
| | | | | |||
Financing activities: | | | | | ||
Proceeds from warehouse borrowings | | | 23,012,034 | | | 12,537,123 |
Payments on warehouse borrowings | | | (21,938,088) | | | (13,058,907) |
Proceeds from term debt borrowings | | | 369,000 | | | 15,000 |
Payments on term debt borrowings | | | (245,156) | | | (4,844) |
Proceeds from other borrowings | | | 21,850 | | | 26,400 |
Payments of debt issuance costs | | | (2,852) | | | (199) |
Decrease in subordinated debt | | | — | | | 30,000 |
Capital contributions from parent | | | — | | | 42,970 |
Net cash provided by (used in) financing activities | | | 1,216,788 | | | (412,457) |
Net decrease in cash, cash equivalents and restricted cash | | | (513) | | | (344) |
Cash, cash equivalents and restricted cash at beginning of period | | | 82,244 | | | 82,588 |
Cash, cash equivalents and restricted cash at end of period | | | $81,731 | | | $82,244 |
Supplemental disclosure: | | | | | ||
Cash paid for interest | | | $50,518 | | | $48,551 |
Cash paid for taxes | | | 330 | | | 2 |
1. | All of Platinum Mortgage, Inc.’s rights and ownership in certain tangible and intangible property, including but not limited to information, books, and records of the Platinum Mortgage, Inc. such as filers, invoices, credit and sales records, personnel records, and all agreements to which Platinum Mortgage, Inc. is a party and identified as material contracts; |
2. | Employees, including underwriters, closers, account managers, administrative staff; |
3. | Building lease and all related facilities contracts; |
4. | Retained assets, including office furniture and computer equipment. |
Fair value of assets acquired: | | | |
Fixed assets | | | $93 |
Consideration transferred: | | | |
Cash | | | 124 |
Earnout | | | 1,648 |
| | | $1,772 | |
Goodwill | | | $1,679 |
Fair value of assets acquired: | | | |
Cash | | | $2 |
Mortgage loans held for sale | | | 214 |
Mortgage servicing rights | | | 1,528 |
Servicing advances | | | 181 |
Accounts receivable | | | 31 |
Foreclosure assets | | | 334 |
Real estate owned | | | 247 |
Prepaid expenses and other assets | | | 20 |
GNMA loans eligible for repurchase | | | 1,580 |
Total assets | | | $4,137 |
| | |
Representation and warranty reserve | | | 85 |
Accrued expenses | | | 424 |
Deferred tax liability, net | | | 304 |
GNMA loans eligible for repurchase | | | 1,580 |
Total liabilities | | | 2,393 |
| | | ||
Net assets | | | 1,744 |
| | | ||
Consideration transferred: | | | |
Cash | | | 2,152 |
Holdback | | | 1,000 |
Goodwill | | | $1,408 |
Consideration received | | | $2,500 |
Less: Fair value of assets | | | (1,591) |
Gain on sale | | | $909 |
1. | Buyer 1: The purchase price was an earnout payment which equaled five basis points per the aggregate loan volume funded (not to exceed $41.0 million) that was produced by transfer employees while employed by the Buyer. The payments were paid quarterly during 2019, in February, April, July, and October. |
2. | Buyer 2: The purchase price consisted of 0.17% of aggregate unpaid principal balance (“UPB”) of all first-lien residential mortgage loans that are originated by transferred employees, closed in the buyer’s name on or after September 1, 2018 for a period of 12 months. Certain fixed assets were considered to be included in the earnout rate. |
| | | Year Ended December 31, 2018 | |
Gain on loans, net | | | $32,160 |
Loan fee income | | | 5,932 |
Total Revenue | | | $38,092 |
Compensation and benefits | | | $(21,778) |
Occupancy and equipment | | | (3,131) |
General and administrative | | | (2,398) |
Amortization and depreciation | | | (253) |
Other expenses | | | (825) |
Income before income tax expense | | | 9,707 |
Income tax expense | | | (2,550) |
Net income from discontinued operations | | | $7,157 |
| | | Year Ended December 31, 2019 | |||||||
| | | Unpaid Principal | | | Fair Value Adjustment | | | Total Fair Value | |
Conventional(1) | | | $454,225 | | | $8,787 | | | $463,012 |
Government(2) | | | 1,052,638 | | | 38,388 | | | 1,091,026 |
Reverse(3) | | | 275 | | | (83) | | | 192 |
Total | | | $1,507,138 | | | $47,092 | | | $1,554,230 |
(1) | Conventional includes FNMA and FHLMC mortgage loans. |
(2) | Government includes GNMA mortgage loans (including Federal Housing Administration, Department of Veterans Affairs and United States Department of Agricultural mortgage loans). |
(3) | Reverse loan presented in Mortgage loans held for sale on the consolidated balance sheets as a result of a repurchase |
| | | Year Ended December 31, 2018 | |||||||
| | | Unpaid Principal | | | Fair Value Adjustment | | | Total Fair Value | |
Conventional(1) | | | $128,255 | | | $2,932 | | | $131,187 |
Government(2) | | | 279,742 | | | 10,630 | | | 290,372 |
Reverse(3) | | | 279 | | | (84) | | | 195 |
Total | | | $408,276 | | | $13,478 | | | $421,754 |
(1) | Conventional includes FNMA and FHLMC mortgage loans. |
(2) | Government includes GNMA mortgage loans (including Federal Housing Administration, Department of Veterans Affairs and United States Department of Agricultural mortgage loans). |
(3) | Reverse loan presented in Mortgage loans held for sale on the consolidated balance sheets as a result of a repurchase |
| | | Year Ended December 31, | ||||
| | | 2019 | | | 2018 | |
Fair value at beginning of period | | | $421,754 | | | $847,897 |
Mortgage loans originated and purchased(1) | | | 23,116,236 | | | 12,067,560 |
Proceeds on sales and payments received(1) | | | (22,003,004) | | | (12,448,060) |
Change in fair value | | | 33,643 | | | (11,429) |
Gain on Sale(2) | | | (14,399) | | | (34,214) |
Fair value at end of period | | | $1,554,230 | | | $421,754 |
(1) | This line as presented on the 2019 consolidated statements of cash flows excludes the portion related to HPMAC, which is included in Business acquisitions within Investing activities. The portion related to HPMAC is recorded on Business acquisitions, net of cash acquired line. This schedule contains HPMAC. |
(2) | This line as presented on the consolidated statements of cash flows excludes OMSR and MSR hedging. |
| | | Year Ended December 31, | ||||
| | | 2019 | | | 2018 | |
Balance at beginning of period | | | $532,526 | | | $463,291 |
MSRs originated | | | 273,628 | | | 170,692 |
MSRs purchased | | | 1,528 | | | 7,044 |
MSRs sold | | | — | | | (40,939) |
Changes in valuation model inputs | | | (133,997) | | | (9,903) |
Change in cash payoffs and principal amortization | | | (98,650) | | | (57,659) |
Balance at end of period | | | $575,035 | | | $532,526 |
| | | Year Ended December 31, | ||||
| | | 2019 | | | 2018 | |
Ginnie Mae | | | $24,611,487 | | | $ 18,762,163 |
Fannie Mae | | | 14,895,853 | | | 10,681,477 |
Freddie Mac | | | 13,021,778 | | | 11,905,232 |
Other | | | 71,428 | | | 74,953 |
Total mortgage servicing portfolio | | | $ 52,600,546 | | | $ 41,423,825 |
| | | | | |||
MSR balance | | | $575,035 | | | $532,526 |
MSR balance as % of unpaid mortgage principal balance | | | 1.09% | | | 1.29% |
| | | Year Ended December 31, | ||||
| | | 2019 | | | 2018 | |
HPF Portfolio | | | | | ||
Discount rate | | | 9.75% | | | 9.50% |
Prepayment speeds | | | 12.53% | | | 9.44% |
HPMAC Portfolio | | | | | ||
Discount rate | | | 10.37% | | | — |
Prepayment speeds | | | 13.30% | | | — |
| | | Discount Rate | | | Prepayment Speeds | |||||||
| | | 100 BPS Adverse Change | | | 200 BPS Adverse Change | | | 10% Adverse Change | | | 20% Adverse Change | |
2019 | | | | | | | | | ||||
HPF Portfolio | | | $(20,938) | | | $(40,288) | | | $(29,530) | | | $(56,176) |
HPMAC Portfolio | | | (52) | | | (100) | | | (81) | | | (154) |
2018 | | | | | | | | | ||||
HPF Portfolio | | | (20,838) | | | (40,213) | | | (22,221) | | | (42,721) |
| | | Year Ended December 31, | ||||
| | | 2019 | | | 2018 | |
Total unpaid principal balance | | | $54,329,300 | | | $41,895,379 |
Loans 30-89 days delinquent | | | 1,308,095 | | | 1,068,685 |
Loans delinquent 90 or more days or in foreclosure | | | 735,282 | | | 639,761 |
| | | Year Ended December 31, | ||||
| | | 2019 | | | 2018 | |
Contractual servicing fees | | | $141,195 | | | $118,096 |
Late fees | | | 6,291 | | | 4,033 |
Other | | | (3,258) | | | (3,080) |
Loan servicing fees | | | $144,228 | | | $119,049 |
| | | Year Ended December 31, 2019 | ||||||||||
| | | Notional Value | | | Derivative Asset | | | Derivative Liability | | | Recorded Gain/(Loss) | |
Balance at December 31, 2019 | | | | | | | | | ||||
Mortgage-backed securities forward trades | | | $3,350,161 | | | $1,443 | | | $5,634 | | | $2,764 |
Interest rate lock commitments | | | 3,171,868 | | | 25,618 | | | — | | | 17,424 |
Hedging Mortgage Servicing Rights | | | 3,140,000 | | | 13,483 | | | — | | | 40,364 |
Margin | | | | | — | | | (3,372) | | | ||
Derivatives before netting | | | | | $40,544 | | | $2,262 | | | ||
Cash placed with counterparties, net | | | | | | | $3,372 | | | |||
| | | Year Ended December 31, 2018 | ||||||||||
| | | Notional Value | | | Derivative Asset | | | Derivative Liability | | | Recorded Gain/(Loss) | |
Balance at December 31, 2018 | | | | | | | | | ||||
Mortgage-backed securities forward trades | | | $736,000 | | | $28 | | | $6,980 | | | $(6,529) |
Interest rate lock commitments | | | 814,133 | | | 7,516 | | | — | | | (4,980) |
Hedging Mortgage Servicing Rights | | | 863,021 | | | 11,446 | | | — | | | 19,464 |
Margin | | | | | — | | | (6,163) | | | ||
Total | | | | | $18,990 | | | $817 | | | ||
| | | | | | | | | |||||
Cash placed with counterparties, net | | | | | | | $6,163 | | | |||
| | | Year Ended December 31, 2019 | |||||||
| | | Gross Amount of Recognized Assets (liabilities) | | | Gross Offset | | | Net Assets (Liabilities) | |
Balance at December 31, 2019 | | | | | | | |||
Derivatives subject to master netting agreements: | | | | | | | |||
Assets: | | | | | | | |||
Mortgage-backed securities forward trades | | | $1,443 | | | $(1,061) | | | $382 |
Hedging mortgage servicing rights | | | 1,005 | | | (2) | | | 1,003 |
Margin (cash placed with counterparties) | | | — | | | 706 | | | 706 |
Liabilities: | | | | | | | |||
Mortgage-backed securities forward trades | | | (5,632) | | | 1,061 | | | (4,571) |
Hedging mortgage servicing rights | | | (2) | | | 2 | | | — |
Margin (cash placed with counterparties) | | | 3,372 | | | (706) | | | 2,666 |
| | | | | | | ||||
Derivatives not subject to master netting agreements: | | | | | | | |||
Assets: | | | | | | | |||
Interest rate lock commitments | | | 25,618 | | | | | 25,618 | |
Hedging Mortgage Servicing Rights | | | 12,478 | | | | | 12,478 | |
Total derivatives | | | | | | | |||
Assets | | | $40,544 | | | $(357) | | | $40,187 |
Liabilities | | | $(2,262) | | | $357 | | | $(1,905) |
| | | Year Ended December 31, 2018 | |||||||
| | | Gross Amount of Recognized Assets (liabilities) | | | Gross Offset | | | Net Assets (Liabilities) | |
Balance at December 31, 2018 | | | | | | | |||
Derivatives subject to master netting agreements: | | | | | | | |||
Assets: | | | | | | | |||
Mortgage-backed securities forward trades | | | $28 | | | $(6) | | | $22 |
Hedging mortgage servicing rights | | | 2,975 | | | — | | | 2,975 |
Margin (cash placed with counterparties) | | | — | | | 639 | | | 639 |
Liabilities: | | | | | | | |||
Mortgage-backed securities forward trades | | | (6,980) | | | 6 | | | (6,974) |
Margin (cash placed with counterparties) | | | 6,163 | | | (639) | | | 5,524 |
Derivatives not subject to master netting agreements: | | | | | | | |||
Assets: | | | | | | | |||
Interest rate lock commitments | | | 7,517 | | | | | 7,517 | |
Hedging Mortgage Servicing Rights | | | 8,470 | | | | | 8,470 | |
Total derivatives | | | | | | | |||
Assets | | | $18,990 | | | $633 | | | $19,623 |
Liabilities | | | $(817) | | | $(633) | | | $(1,450) |
| | | Origination | | | Servicing | | | Total | |
Goodwill as of December 31, 2018 | | | $5,604 | | | $2,098 | | | $7,702 |
Acquisitions | | | 1,408 | | | 1,679 | | | 3,087 |
Goodwill as of December 31, 2019 | | | $7,012 | | | $3,777 | | | 10,789 |
| | | Year Ended December 31, 2019 | |||||||||||||
| | | Amortization Period (months) | | | Gross Carrying Value | | | Accumulated Amortization | | | Impairment Charges | | | Net Carrying Value | |
Customer relationships | | | 36 | | | $5,700 | | | $(4,908) | | | — | | | $792 |
Lease intangible | | | 84 | | | 1,330 | | | (390) | | | (586) | | | 354 |
Total finite-lived intangibles | | | | | 7,030 | | | $(5,298) | | | $(586) | | | $1,146 | |
| | | Year Ended December 31, 2018 | |||||||||||||
| | | Amortization Period (months) | | | Gross Carrying Value | | | Accumulated Amortization | | | Impairment Charges | | | Net Carrying Value | |
Customer relationships | | | 36 | | | $5,700 | | | $(3,009) | | | — | | | $2,691 |
Lease intangible | | | 84 | | | 1,330 | | | (300) | | | (466) | | | 564 |
Total finite-lived intangibles | | | | | 7,030 | | | $(3,309) | | | $(466) | | | $3,255 | |
| | | Year Ended December 31, 2019 | |
2020 | | | $873 |
2021 | | | 80 |
2022 | | | 80 |
2023 | | | 80 |
2024 | | | 33 |
| | | $1,146 |
| | | Year Ended December 31, | ||||
| | | 2019 | | | 2018 | |
Prepaid expenses | | | $24,098 | | | $23,983 |
Equity method investments | | | 31,397 | | | 28,700 |
Deferred tax asset, net | | | 20,667 | | | 11,531 |
Total | | | $76,162 | | | $64,214 |
| | | Year Ended December 31, | ||||
| | | 2019 | | | 2018 | |
Computer and telephone | | | $10,546 | | | $7,171 |
Office furniture and equipment | | | 4,605 | | | 4,333 |
Leasehold improvements | | | 5,286 | | | 4,949 |
Work-in-process for internal use software | | | 1,748 | | | 79 |
Total | | | 22,185 | | | 16,532 |
Less accumulated depreciation | | | (10,134) | | | (6,457) |
Property and equipment, net | | | $12,051 | | | $10,075 |
| | | Year Ended December 31, | ||||
| | | 2019 | | | 2018 | |
Servicing advance receivable | | | $53,531 | | | $41,424 |
Servicing advance reserves | | | (4,308) | | | (4,609) |
Servicing receivable-general | | | 3,523 | | | 2,682 |
Interest on servicing deposits | | | 1,105 | | | 1,006 |
Other | | | 4,021 | | | 3,919 |
Accounts receivable, net at end of period | | | $57,872 | | | $44,422 |
| | | Year Ended December 31, | ||||
| | | 2019 | | | 2018 | |
Servicing advance reserve, at beginning of period | | | ($4,609) | | | ($10,153) |
Additions | | | (3,137) | | | (1,767) |
Charge-offs | | | 3,438 | | | 7,311 |
Servicing advance reserve, at end of period | | | ($4,308) | | | ($4,609) |
Year Ended December 31, 2019 | ||||||||||||
| | | Interest Rate | | | Maturity Date | | | Collateral(8) | | | Balance at December 31, 2019 | |
$300M Warehouse Facility(1) | | | One Month Libor + 1.50% or 3% | | | July 2020 | | | Mortgage loans | | | $299.3 million |
$300M Warehouse Facility(2) | | | One Month Libor + 1.75%* | | | September 2020 | | | Mortgage loans | | | $292.5 million |
$200M Warehouse Facility(3) | | | One Month Libor + 1.50%* | | | Evergreen | | | Mortgage loans | | | $143.0 million |
$600M Warehouse Facility(4) | | | Weighted Average Coupon less 1% or 3.5% | | | May 2020 | | | Mortgage loans | | | $501.8 million |
$250M Warehouse Facility(5) | | | One Month Libor -0.55% | | | May 2020 | | | Mortgage loans | | | $238.9 million |
$0.8M Warehouse Facility(6) | | | Borrowing rate + debenture rate | | | Feb 2020 | | | Mortgage loans | | | $0.8 million |
$50M Warehouse Facility(7) | | | One Month Libor + 2.50% or 4.75% | | | Evergreen | | | Mortgage loans | | | $1.9 million |
Total warehouse lines of credit | | | | | | | | | $1,478.2 million | |||
* | Pricing incentives given for average utilization greater than a threshold. |
(1) | Subsequent to December 31, 2019, this facility was amended with a maturity date of August 2021. |
(2) | Subsequent to December 31, 2019, this facility was amended with a maturity date of September 2021 and an increased capacity up to $500 million. |
(3) | Subsequent to December 31, 2019, this facility was amended with an increased capacity up to $300 million. |
(4) | Subsequent to December 31, 2019, this facility was amended with a maturity date of May 2021 and an increased capacity up to $800 million. Additionally, the interest rate changed from weighted average coupon less 1% or 3.5% to weighted average coupon less 1% or 3% |
(5) | Subsequent to December 31, 2019, this facility was amended with a maturity date of September 2021 and an increased capacity up to $500 million. Additionally, the interest rate changed from one month LIBOR + .55% to one month LIBOR + 1.5%. |
(6) | Subsequent to December 31, 2019, this facility was not renewed upon maturity. |
(7) | Subsequent to December 31, 2019, this facility was closed in May 2020. |
(8) | The Company’s borrowings are 100% secured by the fair value of the mortgage loans held for sale at fair value. |
Year Ended December 31, 2018 | ||||||||||||
| | | Interest Rate | | | Maturity Date | | | Collateral(1) | | | Balance at December 31, 2018 | |
$200M Warehouse Facility | | | One Month Libor + 1.50% | | | July 2019 | | | Mortgage loans | | | $65.1 million |
$125M Warehouse Facility | | | One Month Libor + 1.75% | | | September 2019 | | | Mortgage loans | | | $16.4 million |
$100M Warehouse Facility | | | One Month Libor + 1.75% | | | Evergreen | | | Mortgage loans | | | $11.6 million |
$600M Warehouse Facility | | | Weighted Average Coupon less 1.25% | | | May 2019 | | | Mortgage loans | | | $233.3 million |
$100M Warehouse Facility | | | One Month Libor + 0.25% | | | May 2019 | | | Mortgage loans | | | $69.3 million |
$8.3M Warehouse Facility | | | Borrowing rate + debenture rate | | | Evergreen | | | Mortgage loans | | | $8.3 million |
$2M Warehouse Facility | | | Prime + 1.00% or 4.00% min | | | May 2019 | | | Mortgage loans | | | $0.2 million |
Total warehouse lines of credit | | | | | | | | | $404.2 million | |||
(1) | The Company’s borrowings are 100% secured by the fair value of the mortgage loans held for sale. |
$300M Warehouse Facility | | | June 2020 |
$400M Warehouse Facility | | | August 2020 |
$500M Warehouse Facility | | | October 2020 |
$50M Warehouse Facility (GNMA FHA EBO) | | | October 2020 |
$150M Gestation Facility | | | October 2020 |
| | | Year Ended December 31, 2019 | |
| | | ||
2020 | | | $— |
2021 | | | — |
2022 | | | 338,250 |
2023 | | | 30,750 |
2024 and Thereafter | | | — |
| | | $369,000 |
Year Ended December 31, 2019 | ||||||||||||
| | | Interest Rate | | | Maturity Date | | | Collateral | | | Balance at December 31, 2019 | |
$10M Operating Line of Credit(1) | | | Prime or 4.00% min | | | May 2020 | | | Mortgage loans | | | $10.0 million |
$70M Servicing Advance Facility(2) | | | Libor +3.50% | | | May 2020 | | | Servicing Advances | | | $48.2 million |
$500M Line of Credit | | | 3-month LIBOR (floored at 1%) plus 3.50% and 3.75% annualized cost of funds for FNMA/FHLMC and GNMA collateral | | | January 2023 | | | Servicing Advances | | | $369.0 million |
Total | | | | | | | | | $427.2 million | |||
Debt issuance costs | | | | | | | | | $ (2.3) million | |||
Term debt and other borrowings, net | | | | | | | | | $424.9 million | |||
(1) | Subsequent to December 31, 2019, this facility was amended with a maturity date of May 2021. Additionally, the interest rate changed from Prime or 4.00% to Prime or 3.25%. |
(2) | Subsequent to December 31, 2019, this facility was amended with a maturity date of June 2021 and an increased capacity up to $85 million. |
Year Ended December 31, 2018 | ||||||||||||
| | | Interest Rate | | | Maturity Date | | | Collateral | | | Balance at December 31, 2018 | |
$10M Operating Line of Credit | | | Prime or 4.00% min | | | May 2019 | | | Mortgage loans | | | $10.0 million |
$50M Servicing Advance Facility | | | Libor +3.50% | | | January 2019 | | | Servicing Advances | | | $26.4 million |
$250M Term Debt | | | One Month LIBOR (floored at 1%) + 7% annualized cost of funds | | | October 2022 | | | Servicing Advances | | | $245.2 million |
Total | | | | | | | | | $281.6 million | |||
Debt issuance costs | | | | | | | | | $ (5.3) million | |||
Term debt and other borrowings, net | | | | | | | | | $ 276.3 million | |||
| | | Year Ended December 31, 2019 | |
2020 | | | $7,512 |
2021 | | | 5,830 |
2022 | | | 4,814 |
2023 | | | 2,676 |
2024 | | | 1,634 |
Thereafter | | | 854 |
Total | | | $23,320 |
• | Base of $2,500 plus 25 basis points of outstanding UPB for total loans serviced. |
• | Adjusted/Tangible Net Worth comprises of total equity less goodwill, intangible assets, affiliate receivables, deferred tax assets and certain pledged assets. |
• | Base of $2,500 plus 35 basis points of the issuer’s total single-family effective outstanding obligations. |
• | Adjusted/Tangible Net Worth comprises of total equity less goodwill, intangible assets, affiliate receivables, deferred tax assets and certain pledged assets. |
• | 3.5 basis points of total Agency servicing. |
• | Incremental 200 basis points of total nonperforming Agency, measured as 90 plus day delinquencies, servicing in excess of 6% of the total Agency servicing UPB. |
• | Allowable assets for liquidity may include: cash and cash equivalents (unrestricted); available for sale or held for trading investment grade securities (e.g., Agency MBS, Obligations of GSEs, US Treasury Obligations); and unused/available portion of committed servicing advance lines. |
• | Maintain liquid assets equal to the greater of $1,000 or 10 basis points of our outstanding single-family MBS. |
Home Point Financial Corporation | ||||||
| | | Adjusted Net Worth | | | Net Worth Required | |
HUD | | | $366,250 | | | $2,500 |
Ginnie Mae | | | $366,250 | | | $93,583 |
Fannie Mae | | | $366,250 | | | $137,945 |
Freddie Mac | | | $366,250 | | | $137,945 |
Various States | | | $366,250 | | | $0 - 1,000 |
Home Point Mortgage Acceptance Corporation | ||||||
| | | Adjusted Net Worth | | | Net Worth Required | |
HUD | | | $3,563 | | | $2,500 |
Ginnie Mae | | | $3,563 | | | $2,995 |
Fannie Mae | | | $3,563 | | | $2,878 |
Freddie Mac | | | $3,563 | | | $2,878 |
Various States | | | $3,563 | | | $0 - 1,000 |
| | | Year Ended December 31, | ||||
| | | 2019 | | | 2018 | |
Repurchase reserve, at beginning of period | | | $3,429 | | | $4,199 |
Additions | | | 4,276 | | | 1,367 |
Charge-offs | | | (3,741) | | | (2,137) |
Repurchase reserves, at end of period | | | $3,964 | | | $3,429 |
Level Input: | | | Input Definition: |
Level 1 | | | Unadjusted, quoted prices in active markets for identical assets or liabilities. |
Level 2 | | | Prices determined using other significant observable inputs. Observable inputs are inputs that other market participants would use in pricing an asset or liability and are developed based on market data obtained from sources independent of the Company. These may include quoted prices for similar assets and liabilities, interest rates, prepayment speeds, credit risk and others. |
Level 3 | | | Prices determined using significant unobservable inputs. In situations where quoted prices or observable inputs are unavailable (for example, when there is little or no market activity), unobservable inputs may be used. Unobservable inputs reflect the Company's own assumptions about the factors that market participants would use in pricing the asset or liability and are based on the best information available in the circumstances. |
| | | Year Ended December 31, 2019 | ||||||||||
| | | Level 1 | | | Level 2 | | | Level 3 | | | Total | |
Assets: | | | | | | | | | ||||
Mortgage loans held for sale | | | $— | | | $1,551,136 | | | $— | | | $1,551,136 |
Mortgage loans held for sale – EBO | | | — | | | — | | | 3,094 | | | 3,094 |
Derivative assets (IRLCs) | | | — | | | — | | | 25,618 | | | 25,618 |
Derivative assets (MBS forward trades) | | | — | | | 1,750 | | | — | | | 1,750 |
Derivative assets (MSRs) | | | — | | | 13,176 | | | — | | | 13,176 |
Mortgage servicing rights | | | — | | | — | | | 575,035 | | | 575,035 |
Total assets | | | $— | | | $1,566,062 | | | $603,747 | | | $2,169,809 |
Liabilities: | | | | | | | | | ||||
Derivative liabilities (MBS forward trades) | | | $— | | | $5,634 | | | $— | | | $5,634 |
Total liabilities | | | $— | | | $5,634 | | | $— | | | $5,634 |
| | | Year Ended December 31, 2018 | ||||||||||
| | | Level 1 | | | Level 2 | | | Level 3 | | | Total | |
Assets: | | | | | | | | | ||||
Mortgage loans held for sale | | | $— | | | $416,522 | | | $— | | | $416,522 |
Mortgage loans held for sale – EBO | | | — | | | — | | | 5,232 | | | 5,232 |
Derivative assets (IRLCs) | | | — | | | — | | | 7,517 | | | 7,517 |
Derivative assets (MBS forward trades) | | | — | | | 28 | | | — | | | 28 |
Derivative assets (MSRs) | | | — | | | 11,445 | | | — | | | 11,445 |
Mortgage servicing rights | | | — | | | — | | | 532,526 | | | 532,526 |
Total assets | | | $— | | | $427,995 | | | $545,275 | | | $973,270 |
Liabilities: | | | | | | | | | ||||
Derivative liabilities (MBS forward trades) | | | $— | | | $6,980 | | | $— | | | $6,980 |
Total liabilities | | | $— | | | $6,980 | | | $— | | | $6,980 |
| | | Year Ended December 31, 2019 | |||||||
| | | MSRs | | | IRLC | | | EBO | |
Balance at beginning of period | | | $532,526 | | | $7,517 | | | $5,232 |
Purchases, Sales, Issuances, Contributions and Settlements | | | 273,628 | | | — | | | (1,358) |
Change in fair value | | | (232,647) | | | 18,101 | | | (63) |
Transfers In/Out(1) | | | 1,528 | | | | | (716) | |
Balance at end of period | | | $575,035 | | | $25,618 | | | $3,095 |
| | | Year Ended December 31, 2018 | |||||||
| | | MSRs | | | IRLC | | | EBO | |
Balance at beginning of period | | | $463,291 | | | $11,142 | | | $9,670 |
Purchases, Sales, Issuances, Contributions and Settlements | | | 129,753 | | | — | | | (1,448) |
Change in fair value | | | (67,562) | | | (3,625) | | | 1,097 |
Transfers In/Out(1) | | | 7,044 | | | | | (4,087) | |
Balance at end of period | | | $532,526 | | | $7,517 | | | $5,232 |
(1) | Transfers In/Out represents acquired assets and assets transferred out due to reclassification as REO, foreclosure or claims. |
| | | Fair Value | | | Principal Amount Due Upon Maturity | | | Difference(1) | |
Balance at December 31, 2019 | | | $1,551,136 | | | $1,507,139 | | | $43,997 |
Balance at December 31, 2018 | | | $416,522 | | | $408,276 | | | $8,246 |
(1) | Represents the amount of gains related to changes in fair value of items accounted for using the fair value option included in Gain on sale, net within the consolidated statements of operations. |
| | | Number of Shares | | | Weighted Average Exercise Price | | | Weighted Average Contractual Life (Years) | | | Weighted Average Grant Date Fair Value | |
Outstanding at January 1, 2018 | | | 2,707,200 | | | $10.00 | | | 8.07 | | | $2.23 |
Granted | | | 1,350,625 | | | $10.26 | | | 9.55 | | | $3.15 |
Exercised | | | (3,000) | | | $10.00 | | | — | | | $3.07 |
Forfeited | | | (815,625) | | | $10.05 | | | 7.41 | | | $2.59 |
Outstanding at December 31, 2018 | | | 3,239,200 | | | $10.10 | | | 7.48 | | | $2.52 |
Granted | | | 427,500 | | | $10.20 | | | 9.67 | | | $1.88 |
Exercised | | | — | | | — | | | — | | | — |
Forfeited | | | (374,825) | | | $10.05 | | | 6.15 | | | $2.56 |
Outstanding at December 31, 2019 | | | 3,291,875 | | | $10.12 | | | 7.15 | | | $2.41 |
| | | Number of Shares | | | Weighted Average Grant Date Fair Value | |
Non-vested at January 1, 2018 | | | 2,361,600 | | | $2.25 |
Granted | | | 1,350,625 | | | $3.15 |
Vested | | | (181,400) | | | $2.10 |
Exercised | | | (3,000) | | | $3.07 |
Forfeited | | | (815,625) | | | $2.59 |
Non-vested at December 31, 2018 | | | 2,712,200 | | | $2.60 |
Granted | | | 427,500 | | | $1.88 |
Vested | | | (209,388) | | | $2.24 |
Exercised | | | — | | | — |
Forfeited | | | (374,825) | | | $2.56 |
Non-vested at December 31, 2019 | | | 2,555,487 | | | $2.46 |
| | | Years Ended December 31, | ||||
| | | 2019 | | | 2018 | |
Expected life (in years) | | | 8.3 | | | 8.3 |
Risk-free interest rate | | | 1.70%-2.59% | | | 2.33%-2.95% |
Expected volatility | | | 23.3% | | | 23.3% |
Dividend yield | | | — | | | — |
| | | Year Ended December 31, 2019 | |||||||
| | | Federal | | | State | | | Total | |
Current | | | $(378) | | | $22 | | | $(356) |
Deferred | | | (6,658) | | | (2,486) | | | (9,144) |
Total income tax expense (benefit) | | | $(7,036) | | | $(2,464) | | | $(9,500) |
| | | Year Ended December 31, 2018 | |||||||
| | | Federal | | | State | | | Total | |
Current | | | $(887) | | | $— | | | $(887) |
Deferred | | | (5,296) | | | (1,752) | | | (7,048) |
Total income tax expense (benefit) | | | $(6,183) | | | $(1,752) | | | $(7,935) |
| | | Years Ended December 31, | ||||
| | | 2019 | | | 2018 | |
Income/(Loss) before income taxes | | | $(41,411) | | | $(42,048) |
Statutory federal income tax (21%) | | | (8,697) | | | (8,830) |
State income tax expense, net of federal tax | | | (2,073) | | | (2,185) |
Change in valuation allowance | | | (64) | | | (581) |
Impact of tax rate change | | | 54 | | | 924 |
Impact of equity investments | | | 705 | | | 55 |
Other | | | 575 | | | 132 |
Total income tax expense (benefit) | | | $(9,500) | | | $(10,485) |
Effective tax rate | | | 22.9% | | | 24.9% |
| | | Years Ended December 31, | ||||
| | | 2019 | | | 2018 | |
Deferred tax asset | | | | | ||
Federal NOL carryforward | | | $62,988 | | | $60,069 |
State NOL carryforward | | | 14,062 | | | 13,551 |
Installment sale – Natty Mac | | | — | | | 24,473 |
Interest expense | | | — | | | 1,330 |
Other | | | 5,873 | | | 5,208 |
Total deferred tax asset | | | 82,923 | | | 104,631 |
Deferred tax liability | | | | | ||
MSR | | | (49,205) | | | (88,647) |
Derivatives | | | (6,687) | | | (1,975) |
Investment in Longbridge | | | (4,457) | | | — |
Other | | | — | | | (507) |
Total deferred tax liability | | | (60,349) | | | (91,129) |
Valuation Allowance | | | (1,907) | | | (1,971) |
Net tax asset | | | $20,667 | | | $11,531 |
| | | Year Ended December 31, 2019 | |||||||||||||||||||
| | | Origination | | | Servicing | | | Segments Total | | | All Other | | | Total | | | Reconciliation Item(1) | | | Total Consolidated | |
Revenue | | | | | | | | | | | | | | | |||||||
Gain on loans, net | | | $200,646 | | | $(1,145) | | | $199,501 | | | $— | | | $199,501 | | | | | $199,501 | |
Loan fee income | | | 32,072 | | | — | | | 32,072 | | | 40 | | | 32,112 | | | | | 32,112 | |
Loan servicing fees | | | (846) | | | 145,074 | | | 144,228 | | | — | | | 144,228 | | | | | 144,228 | |
Change in FV of MSRs | | | — | | | (173,134) | | | (173,134) | | | — | | | (173,134) | | | | | (173,134) | |
Interest income | | | 2,697 | | | 18,883 | | | 21,580 | | | (27,721) | | | (6,141) | | | | | (6,141) | |
Other income | | | — | | | 13 | | | 13 | | | 5,847 | | | 5,847 | | | (2,701) | | | 3,159 |
Total U.S. GAAP Revenue | | | $234,569 | | | $(10,309) | | | $224,260 | | | $(21,834) | | | $202,426 | | | $(2,701) | | | $199,725 |
Contribution margin | | | $89,456 | | | $24,593 | | | $114,049 | | | $(78,278) | | | $35,771 | | | | | ||
(1) | The Company includes the income from its equity method investments in the All Other category. In order to reconcile to Total net revenue on the consolidated statements of operations, it must be removed as is presented above. |
| | | Year Ended December 31, 2018 | |||||||||||||||||||
| | | Origination | | | Servicing | | | Segments Total | | | All Other | | | Total | | | Reconciliation Item(1) | | | Total Consolidated | |
Revenue | | | | | | | | | | | | | | | |||||||
Gain on loans, net | | | $84,127 | | | $(59) | | | $84,068 | | | $— | | | $84,068 | | | | | $84,068 | |
Loan fee income | | | 18,462 | | | — | | | 18,462 | | | 1,141 | | | 19,603 | | | | | 19,603 | |
Loan servicing fees | | | — | | | 119,049 | | | 119,049 | | | — | | | 119,049 | | | | | 119,049 | |
Change in FV of MSRs | | | — | | | (47,312) | | | (47,312) | | | — | | | (47,312) | | | | | (47,312) | |
Interest income | | | 6,028 | | | 2,228 | | | 8,256 | | | (20,563) | | | (12,307) | | | | | (12,307) | |
Other income | | | 44 | | | (98) | | | (54) | | | 1,419 | | | 1,365 | | | (209) | | | 1,156 |
Total U.S. GAAP Revenue | | | $108,661 | | | $73,808 | | | $182,469 | | | $(18,003) | | | $164,466 | | | $(209) | | | $164,257 |
Contribution margin | | | $251 | | | $26,180 | | | $26,431 | | | $(78,618) | | | $(52,187) | | | | | ||
(1) | The Company includes the income from its equity method investments in the All Other segment. In order to reconcile to Total net revenue on the consolidated statements of operations, it must be removed as is presented above. |
| | | Years Ended December 31, | ||||
| | | 2019 | | | 2018 | |
Loss from continuing operations before income tax | | | $(41,411) | | | $(42,048) |
Decrease (increase) in MSRs due to valuation assumptions | | | 74,481 | | | (10,348) |
Income from equity method investment | | | 2,701 | | | 209 |
Contribution margin, excluding change in MSRs due to valuation assumption | | | $35,771 | | | $(52,187) |
| | | December 31, | ||||
| | | 2019 | | | 2018 | |
Cash and cash equivalents | | | $202 | | | $460 |
Investment in subsidiary | | | 380,961 | | | 409,068 |
Equity method investment | | | 31,283 | | | 28,701 |
Other assets | | | 486 | | | 566 |
Total assets | | | $412,932 | | | $438,795 |
Accounts payable | | | $2,137 | | | $24 |
Deferred tax liabilities | | | 483 | | | — |
Total liabilities | | | 2,620 | | | 24 |
| | | | | |||
Equity: | | | | | ||
Common stock (100 shares issued and outstanding, par value $.01 per share) | | | — | | | — |
Additional paid in capital | | | 454,861 | | | 454,110 |
Accumulated deficit | | | (44,549) | | | (15,339) |
Total liabilities and equity | | | $412,932 | | | $438,795 |
| | | Years Ended December 31, | ||||
| | | 2019 | | | 2018 | |
Interest income | | | $3 | | | $3 |
Net loss of subsidiaries | | | (30,873) | | | (24,494) |
Total loss | | | $(30,870) | | | $(24,491) |
Total expenses | | | 390 | | | (201) |
Income (loss) before tax | | | (31,260) | | | (24,290) |
Income tax provision | | | (651) | | | (116) |
Income from equity method investments | | | 2,701 | | | 209 |
Total net loss | | | $(29,210) | | | $(24,197) |
| | | Years Ended December 31, | ||||
| | | 2019 | | | 2018 | |
Cash flows from operating activities: | | | | | ||
Net Income | | | $(29,210) | | | $(24,197) |
Adjustments to reconcile net loss to net cash used in operating activities: | | | | | ||
Net loss of subsidiaries | | | 30,873 | | | 24,494 |
Depreciation | | | — | | | 13 |
(Gain) on equity investment | | | (2,701) | | | (2,709) |
Decrease in deferred taxes, net | | | 1,032 | | | 51 |
Increase in prepaid expenses and other assets | | | (468) | | | (1,428) |
(Decrease) increase in accounts payable and other assets | | | 2,113 | | | (282) |
Total operating cash flows | | | $1,639 | | | $(4,058) |
| | | | | |||
Cash flows from investing activities: | | | | | ||
Purchases of property and equipment, net of disposals | | | — | | | 23 |
Investment in subsidiaries | | | (1,896) | | | (38,944) |
Total investing cash flows | | | $(1,896) | | | $ (38,921) |
| | | | | |||
Cash flows from financing activities: | | | | | ||
Capital contributions from parent | | | — | | | 42,970 |
Investment in subsidiaries | | | | | ||
Total net cash (used in) provided by financing activities | | | $— | | | $42,970 |
| | | | | |||
Net increase in cash, cash equivalents and restricted cash | | | $(257) | | | $(9) |
Cash, cash equivalents and restricted cash at beginning of period | | | $460 | | | $469 |
Cash, cash equivalents and restricted cash at end of period | | | $203 | | | $460 |
| | | | | |||
Cash paid for interest | | | — | | | — |
Cash paid for income taxes | | | — | | | 54 |
| | | Percentage of Origination | |
2019 | | | |
State: | | | |
California | | | 22.9% |
Florida | | | 7.0% |
New Jersey | | | 5.2% |
2018 | | | |
State: | | | |
California | | | 22.2% |
Florida | | | 9.7% |
New Jersey | | | 8.3% |
Illinois | | | 7.0% |
| | | Percentage of Servicing Unpaid Principal Balance | |
2019 | | | |
State: | | | |
California | | | 19.35% |
Florida | | | 7.24% |
New Jersey | | | 7.08% |
Illinois | | | 5.27% |
2018 | | | |
State: | | | |
California | | | 20.21% |
Florida | | | 6.89% |
New Jersey | | | 7.98% |
Illinois | | | 5.76% |
| | | Years Ended December 31, | ||||||||||
| | | 2019 | | | 2018 | |||||||
GNMA | | | $ 10,066,347 | | | 47.5% | | | $5,000,967 | | | 41.6% |
FNMA | | | 6,609,090 | | | 31.2% | | | 2,684,593 | | | 22.0% |
FHLMC | | | 3,691,617 | | | 17.4% | | | 3,994,671 | | | 33.3% |
Other | | | 816,779 | | | 3.9% | | | 368,447 | | | 3.1% |
| | | $ 21,183,833 | | | 100% | | | $ 12,012,678 | | | 100% | |
| | | As Reported December 31, 2019 | | | Dividends Adjustment(1) | | | Pro Forma | |
Accounts payable and accrued expenses | | | $39,793 | | | 154,500 | | | 194,239 |
Total liabilities | | | $ 2,498,455 | | | 154,500 | | | 2,652,955 |
Total shareholder’s equity | | | $410,312 | | | (154,500) | | | 255,812 |
(1) | The Company paid a dividend on October 5, 2020 of $154.5 million, which was fully funded through the use of cash on hand. For purposes of the unaudited pro forma combined balance sheets, the payment of the dividend is reflected as a reduction to shareholders’ equity of $154.5 million and the recognition of a payable of $154.5 million. |
Item 13. | Other Expenses of Issuance and Distribution. |
| | | Amount to be paid | |
SEC registration fee | | | $10,910 |
FINRA filing fee | | | 15,500 |
Nasdaq listing fee | | | * |
Legal fees and expenses | | | * |
Accounting fees and expenses | | | * |
Printing and engraving expenses | | | * |
Transfer agent and registrar fees | | | * |
Miscellaneous fees and expenses | | | * |
Total | | | $* |
* | To be completed by amendment. |
Item 14. | Indemnification of Directors and Officers. |
Item 15. | Recent Sales of Unregistered Securities. |
Item 16. | Exhibits and Financial Statement Schedules. |
(A) | Exhibits. |
Exhibit Number | | | Description |
1.1** | | | Form of Underwriting Agreement. |
3.1** | | | Form of Amended and Restated Certificate of Incorporation of the Registrant. |
3.2** | | | Form of Amended and Restated Bylaws of the Registrant. |
4.1** | | | Form of Registration Rights Agreement among the Registrant and certain of its stockholders. |
5.1** | | | Opinion of Simpson Thacher & Bartlett LLP. |
| | | Master Participation Agreement, dated as of May 31, 2017, by and between Home Point Financial Corporation, as seller, and Merchants Bank of Indiana, as participant. | |
| | | Confirmation and Amendment of Participation Agreement, dated as of May 29, 2020, by and between Home Point Financial Corporation, as seller, and Merchants Bank of Indiana, as participant. | |
| | | Master Repurchase Agreement and Securities Contract, dated as of June 3, 2020, by and between Home Point Financial Corporation, as seller, Morgan Stanley Bank, N.A., as buyer, and Morgan Stanley Mortgage Capital Holdings LLC, as agent. | |
| | | Amendment No. 1 to Master Repurchase Agreement and Securities Contract, dated as of August 14, 2020, by and between Home Point Financial Corporation, as seller, Morgan Stanley Bank, N.A., as buyer, and Morgan Stanley Mortgage Capital Holdings LLC, as agent. |
Exhibit Number | | | Description |
| | | Amendment No. 2 to Master Repurchase Agreement and Securities Contract, dated as of November 18, 2020, by and between Home Point Financial Corporation, as seller, Morgan Stanley Bank, N.A., as buyer, and Morgan Stanley Mortgage Capital Holdings LLC, as agent. | |
| | | Amendment No. 3 to Master Repurchase Agreement and Securities Contract, dated as of December 23, 2020, by and between Home Point Financial Corporation, as seller, Morgan Stanley Bank, N.A., as buyer, and Morgan Stanley Mortgage Capital Holdings LLC, as agent. | |
| | | Master Repurchase Agreement, dated as of October 23, 2020, by and among Credit Suisse First Boston Mortgage Capital LLC, as administrative agent, Credit Suisse AG, as buyer, Alpine Securitization LTD, as buyer, the other buyers from time to time party thereto, Home Point Financial Corporation, as seller, and each underlying entity joined thereto from time to time. | |
| | | Mortgage Warehouse Agreement, dated as of August 5, 2020, by and between Home Point Financial Corporation, as seller, and Texas Capital Bank, National Association. | |
| | | Addendum to Mortgage Warehouse Agreement (New York Committed Facility), effective as of September 2, 2020, by and between Home Point Financial Corporation, as seller, and Texas Capital Bank, National Association. | |
| | | Amended and Restated Master Repurchase Agreement, dated as of September 18, 2020, by and among Home Point Financial Corporation, as seller, TIAA, FSB, as administrative agent and a buyer, and the other buyers from time to time party thereto. | |
| | | Amendment No. 1 to Amended and Restated Master Repurchase Agreement and Amended and Restated Pricing Letter, dated as of December 15, 2020, by and among Home Point Financial Corporation, as seller, TIAA, FSB, as administrative agent and a buyer, and Capital One, National Association, as a buyer. | |
| | | Master Repurchase Agreement, dated as of October 28, 2015, by and between UBS Bank USA, as buyer, and Home Point Financial Corporation, as seller. | |
| | | Amendment No. 1 to Master Repurchase Agreement, dated as of May 4, 2016, by and between UBS Bank USA, as buyer, and Home Point Financial Corporation, as seller. | |
| | | Assignment and Amendment No. 2 to Master Repurchase Agreement and Assignment and Amendment No. 8 to Pricing Letter, dated September 15, 2016, by and among Home Point Financial Corporation, as seller, UBS Bank USA, as assignor, and UBS AG, as assignee. | |
| | | Amendment No. 3 to Master Repurchase Agreement, dated as of September 28, 2016, by and between UBS AG, as buyer, and Home Point Financial Corporation, as seller. | |
| | | Amendment No. 4 to Master Repurchase Agreement, dated as of January 5, 2017, by and between UBS AG, as buyer, and Home Point Financial Corporation, as seller. | |
| | | Amendment No. 5 to Master Repurchase Agreement, dated as of October 6, 2017, by and between UBS AG, as buyer, and Home Point Financial Corporation, as seller. | |
| | | Amendment No. 6 to Master Repurchase Agreement, dated as of November 9, 2017, by and between UBS AG, as buyer, and Home Point Financial Corporation, as seller. | |
| | | Amendment No. 7 to Master Repurchase Agreement, dated as of May 7, 2018, by and between UBS AG, as buyer, and Home Point Financial Corporation, as seller. | |
| | | Amendment No. 8 to Master Repurchase Agreement, dated as of July 16, 2018, by and between UBS AG, as buyer, and Home Point Financial Corporation, as seller. | |
| | | Amendment No. 9 to Master Repurchase Agreement, dated as of October 19, 2018, by and between UBS AG, as buyer, and Home Point Financial Corporation, as seller. | |
| | | Amendment No. 10 to Master Repurchase Agreement, dated as of February 25, 2019, by and between UBS AG, as buyer, and Home Point Financial Corporation, as seller. | |
| | | Amendment No. 11 to Master Repurchase Agreement, dated as of September 20, 2019, by and between UBS AG, as buyer, and Home Point Financial Corporation, as seller. | |
| | | Amendment No. 12 to Master Repurchase Agreement, dated as of December 12, 2019, by and between UBS AG, as buyer, and Home Point Financial Corporation, as seller. | |
| | | Amendment No. 13 to Master Repurchase Agreement, dated as of July 6, 2020, by and between UBS AG, as buyer, and Home Point Financial Corporation, as seller. | |
| | | Amendment No. 14 to Master Repurchase Agreement, dated as of September 18, 2020, by and between UBS AG, as buyer, and Home Point Financial Corporation, as seller. |
Exhibit Number | | | Description |
| | | Amendment No. 15 to Master Repurchase Agreement, dated as of October 6, 2020, by and between UBS AG, as buyer, and Home Point Financial Corporation, as seller. | |
| | | Amendment No. 16 to Master Repurchase Agreement, dated as of December 22, 2020, by and between UBS AG, as buyer, and Home Point Financial Corporation, as seller. | |
| | | Master Repurchase Agreement and Securities Contract, dated as of November 23, 2015, by and between Wells Fargo Bank, N.A., as buyer, and Home Point Financial Corporation, as seller. | |
| | | Master Repurchase Agreement, dated as of October 1, 2020, by and between Amherst Pierpont Securities LLC, as buyer, and Home Point Financial Corporation, as seller. | |
| | | Master Repurchase Agreement, dated as of August 14, 2020, by and between Barclays Bank PLC, as purchaser and agent, and Home Point Financial Corporation, as seller. | |
| | | Amended and Restated Credit Agreement, dated as of July 11, 2019, by and among Home Point Financial Corporation, as borrower, Home Point Capital Inc., as guarantor, Goldman Sachs Bank USA, as administrative agent, and the lenders party thereto. | |
| | | First Amendment to Amended and Restated Credit Agreement, dated as of November 27, 2019, by and among Home Point Financial Corporation, as borrower, Home Point Capital Inc., as guarantor, Goldman Sachs Bank USA, as administrative agent, and the lenders party thereto. | |
| | | Second Amendment to Amended and Restated Credit Agreement, dated as of August 5, 2020, by and among Home Point Financial Corporation, as borrower, Home Point Capital Inc., as guarantor, Goldman Sachs Bank USA, as administrative agent, and the lenders party thereto. | |
10.11** | | | Form of Stockholders Agreement. |
| | | Employment Agreement, dated March 31, 2015, by and between Home Point Capital Inc. and William A. Newman. | |
| | | Home Point Capital LP 2015 Option Plan, dated as of March 31, 2015. | |
| | | Amendment No. 1 to Home Point Capital LP 2015 Option Plan, dated January 31, 2020. | |
10.15**† | | | Form of the 2021 Incentive Plan. |
10.16**† | | | Form of Substitute Option Agreement under the 2021 Incentive Plan. |
10.17**† | | | Form of 2021 Employee Stock Purchase Plan. |
| | | Subsidiaries of the Registrant. | |
| | | Consent of BDO USA, LLP. | |
23.2** | | | Consent of Simpson Thacher & Bartlett LLP (included as part of Exhibit 5.1). |
| | | Consent of Laurie S. Goodman to be named as a director nominee. | |
| | | Consent of Timothy R. Morse to be named as a director nominee. | |
| | | Power of Attorney (included on signature pages to this registration statement). |
* | Filed herewith. |
** | To be filed by amendment. |
† | Compensatory arrangements for director(s) and/or executive officer(s). |
+ | Certain portions of this exhibit have been redacted pursuant to Item 601(b)(10)(iv) of Regulation S-K. The Company agrees to furnish supplementally an unredacted copy of the exhibit to the Securities and Exchange Commission upon its request. |
(B) | Financial Statement Schedules. |
Item 17. | Undertakings. |
(1) | For purposes of determining any liability under the Securities Act of 1933, the information omitted from the form of prospectus as filed as part of this registration statement in reliance upon Rule 430A and contained in a form of prospectus filed by the registrant pursuant to Rule 424(b)(1) or (4) or 497(h) under the Securities Act shall be deemed to be part of this registration statement as of the time it was declared effective. |
(2) | For the purpose of determining any liability under the Securities Act of 1933, each post-effective amendment that contains a form of prospectus shall be deemed to be a new registration statement relating to the securities offered therein, and the offering of such securities at that time shall be deemed to be the initial bona fide offering thereof. |
| | | Home Point Capital Inc. | |||||||
| | | | | | | ||||
| | | By: | | | /s/ William A. Newman | ||||
| | | | | Name: | | | William A. Newman | ||
| | | | | Title: | | | President and Chief Executive Officer | ||
Signature | | | Capacity |
| | | ||
/s/ William A. Newman | | | President, Chief Executive Officer and Director (Principal Executive Officer) |
William A. Newman | | ||
| | | ||
/s/ Mark E. Elbaum | | | Chief Financial Officer (Principal Financial Officer and Principal Accounting Officer) |
Mark E. Elbaum | | ||
| | | ||
/s/ Agha S. Khan | | | Director |
Agha S. Khan | | ||
| | | ||
/s/ Stephen A. Levey | | | Director |
Stephen A. Levey | | ||
| | | ||
/s/ Eric L. Rosenzweig | | | Director |
Eric L. Rosenzweig | |