UNITED STATES
SECURITIES AND EXCHANGE COMMISSION
Washington, D.C. 20549
FORM
(Mark One)
For the quarterly period ended
For the transition period from _________ to _________
Commission File Number:
| (Exact name of registrant as specified in its charter) |
| (State or other jurisdiction of incorporation or organization) | (I.R.S. Employer Identification No.) |
| (Address of Principal Executive Offices, including zip code) |
| (Registrant’s telephone number, including area code) |
Securities registered pursuant to Section 12(b) of the Act:
| Title of each class | Trading Symbol(s) | Name of each exchange on which registered | ||
| The | ||||
| The |
Indicate by check mark whether
the registrant (1) has filed all reports required to be filed by Section 13 or 15(d) of the Securities Exchange Act of 1934 during the
preceding 12 months (or for such shorter period that the registrant was required to file such reports), and (2) has been subject to such
filing requirements for the past 90 days.
Indicate by check mark whether
the registrant has submitted electronically every Interactive Data File required to be submitted pursuant to Rule 405 of Regulation S-T
(§232.405 of this chapter) during the preceding 12 months (or for such shorter period that the registrant was required to submit
such files).
Indicate by check mark whether the registrant is a large accelerated filer, an accelerated filer, a non-accelerated filer, a smaller reporting company, or an emerging growth company. See the definitions of “large accelerated filer,” “accelerated filer,” “smaller reporting company,” and “emerging growth company” in Rule 12b-2 of the Exchange Act.
| ☐ Large accelerated filer | ☐ Accelerated filer | |
| ☒ | ||
If an emerging growth company,
indicate by check mark if the registrant has elected not to use the extended transition period for complying with any new or revised financial
accounting standards provided pursuant to Section 13(a) of the Exchange Act.
Indicate by check mark whether
the registrant is a shell company (as defined in Rule 12b-2 of the Exchange Act): Yes ☐
No
As of August 8, 2024, the registrant
had issued and outstanding (i)
RUMBLE INC.
Quarterly Report on Form 10-Q
TABLE OF CONTENTS
i
CAUTIONARY NOTE REGARDING FORWARD-LOOKING STATEMENTS
This Quarterly Report on Form 10-Q (this “Quarterly Report”) contains forward-looking statements regarding, among other things, our plans, strategies and prospects, both business and financial. These statements are based on the beliefs and assumptions of our management. Although we believe that our plans, intentions and expectations reflected in or suggested by these forward-looking statements are reasonable, we cannot provide assurance that we will achieve or realize these plans, intentions or expectations. Forward-looking statements are inherently subject to risks, uncertainties and assumptions. Generally, statements that are not historical facts, including statements concerning possible or assumed future actions, business strategies, events or results of operations, are forward-looking statements. The words “anticipate,” “believe,” “continue,” “could,” “estimate,” “expect,” “intend,” “may,” “might,” “plan,” “possible,” “potential,” “predict,” “project,” “should,” “would” and similar expressions may identify forward-looking statements, but the absence of these words does not mean that a statement is not forward-looking. Investors should read statements that contain these words carefully because they discuss future expectations, contain projects of future results of operations or financial condition; or state other “forward-looking” information. Forward-looking statements are based on information available as of the date of this Quarterly Report and may involve significant judgments and assumptions, known and unknown risks and uncertainties and other factors, many of which are outside our control. There may be events in the future that management is not able to predict accurately or over which we have no control. We do not undertake any obligation to update to otherwise correct any forward-looking statements contained herein to reflect events or circumstances after the date they were made, whether as a result of new information, future events, inaccuracies that become apparent after the date hereof or otherwise, except as may be required under applicable laws. The risk factors and cautionary language contained in this Quarterly Report provide examples of risks, uncertainties, and events that may cause actual results to differ materially from the expectations described in such forward-looking statements, including among other things:
| ● | our ability to grow and manage future growth profitably over time, maintain relationships with customers, compete within our industry and retain key employees; |
| ● | the possibility that we may be adversely impacted by economic, business, and/or competitive factors; |
| ● | our limited operating history makes it difficult to evaluate our business and prospects; |
| ● | our recent and rapid growth may not be indicative of future performance; |
| ● | we may not continue to grow or maintain our active user base, and we may not be able to achieve or maintain profitability; |
| ● | risks relating to our ability to attract new advertisers, or the potential loss of existing advertisers or the reduction of or failure by existing advertisers to maintain or increase their advertising budgets; |
| ● | Rumble Cloud, our recently launched cloud business may not achieve success, and, as a result, our business, financial condition and results of operations could be adversely affected; |
| ● | negative media campaigns may adversely impact our financial performance, results of operations, and relationships with our business partners, including content creators and advertisers; |
| ● | spam activity, including inauthentic and fraudulent user activity, if undetected, may contribute to some amount of overstatement of our performance indicators, including reporting of MAUs by Google; |
| ● | we collect, store, and process large amounts of user video content and personal information of our users and subscribers. If our security measures are breached, our sites and applications may be perceived as not being secure, traffic and advertisers may curtail or stop viewing our content or using our services, our business and operating results could be harmed, and we could face governmental investigations and legal claims from users and subscribers; |
| ● | we may fail to comply with applicable privacy laws; |
ii
| ● | we are subject to cybersecurity risks and interruptions or failures in our information technology systems and as we grow and gain recognition, we will likely need to expend additional resources to enhance our protection from such risks. Notwithstanding our efforts, a cyber incident could occur and result in information theft, data corruption, operational disruption and/or financial loss; |
| ● | we may be found to have infringed on the intellectual property of others, which could expose us to substantial losses or restrict our operations; |
| ● | we may face liability for hosting a variety of tortious or unlawful materials uploaded by third parties, notwithstanding the liability protections of Section 230 of the Communications Decency Act of 1996 (“Section 230”); |
| ● | we may face negative publicity for removing, or declining to remove, certain content, regardless of whether such content violated any law; |
| ● | paid endorsements by our content creators may expose us to regulatory risk, liability, and compliance costs, and, as a result, may adversely affect our business, financial condition and results of operations; |
| ● | our traffic growth, engagement, and monetization depend upon effective operation within and compatibility with operating systems, networks, devices, web browsers and standards, including mobile operating systems, networks, and standards that we do not control; |
| ● | our business depends on continued and unimpeded access to our content and services on the internet. If we or those who engage with our content experience disruptions in internet service, or if internet service providers are able to block, degrade or charge for access to our content and services, we could incur additional expenses and the loss of traffic and advertisers; |
| ● | we face significant market competition, and if we are unable to compete effectively with our competitors for traffic and advertising spend, our business and operating results could be harmed; |
| ● | we rely on data from third parties to calculate certain of our performance metrics. Real or perceived inaccuracies in such metrics may harm our reputation and negatively affect our business; |
| ● | changes to our existing content and services could fail to attract traffic and advertisers or fail to generate revenue; |
| ● | we derive the majority of our revenue from advertising. The failure to attract new advertisers, the loss of existing advertisers, or the reduction of or failure by existing advertisers to maintain or increase their advertising budgets would adversely affect our business; |
| ● | we depend on third-party vendors, including internet service providers, advertising networks, and data centers, to provide core services; |
iii
| ● | hosting and delivery costs may increase unexpectedly; |
| ● | we have offered and intend to continue to offer incentives, including economic incentives, to content creators to join our platform, and these arrangements may involve fixed payment obligations that are not contingent on actual revenue or performance metrics generated by the applicable content creator but rather are based on our modeled financial projections for that creator, which if not satisfied may adversely impact our financial performance, results of operations and liquidity; | |
| ● | we may be unable to develop or maintain effective internal controls; |
| ● | potential diversion of management’s attention and consumption of resources as a result of acquisitions of other companies and success in integrating and otherwise achieving the benefits of recent and potential acquisitions; |
| ● | we may fail to maintain adequate operational and financial resources or raise additional capital or generate sufficient cash flows; |
| ● | changes in tax rates, changes in tax treatment of companies engaged in e-commerce, the adoption of new tax legislation, or exposure to additional tax liabilities may adversely impact our financial results; |
| ● | compliance obligations imposed by new privacy laws, laws regulating social media platforms and online speech in certain jurisdictions in which we operate, or industry practices may adversely affect our business; and |
| ● | other risks and uncertainties indicated in this Quarterly Report and in other filings that we have made or will make with the Securities and Exchange Commission (the “SEC”), including the risk factors described under the caption “Risk Factors” in our Annual Report on Form 10-K for the year ended December 31, 2023. |
iv
PART I - FINANCIAL INFORMATION
ITEM 1. UNAUDITED CONDENSED CONSOLIDATED FINANCIAL STATEMENTS
Rumble Inc.
Condensed Consolidated Interim Financial Statements
(Expressed in U.S. Dollars)
For the three and six months ended June 30, 2024 and 2023
1
Rumble Inc.
Condensed Consolidated Interim Financial Statements
(Expressed in U.S. Dollars)
For the three and six months ended June 30, 2024 and 2023
| Contents | |
| Condensed Consolidated Interim Financial Statements | |
| Condensed Consolidated Interim Statements of Operations | 3 |
| Condensed Consolidated Interim Balance Sheets | 4 |
| Condensed Consolidated Interim Statements of Shareholders’ Equity | 5 |
| Condensed Consolidated Interim Statements of Cash Flows | 7 |
| Notes to the Condensed Consolidated Interim Financial Statements | 8-22 |
2
Rumble Inc.
Condensed Consolidated Interim Statements of Operations
(Expressed in U.S. Dollars)
(Unaudited)
| Three months ended June 30, | Six months ended June 30, | |||||||||||||||
| 2024 | 2023 | 2024 | 2023 | |||||||||||||
| Revenues | $ | $ | $ | $ | ||||||||||||
| Expenses | ||||||||||||||||
| Cost of services (content, hosting, other) | $ | $ | $ | $ | ||||||||||||
| General and administrative | ||||||||||||||||
| Research and development | ||||||||||||||||
| Sales and marketing | ||||||||||||||||
| Acquisition-related transaction costs | ||||||||||||||||
| Amortization and depreciation | ||||||||||||||||
| Changes in fair value of contingent consideration | ( | ) | ( | ) | ||||||||||||
| Total expenses | ||||||||||||||||
| Loss from operations | ( | ) | ( | ) | ( | ) | ( | ) | ||||||||
| Interest income | ||||||||||||||||
| Other expense | ( | ) | ( | ) | ( | ) | ( | ) | ||||||||
| Changes in fair value of warrant liability | ( | ) | ( | ) | ||||||||||||
| Loss before income taxes | ( | ) | ( | ) | ( | ) | ( | ) | ||||||||
| Income tax expense | ( | ) | ( | ) | ( | ) | ( | ) | ||||||||
| Net loss | $ | ( | ) | $ | ( | ) | $ | ( | ) | $ | ( | ) | ||||
| $ | ( | ) | $ | ( | ) | $ | ( | ) | $ | ( | ) | |||||
| Share-based compensation expense included in expenses: | ||||||||||||||||
| Cost of services (content, hosting, and other) | $ | $ | $ | $ | ||||||||||||
| General and administrative | ||||||||||||||||
| Research and development | ||||||||||||||||
| Sales and marketing | ||||||||||||||||
| Total share-based compensation expense | $ | $ | $ | $ | ||||||||||||
The accompanying notes are an integral part of these condensed consolidated interim financial statements.
3
Rumble Inc.
Condensed Consolidated Interim Balance Sheets
(Expressed in U.S. Dollars)
(Unaudited)
| June 30, 2024 |
December 31, 2023 |
|||||||
| Assets | ||||||||
| Current assets | ||||||||
| Cash and cash equivalents | $ | $ | ||||||
| Marketable securities | ||||||||
| Accounts receivable | ||||||||
| Prepaid expenses and other | ||||||||
| Other non-current assets | ||||||||
| Property and equipment, net | ||||||||
| Right-of-use assets, net | ||||||||
| Intangible assets, net | ||||||||
| Goodwill | ||||||||
| $ | $ | |||||||
| Liabilities and Shareholders’ Equity | ||||||||
| Current liabilities | ||||||||
| Accounts payable and accrued liabilities | $ | $ | ||||||
| Deferred revenue | ||||||||
| Deferred tax liability | ||||||||
| Lease liabilities | ||||||||
| Contingent consideration | ||||||||
| Lease liabilities, long-term | ||||||||
| Contingent consideration, net of current portion | ||||||||
| Warrant liability | ||||||||
| Other liability | ||||||||
| Commitments and contingencies (Note 13) | ||||||||
| Shareholders’ equity | ||||||||
| Preferred shares ($ |
||||||||
| Accumulated deficit | ( |
) | ( |
) | ||||
| Additional paid-in capital | ||||||||
| $ | $ | |||||||
The accompanying notes are an integral part of these condensed consolidated interim financial statements.
4
Rumble Inc.
Condensed Consolidated Interim Statements of Shareholders’ Equity
(Expressed in U.S. Dollars)
(Unaudited)
| For the three months ended June 30, 2024 | ||||||||||||||||||||||||||||||||||||
| Number of Common Stock | Additional
Paid-in | Accumulated | ||||||||||||||||||||||||||||||||||
| Class A | Class C | Class D | Class A | Class C | Class D | Capital | Deficit | Total | ||||||||||||||||||||||||||||
| Balance March 31, 2024 | $ | $ | $ | $ | $ | ( | ) | $ | ||||||||||||||||||||||||||||
| Issuance of Class A Common Stock in connection with Callin acquisition | - | - | ||||||||||||||||||||||||||||||||||
| Issuance of Class A Common Stock upon exercise of stock options and vesting of restricted stock units | - | - | ||||||||||||||||||||||||||||||||||
| Net share settlement on restricted stock units | - | - | - | ( | ) | ( | ) | |||||||||||||||||||||||||||||
| Share-based compensation | - | - | - | |||||||||||||||||||||||||||||||||
| Loss for the period | - | - | - | ( | ) | ( | ) | |||||||||||||||||||||||||||||
| Balance June 30, 2024 | $ | $ | $ | $ | $ | ( | ) | $ | ||||||||||||||||||||||||||||
| For the six months ended June 30, 2024 | ||||||||||||||||||||||||||||||||||||
| Number of Common Stock | Additional
Paid-in | Accumulated | ||||||||||||||||||||||||||||||||||
| Class A | Class C | Class D | Class A | Class C | Class D | Capital | Deficit | Total | ||||||||||||||||||||||||||||
| Balance December 31, 2023 | $ | $ | $ | $ | $ | ( | ) | $ | ||||||||||||||||||||||||||||
| Issuance of Class A Common Stock in exchange for Class C Common Stock | ( | ) | - | ( | ) | - | ||||||||||||||||||||||||||||||
| Issuance of Class A Common Stock in connection with Callin acquisition | - | - | ||||||||||||||||||||||||||||||||||
| Issuance of Class A Common Stock upon exercise of stock options and vesting of restricted stock units | - | - | ||||||||||||||||||||||||||||||||||
| Net share settlement on restricted stock units | - | - | - | ( | ) | ( | ) | |||||||||||||||||||||||||||||
| Share-based compensation | - | - | - | |||||||||||||||||||||||||||||||||
| Loss for the period | - | - | - | ( | ) | ( | ) | |||||||||||||||||||||||||||||
| Balance June 30, 2024 | $ | $ | $ | $ | $ | ( | ) | $ | ||||||||||||||||||||||||||||
The accompanying notes are an integral part of these condensed consolidated interim financial statements.
5
Rumble Inc.
Condensed Consolidated Interim Statements of Shareholders’ Equity
(Expressed in U.S. Dollars)
(Unaudited)
| For the three months ended June 30, 2023 | ||||||||||||||||||||||||||||||||||||
| Number of Common Stock | Additional
Paid-in | Accumulated | ||||||||||||||||||||||||||||||||||
| Class A | Class C | Class D | Class A | Class C | Class D | Capital | Deficit | Total | ||||||||||||||||||||||||||||
| Balance March 31, 2023 | $ | $ | $ | $ | $ | ( | ) | $ | ||||||||||||||||||||||||||||
| Issuance of Class A Common Stock in connection with the Callin acquisition | - | - | ||||||||||||||||||||||||||||||||||
| Issuance costs in connection with Callin acquisition | - | - | - | ( | ) | ( | ) | |||||||||||||||||||||||||||||
| Issuance of Class A Common Stock upon vesting of restricted stock units | - | - | ( | ) | ||||||||||||||||||||||||||||||||
| Net share settlement on restricted stock units | ( | ) | - | - | ( | ) | ( | ) | ||||||||||||||||||||||||||||
| Share-based compensation | - | - | - | |||||||||||||||||||||||||||||||||
| Loss for the period | - | - | - | ( | ) | ( | ) | |||||||||||||||||||||||||||||
| Balance June 30, 2023 | $ | $ | $ | $ | $ | ( | ) | $ | ||||||||||||||||||||||||||||
| For the six months ended June 30, 2023 | ||||||||||||||||||||||||||||||||||||
| Number of Common Stock | Additional
Paid-in | Accumulated | ||||||||||||||||||||||||||||||||||
| Class A | Class C | Class D | Class A | Class C | Class D | Capital | Deficit | Total | ||||||||||||||||||||||||||||
| Balance December 31, 2022 | $ | $ | $ | $ | $ | ( | ) | $ | ||||||||||||||||||||||||||||
| Issuance of issuable Class A Common Stock in connection with the Callin acquisition | - | - | ||||||||||||||||||||||||||||||||||
| Issuance costs in connection with Callin acquisition | - | - | - | ( | ) | ( | ) | |||||||||||||||||||||||||||||
| Issuance of Class A Common Stock upon vesting of restricted stock units | - | - | ( | ) | ||||||||||||||||||||||||||||||||
| Net share settlement on restricted stock units | ( | ) | - | - | ( | ) | ( | ) | ||||||||||||||||||||||||||||
| Share-based compensation | - | - | - | |||||||||||||||||||||||||||||||||
| Loss for the period | - | - | - | ( | ) | ( | ) | |||||||||||||||||||||||||||||
| Balance June 30, 2023 | $ | $ | $ | $ | $ | ( | ) | $ | ||||||||||||||||||||||||||||
The accompanying notes are an integral part of these condensed consolidated interim financial statements.
6
Rumble Inc.
Condensed Consolidated Interim Statements of Cash Flows
(Expressed in U.S. Dollars)
(Unaudited)
| For the six months ended June 30, | 2024 | 2023 | ||||||
| Cash flows provided by (used in) | ||||||||
| Operating activities | ||||||||
| Net loss for the period | $ | ( | ) | $ | ( | ) | ||
| Adjustments to reconcile net loss to net cash used in operating activities: | ||||||||
| Amortization and depreciation | ||||||||
| Share-based compensation | ||||||||
| Non-cash interest expense | ||||||||
| Non-cash marketing expense | ||||||||
| Amortization on right-of-use assets | ||||||||
| Change in fair value of warrants | ||||||||
| Change in fair value of contingent consideration | ( | ) | ||||||
| Changes in operating assets and liabilities: | ||||||||
| Accounts receivable | ( | ) | ( | ) | ||||
| Prepaid expenses and other | ( | ) | ( | ) | ||||
| Accounts payable and accrued liabilities | ||||||||
| Deferred revenue | ||||||||
| Deferred tax liability | ||||||||
| Operating lease liabilities | ( | ) | ( | ) | ||||
| Net cash used in operating activities | ( | ) | ( | ) | ||||
| Investing activities | ||||||||
| Purchase of property and equipment | ( | ) | ( | ) | ||||
| Purchase of intangible assets | ( | ) | ( | ) | ||||
| Cash acquired in connection with Callin acquisition | ||||||||
| Cash paid to non-accredited investors in connection with Callin acquisition | ( | ) | ||||||
| Cash paid in connection with North River acquisition | ( | ) | ||||||
| Net cash used in investing activities | ( | ) | ( | ) | ||||
| Financing activities | ||||||||
| Taxes paid from net share settlement for share-based compensation | ( | ) | ||||||
| Proceeds from exercise of stock options | ||||||||
| Share issuance costs | ( | ) | ||||||
| Net cash used in financing activities | ( | ) | ( | ) | ||||
| Decrease in cash and cash equivalents during the period | ( | ) | ( | ) | ||||
| Cash and cash equivalents, beginning of period | ||||||||
| Cash and cash equivalents, end of period | $ | $ | ||||||
| Supplemental cash flow information | ||||||||
| Cash paid for income taxes | $ | $ | ||||||
| Cash paid for interest | ||||||||
| Cash paid for lease liabilities | ||||||||
| Non-cash investing and financing activities: | ||||||||
| Non-cash consideration related to the acquisition of Callin (Note 3) | ||||||||
| Class A Common Stock issued to settle contingent consideration liability | ||||||||
| Property and equipment in accounts payable and accrued liabilities | ||||||||
| Recognition of operating right-of-use assets in exchange of operating lease liabilities | ||||||||
| Share-based compensation capitalized related to intangible assets | ||||||||
The accompanying notes are an integral part of these condensed consolidated interim financial statements.
7
Rumble Inc.
Notes to the Condensed Consolidated Interim Financial Statements
(Expressed in U.S. Dollars)
(Unaudited)
For the three and six months ended June 30, 2024 and 2023
| 1. | Overview and Basis of Presentation |
Nature of Operations
On December 1, 2021, Rumble Inc., a corporation formed under the laws of the Province of Ontario, Canada (“Legacy Rumble”) and CF Acquisition VI, a Delaware corporation (“CFVI”) entered into a business agreement (the “Business Combination Agreement”). On September 16, 2022, pursuant to the terms of the Business Combination Agreement, Legacy Rumble and CFVI announced the completion of a transaction whereby CFVI was renamed Rumble Inc. and Legacy Rumble was renamed Rumble Canada Inc.
Rumble Inc. (“Rumble” or the “Company”) is a high growth, video sharing platform and cloud services provider designed to help content creators manage, distribute, and monetize their content by connecting them with brands, publishers, and directly to their subscribers and followers. The Company’s registered office is located at 444 Gulf of Mexico Drive, Longboat Key, Florida, 34228. The Company’s shares of Class A common stock and warrants are traded on The Nasdaq Global Market (“Nasdaq”) under the symbol “RUM” and “RUMBW”, respectively.
Basis of Presentation
The accompanying unaudited condensed consolidated interim financial statements (the “financial statements”) are prepared in accordance with generally accepted accounting principles in the United States of America (“U.S. GAAP”) and include the results of the Company and its wholly-owned subsidiaries. Any reference in these notes to applicable guidance is meant to refer to the authoritative guidance found in the Accounting Standards Codification (“ASC”) and Accounting Standards Update (“ASU”). All intercompany balances and transactions have been eliminated upon consolidation. These financial statements are presented in U.S. dollars, which is the functional currency of the Company.
These financial statements should be read in conjunction with the Company’s annual consolidated financial statements for the year ended December 31, 2023 (“Annual Financial Statements”). These financial statements have been prepared using the same accounting policies that were described in Note 2 to the Annual Financial Statements.
Use of Estimates
The preparation of these financial statements in conformity with U.S. GAAP requires management to make certain estimates, judgments, and assumptions that affect the reported amounts of assets and liabilities, and the disclosure of contingent assets and liabilities, as of the date of the financial statements, as well as the reported amounts of revenues and expenses during the reporting period. On an ongoing basis, the Company evaluates the estimates used, which include but are not limited to the: allowance for credit losses; valuation of share-based compensation awards; estimates in the determination of the fair value of assets acquired and liabilities assumed in connection with acquisitions; fair value of financial instruments including warrant liability and contingent consideration; discount rate in determining lease liabilities; valuation of long-lived assets and their associated useful lives, valuation of goodwill; and the realization of tax assets, estimates of tax liabilities, and valuation of deferred taxes. These estimates, judgments, and assumptions are reviewed periodically and the impact of any revisions are reflected in the financial statements in the period in which such revisions are made. Actual results could differ materially from those estimates, judgments, or assumptions, and such differences could be material to the Company’s consolidated financial position and results of operations.
8
Rumble Inc.
Notes to the Condensed Consolidated Interim Financial Statements
(Expressed in U.S. Dollars)
(Unaudited)
For the three and six months ended June 30, 2024 and 2023
| 2. | Summary of Significant Accounting Policies |
Trade and Barter Transactions
The Company engages in trade and barter
transactions whereby the Company and its counterparty exchange media campaigns or other promotional services. The Company reviews each
transaction to ensure the advertising it receives has economic substance and records revenue in an amount equal to the fair value of the
products and services received unless this is not reasonable to estimate, in which case the consideration is measured based on the standalone
selling price of the advertising inventory promised or delivered to the customer. Trade and barter revenue is recognized when the performance
obligation is fulfilled and follows the same pattern of recognition as the Company’s normal advertising revenue. Trade and barter
expense is recorded when goods or services are consumed. Trade and barter revenue for the three and six months ended June 30, 2024 and
2023 were $ and $, respectively. Trade and barter expenses for the three and six months ended June 30, 2024 and 2023 were $
Prior Period Reclassifications
Certain amounts in expenses and other income (expenses) in prior periods have been reclassified to conform with current period presentation. The reclassification has no impact on net loss, loss per share or total shareholders’ equity.
| 3. | Acquisitions |
Acquisition of Callin Corp.
On May 15, 2023 (the “Acquisition
Date”), the Company acquired
| Total consideration | $ | |||
| Net assets acquired: | ||||
| Cash | $ | |||
| Accounts receivable | ||||
| Prepaid expenses | ||||
| Property and equipment | ||||
| Software and technology | ||||
| Accounts payable, accruals, and other liabilities | ( | ) | ||
| Deferred tax liability | ( | ) | ||
| Total net assets acquired | $ | |||
| Goodwill | $ |
9
Rumble Inc.
Notes to the Condensed Consolidated Interim Financial Statements
(Expressed in U.S. Dollars)
(Unaudited)
For the three and six months ended June 30, 2024 and 2023
| 3. | Acquisitions (Continued) |
Acquisition of Callin Corp. (Continued)
| Fair Value | ||||
| Shares issued | $ | |||
| Shares to be issued | ||||
| Replacement awards | ||||
| Contingent consideration (liability) – retention payments | ||||
| Contingent consideration (equity) – milestone 1 | ||||
| Contingent consideration (equity) – milestone 2 | ||||
| Contingent consideration payable | ||||
| Total consideration | $ | |||
Under the terms of the acquisition
agreement, the Company is required to issue upfront share consideration of
| ● | Retention payment 1: Services are provided by a selling shareholder for 12 months; |
| ● | Retention payment 2: Services are provided by a selling shareholder for 24 months; |
| ● | Milestone payment 1: Within 12 months, certain feature development and technical performance criteria are achieved, and the acquired technology is integrated into the Company’s existing software and |
| ● | Milestone payment 2: Within 24 months, certain feature development and technical performance criteria are achieved. |
In assessing what is part of the business
combination, the Company has determined that because the two retention payments are contingent on a selling shareholder providing services
post-combination, the portion of those tranches earned by the party providing services should be reflected in the Company’s financial
statements as post-combination expense. In addition, where future services are required by employees in order to earn rights to the contingent
consideration, such rights are being accounted for either entirely as post-combination expense or as replacement awards where the rights
replace unvested options or restricted series FF preferred shares that were originally granted by Callin. Rights to contingent consideration
held by non-accredited investors will be settled in cash at $
| Number of Shares | ||||
| Contingent consideration | ||||
| Share-based compensation (Note 11) | ||||
| Total contingently issuable shares | ||||
10
Rumble Inc.
Notes to the Condensed Consolidated Interim Financial Statements
(Expressed in U.S. Dollars)
(Unaudited)
For the three and six months ended June 30, 2024 and 2023
| 3. | Acquisitions (Continued) |
Acquisition of Callin Corp. (Continued)
During the three and six months ended June 30, 2024, certain of the contingently issuable shares were issued. Refer to Note 11 for the share-based compensation and below for the impact on contingent consideration.
The fair value of the contingent consideration has been estimated as follows:
Retention payments 1 and 2
At the acquisition date, the Company
determined that retention payments 1 and 2 are one unit of account requiring the Company to issue a variable number of shares that is
not indexed to the Company’s stock. As a result, the consideration that is contingent on one of the selling shareholder’s
providing services has been classified as a liability. The contingent consideration is classified Level 3 in the fair value hierarchy.
The key inputs into the fair value determination are the probability of achieving the milestones, which impacts the expected number of
shares to be issued, and the share price on the acquisition date. At the acquisition date, management estimated the number of shares to
be issued is
On May 15, 2024, retention payment
1 was met resulting in the issuance of
The Company has recognized a change
in fair value for the retention payment 1 and 2 contingent consideration of $
Milestone payments 1 and 2
The Company has determined that milestone
payments 1 and 2 are separate units of account because a fixed number of shares will be issued if each contingency is met, and meeting
one contingency is not dependent on the other. The key inputs into the fair value determination are the probability of each contingency
being met, and the share price on the acquisition date. As of June 30, 2024, milestone payments 1 and 2 were met resulting in the issuance
of
The acquired goodwill relates to Callin’s workforce and synergies that are expected to be realized upon the integration of Callin’s technology with the Rumble platform. Such synergies will include the ability to leverage the creator relationships that Rumble has secured to date and will allow for a greater ability to establish brand recognition and monetization of the Callin platform in the future. The goodwill is not expected to be deductible for tax purposes.
Acquisition of North River Project Inc.
On October 3, 2023, the Company acquired
11
Rumble Inc.
Notes to the Condensed Consolidated Interim Financial Statements
(Expressed in U.S. Dollars)
(Unaudited)
For the three and six months ended June 30, 2024 and 2023
| 3. | Acquisitions (Continued) |
Acquisition of North River Project Inc. (Continued)
The Company allocated the contingent payment to the acquired assets based on their relative fair value on the date of acquisition as follows:
| Fair Value | ||||
| Software and technology | $ | 4,500,536 | ||
| Assembled workforce | 184,721 | |||
| Deferred tax liability | (1,030,757 | ) | ||
| Total consideration | $ | 3,654,500 | ||
The additions were allocated to the
cost basis of the acquired assets and the Company recognized a cumulative catch up on the amortization expense in the amount of $
The acquired software and technology
was assigned a useful life of
| 4. | Revenue from Contracts with Customers |
| Three months ended | Six months ended | |||||||||||||||
| June 30 | June 30 | |||||||||||||||
| 2024 | 2023 | 2024 | 2023 | |||||||||||||
| Audience Monetization | $ | $ | $ | $ | ||||||||||||
| Other Initiatives | ||||||||||||||||
| Total revenues | $ | $ | $ | $ | ||||||||||||
Audience Monetization
Audience Monetization includes: advertising fees on the Rumble platform; subscription fees earned primarily from consumer product offerings such as Locals and badges; revenues generated from content that is licensed by third-parties; pay-per-view; and fees from tipping and platform hosting fees. Advertising fees are generated by delivering digital video and display advertisements as well as cost-per-message-read advertisements. Digital video and display advertisements are placed on Rumble websites or mobile applications. Customers pay for advertisements either directly or through relationships with advertising agencies or resellers, based on the number of impressions delivered or the number of actions such as clicks, or purchases taken, by our users.
12
Rumble Inc.
Notes to the Condensed Consolidated Interim Financial Statements
(Expressed in U.S. Dollars)
(Unaudited)
For the three and six months ended June 30, 2024 and 2023
| 4. | Revenue from Contracts with Customers (Continued) |
Other Initiatives
Other Initiatives includes: digital advertisements that are placed on Rumble’s network of third-party publisher websites or mobile applications and cloud. Cloud includes consumption-based fees, subscriptions for infrastructure and professional services.
| Three months ended | Six months ended | |||||||||||||||
| June 30 | June 30 | |||||||||||||||
| 2024 | 2023 | 2024 | 2023 | |||||||||||||
| Point in time | $ | $ | $ | $ | ||||||||||||
| Over time | ||||||||||||||||
| Total revenues | $ | $ | $ | $ | ||||||||||||
Deferred Revenue
Deferred revenue recorded at June
30, 2024 is expected to be fully recognized by June 30, 2025. The deferred revenue balance was $
| 5. | Cash, Cash Equivalents, and Marketable Securities |
| Contracted | June 30, 2024 | December 31, 2023 | ||||||||
| Maturity | Balance | Balance | ||||||||
| Cash | $ | $ | ||||||||
| Treasury bills and money market funds | ||||||||||
| $ | $ | |||||||||
Marketable securities consist of term
deposits of $
As of June 30, 2024 and December 31,
2023, the Company entered into a guarantee/ standby letter of credit in the amount of $
13
Rumble Inc.
Notes to the Condensed Consolidated Interim Financial Statements
(Expressed in U.S. Dollars)
(Unaudited)
For the three and six months ended June 30, 2024 and 2023
| 6. | Property and Equipment |
| June 30, | December 31, | |||||||
| 2024 | 2023 | |||||||
| Computer hardware | $ | $ | ||||||
| Furniture and fixtures | ||||||||
| Leasehold improvements | ||||||||
| Accumulated depreciation | ( | ) | ( | ) | ||||
| Net carrying value | $ | $ | ||||||
Depreciation expense on property and
equipment was $
| 7. | Right-of-Use Assets and Lease Liabilities |
The Company leases several facilities
and data centers under non-cancelable operating leases. Our leases have original lease periods expiring between 2024 and 2027.
| June 30, 2024 | December 31, 2023 | |||||||||||||||
| Accumulated | Accumulated | |||||||||||||||
| Cost | Depreciation | Cost | Depreciation | |||||||||||||
| Right-of-use assets | $ | $ | ( | ) | $ | $ | ( | ) | ||||||||
| Net book value | $ | $ | ||||||||||||||
Operating lease costs for the three
months ended June 30, 2024 and 2023 was $
| June 30, 2024 | December 31, 2023 | |||
| Weighted-average remaining lease term | | |||
| Weighted-average discount rate |
14
Rumble Inc.
Notes to the Condensed Consolidated Interim Financial Statements
(Expressed in U.S. Dollars)
(Unaudited)
For the three and six months ended June 30, 2024 and 2023
| 7. | Right-of-Use Assets and Lease Liabilities (Continued) |
| 2024 | $ | |||
| 2025 | ||||
| 2026 | ||||
| 2027 | ||||
| Less: imputed interest | ( | ) | ||
| Current portion | $ | |||
| Long-term portion | $ |
| * | Imputed interest represents the difference between undiscounted cash flows and cash flows |
| 8. | Intangible Assets |
| June 30, 2024 | ||||||||||||
| Gross Carrying Amount | Accumulated Amortization | Net Carrying Amount | ||||||||||
| Intellectual property | $ | $ | ( | ) | $ | |||||||
| Domain name | ( | ) | ||||||||||
| Brand | ( | ) | ||||||||||
| Software and technology | ( | ) | ||||||||||
| Internal software development | ( | ) | ||||||||||
| Assembled workforce | ( | ) | ||||||||||
| $ | $ | ( | ) | $ | ||||||||
| December 31, 2023 | ||||||||||||
| Gross Carrying Amount | Accumulated Amortization | Net Carrying Amount | ||||||||||
| Intellectual property | $ | $ | ( | ) | $ | |||||||
| Domain name | ( | ) | ||||||||||
| Brand | ( | ) | ||||||||||
| Software and technology | ( | ) | ||||||||||
| Internal software development | ( | ) | ||||||||||
| Assembled workforce | ( | ) | ||||||||||
| $ | $ | ( | ) | $ | ||||||||
15
Rumble Inc.
Notes to the Condensed Consolidated Interim Financial Statements
(Expressed in U.S. Dollars)
(Unaudited)
For the three and six months ended June 30, 2024 and 2023
| 8. | Intangible Assets (Continued) |
Amortization expense related to intangible
assets was $
| 2024 | $ | |||
| 2025 | ||||
| 2026 | ||||
| 2027 | ||||
| 2028 | ||||
| Thereafter | ||||
| $ |
| 9. | Other Liability |
The Company has received certain amounts
from a third party to assist with certain operating expenditures of the Company. These amounts are to be repaid upon settlement of those
expenditures, are non-interest bearing, and have been treated as a long-term liability. As of June 30, 2024 and December 31, 2023, an
amount of $
| 10. | Shareholders’ Equity |
The Company is authorized to issue
| (i) |
| (ii) |
| (iii) |
| (iv) |
| June 30, 2024 | December 31, 2023 | |||||||||||||||
| Number | Amount | Number | Amount | |||||||||||||
| Class A Common Stock | $ | $ | ||||||||||||||
| Class C Common Stock | ||||||||||||||||
| Class D Common Stock | ||||||||||||||||
| Balance | $ | $ | ||||||||||||||
16
Rumble Inc.
Notes to the Condensed Consolidated Interim Financial Statements
(Expressed in U.S. Dollars)
(Unaudited)
For the three and six months ended June 30, 2024 and 2023
| 10. | Shareholders’ Equity (Continued) |
Former holders of Legacy Rumble’s
common shares are eligible to receive up to an aggregate of
| 11. | Share-Based Compensation Expense |
The Company’s stock award plans consist of:
Rumble Inc. Amended and Restated Stock Option Plan
The Company maintains a long-term incentive plan, the Rumble Inc. Amended and Restated Stock Option Plan (the “Stock Option Plan”). The Stock Option Plan governs the terms and conditions of the outstanding awards previously granted under the Stock Option Plan, as well as all options to purchase Legacy Rumble Class A common shares or Legacy Rumble Class B common shares which were converted into options to purchase shares of Class A Common Stock in connection with the Business Combination.
As of June 30, 2024, there were
Rumble Inc. 2022 Stock Incentive Plan
The Rumble Inc. 2022 Stock Incentive
Plan (the “Stock Incentive Plan”) was approved by the board of directors and the stockholders of the Company, and became effective,
on September 16, 2022. The Company initially reserved
As of June 30, 2024, there were
Restricted Stock Units
| Number | Weighted Average Grant Date Fair Value | |||||||
| Outstanding, December 31, 2023 | $ | |||||||
| Granted | ||||||||
| Vested | ( | ) | ||||||
| Forfeited | ( | ) | ||||||
| Outstanding, June 30, 2024 | $ | |||||||
17
Rumble Inc.
Notes to the Condensed Consolidated Interim Financial Statements
(Expressed in U.S. Dollars)
(Unaudited)
For the three and six months ended June 30, 2024 and 2023
| 11. | Share-Based Compensation Expense (Continued) |
Restricted Stock Units (Continued)
The total unrecognized compensation
cost for the RSUs issued is $
Stock Options
| Six months ended June 30, 2024 | ||||||||||||||||
| Service Conditions | Performance Conditions | |||||||||||||||
| Number | Weighted Exercise Price | Number | Weighted Exercise Price | |||||||||||||
| Outstanding, beginning of year | $ | $ | ||||||||||||||
| Granted | ||||||||||||||||
| Exercised | ( | ) | ||||||||||||||
| Forfeited | ( | ) | ||||||||||||||
| Outstanding, end of period | $ | $ | ||||||||||||||
| Vested and exercisable | $ | $ | ||||||||||||||
The aggregate intrinsic value of stock
options is calculated as the difference between the exercise price of the stock options and the fair value of the Company’s Class
A Common Stock for those stock options that had exercise prices lower than the fair value of the Company’s Class A Common Stock.
As of June 30, 2024, the aggregate intrinsic value of options outstanding was $
The total unrecognized compensation
cost for options with a service only condition and options with a performance condition as of June 30, 2024 was $
As of June 30, 2024, the Company has determined that it is not probable that the conditions related to the performance-based stock options will be met, and therefore, the Company has not recognized the related expense in the consolidated statement of operations.
The weighted average grant date fair
value of the outstanding options with a service only condition and options with a performance condition as of June 30, 2024 was $
Rights to Acquisition Related Post-Combination Expense
As described in Note 3, share-based
compensation expense relates to rights to contingent consideration that were accounted for as post-combination expense. Share-based compensation
expense recognized in the condensed consolidated interim statement of operations related to the rights to contingent consideration was
$
18
Rumble Inc.
Notes to the Condensed Consolidated Interim Financial Statements
(Expressed in U.S. Dollars)
(Unaudited)
For the three and six months ended June 30, 2024 and 2023
| 11. | Share-Based Compensation Expense (Continued) |
Rights to Acquisition Related Post-Combination Expense (Continued)
As discussed in Note 3, certain milestones
were met during the three and six months ended June 30, 2024. As a result,
As of June 30, 2024, there was $
| 12. | Loss per Share |
Basic loss per share is computed by dividing net loss attributable to the Company by the weighted-average number of Class A and Class C Common Stock issued and outstanding, excluding those held in escrow as these are contingently issuable shares and have been excluded from the calculation during the three and six months ended June 30, 2024 and 2023. Shares of Class D Common Stock do not share in earnings and not participating securities (i.e., non-economic shares) and therefore, have been excluded from the calculation of weighted-average number of shares outstanding.
Diluted loss per share is computed giving effect to all potentially dilutive shares. Diluted loss per share for all periods presented is the same as basic loss per share as the inclusion of potentially issuable shares would be antidilutive.
| 13. | Commitments and Contingencies |
Commitments
The Company has non-cancelable contractual
commitments of approximately $
Legal Proceedings
In the normal course of business, to facilitate transactions in services and products, the Company indemnifies certain parties. The Company has agreed to hold certain parties harmless against losses arising from a breach of representations or covenants, or out of intellectual property infringement or other claims made against certain parties. Several of these agreements limit the time within which an indemnification claim can be made and the amount of the claim. In addition, the Company has entered into indemnification agreements with its officers and directors, and its bylaws contain similar indemnification obligations to its agents.
Furthermore, many of the Company’s agreements with its customers and partners require the Company to indemnify them for certain intellectual property infringement claims against them, which would increase costs as a result of defending such claims, and may require that we pay significant damages if there were an adverse ruling in any such claims. Customers and partners may discontinue the use of the Company’s services and technologies as a result of injunctions or otherwise, which could result in loss of revenues and adversely impact the business.
19
Rumble Inc.
Notes to the Condensed Consolidated Interim Financial Statements
(Expressed in U.S. Dollars)
(Unaudited)
For the three and six months ended June 30, 2024 and 2023
| 13. | Commitments and Contingencies (Continued) |
It is not possible to make a reasonable estimate of the maximum potential amount under these indemnification agreements due to the unique facts and circumstances involved in each particular agreement. As of June 30, 2024, there were no material indemnification claims that were probable or reasonably possible.
As of June 30, 2024, Rumble was defending
a lawsuit against the Company and one of its shareholders seeking a variety of relief including rescission of a share redemption sale
agreement with the Company or damages alleged to be worth $
The Company is defending the claims and considers that the likelihood that it will be required to make a payment to plaintiffs to be remote.
| 14. | Fair Value Measurements |
| Level 1 | Level 2 | Level 3 | ||||||||||
| Warrant Liability | Marketable Securities | Contingent Consideration | ||||||||||
| December 31, 2023 | $ | $ | $ | |||||||||
| Change in fair value | - | |||||||||||
| Settlement by issuance of shares | - | - | ( | ) | ||||||||
| Reclassification to equity | - | - | ( | ) | ||||||||
| Reclassification to accounts payable and accrued liabilities | - | - | ( | ) | ||||||||
| June 30, 2024 | $ | $ | $ | - | ||||||||
Warrant liability
Warrant liability
consists of warrants issued by the Company in public offerings, private placements, and forward purchase contracts. As of June 30, 2024
and December 31, 2023, the number of warrants outstanding and weighted-average exercise price were
Contingent consideration
The contingent consideration liability arose in May 2023 from the Callin acquisition. Refer to Note 3. The increase in fair value during the year is attributable to changes in the Company’s stock price and the increased probability of each contingency being met. On May 15, 2024, the contingent consideration liability was derecognized. One of the contingent payments was settled through the issuance of shares and the remaining contingent payment was reclassified to equity and accounts payable.
20
Rumble Inc.
Notes to the Condensed Consolidated Interim Financial Statements
(Expressed in U.S. Dollars)
(Unaudited)
For the three and six months ended June 30, 2024 and 2023
| 15. | Credit and Concentration Risks |
Credit risk is the risk that one party to a financial instrument will cause a financial loss for the other party by failing to discharge an obligation. The Company is exposed to credit risk resulting from the possibility that a customer or counterparty to a financial instrument defaults on their financial obligations or if there is a concentration of transactions carried out with the same counterparty. Financial instruments that potentially subject the Company to concentrations of credit risk include cash, cash equivalents, marketable securities and accounts receivable.
The Company’s cash, cash equivalents, and marketable securities are held in reputable banks in its country of domicile and management believes the risk of loss to be remote. We maintain cash balances that exceed the insured limits by the Federal Deposit Insurance Corporation and the Canada Deposit Insurance Corporation.
The Company is exposed to credit risk
in the event of default by its customers. Accounts receivables are recorded at the invoiced amount, do not bear interest, and do not require
collateral. For the three months ended June 30, 2024 and 2023, one customer accounted for $
| 16. | Related Party Transactions |
The Company’s related parties include directors, shareholders and key management.
Compensation to related parties
totaled $
The Company has a vendor relationship
with Cosmic Inc. and Kosmik Development Skopje doo (“Cosmic”) to provide content moderation and software development services.
Cosmic is controlled by Chris Pavlovski, our Chairman and Chief Executive Officer, and Ryan Milnes, a member of our board of directors,
each of whom holds a significant number of Rumble shares. The Company incurred related party expenses for these services of $
There were no other related party transactions during these periods.
21
Rumble Inc.
Notes to the Condensed Consolidated Interim Financial Statements
(Expressed in U.S. Dollars)
(Unaudited)
For the three and six months ended June 30, 2024 and 2023
| 17. | Segmented Information |
Disclosure requirements about segments
of an enterprise establish standards for reporting information regarding operating segments in the condensed consolidated interim financial
statements. These requirements include presenting selected information for each segment. Operating segments are identified as components
of an enterprise for which separate discrete financial information is available for evaluation by the chief operating decision maker in
making decisions regarding how to allocate resources and assess performance. The Company’s chief decision maker is its chief executive
officer. The Company and its chief decision maker view the Company’s operations and manage its business as
| Three months ended | Six months ended | |||||||||||||||
| June 30 | June 30 | |||||||||||||||
| 2024 | 2023 | 2024 | 2023 | |||||||||||||
| United States | $ | $ | $ | $ | ||||||||||||
| Canada | ||||||||||||||||
| Other | ||||||||||||||||
| $ | $ | $ | $ | |||||||||||||
| June 30, 2024 | December 31, 2023 | |||||||
| United States | $ | $ | ||||||
| Canada | ||||||||
| $ | $ | |||||||
| 18. | Subsequent Events |
The Company’s management reviewed all material events through August 12, 2024, and there were no material subsequent events other than those disclosed above.
22
ITEM 2. MANAGEMENT’S DISCUSSION AND ANALYSIS OF FINANCIAL CONDITION AND RESULTS OF OPERATIONS
The following discussion and analysis of our financial condition and results of operations should be read in conjunction with our unaudited condensed consolidated interim financial statements and the related notes included in Item 1 of Part I of this Quarterly Report on Form 10-Q and with our audited consolidated financial statements and related notes included in our Annual Report on Form 10-K for the fiscal year ended December 31, 2023. This discussion contains forward-looking statements that involve risks and uncertainties. Our actual results could differ materially from such forward-looking statements. Factors that could cause or contribute to those differences include, but are not limited to, those identified below and those discussed in the sections titled “1A. Risk Factors” and “Cautionary Note Regarding Forward-Looking Statements” included elsewhere in this Quarterly Report and those discussed in our other filings with the SEC. Additionally, our historical results are not necessarily indicative of the results that may be expected in any future period. Amounts are presented in U.S. dollars.
Overview
We are a high growth, video sharing and cloud services provider platform designed to help content creators manage, distribute, and monetize their content by connecting them with brands, publishers, and directly to their subscribers and followers. Our registered office is 444 Gulf of Mexico Drive, Longboat Key, Florida, 34228. Our shares of Class A common stock and warrants are traded on The Nasdaq Global Market (“Nasdaq”) under the symbols “RUM” and “RUMBW”, respectively.
Revenues
We generate revenues primarily from two types of revenue: Audience Monetization and Other Initiatives.
Audience Monetization includes: advertising fees on the Rumble platform; subscription fees earned primarily from consumer product offerings such as Locals and badges; revenues generated from content that is licensed by third-parties; pay-per-view; and fees from tipping and platform hosting fees. Advertising fees are generated by delivering digital video and display advertisements as well as cost-per-message-read advertisements. Digital video and display advertisements are placed on Rumble websites or mobile applications. Customers pay for advertisements either directly or through relationships with advertising agencies or resellers, based on the number of impressions delivered or the number of actions such as clicks, or purchases taken, by our users.
Other Initiatives includes: digital advertisements that are placed on Rumble’s network of third-party publisher websites or mobile applications; and cloud. Cloud includes consumption-based fees, subscriptions for infrastructure and professional services.
Refer to Note 2, Summary of Significant Accounting Policies, to the Company’s annual consolidated financial statements for the year ended December 31, 2023 (“Annual Financial Statements”)
Expenses
Expenses primarily include cost of services, general and administrative, research and development, sales and marketing, acquisition-related transaction costs, amortization and depreciation, and changes in fair value of contingent consideration. The most significant component of our expenses on an ongoing basis are programming and content, service provider costs, and staffing-related costs.
We expect to continue to invest substantial resources to support our growth and anticipate that each of the following categories of expenses will increase in absolute dollar amounts for the foreseeable future.
23
Cost of Services (Exclusive of Amortization and Depreciation)
Cost of services consists of costs related to obtaining, supporting and hosting the Company’s product offerings. These costs primarily include:
| ● | Programming and content costs related to compensation to content providers, including share-based compensation, from whom video and other content are licensed. These costs are paid to these providers based on revenues generated, or in fixed amounts. In certain circumstances, we incur additional costs related to incentivizing top content creators to promote and join our platform; and |
| ● | Other cost of services such as third-party service provider costs, including data center and networking, and costs paid to publishers. |
General and Administrative Expenses
General and administrative expenses consist primarily of payroll and related expenses, which include bonuses and share-based compensation for our executives and certain other employees. General and administrative expenses also include legal and professional fees, business insurance costs, operating lease costs and other costs. As a public company, we expect to continue to incur material costs related to compliance with applicable laws and regulations, including audit and accounting fees, legal, insurance, investor relations and other costs.
Research and Development Expenses
Research and development expenses consist primarily of payroll and related expenses, which include bonuses and share-based compensation for our employees on our engineering and development teams. Research and development expenses also include consultant fees related to our development activities to originate, develop and enhance our platforms.
Sales and Marketing Expenses
Sales and marketing expenses consist primarily of payroll and related expenses, which include bonuses and share-based compensation for our employees associated with our sales and marketing functions. Sales and marketing expenses also include consultant fees and direct marketing costs related to the promotion of our platforms and solutions. We expect our sales and marketing expenses to increase over time as we promote our platform and brand, increase marketing activities, and grow domestic and international operations.
Acquisition-related Transaction Costs
Acquisition-related transaction costs consist of transaction expenses related to the Callin acquisition.
Amortization and Depreciation
Amortization and depreciation represent the recognition of costs of assets used in operations, including property and equipment and intangible assets, over their estimated service lives.
Change in Fair Value of Contingent Consideration
Certain contingent consideration associated with the Callin acquisition does not meet the criteria for equity classification, and must be recorded as a liability in accordance with guidance contained in ASC 815-40, Derivatives and Hedging Contracts in Entity’s Own Equity (“ASC 815-40”). Because the contingent consideration meets the definition of a liability under ASC 815, Derivatives and Hedging (“ASC 815”), it is measured at fair value at inception and at each reporting date in accordance with the guidance in ASC 820, Fair Value Measurement (“ASC 820”), with any subsequent changes in fair value recognized in the consolidated statement of operations in the applicable period of change.
24
Non-Operating Income and Other Items
Interest Income
Interest income consists of interest earned on our cash, cash equivalents, and marketable securities. We invest in highly liquid securities such as money market funds, treasury bills and term deposits.
Other Income (Expense)
Other income (expense) consists of miscellaneous income earned outside of normal company revenue as well as foreign exchange gains and losses related to gains and losses on transactions denominated in currencies other than the U.S. dollar.
Change in Fair Value of Warrant Liability
We account for our outstanding warrants in accordance with ASC 815-40, under which the warrants issued in connection with Business Combination do not meet the criteria for equity classification, and must be recorded as liabilities. As these warrants meet the definition of a liability under ASC 815, they are measured at fair value at inception and at each reporting date in accordance with the guidance in ASC 820, with any subsequent changes in fair value recognized in the consolidated statement of operations in the applicable period of change.
Income Tax Benefit (Expense)
Income tax benefit (expense) consists of the estimated federal, state, and foreign income taxes incurred in the U.S. and other jurisdictions in which we operate.
Key Business Metrics
To analyze our business performance, determine financial forecasts and help develop long-term strategic plans, we review the key business metrics described below.
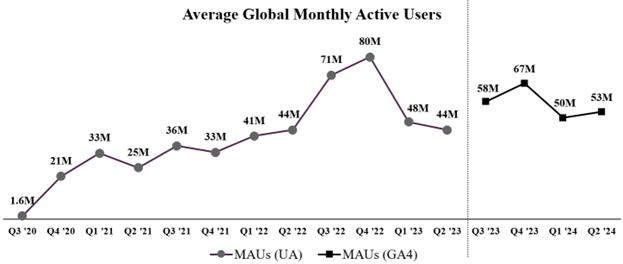
Monthly Active Users (“MAUs”)
We use MAUs as a measure of audience engagement to help us understand the volume of users engaged with our content on a monthly basis. MAUs represent the total web, mobile app, and connected TV users of Rumble for each month, which allows us to measure our total user base calculated from data provided by Google, a third-party analytics provider. Google defines “active users” as the “[n]umber of distinct users who visited your website or application.”1 We have used the Google analytics systems since we first began publicly reporting MAU statistics, and the resulting data have not been independently verified.
As of July 1, 2023, Universal Analytics (“UA”), Google’s analytics platform on which we historically relied for calculating MAUs using company-set parameters, was phased out by Google and ceased processing data. At that time, Google Analytics 4 (“GA4”) succeeded UA as Google’s next-generation analytics platform, which has been used to determine MAUs since the third quarter of 2023 and which we expect to continue to use to determine MAUs in future periods. Although Google has disclosed certain information regarding the transition to GA4,2 Google does not currently make available sufficient information relating to its new GA4 algorithm for us to determine the full effect of the switch from UA to GA4 on our reported MAUs. Because Google has publicly stated that metrics in UA “may be more or less similar” to metrics in GA4, and that “[i]t is not unusual for there to be apparent discrepancies” between the two systems,3 we are unable to determine whether the transition from UA to GA4 has had a positive or negative effect, or the magnitude of such effect, if any, on our reported MAUs. It is therefore possible that MAUs that we reported based on the UA methodology (“MAUs (UA)”) for periods prior to July 1, 2023, cannot be meaningfully compared to MAUs based on the GA4 methodology (“MAUs (GA4)”) in subsequent periods.
| 1 | Google, “[UA→GA4] Comparing Metrics: Google Analytics 4 vs. Universal Analytics, https://support.google.com/analytics/answer/11986666#zippy=%2Cin-this-article (last accessed Mar. 15, 2024) [hereinafter: “Google, Comparing Metrics.”] (providing the technical criteria Google uses to calculate active users). |
2 Id.
3 Id.
25
MAUs (GA4) represent the total web, mobile app, and connected TV users of Rumble for each month,4 which allows us to measure our total user base calculated from data provided by Google.5 Connected TV users were not counted within MAUs within MAUs (UA) for periods prior to July 1, 2023, and we believe the number of such users was immaterial in those prior periods. We also believe that fewer than 1 million MAUs in the current period are from connected TV, making them similarly immaterial. Google’s parameters for measuring “active users” appear to exclude many, but not all, users who access content on Rumble through “embedded” videos on domains other than rumble.com, and we are unable to determine the exact number of users who access “embedded” content within our total number of MAUs. In addition, MAUs (GA4) may rely on statistical sampling and may be based on estimates of data that Google is missing “due to factors such as cookie consent.”6
As with our earlier MAU reporting, there is a potential for minor overlap in the resulting data due to users who access Rumble’s content through the web, our mobile apps, and connected TVs in a given measurement period; however, given that we believe this minor overlap to be immaterial, we do not separately track or report “unique users” as distinct from MAUs. Our reported MAUs have not historically included users of Locals, however, starting in mid-May 2024, Locals users began using Rumble’s single sign-on technology to access their account, which we expect will reduce the number of Locals users not included in our Rumble MAU reporting. We also do not separately report the number of users who register for accounts in any given period, which is different from MAUs.
Like many other major social media companies, we rely on significant paid advertising in order to attract users to our platform; however, we cannot be certain that all or substantially all activity that results from such advertising is genuine. Spam activity, including inauthentic and fraudulent user activity, if undetected, may contribute to some amount of overstatement of our performance indicators, including reporting of MAUs by Google. We continually seek to improve our ability to estimate the total number of spam-generated users, and we eliminate material activity that is substantially likely to be spam from the calculation of our MAUs. We will not, however, succeed in identifying and removing all spam.
MAUs (GA4) were 53 million on average in the second quarter of 2024, an increase of 6% from the first quarter of 2024. We believe that the increase from the first quarter of 2024 is attributable to an increased interest in political news in the second quarter of 2024.
| 4 | During the measurement period, Rumble was available on the following connected TV systems: Roku, Android TV, Amazon Fire, LG, and Samsung TVs. |
| 5 | Google provides additional information on its definition of an “active user,” see Google, Comparing Metrics. |
| 6 | According to the GA4 dashboard, “[a]s of August 26, 2023, Analytics is estimating data that’s missing due to factors such as cookie consent.” |
26
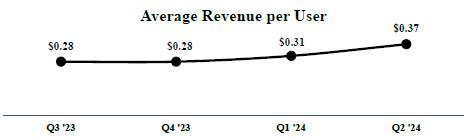
Average Revenue Per User (“ARPU”)
Beginning with the second quarter of 2024, we use ARPU as a measure of our ability to monetize our user base. Quarterly ARPU is calculated as quarterly Audience Monetization revenue divided by MAUs for the relevant quarter (as reported by Google Analytics). ARPU does not include Other Initiatives.
ARPU was $0.37 in the second quarter of 2024, an increase of 19% from the first quarter of 2024. The increase from the first quarter of 2024 is attributable to higher sponsorship revenue.
Estimated Minutes Watched Per Month (“MWPM”)
We use estimated MWPM as a measure of audience engagement to help us understand the volume of users engaged with our content on a monthly basis and the intensity of users’ engagement with the platform. Estimated MWPM represents the monthly average of minutes watched within a quarterly period, which helps us measure user engagement. Estimated MWPM is calculated by converting actual bandwidth consumption into minutes watched, using our management’s best estimate of video resolution quality mix and various encoding parameters. We continually seek to improve our best estimates based on our observations of creator and user behavior on the Rumble platform, which changes based on the introduction of new product features, including livestreaming. We are currently limited, however, in our ability to collect data from certain aspects of our systems. These limits may result in errors that are difficult to quantify, especially as the proportion of livestreaming on the Rumble platform increases over time, and as we improve the quality of various video formats by increasing bit rates.
27
Bandwidth consumption includes video traffic across the entire Rumble platform (website, apps, embedded video, connected TV, RAC, etc.). In addition, our management believes bandwidth consumption includes a nominal amount of non-video traffic on the Rumble and Locals platforms and a potentially significant amount of consumption of Rumble videos outside of the Rumble video player and Rumble apps, due in part to intentional user circumvention of the Rumble platform that, despite our continuous efforts, we are unable to eliminate. Combined, the bandwidth consumption for this traffic may be material and difficult to quantify, resulting in an inability for us to monetize a potentially significant portion of our estimated MWPM.
Estimated MWPM was 8.5 billion on average in the second quarter of 2024, a decrease of 1% from the first quarter of 2024. We believe that the decrease from the first quarter of 2024 was due to our bandwidth consumption moving from third-party service providers’ content delivery networks (“CDNs”) to our own proprietary CDN, offset by an increased interest in political news in the second quarter of 2024. Based on preliminary testing, our own CDN indicates less bandwidth consumption than one of our service providers’ CDNs for comparable user activity. Because we calculate estimated MWPM by converting bandwidth consumption into minutes watched, consumption measured through our own CDN yields a lower estimated MWPM than when measured through that service provider’s CDN.
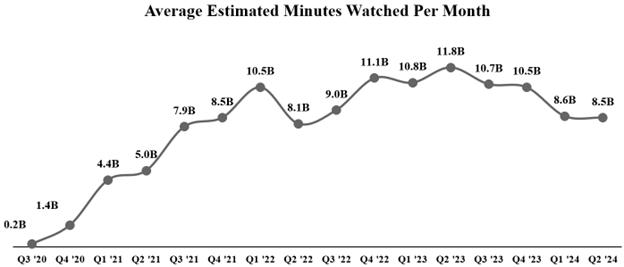
As described above, we introduced a new key business metric, ARPU, this quarter that we believe better reflects the focus of our management team given the current stage of our business. Accordingly, this is the last quarter we plan to report estimated MWPM.
Hours of Uploaded Video Per Day
We use the amount of hours of uploaded video per day as a measure of content creation to help us understand the volume of content being created and uploaded to us on a daily basis. Hours of uploaded video per day were 13,342 on average in the second quarter of 2024, representing an increase of 7% from the first quarter of 2024. We believe that the increase from the first quarter of 2024 is attributable to an increased interest in political news in the second quarter of 2024.
28
As previously disclosed, we believe hours of uploaded video per day have been depressed by YouTube’s decision in the fourth quarter of 2023 to disable the ability of its users to utilize our tool that automatically imports videos from creators’ YouTube channels to their Rumble channels, commonly known as the “YouTube sync” tool. We provided additional information about this issue in a current report on Form 8-K, filed with the SEC on January 16, 2024.
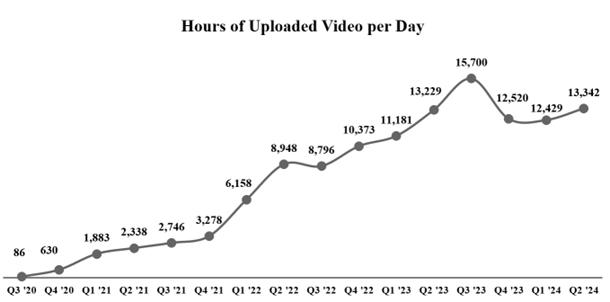
As described above, we introduced a new key business metric, ARPU, this quarter that we believe better reflects the focus of our management team given the current stage of our business. Accordingly, this is the last quarter we plan to report the number of hours of uploaded video per day.
We regularly review, have adjusted in the past, and may in the future adjust our processes for calculating our key business metrics to improve their accuracy, including through the application of new data or technologies or product changes that may allow us to identify previously undetected spam activity. As a result of such adjustments, our key business metrics may not be comparable period-over-period.
29
Results of Operations
The following table sets forth our results of operations data for the periods presented:
Comparisons for three months ended June 30, 2024 and 2023:
The following table sets forth our unaudited condensed consolidated interim statements of operations for the three months ended June 30, 2024 and 2023 and the dollar and percentage change between the two periods:
| For the three months ended June 30, | 2024 | 2023 | Variance ($) | Variance (%) | ||||||||||||
| Revenues | $ | 22,469,543 | $ | 24,974,054 | $ | (2,504,511 | ) | (10 | )% | |||||||
| Expenses | ||||||||||||||||
| Cost of services (content, hosting and other) | $ | 35,692,133 | $ | 40,849,816 | $ | (5,157,683 | ) | (13 | )% | |||||||
| General and administrative | 10,415,016 | 9,199,183 | 1,215,833 | 13 | % | |||||||||||
| Research and development | 5,319,230 | 4,348,760 | 970,470 | 22 | % | |||||||||||
| Sales and marketing | 6,274,749 | 3,697,312 | 2,577,437 | 70 | % | |||||||||||
| Acquisition-related transaction costs | - | 704,202 | (704,202 | ) | (100 | )% | ||||||||||
| Amortization and depreciation | 3,564,219 | 1,043,560 | 2,520,659 | 242 | % | |||||||||||
| Changes in fair value of contingent consideration | 17,768 | (373,996 | ) | 391,764 | (105 | )% | ||||||||||
| Total expenses | 61,283,115 | 59,468,837 | 1,814,278 | 3 | % | |||||||||||
| Loss from operations | (38,813,572 | ) | (34,494,783 | ) | (4,318,789 | ) | 13 | % | ||||||||
| Interest income | 2,174,166 | 3,570,423 | (1,396,257 | ) | (39 | )% | ||||||||||
| Other expense | (3,869 | ) | (2,495 | ) | (1,374 | ) | 55 | % | ||||||||
| Change in fair value of warrant liability | 10,014,200 | 1,489,250 | 8,524,950 | 572 | % | |||||||||||
| Loss before income taxes | (26,629,075 | ) | (29,437,605 | ) | 2,808,530 | (10 | )% | |||||||||
| Income tax expense | (151,625 | ) | (16,475 | ) | (135,150 | ) | 820 | % | ||||||||
| Net loss | $ | (26,780,700 | ) | $ | (29,454,080 | ) | $ | 2,673,380 | (9 | )% | ||||||
Revenues
Revenues decreased by $2.5 million to $22.5 million in the three months ended June 30, 2024 compared to the three months ended June 30, 2023, of which $3.0 million was attributable to a decrease in Audience Monetization revenues, offset by higher Other Initiatives revenues of $0.5 million. The decrease in Audience Monetization was due to decreases in advertising fees offset by increases in subscription and tipping fees. The increase in revenue from Other Initiatives was mostly due to more advertising inventory being monetized by our publisher network.
Cost of Services
Cost of services decreased by $5.2 million to $35.7 million in the three months ended June 30, 2024 compared to the three months ended June 30, 2023. The decrease was due to a decrease in programming and content costs of $5.6 million, offset by an increase in other cost of services of $0.4 million.
General and Administrative Expenses
General and administrative expenses increased by $1.2 million to $10.4 million in the three months ended June 30, 2024 compared to the three months ended June 30, 2023. The increase was due to an increase in payroll and related expenses of $1.1 million as well as an increase in other administrative expenses of $0.1 million which was mainly driven by public company-related costs, including accounting, investor relations, and other administrative services.
30
Research and Development Expenses
Research and development expenses increased by $1.0 million to $5.3 million in the three months ended June 30, 2024 compared to the three months ended June 30, 2023. The increase was due to an increase in payroll and related expenses of $1.1 million, offset by a $0.1 million decrease in costs related to computer software and hardware, and other expenses used in research and development related activity.
Sales and Marketing Expenses
Sales and marketing expenses increased by $2.6 million to $6.3 million in the three months ended June 30, 2024 compared to the three months ended June 30, 2023. The increase was due to an increase in marketing and public relations activities of $1.8 million as well as payroll and related expenses of $0.8 million.
Acquisition-related Transaction Costs
Acquisition-related transaction costs decreased by $0.7 million to $nil in the three months ended June 30, 2024 compared to the three months ended June 30, 2023. Acquisition-related transaction costs for the three months ended June 30, 2023 consisted of transaction costs incurred that were related to acquisitions completed in 2023.
Amortization and Depreciation
Amortization and depreciation increased by $2.5 million to $3.6 million in the three months ended June 30, 2024 compared to the three months ended June 30, 2023. The increase was due to an increase of $1.0 million from depreciation on our property and equipment as we continue to build out our infrastructure as well as an increase in amortization from intangible assets of $1.5 million.
Change in Fair Value of Contingent Consideration
Change in fair value of contingent consideration increased by $0.4 million resulting in a loss of $18 thousand for the three months ended June 30, 2024. The contingent consideration liability arose in connection with the Callin acquisition and the fair value of this contingent consideration was measured using the fair value of the expected number of shares to be issued and Company’s share price at closing. The gain/loss from the change in fair value of contingent consideration can be directly attributable to changes in the Company’s share price since the closing and the probability of contingencies being met.
Interest Income
Interest income decreased by $1.4 million to $2.2 million in the three months ended June 30, 2024 compared to the three months ended June 30, 2023. The decrease was due to the fact that the Company invested less in money market funds, treasury bills, and term deposits.
Other Expense
Other expense increased by an immaterial amount for the three months ended June 30, 2024 compared to the three months ended June 30, 2023.
Change in Fair Value of Warrant Liability
Change in fair value of warrant liability increased by $8.5 million resulting in a gain of $10.0 million in the three months ended June 30, 2024. The warrant liability arose in connection with the warrants offered as part of the Business Combination. As these warrants meet the classification of a financial liability in accordance with ASC 815-40, the related warrant liability is measured at its fair value, determined in accordance with ASC 820, at each reporting period. The fair value of this warrant liability was measured using the fair value of the Company’s warrants listed on the Nasdaq. The decrease in the change in fair value of warrant liability is directly attributable to changes in the trading price of Rumble’s warrants.
31
Income Tax Expense
Income tax expense increased by $0.1 million to $0.2 million in the three months ended June 30, 2024 compared to the three months ended June 30, 2023.
Comparisons for six months ended June 30, 2024 and 2023:
The following table sets forth our unaudited condensed consolidated interim statements of operations for the six months ended June 30, 2024 and 2023 and the dollar and percentage change between the two periods:
| For the six months ended June 30, | 2024 | 2023 | Variance ($) | Variance (%) | ||||||||||||
| Revenues | $ | 40,202,999 | $ | 42,589,429 | $ | (2,386,430 | ) | (6 | )% | |||||||
| Expenses | ||||||||||||||||
| Cost of services (content, hosting and other) | $ | 67,520,487 | $ | 66,864,181 | $ | 656,306 | 1 | % | ||||||||
| General and administrative | 19,737,395 | 17,794,279 | 1,943,116 | 11 | % | |||||||||||
| Research and development | 9,847,022 | 6,966,419 | 2,880,603 | 41 | % | |||||||||||
| Sales and marketing | 9,571,491 | 7,032,877 | 2,538,614 | 36 | % | |||||||||||
| Acquisition-related transaction costs | - | 704,202 | (704,202 | ) | (100 | )% | ||||||||||
| Amortization and depreciation | 5,990,361 | 1,724,634 | 4,265,727 | 247 | % | |||||||||||
| Changes in fair value of contingent consideration | 1,354,357 | (373,996 | ) | 1,728,353 | (462 | )% | ||||||||||
| Total expenses | 114,021,113 | 100,712,596 | 13,308,517 | 13 | % | |||||||||||
| Loss from operations | (73,818,114 | ) | (58,123,167 | ) | (15,694,947 | ) | 27 | % | ||||||||
| Interest income | 4,696,118 | 6,878,350 | (2,182,232 | ) | (32 | )% | ||||||||||
| Other expense | (73,577 | ) | (18,401 | ) | (55,176 | ) | 300 | % | ||||||||
| Change in fair value of warrant liability | (723,695 | ) | (6,842,500 | ) | 6,118,805 | (89 | )% | |||||||||
| Loss before income taxes | (69,919,268 | ) | (58,105,718 | ) | (11,813,550 | ) | 20 | % | ||||||||
| Income tax expense | (151,472 | ) | (16,475 | ) | (134,997 | ) | 819 | % | ||||||||
| Net loss | $ | (70,070,740 | ) | $ | (58,122,193 | ) | $ | (11,948,547 | ) | 21 | % | |||||
Revenues
Revenues decreased by $2.4 million to $40.2 million in the six months ended June 30, 2024 compared to the six months ended June 30, 2023, of which $3.5 million was attributable to a decrease in Audience Monetization revenues, offset by higher Other Initiatives revenues of $1.1 million. The decrease in Audience Monetization was due to decreases in advertising fees offset by increases in subscription and tipping fees. The increase in revenue from Other Initiatives was mostly due to more advertising inventory being monetized by our publisher network.
Cost of Services
Cost of services increased by $0.7 million to $67.5 million in the six months ended June 30, 2024 compared to the six months ended June 30, 2023. The increase was due to an increase in other cost of services of $1.1 million offset by a decrease in programming and content costs of $0.4 million.
32
General and Administrative Expenses
General and administrative expenses increased by $1.9 million to $19.7 million in the six months ended June 30, 2024 compared to the six months ended June 30, 2023. The increase was due to an increase in payroll and related expenses of $0.9 million, share-based compensation of $2.6 million, offset by a decrease in other administrative expenses of $1.6 million. The $2.6 million increase in share-based compensation was related to the recognition of contingent shares issued in connection with the Callin acquisition that were accounted for as a post combination expense as well as the expense of previously and newly granted restricted stock units and stock options for certain employees and executives. The remaining $1.6 million decrease in other administrative expenses was mainly driven by public company-related costs, including accounting, legal, investor relations, and other administrative services.
Research and Development Expenses
Research and development expenses increased by $2.9 million to $9.8 million in the six months ended June 30, 2024 compared to the six months ended June 30, 2023. The increase was due to an increase in payroll and related expenses of $2.8 million, as well as a $0.1 million increase in costs related to computer software and hardware, and other expenses used in research and development related activity.
Sales and Marketing Expenses
Sales and marketing expenses increased by $2.5 million to $9.6 million in the six months ended June 30, 2024 compared to the six months ended June 30, 2023. The increase was due to an increase of $1.5 million in payroll and related expenses, $0.5 million in consulting services, and $0.5 million due to other marketing and public relations activities.
Acquisition-related Transaction Costs
Acquisition-related transaction costs decreased by $0.7 million to $nil in the six months ended June 30, 2024 compared to the six months ended June 30, 2023. Acquisition-related transaction costs for the six months ended June 30, 2023 consisted of transaction costs incurred that were related to acquisitions completed in 2023.
Amortization and Depreciation
Amortization and depreciation increased by $4.3 million to $6.0 million in the six months ended June 30, 2024 compared to the six months ended June 30, 2023. The increase was due to an increase of $1.3 million from depreciation on our property and equipment as we continue to build out our infrastructure as well as an increase in amortization from intangible assets of $3.0 million.
Change in Fair Value of Contingent Consideration
Change in fair value of contingent consideration increased by $1.7 million resulting in a loss of $1.4 million for the six months ended June 30, 2024. The contingent consideration liability arose in connection with the Callin acquisition and the fair value of this contingent consideration was measured using the fair value of the expected number of shares to be issued and Company’s share price at closing. The gain from the change in fair value of contingent consideration can be directly attributable to changes in the Company’s share price since the closing and the probability of contingencies being met.
Interest Income
Interest income decreased by $2.2 million to $4.7 million in the six months ended June 30, 2024 compared to the six months ended June 30, 2023. The decrease was due to the fact that the Company invested less in money market funds, treasury bills, and term deposits.
33
Other Expense
Other expense increased by an immaterial amount for the six months ended June 30, 2024 compared to the six months ended June 30, 2023.
Change in Fair Value of Warrant Liability
Change in fair value of warrant liability decreased by $6.1 million resulting in a loss of $0.7 million in the six months ended June 30, 2024. The warrant liability arose in connection with the warrants offered as part of the Business Combination. As these warrants meet the classification of a financial liability in accordance with ASC 815-40, the related warrant liability is measured at its fair value, determined in accordance with ASC 820, at each reporting period. The fair value of this warrant liability was measured using the fair value of the Company’s warrants listed on the Nasdaq. The decrease in the change in fair value of warrant liability is directly attributable to changes in the trading price of Rumble’s warrants.
Income Tax Expense
Income tax expense increased by $0.1 million to $0.2 million in the six months ended June 30, 2024 compared to the six months ended June 30, 2023.
Liquidity and Capital Resources
Since the completion of our Business Combination in September 2022, we have financed operations primarily through cash generated from operating activities and the funds raised from our Business Combination. The primary short-term requirements for liquidity and capital are to fund general working capital and capital expenditures.
As of June 30, 2024, our cash, cash equivalents, and marketable securities balance was $154.2 million. Cash, cash equivalents, and marketable securities consist of cash on deposit with banks and amounts held in money market funds, treasury bills, and term deposits.
As we have consistently stated, we are using a substantial portion of funds to acquire content by providing economic incentives to a small number of content creators, including sports leagues. As of June 30, 2024, we had entered into programming and content agreements with a minimum contractual cash commitment of $55 million. A significant amount of these minimum contractual cash commitments will be paid over 12 to 36 months, commencing in 2024. In addition to the minimum contractual cash commitments, we have programming and content agreements that have variable cost arrangements. These future costs are dependent upon many factors and are difficult to anticipate, however, these costs may be substantial.
The following table presents a summary of the unaudited condensed consolidated interim statement of cash flows for the six months ended June 30, 2024 and 2023:
| Six months ended June 30, | Variance | |||||||||||
| Net cash provided by (used in): | 2024 | 2023 | ($) | |||||||||
| Operating activities | $ | (55,592,070 | ) | $ | (34,524,828 | ) | $ | (21,067,242 | ) | |||
| Investing activities | (9,149,739 | ) | (7,040,670 | ) | (2,109,069 | ) | ||||||
| Financing activities | (493,347 | ) | (40,478 | ) | (452,869 | ) | ||||||
34
Operating Activities
Net cash used in operating activities for the six months ended June 30, 2024 primarily consisted of net loss adjusted for certain non-cash items, including a $2.0 million loss on the change in fair value of warrants and contingent consideration, $8.6 million change in share-based compensation, $6.6 million changes in amortization and depreciation, $3.0 million changes in non-cash marketing expense, as well as changes in operating assets and liabilities. The increase in net cash used in operating activities during the six months ended June 30, 2024 compared to the six months ended June 30, 2023 was mostly due to an increase in expenses partially offset by changes in revenue and operating assets and liabilities.
Investing Activities
Net cash used in investing activities for the six months ended June 30, 2024 consisted of $5.3 million in purchases of property, equipment, and intangible assets as well as $3.8 million in cash paid in connection with the acquisitions of Callin and North River. The increase in net cash used in investing activities during the six months ended June 30, 2024 compared to the six months ended June 30, 2023 was due to an increase in purchases of intangible assets, offset by a decrease in purchases of property and equipment. Additionally, the increase in net cash used was related to cash paid to non-accredited investors related to the Callin acquisition and cash paid in connection with the North River acquisition in the six months ended June 30, 2024 as well as cash acquired in connection with the Callin acquisition in the six months ended June 30, 2023.
Financing Activities
Net cash used in financing activities for the six months ended June 30, 2024 consisted of $0.8 million in taxes paid from the net share settlement of share-based compensation, offset by $0.3 million from proceeds related to stock options exercised. The increase in net cash used in financing activities was due to the taxes paid from the net share settlement of share-based compensation, offset by proceeds from stock options exercised in the six months ended June 30, 2024 compared to net cash used related to share issuance costs incurred in the six months ended June 30, 2023.
Summary of Quarterly Results
Information for the most recent quarters presented are as follows:
| June 30, 2024 | Mar 31, 2024 | Dec 31, 2023 | Sep 30, 2023 | |||||||||||||
| Total revenue | $ | 22,469,543 | $ | 17,733,456 | $ | 20,391,872 | $ | 17,982,150 | ||||||||
| Net loss | $ | (26,780,700 | ) | $ | (43,290,040 | ) | $ | (29,277,227 | ) | $ | (29,021,042 | ) | ||||
| Jun 30, 2023 | Mar 31, 2023 | Dec 31, 2022 | Sep 30, 2022 | |||||||||||||
| Total revenue | $ | 24,974,054 | $ | 17,615,375 | $ | 19,957,025 | $ | 10,983,182 | ||||||||
| Net loss | $ | (29,454,080 | ) | $ | (28,668,113 | ) | $ | (944,668 | ) | $ | (1,858,452 | ) | ||||
Critical Accounting Policies and Estimates
We prepare our unaudited condensed consolidated interim financial statements in accordance with accounting principles generally accepted in the United States of America (“US GAAP”). The preparation of condensed consolidated interim financial statements also requires us to make estimates and assumptions that affect the reported amounts of assets, liabilities, revenue, costs and expenses and related disclosures. We evaluate our estimates on a continuous basis. We base our estimates on historical experience and on various other assumptions that we believe to be reasonable under the circumstances. Actual results could differ significantly from the estimates made by our management. To the extent that there are differences between our estimates and actual results, our future financial statement presentation, financial condition, results of operations and cash flows will be affected.
35
We believe the following key accounting policies require significant judgments and estimates used in the preparation of our condensed consolidated interim financial statements. Critical accounting policies and estimates are those that we consider the most important to the portrayal of our financial condition and results of operations because they require our most difficult, subjective or complex judgments, often as a result of the need to make estimates about the effects of matters that are inherently uncertain. Accordingly, we believe that these are the most critical to aid in fully understanding and evaluating our financial condition and results of operations.
For further information on the summary of significant accounting policies and the effect on our condensed consolidated interim financial statements, see Note 2, Summary of Significant Accounting Policies, to the Annual Financial Statements.
Acquisitions (Business Combination vs Asset Acquisition)
The Company evaluates whether acquired net assets should be accounted for as a business combination or an asset acquisition by first applying a screen test to determine whether substantially all of the fair value of the gross assets acquired is concentrated in a single identifiable asset or group of similar identifiable assets. If so, the transaction is accounted for as an asset acquisition. If not, the Company applies its judgment to determine whether the acquired net assets meets the definition of a business by considering if the set includes an acquired input, process, and the ability to create outputs.
Valuation of Intangible Assets
The Company acquired intangible assets in connection with acquisitions of Callin and North River. A valuation was performed to determine the estimated fair value of identifiable intangible assets related to the acquisition. Judgment is required to estimate the fair value of these identifiable intangible assets. We may use quoted market prices, prices for similar assets, present value techniques, and other valuation techniques such as the depreciated replacement cost and relief from royalty methods to prepare these estimates. We may need to make estimates of future cash flows and discount rates as well as other assumptions in order to implement these valuation techniques. Due to the degree of judgment involved in our estimation techniques, our estimate may result in significant difference in the estimation of fair value.
Share-based Compensation
The Company issues equity awards such as stock options and restricted stock units to certain of its employees, directors, officers and consultants. We account for equity awards by recognizing the fair value of share-based compensation expense on a straight-line basis over the service period of the award.
For equity awards with a service condition, the fair value is estimated on the grant date using the Black-Scholes option pricing model which takes into account the following inputs: stock price, expected term, volatility, and risk-free interest rate. For equity awards with a market condition, the fair value is estimated on the grant date using a Monte Carlo simulation methodology that includes simulating the stock price using a risk-neutral Geometric Brownian Motion-based pricing model. Changes in the estimated inputs or using other option valuation methods may result in materially different option values and share-based compensation expense.
For equity awards with a performance condition, the Company assesses the likelihood of the performance condition underlying an award being met and recognizes a share-based compensation expense associated with that award only if it is probable the performance condition will be met. Where the performance condition underlying an award is a change in control, the Company considers the performance condition to be probable only when it occurs.
36
Income Taxes
The Company is subject to income taxes in the United States and other foreign jurisdictions. Significant judgment is required in determining our provision for income taxes and income tax assets and liabilities, including evaluating uncertainties in the application of accounting principles and complex tax laws.
Uncertain tax positions are accounted for using a comprehensive model for the manner in which a company should recognize, measure, present and disclose in its financial statements all material uncertain income tax positions. The Company reviews its nexus in various tax jurisdictions and the Company’s tax positions related to all open tax years for events that could change the status of its tax liability, if any, or require an additional liability to be recorded. Such events may be the resolution of issues raised by a taxing authority, expiration of the statute of limitations for a prior open tax year or new transactions for which a tax position may be deemed to be uncertain. Those positions, for which management’s assessment is that there is more than a 50 percent probability of sustaining the position upon challenge by a taxing authority based upon its technical merits, are subjected to the measurement criteria.
Trade and Barter Transactions
The Company engages in trade and barter transactions whereby the Company and its counterparty exchange media campaigns or other promotional services. The Company reviews each transaction to ensure the advertising it receives has economic substance and records revenue in an amount equal to the fair value of the products and services received unless this is not reasonable to estimate, in which case the consideration is measured based on the standalone selling price of the advertising inventory promised or delivered to the customer. Trade and barter revenue is recognized when the performance obligation is fulfilled and follows the same pattern of recognition as the Company’s normal advertising revenue. Trade and barter expense is recorded when goods or services are consumed. The trade and barter expense is recorded in sales and marketing expense in the condensed consolidated interim statement of operations.
New Accounting Pronouncements
See Note 2, Summary of Significant Accounting Policies, to our Annual Financial Statements for the years ended December 31, 2023 and 2022.
JOBS Act Accounting Election
We are an emerging growth company, as defined in the JOBS Act. Under the JOBS Act, emerging growth companies can delay adopting new or revised accounting standards until such time as those standards apply to private companies. We intend to elect to adopt new or revised accounting standards under private company adoption timelines. Accordingly, the timing of our adoption of new or revised accounting standards will not be the same as other public companies that are not emerging growth companies or that have opted out of using such extended transition period and our financial statements may not be comparable to the financial statements of public companies that comply with such new or revised accounting standards.
37
ITEM 3. QUANTITATIVE AND QUALITATIVE DISCLOSURES ABOUT MARKET RISK
We are exposed to certain market risks as part of our ongoing business operations.
Credit and Concentration Risk
We are exposed to credit risk on our cash, cash equivalents, marketable securities, and accounts receivable. We place cash, cash equivalents, and marketable securities with financial institutions with high credit standing, and we place excess cash in money market funds, treasury bills, and deposits. We are exposed to credit risk on our accounts receivable in the event of default by a customer. We bill our customers under customary payment terms and review customers for their creditworthiness. The term between invoicing and payment due date is not significant. A meaningful portion of our revenue is attributable to service agreements with one customer. For the three months ended June 30, 2024 and 2023, one customer accounted for $5,803,843 and $14,596,739 or 26% and 58% of revenue, respectively. For the six months ended June 30, 2024 and 2023, one customer accounted for $8,479,419 and $23,765,265 or 21% and 56% of revenue, respectively. As of June 30, 2024, one customer accounted for 14% of accounts receivable. As of December 31, 2023, one customer accounted for 35% of accounts receivable.
Interest Rate Risk
We are exposed to interest rate risk on our cash, cash equivalents and marketable securities. As of June 30, 2024, we had cash, cash equivalents and marketable securities of $154.2 million, consisting of investments in money market funds, treasury bills, and term deposits for which the fair market value would be affected by changes in the general level of interest rates. However, due to the short-term maturities and the low-risk profile of our investments, an immediate 10% change in interest rates would not have a material effect on the fair market value of our cash, cash equivalents and marketable securities.
ITEM 4. CONTROLS AND PROCEDURES
Evaluation of Disclosure Controls and Procedures
Our management, with the participation of our principal executive officer and principal financial officer, have reviewed and evaluated the effectiveness of our disclosure controls and procedures (as such term is defined in Rules 13a-15(e) and 15d-15(e) under the Securities Exchange Act of 1934, as amended (the “Exchange Act”)) as of the end of the period covered by this Quarterly Report. Based on this review and evaluation, our principal executive officer and principal financial officer concluded that, as of such date, our disclosure controls and procedures were effective to ensure that information required by us in reports that we file or submit under the Exchange Act is (i) recorded, processed, summarized, and reported within the time periods specified in SEC rules and forms and (ii) accumulated and communicated to management, including our principal executive officer and principal financial officer, as appropriate to allow timely decisions regarding required disclosure.
Changes in Internal Controls over Financial Reporting
There were no changes in our internal control over financial reporting during the period covered by this Quarterly Report that have materially affected, or are reasonably likely to materially affect, our internal control over financial reporting.
38
PART II - OTHER INFORMATION
ITEM 1. LEGAL PROCEEDINGS.
We are, and from time to time may become, involved in various legal proceedings arising in the normal course of our business activities, such as copyright infringement and tort claims arising from user-uploaded content, patent infringement claims, breach of contract claims, government demands, putative class actions based upon consumer protection or privacy laws and other matters. The amounts that may be recovered in such matters may be subject to insurance coverage.
On January 2022, we received notification of a lawsuit filed by Kosmayer Investment Inc. (“KII”) against Rumble and Mr. Pavlovski in the Ontario Superior Court of Justice, alleging fraudulent misrepresentation in connection with KII’s decision to redeem its shares of Rumble in August 2020. The case remains in discovery. KII is seeking rescission of such redemption such that, following such rescission, KII would own 20% of the issued and outstanding shares of Rumble or, in the alternative, damages for the lost value of the redeemed shares, which KII has alleged to be worth $419.0 million (based on the value ascribed to the shares of Rumble in the Business Combination), together with other damages including punitive damages and costs. The case remains in discovery. Although we believe that the allegations are meritless and intend to vigorously defend against them, the result or impact of such claim is uncertain, and could result in, among other things, damages, and/or awards of attorneys’ fees or expenses.
In January 2021, we filed an antitrust lawsuit against Google in the United States District Court for the Northern District of California, alleging that Google unlawfully gives an advantage to its YouTube platform over Rumble in search engine results and in the mobile phone market. In June 2021, Google filed a partial motion to dismiss the lawsuit and a motion to strike; in July 2022, the court denied Google’s motion. Summary judgment motions are due in October 2024.
In addition in May 2024, we filed a second antitrust lawsuit against Google, also in the United States District Court for the Northern District of California, related to Google’s monopolization of the online advertising market. Google’s answer to our complaint is due in August 2024. This lawsuit is separate and distinct from the self-preferencing lawsuit filed in January 2021.
Along with co-plaintiff Eugene Volokh, in December 2022, we filed a lawsuit in the U.S. District Court for the Southern District of New York to block the enforcement of New York State’s Social Media Law. In February 2023, the court granted our motion for a preliminary injunction, halting enforcement of the law. The New York Attorney General appealed that decision to the U.S. Court of Appeals for the Second Circuit, where the appeal remains pending.
In November 2023, we filed a defamation lawsuit in the U.S. District Court for the Middle District of Florida against Nandini Jammi and Claire Atkin, co-founders of an organization that targets news outlets and platforms that do not adhere to their political worldview. The lawsuit seeks actual, presumed, and punitive damages against Jammi and Atkin for their defamatory statements about Rumble, in addition to all costs and fees associated with the case. We have also asked the court to prohibit the defendants from repeating their false statements. In May 2024, the defendants filed a motion to dismiss for failure to state a claim. That motion is pending before the court.
In August 2024, we filed an antitrust lawsuit in the U.S. District Court for the Northern District of Texas against the World Federation of Advertisers, WPP plc, and GroupM Worldwide LLC alleging a conspiracy to withhold advertising revenue from Rumble and other digital media platforms. The lawsuit seeks a declaration that the defendants’ conduct is illegal, a permanent injunction against the conduct, damages, interest, and legal fees, among other relief.
39
ITEM 1A. RISK FACTORS.
Except as set forth below, there have been no material changes to the risk factors described under the caption “Risk Factors” in our Annual Report on Form 10-K for the year ended December 31, 2023. You should carefully consider the risks, uncertainties and cautionary statements described therein, together with the other disclosures in this Quarterly Report on Form 10-Q and in our other public filings with the SEC. Any such risks and uncertainties, as well as risks and uncertainties not currently known to us or that we currently deem to be immaterial, may materially adversely affect our business, financial condition and operating results.
Risks Relating to Our Business
We have offered and intend to continue to offer incentives, including economic incentives, to content creators to join our platform, and these arrangements may involve fixed payment obligations that are not contingent on actual revenue or performance metrics generated by the applicable content creator but rather are based on our modeled financial projections for that creator, which if not satisfied may adversely impact our financial performance, results of operations and liquidity.
Our user base and user engagement growth are directly driven by the content available on our platform. We have acquired and expect to continue to acquire content by providing economic incentives, including minimum guaranteed earnings, to a limited number of content creators, including sports leagues. These incentives have included and may continue to include equity grants and cash payments. This content acquisition strategy is intended to allow us to enter key content verticals and secure top content creators in those verticals before we have full monetization capabilities in place. Our present focus is to grow users and usage consumption and experiment with monetization levers, which may not maximize profitability in the immediate term, but which we believe positions our business for the long term. As of June 30, 2024, we had entered into programming and content agreements with a minimum contractual cash commitment of $55 million. In addition to the minimum contractual cash commitments, we have programming and content agreements that have variable cost arrangements. These future costs are dependent upon many factors and are difficult to anticipate, however, these costs may be substantial. To the extent our revenue and/or user growth assumptions associated with any particular creator do not meet our expectations, our financial performance, results of operations and liquidity may be negative impacted, since a failure to achieve these expectations is not expected to reduce our fixed payment obligations to any such creator.
In addition, when these programming and content agreements expire, content creators may choose to leave the Rumble video platform in favor of competing platforms, especially if competing platforms offer superior monetization opportunities. Creators may choose to leave our platform for other monetization-related reasons. For example, we currently do not apportion revenues related to Rumble Premium, our subscription service that provides users ad-free access to our content, among content creators. The loss of a material portion of our existing content creators could result in reductions to our user base and material harm to our business and results of operations.
Our recently launched cloud services business may not achieve success, and, as a result, our business, financial condition and results of operations could be adversely affected.
Our recent expansion into the cloud service business may not be successful and involves various risks relating to this business that may negatively affect our operating results, including:
| ● | our ability to derive an optimal pricing model that enables us to derive sufficient value from our customers while attracting new customers and retaining existing customers; |
| ● | our reliance on third-party providers for data center space and colocation services and on public cloud providers to prevent service disruptions; |
| ● | the intense competition that we face, including from companies with longer operating histories, greater name recognition, larger customer bases and significantly greater financial, technical, sales, marketing and other resources than we have; |
| ● | our ability to attract and retain highly qualified personnel, particularly software and cloud engineers and sales and customer experience personnel; |
| ● | the possibility that we may be unable to maintain and improve our platform performance, especially during peak usage times; |
40
| ● | the possibility that we may underestimate or overestimate our data center capacity requirements and our capital expenditures on data centers, servers and equipment; |
| ● | our ability to obtain standard industry security certifications for our platform and products; |
| ● | our exposure to possible liability and harm to our reputation if the security of our cloud is breached, resulting in the exposure of our customers’ data, including personal information, to cyber criminals and other nefarious actors; |
| ● | the possibility that we may be unable to maintain the compatibility of our platform with third-party applications that our customers use in their businesses; and |
| ● | our ability to respond to rapid technological changes with new solutions and services offerings. |
The occurrence of any of these factors, or our inability to successfully mitigate the results of the associated impact, could also damage our reputation, negatively impact our relationship with our customers, and otherwise materially harm our business, results of operations, and financial condition.
Risks related to our e-commerce business may result in our broader business, financial condition and results of operations being adversely affected.
We recently launched partnerships through which we sell Rumble-branded products through our online store, and we plan to expand such product partnerships in the future. This expansion involves various risks that may negatively affect our operating results, including:
| ● | expansion into new brands, products, services, and technologies will subject us to additional reputational, business, legal, regulatory and financial risks; |
| ● | inability to build and maintain strong brands, including due to unfavorable customer feedback and negative publicity; |
| ● | notwithstanding agreements by our partners to assume liability for the Rumble-branded products they place in our online store, we may be subject to product liability and similar claims and regulatory actions if products sold through our store result in harm, personal injury, death, or environmental or property damage; |
| ● | risks related to additional tax liabilities and collection obligations; |
| ● | market competition could adversely affect prices and demand for the Rumble-branded products we distribute; |
| ● | disruptions in our supply chain and other factors affecting the availability and distribution of our products could adversely impact our business; and |
| ● | risks related to online transactions and payment methods. |
The occurrence of any of these factors, or our inability to successfully mitigate the results of the associated impact, could also damage our reputation, negatively impact our relationships with our customers, and otherwise materially harm our business, results of operations, and financial condition.
We derive the majority of our revenue from advertising. The failure to attract new advertisers, the loss of existing advertisers, or the reduction of or failure by existing advertisers to maintain or increase their advertising budgets may adversely affect our business and operating results.
For the years ended December 31, 2023 and 2022, advertising revenue represents 74% and 79% of total revenue. In addition, a substantial portion of our revenue is derived one advertiser accounting for approximately 46% and 45% of our revenue for the years ended December 31, 2023 and 2022, respectively. As is common in our industry, our advertisers do not have long-term advertising commitments with us. In addition, many of our advertisers purchase advertising services through one of several large advertising agency holding companies. Our revenue could be harmed by the loss of, or a deterioration in our relationship with, any of our largest advertisers or with any advertising agencies or the holding companies that control them. Advertising agencies and potential new advertisers may view our advertising products and services as experimental and unproven, and we may need to devote additional time and resources to educate them about our products and services. Advertisers may cease doing business with us, or they may reduce the prices they are willing to pay to advertise with us, if we do not deliver ads in an effective manner, or if they do not believe that their investment in advertising with us will generate a competitive return relative to alternatives, including online, mobile, and traditional advertising platforms. Advertisers may refuse to advertise on our platform due to a perceived risk to their brand safety standards, especially given the concentration of news and political content on our platform. We believe that our access to certain advertisers has been, and may continue to be, inhibited by the apparent political bias of these companies, some of whom we believe may exercise near monopolistic control over the advertising industry. In response, we recently filed an antitrust lawsuit alleging a conspiracy to withhold advertising revenue from Rumble and other digital media platforms. Our actions to counter these efforts, whether through litigation or publicity campaigns, may not be successful. Any of the foregoing developments may adversely affect our business and operating results.
41
ITEM 2. UNREGISTERED SALES OF EQUITY SECURITIES AND USE OF PROCEEDS.
None.
Item 3. Defaults Upon Senior Securities.
Not applicable.
Item 4. Mine Safety DisclosureS.
Not applicable.
Item 5. Other Information.
42
ITEM 6. EXHIBITS.
The following exhibits are filed as part of, or incorporated by reference into, this Quarterly Report.
| * | Filed herewith |
43
SIGNATURES
Pursuant to the requirements of the Securities Exchange Act of 1934, the registrant has duly caused this report to be signed on its behalf by the undersigned thereunto duly authorized.
| RUMBLE INC. | ||
| Date: August 12, 2024 | /s/ Chris Pavlovski | |
| Name: | Chris Pavlovski | |
| Title: | Chief Executive Officer and Chairman | |
| Date: August 12, 2024 | /s/ Brandon Alexandroff | |
| Name: | Brandon Alexandroff | |
| Title: | Chief Financial Officer | |
44